UNITED STATES
SECURITIES AND EXCHANGE COMMISSION
Washington, D.C. 20549
FORM N-CSR
CERTIFIED SHAREHOLDER REPORT OF REGISTERED
MANAGEMENT INVESTMENT COMPANIES
Investment Company Act file number 811-05742
BlackRock FundsSM
(Exact name of registrant as specified in charter)
100 Bellevue Parkway
Wilmington, DE 19809
(Address of principal executive offices) (Zip code)
Brian Kindelan, Esq.
BlackRock Advisors, Inc.
100 Bellevue Parkway
Wilmington, Delaware 19809
(Name and address of agent for service)
Registrant’s telephone number, including area code: (800) 441-7762
Date of fiscal year end: September 30, 2005
Date of reporting period: March 31, 2005
Form N-CSR is to be used by management investment companies to file reports with the Commission not later than 10 days after the transmission to stockholders of any report that is required to be transmitted to stockholders under Rule 30e-1 under the Investment Company Act of 1940 (17 CFR 270.30e-1). The Commission may use the information provided on Form N-CSR in its regulatory, disclosure review, inspection, and policymaking roles.
A registrant is required to disclose the information specified by Form N-CSR, and the Commission will make this information public. A registrant is not required to respond to the collection of information contained in Form N-CSR unless the Form displays a currently valid Office of Management and Budget (“OMB”) control number. Please direct comments concerning the accuracy of the information collection burden estimate and any suggestions for reducing the burden to Secretary, Securities and Exchange Commission, 450 Fifth Street, NW, Washington, DC 20549-0609. The OMB has reviewed this collection of information under the clearance requirements of 44 U.S.C. § 3507.
| Item 1. | Reports to Stockholders. |
The Report to Shareholders is attached herewith.
ALTERNATIVES  BLACKROCK SOLUTIONS  EQUITIES  FIXED
 INCOME  LIQUIDITYREAL ESTATE BlackRock Funds


Equity Portfolios


Semi-Annual Report to Shareholders

March 31, 2005 (Unaudited)

[GRAPHIC OMITTED]


[GRAPHIC OMITTED]


[GRAPHIC OMITTED]


NOT FDIC INSURED
MAY LOSE VALUE
NO BANK GUARANTEE
                                BLACKROCK FUNDS
                               EQUITY PORTFOLIOS
*Investment Trust
*Large Cap Value Equity
*Large Cap Growth Equity
*Dividend AchieversTM
*Legacy
*Mid-Cap Value Equity
                          *Mid-Cap Growth Equity
                          *Aurora
                          *Small/Mid-Cap Growth
                          *Small Cap Value Equity
                          *Small Cap Core Equity
                          *Small Cap Growth Equity
                          *Global Science & Technology Opportunities
                                                     *Global Resources
                                                     *All-Cap Global Resources
                                                     *Health Sciences
                                                     *U.S. Opportunities
                                                     *International
                                                     Opportunities
                                                     *Asset Allocation
                                                     *Index Equity
                               TABLE OF CONTENTS

Shareholder Letter..........................................................1
Portfolio Summaries
  Investment Trust........................................................2-3
  Large Cap Value Equity..................................................4-5
  Large Cap Growth Equity.................................................6-7
  Dividend AchieversTM....................................................8-9
  Legacy................................................................10-11
  Mid-Cap Value Equity..................................................12-13
  Mid-Cap Growth Equity.................................................14-15
  Aurora................................................................16-17
  Small/Mid-Cap Growth..................................................18-19
  Small Cap Value Equity................................................20-21
  Small Cap Core Equity.................................................22-23
  Small Cap Growth Equity...............................................24-25
  Global Science & Technology Opportunities.............................26-27
  Global Resources......................................................28-29
  All-Cap Global Resources.................................................30
  Health Sciences.......................................................31-32
  U.S. Opportunities....................................................33-34
  International Opportunities...........................................35-36
  Asset Allocation......................................................37-38
  Index Equity..........................................................39-40
  Note on Performance Information..........................................41
Statement of Net Assets/Schedule of Investments........................42-110
  Health Sciences Statement of Assets and Liabilities......................81
Portfolio Financial Statements
  Statements of Operations............................................112-115
  Statements of Changes in Net Assets.................................116-123
  Financial Highlights................................................124-149
Notes to Financial Statements.........................................150-191
Additional Information................................................192-196
DFA Investment Trust Company Annual Report............................197-228

                     PRIVACY PRINCIPLES OF BLACKROCK FUNDS
BlackRock Funds is committed to maintaining the privacy of its shareholders and
to safeguarding their nonpublic personal information. The following information
is provided to help you understand what personal information BlackRock Funds
collects, how we protect that information, and why in certain cases we may
share such information with select other parties.
BlackRock Funds does not receive any nonpublic personal information relating to
its shareholders who purchase shares through their broker-dealers. In the case
of shareholders who are record owners of BlackRock Funds, BlackRock Funds
receives nonpublic personal information on account applications or other forms.
With respect to these shareholders, BlackRock Funds also has access to specific
information regarding their transactions in BlackRock Funds.
BlackRock Funds does not disclose any nonpublic personal information about its
shareholders or former shareholders to anyone, except as permitted by law or as
is necessary in order to service our shareholders' accounts (for example, to a
transfer agent).
BlackRock Funds restricts access to nonpublic personal information about its
shareholders to BlackRock employees with a legitimate business need for the
information. BlackRock Funds maintains physical, electronic and procedural
safeguards designed to protect the nonpublic personal information of our
shareholders.
                                BLACKROCK FUNDS


March 31, 2005


Dear Shareholder:


     We are pleased to present the Semi-Annual Report to Shareholders of the
BlackRock Funds' Equity Portfolios for the period ended March 31, 2005. The
Semi-Annual Report includes important information on each Portfolio, and is
organized as follows:

o   Portfolio Summary - discusses recent portfolio management activity and
highlights total returns.

o   Fund Profile - displays characteristics of each Portfolio's holdings as of
    March 31, 2005.

o   Expense Example - discusses costs in a shareholder account and provides
    information for a shareholder to estimate his or her expenses by share
    class and to compare expenses of each share class to other funds.

o   Statement of Net Assets (or Schedule of Investments/Statement of Assets and
    Liabilities) -  - lists portfolio holdings and includes each holding's
    market value and par amount/number of shares as of March 31, 2005. The
    Statement of Net Assets also contains the net asset value for each share
    class of a Portfolio. If your Portfolio has a Schedule of Investments,
    then the net asset value for each share class may be found in the
    Statement of Assets and Liabilities.

o   Statement of Operations -  displays the components of each Portfolio's
    investment income and provides a detailed look at each Portfolio's
    expenses. The Statement of Operations also lists the aggregate change in
    value of a Portfolio's securities due to market fluctuations and security
    sales.

o   Statement of Changes in Net Assets -  compares Portfolio information from
    the prior period to the current period. Specifically, it details
    shareholder distributions by share class, aggregate realized gains and
    losses, and the change in net assets from the beginning of the period to
    the end of the period.

o   Financial Highlights -  include each Portfolio's expense ratios, net asset
    values, total returns, distributions per share, and turnover ratios for
    the current period and the last five years or since inception.

o   Notes to Financial Statements -  provides additional information on fees, a
    summary of significant accounting policies, a list of affiliated
    transactions, and a summary of purchases and sales of securities.

     In addition to these items, a summary of shareholder privileges is listed
on the inside back cover of the report. Shareholders can find information on
this page describing how to access account balances, recent transactions, and
share prices. It also includes a summary of the Fund's various investment
plans.

     There were two notable recent developments for the BlackRock Funds (the
"Fund").

     First, on January 31, 2005, BlackRock, Inc., the parent of BlackRock
Advisors, Inc., the Fund's investment adviser, acquired SSRM Holdings, Inc.,
the parent of State Street Research & Management Company, the investment
adviser to the former State Street Research Funds. The transaction enhances
BlackRock's investment management platform with additional US equity,
alternative investment, and real estate equity management capabilities. In
addition, the scale and scope of BlackRock's open-end and closed-end mutual
funds and distribution capabilities has expanded significantly. We believe that
we can incorporate the best of both organizations to deliver high quality
products to both institutional and individual investors.

     Second, a proxy statement was recently sent to shareholders of all
portfolios of the Fund asking them to consider and vote upon the election of
nine trustees to the board of trustees of the Fund (the "Board"). Five of the
nine nominees were already serving as trustees of the Fund and the additional
nominees had previously served as trustees of the State Street Research Funds.
Due to the increased size and complexity of the Fund resulting from the
reorganization with the State Street Research Funds, and an increase in the
responsibilities of boards of trustees of funds generally, the current Board
believed it was in the best interest of the Fund to increase the size of the
Board. On April 29, 2005, the special meeting of shareholders was held, at
which all of the nominees included in the proxy were duly elected to the Board.


     We hope you find the report informative, and we thank you for making
BlackRock part of your investment strategy.

Sincerely,
[GRAPHIC OMITTED]


 Anne Ackerley
Managing Director
BlackRock Advisors,Inc.

                                                                               1
                          INVESTMENT TRUST PORTFOLIO


Total Net Assets (3/31/05): $1.4 billion


Performance Benchmark

     S&P 500(Reg. TM) Index


Investment Approach

     Seeks long-term capital appreciation. The Portfolio normally invests at
least 80% of its assets in equity securities. The portfolio management team
uses quantitative techniques to analyze a universe of approximately 800
companies, including those in the S&P 500(Reg. TM) Index and about 300 other
large and medium capitalization companies. Using a multi-factor model, the
management team identifies stocks with rising earnings expectations that sell
at low relative valuations when compared with their sector peers. Based on this
information, and using sophisticated risk measurement tools, the portfolio
management team selects stocks, together with their appropriate weightings,
that it believes will maximize the Portfolio's return per unit of risk. The
Portfolio seeks to maintain market capitalization, sector allocations and style
characteristics similar to the S&P 500(Reg. TM) Index.
Recent Portfolio Management Activity


     o  On January 31, 2005, BlackRock, Inc., the parent of BlackRock Advisors,
Inc. (BAI), acquired SSRM Holdings, Inc., the parent of State Street Research &
Management Company (SSRM), the investment adviser to the State Street Research
mutual funds. In connection with the transaction, the BlackRock Select Equity
Portfolio reorganized with the State Street Research Large Cap Analyst and
Investment Trust Funds (the SSR Funds) and was renamed the BlackRock Investment
Trust Portfolio (the Portfolio). The SSR Funds transferred substantially all of
its assets and liabilities to the Portfolio in exchange for shares of the
Portfolio, which were then distributed to the SSR Fund shareholders.


     o  All share classes outperformed the benchmark for the semi-annual
period.
     o  During the first half of the period the U.S. equity markets experienced
a strong rebound producing positive performance in each of the three months.
The strength of the rally came in November and December as investors appeared
relieved that the long contentious political season had come to an end.
Further, oil prices fell during the fourth quarter of 2004 further fueling the
rally. However, during the second half of the period, the U.S. equity markets
faltered. Investors' concerns centered on rising oil prices, mounting
inflationary pressures and the continued "measured pace" of interest rate
increases from the Federal Open Market Committee. Given this climate of
uncertainty, investors consistently shunned the riskiest stocks as their risk
appetite apparently faded.


     o  During the first half of the period, all share classes of the Portfolio
outperformed the benchmark as the multi-factor model was predictive. Model
strength was driven by the valuation factors while earnings expectation factors
were only periodically predictive. Forecast earnings to price, book to price
and cash flow to price were the strongest performing individual factors. From a
relative return perspective, the consumer cyclicals, utilities and consumer
non-cyclicals sectors helped performance while the technology and finance
sectors hurt relative performance versus the benchmark. The Portfolio's
overweight positions in highly ranked Black & Decker, Nordstrom, Texas
Utilities, Exelon, Constellation Brands and Archer Daniels Midland contributed
positively to relative performance. The avoidance of lower ranked Apple
Computer, EMC, Fannie Mae and American Express hurt relative performance.


     o  During the second half of the period, the multi-factor model was
generally predictive as both the valuation side and the earnings expectation
side aided in stock selection. The Institutional, Service and Investor A share
classes outperformed the benchmark while the Investor B and C share classes
underperformed the benchmark. The estimate momentum, forecast earnings to price
and forecast estimate dispersion factors were particularly powerful. From a
relative return perspective, the health care, technology and transportation
sectors led the way in delivering excess returns relative to the benchmark. In
the health care sector, the avoidance of poorly ranked Biogen Idec coupled with
the overweight of Bausch & Lomb helped performance relative to the benchmark.
The avoidance of poorly ranked eBay drove solid results in the technology
sector while in the transportation sector, the avoidance of low-ranked United
Parcel Service coupled with the overweight of highly ranked Burlington Northern
Santa Fe also aided relative performance. The weakest sector was the commercial
services sector, where the Portfolio's position in highly ranked Computer
Sciences Corp detracted from performance relative to the benchmark.


COMPARISON OF CHANGE IN VALUE OF A $10,000 INVESTMENT IN THE INVESTMENT TRUST
                                   PORTFOLIO
             AND THE S&P 500(REG. TM) INDEX FOR THE PAST TEN YEARS.


                              [LINE CHART]

                 Institutional          Investor A     S&P 500256 Index
                 -------------          ----------     ----------------
03/31/1995          $ 10,000              $ 9,421          $ 10,000
06/30/1995            10,726               10,087            10,955
09/30/1995            11,510               10,823            11,825
12/31/1995            12,198               11,448            12,537
03/31/1996            12,819               12,017            13,210
06/30/1996            13,406               12,554            13,803
09/30/1996            13,795               12,904            14,230
12/31/1996            15,092               14,114            15,416
03/31/1997            15,490               14,471            15,829
06/30/1997            18,198               16,974            18,593
09/30/1997            19,657               18,317            19,985
12/31/1997            19,840               18,467            20,559
03/31/1998            22,576               20,995            23,427
06/30/1998            23,073               21,435            24,201
09/30/1998            20,457               18,980            21,793
12/31/1998            24,723               22,907            26,434
03/31/1999            25,824               23,918            27,751
06/30/1999            27,809               25,721            29,707
09/30/1999            25,973               23,998            27,853
12/31/1999            29,858               27,554            31,997
03/31/2000            30,345               27,991            32,731
06/30/2000            29,048               26,755            31,861
09/30/2000            28,088               25,831            31,553
12/31/2000            25,430               23,347            29,084
03/31/2001            21,310               19,540            25,636
06/30/2001            22,199               20,329            27,136
09/30/2001            18,176               16,638            23,153
12/31/2001            20,002               18,275            25,627
03/31/2002            19,226               17,561            25,698
06/30/2002            16,334               14,897            22,255
09/30/2002            13,733               12,516            18,410
12/31/2002            14,789               13,450            19,964
03/31/2003            14,331               13,030            19,335
06/30/2003            16,406               14,891            22,312
09/30/2003            16,864               15,281            22,902
12/31/2003            18,906               17,107            25,690
03/31/2004            19,682               17,802            26,125
06/30/2004            19,881               17,953            26,575
09/30/2004            19,749               17,817            26,078
12/31/2004            21,661               19,508            28,486
03/31/2005            21,262               19,129            27,874


                            FOR PERIOD ENDING MARCH 31, 2005

                                 Average Annual Total Return
                                            1 Year       3 Year         5 Year        10 Year
                                          ----------   ----------   -------------   ----------
     Institutional Class                      8.02%        3.41%         (6.87)%        7.83%
     Service Class                            7.73%        3.08%         (7.16)%        7.51%
     Investor A Class (Load Adjusted)         1.26%        0.88%         (8.42)%        6.70%
     Investor A Class (NAV)                   7.45%        2.89%         (7.33)%        7.34%
     Investor B Class (Load Adjusted)         2.30%        1.04%         (8.30)%        6.62%
     Investor B Class (NAV)                   6.80%        2.17%         (7.99)%        6.62%
     Investor C Class (Load Adjusted)         5.80%        2.16%         (7.99)%        6.62%
     Investor C Class (NAV)                   6.80%        2.16%         (7.99)%        6.62%

THE PERFORMANCE INFORMATION ABOVE INCLUDES INFORMATION RELATING TO EACH CLASS
OF THE PORTFOLIO SINCE THE COMMENCEMENT OF OPERATIONS OF THE PORTFOLIO, RATHER
THAN THE DATE SUCH CLASS WAS INTRODUCED. THE INCEPTION DATES OF THE PORTFOLIO'S
SHARE CLASSES WERE AS FOLLOWS: INSTITUTIONAL SHARES, 9/13 /93; SERVICE SHARES,
9/15/93; INVESTOR A SHARES, 10/13/93; INVESTOR B SHARES, 3/27/96; AND INVESTOR
C SHARES, 9/27/96. SEE "NOTE ON PERFORMANCE INFORMATION" ON PAGE 41 FOR FURTHER
INFORMATION ON HOW PERFORMANCE DATA WAS CALCULATED,INCLUDING IMPORTANT
INFORMATION ON THE LINE GRAPH ABOVE.


PAST PERFORMANCE IS NOT PREDICTIVE OF FUTURE RESULTS. The graph and table do
not reflect the deduction of taxes that a shareholder would pay on fund
distributions or the redemption of shares. Although the holdings and sectors
listed above were current as of the periods indicated, the Portfolio is
actively managed and its composition will vary.


2
                          INVESTMENT TRUST PORTFOLIO

FUND PROFILE


  Top Ten Holdings (% of long-term investments)
General Electric Co.                    3.9 %
Exxon Mobil Corp.                       3.5
Microsoft Corp.                         3.1
Citigroup, Inc.                         2.5
Pfizer, Inc.                            2.4
Intel Corp.                             2.4
Bank of America Corp.                   2.3
International Business Machines Corp.   2.2
PepsiCo                                 1.7
The Procter & Gamble Co.                1.7
                                        ---
     Total                              25.7 %
                                        =======


   Top Ten Industries (% of long-term
              investments)
Manufacturing                  10.2 %
Oil & Gas                      8.6
Finance                        7.3
Banks                          6.7
Retail Merchandising           6.0
Pharmaceuticals                5.6
Computer & Office Equipment    5.2
Computer Software & Services   5.1
Insurance                      4.8
Telecommunications             4.0
                               ---
     Total                     63.5 %
                               ========


- --------------------------------------------------------------------------------
EXPENSE EXAMPLE


As a shareholder of the Portfolio, you incur two types of costs: (1)
transaction costs, including front and back end sales charges (loads) or
redemption/exchange fees, where applicable; and (2) ongoing costs, including
advisory fees, distribution (12b-1) and service fees, where applicable; and
other Portfolio expenses. This Example is intended to help you understand your
ongoing costs (in dollars) of investing in the Portfolio and to compare these
costs with the ongoing costs of investing in other mutual funds.


The Example below is based on an investment of $1,000 invested at the beginning
of the period and held for the entire period October 1, 2004 to March 31, 2005.


The information under "Actual Expenses," together with the amount you invested,
allows you to estimate actual expenses incurred over the reporting period.
Simply divide your account value by $1,000 (for example, an $8,600 account
value divided by $1,000 = 8.60) and multiply the result by the cost shown for
your share class, in the row entitled "Expenses Incurred During Period", to
estimate the expenses incurred on your account during this period.


The information under "Hypothetical Expenses" provides information about
hypothetical account values and hypothetical expenses based on the Portfolio's
actual expense ratio and an assumed rate of return of 5% per year before
expenses, which is not the Portfolio's actual return. The hypothetical account
values and expenses may not be used to estimate the actual ending account
balance or expense you incurred for the period. You may use this information to
compare the ongoing costs of investing in the Portfolio and other funds. To do
so, compare this 5% hypothetical example with the 5% hypothetical examples that
appear in the shareholder reports of the other funds.


Please note that the expenses shown in the table are meant to highlight your
ongoing costs only and do not reflect any transactional costs, such as front
and back end sales charges (loads) or redemption/exchange fees, where
applicable. Therefore, the hypothetical information is useful in comparing
ongoing costs only, and will not help you determine the relative total costs of
owning different funds. In addition, if these transactional costs were
included, your costs would have been higher.


                                                        Actual Expenses
                        -------------------------------------------------------------------------------
                         Institutional      Service         Investor        Investor        Investor
                             Class           Class          A Class         B Class         C Class
                        --------------- --------------- --------------- --------------- ---------------
Beginning Account
 Value (10/01/04)        $   1,000.00    $   1,000.00    $   1,000.00    $   1,000.00    $   1,000.00
Ending Account Value
 (3/31/05)                   1,076.60        1,074.60        1,073.60        1,069.90        1,069.90
Expenses Incurred
 During Period
 (10/01/04 -
  3/31/05)                       4.18            5.73            5.98            9.88            9.88


                                                     Hypothetical Expenses
                                                  (5% return before expenses)
                        -------------------------------------------------------------------------------
                         Institutional      Service         Investor        Investor        Investor
                             Class           Class          A Class         B Class         C Class
                        --------------- --------------- --------------- --------------- ---------------
Beginning Account
 Value (10/01/04)        $   1,000.00    $   1,000.00    $   1,000.00    $   1,000.00    $   1,000.00
Ending Account Value
 (3/31/05)                   1,020.92        1,019.41        1,019.16        1,015.33        1,015.33
Expenses Incurred
 During Period
 (10/01/04 -
  3/31/05)                       4.08            5.59            5.84            9.67            9.67

For each class of the Portfolio, expenses are equal to the annualized expense
ratio of  0.81%, 1.11%, 1.16%, 1.92%, and 1.92% for the Institutional, Service,
Investor A, B, and C share classes, respectively, multiplied by the average
account value over the period, multiplied by 182/365 (to reflect the one-half
year period).


                                                                               3
                       LARGE CAP VALUE EQUITY PORTFOLIO


Total Net Assets (3/31/05): $368.2 million


Performance Benchmark

     Russell 1000 Value Index


Investment Approach

     Seeks long-term capital appreciation with a secondary objective of current
income by investing at least 80% of its net assets in equity securities issued
by U.S. large capitalization value companies (defined as those with market
capitalizations equal to those within the universe of Russell 1000 Value Index
stocks). The portfolio management team uses quantitative techniques to analyze
a universe of approximately 800 value companies. The management team uses a
multi-factor model, which identifies the key factors that drive the performance
of value stocks. Using this multi-factor model, the management team identifies
stocks with low relative valuations and improving earnings expectations when
compared with their sector peers. Based on this information, and using
sophisticated risk measurement tools, the management team selects stocks,
together with their appropriate weightings, that it believes will maximize the
Portfolio's return per unit of risk. The Portfolio seeks to maintain market
capitalization, sector allocations and style characteristics similar to those
of the Russell 1000 Value Index.
Recent Portfolio Management Activity


     o  On January 31, 2005, BlackRock, Inc., the parent of BlackRock Advisors,
Inc. (BAI), acquired SSRM Holdings, Inc., the parent of State Street Research &
Management Company (SSRM), the investment adviser to the State Street Research
mutual funds. In connection with the transaction, the BlackRock Large Cap Value
Equity Portfolio (the Portfolio) reorganized with the State Street Research
Large Cap Value Fund (the SSR Fund). The SSR Fund transferred substantially all
of its assets and liabilities to the Portfolio in exchange for shares of the
Portfolio, which were then distributed to the SSR Fund shareholders.


     o  All share classes underperformed the benchmark for the semi-annual
period.
     o  During the first half of the period the U.S. equity markets experienced
a strong rebound producing positive performance in each of the three months.
The strength of the rally came in November and December as investors appeared
relieved that the long contentious political season had come to an end.
Further, oil prices fell during the fourth quarter of 2004 further fueling the
rally. However, during the second half of the period, the U.S. equity markets
faltered. Investors' concerns centered on rising oil prices, mounting
inflationary pressures and the continued "measured pace" of interest rate
increases from the Federal Open Market Committee. Given this climate of
uncertainty, investors consistently shunned the riskiest stocks as their risk
appetite apparently faded.


     o  During the first half of the period, all share classes of the Portfolio
under-performed the benchmark. The multi-factor model was essentially flat or
not predictive, producing mixed results. Valuation factors produced modest
predictive power while earnings expectation factors were slightly negative. The
forecast earnings to price, book to price, estimate momentum and earnings
revisions up were individual factors that showed some predictive power while
the earnings revisions down and forecast estimate dispersion factors were
negative. From a relative return perspective, the utilities and consumer
services sectors helped performance while the healthcare, consumer cyclicals
and basic materials sectors each hurt relative performance. The Portfolio's
overweight positions in highly ranked Texas Utilities, Disney and McGraw Hill,
contributed positively to relative performance. Generally, poor stock selection
in the healthcare sector hurt relative performance.


     o  During the second half of the period, the model was generally
predictive as both the valuation side and the earnings expectation side helped
in stock selection. All share classes of the Portfolio outperformed the
benchmark. The factors that were particularly powerful included price momentum,
estimate momentum, forecast earnings to price and forecast estimate dispersion.
From a relative return perspective, the utility, health care and technology
sectors led the way in delivering excess returns. In the utility sector, the
Portfolio's position in highly ranked Constellation Energy Group helped overall
performance. In the health care sector, the Portfolio's position in Coventry
Health Care drove solid results. The avoidance of poorly ranked Lucent
Technologies led to strength in the technology sector. The weakest sector was
the industrial sector which was off modestly due to the Portfolio's position in
Tyco.


COMPARISON OF CHANGE IN VALUE OF A $10,000 INVESTMENT IN THE LARGE CAP VALUE
                                EQUITY PORTFOLIO
            AND THE RUSSELL 1000 VALUE INDEX FOR THE PAST TEN YEARS.


                                  [LINE CHART]

                 Institutional          Investor A     Russell 1000 Value Index
                 -------------          ----------     ------------------------
03/31/1995          $ 10,000              $ 9,425              $ 10,000
06/30/1995            10,790               10,159                10,896
09/30/1995            11,601               10,912                11,848
12/31/1995            12,419               11,667                12,634
03/31/1996            13,123               12,315                13,350
06/30/1996            13,574               12,730                13,579
09/30/1996            14,039               13,152                13,974
12/31/1996            15,423               14,444                15,368
03/31/1997            15,681               14,661                15,762
06/30/1997            17,832               16,645                18,086
09/30/1997            19,326               18,019                19,887
12/31/1997            19,842               18,492                20,775
03/31/1998            22,334               20,780                23,197
06/30/1998            21,998               20,447                23,301
09/30/1998            18,887               17,546                20,601
12/31/1998            21,922               20,335                24,022
03/31/1999            22,171               20,546                24,367
06/30/1999            24,702               22,857                27,114
09/30/1999            21,792               20,151                24,459
12/31/1999            22,720               21,002                25,789
03/31/2000            22,386               20,656                25,912
06/30/2000            21,354               19,681                24,698
09/30/2000            23,151               21,302                26,641
12/31/2000            24,986               22,979                27,599
03/31/2001            23,520               21,585                25,983
06/30/2001            24,206               22,206                27,252
09/30/2001            21,247               19,462                24,267
12/31/2001            22,544               20,623                26,056
03/31/2002            22,445               20,512                27,122
06/30/2002            18,797               17,154                24,812
09/30/2002            15,423               14,072                20,154
12/31/2002            17,144               15,605                22,012
03/31/2003            16,218               14,745                20,941
06/30/2003            18,844               17,130                24,559
09/30/2003            19,114               17,354                25,066
12/31/2003            21,562               19,536                28,623
03/31/2004            22,500               20,365                29,490
06/30/2004            22,571               20,404                29,749
09/30/2004            22,873               20,684                30,209
12/31/2004            25,148               22,704                33,344
03/31/2005            25,263               22,789                33,373


                        FOR PERIOD ENDING MARCH 31, 2005

                                Average Annual Total Return
                                             1 Year       3 Year       5 Year       10 Year
                                          -----------   ----------   ----------   ----------
     Institutional Class                      12.28%        4.02%        2.45%        9.71%
     Service Class                            11.98%        3.70%        2.15%        9.39%
     Investor A Class (Load Adjusted)          5.45%        1.54%        0.78%        8.59%
     Investor A Class (NAV)                   11.90%        3.57%        1.99%        9.23%
     Investor B Class (Load Adjusted)          6.41%        1.63%        0.84%        8.46%
     Investor B Class (NAV)                   10.91%        2.75%        1.20%        8.46%
     Investor C Class (Load Adjusted)          9.95%        2.76%        1.22%        8.47%
     Investor C Class (NAV)                   10.95%        2.76%        1.22%        8.47%

THE PERFORMANCE INFORMATION ABOVE INCLUDES INFORMATION RELATING TO EACH CLASS
OF THE PORTFOLIO SINCE THE COMMENCEMENT OF OPERATIONS OF THE PORTFOLIO, RATHER
THAN THE DATE SUCH CLASS WAS INTRODUCED. THE INCEPTION DATES OF THE PORTFOLIO'S
SHARE CLASSES WERE AS FOLLOWS: INSTITUTIONAL SHARES, 4 /20/92; INVESTOR A
SHARES, 5/2/92; SERVICE SHARES, 7/29/93; INVESTOR B SHARES, 1/18/96; AND
INVESTOR C SHARES, 8/16/96. SEE "NOTE ON PERFORMANCE INFORMATION" ON PAGE 41
FOR FURTHER INFORMATION ON HOW PERFORMANCE DATA WAS CALCULATED, INCLUDING
IMPORTANT INFORMATION ON THE LINE GRAPH ABOVE.


PAST PERFORMANCE IS NOT PREDICTIVE OF FUTURE RESULTS. The graph and table do
not reflect the deduction of taxes that a shareholder would pay on fund
distributions or the redemption of shares. Although the holdings and sectors
listed above were current as of the periods indicated, the Portfolio is
actively managed and its composition will vary.


4
                       LARGE CAP VALUE EQUITY PORTFOLIO

FUND PROFILE


    Top Ten Holdings (% of long-term
              investments)
Exxon Mobil Corp.              6.6 %
General Electric Co.           5.4
Citigroup, Inc.                4.4
Bank of America Corp.          4.2
Altria Group, Inc.             2.6
ConocoPhillips                 2.2
Wachovia Corp.                 2.1
ChevronTexaco Corp.            2.0
Verizon Communications, Inc.   1.9
U.S. Bancorp                   1.8
                               ---
     Total                     33.2 %
                               =======


 Top Ten Industries (% of long-term
            investments)
Oil & Gas                 14.4 %
Banks                     12.6
Manufacturing             10.2
Finance                    8.9
Energy & Utilities         6.0
Telecommunications         5.6
Insurance                  5.3
Retail Merchandising       5.0
Entertainment & Leisure    3.3
Real Estate                2.9
                          ----
     Total                74.2 %
                          ========


- --------------------------------------------------------------------------------
EXPENSE EXAMPLE


As a shareholder of the Portfolio, you incur two types of costs: (1)
transaction costs, including front and back end sales charges (loads) or
redemption/exchange fees, where applicable; and (2) ongoing costs, including
advisory fees, distribution (12b-1) and service fees, where applicable; and
other Portfolio expenses. This Example is intended to help you understand your
ongoing costs (in dollars) of investing in the Portfolio and to compare these
costs with the ongoing costs of investing in other mutual funds.


The Example below is based on an investment of $1,000 invested at the beginning
of the period and held for the entire period October 1, 2004 to March 31, 2005.


The information under "Actual Expenses," together with the amount you invested,
allows you to estimate actual expenses incurred over the reporting period.
Simply divide your account value by $1,000 (for example, an $8,600 account
value divided by $1,000 = 8.60) and multiply the result by the cost shown for
your share class, in the row entitled "Expenses Incurred During Period", to
estimate the expenses incurred on your account during this period.


The information under "Hypothetical Expenses" provides information about
hypothetical account values and hypothetical expenses based on the Portfolio's
actual expense ratio and an assumed rate of return of 5% per year before
expenses, which is not the Portfolio's actual return. The hypothetical account
values and expenses may not be used to estimate the actual ending account
balance or expense you incurred for the period. You may use this information to
compare the ongoing costs of investing in the Portfolio and other funds. To do
so, compare this 5% hypothetical example with the 5% hypothetical examples that
appear in the shareholder reports of the other funds.


Please note that the expenses shown in the table are meant to highlight your
ongoing costs only and do not reflect any transactional costs, such as front
and back end sales charges (loads) or redemption/exchange fees, where
applicable. Therefore, the hypothetical information is useful in comparing
ongoing costs only, and will not help you determine the relative total costs of
owning different funds. In addition, if these transactional costs were
included, your costs would have been higher.


                                                        Actual Expenses
                        -------------------------------------------------------------------------------
                         Institutional      Service         Investor        Investor        Investor
                             Class           Class          A Class         B Class         C Class
                        --------------- --------------- --------------- --------------- ---------------
Beginning Account
 Value (10/01/04)        $   1,000.00    $   1,000.00    $   1,000.00    $   1,000.00    $   1,000.00
Ending Account Value
 (3/31/05)                   1,104.50        1,103.20        1,101.80        1,097.30        1,097.30
Expenses Incurred
 During Period
 (10/01/04 -
  3/31/05)                       4.13            5.70            6.17           10.27           10.06


                                                     Hypothetical Expenses
                                                  (5% return before expenses)
                        -------------------------------------------------------------------------------
                         Institutional      Service         Investor        Investor        Investor
                             Class           Class          A Class         B Class         C Class
                        --------------- --------------- --------------- --------------- ---------------
Beginning Account
 Value (10/01/04)        $   1,000.00    $   1,000.00    $   1,000.00    $   1,000.00    $   1,000.00
Ending Account Value
 (3/31/05)                   1,021.02        1,019.51        1,019.06        1,015.08        1,015.28
Expenses Incurred
 During Period
 (10/01/04 -
  3/31/05)                       3.98            5.49            5.94            9.92            9.72

For each class of the Portfolio, expenses are equal to the annualized expense
ratio of 0.79%, 1.09%, 1.18%, 1.97%,  and 1.93% for the Institutional, Service,
Investor A, B, and C share classes, respectively, multiplied by the average
account value over the period, multiplied by 182/365 (to reflect the one-half
year period).


                                                                               5
                       LARGE CAP GROWTH EQUITY PORTFOLIO


Total Net Assets (3/31/05): $66.5 million


Performance Benchmark

     Russell 1000 Growth Index


Investment Approach

     Seeks long-term capital appreciation by investing at least 80% of its net
assets in equity securities issued by U.S. large capitalization growth
companies (defined as those with market capitalizations equal to those within
the universe of Russell 1000 Growth Index stocks). The portfolio management
team uses quantitative techniques to analyze a universe of approximately 700
growth companies. The management team uses a multi-factor model, which
identifies the key factors that drive the performance of growth stocks. Using
this multi-factor model, the management team identifies stocks with rising
earnings expectations that sell at attractive relative valuations when compared
with their sector peers. Based on this information, and using sophisticated
risk measurement tools, the management team selects stocks, together with their
appropriate weightings, that it believes will maximize the Portfolio's return
per unit of risk. The Portfolio seeks to maintain market capitalization, sector
allocations and style characteristics similar to those of the Russell 1000
Growth Index.


Recent Portfolio Management Activity


     o  All share classes outperformed the benchmark for the semi-annual
period.


     o  During the first half of the period the U.S. equity markets experienced
a strong rebound producing positive performance in each of the three months.
The strength of the rally came in November and December as investors appeared
relieved that the long contentious political season had come to an end.
Further, oil prices fell during the fourth quarter of 2004 further fueling the
rally. However, during the second half of the period, the U.S. equity markets
faltered. Investors' concerns centered on rising oil prices, mounting
inflationary pressures and the continued "measured pace" of interest rate
increases from the Federal Open Market Committee. Given this climate of
uncertainty, investors consistently shunned the riskiest stocks as their risk
appetite apparently faded.


     o  During the first half of the period, the multi-factor model was
predictive as all share classes of the Portfolio outperformed the benchmark.
Model strength was driven by the valuation factors while earnings expectation
factors were only periodically predictive. Forecast earnings to price, book to
price, cash flow to price, estimate momentum and earnings revisions up factors
were the strongest performing factors. From a relative return perspective, the
technology, basic materials and industrials sectors helped performance while
the consumer cyclicals sector hurt performance relative to the benchmark. The
Portfolio's overweight positions in highly ranked Advanced Micro Devices,
Verisign Inc., CheckFree, Nucor, Ball Corp., Parker Hannifin and Tyco
International contributed positively to relative performance. However, the
Portfolio's overweight position in highly ranked Claire's Stores hurt relative
performance to the benchmark.


     o  During the second half of the period, the model was consistently
predictive as both the valuation side and the earnings expectation side helped
in stock selection. All share classes of the Portfolio outperformed the
benchmark. The factors that were particularly powerful included price momentum,
estimate momentum, forecast earnings to price and book to price. From a
relative return perspective, the health care, technology and commercial
services sectors led the way in delivering excess returns versus the benchmark.
In the health care sector, the Portfolio's positions in highly ranked names
like Johnson & Johnson and Bausch & Lomb helped overall performance. The
avoidance of poorly ranked eBay drove solid results in the technology sector.
In the consumer services sector, the Portfolio's position in Darden Restaurants
helped performance relative to the benchmark. The weakest sector was the
commercial services sector where the Portfolio's position in highly ranked
Computer Sciences Corp detracted from performance.


COMPARISON OF CHANGE IN VALUE OF A $10,000 INVESTMENT IN THE LARGE CAP GROWTH
                                     EQUITY
      PORTFOLIO AND THE RUSSELL 1000 GROWTH INDEX FOR THE PAST TEN YEARS.


                                  [LINE CHART]

                 Institutional          Investor A     Russell 1000 Growth Index
                 -------------          ----------     -------------------------
03/31/1995          $ 10,000              $ 9,429               $ 10,000
06/30/1995            10,896               10,265                 10,982
09/30/1995            12,021               11,305                 11,979
12/31/1995            12,324               11,581                 12,525
03/31/1996            13,104               12,306                 13,197
06/30/1996            13,875               13,012                 14,037
09/30/1996            14,266               13,361                 14,543
12/31/1996            14,833               13,872                 15,421
03/31/1997            14,739               13,779                 15,504
06/30/1997            17,533               16,374                 18,436
09/30/1997            19,073               17,795                 19,821
12/31/1997            19,048               17,743                 20,122
03/31/1998            22,256               20,700                 23,171
06/30/1998            23,666               21,993                 24,223
09/30/1998            21,316               19,780                 22,023
12/31/1998            26,917               24,956                 27,911
03/31/1999            29,040               26,888                 29,685
06/30/1999            29,578               27,365                 30,828
09/30/1999            28,874               26,685                 29,699
12/31/1999            36,742               33,937                 37,166
03/31/2000            38,896               35,865                 39,815
06/30/2000            37,640               34,692                 38,740
09/30/2000            35,485               32,638                 36,656
12/31/2000            27,420               25,186                 28,832
03/31/2001            19,903               18,261                 22,806
06/30/2001            20,769               19,023                 24,726
09/30/2001            15,763               14,434                 19,927
12/31/2001            17,928               16,396                 22,943
03/31/2002            17,443               15,926                 22,350
06/30/2002            13,979               12,763                 18,177
09/30/2002            11,623               10,590                 15,442
12/31/2002            12,402               11,288                 16,546
03/31/2003            12,229               11,109                 16,369
06/30/2003            13,701               12,439                 18,711
09/30/2003            14,169               12,845                 19,443
12/31/2003            15,572               14,109                 21,468
03/31/2004            15,953               14,434                 21,637
06/30/2004            16,161               14,596                 22,056
09/30/2004            15,451               13,947                 20,904
12/31/2004            16,958               15,293                 22,821
03/31/2005            16,421               14,791                 21,888


                        FOR PERIOD ENDING MARCH 31, 2005

                                    Average Annual Total Return
                                             1 Year          3 Year          5 Year         10 Year
                                          ------------   -------------   --------------   ----------
     Institutional Class                       2.93%          (1.99)%         (15.84)%        5.08%
     Service Class                             2.55%          (2.30)%         (16.10)%        4.77%
     Investor A Class (Load Adjusted)         (3.39)%         (4.34)%         (17.22)%        3.99%
     Investor A Class (NAV)                    2.47%          (2.43)%         (16.23)%        4.60%
     Investor B Class (Load Adjusted)         (2.80)%         (4.32)%         (17.15)%        3.88%
     Investor B Class (NAV)                    1.70%          (3.17)%         (16.86)%        3.88%
     Investor C Class (Load Adjusted)          0.70%          (3.18)%         (16.87)%        3.87%
     Investor C Class (NAV)                    1.70%          (3.18)%         (16.87)%        3.87%

THE PERFORMANCE INFORMATION ABOVE INCLUDES INFORMATION RELATING TO EACH CLASS
OF THE PORTFOLIO SINCE THE COMMENCEMENT OF OPERATIONS OF THE PORTFOLIO, RATHER
THAN THE DATE SUCH CLASS WAS INTRODUCED. THE INCEPTION DATES OF THE PORTFOLIO'S
SHARE CLASSES WERE AS FOLLOWS: INSTITUTIONAL SHARES, 11/1/89; INVESTOR A
SHARES, 3/14/92; SERVICE SHARES, 7/29/93; INVESTOR B SHARES, 1/24/96; AND
INVESTOR C SHARES, 1/24/97. SEE "NOTE ON PERFORMANCE INFORMATION" ON PAGE 41
FOR FURTHER INFORMATION ON HOW PERFORMANCE DATA WAS CALCULATED, INCLUDING
IMPORTANT INFORMATION ON THE LINE GRAPH ABOVE.


PAST PERFORMANCE IS NOT PREDICTIVE OF FUTURE RESULTS. The graph and table do
not reflect the deduction of taxes that a shareholder would pay on fund
distributions or the redemption of shares. Although the holdings and sectors
listed above were current as of the periods indicated, the Portfolio is
actively managed and its composition will vary.


6
                       LARGE CAP GROWTH EQUITY PORTFOLIO

FUND PROFILE


  Top Ten Holdings (% of long-term investments)
Pfizer, Inc.                            4.5 %
Johnson & Johnson                       4.1
Microsoft Corp.                         3.9
Intel Corp.                             3.9
International Business Machines Corp.   3.0
Procter & Gamble Co.                    2.7
The Home Depot, Inc.                    2.1
UnitedHealth Group, Inc.                1.9
Pepsico, Inc.                           1.9
Wal-Mart Stores, Inc.                   1.8
                                        ---
     Total                              29.8 %
                                        =======


    Top Ten Industries (% of long-term
               investments)
Computer Software & Services     10.1 %
Pharmaceuticals                  9.6
Retail Merchandising             9.0
Medical Instruments & Supplies   8.1
Manufacturing                    8.0
Computer & Office Equipment      6.8
Electronics                      6.3
Finance                          4.4
Insurance                        4.2
Medical & Medical Services       4.1
                                 ---
     Total                       70.6 %
                                 ========


- --------------------------------------------------------------------------------
EXPENSE EXAMPLE


As a shareholder of the Portfolio, you incur two types of costs: (1)
transaction costs, including front and back end sales charges (loads) or
redemption/exchange fees, where applicable; and (2) ongoing costs, including
advisory fees, distribution (12b-1) and service fees, where applicable; and
other Portfolio expenses. This Example is intended to help you understand your
ongoing costs (in dollars) of investing in the Portfolio and to compare these
costs with the ongoing costs of investing in other mutual funds.


The Example below is based on an investment of $1,000 invested at the beginning
of the period and held for the entire period October 1, 2004 to March 31, 2005.


The information under "Actual Expenses," together with the amount you invested,
allows you to estimate actual expenses incurred over the reporting period.
Simply divide your account value by $1,000 (for example, an $8,600 account
value divided by $1,000 = 8.60) and multiply the result by the cost shown for
your share class, in the row entitled "Expenses Incurred During Period", to
estimate the expenses incurred on your account during this period.


The information under "Hypothetical Expenses" provides information about
hypothetical account values and hypothetical expenses based on the Portfolio's
actual expense ratio and an assumed rate of return of 5% per year before
expenses, which is not the Portfolio's actual return. The hypothetical account
values and expenses may not be used to estimate the actual ending account
balance or expense you incurred for the period. You may use this information to
compare the ongoing costs of investing in the Portfolio and other funds. To do
so, compare this 5% hypothetical example with the 5% hypothetical examples that
appear in the shareholder reports of the other funds.


Please note that the expenses shown in the table are meant to highlight your
ongoing costs only and do not reflect any transactional costs, such as front
and back end sales charges (loads) or redemption/exchange fees, where
applicable. Therefore, the hypothetical information is useful in comparing
ongoing costs only, and will not help you determine the relative total costs of
owning different funds. In addition, if these transactional costs were
included, your costs would have been higher.


                                                        Actual Expenses
                        -------------------------------------------------------------------------------
                         Institutional      Service         Investor        Investor        Investor
                             Class           Class          A Class         B Class         C Class
                        --------------- --------------- --------------- --------------- ---------------
Beginning Account
 Value (10/01/04)        $   1,000.00    $   1,000.00    $   1,000.00    $   1,000.00    $   1,000.00
Ending Account Value
 (3/31/05)                   1,062.80        1,061.90        1,060.50        1,056.80        1,056.90
Expenses Incurred
 During Period
 (10/01/04 -
  3/31/05)                       4.21            5.74            6.25           10.07           10.07


                                                     Hypothetical Expenses
                                                  (5% return before expenses)
                        --------------------------------------------------------------------------------
                         Institutional      Service         Investor        Investor        Investor
                             Class           Class          A Class         B Class         C Class
                        --------------- --------------- --------------- --------------- ---------------
Beginning Account
 Value (10/01/04)        $   1,000.00    $   1,000.00    $   1,000.00    $   1,000.00    $   1,000.00
Ending Account Value
 (3/31/05)                   1,020.87        1,019.36        1,018.86        1,015.08        1,015.08
Expenses Incurred
 During Period
 (10/01/04 -
  3/31/05)                       4.13            5.64            6.14            9.92            9.92

For each class of the Portfolio, expenses are equal to the annualized expense
ratio of 0.82%, 1.12%, 1.22%, 1.97%, and 1.97% for the Institutional, Service,
Investor A, B, and C share classes, respectively, multiplied by the average
account value over the period, multiplied by 182/365 (to reflect the one-half
year period).


                                                                               7
                        DIVIDEND ACHIEVERSTM PORTFOLIO


Total Net Assets (3/31/05): $26.4 million


Performance Benchmark

     Russell 1000 Value Index
Investment Approach


     Seeks to provide total return through a combination of current income and
capital appreciation by investing at least 80% of its assets in common stocks
included in the universe of common stocks which Mergent(Reg. TM), a recognized
provider of financial information, has identified as Dividend Achievers(TM). To
qualify for the Dividend Achievers(TM) universe, an issuer must have raised its
annual regular cash dividend on a pre-tax basis for at least each of the last
ten consecutive years. These issuers are also subject to additional screening
criteria applied by Mergent(Reg. TM) such as liquidity. The Portfolio will be
constructed from a broad universe of stocks that the Fund management team
believes to be value stocks and all stocks in the Dividend Achievers(TM)
universe. The portfolio management team screens these issuers utilizing
BlackRock's proprietary Quantitative Equity Model, which uses earnings momentum
and valuation factors to rank stocks within a sector and industry based upon
their expected return, to continuously evaluate fund holdings. The Portfolio
will be constructed with consideration of the characteristics of the Russell
1000 Value Index, such as style, sector, industry, capitalization and
volatility. The Portfolio may invest up to 20% of its assets in common stocks
of issuers that are not included in the Dividend Achievers(TM) universe, and in
fixed income securities when, in the opinion of the portfolio management team,
it is advantageous for the Portfolio to do so.


Recent Portfolio Management Activity
     o  All share classes underperformed the benchmark for the semi-annual
period.
     o  During the first half of the period the U.S. equity markets experienced
a strong rebound producing positive performance in each of the three months.
The strength of the rally came in November and December as investors appeared
relieved that the long contentious political season had come to an end.
Further, oil prices fell during the fourth quarter of 2004 further fueling the
rally. However, during the second half of the period, the U.S. equity markets
faltered. Investors' concerns centered on rising oil prices, mounting
inflationary pressures and the continued "measured pace" of interest rate
increases from the

Federal Open Market Committee. Given this climate of uncertainty, investors
consistently shunned the riskiest stocks as their risk appetite apparently
faded.


     o  During the first half of the period, none of the three primary stock
selection criteria for the Portfolio helped performance as all share classes
underperformed the benchmark. The Mergent's Dividend Achievers(TM) Index
underperformed the broader market, dividend-paying stocks underperformed
non-dividend paying stocks and the multi-factor model was essentially flat or
not predictive during the period. Valuation factors produced modest predictive
power while earnings expectation factors were slightly negative. The forecast
earnings to price, book to price, estimate momentum and earnings revisions up
were individual factors that showed some predictive power while earnings
revisions down and forecast estimate dispersion were negative. From a relative
return perspective, the consumer non-cyclicals and finance sectors helped
performance while the consumer cyclicals and technology sectors each hurt
performance relative to the benchmark. The Portfolio's overweight positions in
highly ranked Altria and John Nuveen contributed positively to relative
performance. The avoidance of Sears, Apple Computer and Hewlett Packard, none
of which are Dividend Achievers(TM), hurt relative performance.


     o  During the second half of the period, the Portfolio's objective to
invest at least 80% of the portfolio in Dividend Achievers(TM) created
headwinds for the Portfolio as the Mergent's Dividend Achievers(TM) Index
underperformed the Russell 1000 Value Index. All share classes of the Portfolio
underperformed the benchmark. The drive for yield also led to a slight
overweight in financials and a slight underweight in energy stocks which
created additional pressure on the Portfolio's performance. The multi-factor
model was generally predictive as both the valuation side and the earnings
expectation side helped in stock selection throughout the period. The factors
that were particularly powerful included estimate momentum, forecast earnings
to price and forecast estimate dispersion. From a relative return perspective,
the weakest sectors included the financial, energy and utility sectors.
Positions in the financials sector that hurt performance included Doral Corp
and United Dominion Realty, both of which are Dividend Achievers(TM). The
Portfolio's position in the energy sector detracted from performance relative
to the benchmark due to the performance of some stocks not held by the
Portfolio - namely Valero and Occidental Petroleum. The same was true in the
utility sector where un-owned Texas Utilities surged. On a positive note, the
technology sector, led by the avoidance of Lucent Technologies, helped offset
some of the weakness.


COMPARISON OF CHANGE IN VALUE OF A $10,000 INVESTMENT IN THE DIVIDEND
                                  ACHIEVERSTM
           PORTFOLIO AND THE RUSSELL 1000 VALUE INDEX FROM INCEPTION.


                                  [LINE CHART]

                 Institutional          Investor A     Russell 1000 Value Index
                 -------------          ----------     ------------------------
09/08/2004          $ 10,000              $ 9,425              $ 10,000
09/30/2004            9,960                9,387                10,026
12/31/2004            10,743               10,132                11,067
03/31/2005            10,549                9,932                11,077


                        FOR PERIOD ENDING MARCH 31, 2005

                             Average Annual Total Return
                                                                        From Inception
                                                                       ---------------
     Institutional Class                                                     5.49%
     Service Class                                                           5.14%
     Investor A Class (Load Adjusted)                                       (0.68)%
     Investor A Class (NAV)                                                  5.38%
     Investor B Class (Load Adjusted)                                        0.69%
     Investor B Class (NAV)                                                  5.19%
     Investor C Class (Load Adjusted)                                        4.06%
     Investor C Class (NAV)                                                  5.06%

THE PERFORMANCE INFORMATION ABOVE INCLUDES INFORMATION RELATING TO EACH CLASS
OF THE PORTFOLIO SINCE THE COMMENCEMENT OF OPERATIONS OF THE PORTFOLIO ON
9/8/04. SEE "NOTE ON PERFORMANCE INFORMATION" ON PAGE 41 FOR FURTHER
INFORMATION ON HOW PERFORMANCE DATA WAS CALCULATED, INCLUDING IMPORTANT
INFORMATION ON THE LINE GRAPH ABOVE.


PAST PERFORMANCE IS NOT PREDICTIVE OF FUTURE RESULTS. The graph and table do
not reflect the deduction of taxes that a shareholder would pay on fund
distributions or the redemption of shares. Although the holdings and sectors
listed above were current as of the periods indicated, the Portfolio is
actively managed and its composition will vary.


8
                        DIVIDEND ACHIEVERSTM PORTFOLIO

FUND PROFILE


    Top Ten Holdings (% of long-term
              investments)
Exxon Mobil Corp.              6.4 %
General Electric Co.           5.4
ChevronTexaco Corp.            4.4
Citigroup, Inc.                4.3
Bank of America Corp.          4.0
Altria Group, Inc.             3.1
SBC Communications, Inc.       2.0
McDonald's Corp.               1.9
Wells Fargo & Co.              1.9
Verizon Communications, Inc.   1.6
                               ---
     Total                     35.0 %
                               =======


Top Ten Industries (% of long-term
          investments)
Oil & Gas              13.5 %
Banks                  13.1
Manufacturing          10.4
Finance                 9.4
Real Estate             6.0
Insurance               5.9
Energy & Utilities      5.6
Telecommunications      5.4
Retail Merchandising    3.9
Tobacco                 3.5
                       ----
  Total                76.7 %
                       ========


- --------------------------------------------------------------------------------
EXPENSE EXAMPLE


As a shareholder of the Portfolio, you incur two types of costs: (1)
transaction costs, including front and back end sales charges (loads) or
redemption/exchange fees, where applicable; and (2) ongoing costs, including
advisory fees, distribution (12b-1) and service fees, where applicable; and
other Portfolio expenses. This Example is intended to help you understand your
ongoing costs (in dollars) of investing in the Portfolio and to compare these
costs with the ongoing costs of investing in other mutual funds.


The Example below is based on an investment of $1,000 invested at the beginning
of the period and held for the entire period October 1, 2004 to March 31, 2005.


The information under "Actual Expenses," together with the amount you invested,
allows you to estimate actual expenses incurred over the reporting period.
Simply divide your account value by $1,000 (for example, an $8,600 account
value divided by $1,000 = 8.60) and multiply the result by the cost shown for
your share class, in the row entitled "Expenses Incurred During Period", to
estimate the expenses incurred on your account during this period.


The information under "Hypothetical Expenses" provides information about
hypothetical account values and hypothetical expenses based on the Portfolio's
actual expense ratio and an assumed rate of return of 5% per year before
expenses, which is not the Portfolio's actual return. The hypothetical account
values and expenses may not be used to estimate the actual ending account
balance or expense you incurred for the period. You may use this information to
compare the ongoing costs of investing in the Portfolio and other funds. To do
so, compare this 5% hypothetical example with the 5% hypothetical examples that
appear in the shareholder reports of the other funds.


Please note that the expenses shown in the table are meant to highlight your
ongoing costs only and do not reflect any transactional costs, such as front
and back end sales charges (loads) or redemption/exchange fees, where
applicable. Therefore, the hypothetical information is useful in comparing
ongoing costs only, and will not help you determine the relative total costs of
owning different funds. In addition, if these transactional costs were
included, your costs would have been higher.


                                                        Actual Expenses
                        -------------------------------------------------------------------------------
                         Institutional      Service         Investor        Investor        Investor
                             Class           Class          A Class         B Class         C Class
                        --------------- --------------- --------------- --------------- ---------------
Beginning Account
 Value (10/01/04)        $   1,000.00    $   1,000.00    $   1,000.00    $   1,000.00    $   1,000.00
Ending Account Value
 (3/31/05)                   1,059.20        1,055.70        1,058.00        1,056.10        1,054.80
Expenses Incurred
 During Period
 (10/01/04 -
  3/31/05)                       4.61            6.03            6.55           10.28           10.17


                                                     Hypothetical Expenses
                                                  (5% return before expenses)
                        -------------------------------------------------------------------------------
                         Institutional      Service         Investor        Investor        Investor
                             Class           Class          A Class         B Class         C Class
                        --------------- --------------- --------------- --------------- ---------------
Beginning Account
 Value (10/01/04)        $   1,000.00    $   1,000.00    $   1,000.00    $   1,000.00    $   1,000.00
Ending Account Value
 (3/31/05)                   1,020.47        1,019.06        1,018.56        1,014.88        1,014.98
Expenses Incurred
 During Period
 (10/01/04 -
  3/31/05)                       4.53            5.94            6.44           10.12           10.02

For each class of the Portfolio, expenses are equal to the annualized expense
ratio of 0.90%, 1.18%, 1.28%, 2.01%, and  1.99% for the Institutional, Service,
Investor A, B, and C share classes, respectively, multiplied by the average
account value over the period, multiplied by 182/365 (to reflect the one-half
year period).


                                                                               9
                               LEGACY PORTFOLIO


Total Net Assets (3/31/05): $287.7 million


Performance Benchmark

     Russell 1000 Growth Index
Investment Approach


     Seeks to provide long-term growth of capital by normally investing at
least 65% of its net assets in common and preferred stock and securities
convertible into common and preferred stocks of mid- and large-capitalization
companies. The Portfolio seeks to invest in fundamentally sound companies with
strong management, superior earnings growth prospects and attractive
valuations. The disciplined investment process uses a bottom-up stock selection
approach as the primary driver of returns. The Portfolio emphasizes large
companies that exhibit stable growth and accelerated earnings.


Recent Portfolio Management Activity


     o  On January 31, 2005, BlackRock, Inc., the parent of BlackRock Advisors,
Inc. (BAI), acquired SSRM Holdings, Inc., the parent of State Street Research &
Management Company (SSRM), the investment adviser to the State Street Research
mutual funds. In connection with the transaction, the BlackRock Legacy
Portfolio (the Portfolio) reorganized with the State Street Research Legacy
Fund (the SSR Fund). The SSR Fund transferred substantially all of its assets
and liabilities to the Portfolio in exchange for shares of the Portfolio, which
were then distributed to the SSR Fund shareholders. For periods prior to
January 31, 2005, the performance information shown reflects the performance of
the SSR Fund, which had substantially similar investment goals and strategies
as the Portfolio.


     o  Both Institutional and Investor A share classes of the Portfolio
outperformed the benchmark for the semi-annual period, while all the other
share classes underperformed the benchmark.


     o  US equity markets lost ground during the first quarter of 2005, as the
S&P 500 Index sustained its largest quarterly loss in two years, declining
2.2%. Investors became increasingly concerned about the impact that higher
commodity prices might have on the economy and fear that inflationary pressures
are on the rise. Market weakness during the first quarter was not enough to
offset gains from the fourth quarter of 2004 as the S&P 500 Index gained 6.9%
during the six-month period. In this environment (for the 6-month period),
mid-cap stocks outperformed their large- and small-cap counterparts, while
value continued to outperform growth.


     o  In this environment, stock selection in energy, materials and
financials drove Portfolio returns, while stock selection decisions in
information technology and health care created a modest drag on performance
relative to the benchmark.


     o  A diverse mix of names contributed positively to absolute and relative
returns, as the Portfolio's gains were broad-based. The largest single
contributor to relative returns during the period was agricultural
biotechnology firm Monsanto within the materials sector.


     o  Energy related commodity prices remained elevated throughout the
period, with crude oil prices nearing all time highs. The Portfolio benefited
from its positions in oil and gas producers EOG Resources and Newfield
Exploration, as well as energy related holdings in the materials sector such as
coal producer Consol Energy.


     o  Results within health care were mixed. While stock selection had a
negative impact on the Portfolio during the period, our modest underweight
position added value. The majority of the underperformance within the sector
can be attributed to positions in Biogen and Elan Corp. PLC, which both fell
due to the unexpected withdrawal of a major drug.


     o  Weak relative performance within technology was largely a result of
stock selection. Our software holdings trailed those in the benchmark, as both
Symantec and Red Hat declined during the period. Additionally, our position in
information storage and management firm EMC detracted from returns.


     o  The Portfolio currently favors more stable growth companies, and we
increased our exposure to the household and personal product industry. However,
we also identified new accelerating earnings opportunities within the
technology sector based on company-specific fundamentals in both software
services and hardware equipment suppliers. At the end of the period, relative
to the Russell 1000 Growth Index, the Portfolio was overweight in consumer
discretionary and energy, and underweight in consumer staples and health care.


      COMPARISON OF CHANGE IN VALUE OF A $10,000 INVESTMENT IN THE LEGACY
          PORTFOLIO AND THE RUSSELL 1000 GROWTH INDEX FROM INCEPTION.


                                  [LINE CHART]

                 Institutional          Investor A     Russell 1000 Growth Index
                 -------------          ----------     -------------------------
12/31/1997          $ 10,000              $ 9,425               $ 10,000
03/31/1998            11,470               10,801                 11,515
06/30/1998            12,290               11,565                 12,038
09/30/1998            10,730               10,085                 10,944
12/31/1998            13,227               12,429                 13,871
03/31/1999            13,907               13,070                 14,752
06/30/1999            14,908               13,994                 15,320
09/30/1999            14,027               13,164                 14,759
12/31/1999            16,608               15,569                 18,470
03/31/2000            16,668               15,616                 19,786
06/30/2000            16,228               15,116                 19,252
09/30/2000            16,849               15,672                 18,217
12/31/2000            15,698               14,597                 14,328
03/31/2001            13,037               12,108                 11,334
06/30/2001            13,547               12,579                 12,288
09/30/2001            11,376               10,561                  9,903
12/31/2001            12,787               11,853                 11,402
03/31/2002            12,867               11,919                 11,107
06/30/2002            10,896               10,081                  9,033
09/30/2002            9,285                8,591                  7,674
12/31/2002            9,815                9,072                  8,223
03/31/2003            9,655                8,921                  8,135
06/30/2003            10,966               10,118                  9,299
09/30/2003            11,336               10,458                  9,663
12/31/2003            12,686               11,693                 10,669
03/31/2004            12,787               11,778                 10,753
06/30/2004            13,057               12,014                 10,961
09/30/2004            12,586               11,580                 10,388
12/31/2004            13,957               12,825                 11,341
03/31/2005            13,207               12,127                 10,878


                        FOR PERIOD ENDING MARCH 31, 2005


                                      Average Annual Total Return
                                             1 Year         3 Year          5 Year       From Inception
                                          ------------   ------------   -------------   ---------------
     Institutional Class                       3.29%          0.87%          (4.55)%          3.91%
     Service Class                             3.04%          0.60%          (4.92)%          3.55%
     Investor A Class (Load Adjusted)         (2.94)%        (1.39)%         (6.05)%          2.70%
     Investor A Class (NAV)                    2.96%          0.58%          (4.93)%          3.54%
     Investor B Class (Load Adjusted)         (2.24)%        (1.31)%         (5.99)%          2.79%
     Investor B Class (NAV)                    2.26%         (0.14)%         (5.61)%          2.79%
     Investor C Class (Load Adjusted)          1.26%         (0.14)%         (5.61)%          2.79%
     Investor C Class (NAV)                    2.26%         (0.14)%         (5.61)%          2.79%

THE PERFORMANCE INFORMATION ABOVE INCLUDES INFORMATION RELATING TO EACH CLASS
OF THE PORTFOLIO SINCE THE COMMENCEMENT OF OPERATIONS OF THE PORTFOLIO, RATHER
THAN THE DATE SUCH CLASS WAS INTRODUCED. THE INCEPTION DATES OF THE PORTFOLIO'S
SHARE CLASSES WERE AS FOLLOWS: INSTITUTIONAL SHARES, 12/31/97; INVESTOR A
SHARES, 12/31/97; INVESTOR C SHARES, 12/31/97; INVESTOR B SHARES, 1/1/99;  AND
SERVICE SHARES, 1/28/05. SEE "NOTE ON PERFORMANCE INFORMATION" ON PAGE 41 FOR
FURTHER INFORMATION ON HOW PERFORMANCE DATA WAS CALCULATED, INCLUDING IMPORTANT
INFORMATION ON THE LINE GRAPH ABOVE.


PAST PERFORMANCE IS NOT PREDICTIVE OF FUTURE RESULTS. The graph and table do
not reflect the deduction of taxes that a shareholder would pay on fund
distributions or the redemption of shares. Although the holdings and sectors
listed above were current as of the periods indicated, the Portfolio is
actively managed and its composition will vary.


10
                               LEGACY PORTFOLIO

FUND PROFILE


    Top Ten Holdings (% of long-term
              investments)
General Electric Co.            3.9 %
Johnson & Johnson               3.9
Microsoft Corp.                 3.7
Yahoo!, Inc                     3.3
Novartis AG - ADR               3.0
UniterHealth Group, Inc.        2.9
Intel Corp.                     2.9
Tyco International Ltd. - ADR   2.8
The Procter & Gamble Co.        2.6
Target Corp.                    2.6
                                ---
     Total                      31.6 %
                                =======


    Top Ten Industries (% of long-term
               investments)
Computer Software & Services     15.1 %
Manufacturing                    12.5
Retail Merchandising              7.2
Medical Instruments & Supplies    7.2
Pharmaceuticals                   7.1
Medical & Medical Services        6.9
Finance                           6.7
Broadcasting                      4.6
Oil & Gas                         4.2
Entartainment & Leisure           4.1
                                 ----
     Total                       75.6 %
                                 ========


- --------------------------------------------------------------------------------
EXPENSE EXAMPLE


As a shareholder of the Portfolio, you incur two types of costs: (1)
transaction costs, including front and back end sales charges (loads) or
redemption/exchange fees, where applicable; and (2) ongoing costs, including
advisory fees, distribution (12b-1) and service fees, where applicable; and
other Portfolio expenses. This Example is intended to help you understand your
ongoing costs (in dollars) of investing in the Portfolio and to compare these
costs with the ongoing costs of investing in other mutual funds.


The Example below is based on an investment of $1,000 invested at the beginning
of the period and held for the entire period October 1, 2004 to March 31, 2005.


The information under "Actual Expenses," together with the amount you invested,
allows you to estimate actual expenses incurred over the reporting period.
Simply divide your account value by $1,000 (for example, an $8,600 account
value divided by $1,000 = 8.60) and multiply the result by the cost shown for
your share class, in the row entitled "Expenses Incurred During Period", to
estimate the expenses incurred on your account during this period.


The information under "Hypothetical Expenses" provides information about
hypothetical account values and hypothetical expenses based on the Portfolio's
actual expense ratio and an assumed rate of return of 5% per year before
expenses, which is not the Portfolio's actual return. The hypothetical account
values and expenses may not be used to estimate the actual ending account
balance or expense you incurred for the period. You may use this information to
compare the ongoing costs of investing in the Portfolio and other funds. To do
so, compare this 5% hypothetical example with the 5% hypothetical examples that
appear in the shareholder reports of the other funds.


Please note that the expenses shown in the table are meant to highlight your
ongoing costs only and do not reflect any transactional costs, such as front
and back end sales charges (loads) or redemption/exchange fees, where
applicable. Therefore, the hypothetical information is useful in comparing
ongoing costs only, and will not help you determine the relative total costs of
owning different funds. In addition, if these transactional costs were
included, your costs would have been higher.


                                                        Actual Expenses
                        -------------------------------------------------------------------------------
                         Institutional      Service         Investor        Investor        Investor
                             Class           Class          A Class         B Class         C Class
                        --------------- --------------- --------------- --------------- ---------------
Beginning Account
 Value (10/01/04)        $   1,000.00   $  1,000.00      $   1,000.00    $   1,000.00    $   1,000.00
Ending Account Value
 (3/31/05)                   1,049.30   993. 00              1,042.20        1,043.60        1,043.60
Expenses Incurred
 During Period
 (10/01/04 -
  3/31/05)                       5.06         2.29               6.43           10.14           10.14


                                                     Hypothetical Expenses
                                                  (5% return before expenses)
                        -------------------------------------------------------------------------------
                         Institutional      Service         Investor        Investor        Investor
                             Class           Class          A Class         B Class         C Class
                        --------------- --------------- --------------- --------------- ---------------
Beginning Account
 Value (10/01/04)        $   1,000.00    $   1,000.00    $   1,000.00    $   1,000.00    $   1,000.00
Ending Account Value
 (3/31/05)                   1,020.00        1,022.68        1,018.64        1,014.95        1,014.95
Expenses Incurred
 During Period
 (10/01/04 -
  3/31/05)                       5.00            2.32            6.36           10.05           10.05

For each class of the Portfolio, expenses are equal to the annualized expense
ratio of 0.99%, 1.35%, 1.26%, 1.99%, and  1.99% for the Institutional, Service,
Investor A, B, and C share classes, respectively, multiplied by the average
account value over the period, multiplied by 182/365 (to reflect the one-half
year period) and 62/365 for the Service share class (to reflect the period the
class was open during the one-half year period).


                                                                              11
                        MID-CAP VALUE EQUITY PORTFOLIO


Total Net Assets (3/31/05): $706.1 million


Performance Benchmark

     Russell Midcap Value Index


Investment Approach

     Seeks long-term capital appreciation by investing primarily in
mid-capitalization stocks believed by the Portfolio management team to be worth
more than is indicated by current market price. The Portfolio normally invests
at least 80% of assets in equity securities issued by US mid-capitalization
value companies (market capitalizations between $1 billion and $10 billion).
The Portfolio management team uses fundamental analysis to examine each company
for financial strength before deciding to purchase the stock.
Recent Portfolio Management Activity


     o  On January 31, 2005, BlackRock, Inc., the parent of BlackRock Advisors,
Inc. (BAI), acquired SSRM Holdings, Inc., the parent of State Street Research &
Management Company (SSRM), the investment adviser to the State Street Research
mutual funds. In connection with the transaction, the Portfolio reorganized
with the State Street Research Mid Cap Value Fund (the SSR Fund). The SSR Fund
transferred substantially all of its assets and liabilities to the Portfolio in
exchange for shares of the Portfolio, which were then distributed to the SSR
Fund shareholders. For periods prior to January 31, 2005, the performance
information shown reflects the performance of the SSR Fund, which had similar
investment goals and strategies as the Portfolio.


     o  All share classes of the Portfolio underperformed the benchmark for the
semi-annual period.


     o  US equity markets lost ground during the first quarter of 2005, as the
S&P 500 Index sustained its largest quarterly loss in two years, declining
2.2%. Investors became increasingly concerned about the impact that higher
commodity prices might have on the economy and feared that inflationary
pressures may be on the rise. Market weakness during the first quarter was not
enough to offset gains from the fourth quarter of 2004, as the S&P 500 Index
gained 6.9% during the six-month period. In this environment, mid-cap stocks
outperformed their large- and small-cap counterparts, while value stocks
continued to outperform growth stocks.


     o  Within the Portfolio's benchmark, the Russell Midcap Value Index, all
major sectors posted positive returns for the six-month period. During the
period, the Portfolio's underweight in financial stocks aided return
comparisons. However, these gains were offset by disappointing results from
Portfolio holdings in the health care and consumer discretionary sectors.


     o  An underweight contributed to outperformance versus the benchmark in
the financials sector. Specifically, the Portfolio continued to be underweight
real estate investment trusts (REITs) and commercial banks, both of which
underperformed during the period covered by this report. In addition, strong
stock selection among investment management and capital markets stocks
contributed positively to sector returns.


     o  An overweight in pharmaceuticals and an underweight in health care
providers contributed to the Portfolio's underperformance in the health care
sector. In addition, stock selection in the consumer discretionary sector
proved to be a significant detractor from relative returns during the period.
Weakness within the sector was primarily the result of underperformance in
select media stocks held in the Portfolio.


     o  Our investment approach is driven by our focus on adding value through
bottom-up fundamental research. As a result, portfolio positioning and
corresponding sector weights relative to the Portfolio's benchmark are largely
determined by stock selection. At the end of the period, the Portfolio reduced
its underweight in the consumer staples sector, and increased its underweights
in financials and telecommunication services.


COMPARISON OF CHANGE IN VALUE OF A $10,000 INVESTMENT IN THE MID-CAP VALUE
                                EQUITY PORTFOLIO
           AND THE RUSSELL MIDCAP VALUE INDEX FOR THE PAST TEN YEARS.


                                  [LINE CHART]

                 Institutional          Investor A     Russell Midcap Value Index
                 -------------          ----------     --------------------------
03/31/1995          $ 10,000              $ 9,424               $ 10,000
06/30/1995            10,745               10,120                 10,867
09/30/1995            11,515               10,838                 11,729
12/31/1995            12,020               11,297                 12,262
03/31/1996            12,640               11,881                 12,947
06/30/1996            13,197               12,388                 13,196
09/30/1996            13,830               12,984                 13,576
12/31/1996            15,094               14,151                 14,746
03/31/1997            15,294               14,330                 14,997
06/30/1997            16,860               15,789                 16,886
09/30/1997            18,983               17,767                 19,040
12/31/1997            19,295               18,049                 19,814
03/31/1998            21,720               20,306                 21,794
06/30/1998            21,657               20,234                 21,234
09/30/1998            18,345               17,141                 18,334
12/31/1998            20,376               19,026                 20,822
03/31/1999            19,709               18,391                 20,174
06/30/1999            21,690               20,227                 22,430
09/30/1999            19,424               18,102                 20,044
12/31/1999            19,812               18,439                 20,801
03/31/2000            19,927               18,545                 21,011
06/30/2000            19,612               18,227                 20,658
09/30/2000            21,900               20,351                 22,652
12/31/2000            25,021               23,232                 24,792
03/31/2001            25,267               23,444                 23,916
06/30/2001            28,220               26,154                 25,601
09/30/2001            23,647               21,912                 22,644
12/31/2001            29,629               27,429                 25,368
03/31/2002            32,266               29,858                 27,372
06/30/2002            29,123               26,927                 26,092
09/30/2002            22,191               20,499                 21,407
12/31/2002            23,772               21,950                 22,920
03/31/2003            21,579               19,898                 21,991
06/30/2003            26,149               24,069                 25,926
09/30/2003            27,642               25,437                 27,466
12/31/2003            32,137               29,539                 31,645
03/31/2004            34,218               31,447                 33,337
06/30/2004            35,258               32,376                 33,914
09/30/2004            35,407               32,479                 34,502
12/31/2004            39,717               36,422                 39,147
03/31/2005            39,544               36,228                 39,450


                        FOR PERIOD ENDING MARCH 31, 2005


                                 Average Annual Total Return
                                             1 Year       3 Year        5 Year       10 Year
                                          -----------   ----------   -----------   -----------
     Institutional Class                      15.56%        7.01%        14.69%        14.74%
     Service Class                            15.17%        6.65%        14.32%        14.41%
     Investor A Class (Load Adjusted)          8.55%        4.58%        12.99%        13.74%
     Investor A Class (NAV)                   15.20%        6.66%        14.33%        14.41%
     Investor B Class (Load Adjusted)          9.87%        4.87%        13.30%        13.57%
     Investor B Class (NAV)                   14.37%        5.92%        13.55%        13.57%
     Investor C Class (Load Adjusted)         13.36%        5.93%        13.56%        13.60%
     Investor C Class (NAV)                   14.36%        5.93%        13.56%        13.60%

THE PERFORMANCE INFORMATION ABOVE INCLUDES INFORMATION RELATING TO EACH CLASS
OF THE PORTFOLIO SINCE THE COMMENCEMENT OF OPERATIONS OF THE PORTFOLIO, RATHER
THAN THE DATE SUCH CLASS WAS INTRODUCED. THE INCEPTION DATES OF THE PORTFOLIO'S
SHARE CLASSES WERE AS FOLLOWS: INVESTOR A SHARES, 8/25/86; INSTITUTIONAL
SHARES, 6/1/93; INVESTOR C SHARES, 6/1/93; INVESTOR B SHARES, 1/1/99;  AND
SERVICE SHARES, 1/28/05; . SEE "NOTE ON PERFORMANCE INFORMATION" ON PAGE 41 FOR
FURTHER INFORMATION ON HOW PERFORMANCE DATA WAS CALCULATED, INCLUDING IMPORTANT
INFORMATION ON THE LINE GRAPH ABOVE.


PAST PERFORMANCE IS NOT PREDICTIVE OF FUTURE RESULTS. The graph and table do
not reflect the deduction of taxes that a shareholder would pay on fund
distributions or the redemption of shares. Although the holdings and sectors
listed above were current as of the periods indicated, the Portfolio is
actively managed and its composition will vary.


12
                        MID-CAP VALUE EQUITY PORTFOLIO

FUND PROFILE


  Top Ten Holdings (% of long-term investments)
Ashland, Inc.                           1.9 %
Public Service Enterprise Group, Inc.   1.8
York International Corp.                1.8
Brunswick Corp.                         1.8
Radian Group, Inc.                      1.8
NCR Corp.                               1.8
EOG Resources, Inc.                     1.7
Federated Department Stores, Inc.       1.7
Owens-Illinois, Inc.                    1.7
ITT Industries, Inc.                    1.7

                                        ---
     Total                              17.7 %
                                        =======


   Top Ten Industries (% of long-term
              investments)
Manufacturing                 14.4 %
Insurance                     7.3
Oil & Gas                     7.3
Finance                       6.9
Computer & Office Equipment   5.5
Banks                         5.4
Retail Merchandising          5.3
Energy & Utilities            5.2
Containers                    4.9
Chemicals                     3.5
                              ---
     Total                    65.7 %
                              ========


- --------------------------------------------------------------------------------
EXPENSE EXAMPLE


As a shareholder of the Portfolio, you incur two types of costs: (1)
transaction costs, including front and back end sales charges (loads) or
redemption/exchange fees, where applicable; and (2) ongoing costs, including
advisory fees, distribution (12b-1) and service fees, where applicable; and
other Portfolio expenses. This Example is intended to help you understand your
ongoing costs (in dollars) of investing in the Portfolio and to compare these
costs with the ongoing costs of investing in other mutual funds.


The Example below is based on an investment of $1,000 invested at the beginning
of the period and held for the entire period October 1, 2004 to March 31, 2005.


The information under "Actual Expenses," together with the amount you invested,
allows you to estimate actual expenses incurred over the reporting period.
Simply divide your account value by $1,000 (for example, an $8,600 account
value divided by $1,000 = 8.60) and multiply the result by the cost shown for
your share class, in the row entitled "Expenses Incurred During Period", to
estimate the expenses incurred on your account during this period.


The information under "Hypothetical Expenses" provides information about
hypothetical account values and hypothetical expenses based on the Portfolio's
actual expense ratio and an assumed rate of return of 5% per year before
expenses, which is not the Portfolio's actual return. The hypothetical account
values and expenses may not be used to estimate the actual ending account
balance or expense you incurred for the period. You may use this information to
compare the ongoing costs of investing in the Portfolio and other funds. To do
so, compare this 5% hypothetical example with the 5% hypothetical examples that
appear in the shareholder reports of the other funds.


Please note that the expenses shown in the table are meant to highlight your
ongoing costs only and do not reflect any transactional costs, such as front
and back end sales charges (loads) or redemption/exchange fees, where
applicable. Therefore, the hypothetical information is useful in comparing
ongoing costs only, and will not help you determine the relative total costs of
owning different funds. In addition, if these transactional costs were
included, your costs would have been higher.


                                                        Actual Expenses
                        -------------------------------------------------------------------------------
                         Institutional      Service         Investor        Investor        Investor
                             Class           Class          A Class         B Class         C Class
                        --------------- --------------- --------------- --------------- ---------------
Beginning Account
 Value (10/01/04)        $   1,000.00    $   1,000.00    $   1,000.00    $   1,000.00    $   1,000.00
Ending Account Value
 (3/31/05)                   1,116.90        1,115.00        1,115.40        1,110.70        1,110.80
Expenses Incurred
 During Period
 (10/01/04 -
  3/31/05)                       5.28            2.25            6.75           10.47           10.47


                                                     Hypothetical Expenses
                                                  (5% return before expenses)
                        -------------------------------------------------------------------------------
                         Institutional      Service         Investor        Investor        Investor
                             Class           Class          A Class         B Class         C Class
                        --------------- --------------- --------------- --------------- ---------------
Beginning Account
 Value (10/01/04)        $   1,000.00    $   1,000.00    $   1,000.00    $   1,000.00    $   1,000.00
Ending Account Value
 (3/31/05)                   1,019.95        1,022.85        1,018.54        1,014.95        1,014.95
Expenses Incurred
 During Period
 (10/01/04 -
  3/31/05)                       5.05            2.15            6.46           10.05           10.05

 For each class of the Portfolio, expenses are equal to the annualized expense
ratio of 1.00%, 1.25%, 1.28%, 1.99%,  and 1.99% for the Institutional, Service,
Investor A, B, and C share classes, respectively, multiplied by the average
account value over the period, multiplied by 182/365 (to reflect the one-half
year period) and 62/365 for the Service share class (to reflect the period the
class was open during the one-half year period).


For the period October 1, 2004 through January 31, 2005, the "Actual Expenses"
table reflects the expenses of the State Street Research Mid-Cap Value Fund
prior to its reorganization with the Portfolio on that date. Restated to
reflect the Portfolio's current expenses for the entire semi-annual period, (i)
"Ending Account Value" on March 31, 2005 would have been $1,115.40 for Investor
A Class shares,  and (ii) "Expenses Incurred During Period" for the period
October 1, 2004 through March 31, 2005 would have been $6.59 for Investor A
Class shares.  "Ending Account Value" and "Expenses Incurred During Period"
would have been the same for Institutional Class, Service Class, Investor B
Class and Investor C Class.


                                                                              13
                        MID-CAP GROWTH EQUITY PORTFOLIO


Total Net Assets (3/31/05): $457.8 million


Performance Benchmark

     Russell Midcap Growth Index
Investment Approach
     Seeks long-term capital appreciation by investing in mid-capitalization
stocks that the portfolio management team believes have above-average earnings
growth potential. The Portfolio normally invests at least 80% of assets in
equity securities issued by U.S. mid-capitalization growth companies (market
capitalization between $1 billion and $10 billion). The management team would
expect these companies to have products, technologies, management, markets and
opportunities which will facilitate earnings growth over time that is well
above the growth rate of the overall economy and the rate of inflation. The
portfolio management team uses a bottom up investment style selecting
securities based upon fundamental analysis (such as analysis of earnings, cash
flows, competitive position and management's abilities).
Recent Portfolio Management Activity


     o  On January 31, 2005, BlackRock, Inc., the parent of BlackRock Advisors,
Inc. (BAI), acquired SSRM Holdings, Inc., the parent of State Street Research &
Management Company (SSRM), the investment adviser to the State Street Research
mutual funds. In connection with the transaction, the BlackRock Mid-Cap Growth
Equity Portfolio (the Portfolio) reorganized with the State Street Research Mid
Cap Growth Fund (the SSR Fund). The SSR Fund transferred substantially all of
its assets and liabilities to the Portfolio in exchange for shares of the
Portfolio, which were then distributed to the SSR Fund shareholders.


     o  All share classes of the Portfolio underperformed the benchmark for the
semi-annual period.


     o  US equity markets lost ground during the first quarter of 2005, as the
S&P 500 Index sustained its largest quarterly loss in two years, declining
2.2%. Investors became increasingly concerned about the impact that higher
commodity prices might have on the economy and feared that inflationary
pressures may be on the rise. Market weakness during the first quarter was not
enough to offset gains from the fourth quarter of 2004 as the S&P 500 Index
gained 6.9% during the six-month period. Mid- capitalization growth stocks
surged higher in the fourth quarter led by technology stocks. The market
reversed course in the first quarter of 2005, with growth stocks performing
relatively poorly, though mid- capitalization stocks outperformed large- and
small- capitalization stocks during this period.


     o  The Portfolio appreciated significantly during this period, with the
sharp fourth quarter rise overshadowing the negative returns in the first
quarter. The Portfolio trailed the benchmark, however, due to weak stock
selection in the health care sector.


     o  The Portfolio's allocation to biotechnology proved to be the largest
impediment during the period. Several of its holdings, most notably Biogen Idec
and OSI Pharmaceuticals, declined significantly during the quarter. The
Portfolio's investments in the consumer discretionary and industrials sector,
also negatively affected the Portfolio.


     o  Strong stock selection in energy contributed favorably to the
Portfolio's relative performance. Rising oil prices have boosted the energy
sector, causing a 15% gain within the benchmark. Two of the top current
holdings in the Portfolio, EOG Resources Inc. and Newfield Exploration Co.
benefited from positive oil demand trends and continued exploration success.
Holdings in the information technology sector also produced profits for the
Portfolio during this period.


     o  Our investment approach is driven by our focus on adding value through
bottom-up fundamental research. As a result, Portfolio positioning and
corresponding sector weights relative to the benchmark are largely determined
by stock selection. As of the end of the period, we have increased the
Portfolio's information technology exposure while decreasing its allocation to
health care and consumer discretionary.


COMPARISON OF CHANGE IN VALUE OF A $10,000 INVESTMENT IN THE MID-CAP GROWTH
                                EQUITY PORTFOLIO
              AND THE RUSSELL MIDCAP GROWTH INDEX FROM INCEPTION.


                                   [LINE CHART]

                 Institutional          Investor A     Russell Midcap Growth Index
                 -------------          ----------     ---------------------------
12/27/1996          $ 10,000              $ 9,425               $ 10,000
12/31/1996            10,040                9,463                 10,009
03/31/1997            8,930                8,407                  9,644
06/30/1997            10,570                9,934                 11,063
09/30/1997            12,200               11,442                 12,612
12/31/1997            11,521               10,802                 12,265
03/31/1998            12,963               12,133                 13,729
06/30/1998            13,135               12,285                 13,721
09/30/1998            11,218               10,478                 11,430
12/31/1998            14,093               13,141                 14,456
03/31/1999            16,050               14,957                 14,951
06/30/1999            18,058               16,801                 16,508
09/30/1999            19,288               17,923                 15,682
12/31/1999            31,151               28,920                 21,874
03/31/2000            37,868               35,115                 26,494
06/30/2000            34,322               31,767                 24,531
09/30/2000            36,964               34,166                 25,151
12/31/2000            27,667               25,545                 19,305
03/31/2001            20,360               18,789                 14,462
06/30/2001            20,852               19,200                 16,802
09/30/2001            16,002               14,723                 12,131
12/31/2001            18,865               17,331                 15,414
03/31/2002            18,673               17,147                 15,142
06/30/2002            15,660               14,354                 12,377
09/30/2002            12,947               11,849                 10,251
12/31/2002            13,481               12,321                 11,191
03/31/2003            13,545               12,382                 11,189
06/30/2003            15,810               14,415                 13,288
09/30/2003            16,173               14,723                 14,239
12/31/2003            18,074               16,448                 15,971
03/31/2004            19,442               17,680                 16,743
06/30/2004            19,677               17,845                 16,919
09/30/2004            18,715               16,962                 16,186
12/31/2004            20,894               18,933                 18,443
03/31/2005            20,467               18,522                 18,135


                        FOR PERIOD ENDING MARCH 31, 2005


                                     Average Annual Total Return
                                             1 Year        3 Year         5 Year        From Inception
                                          ------------   ----------   --------------   ---------------
     Institutional Class                       5.28%         3.11%         (11.58)%          9.06%
     Service Class                             5.11%         2.86%         (11.80)%          8.76%
     Investor A Class (Load Adjusted)         (1.31)%        0.60%         (13.05)%          7.75%
     Investor A Class (NAV)                    4.76%         2.61%         (12.01)%          8.53%
     Investor B Class (Load Adjusted)         (0.49)%        0.74%         (12.86)%          7.77%
     Investor B Class (NAV)                    4.01%         1.88%         (12.64)%          7.77%
     Investor C Class (Load Adjusted)          3.01%         1.88%         (12.59)%          7.77%
     Investor C Class (NAV)                    4.01%         1.88%         (12.59)%          7.77%

THE INCEPTION DATE OF THE PORTFOLIO'S INSTITUTIONAL, SERVICE, INVESTOR A,
INVESTOR B AND INVESTOR C SHARES WAS 12 /27/96. SEE "NOTE ON PERFORMANCE
INFORMATION" ON PAGE 41 FOR FURTHER INFORMATION ON HOW PERFORMANCE DATA WAS
CALCULATED, INCLUDING IMPORTANT INFORMATION ON THE LINE GRAPH ABOVE.


PAST PERFORMANCE IS NOT PREDICTIVE OF FUTURE RESULTS. The graph and table do
not reflect the deduction of taxes that a shareholder would pay on fund
distributions or the redemption of shares.  Although the holdings and sectors
listed above were current as of the periods indicated, the Portfolio is
actively managed and its composition will vary.


14
                        MID-CAP GROWTH EQUITY PORTFOLIO

FUND PROFILE


    Top Ten Holdings (% of long-term investments)
EOG Resources, Inc.                         3.1 %
Nextel Partners, Inc. - Class A             2.3
Community Health Systems, Inc.              2.0
Williams-Sonoma, Inc.                       2.0
Starwood Hotels & Resorts Worldwide, Inc.   1.9
Amdocs Ltd.                                 1.9
Caremark Rx, Inc.                           1.9
Avid Technology, Inc.                       1.9
Adobe Systems, Inc.                         1.9
CONSOL Energy, Inc.                         1.8
                                            ---
     Total                                  20.7 %
                                            =======


     Top Ten Industries (% of long-term
                investments)
Computer Software & Services       11.9 %
Retail Merchandising               11.7
Telecommunications                 11.1
Medical & Medical Services          7.8
Oil & Gas                           6.9
Medical Instruments & Supplies      6.8
Entertainment & Leisure             5.6
Metal & Mining                      4.7
Business Services                   4.5
Semiconductors & Related Devices    4.2
                                   ----
     Total                         75.2 %
                                   ========


- --------------------------------------------------------------------------------
EXPENSE EXAMPLE


As a shareholder of the Portfolio, you incur two types of costs: (1)
transaction costs, including front and back end sales charges (loads) or
redemption/exchange fees, where applicable; and (2) ongoing costs, including
advisory fees, distribution (12b-1) and service fees, where applicable; and
other Portfolio expenses. This Example is intended to help you understand your
ongoing costs (in dollars) of investing in the Portfolio and to compare these
costs with the ongoing costs of investing in other mutual funds.


The Example below is based on an investment of $1,000 invested at the beginning
of the period and held for the entire period October 1, 2004 to March 31, 2005.


The information under "Actual Expenses," together with the amount you invested,
allows you to estimate actual expenses incurred over the reporting period.
Simply divide your account value by $1,000 (for example, an $8,600 account
value divided by $1,000 = 8.60) and multiply the result by the cost shown for
your share class, in the row entitled "Expenses Incurred During Period", to
estimate the expenses incurred on your account during this period.


The information under "Hypothetical Expenses" provides information about
hypothetical account values and hypothetical expenses based on the Portfolio's
actual expense ratio and an assumed rate of return of 5% per year before
expenses, which is not the Portfolio's actual return. The hypothetical account
values and expenses may not be used to estimate the actual ending account
balance or expense you incurred for the period. You may use this information to
compare the ongoing costs of investing in the Portfolio and other funds. To do
so, compare this 5% hypothetical example with the 5% hypothetical examples that
appear in the shareholder reports of the other funds.


Please note that the expenses shown in the table are meant to highlight your
ongoing costs only and do not reflect any transactional costs, such as front
and back end sales charges (loads) or redemption/exchange fees, where
applicable. Therefore, the hypothetical information is useful in comparing
ongoing costs only, and will not help you determine the relative total costs of
owning different funds. In addition, if these transactional costs were
included, your costs would have been higher.


                                                        Actual Expenses
                        -------------------------------------------------------------------------------
                         Institutional      Service         Investor        Investor        Investor
                             Class           Class          A Class         B Class         C Class
                        --------------- --------------- --------------- --------------- ---------------
Beginning Account
 Value (10/01/04)        $   1,000.00    $   1,000.00    $   1,000.00    $   1,000.00    $   1,000.00
Ending Account Value
 (3/31/05)                   1,093.60        1,094.60        1,092.00        1,087.80        1,087.80
Expenses Incurred
 During Period
 (10/01/04 -
  3/31/05)                       6.40            7.97            8.06           11.99           11.99


                                                     Hypothetical Expenses
                                                  (5% return before expenses)
                        -------------------------------------------------------------------------------
                         Institutional      Service         Investor        Investor        Investor
                             Class           Class          A Class         B Class         C Class
                        --------------- --------------- --------------- --------------- ---------------
Beginning Account
 Value (10/01/04)        $   1,000.00    $   1,000.00    $   1,000.00    $   1,000.00    $   1,000.00
Ending Account Value
 (3/31/05)                   1,018.81        1,017.30        1,017.20        1,013.37        1,013.37
Expenses Incurred
 During Period
 (10/01/04 -
  3/31/05)                       6.19            7.70            7.80           11.63           11.63

For each class of the Portfolio, expenses are equal to the annualized expense
ratio of 1.23%, 1.53%, 1.55%, 2.31%, and 2.31% for the Institutional, Service,
Investor A, B, and C share classes, respectively, multiplied by the average
account value over the period, multiplied by 182/365 (to reflect the one-half
year period).


                                                                              15
                               AURORA PORTFOLIO


Total Net Assets (3/31/05): $3.1 billion


Performance Benchmark

     Russell 2500 Value Index


Investment Approach

     Seeks high total return, consisting principally of capital appreciation by
investing at least 80% of its net assets in small- and mid-capitalization
common and preferred stocks and securities convertible into common and
preferred stock. The Portfolio considers issuers of small- and
mid-capitalization value stocks to be companies that are comparable in size to
the companies in the Russell 2500 Value Index or a similar index. In choosing
among small- and mid-capitalization stocks, the management team takes a value
approach, searching for those companies that appear to be trading below their
true worth.
Recent Portfolio Management Activity


     o  On January 31, 2005, BlackRock, Inc., the parent of BlackRock Advisors,
Inc. (BAI), acquired SSRM Holdings, Inc., the parent of State Street Research &
Management Company (SSRM), the investment adviser to the State Street Research
mutual funds. In connection with the transaction, the BlackRock Aurora
Portfolio (the Portfolio) reorganized with the State Street Research Aurora
Fund (the SSR Fund). The SSR Fund transferred substantially all of its assets
and liabilities to the Portfolio in exchange for shares of the Portfolio, which
were then distributed to the SSR Fund shareholders. For periods prior to
January 31, 2005, the performance information shown reflects the performance of
the SSR Fund, which had substantially similar investment goals and strategies
as the Portfolio. The SSR Fund's benchmark was the Russell 2000 Value Index
while the Portfolio's benchmark is the Russell 2500 Value Index.


     o  The Institutional, Investor A, B and C share classes of the Portfolio
underperformed the benchmark for the semi-annual period.


     o  The Service share class of the Portfolio outperformed the benchmark for
the semi-annual period.


     o  US equity markets lost ground during the first quarter of 2005, as the
S&P 500 Index sustained its largest quarterly loss in two years, declining
2.2%. Investors became increasingly concerned about the impact that higher
commodity prices might have on the economy and fear that inflationary pressures
are on the rise. Market weakness during the first quarter was not enough to
offset gains from the fourth quarter of 2004 as the S&P 500 Index gained 6.9%
during the six-month period. In this environment, mid-capitalization stocks
outperformed their large- and small-capitalization counterparts, while value
stocks continued to outperform growth stocks.


     o  Within the Portfolio's benchmark, the Russell 2500 Value Index, all
major sectors posted positive returns for the period. During the period, the
Portfolio's holdings in the financials, consumer discretionary and energy
sectors aided relative returns. However, these gains were offset by relative
weakness in the information technology, industrials and materials sectors.


     o  The combined effects of stock selection and an underweight contributed
to performance versus its benchmark in the financials sector. The Portfolio
continued to be underweight real estate investment trusts (REITs) and
commercial banks, both of which underperformed. In consumer discretionary,
select gaming and specialty retail stocks aided relative returns. In addition,
energy proved to be the strongest performing sector during the period. Stock
selection, particularly among oil and gas companies, and an overweight in
equipment and services stocks, contributed to relative gains.


     o  Information technology was among the weakest performing sectors in the
benchmarks during the period. Stock selection within the sector was a detractor
from return comparisons relative to the benchmark, primarily due to exposure to
equipment and instrument manufacturers and IT services companies/stocks. Stock
selection in the industrials sector also proved to be a drag on performance as
portfolio holdings in the air freight and electrical equipment industries
underperformed. In materials, disappointing results from select chemical and
containers and packaging companies/stocks negatively impacted relative returns.


     o  Our investment approach is driven by our focus on adding value through
bottom-up fundamental research. As a result, portfolio positioning and
corresponding sector weights relative to the benchmarks are largely determined
by stock selection. At the end of the period, the Portfolio held a reduced
overweight in the information technology and industrials sectors versus its
benchmarks, a reduced underweight in the financials sector and an increased
overweight in health care.


COMPARISON OF CHANGE IN VALUE OF A $10,000 INVESTMENT IN THE AURORA PORTFOLIO,
THE RUSSELL 2000 VALUE INDEX AND THE RUSSELL 2500 VALUE INDEX FOR THE PAST TEN
                                    YEARS.


                                                [LINE CHART]

                 Institutional          Investor A     Russell 2000 Value Index     Russell 2500 Value Index
                 -------------          ----------     ------------------------     ------------------------
03/31/1995          $ 10,000              $ 9,422              $ 10,000                     $ 10,000
06/30/1995            10,624               10,000                10,878                       10,889
09/30/1995            11,401               10,723                11,783                       11,759
12/31/1995            11,805               11,098                12,126                       12,211
03/31/1996            13,351               12,542                12,658                       12,763
06/30/1996            15,503               14,556                13,175                       13,155
09/30/1996            16,411               15,400                13,371                       13,562
12/31/1996            18,520               17,375                14,717                       14,922
03/31/1997            19,202               17,992                14,680                       15,043
06/30/1997            23,157               21,677                16,896                       17,176
09/30/1997            28,408               26,596                19,074                       19,314
12/31/1997            27,222               25,479                19,395                       19,861
03/31/1998            30,257               28,299                21,016                       21,756
06/30/1998            28,174               26,337                20,257                       20,977
09/30/1998            21,524               20,100                16,637                       17,522
12/31/1998            23,152               21,607                18,148                       19,479
03/31/1999            22,062               20,581                16,389                       17,920
06/30/1999            27,029               25,193                19,101                       20,791
09/30/1999            26,518               24,700                17,609                       18,994
12/31/1999            31,002               28,857                17,879                       19,770
03/31/2000            34,300               31,846                18,561                       20,692
06/30/2000            36,921               34,223                18,923                       20,569
09/30/2000            40,922               37,900                20,311                       21,985
12/31/2000            42,732               39,541                21,958                       23,880
03/31/2001            43,964               40,659                22,172                       23,409
06/30/2001            49,268               45,529                24,752                       25,746
09/30/2001            40,659               37,530                21,451                       22,539
12/31/2001            49,629               45,798                25,037                       26,205
03/31/2002            54,332               50,102                27,438                       28,437
06/30/2002            49,298               45,359                26,856                       27,444
09/30/2002            37,639               34,586                21,138                       22,401
12/31/2002            39,982               36,737                22,179                       23,621
03/31/2003            37,187               34,145                21,052                       22,495
06/30/2003            45,407               41,664                25,836                       27,282
09/30/2003            50,137               45,965                27,832                       29,403
12/31/2003            60,047               55,004                32,387                       34,234
03/31/2004            62,708               57,398                34,628                       36,348
06/30/2004            64,265               58,779                34,922                       36,534
09/30/2004            61,544               56,258                34,974                       36,624
12/31/2004            69,227               63,227                39,592                       41,619
03/31/2005            66,979               61,134                38,017                       40,735


                        FOR PERIOD ENDING MARCH 31, 2005


                                 Average Annual Total Return
                                            1 Year       3 Year        5 Year       10 Year
                                          ----------   ----------   -----------   -----------
     Institutional Class                      6.81%        7.23%        14.32%        20.95%
     Service Class                            6.76%        6.94%        13.98%        20.59%
     Investor A Class (Load Adjusted)         0.38%        4.77%        12.59%        19.85%
     Investor A Class (NAV)                   6.51%        6.86%        13.93%        20.56%
     Investor B Class (Load Adjusted)         1.46%        5.06%        12.90%        19.68%
     Investor B Class (NAV)                   5.77%        6.10%        13.14%        19.68%
     Investor C Class (Load Adjusted)         4.78%        6.11%        13.13%        19.68%
     Investor C Class (NAV)                   5.74%        6.11%        13.13%        19.68%

THE PERFORMANCE INFORMATION ABOVE INCLUDES INFORMATION RELATING TO EACH CLASS
OF THE PORTFOLIO SINCE THE COMMENCEMENT OF OPERATIONS OF THE PORTFOLIO, RATHER
THAN THE DATE SUCH CLASS WAS INTRODUCED. THE INCEPTION DATES OF THE PORTFOLIO'S
SHARE CLASSES WERE AS FOLLOWS: INSTITUTIONAL SHARES, 2/13/95; INVESTOR A
SHARES, 2/13/95; INVESTOR C SHARES, 2/13/95; INVESTOR B SHARES, 1/1/99; AND
SERVICE SHARES, 1/28/05. SEE "NOTE ON PERFORMANCE INFORMATION" ON PAGE 41 FOR
FURTHER INFORMATION ON HOW PERFORMANCE DATA WAS CALCULATED, INCLUDING IMPORTANT
INFORMATION ON THE LINE GRAPH ABOVE.


PAST PERFORMANCE IS NOT PREDICTIVE OF FUTURE RESULTS. The graph and table do
not reflect the deduction of taxes that a shareholder would pay on fund
distributions or the redemption of shares. Although the holdings and sectors
listed above were current as of the periods indicated, the Portfolio is
actively managed and its composition will vary.


16
                               AURORA PORTFOLIO

FUND PROFILE


Top Ten Holdings (% of long-term investments)
Federated Department Stores, Inc.   1.5 %
Kerr-McGee Corp.                    1.5
Ball Corp.                          1.4
Saks, Inc.                          1.3
BJ's Wholesale Club, Inc.           1.2
Allmerica Financial Corp.           1.1
Bausch & Lomb, Inc.                 1.1
Radian Group, Inc.                  1.1
Triad Hospitals, Inc.               1.1
Affiliated Managers Group, Inc.     1.1
                                    ---
     Total                          12.4 %
                                    =======


    Top Ten Industries (% of long-term
               investments)
Retail Merchandising             8.1 %
Insurance                         7.8
Manufacturing                     7.0
Medical & Medical Services        6.2
Computer & Software Services      5.1
Banks                             5.1
Medical Instruments & Supplies    4.7
Oil & Gas                         4.5
Aerospace                         4.3
Containers                        4.2
                                 ----
     Total                       57.0
                                 ====


- --------------------------------------------------------------------------------
EXPENSE EXAMPLE


As a shareholder of the Portfolio, you incur two types of costs: (1)
transaction costs, including front and back end sales charges (loads) or
redemption/exchange fees, where applicable; and (2) ongoing costs, including
advisory fees, distribution (12b-1) and service fees, where applicable; and
other Portfolio expenses. This Example is intended to help you understand your
ongoing costs (in dollars) of investing in the Portfolio and to compare these
costs with the ongoing costs of investing in other mutual funds.


The Example below is based on an investment of $1,000 invested at the beginning
of the period and held for the entire period October 1, 2004 to March 31, 2005.


The information under "Actual Expenses," together with the amount you invested,
allows you to estimate actual expenses incurred over the reporting period.
Simply divide your account value by $1,000 (for example, an $8,600 account
value divided by $1,000 = 8.60) and multiply the result by the cost shown for
your share class, in the row entitled "Expenses Incurred During Period", to
estimate the expenses incurred on your account during this period.


The information under "Hypothetical Expenses" provides information about
hypothetical account values and hypothetical expenses based on the Portfolio's
actual expense ratio and an assumed rate of return of 5% per year before
expenses, which is not the Portfolio's actual return. The hypothetical account
values and expenses may not be used to estimate the actual ending account
balance or expense you incurred for the period. You may use this information to
compare the ongoing costs of investing in the Portfolio and other funds. To do
so, compare this 5% hypothetical example with the 5% hypothetical examples that
appear in the shareholder reports of the other funds.


Please note that the expenses shown in the table are meant to highlight your
ongoing costs only and do not reflect any transactional costs, such as front
and back end sales charges (loads) or redemption/exchange fees, where
applicable. Therefore, the hypothetical information is useful in comparing
ongoing costs only, and will not help you determine the relative total costs of
owning different funds. In addition, if these transactional costs were
included, your costs would have been higher.


                                                        Actual Expenses
                        -------------------------------------------------------------------------------
                         Institutional      Service         Investor        Investor        Investor
                             Class           Class          A Class         B Class         C Class
                        --------------- --------------- --------------- --------------- ---------------
Beginning Account
 Value (10/01/04)        $   1,000.00    $   1,000.00    $   1,000.00    $   1,000.00    $   1,000.00
Ending Account Value
 (3/31/05)                   1,088.30        1,027.50        1,086.70        1,083.00        1,082.80
Expenses Incurred
 During Period
 (10/01/04 -
  3/31/05)                       5.78            2.45            7.23           10.96           10.96


                                                     Hypothetical Expenses
                                                  (5% return before expenses)
                        -------------------------------------------------------------------------------
                         Institutional      Service         Investor        Investor        Investor
                             Class           Class          A Class         B Class         C Class
                        --------------- --------------- --------------- --------------- ---------------
Beginning Account
 Value (10/01/04)        $   1,000.00    $   1,000.00    $   1,000.00    $   1,000.00    $   1,000.00
Ending Account Value
 (3/31/05)                   1,019.40        1,022.56        1,017.98        1,014.35        1,014.35
Expenses Incurred
 During Period
 (10/01/04 -
  3/31/05)                       5.60            2.44            7.02           10.65           10.65

For each class of the Portfolio, expenses are equal to the annualized expense
ratio of 1.11%, 1.42%, 1.39%, 2.11%,  and 2.11% for the Institutional, Service,
Investor A, B, and C share classes, respectively, multiplied by the average
account value over the period, multiplied by 182/365 (to reflect the one-half
year period) and 62/365 for the Service share class (to reflect the period the
class was open during the one-half year period).


                                                                              17
                        SMALL/MID-CAP GROWTH PORTFOLIO


Total Net Assets (3/31/05): $317.5 million


Performance Benchmark

     Russell 2500 Growth Index
Investment Approach
     Seeks to provide growth of capital by investing at least 80% of its total
assets in small-capitalization and mid-capitalization companies. The Portfolio
views small- and mid-capitalization companies as those that are less mature and
appear to have the potential for rapid growth. The fund generally defines
small- and mid-capitalization companies as those that have similar market
capitalizations to those in the Russell 2500 Growth Index or a similar index.
The management team uses research to identify potential investments, examining
such features as a company's financial condition, business prospects,
competitive position and business strategy.
Recent Portfolio Management Activity


     o  On January 31, 2005, BlackRock, Inc., the parent of BlackRock Advisors,
Inc. (BAI), acquired SSRM Holdings, Inc., the parent of State Street Research &
Management Company (SSRM), the investment adviser to the State Street Research
mutual funds. In connection with the transaction, the BlackRock Small/Mid-Cap
Growth Portfolio (the Portfolio) reorganized with the State Street Research
Emerging Growth Fund (the SSR Fund). The SSR Fund transferred substantially all
of its assets and liabilities to the Portfolio in exchange for shares of the
Portfolio, which were then distributed to the SSR Fund shareholders. For
periods prior to January 31, 2005, the performance information shown reflects
the performance of the SSR Fund, which had substantially similar investment
goals and strategies as the Portfolio. The SSR Fund's benchmark was the Russell
2000 Growth Index while the Portfolio's benchmark is the Russell 2500 Growth
Index.


     o  The Institutional, Investor A, B and C share classes of the Portfolio
underperformed the benchmark for the semi-annual period.  The Service share
class of the Portfolio outperformed the benchmark for the semi-annual period.


     o  US equity markets lost ground during the first quarter of 2005, as the
S&P 500 Index sustained its largest quarterly loss in two years, declining
2.2%. Investors became increasingly concerned about the impact that higher
commodity prices might have on the economy and fear that inflationary pressures
are on the rise. Market weakness during the first quarter was not enough to
offset gains from the fourth quarter of 2004 as the S&P 500 Index gained 6.9%
during the six-month period. Small to mid- capitalization growth stocks surged
higher in the fourth quarter led by technology stocks. The market reversed
course in the first quarter of 2005, with small- to mid-cap growth stocks
performing very poorly.


     o  The Portfolio appreciated significantly during this period, with the
sharp fourth quarter rise overshadowing the negative returns in the first
quarter. The Portfolio posted excellent relative returns in the health care and
materials sectors, but significantly lagged the benchmark within information
technology.


     o  In health care, the Portfolio's stock selection was especially
successful in the health care providers and services industry. The shares of
Community Health Systems and Lifepoint Hospitals appreciated significantly, and
our overweight position in this industry also added value. Stock selection in
the volatile biotechnology sector also contributed favorably during the period.
The Portfolio's exposure to increased pricing in the coal industry produced
outperformance in the materials sector.


     o  Stock selection within the information technology sector was the major
detractor during the period. Internet-related holdings caused the biggest
shortfall in the Portfolio, as stocks such as Ask Jeeves and Autobytel fell
sharply. In addition, an overweight position and stock selection in
communications equipment hurt the Portfolio.


     o  Our investment approach is driven by our focus on adding value through
bottom-up fundamental research. As a result, Portfolio positioning and
corresponding sector weights relative to the benchmark are largely determined
by stock selection. At the end of the period, the Portfolio increased its
industrials and energy exposure while decreasing its allocation to health care.


COMPARISON OF CHANGE IN VALUE OF A $10,000 INVESTMENT IN THE SMALL/MID-CAP
                                     GROWTH
PORTFOLIO, THE RUSSELL 2000 GROWTH INDEX AND THE RUSSELL 2500 GROWTH INDEX FOR
                              THE PAST TEN YEARS.


                                                 [LINE CHART]

                 Institutional          Investor A     Russell 2000 Growth Index     Russell 2500 Growth Index
                 -------------          ----------     -------------------------     -------------------------
03/31/1995          $ 10,000              $ 9,427               $ 10,000                      $ 10,000
06/30/1995            10,665               10,034                 10,992                        10,838
09/30/1995            11,814               11,100                 12,242                        12,043
12/31/1995            11,463               10,767                 12,423                        12,253
03/31/1996            11,983               11,260                 13,136                        13,110
06/30/1996            13,482               12,658                 13,904                        13,780
09/30/1996            13,833               12,978                 13,785                        13,970
12/31/1996            14,415               13,506                 13,822                        14,100
03/31/1997            13,737               12,888                 12,372                        12,972
06/30/1997            16,620               15,572                 14,544                        15,080
09/30/1997            20,521               19,208                 17,005                        17,589
12/31/1997            18,710               17,504                 15,611                        16,181
03/31/1998            21,695               20,282                 17,466                        17,984
06/30/1998            19,429               18,142                 16,463                        17,107
09/30/1998            14,400               13,451                 12,782                        13,308
12/31/1998            18,097               16,875                 15,805                        16,682
03/31/1999            17,368               16,181                 15,539                        16,506
06/30/1999            20,285               18,878                 17,831                        19,280
09/30/1999            18,661               17,364                 16,955                        18,611
12/31/1999            27,593               25,676                 22,616                        25,937
03/31/2000            30,991               28,814                 24,717                        29,865
06/30/2000            28,140               26,149                 22,894                        27,802
09/30/2000            27,312               25,360                 21,985                        26,984
12/31/2000            23,542               21,819                 17,544                        21,764
03/31/2001            19,631               18,192                 14,876                        17,429
06/30/2001            24,000               22,220                 17,550                        21,136
09/30/2001            19,192               17,715                 12,622                        15,413
12/31/2001            23,941               22,049                 15,924                        19,406
03/31/2002            23,841               21,953                 15,612                        18,832
06/30/2002            20,389               18,822                 13,162                        15,700
09/30/2002            18,075               16,665                 10,330                        12,707
12/31/2002            17,955               16,532                 11,105                        13,759
03/31/2003            17,776               16,360                 10,674                        13,319
06/30/2003            22,584               20,770                 13,252                        16,345
09/30/2003            24,160               22,201                 14,639                        17,974
12/31/2003            27,572               25,313                 16,495                        20,132
03/31/2004            30,065               27,604                 17,416                        21,240
06/30/2004            28,509               26,153                 17,432                        21,268
09/30/2004            24,918               22,831                 16,385                        20,076
12/31/2004            28,290               25,905                 18,855                        23,069
03/31/2005            27,252               24,931                 17,569                        22,071


                        FOR PERIOD ENDING MARCH 31, 2005

                                   Average Annual Total Return
                                              1 Year        3 Year         5 Year        10 Year
                                          -------------   ----------   -------------   -----------
     Institutional Class                      ( 9.36)%        4.56%         (2.54)%        10.55%
     Service Class                            ( 9.61)%        4.36%         (2.84)%        10.22%
     Investor A Class (Load Adjusted)         (14.86)%        2.30%         (3.99)%         9.57%
     Investor A Class (NAV)                   ( 9.68)%        4.33%         (2.85)%        10.21%
     Investor B Class (Load Adjusted)         (14.30)%        2.47%         (3.80)%         9.46%
     Investor B Class (NAV)                   (10.26)%        3.57%         (3.48)%         9.46%
     Investor C Class (Load Adjusted)         (11.21)%        3.63%         (3.46)%         9.48%
     Investor C Class (NAV)                   (10.31)%        3.63%         (3.46)%         9.48%

THE PERFORMANCE INFORMATION ABOVE INCLUDES INFORMATION RELATING TO EACH CLASS
OF THE PORTFOLIO SINCE THE COMMENCEMENT OF OPERATIONS OF THE PORTFOLIO, RATHER
THAN THE DATE SUCH CLASS WAS INTRODUCED. THE INCEPTION DATES OF THE PORTFOLIO'S
SHARE CLASSES WERE AS FOLLOWS: INSTITUTIONAL SHARES, 10/4/93; INVESTOR A
SHARES, 2/1/94; INVESTOR C SHARES, 2/1/94; INVESTOR B SHARES, 1/1/99 AND
SERVICE SHARES, 1/28/05. SEE "NOTE ON PERFORMANCE INFORMATION" ON PAGE 41 FOR
FURTHER INFORMATION ON HOW PERFORMANCE DATA WAS CALCULATED, INCLUDING IMPORTANT
INFORMATION ON THE LINE GRAPH ABOVE.


PAST PERFORMANCE IS NOT PREDICTIVE OF FUTURE RESULTS. The graph and table do
not reflect the deduction of taxes that a shareholder would pay on fund
distributions or the redemption of shares.  Although the holdings and sectors
listed above were current as of the periods indicated, the Portfolio is
actively managed and its composition will vary.


18
                        SMALL/MID-CAP GROWTH PORTFOLIO

FUND PROFILE


 Top Ten Holdings (% of long-term investments)
Affiliated Managers Group, Inc.        3.2 %
Navigant Consulting, Inc.              2.4
LifePoint Hospitals, Inc.              2.2
Community Health Systems, Inc.         2.0
UCBH Holdings, Inc.                    2.0
CapitalSource, Inc.                    2.0
Pride International, Inc.              2.0
Digitas, Inc.                          2.0
Advanced Medical Optics, Inc.          1.9
RARE Hospitality International, Inc.   1.9
                                       ---
     Total                             21.6 %
                                       =======


     Top Ten Industries (% of long-term
                investments)
Computer Software & Services       12.5 %
Medical & Medical Services         10.8
Business Services                   8.7
Telecommunications                  7.8
Finance                             7.3
Medical Instruments & Supplies      7.2
Retail Merchandising                6.4
Oil & Gas                           5.9
Semiconductors & Related Devices    4.8
Banks                               4.6
                                   ----
     Total                         76.0 %
                                   ========


- --------------------------------------------------------------------------------
EXPENSE EXAMPLE


As a shareholder of the Portfolio, you incur two types of costs: (1)
transaction costs, including front and back end sales charges (loads) or
redemption/exchange fees, where applicable; and (2) ongoing costs, including
advisory fees, distribution (12b-1) and service fees, where applicable; and
other Portfolio expenses. This Example is intended to help you understand your
ongoing costs (in dollars) of investing in the Portfolio and to compare these
costs with the ongoing costs of investing in other mutual funds.


The Example below is based on an investment of $1,000 invested at the beginning
of the period and held for the entire period October 1, 2004 to March 31, 2005.


The information under "Actual Expenses," together with the amount you invested,
allows you to estimate actual expenses incurred over the reporting period.
Simply divide your account value by $1,000 (for example, an $8,600 account
value divided by $1,000 = 8.60) and multiply the result by the cost shown for
your share class, in the row entitled "Expenses Incurred During Period", to
estimate the expenses incurred on your account during this period.


The information under "Hypothetical Expenses" provides information about
hypothetical account values and hypothetical expenses based on the Portfolio's
actual expense ratio and an assumed rate of return of 5% per year before
expenses, which is not the Portfolio's actual return. The hypothetical account
values and expenses may not be used to estimate the actual ending account
balance or expense you incurred for the period. You may use this information to
compare the ongoing costs of investing in the Portfolio and other funds. To do
so, compare this 5% hypothetical example with the 5% hypothetical examples that
appear in the shareholder reports of the other funds.


Please note that the expenses shown in the table are meant to highlight your
ongoing costs only and do not reflect any transactional costs, such as front
and back end sales charges (loads) or redemption/exchange fees, where
applicable. Therefore, the hypothetical information is useful in comparing
ongoing costs only, and will not help you determine the relative total costs of
owning different funds. In addition, if these transactional costs were
included, your costs would have been higher.


                                                        Actual Expenses
                        -------------------------------------------------------------------------------
                         Institutional      Service         Investor        Investor        Investor
                             Class           Class          A Class         B Class         C Class
                        --------------- --------------- --------------- --------------- ---------------
Beginning Account
 Value (10/01/04)        $   1,000.00    $   1,000.00    $   1,000.00    $   1,000.00    $   1,000.00
Ending Account Value
 (3/31/05)                   1,093.70        1,020.30        1,092.00        1,088.50        1,088.30
Expenses Incurred
 During Period
 (10/01/04 -
  3/31/05)                       5.74            2.32            7.25           10.93           10.93


                                                     Hypothetical Expenses
                                                  (5% return before expenses)
                        -------------------------------------------------------------------------------
                         Institutional      Service         Investor        Investor        Investor
                             Class           Class          A Class         B Class         C Class
                        --------------- --------------- --------------- --------------- ---------------
Beginning Account
 Value (10/01/04)        $   1,000.00    $   1,000.00    $   1,000.00    $   1,000.00    $   1,000.00
Ending Account Value
 (3/31/05)                   1,019.45        1,022.68        1,017.98        1,014.40        1,014.40
Expenses Incurred
 During Period
 (10/01/04 -
  3/31/05)                       5.55            2.32            7.02           10.60           10.60

For each class of the Portfolio, expenses are equal to the annualized expense
ratio of 1.10%, 1.35%, 1.39%, 2.10%, and 2.10% for the Institutional, Service,
Investor A, B, and C share classes, respectively, multiplied by the average
account value over the period, multiplied by 182/365 (to reflect the one-half
year period) and 62/365 for the Service share class (to reflect the period the
class was open during the one-half year period).


For the period October 1, 2004 through January 31, 2005, the "Actual Expenses"
table reflects the expenses of the State Street Research Emerging Growth Fund
prior to its reorganization with the Portfolio on that date. Restated to
reflect the Portfolio's current expenses for the entire semi-annual period, (i)
"Ending Account Value" on March 31, 2005 would have been $1,092.00 for Investor
A Class shares, and (ii) "Expenses Incurred During Period" for the period
October 1, 2004 through March 31, 2005 would have been $7.04 for Investor A
Class shares.  "Ending Account Value" and "Expenses Incurred During Period"
would have been the same for Institutional Class, Service Class, Investor B
Class and Investor C Class.


                                                                              19
                       SMALL CAP VALUE EQUITY PORTFOLIO


Total Net Assets (3/31/05): $129.9 million


Performance Benchmark

     Russell 2000 Value Index


Investment Approach

     Seeks long-term capital appreciation by investing in small capitalization
stocks of companies believed by the portfolio manager to be worth more than is
indicated by current market price. The Portfolio normally invests at least 80%
of its net assets in equity securities issued by U.S. small capitalization
value companies (market capitalizations under $2 billion). The portfolio
manager uses fundamental analysis to examine each company for financial
strength before deciding to purchase the stock.


Recent Portfolio Management Activity


     o  All share classes of the Portfolio outperformed the benchmark for the
semi-annual period.


     o  US equity markets lost ground during the first quarter of 2005, as the
S&P 500 Index sustained its largest quarterly loss in two years, declining
2.2%. Investors became increasingly concerned about the impact that higher
commodity prices might have on the economy and fear that inflationary pressures
are on the rise. Market weakness during the first quarter was not enough to
offset gains from the fourth quarter of 2004 as the S&P 500 Index gained 6.9%
during the six-month period. In this environment (for the six-month period),
mid-capitalization stocks outperformed their large- and small-capitalization
counterparts, while value stocks continued to outperform growth stocks.


     o  Within the Portfolio's benchmark, the Russell 2000 Value Index, all
major sectors posted positive returns for the six-month period. During the
period, the Portfolio's holdings in the financials, industrials and health care
sectors aided returns, more than offsetting weakness as a result of a relative
underweight in energy.


     o  The combined effects of stock selection and an underweight contributed
to relative outperformance in the financials sector. The Portfolio continued to
be underweight real estate investment trusts (REITs), which underperformed
during the period. In addition, strength among select insurance names also
contributed to sector return comparisons. In industrials, the Portfolio
benefited from strong stock selection, particularly among industrial
conglomerates, which appreciated significantly during the period. Gains among
equipment and supply manufacturers contributed to relative returns in the
health care sector.


     o  The energy sector was the strongest performing sector. Although the
Portfolio's oil and gas holdings performed well, an underweight relative to the
benchmark detracted from performance as rising crude oil prices pushed the
sector higher. Stock selection and an underweight in energy equipment and
services names also proved to be a drag on performance relative to the
benchmark during the period.


     o  Our investment approach is driven by our focus on adding value through
bottom-up fundamental research. As a result, portfolio positioning and
corresponding sector weights relative to the benchmark are largely determined
by stock selection. As of the end of the period, the Portfolio has an increased
overweight in consumer staples, an increased underweight in energy, a reduced
underweight in financials and a reduced overweight in industrials.


COMPARISON OF CHANGE IN VALUE OF A $10,000 INVESTMENT IN THE SMALL CAP VALUE
                                EQUITY PORTFOLIO
            AND THE RUSSELL 2000VALUE INDEX FOR THE PAST TEN YEARS.


                                  [LINE CHART]

                 Institutional          Investor A     Russell 2000 Value Index
                 -------------          ----------     ------------------------
03/31/1995          $ 10,000              $ 9,425              $ 10,000
06/30/1995            10,581                9,957                10,878
09/30/1995            11,582               10,884                11,783
12/31/1995            11,920               11,196                12,126
03/31/1996            12,558               11,775                12,658
06/30/1996            12,990               12,158                13,175
09/30/1996            13,046               12,197                13,371
12/31/1996            14,288               13,361                14,717
03/31/1997            14,173               13,231                14,680
06/30/1997            16,808               15,676                16,896
09/30/1997            19,224               17,911                19,074
12/31/1997            19,394               18,042                19,395
03/31/1998            20,917               19,432                21,016
06/30/1998            19,819               18,391                20,257
09/30/1998            15,950               14,789                16,637
12/31/1998            18,188               16,849                18,148
03/31/1999            15,517               14,345                16,389
06/30/1999            18,201               16,806                19,101
09/30/1999            16,783               15,486                17,609
12/31/1999            17,307               15,949                17,879
03/31/2000            17,742               16,329                18,561
06/30/2000            18,028               16,582                18,923
09/30/2000            19,662               18,056                20,311
12/31/2000            20,830               19,131                21,958
03/31/2001            20,174               18,507                22,172
06/30/2001            22,527               20,639                24,752
09/30/2001            19,753               18,072                21,451
12/31/2001            22,044               20,143                25,037
03/31/2002            23,924               21,837                27,438
06/30/2002            22,523               20,544                26,856
09/30/2002            18,123               16,497                21,138
12/31/2002            18,383               16,722                22,179
03/31/2003            18,151               16,494                21,052
06/30/2003            21,758               19,747                25,836
09/30/2003            23,553               21,343                27,832
12/31/2003            27,195               24,614                32,387
03/31/2004            29,365               26,550                34,628
06/30/2004            29,215               26,395                34,922
09/30/2004            28,467               25,693                34,974
12/31/2004            32,681               29,485                39,592
03/31/2005            32,454               29,256                38,017


                        FOR PERIOD ENDING MARCH 31, 2005


                                  Average Annual Total Return
                                             1 Year        3 Year        5 Year       10 Year
                                          -----------   -----------   -----------   -----------
     BlackRock Class                          10.58%        10.72%        12.85%        12.50%
     Institutional Class                      10.52%        10.70%        12.84%        12.49%
     Service Class                            10.21%        10.38%        12.53%        12.16%
     Investor A Class (Load Adjusted)          3.83%         8.09%        11.05%        11.33%
     Investor A Class (NAV)                   10.20%        10.24%        12.37%        11.99%
     Investor B Class (Load Adjusted)          5.44%         8.66%        11.30%        11.17%
     Investor B Class (NAV)                    9.41%         9.42%        11.52%        11.17%
     Investor C Class (Load Adjusted)          8.53%         9.45%        11.52%        11.17%
     Investor C Class (NAV)                    9.42%         9.45%        11.52%        11.17%

THE INSTITUTIONAL CLASS OF THE BLACKROCK SMALL CAP VALUE EQUITY PORTFOLIO
CLOSED TO NEW INVESTORS AS OF 4:00 P.M., MARCH 11, 2002.  EXISTING SHAREHOLDERS
AND PROGRAMS IN THE INSTITUTIONAL SHARE CLASS OF THE FUND AS OF 4:00 P.M.,
MARCH 11, 2002, MAY MAKE ADDITIONAL INVESTMENTS IN CURRENT ACCOUNTS.

THE PERFORMANCE INFORMATION ABOVE INCLUDES INFORMATION RELATING TO EACH CLASS
OF THE PORTFOLIO SINCE THE COMMENCEMENT OF OPERATIONS OF THE PORTFOLIO, RATHER
THAN THE DATE SUCH CLASS WAS INTRODUCED. THE INCEPTION DATES OF THE PORTFOLIO'S
SHARE CLASSES WERE AS FOLLOWS: INSTITUTIONAL SHARES, 4/13/92; INVESTOR A
SHARES, 6/2/92; SERVICE SHARES, 7/29/93; INVESTOR B SHARES, 10/3/94; INVESTOR C
SHARES, 10/1/96; AND BLACKROCK SHARES, 4/12/04. SEE "NOTE ON PERFORMANCE
INFORMATION" ON PAGE 41 FOR FURTHER INFORMATION ON HOW PERFORMANCE DATA WAS
CALCULATED, INCLUDING IMPORTANT INFORMATION ON THE LINE GRAPH ABOVE.


PAST PERFORMANCE IS NOT PREDICTIVE OF FUTURE RESULTS. The graph and table do
not reflect the deduction of taxes that a shareholder would pay on fund
distributions or the redemption of shares. Although the holdings and sectors
listed above were current as of the periods indicated, the Portfolio is
actively managed and its composition will vary.


20
                       SMALL CAP VALUE EQUITY PORTFOLIO

FUND PROFILE


     Top Ten Holdings (% of long-term
               investments)
Laidlaw International, Inc.       2.3 %
Walter Industries, Inc.           2.3
DJ Orthopedics, Inc.              2.0
Ralcorp Holdings, Inc.            2.0
Handleman Co.                     1.9
Affiliated Managers Group, Inc.   1.9
Allmerica Financial Corp.         1.9
Sybron Dental Specialties, Inc.   1.9
Regis Corp.                       1.9
Jarden Corp.                      1.9
                                  ---
     Total                        20.0 %
                                  =======


    Top Ten Industries (% of long-term
               investments)
Retail Merchandising             12.6 %
Banks                            9.5
Manufacturing                    7.5
Oil & Gas                        7.1
Insurance                        6.8
Food & Agriculture               6.2
Entertainment & Leisure          4.8
Finance                          4.7
Medical Instruments & Supplies   4.5
Business Services                4.4
                                 ---
     Total                       68.1 %
                                 ========


- --------------------------------------------------------------------------------
EXPENSE EXAMPLE


As a shareholder of the Portfolio, you incur two types of costs: (1)
transaction costs, including front and back end sales charges (loads) or
redemption/exchange fees, where applicable; and (2) ongoing costs, including
advisory fees, distribution (12b-1) and service fees, where applicable; and
other Portfolio expenses. This Example is intended to help you understand your
ongoing costs (in dollars) of investing in the Portfolio and to compare these
costs with the ongoing costs of investing in other mutual funds.


The Example below is based on an investment of $1,000 invested at the beginning
of the period and held for the entire period October 1, 2004 to March 31, 2005.


The information under "Actual Expenses," together with the amount you invested,
allows you to estimate actual expenses incurred over the reporting period.
Simply divide your account value by $1,000 (for example, an $8,600 account
value divided by $1,000 = 8.60) and multiply the result by the cost shown for
your share class, in the row entitled "Expenses Incurred During Period", to
estimate the expenses incurred on your account during this period.


The information under "Hypothetical Expenses" provides information about
hypothetical account values and hypothetical expenses based on the Portfolio's
actual expense ratio and an assumed rate of return of 5% per year before
expenses, which is not the Portfolio's actual return. The hypothetical account
values and expenses may not be used to estimate the actual ending account
balance or expense you incurred for the period. You may use this information to
compare the ongoing costs of investing in the Portfolio and other funds. To do
so, compare this 5% hypothetical example with the 5% hypothetical examples that
appear in the shareholder reports of the other funds.


Please note that the expenses shown in the table are meant to highlight your
ongoing costs only and do not reflect any transactional costs, such as front
and back end sales charges (loads) or redemption/exchange fees, where
applicable. Therefore, the hypothetical information is useful in comparing
ongoing costs only, and will not help you determine the relative total costs of
owning different funds. In addition, if these transactional costs were
included, your costs would have been higher.


                                                                Actual Expenses
                        -----------------------------------------------------------------------------------------------
                           BlackRock     Institutional      Service         Investor        Investor        Investor
                             Class           Class           Class          A Class         B Class         C Class
                        --------------- --------------- --------------- --------------- --------------- ---------------
Beginning Account
 Value (10/01/04)       $  1,000.00     $  1,000.00     $  1,000.00     $  1,000.00     $  1,000.00     $  1,000.00
Ending Account Value
 (3/31/05)                1,140.00        1,140.00        1,139.30        1,138.70        1,134.60        1,134.70
Expenses Incurred
 During Period
 (10/01/04 -
  3/31/05)                    5.59            5.16            6.60            6.59           10.56           10.56


                                                             Hypothetical Expenses
                                                          (5% return before expenses)
                        -----------------------------------------------------------------------------------------------
                           BlackRock     Institutional      Service         Investor        Investor        Investor
                             Class           Class           Class          A Class         B Class         C Class
                        --------------- --------------- --------------- --------------- --------------- ---------------
Beginning Account
 Value (10/01/04)       $  1,000.00     $  1,000.00     $  1,000.00     $  1,000.00     $  1,000.00     $  1,000.00
Ending Account Value
 (3/31/05)                1,019.71        1,020.12        1,018.76        1,018.76        1,014.98        1,014.98
Expenses Incurred
 During Period
 (10/01/04 -
  3/31/05)                    5.29            4.88            6.24            6.24           10.02           10.02

For each class of the Portfolio, expenses are equal to the annualized expense
ratio of 1.05%, 0.97%, 1.24%, 1.24%, 1.99%, and 1.99% for BlackRock, the
Institutional, Service, Investor A, B, and C share classes, respectively,
multiplied by the average account value over the period, multiplied by 182/365
(to reflect the one-half year period).


                                                                              21
                        SMALL CAP CORE EQUITY PORTFOLIO


Total Net Assets (3/31/05): $25.0 million


Performance Benchmark

     Russell 2000 Index


Investment Approach

     Seeks long-term capital appreciation by normally investing at least 80% of
assets in the equity securities of U.S. small capitalization companies (market
capitalizations under $2 billion). The portfolio management team seeks to
achieve consistent and sustainable performance through various market cycles by
emphasizing stock selection. Stock selection is determined by looking at
companies using a range of valuation criteria, including the strength of their
management and business franchise. The portfolio management team uses
fundamental analysis to examine each company for financial strength before
deciding to purchase the stock.
Recent Portfolio Management Activity


     o  All share classes of the Portfolio outperformed the benchmark for the
semi-annual period.


     o  US equity markets lost ground during the first quarter of 2005, as the
S&P 500 Index sustained its largest quarterly loss in two years, declining
2.2%. Investors became increasingly concerned about the impact that higher
commodity prices might have on the economy and fear that inflationary pressures
are on the rise. Market weakness during the first quarter was not enough to
offset gains from the fourth quarter of 2004 as the S&P 500 Index gained 6.9%
during the six-month period. In this environment (for the six-month period),
mid-capitalization stocks outperformed their large- and small-capitalization
counterparts, while value stocks continued to outperform growth stocks.

     o  Within the Portfolio's benchmark, the Russell 2000 Index, all major
sectors posted positive returns for the period. During the period, the
Portfolio's holdings in the health care, information technology and consumer
discretionary sectors aided returns relative to the benchmark, more than
offsetting relative weakness in the materials and energy sectors.


     o  Stock selection in health care proved to be the single largest
contributor to outperformance during the period, driven primarily by strength
in health care providers and equipment and supply manufacturers. Information
technology proved to be another area of relative strength as select stocks in
the software and electronic equipment and instrument industries outperformed.
In addition, gains among hotel and restaurant stocks held in the Portfolio
contributed to relative outperformance in the consumer discretionary sector.


     o  The energy sector was the strongest performing sector in the benchmark
during the period covered by this report as rising crude oil prices pushed the
sector higher. Although the Portfolio's oil and gas holdings performed well,
they underperformed relative to the benchmark holdings. Stock selection and an
underweight in energy equipment and services names also proved to be a drag on
performance relative to the benchmark during the period.


     o  Our investment approach is driven by our focus on adding value through
bottom up fundamental research. As a result, portfolio positioning and
corresponding sector weights relative to the benchmark are largely determined
by stock selection. At the end of the period, the Portfolio held an increased
overweight in consumer discretionary, a change from an overweight to an
underweight in consumer staples, a reduced underweight in information
technology and an increased underweight in materials.


COMPARISON OF CHANGE IN VALUE OF A $10,000 INVESTMENT IN THE SMALL CAP CORE
                                EQUITY PORTFOLIO
                   AND THE RUSSELL 2000 INDEX FROM INCEPTION.


                              [LINE CHART]

                 Institutional          Investor A     Russell 2000 Index
                 -------------          ----------     ------------------
01/02/2002          $ 10,000              $ 9,425           $ 10,000
03/31/2002            10,680               10,066             10,420
06/30/2002            10,010                9,434              9,550
09/30/2002            8,350                7,870              7,506
12/31/2002            8,900                8,388              7,968
03/31/2003            8,570                8,077              7,610
06/30/2003            10,750               10,132              9,392
09/30/2003            12,000               11,310             10,245
12/31/2003            14,009               13,185             11,733
03/31/2004            15,566               14,633             12,467
06/30/2004            15,586               14,642             12,526
09/30/2004            14,929               14,013             12,168
12/31/2004            17,004               15,950             13,883
03/31/2005            16,444               15,413             13,142


                        FOR PERIOD ENDING MARCH 31, 2005

                             Average Annual Total Return
                                             1 Year         3 Year      From Inception
                                          ------------   -----------   ---------------
     Institutional Class                       5.64%         15.47%          16.59%
     Service Class                             5.51%         15.45%          16.56%
     Investor A Class (Load Adjusted)         (0.74)%        13.01%          14.28%
     Investor A Class (NAV)                    5.33%         15.26%          16.39%
     Investor B Class (Load Adjusted)          0.00%         13.94%          15.32%
     Investor B Class (NAV)                    4.50%         14.83%          15.99%
     Investor C Class (Load Adjusted)          3.50%         14.83%          15.99%
     Investor C Class (NAV)                    4.50%         14.83%          15.99%

THE INCEPTION DATE OF THE PORTFOLIO'S INSTITUTIONAL, SERVICE, INVESTOR A,
INVESTOR B AND INVESTOR C SHARES WAS 1/2/02. SEE "NOTE ON PERFORMANCE
INFORMATION" ON PAGE 41 FOR FURTHER INFORMATION ON HOW PERFORMANCE DATA WAS
CALCULATED, INCLUDING IMPORTANT INFORMATION ON THE LINE GRAPH ABOVE.


PAST PERFORMANCE IS NOT PREDICTIVE OF FUTURE RESULTS. The graph and table do
not reflect the deduction of taxes that a shareholder would pay on fund
distributions or the redemption of shares.  Although the holdings and sectors
listed above were current as the periods indicated, the Portfolio is actively
managed and its composition will vary.


22
                        SMALL CAP CORE EQUITY PORTFOLIO

FUND PROFILE


 Top Ten Holdings (% of long-term investments)
Laureate Education, Inc.               2.4 %
Aviall, Inc.                           2.1
Jarden Corp.                           2.0
DJ Orthopedics, Inc.                   1.9
Digitas, Inc.                          1.7
Kerzner International, Ltd.            1.7
J. Jill Group, Inc.                    1.6
DRS Technologirs, Inc.                 1.6
Orient-Express Hotels Ltd. - Class A   1.6
Gaylord Entertainment Co.              1.5
                                       ---
     Total                             18.1 %
                                       =======


    Top Ten Industries (% of long-term
               investments)
Medical Instruments & Supplies   9.3 %
Oil & Gas                        8.1
Retail Merchandising             8.0
Banks                            7.7
Entertainment & Leisure          7.0
Manufacturing                    6.5
Aerospace                        5.4
Business Services                5.0
Computer Software & Services     4.7
Medical & Medical Services       4.3
                                 ---
     Total                       66.0 %
                                 =======


- --------------------------------------------------------------------------------
EXPENSE EXAMPLE


As a shareholder of the Portfolio, you incur two types of costs: (1)
transaction costs, including front and back end sales charges (loads) or
redemption/exchange fees, where applicable; and (2) ongoing costs, including
advisory fees, distribution (12b-1) and service fees, where applicable; and
other Portfolio expenses. This Example is intended to help you understand your
ongoing costs (in dollars) of investing in the Portfolio and to compare these
costs with the ongoing costs of investing in other mutual funds.


The Example below is based on an investment of $1,000 invested at the beginning
of the period and held for the entire period October 1, 2004 to March 31, 2005.


The information under "Actual Expenses," together with the amount you invested,
allows you to estimate actual expenses incurred over the reporting period.
Simply divide your account value by $1,000 (for example, an $8,600 account
value divided by $1,000 = 8.60) and multiply the result by the cost shown for
your share class, in the row entitled "Expenses Incurred During Period", to
estimate the expenses incurred on your account during this period.


The information under "Hypothetical Expenses" provides information about
hypothetical account values and hypothetical expenses based on the Portfolio's
actual expense ratio and an assumed rate of return of 5% per year before
expenses, which is not the Portfolio's actual return. The hypothetical account
values and expenses may not be used to estimate the actual ending account
balance or expense you incurred for the period. You may use this information to
compare the ongoing costs of investing in the Portfolio and other funds. To do
so, compare this 5% hypothetical example with the 5% hypothetical examples that
appear in the shareholder reports of the other funds.


Please note that the expenses shown in the table are meant to highlight your
ongoing costs only and do not reflect any transactional costs, such as front
and back end sales charges (loads) or redemption/exchange fees, where
applicable. Therefore, the hypothetical information is useful in comparing
ongoing costs only, and will not help you determine the relative total costs of
owning different funds. In addition, if these transactional costs were
included, your costs would have been higher.


                                                        Actual Expenses
                        -------------------------------------------------------------------------------
                         Institutional      Service         Investor        Investor        Investor
                             Class           Class          A Class         B Class         C Class
                        --------------- --------------- --------------- --------------- ---------------
Beginning Account
 Value (10/01/04)        $   1,000.00    $   1,000.00    $   1,000.00    $   1,000.00    $   1,000.00
Ending Account Value
 (3/31/05)                   1,101.50        1,103.80        1,099.90        1,095.00        1,095.00
Expenses Incurred
 During Period
 (10/01/04 -
  3/31/05)                       6.97            8.37            8.88           12.71           12.66


                                                     Hypothetical Expenses
                                                  (5% return before expenses)
                        -------------------------------------------------------------------------------
                         Institutional      Service         Investor        Investor        Investor
                             Class           Class          A Class         B Class         C Class
                        --------------- --------------- --------------- --------------- ---------------
Beginning Account
 Value (10/01/04)        $   1,000.00    $   1,000.00    $   1,000.00    $   1,000.00    $   1,000.00
Ending Account Value
 (3/31/05)                   1,018.45        1,016.94        1,016.44        1,012.71        1,012.77
Expenses Incurred
 During Period
 (10/01/04 -
  3/31/05)                       6.55            8.06            8.56           12.29           12.23

For each class of the Portfolio, expenses are equal to the annualized expense
ratio of 1.30%, 1.60%, 1.70%, 2.44%, and 2.43% for the Institutional, Service,
Investor A, B, and C share classes, respectively, multiplied by the average
account value over the period, multiplied by 182/365 (to reflect the one-half
year period).


                                                                              23
                       SMALL CAP GROWTH EQUITY PORTFOLIO


Total Net Assets (3/31/05): $523.3 million


Performance Benchmark

     Russell 2000 Growth Index


Investment Approach

     Seeks long-term capital appreciation by investing at least 80% of its net
assets in equity securities issued by U.S. small capitalization growth
companies (market capitalizations under $2 billion). The management team would
expect these companies to have products, technologies, management, markets and
opportunities which will facilitate earnings growth over time that is well
above the growth rate of the overall economy and the rate of inflation. The
management team uses a bottom up investment style and selects securities based
upon fundamental analysis (such as analysis of earnings, cash flows,
competitive position and management's abilities).
Recent Portfolio Management Activity


     o  All share classes of the Portfolio outperformed the benchmark for the
semi-annual period.


     o  US equity markets lost ground during the first quarter of 2005, as the
S&P 500 Index sustained its largest quarterly loss in two years, declining
2.2%. Investors became increasingly concerned about the impact that higher
commodity prices might have on the economy and fear that inflationary pressures
are on the rise. Market weakness during the first quarter was not enough to
offset gains from the fourth quarter of 2004 as the S&P 500 Index gained 6.9%
during the six-month period. Small to mid- capitalization growth stocks surged
higher in the fourth quarter led by technology stocks. The market reversed
course in the first quarter of 2005, with small to mid- capitalization growth
stocks performing very poorly.


     o  The Portfolio performed relatively well in this volatile environment.
Stock selection decisions accounted for the Portfolio's success during the
period with particular strength coming from the health care and industrials
sectors.


     o  Within health care, the Portfolio's holdings in the health care
equipment and supplies industry rose signficantly and produced substantial
gains for the Portfolio. The Portfolio's two largest holdings in this industry,
Hologic Inc. and CTI Molecular Imaging Inc. posted excellent results during the
period and appreciated rapidly. The Portfolio also benefited from stock
selection in the industrials sector, where its sizeable investments in the
commercial services and supplies industry produced outsized gains. These
results overshadowed pockets of weakness in the information technology sector.


     o  Our investment approach is driven by our focus on adding value through
bottom-up fundamental research. As a result, Portfolio positioning and
corresponding sector weights relative to the benchmark are largely determined
by stock selection. At the end of period, the Portfolio held an overweight
position in the industrials and materials sectors, while continuing to be
underweight the financial sector.


COMPARISON OF CHANGE IN VALUE OF A $10,000 INVESTMENT IN THE SMALL CAP GROWTH
                                EQUITY PORTFOLIO
           AND THE RUSSELL 2000 GROWTH INDEX FOR THE PAST TEN YEARS.


                                  [LINE CHART]

                 Institutional          Investor A     Russell 2000 Growth Index
                 -------------          ----------     -------------------------
03/31/1995          $ 10,000              $ 9,423               $ 10,000
06/30/1995            11,306               10,642                 10,992
09/30/1995            12,938               12,169                 12,242
12/31/1995            13,892               12,998                 12,423
03/31/1996            15,673               14,647                 13,136
06/30/1996            17,944               16,751                 13,904
09/30/1996            18,873               17,620                 13,785
12/31/1996            18,279               17,044                 13,822
03/31/1997            14,723               13,705                 12,372
06/30/1997            17,927               16,677                 14,544
09/30/1997            21,872               20,313                 17,005
12/31/1997            19,961               18,517                 15,611
03/31/1998            21,882               20,268                 17,466
06/30/1998            21,053               19,485                 16,463
09/30/1998            17,075               15,781                 12,782
12/31/1998            21,433               19,779                 15,805
03/31/1999            22,019               20,314                 15,539
06/30/1999            23,003               21,198                 17,831
09/30/1999            24,749               22,783                 16,955
12/31/1999            36,964               33,998                 22,616
03/31/2000            44,479               40,860                 24,717
06/30/2000            40,293               36,921                 22,894
09/30/2000            40,349               36,899                 21,985
12/31/2000            32,046               29,293                 17,544
03/31/2001            24,158               22,073                 14,876
06/30/2001            25,987               23,710                 17,550
09/30/2001            18,671               17,010                 12,622
12/31/2001            21,041               19,136                 15,924
03/31/2002            19,800               17,989                 15,612
06/30/2002            17,049               15,465                 13,162
09/30/2002            14,313               12,971                 10,330
12/31/2002            15,283               13,828                 11,105
03/31/2003            14,631               13,232                 10,674
06/30/2003            18,114               16,367                 13,252
09/30/2003            19,498               17,591                 14,639
12/31/2003            23,728               21,385                 16,495
03/31/2004            25,462               22,914                 17,416
06/30/2004            24,921               22,425                 17,432
09/30/2004            23,092               20,757                 16,385
12/31/2004            26,193               23,541                 18,855
03/31/2005            25,303               22,715                 17,569


                        FOR PERIOD ENDING MARCH 31, 2005

                                   Average Annual Total Return
                                              1 Year        3 Year         5 Year         10 Year
                                          -------------   ----------   --------------   ----------
     Institutional Class                       (0.63)%        8.52%         (10.67)%        9.73%
     Service Class                             (0.85)%        8.23%         (10.89)%        9.37%
     Investor A Class (Load Adjusted)          (6.54)%        5.97%         (12.13)%        8.55%
     Investor A Class (NAV)                    (0.87)%        8.09%         (11.08)%        9.20%
     Investor B Class (Load Adjusted)          (6.10)%        6.26%         (11.95)%        8.45%
     Investor B Class (NAV)                    (1.67)%        7.29%         (11.70)%        8.45%
     Investor C Class (Load Adjusted)          (2.66)%        7.28%         (11.69)%        8.46%
     Investor C Class (NAV)                    (1.67)%        7.28%         (11.69)%        8.46%

THE PERFORMANCE INFORMATION ABOVE INCLUDES INFORMATION RELATING TO EACH CLASS
OF THE PORTFOLIO SINCE THE COMMENCEMENT OF OPERATIONS OF THE PORTFOLIO, RATHER
THAN THE DATE SUCH CLASS WAS INTRODUCED. THE INCEPTION DATES OF THE PORTFOLIO'S
SHARE CLASSES WERE AS FOLLOWS: INSTITUTIONAL SHARES, 9 /14 /93; SERVICE AND
INVESTOR A SHARES, 9/15 /93; INVESTOR B SHARES, 1/18/96; AND INVESTOR C SHARES,
9/6/96. SEE "NOTE ON PERFORMANCE INFORMATION" ON PAGE 41 FOR FURTHER
INFORMATION ON HOW PERFORMANCE DATA WAS CALCULATED, INCLUDING IMPORTANT
INFORMATION ON THE LINE GRAPH ABOVE.


PAST PERFORMANCE IS NOT PREDICTIVE OF FUTURE RESULTS. The graph and table do
not reflect the deduction of taxes that a shareholder would pay on fund
distributions or the redemption of shares. Although the holdings and sectors
listed above were current as of the periods indicated, the Portfolio is
actively managed and its composition will vary.


24
                       SMALL CAP GROWTH EQUITY PORTFOLIO

FUND PROFILE


   Top Ten Holdings (% of long-term
             investments)
Navigant Consulting, Inc.     2.5 %
Laureate Education, Inc.      2.3
Digitas, Inc.                 2.2
Too, Inc.                     2.2
Accredo Health, Inc.          2.2
Hologic, Inc.                 2.1
CTI Molecular Imaging, Inc.   2.1
Airgas, Inc.                  2.0
Watson Wyatt & Co. Holdings   2.0
CDI Corp.                     1.8
                              ---
     Total                    21.4 %
                              =======


    Top Ten Industries (% of long-term
               investments)
Business Services                16.4 %
Computer Software & Services     13.8
Medical & Medical Services        9.6
Retail Merchandising              8.4
Oil & Gas                         6.9
Medical Instruments & Supplies    6.6
Entertainment & Leisure           5.1
Personal Services                 3.9
Manufacturing                     3.1
Broadcasting                      2.9
                                 ----
     Total                       76.7 %
                                 ========


- --------------------------------------------------------------------------------
EXPENSE EXAMPLE


As a shareholder of the Portfolio, you incur two types of costs: (1)
transaction costs, including front and back end sales charges (loads) or
redemption/exchange fees, where applicable; and (2) ongoing costs, including
advisory fees, distribution (12b-1) and service fees, where applicable; and
other Portfolio expenses. This Example is intended to help you understand your
ongoing costs (in dollars) of investing in the Portfolio and to compare these
costs with the ongoing costs of investing in other mutual funds.


The Example below is based on an investment of $1,000 invested at the beginning
of the period and held for the entire period October 1, 2004 to March 31, 2005.


The information under "Actual Expenses," together with the amount you invested,
allows you to estimate actual expenses incurred over the reporting period.
Simply divide your account value by $1,000 (for example, an $8,600 account
value divided by $1,000 = 8.60) and multiply the result by the cost shown for
your share class, in the row entitled "Expenses Incurred During Period", to
estimate the expenses incurred on your account during this period.


The information under "Hypothetical Expenses" provides information about
hypothetical account values and hypothetical expenses based on the Portfolio's
actual expense ratio and an assumed rate of return of 5% per year before
expenses, which is not the Portfolio's actual return. The hypothetical account
values and expenses may not be used to estimate the actual ending account
balance or expense you incurred for the period. You may use this information to
compare the ongoing costs of investing in the Portfolio and other funds. To do
so, compare this 5% hypothetical example with the 5% hypothetical examples that
appear in the shareholder reports of the other funds.


Please note that the expenses shown in the table are meant to highlight your
ongoing costs only and do not reflect any transactional costs, such as front
and back end sales charges (loads) or redemption/exchange fees, where
applicable. Therefore, the hypothetical information is useful in comparing
ongoing costs only, and will not help you determine the relative total costs of
owning different funds. In addition, if these transactional costs were
included, your costs would have been higher.


                                                        Actual Expenses
                        -------------------------------------------------------------------------------
                         Institutional      Service         Investor        Investor        Investor
                             Class           Class          A Class         B Class         C Class
                        --------------- --------------- --------------- --------------- ---------------
Beginning Account
 Value (10/01/04)        $   1,000.00    $   1,000.00    $   1,000.00    $   1,000.00    $   1,000.00
Ending Account Value
 (3/31/05)                   1,095.70        1,094.80        1,094.30        1,094.40        1,090.30
Expenses Incurred
 During Period
 (10/01/04 -
  3/31/05)                       4.79            6.09            6.09            9.98            9.98


                                                     Hypothetical Expenses
                                                  (5% return before expenses)
                        -------------------------------------------------------------------------------
                         Institutional      Service         Investor        Investor        Investor
                             Class           Class          A Class         B Class         C Class
                        --------------- --------------- --------------- --------------- ---------------
Beginning Account
 Value (10/01/04)        $   1,000.00    $   1,000.00    $   1,000.00    $   1,000.00    $   1,000.00
Ending Account Value
 (3/31/05)                   1,020.37        1,019.11        1,019.11        1,015.33        1,015.33
Expenses Incurred
 During Period
 (10/01/04 -
  3/31/05)                       4.63            5.89            5.89            9.67            9.67

For each class of the Portfolio, expenses are equal to the annualized expense
ratio of 0.92%, 1.17%, 1.17%, 1.92%, and 1.92% for the Institutional, Service,
Investor A, B, and C share classes, respectively, multiplied by the average
account value over the period, multiplied by 182/365 (to reflect the one-half
year period).


                                                                              25
              GLOBAL SCIENCE & TECHNOLOGY OPPORTUNITIES PORTFOLIO


Total Net Assets (3/31/05): $23.6 million


Performance Benchmark


     Pacific Stock Exchange Technology Index


Investment Approach
     Seeks long-term capital appreciation by investing primarily in equity
securities of U.S. and non-U.S. companies in all capitalization ranges selected
for their rapid and sustainable growth potential from the development,
advancement and use of science and/or technology. The Portfolio normally
invests up to 80% of its net assets in equity securities issued by science and
technology companies in all market capitalization ranges. The Portfolio may
invest up to 25% of its net assets in stocks of issuers in emerging market
countries. The Portfolio management team uses a multi-factor screen to identify
stocks that have above average return potential. The factors and weights
assigned to a factor may change depending on market conditions. The most
influential factors over time have been revenue and earnings growth, estimate
revisions, profitability and relative value.


Recent Portfolio Management Activity


     o  All share classes of the Portfolio underperformed the benchmark for the
semi-annual period.


     o  The central forces at play during the semi-annual period were sharply
higher oil prices, rising U.S. interest rates and widening corporate spreads.
The surge in oil prices stoked inflation fears and raised concerns about
already over-leveraged consumers in the U.S. and the U.K. Higher interest rates
and widening corporate spreads triggered the relative weakness in financial
service stocks and utilities. Autos and auto parts stocks were particularly
weak based on poor U.S. sales figures and the anticipation of credit downgrades
for General Motors and Ford. The technology sector continued to suffer from
rich valuations, peak margins, excess capacity and slowing demand growth.


     o  The Pacific Stock Exchange Technology Index gained over 6% during the
semi-annual period; however, the strong gain in the fourth quarter of 2004 was
offset partially by negative performance in the first quarter of 2005. Health
care was the weakest performing group in the benchmark for the period due to
the withdrawal of Biogen's Tysabri from the market in February 2005. The
Portfolio trailed its benchmark during the semi-annual period due to poor stock
selection in the health care sector and an underweight versus the benchmark in
the industrials sector.


     o  Biotechnology stocks were generally poor performers during the period
as the removal of Biogen's Tysabri from the market caused already nervous
investors to exit the group. The biotechnology weight within the Portfolio was
reduced during the period as we believed that it may take time for investors to
regain confidence in the group following such negative news from an industry
leader. The Portfolio was also hurt by an underweight in the industrials
sector. The industrials weight in the benchmark is primarily composed of
aerospace and defense companies. The stocks of these companies have become
relatively more attractive in an uncertain environment due to the visibility of
defense spending. We increased the weight in this sector during the semi-annual
period as we believed these investment opportunities were relatively more
attractive than information technology stocks.


     o  The information technology sector contributed positively to performance
during the semi-annual period. The Portfolio remains underweighted this sector
versus the benchmark as valuations and expectations appear too high. The
holdings are being shifted towards lower expectation stocks which have exposure
to faster growing sectors. As a result, the exposure to Asian stocks within the
Portfolio has increased. Telecommunication services also contributed positively
to performance with positions in U.S. and non-U.S. wireless stocks having a
positive impact on returns. Wireless telecommunications stocks remain an
overweight position in the Portfolio as subscriber growth remains robust and
wireless usage continues to gain at the expense of wireline usage.


COMPARISON OF CHANGE IN VALUE OF A $10,000 INVESTMENT IN THE GLOBAL SCIENCE &
                                   TECHNOLOGY
OPPORTUNITIES PORTFOLIO AND THE PACIFIC STOCK EXCHANGE TECHNOLOGY INDEX FROM
                                   INCEPTION.


                                         [LINE CHART]

                 Institutional          Investor A     Pacific Stock Exchange Technology Index
                 -------------          ----------     ---------------------------------------
05/15/2000          $ 10,000              $ 9,425                     $ 10,000
06/30/2000            11,400               10,745                       10,789
09/30/2000            12,490               11,753                       10,178
12/31/2000            9,490                8,926                        7,983
03/31/2001            6,190                5,815                        6,494
06/30/2001            6,830                6,400                        7,121
09/30/2001            4,410                4,128                        5,077
12/31/2001            5,850                5,476                        6,752
03/31/2002            5,680                5,306                        6,732
06/30/2002            4,520                4,213                        5,049
09/30/2002            3,600                3,355                        3,795
12/31/2002            3,820                3,553                        4,512
03/31/2003            3,660                3,402                        4,497
06/30/2003            4,760                4,420                        5,545
09/30/2003            5,470                5,071                        6,084
12/31/2003            6,070                5,627                        6,887
03/31/2004            6,270                5,796                        7,059
06/30/2004            5,820                5,382                        7,275
09/30/2004            5,410                5,005                        6,736
12/31/2004            6,230                5,749                        7,719
03/31/2005            5,650                5,212                        7,190


                        FOR PERIOD ENDING MARCH 31, 2005

                               Average Annual Total Return
                                              1 Year          3 Year       From Inception
                                          -------------   -------------   ---------------
     Institutional Class                      ( 9.89)%         (0.18)%         (11.05)%
     Service Class                            (10.00)%         (0.41)%         (11.28)%
     Investor A Class (Load Adjusted)         (15.31)%         (2.52)%         (12.51)%
     Investor A Class (NAV)                   (10.08)%         (0.60)%         (11.44)%
     Investor B Class (Load Adjusted)         (14.88)%         (2.50)%         (12.47)%
     Investor B Class (NAV)                   (10.87)%         (1.34)%         (12.11)%
     Investor C Class (Load Adjusted)         (11.76)%         (1.34)%         (12.11)%
     Investor C Class (NAV)                   (10.87)%         (1.34)%         (12.11)%

THE INCEPTION DATE OF THE PORTFOLIO'S INSTITUTIONAL, SERVICE, INVESTOR A,
INVESTOR B, AND INVESTOR C SHARES WAS 5/15/00. SEE "NOTE ON PERFORMANCE
INFORMATION" ON PAGE 41 FOR FURTHER INFORMATION ON HOW PERFORMANCE DATA WAS
CALCULATED, INCLUDING IMPORTANT INFORMATION ON THE LINE GRAPH ABOVE.


PAST PERFORMANCE IS NOT PREDICTIVE OF FUTURE RESULTS. The graph and table do
not reflect the deduction of taxes that a shareholder would pay on fund
distributions or the redemption of shares. Although the holdings and sectors
listed above were current as the periods indicated, the Portfolio is actively
managed and its composition will vary.


26
              GLOBAL SCIENCE & TECHNOLOGY OPPORTUNITIES PORTFOLIO

FUND PROFILE


  Top Ten Holdings (% of long-term investments)
Samsung Electronics Co., Ltd.           2.4 %
Microsoft Corp.                         2.1
Genentech, Inc.                         2.0
International Business Machines Corp.   1.8
Intel Corp.                             1.8
Goodrich Corp.                          1.6
Dell, Inc.                              1.5
Applied Materials, Inc.                 1.5
Electronic Arts, Inc.                   1.5
Yahoo!, Inc.                            1.5
                                        ---
     Total                              17.7 %
                                        =======


     Top Ten Industries (% of long-term
                investments)
Computer Software & Service        20.3 %
Semiconductors & Related Devices   13.0
Telecommunications                  9.6
Pharmaceuticals                     9.1
Computer & Office Equipment         9.0
Electronics                         7.2
Medical & Medical Services          6.6
Medical Instruments & Supplies      5.5
Business Services                   3.0
Aerospace                           2.7
                                   ----
     Total                         86.0 %
                                   ========


- --------------------------------------------------------------------------------
EXPENSE EXAMPLE


As a shareholder of the Portfolio, you incur two types of costs: (1)
transaction costs, including front and back end sales charges (loads) or
redemption/exchange fees, where applicable; and (2) ongoing costs, including
advisory fees, distribution (12b-1) and service fees, where applicable; and
other Portfolio expenses. This Example is intended to help you understand your
ongoing costs (in dollars) of investing in the Portfolio and to compare these
costs with the ongoing costs of investing in other mutual funds.


The Example below is based on an investment of $1,000 invested at the beginning
of the period and held for the entire period October 1, 2004 to March 31, 2005.


The information under "Actual Expenses," together with the amount you invested,
allows you to estimate actual expenses incurred over the reporting period.
Simply divide your account value by $1,000 (for example, an $8,600 account
value divided by $1,000 = 8.60) and multiply the result by the cost shown for
your share class, in the row entitled "Expenses Incurred During Period", to
estimate the expenses incurred on your account during this period.


The information under "Hypothetical Expenses" provides information about
hypothetical account values and hypothetical expenses based on the Portfolio's
actual expense ratio and an assumed rate of return of 5% per year before
expenses, which is not the Portfolio's actual return. The hypothetical account
values and expenses may not be used to estimate the actual ending account
balance or expense you incurred for the period. You may use this information to
compare the ongoing costs of investing in the Portfolio and other funds. To do
so, compare this 5% hypothetical example with the 5% hypothetical examples that
appear in the shareholder reports of the other funds.


Please note that the expenses shown in the table are meant to highlight your
ongoing costs only and do not reflect any transactional costs, such as front
and back end sales charges (loads) or redemption/exchange fees, where
applicable. Therefore, the hypothetical information is useful in comparing
ongoing costs only, and will not help you determine the relative total costs of
owning different funds. In addition, if these transactional costs were
included, your costs would have been higher.


                                                        Actual Expenses
                        -------------------------------------------------------------------------------
                         Institutional      Service         Investor        Investor        Investor
                             Class           Class          A Class         B Class         C Class
                        --------------- --------------- --------------- --------------- ---------------
Beginning Account
 Value (10/01/04)        $   1,000.00    $   1,000.00    $   1,000.00    $   1,000.00    $   1,000.00
Ending Account Value
 (3/31/05)                   1,044.40        1,043.00        1,041.40        1,039.00        1,039.00
Expenses Incurred
 During Period
 (10/01/04 -
  3/31/05)                       7.27            8.79            9.29           13.08           13.08


                                                     Hypothetical Expenses
                                                  (5% return before expenses)
                        -------------------------------------------------------------------------------
                         Institutional      Service         Investor        Investor        Investor
                             Class           Class          A Class         B Class         C Class
                        --------------- --------------- --------------- --------------- ---------------
Beginning Account
 Value (10/01/04)        $   1,000.00    $   1,000.00    $   1,000.00    $   1,000.00    $   1,000.00
Ending Account Value
 (3/31/05)                   1,017.80        1,016.29        1,015.79        1,012.01        1,012.01
Expenses Incurred
 During Period
 (10/01/04 -
  3/31/05)                       7.20            8.71            9.21           12.99           12.99

For each class of the Portfolio, expenses are equal to the annualized expense
ratio of 1.43%, 1.73%, 1.83%, 2.58%, and 2.58% for the Institutional, Service,
Investor A, B, and C share classes, respectively, multiplied by the average
account value over the period, multiplied by 182/365 (to reflect the one-half
year period).


                                                                              27
                          GLOBAL RESOURCES PORTFOLIO


Total Net Assets (3/31/05): $939.4 million


Performance Benchmark

     Lipper Natural Resources Funds Index
     S&P 500(Reg. TM) Index


Investment Approach

     Seeks to provide long-term growth of capital by investing at least 80% of
its total assets in securities of global energy and natural resources companies
and companies in associated businesses, as well as utilities. The Portfolio may
invest in companies located anywhere in the world and will generally invest in
at least three countries and in companies tied economically to a number of
countries. In selecting investments, the management team seeks to invest in
companies and industries that appear to have the potential for above-average
long-term performance. These may include companies that are expected to show
above-average growth over the long term as well as those that appear to be
trading below their true worth. The Portfolio may invest up to 20% of its
assets in other U.S. and foreign investments including stocks and bonds of
companies not associated with energy or natural resources. The Portfolio may
not invest more than 10% of its total assets in non-investment grade bonds.
While the Portfolio tends to emphasize smaller companies, from time to time it
may emphasize companies of other sizes.


Recent Portfolio Management Activity
     o  On January 31, 2005, BlackRock, Inc., the parent of BlackRock Advisors,
Inc. (BAI), acquired SSRM Holdings, Inc., the parent of State Street Research &
Management Company (SSRM), the investment adviser to the State Street Research
mutual funds. In connection with the transaction, the BlackRock Global
Resources Portfolio (the Portfolio) reorganized with the State Street Research
Global Resources Fund (the SSR Fund). The SSR Fund transferred substantially
all of its assets and liabilities to the Portfolio in exchange for shares of
the Portfolio, which were then distributed to the SSR Fund shareholders. For
periods prior to January 31, 2005, the performance information shown reflects
the performance of the SSR Fund, which had substantially similar investment
goals and strategies as the Portfolio.


     o  All share classes outperformed the benchmarks during the semi-annual
period.

     o  During this period, the Portfolio posted substantial gains in a market
environment that has favored energy securities. Energy stocks outperformed the
overall market as higher coal, natural gas and crude oil prices have supported
strengthening fundamentals within these industries. Energy prices rose
dramatically during the period as lower reserve levels, increased energy demand
brought on by positive GDP growth and risks of supply disruption put upward
pricing pressure on energy-related commodities including natural gas, coal and
crude oil. After soaring in October following increased hurricane activity in
the Gulf of Mexico, crude oil and natural gas prices receded in November and
December as inventory levels began to build only to return to elevated levels
following the strain in the system resulting from colder than normal
temperatures in the Northeast in the first few months of 2005. Oil prices set
all-time highs in the first quarter 2005 as many investors became concerned
about the supply constrained environment for oil production. Coal prices
continued to climb as increased steel production has led to increased demand
for metallurgical coal, bolstering coal prices. Additionally, electric
utilities are becoming increasingly reliant on coal as a lower cost alternative
to natural gas for electricity generation purposes.


     o  Although all the primary areas of the energy sector posted solid gains
in the period, the Portfolio's emphasis on exploration and production, coal and
drilling companies helped performance relative to the benchmarks. Holdings in
coal, including Arch Coal, Massey Energy, Peabody Energy and Consol Energy,
gained as earnings growth accelerated on account of higher prices.
Additionally, gains by Plains Exploration and Newfield Exploration bolstered
absolute and relative returns within the Portfolio's exploration and production
exposure. Lastly, Patterson-UTI and Transocean were among the Portfolio's top
performing stocks. Transocean, one of the largest deep ocean drillers, has
benefited as companies have increased capital expenditure as long-term price
expectations have increased. In contrast, exposure to precious metals could not
keep pace with the Portfolio's other investments in this environment, modestly
detracting from the Portfolio's returns relative to the benchmarks.


     o  We continue to focus our investments in coal and oil-related stocks. In
other areas of the Portfolio's holdings, we eliminated exposure to oil refiners
as well as tanker stocks.


COMPARISON OF CHANGE IN VALUE OF A $10,000 INVESTMENT IN THE GLOBAL RESOURCES
                                   PORTFOLIO,
 THE LIPPER NATURAL RESOURCES FUNDS INDEX AND THE S&P 500(REG. TM) INDEX FOR
                              THE PAST TEN YEARS.


                                                  [LINE CHART]

                 Institutional          Investor A     Lipper Natural Resources Funds Index     S&P 500256 Index
                 -------------          ----------     ------------------------------------     ----------------
03/31/1995          $ 10,000              $ 9,423                    $ 10,000                       $ 10,000
06/30/1995            10,955               10,323                      10,450                         10,955
09/30/1995            11,366               10,696                      10,820                         11,825
12/31/1995            11,884               11,180                      11,523                         12,537
03/31/1996            13,777               12,954                      12,462                         13,210
06/30/1996            15,750               14,805                      13,038                         13,803
09/30/1996            17,329               16,272                      13,526                         14,230
12/31/1996            20,279               19,034                      14,850                         15,416
03/31/1997            19,632               18,410                      14,280                         15,829
06/30/1997            21,000               19,685                      15,748                         18,593
09/30/1997            26,698               25,009                      18,389                         19,985
12/31/1997            21,466               20,093                      17,037                         20,559
03/31/1998            21,375               20,015                      17,681                         23,427
06/30/1998            18,037               16,874                      16,530                         24,201
09/30/1998            13,157               12,303                      13,850                         21,793
12/31/1998            11,079               10,351                      13,098                         26,434
03/31/1999            11,210               10,466                      14,301                         27,751
06/30/1999            13,648               12,729                      16,981                         29,707
09/30/1999            14,878               13,871                      17,152                         27,853
12/31/1999            12,824               11,954                      17,488                         31,997
03/31/2000            14,845               13,829                      19,554                         32,731
06/30/2000            18,896               17,590                      20,303                         31,861
09/30/2000            21,663               20,146                      21,756                         31,553
12/31/2000            23,694               22,011                      22,601                         29,084
03/31/2001            23,530               21,833                      21,486                         25,636
06/30/2001            24,298               22,524                      20,850                         27,136
09/30/2001            20,170               18,690                      17,619                         23,153
12/31/2001            23,102               21,393                      19,757                         25,627
03/31/2002            26,000               24,012                      21,733                         25,698
06/30/2002            25,814               23,823                      20,401                         22,255
09/30/2002            22,004               20,230                      17,043                         18,410
12/31/2002            24,430               22,440                      18,331                         19,964
03/31/2003            24,057               22,084                      18,111                         19,335
06/30/2003            29,481               27,040                      19,903                         22,312
09/30/2003            31,095               28,496                      19,877                         22,902
12/31/2003            39,266               35,959                      23,141                         25,690
03/31/2004            42,924               39,276                      24,707                         26,125
06/30/2004            46,134               42,198                      25,960                         26,575
09/30/2004            51,828               47,381                      29,072                         26,078
12/31/2004            58,124               53,083                      31,299                         28,486
03/31/2005            66,472               60,689                      35,612                         27,874


                        FOR PERIOD ENDING MARCH 31, 2005


                                  Average Annual Total Return
                                             1 Year        3 Year        5 Year       10 Year
                                          -----------   -----------   -----------   -----------
     Institutional Class                      54.86%        36.74%        34.96%        20.86%
     Investor A Class (Load Adjusted)         45.63%        33.55%        32.83%        19.76%
     Investor A Class (NAV)                   54.52%        36.22%        34.42%        20.47%
     Investor B Class (Load Adjusted)         49.02%        34.64%        33.42%        19.59%
     Investor B Class (NAV)                   53.52%        35.28%        33.54%        19.59%
     Investor C Class (Load Adjusted)         52.45%        35.29%        33.55%        19.60%
     Investor C Class (NAV)                   53.45%        35.29%        33.55%        19.60%

ALL SHARE CLASSES OF THE BLACKROCK GLOBAL RESOURCES PORTFOLIO CLOSED TO NEW
INVESTORS ON JANUARY 31, 2005. EXISTING SHAREHOLDERS AND PROGRAMS IN THE
PORTFOLIO AS OF JANUARY 31, 2005, MAY MAKE ADDITIONAL INVESTMENTS IN CURRENT
ACCOUNTS.

THE PERFORMANCE INFORMATION ABOVE INCLUDES INFORMATION RELATING TO EACH CLASS
OF THE PORTFOLIO SINCE THE COMMENCEMENT OF OPERATIONS OF THE PORTFOLIO, RATHER
THAN THE DATE SUCH CLASS WAS INTRODUCED. THE INCEPTION DATES OF THE PORTFOLIO'S
SHARE CLASSES WERE AS FOLLOWS: INVESTOR A SHARES, 3/2/90; INSTITUTIONAL SHARES,
6/1/93; INVESTOR C SHARES, 6/1/93; AND INVESTOR B SHARES, 1/1/99. SEE "NOTE ON
PERFORMANCE INFORMATION" ON PAGE 41 FOR FURTHER INFORMATION ON HOW PERFORMANCE
DATA WAS CALCULATED, INCLUDING IMPORTANT INFORMATION ON THE LINE GRAPH ABOVE.


PAST PERFORMANCE IS NOT PREDICTIVE OF FUTURE RESULTS. The graph and table do
not reflect the deduction of taxes that a shareholder would pay on fund
distributions or the redemption of shares. Although the holdings and sectors
listed above were current as of the periods indicated, the Portfolio is
actively managed and its composition will vary.


28
                          GLOBAL RESOURCES PORTFOLIO

FUND PROFILE


 Top Ten Holdings (% of long-term investments)
Peabody Energy Corp.                  6.3 %
Consol Energy, Inc.                   6.2
Massey Energy Co.                     4.9
Penn West Petroleum Ltd.              4.5
Plains Exploration & Production Co.   4.2
Newfield Exploration Co.              4.1
Arch Coal, Inc.                       3.9
Patterson-UTI Energy, Inc.            3.4
Stolt-Nielsen S.A.                    3.2
U.S. Treasury bills                   3.2

                                      ---
     Total                            43.9 %
                                      =======


  Industries (% of long-term
         investments)
Oil & Gas            62.5 %
Metal & Mining       29.2
Conglomerates         2.7
Manufacturing         2.2
Transportation        1.6
Energy & Utilities    1.5
Motor Vehicles        0.2
Finance               0.1
                     ----
  Total              100.0 %
                     ========


- --------------------------------------------------------------------------------
EXPENSE EXAMPLE


As a shareholder of the Portfolio, you incur two types of costs: (1)
transaction costs, including front and back end sales charges (loads) or
redemption/exchange fees, where applicable; and (2) ongoing costs, including
advisory fees, distribution (12b-1) and service fees, where applicable; and
other Portfolio expenses. This Example is intended to help you understand your
ongoing costs (in dollars) of investing in the Portfolio and to compare these
costs with the ongoing costs of investing in other mutual funds.


The Example below is based on an investment of $1,000 invested at the beginning
of the period and held for the entire period October 1, 2004 to March 31, 2005.


The information under "Actual Expenses," together with the amount you invested,
allows you to estimate actual expenses incurred over the reporting period.
Simply divide your account value by $1,000 (for example, an $8,600 account
value divided by $1,000 = 8.60) and multiply the result by the cost shown for
your share class, in the row entitled "Expenses Incurred During Period", to
estimate the expenses incurred on your account during this period.


The information under "Hypothetical Expenses" provides information about
hypothetical account values and hypothetical expenses based on the Portfolio's
actual expense ratio and an assumed rate of return of 5% per year before
expenses, which is not the Portfolio's actual return. The hypothetical account
values and expenses may not be used to estimate the actual ending account
balance or expense you incurred for the period. You may use this information to
compare the ongoing costs of investing in the Portfolio and other funds. To do
so, compare this 5% hypothetical example with the 5% hypothetical examples that
appear in the shareholder reports of the other funds.


Please note that the expenses shown in the table are meant to highlight your
ongoing costs only and do not reflect any transactional costs, such as front
and back end sales charges (loads) or redemption/exchange fees, where
applicable. Therefore, the hypothetical information is useful in comparing
ongoing costs only, and will not help you determine the relative total costs of
owning different funds. In addition, if these transactional costs were
included, your costs would have been higher.


                                                Actual Expenses
                        ---------------------------------------------------------------
                         Institutional      Investor        Investor        Investor
                             Class          A Class         B Class         C Class
                        --------------- --------------- --------------- ---------------
Beginning Account
 Value (10/01/04)        $   1,000.00    $   1,000.00    $   1,000.00    $   1,000.00
Ending Account Value
 (3/31/05)                   1,282.50        1,280.90        1,277.00        1,276.50
Expenses Incurred
 During Period
 (10/01/04 -
  3/31/05)                       7.51           10.18           14.70           14.70


                                             Hypothetical Expenses
                                          (5% return before expenses)
                        ---------------------------------------------------------------
                         Institutional      Investor        Investor        Investor
                             Class          A Class         B Class         C Class
                        --------------- --------------- --------------- ---------------
Beginning Account
 Value (10/01/04)        $   1,000.00    $   1,000.00    $   1,000.00    $   1,000.00
Ending Account Value
 (3/31/05)                   1,018.34        1,015.96        1,011.92        1,011.92
Expenses Incurred
 During Period
 (10/01/04 -
  3/31/05)                       6.66            9.04           13.08           13.08

For each class of the Portfolio, expenses are equal to the annualized expense
ratio of 1.04%, 1.34%, 2.04%, and 2.04% for the Institutional, Investor A, B,
and C share classes, respectively, multiplied by the average account value over
the period, multiplied by 182/365 (to reflect the one-half year period).


For the period October 1, 2004 through January 31, 2005, the "Actual Expenses"
table reflects the expenses of the State Street Research Global Resources Fund
prior to its reorganization with the Portfolio on that date. Restated to
reflect the Portfolio's current expenses for the entire semi-annual period, (i)
"Ending Account Value" on March 31, 2005 would have been $1,281.00, $1,279.00,
$1,277.00, and $1,276.50 for Institutional, Investor A, Investor B and Investor
C Class shares, respectively, and (ii) "Expenses Incurred During Period" for
the period October 1, 2004 through March 31, 2005 would have been $5.91, $7.61,
$11.58, and $11.58 for Institutional, Investor A, Investor B and Investor C
Class shares, respectively.


                                                                              29
                      ALL-CAP GLOBAL RESOURCES PORTFOLIO


Inception Date: February 16, 2005


Total Net Assets (3/31/05): $16.8 million


Performance Benchmark

     S&P 500(Reg. TM) Index
     Lipper Natural Resources Funds Index


Investment Approach

     Seeks to provide long-term growth of capital by investing at least 80% of
its total assets in securities of global energy and natural resources companies
and companies in associated businesses, as well as utilities. The Portfolio may
invest in companies located anywhere in the world and will generally invest in
at least three countries and in companies tied economically to a number of
countries. In selecting investments, the management team seeks to invest in
companies and industries that appear to have the potential for above-average
long-term performance. These may include companies that are expected to show
above-average growth over the long term as well as those that appear to be
trading below their true worth. The Portfolio may invest up to 20% of its
assets in other U.S. and foreign investments including stocks and bonds of
companies not associated with energy or natural resources. The Portfolio may
not invest more than 10% of its total assets in non-investment grade bonds. The
Portfolio does not limit its investments to companies of any particular size,
and may invest in securities of companies with small to large capitalizations.


- --------------------------------------------------------------------------------
FUND PROFILE


 Top Ten Holdings (% of long-term
           investments)
Massey Energy Co.         3.4 %
EOG Resources, Inc.       2.9
Peabody Energy Corp.      2.8
Consol Energy, Inc.       2.6
Transocean, Inc.          2.5
Statoil ASA - ADR         2.4
BHP Billiton Ltd. - ADR   2.4
Arch Coal, Inc.           2.4
Unocal Corp               2.2
Exxon Mobil Corp.         2.2

                          ---
     Total                25.8 %
                          =======


Industries (% of long-term investments)
Oil & Gas                     67.5 %
Metal & Mining                27.5
Conglomerates                  1.8
Energy & Utilities             1.7
Machinery & Heavy Equipment    1.5
                              ----
     Total                    100.0 %
                              ========


- --------------------------------------------------------------------------------
EXPENSE EXAMPLE


As a shareholder of the Portfolio, you incur two types of costs: (1)
transaction costs, including front and back end sales charges (loads) or
redemption/exchange fees, where applicable; and (2) ongoing costs, including
advisory fees, distribution (12b-1) and service fees, where applicable; and
other Portfolio expenses. This Example is intended to help you understand your
ongoing costs (in dollars) of investing in the Portfolio and to compare these
costs with the ongoing costs of investing in other mutual funds.


The Example below is based on an investment of $1,000 invested at the beginning
of the period and held for the entire period February 16, 2005 to March 31,
2005.


The information under "Actual Expenses," together with the amount you invested,
allows you to estimate actual expenses incurred over the reporting period.
Simply divide your account value by $1,000 (for example, an $8,600 account
value divided by $1,000 = 8.60) and multiply the result by the cost shown for
your share class, in the row entitled "Expenses Incurred During Period", to
estimate the expenses incurred on your account during this period.


The information under "Hypothetical Expenses" provides information about
hypothetical account values and hypothetical expenses based on the Portfolio's
actual expense ratio and an assumed rate of return of 5% per year before
expenses, which is not the Portfolio's actual return. The hypothetical account
values and expenses may not be used to estimate the actual ending account
balance or expense you incurred for the period. You may use this information to
compare the ongoing costs of investing in the Portfolio and other funds. To do
so, compare this 5% hypothetical example with the 5% hypothetical examples that
appear in the shareholder reports of the other funds.


Please note that the expenses shown in the table are meant to highlight your
ongoing costs only and do not reflect any transactional costs, such as front
and back end sales charges (loads) or redemption/exchange fees, where
applicable. Therefore, the hypothetical information is useful in comparing
ongoing costs only, and will not help you determine the relative total costs of
owning different funds. In addition, if these transactional costs were
included, your costs would have been higher.


                                                        Actual Expenses
                        -------------------------------------------------------------------------------
                         Institutional      Service         Investor        Investor        Investor
                             Class           Class          A Class         B Class         C Class
                        --------------- --------------- --------------- --------------- ---------------
Beginning Account
 Value (2/16/05)         $   1,000.00    $   1,000.00    $   1,000.00    $   1,000.00    $   1,000.00
Ending Account Value
 (3/31/05)                   1,006.00        1,006.00        1,006.00        1,004.00        1,006.00
Expenses Incurred
 During Period
 (2/16/05 - 3/31/05)             1.23            1.58            1.58            2.40            2.40


                                                     Hypothetical Expenses
                                                  (5% return before expenses)
                        -------------------------------------------------------------------------------
                         Institutional      Service         Investor        Investor        Investor
                             Class           Class          A Class         B Class         C Class
                        --------------- --------------- --------------- --------------- ---------------
Beginning Account
 Value (2/16/05)         $   1,000.00    $   1,000.00    $   1,000.00    $   1,000.00    $   1,000.00
Ending Account Value
 (3/31/05)                   1,023.76        1,023.41        1,023.41        1,022.57        1,022.57
Expenses Incurred
 During Period
 (2/16/05 - 3/31/05)             1.24            1.59            1.59            2.43            2.43

For each class of the Portfolio, expenses are equal to the annualized expense
ratio of 1.04%, 1.34%, 1.34%, 2.04%, and 2.04% for the Institutional, Service,
Investor A, B, and C share classes, respectively, multiplied by the average
account value over the period, multiplied by 43/365 (to reflect the period the
fund was open during the one-half year period).


30
                           HEALTH SCIENCES PORTFOLIO


Total Net Assets (3/31/05): $134.6 million


Performance Benchmark

     Lipper Health/Biotechnology Funds Index
     S&P 500(Reg. TM) Index


Investment Approach

     Seeks to provide long-term growth of capital by investing at least 80% of
its total assets in securities of companies in health sciences and related
industries. The management team expects to invest in health sciences companies
comparable in size to those in the health care sector of the Russell 3000(Reg.
TM) Index or similar companies, including non-U.S. companies. In selecting
investments, the management team seeks to invest in companies and industries
that appear to have the potential for above-average growth over the long term.


Recent Portfolio Management Activity
     o  On January 31, 2005, BlackRock, Inc., the parent of BlackRock Advisors,
Inc. (BAI), acquired SSRM Holdings, Inc., the parent of State Street Research &
Management Company (SSRM), the investment adviser to the State Street Research
mutual funds. In connection with the transaction, the Portfolio reorganized
with the State Street Research Health Sciences Fund (the SSR Fund). The SSR
Fund transferred substantially all of its assets and liabilities to the
Portfolio in exchange for shares of the Portfolio, which were then distributed
to the SSR Fund shareholders. For periods prior to January 31, 2005, the
performance information shown reflects the performance of the SSR Fund, which
had substantially similar investment goals and strategies as the Portfolio.
Performance data for periods prior to January 31, 2005 was generated by SSRM.


     o  All share classes of the Portfolio outperformed the Lipper
Health/Biotechnology Funds Index for the seven-month period. The Institutional
and Investor A share classes of the Portfolio outperformed the S&P 500(Reg. TM)
Index for this period with all other share classes underperforming the S&P
500(Reg. TM) Index.

     o  U.S. equity markets lost ground during the first quarter of 2005, as
the S&P 500(Reg. TM) Index sustained its largest quarterly loss in two years,
declining 2.2%. Investors became increasingly concerned about the impact that
higher commodity prices might have on the economy and feared that inflationary
pressures may be on the rise. However, market weakness during the first quarter
was not enough to offset gains from the last four months of 2004, as the S&P
500(Reg. TM) Index rose 8.0% during the seven-month period. In this
environment, health care stocks posted positive absolute returns, but they
lagged the broader market as the health care sector within the S&P 500(Reg. TM)
Index rose approximately 2.6% during the seven-month period.


     o  The largest positive contribution to performance came from the
Portfolio's emphasis on securities within the health care providers and
services industry. Managed health care providers such as Aetna, WellPoint and
UnitedHealth Group all managed strong absolute gains helping to bolster returns
within the Portfolio during the period. The Portfolio's positioning within
heath care equipment & supplies also aided performance. Small- and
mid-capitalization stocks such as Aspect Medical Systems and Kinetic Concepts
helped drive returns during the period.


     o  While biotechnology stocks struggled during the majority of the period,
positions within the Portfolio held up relatively well, posting positive
absolute returns. Two biotechnology stocks, Transkaryotic Therapies and Alexion
Pharmaceuticals, were among the top performers in the Portfolio over the
seven-month span. Within pharmaceuticals, the Portfolio's exposure to Elan
Corp. Plc detracted from performance as its shares declined due to the
unexpected withdrawal of a major drug. Positions in Pfizer and Ivax also
detracted from absolute gains during the period.


     o  We made a number of changes within the Portfolio consistent with our
investment process during the first quarter of 2005. We reduced our overall
exposure to the biotechnology industry, while gaining exposure to both
hospitals and health care services securities.


  COMPARISON OF CHANGE IN VALUE OF A $10,000 INVESTMENT IN THE HEALTH SCIENCES
PORTFOLIO, THE LIPPER HEALTH/BIOTECHNOLOGY FUNDS INDEX AND THE S&P 500(REG. TM)
                             INDEX FROM INCEPTION.


                                                    [LINE CHART]

                 Institutional          Investor A     Lipper Health/Biotechnology Funds Index     S&P 500256 Index
                 -------------          ----------     ---------------------------------------     ----------------
12/21/1999          $ 10,000              $ 9,425                     $ 10,000                         $ 10,000
12/31/1999            10,580                9,972                       10,647                           10,253
03/31/2000            11,930               11,244                       11,651                           10,488
06/30/2000            14,295               13,473                       13,747                           10,209
09/30/2000            17,001               16,024                       15,153                           10,111
12/31/2000            16,434               15,479                       15,297                            9,319
03/31/2001            14,074               13,265                       12,311                            8,215
06/30/2001            16,242               15,288                       13,941                            8,695
09/30/2001            14,869               13,984                       12,610                            7,419
12/31/2001            17,075               16,042                       13,697                            8,212
03/31/2002            15,972               15,003                       12,812                            8,234
06/30/2002            13,560               12,730                       10,852                            7,131
09/30/2002            12,119               11,361                        9,974                            5,899
12/31/2002            13,192               12,362                       10,108                            6,397
03/31/2003            13,387               12,546                       10,199                            6,196
06/30/2003            18,048               16,898                       11,892                            7,149
09/30/2003            19,750               18,471                       12,190                            7,338
12/31/2003            22,040               20,600                       13,193                            8,232
03/31/2004            23,317               21,782                       13,880                            8,371
06/30/2004            23,507               21,940                       14,089                            8,515
09/30/2004            22,717               21,184                       13,533                            8,356
12/31/2004            25,324               23,599                       14,741                            9,128
03/31/2005            23,888               22,245                       13,912                            8,932


                        FOR PERIOD ENDING MARCH 31, 2005

                                    Average Annual Total Return
                                             1 Year         3 Year        5 Year      From Inception
                                          ------------   -----------   -----------   ---------------
     Institutional Class                       2.45%         14.36%        14.90%          17.94%
     Service Class                             2.18%         14.05%        14.63%          17.68%
     Investor A Class (Load Adjusted)         (3.76)%        11.80%        13.27%          16.36%
     Investor A Class (NAV)                    2.12%         14.03%        14.62%          17.67%
     Investor B Class (Load Adjusted)         (2.88)%        12.34%        13.75%          16.96%
     Investor B Class (NAV)                    1.46%         13.26%        13.98%          17.05%
     Investor C Class (Load Adjusted)          0.50%         13.26%        13.94%          17.01%
     Investor C Class (NAV)                    1.46%         13.26%        13.94%          17.01%

THE PERFORMANCE INFORMATION ABOVE INCLUDES INFORMATION RELATING TO EACH CLASS
OF THE PORTFOLIO SINCE THE COMMENCEMENT OF OPERATIONS OF THE PORTFOLIO, RATHER
THAN THE DATE SUCH CLASS WAS INTRODUCED. THE INCEPTION DATES OF THE PORTFOLIO'S
SHARE CLASSES WERE AS FOLLOWS: INVESTOR A SHARES, 12/21/99; INSTITUTIONAL
SHARES, 10/16/00; INVESTOR B SHARES, 10/16/00; INVESTOR C SHARES, 10/16/00; AND
SERVICE SHARES, 1/28/05 . SEE "NOTE ON PERFORMANCE INFORMATION" ON PAGE 41 FOR
FURTHER INFORMATION ON HOW PERFORMANCE DATA WAS CALCULATED, INCLUDING IMPORTANT
INFORMATION ON THE LINE GRAPH ABOVE.


PAST PERFORMANCE IS NOT PREDICTIVE OF FUTURE RESULTS. The graph and table do
not reflect the deduction of taxes that a shareholder would pay on fund
distributions or the redemption of shares. Although the holdings and sectors
listed above were current as of the periods indicated, the Portfolio is
actively managed and its composition will vary.


                                                                              31
                           HEALTH SCIENCES PORTFOLIO

FUND PROFILE


  Top Ten Holdings (% of long-term investments)
Genentech, Inc.                         5.1 %
Novartis AG - ADR                       4.6
UnitedHealth Group, Inc.                4.1
Abbott Laboratories                     3.8
Caremark Rx, Inc.                       3.7
Roche Holdings Ltd.                     3.5
Transkaryotic Therapies, Inc.           2.6
Becton, Dickinson & Co.                 2.4
Shire Pharmaceuticals Group PLC - ADR   2.4
WellPoint, Inc.                         2.4

                                        ---
     Total                              34.6 %
                                        =======


  Industries (% of long-term investments)
Pharmaceuticals                  46.1 %
Medical & Medical Services       24.6
Medical Instruments & Supplies   21.4
Insurance                         4.5
Manufacturing                     3.4
                                 ----
     Total                       100.0 %
                                 ========


- --------------------------------------------------------------------------------
EXPENSE EXAMPLE


As a shareholder of the Portfolio, you incur two types of costs: (1)
transaction costs, including front and back end sales charges (loads) or
redemption/exchange fees, where applicable; and (2) ongoing costs, including
advisory fees, distribution (12b-1) and service fees, where applicable; and
other Portfolio expenses. This Example is intended to help you understand your
ongoing costs (in dollars) of investing in the Portfolio and to compare these
costs with the ongoing costs of investing in other mutual funds.


The Example below is based on an investment of $1,000 invested at the beginning
of the period and held for the entire period October 1, 2004 to March 31, 2005.


The information under "Actual Expenses," together with the amount you invested,
allows you to estimate actual expenses incurred over the reporting period.
Simply divide your account value by $1,000 (for example, an $8,600 account
value divided by $1,000 = 8.60) and multiply the result by the cost shown for
your share class, in the row entitled "Expenses Incurred During Period", to
estimate the expenses incurred on your account during this period.


The information under "Hypothetical Expenses" provides information about
hypothetical account values and hypothetical expenses based on the Portfolio's
actual expense ratio and an assumed rate of return of 5% per year before
expenses, which is not the Portfolio's actual return. The hypothetical account
values and expenses may not be used to estimate the actual ending account
balance or expense you incurred for the period. You may use this information to
compare the ongoing costs of investing in the Portfolio and other funds. To do
so, compare this 5% hypothetical example with the 5% hypothetical examples that
appear in the shareholder reports of the other funds.


Please note that the expenses shown in the table are meant to highlight your
ongoing costs only and do not reflect any transactional costs, such as front
and back end sales charges (loads) or redemption/exchange fees, where
applicable. Therefore, the hypothetical information is useful in comparing
ongoing costs only, and will not help you determine the relative total costs of
owning different funds. In addition, if these transactional costs were
included, your costs would have been higher.


                                                        Actual Expenses
                        -------------------------------------------------------------------------------
                         Institutional      Service         Investor        Investor        Investor
                             Class           Class          A Class         B Class         C Class
                        --------------- --------------- --------------- --------------- ---------------
Beginning Account
 Value (10/01/04)        $   1,000.00    $   1,000.00    $   1,000.00    $   1,000.00    $   1,000.00
Ending Account Value
 (3/31/05)                   1,051.60          987.70        1,050.10        1,046.60        1,047.30
Expenses Incurred
 During Period
 (10/01/04 -
  3/31/05)                       5.93            2.62            7.10            9.64            8.73


                                                     Hypothetical Expenses
                                                  (5% return before expenses)
                        -------------------------------------------------------------------------------
                         Institutional      Service         Investor        Investor        Investor
                             Class           Class          A Class         B Class         C Class
                        --------------- --------------- --------------- --------------- ---------------
Beginning Account
 Value (10/01/04)        $   1,000.00    $   1,000.00    $   1,000.00    $   1,000.00    $   1,000.00
Ending Account Value
 (3/31/05)                   1,019.14        1,022.33        1,017.98        1,015.46        1,016.37
Expenses Incurred
 During Period
 (10/01/04 -
  3/31/05)                       5.86            2.67            7.02            9.54            8.63

For each class of the Portfolio, expenses are equal to the annualized expense
ratio of 1.16%, 1.55%, 1.39%, 1.89%, and 1.71% for the Institutional, Service,
Investor A, B, and C share classes, respectively, multiplied by the average
account value over the period, multiplied by 182/365 (to reflect the one-half
year period) and 62/365 for the Service share class (to reflect the period the
class was open during the one-half year period).


32
                         U.S. OPPORTUNITIES PORTFOLIO


Total Net Assets (3/31/05): $93.6 million


Performance Benchmark

     S&P/Citigroup Extended Market Index U.S. ("S&P/Citigroup EMI U.S.")


Investment Approach

     Seeks long-term capital appreciation by normally investing at least 80% of
its net assets in equity securities of U.S. emerging capitalization companies
(defined as those with market capitalizations equal to those within the
universe of the S&P/Citigroup EMI U.S. stocks) with relatively attractive
earnings growth potential and valuation. The Portfolio management team uses a
multi-factor screen to identify stocks that have above-average return
potential. The factors and the weight assigned to a factor may change depending
on market conditions. The most influential factors over time have been revenue
and earnings growth, estimate revisions, profitability and relative value.


Recent Portfolio Management Activity


     o  All share classes of the Portfolio underperformed the benchmark for the
semi-annual period.


     o  The central forces at play during the semi-annual period were sharply
higher oil prices, rising U.S. interest rates and widening corporate spreads.
The surge in oil prices stoked inflation fears and raised concerns about
already over-leveraged consumers in the U.S. and the U.K. Higher interest rates
and widening corporate spreads triggered the relative weakness in financial
service stocks and utilities. Autos and auto parts stocks were particularly
weak based on poor U.S. sales figures and the anticipation of credit downgrades
for General Motors and Ford. The technology sector continued to suffer from
rich valuations, peak margins, excess capacity and slowing demand growth.

     o  The S&P/Citigroup Extended Market Index U.S. enjoyed robust gains
during the fourth quarter of 2004, rising 13.96%; however, the benchmark
declined 2.95% during the first quarter of 2005 as weakness in the information
technology, financial services and health care sectors pulled down the
benchmark. The Portfolio (Institutional share class) trailed the benchmark by
96 basis points during the first half of the semi-annual period while
outperforming the benchmark by 60 basis points in the second half of the
period. Good stock selection was the primary driver of the Portfolio's
performance for the semi-annual period, offset slightly by the Portfolio's
sector allocation.


     o  Good stock selection in communications equipment and a lack of exposure
to electronic instrument makers led to the information technology sector's
positive contribution to performance. The Portfolio retained its underweight
position relative to the benchmark in information technology due to fundamental
and valuation concerns.


     o  The Portfolio was negatively impacted by its health care holdings.
Biotechnology stocks were particularly weak during the period. Negative news
from Biogen about the removal of its product, Tysabri, from the market caused
already nervous investors to sell the group. The biotechnology position within
the Portfolio was reduced during the period as the management team believes
investor sentiment could remain negative for a while.


     o  At the end of the semi-annual period, the Portfolio remained
underweight relative to its benchmark in the industrials, materials and energy
sectors. Technology remained an underweight as we believed that expectations
for this sector appeared too high.


COMPARISON OF CHANGE IN VALUE OF A $10,000 INVESTMENT IN THE U.S. OPPORTUNITIES
                                   PORTFOLIO
                 AND THE S&P/CITIGROUP EMI U.S. FROM INCEPTION.


                                [LINE CHART]

                 Institutional          Investor A     S&P/Citigroup EMI U.S.
                 -------------          ----------     ----------------------
05/01/1998          $ 10,000              $ 9,425             $ 10,000
06/30/1998            10,950               10,320                9,518
09/30/1998            9,390                8,841                7,732
12/31/1998            13,030               12,253                9,126
03/31/1999            15,880               14,920                8,645
06/30/1999            20,950               19,661                9,897
09/30/1999            24,730               23,186                9,234
12/31/1999            41,897               39,221               11,107
03/31/2000            55,260               51,678               12,415
06/30/2000            53,197               49,701               11,970
09/30/2000            50,359               46,992               12,452
12/31/2000            38,649               36,015               11,544
03/31/2001            30,128               28,045               10,447
06/30/2001            36,305               33,752               11,892
09/30/2001            27,054               25,120                9,716
12/31/2001            33,256               30,851               11,524
03/31/2002            30,464               28,220               12,034
06/30/2002            25,578               23,660               11,072
09/30/2002            20,257               18,721                9,084
12/31/2002            20,381               18,809                9,693
03/31/2003            19,854               18,312                9,318
06/30/2003            23,732               21,848               11,230
09/30/2003            25,686               23,631               12,104
12/31/2003            30,122               27,679               13,843
03/31/2004            31,503               28,907               14,689
06/30/2004            31,782               29,141               14,773
09/30/2004            31,549               28,907               14,495
12/31/2004            35,644               32,634               16,519
03/31/2005            34,807               31,830               16,031


                        FOR PERIOD ENDING MARCH 31, 2005


                                    Average Annual Total Return
                                             1 Year       3 Year         5 Year       From Inception
                                          -----------   ----------   -------------   ---------------
     Institutional Class                      10.49%        4.54%        ( 8.83)%          19.77%
     Service Class                            10.19%        4.20%        ( 9.14)%          19.39%
     Investor A Class (Load Adjusted)          3.76%        2.06%        (10.30)%          18.23%
     Investor A Class (NAV)                   10.11%        4.09%        ( 9.24)%          19.24%
     Investor B Class (Load Adjusted)          4.79%        2.21%        (10.17)%          18.39%
     Investor B Class (NAV)                    9.29%        3.31%        ( 9.91)%          18.39%
     Investor C Class (Load Adjusted)          8.24%        3.30%        ( 9.92)%          18.37%
     Investor C Class (NAV)                    9.24%        3.30%        ( 9.92)%          18.37%

THE INCEPTION DATE OF THE PORTFOLIO'S INSTITUTIONAL, SERVICE, INVESTOR A,
INVESTOR B, AND INVESTOR C SHARES WAS 5/1/98. SEE "NOTE ON PERFORMANCE
INFORMATION" ON PAGE 41 FOR FURTHER INFORMATION ON HOW PERFORMANCE DATA WAS
CALCULATED, INCLUDING IMPORTANT INFORMATION ON THE LINE GRAPH ABOVE.


PAST PERFORMANCE IS NOT PREDICTIVE OF FUTURE RESULTS. The graph and table do
not reflect the deduction of taxes that a shareholder would pay on fund
distributions or the redemption of shares.  Although the holdings and sectors
listed above were current as the periods indicated, the Portfolio is actively
managed and its composition will vary.


                                                                              33
                         U.S. OPPORTUNITIES PORTFOLIO

FUND PROFILE


  Top Ten Holdings (% of long-term
            investments)
Navigant Consulting, Inc.   1.5 %
Station Casinos, Inc.       1.5
Comverse Technology, Inc.   1.5
Ralcorp Holdings, Inc.      1.4
National-Oilwell, Inc.      1.4
Chesapeake Energy Corp.     1.4
Joy Global, Inc.            1.3
Global Payments, Inc.       1.3
Assurant, Inc.              1.3
T. Rowe Price Group, Inc.   1.3
                            ---
     Total                  13.9 %
                            =======


   Top Ten Industries (% of long-term
              investments)
Oil & Gas                      7.8 %
Retail Merchandising           7.2
Energy & Utilities             7.1
Business Services              6.9
Telecommunications             6.3
Entertainment & Leisure        5.6
Medical & Medical Services     4.8
Manufacturing                  4.3
Metal & Mining                 4.0
Computer Software & Services   3.9
                               ---
     Total                     57.9 %
                               =======


- --------------------------------------------------------------------------------
EXPENSE EXAMPLE


As a shareholder of the Portfolio, you incur two types of costs: (1)
transaction costs, including front and back end sales charges (loads) or
redemption/exchange fees, where applicable; and (2) ongoing costs, including
advisory fees, distribution (12b-1) and service fees, where applicable; and
other Portfolio expenses. This Example is intended to help you understand your
ongoing costs (in dollars) of investing in the Portfolio and to compare these
costs with the ongoing costs of investing in other mutual funds.


The Example below is based on an investment of $1,000 invested at the beginning
of the period and held for the entire period October 1, 2004 to March 31, 2005.


The information under "Actual Expenses," together with the amount you invested,
allows you to estimate actual expenses incurred over the reporting period.
Simply divide your account value by $1,000 (for example, an $8,600 account
value divided by $1,000 = 8.60) and multiply the result by the cost shown for
your share class, in the row entitled "Expenses Incurred During Period", to
estimate the expenses incurred on your account during this period.


The information under "Hypothetical Expenses" provides information about
hypothetical account values and hypothetical expenses based on the Portfolio's
actual expense ratio and an assumed rate of return of 5% per year before
expenses, which is not the Portfolio's actual return. The hypothetical account
values and expenses may not be used to estimate the actual ending account
balance or expense you incurred for the period. You may use this information to
compare the ongoing costs of investing in the Portfolio and other funds. To do
so, compare this 5% hypothetical example with the 5% hypothetical examples that
appear in the shareholder reports of the other funds.


Please note that the expenses shown in the table are meant to highlight your
ongoing costs only and do not reflect any transactional costs, such as front
and back end sales charges (loads) or redemption/exchange fees, where
applicable. Therefore, the hypothetical information is useful in comparing
ongoing costs only, and will not help you determine the relative total costs of
owning different funds. In addition, if these transactional costs were
included, your costs would have been higher.


                                                        Actual Expenses
                        -------------------------------------------------------------------------------
                         Institutional      Service         Investor        Investor        Investor
                             Class           Class          A Class         B Class         C Class
                        --------------- --------------- --------------- --------------- ---------------
Beginning Account
 Value (10/01/04)        $   1,000.00    $   1,000.00    $   1,000.00    $   1,000.00    $   1,000.00
Ending Account Value
 (3/31/05)                   1,103.20        1,101.40        1,101.10        1,097.50        1,097.60
Expenses Incurred
 During Period
 (10/01/04 -
  3/31/05)                       8.37            9.93           10.13           14.03           14.03


                                                     Hypothetical Expenses
                                                  (5% return before expenses)
                        -------------------------------------------------------------------------------
                         Institutional      Service         Investor        Investor        Investor
                             Class           Class          A Class         B Class         C Class
                        --------------- --------------- --------------- --------------- ---------------
Beginning Account
 Value (10/01/04)        $   1,000.00    $   1,000.00    $   1,000.00    $   1,000.00    $   1,000.00
Ending Account Value
 (3/31/05)                   1,016.94        1,015.43        1,015.23        1,011.46        1,011.46
Expenses Incurred
 During Period
 (10/01/04 -
  3/31/05)                       8.06            9.57            9.77           13.54           13.54

For each class of the Portfolio, expenses are equal to the annualized expense
ratio of 1.60%, 1.90%, 1.94%, 2.69%, and 2.69% for the Institutional, Service,
Investor A, B, and C share classes, respectively, multiplied by the average
account value over the period, multiplied by 182/365 (to reflect the one-half
year period).


34
                     INTERNATIONAL OPPORTUNITIES PORTFOLIO


Total Net Assets (3/31/05): $510.2 million


Performance Benchmark

     S&P/Citigroup Extended Market Index
     Global Ex-U.S. ("S&P/Citigroup EMI Global Ex-U.S.")


Investment Approach

     Seeks long-term capital appreciation by normally investing at least 80% of
its net assets in equity securities issued by international emerging
capitalization companies (defined as those with market capitalizations equal to
those within the universe of S&P/Citigroup EMI Global Ex-U.S. stocks). The
Portfolio may invest up to 25% of its net assets in stocks of issuers in
emerging market countries. The Portfolio management team uses a multi-factor
screen to identify tocks that have above average return potential. The factors
and the weight assigned to a factor may change depending on market conditions.
The most influential factors over time have been revenue and earnings growth,
estimate revisions, profitability and relative value.
Recent Portfolio Management Activity


     o  All share classes of the Portfolio outperformed the benchmark for the
semi-annual period.


     o  Relative returns for the Portfolio's asset class remained quite
attractive as evidenced by the performance of the Portfolio's benchmark, the
S&P/Citigroup Extended Market Index Global ex-US for the period. The benchmark
returned 20.4% versus a return of 16.5% for the larger Citigroup Broad Market
Index ex-US and a return of 6.9% for the S&P 500 Index.


     o  During the first half of the semi-annual period, all share classes of
the Portfolio outperformed the benchmark. Strong stock selection in the
cyclical areas such as consumer discretionary, industrials and materials was
the major driver of performance. Favorable stock selection also helped to
offset underweight positions in financials and utilities. These sectors
outperformed in the period as global rates remained low to counter the
decelerating effects of a weak dollar. The Portfolio's overweight to the energy
sector was a modest negative for the period as the energy sector returned less
than the market average. U.S. dollar based investors were once again rewarded
in the last quarter of 2004 as the dollar index declined an additional 7.5%.
Western Europe and emerging markets had strong performance for the period.
Within the Portfolio, the management team initiated exposure to South Africa,
increased exposure to Japan and reduced exposure to Europe.


     o  During the first half of the semi-annual period, the management team
implemented a number of strategy changes in the Portfolio consistent with its
investment limitations. Exposure to financials and industrials were increased
by 494 and 237 basis points, respectively. Exposure to the materials,
technology and consumer discretionary sectors were reduced by 324, 211 and 124
basis points, respectively. The increased exposure to the financials sector
brought the Portfolio in line with the market weight of its benchmark while the
reduction in the materials sector was attributable to US dollar volatility and
a desire to manage that risk.


     o  All share classes of the Portfolio underperformed the benchmark in the
second half of the semi-annual period. Rising oil prices, rising interest rates
and widening credit spreads clashed with the cyclical gearing of the Portfolio
and weighed on the overall market. The Portfolio was negatively impacted by
stock selection in this period. This was driven by the Portfolio's
concentration in larger companies within the benchmark dictated by the
management team's insistence on adequate trading liquidity. Companies with
market values above $2 billion within the benchmark returned 0.86% for the
quarter, significantly underperforming the overall benchmark. The Portfolio
benefited from its relative overweight to the benchmark in the energy and
industrials sectors as these were the only two sectors to outperform the market
in the period.


     o  From a regional perspective, the Portfolio continued to maintain an
overweight in Asia and an underweight in Europe. Emerging markets performed
substantially better late in 2004 than in early 2005; however, the performance
for the total semi-annual period remained positive. The management team
substantially reduced the Portfolio's exposure to emerging markets in the
second half of the semi-annual period on concerns that sharply higher U.S.
rates could quickly unwind the emerging markets carry trade. Country allocation
for the period was neutral.


     o  At the end of the semi-annual period, the Portfolio was positioned
overweight relative to its benchmark in the industrials, energy and materials
sectors. This cyclical exposure was somewhat offset by an underweight in the
technology sector.


COMPARISON OF CHANGE IN VALUE OF A $10,000 INVESTMENT IN THE INTERNATIONAL
                                 OPPORTUNITIES
       PORTFOLIO AND THE S&P/CITIGROUP EMI GLOBAL EX-U.S. FROM INCEPTION.


                                    [LINE CHART]

                 Institutional          Investor A     Citigroup EMI Global Ex-U.S.
                 -------------          ----------     ----------------------------
09/26/1997          $ 10,000              $ 9,497                $ 10,000
09/30/1997            9,970                9,468                  10,028
12/31/1997            9,483                8,996                   8,904
03/31/1998            11,384               10,788                  10,356
06/30/1998            11,997               11,350                  10,158
09/30/1998            9,614                9,092                   8,574
12/31/1998            10,538                9,935                   9,681
03/31/1999            10,764               10,127                   9,846
06/30/1999            12,722               11,963                  10,587
09/30/1999            14,601               13,702                  11,070
12/31/1999            26,522               24,889                  12,137
03/31/2000            33,056               30,958                  12,420
06/30/2000            28,509               26,693                  12,053
09/30/2000            28,037               26,213                  11,372
12/31/2000            24,365               22,749                  10,613
03/31/2001            21,041               19,625                   9,586
06/30/2001            21,601               20,118                   9,847
09/30/2001            18,501               17,205                   8,290
12/31/2001            20,182               18,744                   9,056
03/31/2002            22,684               21,046                   9,630
06/30/2002            22,821               21,140                   9,742
09/30/2002            18,961               17,546                   8,045
12/31/2002            19,572               18,098                   8,433
03/31/2003            18,812               17,370                   8,064
06/30/2003            21,825               20,130                   9,934
09/30/2003            24,850               22,890                  11,272
12/31/2003            29,217               26,892                  13,071
03/31/2004            30,974               28,478                  14,351
06/30/2004            29,828               27,397                  14,316
09/30/2004            30,463               27,949                  14,481
12/31/2004            36,235               33,219                  16,899
03/31/2005            37,104               34,002                  17,441


                        FOR PERIOD ENDING MARCH 31, 2005


                                   Average Annual Total Return
                                             1 Year        3 Year       5 Year      From Inception
                                          -----------   -----------   ----------   ---------------
     Institutional Class                      19.79%        17.82%        2.34%          19.08%
     Service Class                            19.43%        17.49%        2.01%          18.71%
     Investor A Class (Load Adjusted)         13.40%        15.36%        0.85%          17.70%
     Investor A Class (NAV)                   19.40%        17.34%        1.89%          18.51%
     Investor B Class (Load Adjusted)         13.93%        15.58%        0.75%          17.66%
     Investor B Class (NAV)                   18.43%        16.45%        1.13%          17.66%
     Investor C Class (Load Adjusted)         17.47%        16.46%        1.14%          17.66%
     Investor C Class (NAV)                   18.47%        16.46%        1.14%          17.66%

THE INCEPTION DATE OF THE PORTFOLIO'S INSTITUTIONAL, SERVICE, INVESTOR A,
INVESTOR B, AND INVESTOR C SHARES WAS 9/26/97. SEE "NOTE ON PERFORMANCE
INFORMATION" ON PAGE 41 FOR FURTHER INFORMATION ON HOW PERFORMANCE DATA WAS
CALCULATED, INCLUDING IMPORTANT INFORMATION ON THE LINE GRAPH ABOVE.


PAST PERFORMANCE IS NOT PREDICTIVE OF FUTURE RESULTS. The graph and table do
not reflect the deduction of taxes that a shareholder would pay on fund
distributions or the redemption of shares.  Although the holdings and sectors
listed above were current as the periods indicated, the Portfolio is actively
managed and its composition will vary.


                                                                              35
                     INTERNATIONAL OPPORTUNITIES PORTFOLIO

FUND PROFILE


  Top Ten Holdings (% of long-term
            investments)
Prosafe ASA                 1.7 %
Yamaha Motor Co. Ltd.       1.4
Bharti Tele-Ventures Ltd.   1.2
Rheinmetall AG              1.1
Alpha Bank AE               1.1
Wienerberger AG             1.1
Antofagasta PLC             1.1
Bilfinger Berger AG         1.1
Saipem SpA                  1.1
Teck Cominco Ltd.           1.1
                            ---
     Total                  12.0 %
                            =======


  Top Ten Countries (% of
  long-term investments)
Japan            27.2 %
United Kingdom   16.8
United States     6.6
Germany           5.1
Canada            4.1
Hong Kong         3.4
Norway            3.3
Sweden            3.3
Finland           3.1
Netherlands       2.7
                 ----
  Total          75.6 %
                 ========


- --------------------------------------------------------------------------------
EXPENSE EXAMPLE


As a shareholder of the Portfolio, you incur two types of costs: (1)
transaction costs, including front and back end sales charges (loads) or
redemption/exchange fees, where applicable; and (2) ongoing costs, including
advisory fees, distribution (12b-1) and service fees, where applicable; and
other Portfolio expenses. This Example is intended to help you understand your
ongoing costs (in dollars) of investing in the Portfolio and to compare these
costs with the ongoing costs of investing in other mutual funds.


The Example below is based on an investment of $1,000 invested at the beginning
of the period and held for the entire period October 1, 2004 to March 31, 2005.


The information under "Actual Expenses," together with the amount you invested,
allows you to estimate actual expenses incurred over the reporting period.
Simply divide your account value by $1,000 (for example, an $8,600 account
value divided by $1,000 = 8.60) and multiply the result by the cost shown for
your share class, in the row entitled "Expenses Incurred During Period", to
estimate the expenses incurred on your account during this period.


The information under "Hypothetical Expenses" provides information about
hypothetical account values and hypothetical expenses based on the Portfolio's
actual expense ratio and an assumed rate of return of 5% per year before
expenses, which is not the Portfolio's actual return. The hypothetical account
values and expenses may not be used to estimate the actual ending account
balance or expense you incurred for the period. You may use this information to
compare the ongoing costs of investing in the Portfolio and other funds. To do
so, compare this 5% hypothetical example with the 5% hypothetical examples that
appear in the shareholder reports of the other funds.


Please note that the expenses shown in the table are meant to highlight your
ongoing costs only and do not reflect any transactional costs, such as front
and back end sales charges (loads) or redemption/exchange fees, where
applicable. Therefore, the hypothetical information is useful in comparing
ongoing costs only, and will not help you determine the relative total costs of
owning different funds. In addition, if these transactional costs were
included, your costs would have been higher.


                                                        Actual Expenses
                        -------------------------------------------------------------------------------
                         Institutional      Service         Investor        Investor        Investor
                             Class           Class          A Class         B Class         C Class
                        --------------- --------------- --------------- --------------- ---------------
Beginning Account
 Value (10/01/04)        $   1,000.00    $   1,000.00    $   1,000.00    $   1,000.00    $   1,000.00
Ending Account Value
 (3/31/05)                   1,218.00        1,216.80        1,216.50        1,211.80        1,212.20
Expenses Incurred
 During Period
 (10/01/04 -
  3/31/05)                       7.89            9.31            9.53           13.58           13.59


                                                     Hypothetical Expenses
                                                  (5% return before expenses)
                        -------------------------------------------------------------------------------
                         Institutional      Service         Investor        Investor        Investor
                             Class           Class          A Class         B Class         C Class
                        --------------- --------------- --------------- --------------- ---------------
Beginning Account
 Value (10/01/04)        $   1,000.00    $   1,000.00    $   1,000.00    $   1,000.00    $   1,000.00
Ending Account Value
 (3/31/05)                   1,017.80        1,016.49        1,016.29        1,012.56        1,012.56
Expenses Incurred
 During Period
 (10/01/04 -
  3/31/05)                       7.20            8.51            8.71           12.44           12.44

For each class of the Portfolio, expenses are equal to the annualized expense
ratio of 1.43%, 1.69%, 1.73%, 2.47%, and 2.47% for the Institutional, Service,
Investor A, B, and C share classes, respectively, multiplied by the average
account value over the period, multiplied by 182/365 (to reflect the one-half
year period).


36
                          ASSET ALLOCATION PORTFOLIO


Total Net Assets (3/31/05): $789.1 million


Performance Benchmark
     60% S&P 500(Reg. TM) Index / 40% Lehman Brothers U.S. Aggregate Index


Investment Approach


     Seeks to maximize total return, consistent with income generation and
prudent investment management. The Portfolio uses an asset allocation strategy,
investing varying percentages of its portfolio in three major categories:
stocks, bonds and, to a lesser extent, money market instruments. The Portfolio
management team draws upon analysis of financial trends and market conditions
to monitor and adjust the allocation from time to time. The Portfolio
management team assigns varying percentages to individual investment team
members. Some team members are responsible for particular types of stock
investments, such as stocks of larger companies, smaller companies, companies
that appear to be trading below their true worth or international companies.
Within each equity style, investment decisions are made according to a
bottom-up stock selection. The fixed income portion of the Portfolio will
consist of a broad range of bonds including: U.S. Government bonds,
mortgage-backed, asset-backed and corporate debt securities. The Portfolio may
invest up to 25% of total assets in non-investment grade bonds. The Portfolio
may also invest in non-dollar denominated bonds of issuers located outside of
the United States. The fixed income management team seeks bonds that will add
value while controlling risk.
Recent Portfolio Management Activity


     o  On January 31, 2005, BlackRock, Inc., the parent of BlackRock Advisors,
Inc. (BAI), acquired SSRM Holdings, Inc., the parent of State Street Research &
Management Company (SSRM), the investment adviser to the State Street Research
mutual funds. In connection with the transaction, the BlackRock Balanced
Portfolio reorganized with the State Street Research Asset Allocation Fund (the
SSR Fund) and was renamed the BlackRock Asset Allocation Portfolio (the
Portfolio). The SSR Fund transferred substantially all of its assets and
liabilities to the Portfolio in exchange for shares of the Portfolio, which
were then distributed to the SSR Fund shareholders. For periods prior to
January 31, 2005, the performance information shown reflects the performance of
the SSR Fund, which had similar investment goals and strategies as the
Portfolio.


     o  All share classes of the Portfolio outperformed the benchmark for the
semi-annual period.


     o  During the first half of the period the broad equity markets
experienced a strong rebound producing positive performance in each of the
three months. The strength of the rally came in November and December as
investors appeared relieved that the long contentious political season had come
to an end. Further, oil prices fell during the fourth quarter of 2004 further
fueling the rally. However, during the second half of the period, the U.S.
equity markets faltered. Investors' concerns centered on rising oil prices,
mounting inflationary pressures and the continued "measured pace" of interest
rate increases from the Federal Open Market Committee. During the period,
mid-capitalization stocks outperformed both large and small capitalization
stocks, while value stocks outperformed growth stocks within each of the three
capitalization categories. Additionally, the global resource sector was one of
the strongest performers. In the fixed income markets, yields trended higher as
the Federal Reserve continued toward the "normalization" of short-term interest
rates. The Federal Open Market Committee increased the Federal Funds target
rate 4 times during the period, in 25 basis point increments, for a total of
100 basis points. The high yield and emerging market sectors outperformed the
general fixed income market, albeit with much of the out performance occurring
during the fourth quarter of 2004.


     o  The Portfolio's overweight to equity was beneficial to performance as
equity outperformed fixed income during the period. The equity portion of the
Portfolio benefited from four key asset allocation themes: overweighting
mid-capitalization stocks, maintaining overweight to value stocks, maintaining
exposure to global resources and overweighting international equity. In
particular, our overweight position in mid-capitalization value stocks and
position in global resources greatly added value relative to the benchmark.
Additionally, the exposure to major international equity markets and the long
position in foreign currencies added to the Portfolio's performance. Since
early March, the equity portion of the Portfolio shifted toward a more
defensive nature. The Portfolio moved up in market capitalization by trimming
positions in small capitalization, and taking some profit from
mid-capitalization value stocks. For the first quarter 2005, the overweight to
equity hurt performance as equity underperformed fixed income substantially. We
expect that the exposure in global resources will continue to add volatility to
the Portfolio's performance. The Portfolio maintains the overweight to equity,
however, with a more conservative overall profile.


     o  In the fixed income portion of the Portfolio, high-yield and emerging
markets exposure had positive impact on performance relative to the benchmark.
During the period, the Portfolio reduced its allocation to high yield and
emerging markets through profit-taking to increase exposure to high grade
bonds. The Portfolio's position in high yield detracted from performance in the
first quarter 2005. The fixed income portfolio is positioned for low duration,
high quality securities.


     o  The Portfolio continues to emphasize equities over fixed income; ending
the period with a 68% equity/31% fixed income/1% cash target allocation. This
represents an overweight position in equities and underweight position in fixed
income relative to the normal strategic allocation of 60% equity/40% fixed
income/0% cash allocation.


COMPARISON OF CHANGE IN VALUE OF A $10,000 INVESTMENT IN THE ASSET ALLOCATION
                                   PORTFOLIO
AND 60% S&P 500(REG. TM) INDEX / 40% LEHMAN BROTHERS U.S. AGGREGATE INDEX FOR
                              THE PAST TEN YEARS.


                                                [LINE CHART]

                 Institutional          Investor A     60% S&P 500256 Index / 40% Lehman Brothers U.S. Aggreg
                 -------------          ----------     ------------------------------------------------------
03/31/1995          $ 10,000              $ 9,429                             $ 10,000
06/30/1995            10,748               10,140                               10,816
09/30/1995            11,432               10,778                               11,415
12/31/1995            11,670               10,997                               12,023
03/31/1996            12,270               11,555                               12,320
06/30/1996            12,776               12,025                               12,680
09/30/1996            13,267               12,478                               13,015
12/31/1996            14,054               13,210                               13,824
03/31/1997            13,837               12,998                               14,020
06/30/1997            15,185               14,257                               15,676
09/30/1997            16,738               15,705                               16,599
12/31/1997            16,379               15,359                               17,088
03/31/1998            17,979               16,849                               18,611
06/30/1998            17,980               16,840                               19,158
09/30/1998            16,351               15,304                               18,360
12/31/1998            17,778               16,626                               20,674
03/31/1999            17,904               16,738                               21,250
06/30/1999            18,738               17,506                               22,071
09/30/1999            18,107               16,906                               21,297
12/31/1999            20,129               18,780                               23,155
03/31/2000            20,979               19,563                               23,706
06/30/2000            20,837               19,402                               23,491
09/30/2000            21,498               20,024                               23,652
12/31/2000            21,909               20,393                               22,925
03/31/2001            21,097               19,620                               21,551
06/30/2001            22,148               20,582                               22,368
09/30/2001            19,669               18,264                               20,746
12/31/2001            22,913               21,239                               22,074
03/31/2002            22,884               21,218                               22,130
06/30/2002            21,014               19,470                               20,631
09/30/2002            18,760               17,367                               18,804
12/31/2002            19,344               17,895                               19,906
03/31/2003            18,966               17,533                               19,640
06/30/2003            21,370               19,719                               21,631
09/30/2003            22,062               20,365                               21,971
12/31/2003            24,328               22,441                               23,585
03/31/2004            25,311               23,308                               24,077
06/30/2004            25,308               23,310                               24,087
09/30/2004            25,108               23,089                               24,124
12/31/2004            27,125               24,924                               25,542
03/31/2005            26,743               24,571                               25,169


                        FOR PERIOD ENDING MARCH 31, 2005


                                 Average Annual Total Return
                                             1 Year        3 Year       5 Year       10 Year
                                          ------------   ----------   ----------   -----------
     Institutional Class                       5.66%         5.33%        4.97%        10.34%
     Service Class                             5.44%         5.02%        4.67%        10.05%
     Investor A Class (Load Adjusted)         (0.61)%        2.96%        3.44%         9.41%
     Investor A Class (NAV)                    5.42%         5.01%        4.66%        10.05%
     Investor B Class (Load Adjusted)          0.21%         3.21%        3.62%         9.25%
     Investor B Class (NAV)                    4.66%         4.29%        3.94%         9.25%
     Investor C Class (Load Adjusted)          3.61%         4.28%        3.93%         9.24%
     Investor C Class (NAV)                    4.60%         4.28%        3.93%         9.24%

THE PERFORMANCE INFORMATION ABOVE INCLUDES INFORMATION RELATING TO EACH CLASS
OF THE PORTFOLIO SINCE THE COMMENCEMENT OF OPERATIONS OF THE PORTFOLIO, RATHER
THAN THE DATE SUCH CLASS WAS INTRODUCED. THE INCEPTION DATES OF THE PORTFOLIO'S
SHARE CLASSES WERE AS FOLLOWS: INVESTOR A SHARES, 12/29/88; INSTITUTIONAL
SHARES, 6/1/93; INVESTOR C SHARES, 6/1/93; INVESTOR B SHARES, 1/1/99; AND
SERVICE SHARES, 1/28/05. SEE "NOTE ON PERFORMANCE INFORMATION" ON PAGE 41 FOR
FURTHER INFORMATION ON HOW PERFORMANCE DATA WAS CALCULATED, INCLUDING IMPORTANT
INFORMATION ON THE LINE GRAPH ABOVE.


PAST PERFORMANCE IS NOT PREDICTIVE OF FUTURE RESULTS. The graph and table do
not reflect the deduction of taxes that a shareholder would pay on fund
distributions or the redemption of shares.  Although the holdings and sectors
listed above were current as of the periods indicated, the Portfolio is
actively managed


                                                                              37
                          ASSET ALLOCATION PORTFOLIO

FUND PROFILE


   Top Ten Holdings (% of long-term investments)
Federal National Mortgage Association      3.7 %
U.S. Treasury Notes                        3.1
General Electric Co.                       1.5
Exxon Mobil Corp.                          1.4
U.S. Treasury Bonds                        1.0
Government National Mortgage Association   1.0
Citigroup, Inc.                            0.9
CONSOL Energy, Inc.                        0.9
Bank of America Corp.                      0.8
Microsoft Corp.                            0.8

                                           ---
     Total                                 15.1 %
                                           =======


 Credit Quality (% of
fixed income portfolio)1
AAA          61.6 %
AA            7.6
A            12.5
BBB           9.6
\qBBB         8.7
             ----
  Total      100.0 %
             ========


   Top Ten Industries (% of long-term
              investments)
Oil & Gas                      8.6 %
Manufacturing                  6.0
Banks                          5.2
Finance                        4.1
Retail Merchandising           4.0
Insurance                      3.4
Computer & Software Services   3.3
Pharmaceuticals                3.0
Telecommunications             2.8
Energy & Utilities             2.5
                               ---
     Total                     42.9 %
                               =======


1  Using the higher of Standard & Poor's ("S&P") or Moody's Investor Service
("Moody's").

- --------------------------------------------------------------------------------
EXPENSE EXAMPLE


As a shareholder of the Portfolio, you incur two types of costs: (1)
transaction costs, including front and back end sales charges (loads) or
redemption/exchange fees, where applicable; and (2) ongoing costs, including
advisory fees, distribution (12b-1) and service fees, where applicable; and
other Portfolio expenses. This Example is intended to help you understand your
ongoing costs (in dollars) of investing in the Portfolio and to compare these
costs with the ongoing costs of investing in other mutual funds.


The Example below is based on an investment of $1,000 invested at the beginning
of the period and held for the entire period October 1, 2004 to March 31, 2005.


The information under "Actual Expenses," together with the amount you invested,
allows you to estimate actual expenses incurred over the reporting period.
Simply divide your account value by $1,000 (for example, an $8,600 account
value divided by $1,000 = 8.60) and multiply the result by the cost shown for
your share class, in the row entitled "Expenses Incurred During Period", to
estimate the expenses incurred on your account during this period.


The information under "Hypothetical Expenses" provides information about
hypothetical account values and hypothetical expenses based on the Portfolio's
actual expense ratio and an assumed rate of return of 5% per year before
expenses, which is not the Portfolio's actual return. The hypothetical account
values and expenses may not be used to estimate the actual ending account
balance or expense you incurred for the period. You may use this information to
compare the ongoing costs of investing in the Portfolio and other funds. To do
so, compare this 5% hypothetical example with the 5% hypothetical examples that
appear in the shareholder reports of the other funds.


Please note that the expenses shown in the table are meant to highlight your
ongoing costs only and do not reflect any transactional costs, such as front
and back end sales charges (loads) or redemption/exchange fees, where
applicable. Therefore, the hypothetical information is useful in comparing
ongoing costs only, and will not help you determine the relative total costs of
owning different funds. In addition, if these transactional costs were
included, your costs would have been higher.


                                                        Actual Expenses
                        -------------------------------------------------------------------------------
                         Institutional      Service         Investor        Investor        Investor
                             Class           Class          A Class         B Class         C Class
                        --------------- --------------- --------------- --------------- ---------------
Beginning Account
 Value (10/01/04)        $   1,000.00    $   1,000.00    $   1,000.00    $   1,000.00    $   1,000.00
Ending Account Value
 (3/31/05)                   1,065.10        1,064.40        1,064.20        1,060.20        1,060.30
Expenses Incurred
 During Period
 (10/01/04 -
  3/31/05)                       4.84            2.03            6.59           10.27           10.27


                                                     Hypothetical Expenses
                                                  (5% return before expenses)
                        -------------------------------------------------------------------------------
                         Institutional      Service         Investor        Investor        Investor
                             Class           Class          A Class         B Class         C Class
                        --------------- --------------- --------------- --------------- ---------------
Beginning Account
 Value (10/01/04)        $   1,000.00    $   1,000.00    $   1,000.00    $   1,000.00    $   1,000.00
Ending Account Value
 (3/31/05)                   1,020.25        1,023.00        1,018.54        1,014.90        1,014.90
Expenses Incurred
 During Period
 (10/01/04 -
  3/31/05)                       4.75            2.00            6.46           10.10           10.10

For each class of the Portfolio, expenses are equal to the annualized expense
ratio of 0.94%, 1.16%, 1.28%, 2.00%, and 2.00% for the Institutional, Service,
Investor A, B, and C share classes, respectively, multiplied by the average
account value over the period, multiplied by 182/365 (to reflect the one-half
year period) and 62/365 for the Service share class (to reflect the period the
share class was open during the one-half year period).


For the period October 1, 2004 through January 31, 2005, the "Actual Expenses"
table reflects the expenses of the State Street Research Asset Allocation Fund
prior to its reorganization with the Portfolio on that date. Restated to
reflect the Portfolio's current expenses for the entire semi-annual period, (i)
"Ending Account Value" on March 31, 2005 would have been $1,065.10 for
Institutional Class shares and (ii) "Expenses Incurred During Period" for the
period October 1, 2004 through March 31, 2005 would have been $4.43 for
Institutional Class shares.  "Ending Account Value" and "Expenses Incurred
During Period" would been the same for Service Class, Investor A Class,
Investor B Class and Investor C Class.


38
                            INDEX EQUITY PORTFOLIO


Advisor to the Index Master Portfolio

     Dimensional Fund Advisors Inc.


Total Net Assets (3/31/05): $1.3 billion


Performance Benchmark
     S&P 500(Reg. TM) Index


Investment Approach

     Seeks to approximate the investment performance of the S&P 500(Reg. TM)
Index, in terms of total investment return.  In pursuit of this goal, the
Portfolio invests all of its assets indirectly, through the The U.S. Large
Company Series (the Index Master Portfolio) of The DFA Investment Trust
Company, in the stocks of the S&P 500(Reg. TM) Index.  The Index Master
Portfolio, under normal market conditions, invests at least 95% of its total
assets in substantially all the stocks of the S&P 500(Reg. TM) Index in
approximately the same proportion as they are represented in the Index.


Recent Portfolio Management Activity
     o  All share classes of the Portfolio underperformed the benchmark for the
semi-annual period.


     o  Consumer confidence eroded during the first half of the semi-annual
period due to higher energy prices and concerns over the presidential election.
By November, however, the mood changed and the U.S. equity markets rallied due
to the presidential election resolution, falling oil prices, and generally
benign economic releases.


     o  Every sector of the S&P 500(Reg. TM) Index had solid positive returns
in the first half of the semi-annual period.  However, seven of the ten S&P
500(Reg. TM) sectors posted returns below the overall Index return.  The best
performing sectors substantially outperformed, led by economically-sensitive
stocks in the technology, consumer discretionary and utility sectors.  Earnings
prospects for the technology sector, which was up 13.4% for the quarter, did
not significantly improve, but investors appeared to return to the sector for
its higher market sensitivity despite high valuations and weak fundamentals.
Evidence that the U.S. economic "soft patch" had ended drove performance for
consumer discretionary stocks, which were up 13.2% for the period.  Energy
stocks lagged during the quarter with a return of 4.2%, as oil and gas prices
retreated during November and December.  Health care stocks remained a drag on
the market, as large capitalization pharmaceutical stocks fell with the
continued negative news regarding the safety of popular name brand prescription
pain relief drugs.  The heath care sector managed a gain of 4.8% for the
quarter, well behind the market.


     o  During the first half of the semi-annual period, small capitalization
stocks led the U.S. market, gaining 14.1%.  Value stocks outperformed in the
large capitalization sector but growth stocks outperformed in the mid- and
small capitalization range.


     o  During the second half of the semi-annual period U.S. economic
activity, although still trending positive, lost some momentum.  Market
weakness in January and March offset February gains, contributing to the S&P
500(Reg. TM) Index's largest quarterly loss in two years (-2.2%).  Investors
became increasingly concerned about the impact that higher commodity prices
might have on the overall economy and inflation.


     o  During the first quarter of 2005, investors favored defensive areas of
the market as only four of the ten sectors within the S&P 500(Reg. TM) Index
generated positive returns.  In contrast, higher-beta segments of the market,
which performed well in the fourth quarter of 2004, declined in the first
quarter of 2005.  Most notably, the information technology, telecommunications
and financial sectors posted the largest losses.  Small capitalization stocks
also fell out of favor with investors, losing 5.3% during the period compared
to a loss of 1.9% for large capitzalization stocks. From a valuation
standpoint, stronger performance by more defensive areas of the market, such as
the energy and utilities sectors, helped value stocks continue their
significant outperformance over their growth counterparts across capitalization
ranges.


     o  The Portfolio, through the investment of all of its assets in The U.S.
Large Company Series of The DFA Investment Trust Company, holds substantially
all of the stocks contained in the S&P 500(Reg. TM) Index in approximately the
same proportion as the Index.  For the six-months ended March 31, 2005, the S&P
500(Reg. TM) Index returned 6.9%.  The Institutional, Service, Investor A,
Investor B and Investor C class shares of the Portfolio posted total returns of
6.8%, 6.7%, 6.6%, 6.2% and 6.2%, respectively, for the semi-annual period.  The
return of each class was less than the return of the S&P(Reg. TM) 500 Index
primarily because of Portfolio and class-specific expenses.


COMPARISON OF CHANGE IN VALUE OF A $10,000 INVESTMENT IN THE INDEX EQUITY
                                   PORTFOLIO
             AND THE S&P 500(REG. TM) INDEX FOR THE PAST TEN YEARS.


                              [LINE CHART]

                 Institutional          Investor A     S&P 500256 Index
                 -------------          ----------     ----------------
03/31/1995          $ 10,000              $ 9,700          $ 10,000
06/30/1995            10,957               10,636            10,955
09/30/1995            11,799               11,436            11,825
12/31/1995            12,503               12,115            12,537
03/31/1996            13,147               12,717            13,210
06/30/1996            13,723               13,262            13,803
09/30/1996            14,138               13,644            14,230
12/31/1996            15,300               14,761            15,416
03/31/1997            15,698               15,126            15,829
06/30/1997            18,417               17,728            18,593
09/30/1997            19,791               19,032            19,985
12/31/1997            20,337               19,524            20,559
03/31/1998            23,164               22,207            23,427
06/30/1998            23,914               22,922            24,201
09/30/1998            21,554               20,626            21,793
12/31/1998            26,144               24,994            26,434
03/31/1999            27,400               26,168            27,751
06/30/1999            29,280               27,922            29,707
09/30/1999            27,452               26,141            27,853
12/31/1999            31,534               29,993            31,997
03/31/2000            32,250               30,623            32,731
06/30/2000            31,315               29,688            31,861
09/30/2000            31,048               29,389            31,553
12/31/2000            28,620               27,059            29,084
03/31/2001            25,221               23,794            25,636
06/30/2001            26,669               25,126            27,136
09/30/2001            22,735               21,398            23,153
12/31/2001            25,149               23,627            25,627
03/31/2002            25,201               23,638            25,698
06/30/2002            21,820               20,435            22,255
09/30/2002            18,039               16,878            18,410
12/31/2002            19,560               18,265            19,964
03/31/2003            18,934               17,657            19,335
06/30/2003            21,836               20,332            22,312
09/30/2003            22,404               20,829            22,902
12/31/2003            25,127               23,317            25,690
03/31/2004            25,540               23,672            26,125
06/30/2004            25,969               24,041            26,575
09/30/2004            25,477               23,559            26,078
12/31/2004            27,812               25,698            28,486
03/31/2005            27,219               25,120            27,874


                            FOR PERIOD ENDING MARCH 31, 2005

                                  Average Annual Total Return
                                            1 Year       3 Year         5 Year        10 Year
                                          ----------   ----------   -------------   -----------
     Institutional Class                      6.58%        2.60%         (3.33)%        10.53%
     Service Class                            6.18%        2.17%         (3.75)%        10.12%
     Investor A Class (Load Adjusted)         2.92%        1.02%         (4.47)%         9.65%
     Investor A Class (NAV)                   6.12%        2.05%         (3.88)%         9.98%
     Investor B Class (Load Adjusted)         0.80%        0.12%         (4.98)%         9.25%
     Investor B Class (NAV)                   5.30%        1.27%         (4.60)%         9.25%
     Investor C Class (Load Adjusted)         4.31%        1.26%         (4.60)%         9.24%
     Investor C Class (NAV)                   5.31%        1.26%         (4.60)%         9.24%

THE INVESTOR B AND C CLASSES OF THE BLACKROCK INDEX EQUITY PORTFOLIO CLOSED TO
INVESTORS AS OF 4:00 P.M., MAY 28, 2004.

THE PERFORMANCE INFORMATION ABOVE INCLUDES INFORMATION RELATING TO EACH CLASS
OF THE PORTFOLIO SINCE THE COMMENCEMENT OF OPERATIONS OF THE PORTFOLIO, RATHER
THAN THE DATE SUCH CLASS WAS INTRODUCED. THE INCEPTION DATES OF THE PORTFOLIO'S
SHARE CLASSES WERE AS FOLLOWS: INSTITUTIONAL SHARES, 4/20/92; INVESTOR A
SHARES, 6/2/92; SERVICE SHARES, 7/29/93; INVESTOR B SHARES, 2/7/96; AND
INVESTOR C SHARES, 8/14/96. SEE "NOTE ON PERFORMANCE INFORMATION" ON PAGE 41
FOR FURTHER INFORMATION ON HOW PERFORMANCE DATA WAS CALCULATED, INCLUDING
IMPORTANT INFORMATION ON THE LINE GRAPH ABOVE.


PAST PERFORMANCE IS NOT PREDICTIVE OF FUTURE RESULTS. The graph and table do
not reflect the deduction of taxes that a shareholder would pay on fund
distributions or the redemption of shares. Although the holdings and sectors
listed above were current as of the periods indicated, the Portfolio is
actively managed and its composition will vary.


                                                                              39
                            INDEX EQUITY PORTFOLIO

FUND PROFILE


 Top Ten Holdings (% of long-term investments)1
General Electric                       3.5 %
Exxon Mobil Corp.                      3.5
Microsoft Corp.                        2.2
Citigroup, Inc.                        2.2
Johnson & Johnson                      1.8
Pfizer, Inc.                           1.8
Bank of America Corp.                  1.6
Wal-Mart Stores, Inc.                  1.6
International Business Machines Corp   1.4
Intel Corp.                            1.3
                                       ---
     Total                             20.9 %
                                       =======


 Sector Allocation (% of long-term
           investments)2
Financial                19.8 %
Information Technology   15.1
Health Care              13.0
Industrials              11.9
Consumer Discretionary   11.5
Consumer Staples         10.3
Energy                    8.8
Materials                 3.3
Utilities                 3.2
Telecommunications        3.1
                         ----
     Total               100.0 %
                         ========


1  Represents the Top Ten Holdings of The U.S. Large Company Series of The DFA
Investment Trust Company.


2  Represents the Sector Allocation of The U.S. Large Company Series of The DFA
Investment Trust Company.


- --------------------------------------------------------------------------------
EXPENSE EXAMPLE


As a shareholder of the Portfolio, you incur two types of costs: (1)
transaction costs, including front and back end sales charges (loads) or
redemption/exchange fees, where applicable; and (2) ongoing costs, including
advisory fees, distribution (12b-1) and service fees, where applicable; and
other Portfolio expenses. This Example is intended to help you understand your
ongoing costs (in dollars) of investing in the Portfolio and to compare these
costs with the ongoing costs of investing in other mutual funds.


The Example below is based on an investment of $1,000 invested at the beginning
of the period and held for the entire period October 1, 2004 to March 31, 2005.


The information under "Actual Expenses," together with the amount you invested,
allows you to estimate actual expenses incurred over the reporting period.
Simply divide your account value by $1,000 (for example, an $8,600 account
value divided by $1,000 = 8.60) and multiply the result by the cost shown for
your share class, in the row entitled "Expenses Incurred During Period", to
estimate the expenses incurred on your account during this period.


The information under "Hypothetical Expenses" provides information about
hypothetical account values and hypothetical expenses based on the Portfolio's
actual expense ratio and an assumed rate of return of 5% per year before
expenses, which is not the Portfolio's actual return. The hypothetical account
values and expenses may not be used to estimate the actual ending account
balance or expense you incurred for the period. You may use this information to
compare the ongoing costs of investing in the Portfolio and other funds. To do
so, compare this 5% hypothetical example with the 5% hypothetical examples that
appear in the shareholder reports of the other funds.


Please note that the expenses shown in the table are meant to highlight your
ongoing costs only and do not reflect any transactional costs, such as front
and back end sales charges (loads) or redemption/exchange fees, where
applicable. Therefore, the hypothetical information is useful in comparing
ongoing costs only, and will not help you determine the relative total costs of
owning different funds. In addition, if these transactional costs were
included, your costs would have been higher.


                                                        Actual Expenses
                        -------------------------------------------------------------------------------
                         Institutional      Service         Investor        Investor        Investor
                             Class           Class          A Class         B Class         C Class
                        --------------- --------------- --------------- --------------- ---------------
Beginning Account
 Value (10/01/04)        $   1,000.00    $   1,000.00    $   1,000.00    $   1,000.00    $   1,000.00
Ending Account Value
 (3/31/05)                   1,068.40        1,066.70        1,066.30        1,062.30        1,062.40
Expenses Incurred
 During Period
 (10/01/04 -
  3/31/05)                       0.93            2.98            2.98            6.82            6.82


                                                     Hypothetical Expenses
                                                  (5% return before expenses)
                        -------------------------------------------------------------------------------
                         Institutional      Service         Investor        Investor        Investor
                             Class           Class          A Class         B Class         C Class
                        --------------- --------------- --------------- --------------- ---------------
Beginning Account
 Value (10/01/04)        $   1,000.00    $   1,000.00    $   1,000.00    $   1,000.00    $   1,000.00
Ending Account Value
 (3/31/05)                   1,024.09        1,022.08        1,022.08        1,018.30        1,018.30
Expenses Incurred
 During Period
 (10/01/04 -
  3/31/05)                       0.91            2.92            2.92            6.70            6.70

For each class of the Portfolio, expenses are equal to the annualized expense
ratio of 0.18%, 0.58%, 0.58%, 1.33%, and 1.33% for the Institutional, Service,
Investor A, B, and C share classes, respectively, multiplied by the average
account value over the period, multiplied by 182/365 (to reflect the one-half
year period).The Example reflects the expenses for both the Index Equity
Portfolio and The U.S. Large Company Series of The DFA Investment Trust
Company.


40
                                BLACKROCK FUNDS
                        NOTE ON PERFORMANCE INFORMATION


     The performance information above includes information for each class of
each Portfolio since the commencement of operations of the Portfolio, rather
than the date such class was introduced.Performance information for each class
introduced after the commencement of operations of a Portfolio is therefore
based on the performance history of a predecessor class or predecessor classes.
If a class of shares in a Portfolio (the "Subsequent Class") has more than one
predecessor class, the performance data predating the introduction of the
Subsequent Class is based initially on the performance of the Portfolio's first
operational predecessor class (the "Initial Class"); thereafter, the
performance of the Subsequent Class is based upon the performance of any other
predecessor class or classes which were introduced after the Initial Class and
which had total operating expenses more similar to those of the Subsequent
Class. In the case of Investor A, Investor B, Investor C and Service Shares,
the performance information for periods prior to their introduction dates has
not been restated to reflect the shareholder servicing and processing and/or
distribution fees and certain other expenses borne by these share classes
which, if reflected, would reduce the performance quoted. Accordingly, the
performance information may be used in assessing each Portfolio's performance
history but does not reflect how the distinct classes would have performed on a
relative basis prior to the introduction of these classes, which would require
an adjustment to the ongoing expenses. Additionally, the performance
information above does not reflect accounting adjustments required under
accounting principles generally accepted in the United States of America and as
a result there may be variances between what is reported within this section
and that reported in the total return calculation in the Financial Highlights.

     Performance for the Legacy, Mid-Cap Value Equity, Aurora, Small/Mid-Cap
Growth, Global Resources, Health Sciences and Asset Allocation Portfolios for
the periods prior to January 31, 2005 is based on performance of certain former
State Street Research mutual funds that reorganized with the Portfolios on that
date.

     Performance information is restated to reflect the current maximum
front-end sales charge (in the case of Investor A Shares) or the maximum
contingent deferred sales charge (in the case of Investor B and Investor C
Shares), and assumes the reinvestment of dividends and distributions. The
maximum front-end sales charges for Investor A Shares are as follows:
Investment Trust, Large Cap Value Equity, Large Cap Growth Equity, Dividend
AchieversTM, Legacy, Mid-Cap Value Equity, Mid-Cap Growth Equity, Aurora,
Small/Mid Cap Growth, Small Cap Value Equity, Small Cap Core Equity, Small Cap
Growth Equity, Global Science &Technology Opportunities, Global Resources,
All-Cap Global Resources, Health Sciences, U.S.Opportunities, and Asset
Allocation Portfolios -   5.75%; International Opportunities Portfolio -
5.00%; Index Equity Portfolio -  3.00%. The maximum contingent deferred sales
charge for Investor B Shares and Investor C Shares of all of the Portfolios is
4.50% and 1.00%, respectively.

     The performance information also reflects fee waivers and reimbursements
that subsidize and reduce the total operating expenses of each Portfolio. The
Portfolios' returns would have been lower if there were no such waivers and
reimbursements. BlackRock Advisors, Inc. is under no obligation to waive or
continue waiving its fees after February 1, 2006 or February 1, 2007 as
described in the prospectus of the Portfolios. Investment return and principal
value of an investment will fluctuate so that an investor's shares, when
redeemed, may be worth more or less than their original cost.

     The performance shown in the line graphs is that of Institutional Shares
and Investor A Shares of the Portfolios. The actual performance of Investor B,
Investor C and Service Shares is lower than the performance of Institutional
Shares because Investor B, Investor C and Service Shares have higher expenses
than Institutional Shares. Excluding the effects of sales charges, the actual
performance of Investor B and Investor C Shares is lower than the performance
of Investor A Shares because Investor B and Investor C Shares have higher
expenses than Investor A Shares. Purchasers of Investor A Shares generally pay
a front-end sales charge, while purchasers of Investor B and Investor C Shares
may pay a contingent deferred sales charge (depending on how long they hold
their shares) when they sell their shares.


                                                                              41
                                BLACKROCK FUNDS
                            STATEMENT OF NET ASSETS
                           INVESTMENT TRUST PORTFOLIO


AS OF MARCH 31, 2005 (UNAUDITED)


                                          NUMBER
                                        OF SHARES       VALUE
                                       ----------- --------------
COMMON STOCKS - 99.3%
Aerospace - 1.7%
  General Dynamics Corp.                  128,800   $ 13,788,040
  Northrop Grumman Corp.                   11,600        626,168
  Raytheon Co.                            250,700      9,702,090

                                                    ------------
                                                      24,116,298
                                                    ------------
Banks - 6.8%
  Bank of America Corp.                   743,900     32,805,990
  Key Corp.                               289,700      9,400,765
  North Fork Bancorporation, Inc.         355,100      9,850,474
  SunTrust Banks, Inc.                    152,700     11,005,089
  U.S. Bancorp                            490,800     14,144,856
  Wachovia Corp.                          364,600     18,561,786
  Wells Fargo & Co.                         5,700        340,860

                                                    ------------
                                                      96,109,820
                                                    ------------
Beverages & Bottling - 2.5%
  The Coca-Cola Co.                         8,500        354,196
  Coca-Cola Enterprises, Inc.             158,189      3,246,038
  Constellation Brands, Inc.(b)           144,200      7,623,854
  PepsiCo, Inc.                           459,810     24,383,724

                                                    ------------
                                                      35,607,812
                                                    ------------
Broadcasting - 0.8%
  Comcast Corp. - Class A(b)              344,200     11,496,280
                                                    ------------
Business Services - 0.7%
  Accenture Ltd.(b)                       400,100      9,662,415
                                                    ------------
Chemicals - 1.6%
  The Dow Chemical Co.                    358,200     17,856,270
  Lyondell Chemical Co.                   184,400      5,148,448
  Olin Corp.                               11,200        249,760

                                                    ------------
                                                      23,254,478
                                                    ------------
Computer & Office Equipment - 5.1%
  Cisco Systems, Inc.(b)                  755,900     13,523,051
  Dell, Inc.(b)                           326,100     12,528,762
  Hewlett-Packard Co.                     414,600      9,096,324
  International Business Machines
    Corp.                                 339,900     31,060,062
  Lexmark International, Inc.(b)           95,300      7,621,141

                                                    ------------
                                                      73,829,340
                                                    ------------
Computer Software & Services - 5.0%
  BMC Software, Inc.(b)                    14,700        220,500
  Checkfree Corp.(b)                      222,100      9,052,796
  Computer Sciences Corp.(b)               12,300        563,955
  Microsoft Corp.                      1,814,000      43,844,380
  Oracle Corp.(b)                        957,800      11,953,344
  Symantec Corp.(b)                       10,000         213,300
  Yahoo!, Inc.(b)                        196,500       6,661,350

                                                    ------------
                                                      72,509,625
                                                    ------------
Construction - 0.7%
  Pulte Homes, Inc.(c)                   138,300      10,183,029
                                                    ------------
Electronics - 3.3%
  Intel Corp.                          1,502,700      34,907,721
  L-3 Communications Holdings, Inc.      175,700      12,478,214

                                                    ------------
                                                      47,385,935
                                                    ------------
Energy & Utilities - 3.3%
  Exelon Corp.                           363,600      16,685,604
  PG&E Corp.                             421,100      14,359,510
  PPL Corp.                              284,900      15,381,751


                                          NUMBER
                                        OF SHARES       VALUE
                                       ----------- --------------
COMMON STOCKS (Continued)
Energy & Utilities (Continued)
  TXU Corp.                                7,400    $    589,262

                                                    ------------
                                                      47,016,127
                                                    ------------
Entertainment & Leisure - 2.7%
  Harrah's Entertainment, Inc.(c)         89,500       5,779,910
  Time Warner, Inc.(b)(c)              1,105,500      19,401,525
  The Walt Disney Co.                    459,900      13,212,927

                                                    ------------
                                                      38,394,362
                                                    ------------
Finance - 7.2%
  American Express Co.                   317,200      16,294,564
  The Bear Stearns Cos., Inc.              7,300         729,270
  Capital One Financial Corp.(c)           8,800         657,976
  CIT Group, Inc.                        255,700       9,716,600
  Citigroup, Inc.                        811,800      36,482,292
  Countrywide Financial Corp.            207,398       6,732,139
  Fannie Mae                               2,700         147,015
  Franklin Resources, Inc.               108,600       7,455,390
  Freddie Mac                             14,400         910,080
  The Goldman Sachs Group, Inc.          152,400      16,762,476
  MBNA Corp.                               8,900         218,495
  Merrill Lynch & Co., Inc.                3,500         198,100
  Washington Mutual, Inc.                200,400       7,915,800

                                                    ------------
                                                     104,220,197
                                                    ------------
Food & Agriculture - 0.9%
  Archer-Daniels-Midland Co.(c)          523,671      12,871,833
                                                    ------------
Insurance - 4.8%
  Aetna, Inc.                            117,600       8,814,120
  The Allstate Corp.                     162,600       8,790,156
  American International Group, Inc.     371,751      20,598,723
  CHUBB Corp.                            114,800       9,100,196
  Hartford Financial Services Group      110,100       7,548,456
  Prudential Financial, Inc.             143,700       8,248,380
  W.R. Berkley Corp.                     124,400       6,170,240

                                                    ------------
                                                      69,270,271
                                                    ------------
Machinery & Heavy Equipment - 0.0%
  Deere & Co.                              7,200         483,336
                                                    ------------
Manufacturing - 10.1%
  Black & Decker Corp.                    88,500       6,990,615
  Eaton Corp.                            160,800      10,516,320
  Energizer Holdings, Inc.(b)            137,500       8,222,500
  Fortune Brands, Inc.                    97,200       7,837,236
  General Electric Co.                 1,545,100      55,716,306
  Ingersoll-Rand Co. - Class A           111,800       8,904,870
  ITT Industries, Inc.                   119,100      10,747,584
  Mattel, Inc.                           358,600       7,656,110
  Nike, Inc.                             127,400      10,613,694
  Nucor Corp.                             13,600         782,816
  The Stanley Works(c)                    16,700         756,009
  Textron, Inc.                           95,400       7,118,748
  Tyco International Ltd. - ADR          303,300      10,251,540

                                                    ------------
                                                     146,114,348
                                                    ------------
Medical & Medical Services - 3.9%
  Amgen, Inc.(b)                         285,500      16,618,955
  Caremark Rx, Inc.(b)                   374,800      14,909,544
  HCA, Inc.                              137,000       7,339,090
  McKesson Corp.                         282,400      10,660,600

SEE ACCOMPANYING NOTES TO FINANCIAL STATEMENTS.
42
                                BLACKROCK FUNDS
                            STATEMENT OF NET ASSETS
                     INVESTMENT TRUST PORTFOLIO (CONTINUED)


AS OF MARCH 31, 2005 (UNAUDITED)


                                          NUMBER
                                        OF SHARES        VALUE
                                       ----------- ----------------
COMMON STOCKS (Continued)
Medical & Medical Services (Continued)
  STERIS Corp.(b)                         243,300   $    6,143,325

                                                    --------------
                                                        55,671,514
                                                    --------------
Medical Instruments & Supplies - 2.9%
  Bausch & Lomb, Inc.                     132,900        9,741,570
  Becton, Dickinson & Co.                 168,000        9,814,560
  Boston Scientific Corp.(b)                5,400          158,166
  Guidant Corp.                            59,100        4,367,490
  Johnson & Johnson                       272,000       18,267,520

                                                    --------------
                                                        42,349,306
                                                    --------------
Metal & Mining - 0.8%
  CONSOL Energy, Inc.                     244,500       11,496,390
                                                    --------------
Motor Vehicles - 0.9%
  Ford Motor Co.                          505,600        5,728,448
  PACCAR, Inc.                             94,300        6,826,377

                                                    --------------
                                                        12,554,825
                                                    --------------
Oil & Gas - 8.6%
  ChevronTexaco Corp.                     125,900        7,341,229
  ConocoPhillips                          193,300       20,845,472
  EOG Resources, Inc.                     197,000        9,601,780
  Exxon Mobil Corp.                       853,000       50,838,800
  National Fuel Gas Co.                    16,700          477,453
  Newfield Exploration Co.(b)             131,500        9,765,190
  Schlumberger Ltd.                       188,400       13,278,432
  Valero Energy Corp.                     158,200       11,591,314

                                                    --------------
                                                       123,739,670
                                                    --------------
Paper & Forest Products - 0.8%
  Georgia-Pacific Corp.                    17,200          610,428
  Weyerhaeuser Co.                        166,300       11,391,550

                                                    --------------
                                                        12,001,978
                                                    --------------
Pharmaceuticals - 5.5%
  Abbott Laboratories                       4,200          195,804
  Bristol-Myers Squibb Co.                745,700       18,985,522
  Gilead Sciences, Inc.(b)                 12,600          451,080
  Merck & Co., Inc.                       417,500       13,514,475
  Pfizer, Inc.                         1,332,000        34,991,640
  Wyeth                                  276,300        11,654,334

                                                    --------------
                                                        79,792,855
                                                    --------------
Publishing & Printing - 0.8%
  The McGraw-Hill Companies, Inc.        137,700        12,014,325
                                                    --------------
Railroad & Shipping - 1.7%
  Burlington Northern Santa Fe Corp.     247,000        13,320,710
  FedEx Corp.                            123,400        11,593,430

                                                    --------------
                                                        24,914,140
                                                    --------------
Real Estate - 0.9%
  Cendant Corp.                          632,500        12,991,550
  Centex Corp.                             7,500           429,525

                                                    --------------
                                                        13,421,075
                                                    --------------
Restaurants - 0.8%
  McDonald's Corp.                       382,600        11,914,164
                                                    --------------
Retail Merchandising - 5.9%
  AutoZone, Inc.(b)(c)                   115,400         9,889,780
  Barnes & Noble, Inc.(b)                177,328         6,116,043
  CVS Corp.                              159,100         8,371,842
  Federated Department Stores, Inc.      126,400         8,044,096


                                          NUMBER
                                        OF SHARES        VALUE
                                       ----------- ----------------
COMMON STOCKS (Continued)
Retail Merchandising (Continued)
  The Home Depot, Inc.                   425,400    $   16,267,296
  Nordstrom, Inc.                        145,800         8,074,404
  Simon Property Group, Inc.             109,800         6,651,684
  Supervalue, Inc.                       227,800         7,597,130
  Wal-Mart Stores, Inc.                  291,200        14,592,032

                                                    --------------
                                                        85,604,307
                                                    --------------
Security Brokers & Dealers - 0.9%
  E*TRADE Financial Corp.(b)              40,500           486,000
  iShares Russell 1000 Index Fund         11,356           719,970
  Lehman Brothers Holdings, Inc.         130,900        12,325,544

                                                    --------------
                                                        13,531,514
                                                    --------------
Semiconductors & Related Devices - 0.6%
  Lam Research Corp.(b)(c)                14,500           418,470
  Micron Technology, Inc.(b)              36,000           372,240
  NVIDIA Corp.(b)                         12,700           301,752
  QLogic Corp.(b)                        193,200         7,824,600

                                                    --------------
                                                         8,917,062
                                                    --------------
Soaps & Cosmetics - 1.7%
  The Procter & Gamble Co.               455,500        24,141,500
                                                    --------------
Telecommunications - 4.0%
  Motorola, Inc.                         829,800        12,422,106
  Nextel Communications, Inc.(b)         386,000        10,970,120
  SBC Communications, Inc.               282,200         6,685,318
  Scientific-Atlanta, Inc.                 9,600           270,912
  Sprint Corp.                           409,300         9,311,575
  Verizon Communications, Inc.           504,000        17,892,000

                                                    --------------
                                                        57,552,031
                                                    --------------
Tobacco - 1.4%
  Altria Group, Inc.                     316,000        20,663,240
                                                    --------------
Transportation - 0.0%
  Ryder Systems, Inc.                     10,100           421,170
                                                    --------------
TOTAL COMMON STOCKS
  (Cost $1,176,576,195)
                                                     1,433,226,572
                                                    --------------


                                                  PAR/SHARES
                                       MATURITY     (000)
                                      ---------- -----------
SHORT TERM INVESTMENTS - 1.3%
  Morgan Stanley, Floating Rate
    Notes
    2.95%(d)(e)                       11/14/05     $11,639    11,638,761
  Galileo Money Market Fund                          1,094     1,093,578
  Institutional Money Market Trust(e)                6,696     6,696,438

                                                              ----------
TOTAL SHORT TERM INVESTMENTS
  (Cost $19,428,777)                                          19,428,777
                                                              ----------

SEE ACCOMPANYING NOTES TO FINANCIAL STATEMENTS.
                                                                              43
                                BLACKROCK FUNDS
                            STATEMENT OF NET ASSETS
                     INVESTMENT TRUST PORTFOLIO (CONCLUDED)


AS OF MARCH 31, 2005 (UNAUDITED)


                                                 VALUE
                                           -----------------
TOTAL INVESTMENTS IN SECURITIES -  100.6%
  (Cost $1,196,004,972(a))                  $1,452,655,349
LIABILITIES IN EXCESS OF OTHER
  ASSETS -  (0.6)%
  (Including $18,335,199 of payable
  upon return of securities loaned)             (8,365,404)
                                            --------------
NET ASSETS - 100.0%
  (Applicable to 43,075,445 Institutional
  shares, 131,285 Service shares,
  47,761,883 Investor A shares,
  21,769,797 Investor B shares and
  2,183,672 Investor C shares)              $1,444,289,945
                                            ==============


NET ASSET VALUE, OFFERING
  AND REDEMPTION PRICE
  PER INSTITUTIONAL SHARE
  ($549,977,359/43,075,445)              $ 12.77
                                         =======
NET ASSET VALUE, OFFERING
  AND REDEMPTION PRICE
  PER SERVICE SHARE
       ($1,680,607/131,285)              $ 12.80
                                         =======
NET ASSET VALUE AND
  REDEMPTION PRICE PER
  INVESTOR A SHARE
  ($602,950,144/47,761,883)              $ 12.62
                                         =======
MAXIMUM OFFERING PRICE
  PER INVESTOR A SHARE
            ($12.62/0.9425)              $ 13.39
                                         =======
NET ASSET VALUE, OFFERING
  AND REDEMPTION PRICE
  (subject to a maximum contingent
  deferred sales charge of 4.5%)
  PER INVESTOR B SHARE
  ($263,250,416/21,769,797)              $ 12.09
                                         =======
NET ASSET VALUE, OFFERING
  AND REDEMPTION PRICE
  (subject to a maximum contingent
  deferred sales charge of 1.0%)
  PER INVESTOR C SHARE
    ($26,431,419/2,183,672)              $ 12.10
                                         =======


- -------------------

 (a) Cost for Federal income tax purposes is $1,198,915,797. The
     gross unrealized appreciation (depreciation) on a tax basis is as
     follows:
      Gross unrealized appreciation                                      $266,444,539
      Gross unrealized depreciation                                       (12,704,987)
                                                                         ------------
                                                                         $253,739,552
                                                                         ============

     (b) Non-income producing security.
     (c) Total or partial securities on loan.
     (d) Rates shown are the rates as of March 31, 2005.
 (e) Securities purchased with the cash proceeds from securities loaned.


SEE ACCOMPANYING NOTES TO FINANCIAL STATEMENTS.
44
BLACKROCK FUNDS
STATEMENT OF NET ASSETS
LARGE CAP VALUE EQUITY PORTFOLIO
AS OF MARCH 31, 2005 (UNAUDITED)
NUMBER
OF SHARES VALUE
----------- -------------
COMMON STOCKS - 98.7%
Aerospace - 2.1%
General Dynamics Corp. 21,200 $ 2,269,460
Lockheed Martin Corp. 45,500 2,778,230
Raytheon Co. 69,500 2,689,650
-----------
7,737,340
-----------
Banks - 12.4%
Bank of America Corp.(b) 347,300 15,315,930
Key Corp. 88,800 2,881,560
North Fork Bancorporation, Inc. 76,300 2,116,562
SunTrust Banks, Inc.(b) 50,100 3,610,707
U.S. Bancorp 230,800 6,651,656
Wachovia Corp. 151,000 7,687,410
Wells Fargo & Co. 87,400 5,226,520
Zions Bancorp 33,500 2,312,170
-----------
45,802,515
-----------
Beverages & Bottling - 0.5%
Constellation Brands, Inc.(c) 32,300 1,707,701
-----------
Broadcasting - 1.0%
Comcast Corp.(c) 68,900 2,327,442
Liberty Media Corp. - Class A(c) 144,300 1,496,391
-----------
3,823,833
-----------
Chemicals - 2.3%
Air Products & Chemicals, Inc. 34,200 2,164,518
The Dow Chemical Co. 98,500 4,910,225
E.I. du Pont de Nemours & Co. 29,100 1,491,084
-----------
8,565,827
-----------
Computer & Office Equipment - 2.8%
Hewlett-Packard Co. 136,700 2,999,198
International Business Machines
Corp. 59,700 5,455,386
Xerox Corp.(b)(c) 118,700 1,798,305
-----------
10,252,889
-----------
Computer Software & Services - 0.9%
Microsoft Corp. 139,400 3,369,298
-----------
Containers - 0.4%
Owens-Illinois, Inc.(c) 55,900 1,405,326
-----------
Electronics - 0.5%
L-3 Communications Holdings, Inc.(b) 25,800 1,832,316
-----------
Energy & Utilities - 5.9%
Constellation Energy Group 82,100 4,244,570
Exelon Corp. 98,400 4,515,576
PG&E Corp. 104,200 3,553,220
PPL Corp.(b) 99,300 5,361,207
Sempra Energy 59,800 2,382,432
TXU Corp.(b) 19,700 1,568,711
-----------
21,625,716
-----------
Entertainment & Leisure - 3.3%
Caesars Entertainment, Inc.(c) 57,500 1,137,925
Time Warner, Inc.(c) 285,900 5,017,545
The Walt Disney Co. 209,300 6,013,189
-----------
12,168,659
-----------
Finance - 8.7%
The Bear Stearns Cos., Inc. 20,400 2,037,960
Capital One Financial Corp.(b) 13,700 1,024,349
CIT Group, Inc. 36,900 1,402,200
Citigroup, Inc.(d) 353,200 15,872,808
NUMBER
OF SHARES VALUE
----------- -------------
COMMON STOCKS (Continued)
Finance (Continued)
Countrywide Financial Corp. 60,200 $ 1,954,092
Fannie Mae 20,800 1,132,560
The Goldman Sachs Group, Inc. 32,300 3,552,677
Merrill Lynch & Co., Inc. 25,000 1,415,000
Washington Mutual, Inc. 96,800 3,823,600
-----------
32,215,246
-----------
Food & Agriculture - 1.4%
Archer-Daniels-Midland Co. 78,700 1,934,446
Kellogg Co. 73,500 3,180,345
-----------
5,114,791
-----------
Insurance - 5.2%
The Allstate Corp. 48,800 2,638,128
American International Group, Inc. 65,700 3,640,437
CHUBB Corp. 30,800 2,441,516
Genworth Financial, Inc. 35,600 979,712
Hartford Financial Services Group 56,300 3,859,928
MetLife, Inc. 48,800 1,908,080
Nationwide Financial Services, Inc. 27,800 998,020
UnumProvident Corp. 53,000 902,060
W.R. Berkley Corp. 37,500 1,860,000
-----------
19,227,881
-----------
Machinery & Heavy Equipment - 0.4%
Deere & Co. 22,900 1,537,277
-----------
Manufacturing - 10.1%
Black & Decker Corp.(b) 12,600 995,274
The Clorox Co. 28,400 1,788,916
Cooper Industries, Inc. 32,400 2,317,248
Cummins, Inc.(b) 13,600 956,760
Eaton Corp. 21,200 1,386,480
Fortune Brands, Inc. 17,500 1,411,025
General Electric Co. 541,300 19,519,278
Mattel, Inc. 78,000 1,665,300
Nucor Corp.(b) 33,700 1,939,772
Sherwin-Williams Co.(b) 24,900 1,095,351
Textron, Inc. 29,700 2,216,214
Tyco International Ltd. - ADR 53,600 1,811,680
-----------
37,103,298
-----------
Medical & Medical Services - 1.4%
Coventry Health Care, Inc.(b)(c) 39,350 2,681,309
HCA, Inc. 47,800 2,560,646
-----------
5,241,955
-----------
Metal & Mining - 0.5%
CONSOL Energy, Inc. 37,900 1,782,058
-----------
Motor Vehicles - 0.6%
Ford Motor Co. 180,900 2,049,597
-----------
Oil & Gas - 14.2%
Amerada Hess Corp. 28,700 2,761,227
ChevronTexaco Corp. 124,002 7,230,557
ConocoPhillips 72,600 7,829,184
EOG Resources, Inc. 44,100 2,149,434
Exxon Mobil Corp. 404,200 24,090,320
Occidental Petroleum Corp. 28,000 1,992,760
Oneok, Inc. 89,900 2,770,718
Valero Energy Corp.(b) 45,800 3,355,766
-----------
52,179,966
-----------
SEE ACCOMPANYING NOTES TO FINANCIAL STATEMENTS.
45
                                BLACKROCK FUNDS
                            STATEMENT OF NET ASSETS
                  LARGE CAP VALUE EQUITY PORTFOLIO (CONTINUED)


AS OF MARCH 31, 2005 (UNAUDITED)


                                          NUMBER
                                        OF SHARES       VALUE
                                       ----------- --------------
COMMON STOCKS (Continued)
Paper & Forest Products - 1.1%
  Georgia-Pacific Corp.(b)                78,700    $  2,793,063
  Louisiana-Pacific Corp.                 57,000       1,432,980

                                                    ------------
                                                       4,226,043
                                                    ------------
Pharmaceuticals - 2.3%
  Bristol-Myers Squibb Co.               120,100       3,057,746
  Merck & Co., Inc.                       89,400       2,893,878
  Wyeth                                   56,200       2,370,516

                                                    ------------
                                                       8,322,140
                                                    ------------
Publishing & Printing - 0.7%
  The McGraw-Hill Companies, Inc.         29,500       2,573,875
                                                    ------------
Railroad & Shipping - 0.7%
  Burlington Northern Santa Fe Corp.      47,800       2,577,854
                                                    ------------
Real Estate - 2.9%
  Cendant Corp.(b)                       162,300       3,333,642
  Centex Corp.                            31,300       1,792,551
  Equity Office Properties Trust          89,200       2,687,596
  General Growth Properties, Inc.         85,100       2,901,910

                                                    ------------
                                                      10,715,699
                                                    ------------
Restaurants - 0.9%
  McDonald's Corp.                       100,900       3,142,026
                                                    ------------
Retail Merchandising - 5.0%
  Barnes & Noble, Inc.(c)                 73,019       2,518,425
  CVS Corp.                               55,000       2,894,100
  Federated Department Stores, Inc.       42,600       2,711,064
  The Neiman-Marcus Group, Inc. -
    Class A(b)                            26,000       2,379,260
  Reebok International Ltd.               49,900       2,210,570
  Simon Property Group, Inc.(b)           61,000       3,695,380
  Supervalue, Inc.(b)                     57,400       1,914,290

                                                    ------------
                                                      18,323,089
                                                    ------------
Security Brokers & Dealers - 1.8%
  E*TRADE Financial Corp.(c)             190,200       2,282,400
  iShares Russell 1000 Value Index
    Fund                                  23,800       1,567,230
  Lehman Brothers Holdings, Inc.          28,100       2,645,896

                                                    ------------
                                                       6,495,526
                                                    ------------
Semiconductors & Related Devices - 0.2%
  QLogic Corp.(c)                         21,300         862,650
                                                    ------------
Telecommunications - 5.5%
  ALLTEL Corp.                            39,600       2,172,060
  Motorola, Inc.                         168,800       2,526,936
  SBC Communications, Inc.               238,300       5,645,327
  Sprint Corp.                           133,500       3,037,125
  Verizon Communications, Inc.           193,900       6,883,450

                                                    ------------
                                                      20,264,898
                                                    ------------
Tobacco - 2.5%
  Altria Group, Inc.                     143,500       9,383,465
                                                    ------------
Transportation - 0.5%
  J.B. Hunt Transport Services, Inc.      41,300       1,807,701
                                                    ------------
TOTAL COMMON STOCKS
  (Cost $279,335,170)                                363,438,455
                                                    ------------


                                                  PAR/SHARES
                                       MATURITY     (000)        VALUE
                                      ---------- ----------- -------------
SHORT TERM INVESTMENTS - 2.7%
  Morgan Stanley, Floating Rate
    Notes
    2.94%(e)(f)                       11/14/05      $2,685    $2,684,565
  Galileo Money Market Fund                          5,185     5,184,731
  Institutional Money Market Trust(f)                2,077     2,076,960

                                                              ----------
TOTAL SHORT TERM INVESTMENTS
  (Cost $9,946,256)                                            9,946,256
                                                              ----------


TOTAL INVESTMENTS IN SECURITIES -
101.4%
  (Cost $289,281,426(a))                  373,384,711
LIABILITIES IN EXCESS OF
  OTHER ASSETS -  (1.4)%
  (Including $4,761,525 of payable
  upon return of securities loaned)        (5,150,967)
                                          -----------
NET ASSETS - 100.0%
  (Applicable to 9,110,976
  Institutional shares, 2,140,685
  Service shares, 10,966,819
  Investor A shares, 3,394,720
  Investor B shares and 953,397
  Investor C shares)                     $368,233,744
                                         ============


NET ASSET VALUE, OFFERING
  AND REDEMPTION PRICE PER
  INSTITUTIONAL SHARE
   ($126,647,770/9,110,976)              $ 13.90
                                         =======
NET ASSET VALUE, OFFERING AND
  REDEMPTION PRICE PER
  SERVICE SHARE
    ($29,831,342/2,140,685)              $ 13.94
                                         =======
NET ASSET VALUE AND
  REDEMPTION PRICE PER
  INVESTOR A SHARE
  ($152,433,790/10,966,819)              $ 13.90
                                         =======
MAXIMUM OFFERING PRICE
  PER INVESTOR A SHARE
            ($13.90/0.9425)              $ 14.75
                                         =======
NET ASSET VALUE, OFFERING
  AND REDEMPTION PRICE
  (subject to a maximum contingent
  deferred sales charge of 4.5%)
  PER INVESTOR B SHARE
    ($46,305,201/3,394,720)              $ 13.64
                                         =======
NET ASSET VALUE, OFFERING
  AND REDEMPTION PRICE
  (subject to a maximum contingent
  deferred sales charge of 1.0%)
  PER INVESTOR C SHARE
      ($13,015,641/953,397)              $ 13.65
                                         =======

SEE ACCOMPANYING NOTES TO FINANCIAL STATEMENTS.
46
                                BLACKROCK FUNDS
                            STATEMENT OF NET ASSETS
                  LARGE CAP VALUE EQUITY PORTFOLIO (CONCLUDED)


AS OF MARCH 31, 2005 (UNAUDITED)


- -------------------

 (a) Cost for Federal income tax purposes is $291,966,778. The
     gross unrealized appreciation (depreciation) on a tax basis is as
     follows:
      Gross unrealized appreciation                                      $84,322,504
      Gross unrealized depreciation                                       (2,904,571)
                                                                         -----------
                                                                         $81,417,933
                                                                         ===========

     (b) Total or partial securities on loan.
     (c) Non-income producing security.
 (d) Securities, or a portion thereof, pledged as collateral with a value of
       $647,136 on 15 long S&P 500 futures contracts expiring June 2005.  The
       value of such contracts on March 31, 2005 was $4,439,625, with an
       unrealized loss of $22,828 (including commissions of $47).
     (e) Rates shown are the rates as of March 31, 2005.
  (f) Securities purchased with the cash proceeds from securities loaned.

SEE ACCOMPANYING NOTES TO FINANCIAL STATEMENTS.
                                                                              47
BLACKROCK FUNDS
STATEMENT OF NET ASSETS
LARGE CAP GROWTH EQUITY PORTFOLIO
AS OF MARCH 31, 2005 (UNAUDITED)
NUMBER
OF SHARES VALUE
----------- ------------
COMMON STOCKS - 99.8%
Aerospace - 1.3%
General Dynamics Corp. 3,200 $ 342,560
Lockheed Martin Corp. 8,800 537,328
----------
879,888
----------
Banks - 0.6%
U.S. Bancorp 13,900 400,598
----------
Beverages & Bottling - 3.4%
The Coca-Cola Co. 6,800 283,356
Constellation Brands, Inc.(b) 6,400 338,368
Pepsi Bottling Group, Inc. 14,800 412,180
PepsiCo, Inc. 23,200 1,230,296
----------
2,264,200
----------
Broadcasting - 0.7%
Comcast Corp.(b) 13,800 466,164
----------
Business Services - 1.7%
Alliance Data Systems Corp.(b) 16,700 674,680
W.W. Grainger, Inc. 6,800 423,436
----------
1,098,116
----------
Chemicals - 0.4%
The Dow Chemical Co. 5,800 289,130
----------
Computer & Office Equipment - 6.8%
Cisco Systems, Inc.(b)(c) 59,600 1,066,244
Computer Associates International,
Inc. 110 2,981
Dell, Inc.(b) 23,300 895,186
International Business Machines
Corp. 21,500 1,964,670
Lexmark International, Inc.(b)(d) 7,100 567,787
----------
4,496,868
----------
Computer Software & Services - 10.1%
Activision, Inc.(b) 27,200 402,559
BMC Software, Inc.(b) 18,400 276,000
Checkfree Corp.(b) 10,500 427,980
Computer Sciences Corp.(b)(d) 13,600 623,560
Microsoft Corp. 108,100 2,612,777
Oracle Corp.(b) 47,300 590,304
Storage Technology Corp.(b) 18,100 557,480
Symantec Corp.(b)(d) 12,800 273,024
VeriSign, Inc.(b) 17,300 496,510
Yahoo!, Inc.(b)(d) 13,800 467,820
----------
6,728,014
----------
Construction - 0.6%
Lennar Corp.(d) 7,400 419,432
----------
Containers - 0.4%
Ball Corp. 7,000 290,360
----------
Electronics - 6.3%
Amphenol Corp. 9,600 355,584
Arrow Electronics, Inc.(b) 12,200 309,270
Intel Corp. 112,400 2,611,052
L-3 Communications Holdings, Inc.(d) 12,700 901,954
----------
4,177,860
----------
Entertainment & Leisure - 2.7%
Harrah's Entertainment, Inc. 7,800 503,724
Sabre Holdings Corp. 15,400 336,952
Time Warner, Inc.(b) 24,200 424,710
NUMBER
OF SHARES VALUE
----------- ------------
COMMON STOCKS (Continued)
Entertainment & Leisure (Continued)
The Walt Disney Co. 19,200 $ 551,616
----------
1,817,002
----------
Finance - 4.4%
Affiliated Managers Group, Inc.(b) 5,600 347,368
American Express Co. 15,500 796,235
Capital One Financial Corp.(d) 8,800 657,976
Citigroup, Inc. 8,000 359,520
Freddie Mac 6,800 429,760
Providian Financial Corp.(b) 19,500 334,620
----------
2,925,479
----------
Food & Agriculture - 1.7%
Hershey Foods Corp. 12,900 779,934
Kellogg Co. 7,700 333,179
----------
1,113,113
----------
Insurance - 4.2%
AFLAC, Inc. 9,900 368,874
American International Group, Inc. 20,800 1,152,528
W.R. Berkley Corp. 7,900 391,840
WellPoint, Inc.(b) 7,100 889,985
----------
2,803,227
----------
Machinery & Heavy Equipment - 0.6%
Deere & Co. 5,700 382,641
----------
Manufacturing - 8.0%
3M Co. 3,800 325,622
Black & Decker Corp.(d) 7,300 576,627
Dade Behring Holdings, Inc.(b) 12,700 748,411
Fortune Brands, Inc. 6,000 483,780
General Electric Co.(c) 27,000 973,620
Mattel, Inc. 20,000 427,000
Nike, Inc. 8,400 699,804
Nucor Corp.(d) 5,500 316,580
The Stanley Works 9,500 430,065
Tyco International Ltd. - ADR 9,800 331,240
----------
5,312,749
----------
Medical & Medical Services - 4.1%
Amgen, Inc.(b) 17,036 991,666
McKesson Corp. 13,500 509,625
UnitedHealth Group, Inc. 12,900 1,230,402
----------
2,731,693
----------
Medical Instruments & Supplies - 8.0%
Bausch & Lomb, Inc.(d) 7,500 549,750
Becton, Dickinson & Co. 16,500 963,930
C.R. Bard, Inc. 5,900 401,672
Charles River Laboratories
International, Inc.(b) 7,400 348,096
Johnson & Johnson 40,200 2,699,832
Respironics, Inc.(b) 6,500 378,755
----------
5,342,035
----------
Oil & Gas - 1.6%
Baker Hughes, Inc. 13,100 582,819
Devon Energy Corp. 10,200 487,050
----------
1,069,869
----------
SEE ACCOMPANYING NOTES TO FINANCIAL STATEMENTS.
48
                                BLACKROCK FUNDS
                            STATEMENT OF NET ASSETS
                 LARGE CAP GROWTH EQUITY PORTFOLIO (CONTINUED)


AS OF MARCH 31, 2005 (UNAUDITED)


                                          NUMBER
                                        OF SHARES      VALUE
                                       ----------- -------------
COMMON STOCKS (Continued)
Pharmaceuticals - 9.6%
  Abbott Laboratories                     16,800    $   783,216
  Bristol-Myers Squibb Co.                32,700        832,542
  Genentech, Inc.(b)(d)                    9,500        537,795
  Gilead Sciences, Inc.(b)(d)             13,800        494,040
  Merck & Co., Inc.                       12,200        394,914
  Pfizer, Inc.                           114,200      3,000,034
  Wyeth                                    7,500        316,350

                                                    -----------
                                                      6,358,891
                                                    -----------
Publishing & Printing - 0.8%
  The McGraw-Hill Companies, Inc.          6,000        523,500
                                                    -----------
Railroad & Shipping - 0.7%
  FedEx Corp.                              5,100        479,145
                                                    -----------
Real Estate - 0.7%
  Cendant Corp.                           21,400        439,556
                                                    -----------
Restaurants - 1.0%
  Darden Restaurants, Inc.                21,500        659,620
                                                    -----------
Retail Merchandising - 9.0%
  American Eagle Outfitters, Inc.(d)      24,600        726,930
  Coach, Inc.(b)                           9,200        520,996
  Costco Cos., Inc.(d)                     8,700        384,366
  The Home Depot, Inc.                    35,700      1,365,168
  Michaels Stores, Inc.                   18,900        686,070
  Nordstrom, Inc.                          9,700        537,186
  Staples, Inc.                           17,300        543,739
  Wal-Mart Stores, Inc.                   24,100      1,207,651

                                                    -----------
                                                      5,972,106
                                                    -----------
Security Brokers & Dealers - 0.5%
  E*TRADE Financial Corp.(b)              27,600        331,200
                                                    -----------
Semiconductors & Related Devices - 2.0%
  International Rectifier Corp.(b)         6,800        309,400
  Lam Research Corp.(b)                   14,600        421,356
  Micron Technology, Inc.(b)(d)           27,300        282,282
  NVIDIA Corp.(b)                         13,200        313,632

                                                    -----------
                                                      1,326,670
                                                    -----------
Soaps & Cosmetics - 3.9%
  The Gillette Co.                        16,500        832,920
  The Procter & Gamble Co.                33,800      1,791,400

                                                    -----------
                                                      2,624,320
                                                    -----------
Telecommunications - 2.4%
  Motorola, Inc.                          64,200        961,074
  Nextel Communications, Inc.(b)(d)       22,200        630,924

                                                    -----------
                                                      1,591,998
                                                    -----------
Transportation - 1.6%
  J.B. Hunt Transport Services, Inc.      13,600        595,272
  Ryder Systems, Inc.                     10,700        446,190

                                                    -----------
                                                      1,041,462
                                                    -----------
TOTAL COMMON STOCKS
  (Cost $48,426,205)                                 66,356,906
                                                    -----------


                                                  PAR/SHARES
                                       MATURITY     (000)       VALUE
                                      ---------- ----------- -----------
SHORT TERM INVESTMENTS - 0.9%
  Morgan Stanley, Floating Rate
    Notes
    2.94%(e)(f)                       11/14/05       $312     $311,613
  Galileo Money Market Fund                           182      181,781
  Institutional Money Market Trust(f)                  98       97,763

                                                              --------
TOTAL SHORT TERM INVESTMENTS
  (Cost $591,157)                                              591,157
                                                              --------


TOTAL INVESTMENTS IN SECURITIES -  100.7%
  (Cost $49,017,362(a))                      66,948,063
LIABILITIES IN EXCESS OF OTHER
  ASSETS -  (0.7)%
  (Including $409,376 of payable upon
  return of securities loaned)                 (478,416)
                                             ----------
NET ASSETS - 100.0%
  (Applicable to 2,540,449 Institutional
  shares, 1,311,937 Service shares,
  1,857,182 Investor A shares,
  1,313,606 Investor B shares and
  276,111 Investor C shares)                $66,469,647
                                            ===========


NET ASSET VALUE, OFFERING
  AND REDEMPTION PRICE PER
  INSTITUTIONAL SHARE
  ($24,082,552/2,540,449)                  $ 9.48
                                           ======
NET ASSET VALUE, OFFERING
  AND REDEMPTION PRICE PER
  SERVICE SHARE
  ($12,145,970/1,311,937)                  $ 9.26
                                           ======
NET ASSET VALUE AND
  REDEMPTION PRICE PER
  INVESTOR A SHARE
  ($16,937,174/1,857,182)                  $ 9.12
                                           ======
MAXIMUM OFFERING PRICE
  PER INVESTOR A SHARE
           ($9.12/0.9425)                  $ 9.68
                                           ======
NET ASSET VALUE, OFFERING
  AND REDEMPTION PRICE
  (subject to a maximum contingent
  deferred sales charge of 4.5%)
  PER INVESTOR B SHARE
  ($10,996,280/1,313,606)                  $ 8.37
                                           ======
NET ASSET VALUE, OFFERING
  AND REDEMPTION PRICE
  (subject to a maximum contingent
  deferred sales charge of 1.0%)
  PER INVESTOR C SHARE
     ($2,307,671/276,111)                  $ 8.36
                                           ======

SEE ACCOMPANYING NOTES TO FINANCIAL STATEMENTS.
                                                                              49
                                BLACKROCK FUNDS
                            STATEMENT OF NET ASSETS
                 LARGE CAP GROWTH EQUITY PORTFOLIO (CONCLUDED)


AS OF MARCH 31, 2005 (UNAUDITED)


- -------------------

 (a) Cost for Federal income tax purposes is $49,435,776. The gross
     unrealized appreciation (depreciation) on a tax basis is as
     follows:
      Gross unrealized appreciation                                   $18,541,625
      Gross unrealized depreciation                                    (1,029,338)
                                                                      -----------
                                                                      $17,512,287
                                                                      ===========

     (b) Non-income producing security.
  (c) Securities, or a portion thereof, pledged as collateral with a value of
       $669,086 on 1 long S&P 500 futures contracts expiring June 2005.  The
       value of such contracts on March 31, 2005 was $295,975, with an
       unrealized loss of $7,385 (including commissions of $3).
     (d) Total or partial securities on loan.
     (e) Rates shown are the rates as of March 31, 2005.
  (f) Securities purchased with the cash proceeds from securities loaned.

SEE ACCOMPANYING NOTES TO FINANCIAL STATEMENTS.
50
                                BLACKROCK FUNDS
                            STATEMENT OF NET ASSETS
                         DIVIDEND ACHIEVERSTM PORTFOLIO


AS OF MARCH 31, 2005 (UNAUDITED)


                           NUMBER
                         OF SHARES      VALUE
                        ----------- ------------
COMMON STOCKS - 95.7%
Aerospace - 2.8%
  General Dynamics        3,250      $  347,912
Corp.
  United Technologies     3,750         381,226
Corp.

                                     ----------
                                        729,138
                                     ----------
Banks - 12.5%
  Associated              6,600         206,118
Banc-Corp.(b)
  Bank of America       23,100        1,018,710
Corp.(b)
  Comerica, Inc.         3,850          212,058
  Compass Bancshares,    3,250          147,550
Inc.
  Key Corp.              8,650          280,692
  National City Corp.    5,950          199,325
  North Fork             7,000          194,180
Bancorporation, Inc.
  SunTrust Banks,        3,550          255,848
Inc.(b)
  Wachovia Corp.         6,200          315,642
  Wells Fargo & Co.      7,950          475,410

                                     ----------
                                      3,305,533
                                     ----------
Business Services - 0.6%
  PHH Corp.(c)             200            4,374
  W.W. Grainger, Inc.    2,500          155,675

                                     ----------
                                        160,049
                                     ----------
Chemicals - 1.1%
  The Dow Chemical Co.   5,750          286,638
                                     ----------
Computer & Office Equipment - 1.8%
  International
Business Machines
    Corp.                2,400          219,312
  Pitney Bowes, Inc.     5,850          263,952

                                     ----------
                                        483,264
                                     ----------
Computer Software & Services - 1.6%
  Diebold, Inc.          5,250          287,962
  Microsoft Corp.        5,750          138,978

                                     ----------
                                        426,940
                                     ----------
Electronics - 0.5%
  Emerson Electric Co.   1,900          123,367
                                     ----------
Energy & Utilities - 5.4%
  Atmos Energy Corp.     5,750          155,250
  Consolidated Edison,   5,300          223,554
Inc.(b)
  Exelon Corp.           4,800          220,272
  MDU Resources Group,   6,800          187,816
Inc.
  Pinnacle West Capital  4,100          174,291
Corp.
  UGI Corp.              3,850          174,867
  WPS Resources Corp.    5,250          277,830

                                     ----------
                                      1,413,880
                                     ----------
Entertainment & Leisure - 1.0%
  The Walt Disney Co.    9,500          272,935
                                     ----------
Finance - 9.0%
  American Capital       2,500           78,525
Strategies Ltd.(b)
  Citigroup, Inc.       24,050        1,080,807
  Countrywide Financial  3,850          124,971
Corp.
  Doral Financial Corp.  3,250           71,142
  Franklin Resources,    3,350          229,978
Inc.
  Freddie Mac            4,100          259,120
  The Goldman Sachs      1,450          159,486
Group, Inc.
  Protective Life Corp.  3,250          127,725
  Washington Mutual,     6,300          248,850
Inc.(b)

                                     ----------
                                      2,380,604
                                     ----------


                           NUMBER
                         OF SHARES      VALUE
                        ----------- ------------
COMMON STOCKS (Continued)
Food & Agriculture - 1.2%
                         8,650       $  212,617
  Archer-Daniels-Midlan
Co.(b)
  ConAgra Foods,         4,200          113,484
Inc.(b)

                                     ----------
                                        326,101
                                     ----------
Insurance - 5.6%
  AFLAC, Inc.            3,150          117,370
  The Allstate Corp.     4,200          227,052
  American               2,300          127,443
International Group,
Inc.
  CHUBB Corp.            3,750          297,262
  Cigna Corp.            2,300          205,390
  Lincoln National       4,800          216,672
Corp.
  Mercury General Corp.  3,250          179,595
  Old Republic           5,000          116,450
International Corp.

                                     ----------
                                      1,487,234
                                     ----------
Machinery & Heavy Equipment - 0.8%
  Caterpillar, Inc.
                         2,300          210,312
                                     ----------
Manufacturing - 10.0%
  General Electric Co.  37,950        1,368,477
  Harley-Davidson,       2,700          155,952
Inc.(b)
  Nucor Corp.
                         4,100          235,996
  PPG Industries, Inc.
                         3,750          268,200
  Reynold American, Inc. 1,800          145,062
  The Stanley Works(b)   4,100          185,607
  V.F. Corp.             4,600          272,044

                                     ----------
                                      2,631,338
                                     ----------
Medical Instruments & Supplies - 0.6%
  Johnson & Johnson
                         2,500          167,900
                                     ----------
Motor Vehicles - 1.0%
  General Motors         5,250          154,298
Corp.(b)
  Johnson Controls,      1,900          105,944
Inc.

                                     ----------
                                        260,242
                                     ----------
Oil & Gas - 12.9%
  ChevronTexaco         19,000        1,107,890
Corp.(d)
  ConocoPhillips         3,500          377,440
  Exxon Mobil Corp.(d)  27,150        1,618,140
  National Fuel Gas Co.  5,250          150,098
  WGL Holdings, Inc.     5,250          162,540

                                     ----------
                                      3,416,108
                                     ----------
Personal Services -
0.6%
  The Servicemaster Co. 11,500          155,250
                                     ----------
Pharmaceuticals - 2.0%
  Bristol-Myers Squibb Co.(b)
                         5,250          133,664
  Merck & Co., Inc.(b)   8,000          258,959
  Pfizer, Inc.           5,250          137,918

                                     ----------
                                        530,541
                                     ----------
Plastics - 1.1%
  Sonoco Products Co.   10,200          294,270
                                     ----------
Publishing & Printing -
2.3%
  Gannett Co., Inc.(b)   1,800          142,344
  The McGraw-Hill        2,400          209,400
Companies, Inc.
  R.R. Donnelley & Sons  8,150          257,703
Corp.

                                     ----------
                                        609,447
                                     ----------
Real Estate - 5.8%
  CBL & Associates Properties, Inc.
                         2,200          157,322

SEE ACCOMPANYING NOTES TO FINANCIAL STATEMENTS.
                                                                              51
                                BLACKROCK FUNDS
                            STATEMENT OF NET ASSETS
                   DIVIDEND ACHIEVERSTM PORTFOLIO (CONCLUDED)


AS OF MARCH 31, 2005 (UNAUDITED)


                           NUMBER
                         OF SHARES      VALUE
                        ----------- -------------
COMMON STOCKS (Continued)
Real Estate (Continued)
  Cendant Corp.             5,250    $   107,835
  Colonial Properties       5,450        209,334
Trust(b)
  Commercial Net Lease      6,600        121,770
Realty
  General Growth            6,800        231,880
Properties, Inc.
  HRPT Properties Trust    10,950        130,414
  St. Paul Travelers        5,900        216,707
Co., Inc.
  Tanger Factory Outlet     7,300        160,600
Centers, Inc.
  United Dominion           9,000        187,830
Realty Trust, Inc.

                                     -----------
                                       1,523,692
                                     -----------
Restaurants - 1.8%
  McDonald's Corp.         15,350        477,999
                                     -----------
Retail Merchandising - 3.7%
  The Home Depot, Inc.      5,750        219,880
  The May Department        6,800        251,736
Stores Co.
  RPM International,       11,500        210,220
Inc.
  Sara Lee Corp.            6,000        132,960
  Supervalue, Inc.          5,250        175,088

                                     -----------
                                         989,884
                                     -----------
Semiconductors & Related Devices -
0.5%
  Linear Technology         3,250        124,508
                                     -----------
Corp.
Soaps & Cosmetics - 0.9%
  Colgate-Palmolive Co.     2,000        104,340
  The Procter & Gamble      2,300        121,900
Co.(b)

                                     -----------
                                         226,240
                                     -----------
Telecommunications - 5.2%
  ALLTEL Corp.(b)           4,100        224,885
  AT&T Corp.                6,800        127,500
  CenturyTel, Inc.          3,750        123,150
  SBC Communications,      21,300        504,597
Inc.(b)
  Verizon                  11,100        394,050
Communications, Inc.

                                     -----------
                                       1,374,182
                                     -----------
Tobacco - 3.4%
  Altria Group, Inc.       11,900        778,141
  Loews Corp. -             3,250        107,575
Carolina Group

                                     -----------
                                         885,716
                                     -----------
TOTAL COMMON STOCKS
  (Cost $25,323,681)                  25,273,312
                                     -----------


                                                  PAR/SHARES
                                       MATURITY     (000)
                                      ---------- -----------
SHORT TERM INVESTMENTS - 18.2%
  Morgan Stanley, Floating Rate
    Notes
    2.94%(e)(f)                       11/14/05      $1,116    1,115,669
  Galileo Money Market Fund                            761      760,522
  Institutional Money Market Trust(f)                2,942    2,942,241

                                                              ---------
TOTAL SHORT TERM INVESTMENTS
  (Cost $4,818,432)                                           4,818,432
                                                              ---------


                                             VALUE
                                        --------------
TOTAL INVESTMENTS IN SECURITIES -
113.9%
  (Cost $30,142,113(a))                 $30,091,744
LIABILITIES IN EXCESS OF
  OTHER ASSETS -  (13.9)%
  (Including $4,057,910 of payable
  upon return of securities loaned)      (3,681,498)
                                        -----------
NET ASSETS - 100.0%
  (Applicable to 635,827
  Institutional shares, 26,750
  Service shares, 1,053,088
  Investor A shares, 165,013
  Investor B shares and 642,414
  Investor C shares)                    $26,410,246
                                        ===========


NET ASSET VALUE, OFFERING
  AND REDEMPTION PRICE PER
  INSTITUTIONAL SHARE
     ($6,654,426/635,827)                $ 10.47
                                         =======
NET ASSET VALUE, OFFERING
  AND REDEMPTION PRICE PER
  SERVICE SHARE
        ($279,361/26,750)                $ 10.44
                                         =======
NET ASSET VALUE AND
  REDEMPTION PRICE PER
  INVESTOR A SHARE
  ($11,028,678/1,053,088)                $ 10.47
                                         =======
MAXIMUM OFFERING PRICE
  PER INVESTOR A SHARE
          ($10.47/0.9425)                $ 11.11
                                         =======
NET ASSET VALUE, OFFERING
  AND REDEMPTION PRICE
  (subject to a maximum contingent
  deferred sales charge of 4.5%)
  PER INVESTOR B SHARE
     ($1,727,495/165,013)                $ 10.47
                                         =======
NET ASSET VALUE, OFFERING
  AND REDEMPTION PRICE
  (subject to a maximum contingent
  deferred sales charge of 1.0%)
  PER INVESTOR C SHARE
     ($6,720,286/642,414)                $ 10.46
                                         =======


- -------------------

 (a) Cost for Federal income tax purposes is $30,147,007. The gross
     unrealized appreciation (depreciation) on a tax basis is as
     follows:
      Gross unrealized appreciation                                   $623,864
      Gross unrealized depreciation                                   (679,127)
                                                                      --------
                                                                      $(55,263)
                                                                      ========

     (b) Total or partial securities on loan.
     (c) Non-income producing security.
 (d) Securities, or a portion thereof, pledged as collateral with a value of
       $352,698 on 16 long E-Mini S&P 500 futures contracts expiring June 2005.
       The value of such contracts on March 31, 2005 was $947,200, with an
       unrealized gain of $5,023 (including commissions of $39).
     (e) Rates shown are the rates as of March 31, 2005.
  (f) Securities purchased with the cash proceeds from securities loaned.

SEE ACCOMPANYING NOTES TO FINANCIAL STATEMENTS.
52
                                BLACKROCK FUNDS
                            STATEMENT OF NET ASSETS
                                LEGACY PORTFOLIO


AS OF MARCH 31, 2005 (UNAUDITED)


                           NUMBER
                         OF SHARES      VALUE
                        ----------- -------------
COMMON STOCKS - 97.8%
Aerospace - 1.5%
  General Dynamics        39,900     $ 4,271,295
                                     -----------
Corp.
Banks - 1.4%
  J.P. Morgan Chase &   113,700        3,934,020
                                     -----------
Co., Inc.
Broadcasting - 4.5%
  Comcast Corp. - Class 155,590        5,196,706
A(b)
  News Corp. - Class    370,100        6,517,461
B(c)
  XM Satellite Radio     43,300        1,363,950
Holdings, Inc.(b)

                                     -----------
                                      13,078,117
                                     -----------
Business Services - 1.0%
  Alliance Data Systems  69,100        2,791,640
                                     -----------
Corp.(b)
Computer & Office Equipment - 3.7%
  Apple Computer,        51,800        2,158,506
Inc.(b)
  Cisco Systems,        228,680        4,091,085
Inc.(b)
  Dell, Inc.(b)         116,800        4,487,456

                                     -----------
                                      10,737,047
                                     -----------
Computer Software & Services -
14.8%
  Cognizant Technology
Solutions
    Corp.(b)             37,000        1,709,399
  eBay, Inc.(b)          53,500        1,993,410
  EMC Corp.(b)          450,300        5,547,696
  Google, Inc. - Class   15,301        2,761,984
A(b)(c)
  Microsoft Corp.       434,840       10,510,083
  Oracle Corp.(b)       489,900        6,113,952
  VeriSign, Inc.(b)     162,800        4,672,360
  Yahoo!, Inc.(b)       271,100        9,190,290

                                     -----------
                                      42,499,174
                                     -----------
Electronics - 2.8%
  Intel Corp.           351,960        8,176,031
                                     -----------
Entertainment & Leisure - 4.0%
  Harrah's               43,600        2,815,688
Entertainment, Inc.(c)
  Marriott               72,600        4,854,036
International, Inc. -
Class A
  Starwood Hotels &
Resorts
    Worldwide, Inc.      64,800        3,889,944

                                     -----------
                                      11,559,668
                                     -----------
Finance - 6.5%
  American Express Co.  108,850        5,591,624
  Franklin Resources,    61,076        4,192,867
Inc.
  The Goldman Sachs      28,200        3,101,719
Group, Inc.
  Providian Financial   174,200        2,989,272
Corp.(b)(c)
  SLM Corp.              58,200        2,900,688

                                     -----------
                                      18,776,170
                                     -----------
Food & Agriculture - 3.0%
  Monsanto Co.           89,000        5,740,500
  Sysco Corp.            79,900        2,860,420

                                     -----------
                                       8,600,920
                                     -----------
Insurance - 1.2%
  Aetna, Inc.            19,200        1,439,040
  American               36,300        2,011,383
International Group,
Inc.

                                     -----------
                                       3,450,423
                                     -----------
Manufacturing - 12.2%
  The Clorox Co.         72,000        4,535,280
  Danaher Corp.          53,300        2,846,753
  General Electric Co.  305,830       11,028,230


                           NUMBER
                         OF SHARES      VALUE
                        ----------- -------------
COMMON STOCKS (Continued)
Manufacturing (Continued)
  Nike, Inc.             42,600      $ 3,549,006
  Polo Ralph Lauren Corp 84,700        3,286,360
  Rockwell Automation,   36,700        2,078,688
Inc.
  Tyco International Ltd231,200        7,814,560

                                     -----------
                                      35,138,877
                                     -----------
Medical & Medical
Services - 6.8%
  Amgen, Inc.(b)
                         26,550        1,545,476
  Caremark Rx, Inc.(b)
                        129,900        5,167,421
  PacifiCare Health Syste23,200        1,320,544
Inc.(b)
  Quest Diagnostics,     30,700        3,227,491
Inc.
  UnitedHealth Group, Inc86,300        8,231,294

                                     -----------
                                      19,492,226
                                     -----------
Medical Instruments &
Supplies - 7.0%
  Charles River Laboratories
    International, Inc.(b)(c)
                         67,400        3,170,496
  Cytyc Corp.(b)(c)
                         63,500        1,461,135
  Johnson & Johnson     162,620       10,921,559
  St. Jude Medical,      98,600        3,549,600
Inc.(b)
  Zimmer Holdings,       14,000        1,089,340
Inc.(b)

                                     -----------
                                      20,192,130
                                     -----------
Metal & Mining - 1.6%
  CONSOL Energy, Inc.    97,000        4,560,940
                                     -----------
Oil & Gas - 4.1%
  EOG Resources, Inc.    89,800        4,376,852
  Exxon Mobil Corp.
                         46,527        2,773,009
  Newfield Exploration Co.(b)
                         36,500        2,710,490
  Schlumberger Ltd.      27,600        1,945,248

                                     -----------
                                      11,805,599
                                     -----------
Pharmaceuticals - 6.9%
  Allergan, Inc.(c)      45,800        3,181,726
  Genentech, Inc.(b)     84,300        4,772,223
  Novartis AG - ADR
                        178,900        8,368,942
  Pfizer, Inc.
                        136,754        3,592,528

                                     -----------
                                      19,915,419
                                     -----------
Restaurants - 0.5%
  Starbucks Corp.(b)     27,200        1,405,152
                                     -----------
Retail Merchandising -
7.0%
  Chico's FAS,           52,500        1,483,650
Inc.(b)(c)
  Coach, Inc.(b)
                         35,700        2,021,691
  Kohl's Corp.(b)
                         71,000        3,665,730
  PETsMART, Inc.(c)      85,200        2,449,500
  Staples, Inc.         106,000        3,331,580
  Target Corp.          145,700        7,287,914

                                     -----------
                                      20,240,065
                                     -----------
Semiconductors & Related Devices -
1.0%
  Linear Technology      72,500        2,777,475
                                     -----------
Corp.
Soaps & Cosmetics -
3.6%
  Avon Products, Inc.
                         69,700        2,992,918
  The Procter & Gamble Co.(c)
                        137,800        7,303,400

                                     -----------
                                      10,296,318
                                     -----------
Telecommunications -
2.7%
  Harman International
Industries,
    Inc.                 37,000        3,273,020

SEE ACCOMPANY NOTES TO FINANCIAL STATEMENTS.
                                                                              53
                                BLACKROCK FUNDS
                            STATEMENT OF NET ASSETS
                          LEGACY PORTFOLIO (CONCLUDED)


AS OF MARCH 31, 2005 (UNAUDITED)


                           NUMBER
                         OF SHARES       VALUE
                        ----------- --------------
COMMON STOCKS (Continued)
Telecommunications (Continued)
  Qualcomm, Inc.           64,500    $  2,363,925
  Sprint Corp.             93,300       2,122,575

                                     ------------
                                        7,759,520

                                     ------------
TOTAL COMMON STOCKS
  (Cost $244,233,709)                 281,458,226
                                     ------------
SHORT TERM INVESTMENTS - 11.1%
  Galileo Money Market        252         252,329
Fund
  Institutional Money      31,657      31,656,565
Market Trust(d)

                                     ------------
TOTAL SHORT TERM INVESTMENTS
  (Cost $31,908,894)                   31,908,894
                                     ------------


TOTAL INVESTMENTS IN SECURITIES -  108.9%
  (Cost $276,142,603(a))                     313,367,120
LIABILITIES IN EXCESS OF OTHER
  ASSETS -  (8.9)%
  (including $31,656,565 of payable
  upon return of securities loaned)          (25,668,646)
                                             -----------
NET ASSETS - 100.0%
  (Applicable to 3,960,488 Institutional
  shares, 8 Service shares, 9,627,581
  Investor A shares, 7,451,960 Investor
  B shares and 1,694,473 Investor C
  shares)                                  $ 287,698,474
                                           =============


NET ASSET VALUE, OFFERING
  AND REDEMPTION PRICE PER
  INSTITUTIONAL SHARE
   ($52,271,767/3,960,488)                  $ 13.20
                                            =======
NET ASSET VALUE, OFFERING
  AND REDEMPTION PRICE PER
  SERVICE SHARE
                   ($99/8)(e)               $ 12.87
                                            =======
NET ASSET VALUE AND
  REDEMPTION PRICE PER
  INVESTOR A SHARE
  ($123,836,967/9,627,581)                  $ 12.86
                                            =======
MAXIMUM OFFERING PRICE
  PER INVESTOR A SHARE
           ($12.86/0.9425)                  $ 13.64
                                            =======
NET ASSET VALUE, OFFERING
  AND REDEMPTION PRICE
  (subject to a maximum contingent
  deferred sales charge of 4.5%)
  PER INVESTOR B SHARE
   ($90,912,490/7,451,960)                  $ 12.20
                                            =======
NET ASSET VALUE, OFFERING
  AND REDEMPTION PRICE
  (subject to a maximum contingent
  deferred sales charge of 4.5%)
  PER INVESTOR C SHARE
   ($20,677,151/1,694,473)                  $ 12.20
                                            =======


- -------------------

 (a) Cost for Federal income tax purposes is $276,348,213. The
     gross unrealized appreciation (depreciation) on a tax basis is as
     follows:
      Gross unrealized appreciation                                      $44,714,792
      Gross unrealized depreciation                                       (7,695,885)
                                                                         -----------
                                                                         $37,018,907
                                                                         ===========

     (b) Non-income producing security.
     (c) Total or partial securities on loan.
 (d) Securities purchased with the cash proceeds from securities loaned.
 (e) Exact net assets and shares outstanding at March 31, 2005 were $99.29 and
       7.717, respectively.

SEE ACCOMPANY NOTES TO FINANCIAL STATEMENTS.
54
BLACKROCK FUNDS
STATEMENT OF NET ASSETS
MID-CAP VALUE EQUITY PORTFOLIO
AS OF MARCH 31, 2005 (UNAUDITED)
NUMBER
OF SHARES VALUE
----------- -------------
COMMON STOCKS - 97.5%
Aerospace - 1.3%
Alliant Techsystems, Inc.(b) 124,200 $ 8,874,090
-----------
Banks - 5.1%
Comerica, Inc. 178,000 9,804,240
North Fork Bancorporation, Inc. 361,050 10,015,527
Sovereign Bancorp, Inc. 474,400 10,512,704
Trustmark Corp. 202,000 5,858,000
-----------
36,190,471
-----------
Beverages & Bottling - 1.4%
Coca-Cola Enterprises, Inc. 468,300 9,609,516
-----------
Broadcasting - 2.5%
Belo Corp. 343,300 8,287,262
Lin TV Corp.(b) 533,820 9,037,574
-----------
17,324,836
-----------
Business Services - 1.2%
W.W. Grainger, Inc. 131,190 8,169,201
-----------
Chemicals - 3.3%
Ashland, Inc. 194,800 13,143,156
FMC Corp.(b) 124,300 6,643,835
Lyondell Chemical Co. 125,500 3,503,960
-----------
23,290,951
-----------
Computer & Office Equipment - 5.2%
American Power Conversion Corp. 321,200 8,386,532
Avery Dennison Corp. 147,000 9,103,710
HNI Corp. 157,700 7,088,615
NCR Corp.(b) 358,600 12,099,164
Phase Metrics, Inc.(b)(c) 108,409 2,168
-----------
36,680,189
-----------
Computer Software & Services - 2.7%
DST Systems, Inc.(b) 183,900 8,492,502
Unisys Corp.(b) 1,459,000 10,300,540
-----------
18,793,042
-----------
Construction - 0.9%
Dycom Industries, Inc.(b) 274,200 6,303,858
-----------
Containers - 4.6%
Owens-Illinois, Inc.(b) 471,800 11,861,052
Pactiv Corp.(b) 449,100 10,486,485
Smurfit-Stone Container Corp.(b) 656,200 10,151,414
-----------
32,498,951
-----------
Energy & Utilities - 5.0%
Constellation Energy Group 118,500 6,126,450
PPL Corp. 212,700 11,483,673
Public Service Enterprise Group, Inc. 230,100 12,515,139
Reliant Energy, Inc.(b) 440,800 5,016,304
-----------
35,141,566
-----------
Entertainment & Leisure - 1.6%
Alliance Gaming Corp.(b) 278,800 2,673,692
Hilton Hotels Corp. 371,200 8,296,320
-----------
10,970,012
-----------
Finance - 6.6%
Ambac Financial Group, Inc. 154,150 11,522,712
Capital One Financial Corp. 115,700 8,650,889
CIT Group, Inc. 301,700 11,464,600
Freedom Pay, Inc.(c) 473,563 4,736
NUMBER
OF SHARES VALUE
----------- -------------
COMMON STOCKS (Continued)
Finance (Continued)
H&R Block, Inc. 155,900 $ 7,885,422
MoneyGram International, Inc. 366,770 6,928,285
-----------
46,456,644
-----------
Food & Agriculture - 2.6%
Dean Foods Co.(b) 301,300 10,334,590
Del Monte Foods Co.(b) 717,000 7,779,450
-----------
18,114,040
-----------
Insurance - 7.0%
Allmerica Financial Corp.(b) 281,900 10,134,305
Assurant, Inc. 265,500 8,947,350
Axis Capital Holdings Ltd. 321,100 8,682,544
Everest Re Group Ltd. 109,500 9,319,545
Radian Group, Inc. 254,300 12,140,282
-----------
49,224,026
-----------
Manufacturing - 13.6%
American Standard Co., Inc. 226,200 10,513,776
Briggs & Stratton Corp. 291,000 10,595,310
Brunswick Corp. 259,300 12,148,205
ITT Industries, Inc. 129,200 11,659,008
Jones Apparel Group, Inc. 312,600 10,468,974
Newell Rubbermaid, Inc.(d) 461,300 10,120,922
Sherwin-Williams Co. 210,900 9,277,491
Snap-On, Inc. 280,900 8,929,811
York International Corp. 318,800 12,490,584
-----------
96,204,081
-----------
Measuring & Controlling Devices - 0.5%
Thermo Electron Corp.(b) 140,100 3,543,129
-----------
Medical & Medical Services - 2.8%
MedImmune, Inc.(b) 172,500 4,107,225
STERIS Corp.(b) 208,700 5,269,675
Universal Health Services, Inc. 197,500 10,349,000
-----------
19,725,900
-----------
Medical Instruments & Supplies - 1.3%
Hillenbrand Industries, Inc. 165,900 9,202,473
-----------
Metal & Mining - 1.4%
CONSOL Energy, Inc. 207,600 9,761,352
-----------
Oil & Gas - 6.9%
Diamond Offshore Drilling, Inc. 110,900 5,533,910
EOG Resources, Inc. 243,800 11,882,812
KeySpan Corp. 174,300 6,792,471
Newfield Exploration Co.(b) 136,300 10,121,638
NiSource, Inc. 159,100 3,625,889
Pioneer Natural Resources Co.(d) 254,400 10,867,968
-----------
48,824,688
-----------
Paper & Forest Products - 1.9%
Bowater, Inc.(d) 178,000 6,705,260
MeadWestvaco Corp. 216,064 6,875,156
-----------
13,580,416
-----------
Pharmaceuticals - 1.6%
Par Pharmaceutical Cos., Inc.(b) 114,800 3,838,912
Watson Pharmaceuticals, Inc.(b) 252,300 7,753,179
-----------
11,592,091
-----------
SEE ACCOMPANYING NOTES TO FINANCIAL STATEMENTS.
55
                                BLACKROCK FUNDS
                            STATEMENT OF NET ASSETS
                   MID-CAP VALUE EQUITY PORTFOLIO (CONCLUDED)


AS OF MARCH 31, 2005 (UNAUDITED)


                                         NUMBER
                                       OF SHARES       VALUE
                                      ----------- --------------
COMMON STOCKS (Continued)
Publishing & Printing - 2.9%
  Dow Jones & Company, Inc.(d)          283,300    $ 10,586,921
  R.R. Donnelley & Sons Corp.           345,100      10,912,062

                                                   ------------
                                                     21,498,983
                                                   ------------
Railroad & Shipping - 0.7%
  CSX Corp.                             123,200       5,131,280
                                                   ------------
Real Estate - 2.9%
  Boston Properties, Inc.               172,000      10,359,560
  Cendant Corp.                         490,900      10,083,086

                                                   ------------
                                                     20,442,646
                                                   ------------
Restaurants - 1.2%
  Darden Restaurants, Inc.              113,800       3,491,384
  Wendy's International, Inc.           134,900       5,266,496

                                                   ------------
                                                      8,757,880
                                                   ------------
Retail Merchandising - 5.0%
  AnnTaylor Stores Corp.(b)             211,600       5,414,844
  AutoZone, Inc.(b)(d)                   37,400       3,205,180
  Federated Department Stores, Inc.     186,700      11,881,588
  Jarden Corp.(b)                       123,200       5,652,416
  The Kroger Co.(b)                     570,800       9,149,924

                                                   ------------
                                                     35,303,952
                                                   ------------
Security Brokers & Dealers - 1.8%
  A.G. Edwards, Inc.                     80,300       3,597,440
  Janus Capital Group, Inc.             667,000       9,304,650

                                                   ------------
                                                     12,902,090
                                                   ------------
Semiconductors & Related Devices - 1.2%
  Cypress Semiconductor Corp.(b)        365,500       4,605,300
  Teradyne, Inc.(b)                     251,300       3,668,980

                                                   ------------
                                                      8,274,280
                                                   ------------
Telecommunications - 0.8%
  Scientific-Atlanta, Inc.              203,000       5,728,660
                                                   ------------
TOTAL COMMON STOCKS
  (Cost $599,471,199)                               688,115,294
                                                   ------------


                                                  PAR/SHARES
                                       MATURITY     (000)
                                      ---------- -----------
SHORT TERM INVESTMENTS - 5.1%
  Federal Home Loan Bank, Discount
    Notes
    2.55%                             04/01/05     $ 5,500     5,500,000
  Morgan Stanley, Floating Rate
    Notes
    2.94%(e)(f)                       11/14/05       3,486     3,485,718
  Galileo Money Market Fund                          9,842     9,841,506
  Institutional Money Market Trust(f)               17,414    17,413,704

                                                              ----------
TOTAL SHORT TERM INVESTMENTS
  (Cost $36,240,928)                                          36,240,928
                                                              ----------


                             VALUE
                        ---------------
TOTAL INVESTMENTS IN
SECURITIES -  102.6%
  (Cost $635,712,127(a))  $ 724,356,222
LIABILITIES IN EXCESS OF
OTHER
  ASSETS -  (2.6)%
  (Including $20,899,422
of payable
  upon return of            (18,225,010)
                          -------------
securities loaned)
NET ASSETS - 100.0%
  (Applicable to
3,826,394
  Institutional shares,
107,577
  Service shares,
35,499,398 Investor
  A shares, 10,735,363
Investor B
  shares and 7,643,240
Investor C
  shares)                 $ 706,131,212
                          =============


NET ASSET VALUE, OFFERING
  AND REDEMPTION PRICE PER
  INSTITUTIONAL SHARE
    ($48,278,678/3,826,394)              $ 12.62
                                         =======
NET ASSET VALUE, OFFERING
  AND REDEMPTION PRICE PER
  SERVICE SHARE
       ($1,346,188/107,577)              $ 12.51
                                         =======
NET ASSET VALUE AND REDEMPTION
  PRICE PER INVESTOR A SHARE
  ($440,529,737/35,499,398)              $ 12.41
                                         =======
MAXIMUM OFFERING PRICE PER
  INVESTOR A SHARE
            ($12.41/0.9425)              $ 13.17
                                         =======
NET ASSET VALUE, OFFERING
  AND REDEMPTION PRICE
  (subject to a maximum contingent
  deferred sales charge of 4.5%)
  PER INVESTOR B SHARE
  ($126,159,504/10,735,363)              $ 11.75
                                         =======
NET ASSET VALUE, OFFERING
  AND REDEMPTION PRICE
  (subject to a maximum contingent
  deferred sales charge of 1.0%)
  PER INVESTOR C SHARE
    ($89,817,105/7,643,240)              $ 11.75
                                         =======


- -------------------

 (a) Cost for Federal income tax purposes is $638,541,331. The
     gross unrealized appreciation (depreciation) on a tax basis is as
     follows:
      Gross unrealized appreciation                                      $102,581,402
      Gross unrealized depreciation                                      (16,766,511)
                                                                         ------------
                                                                         $85,814,891
                                                                         ============

     (b) Non-income producing security.
  (c) Security valued at fair value as determined in good faith by or under
       the direction of the Trustees.  As of March 31, 2005, this security had
       a total market value of $6,904 which represents less than 0.01% of net
       assets.
     (d) Total or partial securities on loan.
     (e) Rates shown are the rates as of March 31, 2005.
  (f) Securities purchased with the cash proceeds from securities loaned.

SEE ACCOMPANYING NOTES TO FINANCIAL STATEMENTS.
56
BLACKROCK FUNDS
STATEMENT OF NET ASSETS
MID-CAP GROWTH EQUITY PORTFOLIO
AS OF MARCH 31, 2005 (UNAUDITED)
NUMBER
OF SHARES VALUE
----------- -------------
COMMON STOCKS - 99.2%
Advertising - 1.2%
Getty Images, Inc.(b) 79,700 $ 5,667,467
-----------
Aerospace - 1.6%
Alliant Techsystems, Inc.(b) 104,500 7,466,525
-----------
Banks - 0.6%
City National Corp. 37,800 2,639,196
-----------
Business Services - 4.5%
Alliance Data Systems Corp.(b) 155,400 6,278,160
ChoicePoint, Inc.(b) 57,166 2,292,927
The Corporate Executive Board Co. 114,900 7,347,855
Hewitt Associates, Inc. - Class A(b) 51,300 1,364,580
Manpower, Inc. 73,900 3,216,128
-----------
20,499,650
-----------
Computer & Office Equipment - 1.9%
Intuit, Inc.(b) 138,800 6,075,276
Polycom, Inc.(b) 165,700 2,808,615
-----------
8,883,891
-----------
Computer Software & Services - 11.8%
Adobe Systems, Inc.(c) 126,700 8,510,439
BEA Systems, Inc.(b) 200,900 1,601,173
Ceridian Corp.(b) 419,600 7,154,180
Checkfree Corp.(b) 158,500 6,460,460
DST Systems, Inc.(b) 106,700 4,927,406
Mercury Interactive Corp.(b) 109,500 5,188,110
Navteg Corp.(b) 112,500 4,876,875
Siebel Systems, Inc.(b) 372,600 3,401,838
VeriSign, Inc.(b) 267,600 7,680,120
VERITAS Software Corp.(b) 190,323 4,419,300
-----------
54,219,901
-----------
Containers - 1.3%
Owens-Illinois, Inc.(b) 211,400 5,314,596
-----------
Electronics - 2.7%
Amphenol Corp. 137,800 5,104,112
National Semiconductor Corp. 348,356 7,179,617
-----------
12,283,729
-----------
Entertainment & Leisure - 5.5%
GTECH Holdings Corp. 141,900 3,338,907
Marriott International, Inc. - Class A 78,100 5,221,766
Marvel Enterprises, Inc.(b) 261,300 5,226,000
Orient-Express Hotels Ltd. - Class A 108,400 2,829,240
Starwood Hotels & Resorts
Worldwide, Inc. 146,000 8,764,380
-----------
25,380,293
-----------
Finance - 3.0%
Chicago Mercantile Exchange 14,900 2,891,047
Providian Financial Corp.(b) 227,700 3,907,332
T. Rowe Price Group, Inc. 74,200 4,405,996
TCF Financial Corp. 89,600 2,432,640
-----------
13,637,015
-----------
Insurance - 2.8%
Aetna, Inc. 78,800 5,906,060
WellPoint, Inc.(b) 56,400 7,069,740
-----------
12,975,800
-----------
Manufacturing - 3.8%
Pentair, Inc. 150,100 5,853,900
NUMBER
OF SHARES VALUE
----------- -------------
COMMON STOCKS (Continued)
Manufacturing (Continued)
Sealed Air Corp.(b) 139,800 $ 7,261,212
The Warnaco Group, Inc.(b) 182,800 4,394,512
-----------
17,509,624
-----------
Medical & Medical Services - 7.7%
Caremark Rx, Inc.(b) 215,300 8,564,634
Community Health Systems, Inc.(b) 254,800 8,895,068
Coventry Health Care, Inc.(b) 34,600 2,357,644
Medco Health Solutions, Inc.(b) 154,600 7,663,522
Omnicare, Inc. 77,800 2,758,010
Triad Hospitals, Inc.(b) 99,975 5,008,748
-----------
35,247,626
-----------
Medical Instruments & Supplies - 6.7%
C.R. Bard, Inc. 89,800 6,113,584
Charles River Laboratories
International, Inc.(b) 169,800 7,987,392
Cytyc Corp.(b) 299,900 6,900,699
Guidant Corp. 36,000 2,660,400
Kinetic Concepts, Inc.(b) 32,900 1,962,485
PerkinElmer, Inc. 244,600 5,046,098
-----------
30,670,658
-----------
Metal & Mining - 4.8%
CONSOL Energy, Inc. 177,500 8,346,050
Massey Energy Co. 141,300 5,657,652
MSC Industrial Direct Co., Inc. 241,700 7,386,352
-----------
21,390,054
-----------
Oil & Gas - 6.8%
ENSCO International, Inc. 122,600 4,617,116
EOG Resources, Inc. 288,800 14,076,112
Newfield Exploration Co.(b) 109,200 8,109,192
Noble Corp. 76,900 4,322,549
-----------
31,124,969
-----------
Pharmaceuticals - 3.1%
ICOS Corp.(b) 141,800 3,184,828
OSI Pharmaceuticals, Inc.(b) 96,400 3,985,176
Shire Pharmaceuticals Group PLC -
ADR 210,856 7,228,144
-----------
14,398,148
-----------
Restaurants - 0.5%
Ruby Tuesday, Inc. 94,600 2,297,834
-----------
Retail Merchandising - 11.6%
Bed, Bath & Beyond, Inc.(b) 93,100 3,401,874
CDW Corp. 136,800 7,753,824
Chico's FAS, Inc.(b)(c) 278,400 7,867,584
Coach, Inc.(b) 84,200 4,768,246
Foot Locker, Inc. 84,300 2,469,990
PETsMART, Inc.(c) 166,100 4,775,375
Staples, Inc. 214,848 6,752,673
Williams-Sonoma, Inc.(b) 241,500 8,875,125
The Yankee Candle Co.(b) 200,000 6,340,000
-----------
53,004,691
-----------
Security Brokers & Dealers - 1.2%
Lehman Brothers Holdings, Inc. 57,300 5,395,368
-----------
Semiconductors & Related Devices - 4.2%
Altera Corp.(b) 343,600 6,796,408
SEE ACCOMPANYING NOTES TO FINANCIAL STATEMENTS.
57
                                BLACKROCK FUNDS
                            STATEMENT OF NET ASSETS
                  MID-CAP GROWTH EQUITY PORTFOLIO (CONCLUDED)


AS OF MARCH 31, 2005 (UNAUDITED)


                                             NUMBER
                                           OF SHARES       VALUE
                                          ----------- --------------
COMMON STOCKS (Continued)
Semiconductors & Related Devices (Continued)
  Lam Research Corp.(b)(c)                  225,900    $  6,519,474
  Linear Technology Corp.                   152,900       5,857,599

                                                       ------------
                                                         19,173,481
                                                       ------------
Telecommunications - 11.0%
  ADTRAN, Inc.                              187,300       3,303,972
  Amdocs Ltd.(b)                            304,900       8,659,160
  American Tower Corp. - Class A(b)         385,100       7,020,373
  Avid Technology, Inc.(b)                  157,300       8,513,076
  Harman International Industries, Inc.      22,000       1,946,120
  Harris Corp.                              104,000       3,395,600
  Nextel Partners, Inc. - Class A(b)(c)     475,600      10,444,176
  Scientific-Atlanta, Inc.                  180,100       5,082,422
  Syniverse Holdings, Inc.(b)               147,100       2,029,980

                                                       ------------
                                                         50,394,879
                                                       ------------
Waste Management - 0.9%
  Stericycle, Inc.(b)                        97,600       4,313,920
                                                       ------------
TOTAL COMMON STOCKS
  (Cost $377,696,800)                                   453,889,315
                                                       ------------


WARRANTS - 0.0%
  Dime Bancorp, Inc. (expiring
    11/22/05)                          57,900   6,948
  MicroStrategy, Inc. (expiring
    06/24/07)(d)                           13       2

                                                -----
TOTAL WARRANTS
  (Cost $17,331)                                6,950
                                                -----


SHORT TERM INVESTMENTS - 7.4%
  Galileo Money Market    7,044,858       7,044,858
Fund
  Institutional Money    27,001,210      27,001,210
Market Trust(e)

                                         ----------
TOTAL SHORT TERM INVESTMENTS
  (Cost $34,046,068)                     34,046,068
                                         ----------
TOTAL INVESTMENTS IN SECURITIES -  106.6%
  (Cost                                 487,942,333
$411,760,199(a))
LIABILITIES IN EXCESS
OF OTHER
  ASSETS -  (6.6)%
  (Including
$27,001,210 of payable
  upon return of                        (30,177,083)
                                        -----------
securities loaned)
NET ASSETS - 100.0%
  (Applicable to
7,407,048
  Institutional shares,
202,864
  Service shares,
33,420,533 Investor
  A shares, 7,434,051
Investor B
  shares and 2,608,493
Investor C
  shares)                             $ 457,765,250
                                      =============


                                            VALUE
                                         ----------
NET ASSET VALUE, OFFERING
  AND REDEMPTION PRICE PER
  INSTITUTIONAL SHARE
    ($70,974,493/7,407,048)                $ 9.58
                                           ======
NET ASSET VALUE, OFFERING
  AND REDEMPTION PRICE
  PER SERVICE SHARE
       ($1,877,193/202,864)                $ 9.25
                                           ======
NET ASSET VALUE AND
  REDEMPTION PRICE PER
  INVESTOR A SHARE
  ($301,541,107/33,420,533)                $ 9.02
                                           ======
MAXIMUM OFFERING PRICE PER
  INVESTOR A SHARE
              ($9.02/0.955)                $ 9.45
                                           ======
NET ASSET VALUE, OFFERING
  AND REDEMPTION PRICE
  (subject to a maximum contingent
  deferred sales charge of 4.5%)
  PER INVESTOR B SHARE
    ($61,716,671/7,434,051)                $ 8.30
                                           ======
NET ASSET VALUE, OFFERING
  AND REDEMPTION PRICE
  (subject to a maximum contingent
  deferred sales charge of 1.0%)
  PER INVESTOR C SHARE
    ($21,655,786/2,608,493)                $ 8.30
                                           ======


- -------------------

 (a) Cost for Federal income tax purposes is $412,647,207. The
     gross unrealized appreciation (depreciation) on a tax basis is as
     follows:
      Gross unrealized appreciation                                      $82,307,552
      Gross unrealized depreciation                                       (7,012,426)
                                                                         -----------
                                                                         $75,295,126
                                                                         ===========

     (b) Non-income producing security.
     (c) Total or partial securities on loan.
 (d) Security valued at fair value as determined in good faith by or under the
       direction of the Trustees.  As of March 31, 2005, this security had a
       total market value of $2 which represents less than 0.01% of net assets.

 (e) Securities purchased with the cash proceeds from securities loaned.


SEE ACCOMPANYING NOTES TO FINANCIAL STATEMENTS.
58
                                BLACKROCK FUNDS
                            STATEMENT OF NET ASSETS
                                AURORA PORTFOLIO


AS OF MARCH 31, 2005 (UNAUDITED)


                           NUMBER
                         OF SHARES       VALUE
                        ----------- --------------
COMMON STOCKS - 97.4%
Aerospace - 4.2%
  AAR Corp.(b)             469,880   $  6,390,368
  Alliant Techsystems,     281,300     20,098,885
Inc.(b)
  Esterline                533,700     18,439,335
Technologies Corp.(b)
  Goodrich Corp.           532,300     20,381,767
  HEICO Corp.              650,300     13,071,030
  Martin Marietta          296,600     16,585,872
Materials, Inc.
  Teledyne                 477,700     14,952,010
Technologies, Inc.(b)
  Triumph Group,           460,000     17,912,400
Inc.(b)

                                     ------------
                                      127,831,667
                                     ------------
Banks - 5.0%
  City National Corp.      457,900     31,970,578
  First Niagara            885,200     11,693,492
Financial Group, Inc.
  Popular, Inc.            612,500     14,896,000
  Sovereign Bancorp,    1,477,400      32,739,184
Inc.
  Sterling Bancshares,  1,190,941      16,911,362
Inc.
  TD Banknorth, Inc.(b)   723,138      22,590,831
  Zions Bancorp           311,200      21,479,024

                                     ------------
                                      152,280,471
                                     ------------
Broadcasting - 1.4%
  Entercom                539,900      19,177,248
Communications Corp.(b)
  Gray Communications,    735,100      10,636,897
Inc.
  Lin TV Corp.(b)         740,200      12,531,586

                                     ------------
                                       42,345,731
                                     ------------
Business Services - 1.8%
  Hiedrick & Struggles
International,
    Inc.(b)               753,700      27,713,549
  NCO Group, Inc.(b)      519,900      10,164,045
  Stewart Enterprises,  2,761,200      16,981,380
Inc. - Class A

                                     ------------
                                       54,858,974
                                     ------------
Chemicals - 2.4%
  Ashland, Inc.           465,500      31,407,285
  Church & Dwight Co.,    491,200      17,422,864
Inc.(c)
  Minerals                154,000      10,130,120
Technologies, Inc.
  Omnova Solutions,     1,281,733       6,882,906
Inc.(b)
  Sensient Technologies   430,530       9,282,227
Corp.(c)

                                     ------------
                                       75,125,402
                                     ------------
Computer & Office Equipment - 1.1%
  Avery Dennison Corp.    313,200      19,396,476
  Electronics for         875,300      15,615,352
Imaging, Inc.(b)

                                     ------------
                                       35,011,828
                                     ------------
Computer Software & Services - 5.0%
  Ascential Software      958,000      17,751,740
Corp.(b)
  Aspen Technology,     1,193,879       6,781,233
Inc.(b)
  Brooks Automation,    1,221,600      18,543,888
Inc.(b)
  Carreker Corp.(b)     1,115,342       6,257,069
  CIBER, Inc.(b)          571,279       4,153,197
  DST Systems, Inc.(b)    413,176      19,080,468
  EarthLink, Inc.(b)      576,300       5,186,700
  Mentor Graphics       1,590,200      21,785,740
Corp.(b)
  MRO Software, Inc.(b)   863,500      12,114,905
  ProQuest Co.(b)         433,900      15,685,485
  Tech Data Corp.(b)      396,900      14,709,114
  Veritas DGC, Inc.(b)    403,800      12,097,848

                                     ------------
                                      154,147,387
                                     ------------
Construction - 1.5%
  Apogee Enterprises,     948,496      13,544,523
Inc.


                           NUMBER
                         OF SHARES       VALUE
                        ----------- --------------
COMMON STOCKS (Continued)
Construction (Continued)
  Champion Enterprises, 1,497,400    $ 14,075,560
Inc.(b)
  ElkCorp                 500,900      19,264,614

                                     ------------
                                       46,884,697
                                     ------------
Containers - 4.1%
  Anchor Glass          1,592,300       3,566,752
Container Corp.
  Ball Corp.              993,400      41,206,232
  Owens-Illinois,       1,215,200      30,550,128
Inc.(b)
  Packaging Corp. of America
                          880,900      21,397,061
  Pactiv Corp.(b)
                          715,200      16,699,920
  Smurfit-Stone Container 761,573      11,781,534

                                     ------------
                                      125,201,627
                                     ------------
Electronics - 1.7%
  Amphenol Corp.          399,500      14,797,480
  AVX Corp.(c)            634,000       7,766,500
  Excel Technology,       300,286       7,381,030
Inc.(b)
  Technitrol, Inc.      1,429,504      21,328,201

                                     ------------
                                       51,273,211
                                     ------------
Energy & Utilities - 4.0%
  CMS Energy Corp.(b)   1,828,900      23,848,856
  Constellation Energy    254,797      13,173,005
Group
  DPL, Inc.               657,800      16,445,000
  Reliant Energy, Inc.(b)(c)
                        2,183,400      24,847,092
  UGI Corp.
                          292,400      13,280,808
  Westar Energy, Inc.     660,100      14,284,564
  Wisconsin Energy        469,900      16,681,450
Corp.

                                     ------------
                                      122,560,775
                                     ------------
Entertainment & Leisure - 2.2%
  Boyd Gaming Corp.
                          222,500      11,603,375
  Gaylord Entertainment Co438,400      17,711,360
  GTECH Holdings Corp.    916,300      21,560,539
  Hollywood Park,       1,044,600      17,444,820
Inc.(b)

                                     ------------
                                       68,320,094
                                     ------------
Finance - 3.5%
  Affiliated Managers Group, Inc.(b)
                          530,900      32,931,727
  American Capital Strategies Ltd.(c)
                          471,100      14,797,251
  CIT Group, Inc.         672,800      25,566,400
  MCG Capital Corp.     1,057,700      16,272,714
  MoneyGram               542,000      10,238,380
International, Inc.(c)
  Nuveen Investments - Class A
                          188,700       6,476,184

                                     ------------
                                      106,282,656
                                     ------------
Food & Agriculture -
1.7%
  American Italian
Pasta Co. -
    Class A               422,300      11,571,020
  Dean Foods Co.(b)       720,400      24,709,720
  The J. M. Smucker Co.   318,100      16,000,430

                                     ------------
                                       52,281,170
                                     ------------
Furniture - 1.3%
  Steelcase, Inc.(c)      562,400       7,761,120
  Walter Industries,      765,200      32,559,260
Inc.

                                     ------------
                                       40,320,380
                                     ------------
Insurance - 7.6%
  Allmerica Financial Corp.(b)
                          948,200      34,087,790
  AmerUs Group Co.(c)
                          346,800      16,386,300
  Harleysville Group, Inc.488,777       9,707,111
  Hub International       678,600      13,096,980
Ltd.

SEE ACCOMPANYING NOTES TO FINANCIAL STATEMENTS.
                                                                              59
                                BLACKROCK FUNDS
                            STATEMENT OF NET ASSETS
                          AURORA PORTFOLIO (CONTINUED)


AS OF MARCH 31, 2005 (UNAUDITED)


                           NUMBER
                         OF SHARES       VALUE
                        ----------- --------------
COMMON STOCKS (Continued)
Insurance (Continued)
  Humana, Inc.(b)          874,000   $ 27,915,560
  Montpelier Re            803,925     28,257,964
Holdings Ltd.
  Odyssey Re Holdings      747,700     18,722,408
Corp.(c)
  Ohio Casualty            939,100     21,580,518
Corp.(b)
  Platinum Underwriters    501,300     14,888,610
Holdings Ltd.
  Radian Group, Inc.       698,200     33,332,068
  United America           881,700     16,611,228
Indemnity Ltd.(b)

                                     ------------
                                      234,586,537
                                     ------------
Machinery & Heavy Equipment - 2.6%
  Flowserve Corp.(b)       306,600      7,931,742
  JLG Industries, Inc.     588,000     12,671,400
  The Manitowoc Co.,       653,400     26,390,826
Inc.
  Stewart & Stevenson      504,700     11,552,583
Services, Inc.
  Wabtec Corp.          1,025,337      21,009,155

                                     ------------
                                       79,555,706
                                     ------------
Manufacturing - 6.8%
  Belden CDT, Inc.        738,900      16,410,969
  Briggs & Stratton       408,700      14,880,767
Corp.
  Brunswick Corp.         563,400      26,395,290
  Crown Holdings,       1,731,200      26,937,472
Inc.(b)
  Herley Microwave        929,000      15,895,190
Systems, Inc.(b)
  K2, Inc.(b)           1,088,000      14,960,000
  Ladish Co., Inc.(b)     738,100       8,709,580
  Playtex Products,     1,455,500      13,099,500
Inc.(b)
  Rinker Group Ltd. -     270,100      22,631,679
ADR
  Roper Industries,       254,400      16,663,200
Inc.
  Russell Corp.           751,100      13,579,888
  Tredegar Corp.          609,100      10,269,426
  Valmont Industries,     447,406       9,986,102
Inc.

                                     ------------
                                      210,419,063
                                     ------------
Measuring & Controlling Devices -
0.7%
  LeCroy Corp.(b)         524,000       8,976,120
  Watts Water             353,400      11,524,374
Technologies, Inc.

                                     ------------
                                       20,500,494
                                     ------------
Medical & Medical Services - 6.0%
  Davita, Inc.(b)(c)      614,600      25,721,010
  Hooper Holmes, Inc.   3,799,800      14,515,236
  Laboratory Corp. of
America
    Holdings(b)           676,200      32,592,840
  LifePoint Hospitals,    482,600      21,157,184
Inc.(b)
  Province Healthcare     595,600      14,348,004
Co.(b)
  RehabCare Group,        744,800      21,383,208
Inc.(b)
  STERIS Corp.(b)         861,500      21,752,875
  Triad Hospitals,        661,300      33,131,130
Inc.(b)

                                     ------------
                                      184,601,487
                                     ------------
Medical Instruments & Supplies -
4.6%
  Bausch & Lomb, Inc.     464,300      34,033,190
  Beckman Coulter,        352,900      23,450,205
Inc.(c)
  Cambrex Corp.           287,103       6,115,294
  The Cooper Cos., Inc.   217,500      15,855,750
  Cytyc Corp.(b)(c)       193,300       4,447,833
  Fisher Scientific
International,
    Inc.(b)               536,200      30,520,504
  ICU Medical,            363,200      12,893,600
Inc.(b)(c)
  Viasys Healthcare,      702,900      13,411,332
Inc.(b)

                                     ------------
                                      140,727,708
                                     ------------


                           NUMBER
                         OF SHARES       VALUE
                        ----------- --------------
COMMON STOCKS (Continued)
Metal & Mining - 2.1%
  Alpha Natural           739,300    $ 21,195,731
Resources, Inc.(b)
  Massey Energy Co.       702,900      28,144,116
  RTI International       602,800      14,105,520
Metals, Inc.(b)

                                     ------------
                                       63,445,367
                                     ------------
Motor Vehicles - 0.8%
  Oshkosh Truck Corp.     307,800      25,236,522
                                     ------------
Oil & Gas - 4.4%
  Core Laboratories NV(b)
                          692,800      17,784,176
  EOG Resources, Inc.     615,800      30,014,092
  Global Industries,    1,388,400      13,050,960
Inc.(b)
  Kerr-McGee Corp.        556,100      43,559,313
  Vintage Petroleum,      991,000      31,176,860
Inc.

                                     ------------
                                      135,585,401
                                     ------------
Paper & Forest Products - 1.4%
  Caraustar Industries, Inc.(b)
                          788,021      10,165,471
  Kadant, Inc.(b)       1,214,600      22,530,830
  Rayonier, Inc.          211,333      10,467,323

                                     ------------
                                       43,163,624
                                     ------------
Personal Services -
0.6%
  Learning Tree           587,815       8,470,414
International, Inc.(b)
  Steiner Leisure         324,100      10,594,829
Ltd.(b)

                                     ------------
                                       19,065,243
                                     ------------
Pharmaceuticals - 1.1%
  Valeant
Pharmaceuticals
Interna-
    tional(c)             500,100      11,262,252
  Watson                  756,900      23,259,537
Pharmaceuticals,
Inc.(b)

                                     ------------
                                       34,521,789
                                     ------------
Publishing & Printing - 0.6%
  Journal Register Co.(b)
                        1,012,800      16,913,760
                                     ------------
Railroad & Shipping - 0.4%
  RailAmerica, Inc.(b)    956,000      11,930,880
                                     ------------
Real Estate - 2.1%
  Heritage Property Investment Trust
                          484,700      14,385,896
  Highland Hospitality Corp.
                          594,600       6,154,110
  Host Marriott Corp.   1,536,700      25,447,752
  Ryland Group, Inc.      293,500      18,202,870

                                     ------------
                                       64,190,628
                                     ------------
Restaurants - 1.1%
  CKE Restaurants,        982,900      15,578,965
Inc.(b)
  O'Charley's, Inc.(b)    367,100       7,980,754
  Papa John's             260,100       9,030,672
International, Inc.(b)

                                     ------------
                                       32,590,391
                                     ------------
Retail Merchandising - 7.9%
  AnnTaylor Stores Corp.1,124,300      28,770,837
  BJ's Wholesale Club,  1,182,600      36,731,556
Inc.(b)(c)
  Christopher & Banks   1,140,100      20,065,760
Corp.
  CSK Auto Corp.(b)       599,900      10,588,235
  Federated Department
Stores,
    Inc.(c)               712,800      45,362,592
  Longs Drug Stores       452,979      15,500,941
Corp.
  Reebok International    477,100      21,135,530
Ltd.(c)
  Regis Corp.             423,500      17,333,855
  Saks, Inc.(b)         2,135,200      38,540,360

SEE ACCOMPANYING NOTES TO FINANCIAL STATEMENTS.
60
                                BLACKROCK FUNDS
                            STATEMENT OF NET ASSETS
                          AURORA PORTFOLIO (CONCLUDED)


AS OF MARCH 31, 2005 (UNAUDITED)


                           NUMBER
                         OF SHARES        VALUE
                        ----------- ----------------
COMMON STOCKS (Continued)
Retail Merchandising (Continued)
  Tweeter Home
Entertainment
    Group, Inc.(b)       1,584,322   $    8,824,674

                                     --------------
                                        242,854,340
                                     --------------
Security Brokers & Dealers - 0.5%
  A.G. Edwards, Inc.(c)    366,400       16,414,720
                                     --------------
Semiconductors & Related Devices -
0.9%
  IXYS Corp.(b)            898,997       10,284,526
  Novellus Systems,        593,000       15,850,890
Inc.(b)

                                     --------------
                                         26,135,416
                                     --------------
Telecommunications - 2.7%
  Anaren, Inc.(b)          941,600       11,421,608
  Cablevision Systems
New York
    Group - Class A(b)     741,600       20,801,880
  Nextel Partners, Inc.  1,368,100       30,043,476
- - Class A(b)(c)
  NMS Communications     1,295,800        5,558,982
Corp.(b)
  Premiere Global        1,466,600       16,601,912
Servics, Inc.(b)

                                     --------------
                                         84,427,858
                                     --------------
Textiles - 0.6%
  Mohawk Industries,       216,400       18,242,520
                                     --------------
Inc.(b)(c)
Transportation - 1.1%
  Kirby Corp.(b)           251,300       10,562,139
  Laidlaw                1,114,700       23,185,760
International, Inc.(b)

                                     --------------
                                         33,747,899
                                     --------------
TOTAL COMMON STOCKS
  (Cost $2,609,042,105)               2,993,583,423
                                     --------------


                                                  PAR/SHARES
                                       MATURITY     (000)
                                      ---------- -----------
SHORT TERM INVESTMENTS - 10.0%
  Federal Home Loan Bank, Discount
    Notes
    2.55%                             04/01/05     106,500    106,500,000
  Morgan Stanley, Floating Rate
    Notes
    2.95%(d)(e)                       11/14/05       7,083      7,083,028
  Galileo Money Market Fund                          9,435      9,434,781
  Institutional Money Market Trust(d)              185,862    185,861,899

                                                              -----------
TOTAL SHORT TERM INVESTMENTS
  (Cost $308,879,708)                                         308,879,708
                                                              -----------


TOTAL INVESTMENTS IN SECURITIES -  107.4%
  (Cost $2,917,921,813(a))                   3,302,463,131
LIABILITIES IN EXCESS OF OTHER
  ASSETS -  (7.4)%
  (including $192,944,927 of payable
  upon return of securities loaned)           (228,052,454)
                                             -------------
NET ASSETS - 100.0%
  (Applicable to 3,938,258 Institutional
  shares, 4 Service shares, 51,588,516
  Investor A shares, 12,634,863
  Investor B shares and 12,286,427
  Investor C shares)                        $3,074,410,677
                                            ==============


                                               VALUE
                                            -----------
NET ASSET VALUE, OFFERING
  AND REDEMPTION PRICE PER
  INSTITUTIONAL SHARE
     ($159,622,994/3,938,258)               $ 40.53
                                            =======
NET ASSET VALUE, OFFERING
  AND REDEMPTION PRICE PER
  SERVICE SHARE
                     ($152/4)(f)            $ 39.22
                                            =======
NET ASSET VALUE AND
  REDEMPTION PRICE PER
  INVESTOR A SHARE
  ($2,019,006,839/51,588,516)               $ 39.14
                                            =======
MAXIMUM OFFERING PRICE
  PER INVESTOR A SHARE
              ($39.14/0.9425)               $ 41.53
                                            =======
NET ASSET VALUE, OFFERING
  AND REDEMPTION PRICE
  (subject to a maximum contingent
  deferred sales charge of 4.5%)
  PER INVESTOR B SHARE
    ($454,172,934/12,634,863)               $ 35.95
                                            =======
NET ASSET VALUE, OFFERING
  AND REDEMPTION PRICE
  (subject to a maximum contingent
  deferred sales charge of 4.5%)
  PER INVESTOR C SHARE
    ($441,607,758/12,286,427)               $ 35.94
                                            =======


- -------------------

 (a) Cost for Federal income tax purposes is $2,923,067,138. The
     gross unrealized appreciation (depreciation) on a tax basis is as
     follows:
      Gross unrealized appreciation                                      $489,637,924
      Gross unrealized depreciation                                      (110,241,931)
                                                                         ------------
                                                                         $379,395,993
                                                                         ============

     (b) Non-income producing security.
     (c) Total or partial securities on loan.
 (d) Securities purchased with the cash proceeds from securities loaned.
     (e) Rates shown are the rates as of March 31, 2005.
  (f) Exact net assets and shares outstanding at March 31, 2005 were $152.29
       and 3.883, respectively.

SEE ACCOMPANYING NOTES TO FINANCIAL STATEMENTS.
                                                                              61
                                BLACKROCK FUNDS
                            STATEMENT OF NET ASSETS
                         SMALL/MID CAP GROWTH PORTFOLIO


AS OF MARCH 31, 2005 (UNAUDITED)


                           NUMBER
                         OF SHARES      VALUE
                        ----------- -------------
COMMON STOCKS - 95.3%
Banks - 4.4%
  East West Bancorp,      77,500     $ 2,861,300
Inc.
  Southwest Bancorp of  263,400        4,833,390
Texas, Inc.
  UCBH Holdings, Inc.   154,582        6,167,822

                                     -----------
                                      13,862,512
                                     -----------
Broadcasting - 1.4%
  Citadel Broadcasting  212,900        2,923,117
Co.(b)
  Entravision
Communications
    Corp.(b)            167,500        1,485,725

                                     -----------
                                       4,408,842
                                     -----------
Business Services - 8.3%
  Advisory Board Co.(b)  61,500        2,687,550
  The Corporate          82,700        5,288,665
Executive Board Co.
  Digitas, Inc.(b)      597,500        6,034,750
  LECG Corp.(b)         258,406        5,064,758
  Navigant Consulting,  264,000        7,188,720
Inc.(b)

                                     -----------
                                      26,264,443
                                     -----------
Computer & Office Equipment - 1.7%
  Polycom, Inc.(b)      321,300        5,446,035
                                     -----------
Computer Software & Services -
11.9%
  Advanced Digital
Information
    Corp.(b)            311,400        2,553,480
  Aeroflex, Inc.(b)     231,100        2,156,163
  Anteon International  121,400        4,726,102
Corp.(b)
  Autobytel, Inc.(b)(c)  73,042          368,132
  Avocent Corp.(b)       66,500        1,706,390
  BEA Systems, Inc.(b)  515,800        4,110,926
  CACI International,    97,800        5,401,494
Inc.(b)
  Epicor Software       168,500        2,207,350
Corp.(b)
  Hyperion Solutions    113,300        4,997,663
Corp.(b)
  McData Corp. - Class  630,500        2,376,985
A(b)
  Quest Software,       137,000        1,896,080
Inc.(b)
  SonicWALL, Inc.(b)    692,400        3,524,316
  Sybase, Inc.(b)        96,100        1,774,006

                                     -----------
                                      37,799,087
                                     -----------
Entertainment & Leisure - 3.8%
  Boyd Gaming Corp.      28,930        1,508,700
  Hollywood Park,       204,700        3,418,490
Inc.(b)
  Orient-Express Hotels
Ltd. - Class
    A                    94,800        2,474,280
  Station Casinos, Inc.  70,200        4,742,010

                                     -----------
                                      12,143,480
                                     -----------
Finance - 6.9%
  Affiliated Managers   156,100        9,682,883
Group, Inc.(b)
  CapitalSource,        268,000        6,164,000
Inc.(b)
  Collegiate Funding    229,400        3,574,052
Services(b)
  International
Securities Exchange,
    Inc. - Class A(b)     4,700          122,200
  Wright Express        142,600        2,438,460
Corp.(b)

                                     -----------
                                      21,981,595
                                     -----------
Furniture - 1.0%
  Aaron Rents, Inc.     156,050        3,121,000
                                     -----------
Insurance - 1.1%
  Bristol West          221,500        3,433,250
                                     -----------
Holdings, Inc.
Machinery & Heavy Equipment - 0.4%
  Flowserve Corp.(b)     67,400        1,743,638
                                     -----------


                           NUMBER
                         OF SHARES      VALUE
                        ----------- -------------
COMMON STOCKS (Continued)
Manufacturing - 2.5%
  ESCO Technologies,     23,600      $ 1,896,260
Inc.(b)
  Shuffle Master,       107,454        3,111,868
Inc.(b)(d)
  The Warnaco Group,    120,000        2,884,800
Inc.(b)

                                     -----------
                                       7,892,928
                                     -----------
Medical & Medical Services - 10.3%
  Accredo Health,        57,300        2,544,693
Inc.(b)
  Community Health
Systems,
    Inc.(b)(d)          177,600        6,200,016
  Digene Corp.(b)
                         97,400        2,021,050
  LifePoint Hospitals, Inc.(b)
                        149,300        6,545,312
  Martek Biosciences Corp76,900        4,474,811
  Noven                 155,300        2,633,888
Pharmaceuticals,
Inc.(b)
  Pediatrix Medical      40,100        2,750,459
Group, Inc.(b)
  United Surgical
Partners
    International,      121,200        5,547,324
Inc.(b)

                                     -----------
                                      32,717,553
                                     -----------
Medical Instruments & Supplies - 6.8%
  Advanced Medical Optics, Inc.(b)(d)
                        162,700        5,891,367
  Animas Corp.(b)(d)    158,500        3,203,285
  The Cooper Cos., Inc.  54,700        3,987,630
  Cutera, Inc.(b)       116,382        2,243,845
  LCA-Vision, Inc.      136,100        4,532,130
  Wright Medical Group,  76,100        1,826,400
Inc.(b)

                                     -----------
                                      21,684,657
                                     -----------
Metal & Mining - 2.2%
  Alpha Natural         113,900        3,265,513
Resources, Inc.(b)
  CONSOL Energy, Inc.    79,700        3,747,494

                                     -----------
                                       7,013,007
                                     -----------
Motor Vehicles - 0.4%
  Wabash National Corp.  52,300        1,276,120
                                     -----------
Oil & Gas - 5.6%
  Cabot Oil & Gas Corp.  41,900        2,310,785
  Newpark Resources, Inc.(b)
                        615,100        3,622,939
  Patterson-UTI Energy, Inc.
                        136,140        3,406,223
  Pride International, Inc.(b)
                        245,000        6,085,800
  Tidewater, Inc.        59,800        2,323,828

                                     -----------
                                      17,749,575
                                     -----------
Personal Services -
3.0%
  Corinthian Colleges, Inc.(b)(d)
                        208,000        3,269,760
  Educate, Inc.(b)
                         30,100          417,487
  Laureate Education, Inc.(b)(c)
                        133,400        5,708,186

                                     -----------
                                       9,395,433
                                     -----------
Pharmaceuticals - 1.6%
  Alkermes, Inc.(b)(d)  264,800        2,748,624
  MGI Pharma, Inc.(b)    92,600        2,340,002

                                     -----------
                                       5,088,626
                                     -----------
Restaurants - 3.9%
  AFC Enterprises,      157,300        4,012,723
Inc.(b)
  Applebee's International, Inc.
                         91,600        2,524,496
  RARE Hospitality
International,
    Inc.(b)             185,600        5,731,328

                                     -----------
                                      12,268,547
                                     -----------
Retail Merchandising - 6.1%
  99 Cents Only          56,600          745,422
Stores(b)

SEE ACCOMPANYING NOTES TO FINANCIAL STATEMENTS.
62
                                BLACKROCK FUNDS
                            STATEMENT OF NET ASSETS
                   SMALL/MID CAP GROWTH PORTFOLIO (CONCLUDED)


AS OF MARCH 31, 2005 (UNAUDITED)


                           NUMBER
                         OF SHARES       VALUE
                        ----------- --------------
COMMON STOCKS (Continued)
Retail Merchandising (Continued)
  Aeropostale, Inc.(b)     90,300    $  2,957,325
  Central Garden & Pet     22,500         986,850
Co.(b)
  Cost Plus, Inc.(b)       51,365       1,380,691
  Guitar Center,           76,300       4,183,529
Inc.(b)
  Too, Inc.(b)            175,600       4,332,052
  West Marine, Inc.(b)    217,600       4,626,176

                                     ------------
                                       19,212,045
                                     ------------
Semiconductors & Related Devices -
4.6%
  ATMI, Inc.(b)           103,600       2,594,144
  Cymer, Inc.(b)(d)        74,200       1,986,334
  Helix Technology         69,205       1,070,600
Corp.
  Mattson Technology,     194,700       1,545,918
Inc.(b)
  Microsemi Corp.(b)      315,700       5,142,753
  O2Micro International   208,200       2,142,378
Ltd.(b)

                                     ------------
                                       14,482,127
                                     ------------
Telecommunications - 7.4%
  ADTRAN, Inc.            219,100       3,864,924
  American Tower Corp.
- - Class
    A(b)(d)               283,100       5,160,913
  Anaren, Inc.(b)         195,200       2,367,776
  Harman International
Industries,
    Inc.                   42,400       3,750,704
  Scientific-Atlanta,      95,600       2,697,832
Inc.
  SpectraLink Corp.       295,292       4,169,523
  Syniverse Holdings,     109,400       1,509,720
Inc.(b)

                                     ------------
                                       23,521,392
                                     ------------
TOTAL COMMON STOCKS
  (Cost $266,002,419)                 302,505,892
                                     ------------


                                                  PAR/SHARES
                                       MATURITY     (000)
                                      ---------- -----------
SHORT TERM INVESTMENTS - 12.5%
  Morgan Stanley, Floating Rate
    Notes
    2.95%(e)(f)                       11/14/05     $   998       998,264
  Galileo Money Market Fund                          9,665     9,664,670
  Institutional Money Market Trust(e)               28,925    28,925,276

                                                              ----------
TOTAL SHORT TERM INVESTMENTS
  (Cost $39,588,210)                                          39,588,210
                                                              ----------


TOTAL INVESTMENTS IN SECURITIES -  107.8%
  (Cost $305,590,629(a))                     342,094,102
LIABILITIES IN EXCESS OF OTHER
  ASSETS -  (7.8)%
  (including $29,923,540 of payable
  upon return of securities loaned)          (24,620,199)
                                             -----------
NET ASSETS - 100.0%
  (Applicable to 2,596,606 Institutional
  shares, 8 Service shares, 17,709,966
  Investor A shares, 2,078,386 Investor
  B shares and 2,204,393 Investor C
  shares)                                  $ 317,473,903
                                           =============


                                               VALUE
                                            -----------
NET ASSET VALUE, OFFERING
  AND REDEMPTION PRICE PER
  INSTITUTIONAL SHARE
    ($35,482,627/2,596,606)                 $ 13.67
                                            =======
NET ASSET VALUE, OFFERING
  AND REDEMPTION PRICE PER
  SERVICE SHARE
                   ($102/8)(g)              $ 13.06
                                            =======
NET ASSET VALUE AND
  REDEMPTION PRICE PER
  INVESTOR A SHARE
  ($231,376,775/17,709,966)                 $ 13.06
                                            =======
MAXIMUM OFFERING PRICE
  PER INVESTOR A SHARE
            ($13.06/0.9425)                 $ 13.86
                                            =======
NET ASSET VALUE, OFFERING
  AND REDEMPTION PRICE
  (subject to a maximum contingent
  deferred sales charge of 4.5%)
  PER INVESTOR B SHARE
    ($24,535,568/2,078,386)                 $ 11.81
                                            =======
NET ASSET VALUE, OFFERING
  AND REDEMPTION PRICE
  (subject to a maximum contingent
  deferred sales charge of 4.5%)
  PER INVESTOR C SHARE
    ($26,078,831/2,204,393)                 $ 11.83
                                            =======


- -------------------

 (a) Cost for Federal income tax purposes is $308,783,926. The
     gross unrealized appreciation (depreciation) on a tax basis is as
     follows:
      Gross unrealized appreciation                                      $40,973,283
      Gross unrealized depreciation                                       (7,663,107)
                                                                         -----------
                                                                         $33,310,176
                                                                         ===========

     (b) Non-income producing security.
  (c) Security valued at fair value as determined in good faith by or under
       the direction of the Trustees.  As of March 31, 2005, this security had
       a total market value of $368,132 which represents 0.12% of net assets.
     (d) Total or partial securities on loan.
 (e) Securities purchased with the cash proceeds from securities loaned.
     (f) Rates shown are the rates as of March 31, 2005.
 (g) Exact net assets and shares outstanding at March 31, 2005 were $101.94 and
       7.805, respectively.


SEE ACCOMPANYING NOTES TO FINANCIAL STATEMENTS.
                                                                              63
BLACKROCK FUNDS
STATEMENT OF NET ASSETS
SMALL CAP VALUE EQUITY PORTFOLIO
AS OF MARCH 31, 2005 (UNAUDITED)
NUMBER
OF SHARES VALUE
----------- -------------
COMMON STOCKS - 96.1%
Aerospace - 1.2%
The Titan Corp.(b) 96,500 $ 1,752,440
-----------
Banks - 9.1%
Central Pacific Financial Corp. 28,600 962,390
First Niagara Financial Group, Inc. 129,800 1,714,658
Flagstar Bancorp, Inc. 48,200 942,310
Gold Banc Corp., Inc. 126,800 1,779,004
Oriental Financial Group, Inc. 71,880 1,683,430
Sterling Financial Corp.(b) 46,950 1,676,115
Trustmark Corp. 53,800 1,560,200
Washington Federal, Inc. 65,330 1,522,842
-----------
11,840,949
-----------
Beverages & Bottling - 0.6%
NuCo2, Inc.(b) 30,700 807,410
-----------
Business Services - 4.2%
Administaff, Inc. 89,700 1,309,620
The Brink's Co. 56,800 1,965,280
Digitas, Inc.(b) 132,800 1,341,280
PHH Corp.(b) 40,600 887,922
-----------
5,504,102
-----------
Chemicals - 2.6%
Church & Dwight Co., Inc. 48,200 1,709,654
Cytec Industries, Inc. 31,200 1,692,600
-----------
3,402,254
-----------
Computer Software & Services - 2.1%
Brooks Automation, Inc.(b) 41,800 634,524
Novatel Wireless, Inc.(b) 60,200 647,150
Tech Data Corp.(b) 23,100 856,086
TIBCO Software, Inc.(b) 83,700 623,565
-----------
2,761,325
-----------
Construction - 1.8%
Washington Group International,
Inc.(b) 51,200 2,303,488
-----------
Containers - 0.9%
Packaging Corp. of America 49,100 1,192,639
-----------
Energy & Utilities - 3.6%
Northwestern Corp. 64,900 1,711,413
PNM Resources, Inc. 67,000 1,787,560
Thomas & Betts Corp.(b) 35,400 1,143,420
-----------
4,642,393
-----------
Entertainment & Leisure - 4.6%
Gaylord Entertainment Co.(b) 52,100 2,104,840
Great Wolf Resorts, Inc.(b) 50,500 1,259,975
Kerzner International Ltd.(b) 21,000 1,285,830
MTR Gaming Group, Inc.(b) 107,600 1,334,240
-----------
5,984,885
-----------
Finance - 4.5%
Affiliated Managers Group, Inc.(b) 38,200 2,369,546
CompuCredit Corp.(b) 29,900 795,938
Indymac Bancorp, Inc. 50,800 1,727,200
Irwin Financial Corp. 41,800 962,236
-----------
5,854,920
-----------
Food & Agriculture - 6.0%
American Italian Pasta Co. - Class A 29,900 819,260
Chiquita Brands International, Inc.(c) 70,000 1,874,600
Del Monte Foods Co.(b) 69,200 750,820
NUMBER
OF SHARES VALUE
----------- -------------
COMMON STOCKS (Continued)
Food & Agriculture (Continued)
Hain Celestial Group, Inc.(b) 72,200 $ 1,345,808
John B. Sanfilippo & Son, Inc.(b) 21,300 523,554
Ralcorp Holdings, Inc. 51,700 2,447,995
-----------
7,762,037
-----------
Furniture - 3.1%
Aaron Rents, Inc. 55,500 1,110,000
Walter Industries, Inc. 67,900 2,889,145
-----------
3,999,145
-----------
Insurance - 6.6%
Allmerica Financial Corp.(b) 64,900 2,333,155
Aspen Insurance Holdings Ltd. 50,800 1,280,668
Max Re Capital Ltd. 75,100 1,767,103
Montpelier Re Holdings Ltd. 40,100 1,409,515
PXRE Group Ltd. 36,300 931,095
Universal American Financial
Corp.(b) 45,700 790,610
-----------
8,512,146
-----------
Machinery & Heavy Equipment - 0.5%
Axcelis Technologies, Inc.(b) 87,500 638,750
-----------
Manufacturing - 7.2%
Actuant Corp. - Class A(b) 16,200 727,704
Aptargroup, Inc. 25,100 1,304,698
Briggs & Stratton Corp. 55,500 2,020,755
Crown Holdings, Inc.(b) 111,000 1,727,160
Fleetwood Enterprises, Inc.(b) 152,000 1,322,400
K2, Inc.(b) 105,000 1,443,750
Lennox International 37,600 824,192
-----------
9,370,659
-----------
Medical & Medical Services - 2.1%
Apria Healthcare Group, Inc.(b)(c) 21,151 678,947
LifePoint Hospitals, Inc.(b) 45,500 1,994,720
-----------
2,673,667
-----------
Medical Instruments & Supplies - 4.3%
DJ Orthopedics, Inc.(b) 99,100 2,482,455
Sybron Dental Specialties, Inc.(b) 64,900 2,329,910
Symmetry Medical, Inc.(b) 41,500 789,330
-----------
5,601,695
-----------
Metal & Mining - 1.6%
Alpha Natural Resources, Inc.(b) 29,500 845,765
Foundation Coal Holdings, Inc. 52,100 1,224,871
-----------
2,070,636
-----------
Motor Vehicles - 0.5%
Oshkosh Truck Corp. 7,900 647,721
-----------
Oil & Gas - 6.8%
AGL Resources, Inc. 47,400 1,655,682
Airgas, Inc. 24,300 580,527
Energen Corp. 26,900 1,791,540
Forest Oil Corp.(b) 46,100 1,867,050
Vintage Petroleum, Inc. 38,400 1,208,064
Whiting Petroleum Corp.(b) 42,300 1,724,994
-----------
8,827,857
-----------
Pharmaceuticals - 0.8%
Par Pharmaceutical Cos., Inc.(b) 32,000 1,070,080
-----------
SEE ACCOMPANYING NOTES TO FINANCIAL STATEMENTS.
64
                                BLACKROCK FUNDS
                            STATEMENT OF NET ASSETS
                  SMALL CAP VALUE EQUITY PORTFOLIO (CONCLUDED)


AS OF MARCH 31, 2005 (UNAUDITED)


                                         NUMBER
                                       OF SHARES       VALUE
                                      ----------- --------------
COMMON STOCKS (Continued)
Publishing & Printing - 2.3%
  Banta Corp.                            42,700    $  1,827,560
  PRIMEDIA, Inc.(b)                     115,303         501,568
  Scholastic Corp.(b)                    17,900         660,331

                                                   ------------
                                                      2,989,459
                                                   ------------
Real Estate - 3.0%
  HomeBanc Corp.                         56,800         502,112
  Sunstone Hotel Investors, Inc.         84,851       1,820,054
  U-Store-It Trust                       87,500       1,522,500

                                                   ------------
                                                      3,844,666
                                                   ------------
Restaurants - 1.1%
  CKE Restaurants, Inc.(b)               43,500         689,475
  Triarc Cos. - Class A                  50,000         710,000

                                                   ------------
                                                      1,399,475
                                                   ------------
Retail Merchandising - 12.1%
  AnnTaylor Stores Corp.(b)(c)           64,500       1,650,555
  Handleman Co.                         127,700       2,421,192
  Jarden Corp.(b)                        50,400       2,312,352
  Jo-Ann Stores, Inc.(b)                 31,400         882,026
  Prestige Brands Holdings, Inc.(b)      93,100       1,643,215
  RC2 Corp.(b)                           22,200         754,800
  Regis Corp.                            56,800       2,324,824
  Saks, Inc.(b)                         126,800       2,288,740
  The Sports Authority, Inc.(b)          51,700       1,421,750

                                                   ------------
                                                     15,699,454
                                                   ------------
Soaps & Cosmetics - 0.6%
  NU Skin Enterprises, Inc.              32,000         720,320
                                                   ------------
Transportation - 2.3%
  Laidlaw International, Inc.(b)        140,500       2,922,400
                                                   ------------
TOTAL COMMON STOCKS
  (Cost $107,493,297)                               124,796,972
                                                   ------------


SHORT TERM INVESTMENTS - 3.8%
  Galileo Money Market  2,195,940       2,195,940
Fund
  Institutional Money   2,766,280       2,766,280
Market Trust(d)

                                        ---------
TOTAL SHORT TERM INVESTMENTS
  (Cost $4,962,220)                     4,962,220
                                     ------------


TOTAL INVESTMENTS IN
SECURITIES -  99.9%
  (Cost $112,455,517(a))   129,759,192
OTHER ASSETS IN EXCESS
OF
  LIABILITIES - 0.1%
  (Including $2,766,280
of payable
  upon return of                99,425
                           -----------
securities loaned)
NET ASSETS - 100.0%
  (Applicable to 451,065
BlackRock
  shares, 4,609,598
Institutional
  shares, 222,461
Service shares,
  2,346,622 Investor A
shares,
  1,167,063 Investor B
shares and
  518,314 Investor C      $129,858,618
                          ============
shares)


                                            VALUE
                                         -----------
NET ASSET VALUE, OFFERING AND
  REDEMPTION PRICE PER
  BLACKROCK SHARE
     ($6,463,093/451,065)                $ 14.33
                                         =======
NET ASSET VALUE, OFFERING
  AND REDEMPTION PRICE PER
  INSTITUTIONAL SHARE
  ($66,031,086/4,609,598)                $ 14.32
                                         =======
NET ASSET VALUE, OFFERING
  AND REDEMPTION PRICE
  PER SERVICE SHARE
     ($3,145,071/222,461)                $ 14.14
                                         =======
NET ASSET VALUE AND
  REDEMPTION PRICE PER
  INVESTOR A SHARE
  ($32,975,703/2,346,622)                $ 14.05
                                         =======
MAXIMUM OFFERING PRICE
  PER INVESTOR A SHARE
           ($14.05/0.955)                $ 14.71
                                         =======
NET ASSET VALUE, OFFERING
  AND REDEMPTION PRICE
  (subject to a maximum contingent
  deferred sales charge of 4.5%)
  PER INVESTOR B SHARE
  ($14,709,137/1,167,063)                $ 12.60
                                         =======
NET ASSET VALUE, OFFERING
  AND REDEMPTION PRICE
  (subject to a maximum contingent
  deferred sales charge of 1.0%)
  PER INVESTOR C SHARE
     ($6,534,528/518,314)                $ 12.61
                                         =======


- -------------------

 (a) Cost for Federal income tax purposes is $112,588,188. The
     gross unrealized appreciation (depreciation) on a tax basis is as
     follows:
      Gross unrealized appreciation                                      $19,735,586
      Gross unrealized depreciation                                       (2,564,582)
                                                                         -----------
                                                                         $17,171,004
                                                                         ===========


     (b) Non-income producing security.
     (c) Total or partial securities on loan.
 (d) Securities purchased with the cash proceeds from securities loaned.


SEE ACCOMPANYING NOTES TO FINANCIAL STATEMENTS.
                                                                              65
                                BLACKROCK FUNDS
                            STATEMENT OF NET ASSETS
                        SMALL CAP CORE EQUITY PORTFOLIO


AS OF MARCH 31, 2005 (UNAUDITED)


                                            NUMBER
                                          OF SHARES      VALUE
                                         ----------- ------------
COMMON STOCKS - 97.4%
Aerospace - 5.3%
  Aviall, Inc.(b)                        18,350       $  513,800
  DRS Technologies, Inc.(b)               9,250          393,125
  Orbital Sciences Corp.(b)              12,750          123,420
  The Titan Corp.(b)                     15,950          289,652

                                                      ----------
                                                       1,319,997
                                                      ----------
Banks - 7.5%
  Berkshire Hills Bancorp, Inc.           6,650          224,438
  Central Pacific Financial Corp.         9,650          324,722
  Gold Banc Corp., Inc.                  20,700          290,421
  Main Street Banks, Inc.                10,150          268,772
  NewAlliance Bancshares, Inc.           21,350          298,900
  Oriental Financial Group, Inc.         10,945          256,332
  WSFS Financial Corp.                    3,900          204,984

                                                      ----------
                                                       1,868,569
                                                      ----------
Broadcasting - 3.2%
  Alliance Atlantis Communications,
    Inc.(b)                               9,400          232,753
  Cumulus Media, Inc. - Class A(b)       14,900          212,326
  Gray Communications, Inc.              11,750          170,022
  Spanish Broadcasting Systems, Inc. -
    Class A(b)                           18,900          193,914

                                                      ----------
                                                         809,015
                                                      ----------
Business Services - 4.8%
  Digitas, Inc.(b)                       42,000          424,200
  Labor Ready, Inc.(b)                   15,000          279,750
  Navigant Consulting, Inc.(b)           13,500          367,605
  Watson Wyatt & Co. Holdings             4,750          129,200

                                                      ----------
                                                       1,200,755
                                                      ----------
Chemicals - 1.0%
  Cytec Industries, Inc.(c)               4,650          252,262
                                                      ----------
Computer Software & Services - 4.6%
  Ascential Software Corp.(b)            17,000          315,010
  Borland Software Corp.(b)              19,450          157,934
  EarthLink, Inc.(b)                      7,400           66,600
  Progress Software(b)                   12,900          338,238
  TIBCO Software, Inc.(b)                35,450          264,102

                                                      ----------
                                                       1,141,884
                                                      ----------
Construction - 1.0%
  Chicago Bridge & Iron Co. NV - ADR      5,750          253,172
                                                      ----------
Electronics - 1.3%
  Cubic Corp.                             9,400          178,036
  TTM Technologies, Inc.(b)              15,000          156,900

                                                      ----------
                                                         334,936
                                                      ----------
Energy & Utilities - 1.2%
  Magnum Pete, Inc.(b)                   17,900          288,369
                                                      ----------
Entertainment & Leisure - 7.0%
  Gaylord Entertainment Co.(b)            9,150          369,659
  Kerzner International Ltd.(b)           6,850          419,426
  MTR Gaming Group, Inc.(b)              26,700          331,080
  Orient-Express Hotels Ltd. - Class A   14,700          383,670
  Scientific Games Corp. - Class A(b)     9,150          209,078

                                                      ----------
                                                       1,712,913
                                                      ----------
Food & Agriculture - 1.5%
  John B. Sanfilippo & Son, Inc.(b)       5,800          142,564


                                            NUMBER
                                          OF SHARES      VALUE
                                         ----------- ------------
COMMON STOCKS (Continued)
Food & Agriculture (Continued)
  NBTY, Inc.(b)                           9,750       $  244,628

                                                      ----------
                                                         387,192
                                                      ----------
Furniture - 0.8%
  Aaron Rents, Inc.                       9,637          192,740
                                                      ----------
Insurance - 3.0%
  Allmerica Financial Corp.(b)            8,850          318,158
  Max Re Capital Ltd.                     9,500          223,535
  PXRE Group Ltd.                         8,450          216,742

                                                      ----------
                                                         758,435
                                                      ----------
Machinery & Heavy Equipment - 0.9%
  Albany International Corp. - Class A    7,600          234,688
                                                      ----------
Manufacturing - 6.3%
  Aptargroup, Inc.                        5,750          298,885
  Fleetwood Enterprises, Inc.(b)         14,900          129,630
  Hexel Corp.(b)                         16,250          252,039
  K2, Inc.(b)                            18,800          258,500
  Paxar Corp.(b)                         12,950          276,353
  Roper Industries, Inc.                  5,600          366,800

                                                      ----------
                                                       1,582,207
                                                      ----------
Medical & Medical Services - 4.2%
  Accredo Health, Inc.(b)                 5,650          250,915
  Digirad Corp.(b)                       33,850          262,338
  Orchid Biosciences, Inc.(b)            17,400          204,624
  Pediatrix Medical Group, Inc.(b)        3,700          253,783
  VCA Antech, Inc.(b)                     3,450           69,794

                                                      ----------
                                                       1,041,454
                                                      ----------
Medical Instruments & Supplies - 9.1%
  Charles River Laboratories
    International, Inc.(b)                5,710          268,598
  DJ Orthopedics, Inc.(b)                18,450          462,172
  Hologic, Inc.(b)                        6,600          210,376
  IntraLase Corp.(b)                     15,550          260,307
  LCA-Vision, Inc.                       11,100          369,630
  Sybron Dental Specialties, Inc.(b)      7,250          260,275
  Symmetry Medical, Inc.(b)              12,550          238,701
  Wright Medical Group, Inc.(b)           8,650          207,600

                                                      ----------
                                                       2,277,659
                                                      ----------
Oil & Gas - 7.9%
  Airgas, Inc.                           11,750          280,708
  Energen Corp.                           3,100          206,459
  Energy Partners Ltd.(b)                 9,750          253,208
  KCS Energy, Inc.(b)                    19,150          294,144
  Range Resources Corp.                  10,450          244,112
  TETRA Technologies, Inc.(b)             8,300          236,052
  Tidewater, Inc.                         5,300          205,958
  Vintage Petroleum, Inc.                 7,850          246,961

                                                      ----------
                                                       1,967,602
                                                      ----------
Personal Services - 2.3%
  Laureate Education, Inc.(b)            13,650          584,084
                                                      ----------
Pharmaceuticals - 2.4%
  Angiotech Pharmaceuticals, Inc.(b)      5,000           76,750
  Nabi Biopharmaceuticals(b)              5,750           71,760
  Par Pharmaceutical Cos., Inc.(b)        7,150          239,096

SEE ACCOMPANYING NOTES TO FINANCIAL STATEMENTS.
66
                                BLACKROCK FUNDS
                            STATEMENT OF NET ASSETS
                  SMALL CAP CORE EQUITY PORTFOLIO (CONTINUED)


AS OF MARCH 31, 2005 (UNAUDITED)


                                             NUMBER
                                           OF SHARES      VALUE
                                          ----------- -------------
COMMON STOCKS (Continued)
Pharmaceuticals (Continued)
  Valeant Pharmaceuticals International       9,150    $   206,058

                                                       -----------
                                                           593,664
                                                       -----------
Publishing & Printing - 0.7%
  Banta Corp.                                 4,300        184,040
                                                       -----------
Real Estate - 2.0%
  Eagle Hospitality Properties Trust,
    Inc.                                     27,000        242,190
  LaSalle Hotel Properties                    9,200        267,260

                                                       -----------
                                                           509,450
                                                       -----------
Restaurants - 2.4%
  Ruby Tuesday, Inc.                         12,800        310,912
  Texas Roadhouse, Inc.(b)                    6,150        172,692
  Triarc Cos. - Class A                       9,050        128,510

                                                       -----------
                                                           612,114
                                                       -----------
Retail Merchandising - 7.8%
  99 Cents Only Stores(b)                    11,800        155,406
  Brookstone, Inc.(b)                         9,550        154,901
  Handleman Co.                              12,050        228,468
  J. Jill Group, Inc.(b)                     28,600        393,536
  Jarden Corp.(b)                            10,450        479,446
  Jos. A. Bank Clothiers, Inc.(b)(c)         10,000        293,000
  The Sports Authority, Inc.(b)               9,100        250,250

                                                       -----------
                                                         1,955,007
                                                       -----------
Semiconductors & Related Devices - 3.8%
  Integrated Device Technology, Inc.(b)      19,700        236,991
  O2Micro International Ltd.(b)              33,650        346,258
  Rudolph Technologies, Inc.(b)              24,150        363,699

                                                       -----------
                                                           946,948
                                                       -----------
Soaps & Cosmetics - 0.7%
  NU Skin Enterprises, Inc.(c)                8,150        183,456
                                                       -----------
Telecommunications - 1.3%
  Arris Group, Inc.(b)                       48,550        335,480
                                                       -----------
Transportation - 2.2%
  Landstar System, Inc.(b)                    8,900        291,475
  SCS Transportation, Inc.(b)                13,600        252,824

                                                       -----------
                                                           544,299
                                                       -----------
Waste Management - 1.2%
  URS Corp.(b)                               10,050        288,938
                                                       -----------
TOTAL COMMON STOCKS
  (Cost $23,069,206)                                    24,361,329
                                                       -----------


                                                  PAR/SHARES
                                       MATURITY     (000)        VALUE
                                      ---------- ----------- ------------
SHORT TERM INVESTMENTS - 13.5%
  Morgan Stanley, Floating Rate
    Notes
    2.94%(c)(d)                       11/14/05      $  178    $  178,182
  Galileo Money Market Fund                            983       982,697
  Institutional Money Market Trust(e)                2,209     2,208,558

                                                              ----------
TOTAL SHORT TERM INVESTMENTS
  (Cost $3,369,437)                                            3,369,437
                                                              ----------


TOTAL INVESTMENTS IN SECURITIES -  110.9%
  (Cost $26,438,643(a))                  27,730,766
LIABILITIES IN EXCESS OF
  OTHER ASSETS -  (10.9)%
  (Including $2,386,740 of payable
  upon return of securities loaned)      (2,733,589)
                                         ----------
NET ASSETS - 100.0%
  (Applicable to 365,640
  Institutional shares, 307 Service
  shares, 416,431 Investor A
  shares, 222,905 Investor B
  shares and 556,885 Investor C
  shares)                               $24,997,177
                                        ===========

SEE ACCOMPANYING NOTES TO FINANCIAL STATEMENTS.
                                                                              67
                                BLACKROCK FUNDS
                            STATEMENT OF NET ASSETS
                  SMALL CAP CORE EQUITY PORTFOLIO (CONCLUDED)


AS OF MARCH 31, 2005 (UNAUDITED)


                                               VALUE
                                            -----------
NET ASSET VALUE, OFFERING
  AND REDEMPTION PRICE PER
  INSTITUTIONAL SHARE
  ($5,908,848/365,640)                      $ 16.16
                                            =======
NET ASSET VALUE, OFFERING
  AND REDEMPTION PRICE PER
  SERVICE SHARE
          ($4,966/307)(f)                   $ 16.15
                                            =======
NET ASSET VALUE AND REDEMPTION
  PRICE PER INVESTOR A SHARE
  ($6,691,127/416,431)                      $ 16.07
                                            =======
MAXIMUM OFFERING PRICE PER
  INVESTOR A SHARE
       ($16.07/0.9425)                      $ 17.05
                                            =======
NET ASSET VALUE, OFFERING
  AND REDEMPTION PRICE
  (subject to a maximum contingent
  deferred sales charge of 4.5%)
  PER INVESTOR B SHARE
  ($3,542,996/222,905)                      $ 15.89
                                            =======
NET ASSET VALUE, OFFERING
  AND REDEMPTION PRICE
  (subject to a maximum contingent
  deferred sales charge of 1.0%)
  PER INVESTOR C SHARE
  ($8,849,240/556,885)                      $ 15.89
                                            =======


- -------------------

 (a) Cost for Federal income tax purposes is $26,529,319. The gross
     unrealized appreciation (depreciation) on a tax basis is as
     follows:
      Gross unrealized appreciation                                    $1,940,202
      Gross unrealized depreciation                                      (738,755)
                                                                       ----------
                                                                       $1,201,447
                                                                       ==========

     (b) Non-income producing security.
     (c) Total or partial securities on loan.
     (d) Rates shown are the rates as of March 31, 2005.
 (e) Securities purchased with the cash proceeds from securities loaned.
  (f) Exact net assets and shares outstanding at March 31, 2005 were $4,966.28
       and 307.441, respectively.

SEE ACCOMPANYING NOTES TO FINANCIAL STATEMENTS.
68
                                BLACKROCK FUNDS
                            STATEMENT OF NET ASSETS
                       SMALL CAP GROWTH EQUITY PORTFOLIO


AS OF MARCH 31, 2005 (UNAUDITED)


                                             NUMBER
                                           OF SHARES      VALUE
                                          ----------- -------------
COMMON STOCKS - 98.1%
Aerospace - 1.5%
  TIMCO Aviation Services, Inc.(b)               1,750 $       228
  The Titan Corp.(b)                         437,000     7,935,920

                                                       -----------
                                                         7,936,148
                                                       -----------
Air Transportation - 0.8%
  ExpressJet Holdings, Inc.(b)               370,600     4,228,546
                                                       -----------
Broadcasting - 3.0%
  Radio One, Inc. - Class D(b)               476,300     7,025,425
  Spanish Broadcasting Systems, Inc. -
    Class A(b)                               769,000     7,889,940

                                                       -----------
                                                        14,915,365
                                                       -----------
Business Services - 16.1%
  CDI Corp.                                  412,400     9,126,411
  DiamondCluster International, Inc.(b)      501,100     8,067,710
  Digitas, Inc.(b)                        1,133,710     11,450,471
  Global Payments, Inc.                     115,300      7,435,697
  Hiedrick & Struggles International,
    Inc.(b)(c)                              246,234      9,054,023
  Hudson Highland Group, Inc.(b)            360,800      6,166,072
  Labor Ready, Inc.(b)(c)                   175,304      3,269,420
  MPS Group, Inc.(b)                        621,011      6,526,826
  Navigant Consulting, Inc.(b)              476,800     12,983,264
  Watson Wyatt & Co. Holdings               374,300     10,180,960

                                                       -----------
                                                        84,260,854
                                                       -----------
Chemicals - 1.1%
  Agrium, Inc.                              329,300      6,009,725
                                                       -----------
Computer Software & Services - 13.5%
  Advanced Digital Information Corp.(b)     810,300      6,644,460
  Ascential Software Corp.(b)               431,700      7,999,401
  The BISYS Group, Inc.(b)                  376,598      5,905,057
  Borland Software Corp.(b)(c)            1,083,500      8,798,020
  Iomega Corp.(b)                         1,387,200      5,951,088
  Lawson Software(b)                        583,121      3,440,414
  McData Corp. - Class A(b)               1,959,578      7,387,609
  Progress Software(b)                      254,100      6,662,502
  SkillSoft PLC - ADR(b)                  1,053,530      3,876,990
  SonicWALL, Inc.(b)                      1,571,400      7,998,426
  Take-Two Interactive Software,
    Inc.(b)                                  90,900      3,554,190
  Verity, Inc.(b)                           264,700      2,501,415

                                                       -----------
                                                        70,719,572
                                                       -----------
Construction - 1.1%
  Jacobs Engineering Group, Inc.(b)(c)      111,100      5,768,312
                                                       -----------
Electronics - 1.1%
  Integrated Circuit Systems(b)             309,100      5,909,992
                                                       -----------
Entertainment & Leisure - 5.0%
  Argosy Gaming Co.(b)                      101,006      4,638,196
  Orient-Express Hotels Ltd. - Class A      161,200      4,207,320
  Scientific Games Corp. - Class
    A(b)(c)                                 171,000      3,907,350
  Vail Resorts, Inc.(b)                     321,600      8,120,400
  World Wrestling Entertainment, Inc.       448,000      5,376,000

                                                       -----------
                                                        26,249,266
                                                       -----------
Finance - 1.4%
  Affiliated Managers Group, Inc.(b)         51,900      3,219,357
  International Securities Exchange,
    Inc. - Class A(b)                         7,400        192,400


                                             NUMBER
                                           OF SHARES      VALUE
                                          ----------- -------------
COMMON STOCKS (Continued)
Finance (Continued)
  Wright Express Corp.(b)                   233,100    $ 3,986,010

                                                       -----------
                                                         7,397,767
                                                       -----------
Insurance - 0.4%
  Platinum Underwriters Holdings Ltd.        77,100      2,289,870
                                                       -----------
Machinery & Heavy Equipment - 1.7%
  Bucyrus International, Inc. - Class A     121,712      4,754,071
  Flowserve Corp.(b)                        166,400      4,304,768

                                                       -----------
                                                         9,058,839
                                                       -----------
Manufacturing - 3.0%
  Actuant Corp. - Class A(b)                 85,500      3,840,660
  Quanex Corp.                              131,400      7,006,248
  The Warnaco Group, Inc.(b)                200,800      4,827,232

                                                       -----------
                                                        15,674,140
                                                       -----------
Medical & Medical Services - 9.4%
  Accredo Health, Inc.(b)                   252,800     11,226,848
  CryoLife(b)                               875,000      5,416,250
  CTI Molecular Imaging, Inc.(b)            530,800     10,759,316
  Digene Corp.(b)                           174,800      3,627,100
  Digirad Corp.(b)                          371,400      2,878,350
  Exact Sciences Corp.(b)                   647,900      2,313,003
  Noven Pharmaceuticals, Inc.(b)            257,100      4,360,416
  Pediatrix Medical Group, Inc.(b)          105,300      7,222,527
  TLC Vision Corp.(b)                       154,380      1,461,979

                                                       -----------
                                                        49,265,789
                                                       -----------
Medical Instruments & Supplies - 6.5%
  Advanced Medical Optics, Inc.(b)(c)       186,800      6,764,027
  Bruker BioSciences Corp.(b)               435,700      1,533,664
  Charles River Laboratories
    International, Inc.(b)                  132,188      6,218,124
  Hologic, Inc.(b)                          346,075     11,031,141
  IntraLase Corp.(b)                        128,300      2,147,742
  Wright Medical Group, Inc.(b)             267,734      6,425,616

                                                       -----------
                                                        34,120,314
                                                       -----------
Metal & Mining - 2.6%
  Alpha Natural Resources, Inc.(b)          181,600      5,206,472
  Massey Energy Co.                         213,400      8,544,536

                                                       -----------
                                                        13,751,008
                                                       -----------
Motor Vehicles - 0.4%
  Wabash National Corp.                      86,700      2,115,480
                                                       -----------
Oil & Gas - 6.8%
  Airgas, Inc.                              434,100     10,370,649
  Energy Partners Ltd.(b)                   163,000      4,233,110
  KCS Energy, Inc.(b)(c)                    292,300      4,489,728
  Oceaneering International, Inc.(b)        137,900      5,171,250
  Remington Oil & Gas Corp. - Class
    B(b)                                    165,143      5,205,307
  TETRA Technologies, Inc.(b)               218,300      6,208,452

                                                       -----------
                                                        35,678,496
                                                       -----------
Personal Services - 3.8%
  Corinthian Colleges, Inc.(b)(c)           350,900      5,516,148
  Educate, Inc.(b)                           51,400        712,918
  Education Management Corp.(b)              63,600      1,777,620
  Laureate Education, Inc.(b)               275,500     11,788,645

                                                       -----------
                                                        19,795,331
                                                       -----------

SEE ACCOMPANYING NOTES TO FINANCIAL STATEMENTS.
                                                                              69
                                BLACKROCK FUNDS
                            STATEMENT OF NET ASSETS
                 SMALL CAP GROWTH EQUITY PORTFOLIO (CONTINUED)


AS OF MARCH 31, 2005 (UNAUDITED)


                                              NUMBER
                                            OF SHARES       VALUE
                                           ----------- --------------
COMMON STOCKS (Continued)
Pharmaceuticals - 2.1%
  Nabi Biopharmaceuticals(b)                 532,300    $  6,643,104
  Nektar Therapeutics(b)                     181,900       2,535,686
  Par Pharmaceutical Cos., Inc.(b)            58,863       1,968,379

                                                        ------------
                                                          11,147,169
                                                        ------------
Publishing & Printing - 1.2%
  Playboy Enterprises, Inc. - Class B(b)     505,003       6,514,539
                                                        ------------
Restaurants - 1.9%
  AFC Enterprises, Inc.(b)                   263,600       6,724,436
  RARE Hospitality International,
    Inc.(b)                                   38,650       1,193,512
  Texas Roadhouse, Inc.(b)                    78,300       2,198,664

                                                        ------------
                                                          10,116,612
                                                        ------------
Retail Merchandising - 8.2%
  99 Cents Only Stores(b)                    406,100       5,348,337
  Central Garden & Pet Co.(b)                 37,300       1,635,978
  Hot Topic, Inc.(b)                         317,700       6,941,745
  J. Jill Group, Inc.(b)                     492,200       6,772,672
  Reebok International Ltd.(c)               101,700       4,505,310
  Too, Inc.(b)                               459,000      11,323,530
  West Marine, Inc.(b)                       308,500       6,558,710

                                                        ------------
                                                          43,086,282
                                                        ------------
Semiconductors & Related Devices - 2.8%
  Microsemi Corp.(b)                         213,300       3,474,657
  O2Micro International Ltd.(b)              460,000       4,733,400
  Rudolph Technologies, Inc.(b)              384,930       5,797,046

                                                        ------------
                                                          14,005,103
                                                        ------------
Telecommunications - 1.7%
  ADTRAN, Inc.                               368,200       6,495,048
  Syniverse Holdings, Inc.(b)                179,300       2,474,340

                                                        ------------
                                                           8,969,388
                                                        ------------
Transportation - 1.0%
  Werner Enterprises, Inc.                   231,800       4,503,874
                                                        ------------
TOTAL COMMON STOCKS
  (Cost $433,397,062)                                    513,487,781
                                                        ------------
WARRANTS - 0.0%
  MicroStrategy, Inc. (expiring
    06/24/07)                                    638             105
  TIMCO Aviation Services, Inc.
    (expiring 02/28/07)(d)                       692               0

                                                        ------------
TOTAL WARRANTS
  (Cost $6)                                                      105
                                                        ------------


                                                  PAR/SHARES
                                       MATURITY     (000)        VALUE
                                      ---------- ----------- -------------
SHORT TERM INVESTMENTS - 6.0%
  Federal Home Loan Bank, Discount
    Notes
    2.55%                             04/01/05     $ 2,500    $ 2,500,000
  Morgan Stanley, Floating Rate
    Notes
    2.94%(e)(f)                       11/14/05       3,146      3,146,414
  Galileo Money Market Fund                          9,612      9,612,051
  Institutional Money Market Trust(e)               16,203     16,203,152

                                                              -----------
TOTAL SHORT TERM INVESTMENTS
  (Cost $31,461,617)                                           31,461,617
                                                              -----------


TOTAL INVESTMENTS IN SECURITIES -  104.1%
  (Cost $464,858,685(a))                 544,949,503
LIABILITIES IN EXCESS OF
  OTHER ASSETS -  (4.1)%
  (Including $19,349,566 of payable
  upon return of securities loaned)      (21,630,422)
                                         -----------
NET ASSETS - 100.0%
  (Applicable to 19,749,489
  Institutional shares, 1,920,977
  Service shares, 9,790,116
  Investor A shares, 1,458,738
  Investor B shares and 1,086,808
  Investor C shares)                    $523,319,081
                                        ============

SEE ACCOMPANYING NOTES TO FINANCIAL STATEMENTS.
70
                                BLACKROCK FUNDS
                            STATEMENT OF NET ASSETS
                 SMALL CAP GROWTH EQUITY PORTFOLIO (CONCLUDED)


AS OF MARCH 31, 2005 (UNAUDITED)


                                            VALUE
                                         -----------
NET ASSET VALUE, OFFERING
  AND REDEMPTION PRICE
  PER INSTITUTIONAL SHARE
  ($314,246,553/19,749,489)              $ 15.91
                                         =======
NET ASSET VALUE, OFFERING
  AND REDEMPTION PRICE
  PER SERVICE SHARE
    ($29,273,078/1,920,977)              $ 15.24
                                         =======
NET ASSET VALUE AND REDEMPTION
  PRICE PER INVESTOR A SHARE
   ($145,394,809/9,790,116)              $ 14.85
                                         =======
MAXIMUM OFFERING PRICE
  PER INVESTOR A SHARE
            ($14.85/0.9425)              $ 15.76
                                         =======
NET ASSET VALUE, OFFERING
  AND REDEMPTION PRICE
  (subject to a maximum contingent
  deferred sales charge of 4.5%)
  PER INVESTOR B SHARE
    ($19,713,107/1,458,738)              $ 13.51
                                         =======
NET ASSET VALUE, OFFERING
  AND REDEMPTION PRICE
  (subject to a maximum contingent
  deferred sales charge of 1.0%)
  PER INVESTOR C SHARE
    ($14,691,534/1,086,808)              $ 13.52
                                         =======


- -------------------

 (a) Cost for Federal income tax purposes is $466,525,795. The
     gross unrealized appreciation (depreciation) on a tax basis is as
     follows:
      Gross unrealized appreciation                                      $100,359,699
      Gross unrealized depreciation                                      (21,935,991)
                                                                         ------------
                                                                         $78,423,708
                                                                         ============

     (b) Non-income producing security.
     (c) Total or partial securities on loan.
 (d) Security valued at fair value as determined in good faith by or under the
       direction of the Trustees.  As of March 31, 2005, this security had a
       total market value of $0 which represents less than 0.01% of net assets.

 (e) Securities purchased with the cash proceeds from securities loaned.
  (f) Rates shown are the rates as of March 31, 2005.

SEE ACCOMPANYING NOTES TO FINANCIAL STATEMENTS.
                                                                              71
                                BLACKROCK FUNDS
                            STATEMENT OF NET ASSETS
              GLOBAL SCIENCE & TECHNOLOGY OPPORTUNITIES PORTFOLIO


AS OF MARCH 31, 2005 (UNAUDITED)


                           NUMBER
                         OF SHARES      VALUE
                        ----------- ------------
COMMON STOCKS - 96.9%
Germany - 1.2%
Computer Software & Services - 1.2%
  SAP AG - ADR              7,300    $  292,584
                                     ----------
India - 1.3%
Computer Software & Services - 1.3%
  Satyam Computer         33,800        316,210
                                     ----------
Services Ltd.
Indonesia - 0.7%
Telecommunications - 0.7%
  PT Telekomunikasi        6,930        129,867
                                     ----------
Indonesia - ADR
Japan - 2.0%
Machinery & Heavy Equipment - 1.3%
  Hitachi Construction
Machinery Co.
    Ltd.                  11,000        152,103
  Komatsu Ltd.            20,000        150,711

                                     ----------
                                        302,814
                                     ----------
Manufacturing - 0.7%
  Shimadzu Corp.          27,000        161,556
                                     ----------
                                        464,370
                                     ----------
Russia - 0.8%
Telecommunications - 0.8%
  Mobile Telesystems -     5,600        197,064
                                     ----------
ADR
South Korea - 2.3%
Electronics - 2.3%
  Samsung Electronics      1,100        543,772
                                     ----------
Co. Ltd.
Taiwan - 3.6%
Computer & Office Equipment - 1.7%
  Lite-On Technology    196,928         211,892
Corp.
  Quanta Computer, Inc. 123,317         207,055

                                     ----------
                                        418,947
                                     ----------
Electronics - 1.1%
  Hon Hai Precision      56,099         249,281
                                     ----------
Industry Co. Ltd.
Semiconductors & Related Devices -
0.8%
  Taiwan Semiconductor
    Manufacturing Co.   111,621         182,457
                                     ----------
Ltd.
                                        850,685
                                     ----------
United Kingdom - 0.8%
Aerospace - 0.8%
  Meggitt PLC            35,900         178,581
                                     ----------
United States - 84.2%
Aerospace - 2.6%
  Goodrich Corp.          9,700         371,413
  Raytheon Co.            6,300         243,810

                                     ----------
                                        615,223
                                     ----------
Business Services - 2.9%
  Accenture Ltd.(b)      10,900         263,235
  Aquantive, Inc.(b)     15,400         170,478
  Global Payments, Inc.   3,800         245,062

                                     ----------
                                        678,775
                                     ----------
Computer & Office Equipment - 8.6%
  American Power          4,600         120,106
Conversion Corp.
  Apple Computer,         6,000         250,020
Inc.(b)
  Cisco Systems,          8,900         159,221
Inc.(b)
  Computer Associates
International,
    Inc.                  9,731         263,710


                           NUMBER
                         OF SHARES      VALUE
                        ----------- ------------
COMMON STOCKS (Continued)
United States (Continued)
Computer & Office Equipment (Continued)
  Dell, Inc.(b)           9,200      $  353,464
  Hewlett-Packard Co.    10,800         236,952
  International Business Machines
    Corp.                 4,600         420,348
  NCR Corp.(b)            7,500         253,050

                                     ----------
                                      2,056,871
                                     ----------
Computer Software &
Services - 19.7%
  Adobe Systems, Inc.(c)  4,600         308,982
  Ask Jeeves, Inc.(b)(c)  6,000         168,480
  Cadence Design         14,200         212,290
Systems, Inc.(b)
  Citrix Systems,         8,300         197,706
Inc.(b)(c)
  Compuware Corp.(b)
                         35,400         254,880
  DIGI International, Inc.(b)
                          9,300         127,596
  eBay, Inc.(b)(c)        3,600         134,136
  Electronic Arts,        6,700         346,926
Inc.(b)
  EMC Corp.(b)
                         20,100         247,632
  Informatica Corp.(b)
                         26,300         217,501
  iVillage, Inc.(b)      30,000         182,700
  Juniper Networks, Inc.(11,100         244,866
  Microsoft Corp.        19,900         480,983
  OpenTV Corp.(b)        51,100         145,124
  Oracle Corp.(b)        19,500         243,360
  Seagate Technology(b)  12,300         240,465
  Siebel Systems, Inc.(b)19,900         181,687
  Symantec Corp.(b)(c)   11,200         238,896
  TIBCO Software,        16,100         119,945
Inc.(b)
  Yahoo!, Inc.(b)        10,200         345,780

                                     ----------
                                      4,639,935
                                     ----------
Electronics - 5.9%
  Agilent Technologies,   8,500         188,700
Inc.(b)(c)
  Coherent, Inc.(b)       4,300         145,168
  Intel Corp.            17,300         401,879
  Intersil Corp. - Class A
                         12,300         213,036
  National Semiconductor Corp.(c)
                         12,500         257,625
  TTM Technologies, Inc.(17,600         184,096

                                     ----------
                                      1,390,504
                                     ----------
Entertainment & Leisure - 0.7%
  WMS Industries, Inc.(b)(5,800         163,328
                                     ----------
Insurance - 0.8%
  Aetna, Inc.             1,100          82,445
  WellPoint, Inc.(b)
                            800         100,280

                                     ----------
                                        182,725
                                     ----------
Manufacturing - 0.8%
  Powerwave              23,100         178,794
                                     ----------
Technologies, Inc.(b)
Measuring & Controlling
Devices - 1.1%
  KLA-Tencor Corp.(b)(c)
                          5,800         266,858
                                     ----------
Medical & Medical Services - 6.4%
  Biomet, Inc.            6,500         235,950
  Caremark Rx, Inc.(b)    3,300         131,274
  Covance, Inc.(b)        2,900         138,069
  Express Scripts,          900          78,471
Inc.(b)
  LifePoint Hospitals,    1,600          70,144
Inc.(b)
  Medco Health            4,200         208,194
Solutions, Inc.(b)
  Millipore Corp.(b)      3,200         138,880
  Noven Pharmaceuticals, Inc.(b)
                          7,100         120,416

SEE ACCOMPANYING NOTES TO FINANCIAL STATEMENTS.
72
                                BLACKROCK FUNDS
                            STATEMENT OF NET ASSETS
        GLOBAL SCIENCE & TECHNOLOGY OPPORTUNITIES PORTFOLIO (CONTINUED)


AS OF MARCH 31, 2005 (UNAUDITED)


                           NUMBER
                         OF SHARES      VALUE
                        ----------- -------------
COMMON STOCKS (Continued)
United States (Continued)
Medical & Medical Services (Continued)
  Triad Hospitals,        3,600      $   180,360
Inc.(b)
  UnitedHealth Group,     2,100          200,298
Inc.

                                     -----------
                                       1,502,056
                                     -----------
Medical Instruments & Supplies -
5.4%
  Alcon, Inc.             2,700          241,083
  Bausch & Lomb, Inc.     1,000           73,300
  Boston Scientific       5,500          161,095
Corp.(b)
  C.R. Bard, Inc.         2,300          156,584
  Cytyc Corp.(b)(c)       6,600          151,866
  DENTSPLY                2,300          125,143
International, Inc.
  Kinetic Concepts,       1,200           71,580
Inc.(b)
  Medtronic, Inc.         2,300          117,185
  St. Jude Medical,       4,600          165,600
Inc.(b)

                                     -----------
                                       1,263,436
                                     -----------
Pharmaceuticals - 8.8%
  Abgenix, Inc.(b)(c)   21,800           152,600
  ARIAD                  5,800            32,480
Pharmaceuticals,
Inc.(b)
  ArQule, Inc.(b)       20,700            97,497
  Chiron Corp.(b)(c)     2,900           101,674
  First Horizon
Pharmaceutical
    Corp.(b)             7,700           129,976
  Forest Laboratories,   4,500           166,275
Inc.(b)
  Genentech, Inc.(b)(c)  8,100           458,541
  ICOS Corp.(b)          7,700           172,942
  InterMune, Inc.(b)     7,300            80,300
  Novartis AG - ADR      4,600           215,188
  OSI Pharmaceuticals,     900            37,206
Inc.(b)
  Sanofi-Aventis - ADR   2,800           118,552
  Shire Pharmaceuticals
Group PLC -
    ADR                  3,800           130,264
  Transkaryotic          7,200           179,748
Therapies, Inc.(b)

                                     -----------
                                       2,073,243
                                     -----------
Semiconductors & Related Devices -
12.6%
  Analog Devices, Inc.   7,500           271,050
  Applied Materials,    21,400           347,750
Inc.(b)
  Broadcom Corp. -       4,800           143,616
Class A(b)
  Caliper Life          12,200            78,690
Sciences, Inc.(b)
  International          3,400           154,700
Rectifier Corp.(b)
  Lam Research Corp.(b)  7,600           219,336
  Linear Technology      5,900           226,029
Corp.
  Maxim Integrated       5,100           208,437
Products, Inc.
  MEMC Electronic       13,300           178,885
Materials, Inc.(b)
  Novellus Systems,      9,300           248,589
Inc.(b)(c)
  NVIDIA Corp.(b)        5,500           130,680
  Texas Instruments,     9,400           239,606
Inc.


                           NUMBER
                         OF SHARES      VALUE
                        ----------- -------------
COMMON STOCKS (Continued)
United States (Continued)
Semiconductors & Related Devices (Continued)
  Varian Semiconductor
Equipment
    Associates, Inc.(b)  5,900       $   224,259
  Xilinx, Inc.          10,200           298,146

                                     -----------
                                       2,969,773
                                     -----------
Telecommunications - 7.9%
  ADTRAN, Inc.(c)        9,900           174,636
  Alamosa Holdings,     16,700           194,889
Inc.(b)
  Avaya, Inc.(b)        13,100           153,008
  Comverse Technology,  12,600           317,772
Inc.(b)(c)
  Harris Corp.           9,400           306,910
  Nextel                 6,800           193,256
Communications, Inc.(b)
  Qualcomm, Inc.         6,600           241,890
  Scientific-Atlanta,    9,600           270,912
Inc.

                                     -----------
                                       1,853,273
                                     -----------
                                      19,834,794
                                     -----------
TOTAL COMMON STOCKS
  (Cost $20,881,777)                  22,807,927
                                     -----------


                                                  PAR/SHARES
                                       MATURITY     (000)
                                      ---------- -----------
SHORT TERM INVESTMENTS - 17.1%
  Morgan Stanley, Floating Rate
    Notes
    2.95%(d)(e)                       11/14/05      $  161      160,845
  Galileo Money Market Fund                            366      365,775
  Institutional Money Market Trust(e)                3,505    3,504,656

                                                              ---------
TOTAL SHORT TERM INVESTMENTS
  (Cost $4,031,276)                                           4,031,276
                                                              ---------


TOTAL INVESTMENTS IN SECURITIES -
114.0%
  (Cost $24,913,053(a))                    26,839,203
LIABILITIES IN EXCESS OF OTHER
  ASSETS -  (14.0)%
  (Including $3,665,501 of payable
  upon return of securities loaned)        (3,288,707)
                                           ----------
NET ASSETS - 100.0%
  (Applicable to 171,977 Institutional
  shares, 14,438 Service shares,
  1,636,930 Investor A shares,
  2,018,012 Investor B shares and
  506,547 Investor C shares)             $ 23,550,496
                                         ============

SEE ACCOMPANYING NOTES TO FINANCIAL STATEMENTS.
                                                                              73
                                BLACKROCK FUNDS
                            STATEMENT OF NET ASSETS
        GLOBAL SCIENCE & TECHNOLOGY OPPORTUNITIES PORTFOLIO (CONCLUDED)


AS OF MARCH 31, 2005 (UNAUDITED)


                                            VALUE
                                         ----------
NET ASSET VALUE, OFFERING
  AND REDEMPTION PRICE PER
  INSTITUTIONAL SHARE
       ($971,996/171,977)                  $ 5.65
                                           ======
NET ASSET VALUE, OFFERING
  AND REDEMPTION PRICE PER
  SERVICE SHARE
         ($80,530/14,438)                  $ 5.58
                                           ======
NET ASSET VALUE AND REDEMPTION
  PRICE PER INVESTOR A SHARE
   ($9,048,365/1,636,930)                  $ 5.53
                                           ======
MAXIMUM OFFERING PRICE PER
  INVESTOR A SHARE
           ($5.53/0.9425)                  $ 5.87
                                           ======
NET ASSET VALUE, OFFERING
  AND REDEMPTION PRICE
  (subject to a maximum contingent
  deferred sales charge of 4.5%)
  PER INVESTOR B SHARE
  ($10,750,822/2,018,012)                  $ 5.33
                                           ======
NET ASSET VALUE, OFFERING
  AND REDEMPTION PRICE
  (subject to a maximum contingent
  deferred sales charge of 1.0%)
  PER INVESTOR C SHARE
     ($2,698,783/506,547)                  $ 5.33
                                           ======


- -------------------

 (a) Cost for Federal income tax purposes is $25,019,998. The gross
     unrealized appreciation (depreciation) on a tax basis is as
     follows:
      Gross unrealized appreciation                                    $2,472,105
      Gross unrealized depreciation                                      (652,900)
                                                                       ----------
                                                                       $1,819,205
                                                                       ==========

     (b) Non-income producing security.
     (c) Total or partial securities on loan.
     (d) Rates shown are the rates as of March 31, 2005.
 (e) Securities purchased with the cash proceeds from securities loaned.

SEE ACCOMPANYING NOTES TO FINANCIAL STATEMENTS.
74
                                BLACKROCK FUNDS
                            STATEMENT OF NET ASSETS
                           GLOBAL RESOURCES PORTFOLIO


AS OF MARCH 31, 2005 (UNAUDITED)


                           NUMBER
                         OF SHARES       VALUE
                        ----------- --------------
COMMON STOCKS - 96.7%
Canada - 26.1%
Banks - 0.0%
  Quest Capital              61,000  $     92,772
                                     ------------
Corp.(b)
Energy & Utilities - 0.1%
  Tusk Energy Corp.(c)     300,846      1,074,228
                                     ------------
Metal & Mining - 6.4%
  AXMIN, Inc.(b)        2,581,000       1,066,661
  Bema Gold Corp.(b)      250,000         670,000
  Canico Resource         450,000       5,631,277
Corp.(b)
  Crystallex            2,600,000       9,123,283
International Corp.(b)
  Fording Canadian Coal   163,447      15,017,510
Trust(d)
  Gateway Gold Corp.(b)   475,617         452,089
  Gold Reserve, Inc.(b) 1,000,000       3,900,000
  Mag Silver Corp.(b)   1,512,010       1,324,735
  Mena Resources,          20,000           9,423
Inc.(b)
  Minefinders Corp.       250,000       1,670,000
Ltd.(b)
  Nevsun Resources      1,554,800       3,405,563
Ltd.(b)
  NovaGold Resources,     691,418       5,745,684
Inc.(b)
  Radius Gold, Inc.(b)    569,700         687,492
  Romarco Minerals,       223,000          45,158
Inc.(b)
  Southwestern            566,900       4,521,705
Resources Corp.(b)
  St. Jude Resources    1,096,400       1,812,456
Ltd.(b)
  Stratagold Corp.(b)   1,000,000         384,345
  Sunridge Gold           870,700         662,102
Corp.(b)
  Virginia Gold Mines,    823,100       3,340,431
Inc.(b)
  X-Cal Resources       1,755,500         435,302
Ltd.(b)

                                     ------------
                                       59,905,216
                                     ------------
Motor Vehicles - 0.2%
  Westport Innovations,   959,500       1,419,602
                                     ------------
Inc.(b)
Oil & Gas - 19.2%
  Accrete Energy,          13,690          82,603
Inc.(b)
  Argo Energy Ltd.(b)     435,500       1,148,279
  Baytex Energy Trust   1,312,748      16,178,099
  Blizzard Energy,        242,700         587,768
Inc.(b)
  Bow Valley Energy       634,600       1,195,922
Ltd.(b)
  C1 Energy Ltd.(b)       647,099       1,310,404
  Capitol Energy          869,774         733,289
Resources Ltd.(b)
  Chamaelo Energy,        260,900       1,418,954
Inc.(b)
  Cinch Energy Corp.(b)   601,320       1,217,700
  Compton Petroleum     1,171,300      11,762,859
Corp.(b)
  Crew Energy, Inc.(b)    894,615       8,222,605
  Cyries Energy,           69,096         569,970
Inc.(b)
  Delphi Energy           497,600       1,324,356
Corp.(b)
  Drillers Technology     200,000         247,965
Corp.(b)
  Endev Energy, Inc.(b) 1,538,300       1,958,079
  Esprit Energy Trust -   733,525       7,590,803
Class A
  Fairborne Energy        317,020       3,558,401
Ltd.(b)
  Galleon Energy, Inc.  1,096,142       8,924,246
- - Class A(b)(c)
  Hawker Resources,       185,667         728,948
Inc.(b)
  KICK Energy Ltd.(b)     219,700       1,198,512
  Lightning Energy        890,966       3,461,206
Ltd.(b)
  Masters Energy,          27,741          77,960
Inc.(b)
  Midnight Oil            550,300       1,823,948
Exploration Ltd.(b)
  Mustang Resources,
Inc. - Class
    A(b)                  370,600       2,756,871
  Niko Resources Ltd.     246,500      12,721,792
  Oilexco, Inc.(b)      1,498,900       3,716,742
  Pacific Rodera          990,200         990,323
Energy, Inc.(b)
  Paramount Resources
Ltd. - Class
    A                     408,900      10,473,868
  Penn West Petroleum     642,800      42,557,573
Ltd.
  Precision Drilling      156,000      11,646,960
Corp.(b)


                           NUMBER
                         OF SHARES       VALUE
                        ----------- --------------
COMMON STOCKS (Continued)
Canada (Continued)
Oil & Gas (Continued)
  ProEx Energy Ltd.(b)     69,096    $    576,823
  ProspEx Resources Ltd.1,504,120       4,450,758
  Purcell Energy          735,620       1,471,422
Ltd.(b)
  Real Resources, Inc.(b) 200,000       2,273,009
  Technicoil Corp.(b)     753,100       1,867,422
  Tempest Energy Corp.    357,600       1,995,123
- - Class A(b)
  Thunder Energy,         730,132       4,767,569
Inc.(b)
  True Energy, Inc.(b)    753,735       2,822,184
  West Energy Ltd.(b)       2,735          11,665

                                     ------------
                                      180,422,980
                                     ------------
Transportation - 0.2%
  Railpower               360,600       1,806,204
                                     ------------
Technologies Corp.(b)
                                      244,721,002
                                     ------------
Netherlands - 0.7%
Transportation - 0.7%
  Koninklijke (Royal)
P&O Nedlloyd
    NV(b)                 125,000       7,042,459
                                     ------------
Norway - 0.7%
Transportation - 0.7%
  Stolt-Nielsen SA(b)     170,000       6,111,428
                                     ------------
United Kingdom - 1.2%
Oil & Gas - 1.2%
  Expro International     563,941       4,619,498
Group PLC
  Tullow Oil PLC        1,244,198       4,084,945
  Venture Production PLC(b)
                          514,729       2,594,509

                                     ------------
                                       11,298,952
                                     ------------
United States - 68.0%
Conglomerates - 2.6%
  Stolt-Nielsen           676,100      24,238,185
                                     ------------
SA(b)(d)
Energy & Utilities -
1.4%
  KFX, Inc.(b)(d)         393,400       5,271,560
  Longview Energy          85,400       1,281,000
Co.(c)
  McDermott               336,600       6,371,838
International, Inc.(b)

                                     ------------
                                       12,924,398
                                     ------------
Finance - 0.1%
  NGP Capital Resources    64,500       1,037,160
                                     ------------
Co.
Manufacturing - 2.1%
  Maverick Tube           460,100      14,957,851
Corp.(b)
  NS Group, Inc.(b)       150,000       4,711,500

                                     ------------
                                       19,669,351
                                     ------------
Metal & Mining - 21.8%
  Alpha Natural            27,500         788,425
Resources, Inc.(b)
  Arch Coal, Inc.(d)      856,300      36,829,463
  Coeur d'Alene Mines     500,000       1,835,000
Corp.(b)
  CONSOL Energy,        1,231,600      57,909,832
Inc.(d)
  Massey Energy Co.(d)  1,148,400      45,981,936
  Peabody Energy Corp.  1,282,000      59,433,520
  Randgold Resources      200,000       2,472,000
Ltd.(b)

                                     ------------
                                      205,250,176
                                     ------------
Oil & Gas - 40.0%
  Atlas America,           12,764         461,674
Inc.(b)(d)
  BJ Services Co.         478,600      24,829,768
  Brigham Exploration      81,900         755,937
Co.(b)
  CanArgo Energy        5,024,200       6,581,702
Corp.(b)
  Clayton Williams        321,130       8,317,267
Energy, Inc.(b)

SEE ACCOMPANYING NOTES TO FINANCIAL STATEMENTS.
                                                                              75
                                BLACKROCK FUNDS
                            STATEMENT OF NET ASSETS
                     GLOBAL RESOURCES PORTFOLIO (CONTINUED)


AS OF MARCH 31, 2005 (UNAUDITED)


                           NUMBER
                         OF SHARES       VALUE
                        ----------- --------------
COMMON STOCKS (Continued)
United States (Continued)
Oil & Gas (Continued)
  Comstock Resources,      120,300   $  3,457,422
Inc.(b)(d)
  Cross Timbers Royalty      2,490         97,359
Trust
  Denbury Resources,       273,800      9,645,974
Inc.(b)
  Diamond Offshore         333,400     16,636,660
Drilling, Inc.
  The Exploration          282,200      1,620,958
Co.(b)
  Global Industries,       189,496      1,781,262
Inc.(b)
  Grey Wolf, Inc.(b)(d)    471,900      3,105,102
  Halliburton Co.(d)       390,000     16,867,500
  Hanover Compressor       250,000      3,017,500
Co.(b)(d)
  Matador Resources         97,846      1,320,921
Co.(c)
  Nabors Industries        346,500     20,492,010
Ltd.(b)
  Newfield Exploration     521,962     38,760,898
Co.(b)
  Newpark Resources,       500,000      2,945,000
Inc.(b)
  Noble Corp.               90,700      5,098,247
  Parallel Petroleum       192,300      1,413,405
Corp.(b)
  Patterson-UTI Energy,  1,272,408     31,835,648
Inc.
  Penn Virginia            560,000     25,704,000
Corp.(d)
  Petrohawk Energy          12,706        133,159
Corp.(b)(d)
  Pioneer Drilling         176,000      2,423,520
Co.(b)
  Pioneer Natural          379,200     16,199,424
Resources Co.
  Plains Exploration &
Production
    Co.(b)               1,137,505     39,698,924
  Pride International,     200,000      4,968,000
Inc.(b)
  Rowan Cos., Inc.         266,500      7,976,345
  Transocean, Inc.(b)      420,800     21,654,368
  Treasure Island          507,439        461,769
Royalty Trust(b)
  Universal Compression
Holdings,
    Inc.(b)                 35,200      1,333,024
  Vintage Petroleum,       866,100     27,247,506
Inc.
  Weatherford              301,100     17,445,734
International
Ltd.(b)(d)
  Western Gas              321,300     11,068,785
Resources, Inc.

                                     ------------
                                      375,356,772
                                     ------------
Waste Management - 0.0%
  Republic Resources,       28,750          1,725
                                     ------------
Inc.(b)
                                      638,477,767
                                     ------------
TOTAL COMMON STOCKS
  (Cost $538,661,148)                 907,651,608
                                     ------------
WARRANTS - 0.0%
  Cinch Energy Corp.
    (expiring
    07/11/05)(c)           751,650         62,128
  Nevsun Resources
    Ltd. (expiring
    07/07/05)              250,000          2,066
  Oilexco, Inc.
    (expiring 07/11/05)    118,775        175,730
  Purcell Energy Ltd.
    (expiring
    07/07/05)(c)           735,620        182,408
  Westport
    Innovations, Inc.
    (expiring 07/11/05)     92,850         25,326

                                     ------------
TOTAL WARRANTS
  (Cost $0)                               447,658
                                     ------------


                                      PAR/SHARES
                           MATURITY     (000)         VALUE
                          ---------- ----------- --------------
SHORT TERM INVESTMENTS - 16.8%
  Morgan Stanley, Floating Rate
    Notes
       2.94%(e)(f)        11/14/05    $  5,102    $  5,101,902
  U.S. Treasury Bills
       2.33%              04/07/05      28,000      27,989,127
       2.59%              04/07/05       2,000       1,999,135
  Galileo Money Market Fund              8,873       8,872,851
  Institutional Money Market           114,172     114,172,428
Trust(e)

                                                  ------------
TOTAL SHORT TERM INVESTMENTS
  (Cost $158,135,444)                              158,135,443
                                                  ------------


TOTAL INVESTMENTS IN SECURITIES -
113.5%
  (Cost $696,796,592(a))               1,066,234,709
LIABILITIES IN EXCESS OF
  OTHER ASSETS -  (13.5)%
  (including $119,274,330 of
  payable upon return of securities
  loaned)                              (126,809,844)
                                       -------------
NET ASSETS -  100.0%
  (Applicable to 464,645
  Institutional shares, 12,036,430
  Investor A shares, 1,811,481
  Investor B shares and 3,257,473
  Investor C shares outstanding)       $939,424,865
                                       =============


NET ASSET VALUE, OFFERING
  AND REDEMPTION PRICE PER
  INSTITUTIONAL SHARE
      ($26,594,960/464,645)              $ 57.24
                                         =======
NET ASSET VALUE AND REDEMPTION
  PRICE PER INVESTOR A SHARE
  ($658,699,655/12,036,430)              $ 54.73
                                         =======
MAXIMUM OFFERING PRICE PER
  INVESTOR A SHARE
            ($54.73/0.9425)              $ 58.07
                                         =======
NET ASSET VALUE, OFFERING
  AND REDEMPTION PRICE
  (subject to a maximum contingent
  deferred sales charge of 4.5%)
  PER INVESTOR B SHARE
    ($90,876,831/1,811,481)              $ 50.17
                                         =======
NET ASSET VALUE, OFFERING
  AND REDEMPTION PRICE
  (subject to a maximum contingent
  deferred sales charge of 1.0%)
  PER INVESTOR C SHARE
   ($163,253,420/3,257,473)              $ 50.12
                                         =======


- -------------------

 (a) Cost for Federal income tax purposes is $697,027,792. The
     gross unrealized appreciation (depreciation) on a tax basis is as
     follows:
      Gross unrealized appreciation                                      $383,581,213
      Gross unrealized depreciation                                       (14,374,295)
                                                                         ------------
                                                                         $369,206,918
                                                                         ============

SEE ACCOMPANYING NOTES TO FINANCIAL STATEMENTS.
76
                                BLACKROCK FUNDS
                            STATEMENT OF NET ASSETS
                     GLOBAL RESOURCES PORTFOLIO (CONCLUDED)


AS OF MARCH 31, 2005 (UNAUDITED)

     (b) Non-income producing security.
  (c) Security valued at fair value as determined in good faith by or under
       the direction of the Trustees.  As of March 31, 2005, this security had
       a total market value of $12,844,931 which represents  less than 1.4% of
       net assets.
     (d) Total or partial securities on loan.
 (e) Securities purchased with the cash proceeds from securities loaned.
  (f) Rates shown are the rates as of March 31, 2005.

SEE ACCOMPANYING NOTES TO FINANCIAL STATEMENTS.
                                                                              77
                                BLACKROCK FUNDS
                            STATEMENT OF NET ASSETS
                       ALL-CAP GLOBAL RESOURCES PORTFOLIO


AS OF MARCH 31, 2005 (UNAUDITED)


                           NUMBER
                         OF SHARES      VALUE
                        ----------- -------------
COMMON STOCKS - 89.6%

Australia - 5.4%

Metal & Mining - 4.1%
  BHP Billiton Ltd. -   13,800       $   386,124
ADR
  Macarthur Coal Ltd.   56,900           294,900

                                     -----------
                                         681,024
                                     -----------
Oil & Gas - 1.3%
  Santos Ltd.           32,300           224,871
                                     -----------
                                         905,895
                                     -----------
Austria - 1.7%

Oil & Gas - 1.7%
  OMV AG                   900           286,689
                                     -----------
Canada - 9.5%

Metal & Mining - 1.5%
  Teck Cominco Ltd.      6,700           248,374
                                     -----------
Oil & Gas - 8.0%
  Canadian Natural       4,000           226,011
Resources Ltd.
  Compton Petroleum      2,000            20,085
Corp.(b)
  Galleon Energy, Inc.  15,949           129,849
- - Class A(b)
  Husky Energy, Inc.     5,800           174,165
  Nexen, Inc.            1,400            59,016
  Pason Systems, Inc.    2,000            62,570
  Penn West Petroleum    2,800           185,378
Ltd.
  Petro Canada           2,600           150,969
  Talisman Energy, Inc.  9,800           334,670
- - ADR

                                     -----------
                                       1,342,713
                                     -----------
                                       1,591,087
                                     -----------
China - 2.5%

Metal & Mining - 1.7%
  Yanzhou Coal Mining -  4,200           287,112
                                     -----------
ADR
Oil & Gas - 0.8%
  Petrochina Co. Ltd. -  2,000           126,440
                                     -----------
ADR
                                         413,552
                                     -----------
Denmark - 0.3%

Oil & Gas - 0.3%
  A P Moller - Maersk        5            46,666
                                     -----------
A/S
France - 1.4%

Oil & Gas - 1.4%
  Total SA - ADR(c)      2,000           234,460
                                     -----------
Netherlands - 1.9%

Oil & Gas - 1.9%
  Core Laboratories      2,400            61,608
NV(b)
  SBM Offshore NV        4,000           254,731

                                     -----------
                                         316,339
                                     -----------
Norway - 3.1%

Oil & Gas - 3.1%
  Statoil ASA - ADR     22,600           387,364
  Stolt Offshores SA(b) 16,500           127,779

                                     -----------
                                         515,143
                                     -----------
United Kingdom - 4.8%

Metal & Mining - 1.5%
  Rio Tinto PLC - ADR    2,000           259,500
                                     -----------
Oil & Gas - 3.3%
  BG Group PLC - ADR     5,800           228,520


                           NUMBER
                         OF SHARES      VALUE
                        ----------- -------------
COMMON STOCKS (Continued)
United Kingdom (Continued)
Oil & Gas (Continued)
  Cairn Energy PLC(b)
                        14,600       $   320,852

                                     -----------
                                         549,372
                                     -----------
                                         808,872
                                     -----------
United States - 59.0%
Conglomerates - 1.5%
  Stolt-Nielsen SA(b)    7,700           276,045
                                     -----------
Energy & Utilities - 1.6%
  McDermott International, Inc.(b)
                        13,800           261,234
                                     -----------
Machinery & Heavy Equipment - 1.2%
  FMC Technologies, Inc.(6,700           222,306
                                     -----------
Metal & Mining - 15.9%
  Arch Coal, Inc.        8,900           382,789
  CONSOL Energy, Inc.
                         8,900           418,478
  Goldcorp, Inc.         3,800            53,998
  Massey Energy Co.     13,800           552,552
  Natural Resource Partners LP
                         4,000           213,880
  Newmont Mining Corp.   2,800           118,300
  Pan American Silver   10,900           172,820
Corp.(b)
  Peabody Energy Corp.   9,600           445,056
  Silver Standard       13,800           159,804
Resources(b)
  Wheaton River         42,500           150,875
Minerals Ltd.(b)

                                     -----------
                                       2,668,552
                                     -----------
Oil & Gas - 38.8%
  BP PLC                 2,800           174,720
  Burlington Resources, Inc.
                         4,800           240,336
  Canadian Natural Resources
                         1,800           102,276
  Chesapeake Energy Corp.(c)
                        10,900           239,146
  Double Eagle Petroleum Co.(b)
                        16,500           340,890
  Encana Corp.           4,000           281,680
  ENSCO International, Inc.
                         7,700           289,982
  EOG Resources, Inc.(c) 9,400           458,156
  Exxon Mobil Corp.      5,800           345,680
  Hydril(b)
                         4,000           233,640
  Nabors Industries Ltd.(2,000           118,280
  National-Oilwell,      4,839           225,981
Inc.(b)
  Newfield Exploration Co.(b)
                         4,000           297,040
  Noble Corp.
                         5,800           326,018
  Noble Energy, Inc.(c)  4,000           272,080
  Patterson-UTI Energy, Inc.(c)
                         4,000           100,080
  Pioneer Natural Resourc4,800           205,056
  Rowan Cos., Inc.       4,000           119,720
  Royal Dutch Petroleum Co.(c)
                         4,000           240,160
  Schlumberger Ltd.        900            63,432
  Smith International, Inc.
                         2,000           125,460
  Suncor Energy, Inc.    6,700           269,407
  Transocean,            7,700           396,242
Inc.(b)(c)
  Unocal Corp.
                         5,800           357,802
  Vintage Petroleum, Inc 5,100           160,446
  Weatherford International Ltd.(b)
                         4,800           278,112
  XTO Energy, Inc.       7,733           253,952

                                     -----------
                                       6,515,774
                                     -----------
                                       9,943,911
                                     -----------
TOTAL COMMON STOCKS
  (Cost $15,231,443)                  15,062,614
                                     -----------

SEE ACCOMPANYING NOTES TO FINANCIAL STATEMENTS.
78
                                BLACKROCK FUNDS
                            STATEMENT OF NET ASSETS
                 ALL-CAP GLOBAL RESOURCES PORTFOLIO (CONCLUDED)


AS OF MARCH 31, 2005 (UNAUDITED)


                                      PAR/SHARES
                           MATURITY     (000)        VALUE
                          ---------- ----------- ------------
SHORT TERM INVESTMENTS - 20.7%
  Morgan Stanley, Floating Rate
    Notes
       2.94%(d)(e)        11/14/05      $   83    $   83,189
  U.S. Treasury Bills
       2.59%              04/07/05       1,100     1,099,525
       2.62%              05/12/05       1,000       997,016
  Institutional Money Market             1,308     1,308,111
Trust(e)

                                                  ----------
TOTAL SHORT TERM INVESTMENTS
  (Cost $3,487,841)                                3,487,841
                                                  ----------


TOTAL INVESTMENTS IN SECURITIES -  110.3%
  (Cost $18,719,284(a))                      18,550,455
LIABILITIES IN EXCESS OF OTHER
  ASSETS -  (10.3)%
  (including $1,391,300 of payable
  upon return of securities loaned and
  $1,318,954 of investments purchased
  payable)                                   (1,735,895)
                                             ----------
NET ASSETS - 100.0%
  (Applicable to 512,946 Institutional
  shares, 10 Service shares, 790,402
  Investor A shares, 129,023 Investor B
  shares and 241,161 Investor C
  shares)                                  $ 16,814,560
                                           ============


NET ASSET VALUE, OFFERING
  AND REDEMPTION PRICE PER
  INSTITUTIONAL SHARE
  ($5,151,102/512,946)                      $ 10.04
                                            =======
NET ASSET VALUE, OFFERING
  AND REDEMPTION PRICE PER
  SERVICE SHARE
             ($100/10)(f)                   $ 10.04
                                            =======
NET ASSET VALUE AND
  REDEMPTION PRICE PER
  INVESTOR A SHARE
  ($7,944,718/790,402)                      $ 10.05
                                            =======
MAXIMUM OFFERING PRICE
  PER INVESTOR A SHARE
       ($10.05/0.9425)                      $ 10.66
                                            =======
NET ASSET VALUE, OFFERING
  AND REDEMPTION PRICE
  (subject to a maximum contingent
  deferred sales charge of 4.5%)
  PER INVESTOR B SHARE
  ($1,295,943/129,023)                      $ 10.04
                                            =======
NET ASSET VALUE, OFFERING
  AND REDEMPTION PRICE
  (subject to a maximum contingent
  deferred sales charge of 4.5%)
  PER INVESTOR C SHARE
  ($2,422,697/241,161)                      $ 10.05
                                            =======


- -------------------

 (a) Cost for Federal income tax purposes is $18,724,631. The gross
     unrealized appreciation (depreciation) on a tax basis is as
     follows:
      Gross unrealized appreciation                                   $ 158,256
      Gross unrealized depreciation                                    (332,432)
                                                                      ---------
                                                                      $(174,176)
                                                                      =========

     (b) Non-income producing security.
     (c) Total or partial securities on loan.
     (d) Rates shown are the rates as of March 31, 2005.
 (e) Securities purchased with the cash proceeds from securities loaned.
  (f) Exact net assets and shares outstanding at March 31, 2005 were $100.41
       and 10.000, respectively.


SEE ACCOMPANYING NOTES TO FINANCIAL STATEMENTS.
                                                                              79
                                BLACKROCK FUNDS
                            SCHEDULE OF INVESTMENTS
                           HEALTH SCIENCES PORTFOLIO


AS OF MARCH 31, 2005 (UNAUDITED)


                                             NUMBER
                                           OF SHARES       VALUE
                                          ----------- --------------
COMMON STOCKS - 83.7%
Insurance - 3.8%
  Aetna, Inc.                               32,540     $  2,438,873
  WellPoint, Inc.(b)                        21,718        2,722,351

                                                       ------------
                                                          5,161,224
                                                       ------------
Manufacturing - 2.9%
  Roche Holding Ltd.                        73,800        3,968,942
                                                       ------------
Medical & Medical Services - 20.5%
  Amgen, Inc.(b)                            42,720        2,486,731
  Baxter International, Inc.                51,850        1,761,863
  Caremark Rx, Inc.(b)                    106,370         4,231,400
  Community Health Systems, Inc.(b)        53,430         1,865,241
  Covance, Inc.(b)                         33,900         1,613,979
  Express Scripts, Inc.(b)                 11,243           980,277
  Kindred Healthcare, Inc.(b)              20,800           730,080
  LifePoint Hospitals, Inc.(b)             16,700           732,128
  Martek Biosciences Corp.(b)(c)           11,530           670,931
  Medco Health Solutions, Inc.(b)          40,520         2,008,576
  Millipore Corp.(b)                       22,700           985,180
  Omnicare, Inc.                           19,500           691,275
  STERIS Corp.(b)                          96,450         2,435,362
  Triad Hospitals, Inc.(b)                 21,800         1,092,180
  UnitedHealth Group, Inc.                 49,000         4,673,620
  Universal Health Services, Inc.          24,990         1,309,476

                                                       ------------
                                                         28,268,299
                                                       ------------
Medical Instruments & Supplies - 17.9%
  Aspect Medical Systems, Inc.(b)          84,981         1,834,740
  Bausch & Lomb, Inc.                      13,400           982,220
  Beckman Coulter, Inc.(c)                  9,700           644,565
  Becton, Dickinson & Co.                  47,820         2,793,644
  C.R. Bard, Inc.                          38,410         2,614,953
  Cytyc Corp.(b)(c)                       101,500         2,335,515
  DENTSPLY International, Inc.             37,910         2,062,683
  Diagnostic Products Corp.                20,540           992,082
  DJ Orthopedics, Inc.(b)                  35,740           895,287
  Guidant Corp.                            23,300         1,721,870
  Idenix Pharmaceuticals, Inc.(b)(c)       19,500           387,075
  Kinetic Concepts, Inc.(b)                26,440         1,577,146
  Medtronic, Inc.                          12,860           655,217
  Merit Medical Systems, Inc.(b)          111,200         1,333,288
  St. Jude Medical, Inc.(b)                22,080           794,880
  Symmetry Medical, Inc.(b)                50,000           951,000
  Zimmer Holdings, Inc.(b)(c)              25,100         1,953,031

                                                       ------------
                                                         24,529,196
                                                       ------------
Pharmaceuticals - 38.6%
  Abbott Laboratories                      92,750         4,324,005
  Abgenix, Inc.(b)(c)                     312,800         2,189,600
  Alexion Pharmaceuticals, Inc.(b)        114,780         2,486,709
  Alkermes, Inc.(b)                        75,050           779,019
  Allergan, Inc.(c)                        18,830         1,308,120
  Arena Pharmaceuticals, Inc.(b)           90,000           454,500
  ARIAD Pharmaceuticals, Inc.(b)          106,740           597,744
  ArQule, Inc.(b)                          35,434           166,894
  AstraZeneca PLC - ADR                    28,030         1,108,026
  BioMarin Pharmaceutical, Inc.(b)        295,470         1,521,670
  Bristol-Myers Squibb Co.(c)              67,660         1,722,624
  Cardiome Pharma Corp.(b)                105,500           654,100
  Gene Logic, Inc.(b)                     391,580         1,229,561
  Genentech, Inc.(b)                      103,500         5,859,135
  Human Genome Sciences, Inc.(b)(c)            20               184
  ICOS Corp.(b)                           105,990         2,380,535


                                             NUMBER
                                           OF SHARES       VALUE
                                          ----------- --------------
COMMON STOCKS (Continued)
Pharmaceuticals (Continued)
  InterMune, Inc.(b)                      111,700      $  1,228,700
  iShares Dow Jones U.S. Healthcare
    Sector Index Fund                      36,990         2,162,066
  iShares Nasdaq Biotechnology Index
    Fund(b)                                    40             2,549
  IVAX Corp.(b)                            43,527           860,529
  Merck & Co., Inc.                        48,200         1,560,234
  Momenta Pharmaceuticals, Inc.(b)        209,440         1,773,957
  Novartis AG - ADR                       113,700         5,318,886
  OSI Pharmaceuticals, Inc.(b)             28,450         1,176,123
  Pfizer, Inc.                             56,759         1,491,059
  Sanofi-Aventis - ADR(c)                  62,240         2,635,242
  Shire Pharmaceuticals Group PLC -
    ADR                                    80,250         2,750,970
  Threshold Pharmaceuticals, Inc.(b)(c)   104,000           622,960
  Transkaryotic Therapies, Inc.(b)        119,110         2,973,581
  Trimeris, Inc.(b)                         5,030            56,638
  Vertex Pharmaceuticals, Inc.(b)          56,490           528,746
  Wyeth                                    24,200         1,020,756

                                                       ------------
                                                         52,945,422
                                                       ------------
TOTAL COMMON STOCKS
  (Cost $102,174,363)
                                                        114,873,083
                                                       ------------


                                                  PAR/SHARES
                                       MATURITY     (000)
                                      ---------- -----------
SHORT TERM INVESTMENTS - 16.3%
  Federal Home Loan Bank, Discount
    Notes
    2.55%                             04/01/05     $ 4,500     4,500,000
  Morgan Stanley, Floating Rate
    Notes
    2.95%(d)(e)                       11/14/05         745       745,286
  Galileo Money Market Fund                          6,802     6,801,886
  Institutional Money Market Trust(e)               10,270    10,270,254

                                                              ----------
TOTAL SHORT TERM INVESTMENTS
  (Cost $22,317,426)                                          22,317,426
                                                              ----------


TOTAL INVESTMENTS IN
  SECURITIES -  100.0%
  (Cost $124,491,789(a))                   $137,190,509
                                           ============


- -------------------

 (a) Cost for Federal income tax purposes is $125,653,398. The
     gross unrealized appreciation (depreciation) on a tax basis is as
     follows:
      Gross unrealized appreciation                                      $14,453,438
      Gross unrealized depreciation                                       (2,916,327)
                                                                         -----------
                                                                         $11,537,111
                                                                         ===========

     (b) Non-income producing security.
     (c) Total or partial securities on loan.
     (d) Rates shown are the rates as of March 31, 2005.
 (e) Securities purchased with the cash proceeds from securities loaned.

SEE ACCOMPANYING NOTES TO FINANCIAL STATEMENTS.
80
                                BLACKROCK FUNDS
                      STATEMENT OF ASSETS AND LIABILITIES
                           HEALTH SCIENCES PORTFOLIO


MARCH 31, 2005(UNAUDITED)


ASSETS
 Investments at value (Cost $124,491,789)................................     $  137,190,509
 Cash ...................................................................          2,726,806
 Dividends receivable ...................................................            191,335
 Interest receivable ....................................................             12,478
 Investments sold receivable ............................................          5,979,441
 Capital shares sold receivable .........................................          1,071,573
 Prepaid expenses .......................................................             72,304
                                                                              --------------
    TOTAL ASSETS ........................................................        147,244,446
                                                                              --------------
LIABILITIES
 Payable upon return of securities loaned ...............................         11,015,540
 Investments purchased payable ..........................................            753,435
 Capital shares redeemed payable ........................................            518,091
 Advisory fees payable ..................................................             85,447
 Administrative fees payable ............................................             23,504
 Transfer agent fees payable ............................................             67,750
 Other accrued expenses payable .........................................            120,217
 Foreign taxes payable ..................................................             15,828
                                                                              --------------
    TOTAL LIABILITIES ...................................................         12,599,812
                                                                              --------------
NET ASSETS (Applicable to 211,938 Institutional shares, 5 Service shares,
 3,726,544 Investor A shares, 1,522,016 Investor B shares and
 1,343,009 Investor C shares outstanding) ...............................     $  134,644,634
                                                                              ==============
NET ASSET VALUE, OFFERING AND REDEMPTION PRICE
 PER INSTITUTIONAL SHARE ($4,301,963/211,938)............................     $        20.30
                                                                              ==============
NET ASSET VALUE, OFFERING AND REDEMPTION PRICE
 PER SERVICE SHARE ($99/5)(a)............................................     $        20.06
                                                                              ==============
NET ASSET VALUE AND REDEMPTION PRICE
 PER INVESTOR A SHARE ($74,681,630/3,726,544)............................     $        20.04
                                                                              ==============
MAXIMUM OFFERING PRICE PER INVESTOR A SHARE ($20.04/0.9425)..............     $        21.26
                                                                              ==============
NET ASSET VALUE, OFFERING AND REDEMPTION PRICE
 (subject to a maximum contingent deferred sales charge of 4.5%)
 PER INVESTOR B SHARE ($29,598,816/1,522,016)............................     $        19.45
                                                                              ==============
NET ASSET VALUE, OFFERING AND REDEMPTION PRICE
 (subject to a maximum contingent deferred sales charge of 1.0%)
 PER INVESTOR C SHARE ($26,062,126/1,343,009)............................     $        19.41
                                                                              ==============

- ---------
(a) Exact net assets and shares outstanding at March 31, 2005 were $98.81 and
    4.926, respectively.

SEE ACCOMPANYING NOTES TO FINANCIAL STATEMENTS.
                                       81
                                BLACKROCK FUNDS
                            STATEMENT OF NET ASSETS
                          U.S. OPPORTUNITIES PORTFOLIO


AS OF MARCH 31, 2005 (UNAUDITED)


                           NUMBER
                         OF SHARES      VALUE
                        ----------- ------------
COMMON STOCKS - 99.2%
Advertising - 0.8%
  Advo, Inc.              20,500     $  767,725
                                     ----------
Aerospace - 2.3%
  Goodrich Corp.          32,600      1,248,254
  Teledyne                28,000        876,400
Technologies, Inc.(b)

                                     ----------
                                      2,124,654
                                     ----------
Banks - 3.4%
  City National Corp.      9,700        677,254
  Colonial BancGroup,     36,300        744,876
Inc.
  Compass Bancshares,     12,800        581,120
Inc.
  Franklin Bank           33,500        577,875
Corp.(b)
  Sterling Bancorp        25,200        611,604

                                     ----------
                                      3,192,729
                                     ----------
Business Services - 6.9%
  Alliance Data Systems   11,800        476,719
Corp.(b)
  Aquantive, Inc.(b)      58,100        643,167
  Cohen & Steers, Inc.    40,700        671,550
  The Dun & Bradstreet    10,000        614,500
Corp.(b)
  Global Payments, Inc.   18,900      1,218,861
  Korn/Ferry              37,600        715,528
International(b)
  Manpower, Inc.          15,000        652,800
  Navigant Consulting,    52,300      1,424,129
Inc.(b)

                                     ----------
                                      6,417,254
                                     ----------
Chemicals - 2.7%
  Church & Dwight Co.,    14,000        496,580
Inc.
  The Lubrizol Corp.      17,000        690,880
  Lyondell Chemical Co.   17,500        488,600
  Olin Corp.              38,700        863,010

                                     ----------
                                      2,539,070
                                     ----------
Computer Software & Services - 3.8%
  Citrix Systems,         30,000        714,600
Inc.(b)(c)
  Computer Sciences        8,300        380,555
Corp.(b)(c)
  Informatica Corp.(b)    65,100        538,377
  Interwoven, Inc.(b)     64,500        502,455
  Salesforce.Com,         34,000        509,660
Inc.(b)
  SI International,       18,500        511,155
Inc.(b)
  TIBCO Software,         58,700        437,315
Inc.(b)

                                     ----------
                                      3,594,117
                                     ----------
Construction - 2.9%
  Beacon Roofing          26,700        584,330
Supply, Inc.(b)
  Hovanian Enterprises,   10,700        545,700
Inc.(b)
  Pulte Homes, Inc.(c)     8,200        603,766
  Washington Group
International,
    Inc.(b)               21,000        944,790

                                     ----------
                                      2,678,586
                                     ----------
Containers - 1.2%
  Pactiv Corp.(b)         30,600        714,510
  Smurfit-Stone           24,000        371,280
Container Corp.(b)

                                     ----------
                                      1,085,790
                                     ----------
Electronics - 1.4%
  Amphenol Corp.          24,300        900,072
  Intersil Corp. -        25,000        433,000
Class A

                                     ----------
                                      1,333,072
                                     ----------
Energy & Utilities - 7.1%
  Atmos Energy Corp.      20,500        553,500


                           NUMBER
                         OF SHARES      VALUE
                        ----------- ------------
COMMON STOCKS (Continued)
Energy & Utilities (Continued)
  Equitable Resources,    12,400     $  712,256
Inc.
  Magnum Pete, Inc.(b)    63,800      1,027,818
  MDU Resources Group,    33,800        933,556
Inc.
  PPL Corp.               18,100        977,219
  Sempra Energy
                          15,200        605,568
  St. Mary Land & Exploration Co.
                          15,000        750,750
  UGI Corp.               23,000      1,044,660

                                     ----------
                                      6,605,327
                                     ----------
Entertainment & Leisure
- - 5.6%
  Gaylord Entertainment   20,400        824,160
Co.(b)
  Hilton Hotels Corp.     38,700        864,945
  Kerzner International Ltd.(b)
                          10,300        630,669
  Penn National Gaming, Inc.(b)
                          14,600        428,948
  Scientific Games Corp. - Class
    A(b)(c)               19,300        441,005
  Station Casinos, Inc.   20,500      1,384,775
  WMS Industries,         22,500        633,600
Inc.(b)(c)

                                     ----------
                                      5,208,102
                                     ----------
Finance - 1.8%
  CapitalSource,          22,400        515,200
Inc.(b)
  T. Rowe Price Group,    19,900      1,181,662
Inc.

                                     ----------
                                      1,696,862
                                     ----------
Food & Agriculture - 2.0%
  Ralcorp Holdings, Inc.  26,700      1,264,245
  Smithfield Foods,       20,000        631,000
Inc.(b)

                                     ----------
                                      1,895,245
                                     ----------
Insurance - 2.7%
  Aspen Insurance Holdings Ltd.
                          18,600        468,906
  Assurant, Inc.
                          35,100      1,182,870
  Endurance Specialty Holdings Ltd.
                          12,500        473,000
  The PMI Group,          11,700        444,717
Inc.(c)

                                     ----------
                                      2,569,493
                                     ----------
Machinery & Heavy
Equipment - 2.0%
  Bucyrus                 15,700        613,242
International, Inc. -
Class A
  Joy Global, Inc.        35,250      1,235,865

                                     ----------
                                      1,849,107
                                     ----------
Manufacturing - 4.3%
  Gardner Denver, Inc.(b) 18,600        734,886
  ITT Industries, Inc.     5,500        496,320
  Kaydon Corp.            23,500        737,900
  Polo Ralph Lauren       21,000        814,800
Corp.
  Powerwave             100,100         774,774
Technologies, Inc.(b)
  Rockwell Automation, Inc.
                          7,900         447,456

                                     ----------
                                      4,006,136
                                     ----------
Medical & Medical
Services - 4.8%
  Biomet, Inc.           15,000         544,500
  Caremark Rx, Inc.(b)
                         12,500         497,250
  Covance, Inc.(b)
                         16,000         761,760
  LifePoint Hospitals, Inc.(b)
                         13,100         574,304
  Medco Health           19,800         981,486
Solutions, Inc.(b)
  PacifiCare Health       6,500         369,980
Systems, Inc.(b)
  Triad Hospitals, Inc.(b)
                         15,000         751,500

                                     ----------
                                      4,480,780
                                     ----------

SEE ACCOMPANYING NOTES TO FINANCIAL STATEMENTS.
82
                                BLACKROCK FUNDS
                            STATEMENT OF NET ASSETS
                    U.S. OPPORTUNITIES PORTFOLIO (CONTINUED)


AS OF MARCH 31, 2005 (UNAUDITED)


                           NUMBER
                         OF SHARES      VALUE
                        ----------- -------------
COMMON STOCKS (Continued)
Medical Instruments & Supplies -
2.4%
  Bausch & Lomb, Inc.     4,100      $   300,530
  C.R. Bard, Inc.         8,800          599,104
  Charles River
Laboratories
    International,      10,592           498,248
Inc.(b)
  Fisher Scientific
International,
    Inc.(b)              6,700           381,364
  Kinetic Concepts,      7,800           465,270
Inc.(b)

                                     -----------
                                       2,244,516
                                     -----------
Metal & Mining - 3.9%
  Alpha Natural         15,100           432,917
Resources, Inc.(b)
  Arch Coal, Inc.       19,500           838,695
  Freeport-McMoRan
Copper & Gold,
    Inc. - Class B      20,400           808,044
  Inco Ltd.(b)          23,500           935,300
  Oregon Steel Mills,   28,900           664,700
Inc.(b)

                                     -----------
                                       3,679,656
                                     -----------
Oil & Gas - 7.8%
  Chesapeake Energy     57,100         1,252,773
Corp.(c)
  Diamond Offshore       9,500           474,050
Drilling, Inc.
  ENSCO International,  25,500           960,330
Inc.
  Grant Prideco,        23,600           570,176
Inc.(b)
  National-Oilwell,     27,000         1,260,900
Inc.(b)
  Noble Energy, Inc.(c) 13,800           938,676
  Pioneer Natural       16,000           683,520
Resources Co.
  Ultra Petroleum        7,500           381,000
Corp.(b)
  Weatherford           13,000           753,220
International
Ltd.(b)(c)

                                     -----------
                                       7,274,645
                                     -----------
Paper & Forest Products - 0.4%
  Pope & Talbot, Inc.   19,500           342,810
                                     -----------
Personal Services - 0.8%
  Educate, Inc.(b)      19,400           269,078
  Laureate Education,   11,500           492,085
Inc.(b)(c)

                                     -----------
                                         761,163
                                     -----------
Pharmaceuticals - 3.5%
  Abgenix, Inc.(b)(c)   66,500           465,501
  ArQule, Inc.(b)       79,300           373,503
  First Horizon
Pharmaceutical
    Corp.(b)            30,100           508,088
  InterMune, Inc.(b)    34,800           382,800
  Shire Pharmaceuticals
Group PLC -
    ADR                 22,100           757,588
  Transkaryotic         30,500           761,432
Therapies, Inc.(b)

                                     -----------
                                       3,248,912
                                     -----------
Railroad & Shipping - 1.1%
  Norfolk Southern      27,000         1,000,350
                                     -----------
Corp.
Real Estate - 3.7%
  Archstone-Smith Trust 22,500           767,475
  CB Richard Ellis
Group, Inc. - Class
    A(b)                24,800           867,752
  Host Marriott Corp.   30,000           496,800
  Kimco Realty Corp.    12,500           673,750
  The Mills Corp.(c)    13,000           687,700

                                     -----------
                                       3,493,477
                                     -----------
Restaurants - 0.6%
  Wendy's               13,700           534,848
                                     -----------
International, Inc.(c)
Retail Merchandising - 7.2%
  Aeropostale, Inc.(b)  25,000           818,750


                           NUMBER
                         OF SHARES      VALUE
                        ----------- -------------
COMMON STOCKS (Continued)
Retail Merchandising (Continued)
  Brookstone, Inc.(b)   39,200       $   635,824
  Charming Shoppes,     40,000           325,200
Inc.(b)
  Dick's Sporting       15,000           550,950
Goods, Inc.(b)
  Fossil, Inc.(b)       20,000           518,500
  Genesco, Inc.(b)      31,500           895,230
  Pacific Sunwear of California,
    Inc.(b)
                        37,500         1,049,250
  The Pantry, Inc.(b)
                        24,704           765,083
  Saks, Inc.(b)         41,500           749,075
  Urban Outfitters,      8,000           383,760
Inc.(b)

                                     -----------
                                       6,691,622
                                     -----------
Security Brokers &
Dealers - 0.5%
  E*TRADE Financial     38,400           460,800
                                     -----------
Corp.(b)
Semiconductors & Related Devices - 2.3%
  Exar Corp.(b)(c)
                        33,600           450,240
  International Rectifie12,400 (b)       564,200
  Lam Research Corp.(b) 23,000           663,780
  MEMC Electronic       35,000           470,750
Materials, Inc.(b)

                                     -----------
                                       2,148,970
                                     -----------
Telecommunications -
6.2%
  Alamosa Holdings,     63,300           738,711
Inc.(b)
  American Tower Corp.
- - Class
    A(b)(c)             47,500           865,925
  Avaya, Inc.(b)        47,000           548,960
  Cablevision Systems
New York
    Group - Class A(b)  20,000           561,000
  Comverse Technology, Inc.(b)
                        54,300         1,369,446
  Nextel Partners, Inc. - Class A(b)(c)
                        53,500         1,174,860
  Otelco, Inc.          37,319           572,847

                                     -----------
                                       5,831,749
                                     -----------
Textiles - 0.2%
  Innovo Group, Inc.(b) 66,000           327,360
                                     -----------
Transportation - 2.1%
  EGL, Inc.(b)
                        24,000           547,200
  Overnite Corp.        12,500           399,875
  Pacer International,  18,000           430,020
Inc.(b)
  Trinity Industries,   21,600           608,472
Inc.

                                     -----------
                                       1,985,567
                                     -----------
Waste Management - 0.8%
  URS Corp.(b)          24,500           704,375
                                     -----------
                                      92,774,869
                                     -----------
TOTAL COMMON STOCKS
  (Cost $76,649,105)                  92,774,869
                                     -----------


WARRANTS - 0.0%
  Bioject Medical Technologies, Inc.
    (expiring 05/22/06)(d)
  (Cost $0)                           15,000   150
                                               ---

SEE ACCOMPANYING NOTES TO FINANCIAL STATEMENTS.
                                                                              83
                                BLACKROCK FUNDS
                            STATEMENT OF NET ASSETS
                    U.S. OPPORTUNITIES PORTFOLIO (CONCLUDED)


AS OF MARCH 31, 2005 (UNAUDITED)


                                                  PAR/SHARES
                                       MATURITY     (000)        VALUE
                                      ---------- ----------- -------------
SHORT TERM INVESTMENTS - 12.6%
  Morgan Stanley, Floating Rate
    Notes
    2.94%(e)(f)                       11/14/05      $2,076    $ 2,076,397
  Galileo Money Market Fund                            994        993,708
  Institutional Money Market Trust(f)                8,747      8,746,603

                                                              -----------
TOTAL SHORT TERM INVESTMENTS
  (Cost $11,816,708)                                           11,816,708
                                                              -----------


TOTAL INVESTMENTS IN
SECURITIES -  111.8%
  (Cost $88,465,813(a))     104,591,727
LIABILITIES IN EXCESS OF
OTHER
  ASSETS -  (11.8)%
  (Including $10,823,000
of payable
  upon return of            (11,033,330)
                            -----------
securities loaned)
NET ASSETS - 100.0%
  (Applicable to 260,840
Institutional
  shares, 19,305 Service
shares,
  1,375,932 Investor A
shares,
  1,832,946 Investor B
shares and
  935,106 Investor C      $  93,558,397
                          =============
shares)


NET ASSET VALUE, OFFERING
  AND REDEMPTION PRICE PER
  INSTITUTIONAL SHARE
     ($5,854,327/260,840)                $ 22.44
                                         =======
NET ASSET VALUE, OFFERING
  AND REDEMPTION PRICE PER
  SERVICE SHARE
        ($423,819/19,305)                $ 21.95
                                         =======
NET ASSET VALUE AND REDEMPTION
  PRICE PER INVESTOR A SHARE
  ($29,975,372/1,375,932)                $ 21.79
                                         =======
MAXIMUM OFFERING PRICE PER
  INVESTOR A SHARE
          ($21.79/0.9425)                $ 23.12
                                         =======
NET ASSET VALUE, OFFERING
  AND REDEMPTION PRICE
  (subject to a maximum contingent
  deferred sales charge of 4.5%)
  PER INVESTOR B SHARE
  ($37,957,878/1,832,946)                $ 20.71
                                         =======
NET ASSET VALUE, OFFERING
  AND REDEMPTION PRICE
  (subject to a maximum contingent
  deferred sales charge of 1.0%)
  PER INVESTOR C SHARE
    ($19,347,001/935,106)                $ 20.69
                                         =======


- -------------------

 (a) Cost for Federal income tax purposes is $88,584,536. The gross
     unrealized appreciation (depreciation) on a tax basis is as
     follows:
      Gross unrealized appreciation                                   $17,636,794
      Gross unrealized depreciation                                    (1,629,603)
                                                                      -----------
                                                                      $16,007,191
                                                                      ===========


     (b) Non-income producing security.
     (c) Total or partial securities on loan.

 (d) Security valued at fair value as determined in good faith by or under the
       direction of the Trustees.  As of March 31, 2005, this security had a
       total market value of $150 which represents less than 0.01% of net
       assets.
     (e) Rates shown are the rates as of March 31, 2005.
  (f) Securities purchased with the cash proceeds from securities loaned.

SEE ACCOMPANYING NOTES TO FINANCIAL STATEMENTS.
84
                                BLACKROCK FUNDS
                            STATEMENT OF NET ASSETS
                     INTERNATIONAL OPPORTUNITIES PORTFOLIO


AS OF MARCH 31, 2005 (UNAUDITED)


                            NUMBER
                          OF SHARES       VALUE
                        ------------- -------------
COMMON STOCKS - 95.3%
Australia - 1.9%
Metal & Mining - 1.9%
  WMC Resources Ltd.         783,800   $ 4,832,279
  Zinifex Ltd.(b)         2,019,100      4,638,768

                                       -----------
                                         9,471,047
                                       -----------
Austria - 2.3%
Construction - 1.1%
  Wienerberger AG           121,983      5,566,156
                                       -----------
Machinery & Heavy Equipment - 0.4%
  Andritz AG                 28,700      2,571,452
                                       -----------
Telecommunications - 0.8%
  Telekom Austria AG        195,800      3,842,509
                                       -----------
                                        11,980,117
                                       -----------
Belgium - 0.7%
Metal & Mining - 0.7%
  Umicore                    34,116      3,471,723
                                       -----------
Brazil - 0.2%
Medical & Medical Services - 0.0%
  Diagnosticos da            85,600        875,802
                                       -----------
America(b)
Canada - 4.0%
Metal & Mining - 3.4%
  Falconbridge Ltd.          78,300      2,808,794
  First Quantum             120,000      2,232,673
Minerals Ltd.
  Inco Ltd.(b)              107,100      4,252,664
  Inmet Mining Corp.(b)     199,400      3,040,815
  Teck Cominco Ltd.         143,100      5,304,819

                                       -----------
                                        17,639,765
                                       -----------
Oil & Gas - 0.6%
  Niko Resources Ltd.        56,372      2,909,342
                                       -----------
                                        20,549,107
                                       -----------
China - 0.7%
Oil & Gas - 0.7%
  Precision Drilling         47,600      3,560,607
                                       -----------
Corp.(b)
Finland - 3.1%
Banks - 0.5%
  OKO Bank - Class A        170,800      2,801,383
                                       -----------
Machinery & Heavy Equipment - 1.7%
  Kone Oyj - Class B(b)      48,900      3,811,256
  Metso Oyj                 240,100      4,312,464

                                       -----------
                                         8,123,720
                                       -----------
Retail Merchandising - 0.9%
  Kesko Oyj - Class B       182,400      4,698,440
                                       -----------
                                        15,623,543
                                       -----------
France - 2.4%
Advertising - 1.1%
  JC Decaux SA(b)           193,000      5,282,517
                                       -----------
Computer & Office Equipment - 0.9%
  Neopost SA                 54,200      4,705,448
                                       -----------
Construction - 0.4%
  Imerys SA                  27,400      2,076,082
                                       -----------
                                        12,064,047
                                       -----------
Germany - 3.8%
Broadcasting - 0.0%
  Premiere AG(b)             11,400        473,370
                                       -----------


                            NUMBER
                          OF SHARES       VALUE
                        ------------- -------------
COMMON STOCKS (Continued)
Germany (Continued)
Construction - 0.7%
  Bilfinger Berger AG       107,300    $ 5,350,776
                                       -----------
Manufacturing - 1.8%
  Adidas-Salomon AG
                             21,500      3,420,709
  MAN AG
                             60,100      2,694,751
  Norddeutsche Affinerie AG 185,000      4,063,345

                                       -----------
                                        10,178,805
                                       -----------
Telecommunications - 0.5%
  Freenet.De AG(b)          133,000      3,548,672
                                       -----------
                                        19,551,623
                                       -----------
Greece - 1.1%
Banks - 1.1%
  Alpha Bank AE             164,360      5,566,674
                                       -----------
Hong Kong - 3.3%
Banks - 0.2%
  Industrial and Commercial Bank of
    China (Asia) Ltd.       920,300      1,238,969
                                       -----------
Containers - 0.6%
  Cosco Pacific Ltd.      1,478,200      3,212,510
                                       -----------
Entertainment & Leisure - 1.4%
  Playmates Holdings Ltd  5,651,500      1,253,578
  Regal Hotels
International Holdings
    Ltd.(b)             59,689,000       5,204,090

                                       -----------
                                         6,457,668
                                       -----------
Motor Vehicles - 0.5%
  Weichai Power Co.        798,000       2,721,611
                                       -----------
Ltd.
Real Estate - 0.6%
  New World Development Co. Ltd.
                         3,305,100       3,241,811
                                       -----------
                                        16,872,569
                                       -----------
India - 2.4%
Banks - 0.6%
  Industrial Development Bank of
    India Ltd.           1,179,000       2,461,144
                                       -----------
Manufacturing - 0.4%
  Grasim Industries         80,300       2,231,812
                                       -----------
Ltd.
Pharmaceuticals - 0.3%
  Ipca Laboratories Ltd.    77,600         535,017
  Nicholas Piramal Ltd.    221,500       1,126,649

                                       -----------
                                         1,661,666
                                       -----------
Telecommunications -
1.1%
  Bharti Tele-Ventures Ltd.(b)
                         1,227,300       5,813,970
                                       -----------
                                        12,168,592
                                       -----------
Indonesia - 1.2%
Banks - 0.6%
  PT Bank Mandiri
                        14,821,400       2,676,303
                                       -----------
Metal & Mining - 0.6%
  PT Bumi Resources Tbk(32,751,000       2,697,549
                                       -----------
                                         5,373,852
                                       -----------
Italy - 2.4%
Construction - 1.4%
  Buzzi Unicem SpA         189,300       2,939,977
  Italcementi SpA          228,800       3,859,721

                                       -----------
                                         6,799,698
                                       -----------

SEE ACCOMPANYING NOTES TO FINANCIAL STATEMENTS.
                                                                              85
                                BLACKROCK FUNDS
                            STATEMENT OF NET ASSETS
               INTERNATIONAL OPPORTUNITIES PORTFOLIO (CONTINUED)


AS OF MARCH 31, 2005 (UNAUDITED)


                           NUMBER
                         OF SHARES       VALUE
                        ----------- --------------
COMMON STOCKS (Continued)
Italy (Continued)
Oil & Gas - 1.0%
  Saipem SpA               419,000   $  5,325,717
                                     ------------
                                       12,125,415
                                     ------------
Japan - 26.1%
Banks - 3.2%
  Bank of Kyoto Ltd.       278,000      2,404,170
  The Bank of Yokohama     648,000      3,962,154
Ltd.
  The Chiba Bank Ltd.      505,000      3,276,645
  The Iyo Bank Ltd.        194,000      1,719,447
  The Joyo Bank Ltd.       612,200      3,302,537
  The Musashino Bank        39,100      1,794,886
Ltd.

                                     ------------
                                       16,459,839
                                     ------------
Beverages & Bottling - 0.7%
  Sapporo Holdings Ltd.    732,000      3,435,527
                                     ------------
Chemicals - 1.7%
  Tokai Carbon Co. Ltd.    999,000      4,240,333
  Tosoh Corp.              861,600      4,269,334

                                     ------------
                                        8,509,667
                                     ------------
Finance - 4.1%
  K.K. DaVinci               1,450      3,023,093
Advisors(b)
  Mitsui Trust             530,400      5,286,148
Holdings, Inc.
  Nissin Co. Ltd.       1,359,160       3,176,795
  Orix Corp.               23,500       3,003,412
  Pacific Management          600       1,985,789
Corp.
  Sanyo Shinpan Finance    63,500       4,321,990
Co. Ltd.

                                     ------------
                                       20,797,227
                                     ------------
Food & Agriculture - 0.9%
  The Nisshin Oillio      820,000       4,599,850
                                     ------------
Group Ltd.
Leasing - 1.1%
  Diamond Lease Co.        81,300       3,169,606
Ltd.
  RICOH LEASING Co.        47,600       1,243,848
Ltd.
  Sumisho Lease Co.        35,600       1,328,010
Ltd.

                                     ------------
                                        5,741,464
                                     ------------
Machinery & Heavy Equipment - 3.0%
  Hitachi Construction
Machinery Co.
    Ltd.                  305,900       4,229,863
  Juki Corp.(b)           860,200       3,080,184
  Komatsu Ltd.            476,500       3,590,679
  Sumitomo Heavy        1,118,400       4,412,536
Industries Ltd.

                                     ------------
                                       15,313,262
                                     ------------
Manufacturing - 2.5%
  Asahi Diamond           433,600       2,626,897
Industry Co. Ltd.
  Kobe Steel Ltd.       2,337,800       4,130,929
  KOYO SEIKO Co. Ltd.     225,700       3,061,805
  Shimadzu Corp.          468,000       2,800,299

                                     ------------
                                       12,619,930
                                     ------------
Medical Instruments & Supplies -
0.5%
  Nihon Kohden Corp.      207,000       2,632,012
                                     ------------
Motor Vehicles - 3.0%
  KEIHIN Corp.            204,200       3,453,607
  Nissan Shatai Co.       507,000       3,792,072
Ltd.
  SHOWA Corp.             113,500       1,607,634


                           NUMBER
                         OF SHARES       VALUE
                        ----------- --------------
COMMON STOCKS (Continued)
Japan (Continued)
Motor Vehicles (Continued)
  Yamaha Motor Co. Ltd.   414,600    $  7,112,855

                                     ------------
                                       15,966,168
                                     ------------
Real Estate - 0.5%
  JOINT CORP.              97,800       2,450,486
                                     ------------
Retail Merchandising -
3.9%
  FamilyMart Co. Ltd.     104,200       3,078,459
  Gulliver                 32,300       4,363,641
International Co. Ltd.
  RYOHIN KEIKAKU CO.       54,100       2,680,722
Ltd.
  Sundrug Co. Ltd.         69,000       2,386,874
  TSURUHA Co. Ltd.
                           77,300       2,637,855
  Yamada Denki Co. Ltd.
                           86,200       4,529,207

                                     ------------
                                       19,676,758
                                     ------------
Security Brokers & Dealers - 0.9%
  Ichiyoshi Securities    328,000       3,459,087
Co. Ltd.
  Matsui Securities Co.    86,200       1,150,838
Ltd.

                                     ------------
                                        4,609,925
                                     ------------
Telecommunications - 0.1%
  Jupiter
Telecommunications Co.
    Ltd.(b)                   600         479,619
                                     ------------
                                      133,291,734
                                     ------------
Malaysia - 0.7%
Telecommunications -
0.7%
  Maxis Communications  1,438,600       3,577,571
                                     ------------
Berhad
Netherlands - 2.7%
Business Services - 1.5%
  Randstad Holding NV
                           82,189       3,668,083
  Vedior NV               217,400       3,876,492

                                     ------------
                                        7,544,575
                                     ------------
Construction - 0.5%
  Koninklijke BAM Groep    46,100       2,726,074
                                     ------------
NV
Transportation - 0.7%
  Koninklijke (Royal) P&O Nedlloyd
    NV(b)
                           60,000       3,380,381
                                     ------------
                                       13,651,030
                                     ------------
Norway - 3.2%
Banks - 0.5%
  Sparebanken              21,400         840,492
Midt-Norge
  Sparebanken              51,920         953,807
Nord-Norge
  Sparebanken              17,200       1,081,401
Rogaland-Cap Ctf

                                     ------------
                                        2,875,700
                                     ------------
Oil & Gas - 2.7%
  Exploration Resources     7,200         145,952
ASA(b)
  Prosafe ASA             261,200       8,231,788
  Smedvig ASA - Class A   280,800       5,291,904

                                     ------------
                                       13,669,644
                                     ------------
                                       16,545,344
                                     ------------
Portugal - 1.2%
Miscellaneous Services
- - 0.4%
  Brisa Auto Estradas de P285,900       2,418,914
                                     ------------
SA

SEE ACCOMPANYING NOTES TO FINANCIAL STATEMENTS.
86
                                BLACKROCK FUNDS
                            STATEMENT OF NET ASSETS
               INTERNATIONAL OPPORTUNITIES PORTFOLIO (CONTINUED)


AS OF MARCH 31, 2005 (UNAUDITED)


                           NUMBER
                         OF SHARES      VALUE
                        ----------- -------------
COMMON STOCKS (Continued)
Portugal (Continued)
Telecommunications - 0.8%
  PT Multimedia -
Servicos de
    Telecomunicacoes e
Multimedia
    SGPS SA(b)             155,100   $ 3,880,322
                                     -----------
                                       6,299,236
                                     -----------
Singapore - 1.5%
Oil & Gas - 0.6%
  Singapore Petroleum   1,292,500      3,213,029
                                     -----------
Co. Ltd.
Real Estate - 0.9%
  Capitaland Ltd.(b)    3,144,000      4,479,719
                                     -----------
                                       7,692,748
                                     -----------
South Africa - 1.6%
Banks - 0.5%
  ABSA Group Ltd.         227,200      2,752,500
                                     -----------
Conglomerates - 0.5%
  Bidvest Group Ltd.      211,400      2,404,840
                                     -----------
Retail Merchandising - 0.6%
  Edgars Consolidated      64,600      2,854,285
                                     -----------
Stores Ltd.
                                       8,011,625
                                     -----------
South Korea - 2.4%
Chemicals - 0.4%
  Honam Petrochemical      38,500      1,971,443
                                     -----------
Corp.
Construction - 1.3%
  Hanjin Heavy            259,500      3,015,362
Industries Co. Ltd.
  Hyundai Development     195,000      3,552,436
Co.

                                     -----------
                                       6,567,798
                                     -----------
Machinery & Heavy Equipment - 0.7%
  Daewoo Heavy
Industries &
    Machinery Ltd.        392,600      3,502,665
                                     -----------
                                      12,041,906
                                     -----------
Spain - 2.4%
Air Transportation - 0.9%
  Iberia Lineas Aereas  1,382,400      4,635,309
                                     -----------
de Espana SA
Construction - 0.7%
  ACS, Actividades de
Construccion y
    Servicios SA          144,400      3,584,477
                                     -----------
Retail Merchandising - 0.8%
  Cortefiel SA            244,700      4,251,974
                                     -----------
                                      12,471,760
                                     -----------
Sweden - 3.2%
Manufacturing - 1.8%
  SKF AB - Class B        105,700      4,959,940
  SSAB Svenskt Stal AB    176,600      4,400,457

                                     -----------
                                       9,360,397
                                     -----------
Motor Vehicles - 0.6%
  Scania AB                72,500      3,098,379
                                     -----------
Retail Merchandising - 0.8%
  Lindex AB                80,800      3,843,139
                                     -----------
                                      16,301,915
                                     -----------
Switzerland - 1.5%
Advertising - 0.6%
  PubliGroupe SA            9,700      3,088,472
                                     -----------


                           NUMBER
                         OF SHARES      VALUE
                        ----------- -------------
COMMON STOCKS (Continued)
Switzerland (Continued)
Machinery & Heavy Equipment - 0.9%
  Sauer AG(b)              68,400    $ 4,504,908
                                     -----------
                                       7,593,380
                                     -----------
Taiwan - 1.1%
Banks - 0.6%
  Taishin Financial     3,198,678      2,863,032
                                     -----------
Holdings Co. Ltd.
Security Brokers & Dealers - 0.5%
  Yuanta Core Pacific   3,691,554      2,700,766
                                     -----------
Securities Co.
                                       5,563,798
                                     -----------
Thailand - 1.9%
Banks - 0.7%
  Siam Commercial Bank
Public Co.
    Ltd. (Foreign       3,155,100      4,073,439
                                     -----------
Shares)(c)
Metal & Mining - 0.6%
  Banpu Public Co.        737,300      3,053,626
                                     -----------
Ltd.(c)
Telecommunications - 0.6%
  Advanced Info Service
Public Co.
    Ltd. (Foreign       1,099,000      2,809,664
                                     -----------
Shares)(c)
                                       9,936,729
                                     -----------
United Kingdom - 16.3%
Aerospace - 0.6%
  Meggitt PLC             665,765      3,311,779
                                     -----------
Business Services - 0.6%
  Michael Page            788,500      2,890,516
                                     -----------
International PLC
Computer Software &
Services - 0.6%
  SurfControl PLC(b)
                          248,900      2,951,281
                                     -----------
Construction - 1.8%
  BPB PLC                 214,300      2,010,543
  Carillion PLC           688,400      3,173,969
  Taylor Woodrow PLC
                          703,000      4,064,889

                                     -----------
                                       9,249,401
                                     -----------
Electronics - 0.3%
  Ultra Electronics Holdin127,200      1,736,587
                                     -----------
Entertainment & Leisure
- - 2.5%
  Hilton Group PLC        390,400      2,220,487
  InterContinental        319,485      3,727,858
Hotels Group PLC
  Millennium & Copthorne Hotels
    PLC
                          470,200      3,500,667
  Whitbread PLC           187,500      3,300,320

                                     -----------
                                      12,749,332
                                     -----------
Finance - 0.5%
  Paragon Group Companies PLC
                          315,400      2,383,931
                                     -----------
Manufacturing - 0.4%
  IMI PLC                 271,100      2,102,881
                                     -----------
Measuring & Controlling
Devices - 0.7%
  Rotork PLC              432,250      3,806,211
                                     -----------
Medical Instruments &
Supplies - 0.8%
  Alliance Unichem PLC
                          281,028      4,107,541
                                     -----------
Metal & Mining - 1.1%
  Antofagasta PLC         225,500      5,437,123
                                     -----------
Oil & Gas - 1.0%
  Tullow Oil PLC        1,494,600      4,907,064
                                     -----------

SEE ACCOMPANYING NOTES TO FINANCIAL STATEMENTS.
                                                                              87
                                BLACKROCK FUNDS
                            STATEMENT OF NET ASSETS
               INTERNATIONAL OPPORTUNITIES PORTFOLIO (CONCLUDED)


AS OF MARCH 31, 2005 (UNAUDITED)


                            NUMBER
                          OF SHARES        VALUE
                        ------------- --------------
COMMON STOCKS (Continued)
United Kingdom (Continued)
Pharmaceuticals - 0.6%
  Shire Pharmaceuticals     248,500    $  2,838,538
                                       ------------
Group PLC
Publishing & Printing - 0.7%
  Trinity Mirror PLC        271,100       3,591,034
                                       ------------
Retail Merchandising - 1.0%
  Somerfield PLC          1,269,600       5,032,002
                                       ------------
Soaps & Cosmetics - 0.4%
  McBride PLC               736,700       2,108,994
                                       ------------
Transportation - 1.5%
  Arriva PLC                301,000       2,986,055
  Exel PLC                  294,900       4,725,443

                                       ------------
                                          7,711,498
                                       ------------
Waste Management - 1.2%
  Kelda Group PLC           287,500       3,248,710
  Severn Trent PLC          180,900       3,127,747

                                       ------------
                                          6,376,457
                                       ------------
                                         83,292,170
                                       ------------
TOTAL COMMON STOCKS
  (Cost $409,750,472)                   485,525,664
                                       ------------
PREFERRED STOCKS - 2.0%
Brazil - 0.9%
Manufacturing - 0.2%
  Companhia Siderurgica  65,652,300       4,036,437
                                       ------------
de Tubarao
Germany - 1.1%
Machinery & Heavy Equipment - 0.8%
  Rheinmetall AG            106,700       5,685,564
                                       ------------
TOTAL PREFERRED STOCKS
  (Cost $9,008,168)                       9,722,001
                                       ------------


WARRANTS - 0.0%
  Matsui Securities Co. Ltd. (expiring
    5/19/05)(b)
  (Cost $1,586,433)                          144,400   1,891,403
                                                       ---------


                                               PAR/SHARES
                                    MATURITY     (000)
                                   ---------- -----------
SHORT TERM INVESTMENTS - 6.5%
  Federal Home Loan Bank, Discount
    Notes
    2.55%                          04/01/05     $26,000    26,000,000
  Galileo Money Market Fund                       6,671     6,670,757

                                                           ----------
TOTAL SHORT TERM INVESTMENTS
  (Cost $32,670,757)                                       32,670,757
                                                           ----------


                                          VALUE
                                     ---------------
TOTAL INVESTMENTS IN SECURITIES -  103.8%
  (Cost $453,015,830(a))             $529,809,825
LIABILITIES IN EXCESS OF
  OTHER ASSETS -  (3.8)%              (19,620,654)
                                     ------------
NET ASSETS - 100.0%
  (Applicable to 5,285,177
  Institutional shares, 1,151,428
  Service shares, 6,025,349
  Investor A shares, 2,175,745
  Investor B shares and 3,235,730
  Investor C shares)                 $510,189,171
                                     ============


NET ASSET VALUE, OFFERING
  AND REDEMPTION PRICE
  PER INSTITUTIONAL SHARE
  ($155,535,854/5,285,177)               $ 29.43
                                         =======
NET ASSET VALUE, OFFERING
  AND REDEMPTION PRICE
  PER SERVICE SHARE
   ($33,155,064/1,151,428)               $ 28.79
                                         =======
NET ASSET VALUE AND
  REDEMPTION PRICE PER
  INVESTOR A SHARE
  ($172,559,137/6,025,349)               $ 28.64
                                         =======
MAXIMUM OFFERING PRICE PER
  INVESTOR A SHARE
            ($28.64/0.950)               $ 30.15
                                         =======
NET ASSET VALUE, OFFERING
  AND REDEMPTION PRICE
  (subject to a maximum contingent
  deferred sales charge of 4.5%)
  PER INVESTOR B SHARE
   ($59,924,046/2,175,745)               $ 27.54
                                         =======
NET ASSET VALUE, OFFERING
  AND REDEMPTION PRICE
  (subject to a maximum contingent
  deferred sales charge of 1.0%)
  PER INVESTOR C SHARE
   ($89,015,070/3,235,730)               $ 27.51
                                         =======


- -------------------

 (a) Cost for Federal income tax purposes is $453,130,795. The
     gross unrealized appreciation (depreciation) on a tax basis is as
     follows:
      Gross unrealized appreciation                                      $80,100,169
      Gross unrealized depreciation                                       (3,421,139)
                                                                         -----------
                                                                         $76,679,030
                                                                         ===========

     (b) Non-income producing security.
  (c) Security valued at fair value as determined in good faith by or under
       the direction of the Trustees.  As of March 31, 2005, the securities had
       a total market value of $9,936,729 which represents 1.9% of net assets.

SEE ACCOMPANYING NOTES TO FINANCIAL STATEMENTS.
88
                                BLACKROCK FUNDS
                            STATEMENT OF NET ASSETS
                           ASSET ALLOCATION PORTFOLIO


AS OF MARCH 31, 2005 (UNAUDITED)


                           NUMBER
                         OF SHARES      VALUE
                        ----------- -------------
COMMON STOCKS - 68.2%
Australia - 0.5%
Metal & Mining - 0.1%
  BHP Billiton Ltd.       79,154     $ 1,094,173
                                     -----------
Pharmaceuticals - 0.2%
  CSL Ltd.                44,974       1,189,110
                                     -----------
Retail Merchandising - 0.2%
  Woolworths Ltd.       127,864        1,587,492
                                     -----------
                                       3,870,775
                                     -----------
Austria - 0.1%
Banks - 0.1%
  Bank Austria           10,835        1,070,207
                                     -----------
Creditanstalt
Belgium - 0.2%
Beverages & Bottling - 0.2%
  Inbev NV               36,094        1,267,024
                                     -----------
Canada - 1.4%
Energy & Utilities - 0.0%
  Tusk Energy Corp.(b)   10,557           37,696
                                     -----------
Metal & Mining - 0.6%
  Bema Gold Corp.(c)     50,000          134,000
  Crystallex            300,000        1,053,000
International Corp.(c)
  Fording Canadian Coal   7,429          682,577
Trust(d)
  Gateway Gold Corp.(c)  95,109           90,403
  Gold Reserve, Inc.(c) 100,000          390,000
  Minefinders Corp.      40,000          267,200
Ltd.(c)
  NovaGold Resources,   126,700        1,052,877
Inc.(c)
  Southwestern           47,300          387,048
Resources Corp.(c)
  Stratagold Corp.(c)   200,000           76,869
  Sunridge Gold          76,700           58,325
Corp.(c)

                                     -----------
                                       4,192,299
                                     -----------
Motor Vehicles - 0.0%
  Westport Innovations,  74,150          105,302
                                     -----------
Inc.(c)
Oil & Gas - 0.7%
  Accrete Energy,         4,960           29,929
Inc.(c)
  Argo Energy Ltd.(c)    19,200           50,624
  Blizzard Energy,       12,000           29,061
Inc.(c)
  C1 Energy Ltd.(c)      85,733          173,613
  Capitol Energy         31,523           26,576
Resources Ltd.(c)
  Chamaelo Energy,       11,700           63,634
Inc.(c)
  Cinch Energy           60,480           57,210
Corp.(b)(c)
  Compton Petroleum      66,500          667,831
Corp.(c)
  Crew Energy, Inc.(c)    9,400           86,397
  Delphi Energy          18,000           49,097
Corp.(c)
  Endev Energy, Inc.(c) 231,700          294,927
  Esprit Energy Trust -  36,375          375,220
Class A
  Galleon Energy, Inc.   47,160          383,953
- - Class A(b)(c)
  Hawker Resources,       6,464           25,378
Inc.(c)
  KICK Energy Ltd.(c)     9,100           49,644
  Lightning Energy       31,727          123,252
Ltd.(c)
  Midnight Oil           69,600          230,686
Exploration Ltd.(c)
  Mustang Resources,
Inc. - Class
    A(c)                 28,200          209,778
  Niko Resources Ltd.    15,500          799,950
  Oilexco, Inc.(c)       72,025          168,870
  Pacific Rodera         37,300           37,306
Energy, Inc.(c)
  Paramount Resources
Ltd. - Class
    A                    15,600          399,590
  Precision Drilling     10,400          776,464
Corp.(c)
  ProspEx Resources      43,140          127,653
Ltd.(c)


                           NUMBER
                         OF SHARES      VALUE
                        ----------- -------------
COMMON STOCKS (Continued)
Canada (Continued)
Oil & Gas (Continued)
  Purcell Energy        137,546      $   154,616
Ltd.(b)(c)
  Technicoil Corp.(c)    33,500           83,068
  Tempest Energy Corp.   14,700           68,041
- - Class A(c)
  Thunder Energy, Inc.(c)29,367          194,186
  True Energy, Inc.(c)   46,870          175,494
  West Energy Ltd.(c)
                            143              610

                                     -----------
                                       5,912,658
                                     -----------
Retail Merchandising -
0.1%
  Shoppers Drug Mart Corp30,194        1,007,257
                                     -----------
Transportation - 0.0%
  Railpower              17,600           88,156
                                     -----------
Technologies Corp.(c)
                                      11,343,368
                                     -----------
Finland - 0.4%
Energy & Utilities -
0.2%
  Fortum Oyj             98,034        1,913,692
                                     -----------
Finance - 0.2%
  Sampo Oyj              90,843        1,322,314
                                     -----------
                                       3,236,006
                                     -----------
France - 1.8%
Banks - 0.2%
  Credit Agricole SA     58,435        1,592,563
                                     -----------
Construction - 0.4%
  Lafarge SA             12,418        1,205,584
  Vinci SA               11,817        1,707,801

                                     -----------
                                       2,913,385
                                     -----------
Entertainment & Leisure - 0.2%
  Vivendi Universal SA(c)55,974        1,718,998
                                     -----------
Insurance - 0.3%
  Axa                    76,287        2,037,453
                                     -----------
Medical Instruments &
Supplies - 0.1%
  Essilor International   7,317          530,154
                                     -----------
SA
Motor Vehicles - 0.2%
  PSA Peugeot Citroen    22,663        1,443,830
                                     -----------
SA
Oil & Gas - 0.1%
  Technip SA             10,606        1,778,143
                                     -----------
Soaps & Cosmetics -
0.2%
  L'Oreal SA             19,650        1,576,975
                                     -----------
Telecommunications -
0.1%
  Ses Global SA          71,016          922,034
                                     -----------
                                      14,513,535
                                     -----------
Germany - 0.6%
Chemicals - 0.2%
  Bayer AG               43,312        1,433,714
                                     -----------
Finance - 0.2%
  Hypo Real Estate       30,542        1,276,156
                                     -----------
Holding AG
Manufacturing - 0.2%
  Siemens AG             22,503        1,785,464
                                     -----------
                                       4,495,334
                                     -----------

SEE ACCOMPANYING NOTES TO FINANCIAL STATEMENTS.
                                                                              89
                                BLACKROCK FUNDS
                            STATEMENT OF NET ASSETS
                     ASSET ALLOCATION PORTFOLIO (CONTINUED)


AS OF MARCH 31, 2005 (UNAUDITED)


                           NUMBER
                         OF SHARES      VALUE
                        ----------- -------------
COMMON STOCKS (Continued)
Greece - 0.4%
Jewelry - 0.1%
  Folli-Follie SA         34,377     $   978,447
                                     -----------
Telecommunications - 0.3%
  Hellenic
Telecommunications
    Organization SA     116,401        2,060,436
                                     -----------
                                       3,038,884
                                     -----------
Hong Kong - 0.2%
Conglomerates - 0.2%
  Hutchison Whampoa     144,000        1,223,179
                                     -----------
Ltd.
Italy - 0.2%
Oil & Gas - 0.2%
  Eni SpA                65,157        1,696,162
                                     -----------
Japan - 2.5%
Banks - 0.3%
  Mitsubishi Tokyo
Financial Group,
    Inc.                    144        1,252,056
  Mizuho Financial          296        1,403,067
Group, Inc.

                                     -----------
                                       2,655,123
                                     -----------
Beverages & Bottling - 0.1%
  Asahi Breweries Ltd.   78,800        1,023,310
                                     -----------
Chemicals - 0.1%
  Daicel Chemical       185,000        1,020,475
                                     -----------
Industries Ltd.
Conglomerates - 0.2%
  Mitsui & Co. Ltd.     192,000        1,775,318
                                     -----------
Construction - 0.3%
  Daiwa House Industry  130,000        1,497,382
Co. Ltd.
  Obayashi Corp.        186,000        1,149,458

                                     -----------
                                       2,646,840
                                     -----------
Electronics - 0.2%
  Sony Corp.             33,000        1,317,408
                                     -----------
Energy & Utilities - 0.3%
  Hokkaido Electric      51,700        1,053,721
Power Co.
  Tokyo Electric Power   56,900        1,383,134
Co.

                                     -----------
                                       2,436,855
                                     -----------
Finance - 0.1%
  Sanyo Shinpan Finance  12,200          830,366
                                     -----------
Co. Ltd.
Machinery & Heavy Equipment - 0.1%
  Komatsu Ltd.          131,000          987,154
                                     -----------
Motor Vehicles - 0.3%
  Suzuki Motor Corp.     62,100        1,113,573
  Toyota Motor Corp.     29,100        1,085,537

                                     -----------
                                       2,199,110
                                     -----------
Oil & Gas - 0.1%
  Nippon Oil Corp.      145,000        1,031,647
                                     -----------
Real Estate - 0.4%
  Mitsui Fudosan Co.     55,000          647,392
Ltd.
  Tokyo Tatemono Co.    214,000        1,452,543
Ltd.

                                     -----------
                                       2,099,935
                                     -----------
                                      20,023,541
                                     -----------
Norway - 0.3%
Banks - 0.2%
  DNB NOR ASA           169,002        1,733,004
                                     -----------


                           NUMBER
                         OF SHARES      VALUE
                        ----------- -------------
COMMON STOCKS (Continued)
Norway (Continued)
Transportation - 0.1%
  Stolt-Nielsen SA(c)    13,000      $   467,344
                                     -----------
                                       2,200,348
                                     -----------
Puerto Rico - 0.0%
Finance - 0.0%
  Doral Financial Corp.     600           13,134
                                     -----------
Singapore - 0.4%
Business Services -
0.2%
  Jardine Matheson Holdings Ltd.
                         62,800        1,092,719
                                     -----------
Conglomerates - 0.1%
  Keppel Corp. Ltd.     127,000          839,326
                                     -----------
Telecommunications - 0.1%
  Singapore Telecommunications Ltd.
                        685,000        1,071,546
                                     -----------
                                       3,003,591
                                     -----------
South Africa - 0.1%
Banks - 0.1%
  ABSA Group Ltd.
                         53,909          653,101
                                     -----------
Spain - 0.2%
Banks - 0.2%
  Banco Bilbao Vizcaya Argentaria
    SA                  111,466        1,819,522
                                     -----------
Switzerland - 0.8%
Banks - 0.3%
  Credit Suisse          61,742        2,659,998
                                     -----------
Group(c)
Chemicals - 0.2%
  Syngenta AG(c)         12,026        1,260,213
                                     -----------
Pharmaceuticals - 0.3%
  Roche Holding AG
                         21,929        2,358,669
                                     -----------
                                       6,278,880
                                     -----------
Thailand - 0.3%
Banks - 0.2%
  Kasikornbank Public Co. Ltd.
                        765,000        1,144,126
                                     -----------
Manufacturing - 0.1%
  Siam Cement Public    153,700        1,037,372
                                     -----------
Co. Ltd.
                                       2,181,498
                                     -----------
United Kingdom - 2.0%
Energy & Utilities - 0.1%
  Centrica PLC          203,434          887,028
                                     -----------
Food & Agriculture - 0.2%
  Compass Group PLC     316,276        1,443,296
                                     -----------
Insurance - 0.3%
  Prudential PLC        275,864        2,637,652
                                     -----------
Oil & Gas - 0.6%
  BG Group PLC
                        222,874        1,731,958
  Expro International Group PLC
                         22,880          187,420
  Shell Transport & Trading Co. PLC
                        300,095        2,693,546
  Tullow Oil PLC         97,735          320,883
  Venture Production PLC (c)
                         20,752          104,601

                                     -----------
                                       5,038,408
                                     -----------
Pharmaceuticals - 0.5%
  AstraZeneca PLC
                         48,044        1,893,762
  Glaxosmithkline PLC
                         81,478        1,867,554

                                     -----------
                                       3,761,316
                                     -----------

SEE ACCOMPANYING NOTES TO FINANCIAL STATEMENTS.
90
                                BLACKROCK FUNDS
                            STATEMENT OF NET ASSETS
                     ASSET ALLOCATION PORTFOLIO (CONTINUED)


AS OF MARCH 31, 2005 (UNAUDITED)


                           NUMBER
                         OF SHARES      VALUE
                        ----------- -------------
COMMON STOCKS (Continued)
United Kingdom (Continued)
Publishing & Printing - 0.3%
  Reed Elsevier PLC     222,126      $ 2,302,225
                                     -----------
                                      16,069,925
                                     -----------
United States - 55.8%
Advertising - 0.1%
  Getty Images, Inc.(c)   7,900          561,769
  R.H. Donnelley Corp.      725           42,115

                                     -----------
                                         603,884
                                     -----------
Aerospace - 1.0%
  Alliant Techsystems,   24,475        1,748,739
Inc.(c)
  Aviall, Inc.(c)        14,600          408,800
  DRS Technologies,       7,300          310,250
Inc.(c)
  General Dynamics       22,900        2,451,445
Corp.
  Lockheed Martin Corp.  13,900          848,734
  Northrop Grumman       11,800          636,964
Corp.
  Orbital Sciences        9,900           95,832
Corp.(c)
  Raytheon Co.           18,800          727,560
  The Titan Corp.(c)     17,900          325,064

                                     -----------
                                       7,553,388
                                     -----------
Air Transportation - 0.2%
  ExpressJet Holdings,    4,400           50,204
Inc.(c)
  Ryanair Holdings PLC   39,092        1,711,057
- - ADR(c)
  SkyWest, Inc.           1,000           18,590

                                     -----------
                                       1,779,851
                                     -----------
Banks - 3.2%
  AmSouth                23,000          596,851
Bancorporation
  Associated Banc-Corp.   1,575           49,187
  Bank of America       138,700        6,116,670
Corp.(d)
  Bank of Hawaii Corp.    1,000           45,260
  Berkshire Hills         5,300          178,875
Bancorp, Inc.
  Central Pacific         7,700          259,105
Financial Corp.
  City National Corp.     4,300          300,226
  Colonial BancGroup,     2,125           43,605
Inc.
  Comerica, Inc.         20,350        1,120,878
  Compass Bancshares,     1,150           52,210
Inc.
  Gold Banc Corp., Inc.  16,600          232,898
  J.P. Morgan Chase &    25,100          868,460
Co., Inc.
  Key Corp.              44,100        1,431,045
  Main Street Banks,      8,100          214,488
Inc.
  NewAlliance            16,700          233,800
Bancshares, Inc.
  North Fork             80,600        2,235,844
Bancorporation, Inc.
  Oriental Financial      8,800          206,096
Group, Inc.
  Sovereign Bancorp,     56,300        1,247,608
Inc.(d)
  SunTrust Banks,        23,600        1,700,852
Inc.(d)
  Trustmark Corp.        23,075          669,175
  U.S. Bancorp           94,200        2,714,844
  Wachovia Corp.         64,500        3,283,695
  Wells Fargo & Co.      28,200        1,686,360
  WSFS Financial Corp.    3,100          162,936
  Zions Bancorp           9,875          681,572

                                     -----------
                                      26,332,540
                                     -----------
Beverages & Bottling - 0.5%
  The Coca-Cola Co.      18,600          775,062
  Coca-Cola              54,125        1,110,645
Enterprises, Inc.
  Constellation Brands,  20,825        1,101,018
Inc.(c)
  PepsiAmericas, Inc.     1,500           33,990
  PepsiCo, Inc.          16,200          859,086

                                     -----------
                                       3,879,801
                                     -----------


                           NUMBER
                         OF SHARES      VALUE
                        ----------- -------------
COMMON STOCKS (Continued)
United States (Continued)
Broadcasting - 1.0%
  Alliance Atlantis
Communications,
    Inc.(c)               7,500      $   185,708
  Belo Corp.
                         40,150          969,220
  Comcast Corp.(c)(d)    38,000        1,283,640
  Comcast Corp. - Class A (c)
                         34,800        1,162,320
  Cumulus Media, Inc. -  11,900          169,575
Class A(c)
  Entercom                  725           25,752
Communications Corp.(c)
  Gray Communications, Inc.
                          9,400          136,018
  Liberty Media Corp. - Class A(c)
                         41,600          431,392
  Lin TV Corp.(c)        63,475        1,074,632
  News Corp. - Class B   79,000        1,391,190
  Radio One, Inc. -       5,500           81,125
Class D(c)
  Spanish Broadcasting
Systems, Inc.
    - Class A(c)         24,300          249,318
  XM Satellite Radio     11,000          346,500
Holdings, Inc.(c)

                                     -----------
                                       7,506,390
                                     -----------
Business Services -
0.7%
  Alliance Data Systems  31,625        1,277,650
Corp.(c)
  The Brink's Co.         1,475           51,035
  CDI Corp.
                          4,900          108,437
  ChoicePoint, Inc.(c)
                          6,000          240,660
  The Corporate Executive Board Co.
                         11,200          716,240
  DiamondCluster
International,
    Inc.(c)               6,000           96,600
  Digitas, Inc.(c)       47,300          477,730
  The Dun & Bradstreet      875           53,769
Corp.(c)(d)
  Global Payments, Inc.
                          1,400           90,286
  Hewitt Associates, Inc. - Class A(c)
                          5,100          135,660
  Hiedrick & Struggles
International,
    Inc.(c)               3,000          110,310
  Hudson Highland         4,100           70,069
Group, Inc.(c)
  Korn/Ferry              2,000           38,060
International(c)
  Labor Ready,           14,100          262,965
Inc.(c)(d)
  Manpower, Inc.          7,400          322,048
  MPS Group, Inc.(c)      7,300           76,723
  Navigant Consulting,   16,500          449,295
Inc.(c)
  PHH Corp.(c)            1,625           35,539
  W.W. Grainger, Inc.    15,141          942,830
  Watson Wyatt & Co.      8,100          220,320
Holdings

                                     -----------
                                       5,776,226
                                     -----------
Chemicals - 0.8%
  Agrium, Inc.            3,900           71,175
  Air Products &          8,700          550,623
Chemicals, Inc.
  Ashland, Inc.          22,525        1,519,762
  Cytec Industries,       3,700          200,725
Inc.(d)
  The Dow Chemical Co.   46,700        2,327,995
  E.I. du Pont de         9,700          497,028
Nemours & Co.
  FMC Corp.(c)           15,400          823,130
  The Lubrizol Corp.        800           32,512
  Lyondell Chemical Co.  15,600          435,552

                                     -----------
                                       6,458,502
                                     -----------
Computer & Office
Equipment - 1.8%
  American Power         36,600          955,626
Conversion Corp.
  Apple Computer, Inc.(c)
                         11,400          475,038
  Avery Dennison Corp.
                         17,075        1,057,456
  Brocade Communications Systems,
    Inc.                  6,000           35,520
  Cisco Systems,        101,520        1,816,193
Inc.(c)
  Dell, Inc.(c)          45,600        1,751,952

SEE ACCOMPANYING NOTES TO FINANCIAL STATEMENTS.
                                                                              91
                                BLACKROCK FUNDS
                            STATEMENT OF NET ASSETS
                     ASSET ALLOCATION PORTFOLIO (CONTINUED)


AS OF MARCH 31, 2005 (UNAUDITED)


                           NUMBER
                         OF SHARES      VALUE
                        ----------- -------------
COMMON STOCKS (Continued)
United States (Continued)
Computer & Office Equipment (Continued)
  Hewlett-Packard Co.     74,000     $ 1,623,560
  HNI Corp.               18,055         811,572
  International
Business Machines
    Corp.                 38,000       3,472,440
  Intuit, Inc.(c)         13,900         608,403
  Lexmark                  5,300         423,841
International, Inc.(c)
  NCR Corp.(c)            46,075       1,554,570
  Phase Metrics,          50,574           1,011
Inc.(b)(c)
  Polycom, Inc.(c)        16,400         277,980
  Xerox Corp.(c)          31,600         478,740

                                     -----------
                                      15,343,902
                                     -----------
Computer Software & Services - 3.2%
  Activision, Inc.(c)      2,700          39,960
  Adobe Systems,          12,600         846,342
Inc.(d)
  Advanced Digital
Information
    Corp.(c)               9,500          77,900
  Ascential Software      21,500         398,395
Corp.(c)
  The BISYS Group,         4,400          68,992
Inc.(c)
  BMC Software, Inc.(c)   15,800         237,000
  Borland Software        29,200         237,104
Corp.(c)
  Ceridian Corp.(c)       42,900         731,445
  Checkfree Corp.(c)      30,400       1,239,104
  Cognizant Technology
Solutions
    Corp.(c)(d)            8,100         374,220
  Computer Sciences       12,400         568,540
Corp.(c)
  DST Systems, Inc.(c)    32,325       1,492,768
  EarthLink, Inc.(c)       7,200          64,800
  eBay, Inc.(c)           11,800         439,668
  EMC Corp.(c)          100,100        1,233,232
  Google, Inc. - Class    3,355          605,611
A(c)(d)
  IAC/InterActiveCorp(c)      3               68
  Iomega Corp.(c)        25,700          110,253
  Lawson Software(c)      6,800           40,120
  McAfee, Inc.(c)           750           16,920
  McData Corp. - Class   23,300           87,841
A(c)
  Mercury Interactive    11,000          521,180
Corp.(c)
  Microsoft Corp.       251,020        6,067,153
  Navteg Corp.(c)        14,900          645,915
  Oracle Corp.(c)       155,500        1,940,640
  Progress Software(c)   13,300          348,726
  Siebel Systems,        38,400          350,592
Inc.(c)
  SkillSoft PLC -        12,900           47,472
ADR(c)
  SonicWALL, Inc.(c)     18,600           94,674
  Storage Technology      2,000           61,600
Corp.(c)
  Sybase, Inc.(c)         1,300           23,998
  Symantec Corp.(c)(d)   10,000          213,300
  Take-Two Interactive
Software,
    Inc.(c)               1,100           43,010
  TIBCO Software,        27,500          204,875
Inc.(c)
  Unisys Corp.(c)       166,100        1,172,666
  VeriSign, Inc.(c)      63,300        1,816,710
  VERITAS Software       20,000          464,400
Corp.(c)
  Verity, Inc.(c)         3,100           29,295
  Yahoo!, Inc.(c)        71,900        2,437,410

                                     -----------
                                      25,393,899
                                     -----------
Construction - 0.2%
  Chicago Bridge & Iron
Co. NV -
    ADR                   4,400          193,732
  D.R. Horton, Inc.       2,600           76,024


                           NUMBER
                         OF SHARES      VALUE
                        ----------- -------------
COMMON STOCKS (Continued)
United States (Continued)
Construction (Continued)
  Dycom Industries,      34,700      $   797,753
Inc.(c)
  Jacobs Engineering
Group,
    Inc.(c)(d)            1,400           72,688
  Lennar Corp.            1,675           94,939

                                     -----------
                                       1,235,136
                                     -----------
Containers - 0.7%
  Ball Corp.                650           26,962
  Owens-Illinois,        92,775        2,332,364
Inc.(c)
  Pactiv Corp.(c)        50,675        1,183,261
  Smurfit-Stone Container Corp.(c)
                         77,275        1,195,444
  Tupperware Corp.
                         23,000          468,280

                                     -----------
                                       5,206,311
                                     -----------
Electronics - 0.9%
  Amphenol Corp.         18,500          685,240
  Arrow Electronics,      2,450           62,108
Inc.(c)
  Cubic Corp.             7,500          142,050
  Integrated Circuit      3,600           68,832
Systems(c)
  Intel Corp.           173,030        4,019,487
  L-3 Communications     17,075        1,212,666
Holdings, Inc.
  National               27,300          562,653
Semiconductor Corp.
  TTM Technologies,      12,800          133,888
Inc.(c)

                                     -----------
                                       6,886,924
                                     -----------
Energy & Utilities -
1.6%
  Constellation Energy   34,275        1,772,018
Group
  Exelon Corp.           50,700        2,326,622
  KFX, Inc.(c)(d)        11,500          154,100
  Longview Energy         3,200           48,000
Co.(b)
  Magnum Pete, Inc.(c)   14,400          231,984
  McDermott              16,500          312,345
International, Inc.(c)
  MDU Resources Group,    1,900           52,478
Inc.
  NSTAR                     925           50,228
  Pepco Holdings, Inc.    2,650           55,624
  PG&E Corp.             29,300          999,130
  PPL Corp.(d)           71,550        3,862,983
  Public Service
Enterprise Group,
    Inc.(d)              26,250        1,427,738
  Reliant Energy,        55,700          633,866
Inc.(c)(d)
  Sempra Energy          16,700          665,328
  TXU Corp.              14,000        1,114,820
  WPS Resources Corp.     1,050           55,566

                                     -----------
                                      13,762,830
                                     -----------
Entertainment & Leisure
- - 1.8%
  Alliance Gaming        31,775          304,722
Corp.(c)
  Ameristar Casinos,        650           35,542
Inc.(c)
  Argosy Gaming Co.(c)    1,200           55,104
  Caesars                 1,925           38,096
Entertainment, Inc.(c)
  Gaylord Entertainment   7,400          298,960
Co.(c)
  GTECH Holdings Corp.   16,025          377,068
  Harrah's               17,200        1,110,776
Entertainment, Inc.(d)
  Hilton Hotels Corp.
                         46,800        1,045,980
  Kerzner International Ltd.(c)
                          5,500          336,765
  Marriott International, Inc. - Class A
                         25,900        1,731,674
Class A
  Marvel Enterprises,    27,800          556,000
Inc.(c)
  MTR Gaming Group,      17,000          210,800
Inc.(c)
  Orient-Express Hotels
Ltd. - Class
    A                    24,900          649,890
  Sabre Holdings Corp.    1,475           32,273

SEE ACCOMPANYING NOTES TO FINANCIAL STATEMENTS.
92
                                BLACKROCK FUNDS
                            STATEMENT OF NET ASSETS
                     ASSET ALLOCATION PORTFOLIO (CONTINUED)


AS OF MARCH 31, 2005 (UNAUDITED)


                           NUMBER
                         OF SHARES      VALUE
                        ----------- -------------
COMMON STOCKS (Continued)
United States (Continued)
Entertainment & Leisure (Continued)
  Scientific Games
Corp. - Class
    A(c)(d)                 9,400    $   214,790
  Starwood Hotels &
Resorts
    Worldwide, Inc.       28,800       1,728,864
  Time Warner,          134,200        2,355,210
Inc.(c)(d)
  Vail Resorts, Inc.(c)   3,900           98,475
  The Walt Disney Co.   105,600        3,033,888
  World Wrestling         5,200           62,400
Entertainment, Inc.

                                     -----------
                                      14,277,277
                                     -----------
Finance - 3.5%
  Affiliated Managers     1,150           71,334
Group, Inc.(c)
  Ambac Financial        17,750        1,326,812
Group, Inc.
  American Express Co.   24,440        1,255,483
  The Bear Stearns       13,500        1,348,650
Cos., Inc.
  Capital One Financial  22,625        1,691,671
Corp.(d)
  Chicago Mercantile      1,500          291,045
Exchange
  CIT Group, Inc.        44,775        1,701,450
  Citigroup, Inc.       153,500        6,898,290
  Countrywide Financial  18,700          607,002
Corp.
  Fannie Mae             13,600          740,520
  Franklin Resources,    13,520          928,148
Inc.
  Freddie Mac             9,000          568,800
  The Goldman Sachs      22,700        2,496,773
Group, Inc.
  H&R Block, Inc.        17,800          900,324
  Indymac Bancorp, Inc.   1,075           36,550
  International
Securities Exchange,
    Inc. - Class A(c)       100            2,600
  Legg Mason, Inc.          925           72,280
  MBNA Corp.             34,500          846,975
  Merrill Lynch & Co.,   16,400          928,240
Inc.
  MoneyGram              41,775          789,130
International, Inc.
  NGP Capital Resources   2,700           43,416
Co.
  Protective Life Corp.     850           33,405
  Providian Financial    68,100        1,168,596
Corp.(c)
  SLM Corp.              13,000          647,920
  T. Rowe Price Group,    7,200          427,536
Inc.
  TCF Financial Corp.     8,900          241,635
  Washington Mutual,     37,900        1,497,050
Inc.
  Wright Express          2,700           46,170
Corp.(c)

                                     -----------
                                      27,607,805
                                     -----------
Food & Agriculture - 0.9%
                         48,400        1,189,672
  Archer-Daniels-Midlan
Co.(d)
  Corn Products             975           25,340
International, Inc.
  Dean Foods Co.(c)      32,975        1,131,042
  Del Monte Foods        82,000          889,700
Co.(c)
  General Mills,          9,500          466,925
Inc.(d)
  Hormel Foods Corp.      1,350           41,998
  John B. Sanfilippo &    4,600          113,068
Son, Inc.(c)
  Kellogg Co.            21,000          908,670
  Monsanto Co.           19,700        1,270,650
  NBTY, Inc.(c)           7,800          195,702
  Smithfield Foods,       1,250           39,439
Inc.(c)
  Sysco Corp.            17,600          630,080

                                     -----------
                                       6,902,286
                                     -----------
Furniture - 0.0%
  Aaron Rents, Inc.       7,700          154,000
                                     -----------
Insurance - 2.5%
  Aetna, Inc.            19,900        1,491,505
  Allmerica Financial    37,800        1,358,910
Corp.(c)


                           NUMBER
                         OF SHARES      VALUE
                        ----------- -------------
COMMON STOCKS (Continued)
United States (Continued)
Insurance (Continued)
  The Allstate Corp.     28,800      $ 1,556,928
  American Financial      1,100           33,880
Group, Inc.
  American               49,300        2,731,713
International Group,
Inc.
  Assurant, Inc.         30,150        1,016,055
  Axis Capital Holdings  36,815          995,478
Ltd.
  CHUBB Corp.            14,500        1,149,415
  Everest Re Group Ltd.
                         13,075        1,112,812
  First American Corp.
                          1,400           46,116
  Genworth Financial, Inc23,500          646,720
  Hartford Financial     23,000        1,576,880
Services Group
  Max Re Capital Ltd.     7,600          178,828
  Ohio Casualty           1,800           41,364
Corp.(c)
  Platinum Underwriters   1,000           29,700
Holdings Ltd.
  Prudential Financial,   9,100          522,340
Inc.
  PXRE Group Ltd.         6,700          171,855
  Radian Group, Inc.     29,325        1,399,976
  UnumProvident Corp.    35,000          595,700
  W.R. Berkley Corp.     23,300        1,155,680
  WellPoint, Inc.(c)     13,300        1,667,155

                                     -----------
                                      19,479,010
                                     -----------
Machinery & Heavy
Equipment - 0.2%
  AGCO Corp.(c)           1,200           21,900
  Albany International    6,000          185,280
Corp. - Class A
  Bucyrus                 1,501           58,629
International, Inc. -
Class A
  Deere & Co.            13,900          933,107
  Flowserve Corp.(c)      2,000           51,740
  Kennametal, Inc.          600           28,494

                                     -----------
                                       1,279,150
                                     -----------
Manufacturing - 5.4%
  Actuant Corp. - Class   1,000           44,920
A(c)
  American Standard      25,800        1,199,184
Co., Inc.
  Aptargroup, Inc.        4,900          254,702
  Black & Decker         12,225          965,653
Corp.(d)
  BorgWarner, Inc.          750           36,510
  Briggs & Stratton      30,875        1,124,159
Corp.
  Brunswick Corp.
                         30,700        1,438,295
  The Clorox Co.
                         23,300        1,467,667
  Cooper Industries, Inc  9,575          684,804
  Cummins, Inc.          10,250          721,088
  Danaher Corp.          11,800          630,238
  Eaton Corp.            17,200        1,124,880
  Energizer Holdings,       625           37,375
Inc.(c)
  Fleetwood              11,600          100,920
Enterprises, Inc.(c)
  Fortune Brands, Inc.    8,300          669,229
  General Electric Co.  315,120       11,363,227
  Harsco Corp.              875           52,159
  Hexel Corp.(c)         13,000          201,630
  ITT Industries, Inc.   14,800        1,335,552
  Jones Apparel Group,   35,225        1,179,685
Inc.(d)
  K2, Inc.(c)            14,800          203,500
  Mattel, Inc.(d)
                         47,300        1,009,855
  Newell Rubbermaid, Inc.(d)
                         53,225        1,167,756
  Nike, Inc.             17,600        1,466,256
  Nucor Corp.            13,500          777,060
  Paxar Corp.(c)         10,400          221,936
  Pentair, Inc.          20,200          787,800
  Polo Ralph Lauren      18,400          713,920
Corp.
  Precision Castparts       550           42,356
Corp.
  Quanex Corp.(d)         1,600           85,312

SEE ACCOMPANYING NOTES TO FINANCIAL STATEMENTS.
                                                                              93
                                BLACKROCK FUNDS
                            STATEMENT OF NET ASSETS
                     ASSET ALLOCATION PORTFOLIO (CONTINUED)


AS OF MARCH 31, 2005 (UNAUDITED)


                           NUMBER
                         OF SHARES      VALUE
                        ----------- -------------
COMMON STOCKS (Continued)
United States (Continued)
Manufacturing (Continued)
  Reunion Industries,          595   $       178
Inc.(c)
  Rockwell Automation,      8,200        464,448
Inc.
  Roper Industries,         4,400        288,200
Inc.
  Sealed Air Corp.(c)     13,900         721,966
  Sherwin-Williams Co.    50,275       2,211,597
  Snap-On, Inc.           32,150       1,022,048
  The Stanley Works(d)    17,450         789,962
  Textron, Inc.           14,300       1,067,066
  Timken Co.                 925          25,290
  Tyco International      87,500       2,957,500
Ltd. - ADR(d)
  V.F. Corp.                 625          36,962
  The Warnaco Group,      21,500         516,860
Inc.(c)
  York International      36,600       1,433,988
Corp.

                                     -----------
                                      42,643,693
                                     -----------
Measuring & Controlling Devices -
0.1%
  Thermo Electron         17,700         447,633
                                     -----------
Corp.(c)
Medical & Medical Services - 2.0%
  Accredo Health,          7,700         341,957
Inc.(c)
  Amgen, Inc.(c)(d)       16,140         939,509
  Caremark Rx, Inc.(c)    54,500       2,168,010
  Community Health        25,400         886,714
Systems, Inc.(c)
  Covance, Inc.(c)           975          46,420
  Coventry Health Care,   15,925       1,085,130
Inc.(c)
  CryoLife(c)             16,600         102,754
  CTI Molecular            6,200         125,674
Imaging, Inc.(c)
  Digene Corp.(c)          2,000          41,500
  Digirad Corp.(c)        31,500         244,125
  Exact Sciences           8,100          28,917
Corp.(c)
  HCA, Inc.               21,800       1,167,826
  McKesson Corp.          17,500         660,625
  Medco Health            15,500         768,335
Solutions, Inc.(c)
  MedImmune, Inc.(c)      21,625         514,891
  Noven                    3,000          50,880
Pharmaceuticals,
Inc.(c)
  Omnicare, Inc.           8,100         287,145
  Orchid Biosciences,     14,700         172,872
Inc.(c)
  PacifiCare Health        5,850         332,982
Systems, Inc.(c)
  Pediatrix Medical        4,200         288,078
Group, Inc.(c)
  Province Healthcare      1,725          41,555
Co.(c)
  Quest Diagnostics,       6,800         714,884
Inc.
  STERIS Corp.(c)         43,225       1,091,431
  TLC Vision Corp.(c)      1,800          17,046
  Triad Hospitals,        11,400         571,140
Inc.(c)
  UnitedHealth Group,     19,500       1,859,910
Inc.
  Universal Health        22,600       1,184,240
Services, Inc.
  VCA Antech, Inc.(c)      3,300          66,759

                                     -----------
                                      15,801,309
                                     -----------
Medical Instruments & Supplies -
1.8%
  Advanced Medical         2,200          79,662
Optics, Inc.(c)(d)
  Bausch & Lomb, Inc.     11,000         806,300
  Becton, Dickinson &     11,800         689,356
Co.
  Biosite, Inc.(d)           450          23,414
  Bruker BioSciences       5,300          18,656
Corp.(c)
  C.R. Bard, Inc.          9,300         633,144
  Charles River
Laboratories
    International,        37,800       1,778,112
Inc.(c)(d)
  Cytyc Corp.(c)(d)       45,000       1,035,450
  DJ Orthopedics,         14,700         368,235
Inc.(c)
  Edwards Lifesciences       925          39,978
Corp.(c)
  Guidant Corp.            6,700         495,130
  Hillenbrand             18,700       1,037,289
Industries, Inc.


                           NUMBER
                         OF SHARES      VALUE
                        ----------- -------------
COMMON STOCKS (Continued)
United States (Continued)
Medical Instruments & Supplies (Continued)
  Hologic, Inc.(c)         9,800     $   312,375
  Intralase Corp.(c)      14,100         236,034
  Invitrogen                 375          25,950
Corp.(c)(d)
  Johnson & Johnson       53,240       3,575,598
  Kinetic Concepts,        3,400         202,810
Inc.(c)
  LCA-Vision, Inc.         8,900         296,370
  PerkinElmer, Inc.       23,700         488,931
  Respironics, Inc.(c)       625          36,419
  St. Jude Medical,       21,700         781,200
Inc.(c)
  Sybron Dental            5,900         211,810
Specialties, Inc.(c)
  Symmetry Medical,        9,800         186,396
Inc.(c)
  Wright Medical Group,   10,100         242,400
Inc.(c)
  Zimmer Holdings,         3,100         241,211
Inc.(c)

                                     -----------
                                      13,842,230
                                     -----------
Metal & Mining - 1.7%
  Alpha Natural            3,200          91,744
Resources, Inc.(c)
  Arch Coal, Inc.         34,700       1,492,447
  Coeur d'Alene Mines     40,000         146,800
Corp.(c)
  CONSOL Energy, Inc.   138,300        6,502,866
  Massey Energy Co.      57,100        2,286,284
  MSC Industrial Direct  25,400          776,224
Co., Inc.
  Peabody Energy Corp.   38,600        1,789,496

                                     -----------
                                      13,085,861
                                     -----------
Motor Vehicles - 0.2%
  Ford Motor Co.         66,900          757,977
  PACCAR, Inc.            5,900          427,101
  Wabash National Corp.   1,100           26,840

                                     -----------
                                       1,211,918
                                     -----------
Oil & Gas - 6.3%
  Airgas, Inc.           14,500          346,405
  Amerada Hess Corp.(d)  11,600        1,116,036
  Baker Hughes, Inc.     19,800          880,902
  BJ Services Co.        25,000        1,297,000
  Cal Dive                1,075           48,698
International, Inc.
  CanArgo Energy        191,100          250,341
Corp.(c)
  Chesapeake Energy       2,875           63,078
Corp.
  ChevronTexaco Corp.    39,500        2,303,245
  Clayton Williams       42,000        1,087,800
Energy, Inc.(c)
  ConocoPhillips         33,700        3,634,208
  Devon Energy Corp.          2               96
  Diamond Offshore       21,925        1,094,058
Drilling, Inc.
  Energen Corp.           2,500          166,500
  Energy Partners         9,600          249,312
Ltd.(c)
  ENSCO International, Inc.
                         12,800          482,048
  EOG Resources, Inc.
                        107,400        5,234,676
  The Exploration Co.(c) 10,900           62,610
  Exxon Mobil Corp.     176,304       10,507,717
  Global Industries,     50,000          470,000
Inc.(c)
  Grant Prideco,          2,650           64,024
Inc.(c)
  Grey Wolf, Inc.(c)     38,900          255,962
  Halliburton Co.(d)     15,400          666,050
  Helmerich & Payne,        425           16,868
Inc.
  KCS Energy,            18,700          287,232
Inc.(c)(d)
  KeySpan Corp.          20,425          795,962
  Matador Resources         895           12,081
Co.(b)
  Nabors Industries       5,000          295,700
Ltd.(c)
  National Fuel Gas Co.  18,400          526,056
  Newfield Exploration   56,075        4,164,130
Co.(c)
  NiSource, Inc.         18,250          415,918

SEE ACCOMPANYING NOTES TO FINANCIAL STATEMENTS.
94
                                BLACKROCK FUNDS
                            STATEMENT OF NET ASSETS
                     ASSET ALLOCATION PORTFOLIO (CONTINUED)


AS OF MARCH 31, 2005 (UNAUDITED)


                           NUMBER
                         OF SHARES      VALUE
                        ----------- -------------
COMMON STOCKS (Continued)
United States (Continued)
Oil & Gas (Continued)
  Noble Corp.             12,600     $   708,246
  Noble Energy, Inc.(d)      625          42,511
  Occidental Petroleum    10,200         725,934
Corp.
  Oceaneering              1,700          63,750
International, Inc.(c)
  Oneok, Inc.(d)          19,275         594,056
  Parallel Petroleum       7,000          51,450
Corp.(c)
  Patterson-UTI Energy,   33,625         841,298
Inc.(d)
  Petrohawk Energy           565           5,921
Corp.(c)
  Pioneer Drilling        10,900         150,093
Co.(c)
  Pioneer Natural         28,875       1,233,540
Resources Co.
  Plains Exploration &
Production
    Co.(c)                44,500       1,553,050
  Pride International,    30,000         745,200
Inc.(c)
  Range Resources Corp.    4,900         114,464
  Remington Oil & Gas
Corp. - Class
    B(c)                   1,900          59,888
  Rowan Cos., Inc.        15,000         448,950
  Schlumberger Ltd.        6,100         429,928
  Smith International,       550          34,502
Inc.
  TETRA Technologies,      9,100         258,804
Inc.(c)
  Tidewater, Inc.          4,300         167,098
  Transocean, Inc.(c)     22,400       1,152,704
  Treasure Island       300,000          273,000
Royalty Trust(c)
  Universal Compression
Holdings,
    Inc.(c)                 775           29,349
  Valero Energy Corp.    23,000        1,685,210
  Vintage Petroleum,     37,300        1,173,458
Inc.
  Weatherford            11,600          672,104
International Ltd.(c)

                                     -----------
                                      50,009,221
                                     -----------
Paper & Forest Products - 0.4%
  Bowater, Inc.(d)       20,875          786,361
  Georgia-Pacific Corp.  34,400        1,220,856
  Louisiana-Pacific      24,500          615,930
Corp.
  MeadWestvaco Corp.     24,700          785,954

                                     -----------
                                       3,409,101
                                     -----------
Personal Services - 0.1%
  Corinthian Colleges,    4,100           64,452
Inc.(c)(d)
  Educate, Inc.(c)          600            8,322
  Education Management      800           22,360
Corp.(c)
  Laureate Education,    14,300          611,897
Inc.(c)

                                     -----------
                                         707,031
                                     -----------
Pharmaceuticals - 2.0%
  Allergan, Inc.(d)      10,000          694,700
  Angiotech               4,500           69,075
Pharmaceuticals,
Inc.(c)
  Barr Pharmaceuticals,     650           31,741
Inc.
  Bristol-Myers Squibb   63,500        1,616,710
Co.(d)
  Cephalon, Inc.(d)         275           12,878
  Genentech, Inc.(c)     18,800        1,064,268
  Gilead Sciences,       12,500          447,500
Inc.(c)
  ICOS Corp.(c)          14,000          314,440
  Kos Pharmaceuticals,    1,025           42,722
Inc.
  Merck & Co., Inc.(d)   52,400        1,696,188
  Millennium              2,600           21,892
Pharmaceuticals,
Inc.(c)
  Nabi                   10,800          134,784
Biopharmaceuticals(c)
  Nektar                  2,100           29,274
Therapeutics(c)
  Novartis AG - ADR      39,330        1,839,857
  OSI Pharmaceuticals,    9,900          409,266
Inc.(c)
  Par Pharmaceutical     19,750          660,440
Cos., Inc.(c)
  Pfizer, Inc.          133,282        3,501,318


                           NUMBER
                         OF SHARES      VALUE
                        ----------- -------------
COMMON STOCKS (Continued)
United States (Continued)
Pharmaceuticals (Continued)
  Protein Design Labs,      775      $    12,392
Inc.(c)
  Shire Pharmaceuticals
Group PLC -
    ADR                  21,900          750,732
  Valeant
Pharmaceuticals
    International         7,400          166,648
  Watson                 29,050          892,706
Pharmaceuticals,
Inc.(c)
  Wyeth                  29,400        1,240,092

                                     -----------
                                      15,649,623
                                     -----------
Publishing & Printing -
0.5%
  Banta Corp.             3,400          145,520
  Dow Jones & Company,   32,050        1,197,708
Inc.(d)
  Journal Register        2,225           37,158
Co.(c)
  The McGraw-Hill        16,200        1,413,450
Companies, Inc.
  Playboy Enterprises,
Inc. - Class
    B(c)                  5,900           76,110
  R.R. Donnelley & Sons  39,400        1,245,828
Corp.
  Scholastic Corp.(c)     1,325           48,879

                                     -----------
                                       4,164,653
                                     -----------
Railroad & Shipping -
0.4%
  Burlington Northern    28,600        1,542,398
Santa Fe Corp.
  CSX Corp.              14,525          604,966
  FedEx Corp.             8,000          751,600

                                     -----------
                                       2,898,964
                                     -----------
Real Estate - 0.9%
  AMB Property Corp.      1,250           47,250
  Boston Properties, Inc.
                         19,700        1,186,531
  Cendant Corp.
                        134,700        2,766,738
  Centex Corp.           19,000        1,088,130
  Developers                600           23,850
Diversified Realty
Corp.
  Eagle Hospitality
Properties Trust,
    Inc.                 21,600          193,752
  Equity Office          26,300          792,419
Properties Trust
  General Growth         23,900          814,990
Properties, Inc.
  LaSalle Hotel Properties
                          7,400          214,970
  Mack-Cali Realty Corp.
                          1,150           48,702

                                     -----------
                                       7,177,332
                                     -----------
Restaurants - 0.5%
  AFC Enterprises,        3,600           91,836
Inc.(c)
  Darden Restaurants,    15,350          470,938
Inc.
  Jack in the Box, Inc.
                          1,150           42,665
  McDonald's Corp.
                         54,200        1,687,788
  RARE Hospitality International,
    Inc.(c)                 500           15,440
  Ruby Tuesday, Inc.(d)  20,000          485,800
  Starbucks Corp.(c)      6,100          315,126
  Texas Roadhouse,        6,200          174,096
Inc.(c)
  Triarc Cos. - Class A   7,700          109,340
  Wendy's                15,525          606,096
International, Inc.

                                     -----------
                                       3,999,125
                                     -----------
Retail Merchandising -
3.4%
  99 Cents Only          12,100          159,357
Stores(c)
  American Eagle          1,675           49,496
Outfitters, Inc.
  AnnTaylor Stores       24,250          620,558
Corp.(c)(d)
  AutoNation, Inc.        1,500           28,410
  AutoZone, Inc.(c)(d)   10,175          871,998
  Barnes & Noble,        28,175          971,756
Inc.(c)
  Bed, Bath & Beyond,     9,800          358,092
Inc.(c)

SEE ACCOMPANYING NOTES TO FINANCIAL STATEMENTS.
                                                                              95
                                BLACKROCK FUNDS
                            STATEMENT OF NET ASSETS
                     ASSET ALLOCATION PORTFOLIO (CONTINUED)


AS OF MARCH 31, 2005 (UNAUDITED)


                           NUMBER
                         OF SHARES       VALUE
                        ----------- --------------
COMMON STOCKS (Continued)
United States (Continued)
Retail Merchandising (Continued)
  BJ's Wholesale Club,      2,275    $     70,662
Inc.(c)
  Brookstone, Inc.(c)       6,900         111,918
  CDW Corp.               13,300          753,844
  Central Garden & Pet       500           21,930
Co.(c)
  Chico's FAS,            40,400        1,141,704
Inc.(c)(d)
  Coach, Inc.(c)          18,860        1,068,042
  CVS Corp.               15,300          805,086
  Federated Department    45,850        2,917,894
Stores, Inc.
  Foot Locker, Inc.        8,800          257,840
  The Gap, Inc.           36,700          801,528
  Handleman Co.            9,500          180,120
  The Home Depot, Inc.    26,600        1,017,184
  Hot Topic, Inc.(c)       3,700           80,845
  J. Jill Group,          24,500          337,120
Inc.(c)
  Jarden Corp.(c)(d)      22,275        1,021,977
  Jos. A. Bank             8,000          234,400
Clothiers, Inc.(c)(d)
  Kohl's Corp.(c)         15,800          815,754
  The Kroger Co.(c)       65,200        1,045,156
  Longs Drug Stores          800           27,376
Corp.
  Michaels Stores, Inc.    1,850           67,155
  The Neiman-Marcus
Group, Inc. -
    Class A                  975           89,222
  Nordstrom, Inc.         15,300          847,314
  Payless ShoeSource,      1,950           30,789
Inc.
  PETsMART, Inc.(d)       35,000        1,006,250
  Reebok International    12,800          567,040
Ltd.(d)
  Ruddick Corp.            1,400           32,410
  Simon Property Group,   22,300        1,350,934
Inc.
  The Sports Authority,    7,300          200,750
Inc.(c)
  Staples, Inc.           44,500        1,398,635
  Supervalue, Inc.        31,100        1,037,185
  Target Corp.            32,000        1,600,640
  Too, Inc.(c)             5,300          130,751
  Wal-Mart Stores, Inc.   18,400          922,024
  West Marine, Inc.(c)     3,600           76,536
  Williams-Sonoma,        24,900          915,075
Inc.(c)
  The Yankee Candle       19,900          630,830
Co.(c)

                                     ------------
                                       26,673,587
                                     ------------
Security Brokers & Dealers - 1.1%
  A.G. Edwards, Inc.       9,175          411,040
  E*TRADE Financial       43,250          519,000
Corp.(c)
  iShares Russell 1000
Value Index
    Fund                  33,500        2,205,975
  iShares Russell 2000
Value Index
    Fund                  11,925        2,189,430
  iShares Russell
Midcap Growth
    Index Fund             3,110          258,037
  Janus Capital Group,    77,100        1,075,545
Inc.
  Lehman Brothers         13,500        1,271,160
Holdings, Inc.
  Nasdaq-100 Index        12,900          471,495
Tracking Stock

                                     ------------
                                        8,401,682
                                     ------------
Semiconductors & Related Devices -
0.7%
  Altera Corp.(c)         35,800          708,124
  Cypress Semiconductor   46,175          581,805
Corp.(c)
  Integrated Device
Technology,
    Inc.(c)               15,700          188,871
  International              925           42,088
Rectifier Corp.(c)
  Lam Research            39,500        1,139,970
Corp.(c)(d)
  Linear Technology       31,100        1,191,441
Corp.
  Micron Technology,      35,600          368,104
Inc.(c)


                           NUMBER
                         OF SHARES       VALUE
                        ----------- --------------
COMMON STOCKS (Continued)
United States (Continued)
Semiconductors & Related Devices (Continued)
  Microsemi Corp.(c)       2,500     $     40,725
  O2Micro International   32,300          332,367
Ltd.(c)
  QLogic Corp.(c)(d)       8,850          358,425
  Rudolph Technologies,   23,800          358,428
Inc.(c)
  Teradyne, Inc.(c)       28,600          417,560

                                     ------------
                                        5,727,908
                                     ------------
Soaps & Cosmetics -
0.5%
  Avon Products, Inc.     15,500          665,570
  NU Skin Enterprises,     7,900          177,829
Inc.
  The Procter & Gamble    63,280        3,353,840
Co.(d)

                                     ------------
                                        4,197,239
                                     ------------
Telecommunications -
2.2%
  Adtran, Inc.(d)         25,700          453,348
  ALLTEL Corp.(d)         10,800          592,380
  Amdocs Ltd.(c)          31,000          880,400
  American Tower Corp.
- - Class
    A(c)(d)               40,400          736,492
  Arris Group, Inc.(c)    38,800          268,108
  Avid Technology,        16,600          898,392
Inc.(c)
  CenturyTel, Inc.           925           30,377
  Harman International
Industries,
    Inc.                  10,300          911,138
  Harris Corp.            15,950          520,769
  Motorola, Inc.        107,600         1,610,772
  Nextel                 16,700           474,614
Communications, Inc.(c)
  Nextel Partners, Inc.  46,900         1,029,924
- - Class A(c)(d)
  Qualcomm, Inc.         14,200           520,430
  SBC Communications,    82,700         1,959,163
Inc.(d)
  Scientific-Atlanta,    41,650         1,175,363
Inc.
  Sprint Corp.(d)        72,500         1,649,375
  Syniverse Holdings,    17,600           242,880
Inc.(c)
  Verizon                92,800         3,294,400
Communications, Inc.
  West Corp.              1,400            44,800

                                     ------------
                                       17,293,125
                                     ------------
Tobacco - 0.5%
  Altria Group, Inc.
                         56,800         3,714,152
                                     ------------
Transportation - 0.2%
  C.H. Robinson Worldwide, Inc.
                            500            25,765
  J.B. Hunt Transport    11,950           523,052
Services, Inc.
  Landstar System,        7,000           229,250
Inc.(c)
  Ryder Systems,         11,075           461,828
Inc.(d)
  SCS Transportation,    10,900           202,631
Inc.(c)
  Werner Enterprises,     2,700            52,461
Inc.
  Yellow Roadway            875            51,221
Corp.(c)

                                     ------------
                                        1,546,208
                                     ------------
Waste Management - 0.1%
  Republic Services, Inc.
                            875            29,295
  Stericycle, Inc.(c)    10,800           477,360
  URS Corp.(c)            8,000           230,000

                                     ------------
                                          736,655
                                     ------------
                                      440,757,362
                                     ------------
TOTAL COMMON STOCKS
  (Cost $467,587,577)                 538,755,376
                                     ------------

SEE ACCOMPANYING NOTES TO FINANCIAL STATEMENTS.
96
                                BLACKROCK FUNDS
                            STATEMENT OF NET ASSETS
                     ASSET ALLOCATION PORTFOLIO (CONTINUED)


AS OF MARCH 31, 2005 (UNAUDITED)


                           NUMBER
                         OF SHARES      VALUE
                        ----------- -------------
PREFERRED STOCKS - 0.7%
Insurance - 0.3%
  ING Groep NV             66,754    $2,021,429
                                     ----------
Retail Merchandising - 0.2%
  Koninklijke Ahold       180,724     1,517,307
                                     ----------
NV(c)
Transportation - 0.2%
  TNT NV                   62,178     1,773,767
                                     ----------
TOTAL PREFERRED STOCKS
  (Cost $5,269,884)                   5,312,503
                                     ----------


                                      PAR
                       MATURITY      (000)
                    -------------- ---------
U.S. GOVERNMENT & AGENCY OBLIGATIONS - 4.2%
  Federal Home Loan Mortgage
  Corp. Gold, Unsecured Notes
       4.12%            02/24/11    $   325      315,324
  Federal Home Loan Mortgage
  Corp., Unsecured Notes
       3.88%            11/10/08        535      526,419
       4.62%            05/28/13        150      144,609
  Federal National Mortgage
  Association, Unsecured Notes
       2.35%         04/06-04/07        630      613,005
       1.75%            06/16/06         90       87,820
  Resolution Funding Corp. Strip
  Bonds
       6.29%(e)         07/15/18        150       77,300
       6.30%(e)         10/15/18        150       76,184
  Small Business Investment Cos.
  Pass-Through, Series 97-P10C,
  Class 1
       6.85%            08/01/07        244      253,708
  U.S. Treasury Bonds
       3.50%            11/15/09        860      836,686
      10.38%            11/15/12        295      341,762
       8.88%            02/15/19        650      919,953
       6.25%         08/23-05/30      3,475    4,151,011
       6.00%            02/15/26        380      434,699
       6.12%            11/15/27        605      707,117
       5.38%(f)         02/15/31        475      517,693
  U.S. Treasury Notes
       2.50%            05/31/06        335      330,996
       2.38%            08/31/06         95       93,345
       3.12%            01/31/07         95       93,924
       3.38%            02/28/07        125      124,087
       3.00%            11/15/07        555      542,946
       5.62%            05/15/08      4,800    5,030,813
       3.62%            01/15/10        205      200,091
       5.75%            08/15/10      1,325    1,421,891
       4.25%         08/14-11/14        380      372,341
       4.00%(f)         02/15/15     14,135   13,580,638
       7.25%            05/15/16      1,425    1,747,462

                                              ----------
TOTAL U.S. GOVERNMENT & AGENCY
  OBLIGATIONS
  (Cost $33,516,168)                          33,541,824
                                              ----------


                                     PAR
                       MATURITY     (000)       VALUE
                    ------------- --------- -------------
MORTGAGE PASS-THROUGHS - 5.0%
  Federal Home Loan Mortgage
  Corp. Gold
       8.00%         08/08-08/27   $    49   $    52,374
       8.50%            07/01/09         0            24
       4.00%         05/10-05/19       245       238,036
       6.00%         04/13-06/16       225       232,154
       5.00%         11/17-05/34       380       373,682
       9.50%            12/01/22       461       506,572
       7.50%            09/01/27         1           602
       6.50%         01/29-08/32       174       181,039
       5.50%         07/33-08/33     1,292     1,295,137
  Federal National Mortgage
  Association
       8.00%         04/08-02/33       401       429,028
       7.00%         08/08-10/32       705       741,740
       8.50%            02/01/09        27        28,537
       6.50%         01/11-04/35     1,999     2,079,682
       6.00%         09/11-04/35     4,985     5,115,912
       5.50%         04/17-01/35    10,500    10,661,541
       5.00%         03/18-02/35     5,803     5,734,445
       4.00%         07/18-01/20       851       815,658
       4.50%         09/18-04/35     2,151     2,072,157
       7.50%         10/25-01/31       926       990,211
  Government National Mortgage
  Association
       6.50%         02/09-05/32     1,028     1,076,008
       7.50%         11/10-12/29        87        92,193
       6.00%         10/23-02/34     2,728     2,803,328
       7.00%         01/25-05/32       377       398,747
       5.50%         04/33-12/34     1,342     1,356,353
       5.00%            10/20/33     1,760     1,736,293
  Government National Mortgage
  Association 1 Year CMT
       3.75%(g)         05/20/34       280       278,354
  MLCC Mortgage Investors, Inc.,
  Series 95-C2 (IO)
      10.40%(e)         06/15/21     2,599        45,635

                                             -----------
TOTAL MORTGAGE PASS-THROUGHS
  (Cost $39,034,426)                          39,335,442
                                             -----------
MULTIPLE CLASS MORTGAGE PASS-THROUGHS - 0.3%
  Federal Home Loan Mortgage
  Corp., Series 2668, Class AD
       4.00%            01/15/15       263       261,326
  Federal Home Loan Mortgage
  Corp., Series 2707, Class PW
       4.00%            07/15/14       513       512,077
  Federal Home Loan Mortgage
  Corp., Series 2730, Class PA
       3.75%            03/15/11       651       651,270
  Federal Home Loan Mortgage
  Corp., Series 2748, Class LJ
       4.00%            03/15/10       217       217,134
  Federal Home Loan Mortgage
  Corp., Series 2864, Class NA
       5.50%            01/15/31       190       195,065

SEE ACCOMPANYING NOTES TO FINANCIAL STATEMENTS.
                                                                              97
                                BLACKROCK FUNDS
                            STATEMENT OF NET ASSETS
                     ASSET ALLOCATION PORTFOLIO (CONTINUED)


AS OF MARCH 31, 2005 (UNAUDITED)


                                                            PAR
                                              MATURITY     (000)       VALUE
                                             ---------- ---------- ------------
MULTIPLE CLASS MORTGAGE PASS-THROUGHS (Continued)
  Federal National Mortgage
    Association, Series 04-99, Class
    AO
    5.50%                                    01/25/34     $  158    $  159,236
  Salomon Brothers Mortgage
    Securities VI, Series 87-1 (IO)
    7.00%(e)                                 02/17/17         64        16,643
  Salomon Brothers Mortgage
    Securities VI, Series 87-1 (PO)
    1.51%(e)                                 02/17/17         71        66,071
  Salomon Brothers Mortgage
    Securities VI, Series 87-2 (IO)
    7.00%(e)                                 03/06/17         53        14,511
  Salomon Brothers Mortgage
    Securities VI, Series 87-2 (PO)
    1.35%(e)                                 03/06/17         56        50,605
  Structured Asset Securities Corp.,
    Series 96-CFL, Class X1 (IO)
    5.05%(e)                                 02/25/28      1,053        53,950

                                                                    ----------
TOTAL MULTIPLE CLASS MORTGAGE
  PASS-THROUGHS
  (Cost $2,349,668)                                                  2,197,888
                                                                    ----------
COMMERCIAL MORTGAGE BACKED SECURITIES - 6.4%
  Americredit Automobile Receivables
    Trust, Series 02-D, Class A4
    3.40%                                    04/13/09        350       348,371
  Bank of America Alternative Loan
    Trust, Series 04-6, Class 4A1
    5.00%                                    07/25/19         92        89,637
  Bear Stearns Commercial Mortgage
    Securities, Inc., Series 00-WF2,
    Class A2
    7.32%                                    10/15/32        475       528,433
  Bear Stearns Commercial Mortgage
    Securities, Series 99-WF2, Class
    A2
    7.08%                                    07/15/31        250       272,353
  Bear Stearns Commercial Mortgage
    Securities, Series 02-TOP6,
    Class A1
    5.92%                                    10/15/36        887       925,258
  Bear Stearns Commercial Mortgage
    Securities, Series 04-PWR4,
    Class A1
    4.36%                                    06/11/41        915       908,955
  CDC Commercial Mortgage Trust,
    Series 02-FX1, Class A1
    5.25%                                    05/15/19      1,725     1,757,498
  Centex Home Equity, Series 02-A,
    Class MF2
    6.54%                                    01/25/32        478       484,111
  Chase Commercial Mortgage
    Securities Corp., Series 98-2,
    Class A2
    6.39%                                    11/18/30      1,475     1,558,836
  Commercial Mortgage Acceptance
    Corp., Series 98-C2, Class C
    6.48%(g)                                 09/15/30        275       290,245
  Commercial Mortgage
    Pass-Through, Series 2000-C1,
    Class A2
    7.42%                                    08/15/33        180       199,116
  Countrywide Alternative Loan Trust,
    Series 04-27CB, Class A1
    6.00%                                    12/25/34        236       237,479


                                                            PAR
                                              MATURITY     (000)       VALUE
                                             ---------- ---------- ------------
COMMERCIAL MORTGAGE BACKED SECURITIES (Continued)
  Countrywide Home Loans, Series
    01-HYB2, Class B2
    5.54%(g)                                 09/19/31     $  426    $  430,037
  Countrywide Home Loans, Series
    02-HYB2, Class B1
    4.78%(g)                                 09/19/32         77        76,881
  Countrywide Home Loans, Series
    03-27, Class M
    3.98%(g)                                 06/25/33        884       853,874
  Countrywide Home Loans, Series
    03-58, Class B1
    4.57%(g)                                 02/19/34        247       238,290
  DLG Commercial Mortgage Corp.,
    Series 99-CG1, Class A1B
    6.46%                                    03/10/32        150       159,080
  Fannie Mae Grantor Trust, Series
    03-T1, Class R (IO)
    1.00%(e)                                 11/25/12      6,773       232,355
  Federal National Mortgage
    Association, Series 03-84, Class
    GA
    4.50%                                    04/25/09      1,074     1,078,129
  Federal National Mortgage
    Association, Series 04-31, Class
    PK
    3.50%                                    06/25/10        750       748,413
  First Union-Lehman Brothers-Bank
    of America Commercial Mortgage
    Trust, Series 98-C2, Class C3
    6.56%                                    11/18/35        180       189,633
  First Union-Lehman Brothers-Bank
    of America, Series 98-C2, Class
    A1
    6.28%                                    11/18/35         28        27,744
  General Electric Business Loan
    Trust, Series 03-2A, Class B
    3.81%(g)                                 11/15/31      1,116     1,156,698
  General Motors Acceptance Corp.
    Commercial Mortgage Securities,
    Inc., Series 99-C3, Class A2
    7.18%                                    08/15/36        179       195,246
  GGP Mall Properties Trust, Series
    01-C1A, Class C2
    5.56%                                    11/15/11        494       505,089
  GGP Mall Properties Trust, Series
    01-C1A, Class C3
    4.11%(g)                                 02/15/14         53        53,065
  Granite Mortgages PLC, Series
    04-2, Class 1C
    3.75%(g)                                 06/20/44        250       250,000
  Holmes Financing PLC, Series 8,
    Class 1C
    3.28%(g)                                 07/15/40        250       249,969
  Impac CMB Trust, Series 02-3,
    Class B
    5.05%(g)                                 06/25/32        129       129,119
  Impac CMB Trust, Series 02-4F,
    Class M1
    5.58%(g)                                 11/25/32         38        38,512
  Impac CMB Trust, Series 03-5,
    Class M1
    3.60%(g)                                 08/25/33        128       129,394
  Impac CMB Trust, Series 03-7,
    Class M
    4.50%(g)                                 08/25/33         74        75,208

SEE ACCOMPANYING NOTES TO FINANCIAL STATEMENTS.
98
                                BLACKROCK FUNDS
                            STATEMENT OF NET ASSETS
                     ASSET ALLOCATION PORTFOLIO (CONTINUED)


AS OF MARCH 31, 2005 (UNAUDITED)


                                                     PAR
                                       MATURITY     (000)       VALUE
                                      ---------- ---------- -------------
COMMERCIAL MORTGAGE BACKED SECURITIES (Continued)
  Impac CMB Trust, Series 04-1,
    Class M4
    4.05%(g)                          03/25/34     $  187    $  187,312
  Impac CMB Trust, Series 04-5,
    Class 1A1
    3.21%(g)                          10/25/34        412       411,722
  Impac CMB Trust, Series 04-7,
    Class 1A1
    3.22%(g)                          11/25/34        977       978,611
  Impac CMB Trust, Series 04-7,
    Class M4
    4.05%(g)                          11/25/34        470       471,508
  IStar Asset Receivables Trust,
    Series 02-1A, Class D
    3.70%(g)                          05/28/20        225       225,649
  J.P. Morgan Chase Commercial
    Mortgage Securities Corp., Series
    03-FL1A, Class D
    4.00%(g)                          02/17/15         87        87,421
  J.P. Morgan Chase Commercial
    Mortgage Securities Corp., Series
    FL1A, Class F
    4.75%(g)                          02/17/15         87        87,614
  J.P. Morgan Commercial Mortgage
    Finance Corp., Series 97-C5,
    Class C
    7.24%                             09/15/29      1,600     1,732,310
  J.P. Morgan Commercial Mortgage
    Finance Corp., Series 99-C7,
    Class A1
    6.18%                             10/15/35         96        99,005
  J.P. Morgan Commercial Mortgage
    Finance Corp., Series 99-C7,
    Class A2
    6.51%                             10/15/35        600       635,411
  J.P. Morgan Commercial Mortgage
    Finance Corp., Series 99-PLS1,
    Class A2
    7.31%(g)                          02/15/32      1,550     1,668,745
  J.P. Morgan Commercial Mortgage
    Finance Corp., Series 99-PLSI,
    Class D
    7.31%(g)                          02/15/32        650       706,570
  Lehman Brothers Commercial
    Conduit Mortgage Trust, Series
    98-C4, Class A1B
    6.21%                             10/15/35        460       483,519
  Lehman Brothers Commercial
    Conduit Mortgage Trust, Series
    99-C2, Class A2
    7.32%                             10/15/32        250       274,245
  Lehman Brothers Commercial
    Conduit Mortgage Trust, Series
    99-C2, Class E
    7.47%                             10/15/32        125       137,359
  Lehman Brothers-UBS Commercial
    Mortgage Trust, Series 01-C7,
    Class A3
    5.64%                             12/15/25      2,153     2,220,982
  Lehman Brothers-UBS Commercial
    Mortgage Trust, Series 01-C7,
    Class A4
    5.93%                             12/15/25        825       865,532
  Lehman Brothers-UBS Commercial
    Mortgage Trust, Series 01-WM,
    Class A1
    6.16%                             07/14/16        817       856,076


                                                     PAR
                                       MATURITY     (000)       VALUE
                                      ---------- ---------- -------------
COMMERCIAL MORTGAGE BACKED SECURITIES (Continued)
  Lehman Brothers-UBS Commercial
    Mortgage Trust, Series 02-C4,
    Class A3
    4.07%                             09/15/26     $1,796    $1,761,213
  Lehman Brothers-UBS Commercial
    Mortgage Trust, Series 03-C8,
    Class A1
    3.64%                             11/15/27        510       500,433
  Lehman Brothers-UBS Commercial
    Mortgage Trust, Series 04-C2,
    Class A1
    2.95%                             03/15/29        349       333,056
  Lehman Brothers-UBS Commercial
    Mortgage Trust, Series 04-C2,
    Class A2
    3.25%                             03/15/29      1,500     1,430,874
  Lehman Brothers-UBS Commercial
    Mortgage Trust, Series 04-C4,
    Class A2
    4.57%                             06/15/29      1,325     1,323,295
  Lehman Brothers-UBS Commercial
    Mortgage Trust, Series 04-C6,
    Class A1
    3.88%                             08/15/29        263       258,282
  Long Beach Mortgage Loan Trust,
    Series 04-1, Class M5
    3.95%(g)                          02/25/34        475       480,837
  Lothian Mortgages PLC, Series 3A,
    Class A1
    2.83%(g)                          07/24/19        224       224,051
  Master Alternative Loans Trust,
    Series 04-4, Class 1A1
    5.50%                             05/25/34        174       173,732
  Morgan Stanley Capital I, Series
    97-WF1, Class A2
    7.22%                             07/15/29        456       476,858
  Morgan Stanley Capital I, Series
    99-WF1, Class A2
    6.21%                             11/15/31        475       499,021
  Morgan Stanley Capital I, Series
    04-XLF, Class G
    3.86%(g)                          04/15/16        300       301,871
  Morgan Stanley Dean Witter Capital
    I, Series 99-WF1, Class A1
    5.91%                             11/15/31        195       198,503
  Morgan Stanley Dean Witter Capital
    I, Series 01-TOP1, Class C
    7.00%                             02/15/33        125       137,107
  Morgan Stanley Dean Witter Capital
    I, Series 02-TOP7, Class A1
    5.38%                             01/15/39        690       709,200
  Mortgage Capital Funding, Inc.,
    Series 98-MC2, Class B
    6.55%                             06/18/30        295       311,714
  Nationslink Funding Corp., Series
    98-2, Class A2
    6.48%                             08/20/30        225       237,324
  Nationslink Funding Corp., Series
    98-2, Class B
    6.80%                             08/20/30        525       559,950
  Nationslink Funding Corp., Series
    99, Class 1
    6.32%                             01/20/31      2,154     2,260,029
  Nationslink Funding Corp., Series
    99-2, Class D
    7.59%(g)                          06/20/31        175       191,326

SEE ACCOMPANYING NOTES TO FINANCIAL STATEMENTS.
                                                                              99
                                BLACKROCK FUNDS
                            STATEMENT OF NET ASSETS
                     ASSET ALLOCATION PORTFOLIO (CONTINUED)


AS OF MARCH 31, 2005 (UNAUDITED)


                                                     PAR
                                       MATURITY     (000)       VALUE
                                      ---------- ---------- -------------
COMMERCIAL MORTGAGE BACKED SECURITIES (Continued)
  Option One Mortgage Loan Trust,
    Series 98-MC2, Class B
    5.75%(g)                          08/25/33     $  125    $   129,794
  Option One Mortgage Loan Trust,
    Series 02-6, Class M1
    3.60%(g)                          11/25/32        150        151,257
  Permanent Financing PLC, Series
    5, Class 1C
    3.47%(g)                          06/10/42        550        550,000
  Residential Asset Mortgage
    Products, Inc., Series 03-RZ2,
    Class B
    5.50%(g)                          04/25/33        425        425,267
  Salomon Brothers Mortgage
    Securities VII, Series 00-C1,
    Class A2
    7.52%                             12/18/09        460        501,543
  Salomon Brothers Mortgage
    Securities VII, Series 01-MMA,
    Class A2
    6.13%                             02/18/34        482        498,255
  Structured Asset Securities Corp.,
    Series 01-21A, Class B2
    6.37%(g)                          01/25/32         57         57,280
  Structured Asset Securities Corp.,
    Series 03-2A, Class B2II
    5.40%(g)                          02/25/33        222        219,804
  Wachovia Bank Commercial
    Mortgage Trust, Series 03-C5,
    Class A1
    2.99%                             06/15/35      1,086      1,012,869
  Wachovia Bank Commercial
    Mortgage Trust, Series 04-C12,
    Class A1
    3.40%                             07/15/41      1,286      1,258,480
  Wachovia Bank Commercial
    Mortgage Trust, Series 04-WHL3,
    Class G
    3.59%(g)                          03/15/14        250        250,806
  Washington Mutual Mortgage Loan
    Trust, Series 03-AR8, Class B1
    4.21%(g)                          08/25/33        398        389,432
  Washington Mutual Mortgage
    Securities Corp., Series 03-AR11,
    Class A6
    3.98%(g)                          10/25/33      1,350      1,317,928
  Washington Mutual Mortgage
    Securities Corp., Series 03-AR4,
    Class A6
    3.42%(g)                          05/25/33        850        830,087
  Washington Mutual, Series 03-AR1,
    Class A4
    4.13%(g)                          03/25/33         41         40,646
  Washington Mutual, Series 03-AR3,
    Class A5
    3.93%(g)                          04/25/33        300        293,921
  Washington Mutual, Series 03-AR3,
    Class B2
    4.74%(g)                          04/25/33        235        232,098
  Washington Mutual, Series 03-AR5,
    Class A6
    3.70%(g)                          06/25/33        850        831,450
  Washington Mutual, Series 03-AR5,
    Class B2
    4.52%(g)                          06/25/33        477        473,113


                                                     PAR
                                       MATURITY     (000)       VALUE
                                      ---------- ---------- -------------
COMMERCIAL MORTGAGE BACKED SECURITIES (Continued)
  Washington Mutual, Series 04-AR1,
    Class B1
    4.52%(g)                          03/25/34     $1,247    $ 1,195,773
  Washington Mutual, Series 04-AR3,
    Class B1
    4.19%(g)                          06/25/34        224        218,607
  Wells Fargo Mortgage Backed
    Securities, Series 04-K, Class
    1A2
    4.48%(g)                          07/25/34        518        504,744

                                                             -----------
TOTAL COMMERCIAL MORTGAGE BACKED
  SECURITIES
  (Cost $51,072,468)                                          50,298,449
                                                             -----------
ASSET BACKED SECURITIES - 3.6%
  Ameriquest Mortgage Securities,
    Inc., Series 02-3, Class M2
    4.10%(g)                          08/25/32        425        427,963
  Amortizing Residential Collateral
    Trust, Series 02-BC1, Class B
    4.90%(g)                          01/25/32        432        433,412
  Amortizing Residential Collateral
    Trust, Series 02-BC10, Class A3
    3.28%(g)                          01/25/33         20         20,079
  Amortizing Residential Collateral
    Trust, Series 02-BC3, Class M2
    3.95%(g)                          06/25/32        575        579,870
  Amortizing Residential Collateral
    Trust, Series 02-BC5, Class M2
    4.05%(g)                          07/25/32        250        252,504
  Asset Backed Funding Corp. Net
    Interest Margin Trust, Series
    04-OPT4, Class N1
    4.45%                             05/26/34         85         84,076
  Bank One Issuance Trust, Series
    02-C3, Class C3
    3.76%                             08/15/08        300        300,146
  Capital Auto Receivables Asset
    Trust, Series 02-1, Class A4
    4.16%                             07/16/07        157        157,404
  Caterpillar Financial Asset Trust,
    Series 04-A, Class A3
    3.13%                             01/26/09        500        493,699
  Centex Home Equity Loan Trust,
    Series 03-B, Class M3
    5.95%(g)                          06/25/33        475        495,990
  Chase Funding Mortgage Loan
    Asset-Backed Certificates, Series
    03-2, Class 1A4
    3.99%                             08/25/29        275        273,964
  Chase Funding Net Interest Margin
    Trust, Series 03-6A, Class NOTE
    5.00%                             01/27/35         23         23,242
  Chase Funding Net Interest Margin,
    Series 04-1A, Class NOTE
    3.75%                             03/27/35         52         51,905
  Chase Manhattan Auto Owner
    Trust, Series 01-B, Class A4
    3.80%                             05/15/08         65         65,004
  Chase Manhattan Auto Owner
    Trust, Series 02-A, Class CTFS
    4.17%                             09/15/08        346        347,120

SEE ACCOMPANYING NOTES TO FINANCIAL STATEMENTS.
100
                                BLACKROCK FUNDS
                            STATEMENT OF NET ASSETS
                     ASSET ALLOCATION PORTFOLIO (CONTINUED)


AS OF MARCH 31, 2005 (UNAUDITED)


                                                      PAR
                                        MATURITY     (000)       VALUE
                                       ---------- ---------- -------------
ASSET BACKED SECURITIES (Continued)
  Chase Manhattan Auto Owner
    Trust, Series 03-B, Class CTFS
    2.43%                              02/16/10     $1,440    $1,414,870
  Citibank Credit Card Issuance
    Trust, Series 00-C1, Class C1
    7.45%                              09/15/07        300       305,429
  Citibank Credit Card Issuance
    Trust, Series 01-C3, Class C3
    6.65%                              05/15/08        575       591,544
  Citibank Credit Card Issuance
    Trust, Series 03-A6, Class A6
    2.90%                              05/17/10        250       239,726
  Citibank Credit Card Issuance
    Trust, Series 04, Class A1
    2.55%                              01/20/09        450       437,854
  Countrywide Asset-Backed
    Certificates, Series 02-2, Class
    M2
    4.00%(g)                           12/25/31         75        75,441
  Countrywide Asset-Backed
    Certificates, Series 03-2, Class
    M2
    4.50%(g)                           03/26/33      1,075     1,100,233
  Countrywide Asset-Backed
    Certificates, Series 03-3, Class B
    6.35%(g)                           11/25/31        250       256,240
  Countrywide Asset-Backed
    Certificates, Series 03-3, Class
    M6
    5.75%(g)                           07/25/32      1,500     1,548,229
  Countrywide Asset-Backed
    Certificates, Series 03-BCI, Class
    M2
    4.85%(g)                           09/25/32        300       304,521
  Countrywide Asset-Backed
    Certificates, Series 04-13, Class
    AV4
    3.14%(g)                           06/25/35        218       218,309
  Credit-Based Asset Servicing and
    Securitization, Series 04-CB4,
    Class M1
    5.77%(g)                           05/25/35        275       279,080
  Distribution Financial Services
    Trust, Series 01-1, Class A4
    5.67%                              01/17/17         46        46,538
  Fleet Commercial Loan Master
    LLC, Series 02-1A, Class B1
    3.70%(g)                           11/16/09        475       476,092
  Fleet Commercial Loan Master
    LLC, Series 02-1A, Class C1
    4.90%(g)                           11/16/09        750       754,950
  Ford Credit Auto Owner Trust,
    Series 02-A, Class A4A
    4.36%                              09/15/06        181       181,323
  Ford Credit Auto Owner Trust,
    Series 02-A, Class B
    4.79%                              11/15/06        525       527,446
  Ford Credit Auto Owner Trust,
    Series 03-A, Class B2
    3.22%(g)                           08/15/07        325       326,180
  Ford Credit Auto Owner Trust,
    Series 03-B, Class C
    4.18%                              01/15/08         75        74,671
  General Electric Business Loan
    Trust, Series 03-1, Class A
    3.24%(g)                           04/15/31        329       332,535


                                                      PAR
                                        MATURITY     (000)       VALUE
                                       ---------- ---------- -------------
ASSET BACKED SECURITIES (Continued)
  General Electric Business Loan
    Trust, Series 03-1, Class B
    4.11%(g)                           04/15/31     $  219    $  225,348
  General Electric Business Loan
    Trust, Series 04-1, Class B
    3.51%(g)                           05/15/32        264       266,159
  Green Tree Financial Corp., Series
    96-6, Class A6
    7.95%                              09/15/27        475       502,041
  Green Tree Financial Corp., Series
    96-7, Class A6
    7.65%                              10/15/27        454       479,528
  Hedged Mutual Fund Fee Trust,
    Series 03-1A, Class 2
    5.22%                              11/30/10      1,724     1,724,306
  HFG Healthco-4 LLC, Series 02-1A,
    Class A
    3.85%(g)                           06/05/07        200       199,570
  HFG Healthco-4 LLC, Series 02-1A,
    Class B
    4.05%(g)                           06/05/07        125       124,846
  Impac CMB Trust, Series 02-5,
    Class A1
    3.59%(g)                           07/25/32         72        71,935
  Impac CMB Trust, Series 02-8,
    Class A
    3.31%(g)                           03/25/33         52        52,501
  Knollwood CDO Ltd., Series 04-1A,
    Class C
    5.81%(g)                           01/10/39        205       203,715
  Long Beach Asset Holdings Corp.
    Net Interest Margin, Series 04-2,
    Class N1
    4.94%                              06/25/34         77        77,402
  Long Beach Mortgage Loan Trust,
    Series 03-4, Class M5A
    6.85%(g)                           08/25/33        200       208,134
  Massachusetts RRB Special
    Purpose Trust, Series 01-1, Class
    A
    6.53%                              06/01/15      1,158     1,231,615
  MBNA Credit Card Master Note
    Trust, Series 04-A4, Class A4
    2.70%                              09/15/09        350       340,539
  MBNA Credit Card Master Notes
    Trust, Series 01-C3, Class C3
    6.55%                              12/15/08        575       592,800
  Nissan Auto Receivables Owner
    Trust, Series 03-C, Class A3
    2.23%                              03/15/07      1,250     1,242,956
  Option One Mortgage Loan Trust,
    Series 02-6, Class M2
    4.55%(g)                           11/25/32        575       581,674
  Option One Mortgage Loan Trust,
    Series 03-4, Class A4
    3.17%(g)                           07/25/33        414       414,946
  Option One Mortgage Loan Trust,
    Series 03-4, Class M5A
    6.60%(g)                           07/25/33        275       280,534
  Pacific Coast Asset Backed
    Securties CDO, Series 1A, Class
    A
    3.13%(g)                           10/25/36        344       334,323

SEE ACCOMPANYING NOTES TO FINANCIAL STATEMENTS.
                                                                             101
                                BLACKROCK FUNDS
                            STATEMENT OF NET ASSETS
                     ASSET ALLOCATION PORTFOLIO (CONTINUED)


AS OF MARCH 31, 2005 (UNAUDITED)


                                                       PAR
                                         MATURITY     (000)       VALUE
                                        ---------- ---------- -------------
ASSET BACKED SECURITIES (Continued)
  PSE&G Transition Funding LLC,
    Series 01-1, Class A3
    5.98%                               06/15/08     $  600    $   609,714
  Residential Asset Securities Corp.,
    Series 02-KS4, Class AIIB
    3.10%(g)                            07/25/32        124        124,107
  Residential Asset Securities Corp.,
    Series 03-KS1, Class M2
    4.60%(g)                            01/25/33        625        631,190
  Residential Asset Securities Corp.,
    Series 03-KS10, Class MII2
    4.20%(g)                            12/25/33      1,000      1,018,007
  Residential Asset Securities Corp.,
    Series 03-KS2, Class MII2
    4.60%(g)                            04/25/33        425        433,115
  Residential Asset Securities Corp.,
    Series 03-KS9, Class AI1
    3.01%(g)                            02/25/21         25         24,859
  Residential Asset Securities Corp.,
    Series 04-KS3, Class MII3
    4.65%(g)                            04/25/34        400        399,995
  Residential Funding Mortgage
    Securities ll, Series 04-HS2,
    Class AI1
    3.00%(g)                            12/25/18        315        314,947
  Small Business Administration
    Participation Certificates, Series
    97-20F, Class 1
    7.20%                               06/01/17        892        944,038
  Structured Asset Investment Loan
    Trust, Series 03-BC2, Class M2
    4.80%(g)                            04/25/33        350        352,142
  Structured Asset Investment Loan
    Trust, Series 03-BC3, Class M2
    4.80%(g)                            04/25/33        250        251,715
  Structured Asset Receivables Trust,
    Series 03-2
    2.03%(g)                            01/21/09        230        229,873
  Sutter CBO Ltd., Series 01-1A,
    Class A3L
    4.51%(g)                            05/15/07        425        422,875

                                                               -----------
TOTAL ASSET BACKED SECURITIES
  (Cost $28,208,846)                                            28,409,038
                                                               -----------
CORPORATE BONDS - 8.3%
Aerospace - 0.2%
  Lockheed Martin Corp., Senior
    Debentures
    8.50%                               12/01/29         45         60,893
  Northrop Grumman Corp.,
    Debentures
    7.88%                               03/01/26         75         93,964
  Northrop Grumman Corp., Senior
    Debentures
    7.75%                               02/15/31        200        252,807
  Northrop Grumman Corp., Senior
    Unsecured Notes
    4.08%                               11/16/06         55         54,943
  Systems 2001 Asset Trust LLC,
    Equipment Trust Notes
    6.66%(h)                            09/15/13        699        757,885

                                                               -----------
                                                                 1,220,492
                                                               -----------


                                                       PAR
                                         MATURITY     (000)       VALUE
                                        ---------- ---------- -------------
CORPORATE BONDS (Continued)
Banks - 0.4%
  Bank of America Corp., Senior
    Notes
    5.88%                               02/15/09     $   45    $    47,038
  Bank of America Corp., Senior
    Unsecured Notes
    5.25%                               02/01/07         25         25,473
    3.25%                               08/15/08         75         72,221
  Bank of America Corp.,
    Subordinated Notes
    7.40%                               01/15/11        325        366,387
  Bank of Scotland Treasury
    Services, Unsecured Notes
    3.50%(h)                            11/30/07         65         63,662
  BankBoston N.A., Subordinated
    Notes
    7.38%                               09/15/06        125        130,851
  Crestar Capital Trust I, Capital
    Securities
    8.16%                               12/15/26        175        189,906
  Depfa ACS Bank, Senior Notes
    3.62%                               10/29/08        300        296,400
  First Union Capital l, Capital
    Securities
    7.94%                               01/15/27        325        352,293
  Fleetboston Financial Corp., Senior
    Unsecured Notes
    3.85%                               02/15/08         60         59,052
  HBOS Treasury Services PLC,
    Senior Unsecured Notes
    3.60%(h)                            08/15/07         35         34,453
  J.P. Morgan Chase & Co., Senior
    Unsecured Notes
    5.35%                               03/01/07         50         51,019
    5.25%                               05/30/07         25         25,494
    6.00%                               08/01/08        155        162,156
  J.P. Morgan Chase & Co.,
    Subordinated Notes
    6.75%                               02/01/11        550        603,058
  M&T Bank Corp., Senior Unsecured
    Notes
    3.85%(g)                            04/01/13        225        219,320
  Mellon Capital II, Capital Securities
    8.00%                               01/15/27        250        272,636
  SunTrust Bank, Inc., Senior
    Unsecured Notes
    3.62%                               10/15/07        170        167,183
  Swedish Export Credit Corp.,
    Unsecured Notes
    2.88%                               01/26/07         75         73,779
  U.S. Bancorp Capital I, Capital
    Securities
    8.27%                               12/15/26        250        268,572
  U.S. Bancorp, Senior Unsecured
    Notes
    3.95%                               08/23/07         15         14,914
  U.S. Bank NA, Senior Bank Notes
    2.59%                               10/01/07        250        249,542
  UBS Preferred Funding Trust I,
    Capital Securities
    8.62%(g)                            10/29/49         35         41,284

SEE ACCOMPANYING NOTES TO FINANCIAL STATEMENTS.
102
                                BLACKROCK FUNDS
                            STATEMENT OF NET ASSETS
                     ASSET ALLOCATION PORTFOLIO (CONTINUED)


AS OF MARCH 31, 2005 (UNAUDITED)


                                                         PAR
                                         MATURITY       (000)       VALUE
                                      -------------- ---------- ------------
CORPORATE BONDS (Continued)
Banks (Continued)
  Wachovia Corp., Unsecured Notes
     3.62%                                02/17/09     $   35    $   33,913
  Wells Fargo & Co., Senior
    Unsecured Notes
     4.00%                                08/15/08        195       193,081
     3.11%(g)                             09/15/09        105       105,020
     4.20%                                01/15/10         40        39,119
  Wells Fargo & Co., Subordinated
    Notes
     7.80%(g)                             06/15/10         50        50,424
  Wells Fargo Co., Unsecured Notes
     3.50%                                04/04/08         50        48,680

                                                                 ----------
                                                                  4,256,930
                                                                 ----------
Broadcasting - 0.1%
  Charter Communications Holdings
    LLC, Senior Unsecured Notes
     8.00%(h)                             04/30/12        300       298,500
  Charter Communications Holdings
    LLC, Unsecured Notes
    10.25%                                09/15/10        300       308,250
  News America, Inc., Senior
    Debentures
     7.75%                                01/20/24         25        29,049
     7.28%                                06/30/28         35        38,979

                                                                 ----------
                                                                    674,778
                                                                 ----------
Business Services - 0.0%
  United Rentals N.A., Inc., Senior
    Subordinated Notes(d)
     7.75%                                11/15/13        200       194,000
                                                                 ----------
Chemicals - 0.0%
  Equistar Chemical/Funding, Senior
    Unsecured Notes
    10.12%                                09/01/08        250       275,000
  Nalco Co., Senior Subordinated
    Notes
     8.88%                                11/15/13        400       429,000
  Rhodia SA, Senior Notes
    10.25%                                06/01/10        400       436,000

                                                                 ----------
                                                                  1,140,000
                                                                 ----------
Computer & Office Equipment - 0.1%
  Hewlett-Packard Co., Senior
    Unsecured Notes
     3.62%                                03/15/08        475       465,720
                                                                 ----------
Construction - 0.2%
  Associated Materials, Inc., Senior
    Subordinated Notes
     9.75%                                04/15/12        450       483,750
     5.31%                                03/01/14        525       364,875
  Centex Corp., Unsecured Notes
     4.55%                                11/01/10        275       265,779
  MDC Holdings, Inc., Senior Notes
     5.38%                                12/15/14        425       411,709

                                                                 ----------
                                                                  1,526,113
                                                                 ----------
Energy & Utilities - 0.5%
  AES Eastern Energy LP,
    Pass-Through Certificates
     9.00%                                01/02/17        520       593,832


                                                         PAR
                                         MATURITY       (000)       VALUE
                                      -------------- ---------- ------------
CORPORATE BONDS (Continued)
Energy & Utilities (Continued)
  Dominion Resources, Inc., Senior
    Unsecured Notes
     5.70%                                09/17/12     $   50    $   51,851
     7.20%                                09/15/14        450       510,340
  DTE Energy Co., Senior Unsecured
    Notes
     6.45%                                06/01/06        350       359,698
  Entergy Gulf States, Inc., First
    Mortgage Bonds
     3.60%                                06/01/08        300       291,130
  FirstEnergy Corp., Senior
    Unsecured Notes
     7.38%                                11/15/31        260       295,985
  Florida Power Corp., First Mortgage
    Bonds
     6.65%                                07/15/11        100       108,545
  Georgia Power Co., Senior
    Unsecured Notes
     4.88%                                07/15/07        525       532,897
  Indiana Michigan Power, Senior
    Unsecured Notes
     6.12%                                12/15/06        325       335,143
  Pennsylvania Electric Co., Senior
    Unsecured Notes
     5.12%                                04/01/14         50        49,044
  Progress Energy, Inc., Senior
    Unsecured Notes
     7.10%                                03/01/11        300       329,482
     7.75%                                03/01/31        200       239,241
  Reliant Energy, Inc., Senior
    Secured Notes
     9.25%                                07/15/10        110       117,700
     6.75%                                12/15/14         40        37,300

                                                                 ----------
                                                                  3,852,188
                                                                 ----------
Entertainment & Leisure - 0.1%
  River Rock Entertainment, Senior
    Unsecured Notes
     9.75%                                11/01/11        250       275,625
  TCI Communications, Inc., Senior
    Debentures
     7.88%                                08/01/13          2         2,321
  Time Warner Cos., Inc., Debentures
     6.95%                                01/15/28         35        38,103
  Time Warner Cos., Inc., Senior
    Debentures
     7.57%                                02/01/24         30        34,723
     7.70%                                05/01/32        350       416,052

                                                                 ----------
                                                                    766,824
                                                                 ----------
Finance - 2.3%
  AID-Israel, Unsecured Notes
     5.50%                             04/24-09/33        185       196,165
  ASIF Global Financing, Unsecured
    Notes
     3.85%(h)                             11/26/07         25        24,564
     3.90%(h)                             10/22/08         95        92,938
  Associates Corp. NA, Subordinated
    Debentures
     6.88%                                11/15/08        175       188,844

SEE ACCOMPANYING NOTES TO FINANCIAL STATEMENTS.
                                                                             103
                                BLACKROCK FUNDS
                            STATEMENT OF NET ASSETS
                     ASSET ALLOCATION PORTFOLIO (CONTINUED)


AS OF MARCH 31, 2005 (UNAUDITED)


                                                      PAR
                                        MATURITY     (000)       VALUE
                                       ---------- ---------- ------------
CORPORATE BONDS (Continued)
Finance (Continued)
  Bank of America Corp., Capital
    Securities
    8.07%(h)                           12/31/26     $  225    $  246,147
  Bank of America Corp., Senior
    Notes
    4.38%                              12/01/10         25        24,570
  Bank of America Corp., Senior
    Unsecured Notes
    5.38%                              06/15/14         25        25,594
  BCP Crystal Holdings Corp., Senior
    Subordinated Notes
    9.62%(h)                           06/15/14        163       185,820
  Berkshire Hathaway Finance Corp.,
    Senior Unsecured Notes
    2.66%(g)(h)                        01/11/08         60        59,995
    3.38%                              10/15/08         75        72,492
    4.12%(h)                           01/15/10         35        34,101
  CIT Group, Inc., Unsecured Notes
    4.12%                              02/21/06        275       275,656
  Citigroup Capital ll, Capital
    Securities
    7.75%                              12/01/36        225       238,679
  Citigroup, Inc., Senior Unsecured
    Notes
    3.50%                              02/01/08         90        88,246
    3.10%(g)                           06/09/09         35        35,055
  Citigroup, Inc., Subordinated Notes
    5.00%                              09/15/14        944       926,797
  Citigroup, Inc., Unsecured Notes
    3.62%                              02/09/09        175       169,531
    4.12%                              02/22/10      1,425     1,391,698
  Countrywide Home Loans, Inc.,
    Senior Unsecured Notes
    4.12%                              09/15/09        450       433,581
  Credit Suisse First Boston USA,
    Inc., Senior Unsecured Notes
    4.12%                              01/15/10        350       339,705
  Devon Financing Corp., Senior
    Unsecured Notes
    7.88%                              09/30/31         40        49,825
  Eksportfinans, Unsecured Notes
    3.38%                              01/15/08        155       151,550
  EOP Operating LP, Senior Notes
    6.80%                              01/15/09        775       827,544
  EOP Operating LP, Senior
    Unsecured Notes
    7.50%                              04/19/29         30        34,262
  EOP Operating LP, Unsecured
    Notes
    4.75%                              03/15/14         20        18,755
  ERAC USA Finance Co.,
    Unsecured Notes
    8.25%(h)                           05/01/05        450       451,627
    6.62%(h)                           05/15/06        225       229,707
  Ford Motor Credit Co., Senior
    Unsecured Notes
    7.38%                              10/28/09        950       954,152
  General Electric Capital Corp.,
    Senior Unsecured Notes
    4.25%                              01/15/08        245       244,086
    6.12%                              02/22/11        975     1,041,555
    6.75%                              03/15/32         50        57,826


                                                      PAR
                                        MATURITY     (000)       VALUE
                                       ---------- ---------- ------------
CORPORATE BONDS (Continued)
Finance (Continued)
  General Electric Capital Corp.,
    Unsecured Notes
    3.45%                              07/16/07     $  400    $  400,372
    2.81%(g)                           07/28/08        150       150,168
    3.60%                              10/15/08         70        67,927
    4.38%                              11/21/11         15        14,646
  General Motors Acceptance Corp.,
    Senior Unsecured Notes
    7.25%                              03/02/11        750       696,335
    6.88%                              09/15/11         10         9,069
    8.00%                              11/01/31        100        87,297
  General Motors Acceptance Corp.,
    Unsecured Notes
    5.62%                              05/15/09        110       101,026
  The Goldman Sachs Group, Inc.,
    Senior Unsecured Notes
    6.88%                              01/15/11        625       686,475
  Household Finance Corp., Notes
    6.38%                              11/27/12      1,050     1,130,514
  Household Finance Corp., Senior
    Unsecured Notes
    6.38%                              10/15/11        225       243,068
  HSBC Finance Corp., Senior
    Unsecured Notes
    4.75%                              05/15/09         50        50,066
  International Lease Finance Corp.,
    Senior Unsecured Notes
    5.75%                              02/15/07        525       538,865
  J.P. Morgan Capital Trust I, Capital
    Securities
    7.54%                              01/15/27        175       188,202
  John Hancock Global Funding II,
    Secured Notes
    7.90%(h)                           07/02/10        525       599,469
  Lehman Brothers Holdings, Senior
    Unsecured Notes
    3.95%                              11/10/09        375       361,497
  Lehman Brothers Holdings,
    Unsecured Notes
    4.00%                              01/22/08        200       197,820
  MassMutual Global Funding II,
    Senior Secured Notes
    2.55%(h)                           07/15/08         50        47,178
  MBNA Corp., Senior Unsecured
    Notes
    5.62%                              11/30/07        525       538,128
  Merrill Lynch & Co., Inc., Senior
    Unsecured Notes
    3.70%                              04/21/08        425       416,662
  Morgan Stanley & Co., Inc.,
    Subordinated Notes
    4.75%                              04/01/14        750       714,089
  Nationwide Building Society, Senior
    Unsecured Notes
    3.50%(h)                           07/31/07         75        73,586
  Riddell Bell Holdings, Senior
    Subordinated Notes
    8.38%(h)                           10/01/12        200       206,000
  SLM Corp., Senior Unsecured
    Notes
    5.62%                              04/10/07        250       256,388

SEE ACCOMPANYING NOTES TO FINANCIAL STATEMENTS.
104
                                BLACKROCK FUNDS
                            STATEMENT OF NET ASSETS
                     ASSET ALLOCATION PORTFOLIO (CONTINUED)


AS OF MARCH 31, 2005 (UNAUDITED)


                                                      PAR
                                        MATURITY     (000)       VALUE
                                       ---------- ---------- -------------
CORPORATE BONDS (Continued)
Finance (Continued)
  SLM Corp., Unsecured Notes
    4.00%                              01/15/10     $  550    $   532,258
  Sun Life of Canada Capital Trust,
    Capital Securities
    8.53%(h)                           05/29/49        195        215,003
  TIAA Global Markets, Senior
    Unsecured Notes
    3.88%(h)                           01/22/08         55         54,295
  Transdigm, Inc., Senior
    Subordinated Notes
    8.38%                              07/15/11        300        307,875

                                                              -----------
                                                               17,995,345
                                                              -----------
Food & Agriculture - 0.1%
  Cargill Inc., Unsecured Notes
    4.38%(h)                           06/01/13        225        214,937
    6.12%(h)                           04/19/34        300        315,346
  General Mills, Inc., Senior
    Unsecured Notes
    5.12%                              02/15/07         65         66,019

                                                              -----------
                                                                  596,302
                                                              -----------
Insurance - 0.2%
  Allstate Financial Global Funding
    LLC, Senior Unsecured Notes
    6.15%(h)                           02/01/06         50         50,936
  Allstate Financial Global Funding
    LLC, Unsecured Notes
    2.50%(h)(i)                        06/20/08        325        305,329
  Marsh & McLennan Cos., Inc.,
    Senior Unsecured Notes
    5.38%                              07/15/14         20         19,187
  Massachusetts Mutual Life
    Insurance Co., Notes
    5.62%(h)                           05/15/33        425        425,270
  Monumental Global Funding II,
    Senior Secured Notes
    4.38%(h)                           07/30/09         50         49,446
  Protective Life Corp. Secured Trust,
    Secured Notes
    3.70%                              11/24/08         60         58,137
  Wellpoint, Inc., Unsecured Notes
    5.95%(h)                           12/15/34        300        301,217

                                                              -----------
                                                                1,209,522
                                                              -----------
Manufacturing - 0.2%
  General Electric Co., Senior Notes
    5.00%                              02/01/13        750        748,620
  Lockheed Martin Tactical Systems,
    Inc., Senior Debentures
    7.00%                              09/15/23        150        170,670
  TRW Automotive, Inc., Senior
    Unsecured Notes
    9.38%                              02/15/13        500        537,500

                                                              -----------
                                                                1,456,790
                                                              -----------
Medical & Medical Services - 0.1%
  Concentra Operating Corp., Senior
    Subordinated Notes
    9.50%                              08/15/10        375        401,250
  Iasis Healthcare Corp., Senior
    Subordinated Notes
    8.75%                              06/15/14         70         72,800


                                                      PAR
                                        MATURITY     (000)       VALUE
                                       ---------- ---------- -------------
CORPORATE BONDS (Continued)
Medical & Medical Services (Continued)
  UnitedHealth Group, Inc., Senior
    Unsecured Notes
    7.50%                              11/15/05     $  175    $   178,483

                                                              -----------
                                                                  652,533
                                                              -----------
Medical Instruments & Supplies - 0.0%
  Boston Scientific Corp., Senior
    Unsecured Notes
    5.45%                              06/15/14         20         20,388
                                                              -----------
Metal & Mining - 0.3%
  Foundation PA Coal Co., Senior
    Unsecured Notes
    7.25%                              08/01/14        150        154,875
  Ipsco, Inc., Senior Notes
    8.75%                              06/01/13        750        834,375
  Newmont USA Ltd., Senior
    Unsecured Notes
    8.62%                              05/15/11        250        298,509
  Terex Corp., Senior Subordinated
    Notes
    9.25%                              07/15/11        425        463,250
  TRIMAS Corp., Senior
    Subordinated Notes
    9.88%                              06/15/12        600        609,000

                                                              -----------
                                                                2,360,009
                                                              -----------
Motor Vehicles - 0.2%
  Arvinmeritor, Inc., Senior
    Unsecured Notes
    8.75%                              03/01/12        250        261,250
  Daimler Chrysler AG, Senior
    Debentures
    7.45%                              03/01/27         15         16,119
  DaimlerChrysler NA Holdings Corp.,
    Senior Unsecured Notes
    8.50%                              01/18/31        350        422,329
  Ford Motor Co., Unsecured Notes
    7.45%(d)                           07/16/31        300        271,376
  General Motors Corp., Senior
    Unsecured Notes
    8.38%(d)                           07/15/33         10          8,602
  General Motors, Senior Unsecured
    Notes
    8.25%                              07/15/23        250        215,665

                                                              -----------
                                                                1,195,341
                                                              -----------
Oil & Gas - 0.3%
  Anadarko Finance Co., Senior
    Unsecured Notes
    7.50%                              05/01/31        160        195,939
  Conoco Funding Co., Senior
    Unsecured Notes
    6.35%                              10/15/11         40         43,141
  Conoco, Inc., Senior Unsecured
    Notes
    6.95%                              04/15/29        375        447,010
  Consolidated Natural Gas, Senior
    Debentures
    5.00%                              03/01/14         20         19,608
  El Paso Production Holding Co.,
    Senior Notes
    7.75%                              06/01/13        250        252,500

SEE ACCOMPANYING NOTES TO FINANCIAL STATEMENTS.
                                                                             105
                                BLACKROCK FUNDS
                            STATEMENT OF NET ASSETS
                     ASSET ALLOCATION PORTFOLIO (CONTINUED)


AS OF MARCH 31, 2005 (UNAUDITED)


                                                   PAR
                                     MATURITY     (000)       VALUE
                                    ---------- ---------- ------------
CORPORATE BONDS (Continued)
Oil & Gas (Continued)
  Enterprise Products Operating LP,
    Senior Unsecured Notes
     5.60%(h)                       10/15/14     $  150    $  148,040
  Exco Resources, Inc., Senior
    Secured Notes
     7.25%                          01/15/11        600       612,000
  Kern River Funding Corp., Senior
    Unsecured Notes
     4.89%(h)                       04/30/18        254       253,289
  Kerr-McGee Corp., Senior
    Unsecured Notes
     6.88%                          09/15/11        125       133,680
  Newfield Exploration Co., Senior
    Subordinated Notes
     6.62%(h)                       09/01/14        250       261,250
  Pioneer Natural Resources, Senior
    Unsecured Notes
     5.88%                          07/15/16         25        25,567
  Suncor Energy, Inc.
     5.95%                          12/01/34         20        20,958

                                                           ----------
                                                            2,412,982
                                                           ----------
Paper & Forest Products - 0.1%
  International Paper Co., Senior
    Unsecured Notes
     6.75%                          09/01/11        275       301,500
  Weyerhaeuser Co., Senior
    Debentures
     7.38%                          03/15/32        150       177,930

                                                           ----------
                                                              479,430
                                                           ----------
Pharmaceuticals - 0.1%
  Bristol-Myers Squibb Co., Senior
    Debentures
     6.88%                          08/01/49         25        28,770
  Merck & Co., Inc., Senior
    Unsecured Notes
     4.38%                          02/15/13        410       394,689

                                                           ----------
                                                              423,459
                                                           ----------
Publishing & Printing - 0.0%
  Cenveo Corp., Senior Subordinated
    Notes
     7.88%                          12/01/13        275       245,438
                                                           ----------
Real Estate - 0.3%
  Avalonbay Communities, Inc.,
    Senior Unsecured Notes
     7.50%                          12/15/10         25        28,065
  ERP Operating LP, Senior Notes
     6.63%                          04/13/05        600       600,857
  Lennar Corp., Senior Unsecured
    Notes
     3.80%(g)                       03/19/09        400       402,032
  Pulte Homes, Inc., Bonds
     6.38%                          05/15/33        250       238,692
  Reckson Operating Partnership,
    Senior Unsecured Notes
     5.88%                          08/15/14        300       308,398
  The Rouse Co., Unsecured Notes
     3.62%                          03/15/09         50        46,779
  Simon Property Group LP, Senior
    Unsecured Notes
     7.38%                          01/20/06        400       410,057

                                                           ----------
                                                            2,034,880
                                                           ----------


                                                   PAR
                                     MATURITY     (000)       VALUE
                                    ---------- ---------- ------------
CORPORATE BONDS (Continued)
Retail Merchandising - 0.1%
  Ametek, Inc., Senior Notes
     7.20%                          07/15/08     $  150    $  160,144
  The Kroger Co., Senior Unsecured
    Notes
     7.80%                          08/15/07        775       829,693

                                                           ----------
                                                              989,837
                                                           ----------
Telecommunications - 1.1%
  American Tower Corp., Senior
    Unsecured Notes
     7.50%(d)                       05/01/12        800       812,000
  AT&T Wireless Services, Inc.,
    Senior Unsecured Notes
     8.75%                          03/01/31        250       329,828
  BellSouth Corp., Senior Unsecured
    Notes
     4.20%                          09/15/09        610       594,793
  Comcast Cable Communications
    Corp., Senior Unsecured Notes
     7.05%                          03/15/33        815       911,569
  Crown Castle International Corp.,
    Senior Unsecured Notes
     7.50%                          12/01/13        600       655,500
  CSC Holdings, Inc., Senior
    Unsecured Notes
     8.12%                          07/15/09        600       633,000
  Insight Midwest LP, Senior Notes
     9.75%                          10/01/09        325       339,625
  Mediacom Broadband LLC, Senior
    Unsecured Notes
    11.00%                          07/15/13        400       428,000
  Nextel Communications, Inc.,
    Senior Notes
     7.38%                          08/01/15        550       580,938
  Qwest Communications
    International, Senior Unsecured
    Notes
     7.25%(h)                       02/15/11        300       293,250
  Qwest Corp., Senior Unsecured
    Notes
     7.88%(h)                       09/01/11        225       232,312
  SBA Communications Corp., Senior
    Unsecured Notes
     8.50%(h)                       12/01/12        125       129,375
  SBC Communications, Inc.,
    Unsecured Notes
     4.12%                          09/15/09         25        24,316
     5.10%                          09/15/14        225       222,372
     6.45%                          06/15/34         15        15,572
  Sprint Capital Corp., Senior
    Unsecured Notes
     8.75%                          03/15/32        325       421,642
  Superior Essex Communications &
    Essex Group, Senior Notes
     9.00%                          04/15/12        500       507,500
  TCI Communications, Inc., Senior
    Debentures
     7.88%                          02/15/26          5         6,100
  TCI Communications, Inc., Senior
    Notes
     7.12%                          02/15/28         35        39,083
  Verizon Global Funding Corp.,
    Senior Unsecured Notes
     7.75%                          12/01/30        510       616,385

SEE ACCOMPANYING NOTES TO FINANCIAL STATEMENTS.
106
                                BLACKROCK FUNDS
                            STATEMENT OF NET ASSETS
                     ASSET ALLOCATION PORTFOLIO (CONTINUED)


AS OF MARCH 31, 2005 (UNAUDITED)


                                                      PAR
                                        MATURITY     (000)       VALUE
                                       ---------- ---------- -------------
CORPORATE BONDS (Continued)
Telecommunications (Continued)
  Verizon Maryland, Inc., Debentures
     5.12%                             06/15/33     $   10    $     8,615
  Verizon New Jersey, Inc., Senior
    Debentures
     5.88%                             01/17/12        100        103,533
  Vodafone Group PLC, Senior
    Unsecured Notes
     7.75%                             02/15/10         70         79,060
  Western Wireless Corp., Senior
    Unsecured Notes
     9.25%                             07/15/13        775        883,500

                                                              -----------
                                                                8,867,868
                                                              -----------
Transportation - 0.0%
  Gulfmark Offshore, Inc., Senior
    Notes
     7.75%(h)                          07/15/14        225        231,750
                                                              -----------
Yankee - 1.3%
  Ainsworth Lumber Co. Ltd.
    (Canada), Senior Unsecured
    Notes
     6.84%(g)(h)                       10/01/10        400        406,000
  Banque Centrale de Tunisie
    (Tunisia), Senior Unsecured
    Notes
     7.38%                             04/25/12        425        470,688
  British Telecommunication Group
    PLC, Senior Unsecured Notes
     8.88%                             12/15/30        230        306,472
  Corp Andina de Fomento (Spain),
    Senior Unsecured Notes
     6.88%                             03/15/12        125        137,481
  Deutsche Telekom International
    Finance BV (Netherlands), Senior
    Unsecured Notes
     8.75%                             06/15/30        265        346,581
  Eircom Funding (Ireland), Senior
    Subordinated Notes
     8.25%                             08/15/13        600        652,500
  Encana Corp. (Canada), Bonds
     6.50%                             08/15/34        325        359,551
  France Telecom, Senior Unsecured
    Notes
     9.25%                             03/01/31        225        296,134
  Omi Corp. (Mali), Senior Notes
     7.62%                             12/01/13        750        780,000
  Province of Quebec, Unsecured
    Notes
     5.00%                             07/17/09         25         25,455
  Republic of Argentina, Bonds
     3.01%(g)                          08/03/12        700        585,200
  Republic of Colombia, Senior
    Unsecured Notes
    10.75%                             01/15/13        925      1,033,688
  Republic of Panama, Bonds
     7.25%(d)                          03/15/15        500        496,250
  Republic of Turkey, Unsecured
    Notes
     7.25%                             03/15/15        700        684,250
  Rogers Wireless, Inc. (Canada),
    Senior Secured Notes
     9.62%                             05/01/11        550        624,250


                                                      PAR
                                        MATURITY     (000)       VALUE
                                       ---------- ---------- -------------
CORPORATE BONDS (Continued)
Yankee (Continued)
  Russian Federation, Unsecured
    Bonds
     1.00%                             03/31/30     $  500    $   512,250
  Statoil (Norway), Unsecured Notes
     5.12%(h)                          04/30/14         50         50,240
  Telecom Italia Capital
    (Luxembourg), Senior Unsecured
    Notes
     4.95%(h)                          09/30/14        475        455,005
  Thomson Corp. (Canada),
    Unsecured Notes
     5.75%                             02/01/08        250        257,703
  Tyco International Group SA
    (Luxembourg), Senior Unsecured
    Notes
     6.12%                             11/01/08         25         26,301
  Ukraine Government International
    Bonds, Unsecured Notes
     7.65%(h)                          06/11/13        500        535,000
  United Mexican States, Bonds
     8.12%                             12/30/19        180        207,000
  United Mexican States, Senior
    Unsecured Notes
     6.62%(d)                          03/03/15        675        702,000
     8.30%                             08/15/31         25         28,625
  United Mexican States, Unsecured
    Notes
     4.62%                             10/08/08        250        246,750
  XL Capital Ltd. (Kyrgyzstan), Senior
    Unsecured Notes
     6.38%                             11/15/24         20         20,880

                                                              -----------
                                                               10,246,254
                                                              -----------
TOTAL CORPORATE BONDS
  (Cost $64,783,165)
                                                               65,515,173
                                                              -----------


MUNICIPAL BONDS - 0.0%
  Ohana Military Communities LLC,
    Military Housing Revenue Bonds
    (Navy Hawaii Housing
    Privatization Project) Series 04-A,
    Class 1
    6.19%
  (Cost $25,000)                        04/01/49   25   26,929
                                                        ------

SEE ACCOMPANYING NOTES TO FINANCIAL STATEMENTS.
                                                                             107
                                BLACKROCK FUNDS
                            STATEMENT OF NET ASSETS
                     ASSET ALLOCATION PORTFOLIO (CONTINUED)


AS OF MARCH 31, 2005 (UNAUDITED)


                                                  PAR/SHARES
                                       MATURITY     (000)        VALUE
                                      ---------- ----------- -------------
TAXABLE MUNICIPAL BONDS - 0.0%
  California Department of Water
    Resources Revenue Bonds,
    Series 02, Class E
    3.98%
  (Cost $100,000)                     05/01/05     $   100    $   100,032
                                                              -----------
SHORT TERM INVESTMENTS - 12.4%
  Federal Home Loan Bank, Discount
    Notes
    2.55%                             04/01/05       4,000      4,000,001
  Galileo Money Market Fund                          2,537      2,537,140
  Morgan Stanley, Floating Rate
    Notes
    2.94%(j)(g)                       11/14/05      11,910     11,190,170
  U.S. Treasury Bills
    2.59%                             04/07/05       1,800      1,799,223
    2.60%                             04/21/05      34,000     33,950,898
    2.61%                             04/28/05         500        499,021
  Institutional Money Market Trust(j)               43,699     43,699,476

                                                              -----------
TOTAL SHORT TERM INVESTMENTS
  (Cost $97,675,929)                                           97,675,929
                                                              -----------


TOTAL INVESTMENTS IN SECURITIES -
109.1%
  (Cost $789,623,131(a))   861,168,583


CALL OPTIONS WRITTEN - 0.0%
  Federal National Mortgage
    Association 30Yr 5.5%, Strike
    Price 101.718750, Expires
    04/06/05
  (Premiums received $2,021)              (75)                 0
                                                               -
CALL SWAPTIONS WRITTEN - 0.0%
  Citibank, Strike Price 5.67,
    Expires 01/04/10                      (50)(k)        (26,250)
  Deutsche Bank, Strike Price
    5.015, Expires 01/29/07               (35)(k)        (10,467)

                                                         -------
TOTAL CALL SWAPTIONS WRITTEN
  (Premiums received $39,070)                            (36,717)
                                                         -------
PUT SWAPTIONS WRITTEN - 0.0%
  Citibank, Strike Price 5.67,
    Expires 01/04/10                      (50)(k)        (20,480)
  Deutsche Bank, Strike Price
    5.015, Expires 01/29/07               (35)(k)        (15,523)

                                                         -------
TOTAL PUT SWAPTIONS WRITTEN
  (Premiums received $39,070)                            (36,003)
                                                         -------


                                                VALUE
                                          -----------------
LIABILITIES IN EXCESS OF OTHER
  ASSETS -  (9.1)%                          $ (71,762,596)
                                            -------------
(Including $54,889,646 of payable upon
  return of securities loaned)
NET ASSETS - 100.0%
  (Applicable to 2,076,823 Institutional
  shares, 145,876 Service shares,
  34,677,749 Investor A shares,
  12,565,002 Investor B shares and
  4,335,736 Investor C shares)              $ 789,061,125
                                            =============


NET ASSET VALUE, OFFERING
  AND REDEMPTION PRICE PER
  INSTITUTIONAL SHARE
    ($30,597,735/2,076,823)              $ 14.73
                                         =======
NET ASSET VALUE, OFFERING
  AND REDEMPTION PRICE PER
  SERVICE SHARE
       ($2,146,707/145,876)              $ 14.72
                                         =======
NET ASSET VALUE AND
  REDEMPTION PRICE PER
  INVESTOR A SHARE
  ($509,997,906/34,677,749)              $ 14.71
                                         =======
MAXIMUM OFFERING PRICE
  PER INVESTOR A SHARE
            ($14.71/0.9425)              $ 15.61
                                         =======
NET ASSET VALUE, OFFERING
  AND REDEMPTION PRICE
  (subject to a maximum contingent
  deferred sales charge of 4.5%)
  PER INVESTOR B SHARE
  ($183,141,130/12,565,002)              $ 14.58
                                         =======
NET ASSET VALUE, OFFERING
  AND REDEMPTION PRICE
  (subject to a maximum contingent
  deferred sales charge of 4.5%)
  PER INVESTOR C SHARE
    ($63,177,647/4,335,736)              $ 14.57
                                         =======

SEE ACCOMPANYING NOTES TO FINANCIAL STATEMENTS.
108
                                BLACKROCK FUNDS
                            STATEMENT OF NET ASSETS
                     ASSET ALLOCATION PORTFOLIO (CONCLUDED)


AS OF MARCH 31, 2005 (UNAUDITED)


- -------------------

 (a) Cost for Federal income tax purposes is $792,265,852. The
     gross unrealized appreciation (depreciation) on a tax basis is as
     follows:
      Gross unrealized appreciation                                      $80,647,930
      Gross unrealized depreciation                                      (11,745,199)
                                                                         -----------
                                                                         $68,902,731
                                                                         ===========

 (b) Security valued at fair value as determined in good faith by or under the
       direction of the Trustees.  As of March 31, 2005, this security had a
       total market value of $694,567 which represents 0.09% of net assets.
     (c) Non-income producing security.
     (d) Total or partial securities on loan.
     (e) Rates shown are the effective yields as of March 31, 2005.
     (f) Securities, or a portion thereof, subject to financing transactions.
     (g) Rates shown are the rates as of March 31, 2005.
 (h) Security exempt from registration under Rule 144A of the Securities Act of
       1933. These securities may be resold in transactions exempt from
       registration to qualified institutional investors. As of March 31, 2005,
       the Portfolio held 1.1% of its net assets, with a current market value
       of $8,332,922, in securities restricted as to resale.
  (i) Securities, or a portion thereof, pledged as collateral with a value of
       $307,607 on 82 Short U.S. Treasury Notes futures contracts, 136 Long
       U.S. Treasury Notes futures contracts, and 99 Long Treasury Bonds
       futures contracts expiring June 2005.  The value of such contracts on
       March 31, 2005 was $47,957,968, with an unrealized loss of $268,675
       (including commissions of $697).
  (j) Securities purchased with the cash proceeds from securities loaned.
  (k) Each swaption contract is equivalent to $10,000 in notional amount.

SEE ACCOMPANYING NOTES TO FINANCIAL STATEMENTS.
                                                                             109
                                BLACKROCK FUNDS
                            STATEMENT OF NET ASSETS
                             INDEX EQUITY PORTFOLIO


AS OF MARCH 31, 2005 (UNAUDITED)


                                            VALUE
                                      -----------------

Investment in The U.S. Large Company
  Series of The DFA Investment Trust
  Company - 100.2%
  (Cost $1,126,571,854)                $1,346,472,066


LIABILITIES IN EXCESS OF OTHER
  ASSETS - (0.2)%                                (3,183,457)
                                                 ----------
NET ASSETS - 100.0%
  (Applicable to 24,381,166 Institutional
  shares, 3,179,643 Service shares,
  13,511,057 Investor A shares,
  7,210,179 Investor B shares and
  11,494,170 Investor C shares)              $1,343,288,609
                                             ==============


NET ASSET VALUE, OFFERING
  AND REDEMPTION PRICE
  PER INSTITUTIONAL SHARE
  ($553,111,252/24,381,166)              $ 22.69
                                         =======
NET ASSET VALUE, OFFERING
  AND REDEMPTION PRICE
  PER SERVICE SHARE
    ($71,686,971/3,179,643)              $ 22.55
                                         =======
NET ASSET VALUE AND
  REDEMPTION PRICE
  PER INVESTOR A SHARE
  ($304,373,181/13,511,057)              $ 22.53
                                         =======
MAXIMUM OFFERING PRICE
  PER INVESTOR A SHARE
             ($22.53/0.970)              $ 23.23
                                         =======
NET ASSET VALUE, OFFERING
  AND REDEMPTION PRICE
  (subject to a maximum contingent
  deferred sales charge of 4.5%)
  PER INVESTOR B SHARE
   ($159,675,506/7,210,179)              $ 22.15
                                         =======
NET ASSET VALUE, OFFERING
  AND REDEMPTION PRICE
  (subject to a maximum contingent
  deferred sales charge of 1.0%)
  PER INVESTOR C SHARE
  ($254,441,699/11,494,170)              $ 22.14
                                         =======


SEE ACCOMPANYING NOTES TO FINANCIAL STATEMENTS AND ACCOMPANYING FINANCIAL
      STATEMENTS AND RELATED NOTES FOR THE DFA INVESTMENT TRUST COMPANY.
110
                                BLACKROCK FUNDS


            INVESTMENT ABBREVIATIONS
  ADR       American Depository Receipts
  CMT       Constant Maturity Treasury
  IO        Interest Only
  NVDR      Non Voting Depository Receipts
  PLC       Public Limited Company
  PO        Principal Only


                                                                             111
                                BLACKROCK FUNDS
                            STATEMENTS OF OPERATIONS


FOR THE PERIOD ENDED MARCH 31, 2005 (UNAUDITED)


                                                                      LARGE CAP
                                                    INVESTMENT          VALUE
                                                      TRUST             EQUITY
                                                    PORTFOLIO         PORTFOLIO
                                                 10/1/04-3/31/05   10/1/04-3/31/05
                                                ----------------- -----------------
Investment income:
 Interest .....................................   $      30,737     $     14,357
 Securities lending income ....................           5,732            5,626
 Dividends ....................................       6,342,659        3,675,537
 Foreign taxes withheld .......................               -                -
                                                  -------------     ------------
   Total investment income ....................       6,379,128        3,695,520
                                                  -------------     ------------
Expenses:
 Investment advisory fee ......................       1,526,322          770,937
 Administration fee ...........................         217,115          119,145
 Administration fee - class specific ..........         410,565          203,441
 Custodian fee ................................          27,446           27,889
 Transfer agent fee ...........................         522,218          143,746
 Transfer agent fee - class specific ..........          51,372           25,255
 Shareholder servicing fees - class specific ..         429,416          199,920
 Distribution fees - class specific ...........         553,117          191,554
 Legal and audit fee ..........................          23,886           20,734
 Printing fee .................................          51,788           33,613
 Registration fees and expenses ...............          21,266           24,183
 Trustees' fees ...............................           3,756            3,205
 Licensing fees ...............................               -                -
 Other ........................................           8,197            6,398
                                                  -------------     ------------
   Total expenses .............................       3,846,464        1,770,020
                                                  -------------     ------------
    Less investment advisory and adminis-
     tration fees waived ......................        (143,642)         (70,524)
    Less administration fees waived - class
     specific .................................        (230,394)        (105,958)
    Less distribution fees waived - class
     specific .................................        (112,150)         (44,507)
    Less expenses reimbursed by advisor........               -                -
    Less expenses reimbursed by
     distributor (Note D) .....................               -                -
    Reimbursement of distribution fees
     (Note D) .................................               -                -
                                                  -------------     ------------
   Total expenses .............................       3,360,278        1,549,031
                                                  -------------     ------------
 Net investment income (loss) .................       3,018,850        2,146,489
                                                  -------------     ------------
Realized and unrealized gain (loss) on
 investments and foreign currency
 transactions:
 Net increase from payment by affiliate (Note
  D) ..........................................               -                -
 Net realized gain (loss) from:
  Investment transactions .....................     116,622,118       24,890,680
  Futures and options contracts ...............        (362,179)          32,568
                                                  -------------     ------------
                                                    116,259,939       24,923,248
                                                  -------------     ------------
Change in unrealized appreciation
 (depreciation) from:
  Investments .................................     (97,589,634)        (181,590)
  Futures and options contracts ...............         (31,594)         (44,007)
                                                  -------------     ------------
                                                    (97,621,228)        (225,597)
                                                  -------------     ------------
Net gain (loss) on investments and foreign
 currency transactions ........................      18,638,711       24,697,651
                                                  -------------     ------------
Net increase (decrease) in net assets resulting
 from operations ..............................   $  21,657,561     $ 26,844,140
                                                  =============     ============


                                                    LARGE CAP
                                                      GROWTH           DIVIDEND
                                                      EQUITY         ACHIEVERSTM         LEGACY
                                                    PORTFOLIO         PORTFOLIO         PORTFOLIO
                                                 10/1/04-3/31/05   10/1/04-3/31/05   11/1/04-3/31/05
                                                ----------------- ----------------- ----------------
Investment income:
 Interest .....................................   $      4,848        $   6,848       $     19,639
 Securities lending income ....................          2,315              194              9,367
 Dividends ....................................        757,422          196,824          2,862,052
 Foreign taxes withheld .......................              -                -               (244)
                                                  ------------        ---------       ------------
   Total investment income ....................        764,585          203,866          2,890,814
                                                  ------------        ---------       ------------
Expenses:
 Investment advisory fee ......................        209,999           37,655            838,564
 Administration fee ...........................         32,454            5,819             58,556
 Administration fee - class specific ..........         55,486            9,718             73,475
 Custodian fee ................................         19,448            8,501             26,408
 Transfer agent fee ...........................         66,846              500            176,306
 Transfer agent fee - class specific ..........          6,888            1,190              9,121
 Shareholder servicing fees - class specific ..         62,326           11,241            266,153
 Distribution fees - class specific ...........         64,777           14,839            414,036
 Legal and audit fee ..........................         11,987           13,927             31,646
 Printing fee .................................         12,365            2,945             52,511
 Registration fees and expenses ...............         20,992           29,502             23,994
 Trustees' fees ...............................          1,330               31              6,116
 Licensing fees ...............................              -           15,868                  -
 Other ........................................          5,173            4,934             (8,802)
                                                  ------------        ---------       ------------
   Total expenses .............................        570,071          156,670          1,968,084
                                                  ------------        ---------       ------------
    Less investment advisory and adminis-
     tration fees waived ......................        (74,425)         (41,897)                 -
    Less administration fees waived - class
     specific .................................        (27,147)          (3,224)           (26,143)
    Less distribution fees waived - class
     specific .................................         (9,270)          (2,764)           (21,829)
    Less expenses reimbursed by advisor........              -          (17,683)                 -
    Less expenses reimbursed by
     distributor (Note D) .....................              -                -                  -
    Reimbursement of distribution fees
     (Note D) .................................              -                -                  -
                                                  ------------        ---------       ------------
   Total expenses .............................        459,229           91,102          1,920,112
                                                  ------------        ---------       ------------
 Net investment income (loss) .................        305,356          112,764            970,702
                                                  ------------        ---------       ------------
Realized and unrealized gain (loss) on
 investments and foreign currency
 transactions:
 Net increase from payment by affiliate (Note
  D) ..........................................              -                -            294,363
 Net realized gain (loss) from:
  Investment transactions .....................      8,851,648          (42,966)         4,422,778
  Futures and options contracts ...............         95,118           59,253                  -
                                                  ------------        ---------       ------------
                                                     8,946,766           16,287          4,717,141
                                                  ------------        ---------       ------------
Change in unrealized appreciation
 (depreciation) from:
  Investments .................................     (4,002,681)         (43,189)         4,502,767
  Futures and options contracts ...............        (14,349)           5,023                  -
                                                  ------------        ---------       ------------
                                                    (4,017,030)         (38,166)         4,502,767
                                                  ------------        ---------       ------------
Net gain (loss) on investments and foreign
 currency transactions ........................      4,929,736          (21,879)         9,219,908
                                                  ------------        ---------       ------------
Net increase (decrease) in net assets resulting
 from operations ..............................   $  5,235,092        $  90,885       $ 10,190,610
                                                  ============        =========       ============

SEE ACCOMPANYING NOTES TO FINANCIAL STATEMENTS.
                                      112
                          BLACKROCK FUNDS


     MID-CAP          MID-CAP          MID-CAP
      VALUE            VALUE            GROWTH
     EQUITY           EQUITY            EQUITY            AURORA
    PORTFOLIO        PORTFOLIO        PORTFOLIO         PORTFOLIO
 3/1/05-3/31/05   7/1/04-2/28/05   10/1/04-3/31/05   10/1/04-3/31/05
- ---------------- ---------------- ----------------- -----------------
 $      39,566     $    187,175     $      37,929    $    1,286,813
         4,396           95,612             9,643           810,217
       914,359        9,546,084           578,120        17,680,794
             -                -                 -           (24,911)
 -------------     ------------     -------------    --------------
       958,321        9,828,871           625,692        19,752,913
 -------------     ------------     -------------    --------------
       485,894        3,038,640           956,961        14,317,650
        49,799          114,891           101,677           421,608
        88,183           88,510           173,680           749,425
         6,796          106,832            16,296           180,609
        87,079        1,108,449           232,356         2,603,238
        10,947           10,987            21,560            98,995
       140,479        1,047,061           234,467         4,069,457
       177,343        1,174,289           279,847         4,356,457
         8,308           52,379            16,340            48,049
        30,256          180,196            20,085           427,562
         5,580          171,370            24,311            45,158
         1,519           14,829             1,965            35,936
             -                -                 -                 -
         2,108           32,265             5,373           142,896
 -------------     ------------     -------------    --------------
     1,094,291        7,140,698         2,084,918        27,497,040
 -------------     ------------     -------------    --------------
       (82,106)         (61,303)                -                 -
       (86,319)         (87,493)          (29,889)                -
       (37,849)         (38,049)          (61,869)         (354,446)
             -                -                 -                 -
             -         (271,500)                -                 -
             -          (91,069)                -                 -
 -------------     ------------     -------------    --------------
       888,017        6,591,284         1,993,160        27,142,594
 -------------     ------------     -------------    --------------
        70,304        3,237,587        (1,367,468)       (7,389,681)
 -------------     ------------     -------------    --------------
             -          554,230                 -           203,165
    11,904,776       55,516,938        30,932,057       599,000,361
             -                -                 -                 -
 -------------     ------------     -------------    --------------
    11,904,776       56,071,168        30,932,057       599,203,526
 -------------     ------------     -------------    --------------
   (18,755,989)      25,454,000       (13,708,289)     (288,414,761)
             -                -                 -                 -
 -------------     ------------     -------------    --------------
   (18,755,989)      25,454,000       (13,708,289)     (288,414,761)
 -------------     ------------     -------------    --------------
    (6,851,213)      81,525,168        17,223,768       310,788,765
 -------------     ------------     -------------    --------------
 $  (6,780,909)    $ 84,762,755     $  15,856,300    $  303,399,084
 =============     ============     =============    ==============


  SMALL/MID-CAP       SMALL CAP         SMALL CAP         SMALL CAP
      GROWTH         VALUE EQUITY      CORE EQUITY      GROWTH EQUITY
    PORTFOLIO         PORTFOLIO         PORTFOLIO         PORTFOLIO
 10/1/04-3/31/05   10/1/04-3/31/05   10/1/04-3/31/05   10/1/04-3/31/05
- ----------------- ----------------- ----------------- ----------------
  $     46,402      $     20,990       $    8,079       $    209,924
        57,151             6,199              523             30,267
       393,644           946,690           37,490            372,003
             -                 -                -                  -
  ------------      ------------       ----------       ------------
       497,197           973,879           46,092            612,194
  ------------      ------------       ----------       ------------
     1,451,339           369,897           81,938          1,412,488
        78,926            57,166            6,965            217,342
        84,343            94,198           11,763            372,195
        15,059            16,790            6,876             43,640
       778,914            41,549            3,946            116,804
        10,470            11,714            1,460             46,204
       402,886            82,031           15,605            265,990
       298,249           103,725           31,975            213,383
        45,391            14,612            7,777             35,235
        83,497            19,029            2,291             66,581
        25,944            28,158           31,806             32,456
        10,233             1,818              182              7,399
             -                 -                -                  -
        15,147             5,899            2,642             15,811
  ------------      ------------       ----------       ------------
     3,300,398           846,586          205,226          2,845,528
  ------------      ------------       ----------       ------------
       (28,627)           (1,076)         (36,571)                 -
       (78,031)           (6,053)          (2,712)                 -
       (42,559)          (17,473)          (2,298)           (72,493)
             -                 -           (2,692)                 -
      (355,506)                -                -                  -
             -                 -                -                  -
  ------------      ------------       ----------       ------------
     2,795,675           821,984          160,953          2,773,035
  ------------      ------------       ----------       ------------
    (2,298,478)          151,895         (114,861)        (2,160,841)
  ------------      ------------       ----------       ------------
             -                 -                -                  -
    19,014,922        15,628,459          309,227         20,436,926
             -                 -                -                  -
  ------------      ------------       ----------       ------------
    19,014,922        15,628,459          309,227         20,436,926
  ------------      ------------       ----------       ------------
    20,559,954         2,044,685          748,741         26,821,107
             -                 -                -                  -
  ------------      ------------       ----------       ------------
    20,559,954         2,044,685          748,741         26,821,107
  ------------      ------------       ----------       ------------
    39,574,876        17,673,144        1,057,968         47,258,033
  ------------      ------------       ----------       ------------
  $ 37,276,398      $ 17,825,039       $  943,107       $ 45,097,192
  ============      ============       ==========       ============

                    113
                                BLACKROCK FUNDS
                      STATEMENTS OF OPERATIONS (CONCLUDED)


FOR THE PERIOD ENDED MARCH 31, 2005 (UNAUDITED)


                                                  GOBAL SCIENCE         GLOBAL
                                                   & TECHNOLOGY        RESOURCES
                                                    PORTFOLIO          PORTFOLIO
                                                 10/1/04-3/31/05    3/1/05-3/31/05
                                                ----------------- ------------------
Investment income:
 Interest .....................................    $     2,179      $      102,719
 Securities lending income ....................            584              31,502
 Dividends ....................................         92,680             863,188
 Foreign taxes withheld .......................         (1,497)            (74,261)
 Net investment income from master ............              -                   -
                                                   -----------      --------------
   Total investment income ....................         93,946             923,148
                                                   -----------      --------------
Expenses:
 Investment advisory fee ......................        120,721             617,562
 Administration fee ...........................         11,401              66,001
 Administration fee - class specific ..........         19,514             117,988
 Custodian fee ................................          8,093               8,672
 Transfer agent fee ...........................         41,891              52,793
 Transfer agent fee - class specific ..........          2,422              14,836
 Shareholder servicing fees - class specific ..         31,904             199,806
 Distribution fees - class specific ...........         62,698             225,005
 Legal and audit fees .........................         18,632               5,611
 Printing fees ................................          4,603              17,918
 Registration fees and expenses ...............         20,144               4,340
 Trustees' fees ...............................            451               1,674
 Other ........................................          4,407               1,147
                                                   -----------      --------------
   Total expenses .............................        346,881           1,333,353
                                                   -----------      --------------
    Less investment advisory and adminis-
     tration fees waived ......................        (40,975)                  -
    Less administration fees waived - class
     specific .................................         (1,050)            (23,364)
    Less distribution fees waived - class
     specific .................................         (5,011)            (57,662)
    Less expenses reimbursed by advisor........              -                   -
    Less expenses reimbursed by
     distributor (Note D) .....................              -                   -
    Reimbursement of distribution fees
     (Note D) .................................              -                   -
                                                   -----------      --------------
   Total expenses .............................        299,845           1,252,327
                                                   -----------      --------------
 Net investment income (loss) .................       (205,899)           (329,179)
                                                   -----------      --------------
Realized and unrealized gain (loss) on
 investments and foreign currency
 transactions:
 Net increase from payment by affiliate (Note
  D) ..........................................              -                   -
 Net realized gain (loss) from:
  Investment transactions .....................        746,951           3,848,872
  Futures and options contracts ...............              -                   -
  Swap and swaption contracts .................              -                   -
  Foreign currency related transactions .......         18,190             (15,921)
                                                   -----------      --------------
                                                       765,141           3,832,951
                                                   -----------      --------------
Change in unrealized appreciation
 (depreciation) from:
  Investments .................................        659,983         (30,230,131)
  Futures and options contracts ...............              -                   -
  Swap and swaption contracts .................              -                   -
  Foreign currency related transactions .......          3,951              (3,846)
                                                   -----------      --------------
                                                       663,934         (30,233,977)
                                                   -----------      --------------
Net gain (loss) on investments and foreign
 currency transactions ........................      1,429,075         (26,401,026)
                                                   -----------      --------------
Net increase (decrease) in net assets resulting
 from operations ..............................    $ 1,223,176      $  (26,730,205)
                                                   ===========      ==============


                                                                       ALL-CAP
                                                     GLOBAL            GLOBAL             HEALTH
                                                    RESOURCES         RESOURCES          SCIENCES
                                                    PORTFOLIO         PORTFOLIO         PORTFOLIO
                                                 7/1/04-2/28/05   2/16/051-3/31/05    3/1/05-3/31/05
                                                ---------------- ------------------ -----------------
Investment income:
 Interest .....................................  $     183,027      $     8,057       $      16,916
 Securities lending income ....................        172,565              217               6,532
 Dividends ....................................      4,139,881            8,759             154,163
 Foreign taxes withheld .......................       (338,237)            (161)                  -
 Net investment income from master ............              -                -                   -
                                                 -------------      -----------       -------------
   Total investment income ....................      4,157,236           16,872             177,611
                                                 -------------      -----------       -------------
Expenses:
 Investment advisory fee ......................      3,718,767            8,414              85,447
 Administration fee ...........................        116,612              954               9,684
 Administration fee - class specific ..........        108,534            1,462              16,521
 Custodian fee ................................        157,280            3,646               3,205
 Transfer agent fee ...........................        712,293              430              17,825
 Transfer agent fee - class specific ..........         13,597              182               2,051
 Shareholder servicing fees - class specific ..      1,198,486            1,011              27,537
 Distribution fees - class specific ...........      1,420,045            1,274              41,241
 Legal and audit fees .........................         37,648            3,071               2,976
 Printing fees ................................        135,412              600                   -
 Registration fees and expenses ...............         40,502            6,738               4,340
 Trustees' fees ...............................         21,374              122                 155
 Other ........................................         20,267              988                 620
                                                 -------------      -----------       -------------
   Total expenses .............................      7,700,817           28,892             211,602
                                                 -------------      -----------       -------------
    Less investment advisory and adminis-
     tration fees waived ......................              -           (9,367)                  -
    Less administration fees waived - class
     specific .................................        (22,859)            (876)                (44)
    Less distribution fees waived - class
     specific .................................        (52,480)            (363)             (6,363)
    Less expenses reimbursed by advisor........              -           (6,354)                  -
    Less expenses reimbursed by
     distributor (Note D) .....................              -                -                   -
    Reimbursement of distribution fees
     (Note D) .................................              -                -                   -
                                                 -------------      -----------       -------------
   Total expenses .............................      7,625,478           11,932             205,195
                                                 -------------      -----------       -------------
 Net investment income (loss) .................     (3,468,242)           4,940             (27,584)
                                                 -------------      -----------       -------------
Realized and unrealized gain (loss) on
 investments and foreign currency
 transactions:
 Net increase from payment by affiliate (Note
  D) ..........................................         12,780                -                   -
 Net realized gain (loss) from:
  Investment transactions .....................     79,408,370           (3,963)          2,705,353
  Futures and options contracts ...............              -                -                   -
  Swap and swaption contracts .................              -                -                   -
  Foreign currency related transactions .......         21,031           (2,479)                  -
                                                 -------------      -----------       -------------
                                                    79,442,181           (6,442)          2,705,353
                                                 -------------      -----------       -------------
Change in unrealized appreciation
 (depreciation) from:
  Investments .................................    226,280,120         (168,828)         (3,985,803)
  Futures and options contracts ...............              -                -                   -
  Swap and swaption contracts .................              -                -                   -
  Foreign currency related transactions .......          2,148           (1,136)                (67)
                                                 -------------      -----------       -------------
                                                   226,282,268         (169,964)         (3,985,870)
                                                 -------------      -----------       -------------
Net gain (loss) on investments and foreign
 currency transactions ........................    305,724,449         (176,406)         (1,280,517)
                                                 -------------      -----------       -------------
Net increase (decrease) in net assets resulting
 from operations ..............................  $ 302,256,207      $  (171,466)      $  (1,308,101)
                                                 =============      ===========       =============

- ---------
1 Commencement of operations.

SEE ACCOMPANYING NOTES TO FINANCIAL STATEMENTS.
                                      114
                                BLACKROCK FUNDS


     HEALTH                                 INTERNATIONAL            ASSET               ASSET              INDEX
    SCIENCES        U.S. OPPORTUNITIES      OPPORTUNITIES         ALLOCATION          ALLOCATION           EQUITY
    PORTFOLIO            PORTFOLIO            PORTFOLIO            PORTFOLIO           PORTFOLIO          PORTFOLIO
 3/1/04-2/28/05       10/1/04-3/31/05      10/1/04-3/31/05      3/1/05-3/31/05      4/1/04-2/28/05     10/1/04-3/31/05
- ----------------   --------------------   -----------------   ------------------   ----------------   ----------------
  $    141,834         $    14,718          $    203,921        $    1,340,792       $ 11,943,413       $          -
        46,298               2,274                   107                10,718            119,283                  -
       643,884             458,885             3,982,125               934,506          5,679,996                  -
       (15,258)                  -              (463,264)              (25,772)           (34,188)                 -
             -                   -                     -                     -                  -         16,659,408
  ------------         -----------          ------------        --------------       ------------       ------------
       816,758             475,877             3,722,889             2,260,244         17,708,504         16,659,408
  ------------         -----------          ------------        --------------       ------------       ------------
       902,820             549,775             2,064,068               375,319          4,533,788                  -
       109,056              42,483               175,357                55,426            148,991            527,519
        17,387              72,701               298,184                98,893            100,077          1,008,370
       105,866               9,918               197,416                13,950            305,880             54,499
       341,678              99,477               136,056               105,245          1,268,250            237,182
         2,158               9,025                37,016                12,298             12,455            125,548
       288,382             117,540               355,162               164,025          1,417,703          1,045,476
       397,127             246,553               537,163               203,871          1,558,927          1,841,884
        49,176              15,421                34,274                10,323             14,726             81,974
        67,679              16,533                48,900                35,464             90,516            178,224
        53,140              21,891                36,133                 4,433             70,094             38,535
        10,235               1,541                 5,395                 1,333             25,940             19,626
        16,020               5,662                19,761                 2,480             49,780             40,679
  ------------         -----------          ------------        --------------       ------------       ------------
     2,360,724           1,208,520             3,944,885             1,083,060          9,597,127          5,199,516
  ------------         -----------          ------------        --------------       ------------       ------------
             -                   -                     -               (29,434)            (3,438)          (393,133)
          (371)             (3,001)              (32,626)               (3,992)            (3,735)          (401,749)
        (6,915)            (15,699)              (67,650)              (44,174)           (45,002)          (157,993)
             -                   -                     -                     -                  -             (5,320)
      (162,313)                  -                     -                     -                  -                  -
             -                   -                     -                     -           (294,508)                 -
  ------------         -----------          ------------        --------------       ------------       ------------
     2,191,125           1,189,820             3,844,609             1,005,460          8,955,936          4,241,321
  ------------         -----------          ------------        --------------       ------------       ------------
    (1,374,367)           (713,943)             (121,720)            1,254,784          8,752,568         12,418,087
  ------------         -----------          ------------        --------------       ------------       ------------
             -                   -                     -                     -             90,574                  -
     2,830,919           8,971,756            28,802,192            10,976,553         24,909,337         (5,065,159)
      (199,057)                  -                     -                90,903          3,804,994          2,408,634
             -                   -                     -                30,023                  -                  -
             -                   -             2,851,346             1,472,775          3,502,916                  -
  ------------         -----------          ------------        --------------       ------------       ------------
     2,631,862           8,971,756            31,653,538            12,570,254         32,307,821         (2,656,525)
  ------------         -----------          ------------        --------------       ------------       ------------
       832,983           1,474,243            42,777,976           (23,751,638)        10,705,967         80,057,484
             -                 150                     -              (194,910)        (1,136,640)           259,860
             -                   -                     -                31,597                  -                  -
           347                   -            (1,497,103)           (1,480,699)        (1,406,191)                 -
  ------------         -----------          ------------        --------------       ------------       ------------
       833,330           1,474,393            41,280,873           (25,395,650)         8,163,136         80,317,344
  ------------         -----------          ------------        --------------       ------------       ------------
     3,465,192          10,446,149            72,934,411           (12,825,396)        40,470,957         77,660,819
  ------------         -----------          ------------        --------------       ------------       ------------
  $  2,090,825         $ 9,732,206          $ 72,812,691        $  (11,570,612)      $ 49,223,525       $ 90,078,906
  ============         ===========          ============        ==============       ============       ============


                                      115
                                BLACKROCK FUNDS
                      STATEMENTS OF CHANGES IN NET ASSETS


                                                                                    INVESTMENT
                                                                                       TRUST
                                                                                     PORTFOLIO
                                                                        -----------------------------------
                                                                              FOR THE
                                                                         SIX MONTHS ENDED       FOR THE
                                                                              3/31/05         YEAR ENDED
                                                                            (UNAUDITED)         9/30/04
                                                                        ------------------ ----------------
Increase (decrease) in net assets:
 Operations:
  Net investment income (loss) ........................................  $     3,018,850    $     464,290
  Net increase from payment by affiliate (Note D) .....................                -                -
  Net realized gain (loss) on investments, futures, options and
   foreign currency related transactions ..............................      116,259,939       15,696,575
  Net unrealized gain (loss) on investments, futures, options and
   foreign currency related transactions ..............................      (97,621,228)         591,617
                                                                         ---------------    -------------
  Net increase (decrease) in net assets resulting from operations .....       21,657,561       16,752,482
                                                                         ---------------    -------------
Distributions to shareholders from:
 Net investment income:
  Institutional Class .................................................         (399,790)        (709,723)
  Service Class .......................................................           (8,995)         (17,360)
  Investor A Class ....................................................          (55,462)        (136,214)
  Investor B Class ....................................................                -          (30,018)
  Investor C Class ....................................................                -             (379)
                                                                         ---------------    -------------
  Total distributions from net investment income ......................         (464,247)        (893,694)
                                                                         ---------------    -------------
 Net realized gains:
  Institutional Class .................................................                -                -
  Service Class .......................................................                -                -
  Investor A Class ....................................................                -                -
  Investor B Class ....................................................                -                -
  Investor C Class ....................................................                -                -
                                                                         ---------------    -------------
  Total distributions from net realized gains .........................                -                -
                                                                         ---------------    -------------
  Total distributions to shareholders .................................         (464,247)        (893,694)
                                                                         ---------------    -------------
Capital share transactions ............................................    1,329,294,446      (27,355,965)
                                                                         ---------------    -------------
Redemption fees .......................................................            1,927            4,192
                                                                         ---------------    -------------
  Total increase (decrease) in net assets .............................    1,350,489,687      (11,492,985)
Net assets:
  Beginning of period .................................................       93,800,258      105,293,243
                                                                         ---------------    -------------
  End of period .......................................................  $ 1,444,289,945    $  93,800,258
                                                                         ===============    =============
  End of period undistributed net investment income (accumulated
   net investment loss) ...............................................  $     3,018,613    $     464,010


                                                                                     LARGE CAP
                                                                                    VALUE EQUITY
                                                                                     PORTFOLIO
                                                                        ------------------------------------
                                                                              FOR THE
                                                                         SIX MONTHS ENDED       FOR THE
                                                                              3/31/05          YEAR ENDED
                                                                            (UNAUDITED)         9/30/04
                                                                        ------------------ -----------------
Increase (decrease) in net assets:
 Operations:
  Net investment income (loss) ........................................   $   2,146,489     $    3,325,937
  Net increase from payment by affiliate (Note D) .....................               -                  -
  Net realized gain (loss) on investments, futures, options and
   foreign currency related transactions ..............................      24,923,248         42,318,711
  Net unrealized gain (loss) on investments, futures, options and
   foreign currency related transactions ..............................        (225,597)         6,506,748
                                                                          -------------     --------------
  Net increase (decrease) in net assets resulting from operations .....      26,844,140         52,151,396
                                                                          -------------     --------------
Distributions to shareholders from:
 Net investment income:
  Institutional Class .................................................      (1,103,434)        (1,933,922)
  Service Class .......................................................        (200,791)          (624,913)
  Investor A Class ....................................................        (696,901)          (688,191)
  Investor B Class ....................................................        (110,123)           (61,593)
  Investor C Class ....................................................         (36,918)           (22,492)
                                                                          -------------     --------------
  Total distributions from net investment income ......................      (2,148,167)        (3,331,111)
                                                                          -------------     --------------
 Net realized gains:
  Institutional Class .................................................               -                  -
  Service Class .......................................................               -                  -
  Investor A Class ....................................................               -                  -
  Investor B Class ....................................................               -                  -
  Investor C Class ....................................................               -                  -
                                                                          -------------     --------------
  Total distributions from net realized gains .........................               -                  -
                                                                          -------------     --------------
  Total distributions to shareholders .................................      (2,148,167)        (3,331,111)
                                                                          -------------     --------------
Capital share transactions ............................................     103,485,860       (108,979,335)
                                                                          -------------     --------------
Redemption fees .......................................................           5,257             14,983
                                                                          -------------     --------------
  Total increase (decrease) in net assets .............................     128,187,090        (60,144,067)
Net assets:
  Beginning of period .................................................     240,046,654        300,190,721
                                                                          -------------     --------------
  End of period .......................................................   $ 368,233,744     $  240,046,654
                                                                          =============     ==============
  End of period undistributed net investment income (accumulated
   net investment loss) ...............................................   $      40,396     $       42,074

- ---------
1 Commencement of operations.

SEE ACCOMPANYING NOTES TO FINANCIAL STATEMENTS.
                                      116
                                BLACKROCK FUNDS


                                                      DIVIDEND
             LARGE CAP                              ACHIEVERSTM                                LEGACY
      GROWTH EQUITY PORTFOLIO                        PORTFOLIO                                PORTFOLIO
- ------------------------------------   --------------------------------------   -------------------------------------
      FOR THE                                FOR THE                                 FOR THE
 SIX MONTHS ENDED        FOR THE        SIX MONTHS ENDED         FOR THE              PERIOD             FOR THE
      3/31/05           YEAR ENDED           3/31/05         PERIOD 9/08/041     11/1/04-3/31/05        YEAR ENDED
    (UNAUDITED)          9/30/04           (UNAUDITED)       THROUGH 9/30/04       (UNAUDITED)           10/31/04
- ------------------   ---------------   ------------------   -----------------   -----------------   -----------------
  $     305,356       $    (207,097)      $    112,764         $     1,692        $     970,702       $  (2,689,754)
              -                   -                  -                   -              294,363              15,707
      8,946,766          26,413,485             16,287              (3,038)           4,422,778          49,361,911
     (4,017,030)        (14,892,253)           (38,166)             (7,180)           4,502,767         (32,508,263)
  -------------       -------------       ------------         -----------        -------------       -------------
      5,235,092          11,314,135             90,885              (8,526)          10,190,610          14,179,601
  -------------       -------------       ------------         -----------        -------------       -------------
              -                   -            (37,511)                                       -                   -
              -                   -             (1,170)                  -                    -                   -
              -                   -            (45,806)                  -                    -                   -
              -                   -             (3,765)                  -                    -                   -
              -                   -            (14,914)                  -                    -                   -
  -------------       -------------       ------------         -----------        -------------       -------------
              -                   -           (103,166)                  -                    -                   -
  -------------       -------------       ------------         -----------        -------------       -------------
              -                   -             (4,624)                  -                    -                   -
              -                   -               (100)                  -                    -                   -
              -                   -             (5,999)                  -                    -                   -
              -                   -               (348)                  -                    -                   -
              -                   -             (2,127)                  -                    -                   -
  -------------       -------------       ------------         -----------        -------------       -------------
              -                   -            (13,198)                  -                    -                   -
  -------------       -------------       ------------         -----------        -------------       -------------
              -                   -           (116,364)                  -                    -                   -
  -------------       -------------       ------------         -----------        -------------       -------------
    (33,909,704)        (41,160,092)        24,437,324           2,000,500          (31,123,539)        (55,470,941)
  -------------       -------------       ------------         -----------        -------------       -------------
          1,606               2,387              6,427                   -                   89                   -
  -------------       -------------       ------------         -----------        -------------       -------------
    (28,673,006)        (29,843,570)        24,418,272           1,991,974          (20,932,840)        (41,291,340)
     95,142,653         124,986,223          1,991,974                   -          308,631,314         349,922,654
  -------------       -------------       ------------         -----------        -------------       -------------
  $  66,469,647       $  95,142,653       $ 26,410,246         $ 1,991,974        $ 287,698,474       $ 308,631,314
  =============       =============       ============         ===========        =============       =============
  $     305,356       $           -       $     11,290         $     1,692        $     970,702       $           -

                    117
                                BLACKROCK FUNDS
                STATEMENTS OF CHANGES IN NET ASSETS (CONTINUED)


                                                                                                  MID-CAP
                                                                                               VALUE EQUITY
                                                                                                 PORTFOLIO
                                                                           -----------------------------------------------------
                                                                             FOR THE PERIOD                         FOR THE
                                                                             3/1/05-3/31/05    FOR THE PERIOD      YEAR ENDED
                                                                              (UNAUDITED)      7/1/04-2/28/05       6/30/04
                                                                           ----------------- ----------------- -----------------
Increase (decrease) in net assets:
 Operations:
  Net investment income (loss) ...........................................  $      70,304     $   3,237,587     $   2,069,311
  Net increase from payment by affiliate (Note D) ........................              -           554,230            40,116
  Net realized gain (loss) on investments, futures, options and
   foreign currency related transactions .................................     11,904,776        55,516,938        95,045,065
  Net unrealized gain (loss) on investments, futures, options and
   foreign currency related transactions .................................    (18,755,989)       25,454,000        48,344,054
                                                                            -------------     -------------     -------------
  Net increase (decrease) in net assets resulting from operations ........     (6,780,909)       84,762,755       145,498,546
                                                                            -------------     -------------     -------------
Distributions to shareholders from:
 Net investment income:
  Institutional Class ....................................................              -          (383,894)         (242,767)
  Service Class ..........................................................              -                 -        (1,614,937)
  Investor A Class .......................................................              -        (4,857,110)                -
  Investor B Class .......................................................              -           (80,308)                -
  Investor C Class .......................................................              -           (80,956)                -
                                                                            -------------     -------------     -------------
  Total distributions from net investment income .........................              -        (5,402,268)       (1,857,704)
                                                                            -------------     -------------     -------------
 Net realized gains:
  BlackRock Class ........................................................              -                 -                 -
  Institutional Class ....................................................              -        (2,033,124)                -
  Service Class ..........................................................              -                 -                 -
  Investor A Class .......................................................              -       (29,684,283)                -
  Investor B Class .......................................................              -        (7,665,103)                -
  Investor C Class .......................................................              -        (6,254,749)                -
                                                                            -------------     -------------     -------------
  Total distributions from net realized gains ............................              -       (45,637,259)                -
                                                                            -------------     -------------     -------------
  Total distributions to shareholders ....................................              -       (51,039,527)       (1,857,704)
                                                                            -------------     -------------     -------------
Capital share transactions ...............................................     (7,315,176)       45,632,219        84,026,827
                                                                            -------------     -------------     -------------
Redemption fees ..........................................................          8,683               610                 -
                                                                            -------------     -------------     -------------
  Total increase (decrease) in net assets ................................    (14,087,402)       79,356,057       227,667,669
Net assets:
  Beginning of period ....................................................    720,218,614       640,862,557       413,194,888
                                                                            -------------     -------------     -------------
  End of period ..........................................................  $ 706,131,212     $ 720,218,614     $ 640,862,557
                                                                            =============     =============     =============
  End of period undistributed net investment income (accumulated
   net investment loss) ..................................................  $     (92,915)    $    (163,219)    $   2,001,462


                                                                                         MID-CAP
                                                                                      GROWTH EQUITY
                                                                                        PORTFOLIO
                                                                           ------------------------------------
                                                                                 FOR THE
                                                                            SIX MONTHS ENDED       FOR THE
                                                                                 3/31/05          YEAR ENDED
                                                                               (UNAUDITED)         9/30/04
                                                                           ------------------ -----------------
Increase (decrease) in net assets:
 Operations:
  Net investment income (loss) ...........................................  $  (1,367,468)     $  (1,638,806)
  Net increase from payment by affiliate (Note D) ........................              -                  -
  Net realized gain (loss) on investments, futures, options and
   foreign currency related transactions .................................     30,932,057         15,836,766
  Net unrealized gain (loss) on investments, futures, options and
   foreign currency related transactions .................................    (13,708,289)         5,337,808
                                                                            -------------      -------------
  Net increase (decrease) in net assets resulting from operations ........     15,856,300         19,535,768
                                                                            -------------      -------------
Distributions to shareholders from:
 Net investment income:
  Institutional Class ....................................................              -                  -
  Service Class ..........................................................              -                  -
  Investor A Class .......................................................              -                  -
  Investor B Class .......................................................              -                  -
  Investor C Class .......................................................              -                  -
                                                                            -------------      -------------
  Total distributions from net investment income .........................              -                  -
                                                                            -------------      -------------
 Net realized gains:
  BlackRock Class ........................................................              -                  -
  Institutional Class ....................................................              -                  -
  Service Class ..........................................................              -                  -
  Investor A Class .......................................................              -                  -
  Investor B Class .......................................................              -                  -
  Investor C Class .......................................................              -                  -
                                                                            -------------      -------------
  Total distributions from net realized gains ............................              -                  -
                                                                            -------------      -------------
  Total distributions to shareholders ....................................              -                  -
                                                                            -------------      -------------
Capital share transactions ...............................................    319,753,360        (30,635,659)
                                                                            -------------      -------------
Redemption fees ..........................................................          1,728             14,939
                                                                            -------------      -------------
  Total increase (decrease) in net assets ................................    335,611,388        (11,084,952)
Net assets:
  Beginning of period ....................................................    122,153,862        133,238,814
                                                                            -------------      -------------
  End of period ..........................................................  $ 457,765,250      $ 122,153,862
                                                                            =============      =============
  End of period undistributed net investment income (accumulated
   net investment loss) ..................................................  $  (1,367,468)     $           -

SEE ACCOMPANYING NOTES TO FINANCIAL STATEMENTS.
                                      118
                                BLACKROCK FUNDS


                                                  SMALL/MID-CAP
                AURORA                                GROWTH
              PORTFOLIO                             PORTFOLIO
- -------------------------------------- ------------------------------------
      FOR THE                                FOR THE
  SIX MONTHS ENDED        FOR THE       SIX MONTHS ENDED       FOR THE
      3/31/05           YEAR ENDED           3/31/05          YEAR ENDED
    (UNAUDITED)           9/30/04          (UNAUDITED)         9/30/04
- ------------------- ------------------ ------------------ -----------------
 $    (7,389,681)    $   (24,381,485)  $  (2,298,478)      $  (3,915,660)
         203,165             426,457               -             200,956
     599,000,361         376,473,622      19,014,922         (16,219,909)
    (288,414,761)        274,337,207      20,559,954         (10,056,987)
 ---------------     ---------------   --------------      -------------
     303,399,084         626,855,801      37,276,398         (29,991,600)
 ---------------     ---------------   --------------      -------------
               -                   -               -                   -
               -                   -               -                   -
               -                   -               -                   -
               -                   -               -                   -
               -                   -               -                   -
 ---------------     ---------------   --------------      -------------
               -                   -               -                   -
 ---------------     ---------------   --------------      -------------
               -                   -               -                   -
     (16,065,488)            (83,129)              -                   -
               -                   -               -                   -
    (223,189,239)         (1,074,654)              -                   -
     (47,894,772)           (240,069)              -                   -
     (50,120,639)           (244,717)              -                   -
 ---------------     ---------------   --------------      -------------
    (337,270,138)         (1,642,569)              -                   -
 ---------------     ---------------   --------------      -------------
    (337,270,138)         (1,642,569)              -                   -
 ---------------     ---------------   --------------      -------------
    (411,463,746)         67,410,778    (153,274,144)        282,999,700
 ---------------     ---------------   --------------      -------------
          11,141                   -           5,514                   -
 ---------------     ---------------   --------------      -------------
    (445,323,659)        692,624,010    (115,992,232)        253,008,100
   3,519,734,336       2,827,110,326     433,466,135         180,458,035
 ---------------     ---------------   --------------      -------------
 $ 3,074,410,677     $ 3,519,734,336   $ 317,473,903       $ 433,466,135
 ===============     ===============   ==============      =============
 $    (7,403,145)    $             -   $  (2,298,478)      $           -


          SMALL CAP VALUE                      SMALL CAP CORE
          EQUITY PORTFOLIO                    EQUITY PORTFOLIO
- ------------------------------------ -----------------------------------
      FOR THE                              FOR THE
 SIX MONTHS ENDED       FOR THE       SIX MONTHS ENDED       FOR THE
      3/31/05          YEAR ENDED          3/31/05         YEAR ENDED
    (UNAUDITED)         9/30/04          (UNAUDITED)         9/30/04
- ------------------ ----------------- ------------------ ----------------
  $     151,895     $    (639,504)      $  (114,861)      $  (71,169)
              -                 -                 -                -
     15,628,459        27,881,364           309,227           53,507
      2,044,685        (1,229,217)          748,741          339,684
  -------------     -------------       ------------      ------------
     17,825,039        26,012,643           943,107          322,022
  -------------     -------------       ------------      ------------
              -                 -                 -                -
              -                 -                 -                -
              -                 -                 -                -
              -                 -                 -                -
              -                 -                 -                -
  -------------     -------------       ------------      ------------
              -                 -                 -                -
  -------------     -------------       ------------      ------------
     (1,130,480)                -                 -                -
    (12,364,497)       (8,168,630)          (23,123)         (16,091)
       (436,328)         (494,170)                 (1)              (1)
     (6,644,284)       (4,743,664)          (29,098)          (9,184)
     (3,267,502)       (2,034,282)          (12,855)          (2,549)
     (1,382,122)         (807,811)          (38,775)          (1,706)
  -------------     -------------       -------------     ------------
    (25,225,213)      (16,248,557)         (103,852)         (29,531)
  -------------     -------------       -------------     ------------
    (25,225,213)      (16,248,557)         (103,852)         (29,531)
  -------------     -------------       -------------     ------------
      5,190,256       (10,393,367)       14,691,089        7,908,888
  -------------     -------------       -------------     ------------
          3,374             4,681             1,909           18,007
  -------------     -------------       -------------     ------------
     (2,206,544)         (624,600)       15,532,253        8,219,386
    132,065,162       132,689,762         9,464,924        1,245,538
  -------------     -------------       -------------     ------------
  $ 129,858,618     $ 132,065,162       $ 24,997,177      $ 9,464,924
  =============     =============       =============     ============
  $     151,895     $           -       $  (114,861)      $        -

                    119
                                BLACKROCK FUNDS
                STATEMENTS OF CHANGES IN NET ASSETS (CONTINUED)


                                                                                SMALL CAP
                                                                              GROWTH EQUITY
                                                                                PORTFOLIO
                                                                   ------------------------------------
                                                                         FOR THE
                                                                    SIX MONTHS ENDED       FOR THE
                                                                         3/31/05          YEAR ENDED
                                                                       (UNAUDITED)         9/30/04
                                                                   ------------------ -----------------
Increase (decrease) in net assets:
 Operations:
  Net investment income (loss) ...................................   $  (2,160,841)     $  (4,273,122)
  Net increase from payment by affiliate (Note D) ................               -                  -
  Net realized gain (loss) on investments, futures, options and
   foreign currency related transactions .........................      20,436,926         58,198,019
  Net unrealized gain (loss) on investments, futures, options and
   foreign currency related transactions .........................      26,821,107          2,050,695
                                                                     -------------      -------------
  Net increase (decrease) in net assets resulting from operations       45,097,192         55,975,592
                                                                     -------------      -------------
Distributions to shareholders from:
 Net investment income:
  Institutional Class ............................................               -                  -
  Service Class ..................................................               -                  -
  Investor A Class ...............................................               -                  -
  Investor B Class ...............................................               -                  -
  Investor C Class ...............................................               -                  -
                                                                     -------------      -------------
  Total distributions from net investment income .................               -                  -
                                                                     -------------      -------------
 Net realized gains:
  BlackRock Class ................................................               -                  -
  Institutional Class ............................................               -                  -
  Service Class ..................................................               -                  -
  Investor A Class ...............................................               -                  -
  Investor B Class ...............................................               -                  -
  Investor C Class ...............................................               -                  -
                                                                     -------------      -------------
  Total distributions from net realized gains ....................               -                  -
                                                                     -------------      -------------
  Total distributions to shareholders ............................               -                  -
                                                                     -------------      -------------
Capital share transactions .......................................       6,390,003         89,115,438
                                                                     -------------      -------------
Redemption fees ..................................................         172,188             41,261
                                                                     -------------      -------------
  Total increase (decrease) in net assets ........................      51,659,383        145,132,291
Net assets:
  Beginning of period ............................................     471,659,698        326,527,407
                                                                     -------------      -------------
  End of period ..................................................   $ 523,319,081      $ 471,659,698
                                                                     =============      =============
  End of period undistributed net investment income (accumulated
   net investment loss) ..........................................   $  (2,160,841)     $           -


                                                                             GLOBAL SCIENCE
                                                                             AND TECHNOLOGY
                                                                             OPPORTUNITIES
                                                                               PORTFOLIO
                                                                   ----------------------------------
                                                                         FOR THE
                                                                    SIX MONTHS ENDED      FOR THE
                                                                         3/31/05         YEAR ENDED
                                                                       (UNAUDITED)        9/30/04
                                                                   ------------------ ---------------
Increase (decrease) in net assets:
 Operations:
  Net investment income (loss) ...................................    $   (205,899)    $   (663,846)
  Net increase from payment by affiliate (Note D) ................               -                -
  Net realized gain (loss) on investments, futures, options and
   foreign currency related transactions .........................         765,141        4,229,223
  Net unrealized gain (loss) on investments, futures, options and
   foreign currency related transactions .........................         663,934       (3,682,232)
                                                                      ------------     ------------
  Net increase (decrease) in net assets resulting from operations        1,223,176         (116,855)
                                                                      ------------     ------------
Distributions to shareholders from:
 Net investment income:
  Institutional Class ............................................               -                -
  Service Class ..................................................               -                -
  Investor A Class ...............................................               -                -
  Investor B Class ...............................................               -                -
  Investor C Class ...............................................               -                -
                                                                      ------------     ------------
  Total distributions from net investment income .................               -                -
                                                                      ------------     ------------
 Net realized gains:
  BlackRock Class ................................................               -                -
  Institutional Class ............................................               -                -
  Service Class ..................................................               -                -
  Investor A Class ...............................................               -                -
  Investor B Class ...............................................               -                -
  Investor C Class ...............................................               -                -
                                                                      ------------     ------------
  Total distributions from net realized gains ....................               -                -
                                                                      ------------     ------------
  Total distributions to shareholders ............................               -                -
                                                                      ------------     ------------
Capital share transactions .......................................      (4,840,213)      (7,732,472)
                                                                      ------------     ------------
Redemption fees ..................................................             730           11,289
                                                                      ------------     ------------
  Total increase (decrease) in net assets ........................      (3,616,307)      (7,838,038)
Net assets:
  Beginning of period ............................................      27,166,803       35,004,841
                                                                      ------------     ------------
  End of period ..................................................    $ 23,550,496     $ 27,166,803
                                                                      ============     ============
  End of period undistributed net investment income (accumulated
   net investment loss) ..........................................    $   (205,899)    $          -

- ---------
1 Commencement of operations.

SEE ACCOMPANYING NOTES TO FINANCIAL STATEMENTS.
                                      120
                                BLACKROCK FUNDS


                                                            ALL-CAP
                       GLOBAL                               GLOBAL                             HEALTH
                      RESOURCES                            RESOURCES                          SCIENCES
                      PORTFOLIO                            PORTFOLIO                          PORTFOLIO
- ----------------------------------------------------- ------------------ ---------------------------------------------------
  FOR THE PERIOD                         FOR THE        FOR THE PERIOD     FOR THE PERIOD     FOR THE YEAR       FOR THE
  3/1/05-3/31/05    FOR THE PERIOD      YEAR ENDED     2/16/051-3/31/05    3/1/05-3/31/05        ENDED          YEAR ENDED
   (UNAUDITED)      7/1/04-2/28/05       6/30/04          (UNAUDITED)       (UNAUDITED)         2/28/05          2/29/04
- ----------------- ----------------- ----------------- ------------------ ----------------- ----------------- ---------------
  $    (329,179)    $  (3,468,242)    $   1,224,536      $      4,940      $     (27,584)    $  (1,374,367)   $   (492,038)
              -            12,780           274,458                 -                  -                 -               -
      3,832,951        79,429,401        49,398,915            (6,442)         2,705,353         2,631,862      10,260,728
    (30,233,977)      226,282,268       113,653,804          (169,964)        (3,985,870)          833,330      15,869,865
  -------------     -------------     -------------      ------------      -------------     -------------    ------------
    (26,730,205)      302,256,207       164,551,713          (171,466)        (1,308,101)        2,090,825      25,638,555
  -------------     -------------     -------------      ------------      -------------     -------------    ------------
              -          (181,199)         (239,164)                -                  -                 -               -
              -                 -                 -                 -                  -                 -               -
              -        (3,733,634)       (3,857,057)                -                  -                 -               -
              -          (448,727)         (681,846)                -                  -                 -               -
              -          (740,345)         (992,836)                -                  -                 -               -
  -------------     -------------     -------------      ------------      -------------     -------------    ------------
              -        (5,103,905)       (5,770,903)                -                  -                 -               -
  -------------     -------------     -------------      ------------      -------------     -------------    ------------
              -                 -                 -                 -                  -                 -               -
              -          (820,327)                -                 -                  -          (271,998)        (59,350)
              -                 -                 -                 -                  -                 -               -
              -       (17,122,033)                -                 -                  -        (3,693,722)     (1,219,588)
              -        (2,773,442)                -                 -                  -        (1,432,836)       (617,283)
              -        (4,875,287)                -                 -                  -          (970,853)       (195,094)
  -------------     -------------     -------------      ------------      -------------     -------------    ------------
              -       (25,591,089)                -                 -                  -        (6,369,409)     (2,091,315)
  -------------     -------------     -------------      ------------      -------------     -------------    ------------
              -       (30,694,994)       (5,770,903)                -                  -        (6,369,409)     (2,091,315)
  -------------     -------------     -------------      ------------      -------------     -------------    ------------
     (3,647,203)       42,478,605       284,528,279        16,984,948            397,591        42,894,626      50,919,824
  -------------     -------------     -------------      ------------      -------------     -------------    ------------
          3,073               323                 -             1,078                268               306               -
  -------------     -------------     -------------      ------------      -------------     -------------    ------------
    (30,374,335)      314,040,141       443,309,089        16,814,560           (910,242)       38,616,348      74,467,064
    969,799,201       655,759,060       212,449,971                 -        135,554,876        96,938,528      22,471,464
  -------------     -------------     -------------      ------------      -------------     -------------    ------------
  $ 939,424,866     $ 969,799,201     $ 655,759,060      $ 16,814,560      $ 134,644,634     $ 135,554,876    $ 96,938,528
  =============     =============     =============      ============      =============     =============    ============
  $  (5,507,347)    $  (5,178,168)    $   3,393,979      $      4,940      $     (27,584)    $           -    $          -

                    121
                                BLACKROCK FUNDS
                STATEMENTS OF CHANGES IN NET ASSETS (CONCLUDED)


                                                                                       U.S. OPPORTUNITIES
                                                                                           PORTFOLIO
                                                                             --------------------------------------
                                                                                   FOR THE
                                                                              SIX MONTHS ENDED         FOR THE
                                                                                   3/31/05            YEAR ENDED
                                                                                 (UNAUDITED)           9/30/04
                                                                             ------------------   -----------------
Increase (decrease) in net assets:
 Operations:
  Net investment income (loss) ...........................................     $    (713,943)       $  (1,910,678)
  Net increase from payment by affiliate (Note D) ........................                 -                    -
  Net realized gain (loss) on investments, futures, options and
   foreign currency related transactions .................................         8,971,756           21,382,725
  Net unrealized gain (loss) on investments, futures, options and
   foreign currency related transactions .................................         1,474,393            1,106,908
                                                                               -------------        -------------
  Net increase (decrease) in net assets resulting from operations ........         9,732,206           20,578,955
                                                                               -------------        -------------
Distributions to shareholders from:
 Net investment income:
  Institutional Class ....................................................                 -                    -
  Service Class ..........................................................                 -                    -
  Investor A Class .......................................................                 -                    -
  Investor B Class .......................................................                 -                    -
  Investor C Class .......................................................                 -                    -
                                                                               -------------        -------------
  Total distributions from net investment income .........................                 -                    -
                                                                               -------------        -------------
 Net realized gains:
  BlackRock Class ........................................................                 -                    -
  Institutional Class ....................................................                 -                    -
  Service Class ..........................................................                 -                    -
  Investor A Class .......................................................                 -                    -
  Investor B Class .......................................................                 -                    -
  Investor C Class .......................................................                 -                    -
                                                                               -------------        -------------
  Total distributions from net realized gains ............................                 -                    -
                                                                               -------------        -------------
  Total distributions to shareholders ....................................                 -                    -
                                                                               -------------        -------------
Capital share transactions ...............................................       (17,093,448)         (18,603,484)
                                                                               -------------        -------------
Redemption fees ..........................................................             5,172                4,220
                                                                               -------------        -------------
  Total increase (decrease) in net assets ................................        (7,356,070)           1,979,691
Net assets:
  Beginning of period ....................................................       100,914,467           98,934,776
                                                                               -------------        -------------
  End of period ..........................................................     $  93,558,397        $ 100,914,467
                                                                               =============        =============
  End of period undistributed net investment income (accumulated
   net investment loss) ..................................................     $    (713,943)       $           -

SEE ACCOMPANYING NOTES TO FINANCIAL STATEMENTS.
                                      122
                                BLACKROCK FUNDS


           INTERNATIONAL                                     ASSET                                         INDEX
           OPPORTUNITIES                                  ALLOCATION                                       EQUITY
             PORTFOLIO                                     PORTFOLIO                                     PORTFOLIO
- ------------------------------------ ----------------------------------------------------- --------------------------------------
      FOR THE                                                                                    FOR THE
 SIX MONTHS ENDED       FOR THE        FOR THE PERIOD                         FOR THE       SIX MONTHS ENDED        FOR THE
      3/31/05          YEAR ENDED      3/1/05-3/31/05    FOR THE PERIOD      YEAR ENDED          3/31/05           YEAR ENDED
    (UNAUDITED)         9/30/04         (UNAUDITED)      4/1/04-2/28/05       3/31/04          (UNAUDITED)          9/30/04
- ------------------ ----------------- ----------------- ----------------- ----------------- ------------------ -------------------
  $    (121,720)     $    (549,024)    $   1,254,784     $   8,458,060     $   8,516,159    $    12,418,087     $    15,612,410
              -                  -                 -            90,574                 -                  -                   -
     31,653,538         27,213,448        12,570,254        32,217,247        88,662,078         (2,656,525)          4,494,513
     41,280,873         11,162,948       (25,395,650)        8,163,136        61,187,645         80,317,344         170,850,631
  -------------      -------------     -------------     -------------     -------------    ---------------     ---------------
     72,812,691         37,827,372       (11,570,612)       48,929,017       158,365,882         90,078,906         190,957,554
  -------------      -------------     -------------     -------------     -------------    ---------------     ---------------
     (1,442,124)           (52,346)         (100,179)         (549,136)         (378,790)        (6,622,329)         (9,484,238)
       (249,027)            (2,626)           (5,589)                -                 -           (673,961)           (960,810)
     (1,244,655)           (38,301)       (1,243,638)      (13,021,288)       (6,788,195)        (3,130,936)         (3,441,512)
       (134,589)           (31,274)         (187,004)       (2,669,527)         (865,650)        (1,076,368)           (616,709)
       (279,752)           (29,065)          (71,928)       (1,074,297)         (237,660)        (1,704,086)           (966,846)
  -------------      -------------     -------------     -------------     -------------    ---------------     ---------------
     (3,350,147)          (153,612)       (1,608,338)      (17,314,248)       (8,270,295)       (13,207,680)        (15,470,115)
  -------------      -------------     -------------     -------------     -------------    ---------------     ---------------
              -                  -                 -                 -                 -                  -                   -
              -                  -                 -          (669,622)                -                  -                   -
              -                  -                 -                 -                 -                  -                   -
              -                  -                 -       (17,005,778)                -                  -                   -
              -                  -                 -        (5,240,921)                -                  -                   -
              -                  -                 -        (2,030,016)                -                  -                   -
  -------------      -------------     -------------     -------------     -------------    ---------------     ---------------
              -                  -                 -       (24,946,337)                -                  -                   -
  -------------      -------------     -------------     -------------     -------------    ---------------     ---------------
     (3,350,147)          (153,612)       (1,608,338)      (42,260,585)       (8,270,295)       (13,207,680)        (15,470,115)
  -------------      -------------     -------------     -------------     -------------    ---------------     ---------------
    124,934,549        122,058,194       (11,243,598)      147,427,659        30,609,858       (124,689,529)       (247,163,288)
  -------------      -------------     -------------     -------------     -------------    ---------------     ---------------
        150,446             86,362             9,061             4,202                 -             29,583              44,920
  -------------      -------------     -------------     -------------     -------------    ---------------     ---------------
    194,547,539        159,818,316       (24,413,487)      154,100,293       180,705,445        (47,788,720)        (71,630,929)
    315,641,632        155,823,316       813,474,612       659,374,319       478,668,874      1,391,077,329       1,462,708,258
  -------------      -------------     -------------     -------------     -------------    ---------------     ---------------
  $ 510,189,171      $ 315,641,632     $ 789,061,125     $ 813,474,612     $ 659,374,319    $ 1,343,288,609     $ 1,391,077,329
  =============      =============     =============     =============     =============    ===============     ===============
  $  (1,905,637)     $   1,566,230     $  (4,527,148)    $  (4,173,594)    $   4,682,594    $        40,179     $       829,772


                                      123
BLACKROCK FUNDS
FINANCIAL HIGHLIGHTS
FOR A SHARE OUTSTANDING THROUGHOUT EACH PERIOD
GAIN (LOSS)
NET ON INVESTMENTS,
ASSET FOREIGN CURRENCY
VALUE NET AND OPTIONS
BEGINNING INVESTMENT (BOTH REALIZED
OF PERIOD INCOME (LOSS) AND UNREALIZED)
----------- --------------- ------------------
--------
Investment Trust
--------
Institutional Class
10/01/04 through 3/31/0510 $ 11.95 $ 0.07 $ 0.85
9/30/04 10.32 0.0922 1.67
9/30/03 8.50 0.10 1.83
9/30/02 11.25 0.11 ( 2.86)
9/30/01 20.77 0.06 ( 6.46)
9/30/00 20.77 0.07 1.61
Service Class
10/01/04 through 3/31/0510 $ 11.97 $ 0.09 $ 0.80
9/30/04 10.33 0.0622 1.67
9/30/03 8.44 0.10 1.79
9/30/02 11.21 0.01 ( 2.78)
9/30/01 20.73 0.01 ( 6.43)
9/30/00 20.76 0.01 1.61
Investor A Class
10/01/04 through 3/31/0510 $ 11.79 $ 0.01 $ 0.86
9/30/04 10.18 0.0422 1.64
9/30/03 8.41 0.06 1.79
9/30/02 11.17 ( 0.01) ( 2.75)
9/30/01 20.69 ( 0.02) ( 6.42)
9/30/00 20.75 ( 0.02) 1.60
Investor B Class
10/01/04 through 3/31/0510 $ 11.30 $ (0.05) $ 0.84
9/30/04 9.78 ( 0.04)22 1.57
9/30/03 8.06 ( 0.02) 1.74
9/30/02 10.79 ( 0.10) ( 2.63)
9/30/01 20.21 ( 0.13) ( 6.22)
9/30/00 20.44 ( 0.18) 1.58
Investor C Class
10/01/04 through 3/31/0510 $ 11.31 $ (0.04) $ 0.83
9/30/04 9.77 ( 0.04)22 1.58
9/30/03 8.06 ( 0.02)22 1.73
9/30/02 10.79 ( 0.11) ( 2.62)
9/30/01 20.20 ( 0.15) ( 6.19)
9/30/00 20.44 ( 0.16) 1.55
------------
Large Cap Value Equity
------------
Institutional Class
10/01/04 through 3/31/0510 $ 12.70 $ 0.12 $ 1.21
9/30/04 10.77 0.1822 1.93
9/30/03 8.82 0.16 1.94
9/30/02 12.60 0.10 ( 3.42)
9/30/01 15.13 0.14 ( 1.28)
9/30/00 15.75 0.16 0.79
Service Class
10/01/04 through 3/31/0510 $ 12.73 $ 0.12 $ 1.18
9/30/04 10.79 0.1422 1.94
9/30/03 8.83 0.12 1.96
9/30/02 12.61 0.06 ( 3.42)
9/30/01 15.13 0.10 ( 1.27)
9/30/00 15.75 0.11 0.79
DISTRIBUTIONS
DISTRIBUTIONS FROM NET NET
FROM NET DISTRIBUTIONS REALIZED ASSET VALUE
INVESTMENT FROM CAPITAL END OF
INCOME CAPITAL GAINS PERIOD
--------------- --------------- -------------- ------------
--------
Investment Trust
--------
Institutional Class
10/01/04 through 3/31/0510 $ (0.10) $ - $ - $ 12.77
9/30/04 ( 0.13) - - 11.95
9/30/03 ( 0.11) - - 10.32
9/30/02 - - - 8.50
9/30/01 ( 0.05) (0.02) (3.05) 11.25
9/30/00 ( 0.05) - (1.63) 20.77
Service Class
10/01/04 through 3/31/0510 $ (0.06) $ - $ - $ 12.80
9/30/04 ( 0.09) - - 11.97
9/30/03 - - - 10.33
9/30/02 - - - 8.44
9/30/01 ( 0.03) (0.02) (3.05) 11.21
9/30/00 ( 0.02) - (1.63) 20.73
Investor A Class
10/01/04 through 3/31/0510 $ (0.04) $ - $ - $ 12.62
9/30/04 ( 0.07) - - 11.79
9/30/03 ( 0.08) - - 10.18
9/30/02 - - - 8.41
9/30/01 ( 0.01) (0.02) (3.05) 11.17
9/30/00 ( 0.01) - (1.63) 20.69
Investor B Class
10/01/04 through 3/31/0510 $ - $ - $ - $ 12.09
9/30/04 ( 0.01) - - 11.30
9/30/03 - - - 9.78
9/30/02 - - - 8.06
9/30/01 - (0.02) (3.05) 10.79
9/30/00 - - (1.63) 20.21
Investor C Class
10/01/04 through 3/31/0510 $ - $ - $ - $ 12.10
9/30/04 - - - 11.31
9/30/03 - - - 9.77
9/30/02 - - - 8.06
9/30/01 ( 0.02) - (3.05) 10.79
9/30/00 - - (1.63) 20.20
------------
Large Cap Value Equity
------------
Institutional Class
10/01/04 through 3/31/0510 $ (0.13) $ - $ - $ 13.90
9/30/04 ( 0.18) - - 12.70
9/30/03 ( 0.15) - - 10.77
9/30/02 ( 0.09) (0.37) - 8.82
9/30/01 ( 0.14) (1.25) - 12.60
9/30/00 ( 0.16) (1.41) - 15.13
Service Class
10/01/04 through 3/31/0510 $ (0.09) $ - $ - $ 13.94
9/30/04 ( 0.14) - - 12.73
9/30/03 ( 0.12) - - 10.79
9/30/02 ( 0.05) (0.37) - 8.83
9/30/01 ( 0.10) (1.25) - 12.61
9/30/00 ( 0.11) (1.41) - 15.13
SEE ACCOMPANYING NOTES TO FINANCIAL STATEMENTS.
124
                                BLACKROCK FUNDS


                                                       RATIO OF TOTAL                           RATIO OF NET
                                      RATIO OF NET       EXPENSE TO         RATIO OF NET     INVESTMENT INCOME
                        NET ASSETS     EXPENSES TO      AVERAGE NET      INVESTMENT INCOME     TO AVERAGE NET    PORTFOLIO
        TOTAL         END OF PERIOD    AVERAGE NET   ASSETS (EXCLUDING     TO AVERAGE NET    ASSETS (EXCLUDING   TURNOVER
       RETURN             (000)          ASSETS           WAIVERS)             ASSETS             WAIVERS)         RATE
- -------------------- --------------- -------------- ------------------- ------------------- ------------------- ----------
       7.66    %        $  549,977         0.81%2           1.00%2              1.45%2              1.25%2           89%
      17.11                 51,593        0.81             0.99                0.81                0.63              72
      22.80                 60,886        0.81             0.96                0.93                0.79              98
       ( 24.44)            134,859        0.81             0.87                0.36                0.30             124
       ( 35.29)            755,701        0.81             0.82                0.38                0.37             114
       8.14              1,466,964        0.80             0.80                0.33                0.33             103

       7.46    %        $    1,681         1.11%2           1.26%2              1.39%2              1.23%2           89%
      16.83                  1,714        1.07             1.23                0.56                0.40              72
      22.39                  1,988        1.11             1.26                0.64                0.49              98
        (24.71)              3,797        1.11             1.16                0.06                0.02             124
        (35.49)            143,283        1.11             1.12                0.07                0.06             114
       7.81                232,287        1.10             1.10                0.03                0.03             103

          7.36%3        $  602,950         1.16%2           1.35%2              1.04%2              0.86%2           89%
      16.603                17,632        1.26             1.47                0.37                0.16              72
      22.093                19,408        1.28             1.43                0.45                0.30              98
       ( 24.71)3            24,816        1.28             1.36                (0.04)              (0.11)           124
       ( 35.65)3            37,267        1.28             1.30                (0.09)              (0.10)           114
       7.643                76,438        1.25             1.25                (0.11)              (0.11)           103

          6.99%4        $  263,250         1.92%2           2.01%2              0.33%2              0.24%2           89%
      15.704                20,448        2.01             2.13                (0.39)              (0.50)            72
      21.344                21,182        2.03             2.18                (0.30)              (0.45)            98
        (25.30)4            22,119        2.03             2.11                (0.78)              (0.86)           124
        (36.11)4            40,403        2.03             2.05                (0.84)              (0.85)           114
       6.824                81,562        2.01             2.01                (0.87)              (0.87)           103

          6.99%4        $   26,431         1.92%2           2.00%2              0.34%2              0.26%2           89%
      15.784,11              2,413        2.03             2.14                (0.39)              (0.50)            72
      21.224                 1,829        2.03             2.18                (0.25)              (0.40)            98
       ( 25.30)4             1,923        2.03             2.11                (0.80)              (0.87)           124
       ( 36.07)4             3,955        2.03             2.04                (0.09)              (0.09)           114
       6.774                11,108        2.01             2.01                0.87                (0.87)           103

      10.45    %        $  126,648         0.79%2           0.98%2              1.82%2              1.64%2           44%
      19.6711              114,374        0.79             0.91                1.45                1.33              75
      23.93                151,602        0.79             0.91                1.27                1.15             150
       ( 27.41)            369,792        0.79             0.84                0.72                0.68             128
       (  8.22)          1,345,903        0.79             0.80                1.00                0.99             114
       6.24              1,821,839        0.78             0.78                1.11                1.11             121

      10.24    %        $   29,831         1.09%2           1.22%2              1.50%2              1.37%2           44%
      19.3511               46,353        1.09             1.22                1.15                1.03              75
      23.60                 62,080        1.09             1.21                0.98                0.87             150
        (27.66)            133,903        1.09             1.15                0.45                0.40             128
         (8.44)            254,166        1.09             1.10                0.69                0.69             114
       5.91                337,993        1.08             1.08                0.82                0.82             121

                    125
                                BLACKROCK FUNDS
                        FINANCIAL HIGHLIGHTS (CONCLUDED)

                 FOR A SHARE OUTSTANDING THROUGHOUT EACH PERIOD


                                                                  GAIN (LOSS)
                                      NET                       ON INVESTMENTS,                         DISTRIBUTIONS
                                     ASSET                     FOREIGN CURRENCY                           FROM NET         NET
                                     VALUE          NET           AND OPTIONS        DISTRIBUTIONS        REALIZED     ASSET VALUE
                                   BEGINNING     INVESTMENT     (BOTH REALIZED    FROM NET INVESTMENT      CAPITAL       END OF
                                   OF PERIOD   INCOME (LOSS)    AND UNREALIZED)          INCOME             GAINS        PERIOD
                                  ----------- --------------- ------------------ --------------------- -------------- ------------
     ------------------
     Large Cap Value Equity (Continued)
     ------------------
     Invester A Class
     10/01/04 through 3/31/0510    $   12.71     $  0.10           $   1.19           $   (0.10)          $      -     $   13.90
     9/30/04                           10.78       0.1322              1.93             (  0.13)                 -         12.71
     9/30/03                            8.83       0.09                1.96             (  0.10)                 -         10.78
     9/30/02                           12.59       0.02              ( 3.39)            (  0.02)             (0.37)         8.83
     9/30/01                           15.11       0.07              ( 1.27)            (  0.07)             (1.25)        12.59
     9/30/00                           15.74       0.10                0.77             (  0.09)             (1.41)        15.11
     Investor B Class
     10/01/04 through 3/31/0510    $   12.48     $  0.05           $   1.16           $   (0.05)          $      -     $   13.64
     9/30/04                           10.58       0.0322              1.91             (  0.04)                 -         12.48
     9/30/03                            8.66       0.01                1.93             (  0.02)                 -         10.58
     9/30/02                           12.43       ( 0.07)           ( 3.33)                  -              (0.37)         8.66
     9/30/01                           14.97       ( 0.03)           ( 1.26)                  -              (1.25)        12.43
     9/30/00                           15.61       ( 0.01)             0.77                   -              (1.40)        14.97
     Investor C Class
     10/01/04 through 3/31/0510    $   12.48     $  0.05           $   1.17           $   (0.05)          $      -     $   13.65
     9/30/04                           10.59       0.0322              1.90             (  0.04)                 -         12.48
     9/30/03                            8.67       0.01                1.93             (  0.02)                 -         10.59
     9/30/02                           12.44       ( 0.07)           ( 3.33)                  -              (0.37)         8.67
     9/30/01                           14.97       ( 0.03)           ( 1.25)                  -              (1.25)        12.44
     9/30/00                           15.61       0.01                0.75                   -              (1.40)        14.97
     -------------
     Large Cap Growth Equity
     -------------
     Institutional Class
     10/01/04 through 3/31/0510    $    8.92     $  0.06           $   0.50           $       -           $      -     $    9.48
     9/30/04                            8.18       0.0222              0.72                   -                  -          8.92
     9/30/03                            6.71       0.03                1.44                   -                  -          8.18
     9/30/02                            9.10       ( 0.01)           ( 2.38)                  -                  -          6.71
     9/30/01                           23.72       ( 0.02)           (11.82)                  -              (2.78)         9.10
     9/30/00                           22.57       ( 0.06)             4.83                   -              (3.62)        23.72
     Service Class
     10/01/04 through 3/31/0510    $    8.72     $  0.05           $   0.49           $       -           $      -     $    9.26
     9/30/04                            8.03       ( 0.01)22           0.70                   -                  -          8.72
     9/30/03                            6.60       ( 0.01)             1.44                   -                  -          8.03
     9/30/02                            8.99       ( 0.02)           ( 2.37)                  -                  -          6.60
     9/30/01                           23.52       ( 0.05)           (11.70)                  -              (2.78)         8.99
     9/30/00                           22.47       ( 0.13)             4.80                   -              (3.62)        23.52
     Investor A Class
     10/01/04 through 3/31/0510    $    8.60     $  0.04           $   0.48           $       -           $      -     $    9.12
     9/30/04                            7.92       ( 0.02)22           0.70                   -                  -          8.60
     9/30/03                            6.53       ( 0.02)             1.41                   -                  -          7.92
     9/30/02                            8.90       ( 0.05)           ( 2.32)                  -                  -          6.53
     9/30/01                           23.36       ( 0.09)           (11.59)                  -              (2.78)         8.90
     9/30/00                           22.37       ( 0.16)             4.77                   -              (3.62)        23.36
     Investor B Class
     10/01/04 through 3/31/0510    $    7.92     $      -          $   0.45           $       -           $      -     $    8.37
     9/30/04                            7.35       ( 0.08)22           0.65                   -                  -          7.92
     9/30/03                            6.11       ( 0.07)             1.31                   -                  -          7.35
     9/30/02                            8.39       ( 0.12)           ( 2.16)                  -                  -          6.11
     9/30/01                           22.34       ( 0.19)           (10.98)                  -              (2.78)         8.39
     9/30/00                           21.68       ( 0.28)             4.56                   -              (3.62)        22.34
     Investor C Class
     10/01/04 through 3/31/0510    $    7.91     $      -          $   0.45           $       -           $      -     $    8.36
     9/30/04                            7.34       ( 0.08)22           0.65                   -                  -          7.91
     9/30/03                            6.10       ( 0.07)             1.31                   -                  -          7.34
     9/30/02                            8.37       ( 0.13)           ( 2.14)                  -                  -          6.10
     9/30/01                           22.31       ( 0.19)           (10.97)                  -              (2.78)         8.37
     9/30/00                           21.68       ( 0.25)             4.50                   -              (3.62)        22.31

SEE ACCOMPANYING NOTES TO FINANCIAL STATEMENTS.
                                      126
                                BLACKROCK FUNDS


                                                        RATIO OF TOTAL                           RATIO OF NET
                                       RATIO OF NET       EXPENSE TO         RATIO OF NET     INVESTMENT INCOME
                         NET ASSETS     EXPENSES TO      AVERAGE NET      INVESTMENT INCOME     TO AVERAGE NET    PORTFOLIO
        TOTAL          END OF PERIOD    AVERAGE NET   ASSETS (EXCLUDING     TO AVERAGE NET    ASSETS (EXCLUDING   TURNOVER
        RETURN             (000)          ASSETS           WAIVERS)             ASSETS             WAIVERS)         RATE
- --------------------- --------------- -------------- ------------------- ------------------- ------------------- ----------

          10.18%3        $  152,434         1.18%2           1.34%2              1.49%2              1.34%2           44%
       19.193,11             54,311        1.19             1.36                1.05               0.88               75
       23.323                63,733        1.26             1.38                0.83               0.71              150
         (27.70)3            76,044        1.27             1.32                0.22               0.17              128
          (8.64)3            57,672        1.27             1.27                0.53               0.52              114
        5.713                56,689        1.23             1.23                0.66               0.66              121

           9.73%4        $   46,305         1.97%2           2.06%2              0.70%2              0.60%2           44%
       18.344,11             18,203        1.99             2.08                0.25               0.16               75
       22.424                17,634        2.01             2.13                0.09                (0.03)           150
         (28.32)4            17,312        2.01             2.07                (0.51)              (0.56)           128
          (9.36)4            29,178        2.01             2.02                (0.23)              (0.24)           114
        4.934                31,208        2.00             2.00                (0.11)              (0.11)           121

           9.81%4        $   13,016         1.93%2           1.99%2              0.71%2              0.66%2           44%
       18.274,11              6,805        1.99             2.05                0.26               0.20               75
       22.404                 5,141        2.01             2.13                0.09                (0.03)           150
        ( 28.29)4             5,868        2.01             2.06                (0.50)              (0.55)           128
        (  9.29)4             9,738        2.01             2.02                (0.24)              (0.25)           114
        4.934                 7,608        2.00             2.00                (0.13)              (0.13)           121

        6.28    %        $   24,083         0.82%2           1.16%2              1.19%2              0.85%2           27%
        9.0511               27,725        0.82             1.01                0.20               0.01               70
       21.91                 36,686        0.82             0.93                0.19               0.08               90
        ( 26.26)            100,521        0.82             0.87                (0.05)              (0.09)           130
        ( 55.58)            557,928        0.82             0.83                (0.11)              (0.12)           164
       22.90              1,263,796        0.80             0.80                (0.24)              (0.24)           121

        6.19    %        $   12,146         1.12%2           1.40%2              0.83%2              0.55%2           27%
        8.5911               33,182        1.12             1.30                (0.10)              (0.27)            70
       21.67                 43,625        1.12             1.22                (0.11)              (0.22)            90
         (26.59)            130,932        1.12             1.17                (0.30)              (0.34)           130
         (55.68)            158,367        1.12             1.13                (0.41)              (0.42)           164
       22.50                288,904        1.10             1.10                (0.54)              (0.54)           121

           6.05%3        $   16,937         1.22%2           1.51%2              0.81%2              0.51%2           27%
        8.593,11             18,985        1.27             1.50                (0.26)              (0.49)            70
       21.293                27,739        1.29             1.40                (0.27)              (0.38)            90
        ( 26.63)3            34,513        1.29             1.34                (0.48)              (0.52)           130
        ( 55.78)3            35,609        1.29             1.30                (0.59)              (0.60)           164
       22.313                87,375        1.25             1.25                (0.70)              (0.70)           121

           5.68%4        $   10,996         1.97%2           2.17%2              0.04%2             (0.15)%2          27%
        7.764                12,693        2.03             2.16                (1.01)              (1.14)            70
       20.304                14,358        2.04             2.15                (1.01)              (1.12)            90
         (27.18)4            14,332        2.04             2.09                (1.23)              (1.28)           130
         (56.08)4            25,986        2.04             2.05                (1.33)              (1.34)           164
       21.374                65,977        2.01             2.01                (1.46)              (1.46)           121

           5.69%4        $    2,308         1.97%2           2.17%2              0.04%2             (0.16)%2          27%
        7.774                 2,558        2.03             2.18                (1.01)              (1.16)            70
       20.334                 2,579        2.04             2.15                (1.01)              (1.12)            90
        ( 27.12)4             2,424        2.04             2.09                (1.23)              (1.28)           130
        ( 56.11)4             4,711        2.04             2.05                (1.33)              (1.34)           164
       21.214                11,799        2.01             2.01                (1.47)              (1.47)           121

                    127
                                BLACKROCK FUNDS
                        FINANCIAL HIGHLIGHTS (CONTINUED)

                 FOR A SHARE OUTSTANDING THROUGHOUT EACH PERIOD


                                                                  GAIN (LOSS)
                                      NET                       ON INVESTMENTS,                         DISTRIBUTIONS
                                     ASSET                     FOREIGN CURRENCY                           FROM NET         NET
                                     VALUE          NET           AND OPTIONS        DISTRIBUTIONS        REALIZED     ASSET VALUE
                                   BEGINNING     INVESTMENT     (BOTH REALIZED    FROM NET INVESTMENT      CAPITAL       END OF
                                   OF PERIOD   INCOME (LOSS)    AND UNREALIZED)          INCOME             GAINS        PERIOD
                                  ----------- --------------- ------------------ --------------------- -------------- ------------
     ---------
     Dividend Achievers(TM)
     ---------
     Institutional Class
     10/01/04 through 3/31/0510    $   9.96      $   0.08          $   0.51           $   (0.07)         $   (0.01)    $   10.47
     9/08/041 through 9/30/04         10.00         0.0122          (  0.05)                  -                  -          9.96

     Service Class
     10/01/04 through 3/31/0510    $   9.95     $   0.04           $   0.52           $   (0.06)         $   (0.01)    $   10.44
     9/08/041 through 9/30/04         10.00           -22           (  0.05)                  -                  -          9.95

     Investor A Class
     10/01/04 through 3/31/0510    $   9.96     $   0.05           $   0.53           $   (0.06)         $   (0.01)    $   10.47
     9/08/041 through 9/30/04         10.00         0.0122          (  0.05)                  -                  -          9.96

     Investor B Class
     10/01/04 through 3/31/0510    $   9.96     $   0.02           $   0.54           $   (0.04)         $   (0.01)    $   10.47
     9/08/041 through 9/30/04         10.00         0.0122          (  0.05)                  -                  -          9.96

     Investor C Class
     10/01/04 through 3/31/0510    $   9.96     $   0.03           $   0.52           $   (0.04)         $   (0.01)    $   10.46
     9/08/041 through 9/30/04         10.00         0.0122          (  0.05)                  -                  -          9.96
     ---
     Legacy
     ---
     Institutional Class
     11/01/04 through 3/31/0510    $  12.78     $   0.07           $   0.35           $       -          $       -     $   13.20
     10/30/04                         12.17       (  0.04)             0.65                   -                  -         12.78
     10/30/03                         10.14       (  0.02)             2.05                   -                  -         12.17
     10/30/02                         11.74             -           (  1.60)                  -                  -         10.14
     10/30/01                         16.61       (  0.01)          (  4.86)                  -                  -         11.74
     10/30/0023                       16.09       (  0.02)             0.54                   -                  -         16.61
     Service Class
     1/28/051 through 3/31/0510    $  12.96     $   (0.01)        $   (0.08)          $       -          $       -     $   12.86
     Investor A Class
     11/01/04 through 3/31/0510    $  12.47     $   0.06          $    0.33           $       -          $       -     $   12.86
     10/30/04                         11.91       (  0.08)             0.64                   -                  -         12.47
     10/30/03                          9.96       (  0.05)             2.00                   -                  -         11.91
     10/30/02                         11.56       (  0.03)          (  1.57)                  -                  -          9.96
     10/30/01                         16.39       (  0.05)          (  4.78)                  -                  -         11.56
     10/30/0023                       15.99       (  0.04)             0.44                   -                  -         16.39
     Investor B Class
     11/01/04 through 3/31/0510    $  11.86     $   0.01          $    0.33           $       -          $       -     $   12.20
     10/30/04                         11.41       (  0.15)             0.60                   -                  -         11.86
     10/30/03                          9.61       (  0.12)             1.91                   -                  -         11.41
     10/30/02                         11.23       (  0.11)          (  1.51)                  -                  -          9.61
     10/30/01                         16.05       (  0.15)          (  4.67)                  -                  -         11.23
     10/30/0023                       15.71       (  0.10)             0.44                   -                  -         16.05
     Investor C Class
     11/01/04 through 3/31/0510    $  11.86     $   0.02          $    0.32           $       -          $       -     $   12.20
     10/30/04                         11.41       (  0.15)             0.60                   -                  -         11.86
     10/30/03                          9.61       (  0.11)             1.91                   -                  -         11.41
     10/30/02                         11.23       (  0.11)          (  1.51)                  -                  -          9.61
     10/30/01                         16.05       (  0.15)          (  4.67)                  -                  -         11.23
     10/30/0023                       15.71       (  0.10)             0.44                   -                  -         16.05

SEE ACCOMPANYING NOTES TO FINANCIAL STATEMENTS.
                                      128
                                BLACKROCK FUNDS


                                                     RATIO OF TOTAL                           RATIO OF NET
                                    RATIO OF NET       EXPENSE TO         RATIO OF NET     INVESTMENT INCOME
                      NET ASSETS     EXPENSES TO      AVERAGE NET      INVESTMENT INCOME     TO AVERAGE NET    PORTFOLIO
       TOTAL        END OF PERIOD    AVERAGE NET   ASSETS (EXCLUDING     TO AVERAGE NET    ASSETS (EXCLUDING   TURNOVER
      RETURN            (000)          ASSETS           WAIVERS)             ASSETS             WAIVERS)         RATE
- ------------------ --------------- -------------- ------------------- ------------------- ------------------- ----------
       5.92  %        $   6,654          0.90%2           2.20%2              2.07%2              0.77%2           28%
     (  0.40)             1,992         0.902            1.682              1.412               0.632               9

       5.57  %        $     279          1.18%2           1.94%2              1.59%2              0.83%2           28%
       (0.50)                 -         1.202            1.982              1.112               0.332               9

       5.80  %        $  11,029          1.28%2           2.10%2              1.70%2              0.87%2           28%
     (  0.40)3                -         1.302            2.082              1.012               0.232               9

       5.61  %        $   1,727          2.01%2           2.69%2              0.94%2              0.26%2           28%
       (0.40)4                -         2.052            2.582              0.512               0.272               9

       5.48  %        $   6,720          1.99%2           2.74%2              1.02%2              0.28%2           28%
     (  0.40)4                -         2.052            2.582              0.512               0.272               9

       3.29  %        $  52,272          0.99%2           1.01%2              1.03%2              1.02%2           29%
      5.01               52,399         1.14             1.14                (0.31)              (0.31)            91
     20.02               60,878         1.08             1.08                (0.19)              (0.19)           113
     ( 13.63)            41,161         1.08             1.09               0.03                0.02               31
     ( 29.32)             5,077         1.03             1.05                (0.09)              (0.11)            22
      3.23                7,126         1.04             1.04                (0.24)              (0.24)            11

       (0.70) %       $       -          1.35%2           1.47%2             (0.18)%2            (0.18)%2          29%

        3.13%3        $ 123,837          1.26%2           1.32%2              1.00%2              0.94%2           29%
      4.703              99,435         1.44             1.44                (0.62)              (0.62)            91
     19.583             103,247         1.38             1.38                (0.47)              (0.47)           113
     ( 13.84)3           76,798         1.38             1.39                (0.28)              (0.29)            31
     ( 29.47)3          103,774         1.33             1.35                (0.39)              (0.41)            22
      2.503             151,920         1.34             1.34                (0.54)              (0.54)            11

        2.87%4        $  90,912          1.99%2           2.01%2              0.26%2              0.24%2           29%
      3.944              97,938         2.14             2.14                (1.31)              (1.31)            91
     18.734             108,125         2.08             2.08                (1.17)              (1.17)           113
      (14.43)4           90,564         2.08             2.09                (0.98)              (0.99)            31
      (29.99)4          129,464         2.03             2.05                (1.09)              (1.11)            22
      2.104             184,818         2.04             2.04                (1.25)              (1.25)            11

        2.87%4        $  20,677          1.99%2           2.01%2              0.30%2              0.28%2           29%
      3.944              23,854         2.14             2.14                (1.30)              (1.30)            91
     18.734              30,516         2.08             2.08                (1.15)              (1.15)           113
     ( 14.43)4           31,274         2.08             2.09                (0.99)              (1.00)            31
     ( 30.03)4           46,809         2.03             2.05                (1.08)              (1.10)            22
      2.164              76,137         2.04             2.04                (1.24)              (1.24)            11

                    129
BLACKROCK FUNDS
FINANCIAL HIGHLIGHTS (CONTINUED)
FOR A SHARE OUTSTANDING THROUGHOUT EACH PERIOD
GAIN (LOSS)
NET ON INVESTMENTS,
ASSET FOREIGN CURRENCY
VALUE NET AND OPTIONS
BEGINNING INVESTMENT (BOTH REALIZED
OF PERIOD INCOME (LOSS) AND UNREALIZED)
----------- ---------------- ------------------
------------
Mid-Cap Value Equity*
------------
Institutional Class
3/01/05 through 3/31/0510 $ 12.73 $ 0.01 $ (0.12)
7/01/04 through 2/28/05 12.14 0.11 1.44
6/30/04 9.07 0.08 3.08
6/30/03 10.66 0.08 ( 1.21)
6/30/02 11.85 0.04 0.30
6/30/01 8.74 0.10 3.59
6/30/00 10.09 0.17 ( 1.14)
Service Class
3/01/05 through 3/31/0510 $ 12.63 $ - $ (0.12)
1/28/05 through 2/28/05 12.04 ( 0.01) 0.60
Investor A Class
3/01/05 through 3/31/0510 $ 12.53 $ - $ (0.12)
7/01/04 through 2/28/05 11.92 0.07 1.45
6/30/04 8.91 0.05 3.02
6/30/03 10.53 0.06 ( 1.22)
6/30/02 11.73 0.02 0.29
6/30/01 8.66 0.06 3.56
6/30/00 10.00 0.15 ( 1.14)
Investor B Class
3/01/05 through 3/31/0510 $ 11.87 $ - $ (0.12)
7/01/04 through 2/28/05 11.28 ( 0.03) 1.41
6/30/04 8.45 ( 0.02) 2.85
6/30/03 10.05 ( 0.01) ( 1.15)
6/30/02 11.30 ( 0.06) 0.28
6/30/01 8.36 ( 0.02) 3.45
6/30/00 9.67 0.08 ( 1.11)
Investor C Class
3/01/05 through 3/31/0510 $ 11.87 $ - $ (0.12)
7/01/04 through 2/28/05 11.28 ( 0.03) 1.40
6/30/04 8.45 ( 0.02) 2.85
6/30/03 10.04 ( 0.01) ( 1.14)
6/30/02 11.28 ( 0.05) 0.28
6/30/01 8.35 ( 0.01) 3.42
6/30/00 9.63 0.07 ( 1.09)
------------
Mid-Cap Growth Equity
------------
Institutional Class
10/01/04 through 3/31/0510 $ 8.76 $ (0.02) $ 0.84
9/30/04 7.57 ( 0.06)22 1.25
9/30/03 6.06 ( 0.05) 1.56
9/30/02 7.49 ( 0.06)22 ( 1.37)
9/30/01 26.58 0.01 ( 11.62)
9/30/00 19.12 ( 0.08) 14.16
Service Class
10/01/04 through 3/31/0510 $ 8.46 $ (0.10) $ 0.89
9/30/04 7.33 ( 0.08)22 1.21
9/30/03 5.89 ( 0.07) 1.51
9/30/02 7.31 ( 0.11) ( 1.31)
9/30/01 26.19 ( 0.03) ( 11.37)
9/30/00 18.96 ( 0.19) 14.04
*The performance prior to January 31, 2005 set forth in this table is the
financial data of the State Street Research Mid-Cap Value Fund, series
of a predecessor company, the State Street Research Funds. BlackRock Funds
acquired all of the assets and certain stated liabilities of the
State Street Research Mid-Cap Value Equity Fund on January 31, 2005. The net
asset values and other per share information listed have been
restated to reflect the conversion ratios of 1.56483770, 1.57950264,
1.62345461 and 1.63087248 for Institutional, Class A, Class B and Class
C shares, respectively.
DISTRIBUTIONS
FROM NET NET
DISTRIBUTIONS REALIZED ASSET VALUE
FROM NET INVESTMENT CAPITAL END OF
INCOME GAINS PERIOD
--------------------- -------------- ------------
------------
Mid-Cap Value Equity*
------------
Institutional Class
3/01/05 through 3/31/0510 $ - $ - $ 12.62
7/01/04 through 2/28/05 (0.15) (0.81) 12.73
6/30/04 (0.09) - 12.14
6/30/03 - (0.46) 9.07
6/30/02 - (1.53) 10.66
6/30/01 (0.15) (0.43) 11.85
6/30/00 (0.24) (0.14) 8.74
Service Class
3/01/05 through 3/31/0510 $ - $ - $ 12.51
1/28/05 through 2/28/05 - - 12.63
Investor A Class
3/01/05 through 3/31/0510 $ - $ - $ 12.41
7/01/04 through 2/28/05 (0.11) (0.80) 12.53
6/30/04 (0.06) - 11.92
6/30/03 - (0.46) 8.91
6/30/02 - (1.51) 10.53
6/30/01 (0.13) (0.42) 11.73
6/30/00 (0.21) (0.14) 8.66
Investor B Class
3/01/05 through 3/31/0510 $ - $ - $ 11.75
7/01/04 through 2/28/05 (0.01) (0.78) 11.87
6/30/04 - - 11.28
6/30/03 - (0.44) 8.45
6/30/02 - (1.47) 10.05
6/30/01 (0.08) (0.41) 11.30
6/30/00 (0.14) (0.14) 8.36
Investor C Class
3/01/05 through 3/31/0510 $ - $ - $ 11.75
7/01/04 through 2/28/05 (0.01) (0.77) 11.87
6/30/04 - - 11.28
6/30/03 - (0.44) 8.45
6/30/02 - (1.47) 10.04
6/30/01 (0.07) (0.41) 11.28
6/30/00 (0.13) (0.13) 8.35
------------
Mid-Cap Growth Equity
------------
Institutional Class
10/01/04 through 3/31/0510 $ - $ - $ 9.58
9/30/04 - - 8.76
9/30/03 - - 7.57
9/30/02 - - 6.06
9/30/01 - (7.48) 7.49
9/30/00 - (6.62) 26.58
Service Class
10/01/04 through 3/31/0510 $ - $ - $ 9.25
9/30/04 - - 8.46
9/30/03 - - 7.33
9/30/02 - - 5.89
9/30/01 - (7.48) 7.31
9/30/00 - (6.62) 26.19
SEE ACCOMPANYING NOTES TO FINANCIAL STATEMENTS.
130
                                BLACKROCK FUNDS


                                                    RATIO OF TOTAL                           RATIO OF NET
                                   RATIO OF NET       EXPENSE TO         RATIO OF NET     INVESTMENT INCOME
                     NET ASSETS     EXPENSES TO      AVERAGE NET      INVESTMENT INCOME     TO AVERAGE NET    PORTFOLIO
      TOTAL        END OF PERIOD    AVERAGE NET   ASSETS (EXCLUDING     TO AVERAGE NET    ASSETS (EXCLUDING   TURNOVER
      RETURN           (000)          ASSETS           WAIVERS)             ASSETS             WAIVERS)         RATE
- ----------------- --------------- -------------- ------------------- ------------------- ------------------- ----------
      (  0.86)  %    $  48,278          1.00%2           1.28%2              0.58%2              0.30%2           9%
      13.03             50,383         0.992            1.092              1.182               1.082             53
      34.83             30,181         0.98             1.03               0.76                0.71              86
      ( 10.21)          26,099         0.99             1.18               0.93                0.75              66
       3.20             35,116         0.95             1.15               0.42                0.23              69
      43.89             34,577         0.95             1.25               0.90                0.62             116
      (  9.58)          22,994         1.00                 -              1.87                     -            31

        (0.95)  %    $   1,346          1.25%2           1.53%2              0.33%2              0.05%2           9%
       4.89              1,374         1.252            1.492              0.392               0.142             53

      (  0.96)%3     $ 440,530          1.25%2           1.63%2              0.33%2             (0.05)%2          9%
      12.983           448,237         1.242            1.382              0.922               0.782             53
      34.513           363,188         1.28             1.33               0.47                0.42              86
      ( 10.61)3        194,034         1.29             1.48               0.65                0.47              66
       2.963           242,113         1.25             1.41               0.16                0.01              69
      43.493           107,448         1.25             1.55               0.59                0.31             116
      (  9.89)          68,019         1.26                 -              1.62                     -            31

        (1.01)%4     $ 126,160          2.00%2           2.28%2             (0.42)%2            (0.70)%2          9%
      12.394           128,568         1.992            2.092              0.202               0.102             53
      33.534           109,815         1.98             2.03                (0.24)              (0.29)           86
       (11.13)4         79,536         1.99             2.18                (0.05)              (0.23)           66
       2.204            91,416         1.95             2.10                (0.52)              (0.66)           69
      42.514            25,957         1.95             2.25                (0.18)              (0.46)          116
       (10.59)          10,043         2.00                 -              0.92                     -            31

      (  1.01)%4     $  89,817          2.00%2           2.28%2             (0.42)%2            (0.70)%2          9%
      12.404            91,657         1.992            2.092              0.192               0.092             53
      33.534            82,758         1.98             2.03                (0.24)              (0.29)           86
      ( 11.09)4         58,499         1.99             2.19                (0.04)              (0.23)           66
       2.254            62,505         1.95             2.09                (0.51)              (0.64)           69
      42.484            14,062         1.95             2.25                (0.09)              (0.37)          116
      ( 10.57)          10,661         2.00                 -              0.86                     -            31

       9.36   %      $  70,974          1.23%2           1.32%2             (0.62)%2            (0.70)%2         50%
      15.7211           40,337         1.23             1.28                (0.65)              (0.69)           29
      24.9211           46,970         1.21             1.23                (0.52)              (0.54)          168
      ( 19.09)          77,693         1.14             1.14                (0.76)              (0.76)          279
      ( 56.71)         301,779         1.13             1.13               0.06                0.06             584
      91.06            666,420         1.10             1.10                (0.37)              (0.37)          425

       9.34   %      $   1,877          1.53%2           1.57%2             (0.69)%2            (0.73)%2         50%
      15.4211           10,871         1.53             1.56                (0.97)              (0.99)           29
      24.4511           14,115         1.51             1.53                (0.80)              (0.83)          168
       (19.43)          24,082         1.45             1.45                (1.07)              (1.07)          279
       (56.78)          37,691         1.44             1.44                (0.28)              (0.28)          584
      91.13             51,912         1.40             1.40                (0.69)              (0.69)          425

                    131
                                BLACKROCK FUNDS
                        FINANCIAL HIGHLIGHTS (CONTINUED)

                 FOR A SHARE OUTSTANDING THROUGHOUT EACH PERIOD


                                                                  GAIN (LOSS)
                                      NET                       ON INVESTMENTS,                         DISTRIBUTIONS
                                     ASSET                     FOREIGN CURRENCY                           FROM NET         NET
                                     VALUE          NET           AND OPTIONS        DISTRIBUTIONS        REALIZED     ASSET VALUE
                                   BEGINNING     INVESTMENT     (BOTH REALIZED    FROM NET INVESTMENT      CAPITAL       END OF
                                   OF PERIOD   INCOME (LOSS)    AND UNREALIZED)          INCOME             GAINS        PERIOD
                                  ----------- --------------- ------------------ --------------------- -------------- ------------
     -------------------
     Mid-Cap Growth Equity (Continued)
     -------------------
     Investor A Class
     10/01/04 through 3/31/0510    $   8.26     $   (0.02)         $   0.78            $      -           $     -       $   9.02
     9/30/04                           7.17       (  0.09)22           1.18                   -                 -           8.26
     9/30/03                           5.77       (  0.07)             1.47                   -                 -           7.17
     9/30/02                           7.17       (  0.11)          (  1.29)                  -                 -           5.77
     9/30/01                          25.92       (  0.04)          ( 11.23)                  -            ( 7.48)          7.17
     9/30/00                          18.85       (  0.13)            13.82                   -            ( 6.62)         25.92
     Investor B Class
     10/01/04 through 3/31/0510    $   7.63     $   (0.05)         $   0.72            $      -           $     -       $   8.30
     9/30/04                           6.67       (  0.14)22           1.10                   -                 -           7.63
     9/30/03                           5.41       (  0.11)             1.37                   -                 -           6.67
     9/30/02                           6.77       (  0.16)          (  1.20)                  -                 -           5.41
     9/30/01                          25.12       (  0.12)          ( 10.75)                  -            ( 7.48)          6.77
     9/30/00                          18.52       (  0.22)            13.44                   -            ( 6.62)         25.12
     Investor C Class
     10/01/04 through 3/31/0510    $   7.63     $   (0.05)         $   0.72            $      -           $     -       $   8.30
     9/30/04                           6.67       (  0.14)22           1.10                   -                 -           7.63
     9/30/03                           5.41       (  0.11)             1.37                   -                 -           6.67
     9/30/02                           6.77       (  0.18)          (  1.18)                  -                 -           5.41
     9/30/01                          25.10       (  0.13)          ( 10.72)                  -            ( 7.48)          6.77
     9/30/00                          18.52       (  0.21)            13.41                   -            ( 6.62)         25.10
     ---
     Aurora
     ---
     Institutional Class
     10/01/04 through 3/31/0510    $  40.71     $   0.01          $   (4.03)           $      -           $  3.84       $  40.53
     9/30/04                          23.18       (  0.11)             7.66                   -            ( 0.02)         40.71
     9/30/03                          25.05       (  0.11)             8.39                   -            ( 0.15)         33.18
     9/30/02                          27.06       (  0.14)          (  1.87)                  -                 -          25.05
     9/30/01                          29.66        0.13             (  0.39)              (0.03)           ( 2.31)         27.06
     9/30/00                          19.23        0.12               10.31                   -                 -          29.66
     Service Class
     1/28/05 through 3/31/0510     $  38.18     $   0.06          $   (2.86)           $      -           $  3.84       $  39.22
     Investor A Class
     10/01/04 through 3/31/0510    $  39.49     $   (0.05)        $   (4.14)           $      -           $  3.84       $  39.14
     9/30/04                          32.28       (  0.22)             7.45                   -            ( 0.02)         39.49
     9/30/03                          24.43       (  0.19)             8.19                   -            ( 0.15)         32.28
     9/30/02                          26.51       (  0.23)          (  1.85)                  -                 -          24.43
     9/30/01                          29.17        0.02             (  0.37)                  -            ( 2.31)         26.51
     9/30/00                          19.02        0.10               10.05                   -                 -          29.17
     Investor B Class
     10/01/04 through 3/31/0510    $  36.67     $   (0.18)        $   (4.38)           $      -           $  3.84       $  35.95
     9/30/04                          30.19       (  0.45)             6.95                   -            ( 0.02)         36.67
     9/30/03                          23.02       (  0.36)             7.68                   -            ( 0.15)         30.19
     9/30/02                          25.16       (  0.42)          (  1.72)                  -                 -          23.02
     9/30/01                          27.99       (  0.18)          (  0.34)                  -            ( 2.31)         25.16
     9/30/00                          18.38       (  0.07)             9.68                   -                 -          27.99
     Investor C Class
     10/01/04 through 3/31/0510    $  36.67     $   (0.19)        $   (4.38)           $      -           $  3.84       $  35.94
     9/30/04                          30.18       (  0.45)             6.96                   -            ( 0.02)         36.67
     9/30/03                          23.01       (  0.35)             7.67                   -            ( 0.15)         30.18
     9/30/02                          25.16       (  0.42)          (  1.73)                  -                 -          23.01
     9/30/01                          27.99       (  0.18)          (  0.34)                  -            ( 2.31)         25.11
     9/30/00                          18.38       (  0.07)             9.68                   -                 -          27.99

SEE ACCOMPANYING NOTES TO FINANCIAL STATEMENTS.
                                      132
                                BLACKROCK FUNDS


                                                        RATIO OF TOTAL                           RATIO OF NET
                                       RATIO OF NET       EXPENSE TO         RATIO OF NET     INVESTMENT INCOME
                         NET ASSETS     EXPENSES TO      AVERAGE NET      INVESTMENT INCOME     TO AVERAGE NET    PORTFOLIO
        TOTAL          END OF PERIOD    AVERAGE NET   ASSETS (EXCLUDING     TO AVERAGE NET    ASSETS (EXCLUDING   TURNOVER
        RETURN             (000)          ASSETS           WAIVERS)             ASSETS             WAIVERS)         RATE
- --------------------- --------------- -------------- ------------------- ------------------- ------------------- ----------
           9.20%3       $   301,541         1.55%2           1.66%2              (1.12)%2            (1.22)%2         50%
       15.203,11             27,777        1.67             1.77                 (1.09)              (1.19)           29
       24.263,11             25,960        1.68             1.71                 (0.96)              (0.98)          168
        ( 19.53)3            26,242        1.62             1.62                 (1.24)              (1.24)          279
        ( 56.91)3            38,225        1.60             1.60                 (0.38)              (0.38)          584
       90.623                83,152        1.57             1.57                 (0.80)              (0.80)          425

           8.78%4       $    61,717         2.31%2           2.32%2              (1.72)%2            (1.72)%2         50%
       14.394,11             31,900        2.44             2.45                 (1.86)              (1.87)           29
       23.294,11             33,982        2.43             2.45                 (1.69)              (1.71)          168
         (20.09)4            33,822        2.37             2.37                 (1.98)              (1.98)          279
         (57.24)4            51,186        2.35             2.35                 (1.12)              (1.12)          584
       89.384               122,726        2.31             2.31                 (1.53)              (1.53)          425

           8.78%4       $    21,656         2.31%2           2.32%2              (1.72)%2            (1.72)%2         50%
       14.394,11             11,269        2.44             2.45                 (1.86)              (1.87)           29
       23.294,11             12,212        2.43             2.45                 (1.69)              (1.71)          168
        ( 20.09)4            12,092        2.37             2.37                 (1.98)              (1.98)          279
        ( 57.19)4            21,144        2.35             2.35                 (1.10)              (1.10)          584
       89.234                61,542        2.30             2.30                 (1.51)              (1.51)          425

        8.83    %       $   159,623         1.11%2           1.11%2               0.03%2              0.03%2          50%
       22.75                197,475        1.10             1.10                 (0.27)              (0.27)           33
       33.21                142,460        1.25             1.25                 (0.38)              (0.38)           48
        (  7.43)             92,789        1.17             1.18                 (0.43)              (0.44)           42
        (  0.64)             76,711        1.13             1.14                0.36                0.35              26
       54.32                 20,298        1.13             1.13                0.63                0.63              77

        2.73    %       $         -         1.42%2           1.42%2              (0.27)%2            (0.27)%2         50%

           8.67%3       $ 2,019,007         1.39%2           1.42%2              (0.25)%2            (0.28)%2         50%
       22.393             2,169,836        1.40             1.40                 (0.57)              (0.57)           33
       32.903             1,682,504        1.55             1.55                 (0.69)              (0.69)           48
        (  7.85)3         1,449,869        1.47             1.48                 (0.73)              (0.74)           42
        (  0.98)3         1,334,548        1.43             1.44                0.08                0.07              26
       53.453               552,365        1.40             1.40                0.42                0.42              77

           8.30%4       $   454,173         2.11%2           2.11%2              (0.94)%2            (0.94)%2         50%
       21.534               470,430        2.10             2.10                 (1.27)              (1.27)           33
       31.964               401,016        2.25             2.25                 (1.39)              (1.39)           48
          (8.51)4           340,529        2.17             2.18                 (1.43)              (1.44)           42
          (1.67)4           299,062        2.13             2.14                 (0.63)              (0.64)           26
       52.374               110,743        2.13             2.13                 (0.29)              (0.29)           77

           8.28%4       $   441,608         2.11%2           2.11%2              (0.96)%2            (0.96)%2         50%
       21.574               493,980        2.10             2.10                 (1.27)              (1.27)           33
       31.974               409,076        2.25             2.25                 (1.39)              (1.39)           48
        (  8.55)4           402,010        2.17             2.18                 (1.43)              (1.44)           42
        (  1.67)4           378,733        2.13             2.14                 (0.62)              (0.63)           26
       52.374               180,877        2.13             2.13                 (0.30)              (0.30)           77

                    133
                                BLACKROCK FUNDS
                        FINANCIAL HIGHLIGHTS (CONTINUED)

                 FOR A SHARE OUTSTANDING THROUGHOUT EACH PERIOD


                                                                    GAIN (LOSS)
                                       NET                        ON INVESTMENTS,                   DISTRIBUTIONS
                                      ASSET                      FOREIGN CURRENCY   DISTRIBUTIONS     FROM NET         NET
                                      VALUE           NET           AND OPTIONS        FROM NET       REALIZED     ASSET VALUE
                                    BEGINNING     INVESTMENT      (BOTH REALIZED      INVESTMENT       CAPITAL       END OF
                                    OF PERIOD    INCOME (LOSS)    AND UNREALIZED)       INCOME          GAINS        PERIOD
                                   ----------- ---------------- ------------------ --------------- -------------- ------------
     ------------
     Small/Mid-Cap Growth
     ------------
     Institutional Class
     10/01/04 through 3/31/0510     $   12.49     $   (0.11)         $   1.29          $     -        $      -     $   13.67
     9/30/04                            12.11       (  0.10)             0.48                -               -         12.49
     9/30/03                             9.06       (  0.08)             3.13                -               -         12.11
     9/30/02                             9.62       (  0.06)           ( 0.50)               -               -          9.06
     9/30/01                            16.48       (  0.04)             4.54                -         (  2.28)         9.62
     9/30/00                            11.26       (  0.10)             5.32                -               -         16.48
     Service Class
     1/28/05 through 3/31/0510      $   12.81     $   (0.03)         $   0.28          $     -        $      -     $   13.06
     Investor A Class
     10/01/04 through 3/31/0510     $   11.96     $   (0.09)         $   1.19          $     -        $      -     $   13.06
     9/30/04                            11.63       (  0.14)             0.47                -               -         11.96
     9/30/03                             8.73       (  0.11)             3.01                -               -         11.63
     9/30/02                             9.27       (  0.09)           ( 0.45)               -               -          8.73
     9/30/01                            16.08       (  0.08)           ( 4.45)               -         (  2.28)         9.27
     9/30/00                            11.01       (  0.14)             5.21                -               -         16.08
     Investor B Class
     10/01/04 through 3/31/0510     $   10.84     $   (0.11)         $   1.08          $     -        $      -     $   11.81
     9/30/04                            10.62       (  0.21)             0.43                -               -         10.84
     9/30/03                             8.03       (  0.16)             2.75                -               -         10.62
     9/30/02                             8.60       (  0.15)           ( 0.42)               -               -          8.03
     9/30/01                            15.17       (  0.15)           ( 4.14)               -         (  2.28)         8.60
     9/30/00                            10.46       (  0.24)             4.95                -               -         15.17
     Investor C Class
     10/01/04 through 3/31/0510     $   10.87     $   (0.12)         $   1.08          $     -        $      -     $   11.83
     9/30/04                            10.64       (  0.21)             0.44                -               -         10.87
     9/30/03                             8.05       (  0.16)             2.75                -               -         10.64
     9/30/02                             8.61       (  0.15)           ( 0.41)               -               -          8.05
     9/30/01                            15.17       (  0.15)           ( 4.13)               -         (  2.28)         8.61
     9/30/00                            10.46       (  0.24)             4.95                -               -         15.17
     ------------
     Small Cap Value Equity
     ------------
     BlackRock
     10/01/04 through 3/31/0510     $   15.23     $   0.03           $   2.06          $     -       $   (2.99)    $   14.33
     4/12/041 through 9/30/04           16.02             -            ( 0.79)               -               -         15.23
     Institutional Class
     10/01/04 thorough 3/31/0510    $   15.22     $   0.04           $   2.05          $     -       $   (2.99)    $   14.32
     9/30/04                            14.17       (  0.02)22           2.86                -         (  1.79)        15.22
     9/30/03                            12.81        0.01                3.31                -         (  1.96)        14.17
     9/30/02                            16.18             -            ( 1.02)           (0.02)        (  2.33)        12.81
     9/30/01                            17.12        0.16              ( 0.11)           (0.15)        (  0.84)        16.18
     9/30/00                            14.73        0.08                2.44            (0.13)              -         17.12
     Service Class
     10/01/04 through 3/31/0510     $   15.07     $   0.02           $   2.04          $     -       $   (2.99)    $   14.14
     9/30/04                            14.09       (  0.07)22           2.84                -         (  1.79)        15.07
     9/30/03                            12.77       (  0.03)             3.31                -         (  1.96)        14.09
     9/30/02                            16.18       (  0.04)           ( 1.04)               -         (  2.33)        12.77
     9/30/01                            17.10        0.10              ( 0.08)           (0.10)        (  0.84)        16.18
     9/30/00                            14.71             -              2.47            (0.08)              -         17.10

SEE ACCOMPANYING NOTES TO FINANCIAL STATEMENTS.
                                      134
                                BLACKROCK FUNDS


                                                    RATIO OF TOTAL                           RATIO OF NET
                                   RATIO OF NET       EXPENSE TO         RATIO OF NET     INVESTMENT INCOME
                     NET ASSETS     EXPENSES TO      AVERAGE NET      INVESTMENT INCOME     TO AVERAGE NET    PORTFOLIO
      TOTAL        END OF PERIOD    AVERAGE NET   ASSETS (EXCLUDING     TO AVERAGE NET    ASSETS (EXCLUDING   TURNOVER
      RETURN           (000)          ASSETS           WAIVERS)             ASSETS             WAIVERS)         RATE
- ----------------- --------------- -------------- ------------------- ------------------- ------------------- ----------
       9.45   %      $  35,483          1.10%2           1.29%2              (0.86)%2            (1.05)%2         65%
      3.14              87,520         1.09             1.28                 (0.80)              (0.99)          208
     33.66               7,809         1.10             1.55                 (0.78)              (1.23)          167
      (  5.82)           6,054         1.10             1.69                 (0.60)              (1.19)          168
     29.73               5,810         1.10             1.77                 (0.39)              (1.06)          282
     46.36               8,744         1.10             1.33                 (0.64)              (0.87)          219

       1.95   %      $       -          1.35%2           1.54%2              (1.11)%2            (1.30)%2         65%

         9.20%3      $ 231,377          1.39%2           1.67%2              (1.13)%2            (1.41)%2         65%
      2.843            268,065         1.39             1.56                 (1.09)              (1.26)          208
     33.223            117,571         1.40             1.78                 (1.10)              (1.48)          167
      (  5.93)3         41,474         1.40             1.98                 (0.90)              (1.48)          168
      ( 30.22)3         39,522         1.40             2.07                 (0.69)              (1.36)          282
     46.053             53,600         1.37             1.60                 (0.90)              (1.13)          219

         8.95%4      $  24,536          2.10%2           2.35%2              (1.84)%2            (2.09)%2         65%
      2.174             24,880         2.09             2.25                 (1.79)              (1.95)          208
     32.254             19,797         2.10             2.54                 (1.78)              (2.22)          167
        (6.63)4         13,288         2.10             2.68                 (1.60)              (2.18)          168
       (30.48)4         12,749         2.10             2.77                 (1.39)              (2.06)          282
     45.034             16,554         2.10             2.33                 (1.59)              (1.82)          219

         8.83%4      $  26,079          2.10%2           2.36%2              (1.84)%2            (2.10)%2         65%
      2.164             29,627         2.09             2.26                 (1.79)              (1.96)          208
     32.174             13,530         2.10             2.51                 (1.79)              (2.20)          167
      (  6.50)4          5,794         2.10             2.68                 (1.60)              (2.18)          168
      ( 30.40)4          5,332         2.10             2.77                 (1.39)              (2.06)          282
     45.034              9,082         2.10             2.33                 (1.63)              (1.86)          219

      14.00   %      $   6,463          1.05%2           1.06%2               0.41%2              0.41%2          71%
      (  4.93)11         4,787         1.102            1.332                (0.17)2             (0.40)2         154

      14.00   %      $  66,031          0.97%2           0.99%2               0.48%2              0.46%2          71%
     20.8711            66,083         0.95             0.98                 (0.15)              (0.18)          154
     29.9611            69,641         0.91             0.94                0.09                0.06             240
        (8.25)         122,732         0.88             0.89                     -               (0.01)          260
      0.47             367,167         0.87             0.87                0.87                0.87             184
     17.15             470,830         0.86             0.86                0.79                0.79             168

      13.93   %      $   3,145          1.24%2           1.24%2               0.25%2              0.25%2          71%
     20.4511             3,288         1.25             1.29                 (0.45)              (0.48)          154
     29.7011             4,139         1.21             1.24                 (0.19)              (0.22)          240
      (  8.64)           7,242         1.18             1.19                 (0.24)              (0.25)          260
      0.28              47,095         1.17             1.17                0.56                0.56             184
     16.80              50,980         1.16             1.16                0.49                0.49             168

                    135
                                BLACKROCK FUNDS
                        FINANCIAL HIGHLIGHTS (CONTINUED)

                 FOR A SHARE OUTSTANDING THROUGHOUT EACH PERIOD


                                                                  GAIN (LOSS)
                                      NET                       ON INVESTMENTS,
                                     ASSET                     FOREIGN CURRENCY
                                     VALUE          NET           AND OPTIONS
                                   BEGINNING     INVESTMENT     (BOTH REALIZED
                                   OF PERIOD   INCOME (LOSS)    AND UNREALIZED)
                                  ----------- --------------- ------------------
     ------------------
     Small Cap Value Equity (Continued)
     ------------------
     Investor A Class
     10/01/04 through 3/31/0510    $   15.00    $   0.02           $   2.04
     9/30/04                           14.04       (  0.09)22          2.84
     9/30/03                           12.76       (  0.05)            3.29
     9/30/02                           16.18       (  0.10)          ( 0.99)
     9/30/01                           17.10        0.06             ( 0.07)
     9/30/00                           14.71       (  0.02)            2.46
     Investor B Class
     10/01/04 through 3/31/0510    $   13.77    $    (0.04)        $   1.86
     9/30/04                           13.11       (  0.19)22          2.64
     9/30/03                           12.11       (  0.13)            3.09
     9/30/02                           15.58       (  0.20)          ( 0.94)
     9/30/01                           16.56       (  0.06)          ( 0.07)
     9/30/00                           14.31       (  0.23)            2.48
     Investor C Class
     10/01/04 through 3/31/0510    $   13.78    $    (0.04)        $   1.86
     9/30/04                           13.11       (  0.19)22          2.65
     9/30/03                           12.12       (  0.14)            3.09
     9/30/02                           15.59       (  0.20)          ( 0.94)
     9/30/01                           16.57       (  0.05)          ( 0.08)
     9/30/00                           14.31       (  0.28)            2.54
     ------------
     Small Cap Core Equity
     ------------
     Institutional Class
     10/01/04 through 3/31/0510    $   14.77    $    (0.04)        $   1.54
     9/30/04                           11.99       (  0.13)            3.01
     9/30/03                            8.35       (  0.06)            3.70
     1/02/021 through 9/30/02          10.00       (  0.04)          ( 1.61)
     Service Class
     10/01/04 through 3/31/0510    $   14.73    $    (0.01)        $   1.54
     9/30/04                           11.99       (  0.20)            3.04
     9/30/03                            8.35             -             3.64
     1/02/021 through 9/30/02          10.00             -           ( 1.65)
     Investor A Class
     10/01/04 through 3/31/0510    $   14.71    $    (0.06)        $   1.53
     9/30/04                           11.99       (  0.24)            3.04
     9/30/03                            8.35             -             3.64
     1/02/021 through 9/30/02          10.00             -           ( 1.65)
     Investor B Class
     10/01/04 through 3/31/0510    $   14.61    $    (0.09)        $   1.48
     9/30/04                           11.99       (  0.37)            3.07
     9/30/03                            8.35             -             3.64
     1/02/021 through 9/30/02          10.00             -           ( 1.65)
     Investor C Class
     10/01/04 through 3/31/0510    $   14.60    $    (0.10)        $   1.50
     9/30/04                           11.99       (  0.28)            2.99
     9/30/03                            8.35             -             3.64
     1/02/021 through 9/30/02          10.00             -           ( 1.65)


                                                   DISTRIBUTIONS
                                   DISTRIBUTIONS     FROM NET     REDEMPTION       NET
                                      FROM NET       REALIZED     FEES ADDED   ASSET VALUE
                                     INVESTMENT       CAPITAL     TO PAID-IN     END OF
                                       INCOME          GAINS        CAPITAL      PERIOD
                                  --------------- -------------- ------------ ------------
     ------------------
     Small Cap Value Equity
(Continued)
     ------------------
     Investor A Class
     10/01/04 through 3/31/0510      $      -       $   (2.99)     $     -     $   14.05
     9/30/04                                -         (  1.79)           -         15.00
     9/30/03                                -         (  1.96)           -         14.04
     9/30/02                                -         (  2.33)           -         12.76
     9/30/01                            (0.07)        (  0.84)           -         16.18
     9/30/00                            (0.05)              -            -         17.10
     Investor B Class
     10/01/04 through 3/31/0510      $      -       $   (2.99)     $     -     $   12.60
     9/30/04                                -         (  1.79)           -         13.77
     9/30/03                                -         (  1.96)           -         13.11
     9/30/02                                -         (  2.33)           -         12.11
     9/30/01                            (0.01)        (  0.84)           -         15.58
     9/30/00                                -               -            -         16.56
     Investor C Class
     10/01/04 through 3/31/0510      $      -       $   (2.99)     $     -     $   12.61
     9/30/04                                -         (  1.79)           -         13.78
     9/30/03                                -         (  1.96)           -         13.11
     9/30/02                                -         (  2.33)           -         12.12
     9/30/01                            (0.01)        (  0.84)           -         15.59
     9/30/00                                                -            -         16.57
     ------------
     Small Cap Core Equity
     ------------
     Institutional Class
     10/01/04 through 3/31/0510      $      -       $   (0.11)     $     -     $   16.16
     9/30/04                                -         (  0.15)         0.05        14.77
     9/30/03                                -               -            -         11.99
     1/02/021 through 9/30/02               -               -            -          8.35
     Service Class
     10/01/04 through 3/31/0510      $      -       $   (0.11)     $     -     $   16.15
     9/30/04                                -         (  0.15)         0.05        14.73
     9/30/03                                -               -            -         11.99
     1/02/021 through 9/30/02               -               -            -          8.35
     Investor A Class
     10/01/04 through 3/31/0510      $      -       $   (0.11)     $     -     $   16.07
     9/30/04                                -         (  0.15)         0.07        14.71
     9/30/03                                -               -            -         11.99
     1/02/021 through 9/30/02               -               -            -          8.35
     Investor B Class
     10/01/04 through 3/31/0510      $      -       $   (0.11)     $     -     $   15.89
     9/30/04                                -         (  0.15)         0.07        14.61
     9/30/03                                -               -            -         11.99
     1/02/021 through 9/30/02               -               -            -          8.35
     Investor C Class
     10/01/04 through 3/31/0510      $      -       $   (0.11)     $     -     $   15.89
     9/30/04                                -         (  0.15)         0.05        14.60
     9/30/03                                -               -            -         11.99
     1/02/021 through 9/30/02               -               -            -          8.35

SEE ACCOMPANYING NOTES TO FINANCIAL STATEMENTS.
                                      136
                                BLACKROCK FUNDS


                                                           RATIO OF TOTAL                           RATIO OF NET
                                          RATIO OF NET       EXPENSE TO         RATIO OF NET     INVESTMENT INCOME
                            NET ASSETS     EXPENSES TO      AVERAGE NET      INVESTMENT INCOME     TO AVERAGE NET    PORTFOLIO
          TOTAL           END OF PERIOD    AVERAGE NET   ASSETS (EXCLUDING     TO AVERAGE NET    ASSETS (EXCLUDING   TURNOVER
         RETURN               (000)          ASSETS           WAIVERS)             ASSETS             WAIVERS)         RATE
- ------------------------ --------------- -------------- ------------------- ------------------- ------------------- ----------

           13.87%3           $ 32,976          1.24%2           1.34%2              0.20%2              0.10%2           71%
        20.383,11              35,240         1.35             1.47                (0.55)              (0.67)           154
        29.373,11              38,052         1.38             1.41                (0.37)              (0.40)           240
           (8.71)3             43,884         1.35             1.37                (0.62)              (0.64)           260
         0.093                 28,195         1.34             1.34               0.38                0.38              184
        16.603                 25,719         1.32             1.32               0.31                0.31              168

           13.46%4           $ 14,709          1.99%2           1.99%2             (0.55)%2            (0.55)%2          71%
        19.454,11              15,952         2.07             2.09                (1.28)              (1.30)           154
        28.524,11              15,019         2.13             2.16                (1.12)              (1.15)           240
         (  9.46)4             14,402         2.10             2.12                (1.32)              (1.34)           260
         (  0.66)4             16,599         2.09             2.09                (0.37)              (0.37)           184
        15.724                 11,831         2.08             2.08                (0.43)              (0.43)           168

           13.47%4           $  6,535          1.99%2           1.99%2             (0.54)%2            (0.54)%2          71%
        19.534,11               6,715         2.09             2.11                (1.30)              (1.32)           154
        28.424,11               5,839         2.13             2.16                (1.13)              (1.15)           240
           (9.45)4              6,113         2.10             2.12                (1.32)              (1.33)           260
           (0.65)4              7,051         2.09             2.09                (0.37)              (0.37)           184
        15.794                  4,666         2.08             2.08                (0.43)              (0.43)           168

           10.15%18          $  5,909          1.30%2           1.91%2             (0.74)%2            (1.35)%2          46%
        24.5121                 1,802         1.30             2.37                (0.89)              (1.96)            78
        43.59                   1,238         1.30             2.96                (0.62)              (2.28)           218
         ( 16.50)                 835         1.302            2.532               (0.60)2             (1.83)2          233

           10.38%18          $      5          1.60%2           2.16%2             (1.04)%2            (1.60)%2          46%
        24.1720                     -         1.60             2.67                (1.19)             2.26               78
        43.59                       -         1.60             3.26                (0.92)              (2.58)           218
          (16.50)                   -         1.602            2.832               (0.90)2             (2.13)2          233

            9.99%3,18        $  6,691          1.70%2           2.29%2             (1.13)%2            (1.72)%2          46%
        24.013,21               3,154         1.74             2.89                (1.32)              (2.48)            78
        43.593                      7         1.77             3.43                (1.09)              (2.75)           218
         ( 16.50)3                  -         1.772            3.002               (1.07)2             (2.30)2          233

            9.50%4,19        $  3,543          2.44%2           2.91%2             (1.88)%2            (2.35)%2          46%
        23.174,21               1,157         2.49             3.56                (2.07)              (3.15)            78
        43.594                      -         2.52             4.18                (1.84)              (3.50)           218
          (16.50)4                  -         2.522            3.752               (1.82)2             (3.05)2          233

            9.58%4,18        $  8,849          2.43%2           2.91%2             (1.87)%2            (2.35)%2          46%
        23.084,21               3,352         2.47             3.56                (2.03)              (3.11)            78
        43.594                      -         2.52             4.18                (1.84)              (3.50)           218
         ( 16.50)4                  -         2.522            3.752               (1.82)2             (3.05)2          233

                    137
BLACKROCK FUNDS
FINANCIAL HIGHLIGHTS (CONTINUED)
FOR A SHARE OUTSTANDING THROUGHOUT EACH PERIOD
GAIN (LOSS)
NET ON INVESTMENTS,
ASSET FOREIGN CURRENCY
VALUE NET AND OPTIONS
BEGINNING INVESTMENT (BOTH REALIZED
OF PERIOD INCOME (LOSS) AND UNREALIZED)
----------- ---------------- ------------------
-------------
Small Cap Growth Equity
-------------
Institutional Class
10/01/04 through 3/31/0510 $ 14.52 $ (0.05) $ 1.43
9/30/04 12.26 ( 0.11)22 2.37
9/30/03 9.00 ( 0.09) 3.35
9/30/02 11.74 ( 0.17) ( 2.57)
9/30/01 35.76 0.09 (15.38)
9/30/00 25.38 0.07 14.45
Service Class
10/01/04 through 3/31/0510 $ 13.92 $ (0.07) $ 1.38
9/30/04 11.79 ( 0.15)22 2.28
9/30/03 8.67 ( 0.12) 3.24
9/30/02 11.36 ( 0.19) ( 2.50)
9/30/01 34.91 0.03 (14.89)
9/30/00 24.93 ( 0.03) 14.15
Investor A Class
10/01/04 through 3/31/0510 $ 13.57 $ (0.07) $ 1.34
9/30/04 11.51 ( 0.16)22 2.22
9/30/03 8.48 ( 0.13) 3.16
9/30/02 11.12 ( 0.14) ( 2.50)
9/30/01 34.47 ( 0.01) (14.65)
9/30/00 24.73 ( 0.06) 13.94
Investor B Class
10/01/04 through 3/31/0510 $ 12.39 $ (0.13) $ 1.24
9/30/04 10.59 ( 0.24)22 2.04
9/30/03 7.86 ( 0.19) 2.92
9/30/02 10.39 ( 0.23) ( 2.30)
9/30/01 33.05 ( 0.12) (13.85)
9/30/00 23.97 ( 0.26) 13.48
Investor C Class
10/01/04 through 3/31/0510 $ 12.40 $ (0.11) $ 1.22
9/30/04 10.60 ( 0.25)22 2.05
9/30/03 7.86 ( 0.18) 2.92
9/30/02 10.39 ( 0.23) ( 2.30)
9/30/01 33.05 ( 0.12) (13.85)
9/30/00 23.97 ( 0.22) 13.44
----------------------
Global Science & Technology Opportunities
----------------------
Institutional Class
10/01/04 through 3/31/0510 $ 5.42 $ (0.03) $ 0.26
9/30/04 5.46 ( 0.07)22 0.03
9/30/03 3.59 ( 0.05) 1.92
9/30/02 4.41 ( 0.06)22 ( 0.76)
9/30/01 12.49 0.01 ( 8.09)
5/15/00 through 9/30/00 10.00 ( 0.01) 2.50
Service Class
10/01/04 through 3/31/0510 $ 5.35 $ (0.03) $ 0.26
9/30/04 5.41 ( 0.08)22 0.02
9/30/03 3.57 ( 0.06)22 1.90
9/30/02 4.39 ( 0.06)22 ( 0.76)
9/30/01 12.47 - ( 8.08)
5/15/00 through 9/30/00 10.00 ( 0.01) 2.48
Investor A Class
10/01/04 through 3/31/0510 $ 5.31 $ (0.03) $ 0.25
9/30/04 5.38 ( 0.09)22 0.02
9/30/03 3.55 ( 0.07) 1.90
9/30/02 4.38 ( 0.09) ( 0.74)
9/30/01 12.47 ( 0.03) ( 8.06)
5/15/00 through 9/30/00 10.00 ( 0.02) 2.49
DISTRIBUTIONS NET
DISTRIBUTIONS FROM NET REDEMPTION ASSET
FROM NET DISTRIBUTIONS REALIZED FEES ADDED VALUE
INVESTMENT FROM CAPITAL TO PAID-IN END OF
INCOME CAPITAL GAINS CAPITAL PERIOD
--------------- --------------- --------------- ------------ ------------
-------------
Small Cap Growth Equity
-------------
Institutional Class
10/01/04 through 3/31/0510 $ - $ - $ - $ 0.01 $ 15.91
9/30/04 - - - - 14.52
9/30/03 - - - - 12.26
9/30/02 - - - - 9.00
9/30/01 (0.12) (0.10) (8.51) - 11.74
9/30/00 - - (4.14) - 35.76
Service Class
10/01/04 through 3/31/0510 $ - $ - $ - $ 0.01 $ 15.24
9/30/04 - - - - 13.92
9/30/03 - - - - 11.79
9/30/02 - - - - 8.67
9/30/01 (0.08) (0.10) (8.51) - 11.36
9/30/00 - - (4.14) - 34.91
Investor A Class
10/01/04 through 3/31/0510 $ - $ - $ - $ 0.01 $ 14.85
9/30/04 - - - - 13.57
9/30/03 - - - - 11.51
9/30/02 - - - - 8.48
9/30/01 (0.08) (0.10) (8.51) - 11.12
9/30/00 - - (4.14) - 34.47
Investor B Class
10/01/04 through 3/31/0510 $ - $ - $ - $ 0.01 $ 13.51
9/30/04 - - - 0.01 12.39
9/30/03 - - - - 10.59
9/30/02 - - - - 7.86
9/30/01 (0.08) (0.10) (8.51) - 10.39
9/30/00 - - (4.14) - 33.05
Investor C Class
10/01/04 through 3/31/0510 $ - $ - $ - $ 0.01 $ 13.52
9/30/04 - - - 0.01 12.40
9/30/03 - - - - 10.60
9/30/02 - - - - 7.86
9/30/01 (0.08) (0.10) (8.51) - 10.39
9/30/00 - - (4.14) - 33.05
----------------------
Global Science & Technology
Opportunities
----------------------
Institutional Class
10/01/04 through 3/31/0510 $ - $ - $ - $ - $ 5.65
9/30/04 - - - - 5.42
9/30/03 - - - - 5.46
9/30/02 - - - - 3.59
9/30/01 - - - - 4.41
5/15/00 through 9/30/00 - - - - 12.49
Service Class
10/01/04 through 3/31/0510 $ - $ - $ - $ - $ 5.58
9/30/04 - - - - 5.35
9/30/03 - - - - 5.41
9/30/02 - - - - 3.57
9/30/01 - - - - 4.39
5/15/00 through 9/30/00 - - - - 12.47
Investor A Class
10/01/04 through 3/31/0510 $ - $ - $ - $ - $ 5.53
9/30/04 - - - - 5.31
9/30/03 - - - - 5.38
9/30/02 - - - - 3.55
9/30/01 - - - - 4.38
5/15/00 through 9/30/00 - - - - 12.47
SEE ACCOMPANYING NOTES TO FINANCIAL STATEMENTS.
138
                                BLACKROCK FUNDS


                                                           RATIO OF TOTAL                           RATIO OF NET
                                          RATIO OF NET       EXPENSE TO         RATIO OF NET     INVESTMENT INCOME
                            NET ASSETS     EXPENSES TO      AVERAGE NET      INVESTMENT INCOME     TO AVERAGE NET    PORTFOLIO
          TOTAL           END OF PERIOD    AVERAGE NET   ASSETS (EXCLUDING     TO AVERAGE NET    ASSETS (EXCLUDING   TURNOVER
         RETURN               (000)          ASSETS           WAIVERS)             ASSETS             WAIVERS)         RATE
- ------------------------ --------------- -------------- ------------------- ------------------- ------------------- ----------
            9.57%12         $  314,247         0.92%2           0.92%2              (0.68)%2            (0.68)%2         47%
       18.4315                 272,324        0.92             0.93                 (0.73)              (0.74)           81
       36.2211                 164,856        0.89             0.92                 (0.75)              (0.78)          167
         ( 23.34)              176,858        0.85             0.87                 (0.67)              (0.69)          238
         ( 53.73)              843,359        0.82             0.82                0.52                0.52             363
       63.03                 2,196,700        0.78             0.78                0.20                0.20             218

            9.48%12         $   29,273         1.17%2           1.17%2              (0.94)%2            (0.94)%2         47%
       18.0716                  29,569        1.20             1.20                 (1.02)              (1.02)           81
       35.9911                  23,466        1.19             1.22                 (1.05)              (1.08)          167
          (23.68)               29,023        1.15             1.17                 (0.97)              (0.99)          238
          (53.76)              141,001        1.11             1.11                0.20                0.20             363
       62.51                   315,647        1.08             1.08                 (0.09)              (0.09)          218

            9.43%3,12       $  145,395         1.17%2           1.27%2              (0.93)%2            (1.03)%2         47%
       17.903,16               131,795        1.30             1.40                 (1.12)              (1.22)           81
       35.733,11               102,642        1.37             1.40                 (1.22)              (1.25)          167
         ( 23.74)3              95,620        1.33             1.36                 (1.14)              (1.17)          238
         ( 53.90)3              85,211        1.29             1.29                0.02                0.02             363
       61.963                  175,112        1.23             1.23                 (0.21)              (0.21)          218

            9.04%4,12       $   19,713         1.92%2           1.92%2              (1.70)%2            (1.70)%2         47%
       17.004,17                23,983        2.07             2.07                 (1.89)              (1.89)           81
       34.734,11                24,167        2.11             2.14                 (1.97)              (2.00)          167
          (24.35)4              21,958        2.07             2.10                 (1.89)              (1.92)          238
          (54.22)4              37,351        2.03             2.03                 (0.69)              (0.69)          363
       61.074                   95,922        1.98             1.98                 (0.96)              (0.96)          218

            9.03%4,12       $   14,692         1.92%2           1.92%2              (1.69)%2            (1.69)%2         47%
       16.984,16                13,989        2.08             2.08                 (1.90)              (1.90)           81
       34.864,11                11,396        2.11             2.14                 (1.97)              (2.00)          167
         ( 24.35)4               9,665        2.07             2.10                 (1.89)              (1.92)          238
         ( 54.21)4              18,170        2.03             2.03                 (0.67)              (0.67)          363
       61.074                   49,276        1.99             1.99                 (0.92)              (0.92)          218

        4.44     %          $      972         1.43%2           1.88%2              (0.70)%2            (1.15)%2         59%
         (  0.73)11              1,592        1.43             1.63                 (1.12)              (1.32)          115
       52.09                     2,821        1.35             1.63                 (1.06)              (1.34)          226
         ( 18.59)                2,385        1.20             1.31                 (1.00)              (1.11)          587
         ( 64.69)                7,189        1.20             1.45                0.14                 (0.11)          748
       24.90                    21,383        1.202            2.192                (0.21)2             (1.20)2         175

        4.30     %          $       81         1.73%2           2.13%2              (1.03)%2            (1.42)%2         59%
           (1.11)11                 86        1.73             1.94                 (1.41)              (1.61)          115
       51.54                       108        1.67             1.88                 (1.38)              (1.59)          226
          (18.68)                   30        1.50             1.63                 (1.30)              (1.43)          587
          (64.80)                   19        1.50             1.73                     -               (0.24)          748
       24.70                        17        1.502            2.492                (0.51)2             (1.50)2         175

            4.14%3          $    9,048         1.83%2           2.23%2              (1.13)%2            (1.53)%2         59%
         (  1.30)3,11            9,929        1.89             2.14                 (1.56)              (1.81)          115
       51.553                   11,406        1.83             2.10                 (1.53)              (1.81)          226
         ( 18.95)3               9,104        1.67             1.79                 (1.47)              (1.59)          587
         ( 64.88)3              14,551        1.67             1.91                 (0.36)              (0.60)          748
       24.703                   41,474        1.672            2.662                (0.68)2             (1.67)2         175

                    139
BLACKROCK FUNDS
FINANCIAL HIGHLIGHTS (CONTINUED)
FOR A SHARE OUTSTANDING THROUGHOUT EACH PERIOD
GAIN (LOSS)
NET ON INVESTMENTS,
ASSET FOREIGN CURRENCY
VALUE NET AND OPTIONS
BEGINNING INVESTMENT (BOTH REALIZED
OF PERIOD INCOME (LOSS) AND UNREALIZED)
----------- --------------- ------------------
-----------------------------
Global Science & Technology Opportunities (Continued)
-----------------------------
Investor B Class
10/01/04 through 3/31/0510 $ 5.13 $ (0.06) $ 0.26
9/30/04 5.24 ( 0.13)22 0.02
9/30/03 3.49 ( 0.10) 1.85
9/30/02 4.33 ( 0.14) ( 0.70)
9/30/01 12.44 ( 0.09) ( 8.02)
5/15/001 through 9/30/00 10.00 ( 0.03) 2.47
Investor C Class
10/01/04 through 3/31/0510 $ 5.14 $ (0.06) $ 0.25
9/30/04 5.24 ( 0.13)22 0.03
9/30/03 3.49 ( 0.10) 1.85
9/30/02 4.33 ( 0.15) ( 0.69)
9/30/01 12.44 ( 0.10) ( 8.01)
5/15/001 through 9/30/00 10.00 ( 0.03) 2.47
---------
Global Resources
---------
Institutional Class
3/01/05 through 3/31/0510 $ 58.80 $ (0.02) $ (1.54)
7/01/04 through 2/28/05 41.25 ( 0.08) 19.52
6/30/04 26.85 0.27 14.78
6/30/03 23.51 ( 0.04) 3.38
6/30/02 22.13 ( 0.09) 1.47
6/30/01 17.21 ( 0.18) 5.10
6/30/00 12.43 ( 0.15) 4.93
Investor A Class
3/01/05 through 3/31/0510 $ 56.23 $ (0.01) $ (1.49)
7/01/04 through 2/28/05 39.58 ( 0.15) 18.69
6/30/04 25.81 0.21 14.15
6/30/03 22.74 ( 0.10) 3.17
6/30/02 21.50 ( 0.15) 1.39
6/30/01 16.79 ( 0.22) 4.93
6/30/00 12.15 ( 0.17) 4.81
Investor B Class
3/01/05 through 3/31/0510 $ 51.58 $ (0.04) $ (1.37)
7/01/04 through 2/28/05 36.52 ( 0.32) 17.18
6/30/04 23.89 ( 0.06) 13.14
6/30/03 21.20 ( 0.23) 2.92
6/30/02 20.16 ( 0.27) 1.31
6/30/01 15.85 ( 0.33) 4.64
6/30/00 11.56 ( 0.26) 4.55
Investor C Class
3/01/05 through 3/31/0510 $ 51.53 $ (0.04) $ (1.37)
7/01/04 through 2/28/05 36.48 ( 0.30) 17.14
6/30/04 23.88 ( 0.03) 13.10
6/30/03 21.18 ( 0.23) 2.93
6/30/02 20.14 ( 0.28) 1.32
6/30/01 15.84 ( 0.34) 4.64
6/30/00 11.54 ( 0.25) 4.55
-------------
All-Cap Global Resources
-------------
Institutional Class
2/16/051 through 3/31/0510 $ 10.00 $ 0.01 $ 0.03
Service Class
2/16/051 through 3/31/0510 $ 10.00 $ (0.01) $ 0.05
NET
DISTRIBUTIONS DISTRIBUTIONS ASSET VALUE
FROM NET INVESTMENT FROM END OF
INCOME CAPITAL PERIOD
--------------------- --------------- ------------
----------------------------
Global Science & Technology
Opportunities (Continued)
----------------------------
Investor B Class
10/01/04 through 3/31/0510 $ - $ - $ 5.33
9/30/04 - - 5.13
9/30/03 - - 5.24
9/30/02 - - 3.49
9/30/01 - - 4.33
5/15/001 through 9/30/00 - - 12.44
Investor C Class
10/01/04 through 3/31/0510 $ - $ - $ 5.33
9/30/04 - - 5.14
9/30/03 - - 5.24
9/30/02 - - 3.49
9/30/01 - - 4.33
5/15/001 through 9/30/00 - - 12.44
---------
Global Resources
---------
Institutional Class
3/01/05 through 3/31/0510 $ - $ - $ 57.24
7/01/04 through 2/28/05 (0.34) (1.55) 58.80
6/30/04 (0.65) - 41.25
6/30/03 - - 26.85
6/30/02 - - 23.51
6/30/01 - - 22.13
6/30/00 - - 17.21
Investor A Class
3/01/05 through 3/31/0510 $ - $ - $ 54.73
7/01/04 through 2/28/05 (0.34) (1.55) 56.23
6/30/04 (0.59) - 39.58
6/30/03 - - 25.81
6/30/02 - - 22.74
6/30/01 - - 21.50
6/30/00 - - 16.79
Investor B Class
3/01/05 through 3/31/0510 $ - $ - $ 50.17
7/01/04 through 2/28/05 (0.25) (1.55) 51.58
6/30/04 (0.45) - 36.52
6/30/03 - - 23.89
6/30/02 - - 21.20
6/30/01 - - 20.16
6/30/00 - - 15.85
Investor C Class
3/01/05 through 3/31/0510 $ - $ - $ 50.12
7/01/04 through 2/28/05 (0.24) (1.55) 51.53
6/30/04 (0.47) - 36.48
6/30/03 - - 23.88
6/30/02 - - 21.18
6/30/01 - - 20.14
6/30/00 - - 15.84
-------------
All-Cap Global Resources
-------------
Institutional Class
2/16/051 through 3/31/0510 $ - $ - $ 10.04
Service Class
2/16/051 through 3/31/0510 $ - $ - $ 10.04
SEE ACCOMPANYING NOTES TO FINANCIAL STATEMENTS.
140
                                BLACKROCK FUNDS


                                                          RATIO OF TOTAL                           RATIO OF NET
                                         RATIO OF NET       EXPENSE TO         RATIO OF NET     INVESTMENT INCOME
                           NET ASSETS     EXPENSES TO      AVERAGE NET      INVESTMENT INCOME     TO AVERAGE NET    PORTFOLIO
         TOTAL           END OF PERIOD    AVERAGE NET   ASSETS (EXCLUDING     TO AVERAGE NET    ASSETS (EXCLUDING   TURNOVER
         RETURN              (000)          ASSETS           WAIVERS)             ASSETS             WAIVERS)         RATE
- ----------------------- --------------- -------------- ------------------- ------------------- ------------------- ----------
           3.90%4          $  10,751          2.58%2           2.88%2              (1.88)%2            (2.18)%2         59%
        (  2.10)4,11          12,315         2.65             2.82                 (2.33)              (2.50)          115
       50.144                 16,646         2.57             2.85                 (2.28)              (2.55)          226
        ( 19.40)4             12,944         2.38             2.50                 (2.18)              (2.29)          587
        ( 65.19)4             22,062         2.42             2.65                 (1.12)              (1.35)          748
       24.404                 60,094         2.422            3.412                (1.43)2             (2.42)2         175

           3.90%4          $   2,699          2.58%2           2.89%2              (1.88)%2            (2.19)%2         59%
          (1.91)4,11           3,244         2.65             2.80                 (2.33)              (2.48)          115
       50.144                  4,024         2.57             2.85                 (2.28)              (2.55)          226
         (19.40)4              3,010         2.59             2.72                 (2.37)              (2.50)          587
         (65.19)4              5,708         2.42             2.65                 (1.09)              (1.32)          748
       24.404                 13,057         2.422            3.412                (1.43)2             (2.42)2         175

        (  2.65)    %      $  26,595          1.04%2           1.10%2               0.08%2              0.02%2           2%
       47.98                  29,188         1.012            1.022                (0.16)2             (0.17)2          22
       56.49                  20,044         1.04             1.04                0.79                0.79              27
       14.21                  10,144         1.30             1.31                 (0.20)              (0.20)           33
        6.24                   7,995         1.43             1.44                 (0.42)              (0.42)           38
       28.59                   6,935         1.31             1.33                 (0.89)              (0.89)           38
       38.46                   8,599         1.46             1.48                 (1.11)                  -            47

          (2.67)%3         $ 658,700          1.34%2           1.45%2              (0.22)%2            (0.33)%2          2%
       47.733                676,234         1.362            1.382                (0.52)2             (0.54)2          22
       56.063                406,209         1.34             1.34                0.64                0.64              27
       13.503                103,987         1.60             1.61                 (0.47)              (0.47)           33
        5.773                 89,883         1.73             1.74                 (0.73)              (0.73)           38
       28.053                 81,880         1.61             1.63                 (1.11)              (1.11)           38
       38.19                  70,152         1.72             1.74                 (1.34)                  -            47

        (  2.74)%4         $  90,877          2.04%2           2.11%2              (0.92)%2            (0.99)%2          2%
       47.084                 94,506         2.012            2.022                (1.17)2             (1.18)2          22
       55.074                 66,704         2.04             2.04                 (0.20)              (0.20)           27
       12.694                 29,782         2.30             2.31                 (1.17)              (1.17)           33
        5.164                 25,626         2.43             2.44                 (1.41)              (1.41)           38
       27.194                 19,237         2.31             2.33                 (1.78)              (1.78)           38
       37.11                   8,608         2.46             2.48                 (1.78)                  -            47

          (2.74)%4         $ 163,253          2.04%2           2.10%2              (0.92)%2            (0.98)%2          2%
       47.054                169,871         2.012            2.022                (1.17)2             (1.18)2          22
       55.054                122,088         2.04             2.04                 (0.10)              (0.10)           27
       12.754                 37,601         2.30             2.31                 (1.18)              (1.18)           33
        5.164                 31,853         2.43             2.44                 (1.43)              (1.43)           38
       27.154                 30,214         2.31             2.33                 (1.83)              (1.83)           38
       37.26                  23,313         2.46             2.48                 (2.06)                  -            47

        0.40     %         $   5,151          1.04%2           2.62%2               0.74%2             (0.85)%2          4%

        0.40     %         $       -          1.34%2           2.87%2               0.44%2             (1.09)%2          4%

                    141
                                BLACKROCK FUNDS
                        FINANCIAL HIGHLIGHTS (CONTINUED)

                 FOR A SHARE OUTSTANDING THROUGHOUT EACH PERIOD


                                                                  GAIN (LOSS)
                                      NET                       ON INVESTMENTS,
                                     ASSET                     FOREIGN CURRENCY
                                     VALUE          NET           AND OPTIONS
                                   BEGINNING     INVESTMENT     (BOTH REALIZED
                                   OF PERIOD   INCOME (LOSS)    AND UNREALIZED)
                                  ----------- --------------- ------------------
     -------------------
     All-Cap Global Resources (Continued)
     -------------------
     Investor A Class
     2/16/051 through 3/31/0510    $   10.00     $      -          $   0.05
     Investor B Class
     2/16/051 through 3/31/0510    $   10.00     $      -          $   0.04
     Investor C Class
     2/16/051 through 3/31/0510    $   10.00     $      -          $   0.05
     --------
     Health Sciences
     --------
     Institutional Class
     3/01/05 through 3/31/0510     $   20.50     $   0.01         $   (0.21)
     2/28/05                           21.15      (  0.15)             0.57
     2/29/04                           11.64      (  0.06)            10.21
     2/28/03                           14.48      (  0.09)          (  2.71)
     2/28/02                           14.14      (  0.08)             0.47
     2/28/01                           15.50         0.01           (  0.68)
     Service Class
     3/01/05 through 3/31/0510     $   20.24     $   0.01         $   (0.19)
     1/28/051 through 2/28/05          20.30      (  0.01)          (  0.05)
     Investor A Class
     3/01/05 through 3/31/0510     $   20.24    $   (0.04)        $   (0.16)
     2/28/05                           20.96      (  0.17)             0.52
     2/29/04                           11.57      (  0.12)            10.15
     2/28/03                           14.43      (  0.12)          (  2.70)
     2/28/02                           14.14      (  0.13)             0.47
     2/28/01                           13.33      (  0.06)             1.88
     Investor B Class
     3/01/05 through 3/31/0510     $   19.65    $   (0.02)        $   (0.18)
     2/28/05                           20.52      (  0.28)             0.48
     2/29/04                           11.41      (  0.24)             9.99
     2/28/03                           14.34      (  0.21)          (  2.68)
     2/28/02                           14.14      (  0.23)             0.48
     2/28/01                           15.50      (  0.04)          (  0.63)
     Investor C Class
     3/01/05 through 3/31/0510     $   19.61    $   (0.01)        $   (0.19)
     2/28/05                           20.47      (  0.22)             0.43
     2/29/04                           11.39      (  0.23)             9.95
     2/28/03                           14.31      (  0.21)          (  2.67)
     2/28/02                           14.11      (  0.23)             0.48
     2/28/01                           15.50      (  0.04)          (  0.66)


                                                                             NET
                                      DISTRIBUTIONS      DISTRIBUTIONS   ASSET VALUE
                                   FROM NET INVESTMENT        FROM         END OF
                                          INCOME            CAPITAL        PERIOD
                                  --------------------- --------------- ------------
     -------------------
     All-Cap Global Resources
(Continued)
     -------------------
     Investor A Class
     2/16/051 through 3/31/0510             $-             $      -      $   10.05
     Investor B Class
     2/16/051 through 3/31/0510             $-             $      -      $   10.04
     Investor C Class
     2/16/051 through 3/31/0510             $-             $      -      $   10.05
     --------
     Health Sciences
     --------
     Institutional Class
     3/01/05 through 3/31/0510              $-             $      -      $   20.30
     2/28/05                                 -                (1.07)         20.50
     2/29/04                                 -                (0.64)         21.15
     2/28/03                                 -                (0.04)         11.64
     2/28/02                                 -                (0.05)         14.48
     2/28/01                                 -                (0.69)         14.14
     Service Class
     3/01/05 through 3/31/0510              $-             $      -      $   20.06
     1/28/051 through 2/28/05                -                    -          20.24
     Investor A Class
     3/01/05 through 3/31/0510              $-             $      -      $   20.04
     2/28/05                                 -                (1.07)         20.24
     2/29/04                                 -                (0.64)         20.96
     2/28/03                                 -                (0.04)         11.57
     2/28/02                                 -                (0.05)         14.43
     2/28/01                                 -                (1.01)         14.14
     Investor B Class
     3/01/05 through 3/31/0510              $-             $      -      $   19.45
     2/28/05                                 -                (1.07)         19.65
     2/29/04                                 -                (0.64)         20.52
     2/28/03                                 -                (0.04)         11.41
     2/28/02                                 -                (0.05)         14.34
     2/28/01                                 -                (0.69)         14.14
     Investor C Class
     3/01/05 through 3/31/0510              $-             $      -      $   19.41
     2/28/05                                 -                (1.07)         19.61
     2/29/04                                 -                (0.64)         20.47
     2/28/03                                 -                (0.04)         11.39
     2/28/02                                 -                (0.05)         14.31
     2/28/01                                 -                (0.69)         14.11

SEE ACCOMPANYING NOTES TO FINANCIAL STATEMENTS.
                                      142
                                BLACKROCK FUNDS


                                                      RATIO OF TOTAL                           RATIO OF NET
                                     RATIO OF NET       EXPENSE TO         RATIO OF NET     INVESTMENT INCOME
                       NET ASSETS     EXPENSES TO      AVERAGE NET      INVESTMENT INCOME     TO AVERAGE NET    PORTFOLIO
       TOTAL         END OF PERIOD    AVERAGE NET   ASSETS (EXCLUDING     TO AVERAGE NET    ASSETS (EXCLUDING   TURNOVER
       RETURN            (000)          ASSETS           WAIVERS)             ASSETS             WAIVERS)         RATE
- ------------------- --------------- -------------- ------------------- ------------------- ------------------- ----------
         0.50%3         $  7,945          1.34%2           2.97%2              0.44%2              (1.19)%2         4%

         0.40%4         $  1,296          2.04%2           3.62%2             (0.26)%2             (1.84)%2         4%

         0.50%4         $  2,423          2.04%2           3.62%2             (0.26)%2             (1.84)%2         4%

      (  0.98)  %       $  4,302          1.25%2           1.25%2              0.30%2               0.30%2         14%
       1.84                4,262         1.25             1.37                (0.59)               (0.71)         173
      87.73                5,067         1.25             1.84                (0.38)               (0.97)         106
      ( 19.42)               988         1.25             2.75                (0.69)               (2.18)         157
       2.76                1,109         1.25             3.25                (0.56)               (2.53)          75
      (  4.48)               946         1.25             6.86               0.18                  (5.40)         139

        (0.89)  %       $      -          1.50%2           1.50%2              0.05%2               0.05%2         14%
        (0.30)                 -         0.822            0.822               (0.70)2              (0.70)2        173

      (  0.99)%3        $ 74,682          1.50%2           1.60%2              0.06%2              (0.04)%2        14%
       1.523              76,550         1.58             1.73                (0.90)               (1.05)         173
      87.133              54,638         1.55             2.11                (0.71)               (1.27)         106
      ( 19.63)3            9,250         1.55             3.04                (0.99)               (2.47)         157
       2.413              13,069         1.55             3.41                (0.88)               (2.71)          75
      14.313               6,863         1.54             8.44                (0.48)               (7.35)         139

        (1.02)%4        $ 29,599          2.25%2           2.25%2             (0.70)%2             (0.70)%2        14%
       0.804              29,495         2.25             2.39                (1.58)               (1.71)         173
      85.894              22,825         2.25             2.91                (1.44)               (2.10)         106
       (20.24)4            9,290         2.25             3.74                (1.69)               (3.17)         157
       1.774              11,399         2.25             3.99                (1.59)               (3.30)          75
        (4.47)4            4,645         2.25             8.54                (0.81)               (7.07)         139

      (  1.02)%4        $ 26,062          2.25%2           2.25%2             (0.70)%2             (0.70)%2        14%
       0.864              25,248         2.25             2.41                (1.56)               (1.71)         173
      85.874              11,017         2.25             2.77                (1.38)               (1.90)         106
      ( 20.21)4            1,291         2.25             3.74                (1.69)               (3.18)         157
       1.774               1,314         2.25             3.99                (1.58)               (3.29)          75
      (  4.67)4              645         2.25             8.15                (0.83)               (6.70)         139

                    143
BLACKROCK FUNDS
FINANCIAL HIGHLIGHTS (CONTINUED)
FOR A SHARE OUTSTANDING THROUGHOUT EACH PERIOD
GAIN (LOSS)
NET ON INVESTMENTS,
ASSET FOREIGN CURRENCY
VALUE NET AND OPTIONS
BEGINNING INVESTMENT (BOTH REALIZED
OF PERIOD INCOME (LOSS) AND UNREALIZED)
----------- ---------------- ------------------
---------
U. S. Opportunities
---------
Institutional Class
10/01/04 through 3/31/0510 $ 20.34 $ (0.08) $ 2.18
9/30/04 16.56 ( 0.17)22 3.95
9/30/03 13.06 ( 0.16) 3.66
9/30/02 17.76 ( 0.23)22 ( 4.06)
9/30/01 45.41 0.04 (17.61)
9/30/00 24.73 0.03 23.95
Service Class
10/01/04 through 3/31/0510 $ 19.93 $ (0.26) $ 2.28
9/30/04 16.27 ( 0.22)22 3.88
9/30/03 12.88 ( 0.19) 3.58
9/30/02 17.51 ( 0.51) ( 3.79)
9/30/01 45.08 ( 0.05) (17.44)
9/30/00 24.64 ( 0.07) 23.81
Investor A Class
10/01/04 through 3/31/0510 $ 19.78 $ (0.11) $ 2.12
9/30/04 16.17 ( 0.26)22 3.87
9/30/03 12.81 ( 0.21) 3.57
9/30/02 17.41 ( 0.42) ( 3.89)
9/30/01 44.93 ( 0.09) (17.35)
9/30/00 24.60 ( 0.17) 23.80
Investor B Class
10/01/04 through 3/31/0510 $ 18.87 $ (0.19) $ 2.03
9/30/04 15.55 ( 0.39)22 3.71
9/30/03 12.41 ( 0.32) 3.46
9/30/02 16.86 ( 0.54) ( 3.78)
9/30/01 44.15 ( 0.28) (16.93)
9/30/00 24.38 ( 0.45) 23.52
Investor C Class
10/01/04 through 3/31/0510 $ 18.85 $ (0.19) $ 2.03
9/30/04 15.53 ( 0.38)22 3.70
9/30/03 12.40 ( 0.32) 3.45
9/30/02 16.85 ( 0.55) ( 3.77)
9/30/01 44.14 ( 0.29) (16.92)
9/30/00 24.38 ( 0.44) 23.50
--------------
International Opportunities
--------------
Institutional Class
10/01/04 through 3/31/0510 $ 24.44 $ 0.06 $ 5.24
9/30/04 19.96 0.0822 4.41
9/30/03 15.22 - 4.73
9/30/02 14.86 0.05 0.27
9/30/01 22.54 0.30 ( 7.93)
9/30/00 12.90 0.13 10.91
Service Class
10/01/04 through 3/31/0510 $ 23.93 $ 0.04 $ 5.09
9/30/04 19.59 0.0622 4.30
9/30/03 14.98 0.05 4.55
9/30/02 14.66 ( 0.02) 0.30
9/30/01 22.36 0.29 ( 7.94)
9/30/00 12.84 0.08 10.84
Investor A Class
10/01/04 through 3/31/0510 $ 23.78 $ 0.02 $ 5.08
9/30/04 19.49 ( 0.02)22 4.32
9/30/03 14.94 0.01 4.53
9/30/02 14.65 ( 0.03) 0.28
9/30/01 22.34 0.13 ( 7.77)
9/30/00 12.84 0.08 10.82
DISTRIBUTIONS
FROM NET REDEMPTION NET
DISTRIBUTIONS REALIZED FEES ADDED ASSET VALUE
FROM NET INVESTMENT CAPITAL TO PAID-IN END OF
INCOME GAINS CAPITAL PERIOD
--------------------- -------------- ------------ ------------
---------
U. S. Opportunities
---------
Institutional Class
10/01/04 through 3/31/0510 $ - $ - $ - $ 22.44
9/30/04 - - - 20.34
9/30/03 - - - 16.56
9/30/02 ( 0.41) - - 13.06
9/30/01 - (10.08) - 17.76
9/30/00 - ( 3.30) - 45.41
Service Class
10/01/04 through 3/31/0510 $ - $ - $ - $ 21.95
9/30/04 - - - 19.93
9/30/03 - - - 16.27
9/30/02 ( 0.33) - - 12.88
9/30/01 - (10.08) - 17.51
9/30/00 - ( 3.30) - 45.08
Investor A Class
10/01/04 through 3/31/0510 $ - $ - $ - $ 21.79
9/30/04 - - - 19.78
9/30/03 - - - 16.17
9/30/02 ( 0.29) - - 12.81
9/30/01 - (10.08) - 17.41
9/30/00 - ( 3.30) - 44.93
Investor B Class
10/01/04 through 3/31/0510 $ - $ - $ - $ 20.71
9/30/04 - - - 18.87
9/30/03 - - - 15.55
9/30/02 ( 0.13) - - 12.41
9/30/01 - (10.08) - 16.86
9/30/00 - ( 3.30) - 44.15
Investor C Class
10/01/04 through 3/31/0510 $ - $ - $ - $ 20.69
9/30/04 - - - 18.85
9/30/03 - - - 15.53
9/30/02 ( 0.13) - - 12.40
9/30/01 - (10.08) - 16.85
9/30/00 - ( 3.30) - 44.14
--------------
International Opportunities
--------------
Institutional Class
10/01/04 through 3/31/0510 $ (0.32) $ - $ 0.01 $ 29.43
9/30/04 ( 0.02) - 0.01 24.44
9/30/03 - - 0.01 19.96
9/30/02 - - 0.04 15.22
9/30/01 - ( 0.05) - 14.86
9/30/00 - ( 1.40) - 22.54
Service Class
10/01/04 through 3/31/0510 $ (0.28) $ - $ 0.01 $ 28.79
9/30/04 ( 0.02) - - 23.93
9/30/03 - - 0.01 19.59
9/30/02 - - 0.04 14.98
9/30/01 - ( 0.05) - 14.66
9/30/00 - ( 1.40) - 22.36
Investor A Class
10/01/04 through 3/31/0510 $ (0.25) $ - $ 0.01 $ 28.64
9/30/04 ( 0.02) - 0.01 23.78
9/30/03 - - 0.01 19.49
9/30/02 - - 0.04 14.94
9/30/01 - ( 0.05) - 14.65
9/30/00 - ( 1.40) - 22.34
SEE ACCOMPANYING NOTES TO FINANCIAL STATEMENTS.
144
                                BLACKROCK FUNDS


                                                           RATIO OF TOTAL                           RATIO OF NET
                                          RATIO OF NET       EXPENSE TO         RATIO OF NET     INVESTMENT INCOME
                            NET ASSETS     EXPENSES TO      AVERAGE NET      INVESTMENT INCOME     TO AVERAGE NET    PORTFOLIO
          TOTAL           END OF PERIOD    AVERAGE NET   ASSETS (EXCLUDING     TO AVERAGE NET    ASSETS (EXCLUDING   TURNOVER
         RETURN               (000)          ASSETS           WAIVERS)             ASSETS             WAIVERS)         RATE
- ------------------------ --------------- -------------- ------------------- ------------------- ------------------- ----------
       10.32     %          $   5,854          1.60%2           1.69%2              (0.65)%2            (0.74)%2         51%
       22.8311                  6,074         1.60             1.65                 (0.92)              (0.97)          106
       26.80                    7,235         1.52             1.59                 (0.87)              (0.94)          248
         ( 25.04)              10,867         1.45             1.49                 (1.23)              (1.27)          361
         ( 46.34)              35,869         1.45             1.47                0.15                0.14             402
      103.63                  106,727         1.44             1.44                0.09                0.09             445

       10.14     %          $     424          1.90%2           1.95%2              (0.97)%2            (1.02)%2         51%
       22.5011                  2,303         1.90             1.97                 (1.15)              (1.22)          106
       26.32                      421         1.83             1.89                 (1.17)              (1.24)          248
          (25.26)                 483         1.75             1.79                 (1.51)              (1.56)          361
          (46.55)               1,059         1.75             1.77                 (0.19)              (0.21)          402
      102.98                    2,824         1.75             1.75                 (0.20)              (0.20)          445

           10.16%3          $  29,975          1.94%2           2.04%2              (0.99)%2            (1.09)%2         51%
       22.333,11               31,282         2.04             2.15                 (1.36)              (1.46)          106
       26.233                  29,258         2.00             2.06                 (1.34)              (1.40)          248
         ( 25.39)3             28,733         1.92             1.97                 (1.68)              (1.73)          361
         ( 46.61)3             51,232         1.93             1.94                 (0.30)              (0.32)          402
      102.683                 151,588         1.91             1.91                 (0.41)              (0.41)          445

            9.75%4          $  37,958          2.69%2           2.69%2              (1.74)%2            (1.74)%2         51%
       21.354,11               40,994         2.80             2.81                 (2.12)              (2.13)          106
       25.304                  41,259         2.74             2.81                 (2.09)              (2.15)          248
          (25.92)4             43,883         2.67             2.72                 (2.43)              (2.47)          361
          (47.01)4             79,401         2.67             2.69                 (1.06)              (1.08)          402
      101.174                 213,237         2.66             2.66                 (1.14)              (1.14)          445

            9.76%4          $  19,347          2.69%2           2.69%2              (1.74)%2            (1.74)%2         51%
       21.384,11               20,261         2.81             2.83                 (2.13)              (2.15)          106
       25.244                  20,761         2.74             2.81                 (2.09)              (2.15)          248
         ( 25.93)4             22,020         2.67             2.72                 (2.43)              (2.48)          361
         ( 47.02)4             42,007         2.67             2.69                 (1.02)              (1.04)          402
      101.124                 133,540         2.65             2.65                 (1.12)              (1.12)          445

           21.81%12         $ 155,536          1.43%2           1.48%2               0.36%2              0.32%2          48%
       22.5412                 96,535         1.45             1.58                0.31                0.17              98
       31.1413                 57,950         1.41             1.51                0.42                0.32              72
        2.42                   54,164         1.33             1.43                0.27                0.17             104
         ( 33.93)              60,531         1.33             1.40                1.36                1.30             207
       91.76                   85,206         1.33             1.48                0.74                0.59             296

           21.55%12         $  33,155          1.69%2           1.72%2               0.12%2              0.10%2          48%
       22.2512                 19,167         1.75             1.91                0.21                0.05              98
       30.7814                  1,573         1.72             1.80                0.30                0.22              72
        2.18                      670         1.60             1.70                 (0.17)              (0.27)          104
          (34.29)                 500         1.63             1.84                1.50                1.29             207
       91.21                      457         1.63             1.69                0.60                0.54             296

           21.57%3,12       $ 172,559          1.73%2           1.83%2               0.09%2             (0.01)%2         48%
       22.113,12               99,879         1.89             2.06                 (0.06)              (0.24)           98
       30.453,13               37,934         1.89             1.98                0.05                 (0.04)           72
        1.983                  25,969         1.80             1.91                 (0.17)              (0.27)          104
         ( 34.27)3             28,781         1.80             1.89                0.80                0.72             207
       91.043                  40,545         1.79             1.85                0.45                0.39             296

                    145
BLACKROCK FUNDS
FINANCIAL HIGHLIGHTS (CONTINUED)
FOR A SHARE OUTSTANDING THROUGHOUT EACH PERIOD
GAIN (LOSS)
NET ON INVESTMENTS,
ASSET FOREIGN CURRENCY
VALUE NET AND OPTIONS
BEGINNING INVESTMENT (BOTH REALIZED
OF PERIOD INCOME (LOSS) AND UNREALIZED)
----------- ---------------- ------------------
--------------------
International Opportunities (Continued)
--------------------
Investor B Class
10/01/04 through 3/31/0510 $ 22.80 $ (0.09) $ 4.89
9/30/04 18.83 ( 0.21)22 4.19
9/30/03 14.54 ( 0.12) 4.40
9/30/02 14.37 ( 0.16) 0.29
9/30/01 22.06 0.01 ( 7.65)
9/30/00 12.78 ( 0.04) 10.72
Investor C Class
10/01/04 through 3/31/0510 $ 22.80 $ (0.09) $ 4.89
9/30/04 18.84 ( 0.21)22 4.18
9/30/03 14.54 ( 0.11)22 4.40
9/30/02 14.36 ( 0.15) 0.29
9/30/01 22.06 0.01 ( 7.66)
9/30/00 12.78 ( 0.04) 10.72
--------
Asset Allocation*
--------
Institutional Class
3/01/05 through 3/31/0510 $ 14.99 $ 0.03 $ (0.24)
4/01/04 through 2/28/05 14.91 0.20 0.82
3/31/04 11.38 0.24 3.54
3/31/03 14.17 0.28 ( 2.68)
3/31/02 14.05 0.32 0.83
3/31/01 16.26 0.42 ( 0.41)
3/31/00 14.47 0.40 2.03
Service Class
3/01/05 through 3/31/0510 $ 14.97 $ (0.05) $ (0.15)
4/01/04 through 2/28/05 14.63 0.01 0.33
Investor A Class
3/01/05 through 3/31/0510 $ 14.95 $ 0.02 $ (0.22)
4/01/04 through 2/28/05 14.89 0.18 0.80
3/31/04 11.36 0.19 3.55
3/31/03 14.15 0.24 ( 2.68)
3/31/02 14.03 0.28 0.83
3/31/01 16.24 0.39 ( 0.40)
3/31/00 14.45 0.33 2.06
Investor B Class
3/01/05 through 3/31/0510 $ 14.81 $ 0.02 $ (0.24)
4/01/04 through 2/28/05 14.74 0.08 0.81
3/31/04 11.26 0.10 3.49
3/31/03 14.01 0.15 ( 2.63)
3/31/02 13.90 0.17 0.83
3/31/01 16.08 0.26 ( 0.37)
3/31/00 14.32 0.24 2.00
Investor C Class
3/01/05 through 3/31/0510 $ 14.81 $ 0.02 $ (0.24)
4/01/04 through 2/28/05 14.74 0.08 0.81
3/31/04 11.25 0.10 3.50
3/31/03 14.01 0.15 ( 2.65)
3/31/02 13.89 0.18 0.80
3/31/01 16.05 0.27 ( 0.38)
3/31/00 14.27 0.22 2.03
*The performance prior to January 31, 2005 set forth in this table is the
financial data of the State Street Research Asset Allocation Fund,
series of a predecessor company, the State Street Research Funds. BlackRock
Funds acquired all of the assets and certain stated liabilities of
the State Street Research Asset Allocation Fund on January 31, 2005. The net
asset values and other per share information listed have been
restated to reflect the conversion ratios of 0.71889936, 0.71991517,
0.72321182 and 0.72727901 for Institutional, Class A, Class B and Class
C shares, respectively.
DISTRIBUTIONS
FROM NET REDEMPTION NET
DISTRIBUTIONS REALIZED FEES ADDED ASSET VALUE
FROM NET INVESTMENT CAPITAL TO PAID-IN END OF
INCOME GAINS CAPITAL PERIOD
--------------------- -------------- ------------ ------------
--------------------
International Opportunities
(Continued)
--------------------
Investor B Class
10/01/04 through 3/31/0510 $ (0.10) $ - $ 0.01 $ 27.54
9/30/04 ( 0.02) - 0.01 22.80
9/30/03 - - 0.01 18.83
9/30/02 - - 0.04 14.54
9/30/01 - (0.05) - 14.37
9/30/00 - (1.40) - 22.06
Investor C Class
10/01/04 through 3/31/0510 $ (0.10) $ - $ 0.01 $ 27.51
9/30/04 ( 0.02) - 0.01 22.80
9/30/03 - - 0.01 18.84
9/30/02 - - 0.04 14.54
9/30/01 - (0.05) - 14.36
9/30/00 - (1.40) - 22.06
--------
Asset Allocation*
--------
Institutional Class
3/01/05 through 3/31/0510 $ (0.05) $ - $ - $ 14.73
4/01/04 through 2/28/05 ( 0.40) (0.54) - 14.99
3/31/04 ( 0.25) - - 14.91
3/31/03 ( 0.33) (0.06) - 11.38
3/31/02 ( 0.35) (0.68) - 14.17
3/31/01 ( 0.33) (1.89) - 14.05
3/31/00 ( 0.35) (0.29) - 16.26
Service Class
3/01/05 through 3/31/0510 $ (0.04) $ - $ - $ 14.72
4/01/04 through 2/28/05 - - - 14.97
Investor A Class
3/01/05 through 3/31/0510 $ (0.04) $ - $ - $ 14.71
4/01/04 through 2/28/05 ( 0.38) (0.54) - 14.95
3/31/04 ( 0.21) - - 14.89
3/31/03 ( 0.29) (0.06) - 11.36
3/31/02 ( 0.31) (0.68) - 14.15
3/31/01 ( 0.31) (1.89) - 14.03
3/31/00 ( 0.31) (0.29) - 16.24
Investor B Class
3/01/05 through 3/31/0510 $ (0.01) $ - $ - $ 14.58
4/01/04 through 2/28/05 ( 0.28) (0.54) - 14.81
3/31/04 ( 0.11) - - 14.74
3/31/03 ( 0.21) (0.06) - 11.26
3/31/02 ( 0.21) (0.68) - 14.01
3/31/01 ( 0.19) (1.88) - 13.90
3/31/00 ( 0.19) (0.29) - 16.08
Investor C Class
3/01/05 through 3/31/0510 $ (0.02) $ - $ - $ 14.57
4/01/04 through 2/28/05 ( 0.28) (0.54) - 14.81
3/31/04 ( 0.11) - - 14.74
3/31/03 ( 0.21) (0.05) - 11.25
3/31/02 ( 0.19) (0.67) - 14.01
3/31/01 ( 0.18) (1.87) - 13.89
3/31/00 ( 0.18) (0.29) - 16.05
SEE ACCOMPANYING NOTES TO FINANCIAL STATEMENTS.
146
                                BLACKROCK FUNDS


                                                             RATIO OF TOTAL                           RATIO OF NET
                                            RATIO OF NET       EXPENSE TO         RATIO OF NET     INVESTMENT INCOME
                              NET ASSETS     EXPENSES TO      AVERAGE NET      INVESTMENT INCOME     TO AVERAGE NET    PORTFOLIO
           TOTAL            END OF PERIOD    AVERAGE NET   ASSETS (EXCLUDING     TO AVERAGE NET    ASSETS (EXCLUDING   TURNOVER
          RETURN                (000)          ASSETS           WAIVERS)             ASSETS             WAIVERS)         RATE
- -------------------------- --------------- -------------- ------------------- ------------------- ------------------- ----------
            21.10%4,12        $  59,924          2.47%2           2.47%2              (0.71)%2            (0.71)%2         48%
         21.184,12               45,167         2.65             2.72                 (0.94)              (1.00)           98
         29.514,13               31,454         2.63             2.72                 (0.74)              (0.83)           72
          1.184                  25,917         2.54             2.64                 (0.93)              (1.03)          104
          ( 34.71)4              27,895         2.55             2.64                0.06                 (0.03)          207
         89.644                  56,136         2.52             2.60                 (0.27)              (0.33)          296

            21.14%4,12        $  89,015          2.47%2           2.47%2              (0.66)%2            (0.66)%2         48%
         21.124,12               54,894         2.65             2.72                 (0.86)              (0.93)           98
         29.574,13               26,912         2.63             2.72                 (0.71)              (0.80)           72
          1.254                  18,599         2.55             2.66                 (0.95)              (1.05)          104
           (34.71)4              21,019         2.55             2.66                0.07                 (0.03)          207
         89.644                  43,722         2.52             2.58                 (0.27)              (0.32)          296

          (  1.41)    %       $  30,598          0.86%2           1.05%2               2.45%2              2.26%2          19%
          7.17                   31,328         1.032            1.052               1.722               1.702            101
         33.46                   21,989         1.15             1.15                1.74                1.74             216
          ( 17.12)               17,992         1.12             1.13                2.21                2.21             181
          8.47                   26,821         1.10             1.11                2.27                2.27             186
          0.56                   26,917         1.17             1.19                2.85                2.85             181
         17.17                   23,316         1.04                 -               2.62                     -           123

            (1.41)    %       $   2,147          1.16%2           1.30%2               2.16%2              2.02%2          19%
          2.32                    2,171         1.162            1.262                (0.17)2             (0.27)2         101

          (  1.43)%3          $ 509,998          1.25%2           1.40%2               2.05%2              1.91%2          19%
          6.783                 526,929         1.242            1.322               1.562               1.482            101
         32.943                 357,100         1.45             1.45                1.43                1.43             216
          ( 17.37)3             252,069         1.42             1.43                1.92                1.92             181
          8.153                 320,614         1.40             1.41                1.95                1.95             186
          0.293                 272,813         1.44             1.46                2.61                2.61             181
         16.88                  304,400         1.29                 -               2.23                     -           123

            (1.45)%4          $ 183,141          2.01%2           2.05%2               1.30%2              1.26%2          19%
          6.204                 187,689         2.042            2.042               0.732               0.732            101
         32.034                 133,083         2.15             2.15                0.72                0.72             216
           (17.91)4              75,963         2.12             2.13                1.22                1.22             181
          7.304                  81,440         2.10             2.11                1.25                1.25             186
            (0.35)4              56,543         2.17             2.19                1.86                1.86             181
         15.93                   36,045         2.04                 -               1.48                     -           123

          (  1.51)%4          $  63,178          2.01%2           2.05%2               1.39%2              1.35%2          19%
          6.204                  65,357         2.042            2.042               0.762               0.762            101
         32.144                  42,262         2.15             2.15                0.72                0.72             216
          ( 17.96)4              19,079         2.12             2.13                1.21                1.21             181
          7.314                  13,226         2.10             2.11                1.26                1.26             186
          (  0.35)4              12,687         2.17             2.19                1.89                1.89             181
         15.93                   17,093         2.04                 -               1.47                     -           123
                                      147
                                BLACKROCK FUNDS
                        FINANCIAL HIGHLIGHTS (CONTINUED)

                 FOR A SHARE OUTSTANDING THROUGHOUT EACH PERIOD


                                                                  GAIN (LOSS)
                                      NET                       ON INVESTMENTS,                         DISTRIBUTIONS
                                     ASSET                     FOREIGN CURRENCY                           FROM NET         NET
                                     VALUE          NET           AND OPTIONS        DISTRIBUTIONS        REALIZED     ASSET VALUE
                                   BEGINNING     INVESTMENT     (BOTH REALIZED    FROM NET INVESTMENT      CAPITAL       END OF
                                   OF PERIOD   INCOME (LOSS)    AND UNREALIZED)          INCOME             GAINS        PERIOD
                                  ----------- --------------- ------------------ --------------------- -------------- ------------
     -------------
     Index Equity (Continued)
     -------------
     Institutional Class
     10/01/04 through 3/31/0510    $   21.49     $  0.26           $   1.21           $   (0.27)          $      -     $   22.69
     9/30/04                           19.19        0.3422             2.29             (  0.33)                 -         21.49
     9/30/03                           15.69        0.30               3.48             (  0.28)                 -         19.19
     9/30/02                           20.03        0.25             ( 4.34)            (  0.25)                 -         15.69
     9/30/01                           27.59        0.26             ( 7.63)            (  0.19)                 -         20.03
     9/30/00                           24.69        0.27               2.97             (  0.18)             (0.16)        27.59
     Service Class
     10/01/04 through 3/31/0510    $   21.35     $  0.23           $   1.19           $   (0.22)          $      -     $   22.55
     9/30/04                           19.08        0.2522             2.27             (  0.25)                 -         21.35
     9/30/03                           15.62        0.21               3.47             (  0.22)                 -         19.08
     9/30/02                           19.97        0.25             ( 4.41)            (  0.19)                 -         15.62
     9/30/01                           27.54        0.16             ( 7.61)            (  0.12)                 -         19.97
     9/30/00                           24.67        0.16               2.97             (  0.10)                 -         27.54
     Investor A Class
     10/01/04 through 3/31/0510    $   21.34     $  0.21           $   1.20           $   (0.22)          $      -     $   22.53
     9/30/04                           19.07        0.2222             2.28             (  0.23)                 -         21.34
     9/30/03                           15.62        0.18               3.46             (  0.19)                 -         19.07
     9/30/02                           19.95        0.13             ( 4.31)            (  0.15)                 -         15.62
     9/30/01                           27.51        0.12             ( 7.60)            (  0.08)                 -         19.95
     9/30/00                           24.66        0.11               2.96             (  0.06)                 -         27.51
     Investor B Class
     10/01/04 through 3/31/0510    $   20.98     $  0.13           $   1.18           $   (0.14)          $      -     $   22.15
     9/30/04                           18.75        0.0622             2.24             (  0.07)                 -         20.98
     9/30/03                           15.35        0.04               3.42             (  0.06)                 -         18.75
     9/30/02                           19.61       ( 0.01)           ( 4.25)                  -                  -         15.35
     9/30/01                           27.15       ( 0.06)           ( 7.48)                  -                  -         19.61
     9/30/00                           24.44            -              2.84                   -              (0.13)        27.15
     Investor C Class
     10/01/04 through 3/31/0510    $   20.97     $  0.13           $   1.18           $   (0.14)          $      -     $   22.14
     9/30/04                           18.74        0.0622             2.24             (  0.07)                 -         20.97
     9/30/03                           15.35        0.04               3.41             (  0.06)                 -         18.74
     9/30/02                           19.61       ( 0.01)           ( 4.25)                  -                  -         15.35
     9/30/01                           27.15       ( 0.06)           ( 7.48)                  -                  -         19.61
     9/30/00                           24.44       ( 0.06)             2.84                   -              (0.13)        27.15


    1 Commencement of operations of share class.
    2 Annualized.
    3 Sales load not reflected in total return.
    4 Contingent deferred sales load not reflected in total return.
    5 For period 12/1/99 through 11/30/00.
    6 For period 12/1/00 through 9/30/01.
    7 For period 12/1/01 through 9/30/02.
    8 For period 12/1/02 through 9/30/03.
    9 For period 12/1/03 through 9/30/04.
    10 Unaudited.
    11 Redemption fee of 2.00% received by the Portfolios is reflected in total
return calculations.
    12 Redemption fee of 2.00% received by the Portfolios is reflected in total
return calculations. The impact to the return is 1 basis point.

SEE ACCOMPANYING NOTES TO FINANCIAL STATEMENTS.
                                      148
                                BLACKROCK FUNDS


                                                              RATIO OF TOTAL                           RATIO OF NET
                                          RATIO OF NET          EXPENSE TO         RATIO OF NET     INVESTMENT INCOME
                         NET ASSETS        EXPENSES TO         AVERAGE NET      INVESTMENT INCOME     TO AVERAGE NET    PORTFOLIO
        TOTAL          END OF PERIOD       AVERAGE NET      ASSETS (EXCLUDING     TO AVERAGE NET    ASSETS (EXCLUDING   TURNOVER
        RETURN             (000)             ASSETS              WAIVERS)             ASSETS             WAIVERS)         RATE
- --------------------- --------------- -------------------- ------------------- ------------------- ------------------- ----------
       6.84    %         $ 553,111      0.18%2,|P^                 0.38%2              2.25%2              2.05%2           3%
      13.7111              546,947    0.18|P^                 0.36|P^                 1.56                1.38             29
      24.20                618,249    0.18|P^                 0.37|P^                 1.63                1.44            108
       ( 20.65)            741,161    0.18|P^                 0.33|P^                 1.35                1.20             67
       ( 26.78)            557,845    0.18|P^                 0.33|P^                 1.11                0.96             86
      13.10                665,743    0.18|P^                 0.33|P^                 0.98                0.83             85

       6.67    %         $  71,687      0.58%2,|P^                 0.63%2              1.92%2              1.86%2           3%
      13.2011               74,641    0.56|P^                 0.67|P^                 1.17                1.06             29
      23.68                 72,505    0.61|P^                 0.67|P^                 1.19                1.13            108
        (21.02)             63,468    0.61|P^                 0.67|P^                 0.87                0.81             67
        (27.10)            292,389    0.61|P^                 0.63|P^                 0.68                0.66             86
      12.66                378,997    0.59|P^                 0.63|P^                 0.67                0.54             85
          6.63%3         $ 304,373      0.58%2,|P^                 0.73%2,|P^          1.86%2              1.71%2           3%
      13.103,11            312,606    0.70|P^                 0.84|P^                 1.04                0.90             29
      23.413               281,505    0.79|P^                 0.85|P^                 1.01                0.96            108
       ( 21.09)3           222,736    0.79|P^                 0.78|P^                 0.72                0.72             67
       ( 27.23)3            76,363    0.79|P^                 0.81|P^                 0.50                0.48             86
      12.433                93,935    0.78|P^                 0.81|P^                 0.38                0.35             85

          6.23%4         $ 159,676      1.33%2,|P^                 1.39%2,|P^          1.13%2              1.07%2           3%
      12.254,11            177,754    1.46|P^                 1.50|P^                 0.28                0.24             29
      22.594               192,614    1.54|P^                 1.59|P^                 0.27                0.21            108
        (21.72)4           175,100    1.53|P^                 1.55|P^                 (0.04)              (0.05)           67
        (27.77)4           262,027    1.53|P^                 1.55|P^                 (0.25)              (0.26)           86
      11.614               360,792    1.51|P^                 1.54|P^                 (0.35)              (0.38)           85
          6.24%4         $ 254,442      1.33%2,|P^                 1.39%2,|P^          1.12%2              1.07%2           3%
      12.264,11            279,130    1.46|P^                 1.50|P^                 0.28                0.24             29
      22.524               297,835    1.54|P^                 1.59|P^                 0.27                0.21            108
       ( 21.72)4           270,958    1.53|P^                 1.55|P^                 (0.04)              (0.05)           67
       ( 27.77)4           382,356    1.53|P^                 1.55|P^                 (0.25)              (0.26)           86
      11.614               530,586    1.53|P^                 1.56|P^                 (0.37)              (0.40)           85


    13 Redemption fee of 2.00% received by the Portfolios is reflected in total
                                         return calculations. The impact to the
                                         return is 6 basis points.

    14 Redemption fee of 2.00% received by the Portfolios is reflected in total
return calculations. The impact to the return is 7 basis points.
    15 Redemption fee of 2.00% received by the Portfolios is reflected in total
return calculations. The impact to the return is 8 basis points.
    16 Redemption fee of 2.00% received by the Portfolio is reflected in total
return calculations. The impact to the return is 9 basis points.
    17 Redemption fee of 2.00% received by the Portfolios is reflected in total
return calculations. The impact to the return is 10 basis points.
    18 Redemption fee of 2.00% received by the Portfolios is reflected in total
returns calculatins. The impact to the return is 30 basis points.
    19 Redemption fee of 2.00% received by the Portfolios is reflected in the
total returns calculations. The impact to the return is 31 basis points.
    20 Redemption fee of 2.00% received by the Portfolios is reflected in total
return calculations. The impact to the return is 33 basis points.
    21 Redemption fee of 2.00% received by the Portfolios is reflected in total
return calculations. The impact to the return is 34 basis points.
    22 Calculated using the average shares outstanding method.
    23 Effective August 2, 2000, the fiscal year end of the Fund changed from
        April 30 to October 31.
    |P^  Including expenses allocated from the U.S. Large Company Series of The
         DFA Investment Trust Company of 0.06% for the years ended 9/30/00
         through March 31, 2005.


                                      149
                                BLACKROCK FUNDS
                   NOTES TO FINANCIAL STATEMENTS (Unaudited)


(A) Organization

     BlackRock FundsSM (the "Fund") was organized on December 22, 1988, as a
Massachusetts business trust and is registered under the Investment Company Act
of 1940, as amended, as an open-end management investment company. The Fund
currently has 50 portfolios, 20 of which are included in these financial
statements (the "Portfolios"). Each Portfolio is authorized to issue an
unlimited number of shares with a par value of $0.001. Each Portfolio of the
Fund may offer as many as seven classes of shares. Shares of all classes of a
Portfolio represent equal pro rata interests in such Portfolio, except that
each class bears different expenses, which reflect the difference in the range
of services provided to them, mostly due to differences in distribution and
service fees.

     The Index Equity Portfolio accrues its respective share of income net of
expenses daily on its investment in The U.S. Large Company Series of The DFA
Investment Trust Company, which is treated as a partnership for federal income
tax purposes. All of the net investment income and realized and unrealized
gains and losses from the security transactions of the DFA U.S. Large Company
Series Fund are allocated pro rata at the time of such determination.

     Under the Fund's organizational documents, its officers and trustees are
indemnified against certain liabilities arising out of the performance of their
duties to the Fund. In addition, in the normal course of business, the Fund
enters into contracts with its vendors and others that provide for general
indemnifications. The Fund's maximum exposure under these arrangements is
unknown as this would involve future claims that may be made against the Fund.
However, based on experience, the Fund considers the risk of loss from such
claims to be remote.

(B) Fund Reorganizations

     BlackRock, Inc., the parent of BlackRock Advisors, Inc. ("BlackRock"),
recently acquired SSRM Holdings, Inc., the parent of State Street Research &
Management Co. ("SSRM"), the investment adviser of the former State Street
Research mutual funds.

     The Board of Trustees and shareholders of the State Street Research Funds
approved a reorganization with similarly-managed BlackRock Portfolios (the
"Reorganization"), as indicated below. In connection with the Reorganization,
five State Street Research Funds reorganized with newly established BlackRock
Portfolios, as indicated below. The Reorganization was a tax-free event and
took place after the close of business on January 28, 2005.


 STATE STREET RESEARCH FUNDS     BLACKROCK PORTFOLIOS
- -----------------------------   ----------------------
  Investment Trust              Investment Trust1,2
  Large Cap Analyst             Investment Trust1,2
  Large Cap Value               Large Cap Value2
  Mid-Cap Growth                Mid-Cap Growth2
  Mid-Cap Value2                Mid-Cap Value
  Asset Allocation2             Asset Allocation3
  Legacy2                       Legacy4
  Aurora2                       Aurora4
  Emerging Growth2              Small/Mid-Cap Growth4
  Global Resources2             Global Resources4
  Health Sciences2              Health Sciences4

1 Effective January 31, 2005, the BlackRock Select Equity Portfolio changed its
   name to the BlackRock Investment Trust Portfolio.
2 Denotes the surviving or continuing portfolio for purposes of maintaining the
   financial statements and performance history in the post-Reorganization
   funds.

3 Effective January 31, 2005, the BlackRock Balanced Portfolio changed its name
   to the BlackRock Asset Allocation Portfolio.

4 New BlackRock Portfolios.

150
                                BLACKROCK FUNDS

     Under the Agreements and Plans of Reorganizations with respect to the
Reorganization, the State Street Research Class A, Class B and Class R Shares
were exchanged for BlackRock Investor A Class Shares, State Street Research
Class B(1) Shares were exchanged for BlackRock Investor B Class Shares, State
Street Research Class C Shares were exchanged for BlackRock Investor C Class
Shares and State Street Research Class S Shares were exchanged for BlackRock
Institutional Class Shares. The conversion ratios for each Share Class
mentioned above were as follows:


STATE STREET RESEARCH FUNDS        CLASS A        CLASS B(1)       CLASS B         CLASS C         CLASS R         CLASS S
- -----------------------------  --------------- --------------- --------------- --------------- --------------- ---------------
Investment Trust ............      0.77806224      0.77277277      0.75918073      0.77475000              -       0.78011714
Large Cap Analyst ...........      0.89751180      0.89305973      0.87054964      0.89425000              -       0.89987336
Large Cap Value .............      1.24981582      1.21431253      1.20156181      1.21745329              -       1.24909774
Mid-Cap Growth ..............      0.73009098      0.67146166      0.63731327      0.67353407              -       0.73322751
Mid-Cap Value ...............      1.57950264      1.62345461      1.56116554      1.63087248      1.57489743      1.56483770
Asset Allocation ............      0.71991517      0.72321182      0.71704180      0.72727901              -       0.71889936
Legacy ......................      1.00000000      1.00000000      0.98101559      1.00000000      0.99614138      1.00000000
Aurora ......................      1.00000000      1.00000000      0.95337751      1.00000000              -       1.00000000
Emerging Growth .............      1.00000000      1.00000000      0.91664065      1.00000000      0.99539494      1.00000000
Global Resources ............      1.00000000      1.00000000      0.92094612      1.00000000      0.99768147      1.00000000
Health Sciences .............      1.00000000      1.00000000      0.96497882      1.00000000              -       1.00000000

     The net assets before and after the Reorganization and shares issued and
redeemed in the Reorganization were as follows:


                                                                                                         STATE STREET
EXISTING                        COMBINED NET ASSETS       PRIOR NET ASSETS      BLACKROCK PORTFOLIOS'   RESEARCH FUNDS'
BLACKROCK PORTFOLIOS          AS OF JANUARY 28, 2005   AS OF JANUARY 28, 2005       SHARES ISSUED       SHARES REDEEMED
- ---------------------------  ------------------------ ------------------------ ----------------------- ----------------
 Investment Trust .........       $1,498,152,592            $ 94,173,891             112,830,577         144,941,372
 Large Cap Value ..........          375,958,467             220,398,231              11,510,360           9,304,166
 Mid-Cap Growth ...........          469,488,672             112,491,647              40,325,986          56,565,182
 Mid-Cap Value ............          700,767,573              31,360,120              56,941,640          35,763,533
 Asset Allocation .........          808,215,456             118,597,457              47,307,662          65,619,686


                                                                                                            STATE STREET
NEW                                 COMBINED NET ASSETS       PRIOR NET ASSETS      BLACKROCK PORTFOLIOS   RESEARCH FUND'S
BLACKROCK PORTFOLIOS              AS OF JANUARY 28, 2005   AS OF JANUARY 28, 2005       SHARES ISSUED      SHARES REDEEMED
- -------------------------------  ------------------------ ------------------------ ---------------------- ----------------
 Legacy .......................       $  303,167,930                N/A                  23,774,854          23,821,894
 Aurora .......................        3,307,156,075                N/A                  88,632,067          88,854,760
 Small/Mid-Cap Growth .........          352,288,988                N/A                  27,815,846          27,932,833
 Global Resources .............          825,347,266                N/A                  17,184,504          17,250,833
 Health Sciences ..............          138,374,397                N/A                   6,894,017           6,898,634


                                                                             151
                                BLACKROCK FUNDS
             NOTES TO FINANCIAL STATEMENTS (Unaudited) (CONTINUED)

     Included in the net assets from the State Street Research Funds were the
    following components:


                                                                                           NET
                                                  UNDISTRIBUTED      ACCUMULATED       UNREALIZED
                                   PAID IN       NET INVESTMENT       REALIZED        APPRECIATION/         NET
STATE STREET RESEARCH FUND         CAPITAL        INCOME (LOSS)      GAIN (LOSS)     (DEPRECIATION)        ASSETS
- ----------------------------  ----------------- ---------------- ------------------ ---------------- -----------------
Investment Trust ...........   $1,347,362,021     $    884,681     $ (310,301,295)    $325,455,127    $1,363,400,534
Large Cap Analyst ..........       40,605,783          (20,664)        (3,696,837)       3,689,885        40,578,167
Large Cap Value ............      140,661,636          (51,872)       (11,642,475)      26,592,947       155,560,236
Mid-Cap Growth .............      578,507,467       (1,354,506)      (280,110,666)      59,954,730       356,997,025
Legacy .....................      385,380,697        1,305,278       (123,774,086)      40,256,041       303,167,930
Mid-Cap Value ..............      578,832,036          289,106           (794,901)      91,081,212       669,407,453
Aurora .....................    2,419,708,570       (9,149,900)       259,837,698      636,759,707     3,307,156,075
Emerging Growth ............      341,584,995       (1,676,121)       (34,054,396)      46,434,510       352,288,988
Global Resources ...........      501,649,873       (4,726,637)        46,159,901      282,264,129       825,347,266
Health Sciences ............      124,221,974       (1,286,711)           118,458       15,320,676       138,374,397
Asset Allocation ...........      628,277,636       (4,066,275)         2,317,491       63,089,147       689,617,999

(C) Summary of Significant Accounting Policies

     The following is a summary of significant accounting policies followed by
the Fund in the preparation of its financial statements.

     Investment Valuation - Valuation of investments held by each Portfolio is
as follows: investments traded on a national securities exchange or on the
NASDAQ National Market System are valued at the last reported sale price that
day or the NASDAQ official closing price, if applicable; investments traded on
a national securities exchange for which there were no sales on that day and
investments traded on other over-the-counter markets for which market
quotations are readily available are valued at the mean of the bid and asked
prices; and an option or futures contract is valued at the last sales price
prior to 4:00 p.m. (Eastern time), as quoted on the principal exchange or board
of trade on which such option or contract is traded, or in the absence of a
sale, the mean between the last bid and asked prices prior to 4:00 p.m.
(Eastern time). The amortized cost method of valuation will be used with
respect to debt obligations with sixty days or less remaining to maturity
unless the investment adviser and/or sub-adviser under the supervision of the
Board of Trustees determines such method does not represent fair value. Any
assets which are denominated in a non-U.S. currency are translated into U.S.
dollars at the prevailing market rates. In the event that application of these
methods of valuation results in a price for an investment which is deemed not
to be representative of the market value of such investment, the investment
will be valued by, under the direction of or in accordance with a method
approved by the Board of Trustees as reflecting fair value ("Fair Value
Assets"). The investment adviser and/or sub-adviser will submit its
recommendations regarding the valuation and/or valuation methodologies for Fair
Value Assets to a valuation committee. Such valuation committee may accept,
modify or reject any recommendations. The pricing of all Fair Value Assets
shall be subsequently reported to and ratified by the Board of Trustees.

     When determining the price for a Fair Value Asset, the investment adviser
and/or sub-adviser shall seek to determine the price that the Portfolio might
reasonably expect to receive from the current sale of that asset in an
arm's-length transaction. Fair value determinations shall be based upon all
available factors that BlackRock Advisors deems relevant.

     The Index Equity Portfolio's investment reflects its proportionate
interest in the net assets of The U.S. Large Company Series of The DFA
Investment Trust Company.

     Dividends to Shareholders - Dividends from net investment income, which
are recorded on the ex-dividend date, are declared and paid quarterly for the
Portfolios. Net realized capital gains, if any, are distributed at least
annually.

     Foreign Currency Translation - The books and records of the Portfolios are
maintained in U.S. dollars. Foreign currency amounts are translated into U.S.
dollars on the following basis:

     (I)  market value of investment securities, assets and liabilities at the
       current rate of exchange; and

   (II)  purchases and sales of investment securities, income and expenses at
       the relevant rates of exchange prevailing on the respective dates of
       such transactions.


152
                                BLACKROCK FUNDS

     The Portfolios do not isolate that portion of gains and losses on
investment securities which is due to changes in the foreign exchange rates
from that which is due to changes in the market prices of such securities. The
Portfolios report forward foreign currency related transactions as components
of realized gains for financial reporting purposes, whereas such components are
treated as ordinary income for federal income tax purposes.

     Forward Foreign Currency Contracts - Certain Portfolios may enter into
forward foreign currency contracts as a hedge against either specific
transactions or portfolio positions. These contracts are adjusted by the daily
forward exchange rate of the underlying currency and any gains or losses are
recorded as unrealized until the contract settle-ment date. Such contracts,
which protect the value of the Portfolios' investment securities against a
decline in the value of currency, do not eliminate fluctuations in the
underlying prices of the securities. They simply establish an exchange rate at
a future date. Also, although such contracts tend to minimize the risk of loss
due to a decline in the value of a hedged currency, at the same time they tend
to limit any potential gain that might be realized should the value of such
foreign currency increase. Risks may arise upon entering into these contracts
from the potential inability of counterparts to meet the terms of their
contracts and from unanticipated movements in the value of a foreign currency
relative to the U.S. dollar.

     The aggregate principal amounts of the contracts are not recorded as the
Portfolios intend to settle the contracts prior to delivery. Under the terms of
foreign currency contracts open at March 31, 2005, the Portfolios are obligated
to deliver or receive currency in exchange for U.S. dollars as indicated below:


                                                                                                             UNREALIZED
                                                                                            VALUE AT           FOREIGN
 SETTLEMENT         CURRENCY                    CURRENCY                   CONTRACT         MARCH 31,         EXCHANGE
    DATE             AMOUNT                       SOLD                      AMOUNT            2005              GAIN
- ------------   -----------------   ---------------------------------   ---------------   --------------   ----------------
International Opportunities
 06/15/05            9,419,040     Canadian Dollar .................     $ 7,797,880     $ 7,795,716        $      2,164
 06/15/05        4,000,000,000     Japanese Yen ....................      38,418,318      37,560,096             858,222
                                                                         -----------     -----------        ------------
                                                                         $46,216,198     $45,355,812        $    860,386
                                                                         ===========     ===========        ============
                                                                                                            UNREALIZED
                                                                                           VALUE AT          FOREIGN
SETTLEMENT         CURRENCY                CURRENCY                      CONTRACT         MARCH 31,          EXCHANGE
    DATE           AMOUNT                   BOUGHT                         AMOUNT            2005              LOSS
 --------      ------------  -     ----------------------------------   -----------      -----------       ------------
International Opportunities
 06/15/05           16,000,000     Australian Dollar ...............     $12,513,120     $12,293,129        $   (219,991)
 06/15/05           15,000,000     Canadian Dollar .................      12,436,161      12,414,826             (21,335)
 06/15/05           24,000,000     European Currency Unit ..........      31,922,019      31,193,945            (728,074)
 06/15/05           10,500,000     British Pound ...................      19,989,900      19,754,396            (235,504)
 06/15/05           20,000,000     Swiss Franc .....................      17,339,136      16,813,505            (525,631)
                                                                         -----------     -----------        ------------
                                                                         $94,200,336     $92,469,801        $ (1,730,535)
                                                                         ===========     ===========        ============

     Swap Agreements - The Portfolios may invest in swap agreements for the
purpose of hedging against changes in interest rates or foreign currencies.
Swap agreements involve the exchange by the Portfolio with another party of
their respective commitments to pay or receive interest or a specified amount
of a currency (e.g., an exchange of floating rate payments for fixed rate
payments) with respect to a notional amount of principal. Swaps are marked to
market daily based upon quotations from market makers and the change, if any,
is recorded as an unrealized gain or loss in the Statement of Operations. Net
payments of interest are recorded as interest income. Entering into these
agreements involves, to varying degrees, elements of credit and market risk in
excess of the amounts recognized on the Statement of Assets and Liabilities.
Such risks involve the possibility that there will be no liquid market for
these agreements, that the counterparty to the agreement may default on its
obligation to perform and that there may be unfavorable changes in the
fluctuation of interest and/or exchange rates.


                                                                             153
                                BLACKROCK FUNDS
             NOTES TO FINANCIAL STATEMENTS (Unaudited) (CONTINUED)

     At March 31, 2005, the Asset Allocation Portfolio had the following swap
    agreements outstanding:


      Portfolio             Counter-party         Termination Date
 Asset Allocation    Merrill Lynch                   07/31/05
                     Morgan Stanley                  06/14/06
                     Union Bank of Switzerland       08/14/06
                     Morgan Stanley                  11/17/06
                     Union Bank of Switzerland       01/21/10
                     Morgan Stanley                  06/14/14
                     Merrill Lynch                   07/22/14
                     Goldman Sachs                   10/01/14
                     Union Bank of Switzerland       03/23/15
                     Merrill Lynch                   07/29/19
                     Merrill Lynch                   08/13/19
                     Merrill Lynch                   10/27/19
                     Deutsche Bank                   08/15/23


                                                                           Unrealized
                          Interest        Interest     Notional Amount    Appreciation
      Portfolio       Receivable Rate   Payable Rate    (U.S. Dollars)   (Depreciation)
 Asset Allocation           2.29%1           2.45%2       $  700,000       $  (9,190)
                           3.22  %           3.00%3        2,145,000              10
                           2.64  %           2.29%3        1,500,000         (25,599)
                           3.22  %           2.81%3        2,100,000         (10,057)
                           4.10  %           2.68%3          150,000          (2,898)
                            2.48%3          5.31  %          600,000         (27,266)
                            2.68%3          4.93  %          600,000          (3,563)
                            2.56%3          4.51  %          600,000          19,024
                            3.05%3          4.96  %        5,000,000          (7,000)
                            2.74%3          5.37  %          100,000          (3,208)
                           5.16  %           2.79%3          125,000           1,132
                           4.78  %           2.70%3          100,000          (2,967)
                            2.79%3          5.23  %        1,550,000         (11,138)

1 Rate shown is based on Lehman CMBS 8.5+ YR INDEX as of the most recent
    payment date.

2 Rate shown is based on the 1 month LIBOR as of the most recent payment date.

3 Rate shown is based on the 3 month LIBOR as of the most recent payment date.


     Investment Transactions and Investment Income - Investment transactions
are accounted for on the trade date. The cost of investments sold and the
related gain or loss thereon is determined by use of the specific
identification method for both financial reporting and federal income tax
purposes. Interest income is recorded on the accrual basis. Discounts and
premiums on debt securities are accreted or amortized, respectively, for book
and tax purposes using the effective yield-to-maturity method over the term of
the instrument. Dividends are recorded on the ex-dividend date. Paydown gains
and losses on mortgage and asset-backed securities are presented as an
adjustment to interest income.

     Repurchase Agreements - Money market instruments may be purchased from
banks and non-bank dealers subject to the seller's agreement to repurchase them
at an agreed upon date and price. Collateral for repurchase agreements may have
longer maturities than the maximum permissible remaining maturity of portfolio
investments. The seller is required on a daily basis to maintain the value of
the securities subject to the agreement at not less than the repurchase price.
The agreements are conditioned upon the collateral being deposited under the
Federal Reserve book-entry system or held in a separate account by the Fund's
custodian or an authorized securities depository.

     Reverse Repurchase Agreements - The Portfolios may enter into reverse
repurchase agreements with qualified third party brokers-dealers as determined
by and under the direction of the Fund's Board of Trustees. Interest on the
value of the reverse repurchase agreements issued and outstanding is based upon
competitive market rates at the time of issuance and is included within the
related liability on the Statement of Assets and Liabilities. At the time the
Portfolio enters into a reverse repurchase agreement, it identifies for
segregation certain liquid securities having a value not less than the
repurchase price, including accrued interest, of the reverse repurchase
agreement.

     Futures Transactions - The Portfolios may invest in financial futures
contracts for the purposes of hedging their existing portfolio securities, or
securities that the Portfolios intend to purchase, against fluctuations in
value caused by changes in prevailing market interest rates. The Portfolios
invest in futures contracts and options on futures contracts to commit funds
awaiting investments in stocks or to maintain cash liquidity or, except with
respect to the Index Equity Portfolio, for other hedging purposes. Certain
Portfolios may also invest in these instruments to increase returns. These
Portfolios' futures contracts obligate a Portfolio, at maturity, to take or
make delivery of securities, the cash value of a securities index or a stated
quantity of a foreign currency. Upon entering into a futures contract, the
Portfolio is required to deposit cash or pledge securities as initial margin.
Subsequent payments, which are dependent on the daily fluctuations in the value
of the underlying security or securities, are made or received by the Portfolio
each day (daily variation margin) and are recorded as unrealized gains or
losses until the contracts are closed. When the contracts are closed, the
Portfolio records a realized gain or loss equal to the difference between the
proceeds from (or cost of) the closing transaction and the Portfolio's basis in
the contracts. Risks of entering into futures contracts include the possibility
that there will not be a perfect price correlation between the futures
contracts and the underlying securities. Second, it is possible that a lack of
liquidity for futures contracts could exist in the market, resulting in an
inability to


154
                                BLACKROCK FUNDS

liquidate a futures position prior to its maturity date. Third, the purchase of
a futures contract involves the risk that a Portfolio could lose more than the
original margin deposit required to initiate a futures transaction.

     Stripped Mortgage Backed Securities - The Asset Allocation Portfolio may
invest in stripped mortgage-backed securities issued by the U.S. Government,
its agencies and instrumentalities. Stripped mortgage-backed securities are
usually structured with two classes that receive different proportions of the
interest and principal distributions on a pool of mortgage assets. In certain
cases, one class will receive all of the interest (the interest-only or "IO"
class), while the other class will receive all of the principal (the
principal-only or "PO" class). The yield to maturity on IO's is sensitive to
the rate of principal repayments (including prepayments) on the related
underlying mortgage assets, and principal payments may have a material effect
on yield to maturity. If the underlying mortgage assets experience greater than
anticipated prepayments of principal, the Portfolio may not fully recoup its
initial investment in IO's. Such securities will be considered liquid only if
so determined in accordance with guidelines approved by the Trustees. The
Portfolio also may invest in stripped mortgage-backed securities that are
privately issued. These securities will be considered illiquid for purposes of
the Portfolio's limit on illiquid securities.

     Investing in Government Sponsored Enterprises - The Asset Allocation
Portfolio invests in securities issued by the Federal Home Loan Mortgage
Corporation ("Freddie Mac") and similar United States Government sponsored
entities such as Federal National Mortgage Association ("Fannie Mae") and the
Federal Home Loan Banks ("FHLB's"). Freddie Mac, Fannie Mae, and FHLB's,
although chartered and sponsored by Congress, are not funded by Congressional
appropriations and the debt and mortgage-backed securities issued by Freddie
Mac, Fannie Mae and FHLB's are neither guaranteed nor insured by the United
States Government.

     Option Writing/Purchasing - The Portfolios may write or purchase financial
options contracts for the purpose of hedging or earning additional income,
which may be deemed speculative. When the Portfolio writes or purchases an
option, an amount equal to the premium received or paid by the Portfolio is
recorded as a liability or an asset and is subsequently adjusted to the current
market value of the option written or purchased. Premiums received or paid from
writing or purchasing options, which expire, unexercised are treated by the
Portfolio on the expiration date as realized gains or losses. The difference
between the premium and the amount paid or received on effecting a closing
purchase or sale transaction, including brokerage commissions, is also treated
as a realized gain or loss. If an option is exercised, the premium paid or
received is added to the cost of the purchase or proceeds from the sale in
determining whether the Portfolio has realized a gain or loss on investment
transactions. The Portfolio, as writer of an option may have no control over
whether the underlying securities may be sold (call) or purchased (put) and as
a result bears the market risk of an unfavorable change in the price of the
security underlying the written option.

     Swaptions Writing - The Portfolios may write swaption contracts to manage
exposure to fluctuations in interest rates and to enhance portfolio yield.
Swaption contracts written by the Portfolios represent an option that gives the
purchaser the right, but not the obligation, to enter into a previously agreed
upon swap contract on a future date. If a written call swaption is exercised,
the writer will enter a swap and is obligated to pay the fixed rate and receive
a floating rate in exchange. If a written put swaption is exercised, the writer
will enter a swap and is obligated to pay the floating rate and receive a fixed
rated in exchange. Swaptions are marked to market daily based upon quotations
from market makers.

     When a portfolio writes a swaption, the premium received is recorded as a
liability and is subsequently adjusted to the current market value of the
swaption. Changes in the value of the swaption are reported as unrealized gains
or losses in the Statement of Assets and Liabilities or Statement of Net
Assets. Gain or loss is recognized when the swap-tion contract expires or is
closed. Premiums received from writing swaptions that expire or are exercised
are treated by the Portfolio as realized gains from investments. The difference
between the premium and the amount paid on effecting a closing purchase
transaction is also treated as a realized gain, or if the premium is less than
the amount paid for the closing purchase, as a realized loss.

     Entering into a swaption contract involves, to varying degrees, the
elements of credit, market and interest rate risk, associated with both option
contracts and swap contracts. To reduce credit risk from potential counterparty
default, the Portfolios enter into swaption contracts with counterparties whose
creditworthiness has been evaluated by BlackRock. The Portfolios bear the
market risk arising from any change in index values or interest rates.


                                                                             155
                                BLACKROCK FUNDS
             NOTES TO FINANCIAL STATEMENTS (Unaudited) (CONTINUED)

     Written Option and Swaption transactions entered into during the period
ended March 31, 2005, are summarized as follows:

                             ASSET ALLOCATION                                   ASSET ALLOCATION
                        ---------------------------                          -----------------------
                         NUMBER OF                                            NUMBER OF
                         CONTRACTS      PREMIUM                               CONTRACTS    PREMIUM
                        ----------- ---------------                          ----------- -----------
  Balance at 3/31/04         (414)   $    551,636   Balance at 2/28/05          (243)     $ 79,281
  Written                  (2,107)      2,011,209   Written                        -             -
  Purchased                   854      (1,086,358)  Purchased                      -             -
  Expired                     120         (13,320)  Expired                         (2)        880
  Closed                    1,304      (1,383,886)  Closed                         -             -
  Exercised                     -               -   Exercised                      -             -
                           ------    ------------                               ------    --------
  Balance at 2/28/05         (243)   $     79,281   Balance at 3/31/05          (245)     $ 80,161
                           ======    ============                               ======    ========

     TBA Purchase Commitments - The Asset Allocation Portfolio may enter into
"TBA" (to be announced) purchase commitments to purchase or sell securities for
a fixed price at a future date. TBA commitments are considered securities in
themselves, and involve a risk of loss if the value of the security to be
purchased/sold declines/increases prior to settlement date, which is in
addition to the risk of decline in the value of the Portfolio's other assets.
Unsettled TBA commitments are valued at the current market value of the
underlying securities, according to the procedures described under "Security
Valuation".

     Mortgage Dollar Rolls - The Asset Allocation Portfolio may enter into
mortgage dollar rolls (principally using TBA's) in which the Portfolio sells
mortgage securities for delivery in the current month and simultaneously
contracts to repurchase similar, but not identical, securities at an
agreed-upon price on a fixed date. The Portfolio accounts for such dollar rolls
as purchases and sales and receives compensation, in either "fee" or "drop", as
consideration for entering into the commitment to repurchase. The Portfolio
must maintain liquid securities having a value not less than the repurchase
price (including accrued interest) for such dollar rolls. The market value of
the securities that the Portfolio is required to purchase may decline below the
agreed upon repurchase price of those securities.

     In a "fee" roll, the compensation received is recorded as deferred income
and amortized to income over the roll period. In a "drop" roll, the
compensation is paid via a lower price for the security upon its repurchase.
The counterparty receives all principal and interest payments, including
prepayments, made in respect of a security subject to such a contract while it
is the holder. Mortgage dollar rolls may be renewed with a new purchase and
repurchase price and a cash settlement made on settlement date without physical
delivery of the securities subject to the contract. A Portfolio engages in
dollar rolls for the purpose of enhancing its yield, principally by earning a
negotiated fee.

     Financing Transactions - The Portfolios may enter into financial
transactions consisting of the sale by the Portfolio of securities, together
with a commitment to repurchase similar securities at a future date. The
difference between the selling price and the future purchase price is an
adjustment to interest income. If the counterparty to whom the Portfolio sells
the security becomes insolvent, the Portfolio's right to repurchase the
security may be restricted. The value of the security may change over the term
of the financing transaction.

     Inflation-indexed Bonds - Inflation-indexed bonds are fixed income
securities whose principal value is periodically adjusted according to the rate
of inflation. If the index measuring inflation falls, the principal value of
inflation-indexed bonds will be adjusted downward, and consequently the
interest payable on these securities (calculated with respect to a smaller
principal amount) will be reduced. Repayment of the original bond principal
upon maturity (as adjusted for inflation) is guaranteed in the case of U.S.
Treasury inflation-indexed bonds. For bonds that do not provide a similar
guarantee, the adjusted principal value of the bond repaid at maturity may be
less than the original principal.

     Securities Lending - Through an agreement with PFPC Trust Co., the
Portfolios may lend portfolio securities to certain brokers, dealers or other
financial institutions that pay the Portfolios a negotiated fee. Prior to the
close of each business day, loans of U.S. securities are secured by collateral
at least equal to 102% of the market value of the securities on loan. Loans of
foreign securities are secured by collateral at least equal to 105% of the
market value of securities on loan. However, due to market fluctuations, the
value of the securities lent may exceed the value of the collateral. On the
next business day, the collateral is adjusted based on the prior day's market
fluctuations and the current day's lending activity. Cash collateral received
in connection with the securities lending is invested in short-term investments
by the lending agent. The lending agent has hired BlackRock Capital Management,
Inc. ("BCM"), a wholly-owned subsidiary of BlackRock, Inc., and pays BCM to
provide advisory services with respect to the collateral of


156
                                BLACKROCK FUNDS

all of the clients of its securities lending program. The lending agent may
invest such collateral in short-term investments, including the Institutional
Money Market Trust (the "Trust"), a portfolio of money market securities, or
high-quality, short-term instruments with a maturity date not to exceed 397
days. BCM serves as investment adviser to the Trust, but receives no fees from
the Trust for these services. Administrative and accounting services are
provided by PFPC Inc. ("PFPC"), an indirect wholly-owned subsidiary of The PNC
Financial Services Group, Inc. PFPC is paid a fee from the Trust at an annual
rate not to exceed 0.10% of the Trust's average daily net assets. At March 31,
2005, the market value of securities on loan, cash collateral invested in the
Trust and total value of collateral held in connection with securities lending
is summarized as follows:


                                          MARKET VALUE      MARKET VALUE OF         TOTAL MARKET
                                         OF SECURITIES      CASH COLLATERAL           VALUE OF
                                            ON LOAN      INVESTED IN THE TRUST   COLLATERAL RECEIVED
                                        --------------- ----------------------- --------------------
Investment Trust .....................   $ 17,991,171         $  6,696,438          $ 18,335,199
Large Cap Value ......................      4,559,819            2,076,960             4,761,525
Large Cap Growth .....................        392,829               97,763               409,375
Dividend Achievers ...................      3,946,370            2,942,241             4,057,910
Legacy ...............................     30,264,800           31,656,565            31,656,565
Mid-Cap Value ........................     20,367,136           17,413,704            20,899,422
Mid-Cap Growth .......................     25,953,273           27,001,210            27,001,210
Aurora ...............................    186,933,738          185,861,899           192,944,927
Small/Mid-Cap Growth .................     29,036,367           28,925,276            29,923,540
Small Cap Value ......................      2,651,297            2,766,280             2,766,280
Small Cap Core .......................      2,270,969            2,208,558             2,386,740
Small Cap Growth .....................     18,205,514           16,203,152            19,349,566
Global Sciences & Technology .........      3,485,101            3,504,656             3,665,500
Global Resources .....................    117,073,755          114,172,428           119,274,330
All-Cap Global Resources .............      1,404,866            1,308,111             1,391,300
Health Sciences ......................     10,485,573           10,270,254            11,015,540
U.S. Opportunities ...................     10,490,011            8,746,603            10,823,000
Asset Allocation .....................     53,193,232           42,399,476            54,899,646

     In the event of default or bankruptcy by the other party to the agreement,
realization and/or retention of the collateral may be subject to legal
proceedings.

     Prior to January 31, 2005, State Street Bank and Trust Company served as
the securities lending agent for State Street Research Legacy Fund, State
Street Research Mid-Cap Value Fund, State Street Research Aurora Fund, State
Street Research Emerging Growth Fund, State Street Research Global Resources
Fund, State Street Research Health Sciences Fund and State Street Research
Asset Allocation Fund. These Funds received cash or securities as collateral in
an amount equal to at least 100% of the market value of any loaned securities
plus accrued interest. Cash collateral was invested in State Street Navigator
Securities Lending Prime Portfolio.

     Estimates - The preparation of financial statements in conformity with
accounting principles generally accepted in the United States of America
("generally accepted accounting principles") requires the use of management
estimates. Actual results could differ from these estimates.

     Other - Securities denominated in currencies other than U.S. dollars are
subject to changes in value due to fluctuations in exchange rates.

     Some countries in which the Portfolios invest require governmental
approval for the repatriation of investment income, capital or the proceeds of
sales of securities by foreign investors. In addition, if there is a
deterioration in a country's balance of payments or for other reasons, a
country may impose temporary restrictions on foreign capital remittances
abroad.

     The securities exchanges of certain foreign markets are substantially
smaller, less liquid and more volatile than the major securities markets in the
United States. Consequently, acquisition and disposition of securities by the
Portfolios may be inhibited. In addition, a significant proportion of the
aggregate market value of equity securities listed on the major securities
exchanges in emerging markets are held by a smaller number of investors. This
may limit the number of shares available for acquisition or disposition by the
Portfolio.


                                                                             157
                                BLACKROCK FUNDS
             NOTES TO FINANCIAL STATEMENTS (Unaudited) (CONTINUED)

     Expenses that are directly related to one of the Portfolios are charged
directly to that Portfolio. Other operating expenses are prorated to the
Portfolios on the basis of relative net assets. Class-specific expenses are
borne by that class. Differences in net expense ratios between classes of a
Portfolio are due to class-specific expenses, waivers and accrual adjustments.
Income, other expenses and realized and unrealized gains and losses of a
Portfolio are allocated to the respective class on the basis of the relative
net assets each day.

     The following table provides a list of the Portfolios included in this
report along with a summary of their respective class-specific fee arrangements
as provided under the Fund's Amended and Restated Distribution and Service Plan
(the "Plan"). Fees are expressed as a percentage of average daily net asset
values of the respective classes.


                                              Class Specific Fee Arrangement
           Portfolio                                                           Share Classes
                                                        BlackRock              Institutional               Service
                                                  Contractual    Actual    Contractual    Actual    Contractual    Actual
                                     Period         Fees (1)    Fees (5)       Fees      Fees (5)     Fees (1)    Fees (5)
 Investment Trust               9/1/04-3/31/05       N/A          N/A          None        None    0.25%         0.25%
 Large Cap Value                9/1/04-3/31/05       N/A          N/A          None        None    0.25%         0.25%
 Large Cap Growth               9/1/04-3/31/05       N/A          N/A          None        None    0.25%         0.25%
 Dividend AchieversTM           9/1/04-3/31/05       N/A          N/A          None        None    0.25%         0.25%
 Legacy                          Pre-1/31/05         N/A          N/A          None        None        N/A          N/A
                                 Post-1/31/05        N/A          N/A          None        None    0.25%         0.25%
 Mid-Cap Value                   Pre-1/31/05         N/A          N/A          None        None        N/A          N/A
                                 Post-1/31/05        N/A          N/A          None        None    0.25%         0.25%
 Mid-Cap Growth                 9/1/04-3/31/05       N/A          N/A          None        None    0.25%         0.25%
 Aurora                          Pre-1/31/05         N/A          N/A          None        None        N/A          N/A
                                 Post-1/31/05        N/A          N/A          None        None    0.25%         0.25%
 Small/Mid-Cap Growth            Pre-1/31/05         N/A          N/A          None        None        N/A          N/A
                                 Post-1/31/05        N/A          N/A          None        None    0.25%         0.25%
 Small Cap Value                9/1/04-3/31/05   0.25%         0.25%           None        None    0.25%         0.25%
 Small Cap Core                 9/1/04-3/31/05       N/A          N/A          None        None    0.25%         0.25%
 Small Cap Growth               9/1/04-3/31/05       N/A          N/A          None        None    0.25%         0.25%
 Global Science & Technology    9/1/04-3/31/05       N/A          N/A          None        None    0.25%         0.25%
  Opportunities
 Global Resources                Pre-1/31/05         N/A          N/A          None        None        N/A          N/A
                                 Post-1/31/05        N/A          N/A          None        None        N/A          N/A
 All-Cap Global Resources      2/16/05-3/31/05       N/A          N/A          None        None    0.25%         0.25%
 Health Sciences                 Pre-1/31/05         N/A          N/A          None        None        N/A          N/A
                                 Post-1/31/05        N/A          N/A          None        None    0.25%         0.25%
 U.S. Opportunities             9/1/04-3/31/05       N/A          N/A          None        None    0.25%         0.25%
 International Opportunities    9/1/04-3/31/05       N/A          N/A          None        None    0.25%         0.25%
 Asset Allocation                Pre-1/31/05         N/A          N/A          None        None        N/A          N/A
                                 Post-1/31/05        N/A          N/A          None        None    0.25%         0.25%
 Index                          9/1/04-3/31/05       N/A          N/A          None        None    0.25%         0.25%


           Portfolio                                         Share Classes
                                      Investor A               Investor B              Investor C
                                Contractual    Actual    Contractual    Actual    Contractual    Actual
                                    Fees      Fees (5)     Fees (4)    Fees (5)     Fees (4)    Fees (5)
 Investment Trust              0.35%3        0.25%      1.00%         1.00%      1.00%         1.00%
 Large Cap Value               0.35%3        0.25%      1.00%         1.00%      1.00%         1.00%
 Large Cap Growth              0.35%3        0.25%      1.00%         1.00%      1.00%         1.00%
 Dividend AchieversTM          0.35%3        0.25%      1.00%         1.00%      1.00%         1.00%
 Legacy                        0.30%2        0.30%      1.00%         1.00%      1.00%         1.00%
                               0.35%3        0.35%      1.00%         1.00%      1.00%         1.00%
 Mid-Cap Value                 0.30%2        0.30%      1.00%         1.00%      1.00%         1.00%
                               0.35%3        0.25%      1.00%         1.00%      1.00%         1.00%
 Mid-Cap Growth                0.35%3        0.25%      1.00%         1.00%      1.00%         1.00%
 Aurora                        0.30%2        0.30%      1.00%         1.00%      1.00%         1.00%
                               0.35%3        0.25%      1.00%         1.00%      1.00%         1.00%
 Small/Mid-Cap Growth          0.30%2        0.30%      1.00%         1.00%      1.00%         1.00%
                               0.35%3        0.25%      1.00%         1.00%      1.00%         1.00%
 Small Cap Value               0.35%3        0.25%      1.00%         1.00%      1.00%         1.00%
 Small Cap Core                0.35%3        0.25%      1.00%         1.00%      1.00%         1.00%
 Small Cap Growth              0.35%3        0.25%      1.00%         1.00%      1.00%         1.00%
 Global Science & Technology   0.35%3        0.25%      1.00%         1.00%      1.00%         1.00%
  Opportunities
 Global Resources              0.30%2        0.30%      1.00%         1.00%      1.00%         1.00%
                               0.35%3        0.25%      1.00%         1.00%      1.00%         1.00%
 All-Cap Global Resources      0.35%3        0.25%      1.00%         1.00%      1.00%         1.00%
 Health Sciences               0.30%2        0.30%      1.00%         1.00%      1.00%         1.00%
                               0.35%3        0.25%      1.00%         1.00%      1.00%         1.00%
 U.S. Opportunities            0.35%3        0.25%      1.00%         1.00%      1.00%         1.00%
 International Opportunities   0.35%3        0.25%      1.00%         1.00%      1.00%         1.00%
 Asset Allocation              0.30%2        0.30%      1.00%         1.00%      1.00%         1.00%
                               0.35%3        0.25%      1.00%         1.00%      1.00%         1.00%
 Index                         0.35%3        0.25%      1.00%         1.00%      1.00%         1.00%

(1) - The maximum annual contractual fees are comprised of a 0.25% service fee.
(2) - The maximum annual contractual fees are comprised of a 0.05% distribution
fee and a 0.25% service fee.
(3) - The maximum annual contractual fees are comprised of a 0.10% distribution
fee and a 0.25% service fee.
(4) - The maximum annual contractual fees are comprised of a 0.75% distribution
fee and a 0.25% service fee.
(5) - The actual fees are as of March 31, 2005 for Post-January 31, 2005 and
   are as of January 31, 2005 for Pre-January 31, 2005.

     The BlackRock share class bear a Transfer Agent fee at an annual rate not
to exceed .005% of the average daily net assets plus per account fees and
disbursements and each of the Institutional, Service, Investor A, Investor B
and


158
                                BLACKROCK FUNDS

Investor C share classes bear a Transfer Agent fee at an annual rate not to
exceed .018% of the average daily net assets of such respective classes plus
per account fees and disbursements.

     The Index Equity Portfolio invests solely in The U.S. Large Company Series
(the "Series") of The DFA Investment Trust Company (the "DFA Trust"). Advisory
fees are accrued daily and paid monthly to Dimensional Fund Advisors, Inc. at
the Series level as described within the DFA Trust financial statements which
are included elsewhere in the report and should be read in conjunction with the
financial statements of the Index Equity Portfolio.

     For the period ended March 31, 2005, the following shows the various types
of class-specific expenses borne directly by each class of each fund and any
associated waivers of those expenses.


                                                                        SHARE CLASSES
ADMINISTRATION FEES                      ----------------------------------------------------------------------------
                                          BLACKROCK   INSTITUTIONAL   SERVICE   INVESTOR A   INVESTOR B   INVESTOR C      TOTAL
                                         ----------- --------------- --------- ------------ ------------ ------------ ------------
   Investment Trust ....................   $     -      $ 163,373    $ 1,285   $ 160,654    $ 77,240     $ 8,013      $ 410,565
   Large Cap Value .....................         -         87,443     24,132      64,624      20,568       6,674        203,441
   Large Cap Growth ....................         -         19,335     11,936      13,483       8,967       1,765         55,486
   Dividend AchieversTM ................         -          3,173         73       4,137         425       1,910          9,718
   Legacy ..............................         -         13,149          -      31,705      23,271       5,350         73,475
   Mid-Cap Value .......................         -          6,093        167      54,954      15,754      11,215         88,183
   Mid-Cap Growth ......................         -         37,615      4,118      89,805      31,198      10,944        173,680
   Aurora ..............................         -         40,700          -     477,317     115,854     115,554        749,425
   Small/Mid-Cap Growth ................         -          9,059          -      61,984       6,291       7,009         84,343
   Small Cap Value .....................     1,089         49,095      1,949      25,390      11,672       5,003         94,198
   Small Cap Core ......................         -          2,712          1       3,313       1,547       4,190         11,763
   Small Cap Growth ....................         -        217,917     22,057     104,983      16,563      10,675        372,195
   Global Science & Technology
    Opportunities ......................         -          1,010         64       7,287       8,839       2,314         19,514
   Global Resources ....................         -          3,460          -      82,175      11,575      20,778        117,988
   All-Cap Global Resources ............         -            875          -         410          68         109          1,462
   Health Sciences .....................         -            524          -       9,254       3,620       3,123         16,521
   U.S. Opportunities ..................         -          4,492        750      22,827      29,756      14,876         72,701
   International Opportunities .........         -         91,040     18,814      97,558      38,812      51,960        298,184
   Asset Allocation ....................         -          3,818        265      63,936      22,913       7,961         98,893
   Index ...............................         -        401,759     51,699     229,360     126,363     199,189      1,008,370


                                                                         SHARE CLASSES
ADMINISTRATION FEES WAIVED            -----------------------------------------------------------------------------------
                                       BLACKROCK   INSTITUTIONAL     SERVICE     INVESTOR A     INVESTOR B    INVESTOR C
                                      ----------- --------------- ------------ -------------- -------------- ------------
   Investment Trust .................   $     -     $  (163,373)   $     (835)   $  (43,613)    $  (20,653)   $  (1,920)
   Large Cap Value ..................         -         (85,785)      (15,159)            -         (5,014)           -
   Large Cap Growth .................         -         (19,336)       (7,811)            -              -            -
   Dividend AchieversTM .............         -          (3,173)          (51)            -              -            -
   Legacy ...........................         -          (4,579)            -       (11,143)        (8,468)      (1,953)
   Mid-Cap Value ....................         -          (6,006)         (165)      (53,299)       (15,634)     (11,215)
   Mid-Cap Growth ...................         -         (22,276)       (1,108)       (4,934)        (1,161)        (410)
   Small/Mid-Cap Growth .............         -          (8,439)            -       (56,695)        (5,888)      (7,009)
   Small Cap Value ..................      (166)         (5,887)            -             -              -            -
   Small Cap Core ...................         -          (2,712)            -             -              -            -
   Global Science & Technology
    Opportunities ...................         -          (1,010)          (40)            -              -            -
   Global Resources .................         -          (1,551)            -        (7,293)        (5,279)      (9,241)
   All-Cap Global Resources .........         -            (876)            -             -              -            -
   Health Sciences ..................         -             (13)            -             -            (31)           -


ADMINISTRATION FEES WAIVED
                                           TOTAL
                                      ---------------
   Investment Trust .................   $  (230,394)
   Large Cap Value ..................      (105,958)
   Large Cap Growth .................       (27,147)
   Dividend AchieversTM .............        (3,224)
   Legacy ...........................       (26,143)
   Mid-Cap Value ....................       (86,319)
   Mid-Cap Growth ...................       (29,889)
   Small/Mid-Cap Growth .............       (78,031)
   Small Cap Value ..................        (6,053)
   Small Cap Core ...................        (2,712)
   Global Science & Technology
    Opportunities ...................        (1,050)
   Global Resources .................       (23,364)
   All-Cap Global Resources .........          (876)
   Health Sciences ..................           (44)

                               159
                                BLACKROCK FUNDS
             NOTES TO FINANCIAL STATEMENTS (Unaudited) (CONTINUED)


                                                                         SHARE CLASSES
ADMINISTRATION FEES WAIVED               ------------------------------------------------------------------------------
                                          BLACKROCK   INSTITUTIONAL    SERVICE    INVESTOR A   INVESTOR B   INVESTOR C
                                         ----------- --------------- ----------- ------------ ------------ ------------
   U.S. Opportunities ..................      $-       $    (2,767)   $    (234)      $-           $-           $-
   International Opportunities .........       -           (29,896)      (2,730)       -            -            -
   Asset Allocation ....................       -            (3,818)        (174)       -            -            -
   Index ...............................       -          (401,749)           -        -            -            -


ADMINISTRATION FEES WAIVED
                                             TOTAL
                                         -------------
   U.S. Opportunities .................. $ (3,001)
   International Opportunities .........  (32,626)
   Asset Allocation ....................   (3,992)
   Index ............................... (401,749)


                                                                        SHARE CLASSES
TRANSFER AGENT FEES                      ----------------------------------------------------------------------------
                                          BLACKROCK   INSTITUTIONAL   SERVICE   INVESTOR A   INVESTOR B   INVESTOR C     TOTAL
                                         ----------- --------------- --------- ------------ ------------ ------------ ----------
   Investment Trust ....................     $  -        $20,420      $  159      $20,209      $ 9,588      $   996    $ 51,372
   Large Cap Value .....................        -         10,855       2,996        8,022        2,553          829      25,255
   Large Cap Growth ....................        -          2,400       1,482        1,674        1,113          219       6,888
   Dividend AchieversTM ................        -            394           9          497           53          237       1,190
   Legacy ..............................        -          1,632           -        3,936        2,889          664       9,121
   Mid-Cap Value .......................        -            756          21        6,822        1,956        1,392      10,947
   Mid-Cap Growth ......................        -          4,669         511       11,148        3,873        1,359      21,560
   Aurora ..............................        -          5,052           -       65,216       14,382       14,345      98,995
   Small/Mid-Cap Growth ................        -          1,125           -        7,694          781          870      10,470
   Small Cap Value .....................      155          6,095         242        3,152        1,449          621      11,714
   Small Cap Core ......................        -            337           -          411          192          520       1,460
   Small Cap Growth ....................        -         27,052       2,738       13,033        2,056        1,325      46,204
   Global Science & Technology
    Opportunities ......................        -            125           8          905        1,097          287       2,422
   Global Resources ....................        -            430           -       10,390        1,437        2,579      14,836
   All-Cap Global Resources ............        -            109           -           52            8           13         182
   Health & Sciences ...................        -             65           -        1,149          449          388       2,051
   U.S. Opportunities ..................        -            558          93        2,833        3,694        1,847       9,025
   International Opportunities .........        -         11,302       2,335       12,111        4,818        6,450      37,016
   Asset Allocation ....................        -            474          33        7,959        2,844          988      12,298
   Index ...............................        -         50,244       6,418       28,472       15,687       24,727     125,548


                                                                         SHARE CLASSES
SHAREHOLDER SERVICE FEES                 -----------------------------------------------------------------------------
                                          BLACKROCK   INSTITUTIONAL   SERVICE    INVESTOR A   INVESTOR B   INVESTOR C
                                         ----------- --------------- --------- ------------- ------------ ------------
   Investment Trust .................... $   -              $-       $2,215    $ 280,437     $133,133     $13,631
   Large Cap Value .....................     -               -       41,607      111,353       35,459      11,501
   Large Cap Growth ....................     -               -       20,579       23,245       15,460       3,042
   Dividend AchieversTM ................     -               -          120        6,912          732       3,477
   Legacy ..............................     -               -            -      139,772      102,315      24,066
   Mid-Cap Value .......................     -               -          289       93,703       27,150      19,337
   Mid-Cap Growth ......................     -               -        7,099      154,742       53,787      18,839
   Aurora ..............................     -               -            -    2,858,247      596,422     614,788
   Small/Mid-Cap Growth ................     -               -            -      333,588       31,980      37,318
   Small Cap Value ..................... 6,143               -        3,361       43,777       20,125       8,625
   Small Cap Core ......................     -               -            1        5,712        2,668       7,224
   Small Cap Growth ....................     -               -       38,029      180,997       28,557      18,407
   Global Science & Technology
    Opportunities ......................     -               -          110       12,564       15,241       3,989
   Global Resources ....................     -               -            -      144,190       19,954      35,662
   All-Cap Global Resources ............     -               -            -          707          116         188
   Health Sciences .....................     -               -            -       15,944        6,239       5,354
   U.S. Opportunities ..................     -               -        1,292       39,341       51,302      25,605
   International Opportunities .........     -               -       30,476      168,195       66,917      89,574


SHAREHOLDER SERVICE FEES
                                             TOTAL
                                         -------------
   Investment Trust .................... $ 429,416
   Large Cap Value .....................   199,920
   Large Cap Growth ....................    62,326
   Dividend AchieversTM ................    11,241
   Legacy ..............................   266,153
   Mid-Cap Value .......................   140,479
   Mid-Cap Growth ......................   234,467
   Aurora .............................. 4,069,457
   Small/Mid-Cap Growth ................   402,886
   Small Cap Value .....................    82,031
   Small Cap Core ......................    15,605
   Small Cap Growth ....................   265,990
   Global Science & Technology
    Opportunities ......................    31,904
   Global Resources ....................   199,806
   All-Cap Global Resources ............     1,011
   Health Sciences .....................    27,537
   U.S. Opportunities ..................   117,540
   International Opportunities .........   355,162

160
                          BLACKROCK FUNDS


                                                             SHARE CLASSES
SHAREHOLDER SERVICE FEES      ----------------------------------------------------------------------------
                               BLACKROCK   INSTITUTIONAL   SERVICE   INVESTOR A   INVESTOR B   INVESTOR C      TOTAL
                              ----------- --------------- --------- ------------ ------------ ------------ ------------
   Asset Allocation .........      $-            $-       $  457    $110,407     $39,499      $13,662      $ 164,025
   Index ....................       -             -       89,136     395,441     217,799      343,100      1,045,476


                                                 SHARE CLASSES
DISTRIBUTION FEES                    --------------------------------------
                                      INVESTOR A   INVESTOR B   INVESTOR C      TOTAL
                                     ------------ ------------ ------------ ------------
   Investment Trust ................   $112,150    $  399,520   $   41,447   $  553,117
   Large Cap Value .................     40,799       116,233       34,522      191,554
   Large Cap Growth ................      9,270        46,379        9,128       64,777
   Dividend AchieversTM ............      2,765         2,197        9,877       14,839
   Legacy ..........................     34,825       306,952       72,259      414,036
   Mid-Cap Value ...................     37,849        81,484       58,010      177,343
   Mid-Cap Growth ..................     61,869       161,371       56,607      279,847
   Aurora ..........................    722,490     1,789,412    1,844,555    4,356,457
   Small/Mid-Cap Growth ............     90,354        95,940      111,955      298,249
   Small Cap Value .................     17,473        60,374       25,878      103,725
   Small Cap Core ..................      2,298         8,003       21,674       31,975
   Small Cap Growth ................     72,493        85,672       55,218      213,383
   Global Science & Technology
    Opportunities ..................      5,011        45,719       11,968       62,698
   Global Resources ................     57,662        59,873      107,470      225,005
   All-Cap Global Resources ........        363           349          562        1,274
   Health Sciences .................      6,363        18,726       16,152       41,241
   U.S. Opportunities ..............     15,699       153,907       76,947      246,553
   International Opportunities .....     67,649       200,752      268,762      537,163
   Asset Allocation ................     44,174       118,517       41,180      203,871
   Index ...........................    157,993       653,603    1,030,288    1,841,884


                                                                             161
                                BLACKROCK FUNDS
             NOTES TO FINANCIAL STATEMENTS (Unaudited) (CONTINUED)

     The distribution fees for the Investor A share class include accruals for
the State Street Research Class B shares for the period prior to the
Reorganization on January 31, 2005 for the Investment Trust, Large Cap Value
Equity, Mid-Cap Growth Equity, Aurora, Health Sciences and Asset Allocation
Portfolios; and for State Street Research Class B and R share classes for the
Legacy, Mid-Cap Value Equity, Small/Mid-Cap Growth and Global Resources
Portfolios.


                                            SHARE CLASSES
DISTRIBUTION FEES WAIVED                   ---------------
                                              INVESTOR A
                                           ---------------
   Investment Trust ....................     $  (112,150)
   Large Cap Value .....................         (44,507)
   Large Cap Growth ....................          (9,270)
   Dividend AchieversTM ................          (2,764)
   Legacy ..............................         (21,829)
   Mid-Cap Value .......................         (37,849)
   Mid-Cap Growth ......................         (61,869)
   Aurora ..............................        (354,446)
   Small/Mid-Cap Growth ................         (42,559)
   Small Cap Value .....................         (17,743)
   Small Cap Core ......................          (2,298)
   Small Cap Growth ....................         (72,493)
   Global Science & Technology
    Opportunities ......................          (5,011)
   Global Resources ....................         (57,662)
   All-Cap Global Resources ............            (363)
   Health Sciences .....................          (6,363)
   U.S. Opportunities ..................         (15,699)
   International Opportunities .........         (67,650)
   Asset Allocation ....................         (44,174)
   Index ...............................        (157,993)


162
                                BLACKROCK FUNDS

(D) Transactions with Affiliates and Related Parties

     Pursuant to an Investment Advisory Agreement, BlackRock Advisors, Inc.
("BlackRock"), a wholly-owned subsidiary of BlackRock, Inc., serves as
investment adviser for each of the Fund's Equity Portfolios, except for the
Index Equity Portfolio. BlackRock Financial Management, Inc. ("BFM"), a
wholly-owned subsidiary of BlackRock, serves as the sub-adviser for the Asset
Allocation Portfolio. BlackRock International, Ltd. ("BIL"), an indirect
wholly-owned subsidiary of BlackRock, serves as the subadvisor for the
International Opportunities Portfolio.  BlackRock, Inc. is an indirect
majority-owned subsidiary of The PNC Financial Services Group, Inc.

     For its advisory services, BlackRock is entitled to receive fees at the
following annual rates, computed daily and payable monthly, based on each
Portfolio's average daily net assets:

     Large Cap Value Equity, Large Cap Growth Equity, Dividend AchieversTM,
Small Cap Value Equity, Small Cap Growth Equity, Asset Allocation and
Investment Trust - 0.55% of the first $1 billion, 0.50% of the next $1 billion,
0.475% of the next $1 billion and 0.45% of net assets in excess of $3 billion.

     Mid-Cap Value Equity and Mid-Cap Growth Equity - 0.80% of the first $1
billion, 0.70% of the next $1 billion, 0.675% of the next $1 billion and 0.625%
of net assets in excess of $3 billion.

     U.S Opportunities - 1.10% of the first $1 billion, 1.05% of the next $1
billion, 1.025% of the next $1 billion and 1.00% of the net assets in excess of
$3 billion.

     Global Science & Technology Opportunities - 0.90% of the first $1 billion,
0.85% of the next $1 billion, 0.80% of the next $1 billion and 0.75% of net
assets in excess of $3 billion.

     Global Resources, Health Sciences, Small/Mid-Cap Growth and All-Cap Global
Resources - 0.75% of the first $1 billion, 0.70% of the next $1 billion, 0.675%
of the next $1 billion and 0.65% of net assets in excess of $3 billion.

     International Opportunities - 1.00% of the first $1 billion, 0.95% of the
next $1 billion, 0.90% of the next $1 billion and 0.85% of net assets in excess
of $3 billion.

     Small Cap Core Equity - 1.00% of net assets.

     Legacy - 0.65% of the first $1billion, 0.60% of the next $1 billion,
0.575% of the next $1 billion and 0.55% of net assets in excess of $3 billion.

     Aurora - 0.85% of the first $1 billion, 0.80% of the next $1 billion,
0.75% of the next $1 billion and 0.70% of net assets in excess of $3 billion.

     Prior to January 31, 2005, the following Funds had entered into an
agreement with State Street Research & Management Co. to provide advisory,
statistical and research facilities and services. Fees were earned monthly at
the following annual rates:
     State Street Research Legacy - 0.65% of net assets
     State Street Research Mid-Cap Value Equity - 0.65% of net assets
     State Street Research Aurora - 0.85% of net assets
     State Street Research Emerging Growth - 0.75% of net assets
     State Street Research Global Resources - 0.75% of net assets
     State Street Research Health Sciences - 0.75% of net assets
   State Street Research Asset Allocation - 0.75% of the first $500 million in
   net assets annually, 0.70% of the next  $500 million, and 0.65% of any
   amount over $1 billion.

                                                                             163
                                BLACKROCK FUNDS
             NOTES TO FINANCIAL STATEMENTS (Unaudited) (CONTINUED)

     For the period ended March 31, 2005, advisory fees and waivers for each
    portfolio were as follows:


                                                              GROSS                      NET
                                                             ADVISORY                  ADVISORY
                                                               FEE         WAIVER        FEE
                                                          ------------- ----------- -------------
     Investment Trust ..................................   $ 1,526,322   $143,642    $ 1,382,680
     Large Cap Value ...................................       770,937     70,524        700,413
     Large Cap Growth ..................................       209,999     74,425        135,574
     Dividend AchieversTM ..............................        37,655     37,655              -
     Legacy* ...........................................       838,564          -        838,564
     Mid-Cap Value* ....................................       485,894     82,106        403,788
     Mid-Cap Growth ....................................       956,961          -        956,961
     Aurora* ...........................................    14,317,650          -     14,317,650
     Small/Mid-Cap Growth* .............................     1,451,339     28,627      1,422,712
     Small Cap Value ...................................       369,897      1,076        368,821
     Small Cap Core ....................................        81,938     35,845         46,093
     Small Cap Growth ..................................     1,412,488          -      1,412,488
     Global Science & Technology Opportunities .........       120,721     40,975         79,746
     Global Resources* .................................       617,562          -        617,562
     All-Cap Global Resources ..........................         8,414      8,414              -
     Health Sciences* ..................................        85,447          -         85,447
     U.S. Opportunities ................................       549,775          -        549,775
     International Opportunities .......................     2,064,068          -      2,064,068
     Asset Allocation* .................................       375,319     29,434        345,885
     Index .............................................     1,526,322    143,642      1,382,680

     *These Portfolio advisory fees are paid to BlackRock as of January 31,
2005. Prior to that date the fees were paid to the respective adviser of the
predecessor funds. See Note (B) for more information on the Reorganizations.

     The Index Equity Portfolio pays no advisory fee but bears its
proportionate cost of the fee paid by The U.S. Large Company Series of The DFA
Investment Trust.

     In the interest of limiting the expenses of the Portfolios, BlackRock and
the Fund have entered into a series of annual expense limitation agreements.
The agreements set a limit on certain operating expenses of each Portfolio for
the next year and require BlackRock to waive or reimburse fees or expenses if
these operating expenses exceed that limit. These expense limits apply to the
aggregate expenses incurred on a share class (excluding: interest, taxes,
brokerage commissions, other expenditures which are capitalized in accordance
with generally accepted accounting principles and other extraordinary
expenses). At March 31, 2005 the receivable from BlackRock in the All-Cap
Global Resources Portfolio and Index Equity Portfolio was $4,984 and $5,253,
respectively. For the six months ended March 31, 2005, the amount reimbursed by
BlackRock was $17,683 and $2,692 in the Dividend AchieversTM and Small Cap Core
Equity Portfolios, respectively.

     Effective February 1, 2005, BlackRock, BIL and BFM have contractually
agreed to waive or reimburse fees or expenses in order to limit expenses as
follows:

                                                                        SHARE CLASSES
PORTFOLIO                           -------------------------------------------------------------------------------------
                                     BLACKROCK     INSTITUTIONAL     SERVICE     INVESTOR A     INVESTOR B     INVESTOR C
                                    -----------   ---------------   ---------   ------------   ------------   -----------
   Investment Trust .............       NA              0.81%          1.11%         1.16%          1.91%         1.91%
   Large Cap Value ..............       NA              0.79%          1.09%         1.25%          2.00%         2.00%
   Large Cap Growth .............       NA              0.82%          1.12%         1.29%          2.04%         2.04%
   Dividend Achievers ...........       NA              0.90%          1.20%         1.30%          2.05%         2.05%
   Legacy Portfolio .............       NA              1.10%          1.35%         1.35%          2.10%         2.10%
   Mid-Cap Value ................       NA              1.00%          1.25%         1.25%          2.00%         2.00%
   Mid-Cap Growth ...............       NA              1.23%          1.53%         1.58%          2.33%         2.33%
   Aurora .......................       NA              1.19%          1.44%         1.44%          2.19%         2.19%
   Small/Mid-Cap Growth .........       NA              1.10%          1.35%         1.35%          2.10%         2.10%
   Small Cap Value ..............       1.10%           0.97%          1.27%         1.44%          2.19%         2.19%

164
                          BLACKROCK FUNDS


                                                                               SHARE CLASSES
PORTFOLIO                                  -------------------------------------------------------------------------------------
                                            BLACKROCK     INSTITUTIONAL     SERVICE     INVESTOR A     INVESTOR B     INVESTOR C
                                           -----------   ---------------   ---------   ------------   ------------   -----------
   Small Cap Core ......................       NA              1.30%          1.60%         1.77%          2.52%         2.52%
   Small Cap Growth ....................       NA              0.99%          1.29%         1.46%          2.21%         2.21%
   Global Sciences & Technology
    Opportunities ......................       NA              1.43%          1.73%         1.90%          2.65%         2.65%
   Global Resources ....................       NA              1.04%          1.34%         1.34%          2.04%         2.04%
   All-Cap Global Resources ............       NA              1.04%          1.34%         1.34%          2.04%         2.04%
   Health Sciences .....................       NA              1.25%          1.55%         1.55%          2.25%         2.25%
   U.S. Opportunities ..................       NA              1.60%          1.90%         2.07%          2.82%         2.82%
   International Opportunities .........       NA              1.45%          1.75%         1.92%          2.67%         2.67%
   Asset Allocation ....................       NA              0.86%          1.16%         1.33%          2.08%         2.08%
   Index ...............................       NA              0.18%         0.615%        0.785%         1.535%        1.535%

     Prior to January 31, 2005, the State Street Research Mid-Cap Value Equity,
Emerging Growth and Health Sciences Funds limited expenses to 1.25% (plus 12b-1
fees), 1.10% (plus 12b-1 fees) and 1.00% (plus 12b-1 fees), respectively.

     If in the following two years the operating expenses of a share class that
previously received a waiver or reimbursement from BlackRock, BIL or BFM are
less than the expense limit for that share class, the share class is required
to repay BlackRock or BIL up to the amount of fees waived or expenses
reimbursed under the agreement if: (1) the Portfolio of which the share class
is a part has more than $50 million in assets, (2) BlackRock, BIL or BFM
continues to be the Portfolio's investment adviser and (3) the Board of
Trustees of the Fund has approved the payments to BlackRock at the previous
quarterly meeting.

     At March 31, 2005, the amounts subject to possible future reimbursement
under the expense limitation agreement are as follows:

                                                                                                                 TOTAL WAIVERS
                                                            EXPIRING           EXPIRING           EXPIRING        SUBJECT TO
                                                        JANUARY 31, 2006   JANUARY 31, 2007   JANUARY 31, 2008   REIMBURSEMENT
                                                       ------------------ ------------------ ------------------ --------------
   Investment Trust ..................................      $169,360      $ 141,314               $314,411      $ 625,085
   Large Cap Value ...................................       357,981        255,627                 65,314        678,922
   Large Cap Growth ..................................       154,813        166,424                 42,020        363,257
   Dividend AchieversTM ..............................             -         99,618                 23,397        123,015
   Legacy ............................................             -          1,199                 24,944         26,143
   Mid-Cap Value .....................................             -              -                317,221        317,221
   Mid-Cap Growth ....................................         5,005         43,430                 16,859         65,294
   Small/Mid-Cap Growth ..............................             -          5,030                101,628        106,658
   Small Cap Value ...................................             -         25,227                  2,397         27,624
   Small Cap Core ....................................        12,634         52,283                  9,989         74,906
   Small Cap Growth ..................................             -          6,742                      -          6,742
   Global Science & Technology Opportunities .........        23,534         71,419                 12,133        107,086
   Global Resources ..................................             -          2,647                 43,576         46,223
   All-Cap Global Resources ..........................             -              -                 14,222         14,222
   Health Sciences ...................................             -             62                    353            415
   U.S. Opportunities ................................             -         15,890                  1,113         17,003
   International Opportunities .......................        41,722        185,626                 32,320        259,668
   Asset Allocation ..................................             -              -                  9,073          9,073
   Index .............................................             -      1,333,005                205,895      1,538,900


                                                                             165
                                BLACKROCK FUNDS
             NOTES TO FINANCIAL STATEMENTS (Unaudited) (CONTINUED)

     BlackRock pays BIL and BFM fees for their sub-advisory services.

     PFPC, an indirect wholly-owned subsidiary of The PNC Financial Services
Group, Inc., and BlackRock act as co-administrators for the Fund. For these
services, the co-administrators receive a combined administration fee computed
daily and payable monthly, based on a percentage of the average daily net
assets of each Portfolio, at the following annual rates: 0.085% of the first
$500 million, 0.075% of the next $500 million and 0.065% of assets in excess of
$1 billion. In addition, each of the share classes, except for the BlackRock
class, is charged an administration fee based on the following percentage of
average daily net assets of each respective class: 0.145% of the first $500
million, 0.135% of the next $500 million and 0.125% of assets in excess of $1
billion.  The BlackRock class is charged an admistration fee of 0.035% of the
first $500 million, 0.025% of the next $500 million and 0.015% of assets in
excess of $1 billion based upon average daily net assets of its class.  In
addition, PFPC and BlackRock may have, at their discretion, voluntarily waived
all or any portion of their administration fees for any portfolio or share
class.

     For the period ended March 31, 2005, administration fees and waivers for
each Portfolio were as follows:


                                                             GROSS                        NET
                                                        ADMINISTRATION               ADMINISTRATION
                                                              FEE          WAIVER         FEE
                                                       ---------------- ----------- ---------------
   Investment Trust .................................. $ 627,680        $230,394    $ 397,286
   Large Cap Value ...................................   322,586         105,958      216,628
   Large Cap Growth ..................................    87,940          27,147       60,793
   Dividend AchieversTM ..............................    15,537           7,466        8,071
   Legacy* ...........................................   132,031          26,143      105,888
   Mid-Cap Value* ....................................   137,982          86,319       51,663
   Mid-Cap Growth ....................................   275,357          29,889      245,468
   Aurora* ........................................... 1,171,033               -    1,171,033
   Small/Mid-Cap* ....................................   163,269          78,031       85,238
   Small Cap Value ...................................   151,364           6,053      145,311
   Small Cap Core ....................................    18,728           3,438       15,290
   Small Cap Growth ..................................   589,537               -      589,537
   Global Science & Technology Opportunities .........    30,915           1,050       29,865
   Global Resources* .................................   183,989               -      183,989
   All-Cap Global Resources ..........................     2,416           1,829          587
   Health Sciences* ..................................    26,205              44       26,161
   U.S. Opportunities ................................   115,184           3,001      112,183
   International Opportunities .......................   473,541          32,626      440,915
   Asset Allocation* .................................   154,319           3,992      150,327

     *These Portfolio administration fees are paid to PFPC and BlackRock
beginning January 31, 2005. Prior to that date the fees were paid to the
respective administrator of the predecessor funds. See Note (B) above for more
information on the Reorganization.

     Prior to January 31, 2005, State Street Research Legacy Fund, State Street
Research Mid-Cap Value Equity Fund, State Street Research Aurora Fund, State
Street Research Emerging Growth Fund, State Street Research Global Resources
Fund, State Street Research Health Sciences Fund and State Street Research
Asset Allocation Fund paid State Street Research & Management Co. for certain
administrative costs incurred in providing other assistance and services to
each Fund.  The fee was based on actual costs allocated equally among the State
Street Research Funds.

     PFPC Trust Co., an indirect subsidiary of The PNC Financial Services
Group, Inc., serves as custodian for each of the Fund's Portfolios. Prior to
January 31, 2005, State Street Bank and Trust Company served as the State
Street Research Funds' custodian and record keeper for the State Street
Research Legacy Fund, State Street Research Mid-Cap Value Equity Fund, State
Street Research Aurora Fund, State Street Research Emerging Growth Fund, State
Street Research Global Resources Fund, State Street Research Health Sciences
Fund and State Street Research Asset Allocation Fund. PFPC serves as transfer
and dividend disbursing agent for each of the Fund's Portfolios.  Prior to
January 31, 2005, Boston Financial Data Services, Inc. served as the State
Street Research Funds' transfer agent.

     Pursuant to the Fund's Amended and Restated Distribution and Service Plan
(the "Plan"), the Fund may pay BlackRock Distributors, Inc. (the "Distributor")
and/or BlackRock or any other affiliate of PNC Financial Services Group,


166
                                BLACKROCK FUNDS

Inc. fees for distribution and sales support services. Currently, only Investor
A Shares, Investor B Shares and Investor C Shares bear the expense of
distribution fees under the Plan. In addition, the Fund may pay brokers,
dealers, financial institutions and industry professionals (including PNC
Financial Services Group, Inc. and its affiliates) ("service organizations")
fees for the provision of personal services to shareholders. BlackRock may
receive some of the service fees paid by the Fund in return for providing
services to shareholders. Prior to January 31, 2005, State Street Research
Service Center, a division of State Street Research Investment Services, Inc.,
provided certain shareholder services to the State Street Research Funds, such
as responding to inquiries and instructions from investors with respect to the
purchase and redemption of shares of the Funds. For the period October 1, 2004
through January 31, 2005, the State Street Research Funds paid $115,357,
$324,764, $1,712,817, $543,616, $290,168, $51,797 and $226,546, for State
Street Research Legacy, Mid-Cap Value Equity, Aurora, Emerging Growth, Global
Resources, Health Sciences and Asset Allocation Funds, respectively.

     As of the period ended March 31, 2005, affiliated payables were as
follows:


                                                                                         PNC BANK
                                                            PFPC(1)    BLACKROCK(2)   AFFILIATES(3)       TOTAL
                                                         ------------ -------------- --------------- --------------
   Investment Trust .................................... $ 446,719      $  739,893      $  383,393    $ 1,570,005
   Large Cap Value .....................................   125,831         188,134          91,183        405,148
   Large Cap Growth ....................................    44,548          17,479          17,937         79,964
   Dividend AchieversTM ................................     4,168           2,004           8,658         14,830
   Legacy ..............................................   147,915         191,669         123,724        463,308
   Mid-Cap Value .......................................   214,773         422,764         280,841        918,378
   Mid-Cap Growth ......................................   154,005         368,868         137,121        659,994
   Aurora .............................................. 1,352,962       2,565,275       1,225,648      5,143,885
   Small/Mid-Cap Growth ................................   228,546         205,461          95,514        529,521
   Small Cap Value .....................................    32,115          78,796          27,892        138,803
   Small Cap Core ......................................     4,238          16,762          11,126         32,126
   Small Cap Growth ....................................    97,417         327,434          67,940        492,791
   Global Science and Technology Opportunities .........    19,225          12,625          13,883         45,733
   Global Resources ....................................   255,881         734,892         367,059      1,357,832
   All-Cap Global Resources ............................     5,084               -           2,065          7,149
   Health Sciences .....................................    76,365         105,245          62,483        244,093
   U.S. Opportunities ..................................    50,712         103,273          56,735        210,720
   International Opportunities .........................   130,698         488,150         169,397        788,245
   Asset Allocation ....................................   295,609         452,744         323,602      1,071,955
   Index ...............................................   242,496          27,776         444,145        714,417

(1) - Payables to PFPC and PFPC Trust Co. are for Accounting, Administration,
   Custody and Transfer Agent services provided as of March 31, 2005.
(2) - Payables to BlackRock are for Advisory and Administration services
   provided as of March 31, 2005.
(3) - Payables to PNC Financial Services Group, Inc. affiliates are for
   distribution and sales support services as described under the Plan. The
   total payable on behalf of the Fund, as of March 31, 2005, was $5,561,651,
   a porton of which is paid to service organizations, including other PNC
   Financial Services Group, Inc. affiliates.

     State Street Research Investment Service, Inc., from time to time and in
varying amounts, voluntarily assumed some portion of fees or expenses relating
to the State Street Research Funds. During the period ended January 31, 2005,
the amount of such expenses assumed by State Street Research Investment
Service, Inc. were $271,500, $355,506 and $162,313 for the Mid-Cap Value
Equity, Emerging Growth and Health Sciences Funds, respectively.

     Prior to January 31, 2005, State Street Research Investment Service, Inc.
reimbursed a total of $91,069 and $294,508 to Mid-Cap Value Equity and Asset
Allocation Portfolios, respectively, reflecting the estimated excess of
payments received over costs incurred under the plans of distribution pursuant
to Rule 12b-1 under the Investment Company Act of 1940. This amount is shown as
"Reimbursement of distribution fees" in the Statement of Operations.

     Prior to January 31, 2005, State Street Research & Management Co.
conducted an internal review regarding the use of fund brokerage commissions in
consideration of the distribution of shares. In connection with this review,
State Street Research & Management Company determined to reimburse the funds
the entire amount of any such identified


                                                                             167
                                BLACKROCK FUNDS
             NOTES TO FINANCIAL STATEMENTS (Unaudited) (CONTINUED)

brokerage commissions, and reviewed this matter with the Board of Trustees of
the funds. The amount of reimbursement in the State Street Research Legacy,
Mid-Cap Value, Aurora, Global Resources and Asset Allocation Portfolios
amounted to $294,363, $144,758, $203,165, $12,780 and $41,520, respectively,
and are shown as "Net increase from payment by afflliate" on the Statement of
Operations.

     Prior to January 31, 2005, State Street Research & Management Co.
reimbursed the State Street Research Mid-Cap Value Equity and Assest Allocation
Portfolios $409,472 and $49,054, respectively, as a result of a corporate
action processing error. This amount is included in the total amount of "Net
increase from payment by affiliate" on the Statement of Operations.

(E) Purchases and Sales of Securities

     For the period ended March 31, 2005, purchases and sales of securities,
other than short-term investments, dollar rolls and U.S. government securities,
were as follows:


                                                             PURCHASES            SALES
                                                         ----------------   ----------------
   Investment Trust ..................................   $ 612,483,703      $ 662,263,915
   Large Cap Value ...................................     127,625,410        181,601,725
   Large Cap Growth ..................................      20,722,579         50,949,708
   Dividend AchieversTM ..............................      27,001,200          3,519,465
   Legacy ............................................      87,122,483        117,007,792
   Mid-Cap Value .....................................      60,653,547         65,935,211
   Mid-Cap Growth ....................................     137,737,183        171,509,932
   Aurora ............................................   1,666,838,434      2,380,731,349
   Small/Mid-Cap Growth ..............................     250,272,033        418,277,645
   Small Cap Value ...................................      93,697,904        110,060,970
   Small Cap Core ....................................      21,769,537          7,338,090
   Small Cap Growth ..................................     234,255,605        233,426,487
   Global Science & Technology Opportunities .........      15,430,156         19,850,894
   Global Resources ..................................      24,961,902          8,147,083
   All-Cap Global Resources ..........................      16,901,329            354,555
   Health Sciences ...................................      17,020,399         27,750,752
   U.S. Opportunities ................................      49,975,721         66,740,434
   International Opportunities .......................     320,898,283        195,325,612
   Asset Allocation ..................................     113,693,722        127,001,490

     For the period ended March 31, 2005, purchases and sales of U.S.
government securities were as follows:


                                              PURCHASES         SALES
                                           --------------   -------------
   Small Cap Core ......................    $ 1,299,903      $         -
   Small Cap Growth ....................     37,975,612          899,352
   Global Resources ....................     29,984,292                -
   All-Cap Global Resources ............     15,476,652       12,684,823
   International Opportunities .........     59,962,624       13,295,140
   Asset Allocation ....................     83,979,013        9,533,694

168
                                BLACKROCK FUNDS

(F) Capital Shares

     Transactions in capital shares for each period were as follows:


                                                                    INVESTMENT TRUST
                                     -------------------------------------------------------------------------------
                                     FOR THE SIX MONTHS ENDED                          FOR THE YEAR ENDED
                                       3/31/05                                               9/30/04
                                     -----------                             ----------
                                       SHARES               VALUE              SHARES              VALUE
                                     -----------              --------       ----------              -------
Shares issued from the reorganiza-
 tion:(1)
 Institutional Class .............      40,828,647       $   515,833,495                 -       $            -
 Investor A Class ................      48,798,085           609,948,434                 -                    -
 Investor B Class ................      21,137,337           253,399,555                 -                    -
 Investor C Class ................       2,066,508            24,797,217                 -                    -
Shares sold:
 Institutional Class .............         739,776             9,500,475           216,622            2,456,412
 Service Class ...................           2,951                37,670             8,197               93,107
 Investor A Class ................         348,584             4,409,445           183,221            2,109,353
 Investor B Class ................         229,510             2,796,225           139,593            1,538,514
 Investor C Class ................          49,467               594,659            85,616              944,576
Shares issued in reinvestment of
 dividends:
 Institutional Class .............           7,404                94,993            13,608              152,539
 Service Class ...................             587                 7,555             1,287               14,481
 Investor A Class ................           3,914                49,674            11,067              122,834
 Investor B Class ................               -                     -             2,456               26,280
 Investor C Class ................               -                     -                18                  197
Shares redeemed:
 Institutional Class .............      (2,816,201)          (36,291,408)       (1,814,412)         (21,040,940)
 Service Class ...................         (15,384)             (198,282)          (58,824)            (678,027)
 Investor A Class ................      (2,884,409)          (36,771,596)         (604,302)          (6,941,701)
 Investor B Class ................      (1,406,383)          (17,135,861)         (499,549)          (5,498,048)
 Investor C Class ................        (145,640)           (1,777,804)          (59,437)            (655,542)
                                     -------------       ---------------     -------------       --------------
Net increase (decrease) ..........     106,944,753       $ 1,329,294,446        (2,374,839)      $  (27,355,965)
                                     =============       ===============     =============       ==============

(1) See Note (B).

                                                                             169
                                BLACKROCK FUNDS
             NOTES TO FINANCIAL STATEMENTS (Unaudited) (CONTINUED)


                                                                  LARGE CAP VALUE
                                    ---------------------------------------------------------------------------
                                         FOR THE SIX MONTHS ENDED                  FOR THE YEAR ENDED
                                                  3/31/05                                9/30/04
                                    -----------------------------------   -------------------------------------
                                         SHARES             VALUE              SHARES              VALUE
                                    ---------------   -----------------   ---------------   -------------------
Share issued from the
 reorganization:(1)
 Institutional Class ............       1,149,957       $  15,613,371                 -       $             -
 Investor A Class ...............       7,681,441         104,267,398                 -                     -
 Investor B Class ...............       2,233,885          29,747,965                 -                     -
 Investor C Class ...............         445,077           5,931,502                 -                     -
Shares sold:
 Institutional Class ............         595,202           8,290,152           316,937             3,903,308
 Service Class ..................          33,735             451,401           493,431             6,007,440
 Investor A Class ...............         546,838           7,562,761           636,019             7,793,537
 Investor B Class ...............          91,847           1,244,498           156,179             1,857,657
 Investor C Class ...............         113,434           1,509,397           218,843             2,628,823
Shares issued in reinvestment of
 dividends:
 Institutional Class ............          17,827             244,161            31,312               385,701
 Service Class ..................          14,091             193,514            49,696               613,098
 Investor A Class ...............          43,161             590,740            45,966               567,650
 Investor B Class ...............           6,336              85,141             3,582                43,292
 Investor C Class ...............           1,367              18,397               659                 8,032
Shares redeemed:
 Institutional Class ............      (1,654,829)        (22,704,833)       (5,418,443)          (65,488,958)
 Service Class ..................      (1,549,774)        (20,456,390)       (2,654,757)          (32,310,859)
 Investor A Class ...............      (1,578,576)        (21,717,500)       (2,322,080)          (28,657,371)
 Investor B Class ...............        (396,470)         (5,352,522)         (366,792)           (4,399,303)
 Investor C Class ...............        (151,569)         (2,033,293)         (159,711)           (1,931,382)
                                       ----------       -------------        ----------       ---------------
Net increase (decrease) .........       7,642,980       $ 103,485,860        (8,969,159)      $  (108,979,335)
                                       ==========       =============        ==========       ===============

(1) See Note (B).

170
                          BLACKROCK FUNDS


                                                              LARGE CAP GROWTH
                                 ---------------------------------------------------------------------------
                                       FOR THE SIX MONTHS ENDED                  FOR THE YEAR ENDED
                                               3/31/05                                9/30/04
                                 ------------------------------------   ------------------------------------
                                      SHARES              VALUE              SHARES              VALUE
                                 ---------------   ------------------   ---------------   ------------------
Shares sold:
 Institutional Class .........          77,958       $      737,114           414,248       $    3,748,569
 Service Class ...............          78,788              698,023         1,491,678           12,963,992
 Investor A Class ............         204,491            1,870,731           408,084            3,544,786
 Investor B Class ............          71,596              605,075           141,746            1,142,700
 Investor C Class ............          41,422              347,724            65,005              522,781
Shares redeemed:
 Institutional Class .........        (646,041)          (6,096,074)       (1,789,964)         (16,165,845)
 Service Class ...............      (2,570,544)         (23,203,305)       (3,123,574)         (27,376,334)
 Investor A Class ............        (555,355)          (5,096,966)       (1,701,982)         (14,854,493)
 Investor B Class ............        (360,272)          (3,029,768)         (491,755)          (3,942,213)
 Investor C Class ............         (88,739)            (742,258)          (92,909)            (744,035)
                                    ----------       --------------        ----------       --------------
Net decrease .................      (3,746,696)      $  (33,909,704)       (4,679,423)      $  (41,160,092)
                                    ==========       ==============        ==========       ==============


                               171
                                BLACKROCK FUNDS
             NOTES TO FINANCIAL STATEMENTS (Unaudited) (CONTINUED)


                                                        DIVIDEND ACHIEVERSTM
                                   ---------------------------------------------------------------
                                        FOR THE SIX MONTHS ENDED          FOR THE PERIOD 9/8/041
                                                3/31/05                      THROUGH 9/30/04
                                   ----------------------------------   --------------------------
                                        SHARES             VALUE          SHARES         VALUE
                                   ---------------   ----------------   ---------   --------------
Shares sold:
 Institutional Class ...........       446,885         $  4,726,384      200,010     $ 2,000,100
 Service Class .................        26,705              281,750           10             100
 Investor A Class ..............      1,107,213          11,616,333           10             100
 Investor B Class ..............       165,673            1,753,658           10             100
 Investor C Class ..............       644,516            6,776,865           10             100
Shares issued in reinvestment of
 dividends:
 Institutional Class ...........         3,206               33,476            -               -
 Service Class .................            39                  400            -               -
 Investor A Class ..............         3,322               34,640            -               -
 Investor B Class ..............           291                3,028            -               -
 Investor C Class ..............           950                9,899            -               -
Shares redeemed:
 Institutional Class ...........       (14,274)            (149,550)           -               -
 Service Class .................              (4)               (42)           -               -
 Investor A Class ..............       (57,457)            (606,588)           -               -
 Investor B Class ..............          (961)             (10,140)           -               -
 Investor C Class ..............        (3,062)             (32,789)           -               -
                                      ----------       ------------      -------     -----------
Net increase ...................      2,323,042        $ 24,437,324      200,050     $ 2,000,500
                                      ==========       ============      =======     ===========

1 Commencement of operations.

172
                          BLACKROCK FUNDS


                                                                           LEGACY
                                         ---------------------------------------------------------------------------
                                                    FOR THE PERIOD                       FOR THE YEAR ENDED
                                               11/1/04 THROUGH 3/31/05                        10/31/04
                                         ------------------------------------   ------------------------------------
                                              SHARES              VALUE              SHARES              VALUE
                                         ---------------   ------------------   ---------------   ------------------
Net change in shares from reorganiza-
 tion:(1)
 State Street Research Fund:
   Investor A Class (Formerly Class
    A, Class B and Class R) ..........         (47,040)      $            -                 -       $            -
Shares sold:
   Institutional Class (Formerly Class
    S) ...............................         122,450            1,643,618            28,583              361,227
   Service Class .....................               8                  100                 -                    -
   Investor A Class (Formerly Class
    A, Class B and Class R) ..........         549,594            7,216,185         3,342,153           41,469,311
   Investor B Class (Formerly Class
    B(1)) ............................         156,783            1,952,809           475,624            5,595,734
   Investor C Class (Formerly Class
    C) ...............................          44,875              559,571           277,077            3,269,502
Shares issued in reinvestment of
 dividends:
   Institutional Class (Formerly Class
    S) ...............................               -                    -                 -                    -
   Service Class .....................               -                    -                 -                    -
   Investor A Class (Formerly Class
    A, Class B and Class R) ..........               -                    -                 -                    -
   Investor B Class (Formerly Class
    B(1)) ............................               -                    -                 -                    -
   Investor C Class (Formerly Class
    C) ...............................               -                    -                 -                    -
Shares redeemed:
   Institutional Class (Formerly Class
    S) ...............................        (263,483)          (3,544,529)         (928,675)         (11,749,962)
   Service Class .....................               -                    -                 -                    -
   Investor A Class (Formerly Class
    A, Class B and Class R) ..........      (1,714,594)         (22,433,325)       (5,218,348)         (63,485,226)
   Investor B Class (Formerly Class
    B(1)) ............................        (964,047)         (12,010,252)       (1,692,058)         (19,854,531)
   Investor C Class (Formerly Class
    C) ...............................        (361,537)          (4,507,716)         (939,768)         (11,076,996)
                                            ----------       --------------        ----------       --------------
Net decrease .........................      (2,476,991)      $  (31,123,539)       (4,655,412)      $  (55,470,941)
                                            ==========       ==============        ==========       ==============

(1) See Note (B).

                                                                             173
                                BLACKROCK FUNDS
             NOTES TO FINANCIAL STATEMENTS (Unaudited) (CONTINUED)


                                                                        MID-CAP VALUE
                                              -----------------------------------------------------------------
                                                          FOR THE                          FOR THE
                                                          PERIOD                           PERIOD
                                                  3/1/05 THROUGH 3/31/05           7/1/04 THROUGH 2/28/05
                                              ------------------------------- ---------------------------------
                                                   SHARES          VALUE           SHARES           VALUE
                                              --------------- --------------- --------------- -----------------
Net change in shares from reorganiza-
 tion:(1)
 State Street Research Fund:
  Institutional Class (Formerly Class S).....             -    $           -        923,822    $             -
  Investor A Class (Formerly Class A,
   Class B and Class R) .....................             -                -     13,319,536                  -
  Investor B Class (Formerly Class
   B(1)) ....................................             -                -      3,942,678                  -
  Investor C Class (Formerly Class C) .......             -                -      2,992,071                  -
 BlackRock Fund:
  Institutional Class (Formerly Class S).....             -                -      1,247,151         15,137,406
  Service Class .............................             -                -        109,386          1,317,419
  Investor A Class (Formerly Class A,
   Class B and Class R) .....................             -                -        385,111          4,599,212
  Investor B Class (Formerly Class
   B(1)) ....................................             -                -        665,825          7,539,866
  Investor C Class (Formerly Class C) .......             -                -        244,284          2,766,217
Shares sold:
  Institutional Class (Formerly Class S).....       180,803        2,293,047      1,344,505         18,173,943
  Service Class .............................         1,325           16,470          1,813             22,497
  Investor A Class (Formerly Class A,
   Class B and Class R) .....................       855,901       10,707,759      7,009,420        126,713,520
  Investor B Class (Formerly Class
   B(1)) ....................................        76,549          905,301        732,609         12,944,207
  Investor C Class (Formerly Class C) .......       164,623        1,947,176      1,411,687         25,304,297
Shares issued in reinvestment of
 dividends:
  Institutional Class (Formerly Class S).....             -                -        112,046          2,202,945
  Investor A Class (Formerly Class A,
   Class B and Class R) .....................             -                -      1,419,250         27,659,321
  Investor B Class (Formerly Class
   B(1)) ....................................             -                -        313,255          5,942,189
  Investor C Class (Formerly Class C) .......             -                -        190,603          3,632,426
Shares redeemed:
  Institutional Class (Formerly Class S).....      (311,083)      (3,960,257)    (1,260,543)       (17,700,748)
  Service Class .............................        (2,542)         (32,159)        (2,405)           (30,059)
  Investor A Class (Formerly Class A,
   Class B and Class R) .....................    (1,139,288)     (14,266,171)    (8,538,739)      (149,448,063)
  Investor B Class (Formerly Class
   B(1)) ....................................      (172,607)      (2,045,133)      (816,608)       (13,838,156)
  Investor C Class (Formerly Class C) .......      (243,367)      (2,881,209)    (1,614,114)       (27,306,220)
                                                 ----------    -------------     ----------    ---------------
Net increase (decrease) .....................      (589,686)   $  (7,315,176)    24,132,643    $    45,632,219
                                                 ==========    =============     ==========    ===============


                                                        MID-CAP VALUE
                                              ---------------------------------
                                                           FOR THE
                                                         YEAR ENDED
                                                          6/30/2004
                                              ---------------------------------
                                                   SHARES           VALUE
                                              --------------- -----------------
Net change in shares from reorganiza-
 tion:(1)
 State Street Research Fund:
  Institutional Class (Formerly Class S).....             -    $             -
  Investor A Class (Formerly Class A,
   Class B and Class R) .....................             -                  -
  Investor B Class (Formerly Class
   B(1)) ....................................             -                  -
  Investor C Class (Formerly Class C) .......             -                  -
 BlackRock Fund:
  Institutional Class (Formerly Class S).....             -                  -
  Service Class .............................             -                  -
  Investor A Class (Formerly Class A,
   Class B and Class R) .....................             -                  -
  Investor B Class (Formerly Class
   B(1)) ....................................             -                  -
  Investor C Class (Formerly Class C) .......             -                  -
Shares sold:
  Institutional Class (Formerly Class S).....       468,759          7,741,584
  Service Class .............................             -                  -
  Investor A Class (Formerly Class A,
   Class B and Class R) .....................    10,977,111        187,930,330
  Investor B Class (Formerly Class
   B(1)) ....................................       956,816         15,709,737
  Investor C Class (Formerly Class C) .......     1,323,060         22,013,072
Shares issued in reinvestment of
 dividends:
  Institutional Class (Formerly Class S).....        13,906            234,742
  Investor A Class (Formerly Class A,
   Class B and Class R) .....................        89,918          1,507,074
  Investor B Class (Formerly Class
   B(1)) ....................................             -                  -
  Investor C Class (Formerly Class C) .......             -                  -
Shares redeemed:
  Institutional Class (Formerly Class S).....      (732,645)       (12,486,339)
  Service Class .............................             -                  -
  Investor A Class (Formerly Class A,
   Class B and Class R) .....................    (6,610,528)      (108,711,069)
  Investor B Class (Formerly Class
   B(1)) ....................................      (761,699)       (12,440,660)
  Investor C Class (Formerly Class C) .......    (1,071,849)       (17,471,644)
                                                 ----------    ---------------
Net increase (decrease) .....................     4,652,849    $    84,026,827
                                                 ==========    ===============

(1) See Note (B).

174
                          BLACKROCK FUNDS


                                                                   MID-CAP GROWTH
                                    -----------------------------------------------------------------------------
                                    FOR THE SIX MONTHS ENDED                        FOR THE YEAR ENDED
                                      3/31/05                                             9/30/04
                                    ----------                            ----------
                                      SHARES              VALUE             SHARES              VALUE
                                    ----------              -------       ----------              -------
Shares issued from the
 reorganization:(1) .............
 Institutional Class ............       3,275,088       $  30,951,558                 -       $            -
 Investor A Class ...............      31,578,913         281,159,493                 -                    -
 Investor B Class ...............       4,043,711          33,169,388                 -                    -
 Investor C Class ...............       1,428,274          11,716,586                 -                    -
Shares sold:
 Institutional Class ............       1,259,082          12,085,483         1,138,699           10,071,810
 Service Class ..................          12,202             107,158           290,419            2,373,896
 Investor A Class ...............         471,307           4,223,909           728,127            5,999,086
 Investor B Class ...............         124,088           1,024,735           346,652            2,637,708
 Investor C Class ...............          45,636             375,176           120,482              898,547
Shares redeemed:
 Institutional Class ............      (1,733,120)        (16,598,457)       (2,741,486)         (23,538,563)
 Service Class ..................      (1,094,267)        (10,097,460)         (931,008)          (7,817,212)
 Investor A Class ...............      (1,992,289)        (18,010,228)         (987,595)          (8,047,211)
 Investor B Class ...............        (914,953)         (7,539,394)       (1,259,848)          (9,597,814)
 Investor C Class ...............        (342,475)         (2,814,587)         (474,226)          (3,615,906)
                                    -------------       -------------     -------------       --------------
Net increase (decrease) .........      36,161,197       $ 319,753,360        (3,769,784)      $  (30,635,659)
                                    =============       =============     =============       ==============

(1) See Note (B).

                                                                             175
                                BLACKROCK FUNDS
             NOTES TO FINANCIAL STATEMENTS (Unaudited) (CONTINUED)


                                                                           AURORA
                                         --------------------------------------------------------------------------
                                               FOR THE SIX MONTHS ENDED                  FOR THE YEAR ENDED
                                                        3/31/05                               9/30/04
                                         -------------------------------------   ----------------------------------
                                              SHARES              VALUE               SHARES             VALUE
                                         ---------------   -------------------   ---------------   ----------------
Net change in shares from reorganiza-
 tion:(1)
 State Street Research Fund:
   Investor A Class (Formerly Class
    A and Class B) ...................        (222,693)      $             -                 -      $            -
Shares sold:
   Institutional Class (Formerly Class
    S) ...............................         839,849            34,732,567         2,488,213          98,297,733
   Service Class .....................               4                   150                 -                   -
   Investor A Class (Formerly Class
    A and Class B) ...................       8,719,228           349,365,398        21,949,292         845,611,604
   Investor B Class (Formerly Class
    B(1)) ............................         587,746            21,724,499         1,603,178          57,403,099
   Investor C Class (Formerly Class
    C) ...............................       1,155,414            42,670,805         2,676,532          96,224,763
Shares issued in reinvestment of
 dividends:
   Institutional Class (Formerly Class
    S) ...............................         387,865            15,999,438             2,027              78,602
   Service Class .....................               -                     -                 -                   -
   Investor A Class (Formerly Class
    A and Class B) ...................       3,880,515           154,053,052            21,034             788,605
   Investor B Class (Formerly Class
    B(1)) ............................         975,164            35,778,753             5,030             177,068
   Investor C Class (Formerly Class
    C) ...............................         771,557            28,301,088             4,009             141,078
Shares redeemed:
   Institutional Class (Formerly Class
    S) ...............................      (2,139,764)          (88,798,982)       (1,933,475)        (75,747,346)
   Service Class .....................               -                     -                 -                   -
   Investor A Class (Formerly Class
    A and Class B) ...................     (20,715,393)         (826,543,990)      (20,427,745)       (782,354,303)
   Investor B Class (Formerly Class
    B(1)) ............................      (1,755,902)          (64,644,633)       (2,065,212)        (73,852,145)
   Investor C Class (Formerly Class
    C) ...............................      (3,111,406)         (114,101,891)       (2,762,239)        (99,357,980)
                                           -----------       ---------------       -----------      --------------
Net increase (decrease) ..............     (10,627,816)      $  (411,463,746)        1,560,644      $   67,410,778
                                           ===========       ===============       ===========      ==============

(1) See Note (B).

176
                          BLACKROCK FUNDS


                                                                   SMALL/MID-CAP GROWTH
                                         ------------------------------------------------------------------------
                                               FOR THE SIX MONTHS ENDED                 FOR THE YEAR ENDED
                                                        3/31/05                              9/30/04
                                         -------------------------------------   --------------------------------
                                              SHARES              VALUE              SHARES            VALUE
                                         ---------------   -------------------   --------------   ---------------
Net change in shares from reorganiza-
 tion:(1)
 State Street Research Fund:
   Investor A Class (Formerly Class
    A, Class B and Class R) ..........        (116,987)      $             -                -      $           -
Shares sold:
   Institutional Class (Formerly Class
    S) ...............................         679,885             9,164,603        6,902,293         97,401,258
   Service Class .....................               8                   100                -                  -
   Investor A Class (Formerly Class
    A, Class B and Class R) ..........       6,647,465            85,401,394       19,953,301        267,106,896
   Investor B Class (Formerly Class
    B(1)) ............................         124,112             1,450,079          841,240         10,286,273
   Investor C Class (Formerly Class
    C) ...............................         230,373             2,707,060        1,796,388         21,845,563
Shares issued in reinvestment of
 dividends:
   Institutional Class (Formerly Class
    S) ...............................               -                     -                -                  -
   Service Class .....................               -                     -                -                  -
   Investor A Class (Formerly Class
    A, Class B and Class R) ..........               -                     -                -                  -
   Investor B Class (Formerly Class
    B(1)) ............................               -                     -                -                  -
   Investor C Class (Formerly Class
    C) ...............................               -                     -                -                  -
Shares redeemed:
   Institutional Class (Formerly Class
    S) ...............................      (5,092,173)          (68,801,592)        (538,478)        (7,285,710)
   Service Class .....................               -                     -                -                  -
   Investor A Class (Formerly Class
    A, Class B and Class R) ..........     (13,320,981)         (170,358,697)      (7,610,612)       (97,424,044)
   Investor B Class (Formerly Class
    B(1)) ............................        (340,052)           (3,967,169)        (411,875)        (4,915,125)
   Investor C Class (Formerly Class
    C) ...............................        (752,144)           (8,869,922)        (342,131)        (4,015,411)
                                           -----------       ---------------       ----------      -------------
Net increase (decrease) ..............     (11,940,494)      $  (153,274,144)      20,590,126      $ 282,999,700
                                           ===========       ===============       ==========      =============

(1) See Note (B).

                                                                             177
                                BLACKROCK FUNDS
             NOTES TO FINANCIAL STATEMENTS (Unaudited) (CONTINUED)


                                                               SMALL CAP VALUE
                                    ----------------------------------------------------------------------
                                       FOR THE SIX MONTHS ENDED                FOR THE YEAR ENDED
                                                3/31/05                             9/30/04
                                    -------------------------------   ------------------------------------
                                       SHARES            VALUE             SHARES              VALUE
                                    ------------   ----------------   ---------------   ------------------
Shares sold:
 BlackRock Class ................       78,970      $   1,203,154           315,702       $    4,770,100
 Institutional Class ............      163,729          2,350,160           521,530            7,823,358
 Service Class ..................       65,519            921,788            65,337              975,578
 Investor A Class ...............      275,767          4,041,535           547,652            8,197,136
 Investor B Class ...............      159,559          2,036,725           231,497            3,164,522
 Investor C Class ...............       98,419          1,256,536           135,519            1,856,956
Shares issued in reinvestment of
 dividends:
 BlackRock Class ................       80,062          1,130,480                 -                    -
 Institutional Class ............      704,737          9,943,832           478,137            6,837,365
 Service Class ..................       30,692            427,853            33,951              482,112
 Investor A Class ...............      426,767          5,910,720           309,675            4,375,692
 Investor B Class ...............      172,345          2,145,694           103,156            1,346,196
 Investor C Class ...............       52,129            649,004            29,701              387,903
Shares redeemed:
 BlackRock Class ................      (22,318)          (322,000)           (1,351)             (20,000)
 Institutional Class ............     (601,010)        (9,067,934)       (1,571,511)         (23,832,897)
 Service Class ..................      (91,893)        (1,428,727)         (174,903)          (2,606,851)
 Investor A Class ...............     (705,377)       (10,184,050)       (1,218,073)         (18,004,283)
 Investor B Class ...............     (323,096)        (4,236,198)         (322,299)          (4,438,190)
 Investor C Class ...............     (119,629)        (1,588,316)         (123,055)          (1,708,064)
                                      --------      -------------        ----------       --------------
Net increase (decrease) .........      445,372      $   5,190,256          (639,335)      $  (10,393,367)
                                      ========      =============        ==========       ==============

178
                          BLACKROCK FUNDS


                                                           SMALL CAP CORE
                                   --------------------------------------------------------------
                                     FOR THE SIX MONTHS ENDED            FOR THE YEAR ENDED
                                              3/31/05                         9/30/04
                                   -----------------------------   ------------------------------
                                      SHARES           VALUE           SHARES           VALUE
                                   ------------   --------------   -------------   --------------
Shares sold:
 Institutional Class ...........      270,048      $ 4,350,087         124,804      $  1,824,326
 Service Class .................          297            5,000               -                 -
 Investor A Class ..............      252,056        4,059,035         320,205         4,683,838
 Investor B Class ..............      145,634        2,329,248          81,510         1,178,698
 Investor C Class ..............      341,569        5,426,140         233,839         3,405,315
Shares issued in reinvestment of
 dividends:
 Institutional Class ...........          679           11,014             103             1,401
 Service Class .................            -                1               -                 1
 Investor A Class ..............        1,508           24,368             648             8,857
 Investor B Class ..............          680           10,886             188             2,550
 Investor C Class ..............          835           13,381              82             1,114
Shares redeemed:
 Institutional Class ...........      (27,103)        (445,035)       (106,127)       (1,545,748)
 Service Class .................            -                -               -                 -
 Investor A Class ..............      (51,496)        (810,825)       (107,069)       (1,552,486)
 Investor B Class ..............       (2,620)         (42,145)         (2,497)          (34,973)
 Investor C Class ..............      (15,046)        (240,066)         (4,404)          (64,005)
                                      -------      -----------        --------      ------------
Net increase ...................      917,041      $14,691,089         541,282      $  7,908,888
                                      =======      ===========        ========      ============


                                                            SMALL CAP GROWTH
                                 ----------------------------------------------------------------------
                                     FOR THE SIX MONTHS ENDED                FOR THE YEAR ENDED
                                              3/31/05                             9/30/04
                                 ---------------------------------   ----------------------------------
                                      SHARES            VALUE             SHARES             VALUE
                                 ---------------   ---------------   ---------------   ----------------
Shares sold:
 Institutional Class .........       3,755,363      $  59,129,674        9,110,273      $ 136,169,237
 Service Class ...............         239,257          3,580,677          931,862         13,440,785
 Investor A Class ............       1,503,950         22,060,064        4,817,353         65,691,548
 Investor B Class ............          40,658            548,999          287,742          3,759,718
 Investor C Class ............         150,495          2,033,260          398,471          5,122,745
Shares redeemed:
 Institutional Class .........      (2,759,161)       (43,628,083)      (3,801,835)       (55,800,303)
 Service Class ...............        (441,838)        (6,643,985)        (797,925)       (11,305,544)
 Investor A Class ............      (1,427,524)       (21,159,130)      (4,023,966)       (55,474,563)
 Investor B Class ............        (516,805)        (6,944,805)        (634,790)        (8,164,011)
 Investor C Class ............        (192,001)        (2,586,668)        (345,714)        (4,324,174)
                                    ----------      -------------       ----------      -------------
Net increase .................         352,394      $   6,390,003        5,941,471      $  89,115,438
                                    ==========      =============       ==========      =============

                               179
                                BLACKROCK FUNDS
             NOTES TO FINANCIAL STATEMENTS (Unaudited) (CONTINUED)


                                                GLOBAL SCIENCE & TECHNOLOGY OPPORTUNITIES
                                 -----------------------------------------------------------------------
                                     FOR THE SIX MONTHS ENDED                FOR THE YEAR ENDED
                                              3/31/05                              9/30/04
                                 ---------------------------------   -----------------------------------
                                     SHARES            VALUE              SHARES             VALUE
                                 -------------   -----------------   ---------------   -----------------
Shares sold:
 Institutional Class .........         3,660       $      21,210            67,134       $     397,026
 Service Class ...............             -                   -             4,538              29,200
 Investor A Class ............        56,879             323,782           361,677           2,123,218
 Investor B Class ............        28,184             155,421           177,136           1,045,059
 Investor C Class ............         8,421              46,769            83,807             487,728
Shares redeemed:
 Institutional Class .........      (125,642)           (738,661)         (289,383)         (1,640,289)
 Service Class ...............        (1,582)             (9,264)           (8,508)            (47,856)
 Investor A Class ............      (290,990)         (1,656,585)         (611,686)         (3,519,972)
 Investor B Class ............      (408,673)         (2,250,935)         (953,314)         (5,358,747)
 Investor C Class ............      (133,658)           (731,950)         (219,524)         (1,247,839)
                                    --------       -------------          --------       -------------
Net decrease .................      (863,401)      $  (4,840,213)       (1,388,123)      $  (7,732,472)
                                    ========       =============        ==========       =============

180
                          BLACKROCK FUNDS


                                                              GLOBAL RESOURCES
                                       --------------------------------------------------------------
                                                 FOR THE                         FOR THE
                                                  PERIOD                         PERIOD
                                          3/1/05 THROUGH 3/31/05         7/1/04 THROUGH 2/28/05
                                       ---------------------------- ---------------------------------
                                          SHARES         VALUE           SHARES           VALUE
                                       ------------ --------------- --------------- -----------------
Net change in shares from reorganiza-
 tion:(1)
 State Street Research Fund:
   Investor A Class (Formerly Class
    A, Class B and Class R) ..........          -   $         -           (66,329)   $             -
Shares sold:                                    -             -
   Institutional Class (Formerly Class
    S) ...............................     23,343     1,364,669           148,500          6,997,371
   Investor A Class (Formerly Class
    A, Class B and Class R) ..........    434,121    24,513,457         3,470,009        159,385,219
   Investor B Class (Formerly Class
    B(1)) ............................     24,304     1,248,836           274,083         11,326,726
   Investor C Class (Formerly Class
    C) ...............................     36,370     1,864,182           551,493         23,517,245
Shares issued in reinvestment of
 dividends:
   Institutional Class (Formerly Class
    S) ...............................          -             -            17,826            888,813
   Investor A Class (Formerly Class
    A, Class B and Class R) ..........          -             -           367,069         17,395,794
   Investor B Class (Formerly Class
    B(1)) ............................          -             -            51,725          2,266,714
   Investor C Class (Formerly Class
    C) ...............................          -             -            78,414          3,432,162
Shares redeemed:
   Institutional Class (Formerly Class
    S) ...............................    (55,120)   (3,210,463)         (155,837)        (7,836,183)
   Investor A Class (Formerly Class
    A, Class B and Class R) ..........   (423,635)  (23,339,169)       (3,112,124)      (133,160,606)
   Investor B Class (Formerly Class
    B(1)) ............................    (45,119)   (2,274,669)         (320,242)       (13,400,554)
   Investor C Class (Formerly Class
    C) ...............................    (75,749)   (3,814,046)         (679,776)       (28,334,096)
                                         --------   -----------        ----------    ---------------
Net increase (decrease) ..............    (81,485)  $(3,647,203)          624,811    $    42,478,605
                                         ========   ===========        ==========    ===============


                                               GLOBAL RESOURCES
                                       ---------------------------------
                                                    FOR THE
                                                  YEAR ENDED
                                                    6/30/04
                                       ---------------------------------
                                            SHARES           VALUE
                                       --------------- -----------------
Net change in shares from reorganiza-
 tion:(1)
 State Street Research Fund:
   Investor A Class (Formerly Class
    A, Class B and Class R) ..........             -    $             -
Shares sold:
   Institutional Class (Formerly Class
    S) ...............................       271,772          9,113,747
   Investor A Class (Formerly Class
    A, Class B and Class R) ..........    10,307,500        339,803,562
   Investor B Class (Formerly Class
    B(1)) ............................       896,835         26,709,892
   Investor C Class (Formerly Class
    C) ...............................     2,236,902         68,602,549
Shares issued in reinvestment of
 dividends:
   Institutional Class (Formerly Class
    S) ...............................         6,925            237,341
   Investor A Class (Formerly Class
    A, Class B and Class R) ..........       107,280          3,500,772
   Investor B Class (Formerly Class
    B(1)) ............................        19,360            590,047
   Investor C Class (Formerly Class
    C) ...............................        29,496            898,161
Shares redeemed:
   Institutional Class (Formerly Class
    S) ...............................      (170,538)        (5,251,269)
   Investor A Class (Formerly Class
    A, Class B and Class R) ..........    (4,367,520)      (134,940,591)
   Investor B Class (Formerly Class
    B(1)) ............................      (336,078)       (10,133,803)
   Investor C Class (Formerly Class
    C) ...............................      (493,976)       (14,602,129)
                                          ----------    ---------------
Net increase (decrease) ..............     8,507,958    $   284,528,279
                                          ==========    ===============

(1) See Note (B).

                                                                             181
                                BLACKROCK FUNDS
             NOTES TO FINANCIAL STATEMENTS (Unaudited) (CONTINUED)


                                                  ALL-CAP GLOBAL RESOURCES
                                              --------------------------------
                                                       FOR THE PERIOD
                                                 2/16/051 THROUGH 3/31/2005
                                              --------------------------------
                                                  SHARES            VALUE
Shares sold:
 BlackRock Class ..........................             -       $          -
 Institutional Class ......................       512,946          5,132,152
 Service Class ............................            10                100
 Investor A Class .........................       795,846          8,137,151
 Investor B Class .........................       134,999          1,372,570
 Investor C Class .........................       247,120          2,517,094
Shares issued in reinvestment of dividends:
 BlackRock Class ..........................             -                  -
 Institutional Class ......................             -                  -
 Service Class ............................             -                  -
 Investor A Class .........................             -                  -
 Investor B Class .........................             -                  -
 Investor C Class .........................             -                  -
Shares redeemed:
 BlackRock Class ..........................             -                  -
 Institutional Class ......................             -                  -
 Service Class ............................             -                  -
 Investor A Class .........................        (5,444)           (54,800)
 Investor B Class .........................        (5,976)           (60,000)
 Investor C Class .........................        (5,959)           (59,319)
                                                  -------       ------------
Net increase ..............................     1,673,542       $ 16,984,948
                                                =========       ============

1 Commencement of operations.

182
                          BLACKROCK FUNDS


                                                                            HEALTH SCIENCES
                                       ------------------------------------------------------------------------------------------
                                                 FOR THE                        FOR THE                        FOR THE
                                                  PERIOD                      YEAR ENDED                     YEAR ENDED
                                          3/1/05 THROUGH 3/31/05                2/28/05                        2/29/04
                                       ---------------------------- ------------------------------- -----------------------------
                                          SHARES         VALUE           SHARES          VALUE         SHARES          VALUE
                                       ------------ --------------- --------------- --------------- ------------ ----------------
Net change in shares from reorganiza-
 tion:(1)
 State Street Research Fund:
   Investor A Class (Formerly Class
    A, Class B and Class R) ..........          -    $          -          (4,617)  $         -              -    $           -
Shares sold:
   Institutional Class (Formerly Class
    S) ...............................     24,212         491,472         128,213     2,671,247        183,218        3,639,921
   Service Class .....................          -               -               5           100              -                -
   Investor A Class (Formerly Class
    A, Class B and Class R) ..........    164,047       3,249,929       2,836,559    57,282,345      2,738,554       50,111,142
   Investor B Class (Formerly Class
    B(1)) ............................     39,889         770,152         558,845    10,973,167        397,168        7,191,329
   Investor C Class (Formerly Class
    C) ...............................     86,302       1,676,719         961,093    18,966,442        494,043        9,163,916
Shares issued in reinvestment of
 dividends:
   Institutional Class (Formerly Class
    S) ...............................          -               -          12,094       257,622          3,043           58,784
   Investor A Class (Formerly Class
    A, Class B and Class R) ..........          -               -         148,553     3,118,081         57,770        1,103,393
   Investor B Class (Formerly Class
    B(1)) ............................          -               -          64,065     1,311,510         31,705          594,591
   Investor C Class (Formerly Class
    C) ...............................          -               -          25,134       512,969          8,373          156,831
Shares redeemed:
   Institutional Class (Formerly Class
    S) ...............................    (20,207)       (412,000)       (171,969)   (3,493,427)       (31,546)        (578,844)
   Investor A Class (Formerly Class
    A, Class B and Class R) ..........   (219,903)     (4,417,667)     (1,971,584)  (39,527,347)      (967,899)     (17,048,788)
   Investor B Class (Formerly Class
    B(1)) ............................    (18,833)       (359,863)       (234,528)   (4,562,237)      (130,198)      (2,141,232)
   Investor C Class (Formerly Class
    C) ...............................    (30,853)       (601,151)       (236,874)   (4,615,846)       (77,584)      (1,331,219)
                                         --------    ------------      ----------   -----------      ---------    -------------
Net increase .........................     24,654    $    397,591       2,114,989   $42,894,626      2,706,647    $  50,919,824
                                         ========    ============      ==========   ===========      =========    =============

(1) See Note (B).

                                                                             183
                                BLACKROCK FUNDS
             NOTES TO FINANCIAL STATEMENTS (Unaudited) (CONTINUED)


                                                             U.S. OPPORTUNITIES
                                 ---------------------------------------------------------------------------
                                 FOR THE SIX MONTHS ENDED                      FOR THE YEAR ENDED
                                  3/31/05                                            9/30/04
                                 --------                            ----------
                                   SHARES           VALUE              SHARES              VALUE
                                 --------             -------        ----------              -------
Shares sold:
 Institutional Class .........       29,815       $      659,447           117,054       $    2,283,248
 Service Class ...............        3,449               69,610           101,311            1,970,021
 Investor A Class ............       53,201            1,148,885           223,876            4,273,087
 Investor B Class ............       14,464              294,169            77,348            1,397,751
 Investor C Class ............       20,686              421,921            86,540            1,571,088
Shares redeemed:
 Institutional Class .........      (67,576)          (1,510,333)         (255,355)          (4,914,411)
 Service Class ...............      (99,719)          (2,141,701)          (11,639)            (221,344)
 Investor A Class ............     (259,030)          (5,527,025)         (451,932)          (8,551,449)
 Investor B Class ............     (353,950)          (7,236,807)         (559,049)         (10,148,159)
 Investor C Class ............     (160,280)          (3,271,614)         (348,429)          (6,263,316)
                                 ----------       --------------     -------------       --------------
Net decrease .................     (818,938)      $  (17,093,448)       (1,020,275)      $  (18,603,484)
                                 ==========       ==============     =============       ==============


                                                        INTERNATIONAL OPPORTUNITIES
                                   ---------------------------------------------------------------------
                                       FOR THE SIX MONTHS ENDED               FOR THE YEAR ENDED
                                                3/31/05                             9/30/04
                                   ---------------------------------   ---------------------------------
                                       SHARES            VALUE             SHARES            VALUE
                                   -------------   -----------------   -------------   -----------------
Shares sold:
 Institutional Class ...........     1,719,082       $  48,204,927       1,675,872       $  39,545,723
 Service Class .................       488,186          13,464,343         926,448          21,482,231
 Investor A Class ..............     2,380,914          65,431,542       3,199,383          73,871,653
 Investor B Class ..............       369,057           9,741,956         686,235          14,936,708
 Investor C Class ..............     1,044,168          27,548,952       1,411,947          31,064,713
Shares issued in reinvestment of
 dividends:
 Institutional Class ...........        29,812             827,590           1,323              29,679
 Service Class .................         8,721             237,123             114               2,497
 Investor A Class ..............        34,967             945,507           1,346              29,462
 Investor B Class ..............         3,472              90,492             975              20,582
 Investor C Class ..............         5,986             155,815             738              15,558
Shares redeemed:
 Institutional Class ...........      (413,111)        (11,140,313)       (631,675)        (14,723,802)
 Service Class .................      (146,527)         (3,982,867)       (205,804)         (4,765,889)
 Investor A Class ..............      (590,873)        (16,067,161)       (946,356)        (21,631,960)
 Investor B Class ..............      (178,193)         (4,686,894)       (375,821)         (8,266,369)
 Investor C Class ..............      (221,958)         (5,836,463)       (433,956)         (9,552,592)
                                     ---------       -------------       ---------       -------------
Net increase ...................     4,533,703       $ 124,934,549       5,310,769       $ 122,058,194
                                     =========       =============       =========       =============

184
                          BLACKROCK FUNDS


                                                                      ASSET ALLOCATION
                                              -----------------------------------------------------------------
                                                         FOR THE                          FOR THE
                                                          PERIOD                           PERIOD
                                                  3/1/05 THROUGH 3/31/05           4/1/04 THROUGH 2/28/05
                                              ------------------------------ ----------------------------------
                                                 SHARES          VALUE            SHARES            VALUE
                                              ------------ ----------------- ---------------- -----------------
Net change in shares from reorganiza-
 tion:(1)
 State Street Research Fund:
  Institutional Class (Formerly Class S).....          -     $           -         (431,759)   $             -
  Investor A Class (Formerly Class A,
   Class B and Class R) .....................          -                 -      (12,435,419)                 -
  Investor B Class (Formerly Class
   B(1)) ....................................          -                 -       (3,883,624)                 -
  Investor C Class (Formerly Class C) .......          -                 -       (1,561,222)                 -
 BlackRock Fund:
  Institutional Class (Formerly Class S).....          -                 -          756,058         11,073,022
  Service Class .............................          -                 -          159,024          2,325,985
  Investor A Class (Formerly Class A,
   Class B and Class R) .....................          -                 -        4,260,378         62,273,644
  Investor B Class (Formerly Class
   B(1)) ....................................          -                 -        2,633,550         38,144,193
  Investor C Class (Formerly Class C) .......          -                 -          330,149          4,780,614
Shares sold:
  Institutional Class (Formerly Class S).....     69,930         1,037,380          843,355         11,040,921
  Service Class .............................      1,532            22,309            6,047             90,163
  Investor A Class (Formerly Class A,
   Class B and Class R) .....................    262,546         3,905,573        9,147,740         97,457,497
  Investor B Class (Formerly Class
   B(1)) ....................................    190,762         2,802,450        2,760,767         29,631,133
  Investor C Class (Formerly Class C) .......     80,905         1,191,159        2,286,784         24,055,515
Shares issued in reinvestment of
 dividends:
  Institutional Class (Formerly Class S).....      4,917            71,536          115,141          1,215,396
  Service Class .............................         42               611                -                  -
  Investor A Class (Formerly Class A,
   Class B and Class R) .....................     77,603         1,127,278        2,609,782         27,513,302
  Investor B Class (Formerly Class
   B(1)) ....................................     10,928           157,313          666,138          6,990,057
  Investor C Class (Formerly Class C) .......      2,406            34,627          149,839          1,581,290
Shares redeemed:
  Institutional Class (Formerly Class S).....    (88,049)       (1,315,454)      (1,243,828)       (14,502,160)
  Service Class .............................       (782)          (11,861)         (19,987)          (296,380)
  Investor A Class (Formerly Class A,
   Class B and Class R) .....................   (896,841)      (13,320,675)     (11,410,029)      (125,727,173)
  Investor B Class (Formerly Class
   B(1)) ....................................   (309,963)       (4,565,044)      (1,985,558)       (22,062,236)
  Investor C Class (Formerly Class C) .......   (161,667)       (2,380,800)        (733,924)        (8,157,124)
                                                --------     -------------      -----------    ---------------
Net increase (decrease) .....................   (755,731)    $ (11,243,598)      (6,980,598)   $   147,427,659
                                                ========     =============      ===========    ===============


                                                       ASSET ALLOCATION
                                              ----------------------------------
                                                           FOR THE
                                                          YEAR ENDED
                                                           3/31/04
                                              ----------------------------------
                                                   SHARES            VALUE
                                              ---------------- -----------------
Net change in shares from reorganiza-
 tion:(1)
 State Street Research Fund:
  Institutional Class (Formerly Class S).....              -    $             -
  Investor A Class (Formerly Class A,
   Class B and Class R) .....................              -                  -
  Investor B Class (Formerly Class
   B(1)) ....................................              -                  -
  Investor C Class (Formerly Class C) .......              -                  -
 BlackRock Fund:
  Institutional Class (Formerly Class S).....              -                  -
  Service Class .............................              -                  -
  Investor A Class (Formerly Class A,
   Class B and Class R) .....................              -                  -
  Investor B Class (Formerly Class
   B(1)) ....................................              -                  -
  Investor C Class (Formerly Class C) .......              -                  -
Shares sold:
  Institutional Class (Formerly Class S).....        290,764          2,764,953
  Service Class .............................              -                  -
  Investor A Class (Formerly Class A,
   Class B and Class R) .....................      9,714,452         94,326,907
  Investor B Class (Formerly Class
   B(1)) ....................................      4,525,455         43,919,902
  Investor C Class (Formerly Class C) .......      1,980,006         19,760,160
Shares issued in reinvestment of
 dividends:
  Institutional Class (Formerly Class S).....         38,395            376,594
  Service Class .............................              -                  -
  Investor A Class (Formerly Class A,
   Class B and Class R) .....................        665,521          6,521,284
  Investor B Class (Formerly Class
   B(1)) ....................................         84,483            817,086
  Investor C Class (Formerly Class C) .......         23,301            225,953
Shares redeemed:
  Institutional Class (Formerly Class S).....       (476,957)        (4,549,408)
  Service Class .............................              -                  -
  Investor A Class (Formerly Class A,
   Class B and Class R) .....................    (12,055,243)      (115,596,398)
  Investor B Class (Formerly Class
   B(1)) ....................................     (1,463,343)       (14,138,963)
  Investor C Class (Formerly Class C) .......       (392,657)        (3,818,212)
                                                 -----------    ---------------
Net increase (decrease) .....................      2,934,177    $    30,609,858
                                                 ===========    ===============

(1) See Note (B).

                                                                             185
                                BLACKROCK FUNDS
             NOTES TO FINANCIAL STATEMENTS (Unaudited) (CONTINUED)


                                                                       INDEX
                                   ------------------------------------------------------------------------------
                                         FOR THE SIX MONTHS ENDED                    FOR THE YEAR ENDED
                                                  3/31/05                                 9/30/04
                                   -------------------------------------   --------------------------------------
                                        SHARES              VALUE               SHARES               VALUE
                                   ---------------   -------------------   ----------------   -------------------
Shares sold:
 Institutional Class ...........       1,112,747       $    25,288,786          3,269,684       $    69,335,844
 Service Class .................         709,230            16,077,234          1,299,490            27,524,523
 Investor A Class ..............       1,331,448            30,094,517          3,945,583            83,560,549
 Investor B Class ..............          33,767               756,387            411,956             8,501,106
 Investor C Class ..............          30,209               676,374          1,143,687            23,613,472
Shares issued in reinvestment of
 dividends:
 Institutional Class ...........         130,804             2,975,466            209,619             4,493,609
 Service Class .................          29,518               667,446             44,696               951,634
 Investor A Class ..............         131,103             2,964,752            155,141             3,301,221
 Investor B Class ..............          28,674               639,577             17,517               364,388
 Investor C Class ..............          30,342               676,296             18,164               377,866
Shares redeemed:
 Institutional Class ...........      (2,317,419)          (52,032,250)       (10,233,505)         (220,082,336)
 Service Class .................      (1,054,602)          (23,843,613)        (1,649,576)          (35,098,252)
 Investor A Class ..............      (2,602,000)          (58,644,662)        (4,210,051)          (89,446,482)
 Investor B Class ..............      (1,326,526)          (29,417,624)        (2,229,229)          (46,418,387)
 Investor C Class ..............      (1,878,331)          (41,568,215)        (3,739,728)          (78,142,043)
                                      ----------       ---------------        -----------       ---------------
Net decrease ...................      (5,611,036)      $  (124,689,529)       (11,546,552)      $  (247,163,288)
                                      ==========       ===============        ===========       ===============

     There is a 2% redemption fee on shares of the Portfolios redeemed or
exchanged which have been held 90 days or less. The redemption fees are
collected and retained by the Fund for the benefit of the remaining
shareholders. The redemption fees are recorded as a credit to paid in capital.

     On March 31, 2005, three shareholders held approximately 55% of the
outstanding shares of the Large Cap Value Equity Portfolio, three shareholders
held approximately 56% of Large Cap Growth Equity Portfolio, one shareholder
held approximately 100% of the Dividend AchieversTM Portfolio, two shareholders
held approximately 52% of the Mid-Cap Value Equity Portfolio, three
shareholders held approximately 38% of the Mid-Cap Growth Equity Portfolio, two
shareholders held approximately 49% of the Small Cap Value Equity Portfolio,
two shareholders held 30% of the Small Cap Core Equity Portfolio, five
shareholders held approximately 55% of the Small Cap Growth Equity Portfolio,
two shareholders held approximately 15% of the U.S. Opportunities Portfolio,
one shareholder held approximately 8% of the Global Science & Technology
Opportunities Portfolio, three shareholders held approximately 51% of the
International Equity Portfolio, four shareholders held approximately 31% of the
International Opportunities Portfolio, two shareholders held approximately 50%
of the Investment Trust, three shareholders held approximately 56% of the Index
Equity Portfolio and three shareholders held approximately 26% of the Asset
Allocation Portfolio. Some of the shareholders are comprised of omnibus
accounts, which are held on behalf of several individual shareholders.


186
                                BLACKROCK FUNDS

(G) At March 31, 2005, net assets consisted of:


                                                                INVESTMENT         LARGE CAP
                                                                   TRUST             VALUE
                                                            ------------------ -----------------
Capital paid in ...........................................  $ 1,163,729,612     $ 324,222,906
End of period undistributed net investment income .........        3,018,613            40,396
Accumulated net realized gain (loss) on investment
 transactions and futures .................................       20,922,939       (40,110,022)
Net unrealized appreciation (depreciation) on investment
 transactions and futures .................................      256,618,781        84,080,464
                                                             ---------------     -------------
                                                             $ 1,444,289,945     $ 368,233,744
                                                             ===============     =============
                                                                                    MID-CAP
                                                                 LEGACY             VALUE
                                                            ---------------     -------------
Capital paid in ...........................................  $   372,125,289     $ 584,875,046
End of period undistributed net investment income
 (distributions in excess of net investment income or
 accumulated net investment loss) .........................          970,702           (92,915)
Accumulated net realized gain (loss) on investment
 transactions .............................................     (122,622,034)       32,704,986
Net unrealized appreciation on investment transactions ....       37,224,517        88,644,095
                                                             ---------------     -------------
                                                             $   287,698,474     $ 706,131,212
                                                             ===============     =============


                                                                LARGE CAP           DIVIDEND
                                                                  GROWTH          ACHIEVERSTM
                                                            ----------------- -------------------
Capital paid in ...........................................  $  437,082,519     $    26,444,251
End of period undistributed net investment income .........         305,356              11,290
Accumulated net realized gain (loss) on investment
 transactions and futures .................................    (388,841,547)                 51
Net unrealized appreciation (depreciation) on investment
 transactions and futures .................................      17,923,319             (45,346)
                                                             --------------     ---------------
                                                             $   66,469,647     $    26,410,246
                                                             ==============     ===============
                                                                 MID-CAP
                                                                 GROWTH             AURORA
                                                             --------------     ---------------
Capital paid in ...........................................  $  758,719,406     $ 2,103,502,834
End of period undistributed net investment income
 (distributions in excess of net investment income or
 accumulated net investment loss) .........................      (1,367,468)         (7,403,145)
Accumulated net realized gain (loss) on investment
 transactions .............................................    (375,768,820)        593,769,669
Net unrealized appreciation on investment transactions ....      76,182,132         384,541,319
                                                             --------------     ---------------
                                                             $  457,765,250     $ 3,074,410,677
                                                             ==============     ===============


                                                                             187
                                BLACKROCK FUNDS
             NOTES TO FINANCIAL STATEMENTS (Unaudited) (CONTINUED)


                                                SMALL/MID-CAP         SMALL CAP            SMALL CAP             SMALL CAP
                                                   GROWTH               VALUE                CORE                 GROWTH
                                             ------------------   ----------------   --------------------   ------------------
Capital paid in ..........................    $ 299,418,310        $  99,507,121      $ 23,617,626           $ 1,117,744,845
End of period undistributed net investment
 income (distributions in excess of net
 investment income or accumulated net
 investment loss) ........................       (2,298,478)             151,895          (114,861)               (2,160,841)
Accumulated net realized gain (loss) on
 investment transactions .................      (16,149,403)          12,895,906           202,289              (672,355,741)
Net unrealized appreciation on investment
 transactions ............................       36,503,474           17,303,696         1,292,123                80,090,818
                                              -------------        -------------      ------------           ---------------
                                              $ 317,473,903        $ 129,858,618      $ 24,997,177           $   523,319,081
                                              =============        =============      ============           ===============
                                              GLOBAL SCIENCE
                                               & TECHNOLOGY           GLOBAL             ALL-CAP                 HEALTH
                                              OPPORTUNITIES          RESOURCES       GLOBAL RESOURCES            SCIENCES
                                             -------------         -------------     --------------------    ---------------
Capital paid in ..........................   $ 101,329,590         $ 522,562,125     $ 16,986,026            $   120,739,290
End of period undistributed net investment
 income (distributions in excess of net
 investment income or accumulated net
 investment loss) ........................        (205,899)           (5,507,347)           4,940                    (27,584)
Accumulated net realized gain (loss) on
 investment transactions and foreign
 currency related transactions ...........     (79,499,294)           52,933,232           (6,442)                 1,233,926
Net unrealized appreciation (depreciation)
 on investment transactions and foreign
 currency related transactions ...........       1,926,099           369,436,856         (169,964)                12,699,002
                                             --------------        -------------     -------------           ---------------
                                             $  23,550,496         $ 939,424,866     $ 16,814,560            $   134,644,634
                                             ==============        =============     =============           ===============


                                                                  U.S.
                                                             OPPORTUNITIES
                                                           -----------------
Capital paid in ..........................................  $  185,931,106
End of period undistributed net investment income
 (distributions in excess of net investment income or
 accumulated net investment loss) ........................        (713,943)
Accumulated net realized gain (loss) on investment
 transactions, futures, options, swaptions, swap contracts
 and foreign currency related transactions ...............    (107,784,681)
Net unrealized appreciation (depreciation) on investment
 transactions, futures, options, swaptions, swap contracts
 and foreign currency related transactions ...............      16,125,915
                                                            --------------
                                                            $   93,558,397
                                                            ==============


                                                             INTERNATIONAL         ASSET
                                                             OPPORTUNITIES      ALLOCATION           INDEX
                                                           ----------------- ---------------- ------------------
Capital paid in ..........................................   $ 439,025,540    $ 698,385,189    $ 1,220,292,938
End of period undistributed net investment income
 (distributions in excess of net investment income or
 accumulated net investment loss) ........................      (1,905,637)      (4,527,148)            40,179
Accumulated net realized gain (loss) on investment
 transactions, futures, options, swaptions, swap contracts
 and foreign currency related transactions ...............      (2,591,446)      24,414,475       (303,660,113)
Net unrealized appreciation (depreciation) on investment
 transactions, futures, options, swaptions, swap contracts
 and foreign currency related transactions ...............      75,660,714       70,788,609        426,615,605
                                                             -------------    -------------    ---------------
                                                             $ 510,189,171    $ 789,061,125    $ 1,343,288,609
                                                             =============    =============    ===============

(H) Federal Tax Information

     No provision is made for Federal taxes as it is the Fund's intention to
have each Portfolio continue to qualify for and elect the tax treatment
applicable to regulated investment companies under Subchapter M of the Internal
Revenue Code of 1986, as amended, and to make the requisite distributions to
its shareholders which will be sufficient to relieve it from federal income and
excise taxes. Short-term capital gain and foreign currency distributions that
are reported in the Statement of Changes in Net Assets are reported as ordinary
income for federal tax purposes.


188
                                BLACKROCK FUNDS

     Dividends from net investment income and distributions from net realized
capital gains are determined in accordance with U.S. Federal income tax
regulations, which may differ from those amounts determined under accounting
principles generally accepted in the United States.

     The estimated tax character of distributions paid during the six months
ended March 31, 2005, and the tax character of distributions paid during the
year ended September 30, 2004 were as follows:

                                           ORDINARY        LONG-TERM          TOTAL
                                            INCOME       CAPITAL GAIN     DISTRIBUTIONS
                                        -------------   --------------   --------------
   Investment Trust
    3/31/05 .........................    $   464,247     $          -     $    464,247
    9/30/04 .........................        893,694                -          893,694
   Large Cap Value
    3/31/05 .........................      2,148,167                -        2,148,167
    9/30/04 .........................      3,331,111                -        3,331,111
   Dividend Acheivers ...............
    3/31/05 .........................        106,847            9,517          116,364
   Mid-Cap Value
    3/31/05 .........................      5,353,649        1,890,640        7,244,289
    9/30/04 .........................        194,370                -          194,370
   Aurora
    3/31/05 .........................     51,580,297      285,689,841      337,270,138
    9/30/04 .........................              -        1,642,569        1,642,569
   Small Cap Value
    3/31/05 .........................     17,073,528        8,151,685       25,225,213
    9/30/04 .........................      6,523,912        9,724,645       16,248,557
   Small Cap Core
    3/31/05 .........................              -          103,852          103,852
    9/30/04 .........................              -           29,531           29,531
   Global Resources*
    7/1/04 through 3/31/05 ..........      5,103,905       25,591,089       30,694,994
    6/30/04 .........................      5,770,903                -        5,770,903
   Health Sciences*
    3/1/04 through 2/28/05 ..........      1,253,067        5,042,744        6,295,811
   International Opportunities
    3/31/05 .........................      3,350,147                -        3,350,147
    9/30/04 .........................        153,612                -          153,612
   Asset Allocation                                                                  -
    3/31/05 .........................      2,521,137                -        2,521,137
    9/30/04 .........................      1,647,304                -        1,647,304
   Index*
    12/1/04 through 3/31/05 .........     13,207,680                -       13,207,680
    11/30/04 ........................     15,470,115                -       15,470,115

* BlackRock Global Resources Portfolio has a tax year end of 6/30.  BlackRock
   Health Sciences Portfolio has a tax year end of 2/28.  BlackRock Index
   Equity Portfolio has a tax year end of 11/30.


                                                                             189
                                BLACKROCK FUNDS
             NOTES TO FINANCIAL STATEMENTS (Unaudited) (CONTINUED)

     As of March 31, 2005, the estimated tax components of distributable
earnings/(accumulated losses) were as follows:

                                                        UNDISTRIBUTED   UNDISTRIBUTED     ACCUMULATED          POST-
                                                           ORDINARY       LONG-TERM         CAPITAL           OCTOBER
                                                            INCOME       CAPITAL GAIN       LOSSES             LOSSES
                                                       --------------- --------------- ---------------- -------------------
   Investment Trust .................................. $ 3,017,630     $ 16,540,191    $          -        $         -
   Large Cap Value ...................................      40,365                -     (39,259,870)                 -
   Large Cap Growth ..................................     305,356                -    (388,829,419)                 -
   Dividend AchieversTM ..............................      11,293            9,924               -                  -
   Legacy ............................................   1,264,048                -    (122,909,701)                 -
   Mid-Cap Value .....................................  14,591,817       20,637,254               -                  -
   Mid-Cap Growth ....................................           -                -    (375,176,953)                 -
   Aurora ............................................  10,392,006      581,631,357               -                  -
   Small/Mid-Cap Growth ..............................           -                -      (8,533,166)                 -
   Small Cap Value ...................................   6,771,299        6,371,352               -                  -
   Small Cap Core ....................................     113,247           64,858               -                  -
   Small Cap Growth ..................................           -                -    (670,991,529)                 -
   Global Science & Technology Opportunities .........           -                -     (79,386,886)                 -
   Global Resources ..................................  11,364,302       37,974,678               -             (1,227)(1)
   All-Cap Global Resources ..........................       2,066                -               -                  -
   Health Sciences ...................................     628,866        1,767,485                                  -
   U.S. Opportunities ................................           -                -    (107,665,958)                 -
   International Opportunities .......................     786,542                -      (5,590,177)                 -
   Asset Allocation ..................................     278,745                -     (18,029,881)          (191,124)(1)
   Index .............................................           -                -    (201,291,828)                 -

(1) Includes estimated Post-October currency losses of $1,227 for the BlackRock
    Global Resources Portfolio and $191,124 for the BlackRock Asset Allocation
    Portfolio.

     The estimated Post-October losses represent losses realized on investment
transactions from November 1, 2004 through March 31, 2005 that, in accordance
with Federal income tax regulations, the Portfolios may defer and treat as
having arisen in the following fiscal year. For Federal income tax purposes,
capital loss carryforwards may be carried forward and applied against future
capital gains.

     At September 30, 2004, the Portfolios had capital loss carryforwards
available to offset future realized capital gains through the indicated
expiration dates:

                                                       EXPIRING JUNE 30
                                         ---------------------------------------------
                                            2008           2009            2010
                                         ----------    ------------    ------------
   Global Resources .................... $        -    $          -    $          -
                                                     EXPIRING SEPTEMBER 30
                                         ----------------------------------------------
                                            2008           2009            2010
                                         ----------    ------------    ------------
   Investment Trust .................... $        -    $          -    $ 78,286,446
   Large Cap Value .....................          -               -      16,764,384
   Large Cap Growth ....................          -               -     391,628,132
   Dividend AchieversTM ................          -               -               -
   Mid-Cap Growth ......................          -       7,951,583     364,728,815
   Small/Mid-Cap Growth ................          -               -       8,701,249
   Small Cap Growth ....................          -               -     584,779,122
   Global Science & Technology
    Opportunities ......................    861,796       7,130,245      72,072,910
   U.S. Opportunities ..................          -               -     100,187,768
   International Opportunities .........          -       5,406,283      28,712,852
   Asset Allocation ....................          -               -      17,967,754
                                                      EXPIRING OCTOBER 31
                                         ---------------------------------------------
                                            2008           2009            2010
                                         ----------    ------------    ------------
   Legacy .............................. $        -    $ 32,276,168    $ 76,300,059
                                                     EXPIRING NOVEMBER 30
                                         ---------------------------------------------
                                            2008           2009            2010
                                         ----------    ------------    ------------
   Index ............................... $1,523,612    $  8,460,342    $ 79,252,195


                                             2011             TOTAL
                                         ------------          ------
   Global Resources .................... $  4,422,538   $   4,422,538

                                             2011             2012             TOTAL
                                         ------------   -------------           -------
   Investment Trust .................... $ 15,933,441   $           -      $ 94,219,887
   Large Cap Value .....................   45,406,914               -        62,171,298
   Large Cap Growth ....................    5,639,584               -       397,267,716
   Dividend AchieversTM ................            -           2,818             2,818
   Mid-Cap Growth ......................   31,703,152               -       404,383,550
   Small/Mid-Cap Growth ................      153,891               -         8,855,140
   Small Cap Growth ....................  104,987,092               -       689,766,214
   Global Science & Technology
    Opportunities ......................            -               -        80,064,951
   U.S. Opportunities ..................   16,513,511               -       116,701,279
   International Opportunities .........            -               -        34,119,135
   Asset Allocation ....................   24,829,943               -        42,797,697

                                             2011             TOTAL
                                         ------------   -------------
   Legacy .............................. $ 18,377,786   $ 126,954,013

                                             2011             TOTAL
                                         ------------   -------------
   Index ............................... $117,169,455   $ 206,405,604

190
                                BLACKROCK FUNDS

(I) Subsequent Events

     In April of 2005, BlackRock determined that the BlackRock Asset Allocation
Portfolio held high yield bonds as a result of the Reorganization. The
Portfolio sold the bonds and BlackRock reimbursed the Portfolio for the
realized losses incurred from the date of the Reorganization (See Note (B))
through April 18, 2005. The amount of the reimbursement for the realized losses
was $92,690.


                                                                             191
                                BLACKROCK FUNDS
                             ADDITIONAL INFORMATION


(A)  Board of Trustees' Consideration of the Advisory Contracts. Investment
   advisory and subadvisory agreements ("Advisory Contracts") for the Equity
   Portfolios (each, a "Portfolio") of BlackRock Funds (the "Fund") were most
   recently approved by the Board of Trustees (the "Board" or the "Trustees")
   of the Fund at an in-person meeting of the Board held on March 1, 2005,
   including a majority of the Trustees who are not parties to the Advisory
   Contracts or interested persons of any such party (as such term is defined
   in the Investment Company Act of 1940) (the "Independent Trustees").  In
   determining to approve the Advisory Contracts, the Trustees met with the
   relevant investment advisory personnel from BlackRock Advisors, Inc.,
   BlackRock Financial Management, Inc. and BlackRock International, Ltd. (the
   "Advisers") and considered all information they deemed reasonably necessary
   to evaluate the terms of the Advisory Contracts.  The Board received
   materials in advance of the meeting relating to its consideration of the
   Advisory Contracts for the Portfolios being considered for approval or
   renewal, including: (i) fees and expense ratios of each class of each
   Portfolio in comparison to the fees and expense ratios of a peer group of
   funds, which consists of funds that have all of the following similar
   criteria: fund type, investment classification and objective, load type,
   asset level and expense structure and components ("peer group"); (ii)
   information on the investment performance of each Portfolio in comparison
   to the investment performance of a peer universe of funds, which is broader
   than a peer group and consists of funds that have all of the following
   similar criteria: fund type, investment classification and objective and
   load type ("performance universe"); (iii) the Advisers' economic outlook
   for the Portfolios and their general investment outlook for the markets;
   (iv) information with respect to profitability of BlackRock, Inc.
   ("BlackRock") and PNC Bank-affiliated companies with respect to each
   Portfolio, including details regarding the methodology used to calculate
   profitability; (v) information regarding fees paid to service providers
   that are affiliates of the Advisers; and (vi) information regarding
   compliance records and regulatory matters relating to the Advisers.  The
   matters discussed below were considered separately by the Independent
   Trustees in an executive session, during which counsel who is independent
   of the Advisers and the Fund provided guidance to the Independent Trustees.


   Fees and Expenses. In approving the Advisory Contracts, the Trustees,
   including the Independent Trustees, considered the fees and expense ratios
   of each class of shares of each Portfolio.  They compared the fees, both
   before (referred to as "Contractual") and after (referred to as "Actual")
   any fee waivers and expense reimbursements, and expense ratios of each
   Portfolio against fees and expense ratios of a peer group.  Both the peer
   group category and the funds within the peer group with respect to the fee
   and expense ratio comparisons were selected by Lipper, Inc. ("Lipper"),
   which is not affiliated with the Advisers.  The Investor A class and
   Institutional class were used to represent all of the Portfolios' share
   classes for purposes of the Lipper survey, as Lipper differentiated between
   retail and institutional funds in selecting funds in the peer group.
   Taking into account the recent reorganization of certain State Street
   Research mutual funds with certain Portfolios, Lipper used the Portfolios'
   proforma expense information provided by PFPC Inc., the Fund's
   administrator, to reflect post-reorganization data for each of the expense
   categories.1 In evaluating the Portfolios' advisory fees, the Trustees also
   took into account the complexity of investment management for the
   Portfolios relative to other types of funds.

   1The post-reorganization proforma data reflected expense caps, the
   elimination of shareholder processing fees, increased transfer agency fees,
   costs associated with new shareholder administrative services arrangements
   and increased asset levels resulting from the reorganization of the State
   Street Research mutual funds with certain Portfolios.


192
                                BLACKROCK FUNDS

   In considering data based on information provided by Lipper, the Trustees
   noted that of the 19 Portfolios with Advisory Contracts subject to
   re-approval, 14 of the 38 share classes of the Portfolios (37%) have
   contractual advisory fees higher than the median for their respective peer
   groups.2 With regard to the 14 classes that have advisory fees higher than
   the peer group median, the Trustees noted:


       o   In the case of 3 classes (21% of the total classes with advisory
          fees higher than the peer group median), the difference from the
          median of their respective peer groups is 5 basis points or less
          (Institutional class: Mid-Cap Growth Equity; Investor A class:
          International Opportunities, Mid-Cap Growth Equity).


       o   3 classes (21% of the total classes with advisory fees higher than
          the peer group median), while having contractual advisory fees higher
          than the median for their respective peer groups, have actual
          advisory fees that are lowered by waivers or expense reimbursements.
          Specifically, (a) after waivers or expense reimbursements, 2 classes
          (14%) have actual advisory fees lower than or equal to their
          respective peer group medians (Institutional class: Mid-Cap Value
          Equity; Investor A class: Mid-Cap Value Equity); and (b) after
          waivers or expense reimbursements, 1 class (7%) has actual management
          fees lower than or equal to the peer group median (Investor A class:
          Small Cap Core Equity).  For purposes of the Lipper materials,
          advisory fees are a component (together with administrative fees) of
          management fees.


       o   1 class (7% of the total classes with advisory fees higher than the
          peer group median), while having contractual advisory fees higher
          than the median for their respective peer groups, has actual total
          expenses lower than or equal to such medians (Institutional class:
          International Opportunities).


       o   4 classes (29% of the total classes with advisory fees higher than
          the peer group median), while having contractual advisory fees higher
          than the median for their respective peer groups, have at least two
          performance periods out of their one-, three- or five-year
          performance periods that are better than or equal to their respective
          performance universe medians (Institutional class: Aurora, Global
          Resources; Investor A class: Aurora, Global Resources).


       o   3 classes (21% of the total classes with advisory fees higher than
          the peer group median), while having contractual advisory fees higher
          than the median for their respective peer groups, have outperformed
          their respective performance universe medians for one performance
          period out of the one-, three- and five-year periods (Institutional
          class: Small Cap Core Equity, U.S. Opportunities; Investor A class:
          U.S. Opportunities).  Furthermore, the Trustees will continue to
          monitor the fee level and overall performance of these classes.


   The Trustees also were provided with information about the services
   rendered, and the feerates offered, to other clients advised by the
   Advisers, including closed-end investment companies and accounts that are
   not investment companies.


   Following consideration of this information, the Trustees, including the
   Independent Trustees, concluded that the fees to be paid pursuant to the
   Advisory Contracts were fair and reasonable in light of the services
   provided.

   2The Lipper peer group median was chosen as a conservative point of
   reference, taking into account that one-half of the population will have
   fees/expenses lower than the median.


                                                                             193
                                BLACKROCK FUNDS
                             ADDITIONAL INFORMATION

   Nature, Extent and Quality of Services. The Trustees, including the
   Independent Trustees, received information concerning the investment
   philosophy and investment process used by the Advisers in managing the
   Portfolios, as well as a description of the capabilities, personnel and
   services of each Adviser and a copy of the current Form ADV of BlackRock
   Advisors, Inc.  In connection with this, the Trustees considered each of
   the Advisers' in-house research capabilities as well as other resources
   available to its personnel.  The Trustees considered the scope of the
   services provided by the Advisers to the Portfolios under the Advisory
   Contracts relative to services typically provided by third parties to other
   funds.  The Trustees noted that the standard of care applicable under the
   Advisory Contracts was comparable to that found generally in investment
   company advisory agreements.  The Trustees concluded that the scope of the
   Advisers' services to be provided to the Portfolios was consistent with the
   Portfolios' operational requirements, including, in addition to seeking to
   meet their investment objectives, compliance with investment restrictions,
   tax and reporting requirements and related shareholder services.


   The Trustees also considered the quality of the services provided by the
   Advisers to the Portfolios.  The Trustees evaluated the procedures of the
   Advisers designed to fulfill their fiduciary duty to the Portfolios with
   respect to possible conflicts of interest, including their respective codes
   of ethics (regulating the personal trading of their officers and
   employees), the procedures by which each of the Advisers allocate trades
   among its various investment advisory clients, the integrity of the systems
   in place to ensure compliance with the foregoing and the record of each of
   the Advisers in these matters.  The Trustees also received information
   concerning standards of the Advisers with respect to the execution of
   portfolio transactions.


   The Trustees also considered information relating to the education,
   experience and number of investment professionals and other personnel who
   provide services under the applicable Advisory Contract.  The Trustees also
   took into account the time and attention devoted by senior management of
   the Advisers to the Portfolios.  The Trustees also considered the business
   reputation of each Adviser and its respective financial resources and
   concluded that each of the Advisers would be able to meet any reasonably
   foreseeable obligation under the Advisory Contracts.


   Fund Performance. The Board of Trustees, including the Independent
   Trustees, received and considered information about each Portfolio's
   investment performance in comparison to the investment performance of its
   respective performance universe.  The funds included within each
   Portfolio's performance universe were selected by Lipper.  The Board was
   provided with performance data for the one-, three-, five- and ten-year
   periods, as applicable, ended November 30, 2004 ("relevant periods").  The
   Board also reviewed the investment performance of the Portfolios and the
   Adviser's market outlook with respect to the Portfolios.


   The Trustees noted that of the 38 classes of Portfolios subject to review
   at the Board meeting, 8 classes (21%) had been in existence for less than
   five years.3 The Board reviewed the performance record of these classes.
   Of the remaining classes that had existed more than five years, 17 classes
   (45%) performed at or better than their respective performance universe
   medians during at least two of the relevant periods, while 13 classes (34%)
   performed below their respective performance universe medians during at
   least two of the relevant periods.  In regard to each of these 13 classes,
   the Trustees noted:


     3The Dividend Achievers Portfolio (two classes total) was organized in
   2004.

194
                                BLACKROCK FUNDS

   o   All 13 classes performed below their respective performance universe
      medians during at least two of the relevant periods by more than 10%
      (Institutional class: Large Cap Growth Equity, Large Cap Value Equity,
      Mid-Cap Growth Equity, Small Cap Growth Equity, Small Cap Value Equity,
      U.S. Opportunities; Investor A class: Index Equity, Large Cap Growth
      Equity, Large Cap Value Equity, Mid-Cap Growth Equity, Small Cap Growth
      Equity, Small-Cap Value Equity, U.S. Opportunities).  These 13 classes
      consist of classes from 7 different Portfolios.  The Board noted the
      following with respect to these 7 Portfolios (and specific classes, where
      applicable):


       o   Large Cap Growth Equity and Large Cap Value Equity Portfolios - In
          the judgment of the Advisers, the Portfolios' peer groups as selected
          by Lipper did not accurately reflect the asset class of these
          Portfolios.  The Large Cap Growth Equity and Large Cap Value Equity
          Portfolios were compared to multi-cap peer groups that include small
          cap holdings, which dramatically outperformed their large cap
          counterparts during the relevant periods.  When the Advisers compared
          these Portfolios to appropriate benchmarks that, in the judgment of
          the Advisers, are more appropriate (Morningstar peer groups), the
          Large Cap Growth Equity and Large Cap Value Equity Portfolios both
          show steadily improving active performance from five- to three- and
          one-year periods, and the one-year performances of both Portfolios
          exceeded that of Morningstar's benchmark categories.


       o   Mid-Cap Growth Equity, U.S. Opportunities and Index Equity
          Portfolios - In comparing the five-year performance to the three- and
          one-year performance ranking of the Portfolios, the performance
          ranking of each Portfolio has been improving within its respective
          peer group.  In addition, the Advisers informed the Board that the
          U.S. Opportunities Portfolio expanded its investment guidelines
          effective December 2002, changed its Lipper classification to Mid-Cap
          Core Index, and performed in the top Lipper quintile for that
          classification for the two-year period ending November 30, 2004.


       o   Small Cap Growth Equity and Small Cap Value Equity Portfolios - In
          the judgment of the Adviser, the small-cap core peer group selected
          by Lipper does not properly reflect the asset class of the Small Cap
          Growth Equity Portfolio, and when compared to a more appropriate
          benchmark (Morningstar), Small Cap Growth's active three-year period
          performance is positive.  In addition, the Adviser informed the Board
          that a new portfolio management team was introduced for both the
          Small Cap Growth Equity and Small Cap Value Equity Portfolios in the
          past three years, which may have had an impact on the performances of
          those Portfolios.


   The Trustees discussed other factors relevant to the performance of the
   Portfolios.  The Trustees determined that, while the performance records of
   certain of the Portfolios could be improved, the Advisers were taking steps
   to address relative underperformance.


   Profitability. The Board of Trustees, including the Independent Trustees,
   considered the level of the Advisers' and affiliates' profits in respect of
   their relationship with the Portfolios.  This consideration included a
   broad review of the Advisers' methodology in allocating their costs to the
   management of a Portfolio.  The Board of Trustees considered the profits
   realized by the Advisers and affiliates in connection with the operation of
   each Portfolio and whether the amount of profit is a fair profit relative
   to their relationship with the Portfolio.  The Board of Trustees, including
   the Independent Trustees, also considered the Advisers' profit margins in
   comparison with available industry data.  The Board concluded that each
   Adviser's profit is a reasonable profit relative to the services provided
   to the Portfolios.


   Economies of Scale. The Board of Trustees, including the Independent
   Trustees, considered whether there have been economies of scale in respect
   of the management of each Portfolio, whether each Portfolio


                                                                             195
                                BLACKROCK FUNDS
                             ADDITIONAL INFORMATION

   has appropriately benefited from any economies of scale, and whether there
   is potential for realization of any further economies of scale.


   The Board considered that economies of scale were passed on to the
   shareholders in the form of breakpoints to the advisory fee rate.  The
   Board noted that for the fiscal year ended September 30, 2004, none of the
   Portfolios had reached their respective specified asset levels to trigger
   the breakpoints to their respective advisory fee rates.  The Board also
   considered the fee waivers and expense reimbursement arrangements by the
   Advisers.  The Board determined that the advisory fee structure was
   reasonable and that no changes were currently necessary.


   Other Benefits to the Advisers. The Board of Trustees, including the
   Independent Trustees, also took into account not only the advisory fees
   payable by the Portfolios, but also other potential benefits to the
   Advisers, such as the ability to leverage investment professionals that
   also manage other portfolios, raising the profile of BlackRock in the
   broker-dealer community, and the engagement of affiliates of the Advisers
   as service providers to the Portfolios, including for administrative,
   transfer agency, distribution and custodial services.  The Board also noted
   that the Advisers may benefit from the use of soft dollars for research,
   which may be used by the Advisers to manage other accounts.


   The Board concluded that other ancillary benefits that the Advisers and
   their affiliates could be expected to receive with regard to providing
   investment advisory and other services to the Portfolios, such as those
   noted above, were consistent with those available to other mutual fund
   sponsors.


   No single factor was considered in isolation or to be determinative in the
   Board's decision to approve the Advisory Contracts.  Rather, the Board
   concluded, in light of a weighing and balancing of all factors considered,
   that it was in the best interests of each Portfolio to approve the
   continuation of the Advisory Contracts, including the fees to be charged
   for services thereunder.


(B)  PricewaterhouseCoopers LLP ("PwC"), the Fund's former independent auditor,
   has been hired as an
   internal audit supporting service provider by The PNC Financial Services
   Group, Inc. ("PNC"), the parent company of the Fund's investment adviser
   and certain other service providers. In order to provide certain services
   to PNC and its affiliates which would have caused PwC to no longer be
   independent with respect to the Fund, PwC declined to stand for re-election
   as independent auditor of the Fund after the completion of the fiscal 2003
   audit.

   The Fund's Audit Committee approved engaging Deloitte & Touche LLP as the
   independent auditor to audit the Fund's financial statements for fiscal
   year 2005. A majority of the Fund's Board of Trustees, including a majority
   of the independent Trustees, approved the appointment of Deloitte & Touche
   LLP as the Fund's independent auditor for the Fund's fiscal 2005 audit on
   November 12, 2004, subject to the right of the Fund, by a majority vote of
   the shareholders at any meeting called for that purpose, to terminate the
   appointment without penalty.


(C)  As previously disclosed, BlackRock has received subpoenas from various
   federal and state governmental and regulatory authorities and various
   information requests from the Securities and Exchange Commission in
   connection with ongoing industry-wide investigations of mutual fund
   matters.


(D)  The amounts paid by the Fund to the Chief Compliance Officer (CCO) for the
   six months ended March 31, 2005, were $81,903.


196
THE DFA INVESTMENT TRUST COMPANY
THE U.S. LARGE COMPANY SERIES
TABLE OF CONTENTS THE DFA INVESTMENT TRUST COMPANY
THE U.S. LARGE COMPANY SERIES
This report is submitted for the information of the Fund’s shareholders. It is not authorized for distribution to prospective investors unless preceded or accompanied by an effective prospectus.
PERFORMANCE CHART THE DFA INVESTMENT TRUST COMPANY
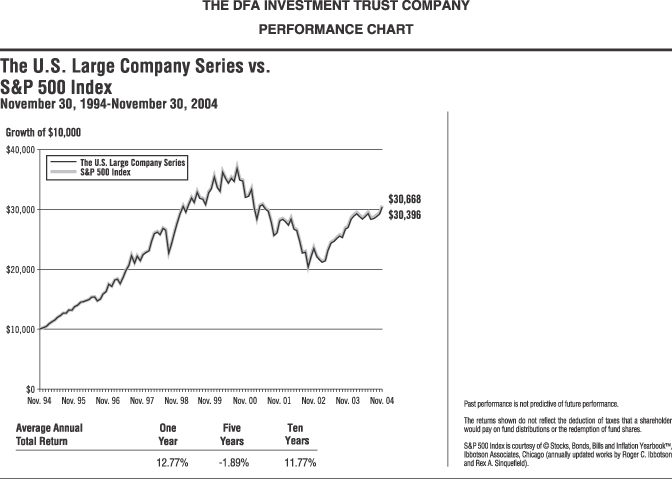
199
DISCLOSURE OF FUND EXPENSES THE DFA INVESTMENT TRUST COMPANY
The following Expense Table is shown so that you can understand the impact of fees on your investment. All mutual funds have operating expenses. As a shareholder of the fund, you incur ongoing costs, which include costs for portfolio management, administrative services, and shareholder reports, among others. Operating expenses, legal and audit services, which are deducted from a fund’s gross income, directly reduce the investment return of the fund. A fund’s expenses are expressed as a percentage of its average net assets. This figure is known as the expense ratio. The following examples are intended help you understand the ongoing fees (in dollars) of investing in the fund and to compare these costs with those of other mutual funds. The examples are based on an investment of $1,000 made at the beginning of the period shown and held for the entire period.
The Expense Table below illustrates your fund’s costs in two ways.
| | • | | Actual fund return. This section helps you to estimate the actual expenses after fee waivers that you paid over the period. The “Ending Account Value” shown is derived from the fund’s actual return, and “Expenses Paid During Period” shows the dollar amount that would have been paid by an investor who started with $1,000 in the fund. You may use the information here, together with the amount you invested, to estimate the expenses that you paid over the period. |
To do so, simply divide your account value by $1,000 (for example, a $7,500 account value divided by $1,000=7.5), then multiply the result by the number given for your fund under the heading “Expenses Paid During Period.”
| | • | | Hypothetical 5% return. This section is intended to help you compare your fund’s costs with those of other mutual funds. It assumes that the fund had a return of 5% before expenses during the period shown, but that the expense ratio is unchanged. In this case — because the return used is not the fund’s actual return — the results do not apply to your investment. The example is useful in making comparisons because the Securities and Exchange Commission requires all mutual funds to calculate expenses based on a 5% return. You can assess your fund’s cost by comparing this hypothetical example with the hypothetical examples that appear in shareholders reports of other funds. |
Please note that the expenses shown in the table are meant to highlight and help you compare ongoing costs only and do not reflect any transactional costs (if any). The “Annualized Expense Ratio” represents the actual expenses for the six month period indicated and may be different from the expense ratio in the Financial Highlights which is for the year ended November 30, 2004.
For the Period June 1, 2004 to November 30, 2004
Expense Table
| | | | | | | | | | | | |
The U.S. Large Company Series
| | Beginning
Account
Value
6/01/04
| | Ending
Account
Value
11/30/04
| | Annualized
Expense
Ratio
| | | Expenses
Paid
During
Period*
|
Actual Fund Return | | $ | 1,000.00 | | $ | 1,056.20 | | 0.05 | % | | $ | 0.26 |
Hypothetical 5% Return | | $ | 1,000.00 | | $ | 1,024.75 | | 0.05 | % | | $ | 0.25 |
| * | Expenses are equal to the fund’s annualized expense ratio multiplied by the average account value over the period, multiplied by the number of days in the most recent fiscal half-year, then divided by 366. |
200
DISCLOSURE OF PORTFOLIO HOLDINGS (Unaudited) THE DFA INVESTMENT TRUST COMPANY
The SEC has adopted the requirement that all Funds file a complete schedule of investments with the SEC for their first and third fiscal quarters on Form N-Q for fiscal quarters starting after July 9, 2004. For The DFA Investment Trust Company, this would be for the fiscal quarters ending August 31 and February 28 (February 29 during leap year). The Form N-Q filing must be made within 60 days of the end of the quarter. The DFA Investment Trust Company filed its first Form N-Q with the SEC on October 27, 2004. It is available upon request, without charge, by calling collect (310) 395-8005 or by mailing a request to Dimensional Fund Advisors, Inc., 1299 Ocean Avenue, 11th floor, Santa Monica, California 90401, or by visiting the SEC’s website at http://www.sec.gov, or they may be reviewed and copied at the SEC’s Public Reference Room in Washington, D.C. (call 1-800-732-0330 for information on the operation of the Public Reference Room).
PORTFOLIO HOLDINGS AS OF NOVEMBER 30, 2004
The SEC adopted a requirement that all Funds present their categories of portfolio holdings in a table, chart or graph format in their annual and semi-annual shareholder reports, whether or not a schedule of investments is utilized. The following table, which presents portfolio holdings as a percent of total investments before short-term investments and collateral for loaned securities, is provided in compliance with such requirement. The categories shown below represent broad industry sectors. Each industry sector consists of one or more specific industry classifications.
| | | |
The U.S. Large Company Series
| | | |
Financials | | 20.0 | % |
Information Technology | | 16.3 | |
Health Care | | 12.4 | |
Industrials | | 11.9 | |
Consumer Discretionary | | 11.4 | |
Consumer Staples | | 10.5 | |
Energy | | 7.5 | |
Telecommunication Services | | 3.3 | |
Materials | | 3.2 | |
Utilities | | 3.0 | |
REITS | | 0.5 | |
| | |
|
|
| | | 100.0 | % |
| | |
|
|
201
SCHEDULE OF INVESTMENTS THE DFA INVESTMENT TRUST COMPANY
The U.S. Large Company Series
| | | | | | |
| | | March 31, 2005
| |
| | | (Unaudited) | |
| | | Shares
| | Value†
| |
| | | | | | | |
COMMON STOCKS — (95.3%) | | | | | | |
3M Co. | | 263,000 | | $ | 22,536,470 | |
Abbott Laboratories | | 530,900 | | | 24,750,558 | |
Ace, Ltd. | | 96,800 | | | 3,994,936 | |
ADC Telecommunications, Inc. | | 276,100 | | | 549,439 | * |
Adobe Systems, Inc. | | 82,900 | | | 5,568,393 | |
Advanced Micro Devices, Inc. | | 134,200 | | | 2,163,304 | * |
AES Corp. | | 221,000 | | | 3,619,980 | * |
Aetna, Inc. | | 100,300 | | | 7,517,485 | |
Affiliated Computer Services, Inc.
Class A | | 43,100 | | | 2,294,644 | * |
AFLAC, Inc. | | 170,900 | | | 6,367,734 | |
Agilent Technologies, Inc. | | 147,200 | | | 3,267,840 | *# |
Air Products & Chemicals, Inc. | | 77,500 | | | 4,904,975 | |
Alberto-Culver Co. Class B | | 28,800 | | | 1,378,368 | |
Albertson’s, Inc. | | 125,300 | | | 2,587,445 | # |
Alcoa, Inc. | | 296,800 | | | 9,019,752 | |
Allegheny Energy, Inc. | | 46,800 | | | 966,888 | *# |
Allegheny Technologies, Inc. | | 30,500 | | | 735,355 | |
Allergan, Inc. | | 44,800 | | | 3,112,256 | |
Allied Waste Industries, Inc. | | 92,400 | | | 675,444 | * |
Allstate Corp. | | 231,300 | | | 12,504,078 | |
Alltel Corp. | | 103,000 | | | 5,649,550 | # |
Altera Corp. | | 126,800 | | | 2,508,104 | * |
Altria Group, Inc. | | 704,500 | | | 46,067,255 | |
AMBAC Financial Group, Inc. | | 37,000 | | | 2,765,750 | |
Amerada Hess Corp. | | 29,000 | | | 2,790,090 | |
Ameren Corp. | | 66,500 | | | 3,259,165 | |
American Electric Power Co., Inc. | | 130,500 | | | 4,444,830 | |
American Express Co. | | 399,500 | | | 20,522,315 | |
American International Group, Inc. | | 887,000 | | | 49,148,670 | |
American Power Conversion Corp. | | 61,200 | | | 1,597,932 | |
American Standard Companies, Inc. | | 61,300 | | | 2,849,224 | |
AmerisourceBergen Corp. | | 37,800 | | | 2,165,562 | |
Amgen, Inc. | | 426,700 | | | 24,838,207 | *# |
AmSouth Bancorporation | | 120,900 | | | 3,137,355 | |
Anadarko Petroleum Corp. | | 80,700 | | | 6,141,270 | |
Analog Devices, Inc. | | 126,900 | | | 4,586,166 | |
Andrew Corp. | | 54,800 | | | 641,708 | * |
Anheuser-Busch Companies, Inc. | | 264,600 | | | 12,539,394 | # |
AON Corp. | | 107,700 | | | 2,459,868 | |
Apache Corp. | | 111,200 | | | 6,808,776 | |
Apartment Investment & Management Co. Class A | | 32,600 | | | 1,212,720 | |
Apollo Group, Inc. Class A | | 56,400 | | | 4,176,984 | * |
Apple Computer, Inc. | | 278,300 | | | 11,596,761 | * |
Applera Corp. — Applied Biosystems Group | | 66,900 | | | 1,320,606 | |
Applied Materials, Inc. | | 568,000 | | | 9,230,000 | * |
Applied Micro Circuits Corp. | | 104,900 | | | 345,121 | * |
Archer-Daniels-Midland Co. | | 212,200 | | | 5,215,876 | |
Archstone-Smith Trust | | 68,100 | | | 2,322,891 | |
Ashland, Inc. | | 22,600 | | | 1,524,822 | |
AT&T Corp. | | 272,500 | | | 5,109,375 | |
Autodesk, Inc. | | 78,200 | | | 2,327,232 | |
Automatic Data Processing, Inc. | | 198,600 | | | 8,927,070 | |
AutoNation, Inc. | | 76,900 | | | 1,456,486 | * |
Autozone, Inc. | | 23,000 | | | 1,971,100 | * |
Avaya, Inc. | | 163,400 | | | 1,908,512 | * |
Avery Dennison Corp. | | 34,700 | | | 2,148,971 | |
Avon Products, Inc. | | 160,600 | | | 6,896,164 | |
Baker Hughes, Inc. | | 115,200 | | | 5,125,248 | |
Ball Corp. | | 37,400 | | | 1,551,352 | |
| | | | | | |
| | | March 31, 2005
| |
| | | (Unaudited) | |
| | | Shares
| | Value†
| |
| | | | | | | |
Bank of America Corp. | | 1,380,500 | | $ | 60,880,050 | |
Bank of New York Co., Inc. | | 265,100 | | | 7,701,155 | |
Bard (C.R.), Inc. | | 35,700 | | | 2,430,456 | |
Bausch & Lomb, Inc. | | 18,300 | | | 1,341,390 | |
Baxter International, Inc. | | 211,100 | | | 7,173,178 | |
BB&T Corp. | | 186,800 | | | 7,300,144 | |
Bear Stearns Companies, Inc. | | 38,500 | | | 3,846,150 | |
Becton Dickinson & Co. | | 86,200 | | | 5,035,804 | |
Bed Bath and Beyond, Inc. | | 103,000 | | | 3,763,620 | * |
BellSouth Corp. | | 623,700 | | | 16,397,073 | |
Bemis Co., Inc. | | 36,500 | | | 1,135,880 | |
Best Buy Co., Inc. | | 101,700 | | | 5,492,817 | |
Big Lots, Inc. | | 38,400 | | | 461,568 | * |
Biogen Idec, Inc. | | 113,600 | | | 3,920,336 | * |
Biomet, Inc. | | 86,100 | | | 3,125,430 | |
BJ Services Co. | | 55,300 | | | 2,868,964 | |
Black & Decker Corp. | | 27,300 | | | 2,156,427 | |
BMC Software, Inc. | | 75,400 | | | 1,131,000 | * |
Boeing Co. | | 283,500 | | | 16,573,410 | |
Boston Scientific Corp. | | 258,800 | | | 7,580,252 | * |
Bristol-Myers Squibb Co. | | 665,400 | | | 16,941,084 | |
Broadcom Corp. | | 99,000 | | | 2,962,080 | * |
Brown-Forman Corp. Class B | | 30,700 | | | 1,680,825 | |
Brunswick Corp. | | 33,000 | | | 1,546,050 | |
Burlington Northern Santa Fe Corp. | | 128,900 | | | 6,951,577 | |
Burlington Resources, Inc. | | 131,800 | | | 6,599,226 | |
Calpine Corp. | | 181,900 | | | 509,320 | *# |
Campbell Soup Co. | | 110,900 | | | 3,218,318 | |
Capital One Financial Corp. | | 84,200 | | | 6,295,634 | |
Cardinal Health, Inc. | | 147,700 | | | 8,241,660 | |
Caremark Rx, Inc. | | 155,700 | | | 6,193,746 | * |
Carnival Corp. | | 179,400 | | | 9,294,714 | |
Caterpillar, Inc. | | 116,800 | | | 10,680,192 | |
Cendant Corp. | | 359,300 | | | 7,380,022 | |
CenterPoint Energy, Inc. | | 98,500 | | | 1,184,955 | |
Centex Corp. | | 43,100 | | | 2,468,337 | |
CenturyTel, Inc. | | 45,800 | | | 1,504,072 | |
ChevronTexaco Corp. | | 716,600 | | | 41,784,946 | |
Chiron Corp. | | 50,300 | | | 1,763,518 | * |
Chubb Corp. | | 65,200 | | | 5,168,404 | |
CIENA Corp. | | 194,900 | | | 335,228 | * |
CIGNA Corp. | | 44,800 | | | 4,000,640 | |
Cincinnati Financial Corp. | | 54,100 | | | 2,359,301 | |
Cinergy Corp. | | 65,200 | | | 2,641,904 | |
Cintas Corp. | | 50,900 | | | 2,102,679 | |
Circuit City Stores, Inc. | | 65,100 | | | 1,044,855 | |
Cisco Systems, Inc. | | 2,201,400 | | | 39,383,046 | * |
CIT Group, Inc. | | 71,800 | | | 2,728,400 | |
Citigroup, Inc. | | 1,779,500 | | | 79,970,730 | |
Citizens Communications Co. | | 114,300 | | | 1,479,042 | |
Citrix Systems, Inc. | | 57,800 | | | 1,376,796 | * |
Clear Channel Communications, Inc. | | 179,500 | | | 6,187,365 | |
Clorox Co. | | 52,200 | | | 3,288,078 | |
CMS Energy Corp. | | 66,500 | | | 867,160 | * |
Coach, Inc. | | 65,100 | | | 3,686,613 | * |
Coca-Cola Co. | | 771,500 | | | 32,148,405 | |
Coca-Cola Enterprises, Inc. | | 120,100 | | | 2,464,452 | |
Colgate-Palmolive Co. | | 179,000 | | | 9,338,430 | |
Comcast Corp. Class A | | 753,300 | | | 25,446,474 | * |
Comerica, Inc. | | 58,000 | | | 3,194,640 | |
Compass Bancshares, Inc. | | 42,100 | | | 1,911,340 | |
Computer Associates International, Inc. | | 182,255 | | | 4,939,110 | |
Computer Sciences Corp. | | 65,100 | | | 2,984,835 | * |
202
SCHEDULE OF INVESTMENTS THE DFA INVESTMENT TRUST COMPANY
The U.S. Large Company Series (Continued)
| | | | | | |
| | | March 31, 2005
| |
| | | (Unaudited) | |
| | | Shares
| | Value†
| |
| | | | | | | |
Compuware Corp. | | 131,900 | | $ | 949,680 | * |
Comverse Technology, Inc. | | 67,400 | | | 1,699,828 | * |
ConAgra, Inc. | | 175,500 | | | 4,742,010 | |
ConocoPhillips | | 236,900 | | | 25,547,296 | |
Consolidated Edison, Inc. | | 82,600 | | | 3,484,068 | |
Constellation Energy Group | | 60,200 | | | 3,112,340 | |
Convergys Corp. | | 48,400 | | | 722,612 | * |
Cooper Industries, Ltd. | | 31,600 | | | 2,260,032 | |
Cooper Tire & Rubber Co. | | 23,900 | | | 438,804 | |
Corning, Inc. | | 480,100 | | | 5,343,513 | * |
Costco Wholesale Corp. | | 160,900 | | | 7,108,562 | |
Countrywide Financial Corp. | | 197,700 | | | 6,417,342 | |
CSX Corp. | | 73,400 | | | 3,057,110 | |
Cummins, Inc. | | 14,600 | | | 1,027,110 | |
CVS Corp. | | 136,300 | | | 7,172,106 | |
Dana Corp. | | 51,100 | | | 653,569 | |
Danaher Corp. | | 93,700 | | | 5,004,517 | |
Darden Restaurants, Inc. | | 50,300 | | | 1,543,204 | |
Deere & Co. | | 84,100 | | | 5,645,633 | |
Dell, Inc. | | 837,500 | | | 32,176,750 | *# |
Delphi Corp. | | 191,100 | | | 856,128 | |
Delta Air Lines, Inc. | | 47,600 | | | 192,780 | *# |
Devon Energy Corp. | | 163,200 | | | 7,792,800 | |
Dillards, Inc. Class A | | 24,000 | | | 645,600 | |
Disney (Walt) Co. | | 697,200 | | | 20,030,556 | |
Dollar General Corp. | | 102,600 | | | 2,247,966 | |
Dominion Resources, Inc. | | 116,000 | | | 8,633,880 | |
Donnelley (R.R.) & Sons Co. | | 73,400 | | | 2,320,908 | |
Dover Corp. | | 69,400 | | | 2,622,626 | |
Dow Chemical Co. | | 324,700 | | | 16,186,295 | |
Dow Jones & Co., Inc. | | 24,000 | | | 896,880 | |
DTE Energy Co. | | 59,300 | | | 2,696,964 | |
Duke Energy Corp. | | 319,400 | | | 8,946,394 | |
DuPont (E.I.) de Nemours & Co., Inc. | | 339,600 | | | 17,401,104 | |
Dynegy, Inc. | | 112,700 | | | 440,657 | * |
E*TRADE Financial Corp. | | 126,200 | | | 1,514,400 | * |
Eastman Chemical Co. | | 26,600 | | | 1,569,400 | |
Eastman Kodak Co. | | 97,600 | | | 3,176,880 | |
Eaton Corp. | | 52,000 | | | 3,400,800 | |
eBay, Inc. | | 412,100 | | | 15,354,846 | * |
Ecolab, Inc. | | 75,200 | | | 2,485,360 | |
Edison International | | 110,900 | | | 3,850,448 | |
El Paso Corp. | | 219,100 | | | 2,318,078 | |
Electronic Arts, Inc. | | 104,900 | | | 5,431,722 | * |
Electronic Data Systems Corp. | | 176,300 | | | 3,644,121 | |
EMC Corp. | | 819,200 | | | 10,092,544 | * |
Emerson Electric Co. | | 142,800 | | | 9,272,004 | |
Engelhard Corp. | | 41,600 | | | 1,249,248 | |
Entergy Corp. | | 72,600 | | | 5,129,916 | |
EOG Resources, Inc. | | 81,400 | | | 3,967,436 | |
Equifax, Inc. | | 46,000 | | | 1,411,740 | |
Equity Office Properties Trust | | 137,300 | | | 4,136,849 | |
Equity Residential | | 96,300 | | | 3,101,823 | |
Exelon Corp. | | 226,400 | | | 10,389,496 | # |
Express Scripts, Inc. | | 25,900 | | | 2,258,221 | * |
Exxon Mobil Corp. | | 2,174,600 | | | 129,606,160 | |
Family Dollar Stores, Inc. | | 57,100 | | | 1,733,556 | |
Federal Home Loan Mortgage Corporation | | 234,300 | | | 14,807,760 | |
Federal National Mortgage Association | | 329,700 | | | 17,952,165 | |
Federated Department Stores, Inc. | | 57,700 | | | 3,672,028 | |
Federated Investors, Inc. | | 32,400 | | | 917,244 | |
FedEx Corp. | | 102,600 | | | 9,639,270 | |
| | | | | | |
| | | March 31, 2005
| |
| | | (Unaudited) | |
| | | Shares
| | Value†
| |
| | | | | | | |
Fifth Third Bancorp | | 177,100 | | $ | 7,611,758 | |
First Data Corp. | | 273,100 | | | 10,735,561 | |
First Horizon National Corp. | | 41,900 | | | 1,709,101 | |
FirstEnergy Corp. | | 112,300 | | | 4,710,985 | |
Fiserv, Inc. | | 65,800 | | | 2,618,840 | * |
Fisher Scientific International, Inc. | | 40,000 | | | 2,276,800 | * |
Fluor Corp. | | 29,100 | | | 1,613,013 | |
Ford Motor Co. | | 623,500 | | | 7,064,255 | |
Forest Laboratories, Inc. | | 119,700 | | | 4,422,915 | * |
Fortune Brands, Inc. | | 49,400 | | | 3,983,122 | |
FPL Group, Inc. | | 133,200 | | | 5,347,980 | |
Franklin Resources, Inc. | | 67,400 | | | 4,627,010 | |
Freeport-McMoRan Copper & Gold, Inc.
Class B | | 60,900 | | | 2,412,249 | |
Freescale Semiconductor, Inc. Class B | | 136,800 | | | 2,359,800 | * |
Gannett Co., Inc. | | 85,600 | | | 6,769,248 | |
Gap, Inc. | | 250,800 | | | 5,477,472 | |
Gateway, Inc. | | 101,800 | | | 410,254 | * |
General Dynamics Corp. | | 68,200 | | | 7,300,810 | |
General Electric Co. | | 3,609,600 | | | 130,162,176 | |
General Mills, Inc. | | 124,300 | | | 6,109,345 | |
General Motors Corp. | | 192,400 | | | 5,654,636 | # |
Genuine Parts Co. | | 59,500 | | | 2,587,655 | |
Genzyme Corp. | | 84,400 | | | 4,831,056 | * |
Georgia-Pacific Corp. | | 88,500 | | | 3,140,865 | |
Gilead Sciences, Inc. | | 147,400 | | | 5,276,920 | * |
Gillette Co. | | 337,600 | | | 17,042,048 | |
Golden West Financial Corp. | | 96,200 | | | 5,820,100 | |
Goodrich (B.F.) Co. | | 40,900 | | | 1,566,061 | |
Goodyear Tire & Rubber Co. | | 59,900 | | | 799,665 | *# |
Grainger (W.W.), Inc. | | 28,400 | | | 1,768,468 | |
Great Lakes Chemical Corp. | | 17,500 | | | 562,100 | |
Guidant Corp. | | 109,900 | | | 8,121,610 | |
H&R Block, Inc. | | 56,300 | | | 2,847,654 | |
Halliburton Co. | | 171,800 | | | 7,430,350 | |
Harley-Davidson, Inc. | | 99,500 | | | 5,747,120 | # |
Harrahs Entertainment, Inc. | | 38,700 | | | 2,499,246 | # |
Hartford Financial Services Group, Inc. | | 100,700 | | | 6,903,992 | |
Hasbro, Inc. | | 56,800 | | | 1,161,560 | |
HCA, Inc. | | 140,200 | | | 7,510,514 | |
Health Management Associates, Inc. | | 83,100 | | | 2,175,558 | |
Heinz (H.J.) Co. | | 119,200 | | | 4,391,328 | |
Hercules, Inc. | | 38,100 | | | 551,688 | * |
Hershey Foods Corp. | | 74,500 | | | 4,504,270 | |
Hewlett-Packard Co. | | 986,100 | | | 21,635,034 | |
Hilton Hotels Corp. | | 131,000 | | | 2,927,850 | |
Home Depot, Inc. | | 747,800 | | | 28,595,872 | |
Honeywell International, Inc. | | 289,700 | | | 10,779,737 | |
Hospira, Inc. | | 53,200 | | | 1,716,764 | * |
Humana, Inc. | | 54,800 | | | 1,750,312 | * |
Huntington Bancshares, Inc. | | 78,900 | | | 1,885,710 | |
Illinois Tool Works, Inc. | | 93,500 | | | 8,371,055 | |
IMS Health, Inc. | | 79,000 | | | 1,926,810 | |
Ingersoll-Rand Co., Ltd. Class A | | 59,000 | | | 4,699,350 | |
Intel Corp. | | 2,120,600 | | | 49,261,538 | |
International Business Machines Corp. | | 556,000 | | | 50,807,280 | |
International Flavors & Fragrances, Inc. | | 30,200 | | | 1,192,900 | |
International Game Technology | | 117,500 | | | 3,132,550 | |
International Paper Co. | | 167,000 | | | 6,143,930 | |
Interpublic Group of Companies, Inc. | | 144,000 | | | 1,768,320 | * |
Intuit, Inc. | | 63,200 | | | 2,766,264 | * |
ITT Industries, Inc. | | 31,400 | | | 2,833,536 | |
Jabil Circuit, Inc. | | 62,500 | | | 1,782,500 | * |
203
SCHEDULE OF INVESTMENTS THE DFA INVESTMENT TRUST COMPANY
The U.S. Large Company Series (Continued)
| | | | | | |
| | | March 31, 2005
| |
| | | (Unaudited) | |
| | | Shares
| | Value†
| |
| | | | | | | |
Janus Capital Group, Inc. | | 80,400 | | $ | 1,121,580 | |
JDS Uniphase Corp. | | 492,000 | | | 821,640 | * |
Jefferson-Pilot Corp. | | 46,500 | | | 2,280,825 | |
Johnson & Johnson | | 1,012,700 | | | 68,012,932 | |
Johnson Controls, Inc. | | 65,100 | | | 3,629,976 | |
Jones Apparel Group, Inc. | | 41,700 | | | 1,396,533 | |
JPMorgan Chase & Co. | | 1,210,300 | | | 41,876,380 | |
KB Home | | 14,200 | | | 1,667,932 | |
Kellogg Co. | | 119,500 | | | 5,170,765 | |
Kerr-McGee Corp. | | 55,600 | | | 4,355,148 | |
KeyCorp | | 138,400 | | | 4,491,080 | |
KeySpan Corp. | | 54,800 | | | 2,135,556 | |
Kimberly-Clark Corp. | | 163,900 | | | 10,773,147 | |
Kinder Morgan, Inc. | | 37,400 | | | 2,831,180 | |
King Pharmaceuticals, Inc. | | 82,300 | | | 683,913 | * |
KLA-Tencor Corp. | | 67,000 | | | 3,082,670 | * |
Knight-Ridder, Inc. | | 25,800 | | | 1,735,050 | |
Kohl’s Corp. | | 111,000 | | | 5,730,930 | * |
L-3 Communications Holdings, Inc. | | 39,300 | | | 2,791,086 | |
Laboratory Corp. of America Holdings | | 46,000 | | | 2,217,200 | * |
Leggett & Platt, Inc. | | 65,000 | | | 1,877,200 | |
Lehman Brothers Holdings, Inc. | | 94,000 | | | 8,851,040 | |
Lexmark International, Inc. | | 43,100 | | | 3,446,707 | * |
Lilly (Eli) & Co. | | 385,800 | | | 20,100,180 | |
Limited Brands, Inc. | | 130,100 | | | 3,161,430 | |
Lincoln National Corp. | | 59,400 | | | 2,681,316 | |
Linear Technology Corp. | | 104,600 | | | 4,007,226 | |
Liz Claiborne, Inc. | | 37,000 | | | 1,484,810 | |
Lockheed Martin Corp. | | 136,700 | | | 8,346,902 | |
Loews Corp. | | 54,400 | | | 4,000,576 | |
Louisiana-Pacific Corp. | | 37,700 | | | 947,778 | |
Lowe’s Companies, Inc. | | 263,200 | | | 15,026,088 | # |
LSI Logic Corp. | | 131,000 | | | 732,290 | * |
Lucent Technologies, Inc. | | 1,508,900 | | | 4,149,475 | * |
M&T Bank Corp. | | 33,500 | | | 3,419,010 | |
Manor Care, Inc. | | 29,300 | | | 1,065,348 | |
Marathon Oil Corp. | | 118,200 | | | 5,545,944 | |
Marriott International, Inc. Class A | | 68,400 | | | 4,573,224 | |
Marsh & McLennan Companies, Inc. | | 180,100 | | | 5,478,642 | |
Marshall & Ilsley Corp. | | 70,700 | | | 2,951,725 | |
Masco Corp. | | 152,600 | | | 5,290,642 | |
Mattel, Inc. | | 141,900 | | | 3,029,565 | |
Maxim Integrated Products, Inc. | | 111,300 | | | 4,548,831 | |
May Department Stores Co. | | 99,500 | | | 3,683,490 | |
Maytag Corp. | | 27,100 | | | 378,587 | # |
MBIA, Inc. | | 47,900 | | | 2,504,212 | |
MBNA Corp. | | 435,100 | | | 10,681,705 | |
McCormick & Co., Inc. | | 46,200 | | | 1,590,666 | |
McDonald’s Corp. | | 433,200 | | | 13,489,848 | |
McGraw-Hill Companies, Inc. | | 64,900 | | | 5,662,525 | |
McKesson Corp. | | 100,600 | | | 3,797,650 | |
MeadWestavco Corp. | | 69,000 | | | 2,195,580 | |
Medco Health Solutions, Inc. | | 93,700 | | | 4,644,709 | * |
Medimmune, Inc. | | 84,700 | | | 2,016,707 | * |
Medtronic, Inc. | | 411,900 | | | 20,986,305 | |
Mellon Financial Corp. | | 144,300 | | | 4,118,322 | |
Merck & Co., Inc. | | 752,000 | | | 24,342,240 | |
Mercury Interactive Corp. | | 28,700 | | | 1,359,806 | * |
Meredith Corp. | | 15,500 | | | 724,625 | |
Merrill Lynch & Co., Inc. | | 317,000 | | | 17,942,200 | |
MetLife, Inc. | | 249,600 | | | 9,759,360 | |
MGIC Investment Corp. | | 32,900 | | | 2,028,943 | |
Micron Technology, Inc. | | 209,000 | | | 2,161,060 | *# |
| | | | | | |
| | | March 31, 2005
| |
| | | (Unaudited) | |
| | | Shares
| | Value†
| |
| | | | | | | |
Microsoft Corp. | | 3,446,000 | | $ | 83,289,820 | |
Millipore Corp. | | 17,000 | | | 737,800 | * |
Molex, Inc. | | 57,100 | | | 1,505,156 | |
Molson Coors Brewing Co. | | 27,400 | | | 2,114,458 | |
Monsanto Co. | | 90,700 | | | 5,850,150 | |
Monster Worldwide, Inc. | | 41,100 | | | 1,152,855 | * |
Moody’s Corp. | | 46,700 | | | 3,776,162 | |
Morgan Stanley | | 378,900 | | | 21,692,025 | |
Motorola, Inc. | | 835,000 | | | 12,499,950 | |
Mylan Laboratories, Inc. | | 91,700 | | | 1,624,924 | # |
Nabors Industries, Ltd. | | 48,200 | | | 2,850,548 | * |
National City Corp. | | 202,400 | | | 6,780,400 | |
National Semiconductor Corp. | | 121,000 | | | 2,493,810 | |
National-Oilwell, Inc. | | 57,100 | | | 2,666,570 | * |
Navistar International Corp. | | 22,400 | | | 815,360 | * |
NCR Corp. | | 63,400 | | | 2,139,116 | * |
Network Appliance, Inc. | | 124,700 | | | 3,449,202 | * |
Newell Rubbermaid, Inc. | | 93,600 | | | 2,053,584 | |
Newmont Mining Corp. | | 151,200 | | | 6,388,200 | |
News Corp. Class A | | 844,600 | | | 14,290,632 | |
Nextel Communications, Inc. | | 383,700 | | | 10,904,754 | * |
Nicor, Inc. | | 15,000 | | | 556,350 | |
NIKE, Inc. Class B | | 78,200 | | | 6,514,842 | |
NiSource, Inc. | | 92,400 | | | 2,105,796 | |
Noble Corp. | | 46,200 | | | 2,596,902 | |
Nordstrom, Inc. | | 42,900 | | | 2,375,802 | |
Norfolk Southern Corp. | | 136,400 | | | 5,053,620 | |
North Fork Bancorporation, Inc. | | 160,300 | | | 4,446,722 | |
Northern Trust Corp. | | 69,300 | | | 3,010,392 | |
Northrop Grumman Corp. | | 122,700 | | | 6,623,346 | |
Novell, Inc. | | 129,100 | | | 769,436 | * |
Novellus Systems, Inc. | | 47,600 | | | 1,272,348 | * |
Nucor Corp. | | 54,400 | | | 3,131,264 | |
Nvidia Corp. | | 56,600 | | | 1,344,816 | * |
Occidental Petroleum Corp. | | 135,200 | | | 9,622,184 | |
Office Depot, Inc. | | 106,500 | | | 2,362,170 | * |
OfficeMax, Inc. | | 31,800 | | | 1,065,300 | |
Omnicom Group, Inc. | | 63,500 | | | 5,621,020 | |
Oracle Corp. | | 1,530,300 | | | 19,098,144 | * |
Paccar, Inc. | | 59,200 | | | 4,285,488 | |
Pactiv Corp. | | 50,600 | | | 1,181,510 | * |
Pall Corp. | | 42,200 | | | 1,144,464 | |
Parametric Technology Corp. | | 92,100 | | | 514,839 | * |
Parker Hannifin Corp. | | 40,900 | | | 2,491,628 | |
Paychex, Inc. | | 121,100 | | | 3,974,502 | |
Penney (J.C.) Co., Inc. | | 97,300 | | | 5,051,816 | |
Peoples Energy Corp. | | 12,900 | | | 540,768 | |
Pepsi Bottling Group, Inc. | | 67,400 | | | 1,877,090 | |
PepsiCo, Inc. | | 571,500 | | | 30,306,645 | |
PerkinElmer, Inc. | | 44,200 | | | 911,846 | |
Pfizer, Inc. | | 2,540,700 | | | 66,744,189 | |
PG&E Corp. | | 122,900 | | | 4,190,890 | |
Phelps Dodge Corp. | | 32,900 | | | 3,346,917 | |
Pinnacle West Capital Corp. | | 31,200 | | | 1,326,312 | |
Pitney Bowes, Inc. | | 78,600 | | | 3,546,432 | |
Plum Creek Timber Co., Inc. | | 62,600 | | | 2,234,820 | |
PMC-Sierra, Inc. | | 61,200 | | | 538,560 | * |
PNC Financial Services Group | | 96,300 | | | 4,957,524 | |
PPG Industries, Inc. | | 59,000 | | | 4,219,680 | |
PPL Corp. | | 64,400 | | | 3,476,956 | |
Praxair, Inc. | | 109,900 | | | 5,259,814 | |
Principal Financial Group, Inc. | | 102,000 | | | 3,925,980 | |
Procter & Gamble Co. | | 859,000 | | | 45,527,000 | |
204
SCHEDULE OF INVESTMENTS THE DFA INVESTMENT TRUST COMPANY
The U.S. Large Company Series (Continued)
| | | | | | |
| | | March 31, 2005
| |
| | | (Unaudited) | |
| | | Shares
| | Value†
| |
| | | | | | | |
Progress Energy, Inc. | | 84,100 | | $ | 3,527,995 | |
Progressive Corp. | | 68,200 | | | 6,258,032 | |
ProLogis | | 62,700 | | | 2,326,170 | |
Providian Financial Corp. | | 99,900 | | | 1,714,284 | * |
Prudential Financial, Inc. | | 178,500 | | | 10,245,900 | |
Public Service Enterprise Group, Inc. | | 81,200 | | | 4,416,468 | |
Pulte Homes, Inc. | | 40,400 | | | 2,974,652 | |
QLogic Corp. | | 31,300 | | | 1,267,650 | * |
Qualcomm, Inc. | | 560,500 | | | 20,542,325 | |
Quest Diagnostics, Inc. | | 31,100 | | | 3,269,543 | |
Qwest Communications International, Inc. | | 569,100 | | | 2,105,670 | *# |
RadioShack Corp. | | 54,000 | | | 1,323,000 | |
Raytheon Co. | | 154,300 | | | 5,971,410 | |
Reebok International, Ltd. | | 19,100 | | | 846,130 | |
Regions Financial Corp. | | 158,200 | | | 5,125,680 | |
Reynolds American, Inc. | | 39,700 | | | 3,199,423 | |
Robert Half International, Inc. | | 54,800 | | | 1,477,408 | |
Rockwell Automation, Inc. | | 59,600 | | | 3,375,744 | |
Rockwell Collins, Inc. | | 60,700 | | | 2,888,713 | |
Rohm & Haas Co. | | 66,200 | | | 3,177,600 | |
Rowan Companies, Inc. | | 36,500 | | | 1,092,445 | |
Ryder System, Inc. | | 21,900 | | | 913,230 | # |
Sabre Holdings Corp. | | 44,800 | | | 980,224 | |
Safeco Corp. | | 43,300 | | | 2,109,143 | |
Safeway, Inc. | | 152,400 | | | 2,823,972 | * |
Sanmina-SCI Corp. | | 178,300 | | | 930,726 | * |
Sara Lee Corp. | | 268,800 | | | 5,956,608 | |
SBC Communications, Inc. | | 1,125,000 | | | 26,651,250 | |
Schering-Plough Corp. | | 502,300 | | | 9,116,745 | |
Schlumberger, Ltd. | | 200,800 | | | 14,152,384 | |
Schwab (Charles) Corp. | | 391,000 | | | 4,109,410 | |
Scientific-Atlanta, Inc. | | 51,800 | | | 1,461,796 | |
Sealed Air Corp. | | 28,400 | | | 1,475,096 | * |
Sears Holdings Corp. | | 22,165 | | | 2,951,840 | *# |
Sempra Energy | | 81,100 | | | 3,231,024 | |
Sherwin-Williams Co. | | 43,100 | | | 1,895,969 | |
Siebel Systems, Inc. | | 175,300 | | | 1,600,489 | * |
Sigma-Aldrich Corp. | | 23,400 | | | 1,433,250 | |
Simon Property Group, Inc. | | 75,300 | | | 4,561,674 | |
SLM Corp. | | 146,400 | | | 7,296,576 | |
Snap-On, Inc. | | 19,700 | | | 626,263 | |
Solectron Corp. | | 330,700 | | | 1,147,529 | * |
Southern Co. | | 253,000 | | | 8,052,990 | |
Southwest Airlines Co. | | 250,900 | | | 3,572,816 | |
Sovereign Bancorp, Inc. | | 127,700 | | | 2,829,832 | |
Sprint Corp. | | 503,300 | | | 11,450,075 | # |
St. Jude Medical, Inc. | | 122,900 | | | 4,424,400 | * |
Staples, Inc. | | 168,700 | | | 5,302,241 | |
Starbucks Corp. | | 136,100 | | | 7,030,926 | * |
Starwood Hotels & Resorts
Worldwide, Inc. | | 72,400 | | | 4,346,172 | |
State Street Corp. | | 113,600 | | | 4,966,592 | |
Stryker Corp. | | 127,600 | | | 5,692,236 | |
Sun Microsystems, Inc. | | 1,150,400 | | | 4,647,616 | * |
Sungard Data Systems, Inc. | | 98,300 | | | 3,391,350 | * |
Sunoco, Inc. | | 23,600 | | | 2,443,072 | |
SunTrust Banks, Inc. | | 115,500 | | | 8,324,085 | |
Supervalu, Inc. | | 46,000 | | | 1,534,100 | |
Symantec Corp. | | 241,600 | | | 5,153,328 | * |
Symbol Technologies, Inc. | | 82,600 | | | 1,196,874 | |
Synovus Financial Corp. | | 105,900 | | | 2,950,374 | |
Sysco Corp. | | 216,900 | | | 7,765,020 | |
T. Rowe Price Group, Inc. | | 42,100 | | | 2,499,898 | |
| | | | | | |
| | | March 31, 2005
| |
| | | (Unaudited) | |
| | | Shares
| | Value†
| |
| | | | | | | |
Target Corp. | | 304,900 | | $ | 15,251,098 | |
TECO Energy, Inc. | | 70,300 | | | 1,102,304 | |
Tektronix, Inc. | | 30,500 | | | 748,165 | |
Tellabs, Inc. | | 157,300 | | | 1,148,290 | * |
Temple-Inland, Inc. | | 19,500 | | | 1,414,725 | |
Tenet Healthcare Corp. | | 159,500 | | | 1,839,035 | * |
Teradyne, Inc. | | 66,100 | | | 965,060 | * |
Texas Instruments, Inc. | | 586,200 | | | 14,942,238 | |
Textron, Inc. | | 46,000 | | | 3,432,520 | |
The Goldman Sachs Group, Inc. | | 152,500 | | | 16,773,475 | |
The Kroger Co. | | 249,300 | | | 3,996,279 | * |
The New York Times Co. Class A | | 49,700 | | | 1,818,026 | |
The St. Paul Travelers Companies, Inc. | | 227,900 | | | 8,370,767 | |
The Stanley Works | | 25,600 | | | 1,158,912 | |
The TJX Companies, Inc. | | 164,100 | | | 4,041,783 | |
The Williams Companies, Inc. | | 194,200 | | | 3,652,902 | |
Thermo Electron Corp. | | 54,500 | | | 1,378,305 | * |
Tiffany & Co. | | 49,600 | | | 1,712,192 | |
Time Warner, Inc. | | 1,565,200 | | | 27,469,260 | * |
Torchmark Corp. | | 36,800 | | | 1,920,960 | |
Toys R Us, Inc. | | 73,300 | | | 1,888,208 | * |
Transocean, Inc. | | 109,400 | | | 5,629,724 | * |
Tribune Co. | | 101,600 | | | 4,050,792 | |
TXU Corp. | | 81,800 | | | 6,513,734 | |
Tyco International, Ltd. | | 685,600 | | | 23,173,280 | |
U.S. Bancorp | | 631,200 | | | 18,191,184 | |
Union Pacific Corp. | | 88,900 | | | 6,196,330 | |
Unisys Corp. | | 114,900 | | | 811,194 | * |
United Parcel Service, Inc. | | 381,200 | | | 27,728,488 | |
United States Steel Corp. | | 38,800 | | | 1,972,980 | |
United Technologies Corp. | | 174,400 | | | 17,729,504 | |
UnitedHealth Group, Inc. | | 218,400 | | | 20,830,992 | |
Univision Communications, Inc.
Class A | | 99,400 | | | 2,752,386 | * |
Unocal Corp. | | 92,100 | | | 5,681,649 | |
UnumProvident Corp. | | 101,300 | | | 1,724,126 | |
UST, Inc. | | 56,300 | | | 2,910,710 | |
Valero Energy Corp. | | 87,400 | | | 6,403,798 | |
VERITAS Software Corp. | | 143,700 | | | 3,336,714 | * |
Verizon Communications, Inc. | | 943,400 | | | 33,490,700 | |
VF Corp. | | 34,000 | | | 2,010,760 | |
Viacom, Inc. Class B | | 580,700 | | | 20,225,781 | |
Visteon Corp. | | 44,200 | | | 252,382 | |
Vulcan Materials Co. | | 35,100 | | | 1,994,733 | |
Wachovia Corp. | | 539,900 | | | 27,486,309 | |
Walgreen Co. | | 347,800 | | | 15,449,276 | |
Wal-Mart Stores, Inc. | | 1,153,700 | | | 57,811,907 | |
Washington Mutual, Inc. | | 297,400 | | | 11,747,300 | |
Waste Management, Inc. | | 193,600 | | | 5,585,360 | |
Waters Corp. | | 41,200 | | | 1,474,548 | * |
Watson Pharmaceuticals, Inc. | | 37,300 | | | 1,146,229 | * |
WellPoint, Inc. | | 103,900 | | | 13,023,865 | * |
Wells Fargo & Co. | | 577,500 | | | 34,534,500 | |
Wendy’s International, Inc. | | 38,800 | | | 1,514,752 | |
Weyerhaeuser Co. | | 82,700 | | | 5,664,950 | |
Whirlpool Corp. | | 22,800 | | | 1,544,244 | |
Wrigley (Wm.) Jr. Co. | | 66,600 | | | 4,366,962 | |
Wyeth | | 455,000 | | | 19,191,900 | |
Xcel Energy, Inc. | | 136,600 | | | 2,346,788 | # |
Xerox Corp. | | 326,100 | | | 4,940,415 | * |
Xilinx, Inc. | | 118,700 | | | 3,469,601 | |
XL Capital, Ltd. | | 47,300 | | | 3,423,101 | |
XTO Energy, Inc. | | 118,300 | | | 3,884,972 | |
205
SCHEDULE OF INVESTMENTS THE DFA INVESTMENT TRUST COMPANY
The U.S. Large Company Series (Continued)
| | | | | | |
| | | March 31, 2005
| |
| | | (Unaudited) | |
| | | Shares
| | Value†
| |
| | | | | | | |
Yahoo!, Inc. | | 444,000 | | $ | 15,051,600 | * |
Yum! Brands, Inc. | | 99,300 | | | 5,144,733 | |
Zimmer Holdings, Inc. | | 84,000 | | | 6,536,040 | * |
Zions Bancorporation | | 30,600 | | | 2,112,012 | |
| | | | |
|
|
|
TOTAL COMMON STOCKS | | | | | | |
(Cost $2,836,380,652) | | | | $ | 3,681,087,600 | |
| | | | |
|
|
|
| | | | | | |
| | | Face Amount
| | Value†
|
| | | (000) | | |
TEMPORARY CASH INVESTMENTS — (4.7%) | | | |
Repurchase Agreement, Merrill Lynch Triparty Repo 2.65%, 04/01/05 (Collateralized by $59,326,000 U.S. Treasury Notes, rates ranging from 1.625% to 6.00%, maturities ranging from 02/28/06 to 04/15/29, valued at $68,126,478) to be repurchased at $67,856,166
(Cost $67,851,171)< | | $ | 67,851 | | $ | 67,851,171 |
Repurchase Agreement, PNC Capital Markets, Inc. 2.61%, 04/01/05 (Collateralized by $119,475,000 FHLMC Notes 4.00%, 09/22/09, valued at $117,234,844) to be repurchased at $115,510,374 (Cost $115,502,000) | | | 115,502 | | | 115,502,000 |
| | | | | |
|
|
TOTAL TEMPORARY CASH INVESTMENTS | | | | | | |
(Cost $183,353,171) | | | | | | 183,353,171 |
| | | | | |
|
|
TOTAL INVESTMENTS — (100.0%) | | | | | | |
(Cost $3,019,733,823)†† | | | | | $ | 3,864,440,771 |
| | | | | |
|
|
| † | See Note B to Financial Statements. |
| * | Non-Income Producing Securities. |
| # | Total or Partial Securities on Loan. |
| < | Security purchased with cash proceeds from securities on loan. |
| †† | The cost for federal income tax purposes is $3,193,357,862. |
206
STATEMENT OF ASSETS AND LIABILITIES THE DFA INVESTMENT TRUST COMPANY
The U.S. Large Company Series
(Amounts in thousands)
| | | |
| | | March 31, 2005
|
| | | (Unaudited) |
Assets: | | | |
Investments at Value (including $65,509 of securities on loan) | | $ | 3,864,441 |
Cash | | | 6,033 |
Receivables: | | | |
Dividends and Interest | | | 4,709 |
Securities Lending Income | | | 9 |
Prepaid Expenses and Other Assets | | | 30 |
| | |
|
|
Total Assets | | | 3,875,222 |
| | |
|
|
| |
Liabilities: | | | |
Payables: | | | |
Collateral on Securities Loaned | | | 67,851 |
Investment Securities Purchased | | | 80,069 |
Due to Advisor | | | 78 |
Futures Margin Variation | | | 44 |
Accrued Expenses | | | 205 |
| | |
|
|
Total Liabilities | | | 148,247 |
| | |
|
|
Net Assets | | $ | 3,726,975 |
| | |
|
|
| |
Investments at Cost | | $ | 3,019,734 |
| | |
|
|
See accompanying notes to financial statements.
207
SCHEDULE OF INVESTMENTS THE DFA INVESTMENT TRUST COMPANY
The U.S. Large Company Series
| | | | | | |
| | | November 30, 2004
| |
| | | Shares
| | Value†
| |
| | | | | | | |
COMMON STOCKS — (88.1%) | | | | | | |
3M Co | | 244,500 | | $ | 19,459,755 | |
Abbott Laboratories | | 487,600 | | | 20,459,696 | |
Ace, Ltd. | | 88,700 | | | 3,585,254 | |
ADC Telecommunications, Inc. | | 252,600 | | | 593,610 | * |
Adobe Systems, Inc. | | 74,900 | | | 4,535,944 | # |
Advanced Micro Devices, Inc. | | 110,900 | | | 2,359,952 | * |
AES Corp. | | 201,900 | | | 2,471,256 | * |
Aetna, Inc. | | 48,000 | | | 5,688,480 | |
Affiliated Computer Services, Inc.
Class A | | 40,000 | | | 2,367,200 | * |
AFLAC, Inc. | | 158,400 | | | 5,959,008 | |
Agilent Technologies, Inc. | | 151,700 | | | 3,472,413 | * |
Air Products & Chemicals, Inc. | | 71,000 | | | 4,064,750 | |
Alberto-Culver Co. Class B | | 28,300 | | | 1,310,290 | |
Albertson’s, Inc. | | 114,900 | | | 2,906,970 | # |
Alcoa, Inc. | | 271,700 | | | 9,232,366 | # |
Allegheny Energy, Inc. | | 42,800 | | | 819,192 | * |
Allegheny Technologies, Inc. | | 29,800 | | | 655,600 | |
Allergan, Inc. | | 41,100 | | | 3,020,850 | |
Allied Waste Industries, Inc. | | 99,400 | | | 903,546 | *# |
Allstate Corp. | | 216,400 | | | 10,928,200 | |
Alltel Corp. | | 96,300 | | | 5,459,247 | |
Altera Corp. | | 116,100 | | | 2,633,148 | * |
Altria Group, Inc. | | 640,800 | | | 36,839,592 | |
AMBAC Financial Group, Inc. | | 33,900 | | | 2,757,087 | |
Amerada Hess Corp. | | 28,500 | | | 2,532,225 | |
Ameren Corp. | | 60,700 | | | 2,939,094 | # |
American Electric Power Co., Inc. | | 123,600 | | | 4,223,412 | |
American Express Co. | | 396,000 | | | 22,061,160 | |
American International Group, Inc. | | 813,800 | | | 51,554,230 | |
American Power Conversion Corp. | | 62,600 | | | 1,323,364 | |
American Standard Companies, Inc. | | 66,800 | | | 2,601,192 | * |
AmerisourceBergen Corp. | | 35,100 | | | 2,068,794 | # |
Amgen, Inc. | | 395,400 | | | 23,739,816 | *# |
AmSouth Bancorporation | | 110,500 | | | 2,865,265 | |
Anadarko Petroleum Corp. | | 78,200 | | | 5,442,720 | |
Analog Devices, Inc. | | 118,200 | | | 4,367,490 | # |
Andrew Corp. | | 50,200 | | | 712,840 | * |
Anheuser-Busch Companies, Inc. | | 250,200 | | | 12,532,518 | |
Anthem, Inc. | | 43,600 | | | 4,417,988 | *# |
AON Corp. | | 98,600 | | | 2,082,432 | # |
Apache Corp. | | 101,800 | | | 5,503,308 | |
Apartment Investment & Management Co. Class A | | 29,600 | | | 1,076,552 | # |
Apollo Group, Inc. Class A | | 60,200 | | | 4,797,940 | *# |
Apple Computer, Inc. | | 121,200 | | | 8,126,460 | * |
Applera Corp. — Applied Biosystems Group | | 63,000 | | | 1,291,500 | |
Applied Materials, Inc. | | 530,400 | | | 8,825,856 | * |
Applied Micro Circuits Corp. | | 97,800 | | | 359,904 | * |
Archer-Daniels-Midland Co. | | 203,300 | | | 4,309,960 | |
Ashland, Inc. | | 22,200 | | | 1,313,130 | |
#AT&T Corp. | | 248,200 | | | 4,542,060 | |
Autodesk, Inc. | | 35,500 | | | 2,322,055 | |
Automatic Data Processing, Inc. | | 182,500 | | | 8,309,225 | |
AutoNation, Inc. | | 83,300 | | | 1,542,716 | * |
Autozone, Inc. | | 26,000 | | | 2,225,600 | *# |
Avaya, Inc. | | 141,400 | | | 2,321,788 | *# |
Avery Dennison Corp. | | 34,500 | | | 2,023,770 | |
Avon Products, Inc. | | 147,700 | | | 5,544,658 | # |
Baker Hughes, Inc. | | 104,200 | | | 4,619,186 | # |
Ball Corp. | | 35,100 | | | 1,570,023 | |
Bank of America Corp. | | 1,270,500 | | | 58,786,035 | |
| | | | | | |
| | | November 30, 2004
| |
| | | Shares
| | Value†
| |
| | | | | | | |
Bank of New York Co., Inc. | | 243,000 | | $ | 7,997,130 | |
Bard (C.R.), Inc. | | 32,700 | | | 1,959,057 | # |
Bausch & Lomb, Inc. | | 16,600 | | | 977,408 | # |
Baxter International, Inc. | | 192,000 | | | 6,076,800 | |
BB&T Corp. | | 173,200 | | | 7,352,340 | |
Bear Stearns Companies, Inc. | | 32,200 | | | 3,142,076 | |
Becton Dickinson & Co. | | 78,300 | | | 4,289,274 | |
Bed Bath and Beyond, Inc. | | 93,900 | | | 3,749,239 | *# |
BellSouth Corp. | | 571,800 | | | 15,335,676 | |
Bemis Co., Inc. | | 33,400 | | | 929,856 | |
Best Buy Co., Inc. | | 101,500 | | | 5,722,570 | |
Big Lots, Inc. | | 36,000 | | | 417,600 | *# |
Biogen Idec, Inc. | | 105,700 | | | 6,202,476 | * |
Biomet, Inc. | | 79,300 | | | 3,796,091 | # |
BJ Services, Co. | | 50,400 | | | 2,553,768 | # |
Black & Decker Corp. | | 25,000 | | | 2,102,250 | |
BMC Software, Inc. | | 69,700 | | | 1,295,026 | * |
Boeing Co. | | 262,200 | | | 14,046,054 | |
Boston Scientific Corp. | | 263,000 | | | 9,155,030 | *# |
Bristol-Myers Squibb Co. | | 607,600 | | | 14,278,600 | |
Broadcom Corp. | | 100,600 | | | 3,271,512 | *# |
Brown-Forman Corp. Class B | | 37,900 | | | 1,819,958 | |
Brunswick Corp. | | 29,900 | | | 1,459,718 | |
Burlington Northern Santa Fe Corp. | | 116,300 | | | 5,238,152 | |
Burlington Resources, Inc. | | 123,300 | | | 5,722,353 | # |
Calpine Corp. | | 166,300 | | | 645,244 | *# |
Campbell Soup Co. | | 128,200 | | | 3,657,546 | |
Capital One Financial Corp. | | 75,400 | | | 5,924,932 | |
Cardinal Health, Inc. | | 134,400 | | | 7,026,432 | |
Caremark Rx, Inc. | | 145,500 | | | 5,203,080 | * |
Carnival Corp. | | 197,700 | | | 10,480,077 | |
Caterpillar, Inc. | | 107,000 | | | 9,795,850 | # |
Cendant Corp. | | 329,700 | | | 7,474,299 | |
CenterPoint Energy, Inc. | | 96,100 | | | 1,072,476 | |
Centex Corp. | | 38,600 | | | 2,025,342 | # |
CenturyTel, Inc. | | 42,200 | | | 1,389,224 | |
ChevronTexaco Corp. | | 665,300 | | | 36,325,380 | |
Chiron Corp. | | 58,600 | | | 1,908,602 | * |
Chubb Corp. | | 59,700 | | | 4,549,737 | |
CIENA Corp. | | 177,800 | | | 453,390 | * |
CIGNA Corp. | | 43,000 | | | 3,010,860 | |
Cincinnati Financial Corp. | | 52,600 | | | 2,356,480 | |
Cinergy Corp. | | 56,400 | | | 2,334,396 | |
Cintas Corp. | | 53,500 | | | 2,392,520 | |
Circuit City Stores, Inc. | | 62,100 | | | 968,139 | |
Cisco Systems, Inc. | | 2,111,900 | | | 39,513,649 | * |
CIT Group, Inc. | | 65,800 | | | 2,812,950 | |
Citigroup, Inc. | | 1,618,000 | | | 72,405,500 | |
Citizens Communications Co. | | 103,600 | | | 1,481,480 | # |
Citrix Systems, Inc. | | 52,800 | | | 1,246,608 | * |
Clear Channel Communications, Inc. | | 184,300 | | | 6,207,224 | |
Clorox Co. | | 66,500 | | | 3,665,480 | |
CMS Energy Corp. | | 59,300 | | | 604,860 | * |
Coach, Inc. | | 58,800 | | | 2,930,592 | * |
Coca-Cola Co. | | 757,800 | | | 29,789,118 | |
Coca-Cola Enterprises, Inc. | | 146,500 | | | 3,047,200 | |
Colgate-Palmolive Co. | | 165,900 | | | 7,629,741 | |
Comcast Corp. Class A | | 698,000 | | | 20,967,920 | * |
Comerica, Inc. | | 53,500 | | | 3,290,250 | |
Computer Associates International, Inc. | | 182,800 | | | 5,580,884 | # |
Computer Sciences Corp. | | 58,900 | | | 3,186,490 | *# |
Compuware Corp. | | 120,600 | | | 695,862 | * |
Comverse Technology, Inc. | | 61,100 | | | 1,299,597 | * |
ConAgra, Inc. | | 165,000 | | | 4,463,250 | |
See accompanying notes to financial statements.
208
SCHEDULE OF INVESTMENTS THE DFA INVESTMENT TRUST COMPANY
The U.S. Large Company Series (Continued)
| | | | | | |
| | | November 30, 2004
| |
| | | Shares
| | Value†
| |
| | | | | | | |
ConocoPhillips . | | 215,100 | | $ | 19,571,949 | |
Consolidated Edison, Inc. | | 75,400 | | | 3,306,290 | |
Constellation Energy Group | | 54,800 | | | 2,394,760 | |
Convergys Corp. | | 44,500 | | | 661,715 | * |
Cooper Industries, Ltd. | | 29,600 | | | 1,962,776 | |
Cooper Tire & Rubber Co. | | 23,400 | | | 477,828 | # |
Coors (Adolph) Co. Class B | | 11,700 | | | 876,330 | |
Corning, Inc. | | 435,300 | | | 5,476,074 | * |
Costco Wholesale Corp. | | 144,000 | | | 6,998,400 | |
Countrywide Financial Corp. | | 175,900 | | | 5,841,639 | |
Crane Co. | | 18,400 | | | 556,784 | |
CSX Corp. | | 67,100 | | | 2,558,523 | |
Cummins, Inc. | | 13,800 | | | 1,098,756 | |
CVS Corp. | | 124,700 | | | 5,657,639 | |
Dana Corp. | | 46,600 | | | 761,910 | |
Danaher Corp. | | 96,300 | | | 5,477,544 | |
Darden Restaurants, Inc. | | 49,300 | | | 1,343,918 | |
Deere & Co. | | 77,500 | | | 5,559,075 | |
Dell, Inc. | | 779,800 | | | 31,597,496 | *# |
Delphi Corp. | | 175,300 | | | 1,577,700 | # |
Delta Air Lines, Inc. | | 39,200 | | | 273,224 | *# |
Deluxe Corp. | | 15,600 | | | 616,824 | |
Devon Energy Corp. | | 151,000 | | | 6,254,420 | |
Dillards, Inc. Class A | | 26,100 | | | 657,198 | |
Disney (Walt) Co. | | 641,700 | | | 17,248,896 | # |
Dollar General Corp. | | 102,600 | | | 2,026,350 | |
Dominion Resources, Inc. | | 103,100 | | | 6,749,957 | |
Donnelley (R.R.) & Sons Co. | | 68,400 | | | 2,373,480 | |
Dover Corp. | | 63,500 | | | 2,568,575 | |
Dow Chemical Co. | | 293,400 | | | 14,807,898 | # |
Dow Jones & Co., Inc. | | 25,600 | | | 1,094,400 | |
DTE Energy Co. | | 54,300 | | | 2,382,684 | |
Duke Energy Corp. | | 292,900 | | | 7,404,512 | # |
DuPont (E.I.) de Nemours & Co., Inc. | | 311,700 | | | 14,126,244 | # |
Dynegy, Inc. | | 118,500 | | | 669,525 | *# |
E*TRADE Financial Corp. | | 116,600 | | | 1,616,076 | * |
Eastman Chemical Co. | | 24,300 | | | 1,321,434 | # |
Eastman Kodak Co. | | 89,500 | | | 2,927,545 | |
Eaton Corp. | | 47,300 | | | 3,188,020 | |
eBay, Inc. | | 206,500 | | | 23,220,925 | *# |
Ecolab, Inc. | | 80,400 | | | 2,812,392 | |
Edison International | | 101,800 | | | 3,247,420 | # |
El Paso Corp. | | 200,200 | | | 2,090,088 | # |
Electronic Arts, Inc. | | 94,800 | | | 4,635,720 | *# |
Electronic Data Systems Corp. | | 160,000 | | | 3,592,000 | |
EMC Corp. | | 751,100 | | | 10,079,762 | * |
Emerson Electric Co. | | 131,200 | | | 8,766,784 | |
Engelhard Corp. | | 38,800 | | | 1,159,732 | |
Entergy Corp. | | 70,900 | | | 4,595,738 | |
EOG Resources, Inc. | | 36,800 | | | 2,762,576 | # |
Equifax, Inc. | | 42,500 | | | 1,173,850 | # |
Equity Office Properties Trust | | 125,800 | | | 3,453,210 | |
Equity Residential | | 87,700 | | | 2,956,367 | |
Exelon Corp. | | 206,200 | | | 8,600,602 | |
Express Scripts, Inc. | | 24,200 | | | 1,741,432 | *# |
Exxon Mobil Corp. | | 2,031,900 | | | 104,134,875 | |
Family Dollar Stores, Inc. | | 52,600 | | | 1,541,180 | |
Federal Home Loan Mortgage Corporation | | 214,600 | | | 14,648,596 | |
Federal National Mortgage Association | | 302,300 | | | 20,768,010 | |
Federated Department Stores, Inc. | | 56,200 | | | 3,079,760 | |
Federated Investors, Inc. | | 33,900 | | | 997,338 | |
FedEx Corp. | | 93,800 | | | 8,913,814 | |
Fifth Third Bancorp . | | 178,000 | | | 8,964,080 | |
| | | | | | |
| | | November 30, 2004
| |
| | | Shares
| | Value†
| |
| | | | | | | |
First Data Corp. | | 267,800 | | $ | 11,003,902 | |
First Horizon National Corp. | | 38,600 | | | 1,686,820 | |
FirstEnergy Corp. | | 103,000 | | | 4,349,690 | |
Fiserv, Inc. | | 61,000 | | | 2,349,110 | * |
Fisher Scientific International, Inc. | | 35,900 | | | 2,029,786 | * |
Fluor Corp. | | 26,100 | | | 1,354,590 | |
Ford Motor Co. | | 571,500 | | | 8,103,870 | # |
Forest Laboratories, Inc. | | 115,700 | | | 4,508,829 | * |
Fortune Brands, Inc. | | 45,000 | | | 3,531,600 | |
FPL Group, Inc. | | 57,900 | | | 4,072,107 | # |
Franklin Resources, Inc. | | 77,900 | | | 5,112,577 | |
Freeport-McMoRan Copper & Gold, Inc.
Class B | | 55,300 | | | 2,163,889 | |
Gannett Co., Inc. | | 83,100 | | | 6,854,919 | |
Gap, Inc. | | 282,300 | | | 6,168,255 | |
Gateway, Inc. | | 116,400 | | | 792,684 | * |
General Dynamics Corp. | | 62,400 | | | 6,761,664 | |
General Electric Co. | | 3,297,700 | | | 116,606,672 | |
General Mills, Inc. | | 118,700 | | | 5,399,663 | |
General Motors Corp. | | 176,400 | | | 6,807,276 | # |
Genuine Parts Co. | | 54,700 | | | 2,374,527 | # |
Genzyme Corp. | | 71,200 | | | 3,987,912 | *# |
Georgia-Pacific Corp. | | 80,600 | | | 2,950,766 | |
Gilead Sciences, Inc. | | 134,500 | | | 4,634,870 | * |
Gillette Co. | | 312,900 | | | 13,608,021 | |
Golden West Financial Corp. | | 47,700 | | | 5,687,748 | # |
Goodrich (B.F.) Co. | | 37,100 | | | 1,177,925 | |
Goodyear Tire & Rubber Co. | | 54,800 | | | 691,576 | *# |
Grainger (W.W.), Inc. | | 28,400 | | | 1,756,824 | |
Great Lakes Chemical Corp. | | 15,900 | | | 465,870 | # |
Guidant Corp. | | 98,300 | | | 6,372,789 | |
H&R Block, Inc. | | 51,500 | | | 2,456,550 | |
Halliburton Co. | | 137,900 | | | 5,702,165 | |
Harley-Davidson, Inc. | | 92,200 | | | 5,331,004 | |
Harrahs Entertainment, Inc. | | 35,000 | | | 2,149,000 | # |
Hartford Financial Services Group, Inc. | | 91,600 | | | 5,862,400 | |
Hasbro, Inc. | | 55,200 | | | 1,050,456 | |
HCA, Inc. | | 150,800 | | | 5,944,536 | |
Health Management Associates, Inc. | | 76,000 | | | 1,678,840 | |
Heinz (H.J.) Co. | | 109,100 | | | 4,054,156 | |
Hercules, Inc. | | 34,900 | | | 520,010 | *# |
Hershey Foods Corp. | | 76,900 | | | 3,983,420 | # |
Hewlett-Packard Co. | | 943,200 | | | 18,864,000 | |
Hilton Hotels Corp. | | 120,200 | | | 2,483,332 | |
Home Depot, Inc. | | 685,700 | | | 28,627,975 | |
Honeywell International, Inc. | | 268,500 | | | 9,486,105 | |
Hospira, Inc. | | 48,700 | | | 1,569,601 | * |
Humana, Inc. | | 49,800 | | | 1,236,036 | * |
Huntington Bancshares, Inc. | | 71,700 | | | 1,739,442 | # |
Illinois Tool Works, Inc. | | 94,400 | | | 8,895,312 | |
IMS Health, Inc. | | 73,000 | | | 1,647,610 | |
Ingersoll-Rand Co., Ltd. Class A | | 54,100 | | | 4,026,122 | |
Intel Corp. | | 2,003,600 | | | 44,780,460 | # |
International Business Machines Corp. | | 523,200 | | | 49,306,368 | |
International Flavors & Fragrances, Inc. | | 29,400 | | | 1,190,700 | |
International Game Technology | | 107,600 | | | 3,803,660 | |
International Paper Co. | | 151,900 | | | 6,306,888 | |
Interpublic Group of Companies, Inc. | | 131,800 | | | 1,635,638 | *# |
Intuit, Inc. | | 59,800 | | | 2,502,032 | * |
ITT Industries, Inc.. | | 28,800 | | | 2,451,456 | |
Jabil Circuit, Inc. | | 62,800 | | | 1,573,768 | * |
Janus Capital Group, Inc. | | 74,800 | | | 1,237,940 | |
JDS Uniphase Corp. | | 449,800 | | | 1,425,866 | * |
Jefferson-Pilot Corp. | | 42,600 | | | 2,095,494 | |
See accompanying notes to financial statements.
209
SCHEDULE OF INVESTMENTS THE DFA INVESTMENT TRUST COMPANY
The U.S. Large Company Series (Continued)
| | | | | | |
| | | November 30, 2004
| |
| | | Shares
| | Value†
| |
| | | | | | | |
Johnson & Johnson | | 927,000 | | $ | 55,916,640 | |
Johnson Controls, Inc. | | 59,400 | | | 3,647,160 | |
Jones Apparel Group, Inc. | | 39,000 | | | 1,385,670 | |
JPMorgan Chase & Co. | | 1,112,500 | | | 41,885,625 | |
KB Home | | 14,500 | | | 1,274,405 | # |
Kellogg Co. | | 129,100 | | | 5,641,670 | |
Kerr-McGee Corp. | | 47,200 | | | 2,937,256 | # |
KeyCorp. | | 127,100 | | | 4,231,159 | # |
KeySpan Corp. | | 50,000 | | | 1,976,000 | |
Kimberly-Clark Corp. | | 154,500 | | | 9,827,745 | |
Kinder Morgan, Inc. | | 38,600 | | | 2,674,980 | # |
King Pharmaceuticals, Inc. | | 75,400 | | | 938,730 | *# |
KLA-Tencor Corp. | | 61,300 | | | 2,762,178 | *# |
Knight-Ridder, Inc. | | 24,200 | | | 1,647,778 | |
Kohl’s Corp. | | 106,700 | | | 4,925,272 | * |
Laboratory Corp. of America Holdings | | 43,600 | | | 2,090,620 | * |
Leggett & Platt, Inc. | | 59,900 | | | 1,788,015 | |
Lehman Brothers Holdings, Inc. | | 84,700 | | | 7,096,166 | |
Lexmark International, Inc. | | 40,500 | | | 3,438,450 | *# |
Lilly (Eli) & Co. | | 353,100 | | | 18,830,823 | |
Limited Brands, Inc. | | 147,600 | | | 3,607,344 | # |
Lincoln National Corp. | | 55,000 | | | 2,531,100 | |
Linear Technology Corp. | | 96,000 | | | 3,663,360 | |
Liz Claiborne, Inc. | | 33,600 | | | 1,379,952 | |
Lockheed Martin Corp. | | 139,000 | | | 8,456,760 | # |
Loews Corp. | | 57,900 | | | 4,047,789 | |
Louisiana-Pacific Corp. | | 34,100 | | | 834,427 | |
Lowe’s Companies, Inc. | | 243,500 | | | 13,472,855 | |
LSI Logic Corp. | | 120,200 | | | 635,858 | * |
Lucent Technologies, Inc. | | 1,346,000 | | | 5,289,780 | *# |
M&T Bank Corp. | | 36,600 | | | 3,858,006 | |
Manor Care, Inc. | | 27,300 | | | 940,485 | |
Marathon Oil Corp. | | 108,100 | | | 4,263,464 | |
Marriott International, Inc. Class A | | 71,500 | | | 4,064,775 | |
Marsh & McLennan Companies, Inc. | | 162,600 | | | 4,648,734 | |
Marshall & Ilsley Corp. | | 69,600 | | | 2,901,624 | |
Masco Corp. | | 135,300 | | | 4,772,031 | # |
Mattel, Inc. | | 129,300 | | | 2,450,235 | # |
Maxim Integrated Products, Inc. | | 101,400 | | | 4,153,344 | # |
May Department Stores Co. | | 91,000 | | | 2,558,920 | # |
#Maytag Corp. | | 24,700 | | | 496,470 | |
MBIA, Inc. | | 44,700 | | | 2,680,212 | |
MBNA Corp. | | 399,100 | | | 10,600,096 | |
McCormick & Co., Inc. | | 42,800 | | | 1,560,060 | |
McDonald’s Corp. | | 392,400 | | | 12,062,376 | |
McGraw-Hill Companies, Inc. | | 59,300 | | | 5,202,389 | |
McKesson Corp. | | 91,700 | | | 2,709,735 | |
MeadWestavco Corp. | | 63,000 | | | 2,119,950 | |
Medco Health Solutions, Inc. | | 85,000 | | | 3,206,200 | * |
Medimmune, Inc. | | 77,800 | | | 2,069,480 | * |
Medtronic, Inc. | | 377,700 | | | 18,148,485 | |
Mellon Financial Corp. | | 132,400 | | | 3,868,728 | |
Merck & Co., Inc. | | 693,000 | | | 19,417,860 | |
Mercury Interactive Corp. | | 29,100 | | | 1,327,251 | * |
Meredith Corp. | | 15,700 | | | 827,704 | |
Merrill Lynch & Co., Inc. | | 293,400 | | | 16,345,314 | |
MetLife, Inc. | | 234,300 | | | 9,137,700 | |
MGIC Investment Corp. | | 30,800 | | | 2,094,400 | |
Micron Technology, Inc. | | 191,000 | | | 2,116,280 | *# |
Microsoft Corp. | | 3,395,900 | | | 91,044,079 | |
Millipore Corp. | | 15,500 | | | 755,160 | * |
Molex, Inc. | | 59,200 | | | 1,632,144 | |
Monsanto Co. | | 83,400 | | | 3,838,068 | |
Monster Worldwide, Inc. | | 37,000 | | | 1,043,030 | * |
| | | | | | |
| | | November 30, 2004
| |
| | | Shares
| | Value†
| |
| | | | | | | |
Moody’s Corp. | | 46,200 | | $ | 3,730,650 | |
Morgan Stanley | | 343,100 | | | 17,412,325 | |
Motorola, Inc. | | 737,900 | | | 14,211,954 | |
Mylan Laboratories, Inc. | | 83,900 | | | 1,523,624 | # |
Nabors Industries, Ltd. | | 46,500 | | | 2,418,000 | * |
National City Corp. | | 207,000 | | | 7,675,560 | |
National Semiconductor Corp. | | 111,800 | | | 1,728,428 | * |
Navistar International Corp. | | 21,800 | | | 897,070 | * |
NCR Corp. | | 29,400 | | | 1,756,062 | * |
Network Appliance, Inc. | | 111,700 | | | 3,368,872 | * |
Newell Rubbermaid, Inc. | | 85,900 | | | 1,982,572 | |
Newmont Mining Corp. | | 138,500 | | | 6,557,975 | |
Nextel Communications, Inc. | | 347,800 | | | 9,898,388 | * |
Nicor, Inc. | | 13,800 | | | 509,220 | # |
NIKE, Inc. Class B | | 82,300 | | | 6,967,518 | |
NiSource, Inc. | | 82,300 | | | 1,793,317 | |
Noble Corp. | | 41,800 | | | 2,025,210 | * |
Nordstrom, Inc. | | 43,900 | | | 1,920,625 | |
Norfolk Southern Corp. | | 123,000 | | | 4,222,590 | |
North Fork Bancorporation, Inc. | | 145,950 | | | 4,203,360 | |
Northern Trust Corp. | | 68,700 | | | 3,231,648 | |
Northrop Grumman Corp. | | 112,000 | | | 6,308,960 | |
Novell, Inc. | | 120,800 | | | 736,880 | *# |
Novellus Systems, Inc. | | 44,600 | | | 1,201,524 | * |
Nucor Corp. | | 49,600 | | | 2,623,840 | # |
Nvidia Corp. | | 52,000 | | | 994,760 | * |
Occidental Petroleum Corp. | | 122,300 | | | 7,363,683 | |
Office Depot, Inc. | | 97,800 | | | 1,603,920 | * |
OfficeMax, Inc. | | 27,500 | | | 832,425 | |
Omnicom Group, Inc. | | 58,500 | | | 4,738,500 | |
Oracle Corp. | | 1,615,000 | | | 20,445,900 | * |
Paccar, Inc. | | 54,200 | | | 4,233,020 | # |
Pactiv Corp. | | 46,900 | | | 1,165,465 | * |
Pall Corp. | | 39,100 | | | 1,059,219 | |
Parametric Technology Corp. | | 84,100 | | | 491,985 | * |
Parker Hannifin Corp. | | 37,300 | | | 2,790,040 | |
Paychex, Inc. | | 118,100 | | | 3,916,196 | |
Penney (J.C.) Co., Inc. | | 90,000 | | | 3,474,000 | |
Peoples Energy Corp. | | 11,800 | | | 526,516 | |
Peoplesoft, Inc. | | 114,600 | | | 2,705,706 | *# |
Pepsi Bottling Group, Inc. | | 79,400 | | | 2,224,788 | |
PepsiCo, Inc. | | 529,100 | | | 26,407,381 | |
PerkinElmer, Inc. | | 40,000 | | | 853,200 | |
Pfizer, Inc. | | 2,358,400 | | | 65,492,768 | |
PG&E Corp. | | 125,200 | | | 4,164,152 | * |
Phelps Dodge Corp. | | 29,400 | | | 2,855,622 | # |
Pinnacle West Capital Corp. | | 28,500 | | | 1,259,700 | # |
Pitney Bowes, Inc. | | 72,200 | | | 3,160,194 | |
Plum Creek Timber Co., Inc. | | 57,300 | | | 2,120,100 | |
PMC-Sierra, Inc. | | 55,300 | | | 610,512 | * |
PNC Financial Services Group | | 88,200 | | | 4,798,080 | |
Power-One, Inc. | | 26,200 | | | 240,778 | * |
PPG Industries, Inc. | | 53,600 | | | 3,616,392 | |
PPL Corp. | | 59,000 | | | 3,065,050 | |
Praxair, Inc. | | 101,500 | | | 4,557,350 | |
Principal Financial Group, Inc. | | 97,900 | | | 3,688,872 | |
Procter & Gamble Co. | | 794,000 | | | 42,463,120 | |
Progress Energy, Inc. | | 77,100 | | | 3,385,461 | |
Progressive Corp. | | 62,500 | | | 5,686,875 | |
ProLogis | | 56,800 | | | 2,285,064 | |
Providian Financial Corp. | | 91,400 | | | 1,466,970 | * |
Prudential Financial, Inc. | | 162,100 | | | 7,934,795 | |
Public Service Enterprise Group, Inc. | | 74,100 | | | 3,259,659 | # |
Pulte Homes, Inc. | | 39,600 | | | 2,188,296 | # |
See accompanying notes to financial statements.
210
SCHEDULE OF INVESTMENTS THE DFA INVESTMENT TRUST COMPANY
The U.S. Large Company Series (Continued)
| | | | | | |
| | | November 30, 2004
| |
| | | Shares
| | Value†
| |
| | | | | | | |
QLogic Corp. | | 28,800 | | $ | 990,432 | * |
Qualcomm, Inc. | | 508,400 | | | 21,159,608 | |
Quest Diagnostics, Inc. | | 31,800 | | | 2,981,250 | # |
Qwest Communications International, Inc. | | 566,900 | | | 2,267,600 | * |
RadioShack Corp. | | 49,900 | | | 1,575,343 | |
Raytheon Co. | | 140,900 | | | 5,683,906 | |
Reebok International, Ltd. | | 18,500 | | | 719,280 | # |
Regions Financial Corp. | | 144,300 | | | 5,049,057 | |
Reynolds American, Inc. | | 46,200 | | | 3,494,106 | # |
Robert Half International, Inc. | | 53,800 | | | 1,454,214 | |
Rockwell Automation, Inc. | | 57,600 | | | 2,724,480 | # |
Rockwell Collins, Inc. | | 55,300 | | | 2,204,258 | |
Rohm & Haas Co. | | 70,100 | | | 3,090,709 | |
Rowan Companies, Inc. | | 33,400 | | | 865,060 | * |
Ryder System, Inc. | | 20,100 | | | 1,078,164 | # |
Sabre Holdings Corp. | | 42,900 | | | 990,132 | |
Safeco Corp. | | 39,400 | | | 1,909,718 | # |
Safeway, Inc. | | 139,600 | | | 2,691,488 | * |
Sanmina-SCI Corp. | | 162,800 | | | 1,437,524 | * |
Sara Lee Corp. | | 247,800 | | | 5,818,344 | |
SBC Communications, Inc. | | 1,035,000 | | | 26,050,950 | |
Schering-Plough Corp. | | 459,900 | | | 8,209,215 | |
Schlumberger, Ltd. | | 184,400 | | | 12,102,172 | |
Schwab (Charles) Corp. | | 426,800 | | | 4,600,904 | |
Scientific-Atlanta, Inc. | | 47,800 | | | 1,415,836 | # |
Sealed Air Corp. | | 26,200 | | | 1,346,942 | * |
Sears, Roebuck & Co. | | 66,200 | | | 3,444,386 | # |
Sempra Energy | | 72,400 | | | 2,677,352 | |
Sherwin-Williams Co. | | 44,500 | | | 1,984,700 | |
Siebel Systems, Inc. | | 157,900 | | | 1,591,632 | * |
Sigma-Aldrich Corp. | | 21,600 | | | 1,290,168 | |
Simon Property Group, Inc. | | 69,000 | | | 4,283,520 | |
SLM Corp. | | 136,200 | | | 6,969,354 | |
Snap-On, Inc. | | 18,100 | | | 572,141 | |
Solectron Corp. | | 300,400 | | | 1,877,500 | * |
Southern Co. | | 230,600 | | | 7,561,374 | |
Southwest Airlines Co. | | 246,800 | | | 3,882,164 | |
Sovereign Bancorp, Inc. | | 107,200 | | | 2,342,320 | |
Sprint Corp. | | 453,700 | | | 10,348,897 | |
St. Jude Medical, Inc. | | 110,600 | | | 4,218,284 | *# |
Staples, Inc. | | 155,400 | | | 4,958,814 | # |
Starbucks Corp. | | 124,100 | | | 6,981,866 | * |
Starwood Hotels & Resorts Worldwide, Inc. | | 65,000 | | | 3,398,850 | |
State Street Corp. | | 105,000 | | | 4,678,800 | |
Stryker Corp. | | 125,300 | | | 5,511,947 | |
Sun Microsystems, Inc. | | 1,038,900 | | | 5,765,895 | *# |
Sungard Data Systems, Inc. | | 90,100 | | | 2,388,551 | * |
Sunoco, Inc. | | 23,500 | | | 1,940,160 | # |
SunTrust Banks, Inc. | | 111,800 | | | 7,971,340 | # |
Supervalu, Inc. | | 42,500 | | | 1,342,575 | |
Symantec Corp. | | 98,400 | | | 6,278,904 | * |
Symbol Technologies, Inc. | | 74,800 | | | 1,133,968 | |
Synovus Financial Corp. | | 96,600 | | | 2,608,200 | |
Sysco Corp. | | 199,700 | | | 6,939,575 | # |
T. Rowe Price Group, Inc. | | 39,700 | | | 2,348,652 | |
Target Corp. | | 282,100 | | | 14,449,162 | # |
TECO Energy, Inc. | | 62,100 | | | 929,016 | # |
Tektronix, Inc. | | 28,700 | | | 900,319 | |
Tellabs, Inc. | | 130,000 | | | 1,111,500 | * |
Temple-Inland, Inc. | | 17,400 | | | 1,036,866 | |
Tenet Healthcare Corp. | | 145,600 | | | 1,579,760 | * |
Teradyne, Inc. | | 60,600 | | | 1,033,836 | * |
| | | | | | |
| | | November 30, 2004
| |
| | | Shares
| | Value†
| |
| | | | | | | |
Texas Instruments, Inc. | | 540,700 | | $ | 13,074,126 | # |
Textron, Inc. | | 43,300 | | | 3,144,446 | |
The Goldman Sachs Group, Inc. | | 151,800 | | | 15,902,568 | |
The Kroger Co. | | 230,800 | | | 3,734,344 | *# |
The New York Times Co. Class A | | 45,900 | | | 1,881,900 | |
The St. Paul Travelers Companies, Inc. | | 208,900 | | | 7,620,672 | |
The Stanley Works | | 25,600 | | | 1,197,056 | # |
The TJX Companies, Inc. | | 152,700 | | | 3,594,558 | # |
Thermo Electron Corp. | | 51,000 | | | 1,542,750 | * |
Tiffany & Co. | | 45,600 | | | 1,395,360 | # |
Time Warner, Inc. | | 1,428,100 | | | 25,291,651 | * |
Torchmark Corp. | | 34,300 | | | 1,883,413 | |
Toys R Us, Inc. | | 66,800 | | | 1,291,912 | *# |
Transocean, Inc. | | 100,200 | | | 4,035,054 | * |
Tribune Co. | | 99,400 | | | 4,310,978 | |
TXU Corp. | | 92,700 | | | 5,823,414 | |
Tyco International, Ltd. | | 627,400 | | | 21,312,778 | |
U.S. Bancorp | | 587,000 | | | 17,392,810 | |
Union Pacific Corp. | | 81,000 | | | 5,138,640 | |
Unisys Corp. | | 104,600 | | | 1,201,854 | * |
United Parcel Service, Inc. | | 351,200 | | | 29,553,480 | |
United States Steel Corp. | | 35,400 | | | 1,853,544 | |
United Technologies Corp. | | 159,800 | | | 15,593,284 | |
UnitedHealth Group, Inc. | | 207,600 | | | 17,199,660 | |
Univision Communications, Inc. Class A | | 100,700 | | | 3,031,070 | * |
Unocal Corp. | | 82,700 | | | 3,807,508 | |
UnumProvident Corp. | | 92,600 | | | 1,441,782 | |
UST, Inc. | | 51,600 | | | 2,271,948 | |
Valero Energy Corp. | | 79,800 | | | 3,733,842 | |
VERITAS Software Corp. | | 135,200 | | | 2,960,880 | * |
Verizon Communications, Inc. | | 864,700 | | | 35,651,581 | |
VF Corp. | | 34,400 | | | 1,857,256 | |
Viacom, Inc. Class B | | 541,900 | | | 18,803,930 | # |
Visteon Corp. | | 40,500 | | | 342,630 | |
Vulcan Materials Co. | | 31,900 | | | 1,654,015 | |
Wachovia Corp. | | 501,560 | | | 25,955,730 | |
Walgreen Co. | | 320,000 | | | 12,217,600 | # |
Wal-Mart Stores, Inc. | | 1,325,100 | | | 68,984,706 | |
Washington Mutual, Inc. | | 272,500 | | | 11,093,475 | |
Waste Management, Inc. | | 181,100 | | | 5,398,591 | # |
Waters Corp. | | 36,900 | | | 1,721,754 | *# |
Watson Pharmaceuticals, Inc. | | 34,200 | | | 993,510 | *# |
Wellpoint Health Networks, Inc. | | 49,100 | | | 6,142,410 | * |
Wells Fargo & Co. | | 527,400 | | | 32,577,498 | # |
Wendy’s International, Inc. | | 35,500 | | | 1,266,285 | |
Weyerhaeuser Co. | | 74,800 | | | 4,936,800 | |
Whirlpool Corp. | | 20,700 | | | 1,336,185 | |
Williams Companies, Inc. | | 173,500 | | | 2,892,245 | |
Winn-Dixie Stores, Inc. | | 44,400 | | | 177,600 | # |
Worthington Industries, Inc. | | 27,300 | | | 587,223 | # |
Wrigley (Wm.) Jr. Co. | | 70,200 | | | 4,829,760 | |
Wyeth | | 416,600 | | | 16,609,842 | |
Xcel Energy, Inc. | | 124,900 | | | 2,255,694 | # |
Xerox Corp. | | 262,100 | | | 4,015,372 | *# |
Xilinx, Inc. | | 108,400 | | | 3,384,248 | |
XL Capital, Ltd. | | 43,200 | | | 3,255,552 | # |
Yahoo!, Inc. | | 425,000 | | | 15,988,500 | *# |
Yum! Brands, Inc. | | 90,800 | | | 4,122,320 | |
Zimmer Holdings, Inc. | | 76,500 | | | 6,242,400 | * |
Zions Bancorporation | | 28,000 | | | 1,862,000 | |
| | | | |
|
|
|
TOTAL COMMON STOCKS | | | | | | |
(Cost $2,594,671,624) | | | | $ | 3,405,448,115 | |
| | | | |
|
|
|
See accompanying notes to financial statements.
211
SCHEDULE OF INVESTMENTS THE DFA INVESTMENT TRUST COMPANY
The U.S. Large Company Series (Continued)
| | | | | | |
| | | Face Amount
(000)
| | Value†
|
| | | | | | | |
TEMPORARY CASH INVESTMENTS — (11.9%) | | | |
Repurchase Agreement, Merrill Lynch Triparty Repo 1.94%, 12/01/04 (Collateralized by $389,672,000 U.S. Treasury Bills, maturities ranging from 12/02/04 to 05/26/05, valued at $388,193,618) to be repurchased at $380,599,191 (Cost $380,578,682)< | | $ | 380,579 | | $ | 380,578,682 |
Repurchase Agreement, PNC Capital Markets, Inc. 1.88%, 12/01/04 (Collateralized by $77,939,000 FHLMC Notes 4.20%, 10/20/09, valued at $78,273,358) to be repurchased at $77,463,045 (Cost $77,459,000) | | | 77,459 | | | 77,459,000 |
| | | | | |
|
|
TOTAL TEMPORARY CASH INVESTMENTS | | | | | | |
(Cost $458,037,682) | | | | | | 458,037,682 |
| | | | | |
|
|
TOTAL INVESTMENTS — (100.0%) | | | | | | |
(Cost $3,052,709,306)†† | | | | | $ | 3,863,485,797 |
| | | | | |
|
|
| † | See Note B to Financial Statements. |
| * | Non-Income Producing Securities. |
| # | Total or Partial Securities on Loan. |
| < | Security purchased with cash proceeds from securities on loan. |
| †† | The cost for federal income tax purposes is $3,213,488. |
See accompanying notes to financial statements.
212
STATEMENT OF ASSETS AND LIABILITIES THE DFA INVESTMENT TRUST COMPANY
The U.S. Large Company Series
(Amounts in thousands)
| | | |
| | | November 30, 2004
|
Assets: | | | |
Investments at Value (including $365,201 of securities on loan) | | $ | 3,863,486 |
Cash | | | 4,320 |
Receivables: | | | |
Dividends and Interest | | | 16,343 |
Fund Shares Sold | | | 3,420 |
Securities Lending | | | 23 |
Prepaid Expenses and Other Assets | | | 2 |
| | |
|
|
Total Assets | | | 3,887,594 |
| | |
|
|
| |
Liabilities: | | | |
Payables: | | | |
Upon Return of Securities Loaned | | | 380,579 |
Fund Shares Redeemed | | | 12,686 |
Due to Advisor | | | 73 |
Payable for Futures Margin Variation | | | 128 |
Accrued Expenses and Other Liabilities | | | 209 |
| | |
|
|
Total Liabilities | | | 393,675 |
| | |
|
|
Net Assets | | $ | 3,493,919 |
| | |
|
|
| |
Investments at Cost | | $ | 3,052,709 |
| | |
|
|
See accompanying notes to financial statements.
213
STATEMENT OF OPERATIONS THE DFA INVESTMENT TRUST COMPANY
The U.S. Large Company Series
(Amounts in thousands)
| | | | |
| | | For the
Year Ended
Nov. 30,
2004
| |
Investment Income | | | | |
Dividends | | $ | 66,149 | |
Interest | | | 661 | |
Income from Securities Lending | | | 356 | |
| | |
|
|
|
| |
Total Investment Income | | | 67,166 | |
| | |
|
|
|
| |
Expenses | | | | |
Investment Advisory Services | | | 823 | |
Accounting & Transfer Agent Fees | | | 494 | |
Custodian Fees | | | 108 | |
Legal Fees | | | 29 | |
Audit Fees | | | 43 | |
S&P 500 Fees | | | 80 | |
Shareholders’ Reports | | | 36 | |
Trustees’ Fees and Expenses | | | 33 | |
Other | | | 58 | |
| | |
|
|
|
| |
Total Expenses | | | 1,704 | |
| | |
|
|
|
| |
Net Investment Income (Loss) | | | 65,462 | |
| | |
|
|
|
| |
Net Realized and Unrealized Gain (Loss) on Investment Securities | | | | |
Net Realized Gain (Loss) on Investment Securities Sold | | | (2,763 | ) |
Net Realized Gain (Loss) on Futures | | | 9,374 | |
Change in Unrealized Appreciation (Depreciation) of: | | | | |
Investment Securities | | | 317,965 | |
Futures | | | 714 | |
| | |
|
|
|
| |
Net Gain (Loss) on Investment Securities | | | 325,290 | |
| | |
|
|
|
| |
Net Increase (Decrease) in Net Assets Resulting from Operations | | $ | 390,752 | |
| | |
|
|
|
See accompanying notes to financial statements.
214
STATEMENT OF CHANGES IN NET ASSETS THE DFA INVESTMENT TRUST COMPANY
The U.S. Large Company Series
(Amounts in thousands)
| | | | | | | | |
| | | Year
Ended
Nov. 30,
2004
| | | Year
Ended
Nov. 30,
2003
| |
Increase (Decrease) in Net Assets | | | | | | | | |
Operations: | | | | | | | | |
Net Investment Income (Loss) | | $ | 65,462 | | | $ | 45,762 | |
Net Realized Gain (Loss) on Investment Securities Sold | | | (2,763 | ) | | | (137,474 | ) |
Net Realized Gain (Loss) on Futures | | | 9,374 | | | | 9,903 | |
Change in Unrealized Appreciation (Depreciation) of: | | | | | | | | |
Investment Securities | | | 317,965 | | | | 447,952 | |
Futures | | | 714 | | | | (3,012 | ) |
| | |
|
|
| |
|
|
|
| | |
Net Increase (Decrease) in Net Assets Resulting from Operations | | | 390,752 | | | | 363,131 | |
| | |
|
|
| |
|
|
|
| | |
Transactions in Interest: | | | | | | | | |
Contributions | | | 571,038 | | | | 547,508 | |
Withdrawals | | | (468,868 | ) | | | (533,199 | ) |
| | |
|
|
| |
|
|
|
| | |
Net Increase (Decrease) from Transactions in Interest | | | 102,170 | | | | 14,309 | |
| | |
|
|
| |
|
|
|
| | |
Total Increase (Decrease) | | | 492,922 | | | | 377,440 | |
| | |
|
|
| |
|
|
|
| | |
Net Assets | | | | | | | | |
Beginning of Period | | | 3,000,997 | | | | 2,623,557 | |
| | |
|
|
| |
|
|
|
| | |
End of Period | | $ | 3,493,919 | | | $ | 3,000,997 | |
| | |
|
|
| |
|
|
|
See accompanying notes to financial statements.
215
FINANCIAL HIGHLIGHTS THE DFA INVESTMENT TRUST COMPANY
The U.S. Large Company Series
| | | | | | | | | | | | | | | | | | | | |
| | | Year
Ended
Nov. 30,
2004
| | | Year
Ended
Nov. 30,
2003
| | | Year
Ended
Nov. 30,
2002
| | | Year
Ended
Nov. 30,
2001
| | | Year
Ended
Nov. 30,
2000
| |
Net Asset Value, Beginning of
Period | | | N/A | | | | N/A | | | | N/A | | | | N/A | | | | N/A | |
| | |
|
|
| |
|
|
| |
|
|
| |
|
|
| |
|
|
|
| | | | | |
Income from Investment Operations | | | | | | | | | | | | | | | | | | | | |
Net Investment Income (Loss) | | | — | | | | — | | | | — | | | | — | | | | — | |
Net Gains (Losses) on Securities
(Realized and Unrealized) | | | — | | | | — | | | | — | | | | — | | | | — | |
| | |
|
|
| |
|
|
| |
|
|
| |
|
|
| |
|
|
|
| | | | | |
Total from Investment Operations | | | — | | | | — | | | | — | | | | — | | | | — | |
| | |
|
|
| |
|
|
| |
|
|
| |
|
|
| |
|
|
|
| | | | | |
Less Distributions | | | | | | | | | | | | | | | | | | | | |
Net Investment Income | | | — | | | | — | | | | — | | | | — | | | | — | |
Net Realized Gains | | | — | | | | — | | | | — | | | | — | | | | — | |
| | |
|
|
| |
|
|
| |
|
|
| |
|
|
| |
|
|
|
| | | | | |
Total Distributions | | | — | | | | — | | | | — | | | | — | | | | — | |
| | |
|
|
| |
|
|
| |
|
|
| |
|
|
| |
|
|
|
| | | | | |
Net Asset Value, End of Period | | | N/A | | | | N/A | | | | N/A | | | | N/A | | | | N/A | |
| | |
|
|
| |
|
|
| |
|
|
| |
|
|
| |
|
|
|
| | | | | |
Total Return | | | 12.77 | % | | | 15.05 | % | | | (16.59 | )% | | | (12.30 | )% | | | (4.25 | )% |
| | |
|
|
| |
|
|
| |
|
|
| |
|
|
| |
|
|
|
| | | | | |
Net Assets, End of Period (thousands) | | $ | 3,493,919 | | | $ | 3,000,997 | | | $ | 2,623,557 | | | $ | 2,831,650 | | | $ | 3,138,812 | |
Ratio of Expenses to Average Net Assets | | | 0.05 | % | | | 0.05 | % | | | 0.05 | % | | | 0.05 | % | | | 0.06 | % |
Ratio of Net Investment Income to Average
Net Assets | | | 1.99 | % | | | 1.75 | % | | | 1.53 | % | | | 1.26 | % | | | 1.12 | % |
Portfolio Turnover Rate | | | 2 | % | | | 8 | % | | | 11 | % | | | 8 | % | | | 8 | % |
N/A Not applicable as The U.S. Large Company Series is organized as a partnership and does not have a unitized value.
See accompanying notes to financial statements.
216
NOTES TO FINANCIAL STATEMENTSTHE DFA INVESTMENT TRUST COMPANY
The DFA Investment Trust Company (the “Trust”) is an open-end management investment company registered under the Investment Company Act of 1940. The Trust consists of twenty-one series, of which The U.S. Large Company Series (the “Series” or “Portfolio”) is presented in this report.
| B. | Significant Accounting Policies: |
The following significant accounting policies are in conformity with accounting principles generally accepted in the United States of America. Such policies are consistently followed by the Fund in preparation of its financial statements. The preparation of financial statements in accordance with accounting principles generally accepted in the United States of America requires management to make estimates and assumptions that affect the reported amounts of assets and liabilities and disclosure of contingent assets and liabilities at the date of the financial statements and the reported amounts of increases and decreases in net assets from operation during the reporting period. Actual results could differ from those estimates and those differences could be material.
1. Security Valuation: Securities held by the Series which are listed on a securities exchange and for which market quotations are readily available are valued at the last quoted sale price of the day. Securities held by the Series that are listed on Nasdaq are valued at the Nasdaq Official Closing Price (“NOCP”). If there is no such reported sale price or NOCP for the day, the Series values securities at the mean between the quoted bid and asked prices. Price information on listed securities is taken from the exchange where the security is primarily traded. Unlisted securities for which market quotations are readily available are valued at the mean between the most recent bid and asked prices. Securities for which quotations are not readily available, or for which market quotations have become unreliable, are valued in good faith at fair value using methods determined by the Board of Trustees.
2. Deferred Compensation Plan: Each eligible Trustee of the Trust may elect participation in the Deferred Compensation Plan (the “Plan”). Under the Plan, effective January 1, 2002, such Trustees may defer payment of a percentage of their total fees earned as a Trustee. These deferred amounts may be treated as though such amounts had been invested in shares of the following funds: U.S. Large Cap Value Portfolio, U.S. Micro Cap Portfolio, DFA International Value Portfolio, Emerging Markets Portfolio and/or DFA Two-Year Global Fixed Income Portfolio. Contributions made under the Plan and the change in unrealized appreciation (depreciation) are included in Trustees’ Fees and Expenses. At November 30, 2004, the total liability for deferred compensation to Trustees is included in Accrued Expenses and Other Liabilities in the amount of $55,348.
3. Repurchase Agreements: The Series may purchase money market instruments subject to the counter-party’s agreement to repurchase them at an agreed upon date and price. The counterparty will be required on a daily basis to maintain the value of the collateral subject to the agreement at not less than the repurchase price (including accrued interest). The agreements are conditioned upon the collateral being deposited under the Federal Reserve book-entry system or with the Trust’s custodian or a third party sub-custodian. In the event of default or bankruptcy by the other party to the agreement, retention of the collateral may be subject to legal proceedings. All open repurchase agreements were entered into on November 30, 2004.
4. Other: Security transactions are accounted for on the trade date. Costs used in determining realized gains and losses on the sale of investment securities are on the basis of identified cost. Dividend income and distributions to shareholders are recorded on the ex-dividend date. Interest income is recorded on the accrual basis. Discount and premium on securities purchased are amortized over the lives of the respective securities utilizing the effective interest method. Expenses directly attributable to a Series are directly charged. Common expenses of the Trust are allocated using methods approved by the Board of Trustees, generally based on average net assets.
Dimensional Fund Advisors Inc. (“Dimensional” or the “Advisor”) provides investment advisory services to the Series. For the year ended November 30, 2004, the Series’ advisory fees were accrued daily and paid monthly to the Advisor based on an effective annual rate of 0.025 of 1% of average daily net assets.
Certain officers of the Trust are also officers, directors and shareholders of the Advisor.
217
NOTES TO FINANCIAL STATEMENTS (Continued) THE DFA INVESTMENT TRUST COMPANY
| D. | Purchases and Sales of Securities: |
For the year ended November 30, 2004, the Series made the following purchases and sales of investment securities other than short-term securities (amounts in thousands):
| | | |
Purchases | | $ | 226,523 |
Sales | | | 62,048 |
There were no purchases or sales of U.S. Government Securities during the year ended November 30, 2004.
No provision for federal income taxes is required since the Series is treated as a partnership for federal income tax purposes. Any interest, dividends and gains or losses have been deemed to have been “passed through” to its Feeder Funds.
At November 30, 2004, the total cost of securities and net realized gains or losses on securities sold for federal income tax purposes were different from amounts reported for financial reporting purposes. The federal tax cost, aggregate gross unrealized appreciation and depreciation of securities held by the Series, at November 30, 2004 were as follows (amounts in thousands):
| | | | | | | | | | |
Federal
Tax Cost
| | Unrealized
Appreciation
| | Unrealized
Depreciation
| | | Net
Unrealized
Appreciation/
(Depreciation)
|
$3,213,488 | | $ | 1,038,480 | | $ | (388,482 | ) | | $ | 649,998 |
In accordance with the Series’ investment objectives and policies, the Series may invest in certain financial instruments that have off-balance sheet risk in excess of the amounts recognized in the financial statements and concentrations of credit and market risk. These instruments and their significant corresponding risks are described below:
Futures Contracts: During the year ended November 30, 2004, the Series entered into futures contracts in accordance with its investment objectives. Upon entering into a futures contract, the Series deposits cash with a broker, equal to the minimum “initial margin” requirements of the exchange on which the contract is traded. Subsequent payments are received from or paid to the broker each day, based on the fluctuation in the market value of the contract. These receipts or payments are known as “variation margin” and are recorded daily by the Series as unrealized gains or losses until the contracts are closed. When the contracts are closed, the Series records a realized gain or loss equal to the difference between the value of the contract at the time it was opened and the value at the time it was closed.
At November 30, 2004, the Series had outstanding 270 long futures contracts on the S&P 500 Index, all of which expire on December 17, 2004. The value of such contracts on November 30, 2004 was $79,251,750, which resulted in an unrealized gain of $2,955,600. Approximately $4,320,000 of cash has been segregated as collateral for the open futures contracts and has been accounted for as cash on the Statement of Assets and Liabilities.
Risks arise upon entering into futures contracts from potential imperfect price correlations between the futures contracts and the underlying securities, from the possibility of an illiquid secondary market for these instruments and from the possibility that the Series could lose more than the initial margin requirements.
The Trust, together with other Dimensional-advised portfolios, has entered into a $50 million unsecured discretionary line of credit effective June 2004 with its domestic custodian bank. Each portfolio is permitted to borrow, subject to its investment limitations, up to a maximum of $50 million, as long as total borrowings under the line of credit do not exceed $50 million in the aggregate. Borrowings under the line of credit are charged interest at the then current federal funds rate plus 1%. Each portfolio is individually, and not jointly, liable for its particular advances under the line of credit. There is no commitment fee on the unused portion of the line of credit, since this is not a committed facility. The agreement for the discretionary line of credit may be terminated by either party at any time. The agreement for the line of credit expires on June 28, 2005. There were no borrowings under the discretionary line of credit by the Series during the year ended November 30, 2004.
218
NOTES TO FINANCIAL STATEMENTS (Continued) THE DFA INVESTMENT TRUST COMPANY
The Trust, together with other Dimensional-advised portfolios, has also entered into an additional $150 million unsecured line of credit effective April 2004 with its international custodian bank. Each portfolio is permitted to borrow, subject to investment limitations, up to a maximum of $150 million, as long as total borrowings under the line of credit do not exceed $150 million in the aggregate. Each portfolio is individually, and not jointly liable for its particular advances under the line of credit. Borrowings under the line of credit are charged interest at rates agreed to by the parties at the time of borrowing. There is no commitment fee on the unused line of credit. The agreement of the line of credit expires in April 2005. There were no borrowings by the Series under the line of credit during the year ended November 30, 2004.
As of November 30, 2004, the Series had securities on loan to broker/dealers, for which the Series held cash collateral. The Series invests the cash collateral, as described below, and records a liability for the return of the collateral, during the period the securities are on loan. Loans of securities are required at all times to be secured by collateral at least equal to 100% of the market value of the securities on loan. However, in the event of default or bankruptcy by the other party to the agreement, realization and/or retention of the collateral may be subject to legal proceedings. In the event that the borrower fails to return loaned securities, and cash collateral being maintained by the borrower is insufficient to cover the value of loaned securities and provided such collateral insufficiency is not the result of investment losses, PNCBank, National Association, the lending agent, has agreed to pay the amount of the shortfall to the portfolio or, at the option of the lending agent, to replace the securities.
The cash collateral received by each portfolio from securities on loan is invested along with cash collateral from the other Portfolios of the Series in repurchase agreements collateralized by U.S. government securities. These investments are accounted for separately for each Portfolio. Securities pledged as collateral for the repurchase agreements are held by a custodian bank until the agreements are repurchased.
I. Contractual Obligations:
In the normal course of business, the Trust enters into contracts that contain a variety of representations and warranties and which provide general indemnification. The Trust’s maximum exposure under these arrangements is unknown as this would involve future claims that may be made against the Trust and/or its affiliates that have not yet occurred. However, based on experience, the Trust expects the risk of loss to be remote.
219
Report of Independent Registered Certified Public Accounting Firm THE DFA INVESTMENT TRUST COMPANY
To the Shareholders of the U.S. Large Company Series and Board of Trustees of
The DFA Investment Trust Company
In our opinion, the accompanying statement of assets and liabilities, including the schedule of investments, and the related statements of operations and of changes in net assets and the financial highlights present fairly, in all material respects, the financial position of The U.S. Large Company Series (one of the portfolios constituting The DFA Investment Trust Company, hereafter referred to as the “Series”) at November 30, 2004, the results of its operations for the year then ended, the changes in its net assets for each of the two years in the period then ended and the financial highlights for each of the five years in the period then ended, in conformity with accounting principles generally accepted in the United States of America. These financial statements and financial highlights (hereafter referred to as “financial statements”) are the responsibility of the Series’ management; our responsibility is to express an opinion on these financial statements based on our audits. We conducted our audits of these financial statements in accordance with the Standards of the Public Company Accounting Oversight Board (United States). Those standards require that we plan and perform the audit to obtain reasonable assurance about whether the financial statements are free of material misstatement. An audit includes examining, on a test basis, evidence supporting the amounts and disclosures in the financial statements, assessing the accounting principles used and significant estimates made by management, and evaluating the overall financial statement presentation. We believe that our audits, which included confirmation of securities at November 30, 2004 by correspondence with the custodian and brokers, provide a reasonable basis for our opinion.
PricewaterhouseCoopers LLP
Fort Lauderdale, Florida
January 14, 2005
220
FUND MANAGEMENT THE DFA INVESTMENT TRUST COMPANY
Trustees/Directors
Each Board of Trustees/Directors of The DFA Investment Trust Company Inc. (“DFAITC”), DFA Investment Dimensions Group Inc. (“DFAIDG”), Dimensional Investment Group Inc. (“DIG”) and Dimensional Emerging Markets Value Fund Inc. (“DEM”) (each, the “Fund” and collectively, the “Funds”) is responsible for establishing the Fund’s policies and for overseeing the management of the Fund. The Trustees/Directors of the Funds, including all of the disinterested Directors, have adopted written procedures to monitor potential conflicts of interest that might develop between portfolios of the Funds (the “Feeder Portfolios”) that invest in certain series of DFAITC or DEM (the “Master Funds”).
Each Board has two standing committees, an Audit Committee and a Portfolio Performance and Service Review Committee (the “Performance Committee”). The Audit Committee is comprised of George M. Constantinides, Roger G. Ibbotson and Abbie J. Smith. Each member of the Audit Committee is a disinterested Director. The Audit Committee oversees the Fund’s accounting and financial reporting policies and practices, the Fund’s internal controls, the Fund’s financial statements and the independent audits thereof and performs other oversight functions as requested by the Board of Trustee’s/Directors. The Audit Committee recommends the appointment of each Fund’s independent registered certified public accounting firm and also acts as a liaison between the Fund’s independent registered certified public accounting firm and the full Board. There were four Audit Committee meetings held during the fiscal year ended November 30, 2004.
The Performance Committee is comprised of Messrs. Constantinides and Ibbotson, Ms. Smith, John R. Gould, Myron S. Scholes and Robert C. Merton. Each member of the Fund’s Performance Committee is a disinterested Director. The Performance Committee regularly reviews and monitors the investment performance of the Fund’s series and reviews the performance of the Fund’s service providers. There were three Performance Committee meetings held during the fiscal year ended November 30, 2004.
Certain biographical information for each disinterested Trustee/Director and each interested Trustee/Director of the Funds is set forth in the tables below, including a description of each Trustee/Director’s experience as a Trustee/Director of the Funds and as a director or trustee of other funds, as well as other recent professional experience.
The statements of additional information (together, “SAI”) of the Funds include additional information about each Trustee/Director. You may obtain copies of the SAI and prospectus of each Fund advised by Dimensional Fund Advisors Inc. by calling collect (310) 395-8005 or by mailing a request to Dimensional Fund Advisors, Inc. 1299 Ocean Avenue, 11th Floor, Santa Monica, California 90401. Prospectuses are also available at www.dfafunds.com.
| | | | | | |
Name, Age, Position
with the Fund
and Address | | Term of Office1 and
Length of Service | | Portfolios within the
DFA Fund Complex2
Overseen | | Principal Occupation(s) During Past 5 Years and
Other Directorships of Public Companies Held |
Disinterested Trustees/Directors |
| | | | |
George M. Constantinides Director of DFAIDG,
DIG and DEM.
Trustee of DFAITC.
1101 E. 58th Street Chicago, IL 60637
Date of Birth: 9/22/47 | | DFAITC — since 1993 DFAIDG — since 1983 DIG — since 1993
DEM — since 1993 | | 75 portfolios in 4 investment companies | | Leo Melamed Professor of Finance, Graduate School of Business, University of Chicago. |
| | | | |
John P. Gould Director of DFAIDG, DIG and DEM. Trustee of DFAITC.
1101 E. 58th Street Chicago, IL 60637
Date of Birth: 1/19/39 | | DFAITC — since 1993 DFAIDG — since 1986
DIG — since 1993
DEM — since 1993 | | 75 portfolios in 4 investment companies | | Steven G. Rothmeier Distinguished Service Professor of Economics, Graduate School of Business, University of Chicago. Senior Vice-President, Lexecon Inc. (economics, law, strategy and finance consulting). Formerly, President, Cardean University (division of UNext.com). Member of the Boards of Milwaukee Mutual Insurance Company and UNext.com. Formerly, Trustee, First Prairie Funds (registered investment company). Trustee, Harbor Fund (registered investment company) (13 Portfolios). |
221
FUND MANAGEMENT (Continued) THE DFA INVESTMENT TRUST COMPANY
| | | | | | |
Name, Age, Position
with the Fund
and Address | | Term of Office1 and
Length of Service | | Portfolios within the
DFA Fund Complex2
Overseen | | Principal Occupation(s) During Past 5 Years and
Other Directorships of Public Companies Held |
| | | | |
Roger G. Ibbotson Director of DFAIDG, DIG and DEM. Trustee of DFAITC. Yale School of Management
P.O. Box 208200
New Haven,
CT 06520-8200
Date of Birth: 5/27/43 | | DFAITC — since 1993 DFAIDG — since 1981 DIG — since 1993 DEM — since 1993 | | 75 portfolios in 4 investment companies | | Professor in Practice of Finance, Yale School of Management. Director, BIRR Portfolio Analysis, Inc. (software products). Chairman, Ibbotson Associates, Inc., Chicago, IL (software, data, publishing and consulting). Partner, Zebra Capital Management, LLC (hedge fund manager). Formerly, Director, Hospital Fund, Inc. (investment management services). |
| | | | |
Robert C. Merton Director of DFAIDG, DIG and DEM. Trustee of DFAITC. Harvard Business School
397 Morgan Hall Soldiers Field Boston,
MA 02163
Date of Birth: 7/31/44 | | DFA ITC — since 2003 DFA IDG — since 2003 DFA DIG — since 2003 DEM — since 2003 | | 75 portfolios in 4 investment companies | | John and Natty McArthur University Professor, Graduate School of Business Administration, Harvard University (since 1998). George Fisher Baker Professor of Business Administration, Graduate School of Business Administration, Harvard University (1988-1998), Cofounder, Chief Science Officer, Integrated Finance Limited (since 2002). Director, MF Risk, Inc. (risk management software) (since 2001). Director, Peninsula Banking Group (bank) (since 2003). Director, Community First Financial Group (bank holding company) (since 2003). Formerly, Co-Founder and Principal, Long-Term Capital Management. Director, Vical Incorporated (biopharmaceutical product development). |
| | | | |
Myron S. Scholes Director of DFAIDG,
DIG and DEM.
Trustee of DFAITC.
Oak Hill Capital Management, Inc.
2775 Sand Hill Rd.
Suite 220 Menlo Park,
CA 94025
Date of Birth: 7/01/41 | | DFAITC — since 1993 DFAIDG — since 1981 DIG — since 1993 DEM — since 1993 | | 75 portfolios in 4 investment companies | | Frank E. Buck Professor Emeritus of Finance, Stanford University. Managing Partner, Oak Hill Capital Management (private equity firm). Chairman, Oak Hill Platinum Partners (hedge fund). Director, Chicago Mercantile Exchange. Consultant, Arbor Investors. Formerly, Director, Smith Breeden Family of Funds. Director, American Century Fund Complex (registered investment companies) (38 Portfolios); and Director, Chicago Mercantile Exchange Holdings Inc |
| | | | |
Abbie J. Smith Director of DFAIDG, DIG and DEM. Trustee of DFAITC. Graduate School of Business University of Chicago 1101 East
58th Street, Chicago,
IL 60637
Date of Birth: 4/30/53 | | DFAITC — since 2000 DFAIDG — since 2000 DIG — since 2000 DEM — since 2000 | | 75 portfolios in 4 investment companies | | Boris and Irene Stern Professor of Accounting, Graduate School of Business, University of Chicago, Formerly, Marvin Bower Fellow, Harvard Business School (9/01 to 8/02). Director, HON Industries Inc. (office furniture) and Director, Ryder System Inc. (transportation). |
222
FUND MANAGEMENT (Continued) THE DFA INVESTMENT TRUST COMPANY
| | | | | | |
Name, Age, Position
with the Fund
and Address | | Term of Office1 and
Length of Service | | Portfolios within the
DFA Fund Complex2
Overseen | | Principal Occupation(s) During Past 5 Years and
Other Directorships of Public Companies Held |
Interested Trustees/Directors** |
| | | | |
David G. Booth Chairman, Director, Chief Executive Officer, Chief Investment Officer and President of DFAIDG, DIG and DEM. Chairman, Trustee, Chief Executive Officer, Chief Investment Officer and President of DFAITC. 1299 Ocean Avenue Santa Monica,
CA 90401
Date of Birth: 12/02/46 | | DFAITC — since 1993 DFAIDG — since 1981 DIG — since 1992 DEM — since 1993 | | 75 portfolios in 4 investment companies | | Chairman, Director, Chief Executive Officer, Chief Investment Officer and President of Dimensional Fund Advisors Inc., DFA Securities Inc., DFAIDG, DIG and DEM. Chairman, Trustee, Chief Executive Officer, Chief Investment Officer and President of DFAITC. Director of Dimensional Fund Advisors Ltd. and formerly Chief Investment Officer. Director, Chief Investment Officer and President of DFA Australia Ltd. Formerly, Director of Dimensional Funds PLC. Chairman, Director, Chief Executive Officer and Chief Investment Officer of Dimensional Fund Advisors Canada Inc. (All Chief Investment Officer positions held starting 1/1/2003 except for Dimensional Fund Advisors Canada Inc., which was from 6/17/2003.) Limited Partner, Oak Hill Partners. Director, University of Chicago Business School. Formerly, Director, SA Funds (registered investment company). Formerly Director, Assante Corporation (investment management) (until 2002). |
| | | | |
Rex A. Sinquefield* Chairman and Director of DFAIDG, DIG and DEM. Trustee and Chairman of DFAITC. 1299 Ocean Avenue Santa Monica,
CA 90401
Date of Birth: 9/07/44 | | DFAITC — since 1993 DFAIDG — since 1981 DIG — since 1992 DEM — since 1993 | | 75 portfolios in 4 investment companies | | Chairman and Director (and prior to 1/1/2003, Chief Investment Officer) of Dimensional Fund Advisors Inc., DFA Securities Inc., DFAIDG, DIG and DEM. Chairman, Trustee (and prior to 1/1/2003, Chief Investment Officer) of DFAITC. Director and formerly President of Dimensional Fund Advisors Ltd. Director (and prior to 1/1/2003, Chief Investment Officer) of DFA Australia Ltd. Director of Dimensional Funds PLC and Dimensional Fund Advisors Canada Inc. Trustee, St. Louis University. Life Trustee and Member of Investment Committee, DePaul University. Director, The German St. Vincent Orphan Home. Member of Investment Committee, Archdiocese of St. Louis. |
| 1 | Each Trustee/Director holds office for an indefinite term until his or her successor is elected and qualified. |
| 2 | Each Trustee/Director is a director or trustee of each of the four registered investment companies within the DFA Fund Complex, which includes the Funds. |
| * | Rex A. Sinquefield and Jeanne C. Sinquefield are husband and wife. |
| ** | Interested Directors are described as such because they are deemed to be “interested persons,” as that term is defined under the Investment Company Act of 1940, as amended, due to their positions with Dimensional Fund Advisors Inc. |
223
FUND MANAGEMENT (Continued) THE DFA INVESTMENT TRUST COMPANY
Officers
The name, age, information regarding positions with the Funds and the principal occupation for each officer of the Funds are set forth below. Each officer listed below holds the same office (except as otherwise noted) in the following entities: Dimensional Fund Advisors Inc. (“Dimensional”), DFA Securities Inc., DFAIDG, DIG, DFAITC and DEM (collectively, the “DFA Entities”). The address of each officer is: Dimensional Fund Advisors Inc. 1299 Ocean Avenue, 11th Floor, Santa Monica, California 90401, unless otherwise indicated.
| | | | |
Name, Age, Position
with the Fund
and Address | | Term of Office1 and
Length of Service | | Principal Occupation(s) During Past 5 Years |
| Officers |
| | | |
Arthur H. Barlow
Vice President
Date of Birth: 11/7/55 | | Since 1993 | | Vice President of all the DFA Entities. Formerly, Vice President of DFA Australia Limited and Dimensional Fund Advisors Ltd. |
| | | |
Valerie A. Brown
Vice President and
Assistant Secretary
Date of Birth: 1/24/67 | | Since 2001 | | Vice President and Assistant Secretary of all the DFA Entities, DFA Australia Limited, Dimensional Fund Advisors Ltd., and since June 2003, Dimensional Fund Advisors Canada Inc. Prior to April 2001, legal counsel for Dimensional (since March 2000). Associate, Jones, Day, Reavis & Pogue from October 1991 to February 2000. |
| | | |
Stephen A. Clark
Vice President
Date of Birth: 8/20/72 | | Since 2004 | | Vice President of all the DFA Entities. April 2001 to April 2004, Portfolio Manager of Dimensional. Formerly, Graduate Student at the University of Chicago (September 2000 to March 2001); and Associate of US Bancorp Piper Jaffrey (September 1999 to September 2000). |
| | | |
Truman A. Clark
Vice President
Date of Birth: 4/8/41 | | Since 1996 | | Vice President of all the DFA Entities. Formerly, Vice President of DFA Australia Limited and Dimensional Fund Advisors Ltd. |
| | | |
Christopher S. Crossan
Vice President
Date of Birth: 12/21/65 | | Since 2004 | | Vice President of all the DFA Entities. Formerly, Senior Compliance Officer, INVESCO Institutional, Inc. and its affiliates (August 2000 to January 2004); Brach Chief, Investment Company and Investment Advisor Inspections, Securities and Exchange Commission (April 1994 to August 2000). |
| | | |
James L. Davis
Vice President
Date of Birth: 11/29/56 | | Since 1999 | | Vice President of all the DFA Entities. Formerly, Vice President of DFA Australia Limited and Dimensional Fund Advisors Ltd. Formerly at Kansas State University, Arthur Andersen & Co., and Phillips Petroleum Co. |
| | | |
Robert T. Deere
Vice President
Date of Birth: 10/8/57 | | Since 1994 | | Vice President of all the DFA Entities and DFA Australia Limited. Formerly, Vice President of Dimensional Fund Advisors Ltd. |
| | | |
Robert W. Dintzner
Vice President
Date of Birth: 3/18/70 | | Since 2001 | | Vice President of all the DFA Entities. Formerly, Vice President of DFA Australia Limited. Prior to April 2001, marketing supervisor and marketing coordinator for Dimensional. |
| | | |
Richard A. Eustice
Vice President and
Assistant Secretary
Date of Birth: 8/5/65 | | Since 1998 | | Vice President and Assistant Secretary of all the DFA Entities and DFA Australia Limited. Formerly, Vice President of Dimensional Fund Advisors Ltd. |
| | | |
Eugene F. Fama, Jr.
Vice President
Date of Birth: 1/21/61 | | Since 1993 | | Vice President of all the DFA Entities. Formerly, Vice President of DFA Australia Limited and Dimensional Fund Advisors Ltd. |
224
FUND MANAGEMENT (Continued) THE DFA INVESTMENT TRUST COMPANY
| | | | |
Name, Age, Position
with the Fund
and Address | | Term of Office1 and
Length of Service | | Principal Occupation(s) During Past 5 Years |
| | | |
Robert M. Fezekas
Vice President
Date of Birth: 10/28/70 | | Since 2001 | | Vice President of all the DFA Entities. Prior to December 2001, Portfolio Manager of Dimensional. |
| | | |
Damon S. Fisher
Vice President
Date of Birth: 8/2/68 | | Since 2004 | | Vice President of all DFA Entities. Prior to April 2004, institutional client service representative of Dimensional. |
| | | |
Gretchen A. Flicker
Vice President
Date of Birth: 6/9/71 | | Since 2004 | | Vice President of all DFA Entities. Prior to April 2004, institutional client service representative of Dimensional. |
| | | |
Glenn S. Freed
Vice President
Date of Birth: 11/24/61 | | Since 2001 | | Vice President of all the DFA Entities. Formerly, Professor and Associate Dean of the Leventhal School of Accounting (September 1998 to August 2001) and Academic Director Master of Business Taxation Program (June 1996 to August 2001) at the University of Southern California Marshall School of Business. |
| | | |
Henry F. Gray
Vice President
Date of Birth: 9/22/67 | | Since 2000 | | Vice President of all the DFA Entities. Formerly, Vice President of DFA Australia Limited. Prior to July 2000, Portfolio Manager. |
| | | |
Kamyab Hashemi-Nejad
Vice President, Controller and Assistant Treasurer
Date of Birth: 1/22/61 | | Since 1997 | | Vice President, Controller and Assistant Treasurer of all the DFA Entities, DFA Australia Limited, and Dimensional Fund Advisors Ltd. Formerly, Assistant Secretary of Dimensional Fund Advisors Ltd |
| | | |
Christine W. Ho
Vice President
Date of Birth: 11/29/1967 | | Since 2004 | | Vice President of all DFA Entities. Prior to April 2004, Assistant Controller of Dimensional. |
| | | |
Jeff J. Jeon
Vice President
Date of Birth: 11/8/73 | | Since 2004 | | Vice President of all DFA Entities. Prior to April 2004, counsel of Dimensional. Formerly, an Associate at Gibson, Dunn & Crutcher LLP (September 1997 to August 2001). |
| | | |
Patrick Keating
Vice President
Date of Birth: 12/21/54 | | Since 2003 | | Vice President of all the DFA Entities and Dimensional Fund Advisors Canada Inc. Formerly, Director, President and Chief Executive Officer, Assante Asset Management, Inc. (October 2000 to December 2002); Director, Assante Capital Management (October 2000 to December 2002); President and Chief Executive Officer, Assante Capital Management (October 2000 to April 2001); Executive Vice President, Assante Corporation (May 2001 to December 2002); Director, Assante Asset Management Ltd. (September 1997 to December 2002); President and Chief Executive Officer, Assante Asset Management Ltd. (September 1998 to May 2001); Executive Vice President, Loring Ward (financial services company) (January 1996 to September 1998). |
| | | |
Joseph F. Kolerich
Vice President
Date of Birth: 11/7/71 | | Since 2004 | | Vice President of all the DFA Entities. From April 2001 to April 2004, Portfolio Manager for Dimensional. Formerly, a trader at Lincoln Capital Fixed Income Management (formerly Lincoln Capital Management Company). |
| | | |
Heather H. Mathews
Vice President
Date of Birth: 12/12/69 | | Since 2004 | | Vice President of all the DFA Entities. Prior to April 2004, Portfolio Manager for Dimensional Fund Advisors Inc. Formerly, Graduate Student at Harvard University (August 1998 to June 2000). |
225
FUND MANAGEMENT (Continued) THE DFA INVESTMENT TRUST COMPANY
| | | | |
Name, Age, Position
with the Fund
and Address | | Term of Office1 and
Length of Service | | Principal Occupation(s) During Past 5 Years |
| | | |
David M. New
Vice President
Date of Birth: 2/9/60 | | Since 2003 | | Vice President of all the DFA Entities. Formerly, Client Service Manager of Dimensional. Formerly, Director of Research, Wurts and Associates (investment consulting firm) (December 2000 to June 2002); and President, Kobe Investment Research (August 1999 to November 2000). |
| | | |
Catherine L. Newell
Vice President and Secretary Date of Birth: 5/7/64 | | Vice President since 1997 and Secretary since 2000 | | Vice President and Secretary of all the DFA Entities. Vice President and Assistant Secretary of DFA Australia Limited (since February 2002, April 1997 and May 2002, respectively). Vice President and Secretary of Dimensional Fund Advisors Canada Inc. (since June 2003). Director, Dimensional Funds plc (since January 2002). Formerly, Assistant Secretary of all DFA Entities and Dimensional Fund Advisors Ltd. |
| | | |
David A. Plecha
Vice President
Date of Birth: 10/26/61 | | Since 1993 | | Vice President of all the DFA Entities, DFA Australia Limited and Dimensional Fund Advisors Ltd |
| | | |
Eduardo A. Repetto
Vice President
Date of Birth: 1/28/67 | | Since 2002 | | Vice President of all the DFA Entities. Formerly, Research Associate for Dimensional (June 2000 to April 2002). Formerly, Research Scientist (August 1998 to June 2000), California Institute of Technology. |
| | | |
Michael T. Scardina
Vice President, Chief Financial Officer and Treasurer
Date of Birth: 10/12/55 | | Since 1993 | | Vice President, Chief Financial Officer and Treasurer of all the DFA Entities, DFA Australia Limited and Dimensional Fund Advisors Ltd., and since June 2003, Dimensional Fund Advisors Canada Inc. Director, Dimensional Fund Advisors Ltd. (since February 2002) and Dimensional Funds, plc (January 2002). |
| | | |
David E. Schneider
Vice President Santa Monica, CA Date of Birth: 1/26/46 | | Since 2001 | | Vice President of all the DFA Entities. Prior to 2001, Regional Director of Dimensional. |
| | | |
John C. Siciliano
Vice President Santa Monica, CA Date of Birth: 8/24/54 | | Since 2001 | | Vice President of all the DFA Entities. Director of Dimensional Fund Advisors, Ltd. Formerly, Vice President of DFA Australia Limited. Formerly, Director of Dimensional Funds plc. Formerly, Managing Principal, Payden & Rygel Investment Counsel (April 1998 to December 2000). |
| | | |
Jeanne C. Sinquefield, Ph.D.* Executive Vice President Santa Monica, CA
Date of Birth: 12/2/46 | | Since 1988 | | Executive Vice President of all the DFA Entities and DFA Australia Limited. Vice President (formerly, Executive Vice President) of Dimensional Fund Advisors Ltd. (since January 2003) and Dimensional Fund Advisor Canada Inc. (since June 2003). |
| | | |
Grady M. Smith
Vice President
Date of Birth: 5/26/56 | | Since 2004 | | Vice President of all the DFA Entities. Prior to April 2004, Portfolio Manager of Dimensional. Formerly, Principal of William M. Mercer, Incorporated (July 1995 to June 2001). |
| | | |
Carl G. Snyder
Vice President Santa Monica, CA Date of Birth: 6/8/63 | | Since 2000 | | Vice President of all the DFA Entities. Prior to July 2000, Portfolio Manager of Dimensional. Formerly, Vice President of DFA Australia Limited. |
| | | |
Lawrence R. Spieth
Vice President
Date of Birth: 11/10/47 | | Since 2004 | | Vice President of all the DFA Entities. Prior to April 2004, institutional client service representative of Dimensional. |
226
FUND MANAGEMENT (Continued) THE DFA INVESTMENT TRUST COMPANY
| | | | |
Name, Age, Position
with the Fund
and Address | | Term of Office1 and
Length of Service | | Principal Occupation(s) During Past 5 Years |
| | | |
Bradley G. Steiman
Vice President
Date of Birth: 3/25/73 | | Since 2004 | | Vice President of all the DFA Entities and Dimensional Fund Advisors Canada Inc. (since June 2003). Prior to April 2002, Regional Director of Dimensional. Formerly, Vice President and General Manager of Assante Global Advisors (July 2000 to April 2002); Vice President of Assante Asset Management Inc. (March 2000 to July 2000); and Private Client Manager at Loring Ward Investment Counsel Ltd. (June 1997 to February 2002). |
| | | |
Karen E. Umland
Vice President Santa Monica, CA Date of Birth: 3/10/66 | | Since 1997 | | Vice President of all the DFA Entities, DFA Australia Limited, Dimensional Fund Advisors Ltd., and since June 2003, Dimensional Fund Advisors Canada Inc. |
| | | |
Carol W. Wardlaw
Vice President
Date of Birth: 8/7/58 | | Since 2004 | | Vice President of all the DFA Entities. Prior to April 2004, institutional client service representative of Dimensional. |
| | | |
Weston J. Wellington
Vice President Santa Monica, CA Date of Birth: 3/1/51 | | Since 1997 | | Vice President of all the DFA Entities. Formerly, Vice President of Dimensional Fund Advisors Ltd. |
| | | |
Daniel M. Wheeler
Vice President Santa Monica, CA Date of Birth: 3/3/45 | | Since 2001 | | Vice President of all the DFA Entities. Prior to 2001, Director of Financial Advisors Services of Dimensional. Director of Dimensional Fund Advisors Ltd. (since October 2003) and President of Dimensional Fund Advisors Canada Inc. (since June 2003). |
| 1 | Each officer holds office for an indefinite term at the pleasure of the Boards of Trustee/Directors and until his or her successor is elected and qualified. |
| * | Rex A. Sinquefield and Jeanne C. Sinquefield are husband and wife. |
227
VOTING PROXIES ON FUND PORTFOLIO SECURITIESTHE DFA INVESTMENT TRUST COMPANY
A description of the policies and procedures that the Fund uses in voting proxies relating to securities held in the portfolio is available without charge, upon request, by calling collect: (310) 395-8005. Information regarding how the Advisor votes these proxies is available from the EDGAR database on the SEC’s website at http://www.sec.gov and from the Advisor’s website at http://www.dfaus.com and reflects the twelve-month period beginning July 1, 2003 and ending June 30, 2004.
228
                                BLACKROCK FUNDS


Investment Adviser


     BlackRock Advisors, Inc.

     Wilmington, Delaware 19809


Sub-Adviser - International Opportunities Portfolio


     BlackRock International, Ltd.

     Edinburgh, Scotland EH3 8JB


Sub-Adviser - Asset Allocation Portfolio


     BlackRock Financial Management, Inc.

     New York, NY 10022

Custodian


     PFPC Trust Co.

     Philadelphia, Pennsylvania 19153


Co-Administrator and Transfer Agent


     PFPC Inc.

     Wilmington, Delaware 19809


Distributor


     BlackRock Distributors, Inc.

     King of Prussia, Pennsylvania 19406


Co-Administrator


     BlackRock Advisors, Inc.

     Wilmington, Delaware 19809


Counsel


     Simpson Thacher & Bartlett LLP

     New York, New York 10017


Independent Registered Public Accountant


     Deloitte & Touche LLP

     Philadelphia, Pennsylvania 19103


The Fund will mail only one copy of shareholder documents, including
prospectuses, annual and semi-annual reports and proxy statements, to
shareholders with multiple accounts at the same address. This practice is
commonly called "householding" and it is intended to reduce expenses and
eliminate duplicate mailings of shareholder documents. Mailings of your
shareholder documents may be householded indefinitely unless you instruct us
otherwise. If you do not want the mailing of these documents to be combined
with those for other members of your household, please contact the Fund at
(800) 441-7762.

The Fund has delegated proxy voting responsibilities to BlackRock and its
affiliates, subject to the general oversight of the Fund's Board of Trustees. A
description of the policies and procedures that BlackRock and its affiliates
use to determine how to vote proxies relating to portfolio securities is
available without charge, upon request, by calling (800)-441-7762, or on the
website of the Securities and Exchange Commission (the "Commission") at
http://www.sec.gov.

Information on how proxies relating to the Fund's voting securities were voted
(if any) by BlackRock during the most recent 12-month period ended June 30th is
available, upon request and without charge, by calling (800) 441-7762 or on the
website of the Commission at http://www.sec.gov.

The Fund files its complete schedule of portfolio holdings for the first and
third quarters of its fiscal year with the Commission on Form N-Q. The Fund's
Form N-Q is available on the Commission's website at http://www.sec.gov and may
be reviewed and copied at the Commission's Public Reference Room in Washington,
D.C. Information regarding the operation of the Public Reference Room may be
obtained by calling 1-800-SEC-0330. The Fund's Form N-Q may also be obtained
upon request, without charge, by calling (800) 441-7762.
                                BLACKROCK FUNDS
                                 FUND SPECTRUM

 BlackRock Funds is a leading mutual fund company currently managing
approximately $26 billion in the following portfolios designed to fit a broad
range of investment goals. Each portfolio is managed by recognized experts in
equity, fixed income, international, and tax-free investing.


STOCK PORTFOLIOS
- --------------------------------------
   Investment Trust                      Small Cap Core Equity
   Large Cap Value Equity                Small Cap Growth Equity
   Large Cap Growth Equity               Global Science & Technology Opportunities
   Dividend AchieversTM                  Global Resources
   Legacy                                All-Cap Global Resources
   Mid-Cap Value Equity                  Health Sciences
   Mid-Cap Growth Equity                 U.S. Opportunities
   Aurora                                International Opportunities
   Small/Mid-Cap Growth                  Index Equity
   Small Cap Value Equity
STOCK & BOND PORTFOLIOS
- --------------------------------------
   Asset Allocation
BOND PORTFOLIOS
- --------------------------------------
   Enhanced Income                       Government Income
   Low Duration Bond                     Inflation Protected Bond
   Intermediate Government Bond          GNMA
   Intermediate Bond                     Managed Income
   Intermediate PLUS Bond                International Bond
   Core Bond Total Return                High Yield Bond
   Core PLUS Total Return
TAX-FREE BOND PORTFOLIOS
- --------------------------------------
   UltraShort Municipal                  Ohio Tax-Free Income
   Tax-Free Income                       Delaware Tax-Free Income
   Pennsylvania Tax-Free Income          Kentucky Tax-Free Income
   New Jersey Tax-Free Income
MONEY MARKET PORTFOLIOS
- --------------------------------------
   Money Market                          North Carolina Municipal Money Market
   U.S. Treasury Money Market            Ohio Municipal Money Market
   Municipal Money Market                Pennsylvania Municipal Money Market
   New Jersey Municipal Money Market     Virginia Municipal Money Market

                             SHAREHOLDER PRIVILEGES

ACCOUNT INFORMATION
Call us at 1-800-441-7762 to get information about your account balances,
recent transactions and share prices.
You can also reach us on the web at www.blackrock.com.

AUTOMATIC INVESTMENT PLANS
Investor Class shareholders who want to invest regularly can arrange to have
$50 or more automatically deducted from their checking or savings account and
invested in any of the BlackRock portfolios.

SYSTEMATIC WITHDRAWAL PLANS
Investor Class shareholders can establish a systematic withdrawal plan and
receive periodic payments of $50 or more from their BlackRock portfolios, as
long as their account is at least $10,000.

RETIREMENT PLANS
Shareholders may make investments in conjunction with Traditional, Rollover,
Roth, Coverdell and Simple IRA's.

ADDITIONAL INFORMATION ABOUT THE BLACKROCK FUNDS
For additional reports or additional information, as well as more current
information about portfolio holdings and characteristics, BlackRock Fund
shareholders and prospective investors may call 1-800-441-7762.
Shares of the Fund are not deposits or obligations of, or guaranteed or
endorsed by PNC Bank, National Association or any other bank and shares are not
federally insured by, guaranteed by, obligations of or otherwise supported by
the U.S. Government, the Federal Deposit Insurance Corporation, the Federal
Reserve Board, or any other governmental agency. Investments in shares of the
fund involve investment risks, including the possible loss of the principal
amount invested.
[GRAPHIC OMITTED]
EQ-SEMI
ALTERNATIVES BLACKROCK SOLUTIONS EQUITIES FIXED
INCOME LIQUIDITYREAL ESTATE BlackRock Funds
Money Market Portfolios
Semi-Annual Report to Shareholders
April 30, 2005 (Unaudited)
[GRAPHIC OMITTED]
[GRAPHIC OMITTED]
[GRAPHIC OMITTED]
NOT FDIC INSURED
MAY LOSE VALUE
NO BANK GUARANTEE
BLACKROCK FUNDS
MONEY MARKET PORTFOLIOS
*Money Market
*U.S. Treasury Money Market
*Municipal Money Market
*New Jersey Municipal Money Market
*North Carolina Municipal Money Market
*Ohio Municipal Money Market
*Pennsylvania Municipal Money Market
*Virginia Municipal Money Market
TABLE OF CONTENTS
Shareholder Letter..........................................................1
Fund Profile/Expense Example
Money Market..............................................................2
U.S. Treasury Money Market................................................3
Municipal Money Market....................................................4
New Jersey Municipal Money Market.........................................5
North Carolina Municipal Money Market.....................................6
Ohio Municipal Money Market...............................................7
Pennsylvania Municipal Money Market.......................................8
Virginia Municipal Money Market...........................................9
Statement of Net Assets.................................................10-38
Key to Investment Abbreviations..........................................39
Portfolio Financial Statements
Statements of Operations..............................................40-41
Statements of Changes in Net Assets...................................42-43
Financial Highlights..................................................44-51
Notes to Financial Statements...........................................52-64
Additional Information..................................................65-69
PRIVACY PRINCIPLES OF BLACKROCK FUNDS
BlackRock Funds is committed to maintaining the privacy of its shareholders and
to safeguarding their nonpublic personal information. The following information
is provided to help you understand what personal information BlackRock Funds
collects, how we protect that information, and why in certain cases we may
share such information with select other parties.
BlackRock Funds does not receive any nonpublic personal information relating to
its shareholders who purchase shares through their broker-dealers. In the case
of shareholders who are record owners of BlackRock Funds, BlackRock Funds
receives nonpublic personal information on account applications or other forms.
With respect to these shareholders, BlackRock Funds also has access to specific
information regarding their transactions in BlackRock Funds.
BlackRock Funds does not disclose any nonpublic personal information about its
shareholders or former shareholders to anyone, except as permitted by law or as
is necessary in order to service our shareholders' accounts (for example, to a
transfer agent).
BlackRock Funds restricts access to nonpublic personal information about its
shareholders to BlackRock employees with a legitimate business need for the
information. BlackRock Funds maintains physical, electronic and procedural
safeguards designed to protect the nonpublic personal information of our
shareholders.
BLACKROCK FUNDS
April 30, 2005
Dear Shareholder:
We are pleased to present the Semi-Annual Report to Shareholders of the
BlackRock Funds' Money Market Portfolios for the six-month period ended March
31, 2005. The Semi-Annual Report includes important information on each
Portfolio, and is organized as follows:
o Fund Profile - displays characteristics of each Portfolio's holdings as of
March 31, 2005.
o Expense Example - discusses costs in a shareholder account and provides
information for a shareholder to estimate his or her expenses by share
class and to compare expenses of each share class to other funds.
o Statement of Net Assets - lists portfolio holdings and includes each
holding's market value and par amount/number of shares as of March 31,
2005. The Statement of Net Assets also contains the net asset value for
each share class of a Portfolio.
o Statement of Operations - displays the components of each Portfolio's
investment income and provides a detailed look at each Portfolio's
expenses. The Statement of Operations also lists the aggregate change in
value of a Portfolio's securities due to market fluctuations and security
sales.
o Statement of Changes in Net Assets - compares Portfolio information from
the prior period to the current period. Specifically, it details
shareholder distributions by share class, aggregate realized gains and
losses, and the change in net assets from the beginning of the period to
the end of the period.
o Financial Highlights - include each Portfolio's expense ratios, net asset
values, total returns, distributions per share, and turnover ratios for the
current period and the last five years or since inception.
o Notes to Financial Statements - provides additional information on fees, a
summary of significant accounting policies, a list of affiliated
transactions, and a summary of purchases and sales of securities.
In addition to these items, a summary of shareholder privileges is listed
on the inside back cover of the report. Shareholders can find information on
this page describing how to access account balances, recent transactions, and
share prices. It also includes a summary of the Fund's various investment
plans.
There were two notable recent developments for the BlackRock Funds (the
"Fund").
First, on January 31, 2005, BlackRock, Inc., the parent of BlackRock
Advisors, Inc. ("BlackRock"), the Fund's investment adviser, acquired SSRM
Holdings, Inc., the parent of State Street Research & Management Company, the
investment adviser to the former State Street Research Funds. The transaction
enhances BlackRock's investment management platform with additional US equity,
alternative investment, and real estate equity management capabilities. In
addition, the scale and scope of BlackRock's open-end and closed-end mutual
funds and distribution capabilities has expanded significantly. We believe that
we can incorporate the best of both organizations to deliver high quality
products to both institutional and individual investors.
Second, a proxy statement was recently sent to shareholders of all
portfolios of the Fund asking them to consider and vote upon the election of
nine trustees to the board of trustees of the Fund (the "Board"). Five of the
nine nominees were already serving as trustees of the Fund and the additional
nominees had previously served as trustees of the State Street Research Funds.
Due to the increased size and complexity of the Fund resulting from the
reorganization with the State Street Research Funds, and an increase in the
responsibilities of boards of trustees of funds generally, the current Board
believed it was in the best interest of the Fund to increase the size of the
Board. In addition, shareholders of the Money Market Portfolio were asked to
consider and vote upon a proposal to change the fundamental investment
limitation on the concentration of investments in the banking industry to a
concentration of investments in the financial services industry. The proposed
change was designed to provide greater flexibility in managing the Money Market
Portfolio. On April 29, 2005, the special meeting of shareholders was held, at
which all of the nominees included in the proxy were duly elected to the Board
and the change to the fundamental investment limitation as described above of
the Money Market Portfolio was approved by its shareholders.
We hope you find the report informative, and we thank you for making
BlackRock part of your investment strategy.
Sincerely,
[GRAPHIC OMITTED]
Anne Ackerley
Managing Director
BlackRock Advisors, Inc.
1
MONEY MARKET PORTFOLIO
FUND PROFILE
Portfolio Diversification (% of
portfolio)
Commercial Paper 32.9 %
Certificates of Deposit 24.7
Variable Rate Obligations 20.2
Agency Obligations 7.4
Repurchase Agreements 6.3
Master Notes 5.7
Corporate Bonds 2.8
-----
Total 100.0%
=====
Maturity Information
- ----------------------------------------------
Maturity Par Percentage
- --------------- -------------- -----------
1-7 Days 267,605,000 17.6%
8-14 Days 85,000,000 5.6
15-30 Days 492,079,000 32.4
31-60 Days 266,192,000 17.5
61-90 Days 383,641,661 25.3
91-120 Days 2,500,000 0.2
121-150 Days 6,490,000 0.4
over 150 Days 15,000,000 1.0
-----
100.0%
=====
Average Weighted Maturity - 40 days
- --------------------------------------------------------------------------------
EXPENSE EXAMPLE
As a shareholder of the Portfolio, you incur ongoing costs, including advisory
fees, distribution (12b-1) and service fees, where applicable; and other
Portfolio expenses. This Example is intended to help you understand your
ongoing costs (in dollars) of investing in the Portfolio and to compare these
costs with the ongoing costs of investing in other mutual funds.
The Example below is based on an investment of $1,000 invested at the beginning
of the period and held for the entire period October 1, 2004 to April 30, 2005.
The information under "Actual Expenses," together with the amount you invested,
allows you to estimate actual expenses incurred over the reporting period.
Simply divide your account value by $1,000 (for example, an $8,600 account
value divided by $1,000 = 8.60) and multiply the result by the cost shown for
your share class, in the row entitled "Expenses Incurred During Period", to
estimate the expenses incurred on your account during this period.
The information under "Hypothetical Expenses" provides information about
hypothetical account values and hypothetical expenses based on the Portfolio's
actual expense ratio and an assumed rate of return of 5% per year before
expenses, which is not the Portfolio's actual return. The hypothetical account
values and expenses may not be used to estimate the actual ending account
balance or expense you incurred for the period. You may use this information to
compare the ongoing costs of investing in the Portfolio and other funds. To do
so, compare this 5% hypothetical example with the 5% hypothetical examples that
appear in the shareholder reports of the other funds.
Please note that the expenses shown in the table are meant to highlight your
ongoing costs only and do not reflect any transactional costs, such as front
and back end sales charges (loads) or redemption/exchange fees, where
applicable. Therefore, the hypothetical information is useful in comparing
ongoing costs only, and will not help you determine the relative total costs of
owning different funds.
Actual Expenses
-----------------------------------------------------------------------------------------------
Hilliard
Institutional Service Lyons Investor Investor Investor
Class Class Class A Class B Class C Class
--------------- --------------- --------------- --------------- --------------- ---------------
Beginning Account
Value (10/01/04) $ 1,000.00 $ 1,000.00 $ 1,000.00 $ 1,000.00 $ 1,000.00 $ 1,000.00
Ending Account Value
(3/31/05) 1,008.90 1,007.40 1,007.20 1,007.30 1,004.80 1,004.80
Expenses Incurred
During Period
(10/01/04 -
3/31/05) 2.10 3.60 3.85 3.75 6.20 6.20
Hypothetical Expenses
(5% return before expenses)
-----------------------------------------------------------------------------------------------
Hilliard
Institutional Service Lyons Investor Investor Investor
Class Class Class A Class B Class C Class
--------------- --------------- --------------- --------------- --------------- ---------------
Beginning Account
Value (10/01/04) $ 1,000.00 $ 1,000.00 $ 1,000.00 $ 1,000.00 $ 1,000.00 $ 1,000.00
Ending Account Value
(3/31/05) 1,022.88 1,021.36 1,021.11 1,021.21 1,018.74 1,018.74
Expenses Incurred
During Period
(10/01/04 -
3/31/05) 2.12 3.64 3.89 3.79 6.26 6.26
For each class of the Portfolio, expenses are equal to the annualized expense
ratio of 0.42%, 0.72%, 0.77%, 0.75%, 1.24%, and 1.24% for the Institutional,
Service, Hilliard Lyons, Investor A, B, and C share classes, respectively,
multiplied by the average account value over the period, multiplied by 182/365
(to reflect the one-half year period).
2
U.S. TREASURY MONEY MARKET PORTFOLIO
FUND PROFILE
Portfolio Diversification (% of
portfolio)
Repurchase Agreements 81.7 %
Treasuries/Agencies 18.3
-----
Total 100.0%
=====
Maturity Information
- ---------------------------------------------
Maturity Par Percentage
- --------------- ------------- -----------
1-7 Days 220,074,000 44.9%
8-14 Days 25,000,000 5.1
15-30 Days 90,000,000 18.4
31-60 Days 155,000,000 31.6
61-90 Days - -
91-120 Days - -
121-150 Days - -
over 150 Days - -
-----
100.0%
=====
Average Weighted Maturity - 16 days
- --------------------------------------------------------------------------------
EXPENSE EXAMPLE
As a shareholder of the Portfolio, you incur ongoing costs, including advisory
fees, distribution (12b-1) and service fees, where applicable; and other
Portfolio expenses. This Example is intended to help you understand your
ongoing costs (in dollars) of investing in the Portfolio and to compare these
costs with the ongoing costs of investing in other mutual funds.
The Example below is based on an investment of $1,000 invested at the beginning
of the period and held for the entire period October 1, 2004 to April 30, 2005.
The information under "Actual Expenses," together with the amount you invested,
allows you to estimate actual expenses incurred over the reporting period.
Simply divide your account value by $1,000 (for example, an $8,600 account
value divided by $1,000 = 8.60) and multiply the result by the cost shown for
your share class, in the row entitled "Expenses Incurred During Period", to
estimate the expenses incurred on your account during this period.
The information under "Hypothetical Expenses" provides information about
hypothetical account values and hypothetical expenses based on the Portfolio's
actual expense ratio and an assumed rate of return of 5% per year before
expenses, which is not the Portfolio's actual return. The hypothetical account
values and expenses may not be used to estimate the actual ending account
balance or expense you incurred for the period. You may use this information to
compare the ongoing costs of investing in the Portfolio and other funds. To do
so, compare this 5% hypothetical example with the 5% hypothetical examples that
appear in the shareholder reports of the other funds.
Please note that the expenses shown in the table are meant to highlight your
ongoing costs only and do not reflect any transactional costs, such as front
and back end sales charges (loads) or redemption/exchange fees, where
applicable. Therefore, the hypothetical information is useful in comparing
ongoing costs only, and will not help you determine the relative total costs of
owning different funds.
Actual Expenses
--------------------------------------------------------
Institutional Class Service Class Investor A Class
--------------------- --------------- ------------------
Beginning Account
Value (10/01/04) $ 1,000.00 $ 1,000.00 $ 1,000.00
Ending Account Value
(3/31/05) 1,008.30 1,006.90 1,006.60
Expenses Incurred
During Period
(10/01/04 -
3/31/05) 2.05 3.55 3.75
Hypothetical Expenses
(5% return before expenses)
-------------------------------------------------------
Institutional Class Service Class Investor A Class
--------------------- --------------- -----------------
Beginning Account
Value (10/01/04) $ 1,000.00 $ 1,000.00 $ 1,000.00
Ending Account Value
(3/31/05) 1,022.93 1,021.42 1,021.21
Expenses Incurred
During Period
(10/01/04 -
3/31/05) 2.07 3.58 3.79
For each class of the Portfolio, expenses are equal to the annualized expense
ratio of 0.41%, 0.71%, and 0.75% for the Institutional, Service, and Investor A
share classes, respectively, multiplied by the average account value over the
period, multiplied by 182/365 (to reflect the one-half year period).
3
MUNICIPAL MONEY MARKET PORTFOLIO
FUND PROFILE
Largest State
Concentration(% of
portfolio)
North Carolina 11.4 %
Virginia 9.8
Maryland 8.2
Texas 8.1
Massachusetts 5.5
Florida 5.0
Colorado 3.7
Connecticut 3.6
Michigan 3.2
Illinois 3.2
----
Total 61.7%
====
Maturity Information
- ---------------------------------------------
Maturity Par Percentage
- --------------- ------------- -----------
1-7 Days 219,293,000 75.8%
8-14 Days - -
15-30 Days 5,992,000 2.1
31-60 Days 4,400,000 1.4
61-90 Days 7,270,000 2.5
91-120 Days 6,559,347 2.3
121-150 Days 13,895,000 4.8
over 150 Days 31,995,000 11.1
-----
100.0%
=====
Average Weighted Maturity - 38 days
- --------------------------------------------------------------------------------
EXPENSE EXAMPLE
As a shareholder of the Portfolio, you incur ongoing costs, including advisory
fees, distribution (12b-1) and service fees, where applicable; and other
Portfolio expenses. This Example is intended to help you understand your
ongoing costs (in dollars) of investing in the Portfolio and to compare these
costs with the ongoing costs of investing in other mutual funds.
The Example below is based on an investment of $1,000 invested at the beginning
of the period and held for the entire period October 1, 2004 to April 30, 2005.
The information under "Actual Expenses," together with the amount you invested,
allows you to estimate actual expenses incurred over the reporting period.
Simply divide your account value by $1,000 (for example, an $8,600 account
value divided by $1,000 = 8.60) and multiply the result by the cost shown for
your share class, in the row entitled "Expenses Incurred During Period", to
estimate the expenses incurred on your account during this period.
The information under "Hypothetical Expenses" provides information about
hypothetical account values and hypothetical expenses based on the Portfolio's
actual expense ratio and an assumed rate of return of 5% per year before
expenses, which is not the Portfolio's actual return. The hypothetical account
values and expenses may not be used to estimate the actual ending account
balance or expense you incurred for the period. You may use this information to
compare the ongoing costs of investing in the Portfolio and other funds. To do
so, compare this 5% hypothetical example with the 5% hypothetical examples that
appear in the shareholder reports of the other funds.
Please note that the expenses shown in the table are meant to highlight your
ongoing costs only and do not reflect any transactional costs, such as front
and back end sales charges (loads) or redemption/exchange fees, where
applicable. Therefore, the hypothetical information is useful in comparing
ongoing costs only, and will not help you determine the relative total costs of
owning different funds.
Actual Expenses
----------------------------------------------------------------------------
Investor
Institutional Class Service Class Hilliard Lyons Class A Class
--------------------- --------------- ---------------------- ---------------
Beginning Account
Value (10/01/04) $ 1,000.00 $ 1,000.00 $ 1,000.00 $ 1,000.00
Ending Account Value
(3/31/05) 1,006.80 1,005.30 1,006.40 1,004.90
Expenses Incurred
During Period
(10/01/04 -
3/31/05) 2.10 3.60 2.60 4.04
Hypothetical Expenses
(5% return before expenses)
----------------------------------------------------------------------------
Investor
Institutional Class Service Class Hilliard Lyons Class A Class
--------------------- --------------- ---------------------- ---------------
Beginning Account
Value (10/01/04) $ 1,000.00 $ 1,000.00 $ 1,000.00 $ 1,000.00
Ending Account Value
(3/31/05) 1,022.88 1,021.36 1,022.37 1,020.92
Expenses Incurred
During Period
(10/01/04 -
3/31/05) 2.12 3.64 2.63 4.08
For each class of the Portfolio, expenses are equal to the annualized expense
ratio of 0.42%, 0.72%, 0.52%, and 0.81% for the Institutional, Service,
Hilliard Lyons, and Investor A share classes, respectively, multiplied by the
average account value over the period, multiplied by 182/365 (to reflect the
one-half year period).
4
NEW JERSEY MUNICIPAL MONEY MARKET PORTFOLIO
FUND PROFILE
Portfolio Diversification (% of
portfolio)
Variable Rate Demand Notes 84.7 %
Municipal Bonds 15.3
-----
Total 100.0
=====
Maturity Information
- ---------------------------------------------
Maturity Par Percentage
- --------------- ------------- -----------
1-7 Days 128,683,000 84.8%
8-14 Days - -
15-30 Days - -
31-60 Days - -
61-90 Days 8,775,000 5.8
91-120 Days 1,000,000 0.7
121-150 Days 4,500,000 3.0
over 150 Days 8,720,543 5.7
-----
100.0%
=====
Average Weighted Maturity - 30 days
- --------------------------------------------------------------------------------
EXPENSE EXAMPLE
As a shareholder of the Portfolio, you incur ongoing costs, including advisory
fees, distribution (12b-1) and service fees, where applicable; and other
Portfolio expenses. This Example is intended to help you understand your
ongoing costs (in dollars) of investing in the Portfolio and to compare these
costs with the ongoing costs of investing in other mutual funds.
The Example below is based on an investment of $1,000 invested at the beginning
of the period and held for the entire period October 1, 2004 to April 30, 2005.
The information under "Actual Expenses," together with the amount you invested,
allows you to estimate actual expenses incurred over the reporting period.
Simply divide your account value by $1,000 (for example, an $8,600 account
value divided by $1,000 = 8.60) and multiply the result by the cost shown for
your share class, in the row entitled "Expenses Incurred During Period", to
estimate the expenses incurred on your account during this period.
The information under "Hypothetical Expenses" provides information about
hypothetical account values and hypothetical expenses based on the Portfolio's
actual expense ratio and an assumed rate of return of 5% per year before
expenses, which is not the Portfolio's actual return. The hypothetical account
values and expenses may not be used to estimate the actual ending account
balance or expense you incurred for the period. You may use this information to
compare the ongoing costs of investing in the Portfolio and other funds. To do
so, compare this 5% hypothetical example with the 5% hypothetical examples that
appear in the shareholder reports of the other funds.
Please note that the expenses shown in the table are meant to highlight your
ongoing costs only and do not reflect any transactional costs, such as front
and back end sales charges (loads) or redemption/exchange fees, where
applicable. Therefore, the hypothetical information is useful in comparing
ongoing costs only, and will not help you determine the relative total costs of
owning different funds.
Actual Expenses
--------------------------------------------------------
Institutional Class Service Class Investor A Class
--------------------- --------------- ------------------
Beginning Account
Value (10/01/04) $ 1,000.00 $ 1,000.00 $ 1,000.00
Ending Account Value
(3/31/05) 1,007.00 1,005.50 1,005.00
Expenses Incurred
During Period
(10/01/04 -
3/31/05) 1.95 3.45 3.85
Hypothetical Expenses
(5% return before expenses)
-------------------------------------------------------
Institutional Class Service Class Investor A Class
--------------------- --------------- -----------------
Beginning Account
Value (10/01/04) $ 1,000.00 $ 1,000.00 $ 1,000.00
Ending Account Value
(3/31/05) 1,023.03 1,021.52 1,021.11
Expenses Incurred
During Period
(10/01/04 -
3/31/05) 1.97 3.48 3.89
For each class of the Portfolio, expenses are equal to the annualized expense
ratio of 0.39%, 0.69%, and 0.77% for the Institutional, Service, and Investor A
share classes, respectively, multiplied by the average account value over the
period, multiplied by 182/365 (to reflect the one-half year period).
5
NORTH CAROLINA MUNICIPAL MONEY MARKET PORTFOLIO
FUND PROFILE
Portfolio Diversification (% of
portfolio)
Variable Rate Demand Notes 80.8 %
Municipal Bonds 13.8
Municipal Put Bonds 5.4
-----
Total 100.0%
=====
Maturity Information
- --------------------------------------------
Maturity Par Percentage
- --------------- ------------ -----------
1-7 Days 47,735,000 86.1%
8-14 Days - -
15-30 Days - -
31-60 Days 2,780,000 5.0
61-90 Days 2,600,000 4.7
91-120 Days 350,000 0.6
121-150 Days - -
over 150 Days 2,000,000 3.6
-----
100.0%
=====
Average Weighted Maturity - 22 days
- --------------------------------------------------------------------------------
EXPENSE EXAMPLE
As a shareholder of the Portfolio, you incur ongoing costs, including advisory
fees, distribution (12b-1) and service fees, where applicable; and other
Portfolio expenses. This Example is intended to help you understand your
ongoing costs (in dollars) of investing in the Portfolio and to compare these
costs with the ongoing costs of investing in other mutual funds.
The Example below is based on an investment of $1,000 invested at the beginning
of the period and held for the entire period October 1, 2004 to April 30, 2005.
The information under "Actual Expenses," together with the amount you invested,
allows you to estimate actual expenses incurred over the reporting period.
Simply divide your account value by $1,000 (for example, an $8,600 account
value divided by $1,000 = 8.60) and multiply the result by the cost shown for
your share class, in the row entitled "Expenses Incurred During Period", to
estimate the expenses incurred on your account during this period.
The information under "Hypothetical Expenses" provides information about
hypothetical account values and hypothetical expenses based on the Portfolio's
actual expense ratio and an assumed rate of return of 5% per year before
expenses, which is not the Portfolio's actual return. The hypothetical account
values and expenses may not be used to estimate the actual ending account
balance or expense you incurred for the period. You may use this information to
compare the ongoing costs of investing in the Portfolio and other funds. To do
so, compare this 5% hypothetical example with the 5% hypothetical examples that
appear in the shareholder reports of the other funds.
Please note that the expenses shown in the table are meant to highlight your
ongoing costs only and do not reflect any transactional costs, such as front
and back end sales charges (loads) or redemption/exchange fees, where
applicable. Therefore, the hypothetical information is useful in comparing
ongoing costs only, and will not help you determine the relative total costs of
owning different funds.
Actual Expenses
--------------------------------------------------------
Institutional Class Service Class Investor A Class
--------------------- --------------- ------------------
Beginning Account
Value (10/01/04) $ 1,000.00 $ 1,000.00 $ 1,000.00
Ending Account Value
(3/31/05) 1,007.30 1,005.80 1,005.50
Expenses Incurred
During Period
(10/01/04 -
3/31/05) 1.50 3.00 3.20
Hypothetical Expenses
(5% return before expenses)
-------------------------------------------------------
Institutional Class Service Class Investor A Class
--------------------- --------------- -----------------
Beginning Account
Value (10/01/04) $ 1,000.00 $ 1,000.00 $ 1,000.00
Ending Account Value
(3/31/05) 1,023.49 1,021.97 1,021.77
Expenses Incurred
During Period
(10/01/04 -
3/31/05) 1.51 3.03 3.23
For each class of the Portfolio, expenses are equal to the annualized expense
ratio of 0.30%, 0.60%, and 0.64% for the Institutional, Service, and Investor A
share classes, respectively, multiplied by the average account value over the
period, multiplied by 182/365 (to reflect the one-half year period).
6
OHIO MUNICIPAL MONEY MARKET PORTFOLIO
FUND PROFILE
Portfolio Diversification (% of
portfolio)
Variable Rate Demand Notes 74.5 %
Municipal Bonds 24.2
Municipal Put Bonds 1.3
-----
Total 100.0%
=====
Maturity Information
- ---------------------------------------------
Maturity Par Percentage
- --------------- ------------- -----------
1-7 Days 122,525,000 75.7%
8-14 Days 3,890,000 2.4
15-30 Days - -
31-60 Days 3,615,000 2.2
61-90 Days 1,685,000 1.0
91-120 Days 3,455,000 2.1
121-150 Days 6,280,000 3.9
over 150 Days 20,347,675 12.7
-----
100.0%
=====
Average Weighted Maturity - 46 days
- --------------------------------------------------------------------------------
EXPENSE EXAMPLE
As a shareholder of the Portfolio, you incur ongoing costs, including advisory
fees, distribution (12b-1) and service fees, where applicable; and other
Portfolio expenses. This Example is intended to help you understand your
ongoing costs (in dollars) of investing in the Portfolio and to compare these
costs with the ongoing costs of investing in other mutual funds.
The Example below is based on an investment of $1,000 invested at the beginning
of the period and held for the entire period October 1, 2004 to April 30, 2005.
The information under "Actual Expenses," together with the amount you invested,
allows you to estimate actual expenses incurred over the reporting period.
Simply divide your account value by $1,000 (for example, an $8,600 account
value divided by $1,000 = 8.60) and multiply the result by the cost shown for
your share class, in the row entitled "Expenses Incurred During Period", to
estimate the expenses incurred on your account during this period.
The information under "Hypothetical Expenses" provides information about
hypothetical account values and hypothetical expenses based on the Portfolio's
actual expense ratio and an assumed rate of return of 5% per year before
expenses, which is not the Portfolio's actual return. The hypothetical account
values and expenses may not be used to estimate the actual ending account
balance or expense you incurred for the period. You may use this information to
compare the ongoing costs of investing in the Portfolio and other funds. To do
so, compare this 5% hypothetical example with the 5% hypothetical examples that
appear in the shareholder reports of the other funds.
Please note that the expenses shown in the table are meant to highlight your
ongoing costs only and do not reflect any transactional costs, such as front
and back end sales charges (loads) or redemption/exchange fees, where
applicable. Therefore, the hypothetical information is useful in comparing
ongoing costs only, and will not help you determine the relative total costs of
owning different funds.
Actual Expenses
--------------------------------------------------------
Institutional Class Service Class Investor A Class
--------------------- --------------- ------------------
Beginning Account
Value (10/01/04) $ 1,000.00 $ 1,000.00 $ 1,000.00
Ending Account Value
(3/31/05) 1,007.20 1,005.80 1,005.80
Expenses Incurred
During Period
(10/01/04 -
3/31/05) 1.95 3.45 3.45
Hypothetical Expenses
(5% return before expenses)
-------------------------------------------------------
Institutional Class Service Class Investor A Class
--------------------- --------------- -----------------
Beginning Account
Value (10/01/04) $ 1,000.00 $ 1,000.00 $ 1,000.00
Ending Account Value
(3/31/05) 1,023.03 1,021.52 1,021.52
Expenses Incurred
During Period
(10/01/04 -
3/31/05) 1.97 3.48 3.48
For each class of the Portfolio, expenses are equal to the annualized expense
ratio of 0.39%, 0.69%, and 0.69% for the Institutional, Service, and Investor A
share classes, respectively, multiplied by the average account value over the
period, multiplied by 182/365 (to reflect the one-half year period).
7
PENNSYLVANIA MUNICIPAL MONEY MARKET PORTFOLIO
FUND PROFILE
Portfolio Diversification (% of
portfolio)
Variable Rate Demand Notes 83.8 %
Commercial Paper 8.1
Municipal Put Bonds 6.1
Municipal Bonds 2.0
-----
Total 100.0%
=====
Maturity Information
- ---------------------------------------------
Maturity Par Percentage
- --------------- ------------- -----------
1-7 Days 423,295,000 81.4%
8-14 Days - -
15-30 Days 14,900,000 2.9
31-60 Days 55,423,000 10.7
61-90 Days 3,285,000 0.6
91-120 Days 2,810,000 0.5
121-150 Days 1,805,000 0.3
over 150 Days 18,580,000 3.6
-----
100.0%
=====
Average Weighted Maturity - 21 days
- --------------------------------------------------------------------------------
EXPENSE EXAMPLE
As a shareholder of the Portfolio, you incur ongoing costs, including advisory
fees, distribution (12b-1) and service fees, where applicable; and other
Portfolio expenses. This Example is intended to help you understand your
ongoing costs (in dollars) of investing in the Portfolio and to compare these
costs with the ongoing costs of investing in other mutual funds.
The Example below is based on an investment of $1,000 invested at the beginning
of the period and held for the entire period October 1, 2004 to April 30, 2005.
The information under "Actual Expenses," together with the amount you invested,
allows you to estimate actual expenses incurred over the reporting period.
Simply divide your account value by $1,000 (for example, an $8,600 account
value divided by $1,000 = 8.60) and multiply the result by the cost shown for
your share class, in the row entitled "Expenses Incurred During Period", to
estimate the expenses incurred on your account during this period.
The information under "Hypothetical Expenses" provides information about
hypothetical account values and hypothetical expenses based on the Portfolio's
actual expense ratio and an assumed rate of return of 5% per year before
expenses, which is not the Portfolio's actual return. The hypothetical account
values and expenses may not be used to estimate the actual ending account
balance or expense you incurred for the period. You may use this information to
compare the ongoing costs of investing in the Portfolio and other funds. To do
so, compare this 5% hypothetical example with the 5% hypothetical examples that
appear in the shareholder reports of the other funds.
Please note that the expenses shown in the table are meant to highlight your
ongoing costs only and do not reflect any transactional costs, such as front
and back end sales charges (loads) or redemption/exchange fees, where
applicable. Therefore, the hypothetical information is useful in comparing
ongoing costs only, and will not help you determine the relative total costs of
owning different funds.
Actual Expenses
--------------------------------------------------------
Institutional Class Service Class Investor A Class
--------------------- --------------- ------------------
Beginning Account
Value (10/01/04) $ 1,000.00 $ 1,000.00 $ 1,000.00
Ending Account Value
(3/31/05) 1,007.00 1,005.50 1,006.00
Expenses Incurred
During Period
(10/01/04 -
3/31/05) 2.10 3.60 3.10
Hypothetical Expenses
(5% return before expenses)
-------------------------------------------------------
Institutional Class Service Class Investor A Class
--------------------- --------------- -----------------
Beginning Account
Value (10/01/04) $ 1,000.00 $ 1,000.00 $ 1,000.00
Ending Account Value
(3/31/05) 1,022.88 1,021.36 1,021.87
Expenses Incurred
During Period
(10/01/04 -
3/31/05) 2.12 3.64 3.13
For each class of the Portfolio, expenses are equal to the annualized expense
ratio of 0.42%, 0.72%, and 0.62% for the Institutional, Service, and Investor A
share classes, respectively, multiplied by the average account value over the
period, multiplied by 182/365 (to reflect the one-half year period).
8
VIRGINIA MUNICIPAL MONEY MARKET PORTFOLIO
FUND PROFILE
Portfolio Diversification (% of
portfolio)
Variable Rate Demand Notes 66.9 %
Municipal Bonds 25.3
Commerical Paper 7.8
-----
Total 100.0%
=====
Maturity Information
- -------------------------------------------
Maturity Par Percentage
- --------------- ----------- -----------
1-7 Days 9,010,000 70.8%
8-14 Days - -
15-30 Days - -
31-60 Days 1,530,000 12.0
61-90 Days 1,425,000 11.2
91-120 Days 305,000 2.5
121-150 Days 450,000 3.5
over 150 Days - -
-----
100.0%
=====
Average Weighted Maturity - 23 days
- --------------------------------------------------------------------------------
EXPENSE EXAMPLE
As a shareholder of the Portfolio, you incur ongoing costs, including advisory
fees, distribution (12b-1) and service fees, where applicable; and other
Portfolio expenses. This Example is intended to help you understand your
ongoing costs (in dollars) of investing in the Portfolio and to compare these
costs with the ongoing costs of investing in other mutual funds.
The Example below is based on an investment of $1,000 invested at the beginning
of the period and held for the entire period October 1, 2004 to April 30, 2005.
The information under "Actual Expenses," together with the amount you invested,
allows you to estimate actual expenses incurred over the reporting period.
Simply divide your account value by $1,000 (for example, an $8,600 account
value divided by $1,000 = 8.60) and multiply the result by the cost shown for
your share class, in the row entitled "Expenses Incurred During Period", to
estimate the expenses incurred on your account during this period.
The information under "Hypothetical Expenses" provides information about
hypothetical account values and hypothetical expenses based on the Portfolio's
actual expense ratio and an assumed rate of return of 5% per year before
expenses, which is not the Portfolio's actual return. The hypothetical account
values and expenses may not be used to estimate the actual ending account
balance or expense you incurred for the period. You may use this information to
compare the ongoing costs of investing in the Portfolio and other funds. To do
so, compare this 5% hypothetical example with the 5% hypothetical examples that
appear in the shareholder reports of the other funds.
Please note that the expenses shown in the table are meant to highlight your
ongoing costs only and do not reflect any transactional costs, such as front
and back end sales charges (loads) or redemption/exchange fees, where
applicable. Therefore, the hypothetical information is useful in comparing
ongoing costs only, and will not help you determine the relative total costs of
owning different funds.
Hypothetical Expenses
Actual Expenses (5% return before expenses)
----------------- ----------------------------
Institutional Institutional
Class Class
----------------- ----------------------------
Beginning Account
Value (10/01/04) $ 1,000.00 $ 1,000.00
Ending Account Value
(3/31/05) 1,007.30 1,023.49
Expenses Incurred
During Period
(10/01/04 -
3/31/05) 1.50 1.51
For the Institutional share class of the Portfolio, expenses are equal to the
annualized expense ratio of 0.30%, multiplied by the average account value over
the period, multiplied by 182/
365 (to reflect the one-half year period).
9
BLACKROCK FUNDS
STATEMENT OF NET ASSETS
MONEY MARKET PORTFOLIO
AS OF MARCH 31, 2005 (UNAUDITED)
PAR
MATURITY (000) VALUE
---------- ---------- --------------
AGENCY OBLIGATIONS - 7.4%
Federal Home Loan Bank Bonds - 2.1%
1.40% 04/01/05 $ 3,000 $ 3,000,000
1.42% 04/04/05 26,000 26,000,000
1.35% 04/15/05 3,000 3,000,000
============
32,000,000
------------
Federal Home Loan Bank Variable Rate Notes -
4.9%
2.88%(b) 06/13/05 75,000 74,979,733
------------
Federal National Mortgage Association Bonds -
0.4%
1.40% 05/03/05 2,500 2,500,000
1.60% 05/13/05 3,000 3,000,000
============
5,500,000
------------
TOTAL AGENCY OBLIGATIONS
(Cost $112,479,733) 112,479,733
------------
CERTIFICATES OF DEPOSIT - 24.8%
Domestic - 19.8%
Banco Santander, Puerto Rico (A-1, P-1)
2.81% 04/18/05 50,000 50,000,001
Banque Nationale de Paribas, New York
(A-1+, P-1)
2.90% 06/13/05 70,000 70,000,704
Credit Suisse First Boston, New York (A-1, P-1)
2.76% 05/03/05 30,000 30,000,000
3.06% 06/21/05 5,000 5,001,095
UBS AG, Stamford Branch (A-1+, P-1)
2.80% 05/02/05 70,000 70,000,150
Washington Mutual Bank F.A. (A-1, P-1)
2.81% 05/03/05 74,250 74,250,000
============
299,251,950
------------
Yankee Dollar - 5.0%
Depfa Bank PLC, New York (A-1+, F-1+)
2.49% 11/01/05 15,000 15,000,000
Eurohypo AG, New York (A-1, P-1)
2.82% 05/02/05 29,705 29,705,000
Societe Generale, New York (A-1+, P-1)
1.44% 05/09/05 30,000 29,999,532
============
74,704,532
------------
TOTAL CERTIFICATES OF DEPOSIT
(Cost $373,956,482) 373,956,482
------------
COMMERCIAL PAPER - 32.9%
Asset-Backed Securities - 23.6%
Atomium Funding Corp. (A-1, P-1)
2.81% 04/22/05 32,600 32,546,563
Brahms Funding Corp. (A-1, P-1)
2.83% 04/21/05 16,874 16,847,470
Cancara Asset Securitisation Limit (A-1+, P-1)
2.80% 04/20/05 18,433 18,405,760
Concord Minutemen Capital Co. LLC (A-1, P-1)
2.84% 04/18/05 35,000 34,953,226
Dakota Notes Program (A-1, P-1)
0.00% 04/14/05 35,000 34,964,864
FCAR Owner Trust Series I (A-1+, P-1)
2.56% 04/04/05 3,800 3,799,192
2.68% 06/03/05 4,300 4,280,059
Lockhart Funding LLC (P-1)
2.71% 05/04/05 15,237 15,199,149
2.96% 06/06/05 25,733 25,593,357
2.97% 06/13/05 34,790 34,580,477
PAR
MATURITY (000) VALUE
---------- ---------- --------------
COMMERCIAL PAPER (Continued)
Asset-Backed Securities (Continued)
Newcastle Certificates (A-1+, P-1)
2.81% 04/19/05 $54,180 $ 54,103,877
Park Sienna LLC (A-1+, P-1)
2.83% 04/20/05 50,119 50,044,142
Victory Receivables Corp. (A-1, P-1)
2.80% 04/21/05 33,033 32,981,615
============
358,299,751
------------
Banks - 0.9%
BankAmerica Corp. (A-1+, P-1)
2.56% 05/04/05 4,500 4,489,522
2.64% 06/13/05 4,500 4,476,184
UBS Finance LLC (A-1+, P-1)
2.50% 04/05/05 4,300 4,298,813
============
13,264,519
------------
Credit Institutions - 5.7%
Countrywide Home Loans, Inc. (A-1, P-2)
2.81% 04/28/05 75,000 74,841,937
General Electric Capital Corp. (A-1+, P-1)
2.44% 04/05/05 2,300 2,299,382
International Lease Finance Corp. (A-1, P-1)
2.61% 04/20/05 7,000 6,990,431
Toyota Motor Credit Co. (A-1+, P-1)
2.58% 05/31/05 2,300 2,290,225
============
86,421,975
------------
Miscellaneous Business Credit Institution - 1.6%
National Rural Utilities Cooperative (A-1, P-1)
2.80% 04/22/05 24,520 24,479,952
------------
Telephone Communications - 1.1%
SBC Communications, Inc. (A-1, P-1)
2.73% 04/25/05 16,160 16,130,589
------------
TOTAL COMMERCIAL PAPER
(Cost $498,596,786) 498,596,786
------------
MASTER NOTES - 5.7%
Security Brokers & Dealers
Bank of America Securities LLC (A-1, P-1)(c)
2.96%(b) 04/01/05 7,600 7,600,000
Merrill Lynch Mortgage Capital, Inc. (A-1, P-1)(c)
2.98% 04/01/05 29,300 29,300,000
Morgan Stanley Mortgage Capital, Inc. (A-1, P-1)(c)
3.04% 04/01/05 50,000 50,000,000
============
TOTAL MASTER NOTES
(Cost $86,900,000)
86,900,000
------------
CORPORATE BONDS - 2.8%
Banks - 0.8%
Bank One Corp. (A-1, P-1)
7.62% 08/01/05 990 1,005,870
Citigroup, Inc. (A-1+, P-1)
2.90% 05/19/05 7,000 7,000,615
Washington Mutual Financial Corp. (A-1, P-1)
8.25% 06/15/05 3,500 3,539,090
Wells Fargo & Co. (A-1+, P-1)
3.02%(b) 06/17/05 1,800 1,799,993
============
13,345,568
------------
SEE ACCOMPANYING NOTES TO FINANCIAL STATEMENTS
10
BLACKROCK FUNDS
STATEMENT OF NET ASSETS
MONEY MARKET PORTFOLIO (CONTINUED)
AS OF MARCH 31, 2005 (UNAUDITED)
PAR
MATURITY (000) VALUE
---------- ---------- --------------
CORPORATE BONDS (Continued)
Finance Services - 1.3%
American Express Credit Corp. (A-1, P-1)
2.93% 04/18/05 $ 7,500 $ 7,500,493
2.85% 08/11/05 3,500 3,501,376
Caterpillar Financial Services Corp. (A-1, P-1)
2.98% 04/25/05 3,000 3,000,596
Goldman Sachs & Co. (A-1, P-1)
1.82% 07/29/05 2,500 2,500,000
Heller Financial, Inc. (A-1+, P-1)
8.00% 06/15/05 1,000 1,010,887
Spear, Leeds & Kellogg LP (A-1, P-1)
8.25% 08/15/05 2,000 2,039,268
============
19,552,620
------------
Manufacturing - 0.3%
General Electric Co. (A-1+, P-1)
2.74% 04/25/05 4,500 4,501,354
------------
Publishing & Printing - 0.4%
Gannett Co, Inc. (A-1, P-1)
4.95% 04/01/05 5,530 5,530,000
------------
TOTAL CORPORATE BONDS
(Cost $42,929,542) 42,929,542
------------
VARIABLE RATE OBLIGATIONS - 20.2%
Asset-Backed Securities - 1.0%
Racers XL (A-1, P-1)
2.85%(b) 04/22/05 11,360 11,360,000
SMM Trust Series 2004G (A-1+, P-1)
2.93%(b) 06/03/05 3,069 3,068,661
============
14,428,661
------------
Banks - 5.9%
HBOS Treasury Services PLC (A-1+, P-1)
3.08%(b) 06/24/05 65,000 65,000,000
Westpac Banking Corp. (AA-, Aa3)
2.99%(b) 06/13/05 24,250 24,250,000
============
89,250,000
------------
Life Insurance - 5.2%
John Hancock Global Funding II (A-1+, P-1)
3.25%(b) 06/06/05 3,400 3,404,431
MetLife Global Funding I (AA, Aa2)
2.89%(b) 04/01/05 15,000 15,000,000
Transamerica Occidental Life Insurance Co.
(A-1+, P-1)
3.05%(b)(d) 06/01/05 60,000 60,000,000
============
78,404,431
------------
Municipal Bonds - 1.5%
De Kalb County Development Authority University
RB Series 1995B DN (A-1+, VMIG-1)
2.85%(e) 04/07/05 3,875 3,875,000
North Carolina Medical Care Commission Hospital
RB (Park Ridge Hospital Project) Series 1988 DN
(NationsBank LOC) (A-1+)
2.28%(e) 04/07/05 200 200,000
North Myrtle Beach Corp. Series 2005 DN (National
Bank of South Carolina LOC)
2.89%(e) 04/07/05 6,100 6,100,000
South Central Texas IDRB Series 1990 DN (Bank
One N.A. LOC) (A-1, P-1)
2.87%(e) 04/07/05 14,800 14,800,000
============
24,975,000
------------
PAR
MATURITY (000) VALUE
---------- ---------- --------------
VARIABLE RATE OBLIGATIONS (Continued)
Personal Credit Institutions - 3.0%
General Electric Capital Corp. (AAA, Aaa)
2.93%(b) 04/18/05 $45,000 $ 45,000,000
------------
Security Brokers & Dealers - 3.6%
Merrill Lynch & Co., Inc. (A+, Aa3)
2.92%(b) 04/11/05 50,000 50,000,000
Morgan Stanley & Co., Inc. (A+, Aa3)
2.93%(b) 04/15/05 4,800 4,802,884
============
54,802,884
------------
TOTAL VARIABLE RATE OBLIGATIONS
(Cost $306,860,976)
306,860,976
------------
REPURCHASE AGREEMENTS - 6.3%
Goldman Sachs & Co.
2.90% 04/01/05 95,800 95,800,000
(Agreement dated 03/31/05 to be
repurchased at $95,807,717,
collateralized by $291,353,757
Federal Home Loan Mortgage
Corporation Bonds and Federal
National Mortgage Association
Bonds 5.50% to 7.50% due
from 03/01/15 to 10/01/34. The
value of the collateral is
$ 97,716,000.)
(Cost $95,800,000)
------------
TOTAL INVESTMENTS IN SECURITIES -
100.1%
(Cost $1,517,523,519(a)) 1,517,523,519
LIABILITIES IN EXCESS OF
OTHER ASSETS - (0.1)% (1,958,085)
-------------
NET ASSETS - 100.0%
(Applicable to 541,872,464
Institutional shares, 363,966,954
Service shares, 117,650,854
Hilliard Lyons shares 465,983,752
Investor A shares, 20,278,598
Investor B shares and 5,989,446
Investor C shares) $1,515,565,434
==============
SEE ACCOMPANYING NOTES TO FINANCIAL STATEMENTS
11
BLACKROCK FUNDS
STATEMENT OF NET ASSETS
MONEY MARKET PORTFOLIO (CONCLUDED)
AS OF MARCH 31, 2005 (UNAUDITED)
VALUE
-----------
NET ASSET VALUE, OFFERING AND
REDEMPTION PRICE PER
INSTITUTIONAL SHARE
($541,779,406/541,872,464) $ 1.00
=======
NET ASSET VALUE, OFFERING AND
REDEMPTION PRICE PER
SERVICE SHARE
($363,925,516/363,966,954) $ 1.00
=======
NET ASSET VALUE, OFFERING AND
REDEMPTION PRICE PER
HILLIARD LYONS SHARE
($117,647,177/117,650,854) $ 1.00
=======
NET ASSET VALUE, OFFERING AND
REDEMPTION PRICE PER
INVESTOR A SHARE
($465,945,851/465,983,752) $ 1.00
=======
NET ASSET VALUE, OFFERING AND
REDEMPTION PRICE PER
INVESTOR B SHARE
($20,278,506/20,278,598) $ 1.00
=======
NET ASSET VALUE, OFFERING AND
REDEMPTION PRICE PER
INVESTOR C SHARE
($5,988,978/5,989,446) $ 1.00
=======
- -------------------
(a) Aggregate cost for Federal income tax purposes.
(b) Rates shown are the rates as of March 31, 2005 and maturities shown are
the next interest readjustment date.
(c) Ratings reflect those of guarantor.
(d) Security is illiquid.
(e) Rates shown are the rates as of March 31, 2005 and maturities shown are
the next interest readjustment date or the date the principal owed can
be recovered through demand.
SEE ACCOMPANYING NOTES TO FINANCIAL STATEMENTS
12
BLACKROCK FUNDS
STATEMENT OF NET ASSETS
U.S. TREASURY MONEY MARKET PORTFOLIO
AS OF APRIL 30, 2005 (UNAUDITED)
PAR
MATURITY (000) VALUE
---------- ---------- ----------------
U.S. TREASURY OBLIGATIONS - 21.7%
U.S. Treasury Bills - 18.1%
2.72% 04/15/05 $75,000 $ 74,920,715
-------------
U.S. Treasury Notes - 3.6%
1.62% 04/30/05 15,000 15,004,145
-------------
TOTAL U.S. TREASURY OBLIGATIONS
(Cost $89,924,860) 89,924,860
-------------
REPURCHASE AGREEMENTS - 96.5%
Deutsche Bank Securities, Inc.
2.70 % 04/01/05 70,000 70,000,000
(Agreement dated 03/31/05 to be
repurchased at $70,005,250,
collateralized by $133,983,863
U.S. Treasury Strips 0.00% due
02/15/18. The value of the
collateral is $71,400,000.)
Deutsche Bank Securities, Inc.
2.55 % 04/11/05 25,000 25,000,000
(Agreement dated 02/09/05 to be
repurchased at $25,108,020,
collateralized by $47,851,379 U.S.
Treasury Strips 0.00% due
02/15/18. The value of the
collateral is $25,500,000.)
Goldman Sachs & Co.
2.70 % 05/03/05 65,000 65,000,000
(Agreement dated 03/24/05 to be
repurchased at $65,195,000,
collateralized by $66,332,000 U.S.
Treasury Bills 2.57% due
04/07/05. The value of the
collateral is $66,300,161.)
Lehman Brothers Inc.
2.60 % 04/01/05 95,000 95,000,000
(Agreement dated 03/31/05 to be
repurchased at $95,006,861,
collateralized by $84,414,000 U.S.
Treasury Notes and Inflation
Indexed Securities 1.39% to
6.50% due from 10/15/06 to
04/15/29. The value of the
collateral is $96,885,075.)
Morgan Stanley & Co., Inc.
2.65 % 04/01/05 55,074 55,074,000
(Agreement dated 03/31/05 to be
repurchased at $55,078,054,
collateralized by $42,776,388 U.S.
Treasury Bonds 7.25% to 7.63%
due from 08/15/22 to 11/15/22.
The value of the collateral is
$ 56,176,247.)
Morgan Stanley & Co., Inc.
2.70 % 05/24/05 15,000 15,000,000
(Agreement dated 02/23/05 to be
repurchased at $15,101,250,
collateralized by $11,650,612 U.S.
Treasury Bonds 7.25% to 7.63%
due from 08/15/22 to 11/15/22.
The value of the collateral is
PAR
MATURITY (000) VALUE
$ 15,300,209.) ---------- ---------- ----------------
REPURCHASE AGREEMENTS (Continued)
UBS Securities LLC
2.70 % 05/03/05 $50,000 $ 50,000,000
(Agreement dated 03/24/05 to be
repurchased at $50,150,000
collateralized by $51,000,000 U.S.
Treasury Bonds 3.38% due
02/15/08. The value of the
collateral is $51,546,000.)
UBS Securities LLC
2.75 % 05/16/05 25,000 25,000,000
(Agreement dated 03/16/05 to be
repurchased at $25,116,493
collateralized by $45,684,000 U.S.
Treasury Bonds and Notes 1.50%
to 13.88% due from 04/30/05 to
05/15/30. The value of the
collateral is $53,197,506.)
=============
TOTAL REPURCHASE AGREEMENTS
(Cost $400,074,000) 400,074,000
-------------
TOTAL INVESTMENTS IN SECURITIES - 118.2%
(Cost $489,998,860(a)) 489,998,860
LIABILITIES IN EXCESS OF OTHER
ASSETS - (18.2)%
(75,455,575)
-------------
(Including $74,920,715 of investment
purchases payable)
NET ASSETS - 100.0%
(Applicable to 180,678,727
Institutional shares, 194,701,223
Service shares and 39,232,986
Investor A shares) $ 414,543,285
=============
NET ASSET VALUE, OFFERING
AND REDEMPTION PRICE PER
INSTITUTIONAL SHARE
($180,651,601/180,678,727) $ 1.00
=======
NET ASSET VALUE, OFFERING
AND REDEMPTION PRICE PER
SERVICE SHARE
($194,646,896/194,701,223) $ 1.00
=======
NET ASSET VALUE, OFFERING
AND REDEMPTION PRICE PER
INVESTOR A SHARE
($39,244,788/39,232,986) $ 1.00
=======
- -------------------
(a) Aggregate cost for Federal income tax purposes.
SEE ACCOMPANYING NOTES TO FINANCIAL STATEMENTS
13
BLACKROCK FUNDS
STATEMENT OF NET ASSETS
MUNICIPAL MONEY MARKET PORTFOLIO
AS OF APRIL 30, 2005 (UNAUDITED)
PAR
MATURITY (000) VALUE
---------- ---------- -------------
MUNICIPAL BONDS - 99.8%
Alabama - 2.3%
Alexander City Industrial Board
IDRB Series 2000 DN (Southtrust
Bank LOC) (A-1, P-1)
2.22%(b) 04/07/05 $ 975 $ 975,000
Columbia IDRB (Alabama Power
Co. Project) Series 1995B DN
(The Southern Co. Guaranty)
(A-1, VMIG-1)
2.25%(b) 04/01/05 1,800 1,800,000
Columbia IDRB (Alabama Power
Co. Project) Series 1999A DN
(The Southern Co. Guaranty)
(A-1, VMIG-1)
2.25%(b) 04/01/05 1,000 1,000,000
Geneva County Health Care
Authority RB Series 2001 DN
(Southtrust Bank LOC)
2.17%(b) 04/07/05 2,833 2,833,000
===========
6,608,000
-----------
Alaska - 0.9%
Anchorage Water RB (Wachovia
Merlots Trust Receipts) Series
2004C-32 MB (MBIA Insurance,
Wachovia Bank N.A. SBPA)
(MIG-1)
1.70% 09/16/05 1,000 1,000,000
Valdez Marine Terminal RB
(ConocoPhillips Co. Project)
Series 1994 MB (A-2, MIG-2)
1.80% 06/01/05 1,600 1,600,000
===========
2,600,000
-----------
Arizona - 2.6%
Pima County IDA Single Family
Mortgage RB (Draw Down
Project) Series 2002 AMT DN
(CDC Insurance)
2.62%(b) 04/01/05 4,637 4,637,000
Pima County IDA Single Family
Mortgage RB (Draw Down
Project) Series 2003 AMT DN
(Trinity Funding Guaranty)
2.83%(b) 04/25/05 2,892 2,892,000
===========
7,529,000
-----------
Arkansas - 0.9%
Little Rock Residential Housing &
Public Facilities Board Capital
Improvement RB (Park Systems
Project) Series 2001 DN (Bank of
America N.A. LOC) (A-1+)
2.38%(b) 04/07/05 2,685 2,685,000
-----------
California - 2.4%
Golden State Tobacco Securitization
Corp. RB (Merrill Lynch P-Float
Trust Receipts) Series 2004
PA-1236 DN (Merrill Lynch & Co.
Guaranty, Merrill Lynch Capital
Services SBPA) (F-1+)
2.37%(b) 04/07/05 1,330 1,330,000
PAR
MATURITY (000) VALUE
---------- ---------- -------------
MUNICIPAL BONDS (Continued)
California (Continued)
Irvine Improvement Board Act of
1915 (Assessment District No.
89-10) Special Assessment
Limited Obligation Series 1990 DN
(Bayerische Landesbank
Girozentrale LOC) (VMIG-1, F-1)
2.28%(b) 04/01/05 $3,675 $ 3,675,000
Sacramento Municipal Utility District
RB Series 2000A DN (AMBAC
Insurance, Wachovia Bank N.A.
LOC) (VMIG-1)
2.32%(b) 04/07/05 1,400 1,400,000
Southern California Public Power
Authority RB (San Juan Power
Project) Series 2002 DN (FSA
Insurance, Wachovia Bank N.A.
LOC) (VMIG-1)
2.32%(b) 04/07/05 690 690,000
===========
7,095,000
-----------
Colorado - 3.7%
Denver Urban Renewal Authority
Tax Increment RB (Merrill Lynch
P-Float Trust Receipts) Series
2004 PT-999 DN (Lloyds Bank
SBPA) (A-1, AA-)
2.37%(b) 04/07/05 1,500 1,500,000
Park Creek Metropolitan District GO
(Merrill Lynch P-Float Trust
Receipts) Series 2004 PT-2321
DN (Merrill Lynch & Co. Guaranty,
Merrill Lynch Capital Services
SBPA) (F-1+)
2.37%(b) 04/07/05 9,345 9,345,000
===========
10,845,000
-----------
Connecticut - 3.6%
Clipper Tax-Exempt RB Series
2004-9 DN (State Street Bank &
Trust Liquidity Facility) (VMIG-1)
2.48%(b) 04/07/05 8,000 8,000,000
Danbury GO Series 2004 BAN
(SP-1+, MIG-1)
3.00% 08/05/05 2,300 2,311,807
===========
10,311,807
-----------
Delaware - 1.9%
Delaware Economic Development
Authority RB (Catholic Diocese of
Wilmington Project) Series 2002
DN (Allied Irish Bank PLC LOC)
(VMIG-1)
2.40%(b) 04/07/05 1,900 1,900,000
Delaware Economic Development
Authority RB (Delmarva Power &
Light Co. Project) Series 1994 DN
(Delmarva Power & Light Co.,
Guaranteed) (A-2, VMIG-2)
2.53%(b) 04/01/05 1,600 1,600,000
Delaware Economic Development
Authority RB (St. Anne's Episcopal
School Project) Series 2001 DN
(Wilmington Trust Co. LOC) (A-1)
2.40%(b) 04/07/05 2,000 2,000,000
===========
5,500,000
-----------
SEE ACCOMPANYING NOTES TO FINANCIAL STATEMENTS
14
BLACKROCK FUNDS
STATEMENT OF NET ASSETS
MUNICIPAL MONEY MARKET PORTFOLIO (CONTINUED)
AS OF APRIL 30, 2005 (UNAUDITED)
PAR
MATURITY (000) VALUE
---------- ---------- -------------
MUNICIPAL BONDS (Continued)
Florida - 5.0%
Florida Board of Education Lottery
RB Series 2000-222Z MB (FGIC
Insurance, J.P. Morgan Chase
Bank Liquidity Facility) (A-1+)
1.30% 04/29/05 $3,100 $ 3,097,372
Florida Housing Finance Corp. Multi
Family RB (Merrill Lynch P-Float
Trust Receipts) Series 2000
PT-1234 DN (Merrill Lynch Capital
Services SBPA) (A-1)
2.37%(b) 04/07/05 1,480 1,480,000
Greater Orlando Aviation Authority
RB (Special Purpose Cessna
Aircraft Project) Series 2001 AMT
DN (Textron, Inc. Guaranty)
(A-2, P-1)
3.39%(b) 04/07/05 4,000 4,000,000
Lee County IDRB Series 1997 AMT
DN (SunTrust Bank LOC)
2.42%(b) 04/07/05 1,910 1,910,000
Putnam County Development
Authority PCRB (Seminole Electric
Co-op Project) Series 1984H-3
MB (A-1, MIG-1)
2.30% 09/15/05 4,000 4,000,000
===========
14,487,372
-----------
Georgia - 0.7%
Emanuel County Development
Authority RB (Jabo Metal
Fabrication Project) Series 2001
AMT DN (SunTrust Bank LOC)
(VMIG-1)
2.39%(b) 04/07/05 1,905 1,905,000
-----------
Illinois - 3.2%
Chicago GO Tender Notes Series
2004 MB (State Street Bank &
Trust LOC) (SP-1+, MIG-1)
2.20% 12/08/05 1,000 1,000,000
Illinois Development Finance
Authority IDRB (Royal Continental
Box Co. Project) Series 1995A
AMT DN (ABN-AMRO Bank N.V.
LOC) (A-1)
2.39%(b) 04/07/05 200 200,000
Metropolitan Pier & Exposition
Authority RB (Dedicated State Tax
Receipts) Series 2005PZ-44 DN
(MBIA Insurance, Merrill Lynch
Capital Services SBPA) (F-1+)
2.40%(b) 04/07/05 500 500,000
Quad Cities Regional Economic
Development Authority RB
(Whitey's Ice Cream
Manufacturing Project) Series
1995 AMT DN (Bank One N.A.
LOC)
2.45%(b) 04/07/05 875 875,000
Regional Transportation Authority
GO (Wachovia Merlots Trust
Receipts) Series 2001A-86 DN
(FGIC Insurance, Wachovia Bank
N.A. LOC) (VMIG-1)
2.35%(b) 04/07/05 2,380 2,380,000
PAR
MATURITY (000) VALUE
---------- ---------- -------------
MUNICIPAL BONDS (Continued)
Illinois (Continued)
Rockford RB (Fairhaven Christian
Center Project) Series 2000 DN
(Bank One N.A. LOC)
2.40%(b) 04/07/05 $1,700 $ 1,700,000
Roselle Village IDRB
(Abrasive-Form, Inc. Project)
Series 1995 AMT DN
(ABN-AMRO Bank N.V. LOC)
2.45%(b) 04/07/05 1,000 1,000,000
Schaumburg IDRB (Termax Corp.
Project) Series 2000 AMT DN
(Bank One N.A. LOC)
2.45%(b) 04/07/05 1,600 1,600,000
===========
9,255,000
-----------
Indiana - 2.0%
Dekko Foundation Educational
Facilities RB Series 2001 DN
(Bank One N.A. LOC)
2.50%(b) 04/07/05 2,700 2,700,000
Hendricks County Industrial
Redevelopment Commission Tax
Increment RB (Heartland Crossing
Project) Series 2000A DN
(Huntington National Bank LOC)
2.35%(b) 04/07/05 1,100 1,100,000
Knox Economic Development RB
(J.W. Hicks Project) Series 1998
AMT DN (Bank One N.A. LOC)
2.45%(b) 04/07/05 1,425 1,425,000
Monroe County IDRB (Griner
Engineering, Inc. Project) Series
1997 AMT DN (Fifth Third Bank
N.A. LOC)
2.49%(b) 04/07/05 653 653,000
===========
5,878,000
-----------
Kentucky - 2.8%
Calvert City PCRB (Air Products &
Chemicals, Inc. Project) Series
1993A DN (A-1)
2.30%(b) 04/07/05 3,000 3,000,000
Calvert City PCRB (Air Products &
Chemicals, Inc. Project) Series
1993B DN (A-1)
2.30%(b) 04/07/05 1,000 1,000,000
Newport Industrial Building RB
(Newport Holdings Project) Series
2001A AMT DN (Huntington
National Bank LOC)
2.46%(b) 04/07/05 1,735 1,735,000
Pulaski County Solid Waste
Disposal RB (National Rural
Utilities for East Kentucky Power
Project) Series 1993B AMT MB
(MIG-1)
2.30% 08/15/05 2,500 2,500,000
===========
8,235,000
-----------
Louisiana - 2.9%
Iberville Parish PCRB (Air Products
& Chemicals Project) Series 1992
DN (A-1)
2.30%(b) 04/07/05 4,000 4,000,000
SEE ACCOMPANYING NOTES TO FINANCIAL STATEMENTS
15
BLACKROCK FUNDS
STATEMENT OF NET ASSETS
MUNICIPAL MONEY MARKET PORTFOLIO (CONTINUED)
AS OF APRIL 30, 2005 (UNAUDITED)
PAR
MATURITY (000) VALUE
---------- ---------- -------------
MUNICIPAL BONDS (Continued)
Louisiana (Continued)
Louisiana Public Facilities Authority
RB (Air Products & Chemicals
Project) Series 2002 AMT DN
(A-1, P-1)
2.35%(b) 04/07/05 $2,000 $ 2,000,000
West Baton Rouge Parish Industrial
District No. 3 RB (Dow Chemical
Co. Project) Series 1994B DN
(P-2)
2.40%(b) 04/01/05 2,500 2,500,000
===========
8,500,000
-----------
Maine - 0.6%
Maine Housing Authority RB (Merrill
Lynch P-Float Trust Receipts)
Series 2004 MT-003 AMT DN
(Merrill Lynch & Co. Guaranty,
Merrill Lynch Capital Services
SBPA) (VMIG-1, Aaa)
2.38%(b) 04/07/05 1,315 1,315,000
-----------
Maryland - 8.2%
Baltimore County RB (Odyssey
School Facility Project) Series
2001 DN (M&T Bank Corp. LOC)
(A-1)
2.20%(b) 04/07/05 3,110 3,110,000
Baltimore County RB (St. Paul's
School for Girls Facility Project)
Series 2000 DN (M&T Bank Corp.
LOC) (A-1)
2.06%(b) 04/07/05 2,335 2,335,000
Maryland Economic Development
Authority RB (Association of
Catholic Charities Project) Series
1999A DN (M&T Bank Corp. LOC)
(A-1)
2.20%(b) 04/07/05 2,525 2,525,000
Maryland Economic Development
Authority RB (Association of
Catholic Charities Project) Series
1999B DN (M&T Bank Corp. LOC)
(A-1)
2.20%(b) 04/07/05 1,500 1,500,000
Maryland Economic Development
Corp. RB (Mirage-Tucker LLC
Facility Project) Series 2002 DN
(M&T Bank Corp. LOC) (VMIG-1)
2.27%(b) 04/07/05 1,375 1,375,000
Maryland Economic Development
Corporation RB (American Health
Assistance Foundation Facility
Project) Series 2001 DN (M&T
Bank Corp. LOC) (A-1)
2.20%(b) 04/07/05 3,435 3,435,000
Maryland Health & Higher Education
Facilities Authority RB (Adventist
Healthcare Project) Series 2003B
DN (M&T Bank Corp. LOC)
(VMIG-1)
2.17%(b) 04/07/05 9,600 9,600,000
===========
23,880,000
-----------
PAR
MATURITY (000) VALUE
---------- ---------- -------------
MUNICIPAL BONDS (Continued)
Massachusetts - 5.5%
Auburn GO Series 2004 BAN
(MIG-1)
2.50% 06/17/05 $3,000 $ 3,005,477
Commonwealth of Massachusetts
GO (Wachovia Merlots Trust
Receipts) Series 2002A-9 DN
(FSA Insurance, Wachovia Bank
N.A. SBPA) (A-1)
2.34%(b) 04/07/05 1,495 1,495,000
Hull County GO Series 2004 BAN
(SP-1+)
3.00% 07/14/05 5,339 5,359,010
Milton GO Series 2004 BAN (MIG-1)
2.75% 09/23/05 3,000 3,015,707
Newton GO Series 2005 BAN
(MIG-1)
2.80% 08/15/05 1,000 1,002,227
Whitman Hanson Regional School
District BAN (SP-1+)
3.25% 01/13/06 2,000 2,015,833
===========
15,893,254
-----------
Michigan - 3.2%
Detroit Economic Development
Corp. RB (E.H. Association Ltd.
Project) Series 2002 DN (Charter
One Bank LOC)
2.35%(b) 04/07/05 3,410 3,410,000
Detroit Sewer & Disposal Authority
RB (Second Lien Project) Series
2001E MB (FGIC Insurance)
(A-1+, MIG-1)
1.55% 08/04/05 2,100 2,100,000
Michigan Strategic Fund Limited
Obligation RB (Horizons of
Michigan Project) Series 2001 DN
(Huntington National Bank LOC)
2.38%(b) 04/07/05 1,575 1,575,000
Michigan Strategic Fund Limited
Obligation RB (Kay Screen
Printing, Inc. Project) Series 2000
AMT DN (Bank One N.A. LOC)
2.45%(b) 04/07/05 2,300 2,300,000
===========
9,385,000
-----------
Mississippi - 1.3%
Mississippi Development Bank
Special Obligation RB
(Correctional Facilities Project)
Series 2002 DN (AMBAC
Insurance, Amsouth Bank of
Alabama SBPA) (A-1)
2.38%(b) 04/07/05 3,855 3,855,000
-----------
Multi-State - 3.2%
Municipal Securities Pool Trust
Receipts RB Series 2004-18 DN
(Multiple Insurances) (A-1+)
2.43%(b)(c) 04/07/05 7,265 7,265,000
Puttable Floating Option Tax-Exempt
Trust Receipts RB Series 2005A
DN (Merrill Lynch Capital Services
SBPA) (F-1+)
2.43%(b) 04/07/05 2,100 2,100,000
===========
9,365,000
-----------
SEE ACCOMPANYING NOTES TO FINANCIAL STATEMENTS
16
BLACKROCK FUNDS
STATEMENT OF NET ASSETS
MUNICIPAL MONEY MARKET PORTFOLIO (CONTINUED)
AS OF APRIL 30, 2005 (UNAUDITED)
PAR
MATURITY (000) VALUE
---------- ---------- -------------
MUNICIPAL BONDS (Continued)
Nevada - 1.5%
Clark County Economic
Development RB (Lutheran
Secondary School Association
Project) Series 2000 DN (M&T
Bank Corp. LOC) (VMIG-1)
2.50%(b) 04/07/05 $1,500 $1,500,000
Reno Capital Improvement RB (Bear
Stearns Trust Certificates) Series
2002A DN (FGIC Insurance, Bear
Stearns LOC) (A-1)
2.32%(b)(c) 04/07/05 2,990 2,990,000
==========
4,490,000
----------
New Hampshire - 0.8%
New Hampshire Health & Education
Facilities Authority RB (Tilton
School Project) Series 1999 DN
(KeyBank N.A. LOC)
2.35%(b) 04/07/05 2,280 2,280,000
----------
New Jersey - 1.2%
New Jersey Economic Development
Authority RB (Merrill Lynch
P-Float Trust Receipts) Series
2004 MT-028 DN (Merrill Lynch
Capital Services SBPA) (A-1)
2.31%(b) 04/07/05 3,400 3,400,000
----------
New York - 1.8%
Auburn IDRB (Fat Tire LLC Project)
Series 1997 DN (KeyBank N.A.
LOC)
2.42%(b) 04/07/05 1,215 1,215,000
Clipper Tax Exempt Certificates RB
Series 2005-7 DN (FGIC & MBIA
Insurance, State Street Bank
SBPA) (A-1+, VM1G1)
2.40%(b) 04/07/05 1,700 1,700,000
Metropolitan Pier & Exposition
Authority RB (Bear Stearns Trust
Certificates) Series 2005A-224 DN
(MBIA Insurance, Bear Stearns
Capital Markets Liquidity Facility)
(VMIG-1)
2.50%(b) 04/07/05 600 600,000
Metropolitan Pier & Exposition
Authority RB (TOC Trust Receipts)
Series 2005Z-1 DN (MBIA
Insurance, Goldman Sachs
Liquidity Facility)
2.40%(b) 04/07/05 600 600,000
Union Springs Central School
District GO Series 2004 BAN
2.50% 06/30/05 1,220 1,222,523
==========
5,337,523
----------
North Carolina - 11.4%
Buncombe County Metropolitan
Sewer District Sewer System RB
Series 2004 DN (XLCA Insurance,
Bank of America N.A. SBPA)
(A-1+, VMIG-1)
2.28%(b) 04/07/05 3,500 3,500,000
PAR
MATURITY (000) VALUE
---------- ---------- -------------
MUNICIPAL BONDS (Continued)
North Carolina (Continued)
Guilford County Industrial Facilities
& Pollution Control Financing
Authority RB (Quantum Group,
Inc. Project) Series 2000 AMT DN
(Bank of America N.A. LOC)
(F-1+, AA)
2.35%(b) 04/07/05 $ 820 $ 820,000
Guilford County Industrial Facilities
PCRB (Recreational
Facilities-YMCA Project) Series
2002 DN (Branch Banking & Trust
Co. LOC) (VMIG-1)
2.27%(b) 04/07/05 700 700,000
Mecklenburg County Public
Improvement GO Series 2000D
MB (AAA, Aaa)
4.75% 04/01/05 1,000 1,000,000
North Carolina GO Series 2002F DN
(Wachovia Bank N.A. LOC)
(A-1, VMIG-1)
2.20%(b) 04/07/05 1,100 1,100,000
North Carolina GO Series 2003A-23
DN (Wachovia Bank N.A. SBPA)
(A-1)
2.35%(b) 04/07/05 300 300,000
North Carolina Medical Care
Commission Health Care Facilities
RB (Carolina Meadows, Inc.
Project) Series 2004 DN (Allied
Irish Bank PLC LOC) (VMIG-1)
2.31%(b) 04/07/05 2,500 2,500,000
North Carolina Medical Care
Commission Health Care Facilities
RB (Novant Health Group Project)
Series 2004A DN (J.P. Morgan
Chase Bank SBPA)
(A-1+, VMIG-1)
2.30%(b) 04/07/05 1,000 1,000,000
North Carolina Medical Care
Commission Health Systems RB
(Catholic Health East Project)
Series 1998D DN (MBIA
Insurance, Bank One SBPA)
(A-1+, VMIG-1)
2.23%(b) 04/07/05 1,400 1,400,000
North Carolina Medical Care
Commission Hospital RB
(Aces-Pooled Equipment
Financing Project) Series 1985
DN (MBIA Insurance, KBC Bank
SBPA) (A-1+, VMIG-1)
2.18%(b) 04/07/05 1,900 1,900,000
North Carolina Medical Care
Commission Hospital RB (Baptist
Hospitals Project) Series 2000 DN
(Wachovia Bank N.A. LOC)
(A-1, VMIG-1)
2.29%(b) 04/07/05 1,700 1,700,000
North Carolina Medical Care
Commission Hospital RB
(McDowell Hospital, Inc. Project)
Series 1999 DN (Wachovia Bank
N.A. SBPA) (A-1)
2.29%(b) 04/07/05 150 150,000
SEE ACCOMPANYING NOTES TO FINANCIAL STATEMENTS
17
BLACKROCK FUNDS
STATEMENT OF NET ASSETS
MUNICIPAL MONEY MARKET PORTFOLIO (CONTINUED)
AS OF APRIL 30, 2005 (UNAUDITED)
PAR
MATURITY (000) VALUE
---------- ---------- -------------
MUNICIPAL BONDS (Continued)
North Carolina (Continued)
North Carolina Medical Care
Commission Hospital RB (Park
Ridge Hospital Project) Series
1988 DN (NationsBank LOC)
(A-1+)
2.28%(b) 04/07/05 $7,425 $ 7,425,000
North Carolina Municipal Power
Agency RB (Catawba Electric Co.
Project) Series 2003 DN (MBIA
Insurance, Bank of New York
SBPA) (A-1+)
2.32%(b) 04/07/05 700 700,000
North Carolina Municipal Power
Agency RB (Merrill Lynch P-Float
Trust Receipts, Catawba Electric
Co. Project) Series 2003 MB
(AMBAC Insurance, Merrill Lynch
Capital Services SPBA)
(AAA, F-1+)
2.40% 01/19/06 2,000 2,000,000
Raleigh County COP (Downtown
Improvement Project) Series
2004A DN (Depfa Bank PLC
SBPA) (A-1+, VMIG-1)
2.29%(b) 04/07/05 1,100 1,100,000
Raleigh County COP (Packaging
Facilities Project) Series 2000A
DN (Bank of America N.A. SBPA)
(A-1+, VMIG-1)
2.30%(b) 04/07/05 1,255 1,255,000
Rockingham County Industrial
Facilities PCRB (Whiteridge, Inc.
Project) Series 1998 AMT DN
(Branch Banking & Trust Co.
LOC) (Aa3, VMIG-1)
2.37%(b) 04/07/05 60 60,000
Union County GO Series 2004A DN
(Depfa Bank PLC SBPA)
(A-1+, VMIG-1)
2.27%(b) 04/07/05 1,900 1,900,000
Winston-Salem Water & Sewer
System RB Series 2002C DN
(Credit Locale de France LOC)
(A-1+, VMIG-1)
2.30%(b) 04/07/05 2,500 2,500,000
===========
33,010,000
-----------
North Dakota - 0.3%
Fargo IDRB (Owen Industries, Inc.
Project) Series 1997 AMT DN
(Wells Fargo Bank LOC) (A-1+)
2.35%(b) 04/07/05 400 400,000
North Dakota Housing Finance
Agency RB Series 2001A-19 AMT
DN (Wachovia Bank N.A. LOC)
(VMIG-1)
2.40%(b) 04/07/05 380 380,000
===========
780,000
-----------
Ohio - 2.5%
Cincinnati City School District GO
(School Energy Conservation
Project) Series 2004 BAN
(SP-1+, MIG-1)
2.50% 09/09/05 3,000 3,011,717
PAR
MATURITY (000) VALUE
---------- ---------- -------------
MUNICIPAL BONDS (Continued)
Ohio (Continued)
Lucas County Economic
Development RB (Maumee Valley
Country Day School Project)
Series 1998 AMT DN (American
National Bank & Trust Co. LOC)
3.28%(b) 04/07/05 $1,030 $ 1,030,000
Ohio Higher Educational Facility
Community RB Series 2000C DN
(Fifth Third Bank N.A. LOC)
2.35%(b) 04/07/05 905 905,000
Ohio PCRB (Ross Incineration
Project) Series 2000-1 AMT DN
(Bank One N.A. LOC)
2.45%(b) 04/07/05 930 930,000
Summit County Civic Facility RB
(Akron Area Electrical Joint
Apprenticeship & Training Trust
Project) Series 2001 DN
(KeyBank N.A. LOC)
2.35%(b) 04/07/05 180 180,000
Wood County IDRB (Aluminite, Inc.
Project) Series 1997 AMT DN
(Sky Bank LOC)
3.28%(b) 04/07/05 1,280 1,280,000
===========
7,336,717
-----------
Pennsylvania - 0.8%
Delaware County IDA PCRB (Exelon
Generation Co. LLC Project) DN
(Wachovia Bank LOC)
(A-1+, VMIG-1)
2.33%(b) 04/07/05 400 400,000
Venango IDRB (Scrubgrass Project)
MB (Dexia Bank N.A. LOC)
(A-1+, P-1)
2.10% 05/04/05 2,000 2,000,000
===========
2,400,000
-----------
Puerto Rico - 0.6%
Commonwealth of Puerto Rico GO
(Tender Option Certificates) Series
2001 DN (FSA Insurance, Bank of
New York Liquidity Facility) (A-1+)
2.29%(b) 04/07/05 1,000 1,000,000
Commonwealth of Puerto Rico
Highway & Transportation
Authority RB (Merrill Lynch
P-Float Trust Receipts) Series
2002 PT-1052 DN (Merrill Lynch
Capital Services Liquidity Facility)
(A-1)
2.31%(b) 04/07/05 700 700,000
===========
1,700,000
-----------
South Carolina - 1.6%
Greenwood County Exempt Facility
IDRB Series 2004 AMT DN (Fuji
Photo Film Co. Guaranty) (A-1+)
2.42%(b) 04/07/05 1,000 1,000,000
Medical University Hospital Authority
RB Series 2005A-5 DN (MBIA
Insurance, Bank of America
SBPA) (VMIG-1)
2.33%(b) 04/07/05 2,230 2,230,000
SEE ACCOMPANYING NOTES TO FINANCIAL STATEMENTS
18
BLACKROCK FUNDS
STATEMENT OF NET ASSETS
MUNICIPAL MONEY MARKET PORTFOLIO (CONTINUED)
AS OF APRIL 30, 2005 (UNAUDITED)
PAR
MATURITY (000) VALUE
---------- ---------- -------------
MUNICIPAL BONDS (Continued)
South Carolina (Continued)
South Carolina Housing Finance &
Development RB (Arrington Place
Apartment Project) Series 2001
AMT DN (SunTrust Bank LOC)
(VMIG-1)
2.39%(b) 04/07/05 $1,300 $ 1,300,000
===========
4,530,000
-----------
Tennessee - 0.3%
Metropolitan Government of
Nashville & Davidson County
Health & Education Facilities
Board RB (Ascension Health
Credit Project) Series 2001B-1 MB
(A-1+, MIG-1)
1.65% 08/03/05 1,000 1,000,000
-----------
Texas - 8.1%
Frisco Independent School District
GO Series 2004C MB (Wachovia
Bank N.A. SBPA) (MIG-1)
1.70% 09/01/05 3,435 3,435,000
Gulf Coast IDRB (Cinergy Solutions
Project) Series 2004 AMT DN
(A-2, VMIG-2)
2.56%(b) 04/07/05 2,000 2,000,000
Laredo Independent School District
Public Facilities Corp. RB Series
2004A MB (AMBAC Insurance)
(AAA, Aaa)
3.00% 08/01/05 1,050 1,053,149
Laredo Independent School District
Public Facilities Corp. RB Series
2004B MB (AMBAC Insurance)
(AAA, Aaa)
3.00% 08/01/05 225 225,676
Laredo Independent School District
Public Facilities Corp. RB Series
2004C MB (AMBAC Insurance)
(AAA, Aaa)
3.00% 08/01/05 720 722,159
Lower Colorado River Authority RB
(Wachovia Merlots Trust Receipts)
Series 2000 DN (FSA Insurance,
Wachovia Bank N.A. SBPA)
(Aaa, VMIG-1)
2.35%(b) 04/07/05 1,900 1,900,000
San Antonio Electric & Gas Systems
RB (Jr. Lien Project) Series 2004
MB (Banque Nationale de Paribas
SBPA) (A-1+, MIG-1)
2.20% 12/01/05 5,000 5,000,000
Texas GO Series 2004 TRAN
(SP-1+, MIG-1)
3.00% 08/31/05 6,000 6,034,864
Texas State Department of Housing
& Community Affairs Single Family
RB Series 2004F AMT MB (CDC
Insurance) (A-1+, Aa1)
1.95% 08/03/05 3,000 3,000,000
===========
23,370,848
-----------
PAR
MATURITY (000) VALUE
---------- ---------- -------------
MUNICIPAL BONDS (Continued)
Vermont - 0.1%
Vermont Educational & Health
Buildings Financing Agency RB
(Rutland Medical Center Project)
Series 2001A DN (National
Westminster Bank LOC) (A-1)
2.37%(b) 04/07/05 $ 400 $ 400,000
-----------
Virginia - 9.8%
Alexandria IDRB (Association for
Supervision & Curriculum
Development Project) Series 1997
DN (Wachovia Bank N.A. LOC)
(A-1)
2.29%(b) 04/07/05 300 300,000
Alexandria IDRB (Young Men's
Christian Association of Billings
Project) Series 1998 DN (M&T
Bank Corp. LOC) (A-1)
2.20%(b) 04/07/05 3,755 3,755,000
Arlington County IDRB (Federal
Home Loan Mortgage Corp.
Liquidity Facility) Series 2005A DN
(Federal Home Loan Mortgage
Corp. Guaranty)
2.30%(b) 04/07/05 700 700,000
Chesapeake Bay Bridge & Tunnel
Commonwealth District RB
(Wachovia Merlots Trust Receipts)
Series 2003 DN (MBIA Insurance,
Wachovia Bank N.A. Liquidity
Facility) (VMIG-1)
2.35%(b) 04/07/05 1,095 1,095,000
Chesterfield County IDRB (Merrill
Lynch P-Float Trust Receipts)
Series 2004 PT-2133 DN (Merrill
Lynch & Co. Guaranty, Merrill
Lynch Capital Services SBPA)
(F-1+, AA-)
2.37%(b) 04/07/05 200 200,000
Commonwealth of Virginia
Transportation Authority RB
(Citibank Trust Receipts) Series
1999 DN (Citibank Liquidity
Facility) (A-1+)
2.32%(b) 04/07/05 2,200 2,200,000
Commonwealth of Virginia
Transportation Board RB (Citibank
Trust Receipts) Series 2000
SG-134 DN (Societe Generale
SBPA) (A-1+)
2.30%(b) 04/07/05 595 595,000
Fairfax County Economic
Development Authority RB
(Citibank Trust Receipts) Series
2003 ROCS-II-R-4024 DN
(Citibank Liquidity Facility)
(VMIG-1)
2.32%(b) 04/07/05 300 300,000
Fairfax County GO Series
2005-1036 DN (Morgan Stanley
Liquidity Facility)
2.32%(b) 04/07/05 1,855 1,855,000
Fairfax County IDRB (Fairfax
Hospital System Project) Series
1988B DN (Inova Health System
Liquidity Facility) (A-1+, VMIG-1)
2.23%(b) 04/07/05 600 600,000
SEE ACCOMPANYING NOTES TO FINANCIAL STATEMENTS
19
BLACKROCK FUNDS
STATEMENT OF NET ASSETS
MUNICIPAL MONEY MARKET PORTFOLIO (CONTINUED)
AS OF APRIL 30, 2005 (UNAUDITED)
PAR
MATURITY (000) VALUE
---------- ---------- -------------
MUNICIPAL BONDS (Continued)
Virginia (Continued)
Halifax County GO (Vepco Project)
Series 2005 TECP (Dominion
Resources Guaranteed)
(A-1, VMIG-1)
2.17% 05/04/05 $2,000 $ 2,000,000
Harrisonburg Redevelopment &
Housing Authority Lease Purchase
RB Series 2001A DN (Societe
Generale LOC) (A-1+)
2.35%(b) 04/07/05 2,140 2,140,000
King George County IDA Solid
Waste Disposal Facility RB
(Garnet of Virginia, Inc. Project)
Series 1996 AMT DN (Morgan
Guaranty Trust LOC) (A-1+)
2.35%(b) 04/07/05 300 300,000
Loudoun County IDRB (Hill School
Project) Series 2002 DN
(SunTrust Bank LOC) (AA-, A-1+)
2.29%(b) 04/07/05 1,100 1,100,000
Loudoun County IDRB (Howard
Hughes Medical Institute Project)
Series 2003D DN (A-1+, VMIG-1)
2.22%(b) 04/07/05 1,500 1,500,000
Loudoun County IDRB (Howard
Hughes Medical Institute Project)
Series 2003E DN (A-1+, VMIG-1)
2.24%(b) 04/01/05 100 100,000
Nelson County IDRB (Taylor
Ramsey Corp. Project) Series
1999 AMT DN (Branch Banking &
Trust Co. LOC) (F-1+)
2.35%(b) 04/07/05 300 300,000
Norfolk Redevelopment & Housing
Authority Multi Family Housing RB
(Residential Rental Project) Series
2003 AMT DN (SunTrust Bank
LOC)
2.44%(b) 04/07/05 2,055 2,055,000
Prince William County RB (Vepco
Project) Series 2005 TECP
(Dominion Resources Guaranty)
(A-2, VMIG-1)
2.17% 05/04/05 400 400,000
Richmond IDRB (Diocese of Virginia
Church School Project) Series
2001 DN (SunTrust Bank LOC)
(VMIG-1)
2.30%(b) 04/01/05 400 400,000
University of Virginia RB Series
(Wachovia Merlots Trust Receipts)
2003B-31 DN (Wachovia Bank
N.A. SBPA) (VMIG-1)
2.35%(b) 04/07/05 900 900,000
Virginia GO Series 2002 MB
(AAA, Aaa)
4.00% 06/01/05 2,670 2,680,965
Virginia Public Building Authority RB
Series 2004 ROCS-RR-II-6027
DN (Citibank Liquidity Facility)
(A-1+, AA+)
2.32%(b) 04/07/05 1,905 1,905,000
PAR
MATURITY (000) VALUE
---------- ---------- -------------
MUNICIPAL BONDS (Continued)
Virginia (Continued)
Virginia Resource Authority Clean
Water State Revolving Fund RB
(Merrill Lynch P-Float Trust
Receipts) Series 2000 PA-790 DN
(Merrill Lynch & Co. Guaranty,
Merrill Lynch Captial Services
SBPA) (A-1)
2.30%(b) 04/07/05 $ 500 $ 500,000
Virginia Small Business Financing
Authority IDRB (Ennstone Project)
Series 1999 AMT DN (Wachovia
Bank N.A. LOC) (Aa2)
2.34%(b) 04/07/05 520 520,000
===========
28,400,965
-----------
Washington - 0.6%
Chelan County Public Utility District
RB (First Union Merlots Trust
Receipts) Series 2001B AMT DN
(MBIA Insurance, Wachovia Bank
N.A. SBPA) (A-1)
2.40%(b) 04/07/05 1,150 1,150,000
Yakima County Public Corp. RB
(Michelsen Packaging Co. Project)
Series 2000 AMT DN (Bank of
America N.A. LOC) (A-1+)
2.40%(b) 04/07/05 605 605,000
===========
1,755,000
-----------
Wisconsin - 1.5%
Amery IDRB (Plastech Corp.
Project) Series 1997 AMT DN
(U.S. Bank N.A. LOC)
2.50%(b) 04/07/05 2,000 2,000,000
Mequon IDRB (Johnson Level GRW
Investment Project) Series 1995
AMT DN (Bank One N.A. LOC)
2.45%(b) 04/07/05 660 660,000
New Berlin School District RB Series
2004 TRAN (MIG-1)
3.00% 09/01/05 1,560 1,569,141
===========
4,229,141
-----------
SEE ACCOMPANYING NOTES TO FINANCIAL STATEMENTS
20
BLACKROCK FUNDS
STATEMENT OF NET ASSETS
MUNICIPAL MONEY MARKET PORTFOLIO (CONCLUDED)
AS OF APRIL 30, 2005 (UNAUDITED)
VALUE
---------------
TOTAL INVESTMENTS IN
SECURITIES - 99.8%
(Cost $289,547,627(a)) $289,547,627
OTHER ASSETS IN EXCESS OF
LIABILITIES - 0.2% 651,167
------------
NET ASSETS - 100.0%
(Applicable to
81,163,340
Institutional shares,
72,909,259
Service
shares,130,767,561
Hilliard
Lyons shares and
5,351,709
Investor A shares) $290,198,794
============
NET ASSET VALUE, OFFERING AND
REDEMPTION PRICE PER
INSTITUTIONAL SHARE
($81,218,038/81,163,340) $ 1.00
=======
NET ASSET VALUE, OFFERING AND
REDEMPTION PRICE PER
SERVICE SHARE
($72,874,023/72,909,259) $ 1.00
=======
NET ASSET VALUE, OFFERING AND
REDEMPTION PRICE PER
HILLIARD LYONS SHARE
($130,755,019/130,767,561) $ 1.00
=======
NET ASSET VALUE, OFFERING AND
REDEMPTION PRICE PER
INVESTOR A SHARE
($5,351,714/5,351,709) $ 1.00
=======
- -------------------
(a) Aggregate cost for Federal income tax purposes.
(b) Rates shown are the rates as of April 30, 2005 and maturities shown are
the next interest readjustment date or the date the principal owed can
be recovered through demand.
(c) Security exempt from registration under Rule 144A of the Securities Act
of 1933. These securities may be resold in transactions exempt from
registration, normally to qualified institutional investors. As of April
30, 2005, the fund held 3.5% of its net assets, with a current market
value of $10,255,000, in securities restricted as to resale.
SEE ACCOMPANYING NOTES TO FINANCIAL STATEMENTS
21
BLACKROCK FUNDS
STATEMENT OF NET ASSETS
NEW JERSEY MUNICIPAL MONEY MARKET PORTFOLIO
AS OF APRIL 30, 2005 (UNAUDITED)
PAR
MATURITY (000) VALUE
---------- ---------- -------------
MUNICIPAL BONDS - 99.6%
New Jersey - 99.5%
Camden County Improvement
Authority RB (Congregation
Beth-El Project) Series 2001 DN
(Commerce Bank N.A. LOC)
2.17%(b) 04/07/05 $ 300 $ 300,000
Cranford Township GO Series 2005
BAN
3.00% 08/24/05 4,500 4,515,141
Fort Lee GO Series 2004 MB (Aa3)
3.35% 07/15/05 1,000 1,004,772
Gloucester County Industrial
Financing Authority PCRB (Exxon
Mobil Corp. Project) Series 2003
DN (Exxon Mobil Corp. Guaranty)
(A-1+, VMIG-1)
2.14%(b) 04/01/05 800 800,000
Hudson County COP Series
2001A-35 DN (MBIA Insurance,
Wachovia Bank N.A. LOC)
(VMIG-1)
2.32%(b) 04/07/05 400 400,000
Middlesex County Improvement
Authority RB (Woodbridge
Township Guaranteed Project)
Series 2004 MB
3.50% 12/22/05 3,000 3,028,764
New Jersey Economic Development
Authority Multi-Mode IDRB (V & S
Amboy Galvanizing LLC Project)
Series 1999 AMT DN (KeyBank
N.A. LOC)
2.42%(b) 04/07/05 2,420 2,420,000
New Jersey Economic Development
Authority RB (Cigarette Project)
Series 2004R ROC-II DN
(Citigroup Guaranty) (VMIG-1)
2.36%(b) 04/07/05 2,095 2,095,000
New Jersey Economic Development
Authority RB (Citibank Trust
Receipts) Series 2004
ROCS-II-R-309 DN (Assured
Guaranty Corp. Insurance) (A-1+)
2.33%(b) 04/07/05 8,495 8,495,000
New Jersey Economic Development
Authority RB (Denglas
Technologies Project) Series 2000
AMT DN (Commerce Bank N.A.
LOC)
2.27%(b) 04/07/05 3,100 3,100,000
New Jersey Economic Development
Authority RB (First Mortgage of
Winchester Project) Series 2004B
DN (Valley National Bank LOC)
(VMIG-1)
2.25%(b) 04/07/05 3,765 3,765,000
New Jersey Economic Development
Authority RB (Hamilton Industrial
Development Project) Series 1998
AMT DN (Wachovia Bank N.A.
LOC)
2.35%(b) 04/07/05 1,625 1,625,000
New Jersey Economic Development
Authority RB (J. James Realty Co.
Project) Series 1998 AMT DN
(Wachovia Bank N.A. LOC)
2.40%(b) 04/07/05 600 600,000
PAR
MATURITY (000) VALUE
---------- ---------- -------------
MUNICIPAL BONDS (Continued)
New Jersey (Continued)
New Jersey Economic Development
Authority RB (Jacea LLC Project)
Series 2004 AMT DN (Wachovia
Bank N.A. LOC)
2.40%(b) 04/07/05 $3,600 $3,600,000
New Jersey Economic Development
Authority RB (Landesbank
Hessen-Thuringen Girozentrale
P-Float Trust Receipts) Series
2004 MT-035 DN (Assured
Guaranty Corp. Insurance,
Landesbank Hessen-Thuringen
Girozentrale SBPA) (A-1)
2.31%(b) 04/07/05 4,195 4,195,000
New Jersey Economic Development
Authority RB (Nandan Co. Project)
Series 2000 AMT DN (M&T Bank
Corp. LOC) (A-1)
2.17%(b) 04/07/05 3,480 3,480,000
New Jersey Economic Development
Authority RB (Nandan Co. Project)
Series 2001 AMT DN (M&T Bank
Corp. LOC) (A-1)
2.17%(b) 04/07/05 1,765 1,765,000
New Jersey Economic Development
Authority RB (Parke Place
Association Project) Series 2000
AMT DN (Commerce Bank N.A.
LOC)
2.27%(b) 04/07/05 3,395 3,395,000
New Jersey Economic Development
Authority RB (Pennington
Montessori School Project) Series
1998 DN (Wachovia Bank N.A.
LOC)
2.40%(b) 04/07/05 1,160 1,160,000
New Jersey Economic Development
Authority RB (Somerset Hills
YMCA Project) Series 2003 DN
(Commerce Bank N.A. LOC)
2.17%(b) 04/07/05 100 100,000
New Jersey Economic Development
Authority RB (Thermal Energy LP
Project) Series 1995 AMT DN
(Bank One N.A. LOC) (VMIG-1)
2.30%(b) 04/07/05 1,900 1,900,000
New Jersey Economic Development
Authority Thermal Energy
Facilities RB (Marina Energy LLC
Project) Series 2001A AMT DN
(Wachovia Bank N.A. LOC)
(A-1, VMIG-1)
2.25%(b) 04/07/05 2,000 2,000,000
New Jersey Educational Facilities
Authority RB Series 2000 SG-148
DN (Societe Generale LOC)
(A-1+)
2.30%(b) 04/07/05 850 850,000
New Jersey Environmental
Infrastructure Trust RB Series
2004-585 AMT DN (J.P. Morgan
Chase Bank SBPA) (VMIG-1)
2.32%(b) 04/07/05 4,050 4,050,000
SEE ACCOMPANYING NOTES TO FINANCIAL STATEMENTS
22
BLACKROCK FUNDS
STATEMENT OF NET ASSETS
NEW JERSEY MUNICIPAL MONEY MARKET PORTFOLIO (CONTINUED)
AS OF APRIL 30, 2005 (UNAUDITED)
PAR
MATURITY (000) VALUE
---------- ---------- -------------
MUNICIPAL BONDS (Continued)
New Jersey (Continued)
New Jersey GO (Lehman Trust
Receipts) Series 2004D-L55J DN
(Lehman Brothers, Inc. Liquidity
Facility) (VMIG-1, F-1)
2.31%(b) 04/07/05 $8,450 $8,450,000
New Jersey GO Series 2004A TAN
(SP-1+, MIG-1)
3.00% 06/24/05 3,850 3,858,174
New Jersey Health Care Facilities
Financing Authority RB (Bayshore
Community Hospital Project)
Series 2004A-1 DN (Commerce
Bank LOC) (VIMG-1)
2.28%(b) 04/07/05 750 750,000
New Jersey Health Care Facilities
Financing Authority RB (Beth
Israel Hospital Project) Series
2004A-2 DN (Commerce Bank
LOC) (VIMG-1)
2.28%(b) 04/07/05 1,550 1,550,000
New Jersey Health Care Facilities
Financing Authority RB (Merrill
Lynch P-Float Trust Receipts)
Series 2001 PT-1319 DN (AMBAC
Insurance, Merrill Lynch Capital
Services SBPA) (A-1)
2.33%(b) 04/07/05 4,690 4,690,000
New Jersey Health Care Facilities
Financing Authority RB (Recovery
Management Systems, Inc.)
Series 2005 DN (Commerce Bank
N.A. LOC) (VMIG-1)
2.12%(b) 04/07/05 2,500 2,500,000
New Jersey Health Care Facilities
Financing Authority RB (Wachovia
Merlots Trust Receipts) Series
2001A DN (Wachovia Bank N.A.
LOC) (VMIG-1)
2.32%(b) 04/07/05 2,685 2,685,000
New Jersey Health Care Facilities
Financing Authority RB Series
2004-943 DN (Morgan Stanley
Group Liquidity Facility, FGIC
Insurance) (F-1+)
2.31%(b) 04/07/05 3,530 3,530,000
New Jersey Housing & Mortgage
Finance Agency Multi-Family RB
Series 2005-1012 AMT DN (FGIC
Insurance, Morgan Stanley Liquid
Facility) (VIMG-1)
2.36%(b) 04/07/05 4,435 4,435,000
New Jersey Housing & Mortgage
Finance Agency RB (Wachovia
Merlots Trust Receipts) Series
2000A-2 DN (MBIA Insurance,
Wachovia Bank N.A. SBPA) (Aaa)
2.37%(b) 04/07/05 1,520 1,520,000
New Jersey Housing & Mortgage
Finance Agency RB Series 2002D
DN (FSA Insured, Lehman SBPA)
(VMIG-1)
2.31%(b) 04/07/05 2,560 2,560,000
PAR
MATURITY (000) VALUE
---------- ---------- -------------
MUNICIPAL BONDS (Continued)
New Jersey (Continued)
New Jersey Tobacco Settlment
Financing Corporation RB (Merrill
Lynch P-Float Trust Receipts)
Series 2005 PA-1284 DN (Merrill
Lynch SBPA, Merrill Lynch
Guarantor) (A-1)
2.35%(b) 04/07/05 $6,250 $6,250,000
New Jersey Transportation Trust
Fund Authority RB Series
2004-967 DN (FSA Insurance,
Morgan Stanley Group Liquidity
Facility) (AAA, F-1+)
2.30%(b) 04/07/05 3,000 3,000,000
New Jersey Turnpike Authority RB
Series 2002J DN (MBIA
Insurance, Lehman Bothers, Inc.
Liquidity Facility) (VMIG-1)
2.31%(b) 04/07/05 3,000 3,000,000
New Milford County GO Series 2004
BAN
3.00% 06/24/05 1,000 1,002,894
Newark GO Series 2003
ROC-II-R-4539 DN (FSA
Insurance, Citibank LOC)
(VMIG-1)
2.31%(b) 04/07/05 1,995 1,995,000
North Caldwell GO Series 2004 BAN
3.00% 09/08/05 1,296 1,299,731
Port Authority of New York & New
Jersey Special Obligation RB
(Merrill Lynch P-Float Trust
Receipts) Series 2003 PT-1755
DN (MBIA Insurance, Merrill Lynch
Capital Services SBPA)
(AAA, F-1+)
2.37%(b) 04/07/05 6,000 6,000,000
Port Authority of New York & New
Jersey Special Obligation RB
(Merrill Lynch P-Float Trust
Receipts) Series 2003 PT-1847
AMT DN (MBIA Insurance, Merrill
Lynch Capital Services SBPA)
(F-1+)
2.37%(b) 04/07/05 3,995 3,995,000
Port Authority of New York & New
Jersey Special Obligation RB
(Merrill Lynch P-Float Trust
Receipts) Series 2004-056 AMT
DN (FGIC Insurance, Banque
Nationale de Paribas SBPA)
(F-1+)
2.33%(b) 04/07/05 7,855 7,855,000
Salem County Pollution Control
Financing Authority PCRB (E.I.
DuPont de Nemours Project)
Series 1982A DN (A-1+, P-1)
2.00%(b) 04/07/05 7,600 7,600,000
Somerville GO Series 2004 BAN
3.00% 06/16/05 925 927,422
SEE ACCOMPANYING NOTES TO FINANCIAL STATEMENTS
23
BLACKROCK FUNDS
STATEMENT OF NET ASSETS
NEW JERSEY MUNICIPAL MONEY MARKET PORTFOLIO (CONCLUDED)
AS OF APRIL 30, 2005 (UNAUDITED)
PAR
MATURITY (000) VALUE
MUNICIPAL BONDS (Continued)
New Jersey (Continued)
Union County Industrial Pollution
Control Financing Authority PCRB
(Exxon Mobil Corp. Project) Series
1989 DN (A-1+, P-1)
2.09%(b) 04/07/05 $6,000 $ 6,000,000
Vernon Township GO Series 2005
BAN
3.25% 01/13/06 3,000 3,021,891
Washington Township Warren
County GO Series 2004 BAN
3.25% 11/01/05 1,425 1,433,174
West Windsor-Plainsboro GO
(Regional School District Project)
Series 2004 MB (Aa2)
2.70% 06/15/05 3,000 3,006,485
============
151,558,448
------------
Puerto Rico - 0.1%
Puerto Rico Public Financing Corp.
RB Series 2004-911 DN
(CIFG-TCRS Credit Support,
Morgan Stanley Group Liquidity
Facility) (AAA, F-1+)
2.30%(b) 04/07/05 223 223,000
------------
TOTAL INVESTMENTS IN SECURITIES - 99.6%
(Cost $151,781,448(a)) 151,781,448
OTHER ASSETS IN EXCESS OF
LIABILITIES - 0.4% 609,510
-----------
NET ASSETS - 100.0%
(Applicable to 74,763,929
Institutional shares, 60,388,673
Service shares and 17,267,959
Investor A shares) $152,390,958
============
NET ASSET VALUE, OFFERING AND
REDEMPTION PRICE PER
INSTITUTIONAL SHARE
($74,757,517/74,763,929) $ 1.00
=======
NET ASSET VALUE, OFFERING AND
REDEMPTION PRICE PER
SERVICE SHARE
($60,361,153/60,388,673) $ 1.00
=======
NET ASSET VALUE, OFFERING AND
REDEMPTION PRICE PER
INVESTOR A SHARE
($17,272,288/17,267,959) $ 1.00
=======
- -------------------
(a) Aggregate cost for Federal income tax purposes.
(b) Rates shown are the rates as of April 30, 2005 and maturities shown are
the next interest readjustment date or the date the principal owed can
be recovered through demand.
SEE ACCOMPANYING NOTES TO FINANCIAL STATEMENTS
24
BLACKROCK FUNDS
STATEMENT OF NET ASSETS
NORTH CAROLINA MUNICIPAL MONEY MARKET PORTFOLIO
AS OF APRIL 30, 2005 (UNAUDITED)
PAR
MATURITY (000) VALUE
---------- ---------- -------------
MUNICIPAL BONDS - 99.7%
North Carolina - 94.6%
Charlotte Airport RB (Banque
Nationale de Paribas P-Float Trust
Receipts) Series 2003 PT-719
AMT MB (MBIA Insurance,
Banque Nationale de Paribas
SBPA) (A-1+)
1.50% 05/05/05 $1,000 $1,000,000
Charlotte COP (Governmental
Facilities Project) Series 2003F
DN (Bank of America N.A. SBPA)
(A-1+, VMIG-1)
2.30%(b) 04/07/05 1,500 1,500,000
Cleveland County Industrial Facilities
PCRB (Blanchford Rubber
Project) Series 2003 DN (Bank
One N.A. LOC)
2.35%(b) 04/07/05 2,640 2,640,000
Greensboro GO Series 2003 MB
(AAA, Aa1)
2.25% 05/01/05 1,780 1,781,687
Guilford County Industrial Facilities
PCRB (Recreational
Facilities-YMCA Project) Series
2002 DN (Branch Banking & Trust
Co. LOC) (VMIG-1)
2.27%(b) 04/07/05 1,115 1,115,000
High Point Combined Enterprise
System RB Series 2005-998 DN
(FGIC Insurance, Morgan Stanley
Liquidity Facility) (F-1+)
2.32%(b) 04/07/05 1,430 1,430,000
High Point GO Series 2002 MB
(AA, Aa3)
4.00% 06/01/05 1,350 1,354,715
High Point Public Improvement GO
Series 2000B MB (AA, Aa3)
5.25% 06/01/05 1,250 1,256,853
Lee County Industrial Facilities
PCRB (Trion, Inc. Project) Series
1995 DN (Wachovia Bank N.A.
LOC)
2.39%(b) 04/07/05 100 100,000
Lee County Industrial Facilities
PCRB (Var-Arden Corp. Project)
Series 1999 AMT DN (Comerica
Bank N.A. LOC)
2.43%(b) 04/07/05 5,000 5,000,000
Mecklenburg County Industrial
Facilities PCRB (Peidmont
Plastics Project) Series 1997 AMT
DN (Branch Banking & Trust Co.
LOC) (Aa3, VMIG-1)
2.37%(b) 04/07/05 990 990,000
Mecklenburg County Public
Improvement GO Series 2000D
MB (AAA, Aaa)
4.75% 04/01/05 1,150 1,150,000
North Carolina Educational Facilities
Financing Agency RB (Gaston
Day School Project) Series 2000
DN (Bank of America N.A. LOC)
(F-1+)
2.30%(b) 04/07/05 100 100,000
PAR
MATURITY (000) VALUE
---------- ---------- -------------
MUNICIPAL BONDS (Continued)
North Carolina (Continued)
North Carolina Housing Finance
Agency RB Series 2002
ROC-II-R-175 DN (Salomon Smith
Barney Liquidity Facility) (VMIG-1)
2.36%(b) 04/07/05 $3,525 $3,525,000
North Carolina Medical Care
Commission Health Care Facilities
RB (Carolina Meadows, Inc.
Project) Series 2004 DN (Allied
Irish Bank PLC LOC) (VMIG-1)
2.31%(b) 04/07/05 2,500 2,500,000
North Carolina Medical Care
Commission Health Care Facilities
RB (Lutheran Services for the
Aging Project) Series 1998 DN
(Branch Banking & Trust Co.
LOC) (A-1)
2.29%(b) 04/07/05 100 100,000
North Carolina Medical Care
Commission Health Care Facilities
RB (Novant Health Group Project)
Series 2004A DN (J.P. Morgan
Chase Bank SBPA)
(A-1+, VMIG-1)
2.30%(b) 04/07/05 500 500,000
North Carolina Medical Care
Commission Hospital RB (Angel
Medical Center, Inc. Project)
Series 1997 DN (Wachovia Bank
N.A. LOC) (A-1)
2.29%(b) 04/07/05 600 600,000
North Carolina Medical Care
Commission Hospital RB (Baptist
Hospital Project) Series 1996 DN
(Wachovia Bank N.A. LOC)
(A-1+, VMIG-1)
2.29%(b) 04/07/05 200 200,000
North Carolina Medical Care
Commission Hospital RB (Baptist
Hospitals Project) Series 2000 DN
(Wachovia Bank N.A. LOC)
(A-1, VMIG-1)
2.29%(b) 04/07/05 600 600,000
North Carolina Medical Care
Commission Hospital RB (Lincoln
Health System Project) Series
1996A DN (Bank of America N.A.
LOC) (A-1, VMIG-1)
2.30%(b) 04/07/05 600 600,000
North Carolina Medical Care
Commission Hospital RB
(Lutheran Retirement Project)
Series 1999 DN (Bank of America
N.A. LOC) (F-1+)
2.30%(b) 04/07/05 1,965 1,965,000
North Carolina Medical Care
Commission Hospital RB
(McDowell Hospital, Inc. Project)
Series 1999 DN (Wachovia Bank
N.A. SBPA) (A-1)
2.29%(b) 04/07/05 650 650,000
SEE ACCOMPANYING NOTES TO FINANCIAL STATEMENTS
25
BLACKROCK FUNDS
STATEMENT OF NET ASSETS
NORTH CAROLINA MUNICIPAL MONEY MARKET PORTFOLIO (CONTINUED)
AS OF APRIL 30, 2005 (UNAUDITED)
PAR
MATURITY (000) VALUE
---------- ---------- -------------
MUNICIPAL BONDS (Continued)
North Carolina (Continued)
North Carolina Medical Care
Commission Hospital RB (Moses
H. Cone Memorial Hospital
Project) Series 1993 DN
(Wachovia Bank N.A. LOC) (A-1)
2.25%(b) 04/07/05 $ 300 $ 300,000
North Carolina Medical Care
Commission Hospital RB (Moses
H. Cone Memorial Hospital
Project) Series 1998 DN
(Wachovia Bank N.A. LOC) (A-1)
2.25%(b) 04/07/05 100 100,000
North Carolina Medical Care
Commission Hospital RB (Park
Ridge Hospital Project) Series
1988 DN (NationsBank LOC)
(A-1+)
2.28%(b) 04/07/05 200 200,000
North Carolina Medical Care
Commission Retirement Facilities
RB (Aldersgate Project) Series
2001 DN (Branch Banking & Trust
Co. LOC) (A-1)
2.35%(b) 04/07/05 1,185 1,185,000
North Carolina Medical Care
Commission Retirement Facilities
RB (Brookwood Project) Series
2001C DN (Branch Banking &
Trust Co. LOC) (A-1)
2.35%(b) 04/07/05 600 600,000
North Carolina Municipal Power
Agency RB (Catawba Electric Co.
Project) Series 2003 DN (MBIA
Insurance, Bank of New York
SBPA) (A-1+)
2.32%(b) 04/07/05 1,700 1,700,000
North Carolina Municipal Power
Agency RB (Merrill Lynch P-Float
Trust Receipts, Catawba Electric
Co. Project) Series 2003 MB
(AMBAC Insurance, Merrill Lynch
Capital Services SPBA)
(AAA, F-1+)
2.40% 01/19/06 2,000 2,000,000
Raleigh Durham Airport Authority RB
Series 2002 AMT DN (FGIC
Insurance)
(AAA, Aaa, VMIG-1, F-1+)
2.28%(b) 04/07/05 800 800,000
Raleigh Durham Airport Authority RB
Series 2005MT-100 DN
(Kredietbank LOC) (VMIG-1)
2.37%(b) 04/07/05 4,145 4,145,000
Raleigh Public Improvement GO
Series 2004A MB (AAA, Aaa)
2.00% 04/01/05 795 795,000
Rockingham County Industrial
Facilities PCRB (Medibeg, Inc.
Project) Series 1997 AMT DN
(Wachovia Bank N.A. LOC) (Aa2)
2.39%(b) 04/07/05 1,300 1,300,000
PAR
MATURITY (000) VALUE
---------- ---------- -------------
MUNICIPAL BONDS (Continued)
North Carolina (Continued)
Rockingham County Industrial
Facilities PCRB (Whiteridge, Inc.
Project) Series 1998 AMT DN
(Branch Banking & Trust Co.
LOC) (Aa3, VMIG-1)
2.37%(b) 04/07/05 $ 540 $ 540,000
Rutherford County Industrial
Facilities PCRB (All American
Homes Project) Series 1996 AMT
DN (Bank One N.A. LOC)
2.45%(b) 04/07/05 1,100 1,100,000
Sampson County Industrial Facilities
PCRB (Dubose Strapping, Inc.
Project) Series 1997 DN
(Wachovia Bank N.A. LOC) (A-1)
2.44%(b) 04/07/05 800 800,000
Union County GO Series 2004A DN
(Depfa Bank PLC SBPA)
(A-1+, VMIG-1)
2.27%(b) 04/07/05 3,100 3,100,000
Wake County GO Series 2004A MB
(Landesbank Hessen-Thuringen
Girozentrale SBPA) (A-1+, MIG-1)
2.00% 04/01/05 1,000 1,007,625
Winston-Salem COP (Risk
Acceptance Management Corp.
Project) Series 1988 DN (National
Westminster Bank LOC) (A-1+)
2.27%(b) 04/07/05 485 485,000
Winston-Salem GO Series 1990 DN
(Wachovia Bank N.A. LOC)
(A-1+, VMIG-1)
2.30%(b) 04/07/05 320 320,000
Winston-Salem Water & Sewer
System RB Series 2002C DN
(Credit Locale de France LOC)
(A-1+, VMIG-1)
2.30%(b) 04/07/05 1,500 1,500,000
===========
52,635,880
-----------
Puerto Rico - 5.1%
Commonwealth of Puerto Rico GO
(Tender Option Certificates) Series
2001 DN (FSA Insurance, Bank of
New York Liquidity Facility) (A-1+)
2.29%(b) 04/07/05 1,500 1,500,000
Commonwealth of Puerto Rico
Highway & Transportation
Authority RB (Merrill Lynch
P-Float Trust Receipts) Series
2002 PT-1052 DN (Merrill Lynch
Capital Services Liquidity Facility)
(A-1)
2.31%(b) 04/07/05 600 600,000
Commonwealth of Puerto Rico
Highway & Transportation
Authority RB Series 1998A DN
(AMBAC Insurance, Bank of Nova
Scotia SBPA) (A-1+, VMIG-1)
2.23%(b) 04/07/05 400 400,000
SEE ACCOMPANYING NOTES TO FINANCIAL STATEMENTS
26
BLACKROCK FUNDS
STATEMENT OF NET ASSETS
NORTH CAROLINA MUNICIPAL MONEY MARKET PORTFOLIO (CONCLUDED)
AS OF APRIL 30, 2005 (UNAUDITED)
PAR
MATURITY (000) VALUE
---------- ------- ------------
MUNICIPAL BONDS (Continued)
Puerto Rico (Continued)
Commonwealth of Puerto Rico RB
Series 2004 TRAN
(SP-1+, MIG-1)
3.00% 07/29/05 $350 $ 351,525
==========
2,851,525
----------
TOTAL INVESTMENTS IN SECURITIES - 99.7%
(Cost $55,487,405(a)) 55,487,405
OTHER ASSETS IN EXCESS OF
LIABILITIES - 0.3% 168,190
----------
NET ASSETS - 100.0%
(Applicable to 55,025,889
Institutional shares, 310,038
Service shares, 318,774 Investor
A shares) $55,655,595
===========
NET ASSET VALUE, OFFERING
AND REDEMPTION PRICE PER
INSTITUTIONAL SHARE
($55,026,557/55,025,889) $ 1.00
=======
NET ASSET VALUE, OFFERING
AND REDEMPTION PRICE PER
SERVICE SHARE
($310,260/310,038) $ 1.00
=======
NET ASSET VALUE, OFFERING
AND REDEMPTION PRICE PER
INVESTOR A SHARE
($318,778/318,774) $ 1.00
=======
- -------------------
(a) Aggregate cost for Federal income tax purposes.
(b) Rates shown are the rates as of April 30, 2005 and maturities shown are
the next interest readjustment date or the date the principal owed can
be recovered through demand.
SEE ACCOMPANYING NOTES TO FINANCIAL STATEMENTS
27
BLACKROCK FUNDS
STATEMENT OF NET ASSETS
OHIO MUNICIPAL MONEY MARKET PORTFOLIO
AS OF APRIL 30, 2005 (UNAUDITED)
PAR
MATURITY (000) VALUE
---------- ---------- -------------
MUNICIPAL BONDS - 102.2%
Ohio - 101.6%
Akron Income Tax RB (Community
Learning Centers Project) Series
2004A DN (FGIC Insurance,
ABN-AMRO Bank N.V. SBPA)
(A-1, F-1+)
2.32%(b) 04/07/05 $3,050 $3,050,000
American Municipal Power, Inc. GO
(Amherst City Project) Series
2004 BAN
2.35% 12/01/05 865 865,000
American Municipal Power, Inc. GO
(Cleveland Public Power Project)
Series 2004 BAN
1.60% 08/18/05 3,215 3,215,000
American Municipal Power, Inc. GO
(Gorsuch Station Improvement
Project) Series 2004A BAN
1.15% 04/01/05 525 525,000
American Municipal Power, Inc. GO
(Gorsuch Station Project) Series
2005-A DN
2.85%(b) 04/07/05 1,000 1,000,000
American Municipal Power, Inc. GO
(Lakeview Project) Series 2005
BAN
2.55% 02/02/06 525 525,000
American Municipal Power, Inc. GO
(Milan Village Project) Series 2005
BAN
2.55% 01/12/06 563 562,675
American Municipal Power, Inc. GO
(Ohio, Inc. Hubbard Project)
Series 2004 BAN
2.45% 12/14/05 495 495,000
American Municipal Power, Inc. GO
(Plymouth Village Project) Series
2004 BAN
2.15% 11/09/05 435 435,000
American Municipal Power, Inc. GO
(St. Mary's Project) Series 2004
BAN
1.90% 10/06/05 1,500 1,500,000
American Municipal Power, Inc. GO
(Village of Woodville Project)
Series 2004 BAN
2.00% 07/21/05 1,700 1,700,000
Ashtabula County IDRB (Brighton
Manor, Inc. Project) Series 1986
AMT DN (KeyBank N.A. LOC)
2.42%(b) 04/07/05 2,500 2,500,000
Avon GO Series 2004 BAN
1.35% 04/14/05 340 340,030
Brooklyn IDRB (Dylon Industries,
Inc. Project) Series 1999 AMT DN
(KeyBank N.A. LOC)
2.42%(b) 04/07/05 850 850,000
Brunswick GO Series 2005 BAN
2.90% 04/06/06 2,030 2,033,938
Butler County GO Series 2004D
BAN
2.75% 09/22/05 3,000 3,016,033
Champaign County IDRB (Allied
Signal, Inc. Project) Series 1998
DN (A-1)
2.60%(b) 04/07/05 1,000 1,000,000
PAR
MATURITY (000) VALUE
---------- ---------- -------------
MUNICIPAL BONDS (Continued)
Ohio (Continued)
Cincinnati City School District GO
(School Energy Conservation
Project) Series 2004 BAN
(SP-1+, MIG-1)
2.50% 09/09/05 $3,000 $3,011,717
Clark County GO Series 2005 BAN
2.75% 02/23/06 1,925 1,929,204
Cleveland Airport System RB
(Banque Nationale de Paribas
Stars & Residual Certificates)
Series 2004-81B AMT DN (FSA
Insurance, Banque Nationale de
Paribas Liquidity Facility)
(VMIG-1)
2.37%(b) 04/07/05 310 310,000
Cleveland-Cuyahoga County Port
Authority RB (Laurel School
Project) Series 2004 DN
(KeyBank N.A. LOC)
2.35%(b) 04/07/05 1,140 1,140,000
Columbus GO Series 1998B BAN
(AAA, Aaa)
5.25% 05/15/05 400 401,893
Cuyahoga County Civic Facility RB
(Orion Services, Inc. Project)
Series 2001 DN (Bank One N.A.
LOC)
2.40%(b) 04/07/05 1,550 1,550,000
Cuyahoga County Economic
Development RB (Berea
Children's Home Project) Series
2000 DN (Huntington National
Bank LOC) (VMIG-1)
2.38%(b) 04/07/05 1,940 1,940,000
Cuyahoga County IDRB (Great
Lakes Brewing Co. Project) Series
2001 AMT DN (Huntington
National Bank LOC)
2.48%(b) 04/07/05 1,260 1,260,000
Cuyahoga County IDRB (Marine
Mechanical Corp. Project) Series
2000 AMT DN (Charter One Bank
LOC)
2.54%(b) 04/07/05 2,610 2,610,000
Cuyahoga County IDRB (Trio
Diversified Co. Project) Series
2000 AMT DN (KeyBank N.A.
LOC)
2.42%(b) 04/07/05 1,875 1,875,000
Delaware County Economic
Development RB (The Columbus
Zoological Park Associates, Inc.
Project) Series 2003 DN
(Huntington National Bank LOC)
2.35%(b) 04/07/05 3,300 3,300,000
Delaware County IDRB (Air Waves,
Inc. Project) Series 1995 DN
(KeyBank N.A. LOC)
2.42%(b) 04/07/05 505 505,000
Erie County IDRB (Brighton Manor
Co. Project) Series 1986 AMT DN
(KeyBank N.A. LOC)
2.42%(b) 04/07/05 3,750 3,750,000
SEE ACCOMPANYING NOTES TO FINANCIAL STATEMENTS
28
BLACKROCK FUNDS
STATEMENT OF NET ASSETS
OHIO MUNICIPAL MONEY MARKET PORTFOLIO (CONTINUED)
AS OF APRIL 30, 2005 (UNAUDITED)
PAR
MATURITY (000) VALUE
---------- ---------- -------------
MUNICIPAL BONDS (Continued)
Ohio (Continued)
Fairfield County GO Series 2004
BAN
2.00% 04/13/05 $1,300 $1,300,346
Franklin County Healthcare Facilities
RB (Heritage Day Health Centers
Project) Series 2002 DN
(Huntington National Bank LOC)
2.35%(b) 04/07/05 1,225 1,225,000
Franklin County Healthcare Facilities
RB (Willow Brook Christian
Project) Series 2004 DN (Fifth
Thrid Bank LOC) (A-1+)
2.30%(b) 04/07/05 2,050 2,050,000
Fulton County IDRB (Haas Door Co.
& Nofziger Doors International,
Inc. Project) Series 1999 AMT DN
(National City Bank N.A. LOC)
2.44%(b) 04/07/05 935 935,000
Geauga County GO Series 2004
BAN
1.80% 08/30/05 1,350 1,351,095
Geauga County RB (Thistle Lane
Project) Series 2000 AMT DN
(Huntington National Bank LOC)
2.48%(b) 04/07/05 2,310 2,310,000
Greene County GO Series 2004
BAN
2.25% 08/18/05 315 315,648
Greene County IDRB (AFC
Stamping & Production, Inc.,
Barsplice Products Project) Series
1995 AMT DN (KeyBank N.A.
LOC)
2.42%(b) 04/07/05 310 310,000
Huber Heights GO (Brandt Pike
Project) Series 2005 MB
3.25% 03/31/06 1,155 1,161,727
Jackson RB (Hospital Facilities
Project) Series 2005 DN (Radian
Insurance, Fifth Third Bank LOC)
(AA, F-1+)
2.33%(b) 04/07/05 2,250 2,250,000
Lebanon GO Series 2004 BAN
2.40% 07/07/05 400 400,731
Lorain County IDRB (Ohio
Metallurgical Services Project)
Series 2001 AMT DN (First Merit
Bank N.A. LOC)
2.56%(b) 04/07/05 2,050 2,050,000
Lyndhurst GO Series 2005 BAN
2.65% 03/02/06 425 425,761
Mahoning County IDRB (M&J
Development Ltd. Project) Series
2002 AMT DN (KeyBank N.A.
LOC)
2.42%(b) 04/07/05 2,640 2,640,000
Mahoning County IDRB (Serra Land
Project) Series 1997 AMT DN
(KeyBank N.A. LOC)
2.42%(b) 04/07/05 1,230 1,230,000
Mahoning County RB (Youngstown
Iron & Metal, Inc. Project) Series
1997 AMT DN (National City Bank
N.A. LOC)
2.49%(b) 04/07/05 600 600,000
PAR
MATURITY (000) VALUE
---------- ---------- -------------
MUNICIPAL BONDS (Continued)
Ohio (Continued)
Mentor IDRB (Arrow Machine Co.
Ltd. Project) Series 1997 DN (First
Merit Bank N.A. LOC)
2.40%(b) 04/07/05 $1,475 $1,475,000
Montgomery County GO Series
2005 BAN
3.00% 12/01/05 1,000 1,004,210
Montgomery County Healthcare
Facilities RB Series 2002 DN
(Bank One N.A. LOC)
2.40%(b) 04/07/05 2,600 2,600,000
North Olmsted GO Series 2004 BAN
1.55% 05/04/05 1,075 1,075,239
Ohio Air Quality Development
Authority PCRB (Ohio Educational
Co. Project) Series 1988C AMT
DN (Wachovia Bank N.A. LOC)
(A-1+, P-1)
2.30%(b) 04/07/05 200 200,000
Ohio Building Authority RB (Adult
Correctional Building Funds
Project) Series 2001 MB (FSA
Insurance)
5.00% 10/01/05 100 101,661
Ohio GO (Citibank Trust Receipts)
Series 2003R-4015 ROC II DN
(Citigroup Global Markets Liquidity
Facility) (VMIG-1)
2.31%(b) 04/07/05 5,230 5,230,000
Ohio GO Series 1996 MB
(AA+, Aa1)
5.05% 04/07/05 250 255,970
Ohio Higher Education Facility RB
(Ashland University Project)
Series 2004 DN (KeyBank N.A.
LOC) (A-1)
2.33%(b) 04/07/05 3,750 3,750,000
Ohio Higher Educational Facility
Community RB Series 2000C DN
(Fifth Third Bank N.A. LOC)
2.35%(b) 04/07/05 530 530,000
Ohio Housing Finance Agency
Mortgage RB Series 2001 AMT
DN (Bank of America N.A. LOC)
(VMIG-1)
2.40%(b) 04/07/05 1,745 1,745,000
Ohio Housing Finance Agency
Multi-Family Housing RB (Lincoln
Park Association Project) Series
1985 MB (Bank One N.A. LOC)
(MIG-1)
2.00% 05/02/05 1,715 1,715,000
Ohio Housing Finance Agency RB
(Clipper Tax-Exempt Certificates
Trust Project) Series 2004-08
AMT DN (Lloyds Bank SBPA)
(VMIG-1)
2.40%(b) 04/07/05 8,250 8,250,000
Ohio IDRB (Ashley Ward, Inc.
Project) Series 1997 AMT DN
(Fifth Third Bank N.A. LOC)
2.43%(b) 04/07/05 695 695,000
SEE ACCOMPANYING NOTES TO FINANCIAL STATEMENTS
29
BLACKROCK FUNDS
STATEMENT OF NET ASSETS
OHIO MUNICIPAL MONEY MARKET PORTFOLIO (CONTINUED)
AS OF APRIL 30, 2005 (UNAUDITED)
PAR
MATURITY (000) VALUE
---------- ---------- -------------
MUNICIPAL BONDS (Continued)
Ohio (Continued)
Ohio PCRB (Ross Incineration
Project) Series 2000-1 AMT DN
(Bank One N.A. LOC)
2.45%(b) 04/07/05 $2,070 $2,070,000
Ohio Public Facilities Community
Higher Educational Capital
Facilities RB Series 1995II-A MB
(Kredietbank N.V. LOC)
(AAA, Aaa)
5.20% 05/01/05 425 426,308
Ohio Solid Waste Facilities RB (Pel
Technologies LLC Project) Series
2002 AMT DN (KeyBank N.A.
LOC) (VMIG-1)
2.35%(b) 04/07/05 3,200 3,200,000
Portage County IDRB (Action Super
Abrasive Project) Series 1996
AMT DN (National City Bank N.A.
LOC)
2.45%(b) 04/07/05 810 810,000
Portage County IDRB
(Bauer/Hibbard Properties Ltd.
Project) Series 1998 DN (National
City Bank N.A. LOC)
2.49%(b) 04/07/05 830 830,000
Putnam County Health Care
Facilities RB (Hilty Memorial
Home Project) Series 2004 DN
(LaSalle Bank N.A. LOC)
2.37%(b) 04/07/05 3,560 3,560,000
Richland County GO Series 2004
BAN
2.15% 08/10/05 500 500,705
Richland County GO Series 2005
BAN
3.25% 03/29/06 965 971,056
Rickenbacker Port Authority RB
(P-Float Trust Receipts) Series
2004 PT-2453 AMT DN (Merrill
Lynch Guaranty) (F-1+)
2.41%(b) 04/07/05 7,950 7,950,000
Sandusky County IDRB (Brighton
Manor Co. Project) Series 1986
AMT DN (Bank One N.A. LOC)
(VMIG-1)
2.42%(b) 04/07/05 2,800 2,800,000
St. Marys GO Series 2004 BAN
1.95% 09/15/05 600 600,674
Stark County IDRB (Thakar
Properties LLC Project) Series
2002 AMT DN (National City Bank
N.A. LOC)
2.39%(b) 04/07/05 4,445 4,445,000
Strongsville IDRB (Web Plastics Co.
Project) Series 1997 DN (National
City Bank N.A. LOC)
2.49%(b) 04/07/05 605 605,000
Summit County Civic Facility RB
(Akron Area Electrical Joint
Apprenticeship & Training Trust
Project) Series 2001 DN
(KeyBank N.A. LOC)
2.35%(b) 04/07/05 1,440 1,440,000
PAR
MATURITY (000) VALUE
---------- ---------- -------------
MUNICIPAL BONDS (Continued)
Ohio (Continued)
Summit County IDRB (Austin
Printing Co., Inc. Project) Series
1994 AMT DN (Bank One N.A.
LOC)
2.49%(b) 04/07/05 $ 100 $ 100,000
Summit County IDRB (Flutes LLC
Project) Series 2002 AMT DN
(Marshall & Ilsley Bank LOC)
2.39%(b) 04/07/05 2,645 2,645,000
Summit County IDRB (Jendrisak
Properties Project) Series 2001
AMT DN (First Merit Bank N.A.
LOC)
2.56%(b) 04/07/05 2,170 2,170,000
Summit County IDRB (KB Compost
Services, Inc. Project) Series 2001
AMT DN (KeyBank N.A. LOC)
2.42%(b) 04/07/05 1,800 1,800,000
Summit County IDRB (Sigma
Properties Project) Series 2000A
AMT DN (National City Bank N.A.
LOC)
2.44%(b) 04/07/05 1,180 1,180,000
Summit County IDRB (Waltco Truck
Equipment Project) Series 1988
AMT MB (Skandinaviska Enskilda
LOC)
2.80% 07/15/05 360 360,000
Summit County Port Authority RB
(Meadow Lane Building LLC
Project) Series 2003A AMT DN
(KeyBank N.A. LOC)
2.42%(b) 04/07/05 2,500 2,500,000
Toledo Multi-Family Housing RB
(Cherrywood Apartments Project)
Series 2001 AMT DN (KeyBank
N.A. LOC)
2.42%(b) 04/07/05 2,795 2,795,000
Trumbull County IDRB (Ellwood
Engineered Project) Series 2004
AMT DN (KeyBank N.A. LOC)
2.42%(b) 04/07/05 1,700 1,700,000
Trumbull County IDRB (United Steel
Service, Inc. Project) Series
2000B AMT DN (Bank One N.A.
LOC)
2.50%(b) 04/07/05 380 380,000
Union County GO (Memorial
Hospital Improvements Project)
Series 2004 BAN
2.00% 04/14/05 2,250 2,250,697
Vermilion GO Series 2004 BAN
1.90% 10/06/05 415 415,420
West Chester Township GO Series
2004 BAN
2.05% 08/11/05 2,250 2,253,598
Western Reserve Housing
Development Corporation
Economic RB (Trumbull
Metropolitan Housing Project)
Series 2003 DN (KeyBank N.A.
LOC)
2.43%(b) 04/07/05 3,520 3,520,000
SEE ACCOMPANYING NOTES TO FINANCIAL STATEMENTS
30
BLACKROCK FUNDS
STATEMENT OF NET ASSETS
OHIO MUNICIPAL MONEY MARKET PORTFOLIO (CONCLUDED)
AS OF APRIL 30, 2005 (UNAUDITED)
PAR
MATURITY (000) VALUE
---------- --------- --------------
MUNICIPAL BONDS (Continued)
Ohio (Continued)
Westlake GO Series 2004 BAN
1.80% 06/09/05 $1,685 $ 1,685,624
Wood County Economic
Development RB (Hammill
Manufacturing Co. Project) Series
2000 AMT DN (Sky Bank LOC)
3.28%(b) 04/07/05 1,735 1,735,000
Wood County Economic
Development RB (Precision
Aggregate II Project) Series 1996
AMT DN (Mid American National
Banking & Trust LOC)
3.28%(b) 04/07/05 1,835 1,835,000
Wood County Economic
Development RB (Sun Seed
Holding Co., Inc. Project) Series
2001A AMT DN (Sky Bank LOC)
3.28%(b) 04/07/05 1,685 1,685,000
Wood County Economic
Development RB (Toledo
Electrical Joint Apprenticeship &
Training Fund Project) Series
2000 DN (Sky Bank LOC)
3.28%(b) 04/07/05 1,030 1,030,000
Wood County IDRB (TMT Leasing
LLC Project) Series 2004 DN
(Huntington National Bank LOC)
2.45%(b) 04/07/05 2,250 2,250,000
============
160,876,960
------------
Puerto Rico - 0.6%
Commonwealth of Puerto Rico RB
Series 2004 TRAN
(SP-1+, MIG-1)
3.00% 07/29/05 995 999,336
------------
TOTAL INVESTMENTS IN SECURITIES -
102.2%
(Cost $161,876,296(a)) 161,876,296
LIABILITIES IN EXCESS OF
OTHER ASSETS - (2.2)% (3,538,356)
-----------
NET ASSETS - 100.0%
(Applicable to 126,851,490
Institutional shares, 11,177,881
Service shares, 20,335,766
Investor A shares) $158,337,940
============
NET ASSET VALUE, OFFERING
AND REDEMPTION PRICE PER
INSTITUTIONAL SHARE
($126,836,489/126,851,490) $ 1.00
=======
NET ASSET VALUE, OFFERING
AND REDEMPTION PRICE PER
SERVICE SHARE
($11,175,314/11,177,881) $ 1.00
=======
NET ASSET VALUE, OFFERING
AND REDEMPTION PRICE PER
INVESTOR A SHARE
($20,326,137/20,335,766) $ 1.00
=======
- -------------------
(a) Aggregate cost for Federal income tax purposes.
(b) Rates shown are the rates as of April 30, 2005 and maturities shown are
the next interest readjustment date or the date the principal owed can
be recovered through demand.
SEE ACCOMPANYING NOTES TO FINANCIAL STATEMENTS
31
BLACKROCK FUNDS
STATEMENT OF NET ASSETS
PENNSYLVANIA MUNICIPAL MONEY MARKET PORTFOLIO
AS OF APRIL 30, 2005 (UNAUDITED)
PAR
MATURITY (000) VALUE
---------- ---------- -------------
MUNICIPAL BONDS - 101.6%
Pennsylvania - 101.0%
Allegheny County IDRB
(Commonwealth Development
Parkway Project) Series 1994A
DN (National City Bank N.A. LOC)
(Aa3)
2.31%(b) 04/07/05 $ 3,000 $ 3,000,000
Allegheny County IDRB (UPMC
Health System Project) Series
2002C DN (Comerica Bank N.A.
LOC) (A-1)
2.30%(b) 04/07/05 1,700 1,700,000
Allegheny County Port Authority RB
Series 1999 MB (MBIA Insurance)
(AAA, Aaa)
5.25% 06/01/05 2,885 2,902,367
Allentown Package Authority RB
Series 2004 MB (FSA Insurance)
(Aaa, AAA)
2.50% 10/01/05 280 281,246
Berks County IDRB (Backman Co.
Project) Series 1994 AMT DN
(M&T Bank Corp. LOC) (P-1)
2.27%(b) 04/07/05 1,615 1,615,000
Berks County IDRB (Beacon
Container Corp. Project) Series
1997A AMT DN (Wachovia Bank
N.A. LOC) (P-1)
2.44%(b) 04/07/05 890 890,000
Berks County IDRB (Tray Pak Co.
Project) RB Series 2001A AMT
DN (Wachovia Bank N.A. LOC)
2.44%(b) 04/07/05 3,325 3,325,000
Blair County IDRB Series 2003 AMT
DN (Fulton Bank LOC)
(A-1, VMIG-1)
2.48%(b) 04/07/05 2,205 2,205,000
Bucks County IDRB (LTL Color
Compounders Project) Series
1999B DN (Wilmington Trust Co.
LOC)
2.44%(b) 04/07/05 1,625 1,625,000
Cambria County IDA Resource
Recovery RB (Cambria Cogen Co.
Project) Series 1998 A-2 AMT DN
(Bayerische Landesbank
Girozentrale LOC) (VMIG-1)
2.48%(b) 04/07/05 16,000 16,000,000
Carlisle Area School District GO
Series 2004-G44 DN (MBIA
Insurance, J.P. Morgan Chase
Bank SBPA) (VMIG-1)
2.32%(b) 04/07/05 2,035 2,035,000
Chester County Health & Education
Facilities Retirement Community
RB (Kendal Crosslands
Community Project) Series 2003
DN (Allied Irish Bank PLC LOC)
(A-1)
2.31%(b) 04/07/05 2,000 2,000,000
Chester County IDRB (RV Industrial,
Inc. Project) Series 2001AMT DN
(M&T Bank Corp. LOC) (A-1)
2.13%(b) 04/07/05 3,850 3,850,000
PAR
MATURITY (000) VALUE
---------- ---------- -------------
MUNICIPAL BONDS (Continued)
Pennsylvania (Continued)
Chester County Industrial
Development Authority Student
Housing RB (University Student
Housing Limited Project) Series
2003 DN (Royal Bank of Scotland
PLC LOC) (VMIG-1)
2.33%(b) 04/07/05 $ 8,000 $ 8,000,000
Crawford County IDRB Series 2000
AMT DN (National City Bank N.A.
LOC)
2.44%(b) 04/07/05 1,165 1,165,000
Cumberland County IDRB
(Lawrence Schiff Silk Co. Project)
Series 1998 AMT DN (Wachovia
Bank N.A. LOC)
2.44%(b) 04/07/05 990 990,000
Delaware County Authority
University RB (Villanova University
Project) Series 2003 MB (FGIC
Insurance) (AAA, Aaa)
2.00% 08/01/05 1,100 1,101,911
Delaware Valley Regional Finance
Authority Local Government RB
Series 2002 DN (Merrill Lynch &
Co. SPBA) (A-1+)
2.38%(b) 04/07/05 4,995 4,995,000
East Hempfield Township IDRB
(Herley Industrial, Inc. Project)
Series 2001 AMT DN (M&T Bank
Corp. LOC) (A-1)
2.27%(b) 04/07/05 2,700 2,700,000
Erie County IDRB (American Turned
Products Project) Series 1997
AMT DN (KeyBank N.A. LOC)
2.42%(b) 04/07/05 1,370 1,370,000
Erie County IDRB (Reed
Manufacturing Project) Series
1997 AMT DN (National City Bank
N.A. LOC)
2.49%(b) 04/07/05 400 400,000
Fayette County IDRB (Dynamic
Material Corp. Project) Series
1998 AMT DN (KeyBank N.A.
LOC)
2.42%(b) 04/07/05 2,270 2,270,000
Franklin County IDRB
(Chambersburg Hospital Project)
Series 2000 DN (AMBAC
Insurance, Wachovia Bank N.A.
SBPA) (A-1)
2.38%(b) 04/07/05 2,105 2,105,000
Franklin County IDRB (Menno
Haven Project) Series 2001 DN
(Radian Insurance, Fleet National
Bank SBPA) (A-1+)
2.35%(b) 04/07/05 1,785 1,785,000
Franklin County IDRB (Precast
System Project) Series 2001A
AMT DN (M&T Bank Corp. LOC)
(A-2, P-1, F-1)
2.27%(b) 04/07/05 1,760 1,760,000
SEE ACCOMPANYING NOTES TO FINANCIAL STATEMENTS
32
BLACKROCK FUNDS
STATEMENT OF NET ASSETS
PENNSYLVANIA MUNICIPAL MONEY MARKET PORTFOLIO (CONTINUED)
AS OF APRIL 30, 2005 (UNAUDITED)
PAR
MATURITY (000) VALUE
---------- ---------- -------------
MUNICIPAL BONDS (Continued)
Pennsylvania (Continued)
Harrisburg Authority School RB
(Harrisburg Project) Series 2003
DN (AMBAC Insurance,
Westdeutsche Landesbank
Girozentrale Liquidity Facility)
(A-1+)
2.12%(b) 04/07/05 $ 4,500 $ 4,500,000
Horizon Hospital System Authority
Health & Housing Facility RB (St.
Paul Homes Project) Series 2002
DN (M&T Bank Corp. LOC)
(VMIG-1)
2.36%(b) 04/07/05 7,455 7,455,000
Lackawanna County IDRB (Herff
Jones, Inc. Project) Series 2001
AMT DN (National City Bank N.A.
LOC)
2.39%(b) 04/07/05 2,800 2,800,000
Lancaster County Hospital Authority
RB (Health Center Luthercare
Project) Series 1999 DN (M&T
Bank Corp. LOC) (A-1)
2.20%(b) 04/07/05 5,085 5,085,000
Lancaster County Hospital Authority
RB (Lancaster General Hospital
Project) Series 2002 DN (Fulton
Bank LOC) (VMIG-1)
2.43%(b) 04/07/05 4,000 4,000,000
Lancaster County Hospital Authority
RB (Landis Homes Retirement
Community Project) Series 2002
DN (M&T Bank Corp. LOC) (A-1)
2.20%(b) 04/07/05 4,615 4,615,000
Lancaster County Hospital Authority
RB (Willow Valley Retirement
Project) Series 2002A DN (Radian
Insurance, Fleet National Bank
SBPA) (A-1+)
2.31%(b) 04/07/05 12,800 12,800,000
Lancaster County IDRB (Clean
Creek Partners Project) Series
2000 AMT DN (M&T Bank Corp.
LOC) (A-1)
2.27%(b) 04/07/05 5,340 5,340,000
Lancaster County IDRB (D&P Skibo
LLC Project) Series 2001 AMT DN
(Wachovia Bank N.A. LOC)
2.44%(b) 04/07/05 1,705 1,705,000
Lancaster County IDRB (Garden
Spot Village Project) Series 2004
DN (Fulton Bank LOC) (VMIG-1)
2.15%(b) 04/07/05 7,700 7,700,000
Lancaster County IDRB (John F.
Martin & Sons Project) Series
2001 AMT DN (Fulton Bank LOC)
(A-2)
2.53%(b) 04/07/05 700 700,000
Lancaster County IDRB (Oakfront
LP Project) Series 2001 AMT DN
(M&T Bank Corp. LOC)
(A-2, P-1, F-1)
2.27%(b) 04/07/05 2,320 2,320,000
Lancaster County IDRB Series 1998
AMT DN (Bank One N.A. LOC)
2.45%(b) 04/07/05 1,800 1,800,000
PAR
MATURITY (000) VALUE
---------- ---------- -------------
MUNICIPAL BONDS (Continued)
Pennsylvania (Continued)
Lawrence County IDRB (L&N
Metallurgical Products Project)
Series 1996 AMT DN (Banque
Nationale de Paribas LOC)
2.54%(b) 04/07/05 $ 4,150 $ 4,150,000
Lawrence County IDRB (Villa Maria
Project) Series 2003 DN (Allied
Irish Bank PLC LOC) (VMIG-1)
2.30%(b) 04/07/05 2,655 2,655,000
Lebanon County Health Facility RB
Series 2000 DN (Northern Trust
LOC) (A-1+)
2.33%(b) 04/07/05 3,000 3,000,000
Lebanon County Health Facility RB
Series 2002 DN (Radian
Insurance, Fleet National Bank
SPBA) (A-1)
2.38%(b) 04/07/05 5,300 5,300,000
Mercer County Industrial Authority
Economic Development RB (Solar
Atmospheres Western
Pennsylvania Project) Series 2001
DN (Fulton Bank LOC) (A-1)
2.34%(b) 04/07/05 2,460 2,460,000
Montgomery County Higher
Education & Health Authority RB
(Pennsylvania Higher Education &
Health Loan Project) Series
1996A DN (M&T Bank Corp. LOC)
(A-2)
2.22%(b) 04/07/05 2,895 2,895,000
Montgomery County IDRB (Apple
Fresh Foods Ltd. Project) Series
1996 AMT DN (Wachovia Bank
N.A. LOC) (VMIG-1)
2.20%(b) 04/07/05 695 695,000
Montgomery County IDRB (First
Mortgage Meadowood Corp.
Project) Series 2005 DN (Citizens
Bank LOC) (VMIG-1)
2.33%(b) 04/07/05 7,250 7,250,000
Montgomery County IDRB (Laneko
Engineering Co. Project) Series
1999A AMT DN (Wachovia Bank
N.A. LOC)
2.39%(b) 04/07/05 1,330 1,330,000
North Penn Health Hospital &
Education Authority Hospital RB
(Maple Village Project) Series
2000B DN (M&T Bank Corp. LOC)
(VMIG-1)
2.40%(b) 04/07/05 7,415 7,415,000
North Pocono School District GO
Series 2003-8 DN (ABN-AMRO
Bank N.V. SBPA, FGIC Insurance)
(F-1+)
2.32%(b) 04/07/05 9,995 9,995,000
Northampton County IDRB
(Bethlehem Contracting Project)
Series 2001A AMT DN (M&T Bank
Corp. LOC) (A-2, P-1, F-2)
2.27%(b) 04/07/05 3,780 3,780,000
SEE ACCOMPANYING NOTES TO FINANCIAL STATEMENTS
33
BLACKROCK FUNDS
STATEMENT OF NET ASSETS
PENNSYLVANIA MUNICIPAL MONEY MARKET PORTFOLIO (CONTINUED)
AS OF APRIL 30, 2005 (UNAUDITED)
PAR
MATURITY (000) VALUE
---------- ---------- -------------
MUNICIPAL BONDS (Continued)
Pennsylvania (Continued)
Northampton County IDRB (Trent
Family Partnership Project) Series
2002 AMT DN (Wachovia Bank
N.A. LOC)
2.44%(b) 04/07/05 $ 2,065 $ 2,065,000
Northampton Township GO Series
2001 MB (FGIC Insurance)
(Aaa, AAA)
3.75% 05/15/05 175 175,498
Pennsylvania Economic
Development Financing Authority
RB (Homewood Retirement
Project) Series 1992E DN (M&T
Bank Corp. LOC) (VMIG-1)
2.17%(b) 04/07/05 4,825 4,825,000
Pennsylvania Economic
Development Financing Authority
RB (Material Technology Project)
Series 2000D AMT DN (Wachovia
Bank N.A. LOC)
2.39%(b) 04/07/05 800 800,000
Pennsylvania Economic
Development Financing Authority
RB (Merrill Lynch P-Float Trust
Receipts) Series 2004 PA-1282
DN (Merrill Lynch & Co. LOC)
(A-1)
2.35%(b) 04/07/05 5,000 5,000,000
Pennsylvania Economic
Development Financing Authority
RB (Sunoco, Inc. Project) Series
2004A AMT DN (Sunoco, Inc.
Guaranty) (A-2, P-2)
2.34%(b) 04/07/05 4,700 4,700,000
Pennsylvania Economic
Development Financing Authority
RB Series 1999D AMT DN
(Wachovia Bank N.A. LOC)
2.44%(b) 04/07/05 1,100 1,100,000
Pennsylvania Energy Development
Authority RB (B&W Ebensburg
Project) Series 1988 DN (Swiss
Bank LOC) (A-1+, VMIG-1)
2.33%(b) 04/07/05 1,000 1,000,000
Pennsylvania Higher Educational
Assistance Agency Student Loan
RB Series 1988A AMT DN
(Student Loan Marketing
Association Guaranty,
Westdeutsche Landesbank
Gironzentrale SBPA)
(A-1+, VMIG-1)
2.27%(b) 04/07/05 1,600 1,600,000
Pennsylvania Higher Educational
Assistance Agency Student Loan
RB Series 1997A AMT DN (Dexia
Credit Local SBPA)
(A-1+, VMIG-1)
2.35%(b) 04/07/05 2,300 2,300,000
Pennsylvania Higher Educational
Assistance Agency Student Loan
RB Series 2001A AMT DN
(AMBAC Insurance)
(A-1+, VMIG-1)
2.35%(b) 04/07/05 1,000 1,000,000
PAR
MATURITY (000) VALUE
---------- ---------- -------------
MUNICIPAL BONDS (Continued)
Pennsylvania (Continued)
Pennsylvania Higher Educational
Assistance Agency Student Loan
RB Series 2001B AMT DN
(Multiple LOCs) (VMIG-1)
2.35%(b) 04/07/05 $ 9,600 $ 9,600,000
Pennsylvania Higher Educational
Assistance Agency Student Loan
RB Series 2002A AMT DN (FSA
Insurance) (A-1+, VMIG-1)
2.35%(b) 04/07/05 20,000 20,000,000
Pennsylvania Higher Educational
Facilities Authority Hospital RB
(Merrill Lynch P-Float Trust
Receipts) Series 2005-2498 DN
(Merrill Lynch Guaranty) (F-1+)
2.38%(b) 04/07/05 5,060 5,060,000
Pennsylvania Higher Educational
Facilities Authority RB
(Association of Independent
Colleges & Universities Project)
Series 2004M-3 MB (M&T Bank
Corp. LOC) (A-1)
2.00% 11/01/05 4,000 4,000,000
Pennsylvania Higher Educational
Facilities Authority RB (Drexel
University Project) Series 2003B
DN (Allied Irish Bank PLC
Liquidity Facility) (Aaa, AA)
2.28%(b) 04/07/05 8,650 8,650,000
Pennsylvania Higher Educational
Facilities Authority RB (Lycoming
College Project) Series 2003 MB
(Allied Irish Bank PLC Liquidity
Facility) (MIG-1)
2.00% 11/01/05 5,500 5,500,000
Pennsylvania Higher Educational
Facilities Authority RB (Merrill
Lynch P-Float Trust Receipts)
Series 2004 MT-042 DN (Lloyds
Bank LOC, Merrill Lynch Capital
Services SBPA) (F-1+)
2.34%(b) 04/07/05 21,000 21,000,000
Pennsylvania Higher Educational
Facilities Authority RB (Mount
Aloysuis College Project) Series
2003 DN (Allied Irish Bank PLC
LOC) (A-1)
2.31%(b) 04/07/05 2,500 2,500,000
Pennsylvania Higher Educational
Facilities Authority RB (Mount
Aloysuis College Project) Series
2003 MB (M&T Bank Corp. LOC)
(MIG-1)
2.00% 11/01/05 1,300 1,300,000
Pennsylvania Higher Educational
Facilities Authority RB (University
of Pennsylvania Health Services
Project) Series 1996C DN (Credit
Suisse LOC) (A-1+, VMIG-1)
2.26%(b) 04/07/05 4,000 4,000,000
Pennsylvania Higher Educational
Facilities Authority RB Series 1998
DN (Banque Nationale de Paribas
LOC) (VMIG-1)
2.34%(b) 04/07/05 2,900 2,900,000
SEE ACCOMPANYING NOTES TO FINANCIAL STATEMENTS
34
BLACKROCK FUNDS
STATEMENT OF NET ASSETS
PENNSYLVANIA MUNICIPAL MONEY MARKET PORTFOLIO (CONTINUED)
AS OF APRIL 30, 2005 (UNAUDITED)
PAR
MATURITY (000) VALUE
---------- ---------- --------------
MUNICIPAL BONDS (Continued)
Pennsylvania (Continued)
Pennsylvania Housing Finance
Agency Single Family Mortgage
RB (Landesbank Hessen P-Float
Trust Receipts) Series 2004-82B
AMT DN (Landesbank
Hessen-Thuringen Girozentrale
LOC) (A-1+, VMIG-1)
2.28%(b) 04/07/05 $10,000 $10,000,000
Pennsylvania Housing Finance
Agency Single Family Mortgage
RB (Landesbank Hessen P-Float
Trust Receipts) Series 2004-85B
AMT DN (Landesbank Hessen
SBPA) (A-1+, VMIG-1)
2.26%(b) 04/07/05 3,500 3,500,000
Pennsylvania Housing Finance
Agency Single Family Mortgage
RB (Landesbank Hessen P-Float
Trust Receipts) Series 2004-85C
AMT DN (Landesbank Hessen
SBPA) (A-1+, VMIG-1)
2.26%(b) 04/07/05 200 200,000
Pennsylvania Housing Finance
Agency Single Family Mortgage
RB (Merrill Lynch P-Float Trust
Receipts) Series 2003 PT-2190
DN (FSA Insurance, Merrill Lynch
Capital Services SBPA) (VMIG-1)
2.35%(b) 04/07/05 4,830 4,830,000
Pennsylvania Housing Financing
Agency RB Series 2005 AMT DN
(Depfa Bank SBPA) (VMIG-1)
2.30%(b) 04/07/05 16,300 16,300,000
Pennsylvania Intergovernmental
Cooperation Authority RB Series
1994 MB (FGIC Insurance)
(AAA, Aaa)
6.75% 06/15/05 300 303,273
Pennsylvania State GO Second
Series 2003 DN (Wachovia Bank
N.A. LOC) (VMIG-1)
2.35%(b) 04/07/05 2,970 2,970,000
Pennsylvania State GO Series 1999
MB (MBIA Insurance) (AAA, Aaa)
5.00% 06/01/05 100 100,572
Pennsylvania State Turnpike
Commission RB (ABN-AMRO
Munitops Trust Certificates) Series
2004-9 MB (AAA, Aaa)
2.32% 04/06/05 13,435 13,435,000
Philadelphia Authority IDRB (30th
Street Station Project) Series
1987 AMT DN (MBIA Insurance,
Royal Bank of Scotland LOC)
(A-1+, VMIG-1)
2.00%(b) 04/30/05 14,900 14,900,000
Philadelphia Authority IDRB (Airport
Project) Series 1998P-1 AMT DN
(FGIC Insurance, Bank of America
N.A. SBPA)
2.43%(b) 04/07/05 5,000 5,000,000
Philadelphia Authority IDRB (Greater
Philadelphia Health System
Project) Series 2003 DN
(Commerce Bank N.A. Liquidity
Facility) (VMIG-1)
2.31%(b) 04/07/05 3,540 3,540,000
PAR
MATURITY (000) VALUE
---------- ---------- --------------
MUNICIPAL BONDS (Continued)
Pennsylvania (Continued)
Philadelphia Authority IDRB (Inglis
Housing Project) Series 1997 MB
(Morgan Guaranty Trust LOC)
(A-1+)
1.97% 05/02/05 $ 3,600 $ 3,599,710
Philadelphia Authority IDRB
(Marketplace Redwood Project)
Series 2001A AMT DN (AMBAC
Insurance, Landesbank
Hessen-Thuringen Girozentrale
SBPA) (A-1+, VMIG-1)
2.26%(b) 04/07/05 1,200 1,200,000
Philadelphia Authority IDRB
(Universal Community Homes
Project) Series 2003 DN
(Wachovia Bank N.A. LOC)
2.39%(b) 04/07/05 2,745 2,745,000
Philadelphia Redevelopment
Authority RB Series 2005 AMT DN
(FGIC Insurance) (Deutsche Bank
Liquidity Facility) (F1+)
2.33%(b) 04/07/05 10,315 10,315,000
Philadelphia Water & Wastewater
RB Series 1995 MB (MBIA
Insurance) (AAA, Aaa)
6.75% 08/01/05 375 381,375
Scranton Lackawanna Health &
Welfare Authority RB (Wachovia
Merlots Trust Receipts) Series
2002A-18 DN (Wachovia Bank
N.A. LOC) (VMIG-1)
2.35%(b) 04/07/05 2,575 2,575,000
Southcentral General Authority RB
(Homewood Hanover Project)
Series 2003 DN (M&T Bank Corp.
LOC) (A-1)
2.20%(b) 04/07/05 18,500 18,500,000
Southcentral General Authority RB
(York Cerebral Palsy Home
Project) Series 2000 DN (Fulton
Bank LOC) (A-1)
2.43%(b) 04/07/05 3,700 3,700,000
Southcentral General Authority RB
Series 2003 DN (AMBAC
Insurance) (A-1)
2.33%(b) 04/07/05 8,000 8,000,000
Southeastern Pennsylvania
Transportation Authority Municipal
Securities Trust Certificates RB
(Bear Stearns Municipal Trust
Certificates) Series 2001-9016A
DN (FGIC Insurance) (A-1)
2.28%(b)(c) 04/07/05 575 575,000
Southeastern Pennsylvania
Transportation Authority Municipal
Securities Trust Certificates RB
(Bear Stearns Municipal Trust
Certificates) Series 2001-9022 DN
(FGIC Insurance) (A-1)
2.28%(b)(c) 04/07/05 100 100,000
State Public School Building
Authority RB (Harrisburg Area
Community College Project)
Series 2004 MB (AMBAC
Insurance) (AAA, Aaa)
2.25% 04/01/05 1,970 1,970,000
SEE ACCOMPANYING NOTES TO FINANCIAL STATEMENTS
35
BLACKROCK FUNDS
STATEMENT OF NET ASSETS
PENNSYLVANIA MUNICIPAL MONEY MARKET PORTFOLIO (CONCLUDED)
AS OF APRIL 30, 2005 (UNAUDITED)
PAR
MATURITY (000) VALUE
---------- ---------- --------------
MUNICIPAL BONDS (Continued)
Pennsylvania (Continued)
State Public School Building
Authority RB (Philadelphia School
District Project) Series 2003-24
DN (FSA Insurance, ABN-AMRO
Bank N.V. SBPA) (VMIG-1)
2.32%(b) 04/07/05 $ 2,145 $ 2,145,000
State Public School Building
Authority RB (Wachovia Merlots
Trust Receipts) Series 2004A-1
DN (FSA Insurance, Wachovia
Bank N.A. LOC) (VMIG-1)
2.35%(b) 04/07/05 3,635 3,635,000
Union County Hospital Authority RB
(Evangelical Community Hospital
Project) Series 2001 MB (Fleet
National Bank SPBA, Radian
Insurance) (A-1)
2.45% 02/01/06 7,500 7,500,000
Union County Hospital Authority RB
(Evangelical Community Hospital
Project) Series 2004 MB (Radian
Insurance) (AA)
2.00% 08/01/05 330 330,220
Union County IDRB (Playworld
Systems, Inc. Project) Series 1999
AMT DN (Wachovia Bank N.A.
LOC)
2.44%(b) 04/07/05 1,000 1,000,000
Union County IDRB (Stabler Cos.,
Inc. Project) Series 2001 AMT DN
(M&T Bank Corp. LOC) (A-1)
2.27%(b) 04/07/05 7,625 7,625,000
Upper Merion General Authority
Lease RB Series 2003 DN
(Commerce Bank N.A. LOC)
(VMIG-1)
2.31%(b) 04/07/05 5,570 5,570,000
Upper St. Clair Township GO Series
2002 MB (FSA Insurance,
ABN-AMRO Bank N.V. SBPA)
(AAA, MIG-1)
2.29% 05/25/05 9,650 9,650,000
Venango IDRB (Scrubgrass Project)
MB (A-1+, P-1)
2.10% 05/04/05 18,000 18,000,000
Venango IDRB (Scrubgrass Project)
MB (Dexia Bank N.A. LOC)
(A-1+, P-1)
2.10% 05/04/05 23,998 23,998,000
Westmoreland County IDRB
(Industrial Development
McCutcheon Enterprise Project)
Series 1999 AMT DN (National
City Bank N.A. LOC)
2.39%(b) 04/07/05 1,970 1,970,000
York County Hospital Authority RB
(Homewood Retirement Centers
of The United Church of Christ,
Inc. Project) Series 1990 DN
(M&T Bank Corp. LOC) (VMIG-1)
2.17%(b) 04/07/05 4,950 4,950,000
York County IDRB (Allied-Signal,
Inc. Project) Series 1993 DN
(FGIC Insurance) (A-1)
2.45%(b) 04/07/05 1,000 1,000,000
PAR
MATURITY (000) VALUE
---------- ---------- --------------
MUNICIPAL BONDS (Continued)
Pennsylvania (Continued)
York County IDRB (Interstate
Holdings Co. Project) Series 2003
AMT DN (Wachovia Bank N.A.
Liquidity Facility)
2.44%(b) 04/07/05 $ 1,335 $ 1,335,000
York County IDRB (York Sheet
Metal, Inc. Project) Series 1998
DN (Wachovia Bank N.A. LOC)
2.44%(b) 04/07/05 2,620 2,620,000
York County IDRB Series 2000 AMT
DN (M&T Bank Corp. LOC) (A-2)
2.27%(b) 04/07/05 2,560 2,560,000
York General Authority RB (Strand
Capitol Performing Arts Center
Project) Series 2002 DN (M&T
Bank Corp. LOC) (A-2)
2.20%(b) 04/07/05 3,800 3,800,000
============
517,319,172
------------
Puerto Rico - 0.6%
Commonwealth of Puerto Rico RB
Series 2004 TRAN
(SP-1+, MIG-1)
3.00% 07/29/05 2,810 2,822,246
------------
TOTAL INVESTMENTS IN
SECURITIES - 101.6%
(Cost $520,141,418(a)) 520,141,418
LIABILITIES IN EXCESS OF
OTHER
ASSETS - (1.6)% (8,140,160)
-----------
NET ASSETS - 100.0%
(Applicable to
405,361,895
Institutional shares,
40,096,736
Service shares,
66,571,956 Investor
A shares) $512,001,258
============
NET ASSET VALUE, OFFERING
AND REDEMPTION PRICE PER
INSTITUTIONAL SHARE
($405,346,691/405,361,895) $ 1.00
=======
NET ASSET VALUE, OFFERING
AND REDEMPTION PRICE PER
SERVICE SHARE
($40,085,278/40,096,736) $ 1.00
=======
NET ASSET VALUE, OFFERING
AND REDEMPTION PRICE PER
INVESTOR A SHARE
($66,569,289/66,571,956) $ 1.00
=======
-------------------
(a) Aggregate cost for Federal income tax purposes.
(b) Rates shown are the rates as of April 30, 2005 and maturities shown are
the next interest readjustment date or the date the principal owed can
be recovered through demand.
(c) Security exempt from registration under Rule 144A of the Securities Act
of 1933. These securities may be resold in transactions exempt from
registration, normally to qualified institutional investors. As of April
30, 2005, the fund held 0.1% of its net assets, with a current market
value of $675,000, in securities restricted as to resale.
SEE ACCOMPANYING NOTES TO FINANCIAL STATEMENTS
36
BLACKROCK FUNDS
STATEMENT OF NET ASSETS
VIRGINIA MUNICIPAL MONEY MARKET PORTFOLIO
AS OF APRIL 30, 2005 (UNAUDITED)
PAR
MATURITY (000) VALUE
---------- ---------- ------------
MUNICIPAL BONDS - 99.5%
Virginia - 94.0%
Arlington County IDRB (Federal
Home Loan Mortgage Corp.
Liquidity Facility) Series 2005A DN
(Federal Home Loan Mortgage
Corp. Guaranty)
2.30%(b) 04/07/05 $ 300 $ 300,000
Chesapeake Bay Bridge & Tunnel
Commonwealth District RB
(Wachovia Merlots Trust Receipts)
Series 2003 DN (MBIA Insurance,
Wachovia Bank N.A. Liquidity
Facility) (VMIG-1)
2.35%(b) 04/07/05 500 500,000
Chesapeake GO Series 1995 MB
(AA)
5.40% 05/01/05 530 542,113
Chesterfield County IDRB (Merrill
Lynch P-Float Trust Receipts)
Series 2004 PT-2133 DN (Merrill
Lynch & Co. Guaranty, Merrill
Lynch Capital Services SBPA)
(F-1+, AA-)
2.37%(b) 04/07/05 1,050 1,050,000
Clarke County Industrial
Development Authority Hospital
Facilities RB (Winchester Medical
Center Inc.) Series 2000 DN
(Morgan Guaranty Trust LOC)
(A-1+, VMIG-1)
2.27%(b) 04/07/05 750 750,000
Commonwealth of Virginia
Transportation Board RB (Citibank
Trust Receipts) Series 2002-1013
DN (Citibank Liquidity Facility)
(A-1+)
2.32%(b) 04/07/05 395 395,000
Danville GO Series 1995 MB (MBIA
Insurance) (Aaa, AAA)
5.30% 04/01/05 480 491,606
Fairfax County Economic
Development Authority RB
(Citibank Trust Receipts) Series
2003 ROCS-II-R-4024 DN
(Citibank Liquidity Facility)
(VMIG-1)
2.32%(b) 04/07/05 400 400,000
Fairfax County Economic
Development Authority RB
(National Industries for Severe
Handicap Project) Series 2002 DN
(SunTrust Bank LOC) (VMIG-1)
2.29%(b) 04/07/05 450 450,000
Fairfax County IDRB (Fairfax
Hospital System Project) Series
1988B DN (Inova Health System
Liquidity Facility) (A-1+, VMIG-1)
2.23%(b) 04/07/05 300 300,000
Fairfax County Redevelopment &
Housing Authority Lease RB
(James Lee Community Center
Project) Series 2004 MB (AA+)
2.25% 06/01/05 725 726,048
PAR
MATURITY (000) VALUE
---------- ---------- ------------
MUNICIPAL BONDS (Continued)
Virginia (Continued)
Hampton Roads Regional Jail
Authority Facilities RB (Citibank
Trust Receipts) Series 2004
ROCS-RR-II-R-2156 DN (MBIA
Insurance) (Citibank Liquidity
Facility) (VMIG-1)
2.32%(b) 04/07/05 $ 670 $ 670,000
Harrisonburg Redevelopment &
Housing Authority Lease Purchase
RB Series 2001A DN (Societe
Generale LOC) (A-1+)
2.35%(b) 04/07/05 760 760,000
Henrico County Economic
Development Authority Residential
Care Facility RB (Westminster
Centerbury Project) Series 2003B
DN (KBC Bank LOC) (VMIG-1)
2.29%(b) 04/07/05 100 100,000
Loudoun County IDRB (Howard
Hughes Medical Institute Project)
Series 2003E DN (A-1+, VMIG-1)
2.24%(b) 04/01/05 100 100,000
Loudoun County IDRB (Howard
Hughes Medical Institute Project)
Series 2003F DN (A-1+, VMIG-1)
2.28%(b) 04/07/05 400 400,000
Prince William County RB (Vepco
Project) Series 2005 TECP
(Dominion Resources Guaranty)
(A-2, VMIG-1)
2.17% 05/04/05 1,000 1,000,000
Riverside Regional Jail Authority
Facilities RB Series 1995 MB
(Aaa, AAA)
5.88% 07/01/05 205 211,322
Roanoke Industrial Development
Authority Hospital RB Series 2002
DN (J.P. Morgan SBPA)
(A-1+, VMIG-1)
2.30%(b) 04/01/05 100 100,000
Virginia Beach Development
Authority IDRB (Ocean Ranch
Motel Corp. Project) Series 1998
DN (Branch Banking & Trust Co.
LOC) (VMIG-1)
2.27%(b) 04/07/05 800 800,000
Virginia Beach Development
Authority MultiFamily Housing RB
Series 1999-1146 DN (Merrill
Lynch Capital Services SBPA)
2.33%(b) 04/07/05 250 250,000
Virginia GO Series 2002 MB
(AAA, Aaa)
4.00% 06/01/05 700 702,876
Virginia Public Building Authority RB
Series 2004 ROCS-RR-II-6027
DN (Citibank Liquidity Facility)
(A-1+, AA+)
2.32%(b) 04/07/05 200 200,000
SEE ACCOMPANYING NOTES TO FINANCIAL STATEMENTS
37
BLACKROCK FUNDS
STATEMENT OF NET ASSETS
VIRGINIA MUNICIPAL MONEY MARKET PORTFOLIO (CONCLUDED)
AS OF APRIL 30, 2005 (UNAUDITED)
PAR
MATURITY (000) VALUE
---------- ------- -------------
MUNICIPAL BONDS (Continued)
Virginia (Continued)
Virginia Resource Authority Clean
Water State Revolving Fund RB
(Merrill Lynch P-Float Trust
Receipts) Series 2000 PA-790 DN
(Merrill Lynch & Co. Guaranty,
Merrill Lynch Captial Services
SBPA) (A-1)
2.30%(b) 04/07/05 $505 $ 505,000
Virginia State Public Building
Authority RB Series 1995 MB
(Aa1)
5.10% 08/01/05 350 353,304
===========
12,057,269
-----------
Puerto Rico - 5.5%
Commonwealth of Puerto Rico
Highway & Transportation
Authority RB Series 1998A DN
(AMBAC Insurance, Bank of Nova
Scotia SBPA) (A-1+, VMIG-1)
2.23%(b) 04/07/05 300 300,000
Commonwealth of Puerto Rico RB
Series 2004 TRAN
(SP-1+, MIG-1)
3.00% 07/29/05 100 100,436
Puerto Rico Municipal Finance
Agency GO Series 1999B MB
(FSA Insurance) (Aaa, AAA)
5.00% 08/01/05 100 101,170
Puerto Rico Public Financing Corp.
RB Series 2004-911 DN
(CIFG-TCRS Credit Support,
Morgan Stanley Group Liquidity
Facility) (AAA, F-1+)
2.30%(b) 04/07/05 200 200,000
===========
701,606
-----------
TOTAL INVESTMENTS IN
SECURITIES - 99.5%
(Cost $12,758,875(a)) 12,758,875
OTHER ASSETS IN EXCESS OF
LIABILITIES - 0.5% 64,162
----------
NET ASSETS - 100.0%
(Applicable to
12,823,305
Institutional shares) $12,823,037
===========
NET ASSET VALUE, OFFERING AND
REDEMPTION PRICE PER
INSTITUTIONAL SHARE
($12,823,037/12,823,305) $ 1.00
=======
- -------------------
(a) Aggregate cost for Federal income tax purposes.
(b) Rates shown are the rates as of April 30, 2005 and maturities shown are
the next interest readjustment date or the date the principal owed can
be recovered through demand.
SEE ACCOMPANYING NOTES TO FINANCIAL STATEMENTS
38
BLACKROCK FUNDS
Key to Investment Abbreviations
AMBAC American Municipal Bond Assurance Corp.
AMT Alternative Minimum Tax
BAN Bond Anticipation Note
CDC CDC Funding Group
COP Certificates of Participation
DN Demand Notes
FGIC Financial Guaranty Insurance Company
FSA Financial Security Assurance
GO General Obligation
IDA Industrial Development Authority
IDRB Industrial Development Revenue Bond
LOC Letter of Credit
MB Municipal Bond
MBIA Municipal Bond Insurance Association
PCRB Pollution Control Revenue Bond
RB Revenue Bond
SBPA Stand-by Bond Purchase Agreement
TAN Tax Anticipation Notes
TECP Tax-Exempt Commercial Paper
TRAN Tax and Revenue Anticipation Note
The ratings provided by the Fitch Investors Service, Moody's Investors Service,
Inc. and Standard & Poor's Ratings Service of the investments in the various
Portfolios are believed to be the most recent ratings available at April 30,
2005.
39
BLACKROCK FUNDS
STATEMENTS OF OPERATIONS
FOR THE PERIOD ENDED APRIL 30, 2005 (UNAUDITED)
U.S. TREASURY MUNICIPAL
MONEY MARKET MONEY MARKET MONEY MARKET
PORTFOLIO PORTFOLIO PORTFOLIO
---------------- --------------- ---------------
Investment income:
Interest ....................................... $ 16,078,274 $ 4,366,733 $ 2,985,156
------------ ----------- -----------
Expenses:
Investment advisory fee ........................ 3,161,044 947,025 754,044
Administration fee ............................. 547,950 178,867 142,430
Administration fee - class specific ............ 689,822 199,928 159,187
Custodian fee .................................. 84,902 33,397 30,908
Transfer agent fee ............................. 334,712 28,179 20,651
Transfer agent fee - class specific ............ 131,034 37,882 30,160
Shareholder servicing fees - class specific..... 1,145,241 288,362 274,257
Distribution fees - class specific ............. 315,510 19,916 71,056
Legal and audit fees ........................... 94,641 28,436 27,688
Printing fee ................................... 104,015 29,867 26,759
Registration fees and expenses ................. 39,088 22,377 26,472
Trustees' fees ................................. 19,643 5,548 4,575
Other .......................................... 49,149 17,881 14,097
------------ ----------- -----------
Total expenses ................................ 6,716,751 1,837,665 1,582,284
Less investment advisory and
administration fees waived .................. (1,508,879) (466,410) (373,326)
Less administration fees waived -
class specific .............................. (340,973) (133,936) (73,246)
Less distribution fees waived - class
specific .................................... (260,011) (19,916) (71,056)
Less shareholder servicing fees
waived - class specific ..................... (18,465) - (169,081)
Less expenses reimbursed by advisor........... - - -
------------ ----------- -----------
Net expenses .................................. 4,588,423 1,217,403 895,575
------------ ----------- -----------
Net investment income ........................... 11,489,851 3,149,330 2,089,581
------------ ----------- -----------
Net realized gain (loss) on investments ......... (3,030) (13,138) 9,984
------------ ----------- -----------
Net increase in net assets resulting
from operations ................................ $ 11,486,821 $ 3,136,192 $ 2,099,565
============ =========== ===========
SEE ACCOMPANYING NOTES TO FINANCIAL STATEMENTS.
40
BLACKROCK FUNDS
NEW JERSEY NORTH CAROLINA OHIO PENNSYLVANIA VIRGINIA
MUNICIPAL MUNICIPAL MUNICIPAL MUNICIPAL MUNICIPAL
MONEY MARKET MONEY MARKET MONEY MARKET MONEY MARKET MONEY MARKET
PORTFOLIO PORTFOLIO PORTFOLIO PORTFOLIO PORTFOLIO
- -------------- --------------- -------------- -------------- -------------
$ 1,381,199 $ 548,940 $ 1,453,234 $ 4,456,352 $ 158,994
----------- ---------- ----------- ----------- ---------
348,560 141,100 355,611 1,103,002 40,515
65,839 26,652 67,171 208,135 7,653
73,585 29,788 75,073 232,855 8,553
13,043 6,197 13,565 37,855 2,740
11,334 6,247 9,564 38,530 1,182
13,942 5,648 14,224 44,120 1,620
94,776 767 38,291 66,125 -
6,878 164 13,140 20,503 -
15,577 11,640 16,594 33,733 6,848
13,243 5,049 12,424 39,556 1,354
7,914 7,267 6,115 8,995 8,238
2,417 691 2,105 7,798 258
6,706 3,338 5,773 17,611 1,567
----------- ---------- ----------- ----------- ---------
673,814 244,548 629,650 1,858,818 80,528
(196,420) (119,758) (195,130) (509,894) (43,897)
(51,210) (29,560) (60,244) (204,348) (8,553)
(6,878) (164) (13,140) (20,503) -
- - - - -
- - - - (1,068)
----------- ---------- ----------- ----------- ---------
419,306 95,066 361,136 1,124,073 27,010
----------- ---------- ----------- ----------- ---------
961,893 453,874 1,092,098 3,332,279 131,984
----------- ---------- ----------- ----------- ---------
(23,064) 10,806 - (33,898) -
----------- ---------- ----------- ----------- ---------
$ 938,829 $ 464,680 $ 1,092,098 $ 3,298,381 $ 131,984
=========== ========== =========== =========== =========
41
BLACKROCK FUNDS
STATEMENTS OF CHANGES IN NET ASSETS
MONEY MARKET PORTFOLIO
---------------------------------------
FOR THE
PERIOD FOR THE
ENDED YEAR
3/31/05 ENDED
(UNAUDITED) 9/30/04
------------------- -------------------
Increase (decrease) in net assets:
Operations:
Net investment income ........................... $ 11,489,851 $ 16,426,664
Net realized gain (loss) on investments ......... (3,030) 76,821
--------------- ----------------
Net increase in net assets resulting from
operations ..................................... 11,486,821 16,503,485
--------------- ----------------
Distributions to shareholders from:
Net investment income:
Institutional Class ............................. (4,658,527) (11,959,475)
Service Class ................................... (2,931,744) (2,148,489)
Hilliard Lyons Class ............................ (859,307) (553,341)
Investor A Class ................................ (2,960,544) (1,750,399)
Investor B Class ................................ (65,529) (13,456)
Investor C Class ................................ (14,200) (1,504)
--------------- ----------------
Total distributions from net investment
income ......................................... (11,489,851) (16,426,664)
--------------- ----------------
Capital share transactions ........................ 59,190,473 (1,597,395,056)
--------------- ----------------
Total increase (decrease) in net assets ......... 59,187,443 (1,597,318,235)
Net assets:
Beginning of period ............................. 1,456,377,991 3,053,696,226
--------------- ----------------
End of period ................................... $ 1,515,565,434 $ 1,456,377,991
=============== ================
End of period undistributed net investment
income ......................................... $ 64,239 $ 64,239
U.S.TREASURY MUNICIPAL
MONEY MARKET PORTFOLIO MONEY MARKET PORTFOLIO
----------------------------------- -----------------------------------
FOR THE FOR THE
PERIOD FOR THE PERIOD FOR THE
ENDED YEAR ENDED YEAR
3/31/05 ENDED 3/31/05 ENDED
(UNAUDITED) 9/30/04 (UNAUDITED) 9/30/04
----------------- ----------------- ----------------- -----------------
Increase (decrease) in net assets:
Operations:
Net investment income ........................... $ 3,149,330 $ 3,056,516 $ 2,089,581 $ 3,446,121
Net realized gain (loss) on investments ......... (13,138) 8,597 9,984 2,605
------------- -------------- ------------- --------------
Net increase in net assets resulting from
operations ..................................... 3,136,192 3,065,113 2,099,565 3,448,726
------------- -------------- ------------- --------------
Distributions to shareholders from:
Net investment income:
Institutional Class ............................. (1,587,299) (2,049,993) (793,058) (2,271,744)
Service Class ................................... (1,299,091) (864,910) (405,035) (354,795)
Hilliard Lyons Class ............................ - - (858,452) (791,645)
Investor A Class ................................ (262,940) (141,613) (33,036) (27,937)
Investor B Class ................................ - - - -
Investor C Class ................................ - - - -
------------- -------------- ------------- --------------
Total distributions from net investment
income ......................................... (3,149,330) (3,056,516) (2,089,581) (3,446,121)
------------- -------------- ------------- --------------
Capital share transactions ........................ (22,649,740) (242,262,681) (41,161,268) (347,358,162)
------------- -------------- ------------- --------------
Total increase (decrease) in net assets ......... (22,662,878) (242,254,084) (41,151,284) (347,355,557)
Net assets:
Beginning of period ............................. 437,206,163 679,460,247 331,350,078 678,705,635
------------- -------------- ------------- --------------
End of period ................................... $ 414,543,285 $ 437,206,163 $ 290,198,794 $ 331,350,078
============= ============== ============= ==============
End of period undistributed net investment
income ......................................... $ 46,591 $ 46,591 $ - $ -
SEE ACCOMPANYING NOTES TO FINANCIAL STATEMENTS
42
BLACKROCK FUNDS
NEW JERSEY MUNICIPAL NORTH CAROLINA MUNICIPAL OHIO MUNICIPAL
MONEY MARKET PORTFOLIO MONEY MARKET PORTFOLIO MONEY MARKET PORTFOLIO
- ----------------------------------- --------------------------------- -----------------------------------
FOR THE FOR THE FOR THE
PERIOD FOR THE PERIOD FOR THE PERIOD FOR THE
ENDED YEAR ENDED YEAR ENDED YEAR
3/31/05 ENDED 3/31/05 ENDED 3/31/05 ENDED
(UNAUDITED) 9/30/04 (UNAUDITED) 9/30/04 (UNAUDITED) 9/30/04
- ----------------- ----------------- --------------- ----------------- ----------------- -----------------
$ 961,893 $ 926,093 $ 453,874 $ 684,695 $ 1,092,098 $ 1,075,474
(23,064) 6,081 10,806 (9,007) - -
------------- ------------- ------------ --------------- ------------- -------------
938,829 932,174 464,680 675,688 1,092,098 1,075,474
------------- ------------- ------------ --------------- ------------- -------------
(560,529) (589,129) (450,372) (681,816) (889,959) (861,610)
(330,680) (274,543) (1,670) (1,083) (53,145) (92,021)
- - - - - -
(70,684) (62,421) (1,832) (1,796) (148,994) (121,843)
- - - - - -
- - - - - -
------------- ------------- ------------ --------------- ------------- -------------
(961,893) (926,093) (453,874) (684,695) (1,092,098) (1,075,474)
------------- ------------- ------------ --------------- ------------- -------------
(836,205) (6,118,893) (3,001,961) (104,373,941) (11,172,704) 35,359,206
------------- ------------- ------------ --------------- ------------- -------------
(859,269) (6,112,812) (2,991,155) (104,382,948) (11,172,704) 35,359,206
153,250,227 159,363,039 58,646,750 163,029,698 169,510,644 134,151,438
------------- ------------- ------------ --------------- ------------- -------------
$ 152,390,958 $ 153,250,227 $ 55,655,595 $ 58,646,750 $ 158,337,940 $ 169,510,644
============= ============= ============ =============== ============= =============
$ - $ - $ - $ - $ - $ -
PENNSYLVANIA MUNICIPAL VIRGINIA MUNICIPAL
MONEY MARKET PORTFOLIO MONEY MARKET PORTFOLIO
----------------------------------- --------------------------------
FOR THE FOR THE FOR THE
PERIOD PERIOD FOR THE PERIOD FOR THE
ENDED ENDED YEAR ENDED YEAR
3/31/05 3/31/05 ENDED 3/31/05 ENDED
(UNAUDITED) (UNAUDITED) 9/30/04 (UNAUDITED) 9/30/04
- ----------------- ----------------- ----------------- --------------- ----------------
$ 961,893 $ 3,332,279 $ 3,424,471 $ 131,984 $ 137,645
(23,064) (33,898) 34,005 - 584
------------- ------------- ------------- ------------ -------------
938,829 3,298,381 3,458,476 131,984 138,229
------------- ------------- ------------- ------------ -------------
(560,529) (2,883,293) (3,106,702) (131,984) (133,087)
(330,680) (199,009) (161,394) - (4,558)
- - - - -
(70,684) (249,977) (156,375) - -
- - - - -
- - - - -
------------- ------------- ------------- ------------ -------------
(961,893) (3,332,279) (3,424,471) (131,984) (137,645)
------------- ------------- ------------- ------------ -------------
(836,205) 23,392,434 (5,693,646) (5,034,023) (45,117,405)
------------- ------------- ------------- ------------ -------------
(859,269) 23,358,536 (5,659,641) (5,034,023) (45,116,821)
153,250,227 488,642,722 494,302,363 17,857,060 62,973,881
------------- ------------- ------------- ------------ -------------
$ 152,390,958 $ 512,001,258 $ 488,642,722 $ 12,823,037 $ 17,857,060
============= ============= ============= ============ =============
$ - $ - $ - $ - $ -
43
BLACKROCK FUNDS
FINANCIAL HIGHLIGHTS
FOR A SHARE OUTSTANDING THROUGHOUT EACH PERIOD
NET NET
ASSET DISTRIBUTIONS ASSET
VALUE NET FROM NET VALUE
BEGINNING INVESTMENT INVESTMENT END OF
OF PERIOD INCOME INCOME PERIOD
=========== ============ =============== ===========
------------
Money Market Portfolio
------------
Institutional Class
10/1/04 through 3/31/0511 $ 1.00 $ 0.0089 $ (0.0089) $ 1.00
9/30/04 1.00 0.0083 ( 0.0083) 1.00
9/30/03 1.00 0.0103 ( 0.0103) 1.00
9/30/02 1.00 0.0186 ( 0.0186) 1.00
9/30/01 1.00 0.0496 ( 0.0496) 1.00
9/30/00 1.00 0.0582 ( 0.0582) 1.00
Service Class
10/1/04 through 3/31/0511 $ 1.00 $ 0.0074 $ (0.0074) $ 1.00
9/30/04 1.00 0.0054 ( 0.0054) 1.00
9/30/03 1.00 0.0073 ( 0.0073) 1.00
9/30/02 1.00 0.0156 ( 0.0156) 1.00
9/30/01 1.00 0.0466 ( 0.0466) 1.00
9/30/00 1.00 0.0552 ( 0.0552) 1.00
Hilliard Lyons Class
10/1/04 through 3/31/0511 $ 1.00 $ 0.0071 $ (0.0071) $ 1.00
9/30/04 1.00 0.0043 ( 0.0043) 1.00
9/30/03 1.00 0.0056 ( 0.0056) 1.00
9/30/02 1.00 0.0139 ( 0.0139) 1.00
9/30/01 1.00 0.0450 ( 0.0450) 1.00
10/18/991 through 9/30/00 1.00 0.0518 ( 0.0518) 1.00
Investor A Class
10/1/04 through 3/31/0511 $ 1.00 $ 0.0072 $ (0.0072) $ 1.00
9/30/04 1.00 0.0044 ( 0.0044) 1.00
9/30/03 1.00 0.0056 ( 0.0056) 1.00
9/30/02 1.00 0.0139 ( 0.0139) 1.00
9/30/01 1.00 0.0449 ( 0.0449) 1.00
9/30/00 1.00 0.0539 ( 0.0539) 1.00
Investor B Class
10/1/04 through 3/31/0511 $ 1.00 $ 0.0048 $ (0.0048) $ 1.00
9/30/04 1.00 0.0015 ( 0.0015) 1.00
9/30/03 1.00 0.0014 ( 0.0014) 1.00
9/30/02 1.00 0.0079 ( 0.0079) 1.00
9/30/01 1.00 0.0389 ( 0.0389) 1.00
9/30/00 1.00 0.0475 ( 0.0475) 1.00
Investor C Class
10/1/04 through 3/31/0511 $ 1.00 $ 0.0048 $ (0.0048) $ 1.00
9/30/04 1.00 0.0014 ( 0.0014) 1.00
9/30/03 1.00 0.0014 ( 0.0014) 1.00
9/30/02 1.00 0.0078 ( 0.0078) 1.00
9/30/01 1.00 0.0389 ( 0.0389) 1.00
9/30/00 1.00 0.0475 ( 0.0475) 1.00
-------------------
U.S. Treasury Money Market Portfolio
-------------------
Institutional Class
10/1/04 through 3/31/0511 $ 1.00 $ 0.0083 $ (0.0083) $ 1.00
9/30/04 1.00 0.0072 ( 0.0072) 1.00
9/30/03 1.00 0.0091 ( 0.0091) 1.00
9/30/02 1.00 0.0166 ( 0.0166) 1.00
9/30/01 1.00 0.0464 ( 0.0464) 1.00
9/30/00 1.00 0.0543 ( 0.0543) 1.00
Service Class
10/1/04 through 3/31/0511 $ 1.00 $ 0.0068 $ (0.0068) $ 1.00
9/30/04 1.00 0.0042 ( 0.0042) 1.00
9/30/03 1.00 0.0061 ( 0.0061) 1.00
9/30/02 1.00 0.0136 ( 0.0136) 1.00
9/30/01 1.00 0.0435 ( 0.0435) 1.00
9/30/00 1.00 0.0513 ( 0.0513) 1.00
SEE ACCOMPANYING NOTES TO FINANCIAL STATEMENTS.
44
BLACKROCK FUNDS
RATIO OF NET
NET RATIO OF TOTAL INVESTMENT INCOME
ASSETS RATIO OF EXPENSES TO AVERAGE RATIO OF NET TO AVERAGE
END OF NET EXPENSES TO NET ASSETS INVESTMENT INCOME NET ASSETS
TOTAL PERIOD AVERAGE NET (EXCLUDING TO AVERAGE NET (EXCLUDING
RETURN (000) ASSETS WAIVERS) ASSETS WAIVERS)
============ ============ ================= ===================== =================== ==================
0.89% $ 541,779 0.42%2 0.72%2 1.77%2 1.47%2
0.84 593,380 0.42 0.63 0.78 0.57
1.04 2,006,202 0.42 0.62 1.04 0.84
1.87 2,462,579 0.42 0.61 1.86 1.67
5.08 2,507,649 0.42 0.60 4.96 4.79
5.98 2,231,404 0.42 0.60 5.83 5.65
0.74% $ 363,926 0.72%2 0.97%2 1.49%2 1.24%2
0.54 374,441 0.71 0.93 0.54 0.32
0.74 431,854 0.72 0.94 0.74 0.53
1.57 567,574 0.72 0.91 1.60 1.41
4.77 853,306 0.72 0.90 4.66 4.49
5.66 629,769 0.72 0.90 5.49 5.31
0.72% $ 117,647 0.77%2 1.08%2 1.44%2 1.13%2
0.43 116,254 0.82 1.13 0.42 0.11
0.57 148,277 0.89 1.10 0.56 0.34
1.40 144,271 0.89 1.08 1.40 1.21
4.59 163,056 0.89 1.07 4.49 4.31
5.30 154,279 0.912 1.092 5.432 5.252
0.73% $ 465,946 0.75%2 1.07%2 1.48%2 1.17%2
0.44 362,495 0.82 1.13 0.43 0.12
0.57 451,676 0.89 1.11 0.57 0.36
1.39 539,268 0.89 1.08 1.38 1.19
4.59 531,518 0.89 1.07 4.43 4.25
5.53 405,740 0.85 1.03 5.37 5.19
0.48% $ 20,278 1.24%2 1.77%2 1.06%2 0.53%2
0.15 8,924 1.10 1.79 0.14 (0.55)
0.14 13,490 1.34 1.86 0.15 (0.37)
0.79 21,864 1.49 1.839 0.77 0.429
3.96 15,853 1.49 1.829 3.64 3.319
4.85 6,371 1.49 1.829 4.84 4.519
0.48% $ 5,989 1.24%2 1.75%2 1.17%2 0.66%2
0.15 884 1.10 1.79 0.14 (0.56)
0.14 2,197 1.35 1.86 0.15 (0.35)
0.79 7,873 1.49 1.839 0.79 0.459
3.96 9,429 1.49 1.829 3.68 3.359
4.85 4,134 1.49 1.829 4.77 4.449
0.83% $ 180,652 0.41%2 0.73%2 1.67%2 1.36%2
0.72 176,136 0.41 0.70 0.68 0.39
0.92 379,240 0.41 0.70 0.93 0.64
1.68 526,344 0.41 0.68 1.62 1.35
4.74 380,200 0.41 0.68 4.61 4.34
5.56 317,272 0.41 0.68 5.43 5.16
0.69% $ 194,647 0.71%2 0.98%2 1.36%2 1.09%2
0.42 219,788 0.71 0.99 0.41 0.13
0.62 250,314 0.71 1.00 0.61 0.32
1.37 265,841 0.71 0.98 1.39 1.11
4.43 398,130 0.71 0.98 4.39 4.12
5.25 412,321 0.71 0.98 5.10 4.83
45
BLACKROCK FUNDS
FINANCIAL HIGHLIGHTS (CONTINUED)
FOR A SHARE OUTSTANDING THROUGHOUT EACH PERIOD
NET NET
ASSET DISTRIBUTIONS ASSET
VALUE NET FROM NET VALUE
BEGINNING INVESTMENT INVESTMENT END OF
OF PERIOD INCOME INCOME PERIOD
=========== ============ =============== ===========
--------------------------
U.S. Treasury Money Market Portfolio (Continued)
--------------------------
Investor A Class
10/1/04 through 3/31/0511 $ 1.00 $ 0.0066 $ (0.0066) $ 1.00
9/30/04 1.00 0.0031 ( 0.0031) 1.00
9/30/03 1.00 0.0044 ( 0.0044) 1.00
9/30/02 1.00 0.0119 ( 0.0119) 1.00
9/30/01 1.00 0.0417 ( 0.0417) 1.00
9/30/00 1.00 0.0497 ( 0.0497) 1.00
Investor B Class
1/10/001 through 2/7/00 $ 1.00 $ 0.0037 $ (0.0037) $ 1.00
Investor C Class
1/22/023 through 2/6/02 $ 1.00 $ 0.0003 $ (0.0003) $ 1.00
------------------
Municipal Money Market Portfolio
------------------
Institutional Class
10/1/04 through 3/31/0511 $ 1.00 $ 0.0068 $ (0.0068) $ 1.00
9/30/04 1.00 0.0073 ( 0.0073) 1.00
9/30/03 1.00 0.0092 ( 0.0092) 1.00
9/30/02 1.00 0.0142 ( 0.0142) 1.00
9/30/01 1.00 0.0315 ( 0.0315) 1.00
9/30/00 1.00 0.0356 ( 0.0356) 1.00
Service Class
10/1/04 through 3/31/0511 $ 1.00 $ 0.0053 $ (0.0053) $ 1.00
9/30/04 1.00 0.0043 ( 0.0043) 1.00
9/30/03 1.00 0.0062 ( 0.0062) 1.00
9/30/02 1.00 0.0112 ( 0.0112) 1.00
9/30/01 1.00 0.0285 ( 0.0285) 1.00
9/30/00 1.00 0.0326 ( 0.0326) 1.00
Hilliard Lyons Class
10/1/04 through 3/31/0511 $ 1.00 $ 0.0063 $ (0.0063) $ 1.00
9/30/04 1.00 0.0056 ( 0.0056) 1.00
9/30/03 1.00 0.0070 ( 0.0070) 1.00
9/30/02 1.00 0.0120 ( 0.0120) 1.00
9/30/01 1.00 0.0292 ( 0.0292) 1.00
10/26/991 through 9/30/00 1.00 0.0316 ( 0.0316) 1.00
Investor A Class
10/1/04 through 3/31/0511 $ 1.00 $ 0.0049 $ (0.0049) $ 1.00
9/30/04 1.00 0.0042 ( 0.0042) 1.00
9/30/03 1.00 0.0048 ( 0.0048) 1.00
9/30/02 1.00 0.0095 ( 0.0095) 1.00
9/30/01 1.00 0.0268 ( 0.0268) 1.00
9/30/00 1.00 0.0309 ( 0.0309) 1.00
------------------------
New Jersey Municipal Money Market Portfolio
------------------------
Institutional Class
10/1/04 through 3/31/0511 $ 1.00 $ 0.0069 $ (0.0069) $ 1.00
9/30/04 1.00 0.0074 ( 0.0074) 1.00
9/30/03 1.00 0.0089 ( 0.0089) 1.00
9/30/02 1.00 0.0134 ( 0.0134) 1.00
9/30/01 1.00 0.0305 ( 0.0305) 1.00
9/30/00 1.00 0.0347 ( 0.0347) 1.00
Service Class
10/1/04 through 3/31/0511 $ 1.00 $ 0.0054 $ (0.0054) $ 1.00
9/30/04 1.00 0.0044 ( 0.0044) 1.00
9/30/03 1.00 0.0059 ( 0.0059) 1.00
9/30/02 1.00 0.0104 ( 0.0104) 1.00
9/30/01 1.00 0.0275 ( 0.0275) 1.00
9/30/00 1.00 0.0317 ( 0.0317) 1.00
SEE ACCOMPANYING NOTES TO FINANCIAL STATEMENTS.
46
BLACKROCK FUNDS
RATIO OF NET
NET RATIO OF TOTAL INVESTMENT INCOME
ASSETS RATIO OF EXPENSES TO AVERAGE RATIO OF NET TO AVERAGE
END OF NET EXPENSES TO NET ASSETS INVESTMENT INCOME NET ASSETS
TOTAL PERIOD AVERAGE NET (EXCLUDING TO AVERAGE NET (EXCLUDING
RETURN (000) ASSETS WAIVERS) ASSETS WAIVERS)
============ =========== ================= ===================== =================== ==================
0.66% $ 39,245 0.75%2 1.07%2 1.32%2 1.00%2
0.31 41,283 0.82 1.19 0.31 (0.06)
0.44 49,906 0.88 1.17 0.47 0.17
1.20 68,299 0.88 1.16 1.15 0.87
4.26 35,178 0.88 1.15 4.17 3.90
5.09 31,808 0.86 1.13 4.91 4.64
0.37% $ -4 1.48%2 1.75%2 4.70%2 4.43%2
0.03% $ -8 1.48%2 1.76%2 0.72%2 0.44%2
0.68% $ 81,218 0.42%2 0.74%2 1.35%2 1.04%2
0.73 126,534 0.42 0.71 0.69 0.41
0.92 437,613 0.42 0.71 0.92 0.64
1.43 428,743 0.42 0.70 1.41 1.13
3.19 491,052 0.42 0.69 3.11 2.83
3.62 314,307 0.42 0.70 3.63 3.35
0.53% $ 72,874 0.72%2 0.99%2 1.07%2 0.80%2
0.43 70,344 0.72 1.00 0.42 0.14
0.62 88,769 0.72 1.01 0.63 0.34
1.12 104,474 0.72 1.00 1.13 0.85
2.88 138,402 0.72 0.99 2.82 2.54
3.31 112,807 0.72 1.00 3.23 2.95
0.64% $ 130,755 0.52%2 1.09%2 1.27%2 0.70%2
0.57 127,151 0.59 1.13 0.56 0.02
0.70 143,305 0.64 0.93 0.70 0.41
1.20 147,755 0.64 0.92 1.17 0.89
2.96 101,506 0.64 0.94 2.92 2.63
3.21 105,572 0.662 0.942 3.422 3.142
0.49% $ 5,352 0.81%2 1.13%2 0.97%2 0.64%2
0.43 7,322 0.72 1.19 0.42 (0.05)
0.49 9,019 0.85 1.18 0.47 0.15
0.95 6,587 0.89 1.17 0.96 0.68
2.71 9,013 0.89 1.16 2.65 2.37
3.13 7,396 0.89 1.17 3.09 2.81
0.70% $ 74,758 0.39%2 0.74%2 1.39%2 1.04%2
0.74 80,530 0.39 0.72 0.74 0.40
0.89 77,267 0.39 0.72 0.89 0.56
1.35 86,573 0.39 0.71 1.34 1.02
3.10 97,007 0.39 0.70 3.03 2.72
3.52 82,080 0.39 0.70 3.45 3.14
0.55% $ 60,361 0.69%2 0.99%2 1.09%2 0.80%2
0.44 59,899 0.69 1.01 0.44 0.12
0.59 64,313 0.69 1.02 0.59 0.26
1.04 65,074 0.69 1.01 1.04 0.71
2.79 60,296 0.69 1.00 2.75 2.44
3.21 55,177 0.69 1.00 3.23 2.92
47
BLACKROCK FUNDS
FINANCIAL HIGHLIGHTS (CONTINUED)
FOR A SHARE OUTSTANDING THROUGHOUT EACH PERIOD
NET NET
ASSET DISTRIBUTIONS ASSET
VALUE NET FROM NET VALUE
BEGINNING INVESTMENT INVESTMENT END OF
OF PERIOD INCOME INCOME PERIOD
=========== ============ =============== ===========
------------------------------
New Jersey Municipal Money Market Portfolio (Continued)
------------------------------
Investor A Class
10/1/04 through 3/31/0511 $ 1.00 $ 0.0050 $ (0.0050) $ 1.00
9/30/04 1.00 0.0044 ( 0.0044) 1.00
9/30/03 1.00 0.0045 ( 0.0045) 1.00
9/30/02 1.00 0.0087 ( 0.0087) 1.00
9/30/01 1.00 0.0258 ( 0.0258) 1.00
9/30/00 1.00 0.0292 ( 0.0292) 1.00
Investor B Class
10/1/99 through 2/8/00 $ 1.00 $ 0.0077 $ (0.0077) $ 1.00
--------------------------
North Carolina Municipal Money Market
Portfolio
--------------------------
Institutional Class
10/1/04 through 3/31/0511 $ 1.00 $ 0.0073 $ (0.0073) $ 1.00
9/30/04 1.00 0.0084 ( 0.0084) 1.00
9/30/03 1.00 0.0097 ( 0.0097) 1.00
9/30/02 1.00 0.0134 ( 0.0134) 1.00
9/30/01 1.00 0.0313 ( 0.0313) 1.00
9/30/00 1.00 0.0362 ( 0.0362) 1.00
Service Class
10/1/04 through 3/31/0511 $ 1.00 $ 0.0058 $ (0.0058) $ 1.00
9/30/04 1.00 0.0054 ( 0.0054) 1.00
9/30/03 1.00 0.0067 ( 0.0067) 1.00
9/30/02 1.00 0.0104 ( 0.0104) 1.00
9/30/01 1.00 0.0283 ( 0.0283) 1.00
9/30/00 1.00 0.0332 ( 0.0332) 1.00
Investor A Class
10/1/04 through 3/31/0511 $ 1.00 $ 0.0055 $ (0.0055) $ 1.00
9/30/04 1.00 0.0054 ( 0.0054) 1.00
9/30/03 1.00 0.0053 ( 0.0053) 1.00
9/30/02 1.00 0.0082 ( 0.0082) 1.00
9/30/01 1.00 0.0266 ( 0.0266) 1.00
9/30/00 1.00 0.0315 ( 0.0315) 1.00
Investor B Class
10/1/01 through 12/14/01 $ 1.00 $ 0.0012 $ (0.0012) $ 1.00
9/30/01 1.00 0.0203 ( 0.0203) 1.00
1/12/001 through 9/30/00 1.00 0.0185 ( 0.0185) 1.00
---------------------
Ohio Municipal Money Market Portfolio
---------------------
Institutional Class
10/1/04 through 3/31/0511 $ 1.00 $ 0.0072 $ (0.0072) $ 1.00
9/30/04 1.00 0.0087 ( 0.0087) 1.00
9/30/03 1.00 0.0105 ( 0.0105) 1.00
9/30/02 1.00 0.0154 ( 0.0154) 1.00
9/30/01 1.00 0.0331 ( 0.0331) 1.00
9/30/00 1.00 0.0361 ( 0.0361) 1.00
Service Class
10/1/04 through 3/31/0511 $ 1.00 $ 0.0057 $ (0.0057) $ 1.00
9/30/04 1.00 0.0057 ( 0.0057) 1.00
9/30/03 1.00 0.0075 ( 0.0075) 1.00
9/30/02 1.00 0.0124 ( 0.0124) 1.00
9/30/01 1.00 0.0301 ( 0.0301) 1.00
9/30/00 1.00 0.0331 ( 0.0331) 1.00
Investor A Class
10/1/04 through 3/31/0511 $ 1.00 $ 0.0057 $ (0.0057) $ 1.00
9/30/04 1.00 0.0046 ( 0.0046) 1.00
9/30/03 1.00 0.0058 ( 0.0058) 1.00
9/30/02 1.00 0.0107 ( 0.0107) 1.00
9/30/01 1.00 0.0284 ( 0.0284) 1.00
9/30/00 1.00 0.0313 ( 0.0313) 1.00
SEE ACCOMPANYING NOTES TO FINANCIAL STATEMENTS.
48
BLACKROCK FUNDS
RATIO OF NET
NET RATIO OF TOTAL INVESTMENT INCOME
ASSETS RATIO OF EXPENSES TO AVERAGE RATIO OF NET TO AVERAGE
END OF NET EXPENSES TO NET ASSETS INVESTMENT INCOME NET ASSETS
TOTAL PERIOD AVERAGE NET (EXCLUDING TO AVERAGE NET (EXCLUDING
RETURN (000) ASSETS WAIVERS) ASSETS WAIVERS)
============ =========== ================= ===================== =================== ==================
0.50% $ 17,272 0.77%2 1.13%2 1.03%2 0.67%2
0.44 12,821 0.69 1.21 0.43 (0.09)
0.45 17,783 0.82 1.19 0.44 0.07
0.87 14,244 0.86 1.18 0.87 0.54
2.61 16,417 0.86 1.17 2.40 2.09
2.96 6,421 0.93 1.24 2.86 2.55
0.77% $ -4 1.46%2 1.77%2 2.33%2 2.02%2
0.73% $ 55,027 0.30%2 0.78%2 1.45%2 0.97%2
0.85 58,168 0.30 0.74 0.84 0.40
0.97 162,465 0.30 0.74 0.96 0.53
1.35 156,476 0.30 0.72 1.32 0.90
3.18 115,139 0.30 0.70 3.10 2.70
3.68 102,155 0.30 0.72 3.62 3.20
0.58% $ 310 0.60%2 1.02%2 1.16%2 0.74%2
0.54 160 0.60 1.03 0.55 0.11
0.67 227 0.60 1.04 0.63 0.20
1.05 205 0.60 1.02 1.14 0.71
2.87 519 0.60 1.00 2.80 2.40
3.37 649 0.60 1.02 3.20 2.78
0.55% $ 319 0.64%2 1.13%2 1.11%2 0.63%2
0.55 319 0.60 1.23 0.54 (0.09)
0.53 338 0.74 1.21 0.53 0.06
0.88 375 0.77 1.19 0.88 0.46
2.70 415 0.77 1.17 2.52 2.12
3.20 358 0.77 1.19 3.15 2.73
0.12% $ -6 1.37%2 1.79%2 0.60%2 0.18%2
2.05 6 1.37 1.77 2.02 1.62
1.86 6 1.372 1.792 2.612 2.192
0.72% $ 126,836 0.39%2 0.73%2 1.45%2 1.11%2
0.87 122,030 0.39 0.72 0.87 0.54
1.06 94,936 0.39 0.72 1.05 0.71
1.55 104,426 0.39 0.72 1.52 1.19
3.36 77,620 0.39 0.71 3.31 2.98
3.67 52,095 0.39 0.71 3.60 3.28
0.58% $ 11,175 0.69%2 0.98%2 1.13%2 0.84%2
0.57 15,311 0.69 1.01 0.56 0.24
0.75 13,061 0.69 1.03 0.75 0.41
1.25 11,511 0.69 1.02 1.19 0.87
3.05 12,667 0.69 1.01 2.95 2.63
3.36 10,284 0.69 1.01 3.29 2.97
0.58% $ 20,326 0.69%2 1.03%2 1.13%2 0.79%2
0.46 32,171 0.80 1.20 0.46 0.06
0.58 26,154 0.86 1.19 0.59 0.25
1.07 30,851 0.86 1.18 1.09 0.77
2.88 44,050 0.86 1.18 2.84 2.51
3.18 41,010 0.87 1.19 3.13 2.81
49
BLACKROCK FUNDS
FINANCIAL HIGHLIGHTS (CONCLUDED)
FOR A SHARE OUTSTANDING THROUGHOUT EACH PERIOD
NET NET
ASSET DISTRIBUTIONS ASSET
VALUE NET FROM NET VALUE
BEGINNING INVESTMENT INVESTMENT END OF
OF PERIOD INCOME INCOME PERIOD
=========== ============ =============== ===========
-------------------------
Pennsylvania Municipal Money Market Portfolio
-------------------------
Institutional Class
10/1/04 through 3/31/0511 $ 1.00 $ 0.0070 $ (0.0070) $ 1.00
9/30/04 1.00 0.0073 ( 0.0073) 1.00
9/30/03 1.00 0.0093 ( 0.0093) 1.00
9/30/02 1.00 0.0131 ( 0.0131) 1.00
9/30/01 1.00 0.0299 ( 0.0299) 1.00
9/30/00 1.00 0.0354 ( 0.0354) 1.00
Service Class
10/1/04 through 3/31/0511 $ 1.00 $ 0.0055 $ (0.0055) $ 1.00
9/30/04 1.00 0.0043 ( 0.0043) 1.00
9/30/03 1.00 0.0063 ( 0.0063) 1.00
9/30/02 1.00 0.0101 ( 0.0101) 1.00
9/30/01 1.00 0.0269 ( 0.0269) 1.00
9/30/00 1.00 0.0324 ( 0.0324) 1.00
Investor A Class
10/1/04 through 3/31/0511 $ 1.00 $ 0.0060 $ (0.0060) $ 1.00
9/30/04 1.00 0.0045 ( 0.0045) 1.00
9/30/03 1.00 0.0049 ( 0.0049) 1.00
9/30/02 1.00 0.0084 ( 0.0084) 1.00
9/30/01 1.00 0.0252 ( 0.0252) 1.00
9/30/00 1.00 0.0304 ( 0.0304) 1.00
Investor Class B
12/12/011 through 4/9/02 $ 1.00 $ 0.0003 $ (0.0003) $ 1.00
----------------------
Virginia Municipal Money Market Portfolio
----------------------
Institutional Class
10/1/04 through 3/31/0511 $ 1.00 $ 0.0073 $ (0.0073) $ 1.00
9/30/04 1.00 0.0082 ( 0.0082) 1.00
9/30/03 1.00 0.0094 ( 0.0094) 1.00
9/30/02 1.00 0.0144 ( 0.0144) 1.00
9/30/01 1.00 0.0323 ( 0.0323) 1.00
9/30/00 1.00 0.0367 ( 0.0367) 1.00
Service Class
10/1/03 through 10/7/03 $ 1.00 $ 0.0001 $ (0.0001) $ 1.00
9/30/03 1.00 0.0084 ( 0.0084) 1.00
9/30/02 1.00 0.0124 ( 0.0124) 1.00
9/30/01 1.00 0.0293 ( 0.0293) 1.00
9/30/00 1.00 0.0337 ( 0.0337) 1.00
Investor A Class
10/1/01 through 3/12/02 $ 1.00 $ 0.0051 $ (0.0051) $ 1.00
9/30/01 1.00 0.0276 ( 0.0276) 1.00
9/30/005 1.00 0.0288 ( 0.0288) 1.00
1 Commencement of operations of share class.
2 Annualized.
3 Reissuance of shares.
4 There were no Investor B shares outstanding as of September 30, 2000.
5 This class has opened, closed and then reopened during the fiscal year.
The financial highlights are reflective of the cumulative periods that
the class opened.
6 There were no Investor B shares outstanding as of September 30, 2002.
SEE ACCOMPANYING NOTES TO FINANCIAL STATEMENTS.
50
BLACKROCK FUNDS
RATIO OF NET
NET RATIO OF TOTAL INVESTMENT INCOME
ASSETS RATIO OF EXPENSES TO AVERAGE RATIO OF NET TO AVERAGE
END OF NET EXPENSES TO NET ASSETS INVESTMENT INCOME NET ASSETS
TOTAL PERIOD AVERAGE NET (EXCLUDING TO AVERAGE NET (EXCLUDING
RETURN (000) ASSETS WAIVERS) ASSETS WAIVERS)
============ =========== ================= ===================== =================== ==================
0.70% $405,347 0.42%2 0.72%2 1.40%2 1.09%2
0.73 426,130 0.42 0.71 0.73 0.44
0.93 416,412 0.42 0.71 0.93 0.64
1.31 466,039 0.42 0.70 1.30 1.02
3.03 459,885 0.42 0.69 2.97 2.70
3.60 400,378 0.42 0.68 3.53 3.27
0.55% $ 40,085 0.72%2 0.97%2 1.10%2 0.85%2
0.43 32,866 0.72 0.99 0.43 0.15
0.63 44,164 0.72 1.01 0.64 0.35
1.01 54,574 0.72 1.01 1.01 0.73
2.72 75,431 0.72 0.99 2.73 2.46
3.29 83,474 0.72 0.98 3.25 2.99
0.60% $ 66,569 0.62%2 0.93%2 1.22%2 0.91%2
0.45 29,647 0.70 1.17 0.44 (0.03)
0.49 33,726 0.87 1.18 0.51 0.19
0.84 68,204 0.88 1.16 0.83 0.55
2.54 75,332 0.89 1.16 2.46 2.19
3.08 62,421 0.92 1.18 3.00 2.74
0.05% $ -6 1.49%2 1.76%2 0.14%2 (0.13)%2
0.73% $ 12,823 0.30%2 0.89%2 1.47%2 0.87%2
0.82 17,857 0.30 0.89 0.83 0.23
0.95 21,963 0.30 0.75 0.93 0.48
1.45 19,808 0.30 0.75 1.50 1.06
3.28 53,823 0.30 0.73 3.26 2.83
3.73 61,561 0.30 0.74 3.65 3.21
0.01% $ -10 0.40%2 1.06%2 0.71%2 0.04%2
0.85 41,011 0.40 1.05 0.85 0.19
1.25 44,143 0.40 1.00 1.19 0.60
2.97 611 0.60 1.03 2.94 2.51
3.42 458 0.60 1.04 3.17 2.73
0.51% $ -7 0.77%2 1.20%2 1.21%2 0.77%2
2.80 3,008 0.77 1.20 2.72 2.28
2.92 3,020 0.87 1.31 3.11 2.67
7 There were no Investor A shares outstanding as of September 30, 2002.
8 There were no Investor C shares outstanding as of September 30, 2002.
9 Certain prior year amounts were reclassified to conform to current year
presentation.
10 There were no Service shares outstanding as of September 30, 2004.
11 Unaudited.
51
BLACKROCK FUNDS
NOTES TO FINANCIAL STATEMENTS (Unaudited)
(A) Organization
BlackRock FundsSM (the "Fund") was organized on December 22, 1988, as a
Massachusetts business trust and is registered under the Investment Company Act
of 1940, as amended, as an open-end management investment company. The Fund
currently has 50 registered portfolios, eight of which are included in these
financial statements (the "Portfolios"). Each Portfolio is authorized to issue
an unlimited number of shares with a par value of $0.001. Each portfolio of the
Fund may offer as many as seven classes of shares. Shares of all classes of a
Portfolio represent equal pro rata interests in such Portfolio, except that
each class bears different expenses which reflect the difference in the range
of services provided to them, mostly due to differences in distribution and
service fees.
Under the Fund's organizational documents, its officers and trustees are
indemnified against certain liabilities arising out of the performance of their
duties to the Fund. In addition, in the normal course of business, the Fund
enters into contracts with its vendors and others that provide for general
indemnifications. The Fund's maximum exposure under these arrangements is
unknown as this would involve future claims that may be made against the Fund.
However, based on experience, the Fund considers the risk of loss from such
claims to be remote.
(B) Fund Reorganization
On January 31, 2005, BlackRock, Inc., the parent of BlackRock Advisors,
Inc. ("BlackRock"), acquired SSRM Holdings, Inc., the parent of State Street
Research & Management Company ("SSRM"), the investment adviser to the former
State Street Research mutual funds.
On January 31, 2005, the BlackRock Money Market Portfolio acquired all of
the assets and certain stated liabilities of the State Street Research Money
Market Fund. The reorganization was pursuant to an Agreement and Plan of
Reorganization, which was approved by the State Street Research shareholders on
January 25, 2005. Under the Agreement and Plan of Reorganization, 8,688,440
Class B and 154,741,254 Class E shares of the State Street Research Money
Market Fund were exchanged for 8,688,440 and 154,741,254 Investor A Class
shares of the BlackRock Money Market Portfolio, respectively; 15,158,957 Class
B(1) shares of the State Street Research Money Market Fund were exchanged for
15,158,957 Investor B Class shares of the BlackRock Money Market Portfolio;
4,761,926 Class C shares of the State Street Research Money Market Fund were
exchanged for 4,761,926 Investor C Class shares of the BlackRock Money Market
Portfolio and 26,966,565 Class S shares of the State Street Research Money
Market Fund were exchanged for 26,966,565 Institutional Class shares of the
BlackRock Money Market Portfolio. The assets of the State Street Research Money
Market Fund, which consisted of securities and related receivables less
liabilities, were converted on a tax-free basis. Upon the reorganization of
such funds on January 31, 2005, the value of the BlackRock Money Market
Portfolio's net assets (including $210,334,574 in net assets of the State
Street Research Money Market Fund) was $1,605,776,413 before the open of
business.
(C) Summary of Significant Accounting Policies
The following is a summary of significant accounting policies followed by
the Fund in the preparation of its financial statements.
Security Valuation - Portfolio securities are valued under the amortized
cost method which approximates current market value. Under this method,
securities are valued at cost when purchased and thereafter, a constant
proportionate amortization of any discount or premium is recorded until the
maturity of the security. Regular review and monitoring of the valuation is
performed in an attempt to avoid dilution or other unfair results to
shareholders. The Fund seeks to maintain the net asset value per share of each
Portfolio at $1.00, although there is no assurance that it will be able to do
so on a continuing basis.
Dividends to Shareholders - Dividends from net investment income are
declared daily and paid monthly. Net realized capital gains, if any, are
distributed at least annually.
Investment Transactions and Investment Income - Investment transactions
are accounted for on the trade date. The cost of investments sold is determined
by use of the specific identification method for both financial reporting and
federal income tax purposes. Interest income is recorded on the accrual basis.
Repurchase Agreements - Money market instruments may be purchased from
banks and non-bank dealers subject to the seller's agreement to repurchase them
at an agreed upon date and price. Collateral for repurchase agreements may have
longer maturities than the maximum permissible remaining maturity of portfolio
investments. The seller is required on a daily basis to maintain the value of
the securities subject to the agreement at not less than the repurchase
52
BLACKROCK FUNDS
price. The agreements are conditioned upon the collateral being deposited under
the Federal Reserve book-entry system or held in a separate account by the
Fund's custodian or an authorized securities depository.
Estimates - The preparation of financial statements in conformity with
accounting principles generally accepted in the United States of America
("generally accepted accounting principles") requires the use of management
estimates. Actual results could differ from these estimates.
Other - Expenses that are directly related to one of the Portfolios are
charged directly to that Portfolio. Other operating expenses are prorated to
the Portfolios on the basis of relative net assets. Class-specific expenses are
borne by that class. Differences in net expense ratios between classes of a
Portfolio are due to class-specific expenses, waivers and accrual adjustments.
Income, other expenses and realized and unrealized gains and losses of a
Portfolio are allocated to the respective class on the basis of the relative
net assets each day.
The following table provides a list of the Portfolios included in this
report along with a summary of their respective class-specific fee arrangements
as provided under the Fund's Amended and Restated Distribution and Service Plan
(the "Plan"). Fees are expressed as a percentage of average daily net asset
values of the respective classes.
Class-Specific Fee Arrangement
Portfolio Share Classes
Institutional Service Hilliard Lyons
Contractual Actual Contractual Actual Contractual Actual
Fees Fees (4) Fees (1) Fees (4) Fees (2) Fees (4)
Money Market None None 0.25% 0.25% 0.35% 0.25%
U.S. Treasury None None 0.25% 0.25% N/A N/A
Municipal None None 0.25% 0.25% 0.35% None
New Jersey Municipal None None 0.25% 0.25% N/A N/A
North Carolina Municipal None None 0.25% 0.25% N/A N/A
Ohio Municipal None None 0.25% 0.25% N/A N/A
Pennsylvania Municipal None None 0.25% 0.25% N/A N/A
Portfolio Share Classes
Investor A Investor B Investor C
Contractual Actual Contractual Actual Contractual Actual
Fees (2) Fees (4) Fees (3) Fees (4) Fees (3) Fees (4)
Money Market 0.35% 0.25% 1.00% 0.75% 1.00% 0.75%
U.S. Treasury 0.35% 0.25% N/A N/A N/A N/A
Municipal 0.35% 0.25% N/A N/A N/A N/A
New Jersey Municipal 0.35% 0.25% N/A N/A N/A N/A
North Carolina Municipal 0.35% 0.25% N/A N/A N/A N/A
Ohio Municipal 0.35% 0.25% N/A N/A N/A N/A
Pennsylvania Municipal 0.35% 0.25% N/A N/A N/A N/A
(1) - The maximum annual contractual fees are comprised of a 0.25% service fee.
(2) - The maximum annual contractual fees are comprised of a 0.10% distribution
fee and a 0.25% service fee.
(3) - The maximum annual contractual fees are comprised of a 0.75% distribution
fee and a 0.25% service fee.
(4) - The actual fees are as of April 30, 2005.
Each of the Institutional, Service, Hilliard Lyons, Investor A, Investor B
and Investor C share classes bear a Transfer Agent fee at an annual rate not to
exceed 0.018% of the average daily net assets of such respective classes plus
per account fees and disbursements.
For the six months ended April 30, 2005, the following shows the various
types of class-specific expenses borne directly by each class of each Portfolio
and any associated waivers of those expenses.
53
BLACKROCK FUNDS
NOTES TO FINANCIAL STATEMENTS (Unaudited) (Continued)
SHARE CLASSES
ADMINISTRATION FEES -------------------------------------------------------------------------------
HILLIARD
INSTITUTIONAL SERVICE LYONS INVESTOR A INVESTOR B INVESTOR C TOTAL
--------------- ------------ ----------- ------------ ------------ ------------ ------------
Money Market ..................... $ 248,716 $ 187,115 $ 56,882 $ 190,079 $ 5,865 $ 1,165 $ 689,822
U.S. Treasury .................... 90,178 90,829 - 18,921 - - 199,928
Municipal ........................ 55,655 36,029 64,251 3,252 - - 159,187
New Jersey Municipal ............. 38,300 28,751 - 6,534 - - 73,585
North Carolina Municipal ......... 29,495 136 - 157 - - 29,788
Ohio Municipal ................... 58,138 4,452 - 12,483 - - 75,073
Pennsylvania Municipal ........... 196,227 17,150 - 19,478 - - 232,855
Virginia Municipal ............... 8,553 - - - - - 8,553
SHARE CLASSES
ADMINISTRATION FEES WAIVED ----------------------------------------------------------------------------
HILLIARD
INSTITUTIONAL SERVICE LYONS INVESTOR A INVESTOR B INVESTOR C TOTAL
--------------- ----------- --------- ------------ ------------ ------------ ------------
Money Market ..................... $ 248,716 $ 88,481 $- $ 235 $ 3,541 $- $ 340,973
U.S. Treasury .................... 90,178 43,758 - - - - 133,936
Municipal ........................ 55,655 17,591 - - - - 73,246
New Jersey Municipal ............. 38,300 12,910 - - - - 51,210
North Carolina Municipal ......... 29,495 65 - - - - 29,560
Ohio Municipal ................... 58,138 2,106 - - - - 60,244
Pennsylvania Municipal ........... 196,227 8,121 - - - - 204,348
Virginia Municipal ............... 8,553 - - - - - 8,553
SHARE CLASSES
TRANSFER AGENT FEES ------------------------------------------------------------------------------
HILLIARD
INSTITUTIONAL SERVICE LYONS INVESTOR A INVESTOR B INVESTOR C TOTAL
--------------- ----------- ----------- ------------ ------------ ------------ ------------
Money Market ..................... $ 47,446 $ 35,453 $ 10,779 $ 36,024 $ 1,111 $ 221 $ 131,034
U.S. Treasury .................... 17,086 17,210 - 3,586 - - 37,882
Municipal ........................ 10,545 6,825 12,174 616 - - 30,160
New Jersey Municipal ............. 7,257 5,447 - 1,238 - - 13,942
North Carolina Municipal ......... 5,592 26 - 30 - - 5,648
Ohio Municipal ................... 11,016 843 - 2,365 - - 14,224
Pennsylvania Municipal ........... 37,180 3,249 - 3,691 - - 44,120
Virginia Municipal ............... 1,620 - - - - - 1,620
54
BLACKROCK FUNDS
SHARE CLASSES
SHAREHOLDER SERVICE FEES ----------------------------------------------------------------
HILLIARD
SERVICE LYONS INVESTOR A INVESTOR B INVESTOR C TOTAL
------------ ------------ ------------ ------------ ------------ --------------
Money Market ..................... $ 492,407 $ 155,200 $ 477,396 $ 17,286 $ 2,952 $ 1,145,241
U.S. Treasury .................... 239,560 - 48,802 - - 288,362
Municipal ........................ 95,117 169,081 10,059 - - 274,257
New Jersey Municipal ............. 74,863 - 19,913 - - 94,776
North Carolina Municipal ......... 359 - 408 - - 767
Ohio Municipal ................... 11,715 - 26,576 - - 38,291
Pennsylvania Municipal ........... 45,131 - 20,994 - - 66,125
SHARE CLASSES
SHAREHOLDER SERVICE FEES WAIVED ----------------------------------------------------
HILLIARD
SERVICE LYONS INVESTOR B INVESTOR C TOTAL
--------- ---------- ------------ ------------ -----------
Money Market ................. $- $ - $ 15,407 $ 3,058 $ 18,465
Municipal .................... - 169,081 - - 169,081
SHARE CLASSES
DISTRIBUTION FEES -------------------------------------------------------------
HILLIARD LYONS INVESTOR A INVESTOR B INVESTOR C TOTAL
---------------- ------------ ------------ ------------ ------------
Money Market ..................... $ 59,880 $ 200,131 $ 46,303 $ 9,196 $ 315,510
U.S. Treasury .................... - 19,916 - - 19,916
Municipal ........................ 67,633 3,423 - - 71,056
New Jersey Municipal ............. - 6,878 - - 6,878
North Carolina Municipal ......... - 164 - - 164
Ohio Municipal ................... - 13,140 - - 13,140
Pennsylvania Municipal ........... - 20,503 - - 20,503
SHARE CLASSES
DISTRIBUTION FEES WAIVED -------------------------------
HILLIARD LYONS INVESTOR A TOTAL
---------------- ------------ ------------
Money Market ..................... $ 59,880 $ 200,131 $ 260,011
U.S. Treasury .................... - 19,916 19,916
Municipal ........................ 67,633 3,423 71,056
New Jersey Municipal ............. - 6,878 6,878
North Carolina Municipal ......... - 164 164
Ohio Municipal ................... - 13,140 13,140
Pennsylvania Municipal ........... - 20,503 20,503
55
BLACKROCK FUNDS
NOTES TO FINANCIAL STATEMENTS (Unaudited) (Continued)
(D) Transactions with Affiliates and Related Parties
Pursuant to an Investment Advisory Agreement, BlackRock, a wholly-owned
subsidiary of BlackRock, Inc., serves as investment adviser to the Portfolios.
BlackRock Institutional Management Corp. ("BIMC"), a wholly-owned subsidiary of
BlackRock, serves as sub-adviser for all of the Portfolios. BlackRock, Inc. is
an indirect majority-owned subsidiary of The PNC Financial Services Group, Inc.
For its advisory services, BlackRock is entitled to receive fees, computed
daily and payable monthly, at the following annual rates, based on each
Portfolio's average daily net assets: 0.45% of the first $1 billion, 0.40% of
the next $1 billion, 0.375% of the next $1 billion and 0.35% of net assets in
excess of $3 billion.
For the six months ended April 30, 2005, advisory fees and waivers for
each Portfolio were as follows:
GROSS NET
ADVISORY ADVISORY
FEE WAIVER FEE
-------------- -------------- --------------
Money Market ..................... $ 3,161,044 $ 1,508,879 $ 1,652,165
U.S. Treasury .................... 947,025 466,410 480,615
Municipal ........................ 754,044 373,326 380,718
New Jersey Municipal ............. 348,560 196,420 152,140
North Carolina Municipal ......... 141,100 119,758 21,342
Ohio Municipal ................... 355,611 195,130 160,481
Pennsylvania Municipal ........... 1,103,002 509,894 593,108
Virginia Municipal ............... 40,515 40,515 -
In the interest of limiting the expenses of the Portfolios, BlackRock and
the Fund have entered into a series of annual expense limitation agreements.
The agreements set a limit on certain operating expenses of each Portfolio for
the next year and require BlackRock to waive or reimburse fees or expenses if
these operating expenses exceed that limit. These expense limits apply to the
aggregate expenses incurred on a share class (excluding: interest, taxes,
brokerage commissions, other expenditures which are capitalized in accordance
with generally accepted accounting principles and other extraordinary
expenses).
Effective February 1, 2005, BlackRock and BIMC has contractually agreed to
waive or reimburse fees or expenses in order to limit expenses:
SHARE CLASSES
PORTFOLIO --------------------------------------------------------------------------------
INSTITUTIONAL SERVICE HILLIARD LYONS INVESTOR A INVESTOR B INVESTOR C
--------------- --------- ---------------- ------------ ------------ -----------
Money Market ................. 0.42% 0.72% 0.91% 0.89% 1.49% 1.49%
U.S. Treasury ................ 0.41% 0.71% NA 0.88% NA NA
Municipal .................... 0.42% 0.72% 0.66% 0.89% NA NA
New Jersey Municipal ......... 0.39% 0.69% NA 0.96% NA NA
North Carolina Municipal ..... 0.30% 0.60% NA 0.87% NA NA
Ohio Municipal ............... 0.39% 0.69% NA 0.96% NA NA
Pennsylvania Municipal ....... 0.42% 0.72% NA 0.99% NA NA
Virginia Municipal ........... 0.30% NA NA NA NA NA
If in the following two years the operating expenses of a share class that
previously received a waiver or reimbursement from BlackRock are less than the
expense limit for that share class, the share class is required to repay
BlackRock up to the amount of fees waived or expenses reimbursed under the
agreement if: (1) the Portfolio of which the share class is a part has more
than $50 million in assets, (2) BlackRock continues to be the Portfolio's
investment adviser and (3) the Board of Trustees of the Fund has approved the
payments to BlackRock at the previous quarterly meeting.
56
BLACKROCK FUNDS
At April 30, 2005, the amounts subject to possible future reimbursement
under the expense limitation agreement are as follows:
EXPIRING EXPIRING EXPIRING TOTAL WAIVERS SUBJECT
JANUARY 31, 2006 JANUARY 31, 2007 JANUARY 31, 2008 TO REIMBURSEMENT
------------------ ------------------ ------------------ ----------------------
Money Market ................. $ 6,569,912 $ 3,692,393 $ 634,820 $ 10,897,125
U.S. Treasury ................ 2,107,024 1,317,236 183,998 3,608,258
Municipal .................... 1,946,590 1,151,500 105,746 3,203,836
New Jersey Municipal ......... 553,395 479,468 75,931 1,108,794
North Carolina Municipal ..... 645,013 261,156 44,936 951,105
Ohio Municipal ............... 492,327 431,627 77,073 1,001,027
Pennsylvania Municipal ....... 1,505,526 1,334,315 224,992 3,064,833
Virginia Municipal ........... 233,309 101,140 17,453 351,902
PFPC Inc. ("PFPC"), an indirect wholy-owned subsidiary of The PNC
Financial Services Group, Inc., and BlackRock act as co-administrators for the
Fund. For these services, the co-administrators receive a combined
administration fee computed daily and payable monthly, based on a percentage of
the average daily net assets of each Portfolio, at the following annual rates:
0.085% of the first $500 million, 0.075% of the next $500 million and 0.065% of
assets in excess of $1 billion. In addition, each of the share classes is
charged an administration fee based on the following percentage of average
daily net assets of each respective class: 0.095% of the first $500 million,
0.085% of the next $500 million and 0.075% of assets in excess of $1 billion.
In addition, PFPC and BlackRock may have, at their discretion, voluntarily
waived all or any portion of their administration fees for any Portfolio or
share class.
For the six months ended April 30, 2005, administration fees and waivers
for each Portfolio were as follows:
GROSS NET
ADMINISTRATION ADMINISTRATION
FEE WAIVER FEE
---------------- ------------ ---------------
Money Market ..................... $ 1,237,772 $ 340,973 $ 896,799
U.S. Treasury .................... 378,795 133,936 244,859
Municipal ........................ 301,617 73,246 228,371
New Jersey Municipal ............. 139,424 51,210 88,214
North Carolina Municipal ......... 56,440 29,560 26,880
Ohio Municipal ................... 142,244 60,244 82,000
Pennsylvania Municipal ........... 440,990 204,348 236,642
Virginia Municipal ............... 16,206 11,935 4,271
PFPC Trust Co., an indirect subsidiary of The PNC Financial Services
Group, Inc., serves as custodian for each of the Fund's Portfolios. PFPC serves
as transfer and dividend disbursing agent.
Pursuant to the Fund's Amended and Restated Distribution and Service Plan
(the "Plan"), the Fund may pay BlackRock Distributors, Inc. (the "Distributor")
and/or BlackRock or any other affiliate of PNC Financial Services Group, Inc.
fees for distribution and sales support services. Currently, only Hilliard
Lyons Shares, Investor A Shares, Investor B Shares and Investor C Shares bear
the expense of distribution fees under the Plan. In addition, the Fund may pay
brokers, dealers, financial institutions and industry professionals (including
PNC Financial Services Group, Inc. and its affiliates) ("service
organizations") fees for the provision of personal services to shareholders.
BlackRock may receive some of the service fees paid by the Fund in return for
providing services to shareholders. Currently, only Hilliard Lyons Shares,
Investor A Shares, Investor B Shares, Investor C Shares and Service Shares bear
the expense of service fees under the Plan. As of April 30, 2005, affiliated
payables were as follows:
PNC BANK
PFPC(1) BLACKROCK(2) AFFILIATES(3) TOTAL
------------ -------------- --------------- ------------
Money Market ..................... $ 405,218 $ 336,168 $ 226,331 $ 967,717
U.S.Treasury ..................... 54,099 97,727 46,132 197,958
Municipal ........................ 41,034 81,600 17,639 140,273
New Jersey Municipal ............. 22,001 35,774 16,861 74,636
North Carolina Municipal ......... 9,217 4,286 133 13,636
Ohio Municipal ................... 20,584 36,106 6,636 63,326
Pennsylvania Municipal ........... 69,703 124,706 18,337 212,746
57
BLACKROCK FUNDS
NOTES TO FINANCIAL STATEMENTS (Unaudited) (Continued)
PNC BANK
PFPC(1) BLACKROCK(2) AFFILIATES(3) TOTAL
--------- -------------- --------------- ---------
Virginia Municipal ......... $1,890 $361 $- $2,251
(1) - Payables to PFPC and PFPC Trust Co. are for Accounting, Administration,
Custody and Transfer Agent services provided as of April 30, 2005.
(2) - Payables to BlackRock are for Advisory and Administration services
provided as of April 30, 2005.
(3) - Payables to PNC Financial Services Group, Inc. affiliates are for
distribution and sales support services as described under the Plan. The
total payable on behalf of the Fund, as of April 30, 2005, was $5,561,651,
a portion of which is paid to service organizations, including other PNC
Financial Services Group, Inc. affiliates.
(E) Capital Shares
Because the Portfolios have each sold and redeemed shares only at a
constant net asset value of $1.00 per share, the number of shares represented
by such sales, acquisitions, reinvestments, and redemptions is the same as the
dollar amounts shown on the next page for such transactions.
Transactions in capital shares for each period were as follows:
MONEY MARKET
------------------------------------------
FOR THE FOR THE YEAR
SIX MONTHS ENDED ENDED
3/31/05 9/30/04
------------------ ---------------------
Shares issued from the acquisition:(1) .........
Institutional Class ......................... $ 26,966,565 $ -
Investor A Class ............................ 163,429,694 -
Investor B Class ............................ 15,158,957 -
Investor C Class ............................ 4,761,926 -
Shares sold:
Institutional Class ......................... 812,143,387 2,276,620,055
Service Class ............................... 731,573,855 1,474,934,413
Hilliard Lyons Class ........................ 58,744,255 173,608,883
Investor A Class ............................ 140,959,607 171,522,913
Investor B Class ............................ 2,586,309 3,083,308
Investor C Class ............................ 1,881,572 328,491
Shares issued in reinvestment of dividends:
Institutional Class ......................... 40,206 5,468
Service Class ............................... 471,926 356,508
Hilliard Lyons Class ........................ 760,116 497,046
Investor A Class ............................ 2,464,713 1,548,464
Investor B Class ............................ 35,169 8,642
Investor C Class ............................ 7,402 940
Shares redeemed:
Institutional Class ......................... (890,749,731) (3,689,497,408)
Service Class ............................... (742,560,087) (1,532,716,956)
Hilliard Lyons Class ........................ (58,111,017) (206,133,442)
Investor A Class ............................ (203,401,895) (262,262,407)
Investor B Class ............................ (6,426,147) (7,658,078)
Investor C Class ............................ (1,546,309) (1,641,896)
-------------- -----------------
Net increase (decrease) ........................ $ 59,190,473 $ (1,597,395,056)
============== =================
(1) See Note (B).
58
BLACKROCK FUNDS
U.S. TREASURY
----------------------------------------
FOR THE FOR THE YEAR
SIX MONTHS ENDED ENDED
3/31/05 9/30/04
------------------ -------------------
Shares sold:
Institutional Class .................... $ 312,618,533 $ 615,824,214
Service Class .......................... 534,569,122 1,039,846,394
Investor A Class ....................... 18,670,024 28,719,726
Shares issued in reinvestment of dividends:
Institutional Class .................... 132 402
Service Class .......................... 35,205 18,679
Investor A Class ....................... 231,616 120,288
Shares redeemed:
Institutional Class .................... (308,096,772) (818,934,544)
Service Class .......................... (559,739,267) (1,070,394,239)
Investor A Class ....................... (20,938,333) (37,463,601)
-------------- ----------------
Net decrease .............................. $ (22,649,740) $ (242,262,681)
============== ================
MUNICIPAL
----------------------------------------
FOR THE FOR THE YEAR
SIX MONTHS ENDED ENDED
3/31/05 9/30/04
------------------ -------------------
Shares sold:
Institutional Class .................... $ 115,453,163 $ 623,753,440
Service Class .......................... 103,576,558 233,032,663
Hilliard Lyons Class ................... 60,994,575 126,790,716
Investor A Class ....................... 6,202,076 18,673,688
Shares issued in reinvestment of dividends:
Institutional Class .................... 2,822 2,237
Service Class .......................... 71,924 53,046
Hilliard Lyons Class ................... 794,707 742,597
Investor A Class ....................... 31,556 25,918
Shares redeemed:
Institutional Class .................... (160,775,227) (934,868,983)
Service Class .......................... (101,120,362) (251,500,050)
Hilliard Lyons Class ................... (58,189,257) (143,666,837)
Investor A Class ....................... (8,203,803) (20,396,597)
-------------- ---------------
Net decrease .............................. $ (41,161,268) $ (347,358,162)
============== ===============
59
BLACKROCK FUNDS
NOTES TO FINANCIAL STATEMENTS (Unaudited) (Continued)
NEW JERSEY MUNICIPAL
-------------------------------------
FOR THE FOR THE YEAR
SIX MONTHS ENDED ENDED
3/31/05 9/30/04
------------------ ----------------
Shares sold:
Institutional Class .................... $ 102,577,492 $ 201,648,068
Service Class .......................... 12,305,511 20,828,471
Investor A Class ....................... 16,534,573 32,564,149
Shares issued in reinvestment of dividends:
Institutional Class .................... 43,536 32,143
Service Class .......................... 17,199 13,401
Investor A Class ....................... 58,242 60,914
Shares redeemed:
Institutional Class .................... (108,380,182) (198,420,615)
Service Class .......................... (11,852,253) (25,258,071)
Investor A Class ....................... (12,140,323) (37,587,353)
-------------- --------------
Net decrease .............................. $ (836,205) $ (6,118,893)
============== ==============
NORTH CAROLINA MUNICIPAL
----------------------------------------
FOR THE FOR THE YEAR
SIX MONTHS ENDED ENDED
3/31/05 9/30/04
------------------ -------------------
Shares sold:
Institutional Class .................... $ 88,120,494 $ 202,122,387
Service Class .......................... 476,349 519,017
Investor A Class ....................... 42,000 42,000
Shares issued in reinvestment of dividends:
Institutional Class .................... 230,615 206,053
Service Class .......................... - 54
Investor A Class ....................... 1,687 1,717
Shares redeemed:
Institutional Class .................... (91,503,100) (306,616,657)
Service Class .......................... (326,481) (585,549)
Investor A Class ....................... (43,525) (62,963)
------------- ---------------
Net decrease .............................. $ (3,001,961) $ (104,373,941)
============= ===============
60
BLACKROCK FUNDS
OHIO MUNICIPAL
-------------------------------------
FOR THE FOR THE YEAR
SIX MONTHS ENDED ENDED
3/31/05 9/30/04
------------------ ----------------
Shares sold:
Institutional Class .................... $ 240,917,431 $ 288,880,251
Service Class .......................... 54,789,037 157,732,223
Investor A Class ....................... 29,476,009 57,848,699
Shares issued in reinvestment of dividends:
Institutional Class .................... 89,431 91,212
Service Class .......................... 19,794 44,984
Investor A Class ....................... 144,795 109,169
Shares redeemed:
Institutional Class .................... (236,199,939) (261,878,328)
Service Class .......................... (58,944,065) (155,527,630)
Investor A Class ....................... (41,465,197) (51,941,374)
-------------- --------------
Net increase (decrease) ................... $ (11,172,704) $ 35,359,206
============== ==============
PENNSYLVANIA MUNICIPAL
-------------------------------------
FOR THE FOR THE YEAR
SIX MONTHS ENDED ENDED
3/31/05 9/30/04
------------------ ----------------
Shares sold:
Institutional Class .................... $ 357,327,144 $ 562,836,682
Service Class .......................... 42,485,267 59,624,658
Investor A Class ....................... 92,447,586 94,465,452
Shares issued in reinvestment of dividends:
Institutional Class .................... 33,631 28,073
Service Class .......................... 51,715 43,501
Investor A Class ....................... 216,347 146,226
Shares redeemed:
Institutional Class .................... (378,115,394) (553,173,570)
Service Class .......................... (35,315,340) (70,969,774)
Investor A Class ....................... (55,738,522) (98,694,894)
-------------- --------------
Net increase (decrease) ................... $ 23,392,434 $ (5,693,646)
============== ==============
VIRGINIA MUNICIPAL
---------------------------------------
FOR THE FOR THE YEAR
SIX MONTHS ENDED ENDED
3/31/05 9/30/04
------------------ ------------------
Shares sold:
Institutional Class .................... $ 45,255,080 $ 71,096,927
Shares issued in reinvestment of dividends:
Institutional Class .................... 14,623 15,183
Shares redeemed:
Institutional Class .................... (50,303,726) (75,219,028)
Service Class .......................... - (41,010,487)
------------- --------------
Net decrease .............................. $ (5,034,023) $ (45,117,405)
============= ==============
61
BLACKROCK FUNDS
NOTES TO FINANCIAL STATEMENTS (Unaudited) (Continued)
On April 30, 2005, three shareholders held approximately 67% of the
outstanding shares of the Money Market Portfolio, four shareholders held
approximately 88% of the outstanding shares of the U.S. Treasury Money Market
Portfolio, three shareholders held approximately 87% of the outstanding shares
of the Municipal Money Market Portfolio, three shareholders held approximately
85% of the outstanding shares of the New Jersey Municipal Money Market
Portfolio, two shareholders held approximately 76% of the outstanding shares of
the North Carolina Municipal Money Market Portfolio, two shareholders held
approximately 70% of the outstanding shares of the Ohio Municipal Money Market
Portfolio, one shareholder held approximately 72% of the outstanding shares of
the Pennsylvania Municipal Money Market Portfolio and four shareholders held
approximately 94% of the outstanding shares of the Virginia Municipal Money
Market Portfolio. Some of the shareholders are comprised of omnibus accounts,
which are held on behalf of several individual shareholders.
(F) At April 30, 2005, net assets consisted of:
NEW JERSEY
MONEY MARKET U.S. TREASURY MUNICIPAL MUNICIPAL
------------------ ----------------- ---------------- ----------------
Capital paid-in ............. $ 1,515,686,842 $ 414,547,273 $ 290,197,186 $ 152,409,236
Undistributed net investment
income .................... 64,239 46,591 - -
Accumulated net realized gain
(loss) on investment
transactions .............. (185,647) (50,579) 1,608 (18,278)
--------------- ------------- ------------- -------------
$ 1,515,565,434 $ 414,543,285 $ 290,198,794 $ 152,390,958
=============== ============= ============= =============
NORTH
CAROLINA OHIO PENNSYLVANIA VIRGINIA
MUNICIPAL MUNICIPAL MUNICIPAL MUNICIPAL
--------------- ---------------- ---------------- ---------------
Capital paid-in .................. $ 55,654,580 $ 158,365,138 $ 512,023,896 $ 12,823,114
Accumulated net realized gain
(loss) on
investment transactions ......... 1,015 (27,198) (22,638) (77)
------------ ------------- ------------- ------------
$ 55,655,595 $ 158,337,940 $ 512,001,258 $ 12,823,037
============ ============= ============= ============
(G) Federal Tax Information
No provision is made for federal taxes as it is the Fund's intention to
have each Portfolio continue to qualify for and elect the tax treatment
applicable to regulated investment companies under Subchapter M of the Internal
Revenue Code of 1986, as amended, and to make the requisite distributions to
its shareholders which will be sufficient to relieve it from federal income and
excise taxes. Short-term capital gain distributions that are reported in the
Statement of Changes in Net Assets are reported as ordinary income for federal
tax purposes. There were no short-term or long-term capital gain distributions
for the six months ended March 31, 2005.
Dividends from net investment income and distributions from net realized
capital gains are determined in accordance with U.S. Federal income tax
regulations, which may differ from those amounts determined under accounting
principles generally accepted in the United States.
62
BLACKROCK FUNDS
The estimated tax character of distribution paid during the six months
ended March 31, 2005 and the tax character of distributions paid during the
year ended September 30, 2004 were as follows:
TAX-FREE ORDINARY
INCOME INCOME
------------ ---------------
Money Market
3/31/05 ......................... $ - $ 11,489,851
9/30/04 ......................... 16,426,664
U.S. Treasury
3/31/05 ......................... - 3,149,330
9/30/04 ......................... 3,056,516
Municipal
3/31/05 ......................... 2,089,581 -
9/30/04 ......................... 3,446,121
New Jersey Municipal .............
3/31/05 ......................... 961,893 -
9/30/04 ......................... 926,093
North Carolina Municipal .........
3/31/05 ......................... 453,874 -
9/30/04 ......................... 684,695
Ohio Municipal ...................
3/31/05 ......................... 1,092,098 -
9/30/04 ......................... 1,075,474
Pennsylvania Municipal ...........
3/31/05 ......................... 3,332,279 -
9/30/04 ......................... 3,424,471
Virginia Municipal ...............
3/31/05 ......................... 131,984 -
9/30/04 ......................... 137,645
As of March 31, 2005, the estimated tax components of distributable
earnings/(accumulated losses) were as follows:
UNDISTRIBUTED UNDISTRIBUTED UNDISTRIBUTED ACCUMULATED POST-
TAX-FREE ORDINARY LONG-TERM CAPITAL OCTOBER
INCOME INCOME CAPITAL GAIN LOSSES LOSSES
--------------- --------------- --------------- --------------- ----------
Money Market ..................... $ - $ 2,614,872 $ - $ (182,617) $ 3,030
U.S. Treasury .................... - 921,995 - (37,441) 13,138
Municipal ........................ 370,435 - 1,608 - -
New Jersey Municipal ............. 192,699 - - - 23,064
North Carolina Municipal ......... 78,900 - 1,015 - -
Ohio Municipal ................... 214,083 - - (27,198) -
Pennsylvania Municipal ........... 673,860 - - - 33,898
Virginia Municipal ............... 27,422 - - (77) -
63
BLACKROCK FUNDS
NOTES TO FINANCIAL STATEMENTS (Unaudited) (Concluded)
The estimated Post-October losses represent losses realized on investment
transactions from November 1, 2004 through March 31, 2005 that, in accordance
with Federal income tax regulations, the Portfolios may defer and treat as
having arisen in the following fiscal year. For Federal income tax purposes,
capital loss carryforwards may be carried forward and applied against future
capital gains.
At September 30, 2004, the Portfolios had capital loss carryforwards
available to offset future realized capital gains through the indicated
expiration dates:
EXPIRING SEPTEMBER 30
--------------------------------------------------------------------------------------
2006 2007 2008 2009 2010 2011 TOTAL
-------- --------- -------- ----------- --------- ----------- ------------
Money Market ..................... $ - $ - $ - $ 97,341 $ - $ 85,276 $ 182,617
U.S. Treasury .................... - - - 13,150 11,911 12,380 37,441
Municipal ........................ - - - 8,376 - - 8,376
North Carolina Municipal ......... - - 784 - - - 784
Ohio Municipal ................... 3,203 16,541 6,193 - - 1,261 27,198
Virginia Municipal ............... - - - - 77 - 77
(H) Subsequent Event
In April of 2005, BlackRock determined that the Municipal Money Market
Portfolio had purchased a security, the interest on which is subject to the
Federal Alternative Minimum Tax ("AMT") (an "AMT Security"), in violation of
the Portfolio's investment policy that limits the Portfolio investments in AMT
securities to 20% of its nets assets. Once the issue was identified, the
amount of AMT securities were decreased and the Portfolio did not incur a gain
or loss. Due to the violation of investment policy, the Advisor reimbursed the
Portfolio $3,098, which represents the additional tax liability that would be
incurred by shareholders if all of the shareholders of the Portfolio were
subject to the AMT.
64
BLACKROCK FUNDS
ADDITIONAL INFORMATION
(A) Board of Trustees' Consideration of the Advisory Contracts. Investment
advisory and subadvisory agreements ("Advisory Contracts") for the Money
Market Portfolios (each, a "Portfolio") of BlackRock Funds (the "Fund")
were most recently approved by the Board of Trustees (the "Board" or the
"Trustees") of the Fund at an in-person meeting of the Board held on March
1, 2005, including a majority of the Trustees who are not parties to the
Advisory Contracts or interested persons of any such party (as such term is
defined in the Investment Company Act of 1940) (the "Independent
Trustees"). In determining to approve the Advisory Contracts, the Trustees
met with the relevant investment advisory personnel from BlackRock
Advisors, Inc. and BlackRock Institutional Management Corporation (the
"Advisers") and considered all information they deemed reasonably necessary
to evaluate the terms of the Advisory Contracts. The Board received
materials in advance of the meeting relating to its consideration of the
Advisory Contracts for the Portfolios being considered for approval or
renewal, including: (i) fees and expense ratios of each class of each
Portfolio in comparison to the fees and expense ratios of a peer group of
funds, which consists of funds that have all of the following similar
criteria: fund type, investment classification and objective, load type,
asset level and expense structure and components ("peer group"); (ii)
information on the investment performance of each Portfolio in comparison
to the investment performance of a peer universe of funds, which is broader
than a peer group and consists of funds that have all of the following
similar criteria: fund type, investment classification and objective and
load type ("performance universe"); (iii) the Advisers' economic outlook
for the Portfolios and their general investment outlook for the markets;
(iv) information with respect to profitability of BlackRock, Inc.
("BlackRock") and PNC Bank-affiliated companies with respect to each
Portfolio, including details regarding the methodology used to calculate
profitability; (v) information regarding fees paid to service providers
that are affiliates of the Advisers; and (vi) information regarding
compliance records and regulatory matters relating to the Advisers. The
matters discussed below were considered separately by the Independent
Trustees in an executive session, during which counsel who is independent
of the Advisers and the Fund provided guidance to the Independent Trustees.
Fees and Expenses. In approving the Advisory Contracts, the Trustees,
including the Independent Trustees, considered the fees and expense ratios
of each class of shares of each Portfolio. They compared the fees, both
before (referred to as "Contractual") and after (referred to as "Actual")
any fee waivers and expense reimbursements, and expense ratios of each
Portfolio against fees and expense ratios of a peer group. Both the peer
group category and the funds within the peer group with respect to the fee
and expense ratio comparisons were selected by Lipper, Inc. ("Lipper"),
which is not affiliated with the Advisers. The Investor A class and
Institutional class were used to represent all of the Portfolios' share
classes for purposes of the Lipper survey, as Lipper differentiated between
retail and institutional funds in selecting funds in the peer group.1
Taking into account the recent reorganization of a State Street Research
mutual fund with the Money Market Portfolio, Lipper used the Portfolio's
proforma expense information provided by PFPC Inc., the Fund's
administrator, to reflect post-reorganization data for each of the expense
categories.2 In evaluating the Portfolios' advisory fees, the Trustees also
took into account the complexity of investment management for the
Portfolios relative to other types of funds.
1Lipper compared Investor A and Institutional classes for each of the
Portfolios to funds in their respective peer groups, with the exception of
the Virginia Municipal Money Market Portfolio, which has outstanding an
Institutional class only.
2The post-reorganization proforma data reflected expense caps, the
elimination of shareholder processing fees, increased transfer agency fees,
costs associated with new shareholder administrative services arrangements
and increased asset levels resulting from the reorganization of the State
Street Research mutual fund with the Money Market Portfolio.
65
BLACKROCK FUNDS
ADDITIONAL INFORMATION
In considering data based on information provided by Lipper, the Trustees
noted that of the 8 Portfolios with Advisory Contracts subject to
re-approval, all of the 15 share classes of the Portfolios (100%) have
contractual advisory fees higher than the median for their respective peer
groups.3 With regard to these 15 classes that have advisory fees higher
than the peer group median, the Trustees noted:
o In the case of 9 classes (60% of the total classes with advisory
fees higher than the peer group median), the difference from the
median of their respective peer groups is 5 basis points or less
(Institutional class: New Jersey Municipal Money Market, North
Carolina Municipal Money Market, Ohio Municipal Money Market,
Virginia Municipal Money Market and Pennsylvania Municipal Money
Market; Investor A class: New Jersey Municipal Money Market, North
Carolina Municipal Money Market, Ohio Municipal Money Market and
Pennsylvania Municipal Money Market).
o 2 classes (13% of the total classes with advisory fees higher than
the peer group median), while having contractual advisory fees higher
than the median for their respective peer groups, have actual
advisory fees that are lower than or equal to their respective peer
group medians as a result of waivers or expense reimbursements
(Investor A class: Money Market and U.S. Treasury Money Market). For
purposes of the Lipper materials, advisory fees are a component
(together with administrative fees) of management fees.
o 3 classes (20% of the total classes with advisory fees higher than
the peer group median), while having contractual advisory fees higher
than the median for their respective peer groups, have at least two
performance periods out of their one-, three- or five-year
performance periods that are better than or equal to their respective
performance universe medians (Institutional class: Money Market,
Municipal Money Market and U.S. Treasury Money Market).
o 1 class (7% of the total classes with advisory fees higher than the
peer group median) has contractual advisory fees higher than the
median for its respective peer group, however, the Trustees will
continue to monitor the fee level and overall performance of this
class (Investor A class: Municipal Money Market Portfolio).
The Trustees also were provided with information about the services
rendered, and the fee rates offered, to other clients advised by the
Advisers, including closed-end investment companies and accounts that are
not investment companies.
Following consideration of this information, the Trustees, including the
Independent Trustees, concluded that the fees to be paid pursuant to the
Advisory Contracts were fair and reasonable in light of the services
provided.
3The Lipper peer group median was chosen as a conservative point of
reference, taking into account that one-half of the population will have
fees/expenses lower than the median.
66
BLACKROCK FUNDS
Nature, Extent and Quality of Services. The Trustees, including the
Independent Trustees, received information concerning the investment
philosophy and investment process used by the Advisers in managing the
Portfolios, as well as a description of the capabilities, personnel and
services of each Adviser and a copy of the current Form ADV of BlackRock
Advisors, Inc. In connection with this, the Trustees considered each of
the Advisers' in-house research capabilities as well as other resources
available to its personnel. The Trustees considered the scope of the
services provided by the Advisers to the Portfolios under the Advisory
Contracts relative to services typically provided by third parties to other
funds. The Trustees noted that the standard of care applicable under the
Advisory Contracts was comparable to that found generally in investment
company advisory agreements. The Trustees concluded that the scope of the
Advisers' services to be provided to the Portfolios was consistent with the
Portfolios' operational requirements, including, in addition to seeking to
meet their investment objectives, compliance with investment restrictions,
tax and reporting requirements and related shareholder services.
The Trustees also considered the quality of the services provided by the
Advisers to the Portfolios. The Trustees evaluated the procedures of the
Advisers designed to fulfill their fiduciary duty to the Portfolios with
respect to possible conflicts of interest, including their respective codes
of ethics (regulating the personal trading of their officers and
employees), the procedures by which each of the Advisers allocate trades
among its various investment advisory clients, the integrity of the systems
in place to ensure compliance with the foregoing and the record of each of
the Advisers in these matters. The Trustees also received information
concerning standards of the Advisers with respect to the execution of
portfolio transactions.
The Trustees also considered information relating to the education,
experience and number of investment professionals and other personnel who
provide services under the applicable Advisory Contract. The Trustees also
took into account the time and attention devoted by senior management of
the Advisers to the Portfolios. The Trustees also considered the business
reputation of each Adviser and its respective financial resources and
concluded that each of the Advisers would be able to meet any reasonably
foreseeable obligation under the Advisory Contracts.
Fund Performance. The Board of Trustees, including the Independent
Trustees, received and considered information about each Portfolio's
investment performance in comparison to the investment performance of its
respective performance universe. The funds included within each
Portfolio's performance universe were selected by Lipper. The Board was
provided with performance data for the one-, three-, five- and ten-year
periods, as applicable, ended November 30, 2004 ("relevant periods"). The
Board also reviewed the investment performance of the Portfolios and the
Advisers' market outlook with respect to the Portfolios.
The Trustees noted that of the 15 classes of Portfolios subject to review
at the Board meeting, all (100%) had been in existence for at least five
years. 8 classes (53%) performed at or better than their respective
performance universe medians during at least two of the relevant periods,
while 7 classes (47%) performed below their respective performance universe
medians during at least two of the relevant periods. In regard to each of
these 7 classes, the Trustees noted:
o 3 classes (43% of the underperforming classes) performed below their
respective performance universe medians during at least two of the
relevant periods. However, their underperformance was by no more than
10% of their respective medians for any of the relevant periods
(Institutional class: Money Market, Municipal Money Market and North
Carolina Municipal Money Market).
o 4 classes (57% of the underperforming classes) performed below their
respective performance universe
67
BLACKROCK FUNDS
ADDITIONAL INFORMATION
medians during at least two of the relevant periods by more than 10%
(Investor A class: New Jersey Municipal Money Market, North Carolina
Municipal Money Market, Pennsylvania Municipal Money Market and U.S.
Treasury Money Market). These 4 classes consist of classes from 4
different Portfolios. The Board noted the following with respect to
these 4 Portfolios:
o North Carolina Municipal Money Market and Pennsylvania Municipal
Money Market Portfolios - In comparing the five-year performance to
the three- and one-year performance ranking of the Portfolios, the
performance ranking of each Portfolio has been improving within its
respective peer group.
o U.S. Treasury Money Market Portfolio - The five-year performance is
only 13 basis points below its performance universe median.
o New Jersey Municipal Money Market Portfolio - The one-year
performance is 1% below its performance universe median.
The Trustees discussed other factors relevant to the performance of the
Portfolios. The Trustees determined that, while the performance records of
certain of the Portfolios could be improved, the Advisers were taking steps
to address relative underperformance..
Profitability. The Board of Trustees, including the Independent Trustees,
considered the level of the Advisers' and affiliates' profits in respect of
their relationship with the Portfolios. This consideration included a
broad review of the Advisers' methodology in allocating their costs to the
management of a Portfolio. The Board of Trustees considered the profits
realized by the Advisers and affiliates in connection with the operation of
each Portfolio and whether the amount of profit is a fair profit relative
to their relationship with the Portfolio. The Board of Trustees, including
the Independent Trustees, also considered the Advisers' profit margins in
comparison with available industry data. The Board concluded that each
Adviser's profit is a reasonable profit relative to the services provided
to the Portfolios.
Economies of Scale. The Board of Trustees, including the Independent
Trustees, considered whether there have been economies of scale in respect
of the management of each Portfolio, whether each Portfolio has
appropriately benefited from any economies of scale, and whether there is
potential for realization of any further economies of scale.
The Board considered that economies of scale were passed on to the
shareholders in the form of breakpoints to the advisory fee rate. The
Board noted that for the fiscal year ended September 30, 2004, only the
Money Market Portfolio had reached its specified asset level to trigger the
breakpoints to its advisory fee rate. The Board also considered the fee
waivers and expense reimbursement arrangements by the Advisers. The Board
determined that the advisory fee structure was reasonable and that no
changes were currently necessary.
Other Benefits to the Advisers. The Board of Trustees, including the
Independent Trustees, also took into account not only the advisory fees
payable by the Portfolios, but also other potential benefits to the
Advisers, such as the ability to leverage investment professionals that
also manage other portfolios, raising the profile of BlackRock in the
broker-dealer community, and the engagement of affiliates of the Advisers
as service providers to the Portfolios, including for administrative,
transfer agency, distribution and custodial services. The Board also noted
that the Advisers may benefit from the use of soft dollars for research,
which may be used by the Advisers to manage other accounts.
68
BLACKROCK FUNDS
The Board concluded that other ancillary benefits that the Advisers and
their affiliates could be expected to receive with regard to providing
investment advisory and other services to the Portfolios, such as those
noted above, were consistent with those available to other mutual fund
sponsors.
No single factor was considered in isolation or to be determinative in the
Board's decision to approve the Advisory Contracts. Rather, the Board
concluded, in light of a weighing and balancing of all factors considered,
that it was in the best interests of each Portfolio to approve the
continuation of the Advisory Contracts, including the fees to be charged
for services thereunder.
(B) PricewaterhouseCoopers LLP ("PwC"), the Fund's former independent auditor,
has been hired as an
internal audit supporting service provider by The PNC Financial Services
Group, Inc. ("PNC"), the parent company of the Fund's investment adviser
and certain other service providers. In order to provide certain services
to PNC and its affiliates which would have caused PwC to no longer be
independent with respect to the Fund, PwC declined to stand for re-election
as independent auditor of the Fund after the completion of the fiscal 2003
audit.
The Fund's Audit Committee approved engaging Deloitte & Touche LLP as the
independent auditor to audit the Fund's financial statements for fiscal
year 2005. A majority of the Fund's Board of Trustees, including a majority
of the independent Trustees, approved the appointment of Deloitte & Touche
LLP as the Fund's independent auditor for the Fund's fiscal 2005 audit on
November 12, 2004, subject to the right of the Fund, by a majority vote of
the shareholders at any meeting called for that purpose, to terminate the
appointment without penalty.
(C) As previously disclosed, BlackRock has received subpoenas from various
federal and state governmental and regulatory authorities and various
information requests from the Securities and Exchange Commission in
connection with ongoing industry-wide investigations of mutual fund
matters.
(D) The amounts paid by the Fund to the Chief Compliance Offier (CCO) for the
six months ended March 31, 2005, were $81,903.
69
BLACKROCK FUNDS
Investment Adviser
BlackRock Advisors, Inc.
Wilmington, Delaware 19809
Sub-Adviser
BlackRock Institutional Management Corporation
Wilmington, Delaware 19809
Custodian
PFPC Trust Co.
Philadelphia, Pennsylvania 19153
Co-Administrator and Transfer Agent
PFPC Inc.
Wilmington, Delaware 19809
Distributor
BlackRock Distributors, Inc.
King of Prussia, Pennsylvania 19406
Co-Administrator
BlackRock Advisors, Inc.
Wilmington, Delaware 19809
Counsel
Simpson Thacher & Bartlett LLP
New York, New York 10017
Independent Registered Public Accounting Firm
Deloitte & Touche LLP
Philadelphia, Pennsylvania 19103
The Fund will mail only one copy of shareholder documents, including
prospectuses, annual and semi-annual reports and proxy statements, to
shareholders with multiple accounts at the same address. This practice is
commonly called "householding" and it is intended to reduce expenses and
eliminate duplicate mailings of shareholder documents. Mailings of your
shareholder documents may be householded indefinitely unless you instruct us
otherwise. If you do not want the mailing of these documents to be combined
with those for other members of your household, please contact the Fund at
(800) 441-7762.
The Fund has delegated proxy voting responsibilities to BlackRock and its
affiliates, subject to the general oversight of the Fund's Board of Trustees. A
description of the policies and procedures that BlackRock and its affiliates
use to determine how to vote proxies relating to portfolio securities is
available without charge, upon request, by calling (800)441-7762, or on the
website of the Securities and Exchange Commission (the "Commission") at
http://www.sec.gov.
Information on how proxies relating to the Fund's voting securities were voted
(if any) by BlackRock during the most recent 12-month period ended June 30th is
available, upon request and without charge, by calling (800) 441-7762 or on the
website of the Commission at http://www.sec.gov.
The Fund files its complete schedule of portfolio holdings for the first and
third quarters of its fiscal year with the Commission on Form N-Q. The Fund's
Form N-Q is available on the Commission's website at http://www.sec.gov and may
be reviewed and copied at the Commission's Public Reference Room in Washington,
D.C. Information regarding the operation of the Public Reference Room may be
obtained by calling 1-800-SEC-0330. The Fund's Form N-Q may also be obtained
upon request, without charge, by calling (800) 441-7762.
BLACKROCK FUNDS
FUND SPECTRUM
BlackRock Funds is a leading mutual fund company currently managing
approximately $26 billion in the following portfolios designed to fit a broad
range of investment goals. Each portfolio is managed by recognized experts in
equity, fixed income, international, and tax-free investing.
STOCK PORTFOLIOS
- --------------------------------------
Investment Trust Small Cap Core Equity
Large Cap Value Equity Small Cap Growth Equity
Large Cap Growth Equity Global Science & Technology Opportunities
Dividend AchieversTM Global Resources
Legacy All-Cap Global Resources
Mid-Cap Value Equity Health Sciences
Mid-Cap Growth Equity U.S. Opportunities
Aurora International Opportunities
Small/Mid-Cap Growth Index Equity
Small Cap Value Equity
STOCK & BOND PORTFOLIOS
- --------------------------------------
Asset Allocation
BOND PORTFOLIOS
- --------------------------------------
Enhanced Income Government Income
Low Duration Bond Inflation Protected Bond
Intermediate Government Bond GNMA
Intermediate Bond Managed Income
Intermediate PLUS Bond International Bond
Core Bond Total Return High Yield Bond
Core PLUS Total Return
TAX-FREE BOND PORTFOLIOS
- --------------------------------------
UltraShort Municipal Ohio Tax-Free Income
Tax-Free Income Delaware Tax-Free Income
Pennsylvania Tax-Free Income Kentucky Tax-Free Income
New Jersey Tax-Free Income
MONEY MARKET PORTFOLIOS
- --------------------------------------
Money Market North Carolina Municipal Money Market
U.S. Treasury Money Market Ohio Municipal Money Market
Municipal Money Market Pennsylvania Municipal Money Market
New Jersey Municipal Money Market Virginia Municipal Money Market
SHAREHOLDER PRIVILEGES
ACCOUNT INFORMATION
Call us at 1-800-441-7762 to get information about your account balances,
recent transactions and share prices. You can also reach us on the web at
www.blackrock.com.
AUTOMATIC INVESTMENT PLANS
Investor Class shareholders who want to invest regularly can arrange to have
$50 or more automatically deducted from their checking or savings account and
invested in any of the BlackRock portfolios.
SYSTEMATIC WITHDRAWAL PLANS
Investor Class shareholders can establish a systematic withdrawal plan and
receive periodic payments of $50 or more from their BlackRock portfolios, as
long as their account is at least $10,000.
RETIREMENT PLANS
Shareholders may make investments in conjunction with Traditional, Rollover,
Roth, Coverdell and Simple IRA's.
ADDITIONAL INFORMATION ABOUT THE BLACKROCK FUNDS
For additional reports or additional information, as well as more current
information about portfolio holdings and characteristics, BlackRock Fund
shareholders and prospective investors may call 1-800-441-7762.
Shares of the Fund are not deposits or obligations of, or guaranteed or
endorsed by PNC Bank, National Association or any other bank and shares are not
federally insured by, guaranteed by, obligations of or otherwise supported by
the U.S. Government, the Federal Deposit Insurance Corporation, the Federal
Reserve Board, or any other governmental agency. Investments in shares of the
fund involve investment risks, including the possible loss of the principal
amount invested.
[GRAPHIC OMITTED]
MM-SEMI
ALTERNATIVES BLACKROCK SOLUTIONS EQUITIES FIXED
INCOME LIQUIDITYREAL ESTATE BlackRock Funds
Taxable Bond Portfolios
Semi-Annual Report to Shareholders
March 31, 2005 (Unaudited)
[GRAPHIC OMITTED]
[GRAPHIC OMITTED]
[GRAPHIC OMITTED]
NOT FDIC INSURED
MAY LOSE VALUE
NO BANK GUARANTEE
BLACKROCK FUNDS
TAXABLE BOND PORTFOLIOS
*Enhanced Income
*Low Duration Bond
*Intermediate Government Bond
*Intermediate Bond
*Intermediate PLUS Bond
*Core Bond Total Return
*Core PLUS Total Return
*Government Income
*Inflation Protected Bond
*GNMA
*Managed Income
*International Bond
*High Yield Bond
TABLE OF CONTENTS
Shareholder Letter..........................................................1
Portfolio Summaries
Enhanced Income.........................................................2-3
Low Duration Bond.......................................................4-5
Intermediate Government Bond............................................6-7
Intermediate Bond.......................................................8-9
Intermediate PLUS Bond................................................10-11
Core Bond Total Return................................................12-13
Core PLUS Total Return................................................14-15
Government Income.....................................................16-17
Inflation Protected Bond..............................................18-19
GNMA..................................................................20-21
Managed Income........................................................22-23
International Bond....................................................24-25
High Yield Bond.......................................................26-27
Note on Performance Information..........................................28
Statement of Net Assets/Schedule of Investments.........................9-105
Core Bond Total Return Statement of Assets and Liabilities................6
Government Income Statement of Assets and Liabilities....................78
GNMA Statement of Assets and Liabilities..................................3
Portfolio Financial Statements
Statements of Operations............................................106-107
Statement of Cash Flows.............................................108-109
Statements of Changes in Net Assets.................................110-113
Financial Highlights................................................114-131
Notes to Financial Statements.........................................132-163
Additional Information................................................164-168
PRIVACY PRINCIPLES OF BLACKROCK FUNDS
BlackRock Funds is committed to maintaining the privacy of its shareholders and
to safeguarding their nonpublic personal information. The following information
is provided to help you understand what personal information BlackRock Funds
collects, how we protect that information, and why in certain cases we may
share such information with select other parties.
BlackRock Funds does not receive any nonpublic personal information relating to
its shareholders who purchase shares through their broker-dealers. In the case
of shareholders who are record owners of BlackRock Funds, BlackRock Funds
receives nonpublic personal information on account applications or other forms.
With respect to these shareholders, BlackRock Funds also has access to specific
information regarding their transactions in BlackRock Funds.
BlackRock Funds does not disclose any nonpublic personal information about its
shareholders or former shareholders to anyone, except as permitted by law or as
is necessary in order to service our shareholders' accounts (for example, to a
transfer agent).
BlackRock Funds restricts access to nonpublic personal information about its
shareholders to BlackRock employees with a legitimate business need for the
information. BlackRock Funds maintains physical, electronic and procedural
safeguards designed to protect the nonpublic personal information of our
shareholders.
BLACKROCK FUNDS
March 31, 2005
Dear Shareholder:
We are pleased to present the Semi-Annual Report to Shareholders of the
BlackRock Funds' Taxable Bond Portfolios for the six-month period ended March
31, 2005. The Semi-Annual Report includes important information on each
Portfolio, and is organized as follows:
o Portfolio Summary - discusses recent portfolio management activity and
highlights total returns.
o Fund Profile - displays characteristics of each Portfolio's holdings as of
March 31, 2005.
o Expense Example - discusses costs in a shareholder account and provides
information for a shareholder to estimate his or her expenses by share
class and to compare expenses of each share class to other funds.
o Statement of Net Assets (or Schedule of Investments/Statement of Assets and
Liabilities) - lists portfolio holdings and includes each holding's
market value and par amount/number of shares as of March 31, 2005. The
Statement of Net Assets also contains the net asset value for each share
class of a Portfolio. If your Portfolio has a Schedule of Investments,
then the net asset value for each share class may be found in the
Statement of Assets and Liabilities.
o Statement of Operations - displays the components of each Portfolio's
investment income and provides a detailed look at each Portfolio's
expenses. The Statement of Operations also lists the aggregate change in
value of a Portfolio's securities due to market fluctuations and security
sales.
o Statement of Cash Flows - explains the change during the period in cash
and cash equivalents (including foreign currency).
o Statement of Changes in Net Assets - compares Portfolio information from
the prior period to the current period. Specifically, it details
shareholder distributions by share class, aggregate realized gains and
losses, and the change in net assets from the beginning of the period to
the end of the period.
o Financial Highlights - include each Portfolio's expense ratios, net asset
values, total returns, distributions per share, and turnover ratios for
the current period and the last five years or since inception.
o Notes to Financial Statements - provides additional information on fees, a
summary of significant accounting policies, a list of affiliated
transactions, and a summary of purchases and sales of securities.
In addition to these items, a summary of shareholder privileges is listed
on the inside back cover of the report. Shareholders can find information on
this page describing how to access account balances, recent transactions, and
share prices. It also includes a summary of the Fund's various investment
plans.
There were two notable recent developments for the BlackRock Funds (the
"Fund").
First, on January 31, 2005, BlackRock, Inc., the parent of BlackRock
Advisors, Inc., the Fund's investment adviser, acquired SSRM Holdings, Inc.,
the parent of State Street Research & Management Company, the investment
adviser to the former State Street Research Funds. The transaction enhances
BlackRock's investment management platform with additional US equity,
alternative investment, and real estate equity management capabilities. In
addition, the scale and scope of BlackRock's open-end and closed-end mutual
funds and distribution capabilities has expanded significantly. We believe that
we can incorporate the best of both organizations to deliver high quality
products to both institutional and individual investors.
Second, a proxy statement was recently sent to shareholders of all
portfolios of the Fund asking them to consider and vote upon the election of
nine trustees to the board of trustees of the Fund (the "Board"). Five of the
nine nominees were already serving as trustees of the Fund and the additional
nominees had previously served as trustees of the State Street Research Funds.
Due to the increased size and complexity of the Fund resulting from the
reorganization with the State Street Research Funds, and an increase in the
responsibilities of boards of trustees of funds generally, the current Board
believed it was in the best interest of the Fund to increase the size of the
Board. On April 29, 2005, the special meeting of shareholders was held, at
which all of the nominees included in the proxy were duly elected to the Board.
We hope you find the report informative, and we thank you for making
BlackRock part of your investment strategy.
Sincerely,
[GRAPHIC OMITTED]
Anne Ackerley
Managing Director
BlackRock Advisors,Inc.
1
ENHANCED INCOME PORTFOLIO
Total Net Assets (3/31/05): $70.3 million
Performance Benchmark
Citigroup 1 Year Treasury Index
Investment Approach
Seeks to maximize total return, consistent with income generation and
prudent investment management by investing primarily in bonds. The management
team selects bonds from several sectors including: U.S. Treasuries and agency
securities, commercial and residential mortgage-backed securities,
collateralized mortgage obligations ("CMOs"), asset-backed securities ("ABS"),
corporate bonds and non-U.S. Government securities. The Portfolio may also
invest in money market instruments. The Portfolio's dollar weighted effective
duration will be between 0 and 18 months during normal market conditions.
Individual investments will be restricted to those securities whose maximum
effective duration at the time of purchase is less than 5 years.
Recent Portfolio Management Activity
o The BlackRock, Institutional and Service share classes of the Portfolio
outperformed the benchmark while the Investor A share class performed in line
for the semi-annual period.
o During the semi-annual period, yields trended higher as the Federal
Reserve continued toward the "normalization" of short-term rates. The Federal
Open Market Committee increased the Federal Funds target rate 4 times during
the period, in 25 basis point increments, for a total of 100 basis points. At
the end of the period, the Federal Funds target rate was at 2.75%. The Federal
Reserve indicated concern about pricing pressures as the "pause" and "neutral"
language was largely removed from dialogue. The spike upward in oil prices was
one of a number of signs of building inflation, an issue that replaced
employment as the market's primary focal point during the latter half of the
period. By the end of the period, the 2-Year Treasury yield had risen by
1.17%.
o During the first half of the period, the Portfolio benefited from its
slightly shorter duration. The Portfolio's exposure to adjustable rate
mortgages ("ARMs") and ABS also contributed positively to returns. The ARMs
market grew substantially over 2004 and will continue to grow as more
homeowners seek the lowest near-term payment. Within the ABS sector, the
management team favored non-prepayment sensitive sectors with holdings focused
in credit card issues.
o During the second half of the period, the Portfolio benefited from its
shorter duration position versus the benchmark, while its yield curve
steepening bias was a slight detractor from performance. The Portfolio's
exposure to ABS and commercial mortgage backed securities ("CMBS") also
contributed positively to performance as both sectors provided excess returns
versus Treasuries. The Portfolio continued to hold a significant allocation to
the ABS sector, and remains concentrated in non-prepayment sensitive sectors
such as autos and credit cards. While the Portfolio continued to hold only a
small allocation to corporates, this sector underperformed during the first
quarter and therefore was a slight detractor from returns. Within the sector,
the Portfolio continued to have a bias towards financials and high quality
issues.
COMPARISON OF CHANGE IN VALUE OF A $10,000 INVESTMENT IN THE ENHANCED INCOME
PORTFOLIO
AND THE CITIGROUP 1 YEAR TREASURY INDEX FROM INCEPTION.
[LINE CHART]
Institutional Investor A Citigroup 1 Year Treasury Index
------------- ---------- -------------------------------
03/04/2004 $ 10,000 $ 9,699 $ 10,000
03/31/2004 10,032 9,719 10,016
06/30/2004 10,007 9,678 9,983
09/30/2004 10,059 9,706 10,031
12/31/2004 10,106 9,715 10,047
03/31/2005 10,132 9,743 10,068
FOR PERIOD ENDING MARCH 31, 2005
Average Annual Total Return
1 Year From Inception
------------ ---------------
BlackRock Class 1.10% 1.26%
Institutional Class 1.00% 1.23%
Service Class 1.63% 1.86%
Investor A Class (Load Adjusted) (2.77)% (2.40)%
Investor A Class (NAV) 0.24% 0.41%
THE PERFORMANCE INFORMATION ABOVE INCLUDES INFORMATION RELATING TO EACH CLASS
OF THE PORTFOLIO SINCE THE COMMENCEMENT OF OPERATIONS OF THE PORTFOLIO, RATHER
THAN THE DATE SUCH CLASS WAS INTRODUCED. THE INCEPTION DATES OF THE PORTFOLIO'S
SHARE CLASSES WERE AS FOLLOWS: BLACKROCK SHARES, 3/4/04; INSTITUTIONAL SHARES,
3/19/04; SERVICE SHARES, 3/19/04; INVESTOR A SHARES, 3/19/04. SEE "NOTE ON
PERFORMANCE INFORMATION" ON PAGE 28 FOR FURTHER INFORMATION ON HOW PERFORMANCE
DATA WAS CALCULATED, INCLUDING IMPORTANT INFORMATION ON THE LINE GRAPH\^ ABOVE.
PAST PERFORMANCE IS NOT PREDICTIVE OF FUTURE RESULTS. The graph and table do
not reflect the deduction of taxes that a shareholder would pay on fund
distributions or the redemption of shares. Although the holdings and sectors
listed above were current as the periods indicated, the Portfolio is actively
managed and its composition will vary.
2
ENHANCED INCOME PORTFOLIO
FUND PROFILE
Credit Quality (% of
investments)1
AAA 97.7 %
AA 1.5
A 0.4
BBB 0.4
-----
Total 100.0%
=====
Sector Allocation (% of long-term investments)
U.S. Government & Agency Obligations 42.2 %
Asset Backed Securities 35.9
Commercial Mortgage Backed Securities 11.0
Mortgage Pass-Throughs 4.2
Corporate Bonds 4.0
Multiple Class Mortgage Pass-Throughs 2.6
Taxable Municipal Bonds 0.1
------
Total 100.0%
======
Portfolio Statistics
Average maturity (years) 1.46
Effective Duration2 0.8
1 Using the higher of Standard & Poor's ("S&P's") or Moody's Investors Service
("Moody's") rating.
2 Duration measures a Portfolio's price risk. Each year of duration represents
an expected 1% change in the net asset value of the fund for every 1%
change in interest rates. Effective duration is typically calculated for
bonds with embedded options and assumes that expected cash flows will
fluctuate as interest rates change.
- --------------------------------------------------------------------------------
EXPENSE EXAMPLE
As a shareholder of the Portfolio, you incur two types of costs: (1)
transaction costs, including front and back end sales charges (loads) where
applicable; and (2) ongoing costs, including advisory fees, distribution
(12b-1) and service fees, where applicable; and other Portfolio expenses. This
Example is intended to help you understand your ongoing costs (in dollars) of
investing in the Portfolio and to compare these costs with the ongoing costs of
investing in other mutual funds.
The Example below is based on an investment of $1,000 invested at the beginning
of the period and held for the entire period October 1, 2004 to March 31, 2005.
The information under "Actual Expenses," together with the amount you invested,
allows you to estimate actual expenses incurred over the reporting period.
Simply divide your account value by $1,000 (for example, an $8,600 account
value divided by $1,000 = 8.60) and multiply the result by the cost shown for
your share class, in the row entitled "Expenses Incurred During Period", to
estimate the expenses incurred on your account during this period.
The information under "Hypothetical Expenses" provides information about
hypothetical account values and hypothetical expenses based on the Portfolio's
actual expense ratio and an assumed rate of return of 5% per year before
expenses, which is not the Portfolio's actual return. The hypothetical account
values and expenses may not be used to estimate the actual ending account
balance or expense you incurred for the period. You may use this information to
compare the ongoing costs of investing in the Portfolio and other funds. To do
so, compare this 5% hypothetical example with the 5% hypothetical examples that
appear in the shareholder reports of the other funds.
Please note that the expenses shown in the table are meant to highlight your
ongoing costs only and do not reflect any transactional costs, such as front
and back end sales charges (loads) or redemption/exchange fees, where
applicable. Therefore, the hypothetical information is useful in comparing
ongoing costs only, and will not help you determine the relative total costs of
owning different funds. In addition, if these transactional costs were
included, your costs would have been higher.
Actual Expenses
---------------------------------------------------------------
BlackRock Institutional Service Investor
Class Class Class A Class
--------------- --------------- --------------- ---------------
Beginning Account
Value (10/01/04) $ 1,000.00 $ 1,000.00 $ 1,000.00 $ 1,000.00
Ending Account Value
(3/31/05) 1,007.70 1,007.20 1,011.90 1,004.80
Expenses Incurred
During Period
(10/01/04 -
3/31/05) 1.50 2.00 3.50 3.49
Hypothetical Expenses
(5% return before expenses)
---------------------------------------------------------------
BlackRock Institutional Service Investor
Class Class Class A Class
--------------- --------------- --------------- ---------------
Beginning Account
Value (10/01/04) $ 1,000.00 $ 1,000.00 $ 1,000.00 $ 1,000.00
Ending Account Value
(3/31/05) 1,023.49 1,022.99 1,021.48 1,021.48
Expenses Incurred
During Period
(10/01/04 -
3/31/05) 1.51 2.01 3.52 3.52
For each class of the Portfolio, expenses are equal to the annualized expense
ratio of 0.30%, 0.40%, 0.70%, and 0.70% for the BlackRock, Institutional,
Service, and Investor A share class, respectively, multiplied by the average
account value over the period, multiplied by 182/365 (to reflect the one-half
year period).
3
LOW DURATION BOND PORTFOLIO
Total Net Assets (3/31/05): $1.7 billion
Performance Benchmark
Merrill Lynch 1-3 Year Treasury Index
Investment Approach
Seeks to realize a rate of return that exceeds the total return of the
Merrill Lynch 1-3 Year Treasury Index by investing primarily in investment
grade bonds that allow it to maintain an average portfolio duration that is
within +/- 20% of the duration of the benchmark. The management team selects
bonds from several sectors including: U.S. Treasuries and agency securities,
commercial and residential mortgage-backed securities, collateralized mortgage
obligations ("CMOs"), asset-backed securities ("ABS"), and corporate bonds. The
Portfolio may invest up to 5% of its assets in non-investment grade bonds and
up to 10% of its assets in non-dollar denominated bonds of issuers located
outside of the United States. Securities are purchased for the Portfolio when
the management team determines that they have the potential for above-average
total return.
Recent Portfolio Management Activity
o The BlackRock, Institutional, Service and Investor A and B share
classes of the Portfolio outperformed the benchmark while the Investor C share
class slightly underperformed for the semi-annual period.
o During the semi-annual period, yields trended higher as the Federal
Reserve continued toward the "normalization" of short-term rates. The Federal
Open Market Committee increased the Federal Funds target rate 4 times during
the period, in 25 basis points increments, for a total of 100 bps. At the end
of the period, the Federal Funds target rate was at 2.75%. The Federal Reserve
indicated concern about pricing pressures as the "pause" and "neutral" language
was largely removed from dialogue. The spike upward in oil prices was one of a
number of signs of building inflation, an issue that replaced employment as the
market's primary focal point during the latter half of the period. By the end
of the period, the 2-Year Treasury yield had risen by 1.17%.
o During the first half of the period, the Portfolio benefited from its
slightly shorter duration. In the Agency sector, the Portfolio maintained a
weighting in 1-year bonds. The Portfolio decreased agency holdings in the
intermediate portion of the curve. The Portfolio's exposure to adjustable rate
mortgages ("ARMs") and ABS also contributed positively to performance. The ARMs
market increased in liquidity as most investors and dealers recognized its
growing significance and permanence in the market. In ABS, the Portfolio
continued to favor non-prepayment sensitive sectors such as autos and credit
cards.
o During the second half of the period, the Portfolio benefited from its
shorter duration position versus the benchmark, while its yield curve
steepening bias was a slight detractor from performance. Within the agencies
sector, the Portfolio maintains its modest allocation and a bias to callable
issues. The Portfolio's exposure to the ABS and commercial mortgage backed
securities ("CMBS") sectors also contributed positively to performance as both
sectors provided excess returns versus Treasuries. While the Portfolio
continues to hold a modest allocation to corporates, this sector underperformed
during the first quarter and therefore was a slight detractor from returns for
the period. Within the sector, the Portfolio continued to have a bias towards
financials and high quality issues.
COMPARISON OF CHANGE IN VALUE OF A $10,000 INVESTMENT IN THE LOW DURATION BOND
PORTFOLIO AND THE MERRILL LYNCH 1-3 YEAR TREASURY INDEX FOR THE PAST TEN YEARS.
[LINE CHART]
Institutional Investor A Merrill Lynch 1-3 Year Treasury Index
------------- ---------- -------------------------------------
03/31/1995 $ 10,000 $ 9,701 $ 10,000
06/30/1995 10,273 9,966 10,321
09/30/1995 10,494 10,180 10,476
12/31/1995 10,701 10,381 10,739
03/31/1996 10,713 10,376 10,775
06/30/1996 10,830 10,477 10,884
09/30/1996 11,007 10,635 11,064
12/31/1996 11,240 10,848 11,274
03/31/1997 11,292 10,885 11,349
06/30/1997 11,536 11,107 11,599
09/30/1997 11,765 11,314 11,826
12/31/1997 11,921 11,451 12,024
03/31/1998 12,115 11,624 12,201
06/30/1998 12,311 11,798 12,388
09/30/1998 12,621 12,082 12,769
12/31/1998 12,712 12,154 12,866
03/31/1999 12,861 12,282 12,943
06/30/1999 12,947 12,350 13,017
09/30/1999 13,115 12,495 13,181
12/31/1999 13,228 12,588 13,260
03/31/2000 13,401 12,738 13,426
06/30/2000 13,618 12,929 13,657
09/30/2000 13,940 13,219 13,944
12/31/2000 14,321 13,565 14,320
03/31/2001 14,716 13,937 14,715
06/30/2001 14,884 14,065 14,888
09/30/2001 15,363 14,501 15,391
12/31/2001 15,427 14,559 15,509
03/31/2002 15,467 14,564 15,510
06/30/2002 15,812 14,872 15,878
09/30/2002 16,181 15,216 16,260
12/31/2002 16,343 15,340 16,401
03/31/2003 16,436 15,414 16,498
06/30/2003 16,600 15,570 16,616
09/30/2003 16,638 15,592 16,687
12/31/2003 16,651 15,590 16,699
03/31/2004 16,808 15,708 16,712
06/30/2004 16,651 15,563 16,820
09/30/2004 16,809 15,700 16,861
12/31/2004 16,876 15,736 16,864
03/31/2005 16,868 15,719 16,879
FOR PERIOD ENDING MARCH 31, 2005
Average Annual Total Return
1 Year 3 Year 5 Year 10 Year
------------ ---------- ---------- ----------
BlackRock Class 0.51% 3.06% 4.87% 5.48%
Institutional Class 0.36% 2.93% 4.71% 5.37%
Service Class 0.09% 2.64% 4.40% 5.07%
Investor A Class (Load Adjusted) (2.89)% 1.54% 3.66% 4.63%
Investor A Class (NAV) 0.07% 2.58% 4.29% 4.95%
Investor B Class (Load Adjusted) (5.00)% 0.67% 3.19% 4.29%
Investor B Class (NAV) (0.58)% 1.81% 3.54% 4.29%
Investor C Class (Load Adjusted) (1.66)% 1.78% 3.50% 4.28%
Investor C Class (NAV) (0.68)% 1.78% 3.50% 4.28%
THE PERFORMANCE INFORMATION ABOVE INCLUDES INFORMATION RELATING TO EACH CLASS
OF THE PORTFOLIO SINCE THE COMMENCEMENT OF OPERATIONS OF THE PORTFOLIO, RATHER
THAN THE DATE SUCH CLASS WAS INTRODUCED. THE INCEPTION DATES OF THE
PORTFOLIO'S SHARE CLASSES WERE AS FOLLOWS: INSTITUTIONAL SHARES, 7 /17/92;
SERVICE SHARES, 1 /12 /96; INVESTOR A SHARES, 1 /12 /96; INVESTOR B SHARES,
11/18 /96; INVESTOR C SHARES,
2 /24 /97; AND BLACKROCK SHARES, 6/3/97. SEE "NOTE ON PERFORMANCE INFORMATION"
ON PAGE 28 FOR FURTHER INFORMATION ON HOW PERFORMANCE DATA WAS CALCULATED,
INCLUDING IMPORTANT INFORMATION ON THE LINE GRAPH\^ ABOVE.
PAST PERFORMANCE IS NOT PREDICTIVE OF FUTURE RESULTS. The graph and table do
not reflect the deduction of taxes that a shareholder would pay on fund
distributions or the redemption of shares. Although the holdings and sectors
listed above were current as the periods indicated, the Portfolio is actively
managed and its composition will vary.
4
LOW DURATION BOND PORTFOLIO
FUND PROFILE
Credit Quality (% of
investments)1
AAA 93.4 %
AA 3.6
A 1.0
BBB 1.7
\qBBB 0.3
-----
Total 100.0%
=====
Sector Allocation (% of long-term investments)
U.S. Government & Agency Obligations 53.9 %
Asset Backed Securities 15.8
Commercial Mortgage Backed Securities 11.0
Mortgage Pass-Throughs 8.1
Corporate Bonds 7.9
Foreign Bonds 1.4
Multiple Class Mortgage Pass-Throughs 1.2
Taxable Municipal Bonds 0.4
Preferred Stocks 0.3
------
Total 100.0%
======
Portfolio Statistics
Average maturity (years) 2.19
Effective Duration2 1.5
1 Using the higher of Standard & Poor's ("S&P's") or Moody's Investors Service
("Moody's") rating.
2 Duration measures a Portfolio's price risk. Each year of duration represents
an expected 1% change in the net asset value of the fund for every 1%
change in interest rates. Effective duration is typically calculated for
bonds with embedded options and assumes that expected cash flows will
fluctuate as interest rates change.
- --------------------------------------------------------------------------------
EXPENSE EXAMPLE
As a shareholder of the Portfolio, you incur two types of costs: (1)
transaction costs, including front and back end sales charges (loads) where
applicable; and (2) ongoing costs, including advisory fees, distribution
(12b-1) and service fees, where applicable; and other Portfolio expenses. This
Example is intended to help you understand your ongoing costs (in dollars) of
investing in the Portfolio and to compare these costs with the ongoing costs of
investing in other mutual funds.
The Example below is based on an investment of $1,000 invested at the beginning
of the period and held for the entire period October 1, 2004 to March 31, 2005.
The information under "Actual Expenses," together with the amount you invested,
allows you to estimate actual expenses incurred over the reporting period.
Simply divide your account value by $1,000 (for example, an $8,600 account
value divided by $1,000 = 8.60) and multiply the result by the cost shown for
your share class, in the row entitled "Expenses Incurred During Period", to
estimate the expenses incurred on your account during this period.
The information under "Hypothetical Expenses" provides information about
hypothetical account values and hypothetical expenses based on the Portfolio's
actual expense ratio and an assumed rate of return of 5% per year before
expenses, which is not the Portfolio's actual return. The hypothetical account
values and expenses may not be used to estimate the actual ending account
balance or expense you incurred for the period. You may use this information to
compare the ongoing costs of investing in the Portfolio and other funds. To do
so, compare this 5% hypothetical example with the 5% hypothetical examples that
appear in the shareholder reports of the other funds.
Please note that the expenses shown in the table are meant to highlight your
ongoing costs only and do not reflect any transactional costs, such as front
and back end sales charges (loads) or redemption/exchange fees, where
applicable. Therefore, the hypothetical information is useful in comparing
ongoing costs only, and will not help you determine the relative total costs of
owning different funds. In addition, if these transactional costs were
included, your costs would have been higher.
Actual Expenses
-----------------------------------------------------------------------------------------------
BlackRock Institutional Service Investor Investor Investor
Class Class Class A Class B Class C Class
--------------- --------------- --------------- --------------- --------------- ---------------
Beginning Account
Value (10/01/04) $ 1,000.00 $ 1,000.00 $ 1,000.00 $ 1,000.00 $ 1,000.00 $ 1,000.00
Ending Account Value
(3/31/05) 1,003.30 1,003.50 1,002.20 1,001.20 998.40 997.40
Expenses Incurred
During Period
(10/01/04 -
3/31/05) 1.99 2.74 4.03 4.03 7.75 7.80
Hypothetical Expenses
(5% return before expenses)
-----------------------------------------------------------------------------------------------
BlackRock Institutional Service Investor Investor Investor
Class Class Class A Class B Class C Class
--------------- --------------- --------------- --------------- --------------- ---------------
Beginning Account
Value (10/01/04) $ 1,000.00 $ 1,000.00 $ 1,000.00 $ 1,000.00 $ 1,000.00 $ 1,000.00
Ending Account Value
(3/31/05) 1,022.99 1,022.23 1,020.92 1,020.92 1,017.15 1,017.10
Expenses Incurred
During Period
(10/01/04 -
3/31/05) 2.01 2.77 4.08 4.08 7.85 7.90
For each class of the Portfolio, expenses are equal to the annualized expense
ratio of 0.40%, 0.55%, 0.81%, 0.81%, 1.56%, and 1.57% for the BlackRock,
Institutional, Service, Investor A, B, and C share classes, respectively,
multiplied by the average account value over the period, multiplied by 182/365
(to reflect the one-half year period).
5
INTERMEDIATE GOVERNMENT BOND PORTFOLIO
Total Net Assets (3/31/05) $732.9 million
Performance Benchmark
Lehman Brothers Intermediate Government Index
Investment Approach
Seeks to maximize total return consistent with income generation and
prudent investment management by investing primarily in the highest rated
government and agency bonds that allow it to maintain an average portfolio
duration that is within +/- 20% of the Lehman Brothers Intermediate Government
Index. The Portfolio normally invests at least 80% of its assets in bonds that
are issued or guaranteed by the U.S. Government and its agencies. The
management team selects bonds from several sectors including: U.S. Treasuries
and agency securities, commercial and residential mortgage-backed securities,
collateralized mortgage obligations ("CMOs"), asset-backed securities ("ABS")
and corporate bonds. Securities are purchased for the Portfolio when the
management team determines that they have the potential for above-average total
return.
Recent Portfolio Management Activity
o On January 31, 2005, BlackRock, Inc., the parent of BlackRock Advisors,
Inc. (BAI), acquired SSRM Holdings, Inc., the parent of State Street Research &
Management Company (SSRM), the investment adviser to the State Street Research
mutual funds. In connection with the transaction, the BlackRock Intermediate
Government Bond Portfolio (the Portfolio) reorganized with the State Street
Research Government Income Fund (the SSR Fund). The SSR Fund transferred
substantially all of its assets and liabilities to the Portfolio in exchange
for shares of the Portfolio, which were then distributed to the SSR Fund
shareholders.
o The Institutional, Service and Investor A share classes of the
Portfolio outperformed the benchmark while the Investor B and C share classes
underperformed for the semi-annual period.
o During the semi-annual period, yields trended higher as the Federal
Reserve continued toward the "normalization" of short-term rates. The Federal
Open Market Committee increased the Federal Funds target rate 4 times during
the period, in 25 basis point increments, for a total of 100 basis points. At
the end of the period, the Federal Funds target rate was at 2.75%. The Federal
Reserve indicated concern about pricing pressures as the "pause" and "neutral"
language was largely removed from dialogue. The spike upward in oil prices was
one of a number of signs of building inflation, an issue that replaced
employment as the market's primary focal point during the latter half of the
period. By the end of the period, the yield of the 10-Year Treasury had risen
by 0.36%.
o During the first half of the period, the Portfolio benefited from its
slightly shorter duration and yield curve flattening position. The Portfolio
held an underweight position to Treasuries. The Portfolio was underweight
agencies relative to the benchmark. The Portfolio maintained a meaningful
weight in adjustable rate mortgages ("ARMs"), which contributed positively to
performance. The ARMs market increased in liquidity as most investors and
dealers recognized its growing significance and permanence in the market. ABS
and commercial mortgage backed securities ("CMBS") also contributed positively
to performance. The Portfolio maintained a modest allocation to ABS, favoring
non-prepayment sensitive sectors such as autos and credit cards.
o During the second half of the period, the Portfolio benefited from its
shorter duration position versus the benchmark, while its yield curve
steepening bias slightly detracted from returns. Within the agencies sector,
the Portfolio maintained its underweight and a bias to callable issues. Within
the MBS sector, the Portfolio continued to hold a significant weight in ARMs.
The Portfolio maintains modest exposure to the ABS and CMBS sectors, which
contributed positively to performance as both sectors provided strong excess
returns versus Treasuries. Within the ABS sector we continue to concentrate on
non-prepayment sensitive sectors such as autos and credit cards.
COMPARISON OF CHANGE IN VALUE OF A $10,000 INVESTMENT IN THE INTERMEDIATE
GOVERNMENT BOND
PORTFOLIO AND THE LEHMAN BROTHERS INTERMEDIATE GOVERNMENT INDEX FOR THE PAST
TEN YEARS.
[LINE CHART]
Institutional Investor A Lehman Brothers Intermediate Government Index
------------- ---------- ---------------------------------------------
03/31/1995 $ 10,000 $ 9,596 $ 10,000
06/30/1995 10,423 9,995 10,468
09/30/1995 10,582 10,139 10,630
12/31/1995 10,891 10,435 10,985
03/31/1996 10,833 10,358 10,910
06/30/1996 10,898 10,408 10,984
09/30/1996 11,092 10,580 11,172
12/31/1996 11,371 10,833 11,431
03/31/1997 11,368 10,818 11,427
06/30/1997 11,686 11,108 11,746
09/30/1997 11,988 11,381 12,047
12/31/1997 12,250 11,616 12,314
03/31/1998 12,432 11,775 12,499
06/30/1998 12,671 11,988 12,730
09/30/1998 13,166 12,442 13,323
12/31/1998 13,182 12,443 13,356
03/31/1999 13,205 12,449 13,320
06/30/1999 13,135 12,369 13,295
09/30/1999 13,265 12,476 13,429
12/31/1999 13,292 12,500 13,423
03/31/2000 13,508 12,676 13,643
06/30/2000 13,741 12,892 13,891
09/30/2000 14,133 13,244 14,263
12/31/2000 14,654 13,716 14,829
03/31/2001 15,123 14,139 15,274
06/30/2001 15,186 14,194 15,338
09/30/2001 15,955 14,909 16,099
12/31/2001 15,937 14,861 16,077
03/31/2002 15,925 14,832 16,035
06/30/2002 16,495 15,344 16,655
09/30/2002 17,228 16,006 17,457
12/31/2002 17,381 16,129 17,627
03/31/2003 17,534 16,267 17,791
06/30/2003 17,851 16,525 18,091
09/30/2003 17,761 16,423 18,067
12/31/2003 17,718 16,379 18,030
03/31/2004 18,061 16,677 18,428
06/30/2004 17,705 16,329 18,003
09/30/2004 18,118 16,676 18,410
12/31/2004 18,188 16,723 18,450
03/31/2005 18,083 16,626 18,325
FOR PERIOD ENDING MARCH 31, 2005
Average Annual Total Return
1 Year 3 Year 5 Year 10 Year
------------ ---------- ---------- ----------
Institutional Class 0.12% 4.33% 6.01% 6.10%
Service Class (0.18)% 4.02% 5.67% 5.78%
Investor A Class (Load Adjusted) (4.27)% 2.47% 4.71% 5.22%
Investor A Class (NAV) (0.30)% 3.88% 5.58% 5.65%
Investor B Class (Load Adjusted) (5.40)% 1.97% 4.40% 4.96%
Investor B Class (NAV) (1.05)% 3.08% 4.74% 4.96%
Investor C Class (Load Adjusted) (2.02)% 3.11% 4.76% 4.97%
Investor C Class (NAV) (1.05)% 3.11% 4.76% 4.97%
THE PERFORMANCE INFORMATION ABOVE INCLUDES INFORMATION RELATING TO EACH CLASS
OF THE PORTFOLIO SINCE THE COMMENCEMENT OF OPERATIONS OF THE PORTFOLIO, RATHER
THAN THE DATE SUCH CLASS WAS INTRODUCED. THE INCEPTION DATES OF THE PORTFOLIO'S
SHARE CLASSES WERE AS FOLLOWS: INSTITUTIONAL SHARES, 4/20/92; INVESTOR A
SHARES, 5 /11/92; SERVICE SHARES, 7/29/93; INVESTOR C SHARES, 10/8/96; AND
INVESTOR B SHARES, 10 /11/96. SEE "NOTE ON PERFORMANCE INFORMATION" ON PAGE
28 FOR FURTHER INFORMATION ON HOW PERFORMANCE DATA WAS CALCULATED, INCLUDING
IMPORTANT INFORMATION ON THE LINE GRAPH\^ ABOVE.
PAST PERFORMANCE IS NOT PREDICTIVE OF FUTURE RESULTS. The graph and table do
not reflect the deduction of taxes that a shareholder would pay on fund
distributions or the redemption of shares. Although the holdings and sectors
listed above were current as the periods indicated, the Portfolio is actively
managed and its composition will vary.
6
INTERMEDIATE GOVERNMENT BOND PORTFOLIO
FUND PROFILE
Credit Quality (% of
investments)1
AAA 99.7 %
AA 0.3
-----
Total 100.0%
=====
Sector Allocation (% of long-term investments)
U.S. Government & Agency Obligations 63.2 %
Mortgage Pass-Throughs 20.2
Commercial Mortgage Backed Securities 7.4
Multiple Class Mortgage Pass-Throughs 3.3
Asset Backed Securities 2.9
Corporate Bonds 1.9
Taxable Municipal Bonds 0.8
Project Loans 0.3
------
Total 100.0%
======
Portfolio Statistics
Average maturity (years) 4.12
Effective Duration2 2.8
1 Using the higher of Standard & Poor's ("S&P's") or Moody's Investors Service
("Moody's") rating.
2 Duration measures a Portfolio's price risk. Each year of duration represents
an expected 1% change in the net asset value of the fund for every 1%
change in interest rates. Effective duration is typically calculated for
bonds with embedded options and assumes that expected cash flows will
fluctuate as interest rates change.
- --------------------------------------------------------------------------------
EXPENSE EXAMPLE
As a shareholder of the Portfolio, you incur two types of costs: (1)
transaction costs, including front and back end sales charges (loads) where
applicable; and (2) ongoing costs, including advisory fees, distribution
(12b-1) and service fees, where applicable; and other Portfolio expenses. This
Example is intended to help you understand your ongoing costs (in dollars) of
investing in the Portfolio and to compare these costs with the ongoing costs of
investing in other mutual funds.
The Example below is based on an investment of $1,000 invested at the beginning
of the period and held for the entire period October 1, 2004 to March 31, 2005.
The information under "Actual Expenses," together with the amount you invested,
allows you to estimate actual expenses incurred over the reporting period.
Simply divide your account value by $1,000 (for example, an $8,600 account
value divided by $1,000 = 8.60) and multiply the result by the cost shown for
your share class, in the row entitled "Expenses Incurred During Period", to
estimate the expenses incurred on your account during this period.
The information under "Hypothetical Expenses" provides information about
hypothetical account values and hypothetical expenses based on the Portfolio's
actual expense ratio and an assumed rate of return of 5% per year before
expenses, which is not the Portfolio's actual return. The hypothetical account
values and expenses may not be used to estimate the actual ending account
balance or expense you incurred for the period. You may use this information to
compare the ongoing costs of investing in the Portfolio and other funds. To do
so, compare this 5% hypothetical example with the 5% hypothetical examples that
appear in the shareholder reports of the other funds.
Please note that the expenses shown in the table are meant to highlight your
ongoing costs only and do not reflect any transactional costs, such as front
and back end sales charges (loads) or redemption/exchange fees, where
applicable. Therefore, the hypothetical information is useful in comparing
ongoing costs only, and will not help you determine the relative total costs of
owning different funds. In addition, if these transactional costs were
included, your costs would have been higher.
Actual Expenses
-------------------------------------------------------------------------------
Institutional Service Investor Investor Investor
Class Class A Class B Class C Class
--------------- --------------- --------------- --------------- ---------------
Beginning Account
Value (10/01/04) $ 1,000.00 $ 1,000.00 $ 1,000.00 $ 1,000.00 $ 1,000.00
Ending Account Value
(3/31/05) 998.00 996.50 997.00 992.30 992.30
Expenses Incurred
During Period
(10/01/04 -
3/31/05) 2.98 4.47 4.97 8.67 8.67
Hypothetical Expenses
(5% return before expenses)
-------------------------------------------------------------------------------
Institutional Service Investor Investor Investor
Class Class A Class B Class C Class
--------------- --------------- --------------- --------------- ---------------
Beginning Account
Value (10/01/04) $ 1,000.00 $ 1,000.00 $ 1,000.00 $ 1,000.00 $ 1,000.00
Ending Account Value
(3/31/05) 1,021.98 1,020.47 1,019.97 1,016.19 1,016.19
Expenses Incurred
During Period
(10/01/04 -
3/31/05) 3.02 4.53 5.03 8.81 8.81
For each class of the Portfolio, expenses are equal to the annualized expense
ratio of 0.60%, 0.90%, 1.00%, 1.75%, and 1.75% for the Institutional, Service,
Investor A, B, and C share classes, respectively, multiplied by the average
account value over the period, multiplied by 182/365 (to reflect the one-half
year period).
7
INTERMEDIATE BOND PORTFOLIO
Total Net Assets (3/31/05): $894.8 million
Performance Benchmark
Lehman Brothers Intermediate Government/Credit Index
Investment Approach
Seeks to maximize total return, consistent with income generation and
prudent investment management by investing primarily in bonds that allow it to
maintain an average portfolio duration that is within +/- 20% of the Lehman
Brothers Intermediate Government/Credit Index. The Portfolio normally invests
at least 80% of its assets in bonds and only buys securities rated investment
grade at the time of purchase by at least one major rating agency or determined
by the management team to be of similar quality. The portfolio management team
selects bonds from several categories including: U.S. Treasuries and agency
securities, commercial and residential mortgage-backed securities,
collateralized mortgage obligations ("CMOs"), asset-backed securities and
corporate bonds. Securities are purchased for the Portfolio when the
management team determines that they have the potential for above-average total
return. The Portfolio's dollar-weighted average maturity will be between 3 and
10 years.
Recent Portfolio Management Activity
o The BlackRock, Institutional, Service and Investor A share classes of
the Portfolio outperformed the benchmark while the Investor B and C share
classes underperformed the benchmark for the semi-annual period.
o During the semi-annual period, yields trended higher as the Federal
Reserve continued toward the "normalization" of short-term rates. The Federal
Open Market Committee increased the Federal Funds target rate 4 times during
the period, in 25 basis point increments, for a total of 100 basis points. At
the end of the period, the Federal Funds target rate was at 2.75%. The Federal
Reserve indicated concern about pricing pressures as the "pause" and "neutral"
language was largely removed from dialogue. The spike upward in oil prices was
one of a number of signs of building inflation, an issue that replaced
employment as the market's primary focal point during the latter half of the
period. By the end of the period, the yield of the 10-Year Treasury had risen
by 0.36%.
o In the first half of the semi-annual period, corporate bond performance
was driven both by positive fundamentals and strong technicals. Additionally,
expected turbulence from the elections never materialized and volatility
dropped steadily during November and December. Fundamentals remained strong as
corporate earnings grew given the robust macroeconomic climate.
o In the first half of the semi-annual period, the Portfolio benefited
from its yield curve flattening position. The Portfolio was significantly
underweight in corporates on a duration basis relative to the benchmark which
detracted from performance as the corporate sector returned 0.86% over
duration-adjusted Treasuries. Within corporate sector distributions,
underweights were focused in brokers, sovereign, auto and utility names while
favoring finance and cable/media. Additional relative underweights were in
Treasuries and agency securities, with the agency sector returning 0.42% over
duration-adjusted Treasuries. The Portfolio maintained a beneficial overweight
in asset-backed securities, concentrated in credit card and auto issues.
Asset-backed securities returned 0.31% over duration-adjusted Treasuries for
the period. The Portfolio also had a significant weighting in adjustable rate
mortgages.
o During the second half of the semi-annual period, interest rates backed
up and swap spreads widened. The backdrop of increased interest rate
volatility and General Motors' dramatic reduction of its 2005 earnings forecast
convinced the market to charge a higher risk premium for credit. March posted
- -0.86% of excess return for the Lehman Credit Index, the worst month since July
2002.
o For the second half of the semi-annual period, the Portfolio was short
duration versus the benchmark with an underweight of intermediate maturities
along the yield curve. The Portfolio's yield curve steepening bias was a
slight detractor from returns as the yield curve flattened during the period.
We maintained a significant underweight in corporates on a duration-adjusted
basis which benefited the Portfolio as corporates returned -0.55% over
duration-adjusted Treasuries. Within the corporates sector, the Portfolio
exhibited a bias towards financials and higher credit quality names. The
Portfolio was relatively underweight to its benchmark in Treasuries and agency
securities. The Portfolio benefited from its relative overweight position in
commercial mortgage-backed securities and asset-backed securities with these
sectors returning 0.15% and 0.09%, respectively, over duration-adjusted
Treasuries.
COMPARISON OF CHANGE IN VALUE OF A $10,000 INVESTMENT IN THE INTERMEDIATE BOND
PORTFOLIO AND
THE LEHMAN BROTHERS INTERMEDIATE GOVERNMENT/CREDIT INDEX FOR THE PAST TEN
YEARS.
[LINE CHART]
Institutional Investor A Lehman Brothers Intermediate Government/Credit Index
------------- ---------- ----------------------------------------------------
03/31/1995 $ 10,000 $ 9,600 $ 10,000
06/30/1995 10,452 10,027 10,500
09/30/1995 10,647 10,197 10,673
12/31/1995 11,002 10,527 11,047
03/31/1996 10,917 10,443 10,956
06/30/1996 10,997 10,508 11,024
09/30/1996 11,191 10,680 11,220
12/31/1996 11,476 10,939 11,495
03/31/1997 11,470 10,921 11,482
06/30/1997 11,810 11,232 11,821
09/30/1997 12,131 11,523 12,140
12/31/1997 12,349 11,717 12,400
03/31/1998 12,545 11,888 12,592
06/30/1998 12,768 12,086 12,829
09/30/1998 13,199 12,479 13,405
12/31/1998 13,224 12,488 13,443
03/31/1999 13,296 12,542 13,419
06/30/1999 13,240 12,474 13,366
09/30/1999 13,344 12,557 13,489
12/31/1999 13,354 12,552 13,496
03/31/2000 13,582 12,737 13,699
06/30/2000 13,828 12,953 13,930
09/30/2000 14,263 13,360 14,331
12/31/2000 14,787 13,835 14,861
03/31/2001 15,292 14,291 15,365
06/30/2001 15,381 14,342 15,468
09/30/2001 16,149 15,041 16,180
12/31/2001 16,101 14,994 16,193
03/31/2002 16,142 15,016 16,157
06/30/2002 16,651 15,471 16,732
09/30/2002 17,394 16,142 17,490
12/31/2002 17,722 16,433 17,786
03/31/2003 18,019 16,693 18,054
06/30/2003 18,536 17,141 18,545
09/30/2003 18,507 17,116 18,542
12/31/2003 18,495 17,107 18,553
03/31/2004 18,918 17,465 19,012
06/30/2004 18,484 17,050 18,532
09/30/2004 18,983 17,497 19,033
12/31/2004 19,070 17,566 19,117
03/31/2005 18,944 17,438 18,950
FOR PERIOD ENDING MARCH 31, 2005
Average Annual Total Return
1 Year 3 Year 5 Year 10 Year
------------ ---------- ---------- ----------
BlackRock Class 0.18% 5.64% 7.04% 6.71%
Institutional Class 0.13% 5.48% 6.88% 6.60%
Service Class (0.24)% 5.17% 6.57% 6.28%
Investor A Class (Load Adjusted) (4.12)% 3.69% 5.63% 5.72%
Investor A Class (NAV) (0.16)% 5.11% 6.48% 6.15%
Investor B Class (Load Adjusted) (5.24)% 3.25% 5.34% 5.59%
Investor B Class (NAV) (0.90)% 4.33% 5.67% 5.59%
Investor C Class (Load Adjusted) (1.87)% 4.32% 5.69% 5.59%
Investor C Class (NAV) (0.90)% 4.32% 5.69% 5.59%
THE PERFORMANCE INFORMATION ABOVE INCLUDES INFORMATION RELATING TO EACH CLASS
OF THE PORTFOLIO SINCE THE COMMENCEMENT OF OPERATIONS OF THE PORTFOLIO, RATHER
THAN THE DATE SUCH CLASS WAS INTRODUCED. THE INCEPTION DATES OF THE PORTFOLIO'S
SHARE CLASSES WERE AS FOLLOWS: INSTITUTIONAL SHARES, 9/17/93; SERVICE SHARES, 9
/23/93; INVESTOR A SHARES, 5 /20/94; INVESTOR B SHARES, 2 /5/98; BLACKROCK
SHARES, 5/1/98 AND INVESTOR C SHARES, 10/16/98. SEE "NOTE ON PERFORMANCE
INFORMATION" ON PAGE 28 FOR FURTHER INFORMATION ON HOW PERFORMANCE DATA WAS
CALCULATED, INCLUDING IMPORTANT INFORMATION ON THE LINE GRAPH\^ ABOVE.
PAST PERFORMANCE IS NOT PREDICTIVE OF FUTURE RESULTS. The graph and table do
not reflect the deduction of taxes that a shareholder would pay on fund
distributions or the redemption of shares. Although the holdings and sectors
listed above were current as the periods indicated, the Portfolio is actively
managed and its composition will vary.
8
INTERMEDIATE BOND PORTFOLIO
FUND PROFILE
Credit Quality (% of
investments)1
AAA 67.1 %
AA 15.6
A 6.7
BBB 10.3
\qBBB 0.3
-----
Total 100.0%
=====
Sector Allocation (% of long-term investments)
Corporate Bonds 39.3 %
U.S. Government & Agency Obligations 33.7
Commercial Mortgage Backed Securities 14.0
Asset Backed Securities 8.3
Mortgage Pass-Throughs 2.5
Taxable Municipal Bonds 1.3
Certificate of Deposit 0.5
Project Loans 0.2
Multiple Class Mortgage Pass-Throughs 0.2
------
Total 100.0%
======
Portfolio Statistics
Average maturity (years) 4.19
Effective Duration2 3.1
1 Using the higher of Standard & Poor's ("S&P's") or Moody's Investors Service
("Moody's") rating.
2 Duration measures a Portfolio's price risk. Each year of duration represents
an expected 1% change in the net asset value of the fund for every 1%
change in interest rates. Effective duration is typically calculated for
bonds with embedded options and assumes that expected cash flows will
fluctuate as interest rates change.
- --------------------------------------------------------------------------------
EXPENSE EXAMPLE
As a shareholder of the Portfolio, you incur two types of costs: (1)
transaction costs, including front and back end sales charges (loads) where
applicable; and (2) ongoing costs, including advisory fees, distribution
(12b-1) and service fees, where applicable; and other Portfolio expenses. This
Example is intended to help you understand your ongoing costs (in dollars) of
investing in the Portfolio and to compare these costs with the ongoing costs of
investing in other mutual funds.
The Example below is based on an investment of $1,000 invested at the beginning
of the period and held for the entire period October 1, 2004 to March 31, 2005.
The information under "Actual Expenses," together with the amount you invested,
allows you to estimate actual expenses incurred over the reporting period.
Simply divide your account value by $1,000 (for example, an $8,600 account
value divided by $1,000 = 8.60) and multiply the result by the cost shown for
your share class, in the row entitled "Expenses Incurred During Period", to
estimate the expenses incurred on your account during this period.
The information under "Hypothetical Expenses" provides information about
hypothetical account values and hypothetical expenses based on the Portfolio's
actual expense ratio and an assumed rate of return of 5% per year before
expenses, which is not the Portfolio's actual return. The hypothetical account
values and expenses may not be used to estimate the actual ending account
balance or expense you incurred for the period. You may use this information to
compare the ongoing costs of investing in the Portfolio and other funds. To do
so, compare this 5% hypothetical example with the 5% hypothetical examples that
appear in the shareholder reports of the other funds.
Please note that the expenses shown in the table are meant to highlight your
ongoing costs only and do not reflect any transactional costs, such as front
and back end sales charges (loads) or redemption/exchange fees, where
applicable. Therefore, the hypothetical information is useful in comparing
ongoing costs only, and will not help you determine the relative total costs of
owning different funds. In addition, if these transactional costs were
included, your costs would have been higher.
Actual Expenses
-----------------------------------------------------------------------------------------------
BlackRock Institutional Service Investor Investor Investor
Class Class Class A Class B Class C Class
--------------- --------------- --------------- --------------- --------------- ---------------
Beginning Account
Value (10/01/04) $ 1,000.00 $ 1,000.00 $ 1,000.00 $ 1,000.00 $ 1,000.00 $ 1,000.00
Ending Account Value
(3/31/05) 998.70 997.90 996.60 996.60 992.90 993.90
Expenses Incurred
During Period
(10/01/04 -
3/31/05) 2.24 2.98 4.27 4.27 7.98 7.98
Hypothetical Expenses
(5% return before expenses)
-----------------------------------------------------------------------------------------------
BlackRock Institutional Service Investor Investor Investor
Class Class Class A Class B Class C Class
--------------- --------------- --------------- --------------- --------------- ---------------
Beginning Account
Value (10/01/04) $ 1,000.00 $ 1,000.00 $ 1,000.00 $ 1,000.00 $ 1,000.00 $ 1,000.00
Ending Account Value
(3/31/05) 1,022.73 1,021.98 1,020.67 1,020.67 1,016.89 1,016.89
Expenses Incurred
During Period
(10/01/04 -
3/31/05) 2.27 3.02 4.33 4.33 8.11 8.11
For each class of the Portfolio, expenses are equal to the annualized expense
ratio of 0.45%, 0.60%, 0.86%, 0.86%, 1.61%, and 1.61% for the BlackRock,
Institutional, Service, Investor A, B, and C share classes, respectively,
multiplied by the average account value over the period, multiplied by 182/365
(to reflect the one-half year period).
9
INTERMEDIATE PLUS BOND PORTFOLIO
Total Net Assets (3/31/05): $21.9 million
Performance Benchmark
Lehman Brothers Intermediate Aggregate Index
Investment Approach
Seeks to maximize total return, consistent with income generation and
prudent investment management, by investing primarily in bonds that allow it to
maintain an average portfolio duration that is within +/- 20% of the duration
of the Lehman Brothers Intermediate Aggregate Index. The Portfolio invests
primarily in dollar-denominated investment grade bonds, but may invest up to
20% of its assets in any combination of non-investment grade bonds (high yield
or junk bonds), non-dollar denominated bonds and bonds of emerging market
issuers. The Portfolio's investment in non-dollar denominated bonds may be on
a currency hedged or unhedged basis. The portfolio management team selects
bonds from several categories including: U.S. Treasuries and agency securities,
commercial and residential mortgage-backed securities, collateralized mortgage
obligations ("CMOs"), asset-backed securities and corporate bonds. Securities
are purchased for the Portfolio when the management team determines that they
have the potential for above-average total return. The Portfolio's
dollar-weighted average maturity will be between 3 and 10 years.
Recent Portfolio Management Activity
o In late January, the Portfolio changed its benchmark to the Lehman
Brothers Intermediate Aggregate Index. The new benchmark more adequately
reflects the universe of securities in which the Portfolio will invest.
o The BlackRock, Institutional and Service share classes of the Portfolio
outperformed the Lehman Brothers Intermediate Government/Credit Index; the
Portfolio's former benchmark, while the Investor A, B and C share classes
underperformed this benchmark for the semi-annual period. The Service share
class of the Portfolio outperformed the Lehman Brothers Intermediate Aggregate
Index; the Portfolio's current benchmark, while the BlackRock, Institutional,
Investor A, B and C share classes underperformed this benchmark for the
semi-annual period.
o During the semi-annual period, yields trended higher as the Federal
Reserve continued toward the "normalization" of short-term rates. The Federal
Open Market Committee increased the Federal Funds target rate 4 times during
the period, in 25 basis point increments, for a total of 100 basis points. At
the end of the period, the Federal Funds target rate was at 2.75%. The Federal
Reserve indicated concern about pricing pressures as the "pause" and "neutral"
language was largely removed from dialogue. The spike upward in oil prices was
one of a number of signs of building inflation, an issue that replaced
employment as the market's primary focal point during the latter half of the
period. By the end of the period, the yield of the 10-Year Treasury had risen
by 0.36%.
o In the first half of the semi-annual period, corporate bond performance
was driven both by positive fundamentals and strong technicals. Additionally,
expected turbulence from the elections never materialized and volatility
dropped steadily during November and December. Fundamentals remained strong as
corporate earnings grew given the robust macroeconomic climate.
o During the first half of the semi-annual period, the Portfolio
benefited from its non-dollar, high yield and emerging markets exposure. The
high yield and emerging markets sectors returned 4.31% and 4.55%, respectively,
over duration-adjusted Treasuries for the period. The Portfolio also benefited
from its yield curve flattening bias.
o During the second half of the semi-annual period, interest rates rose
and swap spreads widened. The backdrop of increased interest rate volatility
and General Motors' dramatic reduction of its 2005 earnings forecast convinced
the market to charge a higher risk premium for credit. March posted -86 basis
points of excess return for the Lehman Credit Index, the worst month since July
2002.
o During the first quarter of 2005, the Portfolio was short duration
versus its benchmark with an underweight of intermediate maturities along the
curve. While the Portfolio benefited from its shorter duration position, its
yield curve steepening bias slightly detracted from returns during the period.
Non-dollar exposure was a positive contributor to performance while the
Portfolio's small allocation to the high yield sector detracted from returns as
high yield returned -0.94% over duration-adjusted Treasuries. The Portfolio
maintained a significant underweight in corporates on a duration-adjusted basis
which benefited performance as corporates returned -0.55% over
duration-adjusted Treasuries. Within the corporate sector, the Portfolio
exhibited a bias towards financials and higher credit quality names. The
Portfolio's relative overweight in the commercial mortgage-backed securities
and asset-backed securities sectors were beneficial to performance with each
sector returning 0.15% and 0.09%, respectively, over duration-adjusted
Treasuries. Emerging markets holdings were focused in Colombia, Argentina and
Russia, while the non-dollar allocation had a focus on New Zealand bonds.
COMPARISON OF CHANGE IN VALUE OF A $10,000 INVESTMENT IN THE INTERMEDIATE PLUS
BOND
PORTFOLIO, THE LEHMAN BROTHERS INTERMEDIATE AGGREGATE INDEX AND THE LEHMAN
BROTHERS
INTERMEDIATE GOVERNMENT/CREDIT INDEX FROM INCEPTION.
[LINE CHART]
Lehman Brothers Intermediate
Institutional Investor A Lehman Brothers Intermediate Aggregate Index Government/Credit Index
------------- ---------- -------------------------------------------- ----------------------------
08/18/2004 $ 10,000 $ 9,597 $ 10,000 $ 10,000
09/30/2004 10,060 9,655 10,064 10,063
12/31/2004 10,133 9,673 10,142 10,107
03/31/2005 10,072 9,595 10,085 10,019
FOR PERIOD ENDING MARCH 31, 2005
Average Annual Total Return
From Inception
---------------
BlackRock Class 0.70%
Institutional Class 0.73%
Service Class 4.09%
Investor A Class (Load Adjusted) (4.05)%
Investor A Class (NAV) (0.02)%
Investor B Class (Load Adjusted) (4.60)%
Investor B Class (NAV) (0.11)%
Investor C Class (Load Adjusted) (1.11)%
Investor C Class (NAV) (0.11)%
THE PERFORMANCE INFORMATION ABOVE INCLUDES INFORMATION RELATING TO EACH CLASS
OF THE PORTFOLIO SINCE THE COMMENCEMENT OF OPERATIONS OF THE PORTFOLIO ON
8/18/04. SEE "NOTE ON PERFORMANCE INFORMATION" ON PAGE 28 FOR FURTHER
INFORMATION ON HOW PERFORMANCE DATA WAS CALCULATED, INCLUDING IMPORTANT
INFORMATION ON THE LINE GRAPH\^ ABOVE.
PAST PERFORMANCE IS NOT PREDICTIVE OF FUTURE RESULTS. The graph and table do
not reflect the deduction of taxes that a shareholder would pay on fund
distributions or the redemption of shares. Although the holdings and sectors
listed above were current as the periods indicated, the Portfolio is actively
managed and its composition will vary.
10
INTERMEDIATE PLUS BOND PORTFOLIO
FUND PROFILE
Credit Quality (% of
investments)1
AAA 82.0 %
AA 6.9
A 3.4
BBB 4.8
\qBBB 2.9
-----
Total 100.0%
=====
Sector Allocation (% of long-term investments)
Mortgage Pass-Through 25.0 %
Corporate Bonds 22.9
U.S. Government & Agency Obligations 21.9
Commercial Mortgage Backed Securities 17.0
Asset Backed Securities 7.6
Multiple Class Mortgage Pass-Throughs 2.3
Foreign Bonds 2.2
Taxable Municipal Bonds 0.9
Preferred Stocks 0.2
------
Total 100.0%
======
Portfolio Statistics
Average maturity (years) 4.52
Effective Duration2 2.9
1 Using the higher of Standard & Poor's ("S&P's") or Moody's Investors Service
("Moody's") rating.
2 Duration measures a Portfolio's price risk. Each year of duration represents
an expected 1% change in the net asset value of the fund for every 1%
change in interest rates. Effective duration is typically calculated for
bonds with embedded options and assumes that expected cash flows will
fluctuate as interest rates change.
- --------------------------------------------------------------------------------
EXPENSE EXAMPLE
As a shareholder of the Portfolio, you incur two types of costs: (1)
transaction costs, including front and back end sales charges (loads) where
applicable; and (2) ongoing costs, including advisory fees, distribution
(12b-1) and service fees, where applicable; and other Portfolio expenses. This
Example is intended to help you understand your ongoing costs (in dollars) of
investing in the Portfolio and to compare these costs with the ongoing costs of
investing in other mutual funds.
The Example below is based on an investment of $1,000 invested at the beginning
of the period and held for the entire period October 1, 2004 to March 31, 2005.
The information under "Actual Expenses," together with the amount you invested,
allows you to estimate actual expenses incurred over the reporting period.
Simply divide your account value by $1,000 (for example, an $8,600 account
value divided by $1,000 = 8.60) and multiply the result by the cost shown for
your share class, in the row entitled "Expenses Incurred During Period", to
estimate the expenses incurred on your account during this period.
The information under "Hypothetical Expenses" provides information about
hypothetical account values and hypothetical expenses based on the Portfolio's
actual expense ratio and an assumed rate of return of 5% per year before
expenses, which is not the Portfolio's actual return. The hypothetical account
values and expenses may not be used to estimate the actual ending account
balance or expense you incurred for the period. You may use this information to
compare the ongoing costs of investing in the Portfolio and other funds. To do
so, compare this 5% hypothetical example with the 5% hypothetical examples that
appear in the shareholder reports of the other funds.
Please note that the expenses shown in the table are meant to highlight your
ongoing costs only and do not reflect any transactional costs, such as front
and back end sales charges (loads) or redemption/exchange fees, where
applicable. Therefore, the hypothetical information is useful in comparing
ongoing costs only, and will not help you determine the relative total costs of
owning different funds. In addition, if these transactional costs were
included, your costs would have been higher.
Actual Expenses
-----------------------------------------------------------------------------------------------
BlackRock Institutional Service Investor Investor Investor
Class Class Class A Class B Class C Class
--------------- --------------- --------------- --------------- --------------- ---------------
Beginning Account
Value (10/01/04) $ 1,000.00 $ 1,000.00 $ 1,000.00 $ 1,000.00 $ 1,000.00 $ 1,000.00
Ending Account Value
(3/31/05) 1,001.30 1,001.20 1,036.80 993.80 992.90 992.90
Expenses Incurred
During Period
(10/01/04 -
3/31/05) 1.99 2.74 4.05 3.97 7.68 7.68
Hypothetical Expenses
(5% return before expenses)
-----------------------------------------------------------------------------------------------
BlackRock Institutional Service Investor Investor Investor
Class Class Class A Class B Class C Class
--------------- --------------- --------------- --------------- --------------- ---------------
Beginning Account
Value (10/01/04) $ 1,000.00 $ 1,000.00 $ 1,000.00 $ 1,000.00 $ 1,000.00 $ 1,000.00
Ending Account Value
(3/31/05) 1,022.99 1,022.23 1,020.97 1,020.97 1,017.20 1,017.20
Expenses Incurred
During Period
(10/01/04 -
3/31/05) 2.01 2.77 4.03 4.03 7.80 7.80
For each class of the Portfolio, expenses are equal to the annualized expense
ratio of 0.40%, 0.55%, 0.80%, 0.80%, 1.55%, and 1.55% for the BlackRock,
Institutional, Service, Investor A, B, and C share classes, respectively,
multiplied by the average account value over the period, multiplied by 182/365
(to reflect the period the fund was open during the one-half year period).
11
CORE BOND TOTAL RETURN PORTFOLIO
Total Net Assets (3/31/05): $2.5 billion
Performance Benchmark
Lehman Brothers U.S. Aggregate Index
Investment Approach
Seeks to realize a total return that exceeds that of the Lehman Brothers
U.S. Aggregate Index by investing at least 80% of its assets in bonds that
allow it to maintain an average portfolio duration that is within +/- 20% of
the duration of the benchmark. The Portfolio management team selects bonds
from several categories including: U.S. Treasuries and agency securities,
commercial and residential mortgage-backed securities, collateralized mortgage
obligations ("CMOs"), asset-backed securities and corporate bonds. The
Portfolio may invest up to 10% of its assets in non-dollar denominated bonds of
issuers located outside of the United States. The Portfolio's investment in
non-dollar denominated bonds may be on a currency hedged or unhedged basis.
Securities are purchased for the Portfolio when the management team determines
that they have the potential for above-average total return.
Recent Portfolio Management Activity
o The BlackRock, Institutional, Service and Investor A share classes of
the Portfolio outperformed the benchmark while the other share classes
underperformed the benchmark for the semi-annual period.
o During the semi-annual period, yields trended higher as the Federal
Reserve continued toward the "normalization" of short-term rates. The Federal
Open Market Committee increased the Federal Funds target rate 4 times during
the period, in 25 basis point increments, for a total of 100 basis points. At
the end of the period, the Federal Funds target rate was at 2.75%. The Federal
Reserve indicated concern about pricing pressures as the "pause" and "neutral"
language was largely removed from dialogue. The spike upward in oil prices was
one of a number of signs of building inflation, an issue that replaced
employment as the market's primary focal point during the latter half of the
period. By the end of the period, the yield of the 10-Year Treasury had risen
by 0.36%.
o In the first half of the semi-annual period, the major domestic spread
sectors - agencies, corporates, asset-backed securities ("ABS"), commercial
mortgage-backed securities ("CMBS") and mortgage-backed securities ("MBS")
- -continued their winning ways, posting excess returns over duration-weighted
Treasuries for each month in the quarter. Agency spreads tightened versus both
swaps and Treasuries despite continued negative headlines and the Lehman MBS
Index outperformed Treasuries by 84 basis points during the fourth quarter of
2004. Corporate bond performance during the quarter was driven both by
positive fundamentals and strong technicals with volatility dropping steadily
during November and December.
o The Portfolio's yield curve flattening bias and short duration
positioning relative to its benchmark contributed positively to performance
during the first half of the semi-annual period. The Portfolio suffered from
its underweight in the corporate and mortgage sectors, which returned 0.86% and
0.84%, respectively, over duration-adjusted Treasuries. The Portfolio had a
concentrated underweight in 30-year versus 15-year maturities in mortgages and
exhibited a high quality bias with a strong underweight in BBB-rated issues in
the corporate sector.
o During the second half of the semi-annual period, Agency spreads
tightened versus both swaps and Treasuries, despite negative headlines and
Congressional hearings. The Lehman MBS Index outperformed Treasuries by a
modest 5 basis points with option adjusted spreads widening over the quarter as
fixed rate mortgages failed to rally in line with the drop in volatility. In
the corporate sector, interest rates backed up and swap spreads widened. March
posted -86 basis points of excess return for the Lehman Credit Index, the worst
month since July 2002.
o During the second half of the semi-annual period, the Portfolio
benefited from its yield curve flattening bias as well as its short duration
positioning relative to its benchmark. The Portfolio was significantly
underweight MBS relative to the benchmark, which detracted from performance as
the mortgage sector returned 0.05% over duration-adjusted Treasuries. Within
the mortgage sector, the Portfolio had a concentrated relative underweight in
30-year versus 15-year maturities. In the corporate sector, the Portfolio
benefited from its underweight on a duration basis as the sector returned
- -0.55% over duration-adjusted Treasuries. In the corporate sector, the
Portfolio exhibited a high quality bias with a strong underweight to BBB-rated
issues. The Portfolio also benefited from its relative overweight in the CMBS
and ABS sectors, which returned 0.15% and 0.09%, respectively, over
duration-adjusted Treasuries.
COMPARISON OF CHANGE IN VALUE OF A $10,000 INVESTMENT IN THE CORE BOND TOTAL
RETURN PORTFOLIO
AND THE LEHMAN BROTHERS U.S. AGGREGATE INDEX FOR THE PAST TEN YEARS.
[LINE CHART]
Institutional Investor A Lehman Brothers U.S. Aggregate Index
------------- ---------- ------------------------------------
03/31/1995 $ 10,000 $ 9,604 $ 10,000
06/30/1995 10,587 10,168 10,609
09/30/1995 10,797 10,369 10,818
12/31/1995 11,272 10,826 11,279
03/31/1996 11,006 10,559 11,078
06/30/1996 11,072 10,609 11,141
09/30/1996 11,293 10,809 11,346
12/31/1996 11,679 11,166 11,686
03/31/1997 11,647 11,122 11,621
06/30/1997 12,036 11,480 12,050
09/30/1997 12,426 11,838 12,451
12/31/1997 12,733 12,116 12,818
03/31/1998 12,939 12,298 13,016
06/30/1998 13,246 12,575 13,320
09/30/1998 13,739 13,027 13,883
12/31/1998 13,772 13,043 13,930
03/31/1999 13,753 13,009 13,859
06/30/1999 13,618 12,866 13,737
09/30/1999 13,717 12,944 13,831
12/31/1999 13,687 12,901 13,814
03/31/2000 14,030 13,209 14,119
06/30/2000 14,271 13,406 14,365
09/30/2000 14,717 13,823 14,798
12/31/2000 15,361 14,411 15,420
03/31/2001 15,819 14,840 15,888
06/30/2001 15,838 14,839 15,978
09/30/2001 16,636 15,569 16,714
12/31/2001 16,620 15,535 16,722
03/31/2002 16,627 15,523 16,738
06/30/2002 17,231 16,068 17,356
09/30/2002 17,861 16,619 18,151
12/31/2002 18,229 16,964 18,437
03/31/2003 18,515 17,198 18,694
06/30/2003 19,007 17,640 19,161
09/30/2003 18,966 17,603 19,133
12/31/2003 19,014 17,614 19,194
03/31/2004 19,448 18,001 19,704
06/30/2004 19,086 17,650 19,222
09/30/2004 19,664 18,190 19,837
12/31/2004 19,875 18,354 20,026
03/31/2005 19,830 18,320 19,930
FOR PERIOD ENDING MARCH 31, 2005
Average Annual Total Return
1 Year 3 Year 5 Year 10 Year
------------ ---------- ---------- ----------
BlackRock Class 2.11% 6.27% 7.36% 7.23%
Institutional Class 1.96% 6.05% 7.17% 7.09%
Service Class 1.69% 5.74% 6.85% 6.80%
Investor A Class (Load Adjusted) (2.32)% 4.24% 5.90% 6.24%
Investor A Class (NAV) 1.77% 5.68% 6.76% 6.67%
Investor B Class (Load Adjusted) (3.52)% 3.78% 5.63% 5.94%
Investor B Class (NAV) 0.91% 4.85% 5.95% 5.94%
Investor C Class (Load Adjusted) (0.08)% 4.89% 5.97% 5.95%
Investor C Class (NAV) 0.91% 4.89% 5.97% 5.95%
THE PERFORMANCE INFORMATION ABOVE INCLUDES INFORMATION RELATING TO EACH CLASS
OF THE PORTFOLIO SINCE THE COMMENCEMENT OF OPERATIONS OF THE PORTFOLIO, RATHER
THAN THE DATE SUCH CLASS WAS INTRODUCED. THE INCEPTION DATES OF THE PORTFOLIO'S
SHARE CLASSES WERE AS FOLLOWS: INSTITUTIONAL SHARES, 12 /9 /92; SERVICE SHARES,
1 /12/96; INVESTOR A SHARES, 1 /31/96; INVESTOR B SHARES, 3 /18/96; INVESTOR C
SHARES,
2 /28/97; AND BLACKROCK SHARES, 5 /1/97. SEE "NOTE ON PERFORMANCE INFORMATION"
ON PAGE 28 FOR FURTHER INFORMATION ON HOW PERFORMANCE DATA WAS CALCULATED,
INCLUDING IMPORTANT INFORMATION ON THE LINE GRAPH\^ ABOVE.
PAST PERFORMANCE IS NOT PREDICTIVE OF FUTURE RESULTS. The graph and table do
not reflect the deduction of taxes that a shareholder would pay on fund
distributions or the redemption of shares. Although the holdings and sectors
listed above were current as of the periods indicated, the Portfolio is
actively managed and its composition will vary.
12
CORE BOND TOTAL RETURN PORTFOLIO
FUND PROFILE
Credit Quality (% of
investments)1
AAA 82.6 %
AA 9.2
A 3.0
BBB 4.8
\qBBB 0.4
-----
Total 100.0%
=====
Sector Allocation (% of long-term investments)
U.S. Government & Agency Obligations 31.3 %
Corporate Bonds 23.3
Mortgage Pass-Throughs 20.4
Commercial Mortgage Backed Securities 11.4
Asset Backed Securities 7.8
Multiple Class Mortgage Pass-Throughs 3.3
Foreign Bonds 1.8
Certificate of Deposit 0.4
Taxable Municipal Bonds 0.3
------
Total 100.0%
======
Portfolio Statistics
Average maturity (years) 6.70
Effective Duration2 3.7
1 Using the higher of Standard & Poor's ("S&P's") or Moody's Investors Service
("Moody's") rating.
2 Duration measures a Portfolio's price risk. Each year of duration represents
an expected 1% change in the net asset value of the fund for every 1%
change in interest rates. Effective duration is typically calculated for
bonds with embedded options and assumes that expected cash flows will
fluctuate as interest rates change.
- --------------------------------------------------------------------------------
EXPENSE EXAMPLE
As a shareholder of the Portfolio, you incur two types of costs: (1)
transaction costs, including front and back end sales charges (loads) where
applicable; and (2) ongoing costs, including advisory fees, distribution
(12b-1) and service fees, where applicable; and other Portfolio expenses. This
Example is intended to help you understand your ongoing costs (in dollars) of
investing in the Portfolio and to compare these costs with the ongoing costs of
investing in other mutual funds.
The Example below is based on an investment of $1,000 invested at the beginning
of the period and held for the entire period October 1, 2004 to March 31, 2005.
The information under "Actual Expenses," together with the amount you invested,
allows you to estimate actual expenses incurred over the reporting period.
Simply divide your account value by $1,000 (for example, an $8,600 account
value divided by $1,000 = 8.60) and multiply the result by the cost shown for
your share class, in the row entitled "Expenses Incurred During Period", to
estimate the expenses incurred on your account during this period.
The information under "Hypothetical Expenses" provides information about
hypothetical account values and hypothetical expenses based on the Portfolio's
actual expense ratio and an assumed rate of return of 5% per year before
expenses, which is not the Portfolio's actual return. The hypothetical account
values and expenses may not be used to estimate the actual ending account
balance or expense you incurred for the period. You may use this information to
compare the ongoing costs of investing in the Portfolio and other funds. To do
so, compare this 5% hypothetical example with the 5% hypothetical examples that
appear in the shareholder reports of the other funds.
Please note that the expenses shown in the table are meant to highlight your
ongoing costs only and do not reflect any transactional costs, such as front
and back end sales charges (loads) or redemption/exchange fees, where
applicable. Therefore, the hypothetical information is useful in comparing
ongoing costs only, and will not help you determine the relative total costs of
owning different funds. In addition, if these transactional costs were
included, your costs would have been higher.
Actual Expenses
-----------------------------------------------------------------------------------------------
BlackRock Institutional Service Investor Investor Investor
Class Class Class A Class B Class C Class
--------------- --------------- --------------- --------------- --------------- ---------------
Beginning Account
Value (10/01/04) $ 1,000.00 $ 1,000.00 $ 1,000.00 $ 1,000.00 $ 1,000.00 $ 1,000.00
Ending Account Value
(3/31/05) 1,009.20 1,008.50 1,007.20 1,007.20 1,002.30 1,003.40
Expenses Incurred
During Period
(10/01/04 - 3/31/05) 2.00 2.75 4.04 4.04 7.77 7.77
Hypothetical Expenses
(5% return before expenses)
-----------------------------------------------------------------------------------------------
BlackRock Institutional Service Investor Investor Investor
Class Class Class A Class B Class C Class
--------------- --------------- --------------- --------------- --------------- ---------------
Beginning Account
Value (10/01/04) $ 1,000.00 $ 1,000.00 $ 1,000.00 $ 1,000.00 $ 1,000.00 $ 1,000.00
Ending Account Value
(3/31/05) 1,022.99 1,022.23 1,020.92 1,020.92 1,017.15 1,017.15
Expenses Incurred
During Period
(10/01/04 - 3/31/05) 2.01 2.77 4.08 4.08 7.85 7.85
For each class of the Portfolio, expenses are equal to the annualized expense
ratio of 0.40%, 0.55%, 0.81%, 0.81%, 1.56%, and 1.56% for the BlackRock,
Institutional, Service, Investor A, B, and C share classes, respectively,
multiplied by the average account value over the period, multiplied by 182/365
(to reflect the one-half year period).
13
CORE PLUS TOTAL RETURN PORTFOLIO
Total Net Assets (3/31/05): $371.2 million
Performance Benchmark
Lehman Brothers U.S. Aggregate Index
Investment Approach
Seeks to realize a total return that exceeds that of the Lehman Brothers
U.S. Aggregate Index by normally investing at least 80% of its assets in bonds
that allow it to maintain an average portfolio duration that is within +/- 20%
of the duration of the benchmark. The portfolio management team invests
primarily in dollar-denominated investment grade bonds but may invest up to 20%
of its assets in any combination of non-investment grade bonds (high yield or
junk bonds), non-dollar denominated bonds and bonds of emerging market issuers.
The Portfolio's investment in non-dollar denominated bonds may be on a currency
hedged or unhedged basis. The portfolio management team selects bonds from
several categories including: U.S. Treasuries and agency securities, commercial
and residential mortgage-backed securities, collateralized mortgage obligations
("CMOs"), asset-backed securities and corporate bonds. Securities are
purchased for the Portfolio when the management team determines that they have
the potential for above-average total return.
Recent Portfolio Management Activity
o The BlackRock, Institutional, Service and Investor A share classes of
the Portfolio outperformed the benchmark while the other share classes
underperformed the benchmark for the semi-annual period.
o During the semi-annual period, yields trended higher as the Federal
Reserve continued toward the "normalization" of short-term rates. The Federal
Open Market Committee increased the Federal Funds target rate 4 times during
the period, in 25 basis point increments, for a total of 100 basis points. At
the end of the period, the Federal Funds target rate was at 2.75%. The Federal
Reserve indicated concern about pricing pressures as the "pause" and "neutral"
language was largely removed from dialogue. The spike upward in oil prices was
one of a number of signs of building inflation, an issue that replaced
employment as the market's primary focal point during the latter half of the
period. By the end of the period, the yield of the 10-Year Treasury had risen
by 0.36%.
o In the first half of the semi-annual period, the major domestic spread
sectors - agencies, corporates, asset-backed securities ("ABS"), commercial
mortgage-backed securities ("CMBS") and mortgage-backed securities ("MBS")
- -continued their winning ways, posting excess returns over duration-weighted
Treasuries for each month in the quarter. Agency spreads tightened versus both
swaps and Treasuries despite continued negative headlines and the Lehman MBS
index outperformed Treasuries by 84 basis points during the fourth quarter.
Corporate bond performance during the quarter was driven both by positive
fundamentals and strong technicals with volatility dropping steadily during
November and December.
o During the first half of the semi-annual period, the Portfolio
benefited from its yield curve flattening bias. The Portfolio also benefited
from its non-dollar exposure, high yield allocation and emerging market
exposure as the high yield and emerging market sectors returned 4.31% and
4.55%, respectively, over duration-adjusted Treasuries. The Portfolio was
underweight MBS relative to its benchmark, with an underweight in 30-year
maturity securities versus 15-year maturities. The Portfolio was also
underweight in the corporate sector, and exhibited a high quality bias with a
strong underweight in BBB-rated issues. The Portfolio's underweight to
corporates and mortgages detracted from performance during the period as
corporates and mortgages returned 0.86% and 0.84%, respectively, over
duration-adjusted Treasuries.
o During the second half of the semi-annual period, agency spreads
tightened versus both swaps and Treasuries, despite negative headlines and
Congressional hearings. The Lehman MBS Index outperformed Treasuries by a
modest 5 basis points with option adjusted spreads widening over the quarter as
fixed rate mortgages failed to rally in line with the drop in volatility. In
the corporate sector, interest rates backed up and swap spreads widened. March
posted -86 basis points of excess return for the Lehman Credit Index, the worst
month since July 2002.
o During the first quarter of 2005, the Portfolio benefited from its
yield curve flattening bias as well as its short duration positioning relative
to its benchmark. Non-dollar exposure and the Portfolio's allocation to the
high yield sector detracted from performance with the high yield sector
returning -0.94% over duration-adjusted Treasuries. The Portfolio was
underweight MBS relative to its benchmark, with an underweight in 30-year
maturity securities versus 15-year maturities. The Portfolio was also
underweight in the corporate sector and exhibited a high quality bias with a
relative underweight to BBB-rated issues. The Portfolio's underweight to
corporates benefited the Portfolio while the underweight to mortgages detracted
from performance as the sectors returned -0.55% and 0.05%, respectively, over
duration-adjusted Treasuries. High yield exposure in the Portfolio was focused
on higher quality issues while emerging markets holdings were based in Russia
and Colombia.
COMPARISON OF CHANGE IN VALUE OF A $10,000 INVESTMENT IN THE CORE PLUS TOTAL
RETURN PORTFOLIO
AND THE LEHMAN BROTHERS U.S. AGGREGATE INDEX FROM INCEPTION.
[LINE CHART]
Institutional Investor A Lehman Brothers U.S. Aggregate Index
------------- ---------- ------------------------------------
12/07/2001 $ 10,000 $ 9,597 $ 10,000
12/31/2001 10,098 9,691 10,086
03/31/2002 10,061 9,648 10,095
06/30/2002 10,358 9,921 10,468
09/30/2002 10,721 10,257 10,948
12/31/2002 10,992 10,507 11,120
03/31/2003 11,143 10,642 11,275
06/30/2003 11,489 10,963 11,557
09/30/2003 11,455 10,921 11,540
12/31/2003 11,492 10,957 11,576
03/31/2004 11,705 11,172 11,884
06/30/2004 11,434 10,937 11,594
09/30/2004 11,788 11,276 11,964
12/31/2004 11,880 11,400 12,079
03/31/2005 11,892 11,359 12,021
FOR PERIOD ENDING MARCH 31, 2005
Average Annual Total Return
1 Year 3 Year From Inception
------------ ---------- ---------------
BlackRock Class 2.02% 6.05% 5.71%
Institutional Class 1.60% 5.73% 5.37%
Service Class 1.68% 5.82% 5.50%
Investor A Class (Load Adjusted) (2.37)% 4.18% 3.92%
Investor A Class (NAV) 1.68% 5.59% 5.22%
Investor B Class (Load Adjusted) (3.53)% 3.74% 3.68%
Investor B Class (NAV) 0.91% 4.81% 4.51%
Investor C Class (Load Adjusted) 0.03% 4.78% 4.48%
Investor C Class (NAV) 1.02% 4.78% 4.48%
THE PERFORMANCE INFORMATION ABOVE INCLUDES INFORMATION RELATING TO EACH CLASS
OF THE PORTFOLIO SINCE THE COMMENCEMENT OF OPERATIONS OF THE PORTFOLIO ON
12/7/01. SEE "NOTE ON PERFORMANCE INFORMATION" ON PAGE 28 FOR FURTHER
INFORMATION ON HOW PERFORMANCE DATA WAS CALCULATED, INCLUDING IMPORTANT
INFORMATION ON THE LINE GRAPH\^ ABOVE.
PAST PERFORMANCE IS NOT PREDICTIVE OF FUTURE RESULTS. The graph and table do
not reflect the deduction of taxes that a shareholder would pay on fund
distributions or the redemption of shares. Although the holdings and sectors
listed above were current as of the periods indicated, the Portfolio is
actively managed and its composition will vary.
14
CORE PLUS TOTAL RETURN PORTFOLIO
FUND PROFILE
Credit Quality (% of
investments)1
AAA 82.8 %
AA 7.4
A 3.1
BBB 5.2
\qBBB 1.5
-----
Total 100.0%
=====
Sector Allocation (% of long-term investments)
U.S. Government & Agency Obligations 35.3 %
Corporate Bonds 22.2
Mortgage Pass-Throughs 17.1
Commercial Mortgage Backed Securities 10.6
Asset Backed Securities 6.7
Multiple Class Mortgage Pass-Through 5.5
Foreign Bonds 2.0
Certificate of Deposit 0.3
Taxable Municipal Bonds 0.2
Preferred Stocks 0.1
------
Total 100.0%
======
Portfolio Statistics
Average maturity (years) 6.22
Effective Duration2 3.7
1 Using the higher of Standard & Poor's ("S&P's") or Moody's Investors Service
("Moody's") rating.
2 Duration measures a Portfolio's price risk. Each year of duration represents
an expected 1% change in the net asset value of the fund for every 1%
change in interest rates. Effective duration is typically calculated for
bonds with embedded options and assumes that expected cash flows will
fluctuate as interest rates change.
- --------------------------------------------------------------------------------
EXPENSE EXAMPLE
As a shareholder of the Portfolio, you incur two types of costs: (1)
transaction costs, including front and back end sales charges (loads) where
applicable; and (2) ongoing costs, including advisory fees, distribution
(12b-1) and service fees, where applicable; and other Portfolio expenses. This
Example is intended to help you understand your ongoing costs (in dollars) of
investing in the Portfolio and to compare these costs with the ongoing costs of
investing in other mutual funds.
The Example below is based on an investment of $1,000 invested at the beginning
of the period and held for the entire period October 1, 2004 to March 31, 2005.
The information under "Actual Expenses," together with the amount you invested,
allows you to estimate actual expenses incurred over the reporting period.
Simply divide your account value by $1,000 (for example, an $8,600 account
value divided by $1,000 = 8.60) and multiply the result by the cost shown for
your share class, in the row entitled "Expenses Incurred During Period", to
estimate the expenses incurred on your account during this period.
The information under "Hypothetical Expenses" provides information about
hypothetical account values and hypothetical expenses based on the Portfolio's
actual expense ratio and an assumed rate of return of 5% per year before
expenses, which is not the Portfolio's actual return. The hypothetical account
values and expenses may not be used to estimate the actual ending account
balance or expense you incurred for the period. You may use this information to
compare the ongoing costs of investing in the Portfolio and other funds. To do
so, compare this 5% hypothetical example with the 5% hypothetical examples that
appear in the shareholder reports of the other funds.
Please note that the expenses shown in the table are meant to highlight your
ongoing costs only and do not reflect any transactional costs, such as front
and back end sales charges (loads) or redemption/exchange fees, where
applicable. Therefore, the hypothetical information is useful in comparing
ongoing costs only, and will not help you determine the relative total costs of
owning different funds. In addition, if these transactional costs were
included, your costs would have been higher.
Actual Expenses
-----------------------------------------------------------------------------------------------
BlackRock Institutional Service Investor Investor Investor
Class Class Class A Class B Class C Class
--------------- --------------- --------------- --------------- --------------- ---------------
Beginning Account
Value (10/01/04) $ 1,000.00 $ 1,000.00 $ 1,000.00 $ 1,000.00 $ 1,000.00 $ 1,000.00
Ending Account Value
(3/31/05) 1,009.50 1,008.80 1,007.40 1,007.40 1,004.60 1,003.70
Expenses Incurred
During Period
(10/01/04 - 3/31/05) 2.00 2.75 3.99 3.89 7.78 7.42
Hypothetical Expenses
(5% return before expenses)
-----------------------------------------------------------------------------------------------
BlackRock Institutional Service Investor Investor Investor
Class Class Class A Class B Class C Class
--------------- --------------- --------------- --------------- --------------- ---------------
Beginning Account
Value (10/01/04) $ 1,000.00 $ 1,000.00 $ 1,000.00 $ 1,000.00 $ 1,000.00 $ 1,000.00
Ending Account Value
(3/31/05) 1,022.99 1,022.23 1,020.97 1,021.07 1,017.15 1,017.50
Expenses Incurred
During Period
(10/01/04 - 3/31/05) 2.01 2.77 4.03 3.93 7.85 7.50
For each class of the Portfolio, expenses are equal to the annualized expense
ratio of 0.40%, 0.55%, 0.80%, 0.78%, 1.56%, and 1.49% for the BlackRock,
Institutional, Service, Investor A, B, and C share classes, respectively,
multiplied by the average account value over the period, multiplied by 182/365
(to reflect the one-half year period).
15
GOVERNMENT INCOME PORTFOLIO
Total Net Assets (3/31/05): $449.5 million
Performance Benchmark
Lehman Brothers Mortgage/Merrill Lynch 10-Year Treasury Index
Investment Approach
Seeks to maximize total return, consistent with income generation and
prudent investment management, by investing primarily in the highest rated
government and agency bonds in the ten to fifteen year maturity range and in
mortgages guaranteed by the U.S. Government or its agencies. Securities
purchased for the Portfolio are rated in the highest rating category (AAA or
Aaa) at the time of purchase by at least one major rating agency or are
determined by the management team to be of similar quality. The portfolio
management team selects bonds from several categories including: U.S.
Treasuries and agency securities, commercial and residential mortgage-backed
securities ("MBS"), collateralized mortgage obligations ("CMOs"), asset-backed
securities and corporate bonds. Securities are purchased for the Portfolio
when the management team determines that they have the potential for
above-average total return.
Recent Portfolio Management Activity
o The BlackRock and Service share classes outperformed the benchmark
while the other share classes underperformed the benchmark for the semi-annual
period.
o During the period, yields trended higher as the Federal Reserve
continued toward the "normalization" of short-term rates. The Federal Open
Market Committee increased the Federal Funds target rate 4 times during the
period, in 25 basis point increments, for a total of 100 basis points. At the
end of the period, the Federal Funds target rate was at 2.75%. The Federal
Reserve indicated concern about pricing pressures as the "pause" and "neutral"
language was largely removed from dialogue. The spike upward in oil prices was
one of a number of signs of building inflation, an issue that replaced
employment as the market's primary focal point during the latter half of the
period. By the end of the period, the yield of the 10-Year Treasury had risen
by 0.36%.
o During the first half of the period, MBS, as measured by the Lehman MBS
Index, outperformed duration-adjusted Treasuries by 84 basis points. The
Lehman MBS Index benefited from the drop in both implied and actual volatility.
Powerful technicals continued to drive the very strong performance of the
sector. During the period, the Portfolio benefited from its allocation to
agencies, which returned 42 basis points over duration-adjusted Treasuries.
However, the Portfolio suffered from its underweight to MBS as the group
outperformed duration-adjusted Treasuries. The Portfolio benefited from its
short duration position relative to the benchmark as interest rates trended
higher during the period. Additionally, the Portfolio's bias toward lower
coupon securities relative to the benchmark contributed to performance.
o During the second half of the period, MBS, as measured by the Lehman
MBS Index, outperformed Treasuries by a modest 5 basis points. January was the
only month of positive performance, buoyed by demand from domestic banks eager
to utilize balance sheets at the start of the year 2005. February and March
were difficult months, as MBS gave back most of the 25 basis points of excess
return earned in January. The negative convexity of mortgages was evident
during the period as interest rates rose on continued tightening of monetary
policy and increased inflation concerns. As a result of the increase in
interest rates, many participants, particularly mortgage servicers, had to shed
duration in the form of MBS. During the period, the Portfolio benefited from
its short duration position relative to the benchmark and its yield curve
flattening bias. Additionally, the Portfolio's bias towards 15-year issues
relative to 30-year issues also contributed to performance relative to the
benchmark. The Portfolio's underweight to MBS slightly detracted from
performance as MBS modestly outperformed duration-adjusted Treasuries. At the
end of the period, the Portfolio remained underweight to MBS versus its
benchmark.
COMPARISON OF CHANGE IN VALUE OF A $10,000 INVESTMENT IN THE GOVERNMENT INCOME
PORTFOLIO AND
THE LEHMAN BROTHERS MORTGAGE/MERRILL LYNCH 10-YEAR TREASURY INDEX FOR THE PAST
TEN YEARS.
[LINE CHART]
Investor A Lehman Brothers Mortgage/Merrill Lynch 10 Year Treasury In
---------- ----------------------------------------------------------
03/31/1995 $ 9,548 $ 10,000
06/30/1995 10,209 10,705
09/30/1995 10,396 10,897
12/31/1995 10,819 11,390
03/31/1996 10,603 11,125
06/30/1996 10,631 11,126
09/30/1996 10,857 11,332
12/31/1996 11,188 11,696
03/31/1997 11,162 11,576
06/30/1997 11,599 12,069
09/30/1997 11,995 12,495
12/31/1997 12,365 12,906
03/31/1998 12,562 13,100
06/30/1998 12,874 13,395
09/30/1998 13,331 14,188
12/31/1998 13,354 14,180
03/31/1999 13,241 14,020
06/30/1999 13,048 13,761
09/30/1999 13,144 13,851
12/31/1999 13,052 13,711
03/31/2000 13,333 14,082
06/30/2000 13,625 14,345
09/30/2000 14,114 14,723
12/31/2000 14,806 15,495
03/31/2001 15,227 15,851
06/30/2001 15,192 15,755
09/30/2001 16,251 16,647
12/31/2001 16,158 16,464
03/31/2002 16,148 16,381
06/30/2002 17,048 17,146
09/30/2002 18,130 18,325
12/31/2002 18,347 18,393
03/31/2003 18,534 18,585
06/30/2003 19,002 18,971
09/30/2003 18,917 18,854
12/31/2003 18,905 18,812
03/31/2004 19,506 19,427
06/30/2004 18,831 18,846
09/30/2004 19,549 19,566
12/31/2004 19,645 19,714
03/31/2005 19,531 19,580
FOR PERIOD ENDING MARCH 31, 2005
Average Annual Total Return
1 Year 3 Year 5 Year 10 Year
------------ ---------- ---------- ----------
BlackRock Class 0.52% 6.96% 8.19% 7.55%
Service Class 0.04% 6.51% 7.91% 7.41%
Investor A Class (Load Adjusted) (4.36)% 4.92% 6.94% 6.92%
Investor A Class (NAV) 0.13% 6.55% 7.93% 7.42%
Investor B Class (Load Adjusted) (4.97)% 4.74% 6.83% 6.63%
Investor B Class (NAV) (0.62)% 5.79% 7.13% 6.63%
Investor C Class (Load Adjusted) (1.59)% 5.76% 7.10% 6.61%
Investor C Class (NAV) (0.62)% 5.76% 7.10% 6.61%
THE PERFORMANCE INFORMATION ABOVE INCLUDES INFORMATION RELATING TO EACH CLASS
OF THE PORTFOLIO SINCE THE COMMENCEMENT OF OPERATIONS OF THE PORTFOLIO, RATHER
THAN THE DATE SUCH CLASS WAS INTRODUCED. THE INCEPTION DATES OF THE PORTFOLIO'S
SHARE CLASSES WERE AS FOLLOWS: INVESTOR A SHARES, 10/3 /94; INVESTOR B SHARES,
10/3/94; INVESTOR C SHARES, 2 /28/97; BLACKROCK SHARES, 2/10/03; AND SERVICE
SHARES, 10/
27/04. SEE "NOTE ON PERFORMANCE INFORMATION" ON PAGE 28 FOR FURTHER INFORMATION
ON HOW PERFORMANCE DATA WAS CALCULATED. THE PERFORMANCE SHOWN IN THE LINE GRAPH
IS THAT OF INVESTOR A SHARES OF THE PORTFOLIO. EXCLUDING THE EFFECTS OF SALES
CHARGES, THE ACTUAL PERFORMANCE OF INVESTOR B AND INVESTOR C SHARES IS LOWER
THAN THE PERFORMANCE OF INVESTOR A SHARES BECAUSE INVESTOR B AND INVESTOR C
SHARES HAVE HIGHER EXPENSES THAN INVESTOR A SHARES. PURCHASES OF INVESTOR A
SHARES GENERALLY PAY A FRONT-END SALES CHARGE, WHILE PURCHASERS OF INVESTOR B
AND INVESTOR C SHARES MAY PAY A CONTINGENT DEFERRED SALES CHARGE (DEPENDING ON
HOW LONG THEY HOLD THEIR SHARES) WHEN THEY SELL THEIR SHARES.
PAST PERFORMANCE IS NOT PREDICTIVE OF FUTURE RESULTS. The graph and table do
not reflect the deduction of taxes that a shareholder would pay on fund
distributions or the redemption of shares. Although the holdings and sectors
listed above were current as of the periods indicated, the Portfolio is
actively managed and its composition will vary.
16
GOVERNMENT INCOME PORTFOLIO
FUND PROFILE
Credit Quality (% of
investments)1
AAA 99.8 %
Unrated 0.2
-----
Total 100.0%
=====
Sector Allocation (% of long-term investments)
U.S. Government & Agency Obligations 49.8 %
Mortgage Pass-Throughs 49.0
Commercial Mortgage Backed Securities 0.7
Asset Backed Securities 0.4
Multiple Class Mortgage Pass-Throughs 0.1
------
Total 100.0%
======
Portfolio Statistics
Average maturity (years) 7.41
Effective Duration2 4.7
1 Using the higher of Standard & Poor's ("S&P's") or Moody's Investors Service
("Moody's") rating.
2 Duration measures a Portfolio's price risk. Each year of duration represents
an expected 1% change in the net asset value of the fund for every 1%
change in interest rates. Effective duration is typically calculated for
bonds with embedded options and assumes that expected cash flows will
fluctuate as interest rates change.
- --------------------------------------------------------------------------------
EXPENSE EXAMPLE
As a shareholder of the Portfolio, you incur two types of costs: (1)
transaction costs, including front and back end sales charges (loads) where
applicable; and (2) ongoing costs, including advisory fees, distribution
(12b-1) and service fees, where applicable; and other Portfolio expenses. This
Example is intended to help you understand your ongoing costs (in dollars) of
investing in the Portfolio and to compare these costs with the ongoing costs of
investing in other mutual funds.
The Example below is based on an investment of $1,000 invested at the beginning
of the period and held for the entire period October 1, 2004 to March 31, 2005.
The information under "Actual Expenses," together with the amount you invested,
allows you to estimate actual expenses incurred over the reporting period.
Simply divide your account value by $1,000 (for example, an $8,600 account
value divided by $1,000 = 8.60) and multiply the result by the cost shown for
your share class, in the row entitled "Expenses Incurred During Period", to
estimate the expenses incurred on your account during this period.
The information under "Hypothetical Expenses" provides information about
hypothetical account values and hypothetical expenses based on the Portfolio's
actual expense ratio and an assumed rate of return of 5% per year before
expenses, which is not the Portfolio's actual return. The hypothetical account
values and expenses may not be used to estimate the actual ending account
balance or expense you incurred for the period. You may use this information to
compare the ongoing costs of investing in the Portfolio and other funds. To do
so, compare this 5% hypothetical example with the 5% hypothetical examples that
appear in the shareholder reports of the other funds.
Please note that the expenses shown in the table are meant to highlight your
ongoing costs only and do not reflect any transactional costs, such as front
and back end sales charges (loads) or redemption/exchange fees, where
applicable. Therefore, the hypothetical information is useful in comparing
ongoing costs only, and will not help you determine the relative total costs of
owning different funds. In addition, if these transactional costs were
included, your costs would have been higher.
Actual Expenses
-------------------------------------------------------------------------------
BlackRock Service Investor Investor Investor
Class Class A Class B Class C Class
--------------- --------------- --------------- --------------- ---------------
Beginning Account
Value (10/01/04) $ 1,000.00 $ 1,000.00 $ 1,000.00 $ 1,000.00 $ 1,000.00
Ending Account Value
(3/31/05) 1,001.10 993.60 999.10 995.30 995.30
Expenses Incurred
During Period
(10/01/04 -
3/31/05) 2.24 3.59 4.27 7.99 7.99
Hypothetical Expenses
(5% return before expenses)
-------------------------------------------------------------------------------
BlackRock Service Investor Investor Investor
Class Class A Class B Class C Class
--------------- --------------- --------------- --------------- ---------------
Beginning Account
Value (10/01/04) $ 1,000.00 $ 1,000.00 $ 1,000.00 $ 1,000.00 $ 1,000.00
Ending Account Value
(3/31/05) 1,022.73 1,021.36 1,020.67 1,016.89 1,016.89
Expenses Incurred
During Period
(10/01/04 -
3/31/05) 2.27 3.64 4.33 8.11 8.11
For each class of the Portfolio, expenses are equal to the annualized expense
ratio of 0.45%, 0.85%, 0.86%, 1.61%, and 1.61% for the BlackRock, Service,
Investor A, B, and C share classes, respectively, multiplied by the average
account value over the period, multiplied by 182/365 (to reflect the one-half
year period).
17
INFLATION PROTECTED BOND PORTFOLIO
Total Net Assets (3/31/05): $35.7 million
Performance Benchmark
Lehman Global Real: U.S. TIPS Index
Investment Approach
Seeks to maximize real return, consistent with preservation of real
capital and prudent investment management. The Portfolio normally invests at
least 80% of its assets in inflation-indexed bonds of varying maturities issued
by the U.S. and non-U.S. governments, their agencies or instrumentalities, and
U.S. and non-U.S. corporations and maintains an average portfolio duration that
is within +/- 20% of the Lehman Global Real: U.S. TIPS Index. The Portfolio
may invest up to 20% of its assets in non-investment grade bonds or securities
of emerging market issuers. The Portfolio may also invest up to 20% of its
assets in non-dollar denominated securities of non-U.S. issuers, and may invest
without limit in U.S. dollar denominated securities of non-U.S. issuers. The
management team may also purchase U.S. Treasury and agency securities,
commercial and residential mortgage backed securities, collateralized mortgage
obligations (CMOs), asset-backed securities and corporate bonds. Securities are
purchased for the Portfolio when the management team believes that they have
the potential for above-average real return.
Recent Portfolio Management Activity
o The BlackRock, Institutional, Service and Investor A share classes
outperformed the benchmark for the semi-annual period. The Investor B and C
share classes underperformed the benchmark for the semi-annual period.
o During the period, yields trended higher as the Federal Reserve
continued toward the "normalization" of short-term rates. The Federal Open
Market Committee increased the Federal Funds target rate 4 times during the
period, in 25 basis point increments, for a total of 100 basis points. At the
end of the period, the Federal Funds target rate was at 2.75%. The Federal
Reserve indicated concern about pricing pressures as the "pause" and "neutral"
language was largely removed from dialogue. The spike upward in oil prices was
one of a number of signs of building inflation, an issue that replaced
employment as the market's primary focal point during the latter half of the
period. By the end of the period, the yield of the 10-Year Treasury had risen
by 0.36%.
o Treasury inflation protected securities (TIPS) outperformed the nominal
market during the first half of the period. The October Consumer Price Index
was strong due to a spike in oil. Despite a subsequent drop in commodity
prices during the quarter, TIPS continued to find support due to weakness in
the U.S. dollar. Ten-year and 30-year breakevens closed the quarter at 2.58%
and 2.97%, respectively. To cover a growing budget deficit, the Treasury
increased TIPS issuance to an all-time high in 2004. The main contributors to
out performance relative to the benchmark were the Portfolio's short duration
position and yield curve flattening bias. The Portfolio had an overweight on
the long end of the yield curve relative to the benchmark.
o During the second half of the period, TIPS continued to outperform the
nominal market. Commodity prices, led by oil, continued their rise, causing
the market to ratchet-up inflation expectations. Dollar weakness early in the
quarter contributed to inflation concerns. Ten-year and 30-year breakevens
closed at 2.71% and 2.95%, respectively. Late in the period, some of these
trends began to reverse with commodities off of their highs and a rebound in
the US dollar. During the period, the Portfolio continued to benefit from its
short duration position relative to the benchmark and yield curve flattening
bias. The Portfolio established a number of small positions in sectors outside
of U.S. TIPS. The Portfolio added exposure to Swedish and Canadian inflation
linked securities, adjustable rate mortgages, commercial-backed mortgages and
non-U.S. securities.
COMPARISON OF CHANGE IN VALUE OF A $10,000 INVESTMENT IN THE INFLATION
PROTECTED BOND PORTFOLIO AND THE LEHMAN GLOBAL REAL: U.S. TIPS INDEX FROM
INCEPTION.
[LINE CHART]
Institutional Investor A Lehman Global Real: U.S. TIPS Index
------------- ---------- -----------------------------------
06/28/2004 $ 10,000 $ 9,699 $ 10,000
06/30/2004 10,110 9,806 10,118
09/30/2004 10,540 10,195 10,506
12/31/2004 10,808 10,438 10,771
03/31/2005 10,796 10,427 10,735
FOR PERIOD ENDING MARCH 31, 2005
Average Annual Total Return
From Inception
---------------
BlackRock Class 7.59%
Institutional Class 7.96%
Service Class 6.44%
Investor A Class (Load Adjusted) 4.28%
Investor A Class (NAV) 7.51%
Investor B Class (Load Adjusted) 2.60%
Investor B Class (NAV) 7.10%
Investor C Class (Load Adjusted) 6.50%
Investor C Class (NAV) 7.50%
THE PERFORMANCE INFORMATION ABOVE INCLUDES INFORMATION RELATING TO EACH CLASS
OF THE PORTFOLIO SINCE THE COMMENCEMENT OF OPERATIONS OF THE PORTFOLIO ON
6/28/04. SEE "NOTE ON PERFORMANCE INFORMATION" ON PAGE 28 FOR FURTHER
INFORMATION ON HOW PERFORMANCE DATA WAS CALCULATED, INCLUDING IMPORTANT
INFORMATION ON THE LINE GRAPH\^ ABOVE.
PAST PERFORMANCE IS NOT PREDICTIVE OF FUTURE RESULTS. The graph and table do
not reflect the deduction of taxes that a shareholder would pay on fund
distributions or the redemption of shares. Although the holdings and sectors
listed above were current as the periods indicated, the Portfolio is actively
managed and its composition will vary.
18
INFLATION PROTECTED BOND PORTFOLIO
FUND PROFILE
Credit Quality (% of
investments)1
AAA 99.7 %
BBB 0.3
-----
Total 100.0%
=====
Sector Allocation (% of long-term investments)
U.S. Government & Agency Obligations 89.5 %
Mortgage Pass-Throughs 5.2
Foreign Bonds 5.0
Corporate Bonds 0.3
-----
Total 100.0%
=====
Portfolio Statistics
Average maturity (years) 10.79
Effective Duration2 8.0
1 Using the higher of Standard & Poor's ("S&P's") or Moody's Investors Service
("Moody's") rating.
2 Duration measures a Portfolio's price risk. Each year of duration represents
an expected 1% change in the net asset value of the fund for every 1%
change in interest rates. Effective duration is typically calculated for
bonds with embedded options and assumes that expected cash flows will
fluctuate as interest rates change.
- --------------------------------------------------------------------------------
EXPENSE EXAMPLE
As a shareholder of the Portfolio, you incur two types of costs: (1)
transaction costs, including front and back end sales charges (loads) where
applicable; and (2) ongoing costs, including advisory fees, distribution
(12b-1) and service fees, where applicable; and other Portfolio expenses. This
Example is intended to help you understand your ongoing costs (in dollars) of
investing in the Portfolio and to compare these costs with the ongoing costs of
investing in other mutual funds.
The Example below is based on an investment of $1,000 invested at the beginning
of the period and held for the entire period October 1, 2004 to March 31, 2005.
The information under "Actual Expenses," together with the amount you invested,
allows you to estimate actual expenses incurred over the reporting period.
Simply divide your account value by $1,000 (for example, an $8,600 account
value divided by $1,000 = 8.60) and multiply the result by the cost shown for
your share class, in the row entitled "Expenses Incurred During Period", to
estimate the expenses incurred on your account during this period.
The information under "Hypothetical Expenses" provides information about
hypothetical account values and hypothetical expenses based on the Portfolio's
actual expense ratio and an assumed rate of return of 5% per year before
expenses, which is not the Portfolio's actual return. The hypothetical account
values and expenses may not be used to estimate the actual ending account
balance or expense you incurred for the period. You may use this information to
compare the ongoing costs of investing in the Portfolio and other funds. To do
so, compare this 5% hypothetical example with the 5% hypothetical examples that
appear in the shareholder reports of the other funds.
Please note that the expenses shown in the table are meant to highlight your
ongoing costs only and do not reflect any transactional costs, such as front
and back end sales charges (loads) or redemption/exchange fees, where
applicable. Therefore, the hypothetical information is useful in comparing
ongoing costs only, and will not help you determine the relative total costs of
owning different funds. In addition, if these transactional costs were
included, your costs would have been higher.
Actual Expenses
-----------------------------------------------------------------------------------------------
BlackRock Institutional Service Investor Investor Investor
Class Class Class A Class B Class C Class
--------------- --------------- --------------- --------------- --------------- ---------------
Beginning Account
Value (10/01/04) $ 1,000.00 $ 1,000.00 $ 1,000.00 $ 1,000.00 $ 1,000.00 $ 1,000.00
Ending Account Value
(3/31/05) 1,024.20 1,024.30 1,024.40 1,022.80 1,018.00 1,018.90
Expenses Incurred
During Period
(10/01/04 -
3/31/05 1.51 2.01 3.27 3.27 7.07 6.73
Hypothetical Expenses
(5% return before expenses)
-----------------------------------------------------------------------------------------------
BlackRock Institutional Service Investor Investor Investor
Class Class Class A Class B Class C Class
--------------- --------------- --------------- --------------- --------------- ---------------
Beginning Account
Value (10/01/04) $ 1,000.00 $ 1,000.00 $ 1,000.00 $ 1,000.00 $ 1,000.00 $ 1,000.00
Ending Account Value
(3/31/05) 1,023.49 1,022.99 1,021.73 1,021.73 1,017.90 1,018.25
Expenses Incurred
During Period
(10/01/04 -
3/31/05 1.51 2.01 3.27 3.27 7.10 6.75
For each class of the Portfolio, expenses are equal to the annualized expense
ratio of 0.30%, 0.40%, 0.65%, 0.65%, 1.41%, and 1.34% for the BlackRock,
Institutional, Service, Investor A, B, and C share classes, respectively,
multiplied by the average account value over the period, multiplied by 182/365
(to reflect the period the fund was open during the one-half year period).
19
GNMA PORTFOLIO
Total Net Assets (3/31/05): $222.2 million
Performance Benchmark
Lehman Brothers GNMA MBS Index
Investment Approach
Seeks to maximize total return, consistent with income generation and
prudent investment management, by investing primarily in securities issued by
the Government National Mortgage Association ("GNMA") as well as other U.S.
Government securities in the five to ten year maturity range. Securities
purchased by the Portfolio are rated in the highest rating category (AAA or
Aaa) at the time of purchase by at least one major rating agency or are
determined by the portfolio management team to be of similar quality.
Securities are purchased for the Portfolio when the management team determines
that they have the potential for above-average total return.
Recent Portfolio Management Activity
o All share classes underperformed the benchmark for the semi-annual
period.
o During the period, yields trended higher as the Federal Reserve
continued toward the "normalization" of short-term rates. The Federal Open
Market Committee increased the Federal Funds target rate 4 times during the
period, in 25 basis point increments, for a total of 100 basis points. At the
end of the period, the Federal Funds target rate was at 2.75%. The Federal
Reserve indicated concern about pricing pressures as the "pause" and "neutral"
language was largely removed from dialogue. The spike upward in oil prices was
one of a number of signs of building inflation, an issue that replaced
employment as the market's primary focal point during the latter half of the
period. By the end of the period, the yield of the 10-Year Treasury had risen
by 0.36%.
o During the first half of the period, residential mortgage-backed
securities ("MBS"), as measured by the Lehman MBS Index, outperformed
duration-adjusted Treasuries by 84 basis points. The Lehman MBS Index
benefited from the drop in both implied and actual volatility. Powerful
technicals continued to drive the very strong performance of the sector.
During the period, the Portfolio benefited from its short duration position
relative to the benchmark as interest rates trended higher during the period.
Additionally, the Portfolio's bias toward lower coupon securities relative to
the benchmark contributed to performance. However, the Portfolio suffered from
its underweight to mortgages as the group outperformed duration-adjusted
Treasuries.
o During the second half of the period, MBS, as measured by the Lehman
MBS Index, outperformed duration-adjusted Treasuries by a modest 5 basis
points. January was the only month of positive performance, buoyed by demand
from domestic banks eager to utilize balance sheets at the start of the year
2005. February and March were difficult months, as mortgages gave back most of
the 25 basis points of excess return earned in January. The negative convexity
of mortgages was evident during the period as interest rates rose on continued
tightening of monetary policy and increased inflation concerns. As a result of
the increase in interest rates, many participants, particularly mortgage
servicers, had to shed duration in the form of MBS. During the period, the
Portfolio benefited from its short duration position relative to the benchmark
and its yield curve flattening bias. Additionally, the Portfolio's bias
towards 15-year issues relative to 30-year issues also contributed to
performance relative to the benchmark. The Portfolio's underweight to
mortgages slightly detracted from performance as MBS modestly outperformed
duration-adjusted Treasuries. At the end of the period, the Portfolio remained
underweight to MBS versus its benchmark.
COMPARISON OF CHANGE IN VALUE OF A $10,000 INVESTMENT IN THE GNMA PORTFOLIO AND
THE LEHMAN
BROTHERS GNMA MBS INDEX FOR THE PAST TEN YEARS.
[LINE CHART]
Institutional Investor A Lehman Brothers GNMA MBS Index
------------- ---------- ------------------------------
03/31/1995 $ 10,000 $ 9,597 $ 10,000
06/30/1995 10,580 10,141 10,529
09/30/1995 10,792 10,332 10,764
12/31/1995 11,148 10,661 11,118
03/31/1996 11,049 10,554 11,084
06/30/1996 11,135 10,624 11,162
09/30/1996 11,345 10,811 11,396
12/31/1996 11,671 11,109 11,732
03/31/1997 11,683 11,107 11,748
06/30/1997 12,136 11,524 12,206
09/30/1997 12,506 11,862 12,565
12/31/1997 12,802 12,128 12,850
03/31/1998 13,027 12,328 13,058
06/30/1998 13,310 12,578 13,278
09/30/1998 13,617 12,853 13,617
12/31/1998 13,771 12,983 13,738
03/31/1999 13,877 13,068 13,876
06/30/1999 13,718 12,903 13,817
09/30/1999 13,843 13,005 13,943
12/31/1999 13,809 12,958 14,002
03/31/2000 14,106 13,221 14,275
06/30/2000 14,449 13,527 14,579
09/30/2000 14,907 13,926 15,016
12/31/2000 15,446 14,470 15,558
03/31/2001 15,913 14,889 15,978
06/30/2001 16,061 15,010 16,184
09/30/2001 16,820 15,699 16,806
12/31/2001 16,981 15,845 16,837
03/31/2002 17,172 16,004 17,017
06/30/2002 17,764 16,534 17,569
09/30/2002 18,153 16,876 18,045
12/31/2002 18,479 17,158 18,300
03/31/2003 18,609 17,258 18,453
06/30/2003 18,797 17,411 18,554
09/30/2003 18,879 17,466 18,632
12/31/2003 19,073 17,625 18,823
03/31/2004 19,321 17,832 19,121
06/30/2004 19,154 17,658 18,947
09/30/2004 19,627 18,077 19,407
12/31/2004 19,811 18,234 19,642
03/31/2005 19,771 18,186 19,653
FOR PERIOD ENDING MARCH 31, 2005
Average Annual Total Return
1 Year 3 Year 5 Year 10 Year
------------ ---------- ---------- ----------
BlackRock Class 2.59% 4.92% 7.05% 7.09%
Institutional Class 2.33% 4.81% 6.99% 7.05%
Service Class 2.16% 4.55% 6.68% 6.74%
Investor A Class (Load Adjusted) (2.14)% 2.93% 5.71% 6.16%
Investor A Class (NAV) 1.98% 4.35% 6.58% 6.60%
Investor B Class (Load Adjusted) (3.18)% 2.55% 5.42% 5.79%
Investor B Class (NAV) 1.23% 3.62% 5.74% 5.79%
Investor C Class (Load Adjusted) 0.35% 3.63% 5.73% 5.78%
Investor C Class (NAV) 1.33% 3.63% 5.73% 5.78%
IN CONNECTION WITH THE CONVERSION OF VARIOUS COMMON TRUST FUNDS MAINTAINED BY
PNC BANK AND PNC BANK, DELAWARE ("PNC-DE"), AN AFFILIATE OF PNC BANK, INTO THE
FUND BETWEEN MAY 1 AND MAY 15,1998 (THE "CTF CONVERSION"), THE GNMA PORTFOLIO
WAS ESTABLISHED TO RECEIVE THE ASSETS OF THE GNMA FUND OF PNC BANK. PERFORMANCE
INFORMATION PRESENTED FOR THIS PORTFOLIO INCLUDES PERFORMANCE FOR THE
PREDECESSOR COMMON TRUST FUND WHICH TRANSFERRED ITS ASSETS AND LIABILITIES TO
THE RELATED PORTFOLIO PURSUANT TO THE CTF CONVERSION. PERFORMANCE INFORMATION
PRESENTED IS BASED UPON THE PERFORMANCE OF THE GNMA FUND FOR PERIODS PRIOR TO
THE CTF CONVERSION. SEE "NOTE ON PERFORMANCE INFORMATION" ON PAGE 28 FOR
FURTHER INFORMATION ON HOW PERFORMANCE DATA WAS CALCULATED, INCLUDING IMPORTANT
INFORMATION ON THE LINE GRAPH\^ ABOVE.
PAST PERFORMANCE IS NOT PREDICTIVE OF FUTURE RESULTS. The graph and table do
not reflect the deduction of taxes that a shareholder would pay on fund
distributions or the redemption of shares. Although the holdings and sectors
listed above were current as of the periods indicated, the Portfolio is
actively managed and its composition will vary.
20
GNMA PORTFOLIO
FUND PROFILE
Credit Quality (% of
investments)1
AAA 96.7 %
AA 3.3
-----
Total 100.0%
=====
Sector Allocation (% of long-term investments)
Mortgage Pass-Throughs 95.9 %
Commercial Mortgage Backed Securities 2.4
Asset Backed Securities 0.9
U.S. Government & Agency Obligations 0.6
Multiple Class Mortgage Pass-Throughs 0.2
------
Total 100.0%
======
Portfolio Statistics
Average maturity (years) 5.09
Effective Duration2 2.8
1 Using the higher of Standard & Poor's ("S&P's") or Moody's Investors Service
("Moody's") rating.
2 Duration measures a Portfolio's price risk. Each year of duration represents
an expected 1% change in the net asset value of the fund for every 1%
change in interest rates. Effective duration is typically calculated for
bonds with embedded options and assumes that expected cash flows will
fluctuate as interest rates change.
- --------------------------------------------------------------------------------
EXPENSE EXAMPLE
As a shareholder of the Portfolio, you incur two types of costs: (1)
transaction costs, including front and back end sales charges (loads) where
applicable; and (2) ongoing costs, including advisory fees, distribution
(12b-1) and service fees, where applicable; and other Portfolio expenses. This
Example is intended to help you understand your ongoing costs (in dollars) of
investing in the Portfolio and to compare these costs with the ongoing costs of
investing in other mutual funds.
The Example below is based on an investment of $1,000 invested at the beginning
of the period and held for the entire period October 1, 2004 to March 31, 2005.
The information under "Actual Expenses," together with the amount you invested,
allows you to estimate actual expenses incurred over the reporting period.
Simply divide your account value by $1,000 (for example, an $8,600 account
value divided by $1,000 = 8.60) and multiply the result by the cost shown for
your share class, in the row entitled "Expenses Incurred During Period", to
estimate the expenses incurred on your account during this period.
The information under "Hypothetical Expenses" provides information about
hypothetical account values and hypothetical expenses based on the Portfolio's
actual expense ratio and an assumed rate of return of 5% per year before
expenses, which is not the Portfolio's actual return. The hypothetical account
values and expenses may not be used to estimate the actual ending account
balance or expense you incurred for the period. You may use this information to
compare the ongoing costs of investing in the Portfolio and other funds. To do
so, compare this 5% hypothetical example with the 5% hypothetical examples that
appear in the shareholder reports of the other funds.
Please note that the expenses shown in the table are meant to highlight your
ongoing costs only and do not reflect any transactional costs, such as front
and back end sales charges (loads) or redemption/exchange fees, where
applicable. Therefore, the hypothetical information is useful in comparing
ongoing costs only, and will not help you determine the relative total costs of
owning different funds. In addition, if these transactional costs were
included, your costs would have been higher.
Actual Expenses
-----------------------------------------------------------------------------------------------
BlackRock Institutional Service Investor Investor Investor
Class Class Class A Class B Class C Class
--------------- --------------- --------------- --------------- --------------- ---------------
Beginning Account
Value (10/01/04) $ 1,000.00 $ 1,000.00 $ 1,000.00 $ 1,000.00 $ 1,000.00 $ 1,000.00
Ending Account Value
(3/31/05) 1,009.10 1,007.30 1,007.10 1,006.00 1,002.20 1,002.30
Expenses Incurred
During Period
(10/01/04 -
3/31/05) 2.30 3.04 4.34 4.34 8.06 8.11
Hypothetical Expenses
(5% return before expenses)
-----------------------------------------------------------------------------------------------
BlackRock Institutional Service Investor Investor Investor
Class Class Class A Class B Class C Class
--------------- --------------- --------------- --------------- --------------- ---------------
Beginning Account
Value (10/01/04) $ 1,000.00 $ 1,000.00 $ 1,000.00 $ 1,000.00 $ 1,000.00 $ 1,000.00
Ending Account Value
(3/31/05) 1,022.68 1,021.93 1,020.62 1,020.62 1,016.84 1,016.79
Expenses Incurred
During Period
(10/01/04 -
3/31/05) 2.32 3.07 4.38 4.38 8.16 8.21
For each class of the Portfolio, expenses are equal to the annualized expense
ratio of 0.46%, 0.61%, 0.87%, 0.87%, 1.62%, and 1.63% for the BlackRock,
Institutional, Service, Investor A, B, and C share classes, respectively,
multiplied by the average account value over the period, multiplied by 182/365
(to reflect the one-half year period).
21
MANAGED INCOME PORTFOLIO
Total Net Assets (3/31/05): $716.8 million
Performance Benchmark
Lehman Brothers U.S. Aggregate Index
Investment Approach
Seeks to maximize total return, consistent with income generation and
prudent investment management, by investing primarily in investment grade bonds
that allow it to maintain an average portfolio duration that is within +/- 20%
of the duration of the Lehman Brothers U.S. Aggregate Index. The Portfolio
normally invests at least 80% of its assets in bonds and only buys securities
rated investment grade at the time of purchase by at least one major rating
agency or determined by the management team to be of similar quality. The
Portfolio may invest up to 10% of its assets in non-dollar denominated bonds of
issuers located outside of the United States. The Portfolio's investment in
non-dollar denominated bonds may be on a currency hedged or unhedged basis.
The portfolio management team selects bonds from several categories including:
U.S. Treasuries and agency securities, commercial and residential
mortgage-backed securities, collateralized mortgage obligations ("CMOs"),
asset-backed securities and corporate bonds. Securities are purchased for the
Portfolio when the management team determines that they have the potential for
above-average total return.
Recent Portfolio Management Activity
o The Institutional, Service and Investor A share classes of the
Portfolio outperformed the benchmark while the other share classes
underperformed the benchmark for the semi-annual period.
o During the semi-annual period, yields trended higher as the Federal
Reserve continued toward the "normalization" of short-term rates. The Federal
Open Market Committee increased the Federal Funds target rate 4 times during
the period, in 25 basis points increments, for a total of 100 basis points. At
the end of the period, the Federal Funds target rate was at 2.75%. The Federal
Reserve indicated concern about pricing pressures as the "pause" and "neutral"
language was largely removed from dialogue. The spike upward in oil prices was
one of a number of signs of building inflation, an issue that replaced
employment as the market's primary focal point during the latter half of the
period. By the end of the period, the yield of the 10-Year Treasury had risen
by 0.36%.
o In the first half of the semi-annual period, the major domestic spread
sectors - agencies, corporates, asset-backed securities ("ABS"), commercial
mortgage-backed securities ("CMBS") and mortgage-backed securities ("MBS")
- -continued their winning ways, posting excess returns over duration-weighted
Treasuries for each month in the quarter. Agency spreads tightened versus both
swaps and Treasuries despite continued negative headlines and the Lehman MBS
index outperformed Treasuries by 84 basis points during the fourth quarter of
2004. Corporate bond performance during the quarter was driven both by
positive fundamentals and strong technicals with volatility dropping steadily
during November and December.
o The Portfolio benefited from its yield curve flattening bias and short
duration positioning relative to the benchmark during the fourth quarter of
2004. The Portfolio suffered from its underweight in the corporate and mortgage
sectors, which returned 0.86% and 0.84%, respectively, over duration-adjusted
Treasuries. The Portfolio had a concentrated underweight in 30-year versus
15-year maturities in mortgages and exhibited a high quality bias with a strong
underweight in BBB-rated issues in the corporate sector.
o During the second half of the semi-annual period, Agency spreads
tightened versus both swaps and Treasuries, despite negative headlines and
Congressional hearings. The Lehman MBS Index outperformed Treasuries by a
modest 5 basis points with option adjusted spreads widening over the quarter as
fixed rate mortgages failed to rally in line with the drop in volatility. In
the corporate sector, interest rates backed up and swap spreads widened. March
posted -86 basis points of excess return for the Lehman Credit Index, the worst
month since July 2002.
o The Portfolio benefited from its yield curve flattening bias during the
first quarter of 2005 as well as its short duration positioning relative to its
benchmark. The Portfolio was significantly underweight MBS relative to the
benchmark, which detracted from performance as the mortgage sector returned
0.05% over duration-adjusted Treasuries. In the corporate sector, the Portfolio
benefited from its underweight on a duration basis as the sector returned
- -0.55% over duration-adjusted Treasuries. In the corporate sector, the
Portfolio exhibited a high quality bias with a strong underweight to BBB-rated
issues The Portfolio also benefited from its relative overweight in the CMBS
and ABS sectors, which returned 0.15% and 0.09%, respectively, over
duration-adjusted Treasuries.
COMPARISON OF CHANGE IN VALUE OF A $10,000 INVESTMENT IN THE MANAGED INCOME
PORTFOLIO AND
THE LEHMAN BROTHERS U.S. AGGREGATE INDEX FOR THE PAST TEN YEARS.
[LINE CHART]
Institutional Investor A Lehman Brothers U.S. Aggregate Index
------------- ---------- ------------------------------------
03/31/1995 $ 10,000 $ 9,549 $ 10,000
06/30/1995 10,570 10,082 10,609
09/30/1995 10,757 10,246 10,818
12/31/1995 11,213 10,668 11,279
03/31/1996 10,989 10,442 11,078
06/30/1996 11,035 10,473 11,141
09/30/1996 11,222 10,638 11,346
12/31/1996 11,598 10,982 11,686
03/31/1997 11,565 10,938 11,621
06/30/1997 11,981 11,318 12,050
09/30/1997 12,373 11,675 12,451
12/31/1997 12,695 11,965 12,818
03/31/1998 12,881 12,126 13,016
06/30/1998 13,219 12,430 13,320
09/30/1998 13,517 12,695 13,883
12/31/1998 13,621 12,778 13,930
03/31/1999 13,629 12,770 13,859
06/30/1999 13,489 12,625 13,737
09/30/1999 13,594 12,707 13,831
12/31/1999 13,538 12,640 13,814
03/31/2000 13,828 12,896 14,119
06/30/2000 14,066 13,116 14,365
09/30/2000 14,524 13,514 14,798
12/31/2000 15,152 14,096 15,420
03/31/2001 15,623 14,517 15,888
06/30/2001 15,672 14,545 15,978
09/30/2001 16,468 15,252 16,714
12/31/2001 16,466 15,231 16,722
03/31/2002 16,444 15,193 16,738
06/30/2002 17,038 15,723 17,356
09/30/2002 17,591 16,215 18,151
12/31/2002 18,034 16,604 18,437
03/31/2003 18,309 16,837 18,694
06/30/2003 18,836 17,302 19,161
09/30/2003 18,823 17,270 19,133
12/31/2003 18,861 17,283 19,194
03/31/2004 19,282 17,649 19,704
06/30/2004 18,907 17,285 19,222
09/30/2004 19,483 17,793 19,837
12/31/2004 19,668 17,962 20,026
03/31/2005 19,625 17,887 19,930
FOR PERIOD ENDING MARCH 31, 2005
Average Annual Total Return
1 Year 3 Year 5 Year 10 Year
------------ ---------- ---------- ----------
Institutional Class 1.78% 6.07% 7.25% 6.97%
Service Class 1.47% 5.76% 6.93% 6.66%
Investor A Class (Load Adjusted) (3.25)% 4.00% 5.78% 5.99%
Investor A Class (NAV) 1.35% 5.59% 6.76% 6.48%
Investor B Class (Load Adjusted) (3.79)% 3.74% 5.65% 5.87%
Investor B Class (NAV) 0.59% 4.81% 5.97% 5.87%
Investor C Class (Load Adjusted) (0.38)% 4.85% 5.94% 5.85%
Investor C Class (NAV) 0.60% 4.85% 5.94% 5.85%
THE PERFORMANCE INFORMATION ABOVE INCLUDES INFORMATION RELATING TO EACH CLASS
OF THE PORTFOLIO SINCE THE COMMENCEMENT OF OPERATIONS OF THE PORTFOLIO, RATHER
THAN THE DATE SUCH CLASS WAS INTRODUCED. THE INCEPTION DATES OF THE PORTFOLIO'S
SHARE CLASSES WERE AS FOLLOWS: INSTITUTIONAL SHARES, 11 /1/89; INVESTOR A
SHARES, 2 /5 /92; SERVICE SHARES, 7/29/93; INVESTOR B SHARES, 7/15 /97; AND
INVESTOR C SHARES, 11/22/99. SEE "NOTE ON PERFORMANCE INFORMATION" ON PAGE
28 FOR FURTHER INFORMATION ON HOW PERFORMANCE DATA WAS CALCULATED, INCLUDING
IMPORTANT INFORMATION ON THE LINE GRAPH\^ ABOVE.
PAST PERFORMANCE IS NOT PREDICTIVE OF FUTURE RESULTS. The graph and table do
not reflect the deduction of taxes that a shareholder would pay on fund
distributions or the redemption of shares. Although the holdings and sectors
listed above were current as of the periods indicated, the Portfolio is
actively managed and its composition will vary.
22
MANAGED INCOME PORTFOLIO
FUND PROFILE
Credit Quality (% of
investments)1
AAA 83.1 %
AA 9.1
A 3.9
BBB 3.7
\qBBB 0.2
-----
Total 100.0%
=====
Sector Allocation (% of long-term investments)
U.S. Government & Agency Obligations 38.6 %
Corporate Bonds 21.0
Mortgage Pass-Throughs 19.6
Commercial Mortgage Backed Securities 9.1
Asset Backed Securities 6.9
Project Loans 2.3
Taxable Municipal Bonds 1.3
Certificate of Deposit 0.4
Foreign Bonds 0.4
Multiple Class Mortgage Pass-Throughs 0.4
------
Total 100.0%
======
Portfolio Statistics
Average maturity (years) 7.33
Effective Duration2 3.7
1 Using the higher of Standard & Poor's ("S&P's") or Moody's Investors Service
("Moody's") rating.
2 Duration measures a Portfolio's price risk. Each year of duration represents
an expected 1% change in the net asset value of the fund for every 1%
change in interest rates. Effective duration is typically calculated for
bonds with embedded options and assumes that expected cash flows will
fluctuate as interest rates change.
- --------------------------------------------------------------------------------
EXPENSE EXAMPLE
As a shareholder of the Portfolio, you incur two types of costs: (1)
transaction costs, including front and back end sales charges (loads) where
applicable; and (2) ongoing costs, including advisory fees, distribution
(12b-1) and service fees, where applicable; and other Portfolio expenses. This
Example is intended to help you understand your ongoing costs (in dollars) of
investing in the Portfolio and to compare these costs with the ongoing costs of
investing in other mutual funds.
The Example below is based on an investment of $1,000 invested at the beginning
of the period and held for the entire period October 1, 2004 to March 31, 2005.
The information under "Actual Expenses," together with the amount you invested,
allows you to estimate actual expenses incurred over the reporting period.
Simply divide your account value by $1,000 (for example, an $8,600 account
value divided by $1,000 = 8.60) and multiply the result by the cost shown for
your share class, in the row entitled "Expenses Incurred During Period", to
estimate the expenses incurred on your account during this period.
The information under "Hypothetical Expenses" provides information about
hypothetical account values and hypothetical expenses based on the Portfolio's
actual expense ratio and an assumed rate of return of 5% per year before
expenses, which is not the Portfolio's actual return. The hypothetical account
values and expenses may not be used to estimate the actual ending account
balance or expense you incurred for the period. You may use this information to
compare the ongoing costs of investing in the Portfolio and other funds. To do
so, compare this 5% hypothetical example with the 5% hypothetical examples that
appear in the shareholder reports of the other funds.
Please note that the expenses shown in the table are meant to highlight your
ongoing costs only and do not reflect any transactional costs, such as front
and back end sales charges (loads) or redemption/exchange fees, where
applicable. Therefore, the hypothetical information is useful in comparing
ongoing costs only, and will not help you determine the relative total costs of
owning different funds. In addition, if these transactional costs were
included, your costs would have been higher.
Actual Expenses
-------------------------------------------------------------------------------
Institutional Service Investor Investor Investor
Class Class A Class B Class C Class
--------------- --------------- --------------- --------------- ---------------
Beginning Account
Value (10/01/04) $ 1,000.00 $ 1,000.00 $ 1,000.00 $ 1,000.00 $ 1,000.00
Ending Account Value
(3/31/05) 1,007.30 1,005.80 1,005.30 1,001.50 1,002.50
Expenses Incurred
During Period
(10/01/04 -
3/31/05) 3.24 4.74 5.24 8.96 8.86
Hypothetical Expenses
(5% return before expenses)
-------------------------------------------------------------------------------
Institutional Service Investor Investor Investor
Class Class A Class B Class C Class
--------------- --------------- --------------- --------------- ---------------
Beginning Account
Value (10/01/04) $ 1,000.00 $ 1,000.00 $ 1,000.00 $ 1,000.00 $ 1,000.00
Ending Account Value
(3/31/05) 1,021.73 1,020.22 1,019.71 1,015.94 1,016.04
Expenses Incurred
During Period
(10/01/04 -
3/31/05) 3.27 4.78 5.29 9.06 8.96
For each class of the Portfolio, expenses are equal to the annualized expense
ratio of 0.65%, 0.95%, 1.05%, 1.80%, and 1.78% for the Institutional, Service,
Investor A, B, and C share classes, respectively, multiplied by the average
account value over the period, multiplied by 182/365 (to reflect the one-half
year period).
23
INTERNATIONAL BOND PORTFOLIO
Total Net Assets (3/31/05): $798.3 million
Performance Benchmark
Citigroup Non-U.S.World Government Bond Index
Investment Approach
Seeks to realize a total return that exceeds that of the Citigroup
Non-U.S. World Government Bond Index by investing primarily in non-dollar
denominated bonds of issuers located outside of the United States in the five
to fifteen year maturity range. The Portfolio normally invests at least 80% of
its assets in bonds and at least 65% of it assets in bonds of a diversified
group on non-U.S. issuers from at least three developed countries. The
Portfolio may only buy securities rated investment grade at the time of
purchase by at least one major rating agency or determined by the management
team to be of similar quality. Securities are purchased for the Portfolio when
the management team determines that they have the potential for above-average
total return.
Recent Portfolio Management Activity
o All share classes of the Portfolio underperformed the benchmark for the
semi-annual period.
o Non-US bond markets dramatically outperformed the U.S. bond market
during the first half of the semi-annual period as several macroeconomic themes
came to the forefront. The rebound in U.S. economic growth and the
determination of the Federal Reserve to maintain its measured tightening
process contrasted with more sluggish conditions in Europe and Japan. After
trading in a relatively narrow range for most of the year, the US dollar broke
sharply lower against major currencies in the fourth quarter. The
trade-weighted dollar index was down 7.5% with the dollar establishing record
lows against the euro and multi-year lows against most major currencies. The
U.S. dollar's broad weakness highlighted the structural issues surrounding the
U.S. budget and current account deficits and the ability to continue to finance
those deficits with foreign capital inflows. At the same time, the strength of
the euro and other currencies exacerbated the slowdown concerns for those
countries, leading to lowered expectations for central bank tightening.
o During the fourth quarter of 2004, German 5-year bond yields declined
29 basis points to 3.03%, reflecting downward revisions of Eurozone growth to
2% and expectations that the European Central Bank ("ECB") will remain on hold
throughout most of 2005. Sterling bonds rallied as sluggishness in the housing
sector led to revisions in consumer spending and tightening expectations by the
Bank of England's Monetary Policy Committee ("MPC"). Canadian bonds rallied as
the Bank of Canada abruptly halted their tightening program in light of a
stronger Canadian dollar.
o The Portfolio took advantage of a cheapening in Canadian bonds to
reestablish an overweight position during the fourth quarter of 2004; at
quarter-end the Portfolio was neutral relative to the benchmark. The Portfolio
also benefited from its overweight in Sweden and Canada and a position in U.K.
swap spreads relative to its benchmark. The Portfolio was overweight Europe
during the quarter while positioned neutral relative to the benchmark by
quarter-end.
o In the second half of the semi-annual period, European bonds were, on
balance, unchanged over the period. In contrast to the U.S., where a
combination of solid economic growth and inflation fears pushed up interest
rates, disappointing economic releases dampened optimism for a significant
European rebound. Higher oil prices and the strong euro continued to hamper
manufacturing, resulting in sluggish GDP growth in the entire Euro-zone, in
particular Germany, and rising unemployment in the major economies. This
environment reinforced expectations that the ECB would continue to hold
official rates at 2% throughout most of the year. Growth in the U.K. remained
relatively robust, but the MPC nonetheless kept rates unchanged throughout the
quarter. The euro depreciated 4.4% versus the U.S. dollar during the quarter,
and it remains vulnerable given the cyclical factors of higher relative U.S.
growth.
o Japan also experienced disappointing economic news during the first
quarter, resulting in a modest decline in bond yields. In particular, the
fourth quarter GDP was released as a modest negative number, the third
consecutive quarter of negative growth. The yen remained in a narrow range
throughout the quarter, but weakened at quarter end versus the resurgent U.S.
dollar. In the Dollar Bloc, Canadian bonds outperformed U.S. bonds as the Bank
of Canada kept official rates unchanged at 2.5% given the persistent strength
of the Canadian dollar and sluggish economic conditions. In contrast, the
Reserve Bank of Australia and the Reserve Bank of New Zealand both raised
official rates 25 basis points, to 5.50% and 6.75%, respectively.
o Within the Dollar Bloc, the Portfolio's underweight position in
Australia benefited performance as the rates backed up during the quarter. The
short duration stance in the U.S. also aided performance as the U.S. market
sold off amid concerns over higher inflation. In the Pan Europe Bloc, the
Portfolio's overweight position in Germany and yield curve flattening bias
which helped performance was offset by the Portfolio's underweight in other
European governments. The Portfolio's underweight position in the U.K. also
benefited performance as rates backed up across the yield curve. In the Asia
Bloc, the Portfolio's underweight to Japan detracted from performance as weak
economic data led the Japanese market to rally.
COMPARISON OF CHANGE IN VALUE OF A $10,000 INVESTMENT IN THE INTERNATIONAL BOND
PORTFOLIO
AND THE CITIGROUP NON-U.S. WORLD GOVERNMENT BOND INDEX FOR THE PAST TEN YEARS.
[LINE CHART]
Service Investor A Citigroup Non-U.S. World Government Bond Index
---------- ---------- ----------------------------------------------
03/31/1995 $ 10,000 $ 9,498 $ 10,000
06/30/1995 10,376 9,855 10,489
09/30/1995 10,559 10,028 10,234
12/31/1995 11,072 10,516 10,446
03/31/1996 11,112 10,554 10,270
06/30/1996 11,365 10,791 10,311
09/30/1996 11,804 11,204 10,646
12/31/1996 12,225 11,596 10,872
03/31/1997 12,342 11,702 10,244
06/30/1997 12,755 12,088 10,533
09/30/1997 13,130 12,438 10,555
12/31/1997 13,440 12,726 10,409
03/31/1998 13,785 13,048 10,452
06/30/1998 14,019 13,264 10,626
09/30/1998 14,728 13,928 11,647
12/31/1998 14,939 14,122 12,261
03/31/1999 15,149 14,315 11,667
06/30/1999 15,008 14,175 11,144
09/30/1999 14,964 14,127 11,825
12/31/1999 14,965 14,123 11,639
03/31/2000 15,267 14,402 11,504
06/30/2000 15,659 14,765 11,413
09/30/2000 15,969 15,051 10,896
12/31/2000 16,665 15,700 11,333
03/31/2001 17,239 16,235 10,777
06/30/2001 17,381 16,362 10,564
09/30/2001 17,881 16,825 11,384
12/31/2001 17,945 16,878 10,932
03/31/2002 17,852 16,783 10,728
06/30/2002 18,315 17,212 12,226
09/30/2002 18,841 17,699 12,573
12/31/2002 19,146 17,978 13,335
03/31/2003 19,552 18,351 13,833
06/30/2003 20,344 19,069 14,415
09/30/2003 20,850 19,553 14,811
12/31/2003 22,174 20,768 15,805
03/31/2004 22,396 20,985 16,053
06/30/2004 21,695 20,320 15,509
09/30/2004 22,287 20,871 16,018
12/31/2004 24,573 23,012 17,722
03/31/2005 23,772 22,262 17,173
FOR PERIOD ENDING MARCH 31, 2005
Average Annual Total Return
1 Year 3 Year 5 Year 10 Year
---------- ----------- ---------- ----------
BlackRock Class 6.49% 10.36% 9.59% 9.34%
Institutional Class 6.33% 10.30% 9.56% 9.32%
Service Class 6.14% 10.02% 9.26% 9.05%
Investor A Class (Load Adjusted) 0.74% 8.01% 7.99% 8.33%
Investor A Class (NAV) 6.08% 9.87% 9.10% 8.89%
Investor B Class (Load Adjusted) 0.70% 8.07% 8.00% 8.16%
Investor B Class (NAV) 5.20% 9.06% 8.29% 8.16%
Investor C Class (Load Adjusted) 4.28% 9.07% 8.34% 8.18%
Investor C Class (NAV) 5.28% 9.07% 8.34% 8.18%
THE PERFORMANCE INFORMATION ABOVE INCLUDES INFORMATION RELATING TO EACH CLASS
OF THE PORTFOLIO SINCE THE COMMENCEMENT OF OPERATIONS OF THE PORTFOLIO, RATHER
THAN THE DATE SUCH CLASS WAS INTRODUCED. THE INCEPTION DATES OF THE PORTFOLIO'S
SHARE CLASSES WERE AS FOLLOWS: SERVICE SHARES, 7/1/91; INVESTOR B SHARES, 4
/19/96; INVESTOR A SHARES, 4 /22 /96; INSTITUTIONAL SHARES, 6 /10 /96; AND
INVESTOR C SHARES, 9/11/96. SEE "NOTE ON PERFORMANCE INFORMATION" ON PAGE 28
FOR FURTHER INFORMATION ON HOW PERFORMANCE DATA WAS CALCULATED, INCLUDING
IMPORTANT INFORMATION ON THE LINE GRAPH + ABOVE.
PAST PERFORMANCE IS NOT PREDICTIVE OF FUTURE RESULTS. The graph and table do
not reflect the deduction of taxes that a shareholder would pay on fund
distributions or the redemption of shares. Although the holdings and sectors
listed above were current as of the periods indicated, the Portfolio is
actively managed and its composition will vary.
24
INTERNATIONAL BOND PORTFOLIO
FUND PROFILE
Credit Quality (% of
investments)1
AAA 85.9 %
AA 7.9
A 3.9
BBB 0.9
Unrated 1.4
-----
Total 100.0%
=====
Top 10 Country Allocation
(% of long-term
investments)
Germany 34.3 %
United States 12.6
Japan 9.4
Sweden 6.3
Ireland 5.4
Netherlands 4.1
New Zealand 5.6
Finland 3.4
Mexico 3.0
Austria 2.7
----
Total 86.8%
====
Portfolio Statistics
Average maturity (years) 7.26
Effective Duration2 4.1
1 Using the higher of Standard & Poor's ("S&P's") or Moody's Investors Service
("Moody's") rating.
2 Duration measures a Portfolio's price risk. Each year of duration represents
an expected 1% change in the net asset value of the fund for every 1%
change in interest rates. Effective duration is typically calculated for
bonds with embedded options and assumes that expected cash flows will
fluctuate as interest rates change.
- --------------------------------------------------------------------------------
EXPENSE EXAMPLE
As a shareholder of the Portfolio, you incur two types of costs: (1)
transaction costs, including front and back end sales charges (loads) or
redemption/exchange fees, where applicable; and (2) ongoing costs, including
advisory fees, distribution (12b-1) and service fees, where applicable; and
other Portfolio expenses. This Example is intended to help you understand your
ongoing costs (in dollars) of investing in the Portfolio and to compare these
costs with the ongoing costs of investing in other mutual funds.
The Example below is based on an investment of $1,000 invested at the beginning
of the period and held for the entire period October 1, 2004 to March 31, 2005.
The information under "Actual Expenses," together with the amount you invested,
allows you to estimate actual expenses incurred over the reporting period.
Simply divide your account value by $1,000 (for example, an $8,600 account
value divided by $1,000 = 8.60) and multiply the result by the cost shown for
your share class, in the row entitled "Expenses Incurred During Period", to
estimate the expenses incurred on your account during this period.
The information under "Hypothetical Expenses" provides information about
hypothetical account values and hypothetical expenses based on the Portfolio's
actual expense ratio and an assumed rate of return of 5% per year before
expenses, which is not the Portfolio's actual return. The hypothetical account
values and expenses may not be used to estimate the actual ending account
balance or expense you incurred for the period. You may use this information to
compare the ongoing costs of investing in the Portfolio and other funds. To do
so, compare this 5% hypothetical example with the 5% hypothetical examples that
appear in the shareholder reports of the other funds.
Please note that the expenses shown in the table are meant to highlight your
ongoing costs only and do not reflect any transactional costs, such as front
and back end sales charges (loads) or redemption/exchange fees, where
applicable. Therefore, the hypothetical information is useful in comparing
ongoing costs only, and will not help you determine the relative total costs of
owning different funds. In addition, if these transactional costs were
included, your costs would have been higher.
Actual Expenses
-----------------------------------------------------------------------------------------------
BlackRock Institutional Service Investor Investor Investor
Class Class Class A Class B Class C Class
--------------- --------------- --------------- --------------- --------------- ---------------
Beginning Account
Value (10/01/04) $ 1,000.00 $ 1,000.00 $ 1,000.00 $ 1,000.00 $ 1,000.00 $ 1,000.00
Ending Account Value
(3/31/05) 1,068.80 1,067.90 1,066.60 1,066.60 1,062.70 1,063.50
Expenses Incurred
During Period
(10/01/04 -
3/31/05) 3.96 4.68 5.96 5.91 9.80 9.75
Hypothetical Expenses
(5% return before expenses)
-----------------------------------------------------------------------------------------------
BlackRock Institutional Service Investor Investor Investor
Class Class Class A Class B Class C Class
--------------- --------------- --------------- --------------- --------------- ---------------
Beginning Account
Value (10/01/04) $ 1,000.00 $ 1,000.00 $ 1,000.00 $ 1,000.00 $ 1,000.00 $ 1,000.00
Ending Account Value
(3/31/05) 1,021.12 1,020.42 1,019.16 1,019.21 1,015.38 1,015.43
Expenses Incurred
During Period
(10/01/04 -
3/31/05) 3.88 4.58 5.84 5.79 9.62 9.57
For each class of the Portfolio, expenses are equal to the annualized expense
ratio of 0.77%, 0.91%, 1.16%, 1.15%, 1.91%, and 1.90% for the BlackRock,
Institutional, Service, Investor A, B, and C share classes, respectively,
multiplied by the average account value over the period, multiplied by 182/365
(to reflect the one-half year period) and 134/365 for the BlackRock class (to
reflect the period the class was open during the one-half year.)
25
HIGH YIELD BOND PORTFOLIO
Total Net Assets (3/31/05): $902.8 million
Performance Benchmark
Lehman Brothers U.S. Corporate High Yield Index
Investment Approach
Seeks to maximize total return, consistent with income generation and
prudent investment management, by investing primarily in non-investment grade
(or high yield) bonds, including convertible and preferred securities. The high
yield securities purchased by the Portfolio will generally be in the lower
rating categories of major rating agencies (BB or lower by Standard & Poors or
Ba or lower by Moody's) or will be determined by the portfolio management team
to be of similar quality. The Portfolio may invest up to 10% of its assets in
non-dollar denominated bonds of issuers located outside of the United States.
The management team evaluates sectors of the high yield market and individual
bonds within these sectors. Securities are purchased for the Portfolio when the
management team determines that they have the potential for above average total
return.
Recent Portfolio Management Activity
o On January 31, 2005, BlackRock, Inc., the parent of BlackRock
Advisors, Inc. (BAI), acquired SSRM Holdings, Inc., the parent of State Street
Research & Management Company (SSRM), the investment adviser to the State
Street Research mutual funds. In connection with the transaction, the BlackRock
High Yield Bond Portfolio (the Portfolio) reorganized with the State Street
Research High Income Fund (the SSR Fund). The SSR Fund transferred
substantially all of its assets and liabilities to the Portfolio in exchange
for shares of the Portfolio, which were then distributed to the SSR Fund
shareholders.
o All share classes of the Portfolio outperformed the benchmark for the
semi-annual period.
o During the first half of the period, high yield issues, as measured by
the Lehman Brothers U.S. Corporate High Yield Index, outperformed Treasuries by
4.31%. The stable Treasury market and improving credit fundamentals led
investors to become increasingly comfortable with risk and bid up the entire
market. With default rates hovering around 1%, improving corporate earnings,
real GDP growth at 4.0% and the rolling 12-month ratio of upgraded companies to
downgraded companies at 0.85:1 (the highest since September of 1998), investors
became more comfortable taking on and, in some cases, seeking out more risk.
During the period, the Portfolio benefited from its overweight to B-rated
issues and underweight to BB-rated issues as B-rated issues outperformed
BB-rated issues by 1.20%. Additionally, the Portfolio's overweight to the
electric and media-noncable sectors and underweight to the healthcare sector
also aided performance relative to the benchmark. Negative contributors to
performance were underweights to the wire lines, entertainment and airlines
sectors.
o During the second half of the period, high yield issues, as measured by
the Lehman Brothers U.S. Corporate High Yield Index, underperformed Treasuries
by 0.94%. High yield began the period with negative returns across ratings
categories, although certain sectors managed positive returns for the period.
Within sectors, the insurance, wireless and restaurant sectors performed well,
while the pharmaceutical, automotive and airlines sectors suffered. During the
period, the Portfolio continued to benefit from its overweight to B-rated
issues and underweight to BB-rated issues. The Portfolio also benefited from
outperformance in the automotive sector and an overweight to the media-noncable
sector relative to the benchmark. The Portfolio's overweight to the
pharmaceuticals, metals and chemicals sectors detracted from performance
relative to the benchmark.
COMPARISON OF CHANGE IN VALUE OF A $10,000 INVESTMENT IN THE HIGH YIELD BOND
PORTFOLIO AND THE
LEHMAN BROTHERS U.S. CORPORATE HIGH YIELD INDEX FROM INCEPTION.
[LINE CHART]
Institutional Investor A Lehman Brothers U.S. Corporate High Yield Index
------------- ---------- -----------------------------------------------
11/19/1998 $ 10,000 $ 9,497 $ 10,000
12/31/1998 10,128 9,613 10,160
03/31/1999 10,465 9,922 10,347
06/30/1999 10,622 10,059 10,382
09/30/1999 10,593 10,019 10,234
12/31/1999 11,013 10,394 10,402
03/31/2000 10,883 10,269 10,159
06/30/2000 10,994 10,362 10,276
09/30/2000 10,923 10,282 10,334
12/31/2000 10,221 9,610 9,793
03/31/2001 10,764 10,110 10,415
06/30/2001 10,647 9,988 10,177
09/30/2001 10,318 9,667 9,746
12/31/2001 10,941 10,239 10,310
03/31/2002 11,210 10,478 10,483
06/30/2002 10,860 10,140 9,810
09/30/2002 10,510 9,800 9,523
12/31/2002 11,060 10,301 10,164
03/31/2003 11,785 10,949 10,938
06/30/2003 13,024 12,088 12,044
09/30/2003 13,346 12,373 12,377
12/31/2003 14,164 13,133 13,109
03/31/2004 14,518 13,446 13,416
06/30/2004 14,450 13,368 13,287
09/30/2004 15,085 13,944 13,931
12/31/2004 15,894 14,700 14,568
03/31/2005 15,702 14,494 14,334
FOR PERIOD ENDING MARCH 31, 2005
Average Annual Total Return
1 Year 3 Year 5 Year From Inception
---------- ----------- ---------- ---------------
BlackRock Class 8.31% 12.05% 7.77% 7.48%
Institutional Class 8.15% 11.89% 7.61% 7.35%
Service Class 7.86% 11.57% 7.29% 7.00%
Investor A Class (Load Adjusted) 2.37% 9.54% 6.03% 6.01%
Investor A Class (NAV) 7.79% 11.42% 7.14% 6.87%
Investor B Class (Load Adjusted) 2.53% 9.64% 6.07% 6.07%
Investor B Class (NAV) 7.00% 10.60% 6.34% 6.07%
Investor C Class (Load Adjusted) 5.87% 10.54% 6.33% 6.05%
Investor C Class (NAV) 6.86% 10.54% 6.33% 6.05%
THE PERFORMANCE INFORMATION ABOVE INCLUDES INFORMATION RELATING TO EACH CLASS
OF THE PORTFOLIO SINCE THE COMMENCEMENT OF OPERATIONS OF THE PORTFOLIO ON
11/19/98. SEE "NOTE ON PERFORMANCE INFORMATION" ON PAGE 28 FOR FURTHER
INFORMATION ON HOW PERFORMANCE DATA WAS CALCULATED, INCLUDING IMPORTANT
INFORMATION ON THE LINE GRAPH\^ ABOVE.
PAST PERFORMANCE IS NOT PREDICTIVE OF FUTURE RESULTS. The graph and table do
not reflect the deduction of taxes that a shareholder would pay on fund
distributions or the redemption of shares. Although the holdings and sectors
listed above were current as of the periods indicated, the Portfolio is
actively managed and its composition will vary.
26
HIGH YIELD BOND PORTFOLIO
FUND PROFILE
Credit Quality (% of
investments)1
BBB or BBB 4.0 %
BB 27.0
B 54.0
CCC 11.0
\qCCC 1.0
Unrated 3.0
-----
Total 100.0%
=====
Top 10 Industries (% of long-term
investments)
Telecommunications 11.6 %
Energy & Utilities 10.6
Oil & Gas 7.7
Broadcasting 6.7
Manufacturing 6.7
Finance 5.1
Chemicals 4.7
Entertainment & Leisure 4.3
Metal & Mining 3.8
Transportation 3.4
----
Total 64.6%
====
Portfolio Statistics
Average maturity (years) 6.30
Modified Duration2 4.5
1 Using the higher of Standard & Poor's ("S&P's") or Moody's Investors Service
("Moody's") rating.
2 Duration measures a Portfolio's price risk. Each year of duration represents
an expected 1% change in the net asset value of the fund for every 1%
change in interest rates. Modified duration assumes that cash flows remain
constant as interest rates change.
- --------------------------------------------------------------------------------
EXPENSE EXAMPLE
As a shareholder of the Portfolio, you incur two types of costs: (1)
transaction costs, including front and back end sales charges (loads) or
redemption/exchange fees, where applicable; and (2) ongoing costs, including
advisory fees, distribution (12b-1) and service fees, where applicable; and
other Portfolio expenses. This Example is intended to help you understand your
ongoing costs (in dollars) of investing in the Portfolio and to compare these
costs with the ongoing costs of investing in other mutual funds.
The Example below is based on an investment of $1,000 invested at the beginning
of the period and held for the entire period October 1, 2004 to March 31, 2005.
The information under "Actual Expenses," together with the amount you invested,
allows you to estimate actual expenses incurred over the reporting period.
Simply divide your account value by $1,000 (for example, an $8,600 account
value divided by $1,000 = 8.60) and multiply the result by the cost shown for
your share class, in the row entitled "Expenses Incurred During Period", to
estimate the expenses incurred on your account during this period.
The information under "Hypothetical Expenses" provides information about
hypothetical account values and hypothetical expenses based on the Portfolio's
actual expense ratio and an assumed rate of return of 5% per year before
expenses, which is not the Portfolio's actual return. The hypothetical account
values and expenses may not be used to estimate the actual ending account
balance or expense you incurred for the period. You may use this information to
compare the ongoing costs of investing in the Portfolio and other funds. To do
so, compare this 5% hypothetical example with the 5% hypothetical examples that
appear in the shareholder reports of the other funds.
Please note that the expenses shown in the table are meant to highlight your
ongoing costs only and do not reflect any transactional costs, such as front
and back end sales charges (loads) or redemption/exchange fees, where
applicable. Therefore, the hypothetical information is useful in comparing
ongoing costs only, and will not help you determine the relative total costs of
owning different funds. In addition, if these transactional costs were
included, your costs would have been higher.
Actual Expenses
-----------------------------------------------------------------------------------------------
BlackRock Institutional Service Investor Investor Investor
Class Class Class A Class B Class C Class
--------------- --------------- --------------- --------------- --------------- ---------------
Beginning Account
Value (10/01/04) $ 1,000.00 $ 1,000.00 $ 1,000.00 $ 1,000.00 $ 1,000.00 $ 1,000.00
Ending Account Value
(3/31/05) 1,041.60 1,040.90 1,039.50 1,039.50 1,035.70 1,034.40
Expenses Incurred
During Period
(10/01/04 -
3/31/05) 2.79 3.55 4.87 4.87 8.66 8.70
Hypothetical Expenses
(5% return before expenses)
-----------------------------------------------------------------------------------------------
BlackRock Institutional Service Investor Investor Investor
Class Class Class A Class B Class C Class
--------------- --------------- --------------- --------------- --------------- ---------------
Beginning Account
Value (10/01/04) $ 1,000.00 $ 1,000.00 $ 1,000.00 $ 1,000.00 $ 1,000.00 $ 1,000.00
Ending Account Value
(3/31/05) 1,022.23 1,021.48 1,020.17 1,020.17 1,016.39 1,016.34
Expenses Incurred
During Period
(10/01/04 -
3/31/05) 2.77 3.52 4.83 4.83 8.61 8.66
For each class of the Portfolio, expenses are equal to the annualized expense
ratio of 0.55%, 0.70%, 0.96%, 0.96%, 1.71%, and 1.72% for the BlackRock,
Institutional, Service, Investor A, B, and C share classes, respectively,
multiplied by the average account value over the period, multiplied by 182/365
(to reflect the one-half year period).
27
BLACKROCK FUNDS
NOTE ON PERFORMANCE INFORMATION
The performance information above includes information for each class of
each Portfolio since the commencement of operations of the Portfolio, rather
than the date such class was introduced. Performance information for each class
introduced after the commencement of operations of a Portfolio is therefore
based on the performance history of a predecessor class or predecessor classes.
If a class of shares in a Portfolio (the "Subsequent Class") has more than one
predecessor class, the performance data predating the introduction of the
Subsequent Class is based initially on the performance of the Portfolio's first
operational predecessor class (the "Initial Class"); thereafter, the
performance of the Subsequent Class is based upon the performance of any other
predecessor class or classes which were introduced after the Initial Class and
which had total operating expenses more similar to those of the Subsequent
Class. In the case of Investor A, Investor B, Investor C and Service Shares,
the performance information for periods prior to their introduction dates has
not been restated to reflect the shareholder servicing and processing and/or
distribution fees and certain other expenses borne by these share classes
which, if reflected, would reduce the performance quoted. Accordingly, the
performance information may be used in assessing each Portfolio's performance
history but does not reflect how the distinct classes would have performed on a
relative basis prior to the introduction of these classes, which would require
an adjustment to the ongoing expenses. Additionally, the performance
information above does not reflect accounting adjustments required under
accounting principles generally accepted in the United States of America and as
a result there may be variances between what is reported within this section
and that reported in the total return calculation in the Financial Highlights.
Performance information is restated to reflect the current maximum
front-end sales charge (in the case of Investor A Shares) or the maximum
contingent deferred sales charge (in the case of Investor B and Investor C
Shares), and assumes the reinvestment of dividends and distributions. The
maximum front-end sales charges for Investor A Shares are as follows:
Intermediate PLUS Bond, Intermediate Government Bond, Intermediate Bond, Core
Bond Total Return, Core PLUS Total Return and GNMA - 4.00%; Government Income
and Managed Income - 4.50%; International Bond and High Yield Bond - 5.00%; and
Inflation Protected Bond, Enhanced Income and Low Duration Bond - 3.00%. The
maximum contingent deferred sales charge for Investor B Shares and Investor C
Shares of all of the Portfolios is 4.50% and 1.00%, respectively.
The performance information also reflects fee waivers and reimbursements
that subsidize and reduce the total operating expenses of each Portfolio. The
Portfolios' returns would have been lower if there were not such waivers and
reimbursements. BlackRock Advisors, Inc. is under no obligation to waive or
continue waiving its fees after February 1, 2006 or February 1, 2007 as
described in the prospectus of the Portfolios. Investment return and principal
value of an investment will fluctuate so that an investor's shares, when
redeemed, may be worth more or less than their original cost.
\^ The performance shown in the line graph is that of Institutional Shares and
Investor A Shares of the Portfolios. The actual performance of Investor B,
Investor C and Service Shares is lower than the performance of Institutional
Shares because Investor B, Investor C and Service Shares have higher
expenses than Institutional Shares. Excluding the effects of sales charges,
the actual performance of Investor B and Investor C Shares is lower than the
performance of Investor A Shares because Investor B and Investor C Shares
have higher expenses than Investor A Shares. Purchasers of Investor A Shares
generally pay a front-end sales charge, while purchasers of Investor B and
Investor C Shares may pay a contingent deferred sales charge (depending on
how long they hold their shares) when they sell their shares.
* The performance shown in the line graph is that of Service Shares and
Investor A Shares of the Portfolios. The actual performance of Investor B
and Investor C Shares is lower than the performance of Service Shares
because Investor B and Investor C Shares have higher expenses than Service
Shares. Excluding the effects of sales charges, the actual performance of
Investor B and Investor C Shares is lower than the performance of Investor A
Shares because Investor B and Investor C Shares have higher expenses than
Investor A Shares. Purchasers of Investor A Shares generally pay a front-end
sales charge, while purchasers of Investor B and Investor C Shares may pay a
contingent deferred sales charge (depending on how long they hold their
shares) when they sell their shares.
28
BLACKROCK FUNDS
STATEMENT OF NET ASSETS
ENHANCED INCOME PORTFOLIO
AS OF MARCH 31, 2005 (UNAUDITED)
PAR
MATURITY (000) VALUE
-------------- ---------- -------------
U.S. GOVERNMENT & AGENCY OBLIGATIONS - 52.5%
Federal Home Loan Bank, Bonds
1.70% 12/30/05 $ 745 $ 734,789
Federal Home Loan Mortgage Corp.,
Unsecured Notes
3.88%(b) 11/10/08 1,825 1,845,219
Federal National Mortgage
Association, Bonds
2.77%(b) 12/29/06 275 269,485
Federal National Mortgage
Association, Unsecured Notes
2.75% 05/10/06 800 790,933
2.71% 01/30/07 550 537,703
U.S. Treasury Bonds
10.00% 05/15/10 485 489,054
12.75% 11/15/10 255 269,623
10.38% 11/15/12 325 376,518
U.S. Treasury Notes
1.62% 04/05-10/05 2,440 2,431,844
1.12% 06/30/05 2,425 2,415,528
1.50% 07/31/05 8,400 8,361,283
2.00% 08/31/05 6,040 6,014,517
1.88% 11/30/05 4,620 4,578,854
2.75% 07/31/06 1,730 1,710,605
2.38% 08/31/06 3,545 3,483,239
2.50% 10/31/06 2,095 2,056,701
3.50% 02/15/10 450 436,764
===========
TOTAL U.S. GOVERNMENT & AGENCY
OBLIGATIONS
(Cost $36,961,472) 36,802,659
-----------
MORTGAGE PASS-THROUGHS - 5.2%
Federal Home Loan Mortgage Corp.
ARM
3.54%(b) 05/01/34 780 759,630
3.57%(b) 07/01/34 793 788,485
4.31%(b) 11/01/34 538 529,619
4.49%(b) 10/01/37 242 249,361
Government National Mortgage
Association II ARM
4.12%(b) 11/20/29 95 96,741
3.50%(b) 08/20/31 169 171,302
Government National Mortgage
Association II Hybrid
3.75%(b) 06/20/34 352 350,482
MLCC Mortgage Investors, Inc.,
Series 97-B, Class A
2.87%(b) 03/15/26 740 741,701
===========
TOTAL MORTGAGE PASS-THROUGHS
(Cost $3,702,765) 3,687,321
-----------
MULTIPLE CLASS MORTGAGE PASS-THROUGHS - 3.3%
Federal Home Loan Mortgage Corp.,
Series 04-SF5, Class GB
1.77% 12/15/07 604 593,379
Federal Home Loan Mortgage Corp.,
Series 2763, Class PA
4.50% 09/15/10 133 133,440
Federal Home Loan Mortgage Corp.,
Series 2808, Class PA
4.00% 09/15/12 1,000 1,000,633
Federal National Mortgage
Association, Series 02-39, Class
FB
3.38%(b) 03/18/32 71 71,323
PAR
MATURITY (000) VALUE
-------------- ---------- -------------
MULTIPLE CLASS MORTGAGE PASS-THROUGHS (Continued)
Federal National Mortgage
Association, Series 04-25, Class
PA
5.50% 10/25/30 $ 133 $ 136,460
Federal National Mortgage
Association, Series 04-36, Class
BS
5.50% 11/25/30 180 184,258
Federal National Mortgage
Association, Series 04-W10, Class
A1
5.75% 08/25/34 229 232,775
===========
TOTAL MULTIPLE CLASS MORTGAGE
PASS-THROUGHS
(Cost $2,374,149)
2,352,268
-----------
COMMERCIAL MORTGAGE BACKED SECURITIES - 13.6%
Bayview Financial Acquisition Trust,
Series 98-1, Class A1
7.01%(c) 05/25/29 296 295,848
Bear Stearns Commercial Mortgage
Securities, Series 00-WF, Class A1
7.11% 10/15/32 392 412,425
Bear Stearns Mortgage Trust, Series
04-12, Class 1A1
3.20%(b) 01/25/35 435 435,928
Bear Stearns Mortgage Trust, Series
04-13, Class A1
3.22%(b) 11/25/34 668 669,812
Bear Stearns Mortgage Trust, Series
04-7, Class 4A
3.18%(b) 10/25/34 329 331,179
Commercial Mortgage Acceptance
Corp., Series 98-C2, Class A2
6.03% 09/15/30 369 382,213
Countrywide Home Loans, Series
04-29, Class A2
2.92%(b) 02/25/35 808 812,454
Credit Suisse First Boston Mortgage
Securities Corp., Series 98-C1,
Class A1B
6.48% 05/17/40 310 327,089
Credit Suisse First Boston Mortgage
Securities Corp., Series 00-C1,
Class A1
7.32% 04/15/42 451 478,001
Credit Suisse First Boston Mortgage
Securities Corp., Series 02-10,
Class 2A1
7.50% 05/25/32 106 109,015
General Motors Acceptance Corp.
Commercial Mortgage Securities,
Inc., Series 99-C3, Class A2
7.18% 08/15/36 161 176,197
General Motors Acceptance Corp.
Commercial Mortgage Securities,
Inc., Series 03-C2, Class X2 (IO)
2.82%(d) 05/10/40 6,984 60,055
Goldman Sachs Mortgage Securities
Corp. II, Series 98-C1, Class A3
6.14% 10/18/30 499 521,212
GSR Mortgage Loan Trust, Series
04-9, Class 3A1
3.69% 08/25/34 180 179,790
SEE ACCOMPANYING NOTES TO FINANCIAL STATEMENTS.
29
BLACKROCK FUNDS
STATEMENT OF NET ASSETS
ENHANCED INCOME PORTFOLIO (CONTINUED)
AS OF MARCH 31, 2005 (UNAUDITED)
PAR
MATURITY (000) VALUE
---------- ---------- ------------
COMMERCIAL MORTGAGE BACKED SECURITIES (Continued)
Lehman Brothers-UBS Commercial
Mortgage Trust, Series 00-C5,
Class A1
6.41% 01/15/10 $ 431 $ 448,810
Merrill Lynch Mortgage Investors
Trust, Series 04-E, Class A2A
3.72%(b) 11/25/29 509 510,337
Merrill Lynch Mortgage Trust, Series
02-MW1, Class XP (IO)
2.81%(d) 07/12/34 1,442 73,864
MortgageIT Trust, Series 04-1, Class
A1
3.24%(b) 11/25/34 654 656,685
Nationslink Funding Corp., Series 99,
Class 1
6.32% 01/20/31 445 466,745
Structured Asset Receivable Trust,
Series 04-1
2.58%(b) 04/21/11 489 489,455
Structured Asset Securities Corp.,
Series 04-3AC, Class A2
4.92%(b) 03/25/34 289 288,830
Structured Mortgage Loan Trust,
Series 04-13, Class A2
3.15%(b) 09/25/34 244 244,239
Washington Mutual Mortgage Loan
Trust, Series 03-AR8, Class A
4.03%(b) 08/25/33 291 287,064
Wells Fargo Mortgage Backed
Securities Trust, Series 04-V, Class
1A2
3.83%(b) 10/25/34 922 909,341
==========
TOTAL COMMERCIAL MORTGAGE BACKED
SECURITIES
(Cost $9,602,392) 9,566,588
----------
ASSET BACKED SECURITIES - 44.5%
Adjustable Rate Mortgage Trust,
Series 04-4, Class 5A3
3.22%(b) 03/25/35 501 502,107
American Express Credit Account
Master Trust, Series 00-3, Class A
2.97%(b) 11/15/07 150 150,007
American Express Credit Account
Master Trust, Series 01-1, Class A
2.95%(b) 09/15/08 625 625,700
American Express Credit Account
Master Trust, Series 05-1, Class A
2.88% 08/15/12 650 650,203
Auto Receivables Owner Trust,
Series 05-1, Class A3
3.53% 10/21/08 550 545,858
Banc of America Funding Corp.,
Series 04-C, Class 4A2
3.19%(b) 12/20/34 617 618,607
Bank One Issuance Trust, Series
02-A4, Class A4
2.94% 06/16/08 700 697,835
Bank One Issuance Trust, Series
03-A2, Class A2
2.86% 10/15/08 600 600,198
BMW Vehicle Owner Trust, Series
05-A, Class A3
4.02% 02/25/09 575 573,516
PAR
MATURITY (000) VALUE
---------- ---------- ------------
ASSET BACKED SECURITIES (Continued)
Capital Auto Receivables Asset Trust,
Series 02-1, Class A4
4.16% 07/16/07 $ 142 $ 141,665
Capital Auto Receivables Asset Trust,
Series 03-1, Class A3A
2.75% 04/16/07 600 596,182
Capital Auto Receivables Asset Trust,
Series 04-1, Class A3
2.00% 11/15/07 775 761,333
Capital Auto Receivables Asset Trust,
Series 04-2, Class A2
3.35% 02/15/08 550 544,844
Chase Credit Card Owner Trust,
Series 00-3, Class A
2.94%(b) 01/15/08 150 150,122
Chase Funding Mortgage Loan,
Series 03-5, Class 1A1
2.97% 04/25/18 318 317,579
Chase Issuance Trust, Series 04-A9,
Class A9
3.22% 06/15/10 400 390,596
Chase Manhattan Auto Owner Trust,
Series 03-B, Class A3
1.82% 07/16/07 400 397,064
Chase Manhattan Auto Owner Trust,
Series 03-C, Class A3
2.26% 11/15/07 815 806,345
Citibank Credit Card Issuance Trust,
Series 00-A1, Class A1
6.90% 10/15/05 550 559,807
Citibank Credit Card Issuance Trust,
Series 03-A2, Class A2
2.70% 01/15/06 375 372,263
Citibank Credit Card Issuance Trust,
Series 04, Class A1
2.55% 01/20/09 325 316,228
Citibank Credit Card Issuance Trust,
Series 04-A4, Class A4
3.20% 08/24/07 300 292,980
Citibank Omni-S Master Trust, Series
02-4, Class A
2.94% 08/15/05 550 550,258
Countrywide Asset-Backed
Certificates, Series 04-13, Class
AV4
3.14%(b)(e) 06/25/35 654 654,927
Daimler Chrysler Auto Trust, Series
02-B, Class A4
3.53% 12/06/07 605 604,464
Daimler Chrysler Auto Trust, Series
03-A, Class A3
2.12% 11/08/06 604 602,164
Daimler Chrysler Auto Trust, Series
03-B, Class A3
2.25% 08/08/07 675 669,727
Daimler Chrysler Auto Trust, Series
04-A, Class A2
1.41% 11/08/06 336 334,669
Daimler Chrysler Auto Trust, Series
04-B, Class A2
2.48% 02/08/07 966 963,910
SEE ACCOMPANYING NOTES TO FINANCIAL STATEMENTS.
30
BLACKROCK FUNDS
STATEMENT OF NET ASSETS
ENHANCED INCOME PORTFOLIO (CONTINUED)
AS OF MARCH 31, 2005 (UNAUDITED)
PAR
MATURITY (000) VALUE
---------- ---------- -------------
ASSET BACKED SECURITIES (Continued)
Discover Card Master Trust I, Series
96-3, Class A
6.05% 08/18/08 $ 720 $ 734,097
Discover Card Master Trust I, Series
01-2, Class A
2.97%(b) 07/15/08 525 525,535
Discover Card Master Trust I, Series
02-4, Class A
2.87%(b) 10/17/05 430 430,156
Ford Credit Auto Owner Trust, Series
05-A, Class A3
3.48% 11/17/08 675 669,202
GSAA Home Equity Trust, Series
00-8, Class A3A
3.22%(b) 09/25/34 515 515,492
Honda Auto Receivables Owner
Trust, Series 02-3, Class A4
3.61% 12/18/07 575 574,909
Honda Auto Receivables Owner
Trust, Series 03-2, Class A3
1.69% 02/21/07 387 384,359
Honda Auto Receivables Owner
Trust, Series 03-3, Class A3
2.14% 04/23/07 625 620,065
Honda Auto Receivables Owner
Trust, Series 04-2, Class A2
2.52% 02/15/07 288 286,829
Honda Auto Receivables Owner
Trust, Series 04-2, Class A3
3.30% 06/16/08 150 148,737
Honda Auto Receivables Owner
Trust, Series 04-3, Class A3
3.01% 10/20/08 450 442,220
MBNA Credit Card Master Note
Trust, Series 02-A6, Class A6
3.90% 11/15/07 400 400,724
MBNA Master Credit Card Trust,
Series 95-C, Class A
6.45% 02/15/08 130 130,884
MBNA Master Credit Card Trust,
Series 96-G, Class A
2.99%(b) 12/15/08 1,180 1,182,557
Missouri Higher Education Loan
Authority, Series 97, Class P
3.48% 07/25/08 290 290,260
Nissan Auto Receivables Owner
Trust, Series 02-A, Class A4
4.28% 10/16/06 261 261,351
Nissan Auto Receivables Owner
Trust, Series 02-C, Class A3
2.60% 08/15/06 67 67,187
Nissan Auto Receivables Owner
Trust, Series 03-A, Class A3
1.89% 12/15/06 605 602,812
Nissan Auto Receivables Owner
Trust, Series 03-B, Class A3
1.51% 08/15/07 504 499,381
Nissan Auto Receivables Owner
Trust, Series 03-C, Class A4
2.70% 12/17/07 550 542,350
Nissan Auto Receivables Owner
Trust, Series 04-A, Class A2
1.40% 07/17/06 267 265,770
Nissan Auto Receivables Owner
Trust, Series 04-A, Class A3
2.01% 11/15/07 675 663,342
PAR
MATURITY (000) VALUE
---------- ---------- -------------
ASSET BACKED SECURITIES (Continued)
Nissan Auto Receivables Owner
Trust, Series 04-C, Class A3
2.85% 10/15/07 $ 550 $ 543,208
Option One Mortgage Loan Trust,
Series 01-4, Class A
3.15%(b) 01/25/32 42 42,320
Permanent Financing PLC, Series 6,
Class 2A
2.55%(b) 12/10/11 425 425,332
Residential Accredit Loans, Inc.,
Series 01-QS19, Class A1
6.00% 12/25/16 398 397,526
Residential Asset Securities Corp.,
Series 01-KS4, Class AIB
3.17%(b) 05/25/32 474 474,401
Saxson Asset Securities Trust, Series
02-3, Class AV
3.25% 12/25/32 375 375,485
Sears Credit Account Master Trust,
Series 00-2, Class A
6.75% 09/16/09 325 329,616
Standard Credit Card Master Trust,
Series 95-9, Class A
6.55% 10/07/07 600 609,261
USAA Auto Owner Trust, Series 03-1,
Class A3
1.58% 06/15/07 480 476,335
USAA Auto Owner Trust, Series 04-1,
Class A3
2.06% 04/15/08 600 590,099
USAA Auto Owner Trust, Series 04-2,
Class A3
3.03% 06/16/08 250 246,690
USAA Auto Owner Trust, Series 05-1,
Class A2
3.55% 09/17/07 350 349,234
USAA Auto Owner Trust, Series 05-1,
Class A3
3.93% 07/15/09 325 322,969
Vanderbilt Mortgage and Finance,
Inc., Series 99-D, Class IA3
7.06%(b) 10/07/17 68 68,712
WFS Financial Owner Trust, Series
02-4, Class A3A
2.39% 08/20/07 407 406,253
WFS Financial Owner Trust, Series
02-4, Class A4A
3.11% 08/20/10 425 419,264
===========
TOTAL ASSET BACKED SECURITIES
(Cost $31,439,567) 31,306,082
-----------
CORPORATE BONDS - 5.0%
Banks - 0.7%
Banc One Corp., Senior Unsecured
Notes
2.62% 06/30/08 20 18,884
Bank of America Corp., Senior
Unsecured Notes
3.88% 01/15/08 100 98,712
3.25% 08/15/08 20 19,259
J.P. Morgan Chase & Co., Senior
Unsecured Notes
5.25% 05/30/07 150 152,955
SEE ACCOMPANYING NOTES TO FINANCIAL STATEMENTS.
31
BLACKROCK FUNDS
STATEMENT OF NET ASSETS
ENHANCED INCOME PORTFOLIO (CONTINUED)
AS OF MARCH 31, 2005 (UNAUDITED)
PAR
MATURITY (000) VALUE
---------- ---------- ------------
CORPORATE BONDS (Continued)
Banks (Continued)
U.S. Central Credit Union, Unsecured
Notes
2.75% 05/30/08 $ 30 $ 28,568
Wells Fargo & Co., Senior Unsecured
Notes
5.12% 02/15/07 180 183,197
==========
501,575
----------
Beverages & Bottling - 0.2%
Cadbury Schweppes PLC,
Unsecured Notes
3.88%(c) 10/01/08 40 39,000
----------
Entertainment & Leisure - 0.0%
Time Warner Cos., Inc., Debentures
8.18% 08/15/07 25 26,926
----------
Finance - 2.6%
ASIF Global Financing, Unsecured
Notes
3.90%(c) 10/22/08 20 19,566
Citigroup, Inc., Senior Unsecured
Notes
3.50% 02/01/08 200 196,102
Diageo Capital PLC, Notes
3.38% 03/20/08 15 14,593
General Electric Capital Corp.,
Unsecured Notes
3.45%(b) 07/16/07 1,450 1,448,630
Golden West Financial Corp., Senior
Unsecured Notes
4.12% 08/15/07 15 14,974
Household Finance Corp., Unsecured
Notes
4.12% 12/15/08 150 147,414
==========
1,841,279
----------
Food & Agriculture - 0.2%
General Mills, Inc., Senior Unsecured
Notes
6.45% 10/15/06 100 103,313
Kellogg Co., Unsecured Notes
2.88% 06/01/08 50 47,641
==========
150,954
----------
Oil & Gas - 0.2%
Consolidated Natural Gas Co.,
Senior Unsecured Notes
5.38% 11/01/06 130 132,660
----------
Pharmaceuticals - 0.5%
Merck & Co., Inc., Senior Unsecured
Notes
5.25% 07/01/06 50 50,663
Merck & Co., Inc., Unsecured Notes
4.73%(b)(c) 02/22/06 300 301,640
==========
352,303
----------
Railroad & Shipping - 0.2%
Canadian National Railway Co.,
Senior Notes
6.45%(b) 07/15/06 125 128,485
----------
Retail Merchandising - 0.0%
Federated Department Stores, Inc.,
Senior Unsecured Notes
6.62% 09/01/08 25 26,328
----------
PAR
MATURITY (000) VALUE
---------- ---------- ------------
CORPORATE BONDS (Continued)
Telecommunications - 0.2%
Verizon Global Funding Corp., Senior
Unsecured Notes
6.12% 06/15/07 $ 125 $ 129,701
Vodafone Group PLC, Senior
Unsecured Notes
3.95% 01/30/08 10 9,881
==========
139,582
----------
Yankee - 0.2%
Province of British Columbia
5.38% 10/29/08 15 15,540
Province of Quebec, Debentures
7.00% 01/30/07 15 15,754
Republic of Italy, Unsecured Notes
2.75% 12/15/06 125 122,545
==========
153,839
----------
TOTAL CORPORATE BONDS
(Cost $3,522,608) 3,492,931
----------
TAXABLE MUNICIPAL BONDS - 0.1%
New York Sales Tax Asset
Receivables Corp. Revenue
Bonds, Series 04, Class B
3.29%
(Cost $80,000) 10/15/07 80 78,270
----------
SHORT TERM INVESTMENTS - 0.2%
Galileo Money Market Fund
(Cost $137,634)
138 137,634
----------
SEE ACCOMPANYING NOTES TO FINANCIAL STATEMENTS.
32
BLACKROCK FUNDS
STATEMENT OF NET ASSETS
ENHANCED INCOME PORTFOLIO (CONCLUDED)
AS OF MARCH 31, 2005 (UNAUDITED)
VALUE
----------------
TOTAL INVESTMENTS IN SECURITIES - 124.4%
(Cost $87,820,587(a)) $ 87,423,753
LIABILITIES IN EXCESS OF OTHER
ASSETS - (24.4)% (17,127,802)
-------------
(including $16,403,337 of payable for
financing transactions)
NET ASSETS - 100.0%
(Applicable to 3,030,627 BlackRock
shares, 4,069,084 Institutional
shares, 5,004 Service shares and 10
Investor A shares outstanding) $ 70,295,951
=============
NET ASSET VALUE, OFFERING AND
REDEMPTION PRICE PER
BLACKROCK SHARE
($29,988,786/3,030,627) $ 9.90
=======
NET ASSET VALUE, OFFERING
AND REDEMPTION PRICE PER
INSTITUTIONAL SHARE
($40,257,981/4,069,084) $ 9.89
=======
NET ASSET VALUE, OFFERING
AND REDEMPTION PRICE PER
SERVICE SHARE
($49,084/5,004) $ 9.81
=======
NET ASSET VALUE AND REDEMPTION
PRICE PER INVESTOR A SHARE
($100/10)(f) $ 9.88
=======
MAXIMUM OFFERING PRICE PER
INVESTOR A SHARE
($9.88/0.970) $ 10.19
=======
- -------------------
(a) Cost for Federal income tax purposes is $87,825,342. The gross
unrealized appreciation (depreciation) on a tax basis is as
follows:
Gross unrealized appreciation $ 38,444
Gross unrealized depreciation (440,033)
---------
$(401,589)
=========
(b) Rates shown are the rates as of March 31, 2005.
(c) Security exempt from registration under Rule 144A of the Securities Act
of 1933. These securities may be resold in transactions exempt from
registration to qualified institutional investors. As of March 31, 2005,
the Portfolio held 0.9% of its net assets, with a current market value
of $656,054 in securities restricted as to resale.
(d) Rates shown are the effective yields as of March 31, 2005.
(e) Securities, or a portion thereof, pledged as collateral with a value of
$654,927 on 10 long U.S. Treasury Note futures contracts and 74 short
U.S. Treasury Note futures contracts expiring June 2005. The value of
such contracts on March 31, 2005 was $9,993,844 with an unrealized gain
of $47,156 (including commissions of $185).
(f) Exact net assets and shares outstanding at March 31, 2005 were $100.32
and 10.156, respectively.
SEE ACCOMPANYING NOTES TO FINANCIAL STATEMENTS.
33
BLACKROCK FUNDS
STATEMENT OF NET ASSETS
LOW DURATION BOND PORTFOLIO
AS OF MARCH 31, 2005 (UNAUDITED)
NUMBER
OF SHARES VALUE
----------- -------------
PREFERRED STOCKS - 0.4%
Raytheon Co. Trust I, 7.00%
(Cost $7,762,494) 145,000 $7,607,135
----------
PAR
MATURITY (000)
-------------- -----------
U.S. GOVERNMENT & AGENCY OBLIGATIONS - 70.5%
Federal Home Loan Mortgage Corp.,
Unsecured Notes
2.88%(b) 09/15/05 $119,334 119,153,925
1.88%(b) 02/15/06 39,350 38,750,857
3.88%(b) 11/10/08 82,040 82,171,850
Federal National Mortgage
Association, Bonds
2.77%(b) 12/29/06 7,640 7,486,772
Federal National Mortgage
Association, Unsecured Notes
2.71%(b) 01/30/07 44,825 43,822,758
Small Business Administration
Participation Certificates, Series
97, Class A
3.35% 08/15/22 1,061 1,008,550
U.S. Treasury Bonds
10.00%(c)(d) 05/15/10 67,419 67,982,555
12.75%(d) 11/15/10 26,700 28,231,085
10.38%(c) 11/15/12 9,020 10,449,814
U.S. Treasury Notes
1.62%(d) 04/30/05 67,620 67,556,572
6.75% 05/15/05 28,700 28,835,665
1.25% 05/31/05 29,125 29,055,595
1.50% 07/05-03/06 47,405 46,905,740
2.00%(d) 08/31/05 42,630 42,450,144
5.75% 11/15/05 31,795 32,278,125
5.88% 11/15/05 15,050 15,291,041
2.25%(d) 04/30/06 163,210 161,036,043
2.75%(d) 07/31/06 148,655 146,988,429
2.50%(d) 10/31/06 153,325 150,522,066
2.88%(d) 11/30/06 94,380 93,096,998
3.00% 12/31/06 1,220 1,204,512
3.38%(d) 02/28/07 450 446,713
===========
TOTAL U.S. GOVERNMENT & AGENCY
OBLIGATIONS
(Cost $1,228,264,575) 1,214,725,809
-------------
MORTGAGE PASS-THROUGHS - 10.5%
Federal Home Loan Mortgage Corp.
8.25% 06/01/09 5 4,763
5.00% 11/15/16 7,835 7,896,717
7.00% 11/15/21 2,588 2,591,757
5.50% 03/15/26 12,838 13,051,996
Federal Home Loan Mortgage Corp.
ARM
5.18%(b) 07/01/20 772 779,029
4.12%(b) 09/01/23 664 678,365
2.77%(b) 06/01/28 1,491 1,478,108
7.36%(b) 03/01/31 102 104,818
3.54%(b) 05/01/34 5,845 5,690,316
3.35%(b) 07/01/34 1,502 1,484,007
3.57%(b) 07/01/34 4,533 4,504,508
4.31%(b) 11/01/34 19,294 19,007,212
PAR
MATURITY (000) VALUE
-------------- --------- --------------
MORTGAGE PASS-THROUGHS (Continued)
Federal National Mortgage
Association
6.50% 11/01/08 $ 581 $ 600,623
5.50% 02/09-06/09 148 150,476
6.00% 03/12-02/17 1,489 1,545,803
4.00% 10/25/16 3,599 3,601,115
Federal National Mortgage
Association 1Year CMT
6.05%(b) 09/01/29 137 142,166
4.21%(b) 12/01/30 968 996,660
6.64%(b) 12/01/31 1,029 1,056,882
5.58%(b) 08/01/32 2,357 2,411,812
5.53%(b) 01/01/33 5,300 5,332,491
Federal National Mortgage
Association ARM
4.18%(b) 10/01/33 1,237 1,233,289
4.30%(b) 01/01/34 1,098 1,085,861
4.02%(b) 04/01/34 1,061 1,049,175
3.94%(b) 05/01/34 21,738 21,440,944
4.56%(b) 02/01/35 28,491 28,258,746
6.17%(b) 04/01/40 3,394 3,469,865
Federal National Mortgage
Association COFI
4.81%(b) 05/01/27 161 164,235
Federal National Mortgage
Association MULTI
3.44%(b) 12/01/09 8,499 8,575,134
Government National Mortgage
Association
7.25% 04/15/06 3 2,921
6.00% 12/08-02/11 1,012 1,046,211
6.50% 06/15/09 831 861,487
5.00% 09/20/21 552 552,087
Government National Mortgage
Association 1 Year CMT
3.75% 05/20/34 15,476 15,398,892
Government National Mortgage
Association II Hybrid
3.75% 06/20/34 22,603 22,490,521
MLCC Mortgage Investors, Inc.,
Series 97-B, Class A
2.87%(b) 03/15/26 1,912 1,915,707
MLCC Mortgage Investors, Inc.,
Series 99-A, Class A
3.19%(b) 03/15/25 988 992,949
============
TOTAL MORTGAGE PASS-THROUGHS
(Cost $182,508,915) 181,647,648
------------
MULTIPLE CLASS MORTGAGE PASS-THROUGHS - 1.5%
Federal National Mortgage
Association Grantor Trust, Series
02-T6, Class A1
3.31%(b) 02/25/32 2,765 2,691,623
Federal National Mortgage
Association, Series 04-W10, Class
A1
5.75% 08/25/34 23,681 24,022,385
============
TOTAL MULTIPLE CLASS MORTGAGE
PASS-THROUGHS
(Cost $27,033,066) 26,714,008
------------
SEE ACCOMPANYING NOTES TO FINANCIAL STATEMENTS.
34
BLACKROCK FUNDS
STATEMENT OF NET ASSETS
LOW DURATION BOND PORTFOLIO (CONTINUED)
AS OF MARCH 31, 2005 (UNAUDITED)
PAR
MATURITY (000) VALUE
---------- ---------- --------------
COMMERCIAL MORTGAGE BACKED SECURITIES - 14.3%
Bayview Financial Acquisition Trust,
Series 98-1, Class A1
7.01%(e) 05/25/29 $ 726 $ 726,172
Bear Stearns Mortgage Trust, Series
04-13, Class A1
3.22%(b) 11/25/34 17,890 17,936,068
Bear Stearns Mortgage Trust, Series
04-7, Class 4A
3.18%(b) 10/25/34 18,531 18,646,693
Commercial Mortgage Acceptance
Corp., Series 98-C2, Class A2
6.03% 09/15/30 11,962 12,379,442
Countrywide Home Loans, Series
01-HYB1, Class A1
3.90%(b) 06/19/31 226 224,794
Countrywide Home Loans, Series
04-29, Class 1A1
2.92%(b) 02/25/35 14,555 14,633,538
Credit Suisse First Boston Mortgage
Securities Corp., Series 98-C2,
Class A2
6.30% 11/11/30 8,503 8,975,202
First Republic Mortgage Loan Trust,
Series 00-FRB1, Class A2
4.06%(b) 06/25/30 910 909,348
General Motors Acceptance Corp.
Commercial Mortgage Securities,
Inc., Series 99-C3, Class A2
7.18% 08/15/36 9,161 9,995,633
Goldman Sachs Mortgage Securities
Corp. II, Series 98-C1, Class A3
6.14% 10/18/30 13,273 13,852,833
Goldman Sachs Mortgage Securities
Corp. II, Series 00-1, Class A
3.20% 06/20/24 805 806,224
Goldman Sachs Mortgage Securities
Corp. II, Series 03-C1, Class X2
(IO)
3.41%(f) 01/10/40 253,240 8,040,685
Goldman Sachs Mortgage Securities
Corp., Series 04-11, Class 2A2
3.17%(b) 12/25/34 16,347 16,374,865
GSR Mortgage Loan Trust, Series
04-9, Class 3A1
3.69% 08/25/34 23,481 23,480,513
Lehman Brothers Commercial
Conduit Mortgage Trust, Series
96-C2, Class A
7.51%(b) 10/25/26 38 38,088
Lehman Brothers-UBS Commercial
Mortgage Trust, Series 00-C5,
Class A1
6.41% 01/15/10 11,618 12,092,944
Lehman Brothers-UBS Commercial
Mortgage Trust, Series 03-C3,
Class XCP (IO)
3.53%(f) 02/15/37 43,275 1,817,974
Lehman Brothers-UBS Commercial
Mortgage Trust, Series 03-C5,
Class XCP (IO)
2.59%(f) 04/15/37 193,402 6,041,144
MortgageIT Trust, Series 04-1, Class
A1
3.24%(b) 11/25/34 21,204 21,278,416
Nationslink Funding Corp., Series 99,
Class 1
6.32% 01/20/31 10,895 11,432,797
PAR
MATURITY (000) VALUE
---------- ---------- --------------
COMMERCIAL MORTGAGE BACKED SECURITIES (Continued)
Residential Funding Mortgage
Securities I, Inc., Series 04-SRI,
Class A1
5.50% 09/25/33 $ 14,551 $ 14,740,046
Structured Asset Securities Corp.,
Series 04-3AC, Class A2
4.92%(b) 03/25/34 16,352 16,318,915
Structured Mortgage Loan Trust,
Series 04-13, Class A2
3.15%(b) 09/25/34 13,479 13,482,781
Washington Mutual Mortgage Loan
Trust, Series 03-AR10, Class A6
4.08%(b) 10/25/33 550 541,056
Washington Mutual Mortgage
Securities Corp., Series 02-AR1,
Class IA1
4.40%(b) 11/25/30 1,239 1,243,965
Washington Mutual Mortgage
Securities Corp., Series 02-AR2,
Class 3A1
5.77%(b) 08/25/32 1,155 1,156,040
============
TOTAL COMMERCIAL MORTGAGE BACKED
SECURITIES
(Cost $248,055,289) 247,166,176
------------
PROJECT LOANS - 0.0%
Federal Housing Authority, Series 82
7.43%
(Cost $23,139) 09/01/22 23 24,107
------------
ASSET BACKED SECURITIES - 20.6%
Amresco Independence Funding,
Inc., Series 99-1, Class A
3.25%(b)(e) 06/15/26 5,638 5,590,743
Bank One Issuance Trust, Series
04-A2, Class A2
2.84%(b) 10/15/09 15,000 15,005,217
BMW Vehicle Owner Trust, Series
05-A, Class A3
4.02% 02/25/09 14,075 14,038,686
Business Loan Express, Inc., Series
98-1, Class A
4.50%(b)(e) 01/15/25 448 439,394
Capco America Securitization Corp.,
Series 98-D7, Class PS1 (IO)
8.89%(f) 10/15/30 35,923 1,522,262
Capital Auto Receivables Asset Trust,
Series 02-3, Class A3
3.58%(c) 10/16/06 5,879 5,888,537
Capital Auto Receivables Asset Trust,
Series 02-5, Class A4
2.92% 04/15/08 18,950 18,843,780
Capital Auto Receivables Owner
Trust, Series 04-2. Class A2
3.35% 02/15/08 18,300 18,128,438
Chase Issuance Trust, Series 04-A9,
Class A9
3.22% 06/15/10 13,875 13,548,799
Chase Manhattan Auto Owner Trust,
Series 02-B, Class A4
4.21% 01/15/09 13,251 13,307,816
Citibank Credit Card Issuance Trust,
Series 03-A2, Class A2
2.70% 01/15/06 16,395 16,275,331
Citibank Credit Card Issuance Trust,
Series 04, Class A1
2.55% 01/20/09 17,550 17,076,326
SEE ACCOMPANYING NOTES TO FINANCIAL STATEMENTS.
35
BLACKROCK FUNDS
STATEMENT OF NET ASSETS
LOW DURATION BOND PORTFOLIO (CONTINUED)
AS OF MARCH 31, 2005 (UNAUDITED)
PAR
MATURITY (000) VALUE
---------- ---------- --------------
ASSET BACKED SECURITIES (Continued)
Citibank Credit Card Issuance Trust,
Series 04-A4, Class A4
3.20% 08/24/07 $16,700 $ 16,309,220
Daimler Chrysler Auto Trust, Series
03-B, Class A3
2.25% 08/08/07 19,225 19,074,814
Epoch, Series 02, Class 2l
2.97%(b) 05/30/07 8,500 8,534,000
Ford Credit Auto Owner Trust, Series
05-A, Class A3
3.48% 11/17/08 17,500 17,349,675
Green Tree Financial Corp., Series
93-4, Class A5
7.05% 01/15/19 2,035 2,120,370
Green Tree Financial Corp., Series
96-8, Class A6
7.60% 10/15/27 4,769 5,037,959
Green Tree Financial Corp., Series
98-6, Class A6
6.27% 06/01/30 301 305,974
Green Tree Financial Corp., Series
99-2, Class A3
6.08% 12/01/30 8,209 8,328,881
Heller Financial Commercial
Mortgage Asset Corp., Series 98-1,
Class A
3.12%(b)(e) 07/15/24 2,944 2,855,217
Honda Auto Receivables Owner
Trust, Series 04-2, Class A2
2.52% 02/15/07 15,968 15,919,027
Honda Auto Receivables Owner
Trust, Series 04-2, Class A3
3.30% 06/16/08 17,915 17,764,156
Honda Auto Receivables Owner
Trust, Series 04-3, Class A3
3.01% 10/20/08 15,350 15,084,598
IFC Small Business Administration
Loan-Backed Certificates, Series
97-1, Class A
3.50%(b)(e) 01/15/24 1,014 973,226
MBNA Master Credit Card Trust,
Series 99-L, Class A
3.06%(b) 03/16/09 21,175 21,252,282
Missouri Higher Education Loan
Authority, Series 97, Class P
3.48%(b) 07/25/08 608 607,853
The Money Store Small Business
Administration Loan-Backed
Securities, Series 96-2, Class A
3.36%(b) 04/15/24 262 248,128
The Money Store Small Business
Administration Loan-Backed
Securities, Series 97-1, Class A
3.25%(b) 01/15/25 717 673,334
3.40%(b) 04/15/28 902 839,996
The Money Store Small Business
Administration Loan-Backed
Securities, Series 97-1, Class B
3.73%(b) 01/15/25 408 383,126
Mortgage Capital Funding, Inc.,
Series 98-MC1, Class X (IO)
8.50%(f) 03/18/30 78,155 1,205,215
PBG Equipment Trust, Series 00-1A,
Class A
6.27%(e) 01/20/12 1,882 1,898,031
PAR
MATURITY (000) VALUE
---------- ---------- --------------
ASSET BACKED SECURITIES (Continued)
PMC Capital Limited Partnership,
Series 98-1, Class A
4.25%(b)(e) 04/01/21 $ 3,484 $ 3,545,615
PMC Capital Small Business
Administration Loan-Backed
Adjustable Rate Certificates, Series
97-1, Class B
3.95%(b)(e) 09/15/23 156 156,195
PMC Capital Small Business
Administration Loan-Backed
Certificates, Series 97-1, Class A
3.60%(b)(e) 09/15/23 489 492,396
Residential Accredit Loans, Inc.,
Series 01-QS19, Class A1
6.00% 12/25/16 628 628,181
Sears Credit Account Master Trust,
Series 00-2, Class A
6.75% 09/16/09 10,766 10,918,898
Structured Asset Receivables Trust,
Series 03-1
2.13%(e) 01/21/10 16,411 16,411,002
SWB Loan Backed Certificates,
Series 98-1, Class AV
3.25%(b) 09/15/24 851 812,868
Toyota Auto Receivables Owner
Trust, Series 02-A, Class A4
4.00% 07/15/08 7,853 7,861,618
USAA Auto Owner Trust, Series 05-1,
Class A2
3.55% 09/17/07 9,850 9,828,453
USAA Auto Owner Trust, Series 05-1,
Class A3
3.93% 07/15/09 8,650 8,595,938
============
TOTAL ASSET BACKED SECURITIES
(Cost $357,312,004) 355,681,575
------------
CORPORATE BONDS - 10.3%
Banks - 2.2%
Bank of America Corp., Senior
Unsecured Notes
3.25% 08/15/08 2,175 2,094,418
J.P. Morgan Chase & Co., Senior
Unsecured Notes
6.00% 08/01/08 3,180 3,326,808
State Street Capital Trust II, Capital
Securities
3.29%(b) 02/15/08 1,700 1,705,899
U.S. Bank N.A., Subordinated Notes
6.50% 02/01/08 3,580 3,771,935
U.S. Central Credit Union, Unsecured
Notes
2.75% 05/30/08 3,700 3,523,399
Wells Fargo & Co., Senior Unsecured
Notes
3.11%(b) 09/15/09 22,515 22,519,278
Wells Fargo Co., Unsecured Notes
3.50% 04/04/08 1,200 1,168,332
============
38,110,069
------------
Beverages & Bottling - 0.3%
Cadbury Schweppes PLC,
Unsecured Notes
3.88%(e) 10/01/08 4,790 4,670,298
------------
SEE ACCOMPANYING NOTES TO FINANCIAL STATEMENTS.
36
BLACKROCK FUNDS
STATEMENT OF NET ASSETS
LOW DURATION BOND PORTFOLIO (CONTINUED)
AS OF MARCH 31, 2005 (UNAUDITED)
PAR
MATURITY (000) VALUE
---------- ---------- --------------
CORPORATE BONDS (Continued)
Energy & Utilities - 0.4%
Dominion Resources, Inc., Senior
Unsecured Notes
3.66% 11/15/06 $ 4,550 $ 4,514,460
Virginia Electric & Power Co., Senior
Unsecured Notes
5.75% 03/31/06 2,315 2,353,796
============
6,868,256
------------
Entertainment & Leisure - 0.4%
Time Warner Cos., Inc., Debentures
8.18% 08/15/07 3,354 3,612,373
Time Warner Cos., Inc., Senior Notes
7.75% 06/15/05 2,500 2,521,022
============
6,133,395
------------
Finance - 3.9%
ASIF Global Financing, Unsecured
Notes
3.90%(b)(e) 10/22/08 2,540 2,484,857
Citigroup, Inc., Senior Unsecured
Notes
3.50% 02/01/08 5,200 5,098,652
Diageo Capital PLC, Notes
3.38% 03/20/08 2,840 2,762,877
Eksportfinans, Unsecured Notes
3.38% 01/15/08 9,315 9,107,676
General Electric Capital Corp., Notes
8.75% 05/21/07 5,320 5,806,615
General Electric Capital Corp., Senior
Unsecured Notes
6.00% 06/15/12 680 720,282
General Electric Capital Corp.,
Unsecured Notes
3.45%(b) 07/16/07 34,750 34,642,794
Household Finance Corp., Unsecured
Notes
4.12% 12/15/08 4,375 4,299,575
Nationwide Building Society, Senior
Unsecured Notes
3.50%(e) 07/31/07 1,975 1,937,752
SLM Corp., Senior Unsecured Notes
3.62% 03/17/08 650 635,223
============
67,496,303
------------
Food & Agriculture - 1.0%
General Mills, Inc., Senior Unsecured
Notes
6.45% 10/15/06 11,430 11,808,676
Kellogg Co., Unsecured Notes
2.88% 06/01/08 5,865 5,588,272
============
17,396,948
------------
Pharmaceuticals - 0.5%
Merck & Co., Inc., Senior Unsecured
Notes
5.25% 07/01/06 1,750 1,773,226
Merck & Co., Inc., Unsecured Notes
4.73%(b)(e) 02/22/06 6,800 6,837,162
============
8,610,388
------------
PAR
MATURITY (000) VALUE
---------- ---------- --------------
CORPORATE BONDS (Continued)
Railroad & Shipping - 0.2%
Canadian National Railway Co.,
Senior Notes
6.45%(b) 07/15/06 $ 3,970 $ 4,080,680
------------
Retail Merchandising - 0.0%
Federated Department Stores, Inc.,
Senior Unsecured Notes
6.62% 09/01/08 800 842,505
------------
Telecommunications - 0.4%
Verizon Global Funding Corp., Senior
Unsecured Notes
6.12% 06/15/07 5,415 5,618,657
Vodafone Group PLC, Senior
Unsecured Notes
3.95% 01/30/08 1,543 1,524,660
============
7,143,317
------------
Yankee - 1.0%
Province of British Columbia
5.38% 10/29/08 1,840 1,906,179
Province of Quebec, Debentures
7.00% 01/30/07 1,910 2,006,044
Republic of Italy, Unsecured Notes
2.75% 12/15/06 13,100 12,842,717
============
16,754,940
------------
TOTAL CORPORATE BONDS
(Cost $179,877,785)
178,107,099
------------
FOREIGN BONDS - 1.8%
Bundesrepublic Deutschland (EUR)
4.75% 07/04/34 2,275 3,273,329
4.00% 01/04/37 4,025 5,137,179
Government of New Zealand (NZD)
7.00% 07/15/09 32,000 23,382,065
============
TOTAL FOREIGN BONDS
(Cost $31,567,542) 31,792,573
------------
TAXABLE MUNICIPAL BONDS - 0.6%
New York Sales Tax Asset
Receivables Corp. Revenue
Bonds, Series 04, Class B
3.29% 10/15/07 2,640 2,582,923
Texas Public Finance Authority
Unemployment Compensation
Obligation Assessment Revenue
Bonds, Series 03, Class B
2.62% 06/15/06 7,430 7,319,442
============
TOTAL TAXABLE MUNICIPAL BONDS
(Cost $10,061,536)
9,902,365
------------
SHORT TERM INVESTMENTS - 0.2%
Federal Home Loan Bank, Discount
Notes
2.55% 04/01/05 400 400,000
Galileo Money Market Fund
3,466 3,466,458
============
TOTAL SHORT TERM INVESTMENTS
(Cost $3,866,458)
3,866,458
------------
SEE ACCOMPANYING NOTES TO FINANCIAL STATEMENTS.
37
BLACKROCK FUNDS
STATEMENT OF NET ASSETS
LOW DURATION BOND PORTFOLIO (CONCLUDED)
AS OF MARCH 31, 2005 (UNAUDITED)
VALUE
-----------------
TOTAL INVESTMENTS IN SECURITIES -
130.7%
(Cost $2,276,332,803(a)) $2,257,234,953
LIABILITIES IN EXCESS OF
OTHER ASSETS - (30.7)%
(including $544,409,991 of
payable for financing transactions) (530,779,183)
--------------
NET ASSETS - 100.0%
(Applicable to 70,603,049
BlackRock shares, 42,344,659
Institutional shares, 37,269,753
Service shares, 8,180,107
Investor A shares, 5,482,102
Investor B shares and 9,047,281
Investor C shares outstanding) $1,726,455,770
==============
NET ASSET VALUE, OFFERING AND
REDEMPTION PRICE PER
BLACKROCK SHARE
($704,586,480/70,603,049) $ 9.98
=======
NET ASSET VALUE, OFFERING
AND REDEMPTION PRICE PER
INSTITUTIONAL SHARE
($422,890,520/42,344,659) $ 9.99
=======
NET ASSET VALUE, OFFERING
AND REDEMPTION PRICE PER
SERVICE SHARE
($372,209,237/37,269,753) $ 9.99
=======
NET ASSET VALUE AND REDEMPTION
PRICE PER INVESTOR A SHARE
($81,716,412/8,180,107) $ 9.99
=======
MAXIMUM OFFERING PRICE PER
INVESTOR A SHARE
($9.99/0.970) $ 10.30
=======
NET ASSET VALUE, OFFERING
AND REDEMPTION PRICE
(subject to a maximum contingent
deferred sales charge of 4.5%)
PER INVESTOR B SHARE
($54,744,711/5,482,102) $ 9.99
=======
NET ASSET VALUE, OFFERING
AND REDEMPTION PRICE
(subject to a maximum contingent
deferred sales charge of 1.0%)
PER INVESTOR C SHARE
($90,308,410/9,047,281) $ 9.98
=======
- -------------------
(a) Cost for Federal income tax purposes is $2,276,577,679. The
gross unrealized appreciation (depreciation) on a tax basis is as
follows:
Gross unrealized appreciation $ 8,729,463
Gross unrealized depreciation (28,072,189)
------------
$(19,342,726)
============
(b) Rates shown are the rates as of March 31, 2005.
(c) Securities, or a portion thereof, pledged as collateral with a value of
$7,480,428 on 1,029 long U.S. Treasury Note futures contracts and 2,534
short U.S. Treasury Note futures contracts and 223 short Euro Bobl
futures contracts expiring June 2005 and 220 long Euro-dollar futures
contracts expiring September 2005 and 220 long Euro-dollar futures
expiring December 2005. The value of such contracts on March 31, 2005
was $622,764,790, with an unrealized gain of $1,574,598 (including
commissions of $9,843).
(d) Securities, or a portion thereof, subject to financing transactions.
(e) Security exempt from registration under Rule 144A of the Securities Act of
1933. These securities may be resold in transactions exempt from
registration to qualified institutional investors. As of March 31, 2005,
the Portfolio held 2.8% of its net assets, with a current market value
of $49,018,060, in securities restricted as to resale.
(f) Rates shown are the effective yields as of March 31, 2005.
SEE ACCOMPANYING NOTES TO FINANCIAL STATEMENTS.
38
BLACKROCK FUNDS
STATEMENT OF NET ASSETS
INTERMEDIATE GOVERNMENT BOND PORTFOLIO
AS OF MARCH 31, 2005 (UNAUDITED)
PAR
MATURITY (000) VALUE
-------------- ---------- --------------
U.S. GOVERNMENT & AGENCY OBLIGATIONS - 66.1%
Federal Home Loan Bank,
Unsecured Notes
2.40% 03/30/07 $ 6,000 $ 5,818,464
3.00% 04/30/07 5,010 4,910,346
Federal Home Loan Mortgage Corp.,
Unsecured Notes
2.50% 08/24/06 4,525 4,442,717
2.75% 09/15/06 8,100 7,973,713
3.01% 04/07-04/07 10,760 10,556,036
Federal National Mortgage
Association, Debentures
5.88% 02/02/06 3,800 3,866,040
Federal National Mortgage
Association, Unsecured Notes
2.10% 04/19/06 5,400 5,307,525
2.00% 04/20/06 5,100 5,007,200
2.75% 05/10/06 5,925 5,857,846
2.80% 11/17/06 5,000 4,910,985
2.71% 01/30/07 7,275 7,112,338
3.00% 02/23/07 5,000 4,907,775
7.12% 06/15/10 37,575 41,973,154
6.62% 11/15/10 5,000 5,493,850
4.75% 02/21/13 1,595 1,564,435
4.12% 04/15/14 18,475 17,538,576
Overseas Private Investment Co.
3.42% 01/15/15 2,924 2,759,464
Small Business Administration
Participation Certificates, Series
96-20H, Class 1
7.25% 08/01/16 1,905 2,011,044
Small Business Administration
Participation Certificates, Series
96-20J, Class 1
7.20% 10/01/16 1,673 1,762,823
Small Business Administration
Participation Certificates, Series
98-20J, Class 1
5.50% 10/01/18 2,791 2,852,652
U.S. Treasury Bonds
10.75% 08/15/05 18,750 19,294,912
12.75% 11/15/10 2,275 2,405,458
10.38% 11/15/12 37,420 43,351,669
12.00% 08/15/13 17,600 21,965,627
10.62% 08/15/15 26,000 38,955,306
9.88% 11/15/15 7,700 11,105,448
6.12% 11/15/27 4,365 5,101,764
5.38% 02/15/31 425 463,200
PAR
MATURITY (000) VALUE
-------------- ---------- --------------
U.S. GOVERNMENT & AGENCY OBLIGATIONS (Continued)
U.S. Treasury Notes
5.75% 11/15/05 $ 555 $ 563,433
1.62% 02/28/06 1,180 1,161,193
2.75% 06/30/06 10,880 10,770,351
7.00% 07/15/06 17,175 17,900,920
2.38% 08/15/06 7,775 7,644,708
2.50%(b) 10/31/06 53,145 52,173,456
3.38%(b) 02/07-10/09 6,615 6,478,139
2.62% 03/15/09 2,135 2,022,912
4.00% 06/09-02/15 10,525 10,250,245
3.50% 12/15/09 1,955 1,899,022
3.62% 01/15/10 34,110 33,293,236
6.50% 02/15/10 24,600 27,087,872
4.88%(b) 02/15/12 11,320 11,689,224
4.25%(b) 11/15/14 12,615 12,354,324
============
TOTAL U.S. GOVERNMENT & AGENCY
OBLIGATIONS
(Cost $488,794,243)
484,559,402
------------
MORTGAGE PASS-THROUGHS - 21.0%
Federal Home Loan Mortgage Corp.
9.00% 12/01/09 519 551,163
Federal Home Loan Mortgage Corp.
ARM
3.54%(c) 05/01/34 4,421 4,304,567
3.57%(c) 07/01/34 4,421 4,392,994
3.74%(c) 07/01/34 2,646 2,576,330
4.41%(c) 11/01/34 3,439 3,399,806
4.32%(c) 02/01/35 10,175 10,019,831
4.78%(c) 03/01/35 12,200 12,139,000
4.80%(c) 03/01/35 12,000 11,940,000
Federal National Mortgage
Association
8.00% 04/08-06/08 895 928,696
6.50% 05/08-12/29 4,204 4,360,274
8.50% 02/09-08/09 964 1,012,220
9.00% 05/09-04/16 847 898,525
6.00% 05/13-04/16 452 465,063
7.00% 01/17-04/32 2,112 2,223,444
5.00% 06/18-06/23 3,680 3,658,862
4.50% 10/01/18 1,299 1,272,893
5.50% 01/01/24 1,161 1,171,829
7.50% 07/01/29 909 971,923
SEE ACCOMPANYING NOTES TO FINANCIAL STATEMENTS.
39
BLACKROCK FUNDS
STATEMENT OF NET ASSETS
INTERMEDIATE GOVERNMENT BOND PORTFOLIO (CONTINUED)
AS OF MARCH 31, 2005 (UNAUDITED)
PAR
MATURITY (000) VALUE
---------- ---------- --------------
MORTGAGE PASS-THROUGHS (Continued)
Federal National Mortgage
Association ARM
6.09%(c) 10/01/08 $ 6,763 $ 7,037,318
4.47%(c) 12/01/32 6,339 6,428,783
4.02%(c) 04/01/34 2,498 2,469,932
3.90%(c) 05/01/34 2,747 2,704,052
4.43%(c) 06/01/34 10,552 10,463,746
3.72%(c) 07/01/34 3,696 3,612,809
4.50%(c) 07/01/34 12,354 12,327,022
4.84%(c) 11/01/34 2,823 2,814,493
4.88%(c) 11/01/34 2,799 2,793,220
4.65%(c) 02/01/35 15,501 15,490,577
Federal National Mortgage
Association Hybrid, ARM
3.48%(c) 06/01/34 3,115 3,081,627
Federal National Mortgage
Association Multi-Family
6.54%(c) 12/01/18 565 576,082
Government National Mortgage
Association
6.00% 02/15/11 590 612,697
9.50% 09/15/19 47 51,857
4.50% 02/01/35 5,273 5,287,100
Government National Mortgage
Association II Hybrid
3.75%(c) 06/20/34 3,663 3,645,013
3.50% 07/20/34 8,669 8,503,370
MLCC Mortgage Investors, Inc.,
Series 95-C2 (IO)
10.40%(d) 06/15/21 3,254 57,134
============
TOTAL MORTGAGE PASS-THROUGHS
(Cost $154,167,198) 154,244,252
------------
MULTIPLE CLASS MORTGAGE PASS-THROUGHS - 3.5%
Federal Home Loan Mortgage Corp.,
Series 1361, Class I
6.00% 09/15/07 158 159,754
Federal Home Loan Mortgage Corp.,
Series 2668, Class AD
4.00% 01/15/15 2,676 2,660,773
Federal Home Loan Mortgage Corp.,
Series 2718, Class MR
4.00% 08/15/13 2,788 2,779,871
Federal Home Loan Mortgage Corp.,
Series 2730, Class PA
3.75% 03/15/11 4,375 4,378,394
Federal Home Loan Mortgage Corp.,
Series 2748, Class LJ
4.00% 03/15/10 2,816 2,822,725
Federal National Mortgage
Association Grantor Trust, Series
02-T6, Class A1
3.31%(c) 02/25/32 732 712,711
Federal National Mortgage
Association, Series 01-35, Class
VC
6.50% 07/25/31 4,510 4,593,095
Federal National Mortgage
Association, Series 01-T2, Class B
6.02% 11/25/10 3,600 3,837,352
PAR
MATURITY (000) VALUE
---------- ---------- --------------
MULTIPLE CLASS MORTGAGE PASS-THROUGHS (Continued)
Federal National Mortgage
Association, Series 04-W10, Class
A1
5.75% 08/25/34 $ 3,970 $ 4,027,008
============
TOTAL MULTIPLE CLASS MORTGAGE
PASS-THROUGHS
(Cost $26,056,176)
25,971,683
------------
COMMERCIAL MORTGAGE BACKED SECURITIES - 7.7%
Bear Stearns Commercial Mortgage
Securities, Series 02-TOP6, Class
A1
5.92% 10/15/36 2,472 2,577,504
Bear Stearns Commercial Mortgage
Securities, Series 04-PWR4, Class
A1
4.36% 06/11/41 2,276 2,260,735
Bear Stearns Mortgage Trust, Series
04-13, Class A1
3.22% 11/25/34 3,327 3,335,104
Chase Commercial Mortgage
Securities Corp., Series 98-2,
Class A1
6.02% 11/18/30 683 694,460
Credit Suisse First Boston Mortgage
Securities Corp., Series 01-33,
Class 4A1
6.50% 04/25/16 66 66,327
Deutsche Mortgage Securities, Inc.,
Series 04-4, Class 3AR1
3.76% 06/25/34 1,535 1,503,143
First Union National Bank
Commercial Mortgage Trust, Series
00-C2, Class A2
7.20% 10/15/32 3,640 4,047,233
First Union-Lehman Brothers-Bank of
America, Series 98-C2, Class A1
6.28% 11/18/35 459 458,729
General Motors Acceptance Corp.
Commercial Mortgage Securities,
Inc., Series 97-C1, Class X (IO)
8.26%(d) 07/15/27 11,151 436,157
General Motors Acceptance Corp.
Commercial Mortgage Securities,
Inc., Series 99-C3, Class A2
7.18% 08/15/36 1,462 1,595,301
GSR Mortgage Loan Trust, Series
04-9, Class 3A1
3.69% 08/25/34 3,551 3,550,843
J.P. Morgan Chase Commercial
Mortgage Securities Corp., Series
01-CIBC, Class A3
6.26% 03/15/33 1,650 1,770,822
Lehman Brothers-UBS Commercial
Mortgage Trust, Series 00-C5,
Class A1
6.41% 01/15/10 2,359 2,455,990
Lehman Brothers-UBS Commercial
Mortgage Trust, Series 01-C7,
Class A3
5.64% 12/15/25 3,902 4,025,529
SEE ACCOMPANYING NOTES TO FINANCIAL STATEMENTS.
40
BLACKROCK FUNDS
STATEMENT OF NET ASSETS
INTERMEDIATE GOVERNMENT BOND PORTFOLIO (CONTINUED)
AS OF MARCH 31, 2005 (UNAUDITED)
PAR
MATURITY (000) VALUE
---------- ---------- -------------
COMMERCIAL MORTGAGE BACKED SECURITIES (Continued)
Lehman Brothers-UBS Commercial
Mortgage Trust, Series 04-C2,
Class A2
3.25% 03/15/29 $2,100 $ 2,003,223
Lehman Brothers-UBS Commercial
Mortgage Trust, Series 04-C4,
Class A1
3.82% 06/15/29 2,567 2,542,165
Morgan Stanley Dean Witter Capital
I, Series 99-WF1, Class A1
5.91% 11/15/31 1,226 1,245,780
Morgan Stanley Dean Witter Capital
I, Series 02-TOP7, Class A1
5.38% 01/15/39 3,870 3,975,254
MortgageIT Trust, Series 04-1, Class
A1
3.24%(c) 11/25/34 3,499 3,511,440
Structured Mortgage Loan Trust,
Series 04-13, Class A2
3.15%(c) 09/25/34 2,167 2,167,625
Summit Mortgage Trust, Series 00-1,
Class B1
6.06%(c) 12/28/12 68 67,514
Wachovia Bank Commercial
Mortgage Trust, Series 03-C5,
Class A1
2.99% 06/15/35 2,633 2,456,745
Wachovia Bank Commercial
Mortgage Trust, Series 04-C12,
Class A1
3.40% 07/15/41 2,550 2,494,881
Washington Mutual Mortgage
Securities Corp., Series 03-AR11,
Class A6
3.98%(c) 10/25/33 3,275 3,197,196
Washington Mutual Mortgage
Securities Corp., Series 03-AR4,
Class A6
3.42%(c) 05/25/33 4,350 4,248,094
===========
TOTAL COMMERCIAL MORTGAGE BACKED
SECURITIES
(Cost $57,123,572) 56,687,794
-----------
PROJECT LOANS - 0.3%
Federal Housing Authority, Merrill
Lynch Project, Series 29, Class
1A1
7.43% 06/01/22 540 553,982
Federal Housing Authority, USGI
Project, Series 56
7.46% 01/01/23 1,440 1,480,435
===========
TOTAL PROJECT LOANS
(Cost $2,024,185) 2,034,417
-----------
ASSET BACKED SECURITIES - 3.0%
Boston Edison Co., Series 99-1,
Class A4
6.91% 09/15/09 4,475 4,651,807
Capital Auto Receivables Asset Trust,
Series 02-3, Class A3
3.58% 10/16/06 1,913 1,915,548
Chase Issuance Trust, Series 04-A9,
Class A9
3.22% 06/15/10 2,225 2,172,690
Citibank Credit Card Issuance Trust,
Series 04-A4, Class A4
3.20% 08/24/07 2,700 2,636,821
PAR
MATURITY (000) VALUE
---------- ---------- -------------
ASSET BACKED SECURITIES (Continued)
Green Tree Financial Corp., Series
97-5, Class A7
7.13% 05/15/29 $2,335 $ 2,487,403
MBNA Credit Card Master Note
Trust, Series 04-A4, Class A4
2.70%(e) 09/15/09 3,000 2,918,908
The Money Store Small Business
Administration Loan Trust, Series
99-1, Class A
3.30%(c) 07/15/25 1,191 1,181,616
PMC Capital Small Business
Administration Loan-Backed
Certificates, Series 97-1, Class A
3.60%(c)(f) 09/15/23 489 492,396
Structured Asset Receivables Trust,
Series 03-2
2.03%(c) 01/21/09 2,850 2,850,426
SWB Loan-Backed Certificates,
Series 99-1, Class A
7.38% 05/15/25 953 962,028
===========
TOTAL ASSET BACKED SECURITIES
(Cost $22,125,663) 22,269,643
-----------
CORPORATE BONDS - 2.1%
Finance - 1.6%
General Electric Capital Corp.,
Unsecured Notes
3.45% 07/16/07 6,650 6,656,185
Private Export Funding Corp., Senior
Unsecured Notes
3.38% 02/15/09 5,250 5,072,702
===========
11,728,887
-----------
Oil & Gas - 0.4%
ENSCO Offshore Co.
6.36% 12/01/15 2,548 2,727,431
===========
TOTAL CORPORATE BONDS
(Cost $14,442,713)
14,456,318
-----------
TAXABLE MUNICIPAL BONDS - 0.8%
Stanislaus County, California Taxable
Pension Obligation Refunding
Revenue Bonds, Series 95
7.15% 08/15/13 3,490 3,921,259
United States Department of Housing
and Urban Development, Section
108 Government Guaranteed
Participation Certificates, Series
HUD 2003-A
4.44% 08/01/11 2,099 2,071,902
===========
TOTAL TAXABLE MUNICIPAL BONDS
(Cost $5,589,000)
5,993,161
-----------
SEE ACCOMPANYING NOTES TO FINANCIAL STATEMENTS.
41
BLACKROCK FUNDS
STATEMENT OF NET ASSETS
INTERMEDIATE GOVERNMENT BOND PORTFOLIO (CONCLUDED)
AS OF MARCH 31, 2005 (UNAUDITED)
PAR/SHARES
MATURITY (000) VALUE
---------- ----------- -------------
SHORT TERM INVESTMENTS - 0.8%
Federal Home Loan
Bank, Discount
Notes
2.55% 04/01/05 $2,900 $2,900,000
Galileo Money Market Fund 3,208 3,208,036
==========
TOTAL SHORT TERM INVESTMENTS
(Cost $6,108,036) 6,108,036
----------
TOTAL INVESTMENTS IN SECURITIES -
105.3%
(Cost $776,430,786(a)) 772,324,706
NUMBER OF
CONTRACTS
-----------------
CALL OPTIONS WRITTEN - 0.0%
Federal National
Mortgage
Association 30Yr
5.5%, Strike
Price 101.718750,
Expires
04/06/05
(Premiums received (1,400) (1)
---
$37,734)
CALL SWAPTIONS WRITTEN - 0.0%
Citibank, Strike Price
5.67, Expires
01/04/10
(Premiums received (390)(g) (204,750)
----------
$200,460)
PUT SWAPTIONS WRITTEN - 0.0%
Citibank, Strike Price
5.67, Expires
01/04/10 (390)(g) (159,744)
Union Bank of
Switzerland, Strike
Price 5.75, Expires (2,300)(g) (35,650)
09/23/05
==========
TOTAL PUT SWAPTIONS WRITTEN
(Premiums received (195,394)
----------
$700,710)
LIABILITIES IN EXCESS OF OTHER
ASSETS - (5.3)%
(including $30,573,785 of payable for
financing
transactions) (38,991,528)
-----------
NET ASSETS - 100.0%
(Applicable to 23,036,823 Institutional
shares, 136,368 Service shares,
37,802,483 Investor A shares,
8,316,929 Investor B shares and
2,322,348 Investor C shares
outstanding) $ 732,933,033
=============
VALUE
-----------
NET ASSET VALUE, OFFERING
AND REDEMPTION PRICE PER
INSTITUTIONAL SHARE
($235,472,416/23,036,823) $ 10.22
=======
NET ASSET VALUE, OFFERING
AND REDEMPTION PRICE PER
SERVICE SHARE
($1,392,860/136,368) $ 10.21
=======
NET ASSET VALUE AND REDEMPTION
PRICE PER INVESTOR A SHARE
($387,307,871/37,802,483) $ 10.25
=======
MAXIMUM OFFERING PRICE
PER INVESTOR A SHARE
($10.25/0.960) $ 10.67
=======
NET ASSET VALUE, OFFERING
AND REDEMPTION PRICE
(subject to a maximum contingent
deferred sales charge of 4.5%)
PER INVESTOR B SHARE
($85,005,817/8,316,929) $ 10.22
=======
NET ASSET VALUE, OFFERING
AND REDEMPTION PRICE
(subject to a maximum contingent
deferred sales charge of 1.0%)
PER INVESTOR C SHARE
($23,754,069/2,322,348) $ 10.23
=======
- -------------------
(a) Cost for Federal income tax purposes is $776,673,409. The
gross unrealized appreciation (depreciation) on a tax basis is as
follows:
Gross unrealized appreciation $ 8,115,051
Gross unrealized depreciation (12,463,754)
-----------
$(4,348,703)
===========
(b) Securities, or a portion thereof, subject to financing transactions.
(c) Rates shown are the rates as of March 31, 2005.
(d) Rates shown are the effective yields as of March 31, 2005.
(e) Securities, or a portion thereof, pledged as collateral with a value of
$2,918,908 on 720 short U.S. Treasury Note futures contracts and 32
short U.S. Treasury Bond futures contracts expiring June 2005, 39 long
Euro-dollar contracts expiring September 2005 and 39 long Euro-dollar
contracts expiring December 2005. The value of such contracts on March
31, 2005 was $99,444,869, with an unrealized gain of $340,809 (including
commissions of $2,212).
(f) Security exempt from registration under Rule 144A of the Securities Act
of 1933. These securities may be resold in transactions exempt from
registration to qualified institutional investors. As of March 31, 2005,
the Portfolio held 0.1% of its net assets, with a current market value
of $492,396, in securities restricted as to resale.
(g) Each swaption contract is equivalent to $10,000 in notional amount.
SEE ACCOMPANYING NOTES TO FINANCIAL STATEMENTS.
42
BLACKROCK FUNDS
STATEMENT OF NET ASSETS
INTERMEDIATE BOND PORTFOLIO
AS OF MARCH 31, 2005 (UNAUDITED)
PAR
MATURITY (000) VALUE
-------------- ---------- --------------
U.S. GOVERNMENT & AGENCY OBLIGATIONS - 33.7%
Federal Home Loan Mortgage Corp.
Gold, Unsecured Notes
4.12% 02/24/11 $ 9,890 $ 9,595,545
Federal Home Loan Mortgage Corp.,
Unsecured Notes
2.60% 08/07/06 5,955 5,857,421
3.75% 02/27/09 10,025 9,800,490
4.75% 10/11/12 3,980 3,930,879
5.00% 10/27/14 5,500 5,412,880
Federal National Mortgage
Association, Unsecured Notes
2.15%(b) 04/13/06 9,875 9,713,761
2.74%(b) 05/05/06 8,030 7,939,759
1.75% 06/16/06 4,175 4,073,861
2.71%(b) 01/30/07 9,625 9,409,795
4.75% 02/21/13 10,740 10,534,189
Small Business Administration
Participation Certificates, Series
92-20H, Class 1
7.40% 08/01/12 692 726,116
Small Business Administration
Participation Certificates, Series
96-20H, Class 1
7.25% 08/01/16 2,172 2,293,296
Small Business Administration,
Series 01-P10, Class B-1
6.34% 08/01/11 2,667 2,778,905
Small Business Investment Cos.
Pass-Through, Series 97-P10D,
Class 1
6.51% 11/10/07 93 96,320
U.S. Treasury Bonds
10.00% 05/15/10 5,475 5,520,766
10.38%(c) 11/15/12 4,545 5,265,455
8.12% 08/15/19 6,475 8,711,154
8.75% 08/15/20 2,825 4,028,275
8.00% 11/15/21 3,575 4,854,739
6.12% 11/15/27 1,950 2,279,139
U.S. Treasury Notes
2.50% 09/30/06 1,550 1,523,602
3.00% 12/31/06 8,960 8,846,253
3.12%(d) 01/31/07 9,825 9,713,701
3.38% 02/07-10/09 44,820 43,804,242
4.00%(d) 06/09-02/15 63,380 61,936,499
3.50% 12/15/09 2,085 2,025,300
3.62% 01/15/10 160 156,169
5.75% 08/15/10 975 1,046,297
5.00% 02/15/11 1,005 1,043,826
4.88%(d) 02/15/12 20,690 21,364,846
4.25%(d) 11/15/14 38,945 38,140,241
============
TOTAL U.S. GOVERNMENT & AGENCY
OBLIGATIONS
(Cost $306,707,197) 302,423,721
------------
MORTGAGE PASS-THROUGHS - 2.2%
Federal Home Loan Mortgage Corp.
3.00% 04/19/07 7,820 7,669,362
Federal Home Loan Mortgage Corp.
Gold
7.25% 12/01/06 0 243
Federal National Mortgage
Association
5.50% 02/01/09 639 646,025
8.50% 08/01/09 230 234,496
6.00% 05/16-02/17 808 834,384
PAR
MATURITY (000) VALUE
-------------- ---------- --------------
MORTGAGE PASS-THROUGHS (Continued)
Federal National Mortgage
Association ARM
4.02%(b) 04/01/34 $ 7,868 $ 7,781,379
Government National Mortgage
Association
7.25% 04/15/06 8 8,011
MLCC Mortgage Investors, Inc.,
Series 95-C2 (IO)
10.40%(e) 06/15/21 5,232 91,876
Structured Asset Securities Corp.,
Series 03-AL1, Class A
3.36% 04/25/31 3,085 2,842,782
============
TOTAL MORTGAGE PASS-THROUGHS
(Cost $20,370,654)
20,108,558
------------
MULTIPLE CLASS MORTGAGE PASS-THROUGHS - 0.4%
Federal Home Loan Mortgage Corp.,
Series 1361, Class I
6.00% 09/15/07 293 296,685
Federal Home Loan Mortgage Corp.,
Series 96T-2, Class A
7.00% 01/25/21 961 970,433
Federal National Mortgage
Association Grantor Trust, Series
02-T6, Class A1
3.31%(b) 02/25/32 2,056 2,001,657
Federal National Mortgage
Association, Series 89-16, Class B
(PO)
13.92%(e) 03/25/19 141 118,259
============
TOTAL MULTIPLE CLASS MORTGAGE
PASS-THROUGHS
(Cost $3,282,215)
3,387,034
------------
COMMERCIAL MORTGAGE BACKED SECURITIES - 14.0%
Banc of America Commercial
Mortgage, Inc., Series 01-1, Class
A2
6.50% 04/15/36 4,950 5,362,195
Banc of America Commerical
Mortgage, Inc., Series 04-5, Class
A2
4.18% 11/10/41 5,450 5,352,937
Bayview Financial Acquisition Trust,
Series 98-1, Class A1
7.01% 05/25/29 456 456,592
Bear Stearns Mortgage Trust, Series
04-12, Class 1A1
3.20%(b) 01/25/35 1,396 1,399,559
Bear Stearns Mortgage Trust, Series
04-13, Class A1
3.22%(b) 11/25/34 9,984 10,009,963
Bear Stearns Mortgage Trust, Series
04-7, Class 4A
3.18%(b) 10/25/34 9,106 9,162,614
Commercial Mortgage Acceptance
Corp., Series 98-C2, Class A2
6.03% 09/15/30 6,135 6,348,976
Countrywide Home Loans, Series
04-29, Class 1A1
2.92%(b) 02/25/35 9,248 9,298,589
Credit Suisse First Boston Mortgage
Securities Corp., Series 01-33,
Class 4A1
6.50% 04/25/16 178 179,853
SEE ACCOMPANYING NOTES TO FINANCIAL STATEMENTS.
43
BLACKROCK FUNDS
STATEMENT OF NET ASSETS
INTERMEDIATE BOND PORTFOLIO (CONTINUED)
AS OF MARCH 31, 2005 (UNAUDITED)
PAR
MATURITY (000) VALUE
---------- ---------- --------------
COMMERCIAL MORTGAGE BACKED SECURITIES (Continued)
First Republic Mortgage Loan Trust,
Series 00-FRB1, Class A2
4.06%(b) 06/25/30 $ 1,582 $ 1,582,144
First Union National Bank
Commercial Mortgage Trust, Series
00-C2, Class A2
7.20% 10/15/32 4,430 4,925,618
General Motors Acceptance Corp.
Commercial Mortgage Securities,
Inc., Series 97
7.43% 02/21/21 508 521,850
General Motors Acceptance Corp.
Commercial Mortgage Securities,
Inc., Series 97-C1, Class X (IO)
8.00%(e) 07/15/27 16,691 652,882
General Motors Acceptance Corp.
Commercial Mortgage Securities,
Inc., Series 99-C3, Class A2
7.18% 08/15/36 4,522 4,933,528
General Motors Acceptance Corp.
Commercial Mortgage Securities,
Inc., Series 00-C2, Class A2
7.46% 08/16/33 4,690 5,227,739
Lehman Brothers Commercial
Conduit Mortgage Trust, Series
99-C2, Class A1
7.10% 10/15/32 3,017 3,130,403
Lehman Brothers-UBS Commercial
Mortgage Trust, Series 00-C5,
Class A1
6.41% 01/15/10 5,046 5,252,743
MortgageIT Trust, Series 04-1, Class
A1
3.24%(b) 11/25/34 11,061 11,099,799
NationsLink Funding Corp., Series
99-SL, Class A6
6.61% 04/10/07 4,842 4,919,081
NYC Mortgage Loan Trust, Series
96, Class A1
6.75% 06/25/11 4,497 4,675,930
Structured Mortgage Loan Trust,
Series 04-13, Class A2
3.15%(b) 09/25/34 8,199 8,201,104
Structured Mortgage Loan Trust,
Series 04-6, Class 4A1
4.89%(b) 06/25/34 11,435 11,230,260
Summit Mortgage Trust, Series 00-1,
Class B1
6.06%(b) 12/28/12 135 135,028
Wells Fargo Mortgage Backed
Securities Trust, Series 04-5, Class
A1
4.53%(b) 04/01/34 11,875 11,780,717
============
TOTAL COMMERCIAL MORTGAGE BACKED
SECURITIES
(Cost $126,188,492) 125,840,104
------------
PROJECT LOANS - 0.3%
Federal Housing Authority, USGI
Project, Series 56
7.46%
(Cost $1,428,214) 01/01/23 1,417 1,456,166
------------
CERTIFICATE OF DEPOSIT - 0.4%
State Street Bank & Trust
2.92%(b) 12/11/06 2,075 2,073,967
PAR
MATURITY (000) VALUE
---------- ---------- --------------
CERTIFICATE OF DEPOSIT (Continued)
SunTrust Bank, Inc.
4.42% 06/15/09 $ 1,375 $ 1,365,925
============
TOTAL CERTIFICATE OF DEPOSIT
(Cost $3,449,300) 3,439,892
------------
ASSET BACKED SECURITIES - 8.3%
Amresco Independence Funding,
Inc., Series 00-1, Class A
3.65%(b) 01/15/27 1,579 1,563,025
Boston Edison Co., Series 99-1,
Class A4
6.91% 09/15/09 5,500 5,717,305
Chase Issuance Trust, Series 04-A9,
Class A9
3.22% 06/15/10 6,100 5,956,589
Citibank Credit Card Issuance Trust,
Series 04, Class A1
2.55% 01/20/09 7,880 7,667,319
Citibank Credit Card Issuance Trust,
Series 04-A4, Class A4
3.20% 08/24/07 8,375 8,179,025
Daimler Chrysler Auto Trust, Series
04-5, Class A3
3.18% 09/08/08 7,300 7,229,993
Epoch, Series 02, Class 2l
2.97%(b) 05/30/07 4,900 4,919,600
Green Tree Financial Corp., Series
96-7, Class A6
7.65%(c) 10/15/27 1,498 1,582,444
GSAA Home Equity Trust, Series
00-8, Class A3A
3.22%(b) 09/25/34 1,895 1,897,011
IFC Small Business Administration
Loan-Backed Certificates, Series
97-1, Class A
3.50%(b)(f) 01/15/24 713 684,481
MBNA Credit Card Master Note
Trust, Series 04-A4, Class A4
2.70% 09/15/09 7,900 7,686,455
MBNA Master Credit Card Trust,
Series 96-G, Class A
2.99%(b) 12/15/08 4,415 4,424,567
The Money Store Small Business
Administration Loan Trust, Series
96-1, Class A
3.45%(b) 07/15/21 1,995 1,923,665
The Money Store Small Business
Administration Loan Trust, Series
97-2, Class A
3.30%(b) 02/15/29 882 828,914
The Money Store Small Business
Administration Loan Trust, Series
99-1, Class A
3.30%(b) 07/15/25 1,948 1,933,554
PBG Equipment Trust, Series 00-1A,
Class A
6.27%(f) 01/20/12 1,699 1,713,810
PMC Capital Limited Partnership,
Series 98-1, Class A
4.25%(b)(f) 04/01/21 1,152 1,172,523
PMC Capital Small Business
Administration Loan-Backed
Certificates, Series 97-1, Class A
3.60%(b)(f) 09/15/23 803 807,998
SEE ACCOMPANYING NOTES TO FINANCIAL STATEMENTS.
44
BLACKROCK FUNDS
STATEMENT OF NET ASSETS
INTERMEDIATE BOND PORTFOLIO (CONTINUED)
AS OF MARCH 31, 2005 (UNAUDITED)
PAR
MATURITY (000) VALUE
---------- ---------- -------------
ASSET BACKED SECURITIES (Continued)
Structured Asset Receivables Trust,
Series 03-2
2.03%(b) 01/21/09 $ 5,908 $ 5,907,738
SWB Loan-Backed Certificates,
Series 99-1, Class A
7.38% 05/15/25 2,272 2,294,958
===========
TOTAL ASSET BACKED SECURITIES
(Cost $74,287,724) 74,090,974
-----------
CORPORATE BONDS - 39.5%
Aerospace - 0.7%
Lockheed Martin Corp., Debentures
7.65% 05/01/16 1,340 1,601,845
Northrop Grumman Corp., Senior
Unsecured Notes
4.08% 11/16/06 1,445 1,443,497
7.12%(f) 02/15/11 935 1,042,700
Raytheon Co., Senior Notes
6.75% 08/15/07 1,752 1,843,363
===========
5,931,405
-----------
Banks - 10.4%
American Express Bank Ltd., Bank
Notes
2.93%(b) 11/21/07 3,150 3,149,968
Banc One Corp., Senior Unsecured
Notes
2.62% 06/30/08 105 99,143
Bank of America Corp., Senior
Unsecured Notes
3.25% 08/15/08 3,100 2,985,148
Bank of America Corp., Subordinated
Notes
7.20% 04/15/06 795 818,441
7.80% 02/15/10 1,115 1,262,150
Bank One N.A., Senior Bank Notes
5.50% 03/26/07 1,385 1,420,013
Bank One N.A., Senior Unsecured
Notes
3.70% 01/15/08 2,325 2,285,963
BankBoston N.A., Subordinated Bank
Notes
6.38% 04/15/08 2,575 2,713,177
BankBoston N.A., Subordinated
Notes
7.00% 09/15/07 450 478,257
Depfa ACS Bank, Senior Notes
3.62% 10/29/08 5,150 5,088,200
Deutsche Bank AG, Deposit Notes
3.84% 03/15/07 1,975 1,970,260
Firstar Bank N.A., Subordinated
Notes
7.80%(b) 07/05/10 2,600 2,628,803
Fleetboston Financial Corp., Senior
Unsecured Notes
3.85% 02/15/08 685 674,179
HBOS Treasury Services PLC,
Unsecured Notes
3.75%(f) 09/30/08 1,360 1,328,448
The Huntington National Bank,
Subordinated Bank Notes
2.75% 10/16/06 750 733,995
J.P. Morgan Chase & Co., Senior
Unsecured Notes
5.25% 05/30/07 8,210 8,371,762
PAR
MATURITY (000) VALUE
---------- ---------- -------------
CORPORATE BONDS (Continued)
Banks (Continued)
J.P. Morgan Chase & Co.,
Subordinated Notes
6.25% 02/15/11 $ 1,500 $ 1,605,010
Landeskreditbank
Baden-Wurttemberg-Forderbank,
Unsecured Notes
3.42% 07/27/06 18,975 18,842,554
National City Bank Cleveland, Senior
Bank Notes
3.21%(b) 06/29/09 3,575 3,573,867
SunTrust Bank, Inc., Senior
Unsecured Notes
3.62% 10/15/07 1,485 1,460,395
4.00% 10/15/08 1,100 1,085,725
Swedish Export Credit Corp.,
Unsecured Notes
3.50% 01/15/08 6,625 6,496,144
U.S. Bank N.A., Senior Bank Notes
2.40% 03/12/07 4,560 4,415,950
3.75% 02/06/09 850 824,338
U.S. Bank N.A., Subordinated Notes
6.30% 07/15/08 1,360 1,437,831
U.S. Central Credit Union, Unsecured
Notes
2.75% 05/30/08 1,915 1,823,597
UBS Preferred Funding Trust I,
Capital Securities
8.62%(b) 10/29/49 475 560,286
Wachovia Corp., Subordinated Notes
5.62% 12/15/08 2,150 2,238,593
Wells Fargo & Co., Senior Unsecured
Notes
5.90% 05/21/06 1,600 1,633,970
5.25% 12/01/07 1,700 1,739,550
3.11%(b) 09/15/09 2,795 2,795,531
4.20% 01/15/10 4,425 4,327,384
Wells Fargo & Co., Subordinated
Notes
5.00% 11/15/14 1,040 1,029,973
World Savings Bank, Unsecured
Notes
4.12% 03/10/08 1,375 1,367,299
===========
93,265,904
-----------
Beverages & Bottling - 0.1%
Cadbury Schweppes PLC,
Unsecured Notes
3.88%(f) 10/01/08 1,290 1,257,763
-----------
Broadcasting - 0.4%
Cox Communications, Inc., Senior
Unsecured Notes
7.75% 11/01/10 295 327,643
7.12% 10/01/12 900 981,535
News America, Inc., Senior
Unsecured Notes
5.30% 12/15/14 2,550 2,504,738
===========
3,813,916
-----------
Construction - 0.1%
Pulte Homes, Inc., Senior Unsecured
Notes
5.20% 02/15/15 700 660,950
-----------
SEE ACCOMPANYING NOTES TO FINANCIAL STATEMENTS.
45
BLACKROCK FUNDS
STATEMENT OF NET ASSETS
INTERMEDIATE BOND PORTFOLIO (CONTINUED)
AS OF MARCH 31, 2005 (UNAUDITED)
PAR
MATURITY (000) VALUE
---------- ---------- -------------
CORPORATE BONDS (Continued)
Energy & Utilities - 1.9%
Carolina Power & Light, Senior
Secured Notes
7.50% 04/01/05 $ 2,850 $ 2,849,773
Dominion Resources, Inc., Senior
Unsecured Notes
3.66% 11/15/06 2,250 2,232,425
5.12% 12/15/09 455 461,511
Nisource Finance Corp., Unsecured
Notes
3.43%(b) 11/23/09 2,450 2,467,076
PECO Energy Co., First Refunding
Mortgages
5.95% 11/01/11 1,900 1,989,941
Scottish Power PLC, Unsecured
Notes
4.91% 03/15/10 2,300 2,300,331
TXU Corp., Senior Unsecured Notes
4.80%(f) 11/15/09 2,400 2,325,048
Virginia Electric and Power Co.,
Unsecured Notes
5.73% 11/25/08 2,514 2,587,157
===========
17,213,262
-----------
Entertainment & Leisure - 0.4%
TCI Communications, Inc., Senior
Debentures
7.88% 08/01/13 735 853,026
Time Warner, Inc., Senior Unsecured
Notes
6.88% 05/01/12 1,395 1,524,177
Turner Broadcasting Corp., Senior
Notes
8.38% 07/01/13 300 357,231
The Walt Disney Co., Senior
Unsecured Notes
6.20% 06/20/14 475 507,214
===========
3,241,648
-----------
Finance - 12.3%
American Express Co., Senior
Unsecured Notes
4.38% 07/30/09 890 880,148
American Honda Finance Corp.,
Senior Unsecured Notes
4.50%(f) 05/26/09 2,100 2,090,529
Archstone-Smith Trust Corp., Senior
Unsecured Notes
5.00% 08/15/07 850 859,630
3.00% 06/15/08 925 882,348
ASIF Global Financing, Unsecured
Notes
3.85%(f) 11/26/07 2,945 2,893,639
3.90%(f) 10/22/08 320 313,053
Associates Corp. of North America,
Senior Notes
6.25% 11/01/08 2,000 2,118,334
Berkshire Hathaway Finance Corp.,
Senior Unsecured Notes
3.40%(f) 07/02/07 1,900 1,865,876
4.12% 01/15/10 2,565 2,499,132
Cable and Wireless Optus Finance
Ltd., Unsecured Notes
8.00%(f) 06/22/10 1,425 1,648,668
PAR
MATURITY (000) VALUE
---------- ---------- -------------
CORPORATE BONDS (Continued)
Finance (Continued)
Citigroup, Inc., Senior Unsecured
Notes
5.75% 05/10/06 $ 2,150 $ 2,191,035
5.00% 03/06/07 2,690 2,728,241
Citigroup, Inc., Subordinated Notes
7.75% 06/15/06 3,480 3,630,955
6.38% 11/15/08 1,710 1,819,368
Citigroup, Inc., Unsecured Notes
4.12% 02/22/10 6,585 6,431,109
Diageo Capital PLC, Notes
3.38% 03/20/08 1,860 1,809,490
Eksportfinans ASA, Unsecured Notes
4.38% 07/15/09 6,550 6,525,765
EOP Operating LP, Unsecured Notes
4.65% 10/01/10 765 749,432
4.75% 03/15/14 1,130 1,059,654
Ford Motor Credit Co., Unsecured
Notes
5.70% 01/15/10 3,125 2,943,612
General Electric Capital Corp.,
Unsecured Notes
3.45%(b) 07/16/07 10,785 10,780,806
3.50% 08/15/07 3,820 3,752,233
4.12% 03/04/08 5,315 5,275,334
3.60%(b) 10/15/08 7,370 7,151,693
General Motors Acceptance Corp.,
Senior Unsecured Notes
7.75% 01/19/10 1,185 1,138,188
7.25% 03/02/11 800 742,758
6.88% 09/15/11 2,835 2,570,948
Household Finance Corp., Notes
4.62% 01/15/08 1,940 1,945,067
Household Finance Corp., Senior
Unsecured Notes
7.20% 07/15/06 1,975 2,051,462
5.75% 01/30/07 500 513,197
Household Finance Corp., Unsecured
Notes
4.12% 12/15/08 775 761,639
Lehman Brothers Holdings, Inc.,
Senior Notes
6.62% 02/05/06 625 638,969
MassMutual Global Funding II,
Senior Secured Notes
2.55%(f) 07/15/08 2,535 2,391,914
Nationwide Building Society,
Unsecured Notes
2.62%(f) 01/30/07 1,795 1,748,273
4.25%(f) 02/01/10 1,600 1,568,500
Principal Life Global Funding I,
Unsecured Notes
3.62%(f) 04/30/08 3,600 3,516,948
Prudential Financial, Inc., Senior
Unsecured Notes
3.75% 05/01/08 1,375 1,346,208
Prudential Funding LLC, Senior
Unsecured Notes
6.60%(f) 05/15/08 810 857,944
The Rouse Co., Unsecured Notes
5.38% 11/26/13 1,405 1,344,516
SLM Corp., Senior Unsecured Notes
3.62% 03/17/08 4,200 4,104,517
SEE ACCOMPANYING NOTES TO FINANCIAL STATEMENTS.
46
BLACKROCK FUNDS
STATEMENT OF NET ASSETS
INTERMEDIATE BOND PORTFOLIO (CONTINUED)
AS OF MARCH 31, 2005 (UNAUDITED)
PAR
MATURITY (000) VALUE
---------- ---------- --------------
CORPORATE BONDS (Continued)
Finance (Continued)
SP Power Assets Ltd., Unsecured
Notes
3.80%(f) 10/22/08 $1,925 $ 1,879,435
Swedbank, Capital Securities
7.50%(b)(f) 09/29/49 2,200 2,519,508
TIAA Global Markets, Senior
Unsecured Notes
3.88%(f) 01/22/08 3,000 2,961,537
Washington Mutual Finance Corp.,
Senior Unsecured Notes
6.25% 05/15/06 2,750 2,817,650
============
110,319,262
------------
Food & Agriculture - 1.3%
General Mills, Inc., Senior Unsecured
Notes
6.45% 10/15/06 1,270 1,312,075
5.12% 02/15/07 5,190 5,271,379
Kellogg Co., Unsecured Notes
2.88% 06/01/08 1,125 1,071,919
Kraft Foods, Inc., Senior Unsecured
Notes
4.00% 10/01/08 2,150 2,108,069
Nabisco, Inc., Senior Notes
6.85% 06/15/05 1,485 1,495,024
============
11,258,466
------------
Insurance - 0.9%
Marsh & McLennan Cos., Inc., Senior
Unsecured Notes
2.77% 07/13/07 1,400 1,393,374
Metropolitan Life Global Funding I,
Unsecured Notes
2.60%(f) 06/19/08 1,540 1,457,445
Monumental Global Funding II,
Senior Secured Notes
4.38%(f) 07/30/09 1,075 1,063,100
New York Life Global Funding,
Unsecured Notes
3.88%(f)(g) 01/15/09 2,945 2,883,229
Protective Life Corp. Secured Trust,
Secured Notes
3.70% 11/24/08 1,110 1,075,534
============
7,872,682
------------
Medical & Medical Services - 0.3%
United Health Group, Inc., Unsecured
Notes
3.38% 08/15/07 660 646,302
Wellpoint Health Network, Inc.,
Senior Unsecured Notes
6.38% 06/15/06 1,400 1,435,589
WellPoint, Inc., Unsecured Notes
3.50% 09/01/07 630 618,608
============
2,700,499
------------
Medical Instruments & Supplies - 0.1%
Boston Scientific Corp., Senior
Unsecured Notes
5.45% 06/15/14 625 637,169
------------
Motor Vehicles - 0.2%
Daimler Chrysler N.A. Holding Corp.,
Notes
4.75% 01/15/08 1,225 1,223,456
PAR
MATURITY (000) VALUE
---------- ---------- --------------
CORPORATE BONDS (Continued)
Motor Vehicles (Continued)
General Motors Corp., Senior
Unsecured Notes
7.20%(g) 01/15/11 $2,125 $ 1,908,588
============
3,132,044
------------
Oil & Gas - 2.2%
Anadarko Petroleum Corp., Senior
Unsecured Notes
3.25% 05/01/08 1,600 1,544,074
Atlantic Richfield Co., Debentures
10.88% 07/15/05 2,960 3,023,137
Encana Corp.(Canada), Senior
Unsecured Notes
4.75% 10/15/13 1,410 1,381,180
Encana Corp., Unsecured Notes
4.60% 08/15/09 175 173,995
Occidental Petroleum Corp., Senior
Unsecured Notes
6.75% 01/15/12 980 1,090,701
Ocean Energy, Inc., Senior
Unsecured Notes
4.38% 10/01/07 1,660 1,660,314
Texas Eastern Transmission LLP,
Senior Unsecured Notes
5.25% 07/15/07 1,590 1,616,585
Tosco Corp., Senior Notes
7.62% 05/15/06 2,525 2,621,288
Tosco Corp., Senior Unsecured
Notes
7.25% 01/01/07 805 842,904
Union Pacific Resources, Inc.,
Debentures
7.38% 05/15/06 5,845 6,045,542
============
19,999,720
------------
Pharmaceuticals - 0.9%
CVS Corp., Senior Unsecured Notes
4.00% 09/15/09 1,145 1,117,193
Merck & Co., Inc., Senior Unsecured
Notes
4.38% 02/15/13 1,820 1,752,032
Merck & Co., Inc., Unsecured Notes
4.73%(b)(f) 02/22/06 3,600 3,619,674
2.50% 03/30/07 1,640 1,589,260
============
8,078,159
------------
Real Estate - 1.2%
Avalonbay Communities, Inc., Senior
Unsecured Notes
5.00% 08/01/07 1,380 1,393,552
6.12% 11/01/12 760 797,316
CarrAmerica Realty, Corp., Senior
Unsecured Notes
5.12% 09/01/11 1,265 1,254,437
EOP Operating LP, Senior Unsecured
Notes
6.95% 03/02/11 2,820 3,084,978
The Rouse Co., Unsecured Notes
3.62% 03/15/09 600 561,353
Simon Property Group LP, Senior
Unsecured Notes
5.45% 03/15/13 940 941,307
SEE ACCOMPANYING NOTES TO FINANCIAL STATEMENTS.
47
BLACKROCK FUNDS
STATEMENT OF NET ASSETS
INTERMEDIATE BOND PORTFOLIO (CONTINUED)
AS OF MARCH 31, 2005 (UNAUDITED)
PAR
MATURITY (000) VALUE
-------------- ---------- --------------
CORPORATE BONDS (Continued)
Real Estate (Continued)
Simon Property Group, Inc.,
Unsecured Notes
3.75% 01/30/09 $ 2,550 $ 2,447,380
============
10,480,323
------------
Retail Merchandising - 0.5%
Federated Department Stores, Inc.,
Senior Unsecured Notes
6.62% 09/01/08 1,900 2,000,949
Kroger Co., Senior Unsecured Notes
6.80% 04/01/11 1,945 2,108,565
============
4,109,514
------------
Telecommunications - 2.8%
AT&T Broadband Corp., Unsecured
Notes
8.38% 03/15/13 1,775 2,109,114
Comcast Cable Communications
Corp., Senior Notes
8.38% 11/05-05/07 2,440 2,514,674
Comcast Cable Communications
Corp., Senior Unsecured Notes
5.50% 03/15/11 190 193,977
Continental Cablevision, Inc., Senior
Notes
8.30% 05/15/06 1,050 1,091,033
Lenfest Communications, Inc., Senior
Notes
7.62% 02/15/08 1,815 1,939,781
Qwest Corp., Senior Unsecured
Notes
8.88%(f) 03/15/12 340 370,600
SBC Communications, Inc., Senior
Unsecured Notes
5.88% 02/01/12 1,285 1,339,715
SBC Communications, Inc.,
Unsecured Notes
4.12% 09/15/09 1,900 1,847,984
5.10% 09/15/14 1,000 988,319
Sprint Capital Corp.
7.62% 01/30/11 1,125 1,252,250
TCI Communications, Inc., Senior
Debentures
8.75% 08/01/15 965 1,206,789
Telus Corp., Senior Unsecured Notes
7.50% 06/01/07 2,100 2,231,565
Verizon New Jersey, Inc., Senior
Debentures
5.88% 01/17/12 5,015 5,192,180
Vodafone Group PLC, Senior
Unsecured Notes
3.95% 01/30/08 2,595 2,564,156
7.75% 02/15/10 280 316,238
============
25,158,375
------------
Transportation - 0.5%
Burlington Northern Santa Fe Corp.,
Senior Unsecured Notes
7.88% 04/15/07 4,500 4,807,620
------------
Yankee - 2.3%
Canadian National Railway Co.,
Senior Unsecured Notes
4.25% 08/01/09 2,075 2,049,166
PAR
MATURITY (000) VALUE
-------------- ---------- --------------
CORPORATE BONDS (Continued)
Yankee (Continued)
Deutsche Telekom International
Finance BV, Senior Unsecured
Notes
8.25% 06/15/05 $ 2,415 $ 2,436,928
Province of British Columbia
5.38% 10/29/08 2,340 2,424,163
Province of Quebec, Unsecured
Notes
5.75% 02/15/09 1,355 1,415,018
5.00% 07/17/09 1,740 1,771,670
Telecom Italia Capital (Luxembourg),
Senior Unsecured Notes
4.95%(f) 09/30/14 1,250 1,197,382
Telefonica Europe BV, Senior
Unsecured Notes
7.75% 09/15/10 2,775 3,147,977
United Mexican States, Unsecured
Notes
10.38% 02/17/09 4,850 5,732,700
============
20,175,004
------------
TOTAL CORPORATE BONDS
(Cost $355,601,418)
354,113,685
------------
TAXABLE MUNICIPAL BONDS - 1.3%
Elmhurst, Illinois Sales Tax Revenue
Bonds, Series 98
5.62% 05/15/10 250 254,252
Oregon School Board Taxable
Pension Deferred Interest Bonds,
Series A
1.00% 06/30/07 2,700 2,452,302
Port Authority of New York & New
Jersey Revenue Notes, Series 04,
Class XX
3.30% 09/15/07 4,200 4,108,230
Sales Tax Asset Receivable Corp.
Revenue Bonds, Series 04, Class
B
3.83% 10/15/09 1,280 1,246,746
Texas Public Finance Authority
Taxable Revenue Bonds, Series 03
3.12% 06/15/07 2,020 1,976,913
Wisconsin General Revenue Bonds,
Series 03, Class A
4.80% 05/01/13 1,910 1,903,621
============
TOTAL TAXABLE MUNICIPAL BONDS
(Cost $12,036,737) 11,942,064
------------
SHORT TERM INVESTMENTS - 7.7%
Federal Home Loan Bank, Discount
Notes
2.55% 04/01/05 55,200 55,200,000
Galileo Money Market Fund
10,619 10,618,882
Institutional Money Market Trust(h)
3,341 3,340,800
============
TOTAL SHORT TERM INVESTMENTS
(Cost $69,159,682)
69,159,682
------------
TOTAL INVESTMENTS IN SECURITIES -
107.8%
(Cost $972,511,633(a)) 965,961,880
SEE ACCOMPANYING NOTES TO FINANCIAL STATEMENTS.
48
BLACKROCK FUNDS
STATEMENT OF NET ASSETS
INTERMEDIATE BOND PORTFOLIO (CONTINUED)
AS OF MARCH 31, 2005 (UNAUDITED)
NUMBER OF
CONTRACTS VALUE
----------------- -------------
CALL OPTIONS WRITTEN -
Federal National
Mortgage
Association 30Yr
5.5%, Strike
Price 101.718750,
Expires
04/06/05
(Premiums received (2,285) $ (2)
----------
$61,588)
CALL SWAPTIONS WRITTEN - (0.1)%
Citibank, Strike Price
5.67, Expires
01/04/10
(Premiums received (1,250) (656,250)
----------
$642,500)
PUT SWAPTIONS WRITTEN - 0.0%
Citibank, Strike Price
5.67, Expires
01/04/10 (1,250)(i) (512,000)
Goldman Sachs, Strike
Price 5.50,
Expires 08/26/05 (1,730)(i) (119,750)
Union Bank of
Switzerland, Strike
Price 5.75, Expires (5,200)(i) (80,600)
09/23/05
==========
TOTAL PUT SWAPTIONS WRITTEN
(Premiums received (712,350)
----------
$1,927,262)
LIABILITIES IN EXCESS OF OTHER
ASSETS - (7.8)% (69,785,274)
-----------
(including $96,485,916 of payable for
financing transactions and
$3,340,800 of payable upon return of
securities loaned)
NET ASSETS - 100.0%
(Applicable to 46,248,297 BlackRock
shares, 33,826,246 Institutional
shares, 10,218,233 Service shares,
3,167,588 Investor A shares,
1,264,699 Investor B shares and
1,282,219 Investor C shares
outstanding) $ 894,808,004
=============
VALUE
----------
NET ASSET VALUE, OFFERING
AND REDEMPTION PRICE PER
BLACKROCK SHARE
($431,071,093/46,248,297) $ 9.32
======
NET ASSET VALUE, OFFERING
AND REDEMPTION PRICE PER
INSTITUTIONAL SHARE
($315,224,678/33,826,246) $ 9.32
======
NET ASSET VALUE, OFFERING
AND REDEMPTION PRICE PER
SERVICE SHARE
($95,251,905/10,218,233) $ 9.32
======
NET ASSET VALUE AND
REDEMPTION PRICE PER
INVESTOR A SHARE
($29,514,418/3,167,588) $ 9.32
======
MAXIMUM OFFERING PRICE
PER INVESTOR A SHARE
($9.32/0.960) $ 9.71
======
NET ASSET VALUE, OFFERING
AND REDEMPTION PRICE
(subject to a maximum contingent
deferred sales charge of 4.5%)
PER INVESTOR B SHARE
($11,786,999/1,264,699) $ 9.32
======
NET ASSET VALUE, OFFERING
AND REDEMPTION PRICE
(subject to a maximum contingent
deferred sales charge of 4.5%)
PER INVESTOR C SHARE
($11,958,911/1,282,219) $ 9.33
======
SEE ACCOMPANYING NOTES TO FINANCIAL STATEMENTS.
49
BLACKROCK FUNDS
STATEMENT OF NET ASSETS
INTERMEDIATE BOND PORTFOLIO (CONCLUDED)
AS OF MARCH 31, 2005 (UNAUDITED)
- -------------------
(a) Cost for Federal income tax purposes is $973,684,014. The
gross unrealized appreciation (depreciation) on a tax basis is as
follows:
Gross unrealized appreciation $ 5,422,030
Gross unrealized depreciation (13,144,164)
-----------
$(7,722,134)
===========
(b) Rates shown are the rates as of March 31, 2005.
(c) Securities, or a portion thereof, pledged as collateral with a value of
$1,848,902 on 343 long U.S. Treasury Note futures contracts, 4 short
U.S. Treasury Bond futures contracts and 1,064 short U.S. Treasury Note
futures contracts expiring June 2005. The value of such contracts on
March 31, 2005 was $147,282,205, with an unrealized gain of $805,947
(including commissions of 2,695).
(d) Securities, or a portion thereof, subject to financing transactions.
(e) Rates shown are the effective yields as of March 31, 2005.
(f) Security exempt from registration under Rule 144A of the Securities Act
of 1933. These securities may be resold in transactions exempt from
registration to qualified institutional investors. As of March 31, 2005,
the Portfolio held 5.3% of its net assets, with a current market value
of $47,180,025 in securities restricted as to resale.
(g) Total or partial securities on loan.
(h) Securities purchased with the cash proceeds from securities loaned.
(i) Each swaption contract is equivalent to $10,000 in notional amount.
SEE ACCOMPANYING NOTES TO FINANCIAL STATEMENTS.
50
BLACKROCK FUNDS
STATEMENT OF NET ASSETS
INTERMEDIATE PLUS BOND PORTFOLIO
AS OF MARCH 31, 2005 (UNAUDITED)
NUMBER
OF SHARES VALUE
----------- ----------
PREFERRED STOCKS - 0.2%
Raytheon Co. Trust I, 7.00%
(Cost $42,375) 800 $41,970
-------
PAR
MATURITY (000)
-------------- --------
U.S. GOVERNMENT & AGENCY OBLIGATIONS - 23.2%
Federal Home Loan Mortgage Corp.,
Unsecured Notes
3.01% 04/19/07 $ 275 269,756
3.88% 11/10/08 225 221,391
5.00% 10/27/14 100 98,416
Federal National Mortgage
Association, Unsecured Notes
2.15% 04/13/06 300 295,103
2.74% 05/05/06 225 222,471
1.75% 06/16/06 125 121,972
2.71% 01/30/07 250 244,410
4.75% 02/21/13 200 196,167
Small Business Administration
Participation Certificates,
Series
96-20E, Class 1
7.60% 05/01/16 135 143,481
U.S. Treasury Bonds
10.00% 05/15/10 150 151,254
10.38%(b) 11/15/12 205 237,497
U.S. Treasury Notes
3.38% 02/07-02/08 910 897,966
4.00% 03/10-02/15 770 759,902
4.25% 08/14-11/14 1,280 1,254,607
=========
TOTAL U.S. GOVERNMENT & AGENCY
OBLIGATIONS
(Cost $5,183,352) 5,114,393
---------
MORTGAGE PASS-THROUGHS - 26.4%
Federal Home Loan Mortgage Corp.
5.50% 03/15/34 230 233,465
Federal Home Loan Mortgage Corp.
ARM
3.75%(c) 08/01/29 62 63,698
3.35%(c) 07/01/34 319 314,789
Federal Home Loan Mortgage Corp.
Gold
4.50% 03/01/10 57 57,016
6.00% 04/17-05/17 0 2
5.00% 04/15/34 200 195,625
Federal Home Loan Mortgage Corp.
Gold ARM
4.02%(c) 03/01/34 174 171,818
Federal National Mortgage
Association
6.00% 09/10-04/35 241 247,484
4.50% 04/20/19 300 293,250
5.00% 04/19-04/35 700 688,562
5.50% 04/20-04/34 1,100 1,110,125
6.50% 04/13/35 1,000 1,037,500
Federal National Mortgage
Association ARM
4.18%(c) 10/01/33 369 368,146
4.32%(c) 12/01/33 240 237,834
4.30%(c) 01/01/34 314 310,246
4.02%(c) 04/01/34 486 480,872
=========
TOTAL MORTGAGE PASS-THROUGHS
(Cost $5,853,889) 5,810,432
---------
PAR
MATURITY (000) VALUE
---------- -------- -----------
MULTIPLE CLASS MORTGAGE PASS-THROUGHS - 2.5%
Federal Home Loan Mortgage Corp.,
Series 2927, Class BA
5.50% 12/31/49 $ 110 $111,669
Federal National Mortgage
Association, Series 04-25, Class
PA
5.50% 10/25/30 222 227,434
Federal National Mortgage
Association, Series 04-36, Class
BS
5.50% 11/25/30 180 184,257
Structured Asset Securities Corp.,
Series 96-CFL, Class X1 (IO)
1.97%(d) 02/25/28 421 21,580
========
TOTAL MULTIPLE CLASS MORTGAGE
PASS-THROUGHS
(Cost $563,030) 544,940
--------
COMMERCIAL MORTGAGE BACKED SECURITIES - 18.1%
Banc of America Commercial
Mortgage, Inc., Series 02-2, Class
A3
5.12% 07/11/43 130 131,576
Bear Stearns Commercial Mortgage
Securities, Inc., Series 00-WF2,
Class A2
7.32% 10/15/32 110 122,374
Bear Stearns Commerical Mortgage
Securities Corp. II, Series
05-PWR7, Class A2
4.94% 02/11/41 140 139,911
Bear Stearns Mortgage Trust, Series
04-13, Class A1
3.22%(c) 11/25/34 283 283,740
Chase Commercial Mortgage
Securities Corp., Series 97-1,
Class X (IO)
1.41%(d) 04/19/15 2,794 73,493
Chase Commercial Mortgage
Securities Corp., Series 00-3,
Class A2
7.32% 10/15/32 130 144,837
Countrywide Alternative Loan Trust,
Series 04-2CB, Class 4A1
5.00% 03/25/19 1 1,102
Countrywide Home Loans, Series
04-29, Class 1A1
2.92%(c) 02/25/35 224 225,419
Credit Suisse First Boston Mortgage
Securities Corp., Series 97-C1,
Class AX (IO)
1.74%(d) 06/20/29 2,459 113,774
Credit Suisse First Boston Mortgage
Securities Corp., Series 97-C2,
Class AX (IO)
1.16%(d) 01/17/35 719 19,117
Credit Suisse First Boston Mortgage
Securities Corp., Series 00-C1,
Class A1
7.32% 04/15/42 160 169,418
Donaldson, Lufkin and Jenrette, Inc.
Commercial Mortgage Corp.,
Series 00-CKP1, Class A1B
7.18% 08/10/10 100 110,586
SEE ACCOMPANYING NOTES TO FINANCIAL STATEMENTS.
51
BLACKROCK FUNDS
STATEMENT OF NET ASSETS
INTERMEDIATE PLUS BOND PORTFOLIO (CONTINUED)
AS OF MARCH 31, 2005 (UNAUDITED)
PAR
MATURITY (000) VALUE
---------- ---------- ------------
COMMERCIAL MORTGAGE BACKED SECURITIES (Continued)
Donaldson, Lufkin and Jenrette, Inc.
Commerical Mortgage Corp.,
Series 98-CF1, Class A1B
6.41% 02/18/31 $ 200 $ 209,655
General Electric Capital Commercial
Mortgage Corp., Series 05-C1,
Class A3
4.58% 06/10/48 130 127,334
General Motors Acceptance Corp.
Commercial Mortgage Securities,
Inc., Series 97-C1, Class X (IO)
1.56%(d) 07/15/27 1,833 71,716
General Motors Acceptance Corp.
Commercial Mortgage Securities,
Inc., Series 99-C2, Class A2
6.94% 09/15/33 100 107,973
General Motors Acceptance Corp.
Commercial Mortgage Securities,
Inc., Series 99-C3, Class A2
7.18% 08/15/36 122 133,339
General Motors Acceptance Corp.
Commercial Mortgage Securities,
Inc., Series 00-C2, Class A2
7.46% 08/16/33 115 128,186
GSR Mortgage Loan Trust, Series
03-13, Class 1A1
4.51%(c) 10/25/33 213 206,697
Lehman Brothers-UBS Commercial
Mortgage Trust, Series 00-C3,
Class A2
7.95% 05/15/25 140 158,459
Lehman Brothers-UBS Commercial
Mortgage Trust, Series 01-C2,
Class A2
6.65% 11/15/27 150 164,194
Lehman Brothers-UBS Commercial
Mortgage Trust, Series 03-C7,
Class A3
4.56%(c) 09/15/27 110 108,646
Lehman Brothers-UBS Commercial
Mortgage Trust, Series 05-C1,
Class A3
4.54% 12/15/49 150 146,445
Morgan Stanley Capital I Inc., Series
97-HF1, Class X
4.76%(c) 07/15/29 479 11,553
Morgan Stanley Capital I Inc., Series
03-T11, Class A2
4.34% 06/13/41 80 78,829
MortgageIT Trust, Series 04-1, Class
A1
3.24%(c) 11/25/34 364 364,825
Structured Mortgage Loan Trust,
Series 04-13, Class A2
3.15%(c) 09/25/34 183 183,180
Wells Fargo Mortgage Backed
Securities Trust, Series 04-5, Class
A1
4.53%(c) 04/01/34 214 212,497
==========
TOTAL COMMERCIAL MORTGAGE BACKED
SECURITIES
(Cost $4,010,235) 3,948,875
----------
ASSET BACKED SECURITIES - 7.9%
Capital Auto Receivables Asset Trust,
Series 04-2, Class A4
3.75% 07/15/09 225 220,693
PAR
MATURITY (000) VALUE
---------- ---------- ------------
ASSET BACKED SECURITIES (Continued)
Chase Issuance Trust, Series 04-A9,
Class A9
3.22% 06/15/10 $ 175 $ 170,886
Citibank Credit Card Issuance Trust,
Series 03-A3, Class A3
3.10% 03/10/10 125 120,918
Citibank Credit Card Issuance Trust,
Series 04, Class A1
2.55% 01/20/09 225 218,927
Discover Card Master Trust I, Series
01-2, Class A
2.97%(c) 07/15/08 250 250,255
Green Tree Financial Corp., Series
99-2, Class A3
6.08% 12/01/30 114 115,902
MBNA Credit Card Master Note
Trust, Series 04-A4, Class A4
2.70% 09/15/09 175 170,270
Nissan Auto Receivables Owner
Trust, Series 03-C, Class A3
2.23% 03/15/07 225 223,732
Standard Credit Card Master Trust I,
Series 94-2, Class A
7.25% 04/07/06 235 242,871
==========
TOTAL ASSET BACKED SECURITIES
(Cost $1,756,386) 1,734,454
----------
CORPORATE BONDS - 24.3%
Aerospace - 0.2%
BE Aerospace, Inc., Senior Notes
8.50% 10/01/10 5 5,450
Northrop Grumman Corp., Senior
Unsecured Notes
4.08% 11/16/06 35 34,964
Raytheon Co., Senior Unsecured
Notes
4.50% 11/15/07 7 7,002
==========
47,416
----------
Banks - 6.5%
Bank of America Corp., Senior
Unsecured Notes
5.25% 02/01/07 75 76,420
3.25% 08/15/08 75 72,221
Bank of America Corp., Subordinated
Notes
7.80% 02/15/10 5 5,660
Bank of Scotland Treasury Services,
Unsecured Notes
3.50%(e) 11/30/07 30 29,383
Bank One N.A., Senior Bank Notes
5.50% 03/26/07 50 51,264
Depfa ACS Bank, Senior Notes
3.62% 10/29/08 50 49,400
Firstar Bank N.A., Subordinated
Notes
7.80% 07/05/10 25 25,277
J.P. Morgan Chase & Co.,
Subordinated Notes
7.12% 06/15/09 25 27,232
Landeskreditbank
Baden-Wurttemberg-Forderbank,
Unsecured Notes
3.42% 07/27/06 575 570,986
SEE ACCOMPANYING NOTES TO FINANCIAL STATEMENTS.
52
BLACKROCK FUNDS
STATEMENT OF NET ASSETS
INTERMEDIATE PLUS BOND PORTFOLIO (CONTINUED)
AS OF MARCH 31, 2005 (UNAUDITED)
PAR
MATURITY (000) VALUE
---------- ---------- ------------
CORPORATE BONDS (Continued)
Banks (Continued)
SunTrust Bank, Inc., Senior
Unsecured Notes
3.62% 10/15/07 $ 70 $ 68,840
4.00% 10/15/08 40 39,481
Swedish Export Credit Corp.,
Unsecured Notes
3.50% 01/15/08 75 73,541
U.S. Bancorp, Senior Unsecured
Notes
3.95% 08/23/07 115 114,342
UBS Preferred Funding Trust I,
Capital Securities
8.62%(c) 10/29/49 10 11,796
Wachovia Corp., Senior Notes
3.50% 08/15/08 15 14,563
Wells Fargo & Co., Senior Unsecured
Notes
5.90% 05/21/06 100 102,123
4.20% 01/15/10 100 97,794
==========
1,430,323
----------
Broadcasting - 0.4%
Charter Communications Holdings
LLC, Senior Unsecured Notes
10.75% 10/01/09 30 24,524
Charter Communications Holdings
LLC, Unsecured Notes
10.25% 09/15/10 45 46,238
Cox Communications, Inc., Senior
Unsecured Notes
7.12% 10/01/12 25 27,265
==========
98,027
----------
Construction - 0.2%
D.R. Horton, Inc., Senior Unsecured
Notes
7.88% 08/15/11 10 10,926
International Steel Group, Inc.,
Senior Unsecured Notes
6.50% 04/15/14 15 15,299
Ryland Group, Inc., Senior
Unsecured Notes
8.00% 08/15/06 10 10,491
==========
36,716
----------
Energy & Utilities - 1.6%
AES Corp., Senior Secured Notes
8.75%(e) 05/15/13 10 10,850
Dominion Resources, Inc., Senior
Unsecured Notes
7.20% 09/15/14 40 45,364
Exelon Generation Corp., Senior
Unsecured Notes
6.75% 05/01/11 10 10,881
Midwest Generation LLC, Senior
Secured Notes
8.75% 05/01/34 35 39,025
National Waterworks, Inc., Senior
Subordinated Notes, Series B
10.50% 12/01/12 5 5,561
Nisource Finance Corp., Unsecured
Notes
3.43%(c) 11/23/09 75 75,523
PAR
MATURITY (000) VALUE
---------- ---------- ------------
CORPORATE BONDS (Continued)
Energy & Utilities (Continued)
Progress Energy, Inc., Senior
Unsecured Notes
7.10% 03/01/11 $ 25 $ 27,457
Reliant Energy, Inc., Senior Secured
Notes
6.75% 12/15/14 5 4,650
Scottish Power PLC, Unsecured
Notes
4.91% 03/15/10 25 25,004
Texas Genco LLC, Senior Unsecured
Notes
6.88%(e) 12/15/14 10 10,000
Transcontinental Gas Pipe Line
Corp., Senior Notes
8.88% 07/15/12 5 5,875
TXU Corp., Senior Unsecured Notes
4.80%(e) 11/15/09 100 96,877
==========
357,067
----------
Entertainment & Leisure - 0.1%
MGM Mirage, Inc., Senior Notes
6.00% 10/01/09 5 4,931
TCI Communications, Inc., Senior
Debentures
7.88% 08/01/13 5 5,803
Turner Broadcasting Corp., Senior
Notes
8.38% 07/01/13 15 17,862
==========
28,596
----------
Finance - 6.8%
Archstone-Smith Trust, Senior
Unsecured Notes
5.62% 08/15/14 25 25,375
ASIF Global Financing, Unsecured
Notes
3.90%(e) 10/22/08 45 44,023
Berkshire Hathaway Finance Corp.,
Senior Unsecured Notes
4.12%(e) 01/15/10 80 77,946
Citigroup, Inc., Senior Unsecured
Notes
6.20% 03/15/09 35 36,912
Citigroup, Inc., Subordinated Notes
6.38% 11/15/08 30 31,919
Citigroup, Inc., Unsecured Notes
4.12% 02/22/10 230 224,625
Eksportfinans ASA, Unsecured Notes
4.38% 07/15/09 20 19,926
EOP Operating LP, Unsecured Notes
4.75% 03/15/14 15 14,066
Ford Motor Credit Co., Unsecured
Notes
5.70% 01/15/10 50 47,098
General Electric Capital Corp.,
Unsecured Notes
3.45% 07/16/07 425 425,394
3.50% 08/15/07 50 49,113
3.60% 10/15/08 10 9,704
4.38% 11/21/11 10 9,764
SEE ACCOMPANYING NOTES TO FINANCIAL STATEMENTS.
53
BLACKROCK FUNDS
STATEMENT OF NET ASSETS
INTERMEDIATE PLUS BOND PORTFOLIO (CONTINUED)
AS OF MARCH 31, 2005 (UNAUDITED)
PAR
MATURITY (000) VALUE
---------- ---------- ------------
CORPORATE BONDS (Continued)
Finance (Continued)
General Motors Acceptance Corp.,
Senior Unsecured Notes
7.75% 01/19/10 $ 40 $ 38,420
Household Finance Corp., Senior
Notes
6.45% 02/01/09 20 21,188
MassMutual Global Funding II,
Senior Secured Notes
2.55%(e) 07/15/08 35 33,023
Nationwide Building Society, Senior
Unsecured Notes
3.50%(e) 07/31/07 50 49,057
Nationwide Building Society,
Unsecured Notes
4.25%(e) 02/01/10 25 24,508
Principal Life Global Funding I,
Unsecured Notes
3.62%(e) 04/30/08 90 87,924
Prudential Funding LLC, Senior
Unsecured Notes
6.60%(e) 05/15/08 25 26,480
Refco Finance Holdings LLC, Senior
Subordinated Notes
9.00%(e) 08/01/12 10 10,750
The Rouse Co., Unsecured Notes
5.38% 11/26/13 30 28,709
SLM Corp., Senior Unsecured Notes
3.62% 03/17/08 100 97,727
2.91%(c) 07/25/08 15 15,033
TIAA Global Markets, Senior
Unsecured Notes
3.88%(e) 01/22/08 45 44,423
==========
1,493,107
----------
Food & Agriculture - 0.1%
General Mills, Inc., Senior Unsecured
Notes
5.12% 02/15/07 20 20,314
----------
Industrial - 0.1%
Osprey Trust / Osprey I, Inc., Senior
Secured Notes
7.80%(d)(e)(f)(g) 01/15/49 50 21,000
----------
Insurance - 0.4%
Marsh & McLennan Cos., Inc., Senior
Unsecured Notes
2.77% 07/13/07 40 39,811
New York Life Global Funding,
Unsecured Notes
3.88%(e) 01/15/09 45 44,056
==========
83,867
----------
Manufacturing - 0.3%
Briggs & Stratton Corp., Senior
Unsecured Notes
8.88% 03/15/11 20 23,150
Ispat Inland ULC, Senior Secured
Notes
9.75% 04/01/14 7 8,190
Lockheed Martin Tactical Systems,
Inc., Senior Debentures
7.00% 09/15/23 30 34,134
==========
65,474
----------
PAR
MATURITY (000) VALUE
---------- ---------- ------------
CORPORATE BONDS (Continued)
Medical & Medical Services - 0.3%
Bio-Rad Laboratories, Inc., Senior
Subordinated Notes
6.12%(e) 12/15/14 $ 10 $ 9,799
United Health Group, Inc., Unsecured
Notes
3.38% 08/15/07 20 19,585
Wellpoint Health Network, Inc.,
Senior Unsecured Notes
6.38% 06/15/06 25 25,636
==========
55,020
----------
Medical Instruments & Supplies - 0.1%
Boston Scientific Corp., Senior
Unsecured Notes
5.45% 06/15/14 15 15,292
----------
Metal & Mining - 0.0%
TRIMAS Corp., Senior Subordinated
Notes
9.88% 06/15/12 5 5,075
----------
Motor Vehicles - 0.3%
Daimler Chrysler N.A. Holding Corp.,
Notes
4.75% 01/15/08 25 24,968
General Motors Corp., Senior
Unsecured Notes
7.20% 01/15/11 50 44,908
==========
69,876
----------
Oil & Gas - 0.5%
Devon Financing Corp., Senior
Unsecured Notes
6.88% 09/30/11 35 38,536
El Paso Production Holding Co.,
Senior Notes
7.75% 06/01/13 10 10,100
OAO Gazprom, Unsecured Notes
9.62% 03/01/13 40 45,764
The Williams Cos., Inc., Senior
Unsecured Notes
7.12% 09/01/11 10 10,400
==========
104,800
----------
Pharmaceuticals - 1.4%
Elan Finance Corp., Unsecured
Notes
7.75%(e) 11/15/11 10 7,500
Merck & Co., Inc., Senior Unsecured
Notes
5.25% 07/01/06 25 25,332
Merck & Co., Inc., Unsecured Notes
4.73%(c)(e) 02/22/06 250 251,366
2.50% 03/30/07 25 24,227
==========
308,425
----------
Publishing & Printing - 0.2%
News America, Inc., Senior
Unsecured Notes
5.30%(e) 12/15/14 50 49,112
----------
Railroad & Shipping - 0.2%
Burlington Northern Santa Fe Corp.,
Debentures
7.29% 06/01/36 40 48,760
----------
SEE ACCOMPANYING NOTES TO FINANCIAL STATEMENTS.
54
BLACKROCK FUNDS
STATEMENT OF NET ASSETS
INTERMEDIATE PLUS BOND PORTFOLIO (CONTINUED)
AS OF MARCH 31, 2005 (UNAUDITED)
PAR
MATURITY (000) VALUE
---------- ---------- ------------
CORPORATE BONDS (Continued)
Real Estate - 0.5%
Avalonbay Communities, Inc., Senior
Unsecured Notes
6.12% 11/01/12 $ 20 $ 20,982
ERP Operating LP, Unsecured Notes
5.20% 04/01/13 55 54,835
The Rouse Co., Unsecured Notes
3.62% 03/15/09 40 37,424
==========
113,241
----------
Retail Merchandising - 0.1%
Federated Department Stores, Inc.,
Senior Unsecured Notes
6.30% 04/01/09 20 20,908
----------
Semiconductors & Related Devices - 0.0%
Freescale Semiconductor, Inc.,
Senior Unsecured Notes
5.41% 07/15/09 5 5,138
Magnachip Semiconductor, Senior
Secured Notes
6.26%(c)(e) 12/15/11 5 5,124
==========
10,262
----------
Telecommunications - 1.8%
AT&T Broadband Corp., Unsecured
Notes
8.38% 03/15/13 100 118,823
Cincinnati Bell, Inc., Senior
Subordinated Notes
8.38% 01/15/14 10 9,850
Comcast Cable Communications
Corp., Senior Unsecured Notes
6.38% 01/30/06 5 5,096
5.50% 03/15/11 10 10,209
Intelsat Bermuda Ltd., Senior
Unsecured Notes
7.80%(c)(e) 01/15/12 5 5,075
8.25%(e) 01/15/13 5 5,012
SBC Communications, Inc.,
Unsecured Notes
4.12% 09/15/09 125 121,578
Verizon New Jersey, Inc., Senior
Debentures
5.88% 01/17/12 70 72,473
Vodafone Group PLC, Senior
Unsecured Notes
7.75% 02/15/10 35 39,531
==========
387,647
----------
Transportation - 0.1%
Overseas Shipholding Group, Inc.,
Senior Unsecured Notes
7.50% 02/15/24 15 15,075
----------
Waste Management - 0.2%
Allied Waste N.A., Inc., Senior Notes
8.88% 04/01/08 15 15,506
Allied Waste N.A., Inc., Senior
Secured Notes
8.50% 12/01/08 25 25,875
Allied Waste N.A., Inc., Senior
Unsecured Notes
9.25% 09/01/12 5 5,350
==========
46,731
----------
PAR
MATURITY (000) VALUE
---------- ---------- ------------
CORPORATE BONDS (Continued)
Yankee - 1.9%
Canadian National Railway Co.,
Senior Unsecured Notes
4.25% 08/01/09 $ 40 $ 39,502
Omi Corp. (Mali), Senior Notes
7.62% 12/01/13 5 5,200
Republic of Argentina, Bonds
3.01%(c) 08/03/12 60 50,160
Republic of Colombia, Senior
Unsecured Notes
9.75% 04/09/11 90 99,190
Telecom Italia Capital (Luxembourg),
Senior Unsecured Notes
4.95%(e) 09/30/14 25 23,948
Telefonica Europe BV, Senior
Unsecured Notes
7.75% 09/15/10 115 130,457
Tyco International Group SA
(Luxembourg), Senior Unsecured
Notes
6.12% 11/01/08 25 26,301
United Mexican States, Bonds
8.12% 12/30/19 20 23,000
United Mexican States, Unsecured
Notes
4.62% 10/08/08 25 24,675
==========
422,433
----------
TOTAL CORPORATE BONDS
(Cost $5,418,118)
5,354,564
----------
FOREIGN BONDS - 2.3%
Bundesrepublic Deutschland (EUR)
4.75% 07/04/34 25 35,970
4.00% 01/04/37 50 63,816
Government of New Zealand (NZD)
6.00% 11/15/11 590 415,138
==========
TOTAL FOREIGN BONDS
(Cost $523,478) 514,924
----------
TAXABLE MUNICIPAL BONDS - 0.9%
Port Authority of New York & New
Jersey Revenue Notes, Series 04,
Class XX
3.30% 09/15/07 125 122,269
Sales Tax Asset Receivable Corp.
Revenue Bonds, Series 04, Class
B
3.60% 10/15/08 35 34,217
Wisconsin General Revenue Bonds,
Series 03, Class A
4.80% 05/01/13 50 49,832
==========
TOTAL TAXABLE MUNICIPAL BONDS
(Cost $210,142) 206,318
----------
SHORT TERM INVESTMENTS - 22.7%
Federal Home Loan Bank, Discount
Notes
2.55%
(Cost $5,000,000) 04/01/05 5,000 5,000,000
----------
SEE ACCOMPANYING NOTES TO FINANCIAL STATEMENTS.
55
BLACKROCK FUNDS
STATEMENT OF NET ASSETS
INTERMEDIATE PLUS BOND PORTFOLIO (CONTINUED)
AS OF MARCH 31, 2005 (UNAUDITED)
VALUE
--------------
TOTAL INVESTMENTS IN SECURITIES - 128.5%
(Cost $28,561,005(a)) $28,270,870
NUMBER OF
CONTRACTS
--------------
CALL OPTIONS WRITTEN - 0.0%
Deutsche Bank, Strike
Price 5.50,
Expires 04/06/05 (35) (27)
Federal National
Mortgage
Association 30Yr
5.5%, Strike
Price 101.718750,
Expires
04/06/05 (65) 0
===
TOTAL CALL OPTIONS WRITTEN
(Premiums received (27)
---
$2,627)
CALL SWAPTIONS WRITTEN - 0.0%
Citibank, Strike Price
5.67, Expires
01/04/10
(Premiums received (40)(h) (21,000)
-------
$20,560)
PUT OPTIONS WRITTEN - 0.0%
Chase Securities,
Strike Price 5.05,
Expires 07/18/05
(Premiums received (200) (16,987)
-------
$12,670)
PUT SWAPTIONS WRITTEN - 0.0%
Citibank, Strike Price
5.67, Expires
01/04/10 (40)(h) (16,384)
Goldman Sachs, Strike
Price 5.50,
Expires 08/26/05 (50)(h) (3,461)
=======
TOTAL PUT SWAPTIONS WRITTEN
(Premiums received (19,845)
-------
$25,004)
VALUE
----------------
LIABILITIES IN EXCESS OF
OTHER
ASSETS - (28.5)%
(including $6,735,986 of
payable for
investments purchased) $ (6,271,902)
------------
NET ASSETS - 100.0%
(Applicable to 2,229,352
BlackRock
shares, 10 Institutional
shares, 10
Service shares, 1,940
Investor A
shares, 10 Investor B
shares and 10
Investor C shares $ 21,941,109
============
outstanding)
NET ASSET VALUE, OFFERING AND
REDEMPTION PRICE PER
BLACKROCK SHARE
($21,921,358/2,229,352) $ 9.83
=======
NET ASSET VALUE, OFFERING
AND REDEMPTION PRICE PER
INSTITUTIONAL SHARE
($100/10)(i) $ 10.01
=======
NET ASSET VALUE, OFFERING
AND REDEMPTION PRICE PER
SERVICE SHARE
($104/10)(j) $ 10.40
=======
NET ASSET VALUE AND REDEMPTION
PRICE PER INVESTOR A SHARE
($19,347/1,940) $ 9.97
=======
MAXIMUM OFFERING PRICE PER
INVESTOR A SHARE
($9.97/0.960) $ 10.39
=======
NET ASSET VALUE, OFFERING
AND REDEMPTION PRICE
(subject to a maximum contingent
deferred sales charge of 4.5%)
PER INVESTOR B SHARE
($100/10)(k) $ 9.98
=======
NET ASSET VALUE, OFFERING
AND REDEMPTION PRICE
(subject to a maximum contingent
deferred sales charge of 1.0%)
PER INVESTOR C SHARE
($100/10)(k) $ 9.98
=======
SEE ACCOMPANYING NOTES TO FINANCIAL STATEMENTS.
56
BLACKROCK FUNDS
STATEMENT OF NET ASSETS
INTERMEDIATE PLUS BOND PORTFOLIO (CONCLUDED)
AS OF MARCH 31, 2005 (UNAUDITED)
- -------------------
(a) Cost for Federal income tax purposes is $28,569,416. The gross
unrealized appreciation (depreciation) on a tax basis is as
follows:
Gross unrealized appreciation $ 33,949
Gross unrealized depreciation (332,495)
---------
$(298,546)
=========
(b) Securities, or a portion thereof, pledged as collateral with a value of
$115,852 on 1 long U.S. Treasury Note futures contracts and 29 short
U.S. Treasury Notes futures contracts and 3 short Euro Bobl futures
contracts expiring June 2005 and 3 long Euro-dollar futures contracts
expiring September 2005 and 3 long Euro-dollar futures contracts
expiring December 2005. The value of such contracts on March 31, 2005
was $5,204,240 with an unrealized gain of $1,322 (including commissions
of $84).
(c) Rates shown are the rates as of March 31, 2005.
(d) Rates shown are the effective yields as of March 31, 2005.
(e) Security exempt from registration under Rule 144A of the Securities Act of
1933. These securities may be resold in transactions exempt from
registration to qualified institutional investors. As of March 31, 2005,
the Portfolio held 4.4% of its net assets, with a market value of
$967,235 in securities restricted as to resale.
(f) Non-income producing security.
(g) Security in default.
(h) Each swaption contract is equivalent to $10,000 in notional amount.
(i) Exact net assets and shares outstanding at March 31, 2005 were $100.14
and 10.008, respectively.
(j) Exact net assets and shares outstanding at March 31, 2005 were $104.09
and 10.008, respectively.
(k) Exact net assets and shares outstanding at March 31, 2005 were $99.89
and 10.009, respectively.
SEE ACCOMPANYING NOTES TO FINANCIAL STATEMENTS.
57
BLACKROCK FUNDS
SCHEDULE OF INVESTMENTS
CORE BOND TOTAL RETURN PORTFOLIO
AS OF MARCH 31, 2005 (UNAUDITED)
PAR
MATURITY (000) VALUE
-------------- ---------- --------------
U.S. GOVERNMENT & AGENCY OBLIGATIONS - 27.1%
Federal Home Loan Mortgage Corp.,
Unsecured Notes
4.62% 05/28/13 $ 7,375 $ 7,109,944
6.35% 10/15/23 9,957 10,314,587
Federal National Mortgage
Association, Unsecured Notes
1.75% 06/16/06 4,175 4,073,861
2.71% 01/30/07 14,300 13,980,266
2.35% 04/05/07 3,985 3,857,034
Overseas Private Investment Co.
4.09%(b) 05/29/12 323 296,898
4.30%(b) 05/29/12 900 844,609
4.64%(b) 05/29/12 670 639,487
4.68%(b) 05/29/12 378 355,819
4.87%(b) 05/29/12 2,856 2,755,360
5.40%(b) 05/29/12 3,559 3,542,126
5.46%(b) 05/29/12 408 410,382
5.79%(b) 05/29/12 720 729,113
5.88%(b) 05/29/12 383 390,115
5.94%(b) 05/29/12 1,367 1,393,666
5.95%(b) 05/29/12 389 395,894
6.10%(b) 05/29/12 459 470,105
6.81%(b) 05/29/12 554 572,954
6.89%(b) 05/29/12 4,415 4,602,372
6.91%(b) 05/29/12 1,484 1,523,705
7.35%(b) 05/29/12 398 416,364
Resolution Funding Corp. Strip
Bonds
6.29%(c) 07/15/18 2,850 1,468,690
6.30%(c) 10/15/18 2,850 1,447,498
Small Business Administration
Participation Certificates, Series
92-20H, Class 1
7.40% 08/01/12 42 43,567
Small Business Administration
Participation Certificates, Series
96-20J, Class 1
7.20% 10/01/16 1,303 1,372,751
Small Business Administration
Participation Certificates, Series
97-20B, Class 1
7.10% 02/01/17 1,317 1,389,939
Small Business Investment Cos.
Pass-Through, Series 97-P10C,
Class 1
6.85% 08/01/07 1,414 1,471,504
Small Business Investment Cos.
Pass-Through, Series 97-P10D,
Class 1
6.51% 11/10/07 87 89,899
Small Business Investment Cos.
Pass-Through, Series 03-10A,
Class 1
4.63% 03/10/13 10,576 10,466,443
U.S. Treasury Bonds
10.38%(d) 11/15/12 17,985 20,835,910
8.12% 08/15/19 52,385 70,476,266
8.50%(d) 02/15/20 33,165 46,147,273
8.00% 11/15/21 8,320 11,298,302
6.00% 02/15/26 41,035 46,941,783
6.75%(d) 08/15/26 30,565 38,061,769
6.12% 11/15/27 27,060 31,627,430
5.50% 08/15/28 15,995 17,375,816
PAR
MATURITY (000) VALUE
-------------- ---------- --------------
U.S. GOVERNMENT & AGENCY OBLIGATIONS (Continued)
U.S. Treasury Notes
3.00% 12/31/06 $ 19,910 $ 19,657,243
3.12% 01/31/07 55,275 54,648,845
3.75% 03/31/07 8,044 8,037,718
3.62% 01/15/10 102,455 100,001,715
4.00%(e) 03/10-02/15 21,555 20,898,233
5.00% 02/15/11 3,935 4,087,021
4.75% 05/15/14 60,510 61,644,562
4.25% 08/14-11/14 106,548 104,396,009
============
TOTAL U.S. GOVERNMENT & AGENCY
OBLIGATIONS
(Cost $736,594,916)
732,560,847
------------
MORTGAGE PASS-THROUGHS - 17.7%
Federal Home Loan Mortgage Corp.
Gold
4.00% 07/10-05/19 9,931 9,737,080
5.50% 03/11-04/35 22,268 22,707,509
6.00% 04/11-12/32 23,915 24,703,240
5.00% 11/17-04/34 45,051 44,193,940
8.00% 11/22-10/25 24 26,018
7.00% 03/25-05/31 273 287,956
7.50% 07/26-05/30 8 8,063
6.50% 12/28-04/34 2,312 2,402,009
Federal National Mortgage
Association
6.50% 06/08-04/35 96,844 100,560,050
7.00% 11/08-08/32 11,730 12,341,207
5.50% 02/09-01/35 66,623 67,313,215
8.00% 10/09-05/22 22 23,025
6.00% 09/11-04/35 20,597 21,185,403
4.00% 06/14-12/19 71 68,047
4.50% 01/18-10/19 37,525 36,695,862
5.00% 03/18-05/34 81,983 80,801,385
7.50% 09/01/22 3 3,711
Federal National Mortgage
Association ARM
6.47%(f) 01/01/31 6,615 6,689,084
Government National Mortgage
Association
7.00% 03/13-02/33 5,253 5,553,196
6.00% 11/14-09/34 27,708 28,506,925
9.00% 07/15/18 7 7,269
6.50% 03/24-04/35 1,629 1,706,105
7.50% 11/29-02/30 6 6,537
5.50% 03/32-11/34 12,603 12,733,098
MLCC Mortgage Investors, Inc.,
Series 95-C2 (IO)
10.40%(c) 06/15/21 8,447 148,332
============
TOTAL MORTGAGE PASS-THROUGHS
(Cost $479,553,942)
478,408,266
------------
MULTIPLE CLASS MORTGAGE PASS-THROUGHS - 2.8%
Federal Home Loan Mortgage Corp.,
Series 1361, Class I
6.00% 09/15/07 542 547,726
Federal Home Loan Mortgage Corp.,
Series 2594, Class TV
5.50% 03/15/14 7,350 7,494,738
Federal Home Loan Mortgage Corp.,
Series 2864, Class NA
5.50% 01/15/31 13,200 13,551,912
SEE ACCOMPANYING NOTES TO FINANCIAL STATEMENTS.
58
BLACKROCK FUNDS
SCHEDULE OF INVESTMENTS
CORE BOND TOTAL RETURN PORTFOLIO (CONTINUED)
AS OF MARCH 31, 2005 (UNAUDITED)
PAR
MATURITY (000) VALUE
---------- ---------- -------------
MULTIPLE CLASS MORTGAGE PASS-THROUGHS (Continued)
Federal National Mortgage
Association, Series 96-48, Class Z
7.00% 11/25/26 $ 5,023 $ 5,301,687
Federal National Mortgage
Association, Series 04-28, Class
PB
6.00% 08/25/28 15,556 15,896,952
Federal National Mortgage
Association, Series 04-99, Class
AO
5.50% 01/25/34 13,383 13,524,106
Federal National Mortgage
Association, Series 2922, Class
GA
5.50% 01/25/35 19,164 19,427,617
Salomon Brothers Mortgage
Securities VI, Series 87-1 (IO)
7.00%(c) 02/17/17 255 66,857
Salomon Brothers Mortgage
Securities VI, Series 87-1 (PO)
7.00%(c) 02/17/17 266 246,422
Salomon Brothers Mortgage
Securities VI, Series 87-2 (IO)
7.00%(c) 03/06/17 210 58,007
Salomon Brothers Mortgage
Securities VI, Series 87-2 (PO)
7.00%(c) 03/06/17 210 188,092
Salomon Brothers Mortgage
Securities, Series 87-3, Class A
(PO)
12.50%(c) 10/23/17 112 101,662
Structured Asset Securities Corp.,
Series 96-CFL, Class X1 (IO)
12.60%(c) 02/25/28 7,474 383,047
===========
TOTAL MULTIPLE CLASS MORTGAGE
PASS-THROUGHS
(Cost $78,772,604) 76,788,825
-----------
COMMERCIAL MORTGAGE BACKED SECURITIES - 9.9%
Banc of America Commercial
Mortgage, Inc., Series 01-1, Class
A2
6.50% 04/15/36 13,750 14,894,987
Banc of America Commercial
Mortgage, Inc., Series 05-1, Class
A4
1.99% 11/10/42 13,880 13,949,400
Bank of America Alternative Loan
Trust, Series 04-6, Class 4A1
5.00% 07/25/19 8,896 8,694,819
Bear Stearns Commercial Mortgage
Securities, Inc., Series 04-PWR6,
Class A6
4.83% 11/11/41 14,200 13,847,272
Chase Commercial Mortgage
Securities Corp., Series 97-1,
Class X (IO)
6.86%(c) 04/19/15 29,676 780,569
Chase Commercial Mortgage
Securities Corp., Series 99-2,
Class A2
7.20% 01/15/32 10,105 11,104,744
Citigroup Mortgage Loan Trust, Inc.,
Series 03-UP3, Class A2
7.00% 09/25/33 5,809 5,996,567
PAR
MATURITY (000) VALUE
---------- ---------- -------------
COMMERCIAL MORTGAGE BACKED SECURITIES (Continued)
Commercial Mortgage Acceptance
Corp., Series 98-C2, Class A2
6.03% 09/15/30 $17,235 $17,836,588
Countrywide Alternative Loan Trust,
Series 04-27CB, Class A1
6.00% 12/25/34 16,354 16,452,528
Credit Suisse First Boston Mortgage
Securities Corp., Series 97-C1,
Class AX (IO)
8.60%(c) 06/20/29 40,540 1,875,790
Credit Suisse First Boston Mortgage
Securities Corp., Series 97-C2,
Class AX (IO)
8.32%(c) 01/17/35 13,865 368,814
First Union National Bank
Commercial Mortgage Trust, Series
00-C2, Class A2
7.20% 10/15/32 10,000 11,118,776
First Union-Lehman Brothers
Commercial Mortgage Trust, Series
97-C1, Class D
7.50% 04/18/29 50 53,171
First Union-Lehman Brothers-Bank of
America Commercial Mortgage
Trust, Series 98-C2, Class C3
6.56% 11/18/35 11,227 11,827,808
General Motors Acceptance Corp.
Commercial Mortgage Securities,
Inc., Series 97-C1, Class X (IO)
8.26%(c) 07/15/27 37,170 1,453,932
General Motors Acceptance Corp.
Commercial Mortgage Securities,
Inc., Series 99-C3, Class A2
7.18% 08/15/36 10,444 11,395,689
General Motors Acceptance Corp.
Commercial Mortgage Securities,
Inc., Series 00-C2, Class A2
7.46% 08/16/33 11,470 12,785,110
General Motors Acceptance Corp.,
Commercial Mortgage Securities,
Inc., Series 03-C3, Class A3
4.65% 04/10/40 1,840 1,822,301
Goldman Sachs Mortgage Securities
Corp. II, Series 98-C1, Class A2
6.62% 10/18/30 30 31,752
Goldman Sachs Mortgage Securities
Corp. II, Series 98-C1, Class A3
6.14% 10/18/30 6,683 6,975,280
GSR Mortgage Loan Trust, Series
03-10, Class 2A1
4.48%(f) 10/25/33 8,426 8,088,506
GSR Mortgage Loan Trust, Series
03-13, Class 1A1
4.51%(f) 10/25/33 17,476 16,996,117
Lehman Brothers Commercial
Conduit Mortgage Trust, Series
98-C4, Class X (IO)
9.77%(c) 09/15/23 15,746 339,272
Lehman Brothers Commercial
Conduit Mortgage Trust, Series
99-C2, Class A1
7.10% 10/15/32 753 781,360
SEE ACCOMPANYING NOTES TO FINANCIAL STATEMENTS.
59
BLACKROCK FUNDS
SCHEDULE OF INVESTMENTS
CORE BOND TOTAL RETURN PORTFOLIO (CONTINUED)
AS OF MARCH 31, 2005 (UNAUDITED)
PAR
MATURITY (000) VALUE
-------------- ---------- --------------
COMMERCIAL MORTGAGE BACKED SECURITIES (Continued)
Lehman Brothers Commercial
Conduit Mortgage Trust, Series
99-C2, Class A2
7.32% 10/15/32 $ 85 $ 93,243
Lehman Brothers-UBS Commercial
Mortgage Trust, Series 00-C5,
Class A1
6.41% 01/15/10 10,388 10,813,003
Merrill Lynch Mortgage Investors,
Inc., Series 03-KEY1, Class A4
5.24% 11/12/35 7,100 7,181,563
Morgan Stanley Capital Investments,
Series 99-FNV1, Class A2
6.53% 03/15/31 10,415 11,051,377
Paine Webber Mortgage Acceptance
Corp., Series 99-C1, Class A2
6.82% 04/15/09 81 86,446
Residential Accredit Loans, Inc.,
Series 99-QS8, Class A1
6.50% 06/25/14 2,794 2,816,174
Summit Mortgage Trust, Series 00-1,
Class B1
6.06%(f) 12/28/12 158 157,533
Union Planters Mortgage Finance
Corp., Series 99-1, Class A1
6.25% 04/01/29 108 108,547
Wachovia Bank Commercial
Mortgage Trust, Series 03, Class
C6
5.12% 08/15/35 18,000 18,083,615
Wells Fargo Mortgage Backed
Securities, Series 04-K, Class 1A2
4.48%(f) 07/25/34 28,333 27,628,747
============
TOTAL COMMERCIAL MORTGAGE BACKED
SECURITIES
(Cost $271,828,810) 267,491,400
------------
CERTIFICATE OF DEPOSIT - 0.3%
State Street Bank & Trust
2.92%(f) 12/11/06 5,525 5,522,251
SunTrust Bank, Inc.
4.42% 06/15/09 3,795 3,769,953
============
TOTAL CERTIFICATE OF DEPOSIT
(Cost $9,318,136) 9,292,204
------------
ASSET BACKED SECURITIES - 6.7%
Chase Issuance Trust, Series 04-A9,
Class A9
3.22% 06/15/10 18,875 18,431,249
Citibank Credit Card Issuance Trust,
Series 03-A6, Class A6
2.90% 05/17/10 17,060 16,358,936
Citibank Credit Card Issuance Trust,
Series 04, Class A1
2.55% 01/20/09 21,980 21,386,760
Citibank Credit Card Issuance Trust,
Series 04-A4, Class A4
3.20% 08/24/07 23,700 23,145,420
Conseco Finance Securitizations
Corp., Series 01-3, Class A2
5.16% 05/01/33 295 295,403
Countrywide Asset-Backed
Certificates, Series 04-14, Class
A4
3.13%(f) 06/25/35 18,696 18,720,053
PAR
MATURITY (000) VALUE
-------------- ---------- --------------
ASSET BACKED SECURITIES (Continued)
Greenwich Capital Commercial
Funding Corp., Series 04-GG1A,
Class A4
4.76% 06/10/36 $13,430 $ 13,333,841
MBNA Credit Card Master Note
Trust, Series 03, Class A7
2.65% 11/15/10 20,000 18,979,156
MBNA Credit Card Master Note
Trust, Series 04-A4, Class A4
2.70% 09/15/09 21,400 20,821,537
Structured Asset Receivables Trust,
Series 03-2
2.03%(f) 01/21/09 14,758 14,757,851
Student Loan Marketing Association
Student Loan Trust, Series 99-3,
Class A2
2.26%(f) 07/25/12 16,245 16,280,722
============
TOTAL ASSET BACKED SECURITIES
(Cost $185,925,123) 182,510,928
------------
CORPORATE BONDS - 20.2%
Aerospace - 0.4%
Lockheed Martin Corp., Senior
Debentures
8.50% 12/01/29 2,325 3,146,180
Northrop Grumman Corp., Senior
Debentures
7.75% 03/15/26 1,100 1,361,855
Northrop Grumman Corp., Senior
Unsecured Notes
4.08% 11/16/06 3,860 3,855,986
7.12% 02/15/11 1,710 1,906,968
Raytheon Co., Senior Notes
6.15% 11/01/08 18 18,832
============
10,289,821
------------
Banks - 4.2%
Banc One Corp., Senior Unsecured
Notes
2.62% 06/30/08 4,806 4,537,936
Bank of America Corp., Senior
Unsecured Notes
3.88% 01/15/08 2,275 2,245,668
3.25% 08/15/08 1,300 1,251,836
Bank of America Corp., Subordinated
Notes
6.25% 04/01/08 1,385 1,455,185
Bank of Scotland Treasury Services,
Unsecured Notes
3.50%(g) 11/30/07 5,450 5,337,828
Bank One Texas N.A., Subordinated
Bank Notes
6.25% 02/15/08 3,225 3,381,812
BankBoston N.A., Subordinated Bank
Notes
6.38% 03/08-04/08 2,275 2,396,047
Depfa ACS Bank, Senior Notes
3.62% 10/29/08 8,000 7,904,000
Deutsche Bank AG, Deposit Notes
3.84%(f) 03/15/07 5,500 5,486,800
Fleet National Bank, Subordinated
Bank Notes
5.75% 01/15/09 1,590 1,654,952
SEE ACCOMPANYING NOTES TO FINANCIAL STATEMENTS.
60
BLACKROCK FUNDS
SCHEDULE OF INVESTMENTS
CORE BOND TOTAL RETURN PORTFOLIO (CONTINUED)
AS OF MARCH 31, 2005 (UNAUDITED)
PAR
MATURITY (000) VALUE
-------------- ---------- --------------
CORPORATE BONDS (Continued)
Banks (Continued)
FleetBoston Financial Corp., Senior
Unsecured Notes
4.20% 11/30/07 $ 3,310 $ 3,296,032
HBOS Treasury Services PLC,
Senior Unsecured Notes
3.60%(g) 08/15/07 2,750 2,707,048
HSBC Bank USA, Senior Bank Notes
3.88% 09/15/09 5,425 5,263,715
The Huntington National Bank,
Subordinated Bank Notes
2.75% 10/16/06 1,685 1,649,042
J.P. Morgan Chase & Co., Senior
Unsecured Notes
5.35% 03/01/07 4,902 5,001,903
5.25% 05/30/07 450 458,866
4.00% 02/01/08 1,915 1,892,909
3.62% 05/01/08 2,509 2,447,743
6.00% 08/01/08 3,475 3,635,427
National City Bank Indiana,
Unsecured Notes
3.30% 05/15/07 1,000 987,621
National City Bank, Unsecured Notes
3.38% 10/15/07 4,235 4,153,112
The Royal Bank of Scotland Group
PLC
4.71% 12/29/49 1,395 1,347,112
The Royal Bank of Scotland Group
PLC, Capital Trust
6.80% 12/31/49 3,000 3,048,014
SunTrust Bank, Inc., Senior
Unsecured Notes
3.62% 10/15/07 2,855 2,807,693
4.00% 10/15/08 3,000 2,961,069
Swedish Export Credit Corp.,
Unsecured Notes
2.88% 01/26/07 2,700 2,656,044
U.S. Bancorp, Senior Unsecured
Notes
3.95% 08/23/07 1,315 1,307,478
U.S. Bank N.A., Senior Bank Notes
2.40% 03/12/07 6,500 6,294,665
UBS Preferred Funding Trust I,
Capital Securities
8.62%(f) 10/29/49 1,390 1,639,573
Wachovia Corp., Senior Notes
3.50% 08/15/08 1,945 1,888,334
Wells Fargo & Co., Senior Unsecured
Notes
4.00% 08/15/08 7,285 7,213,316
4.20% 01/15/10 12,200 11,930,868
Wells Fargo & Co., Subordinated
Notes
7.80%(f) 06/15/10 3,625 3,655,754
World Savings Bank, Unsecured
Notes
4.12% 03/10/08 3,675 3,654,417
============
117,549,819
------------
PAR
MATURITY (000) VALUE
-------------- ---------- --------------
CORPORATE BONDS (Continued)
Broadcasting - 0.2%
News America, Inc., Senior
Debentures
7.75% 01/20/24 $ 1,285 $ 1,493,109
7.12% 04/08/28 1,175 1,288,929
7.28% 06/30/28 300 334,106
7.62% 11/30/28 2,010 2,314,991
News America, Inc., Senior
Unsecured Notes
6.20%(g) 12/15/34 850 840,451
============
6,271,586
------------
Chemicals - 0.1%
Schering-Plough Corp., Senior
Unsecured Notes
6.75%(f) 12/01/33 1,600 1,790,141
------------
Construction - 0.1%
Pulte Homes, Inc., Senior Unsecured
Notes
5.20% 02/15/15 1,900 1,794,008
------------
Energy & Utilities - 0.7%
Dominion Resources, Inc.,
Debentures
6.80% 12/15/27 2,500 2,807,532
FirstEnergy Corp., Senior Unsecured
Notes
7.38% 11/15/31 1,065 1,212,396
Florida Power Corp., First Mortgage
Bonds
5.90% 03/01/33 550 560,130
Pennsylvania Electric Co., Senior
Unsecured Notes
5.12% 04/01/14 1,525 1,495,857
Progress Energy, Inc., Senior
Unsecured Notes
7.10% 03/01/11 3,180 3,492,500
7.75% 03/01/31 1,025 1,226,105
Scottish Power PLC, Unsecured
Notes
4.91% 03/15/10 3,200 3,200,461
TXU Corp., Senior Unsecured Notes
4.80%(g) 11/15/09 6,000 5,812,620
============
19,807,601
------------
Entertainment & Leisure - 0.3%
Time Warner Cos., Inc., Debentures
6.95% 01/15/28 3,955 4,305,674
Time Warner Cos., Inc., Senior
Debentures
7.62% 04/15/31 20 23,495
7.70% 05/01/32 2,450 2,912,364
Viacom, Inc., Senior Debentures
7.88% 07/30/30 1,225 1,455,092
============
8,696,625
------------
Finance - 8.8%
AID-Israel, Unsecured Notes
5.50% 04/24-09/33 12,210 12,956,554
SEE ACCOMPANYING NOTES TO FINANCIAL STATEMENTS.
61
BLACKROCK FUNDS
SCHEDULE OF INVESTMENTS
CORE BOND TOTAL RETURN PORTFOLIO (CONTINUED)
AS OF MARCH 31, 2005 (UNAUDITED)
PAR
MATURITY (000) VALUE
---------- ---------- --------------
CORPORATE BONDS (Continued)
Finance (Continued)
American Express Co., Senior
Unsecured Notes
4.38% 07/30/09 $ 3,125 $ 3,090,406
Archstone-Smith Trust, Senior
Unsecured Notes
5.62% 08/15/14 2,575 2,613,599
ASIF Global Financing, Unsecured
Notes
3.85%(g) 11/26/07 1,685 1,655,614
Berkshire Hathaway Finance Corp.,
Senior Unsecured Notes
3.40% 07/02/07 8,030 7,885,781
4.12%(g) 01/15/10 5,210 5,076,209
Citigroup Global Markets Holdings,
Inc., Senior Unsecured Notes
6.50% 02/15/08 2,880 3,048,494
Citigroup, Inc., Senior Unsecured
Notes
5.75% 05/10/06 4,095 4,173,157
5.50% 08/09/06 2,500 2,547,109
5.00% 03/06/07 4,165 4,224,210
3.50% 02/01/08 22,765 22,321,310
6.20% 03/15/09 1,700 1,792,932
Citigroup, Inc., Subordinated Notes
7.75% 06/15/06 675 704,280
Citigroup, Inc., Unsecured Notes
3.62% 02/09/09 1,080 1,046,250
4.12% 02/22/10 18,150 17,725,834
Devon Financing Corp., Senior
Unsecured Notes
7.88% 09/30/31 3,430 4,272,528
Diageo Capital PLC, Notes
3.38% 03/20/08 1,190 1,157,684
Eksportfinans, Unsecured Notes
3.38% 01/15/08 12,900 12,612,885
EOP Operating LP, Unsecured Notes
4.65% 10/01/10 665 651,467
4.75% 03/15/14 2,460 2,306,858
General Electric Capital Corp.,
Unsecured Notes
3.45% 07/16/07 41,180 41,185,138
4.12% 03/04/08 12,665 12,570,481
3.60% 10/15/08 11,205 10,873,097
General Motors Acceptance Corp.,
Debentures
6.51%(c) 12/01/12 1,630 825,876
General Motors Acceptance Corp.,
Senior Unsecured Notes
7.75% 01/19/10 4,180 4,014,873
7.25% 03/02/11 2,125 1,972,950
6.88% 09/15/11 1,340 1,215,192
Household Finance Corp., Senior
Unsecured Notes
7.88% 03/01/07 2,200 2,342,846
Household Finance Corp., Unsecured
Notes
4.12% 12/15/08 1,980 1,945,865
HSBC Finance Corp., Senior
Unsecured Notes
4.75% 05/15/09 2,780 2,783,646
Lehman Brothers Holdings, Inc.,
Senior Unsecured Notes
7.00% 02/01/08 175 186,729
PAR
MATURITY (000) VALUE
---------- ---------- --------------
CORPORATE BONDS (Continued)
Finance (Continued)
MassMutual Global Funding II,
Senior Secured Notes
2.55%(g) 07/15/08 $ 3,740 $ 3,528,899
Metropolitan Life Global Funding,
Inc., Unsecured Notes
4.25%(g) 07/30/09 3,170 3,080,923
Nationwide Building Society, Senior
Unsecured Notes
3.50%(g) 07/31/07 7,250 7,113,265
Nationwide Building Society,
Unsecured Notes
4.25%(g) 02/01/10 2,100 2,058,656
Qwest Capital Funding, Inc., Senior
Notes
6.38%(h) 07/15/08 3,350 3,098,750
The Rouse Co., Unsecured Notes
5.38% 11/26/13 3,480 3,330,189
SLM Corp., Unsecured Notes
4.00% 01/15/10 7,525 7,282,253
SP Powerassets Ltd., Unsecured
Notes
5.00%(g) 10/22/13 300 296,961
Sun Life of Canada Capital Trust,
Capital Securities
8.53%(g) 05/29/49 2,880 3,175,430
Swedbank, Capital Securities
7.50%(f)(g) 09/29/49 2,800 3,206,647
TIAA Global Markets, Senior
Unsecured Notes
3.88%(g) 01/22/08 5,965 5,888,523
USAA Capital Corp., Senior
Unsecured Notes
4.00%(g) 12/10/07 3,065 3,043,180
============
236,883,530
------------
Food & Agriculture - 0.2%
Albertson's, Inc., Senior Debentures
8.00% 05/01/31 1,210 1,424,447
General Mills, Inc., Senior Unsecured
Notes
5.12% 02/15/07 3,200 3,250,176
Kraft Foods, Inc., Senior Unsecured
Notes
6.25% 06/01/12 1,000 1,075,025
============
5,749,648
------------
Industrial - 0.0%
Osprey Trust / Osprey I, Inc., Senior
Secured Notes
7.63%(f)(g) 01/15/49 2,375 997,500
------------
Insurance - 0.9%
AIG SunAmerica Global Funding,
Senior Notes
6.90%(g) 03/15/32 1,170 1,362,082
Allstate Financial Global Funding
LLC, Senior Unsecured Notes
6.15%(g) 02/01/06 4,400 4,482,390
Liberty Mutual Group, Inc.
6.50%(g) 03/15/35 1,875 1,815,985
Marsh & McLennan Cos, Inc., Senior
Unsecured Notes
5.38% 03/15/07 1,625 1,650,564
SEE ACCOMPANYING NOTES TO FINANCIAL STATEMENTS.
62
BLACKROCK FUNDS
SCHEDULE OF INVESTMENTS
CORE BOND TOTAL RETURN PORTFOLIO (CONTINUED)
AS OF MARCH 31, 2005 (UNAUDITED)
PAR
MATURITY (000) VALUE
---------- ---------- -------------
CORPORATE BONDS (Continued)
Insurance (Continued)
Monumental Global Funding II,
Senior Secured Notes
4.38%(g) 07/30/09 $3,025 $ 2,991,513
Monumental Global Funding II,
Senior Unsecured Notes
5.20%(g) 01/30/07 2,650 2,700,892
New York Life Global Funding,
Unsecured Notes
3.88%(g) 01/15/09 2,000 1,958,050
Protective Life Corp. Secured Trust,
Secured Notes
3.70% 11/24/08 3,080 2,984,366
Wellpoint, Inc., Unsecured Notes
5.95%(g) 12/15/34 3,105 3,117,597
===========
23,063,439
-----------
Medical Instruments & Supplies - 0.1%
Boston Scientific Corp., Senior
Unsecured Notes
5.45% 06/15/14 1,470 1,498,621
-----------
Motor Vehicles - 0.1%
Daimler Chrysler AG, Senior
Debentures
7.45% 03/01/27 1,425 1,531,296
Daimler Chrysler N.A. Holding Corp.,
Unsecured Notes
4.05% 06/04/08 205 199,546
===========
1,730,842
-----------
Oil & Gas - 0.5%
Anadarko Finance Co., Senior
Unsecured Notes
7.50% 05/01/31 980 1,200,124
Atlantic Richfield Co., Debentures
9.12%(d) 03/01/11 4,960 6,032,402
Conoco Funding Co., Senior
Unsecured Notes
6.35% 10/15/11 870 938,347
Consolidated Natural Gas Co.,
Senior Unsecured Notes
5.38% 11/01/06 2,405 2,454,206
Occidental Petroleum Corp., Senior
Unsecured Notes
5.88% 01/15/07 2,750 2,828,540
Suncor Energy, Inc.
5.95% 12/01/34 1,045 1,095,076
===========
14,548,695
-----------
Pharmaceuticals - 0.3%
Bristol-Myers Squibb Co., Senior
Debentures
6.88% 08/01/49 1,679 1,932,213
Merck & Co., Inc., Senior Debentures
6.40% 03/01/28 1,000 1,086,476
Merck & Co., Inc., Senior Unsecured
Notes
4.38% 02/15/13 2,200 2,117,841
Merck & Co., Inc., Unsecured Notes
4.75% 03/01/15 2,600 2,508,610
===========
7,645,140
-----------
PAR
MATURITY (000) VALUE
---------- ---------- -------------
CORPORATE BONDS (Continued)
Real Estate - 0.2%
Camden Property Trust, Unsecured
Notes
4.70% 07/15/09 $1,400 $ 1,378,650
The Rouse Co., Unsecured Notes
3.62%(f) 03/15/09 1,455 1,361,281
Simon Property Group, Inc., Notes
7.38% 06/15/18 1,390 1,555,026
===========
4,294,957
-----------
Retail Merchandising - 0.1%
Federated Department Stores, Senior
Debentures
7.00% 02/15/28 1,000 1,081,543
6.90% 04/01/29 550 589,123
May Department Stores Co.,
Debentures
6.70% 07/15/34 1,000 1,029,907
May Department Stores Co.,
Unsecured Notes
5.75% 07/15/14 650 651,922
===========
3,352,495
-----------
Telecommunications - 1.4%
AT&T Broadband Corp., Unsecured
Notes
8.38% 03/15/13 1,275 1,514,997
BellSouth Corp., Senior Unsecured
Notes
4.20% 09/15/09 680 663,049
6.55% 06/15/34 1,325 1,417,796
Comcast Cable Communications
Corp., Senior Notes
8.38% 11/01/05 160 163,690
Comcast Cable Communications
Corp., Senior Unsecured Notes
6.38% 01/30/06 95 96,821
5.50% 03/15/11 510 520,674
7.05% 03/15/33 1,235 1,381,335
Continental Cablevision, Inc., Senior
Notes
8.30%(d) 05/15/06 5,655 5,875,992
New England Telephone & Telegraph
Co., Debentures
7.88% 11/15/29 1,355 1,597,859
SBC Communications, Inc.,
Unsecured Notes
4.12% 09/15/09 945 919,130
6.45% 06/15/34 2,625 2,725,170
Sprint Capital Corp., Senior Notes
6.88% 11/15/28 845 904,649
Sprint Capital Corp., Senior
Unsecured Notes
8.75% 03/15/32 925 1,200,059
TCI Communications, Inc., Senior
Debentures
7.88% 02/15/26 4,690 5,721,678
Verizon Global Funding Corp., Senior
Unsecured Notes
7.75% 12/01/30 1,265 1,528,876
Verizon Maryland, Inc., Debentures
5.12% 06/15/33 650 560,005
SEE ACCOMPANYING NOTES TO FINANCIAL STATEMENTS.
63
BLACKROCK FUNDS
SCHEDULE OF INVESTMENTS
CORE BOND TOTAL RETURN PORTFOLIO (CONTINUED)
AS OF MARCH 31, 2005 (UNAUDITED)
PAR
MATURITY (000) VALUE
---------- ---------- --------------
CORPORATE BONDS (Continued)
Telecommunications (Continued)
Verizon Maryland, Inc., Senior
Debentures
6.12% 03/01/12 $ 3,705 $ 3,887,041
Verizon New Jersey, Inc., Senior
Debentures
5.88% 01/17/12 500 517,665
Vodafone Group PLC, Senior
Unsecured Notes
7.75% 02/15/10 5,875 6,635,354
============
37,831,840
------------
Transportation - 0.1%
Burlington Northern Santa Fe Corp.,
Senior Unsecured Notes
6.12% 03/15/09 575 601,728
Canadian National Railway Co.,
Senior Unsecured Notes
6.25% 08/01/34 600 656,190
Southwest Airlines Co., Senior
Unsecured Notes
5.12% 03/01/17 1,000 940,160
============
2,198,078
------------
Yankee - 1.5%
British Telecommunication Group
PLC, Senior Unsecured Notes
8.88% 12/15/30 1,235 1,645,624
Canadian Pacific Railroad Co.,
Senior Unsecured Notes
6.25% 10/15/11 1,900 2,058,772
Deutsche Telekom International
Finance BV (Netherlands), Senior
Unsecured Notes
8.75% 06/15/30 1,080 1,412,479
France Telecom, Senior Unsecured
Notes
9.25%(f) 03/01/31 1,350 1,776,805
Pemex Finance Ltd. (Luxembourg),
Senior Unsecured Notes
9.03% 02/15/11 1,700 1,915,747
Province of Quebec, Unsecured
Notes
5.00% 07/17/09 1,950 1,985,492
Statoil (Norway), Unsecured Notes
5.12%(g) 04/30/14 3,260 3,275,681
Telecom Italia Capital (Luxembourg),
Senior Unsecured Notes
4.95%(g) 09/30/14 960 919,590
Telecom Italia Capital (Luxembourg),
Unsecured Notes
6.00%(g) 09/30/34 4,050 3,921,745
Telefonica Europe BV, Senior
Unsecured Notes
7.75% 09/15/10 2,075 2,353,891
Tyco International Group SA
(Luxembourg), Senior Unsecured
Notes
6.12% 11/01/08 2,225 2,340,789
United Mexican States, Bonds
8.12% 12/30/19 2,975 3,421,250
United Mexican States, Senior
Unsecured Notes
8.38% 01/14/11 2,930 3,334,340
8.00% 09/24/22 4,235 4,806,725
PAR
MATURITY (000) VALUE
---------- ---------- --------------
CORPORATE BONDS (Continued)
Yankee (Continued)
United Mexican States, Unsecured
Notes
10.38% 02/17/09 $ 2,860 $ 3,380,520
5.88% 01/15/14 580 575,650
XL Capital Ltd. (Kyrgyzstan), Senior
Unsecured Notes
6.38% 11/15/24 1,430 1,492,904
============
40,618,004
------------
TOTAL CORPORATE BONDS
(Cost $548,091,823) 546,612,390
------------
FOREIGN BONDS - 1.7%
Bundesrepublic Deutschland (EUR)
4.75% 07/04/34 3,700 5,323,655
4.00% 01/04/37 5,975 7,625,999
General Motors Corp. (EUR)
8.38% 07/05/33 3,055 3,469,965
Government of New Zealand (NZD)
6.00% 11/15/11 37,000 26,034,048
============
TOTAL FOREIGN BONDS
(Cost $43,836,039) 42,453,667
------------
TAXABLE MUNICIPAL BONDS - 0.2%
California Department of Water
Resources Revenue Bonds, Series
02, Class E
3.98% 05/01/05 3,350 3,351,072
Fort Irwin Land LLC Military Housing
Revenue Bonds, Class II, Series A
5.30% 12/15/35 3,415 3,252,104
============
TOTAL TAXABLE MUNICIPAL BONDS
(Cost $6,763,349) 6,603,176
------------
SHORT TERM INVESTMENTS - 13.4%
Federal Home Loan Bank, Discount
Notes
2.40% 04/01/05 309,500 309,499,999
2.55% 04/01/05 12,500 12,500,000
2.62% 04/11/05 25,000 24,981,806
Galileo Money Market Fund 9,297 9,296,611
Institutional Money Market Trust(i)
6,686 6,686,430
============
TOTAL SHORT TERM INVESTMENTS
(Cost $362,964,846) 362,964,846
------------
TOTAL INVESTMENTS IN
SECURITIES - 100.0%
(Cost $2,723,649,588(a)) $2,705,686,549
==============
SEE ACCOMPANYING NOTES TO FINANCIAL STATEMENTS.
64
BLACKROCK FUNDS
SCHEDULE OF INVESTMENTS
CORE BOND TOTAL RETURN PORTFOLIO (CONCLUDED)
AS OF MARCH 31, 2005 (UNAUDITED)
NUMBER OF
CONTRACTS VALUE
----------- --------------
CALL OPTIONS WRITTEN - 0.0%
Deutsche Bank, Strike Price 5.50,
Expires 04/06/05 (3,240) $(2,530)
Federal National Mortgage
Association 30Yr 5.5%, Strike
Price 101.718750, Expires
04/06/05 (7,050) (7)
=========
TOTAL CALL OPTIONS WRITTEN
(Premiums received $271,019) (2,537)
---------
CALL SWAPTIONS WRITTEN - (0.1)%
Citibank, Strike Price
5.67, Expires
01/04/10 (3,270)(j) (1,716,750)
Deutsche Bank, Strike
Price 5.015,
Expires 01/29/07 (2,992)(j) (894,638)
==========
TOTAL CALL SWAPTIONS WRITTEN
(Premiums received (2,611,388)
----------
$2,823,533)
PUT OPTIONS WRITTEN - 0.0%
September 10 year U.S.
Treasury
Notes futures, Strike
Price 105,
Expires 09/30/05
(Premiums received (104) (42,250)
-------
$53,334)
PUT SWAPTIONS WRITTEN - (0.1)%
Citibank, Strike Price
5.67, Expires
01/04/10 (3,270)(j) (1,339,392)
Deutsche Bank, Strike
Price 5.015,
Expires 01/29/07 (2,992)(j) (1,326,801)
Goldman Sachs, Strike
Price 5.50,
Expires 08/26/05 (4,870)(j) (337,101)
Union Bank of
Switzerland, Strike
Price 5.75, Expires (20,700)(j) (320,850)
09/23/05
==========
TOTAL PUT SWAPTIONS WRITTEN
(Premiums received (3,324,144)
----------
$7,758,629)
- -------------------
(a) Cost for Federal income tax purposes is $2,726,922,184. The
gross unrealized appreciation (depreciation) on a tax basis is as
follows:
Gross unrealized appreciation $ 15,115,800
Gross unrealized depreciation (36,351,435)
------------
$(21,235,635)
============
(b) Securities valued at fair value as determined in good faith by or under
the direction of the Trustees. These securities had a total market
value of $19,338,969 which represents 0.76% of net assets.
(c) Rates shown are the effective yields as of March 31, 2005.
(d) Securities, or a portion thereof, pledged as collateral with a value of
$9,412,367 on 3,394 short U.S. Treasury Note futures contracts expiring
June 2005 and 325 long Euro-dollar futures contracts expiring September
2005 and 325 long Euro-dollar futures contracts expiring December 2005
and 326 short Euro-Bobl futures contracts expiring June 2005. The value
of such contracts on March 31, 2005 was $578,486,476, with an unrealized
gain of $2,184,693 (including commissions of $9,895).
(e) Securities, or a portion thereof, subject to financing transactions.
(f) Rates shown are the rates as of March 31, 2005.
(g) Security exempt from registration under Rule 144A of the Securities Act of
1933. These securities may be resold in transactions exempt from
registration to qualified institutional investors. As of March 31, 2005,
the Portfolio held 3.2% of its net assets, with a current market value
of $80,365,279, in securities restricted as to resale.
(h) Total or partial securities on loan.
(i) Securities purchased with the cash proceeds from securities loaned.
(j) Each swaption contract is equivalent to $10,000 in notional amount.
SEE ACCOMPANYING NOTES TO FINANCIAL STATEMENTS.
65
BLACKROCK FUNDS
STATEMENT OF ASSETS AND LIABILITIES
CORE BOND TOTAL RETURN PORTFOLIO
MARCH 31, 2005(UNAUDITED)
ASSETS
Investments at value (Cost $2,723,649,588)............................... $ 2,705,686,549
Cash denominated in foreign currencies (Cost $640,942)................... 655,464
Interest receivable ..................................................... 18,552,513
Investments sold receivable ............................................. 129,934,580
Capital shares sold receivable .......................................... 3,518,347
Prepaid expenses ........................................................ 142,073
Unrealized appreciation on forward foreign currency contracts ........... 573,201
Unrealized appreciation on interest rate swaps .......................... 5,126,439
Futures margin receivable ............................................... 21,276
----------------
TOTAL ASSETS ......................................................... 2,864,210,442
----------------
LIABILITIES
Payable upon return of securities loaned ................................ 6,686,430
Investments purchased payable ........................................... 277,689,408
Capital shares redeemed payable ......................................... 2,302,098
Distributions payable ................................................... 3,686,471
Advisory fees payable ................................................... 530,037
Administrative fees payable ............................................. 273,571
Transfer agent fees payable ............................................. 166,720
Other accrued expenses payable .......................................... 462,655
Payable for financing transactions ...................................... 14,950,855
Options written, at fair value (premiums received $324,353).............. 44,787
Swaptions written, at fair value (premiums received $10,582,162)......... 5,935,532
Futures margin payable .................................................. 1,505,254
Futures sold payable .................................................... 118
Unrealized depreciation on forward foreign currency contracts ........... 221,817
Unrealized depreciation on interest rate swaps .......................... 10,039,695
================
TOTAL LIABILITIES .................................................... 324,495,448
----------------
NET ASSETS (Applicable to 161,087,452 BlackRock shares,
58,670,094 Institutional shares, 15,773,389 Service shares,
14,373,660 Investor A shares, 5,373,318 Investor B shares and
8,128,504 Investor C shares outstanding) ................................ $ 2,539,714,994
================
NET ASSET VALUE, OFFERING AND REDEMPTION PRICE
PER BLACKROCK SHARE ($1,554,322,168/161,087,452)......................... $ 9.65
================
NET ASSET VALUE, OFFERING AND REDEMPTION PRICE
PER INSTITUTIONAL SHARE ($564,885,076/58,670,094)........................ $ 9.63
================
NET ASSET VALUE, OFFERING AND REDEMPTION PRICE
PER SERVICE SHARE ($151,854,683/15,773,389).............................. $ 9.63
================
NET ASSET VALUE AND REDEMPTION PRICE
PER INVESTOR A SHARE ($138,519,058/14,373,660)........................... $ 9.64
================
MAXIMUM OFFERING PRICE PER INVESTOR A SHARE ($9.64/0.960)................. $ 10.04
================
NET ASSET VALUE, OFFERING AND REDEMPTION PRICE
(subject to a maximum contingent deferred sales charge of 4.5%)
PER INVESTOR B SHARE ($51,762,959/5,373,318)............................. $ 9.63
================
NET ASSET VALUE, OFFERING AND REDEMPTION PRICE
(subject to a maximum contingent deferred sales charge of 1.0%)
PER INVESTOR C SHARE ($78,371,050/8,128,504)............................. $ 9.64
================
SEE ACCOMPANYING NOTES TO FINANCIAL STATEMENTS.
66
BLACKROCK FUNDS
STATEMENT OF NET ASSETS
CORE PLUS TOTAL RETURN PORTFOLIO
AS OF MARCH 31, 2005 (UNAUDITED)
NUMBER
OF SHARES VALUE
----------- -----------
PREFERRED STOCKS - 0.1%
Raytheon Co. Trust I, 7.00%
(Cost $211,461) 3,950 $207,229
--------
PAR
MATURITY (000)
-------------- ---------
U.S. GOVERNMENT & AGENCY OBLIGATIONS - 31.8%
Federal Home Loan Mortgage
Corp.,
Unsecured Notes
3.88% 11/10/08 $ 2,065 2,031,877
Federal National Mortgage
Association, Notes
3.12% 03/16/09 1,800 1,715,881
Federal National Mortgage
Association, Unsecured Notes
1.75% 06/16/06 185 180,518
2.35% 04/05/07 2,785 2,695,568
4.00% 01/26/09 3,445 3,396,501
4.75% 02/21/13 1,430 1,402,597
Resolution Funding Corp. Strip
Bonds
6.29%(b) 07/15/18 100 51,533
6.30%(b) 10/15/18 100 50,789
Small Business Administration
Participation Certificates,
Series
02-P10B, Class 1
5.20% 08/01/12 599 605,813
Small Business Administration
Participation Certificates,
Series
04-P10A, Class 1
4.50% 02/01/14 1,505 1,473,103
U.S. Treasury Bonds
10.38%(c) 11/15/12 1,975 2,288,069
8.12%(d) 08/15/19 11,885 15,989,509
8.50% 02/15/20 1,100 1,530,591
8.75% 08/15/20 2,785 3,971,237
8.00% 11/15/21 1,255 1,704,251
6.00% 02/15/26 6,775 7,750,227
6.75% 08/15/26 1,645 2,048,474
6.12% 11/15/27 1,315 1,536,958
5.50% 08/15/28 1,810 1,966,254
U.S. Treasury Notes
2.88% 11/30/06 6,500 6,411,639
3.00% 12/31/06 5,650 5,578,273
3.12% 01/31/07 22,230 21,978,179
3.75% 03/31/07 7,925 7,918,811
5.00% 02/15/11 525 545,282
4.75% 05/15/14 2,390 2,434,812
4.25% 08/14-11/14 18,375 18,008,627
4.00% 02/15/15 3,295 3,165,773
==========
TOTAL U.S. GOVERNMENT & AGENCY
OBLIGATIONS
(Cost $119,322,900) 118,431,146
-----------
MORTGAGE PASS-THROUGHS - 15.4%
Federal Home Loan Mortgage Corp.
Gold
4.00% 05/10-05/19 893 874,905
6.00% 05/13-08/17 847 875,703
5.50% 08/17-04/19 462 472,591
4.50% 06/01/19 777 761,931
6.50% 04/31-04/34 1,650 1,712,867
5.00% 04/34-10/34 5,496 5,375,772
PAR
MATURITY (000) VALUE
------------- --------- -------------
MORTGAGE PASS-THROUGHS (Continued)
Federal National Mortgage
Association
6.00% 07/12-04/35 $ 4,303 $ 4,432,548
5.50% 07/14-01/35 7,033 7,088,566
6.50% 03/16-04/35 11,682 12,122,846
5.00% 09/17-01/35 7,636 7,549,117
4.50% 04/19-07/19 4,052 3,960,772
4.00% 12/01/19 81 77,777
7.00% 03/31-07/34 810 854,363
Federal National Mortgage
Association ARM
4.58%(e) 01/01/35 3,242 3,224,193
Government National Mortgage
Association
6.00% 11/28-01/34 2,899 2,982,672
7.00% 08/30-09/31 394 416,512
6.50% 04/15/31 291 304,274
5.50% 11/33-04/34 1,396 1,410,373
Government National Mortgage
Association 1 Year CMT
3.75% 05/20/34 2,774 2,760,340
===========
TOTAL MORTGAGE PASS-THROUGHS
(Cost $57,435,894) 57,258,122
-----------
MULTIPLE CLASS MORTGAGE PASS-THROUGHS - 5.0%
Federal Home Loan Mortgage Corp.
Series 04-2825, Class VP
5.50% 06/15/15 1,413 1,438,116
Federal Home Loan Mortgage Corp.,
Series 04-2877, Class PA
5.50% 07/15/33 1,019 1,032,458
Federal Home Loan Mortgage Corp.,
Series 2927, Class BA
5.50% 12/31/49 1,810 1,837,467
Federal National Mortgage
Association, Series 99-7, Class AB
6.00% 03/25/29 824 839,794
Federal National Mortgage
Association, Series 02-73, Class
AN
5.00% 11/25/17 1,800 1,788,691
Federal National Mortgage
Association, Series 03-35, Class
TE
5.00% 05/25/18 1,680 1,670,573
Federal National Mortgage
Association, Series 03-46, Class
PT
3.00% 08/25/22 1,775 1,711,805
Federal National Mortgage
Association, Series 04-29, Class
HC
7.50% 07/25/30 1,773 1,902,472
Federal National Mortgage
Association, Series 04-69, Class
AZ
5.00% 06/25/19 1,633 1,620,592
Federal National Mortgage
Association, Series 04-99, Class
AO
5.50% 01/25/34 1,723 1,741,643
SEE ACCOMPANYING NOTES TO FINANCIAL STATEMENTS.
67
BLACKROCK FUNDS
STATEMENT OF NET ASSETS
CORE PLUS TOTAL RETURN PORTFOLIO (CONTINUED)
AS OF MARCH 31, 2005 (UNAUDITED)
PAR
MATURITY (000) VALUE
---------- ---------- -------------
MULTIPLE CLASS MORTGAGE PASS-THROUGHS (Continued)
Federal National Mortgage
Association, Series 2922, Class
GA
5.50% 01/25/35 $ 2,832 $ 2,870,977
===========
TOTAL MULTIPLE CLASS MORTGAGE
PASS-THROUGHS
(Cost $18,748,292) 18,454,588
-----------
COMMERCIAL MORTGAGE BACKED SECURITIES - 9.6%
Banc of America Commercial
Mortgage, Inc., Series 01-1, Class
A2
6.50% 04/15/36 2,030 2,199,042
Bank of America Alternative Loan
Trust, Series 04-7, Class 4A1
5.00%(e) 08/25/19 1,033 1,011,377
Bear Stearns Commercial Mortgage
Securities, Inc., Series 00-WF2,
Class A2
7.32% 10/15/32 1,400 1,557,485
Chase Commercial Mortgage
Securities Corp., Series 99-2,
Class A2
7.20% 01/15/32 285 313,197
Chase Commercial Mortgage
Securities Corp., Series 00-1,
Class A2
7.76% 04/15/32 565 624,302
Commercial Mortgage Acceptance
Corp., Series 98-C2, Class A2
6.03% 09/15/30 2,524 2,611,786
Countrywide Alternative Loan Trust,
Series 04-27CB, Class A1
6.00% 12/25/34 2,077 2,089,813
Countrywide Home Loans, Series
04-29, Class 1A1
2.92%(e) 02/25/35 2,284 2,296,470
Credit Suisse First Boston Mortgage
Securities Corp., Series 01-CK6,
Class A3
6.39% 10/15/11 325 351,289
GE Capital Commercial Mortgage
Corp., Series 01-3, Class A2
6.07% 06/10/38 1,670 1,783,299
General Motors Acceptance Corp.
Commercial Mortgage Securities,
Inc., Series 99-C3, Class A2
7.18% 08/15/36 1,514 1,652,446
General Motors Acceptance Corp.
Commercial Mortgage Securities,
Inc., Series 00-C1, Class A2
7.72% 03/15/33 1,490 1,662,147
General Motors Acceptance Corp.
Commercial Mortgage Securities,
Inc., Series 00-C2, Class A2
7.46% 08/16/33 1,390 1,549,373
Goldman Sachs Mortgage Securities
Corp. II, Series 99-C1, Class A2
6.11% 11/18/30 1,963 2,045,531
Goldman Sachs Mortgage Securities
Corp. II, Series 03-C1, Class X2
(IO)
3.40%(b) 01/10/40 22,541 715,692
Goldman Sachs Mortgage Securities
Corp. II, Series 04-GG2, Class A4
4.96% 08/10/38 1,625 1,627,535
PAR
MATURITY (000) VALUE
---------- ---------- -------------
COMMERCIAL MORTGAGE BACKED SECURITIES (Continued)
Greenwich Capital Commercial
Funding Corp., Series 05-GG3,
Class A3
4.57% 08/10/42 $ 2,445 $ 2,390,574
J.P. Morgan Chase Commercial
Mortgage Securities Corp., Series
01-CIB2, Class A3
6.43% 04/15/35 820 883,869
J.P. Morgan Chase Commercial
Mortgage Securities Corp., Series
01-CIBC, Class A3
6.26% 03/15/33 1,150 1,234,209
Lehman Brothers Commercial
Conduit Mortgage Trust, Series
98-C4, Class A1B
6.21% 10/15/35 900 946,016
Lehman Brothers-UBS Commercial
Mortgage Trust, Series 00-C4,
Class A2
7.37% 08/15/26 1,245 1,387,374
Lehman Brothers-UBS Commercial
Mortgage Trust, Series 02-C7,
Class A2
3.90% 12/15/26 510 503,176
Lehman Brothers-UBS Commercial
Mortgage Trust, Series 04-C8,
Class A2
4.20% 12/15/29 1,500 1,467,825
Morgan Stanley Capital Investments,
Series 98-HF2, Class A2
6.48% 11/15/30 365 384,665
Morgan Stanley Capital Investments,
Series 99-FNV1, Class A2
6.53% 03/15/31 500 530,551
Salomon Brothers Mortgage
Securities VII, Series 00-C3, Class
A2
6.59% 10/18/10 1,650 1,779,338
===========
TOTAL COMMERCIAL MORTGAGE BACKED
SECURITIES
(Cost $36,144,065) 35,598,381
-----------
CERTIFICATE OF DEPOSIT - 0.3%
State Street Bank & Trust, Deposit
Notes
2.92%(e) 12/11/06 675 674,664
SunTrust Bank, Inc.
4.42% 06/15/09 430 427,162
===========
TOTAL CERTIFICATE OF DEPOSIT
(Cost $1,104,772) 1,101,826
-----------
ASSET BACKED SECURITIES - 6.0%
Asset Securitization Corp., Series
97-D5, Class A1C
6.75% 02/14/41 945 990,908
Chase Issuance Trust, Series 04-A9,
Class A9
3.22% 06/15/10 2,275 2,221,515
Citibank Credit Card Issuance Trust,
Series 03-A3, Class A3
3.10% 03/10/10 1,125 1,088,262
Citibank Credit Card Issuance Trust,
Series 03-A6, Class A6
2.90% 05/17/10 1,805 1,730,825
SEE ACCOMPANYING NOTES TO FINANCIAL STATEMENTS.
68
BLACKROCK FUNDS
STATEMENT OF NET ASSETS
CORE PLUS TOTAL RETURN PORTFOLIO (CONTINUED)
AS OF MARCH 31, 2005 (UNAUDITED)
PAR
MATURITY (000) VALUE
---------- ---------- -------------
ASSET BACKED SECURITIES (Continued)
Citibank Credit Card Issuance Trust,
Series 04, Class A1
2.55% 01/20/09 $3,270 $ 3,181,744
Countrywide Alternative Loan Trust,
Series 04-18CB, Class 2A5
3.30%(e) 09/25/34 1,695 1,697,429
Countrywide Asset-Backed
Certificates, Series 04-13, Class
AV4
3.14%(e) 06/25/35 2,277 2,280,116
MBNA Credit Card Master Note
Trust, Series 03, Class A6
2.75% 10/15/10 1,500 1,430,101
MBNA Credit Card Master Note
Trust, Series 03, Class A7
2.65% 11/15/10 3,250 3,084,113
MBNA Credit Card Master Note
Trust, Series 04-A4, Class A4
2.70% 09/15/09 2,620 2,549,179
Structured Asset Receivables Trust,
Series 03-2
2.03%(e) 01/21/09 1,448 1,448,200
Structured Asset Securities Corp.,
Series 03-AL2, Class A
3.36% 01/25/31 879 797,907
===========
TOTAL ASSET BACKED SECURITIES
(Cost $23,043,299) 22,500,299
-----------
CORPORATE BONDS - 20.0%
Aerospace - 0.4%
BE Aerospace, Inc., Senior Notes
8.50% 10/01/10 110 119,900
Lockheed Martin Corp., Senior
Debentures
8.50% 12/01/29 370 500,683
Northrop Grumman Corp.,
Debentures
7.88% 03/01/26 105 131,549
Northrop Grumman Corp., Senior
Debentures
7.75% 02/15/31 215 271,767
Northrop Grumman Corp., Senior
Unsecured Notes
4.08% 11/16/06 495 494,485
===========
1,518,384
-----------
Banks - 3.5%
Banc One Corp., Senior Unsecured
Notes
2.62% 06/30/08 375 354,084
Bank of America Corp., Senior
Unsecured Notes
5.25% 02/01/07 425 433,044
3.88% 01/15/08 210 207,292
3.25% 08/15/08 460 442,957
2.96%(e) 02/17/09 250 250,321
3.38% 02/17/09 565 541,876
5.38% 06/15/14 95 97,257
Bank of America Corp., Subordinated
Notes
7.80% 02/15/10 75 84,898
Bank of Scotland Treasury Services,
Unsecured Notes
3.50%(f) 11/30/07 350 342,796
PAR
MATURITY (000) VALUE
---------- ---------- -------------
CORPORATE BONDS (Continued)
Banks (Continued)
Depfa ACS Bank, Senior Notes
3.62% 10/29/08 $ 850 $ 839,800
Deutsche Bank AG, Deposit Notes
3.84%(e) 03/15/07 800 798,080
HBOS Treasury Services PLC,
Unsecured Notes
3.75%(f) 09/30/08 505 493,284
HSBC Bank USA, Senior Bank Notes
3.88% 09/15/09 340 329,892
J.P. Morgan Chase & Co., Senior
Unsecured Notes
5.25% 05/30/07 75 76,478
J.P. Morgan Chase & Co.,
Subordinated Notes
5.75% 10/15/08 375 388,845
7.12% 06/15/09 100 108,927
National City Bank Cleveland, Senior
Bank Notes
3.21%(e) 06/29/09 525 524,834
National City Bank, Unsecured Notes
3.38% 10/15/07 455 446,202
The Royal Bank of Scotland Group
PLC
4.71%(e) 12/29/49 200 193,134
SunTrust Bank, Inc., Senior
Unsecured Notes
3.62% 10/15/07 665 653,981
4.00% 10/15/08 325 320,782
Swedish Export Credit Corp.,
Unsecured Notes
2.88% 01/26/07 375 368,895
U.S. Bancorp, Senior Unsecured
Notes
3.95% 08/23/07 115 114,342
U.S. Bank N.A., Senior Bank Notes
2.40% 03/12/07 715 692,413
UBS Preferred Funding Trust I,
Capital Securities
8.62%(e) 10/29/49 40 47,182
Wachovia Corp., Subordinated Notes
6.30% 04/15/28 440 462,483
Wells Fargo & Co., Senior Unsecured
Notes
4.00% 08/15/08 2,010 1,990,222
4.20% 01/15/10 1,140 1,114,852
Wells Fargo & Co., Subordinated
Notes
7.80%(e) 06/15/10 325 327,757
===========
13,046,910
-----------
Broadcasting - 0.3%
Charter Communications Holdings
LLC, Unsecured Notes
10.25% 09/15/10 30 30,825
News America, Inc., Senior
Debentures
7.12% 04/08/28 125 137,120
7.30% 04/30/28 150 167,141
7.28% 06/30/28 125 139,210
7.62% 11/30/28 140 161,243
SEE ACCOMPANYING NOTES TO FINANCIAL STATEMENTS.
69
BLACKROCK FUNDS
STATEMENT OF NET ASSETS
CORE PLUS TOTAL RETURN PORTFOLIO (CONTINUED)
AS OF MARCH 31, 2005 (UNAUDITED)
PAR
MATURITY (000) VALUE
---------- ---------- ------------
CORPORATE BONDS (Continued)
Broadcasting (Continued)
News America, Inc., Senior
Unsecured Notes
6.20%(f) 12/15/34 $ 325 $ 321,350
==========
956,889
----------
Construction - 0.2%
D.R. Horton, Inc., Senior Unsecured
Notes
7.88% 08/15/11 55 60,093
8.50% 04/15/12 25 27,125
5.62% 09/15/14 240 227,837
International Steel Group, Inc.,
Senior Unsecured Notes
6.50% 04/15/14 45 45,900
K. Hovnanian Enterprises, Inc.,
Senior Unsecured Notes
6.50% 01/15/14 170 166,175
Pulte Homes, Inc., Senior Unsecured
Notes
5.20% 02/15/15 280 264,380
==========
791,510
----------
Energy & Utilities - 0.7%
Dominion Resources, Inc., Senior
Unsecured Notes
5.70% 09/17/12 450 466,660
Exelon Generation Corp., Senior
Unsecured Notes
6.75% 05/01/11 100 108,812
FirstEnergy Corp., Senior Unsecured
Notes
7.38% 11/15/31 480 546,432
Midwest Generation LLC,
Pass-Through Certificates, Series
B
8.56% 01/02/16 60 67,200
Midwest Generation LLC, Senior
Secured Notes
8.75% 05/01/34 155 172,825
National Waterworks, Inc., Senior
Subordinated Notes, Series B
10.50% 12/01/12 30 33,375
Orion Power Holdings, Inc., Senior
Unsecured Notes
12.00% 05/01/10 120 145,500
Progress Energy, Inc., Senior
Unsecured Notes
7.75% 03/01/31 360 430,632
Reliant Energy, Inc., Senior Secured
Notes
9.25% 07/15/10 25 26,750
6.75% 12/15/14 5 4,650
Texas Genco LLC, Senior Unsecured
Notes
6.88%(f) 12/15/14 85 85,000
Transcontinental Gas Pipe Line
Corp., Senior Notes
8.88% 07/15/12 125 146,875
TXU Corp., Senior Unsecured Notes
4.80%(f) 11/15/24 400 382,244
==========
2,616,955
----------
PAR
MATURITY (000) VALUE
---------- ---------- ------------
CORPORATE BONDS (Continued)
Entertainment & Leisure - 0.5%
MGM Mirage, Inc., Senior Notes
6.00% 10/01/09 $ 55 $ 54,244
TCI Communications, Inc., Senior
Debentures
7.88% 08/01/13 150 174,087
Time Warner Cos., Inc., Debentures
8.18% 08/15/07 25 26,926
Time Warner Cos., Inc., Senior
Debentures
7.57% 02/01/24 720 833,342
7.70% 05/01/32 175 208,026
Time Warner Cos., Inc., Senior
Unsecured Notes
6.12% 04/15/06 25 25,511
6.75% 04/15/11 200 216,119
Viacom, Inc., Senior Debentures
7.88% 07/30/30 50 59,392
The Walt Disney Co., Senior
Unsecured Notes
6.20% 06/20/14 125 133,476
==========
1,731,123
----------
Finance - 8.6%
AID-Israel, Unsecured Notes
5.50% 04/26/24 625 660,246
American Express Co., Senior
Unsecured Notes
4.38% 07/30/09 400 395,572
ASIF Global Financing, Unsecured
Notes
3.85%(c)(f) 11/26/07 705 692,705
Associates Corp. of North America,
Senior Notes
6.25% 11/01/08 275 291,271
Berkshire Hathaway Finance Corp.,
Senior Unsecured Notes
3.40% 07/02/07 410 402,635
3.38% 10/15/08 500 483,281
4.12%(f) 01/15/10 620 604,079
California Preferred Fund Trust,
Notes
7.00% 12/31/49 200 210,200
Citigroup, Inc., Senior Unsecured
Notes
5.75% 05/10/06 2,000 2,038,172
4.25% 07/29/09 1,945 1,919,637
Citigroup, Inc., Unsecured Notes
3.62% 02/09/09 620 600,625
4.12% 02/22/10 2,475 2,417,159
Devon Financing Corp., Senior
Unsecured Notes
7.88% 09/30/31 285 355,006
Diageo Capital PLC, Notes
3.38% 03/20/08 325 316,174
Eksportfinans, Unsecured Notes
3.38% 01/15/08 1,555 1,520,390
EOP Operating LP, Senior Unsecured
Notes
7.00% 07/15/11 360 396,467
SEE ACCOMPANYING NOTES TO FINANCIAL STATEMENTS.
70
BLACKROCK FUNDS
STATEMENT OF NET ASSETS
CORE PLUS TOTAL RETURN PORTFOLIO (CONTINUED)
AS OF MARCH 31, 2005 (UNAUDITED)
PAR
MATURITY (000) VALUE
---------- ---------- -------------
CORPORATE BONDS (Continued)
Finance (Continued)
EOP Operating LP, Unsecured Notes
4.65% 10/01/10 $ 160 $ 156,744
4.75% 03/15/14 100 93,775
General Electric Capital Corp., Senior
Unsecured Notes
6.50% 12/10/07 200 210,628
General Electric Capital Corp.,
Unsecured Notes
3.45% 07/16/07 6,615 6,616,803
4.12% 03/04/08 1,685 1,672,425
3.60%(e) 10/15/08 1,585 1,538,051
General Motors Acceptance Corp.,
Senior Unsecured Notes
7.75% 01/19/10 795 763,594
7.25% 03/02/11 250 232,112
General Motors Acceptance Corp.,
Unsecured Notes
4.20%(e) 09/23/08 425 387,975
Household Finance Corp., Senior
Unsecured Notes
7.20% 07/15/06 50 51,936
8.00% 07/15/10 466 533,089
Household Finance Corp., Unsecured
Notes
4.12% 12/15/08 580 570,001
HSBC Finance Corp., Senior
Unsecured Notes
4.75% 05/15/09 340 340,446
Lehman Brothers Holdings, Inc.,
Senior Notes
6.62% 02/05/06 851 870,020
Nationwide Building Society, Senior
Unsecured Notes
3.50%(f) 07/31/07 850 833,969
Nationwide Building Society,
Unsecured Notes
4.25%(f) 02/01/10 525 514,664
Refco Finance Holdings LLC, Senior
Subordinated Notes
9.00%(f) 08/01/12 100 107,500
The Rouse Co., Unsecured Notes
5.38% 11/26/13 825 789,485
SLM Corp., Senior Unsecured Notes
5.62% 04/10/07 570 584,564
SLM Corp., Unsecured Notes
4.00% 01/15/10 850 822,580
TIAA Global Markets, Senior
Unsecured Notes
3.88%(f) 01/22/08 465 459,038
USAA Capital Corp., Senior
Unsecured Notes
4.00%(f) 12/10/07 370 367,366
===========
31,820,384
-----------
Food & Agriculture - 0.2%
Albertson's, Inc., Senior Debentures
8.00% 05/01/31 145 170,698
General Mills, Inc., Senior Unsecured
Notes
5.12% 02/15/07 185 187,901
Kraft Foods, Inc., Senior Unsecured
Notes
6.25% 06/01/12 415 446,135
===========
804,734
-----------
PAR
MATURITY (000) VALUE
---------- ---------- -------------
CORPORATE BONDS (Continued)
Food & Agriculture (Continued)
Insurance - 0.5%
Allstate Financial Global Funding
LLC, Senior Unsecured Notes
6.15%(f) 02/01/06 $ 500 $ 509,361
American General Corp., Senior
Unsecured Notes
7.50%(c) 08/11/10 150 167,542
Monumental Global Funding II,
Senior Secured Notes
4.38%(f) 07/30/09 350 346,126
New York Life Insurance Co.,
Unsecured Notes
5.88%(f) 05/15/33 100 103,920
Protective Life Corp. Secured Trust,
Secured Notes
3.70% 11/24/08 330 319,754
Wellpoint, Inc., Unsecured Notes
5.95%(f) 12/15/34 345 346,400
===========
1,793,103
-----------
Manufacturing - 0.0%
Briggs & Stratton Corp., Senior
Unsecured Notes
8.88% 03/15/11 50 57,875
Ispat Inland ULC, Senior Secured
Notes
9.75% 04/01/14 75 87,750
===========
145,625
-----------
Medical & Medical Services - 0.0%
Bio-Rad Laboratories, Inc., Senior
Subordinated Notes
6.12%(f) 12/15/14 100 98,000
HCA, Inc., Unsecured Notes
5.50% 12/01/09 85 84,034
===========
182,034
-----------
Medical Instruments & Supplies - 0.1%
Boston Scientific Corp., Senior
Unsecured Notes
5.45% 06/15/14 190 193,699
-----------
Metal & Mining - 0.0%
TRIMAS Corp., Senior Subordinated
Notes
9.88% 06/15/12 100 101,500
-----------
Motor Vehicles - 0.1%
Daimler Chrysler AG, Senior
Debentures
7.45% 03/01/27 135 145,070
Daimler Chrysler N.A. Holding Corp.,
Unsecured Notes
4.05% 06/04/08 65 63,271
===========
208,341
-----------
Oil & Gas - 0.9%
Anadarko Finance Co., Senior
Unsecured Notes
7.50% 05/01/31 300 367,385
Conoco Funding Co., Senior
Unsecured Notes
6.35% 10/15/11 175 188,748
SEE ACCOMPANYING NOTES TO FINANCIAL STATEMENTS.
71
BLACKROCK FUNDS
STATEMENT OF NET ASSETS
CORE PLUS TOTAL RETURN PORTFOLIO (CONTINUED)
AS OF MARCH 31, 2005 (UNAUDITED)
PAR
MATURITY (000) VALUE
---------- ---------- ------------
CORPORATE BONDS (Continued)
Oil & Gas (Continued)
Consolidated Natural Gas, Inc.,
Senior Debentures
5.00% 03/01/14 $ 235 $ 230,399
Consolidated Natural Gas, Inc.,
Senior Unsecured Notes
6.25% 11/01/11 150 160,681
Devon Energy Corp., Senior
Debentures
7.95% 04/15/32 230 289,984
El Paso Natural Gas Co., Debentures
8.62% 01/15/22 130 147,632
El Paso Production Holding Co.,
Senior Notes
7.75% 06/01/13 45 45,450
Encana Corp.(Canada), Senior
Unsecured Notes
4.75% 10/15/13 340 333,050
Enterprise Products Operating LP,
Senior Unsecured Notes
4.00% 10/15/07 225 221,884
OAO Gazprom, Senior Unsecured
Notes
9.62%(f) 03/01/13 300 342,750
OAO Gazprom, Unsecured Notes
9.62% 03/01/13 260 297,464
Occidental Petroleum Corp., Senior
Notes
8.45% 02/15/29 70 94,363
Phillips Petroleum Co., Senior
Debentures
7.00% 03/30/29 80 94,327
Pioneer Natural Resources Co.,
Senior Notes
7.20% 01/15/28 140 161,934
Suncor Energy, Inc.
5.95% 12/01/34 120 125,750
The Williams Cos., Inc., Senior
Unsecured Notes
7.62% 07/15/19 80 86,800
7.75% 06/15/31 25 27,000
==========
3,215,601
----------
Pharmaceuticals - 0.3%
Bristol-Myers Squibb Co., Senior
Debentures
6.88% 08/01/49 195 224,408
Elan Finance Corp., Unsecured
Notes
7.75%(f) 11/15/11 145 108,750
Merck & Co., Inc., Senior Debentures
5.95% 12/01/28 155 160,190
Merck & Co., Inc., Unsecured Notes
4.75% 03/01/15 550 530,668
==========
1,024,016
----------
Real Estate - 0.3%
Avalonbay Communities, Inc., Senior
Unsecured Notes
6.62% 09/15/11 180 194,772
Camden Property Trust, Unsecured
Notes
4.70% 07/15/09 380 374,205
PAR
MATURITY (000) VALUE
---------- ---------- ------------
CORPORATE BONDS (Continued)
Real Estate (Continued)
Developers Diversified Realty Corp.,
Senior Unsecured Notes
3.88% 01/30/09 $ 475 $ 456,451
==========
1,025,428
----------
Retail Merchandising - 0.2%
Delhaize America, Inc., Senior
Debentures
9.00% 04/15/31 160 194,390
Federated Department Stores, Senior
Debentures
6.90% 04/01/29 225 241,005
Kroger Co., Senior Unsecured Notes
6.80% 04/01/11 250 271,024
May Department Stores Co.,
Debentures
6.70% 07/15/34 125 128,738
==========
835,157
----------
Semiconductors & Related Devices - 0.0%
Freescale Semiconductor, Inc.,
Senior Unsecured Notes
5.41% 07/15/09 50 51,375
Magnachip Semiconductor, Senior
Secured Notes
6.26%(e)(f) 12/15/11 60 61,500
==========
112,875
----------
Telecommunications - 1.4%
AT&T Broadband Corp., Unsecured
Notes
8.38% 03/15/13 525 623,822
BellSouth Corp., Senior Unsecured
Notes
4.20% 09/15/09 525 511,912
6.55% 06/15/34 150 160,505
Cincinnati Bell, Inc., Senior
Subordinated Notes
8.38% 01/15/14 110 108,350
Comcast Cable Communications
Corp., Senior Unsecured Notes
5.50% 03/15/11 210 214,395
7.05% 03/15/33 190 212,513
Continental Cablevision, Inc., Senior
Notes
8.30% 05/15/06 400 415,632
CSC Holdings, Inc., Senior
Debentures
7.88% 02/15/18 60 63,750
Intelsat Bermuda Ltd., Senior
Unsecured Notes
7.80%(e)(f) 01/15/12 70 71,050
8.25%(f) 01/15/13 40 40,100
New Jersey Bell Telephone,
Debentures
7.85% 11/15/29 35 42,668
Qwest Corp., Senior Unsecured
Notes
7.88%(f) 09/01/11 255 263,289
SEE ACCOMPANYING NOTES TO FINANCIAL STATEMENTS.
72
BLACKROCK FUNDS
STATEMENT OF NET ASSETS
CORE PLUS TOTAL RETURN PORTFOLIO (CONTINUED)
AS OF MARCH 31, 2005 (UNAUDITED)
PAR
MATURITY (000) VALUE
---------- ---------- -------------
CORPORATE BONDS (Continued)
Telecommunications (Continued)
SBC Communications, Inc.,
Unsecured Notes
4.12% 09/15/09 $ 110 $ 106,989
6.45% 06/15/34 345 358,165
Sprint Capital Corp., Senior
Unsecured Notes
8.75% 03/15/32 200 259,472
TCI Communications, Inc., Senior
Debentures
8.75% 08/01/15 360 450,201
7.88% 02/15/26 140 170,796
Verizon Global Funding Corp., Senior
Unsecured Notes
7.75% 12/01/30 455 549,912
Verizon Maryland, Inc., Debentures
5.12% 06/15/33 95 81,847
Verizon New Jersey, Inc., Senior
Debentures
5.88% 01/17/12 365 377,895
Vodafone Group PLC, Unsecured
Notes
5.00% 12/16/13 275 273,143
===========
5,356,406
-----------
Transportation - 0.1%
Overseas Shipholding Group, Inc.,
Senior Unsecured Notes
7.50% 02/15/24 170 170,850
Southwest Airlines Co., Senior
Unsecured Notes
5.12% 03/01/17 175 164,528
===========
335,378
-----------
Yankee - 1.7%
AID-Israel, Unsecured Notes
5.50% 09/18/23 850 897,124
British Telecommunication Group
PLC, Senior Unsecured Notes
8.88% 12/15/30 10 13,325
Deutsche Telekom International
Finance BV (Netherlands), Senior
Unsecured Notes
8.75% 06/15/30 30 39,236
Deutsche Telekom International
Finance BV, Senior Unsecured
Notes
8.25% 06/15/05 200 201,816
Encana Corp. (Canada), Bonds
6.50% 08/15/34 140 154,883
France Telecom, Senior Unsecured
Notes
9.25% 03/01/31 175 230,327
Omi Corp. (Mali), Senior Notes
7.62% 12/01/13 150 156,000
Province of Quebec, Unsecured
Notes
5.00% 07/17/09 290 295,278
Republic of Colombia, Senior
Unsecured Notes
9.75% 04/09/11 744 818,319
Telecom Italia Capital (Luxembourg),
Unsecured Notes
6.00%(f) 09/30/34 540 522,899
PAR
MATURITY (000) VALUE
---------- ---------- -------------
CORPORATE BONDS (Continued)
Yankee (Continued)
Telefonica Europe BV, Senior
Unsecured Notes
7.75% 09/15/10 $ 160 $ 181,505
Tyco International Group SA
(Luxembourg), Senior Unsecured
Notes
6.12% 11/01/08 425 447,117
United Mexican States, Bonds
8.12% 12/30/19 460 529,000
United Mexican States, Senior
Unsecured Notes
8.38% 01/14/11 705 802,290
6.62% 03/03/15 140 145,600
8.00% 09/24/22 605 686,675
XL Capital Ltd. (Kyrgyzstan), Senior
Unsecured Notes
6.38% 11/15/24 300 313,197
===========
6,434,591
-----------
TOTAL CORPORATE BONDS
(Cost $74,587,524)
74,250,643
-----------
FOREIGN BONDS - 1.8%
Bundesrepublic Deutschland (EUR)
4.75% 07/04/34 475 683,442
4.00% 01/04/37 825 1,052,962
General Motors Corp. (EUR)
8.38% 07/05/33 415 471,370
Mexican Fixed Rate Bonds (MXP)
8.00% 12/24/08 16,080 1,344,326
9.00% 12/24/09 11,253 963,019
New Zealand Government (NZD)
6.00% 04/15/15 3,300 2,318,781
=========
TOTAL FOREIGN BONDS
(Cost $6,765,637) 6,833,900
---------
TAXABLE MUNICIPAL BONDS - 0.2%
California Department of Water
Resources Revenue Bonds, Series
02, Class E
3.98% 05/01/05 175 175,056
Fort Irwin Land California LLC
Revenue Bonds, Series 05
5.40% 12/15/47 600 563,382
=========
TOTAL TAXABLE MUNICIPAL BONDS
(Cost $774,706) 738,438
---------
SHORT TERM INVESTMENTS - 15.7%
Federal Home Loan Bank, Discount
Notes
2.55% 04/01/05 48,000 48,000,000
Galileo Money Market Fund 10,480 10,479,662
==========
TOTAL SHORT TERM INVESTMENTS
(Cost $58,479,662) 58,479,662
----------
TOTAL INVESTMENTS IN SECURITIES -
105.9%
(Cost $396,618,212(a)) 393,854,234
SEE ACCOMPANYING NOTES TO FINANCIAL STATEMENTS.
73
BLACKROCK FUNDS
STATEMENT OF NET ASSETS
CORE PLUS TOTAL RETURN PORTFOLIO (CONTINUED)
AS OF MARCH 31, 2005 (UNAUDITED)
NUMBER OF
CONTRACTS VALUE
----------------- ---------------
CALL OPTIONS WRITTEN - 0.0%
Deutsche Bank, Strike
Price 5.50,
Expires 04/06/05 (480) $ (375)
Federal National
Mortgage
Association 30Yr
5.5%, Strike
Price 101.718750,
Expires
04/06/05 (940) (1)
===========
TOTAL CALL OPTIONS WRITTEN
(Premiums received (376)
-----------
$37,336)
CALL SWAPTIONS WRITTEN - (0.1)%
Citibank, Strike Price
5.67, Expires
01/04/10 (370)(g) (194,250)
Deutsche Bank, Strike
Price 5.015,
Expires 01/29/07 (442)(g) (132,035)
===========
TOTAL CALL SWAPTIONS WRITTEN
(Premiums received (326,285)
-----------
$358,833)
PUT OPTIONS WRITTEN - 0.0%
September 10 year U.S.
Treasury
Notes futures, Strike
Price 105,
Expires 09/30/05
(Premiums received (15) (6,094)
-----------
$7,692)
PUT SWAPTIONS WRITTEN - (0.1)%
Citibank, Strike Price
5.67, Expires
01/04/10 (370)(g) (151,552)
Deutsche Bank, Strike
Price 5.015,
Expires 01/29/07 (442)(g) (195,816)
Goldman Sachs, Strike
Price 5.50,
Expires 08/26/05 (700)(g) (48,454)
Union Bank of
Switzerland, Strike
Price 5.75, Expires (1,600)(g) (24,800)
09/23/05
===========
TOTAL PUT SWAPTIONS WRITTEN
(Premiums received (420,622)
-----------
$769,049)
LIABILITIES IN EXCESS OF OTHER
ASSETS - (5.9)%
(including $32,158,270 of payable for
investments purchased) (21,855,374)
-----------
NET ASSETS - 100.0%
(Applicable to 36,189,060 BlackRock
shares, 40 Institutional shares, 2,861
Service shares, 2,555 Investor A
shares, 9,623 Investor B shares and
2,664 Investor C shares outstanding) $ 371,245,483
=============
VALUE
-----------
NET ASSET VALUE, OFFERING
AND REDEMPTION PRICE PER
BLACKROCK SHARE
($371,063,363/36,189,060) $ 10.25
=======
NET ASSET VALUE, OFFERING
AND REDEMPTION PRICE PER
INSTITUTIONAL SHARE
($415/40)(h) $ 10.19
=======
NET ASSET VALUE, OFFERING
AND REDEMPTION PRICE PER
SERVICE SHARE
($29,499/2,861) $ 10.31
=======
NET ASSET VALUE AND
REDEMPTION PRICE PER
INVESTOR A SHARE
($26,220/2,555) $ 10.26
=======
MAXIMUM OFFERING PRICE
PER INVESTOR A SHARE
($10.26/0.960) $ 10.69
=======
NET ASSET VALUE, OFFERING
AND REDEMPTION PRICE
(subject to a maximum contingent
deferred sales charge of 4.5%)
PER INVESTOR B SHARE
($98,686/9,623) $ 10.26
=======
NET ASSET VALUE, OFFERING
AND REDEMPTION PRICE
(subject to a maximum contingent
deferred sales charge of 4.5%)
PER INVESTOR C SHARE
($27,300/2,664) $ 10.25
=======
- -------------------
(a) Cost for Federal income tax purposes is $397,041,822. The
gross unrealized appreciation (depreciation) on a tax basis is as
follows:
Gross unrealized appreciation $ 1,860,317
Gross unrealized depreciation (5,047,905)
-----------
$(3,187,588)
===========
(b) Rates shown are the effective yields as of March 31, 2005.
SEE ACCOMPANYING NOTES TO FINANCIAL STATEMENTS.
74
BLACKROCK FUNDS
STATEMENT OF NET ASSETS
CORE PLUS TOTAL RETURN PORTFOLIO (CONCLUDED)
AS OF MARCH 31, 2005 (UNAUDITED)
(c) Securities, or a portion thereof, pledged as collateral with a value of
$676,418 on 2 long U.S. Treasury Bond futures contracts and 280 short
U.S. Treasury Note futures contracts expiring June 2005 and 43 long
Euro-dollar futures contracts expiring September 2005 and 47 short
Euro-dollar futures contracts expiring June 2005. The value of such
contracts on March 31, 2005 was $57,847,011, with an unrealized gain of
$43,520 (including commissions of $951).
(d) Securities, or a portion thereof, with a market value of $1,461,871 have
been pledged as collateral for swap and swaption contracts.
(e) Rates shown are the rates as of March 31, 2005.
(f) Security exempt from registration under Rule 144A of the Securities Act
of 1933. These securities may be resold in transactions exempt from
registration to qualified institutional investors. As of March 31, 2005,
the Portfolio held 2.2% of its net assets, with a current market value
of $8,018,138, in securities restricted as to resale.
(g) Each swaption contract is equivalent to $10,000 in notional amount.
(h) Exact net assets and shares outstanding at March 31, 2005 were $414.88 and
40.701, respectively.
SEE ACCOMPANYING NOTES TO FINANCIAL STATEMENTS.
75
BLACKROCK FUNDS
SCHEDULE OF INVESTMENTS
GOVERNMENT INCOME PORTFOLIO
AS OF MARCH 31, 2005 (UNAUDITED)
PAR
MATURITY (000) VALUE
-------------- ---------- --------------
U.S. GOVERNMENT & AGENCY OBLIGATIONS - 42.7%
Small Business Administration
Participation Certificates, Series
96-20J, Class 1
7.20% 10/01/16 $ 160 $ 168,781
Small Business Administration
Participation Certificates, Series
98-20J, Class 1
5.50% 10/01/18 136 138,731
Small Business Investment Cos.
Pass-Through, Series 03-10A,
Class 1
4.63% 03/10/13 1,319 1,305,227
U.S. Treasury Bonds
8.00%(b) 11/15/21 2,820 3,829,473
6.50% 11/15/26 735 892,278
5.38% 02/15/31 4,000 4,359,532
U.S. Treasury Notes
3.25% 08/15/07 6,290 6,205,230
3.38% 10/15/09 3,085 2,986,906
4.00% 11/12-02/14 69,045 66,648,831
4.25% 11/13-11/14 128,715 126,098,282
4.75% 05/15/14 11,130 11,338,688
============
TOTAL U.S. GOVERNMENT & AGENCY
OBLIGATIONS
(Cost $226,962,279) 223,971,959
------------
MORTGAGE PASS-THROUGHS - 42.0%
Federal Home Loan Mortgage Corp.
6.00% 12/01/12 86 89,324
5.50% 10/13-11/13 341 348,356
7.50% 11/01/25 2 1,754
6.50% 08/32-10/32 331 343,710
Federal Home Loan Mortgage Corp.
Gold
6.00% 10/13-10/33 2,690 2,779,657
5.50% 05/14-01/35 388 394,136
4.50% 06/01/19 2,041 2,000,068
8.00% 01/25-11/26 189 204,247
6.50% 03/29-04/34 471 488,905
7.00% 09/31-04/32 215 227,066
Federal National Mortgage
Association
6.00% 08/08-04/35 60,093 61,536,776
7.00% 08/09-12/11 37 38,572
4.00% 05/10-03/20 20,644 19,859,810
6.50% 01/13-10/34 9,162 9,535,784
5.50%(b) 12/13-03/35 55,016 55,145,665
8.00% 08/01/14 18 18,533
5.00% 02/18-04/35 49,144 48,277,932
4.50% 06/18-04/35 17,686 17,228,737
7.50% 06/24-04/26 60 64,049
Government National Mortgage
Association
8.00% 04/20/13 86 90,912
6.00% 01/14-06/14 298 309,658
5.50% 03/14-08/33 698 716,078
7.00% 10/27-06/28 359 379,732
7.50% 11/15/27 2 1,693
5.00% 07/33-04/35 84 92,182
6.50% 04/20/35 100 104,375
============
TOTAL MORTGAGE PASS-THROUGHS
(Cost $221,383,253) 220,277,711
------------
PAR
MATURITY (000) VALUE
-------------- ---------- --------------
MULTIPLE CLASS MORTGAGE PASS-THROUGHS - 0.1%
Federal National Mortgage
Association, Series 03-130, Class
SP (IO)
1.00%(c) 08/25/28 $ 8,985 $ 440,204
Salomon Brothers Mortgage
Securities VI, Series 87-1 (IO)
7.00%(c) 02/17/17 45 11,748
Salomon Brothers Mortgage
Securities VI, Series 87-1 (PO)
7.00%(c) 02/17/17 45 41,477
============
TOTAL MULTIPLE CLASS MORTGAGE
PASS-THROUGHS
(Cost $603,416)
493,429
------------
COMMERCIAL MORTGAGE BACKED SECURITIES - 0.6%
General Motors Acceptance Corp.
Commercial Mortgage Securities,
Inc., Series 99-C3, Class A2
7.18% 08/15/36 986 1,076,234
Goldman Sachs Residential
Mortgage Loan Trust, Series
03-13, Class 1A1
4.51%(d) 10/25/33 2,012 1,956,388
Residential Accredit Loans, Series
03-QS4, Class A (IO)
6.00% 03/25/33 525 92,805
Washington Mutual Mortgage
Securities Corp., Series 02-S8,
Class 1A3
8.00% 01/25/33 93 92,510
============
TOTAL COMMERCIAL MORTGAGE BACKED
SECURITIES
(Cost $3,253,383)
3,217,937
------------
PROJECT LOANS - 0.0%
Federal Housing Authority, Series 82
7.43%
(Cost $2,948) 09/01/22 3 2,922
------------
ASSET BACKED SECURITIES - 0.4%
The Money Store Small Business
Administration Loan Trust, Series
99-1, Class A
3.30%(d) 07/15/25 108 107,419
Structured Asset Receivables Trust,
Series 03-2
2.03%(d) 01/21/09 1,402 1,402,226
============
TOTAL ASSET BACKED SECURITIES
(Cost $1,506,674)
1,509,645
------------
SEE ACCOMPANYING NOTES TO FINANCIAL STATEMENTS.
76
BLACKROCK FUNDS
SCHEDULE OF INVESTMENTS
GOVERNMENT INCOME PORTFOLIO (CONCLUDED)
AS OF MARCH 31, 2005 (UNAUDITED)
PAR/SHARES
MATURITY (000) VALUE
---------- ----------- --------------
SHORT TERM INVESTMENTS - 14.2%
Federal Home Loan Bank, Discount
Notes
2.55% 04/01/05 $64,000 $64,000,000
Galileo Money Market Fund 10,692 10,691,678
===========
TOTAL SHORT TERM INVESTMENTS
(Cost $74,691,678) 74,691,678
-----------
TOTAL INVESTMENTS IN
SECURITIES - 100.0%
(Cost $528,403,631(a)) $524,165,281
============
NUMBER OF
CONTRACTS
----------
CALL OPTIONS WRITTEN - 0.0%
June 10 year U.S.
Treasury Notes
futures, Strike Price
113, Expires
06/30/05 (93) (2,906)
September 10 year U.S.
Treasury
Notes futures, Strike
Price 111,
Expires 09/30/05 (134) (92,125)
=======
TOTAL CALL OPTIONS WRITTEN
(Premiums received (95,031)
-------
$131,240)
PUT OPTIONS PURCHASED - 0.0%
June 10 year U.S.
Treasury Notes
futures, Strike Price
108, Expires
06/30/05
(Cost $84,710) 142 57,688
------
PUT OPTIONS WRITTEN - 0.0%
June 10 year U.S.
Treasury Notes
futures, Strike Price
109, Expires
06/30/05 (93) (68,297)
June 10 year U.S.
Treasury Notes
futures, Strike Price
110, Expires
06/30/05 (71) (87,641)
=======
TOTAL PUT OPTIONS WRITTEN
(Premiums received (155,938)
--------
$152,602)
- -------------------
(a) Cost for Federal income tax purposes is $529,979,696. The
gross unrealized appreciation (depreciation) on a tax basis is as
follows:
Gross unrealized appreciation $ 1,092,038
Gross unrealized depreciation (6,906,453)
-----------
$(5,814,415)
===========
(b) Securities, or a portion thereof, pledged as collateral with a value of
$1,294,293 on 766 short U.S. Treasury Note futures contracts, 18 long
U.S. Treasury Note futures contracts expiring June 2005, 35 long U.S.
Treasury Note futures contracts, 160 long Euro-dollar futures contracts
expiring September 2005, 368 long Euro-dollar futures contracts expiring
December 2005 and 160 short Euro-dollar futures contracts expiring
September 2006. The value of such contracts on March 31, 2005 was
$257,386,347, with an unrealized gain of $221,196 (including commissions
of $3,814).
(c) Rates shown are the effective yields as of March 31, 2005.
(d) Rates shown are the rates as of March 31, 2005.
SEE ACCOMPANYING NOTES TO FINANCIAL STATEMENTS.
77
BLACKROCK FUNDS
STATEMENT OF ASSETS AND LIABILITIES
GOVERNMENT INCOME PORTFOLIO
MARCH 31, 2005 (UNAUDITED)
ASSETS
Investments at value (Cost $528,403,631)................................. $ 524,165,281
Option purchased at value (premiums paid $84,710)........................ 57,688
Interest receivable ..................................................... 3,645,120
Interest receivable on interest rate swaps .............................. 21,035
Investments sold receivable ............................................. 391,566,982
Capital shares sold receivable .......................................... 1,259,293
Prepaid expenses ........................................................ 32,574
Unrealized appreciation on interest rate swaps .......................... 1,220,790
Futures margin receivable ............................................... 7,628
--------------
TOTAL ASSETS ......................................................... 921,976,391
--------------
LIABILITIES
Investments purchased payable ........................................... 468,995,655
Capital shares redeemed payable ......................................... 940,756
Distributions payable ................................................... 1,148,594
Advisory fees payable ................................................... 85,986
Administrative fees payable ............................................. 84,881
Transfer agent fees payable ............................................. 30,151
Other accrued expenses payable .......................................... 144,292
Interest payable on interest rate swaps ................................. 76,782
Options written, at fair value (premiums received $283,842).............. 250,969
Futures margin payable .................................................. 231,365
Unrealized depreciation on interest rate swaps .......................... 480,677
--------------
TOTAL LIABILITIES .................................................... 472,470,108
--------------
NET ASSETS (Applicable to 999,922 BlackRock shares,
17,680,788 Service shares, 16,283,098 Investor A shares,
3,858,541 Investor B shares and 2,404,726 Investor C shares outstanding) $ 449,506,283
==============
NET ASSET VALUE, OFFERING AND REDEMPTION PRICE
PER BLACKROCK SHARE ($10,907,689/999,922)................................ $ 10.91
==============
NET ASSET VALUE, OFFERING AND REDEMPTION PRICE
PER SERVICE SHARE ($192,704,664/17,680,788).............................. $ 10.90
==============
NET ASSET VALUE AND REDEMPTION PRICE
PER INVESTOR A SHARE ($177,620,406/16,283,098)........................... $ 10.91
==============
MAXIMUM OFFERING PRICE PER INVESTOR A SHARE ($10.91/0.955)................ $ 11.42
==============
NET ASSET VALUE, OFFERING AND REDEMPTION PRICE
(subject to a maximum contingent deferred sales charge of 4.5%)
PER INVESTOR B SHARE ($42,087,875/3,858,541)............................. $ 10.91
==============
NET ASSET VALUE, OFFERING AND REDEMPTION PRICE
(subject to a maximum contingent deferred sales charge of 1.0%)
PER INVESTOR C SHARE ($26,185,649/2,404,726)............................. $ 10.89
==============
SEE ACCOMPANYING NOTES TO FINANCIAL STATEMENTS.
78
BLACKROCK FUNDS
STATEMENT OF NET ASSETS
INFLATION PROTECTED BOND PORTFOLIO
AS OF MARCH 31, 2005 (UNAUDITED)
PAR
MATURITY (000) VALUE
-------------- --------- -------------
U.S. GOVERNMENT & AGENCY OBLIGATIONS - 79.5%
U.S. Treasury Inflation
Protected
Bonds
2.38% 01/15/25 $3,320 $ 3,612,594
3.62%(b) 04/15/28 1,365 2,115,372
3.88% 04/15/29 2,450 3,908,227
3.38% 04/15/32 350 498,988
U.S. Treasury Inflation
Protected
Notes
3.88% 01/15/09 1,475 1,891,333
4.25% 01/15/10 70 90,313
0.88% 04/15/10 955 940,294
3.38% 01/15/12 1,155 1,392,072
3.00% 07/15/12 2,575 3,005,616
1.88% 07/15/13 2,425 2,561,629
2.00% 01/14-07/14 4,345 4,561,382
1.62% 01/15/15 1,150 1,131,491
U.S. Treasury Notes
3.38% 02/28/07 2,775 2,754,729
===========
TOTAL U.S. GOVERNMENT & AGENCY
OBLIGATIONS
(Cost $27,883,539) 28,464,040
-----------
MORTGAGE PASS-THROUGHS - 4.6%
Federal National Mortgage
Association ARM
4.43%(c) 06/01/34 662 656,638
4.65%(c) 02/01/35 993 992,592
=======
TOTAL MORTGAGE PASS-THROUGHS
(Cost $1,662,089) 1,649,230
---------
CORPORATE BONDS - 0.4%
Yankee - 0.4%
United Mexican States, Senior
Unsecured Notes
6.62%
(Cost $103,347) 03/03/15 100 104,000
-------
FOREIGN BONDS - 4.4%
Bundesrepublic
Deutschland (EUR)
4.75% 07/04/34 50 71,941
4.00% 01/04/37 75 95,724
Canada Government Real
Return
(CND)
3.00% 12/01/36 440 452,015
Swedish Government
(SEK)
4.00% 12/01/08 6,287 965,967
=======
TOTAL FOREIGN BONDS
(Cost $1,588,535) 1,585,647
---------
PAR/SHARES
MATURITY (000) VALUE
---------- ----------- -------------
SHORT TERM INVESTMENTS - 8.6%
Federal Home Loan Bank, Discount
Notes
2.55% 04/01/05 $3,000 $3,000,000
Galileo Money Market Fund 92 92,122
==========
TOTAL SHORT TERM INVESTMENTS
(Cost $3,092,122) 3,092,122
----------
TOTAL INVESTMENTS IN SECURITIES - 97.5%
(Cost $34,329,632(a)) 34,895,039
NUMBER OF
CONTRACTS
-----------
CALL OPTIONS WRITTEN - 0.0%
September 10 year U.S.
Treasury
Notes futures, Strike
Price 112,
Expires 09/30/05
(Premiums received (39) (17,062)
-------
$21,656)
CALL SWAPTIONS WRITTEN - (0.1)%
Deutsche Bank, Strike
Price 5.15,
Expires 01/11/07
(Premiums received (130)(d) (44,323)
-------
$50,375)
PUT OPTIONS PURCHASED - 0.0%
June 10 year U.S.
Treasury Notes
futures, Strike Price
108, Expires
06/30/05
(Cost $4,852) 14 5,688
-----
PUT OPTIONS WRITTEN - 0.0%
June 10 year U.S.
Treasury Notes
futures, Strike Price
110, Expires
06/30/05
(Premiums received (7) (8,641)
------
$6,653)
PUT SWAPTIONS WRITTEN - (0.1)%
Deutsche Bank, Strike
Price 5.15,
Expires 01/11/07
(Premiums received (130)(d) (50,181)
-------
$50,375)
OTHER ASSETS IN EXCESS OF
LIABILITIES - 2.5% 905,031
-------
NET ASSETS - 100.0%
(Applicable to 2,403,281 BlackRock
shares, 411,637 Institutional shares,
29 Service shares, 383,670 Investor
A shares, 84,623 Investor B shares
and 169,639 Investor C shares
outstanding) $35,685,551
===========
SEE ACCOMPANYING NOTES TO FINANCIAL STATEMENTS.
79
BLACKROCK FUNDS
STATEMENT OF NET ASSETS
INFLATION PROTECTED BOND PORTFOLIO (CONCLUDED)
AS OF MARCH 31, 2005 (UNAUDITED)
VALUE
-----------
NET ASSET VALUE, OFFERING
AND REDEMPTION PRICE PER
BLACKROCK SHARE
($24,721,918/2,403,281) $ 10.29
=======
NET ASSET VALUE, OFFERING
AND REDEMPTION PRICE PER
INSTITUTIONAL SHARE
($4,310,633/411,637) $ 10.47
=======
NET ASSET VALUE, OFFERING
AND REDEMPTION PRICE PER
SERVICE SHARE
($307/29)(e) $ 10.52
=======
NET ASSET VALUE AND
REDEMPTION PRICE PER
INVESTOR A SHARE
($3,994,060/383,670) $ 10.41
=======
MAXIMUM OFFERING PRICE
PER INVESTOR A SHARE
($10.41/0.970) $ 10.73
=======
NET ASSET VALUE, OFFERING
AND REDEMPTION PRICE
(subject to a maximum contingent
deferred sales charge of 4.5%)
PER INVESTOR B SHARE
($882,402/84,623) $ 10.43
=======
NET ASSET VALUE, OFFERING
AND REDEMPTION PRICE
(subject to a maximum contingent
deferred sales charge of 4.5%)
PER INVESTOR C SHARE
($1,776,229/169,639) $ 10.47
=======
- -------------------
(a) Also cost for Federal income tax purposes. The gross unrealized
appreciation (depreciation) on a tax basis is as follows:
Gross unrealized appreciation $627,691
Gross unrealized depreciation (62,284)
--------
$565,407
========
(b) Securities, or a portion thereof, pledged as collateral with a value of
$65,724 on 43 long U.S. Treasury Note futures contracts and 40 short
U.S. Treasury Note futures contracts and 10 short Canadian Government
Bond futures contracts and 5 short Euro Bobl futures contracts expiring
June 2005. The value of such contracts on March 31, 2005 was
$14,832,008, with an unrealized loss of $13,080 (including commissions
of $210).
(c) Rates shown are the rates as of March 31, 2005.
(d) Each swaption contract is equivalent to $10,000 in notional amount.
(e) Exact net assets and shares outstanding at March 31, 2005 were $307.48 and
29.235, respectively.
SEE ACCOMPANYING NOTES TO FINANCIAL STATEMENTS.
80
BLACKROCK FUNDS
SCHEDULE OF INVESTMENTS
GNMA PORTFOLIO
AS OF MARCH 31, 2005 (UNAUDITED)
PAR
MATURITY (000) VALUE
-------------- ---------- --------------
U.S. GOVERNMENT & AGENCY OBLIGATIONS - 0.5%
U.S. Treasury Bonds
6.50%
(Cost $1,344,637) 11/15/26 $ 1,130 $ 1,371,802
------------
MORTGAGE PASS-THROUGHS - 79.0%
Federal Home Loan Mortgage Corp.
Gold
5.50% 06/13-02/18 737 753,462
6.00%(b) 11/13-04/34 428 441,653
6.50% 12/13-04/31 482 504,356
8.00% 07/01/17 63 68,590
9.00% 12/01/19 1 931
7.50% 09/26-03/27 11 11,706
5.00% 09/01/33 87 85,680
Federal National Mortgage
Association
6.00% 04/11-04/35 13,703 14,007,171
6.50% 02/13-04/34 1,093 1,138,618
5.50% 12/13-02/35 11,235 11,260,471
8.00% 08/01/14 140 142,088
4.50% 08/18-06/34 884 863,834
4.00% 03/01/19 136 129,791
8.50% 10/01/24 6 6,032
5.00% 05/34-04/35 600 586,500
Government National Mortgage
Association
8.00% 12/07-08/24 589 634,303
5.50% 11/08-04/34 56,288 56,881,363
6.50% 03/16-12/34 34,568 36,072,384
7.00%(b) 09/17-05/32 2,690 2,848,944
5.00% 12/17-12/34 42,509 42,360,220
9.00% 05/18-07/21 305 334,230
10.00% 12/15/20 3 3,817
7.50% 10/25-11/29 532 570,658
6.00% 01/28-01/35 44,708 45,926,701
4.50% 12/34-01/35 5,915 5,667,420
Government National Mortgage
Association II
6.00% 02/20/29 169 173,505
============
TOTAL MORTGAGE PASS-THROUGHS
(Cost $222,368,898) 221,474,428
------------
MULTIPLE CLASS MORTGAGE PASS-THROUGHS - 0.2%
Federal National Mortgage
Association, Series 03-130, Class
SP (IO)
1.00%(c)
(Cost $583,264) 08/25/28 10,175 498,479
------------
COMMERCIAL MORTGAGE BACKED SECURITIES - 2.0%
General Motors Acceptance Corp.
Commercial Mortgage Securities,
Inc., Series 99-C3, Class A2
7.18% 08/15/36 1,257 1,371,483
GSR Mortgage Loan Trust, Series
03-13, Class 1A1
4.51%(d) 10/25/33 4,023 3,912,775
Residential Accredit Loans, Series
03-QS4, Class A (IO)
6.00%(c) 03/25/33 656 116,007
PAR
MATURITY (000) VALUE
-------------- ---------- --------------
COMMERCIAL MORTGAGE BACKED SECURITIES (Continued)
Washington Mutual Mortgage
Securities Corp., Series 02-S8,
Class 1A3
8.00% 01/25/33 $ 124 $ 123,346
============
TOTAL COMMERCIAL MORTGAGE BACKED
SECURITIES
(Cost $5,575,503)
5,523,611
------------
PROJECT LOANS - 0.0%
Federal Housing Authority, Series 82
7.43%
(Cost $15,247) 09/01/22 15 15,342
------------
ASSET BACKED SECURITIES - 0.8%
The Money Store Small Business
Administration Loan Trust, Series
99-1, Class A
3.30%(d) 07/15/25 325 322,259
Structured Asset Receivables Trust,
Series 03-2
2.03%(d) 01/21/09 1,793 1,793,010
============
TOTAL ASSET BACKED SECURITIES
(Cost $2,112,839)
2,115,269
------------
SHORT TERM INVESTMENTS - 17.5%
Federal Home Loan Bank, Discount
Notes
2.55% 04/01/05 39,000 39,000,000
Galileo Money Market Fund
10,408 10,408,456
============
TOTAL SHORT TERM INVESTMENTS
(Cost $49,408,456)
49,408,456
------------
TOTAL INVESTMENTS IN
SECURITIES - 100.0%
(Cost $281,408,844(a)) $280,407,387
============
NUMBER OF
CONTRACTS
----------
CALL OPTIONS WRITTEN - 0.0%
June 10 year U.S.
Treasury Notes
futures, Strike Price
113, Expires
06/30/05 (49) (1,531)
September 10 year U.S.
Treasury
Notes futures, Strike
Price 111,
Expires 09/30/05 (66) (45,375)
=======
TOTAL CALL OPTIONS WRITTEN
(Premiums received (46,906)
-------
$66,428)
PUT OPTIONS PURCHASED - 0.0%
June 10 year U.S.
Treasury Notes
futures, Strike Price
108, Expires
06/30/05
(Cost $44,145) 74 30,062
------
SEE ACCOMPANYING NOTES TO FINANCIAL STATEMENTS.
81
BLACKROCK FUNDS
SCHEDULE OF INVESTMENTS
GNMA PORTFOLIO (CONCLUDED)
AS OF MARCH 31, 2005 (UNAUDITED)
NUMBER OF
CONTRACTS VALUE
----------- -------------
PUT OPTIONS WRITTEN - 0.0%
June 10 year U.S.
Treasury Notes
futures, Strike Price
109, Expires
06/30/05 (49) $ (35,984)
June 10 year U.S.
Treasury Notes
futures, Strike Price
110, Expires
06/30/05 (37) (45,672)
=========
TOTAL PUT OPTIONS WRITTEN
(Premiums received (81,656)
---------
$79,812)
- -------------------
(a) Cost for Federal income tax purposes is $281,484,759. The
gross unrealized appreciation (depreciation) on a tax basis is as
follows:
Gross unrealized appreciation $ 1,135,736
Gross unrealized depreciation (2,213,108)
-----------
$(1,077,372)
===========
(b) Securities, or a portion thereof, pledged as collateral with a value of
$499,332 on 56 long U.S. Treasury Note futures contracts, 201 short U.S.
Treasury Note futures contracts and 122 short Interest Rate Swap futures
contracts expiring June 2005 and 17 long U.S. Treasury Note futures
contracts and 83 long Euro-dollar futures contracts expiring September
2005 and 185 long Euro-dollar futures contracts expiring December 2005
and 83 short Euro-dollar futures contracts expiring September 2006. The
value of such contracts on March 31, 2005 was $132,190,462 with an
unrealized gain of $46,801 (including commissions of $1,925).
(c) Rates shown are the effective yields as of March 31, 2005.
(d) Rates shown are the rates as of March 31, 2005.
SEE ACCOMPANYING NOTES TO FINANCIAL STATEMENTS.
82
BLACKROCK FUNDS
STATEMENT OF ASSETS AND LIABILITIES
GNMA PORTFOLIO
MARCH 31, 2005 (UNAUDITED)
ASSETS
Investments at value (Cost $281,408,844)............................ $ 280,407,387
Option purchased at value (premiums paid $44,145)................... 30,062
Interest receivable ................................................ 1,036,674
Interest receivable on interest rate swaps ......................... 25,365
Investments sold receivable ........................................ 162,381,317
Capital shares sold receivable ..................................... 239,193
Prepaid expenses ................................................... 29,797
Unrealized appreciation on interest rate swaps ..................... 350,403
Futures margin receivable .......................................... 5,312
--------------
TOTAL ASSETS .................................................... 444,505,510
--------------
LIABILITIES
Investments purchased payable ...................................... 220,041,887
Capital shares redeemed payable .................................... 572,974
Distributions payable .............................................. 577,792
Advisory fees payable .............................................. 33,433
Administrative fees payable ........................................ 41,607
Transfer agent fees payable ........................................ 27,608
Other accrued expenses payable ..................................... 86,712
Interest payable on interest rate swaps ............................ 92,590
Options written, at fair value (premiums received $146,240)......... 128,563
Futures margin payable ............................................. 108,024
Unrealized depreciation on interest rate swaps ..................... 625,490
--------------
TOTAL LIABILITIES ............................................... 222,336,680
--------------
NET ASSETS (Applicable to 1,102,802 BlackRock shares,
13,663,429 Institutional shares, 822,113 Service shares,
1,639,677 Investor A shares, 2,362,984 Investor B shares and
3,178,990 Investor C shares outstanding) ........................... $ 222,168,830
==============
NET ASSET VALUE, OFFERING AND REDEMPTION PRICE
PER BLACKROCK SHARE ($10,748,204/1,102,802)......................... $ 9.75
==============
NET ASSET VALUE, OFFERING AND REDEMPTION PRICE
PER INSTITUTIONAL SHARE ($133,275,558/13,663,429)................... $ 9.75
==============
NET ASSET VALUE, OFFERING AND REDEMPTION PRICE
PER SERVICE SHARE ($8,012,404/822,113).............................. $ 9.75
==============
NET ASSET VALUE AND REDEMPTION PRICE
PER INVESTOR A SHARE ($16,060,302/1,639,677)........................ $ 9.79
==============
MAXIMUM OFFERING PRICE PER INVESTOR A SHARE ($9.79/0.960)............ $ 10.20
==============
NET ASSET VALUE, OFFERING AND REDEMPTION PRICE
(subject to a maximum contingent deferred sales charge of 4.5%)
PER INVESTOR B SHARE ($23,070,425/2,362,984)........................ $ 9.76
==============
NET ASSET VALUE, OFFERING AND REDEMPTION PRICE
(subject to a maximum contingent deferred sales charge of 1.0%)
PER INVESTOR C SHARE ($31,001,937/3,178,990)........................ $ 9.75
==============
SEE ACCOMPANYING NOTES TO FINANCIAL STATEMENTS.
83
BLACKROCK FUNDS
STATEMENT OF NET ASSETS
MANAGED INCOME PORTFOLIO
AS OF MARCH 31, 2005 (UNAUDITED)
PAR
MATURITY (000) VALUE
-------------- ---------- --------------
U.S. GOVERNMENT & AGENCY OBLIGATIONS - 43.3%
Federal Home Loan Mortgage Corp.,
Unsecured Notes
3.88% 11/10/08 $ 3,055 $ 3,005,998
Federal National Mortgage
Association, Unsecured Notes
1.75% 06/16/06 2,120 2,068,643
2.35% 04/05/07 7,880 7,626,957
4.00% 01/26/09 6,520 6,428,211
4.75% 02/21/13 2,990 2,932,703
Overseas Private Investment Co.
4.09%(b) 05/29/12 455 418,357
4.30%(b) 05/29/12 1,268 1,190,132
4.64%(b) 05/29/12 944 901,096
4.68%(b) 05/29/12 533 501,381
4.87%(b) 05/29/12 4,024 3,882,552
5.40%(b) 05/29/12 5,015 4,991,178
5.46%(b) 05/29/12 575 578,266
5.79%(b) 05/29/12 1,015 1,027,387
5.88%(b) 05/29/12 540 549,708
5.94%(b) 05/29/12 1,926 1,963,803
5.95%(b) 05/29/12 549 557,851
6.10%(b) 05/29/12 647 662,420
6.81%(b) 05/29/12 780 807,344
6.89%(b) 05/29/12 6,221 6,485,160
6.91%(b) 05/29/12 2,091 2,147,039
7.35%(b) 05/29/12 561 586,694
Resolution Funding Corp. Strip
Bonds
6.29%(c) 07/15/18 1,725 888,944
6.30%(c) 10/15/18 1,725 876,117
Small Business Administration
Participation Certificates, Series
96-20B, Class 1
6.38% 02/01/16 2,377 2,466,002
Small Business Administration
Participation Certificates, Series
96-20K, Class 1
6.95% 11/01/16 4,137 4,343,490
Small Business Administration
Participation Certificates, Series
97, Class A
3.35%(d) 08/15/22 826 784,427
Small Business Administration
Participation Certificates, Series
97-20B, Class 1
7.10% 02/01/17 2,864 3,022,417
Small Business Administration
Participation Certificates, Series
97-20G, Class 1
6.85% 07/01/17 5,300 5,575,524
U.S. Treasury Bonds
10.38%(e)(f) 11/15/12 6,600 7,646,206
8.12%(f) 08/15/19 28,490 38,329,078
8.50% 02/15/20 950 1,321,873
8.00% 11/15/21 6,380 8,663,842
6.00% 02/15/26 12,720 14,550,980
6.75% 08/15/26 15,020 18,704,000
6.12% 11/15/27 4,845 5,662,783
5.50% 08/15/28 1,590 1,727,263
PAR
MATURITY (000) VALUE
-------------- ---------- --------------
U.S. GOVERNMENT & AGENCY OBLIGATIONS (Continued)
U.S. Treasury Notes
3.00% 12/31/06 $ 5,345 $ 5,277,145
3.75%(f) 03/31/07 35,600 35,572,196
3.62% 01/15/10 50,965 49,744,643
4.00% 03/15/10 3,995 3,963,791
5.00% 02/15/11 410 425,840
4.75% 05/15/14 8,485 8,644,094
4.25% 08/14-11/14 44,835 43,932,756
============
TOTAL U.S. GOVERNMENT & AGENCY
OBLIGATIONS
(Cost $312,136,639)
311,436,291
------------
MORTGAGE PASS-THROUGHS - 22.1%
Federal Home Loan Mortgage Corp.
3.00% 04/19/07 5,900 5,786,348
5.00% 03/15/18 2,370 2,341,436
5.50% 01/15/35 3,600 3,656,520
Federal Home Loan Mortgage Corp.
Gold
6.50% 03/09-12/30 1,289 1,344,582
4.00% 05/01/10 2,356 2,311,391
6.00% 11/12-07/34 8,218 8,434,838
5.50% 10/01/17 1,144 1,169,050
7.50% 11/25-10/27 36 38,465
7.00% 04/29-04/32 91 95,679
5.00% 04/15/34 6,800 6,651,250
Federal Home Loan Mortgage Corp.,
ARM
4.38%(d) 01/01/35 9,484 9,403,922
Federal National Mortgage
Association
7.00% 06/06-09/34 3,099 3,269,273
6.00% 02/09-04/35 12,580 12,964,716
6.50% 02/11-04/35 21,075 21,893,915
5.50% 09/13-09/34 28,914 29,211,195
4.50% 04/19-06/19 10,615 10,383,609
5.00% 04/19-04/34 22,994 22,657,783
4.00% 06/01/19 47 44,854
4.31%(d) 12/01/34 8,095 7,981,247
Government National Mortgage
Association
9.50% 09/16-11/16 23 25,286
9.00% 03/15/18 14 14,997
6.50% 12/23-04/35 4,709 4,923,597
6.00% 11/28-10/33 758 780,241
5.50% 11/33-12/34 2,168 2,190,674
MLCC Mortgage Investors, Inc.,
Series 95-C2 (IO)
10.40%(c) 06/15/21 12,421 218,106
============
TOTAL MORTGAGE PASS-THROUGHS
(Cost $157,669,365) 157,792,974
------------
MULTIPLE CLASS MORTGAGE PASS-THROUGHS - 0.6%
Federal Home Loan Mortgage Corp.
Series 04-2825, Class VP
5.50%
(Cost $3,351,312) 06/15/15 3,221 3,279,487
------------
SEE ACCOMPANYING NOTES TO FINANCIAL STATEMENTS.
84
BLACKROCK FUNDS
STATEMENT OF NET ASSETS
MANAGED INCOME PORTFOLIO (CONTINUED)
AS OF MARCH 31, 2005 (UNAUDITED)
PAR
MATURITY (000) VALUE
---------- ---------- -------------
COMMERCIAL MORTGAGE BACKED SECURITIES - 10.2%
Banc of America Alternative Loan
Trust, Series 04-11, Class 2CB1
6.00% 12/25/34 $ 3,788 $ 3,799,109
Banc of America Commercial
Mortgage, Inc., Series 01-1, Class
A2
6.50% 04/15/36 4,030 4,365,585
Bear Stearns Commercial Mortgage
Securities, Inc., Series 00-WF2,
Class A2
7.32% 10/15/32 4,590 5,106,330
Bear Stearns Commercial Mortgage
Securities, Inc., Series 04-PWR6,
Class A6
4.83% 11/11/41 4,155 4,051,790
Commercial Mortgage Acceptance
Corp., Series 98-C2, Class A2
6.03% 09/15/30 5,006 5,181,104
Donaldson, Lufkin and Jenrette, Inc.
Commerical Mortgage Corp.,
Series 98-CF1, Class A1B
6.41% 02/18/31 7,750 8,124,126
General Motors Acceptance Corp.
Commercial Mortgage Securities,
Inc., Series 99-C3, Class A2
7.18% 08/15/36 3,815 4,162,070
Goldman Sachs Mortgage Securities
Corp. II, Series 98-C1, Class A3
6.14% 10/18/30 5,384 5,619,315
Goldman Sachs Mortgage Securities
Corp. II, Series 04-GG2, Class A4
4.96% 08/10/38 3,500 3,505,460
Lehman Brothers-UBS Commercial
Mortgage Trust, Series 00-C4,
Class A2
7.37% 08/15/26 5,680 6,329,548
Lehman Brothers-UBS Commerical
Mortgage Trust, Series 03-C7,
Class A2
4.06%(d) 09/15/27 2,480 2,426,217
Morgan Stanley Capital I Inc., Series
03-T11, Class A2
4.34% 06/13/41 2,950 2,906,809
Morgan Stanley Capital Investments,
Series 98-HF2, Class A2
6.48% 11/15/30 4,645 4,895,261
Residential Accredit Loans, Inc.,
Series 99-QS8, Class A1
6.50% 06/25/14 1,743 1,757,473
Salomon Brothers Mortgage
Securities VII, Series 00-C1, Class
A2
7.52% 12/18/09 5,565 6,067,575
Summit Mortgage Trust, Series 00-1,
Class B1
6.06%(d) 12/28/12 209 209,051
USGI, Series 87
7.43% 12/01/22 168 172,946
Wachovia Bank Commercial
Mortgage Trust, Series 03, Class
C6
5.12% 08/15/35 4,470 4,490,764
===========
TOTAL COMMERCIAL MORTGAGE BACKED
SECURITIES
(Cost $74,690,476) 73,170,533
-----------
PAR
MATURITY (000) VALUE
---------- ---------- -------------
PROJECT LOANS - 2.6%
Whittier Rehab at Haverhill Project
Loan
7.60% 12/01/39 $10,875 $11,432,328
Whittier Rehab at Westborough
Project Loan
8.12% 02/28/37 6,943 7,312,852
===========
TOTAL PROJECT LOANS
(Cost $17,559,396) 18,745,180
-----------
CERTIFICATE OF DEPOSIT - 0.4%
State Street Bank & Trust
2.92%(d) 12/11/06 1,625 1,624,191
SunTrust Bank, Inc.
4.42% 06/15/09 1,260 1,251,684
===========
TOTAL CERTIFICATE OF DEPOSIT
(Cost $2,884,452) 2,875,875
-----------
ASSET BACKED SECURITIES - 7.7%
Chase Issuance Trust, Series 04-A9,
Class A9
3.22% 06/15/10 5,675 5,541,581
Citibank Credit Card Issuance Trust,
Series 00, Class A3
6.88% 11/16/09 6,275 6,677,298
Citibank Credit Card Issuance Trust,
Series 04, Class A1
2.55% 01/20/09 9,150 8,903,042
Countrywide Asset-Backed
Certificates, Series 04-14, Class
A4
3.13%(d) 06/25/35 5,486 5,493,143
Ford Credit Auto Owner Trust, Series
05-A, Class A3
3.48% 11/17/08 7,450 7,386,004
Green Tree Financial Corp., Series
96-7, Class A6
7.65% 10/15/27 4,665 4,927,151
MBNA Credit Card Master Note
Trust, Series 04-A4, Class A4
2.70% 09/15/09 7,200 7,005,377
The Money Store Small Business
Administration Loan-Backed
Securities, Series 97-1, Class A
3.40%(d) 04/15/28 1,857 1,729,404
Railcar Leasing LLC, Series 97-1,
Class A1
6.75% 07/15/06 2,515 2,550,822
Small Business Administration
Participation Certificates, Series
97-20F, Class 1
7.20% 06/01/17 847 896,239
Structured Asset Receivables Trust,
Series 03-2
2.03%(d) 01/21/09 4,230 4,229,664
===========
TOTAL ASSET BACKED SECURITIES
(Cost $55,954,822) 55,339,725
-----------
CORPORATE BONDS - 23.7%
Aerospace - 0.5%
Lockheed Martin Corp., Senior
Debentures
8.50% 12/01/29 985 1,332,898
SEE ACCOMPANYING NOTES TO FINANCIAL STATEMENTS.
85
BLACKROCK FUNDS
STATEMENT OF NET ASSETS
MANAGED INCOME PORTFOLIO (CONTINUED)
AS OF MARCH 31, 2005 (UNAUDITED)
PAR
MATURITY (000) VALUE
---------- ---------- -------------
CORPORATE BONDS (Continued)
Aerospace (Continued)
Northrop Grumman Corp., Senior
Unsecured Notes
4.08% 11/16/06 $1,205 $ 1,203,747
7.12% 02/15/11 915 1,020,395
Raytheon Co., Senior Unsecured
Notes
4.50% 11/15/07 383 383,111
===========
3,940,151
-----------
Banks - 5.9%
American Express Bank Ltd., Bank
Notes
2.93%(d) 11/21/07 2,450 2,449,976
Banc One Corp., Senior Unsecured
Notes
2.62% 06/30/08 1,415 1,336,076
Bank of America Corp., Senior
Unsecured Notes
5.25% 02/01/07 425 433,044
3.38% 02/17/09 1,350 1,294,747
Bank of America Corp., Subordinated
Notes
7.80% 02/15/10 1,190 1,347,048
Bank of Scotland Treasury Services,
Unsecured Notes
3.50%(g) 11/30/07 1,630 1,596,451
BankBoston N.A., Subordinated
Notes
7.00% 09/15/07 1,500 1,594,185
Deutsche Bank AG, Deposit Notes
3.84%(d) 03/15/07 1,600 1,596,160
HBOS Treasury Services PLC,
Senior Unsecured Notes
3.60%(g) 08/15/07 855 841,646
The Huntington National Bank,
Subordinated Bank Notes
2.75% 10/16/06 480 469,757
International Finance Corp., Senior
Unsecured Notes
7.12% 04/06/05 3,875 3,875,465
J.P. Morgan Chase & Co., Senior
Unsecured Notes
5.25% 05/30/07 3,380 3,446,596
Lloyds TSB Bank PLC, Subordinated
Notes
6.90% 11/29/49 2,000 2,051,078
National City Bank Cleveland, Senior
Bank Notes
3.21%(d) 06/29/09 1,350 1,349,572
National City Bank, Unsecured Notes
3.38% 10/15/07 185 181,423
The Royal Bank of Scotland Group
PLC
4.71%(d) 12/29/49 600 579,403
The Royal Bank of Scotland Group
PLC, Capital Trust
6.80% 12/31/49 1,000 1,016,005
SunTrust Bank, Inc., Senior
Unsecured Notes
3.62% 10/15/07 1,540 1,514,482
Swedish Export Credit Corp.,
Unsecured Notes
2.88% 01/26/07 1,550 1,524,766
PAR
MATURITY (000) VALUE
---------- ---------- -------------
CORPORATE BONDS (Continued)
Banks (Continued)
U.S. Bancorp, Senior Unsecured
Notes
3.95% 08/23/07 $ 335 $ 333,084
U.S. Bank N.A., Senior Bank Notes
2.87% 02/01/07 1,040 1,014,104
2.40% 03/12/07 1,580 1,530,088
U.S. Bank N.A., Subordinated Notes
6.50% 02/01/08 2,420 2,549,743
Wachovia Corp., Senior Notes
3.50% 08/15/08 1,165 1,131,059
Wells Fargo & Co., Senior Unsecured
Notes
4.00% 08/15/08 1,925 1,906,058
4.20% 01/15/10 3,765 3,681,944
Wells Fargo & Co., Subordinated
Notes
7.80%(d) 06/15/10 1,450 1,462,302
===========
42,106,262
-----------
Broadcasting - 0.3%
News America, Inc., Senior
Debentures
7.12% 04/08/28 300 329,087
7.62% 11/30/28 1,150 1,324,497
News America, Inc., Senior
Unsecured Notes
6.20%(g) 12/15/34 275 271,911
===========
1,925,495
-----------
Chemicals - 0.1%
Schering-Plough Corp., Senior
Unsecured Notes
6.75% 12/01/33 500 559,419
-----------
Energy & Utilities - 0.5%
FirstEnergy Corp., Senior Unsecured
Notes
7.38% 11/15/31 400 455,360
Florida Power Corp., First Mortgage
Bonds
6.65% 07/15/11 960 1,042,032
5.90% 03/01/33 175 178,223
Progress Energy, Inc., Senior
Unsecured Notes
7.10% 03/01/11 1,140 1,252,029
TXU Corp., Senior Unsecured Notes
4.80%(g) 11/15/24 1,000 955,609
===========
3,883,253
-----------
Entertainment & Leisure - 0.3%
Time Warner Cos., Inc., Senior
Debentures
9.15% 02/01/23 535 701,947
7.57% 02/01/24 750 868,064
7.70% 05/01/32 575 682,636
Viacom, Inc., Senior Debentures
7.88% 07/30/30 125 148,479
===========
2,401,126
-----------
Finance - 8.5%
American Express Co., Senior
Unsecured Notes
4.38% 07/30/09 375 370,849
SEE ACCOMPANYING NOTES TO FINANCIAL STATEMENTS.
86
BLACKROCK FUNDS
STATEMENT OF NET ASSETS
MANAGED INCOME PORTFOLIO (CONTINUED)
AS OF MARCH 31, 2005 (UNAUDITED)
PAR
MATURITY (000) VALUE
---------- ---------- -------------
CORPORATE BONDS (Continued)
Finance (Continued)
ASIF Global Financing, Unsecured
Notes
3.85%(g) 11/26/07 $ 3,090 $ 3,036,110
3.90%(g) 10/22/08 285 278,813
Associates Corp. of North America,
Senior Notes
6.25% 11/01/08 690 730,825
The Bear Stearns Cos., Inc.,
Unsecured Notes
2.88% 07/02/08 1,000 951,824
Berkshire Hathaway Finance Corp.,
Senior Unsecured Notes
3.38% 10/15/08 1,925 1,860,632
4.12%(g) 01/15/10 1,260 1,227,644
California Preferred Fund Trust,
Notes
7.00% 12/31/49 800 840,800
Citigroup, Inc., Senior Unsecured
Notes
6.20% 03/15/09 1,200 1,265,599
Citigroup, Inc., Subordinated Notes
6.00% 10/31/33 685 715,202
Citigroup, Inc., Unsecured Notes
3.62% 02/09/09 3,655 3,540,781
4.12% 02/22/10 3,900 3,808,857
Devon Financing Corp., Senior
Unsecured Notes
7.88% 09/30/31 350 435,972
Eksportfinans, Unsecured Notes
3.38% 01/15/08 3,770 3,686,091
EOP Operating LP, Unsecured Notes
4.65% 10/01/10 255 249,811
4.75% 03/15/14 460 431,364
General Electric Capital Corp.,
Unsecured Notes
3.45% 07/16/07 10,250 10,259,532
4.12% 03/04/08 5,400 5,359,700
3.60% 10/15/08 3,005 2,915,989
4.38% 11/21/11 330 322,207
General Motors Acceptance Corp.,
Senior Unsecured Notes
7.75% 01/19/10 845 811,619
7.25% 03/02/11 600 557,068
6.88% 09/15/11 1,905 1,727,568
Household Finance Corp., Senior
Unsecured Notes
6.50% 11/15/08 1,615 1,711,776
Lehman Brothers Holdings, Inc.,
Senior Unsecured Notes
7.00% 02/01/08 345 368,123
Metropolitan Life Global Funding,
Inc., Unsecured Notes
4.25%(g) 07/30/09 1,080 1,049,652
Nationwide Building Society, Senior
Unsecured Notes
3.50%(g) 07/31/07 1,725 1,692,466
Nationwide Building Society,
Unsecured Notes
4.25%(g) 02/01/10 1,000 980,312
SLM Corp., Senior Unsecured Notes
3.62% 03/17/08 3,155 3,083,274
Sun Life of Canada Capital Trust,
Capital Securities
8.53%(g) 05/29/49 2,700 2,976,966
PAR
MATURITY (000) VALUE
---------- ---------- -------------
CORPORATE BONDS (Continued)
Finance (Continued)
TIAA Global Markets, Senior
Unsecured Notes
4.12%(g) 11/15/07 $ 1,850 $ 1,839,757
3.88%(g) 01/22/08 1,165 1,150,064
USAA Capital Corp., Senior
Unsecured Notes
4.00%(g) 12/10/07 920 913,452
===========
61,150,699
-----------
Food & Agriculture - 0.2%
Albertson's, Inc., Senior Debentures
8.00% 05/01/31 340 400,258
General Mills, Inc., Senior Unsecured
Notes
5.12% 02/15/07 925 939,504
===========
1,339,762
-----------
Insurance - 1.0%
Liberty Mutual Group, Inc.
6.50% 03/15/35 530 513,319
Marsh & McLennan Cos., Inc., Senior
Unsecured Notes
2.77%(d) 07/13/07 475 472,752
Monumental Global Funding II,
Senior Secured Notes
4.38%(g) 07/30/09 925 914,760
Monumental Global Funding II,
Unsecured Notes
2.80%(g) 07/15/08 2,480 2,361,640
New York Life Global Funding,
Unsecured Notes
3.88%(g) 01/15/09 775 758,744
Protective Life Corp. Secured Trust,
Secured Notes
3.70% 11/24/08 1,330 1,288,704
Wellpoint, Inc., Unsecured Notes
5.95%(g) 12/15/34 675 677,737
===========
6,987,656
-----------
Manufacturing - 0.2%
Belvoir Land LLC Class II,
Unsecured Notes
5.40%(g) 12/15/47 1,175 1,103,290
-----------
Medical & Medical Services - 0.3%
United Health Group, Inc., Unsecured
Notes
3.38% 08/15/07 1,645 1,610,860
Wellpoint Health Network, Inc.,
Senior Unsecured Notes
6.38% 06/15/06 700 717,794
===========
2,328,654
-----------
Medical Instruments & Supplies - 0.1%
Boston Scientific Corp., Senior
Unsecured Notes
5.45%(h) 06/15/14 490 499,540
-----------
Motor Vehicles - 0.3%
Daimler Chrysler AG, Senior
Debentures
7.45% 03/01/27 870 934,897
Daimler Chrysler N.A. Holding Corp.,
Unsecured Notes
4.05% 06/04/08 150 146,009
SEE ACCOMPANYING NOTES TO FINANCIAL STATEMENTS.
87
BLACKROCK FUNDS
STATEMENT OF NET ASSETS
MANAGED INCOME PORTFOLIO (CONTINUED)
AS OF MARCH 31, 2005 (UNAUDITED)
PAR
MATURITY (000) VALUE
---------- ---------- -------------
CORPORATE BONDS (Continued)
Motor Vehicles (Continued)
General Motors Corp., Senior
Unsecured Notes
7.20% 01/15/11 $1,575 $ 1,414,600
===========
2,495,506
-----------
Oil & Gas - 0.8%
Anadarko Finance Co., Senior
Unsecured Notes
7.50% 05/01/31 310 379,632
Conoco Funding Co., Senior
Unsecured Notes
6.35% 10/15/11 665 717,242
Consolidated Natural Gas Co.,
Senior Unsecured Notes
5.38% 11/01/06 1,850 1,887,851
Devon Energy Corp., Senior
Debentures
7.95% 04/15/32 575 724,960
Suncor Energy, Inc.
5.95% 12/01/34 470 492,522
Texaco Capital, Inc., Debentures
8.88% 09/01/21 1,350 1,870,002
===========
6,072,209
-----------
Pharmaceuticals - 0.2%
Merck & Co., Inc., Senior Unsecured
Notes
4.38% 02/15/13 1,000 962,655
Merck & Co., Inc., Unsecured Notes
4.75% 03/01/15 800 771,880
===========
1,734,535
-----------
Real Estate - 0.6%
ERP Operating LP, Unsecured Notes
5.20% 04/01/13 2,975 2,966,100
The Rouse Co., Unsecured Notes
3.62% 03/15/09 1,615 1,510,975
===========
4,477,075
-----------
Retail Merchandising - 0.3%
Federated Department Stores, Senior
Debentures
6.90% 04/01/29 300 321,340
May Department Stores Co.,
Debentures
6.70% 07/15/34 515 530,401
May Department Stores Co.,
Unsecured Notes
5.75% 07/15/14 1,100 1,103,253
===========
1,954,994
-----------
Telecommunications - 1.5%
AT&T Broadband Corp., Unsecured
Notes
8.38% 03/15/13 350 415,883
Comcast Cable Communications
Corp., Senior Unsecured Notes
6.38% 01/30/06 413 420,917
Continental Cablevision, Inc., Senior
Notes
8.30% 05/15/06 2,640 2,743,169
PAR
MATURITY (000) VALUE
---------- ---------- -------------
CORPORATE BONDS (Continued)
Telecommunications (Continued)
Cox Communications, Inc.,
Unsecured Notes
4.62% 06/01/13 $ 280 $ 260,911
New England Telephone & Telegraph
Co., Debentures
7.88% 11/15/29 200 235,846
SBC Communications, Inc.,
Unsecured Notes
4.12% 09/15/09 280 272,334
6.45% 06/15/34 725 752,666
TCI Communications, Inc., Senior
Debentures
7.88% 02/15/26 1,040 1,268,773
TCI Communications, Inc., Senior
Notes
7.12% 02/15/28 620 692,329
Verizon Global Funding Corp., Senior
Unsecured Notes
7.75% 12/01/30 270 326,321
Verizon Maryland, Inc., Senior
Debentures
6.12% 03/01/12 575 603,252
Verizon Pennsylvania, Inc.,
Debentures
5.65% 11/15/11 1,795 1,854,298
Vodafone Group PLC, Senior
Unsecured Notes
7.88% 02/15/30 660 842,583
Vodafone Group PLC, Unsecured
Notes
5.00% 12/16/13 90 89,392
===========
10,778,674
-----------
Yankee - 2.1%
AID-Israel, Unsecured Notes
5.50% 09/18/23 5,000 5,277,200
British Telecommunication Group
PLC, Senior Unsecured Notes
8.88% 12/15/30 45 59,962
Deutsche Telekom International
Finance BV (Netherlands), Senior
Unsecured Notes
8.75% 06/15/30 590 771,632
Pemex Finance Ltd. (Luxembourg),
Senior Unsecured Notes
9.03% 02/15/11 3,505 3,949,820
Province of Quebec, Debentures
6.12% 01/22/11 710 760,169
Telecom Italia Capital (Luxembourg),
Senior Unsecured Notes
4.95%(g) 09/30/14 615 589,112
Telecom Italia Capital (Luxembourg),
Unsecured Notes
6.00%(g) 09/30/34 250 242,083
Telefonica Europe BV, Senior
Unsecured Notes
7.75% 09/15/10 475 538,843
United Mexican States, Senior
Unsecured Notes
6.62%(h) 03/03/15 2,030 2,111,200
SEE ACCOMPANYING NOTES TO FINANCIAL STATEMENTS.
88
BLACKROCK FUNDS
STATEMENT OF NET ASSETS
MANAGED INCOME PORTFOLIO (CONTINUED)
AS OF MARCH 31, 2005 (UNAUDITED)
PAR
MATURITY (000) VALUE
---------- -------- --------------
CORPORATE BONDS (Continued)
Yankee (Continued)
XL Capital Ltd. (Kyrgyzstan), Senior
Unsecured Notes
6.38% 11/15/24 $ 505 $ 527,214
============
14,827,235
------------
TOTAL CORPORATE BONDS
(Cost $170,380,884) 170,565,535
------------
FOREIGN BONDS - 0.5%
Bundesrepublic Deutschland (EUR)
4.75% 07/04/34 925 1,330,914
4.00% 01/04/37 1,675 2,137,832
============
TOTAL FOREIGN BONDS
(Cost $3,514,210) 3,468,746
------------
TAXABLE MUNICIPAL BONDS - 1.5%
California Department of Water
Resources Revenue Bonds, Series
02, Class E
3.98% 05/01/05 1,825 1,825,584
Los Angeles County Pension
Obligation Revenue Bonds, Series
95, Class D
6.97% 06/30/08 7,355 7,920,967
Ohana Military Communities LLC,
Military Housing Revenue Bonds
(Navy Hawaii Housing Privatization
Project) Series 04-A, Class 1
6.19% 04/01/49 750 807,870
============
TOTAL TAXABLE MUNICIPAL BONDS
(Cost $9,929,994) 10,554,421
------------
SHORT TERM INVESTMENTS - 0.4%
Galileo Money Market Fund 379 378,723
Institutional Money Market Trust(i) 2,332 2,332,000
============
TOTAL SHORT TERM INVESTMENTS
(Cost $2,710,723) 2,710,723
------------
TOTAL INVESTMENTS IN SECURITIES -
113.0%
(Cost $810,782,273(a)) 809,939,490
NUMBER OF
CONTRACTS VALUE
----------- ------------
CALL OPTIONS WRITTEN - 0.0%
Deutsche Bank, Strike
Price 5.50,
Expires 04/06/05 (95) $(742)
Federal National
Mortgage
Association 30Yr
5.5%, Strike
Price 101.718750,
Expires
04/06/05 (1,865) (2)
=======
TOTAL CALL OPTIONS WRITTEN
(Premiums received (744)
-------
$74,018)
CALL SWAPTIONS WRITTEN - (0.1)%
Citibank, Strike Price
5.67, Expires
01/04/10 (1,000)(j) (525,000)
Deutsche Bank, Strike
Price 5.015,
Expires 01/29/07 (877)(j) (262,276)
========
TOTAL CALL SWAPTIONS WRITTEN
(Premiums received (787,276)
--------
$849,014)
PUT OPTIONS WRITTEN - 0.0%
September 10 year U.S.
Treasury
Notes futures, Strike
Price 105,
Expires 09/30/05
(Premiums received (29) (11,781)
-------
$14,872)
PUT SWAPTIONS WRITTEN - (0.2)%
Citibank, Strike Price
5.67, Expires
01/04/10 (1,000)(j) (409,600)
Deutsche Bank, Strike
Price 5.015,
Expires 01/29/07 (877)(j) (388,970)
Goldman Sachs, Strike
Price 5.50,
Expires 08/26/05 (1,380)(j) (95,524)
Union Bank of
Switzerland, Strike
Price 5.75, Expires (9,100)(j) (141,050)
09/23/05
========
TOTAL PUT SWAPTIONS WRITTEN
(Premiums received (1,035,144)
----------
$2,950,918)
SEE ACCOMPANYING NOTES TO FINANCIAL STATEMENTS.
89
BLACKROCK FUNDS
STATEMENT OF NET ASSETS
MANAGED INCOME PORTFOLIO (CONCLUDED)
AS OF MARCH 31, 2005 (UNAUDITED)
VALUE
-----------------
LIABILITIES IN EXCESS OF OTHER
ASSETS - (12.7)%
(including $193,930,256 of payable for
financing
transactions and $2,332,000 of payable
upon return
of securities loaned) $ (91,315,818)
-------------
NET ASSETS - 100.0%
(Applicable to 58,354,412 Institutional
shares, 7,634,945 Service shares,
3,223,479 Investor A shares, 743,501
Investor B shares and 112,609
Investor C shares outstanding) $ 716,788,727
=============
NET ASSET VALUE, OFFERING
AND REDEMPTION PRICE PER
INSTITUTIONAL SHARE
($596,945,700/58,354,412) $ 10.23
=======
NET ASSET VALUE, OFFERING
AND REDEMPTION PRICE PER
SERVICE SHARE
($78,099,478/7,634,945) $ 10.23
=======
NET ASSET VALUE AND
REDEMPTION PRICE PER
INVESTOR A SHARE
($32,986,382/3,223,479) $ 10.23
=======
MAXIMUM OFFERING PRICE
PER INVESTOR A SHARE
($10.23/.0955) $ 10.71
=======
NET ASSET VALUE, OFFERING
AND REDEMPTION PRICE
(subject to a maximum contingent
deferred sales charge of 4.5%)
PER INVESTOR B SHARE
($7,607,913/743,501) $ 10.23
=======
NET ASSET VALUE, OFFERING
AND REDEMPTION PRICE
(subject to a maximum contingent
deferred sales charge of 4.5%)
PER INVESTOR C SHARE
($1,149,254/112,609) $ 10.21
=======
- -------------------
(a) Cost for Federal income tax purposes is $812,060,805. The
gross unrealized appreciation (depreciation) on a tax basis is as
follows:
Gross unrealized appreciation $ 8,844,155
Gross unrealized depreciation (10,965,470)
-----------
$(2,121,315)
===========
(b) Securities valued at fair value as determined in good faith by or under
the direction of the Trustees. These securities had a total market
value of $27,250,368 which represents 3.80% of net assets.
(c) Rates shown are the effective yields as of March 31, 2005.
(d) Rates shown are the rates as of March 31, 2005.
(e) Securities, or a portion thereof, pledged as collateral with a value of
$1,578,751 on 18 long U.S. Treasury Note futures contracts, 1,913 short
U.S. Treasury Note futures contracts, 92 short Euro Bobl futures
contracts expiring June 2005, 97 long Euro-dollar futures contracts
expiring September 2005 and 97 long Euro futures contracts expiring
December 2005. The value of such contracts on March 31, 2005 was
$280,808,667, with an unrealized gain of $2,018,205 (including
commissions of $4,672).
(f) Securities, or a portion thereof, subject to financing transactions.
(g) Security exempt from registration under Rule 144A of the Securities Act of
1933. These securities may be resold in transactions exempt from
registration to qualified institutional investors. As of March 31, 2005,
the Portfolio held 3.6% of its net assets, with a current market value
of $25,458,219, in securities restricted as to resale.
(h) Total or partial securities on loan.
(i) Securities purchased with the cash proceeds from securities loaned.
(j) Each swaption contract is equivalent to $10,000 in notional amount.
SEE ACCOMPANYING NOTES TO FINANCIAL STATEMENTS.
90
BLACKROCK FUNDS
STATEMENT OF NET ASSETS
INTERNATIONAL BOND PORTFOLIO
AS OF MARCH 31, 2005 (UNAUDITED)
PAR
MATURITY (000) VALUE
---------- ------------- --------------
FOREIGN BONDS - 64.7%
Australia - 0.1%
QBE Insurance Group Ltd., Senior
Unsecured Bonds (GBP)
5.62% 09/28/09 $ 620 $ 1,179,548
------------
Austria - 2.0%
Bank Austria Creditanstalt, Senior
Unsecured Notes (GBP)
5.62% 07/12/11 3,490 6,758,832
Republic of Austria (CND)
5.00% 12/20/24 2,000 1,626,648
Republic of Austria (EUR)
3.90% 10/20/05 5,850 7,671,662
============
16,057,142
------------
Belgium - 0.7%
Belgium Kingdom (EUR)
3.75% 03/28/09 4,250 5,699,808
------------
Canada - 0.2%
Province of Ontario (CND)
5.60% 06/02/35 2,070 1,793,735
------------
Denmark - 1.9%
Kingdom of Denmark (DKK)
7.00% 11/10/24 3,650 886,953
Realkredit Danmark (DKK)
5.00% 10/01/35 46,478 8,191,727
Totalkredit, Mortgage Bonds (DKK)
5.00% 10/01/35 33,914 5,977,421
============
15,056,101
------------
Finland - 2.5%
Finnish Government Bonds (EUR)
3.00% 07/04/08 4,300 5,632,126
4.25% 07/04/15 10,385 14,204,603
============
19,836,729
------------
France - 1.1%
French Treasury Notes (EUR)
3.00% 07/12/08 4,300 5,631,288
Government of France (EUR)
5.75% 10/25/32 1,500 2,468,730
Reseau Ferre de France, Unsecured
Notes (GBP)
5.25% 12/07/28 435 850,821
============
8,950,839
------------
Germany - 25.4%
Bundesobligation (EUR)
4.25% 02/15/08 15,000 20,326,926
3.25% 04/17/09 6,860 9,034,152
3.50% 10/09/09 580 769,949
Bundesrepublic Deutschland (EUR)
5.38% 01/04/10 6,675 9,570,588
5.25% 01/04/11 6,815 9,814,985
4.25% 07/04/14 21,000 28,710,699
3.75% 01/04/15 22,850 29,998,643
6.25% 01/04/24 13,450 22,600,734
5.50% 01/04/31 3,420 5,424,218
4.75% 07/04/34 28,095 40,423,806
4.00% 01/04/37 2,330 2,973,822
KFW (CND)
4.95% 10/14/14 4,000 3,385,049
5.05% 02/04/25 9,395 7,689,091
PAR
MATURITY (000) VALUE
---------- ------------- --------------
FOREIGN BONDS (Continued)
Germany (Continued)
Landesbank Baden-Wuerttemberg
(EUR)
4.75% 11/26/10 $ 4,425 $ 8,243,209
NRW Bank (GBP)
4.75% 12/07/07 2,000 3,751,059
============
202,716,930
------------
Ireland - 4.0%
Depfa ACS Bank (JPY)
1.65% 12/20/16 1,400,000 13,269,634
Irish Treasury Notes (EUR)
3.25% 04/18/09 14,000 18,428,493
============
31,698,127
------------
Italy - 1.2%
Buoni Poliennali Del Tesoro (EUR)
5.00% 02/01/12 6,500 9,286,897
------------
Japan - 7.0%
Development Bank of Japan (JPY)
1.60% 06/20/14 1,660,000 16,043,242
1.70% 09/20/22 401,000 3,676,784
Japan Finance Corp. (GBP)
5.75% 08/09/19 4,660 9,358,909
Japan Government Bond (JPY)
1.90% 06/20/14 2,700,000 26,707,685
============
55,786,620
------------
Mexico - 2.2%
Mexican Fixed Rate Bonds (MXP)
9.00% 12/24/09 207,920 17,793,556
------------
Netherlands - 3.1%
Government of Netherlands (EUR)
4.00% 07/15/05 8,965 11,709,356
5.75% 02/15/07 1,845 2,539,153
4.25% 07/15/13 7,400 10,128,547
============
24,377,056
------------
New Zealand - 4.1%
General Electric Capital Corp. (NZD)
6.62% 02/04/10 13,100 9,206,322
Government of New Zealand (NZD)
7.00% 07/15/09 13,875 10,138,316
6.00% 11/15/11 19,475 13,703,057
============
33,047,695
------------
Poland - 1.4%
Poland Government Bonds (PLN)
6.00% 05/24/09 12,700 4,110,898
5.00% 10/24/13 21,935 6,715,400
============
10,826,298
------------
Portugal - 0.5%
Portugal Government Bonds (EUR)
4.38% 06/16/14 2,950 4,058,320
------------
South Africa - 0.2%
Republic of South Africa (GBP)
9.38% 02/06/06 775 1,508,332
------------
SEE ACCOMPANYING NOTES TO FINANCIAL STATEMENTS.
91
BLACKROCK FUNDS
STATEMENT OF NET ASSETS
INTERNATIONAL BOND PORTFOLIO (CONTINUED)
AS OF MARCH 31, 2005 (UNAUDITED)
PAR
MATURITY (000) VALUE
---------- ---------- --------------
FOREIGN BONDS (Continued)
Spain - 1.7%
Bonos y Obligation del Estado (EUR)
6.00% 01/31/08 $ 1,650 $ 2,336,300
4.00% 01/31/10 700 949,099
5.75% 07/30/32 2,475 4,064,463
Kingdom of Spain (EUR)
5.00% 07/30/12 4,155 5,955,802
============
13,305,664
------------
Sweden - 4.6%
AB Spintab (SEK)
6.00% 04/20/09 7,100 1,112,717
AB Spintab, Notes (EUR)
4.38% 04/20/09 1,780 2,422,332
Stadshypotek AB (SEK)
6.00% 06/18/08 73,000 11,303,641
Swedish Government Bonds (SEK)
4.00% 12/01/08 144,095 22,138,211
============
36,976,901
------------
United Kingdom - 0.8%
Aviva PLC, Subordinated Notes
(EUR)
5.70% 06/29/49 630 914,347
BP Capital Markets PLC, Senior
Unsecured Notes (GBP)
5.12% 12/07/08 1,345 2,550,791
Network Rail Infrastructure Finance
(GBP)
4.88% 11/27/15 1,630 3,051,870
============
6,517,008
------------
TOTAL FOREIGN BONDS
(Cost $497,738,864) 516,473,306
------------
U.S. GOVERNMENT & AGENCY OBLIGATIONS - 1.2%
U.S. Treasury Bonds
6.12% 11/15/27 535 625,303
U.S. Treasury Notes
4.00% 02/15/15 9,400 9,031,341
============
TOTAL U.S. GOVERNMENT & AGENCY
OBLIGATIONS
(Cost $9,580,967) 9,656,644
------------
MORTGAGE PASS-THROUGHS - 1.0%
Federal Home Loan Mortgage Corp.
ARM
4.65%(b)
(Cost $8,046,537) 02/01/35 8,025 7,989,321
------------
COMMERCIAL MORTGAGE BACKED SECURITIES - 4.6%
Banc of America Commercial
Mortgage, Inc., Series 01-1, Class
A2
6.50% 04/15/36 3,690 3,997,273
Banc of America Commercial
Mortgage, Inc., Series 04-5, Class
A3
4.56% 11/10/41 2,470 2,420,205
Banc of America Commercial
Mortgage, Inc., Series 05-1, Class
A4
1.99% 11/10/42 4,320 4,341,599
PAR
MATURITY (000) VALUE
---------- ---------- --------------
COMMERCIAL MORTGAGE BACKED SECURITIES (Continued)
Bear Stearns Commercial Mortgage
Securities, Inc., Series 04-PWR6,
Class A6
4.83% 11/11/41 $ 3,210 $ 3,130,264
Bear Stearns Mortgage Trust, Series
04-13, Class A1
3.22%(b) 11/25/34 6,621 6,637,648
Commercial Mortgage Acceptance
Corp., Series 98-C2, Class A2
6.03% 09/15/30 4,596 4,756,424
General Motors Acceptance Corp.
Commercial Mortgage Securities,
Inc., Series 00-C2, Class A2
7.46% 08/16/33 1,890 2,106,701
J.P. Morgan Chase Commercial
Mortgage Security, Series 04-CBX,
Class A4
4.53% 11/12/39 2,700 2,638,386
Lehman Brothers-UBS Commercial
Mortgage Trust, Series 00-C4,
Class A2
7.37% 08/15/26 1,800 2,005,841
Lehman Brothers-UBS Commercial
Mortgage Trust, Series 04-C8,
Class A4
4.51% 12/15/29 3,825 3,749,040
Morgan Stanley Capital Investments,
Series 99-FNV1, Class A2
6.53% 03/15/31 685 726,855
============
TOTAL COMMERCIAL MORTGAGE BACKED
SECURITIES
(Cost $36,998,707)
36,510,236
------------
ASSET BACKED SECURITIES - 1.6%
Chase Issuance Trust, Series 04-A9,
Class A9
3.22% 06/15/10 3,450 3,368,889
Citibank Credit Card Issuance Trust,
Series 03-A6, Class A6
2.90% 05/17/10 1,375 1,318,496
Citibank Credit Card Issuance Trust,
Series 04-A4, Class A4
3.20% 08/24/07 3,175 3,100,705
Greenwich Capital Commercial
Funding Corp., Series 04-GG1A,
Class A4
4.76% 06/10/36 1,940 1,926,110
Student Loan Marketing Association
Student Loan Trust, Series 99-3,
Class A2
2.26%(b)(c) 07/25/12 928 930,327
Student Loan Marketing Association
Student Loan Trust, Series 03-7
(GBP)
5.15% 09/15/39 1,280 2,411,202
============
TOTAL ASSET BACKED SECURITIES
(Cost $12,984,393) 13,055,729
------------
CORPORATE BONDS - 0.9%
Citigroup, Inc., Unsecured Bonds
2.24% 12/09/22 200,000 1,850,679
SEE ACCOMPANYING NOTES TO FINANCIAL STATEMENTS.
92
BLACKROCK FUNDS
STATEMENT OF NET ASSETS
INTERNATIONAL BOND PORTFOLIO (CONCLUDED)
AS OF MARCH 31, 2005 (UNAUDITED)
PAR
MATURITY (000) VALUE
---------- --------- -------------
CORPORATE BONDS (Continued)
Nissan Motor Acceptance
Corp.,
Unsecured Notes
4.62%(d) 03/08/10 $2,175 $2,141,600
United Mexican States,
Senior
Unsecured Notes
8.38% 01/14/11 273 310,674
8.00%(e) 09/24/22 2,600 2,951,000
==========
TOTAL CORPORATE BONDS
(Cost $7,501,688) 7,253,953
----------
SHORT TERM INVESTMENTS - 23.2%
Federal Home Loan Bank, Discount
Notes
2.55% 04/01/05 20,000 20,000,000
Galileo Money Market Fund 12,429 12,428,647
U.S. Treasury Bills
2.59% 04/28/05 50,000 49,902,969
2.60% 04/28/05 100,000 99,813,961
Institutional Money Market Trust(f) 3,016 3,016,000
==========
TOTAL SHORT TERM INVESTMENTS
(Cost $185,161,577) 185,161,577
-----------
TOTAL INVESTMENTS IN
SECURITIES - 97.2%
(Cost $758,012,733(a)) 776,100,766
NUMBER OF
CONTRACTS
-----------------
PUT SWAPTIONS WRITTEN - 0.0%
Goldman Sachs, Strike
Price 5.50,
Expires 08/26/05
(Premiums received (1,480)(g) (102,445)
--------
$131,541)
OTHER ASSETS IN EXCESS OF
LIABILITIES - 2.8% 22,346,337
----------
(including $3,016,000 of
payable
upon return of
securities loaned)
NET ASSETS - 100.0%
(Applicable to 7,709,123
BlackRock
shares, 27,393,112
Institutional
shares, 9,273,964
Service shares,
16,012,506 Investor A
shares,
1,819,999 Investor B
shares and
5,191,226 Investor C
shares
outstanding) $798,344,658
============
VALUE
-----------
NET ASSET VALUE, OFFERING
AND REDEMPTION PRICE PER
BLACKROCK SHARE
($91,240,478/7,709,123) $ 11.84
=======
NET ASSET VALUE, OFFERING
AND REDEMPTION PRICE PER
INSTITUTIONAL SHARE
($324,244,073/27,393,112) $ 11.84
=======
NET ASSET VALUE, OFFERING
AND REDEMPTION PRICE PER
SERVICE SHARE
($109,874,248/9,273,964) $ 11.85
=======
NET ASSET VALUE AND
REDEMPTION PRICE PER
INVESTOR A SHARE
($189,760,386/16,012,506) $ 11.85
=======
MAXIMUM OFFERING PRICE
PER INVESTOR A SHARE
($11.85/.950) $ 12.47
=======
NET ASSET VALUE, OFFERING
AND REDEMPTION PRICE
(subject to a maximum contingent
deferred sales charge of 4.5%)
PER INVESTOR B SHARE
($21,567,089/1,819,999) $ 11.85
=======
NET ASSET VALUE, OFFERING
AND REDEMPTION PRICE
(subject to a maximum contingent
deferred sales charge of 4.5%)
PER INVESTOR C SHARE
($61,658,384/5,191,226) $ 11.88
=======
- -------------------
(a) Cost for Federal income tax purposes is $758,082,307. The
gross unrealized appreciation (depreciation) on a tax basis is as
follows:
Gross unrealized appreciation $40,049,068
Gross unrealized depreciation (22,030,609)
-----------
$18,018,459
===========
(b) Rates shown are the rates as of March 31, 2005.
SEE ACCOMPANYING NOTES TO FINANCIAL STATEMENTS.
93
BLACKROCK FUNDS
STATEMENT OF NET ASSETS
INTERNATIONAL BOND PORTFOLIO (CONCLUDED)
AS OF MARCH 31, 2005 (UNAUDITED)
(c) Securities, or a portion thereof, pledged as collateral with a value of
$2,248,823 on 1,230 short U.S. Treasury Note futures contracts, 227
short Australian Treasury Bond futures contracts, 17 short Gilt British
futures contracts, 124 short Canadian Bank Acceptance futures contracts,
17 short Euro Bund futures contracts, 70 short Euro Bobl futures
contracts, 13 long Japan Government Bond futures contracts expiring June
2005 and 399 short Euro Euribor futures contracts, 400 long Euro Euribor
futures contracts expiring September 2005. The value of such contracts
on March 31, 2005 was $475,457,787, with an unrealized gains of
$1,274,003 (including commissions of $2,702).
(d) Security exempt from registration under Rule 144A of the Securities Act of
1933. These securities may be resold in transactions exempt from
registration to qualified institutional investors. As of March 31, 2005,
the Portfolio held 0.3% of its net assets, with a current market value
of $2,141,600 in securities restricted as to resale.
(e) Total or partial securities on loan.
(f) Securities purchased with the cash proceeds from securities loaned.
(g) Each swaption contract is equivalent to $10,000 in notional amount.
SEE ACCOMPANYING NOTES TO FINANCIAL STATEMENTS.
94
BLACKROCK FUNDS
STATEMENT OF NET ASSETS
HIGH YIELD BOND PORTFOLIO
AS OF MARCH 31, 2005 (UNAUDITED)
NUMBER
OF SHARES VALUE
----------- ------------
COMMON STOCKS - 0.3%
Freedom Pay, Inc. 3,459,874 $ 34,599
HCI Direct, Inc., Class A(b)(c) 242,857 2,671,427
Mattress Discounters Corp.(b)(c) 22,488 0
Phase Metrics, Inc. 842,908 16,858
Reunion Industries, Inc. 8,341 2,502
Spectrasite, Inc.(c) 133 7,710
==========
TOTAL COMMON STOCKS
(Cost $16,368,554) 2,733,096
----------
PREFERRED STOCKS - 0.0%
Adelphia Business Solutions, Inc.,
Series B(c) 2,200 0
Paxson Communications Corp.(c) 17 118,715
TNP Enterprises, Inc., Senior
Stock(c)(d) 1 1,168
==========
TOTAL PREFERRED STOCKS
(Cost $1,974,854) 119,883
----------
WARRANTS - 0.0%
DIVA Systems Corp. (issued
02/19/98, expiring 03/01/08, strike
price $.01)(c) 4,500 0
Mattress Discounters Co. (issued
08/03/99, expiring 07/15/07, strike
price $.01)(c)(e) 1,500 2
PF Net Communications, Inc. (issued
05/10/00, expiring 05/15/10, strike
price $.01)(c)(e) 1,000 0
Ubiquitel, Inc. (issued 04/11/00,
expiring 04/15/10, strike price
$ 22.74)(c)(e) 30,000 0
==========
TOTAL WARRANTS
(Cost $352,295) 2
----------
PAR
MATURITY (000)
---------- ---------
ASSET BACKED SECURITIES - 0.5%
Continental Airlines, Inc.,
Pass-Through Certificates, Series
99-1B
6.80% 08/02/18 $2,116 1,777,096
Credit Suisse Asset Management
Funding Corp., Subordinated
Bonds, Series 2A, Class D1
12.78% 10/15/16 1,500 1,522,499
Northwest Airlines, Inc.,
Pass-Through Certificates, Series
99-2B
7.95% 03/01/15 1,747 1,467,098
=========
TOTAL ASSET BACKED SECURITIES
(Cost $4,711,648) 4,766,693
---------
CORPORATE BONDS - 94.3%
Aerospace - 1.5%
AAR Corp., Senior Unsecured Notes
6.88% 12/15/07 1,845 1,886,512
8.39% 05/15/11 3,850 3,927,001
BE Aerospace, Inc., Senior Notes
8.50% 10/01/10 2,510 2,735,901
BE Aerospace, Inc., Senior
Subordinated Notes
8.88% 05/01/11 1,290 1,309,350
PAR
MATURITY (000) VALUE
---------- -------- -------------
CORPORATE BONDS (Continued)
Aerospace (Continued)
Sequa Corp., Senior Unsecured
Notes
8.88% 04/01/08 $ 980 $ 1,038,800
Standard Aero Holdings, Inc., Senior
Subordinated Notes
8.25%(e) 09/01/14 1,485 1,522,125
Titan Corp., Senior Subordinated
Notes
8.00% 05/15/11 1,405 1,461,200
===========
13,880,889
-----------
Broadcasting - 6.4%
Adelphia Communications Corp.,
Senior Notes
10.50%(c)(f) 12/31/05 2,000 1,809,999
0.13%(g) 12/31/49 1,000 910,000
Adelphia Communications Corp.,
Senior Unsecured Notes
12.74% 10/01/10 5,950 5,340,125
Cablevision Systems Corp., Senior
Unsecured Notes
6.67%(e)(h) 04/01/09 1,460 1,547,600
Charter Communications Holdings
LLC, Discount Notes
17.33%(g)(i) 01/15/12 8,350 5,218,750
Charter Communications Holdings
LLC, Senior Unsecured Notes
11.12%(i) 01/15/11 3,215 2,612,188
8.00%(e) 04/30/12 4,325 4,303,375
Charter Communications Holdings
LLC, Unsecured Notes
10.25% 09/15/10 2,750 2,825,625
Charter Communications, Inc., Senior
Unsecured Notes
5.88%(e) 11/16/09 6,470 5,596,550
Echostar DBS Corp., Senior Notes
6.38% 10/01/11 1,700 1,666,000
Echostar DBS Corp., Senior
Unsecured Notes
5.81%(h) 10/01/08 1,585 1,622,644
6.62%(e) 10/01/14 1,600 1,544,000
Fisher Communications, Inc., Senior
Unsecured Notes
8.62% 09/15/14 1,145 1,233,738
Nexstar Finance LLC, Senior
Subordinated Notes
12.00% 04/01/08 1,720 1,823,200
Nexstar Finance, Inc., Senior
Subordinated Notes
7.00% 01/15/14 1,130 1,067,850
Nexstar Finance, Inc., Subordinated
Notes
7.00%(e) 01/15/14 1,730 1,634,850
Radio One, Inc., Senior Subordinated
Notes
6.38%(e) 02/15/13 1,750 1,701,875
Rainbow National Services LLC,
Senior Subordinated Notes
10.38%(e) 09/01/14 6,895 7,653,450
Rogers Cable, Inc., Senior Secured
Notes
6.75% 03/15/15 640 643,200
SEE ACCOMPANYING NOTES TO FINANCIAL STATEMENTS.
95
BLACKROCK FUNDS
STATEMENT OF NET ASSETS
HIGH YIELD BOND PORTFOLIO (CONTINUED)
AS OF MARCH 31, 2005 (UNAUDITED)
PAR
MATURITY (000) VALUE
---------- ---------- -------------
CORPORATE BONDS (Continued)
Broadcasting (Continued)
XM Satellite Radio, Inc., Senior
Secured Notes
14.00% 03/15/10 $3,000 $ 3,352,500
Young Broadcasting, Inc., Senior
Subordinated Notes
10.00%(i) 03/01/11 3,140 3,210,650
Young Broadcasting, Inc., Senior
Unsecured Notes
8.75% 01/15/14 700 663,250
===========
57,981,419
-----------
Business Services - 3.0%
Crystal U.S. Holdings, Senior
Unsecured Notes
9.81%(e)(g)(i)(j) 10/01/14 2,820 1,974,000
DI Finance/Dyncorp International,
Senior Subordinated Notes
9.50%(e) 02/15/13 8,285 8,326,425
Knowledge Learning CTR, Senior
Subordinated Notes
7.75%(e) 02/01/15 5,250 5,066,250
Polymer Holdings LLC, Senior
Unsecured Notes
11.28%(e)(g) 07/15/14 1,650 1,027,125
Service Corp. International, Senior
Unsecured Notes
7.70% 04/15/09 2,630 2,708,900
UGS Corp., Senior Subordinated
Notes
10.00%(e) 06/01/12 1,965 2,171,325
United Rentals N.A., Inc., Senior
Subordinated Notes
7.75%(i) 11/15/13 3,515 3,409,550
7.00%(i) 02/15/14 3,010 2,761,675
===========
27,445,250
-----------
Chemicals - 4.5%
Airgas, Inc., Senior Unsecured Notes
6.25% 07/15/14 614 614,000
Equistar Chemical/Funding, Senior
Unsecured Notes
10.12% 09/01/08 4,975 5,472,500
10.62% 05/01/11 520 583,700
Equistar Chemicals LP, Senior
Unsecured Notes
8.75% 02/15/09 1,090 1,169,025
Huntsman Advanced Materials LLC,
Senior Secured Notes
11.00%(e) 07/15/10 1,175 1,351,250
Huntsman LLC, Senior Notes
11.75%(e) 07/15/12 1,114 1,303,380
Huntsman LLC, Senior Secured
Notes
11.62% 10/15/10 1,565 1,831,050
IMC Global, Inc., Senior Unsecured
Notes
10.88% 06/01/08 2,285 2,616,325
Innophos, Inc., Senior Subordinated
Notes
8.88%(e) 08/15/14 2,280 2,394,000
Lyondell Chemical Co., Senior
Secured Notes
9.62% 05/01/07 2,325 2,493,562
11.12% 07/15/12 1,120 1,282,400
PAR
MATURITY (000) VALUE
---------- ---------- -------------
CORPORATE BONDS (Continued)
Chemicals (Continued)
Millenium America, Inc., Senior
Unsecured Notes
9.25% 06/15/08 $ 600 $ 643,500
Nalco Co., Senior Subordinated
Notes
8.88%(i) 11/15/13 4,060 4,354,350
Nova Chemicals Corp., Senior
Unsecured Notes
6.50% 01/15/12 3,700 3,792,500
Polypore, Inc., Senior Subordinated
Notes
8.75% 05/15/12 320 297,600
Rhodia SA, Senior Notes
10.25%(i) 06/01/10 6,060 6,605,400
Rhodia SA, Senior Subordinated
Notes
8.88%(i) 06/01/11 2,415 2,348,588
Rockwood Specialties Group, Inc.,
Senior Subordinated Notes
10.62% 05/15/11 1,500 1,665,000
===========
40,818,130
-----------
Computer Software & Services - 0.7%
NDC Health Corp., Senior
Subordinated Notes
10.50% 12/01/12 2,930 3,010,574
Unisys Corp., Unsecured Notes
6.88% 03/15/10 925 922,688
Xerox Corp., Senior Notes
6.88% 08/15/11 2,690 2,740,438
===========
6,673,700
-----------
Construction - 2.0%
Associated Materials, Inc., Senior
Subordinated Notes
9.75%(h) 04/15/12 475 510,625
5.16%(g) 03/01/14 2,975 2,067,625
D.R. Horton, Inc., Senior Unsecured
Notes
6.88% 05/01/13 1,000 1,035,000
International Steel Group, Inc.,
Senior Unsecured Notes
6.50% 04/15/14 690 703,800
K. Hovnanian Enterprises, Inc.,
Senior Unsecured Notes
10.50% 10/01/07 2,000 2,220,000
Millar Western Forest Products Ltd.,
Senior Notes
7.75% 11/15/13 1,455 1,440,450
Nortek Holdings, Inc., Senior Notes
10.73%(e)(g)(i) 03/01/14 3,560 1,913,500
Nortek, Inc., Senior Subordinated
Notes
8.50% 09/01/14 3,350 3,232,750
North American Energy Partners,
Senior Unsecured Notes
8.75% 12/01/11 4,070 3,744,400
NVR, Inc., Senior Unsecured Notes
5.00%(i) 06/15/10 1,605 1,576,912
===========
18,445,062
-----------
SEE ACCOMPANYING NOTES TO FINANCIAL STATEMENTS.
96
BLACKROCK FUNDS
STATEMENT OF NET ASSETS
HIGH YIELD BOND PORTFOLIO (CONTINUED)
AS OF MARCH 31, 2005 (UNAUDITED)
PAR
MATURITY (000) VALUE
------------ ---------- -------------
CORPORATE BONDS (Continued)
Containers - 1.8%
Ball Corp., Senior Unsecured Notes
6.88% 12/15/12 $ 700 $ 721,876
Concentra Operating Corp., Senior
Subordinated Notes
9.12% 06/01/12 2,740 2,918,101
Constar International, Senior Secured
Notes
6.15%(e) 02/15/12 2,070 2,111,400
Crown Holdings, Inc., Debentures
8.00% 04/15/23 1,680 1,625,400
Graham Packaging Co., Senior
Notes
8.50%(e)(i) 10/15/12 385 388,850
Graham Packaging Co., Senior
Subordinated Notes
9.88%(e) 10/15/14 4,005 4,005,000
Owens-Brockway Glass Container,
Inc., Senior Secured Notes
8.88% 02/15/09 2,100 2,241,750
Owens-Brockway Glass Container,
Inc., Senior Unsecured Notes
8.25% 05/15/13 2,025 2,151,562
===========
16,163,939
-----------
Electronics - 0.6%
Amkor Technology, Inc., Senior
Unsecured Notes
9.25%(i) 02/15/08 1,460 1,394,299
Celestica, Inc., Senior Subordinated
Notes
7.88% 07/01/11 2,135 2,167,025
Condor Systems, Inc., Senior
Subordinated Notes, Series B
11.88%(c)(f) 05/01/09 1,500 938
Northwestern Corp., Senior Secured
Notes
5.88%(e) 11/01/14 2,320 2,305,500
===========
5,867,762
-----------
Energy & Utilities - 10.4%
AES Eastern Energy LP,
Pass-Through Certificates
9.00% 01/02/17 3,114 3,557,576
AES Ironwood LLC, Senior Secured
Notes
8.86% 11/30/25 1,642 1,855,470
AES Red Oak LLC, Senior Secured
Notes
8.54% 11/30/19 5,024 5,626,602
CE Generation LLC, Senior Notes
7.42% 12/15/18 5,189 5,474,283
Centerpoint Energy, Inc., Senior
Unsecured Notes
7.25% 09/01/10 505 552,114
Citizens Communications Co., Senior
Unsecured Notes
9.25% 05/15/11 3,000 3,285,000
6.25% 01/15/13 1,400 1,316,000
CMS Energy Corp., Senior
Unsecured Notes
9.88% 10/15/07 3,025 3,278,344
PAR
MATURITY (000) VALUE
------------ ---------- -------------
CORPORATE BONDS (Continued)
Energy & Utilities (Continued)
Colorado Interstate Gas, Senior
Unsecured Notes
5.95%(e) 03/15/15 $ 1,570 $ 1,503,275
Edison Mission Energy, Senior
Unsecured Notes
10.00% 08/15/08 1,610 1,787,100
9.88% 04/15/11 200 231,000
Elwood Energy LLC, Senior Secured
Notes
8.16% 07/05/26 11,446 12,676,310
FPL Energy National Wind, Senior
Secured Notes
6.12%(e) 03/25/19 875 861,875
Homer City Funding LLC, Senior
Secured Notes
8.73% 10/01/26 1,373 1,593,246
Midwest Generation LLC,
Pass-Through Certificates
8.30% 07/02/09 565 604,550
Midwest Generation LLC,
Pass-Through Certificates, Series
B
8.56% 01/02/16 2,820 3,158,400
Midwest Generation LLC, Senior
Secured Notes
8.75% 05/01/34 2,655 2,960,325
Mirant Americas Generation, Inc.,
Senior Unsecured Notes
12.91% 05/01/06 1,000 1,155,000
Mirant Corp., Senior Unsecured
Notes
7.90%(e)(i) 07/15/09 640 505,600
7.40%(e)(i) 07/15/49 1,290 1,006,200
Mirant Mid-Atlantic LLC,
Pass-Through Certificates
8.62% 06/30/12 5,796 6,259,377
Mission Energy Holding Co., Senior
Secured Notes
13.50% 07/15/08 6,770 8,124,000
National Waterworks, Inc., Senior
Subordinated Notes, Series B
10.50% 12/01/12 1,875 2,085,938
Orion Power Holdings, Inc., Senior
Unsecured Notes
12.00% 05/01/10 7,850 9,518,125
Reliant Energy, Inc., Senior Secured
Notes
9.25% 07/15/10 2,490 2,664,300
6.75% 12/15/14 2,535 2,357,550
Texas Genco LLC, Senior Unsecured
Notes
6.88%(e) 12/15/14 2,830 2,830,000
Transcontinental Gas Pipe Line
Corp., Senior Notes
8.88% 07/15/12 3,545 4,165,375
TXU Corp., Senior Unsecured Notes
11/15/09-
4.80%(e) 11/15/24 1,640 1,579,373
===========
92,572,308
-----------
SEE ACCOMPANYING NOTES TO FINANCIAL STATEMENTS.
97
BLACKROCK FUNDS
STATEMENT OF NET ASSETS
HIGH YIELD BOND PORTFOLIO (CONTINUED)
AS OF MARCH 31, 2005 (UNAUDITED)
PAR
MATURITY (000) VALUE
---------- ---------- -------------
CORPORATE BONDS (Continued)
Entertainment & Leisure - 4.1%
Choctaw Resort Development
Enterprise, Senior Unsecured
Notes
7.25%(e) 11/15/19 $ 540 $ 534,599
K2, Inc., Senior Unsecured Notes
7.38% 07/01/14 970 1,003,950
Lazydays RV Center, Inc., Senior
Notes
11.75% 05/15/12 4,205 4,488,838
MGM Mirage, Inc., Senior Notes
6.00% 10/01/09 3,820 3,767,475
MGM Mirage, Inc., Senior Unsecured
Notes
6.75% 09/01/12 1,500 1,515,000
Mohegan Tribal Gaming Authority,
Senior Unsecured Notes
6.12%(e) 02/15/13 1,700 1,674,500
Penn National Gaming, Inc., Senior
Subordinated Notes
6.75%(e) 03/09/15 2,800 2,716,000
Pinnacle Entertainment, Inc., Senior
Subordinated Notes
8.75%(i) 10/01/13 835 864,225
River Rock Entertainment, Senior
Unsecured Notes
9.75% 11/01/11 4,375 4,823,438
Station Casinos, Inc., Senior Notes
6.00% 04/01/12 1,100 1,091,750
True Temper Sports, Inc., Senior
Subordinated Notes
8.38% 09/15/11 945 826,875
Universal City Florida, Unsecured
Notes
7.49%(e)(h) 05/01/10 4,700 4,911,500
Virgin River Casino Corp., Senior
Secured Notes
9.00%(e) 01/15/12 2,330 2,434,850
Waterford Gaming LLC, Senior
Unsecured Notes
8.62%(e) 09/15/12 3,462 3,738,960
WMG Holdings Corp., Senior
Unsecured Notes
7.38%(e)(h)(i) 12/15/11 2,825 2,895,625
===========
37,287,585
-----------
Finance - 4.7%
ALH Finance Corp., Senior
Subordinated Notes
8.50%(i) 01/15/13 630 621,063
Ameriserve Finance Trust, Senior
Secured Notes
12.00%(c)(e)(f)(i) 09/15/06 500 25,000
AMR Real Estate, Senior Unsecured
Notes
8.12% 06/01/12 3,075 3,167,250
Arch Western Finance, Senior Notes
6.75%(h) 07/01/13 1,575 1,571,062
BCP Crystal Holdings Corp., Senior
Subordinated Notes
9.62%(e) 06/15/14 2,047 2,333,580
Calpine Canada Energy Finance
ULC, Senior Unsecured Notes
8.50%(i) 05/01/08 9,845 7,014,562
PAR
MATURITY (000) VALUE
---------- ---------- -------------
CORPORATE BONDS (Continued)
Finance (Continued)
Capital Guardian Ltd., Subordinated
Bonds
11.45% 05/24/13 $1,000 $ 995,900
Crown European Holdings SA,
Senior Secured Notes
10.88%(i) 03/01/13 1,920 2,227,200
Hilcorp Energy/Finance, Senior Notes
10.50%(e) 09/01/10 4,135 4,589,850
Jason, Inc., Second Lien Notes
Certificates
11.00%(b)(h) 12/15/07 1,500 1,500,000
K&F Acquisition, Inc., Senior
Subordinated Notes
7.75%(e) 11/15/14 1,515 1,469,550
MDP Acquisitions PLC, Senior
Unsecured Notes
9.62% 10/01/12 2,175 2,338,125
NSP Holdings/Capital Corp., Senior
Unsecured Notes
11.75%(e)(i) 01/01/12 1,850 1,887,000
Refco Finance Holdings LLC, Senior
Subordinated Notes
9.00%(e) 08/01/12 1,700 1,827,500
Riddell Bell Holdings, Senior
Subordinated Notes
8.38%(e) 10/01/12 4,095 4,217,850
Salton Sea Funding, Senior Secured
Notes
7.48% 11/30/18 1,056 1,146,034
Smurfit Capital Funding PLC,
Debentures
7.50% 11/20/25 825 792,000
Transdigm, Inc., Senior Subordinated
Notes
8.38% 07/15/11 2,400 2,463,000
Vanguard Health Holdings II, Senior
Subordinated Notes
9.00% 10/01/14 2,295 2,398,275
Zais Investment Grade Ltd., Secured
Notes
9.95%(d) 09/23/14 1,275 127,476
===========
42,712,277
-----------
Food & Agriculture - 0.6%
B&G Foods Holding Corp., Senior
Notes
8.00% 10/01/11 2,170 2,256,800
Gold Kist, Inc., Senior Notes
10.25% 03/15/14 1,546 1,770,170
Nebco Evans Holding Co., Senior
Notes
17.25%(b)(c)(f)(g) 07/15/07 800 0
Smithfield Foods, Inc., Senior
Unsecured Notes
7.00% 08/01/11 1,215 1,243,856
===========
5,270,826
-----------
Insurance - 0.9%
Coventry Health Care, Inc., Senior
Unsecured Notes
5.88%(e) 01/15/12 990 989,999
6.12%(e) 01/15/15 990 990,000
SEE ACCOMPANYING NOTES TO FINANCIAL STATEMENTS.
98
BLACKROCK FUNDS
STATEMENT OF NET ASSETS
HIGH YIELD BOND PORTFOLIO (CONTINUED)
AS OF MARCH 31, 2005 (UNAUDITED)
PAR
MATURITY (000) VALUE
---------- ---------- -------------
CORPORATE BONDS (Continued)
Insurance (Continued)
Crum & Forster Holdings Corp.,
Senior Notes
10.38% 06/15/13 $1,425 $ 1,596,000
Fairfax Financial Holdings Ltd.,
Debenture Notes
8.30% 04/15/26 790 750,500
Fairfax Financial Holdings Ltd.,
Senior Notes
6.88%(i) 04/15/08 665 669,988
Fairfax Financial Holdings Ltd.,
Senior Unsecured Notes
7.75% 04/26/12 2,935 2,832,275
===========
7,828,762
-----------
Machinery & Heavy Equipment - 0.6%
JLG Industries, Inc., Senior
Subordinated Notes
8.38%(i) 06/15/12 2,315 2,465,475
K&F Parent, Inc., Senior Unsecured
Notes
11.50%(e) 02/01/15 3,140 3,077,200
===========
5,542,675
-----------
Manufacturing - 6.4%
Argo Tech Corp., Senior Unsecured
Notes
9.25% 06/01/11 1,180 1,271,450
Blount International, Inc., Senior
Subordinated Notes
8.88% 08/01/12 4,050 4,272,750
Briggs & Stratton Corp., Senior
Unsecured Notes
8.88% 03/15/11 570 659,775
California Steel Industries, Inc.,
Senior Unsecured Notes
6.12% 03/15/14 1,990 1,850,700
Coleman Cable, Inc., Senior Notes
9.88%(e) 10/01/12 1,350 1,415,811
Cummins, Inc., Senior Debentures
7.12% 03/01/28 1,440 1,458,000
Delco Remy International, Inc.,
Senior Secured Notes
6.66%(h)(i) 04/15/09 2,215 2,226,075
Erico International Corp., Senior
Subordinated Notes
8.88% 03/01/12 4,405 4,526,138
General Cable Corp., Senior
Unsecured Notes
9.50% 11/15/10 2,480 2,709,400
Gentek, Inc., Escrow Bonds
0.00%(k) 12/01/33 1,000 0
Goodman Global Holdings, Senior
Subordinated Notes
7.88%(e)(i) 12/15/12 5,960 5,483,200
Goodman Global Holdings, Senior
Unsecured Notes
5.76%(e)(h) 06/15/12 1,160 1,148,400
Hexcel Corp., Senior Subordinated
Notes
6.75%(e) 02/01/15 3,275 3,152,188
Ispat Inland ULC, Senior Secured
Notes
9.75% 04/01/14 2,599 3,040,830
PAR
MATURITY (000) VALUE
---------- ---------- -------------
CORPORATE BONDS (Continued)
Manufacturing (Continued)
Metaldyne Corp., Senior Unsecured
Notes
10.00%(e)(i) 11/01/13 $5,065 $ 4,659,800
Navistar International Corp., Senior
Unsecured Notes
6.25%(e) 03/01/12 5,650 5,367,500
Norcross Safety Products LLC,
Senior Subordinated Notes
9.88% 08/15/11 3,350 3,584,500
Park-Ohio Industries, Inc., Senior
Subordinated Notes
8.38%(e) 11/15/14 4,425 4,181,625
Russell Metals, Inc., Senior
Subordinated Notes
6.38%(e) 03/01/14 1,415 1,379,625
Stanadyne Corp., Senior
Subordinated Notes
10.00% 08/15/14 1,815 1,869,450
TRW Automotive, Inc., Senior
Unsecured Notes
9.38% 02/15/13 3,505 3,767,875
===========
58,025,092
-----------
Medical & Medical Services - 2.7%
Ardent Health Services, Senior
Subordinated Notes
10.00% 08/15/13 2,800 3,318,000
Bio-Rad Laboratories, Inc., Senior
Subordinated Notes
7.50% 08/15/13 2,575 2,690,875
Concentra Operating Corp., Senior
Subordinated Notes
9.50% 08/15/10 2,350 2,514,500
HCA, Inc., Unsecured Notes
5.50% 12/01/09 3,350 3,311,944
6.75% 07/15/13 730 747,177
Healthsouth Corp., Senior Unsecured
Notes
7.62% 06/01/12 2,600 2,496,000
Insight Health Services Corp., Senior
Subordinated Notes, Series B
9.88%(i) 11/01/11 2,220 2,181,150
Neighborcare, Inc., Senior
Subordinated Notes
6.88% 11/15/13 3,750 3,909,375
Province Healthcare Co., Senior
Subordinated Notes
7.50% 06/01/13 1,475 1,639,094
U.S. Oncology, Inc., Senior
Subordinated Notes
9.00%(e)(i) 08/15/12 1,725 1,811,250
===========
24,619,365
-----------
Medical Instruments & Supplies - 1.0%
National Nephrology Associates,
Senior Subordinated Notes
9.00%(e) 11/01/11 2,645 2,932,644
Perkinelmer, Inc., Senior
Subordinated Notes
8.88% 01/15/13 3,235 3,590,850
SEE ACCOMPANYING NOTES TO FINANCIAL STATEMENTS.
99
BLACKROCK FUNDS
STATEMENT OF NET ASSETS
HIGH YIELD BOND PORTFOLIO (CONTINUED)
AS OF MARCH 31, 2005 (UNAUDITED)
PAR
MATURITY (000) VALUE
---------- ---------- -------------
CORPORATE BONDS (Continued)
Medical Instruments & Supplies (Continued)
Universal Hospital Services, Inc.,
Senior Notes
10.12% 11/01/11 $2,525 $ 2,575,500
===========
9,098,994
-----------
Metal & Mining - 3.5%
AK Steel Corp., Senior Unsecured
Notes
7.88% 02/15/09 1,340 1,316,550
7.75% 06/15/12 1,090 1,054,575
Alpha Natural Resources, Senior
Notes
10.00%(e) 06/01/12 1,500 1,680,000
Century Aluminum Co., Senior
Unsecured Notes
7.50%(i) 08/15/14 2,605 2,618,025
Foundation PA Coal Co., Senior
Unsecured Notes
7.25% 08/01/14 3,225 3,329,812
Ipsco, Inc., Senior Notes
8.75% 06/01/13 5,810 6,463,625
Novelis, Inc., Senior Unsecured
Notes
7.25%(e) 02/15/15 1,295 1,272,338
Plains E&P Co., Senior Unsecured
Notes
7.12% 06/15/14 1,000 1,055,000
Terex Corp., Senior Subordinated
Notes
9.25% 07/15/11 3,875 4,223,750
TRIMAS Corp., Senior Subordinated
Notes
9.88% 06/15/12 8,725 8,855,875
===========
31,869,550
-----------
Motor Vehicles - 2.2%
Accuride Corp., Senior Subordinated
Notes
8.50%(e) 02/01/15 3,775 3,699,500
Arvinmeritor, Inc., Senior Unsecured
Notes
8.75% 03/01/12 5,495 5,742,275
Delphi Corp., Senior Unsecured
Notes
6.50%(i) 05/01/09 2,120 1,907,116
Dura Operating Corp., Senior
Unsecured Notes
8.62%(i) 04/15/12 950 878,750
Eagle-Picher, Inc., Senior Notes
9.75%(i) 09/01/13 3,285 2,102,400
Holley Performance Products, Senior
Unsecured Notes
12.25% 09/15/07 4,025 3,220,000
Tenneco Automotive, Inc., Senior
Secured Notes
10.25% 07/15/13 2,450 2,731,750
===========
20,281,791
-----------
Oil & Gas - 7.4%
ANR Pipelines, Senior Debentures
9.62% 11/01/21 1,905 2,362,200
PAR
MATURITY (000) VALUE
---------- ---------- -------------
CORPORATE BONDS (Continued)
Oil & Gas (Continued)
Chesapeake Energy Corp., Senior
Unsecured Notes
9.00% 08/15/12 $1,725 $ 1,906,125
7.00% 08/15/14 415 427,450
6.38%(e) 06/15/15 2,080 2,080,000
6.88% 01/15/16 975 984,750
Citgo Petroleum Corp., Senior
Unsecured Notes
6.00%(e) 10/15/11 1,330 1,310,050
Coastal Corp., Senior Unsecured
Notes
7.75%(i) 06/15/10 1,870 1,870,000
Compagnie Generale de
Geophysique, Senior Unsecured
Notes
10.62%(i) 11/15/07 1,333 1,407,648
Compton Petroleum Corp., Senior
Unsecured Notes
9.90% 05/15/09 3,000 3,240,000
Dynegy-Roseton Danskammer LLC,
Pass-Through Certificates
7.27% 11/08/10 3,835 3,748,712
El Paso Corp., Senior Unsecured
Notes
7.88% 06/15/12 615 608,850
7.38% 12/15/12 1,700 1,644,750
7.75% 10/15/35 2,000 1,860,000
7.42%(i) 02/15/37 1,640 1,451,400
El Paso Natural Gas Co., Senior
Notes
7.62% 08/01/10 755 791,702
El Paso Production Holding Co.,
Senior Notes
7.75% 06/01/13 6,095 6,155,950
Exco Resources, Inc., Senior
Secured Notes
7.25% 01/15/11 3,885 3,962,700
Frontier Oil Corp., Senior Unsecured
Notes
6.62% 10/01/11 2,005 2,005,000
KCS Energy, Inc., Senior Unsecured
Notes
7.12% 04/01/12 3,825 3,863,250
Northwest Pipeline Corp., Senior
Notes
6.62% 12/01/07 500 508,750
Parker Drilling Co., Senior Unsecured
Notes
7.66%(h) 09/01/10 1,000 1,035,000
The Premcor Refining Group, Inc.,
Senior Notes
6.75%(e) 05/01/14 2,500 2,531,250
7.50% 06/15/15 1,195 1,248,775
Pride International, Inc., Senior
Unsecured Notes
7.38% 07/15/14 1,400 1,498,000
Range Resources Corp., Senior
Subordinated Notes
7.38% 07/15/13 2,325 2,371,500
6.38%(e) 03/15/15 430 421,400
SEE ACCOMPANYING NOTES TO FINANCIAL STATEMENTS.
100
BLACKROCK FUNDS
STATEMENT OF NET ASSETS
HIGH YIELD BOND PORTFOLIO (CONTINUED)
AS OF MARCH 31, 2005 (UNAUDITED)
PAR
MATURITY (000) VALUE
---------- ---------- -------------
CORPORATE BONDS (Continued)
Oil & Gas (Continued)
Stone Energy Corp., Senior
Subordinated Notes
6.75% 12/15/14 $ 520 $ 509,600
Swift Energy Co., Senior Unsecured
Notes
7.62% 07/15/11 775 806,000
Tennessee Gas Pipeline, Senior
Unsecured Notes
8.38% 06/15/32 1,565 1,748,888
Transcontinental Gas Pipeline Corp.,
Senior Debentures
7.25% 12/01/26 2,515 2,653,325
Utilicorp Canada Finance, Senior
Unsecured Notes
7.75% 06/15/11 6,365 6,555,950
Whiting Petroleum Corp., Senior
Subordinated Notes
7.25% 05/01/12 1,005 1,035,150
Williams Cos., Credit Link Certificates
6.75% 04/15/09 1,000 1,025,000
The Williams Cos., Inc., Senior
Unsecured Notes
7.62% 07/15/19 660 716,100
7.75% 06/15/31 325 351,000
===========
66,696,225
-----------
Paper & Forest Products - 2.3%
Abitibi-Consolidated, Inc., Senior
Unsecured Notes
8.38% 04/01/15 3,300 3,234,000
Boise Cascade LLC, Senior
Unsecured Notes
5.54%(e)(h) 10/15/12 940 951,750
Bowater Canada Finance Corp.,
Senior Unsecured Notes
7.95% 11/15/11 5,075 5,265,312
Bowater, Inc., Senior Unsecured
Notes
6.01%(h) 03/15/10 360 369,900
Cascades, Inc., Senior Unsecured
Notes
7.25%(e) 02/15/13 600 615,000
Cascades, Inc., Unsecured Notes
7.25% 02/15/13 1,675 1,708,500
Donohue Forest Products, Senior
Notes
7.62% 05/15/07 1,515 1,522,575
Georgia-Pacific Corp., Debentures
7.70% 06/15/15 900 986,625
Georgia-Pacific Corp., Senior Notes
7.38% 07/15/08 2,500 2,625,000
Georgia-Pacific Corp., Senior
Unsecured Notes
8.00% 01/15/24 125 140,000
Norske Skog Canada Ltd., Senior
Unsecured Notes
7.38% 03/01/14 1,480 1,435,600
Pliant Corp., Senior Secured Notes
11.12% 09/01/09 640 640,000
Pliant Corp., Senior Secured Notes
8.17%(g) 06/15/09 1,560 1,404,000
===========
20,898,262
-----------
PAR
MATURITY (000) VALUE
---------- ---------- -------------
CORPORATE BONDS (Continued)
Pharmaceuticals - 1.3%
Athena Neurosciences, Inc., Senior
Unsecured Notes
7.25%(i) 02/21/08 $1,170 $ 982,800
Curative Health Services, Senior
Unsecured Notes
10.75% 05/01/11 2,810 2,311,225
Elan Finance Corp., Unsecured
Notes
6.49%(e)(h)(i) 11/15/11 1,610 1,372,525
7.75%(e)(i) 11/15/11 8,950 6,712,500
===========
11,379,050
-----------
Publishing & Printing - 2.4%
Cenveo Corp., Senior Subordinated
Notes
7.88% 12/01/13 2,220 1,981,350
Dex Media West/Finance, Senior
Subordinated Notes
9.88% 08/15/13 3,798 4,234,770
Nextmedia Operating, Inc., Senior
Subordinated Notes
10.75% 07/01/11 2,265 2,457,525
Primedia, Inc., Senior Notes
7.62% 04/01/08 1,275 1,281,375
Primedia, Inc., Senior Unsecured
Notes
8.16%(h) 05/15/10 1,300 1,381,250
8.00% 05/15/13 1,000 1,020,000
Quebecor Media, Inc., Senior
Unsecured Notes
11.12% 07/15/11 2,000 2,215,000
Vertis, Inc., Senior Notes
13.50%(e)(i) 12/07/09 5,165 4,209,475
Vertis, Inc., Senior Unsecured Notes
10.88%(i) 06/15/09 915 873,825
WRC Media, Inc., Senior
Subordinated Notes
12.75% 11/15/09 2,275 2,093,000
===========
21,747,570
-----------
Real Estate - 1.2%
AMR Real Estate, Senior Unsecured
Notes
7.12%(e) 02/15/13 3,125 3,062,500
John Q. Hammons Hotels LP, First
Mortgage Notes
8.88% 05/15/12 4,590 4,968,675
Technical Olympic USA, Inc., Senior
Subordinated Notes
7.50% 03/15/11 2,025 1,944,000
Wynn Las Vegas LLC/Corp., First
Mortgage Notes
6.62%(e) 12/01/14 1,380 1,311,000
===========
11,286,175
-----------
Retail Merchandising - 3.0%
AutoNation, Inc., Senior Unsecured
Notes
9.00%(e)(i) 08/01/08 1,600 1,760,000
Chattem, Inc., Senior Subordinated
Notes
7.00% 03/01/14 695 712,375
SEE ACCOMPANYING NOTES TO FINANCIAL STATEMENTS.
101
BLACKROCK FUNDS
STATEMENT OF NET ASSETS
HIGH YIELD BOND PORTFOLIO (CONTINUED)
AS OF MARCH 31, 2005 (UNAUDITED)
PAR
MATURITY (000) VALUE
---------- ---------- -------------
CORPORATE BONDS (Continued)
Retail Merchandising (Continued)
Duane Reade Inc., Senior
Subordinated Notes
9.75%(i) 08/01/11 $3,150 $ 2,772,000
Duane Reade, Inc., Senior Secured
Notes
7.51%(e)(h) 12/15/10 1,500 1,475,625
Finlay Fine Jewelry Corp., Senior
Unsecured Notes
8.38% 06/01/12 5,715 5,400,675
J.C. Penney Co., Inc., Debentures
7.12% 11/15/23 4,620 4,573,800
Jostens, Inc., Senior Subordinated
Notes
12.75% 05/01/10 1,280 1,361,600
Rite Aid Corp., Senior Debentures
7.70%(i) 02/15/27 990 816,750
Rite Aid Corp., Senior Unsecured
Notes
6.12%(e)(i) 12/15/08 4,405 4,096,650
Rite Aid Corp., Unsecured Notes
11.25% 07/01/08 610 652,700
Saks, Inc., Unsecured Notes
9.88% 10/01/11 3,375 3,645,000
===========
27,267,175
-----------
Security Brokers & Dealers - 0.3%
E*trade Financial Corp., Senior
Unsecured Notes
8.00% 06/15/11 545 566,800
Rural Metro Corp., Senior Notes
12.75% 03/15/16 1,345 672,500
Rural Metro Corp., Senior
Subordinated Notes
9.88%(e)(i) 03/15/15 1,750 1,785,000
===========
3,024,300
-----------
Semiconductors & Related Devices - 1.4%
Freescale Semiconductor, Inc.,
Senior Unsecured Notes
5.41%(h)(i) 07/15/09 1,550 1,592,626
6.88% 07/15/11 735 755,212
Magnachip Semiconductor, Senior
Secured Notes
6.26%(e)(h) 12/15/11 1,750 1,793,750
6.88%(e) 12/15/11 930 939,300
Magnachip Semiconductor, Senior
Subordinated Notes
8.00%(e) 12/15/14 2,385 2,444,625
Sanmina-SCI Corp., Senior
Subordinated Notes
6.75%(e) 03/01/13 1,975 1,851,562
Stats Chippac LTD, Senior
Unsecured Notes
6.75%(e) 11/15/11 2,100 1,995,000
===========
11,372,075
-----------
Telecommunications - 11.2%
Alamosa Delaware, Inc., Senior
Unsecured Notes
8.50%(i) 01/31/12 3,950 4,108,000
American Tower Corp., Senior
Unsecured Notes
7.50%(i) 05/01/12 5,025 5,100,375
PAR
MATURITY (000) VALUE
---------- ---------- -------------
CORPORATE BONDS (Continued)
Telecommunications (Continued)
Asia Global Crossing Ltd., Senior
Unsecured Notes
13.38%(c)(f)(l) 10/15/10 $2,000 $ 100,000
AT&T Corp., Senior Unsecured Notes
9.05%(h) 11/15/11 3,950 4,498,061
9.75%(h) 11/15/31 870 1,068,656
CCO Holdings LLC/Capital Corp.,
Senior Unsecured Notes
7.14%(e)(h)(i) 12/15/10 1,270 1,257,300
Centennial Communications, Senior
Subordinated Notes
10.75% 12/15/08 4,500 4,635,000
Centennial Communications, Senior
Unsecured Notes
8.12% 02/01/14 2,535 2,585,700
Cincinnati Bell, Inc., Senior
Subordinated Notes
8.38%(i) 01/15/14 4,755 4,683,675
Cincinnati Bell, Inc., Senior
Unsecured Notes
7.25%(i) 07/15/13 3,045 3,029,775
Crown Castle International Corp.,
Senior Unsecured Notes
7.50% 12/01/13 5,000 5,462,500
CSC Holdings, Inc., Senior
Debentures
7.88%(e) 02/15/18 1,560 1,657,500
CSC Holdings, Inc., Senior
Unsecured Notes
8.12% 07/15/09 450 474,750
7.62% 04/01/11 1,835 1,903,811
6.75%(e) 04/15/12 360 358,200
Dobson Cellular Systems, Senior
Secured Notes
8.38%(e) 11/01/11 2,295 2,346,638
Dobson Cellular Systems, Senior
Secured Notes
7.49%(e)(h) 11/01/11 1,595 1,634,875
Granite Broadcasting Corp., Senior
Secured Notes
9.75%(i) 12/01/10 955 888,150
Insight Midwest LP, Senior Notes
9.75% 10/01/09 1,750 1,828,750
Intelsat Bermuda Ltd., Senior
Unsecured Notes
7.80%(e)(h) 01/15/12 3,720 3,775,800
8.25%(e) 01/15/13 2,250 2,255,625
8.62%(e) 01/15/15 2,050 2,091,000
Intelsat Ltd., Senior Unsecured Notes
5.25% 11/01/08 1,025 940,438
iPCS, Inc., Senior Unsecured Notes
11.50% 05/01/12 325 365,625
Lucent Technologies, Inc.,
Debentures
6.50% 01/15/28 4,306 3,692,395
Lucent Technologies, Inc., Senior
Debentures
6.45% 03/15/29 1,000 862,500
Lucent Technologies, Inc., Senior
Unsecured Notes
5.50%(i) 11/15/08 265 259,038
SEE ACCOMPANYING NOTES TO FINANCIAL STATEMENTS.
102
BLACKROCK FUNDS
STATEMENT OF NET ASSETS
HIGH YIELD BOND PORTFOLIO (CONTINUED)
AS OF MARCH 31, 2005 (UNAUDITED)
PAR
MATURITY (000) VALUE
---------- ---------- --------------
CORPORATE BONDS (Continued)
Telecommunications (Continued)
MCI, Inc., Senior Unsecured Notes
7.69% 05/01/09 $ 495 $ 514,800
Mediacom Broadband LLC, Senior
Unsecured Notes
11.00% 07/15/13 3,000 3,210,000
Nortel Networks Corp., Unsecured
Notes
6.88% 09/01/23 750 693,750
Nortel Networks Ltd., Unsecured
Notes
6.12% 02/15/06 620 621,550
Northern Telecom Capital Corp.,
Unsecured Notes
7.88% 06/15/26 1,100 1,105,500
PanAmSat Corp., Senior Debentures
6.88% 01/15/28 2,690 2,447,900
PF Net Communications, Inc., Senior
Unsecured Notes
13.75%(c)(f) 05/15/10 1,000 0
Qwest Communications International,
Inc., Senior Debentures
6.88% 07/15/28 590 458,725
Qwest Communications International,
Inc., Senior Unsecured Notes
6.29%(e)(h) 02/15/09 3,000 3,022,500
7.75%(e)(i) 02/15/14 690 669,300
Qwest Corp., Senior Subordinated
Notes
14.00%(e)(h) 12/15/10 4,515 5,214,825
Qwest Corp., Senior Unsecured
Notes
7.88%(e) 09/01/11 3,175 3,278,188
8.88%(e) 03/15/12 2,640 2,877,600
Rodgers Wireless, Inc., Senior
Secured Notes
6.14%(h) 12/15/10 795 806,925
7.25% 12/15/12 360 369,900
Rodgers Wireless, Inc., Senior
Subordinated Notes
8.00%(i) 12/15/12 2,730 2,805,075
Rural Cellular Corp., Senior
Unsecured Notes
9.88%(i) 02/01/10 1,705 1,722,050
Superior Essex Communications &
Essex Group, Senior Notes
9.00% 04/15/12 5,200 5,278,000
Western Wireless Corp., Senior
Unsecured Notes
9.25%(i) 07/15/13 2,375 2,707,500
Zeus Special Sub/Intelsat Ltd.,
Senior Unsecured Notes
9.25% 02/01/15 2,185 1,371,088
============
101,039,313
------------
Tires & Rubber - 0.3%
Cooper Standard Auto, Senior
Unsecured Notes
7.00%(e)(i) 12/15/12 1,930 1,761,125
Kraton Polymers LLC, Senior
Subordinated Notes
8.12%(e)(i) 01/15/14 1,210 1,146,475
============
2,907,600
------------
PAR
MATURITY (000) VALUE
---------- ---------- --------------
CORPORATE BONDS (Continued)
Transportation - 3.3%
CHC Helicopter Corp., Senior
Subordinated Notes
7.38%(e) 05/01/14 $3,160 $ 3,077,049
General Maritime Corp., Senior
Unsecured Notes
10.00% 03/15/13 1,200 1,335,000
Gulfmark Offshore, Inc., Senior Notes
7.75%(e) 07/15/14 3,200 3,296,000
H-Lines Finance Holding, Senior
Notes
9.92%(e)(g) 04/01/13 4,713 3,664,358
Horizon Lines LLC, Senior Notes
9.00%(e) 11/01/12 3,250 3,493,750
Hornbeck Offshore Services, Inc.,
Senior Unsecured Notes
6.12% 12/01/14 955 945,450
Overseas Shipholding Group, Inc.,
Debentures
8.75% 12/01/13 4,350 4,828,500
Overseas Shipholding Group, Inc.,
Senior Unsecured Notes
7.50% 02/15/24 55 55,275
Stanadyne Corp., Senior Unsecured
Notes
12.00%(e)(g) 02/15/15 5,750 3,406,875
Teekay Shipping Corp., Senior
Unsecured Notes
8.88% 07/15/11 1,250 1,415,625
Transportacion Ferroviaria Mexicana,
SA de CV, Senior Unsecured
Notes
12.50% 06/15/12 2,000 2,260,000
Ultrapetrol (Bahamas) Ltd., Second
Mortgage Bonds
9.00%(e) 11/24/14 1,950 1,842,750
============
29,620,632
------------
Waste Management - 0.7%
Allied Waste N.A., Inc., Senior Notes
8.88% 04/01/08 675 697,781
Allied Waste N.A., Inc., Senior
Secured Notes
8.50% 12/01/08 1,740 1,800,900
Allied Waste N.A., Inc., Senior
Unsecured Notes
9.25% 09/01/12 1,075 1,150,250
Casella Waste Systems, Inc., Senior
Subordinated Notes
9.75% 02/01/13 1,225 1,347,500
============
4,996,431
------------
Yankee - 1.9%
Ainsworth Lumber Co. Ltd. (Canada),
Senior Unsecured Notes
6.84%(e)(h) 10/01/10 3,800 3,857,000
Eircom Funding (Ireland), Senior
Subordinated Notes
8.25% 08/15/13 2,650 2,881,875
Omi Corp. (Mali), Senior Notes
7.62% 12/01/13 7,870 8,184,800
SEE ACCOMPANYING NOTES TO FINANCIAL STATEMENTS.
103
BLACKROCK FUNDS
STATEMENT OF NET ASSETS
HIGH YIELD BOND PORTFOLIO (CONCLUDED)
AS OF MARCH 31, 2005 (UNAUDITED)
PAR/SHARES
MATURITY (000) VALUE
---------- ----------- --------------
CORPORATE BONDS (Continued)
Yankee (Continued)
Rogers Wireless, Inc. (Canada),
Senior Secured Notes
9.62% 05/01/11 $ 1,750 $ 1,986,250
============
16,909,925
------------
TOTAL CORPORATE BONDS
(Cost $854,380,372) 851,530,109
------------
FOREIGN BONDS - 0.9%
Aero Investments (EUR)
10.68%(h) 03/01/15 4,125 5,133,198
Cablecom Luxembourg SCA (EUR)
4.90%(h) 04/15/12 2,650 3,437,175
============
TOTAL FOREIGN BONDS
(Cost $8,709,997) 8,570,373
------------
TERM LOANS - 0.3%
Intermet Term B Loan
6.64%(h) 03/31/09 1,000 1,000,000
Polar Corp. Term 2nd Lien Loan
8.84%(h) 05/30/10 1,250 1,275,000
============
TOTAL TERM LOANS
(Cost $2,198,516) 2,275,000
------------
SHORT TERM INVESTMENTS - 11.3%
Federal Home Loan Bank, Discount
Notes
2.55% 04/01/05 5,000 5,000,000
Galileo Money Market Fund 10,481 10,481,178
Institutional Money Market Trust(m) 86,494 86,493,930
============
TOTAL SHORT TERM INVESTMENTS
(Cost $101,975,108) 101,975,108
------------
TOTAL INVESTMENTS IN SECURITIES -
107.6%
(Cost $990,671,344(a)) 971,970,264
NUMBER OF
CONTRACTS
----------
PUT OPTIONS WRITTEN - 0.0%
Adelphia Communications
Bridge
Loan, Strike Price
100.00, Expires
10/31/04(b) (144) (67,627)
Movie Gallery Bridge
Loan, Strike
Price 100.00, Expires (101) (100,800)
04/30/05(b)
========
TOTAL PUT OPTIONS WRITTEN
(Premiums received (168,427)
--------
$123,033)
LIABILITIES IN EXCESS OF OTHER
ASSETS - (7.6)%
(including $86,493,930 of payable
upon return of
securities loaned) (69,046,623)
-----------
NET ASSETS - 100.0%
(Applicable to 16,822,635 BlackRock
shares, 20,078,430 Institutional
shares, 16,656,572 Service shares,
35,770,864 Investor A shares,
15,192,957 Investor B shares and
7,622,426 Investor C shares
outstanding) $ 902,755,214
=============
VALUE
----------
NET ASSET VALUE, OFFERING
AND REDEMPTION PRICE PER
BLACKROCK SHARE
($135,408,882/16,822,635) $ 8.05
======
NET ASSET VALUE, OFFERING
AND REDEMPTION PRICE PER
INSTITUTIONAL SHARE
($161,619,503/20,078,430) $ 8.05
======
NET ASSET VALUE, OFFERING
AND REDEMPTION PRICE PER
SERVICE SHARE
($134,102,001/16,656,572) $ 8.05
======
NET ASSET VALUE AND
REDEMPTION PRICE PER
INVESTOR A SHARE
($287,962,396/35,770,864) $ 8.05
======
MAXIMUM OFFERING PRICE
PER INVESTOR A SHARE
($8.05/0.950) $ 8.47
======
NET ASSET VALUE, OFFERING
AND REDEMPTION PRICE
(subject to a maximum contingent
deferred sales charge of 4.5%)
PER INVESTOR B SHARE
($122,271,597/15,192,957) $ 8.05
======
NET ASSET VALUE, OFFERING
AND REDEMPTION PRICE
(subject to a maximum contingent
deferred sales charge of 4.5%)
PER INVESTOR C SHARE
($61,390,835/7,622,426) $ 8.05
======
- -------------------
(a) Cost for Federal income tax purposes is $991,609,597. The
gross unrealized appreciation (depreciation) on a tax basis is as
follows:
Gross unrealized appreciation $ 19,871,603
Gross unrealized depreciation (39,510,936)
------------
$(19,639,333)
============
(b) Securities valued at fair value as determined in good faith by or under
the direction of the Trustees. These securities had a total market value
of $4,003,000 which represents 0.44% of net assets.
(c) Non-income producing security.
(d) Payment in kind security.
(e) Security exempt from registration under Rule 144A of the Securities Act of
1933. These securities may be resold in transactions exempt from
registration to qualified institutional investors. As of March 31, 2005,
the Portfolio held 27.2% of its net assets, with a current market value
of $245,329,295, in securities restricted as to resale.
(f) Security in default.
(g) Rates shown are the effective yields as of March 31, 2005.
(h) Rates shown are the rates as of March 31, 2005.
(i) Total or partial securities on loan.
(j) Debt obligation initially issued in zero coupon form which converts to
coupon form at a specified date and rate. The rates shown are the
effective yields as of March 31, 2005.
(k) Security held in escrow for future payments
(l) Security is illiquid.
(m) Securities purchased with the cash proceeds from securities loaned.
SEE ACCOMPANYING NOTES TO FINANCIAL STATEMENTS.
104
BLACKROCK FUNDS
KEY TO INVESTMENT ABBREVIATIONS
ARM Adjustable Rate Mortgage
CMT Constant Maturity Treasury Rate
CND Canadian Dollar
COFI Cost of Funds Index
DKK Danish Krone
EUR European Currency Unit
GBP Great British Pound
IO Interest Only
JPY Japanese Yen
LTD Limited-Liability Company
MULTI Multi-issued pools
MXP Mexican Peso
NZD New Zealand Dollar
PLC Project Loan Certificate
PLN Polish Zloty
PO Principal Only
SEK Swedish Krone
105
BLACKROCK FUNDS
STATEMENTS OF OPERATIONS
FOR THE PERIOD ENDED MARCH 31, 2005(UNAUDITED)
ENHANCED LOW DURATION INTERMEDIATE INTERMEDIATE INTERMEDIATE
INCOME BOND GOVERNMENT BOND PLUS BOND
PORTFOLIO PORTFOLIO BOND PORTFOLIO PORTFOLIO PORTFOLIO
------------- ---------------- ---------------- ---------------- ---------------
Investment income:
Interest .................................. $ 888,597 $ 31,309,995 $ 9,660,318 $ 19,264,953 $ 531,933
Securities lending income ................. 6 171 268 4,657 -
Dividends ................................. - 253,750 - - 1,400
---------- ------------- ------------ ------------- ----------
Total investment income .................. 888,603 31,563,916 9,660,586 19,269,610 533,333
---------- ------------- ------------ ------------- ----------
Expenses:
Investment advisory fee ................... 124,076 4,273,223 1,124,779 2,320,196 64,879
Administration fee ........................ 26,366 656,026 187,070 372,961 11,029
Administration fee - class specific ....... 34,166 888,696 326,507 424,478 4,543
Custodian fee ............................. 10,158 133,542 38,324 72,890 6,168
Transfer agent fee ........................ 2,819 209,288 219,470 75,790 582
Transfer agent fee - class specific ....... 4,305 114,048 40,532 54,173 649
Shareholder servicing fees - class
specific ................................. 15 760,535 266,003 186,775 2
Distribution fees - class specific ........ - 675,124 277,155 115,658 1
Legal and audit fees ...................... 16,333 108,072 28,460 61,136 13,815
Printing fee .............................. 7,050 101,713 13,054 54,330 7,644
Registration fees and expenses ............ 15,603 58,047 26,194 32,104 13,540
Trustees' fees ............................ 848 27,825 5,335 14,417 93
Other ..................................... 5,095 99,519 16,323 54,442 7,392
---------- ------------- ------------ ------------- ----------
Total expenses excluding interest
expense ................................. 246,834 8,105,658 2,569,206 3,839,350 130,337
Interest expense ........................ 11 324 - - -
---------- ------------- ------------ ------------- ----------
Total expenses ........................... 246,845 8,105,982 2,569,206 3,839,350 130,337
---------- ------------- ------------ ------------- ----------
Less investment advisory and
administration fees waived ............. (111,205) (2,134,964) (348,141) (993,442) (64,812)
Less administration fee waived -
class specific ......................... (15,745) (132,267) (172,763) (91,960) (4,541)
Less distribution fee waived - class
specific ............................... - (41,740) (79,275) (16,633) (1)
Less expenses reimbursed by
advisor ................................ (5,611) - - - (9,076)
---------- ------------- ------------ ------------- -----------
Net expenses ............................. 114,284 5,797,011 1,969,027 2,737,315 51,907
---------- ------------- ------------ ------------- -----------
Net investment income ...................... 774,319 25,766,905 7,691,559 16,532,295 481,426
---------- ------------- ------------ ------------- -----------
Realized and unrealized gain (loss) on
investments and foreign currency
transactions:
Net realized gain (loss) from:
Investment transactions .................. (93,877) (5,265,745) 2,138,470 2,082,664 (171,165)
Futures and options contracts ............ 149,191 1,928,723 151,281 839,686 27,818
Swap and swaption contracts .............. (50,975) 424,046 17,131 (1,940,514) 7,537
Foreign currency related transactions..... 21,178 1,465,391 - - (2,365)
---------- ------------- ------------ ------------- -----------
25,517 (1,447,585) 2,306,882 981,836 (138,175)
---------- ------------- ------------ ------------- -----------
Change in unrealized appreciation
depreciation from:
Investments .............................. (375,778) (19,214,905) (8,759,155) (20,168,454) (295,496)
Futures and options contracts ............ 50,635 2,120,557 704,682 1,483,144 2,527
Swap and swaption contracts .............. (27,285) (3,451,756) (46,868) (561,897) (12,875)
Foreign currency related transactions..... 6,327 689,627 - - 5,741
---------- ------------- ------------ ------------- -----------
(346,101) (19,856,477) (8,101,341) (19,247,207) (300,103)
---------- ------------- ------------ ------------- -----------
Net gain (loss) on investments and foreign
currency transactions ..................... (320,584) (21,304,062) (5,794,459) (18,265,371) (438,278)
---------- ------------- ------------ ------------- -----------
Net increase (decrease) in net assets
resulting from operations ................. $ 453,735 $ 4,462,843 $ 1,897,100 $ (1,733,076) $ 43,148
========== ============= ============ ============= ===========
SEE ACCOMPANYING NOTES TO FINANCIAL STATEMENTS.
106
BLACKROCK FUNDS
INFLATION
CORE BOND CORE PLUS GOVERNMENT PROTECTED MANAGED INTERNATIONAL HIGH YIELD
TOTAL RETURN TOTAL RETURN INCOME BOND GNMA INCOME BOND BOND
PORTFOLIO PORTFOLIO PORTFOLIO PORTFOLIO PORTFOLIO PORTFOLIO PORTFOLIO PORTFOLIO
- ---------------- ----------------- ----------------- ------------- -------------- --------------- --------------- ---------------
$ 58,759,879 $ 7,340,534 $ 9,354,062 $ 396,578 $ 6,000,444 $ 19,953,600 $ 10,356,762 $ 29,254,878
13,680 - - - - 2,327 320 222,799
- 6,913 - - - - - 2,221,888
------------- ------------ ------------- ---------- ------------ ------------- ------------ -------------
58,773,559 7,347,447 9,354,062 396,578 6,000,444 19,955,927 10,357,082 31,699,565
------------- ------------ ------------- ---------- ------------ ------------- ------------ -------------
5,906,570 838,791 951,772 57,088 632,752 1,865,271 1,698,296 1,867,960
901,891 142,594 161,801 12,131 97,789 304,722 255,946 305,126
945,862 58,799 269,035 7,354 161,119 534,481 411,129 468,115
228,194 51,729 58,968 3,721 48,544 88,249 89,991 56,152
181,163 15,531 52,572 1,573 37,097 67,858 127,721 200,569
132,299 8,397 33,434 986 20,040 67,147 51,245 58,551
532,303 187 460,553 2,626 100,748 148,696 392,090 554,687
582,740 398 335,908 3,418 233,935 53,308 325,117 702,309
148,677 30,858 23,945 10,201 26,837 53,803 32,877 43,424
140,215 17,594 16,777 1,150 12,621 39,816 30,524 35,886
50,073 5,806 22,316 38,770 23,608 24,973 45,144 42,413
38,264 5,038 3,493 426 3,713 11,787 7,203 9,559
131,122 21,023 12,750 6,265 14,938 44,423 25,462 50,104
------------- ------------ ------------- ---------- ------------ ------------- ------------ -------------
9,919,373 1,196,745 2,403,324 145,709 1,413,741 3,304,534 3,492,745 4,394,855
- - - - 12,063 2,014 - 7,583
------------- ------------ ------------- ---------- ------------ ------------- ------------ -------------
9,919,373 1,196,745 2,403,324 145,709 1,425,804 3,306,548 3,492,745 4,402,438
------------- ------------ ------------- ---------- ------------ ------------- ------------ -------------
(2,691,988) (466,320) (464,092) (69,219) (385,739) (143,429) (1,933) (573,047)
(209,619) (58,690) (1,908) (4,631) (7,017) (483,349) (4,613) (30,277)
(68,032) (8) (73,276) (686) (8,118) (17,106) (78,038) (75,123)
- - - (20,921) - - - -
------------- ------------- ------------- ---------- ------------ ------------- ------------ -------------
6,949,734 671,727 1,864,048 50,252 1,024,930 2,662,664 3,408,161 3,723,991
------------- ------------- ------------- ---------- ------------ ------------- ------------ -------------
51,823,825 6,675,720 7,490,014 346,326 4,975,514 17,293,263 6,948,921 27,975,574
------------- ------------- ------------- ---------- ------------ ------------- ------------ -------------
4,845,744 1,349,323 (538,235) 338,095 1,136,214 1,483,748 3,802,911 22,860,466
1,865,305 252,097 (1,759,767) 8,449 (986,286) 466,998 2,352,313 -
(261,920) 107,125 180,450 - 116,407 64,146 (40,808) (160,431)
3,706,268 (4,503) - 3,137 - 1,189,815 20,571,490 (769)
------------- ------------- ------------- ---------- ------------ ------------- ------------ -------------
10,155,397 1,704,041 (2,117,552) 349,681 266,335 3,204,706 26,685,906 22,699,265
------------- ------------- ------------- ---------- ------------ ------------- ------------ -------------
(50,949,671) (6,605,813) (8,730,821) (133,266) (3,740,552) (19,103,149) 438,012 (27,599,116)
8,289,882 703,390 296,979 (4,035) 405,215 4,387,032 1,290,892 (113,785)
(764,447) (128,325) 791,176 753 (338,817) (831,263) (16,010) 421,564
2,060,147 384,972 - 12,274 - 701,963 (9,094,912) 48,089
------------- ------------- ------------- ---------- ------------ ------------- ------------ -------------
(41,364,089) (5,645,776) (7,642,666) (124,274) (3,674,154) (14,845,417) (7,382,018) (27,243,248)
------------- ------------- ------------- ---------- ------------ ------------- ------------ -------------
(31,208,692) (3,941,735) (9,760,218) 225,407 (3,407,819) (11,640,711) 19,303,888 (4,543,983)
------------- ------------- ------------- ---------- ------------ ------------- ------------ -------------
$ 20,615,133 $ 2,733,985 $ (2,270,204) $ 571,733 $ 1,567,695 $ 5,652,552 $ 26,252,809 $ 23,431,591
============= ============= ============= ========== ============ ============= ============ =============
107
BLACKROCK FUNDS
STATEMENT OF CASH FLOWS
LOW DURATION PORTFOLIO
FOR THE SIX MONTHS ENDED MARCH 31, 2005(UNAUDITED)
Increase (decrease) in cash
Cash flows from operating activities:
Net increase (decrease) in net assets from operations ................................... $ 4,462,843
Adjustments to reconcile net increase in net assets from operations to net cash provided
by
(used for) operating activities:
Purchase of long-term investment securities .......................................... (1,981,222,051)
Proceeds from disposition of long-term investment securities ......................... 1,730,882,637
Increase (decrease) in options written, at value ..................................... -
Increase (decrease) in swaptions written, at value ................................... -
Net purchase of short term investment securities ..................................... (2,255,254)
Amortization (accretion) of premium (discount) ....................................... 3,958,787
(Increase) decrease in futures variation margin ...................................... 834,176
(Increase) decrease in interest receivable ........................................... 2,930,437
(Increase) decrease in investments sold receivable ................................... 19,586,811
(Increase) decrease in principal paydown receivable .................................. (78,989)
(Increase) decrease in collateral received for securities loaned ..................... -
Increase (decrease) in payable upon return of securities loaned ...................... -
(Increase) decrease in interest receivable on interest rate swaps .................... -
(Increase) decrease in prepaid expenses .............................................. 20,246
Increase (decrease) in investments purchased payable ................................. (13,573,079)
Increase (decrease) in interest payable on interest rate swaps ....................... -
(Increase) decrease in collateral received for swap contracts ........................ -
Increase (decrease) in payable upon termination of swap contracts .................... -
Increase (decrease) in accrued expenses .............................................. 102,530
Net (increase) decrease in unrealized appreciation (depreciation) on investment
securities .......................................................................... 19,214,905
Net (increase) decrease in unrealized appreciation (depreciation) on futures and
options ............................................................................. (2,120,557)
Net (increase) decrease in unrealized appreciation (depreciation) on swap
and swaption contracts .............................................................. 2,762,129
Net realized (gain) loss on investment securities .................................... 5,265,745
----------------
Net realized (gain) loss on futures and options ...................................... (1,928,723)
Net realized (gain) loss on swap and swaption contracts .............................. (1,889,437)
----------------
Net cash provided by (used for) operating activities .................................... (213,046,844)
----------------
Cash flows from financing activities:
Net borrowing (repayment) of reverse repurchase agreements and other
short term borrowings ............................................................... 357,759,161
Proceeds from units sold ............................................................. 343,586,773
Payments on units redeemed ........................................................... (479,237,001)
Cash distributions paid .............................................................. (9,062,089)
----------------
Net cash provided by (used for) financing activities .................................... 213,046,844
----------------
Net increase (decrease) in cash .......................................................... -
----------------
Cash:
Beginning balance ....................................................................... -
----------------
Ending balance .......................................................................... $ -
================
Supplemental disclosure of cash flow information:
Reinvestment of dividends and distributions (non-cash financing activity) ................ $ 13,511,404
Cash paid during the period for interest ................................................. $ (324)
SEE ACCOMPANYING NOTES TO FINANCIAL STATEMENTS.
108
BLACKROCK FUNDS
STATEMENT OF CASH FLOWS
MANAGED INCOME PORTFOLIO
FOR THE SIX MONTHS ENDED MARCH 31, 2005(UNAUDITED)
Increase (decrease) in cash $ 5,652,552
Cash flows from operating activities:
Net increase (decrease) in net assets from operations ...................................
Adjustments to reconcile net increase in net assets from operations to net cash provided
by
(used for) operating activities:
Purchase of long-term investment securities .......................................... (1,149,784,484)
Proceeds from disposition of long-term investment securities ......................... 1,267,184,142
Increase (decrease) in options written, at value ..................................... 35,900
Increase (decrease) in swaptions written, at value ................................... 1,195,888
Net purchase of short term investment securities ..................................... 4,443,577
Amortization (accretion) of premium (discount) ....................................... 1,310,027
(Increase) decrease in futures variation margin ...................................... 864,748
(Increase) decrease in interest receivable ........................................... 1,911,170
(Increase) decrease in investments sold receivable ................................... 97,826,989
(Increase) decrease in principal paydown receivable .................................. (124,748)
(Increase) decrease in collateral received for securities loaned ..................... (1,899,250)
Increase (decrease) in payable upon return of securities loaned ...................... 1,899,250
(Increase) decrease in interest receivable on interest rate swaps .................... 57,019
(Increase) decrease in prepaid expenses .............................................. (4,194)
Increase (decrease) in investments purchased payable ................................. (94,273,404)
Increase (decrease) in interest payable on interest rate swaps ....................... (119,588)
(Increase) decrease in collateral received for swap contracts ........................ (703,481)
Increase (decrease) in payable upon termination of swap contracts .................... 703,481
Increase (decrease) in accrued expenses .............................................. 18,101
Net (increase) decrease in unrealized appreciation (depreciation) on investment
securities .......................................................................... 19,103,149
Net (increase) decrease in unrealized appreciation (depreciation) on futures and
options ............................................................................. (4,387,032)
Net (increase) decrease in unrealized appreciation (depreciation) on swap
and swaption contracts .............................................................. 129,301
Net realized (gain) loss on investment securities .................................... (1,483,748)
----------------
Net realized (gain) loss on futures and options ...................................... (466,998)
Net realized (gain) loss on swap and swaption contracts .............................. (1,253,961)
----------------
Net cash provided by (used for) operating activities .................................... 147,834,406
----------------
Cash flows from financing activities:
Net borrowing (repayment) of reverse repurchase agreements and other
short term borrowings ............................................................... (90,774,634)
Proceeds from units sold ............................................................. 53,508,712
Payments on units redeemed ........................................................... (96,372,150)
Cash distributions paid .............................................................. (14,196,334)
----------------
Net cash provided by (used for) financing activities .................................... (147,834,406)
----------------
Net increase (decrease) in cash .......................................................... -
----------------
Cash:
Beginning balance ....................................................................... -
----------------
Ending balance .......................................................................... $ -
================
Supplemental disclosure of cash flow information:
Reinvestment of dividends and distributions (non-cash financing activity) ................ $ 4,044,734
Cash paid during the period for interest ................................................. $ (2,014)
109
BLACKROCK FUNDS
STATEMENTS OF CHANGES IN NET ASSETS
ENHANCED
INCOME
PORTFOLIO
-----------------------------------
FOR THE
SIX MONTHS
ENDED
3/31/05 FOR THE PERIOD
(UNAUDITED) 3/4/04-9/30/041
---------------- ------------------
Increase (decrease) in net assets:
Operations:
Net investment income .................................. $ 774,319 $ 335,513
Net realized gain (loss) on investments, futures,
options, swap and swaption contracts and foreign
currency related transactions ......................... 25,517 (219,169)
Net unrealized appreciation/depreciation on
investments, futures, options, swap and swaption
contracts and foreign currency related
transactions .......................................... (346,101) (30,863)
------------ ------------
Net increase (decrease) in net assets resulting from
operations ............................................ 453,735 85,481
------------ ------------
Distributions to shareholders from:
Net investment income:
BlackRock Class ........................................ (251,608) (213,539)
Institutional Class .................................... (522,567) (153,489)
Service Class .......................................... (144) (2)
Investor A Class ....................................... - (1)
Investor B Class ....................................... - -
Investor C Class ....................................... - -
------------ -------------
Total distributions from net investment income ......... (774,319) (367,031)
------------ -------------
Net realized gains:
BlackRock Class ........................................ - -
Institutional Class .................................... - -
Service Class .......................................... - -
Investor A Class ....................................... - -
Investor B Class ....................................... - -
Investor C Class ....................................... - -
------------ -------------
Total distributions from net realized gains ............ - -
------------ -------------
Total distributions to shareholders .................... (774,319) (367,031)
------------ -------------
Capital share transactions ............................... 15,972,390 54,925,695
------------ -------------
Redemption fees .......................................... - -
------------ -------------
Total increase (decrease) in net assets ................ 15,651,806 54,644,145
Net assets:
Beginning of period .................................... 54,644,145 -
------------ -------------
End of period .......................................... $ 70,295,951 $ 54,644,145
============ =============
End of period undistributed net investment income
(distributions in excess of net investment
income) ............................................... $ (12,453) $ (12,452)
INTERMEDIATE
LOW DURATION GOVERNMENT
BOND PORTFOLIO BOND PORTFOLIO
--------------------------------------- -----------------
FOR THE FOR THE
SIX MONTHS SIX MONTHS
ENDED FOR THE ENDED
3/31/05 YEAR ENDED 3/31/05
(UNAUDITED) 9/30/04 (UNAUDITED)
------------------- ------------------- -----------------
Increase (decrease) in net assets:
Operations:
Net investment income .................................. $ 25,766,905 $ 36,962,711 $ 7,691,559
Net realized gain (loss) on investments, futures,
options, swap and swaption contracts and foreign
currency related transactions ......................... (1,447,585) (10,723,689) 2,306,882
Net unrealized appreciation/depreciation on
investments, futures, options, swap and swaption
contracts and foreign currency related
transactions .......................................... (19,856,477) (10,258,210) (8,101,341)
--------------- --------------- -------------
Net increase (decrease) in net assets resulting from
operations ............................................ 4,462,843 15,980,812 1,897,100
--------------- --------------- -------------
Distributions to shareholders from:
Net investment income:
BlackRock Class ........................................ (10,193,580) (16,101,779) -
Institutional Class .................................... (6,140,763) (9,546,236) (3,739,058)
Service Class .......................................... (4,359,517) (4,914,169) (18,699)
Investor A Class ....................................... (1,012,126) (1,638,667) (2,455,574)
Investor B Class ....................................... (503,486) (667,531) (415,977)
Investor C Class ....................................... (887,970) (1,422,382) (175,349)
--------------- --------------- -------------
Total distributions from net investment income ......... (23,097,442) (34,290,764) (6,804,657)
--------------- --------------- -------------
Net realized gains:
BlackRock Class ........................................ - (3,237,280) -
Institutional Class .................................... - (2,090,517) (1,106,478)
Service Class .......................................... - (1,158,715) (6,048)
Investor A Class ....................................... - (463,589) (183,301)
Investor B Class ....................................... - (352,109) (47,030)
Investor C Class ....................................... - (776,700) (55,783)
--------------- --------------- -------------
Total distributions from net realized gains ............ - (8,078,910) (1,398,640)
--------------- --------------- -------------
Total distributions to shareholders .................... (23,097,442) (42,369,674) (8,203,297)
--------------- --------------- -------------
Capital share transactions ............................... (128,738,244) 164,789,326 433,565,571
--------------- --------------- -------------
Redemption fees .......................................... 1,205 - -
--------------- --------------- -------------
Total increase (decrease) in net assets ................ (147,371,638) 138,400,464 427,259,374
Net assets:
Beginning of period .................................... 1,873,827,408 1,735,426,944 305,673,659
--------------- --------------- -------------
End of period .......................................... $ 1,726,455,770 $ 1,873,827,408 $ 732,933,033
=============== =============== =============
End of period undistributed net investment income
(distributions in excess of net investment
income) ............................................... $ 3,039,919 $ 370,456 $ 573,007
INTERMEDIATE
GOVERNMENT
BOND PORTFOLIO
-----------------
FOR THE
YEAR ENDED
9/30/04
-----------------
Increase (decrease) in net assets:
Operations:
Net investment income .................................. $ 10,699,389
Net realized gain (loss) on investments, futures,
options, swap and swaption contracts and foreign
currency related transactions ......................... 1,787,815
Net unrealized appreciation/depreciation on
investments, futures, options, swap and swaption
contracts and foreign currency related
transactions .......................................... (6,798,758)
-------------
Net increase (decrease) in net assets resulting from
operations ............................................ 5,688,446
-------------
Distributions to shareholders from:
Net investment income:
BlackRock Class ........................................ -
Institutional Class .................................... (8,451,541)
Service Class .......................................... (46,005)
Investor A Class ....................................... (1,704,214)
Investor B Class ....................................... (310,631)
Investor C Class ....................................... (419,572)
-------------
Total distributions from net investment income ......... (10,931,963)
-------------
Net realized gains:
BlackRock Class ........................................ -
Institutional Class .................................... -
Service Class .......................................... -
Investor A Class ....................................... -
Investor B Class ....................................... -
Investor C Class ....................................... -
-------------
Total distributions from net realized gains ............ -
-------------
Total distributions to shareholders .................... (10,931,963)
-------------
Capital share transactions ............................... (6,172,509)
-------------
Redemption fees .......................................... -
-------------
Total increase (decrease) in net assets ................ (11,416,026)
Net assets:
Beginning of period .................................... 317,089,685
-------------
End of period .......................................... $ 305,673,659
=============
End of period undistributed net investment income
(distributions in excess of net investment
income) ............................................... $ (313,895)
- ---------
1 Commencement of operations.
SEE ACCOMPANYING NOTES TO FINANCIAL STATEMENTS.
110
BLACKROCK FUNDS
INTERMEDIATE INTERMEDIATE PLUS
BOND PORTFOLIO BOND PORTFOLIO
- ----------------------------------- ----------------------------------
FOR THE FOR THE
SIX MONTHS SIX MONTHS
ENDED FOR THE ENDED
3/31/05 YEAR ENDED 3/31/05 FOR THE PERIOD
(UNAUDITED) 9/30/04 (UNAUDITED) 8/18/04-9/30/041
- ----------------- ----------------- --------------- ------------------
$ 16,532,295 $ 33,037,063 $ 481,426 $ 118,733
981,836 7,771,479 (138,175) 14,953
(19,247,207) (17,841,712) (300,103) 5,297
------------- ------------- ------------ ------------
(1,733,076) 22,966,830 43,148 138,983
------------- ------------- ------------ ------------
(7,733,301) (15,750,126) (481,390) (121,847)
(5,340,862) (13,010,903) - -
(1,359,689) (2,218,577) - -
(500,879) (1,285,713) (36) -
(146,542) (339,078) - -
(149,943) (363,366) - -
------------- ------------- ------------ ------------
(15,231,216) (32,967,763) (481,426) (121,847)
------------- ------------- ------------ ------------
(3,605,317) (8,456,396) (22,983) -
(2,617,586) (8,468,244) - -
(720,929) (1,395,950) - -
(278,111) (910,295) - -
(106,933) (311,883) - -
(110,018) (351,717) - -
------------- ------------- ------------ ------------
(7,438,894) (19,894,485) (22,983) -
------------- ------------- ------------ ------------
(22,670,110) (52,862,248) (504,409) (121,847)
------------- ------------- ------------ ------------
(4,498,446) 69,338,781 (3,593,934) 25,979,168
------------- ------------- ------------ ------------
- - - -
------------- ------------- ------------ ------------
(28,901,632) 39,443,363 (4,055,195) 25,996,304
923,709,636 884,266,273 25,996,304 -
------------- ------------- ------------ ------------
$ 894,808,004 $ 923,709,636 $ 21,941,109 $ 25,996,304
============= ============= ============ ============
$ 1,736,937 $ 435,858 $ 156 $ 157
CORE BOND CORE PLUS
TOTAL RETURN PORTFOLIO TOTAL RETURN PORTFOLIO
- --------------------------------------- --------------------------------------
FOR THE FOR THE
SIX MONTHS SIX MONTHS
ENDED FOR THE ENDED FOR THE
3/31/05 YEAR ENDED 3/31/05 YEAR ENDED
(UNAUDITED) 9/30/04 (UNAUDITED) 9/30/04
- ------------------- ------------------- ------------------- ------------------
$ 51,823,825 $ 99,866,904 $ 6,675,720 $ 10,331,787
10,155,397 3,895,102 1,704,041 (912,455)
(41,364,089) (14,325,035) (5,645,776) 984,328
--------------- --------------- ------------- --------------
20,615,133 89,436,971 2,733,985 10,403,660
--------------- --------------- ------------- --------------
(28,162,924) (48,517,179) (6,184,753) (9,749,470)
(11,312,780) (33,017,672) (3) (4)
(2,552,849) (5,040,584) (473) (251)
(2,305,362) (4,395,274) (277) (249)
(706,544) (1,743,639) (1,212) (1,831)
(1,073,519) (2,388,478) (90) (3)
--------------- --------------- -------------- ---------------
(46,113,978) (95,102,826) (6,186,808) (9,751,808)
--------------- --------------- -------------- --------------
(2,614,942) (26,256,064) - (2,841,616)
(1,031,692) (22,929,791) - (2)
(256,095) (3,469,665) - (2)
(232,258) (2,988,709) - (96)
(94,378) (1,715,637) - (900)
(143,147) (2,208,746) - (2)
--------------- --------------- -------------- ---------------
(4,372,512) (59,568,612) - (2,842,618)
--------------- --------------- -------------- --------------
(50,486,490) (154,671,438) (6,186,808) (12,594,426)
--------------- --------------- -------------- --------------
43,952,531 242,826,510 89,460,061 63,092,827
--------------- --------------- -------------- --------------
- 1 - -
--------------- --------------- -------------- --------------
14,081,174 177,592,044 86,007,238 60,902,061
2,525,633,820 2,348,041,776 285,238,245 224,336,184
--------------- --------------- -------------- --------------
$ 2,539,714,994 $ 2,525,633,820 $ 371,245,483 $ 285,238,245
=============== =============== ============== ==============
$ 3,486,023 $ (2,223,824) $ 717,472 $ 228,560
111
BLACKROCK FUNDS
STATEMENTS OF CHANGES IN NET ASSETS (CONCLUDED)
GOVERNMENT
INCOME PORTFOLIO
-----------------------------------
FOR THE
SIX MONTHS
ENDED FOR THE
3/31/05 YEAR ENDED
(UNAUDITED) 9/30/04
----------------- -----------------
Increase (decrease) in net assets:
Operations:
Net investment income .................................. $ 7,490,014 $ 6,350,140
Net realized gain (loss) on investments, futures,
options, swap and swaption contracts and foreign
currency related transactions ......................... (2,117,552) (2,257,615)
Net unrealized appreciation/depreciation on
investments, futures, options, swap and swaption
contracts and foreign currency related
transactions .......................................... (7,642,666) 1,061,473
------------- -------------
Net increase (decrease) in net assets resulting from
operations ............................................ (2,270,204) 5,153,998
------------- -------------
Distributions to shareholders from:
Net investment income:
BlackRock Class ........................................ (279,289) (186,632)
Institutional Class .................................... - -
Service Class .......................................... (3,938,293) -
Investor A Class ....................................... (3,487,922) (3,390,674)
Investor B Class ....................................... (860,325) (1,246,261)
Investor C Class ....................................... (524,842) (688,847)
------------- -------------
Total distributions from net investment income ......... (9,090,671) (5,512,414)
------------- -------------
Net realized gains:
BlackRock Class ........................................ - (40)
Institutional Class .................................... - -
Service Class .......................................... - -
Investor A Class ....................................... - (1,252,750)
Investor B Class ....................................... - (740,622)
Investor C Class ....................................... - (407,937)
------------- -------------
Total distributions from net realized gains ............ - (2,401,349)
------------- -------------
Total distributions to shareholders .................... (9,090,671) (7,913,763)
------------- -------------
Capital share transactions ............................... 252,815,115 40,817,268
------------- -------------
Redemption fees .......................................... - -
------------- -------------
Total increase (decrease) in net assets ................ 241,454,240 38,057,503
Net assets:
Beginning of period .................................... 208,052,043 169,994,540
------------- -------------
End of period .......................................... $ 449,506,283 $ 208,052,043
============= =============
End of period undistributed net investment income
(distributions in excess of net investment
income) ............................................... $ (578,569) $ 1,022,088
INFLATION PROTECTED GNMA
BOND PORTFOLIO PORTFOLIO
------------------------------------- -----------------
FOR THE FOR THE
SIX MONTHS SIX MONTHS
ENDED ENDED
3/31/05 FOR THE PERIOD 3/31/05
(UNAUDITED) 6/28/04-9/30/041 (UNAUDITED)
------------------ ------------------ -----------------
Increase (decrease) in net assets:
Operations:
Net investment income .................................. $ 346,326 $ 226,154 $ 4,975,514
Net realized gain (loss) on investments, futures,
options, swap and swaption contracts and foreign
currency related transactions ......................... 349,681 230,428 266,335
Net unrealized appreciation/depreciation on
investments, futures, options, swap and swaption
contracts and foreign currency related
transactions .......................................... (124,274) 551,836 (3,674,154)
------------ ------------ -------------
Net increase (decrease) in net assets resulting from
operations ............................................ 571,733 1,008,418 1,567,695
------------ ------------ -------------
Distributions to shareholders from:
Net investment income:
BlackRock Class ........................................ (563,209) (244,948) (228,658)
Institutional Class .................................... (41,310) - (2,846,887)
Service Class .......................................... - - (72,932)
Investor A Class ....................................... (24,291) (116) (318,555)
Investor B Class ....................................... (3,519) (29) (377,986)
Investor C Class ....................................... (6,690) - (550,656)
------------ ------------ -------------
Total distributions from net investment income ......... (639,019) (245,093) (4,395,674)
------------ ------------ -------------
Net realized gains:
BlackRock Class ........................................ (245,658) - -
Institutional Class .................................... (16,405) - -
Service Class .......................................... (1) - -
Investor A Class ....................................... (8,360) - -
Investor B Class ....................................... (1,956) - -
Investor C Class ....................................... (3,694) - -
------------- ------------ -------------
Total distributions from net realized gains ............ (276,074) - -
------------- ------------ -------------
Total distributions to shareholders .................... (915,093) (245,093) (4,395,674)
------------- ------------ -------------
Capital share transactions ............................... 15,105,213 20,160,373 (22,564,396)
------------- ------------ -------------
Redemption fees .......................................... - - -
------------- ------------ -------------
Total increase (decrease) in net assets ................ 14,761,853 20,923,698 (25,392,375)
Net assets:
Beginning of period .................................... 20,923,698 - 247,561,205
------------- ------------ -------------
End of period .......................................... $ 35,685,551 $ 20,923,698 $ 222,168,830
============= ============ =============
End of period undistributed net investment income
(distributions in excess of net investment
income) ............................................... $ (241,376) $ 51,317 $ 254,825
GNMA
PORTFOLIO
-----------------
FOR THE
YEAR ENDED
9/30/04
-----------------
Increase (decrease) in net assets:
Operations:
Net investment income .................................. $ 12,573,800
Net realized gain (loss) on investments, futures,
options, swap and swaption contracts and foreign
currency related transactions ......................... 107,676
Net unrealized appreciation/depreciation on
investments, futures, options, swap and swaption
contracts and foreign currency related
transactions .......................................... (2,663,323)
-------------
Net increase (decrease) in net assets resulting from
operations ............................................ 10,018,153
-------------
Distributions to shareholders from:
Net investment income:
BlackRock Class ........................................ (1,338,791)
Institutional Class .................................... (8,673,330)
Service Class .......................................... (93,657)
Investor A Class ....................................... (947,977)
Investor B Class ....................................... (1,270,170)
Investor C Class ....................................... (1,985,772)
-------------
Total distributions from net investment income ......... (14,309,697)
-------------
Net realized gains:
BlackRock Class ........................................ -
Institutional Class .................................... -
Service Class .......................................... -
Investor A Class ....................................... -
Investor B Class ....................................... -
Investor C Class ....................................... -
-------------
Total distributions from net realized gains ............ -
-------------
Total distributions to shareholders .................... (14,309,697)
-------------
Capital share transactions ............................... (84,565,804)
-------------
Redemption fees .......................................... 15
-------------
Total increase (decrease) in net assets ................ (88,857,333)
Net assets:
Beginning of period .................................... 336,418,538
-------------
End of period .......................................... $ 247,561,205
=============
End of period undistributed net investment income
(distributions in excess of net investment
income) ............................................... $ (325,015)
- ---------
1 Commencement of operations.
SEE ACCOMPANYING NOTES TO FINANCIAL STATEMENTS.
112
BLACKROCK FUNDS
MANAGED INTERNATIONAL HIGH YIELD
INCOME PORTFOLIO BOND PORTFOLIO BOND PORTFOLIO
- ------------------------------------- ------------------------------------ -------------------------------------
FOR THE FOR THE FOR THE
SIX MONTHS SIX MONTHS SIX MONTHS
ENDED FOR THE ENDED FOR THE ENDED FOR THE
3/31/05 YEAR ENDED 3/31/05 YEAR ENDED 3/31/05 YEAR ENDED
(UNAUDITED) 9/30/04 (UNAUDITED) 9/30/04 (UNAUDITED) 9/30/04
- ----------------- ----------------- ----------------- ---------------- ----------------- -----------------
$ 17,293,263 $ 38,800,743 $ 6,948,921 $ 7,189,923 $ 27,975,574 $ 44,111,805
3,204,706 196,121 26,685,906 10,996,047 22,699,265 33,594,357
(14,845,417) (11,092,359) (7,382,018) (64,501) (27,243,248) (6,063,310)
------------- -------------- ------------- ------------- ------------- -------------
5,652,552 27,904,505 26,252,809 18,121,469 23,431,591 71,642,852
------------- -------------- ------------- ------------- ------------- -------------
- - (1,810,394) (423,849) (4,793,126) (6,682,859)
(13,179,990) (33,874,661) (6,595,358) (4,289,402) (5,832,929) (12,247,677)
(1,468,671) (3,677,325) (2,535,157) (2,578,046) (4,317,006) (7,116,452)
(651,125) (1,797,350) (4,219,848) (3,713,909) (5,268,853) (4,942,313)
(130,568) (330,340) (451,566) (425,800) (3,146,307) (6,367,995)
(16,679) (27,287) (1,074,741) (787,077) (1,881,390) (4,444,804)
------------- -------------- ------------- ------------- ------------- -------------
(15,447,033) (39,706,963) (16,687,064) (12,218,083) (25,239,611) (41,802,100)
------------- -------------- ------------- ------------- ------------- -------------
- - (31,979) - (2,217,477) -
(2,338,691) (20,585,568) (111,687) - (2,744,299) -
(263,605) (2,347,707) (45,846) - (2,126,281) -
(128,734) (1,248,261) (76,674) - (1,216,391) -
(32,026) (267,625) (9,510) - (1,516,927) -
(4,139) (19,166) (22,658) - (990,873) -
------------- -------------- ------------- ------------- ------------- -------------
(2,767,195) (24,468,327) (298,354) - (10,812,248) -
------------- -------------- ------------- ------------- ------------- -------------
(18,214,228) (64,175,290) (16,985,418) (12,218,083) (36,051,859) (41,802,100)
------------- -------------- ------------- ------------- ------------- -------------
(40,454,015) (157,771,373) 362,875,593 201,930,564 287,192,464 22,209,066
------------- -------------- ------------- ------------- ------------- -------------
- - 12,885 47,581 5,278 56,693
------------- -------------- ------------- ------------- ------------- -------------
(53,015,691) (194,042,158) 372,155,869 207,881,531 274,577,474 52,106,511
769,804,418 963,846,576 426,188,789 218,307,258 628,177,740 576,071,229
------------- -------------- ------------- ------------- ------------- -------------
$ 716,788,727 $ 769,804,418 $ 798,344,658 $ 426,188,789 $ 902,755,214 $ 628,177,740
============= ============== ============= ============= ============= =============
$ 2,131,116 $ 284,886 $ (6,791,846) $ 2,946,297 $ 1,528,247 $ (1,207,716)
113
BLACKROCK FUNDS
FINANCIAL HIGHLIGHTS
FOR A SHARE OUTSTANDING THROUGHOUT EACH PERIOD
NET NET GAIN NET
ASSET (LOSS) ON DISTRIBUTIONS DISTRIBUTIONS ASSET
VALUE NET INVESTMENTS FROM NET FROM NET VALUE
BEGINNING INVESTMENT (BOTH REALIZED INVESTMENT REALIZED END OF
OF PERIOD INCOME14 AND UNREALIZED)14 INCOME6 GAINS PERIOD
=========== ============ =================== =============== =============== ===========
--------------
Enhanced Income Portfolio
--------------
BlackRock Class
10/01/04 through 3/31/0515 $ 9.94 $ 0.13 $ (0.04) $ (0.13) $ - $ 9.90
3/04/041 through 9/30/04 10.00 0.117 ( 0.05) ( 0.12) - 9.94
Institutional Class
10/01/04 through 3/31/0515 $ 9.94 $ 0.12 $ (0.05) $ (0.12) $ - $ 9.89
3/19/041 through 9/30/04 10.00 0.097 ( 0.05) ( 0.10) - 9.94
Service Class
10/01/04 through 3/31/0515 $ 9.86 $ 0.12 $ (0.05) $ (0.12) $ - $ 9.81
3/19/041 through 9/30/04 10.00 0.147 ( 0.08) ( 0.20) - 9.86
Investor A Class
10/01/04 through 3/31/0515 $ 9.93 $ 0.10 $ (0.05) $ 0.10 $ - $ 9.88
3/19/041 through 9/30/04 10.00 0.067 ( 0.07) ( 0.06) - 9.93
---------------
Low Duration Bond Portfolio
---------------
BlackRock Class
10/01/04 through 3/31/0515 $ 10.09 $ 0.16 $ (0.13) $ (0.14) $ - $ 9.98
9/30/04 10.23 0.237 ( 0.11) ( 0.21) (0.04) 10.09
9/30/03 10.25 0.30 0.01 ( 0.32) (0.01) 10.23
9/30/02 10.20 0.42 0.13 ( 0.45) (0.05) 10.25
9/30/01 9.81 0.57 0.42 ( 0.60) - 10.20
9/30/00 9.82 0.61 ( 0.01) ( 0.61) - 9.81
Institutional Class
10/01/04 through 3/31/0515 $ 10.09 $ 0.16 $ (0.12) $ (0.14) $ - $ 9.99
9/30/04 10.23 0.217 ( 0.11) ( 0.20) (0.04) 10.09
9/30/03 10.25 0.26 0.03 ( 0.30) (0.01) 10.23
9/30/02 10.21 0.41 0.12 ( 0.44) (0.05) 10.25
9/30/01 9.82 0.56 0.41 ( 0.58) - 10.21
9/30/00 9.82 0.61 ( 0.01) ( 0.60) - 9.82
Service Class
10/01/04 through 3/31/0515 $ 10.09 $ 0.21 $ (0.19) $ (0.12) $ - $ 9.99
9/30/04 10.23 0.197 ( 0.12) ( 0.17) (0.04) 10.09
9/30/03 10.25 0.24 0.02 ( 0.27) (0.01) 10.23
9/30/02 10.21 0.38 0.12 ( 0.41) (0.05) 10.25
9/30/01 9.82 0.53 0.41 ( 0.55) - 10.21
9/30/00 9.82 0.57 - ( 0.57) - 9.82
Investor A Class
10/01/04 through 3/31/0515 $ 10.10 $ 0.14 $ (0.13) $ (0.12) $ - $ 9.99
9/30/04 10.24 0.187 ( 0.12) ( 0.16) (0.04) 10.10
9/30/03 10.26 0.21 0.04 ( 0.26) (0.01) 10.24
9/30/02 10.21 0.36 0.13 ( 0.39) (0.05) 10.26
9/30/01 9.82 0.52 0.41 ( 0.54) - 10.21
9/30/00 9.82 0.55 - ( 0.55) - 9.82
Investor B Class
10/01/04 through 3/31/0515 $ 10.09 $ 0.10 $ (0.12) $ (0.08) $ - $ 9.99
9/30/04 10.23 0.107 ( 0.11) ( 0.09) (0.04) 10.09
9/30/03 10.25 0.15 0.03 ( 0.19) (0.01) 10.23
9/30/02 10.21 0.29 0.12 ( 0.32) (0.05) 10.25
9/30/01 9.82 0.44 0.41 ( 0.46) - 10.21
9/30/00 9.82 0.48 - ( 0.48) - 9.82
Investor C Class
10/01/04 through 3/31/0515 $ 10.09 $ 0.10 $ (0.13) $ (0.08) $ - $ 9.98
9/30/04 10.23 0.107 ( 0.11) ( 0.09) (0.04) 10.09
9/30/03 10.25 0.15 0.03 ( 0.19) (0.01) 10.23
9/30/02 10.21 0.30 0.11 ( 0.32) (0.05) 10.25
9/30/01 9.82 0.44 0.41 ( 0.46) - 10.21
9/30/00 9.82 0.48 - ( 0.48) - 9.82
SEE ACCOMPANYING NOTES TO FINANCIAL STATEMENTS.
114
BLACKROCK FUNDS
RATIO OF NET RATIO OF NET
EXPENSES TO RATIO OF TOTAL INVESTMENT
NET AVERAGE NET EXPENSES INCOME
ASSETS RATIO OF NET ASSETS TO AVERAGE RATIO OF NET TO AVERAGE
END OF EXPENSES TO (EXCLUDING NET ASSETS INVESTMENT INCOME NET ASSETS PORTFOLIO
TOTAL PERIOD AVERAGE NET INTEREST (EXCLUDING TO AVERAGE NET (EXCLUDING TURNOVER
RETURN (000) ASSETS EXPENSE) WAIVERS) ASSETS14 WAIVERS)14 RATE
========================= =========== ============== ============= ================ =================== ============== ==========
0.88 % $ 29,989 0.30%2 0.30%2 0.72%2 2.57%2 2.15%2 65%
0.58 18,677 0.172 0.172 0.472 1.072 0.782 208
0.72 % $ 40,258 0.40%2 0.40%2 0.83%2 2.46%2 2.03%2 65%
0.40 35,967 0.212 0.212 0.512 0.932 0.632 208
0.68 % $ 49 0.70%2 0.70%2 1.08%2 2.16%2 1.78%2 65%
0.61 - 0.502 0.502 1.052 1.452 0.902 208
0.48%3 $ - 0.70%2 0.70%2 1.18%2 2.16%2 1.68%2 65%
(0.12)3 - (0.10)2 (0.10)2 (0.10)2 0.562 0.572 208
0.33%8 $ 704,586 0.40%2 0.40%2 0.67%2 3.13%2 2.86%2 77%
1.18 772,355 0.40 0.40 0.65 2.25 1.99 216
2.98 625,363 0.40 0.40 0.67 2.31 2.04 195
5.58 281,844 0.40 0.40 0.79 3.86 3.47 195
10.38 114,205 0.99 0.40 1.28 5.78 5.48 168
6.35 86,868 2.25 0.40 2.66 6.30 5.89 182
0.35%8 $ 422,891 0.55%2 0.55%2 0.80%2 2.98%2 2.73%2 77%
1.03 477,622 0.55 0.55 0.78 2.09 1.86 216
2.82 477,420 0.55 0.55 0.80 2.28 2.03 195
5.32 298,698 0.55 0.55 0.81 3.76 3.50 195
10.21 135,243 1.24 0.55 1.52 5.64 5.36 168
6.29 126,818 2.43 0.55 2.71 6.16 5.88 182
0.22%8 $ 372,209 0.81%2 0.81%2 1.05%2 2.73%2 2.49%2 77%
0.73 345,733 0.84 0.84 1.07 1.83 1.60 216
2.52 248,426 0.85 0.85 1.10 1.94 1.69 195
5.01 120,857 0.85 0.85 1.11 3.40 3.15 195
9.88 42,909 1.41 0.85 1.68 5.25 4.97 168
5.98 19,745 2.77 0.85 3.05 5.86 5.58 182
0.12%3,8 $ 81,716 0.81%2 0.81%2 1.15%2 2.72%2 2.38%2 77%
0.693 87,317 0.88 0.88 1.27 1.74 1.35 216
2.473 102,047 0.90 0.90 1.20 1.91 1.61 195
4.933 69,211 1.02 1.02 1.27 3.18 2.93 195
9.703 12,808 1.43 1.00 1.70 4.91 4.64 168
5.803 2,512 2.94 1.02 3.22 5.69 5.41 182
( 0.16)%4,8 $ 54,745 1.56%2 1.56%2 1.80%2 1.97%2 1.73%2 77%
( 0.06)4 66,253 1.63 1.63 1.92 1.00 0.71 216
1.704 83,937 1.65 1.65 1.95 1.17 0.87 195
4.054 53,087 1.77 1.77 2.02 2.48 2.23 195
8.894 20,485 2.28 1.76 2.55 4.29 4.02 168
5.014 8,142 3.66 1.77 3.94 4.93 4.65 182
(0.26)%4,8 $ 90,308 1.57%2 1.57%2 1.81%2 1.97%2 1.74%2 77%
(0.06)4 124,548 1.63 1.63 1.93 0.98 0.69 216
1.704 198,234 1.65 1.65 1.95 1.16 0.86 195
4.054 118,851 1.77 1.77 2.00 2.30 2.05 195
8.894 9,282 1.99 1.72 2.26 4.04 3.77 168
5.014 807 3.69 1.77 3.97 4.96 4.68 182
115
BLACKROCK FUNDS
FINANCIAL HIGHLIGHTS (CONTINUED)
FOR A SHARE OUTSTANDING THROUGHOUT EACH PERIOD
NET NET GAIN NET
ASSET (LOSS) ON DISTRIBUTIONS DISTRIBUTIONS ASSET
VALUE NET INVESTMENTS FROM NET FROM NET VALUE
BEGINNING INVESTMENT (BOTH REALIZED INVESTMENT REALIZED END OF
OF PERIOD INCOME14 AND UNREALIZED)14 INCOME6 GAINS PERIOD
=========== ============ =================== =============== =============== ============
---------------------
Intermediate Government Bond Portfolio
---------------------
Institutional Class
10/01/04 through 3/31/0515 $ 10.45 $ 0.16 $ (0.18) $ (0.16) $ (0.05) $ 10.22
9/30/04 10.63 0.387 ( 0.17) ( 0.39) - 10.45
9/30/03 10.82 0.48 ( 0.15) ( 0.52) - 10.63
9/30/02 10.55 0.55 0.26 ( 0.54) - 10.82
9/30/01 9.91 0.61 0.63 ( 0.60) - 10.55
9/30/00 9.89 0.61 0.01 ( 0.59) ( 0.01) 9.91
Service Class
10/01/04 through 3/31/0515 $ 10.44 $ 0.15 $ (0.18) $ (0.15) $ (0.05) $ 10.21
9/30/04 10.62 0.357 ( 0.17) ( 0.36) - 10.44
9/30/03 10.81 0.45 ( 0.16) ( 0.48) - 10.62
9/30/02 10.55 0.52 0.25 ( 0.51) - 10.81
9/30/01 9.91 0.58 0.63 ( 0.57) - 10.55
9/30/00 9.89 0.58 0.01 ( 0.56) ( 0.01) 9.91
Investor A Class
10/01/04 through 3/31/0515 $ 10.47 $ 0.14 $ (0.17) $ (0.14) $ (0.05) $ 10.25
9/30/04 10.65 0.337 ( 0.17) ( 0.34) - 10.47
9/30/03 10.84 0.44 ( 0.16) ( 0.47) - 10.65
9/30/02 10.57 0.51 0.25 ( 0.49) - 10.84
9/30/01 9.91 0.56 0.65 ( 0.55) - 10.57
9/30/00 9.89 0.55 0.02 ( 0.54) ( 0.01) 9.91
Investor B Class
10/01/04 through 3/31/0515 $ 10.45 $ 0.10 $ (0.18) $ (0.10) $ (0.05) $ 10.22
9/30/04 10.62 0.257 ( 0.16) ( 0.26) - 10.45
9/30/03 10.82 0.34 ( 0.15) ( 0.39) - 10.62
9/30/02 10.55 0.43 0.25 ( 0.41) - 10.82
9/30/01 9.91 0.49 0.63 ( 0.48) - 10.55
9/30/00 9.89 0.48 0.02 ( 0.47) ( 0.01) 9.91
Investor C Class
10/01/04 through 3/31/0515 $ 10.46 $ 0.10 $ (0.18) $ (0.10) $ (0.05) $ 10.23
9/30/04 10.63 0.267 ( 0.17) ( 0.26) - 10.46
9/30/03 10.83 0.34 ( 0.15) ( 0.39) - 10.63
9/30/02 10.55 0.42 0.27 ( 0.41) - 10.83
9/30/01 9.91 0.49 0.63 ( 0.48) - 10.55
9/30/00 9.89 0.48 0.02 ( 0.47) ( 0.01) 9.91
--------------
Intermediate Bond Portfolio
--------------
BlackRock Class
10/01/04 through 3/31/0515 $ 9.57 $ 0.17 $ (0.16) $ (0.18) $ (0.08) $ 9.32
9/30/04 9.89 0.357 ( 0.09) ( 0.36) ( 0.22) 9.57
9/30/03 9.81 0.49 0.13 ( 0.52) ( 0.02) 9.89
9/30/02 9.72 0.55 0.18 ( 0.54) ( 0.10) 9.81
9/30/01 9.13 0.57 0.61 ( 0.59) - 9.72
9/30/00 9.10 0.58 0.03 ( 0.58) - 9.13
Institutional Class
10/01/04 through 3/31/0515 $ 9.57 $ 0.16 $ (0.18) $ (0.15) $ (0.08) $ 9.32
9/30/04 9.89 0.347 ( 0.10) ( 0.34) ( 0.22) 9.57
9/30/03 9.81 0.47 0.14 ( 0.51) ( 0.02) 9.89
9/30/02 9.71 0.54 0.19 ( 0.53) ( 0.10) 9.81
9/30/01 9.13 0.57 0.59 ( 0.58) - 9.71
9/30/00 9.10 0.58 0.02 ( 0.57) - 9.13
Service Class
10/01/04 through 3/31/0515 $ 9.57 $ 0.15 $ (0.18) $ (0.14) $ (0.08) $ 9.32
9/30/04 9.89 0.317 ( 0.10) ( 0.31) ( 0.22) 9.57
9/30/03 9.81 0.44 0.14 ( 0.48) ( 0.02) 9.89
9/30/02 9.71 0.52 0.18 ( 0.50) ( 0.10) 9.81
9/30/01 9.13 0.53 0.60 ( 0.55) - 9.71
9/30/00 9.10 0.55 0.02 ( 0.54) - 9.13
SEE ACCOMPANYING NOTES TO FINANCIAL STATEMENTS.
116
BLACKROCK FUNDS
RATIO OF NET
RATIO OF NET RATIO OF TOTAL INVESTMENT
NET EXPENSES TO EXPENSES RATIO OF NET INCOME
ASSETS RATIO OF NET AVERAGE NET TO AVERAGE INVESTMENT TO AVERAGE
END OF EXPENSES TO ASSETS NET ASSETS INCOME NET ASSETS PORTFOLIO
TOTAL PERIOD AVERAGE NET (EXCLUDING (EXCLUDING TO AVERAGE NET (EXCLUDING TURNOVER
RETURN (000) ASSETS INTEREST EXPENSE) WAIVERS) ASSETS14 WAIVERS)14 RATE
=================== ============= ============== =================== ================ ================ ============= ==========
( 0.20) % $ 235,472 0.60%2 0.60%2 0.88%2 3.46%2 3.18%2 82%
2.01 236,212 0.60 0.60 0.84 3.62 3.38 200
3.09 230,609 0.60 0.60 0.85 4.51 4.26 143
7.97 281,983 0.60 0.60 0.83 5.38 5.16 183
12.90 309,383 1.33 0.60 1.54 5.98 5.76 157
6.54 325,510 1.02 0.60 1.23 6.17 5.96 131
(0.35) % $ 1,393 0.90%2 0.90%2 1.13%2 3.15%2 2.92%2 82%
1.71 1,235 0.86 0.86 1.08 3.38 3.16 200
2.79 1,447 0.90 0.90 1.15 4.22 3.97 143
7.56 2,007 0.91 0.90 1.12 5.34 5.12 183
12.56 32,336 1.56 0.90 1.78 5.66 5.44 157
6.23 25,325 1.32 0.90 1.54 5.86 5.65 131
( 0.30)%3 $ 387,308 1.00%2 1.00%2 1.28%2 2.77%2 2.49%2 82%
1.543 43,500 1.05 1.05 1.33 3.17 2.89 200
2.603 54,693 1.07 1.07 1.32 3.99 3.75 143
7.463 52,507 1.08 1.07 1.30 4.83 4.61 183
12.583 14,033 1.64 1.04 1.85 5.30 5.09 157
6.053 9,262 1.47 1.08 1.69 5.66 5.45 131
(0.77)%4 $ 85,006 1.75%2 1.75%2 1.93%2 2.04%2 1.86%2 82%
0.884 10,533 1.80 1.80 1.98 2.43 2.25 200
1.754 12,312 1.82 1.82 2.06 3.22 2.97 143
6.684 8,197 1.81 1.81 2.04 4.00 3.78 183
11.554 3,518 2.34 1.81 2.56 4.68 4.47 157
5.264 1,398 2.24 1.81 2.45 4.96 4.75 131
( 0.77)%4 $ 23,754 1.75%2 1.75%2 1.90%2 2.24%2 2.09%2 82%
0.884 14,194 1.80 1.80 1.98 2.45 2.27 200
1.754 18,028 1.82 1.82 2.06 3.13 2.89 143
6.774 7,389 1.81 1.81 2.03 3.93 3.71 183
11.554 1,677 2.24 1.77 2.45 4.58 4.37 157
5.264 598 2.23 1.81 2.44 4.87 4.66 131
( 0.13) % $ 431,071 0.45%2 0.45%2 0.70%2 3.70%2 3.45%2 96%
2.72 444,821 0.45 0.45 0.69 3.67 3.43 216
6.56 392,112 0.45 0.45 0.69 4.92 4.68 220
7.87 371,857 0.48 0.45 0.81 5.80 5.48 239
13.39 524,046 0.70 0.45 0.92 6.08 5.86 250
7.05 152,412 1.24 0.45 1.59 6.57 6.22 199
(0.21) % $ 315,225 0.60%2 0.60%2 0.82%2 3.55%2 3.33%2 96%
2.57 332,460 0.60 0.60 0.81 3.53 3.32 216
6.40 371,079 0.61 0.60 0.84 4.81 4.59 220
7.82 378,616 0.63 0.60 0.84 5.66 5.45 239
13.11 502,749 0.95 0.60 1.16 6.03 5.83 250
6.89 516,538 1.43 0.60 1.65 6.42 6.20 199
( 0.34) % $ 95,252 0.86%2 0.86%2 1.07%2 3.29%2 3.08%2 96%
2.26 84,013 0.89 0.89 1.10 3.23 3.02 216
6.08 56,632 0.89 0.89 1.11 4.44 4.22 220
7.50 35,198 0.94 0.90 1.15 5.36 5.15 239
12.77 35,351 1.21 0.90 1.41 5.70 5.49 250
6.57 25,242 1.74 0.90 1.96 6.11 5.89 199
117
BLACKROCK FUNDS
FINANCIAL HIGHLIGHTS (CONTINUED)
FOR A SHARE OUTSTANDING THROUGHOUT EACH PERIOD
NET NET GAIN NET
ASSET (LOSS) ON DISTRIBUTIONS DISTRIBUTIONS ASSET
VALUE NET INVESTMENTS FROM NET FROM NET VALUE
BEGINNING INVESTMENT (BOTH REALIZED INVESTMENT REALIZED END OF
OF PERIOD INCOME14 AND UNREALIZED)14 INCOME6 GAINS PERIOD
=========== ============ =================== =============== =============== ===========
---------------------
Intermediate Bond Portfolio (Continued)
---------------------
Investor A Class
10/01/04 through 3/31/0515 $ 9.57 $ 0.16 $ (0.19) $ (0.14) $ (0.08) $ 9.32
9/30/04 9.88 0.317 ( 0.09) ( 0.31) ( 0.22) 9.57
9/30/03 9.81 0.43 0.14 ( 0.48) ( 0.02) 9.88
9/30/02 9.71 0.49 0.19 ( 0.48) ( 0.10) 9.81
9/30/01 9.12 0.52 0.61 ( 0.54) - 9.71
9/30/00 9.10 0.53 0.02 ( 0.53) - 9.12
Investor B Class
10/01/04 through 3/31/0515 $ 9.57 $ 0.13 $ (0.19) $ (0.11) $ (0.08) $ 9.32
9/30/04 9.89 0.237 ( 0.09) ( 0.24) ( 0.22) 9.57
9/30/03 9.81 0.36 0.14 ( 0.40) ( 0.02) 9.89
9/30/02 9.72 0.43 0.17 ( 0.41) ( 0.10) 9.81
9/30/01 9.13 0.45 0.61 ( 0.47) - 9.72
9/30/00 9.10 0.47 0.02 ( 0.46) - 9.13
Investor C Class
10/01/04 through 3/31/0515 $ 9.57 $ 0.13 $ (0.18) $ (0.11) $ (0.08) $ 9.33
9/30/04 9.89 0.237 ( 0.09) ( 0.24) ( 0.22) 9.57
9/30/03 9.82 0.35 0.14 ( 0.40) ( 0.02) 9.89
9/30/02 9.72 0.42 0.19 ( 0.41) ( 0.10) 9.82
9/30/01 9.14 0.45 0.60 ( 0.47) - 9.72
9/30/00 9.10 0.46 0.04 ( 0.46) - 9.14
-----------------
Intermediate PLUS Bond Portfolio
-----------------
BlackRock Class
10/01/04 through 3/31/0515 $ 10.01 $ 0.18 $ (0.17) $ (0.18) $ (0.01) $ 9.83
8/18/041 through 9/30/04 10.00 0.107 ( 0.04) ( 0.05) - 10.01
Institutional Class
10/01/04 through 3/31/0515 $ 10.06 $ 0.12 $ (0.16) $ - $ (0.01) $ 10.01
8/18/041 through 9/30/04 10.00 0.067 - - - 10.06
Service Class
10/01/04 through 3/31/0515 $ 10.04 $ 0.51 $ (0.14) $ - $ (0.01) $ 10.40
8/18/041 through 9/30/04 10.00 0.017 0.03 - - 10.04
Investor A Class
10/01/04 through 3/31/0515 $ 10.06 $ 0.02 $ (0.08) $ (0.02) $ (0.01) $ 9.97
8/18/041 through 9/30/04 10.00 0.067 - - - 10.06
Investor B Class
10/01/04 through 3/31/0515 $ 10.06 $ 0.10 $ (0.17) $ - $ (0.01) $ 9.98
8/18/041 through 9/30/04 10.00 0.067 - - - 10.06
Investor C Class
10/01/04 through 3/31/0515 $ 10.06 $ 0.10 $ (0.17) $ - $ (0.01) $ 9.98
8/18/041 through 9/30/04 10.00 0.067 - - - 10.06
-----------------
Core Bond Total Return Portfolio
-----------------
BlackRock Class
10/01/04 through 3/31/0515 $ 9.76 $ 0.20 $ (0.11) $ (0.18) $ (0.02) $ 9.65
9/30/04 10.03 0.407 ( 0.06) ( 0.36) ( 0.25) 9.76
9/30/03 10.02 0.45 0.16 ( 0.55) ( 0.05) 10.03
9/30/02 9.98 0.54 0.20 ( 0.58) ( 0.12) 10.02
9/30/01 9.36 0.58 0.62 ( 0.58) - 9.98
9/30/00 9.31 0.61 0.05 ( 0.60) ( 0.01) 9.36
Institutional Class
10/01/04 through 3/31/0515 $ 9.74 $ 0.21 $ (0.12) $ (0.18) $ (0.02) $ 9.63
9/30/04 10.01 0.397 ( 0.04) ( 0.37) ( 0.25) 9.74
9/30/03 10.00 0.44 0.16 ( 0.54) ( 0.05) 10.01
9/30/02 9.98 0.53 0.18 ( 0.57) ( 0.12) 10.00
9/30/01 9.36 0.57 0.62 ( 0.57) - 9.98
9/30/00 9.31 0.60 0.05 ( 0.59) ( 0.01) 9.36
SEE ACCOMPANYING NOTES TO FINANCIAL STATEMENTS.
118
BLACKROCK FUNDS
RATIO OF NET RATIO OF NET
EXPENSES TO RATIO OF TOTAL INVESTMENT
NET AVERAGE NET EXPENSES RATIO OF NET INCOME
ASSETS RATIO OF NET ASSETS TO AVERAGE INVESTMENT TO AVERAGE
END OF EXPENSES TO (EXCLUDING NET ASSETS INCOME NET ASSETS PORTFOLIO
TOTAL PERIOD AVERAGE NET INTEREST (EXCLUDING TO AVERAGE NET (EXCLUDING TURNOVER
RETURN (000) ASSETS EXPENSE) WAIVERS) ASSETS14 WAIVERS)14 RATE
================= ============== ============== ============= ================ ================ ============== ==========
( 0.34)%3 $ 29,514 0.86%2 0.86%2 1.17%2 3.30%2 2.98%2 96%
2.333 33,977 0.93 0.93 1.29 3.20 2.83 216
5.923 38,547 0.94 0.94 1.21 4.46 4.19 220
7.323 26,805 1.12 1.07 1.33 5.22 5.01 239
12.583 7,106 1.33 1.06 1.54 5.44 5.24 250
6.273 3,398 1.95 1.08 2.16 5.98 5.76 199
(0.71)%4 $ 11,787 1.61%2 1.61%2 1.83%2 2.55%2 2.33%2 96%
1.464 14,106 1.68 1.68 1.94 2.45 2.18 216
5.244 12,850 1.69 1.69 1.96 3.67 3.40 220
6.414 6,291 1.86 1.81 2.07 4.45 4.24 239
11.874 2,933 2.05 1.80 2.25 4.67 4.47 250
5.604 1,071 2.66 1.82 2.87 5.19 4.97 199
( 0.61)%4 $ 11,959 1.61%2 1.61%2 1.83%2 2.55%2 2.34%2 96%
1.464 14,334 1.67 1.67 1.93 2.45 2.18 216
5.134 13,046 1.68 1.68 1.95 3.51 3.25 220
6.524 3,950 1.85 1.80 2.06 4.37 4.16 239
11.744 885 2.11 1.81 2.31 4.74 4.54 250
5.714 475 2.71 1.82 2.92 5.20 4.98 199
0.13 % $ 21,922 0.40%2 0.40%2 1.00%2 3.69%2 3.09%2 119%
0.57 25,918 0.112 0.112 0.272 1.052 0.882 114
0.12 % $ - 0.55%2 0.55%2 1.12%2 3.57%2 3.00%2 119%
0.60 - (0.18)2 (0.18)2 (0.17)2 0.572 0.562 114
3.68 % $ - 0.80%2 0.80%2 1.37%2 3.32%2 2.75%2 119%
0.40 - 0.712 0.712 1.042 0.102 0.232 114
(0.62)%3 $ 19 0.80%2 0.80%2 1.47%2 3.32%2 2.65%2 119%
0.603 - (0.18)2 (0.18)2 (0.17)2 0.572 0.562 114
( 0.71)%4 $ - 1.55%2 1.55%2 2.12%2 2.57%2 2.00%2 119%
0.604 - (0.18)2 (0.18)2 (0.17)2 0.572 0.562 114
(0.71)%4 $ - 1.55%2 1.55%2 2.12%2 2.57%2 2.00%2 119%
0.604 - (0.18)2 (0.18)2 (0.17)2 0.572 0.562 114
0.92 % $ 1,554,322 0.40%2 0.40%2 0.64%2 4.21%2 3.97%2 148%
3.83 1,400,826 0.40 0.40 0.63 4.13 3.89 360
6.33 1,035,461 0.40 0.40 0.65 4.52 4.28 6599
7.74 763,736 0.46 0.40 0.79 5.48 5.14 359
13.21 530,153 0.47 0.40 0.72 6.04 5.80 304
7.45 320,489 0.62 0.40 0.99 6.66 6.29 248
0.85 % $ 564,885 0.55%2 0.55%2 0.77%2 4.09%2 3.87%2 148%
3.68 697,687 0.55 0.55 0.76 3.97 3.76 360
6.19 907,864 0.55 0.55 0.78 4.44 4.21 6599
7.36 918,935 0.60 0.55 0.82 5.36 5.14 359
13.04 1,088,073 0.63 0.55 0.85 5.91 5.68 304
7.29 1,051,089 0.78 0.55 1.02 6.48 6.24 248
119
BLACKROCK FUNDS
FINANCIAL HIGHLIGHTS (CONTINUED)
FOR A SHARE OUTSTANDING THROUGHOUT EACH PERIOD
NET NET GAIN NET
ASSET NET (LOSS) ON DISTRIBUTIONS DISTRIBUTIONS ASSET
VALUE INVESTMENT INVESTMENTS FROM NET FROM NET VALUE
BEGINNING INCOME (BOTH REALIZED INVESTMENT REALIZED END OF
OF PERIOD (LOSS)14 AND UNREALIZED)14 INCOME6 GAINS PERIOD
=========== ============ =================== =============== =============== ===========
-----------------------
Core Bond Total Return Portfolio (Continued)
-----------------------
Service Class
10/01/04 through 3/31/0515 $ 9.74 $ 0.18 $ (0.11) $ (0.16) $ (0.02) $ 9.63
9/30/04 10.01 0.367 ( 0.04) ( 0.34) ( 0.25) 9.74
9/30/03 9.99 0.42 0.16 ( 0.51) ( 0.05) 10.01
9/30/02 9.98 0.52 0.15 ( 0.54) ( 0.12) 9.99
9/30/01 9.36 0.54 0.62 ( 0.54) - 9.98
9/30/00 9.31 0.57 0.05 ( 0.56) ( 0.01) 9.36
Investor A Class
10/01/04 through 3/31/0515 $ 9.75 $ 0.18 $ (0.11) $ (0.16) $ (0.02) $ 9.64
9/30/04 10.01 0.357 ( 0.02) ( 0.34) ( 0.25) 9.75
9/30/03 10.00 0.40 0.16 ( 0.50) ( 0.05) 10.01
9/30/02 9.99 0.47 0.18 ( 0.52) ( 0.12) 10.00
9/30/01 9.36 0.53 0.62 ( 0.52) - 9.99
9/30/00 9.31 0.55 0.05 ( 0.54) ( 0.01) 9.36
Investor B Class
10/01/04 through 3/31/0515 $ 9.75 $ 0.18 $ (0.11) $ (0.13) $ (0.02) $ 9.63
9/30/04 10.01 0.287 ( 0.02) ( 0.27) ( 0.25) 9.75
9/30/03 10.00 0.33 0.16 ( 0.43) ( 0.05) 10.01
9/30/02 9.98 0.41 0.18 ( 0.45) ( 0.12) 10.00
9/30/01 9.35 0.46 0.62 ( 0.45) - 9.98
9/30/00 9.31 0.48 0.04 ( 0.47) ( 0.01) 9.35
Investor C Class
10/01/04 through 3/31/0515 $ 9.75 $ 0.15 $ (0.11) $ (0.13) $ (0.02) $ 9.64
9/30/04 10.02 0.287 ( 0.03) ( 0.27) ( 0.25) 9.75
9/30/03 10.01 0.33 0.16 ( 0.43) ( 0.05) 10.02
9/30/02 9.99 0.42 0.17 ( 0.45) ( 0.12) 10.01
9/30/01 9.35 0.46 0.63 ( 0.45) - 9.99
9/30/00 9.31 0.47 0.05 ( 0.47) ( 0.01) 9.35
-----------------
Core PLUS Total Return Portfolio
-----------------
BlackRock Class
10/01/04 through 3/31/0515 $ 10.34 $ 0.20 $ (0.10) $ (0.19) $ - $ 10.25
9/30/04 10.46 0.387 ( 0.01) ( 0.36) ( 0.13) 10.34
9/30/03 10.31 0.42 0.29 ( 0.50) ( 0.06) 10.46
12/07/011 through 9/30/02 10.00 0.40 0.32 ( 0.41) - 10.31
Institutional Class
10/01/04 through 3/31/0515 $ 10.28 $ 0.17 $ (0.08) $ (0.18) $ - $ 10.19
9/30/04 10.46 0.287 0.02 ( 0.35) ( 0.13) 10.28
9/30/03 10.31 0.40 0.29 ( 0.48) ( 0.06) 10.46
12/07/011 through 9/30/02 10.00 0.24 0.47 ( 0.40) - 10.31
Service Class
10/01/04 through 3/31/0515 $ 10.40 $ 0.19 $ (0.11) $ (0.17) $ - $ 10.31
9/30/04 10.46 0.387 0.01 ( 0.32) ( 0.13) 10.40
9/30/03 10.31 0.37 0.29 ( 0.45) ( 0.06) 10.46
12/07/011 through 9/30/02 10.00 0.23 0.48 ( 0.40) - 10.31
Investor A Class
10/01/04 through 3/31/0515 $ 10.35 $ 0.17 $ (0.09) $ (0.17) $ - $ 10.26
9/30/04 10.46 0.337 - ( 0.31) ( 0.13) 10.35
9/30/03 10.31 0.37 0.29 ( 0.45) ( 0.06) 10.46
12/07/011 through 9/30/02 10.00 0.08 0.59 ( 0.36) - 10.31
Investor B Class
10/01/04 through 3/31/0515 $ 10.34 $ 0.15 $ (0.10) $ (0.13) $ - $ 10.26
9/30/04 10.46 0.257 - ( 0.24) ( 0.13) 10.34
9/30/03 10.31 0.29 0.29 ( 0.37) ( 0.06) 10.46
12/07/011 through 9/30/02 10.00 0.43 0.21 ( 0.33) - 10.31
SEE ACCOMPANYING NOTES TO FINANCIAL STATEMENTS.
120
BLACKROCK FUNDS
RATIO OF NET
RATIO OF NET RATIO OF TOTAL INVESTMENT
NET EXPENSES TO EXPENSES RATIO OF NET INCOME
ASSETS RATIO OF NET AVERAGE NET TO AVERAGE INVESTMENT TO AVERAGE
END OF EXPENSES TO ASSETS NET ASSETS INCOME NET ASSETS PORTFOLIO
TOTAL PERIOD AVERAGE NET (EXCLUDING (EXCLUDING TO AVERAGE NET (EXCLUDING TURNOVER
RETURN (000) ASSETS INTEREST EXPENSE) WAIVERS) ASSETS14 WAIVERS)14 RATE
============= ============ ============== =================== ================ ================ ============= ==========
0.72 % $ 151,855 0.81%2 0.81%2 1.02%2 3.82%2 3.61%2 148%
3.38 152,085 0.84 0.84 1.05 3.69 3.48 360
5.98 139,499 0.85 0.85 1.08 4.09 3.86 6599
6.94 115,774 0.91 0.85 1.13 5.07 4.85 359
12.71 112,748 0.91 0.85 1.13 5.56 5.34 304
6.98 59,334 0.11 0.85 1.35 6.16 5.92 248
0.72%3 $ 138,519 0.81%2 0.81%2 1.12%2 3.81%2 3.50%2 148%
3.443 132,561 0.88 0.88 1.23 3.65 3.30 360
5.813 113,190 0.90 0.90 1.25 4.01 3.66 6599
6.753 90,460 1.08 1.02 1.30 4.89 4.67 359
12.633 22,123 1.07 1.02 1.28 5.34 5.13 304
5.893 6,977 1.27 1.02 1.51 5.96 5.72 248
0.23%4 $ 51,763 1.56%2 1.56%2 1.77%2 3.07%2 2.86%2 148%
2.664 56,758 1.63 1.63 1.88 2.88 2.63 360
5.034 70,550 1.65 1.65 2.00 3.26 2.91 6599
6.064 56,047 1.83 1.76 2.04 4.14 3.92 359
11.694 36,314 1.81 1.75 2.02 4.62 4.41 304
5.894 12,189 2.04 1.77 2.28 5.23 4.99 248
0.34%4 $ 78,371 1.56%2 1.56%2 1.77%2 3.07%2 2.86%2 148%
2.564 85,717 1.62 1.62 1.87 2.89 2.64 360
5.024 81,478 1.65 1.65 2.00 3.22 2.87 6599
6.064 47,326 1.82 1.76 2.04 4.14 3.92 359
11.804 21,678 1.79 1.75 2.00 4.57 4.36 304
6.004 2,911 2.07 1.77 2.31 5.17 4.93 248
0.95 % $ 371,064 0.40%2 0.40%2 0.71%2 3.98%2 3.67%2 171%
3.65 285,096 0.40 0.40 0.71 3.68 3.37 412
7.00 224,248 0.40 0.40 0.75 3.61 3.26 1,02110
7.37 95,503 0.322 0.322 0.722 3.942 3.542 330
0.88 % $ - 0.55%2 0.55%2 0.83%2 3.83%2 3.55%2 171%
2.91 - 1.12 0.97 1.34 2.73 2.52 412
6.84 - 0.55 0.55 0.90 3.47 3.12 1,02110
7.21 - 0.522 0.522 0.932 3.802 3.382 330
0.74 % $ 29 0.80%2 0.80%2 1.08%2 3.58%2 3.30%2 171%
3.78 29 0.78 0.78 1.07 3.74 3.45 412
6.53 - 0.85 0.85 1.20 3.17 2.82 1,02110
7.22 - 0.822 0.822 1.232 3.502 3.082 330
0.74%3 $ 26 0.78%2 0.78%2 1.16%2 3.49%2 3.11%2 171%
3.253 9 0.86 0.86 1.28 3.21 2.79 412
6.473 8 0.90 0.90 1.25 3.12 2.77 1,02110
6.883 2 0.992 0.992 1.402 3.332 2.912 330
0.36%4 $ 99 1.56%2 1.56%2 1.84%2 2.71%2 2.43%2 171%
2.384 103 1.63 1.63 1.97 2.46 2.12 412
5.684 80 1.65 1.65 2.00 2.36 2.01 1,02110
6.464 - 1.742 1.742 2.152 2.582 2.162 330
121
BLACKROCK FUNDS
FINANCIAL HIGHLIGHTS (CONTINUED)
FOR A SHARE OUTSTANDING THROUGHOUT EACH PERIOD
NET NET GAIN
ASSET NET (LOSS) ON
VALUE INVESTMENT INVESTMENTS
BEGINNING INCOME (BOTH REALIZED
OF PERIOD (LOSS)14 AND UNREALIZED)14
=========== ============ ===================
------------------------
Core PLUS Total Return Portfolio (Continued)
------------------------
Investor C Class
10/01/04 through 3/31/0515 $ 10.33 $ 0.12 $ (0.07)
9/30/04 10.46 0.277 ( 0.03)
9/30/03 10.31 0.29 0.29
12/07/011 through 9/30/02 10.00 0.43 0.21
---------------
Government Income Portfolio
---------------
BlackRock Class
10/01/04 through 3/31/0515 $ 11.18 $ 0.24 $ (0.23)
9/30/04 11.34 0.477 ( 0.05)
2/10/031 through 9/30/03 11.27 0.607 ( 0.19)
Service Class
10/27/041 through 3/31/0515 $ 11.21 $ 0.14 $ (0.21)
Investor A Class
10/01/04 through 3/31/0515 $ 11.18 $ 0.21 $ (0.22)
9/30/04 11.33 0.407 ( 0.04)
9/30/03 11.40 0.347 0.14
9/30/02 10.99 0.457 0.74
9/30/01 10.03 0.56 0.94
9/30/00 9.92 0.56 0.13
Investor B Class
10/01/04 through 3/31/0515 $ 11.18 $ 0.18 $ (0.23)
9/30/04 11.33 0.317 ( 0.03)
9/30/03 11.40 0.307 0.10
9/30/02 10.98 0.397 0.73
9/30/01 10.03 0.48 0.93
9/30/00 9.92 0.49 0.13
Investor C Class
10/01/04 through 3/31/0515 $ 11.16 $ 0.18 $ (0.23)
9/30/04 11.31 0.317 ( 0.03)
9/30/03 11.38 0.307 0.10
9/30/02 10.97 0.367 0.75
9/30/01 10.02 0.47 0.94
9/30/00 9.92 0.49 0.12
-----------------
Inflation Protected Bond Portfolio
-----------------
BlackRock Class
10/01/04 through 3/31/0515 $ 10.38 $ 0.13 $ 0.12
6/28/041 through 9/30/04 10.00 0.127 0.38
Institutional Class
10/01/04 through 3/31/0515 $ 10.54 $ 0.14 $ 0.11
6/28/041 through 9/30/04 10.00 0.167 0.38
Service Class
10/01/04 through 3/31/0515 $ 10.39 $ 0.03 $ 0.22
6/28/041 through 9/30/04 10.00 ( 0.02)7 0.41
Investor A Class
10/01/04 through 3/31/0515 $ 10.50 $ 0.16 $ 0.07
6/28/041 through 9/30/04 10.00 0.017 0.51
Investor B Class
10/01/04 through 3/31/0515 $ 10.51 $ 0.13 $ 0.07
6/28/041 through 9/30/04 10.00 ( 0.01)7 0.53
Investor C Class
10/01/04 through 3/31/0515 $ 10.55 $ 0.13 $ 0.07
6/28/041 through 9/30/04 10.00 ( 0.01)7 0.56
NET
DISTRIBUTIONS DISTRIBUTIONS ASSET
FROM NET DISTRIBUTIONS FROM NET VALUE
INVESTMENT FROM REALIZED END OF
INCOME6 CAPITAL GAINS PERIOD
=============== =============== =============== ============
------------------------
Core PLUS Total Return
Portfolio (Continued)
------------------------
Investor C Class
10/01/04 through 3/31/0515 $ (0.13) $ - $ - $ 10.25
9/30/04 ( 0.24) - ( 0.13) 10.33
9/30/03 ( 0.37) - ( 0.06) 10.46
12/07/011 through 9/30/02 ( 0.33) - - 10.31
---------------
Government Income Portfolio
---------------
BlackRock Class
10/01/04 through 3/31/0515 $ (0.28) $ - $ - $ 10.91
9/30/04 ( 0.42) - ( 0.16) 11.18
2/10/031 through 9/30/03 ( 0.34) - - 11.34
Service Class
10/27/041 through 3/31/0515 $ (0.24) $ - $ - $ 10.90
Investor A Class
10/01/04 through 3/31/0515 $ (0.26) $ - $ - $ 10.91
9/30/04 ( 0.36) - ( 0.16) 11.18
9/30/03 ( 0.46) - ( 0.09) 11.33
9/30/02 ( 0.51) - ( 0.27) 11.40
9/30/01 ( 0.54) - - 10.99
9/30/00 ( 0.54) (0.04) - 10.03
Investor B Class
10/01/04 through 3/31/0515 $ (0.22) $ - $ - $ 10.91
9/30/04 ( 0.27) - ( 0.16) 11.18
9/30/03 ( 0.38) - ( 0.09) 11.33
9/30/02 ( 0.43) - ( 0.27) 11.40
9/30/01 ( 0.46) - - 10.98
9/30/00 ( 0.47) (0.04) - 10.03
Investor C Class
10/01/04 through 3/31/0515 $ (0.22) $ - $ - $ 10.89
9/30/04 ( 0.27) - ( 0.16) 11.16
9/30/03 ( 0.38) - ( 0.09) 11.31
9/30/02 ( 0.43) - ( 0.27) 11.38
9/30/01 ( 0.46) - - 10.97
9/30/00 ( 0.47) (0.04) - 10.02
-----------------
Inflation Protected Bond
Portfolio
-----------------
BlackRock Class
10/01/04 through 3/31/0515 $ (0.24) $ - $ (0.10) $ 10.29
6/28/041 through 9/30/04 ( 0.12) - - 10.38
Institutional Class
10/01/04 through 3/31/0515 $ (0.22) $ - $ (0.10) $ 10.47
6/28/041 through 9/30/04 - - - 10.54
Service Class
10/01/04 through 3/31/0515 $ (0.02) $ - $ (0.10) $ 10.52
6/28/041 through 9/30/04 - - - 10.39
Investor A Class
10/01/04 through 3/31/0515 $ (0.22) $ - $ (0.10) $ 10.41
6/28/041 through 9/30/04 ( 0.02) - - 10.50
Investor B Class
10/01/04 through 3/31/0515 $ (0.18) $ - $ (0.10) $ 10.43
6/28/041 through 9/30/04 ( 0.01) - - 10.51
Investor C Class
10/01/04 through 3/31/0515 $ (0.18) $ - $ (0.10) $ 10.47
6/28/041 through 9/30/04 - - - 10.55
SEE ACCOMPANYING NOTES TO FINANCIAL STATEMENTS.
122
BLACKROCK FUNDS
RATIO OF NET
RATIO OF NET RATIO OF TOTAL INVESTMENT
NET EXPENSES TO EXPENSES RATIO OF NET INCOME
ASSETS RATIO OF NET AVERAGE NET TO AVERAGE INVESTMENT TO AVERAGE
END OF EXPENSES TO ASSETS NET ASSETS INCOME NET ASSETS PORTFOLIO
TOTAL PERIOD AVERAGE NET (EXCLUDING (EXCLUDING TO AVERAGE NET (EXCLUDING TURNOVER
RETURN (000) ASSETS INTEREST EXPENSE) WAIVERS) ASSETS14 WAIVERS)14 RATE
================ =========== ============== =================== ================ ================ ============= ==========
0.46%4 $ 27 1.49%2 1.49%2 1.76%2 2.78%2 2.51%2 171%
2.284 - 0.07 0.07 0.20 2.67 2.54 412
5.684 - 1.65 1.65 2.00 2.37 2.02 1,02110
6.464 - 1.742 1.742 2.152 2.582 2.162 330
0.11 % $ 10,908 0.45%2 0.45%2 0.73%2 4.45%2 4.17%2 274%
3.85 10,899 0.44 0.44 0.78 4.25 3.92 345
3.68 3 0.292 0.292 0.472 2.952 2.762 1,98111
(0.64) % $ 192,704 0.85%2 0.85%2 1.09%2 4.09%2 3.85%2 274%
0.09%3 $ 177,620 0.86%2 0.86%2 1.20%2 4.04%2 3.69%2 274%
3.343 126,332 0.98 0.98 1.38 3.63 3.23 345
4.343 86,559 1.07 1.07 1.34 3.05 2.78 1,98111
11.473 42,845 1.11 1.07 1.41 4.26 3.97 615
15.363 12,040 1.31 1.06 1.60 5.25 4.96 849
7.273 5,716 2.43 1.06 2.77 5.70 5.36 168
(0.47)%4 $ 42,088 1.61%2 1.61%2 1.86%2 3.29%2 3.05%2 274%
2.574 44,786 1.73 1.73 2.03 2.81 2.51 345
3.564 53,897 1.82 1.82 2.09 2.62 2.35 1,98111
10.744 48,240 1.87 1.82 2.17 3.69 3.40 615
14.414 29,936 2.10 1.82 2.39 4.62 4.33 849
6.484 24,608 3.25 1.82 3.60 5.05 4.71 168
(0.47)%4 $ 26,186 1.61%2 1.61%2 1.86%2 3.30%2 3.05%2 274%
2.574 26,036 1.73 1.73 2.03 2.81 2.51 345
3.564 29,537 1.82 1.82 2.09 2.61 2.34 1,98111
10.664 18,378 1.84 1.81 2.13 3.42 3.13 615
14.424 3,589 2.04 1.80 2.33 4.50 4.21 849
6.384 1,279 3.29 1.82 3.64 5.10 4.76 168
2.42 % $ 24,723 0.30%2 0.30%2 0.97%2 2.59%2 1.92%2 247%
5.05 20,763 0.082 0.082 0.222 1.152 1.012 96
2.43 % $ 4,311 0.40%2 0.40%2 1.02%2 2.49%2 1.87%2 247%
5.40 - (0.20)2 (0.20)2 (0.14)2 1.532 1.472 96
2.44 % $ - 0.65%2 0.65%2 1.27%2 2.24%2 1.62%2 247%
3.90 - 0.792 0.792 1.392 (0.17)2 (0.77)2 96
2.18%3 $ 3,994 0.65%2 0.65%2 1.33%2 2.24%2 1.56%2 247%
5.213 93 0.162 0.162 0.302 0.142 0.282 96
1.90%4 $ 882 1.41%2 1.41%2 2.02%2 1.48%2 0.87%2 247%
5.214 61 0.382 0.382 0.512 (0.15)2 (0.27)2 96
1.89%4 $ 1,776 1.34%2 1.34%2 1.90%2 1.55%2 0.99%2 247%
5.514 6 0.192 0.192 0.272 (0.12)2 0.202 96
123
BLACKROCK FUNDS
FINANCIAL HIGHLIGHTS (CONTINUED)
FOR A SHARE OUTSTANDING THROUGHOUT EACH PERIOD
NET NET GAIN NET
ASSET (LOSS) ON DISTRIBUTIONS DISTRIBUTIONS ASSET
VALUE NET INVESTMENTS FROM NET FROM NET VALUE
BEGINNING INVESTMENT (BOTH REALIZED INVESTMENT REALIZED END OF
OF PERIOD INCOME14 AND UNREALIZED)14 INCOME6 GAINS PERIOD
=========== ============ =================== =============== =============== ===========
--------
GNMA Portfolio
--------
BlackRock Class
10/01/04 through 3/31/0515 $ 9.87 $ 0.23 $ (0.14) $ (0.21) $ - $ 9.75
9/30/04 10.02 0.487 ( 0.14) ( 0.49) - 9.87
12/19/021 through 9/30/03 10.27 0.41 ( 0.18) ( 0.48) - 10.02
Institutional Class
10/01/04 through 3/31/0515 $ 9.88 $ 0.22 $ (0.15) $ (0.20) $ - $ 9.75
9/30/04 10.02 0.477 ( 0.09) ( 0.52) - 9.88
9/30/03 10.23 0.48 ( 0.08) ( 0.61) - 10.02
9/30/02 10.28 0.61 0.18 ( 0.63) ( 0.21) 10.23
9/30/01 9.70 0.63 0.58 ( 0.63) - 10.28
9/30/00 9.61 0.64 0.11 ( 0.64) ( 0.02) 9.70
Service Class
10/01/04 through 3/31/0515 $ 9.87 $ 0.20 $ (0.13) $ (0.19) $ - $ 9.75
9/30/04 10.01 0.447 ( 0.08) ( 0.50) - 9.87
9/30/03 10.23 0.50 ( 0.14) ( 0.58) - 10.01
9/30/02 10.29 0.56 0.19 ( 0.60) ( 0.21) 10.23
9/30/01 9.72 0.60 0.57 ( 0.60) - 10.29
9/30/00 9.61 0.59 0.15 ( 0.61) ( 0.02) 9.72
Investor A Class
10/01/04 through 3/31/0515 $ 9.92 $ 0.18 $ (0.15) $ (0.16) $ - $ 9.79
9/30/04 10.06 0.437 ( 0.09) ( 0.48) - 9.92
9/30/03 10.27 0.46 ( 0.11) ( 0.56) - 10.06
9/30/02 10.32 0.54 0.20 ( 0.58) ( 0.21) 10.27
9/30/01 9.71 0.58 0.61 ( 0.58) - 10.32
9/30/00 9.61 0.57 0.14 ( 0.59) ( 0.02) 9.71
Investor B Class
10/01/04 through 3/31/0515 $ 9.89 $ 0.17 $ (0.15) $ (0.15) $ - $ 9.76
9/30/04 10.03 0.367 ( 0.09) ( 0.41) - 9.89
9/30/03 10.24 0.38 ( 0.11) ( 0.48) - 10.03
9/30/02 10.29 0.47 0.19 ( 0.50) ( 0.21) 10.24
9/30/01 9.71 0.51 0.58 ( 0.51) - 10.29
9/30/00 9.61 0.50 0.14 ( 0.52) ( 0.02) 9.71
Investor C Class
10/01/04 through 3/31/0515 $ 9.88 $ 0.18 $ (0.16) $ (0.15) $ - $ 9.75
9/30/04 10.01 0.367 ( 0.08) ( 0.41) - 9.88
9/30/03 10.23 0.38 ( 0.12) ( 0.48) - 10.01
9/30/02 10.27 0.45 0.22 ( 0.50) ( 0.21) 10.23
9/30/01 9.68 0.51 0.59 ( 0.51) - 10.27
9/30/00 9.61 0.52 0.09 ( 0.52) ( 0.02) 9.68
-------------
Managed Income Portfolio
-------------
Institutional Class
10/01/04 through 3/31/0515 $ 10.41 $ 0.24 $ (0.16) $ (0.22) $ (0.04) $ 10.23
9/30/04 10.80 0.477 ( 0.10) ( 0.48) ( 0.28) 10.41
9/30/03 10.71 0.55 0.17 ( 0.63) - 10.80
9/30/02 10.60 0.60 0.10 ( 0.59) - 10.71
9/30/01 9.92 0.61 0.68 ( 0.61) - 10.60
9/30/00 9.92 0.62 0.02 ( 0.62) ( 0.02) 9.92
SEE ACCOMPANYING NOTES TO FINANCIAL STATEMENTS.
124
BLACKROCK FUNDS
RATIO OF NET RATIO OF NET
EXPENSES TO RATIO OF TOTAL INVESTMENT
NET AVERAGE NET EXPENSES RATIO OF NET INCOME
ASSETS RATIO OF NET ASSETS TO AVERAGE INVESTMENT TO AVERAGE
END OF EXPENSES TO (EXCLUDING NET ASSETS INCOME NET ASSETS PORTFOLIO
TOTAL PERIOD AVERAGE NET INTEREST (EXCLUDING TO AVERAGE NET (EXCLUDING TURNOVER
RETURN (000) ASSETS EXPENSE) WAIVERS) ASSETS14 WAIVERS)14 RATE
=============== ============ ============== ============= ================ ================ ============== ==========
0.91 % $ 10,749 0.46%2 0.45%2 0.83%2 4.74%2 4.36%2 281%
4.02 10,659 0.50 0.45 0.83 4.85 4.51 228
2.33 59,935 0.352 0.352 0.612 3.322 3.052 1,36512
0.73 % $ 133,276 0.61%2 0.60%2 0.95%2 4.60%2 4.26%2 281%
3.97 151,558 0.66 0.60 0.97 4.74 4.43 228
4.00 172,358 0.64 0.60 0.95 4.89 4.58 1,36512
8.03 183,328 0.95 0.60 1.24 5.99 5.70 401
12.84 117,528 1.34 0.60 1.66 6.30 5.97 773
7.58 95,108 1.49 0.60 1.84 6.66 6.30 184
0.71 % $ 8,012 0.87%2 0.86%2 1.20%2 4.07%2 3.72%2 281%
3.67 2,271 0.94 0.89 1.25 4.45 4.13 228
3.58 1,554 0.93 0.90 1.25 4.70 4.39 1,36512
7.61 1,069 1.14 0.90 1.44 5.37 5.07 401
12.38 224 1.59 0.90 1.92 5.97 5.65 773
7.47 197 1.78 0.90 2.15 6.32 5.96 184
0.60%3 $ 16,060 0.87%2 0.86%2 1.30%2 4.34%2 3.91%2 281%
3.503 18,080 1.05 0.99 1.46 4.34 3.93 228
3.503 18,978 1.11 1.07 1.42 4.27 3.96 1,36512
7.503 13,620 1.36 1.07 1.65 5.18 4.89 401
12.743 3,672 1.81 1.07 2.13 5.77 5.45 773
7.183 1,882 1.98 1.08 2.33 6.21 5.85 184
0.22%4 $ 23,070 1.62%2 1.61%2 1.96%2 3.59%2 3.26%2 281%
2.744 25,439 1.80 1.74 2.11 3.62 3.31 228
2.744 32,486 1.85 1.82 2.16 3.56 3.25 1,36512
6.724 23,928 2.07 1.80 2.36 4.44 4.15 401
11.484 4,936 2.53 1.77 2.83 4.67 4.36 773
6.394 335 2.71 1.81 3.06 5.38 5.03 184
0.23%4 $ 31,002 1.63%2 1.62%2 1.96%2 3.64%2 3.30%2 281%
2.854 39,542 1.80 1.74 2.11 3.62 3.31 228
2.644 51,109 1.85 1.82 2.16 3.55 3.24 1,36512
6.844 36,220 1.94 1.79 2.23 4.13 3.84 401
11.624 1,225 2.48 1.75 2.79 4.54 4.23 773
6.394 29 2.69 1.81 3.04 5.47 5.12 184
0.73 % $ 596,946 0.65%2 0.65%2 0.83%2 4.70%2 4.52%2 128%
3.60 644,083 0.65 0.65 0.81 4.50 4.34 284
6.91 810,452 0.65 0.65 0.82 5.06 4.89 61313
6.82 924,211 0.75 0.65 0.90 5.63 5.50 290
13.39 1,042,238 1.07 0.65 1.19 5.99 5.87 262
6.84 1,158,375 1.30 0.65 1.41 6.43 6.32 205
125
BLACKROCK FUNDS
FINANCIAL HIGHLIGHTS (CONTINUED)
FOR A SHARE OUTSTANDING THROUGHOUT EACH PERIOD
NET NET GAIN
ASSET (LOSS) ON
VALUE NET INVESTMENTS
BEGINNING INVESTMENT (BOTH REALIZED
OF PERIOD INCOME14 AND UNREALIZED)14
=========== ============ ===================
--------------------
Managed Income Portfolio (Continued)
--------------------
Service Class
10/01/04 through 3/31/0515 $ 10.41 $ 0.22 $ (0.16)
9/30/04 10.80 0.447 ( 0.10)
9/30/03 10.71 0.54 0.15
9/30/02 10.60 0.57 0.10
9/30/01 9.92 0.58 0.68
9/30/00 9.92 0.59 0.02
Investor A Class
10/01/04 through 3/31/0515 $ 10.41 $ 0.23 $ (0.17)
9/30/04 10.80 0.427 ( 0.10)
9/30/03 10.71 0.49 0.18
9/30/02 10.60 0.53 0.12
9/30/01 9.92 0.56 0.68
9/30/00 9.92 0.59 0.01
Investor B Class
10/01/04 through 3/31/0515 $ 10.41 $ 0.18 $ (0.16)
9/30/04 10.80 0.357 ( 0.11)
9/30/03 10.71 0.41 0.18
9/30/02 10.60 0.46 0.11
9/30/01 9.92 0.49 0.68
9/30/00 9.92 0.51 0.02
Investor C Class
10/01/04 through 3/31/0515 $ 10.38 $ 0.19 $ (0.16)
9/30/04 10.78 0.357 ( 0.12)
9/30/03 10.68 0.41 0.19
9/30/02 10.57 0.46 0.11
9/30/01 9.91 0.49 0.66
11/22/995 through 9/30/00 9.92 0.44 ( 0.02)
--------------
International Bond Portfolio
--------------
BlackRock Class
10/01/04 through 3/31/0515 $ 11.41 $ 0.18 $ 0.61
5/18/041 through 9/30/04 10.96 0.117 0.51
Institutional Class
10/01/04 through 3/31/0515 $ 11.41 $ 0.16 $ 0.62
9/30/04 11.07 0.287 0.51
9/30/03 10.54 0.297 0.81
9/30/02 10.53 0.427 0.17
9/30/01 10.69 0.55 0.68
9/30/00 11.81 0.49 0.23
Service Class
10/01/04 through 3/31/0515 $ 11.42 $ 0.15 $ 0.62
9/30/04 11.08 0.257 0.50
9/30/03 10.54 0.267 0.81
9/30/02 10.53 0.377 0.19
9/30/01 10.69 0.50 0.70
9/30/00 10.81 0.46 0.23
Investor A Class
10/01/04 through 3/31/0515 $ 11.42 $ 0.15 $ 0.62
9/30/04 11.07 0.237 0.52
9/30/03 10.54 0.247 0.81
9/30/02 10.53 0.357 0.19
9/30/01 10.69 0.47 0.71
9/30/00 10.81 0.46 0.21
NET
DISTRIBUTIONS DISTRIBUTIONS ASSET
FROM NET DISTRIBUTIONS FROM NET VALUE
INVESTMENT FROM REALIZED END OF
INCOME6 CAPITAL GAINS PERIOD
=============== =============== =============== ============
--------------------
Managed Income Portfolio
(Continued)
--------------------
Service Class
10/01/04 through 3/31/0515 $ (0.20) $ - $ (0.04) $ 10.23
9/30/04 ( 0.45) - - 10.41
9/30/03 ( 0.60) - - 10.80
9/30/02 ( 0.56) - - 10.71
9/30/01 ( 0.58) - - 10.60
9/30/00 ( 0.59) - ( 0.02) 9.92
Investor A Class
10/01/04 through 3/31/0515 $ (0.20) $ - $ (0.04) $ 10.23
9/30/04 ( 0.43) - ( 0.28) 10.41
9/30/03 ( 0.58) - - 10.80
9/30/02 ( 0.54) - - 10.71
9/30/01 ( 0.56) - - 10.60
9/30/00 ( 0.58) - ( 0.02) 9.92
Investor B Class
10/01/04 through 3/31/0515 $ (0.16) $ - $ (0.04) $ 10.23
9/30/04 ( 0.35) - ( 0.28) 10.41
9/30/03 ( 0.50) - - 10.80
9/30/02 ( 0.46) - - 10.71
9/30/01 ( 0.49) - - 10.60
9/30/00 ( 0.51) - ( 0.02) 9.92
Investor C Class
10/01/04 through 3/31/0515 $ (0.16) $ - $ (0.04) $ 10.21
9/30/04 ( 0.35) - ( 0.28) 10.38
9/30/03 ( 0.50) - - 10.78
9/30/02 ( 0.46) - - 10.68
9/30/01 ( 0.49) - - 10.57
11/22/995 through 9/30/00 ( 0.43) - - 9.91
--------------
International Bond Portfolio
--------------
BlackRock Class
10/01/04 through 3/31/0515 $ (0.35) $ - $ (0.01) $ 11.84
5/18/041 through 9/30/04 ( 0.17) - - 11.41
Institutional Class
10/01/04 through 3/31/0515 $ (0.34) $ - $ (0.01) $ 11.84
9/30/04 ( 0.45) - - 11.41
9/30/03 ( 0.33) (0.17) ( 0.07) 11.07
9/30/02 ( 0.58) - - 10.54
9/30/01 ( 1.39) - - 10.53
9/30/00 ( 0.52) - 0.32 10.69
Service Class
10/01/04 through 3/31/0515 $ (0.33) $ - $ (0.01) $ 11.85
9/30/04 ( 0.41) - - 11.42
9/30/03 ( 0.29) (0.17) ( 0.07) 11.08
9/30/02 ( 0.55) - - 10.54
9/30/01 ( 1.36) - - 10.53
9/30/00 ( 0.49) - ( 0.32) 10.69
Investor A Class
10/01/04 through 3/31/0515 $ (0.33) $ - $ (0.01) $ 11.85
9/30/04 ( 0.40) - - 11.42
9/30/03 ( 0.28) (0.17) ( 0.07) 11.07
9/30/02 ( 0.53) - - 10.54
9/30/01 ( 1.34) - - 10.53
9/30/00 ( 0.47) - ( 0.32) 10.69
SEE ACCOMPANYING NOTES TO FINANCIAL STATEMENTS.
126
BLACKROCK FUNDS
RATIO OF NET RATIO OF NET
EXPENSES TO RATIO OF TOTAL INVESTMENT
NET AVERAGE NET EXPENSES RATIO OF NET INCOME
ASSETS RATIO OF NET ASSETS TO AVERAGE INVESTMENT TO AVERAGE
END OF EXPENSES TO (EXCLUDING NET ASSETS INCOME NET ASSETS PORTFOLIO
TOTAL PERIOD AVERAGE NET INTEREST (EXCLUDING TO AVERAGE NET (EXCLUDING TURNOVER
RETURN (000) ASSETS EXPENSE) WAIVERS) ASSETS14 WAIVERS)14 RATE
================= ============ ============== ============= ================ ================ ============== ==========
0.58 % $ 78,099 0.95%2 0.95%2 1.08%2 4.38%2 4.25%2 128%
3.29 80,253 0.95 0.95 1.11 4.21 4.05 284
6.58 92,336 0.95 0.95 1.13 4.74 4.56 61313
6.50 137,084 1.06 0.95 1.19 5.30 5.17 290
13.05 238,117 1.37 0.95 1.48 5.69 5.57 262
6.52 284,075 1.59 0.95 1.70 6.14 6.03 205
0.53%3 $ 32,987 1.05%2 1.05%2 1.18%2 4.31%2 4.17%2 128%
3.133 35,462 1.10 1.10 1.30 4.06 3.86 284
6.413 49,870 1.12 1.12 1.30 4.57 4.40 61313
6.323 52,794 1.12 1.12 1.38 5.14 5.00 290
12.863 20,196 1.13 1.13 1.61 5.47 5.35 262
6.353 16,936 1.12 1.12 1.89 6.02 5.91 205
0.15%4 $ 7,608 1.80%2 1.80%2 1.84%2 3.57%2 3.53%2 128%
2.364 9,136 1.85 1.85 1.95 3.31 3.21 284
5.614 10,425 1.87 1.87 2.05 3.80 3.63 61313
5.534 9,582 1.99 1.87 2.11 4.43 4.30 290
12.034 7,981 2.21 1.87 2.33 4.71 4.60 262
5.564 4,831 2.53 1.87 2.64 5.22 5.11 205
0.25%4 $ 1,149 1.78%2 1.78%2 1.82%2 3.53%2 3.49%2 128%
2.264 870 1.84 1.84 1.95 3.34 3.24 284
5.734 763 1.87 1.87 2.05 3.77 3.60 61313
5.544 554 2.00 1.87 2.14 4.44 4.30 290
11.844 345 2.03 1.86 2.14 4.60 4.49 262
4.914 31 2.362 1.782 2.472 5.242 5.132 205
6.88%8 $ 91,240 0.77%2 0.77%2 0.79%2 2.59%2 2.57%2 68%
5.718 35,748 0.782 0.782 0.892 2.582 2.472 240
6.79%8 $ 324,244 0.91%2 0.91%2 0.91%2 2.45%2 2.45%2 68%
7.208 133,544 0.94 0.94 0.96 2.44 2.41 240
10.78 64,038 0.94 0.94 0.94 2.69 2.69 209
5.79 35,425 1.05 0.90 1.05 3.89 3.89 206
12.30 73,636 2.43 0.88 2.43 5.54 5.54 111
7.04 69,172 1.38 0.92 1.38 4.69 4.69 266
6.66%8 $ 109,874 1.16%2 1.16%2 1.16%2 2.21%2 2.21%2 68%
6.898 80,024 1.23 1.23 1.25 2.18 2.15 240
10.55 48,584 1.24 1.24 1.24 2.41 2.41 209
5.47 27,131 1.30 1.20 1.30 3.55 3.55 206
11.97 11,045 2.74 1.20 2.74 5.08 5.08 111
6.72 4,092 1.66 1.22 1.66 4.36 4.36 266
6.66%3,8 $ 189,760 1.15%2 1.15%2 1.26%2 2.18%2 2.08%2 68%
6.843,8 123,145 1.31 1.31 1.43 2.06 1.93 240
10.273 74,821 1.41 1.41 1.41 2.21 2.21 209
5.293 39,727 1.47 1.37 1.47 3.36 3.36 206
11.793 16,827 2.88 1.36 2.88 4.85 4.85 111
6.543 5,435 1.89 1.38 1.89 4.20 4.20 266
127
BLACKROCK FUNDS
FINANCIAL HIGHLIGHTS (CONTINUED)
FOR A SHARE OUTSTANDING THROUGHOUT EACH PERIOD
NET NET GAIN
ASSET (LOSS) ON
VALUE NET INVESTMENTS
BEGINNING INVESTMENT (BOTH REALIZED
OF PERIOD INCOME14 AND UNREALIZED)14
=========== ============ ===================
---------------------
International Bond Portfolio (Continued)
---------------------
Investor B Class
10/01/04 through 3/31/0515 $ 11.42 $ 0.09 $ 0.63
9/30/04 11.07 0.157 0.51
9/30/03 10.54 0.167 0.81
9/30/02 10.53 0.277 0.19
9/30/01 10.69 0.39 0.71
9/30/00 10.81 0.36 0.23
Investor C Class
10/01/04 through 3/31/0515 $ 11.45 $ 0.11 $ 0.61
9/30/04 11.10 0.157 0.51
9/30/03 10.56 0.157 0.83
9/30/02 10.55 0.277 0.19
9/30/01 10.69 0.39 0.73
9/30/00 10.81 0.35 0.24
-------------
High Yield Bond Portfolio
-------------
BlackRock Class
10/01/04 through 3/31/0515 $ 8.14 $ 0.32 $ 0.02
9/30/04 7.74 0.627 0.37
9/30/03 6.75 0.71 1.03
9/30/02 7.39 0.85 ( 0.66)
9/30/01 8.92 0.99 ( 1.45)
9/30/00 9.73 1.14 ( 0.82)
Institutional Class
10/01/04 through 3/31/0515 $ 8.14 $ 0.32 $ 0.02
9/30/04 7.74 0.617 0.37
9/30/03 6.75 0.73 1.00
9/30/02 7.39 0.82 ( 0.64)
9/30/01 8.92 0.94 ( 1.41)
9/30/00 9.73 1.12 ( 0.82)
Service Class
10/01/04 through 3/31/0515 $ 8.14 $ 0.31 $ 0.02
9/30/04 7.74 0.597 0.37
9/30/03 6.75 0.73 0.98
9/30/02 7.39 0.86 ( 0.71)
9/30/01 8.92 0.88 ( 1.38)
9/30/00 9.73 1.08 ( 0.81)
Investor A Class
10/01/04 through 3/31/0515 $ 8.14 $ 0.30 $ 0.03
9/30/04 7.73 0.587 0.38
9/30/03 6.75 0.73 0.96
9/30/02 7.40 0.82 ( 0.69)
9/30/01 8.92 0.90 ( 1.40)
9/30/00 9.73 1.07 ( 0.81)
Investor B Class
10/01/04 through 3/31/0515 $ 8.14 $ 0.28 $ 0.02
9/30/04 7.73 0.527 0.38
9/30/03 6.75 0.65 0.98
9/30/02 7.39 0.74 ( 0.66)
9/30/01 8.91 0.83 ( 1.40)
9/30/00 9.73 0.99 ( 0.81)
NET
DISTRIBUTIONS DISTRIBUTIONS ASSET
FROM NET DISTRIBUTIONS FROM NET VALUE
INVESTMENT FROM REALIZED END OF
INCOME6 CAPITAL GAINS PERIOD
=============== =============== =============== ============
---------------------
International Bond Portfolio
(Continued)
---------------------
Investor B Class
10/01/04 through 3/31/0515 $ (0.28) $ - $ (0.01) $ 11.85
9/30/04 ( 0.31) - - 11.42
9/30/03 ( 0.20) (0.17) ( 0.07) 11.07
9/30/02 ( 0.45) - - 10.54
9/30/01 ( 1.26) - - 10.53
9/30/00 ( 0.39) - ( 0.32) 10.69
Investor C Class
10/01/04 through 3/31/0515 $ (0.28) $ - $ (0.01) $ 11.88
9/30/04 ( 0.31) - - 11.45
9/30/03 ( 0.20) (0.17) ( 0.07) 11.10
9/30/02 ( 0.45) - - 10.56
9/30/01 ( 1.26) - - 10.55
9/30/00 ( 0.39) - ( 0.32) 10.69
-------------
High Yield Bond Portfolio
-------------
BlackRock Class
10/01/04 through 3/31/0515 $ (0.29) $ - $ (0.14) $ 8.05
9/30/04 ( 0.59) - - 8.14
9/30/03 ( 0.75) - - 7.74
9/30/02 ( 0.83) - - 6.75
9/30/01 ( 1.07) - - 7.39
9/30/00 ( 1.13) - - 8.92
Institutional Class
10/01/04 through 3/31/0515 $ (0.29) $ - $ (0.14) $ 8.05
9/30/04 ( 0.58) - - 8.14
9/30/03 ( 0.74) - - 7.74
9/30/02 ( 0.82) - - 6.75
9/30/01 ( 1.06) - - 7.39
9/30/00 ( 1.11) - - 8.92
Service Class
10/01/04 through 3/31/0515 $ (0.28) $ - $ (0.14) $ 8.05
9/30/04 ( 0.56) - - 8.14
9/30/03 ( 0.72) - - 7.74
9/30/02 ( 0.79) - - 6.75
9/30/01 ( 1.03) - - 7.39
9/30/00 ( 1.08) - - 8.92
Investor A Class
10/01/04 through 3/31/0515 $ (0.28) $ - $ (0.14) $ 8.05
9/30/04 ( 0.55) - - 8.14
9/30/03 ( 0.71) - - 7.73
9/30/02 ( 0.78) - - 6.75
9/30/01 ( 1.02) - - 7.40
9/30/00 ( 1.07) - - 8.92
Investor B Class
10/01/04 through 3/31/0515 $ (0.25) $ - $ (0.14) $ 8.05
9/30/04 ( 0.49) - - 8.14
9/30/03 ( 0.65) - - 7.73
9/30/02 ( 0.72) - - 6.75
9/30/01 ( 0.95) - - 7.39
9/30/00 ( 1.00) - - 8.91
SEE ACCOMPANYING NOTES TO FINANCIAL STATEMENTS.
128
BLACKROCK FUNDS
RATIO OF NET RATIO OF NET
EXPENSES TO RATIO OF TOTAL INVESTMENT
NET AVERAGE NET EXPENSES RATIO OF NET INCOME
ASSETS RATIO OF NET ASSETS TO AVERAGE INVESTMENT TO AVERAGE
END OF EXPENSES TO (EXCLUDING NET ASSETS INCOME NET ASSETS PORTFOLIO
TOTAL PERIOD AVERAGE NET INTEREST (EXCLUDING TO AVERAGE NET (EXCLUDING TURNOVER
RETURN (000) ASSETS EXPENSE) WAIVERS) ASSETS14 WAIVERS)14 RATE
=================== =========== ============== ============= ================ ================ ============== ==========
6.27%4,8 $ 21,568 1.91%2 1.91%2 1.91%2 1.45%2 1.45%2 68%
6.044,8 16,780 2.06 2.06 2.09 1.32 1.29 240
9.454 13,087 2.16 2.16 2.16 1.51 1.51 209
4.514 11,470 2.25 2.11 2.25 2.64 2.64 206
10.964 7,393 3.63 2.10 3.63 4.17 4.17 111
5.744 3,283 2.59 2.13 2.59 3.45 3.45 266
6.25%4,8 $ 61,659 1.90%2 1.90%2 1.90%2 1.44%2 1.44%2 68%
6.034,8 36,947 2.04 2.04 2.07 1.32 1.29 240
9.534 17,777 2.15 2.15 2.15 1.44 1.44 209
4.504 8,427 2.23 2.11 2.23 2.62 2.62 206
11.154 4,182 3.64 2.10 3.64 4.20 4.20 111
5.744 2,228 2.56 2.15 2.56 3.43 3.43 266
4.16%8 $ 135,408 0.55%2 0.55%2 0.74%2 7.95%2 7.77%2 76%
13.208 126,976 0.55 0.55 0.73 7.71 7.53 172
27.17 57,207 0.61 0.55 0.77 9.83 9.67 212
2.15 532,240 0.73 0.55 0.89 11.15 11.01 301
( 5.52) 27,766 0.84 0.55 1.10 5.54 5.29 331
3.26 - 1.21 0.55 0.90 11.38 11.11 235
4.09%8 $ 161,620 0.70%2 0.70%2 0.86%2 7.77%2 7.62%2 76%
13.038 162,166 0.70 0.70 0.85 7.63 7.48 172
26.98 170,902 0.76 0.70 0.90 9.63 9.49 212
2.00 94,065 0.87 0.70 1.01 10.94 10.80 301
(5.66) 95,663 1.06 0.70 1.22 11.22 11.06 331
3.11 72,839 1.24 0.70 1.41 11.95 11.78 235
3.95%8 $ 134,102 0.96%2 0.95%2 1.11%2 7.56%2 7.41%2 76%
12.718 112,004 0.99 0.99 1.14 7.30 7.16 172
26.61 85,247 1.06 1.00 1.20 9.31 9.17 212
1.69 29,344 1.17 1.00 1.34 11.37 11.20 301
( 5.95) 9 1.36 1.00 1.52 11.82 11.66 331
2.80 43 1.60 1.00 1.63 12.13 12.10 235
3.95%3,8 $ 287,962 0.96%2 0.96%2 1.22%2 7.28%2 7.02%2 76%
12.703,8 72,806 1.10 1.09 1.34 7.29 7.05 172
26.253 82,391 1.22 1.17 1.36 8.81 8.68 212
1.383 18,932 1.33 1.17 1.48 10.42 10.28 301
(5.98)3 8,980 1.52 1.17 1.68 10.55 10.39 331
2.633 5,094 1.70 1.17 1.88 11.41 11.23 235
3.57%4,8 $ 122,272 1.71%2 1.71%2 1.87%2 6.74%2 6.59%2 76%
11.874,8 92,243 1.85 1.84 1.99 6.49 6.35 172
25.344 107,078 1.98 1.92 2.12 8.39 8.25 212
0.754 57,612 2.09 1.92 2.23 9.81 9.66 301
( 6.71)4 49,786 2.27 1.91 2.43 10.01 9.85 331
1.744 39,897 2.47 1.92 2.57 10.84 10.74 235
129
BLACKROCK FUNDS
FINANCIAL HIGHLIGHTS (CONCLUDED)
FOR A SHARE OUTSTANDING THROUGHOUT EACH PERIOD
NET NET GAIN
ASSET (LOSS) ON
VALUE NET INVESTMENTS
BEGINNING INVESTMENT (BOTH REALIZED
OF PERIOD INCOME14 AND UNREALIZED)14
=========== ============ ===================
-------------------
High Yield Bond Portfolio (Continued)
-------------------
Investor C Class
10/01/04 through 3/31/0515 $ 8.15 $ 0.28 $ 0.01
9/30/04 7.74 0.527 0.38
9/30/03 6.75 0.67 0.97
9/30/02 7.40 0.76 ( 0.69)
9/30/01 8.92 0.83 ( 1.40)
9/30/00 9.73 0.99 ( 0.80)
NET
DISTRIBUTIONS DISTRIBUTIONS ASSET
FROM NET DISTRIBUTIONS FROM NET VALUE
INVESTMENT FROM REALIZED END OF
INCOME6 CAPITAL GAINS PERIOD
=============== =============== =============== ===========
-------------------
High Yield Bond Portfolio
(Continued)
-------------------
Investor C Class
10/01/04 through 3/31/0515 $ (0.25) $- $ (0.14) $ 8.05
9/30/04 ( 0.49) - - 8.15
9/30/03 ( 0.65) - - 7.74
9/30/02 ( 0.72) - - 6.75
9/30/01 ( 0.95) - - 7.40
9/30/00 ( 1.00) - - 8.92
1 Commencement of operations of share class.
2 Annualized.
3 Sales load not reflected in total return.
4 Contingent deferred sales load not reflected in total return.
5 Reissuance of shares.
6 Certain prior year amounts were reclassified to conform to current year
presentation (Note C).
7 Calculated using the average shares outstanding method.
8 Redemption fee of 2.00% is reflected in total return calculations.
SEE ACCOMPANYING NOTES TO FINANCIAL STATEMENTS.
130
BLACKROCK FUNDS
RATIO OF NET RATIO OF NET
EXPENSES TO RATIO OF TOTAL INVESTMENT
NET AVERAGE NET EXPENSES RATIO OF NET INCOME
ASSETS RATIO OF NET ASSETS TO AVERAGE INVESTMENT TO AVERAGE
END OF EXPENSES TO (EXCLUDING NET ASSETS INCOME NET ASSETS PORTFOLIO
TOTAL PERIOD AVERAGE NET INTEREST (EXCLUDING TO AVERAGE NET (EXCLUDING TURNOVER
RETURN (000) ASSETS EXPENSE) WAIVERS) ASSETS14 WAIVERS)14 RATE
=================== =========== ============== ============= ================ ================ ============== ==========
3.44%4,8 $ 61,391 1.72%2 1.71%2 1.87%2 6.79%2 6.64%2 76%
11.864,8 61,983 1.85 1.85 1.99 6.50 6.35 172
25.484 73,246 1.97 1.92 2.11 8.14 8.00 212
0.614 21,939 2.08 1.91 2.23 9.73 9.59 301
( 6.70)4 11,319 2.25 1.91 2.41 9.63 9.47 331
1.864 3,758 2.45 1.92 2.63 10.63 10.45 235
9 Includes dollar roll transactions, excluding these transactions the
portfolio turnover would have been
257%.
10 Includes dollar roll transactions, excluding these transactions the
portfolio turnover would have been 319%.
11 Includes dollar roll transactions, excluding these transactions the
portfolio turnover would have been 371%.
12 Includes dollar roll transactions, excluding these transactions the
portfolio turnover would have been 268%.
13 Includes dollar roll transactions, excluding these transactions the
portfolio turnover would have been 206%.
14 Refer to Section C of the Notes to Financial Statements.
15 Unaudited.
131
BLACKROCK FUNDS
NOTES TO FINANCIAL STATEMENTS (Unaudited)
(A) Organization
BlackRock FundsSM (the "Fund") was organized on December 22, 1988, as a
Massachusetts business trust and is registered under the Investment Company Act
of 1940, as amended, as an open-end management investment company. The Fund
currently has 50 portfolios, thirteen of which are included in these financial
statements (the "Portfolios"). Each Portfolio is authorized to issue an
unlimited number of shares with a par value of $0.001. Each portfolio of the
Fund may offer as many as seven classes of shares. Shares of all classes of a
Portfolio represent equal pro rata interests in such Portfolio, except that
each class bears different expenses which reflect the difference in the range
of services provided to them, mostly due to differences in distribution and
service fees.
Under the Fund's organizational documents, its officers and trustees are
indemnified against certain liabilities arising out of the performance of their
duties to the Fund. In addition, in the normal course of business, the Fund
enters into contracts with its vendors and others that provide for general
indemnifications. The Fund's maximum exposure under these arrangements is
unknown as this would involve future claims that may be made against the Fund.
However, based on experience, the Fund considers the risk of loss from such
claims to be remote.
(B) Fund Reorganization
On January 31, 2005, BlackRock, Inc., the parent of BlackRock Advisors,
Inc. ("BlackRock"), a wholly owned subsidiary of BlackRock, Inc., acquired SSRM
Holdings, Inc., the parent of State Street Research & Management Company
("SSRM"), the investment adviser to the former State Street Research mutual
funds.
On January 31, 2005, the BlackRock Intermediate Government Bond Portfolio
acquired all of the assets and certain stated liabilities of the State Street
Research Government Income Fund. The reorganization was pursuant to an
Agreement and Plan of Reorganization, which was approved by the State Street
Research shareholders on January 25, 2005. Under the Agreement and Plan of
Reorganization, 28,802,131 Class A shares, 1,440,271 Class B shares and 8,786
Class R shares of the State Street Research Government Income Fund were
exchanged for 34,230,267, 1,704,773 and 10,444 Investor A Class shares ,
respectively, of the BlackRock Intermediate Government Bond Portfolio;
6,655,830 Class B(1) shares of the State Street Research Government Income Fund
were exchanged for 7,860,023 Investor B Class shares of the BlackRock
Intermediate Government Bond Portfolio; 1,118,423 Class C shares of the State
Street Research Government Income Fund were exchanged for 1,326,873 Investor C
Class shares of the BlackRock Intermediate Government Bond Portfolio; and
506,641 Class S shares of the State Street Research Government Income Fund were
exchanged for 603,030 Institutional shares of the BlackRock Intermediate
Government Bond Portfolio. The assets of the State Street Research Government
Income Fund, which consisted of securities and related receivables less
liabilities, were converted on a tax-free basis. Upon the reorganization of
such funds on January 31, 2005, the value of the BlackRock Intermediate
Government Bond Portfolio's net assets (including $474,664,383 in net assets of
the State Street Research Government Income Fund, including $2,522,392 of
unrealized depreciation, undistributed net investment income of $68,232 and
undistributed net realized loss on investments of ($21,212,995), which was
classified as paid-in-capital) was $771,988,963 before the open of business.
On January 31, 2005, the BlackRock High Yield Bond Portfolio acquired all
of the assets and certain stated liabilities of the State Street Research High
Income Fund. The reorganization was pursuant to an Agreement and Plan of
Reorganization, which was approved by the State Street Research shareholders on
January 25, 2005. Under the Agreement and Plan of Reorganization, 58,203,330
Class A shares and 8,812,212 Class B shares of the State Street Research High
Income Fund were exchanged for 24,943,276 and 3,736,993 Investor A Class
shares, respectively, of the BlackRock High Yield Bond Portfolio; 10,782,618
Class B(1) shares of the State Street Research High Income Fund were exchanged
for 4,562,480 Investor B Class shares of the BlackRock High Yield Bond
Portfolio; 2,998,505 Class C shares of the State Street Research High Income
Fund were exchanged for 1,274,746 Investor C Class shares of the BlackRock High
Yield Bond Portfolio; and 1,179,029 Class S shares of the State Street Research
High Income Fund were exchanged for 499,336 Institutional shares of the
BlackRock High Yield Bond Portfolio. The assets of the State Street Research
High Income Fund, which consisted of securities and related receivables less
liabilities, were converted on a tax-free basis. Upon the reorganization of
such funds on January 31, 2005, the value of the BlackRock High Yield Bond
Portfolio's net assets (including $288,908,495 in net assets of the State
Street Research High Income Fund, including $1,371,468 of unrealized
appreciation, undistributed net investment loss of ($41,660) and undistributed
net realized loss on investments of ($450,012,483), which was classified as
paid-in-capital) was $944,088,761 before the open of business.
132
BLACKROCK FUNDS
(C) Summary of Significant Accounting Policies
The following is a summary of significant accounting policies followed by
the Fund in the preparation of its financial statements.
Investment Valuation - Valuation of investments held by each Bond
Portfolio is as follows: fixed income investments are valued by using market
quotations or prices provided by market makers; a portion of the fixed income
investments are valued utilizing one or more pricing services approved by the
Board of Trustees; an option or futures contract is valued at the last sales
price prior to 4:00 p.m. (Eastern time), as quoted on the principal exchange or
board of trade on which such option or futures contract is traded, or in the
absence of a sale, the mean between the last bid and asked prices prior to 4:00
p.m. (Eastern time); the amortized cost method of valuation will be used with
respect to debt securities with sixty days or less remaining to maturity unless
the investment adviser and/or sub-adviser under the supervision of the Board of
Trustees determines that such method does not represent fair value. Any assets
which are denominated in a non-U.S. currency are translated into U.S. dollars
at the prevailing market rates. In the event that application of these methods
of valuation results in a price for an investment which is deemed not to be
representative of the market value of such investment, the investment will be
valued by, under the direction of or in accordance with a method approved by
the Board of Trustees as reflecting fair value ("Fair Value Assets"). The
investment adviser and/or sub-adviser will submit its recommendations regarding
the valuation and/or valuation methodologies for Fair Value Assets to a
valuation committee. Such valuation committee may accept, modify or reject any
recommendations. The pricing of all Fair Value Assets shall be subsequently
reported to and ratified by the Board of Trustees.
When determining the price for a Fair Value Asset, the investment adviser
and/or sub-adviser shall seek to determine the price that the Portfolio might
reasonably expect to receive from the current sale of that asset in an
arm's-length transaction. Fair value determinations shall be based upon all
available factors that BlackRock Advisors deems relevant.
Dividends to Shareholders - Dividends from net investment income are
declared by each Portfolio each day on "settled" shares (i.e. shares for which
the particular Portfolio has received payment) and are paid monthly. Over the
course of a year, substantially all of each Portfolio's net investment income
will be declared as dividends. The amount of the daily dividend for each
Portfolio will be based on periodic projections of its net investment income.
Net realized capital gains, if any, are distributed at least annually.
Foreign Currency Translation - The books and records of the Portfolios are
maintained in U.S. dollars. Foreign currency amounts are translated into U.S.
dollars on the following basis:
(I) Market value of investment securities, assets and liabilities at the
current rate of exchange; and
(II) Purchases and sales of investment securities, income and expenses at
the relevant rates of exchange prevailing on the respective dates of
such transactions.
The Portfolios isolate that portion of gains and losses on investment
securities which is due to changes in the foreign exchange rates from that
which is due to changes in market prices of such securities.
The Portfolios report certain foreign currency related transactions as
components of realized and unrealized gains for financial reporting purposes,
whereas such components are treated as ordinary income for federal income tax
purposes.
Forward Foreign Currency Contracts - Certain Portfolios may enter into
forward foreign currency contracts as a hedge against either specific
transactions or Portfolio positions. These contracts are adjusted by the daily
forward exchange rate of the underlying currency and any gains or losses are
recorded as unrealized until the contract settlement date. Such contracts,
which protect the value of the Portfolio's investment securities against a
decline in the value of currency, do not eliminate fluctuations in the
underlying prices of the securities. They simply establish an exchange rate at
a future date. Also, although such contracts tend to minimize the risk of loss
due to a decline in the value of a hedged currency, at the same time they tend
to limit any potential gain that might be realized should the value of such
foreign currency increase. Risks may arise upon entering into these contracts
from the potential inability of counterparties to meet the terms of their
contracts and from unanticipated movements in the value of a foreign currency
relative to the U.S. dollar.
The aggregate principal amounts of the contracts are not recorded as the
Portfolios intend to settle the contracts prior to delivery. Under the terms of
foreign currency contracts open at March 31, 2005, the Portfolios are obligated
to deliver or receive currency in exchange for U.S. dollars as indicated below:
133
BLACKROCK FUNDS
NOTES TO FINANCIAL STATEMENTS (Unaudited) (CONTINUED)
UNREALIZED
VALUE AT FOREIGN
SETTLEMENT CURRENCY CURRENCY CONTRACT MARCH 31, EXCHANGE
DATE AMOUNT SOLD AMOUNT 2005 GAIN/(LOSS)
- ------------ ---------------- --------------------------------- --------------- --------------- --------------
Low Duration Bond
04/26/05 6,499,371 European Currency Unit .......... $ 8,716,868 $ 8,435,599 $ 281,269
04/27/05 33,881,000 New Zealand Dollar .............. 23,957,831 24,101,791 (143,960)
------------ ------------ ----------
$ 32,674,699 $ 32,537,390 $ 137,309
============ ============ ==========
Intermediate PLUS
04/26/05 77,054 European Currency Unit .......... $ 103,351 $ 100,009 $ 3,342
04/27/05 593,975 New Zealand Dollar .............. 424,473 422,534 1,939
------------ ------------ ----------
$ 527,824 $ 522,543 $ 5,281
============ ============ ==========
Core Bond Total Return
04/26/05 13,130,000 European Currency Unit .......... $ 17,614,761 $ 17,041,560 $ 573,201
04/27/05 37,286,500 New Zealand Dollar .............. 26,302,531 26,524,348 (221,817)
------------ ------------ ----------
$ 43,917,292 $ 43,565,908 $ 351,384
============ ============ ==========
Core PLUS Total Return
04/25/05 8,517,284 Mexican Peso .................... $ 745,006 $ 757,885 $ (12,879)
04/26/05 1,765,708 European Currency Unit .......... 2,368,903 2,291,730 77,173
04/27/05 3,314,255 New Zealand Dollar .............. 2,337,932 2,357,648 (19,716)
------------ ------------ ----------
$ 5,451,841 $ 5,407,263 $ 44,578
============ ============ ==========
Inflation Protected Bond
04/22/05 6,942,074 Swedish Krone ................... $ 1,001,059 $ 983,503 $ 17,556
04/26/05 156,478 European Currency Unit .......... 209,982 203,094 6,888
04/28/05 540,000 Canadian Dollar ................. 435,695 446,640 (10,945)
------------ ------------ ----------
$ 1,646,736 $ 1,633,237 $ 13,499
============ ============ ==========
Managed Income
04/26/05 2,680,152 European Currency Unit .......... $ 3,594,632 $ 3,478,596 $ 116,036
============ ============ ==========
International Bond
04/21/05 6,618,383 British Pound ................... $ 12,301,181 $ 12,494,823 $ (193,642)
04/22/05 207,433,506 Swedish Krone ................... 29,941,913 29,464,150 477,763
04/25/05 242,544,520 Mexican Peso .................... 21,476,867 21,602,333 (125,466)
04/26/05 41,900,000 European Currency Unit .......... 68,846,071 68,392,515 453,556
04/27/05 6,050,000 European Currency Unit .......... 7,967,223 7,980,776 (13,553)
04/27/05 3,819,000,000 Japanese Yen .................... 36,535,700 35,769,814 765,886
04/27/05 52,455,215 New Zealand Dollar .............. 37,158,384 37,288,314 (129,930)
04/28/05 762,408 Australian Dollar ............... 594,482 588,636 5,846
04/28/05 14,950,206 Canadian Dollar ................. 12,175,381 12,359,424 (184,043)
04/28/05 81,999,187 Danish Krone .................... 14,364,357 14,312,252 52,105
04/28/05 5,499,696 European Currency Unit .......... 7,229,451 7,150,913 78,538
04/28/05 37,830,407 Polish Zloty .................... 12,542,151 12,017,665 524,486
------------ ------------ ----------
$261,133,161 $259,421,615 $1,711,546
============ ============ ==========
High Yield Bond
04/26/05 4,080,000 European Currency Unit .......... $ 5,308,867 $ 5,295,473 $ 13,394
============ ============ ==========
134
BLACKROCK FUNDS
UNREALIZED
VALUE AT FOREIGN
SETTLEMENT CURRENCY CURRENCY CONTRACT MARCH 31, EXCHANGE
DATE AMOUNT BOUGHT AMOUNT 2005 GAIN/(LOSS)
- ------------ ----------------- --------------------------------- -------------- -------------- -----------------
International Bond
04/20/05 120,950,000 Mexican Peso .................... $ 10,677,323 $ 10,782,933 $ 105,610
04/21/05 3,012,760 Australian Dollar ............... 2,257,220 2,327,390 70,170
04/21/05 10,673,000 British Pound ................... 20,069,492 20,149,520 80,028
04/22/05 7,776,456 Norwegian Krone ................. 1,242,437 1,232,148 (10,289)
04/22/05 9,573,653 Swiss Francs .................... 8,146,916 8,040,762 (106,154)
04/22/05 16,750,000 Swedish Krone ................... 2,395,629 2,379,194 (16,435)
04/25/05 3,300,000 Singapore Dollar ................ 2,023,174 2,000,003 (23,171)
04/26/05 125,300,355 European Currency Unit .......... 163,961,866 162,906,774 (1,055,092)
04/27/05 28,935,090,238 Japanese Yen .................... 282,999,948 271,008,645 (11,991,303)
04/27/05 6,300,000 New Zealand Dollar .............. 4,475,394 4,478,418 3,024
04/28/05 836,252 Australian Dollar ............... 655,519 645,650 (9,869)
04/28/05 7,800,000 Canadian Dollar ................. 6,317,657 6,448,306 130,649
04/28/05 58,300,000 Danish Krone .................... 10,235,256 10,175,763 (59,493)
04/28/05 3,832,188 British Pound ................... 7,229,451 7,228,361 (1,090)
04/28/05 9,500,000 Polish Zloty .................... 2,993,635 3,017,885 24,250
------------ ------------ -------------
$525,680,917 $512,821,752 $ (12,859,165)
============ ============ =============
Swap Agreements - The Portfolios may invest in swap agreements for the
purpose of hedging against changes in interest rates or foreign currencies.
Swap agreements involve the exchange by the Portfolios with another party of
their respective commitments to pay or receive interest or a specified amount
of a currency (e.g., an exchange of floating rate payments for fixed rate
payments) with respect to a notional amount of principal. Swaps are marked to
market daily based upon quotations from market makers and the change, if any,
is recorded as an unrealized gain or loss in the Statements of Operations. Net
payments of interest are recorded as interest income. Entering into these
agreements involves, to varying degrees, elements of credit and market risk in
excess of the amounts recognized on the Statements of Assets and Liabilities.
Such risks involve the possibility that there will be no liquid market for
these agreements, that the counter-party to the agreement may default on its
obligation to perform and that there may be unfavorable changes in the
fluctuation of interest and/or exchange rates.
At March 31, 2005, the following Portfolios had swap agreements
outstanding:
Interest Interest Unrealized
Termination Receivable Payable Notional Amount Appreciation
Portfolio Counter-party Date Rate Rate (U.S. Dollars) (Depreciation)
Enhanced Income Deutsche Bank 12/29/2006 3.42 % 2.55%1 $ 8,000,000 $ (27,285)
Low Duration Bond Union Bank of 08/14/2006 2.64 % 2.29%1 49,000,000 (836,220)
Switzerland
Goldman Sachs 02/02/2007 3.50 % 2.75%1 90,000,000 (931,300)
Deutsche Bank 02/10/2007 2.68 % 2.77%1 80,300,000 (2,129,602)
Morgan Stanley 03/30/2007 4.70%2 N/A3 167,000,000 125,450
Intermediate Goldman Sachs 09/01/2005 2.29%4 2.58%5 16,450,000 16,412
Government Bond Union Bank of 08/14/2006 2.64 % 2.29%1 10,000,000 (170,657)
Switzerland
Morgan Stanley 11/17/2006 3.22 % 2.81%1 14,300,000 (68,482)
Goldman Sachs 02/02/2007 3.50 % 2.75%1 16,000,000 165,564
Deutsche Bank 02/10/2007 2.68 % 2.77%1 12,800,000 (339,463)
Morgan Stanley 03/30/2007 4.70%2 N/A3 71,600,000 53,785
Union Bank of 04/22/2007 2.68%1 3.04 % 24,000,000 347,280
Switzerland
Union Bank of 09/26/2008 3.52 % 2.55%1 3,400,000 (103,156)
Switzerland
Morgan Stanley 06/14/2014 2.48%1 5.31 % 4,700,000 (213,580)
Deutsche Bank 08/15/2023 2.79%1 5.23 % 4,000,000 (28,743)
135
BLACKROCK FUNDS
NOTES TO FINANCIAL STATEMENTS (Unaudited) (CONTINUED)
Interest Interest Unrealized
Termination Receivable Payable Notional Amount Appreciation
Portfolio Counter-party Date Rate Rate (U.S. Dollars) (Depreciation)
Intermediate Bond Merrill Lynch 07/31/2005 2.29%4 2.45%5 $ 17,245,000 $ (226,395)
Goldman Sachs 09/01/2005 2.29%4 2.58%5 20,100,000 20,054
Union Bank of 08/14/2006 2.64 % 2.29%1 26,000,000 (443,709)
Switzerland
Morgan Stanley 11/17/2006 3.22 % 2.81%1 56,000,000 (268,180)
Goldman Sachs 02/02/2007 3.50 % 2.75%1 131,000,000 (135,558)
Morgan Stanley 03/30/2007 4.70%2 N/A3 86,800,000 65,204
Union Bank of 04/22/2007 2.68%1 3.04 % 76,000,000 1,099,720
Switzerland
Union Bank of 09/26/2008 3.52 % 2.55%1 7,600,000 (230,584)
Switzerland
Union Bank of 01/21/2010 4.10 % 2.68%1 47,750,000 (922,530)
Switzerland
Morgan Stanley 06/14/2014 2.48%1 5.31 % 14,400,000 (654,373)
Merrill Lynch 07/22/2014 2.68%1 4.93 % 15,300,000 (90,845)
Goldman Sachs 10/01/2014 2.56%1 4.52 % 16,100,000 510,484
Deutsche Bank 08/15/2023 2.79%1 5.23 % 13,000,000 (93,414)
Intermediate PLUS Goldman Sachs 09/01/2005 2.29%4 2.58%5 575,000 574
Bond
Morgan Stanley 03/30/2007 4.70%2 N/A3 2,400,000 1,803
Union Bank of 01/21/2010 4.10 % 2.68%1 1,350,000 (26,082)
Switzerland
JP Morgan 03/03/2012 4.58 % 2.93%1 300,000 (2,961)
Chase
Union Bank of 11/26/2014 2.89%1 4.58 % 1,000,000 13,791
Switzerland
Core Bond Merrill Lynch 07/31/2005 2.29%4 2.45%5 46,175,000 (606,190)
Total Return Goldman Sachs 09/01/2005 2.29%4 2.58%5 56,575,000 56,444
Morgan Stanley 06/14/2006 3.22 % 2.48%1 114,465,000 523
Morgan Stanley 06/17/2006 3.21 % 2.50%1 84,600,000 (26,541)
Union Bank of 08/14/2006 2.64 % 2.29%1 66,500,000 (1,134,870)
Switzerland
Morgan Stanley 11/17/2006 3.22 % 2.81%1 140,400,000 (672,366)
Goldman Sachs 02/02/2007 3.50 % 2.75%1 180,000,000 (1,862,599)
Morgan Stanley 03/30/2007 4.70%2 N/A3 244,600,000 183,742
Union Bank of 04/16/2007 2.66%1 3.00 % 150,000,000 2,278,800
Switzerland
Union Bank of 09/26/2008 3.52 % 2.55%1 30,300,000 (919,302)
Switzerland
Union Bank of 01/21/2010 4.10 % 2.68%1 36,850,000 (711,942)
Switzerland
Morgan Stanley 02/17/2014 2.81%1 4.41 % 34,300,000 1,119,598
Goldman Sachs 04/22/2014 2.68%1 4.89 % 30,000,000 (476,387)
Citibank 06/10/2014 2.46%1 5.24 % 29,000,000 (1,147,820)
Morgan Stanley 06/14/2014 2.48%1 5.31 % 37,300,000 (1,695,008)
Merrill Lynch 07/22/2014 2.68%1 4.93 % 41,100,000 (244,035)
Goldman Sachs 10/01/2014 2.56%1 4.51 % 10,200,000 323,413
Merrill Lynch 03/17/2015 3.03%1 4.90 % 53,400,000 133,275
Union Bank of 12/07/2015 5.94%6 N/A7 14,900,000 956,580
Switzerland
Merrill Lynch 07/29/2019 2.74%1 5.37 % 6,150,000 (197,287)
Merrill Lynch 08/13/2019 5.16 % 2.79%1 8,175,000 74,064
Merrill Lynch 10/27/2019 4.78 % 2.70%1 5,100,000 (151,334)
Deutsche Bank 08/15/2023 2.79%1 5.23 % 27,000,000 (194,014)
136
BLACKROCK FUNDS
Interest Interest Unrealized
Termination Receivable Payable Notional Amount Appreciation
Portfolio Counter-party Date Rate Rate (U.S. Dollars) (Depreciation)
Core PLUS Merrill Lynch 07/31/2005 2.29%4 2.45%5 $ 5,500,000 $ (72,205)
Total Return Goldman Sachs 09/01/2005 2.29%4 2.58%5 8,180,000 8,161
Morgan Stanley 06/14/2006 3.22 % 2.48%1 10,855,000 50
Morgan Stanley 06/17/2006 3.21 % 2.50%1 8,000,000 (2,510)
Union Bank of 08/14/2006 2.64 % 2.29%1 5,000,000 (85,329)
Switzerland
Morgan Stanley 11/17/2007 3.22 % 2.81%1 18,600,000 (89,074)
Morgan Stanley 03/30/2007 4.70%2 N/A3 35,200,000 26,442
Union Bank of 09/26/2008 3.52 % 2.55%1 2,300,000 (69,782)
Switzerland
Union Bank of 01/21/2010 4.10 % 2.68%1 625,000 (120,750)
Switzerland
Morgan Stanley 02/17/2014 2.81%1 4.41 % 3,500,000 114,245
Goldman Sachs 04/22/2014 2.68%1 4.89 % 8,000,000 (127,037)
Morgan Stanley 06/14/2014 2.48%1 5.31 % 4,300,000 (195,403)
Merrill Lynch 07/22/2014 2.68%1 4.93 % 4,900,000 (29,094)
Merrill Lynch 03/17/2015 3.30%1 4.90 % 6,200,000 15,474
Deutsche Bank 04/01/2015 5.03%8 N/A9 3,500,000 (23,950)
Union Bank of 12/07/2015 5.94%6 N/A7 1,400,000 89,880
Switzerland
Merrill Lynch 07/29/2019 2.74%1 5.37 % 725,000 (23,257)
Merrill Lynch 08/13/2019 5.16 % 2.79%1 1,000,000 9,060
Merrill Lynch 10/27/2019 4.78 % 2.70%1 600,000 (17,804)
Government Deutsche Bank 06/24/2005 2.53%1 1.38 % 45,000,000 42,232
Income Merrill Lynch 07/31/2005 2.29%4 2.45%5 3,655,000 (47,983)
Goldman Sachs 09/01/2005 2.29%4 2.58%5 9,880,000 9,857
Morgan Stanley 06/14/2006 3.22 % 2.48%1 8,190,000 37
Morgan Stanley 06/17/2006 3.21 % 2.50%1 6,100,000 (1,914)
Union Bank of 08/14/2006 2.64 % 2.29%1 8,000,000 (136,526)
Switzerland
Morgan Stanley 11/17/2006 3.22 % 2.81%1 20,700,000 (99,131)
Deutsche Bank 03/23/2007 4.53%10 N/A11 160,000,000 (118,331)
Union Bank of 04/16/2007 2.66%1 3.00 % 10,000,000 151,920
Switzerland
Union Bank of 01/21/2010 4.10 % 2.68%1 1,650,000 (31,878)
Switzerland
Deutsche Bank 03/23/2010 3.05%1 4.60 % 34,100,000 11,732
Merrill Lynch 07/22/2014 2.68%1 4.93 % 3,300,000 (19,594)
Morgan Stanley 10/01/2014 2.56%1 4.52 % 3,400,000 49,736
Union Bank of 11/26/2014 2.89%1 4.58 % 50,000,000 689,560
Switzerland
Union Bank of 03/21/2015 4.88 % 3.05%1 6,000,000 (25,320)
Switzerland
Deutsche Bank 03/24/2015 5.08 % 3.06%1 11,100,000 121,233
Deutsche Bank 03/29/2015 5.11 % 3.09%1 11,000,000 144,483
Inflation Protected Goldman Sachs 09/01/2005 2.29%4 2.58%5 755,000 753
Bond
GNMA Deutsche Bank 06/24/2005 2.53%1 1.38 % 55,000,000 51,617
Merrill Lynch 07/31/2005 2.29%4 2.45%5 4,790,000 (62,884)
Goldman Sachs 09/01/2005 2.29%4 2.58%5 4,985,000 4,974
Morgan Stanley 06/14/2006 3.22 % 2.48%1 16,185,000 74
Morgan Stanley 06/17/2006 3.21 % 2.50%1 12,000,000 (3,765)
Union Bank of 08/14/2006 2.64 % 2.29%1 10,000,000 (170,657)
Switzerland
Morgan Stanley 11/17/2006 3.22 % 2.81%1 13,900,000 (66,566)
Deutsche Bank 03/23/2007 4.53%10 N/A11 80,000,000 (59,165)
Union Bank of 04/16/2007 2.66%1 3.00 % 15,000,000 227,880
Switzerland
Union Bank of 01/21/2010 4.10 % 2.68%1 3,325,000 (64,239)
Switzerland
Deutsche Bank 03/23/2010 3.05%1 4.60 % 17,100,000 5,883
Morgan Stanley 06/14/2014 2.48%1 5.31 % 3,800,000 (172,682)
Merrill Lynch 07/22/2014 2.68%1 4.93 % 4,300,000 (25,532)
Morgan Stanley 10/01/2014 2.56%1 4.52 % 4,100,000 59,975
137
BLACKROCK FUNDS
NOTES TO FINANCIAL STATEMENTS (Unaudited) (CONTINUED)
Interest Interest Unrealized
Termination Receivable Payable Notional Amount Appreciation
Portfolio Counter-party Date Rate Rate (U.S. Dollars) (Depreciation)
Managed Income Merrill Lynch 07/31/2005 2.29%4 2.45%5 $ 14,725,000 $ (193,311)
Goldman Sachs 09/01/2005 2.29%4 2.58%5 16,030,000 15,993
Morgan Stanley 06/14/2006 3.22 % 2.48%1 46,345,000 212
Morgan Stanley 06/17/2006 3.21 % 2.50%1 34,200,000 (10,730)
Union Bank of 08/14/2006 2.64 % 2.29%1 28,000,000 (477,840)
Switzerland
Morgan Stanley 11/17/2006 3.22 % 2.81%1 38,000,000 (181,979)
Morgan Stanley 03/30/2007 4.70%2 N/A3 69,800,000 52,433
Union Bank of 04/16/2007 2.66%1 3.00 % 50,000,000 759,600
Switzerland
Union Bank of 09/26/2008 3.52 % 2.55%1 13,300,000 (403,522)
Switzerland
Goldman Sachs 04/15/2009 3.74 % 2.66%1 49,000,000 (826,514)
Union Bank of 01/21/2010 4.10 % 2.68%1 2,600,000 (50,232)
Switzerland
Morgan Stanley 02/17/2014 2.81%1 4.41 % 12,000,000 391,696
Goldman Sachs 04/22/2014 2.68%1 4.89 % 20,000,000 (317,591)
Citibank 06/10/2014 2.46%1 5.24 % 9,500,000 (376,010)
Morgan Stanley 06/14/2014 2.48%1 5.31 % 12,100,000 (549,855)
Merrill Lynch 07/22/2014 2.68%1 4.93 % 13,100,000 (77,782)
Merrill Lynch 03/17/2015 3.03%1 4.90 % 17,000,000 42,428
Union Bank of 03/21/2015 4.88 % 3.05%1 10,000,000 (42,200)
Switzerland
Union Bank of 12/07/2015 5.94%6 N/A7 5,900,000 378,780
Switzerland
Merrill Lynch 07/29/2019 2.74%1 5.37 % 1,950,000 (62,554)
Merrill Lynch 08/13/2019 5.16 % 2.79%1 2,550,000 23,102
Merrill Lynch 10/27/2019 4.78 % 2.70%1 1,600,000 23,102
Deutsche Bank 08/15/2019 2.79%1 5.23 % 18,000,000 (129,343)
International Bond Morgan Stanley 06/14/2006 3.22 % 2.48%1 11,050,000 50
Morgan Stanley 06/17/2006 3.21 % 2.50%1 8,200,000 (2,572)
Deutsche Bank 04/01/2007 4.28%8 N/A9 20,000,000 29,460
Morgan Stanley 02/17/2014 2.81%1 4.41 % 4,100,000 1,338,300
Morgan Stanley 06/14/2014 2.48%1 5.31 % 5,800,000 (263,567)
Deutsche Bank 04/01/2015 5.03%8 N/A9 11,000,000 (75,273)
High Yield Citibank 12/20/2009 3.75 % N/A12 6,000,000 88,122
Goldman Sachs 12/20/2009 N/A13 3.75 % 10,000,000 330,209
Citibank 03/20/2010 4.74 % N/A14 6,000,000 122,075
Merrill Lynch 06/20/2010 N/A15 .99 % 2,000,000 2,251
Merrill Lynch 06/20/2010 1.90 % N/A16 2,000,000 (6,510)
1 Rate shown is based on the 3 month LIBOR as of the most recent payment date.
2 Per the terms of the agreement, rate becomes effective 03/30/06.
3 Rate to be determined based on the 3 month LIBOR on 03/30/06.
4 Rate shown is based on Lehman CMBS 8.5+ YR INDEX as of the most recent
payment date.
5 Rate shown is based on the 1 month LIBOR as of the most recent payment date.
6 Per the terms of the agreement, rate becomes effective 12/07/05.
7 Rate to be determined based on the 3 month LIBOR on 12/07/05.
8 Per the terms of the agreement, rate becomes effective 04/01/05.
9 Rate to be determined based on the 3 month LIBOR on 04/01/05.
10 Per the terms of the agreement, rate becomes effective 03/23/06.
11 Rate to be determined based on the 3 month LIBOR on 03/23/06.
12 Rate to be determined upon notice of event of default by The Goodyear Tire &
Rubber Company on 7.857% bond issue maturing 08/15/2011.
13 Rate to be determined upon notice of event of default by DJ CDX:NA.HY.3
14 Rate to be determined upon notice of event of default by Levi Strauss &
Company on 12.25% ond issue maturing 12/15/2012.
15 Rate to be determined upon notice of event of default by Teco Energy, Inc.
on 7.20% bond issue maturing 05/01/2011.
16 Rate to be determined upon notice of event of default by CMS Energy
Corporation 8.50% bond issue maturing 04/15/2011.
The Fund has reclassified periodic payments made under interest rate swap
agreements, previously included within interest income, as a component of
realized gain (loss) in the statement of operations. For consistency, similar
reclassifications have been made to amounts appearing in the previous year's
statement of changes in net assets and the per share amounts in prior year
financial highlights. Prior year net investment income ratios in the financial
highlights have also been modified accordingly. This reclassification had no
effect on the Portfolios' net asset value,
138
BLACKROCK FUNDS
either in total or per share, or the total increase (decrease) in net assets
from operations during any period.
LOW DURATION BOND
---------------------------------------------------------------------------------
BLACKROCK INSTITUTIONAL SERVICE INVESTOR A INVESTOR B INVESTOR C
----------- --------------- ------------- ------------ ------------ -------------
Net Investment Income Ratio ........
9/30/2003 ......................... -% (0.01)% (0.01)% (0.01)% (0.01)% (0.01)%
9/30/2002 ......................... -% -% -% -% -% -%
9/30/2001 ......................... -% -% (0.01)% (0.01)% -% (0.01)%
9/30/2000 ......................... -% -% -% -% -% -%
Net Investment Income per Share.....
9/30/2003 ......................... $ - $ - $ - $ - $ - $ -
9/30/2002 ......................... $ - $ - $ - $ - $ - $ -
9/30/2001 ......................... $ - $ - $ - $ - $ - $ -
9/30/2000 ......................... $ (0.01) $ - $ - $ - $ - $ -
INTERMEDIATE GOVERNMENT BOND
-----------------------------------------------------------------
INSTITUTIONAL SERVICE INVESTOR A INVESTOR B INVESTOR C
--------------- ------------ ------------ ------------ ------------
Net Investment Income Ratio ........
9/30/2003 ......................... 0.05% 0.05% 0.05% 0.05% 0.05%
9/30/2002 ......................... 0.12% 0.11% 0.12% 0.12% 0.12%
9/30/2001 ......................... 0.01% 0.01% 0.01% 0.01% 0.01%
9/30/2000 ......................... -% ( 0.01)% -% ( 0.01)% -%
Net Investment Income per Share.....
9/30/2003 ......................... $ - $ 0.01 $ 0.01 $ - $ -
9/30/2002 ......................... $ 0.01 $ 0.01 $ 0.02 $ 0.02 $ 0.01
9/30/2001 ......................... $ - $ - $ - $ 0.01 $ 0.01
9/30/2000 ......................... $ - $ - $ - $ 0.01 $ -
INTERMEDIATE BOND
-----------------------------------------------------------------------------------
BLACKROCK INSTITUTIONAL SERVICE INVESTOR A INVESTOR B INVESTOR C
------------- --------------- ------------- ------------ ------------ -------------
Net Investment Income Ratio ........
9/30/2003 ......................... ( 0.08)% ( 0.07)% ( 0.08)% ( 0.08)% ( 0.07)% ( 0.07)%
9/30/2002 ......................... ( 0.02)% ( 0.02)% ( 0.02)% ( 0.02)% ( 0.02)% ( 0.02)%
9/30/2001 ......................... 0.01% 0.01% 0.01% 0.01% 0.01% 0.01%
9/30/2000 ......................... ( 0.01)% -% ( 0.01)% -% -% -%
Net Investment Income per Share.....
9/30/2003 ......................... $ - $ (0.01) $ (0.01) $ (0.01) $ (0.01) $ (0.01)
9/30/2002 ......................... $ (0.01) $ (0.01) $ - $ (0.01) $ - $ -
9/30/2001 ......................... $ - $ 0.01 $ - $ 0.01 $ - $ -
9/30/2000 ......................... $ - $ - $ - $ - $ - $ -
139
BLACKROCK FUNDS
NOTES TO FINANCIAL STATEMENTS (Unaudited) (CONTINUED)
CORE BOND TOTAL RETURN
--------------------------------------------------------------------------------
BLACKROCK INSTITUTIONAL SERVICE INVESTOR A INVESTOR B INVESTOR C
------------- --------------- ------------ ------------ ------------ -----------
Net Investment Income Ratio ........
9/30/2003 ......................... 0.02% 0.01% 0.01% 0.01% 0.02% 0.01%
9/30/2002 ......................... ( 0.10)% ( 0.10)% (0.10)% ( 0.10)% (0.10)% (0.10)%
9/30/2001 ......................... 0.02% 0.01% 0.01% 0.01% 0.02% 0.01%
9/30/2000 ......................... ( 0.02)% ( 0.03)% (0.01)% -% -% -%
Net Investment Income per Share.....
9/30/2003 ......................... $ - $ - $ - $ - $ - $ -
9/30/2002 ......................... $ (0.01) $ (0.01) $ - $ (0.01) $ - $ -
9/30/2001 ......................... $ - $ - $ - $ 0.01 $ - $ -
9/30/2000 ......................... $ - $ - $ - $ - $ - $ -
CORE PLUS TOTAL RETURN
-----------------------------------------------------------------------------------
BLACKROCK INSTITUTIONAL SERVICE INVESTOR A INVESTOR B INVESTOR C
------------- --------------- ------------- ------------ ------------ -------------
Net Investment Income Ratio ........
9/30/2003 ......................... (0.01)% (0.01)% (0.01)% (0.01)% (0.01)% (0.01)%
Net Investment Income per Share.....
9/30/2003 ......................... $ - $ - $ - $ - $ - $ -
GOVERNMENT INCOME
--------------------------------------------------
BLACKROCK INVESTOR A INVESTOR B INVESTOR C
----------- ------------ ------------ ------------
Net Investment Income Ratio ........
9/30/2003 ......................... 0.07% 0.07% 0.07% 0.07%
9/30/2002 ......................... -% 0.20% 0.20% 0.21%
9/30/2001 ......................... -% 0.09% 0.10% 0.09%
9/30/2000 ......................... -% ( 0.01)% -% -%
Net Investment Income per Share.....
9/30/2003 ......................... $ 0.01 $ 0.01 $ 0.01 $ 0.01
9/30/2002 ......................... $ - $ 0.02 $ 0.02 $ 0.02
9/30/2001 ......................... $ - $ 0.01 $ 0.01 $ -
9/30/2000 ......................... $ - $ - $ - $ -
GNMA
------------------------------------------------------------------------------
BLACKROCK INSTITUTIONAL SERVICE INVESTOR A INVESTOR B INVESTOR C
----------- --------------- ------------ ------------ ------------ -----------
Net Investment Income Ratio ........
9/30/2003 ......................... 0.11% 0.12% 0.11% 0.12% 0.12% 0.11%
9/30/2002 ......................... -% 0.37% 0.36% 0.37% 0.37% 0.36%
9/30/2001 ......................... -% ( 0.10)% ( 0.10)% ( 0.10)% ( 0.10)% ( 0.10)%
9/30/2000 ......................... -% 0.14% 0.15% 0.15% 0.14% 0.14%
Net Investment Income per Share.....
9/30/2003 ......................... $ - $ 0.02 $ 0.01 $ 0.01 $ 0.01 $ 0.01
9/30/2002 ......................... $ - $ 0.02 $ 0.01 $ 0.03 $ 0.02 $ 0.01
9/30/2001 ......................... $ - $ (0.01) $ (0.01) $ (0.01) $ - $ -
9/30/2000 ......................... $ - $ 0.01 $ 0.01 $ 0.01 $ 0.01 $ 0.02
140
BLACKROCK FUNDS
MANAGED INCOME
------------------------------------------------------------------
INSTITUTIONAL SERVICE INVESTOR A INVESTOR B INVESTOR C
--------------- ------------- ------------ ------------ ------------
Net Investment Income Ratio ........
9/30/2003 ......................... ( 0.03)% ( 0.03)% ( 0.03)% ( 0.02)% ( 0.02)%
9/30/2002 ......................... ( 0.04)% ( 0.04)% ( 0.04)% ( 0.04)% ( 0.05)%
9/30/2001 ......................... 0.01% 0.01% 0.01% 0.01% 0.01%
9/30/2000 ......................... ( 0.01)% ( 0.01)% ( 0.01)% ( 0.01)% ( 0.01)%
Net Investment Income per Share.....
9/30/2003 ......................... $ - $ - $ - $ - $ -
9/30/2002 ......................... $ (0.01) $ (0.01) $ (0.01) $ (0.01) $ (0.01)
9/30/2001 ......................... $ - $ - $ - $ - $ -
9/30/2000 ......................... $ - $ (0.01) $ - $ - $ -
Investment Transactions and Investment Income - Investment transactions
are accounted for on the trade date. The cost of investments sold and the
related gain or loss is determined by use of the specific identification method
for both financial reporting and federal income tax purposes. Interest income
is recorded on the accrual basis. Discounts and premiums on debt securities are
amortized for book and tax purposes using the effective yield-to-maturity
method over the term of the instrument. Dividends are recorded on the
ex-dividend date.
Repurchase Agreements - Money market instruments may be purchased from
banks and non-bank dealers subject to the seller's agreement to repurchase them
at an agreed upon date and price. Collateral for repurchase agreements may have
longer maturities than the maximum permissible remaining maturity of portfolio
investments. The seller is required on a daily basis to maintain the value of
the securities subject to the agreement at not less than the repurchase price.
The agreements are conditioned upon the collateral being deposited under the
Federal Reserve book-entry system or held in a separate account by the
Portfolio's custodian or an authorized securities depository.
Reverse Repurchase Agreements - The Portfolios may enter into reverse
repurchase agreements with qualified third party brokers-dealers as determined
by and under the direction of the Portfolio's Board of Trustees. Interest on
the value of the reverse repurchase agreements issued and outstanding is based
upon competitive market rates at the time of issuance and is included within
the related liability on the statement of assets and liabilities. At the time
the Portfolios enter into a reverse repurchase agreement, it identifies for
segregation certain liquid securities having a value not less than the
repurchase price, including accrued interest, of the reverse repurchase
agreement.
Futures Transactions - The Portfolios use futures and options on futures
contracts typically as a substitute for taking a position in the underlying
asset and/or as part of a strategy designed to reduce exposure to other risks,
such as interest rate or currency risk. The Portfolio may also use these
instruments for leverage. These futures contracts obligate a Portfolio, at
maturity, to take or make delivery of securities, the cash value of a
securities index or a stated quantity of a foreign currency. Upon entering into
a futures contract, the Portfolios are required to deposit cash or pledge
securities as initial margin. Subsequent payments, which are dependent on the
daily fluctuations in the value of the underlying security or securities, are
made or received by the Portfolios each day (daily variation margin) and are
recorded as unrealized gains or losses until the contracts are closed. When the
contracts are closed, the Portfolios record a realized gain or loss equal to
the difference between the proceeds from (or cost of) the closing transaction
and the Portfolios' basis in the contracts. Risks of entering into futures
contracts include the possibility that there will not be a perfect price
correlation between the futures contracts and the underlying securities.
Second, it is possible that a lack of liquidity for futures contracts could
exist in the market, resulting in an inability to liquidate a futures position
prior to its maturity date. Third, the purchase of a futures contract involves
the risk that a Portfolio could lose more than the original margin deposit
required to initiate a futures transaction.
Stripped Mortgage Backed Securities - The Portfolios may invest in
stripped mortgage-backed securities issued by the U.S. Government, its agencies
and instrumentalities. Stripped mortgage-backed securities are usually
structured with two classes that receive different proportions of the interest
and principal distributions on a pool of mortgage assets. In certain cases, one
class will receive all of the interest (the interest-only or "IO" class), while
the other class will receive all of the principal (the principal-only or "PO"
class). The yield to maturity on IOs is sensitive to the rate of principal
repayments (including prepayments) on the related underlying mortgage assets,
and principal payments may have a material effect on yield to maturity. If the
underlying mortgage assets experience greater than anticipated prepayments of
principal, a Portfolio may not fully recoup its initial investment in IOs. Such
securities will be considered
141
BLACKROCK FUNDS
NOTES TO FINANCIAL STATEMENTS (Unaudited) (CONTINUED)
liquid only if so determined in accordance with guidelines established by the
Trustees. The Portfolios also may invest in stripped mortgage-backed securities
that are privately issued. These securities will be considered illiquid for
purposes of each Portfolio's limit on illiquid securities.
Investing in Government Sponsored Enterprises - The Portfolios invest in
securities issued by the Federal Home Loan Mortgage Corporation ("Freddie Mac")
and similar United States Government sponsored entities such as Federal
National Mortgage Association ("Fannie Mae") and the Federal Home Loan Banks
("FHLB's"). Freddie Mac, Fannie Mae, and FHLB's, although chartered and
sponsored by Congress, are not funded by Congressional appropriations and the
debt and mortgage-backed securities issued by Freddie Mac, Fannie Mae and
FHLB's are neither guaranteed nor insured by the United States Government.
Option Writing/Purchasing - The Portfolios may write or purchase financial
options contracts for the purpose of hedging or earning additional income,
which may be deemed speculative. When the Portfolios write or purchase an
option, an amount equal to the premium received or paid by the Portfolios is
recorded as a liability or an asset and is subsequently adjusted to the current
market value of the option written or purchased. Premiums received or paid from
writing or purchasing options which expire unexercised are treated by the
Portfolios on the expiration date as realized gains or losses. The difference
between the premium and the amount paid or received on effecting a closing
purchase or sale transaction, including brokerage commissions, is also treated
as a realized gain or loss. If an option is exercised, the premium paid or
received is added to the cost of the purchase or proceeds from the sale in
determining whether the Portfolios have realized a gain or a loss on investment
transactions. The Portfolios as writers of an option may have no control over
whether the underlying securities may be sold (call) or purchased (put) and as
a result bears the market risk of an unfavorable change in the price of the
security underlying the written option.
Swaptions Writing - The Portfolios may write swaption contracts to manage
exposure to fluctuations in interest rates and to enhance portfolio yield.
Swaption contracts wirtten by the Portfolios represent an option that gives the
purchaser the right, but not the obligation, to enter into a previously agreed
upon swap contract on a future date. If a written call swaption is exercised,
the writer will enter a swap and is obligated to pay the fixed rate and receive
a floating rate in exchange. If a written put swaption is exercised, the writer
will enter a swap and is obligated to pay the floating rate and receive a fixed
rate in exchange. Swaptions are marked to market daily based upon quotations
from market makers.
When a Portfolio writes a swaption, the premium received is recorded as a
liability and is subsequently adjusted to the current market value of the
swaption. Changes in the value of the swaption are reported as unrealized gains
or losses in the Statement of Assets and Liabilities or Statement of Net
Assets. Gain or loss is recognized when the swaption contract expires or is
closed. Premiums received from writing swaptions that expire or are exercised
are treated by the Portfolio as realized gains from investments. The difference
between the premium and the amount paid on effecting a closing purchase
transaction is also treated as a realized gain, or if the premium is less than
the amount paid for the closing purchase, as a realized loss.
Entering into a swaption contract involves, to varying degrees, the
elements of credit, market and interest rate risk, associated with both option
contracts and swap contracts. To reduce credit risk from potential counterparty
default, the Portfolios enter into swaption contracts with counterparties whose
creditworthiness has been evaluated by BlackRock. The Portfolios bear the
market risk arising from any change in index values or interest rates.
Written or Purchased Option and Swaption transactions entered into during
the six months ended March 31, 2005 are summarized as follows:
INTERMEDIATE INTERMEDIATE INTERMEDIATE
GOVERNMENT BOND BOND PLUS BOND
--------------------------- ----------------------------- -------------------------
NUMBER OF NUMBER OF NUMBER OF
CONTRACTS PREMIUM CONTRACTS PREMIUM CONTRACTS PREMIUM
----------- ------------- ----------- --------------- ----------- -----------
Balance at 9/30/04 ......... 4,410 $ 568,835 11,512 $ 1,350,390 2 $ 1,325
Purchased .................. (1,578) (149,348) (5,056) (476,572) (8) (3,616)
Written .................... 3,744 724,417 11,533 2,417,345 832 98,025
Expired .................... 1,543 136,808 4,946 437,352 2 1,097
Closed ..................... (3,639) (341,808) (11,220) (1,097,165) (398) (35,970)
------ ---------- ------- ------------ ------ ---------
Balance at 3/31/05 ......... 4,480 $ 938,904 11,715 $ 2,631,350 430 $ 60,861
====== ========== ======= ============ ====== =========
142
BLACKROCK FUNDS
CORE BOND CORE PLUS
TOTAL RETURN TOTAL RETURN GOVERNMENT INCOME
----------------------------- --------------------------- ---------------------------
NUMBER OF NUMBER OF NUMBER OF
CONTRACTS PREMIUM CONTRACTS PREMIUM CONTRACTS PREMIUM
----------- --------------- ----------- ------------- ----------- -------------
Balance at 9/30/04 ......... 37,600 $ 6,144,238 3,642 $ 552,320 (72) $ (30,885)
Purchased .................. (23,776) (1,675,099) (2,806) (203,394) (217) (96,840)
Written .................... 40,916 8,803,842 5,263 1,099,842 423 294,246
Expired .................... 23,315 817,793 2,742 96,327 71 37,887
Closed ..................... (29,567) (3,184,259) (3,482) (372,185) 44 (5,276)
------- ------------ ------ ---------- ---- ---------
Balance at 3/31/05 ......... 48,488 $ 10,906,515 5,359 $1,172,910 249 $ 199,132
======= ============ ====== ========== ==== =========
INFLATION
PROTECTED BOND GNMA MANAGED INCOME
------------------------- --------------------------- ---------------------------
NUMBER OF NUMBER OF NUMBER OF
CONTRACTS PREMIUM CONTRACTS PREMIUM CONTRACTS PREMIUM
----------- ----------- ----------- ------------- ----------- -------------
Balance at 9/30/04 ......... 6 $ 4,032 (108) $ (47,058) 14,500 $2,500,874
Purchased .................. (14) (4,852) (124) (52,231) (7,378) (510,290)
Written .................... 308 129,723 221 152,748 11,125 2,640,888
Expired .................... (2) (664) 121 60,418 7,242 241,835
Closed ..................... (6) (4,032) 17 (11,782) (9,266) (984,485)
------ -------- ---- --------- ------ ----------
Balance at 3/31/05 ......... 292 $124,207 127 $ 102,095 16,223 $3,888,822
===== ======== ==== ========= ====== ==========
INTERNATIONAL BOND HIGH YIELD BOND
------------------------- ---------------------------
NUMBER OF NUMBER OF
CONTRACTS PREMIUM CONTRACTS PREMIUM
----------- ----------- ----------- -------------
Balance at 9/30/04 ......... 56 $ 37,002 302 $ 162,256
Purchased .................. - - - -
Written .................... 1,522 145,179 350 223,643
Expired .................... (28) (8,344) (407) (262,866)
Closed ..................... (70) (42,296) - -
----- --------- ---- ----------
Balance at 3/31/05 ......... 1,480 $ 131,541 245 $ 123,033
===== ========= ==== ==========
TBA Purchase Commitments - The Portfolios may enter into "TBA" (to be
announced) purchases or sell securities for a fixed price at a future date. TBA
commitments are considered securities in themselves, and involve a risk of loss
if the value of the security to be purchased/sold declines/increases prior to
settlement date, which is in addition to the risk of decline in the value of a
Portfolios' other assets. Unsettled TBA commitments are valued at the current
market value of the underlying securities, according to the procedures
described under "Security Valuation".
Mortgage Dollar Rolls - The Portfolios may enter into mortgage dollar
rolls (principally using TBA's) in which the Portfolios sell mortgage
securities for delivery in the current month and simultaneously contracts to
repurchase similar, but not identical, securities at an agreed-upon price on a
fixed date. The Portfolios account for such dollar rolls as purchases and sales
and receive compensation, in either "fee" or "drop", as consideration for
entering into the commitment to repurchase. A Portfolio must maintain liquid
securities having a value not less than the repurchase price (including accrued
interest) for such dollar rolls. The market value of the securities that a
Portfolio is required to purchase may decline below the agreed upon repurchase
price of those securities.
In a "fee" roll, the compensation is recorded as deferred income and
amortized to income over the roll period. In a "drop" roll, the compensation is
paid via a lower price for the security upon its repurchase. The counterparty
receives all principal and interest payments, including prepayments, made in
respect of a security subject to such a contract while it is the holder.
Mortgage dollar rolls may be renewed with a new purchase and repurchase price
and a cash settlement made on settlement date without physical delivery of the
securities subject to the contract. A Portfolio engages in dollar rolls for the
purpose of enhancing its yield, principally by earning a negotiated fee.
143
BLACKROCK FUNDS
NOTES TO FINANCIAL STATEMENTS (Unaudited) (CONTINUED)
Financing Transactions - The Portfolios may enter into financing
transactions consisting of a sale by the Portfolio of securities, together with
a commitment to repurchase similar securities at a future date. The difference
between the selling price and the future purchase price is an adjustment to
interest income. If the counterparty to whom the Portfolio sells the security
becomes insolvent, a Portfolio's right to repurchase the security may be
restricted. The value of the security may change over the term of the financing
transaction.
Inflation-indexed Bonds - Inflation-indexed bonds are fixed income
securities whose principal value is periodically adjusted according to the rate
of inflation. If the index measuring inflation falls, the principal value of
inflation-indexed bonds will be adjusted downward, and consequently the
interest payable on these securities (calculated with respect to a smaller
principal amount) will be reduced. Repayment of the original bond principal
upon maturity (as adjusted for inflation) is guaranteed in the case of U.S.
Treasury inflation-indexed bonds. For bonds that do not provide a similar
guarantee, the adjusted principal value of the bond repaid at maturity may be
less than the original principal.
Bridge Debt Commitments - At March 31, 2005, the High Yield Bond Portfolio
had $24,507,000 in commitments outstanding to fund high yield bridge debt. The
High Yield Bond Portfolio is entitled to a fee upon the expiration of the
commitment period, generally within six months of the initial commitment date.
The bridge debt terms approximate market rates at the time the commitment is
entered into.
Securities Lending - Through an agreement with PFPC Trust Co., the
Portfolios may lend portfolio securities to certain brokers, dealers or other
financial institutions that pay the Portfolios a negotiated fee. Prior to the
close of each business day, loans of U.S. securities are secured by collateral
at least equal to 102% of the market value of the securities on loan. Loans of
foreign securities are secured by collateral at least equal to 105% of the
market value of securities on loan. However, due to market fluctuations, the
value of the securities lent may exceed the value of the collateral. On the
next business day, the collateral is adjusted based on the prior day's market
fluctuations and the current day's lending activity. Cash collateral received
in connection with the securities lending is invested in short-term investments
by the lending agent. The lending agent has hired BlackRock Capital Management,
Inc. ("BCM"), a wholly-owned subsidiary of BlackRock, Inc., and pays BCM to
provide advisory services with respect to the collateral of all of the clients
of its securities lending program. The lending agent may invest such collateral
in short-term investments, including the Institutional Money Market Trust (the
"Trust"), a portfolio of money market securities, or high-quality, short-term
instruments with a maturity date not to exceed 397 days. BCM serves as
investment adviser to the Trust, but receives no fees from the Trust for these
services. Administrative and accounting services are provided by PFPC Inc.
("PFPC"), an indirect wholly-owned subsidiary of The PNC Financial Services
Group, Inc. PFPC is paid a fee from the Trust at an annual rate not to exceed
0.10% of the Trust's average daily net assets.
144
BLACKROCK FUNDS
MARKET VALUE MARKET VALUE OF TOTAL MARKET
OF SECURITIES CASH COLLATERAL VALUE OF
ON LOAN INVESTED IN THE TRUST COLLATERAL RECEIVED
--------------- ----------------------- --------------------
Intermediate Bond .............. $ 3,210,691 $ 3,340,800 $ 3,340,800
Core Bond Total Return ......... 6,508,925 6,686,430 6,686,430
Managed Income ................. 2,282,149 2,332,000 2,332,000
International Bond ............. 2,951,000 3,016,000 3,016,000
High Yield Bond ................ 81,432,265 86,493,930 86,493,930
In the event of default or bankruptcy by the other party to the agreement,
realization and/or retention of the collateral may be subject to legal
proceedings.
Transfers In-Kind - During the period ended September 30, 2004, certain
shareholders of the Enhanced Income Portfolio, Core Bond Total Return Portfolio
and the Intermediate Plus Portfolio transferred cash and securities with a
value of $31,831,191, $183,623,838 and $22,630,997, respectively, in exchange
for Portfolio shares. The securities contributed were subject to a taxable
event prior to the in-kind transfers to the Portfolios and had the same market
value and cost basis as of the date of transfer. Accordingly, for purposes of
generally accepted accounting principles, the book cost of any securities
transferred in-kind to the Portfolios were equal to the market value of such
securities on their date of contribution to the Portfolios resulting in no
difference between book cost and tax cost.
Estimates - The preparation of financial statements in conformity with
accounting principles generally accepted in the United States of America
("Generally Accepted Accounting Principles") requires the use of management
estimates. Actual results could differ from these estimates.
Other - Securities denominated in currencies other than U.S. dollars are
subject to changes in value due to fluctuations in exchange rates.
Some countries in which the Portfolios invest require governmental
approval for the repatriation of investment income, capital or the proceeds of
sales of securities by foreign investors. In addition, if there is
deterioration in a country's balance of payments or for other reasons, a
country may impose temporary restrictions on foreign capital remittances
abroad.
The securities exchanges of certain foreign markets are substantially
smaller, less liquid and more volatile than the major securities markets in the
United States. Consequently, acquisition and disposition of securities by the
Portfolios may be inhibited.
Expenses that are directly related to one of the Portfolios are charged
directly to that Portfolio. Other operating expenses are prorated to the
Portfolios on the basis of relative net assets. Class-specific expenses are
borne by that class. Differences in net expense ratios between classes of a
Portfolio are due to class-specific expenses, waivers and accrual adjustments.
Income, other expenses and realized and unrealized gains and losses of a
Portfolio are allocated to the respective class on the basis of the relative
net assets each day.
145
BLACKROCK FUNDS
NOTES TO FINANCIAL STATEMENTS (Unaudited) (CONTINUED)
The following table provides a list of the Portfolios included in this
report along with a summary of their respective class-specific fee arrangements
as provided under the Fund's Amended and Restated Distribution and Service Plan
(the "Plan"). Fees are expressed as a percentage of average daily net asset
values of the respective classes.
Class Specific Fee Arrangements
Portfolio Share Classes
BlackRock Institutional Service
Contractual Actual Contractual Actual Contractual Actual
Fees Fees(4) Fees Fees(4) Fees(1) Fees(4)
Enhanced Income None None None None 0.25% 0.25%
Low Duration Bond None None None None 0.25% 0.25%
Intermediate Government Bond N/A N/A None None 0.25% 0.25%
Intermediate Bond None None None None 0.25% 0.25%
Intermediate PLUS Bond None None None None 0.25% 0.25%
Core Bond Total Return None None None None 0.25% 0.25%
Core PLUS Total Return None None None None 0.25% 0.25%
Government Income None None N/A N/A 0.25% 0.25%
Inflation Protected Bond None None None None 0.25% 0.25%
GNMA None None None None 0.25% 0.25%
Managed Income N/A N/A None None 0.25% 0.25%
International Bond None None None None 0.25% 0.25%
High Yield Bond None None None None 0.25% 0.25%
Portfolio Share Classes
Investor A Investor B Investor C
Contractual Actual Contractual Actual Contractual Actual
Fees(2) Fees(4) Fees(3) Fees(4) Fees(3) Fees(4)
Enhanced Income 0.35% 0.25% N/A N/A N/A N/A
Low Duration Bond 0.35% 0.25% 1.00% 1.00% 1.00% 1.00%
Intermediate Government Bond 0.35% 0.25% 1.00% 1.00% 1.00% 1.00%
Intermediate Bond 0.35% 0.25% 1.00% 1.00% 1.00% 1.00%
Intermediate PLUS Bond 0.35% 0.25% 1.00% 1.00% 1.00% 1.00%
Core Bond Total Return 0.35% 0.25% 1.00% 1.00% 1.00% 1.00%
Core PLUS Total Return 0.35% 0.25% 1.00% 1.00% 1.00% 1.00%
Government Income 0.35% 0.25% 1.00% 1.00% 1.00% 1.00%
Inflation Protected Bond 0.35% 0.25% 1.00% 1.00% 1.00% 1.00%
GNMA 0.35% 0.25% 1.00% 1.00% 1.00% 1.00%
Managed Income 0.35% 0.25% 1.00% 1.00% 1.00% 1.00%
International Bond 0.35% 0.25% 1.00% 1.00% 1.00% 1.00%
High Yield Bond 0.35% 0.25% 1.00% 1.00% 1.00% 1.00%
(1) - The maximum annual contractual fees are comprised of a 0.25% service fee.
(2) - The maximum annual contractual fees are comprised of a 0.10% distribution
fee and a 0.25% service fee.
(3) - The maximum annual contractual fees are comprised of a 0.75% distribution
fee and a 0.25% service fee.
(4) - The actual fees are as of March 31, 2005.
The BlackRock shares bear a Transfer Agent fee at an annual rate not to
exceed 0.005% of the average daily net assets plus per account fees and
disbursements and each of the Institutional, Service, Investor A, Investor B
and Investor C share classes bear a Tranfer Agent fee at an annual rate not to
exceed 0.018% of the average daily net assets of such respective classes plus
per account fees and disbursements.
For the six months ended March 31, 2005, the following shows the various
types of class specific expenses borne directly by each class of each Portfolio
and any associated waivers of those expenses.
SHARE CLASSES
ADMINISTRATION FEES ---------------------------------------
BLACKROCK INSTITUTIONAL SERVICE
----------- --------------- -----------
Enhanced Income ...................... $ 3,431 $ 30,726 $ 9
Low Duration Bond .................... 115,265 332,074 258,069
Intermediate Government Bond ......... - 172,145 948
Intermediate Bond .................... 79,036 236,872 65,305
Intermediate PLUS Bond ............... 4,541 - -
Core Bond Total Return ............... 186,396 450,721 110,108
Core PLUS Total Return ............... 58,690 - 22
Government Income .................... 1,908 - 110,274
Inflation Protected Bond ............. 4,217 1,613 -
GNMA ................................. 1,874 100,841 2,709
Managed Income ....................... - 448,238 54,413
International Bond ................... 11,140 171,999 67,813
High Yield Bond ...................... 23,524 121,349 92,992
SHARE CLASSES
ADMINISTRATION FEES --------------------------------------------------
INVESTOR A INVESTOR B INVESTOR C TOTAL
------------ ------------ ------------ -----------
Enhanced Income ...................... $ - $ - $ - $ 34,166
Low Duration Bond .................... 60,834 43,975 78,479 888,696
Intermediate Government Bond ......... 115,157 26,076 12,181 326,507
Intermediate Bond .................... 24,121 9,463 9,681 424,478
Intermediate PLUS Bond ............... 2 - - 4,543
Core Bond Total Return ............... 99,198 39,446 59,993 945,862
Core PLUS Total Return ............... 12 71 4 58,799
Government Income .................... 106,082 31,603 19,168 269,035
Inflation Protected Bond ............. 995 156 373 7,354
GNMA ................................. 12,073 17,717 25,905 161,119
Managed Income ....................... 24,831 6,218 781 534,481
International Bond ................... 112,409 13,951 33,817 411,129
High Yield Bond ...................... 108,994 75,635 45,621 468,115
146
BLACKROCK FUNDS
SHARE CLASSES
ADMINISTRATION FEES WAIVED ---------------------------------------------------------
BLACKROCK INSTITUTIONAL SERVICE TOTAL
------------- --------------- ------------ --------------
Enhanced Income ...................... $ (3,431) $ (12,314) $ - $ (15,745)
Low Duration Bond .................... (115,265) (17,002) - (132,267)
Intermediate Government Bond ......... - (172,145) (618) (172,763)
Intermediate Bond .................... (79,036) (12,924) - (91,960)
Intermediate PLUS Bond ............... (4,541) - - (4,541)
Core Bond Total Return ............... (186,396) (23,223) - (209,619)
Core PLUS Total Return ............... (58,690) - - (58,690)
Government Income .................... (1,908) - - (1,908)
Inflation Protected Bond ............. (4,217) (414) - (4,631)
GNMA ................................. (1,874) (5,143) - (7,017)
Managed Income ....................... - (448,238) (35,111) (483,349)
International Bond ................... (4,613) - - (4,613)
High Yield Bond ...................... (23,524) (6,753) - (30,277)
SHARE CLASSES
TRANSFER AGENT FEES ---------------------------------------------------------------------------------------
BLACKROCK INSTITUTIONAL SERVICE INVESTOR A INVESTOR B INVESTOR C TOTAL
----------- --------------- --------- ------------ ------------ ------------ ----------
Enhanced Income ...................... $ 490 $ 3,814 $ 1 $ - $ - $ - $ 4,305
Low Duration Bond .................... 18,067 41,223 32,036 7,521 5,459 9,742 114,048
Intermediate Government Bond ......... - 21,370 118 14,295 3,237 1,512 40,532
Intermediate Bond .................... 11,291 29,405 8,107 2,994 1,174 1,202 54,173
Intermediate PLUS Bond ............... 649 - - - - - 649
Core Bond Total Return ............... 37,200 56,772 13,669 12,314 4,897 7,447 132,299
Core PLUS Total Return ............... 8,384 - 2 1 10 - 8,397
Government Income .................... 273 - 13,689 13,169 3,924 2,379 33,434
Inflation Protected Bond ............. 603 200 - 118 19 46 986
GNMA ................................. 268 12,518 340 1,499 2,199 3,216 20,040
Managed Income ....................... - 56,441 6,755 3,082 772 97 67,147
International Bond ................... 1,591 21,352 8,418 13,954 1,732 4,198 51,245
High Yield Bond ...................... 3,360 15,064 11,545 13,530 9,389 5,663 58,551
147
BLACKROCK FUNDS
NOTES TO FINANCIAL STATEMENTS (Unaudited) (CONTINUED)
SHARE CLASSES
SHAREHOLDER SERVICE FEES --------------------------------------------------------------------
SERVICE INVESTOR A INVESTOR B INVESTOR C TOTAL
---------- ------------ ------------ ------------ ----------
Enhanced Income ...................... $ 15 $ - $ - $ - $ 15
Low Duration Bond .................... 449,946 104,461 75,820 135,308 765,535
Intermediate Government Bond ......... 1,634 198,433 44,935 21,001 266,003
Intermediate Bond .................... 112,179 41,588 16,316 16,692 186,775
Intermediate PLUS Bond ............... - 2 - - 2
Core Bond Total Return ............... 189,844 103,436 67,998 171,025 532,303
Core PLUS Total Return ............... 36 8 123 20 187
Government Income .................... 190,128 182,881 54,497 33,047 460,553
Inflation Protected Bond ............. - 1,716 268 642 2,626
GNMA ................................. 4,722 20,815 30,547 44,664 100,748
Managed Income ....................... 93,816 42,813 10,720 1,347 148,696
International Bond ................... 115,925 193,809 24,050 58,306 392,090
High Yield Bond ...................... 157,867 78,596 130,400 187,824 554,687
SHARE CLASSES
DISTRIBUTION FEES ---------------------------------------------------------
INVESTOR A INVESTOR B INVESTOR C TOTAL
------------ ------------ ------------ ------------
Low Duration Bond .................... $ 41,740 $ 227,459 $ 405,925 $ 675,124
Intermediate Government Bond ......... 79,275 134,877 63,003 277,155
Intermediate Bond .................... 16,633 48,949 50,076 115,658
Intermediate PLUS Bond ............... 1 - - 1
Core Bond Total Return ............... 68,032 204,400 310,308 582,740
Core PLUS Total Return ............... 8 367 23 398
Government Income .................... 73,276 163,490 99,142 335,908
Inflation Protected Bond ............. 686 805 1,927 3,418
GNMA ................................. 8,118 91,825 133,992 233,935
Managed Income ....................... 17,106 32,161 4,041 53,308
International Bond ................... 78,038 72,162 174,917 325,117
High Yield Bond ...................... 75,123 391,217 235,969 702,309
SHARE CLASSES
DISTRIBUTION FEES WAIVED ----------------
INVESTOR A
----------------
Low Duration Bond .................... $ (41,740)
Intermediate Government Bond ......... (79,275)
Intermediate Bond .................... (16,633)
Intermediate PLUS Bond ............... (1)
Core Bond Total Return ............... (68,032)
Core PLUS Total Return ............... (8)
Government Income .................... (73,276)
Inflation Protected Bond ............. (686)
GNMA ................................. (8,118)
Managed Income ....................... (17,106)
International Bond ................... (78,038)
High Yield Bond ...................... (75,123)
(D) Transactions with Affiliates and Related Parties
Pursuant to an Investment Advisory Agreement, BlackRock serves as
investment adviser to the Portfolios. BlackRock Financial Management, Inc.,
("BFM"), a wholly-owned subsidiary of BlackRock, serves as sub-adviser for all
of the Portfolios. BlackRock, Inc. is an indirect majority-owned subsidiary of
The PNC Financial Services Group, Inc.
148
BLACKROCK FUNDS
For its advisory services, BlackRock is entitled to receive fees, computed
daily and payable monthly, at the following annual rates, based on each
Portfolio's average daily net assets:
EACH PORTFOLIO
EXCEPT THE ENHANCED INCOME,
INTERNATIONAL BOND, INFLATION INTERNATIONAL BOND INFLATION PROTECTED
PROTECTED BOND & GNMA & GNMA BOND
------------------------------- -------------------- --------------------
INVESTMENT INVESTMENT INVESTMENT
AVERAGE DAILY NET ASSETS ADVISORY FEE ADVISORY FEE ADVISORY FEE
- ------------------------------- ------------------------------- -------------------- --------------------
first $1 billion .500% .550% .400%
$1 billion-$2 billion .450 .500 .375
$2 billion-$3 billion .425 .475 .350
greater than $3 billion .400 .450 .325
The investment advisory fee for the Enhanced Income Portfolio is .40%.
For the six months ended March 31, 2005, advisory fees and waivers are as
follows:
GROSS NET
ADVISORY ADVISORY
FEE WAIVER FEE
------------ ------------ ------------
Enhanced Income ...................... $ 124,076 $ 107,263 $ 16,813
Low Duration Bond .................... 4,273,223 2,134,964 2,138,259
Intermediate Government Bond ......... 1,124,779 348,141 776,638
Intermediate Bond .................... 2,320,196 993,442 1,326,754
Intermediate PLUS Bond ............... 64,879 62,555 2,324
Core Bond Total Return ............... 5,906,570 2,691,988 3,214,582
Core PLUS Total Return ............... 838,791 466,320 372,471
Government Income .................... 951,772 464,092 487,680
Inflation Protected Bond ............. 57,088 57,088 -
GNMA ................................. 632,752 385,739 247,013
Managed Income ....................... 1,865,271 143,429 1,721,842
International Bond ................... 1,698,296 1,933 1,696,363
High Yield Bond ...................... 1,867,960 573,047 1,294,913
In the interest of limiting the expenses of the Portfolios, BlackRock and
the Fund have entered into a series of annual expense limitation agreements.
The agreements set a limit on certain of the operating expenses of each
Portfolio for the next year and require BlackRock to waive or reimburse fees or
expenses if these operating expenses exceed that limit. These expense limits
apply to the aggregate expenses incurred on a share class (excluding: interest,
taxes, brokerage commissions, other expenditures which are capitalized in
accordance with generally accepted accounting principles and other
extraordinary expenses). At March 31, 2005, the receivable from BlackRock in
the Inflation Protected Bond Portfolio was $2,350.
Effective February 1, 2005, BlackRock and BFM has contractually agreed to
waive or reimburse fees or expenses in order to limit expenses:
SHARE CLASSES
PORTFOLIO ---------------------------------------------------------------------------
BLACKROCK INSTITUTIONAL SERVICE INVESTOR A INVESTOR B INVESTOR C
----------- --------------- --------- ------------ ------------ -----------
Enhanced Income ...................... 0.30% 0.40% 0.75% 0.80% NA NA
Low Duration Bond .................... 0.40% 0.55% 0.85% 0.90% 1.65% 1.65%
Intermediate Government Bond ......... NA 0.60% 0.90% 1.07% 1.82% 1.82%
Intermediate Bond .................... 0.45% 0.60% 0.90% 0.95% 1.70% 1.70%
Intermediate PLUS Bond ............... 0.40% 0.55% 0.85% 0.90% 1.65% 1.65%
Core Bond Total Return ............... 0.40% 0.55% 0.85% 0.90% 1.65% 1.65%
Core PLUS Total Return ............... 0.40% 0.55% 0.85% 0.90% 1.65% 1.65%
Government Income .................... 0.45% NA 0.90% 1.07% 1.82% 1.82%
Inflation Protected Bond ............. 0.30% 0.40% 0.75% 0.85% 1.60% 1.60%
GNMA ................................. 0.45% 0.60% 0.90% 1.07% 1.82% 1.82%
149
BLACKROCK FUNDS
NOTES TO FINANCIAL STATEMENTS (Unaudited) (CONTINUED)
SHARE CLASSES
PORTFOLIO -------------------------------------------------------------------------------------
BLACKROCK INSTITUTIONAL SERVICE INVESTOR A INVESTOR B INVESTOR C
----------- --------------- --------- ------------ ------------ -----------
Managed Income ............. NA 0.65% 0.95% 1.12% 1.87% 1.87%
International Bond ......... 0.78% 1.03% 1.33% 1.50% 2.25% 2.25%
High Yield Bond ............ 0.55% 0.70% 1.00% 1.17% 1.92% 1.92%
If in the following two years the operating expenses of a share class that
previously received a waiver or reimbursement from BlackRock are less than the
expense limit for that share class, the share class is required to repay
BlackRock up to the amount of fees waived or expenses reimbursed under the
agreement if: (1) the Portfolio of which the share class is a part has more
than $50 million in assets, (2) BlackRock continues to be the Portfolio's
investment adviser and (3) the Board of Trustees of the Fund has approved the
payments to BlackRock at the previous quarterly meeting.
At March 31, 2005, the amounts subject to possible future reimbursement
under the expense limitation agreement are as follows:
TOTAL WAIVERS
EXPIRING EXPIRING EXPIRING SUBJECT TO
JANUARY 31, 2006 JANUARY 31, 2007 JANUARY 31, 2008 REIMBURSEMENT
------------------ ------------------ ------------------ --------------
Enhanced Income ................... $ - $ 271,986 $ 43,125 $ 315,111
Low Duration Bond ................. 3,619,537 4,373,486 696,922 8,689,945
Intermediate Government Bond ...... 639,093 644,606 235,037 1,518,736
Intermediate Bond ................. 1,750,280 2,070,723 341,393 4,162,396
Intermediate PLUS Bond ............ - 146,763 22,797 169,560
Core Bond Total Return ............ 5,029,818 5,428,876 943,609 11,402,303
Core PLUS Total Return ............ 606,696 941,716 192,222 1,740,634
Government Income ................. 361,714 370,960 87,523 820,197
Inflation Protected Bond .......... - 182,591 31,766 214,357
GNMA Portfolio .................... 830,940 696,440 109,965 1,637,345
Managed Income .................... 1,600,137 1,236,635 216,139 3,052,911
International Bond ................ 16,453 26,818 3,417 46,688
High Yield Bond ................... 740,256 686,917 121,434 1,548,607
BlackRock pays BFM fees for its sub-advisory services.
PFPC, an indirect subsidiary of The PNC Financial Services Group, Inc.,
and BlackRock act as co-administrators for the Fund. For these services, the
co-administrators receive a combined administration fee computed daily and
payable monthly, based on a percentage of the average daily net assets of each
Portfolio, at the following annual rates: 0.085% of the first $500 million,
0.075% of the next $500 million and 0.065% of assets in excess of $1 billion.
In addition, each of the share classes, except for the BlackRock Class, is
charged an administration fee based on the following percentage of average
daily net assets of each respective class: 0.145% of the first $500 million,
0.135% of the next $500 million and 0.125% of assets in excess of $1 billion.
The BlackRock Class is charged an administration fee of 0.035% of the first
$500 million, 0.025% of the next $500 million and 0.015% of assets in excess of
$1 billion based upon average daily net assets. In addition, PFPC and BlackRock
may have, at their discretion, voluntarily waived all or any portion of their
administration fees for any Portfolio or share class.
150
BLACKROCK FUNDS
For the six months ended March 31, 2005, administration fees and waivers
are as follows:
GROSS NET
ADMINISTRATION ADMINISTRATION
FEE WAIVER FEE
---------------- ----------- ---------------
Enhanced Income ...................... $ 60,532 $ 19,687 $ 40,845
Low Duration Bond .................... 1,544,722 132,267 1,412,455
Intermediate Government Bond ......... 513,577 172,763 340,814
Intermediate Bond .................... 797,439 91,960 705,479
Intermediate PLUS Bond ............... 15,572 6,798 8,774
Core Bond Total Return ............... 1,847,753 209,619 1,638,134
Core PLUS Total Return ............... 201,393 58,690 142,703
Government Income .................... 430,836 1,908 428,928
Inflation Protected Bond ............. 19,485 16,762 2,723
GNMA ................................. 258,908 7,017 251,891
Managed Income ....................... 839,203 483,349 355,854
International Bond ................... 667,075 4,613 662,462
High Yield Bond ...................... 773,241 30,277 742,964
PFPC Trust Co., an indirect subsidiary of The PNC Financial Services
Group, Inc., serves as custodian for each of the Fund's Portfolios. PFPC serves
as transfer and dividend disbursing agent.
Pursuant to the Fund's Amended and Restated Distribution and Service Plan
(the "Plan"), the Portfolio may pay BlackRock Distributors, Inc. (the
"Distributor") and/or BlackRock or any other affiliate of PNC Financial
Services Group, Inc. fees for distribution and sales support services.
Currently, only Investor A Shares, Investor B Shares and Investor C Shares bear
the expense of distribution fees under the Plan. In addition, the Portfolio may
pay brokers, dealers, financial institutions and industry professionals
(including PNC Financial Services Group, Inc. and its affiliates) ("service
organizations") fees for the provision of personal services to shareholders.
BlackRock may receive some of the service fees paid by the Portfolio in return
for providing services to shareholders. Currently, only Investor A Shares,
Investor B Shares, Investor C Shares and Service Shares bear the expense of
service fees under the Plan.
At March 31, 2005, affiliated payables were as follows:
PNC BANK
PFPC (1) BLACKROCK (2) AFFILIATES (3)
---------- --------------- ---------------
Enhanced Income ...................... $ 9,417 $ 8,181 $ 10
Low Duration Bond .................... 254,090 491,434 222,363
Intermediate Government Bond ......... 244,005 267,688 177,753
Intermediate Bond .................... 124,533 284,252 47,070
Intermediate PLUS Bond ............... 5,188 412 3
Core Bond Total Return ............... 308,626 683,733 173,337
Core PLUS Total Return ............... 46,948 72,742 119
Government Income .................... 69,020 145,689 135,173
Inflation Protected Bond ............. 5,477 - 2,279
GNMA ................................. 49,279 62,326 52,208
Managed Income ....................... 119,260 293,050 31,261
International Bond ................... 117,771 460,602 129,034
High Yield Bond ...................... 220,415 373,322 255,870
(1) - Payables to PFPC and PFPC Trust Co. are for Accounting, Administration,
Custody and Transfer Agent services provided as of March 31, 2005.
(2) - Payables to BlackRock are for Advisory and Administration services
provided as of March 31, 2005.
(3) - Payables to PNC Financial Services Group, Inc. affiliates are for
distribution and sales support services as described under the Plan. The
total payable on behalf of the Fund, as of March 31, 2005, was $5,561,651,
substantially all of which is paid to service organizations, including
other PNC Bank affiliates.
151
BLACKROCK FUNDS
NOTES TO FINANCIAL STATEMENTS (Unaudited) (CONTINUED)
(E) Purchases and Sales of Securities
For the six months ended March 31, 2005, purchases and sales of
securities, other than short-term investments, dollar rolls and U.S. government
securities, were as follows:
PURCHASES SALES
---------------- ----------------
Enhanced Income ...................... $ 46,977,459 $ 5,723,474
Low Duration Bond .................... 832,217,335 269,717,175
Intermediate Government Bond ......... 265,072,914 108,985,553
Intermediate Bond .................... 334,648,489 273,645,728
Intermediate PLUS Bond ............... 20,829,209 24,079,052
Core Bond Total Return ............... 1,318,235,983 1,601,748,712
Core PLUS Total Return ............... 213,658,734 209,154,847
Government Income .................... 946,718,693 883,961,494
Inflation Protected Bond ............. 4,177,712 -
GNMA ................................. 506,623,952 503,452,773
Managed Income ....................... 368,446,940 497,010,766
International Bond ................... 647,368,313 262,737,330
High Yield Bond ...................... 607,726,842 525,604,916
For the six months ended March 31, 2005, purchases and sales of U.S.
government securities were as follows:
PURCHASES SALES
---------------- ----------------
Enhanced Income ...................... $ 44,236,396 $ 38,602,074
Low Duration Bond .................... 1,171,699,642 1,378,336,027
Intermediate Government Bond ......... 377,797,800 323,691,581
Intermediate Bond .................... 892,969,326 614,292,113
Intermediate PLUS Bond ............... 23,322,208 19,783,906
Core Bond Total Return ............... 3,465,013,618 2,465,107,019
Core PLUS Total Return ............... 493,185,757 350,937,149
Government Income .................... 478,035,455 329,268,527
Inflation Protected Bond ............. 96,616,401 62,473,969
GNMA ................................. 280,542,321 212,527,579
Managed Income ....................... 816,028,743 705,171,300
International Bond ................... 693,772,691 321,864,084
High Yield Bond ...................... 109,988,534 3,197,477
152
BLACKROCK FUNDS
(F) Capital Shares
Transactions in capital shares for each period were as follows:
ENHANCED INCOME
------------------------------------------------------------------------
FOR THE SIX MONTHS ENDED FOR THE PERIOD 3/4/041
3/31/05 THROUGH 9/30/04
----------------------------------- ----------------------------------
SHARES VALUE SHARES VALUE
----------------- --------------- --------------- ----------------
Shares sold:
BlackRock Class ........................ 2,418,161 $ 23,980,048 5,073,642 $ 50,670,2722
Institutional Class .................... 2,681,338 26,615,059 4,224,099 42,063,617
Service Class .......................... 4,994 49,092 10 100
Investor A Class ....................... - - 10 100
Shares issued in reinvestment of dividends:
BlackRock Class ........................ 15,055 149,339 16,269 162,231
Institutional Class .................... - 2 1,266 12,605
Service Class .......................... 4 42 - -
Investor A Class ....................... - 1 - -
Shares redeemed:
BlackRock Class ........................ (1,281,094) (12,712,190) (3,211,406) (31,937,984)
Institutional Class .................... (2,229,536) (22,108,964) (608,083) (6,045,246)
Service Class .......................... (4) (39) - -
------------- ------------- ---------- -------------
Net increase .............................. 1,608,918 $ 15,972,390 5,495,807 $ 54,925,695
============ ============= ========== =============
LOW DURATION BOND
------------------------------------------------------------------------
FOR THE SIX MONTHS ENDED FOR THE YEAR ENDED
3/31/05 9/30/04
------------------------------------ ---------------------------------
SHARES VALUE SHARES VALUE
---------------- ------------------- ---------------- ----------------
Shares sold:
BlackRock Class ............................. 14,780,462 $ 148,449,423 44,025,335 $ 446,498,575
Institutional Class ......................... 8,128,303 81,799,101 24,282,119 245,998,351
Service Class ............................... 8,296,446 83,418,838 16,906,063 171,124,176
Investor A Class ............................ 1,821,988 18,318,886 6,586,743 66,824,073
Investor B Class ............................ 155,503 1,563,180 1,237,328 12,527,828
Investor C Class ............................ 578,313 5,811,710 2,875,003 29,091,603
Shares issued in reinvestment of dividends:
BlackRock Class ............................. 738,703 7,414,385 1,397,157 14,141,528
Institutional Class ......................... 43,626 438,391 211,305 2,142,104
Service Class ............................... 425,219 4,270,962 632,774 6,408,949
Investor A Class ............................ 81,524 819,004 150,038 1,520,489
Investor B Class ............................ 23,358 234,484 49,840 505,072
Investor C Class ............................ 33,297 334,178 80,404 814,680
Shares redeemed:
BlackRock Class ............................. (21,490,537) (216,188,570) (29,993,094) (302,896,298)
Institutional Class ......................... (13,147,426) (132,198,686) (23,820,299) (241,181,632)
Service Class ............................... (5,704,398) (57,358,833) (7,559,029) (76,490,802)
Investor A Class ............................ (2,371,840) (23,864,717) (8,056,604) (81,466,569)
Investor B Class ............................ (1,261,319) (12,685,844) (2,925,422) (29,616,425)
Investor C Class ............................ (3,909,962) (39,314,136) (9,991,118) (101,156,376)
----------- --------------- ----------- --------------
Net increase (decrease) ........................ (12,778,740) $ (128,738,244) 16,088,543 $ 164,789,326
=========== =============== =========== ==============
1 Commencement of operations.
2 Includes 3,183,119 shares issued in exchange for cash and securities
transferred in-kind with a value of $31,831,191. See Note (C).
153
BLACKROCK FUNDS
NOTES TO FINANCIAL STATEMENTS (Unaudited) (CONTINUED)
INTERMEDIATE GOVERNMENT BOND
-----------------------------------------------------------------------
FOR THE SIX MONTHS ENDED FOR THE YEAR ENDED
3/31/05 9/30/04
---------------------------------- ----------------------------------
SHARES VALUE SHARES VALUE
--------------- ---------------- --------------- ----------------
Shares issued from the reorganization:(1)
Institutional Class .................... 603,030 $ 6,247,476 - $ -
Investor A Class ....................... 35,945,484 373,247,336 - -
Investor B Class ....................... 7,860,023 81,415,016 - -
Investor C Class ....................... 1,326,873 13,754,555 - -
Shares sold:
Institutional Class .................... 3,442,751 35,320,881 7,030,782 73,254,751
Service Class .......................... 42,391 440,310 15,696 163,328
Investor A Class ....................... 914,786 353,130 1,938,301 20,278,933
Investor B Class ....................... 167,857 3,160,650 240,142 2,516,240
Investor C Class ....................... 97,901 2,761,553 498,526 5,220,024
Shares issued in reinvestment of dividends:
Institutional Class .................... 148,455 1,537,553 34,701 361,433
Service Class .......................... 1,174 12,148 1,200 12,556
Investor A Class ....................... 184,598 1,906,036 148,299 1,554,893
Investor B Class ....................... 65,721 677,794 18,053 188,928
Investor C Class ....................... 12,482 129,078 18,338 192,130
Shares redeemed:
Institutional Class .................... (3,761,096) (39,023,951) (6,165,653) (64,253,054)
Service Class .......................... (25,462) (264,755) (34,895) (360,371)
Investor A Class ....................... (3,395,335) (35,119,058) (3,069,832) (32,098,235)
Investor B Class ....................... (784,731) (8,090,193) (409,168) (4,270,645)
Investor C Class ....................... (472,443) (4,899,988) (855,357) (8,933,420)
---------- ------------- ---------- -------------
Net increase (decrease) ................... 42,374,459 $ 433,565,571 (590,867) $ (6,172,509)
========== ============= ========== =============
(1) See Note (B).
INTERMEDIATE BOND
-------------------------------------------------------------------------
FOR THE SIX MONTHS ENDED FOR THE YEAR ENDED
3/31/05 9/30/04
----------------------------------- -----------------------------------
SHARES VALUE SHARES VALUE
--------------- ----------------- ---------------- ----------------
Shares sold:
BlackRock Class ........................ 5,743,609 $ 55,061,592 22,194,526 $ 212,446,272
Institutional Class .................... 3,978,496 37,624,323 7,323,200 70,358,931
Service Class .......................... 2,465,341 23,366,465 4,484,117 42,898,126
Investor A Class ....................... 572,137 5,424,615 2,301,278 22,081,709
Investor B Class ....................... 62,237 589,317 514,527 4,943,361
Investor C Class ....................... 66,880 632,967 853,762 8,248,621
Shares issued in reinvestment of dividends:
BlackRock Class ........................ 950,383 8,987,478 2,117,759 20,302,155
Institutional Class .................... 207,465 1,962,309 713,471 6,828,346
Service Class .......................... 214,997 2,031,979 380,166 3,646,160
Investor A Class ....................... 68,861 650,949 208,853 2,003,401
Investor B Class ....................... 11,277 106,641 26,753 256,573
Investor C Class ....................... 9,428 89,201 26,824 257,392
Shares redeemed:
BlackRock Class ........................ (6,933,125) (65,942,105) (17,474,823) (166,947,949)
Institutional Class .................... (5,110,671) (48,230,514) (10,819,909) (103,213,183)
Service Class .......................... (1,241,092) (11,747,120) (1,812,220) (17,318,652)
Investor A Class ....................... (1,024,972) (9,672,189) (2,858,148) (27,250,206)
Investor B Class ....................... (283,051) (2,679,438) (366,749) (3,497,597)
Investor C Class ....................... (291,124) (2,754,916) (702,324) (6,704,679)
---------- ------------- ----------- --------------
Net increase (decrease) ................... (532,924) $ (4,498,446) 7,111,063 $ 69,338,781
========== ============= =========== ==============
154
BLACKROCK FUNDS
INTERMEDIATE PLUS BOND
------------------------------------------------------------------
FOR THE SIX MONTHS ENDED FOR THE PERIOD 08/18/041
03/31/05 THROUGH 9/30/04
--------------------------------- ------------------------------
SHARES VALUE SHARES VALUE
------------- ----------------- ----------- ----------------
Shares sold:
BlackRock Class ......................... - $ - 2,587,024 $ 25,870,9852
Institutional Class ..................... - - 10 100
Service Class ........................... - - 10 100
Investor A Class ........................ 1,930 19,249 10 100
Investor B Class ........................ - - 10 100
Investor C Class ........................ - - 10 100
Shares issued in reinvestment of dividends:
BlackRock Class ......................... 44,881 446,299 10,755 107,683
Investor A Class ........................ - 37 - -
Shares redeemed:
BlackRock Class ......................... (413,308) (4,059,519) - -
-------- ------------- --------- -------------
Net increase (decrease) ................... (366,497) $ (3,593,934) 2,597,829 $ 25,979,168
======== ============= ========= =============
1 Commencement of operations.
2 Includes 2,263,100 shares issued in exchage for cash and securities
transferred in-kind with a value of $22,630,997. See Note (C).
CORE BOND TOTAL RETURN
--------------------------------------------------------------------------
FOR THE SIX MONTHS ENDED FOR THE YEAR ENDED
03/31/05 9/30/04
----------------------------------- ------------------------------------
SHARES VALUE SHARES VALUE
---------------- ---------------- ---------------- -----------------
Shares sold:
BlackRock Class ......................... 38,216,988 $ 373,499,666 81,098,736 $ 789,585,8241
Institutional Class ..................... 5,819,080 56,597,795 26,144,657 252,656,949
Service Class ........................... 1,659,609 16,150,970 3,697,122 35,865,812
Investor A Class ........................ 3,555,462 34,641,660 7,005,512 68,270,389
Investor B Class ........................ 372,493 3,623,948 890,516 8,667,236
Investor C Class ........................ 696,526 6,788,536 3,948,277 38,572,706
Shares issued in reinvestment of dividends:
BlackRock Class ......................... 2,691,242 26,215,296 6,196,050 60,273,505
Institutional Class ..................... 208,466 2,028,368 2,256,020 21,880,616
Service Class ........................... 221,943 2,157,742 639,548 6,211,063
Investor A Class ........................ 248,958 2,422,039 646,516 6,283,630
Investor B Class ........................ 34,156 332,265 146,718 1,427,283
Investor C Class ........................ 20,135 196,030 70,845 689,098
Shares redeemed:
BlackRock Class ......................... (23,328,346) (227,847,050) (47,023,192) (456,436,915)
Institutional Class ..................... (18,985,137) (184,857,469) (47,480,602) (458,774,449)
Service Class ........................... (1,723,679) (16,765,247) (2,662,425) (25,922,395)
Investor A Class ........................ (3,027,886) (29,471,955) (5,361,239) (51,943,127)
Investor B Class ........................ (857,497) (8,345,739) (2,259,950) (21,914,448)
Investor C Class ........................ (1,376,442) (13,414,324) (3,362,504) (32,566,267)
----------- -------------- ----------- --------------
Net increase .............................. 4,446,071 $ 43,952,531 24,590,605 $ 242,826,510
=========== ============== =========== ==============
1 Includes 19,013,204 shares issued in exchange for cash and securities
transferred in-kind with a value of $183,623,838. See Note (C).
155
BLACKROCK FUNDS
NOTES TO FINANCIAL STATEMENTS (Unaudited) (CONTINUED)
CORE PLUS TOTAL RETURN
-----------------------------------------------------------------------
FOR THE SIX MONTHS ENDED FOR THE YEAR ENDED
3/31/05 9/30/04
---------------------------------- ----------------------------------
SHARES VALUE SHARES VALUE
--------------- ---------------- --------------- ----------------
Shares sold:
BlackRock Class ........................ 13,265,754 $ 137,532,873 13,869,951 $ 142,757,694
Institutional Class .................... 29 300 - -
Service Class .......................... - - 2,781 28,000
Investor A Class ....................... 2,122 22,058 571 5,780
Investor B Class ....................... 460 4,892 3,938 40,392
Investor C Class ....................... 2,644 27,500 - -
Shares issued in reinvestment of dividends:
BlackRock Class ........................ 518,312 5,360,096 1,158,111 11,907,717
Institutional Class .................... - 3 - 5
Service Class .......................... 45 473 24 253
Investor A Class ....................... 22 227 35 365
Investor B Class ....................... 73 758 168 1,730
Investor C Class ....................... 9 90 - 5
Shares redeemed:
BlackRock Class ........................ (5,158,930) (53,475,148) (8,898,892) (91,625,793)
Investor A Class ....................... (450) (4,664) (466) (4,737)
Investor B Class ....................... (904) (9,397) (1,792) (18,584)
---------- ------------- ---------- -------------
Net increase .............................. 8,629,186 $ 89,460,061 6,134,429 $ 63,092,827
========== ============= ========== =============
GOVERNMENT INCOME
----------------------------------------------------------------------
FOR THE SIX MONTHS ENDED FOR THE YEAR ENDED
3/31/05 9/30/04
---------------------------------- ---------------------------------
SHARES VALUE SHARES VALUE
--------------- ---------------- --------------- ---------------
Shares sold:
BlackRock Class ........................ - $ - 962,906 $ 10,785,337
Service Class .......................... 17,834,792 200,063,444 - -
Investor A Class ....................... 6,823,815 75,483,968 8,254,569 91,605,279
Investor B Class ....................... 465,535 5,168,609 813,536 9,028,628
Investor C Class ....................... 441,929 4,893,220 740,703 8,204,120
Shares issued in reinvestment of dividends:
BlackRock Class ........................ 25,242 279,286 16,934 186,475
Service Class .......................... 11 118 - -
Investor A Class ....................... 212,558 2,350,060 310,038 3,440,580
Investor B Class ....................... 39,843 440,730 105,693 1,174,795
Investor C Class ....................... 26,214 289,461 54,418 603,660
Shares redeemed:
BlackRock Class ........................ (193) (2,148) (5,189) (58,352)
Service Class .......................... (154,015) (1,706,382) - -
Investor A Class ....................... (2,054,045) (22,807,514) (4,903,988) (53,940,688)
Investor B Class ....................... (653,248) (7,253,723) (1,668,127) (18,404,329)
Investor C Class ....................... (396,525) (4,384,014) (1,072,691) (11,808,237)
---------- ------------- ---------- -------------
Net increase .............................. 22,611,913 $ 252,815,115 3,608,802 $ 40,817,268
========== ============= ========== =============
156
BLACKROCK FUNDS
INFLATION PROTECTED BOND
-------------------------------------------------------------------
FOR THE SIX MONTHS ENDED FOR THE PERIOD 06/28/041
3/31/05 THROUGH 9/30/04
-------------------------------- --------------------------------
SHARES VALUE SHARES VALUE
------------- ---------------- ----------- ------------------
Shares sold:
BlackRock Class ........................ 817,563 $ 8,557,029 2,000,010 $ 20,000,102
Institutional Class .................... 416,317 4,396,449 10 100
Service Class .......................... 19 200 10 100
Investor A Class ....................... 386,489 4,059,030 8,902 92,956
Investor B Class ....................... 79,321 828,638 5,844 61,094
Investor C Class ....................... 169,218 1,783,744 574 6,000
Shares issued in reinvestment of dividends:
BlackRock Class ........................ 3,988 41,476 - 1
Institutional Class .................... 3,265 34,472 - -
Service Class .......................... - 1 - -
Investor A Class ....................... 2,579 27,008 - 2
Investor B Class ....................... 407 4,279 2 19
Investor C Class ....................... 662 6,978 - -
Shares redeemed:
BlackRock Class ........................ (418,280) (4,381,838) - (1)
Institutional Class .................... (7,955) (83,521) - -
Investor A Class ....................... (14,300) (150,174) - -
Investor B Class ....................... (951) (9,972) - -
Investor C Class ....................... (815) (8,586) - -
-------- ------------ --------- -------------
Net increase .............................. 1,437,527 $ 15,105,213 2,015,352 $ 20,160,373
========= ============ ========= =============
1 Commencement of operations.
GNMA
---------------------------------------------------------------------------
FOR THE SIX MONTHS ENDED FOR THE YEAR ENDED
3/31/05 9/30/04
------------------------------------ ------------------------------------
SHARES VALUE SHARES VALUE
--------------- ------------------ --------------- ------------------
Shares sold:
BlackRock Class ........................ 71 $ 700 7,743 $ 77,432
Institutional Class .................... 855,490 8,430,116 2,753,451 27,123,287
Service Class .......................... 663,707 6,565,255 123,324 1,216,598
Investor A Class ....................... 247,754 2,455,095 896,224 8,911,508
Investor B Class ....................... 95,908 946,643 456,867 4,531,094
Investor C Class ....................... 151,967 1,498,683 1,208,682 11,999,511
Shares issued in reinvestment of dividends:
BlackRock Class ........................ 23,246 228,652 57,209 564,581
Institutional Class .................... 3,797 37,384 18,460 182,613
Service Class .......................... 3,313 32,582 8,806 79,966
Investor A Class ....................... 20,340 201,057 57,839 574,179
Investor B Class ....................... 19,968 196,667 67,877 672,159
Investor C Class ....................... 13,374 131,604 49,441 488,662
Shares redeemed:
BlackRock Class ........................ (464) (4,588) (4,966,583) (49,690,525)
Institutional Class .................... (2,538,686) (25,078,781) (4,626,153) (45,685,645)
Service Class .......................... (75,019) (738,652) (57,171) (554,739)
Investor A Class ....................... (451,105) (4,474,149) (1,017,767) (10,094,068)
Investor B Class ....................... (325,827) (3,214,821) (1,191,717) (11,738,181)
Investor C Class ....................... (991,651) (9,777,843) (2,356,064) (23,224,236)
---------- -------------- ---------- --------------
Net decrease .............................. (2,283,817) $ (22,564,396) (8,509,532) $ (84,565,804)
========== ============== ========== ==============
157
BLACKROCK FUNDS
NOTES TO FINANCIAL STATEMENTS (Unaudited) (CONTINUED)
MANAGED INCOME
-----------------------------------------------------------------------------
FOR THE SIX MONTHS ENDED FOR THE YEAR ENDED
3/31/05 9/30/04
------------------------------------ --------------------------------------
SHARES VALUE SHARES VALUE
--------------- ------------------ ---------------- -------------------
Shares sold:
Institutional Class .................... 2,490,664 $ 25,844,617 3,443,975 $ 35,951,136
Service Class .......................... 2,277,073 23,617,652 4,433,492 46,198,406
Investor A Class ....................... 281,506 2,920,646 570,805 5,950,344
Investor B Class ....................... 66,407 688,522 107,781 1,126,942
Investor C Class ....................... 33,214 344,603 34,767 362,960
Shares issued in reinvestment of dividends:
Institutional Class .................... 209,272 2,169,524 1,668,069 17,415,674
Service Class .......................... 96,880 1,003,127 307,188 3,208,282
Investor A Class ....................... 76,132 789,103 275,744 2,884,964
Investor B Class ....................... 7,436 77,090 26,510 277,153
Investor C Class ....................... 570 5,890 1,107 11,516
Shares redeemed:
Institutional Class .................... (6,233,694) (64,638,170) (18,238,033) (188,924,478)
Service Class .......................... (2,450,644) (25,466,999) (5,576,224) (58,216,243)
Investor A Class ....................... (540,454) (5,605,756) (2,055,845) (21,478,189)
Investor B Class ....................... (208,049) (2,152,168) (221,467) (2,301,380)
Investor C Class ....................... (4,985) (51,696) (22,880) (238,460)
---------- -------------- ----------- ---------------
Net decrease .............................. (3,898,672) $ (40,454,015) (15,245,011) $ (157,771,373)
========== ============== =========== ===============
INTERNATIONAL BOND
-----------------------------------------------------------------------
FOR THE SIX MONTHS ENDED FOR THE YEAR ENDED
3/31/05 9/30/04
-------------------------------- ------------------------------------
SHARES VALUE SHARES VALUE
-------------- --------------- ---------------- -----------------
Shares sold:
BlackRock Class ........................ 5,124,780 $ 61,906,382 3,438,204 $ 38,322,016
Institutional Class .................... 18,967,751 229,029,625 12,598,557 143,701,530
Service Class .......................... 3,348,092 40,377,882 14,327,492 160,851,025
Investor A Class ....................... 7,536,571 90,386,278 7,379,261 83,985,204
Investor B Class ....................... 484,222 5,834,885 528,566 6,047,568
Investor C Class ....................... 2,319,258 27,989,329 2,102,139 24,069,974
Shares issued in reinvestment of dividends:
BlackRock Class ........................ 113,491 1,375,722 34,973 393,135
Institutional Class .................... 134,104 1,627,410 135,936 1,537,371
Service Class .......................... 204,944 2,487,183 230,005 2,605,444
Investor A Class ....................... 291,395 3,538,170 300,294 3,398,972
Investor B Class ....................... 24,390 296,505 25,707 291,106
Investor C Class ....................... 59,667 726,660 45,702 518,500
Shares redeemed:
BlackRock Class ........................ (662,817) (7,927,813) (339,508) (3,810,564)
Institutional Class .................... (3,415,074) (41,111,714) (6,813,808) (76,313,065)
Service Class .......................... (1,287,058) (15,457,095) (11,936,202) (133,411,074)
Investor A Class ....................... (2,601,701) (31,323,227) (3,650,626) (41,338,051)
Investor B Class ....................... (157,724) (1,894,823) (266,978) (3,022,485)
Investor C Class ....................... (415,829) (4,985,766) (521,630) (5,896,042)
---------- ------------- ----------- --------------
Net increase .............................. 30,068,462 $ 362,875,593 17,618,084 $ 201,930,564
========== ============= =========== ==============
158
BLACKROCK FUNDS
HIGH YIELD BOND
-----------------------------------------------------------------------
FOR THE SIX MONTHS ENDED FOR THE YEAR ENDED
3/31/05 9/30/04
---------------------------------- ----------------------------------
SHARES VALUE SHARES VALUE
--------------- ---------------- --------------- ----------------
Shares issued from the reorganization:(1)
Institutional Class .................... 499,336 $ 4,119,515 - $ -
Investor A Class ....................... 28,680,269 236,635,082 - -
Investor B Class ....................... 4,562,480 37,633,102 - -
Investor C Class ....................... 1,274,746 10,520,796 - -
Shares sold:
BlackRock Class ........................ 1,732,468 14,441,389 10,537,232 84,539,437
Institutional Class .................... 3,630,127 33,493,160 8,671,443 69,329,774
Service Class .......................... 4,133,671 34,192,894 7,643,139 61,340,427
Investor A Class ....................... 1,654,180 18,369,011 7,416,713 59,235,980
Investor B Class ....................... 787,943 6,520,253 2,067,712 16,574,993
Investor C Class ....................... 582,254 6,788,690 1,996,826 16,006,791
Shares issued in reinvestment of dividends:
BlackRock Class ........................ 789,939 6,524,456 830,734 6,662,361
Institutional Class .................... 276,945 2,290,782 152,431 1,221,478
Service Class .......................... 183,363 1,512,506 126,014 1,010,749
Investor A Class ....................... 494,347 4,066,959 351,549 2,811,695
Investor B Class ....................... 281,301 2,321,558 363,924 2,910,188
Investor C Class ....................... 153,016 1,264,907 250,916 2,008,325
Shares redeemed:
BlackRock Class ........................ (1,295,104) (10,834,372) (3,165,692) (25,563,660)
Institutional Class .................... (4,245,175) (35,278,398) (10,991,762) (88,005,527)
Service Class .......................... (1,414,509) (11,656,463) (5,028,290) (39,768,982)
Investor A Class ....................... (3,998,976) (33,034,427) (9,479,104) (75,936,201)
Investor B Class ....................... (1,770,259) (26,180,633) (4,946,611) (39,306,922)
Investor C Class ....................... (1,996,062) (16,518,303) (4,101,802) (32,861,840)
---------- ------------- ----------- -------------
Net increase .............................. 34,996,300 $ 287,192,464 2,695,372 $ 22,209,066
========== ============= =========== =============
(1) See Note (B).
On March 31, 2005, four shareholders held approximately 94% of the
outstanding shares of the Enhanced Income Portfolio, two shareholders held
approximately 39% of the outstanding shares of the Low Duration Bond Portfolio,
two shareholders held approximately 38% of the outstanding shares of the
Intermediate Government Portfolio, five shareholders held approximately 65% of
the outstanding shares of the Intermediate Bond Portfolio, two shareholders
held 100% of the Intermediate PLUS Portfolio, two shareholders held
approximately 27% of the outstanding shares of the Core Bond Total Return
Portfolio, seven shareholders held approximately 65% of the outstanding shares
of the Core PLUS Total Return Portfolio, seven shareholders held approximately
56% of the outstanding shares of the Government Income Portfolio, four
shareholder held approximately 83% of the outstanding shares of the Inflation
Protected Portfolio, two shareholders held approximately 66% of the outstanding
shares of the GNMA Portfolio, two shareholders held approximately 86% of the
outstanding shares of the Managed Income Portfolio, three shareholders held
approximately 35% of the outstanding shares of the International Bond Portfolio
and two shareholders held approximately 23% of the outstanding shares of the
High Yield Bond Portfolio. Some of the shareholders are comprised of omnibus
accounts, which are held on behalf of several individual shareholders.
159
BLACKROCK FUNDS
NOTES TO FINANCIAL STATEMENTS (Unaudited) (CONTINUED)
(G) At March 31, 2005, net assets consisted of:
LOW INTERMEDIATE INTERMEDIATE
ENHANCED DURATION GOVERNMENT INTERMEDIATE PLUS
INCOME BOND BOND BOND BOND
--------------- ------------------ ---------------- ---------------- ---------------
Capital paid-in ........................ $ 70,898,086 $ 1,756,399,090 $ 736,303,620 $ 900,553,708 $ 22,385,235
End of period undistributed net
investment income
(distributions in excess of net
investment income) .................... (12,453) 3,039,919 573,007 1,736,937 156
Accumulated net realized gain
(loss) on investment
transactions, futures, options,
swaptions, swap contracts and
foreign currency related
transactions .......................... (212,718) (11,812,866) 2,477,423 (411,454) (149,476)
Net unrealized depreciation on
investment transactions
futures, options, swaptions,
swap contracts and foreign
currency related transactions ......... (376,964) (21,170,373) (6,421,017) (7,071,187) (294,806)
------------ --------------- ------------- ------------- ------------
$ 70,295,951 $ 1,726,455,770 $ 732,933,033 $ 894,808,004 $ 21,941,109
============ =============== ============= ============= ============
CORE BOND CORE PLUS GOVERNMENT INFLATION
TOTAL RETURN TOTAL RETURN INCOME PROTECTED BOND GNMA
------------------ ---------------- ---------------- ---------------- ----------------
Capital paid-in ................ $ 2,539,684,524 $ 372,559,176 $ 458,749,957 $ 35,195,330 $ 229,718,289
End of period undistributed net
investment income
(distributions in excess of net
investment income) ............ 3,486,023 717,472 (578,569) (241,376) 254,825
Accumulated net realized gain
(loss) on investment
transactions, futures, options,
swaptions, swap contracts and
foreign currency related
transactions .................. 12,008,148 813,972 (5,393,835) 304,035 (6,578,137)
Net unrealized appreciation
(depreciation) on investment
transactions, futures, options,
swaptions, swap contracts and
foreign currency related
transactions .................. (15,463,701) (2,845,137) (3,271,270) 427,562 (1,226,147)
--------------- ------------- ------------- ------------ -------------
$ 2,539,714,994 $ 371,245,483 $ 449,506,283 $ 35,685,551 $ 222,168,830
=============== ============= ============= ============ =============
160
BLACKROCK FUNDS
MANAGED INTERNATIONAL HIGH YIELD
INCOME BOND BOND
---------------- ----------------- ----------------
Capital paid-in ........................ $ 709,413,705 $ 770,533,244 $ 897,348,391
End of period undistributed net
investment income
(distributions in excess of net
investment income) .................... 2,131,116 (6,791,846) 1,528,247
Accumulated net realized gain
on investment transactions,
futures, options, swaptions,
swap contracts and foreign
currency related transactions ......... 3,692,391 26,475,444 20,696,319
Net unrealized appreciation
(depreciation) on investment
transactions, futures, options,
swaptions, swap contracts and
foreign currency related
transactions .......................... 1,551,515 8,127,816 (16,817,743)
------------- ------------- -------------
$ 716,788,727 $ 798,344,658 $ 902,755,214
============= ============= =============
(H) Federal Tax Information
No provision is made for federal taxes as it is the Fund's intention to
have each Portfolio continue to qualify for and elect the tax treatment
applicable to regulated investment companies under Subchapter M of the Internal
Revenue Code of 1986, as amended, and to make the requisite distributions to
its shareholders which will be sufficient to relieve it from federal income and
excise taxes. Short-term capital gain and foreign currency distributions that
are reported in the Statement of Changes in Net Assets are reported as ordinary
income for federal tax purposes. There were no short term or long term capital
gain distributions for the six months ended March 31, 2005.
Dividends from net investment income and distributions from net realized
capital gains are determined in accordance with U.S. Federal income tax
regulations, which may differ from those amounts determined under accounting
principles generally accepted in the United States.
161
BLACKROCK FUNDS
NOTES TO FINANCIAL STATEMENTS (Unaudited) (CONTINUED)
The estimated tax character of distributions paid during the six months
ended March 31, 2005, and the tax character of distributions paid during the
year ended September 30, 2004, were as follows:
ORDINARY LONG-TERM TOTAL
INCOME CAPITAL GAIN DISTRIBUTIONS
-------------- -------------- ---------------
Enhanced Income ......................
3/31/05 ............................. $ 774,320 $ - $ 774,320
9/30/04 ............................. 367,031 - 367,031
Low Duration Bond ....................
3/31/05 ............................. 23,097,442 - 23,097,442
9/30/04 ............................. 42,369,674 - 42,369,674
Intermediate Government Bond .........
3/31/05 ............................. 6,804,657 1,398,640 8,203,297
9/30/04 ............................. 10,931,963 - 10,931,963
Intermediate Bond ....................
3/31/05 ............................. 15,231,216 7,438,894 22,670,110
9/30/04 ............................. 35,663,787 17,198,461 52,862,248
Intermediate PLUS Bond ...............
3/31/05 ............................. 497,097 7,313 504,410
9/30/04 ............................. 121,847 - 121,847
Core Bond Total Return ...............
3/31/05 ............................. 46,140,005 4,346,485 50,486,490
9/30/04 ............................. 126,658,867 28,012,571 154,671,438
Core PLUS Total Return ...............
3/31/05 ............................. 6,186,808 - 6,186,808
9/30/04 ............................. 11,165,451 1,428,975 12,594,426
Government Income ....................
3/31/05 ............................. 9,090,671 - 9,090,671
9/30/04 ............................. 6,519,101 1,394,662 7,913,763
Inflation Protected Bond .............
3/31/05 ............................. 912,659 2,434 915,093
9/30/04 ............................. 245,093 - 245,093
GNMA .................................
3/31/05 ............................. 4,395,674 - 4,395,674
9/30/04 ............................. 14,309,697 - 14,309,697
Managed Income .......................
3/31/05 ............................. 15,454,221 2,760,007 18,214,228
9/30/04 ............................. 47,616,005 16,559,285 64,175,290
International Bond ...................
3/31/05 ............................. 16,796,460 188,958 16,985,418
9/30/04 ............................. 12,218,083 - 12,218,083
High Yield Bond ......................
3/31/05 ............................. 35,252,419 799,440 36,051,859
9/30/04 ............................. 41,802,100 - 41,802,100
162
BLACKROCK FUNDS
As of March 31, 2005, the estimated tax components of distributable
earnings/(accumulated losses) were as follows:
UNDISTRIBUTED UNDISTRIBUTED ACCUMULATED POST-
ORDINARY LONG-TERM CAPITAL OCTOBER
INCOME CAPITAL GAIN LOSSES LOSSES
--------------- --------------- --------------- ---------------
Enhanced Income ...................... $ 137,518 $ - $ (167,707) $ -
Low Duration Bond .................... 10,752,231 - (11,482,100) (1,429,045)
Intermediate Government Bond ......... 2,645,161 1,783,155 - -
Intermediate Bond .................... 2,751,704 1,989,830 - -
Intermediate PLUS Bond ............... 105,241 - (9,326) (130,612)
Core Bond Total Return ............... 21,223,436 7,826,667 - -
Core PLUS Total Return ............... 3,209,913 218,512 - -
Government Income .................... 1,155,574 - (1,797,795) (2,360,373)
Inflation Protected Bond ............. 336,153 - - -
GNMA ................................. 1,468,137 - (6,717,753) (606,650)
Managed Income ....................... 7,779,653 4,753,019 - -
International Bond ................... 9,955,782 1,878,780 - -
High Yield Bond ...................... 20,589,933 8,213,791 - -
The estimated Post-October losses represent losses realized on investment
transactions from November 1, 2004 through March 31, 2005 that, in accordance
with Federal income tax regulations, the Portfolios may defer and treat as
having arisen in the following fiscal year. For Federal income tax purposes,
capital loss carryforwards may be carried forward and applied against future
capital gains.
At September 30, 2004, the Portfolios had capital loss carryforwards
available to offset future realized capital gains through the indicated
expiration dates:
EXPIRING SEPTEMBER 30
-------------------------------------------------
2010 2011 2012 TOTAL
---------- ------------ ------------ ------------
Enhanced Income ........... $ - $ - $ 240,751 $ 240,751
Low Duration Bond ......... - - 440,690 440,690
Government Income ......... - - 74,687 74,687
GNMA ...................... 603,989 1,576,264 2,473,978 4,654,231
163
BLACKROCK FUNDS
ADDITIONAL INFORMATION
(A) Board of Trustees' Consideration of the Advisory Contracts. Investment
advisory and subadvisory agreements ("Advisory Contracts") for the Taxable
Bond Portfolios (each, a "Portfolio") of BlackRock Funds (the "Fund") were
most recently approved by the Board of Trustees (the "Board" or the
"Trustees") of the Fund at an in-person meeting of the Board held on March
1, 2005, including a majority of the Trustees who are not parties to the
Advisory Contracts or interested persons of any such party (as such term is
defined in the Investment Company Act of 1940) (the "Independent
Trustees"). In determining to approve the Advisory Contracts, the Trustees
met with the relevant investment advisory personnel from BlackRock
Advisors, Inc. and BlackRock Financial Management, Inc. (the "Advisers")
and considered all information they deemed reasonably necessary to evaluate
the terms of the Advisory Contracts. The Board received materials in
advance of the meeting relating to its consideration of the Advisory
Contracts for the Portfolios being considered for approval or renewal,
including: (i) fees and expense ratios of each class of each Portfolio in
comparison to the fees and expense ratios of a peer group of funds, which
consists of funds that have all of the following similar criteria: fund
type, investment classification and objective, load type, asset level and
expense structure and components ("peer group"); (ii) information on the
investment performance of each Portfolio in comparison to the investment
performance of a peer universe of funds, which is broader than a peer group
and consists of funds that have all of the following similar criteria: fund
type, investment classification and objective and load type ("performance
universe"); (iii) the Advisers' economic outlook for the Portfolios and
their general investment outlook for the markets; (iv) information with
respect to profitability of BlackRock, Inc. ("BlackRock") and PNC
Bank-affiliated companies with respect to each Portfolio, including details
regarding the methodology used to calculate profitability; (v) information
regarding fees paid to service providers that are affiliates of the
Advisers; and (vi) information regarding compliance records and regulatory
matters relating to the Advisers. The matters discussed below were
considered separately by the Independent Trustees in an executive session,
during which counsel who is independent of the Advisers and the Fund
provided guidance to the Independent Trustees.
Fees and Expenses. In approving the Advisory Contracts, the Trustees,
including the Independent Trustees, considered the fees and expense ratios
of each class of shares of each Portfolio. They compared the fees, both
before (referred to as "Contractual") and after (referred to as "Actual")
any fee waivers and expense reimbursements, and expense ratios of each
Portfolio against fees and expense ratios of a peer group. Both the peer
group category and the funds within the peer group with respect to the fee
and expense ratio comparisons were selected by Lipper, Inc. ("Lipper"),
which is not affiliated with the Advisers. The Investor A class and
Institutional class were used to represent all of the Portfolios' share
classes for purposes of the Lipper survey, as Lipper differentiated between
retail and institutional funds in selecting funds in the peer group.1
Taking into account the recent reorganization of certain State Street
Research mutual funds with certain Portfolios, Lipper used the Portfolios'
proforma expense information provided by PFPC Inc., the Fund's
administrator, to reflect post-reorganization data for each of the expense
categories.2 In evaluating the Portfolios' advisory fees, the Trustees also
took into account the complexity of investment management for the
Portfolios relative to other types of funds.
1Lipper compared Investor A and Institutional classes for each of the
Portfolios to funds in their respective peer groups, with the exceptions of
the Core PLUS Total Return Portfolio, the Government Income Portfolio and
the Intermediate PLUS Bond Portfolio, which substituted the BlackRock share
class which has a similar expense structure to the Institutional share
class.
2The post-reorganization proforma data reflected expense caps, the
elimination of shareholder processing fees, increased transfer agency fees,
costs associated with new shareholder administrative services arrangements
and increased asset levels resulting from the reorganization of the State
Street Research mutual funds with certain Portfolios.
164
BLACKROCK FUNDS
In considering data based on information provided by Lipper, the Trustees
noted that of the 13 Portfolios with Advisory Contracts subject to
re-approval, 12 of the 26 share classes of the Portfolios (46%) have
contractual advisory fees higher than the median for their respective peer
groups.3 With regard to the 12 classes that have advisory fees higher than
the peer group median, the Trustees noted:
o In the case of 6 classes (50% of the total classes with advisory
fees higher than the peer group median), the difference from the
median of their respective peer groups is 5 basis points or less
(Institutional class or BlackRock class (as applicable): Core PLUS
Total Return, Enhanced Income, Government Income; Investor A class:
Core Bond Total Return, GNMA, Low Duration Bond).
o 5 classes (42% of the total classes with advisory fees higher than
the peer group median), while having contractual advisory fees higher
than the median for their respective peer groups, have actual
advisory fees that are lowered by waivers or expense reimbursements.
Specifically, (a) after waivers or expense reimbursements, 4 classes
(33%) have actual advisory fees lower than or equal to their
respective peer group medians (Institutional class: Core Bond Total
Return, Intermediate Bond, Low Duration Bond; Investor A class:
Intermediate Bond); and (b) after waivers or expense reimbursements,
1 class (8%) has actual management fees lower than or equal to the
peer group median (Institutional class: GNMA). For purposes of the
Lipper materials, advisory fees are a component (together with
administrative fees) of management fees.
o 1 class (8% of the total classes with advisory fees higher than the
peer group median), while having contractual advisory fees higher
than the median for its peer group, has actual total expenses lower
than or equal to such median (Institutional class: Managed Income).
The Trustees also were provided with information about the services
rendered, and the fee rates offered, to other clients advised by the
Advisers, including closed-end investment companies and accounts that are
not investment companies.
Following consideration of this information, the Trustees, including the
Independent Trustees, concluded that the fees to be paid pursuant to the
Advisory Contracts were fair and reasonable in light of the services
provided.
Nature, Extent and Quality of Services. The Trustees, including the
Independent Trustees, received information concerning the investment
philosophy and investment process used by the Advisers in managing the
Portfolios, as well as a description of the capabilities, personnel and
services of each Adviser and a copy of the current Form ADV of BlackRock
Advisors, Inc. In connection with this, the Trustees considered each of
the Advisers' in-house research capabilities as well as other resources
available to its personnel. The Trustees considered the scope of the
services provided by the Advisers to the Portfolios under the Advisory
Contracts relative to services typically provided by third parties to other
funds. The Trustees noted that the standard of care applicable under the
Advisory Contracts was comparable to that found generally in investment
company advisory agreements. The Trustees concluded that the scope of the
Advisers' services to be provided to the Portfolios was consistent with the
Portfolios' operational requirements, including, in addition to seeking to
meet their investment objectives, compliance with investment restrictions,
tax and reporting requirements and related shareholder services.
3The Lipper peer group median was chosen as a conservative point of
reference, taking into account that one-half of the population will have
fees/expenses lower than the median.
165
BLACKROCK FUNDS
ADDITIONAL INFORMATION
The Trustees also considered the quality of the services provided by the
Advisers to the Portfolios. The Trustees evaluated the procedures of the
Advisers designed to fulfill their fiduciary duty to the Portfolios with
respect to possible conflicts of interest, including their respective codes
of ethics (regulating the personal trading of their officers and
employees), the procedures by which each of the Advisers allocate trades
among its various investment advisory clients, the integrity of the systems
in place to ensure compliance with the foregoing and the record of each of
the Advisers in these matters. The Trustees also received information
concerning standards of the Advisers with respect to the execution of
portfolio transactions.
The Trustees also considered information relating to the education,
experience and number of investment professionals and other personnel who
provide services under the applicable Advisory Contract. The Trustees also
took into account the time and attention devoted by senior management of
the Advisers to the Portfolios. The Trustees also considered the business
reputation of each Adviser and its respective financial resources and
concluded that each of the Advisers would be able to meet any reasonably
foreseeable obligation under the Advisory Contracts.
Fund Performance. The Board of Trustees, including the Independent
Trustees, received and considered information about each Portfolio's
investment performance in comparison to the investment performance of its
respective performance universe. The funds included within each
Portfolio's performance universe were selected by Lipper. The Board was
provided with performance data for the one-, three-, five- and ten-year
periods, as applicable, ended November 30, 2004 ("relevant periods"). The
Board also reviewed the investment performance of the Portfolios and the
Advisers' market outlook with respect to the Portfolios.
The Trustees noted that of the 26 classes of Portfolios subject to review
at the Board meeting, 9 classes (35%) had been in existence for less than
five years.4 The Board reviewed the performance record of these classes.
Of the remaining classes that had existed more than five years, 15 classes
(57%) performed at or better than their respective performance universe
medians during at least two of the relevant periods, while 2 classes (8%)
performed below their respective performance universe medians during at
least two of the relevant periods. In regard to each of these 2 classes,
the Trustees noted:
o 1 class (50% of the underperforming classes) performed below its
performance universe median during at least two of the relevant periods.
However, its underperformance was by no more than 10% of the median for
any of the relevant periods (Institutional class: Intermediate
Government).
o 1 class (50% of the underperforming classes) performed below its
performance universe median during at least two of the relevant periods
by more than 10% (Investor A class: Low Duration Bond). The Board noted
that with respect to this class of the Low Duration Bond Portfolio, the
five-year performance is only 13 basis points below its performance
universe median.
The Trustees discussed other factors relevant to the performance of the
Portfolios. The Trustees determined that, while the performance records of
certain of the Portfolios could be improved, the Advisers were taking steps
to address relative underperformance.
4The following three Portfolios (six classes total) were organized in 2004:
Enhanced Income, Inflation Protected Bond and Intermediate PLUS Bond
Portfolios.
166
BLACKROCK FUNDS
Profitability. The Board of Trustees, including the Independent Trustees,
considered the level of the Advisers' and affiliates' profits in respect of
their relationship with the Portfolios. This consideration included a
broad review of the Advisers' methodology in allocating their costs to the
management of a Portfolio. The Board of Trustees considered the profits
realized by the Advisers and affiliates in connection with the operation of
each Portfolio and whether the amount of profit is a fair profit relative
to their relationship with the Portfolio. The Board of Trustees, including
the Independent Trustees, also considered the Advisers' profit margins in
comparison with available industry data. The Board concluded that each
Adviser's profit is a reasonable profit relative to the services provided
to the Portfolios.
Economies of Scale. The Board of Trustees, including the Independent
Trustees, considered whether there have been economies of scale in respect
of the management of each Portfolio, whether each Portfolio has
appropriately benefited from any economies of scale, and whether there is
potential for realization of any further economies of scale.
The Board considered that economies of scale were passed on to the
shareholders in the form of breakpoints to the advisory fee rate. The
Board noted that for the fiscal year ended September 30, 2004, only the Low
Duration Bond Portfolio and Core Bond Total Return Portfolio had reached
their respective specified asset levels to trigger the breakpoints to their
respective advisory fee rates. The Board also considered the fee waivers
and expense reimbursement arrangements by the Advisers. The Board
determined that the advisory fee structure was reasonable and that no
changes were currently necessary.
Other Benefits to the Advisers. The Board of Trustees, including the
Independent Trustees, also took into account not only the advisory fees
payable by the Portfolios, but also other potential benefits to the
Advisers, such as the ability to leverage investment professionals that
also manage other portfolios, raising the profile of BlackRock in the
broker-dealer community, and the engagement of affiliates of the Advisers
as service providers to the Portfolios, including for administrative,
transfer agency, distribution and custodial services. The Board also noted
that the Advisers may benefit from the use of soft dollars for research,
which may be used by the Advisers to manage other accounts.
The Board concluded that other ancillary benefits that the Advisers and
their affiliates could be expected to receive with regard to providing
investment advisory and other services to the Portfolios, such as those
noted above, were consistent with those available to other mutual fund
sponsors.
No single factor was considered in isolation or to be determinative in the
Board's decision to approve the Advisory Contracts. Rather, the Board
concluded, in light of a weighing and balancing of all factors considered,
that it was in the best interests of each Portfolio to approve the
continuation of the Advisory Contracts, including the fees to be charged
for services thereunder.
(B) PricewaterhouseCoopers LLP ("PwC"), the Fund's former independent auditor,
has been hired as an
internal audit supporting service provider by The PNC Financial Services
Group, Inc. ("PNC"), the parent company of the Fund's investment adviser
and certain other service providers. In order to provide certain services
to PNC and its affiliates which would have caused PwC to no longer be
independent with respect to the Fund, PwC declined to stand for re-election
as independent auditor of the Fund after the completion of the fiscal 2003
audit.
The Fund's Audit Committee approved engaging Deloitte & Touche LLP as the
independent auditor to audit the Fund's financial statements for fiscal
year 2005. A majority of the Fund's Board of Trustees, including a majority
of the independent Trustees, approved the appointment of Deloitte & Touche
LLP as the Fund's independent auditor for the Fund's fiscal 2005 audit on
November 12, 2004, subject to the right of
167
BLACKROCK FUNDS
ADDITIONAL INFORMATION
the Fund, by a majority vote of the shareholders at any meeting called for
that purpose, to terminate the appointment without penalty.
(C) As previously disclosed, BlackRock has received subpoenas from various
federal and state governmental and regulatory authorities and various
information requests from the Securities and Exchange Commission in
connection with ongoing industry-wide investigations of mutual fund
matters.
(D) The amounts paid by the Fund for the Chief Compliance Officer (CCO) for
the six months ended March 31, 2005, were $81,903.
168
BLACKROCK FUNDS
Investment Adviser
BlackRock Advisors, Inc.
Wilmington, Delaware 19809
Sub-Adviser
BlackRock Financial Management, Inc.
New York, New York 10022
Custodian
PFPC Trust Co.
Philadelphia, Pennsylvania 19153
Co-Administrator and Transfer Agent
PFPC Inc.
Wilmington, Delaware 19809
Distributor
BlackRock Distributors, Inc.
King of Prussia, Pennsylvania 19406
Co-Administrator
BlackRock Advisors, Inc.
Wilmington, Delaware 19809
Counsel
Simpson Thacher & Bartlett LLP
New York, New York 10017
Independent Registered Public Accounting Firm
Deloitte & Touche LLP
Philadelphia, Pennsylvania 19103
The Fund will mail only one copy of shareholder documents, including
prospectuses, annual and semi-annual reports and proxy statements, to
shareholders with multiple accounts at the same address. This practice is
commonly called "householding" and it is intended to reduce expenses and
eliminate duplicate mailings of shareholder documents. Mailings of your
shareholder documents may be householded indefinitely unless you instruct us
otherwise. If you do not want the mailing of these documents to be combined
with those for other members of your household, please contact the Fund at
(800) 441-7762.
The Fund has delegated proxy voting responsibilities to BlackRock and its
affiliates, subject to the general oversight of the Fund's Board of Trustees. A
description of the policies and procedures that BlackRock and its affiliates
use to determine how to vote proxies relating to portfolio securities is
available without charge, upon request, by calling (800) 441-7762, or on the
website of the Securities and Exchange Commission (the "Commission") at
http://www.sec.gov.
Information on how proxies relating to the Fund's voting securities were voted
(if any) by BlackRock during the most recent 12-month period ended June 30th is
available, upon request and without charge, by calling (800) 441-7762 or on the
website of the Commission at http://www.sec.gov.
The Fund files its complete schedule of portfolio holdings for the first and
third quarters of its fiscal year with the Commission on Form N-Q. The Fund's
Form N-Q is available on the Commission's website at http://www.sec.gov and may
be reviewed and copied at the Commission's Public Reference Room in Washington,
D.C. Information regarding the operation of the Public Reference Room may be
obtained by calling 1-800-SEC-0330. The Fund's Form N-Q may also be obtained
upon request, without charge, by calling (800) 441-7762.
BLACKROCK FUNDS
FUND SPECTRUM
BlackRock Funds is a leading mutual fund company currently managing
approximately $26 billion in the following portfolios designed to fit a broad
range of investment goals. Each portfolio is managed by recognized experts in
equity, fixed income, international, and tax-free investing.
STOCK PORTFOLIOS
- --------------------------------------
Investment Trust Small Cap Core Equity
Large Cap Value Equity Small Cap Growth Equity
Large Cap Growth Equity Global Science & Technology Opportunities
Dividend AchieversTM Global Resources
Legacy All-Cap Global Resources
Mid-Cap Value Equity Health Sciences
Mid-Cap Growth Equity U.S. Opportunities
Aurora International Opportunities
Small/Mid-Cap Growth Index Equity
Small Cap Value Equity
STOCK & BOND PORTFOLIOS
- --------------------------------------
Asset Allocation
BOND PORTFOLIOS
- --------------------------------------
Enhanced Income Government Income
Low Duration Bond Inflation Protected Bond
Intermediate Government Bond GNMA
Intermediate Bond Managed Income
Intermediate PLUS Bond International Bond
Core Bond Total Return High Yield Bond
Core PLUS Total Return
TAX-FREE BOND PORTFOLIOS
- --------------------------------------
UltraShort Municipal Ohio Tax-Free Income
Tax-Free Income Delaware Tax-Free Income
Pennsylvania Tax-Free Income Kentucky Tax-Free Income
New Jersey Tax-Free Income
MONEY MARKET PORTFOLIOS
- --------------------------------------
Money Market North Carolina Municipal Money Market
U.S. Treasury Money Market Ohio Municipal Money Market
Municipal Money Market Pennsylvania Municipal Money Market
New Jersey Municipal Money Market Virginia Municipal Money Market
SHAREHOLDER PRIVILEGES
ACCOUNT INFORMATION
Call us at 1-800-441-7762 to get information about your account balances,
recent transactions and share prices.
You can also reach us on the web at www.blackrock.com.
AUTOMATIC INVESTMENT PLANS
Investor Class shareholders who want to invest regularly can arrange to have
$50 or more automatically deducted from their checking or savings account and
invested in any of the BlackRock portfolios.
SYSTEMATIC WITHDRAWAL PLANS
Investor Class shareholders can establish a systematic withdrawal plan and
receive periodic payments of $50 or more from their BlackRock portfolios, as
long as their account is at least $10,000.
RETIREMENT PLANS
Shareholders may make investments in conjunction with Traditional, Rollover,
Roth, Coverdell and Simple IRA's.
ADDITIONAL INFORMATION ABOUT THE BLACKROCK FUNDS
For additional reports or additional information, as well as more current
information about portfolio holdings and characteristics, BlackRock Fund
shareholders and prospective investors may call 1-800-441-7762.
Shares of the Fund are not deposits or obligations of, or guaranteed or
endorsed by PNC Bank, National Association or any other bank and shares are not
federally insured by, guaranteed by, obligations of or otherwise supported by
the U.S. Government, the Federal Deposit Insurance Corporation, the Federal
Reserve Board, or any other governmental agency. Investments in shares of the
fund involve investment risks, including the possible loss of the principal
amount invested.
[GRAPHIC OMITTED]
BND-SEMI1
ALTERNATIVES BLACKROCK SOLUTIONS EQUITIES FIXED
INCOME LIQUIDITYREAL ESTATE BlackRock Funds
Tax-Free Bond Portfolios
Semi-Annual Report to Shareholders
March 31, 2005 (Unaudited)
[GRAPHIC OMITTED]
[GRAPHIC OMITTED]
[GRAPHIC OMITTED]
NOT FDIC INSURED
MAY LOSE VALUE
NO BANK GUARANTEE
BLACKROCK FUNDS
TAX-FREE BOND PORTFOLIOS
*UltraShort Municipal
*Tax-Free Income
*Pennsylvania Tax-Free Income
*New Jersey Tax-Free Income
*Ohio Tax-Free Income
*Delaware Tax-Free Income
*Kentucky Tax-Free Income
TABLE OF CONTENTS
Shareholder Letter..........................................................1
Portfolio Summaries
UltraShort Municipal....................................................2-3
Tax-Free Income.........................................................4-5
Pennsylvania Tax-Free Income............................................6-7
New Jersey Tax-Free Income..............................................8-9
Ohio Tax-Free Income..................................................10-11
Delaware Tax-Free Income..............................................12-13
Kentucky Tax-Free Income..............................................14-15
Note on Performance Information..........................................16
Statement of Net Assets..................................................7-36
Portfolio Financial Statements
Statements of Operations.................................................37
Statements of Changes in Net Assets...................................38-39
Financial Highlights..................................................40-49
Notes to Financial Statements...........................................50-64
Additional Information..................................................65-68
PRIVACY PRINCIPLES OF BLACKROCK FUNDS
BlackRock Funds is committed to maintaining the privacy of its shareholders and
to safeguarding their nonpublic personal information. The following information
is provided to help you understand what personal information BlackRock Funds
collects, how we protect that information, and why in certain cases we may
share such information with select other parties.
BlackRock Funds does not receive any nonpublic personal information relating to
its shareholders who purchase shares through their broker-dealers. In the case
of shareholders who are record owners of BlackRock Funds, BlackRock Funds
receives nonpublic personal information on account applications or other forms.
With respect to these shareholders, BlackRock Funds also has access to specific
information regarding their transactions in BlackRock Funds.
BlackRock Funds does not disclose any nonpublic personal information about its
shareholders or former shareholders to anyone, except as permitted by law or as
is necessary in order to service our shareholders' accounts (for example, to a
transfer agent).
BlackRock Funds restricts access to nonpublic personal information about its
shareholders to BlackRock employees with a legitimate business need for the
information. BlackRock Funds maintains physical, electronic and procedural
safeguards designed to protect the nonpublic personal information of our
shareholders.
BLACKROCK FUNDS
March 31, 2005
Dear Shareholder:
We are pleased to present the Semi-Annual Report to Shareholders of the
BlackRock Funds' Tax-Free Bond Portfolios for the six-month period ended March
31, 2005. The Semi-Annual Report includes important information on each
Portfolio, and is organized as follows:
o Portfolio Summary - discusses recent portfolio management activity and
highlights total returns.
o Fund Profile - displays characteristics of each Portfolio's holdings as of
March 31, 2005.
o Expense Example - discusses costs in a shareholder account and provides
information for a shareholder to estimate his or her expenses by share
class and to compare expenses of each share class to other funds.
o Statement of Net Assets - lists portfolio holdings and includes each
holding's market value and par amount/number of shares as of March 31,
2005. The Statement of Net Assets also contains the net asset value for
each share class of a Portfolio.
o Statement of Operations - displays the components of each Portfolio's
investment income and provides a detailed look at each Portfolio's
expenses. The Statement of Operations also lists the aggregate change in
value of a Portfolio's securities due to market fluctuations and security
sales.
o Statement of Changes in Net Assets - compares Portfolio information from
the prior period to the current period. Specifically, it details
shareholder distributions by share class, aggregate realized gains and
losses, and the change in net assets from the beginning of the period to
the end of the period.
o Financial Highlights - include each Portfolio's expense ratios, net asset
values, total returns, distributions per share, and turnover ratios for the
current period and the last five years or since inception.
o Notes to Financial Statements - provides additional information on fees, a
summary of significant accounting policies, a list of affiliated
transactions, and a summary of purchases and sales of securities.
In addition to these items, a summary of shareholder privileges is listed
on the inside back cover of the report. Shareholders can find information on
this page describing how to access account balances, recent transactions, and
share prices. It also includes a summary of the Fund's various investment
plans.
There were two notable recent developments for the BlackRock Funds (the
"Fund").
First, on January 31, 2005, BlackRock, Inc., the parent of BlackRock
Advisors, Inc., the Fund's investment adviser, acquired SSRM Holdings, Inc.,
the parent of State Street Research & Management Company, the investment
adviser to the former State Street Research Funds. The transaction enhances
BlackRock's investment management platform with additional US equity,
alternative investment, and real estate equity management capabilities. In
addition, the scale and scope of BlackRock's open-end and closed-end mutual
funds and distribution capabilities has expanded significantly. We believe that
we can incorporate the best of both organizations to deliver high quality
products to both institutional and individual investors.
Second, a proxy statement was recently sent to shareholders of all
portfolios of the Fund asking them to consider and vote upon the election of
nine trustees to the board of trustees of the Fund (the "Board"). Five of the
nine nominees were already serving as trustees of the Fund and the additional
nominees had previously served as trustees of the State Street Research Funds.
Due to the increased size and complexity of the Fund resulting from the
reorganization with the State Street Research Funds, and an increase in the
responsibilities of boards of trustees of funds generally, the current Board
believed it was in the best interest of the Fund to increase the size of the
Board. On April 29, 2005, the special meeting of shareholders was held, at
which all of the nominees included in the proxy were duly elected to the Board.
We hope you find the report informative, and we thank you for making
BlackRock part of your investment strategy.
Sincerely,
[GRAPHIC OMITTED]
Anne Ackerley
Managing Director
BlackRock Advisors,Inc.
1
ULTRASHORT MUNICIPAL PORTFOLIO
Total Net Assets (3/31/05): $37.0 million
Investment Approach
Seeks to maximize total return consistent with income generation and
prudent investment management by investing primarily in bonds issued by or on
behalf of states, possessions and territories of the United States, their
political subdivisions and their agencies and authorities (and related
tax-exempt derivative securities), the interest on which is exempt from Federal
income tax ("municipal securities"). These municipal securities may not be
exempt from the Federal Alternative Minimum Tax. The Portfolio normally invests
at least 80% of its assets in municipal securities, including both general
obligation and revenue bonds, from a diverse range of issuers.
Recent Portfolio Management Activity
o All share classes of the Portfolio outperformed the Portfolio's Lipper
peer group (Short Municipal Debt Funds) during the semi-annual period.
o During the semi-annual period, the municipal yield curve, as measured
by the spread between 2-year and 30-year rates, flattened by approximately 100
basis points. Yields on the 2-year portion of the yield curve rose 90 basis
points while the 30-year rates declined by 10 basis points. The shorter end of
the municipal yield curve saw similarly dramatic increases in interest rates as
evidenced by the 63 basis point and 91 basis point increase in overnight and
one-year tax exempt interest rates, respectively.
o The strategy for the Portfolio remained consistent throughout the
semi-annual period. The Portfolio continued to be structured to take advantage
of a rising interest rate environment for shorter duration assets. The
Portfolio consistently held over 50% of its assets in variable rate assets and
held less than 20% of the Portfolio's assets in maturities greater than one
year.
o While national new issue supply declined in 2004 by 6.6% to $358
billion, the new supply issuance during the first quarter of 2005 was the
highest first quarter on record. A total of $97 billion was issued, which
represents a 12% increase over the first quarter of 2004. Despite a higher
interest rate environment, which typically slows new issue supply, the
flattening of the Treasury yield curve has created more advance refunding
opportunities for issues to lower total debt cost. The increase in supply has
been primarily absorbed by continued demand from insurance companies as well as
retail investors. During the first quarter of 2005, a total of $1.7 billion
flowed into open-end mutual funds. In addition to the positive underwriting
environment for most insurance companies, the high credit quality, low
volatility and high after-tax income that the sector had to offer continued to
appeal to many investors, especially at a time when taxable credit spreads were
near their all-time tights.
COMPARISON OF CHANGE IN VALUE OF A $10,000 INVESTMENT IN THE ULTRASHORT
MUNICIPAL PORTFOLIO,
THE LEHMAN BROTHERS 1 YEAR MUNICIPAL BOND INDEX AND THE LIPPER SHORT MUNICIPAL
DEBT FUNDS
FROM INCEPTION.
[LINE CHART]
Institutional Investor A Lehman Brothers 1 Year Municipal Bond Index Lipper Short Municipal Debt Funds
------------- ---------- ------------------------------------------- ---------------------------------
03/03/2004 $ 10,000 $ 9,699 $ 10,000 $ 10,000
03/31/2004 10,000 9,690 10,001 9,989
06/30/2004 9,955 9,682 9,971 9,916
09/30/2004 10,009 9,721 10,047 10,017
12/31/2004 10,044 9,741 10,049 10,040
03/31/2005 10,060 9,742 10,048 10,023
FOR PERIOD ENDING MARCH 31, 2005
Average Annual Total Return
From
1 Year Inception
------------ ------------
BlackRock Class 0.72% 0.68%
Institutional Class 0.61% 0.56%
Service Class 0.82% 0.71%
Investor A Class (Load Adjusted) (2.50)% (2.40)%
Investor A Class (NAV) 0.53% 0.41%
THE PERFORMANCE OF THE LEHMAN BROTHERS 1 YEAR MUNICIPAL BOND INDEX (THE
"BENCHMARK") IS PRESENTED FOR COMPARATIVE PURPOSES IN RESPONSE TO REQUIREMENTS
OF THE SECURITIES AND EXCHANGE COMMISSION. HOWEVER, BLACKROCK BELIEVES THAT
DIFFERENCES BETWEEN THE WAYS IN WHICH THE PORTFOLIO IS MANAGED AND THE
BENCHMARK IS CONSTRUCTED MAY MAKE COMPARISONS BETWEEN THE PORTFOLIO AND
BENCHMARK PERFORMANCE LESS MEANINGFUL TO INVESTORS. THEREFORE, THE PERFORMANCE
OF THE LIPPER SHORT MUNICIPAL DEBT FUNDS IS ALSO PRESENTED.
THE PERFORMANCE INFORMATION ABOVE INCLUDES INFORMATION RELATING TO EACH CLASS
OF THE PORTFOLIO SINCE THE COMMENCEMENT OF OPERATIONS OF THE PORTFOLIO, RATHER
THAN THE DATE SUCH CLASS WAS INTRODUCED. THE INCEPTION DATES OF THE PORTFOLIO'S
SHARE CLASSES WERE AS FOLLOWS: BLACKROCK SHARES, 3/3/04; INSTITUTIONAL SHARES,
3/19/04; SERVICE SHARES, 3/19/04; AND INVESTOR A SHARES, 3/19/04. SEE "NOTE ON
PERFORMANCE INFORMATION" ON PAGE 16 FOR FURTHER INFORMATION ON HOW PERFORMANCE
DATA WAS CALCULATED, INCLUDING IMPORTANT INFORMATION ON THE LINE GRAPH\^ ABOVE.
PAST PERFORMANCE IS NOT PREDICTIVE OF FUTURE RESULTS. The graph and table do
not reflect the deduction of taxes that a shareholder would pay on fund
distributions or the redemption of shares. Although the holdings and sectors
listed above were current as of the periods indicated, the Portfolio is
actively managed and its composition will vary.
2
ULTRASHORT MUNICIPAL PORTFOLIO
FUND PROFILE
Credit Quality (% of
investments)1
AAA 11.7 %
AA 32.8
A 34.2
BBB 11.4
Unrated 9.9
----
Total 100.0 %
========
Largest State Concentration
(% of portfolio, excluding
money market investments)
Texas 15.3 %
Ohio 10.9
Pennsylvania 10.0
Florida 5.4
Alaska 5.4
Tennessee 4.5
South Carolina 3.5
Georgia 3.3
Virginia 2.9
Oregon 2.9
----
Total 64.1 %
========
Portfolio Statistics
Average maturity (years) 0.47
Modified Duration2 0.4
1 Using the highest of Standard & Poor's ("S&P's"), Fitch Ratings ("Fitch"),
or Moody's Investors Service ("Moody's") rating.
2 Duration measures a Portfolio's price risk. Each year of duration represents
an expected 1% change in the net asset value of the fund for every 1%
change in interest rates. Modified duration assumes that cash flows remain
constant as interest rates change.
- --------------------------------------------------------------------------------
EXPENSE EXAMPLE
As a shareholder of the Portfolio, you incur two types of costs: (1)
transaction costs, including front and back end sales charges (loads) where
applicable; and (2) ongoing costs, including advisory fees, distribution
(12b-1) and service fees, where applicable; and other Portfolio expenses. This
Example is intended to help you understand your ongoing costs (in dollars) of
investing in the Portfolio and to compare these costs with the ongoing costs of
investing in other mutual funds.
The Example below is based on an investment of $1,000 invested at the beginning
of the period and held for the entire period October 1, 2004 to March 31, 2005.
The information under "Actual Expenses," together with the amount you invested,
allows you to estimate actual expenses incurred over the reporting period.
Simply divide your account value by $1,000 (for example, an $8,600 account
value divided by $1,000 = 8.60) and multiply the result by the cost shown for
your share class, in the row entitled "Expenses Incurred During Period", to
estimate the expenses incurred on your account during this period.
The information under "Hypothetical Expenses" provides information about
hypothetical account values and hypothetical expenses based on the Portfolio's
actual expense ratio and an assumed rate of return of 5% per year before
expenses, which is not the Portfolio's actual return. The hypothetical account
values and expenses may not be used to estimate the actual ending account
balance or expense you incurred for the period. You may use this information to
compare the ongoing costs of investing in the Portfolio and other funds. To do
so, compare this 5% hypothetical example with the 5% hypothetical examples that
appear in the shareholder reports of the other funds.
Please note that the expenses shown in the table are meant to highlight your
ongoing costs only and do not reflect any transactional costs, such as front
and back end sales charges (loads) or redemption/exchange fees, where
applicable. Therefore, the hypothetical information is useful in comparing
ongoing costs only, and will not help you determine the relative total costs of
owning different funds. In addition, if these transactional costs were
included, your costs would have been higher.
Actual Expenses
---------------------------------------------------------------
BlackRock Institutional Service Investor
Class Class Class A Class
--------------- --------------- --------------- ---------------
Beginning Account
Value (10/01/04) $ 1,000.00 $ 1,000.00 $ 1,000.00 $ 1,000.00
Ending Account Value
(3/31/05) 1,005.70 1,005.10 1,009.30 1,002.20
Expenses Incurred
During Period
(10/01/04 -
3/31/05) 1.75 2.24 3.50 3.48
Hypothetical Expenses
(5% return before expenses)
---------------------------------------------------------------
BlackRock Institutional Service Investor
Class Class Class A Class
--------------- --------------- --------------- ---------------
Beginning Account
Value (10/01/04) $ 1,000.00 $ 1,000.00 $ 1,000.00 $ 1,000.00
Ending Account Value
(3/31/05) 1,023.24 1,022.73 1,021.48 1,021.48
Expenses Incurred
During Period
(10/01/04 -
3/31/05) 1.76 2.27 3.52 3.52
For each class of the Portfolio, expenses are equal to the annualized expense
ratio of 0.35%, 0.45%, 0.70%, and 0.70% for the BlackRock, Institutional,
Service, and Investor A share classes, respectively, multiplied by the average
account value over the period, multiplied by 182/365 (to reflect the one-half
year period).
3
TAX-FREE INCOME PORTFOLIO
Total Net Assets (3/31/05): $425.2 million
Investment Approach
Seeks to maximize total return consistent with income generation and
prudent investment management by investing primarily in bonds issued by or on
behalf of states, possessions and territories of the United States, their
political subdivisions and their agencies and authorities (and related
tax-exempt derivative securities), the interest on which the Portfolio manager
believes is exempt from Federal income tax, including the Federal Alternative
Minimum Tax ("municipal securities"). The Portfolio normally invests at least
80% of its assets in municipal securities, including both general obligation
and revenue bonds, from a diverse range of issuers. The Portfolio emphasizes
securities in the ten to twenty year maturity range.
Recent Portfolio Management Activity
o All share classes of the Portfolio outperformed the Portfolio's Lipper
peer group (General Municipal Debt Funds) during the semi-annual period.
o During the semi-annual period, the municipal yield curve, as measured
by the spread between 2-year and 30-year rates, flattened by approximately 100
basis points. Yields on the 2-year portion of the curve rose 90 basis points
while the 30-year rates declined by 10 basis points. During the first half of
the semi-annual period, the Portfolio actively traded long 5% coupon bonds due
to our interest rate outlook and the attractive relative value of these bonds
versus shorter maturity municipals that we traded out of. This activity
accounted for the relative performance versus the Portfolio's benchmark (Lehman
Brothers Municipal Bond Index) and its Lipper peer group and offset the
Portfolio's more defensive premium coupon structure.
o The Portfolio's continued bias towards a higher interest rate
environment was a modest negative for the semi-annual period as the longer
portions of the Lehman Brothers Municipal Bond Index were the best performers.
This bias is expressed through the Portfolio's higher coupon weighting as well
as through the duration of its holdings compared to the benchmark.
o While national new issue supply declined in 2004 by 6.6% to $358
billion, the new supply issuance during the first quarter of 2005 was the
highest first quarter on record. A total of $97 billion was issued, which
represents a 12% increase over the first quarter of 2004. Despite a higher
interest rate environment, which typically slows new issue supply, the
flattening of the Treasury yield curve has created more advance refunding
opportunities for issues to lower total debt cost. The increase in supply has
been primarily absorbed by continued demand from insurance companies as well as
retail investors. During the first quarter of 2005, a total of $1.7 billion
flowed into open-end mutual funds. In addition to the positive underwriting of
most insurance companies, the high credit quality, low volatility and high
after-tax income that the sector had to offer continued to appeal to many
investors, especially at a time when taxable credit spreads were near their
all-time tights.
o Fundamentally, tax receipts have grown for the past two years, a
manifestation of the improving economy. The most recent economic acceleration
has provided the states with increased revenues, which has fueled positive
operations for all but a few state governments. At the end of the semi-annual
period, forty-six states have reported that fiscal year 2005 revenue
projections are on or above budget. The revenue growth is helping states
rebuild their reserve funds, many of which were depleted during the fiscal
crisis of 2001. Overall, the credit trend has grown more positive, exemplified
by ratings upgrades over the last few quarters for the states of California,
Florida and New York.
COMPARISON OF CHANGE IN VALUE OF A $10,000 INVESTMENT IN THE TAX-FREE INCOME
PORTFOLIO,
THE LEHMAN BROTHERS MUNICIPAL BOND INDEX AND THE LIPPER GENERAL MUNICIPAL DEBT
FUNDS
FOR THE PAST TEN YEARS.
[LINE CHART]
Institutional Investor A Lehman Brothers Municipal Bond Index Lipper General Municipal Debt Funds
------------- ---------- ------------------------------------ -----------------------------------
03/31/1995 $ 10,000 $ 9,603 $ 10,000 $ 10,000
06/30/1995 10,174 9,757 10,242 10,198
09/30/1995 10,471 10,028 10,536 10,436
12/31/1995 10,950 10,465 10,971 10,920
03/31/1996 10,857 10,374 10,838 10,724
06/30/1996 10,958 10,458 10,921 10,780
09/30/1996 11,250 10,724 11,173 11,026
12/31/1996 11,577 11,022 11,457 11,288
03/31/1997 11,567 11,000 11,431 11,234
06/30/1997 11,984 11,383 11,825 11,626
09/30/1997 12,386 11,751 12,181 11,988
12/31/1997 12,749 12,081 12,512 12,323
03/31/1998 12,917 12,225 12,656 12,438
06/30/1998 13,105 12,389 12,848 12,603
09/30/1998 13,482 12,731 13,243 12,973
12/31/1998 13,567 12,796 13,323 12,983
03/31/1999 13,638 12,848 13,441 13,047
06/30/1999 13,400 12,609 13,203 12,747
09/30/1999 13,256 12,459 13,150 12,572
12/31/1999 13,002 12,206 13,047 12,378
03/31/2000 13,375 12,541 13,430 12,732
06/30/2000 13,547 12,688 13,633 12,870
09/30/2000 13,893 12,996 13,962 13,166
12/31/2000 14,426 13,480 14,573 13,733
03/31/2001 14,707 13,726 14,896 14,000
06/30/2001 14,836 13,818 14,993 14,067
09/30/2001 15,256 14,205 15,414 14,430
12/31/2001 15,115 14,058 15,320 14,271
03/31/2002 15,259 14,162 15,465 14,385
06/30/2002 15,650 14,522 16,031 14,875
09/30/2002 16,031 14,857 16,792 15,529
12/31/2002 16,022 14,832 16,792 15,470
03/31/2003 16,025 14,817 16,994 15,578
06/30/2003 16,594 15,325 17,432 15,988
09/30/2003 16,575 15,290 17,446 15,978
12/31/2003 16,776 15,457 17,684 16,207
03/31/2004 16,946 15,596 17,990 16,434
06/30/2004 16,636 15,292 17,564 16,048
09/30/2004 17,148 15,764 18,249 16,614
12/31/2004 17,404 15,974 18,477 16,807
03/31/2005 17,457 16,013 18,470 16,765
FOR PERIOD ENDING MARCH 31, 2005
Average Annual Total Return
1 Year 3 Year 5 Year 10 Year
------------ ---------- ---------- ----------
BlackRock Class 3.17% 4.65% 5.51% 5.75%
Institutional Class 3.01% 4.59% 5.47% 5.73%
Service Class 2.74% 4.26% 5.15% 5.41%
Investor A Class (Load Adjusted) (1.46)% 2.78% 4.16% 4.82%
Investor A Class (NAV) 2.67% 4.18% 5.01% 5.25%
Investor B Class (Load Adjusted) (2.54)% 2.30% 3.89% 4.57%
Investor B Class (NAV) 1.91% 3.40% 4.23% 4.57%
Investor C Class (Load Adjusted) 0.92% 3.40% 4.23% 4.56%
Investor C Class (NAV) 1.91% 3.40% 4.23% 4.56%
THE PERFORMANCE OF THE LEHMAN BROTHERS MUNICIPAL BOND INDEX (THE "BENCHMARK")
IS PRESENTED FOR COMPARATIVE PURPOSES IN RESPONSE TO REQUIREMENTS OF THE
SECURITIES AND EXCHANGE COMMISSION. HOWEVER, BLACKROCK BELIEVES THAT
DIFFERENCES BETWEEN THE WAYS IN WHICH THE PORTFOLIO IS MANAGED AND THE
BENCHMARK IS CONSTRUCTED MAY MAKE COMPARISONS BETWEEN THE PORTFOLIO AND
BENCHMARK PERFORMANCE LESS MEANINGFUL TO INVESTORS. THEREFORE, THE PERFORMANCE
OF THE LIPPER GENERAL MUNICIPAL DEBT FUNDS IS ALSO PRESENTED.
THE PERFORMANCE INFORMATION ABOVE INCLUDES INFORMATION RELATING TO EACH CLASS
OF THE PORTFOLIO SINCE THE COMMENCEMENT OF OPERATIONS OF THE PORTFOLIO, RATHER
THAN THE DATE SUCH CLASS WAS INTRODUCED. THE INCEPTION DATES OF THE PORTFOLIO'S
SHARE CLASSES WERE AS FOLLOWS: INVESTOR A SHARES, 5/14/90; INSTITUTIONAL
SHARES, 1/21/93; SERVICE SHARES, 7/29/93; INVESTOR B SHARES, 7/18/96, INVESTOR
C SHARES, 2/28/97 AND BLACKROCK SHARES, 12/22/03. SEE "NOTE ON PERFORMANCE
INFORMATION" ON PAGE 16 FOR FURTHER INFORMATION ON HOW PERFORMANCE DATA WAS
CALCULATED, INCLUDING IMPORTANT INFORMATION ON THE LINE GRAPH\^ ABOVE.
PAST PERFORMANCE IS NOT PREDICTIVE OF FUTURE RESULTS. The graph and table do
not reflect the deduction of taxes that a shareholder would pay on fund
distributions or the redemption of shares. Although the holdings and sectors
listed above were current as of the periods indicated, the Portfolio is
actively managed and its composition will vary.
4
TAX-FREE INCOME PORTFOLIO
FUND PROFILE
Credit Quality (% of
investments)1
AAA 62.1 %
AA 17.1
A 7.8
BBB 10.1
\qBBB 1.8
Unrated 1.1
----
Total 100.0 %
========
Largest State Concentration
(% of long-term
investments)
Pennsylvania 10.7 %
New York 9.8
Texas 7.2
California 6.5
New Jersey 6.3
Washington 6.1
Georgia 4.6
Virginia 4.4
Florida 4.3
Massachusetts 4.2
---
Total 64.1 %
========
Portfolio Statistics
Average maturity (years) 6.41
Modified Duration2 4.2
1 Using the higher of Standard & Poor's ("S&P's") or Moody's Investors Service
("Moody's") rating.
2 Duration measures a Portfolio's price risk. Each year of duration represents
an expected 1% change in the net asset value of the fund for every 1%
change in interest rates. Modified duration assumes that cash flows remain
constant as interest rates change.
- --------------------------------------------------------------------------------
EXPENSE EXAMPLE
As a shareholder of the Portfolio, you incur two types of costs: (1)
transaction costs, including front and back end sales charges (loads) where
applicable; and (2) ongoing costs, including advisory fees, distribution
(12b-1) and service fees, where applicable; and other Portfolio expenses. This
Example is intended to help you understand your ongoing costs (in dollars) of
investing in the Portfolio and to compare these costs with the ongoing costs of
investing in other mutual funds.
The Example below is based on an investment of $1,000 invested at the beginning
of the period and held for the entire period October 1, 2004 to March 31, 2005.
The information under "Actual Expenses," together with the amount you invested,
allows you to estimate actual expenses incurred over the reporting period.
Simply divide your account value by $1,000 (for example, an $8,600 account
value divided by $1,000 = 8.60) and multiply the result by the cost shown for
your share class, in the row entitled "Expenses Incurred During Period", to
estimate the expenses incurred on your account during this period.
The information under "Hypothetical Expenses" provides information about
hypothetical account values and hypothetical expenses based on the Portfolio's
actual expense ratio and an assumed rate of return of 5% per year before
expenses, which is not the Portfolio's actual return. The hypothetical account
values and expenses may not be used to estimate the actual ending account
balance or expense you incurred for the period. You may use this information to
compare the ongoing costs of investing in the Portfolio and other funds. To do
so, compare this 5% hypothetical example with the 5% hypothetical examples that
appear in the shareholder reports of the other funds.
Please note that the expenses shown in the table are meant to highlight your
ongoing costs only and do not reflect any transactional costs, such as front
and back end sales charges (loads) or redemption/exchange fees, where
applicable. Therefore, the hypothetical information is useful in comparing
ongoing costs only, and will not help you determine the relative total costs of
owning different funds. In addition, if these transactional costs were
included, your costs would have been higher.
Actual Expenses
-----------------------------------------------------------------------------------------------
BlackRock Institutional Service Investor Investor Investor
Class Class Class A Class B Class C Class
--------------- --------------- --------------- --------------- --------------- ---------------
Beginning Account
Value (10/01/04) $ 1,000.00 $ 1,000.00 $ 1,000.00 $ 1,000.00 $ 1,000.00 $ 1,000.00
Ending Account Value
(3/31/05) 1,018.80 1,018.00 1,016.70 1,015.80 1,012.90 1,012.90
Expenses Incurred
During Period
(10/01/04 -
3/31/05) 2.26 3.01 4.31 4.31 8.06 8.16
Hypothetical Expenses
(5% return before expenses)
-----------------------------------------------------------------------------------------------
BlackRock Institutional Service Investor Investor Investor
Class Class Class A Class B Class C Class
--------------- --------------- --------------- --------------- --------------- ---------------
Beginning Account
Value (10/01/04) $ 1,000.00 $ 1,000.00 $ 1,000.00 $ 1,000.00 $ 1,000.00 $ 1,000.00
Ending Account Value
(3/31/05) 1,022.73 1,021.98 1,020.67 1,020.67 1,016.89 1,016.79
Expenses Incurred
During Period
(10/01/04 -
3/31/05) 2.27 3.02 4.33 4.33 8.06 8.21
For each class of the Portfolio, expenses are equal to the annualized expense
ratio of 0.45%, 0.60%, 0.86%, 0.86%, 1.61%, and 1.63% for the BlackRock,
Institutional, Service, Investor A, B, and C share classes, respectively,
multiplied by the average account value over the period, multiplied by 182/365
(to reflect the one-half year period).
5
PENNSYLVANIA TAX-FREE INCOME PORTFOLIO
Total Net Assets (3/31/05): $668.2 million
Investment Approach
Seeks to maximize total return consistent with income generation and
prudent investment management by investing primarily in bonds issued by or on
behalf of states, possessions and territories of the United States, their
political subdivisions and their agencies and authorities (and related
tax-exempt derivative securities), the interest on which the Portfolio manager
believes is exempt from Federal income tax (including the Federal Alternative
Minimum Tax) and Pennsylvania state income tax ("municipal securities"). The
Portfolio normally invests at least 80% of its assets in municipal securities,
including both general obligation and revenue bonds, from a diverse range of
issuers (including issuers located outside of Pennsylvania). The Portfolio
emphasizes securities in the ten to twenty year maturity range.
Recent Portfolio Management Activity
o All share classes of the Portfolio underperformed the Portfolio's
Lipper peer group (Pennsylvania Municipal Debt Funds) during the semi-annual
period.
o During the semi-annual period, the municipal yield curve, as measured
by the spread between 2-year and 30-year rates, flattened by approximately 100
basis points. Yields on the 2-year portion of the curve rose 90 basis points
while the 30-year rates declined by 10 basis points.
o During the semi-annual period, the Portfolio continued to have a
predominant focus on premium coupon bonds, as evidenced by the 5.5% average
coupon on the bonds in the Portfolio versus an average of 5.13% for the
Portfolio's benchmark (Lehman Brothers Municipal Bond Index). In addition, the
exposure in the Portfolio to securities with significant levels of unrealized
gains and short calls resulted in the Portfolio behaving more like an
intermediate portfolio than a long portfolio. This structure produces
competitive levels of income with less duration exposure than longer funds. The
defensive structure of the Portfolio holdings was a primary contributor to
performance for the semi-annual period.
o The Portfolio's continued bias towards a higher interest rate
environment was a modest negative for the semi-annual period as the longer
portions of the Lehman Brothers Municipal Bond Index were the best performers.
This bias is expressed through the Portfolio's higher coupon weighting as well
as through the shorter duration of its holdings compared to the benchmark.
o While national new issue supply declined in 2004 by 6.6% to $358
billion, the new supply issuance during the first quarter of 2005 was the
highest first quarter on record. A total of $97 billion was issued, which
represents a 12% increase over the first quarter of 2004. Despite a higher
interest rate environment, which typically slows new issue supply, the
flattening of the Treasury yield curve has created more advance refunding
opportunities for issues to lower total debt cost. The increase in supply has
been primarily absorbed by continued demand from insurance companies as well as
retail investors. During the first quarter of 2005, a total of $1.7 billion
flowed into open-end mutual funds. With $3.94 billion in new issuance,
Pennsylvania placed sixth amongst states for new issuance in the first quarter
of 2005. New issuance in the state increased 59% over the same period in 2004.
o Fundamentally, tax receipts have grown for the past two years, a
manifestation of the improving economy. The most recent economic acceleration
has provided the states with increased revenues, which has fueled positive
operations for all but a few state governments. At the end of the semi-annual
period, forty-six states have reported that fiscal year 2005 revenue
projections are on or above budget. The revenue growth is helping states
rebuild their reserve funds, many of which were depleted during the fiscal
crisis of 2001.
COMPARISON OF CHANGE IN VALUE OF A $10,000 INVESTMENT IN THE PA TAX-FREE INCOME
PORTFOLIO,
THE LEHMAN BROTHERS MUNICIPAL BOND INDEX AND THE LIPPER PENNSYLVANIA MUNICIPAL
DEBT FUNDS
FOR THE PAST TEN YEARS.
[LINE CHART]
Institutional Investor A Lehman Brothers Municipal Bond Index Lipper Pennsylvania Municipal Debt Funds
------------- ---------- ------------------------------------ ----------------------------------------
03/31/1995 $ 10,000 $ 9,598 $ 10,000 $ 10,000
06/30/1995 10,231 9,808 10,242 10,208
09/30/1995 10,556 10,108 10,536 10,451
12/31/1995 10,999 10,520 10,971 10,937
03/31/1996 10,871 10,386 10,838 10,742
06/30/1996 10,968 10,467 10,921 10,816
09/30/1996 11,220 10,695 11,173 11,066
12/31/1996 11,506 10,956 11,457 11,320
03/31/1997 11,463 10,903 11,431 11,280
06/30/1997 11,815 11,226 11,825 11,651
09/30/1997 12,165 11,546 12,181 11,993
12/31/1997 12,507 11,857 12,512 12,325
03/31/1998 12,659 11,989 12,656 12,449
06/30/1998 12,861 12,166 12,848 12,620
09/30/1998 13,201 12,474 13,243 12,935
12/31/1998 13,271 12,527 13,323 12,948
03/31/1999 13,378 12,614 13,441 13,026
06/30/1999 13,156 12,391 13,203 12,780
09/30/1999 13,093 12,318 13,150 12,575
12/31/1999 12,967 12,186 13,047 12,346
03/31/2000 13,296 12,482 13,430 12,677
06/30/2000 13,489 12,648 13,633 12,809
09/30/2000 13,814 12,938 13,962 13,124
12/31/2000 14,259 13,339 14,573 13,629
03/31/2001 14,582 13,613 14,896 13,877
06/30/2001 14,627 13,639 14,993 13,970
09/30/2001 15,008 13,991 15,414 14,369
12/31/2001 14,932 13,891 15,320 14,245
03/31/2002 15,050 13,984 15,465 14,350
06/30/2002 15,552 14,448 16,031 14,824
09/30/2002 15,988 14,835 16,792 15,473
12/31/2002 16,024 14,838 16,792 15,428
03/31/2003 16,176 14,975 16,994 15,577
06/30/2003 16,583 15,321 17,432 15,964
09/30/2003 16,494 15,219 17,446 15,940
12/31/2003 16,704 15,395 17,684 16,170
03/31/2004 16,810 15,489 17,990 16,390
06/30/2004 16,517 15,201 17,564 15,993
09/30/2004 16,959 15,592 18,249 16,531
12/31/2004 17,151 15,753 18,477 16,744
03/31/2005 17,152 15,724 18,470 16,749
FOR PERIOD ENDING MARCH 31, 2005
Average Annual Total Return
1 Year 3 Year 5 Year 10 Year
------------ ---------- ---------- ----------
Institutional Class 2.04% 4.46% 5.22% 5.54%
Service Class 1.73% 4.15% 4.89% 5.22%
Investor A Class (Load Adjusted) (2.53)% 2.59% 3.88% 4.63%
Investor A Class (NAV) 1.51% 3.99% 4.73% 5.06%
Investor B Class (Load Adjusted) (3.52)% 2.14% 3.65% 4.32%
Investor B Class (NAV) 0.85% 3.23% 3.99% 4.32%
Investor C Class (Load Adjusted) (0.21)% 3.22% 3.98% 4.34%
Investor C Class (NAV) 0.76% 3.22% 3.98% 4.34%
THE PERFORMANCE OF THE LEHMAN BROTHERS MUNICIPAL BOND INDEX (THE "BENCHMARK")
IS PRESENTED FOR COMPARATIVE PURPOSES IN RESPONSE TO REQUIREMENTS OF THE
SECURITIES AND EXCHANGE COMMISSION. HOWEVER, BLACKROCK BELIEVES THAT
DIFFERENCES BETWEEN THE WAYS IN WHICH THE PORTFOLIO IS MANAGED AND THE
BENCHMARK IS CONSTRUCTED MAY MAKE COMPARISONS BETWEEN THE PORTFOLIO AND
BENCHMARK PERFORMANCE LESS MEANINGFUL TO INVESTORS. THEREFORE, THE PERFORMANCE
OF THE LIPPER PENNSYLVANIA MUNICIPAL DEBT FUNDS IS ALSO PRESENTED.
THE PERFORMANCE INFORMATION ABOVE INCLUDES INFORMATION RELATING TO EACH CLASS
OF THE PORTFOLIO SINCE THE COMMENCEMENT OF OPERATIONS OF THE PORTFOLIO, RATHER
THAN THE DATE SUCH CLASS WAS INTRODUCED. THE INCEPTION DATES OF THE PORTFOLIO'S
SHARE CLASSES WERE AS FOLLOWS: INSTITUTIONAL AND INVESTOR A SHARES, 12/1/92;
SERVICE SHARES, 7/29/93; INVESTOR B SHARES, 10/3/94 AND INVESTOR C SHARES,
8/14/98. SEE "NOTE ON PERFORMANCE INFORMATION" ON PAGE 16 FOR FURTHER
INFORMATION ON HOW PERFORMANCE DATA WAS CALCULATED, INCLUDING IMPORTANT
INFORMATION ON THE LINE GRAPH\^ ABOVE.
PAST PERFORMANCE IS NOT PREDICTIVE OF FUTURE RESULTS. The graph and table do
not reflect the deduction of taxes that a shareholder would pay on fund
distributions or the redemption of shares. Although the holdings and sectors
listed above were current as of as of the periods indicated, the Portfolio is
actively managed and its composition will vary.
6
PENNSYLVANIA TAX-FREE INCOME PORTFOLIO
FUND PROFILE
Credit Quality (% of
investments)1
AAA 78.8 %
AA 6.1
A 11.1
BBB 3.9
Unrated 0.1
----
Total 100.0 %
========
Portfolio Statistics
Average maturity (years) 5.62
Modified Duration2 3.5
1 Using the higher of Standard & Poor's ("S&P's") or Moody's Investors Service
("Moody's") rating.
2 Duration measures a Portfolio's price risk. Each year of duration represents
an expected 1% change in the net asset value of the fund for every 1%
change in interest rates. Modified duration assumes that cash flows remain
constant as interest rates change.
- --------------------------------------------------------------------------------
EXPENSE EXAMPLE
As a shareholder of the Portfolio, you incur two types of costs: (1)
transaction costs, including front and back end sales charges (loads) where
applicable; and (2) ongoing costs, including advisory fees, distribution
(12b-1) and service fees, where applicable; and other Portfolio expenses. This
Example is intended to help you understand your ongoing costs (in dollars) of
investing in the Portfolio and to compare these costs with the ongoing costs of
investing in other mutual funds.
The Example below is based on an investment of $1,000 invested at the beginning
of the period and held for the entire period October 1, 2004 to March 31, 2005.
The information under "Actual Expenses," together with the amount you invested,
allows you to estimate actual expenses incurred over the reporting period.
Simply divide your account value by $1,000 (for example, an $8,600 account
value divided by $1,000 = 8.60) and multiply the result by the cost shown for
your share class, in the row entitled "Expenses Incurred During Period", to
estimate the expenses incurred on your account during this period.
The information under "Hypothetical Expenses" provides information about
hypothetical account values and hypothetical expenses based on the Portfolio's
actual expense ratio and an assumed rate of return of 5% per year before
expenses, which is not the Portfolio's actual return. The hypothetical account
values and expenses may not be used to estimate the actual ending account
balance or expense you incurred for the period. You may use this information to
compare the ongoing costs of investing in the Portfolio and other funds. To do
so, compare this 5% hypothetical example with the 5% hypothetical examples that
appear in the shareholder reports of the other funds.
Please note that the expenses shown in the table are meant to highlight your
ongoing costs only and do not reflect any transactional costs, such as front
and back end sales charges (loads) or redemption/exchange fees, where
applicable. Therefore, the hypothetical information is useful in comparing
ongoing costs only, and will not help you determine the relative total costs of
owning different funds. In addition, if these transactional costs were
included, your costs would have been higher.
Actual Expenses
-------------------------------------------------------------------------------
Institutional Service Investor Investor Investor
Class Class A Class B Class C Class
--------------- --------------- --------------- --------------- ---------------
Beginning Account
Value (10/01/04) $ 1,000.00 $ 1,000.00 $ 1,000.00 $ 1,000.00 $ 1,000.00
Ending Account Value
(3/31/05) 1,011.40 1,009.90 1,008.50 1,004.70 1,004.70
Expenses Incurred
During Period
(10/01/04 -
3/31/05) 3.00 4.50 4.99 8.72 8.72
Hypothetical Expenses
(5% return before expenses)
-------------------------------------------------------------------------------
Institutional Service Investor Investor Investor
Class Class A Class B Class C Class
--------------- --------------- --------------- --------------- ---------------
Beginning Account
Value (10/01/04) $ 1,000.00 $ 1,000.00 $ 1,000.00 $ 1,000.00 $ 1,000.00
Ending Account Value
(3/31/05) 1,021.98 1,020.47 1,019.97 1,016.19 1,016.19
Expenses Incurred
During Period
(10/01/04 -
3/31/05) 3.02 4.53 5.03 8.81 8.81
For each class of the Portfolio, expenses are equal to the annualized expense
ratio of 0.60%, 0.90%, 1.00%, 1.75%, and 1.75% for the Institutional, Service,
Investor A, B, and C share classes, respectively, multiplied by the average
account value over the period, multiplied by 182/365 (to reflect the one-half
year period).
7
NEW JERSEY TAX-FREE INCOME PORTFOLIO
Total Net Assets (3/31/05): $179.6 million
Investment Approach
Seeks to maximize total return consistent with income generation and
prudent investment management by investing primarily in bonds issued by or on
behalf of states, possessions and territories of the United States, their
political subdivisions and their agencies and authorities (and related
tax-exempt derivative securities), the interest on which the Portfolio manager
believes is exempt from Federal income tax (including the Federal Alternative
Minimum Tax) and New Jersey state income tax ("municipal securities"). The
Portfolio normally invests at least 80% of its assets in municipal securities,
including both general obligation and revenue bonds, from a diverse range of
issuers (including issuers located outside of New Jersey). The Portfolio
emphasizes securities in the ten to twenty year maturity range.
Recent Portfolio Management Activity
o All share classes of the Portfolio underperformed the Portfolio's
Lipper peer group (New Jersey Municipal Debt Funds) during the semi-annual
period.
o During the semi-annual period, the municipal yield curve, as measured
by the spread between 2-year and 30-year rates, flattened by approximately 100
basis points. Yields on the 2-year portion of the curve rose 90 basis points
while the 30-year rates declined by 10 basis points.
o During the first half of the semi-annual period, the Portfolio
continued to have a predominant focus on premium coupon bonds as evidenced by
the 5.68% average coupon for the Portfolio versus an average coupon of 5.14%
for the Portfolio's benchmark (Lehman Brothers Municipal Bond Index). A primary
contributor to performance during the first half of the semi-annual period was
yield curve positioning as the Portfolio had lower exposure to short maturities
and long bonds with short calls. During this period, we offset some of
the longer duration of the Portfolio with the sale of Treasury futures in order
to bring the Portfolio more inline with other BlackRock tax-free portfolios.
o The Portfolio's continued bias towards a higher interest rate
environment was a modest negative for the semi-annual period as the longer
portions of the Lehman Brothers Municipal Bond Index were the best performers.
This bias is expressed through the Portfolio's higher coupon weighting as well
as through the duration of its holdings compared to the benchmark.
o While national new issue supply declined in 2004 by 6.6% to $358
billion, the new supply issuance during the first quarter of 2005 was the
highest first quarter on record. A total of $97 billion was issued, which
represents a 12% increase over the first quarter of 2004. Despite a higher
interest rate environment, which typically slows new issue supply, the
flattening of the Treasury yield curve has created more advance refunding
opportunities for issues to lower total debt cost. The increase in supply has
been primarily absorbed by continued demand from insurance companies as well as
retail investors. With $5.17 billion in new issuance during the first quarter
of 2005, New Jersey saw an increase of 87% over the same period of 2004. During
the first quarter of 2005, a total of $1.7 billion flowed into open-end mutual
funds. In addition to the positive underwriting environment for most insurance
companies, the high credit quality, low volatility and high after-tax income
that the sector had to offer continued to appeal to many investors, especially
at a time when taxable credit spreads were near their all-time tights.
o Fundamentally, tax receipts have grown for the past two years, a
manifestation of the improving economy. The most recent economic acceleration
has provided the states with increased revenues, which has fueled positive
operations for all but a few state governments. At the end of the semi-annual
period, forty-six states have reported that fiscal year 2005 revenue
projections are on or above budget. The revenue growth is helping states
rebuild their reserve funds, many of which were depleted during the fiscal
crisis of 2001.
COMPARISON OF CHANGE IN VALUE OF A $10,000 INVESTMENT IN THE NJ TAX-FREE INCOME
PORTFOLIO,
THE LEHMAN BROTHERS MUNICIPAL BOND INDEX AND THE LIPPER NEW JERSEY MUNICIPAL
DEBT FUNDS
FOR THE PAST TEN YEARS.
[LINE CHART]
Service Investor A Lehman Brothers Municipal Bond Index Lipper New Jersey Municipal Debt Funds
---------- ---------- ------------------------------------ --------------------------------------
03/31/1995 $ 10,000 $ 9,599 $ 10,000 $ 10,000
06/30/1995 10,196 9,787 10,242 10,219
09/30/1995 10,461 10,041 10,536 10,451
12/31/1995 10,829 10,395 10,971 10,893
03/31/1996 10,733 10,293 10,838 10,705
06/30/1996 10,763 10,317 10,921 10,778
09/30/1996 10,951 10,493 11,173 11,015
12/31/1996 11,224 10,751 11,457 11,266
03/31/1997 11,194 10,718 11,431 11,236
06/30/1997 11,507 11,013 11,825 11,579
09/30/1997 11,839 11,326 12,181 11,915
12/31/1997 12,151 11,620 12,512 12,228
03/31/1998 12,251 11,711 12,656 12,341
06/30/1998 12,430 11,877 12,848 12,510
09/30/1998 12,820 12,244 13,243 12,879
12/31/1998 12,877 12,293 13,323 12,924
03/31/1999 12,918 12,327 13,441 12,995
06/30/1999 12,654 12,070 13,203 12,738
09/30/1999 12,608 12,021 13,150 12,561
12/31/1999 12,519 11,931 13,047 12,353
03/31/2000 12,768 12,163 13,430 12,663
06/30/2000 12,952 12,333 13,633 12,817
09/30/2000 13,219 12,582 13,962 13,117
12/31/2000 13,734 13,067 14,573 13,671
03/31/2001 14,056 13,367 14,896 13,967
06/30/2001 14,130 13,421 14,993 14,073
09/30/2001 14,507 13,785 15,414 14,354
12/31/2001 14,340 13,621 15,320 14,234
03/31/2002 14,559 13,811 15,465 14,380
06/30/2002 15,060 14,292 16,031 14,853
09/30/2002 15,543 14,732 16,792 15,397
12/31/2002 15,555 14,750 16,792 15,386
03/31/2003 15,710 14,878 16,994 15,471
06/30/2003 16,103 15,257 17,432 15,873
09/30/2003 15,984 15,137 17,446 15,848
12/31/2003 16,185 15,308 17,684 16,101
03/31/2004 16,389 15,495 17,990 16,312
06/30/2004 16,030 15,162 17,564 15,909
09/30/2004 16,589 15,686 18,249 16,463
12/31/2004 16,799 15,881 18,477 16,685
03/31/2005 16,766 15,832 18,470 16,709
FOR PERIOD ENDING MARCH 31, 2005
Average Annual Total Return
1 Year 3 Year 5 Year 10 Year
------------ ---------- ---------- ----------
Institutional Class 2.52% 5.10% 5.90% 5.51%
Service Class 2.30% 4.82% 5.60% 5.30%
Investor A Class (Load Adjusted) (1.89)% 3.25% 4.55% 4.70%
Investor A Class (NAV) 2.18% 4.66% 5.41% 5.13%
Investor B Class(Load Adjusted) (3.00)% 2.85% 4.31% 4.46%
Investor B Class (NAV) 1.41% 3.94% 4.65% 4.46%
Investor C Class(Load Adjusted) 0.43% 3.90% 4.68% 4.47%
Investor C Class (NAV) 1.41% 3.90% 4.68% 4.47%
THE PERFORMANCE OF THE LEHMAN BROTHERS MUNICIPAL BOND INDEX (THE "BENCHMARK")
IS PRESENTED FOR COMPARATIVE PURPOSES IN RESPONSE TO REQUIREMENTS OF THE
SECURITIES AND EXCHANGE COMMISSION. HOWEVER, BLACKROCK BELIEVES THAT
DIFFERENCES BETWEEN THE WAYS IN WHICH THE PORTFOLIO IS MANAGED AND THE
BENCHMARK IS CONSTRUCTED MAY MAKE COMPARISONS BETWEEN THE PORTFOLIO AND
BENCHMARK PERFORMANCE LESS MEANINGFUL TO INVESTORS. THEREFORE, THE PERFORMANCE
OF THE LIPPER NEW JERSEY MUNICIPAL DEBT FUNDS IS ALSO PRESENTED.
THE PERFORMANCE INFORMATION ABOVE INCLUDES INFORMATION RELATING TO EACH CLASS
OF THE PORTFOLIO SINCE THE COMMENCEMENT OF OPERATIONS OF THE PORTFOLIO, RATHER
THAN THE DATE SUCH CLASS WAS INTRODUCED. THE INCEPTION DATES OF THE PORTFOLIO'S
SHARE CLASSES WERE AS FOLLOWS: SERVICE SHARES, 7/1/91; INVESTOR A SHARES,
1/26/96; INVESTOR B SHARES, 7/2/96; INSTITUTIONAL SHARES, 5/4/98 AND INVESTOR C
SHARES, 12/9/98. SEE "NOTE ON PERFORMANCE INFORMATION" ON PAGE 16 FOR FURTHER
INFORMATION ON HOW PERFORMANCE DATA WAS CALCULATED, INCLUDING IMPORTANT
INFORMATION ON THE LINE GRAPH* ABOVE.
PAST PERFORMANCE IS NOT PREDICTIVE OF FUTURE RESULTS. The graph and table do
not reflect the deduction of taxes that a shareholder would pay on fund
distributions or the redemption of shares. Although the holdings and sectors
listed above were current as of as of the periods indicated, the Portfolio is
actively managed and its composition will vary.
8
NEW JERSEY TAX-FREE INCOME PORTFOLIO
FUND PROFILE
Credit Quality (% of
investments)1
AAA 63.9 %
AA 6.8
A 14.9
BBB 11.2
Unrated 3.2
----
Total 100.0 %
========
Portfolio Statistics
Average maturity (years) 7.81
Modified Duration2 5.3
1 Using the higher of Standard & Poor's ("S&P's") or Moody's Investors Service
("Moody's") rating.
2 Duration measures a Portfolio's price risk. Each year of duration represents
an expected 1% change in the net asset value of the fund for every 1%
change in interest rates. Modified duration assumes that cash flows remain
constant as interest rates change.
- --------------------------------------------------------------------------------
EXPENSE EXAMPLE
As a shareholder of the Portfolio, you incur two types of costs: (1)
transaction costs, including front and back end sales charges (loads) where
applicable; and (2) ongoing costs, including advisory fees, distribution
(12b-1) and service fees, where applicable; and other Portfolio expenses. This
Example is intended to help you understand your ongoing costs (in dollars) of
investing in the Portfolio and to compare these costs with the ongoing costs of
investing in other mutual funds.
The Example below is based on an investment of $1,000 invested at the beginning
of the period and held for the entire period October 1, 2004 to March 31, 2005.
The information under "Actual Expenses," together with the amount you invested,
allows you to estimate actual expenses incurred over the reporting period.
Simply divide your account value by $1,000 (for example, an $8,600 account
value divided by $1,000 = 8.60) and multiply the result by the cost shown for
your share class, in the row entitled "Expenses Incurred During Period", to
estimate the expenses incurred on your account during this period.
The information under "Hypothetical Expenses" provides information about
hypothetical account values and hypothetical expenses based on the Portfolio's
actual expense ratio and an assumed rate of return of 5% per year before
expenses, which is not the Portfolio's actual return. The hypothetical account
values and expenses may not be used to estimate the actual ending account
balance or expense you incurred for the period. You may use this information to
compare the ongoing costs of investing in the Portfolio and other funds. To do
so, compare this 5% hypothetical example with the 5% hypothetical examples that
appear in the shareholder reports of the other funds.
Please note that the expenses shown in the table are meant to highlight your
ongoing costs only and do not reflect any transactional costs, such as front
and back end sales charges (loads) or redemption/exchange fees, where
applicable. Therefore, the hypothetical information is useful in comparing
ongoing costs only, and will not help you determine the relative total costs of
owning different funds. In addition, if these transactional costs were
included, your costs would have been higher.
Actual Expenses
-------------------------------------------------------------------------------
Institutional Service Investor Investor Investor
Class Class A Class B Class C Class
--------------- --------------- --------------- --------------- ---------------
Beginning Account
Value (10/01/04) $ 1,000.00 $ 1,000.00 $ 1,000.00 $ 1,000.00 $ 1,000.00
Ending Account Value
(3/31/05) 1,011.30 1,010.70 1,009.30 1,006.40 1,006.40
Expenses Incurred
During Period
(10/01/04 -
3/31/05) 3.00 4.50 4.95 8.73 8.73
Hypothetical Expenses
(5% return before expenses)
-------------------------------------------------------------------------------
Institutional Service Investor Investor Investor
Class Class A Class B Class C Class
--------------- --------------- --------------- --------------- ---------------
Beginning Account
Value (10/01/04) $ 1,000.00 $ 1,000.00 $ 1,000.00 $ 1,000.00 $ 1,000.00
Ending Account Value
(3/31/05) 1,021.98 1,020.47 1,020.02 1,016.19 1,016.19
Expenses Incurred
During Period
(10/01/04 -
3/31/05) 3.02 4.53 4.98 8.81 8.81
For each class of the Portfolio, expenses are equal to the annualized expense
ratio of 0.60%, 0.90%, 1.00%, 1.75%, and 1.75% for the Institutional, Service,
Investor A, B, and C share classes, respectively, multiplied by the average
account value over the period, multiplied by 182/365 (to reflect the one-half
year period).
9
OHIO TAX-FREE INCOME PORTFOLIO
Total Net Assets (3/31/05): $124.4 million
Investment Approach
Seeks to maximize total return consistent with income generation and
prudent investment management by investing primarily in bonds issued by or on
behalf of states, possessions and territories of the United States, their
political subdivisions and their agencies and authorities (and related
tax-exempt derivative securities), the interest on which the Portfolio manager
believes is exempt from Federal income tax (including the Federal Alternative
Minimum Tax) and Ohio state income tax ("municipal securities"). The Portfolio
normally invests at least 80% of its assets in municipal securities, including
both general obligation and revenue bonds, from a diverse range of issuers
(including issuers located outside of Ohio). The Portfolio emphasizes
securities in the ten to twenty year maturity range.
Recent Portfolio Management Activity
o The Institutional, Service and Investor A share classes of the
Portfolio outperformed the Portfolio's Lipper peer group (Ohio Municipal Debt
Funds) during the semi-annual period while the Investor B and Investor C share
classes underperformed relative to the Lipper peer group.
o During the semi-annual period, the municipal yield curve, as measured
by the spread between 2-year and 30-year rates, flattened by approximately 100
basis points. Yields on the 2-year portion of the curve rose 90 basis points
while the 30-year rates declined by 10 basis points.
o During the first half of the semi-annual period, the Portfolio
continued to have a predominant focus on premium coupon bonds as evidenced by
the 5.46% average coupon of the Portfolio versus an average of 5.14% for the
Portfolio's benchmark (Lehman Brothers Municipal Bond Index). The defensive
structure of the Portfolio holdings was a primary contributor to performance
for this period.
o The Portfolio's continued bias towards a higher interest rate
environment was a modest negative for the semi-annual period as the longer
portions of the Lehman Brothers Municipal Bond Index were the best performers.
This bias is expressed through the Portfolio's higher coupon weighting as well
as through the shorter duration of its holdings compared to the benchmark.
o While national new issue supply declined in 2004 by 6.6% to $358
billion, the new supply issuance during the first quarter of 2005 was the
highest first quarter on record. A total of $97 billion was issued, which
represents a 12% increase over the first quarter of 2004. Despite a higher
interest rate environment, which typically slows new issue supply, the
flattening of the Treasury yield curve has created more advance refunding
opportunities for issues to lower total debt cost. The increase in supply has
been primarily absorbed by continued demand from insurance companies as well as
retail investors. In contrast to the overall market, new issue supply of $2.67
billion in Ohio was a decline of approximately 14% over the same period of
2004. During the first quarter of 2005, a total of $1.7 billion flowed into
open-end mutual funds. In addition to the positive underwriting environment for
most insurance companies, the high credit quality, low volatility and high
after-tax income that the sector had to offer continued to appeal to many
investors, especially at a time when taxable credit spreads were near their
all-time tights.
o Fundamentally, tax receipts have grown for the past two years, a
manifestation of the improving economy. The most recent economic acceleration
has provided the states with increased revenues, which has fueled positive
operations for all but a few state governments. At the end of the semi-annual
period, forty-six states have reported that fiscal year 2005 revenue
projections are on or above budget. The revenue growth is helping states
rebuild their reserve funds, many of which were depleted during the fiscal
crisis of 2001.
COMPARISON OF CHANGE IN VALUE OF A $10,000 INVESTMENT IN THE OH TAX-FREE INCOME
PORTFOLIO,
THE LEHMAN BROTHERS MUNICIPAL BOND INDEX AND THE LIPPER OHIO MUNICIPAL DEBT
FUNDS
FOR THE PAST TEN YEARS.
[LINE CHART]
Institutional Investor A Lehman Brothers Municipal Bond Index Lipper Ohio Municipal Debt Funds
------------- ---------- ------------------------------------ --------------------------------
03/31/1995 $ 10,000 $ 9,600 $ 10,000 $ 10,000
06/30/1995 10,203 9,787 10,242 10,170
09/30/1995 10,498 10,062 10,536 10,416
12/31/1995 10,965 10,501 10,971 10,859
03/31/1996 10,789 10,320 10,838 10,669
06/30/1996 10,880 10,395 10,921 10,747
09/30/1996 11,140 10,632 11,173 10,990
12/31/1996 11,421 10,887 11,457 11,247
03/31/1997 11,391 10,845 11,431 11,205
06/30/1997 11,744 11,168 11,825 11,551
09/30/1997 12,091 11,485 12,181 11,869
12/31/1997 12,410 11,774 12,512 12,178
03/31/1998 12,524 11,868 12,656 12,292
06/30/1998 12,723 12,043 12,848 12,449
09/30/1998 13,126 12,410 13,243 12,785
12/31/1998 13,199 12,465 13,323 12,828
03/31/1999 13,292 12,538 13,441 12,909
06/30/1999 12,975 12,224 13,203 12,668
09/30/1999 12,944 12,181 13,150 12,519
12/31/1999 12,799 12,030 13,047 12,330
03/31/2000 13,157 12,352 13,430 12,669
06/30/2000 13,351 12,532 13,633 12,815
09/30/2000 13,659 12,793 13,962 13,107
12/31/2000 14,233 13,315 14,573 13,634
03/31/2001 14,615 13,657 14,896 13,895
06/30/2001 14,714 13,734 14,993 13,952
09/30/2001 15,217 14,187 15,414 14,294
12/31/2001 15,067 14,030 15,320 14,200
03/31/2002 15,246 14,180 15,465 14,314
06/30/2002 15,865 14,739 16,031 14,769
09/30/2002 16,495 15,307 16,792 15,398
12/31/2002 16,479 15,260 16,792 15,346
03/31/2003 16,642 15,407 16,994 15,490
06/30/2003 17,081 15,795 17,432 15,889
09/30/2003 16,955 15,660 17,446 15,835
12/31/2003 17,185 15,854 17,684 16,049
03/31/2004 17,397 16,031 17,990 16,255
06/30/2004 17,257 15,883 17,564 15,874
09/30/2004 17,773 16,341 18,249 16,438
12/31/2004 17,950 16,488 18,477 16,632
03/31/2005 17,964 16,499 18,470 16,585
FOR PERIOD ENDING MARCH 31, 2005
Average Annual Total Return
1 Year 3 Year 5 Year 10 Year
------------ ---------- ---------- ----------
Institutional Class 3.26% 5.62% 6.43% 6.03%
Service Class 3.13% 5.37% 6.17% 5.74%
Investor A Class (Load Adjusted) (1.16)% 3.75% 5.10% 5.14%
Investor A Class (NAV) 2.92% 5.18% 5.96% 5.56%
Investor B Class (Load Adjusted) (2.29)% 3.31% 4.84% 4.78%
Investor B Class (NAV) 2.15% 4.40% 5.17% 4.78%
Investor C Class (Load Adjusted) 1.16% 4.40% 5.17% 4.78%
Investor C Class (NAV) 2.15% 4.40% 5.17% 4.78%
THE PERFORMANCE OF THE LEHMAN BROTHERS MUNICIPAL BOND INDEX (THE "BENCHMARK")
IS PRESENTED FOR COMPARATIVE PURPOSES IN RESPONSE TO REQUIREMENTS OF THE
SECURITIES AND EXCHANGE COMMISSION. HOWEVER, BLACKROCK BELIEVES THAT
DIFFERENCES BETWEEN THE WAYS IN WHICH THE PORTFOLIO IS MANAGED AND THE
BENCHMARK IS CONSTRUCTED MAY MAKE COMPARISONS BETWEEN THE PORTFOLIO AND
BENCHMARK PERFORMANCE LESS MEANINGFUL TO INVESTORS. THEREFORE, THE PERFORMANCE
OF THE LIPPER OHIO MUNICIPAL DEBT FUNDS IS ALSO PRESENTED.
THE PERFORMANCE INFORMATION ABOVE INCLUDES INFORMATION RELATING TO EACH CLASS
OF THE PORTFOLIO SINCE THE COMMENCEMENT OF OPERATIONS OF THE PORTFOLIO, RATHER
THAN THE DATE SUCH CLASS WAS INTRODUCED. THE INCEPTION DATES OF THE PORTFOLIO'S
SHARE CLASSES WERE AS FOLLOWS: INSTITUTIONAL AND INVESTOR A SHARES, 12/1/92;
SERVICE SHARES, 7/29/93; INVESTOR B SHARES, 10/13/94 AND INVESTOR C SHARES,
8/26/98. SEE "NOTE ON PERFORMANCE INFORMATION" ON PAGE 16 FOR FURTHER
INFORMATION ON HOW PERFORMANCE DATA WAS CALCULATED, INCLUDING IMPORTANT
INFORMATION ON THE LINE GRAPH\^ ABOVE.
PAST PERFORMANCE IS NOT PREDICTIVE OF FUTURE RESULTS. The graph and table do
not reflect the deduction of taxes that a shareholder would pay on fund
distributions or the redemption of shares. Although the holdings and sectors
listed above were current as of the periods indicated, the Portfolio is
actively managed and its composition will vary.
10
OHIO TAX-FREE INCOME PORTFOLIO
FUND PROFILE
Credit Quality (% of
investments)1
AAA 79.1 %
AA 10.7
A 3.2
BBB 7.0
----
Total 100.0 %
========
Portfolio Statistics
Average maturity (years) 5.02
Modified Duration2 3.8
1 Using the higher of Standard & Poor's ("S&P's") or Moody's Investors Service
("Moody's") rating.
2 Duration measures a Portfolio's price risk. Each year of duration represents
an expected 1% change in the net asset value of the fund for every 1%
change in interest rates. Modified duration assumes that cash flows remain
constant as interest rates change.
- --------------------------------------------------------------------------------
EXPENSE EXAMPLE
As a shareholder of the Portfolio, you incur two types of costs: (1)
transaction costs, including front and back end sales charges (loads) where
applicable; and (2) ongoing costs, including advisory fees, distribution
(12b-1) and service fees, where applicable; and other Portfolio expenses. This
Example is intended to help you understand your ongoing costs (in dollars) of
investing in the Portfolio and to compare these costs with the ongoing costs of
investing in other mutual funds.
The Example below is based on an investment of $1,000 invested at the beginning
of the period and held for the entire period October 1, 2004 to March 31, 2005.
The information under "Actual Expenses," together with the amount you invested,
allows you to estimate actual expenses incurred over the reporting period.
Simply divide your account value by $1,000 (for example, an $8,600 account
value divided by $1,000 = 8.60) and multiply the result by the cost shown for
your share class, in the row entitled "Expenses Incurred During Period", to
estimate the expenses incurred on your account during this period.
The information under "Hypothetical Expenses" provides information about
hypothetical account values and hypothetical expenses based on the Portfolio's
actual expense ratio and an assumed rate of return of 5% per year before
expenses, which is not the Portfolio's actual return. The hypothetical account
values and expenses may not be used to estimate the actual ending account
balance or expense you incurred for the period. You may use this information to
compare the ongoing costs of investing in the Portfolio and other funds. To do
so, compare this 5% hypothetical example with the 5% hypothetical examples that
appear in the shareholder reports of the other funds.
Please note that the expenses shown in the table are meant to highlight your
ongoing costs only and do not reflect any transactional costs, such as front
and back end sales charges (loads) or redemption/exchange fees, where
applicable. Therefore, the hypothetical information is useful in comparing
ongoing costs only, and will not help you determine the relative total costs of
owning different funds. In addition, if these transactional costs were
included, your costs would have been higher.
Actual Expenses
-------------------------------------------------------------------------------
Institutional Service Investor Investor Investor
Class Class A Class B Class C Class
--------------- --------------- --------------- --------------- ---------------
Beginning Account
Value (10/01/04) $ 1,000.00 $ 1,000.00 $ 1,000.00 $ 1,000.00 $ 1,000.00
Ending Account Value
(3/31/05) 1,010.70 1,010.20 1,009.70 1,005.90 1,005.00
Expenses Incurred
During Period
(10/01/04 -
3/31/05) 3.00 4.50 4.95 8.73 8.67
Hypothetical Expenses
(5% return before expenses)
-------------------------------------------------------------------------------
Institutional Service Investor Investor Investor
Class Class A Class B Class C Class
--------------- --------------- --------------- --------------- ---------------
Beginning Account
Value (10/01/04) $ 1,000.00 $ 1,000.00 $ 1,000.00 $ 1,000.00 $ 1,000.00
Ending Account Value
(3/31/05) 1,021.98 1,020.47 1,020.02 1,016.19 1,016.24
Expenses Incurred
During Period
(10/01/04 -
3/31/05) 3.02 4.53 4.98 8.81 8.76
For each class of the Portfolio, expenses are equal to the annualized expense
ratio of 0.60%, 0.90%, 0.99%, 1.75%, and 1.74% for the Institutional, Service,
Investor A, B, and C share classes, respectively, multiplied by the average
account value over the period, multiplied by 182/365 (to reflect the one-half
year period).
11
DELAWARE TAX-FREE INCOME PORTFOLIO
Total Net Assets (3/31/05): $91.0 million
Investment Approach
Seeks to maximize total return consistent with income generation and
prudent investment management by investing primarily in bonds issued by or on
behalf of states, possessions and territories of the United States, their
political subdivisions and their agencies and authorities (and related
tax-exempt derivative securities), the interest on which the Portfolio manager
believes is exempt from Federal income tax (including the Federal Alternative
Minimum Tax) and Delaware state income tax ("municipal securities"). The
Portfolio normally invests at least 80% of its assets in municipal securities,
including both general obligation and revenue bonds, from a diverse range of
issuers (including issuers located outside of Delaware). The Portfolio
emphasizes securities in the ten to twenty year maturity range.
Recent Portfolio Management Activity
o All share classes of the Portfolio underperformed the Portfolio's
Lipper peer group (Other States Municipal Debt Funds) during the semi-annual
period.
o During the semi-annual period, the municipal yield curve, as measured
by the spread between 2-year and 30-year rates, flattened by approximately 100
basis points. Yields on the 2-year portion of the curve rose 90 basis points
while the 30-year rates declined by 10 basis points.
o During the first half of the semi-annual period, the Portfolio
continued to have a premium coupon bias as expressed by an average coupon of
approximately 5.50% for the Portfolio versus an average of 5.14% for the
Portfolio's benchmark (Lehman Brothers Municipal Bond Index). Due to the longer
duration of the Portfolio's assets resulting from its structure and a lack of
trading opportunities into Delaware exempt securities during
this period, we shortened the Portfolio's duration through the sale of Treasury
futures in order to bring the Portfolio more inline with other BlackRock
tax-free portfolios.
o The Portfolio's continued bias towards a higher interest rate
environment was a modest negative for the semi-annual period as the longer
portions of the Lehman Brothers Municipal Bond Index were the best performers.
This bias is expressed through the Portfolio's higher coupon weighting as well
as through the duration of its holdings compared to the benchmark.
o While national new issue supply declined in 2004 by 6.6% to $358
billion, the new supply issuance during the first quarter of 2005 was the
highest first quarter on record. A total of $97 billion was issued, which
represents a 12% increase over the first quarter of 2004. Despite a higher
interest rate environment, which typically slows new issue supply, the
flattening of the Treasury yield curve has created more advance refunding
opportunities for issues to lower total debt cost. The increase in supply has
been primarily absorbed by continued demand from insurance companies as well as
retail investors. New issuance supply in Delaware was $650 million for the
first quarter. During the first quarter of 2005, a total of $1.7 billion flowed
into open-end mutual funds. In addition to the positive underwriting
environment for most insurance companies, the high credit quality, low
volatility and high after-tax income that the sector had to offer continued to
appeal to many investors, especially at a time when taxable credit spreads were
near their all-time tights.
o Fundamentally, tax receipts have grown for the past two years, a
manifestation of the improving economy. The most recent economic acceleration
has provided the states with increased revenues, which has fueled positive
operations for all but a few state governments. At the end of the semi-annual
period, forty-six states have reported that fiscal year 2005 revenue
projections are on or above budget. The revenue growth is helping states
rebuild their reserve funds, many of which were depleted during the fiscal
crisis of 2001.
COMPARISON OF CHANGE IN VALUE OF A $10,000 INVESTMENT IN THE DE TAX-FREE INCOME
PORTFOLIO,
THE LEHMAN BROTHERS MUNICIPAL BOND INDEX AND THE LIPPER OTHER STATES MUNICIPAL
DEBT FUNDS
FOR THE PAST TEN YEARS.
[LINE CHART]
Institutional Investor A Lehman Brothers Municipal Bond Index Lipper Other States Municipal Debt Funds
------------- ---------- ------------------------------------ ----------------------------------------
03/31/1995 $ 10,000 $ 9,604 $ 10,000 $ 10,000
06/30/1995 10,228 9,811 10,242 10,148
09/30/1995 10,500 10,060 10,536 10,406
12/31/1995 10,785 10,321 10,971 10,848
03/31/1996 10,741 10,267 10,838 10,677
06/30/1996 10,786 10,298 10,921 10,762
09/30/1996 10,954 10,445 11,173 10,997
12/31/1996 11,178 10,647 11,457 11,240
03/31/1997 11,157 10,615 11,431 11,222
06/30/1997 11,433 10,864 11,825 11,575
09/30/1997 11,698 11,103 12,181 11,888
12/31/1997 11,896 11,278 12,512 12,196
03/31/1998 12,001 11,364 12,656 12,314
06/30/1998 12,192 11,532 12,848 12,475
09/30/1998 12,613 11,916 13,243 12,823
12/31/1998 12,692 11,977 13,323 12,853
03/31/1999 12,800 12,065 13,441 12,932
06/30/1999 12,516 11,783 13,203 12,689
09/30/1999 12,473 11,729 13,150 12,519
12/31/1999 12,392 11,639 13,047 12,330
03/31/2000 12,727 11,940 13,430 12,656
06/30/2000 12,903 12,091 13,633 12,794
09/30/2000 13,160 12,317 13,962 13,102
12/31/2000 13,653 12,764 14,573 13,638
03/31/2001 13,958 13,034 14,896 13,882
06/30/2001 14,016 13,073 14,993 13,951
09/30/2001 14,497 13,506 15,414 14,311
12/31/2001 14,311 13,317 15,320 14,221
03/31/2002 14,463 13,442 15,465 14,321
06/30/2002 15,069 13,990 16,031 14,782
09/30/2002 15,766 14,620 16,792 15,383
12/31/2002 15,694 14,522 16,792 15,323
03/31/2003 15,816 14,632 16,994 15,448
06/30/2003 16,295 15,058 17,432 15,797
09/30/2003 16,180 14,933 17,446 15,767
12/31/2003 16,376 15,111 17,684 15,969
03/31/2004 16,530 15,236 17,990 16,127
06/30/2004 16,129 14,849 17,564 15,822
09/30/2004 16,798 15,433 18,249 16,300
12/31/2004 16,958 15,580 18,477 16,454
03/31/2005 16,885 15,497 18,470 16,422
FOR PERIOD ENDING MARCH 31, 2005
Average Annual Total Return
1 Year 3 Year 5 Year 10 Year
------------ ---------- ---------- ----------
Institutional Class 2.14% 5.30% 5.82% 5.38%
Service Class 1.84% 4.98% 5.50% 5.06%
Investor A Class (Load Adjusted) (2.40)% 3.45% 4.49% 4.48%
Investor A Class (NAV) 1.71% 4.86% 5.36% 4.90%
Investor B Class (Load Adjusted) (3.45)% 2.99% 4.24% 4.12%
Investor B Class (NAV) 0.95% 4.08% 4.57% 4.12%
Investor C Class (Load Adjusted) (0.03)% 4.04% 4.55% 4.11%
Investor C Class (NAV) 0.95% 4.04% 4.55% 4.11%
THE PERFORMANCE OF THE LEHMAN BROTHERS MUNICIPAL BOND INDEX (THE "BENCHMARK")
IS PRESENTED FOR COMPARATIVE PURPOSES IN RESPONSE TO REQUIREMENTS OF THE
SECURITIES AND EXCHANGE COMMISSION. HOWEVER, BLACKROCK BELIEVES THAT
DIFFERENCES BETWEEN THE WAYS IN WHICH THE PORTFOLIO IS MANAGED AND THE
BENCHMARK IS CONSTRUCTED MAY MAKE COMPARISONS BETWEEN THE PORTFOLIO AND
BENCHMARK PERFORMANCE LESS MEANINGFUL TO INVESTORS. THEREFORE, THE PERFORMANCE
OF THE LIPPER OTHER STATES MUNICIPAL DEBT FUNDS IS ALSO PRESENTED.
IN CONNECTION WITH THE CONVERSION OF VARIOUS COMMON TRUST FUNDS MAINTAINED BY
PNC BANK AND PNC BANK, DELAWARE ("PNC-DE"), AN AFFILIATE OF PNC BANK, INTO THE
FUND BETWEEN MAY 1 AND MAY 15, 1998 (THE "CTF CONVERSION"), THE DELAWARE
TAX-FREE INCOME PORTFOLIO WAS ESTABLISHED TO RECEIVE THE ASSETS OF THE DE
TAX-FREE INCOME FUND OF PNC-DE. PERFORMANCE INFORMATION PRESENTED FOR THIS
PORTFOLIO INCLUDES PERFORMANCE FOR THE PREDECESSOR COMMON TRUST FUND WHICH
TRANSFERRED ITS ASSETS AND LIABILITIES TO THE RELATED PORTFOLIO PURSUANT TO THE
CTF CONVERSION. PERFORMANCE INFORMATION PRESENTED IS BASED UPON THE PERFORMANCE
OF THE DE TAX-FREE INCOME FUND FOR PERIODS PRIOR TO THE CTF CONVERSION. SEE
"NOTE ON PERFORMANCE INFORMATION" ON PAGE 16 FOR FURTHER INFORMATION ON HOW
PERFORMANCE DATA WAS CALCULATED, INCLUDING IMPORTANT INFORMATION ON THE LINE
GRAPH\^ ABOVE.
PAST PERFORMANCE IS NOT PREDICTIVE OF FUTURE RESULTS. The graph and table do
not reflect the deduction of taxes that a shareholder would pay on fund
distributions or the redemption of shares. Although the holdings and sectors
listed above were current as of the periods indicated, the Portfolio is
actively managed and its composition will vary.
12
DELAWARE TAX-FREE INCOME PORTFOLIO
FUND PROFILE
Credit Quality (% of
investments)1
AAA 70.1 %
AA 4.2
A 16.3
BBB 9.4
----
Total 100.0 %
========
Portfolio Statistics
Average maturity (years) 6.16
Modified Duration2 5.4
1 Using the higher of Standard & Poor's ("S&P's") or Moody's Investors Service
("Moody's") rating.
2 Duration measures a Portfolio's price risk. Each year of duration represents
an expected 1% change in the net asset value of the fund for every 1%
change in interest rates. Modified duration assumes that cash flows remain
constant as interest rates change.
- --------------------------------------------------------------------------------
EXPENSE EXAMPLE
As a shareholder of the Portfolio, you incur two types of costs: (1)
transaction costs, including front and back end sales charges (loads) where
applicable; and (2) ongoing costs, including advisory fees, distribution
(12b-1) and service fees, where applicable; and other Portfolio expenses. This
Example is intended to help you understand your ongoing costs (in dollars) of
investing in the Portfolio and to compare these costs with the ongoing costs of
investing in other mutual funds.
The Example below is based on an investment of $1,000 invested at the beginning
of the period and held for the entire period October 1, 2004 to March 31, 2005.
The information under "Actual Expenses," together with the amount you invested,
allows you to estimate actual expenses incurred over the reporting period.
Simply divide your account value by $1,000 (for example, an $8,600 account
value divided by $1,000 = 8.60) and multiply the result by the cost shown for
your share class, in the row entitled "Expenses Incurred During Period", to
estimate the expenses incurred on your account during this period.
The information under "Hypothetical Expenses" provides information about
hypothetical account values and hypothetical expenses based on the Portfolio's
actual expense ratio and an assumed rate of return of 5% per year before
expenses, which is not the Portfolio's actual return. The hypothetical account
values and expenses may not be used to estimate the actual ending account
balance or expense you incurred for the period. You may use this information to
compare the ongoing costs of investing in the Portfolio and other funds. To do
so, compare this 5% hypothetical example with the 5% hypothetical examples that
appear in the shareholder reports of the other funds.
Please note that the expenses shown in the table are meant to highlight your
ongoing costs only and do not reflect any transactional costs, such as front
and back end sales charges (loads) or redemption/exchange fees, where
applicable. Therefore, the hypothetical information is useful in comparing
ongoing costs only, and will not help you determine the relative total costs of
owning different funds. In addition, if these transactional costs were
included, your costs would have been higher.
Actual Expenses
---------------------------------------------------------------
Institutional Investor Investor Investor
Class A Class B Class C Class
--------------- --------------- --------------- ---------------
Beginning Account
Value (10/01/04) $ 1,000.00 $ 1,000.00 $ 1,000.00 $ 1,000.00
Ending Account Value
(3/31/05) 1,005.20 1,004.20 999.40 999.40
Expenses Incurred
During Period
(10/01/04 -
3/31/05) 3.49 5.38 9.15 9.20
Hypothetical Expenses
(5% return before expenses)
---------------------------------------------------------------
Institutional Investor Investor Investor
Class A Class B Class C Class
--------------- --------------- --------------- ---------------
Beginning Account
Value (10/01/04) $ 1,000.00 $ 1,000.00 $ 1,000.00 $ 1,000.00
Ending Account Value
(3/31/05) 1,021.48 1,019.56 1,015.74 1,015.69
Expenses Incurred
During Period
(10/01/04 -
3/31/05) 3.52 5.44 9.26 9.31
For each class of the Portfolio, expenses are equal to the annualized expense
ratio of 0.70%, 1.08%, 1.84%, and 1.85% for the Institutional, Investor A, B,
and C share classes, respectively, multiplied by the average account value over
the period, multiplied by 182/365 (to reflect the one-half year period).
13
KENTUCKY TAX-FREE INCOME PORTFOLIO
Total Net Assets (3/31/05): $84.7 million
Investment Approach
Seeks to maximize total return consistent with income generation and
prudent investment management by investing primarily in bonds issued by or on
behalf of states, possessions and territories of the United States, their
political subdivisions and their agencies and authorities (and related
tax-exempt derivative securities), the interest on which the Portfolio manager
believes is exempt from Federal income tax (including the Federal Alternative
Minimum Tax) and Kentucky state income tax ("municipal securities"). The
Portfolio normally invests at least 80% of its assets in municipal securities,
including both general obligation and revenue bonds, from a diverse range of
issuers (including issuers located outside of Kentucky). The Portfolio
emphasizes securities in the ten to twenty year maturity range.
Recent Portfolio Management Activity
o All share classes of the Portfolio outperformed the Portfolio's Lipper
peer group (Kentucky Municipal Debt Funds) during the semi-annual period.
o During the semi-annual period, the municipal yield curve, as measured
by the spread between 2-year and 30-year rates, flattened by approximately 100
basis points. Yields on the 2-year portion of the curve rose 90 basis points
while the 30-year rates declined by 10 basis points.
o During the first half of the semi-annual period, the Portfolio's lower
exposure to the shorter maturities on the municipal yield curve was beneficial
to performance as successively longer maturities outperformed shorter
maturities. The Portfolio also continued to have a high coupon bias with an
average coupon of approximately 5.70% versus an average coupon of 5.14% for its
benchmark (Lehman Brothers Municipal Bond Index). During the period, we offset
some of the longer duration of the Portfolio with the sale of Treasury
futures in order to bring the Portfolio more inline with BlackRock's other
tax-free portfolios.
o The Portfolio's continued bias towards a higher interest rate
environment was a modest negative for the semi-annual period as the longer
portions of the Lehman Brothers Municipal Bond Index were the best performers.
This bias is expressed through the Portfolio's higher coupon weighting as well
as through the duration of its holdings compared to the benchmark.
o While national new issue supply declined in 2004 by 6.6% to $358
billion, the new supply issuance during the first quarter of 2005 was the
highest first quarter on record. A total of $97 billion was issued, which
represents a 12% increase over the first quarter of 2004. Despite a higher
interest rate environment, which typically slows new issue supply, the
flattening of the Treasury yield curve has created more advance refunding
opportunities for issues to lower total debt cost. The increase in supply has
been primarily absorbed by continued demand from insurance companies as well as
retail investors. In contrast to the overall market, new issue supply of $588
million in Kentucky was a decline of approximately 51% versus the same period
of 2004. During the first quarter of 2005, a total of $1.7 billion flowed into
open-end mutual funds. In addition to the positive underwriting environment for
most insurance companies, the high credit quality, low volatility and high
after-tax income that the sector had to offer continued to appeal to many
investors, especially at a time when taxable credit spreads were near their
all-time tights.
o Fundamentally, tax receipts have grown for the past two years, a
manifestation of the improving economy. The most recent economic acceleration
has provided the states with increased revenues, which has fueled positive
operations for all but a few state governments. At the end of the semi-annual
period, forty-six states have reported that fiscal year 2005 revenue
projections are on or above budget. The revenue growth is helping states
rebuild their reserve funds, many of which were depleted during the fiscal
crisis of 2001.
COMPARISON OF CHANGE IN VALUE OF A $10,000 INVESTMENT IN THE KY TAX-FREE INCOME
PORTFOLIO,
THE LEHMAN BROTHERS MUNICIPAL BOND INDEX AND THE LIPPER KENTUCKY MUNICIPAL DEBT
FUNDS
FOR THE PAST TEN YEARS.
[LINE CHART]
Institutional Investor A Lehman Brothers Municipal Bond Index Lipper Kentucky Municipal Debt Funds
------------- ---------- ------------------------------------ ------------------------------------
03/31/1995 $ 10,000 $ 9,601 $ 10,000 $ 10,000
06/30/1995 10,234 9,814 10,242 10,173
09/30/1995 10,510 10,067 10,536 10,442
12/31/1995 10,766 10,300 10,971 10,906
03/31/1996 10,733 10,257 10,838 10,714
06/30/1996 10,767 10,277 10,921 10,815
09/30/1996 10,945 10,435 11,173 11,043
12/31/1996 11,156 10,623 11,457 11,276
03/31/1997 11,178 10,632 11,431 11,276
06/30/1997 11,453 10,881 11,825 11,607
09/30/1997 11,730 11,131 12,181 11,941
12/31/1997 11,975 11,350 12,512 12,249
03/31/1998 12,078 11,435 12,656 12,378
06/30/1998 12,281 11,613 12,848 12,536
09/30/1998 12,666 11,964 13,243 12,861
12/31/1998 12,735 12,014 13,323 12,899
03/31/1999 12,804 12,066 13,441 12,975
06/30/1999 12,569 11,830 13,203 12,761
09/30/1999 12,511 11,762 13,150 12,629
12/31/1999 12,427 11,669 13,047 12,478
03/31/2000 12,673 11,886 13,430 12,759
06/30/2000 12,829 12,031 13,633 12,856
09/30/2000 13,094 12,252 13,962 13,129
12/31/2000 13,517 12,633 14,573 13,583
03/31/2001 13,842 12,922 14,896 13,823
06/30/2001 13,938 12,996 14,993 13,908
09/30/2001 14,260 13,281 15,414 14,204
12/31/2001 14,111 13,127 15,320 14,116
03/31/2002 14,324 13,296 15,465 14,254
06/30/2002 14,734 13,675 16,031 14,676
09/30/2002 15,030 13,919 16,792 15,150
12/31/2002 15,074 13,958 16,792 15,159
03/31/2003 15,207 14,065 16,994 15,308
06/30/2003 15,588 14,385 17,432 15,672
09/30/2003 15,535 14,334 17,446 15,648
12/31/2003 15,735 14,487 17,684 15,860
03/31/2004 15,928 14,662 17,990 16,080
06/30/2004 15,662 14,400 17,564 15,767
09/30/2004 16,158 14,841 18,249 16,293
12/31/2004 16,426 15,072 18,477 16,479
03/31/2005 16,460 15,089 18,470 16,462
FOR PERIOD ENDING MARCH 31, 2005
Average Annual Total Return
1 Year 3 Year 5 Year 10 Year
------------ ---------- ---------- ----------
Institutional Class 3.34% 4.74% 5.37% 5.11%
Service Class 2.93% 4.43% 5.05% 4.79%
Investor A Class (Load Adjusted) (1.23)% 2.88% 4.03% 4.20%
Investor A Class (NAV) 2.91% 4.31% 4.89% 4.62%
Investor B Class (Load Adjusted) (2.34)% 2.43% 3.76% 3.85%
Investor B Class (NAV) 2.14% 3.53% 4.11% 3.85%
Investor C Class (Load Adjusted) 1.04% 3.48% 4.10% 3.86%
Investor C Class (NAV) 2.03% 3.48% 4.10% 3.86%
THE PERFORMANCE OF THE LEHMAN BROTHERS MUNICIPAL BOND INDEX (THE "BENCHMARK")
IS PRESENTED FOR COMPARATIVE PURPOSES IN RESPONSE TO REQUIREMENTS OF THE
SECURITIES AND EXCHANGE COMMISSION. HOWEVER, BLACKROCK BELIEVES THAT
DIFFERENCES BETWEEN THE WAYS IN WHICH THE PORTFOLIO IS MANAGED AND THE
BENCHMARK IS CONSTRUCTED MAY MAKE COMPARISONS BETWEEN THE PORTFOLIO AND
BENCHMARK PERFORMANCE LESS MEANINGFUL TO INVESTORS. THEREFORE, THE PERFORMANCE
OF THE LIPPER KENTUCKY MUNICIPAL DEBT FUNDS IS ALSO PRESENTED.
IN CONNECTION WITH THE CONVERSION OF VARIOUS COMMON TRUST FUNDS MAINTAINED BY
PNC BANK AND PNC BANK, DELAWARE ("PNC-DE "), AN AFFILIATE OF PNC BANK,INTO THE
FUND BETWEEN MAY 1 AND MAY 15,1998 (THE "CTF CONVERSION"), THE KENTUCKY
TAX-FREE INCOME PORTFOLIO WAS ESTABLISHED TO RECEIVE THE ASSETS OF THE KY
TAX-FREE INCOME FUND OF PNC BANK.PERFORMANCE INFORMATION PRESENTED FOR THIS
PORTFOLIO INCLUDES PERFORMANCE FOR THE PREDECESSOR COMMON TRUST FUND WHICH
TRANSFERRED ITS ASSETS AND LIABILITIES TO THE RELATED PORTFOLIO PURSUANT TO THE
CTF CONVERSION. PERFORMANCE INFORMATION PRESENTED IS BASED UPON THE PERFORMANCE
OF THE KY TAX-FREE INCOME FUND FOR PERIODS PRIOR TO THE CTF CONVERSION. SEE
"NOTE ON PERFORMANCE INFORMATION" ON PAGE 16 FOR FURTHER INFORMATION ON HOW
PERFORMANCE DATA WAS CALCULATED, INCLUDING IMPORTANT INFORMATION ON THE LINE
GRAPH\^ ABOVE.
PAST PERFORMANCE IS NOT PREDICTIVE OF FUTURE RESULTS. The graph and table do
not reflect the deduction of taxes that a shareholder would pay on fund
distributions or the redemption of shares. Although the holdings and sectors
listed above were current as of the periods indicated, the Portfolio is
actively managed and its composition will vary.
14
KENTUCKY TAX-FREE INCOME PORTFOLIO
FUND PROFILE
Credit Quality (% of
investments)1
AAA 55.8 %
AA 14.9
A 10.5
BBB 16.9
Unrated 1.9
----
Total 100.0 %
========
Portfolio Statistics
Average maturity (years) 5.66
Modified Duration2 3.9
1 Using the higher of Standard & Poor's ("S&P's") or Moody's Investors Service
("Moody's") rating.
2 Duration measures a Portfolio's price risk. Each year of duration represents
an expected 1% change in the net asset value of the fund for every 1%
change in interest rates. Modified duration assumes that cash flows remain
constant as interest rates change.
- --------------------------------------------------------------------------------
EXPENSE EXAMPLE
As a shareholder of the Portfolio, you incur two types of costs: (1)
transaction costs, including front and back end sales charges (loads) where
applicable; and (2) ongoing costs, including advisory fees, distribution
(12b-1) and service fees, where applicable; and other Portfolio expenses. This
Example is intended to help you understand your ongoing costs (in dollars) of
investing in the Portfolio and to compare these costs with the ongoing costs of
investing in other mutual funds.
The Example below is based on an investment of $1,000 invested at the beginning
of the period and held for the entire period October 1, 2004 to March 31, 2005.
The information under "Actual Expenses," together with the amount you invested,
allows you to estimate actual expenses incurred over the reporting period.
Simply divide your account value by $1,000 (for example, an $8,600 account
value divided by $1,000 = 8.60) and multiply the result by the cost shown for
your share class, in the row entitled "Expenses Incurred During Period", to
estimate the expenses incurred on your account during this period.
The information under "Hypothetical Expenses" provides information about
hypothetical account values and hypothetical expenses based on the Portfolio's
actual expense ratio and an assumed rate of return of 5% per year before
expenses, which is not the Portfolio's actual return. The hypothetical account
values and expenses may not be used to estimate the actual ending account
balance or expense you incurred for the period. You may use this information to
compare the ongoing costs of investing in the Portfolio and other funds. To do
so, compare this 5% hypothetical example with the 5% hypothetical examples that
appear in the shareholder reports of the other funds.
Please note that the expenses shown in the table are meant to highlight your
ongoing costs only and do not reflect any transactional costs, such as front
and back end sales charges (loads) or redemption/exchange fees, where
applicable. Therefore, the hypothetical information is useful in comparing
ongoing costs only, and will not help you determine the relative total costs of
owning different funds. In addition, if these transactional costs were
included, your costs would have been higher.
Actual Expenses
-------------------------------------------------------------------------------
Institutional Service Investor Investor Investor
Class Class A Class B Class C Class
--------------- --------------- --------------- --------------- ---------------
Beginning Account
Value (10/01/04) $ 1,000.00 $ 1,000.00 $ 1,000.00 $ 1,000.00 $ 1,000.00
Ending Account Value
(3/31/05) 1,018.70 1,016.10 1,016.70 1,012.90 1,011.90
Expenses Incurred
During Period
(10/01/04 -
3/31/05) 3.51 5.01 5.47 9.21 9.20
Hypothetical Expenses
(5% return before expenses)
-------------------------------------------------------------------------------
Institutional Service Investor Investor Investor
Class Class A Class B Class C Class
--------------- --------------- --------------- --------------- ---------------
Beginning Account
Value (10/01/04) $ 1,000.00 $ 1,000.00 $ 1,000.00 $ 1,000.00 $ 1,000.00
Ending Account Value
(3/31/05) 1,021.48 1,019.97 1,019.51 1,015.74 1,015.74
Expenses Incurred
During Period
(10/01/04 -
3/31/05) 3.52 5.03 5.49 9.26 9.26
For each class of the Portfolio, expenses are equal to the annualized expense
ratio of 0.70%, 1.00%, 1.09%, 1.84%, and 1.84% for the Institutional, Service,
Investor A, B, and C share classes, respectively, multiplied by the average
account value over the period, multiplied by 182/365 (to reflect the one-half
year period).
15
BLACKROCK FUNDS
NOTE ON PERFORMANCE INFORMATION
The performance information above includes information for each class of
each Portfolio since the commencement of operations of the Portfolio, rather
than the date such class was introduced. Performance information for each class
introduced after the commencement of operations of a Portfolio is therefore
based on the performance history of a predecessor class or predecessor classes.
If a class of shares in a Portfolio (the "Subsequent Class") has more than one
predecessor class, the performance data predating the introduction of the
Subsequent Class is based initially on the performance of the Portfolio's first
operational predecessor class (the "Initial Class"); thereafter, the
performance of the Subsequent Class is based upon the performance of any other
predecessor class or classes which were introduced after the Initial Class and
which had total operating expenses more similar to those of the Subsequent
Class. In the case of Investor A, Investor B, Investor C and Service Shares,
the performance information for periods prior to their introduction dates has
not been restated to reflect the shareholder servicing and processing and/or
distribution fees and certain other expenses borne by these share classes
which, if reflected, would reduce the performance quoted. Accordingly, the
performance information may be used in assessing each Portfolio's performance
history but does not reflect how the distinct classes would have performed on a
relative basis prior to the introduction of these classes, which would require
an adjustment to the ongoing expenses. Additionally, the performance
information above does not reflect accounting adjustments required under
accounting principles generally accepted in the United States of America and as
a result there may be variances between what is reported within this section
and that reported in the total return calculation in the Financial Highlights.
Performance information is restated to reflect the current maximum
front-end sales charge (in the case of Investor A Shares) or the maximum
contingent deferred sales charge (in the case of Investor B and Investor C
Shares), and assumes the reinvestment of dividends and distributions. The
maximum front-end sales charges for Investor A Shares are as follows:
UltraShort Municipal - 3.00% and Tax-Free Income, Pennsylvania Tax-Free Income,
New Jersey Tax-Free Income, Ohio Tax-Free Income, Delaware Tax-Free Income and
Kentucky Tax-Free Income - 4.00%. The maximum contingent deferred sales charge
for Investor B Shares and Investor C Shares of all of the Portfolios is 4.50%
and 1.00%, respectively.
The performance information also reflects fee waivers and reimbursements
that subsidize and reduce the total operating expenses of each Portfolio. The
Portfolios' returns would have been lower if there were not such waivers and
reimbursements. BlackRock Advisors, Inc. is under no obligation to waive or
continue waiving its fees after February 1, 2006. Investment return and
principal value of an investment will fluctuate so that an investor's shares,
when redeemed, may be worth more or less than their original cost.
The performance information for the Lipper Short Municipal Debt Funds,
Lipper General Municipal Debt Funds, Lipper Pennsylvania Municipal Debt Funds,
Lipper New Jersey Municipal Debt Funds, Lipper Ohio Municipal Debt Funds,
Lipper Other States Municipal Debt Funds and Lipper Kentucky Municipal Debt
Funds represents the average of the total returns reported by all of the mutual
funds designated by Lipper, Inc. as falling into the respective category. These
total returns are reported net of expenses and other fees that the Securities
and Exchange Commission requires to be reflected in a mutual fund's
performance.
\^ The performance shown in the line graph is that of Institutional Shares and
Investor A Shares of the Portfolios. The actual performance of Investor B,
Investor C and Service Shares is lower than the performance of Institutional
Shares because Investor B, Investor C and Service Shares have higher
expenses than Institutional Shares. Excluding the effects of sales charges,
the actual performance of Investor B and Investor C Shares is lower than the
performance of Investor A Shares because Investor B and Investor C Shares
have higher expenses than Investor A Shares. Purchasers of Investor A Shares
generally pay a front-end sales charge, while purchasers of Investor B and
Investor C Shares may pay a contingent deferred sales charge (depending on
how long they hold their shares) when they sell their shares.
* The performance shown in the line graph is that of Service Shares and
Investor A Shares of the Portfolios. The actual performance of Investor B
and Investor C Shares is lower than the performance of Service Shares
because Investor B and Investor C Shares have higher expenses than Service
Shares. Excluding the effects of sales charges, the actual performance of
Investor B and Investor C Shares is lower than the performance of Investor A
Shares because Investor B and Investor C Shares have higher expenses than
Investor A Shares. Purchasers of Investor A Shares generally pay a front-end
sales charge, while purchasers of Investor B and Investor C Shares may pay a
contingent deferred sales charge (depending on how long they hold their
shares) when they sell their shares.
16
BLACKROCK FUNDS
STATEMENT OF NET ASSETS
ULTRASHORT MUNICIPAL PORTFOLIO
AS OF MARCH 31, 2005 (UNAUDITED)
PAR
MATURITY (000) VALUE
---------- ---------- -------------
MUNICIPAL BONDS - 99.4%
Alaska - 5.4%
Anchorage Wastewater Rev.,
Wachovia Merlots Tr. Receipts,
Ser. 04C-25
1.70% 09/01/05 $1,000 $1,000,000
Anchorage Wtr. Rev., Wachovia
Merlots Tr. Receipts, Ser. 04C-32
1.70% 09/16/05 1,000 996,941
==========
1,996,941
----------
District of Columbia - 2.7%
Met. Washington D.C. Arpt. Auth.
Sys. Rev., Ser. 02D
4.00% 10/01/05 1,000 1,006,850
----------
Florida - 5.4%
Putnam Cnty. Dev. Auth. Poll. Ctrl.
Rev., Seminole Elec. Corp. Prj.,
Ser. 84H-3
2.30% 03/15/14 2,000 2,000,000
----------
Georgia - 3.2%
Atlanta Georgia Arpt. Rev., Ser.
04-C14 AMT DN
2.40%(b) 04/07/05 1,200 1,200,000
----------
Illinois - 0.2%
Chicago Trans. Auth. Cap. Gtd. Tr.
Receipts Rev., Ser. 03A
4.00% 06/01/06 90 90,093
----------
Indiana - 2.7%
Indiana St. Dev. Fin. Auth. Econ.
Dev. Rev., IVC Coatings Prj., Ser.
00 AMT DN
2.45%(b) 04/07/05 1,000 1,000,000
----------
Michigan - 2.7%
Oakland Cnty. Michigan Econ. Dev.
Corp. Ltd. Oblig. Rev., Exhibit
Enterprises, Inc. Prj., Ser. 04 AMT
DN
2.43%(b) 04/07/05 1,000 1,000,000
----------
Minnesota - 1.5%
Minneapolis & St. Paul Met. Arpts.
Comm. Arpt. Rev., Ser. 99B AMT
5.50% 01/01/10 500 538,940
----------
Multi-State - 8.0%
Charter Mac Equity Issuer Tr. Rev.,
Ser. 04 AMT DN
2.41%(b) 04/07/05 1,300 1,300,000
Mun. Securities Pool Tr. Receipts
Rev., Ser. 04 PG-17 DN
2.43%(b) 04/07/05 1,660 1,660,000
==========
2,960,000
----------
New Jersey - 1.1%
Newark G.O., Ser. 03
4.00% 07/15/08 385 397,285
----------
New Mexico - 2.7%
Farmington Poll. Ctrl. Rev., Pub.
Svcs. San Juan Prj., Ser. 03B
2.10% 04/01/33 1,000 988,420
----------
New York - 1.4%
New York City G.O., Ser. 04I
5.00% 08/01/09 500 530,640
----------
PAR
MATURITY (000) VALUE
---------- ---------- -------------
MUNICIPAL BONDS (Continued)
North Carolina - 2.7%
North Carolina Mun. Pwr. Agcy. No. 1
Catawba Elec. Rev.
P-FLOATS-PT-757
2.40% 01/01/11 $1,000 $1,000,000
----------
Ohio - 10.9%
Clipper Tax-Exempt CTF Tr., Ser.
04-08
2.40% 07/01/08 800 800,000
Clipper Tax-Exempt CTF Tr., Ser.
04-9
2.48% 06/01/08 2,000 2,000,000
Columbus City Sch. Dist. G.O.,
Wachovia Merlots Tr. Receipts,
Ser. 04C-29
1.70% 09/16/05 1,000 996,942
Ohio Bldg. Auth. Rev., St. Fac.
Admin. Bldg. Fd. Prj., Ser. 03A
4.50% 04/01/08 220 229,046
==========
4,025,988
----------
Oklahoma - 2.7%
Oklahoma Dev. Fin. Auth. Rev.
AMT-Var.-ConocoPhillips Co. Prj.
2.42% 12/01/05 1,000 999,861
----------
Oregon - 2.9%
Metro G.O. Ref., Ser. 02A
4.38% 01/01/08 1,045 1,083,029
----------
Pennsylvania - 10.0%
Pennsylvania Econ. Dev. Fin. Auth.
Wstwtr. Trtmnt. Rev. Var.
Ref.-Sunoco Inc.-R&M Prj., Ser. A
2.34% 10/01/34 2,200 2,200,000
Venango IDA Resource
2.10% 05/04/05 1,500 1,499,670
==========
3,699,670
----------
Puerto Rico - 1.4%
Puerto Rico Pub. Bldgs. Auth. Rev.,
Govt. Facs. Prj., Prerefunded Ser.
02C
5.00% 07/01/05 365 367,405
Puerto Rico Pub. Bldgs. Auth. Rev.,
Govt. Facs. Prj., Ser. 02C
5.00% 07/01/05 135 135,794
==========
503,199
----------
South Carolina - 3.5%
Greenwood Cnty. Exempt Fac. Ind.
Rev. Var. Ref.-Fuji Photo Film Prj.
2.42% 09/01/11 1,300 1,300,000
----------
Tennessee - 4.5%
Coffee Cnty. Ind. Bd., Inc. Ind. Dev.
Rev., Comtec Polymers, Inc. Prj.,
Ser. 97 AMT DN
2.48%(b) 04/07/05 1,650 1,650,000
----------
Texas - 15.3%
Frisco Indpt. Sch. Dist. G.O.,
Wachovia Merlots Tr. Receipts,
Ser. 04C-24
1.70% 09/01/05 1,000 1,000,000
SEE ACCOMPANYING NOTES TO FINANCIAL STATEMENTS
17
BLACKROCK FUNDS
STATEMENT OF NET ASSETS
ULTRASHORT MUNICIPAL PORTFOLIO (CONCLUDED)
AS OF MARCH 31, 2005 (UNAUDITED)
PAR
MATURITY (000) VALUE
---------- -------- -------------
MUNICIPAL BONDS (Continued)
Texas (Continued)
Gulf Coast Wst. Disp. Auth.
Environmental Facs. Rev.
Adj.-Exxon Mobil Prj.
2.34% 09/01/25 $ 800 $ 800,000
Gulf Coast Wst. Disp. Auth.
Environmental Facs. Rev. Var.-Air
Products Prj.
2.35% 12/01/39 1,450 1,450,000
Houston Texas Hsg. Fin. Corp. Rev.,
Ser. 04 PT-2101 AMT DN
2.41%(b) 04/07/05 2,000 2,000,000
Texas St. Tpke. Auth. Ctr. Tpke. Sys.
Rev., Ser. 02
5.00% 06/01/08 385 405,982
===========
5,655,982
-----------
Utah - 2.8%
Salt Lake Cnty. Utah Solid Wst. Disp.
Rev. Adjustable-Kennecott Copper
Prj., Ser. A
2.35% 08/01/30 500 500,000
Utah Assd. Mun. Pwr. Sys. Rev.,
Payson Pwr. Prj., Ser. 03A
5.00% 04/01/08 500 526,920
===========
1,026,920
-----------
Virginia - 2.9%
Fairfax Cnty. Ref., Pub. Import Ser. A
4.25% 06/01/08 1,050 1,091,128
-----------
Washington - 2.8%
Port Seattle Rev. P-FLOAT-MT 051
2.37% 12/01/14 1,040 1,040,000
-----------
TOTAL MUNICIPAL BONDS
(Cost $36,901,628) 36,784,946
-----------
MONEY MARKET FUND - 0.2%
Wilmington Trust Tax-Free Money
Market Fund
(Cost $71,226) 71 71,226
-----------
TOTAL INVESTMENTS IN SECURITIES - 99.6%
(Cost $36,972,854(a)) 36,856,172
OTHER ASSETS IN EXCESS OF
LIABILITIES - 0.4% 166,006
----------
NET ASSETS - 100.0%
(Applicable to 2,671,670
BlackRock shares, 1,058,181
Institutional shares, 10 Service
shares and 10 Investor A shares
outstanding) $37,022,178
===========
VALUE
----------
NET ASSET VALUE, OFFERING AND
REDEMPTION PRICE PER
BLACKROCK SHARE
($26,525,601/2,671,670) $ 9.93
=======
NET ASSET VALUE, OFFERING
AND REDEMPTION PRICE PER
INSTITUTIONAL SHARE
($10,496,377/1,058,181) $ 9.92
=======
NET ASSET VALUE, OFFERING
AND REDEMPTION PRICE PER
SERVICE SHARE
($100/10)(c) $ 10.03
=======
NET ASSET VALUE AND REDEMPTION
PRICE PER INVESTOR A SHARE
($100/10)(d) $ 10.00
=======
MAXIMUM OFFERING PRICE PER
INVESTOR A SHARE
($10.00/0.970) $ 10.31
=======
- -------------------
(a) Also cost for Federal income tax purposes. The gross unrealized
appreciation (depreciation) on a tax basis is as follows:
Gross unrealized appreciation $ 93
Gross unrealized depreciation (116,775)
---------
$(116,682)
=========
(b) Rates shown are the rates as of March 31, 2005, and maturities shown are
the longer of the next interest readjustment date or the date the
principal owed can be recovered through demand.
(c) Exact net assets and shares outstanding at March 31, 2005 were $100.55
and 10.028, respectively.
(d) Exact net assets and shares outstanding at March 31, 2005 were $100.27 and
10.026, respectively.
SEE ACCOMPANYING NOTES TO FINANCIAL STATEMENTS
18
BLACKROCK FUNDS
STATEMENT OF NET ASSETS
TAX-FREE INCOME PORTFOLIO
AS OF MARCH 31, 2005 (UNAUDITED)
PAR
MATURITY (000) VALUE
------------ ---------- -------------
MUNICIPAL BONDS - 101.4%
Alabama - 4.0%
Alabama Rev., Priv. Coll. & Tuskegee
Univ. Prj., Ser. 96A
5.90%(b) 09/01/16 $1,000 $ 1,061,640
Alabama St. Pub. Sch. & Coll. Auth.
Cap. Imp. Rev., Ser. 98
5.12% 11/01/09 1,000 1,076,100
Alabama St. Pub. Sch. & Coll. Auth.
Cap. Imp. Rev., Ser. 99C
5.75% 07/01/18 3,000 3,307,440
Alabama St. Pub. Sch. & Coll. Auth.
Cap. Imp. Rev., Ser. 99D
5.75%(b) 08/01/10 1,000 1,109,620
Courtland Ind. Dev. Solid Waste
Disp. Rev., Champion Intl. Corp.
Prj., Ser. 99 AMT
6.00% 08/01/29 1,500 1,555,440
Jefferson Cnty. Swr. Rev., Ref.
Warrants, Ser. 03B-8
5.25% 02/01/13 7,725 8,272,162
===========
16,382,402
-----------
Alaska - 0.6%
Alaska Ind. Dev. & Expt. Auth.
Revolving Fd. Rev., Ser. 97A AMT
6.00% 04/01/07 2,500 2,641,275
-----------
Arizona - 0.8%
Arizona Sch. Fac. Bd. Rev., St. Sch.
Imp. Prj., Ser. 02
5.50% 07/01/12 1,180 1,318,497
Maricopa Cnty. Cmnty. Coll. Dist.
G.O., Ser. 02
5.25% 07/01/11 1,000 1,092,580
Yuma Mun. Property Corp. Rev.,
Mun. Fac. Prj., Ser. 03A
5.00% 07/01/10 1,010 1,087,406
===========
3,498,483
-----------
California - 6.6%
California St. Econ. Recovery G.O.,
Ser. 04A
5.25% 07/01/13 7,500 8,240,400
California St. G.O., Ser. 90
6.50% 11/01/06 340 359,047
Foothill Eastern Corridor Agcy. Toll
Rd. Rev., Ser. 99
5.75% 01/15/40 8,500 8,581,005
Golden St. Tobacco Securitization
Corp. Rev., Ser. 03B
5.00% 06/01/13 2,675 2,686,797
Los Altos Sch. Dist. Cap. Apprec.
G.O., Ser. 01B
5.87%(c) 08/01/21 3,380 1,436,500
Sacramento Cnty. Sanit. Dist. Fing.
Auth. Rev., Ser. 04A
5.00% 12/01/35 5,000 5,170,000
Sacramento Mun. Util. Dist. Elec.
Rev., Prerefunded Ser. 92C
5.75% 11/15/09 430 431,961
Stockton-East Wtr. Dist. Rev., Ser.
02B
6.12%(c) 04/01/28 4,495 1,171,037
===========
28,076,747
-----------
PAR
MATURITY (000) VALUE
------------ ---------- -------------
MUNICIPAL BONDS (Continued)
Colorado - 0.4%
Arapahoe Cnty. Cap. Imp. Tr. Fd.
Hwy. Rev., Prerefunded Ser.
86E-470
6.90% 08/31/05 $ 750 $ 786,270
Colorado Dept. Trans. Rev., Ser. 02B
5.00% 06/15/11 1,000 1,083,990
===========
1,870,260
-----------
District of Columbia - 0.0%
District of Columbia G.O.,
Prerefunded Ser. 93A-1
6.00% 06/01/11 50 57,044
-----------
Florida - 4.4%
Florida St. Bd. of Ed. Cap. Outlay
G.O., Ser. 00D
5.75% 06/01/22 7,800 8,573,682
Florida St. Dept. Gen. Svcs. Division
Fac. Management Rev., Fac. Pool
Prj., Ser. 03A
5.25% 09/01/10 1,400 1,527,582
Hillsborough Cnty. Ind. Dev. Auth.
Exempt Fac. Rev., Nat. Gypsum
Prj., Ser. 00A AMT
7.12% 04/01/30 2,000 2,181,420
Jacksonville Hlth. Fac. Auth. Hosp.
Rev., Baptist Med. Ctr. Prj. Ser. 01
2.23% 08/15/21 700 700,000
St. Petersburg Excise Tax Rev., Ser.
93
5.15% 10/01/11 1,655 1,808,270
Tampa Wtr. & Swr. Rev., Ser. 02
10/01/14-
6.00% 10/01/16 2,455 2,882,862
Tampa Wtr. & Swr. Rev., Ser. 02B
5.00% 07/01/10 1,000 1,076,640
===========
18,750,456
-----------
Georgia - 4.7%
Atlanta Arpt. Fac. Rev., Ser. 94A
6.50% 01/01/10 1,000 1,140,200
Atlanta Arpt. Psngr. Fac. Rev., Ser.
04J
5.00% 01/01/34 5,000 5,115,800
Augusta Wtr. & Swr. Rev., Ser. 04
5.25% 10/01/39 3,000 3,184,110
Cobb Cnty. & Marietta Wtr. Auth.
Rev., Ser. 02
5.50% 11/01/14 1,000 1,131,630
Forsyth Cnty. Sch. Dist. G.O., Ser. 92
6.70% 07/01/12 1,000 1,147,320
Fulton Cnty. Fac. Corp. COP, Fulton
Cnty. Pub. Purp. Prj., Ser. 99
5.50% 11/01/18 1,000 1,093,780
Fulton Cnty. Wtr. & Swr. Rev., Ser. 04
5.00% 01/01/35 5,000 5,156,750
Georgia Mun. Elec. Auth. Pwr. Rev.,
Ser. 93B
5.70% 01/01/19 1,000 1,135,160
Georgia St. G.O., Ser. 97C
6.25% 08/01/11 750 866,481
===========
19,971,231
-----------
SEE ACCOMPANYING NOTES TO FINANCIAL STATEMENTS
19
BLACKROCK FUNDS
STATEMENT OF NET ASSETS
TAX-FREE INCOME PORTFOLIO (CONTINUED)
AS OF MARCH 31, 2005 (UNAUDITED)
PAR
MATURITY (000) VALUE
---------- ---------- -------------
MUNICIPAL BONDS (Continued)
Hawaii - 1.2%
Hawaii St. G.O., Ser. 02CZ
5.25% 07/01/10 $ 1,000 $ 1,089,040
Hawaii St. Hbr. Cap. Imp. Rev., Ser.
97 AMT
5.50% 07/01/27 3,750 3,882,712
===========
4,971,752
-----------
Illinois - 3.7%
Chicago Wtr. Rev., Prerefunded Ser.
97
5.50% 11/01/07 8,885 9,620,767
Chicago Wtr. Rev., Ser. 97
5.50% 11/01/22 1,020 1,095,734
Cook Cnty. G.O., Prerefunded Ser.
96
5.88% 11/15/06 2,000 2,118,860
Illinois G.O., Prerefunded Ser. 02
5.25% 10/01/12 1,000 1,104,700
Illinois Hsg. Dev. Auth. Rev.,
Multi-Fam. Prj., Ser. 94-5
6.65% 09/01/14 1,620 1,643,377
===========
15,583,438
-----------
Kansas - 0.6%
Sedgwick Cnty. Uni. Sch. Dist. No.
259 Wichita G.O., Ser. 01
5.25% 09/01/09 2,250 2,429,415
-----------
Louisiana - 0.5%
Orleans Rev., Levee Dist. Pub. Imp.
Prj., Ser. 86
5.95% 11/01/15 2,170 2,282,341
-----------
Maryland - 1.9%
Maryland St. Hlth. & Hgr. Edl. Fac.
Auth. Rev., Ser. 94D
2.30% 01/01/29 6,000 6,000,000
Univ. of Maryland Sys. Aux. Fac. &
Tuition Rev., Ser. 00A
5.00% 10/01/09 1,050 1,126,167
Washington Subn. Sanit. Dist. G.O.,
Wtr. Sply. Prj., Ser. 03
5.25% 06/01/10 1,000 1,092,700
===========
8,218,867
-----------
Massachusetts - 4.3%
Massachusetts St. Cons. Ln. G.O.,
Ser. 02D
5.25% 08/01/10 1,000 1,085,270
Massachusetts St. Dev. Fin. Agy.
Rev., Boston Univ. Prj. Ser. 02R-2
2.27% 10/01/42 2,200 2,200,000
Massachusetts St. Hlth. & Edl. Facs.
Auth. Rev., Harvard Univ. Prj., Ser.
01DD
5.00% 07/15/35 8,570 8,792,049
Massachusetts St. Hlth. & Edl. Facs.
Auth. Rev., Newton-Wellesley
Hosp. Prj., Ser. 97G
6.12% 07/01/15 1,000 1,081,050
Massachusetts St. Tpke. Auth. Met.
Hwy. Sys. Rev., Ser. 97A
5.00% 01/01/37 5,000 5,076,200
===========
18,234,569
-----------
PAR
MATURITY (000) VALUE
---------- ---------- -------------
MUNICIPAL BONDS (Continued)
Michigan - 0.5%
Huron Vy. Sch. Dist. G.O.,
Prerefunded Ser. 96
5.88% 05/01/07 $ 2,000 $ 2,120,860
-----------
Mississippi - 0.3%
Mississippi St. G.O., Ser. 02A
5.38% 12/01/10 1,275 1,397,324
-----------
Missouri - 1.5%
Lake of The Ozarks Cmnty. Bldg.
Corp. Sys. Rev., Ser. 98
5.25% 12/01/14 4,915 4,739,830
Missouri St. Env. Imp. & Energy Res.
Auth. Wtr. Poll. Rev., Drinking Wtr.
Prj., Ser. 02B
5.25% 07/01/11 1,540 1,688,887
===========
6,428,717
-----------
Multi-State - 4.1%
Charter Mac Equity Issue Tr.
6.62%(d) 06/30/09 3,000 3,207,330
7.60%(d) 11/30/10 9,000 10,059,300
MuniMae TE Bond Subs., LLC
6.88%(d) 06/30/09 4,000 4,314,360
===========
17,580,990
-----------
Nebraska - 0.3%
Omaha Pub. Pwr. Dist. Elec. Rev.,
Ser. 92B
6.15% 02/01/12 1,000 1,123,280
-----------
Nevada - 0.7%
Clark Cnty. Arpt. Rev., Ser. 04A-1
5.50% 07/01/15 1,780 1,939,897
Clark Cnty. Bond Bank G.O., Ser. 02
5.00% 06/01/10 1,000 1,074,060
===========
3,013,957
-----------
New Hampshire - 3.5%
New Hampshire Hlth. & Ed. Fac.
Auth. Rev., Dartmouth Hitchcock
Oblig., Ser. 01A
2.26% 08/01/31 15,000 15,000,000
-----------
New Jersey - 6.4%
Gloucester Cnty. Ind. Poll. Ctrl. fdg.
Auth. Rev. Ref., Exxon Mobil Prj.
2.14% 01/01/22 1,500 1,500,001
Middlesex Cnty. Imp. Auth. Rev.,
Heldrich Center Hotel Prj., Ser. A
5.00% 01/01/32 2,000 1,940,220
Middlesex Cnty. Imp. Auth. Rev.,
Heldrich Ctr. Htl. Prj., Ser. 05A
5.12% 01/01/37 2,500 2,430,425
New Jersey St. Edl. Fac. Auth. Rev.,
Princeton Univ. Prj., Ser. 05A
5.00% 07/01/30 2,500 2,607,750
New Jersey St. Tpke. Auth. Rev.,
Prerefunded, Ser. 00A
5.75% 01/01/10 2,820 3,110,234
New Jersey St. Tpke. Auth. Rev.,
Ser. 00A
5.75% 01/01/16 1,180 1,289,551
SEE ACCOMPANYING NOTES TO FINANCIAL STATEMENTS
20
BLACKROCK FUNDS
STATEMENT OF NET ASSETS
TAX-FREE INCOME PORTFOLIO (CONTINUED)
AS OF MARCH 31, 2005 (UNAUDITED)
PAR
MATURITY (000) VALUE
------------- ---------- --------------
MUNICIPAL BONDS (Continued)
New Jersey (Continued)
New Jersey St. Trans. Tr. Fd. Auth.
Trans. Sys. Rev., Prerefunded Ser.
00A
6.00% 06/15/10 $10,000 $11,288,800
Port Auth. New York & New Jersey
S.O., JFK Intl. Arpt. Term. Prj., Ser.
97-6 AMT
6.25% 12/01/09 2,680 2,934,841
===========
27,101,822
-----------
New Mexico - 0.3%
New Mexico St. Hwy. Comm. Rev.,
Sr. Subs. Lien Tax Prj., Ser. 02A
5.25% 06/15/10 1,000 1,085,870
-----------
New York - 10.0%
New York City G.O., Prerefunded
Ser. 95B
6.38% 08/15/05 3,840 3,935,270
New York City G.O., Ser. 94A
6.00% 08/01/05 10 10,140
New York City G.O., Ser. 96A
6.00% 08/01/05 2,000 2,023,580
New York City G.O., Ser. 03I
5.75% 03/01/19 5,000 5,484,850
New York City Ind. Dev. Agcy. Rev.,
Term. One Grp. Assoc. Prj., Ser.
94 AMT
01/01/08-
6.00% 01/01/19 860 873,529
New York City Transitional Fin. Auth.
Rev., Ser. 02A
5.25% 11/01/11 3,300 3,610,002
New York City Transitional Fin. Auth.
Rev., Ser. 02C
5.25% 08/01/10 1,300 1,423,409
New York St Env. Fac. Corp. Clean
Wtr. & Drinking Rev., NYC Mun.
Wtr. Fin. Prj., Ser. 04
5.00% 06/15/34 7,600 7,848,368
New York St. Loc. Govt. Assistance
Corp. Rev., Prerefunded Ser. 95A
5.70% 04/01/05 340 346,800
Sales Tax Asset Rcvbl. Corp. Rev.,
Ser. 04A
5.00% 10/15/29 5,000 5,207,650
5.00% 10/15/32 5,000 5,184,050
Tobacco Settlement Fin. Corp. Rev.,
Ser. 03A-1
5.50% 06/01/14 6,075 6,550,551
===========
42,498,199
-----------
North Carolina - 0.1%
North Carolina Mun. Pwr. Agcy. Rev.,
Catawba Elec. Prj., Ser. 92A
6.00% 01/01/10 300 334,272
-----------
Ohio - 0.1%
Cleveland-Cuyahoga Cnty. Port Auth.
Rev., Ser. 97 AMT
6.00% 03/01/07 440 458,735
-----------
Oregon - 3.3%
Clackamas Cnty. G.O., Sch. Dist. No.
62 Oregon City Prj., Prerefunded
Ser. 00C
5.50% 06/15/10 3,185 3,520,030
PAR
MATURITY (000) VALUE
------------- ---------- --------------
MUNICIPAL BONDS (Continued)
Oregon (Continued)
Klamath Falls Elec. Sr. Lien Rev.,
Klamath Cogen Prj., Ser. 99
6.00% 01/01/25 $ 7,500 $ 7,505,625
Oregon St. Dept. Admin. Svcs.
Lottery Rev., Ser. 03A
5.00% 04/01/11 1,035 1,117,645
Oregon St. Dept. Admin. Svcs. Rev.,
Ser. 03
5.00% 09/01/10 1,900 2,046,946
===========
14,190,246
-----------
Pennsylvania - 10.8%
Beaver Cnty. G.O., Prerefunded Ser.
96A
5.75% 10/01/06 1,000 1,045,710
Central Bucks Sch. Dist. G.O., Ser. A
5.00% 05/15/20 3,000 3,144,210
Delaware Cnty. Auth. Rev., Mercy
Hlth. Corp. Prj., Ser. 96
5.75% 12/15/20 2,400 2,520,984
Delaware Cnty. Indl. Auth. Arpt. Fac.
Rev., UTD Parcel Svc Prj., Ser. 85
2.22% 12/01/15 1,200 1,200,000
Delaware Vy. Regl. Fin. Auth. Loc.
Govt. Rev., Ser. 98A
5.50% 08/01/28 10,500 11,907,420
Delaware Vy. Regl. Fin. Auth. Loc.
Govt. RITES PA-1041 Rev., Ser.
02B
30.67%(e) 07/01/32 1,000 2,332,800
Lehigh Cnty. Gen. Purp. Auth. Rev.,
Kidspeace Oblig. Prj., Ser. 98
6.00% 11/01/23 2,650 2,774,762
Northampton Cnty. Gen. Purp. Auth.
Rev., Cnty. Agreement Prj., Ser. 01
5.00% 10/01/10 2,130 2,291,603
Pennsylvania Con. Ctr. Auth. Rev.,
Ser. 94A
6.60% 09/01/09 4,250 4,350,895
Pennsylvania St. Hgr. Ed. Assist.
Agcy., Ser. A
2.27% 12/01/24 300 300,000
Pennsylvania St. Hgr. Ed. Fac. Auth.
Hlth. Svcs. Rev., Univ. of
Pennsylvania Hlth. Svcs. Prj., Ser.
96A
5.88% 01/01/15 3,450 3,567,128
5.75% 01/01/17 3,535 3,651,832
Philadelphia Ind. Dev. Auth. Arpt.
Fac. Rev., Aero Philadelphia LLC
Prj., Ser. 99 AMT
5.25% 01/01/09 600 601,764
Philadelphia Ind. Dev. Auth. Rev.,
PGH Dev. Corp. Prj., Ser. 93
5.25% 07/01/17 1,935 1,939,218
Philadelphia Sch. Dist. G.O., Ser.
99C
5.75% 03/01/29 4,000 4,434,640
===========
46,062,966
-----------
Puerto Rico - 3.6%
Puerto Rico Cmwlth. Govt. Dev. Bank
Rev., Ref. Ser. 85
2.19% 12/01/15 600 599,999
SEE ACCOMPANYING NOTES TO FINANCIAL STATEMENTS
21
BLACKROCK FUNDS
STATEMENT OF NET ASSETS
TAX-FREE INCOME PORTFOLIO (CONTINUED)
AS OF MARCH 31, 2005 (UNAUDITED)
PAR
MATURITY (000) VALUE
---------- ---------- --------------
MUNICIPAL BONDS (Continued)
Puerto Rico (Continued)
Puerto Rico Cmwlth. Infra. Fin. Auth.
Spec. RITES PA-782 Rev., Ser.
01G
13.44%(e) 10/01/40 $ 3,985 $ 5,222,024
Puerto Rico Elec. Pwr. Auth. Rev.,
Ser. 94S
7.00% 07/01/06 1,000 1,050,230
Puerto Rico Elec. Pwr. Auth. Rev.,
Ser. 05RR
5.00% 07/01/35 4,000 4,162,360
Puerto Rico Pub. Fin. Corp. Cmwlth.
Approp. Rev., Prerefunded Ser.
02E
5.50% 02/01/12 2,990 3,323,146
Puerto Rico Pub. Fin. Corp. Cmwlth.
Approp. Rev., Ser. 02E
5.50% 08/01/29 1,010 1,084,639
============
15,442,398
------------
Rhode Island - 0.7%
Rhode Island Depositors Econ.
Protection Corp. S.O., Prerefunded
Ser. 93
5.62% 08/01/09 190 207,729
Rhode Island Depositors Econ.
Protection Corp. S.O., Ser. 93
5.62% 08/01/09 665 690,164
Rhode Island St. Hlth. & Ed. Bldg.
Corp. Rev., Hosp. Fin. Lifespan
Oblig. Grp. Prj., Ser. 96
5.50% 05/15/16 2,000 2,116,979
============
3,014,872
------------
South Dakota - 0.1%
South Dakota St. Lease Rev., Trans.
Cert. Prj., Ser. 93A
6.38% 09/01/05 500 508,015
------------
Tennessee - 1.7%
Chattanooga G.O., Ser. 02
5.38% 09/01/11 1,270 1,399,413
Clarksville Pub. Bldg. Auth. Rev., Ser.
04
2.30% 07/01/34 5,700 5,700,000
============
7,099,413
------------
Texas - 7.3%
Brazos River Auth. Poll. Ctrl. Rev.,
Texas Util. Elec. Co. Prj.,
Prerefunded Ser. 95C AMT
5.55% 04/01/08 5,000 5,439,800
Dallas Ind. Dev. Corp. Rev., CR/PL,
Inc. Prj., Ser. 87 AMT
7.50% 08/01/17 1,550 1,601,367
Frisco Indpt. Sch. Dist. G.O., Ser.
05A
5.00% 07/15/30 4,600 4,712,930
Grand Prairie Indpt. Sch. Dist. G.O.,
Prerefunded Ser. 00A
5.80% 08/15/11 4,925 5,565,742
Killeen Indpt. Sch. Dist. G.O., Ser. 02
5.00% 02/15/12 1,195 1,287,577
PAR
MATURITY (000) VALUE
---------- ---------- --------------
MUNICIPAL BONDS (Continued)
Texas (Continued)
Texas Affordable Hsg. Corp.
Multi-Fam. Hsg. Rev., Ser. 01A
4.75% 11/01/11 $ 6,635 $ 6,528,243
Texas Wtr. Fin. Assist. G.O., Ser. 00
5.75% 08/01/22 3,445 3,783,127
Travis Cnty. Hlth. Fac. Dev. Corp.
Rev., Ascension Hlth. Credit Prj.,
Prerefunded Ser. 99A
5.88% 11/15/09 1,980 2,208,868
============
31,127,654
------------
Utah - 0.0%
Salt Lake City Hosp. Rev., Ser. 88A
8.12% 05/15/15 100 124,483
------------
Virginia - 4.2%
Fairfax Cnty. Indl. Dev. Auth. Rev.,
Hlth. Care-Inov. Hlth. Sys. Prj., Ser.
00
2.23% 01/01/30 12,000 12,000,000
Pocahontas Pkwy. Toll Rd. Rev., Ser.
98B
5.85%(c) 08/15/23 14,300 4,753,034
Virginia Cmwlth. Trans. Bd. Rev.,
Federal Hwy. Reimbursement
Notes Prj., Ser. 02
5.00% 10/01/11 1,000 1,082,770
============
17,835,804
------------
Washington - 6.2%
King Cnty. G.O., Sch. Dist. No. 414
Lake Washington Prj., Ser. 00
5.75% 12/01/10 500 559,695
King Cnty. G.O., Ser. 03
5.00% 06/01/10 1,050 1,126,220
Pierce Cnty. G.O., Sch. Dist. No. 416
White River Prj., Ser. 00
6.00% 12/01/13 5,345 6,036,643
Washington St. G.O., Ser. 00B
6.00% 01/01/25 14,000 15,431,780
Washington St. Pub. Pwr. Sply. Sys.
Rev., Nuclear Prj. No. 3, Ser. 96A
6.00% 07/01/06 3,000 3,115,560
============
26,269,898
------------
West Virginia - 0.1%
West Virginia Pub. Energy Auth.
Rev., Morgantown Energy Assoc.
Prj., Ser. 90A AMT
5.05% 07/01/08 360 365,350
------------
Wisconsin - 0.4%
Kenosha G.O., Ser. 03B
5.00% 09/01/11 1,000 1,078,830
------------
Wyoming - 1.5%
Kemmerer Poll. Ctrl. Rev., Exxon Prj.
Ser. 84
2.22% 11/01/14 6,500 6,500,000
------------
TOTAL MUNICIPAL BONDS
(Cost $413,960,645)
430,732,235
------------
SEE ACCOMPANYING NOTES TO FINANCIAL STATEMENTS
22
BLACKROCK FUNDS
STATEMENT OF NET ASSETS
TAX-FREE INCOME PORTFOLIO (CONCLUDED)
AS OF MARCH 31, 2005 (UNAUDITED)
PAR
MATURITY (000) VALUE
---------- ------- ---------
MORTGAGE PASS-THROUGHS - 0.0%
Government National
Mortgage
Association
6.00%
(Cost $6,300) 11/15/31 $6 $6,242
------
SHORT TERM INVESTMENTS - 0.9%
Valdez Alaska Marine Term. Rev.,
Exxon Mobil Corp. Prj., Ser. 01 DN
2.22%(f)
(Cost $4,000,000) 12/01/29 4,000 4,000,000
---------
MONEY MARKET FUND - 0.2%
Wilmington Trust Tax-Free Money
Market Fund
(Cost $1,042,338) 1,042 1,042,338
---------
TOTAL INVESTMENTS IN SECURITIES - 102.5%
(Cost $419,009,283(a)) 435,780,815
LIABILITIES IN EXCESS OF OTHER
ASSETS - (2.5)% (10,609,191)
-----------
NET ASSETS - 100.0%
(Applicable to 9,316,931 BlackRock
shares, 27,387,773 Institutional
shares, 222,342 Service shares,
788,441 Investor A shares, 455,076
Investor B shares and 209,712
Investor C shares outstanding) $ 425,171,624
=============
NET ASSET VALUE, OFFERING AND
REDEMPTION PRICE PER
BLACKROCK SHARE
($103,188,150/9,316,931) $ 11.08
=======
NET ASSET VALUE, OFFERING
AND REDEMPTION PRICE PER
INSTITUTIONAL SHARE
($303,417,391/27,387,773) $ 11.08
=======
NET ASSET VALUE, OFFERING
AND REDEMPTION PRICE PER
SERVICE SHARE
($2,461,161/222,342) $ 11.07
=======
NET ASSET VALUE AND REDEMPTION
PRICE PER INVESTOR A SHARE
($8,738,768/788,441) $ 11.08
=======
MAXIMUM OFFERING PRICE PER
INVESTOR A SHARE
($11.08/0.960) $ 11.55
=======
NET ASSET VALUE, OFFERING
AND REDEMPTION PRICE
(subject to a maximum contingent
deferred sales charge of 4.5%)
PER INVESTOR B SHARE
($5,042,678/455,076) $ 11.08
=======
NET ASSET VALUE, OFFERING
AND REDEMPTION PRICE
(subject to a maximum contingent
deferred sales charge of 1.0%)
PER INVESTOR C SHARE
($2,323,476/209,712) $ 11.08
=======
- -------------------
(a) Cost for Federal income tax purposes is $419,011,783. The
gross unrealized appreciation (depreciation) on a tax basis is as
follows:
Gross unrealized appreciation $18,170,561
Gross unrealized depreciation (1,401,529)
-----------
$16,769,032
===========
(b) Securities, or a portion thereof, pledged as collateral with a value of
$2,187,650 on 755 short U.S. Treasury Note futures contracts expiring
June 2005. The value of such contracts on March 31, 2005 was
$82,445,551, with an unrealized gain of $828,910 (including commissions
of $1,510).
(c) The rate shown is the effective yield on the zero coupon bonds at the
time of purchase.
(d) Security exempt from registration under Rule 144A of the Securities Act of
1933. These securities may be resold in transactions exempt from
registration to qualified institutional investors. As of March 31, 2005,
the Portfolio held 4.1% of its net assets, with a current market value
of $17,580,990 in securities restricted as to resale.
(e) Rates shown are the rates as of March 31, 2005.
(f) Rates shown are the rates as of March 31, 2005, and maturities shown are
the longer of the next interest readjustment date or the date the
principal owed can be recovered through demand.
SEE ACCOMPANYING NOTES TO FINANCIAL STATEMENTS
23
BLACKROCK FUNDS
STATEMENT OF NET ASSETS
PENNSYLVANIA TAX-FREE INCOME PORTFOLIO
AS OF MARCH 31, 2005 (UNAUDITED)
PAR
MATURITY (000) VALUE
---------- ---------- --------------
MUNICIPAL BONDS - 100.7%
Multi-State - 8.0%
Charter Mac Equity Issue Tr.
6.62%(b) 06/30/09 $25,000 $26,727,750
7.60%(b) 11/30/10 10,000 11,177,000
MuniMae TE Bond Subs., LLC
6.88%(b) 06/30/09 4,000 4,314,360
7.75%(b) 11/01/10 10,000 11,405,400
===========
53,624,510
-----------
Pennsylvania - 84.1%
Allegheny Cnty. Hosp. Dev. Auth.
Rev., Hlth. Ctr. Univ. of Pittsburgh
Med. Ctr. Prj., Ser. 97B
6.00% 07/01/25 7,000 8,363,880
Allegheny Cnty. Hosp. Dev. Auth.
Rev., Prerefunded Ser. 95A
6.00% 09/01/07 5,000 5,365,950
6.20% 09/01/07 1,000 1,077,810
Allegheny Cnty. Hosp. Dev. Auth.
Rev., Univ. of Pittsburgh Med. Ctr.
Prj., Ser. 95
5.35% 12/01/17 10,000 10,269,100
Beaver Cnty. Hosp. Auth. Rev.,
Prerefunded Ser. 96A
5.80% 10/01/06 5,830 6,100,687
Berks Cnty. G.O., Ser. 98
5.38% 11/15/28 6,685 6,920,446
Bradford Area Sch. Dist. G.O.,
Prerefunded Ser. 95
5.80% 10/01/05 1,465 1,489,423
Central Bucks Sch. Dist. G.O., Ser. A
5.00% 05/15/20 4,570 4,789,680
Dauphin Cnty. Gen. Auth. Hlth. Sys.
Rev., Pinnacle Hlth. Sys. Prj., Ser.
97
5.50% 05/15/17 3,500 3,691,240
Dauphin Cnty. Gen. Auth. Hosp.
Rev., Hapsco Western
Pennsylvania Hosp. Prj., Ser. 92
6.25% 07/01/16 1,000 1,156,100
Delaware Cnty. Auth. Coll. Rev.,
Haverford Coll. Prj., Ser. 00
5.75% 11/15/25 6,795 7,499,098
Delaware Cnty. Auth. Hosp. Rev.,
Ser. 95
5.50% 08/15/15 6,480 6,676,344
Delaware Cnty. Auth. Rev., Mercy
Hlth. Corp. Prj., Ser. 96
5.75% 12/15/20 3,735 3,923,281
Delaware Cnty. Ind. Dev. Auth. Rev.,
Ser. 99 AMT
6.00% 06/01/29 3,400 3,738,708
Delaware Cnty. Mem. Hosp. Auth.
Rev., Ser. 95
5.50% 08/15/19 3,000 3,090,900
Delaware Cnty. Rev., Prerefunded
Ser. 95
5.50% 10/01/05 1,075 1,091,093
Delaware River Port Auth.
Pennsylvania & New Jersey Rev.,
Port Dist. Prj., Ser. 99B
5.70% 01/01/22 8,930 9,768,259
Delaware River Port Auth.
Pennsylvania & New Jersey Rev.,
Ser. 99
5.75% 01/01/16 8,000 8,779,280
PAR
MATURITY (000) VALUE
---------- ---------- --------------
MUNICIPAL BONDS (Continued)
Pennsylvania (Continued)
Delaware River Port Auth.
Pennsylvania & New Jersey RITES
Rev., Ser. 99
15.41%(c) 01/01/22 $10,000 $13,853,000
Delaware Vy. Regl. Fin. Auth. Loc.
Govt. Rev., Ser. 96A
5.90% 04/15/16 2,540 2,622,093
Delaware Vy. Regl. Fin. Auth. Loc.
Govt. Rev., Ser. 97B
5.60% 07/01/17 2,000 2,278,020
Delaware Vy. Regl. Fin. Auth. Loc.
Govt. Rev., Ser. 98A
5.50% 08/01/28 33,050 37,480,022
Delaware Vy. Regl. Fin. Auth. Loc.
Govt. RITES PA-1041 Rev., Ser.
02A
30.67%(c) 07/01/32 2,000 4,665,600
Dover Area Sch. Dist. G.O.,
Prerefunded Ser. 96
5.75% 04/01/06 2,445 2,522,140
Indiana Cnty. Ind. Dev. Auth. Poll.
Ctrl. Rev., New York St. Elec. &
Gas Corp. Prj., Ser. 95A
6.00% 06/01/06 1,000 1,037,020
Kennett Cons. Sch. Dist. G.O., Ser.
02A
5.50% 02/15/14 1,245 1,376,460
Lancaster Cnty. Hosp. Auth. Rev.,
Hlth. Ctr. Masonic Homes Prj., Ser.
94
5.30% 11/15/08 500 512,015
Lancaster Swr. Auth. Sply. S.O., Ser.
98
5.25% 04/01/21 8,480 8,682,078
Lehigh Cnty. Gen. Purp. Auth. Rev.,
Kidspeace Oblig. Prj., Ser. 98
5.70% 11/01/09 3,000 3,176,370
6.00% 11/01/18 2,000 2,115,000
Luzerne Cnty. Flood Prot. Auth. Gtd.
Rev., Prerefunded Ser. 96
5.60% 07/15/06 4,720 4,896,622
Lycoming Cnty. Auth. Hosp. Rev.,
Divine Providence Hosp. Prj., Ser.
95
5.38% 11/15/10 6,480 6,714,900
McKeesport Area Sch. Dist. G.O.,
Prerefunded Ser. 96A
5.75% 10/01/06 1,750 1,829,992
Methacton Sch. Dist. Auth. Rev.,
Prerefunded Ser. 78
6.50% 10/01/06 475 501,524
Montgomery Cnty. Hgr. Ed. & Hlth.
Auth. Coll. Rev., Beaver Coll. Prj.,
Ser. 96
5.75% 04/01/12 1,690 1,773,047
Montgomery Cnty. Hgr. Ed. & Hlth.
Auth. Rev., Holy Redeemer Hosp.
Prj., Ser. 97A
5.25% 10/01/27 9,000 9,338,850
Montgomery Cnty. Hgr. Ed. & Hlth.
Auth. Rev., Pottstown Hlth. Care
Corp. Prj., Prerefunded Ser. 98
5.00% 01/01/09 6,235 6,705,493
SEE ACCOMPANYING NOTES TO FINANCIAL STATEMENTS
24
BLACKROCK FUNDS
STATEMENT OF NET ASSETS
PENNSYLVANIA TAX-FREE INCOME PORTFOLIO (CONTINUED)
AS OF MARCH 31, 2005 (UNAUDITED)
PAR
MATURITY (000) VALUE
------------- ---------- -------------
MUNICIPAL BONDS (Continued)
Pennsylvania (Continued)
Northampton Cnty. Hgr. Ed. Auth.
Rev., Moravian Coll. Prj., Ser. 94
6.10% 07/01/12 $ 1,950 $ 1,990,191
Northeastern Hosp. & Ed. Auth. Rev.,
Luzerne Cnty. Coll. Prj., Ser. 97
5.15% 08/15/16 3,245 3,385,411
Northeastern Hosp. & Ed. Auth. Rev.,
Wyoming Vy. Hlth. Care Prj., Ser.
94A
6.50% 01/01/07 1,000 1,026,220
Northgate Sch. Auth. Bldg. Rev., Ser.
78
6.38% 02/15/07 825 878,864
Parkland Sch. Dist. Rev.,
Prerefunded Ser. 96
5.75% 03/01/06 2,910 2,994,070
Pennsbury Sch. Dist. G.O., Ser. 02
01/15/18-
5.50% 01/15/19 4,625 5,062,980
Pennsylvania Con. Ctr. Auth. Rev.,
Ser. 89A
6.70% 09/01/16 1,000 1,186,700
Pennsylvania Con. Ctr. Auth. Rev.,
Ser. 94A
6.60% 09/01/09 12,465 12,760,919
Pennsylvania Hgr. Ed. Assistance
Agcy. Rev., Cap. Acquisition Prj.,
Prerefunded Ser. 00
5.88% 12/15/10 16,400 18,475,420
Pennsylvania Hgr. Ed. Fac. Auth.
Rev., Univ. of Pennsylvania Prj.,
Ser. 98
5.75% 01/01/06 8,165 8,434,853
Pennsylvania Hsg. Fin. Agcy.
Multi-Fam. FHA Ins. Rev., Ser. 92
8.10% 07/01/13 1,425 1,428,406
Pennsylvania Hsg. Fin. Agcy. Rev.,
Ser. 98 AMT
5.50%(d) 04/01/30 13,155 3,135,231
Pennsylvania Hsg. Fin. Agcy. Rev.,
Ser. 99 AMT
5.85% 10/01/18 285 285,000
Pennsylvania Hsg. Fin. Agcy. Rev.,
Sgl. Fam. Mtg. Prj., Ser. 99-66A
AMT
5.65% 04/01/29 9,585 9,717,273
Pennsylvania Infra. Investment Auth.
Rev., Pennvest Ln. Pool Prj., Ser.
94
6.00% 09/01/06 1,930 2,016,387
Pennsylvania Intergovtl. Coop. Auth.
Spec. Tax Rev., City of
Philadelphia Fdg. Prj., Ser. 96
5.60% 06/15/12 1,000 1,033,100
06/15/16-
5.50% 06/15/20 10,500 10,835,265
Pennsylvania St. Dept. Gen. Svcs.
COP, Ser. 01
4.25% 11/01/05 1,860 1,878,879
05/01/10-
4.50% 11/01/10 4,590 4,828,713
05/01/11-
5.00% 11/01/14 18,695 20,041,847
05/01/15-
5.25% 05/01/16 7,740 8,342,774
PAR
MATURITY (000) VALUE
------------- ---------- -------------
MUNICIPAL BONDS (Continued)
Pennsylvania (Continued)
Pennsylvania St. Hgr. Ed. Assist.
Agcy. Stud. Ln. Rev., Ser. A
2.27%(c) 12/01/24 $15,000 $15,000,000
Pennsylvania St. Hgr. Ed. Assist.
Agcy. Stud. Ln. Rev., Ser. C
2.27%(c) 07/01/18 5,000 5,000,000
Pennsylvania St. Hgr. Ed. Fac. Auth.
Coll. & Univ. Rev., Bryn Mawr Coll.
Prj., Prerefunded Ser. 95
6.00% 12/01/05 1,200 1,251,924
Pennsylvania St. Hgr. Ed. Fac. Auth.
Coll. & Univ. Rev., Lafayette Coll.
Prj., Ser. 00
6.00% 05/01/30 155 171,797
Pennsylvania St. Hgr. Ed. Fac. Auth.
Coll. & Univ. Rev., Trustees Univ.
Prj., Ser. 98
5.50% 07/15/38 9,500 10,146,855
Pennsylvania St. Hgr. Ed. Fac. Auth.
Hlth. Svcs. Rev., Univ. of
Pennsylvania Hlth. Svcs. Prj., Ser.
96A
5.75% 01/01/17 12,250 12,654,862
Pennsylvania St. Hgr. Ed. Fac. Auth.
Rev. Variable St. Sys. Hgr. Ed.,
Ser. AB
2.23% 06/01/11 1,845 1,845,000
Pennsylvania St. Ind. Dev. Auth.
Rev., Econ. Dev. Prj., Ser. 94
7.00% 01/01/06 1,000 1,032,090
Pennsylvania St. Ind. Dev. Auth.
Rev., Econ. Dev. Prj., Ser. 02
5.50% 07/01/16 8,000 8,881,840
Pennsylvania St. Tpke. Comm. Rev.,
Ser. 01
5.00% 06/01/10 2,100 2,260,671
5.50% 12/01/13 3,000 3,375,390
Pennsylvania St. Univ. Rev., Ser. A
09/01/29-
5.00% 09/01/35 4,000 4,130,980
Pensylvania St. Hgr. Ed. Fac. Auth.
Rev. Drexel Univ. Prj., Ser. B
2.28% 05/01/33 6,100 6,100,000
Philadelphia Auth. Dev. Lease Rev.,
Ser. 01B
5.25% 10/01/09 1,750 1,892,800
Philadelphia G.O., Ser. 94
5.90% 11/15/09 980 1,004,196
Philadelphia Gas Works Rev., Ser. 94
5.25% 08/01/24 2,900 2,962,640
Philadelphia Gas Works Rev., Ser. 01
08/01/14-
5.50% 08/01/18 7,415 8,054,829
Philadelphia Hosp. & Hgr. Ed. Fac.
Auth. Hosp. Rev., Frankford Hosp.
Prj., Ser. 95
5.50% 01/01/07 1,235 1,268,617
5.60% 01/01/08 1,245 1,278,964
Philadelphia Hosp. & Hgr. Ed. Fac.
Auth. Hosp. Rev., Nazareth Hosp.
Franciscan Prj., Prerefunded Ser.
96B
5.00% 07/01/06 4,590 4,812,156
SEE ACCOMPANYING NOTES TO FINANCIAL STATEMENTS
25
BLACKROCK FUNDS
STATEMENT OF NET ASSETS
PENNSYLVANIA TAX-FREE INCOME PORTFOLIO (CONTINUED)
AS OF MARCH 31, 2005 (UNAUDITED)
PAR
MATURITY (000) VALUE
------------- ---------- --------------
MUNICIPAL BONDS (Continued)
Pennsylvania (Continued)
Philadelphia Ind. Dev. Auth. Rev.,
American Coll. of Physicians Prj.,
Ser. 00
06/15/20-
5.50% 06/15/25 $14,685 $ 15,726,801
Philadelphia Ind. Dev. Auth. Rev.,
Girard Estate Coal Mining Prj., Ser.
96
5.38% 11/15/12 3,945 4,115,897
5.50% 11/15/16 1,650 1,719,646
Philadelphia Ind. Dev. Auth. Rev.,
PGH Dev. Corp. Prj., Ser. 93
5.50% 07/01/10 1,035 1,044,553
Philadelphia Pk. Auth. Rev., Arpt. Pk.
Prj., Ser. 99
5.62% 09/01/18 4,430 4,805,620
Philadelphia Pk. Auth. Rev., Ser. 97
5.40% 09/01/15 5,900 6,221,727
Philadelphia Pk. Auth. Rev., Ser. 99
09/01/13-
5.62% 09/01/17 5,885 6,409,604
Philadelphia Sch. Dist. G.O.,
Prerefunded Ser. 95B
5.50% 09/01/05 4,500 4,647,735
Philadelphia Sch. Dist. G.O., Ser.
95A
6.25% 09/01/06 2,255 2,363,646
Philadelphia Sch. Dist. G.O., Ser.
95B
5.50% 09/01/18 4,890 5,001,101
Philadelphia Sch. Dist. G.O., Ser.
99C
5.75% 03/01/29 11,000 12,195,260
Philadelphia Sch. Dist. G.O., Ser.
00A
02/01/12-
5.75% 02/01/13 10,215 11,421,289
Philadelphia Wtr. & Waste Wtr. Rev.,
Ser. 93
5.50% 06/15/07 6,780 7,154,798
Pittsburgh Sch. Dist. G.O.,
Prerefunded Ser. 97
5.50% 09/01/09 4,500 4,558,545
Pleasant Vy. Sch. Dist. G.O.,
Prerefunded Ser. 95
5.60% 11/15/05 1,180 1,203,104
Pleasant Vy. Sch. Dist. G.O., Ser. 95
5.60% 11/15/14 205 208,911
Pottstown Borough Auth. Swr. Rev.,
Ser. 96
5.50% 11/01/16 1,360 1,415,855
Punxsutawney Area Sch. Dist. G.O.,
Prerefunded Ser. 95
5.80% 04/15/05 1,000 1,001,010
Riverside Beaver Cnty. Sch. Dist.
Rev., Prerefunded Ser. 96
5.50% 02/15/06 3,725 3,819,503
Riverside Sch. Dist. G.O.,
Prerefunded Ser. 00
5.50% 10/15/10 3,300 3,639,537
South Fork Mun. Auth. Hosp. Rev.,
Good Samaritan Med. Ctr. Prj.,
Ser. 96B
5.38% 07/01/16 4,000 4,188,080
PAR
MATURITY (000) VALUE
------------- ---------- --------------
MUNICIPAL BONDS (Continued)
Pennsylvania (Continued)
Southeastern Pennsylvania Trans.
Auth. Rev., Ser. 97
5.55% 03/01/13 $ 3,500 $ 3,726,765
5.38% 03/01/17 6,270 6,656,044
Springford Sch. Dist. G.O., Ser. 97
5.15% 02/01/18 10,010 10,355,946
Washington Cnty. Auth. Rev., Ser. 99
6.15% 12/01/29 6,340 6,714,757
Washington Cnty. Ind. Dev. Auth.
Poll. Ctrl. Rev., West Penn Pwr.
Co. Prj., Ser. 95G
6.05% 04/01/14 2,500 2,559,375
West Mifflin Sanit. Swr. Mun. Auth.
Swr. Rev., Prerefunded Ser. 96
5.70% 08/01/06 1,445 1,502,786
Westmoreland Cnty. Ind. Dev. Auth.
Rev., Westmoreland Hlth. Sys. Prj.,
Ser. 93A
6.00% 07/01/11 200 202,082
Westview Mun. Auth. S.O., Ser. 85
9.25% 11/15/05 385 394,413
Williamsport Area Sch. Dist. Auth.
Rev., Ser. 78
6.00% 03/01/07 70 73,469
Wilson Sch. Dist. G.O., Prerefunded
Ser. 97
5.50%(e) 05/15/07 8,015 8,450,295
============
562,233,793
------------
Puerto Rico - 8.6%
Puerto Rico Cmwlth. G.O., Ser. 02
07/01/11-
5.50% 07/01/12 22,000 24,692,199
Puerto Rico Cmwlth. Hwy. & Trans.
Auth. Rev., Ser. 98A
2.23% 07/01/28 1,150 1,149,999
Puerto Rico Cmwlth. Infra. Fin. Auth.
S.O. RITES, Ser. 00A
12.94%(c) 10/01/16 400 554,136
Puerto Rico Cmwlth. Infra. Fin. Auth.
S.O. RITES, Ser. 00B
13.44%(c) 10/01/17 500 702,930
Puerto Rico Cmwlth. Infra. Fin. Auth.
S.O. RITES, Ser. 00C
13.44%(c) 10/01/18 500 701,870
Puerto Rico Cmwlth. Infra. Fin. Auth.
S.O. RITES, Ser. 00D
13.44%(c) 10/01/19 690 965,683
Puerto Rico Cmwlth. Infra. Fin. Auth.
S.O. RITES, Ser. 00E
13.44%(c) 10/01/20 250 348,835
Puerto Rico Cmwlth. Infra. Fin. Auth.
S.O. RITES, Ser. 00F
12.94%(c) 10/01/24 250 328,685
Puerto Rico Elec. Pwr. Auth. Rev.,
Ser. 05RR
5.00% 07/01/35 6,000 6,243,540
Puerto Rico Mun. Fin. Agy. Rev., Ser.
99
5.50% 08/01/18 6,500 7,075,575
SEE ACCOMPANYING NOTES TO FINANCIAL STATEMENTS
26
BLACKROCK FUNDS
STATEMENT OF NET ASSETS
PENNSYLVANIA TAX-FREE INCOME PORTFOLIO (CONCLUDED)
AS OF MARCH 31, 2005 (UNAUDITED)
PAR
MATURITY (000) VALUE
---------- --------- ----------------
MUNICIPAL BONDS (Continued)
Puerto Rico (Continued)
Puerto Rico Pub. Fin. Corp. Cmwlth.
Approp. Rev., Prerefunded Ser.
02E
5.50% 02/01/12 $9,340 $ 10,380,663
Puerto Rico Pub. Fin. Corp. Cmwlth.
Approp. Rev., Ser. 02E
5.50% 08/01/29 3,160 3,393,524
============
56,537,639
------------
TOTAL MUNICIPAL BONDS
(Cost $624,467,930) 672,395,942
------------
MONEY MARKET FUND - 0.1%
Wilmington Trust Tax-Free Money
Market Fund
(Cost $786,750) 787 786,750
------------
TOTAL INVESTMENTS IN SECURITIES - 100.8%
(Cost $625,254,680(a)) 673,182,692
LIABILITIES IN EXCESS OF OTHER
ASSETS - (0.8)% (5,031,068)
------------
NET ASSETS - 100.0%
(Applicable to 58,124,586 Institutional
shares, 483,257 Service shares,
3,057,815 Investor A shares,
1,590,395 Investor B shares and
170,466 Investor C shares
outstanding) $668,151,624
============
NET ASSET VALUE, OFFERING AND
REDEMPTION PRICE PER
INSTITUTIONAL SHARE
($612,429,074/58,124,586) $ 10.54
=======
NET ASSET VALUE, OFFERING
AND REDEMPTION PRICE PER
SERVICE SHARE
($5,087,246/483,257) $ 10.53
=======
NET ASSET VALUE AND REDEMPTION
PRICE PER INVESTOR
A SHARE
($32,204,238/3,057,815) $ 10.53
=======
MAXIMUM OFFERING PRICE PER
INVESTOR A SHARE
($10.53/0.960) $ 10.97
=======
NET ASSET VALUE, OFFERING
AND REDEMPTION PRICE
(subject to a maximum contingent
deferred sales charge of 4.5%)
PER INVESTOR B SHARE
($16,642,595/1,590,395) $ 10.46
=======
NET ASSET VALUE, OFFERING
AND REDEMPTION PRICE
(subject to a maximum contingent
deferred sales charge of 1.0%)
PER INVESTOR C SHARE
($1,788,471/170,466) $ 10.49
=======
- -------------------
(a) Cost for Federal income tax purposes is $625,393,263. The
gross unrealized appreciation (depreciation) on a tax basis is as
follows:
Gross unrealized appreciation $48,328,007
Gross unrealized depreciation (538,578)
-----------
$47,789,429
===========
(b) Security exempt from registration under Rule 144A of the Securities Act of
1933. These securities may be resold in transactions exempt from
registration to qualified institutional investors. As of March 31, 2005,
the Portfolio held 8.0% of its net assets, with a current market value
of $53,624,510 in securities restricted as to resale.
(c) Rates shown are the rates as of March 31, 2005.
(d) The rate shown is the effective yield on the zero coupon bonds at the time
of purchase.
(e) Securities, or a portion thereof, pledged as collateral with a value of
$2,108,620 on 1,291 short U.S. Treasury Note futures contracts expiring
June 2005. The value of such contracts on March 31, 2005 was
$141,061,928, with an unrealized gain of $1,417,564 (including
commissions of $2,582).
SEE ACCOMPANYING NOTES TO FINANCIAL STATEMENTS
27
BLACKROCK FUNDS
STATEMENT OF NET ASSETS
NEW JERSEY TAX-FREE INCOME PORTFOLIO
AS OF MARCH 31, 2005 (UNAUDITED)
PAR
MATURITY (000) VALUE
------------- ---------- -------------
MUNICIPAL BONDS - 103.0%
Multi-State - 6.8%
Charter Mac Equity Issue Tr.
6.62%(b) 06/30/09 $ 1,000 $ 1,069,109
7.60%(b) 11/30/10 4,000 4,470,800
MuniMae TE Bond Subs., LLC
6.88%(b) 06/30/09 4,000 4,314,360
7.75%(b) 11/01/10 2,000 2,281,080
===========
12,135,349
-----------
New Jersey - 76.9%
Delaware River Port Auth.
Pennsylvania & New Jersey RITES
PA-611 Rev., Ser. 00
11.42% 01/01/26 5,000 6,434,850
Garden St. Preservation Tr. Cap.
Apprec. Rev., Ser. 03B
5.17% 11/01/24 10,000 3,914,400
Gloucester Cnty. Ind. Poll. Ctrl. Corp.
Auth. Rev. Ref., Exxon Mobil Prj.
2.14% 01/01/22 2,200 2,200,000
Gloucester Cnty. Srs. Hsg. Dev.
Corp. Rev., Sect. 8 Colonial Pk.
Prj., Ser. 94A
6.20% 09/15/11 1,250 1,268,700
Hopatcong Boro G.O., Ser. 03
5.75% 08/01/33 2,300 2,553,184
Jersey City G.O., Ser. 96A
6.00% 10/01/05 1,655 1,684,029
Knowlton Twp. Bd. of Ed. G.O., Ser.
91
6.60% 08/15/11 169 197,901
Middlesex Cnty. Imp. Auth. Rev.,
Heldrich Center Hotel Prj., Ser. A
01/01/15-
5.00% 01/01/32 3,000 2,967,100
Middlesex Cnty. Imp. Auth. Rev.,
Monroe Twp., Ser. 96
5.80% 09/15/13 1,725 1,813,544
Middlesex Cnty. Imp. Auth. Rev., New
Brunswick Apts. Rental Hsg. Prj.,
Ser. 02 AMT
5.15% 02/01/24 3,000 3,054,690
Morristown Cnty. G.O., Ser. 95
6.40% 08/01/14 500 516,260
New Jersey Econ. Dev. Auth. Lease
Rev., Ser. 00
6.00% 06/01/21 4,780 5,331,803
New Jersey Econ. Dev. Auth. Rev.,
Kapkowski Rd. Landfill Prj., Ser. 02
6.50% 04/01/28 2,500 2,856,975
New Jersey Econ. Dev. Auth. Rev.,
Cigarrette Tax
5.75% 06/15/34 3,615 3,729,993
New Jersey Econ. Dev. Auth. Rev.,
Motor Vehicle Comm. Prj., Ser.
03A
3.52%(c) 07/01/12 4,000 2,929,080
New Jersey Econ. Dev. Auth. Rev.,
Performing Arts Ctr. Prj., Ser. 96C
5.75% 06/15/08 4,440 4,659,203
New Jersey Econ. Dev. Auth. Rev.,
Sch. Fac. Const. Prj., Ser. 03F
5.25% 06/15/13 5,000 5,447,300
New Jersey Econ. Dev. Auth. Rev.,
Ser. 99
6.20% 12/01/24 3,000 3,305,940
PAR
MATURITY (000) VALUE
------------- ---------- -------------
MUNICIPAL BONDS (Continued)
New Jersey (Continued)
New Jersey Econ. Dev. Auth. Rev.,
St. Barnabas Med. Ctr. Prj., Ser.
97A
5.62% 07/01/23 $ 4,000 $ 1,663,120
New Jersey Econ. Dev. Auth. Solid
Waste Rev., Waste Management
New Jersey Prj., Ser. 04A AMT
5.30% 06/01/15 1,000 1,028,150
New Jersey Edl. Facs. Auth. Rev.,
Institute of Tech. Prj., Ser. 04B
5.00% 07/01/16 4,150 4,431,162
5.00% 07/01/21 2,750 2,886,785
New Jersey Edl. Facs. Auth. Rev.,
Rowan Coll. Prj., Prerefunded Ser.
96E
5.88% 07/01/06 2,185 2,292,742
New Jersey Hlth. Care Fac. Fin.
Auth. Rev., Kennedy Hlth. Sys.
Prj., Ser. 01
5.50% 07/01/21 2,000 2,117,620
5.62% 07/01/31 455 477,745
New Jersey Hlth. Care Fac. Fin.
Auth. Rev., Robert Wood Johnson
Univ. Prj., Ser. 96C
5.75% 07/01/07 2,595 2,709,933
New Jersey Sports & Expo. Auth.
Rev., Ser. 00A
5.50% 03/01/20 5,000 5,372,350
New Jersey St. Edl. Facs. Auth. Rev.,
Fairleigh Dickinson Univ. Prj., Ser.
D
5.25% 07/01/32 3,000 3,039,780
New Jersey St. Edl. Facs. Auth. Rev.,
Princeton Univ. Prj., Ser. B
2.16% 07/01/22 2,735 2,735,000
New Jersey St. Edl. Facs. Auth. Rev.,
Princeton Univ. Prj., Ser. F
2.08% 07/01/23 2,800 2,800,000
New Jersey St. G.O., Ser. 00
5.75% 05/01/12 2,500 2,811,300
New Jersey St. G.O., Ser. 01H
5.25% 07/01/14 4,975 5,463,198
New Jersey St. Hsg. & Mtg. Fin.
Agcy. Rev., Ser. 00B
6.25% 11/01/26 1,435 1,514,657
New Jersey St. Hwy. Auth. Rev.,
Garden St. Pkwy. Prj., Ser. 92
6.20% 01/01/10 750 828,772
New Jersey St. Tpke. Auth. Rev.,
Prerefunded Ser. 91C
6.50% 01/01/16 3,155 3,739,590
New Jersey St. Tpke. Auth. Rev.,
Ser. 91C
6.50% 01/01/16 845 1,006,902
New Jersey St. Trans. Tr. Fd. Admin.
Grant Rev., Prerefunded Ser. 00A
6.12% 09/15/09 2,500 2,785,300
New Jersey St. Trans. Tr. Fd. Auth.
Trans. Sys. Rev., Prerefunded Ser.
00A
6.00% 06/15/10 2,500 2,822,200
New Jersey St. Trans. Tr. Fd. Auth.
Trans. Sys. Rev., Prerefunded Ser.
01B
6.00% 12/15/11 2,500 2,852,375
SEE ACCOMPANYING NOTES TO FINANCIAL STATEMENTS
28
BLACKROCK FUNDS
STATEMENT OF NET ASSETS
NEW JERSEY TAX-FREE INCOME PORTFOLIO (CONTINUED)
AS OF MARCH 31, 2005 (UNAUDITED)
PAR
MATURITY (000) VALUE
---------- ---------- --------------
MUNICIPAL BONDS (Continued)
New Jersey (Continued)
New Jersey St. Trans. Tr. Fd. Auth.
Trans. Sys. Rev., Ser. 99A
5.75% 06/15/20 $2,820 $ 3,224,896
New Jersey St. Waste Wtr. Trtmnt.
Tr. Rev., Ser. 96C
6.25% 05/15/06 3,455 3,593,269
North Hudson Swr. Auth. Rev., Ser.
01A
5.41% 08/01/21 5,000 2,316,400
Port Auth. New York & New Jersey
Rev., Ser. 95 AMT
5.75% 11/01/09 3,275 3,315,086
Port Auth. New York & New Jersey
S.O. Rev., JFK Intl. Arpt. Term.
Prj., Ser. 97-6 AMT
5.75% 12/01/22 2,000 2,152,720
Port Auth. New York & New Jersey
S.O., JFK Intl. Arpt. Term. Prj., Ser.
97-6 AMT
6.25% 12/01/09 7,000 7,665,630
Rutgers St. Univ. Rev., Ser. 04E
5.00% 05/01/31 4,245 4,401,513
Summit Cnty. G.O., Ser. 01
5.25% 06/01/14 1,145 1,274,179
============
138,187,326
------------
Puerto Rico - 19.3%
Puerto Rico Cmwlth. G.O., Pub. Imp.
Prj., Ser. 01
5.50% 07/01/19 5,000 5,754,900
Puerto Rico Cmwlth. Hwy. & Trans.
Auth. Rev., Prerefunded Ser. 00B
6.00% 07/01/10 3,000 3,405,660
Puerto Rico Cmwlth. Hwy. & Trans.
Auth. Rev., Ser. 98A
2.23% 07/01/28 1,500 1,500,000
Puerto Rico Cmwlth. Hwy. & Trans.
Auth. Rev., Ser. 00C
6.00% 07/01/29 2,000 2,246,840
Puerto Rico Cmwlth. Hwy. & Trans.
Auth. Rev., Ser. 02D
5.38% 07/01/36 1,000 1,056,010
Puerto Rico Cmwlth. Infra. Fin. Auth.
S.O. RITES, Ser. 00A
12.94% 10/01/16 400 554,136
Puerto Rico Cmwlth. Infra. Fin. Auth.
S.O. RITES, Ser. 00B
13.44% 10/01/17 500 702,930
Puerto Rico Cmwlth. Infra. Fin. Auth.
S.O. RITES, Ser. 00C
13.44% 10/01/18 500 701,870
PAR
MATURITY (000) VALUE
---------- ---------- --------------
MUNICIPAL BONDS (Continued)
Puerto Rico (Continued)
Puerto Rico Cmwlth. Infra. Fin. Auth.
S.O. RITES, Ser. 00D
13.44% 10/01/19 $ 650 $ 909,701
Puerto Rico Cmwlth. Infra. Fin. Auth.
S.O. RITES, Ser. 00E
13.44% 10/01/20 250 348,835
Puerto Rico Cmwlth. Infra. Fin. Auth.
S.O. RITES, Ser. 00F
12.94% 10/01/24 250 328,685
Puerto Rico Cmwlth. Infra. Fin. Auth.
Spec. RITES PA-569 Rev., Ser. 99
9.24% 07/01/12 2,000 2,363,000
Puerto Rico Elec. Pwr. Auth. Rev.,
Ser. 05RR
5.00% 07/01/35 4,000 4,162,360
Puerto Rico Pub. Bldgs. Auth. Rev.,
Govt. Facs. Prj., Ser. 02
5.25% 07/01/25 4,535 5,139,561
Puerto Rico Pub. Fin. Corp. Cmwlth.
Approp. Rev., Prerefunded Ser.
02E
5.50% 02/01/12 3,740 4,156,711
Puerto Rico Pub. Fin. Corp. Cmwlth.
Approp. Rev., Ser. 02E
5.50% 08/01/29 1,260 1,353,114
============
34,684,313
------------
TOTAL MUNICIPAL BONDS
(Cost $174,004,514) 185,006,988
------------
MONEY MARKET FUND - 0.1%
Wilmington Trust Tax-Free Money
Market Fund
(Cost $204,200) 204 204,200
------------
TOTAL INVESTMENTS IN
SECURITIES - 103.1%
(Cost $174,208,714(a)) 185,211,188
LIABILITIES IN EXCESS OF
OTHER
ASSETS - (3.1)% (5,622,952)
-----------
NET ASSETS - 100.0%
(Applicable to
12,384,112 Institutional
shares, 1,350,961
Service shares,
521,056 Investor A
shares, 988,010
Investor B shares and
257,596
Investor C shares $179,588,236
============
outstanding)
SEE ACCOMPANYING NOTES TO FINANCIAL STATEMENTS
29
BLACKROCK FUNDS
STATEMENT OF NET ASSETS
NEW JERSEY TAX-FREE INCOME PORTFOLIO (CONCLUDED)
AS OF MARCH 31, 2005 (UNAUDITED)
VALUE
-----------
NET ASSET VALUE, OFFERING
AND REDEMPTION PRICE PER
INSTITUTIONAL SHARE
($143,464,314/12,384,112) $ 11.58
=======
NET ASSET VALUE, OFFERING
AND REDEMPTION PRICE PER
SERVICE SHARE
($15,651,205/1,350,961) $ 11.59
=======
NET ASSET VALUE AND REDEMPTION
PRICE PER INVESTOR A SHARE
($6,035,491/521,056) $ 11.58
=======
MAXIMUM OFFERING PRICE PER
INVESTOR A SHARE
($11.58/0.960) $ 12.07
=======
NET ASSET VALUE, OFFERING
AND REDEMPTION PRICE
(subject to a maximum contingent
deferred sales charge of 4.5%)
PER INVESTOR B SHARE
($11,446,868/988,010) $ 11.59
=======
NET ASSET VALUE, OFFERING
AND REDEMPTION PRICE
(subject to a maximum contingent
deferred sales charge of 1.0%)
PER INVESTOR C SHARE
($2,990,358/257,596) $ 11.61
=======
- -------------------
(a) Also cost for Federal income tax purposes. The gross unrealized
appreciation (depreciation) on a tax basis is as follows:
Gross unrealized appreciation $12,153,879
Gross unrealized depreciation (1,151,405)
-----------
$11,002,474
===========
(b) Security exempt from registration under Rule 144A of the Securities Act of
1933. These securities may be resold in transactions exempt from
registration to qualified institutional investors. As of March 31, 2005,
the Portfolio held 6.8% of its net assets, with a current market value
of $12,135,349 in securities restricted as to resale.
(c) Securities, or a portion thereof, pledged as collateral with a value of
$732,270 on 361 short U.S. Treasury Note futures contracts expiring June
2005. The value of such contracts on March 31, 2005 was $39,444,892
with an unrealized gain of $396,225 (including commissions of $722).
SEE ACCOMPANYING NOTES TO FINANCIAL STATEMENTS
30
BLACKROCK FUNDS
STATEMENT OF NET ASSETS
OHIO TAX-FREE INCOME PORTFOLIO
AS OF MARCH 31, 2005 (UNAUDITED)
PAR
MATURITY (000) VALUE
---------- ---------- -------------
MUNICIPAL BONDS - 100.1%
Multi-State - 5.4%
Charter Mac Equity Issue Tr.
6.62%(b) 06/30/09 $1,000 $1,069,110
7.60%(b) 11/30/10 1,000 1,117,700
MuniMae TE Bond Subs., LLC
6.88%(b) 06/30/09 2,000 2,157,180
7.75%(b) 11/01/10 2,000 2,281,080
==========
6,625,070
----------
Ohio - 73.8%
Akron G.O., Ser. 01
5.50% 12/01/21 1,000 1,081,080
Akron Swr. Sys. Rev., Ser. 96
5.88% 12/01/16 500 529,375
Brunswick G.O., Ser. 94
6.30% 12/01/14 210 215,426
Butler Cnty. Trans. Imp. Dist. Rev.,
Ser. 97A
6.00%(c) 04/01/11 600 657,354
Cleveland COP, Cleveland Stadium
Prj., Ser. 97
5.25% 11/15/10 2,500 2,671,375
Cleveland Pkg. Fac. Rev., Ser. 96
6.00% 09/15/06 1,275 1,333,816
Cleveland St. Univ. Gen. Receipts
Rev., Ser. 04
5.00% 06/01/34 3,000 3,093,180
Cleveland-Cuyahoga Cnty. Port Auth.
Rev., Ser. 97 AMT
6.00% 03/01/07 290 302,348
Columbus G.O., Ser. 86
7.38% 07/01/06 1,000 1,056,520
Columbus G.O., Ser. 02
5.00% 06/15/09 2,975 3,210,739
Cuyahoga Cnty. Multi-Fam. Rev., Ser.
02 AMT
5.35% 09/20/27 1,000 1,020,050
Fairfield City Sch. Dist. G.O., Ser. 94
7.45% 12/01/14 1,000 1,240,670
Greater Cleveland Regl. Trans. Auth.
Cap. Imp. Rev., Ser. 01A
5.12% 12/01/21 1,000 1,052,570
Greater Cleveland Regl. Trans. Auth.
G.O., Ser. 96
6.25% 12/01/06 2,935 3,100,007
Hamilton Cnty. Elec. Rev., Ser. 02A
2.28% 10/01/23 625 625,000
Hamilton Cnty. Hosp. Fac. Rev., Ser.
02A
2.29% 06/01/27 5,300 5,300,000
Hamilton Cnty. Sales Tax Rev., Ser.
01B
5.25% 12/01/32 5,000 5,218,000
Jackson Loc. Sch. Dist. Stark &
Summit Cnty. Constr. & Imp. G.O.,
Ser. 04
5.00% 12/01/33 2,105 2,167,203
Kent St. Univ. Rev., Ser. 01
2.27% 05/01/31 4,000 4,000,000
Kings Sch. Dist. G.O., Prerefunded
Ser. 94
7.60% 12/01/05 200 206,714
Lucas Cnty. G.O., Ser. 96
6.00% 12/01/05 500 511,355
PAR
MATURITY (000) VALUE
---------- ---------- -------------
MUNICIPAL BONDS (Continued)
Ohio (Continued)
Marysville Sch. Dist. G.O.,
Prerefunded Ser. 98
6.00% 12/01/10 $1,910 $2,178,183
Mason City Sch. Dist. G.O., Ser. 01
5.38% 12/01/18 3,000 3,280,950
New Albany Cmnty. Auth. Fac. Rev.,
Ser. 01B
5.12% 10/01/21 2,750 2,900,975
North Royalton City Sch. Dist. G.O.,
Ser. 94
6.62% 12/01/06 100 106,225
Northwestern Sch. Dist. Rev., Wayne
& Ashland Cntys. Prj., Ser. 94
7.20% 12/01/10 300 345,261
Ohio G.O., Prerefunded Ser. 95
6.00% 08/01/05 225 232,150
Ohio Hsg. Fin. Agcy. Rev., Wind
River Prj., Ser. 94A AMT
5.55% 11/01/18 300 309,375
Ohio St. Bldg. Auth. Data Ctr. Rev.,
Ser. 93A
5.90% 10/01/07 450 481,743
Ohio St. Bldg. Auth. Disalle Govt. Ctr.
Rev., Ser. 96A
6.00% 10/01/05 1,000 1,017,390
Ohio St. Comm. Sch. Cap. Fac. Rev.,
Prerefunded Ser. 94A
5.75% 06/15/09 1,000 1,099,710
Ohio St. Env. Imp. Rev., USX Corp.
Prj., Ser. 99
5.62% 05/01/29 1,000 1,065,800
Ohio St. Hgr. Ed. Fac. Denison Univ.
Rev., Ser. 01
5.12% 11/01/21 3,000 3,168,360
Ohio St. Univ. G.O., Ser. 02A
5.25% 12/01/18 3,290 3,547,475
Ohio St. Wtr. Dev. Auth. Poll. Ctrl.
Fac. Rev., Republic Steel Prj., Ser.
95
6.38% 06/01/07 1,260 1,307,628
Ohio St. Wtr. Dev. Auth. Poll. Ctrl.
Rev., Ser. 02
5.25% 12/01/15 3,415 3,769,784
Ohio St. Wtr. Dev. Auth. Rev., Fresh
Wtr Imp. Prj., Ser. 04
5.00% 12/01/34 3,000 3,084,150
Ohio St. Wtr. Dev. Auth. Rev.,
Steel-Cargill North Star Broken Hill
Prj., Ser. 95 AMT
6.30% 09/01/20 500 517,935
Ohio St. Wtr. Dev. Poll. Ctrl. Fac.
Rev., Wtr. Ctrl. St. Match Prj.,
Prerefunded Ser. 95
5.70% 06/01/05 1,300 1,320,137
Pickerington Loc. Sch. Dist. Fac.
Constr. & Imp. Rev., Ser. 01
5.25% 12/01/20 1,000 1,075,990
Scioto Cnty. Rev., Marine Term.
Norfolk Southern Corp. Prj., Ser.
98
5.30% 08/15/13 3,000 3,098,280
Springboro Wtr. Sys. Rev., Ser. 98
5.00% 12/01/18 2,500 2,599,725
SEE ACCOMPANYING NOTES TO FINANCIAL STATEMENTS
31
BLACKROCK FUNDS
STATEMENT OF NET ASSETS
OHIO TAX-FREE INCOME PORTFOLIO (CONCLUDED)
AS OF MARCH 31, 2005 (UNAUDITED)
PAR
MATURITY (000) VALUE
---------- -------- --------------
MUNICIPAL BONDS (Continued)
Ohio (Continued)
Toledo G.O., Ser. 96
6.00% 12/01/06 $ 500 $ 526,100
Trotwood-Madison City Sch. Dist.
G.O., Ser. 02
5.00% 12/01/30 2,000 2,056,220
Univ. of Cincinnati Rev., Ser. 01A
5.00% 06/01/31 2,000 2,050,640
Univ. of Toledo Rev., Ser. 02
5.25% 06/01/18 1,195 1,272,376
University Akron Gen. Rcpts. Rev.,
Ser. 04
2.28% 01/01/29 5,000 5,000,000
West Muskingum Loc. Sch. Dist.,
Sch. Fac. Constr. & Imp. G.O., Ser.
03
5.00% 12/01/24 3,000 3,132,630
Westerville City Sch. Dist. G.O., Ser.
87
6.25% 12/01/05 1,000 1,024,130
Westlake G.O., Ser. 96
6.40% 12/01/08 1,560 1,673,147
============
91,835,251
------------
Puerto Rico - 20.9%
Puerto Rico Cmwlth. G.O., Ser. 02
5.50% 07/01/11 5,000 5,591,500
Puerto Rico Cmwlth. Hwy. & Trans.
Auth. RITES Rev., Ser. 98
8.22%(d) 07/01/18 5,000 5,677,050
Puerto Rico Cmwlth. Infra. Fin. Auth.
S.O. RITES, Ser. 00A
12.94%(d) 10/01/16 400 554,136
Puerto Rico Cmwlth. Infra. Fin. Auth.
S.O. RITES, Ser. 00B
13.44%(d) 10/01/17 500 702,930
Puerto Rico Cmwlth. Infra. Fin. Auth.
S.O. RITES, Ser. 00C
13.44%(d) 10/01/18 500 701,870
Puerto Rico Cmwlth. Infra. Fin. Auth.
S.O. RITES, Ser. 00D
13.44%(d) 10/01/19 650 909,701
Puerto Rico Cmwlth. Infra. Fin. Auth.
S.O. RITES, Ser. 00E
13.44%(d) 10/01/20 250 348,835
Puerto Rico Cmwlth. Infra. Fin. Auth.
S.O. RITES, Ser. 00F
12.94%(d) 10/01/24 250 328,685
Puerto Rico Elec. Pwr. Auth. Rev.,
Ser. 05RR
5.00% 07/01/35 2,000 2,081,180
Puerto Rico Pub. Bldgs. Auth. RITES
PA-577 Rev., Ser. 99
11.77%(d) 07/01/27 4,000 4,740,120
Puerto Rico Pub. Fin. Corp. Cmwlth.
Approp. Rev., Prerefunded Ser.
02E
5.50% 02/01/12 2,990 3,323,146
Puerto Rico Pub. Fin. Corp. Cmwlth.
Approp. Rev., Ser. 02E
5.50% 08/01/29 1,010 1,084,639
============
26,043,792
------------
TOTAL MUNICIPAL BONDS
(Cost $115,825,910) 124,504,113
------------
SHARES
(000) VALUE
------- ----------------
MONEY MARKET FUND - 0.5%
Wilmington Trust
Tax-Free Money
Market Fund
(Cost $575,902) 576 $ 575,902
------------
TOTAL INVESTMENTS IN SECURITIES -
100.6%
(Cost $116,401,812(a)) 125,080,015
LIABILITIES IN EXCESS OF
OTHER
ASSETS - (0.6)% (685,678)
------------
NET ASSETS - 100.0%
(Applicable to
9,355,093 Institutional
shares, 66,987 Service
shares,
637,510 Investor A
shares, 938,472
Investor B shares and
578,735
Investor C shares $124,394,337
============
outstanding)
NET ASSET VALUE, OFFERING
AND REDEMPTION PRICE PER
INSTITUTIONAL SHARE
($100,515,385/9,355,093) $ 10.74
=======
NET ASSET VALUE, OFFERING
AND REDEMPTION PRICE PER
SERVICE SHARE
($720,548/66,987) $ 10.76
=======
NET ASSET VALUE AND REDEMPTION
PRICE PER INVESTOR A SHARE
($6,850,741/637,510) $ 10.75
=======
MAXIMUM OFFERING PRICE PER
INVESTOR A SHARE
($10.75/0.960) $ 11.18
=======
NET ASSET VALUE, OFFERING
AND REDEMPTION PRICE
(subject to a maximum contingent
deferred sales charge of 4.5%)
PER INVESTOR B SHARE
($10,085,247/938,472) $ 10.75
=======
NET ASSET VALUE, OFFERING
AND REDEMPTION PRICE
(subject to a maximum contingent
deferred sales charge of 1.0%)
PER INVESTOR C SHARE
($6,222,416/578,735) $ 10.75
=======
- -------------------
(a) Also cost for Federal income tax purposes. The gross unrealized
appreciation (depreciation) on a tax basis is as follows:
Gross unrealized appreciation $8,681,543
Gross unrealized depreciation (3,340)
----------
$8,678,203
==========
(b) Security exempt from registration under Rule 144A of the Securities Act of
1933. These securities may be resold in transactions exempt from
registration to qualified institutional investors. As of March 31, 2005,
the Portfolio held 5.4% of its net assets, with a current market value
of $6,625,070 in securities restricted as to resale.
(c) Securities, or a portion thereof, pledged as collateral with a value of
$662,166 on 202 short U.S. Treasury Note futures contracts expiring June
2005. The value of such contracts on March 31, 2005 was $22,071,657.26,
with an unrealized gain of $221,718 (including commissions of $404) .
(d) Rates shown are the rates as of March 31, 2005.
SEE ACCOMPANYING NOTES TO FINANCIAL STATEMENTS
32
BLACKROCK FUNDS
STATEMENT OF NET ASSETS
DELAWARE TAX-FREE INCOME PORTFOLIO
AS OF MARCH 31, 2005 (UNAUDITED)
PAR
MATURITY (000) VALUE
------------- ---------- -------------
MUNICIPAL BONDS - 99.7%
Delaware - 59.7%
Delaware River & Bay Auth. Rev.,
Ser. 96
6.00% 01/01/06 $1,160 $ 1,189,232
Delaware River & Bay Auth. Rev.,
Ser. 03
5.25% 01/01/22 1,000 1,102,720
Delaware St. Econ. Dev. Auth. Poll.
Ctrl. Rev., Delmarva Pwr. Prj., Ser.
02B
5.20% 02/01/19 1,000 1,064,830
Delaware St. Econ. Dev. Auth. Rev.,
Del. Tech. Pk. Univ. Del. Prj., Ser.
00
6.00% 02/01/21 1,000 1,118,920
Delaware St. Econ. Dev. Auth. Rev.,
Delmarva Pwr. Prj., Ser. 00 AMT
5.65% 07/01/28 3,850 4,021,440
Delaware St. Econ. Dev. Auth. Rev.,
First Mtg. Gilpin ACA CBI Prj., Ser.
98
5.62% 07/01/19 2,000 2,079,360
Delaware St. Econ. Dev. Auth. Rev.,
United Wtr. Delaware, Inc. Prj.,
Ser. 95 AMT
6.20%(b) 06/01/25 2,000 2,050,760
Delaware St. Econ. Dev. Auth. Rev.,
Wtr. Dev. Prj., Ser. 92B
6.45% 12/01/07 1,165 1,261,520
Delaware St. G.O., Ser. 03A
5.00% 01/01/10 1,000 1,078,520
Delaware St. G.O., Ser. 03B
07/01/08-
5.00% 07/01/11 2,600 2,803,096
Delaware St. G.O., Ser. 04A
5.00% 01/01/09 2,000 2,138,920
Delaware St. Hlth. Fac. Auth. Rev.,
Beebe Med. Ctr. Prj., Ser. 04A
5.50% 06/01/24 1,000 1,034,820
Delaware St. Hlth. Fac. Auth. Rev.,
Catholic Hlth. East Prj., Ser. 03D
5.12% 11/15/24 1,750 1,767,500
5.25% 11/15/28 2,225 2,252,547
Delaware St. Hlth. Fac. Auth. Rev.,
Christiana Care Hlth. Svcs. Prj.,
Ser. 03
5.25% 10/01/12 3,000 3,273,030
Delaware St. Hlth. Fac. Auth. Rev.,
Med. Ctr. of Delaware Prj., Ser. 92
6.25% 10/01/05 1,875 1,910,325
Delaware St. Hsg. Auth. Rev.,
Multi-Fam. Mtg. Prj., Ser. 92C
7.38% 01/01/15 2,000 2,000,340
Delaware St. Hsg. Auth. Rev.,
Multi-Fam. Mtg. Prj., Ser. 01A
5.40% 07/01/24 3,280 3,328,741
Delaware St. Hsg. Auth. Rev., Sr.
Sgl. Fam. Mtg. Prj., Ser. 00 AMT
5.90% 07/01/20 1,660 1,721,005
Delaware St. Hsg. Auth. Rev., Sr.
Sgl. Fam. Mtg. Prj., Ser. 02A AMT
5.40% 01/01/34 1,335 1,348,243
Delaware St. Trans. Auth. Rev., Ser.
97
5.00% 07/01/08 1,000 1,054,760
PAR
MATURITY (000) VALUE
------------- ---------- -------------
MUNICIPAL BONDS (Continued)
Delaware (Continued)
Kent Cnty. Stud. Hsg. Rev., Del. St.
Univ. Prj., Ser. 04A
07/01/25-
5.00% 07/01/30 $2,100 $ 2,087,122
New Castle Cnty. G.O., Ser. 02A
5.25% 10/01/12 1,745 1,937,369
New Castle Cnty. G.O., Ser. 04
5.00% 10/01/20 2,695 2,887,369
Sussex Cnty. G.O., Prerefunded Ser.
93
5.60% 04/15/05 225 225,216
5.70% 04/15/05 230 230,225
Sussex Cnty. G.O., Ser. 03
5.00% 10/15/08 2,270 2,413,055
Wilmington G.O., Ser. 02
5.38% 06/01/17 1,500 1,633,980
Wilmington Pk. Auth. Gtd. Pk. Rev.,
Ser. 92A
6.00% 09/15/06 25 25,080
Wilmington Pk. Auth. Gtd. Pk. Rev.,
Ser. 02
09/15/14-
5.25% 09/15/15 2,965 3,288,120
===========
54,328,165
-----------
Multi-State - 7.3%
Charter Mac Equity Issue Tr.
6.62%(c) 06/30/09 1,000 1,069,111
7.60%(c) 11/30/10 1,000 1,117,700
MuniMae TE Bond Subs., LLC
6.88%(c) 06/30/09 2,000 2,157,180
7.75%(c) 11/01/10 2,000 2,281,080
===========
6,625,071
-----------
Puerto Rico - 32.7%
Puerto Rico Cmwlth. G.O., Ser. 02
5.50% 07/01/11 3,000 3,354,900
Puerto Rico Cmwlth. Govt. Dev. Bank
Rev., Ref. Ser. 85
2.19% 12/01/15 3,000 3,000,000
Puerto Rico Cmwlth. Hwy. & Trans.
Auth. Rev., Ser. 98A
2.23% 07/01/28 6,400 6,400,000
Puerto Rico Cmwlth. Infra. Fin. Auth.
S.O. RITES, Ser. 00A
12.94%(d) 10/01/16 400 554,136
Puerto Rico Cmwlth. Infra. Fin. Auth.
S.O. RITES, Ser. 00B
13.44%(d) 10/01/17 500 702,930
Puerto Rico Cmwlth. Infra. Fin. Auth.
S.O. RITES, Ser. 00C
13.44%(d) 10/01/18 500 701,870
Puerto Rico Cmwlth. Infra. Fin. Auth.
S.O. RITES, Ser. 00D
13.44%(d) 10/01/19 650 909,701
Puerto Rico Cmwlth. Infra. Fin. Auth.
S.O. RITES, Ser. 00E
13.44%(d) 10/01/20 250 348,835
Puerto Rico Cmwlth. Infra. Fin. Auth.
S.O. RITES, Ser. 00F
12.94%(d) 10/01/24 250 328,685
SEE ACCOMPANYING NOTES TO FINANCIAL STATEMENTS
33
BLACKROCK FUNDS
STATEMENT OF NET ASSETS
DELAWARE TAX-FREE INCOME PORTFOLIO (CONCLUDED)
AS OF MARCH 31, 2005 (UNAUDITED)
PAR
MATURITY (000) VALUE
---------- --------- -------------
MUNICIPAL BONDS (Continued)
Puerto Rico (Continued)
Puerto Rico Elec. Pwr. Auth. Rev.,
Ser. 05RR
5.00% 07/01/35 $1,500 $ 1,560,885
Puerto Rico Pub. Fin. Corp. Cmwlth.
Approp. Rev., Ser. 98A
5.38% 06/01/14 50 56,244
Puerto Rico Pub. Fin. Corp. RITES
Rev., Ser. 98
8.91%(d) 06/01/12 5,000 6,423,800
Puerto Rico Pub. Fin. Corp. RITES
Rev., Ser. 99
10.01%(d) 06/01/14 4,025 5,460,637
===========
29,802,623
-----------
TOTAL MUNICIPAL BONDS
(Cost $86,078,618) 90,755,859
-----------
MONEY MARKET FUND - 0.7%
Wilmington Trust Tax-Free Money
Market Fund
(Cost $594,427) 594 594,427
-----------
TOTAL INVESTMENTS IN
SECURITIES - 100.4%
(Cost $86,673,045(a)) 91,350,286
LIABILITIES IN EXCESS OF
OTHER
ASSETS - (0.4)% (327,487)
----------
NET ASSETS - 100.0%
(Applicable to 5,478,871
Institutional
shares, 1,440,210
Investor A shares,
818,206 Investor B
shares and
1,390,236 Investor C
shares
outstanding) $91,022,799
===========
NET ASSET VALUE, OFFERING AND
REDEMPTION PRICE PER
INSTITUTIONAL SHARE
($54,625,840/5,478,871) $ 9.97
=======
NET ASSET VALUE AND REDEMPTION
PRICE PER INVESTOR A SHARE
($14,367,375/1,440,210) $ 9.98
=======
MAXIMUM OFFERING PRICE PER
INVESTOR A SHARE
($9.98/0.960) $ 10.38
=======
NET ASSET VALUE, OFFERING
AND REDEMPTION PRICE
(subject to a maximum contingent
deferred sales charge of 4.5%)
PER INVESTOR B SHARE
($8,163,131/818,206) $ 9.98
=======
NET ASSET VALUE, OFFERING
AND REDEMPTION PRICE
(subject to a maximum contingent
deferred sales charge of 1.0%)
PER INVESTOR C SHARE
($13,866,453/1,390,236) $ 9.97
=======
- -------------------
(a) Cost for Federal income tax purposes is $86,735,985. The gross
unrealized appreciation (depreciation) on a tax basis is as
follows:
Gross unrealized appreciation $5,023,203
Gross unrealized depreciation (408,902)
----------
$4,614,301
==========
(b) Securities, or a portion thereof, pledged as collateral with a value of
$1,028,770 on 153 short U.S. Treasury Note futures contracts expiring
June 2005. The value of such contracts on March 31, 2005 was
$16,717,641, with an unrealized gain of $167,929 (including commissions
of $306).
(c) Security exempt from registration under Rule 144A of the Securities Act
of 1933. These securities may be resold in transactions exempt from
registration to qualified institutional investors. As of March 31, 2005,
the Portfolio held 7.3% of its net assets, with a current market value
of $6,625,071 in securities restricted as to resale.
(d) Rates shown are the rates as of March 31, 2005.
SEE ACCOMPANYING NOTES TO FINANCIAL STATEMENTS
34
BLACKROCK FUNDS
STATEMENT OF NET ASSETS
KENTUCKY TAX-FREE INCOME PORTFOLIO
AS OF MARCH 31, 2005 (UNAUDITED)
PAR
MATURITY (000) VALUE
------------- ---------- -------------
MUNICIPAL BONDS - 100.5%
Kentucky - 67.9%
Boone Cnty. Sch. Dist. Fin. Corp.
Sch. Bldg. Rev., Ser. 00B
5.38% 08/01/20 $2,500 $ 2,667,297
Bowling Green Sch. Dist. Fin. Corp.
Rev., Ser. 00
01/01/18-
5.75% 01/01/20 2,185 2,394,146
Breckinridge Cnty. Lease Prg. Tr.
Rev., Ser 99
2.29% 12/01/29 2,000 2,000,000
Frankfort Elec. & Wtr. Plant Bd. Rev.,
Ser. 99
5.60% 12/01/19 1,045 1,144,056
Grayson Cnty. Sch. Dist. Fin. Corp.
Sch. Bldg. Rev., Prerefunded Ser.
95B
5.95% 01/01/08 830 846,600
Hardin Cnty. Sch. Dist. Fin. Corp.
Sch. Bldg. Rev., Ser. 00
5.50% 02/01/16 1,675 1,810,960
Hopkins Cnty. G.O., Detention Fac.
Prj., Ser. 00
5.75% 02/01/20 1,800 1,979,928
Jefferson Cnty. Sch. Dist. Fin. Corp.
Sch. Bldg. Rev., Ser. 99A
5.25% 01/01/14 2,000 2,146,500
Kenton Cnty. Arpt. Bd. Arpt. Rev.,
Cincinnati Northern Kentucky Prj.,
Ser. 97A AMT
5.95% 03/01/07 1,730 1,824,441
6.30% 03/01/15 1,000 1,078,370
Kentucky Econ. Dev. Fin. Auth. Hlth.
Sys. Rev., Norton Healthcare, Inc.
Prj., Ser. 00A
6.62% 10/01/28 1,750 1,899,240
Kentucky Hsg. Corp. Hsg. Rev., Ser.
96D
5.80% 07/01/13 2,905 3,012,602
Kentucky Hsg. Corp. Hsg. Rev., Ser.
01F AMT
5.45% 01/01/32 2,990 3,063,196
Kentucky St. Econ. Dev. Fin. Auth.
Hosp. Fac. Rev., Ser 97C
2.28% 01/01/22 1,550 1,550,000
Kentucky St. Property & Bldg.
Comm. Rev., Prj. 65, Prerefunded
Ser. 00
5.95% 02/01/10 2,325 2,599,676
Kentucky St. Tpke. Auth. Econ. Dev.
Rev., Revitalization Prj., Ser. 95
6.50% 07/01/08 3,000 3,314,760
Kentucky St. Tpke. Auth. Econ. Dev.
Rev., Revitalization Prj., Ser. 01A
5.50%(b) 07/01/15 1,000 1,126,740
Lexington-Fayette Urban Cnty. Govt.
G.O., Ser. 00A
5.75% 02/01/20 1,500 1,649,940
Lexington-Fayette Urban Cnty. Govt.
Swr. Sys. Rev., Ser. 01A
07/01/20-
5.00% 07/01/21 3,775 3,965,748
Louisville & Jefferson Cnty. Met. Swr.
& Drain Sys. Rev., Ser. 97A
6.25% 05/15/26 1,015 1,090,191
PAR
MATURITY (000) VALUE
------------- ---------- -------------
MUNICIPAL BONDS (Continued)
Kentucky (Continued)
Louisville & Jefferson Cnty. Met. Swr.
& Drain Sys. Rev., Ser. 99A
5.75% 05/15/33 $3,750 $ 4,123,089
Louisville & Jefferson Cnty. Reg.
Arpt. Auth Spec. Fac. Rev., Ser.
99C
2.24% 01/01/29 3,300 3,300,000
Louisville & Jefferson Cnty. Regl.
Arpt. Auth. Arpt. Sys. Rev., Ser.
01A AMT
5.75% 07/01/15 1,755 1,915,354
Louisville & Jefferson Cnty. Regl.
Arpt. Auth. Spec. Fac. Rev., Ser.
99 AMT
5.50% 03/01/19 4,285 4,224,881
Louisville Wtrwks. Brd. Wtr. Sys.
Rev., Louisville Wtr. Co. Prj., Ser.
00
5.25% 11/15/16 2,590 2,778,889
===========
57,506,604
-----------
Multi-State - 9.2%
Charter Mac Equity Issue Tr.
6.62%(c) 06/30/09 1,000 1,069,110
7.60%(c) 11/30/10 4,000 4,470,800
MuniMae TE Bond Subs., LLC
7.75%(c) 11/01/10 2,000 2,281,080
===========
7,820,990
-----------
Puerto Rico - 23.4%
Puerto Rico Cmwlth. Hwy. & Trans.
Auth. Rev., Ser. 00C
6.00% 07/01/29 5,000 5,617,100
Puerto Rico Cmwlth. Infra. Fin. Auth.
S.O. RITES, Ser. 00A
12.94%(d) 10/01/16 400 554,136
Puerto Rico Cmwlth. Infra. Fin. Auth.
S.O. RITES, Ser. 00B
13.44%(d) 10/01/17 500 702,930
Puerto Rico Cmwlth. Infra. Fin. Auth.
S.O. RITES, Ser. 00C
13.44%(d) 10/01/18 500 701,870
Puerto Rico Cmwlth. Infra. Fin. Auth.
S.O. RITES, Ser. 00D
13.44%(d) 10/01/19 650 909,701
Puerto Rico Cmwlth. Infra. Fin. Auth.
S.O. RITES, Ser. 00E
13.44%(d) 10/01/20 250 348,835
Puerto Rico Cmwlth. Infra. Fin. Auth.
S.O. RITES, Ser. 00F
12.94%(d) 10/01/24 250 328,685
Puerto Rico Cmwlth. Infra. Fin. Auth.
Spec. RITES PA-569 Rev., Ser. 99
9.24%(d) 07/01/12 1,335 1,577,301
Puerto Rico Cmwlth. Pub. Imp. G.O.,
Ser. 04A
5.00% 07/01/29 2,000 2,048,920
Puerto Rico Elec. Pwr. Auth. Rev.,
Ser. 05RR
5.00% 07/01/35 1,500 1,560,885
SEE ACCOMPANYING NOTES TO FINANCIAL STATEMENTS
35
BLACKROCK FUNDS
STATEMENT OF NET ASSETS
KENTUCKY TAX-FREE INCOME PORTFOLIO (CONCLUDED)
AS OF MARCH 31, 2005 (UNAUDITED)
PAR
MATURITY (000) VALUE
---------- --------- -------------
MUNICIPAL BONDS (Continued)
Puerto Rico (Continued)
Puerto Rico Pub. Fin.
Corp. Cmwlth.
Approp. Rev.,
Prerefunded Ser.
02E
5.50% 02/01/12 $3,740 $ 4,156,711
Puerto Rico Pub. Fin.
Corp. Cmwlth.
Approp. Rev., Ser. 02E
5.50% 08/01/29 1,260 1,353,114
===========
19,860,188
-----------
TOTAL MUNICIPAL BONDS
(Cost $78,547,112) 85,187,782
-----------
MONEY MARKET FUND - 0.1%
Wilmington Trust
Tax-Free Money
Market Fund
(Cost $84,466) 84,466 84,466
------
TOTAL INVESTMENTS IN SECURITIES -
100.6%
(Cost $78,631,578(a)) 85,272,248
LIABILITIES IN EXCESS OF
OTHER ASSETS - (0.6)% (550,012)
----------
NET ASSETS - 100.0%
(Applicable to 7,564,156
Institutional shares, 24,616
Service shares, 570,097 Investor
A shares, 406,783 Investor B
shares and 142,654 Investor C
shares outstanding) $84,722,236
===========
NET ASSET VALUE, OFFERING
AND REDEMPTION PRICE PER
INSTITUTIONAL SHARE
($73,588,353/7,564,156) $ 9.73
=======
NET ASSET VALUE, OFFERING
AND REDEMPTION PRICE PER
SERVICE SHARE
($239,619/24,616) $ 9.73
=======
NET ASSET VALUE AND REDEMPTION
PRICE PER INVESTOR A SHARE
($5,545,333/570,097) $ 9.73
=======
MAXIMUM OFFERING PRICE PER
INVESTOR A SHARE
($9.73/0.960) $ 10.14
=======
NET ASSET VALUE, OFFERING
AND REDEMPTION PRICE
(subject to a maximum contingent
deferred sales charge of 4.5%)
PER INVESTOR B SHARE
($3,957,548/406,783) $ 9.73
=======
NET ASSET VALUE, OFFERING
AND REDEMPTION PRICE
(subject to a maximum contingent
deferred sales charge of 1.0%)
PER INVESTOR C SHARE
($1,391,383/142,654) $ 9.75
=======
- -------------------
(a) Cost for Federal income tax purposes is $78,659,295. The gross
unrealized appreciation (depreciation) on a tax basis is as
follows:
Gross unrealized appreciation $6,654,288
Gross unrealized depreciation (41,335)
----------
$6,612,953
==========
(b) Securities or a portion thereof, pledged as collateral with a value of
$1,144,960 on 185 short U.S. Treasury Note futures contracts expiring
June 2005. The value of such contracts on March 31, 2005 was
$20,214,142, with an unrealized gain of $203,022 (including commissions
of $370).
(c) Security exempt from registration under Rule 144A of the Securities Act
of 1933. These securities may be resold in transactions exempt from
registration to qualified institutional investors. As of March 31, 2005,
the Portfolio held 9.2% of its net assets, with a current market value
of $7,820,990 in securities restricted as to resale.
(d) Rates shown are the rates as of March 31, 2005.
KEY TO INVESTMENT ABBREVIATIONS
AMT Alternative Minimum Tax
COP Certificates of Participation
DN Demand Notes
G.O. General Obligations
RITES Residual Interest Tax-Exempt Security - Note B
S.O. Special Obligations
SEE ACCOMPANYING NOTES TO FINANCIAL STATEMENTS
36
BLACKROCK FUNDS
STATEMENTS OF OPERATIONS
FOR THE PERIOD ENDED MARCH 31, 2005(UNAUDITED)
PENNSYLVANIA
ULTRASHORT TAX-FREE TAX-FREE
MUNICIPAL INCOME INCOME
PORTFOLIO PORTFOLIO PORTFOLIO
------------ --------------- ---------------
Investment income:
Interest ................................... $ 434,730 $ 10,188,967 $ 17,813,400
--------- ------------ -------------
Expenses:
Investment advisory fee .................... 104,348 1,068,021 1,702,354
Administration fee ......................... 19,710 181,564 280,285
Administration fee - class specific ........ 15,592 253,375 487,563
Custodian fee .............................. 4,012 33,022 58,375
Transfer agent fee ......................... 3,109 30,661 56,295
Transfer agent fee - class specific ........ 2,043 31,789 61,294
Shareholder servicing fees - class
specific .................................. - 22,906 74,155
Distribution fees - class specific ......... - 33,451 91,609
Legal and audit fees ....................... 11,914 40,561 59,227
Printing fees .............................. 2,932 21,146 28,361
Registration fees .......................... 19,647 25,522 10,724
Trustees' fees ............................. 573 6,761 10,575
Other ...................................... 4,517 27,278 32,554
--------- ------------ -------------
Total expenses ........................... 188,397 1,776,057 2,953,371
--------- ------------ -------------
Less investment advisory and
administration
fees waived ............................ (90,961) (484,016) (256,331)
Less administration fees waived -
class specific ......................... (9,479) (29,986) (448,842)
Less distribution fees waived -
class specific ......................... - (3,931) (16,502)
--------- ------------ -------------
Net expenses ............................. 87,957 1,258,124 2,231,696
--------- ------------ -------------
Net investment income ....................... 346,773 8,930,843 15,581,704
--------- ------------ -------------
Realized and unrealized gain (loss) on
investments:
Net realized gain (loss) from:
Investment transactions ................... (25,655) 1,637,000 246,965
Futures contracts ......................... - 404,988 596,365
--------- ------------ -------------
(25,655) 2,041,988 843,330
--------- ------------ -------------
Change in unrealized appreciation/
depreciation from:
Investments ............................... (50,340) (4,679,808) (11,656,998)
Futures contracts ......................... - 1,359,462 2,364,180
--------- ------------ -------------
(50,340) (3,320,346) (9,292,818)
--------- ------------ -------------
Net loss on investments ..................... (75,995) (1,278,358) (8,449,488)
--------- ------------ -------------
Net increase in net assets resulting from
operations ................................. $ 270,778 $ 7,652,485 $ 7,132,216
========= ============ =============
NEW JERSEY OHIO DELAWARE KENTUCKY
TAX-FREE TAX-FREE TAX-FREE TAX-FREE
INCOME INCOME INCOME INCOME
PORTFOLIO PORTFOLIO PORTFOLIO PORTFOLIO
-------------- -------------- -------------- --------------
Investment income:
Interest ................................... $ 4,726,250 $ 3,067,109 $ 2,228,495 $ 2,327,644
------------ ------------ ------------ ------------
Expenses:
Investment advisory fee .................... 467,400 303,006 254,544 236,581
Administration fee ......................... 79,458 51,511 39,339 36,562
Administration fee - class specific ........ 135,564 87,834 67,104 62,375
Custodian fee .............................. 15,189 10,709 8,059 7,876
Transfer agent fee ......................... 24,396 10,167 9,189 7,993
Transfer agent fee - class specific ........ 16,829 10,904 8,330 7,743
Shareholder servicing fees - class
specific .................................. 46,050 27,960 44,303 13,803
Distribution fees - class specific ......... 58,873 63,304 91,735 22,916
Legal and audit fees ....................... 20,994 16,317 13,948 13,367
Printing fees .............................. 9,548 6,381 5,786 -
Registration fees .......................... 7,940 6,541 5,825 7,001
Trustees' fees ............................. 2,939 1,820 1,394 1,363
Other ...................................... 11,491 9,893 11,936 3,871
------------ ------------ ------------ ------------
Total expenses ........................... 896,671 606,347 561,492 421,451
------------ ------------ ------------ ------------
Less investment advisory and
administration
fees waived ............................ (95,276) (63,841) (34,473) (24,449)
Less administration fees waived -
class specific ......................... (116,316) (71,952) (41,068) (51,683)
Less distribution fees waived -
class specific ......................... (3,080) (2,772) (6,623) (2,705)
------------ ------------ ------------ ------------
Net expenses ............................. 681,999 467,782 479,328 342,614
------------ ------------ ------------ ------------
Net investment income ....................... 4,044,251 2,599,327 1,749,167 1,985,030
------------ ------------ ------------ ------------
Realized and unrealized gain (loss) on
investments:
Net realized gain (loss) from:
Investment transactions ................... 593,998 2,678 - 725,565
Futures contracts ......................... 166,058 114,548 92,896 66,078
------------ ------------ ------------ ------------
760,056 117,226 92,896 791,643
------------ ------------ ------------ ------------
Change in unrealized appreciation/
depreciation from:
Investments ............................... (3,288,401) (1,895,180) (1,791,728) (1,582,181)
Futures contracts ......................... 660,317 361,183 271,524 346,001
------------ ------------ ------------ ------------
(2,628,084) (1,533,997) (1,520,204) (1,236,180)
------------ ------------ ------------ ------------
Net loss on investments ..................... (1,868,028) (1,416,771) (1,427,308) (444,537)
------------ ------------ ------------ ------------
Net increase in net assets resulting from
operations ................................. $ 2,176,223 $ 1,182,556 $ 321,859 $ 1,540,493
============ ============ ============ ============
SEE ACCOMPANYING NOTES TO FINANCIAL STATEMENTS.
37
BLACKROCK FUNDS
STATEMENTS OF CHANGES IN NET ASSETS
ULTRASHORT
MUNICIPAL TAX-FREE
PORTFOLIO INCOME PORTFOLIO
-------------------------------- -----------------------------------
FOR THE FOR THE
SIX MONTHS SIX MONTHS
ENDED FOR THE ENDED FOR THE
3/31/05 YEAR ENDED 3/31/05 YEAR ENDED
(UNAUDITED) 9/30/04 (UNAUDITED) 9/30/04
--------------- ---------------- ----------------- -----------------
Increase (decrease) in net assets:
Operations:
Net investment income ................................... $ 346,773 $ 228,525 $ 8,930,843 $ 18,245,677
Net realized gain (loss) on investments, futures
contracts and swap contracts ........................... (25,655) (34,465) 2,041,988 (5,920,604)
Net unrealized appreciation/depreciation on
investments, futures contracts and swap
contracts .............................................. (50,340) (66,342) (3,320,346) 875,457
------------ ------------ ------------- -------------
Net increase in net assets resulting from operations..... 270,778 127,718 7,652,485 13,200,530
------------ ------------ ------------- -------------
Distributions to shareholders from:
Net investment income:
BlackRock Class ......................................... (250,492) (179,446) (2,191,221) (3,389,118)
Institutional Class ..................................... (96,281) (49,079) (6,314,587) (14,335,425)
Service Class ........................................... - - (49,916) (117,019)
Investor A Class ........................................ - - (151,966) (315,503)
Investor B Class ........................................ - - (84,191) (210,750)
Investor C Class ........................................ - - (38,189) (107,913)
------------ ------------ ------------- -------------
Total distributions from net investment income .......... (346,773) (228,525) (8,830,070) (18,475,728)
------------ ------------ ------------- -------------
Capital share transactions ................................ (9,105,132) 46,304,112 (1,461,827) 77,137,177
------------ ------------ ------------- -------------
Total increase (decrease) in net assets ................. (9,181,127) 46,203,305 (2,639,412) 71,861,979
Net assets:
Beginning of period ..................................... 46,203,305 - 427,811,036 355,949,057
------------ ------------ ------------- -------------
End of period ........................................... $ 37,022,178 $ 46,203,305 $ 425,171,624 $ 427,811,036
============ ============ ============= =============
End of period undistributed net investment
income(distributions in excess of net investment
income) ................................................ $ - $ - $ 511,942 $ 411,169
PENNSYLVANIA TAX-FREE
INCOME PORTFOLIO
-----------------------------------
FOR THE
SIX MONTHS
ENDED FOR THE
3/31/05 YEAR ENDED
(UNAUDITED) 9/30/04
----------------- -----------------
Increase (decrease) in net assets:
Operations:
Net investment income ................................... $ 15,581,704 $ 35,471,728
Net realized gain (loss) on investments, futures
contracts and swap contracts ........................... 843,330 (10,787,108)
Net unrealized appreciation/depreciation on
investments, futures contracts and swap
contracts .............................................. (9,292,818) (4,661,640)
------------- --------------
Net increase in net assets resulting from operations..... 7,132,216 20,022,980
------------- --------------
Distributions to shareholders from:
Net investment income:
BlackRock Class ......................................... - -
Institutional Class ..................................... (15,329,732) (33,207,760)
Service Class ........................................... (124,285) (265,934)
Investor A Class ........................................ (748,657) (1,523,244)
Investor B Class ........................................ (345,003) (805,047)
Investor C Class ........................................ (35,183) (74,099)
------------- --------------
Total distributions from net investment income .......... (16,582,860) (35,876,084)
------------- --------------
Capital share transactions ................................ (12,134,205) (115,369,997)
------------- --------------
Total increase (decrease) in net assets ................. (21,584,849) (131,223,101)
Net assets:
Beginning of period ..................................... 689,736,473 820,959,574
------------- --------------
End of period ........................................... $ 668,151,624 $ 689,736,473
============= ==============
End of period undistributed net investment
income(distributions in excess of net investment
income) ................................................ $ 788,050 $ 1,789,206
SEE ACCOMPANYING NOTES TO FINANCIAL STATEMENTS
38
BLACKROCK FUNDS
NEW JERSEY TAX-FREE OHIO TAX-FREE
INCOME PORTFOLIO INCOME PORTFOLIO
- ----------------------------------- -----------------------------------
FOR THE FOR THE
SIX MONTHS SIX MONTHS
ENDED FOR THE ENDED FOR THE
3/31/05 YEAR ENDED 3/31/05 YEAR ENDED
(UNAUDITED) 9/30/04 (UNAUDITED) 9/30/04
- ----------------- ----------------- ----------------- -----------------
$ 4,044,251 $ 7,867,767 $ 2,599,327 $ 5,683,096
760,056 (886,203) 117,226 (969,457)
(2,628,084) (686,024) (1,533,997) 598,508
------------- ------------- ------------- -------------
2,176,223 6,295,540 1,182,556 5,312,147
------------- ------------- ------------- -------------
- - - -
(3,243,659) (6,863,373) (2,340,772) (4,470,836)
(319,501) (744,479) (15,792) (22,292)
(121,009) (261,877) (119,743) (227,306)
(184,790) (446,053) (182,597) (360,029)
(51,241) (94,055) (107,077) (192,153)
------------- ------------- ------------- -------------
(3,920,200) (8,409,837) (2,765,981) (5,272,616)
------------- ------------- ------------- -------------
(7,654,064) 29,571,028 7,813,492 (3,878,630)
------------- ------------- ------------- -------------
(9,398,041) 27,456,731 6,230,067 (3,839,099)
188,986,277 161,529,546 118,164,270 122,003,369
------------- ------------- ------------- -------------
$ 179,588,236 $ 188,986,277 $ 124,394,337 $ 118,164,270
============= ============= ============= =============
$ (412,502) $ (536,553) $ 91,535 $ 258,189
DELAWARE TAX-FREE KENTUCKY TAX-FREE
INCOME PORTFOLIO INCOME PORTFOLIO
--------------------------------- --------------------------------
FOR THE FOR THE FOR THE
SIX MONTHS SIX MONTHS SIX MONTHS
ENDED ENDED FOR THE ENDED FOR THE
3/31/05 3/31/05 YEAR ENDED 3/31/05 YEAR ENDED
(UNAUDITED) (UNAUDITED) 9/30/04 (UNAUDITED) 9/30/04
- ----------------- ---------------- ---------------- --------------- ----------------
$ 4,044,251 $ 1,749,167 $ 3,808,807 $ 1,985,030 $ 5,002,658
760,056 92,896 (679,225) 791,643 (351,331)
(2,628,084) (1,520,204) (63,970) (1,236,180) (759,112)
------------- ------------ ------------ ------------ -------------
2,176,223 321,859 3,065,612 1,540,493 3,892,215
------------- ------------ ------------ ------------ -------------
- - - - -
(3,243,659) (1,197,113) (2,658,162) (1,394,540) (4,386,451)
(319,501) - - (4,106) (6,946)
(121,009) (252,973) (477,990) (90,004) (207,211)
(184,790) (130,418) (312,260) (50,748) (124,106)
(51,241) (218,469) (548,634) (18,535) (41,249)
------------- ------------ ------------ ------------ -------------
(3,920,200) (1,798,973) (3,997,046) (1,557,933) (4,765,963)
------------- ------------ ------------ ------------ -------------
(7,654,064) 2,047,682 5,180,305 (4,834,853) (34,434,107)
------------- ------------ ------------ ------------ -------------
(9,398,041) 570,568 4,248,871 (4,852,293) (35,307,855)
188,986,277 90,452,231 86,203,360 89,574,529 124,882,384
------------- ------------ ------------ ------------ -------------
$ 179,588,236 $ 91,022,799 $ 90,452,231 $ 84,722,236 $ 89,574,529
============= ============ ============ ============ =============
$ (412,502) $ (240,613) $ (190,807) $ 186,850 $ (240,247)
39
BLACKROCK FUNDS
FINANCIAL HIGHLIGHTS
FOR A SHARE OUTSTANDING THROUGHOUT EACH PERIOD
NET NET GAIN NET
ASSET (LOSS) ON DISTRIBUTIONS ASSET
VALUE NET INVESTMENTS FROM NET VALUE
BEGINNING INVESTMENT (BOTH REALIZED INVESTMENT END OF
OF PERIOD INCOME AND UNREALIZED) INCOME PERIOD
=========== ============ ================= =============== ===========
----------------
UltraShort Municipal Portfolio
----------------
BlackRock Class
10/1/04 through 3/31/058 $ 9.95 $ 0.08 $ (0.02) $ (0.08) $ 9.93
3/03/041 through 9/30/04 10.00 0.077 ( 0.05) ( 0.07) 9.95
Institutional Class
10/1/04 through 3/31/058 $ 9.94 $ 0.07 $ (0.02) $ (0.07) $ 9.92
3/19/041 through 9/30/04 10.00 0.057 ( 0.06) ( 0.05) 9.94
Service Class
10/1/04 through 3/31/058 $ 9.94 $ 0.11 $ (0.02) $ - $ 10.03
3/19/041 through 9/30/04 10.00 0.037 ( 0.07) ( 0.02) 9.94
Investor A Class
10/1/04 through 3/31/058 $ 9.98 $ 0.04 $ (0.02) $ - $ 10.00
3/19/041 through 9/30/04 10.00 0.077 ( 0.07) ( 0.02) 9.98
-------------
Tax-Free Income Portfolio
-------------
BlackRock Class
10/1/04 through 3/31/058 $ 11.11 $ 0.24 $ (0.03) $ (0.24) $ 11.08
12/22/031 through 9/30/04 11.22 0.377 ( 0.10) ( 0.38) 11.11
Institutional Class
10/1/04 through 3/31/058 $ 11.11 $ 0.23 $ (0.03) $ (0.23) $ 11.08
9/30/04 11.22 0.487 ( 0.10) ( 0.49) 11.11
9/30/03 11.38 0.54 ( 0.17) ( 0.53) 11.22
9/30/02 11.38 0.57 ( 0.01) ( 0.56) 11.38
9/30/01 10.92 0.57 0.48 ( 0.59) 11.38
9/30/00 10.96 0.57 ( 0.07) ( 0.54) 10.92
Service Class
10/1/04 through 3/31/058 $ 11.10 $ 0.22 $ (0.04) $ (0.21) $ 11.07
9/30/04 11.21 0.457 ( 0.10) ( 0.46) 11.10
9/30/03 11.38 0.49 ( 0.16) ( 0.50) 11.21
9/30/02 11.38 0.55 ( 0.02) ( 0.53) 11.38
9/30/01 10.92 0.54 0.47 ( 0.55) 11.38
9/30/00 10.96 0.54 ( 0.07) ( 0.51) 10.92
Investor A Class
10/1/04 through 3/31/058 $ 11.12 $ 0.22 $ (0.05) $ (0.21) $ 11.08
9/30/04 11.22 0.447 ( 0.10) ( 0.44) 11.12
9/30/03 11.38 0.48 ( 0.16) ( 0.48) 11.22
9/30/02 11.38 0.52 ( 0.01) ( 0.51) 11.38
9/30/01 10.92 0.52 0.48 ( 0.54) 11.38
9/30/00 10.96 0.51 ( 0.06) ( 0.49) 10.92
Investor B Class
10/1/04 through 3/31/058 $ 11.11 $ 0.18 $ (0.04) $ (0.17) $ 11.08
9/30/04 11.22 0.367 ( 0.11) ( 0.36) 11.11
9/30/03 11.38 0.40 ( 0.16) ( 0.40) 11.22
9/30/02 11.38 0.43 ( 0.01) ( 0.42) 11.38
9/30/01 10.92 0.42 0.49 ( 0.45) 11.38
9/30/00 10.96 0.44 ( 0.07) ( 0.41) 10.92
Investor C Class
10/1/04 through 3/31/058 $ 11.12 $ 0.18 $ (0.05) $ (0.17) $ 11.08
9/30/04 11.21 0.357 ( 0.08) ( 0.36) 11.12
9/30/03 11.38 0.41 ( 0.18) ( 0.40) 11.21
9/30/02 11.38 0.43 ( 0.01) ( 0.42) 11.38
9/30/01 10.93 0.41 0.49 ( 0.45) 11.38
9/30/00 10.96 0.46 ( 0.08) ( 0.41) 10.93
SEE ACCOMPANYING NOTES TO FINANCIAL STATEMENTS.
40
BLACKROCK FUNDS
RATIO OF NET
NET RATIO OF INVESTMENT INCOME
ASSETS RATIO OF NET TOTAL EXPENSES TO RATIO OF NET TO AVERAGE
END OF EXPENSES TO AVERAGE NET ASSETS INVESTMENT INCOME NET ASSETS PORTFOLIO
TOTAL PERIOD AVERAGE NET (EXCLUDING TO AVERAGE NET (EXCLUDING TURNOVER
RETURN (000) ASSETS WAIVERS) ASSETS WAIVERS) RATE
=============== ========== ============== ==================== =================== ================== ==========
0.57 % $ 26,526 0.35%2 0.78%2 1.53%2 1.10%2 29%
0.16 32,027 0.352 0.922 1.142 0.572 14
0.51 % $ 10,496 0.45%2 0.90%2 1.42%2 0.97%2 29%
(0.09) 14,176 0.452 1.042 0.962 0.372 14
0.93 % $ - 0.70%2 1.15%2 1.17%2 0.72%2 29%
( 0.34) - 0.752 1.332 0.662 0.082 14
0.22 % $ - 0.70%2 1.25%2 1.17%2 0.62%2 29%
0.043 - 0.802 1.382 0.612 0.032 14
1.88 % $103,188 0.45%2 0.71%2 4.32%2 4.06%2 41%
2.46 100,489 0.452 0.692 4.342 4.102 73
1.80 % $303,417 0.60%2 0.83%2 4.17%2 3.93%2 41%
3.46 308,122 0.60 0.82 4.34 4.12 73
3.40 334,685 0.60 0.83 4.80 4.57 76
5.08 360,392 0.60 0.81 5.10 4.89 47
9.81 351,551 0.60 0.81 5.06 4.85 38
4.80 318,300 0.60 0.82 5.32 5.10 43
1.67 % $ 2,461 0.86%2 1.09%2 3.92%2 3.69%2 41%
3.16 2,702 0.86 1.08 4.09 3.87 73
2.99 2,971 0.90 1.13 4.46 4.23 76
4.77 3,103 0.90 1.11 4.81 4.60 47
9.49 3,651 0.90 1.11 4.77 4.55 38
4.49 5,347 0.90 1.12 5.02 4.80 43
1.58%3 $ 8,739 0.86%2 1.19%2 3.91%2 3.59%2 41%
3.103 7,711 1.00 1.31 3.95 3.64 73
2.913 8,573 1.07 1.30 4.31 4.08 76
4.593 8,179 1.07 1.29 4.62 4.41 47
9.303 7,309 1.07 1.28 4.61 4.39 38
4.313 8,751 1.07 1.29 4.85 4.63 43
1.29%4 $ 5,043 1.61%2 1.84%2 3.17%2 2.94%2 41%
2.244 5,869 1.75 1.97 3.21 2.99 73
2.144 7,161 1.82 2.05 3.57 3.34 76
3.814 6,211 1.82 2.03 3.87 3.66 47
8.494 4,884 1.81 2.02 3.82 3.60 38
3.544 2,723 1.82 2.04 4.09 3.87 43
1.20%4 $ 2,323 1.63%2 1.86%2 3.20%2 2.97%2 41%
2.334 2,918 1.73 1.95 3.17 2.96 73
2.054 2,559 1.82 2.05 3.59 3.36 76
3.814 2,857 1.82 2.03 3.89 3.68 47
8.394 2,604 1.81 2.02 3.80 3.59 38
3.634 1,129 1.82 2.04 4.13 3.91 43
41
BLACKROCK FUNDS
FINANCIAL HIGHLIGHTS (CONTINUED)
FOR A SHARE OUTSTANDING THROUGHOUT EACH PERIOD
NET NET GAIN NET
ASSET (LOSS) ON DISTRIBUTIONS ASSET
VALUE NET INVESTMENTS FROM NET VALUE
BEGINNING INVESTMENT (BOTH REALIZED INVESTMENT END OF
OF PERIOD INCOME AND UNREALIZED) INCOME PERIOD
=========== ============ ================= =============== ============
--------------------
Pennsylvania Tax-Free Income Portfolio
--------------------
Institutional Class
10/1/04 through 3/31/058 $ 10.68 $ 0.25 $ (0.13) $ (0.26) $ 10.54
9/30/04 10.90 0.517 ( 0.21) ( 0.52) 10.68
9/30/03 11.06 0.53 ( 0.19) ( 0.50) 10.90
9/30/02 10.89 0.53 0.16 ( 0.52) 11.06
9/30/01 10.56 0.55 0.34 ( 0.56) 10.89
9/30/00 10.52 0.54 0.02 ( 0.52) 10.56
Service Class
10/1/04 through 3/31/058 $ 10.67 $ 0.23 $ (0.12) $ (0.25) $ 10.53
9/30/04 10.89 0.487 ( 0.21) ( 0.49) 10.67
9/30/03 11.05 0.49 ( 0.18) ( 0.47) 10.89
9/30/02 10.88 0.50 0.16 ( 0.49) 11.05
9/30/01 10.55 0.52 0.34 ( 0.53) 10.88
9/30/00 10.52 0.51 0.01 ( 0.49) 10.55
Investor A Class
10/1/04 through 3/31/058 $ 10.68 $ 0.23 $ (0.14) $ (0.24) $ 10.53
9/30/04 10.89 0.467 ( 0.20) ( 0.47) 10.68
9/30/03 11.06 0.48 ( 0.20) ( 0.45) 10.89
9/30/02 10.89 0.48 0.16 ( 0.47) 11.06
9/30/01 10.56 0.49 0.35 ( 0.51) 10.89
9/30/00 10.52 0.49 0.02 ( 0.47) 10.56
Investor B Class
10/1/04 through 3/31/058 $ 10.61 $ 0.19 $ (0.14) $ (0.20) $ 10.46
9/30/04 10.82 0.397 ( 0.21) ( 0.39) 10.61
9/30/03 10.98 0.40 ( 0.19) ( 0.37) 10.82
9/30/02 10.81 0.40 0.16 ( 0.39) 10.98
9/30/01 10.48 0.42 0.34 ( 0.43) 10.81
9/30/00 10.44 0.42 0.02 ( 0.40) 10.48
Investor C Class
10/1/04 through 3/31/058 $ 10.64 $ 0.19 $ (0.14) $ (0.20) $ 10.49
9/30/04 10.85 0.397 ( 0.21) ( 0.39) 10.64
9/30/03 11.01 0.39 ( 0.18) ( 0.37) 10.85
9/30/02 10.84 0.41 0.15 ( 0.39) 11.01
9/30/01 10.51 0.41 0.35 ( 0.43) 10.84
9/30/00 10.48 0.42 0.01 ( 0.40) 10.51
-------------------
New Jersey Tax-Free Income Portfolio
-------------------
Institutional Class
10/1/04 through 3/31/058 $ 11.70 $ 0.26 $ (0.13) $ (0.25) $ 11.58
9/30/04 11.80 0.537 ( 0.06) ( 0.57) 11.70
9/30/03 12.10 0.62 ( 0.29) ( 0.63) 11.80
9/30/02 11.83 0.61 0.28 ( 0.62) 12.10
9/30/01 11.31 0.60 0.52 ( 0.60) 11.83
9/30/00 11.30 0.58 ( 0.02) ( 0.55) 11.31
Service Class
10/1/04 through 3/31/058 $ 11.70 $ 0.24 $ (0.12) $ (0.23) $ 11.59
9/30/04 11.80 0.507 ( 0.07) ( 0.53) 11.70
9/30/03 12.10 0.58 ( 0.29) ( 0.59) 11.80
9/30/02 11.83 0.58 0.28 ( 0.59) 12.10
9/30/01 11.31 0.57 0.51 ( 0.56) 11.83
9/30/00 11.30 0.56 ( 0.03) ( 0.52) 11.31
SEE ACCOMPANYING NOTES TO FINANCIAL STATEMENTS.
42
BLACKROCK FUNDS
RATIO OF NET
NET RATIO OF INVESTMENT INCOME
ASSETS RATIO OF NET TOTAL EXPENSES TO RATIO OF NET TO AVERAGE
END OF EXPENSES TO AVERAGE NET ASSETS INVESTMENT INCOME NET ASSETS PORTFOLIO
TOTAL PERIOD AVERAGE NET (EXCLUDING TO AVERAGE NET (EXCLUDING TURNOVER
RETURN (000) ASSETS WAIVERS) ASSETS WAIVERS) RATE
=============== ============ ============== ==================== =================== ================== ==========
1.14 % $ 612,429 0.60%2 0.82%2 4.63%2 4.41%2 3%
2.82 628,714 0.60 0.80 4.76 4.56 2
3.16 752,199 0.60 0.80 4.80 4.60 3
6.53 890,070 0.60 0.79 4.90 4.71 22
8.65 903,225 0.60 0.79 5.10 4.91 13
5.50 884,678 0.60 0.79 5.19 5.00 31
0.99 % $ 5,087 0.90%2 1.11%2 4.34%2 4.13%2 3%
2.51 5,733 0.90 1.10 4.48 4.28 2
2.86 6,118 0.90 1.11 4.51 4.30 3
6.22 6,005 0.90 1.09 4.62 4.43 22
8.33 6,911 0.90 1.09 4.81 4.62 13
5.09 12,646 0.90 1.09 4.90 4.71 31
0.85%3 $ 32,204 1.00%2 1.17%2 4.24%2 4.07%2 3%
2.443 33,769 1.05 1.29 4.32 4.09 2
2.593 35,874 1.08 1.28 4.34 4.13 3
6.043 37,344 1.08 1.27 4.44 4.25 22
8.143 39,306 1.07 1.26 4.62 4.43 13
5.033 30,770 1.07 1.26 4.74 4.55 31
0.47%4 $ 16,643 1.75%2 1.83%2 3.52%2 3.45%2 3%
1.694 19,604 1.75 1.89 3.66 3.52 2
1.934 24,795 1.82 2.03 3.63 3.42 3
5.284 28,346 1.82 2.02 3.72 3.53 22
7.404 26,062 1.82 2.01 3.90 3.72 13
4.334 21,584 1.82 2.01 4.01 3.82 31
0.47%4 $ 1,788 1.75%2 1.83%2 3.51%2 3.43%2 3%
1.694 1,916 1.80 1.94 3.60 3.46 2
1.924 1,974 1.82 2.03 3.61 3.40 3
5.274 1,615 1.81 2.00 3.69 3.50 22
7.384 875 1.81 2.00 3.84 3.66 13
4.324 388 1.82 2.01 4.01 3.82 31
1.13 % $ 143,464 0.60%2 0.85%2 4.46%2 4.21%2 5%
4.10 151,808 0.60 0.83 4.54 4.31 15
2.80 124,713 0.60 0.83 5.17 4.94 22
7.82 128,553 0.60 0.82 5.20 4.98 14
10.07 129,635 0.60 0.82 5.12 4.90 28
5.15 130,463 0.60 0.82 5.24 5.02 77
1.07 % $ 15,651 0.90%2 1.10%2 4.16%2 3.96%2 5%
3.79 15,940 0.90 1.11 4.27 4.06 15
2.50 16,534 0.90 1.13 4.87 4.64 22
7.49 17,506 0.90 1.12 4.89 4.67 14
9.75 16,530 0.90 1.12 4.82 4.60 28
4.84 18,673 0.90 1.12 4.92 4.70 77
43
BLACKROCK FUNDS
FINANCIAL HIGHLIGHTS (CONTINUED)
FOR A SHARE OUTSTANDING THROUGHOUT EACH PERIOD
NET NET GAIN NET
ASSET (LOSS) ON DISTRIBUTIONS ASSET
VALUE NET INVESTMENTS FROM NET VALUE
BEGINNING INVESTMENT (BOTH REALIZED INVESTMENT END OF
OF PERIOD INCOME AND UNREALIZED) INCOME PERIOD
=========== ============ ================= =============== ============
--------------------------
New Jersey Tax-Free Income Portfolio (Continued)
--------------------------
Investor A Class
10/1/04 through 3/31/058 $ 11.70 $ 0.24 $ (0.13) $ (0.23) $ 11.58
9/30/04 11.80 0.487 ( 0.06) ( 0.52) 11.70
9/30/03 12.10 0.56 ( 0.29) ( 0.57) 11.80
9/30/02 11.83 0.55 0.29 ( 0.57) 12.10
9/30/01 11.31 0.53 0.53 ( 0.54) 11.83
9/30/00 11.30 0.53 ( 0.02) ( 0.50) 11.31
Investor B Class
10/1/04 through 3/31/058 $ 11.70 $ 0.19 $ (0.11) $ (0.19) $ 11.59
9/30/04 11.80 0.397 ( 0.06) ( 0.43) 11.70
9/30/03 12.10 0.47 ( 0.29) ( 0.48) 11.80
9/30/02 11.83 0.46 0.29 ( 0.48) 12.10
9/30/01 11.31 0.43 0.54 ( 0.45) 11.83
9/30/00 11.30 0.45 ( 0.02) ( 0.42) 11.31
Investor C Class
10/1/04 through 3/31/058 $ 11.72 $ 0.19 $ (0.11) $ (0.19) $ 11.61
9/30/04 11.82 0.397 ( 0.06) ( 0.43) 11.72
9/30/03 12.13 0.46 ( 0.29) ( 0.48) 11.82
9/30/025 11.85 0.45 0.31 ( 0.48) 12.13
2/6/01 through 9/30/01 11.70 0.29 0.15 ( 0.29) 11.85
10/1/99 through 3/3/00 11.30 0.18 ( 0.26) ( 0.18) 11.04
----------------
Ohio Tax-Free Income Portfolio
----------------
Institutional Class
10/1/04 through 3/31/058 $ 10.88 $ 0.24 $ (0.12) $ (0.26) $ 10.74
9/30/04 10.87 0.547 ( 0.03) ( 0.50) 10.88
9/30/03 11.09 0.52 ( 0.22) ( 0.52) 10.87
9/30/02 10.80 0.52 0.35 ( 0.58) 11.09
9/30/01 10.22 0.57 0.57 ( 0.56) 10.80
9/30/00 10.19 0.54 - ( 0.51) 10.22
Service Class
10/1/04 through 3/31/058 $ 10.89 $ 0.22 $ (0.11) $ (0.24) $ 10.76
9/30/04 10.87 0.517 ( 0.02) ( 0.47) 10.89
9/30/03 11.09 0.52 ( 0.26) ( 0.48) 10.87
9/30/02 10.80 0.48 0.36 ( 0.55) 11.09
9/30/01 10.22 0.54 0.57 ( 0.53) 10.80
9/30/00 10.19 0.51 - ( 0.48) 10.22
Investor A Class
10/1/04 through 3/31/058 $ 10.88 $ 0.22 $ (0.11) $ (0.24) $ 10.75
9/30/04 10.87 0.497 ( 0.03) ( 0.45) 10.88
9/30/03 11.09 0.46 ( 0.21) ( 0.47) 10.87
9/30/02 10.80 0.46 0.36 ( 0.53) 11.09
9/30/01 10.22 0.52 0.57 ( 0.51) 10.80
9/30/00 10.19 0.49 - ( 0.46) 10.22
Investor B Class
10/1/04 through 3/31/058 $ 10.88 $ 0.18 $ (0.12) $ (0.19) $ 10.75
9/30/04 10.87 0.417 ( 0.03) ( 0.37) 10.88
9/30/03 11.09 0.39 ( 0.23) ( 0.38) 10.87
9/30/02 10.80 0.39 0.35 ( 0.45) 11.09
9/30/01 10.22 0.42 0.59 ( 0.43) 10.80
9/30/00 10.19 0.42 - ( 0.39) 10.22
Investor C Class
10/1/04 through 3/31/058 $ 10.89 $ 0.18 $ (0.13) $ (0.19) $ 10.75
9/30/04 10.87 0.417 ( 0.02) ( 0.37) 10.89
9/30/03 11.09 0.40 ( 0.24) ( 0.38) 10.87
9/30/02 10.80 0.39 0.35 ( 0.45) 11.09
9/30/01 10.22 0.41 0.60 ( 0.43) 10.80
9/30/00 10.19 0.42 - ( 0.39) 10.22
SEE ACCOMPANYING NOTES TO FINANCIAL STATEMENTS.
44
BLACKROCK FUNDS
RATIO OF NET
NET RATIO OF INVESTMENT INCOME
ASSETS RATIO OF NET TOTAL EXPENSES TO RATIO OF NET TO AVERAGE
END OF EXPENSES TO AVERAGE NET ASSETS INVESTMENT INCOME NET ASSETS PORTFOLIO
TOTAL PERIOD AVERAGE NET (EXCLUDING TO AVERAGE NET (EXCLUDING TURNOVER
RETURN (000) ASSETS WAIVERS) ASSETS WAIVERS) RATE
============== ============ ============== ==================== =================== ================== ==========
0.93%3 $ 6,035 0.99%2 1.19%2 4.07%2 3.86%2 5%
3.633 6,193 1.05 1.31 4.12 3.86 15
2.323 5,995 1.08 1.30 4.70 4.48 22
7.313 5,812 1.07 1.29 4.66 4.44 14
9.563 3,207 1.07 1.29 4.64 4.42 28
4.673 1,723 1.07 1.29 4.81 4.59 77
0.64%4 $ 11,447 1.75%2 1.85%2 3.31%2 3.21%2 5%
2.854 11,696 1.80 1.97 3.37 3.20 15
1.554 12,411 1.82 2.04 3.93 3.71 22
6.524 9,066 1.81 2.03 3.92 3.71 14
8.754 5,707 1.79 2.01 3.85 3.64 28
3.894 1,614 1.82 2.04 4.02 3.80 77
0.64%4 $ 2,990 1.75%2 1.85%2 3.31%2 3.20%2 5%
2.854 3,350 1.78 1.94 3.31 3.15 15
1.474 1,877 1.82 2.04 3.91 3.69 22
6.594 1,106 1.80 2.01 3.75 3.54 14
3.804 157 1.782 2.002 3.822 3.622 28
( 0.73)4 -5 1.822 2.042 3.902 3.682 77
1.07 % $ 100,515 0.60%2 0.85%2 4.46%2 4.21%2 0%
4.82 96,730 0.60 0.84 4.97 4.73 6
2.79 97,589 0.60 0.83 4.78 4.55 18
8.40 96,974 0.60 0.81 4.93 4.71 28
11.41 92,047 0.60 0.84 5.42 5.18 19
5.52 89,239 0.60 0.85 5.41 5.16 23
1.02 % $ 721 0.90%2 1.10%2 4.16%2 3.96%2 0%
4.60 700 0.81 1.02 4.74 4.52 6
2.48 727 0.90 1.12 4.58 4.36 18
8.08 205 0.90 1.12 4.59 4.37 28
11.08 40 0.89 1.13 5.13 4.89 19
5.20 38 0.90 1.15 5.09 4.84 23
0.97%3 $ 6,851 0.99%2 1.19%2 4.05%2 3.84%2 0%
4.343 5,043 1.07 1.34 4.56 4.29 6
2.313 7,494 1.08 1.31 4.32 4.09 18
7.903 15,587 1.06 1.28 4.37 4.16 28
10.893 3,674 1.07 1.31 4.97 4.73 19
5.033 3,243 1.07 1.32 4.94 4.69 23
0.59%4 $ 10,085 1.75%2 1.85%2 3.32%2 3.21%2 0%
3.574 10,280 1.79 1.97 3.78 3.60 6
1.544 10,453 1.82 2.05 3.55 3.32 18
7.104 8,740 1.81 2.03 3.65 3.44 28
10.084 4,277 1.80 2.04 4.20 3.97 19
4.254 1,668 1.82 2.07 4.19 3.94 23
0.50%4 $ 6,222 1.74%2 1.84%2 3.30%2 3.20%2 0%
3.664 5,411 1.77 1.95 3.80 3.62 6
1.544 5,740 1.82 2.05 3.55 3.32 18
7.094 3,632 1.80 2.01 3.60 3.39 28
10.084 1,496 1.80 2.04 4.05 3.82 19
4.254 412 1.82 2.07 4.19 3.94 23
45
BLACKROCK FUNDS
FINANCIAL HIGHLIGHTS (CONTINUED)
FOR A SHARE OUTSTANDING THROUGHOUT EACH PERIOD
NET NET GAIN NET
ASSET (LOSS) ON DISTRIBUTIONS ASSET
VALUE NET INVESTMENTS FROM NET VALUE
BEGINNING INVESTMENT (BOTH REALIZED INVESTMENT END OF
OF PERIOD INCOME AND UNREALIZED) INCOME PERIOD
=========== ============ ================= =============== ===========
------------------
Delaware Tax-Free Income Portfolio
------------------
Institutional Class
10/1/04 through 3/31/058 $ 10.13 $ 0.21 $ (0.16) $ (0.21) $ 9.97
9/30/04 10.23 0.477 ( 0.08) ( 0.49) 10.13
9/30/03 10.54 0.52 ( 0.27) ( 0.56) 10.23
9/30/02 10.20 0.55 0.31 ( 0.52) 10.54
9/30/01 9.68 0.50 0.46 ( 0.44) 10.20
9/30/00 9.62 0.47 0.04 ( 0.45) 9.68
Service Class
10/1/01 through 5/2/02 $ 10.20 $ 0.29 $ (0.09) $ (0.28) $ 10.12
9/30/01 9.68 0.48 0.45 ( 0.41) 10.20
9/30/00 9.62 0.44 0.04 ( 0.42) 9.68
Investor A Class
10/1/04 through 3/31/058 $ 10.13 $ 0.19 ( 0.15) $ (0.19) $ 9.98
9/30/04 10.24 0.427 ( 0.09) ( 0.44) 10.13
9/30/03 10.54 0.45 ( 0.24) ( 0.51) 10.24
9/30/02 10.20 0.49 0.32 ( 0.47) 10.54
9/30/01 9.68 0.45 0.47 ( 0.40) 10.20
9/30/00 9.62 0.43 0.04 ( 0.41) 9.68
Investor B Class
10/1/04 through 3/31/058 $ 10.14 $ 0.15 $ (0.16) $ (0.15) $ 9.98
9/30/04 10.24 0.357 ( 0.08) ( 0.37) 10.14
9/30/03 10.54 0.37 ( 0.23) ( 0.44) 10.24
9/30/02 10.20 0.42 0.32 ( 0.40) 10.54
9/30/01 9.68 0.37 0.47 ( 0.32) 10.20
9/30/00 9.62 0.35 0.05 ( 0.34) 9.68
Investor C Class
10/1/04 through 3/31/058 $ 10.13 $ 0.15 $ (0.16) $ (0.15) $ 9.97
9/30/04 10.24 0.357 ( 0.09) ( 0.37) 10.13
9/30/03 10.54 0.37 ( 0.23) ( 0.44) 10.24
9/30/02 10.20 0.38 0.36 ( 0.40) 10.54
9/30/01 9.68 0.36 0.48 ( 0.32) 10.20
9/30/00 9.62 0.35 0.05 ( 0.34) 9.68
SEE ACCOMPANYING NOTES TO FINANCIAL STATEMENTS.
46
BLACKROCK FUNDS
RATIO OF NET
NET RATIO OF INVESTMENT INCOME
ASSETS RATIO OF NET TOTAL EXPENSES TO RATIO OF NET TO AVERAGE
END OF EXPENSES TO AVERAGE NET ASSETS INVESTMENT INCOME NET ASSETS PORTFOLIO
TOTAL PERIOD AVERAGE NET (EXCLUDING TO AVERAGE NET (EXCLUDING TURNOVER
RETURN (000) ASSETS WAIVERS) ASSETS WAIVERS) RATE
================== =========== ============== ==================== =================== ================== ==========
0.52 % $ 54,626 0.70%2 0.92%2 4.12%2 3.90%2 1%
3.92 54,451 0.70 0.89 4.61 4.42 3
2.53 54,512 0.70 0.90 5.06 4.86 34
8.75 71,516 0.70 0.89 5.40 5.22 17
10.16 79,535 0.70 0.90 4.99 4.79 14
5.50 94,865 0.70 0.91 4.90 4.69 27
1.95 % $ -6 1.00%2 1.17%2 5.32%2 5.14%2 17%
9.83 - 0.87 1.02 4.83 4.68 14
5.19 - 1.00 1.21 4.60 4.39 27
0.42%3 $ 14,367 1.08%2 1.26%2 3.72%2 3.54%2 1%
3.353 12,895 1.14 1.40 4.16 3.90 3
2.153 8,634 1.17 1.36 4.48 4.30 34
8.253 5,106 1.18 1.36 4.90 4.71 17
9.653 4,304 1.17 1.37 4.53 4.34 14
5.013 3,741 1.17 1.38 4.45 4.24 27
(0.06)%4 $ 8,163 1.84%2 1.92%2 2.97%2 2.90%2 1%
2.684 8,606 1.89 2.02 3.42 3.29 3
1.384 8,528 1.92 2.09 3.70 3.52 34
7.454 3,130 1.92 2.11 4.14 3.96 17
8.844 2,505 1.91 2.11 3.79 3.60 14
4.234 1,769 1.92 2.13 3.67 3.46 27
( 0.06)%4 $ 13,866 1.85%2 1.92%2 2.97%2 2.90%2 1%
2.584 14,500 1.89 2.02 3.43 3.30 3
1.384 14,529 1.91 2.08 3.56 3.40 34
7.454 3,149 1.90 2.09 3.96 3.77 17
8.844 638 1.92 2.12 3.78 3.59 14
4.234 371 1.92 2.13 3.67 3.46 27
47
BLACKROCK FUNDS
FINANCIAL HIGHLIGHTS (CONCLUDED)
FOR A SHARE OUTSTANDING THROUGHOUT EACH PERIOD
NET NET GAIN NET
ASSET (LOSS) ON DISTRIBUTIONS ASSET
VALUE NET INVESTMENTS FROM NET VALUE
BEGINNING INVESTMENT (BOTH REALIZED INVESTMENT END OF
OF PERIOD INCOME AND UNREALIZED) INCOME PERIOD
=========== ============ ================= =============== ===========
------------------
Kentucky Tax-Free Income Portfolio
------------------
Institutional Class
10/1/04 through 3/31/058 $ 9.73 $ 0.23 $ (0.05) $ (0.18) $ 9.73
9/30/04 9.77 0.457 ( 0.07) ( 0.42) 9.73
9/30/03 9.99 0.48 ( 0.20) ( 0.50) 9.77
9/30/02 9.94 0.49 0.07 ( 0.51) 9.99
9/30/01 9.60 0.50 0.34 ( 0.50) 9.94
9/30/00 9.63 0.48 ( 0.05) ( 0.46) 9.60
Service Class
10/1/04 through 3/31/058 $ 9.74 $ 0.21 $ (0.05) $ (0.17) $ 9.73
9/30/04 9.78 0.437 ( 0.08) ( 0.39) 9.74
9/30/03 9.99 0.45 ( 0.19) ( 0.47) 9.78
9/30/02 9.95 0.46 0.06 ( 0.48) 9.99
9/30/01 9.60 0.47 0.35 ( 0.47) 9.95
9/30/00 9.63 0.44 ( 0.04) ( 0.43) 9.60
Investor A Class
10/1/04 through 3/31/058 $ 9.73 $ 0.21 $ (0.05) $ (0.16) $ 9.73
9/30/04 9.77 0.417 ( 0.07) ( 0.38) 9.73
9/30/03 9.99 0.44 ( 0.20) ( 0.46) 9.77
9/30/02 9.94 0.44 0.07 ( 0.46) 9.99
9/30/01 9.60 0.45 0.34 ( 0.45) 9.94
9/30/00 9.63 0.44 ( 0.05) ( 0.42) 9.60
Investor B Class
10/1/04 through 3/31/058 $ 9.73 $ 0.17 $ (0.04) $ (0.13) $ 9.73
9/30/04 9.77 0.337 ( 0.07) ( 0.30) 9.73
9/30/03 9.99 0.36 ( 0.20) ( 0.38) 9.77
9/30/02 9.94 0.37 0.07 ( 0.39) 9.99
9/30/01 9.60 0.37 0.35 ( 0.38) 9.94
9/30/00 9.63 0.37 ( 0.05) ( 0.35) 9.60
Investor C Class
10/1/04 through 3/31/058 $ 9.76 $ 0.18 $ (0.06) $ (0.13) $ 9.75
9/30/04 9.79 0.337 ( 0.06) ( 0.30) 9.76
9/30/03 10.02 0.36 ( 0.21) ( 0.38) 9.79
9/30/02 9.97 0.37 0.07 ( 0.39) 10.02
9/30/01 9.62 0.37 0.36 ( 0.38) 9.97
9/30/00 9.63 0.41 ( 0.07) ( 0.35) 9.62
1 Commencement of operations of share class.
2 Annualized.
3 Sales load not reflected in total return.
4 Contingent deferred sales load not reflected in total return.
5 There were no Investor C shares outstanding as of September 30, 2000.
6 There were no Service shares outstanding as of September 30, 2002.
7 Calculated using the average shares outstanding method.
8 Unaudited.
SEE ACCOMPANYING NOTES TO FINANCIAL STATEMENTS.
48
BLACKROCK FUNDS
RATIO OF NET
NET RATIO OF INVESTMENT INCOME
ASSETS RATIO OF NET TOTAL EXPENSES TO RATIO OF NET TO AVERAGE
END OF EXPENSES TO AVERAGE NET ASSETS INVESTMENT INCOME NET ASSETS PORTFOLIO
TOTAL PERIOD AVERAGE NET (EXCLUDING TO AVERAGE NET (EXCLUDING TURNOVER
RETURN (000) ASSETS WAIVERS) ASSETS WAIVERS) RATE
=============== =========== ============== ==================== =================== ================== ==========
1.87 % $ 73,588 0.70%2 0.89%2 4.71%2 4.52%2 4%
4.01 78,549 0.70 0.89 4.61 4.42 8
2.95 115,104 0.70 0.88 4.94 4.76 37
5.82 135,938 0.70 0.87 4.99 4.81 12
8.91 146,620 0.70 0.86 5.09 4.93 32
4.66 150,646 0.70 0.88 5.06 4.88 55
1.61 % $ 240 1.00%2 1.14%2 4.41%2 4.26%2 4%
3.69 247 1.00 1.17 4.40 4.22 8
2.74 103 1.00 1.18 4.57 4.39 37
5.40 92 1.00 1.17 4.69 4.52 12
8.69 91 1.00 1.16 4.79 4.63 32
4.35 88 1.00 1.18 4.76 4.58 55
1.67%3 $ 5,545 1.09%2 1.25%2 4.33%2 4.17%2 4%
3.533 5,482 1.15 1.36 4.19 3.97 8
2.463 4,701 1.17 1.35 4.42 4.24 37
5.333 3,612 1.18 1.35 4.52 4.35 12
8.403 3,214 1.17 1.33 4.64 4.47 32
4.173 3,686 1.17 1.35 4.63 4.45 55
1.29%4 $ 3,958 1.84%2 1.89%2 3.57%2 3.51%2 4%
2.764 3,897 1.89 2.02 3.44 3.31 8
1.704 3,795 1.92 2.09 3.64 3.46 37
4.554 2,311 1.91 2.08 3.71 3.54 12
7.604 978 1.89 2.05 3.79 3.62 32
3.404 279 1.92 2.10 3.86 3.68 55
1.19%4 $ 1,391 1.84%2 1.90%2 3.57%2 3.51%2 4%
2.864 1,399 1.88 2.00 3.43 3.31 8
1.594 1,179 1.92 2.10 3.69 3.50 37
4.534 1,036 1.90 2.08 3.61 3.44 12
7.694 236 1.91 2.07 3.75 3.57 32
3.614 69 1.92 2.10 3.78 3.60 55
49
BLACKROCK FUNDS
NOTES TO FINANCIAL STATEMENTS (Unaudited)
(A) Organization
BlackRock FundsSM (the "Fund") was organized on December 22, 1988, as a
Massachusetts business trust and is registered under the Investment Company Act
of 1940, as amended, as an open-end management investment company. The Fund
currently has 50 registered portfolios, seven of which are included in these
financial statements (the "Portfolios"). Each Portfolio is authorized to issue
an unlimited number of shares with a par value of $0.001. Each portfolio of the
Fund may offer as many as seven classes of shares. Shares of all classes of a
Portfolio represent equal pro rata interests in such Portfolio, except that
each class bears different expenses which reflect the difference in the range
of services provided to them, mostly due to differences in distribution and
service fees.
Under the Fund's organizational documents, its officers and trustees are
indemnified against certain liabilities arising out of the performance of their
duties to the Fund. In addition, in the normal course of business, the Fund
enters into contracts with its vendors and others that provide for general
indemnifications. The Fund's maximum exposure under these arrangements is
unknown as this would involve future claims that may be made against the Fund.
However, based on experience, the Fund considers the risk of loss from such
claims to be remote.
(B) Summary of Significant Accounting Policies
The following is a summary of significant accounting policies followed by
the Fund in the preparation of its financial statements.
Investment Valuation - Valuation of investments held by each Bond
Portfolio is as follows: fixed income investments are valued by using market
quotations or prices provided by market makers; a portion of the fixed income
investments are valued utilizing one or more pricing services approved by the
Board of Trustees; an option or futures contract is valued at the last sales
price prior to 4:00 p.m. (Eastern time), as quoted on the principal exchange or
board of trade on which such option or futures contract is traded, or in the
absence of a sale, the mean between the last bid and asked prices prior to 4:00
p.m. (Eastern time); the amortized cost method of valuation will be used with
respect to debt obligations with sixty days or less remaining to maturity
unless the investment adviser and/or sub-adviser under the supervision of the
Board of Trustees determines that such method does not represent fair value. In
the event that application of these methods of valuation results in a price for
an investment which is deemed not to be representative of the market value of
such investment, the investment will be valued by, under the direction of or in
accordance with a method approved by the Board of Trustees as reflecting fair
value ("Fair Value Assets"). The investment adviser and/or sub-adviser will
submit its recommendations regarding the valuation and/or valuation
methodologies for Fair Value Assets to a valuation committee. Such valuation
committee may accept, modify or reject any recommendations. The pricing of all
Fair Value Assets shall be subsequently reported to and ratified by the Board
of Trustees.
When determining the price for a Fair Value Asset, the investment adviser
and/or sub-adviser shall seek to determine the price that the Portfolio might
reasonably expect to receive from the current sale of that asset in an
arm's-length transaction. Fair value determinations shall be based upon all
available factors that BlackRock deems relevant.
Dividends to Shareholders - Dividends from net investment income are
declared by each Portfolio each day on "settled" shares (i.e. shares for which
the particular Portfolio has received payment) and are paid monthly. Over the
course of a year, substantially all of each Portfolio's net investment income
will be declared as dividends. The amount of the daily dividend for each
Portfolio will be based on periodic projections of its net investment income.
Net realized capital gains, if any, are distributed at least annually.
Swap Agreements - The Portfolios may invest in swap agreements for the
purpose of hedging against changes in interest rates. Swap agreements involve
the exchange by the Portfolios with another party of their respective
commitments to pay or receive interest (e.g., an exchange of floating rate
payments for fixed rate payments) with respect to a notional amount of
principal. Swaps are marked to market daily based upon quotations from market
makers and the change, if any, is recorded as an unrealized gain or loss in the
Statements of Operations. Net payments of interest are recorded as interest
income. Entering into these agreements involves, to varying degrees, elements
of credit and market risk in excess of the amounts recognized on the Statements
of Net Assets. Such risks involve the possibility that there will be no liquid
market for these agreements, that the counter-party to the agreement may
default on its obligation to perform and that there may be unfavorable change
in the fluctuation of interest and/or exchange rates. There were no swap
agreements held by the Portfolios at March 31, 2005.
The Fund has reclassified periodic payments made under interest rate swap
agreements, previously included within interest income, as a component of
realized gain (loss) in the Statement of Operations. For consistency, similar
reclassifications
50
BLACKROCK FUNDS
have been made to amounts appearing in the per share amounts in prior year
financial highlights. Prior year net investment income ratios in the financial
highlights have also been modified accordingly. This reclassification had no
effect on the Portfolio's net asset value, either in total or per share, or
their total increase (decrease) in net assets from operations during any
period.
As a result of recent changes in GAAP, the Portfolio's have reclassified
periodic payments made under interest rate swap agreements, previously included
within interest income, as a component of realized gain (loss) in the Statement
of Operations. The effects of these reclassifications are as follows:
TAX-FREE INCOME
---------------------------------------------------------------
INSTITUTIONAL SERVICE INVESTOR A INVESTOR B INVESTOR C
--------------- --------- ------------ ------------ -----------
Net Investment Income Ratio .......
9/30/2002 ........................ 0.08% 0.07% 0.07% 0.07% 0.07%
Net Investment Income per Share....
9/30/2002 ........................ $ 0.00 $ 0.01 $ 0.00 $ 0.00 $ 0.00
PENNSYLVANIA TAX-FREE INCOME
---------------------------------------------------------------
INSTITUTIONAL SERVICE INVESTOR A INVESTOR B INVESTOR C
--------------- --------- ------------ ------------ -----------
Net Investment Income Ratio .......
9/30/2002 ........................ 0.06% 0.06% 0.06% 0.07% 0.07%
Net Investment Income per Share....
9/30/2002 ........................ $ 0.00 $ 0.00 $ 0.00 $ 0.00 $ 0.01
NEW JERSEY TAX-FREE INCOME
---------------------------------------------------------------
INSTITUTIONAL SERVICE INVESTOR A INVESTOR B INVESTOR C
--------------- --------- ------------ ------------ -----------
Net Investment Income Ratio .......
9/30/2002 ........................ 0.06% 0.05% 0.05% 0.05% 0.05%
Net Investment Income per Share....
9/30/2002 ........................ $ 0.01 $ 0.01 $ 0.01 $ 0.01 $ 0.01
OHIO TAX-FREE INCOME
---------------------------------------------------------------
INSTITUTIONAL SERVICE INVESTOR A INVESTOR B INVESTOR C
--------------- --------- ------------ ------------ -----------
Net Investment Income Ratio .......
9/30/2002 ........................ 0.04% 0.05% 0.05% 0.05% 0.05%
Net Investment Income per Share....
9/30/2002 ........................ $ 0.00 $ 0.01 $ 0.00 $ 0.01 $ 0.01
DELAWARE TAX-FREE INCOME
---------------------------------------------------------------
INSTITUTIONAL SERVICE INVESTOR A INVESTOR B INVESTOR C
--------------- --------- ------------ ------------ -----------
Net Investment Income Ratio .......
9/30/2002 ........................ 0.06% 0.06% 0.05% 0.06% 0.05%
Net Investment Income per Share....
9/30/2002 ........................ $ 0.00 $ 0.00 $ 0.01 $ 0.01 $ 0.00
KENTUCKY TAX-FREE INCOME
---------------------------------------------------------------
INSTITUTIONAL SERVICE INVESTOR A INVESTOR B INVESTOR C
--------------- --------- ------------ ------------ -----------
Net Investment Income Ratio .......
9/30/2002 ........................ 0.05% 0.06% 0.06% 0.06% 0.06%
Net Investment Income per Share....
9/30/2002 ........................ $ 0.00 $ 0.00 $ 0.00 $ 0.01 $ 0.01
Investment Transactions and Investment Income - Investment transactions
are accounted for on the trade date. The cost of investments sold and the
related gain or loss is determined by use of the specific identification method
for both financial reporting and federal income tax purposes. Interest income
is recorded on the accrual basis. Discounts
51
BLACKROCK FUNDS
NOTES TO FINANCIAL STATEMENTS (Unaudited) (CONTINUED)
and premiums on debt securities are amortized for book and tax purposes using
the effective yield-to-maturity method over the term of the instrument.
Futures Transactions - The Portfolios may invest in financial futures
contracts for the purpose of hedging their existing portfolio securities, or
securities that the Portfolios intend to purchase, against fluctuations in
value caused by changes in prevailing market interest rates. Upon entering into
a futures contract, a Portfolio is required to deposit cash or pledge
securities as initial margin. Subsequent payments, which are dependent on the
daily fluctuations in the value of the underlying security or securities, are
made or received by the Portfolio each day (daily variation margin) and are
recorded as unrealized gains or losses until the contracts are closed. When the
contracts are closed, the Portfolio records a realized gain or loss equal to
the difference between the proceeds from (or cost of) the closing transaction
and the Portfolio's basis in the contracts. Risks of entering into futures
contracts include the possibility that there will not be a perfect price
correlation between the futures contracts and the underlying securities.
Second, it is possible that a lack of liquidity for futures contracts could
exist in the market, resulting in an inability to liquidate a futures position
prior to its maturity date. Third, the purchase of a futures contract involves
the risk that a Portfolio could lose more than the original margin deposit
required to initiate a futures transaction.
Tender Option Bonds - A tender option bond is a synthetic floating or
variable rate security issued when long term bonds are purchased in the primary
or secondary market and are then deposited into a trust. Custodial receipts are
then issued to investors, such as the Portfolio, evidencing ownership interests
in the trust. The remarketing agent for the trust sets a floating or variable
rate on typically a weekly basis. Tender option bonds may be considered to be
derivatives. Derivatives involve special risks, including possible default by
the other party to the transaction, illiquidity and, to the extent the
adviser's view as to certain market movements is incorrect, the risk that the
use of derivatives could result in significantly greater losses than if they
had not been used.
Option Writing/Purchasing - The Portfolios may write or purchase financial
options contracts for the purpose of hedging or earning additional income,
which may be deemed speculative. When the Portfolios write or purchase an
option, an amount equal to the premium received or paid by the Portfolios is
recorded as a liability or an asset and is subsequently adjusted to the current
market value of the option written or purchased. Premiums received or paid from
writing or purchasing options which expire unexercised are treated by the
Portfolios on the expiration date as realized gains or losses. The difference
between the premium and the amount paid or received on effecting a closing
purchase or sale transaction, including brokerage commissions, is also treated
as a realized gain or loss. If an option is exercised, the premium paid or
received is added to the cost of the purchase or proceeds from the sale in
determining whether the Portfolios have realized a gain or a loss on investment
transactions. The Portfolios, as writers of options, may have no control over
whether the underlying securities may be sold (call) or purchased (put) and as
a result bear the market risk of unfavorable change in the price of the
security underlying the written options. There were no options held by the
Portfolios at March 31, 2005.
Estimates - The preparation of financial statements in conformity with
accounting principles generally accepted in the United States of America
("generally accepted accounting principles") requires the use of management
estimates. Actual results could differ from these estimates.
Other - Expenses that are directly related to one of the Portfolios are
charged directly to that Portfolio. Other operating expenses are prorated to
the Portfolios on the basis of relative net assets. Class-specific expenses are
borne by that class. Differences in net expense ratios between classes of a
Portfolio are due to class-specific expenses, waivers and accrual adjustments.
Income, other expenses and realized and unrealized gains and losses of a
Portfolio are allocated to the respective class on the basis of the relative
net assets each day.
52
BLACKROCK FUNDS
The following table provides a list of the Portfolios included in this
report along with a summary of their respective class-specific fee arrangements
as provided under the Fund's Amended and Restated Distribution and Service Plan
(the "Plan"). Fees are expressed as a percentage of average daily net asset
values of the respective classes.
Class-Specific Fee Arrangements
Portfolio Share Classes
BlackRock Institutional Service
Contractual Actual Contractual Actual Contractual Actual
Fees Fees(4) Fees Fees(4) Fees(1) Fees(4)
UltraShort Municipal None None None None 0.25% 0.25%
Tax-Free Income None None None None 0.25% 0.25%
Pennsylvania Tax-Free Income N/A N/A None None 0.25% 0.25%
New Jersey Tax-Free Income N/A N/A None None 0.25% 0.25%
Ohio Tax-Free Income N/A N/A None None 0.25% 0.25%
Delaware Tax-Free Income N/A N/A None None 0.25% N/A
Kentucky Tax-Free Income N/A N/A None None 0.25% 0.25%
Portfolio Share Classes
Investor A Investor B Investor C
Contractual Actual Contractual Actual Contractual Actual
Fees(2) Fees(4) Fees(3) Fees(4) Fees(3) Fees(4)
UltraShort Municipal 0.35% 0.25% N/A N/A N/A N/A
Tax-Free Income 0.35% 0.25% 1.00% 1.00% 1.00% 1.00%
Pennsylvania Tax-Free Income 0.35% 0.25% 1.00% 1.00% 1.00% 1.00%
New Jersey Tax-Free Income 0.35% 0.25% 1.00% 1.00% 1.00% 1.00%
Ohio Tax-Free Income 0.35% 0.25% 1.00% 1.00% 1.00% 1.00%
Delaware Tax-Free Income 0.35% 0.25% 1.00% 1.00% 1.00% 1.00%
Kentucky Tax-Free Income 0.35% 0.25% 1.00% 1.00% 1.00% 1.00%
(1) - The maximum annual contractual fees are comprised of a .25% service fee.
(2) - The maximum annual contractual fees are comprised of a .10% distribution
fee and a .25% service fee.
(3) - The maximum annual contractual fees are comprised of a .75% distribution
fee and a .25% service fee.
(4) - The actual fees are as of March 31, 2005.
The BlackRock share class bears a Transfer Agent fee at an annual rate not
to exceed .005% of its average daily net assets plus per account fees and
disbursements, and each of the Institutional, Service, Investor A, Investor B
and Investor C share classes bear a Tranfer Agent fee at an annual rate not to
exceed .018% of the average daily net assets of such respective classes plus
per account fees and disbursements.
For the six months ended March 31, 2005, the following shows the various
types of class-specific expenses borne directly by each class of each Portfolio
and any associated waivers of those expenses.
SHARE CLASSES
ADMINISTRATION FEES ----------------------------------------------------------------------------
BLACKROCK INSTITUTIONAL SERVICE INVESTOR A INVESTOR B INVESTOR C TOTAL
----------- --------------- --------- ------------ ------------ ------------ ----------
UltraShort Municipal ................. $ 5,736 $ 9,856 $ - $ - $ - $ - $15,592
Tax-Free Income ...................... 17,944 222,146 1,872 5,706 3,926 1,781 253,375
Pennsylvania Tax-Free Income ......... - 445,177 3,897 23,968 13,174 1,347 487,563
New Jersey Tax-Free Income ........... - 108,791 11,519 4,468 8,441 2,345 135,564
Ohio Tax-Free Income ................. - 71,617 517 3,997 7,378 4,325 87,834
Delaware Tax-Free Income ............. - 41,070 - 9,579 6,151 10,304 67,104
Kentucky Tax-Free Income ............. - 54,369 174 3,925 2,860 1,047 62,375
53
BLACKROCK FUNDS
NOTES TO FINANCIAL STATEMENTS (Unaudited) (CONTINUED)
SHARE CLASSES
ADMINISTRATION FEES WAIVED --------------------------------------------------------------------------------
BLACKROCK INSTITUTIONAL SERVICE INVESTOR A INVESTOR B INVESTOR C
------------- --------------- ----------- ------------ ------------ ------------
UltraShort Municipal ................. $ (5,736) $ (3,743) $ - $- $- $-
Tax-Free Income ...................... (17,944) (12,089) - - - -
Pennsylvania Tax-Free Income ......... - (445,176) (3,666) - - -
New Jersey Tax-Free Income ........... - (108,791) (7,525) - - -
Ohio Tax-Free Income ................. - (71,615) (337) - - -
Delaware Tax-Free Income ............. - (41,068) - - - -
Kentucky Tax-Free Income ............. - (51,578) (105) - - -
ADMINISTRATION FEES WAIVED
TOTAL
-------------
UltraShort Municipal ................. $ (9,479)
Tax-Free Income ...................... (30,033)
Pennsylvania Tax-Free Income ......... (448,842)
New Jersey Tax-Free Income ........... (116,316)
Ohio Tax-Free Income ................. (71,952)
Delaware Tax-Free Income ............. (41,068)
Kentucky Tax-Free Income ............. (51,683)
SHARE CLASSES
TRANSFER AGENT FEES ----------------------------------------------------------------------------
BLACKROCK INSTITUTIONAL SERVICE INVESTOR A INVESTOR B INVESTOR C TOTAL
----------- --------------- --------- ------------ ------------ ------------ ----------
UltraShort Municipal ................. $ 819 $ 1,224 $ - $ - $ - $ - $ 2,043
Tax-Free Income ...................... 2,563 27,578 232 708 487 221 31,789
Pennsylvania Tax-Free Income ......... - 56,033 484 2,975 1,635 167 61,294
New Jersey Tax-Free Income ........... - 13,505 1,430 555 1,048 291 16,829
Ohio Tax-Free Income ................. - 8,890 65 496 916 537 10,904
Delaware Tax-Free Income ............. - 5,098 - 1,189 764 1,279 8,330
Kentucky Tax-Free Income ............. - 6,749 22 487 355 130 7,743
SHARE CLASSES
SHAREHOLDER SERVICE FEES ------------------------------------------------------
SERVICE INVESTOR A INVESTOR B INVESTOR C TOTAL
--------- ------------ ------------ ------------ -----------
Tax-Free Income ...................... $ 3,228 $ 9,838 $ 6,769 $ 3,071 $ 22,906
Pennsylvania Tax-Free Income ......... 7,794 41,325 22,714 2,322 74,155
New Jersey Tax-Free Income ........... 19,839 7,613 14,555 4,043 46,050
Ohio Tax-Free Income ................. 891 6,892 12,720 7,457 27,960
Delaware Tax-Free Income ............. - 16,024 10,513 17,766 44,303
Kentucky Tax-Free Income ............. 300 6,767 4,931 1,805 13,803
SHARE CLASSES
DISTRIBUTION FEES ------------------------------------------
INVESTOR A INVESTOR B INVESTOR C TOTAL
------------ ------------ ------------ -----------
Tax-Free Income ...................... $ 3,931 $ 20,307 $ 9,213 $ 33,451
Pennsylvania Tax-Free Income ......... 16,502 68,141 6,966 91,609
New Jersey Tax-Free Income ........... 3,081 43,662 12,130 58,873
Ohio Tax-Free Income ................. 2,772 38,160 22,372 63,304
Delaware Tax-Free Income ............. 6,623 31,815 53,297 91,735
Kentucky Tax-Free Income ............. 2,705 14,794 5,417 22,916
SHARE CLASS
DISTRIBUTION FEES WAIVED -------------
INVESTOR A TOTAL
------------- -------------
Tax-Free Income ...................... $ (3,931) $ (3,931)
Pennsylvania Tax-Free Income ......... (16,502) (16,502)
New Jersey Tax-Free Income ........... (3,080) (3,080)
Ohio Tax-Free Income ................. (2,772) (2,772)
Delaware Tax-Free Income ............. (6,623) (6,623)
Kentucky Tax-Free Income ............. (2,705) (2,705)
54
BLACKROCK FUNDS
(C) Transactions with Affiliates and Related Parties
Pursuant to an Investment Advisory Agreement, BlackRock Advisors, Inc.
("BlackRock"), a wholly-owned subsidiary of BlackRock, Inc., serves as
investment adviser to the Portfolios. BlackRock Financial Management, Inc.
("BFM"), a wholly-owned subsidiary of BlackRock, serves as sub-adviser for all
of the Portfolios. BlackRock, Inc. is an indirect majority-owned subsidiary of
The PNC Financial Services Group, Inc.
For its advisory services, BlackRock is entitled to receive fees, computed
daily and payable monthly, at the following annual rates, based on each
Portfolio's average daily net assets:
TAX-FREE INCOME, PENNSYLVANIA DELAWARE TAX-FREE
TAX-FREE INCOME, NEW JERSEY TAX-FREE INCOME INCOME AND KENTUCKY
AND OHIO TAX-FREE INCOME PORTFOLIOS TAX-FREE INCOME PORTFOLIOS
--------------------------------------------- ---------------------------
INVESTMENT INVESTMENT
AVERAGE DAILY NET ASSETS ADVISORY FEE ADVISORY FEE
- ------------------------------- --------------------------------------------- ---------------------------
first $1 billion .500% .550%
$1 billion - $2 billion .450 .500
$2 billion - $3 billion .425 .475
greater than $3 billion .400 .450
The investment advisory fee for the UltraShort Municipal Portfolio is
..45%.
For the six months ended March 31, 2005, advisory fees and waivers for
each Portfolio were as follows:
GROSS NET
ADVISORY ADVISORY
FEE WAIVER FEE
------------ ----------- ------------
UltraShort Municipal ................. $ 104,348 $ 90,961 $ 13,387
Tax-Free Income ...................... 1,068,021 484,016 584,005
Pennsylvania Tax-Free Income ......... 1,702,354 256,331 1,446,023
New Jersey Tax-Free Income ........... 467,400 95,276 372,124
Ohio Tax-Free Income ................. 303,006 63,841 239,165
Delaware Tax-Free Income ............. 254,544 34,473 220,071
Kentucky Tax-Free Income ............. 236,581 24,449 212,132
In the interest of limiting the expenses of the Portfolios, BlackRock and
the Fund have entered into a series of annual expense limitation agreements.
The agreements set a limit on certain operating expenses of each Portfolio for
the next year and requires BlackRock to waive or reimburse fees or expenses if
these operating expenses exceed that limit. These expense limits apply to the
aggregate expenses incurred on a share class (excluding: interest, taxes,
brokerage commissions, other expenditures which are capitalized in accordance
with generally accepted accounting principles and other extraordinary
expenses).
Effective February 1, 2005, BlackRock and BFM has contractually agreed to
waive or reimburse fees or expenses in order to limit expenses:
SHARE CLASSES
PORTFOLIO ---------------------------------------------------------------------------
BLACKROCK INSTITUTIONAL SERVICE INVESTOR A INVESTOR B INVESTOR C
----------- --------------- --------- ------------ ------------ -----------
UltraShort Municipal ................. 0.35% 0.45% 0.75% 0.80% NA NA
Tax-Free Income ...................... 0.45% 0.60% 0.90% 1.07% 1.82% 1.82%
Pennsylvania Tax-Free Income ......... NA 0.60% 0.90% 1.07% 1.82% 1.82%
New Jersey Tax-Free Income ........... NA 0.60% 0.90% 1.07% 1.82% 1.82%
Ohio Tax-Free Income ................. NA 0.60% 0.90% 1.07% 1.82% 1.82%
Delaware Tax-Free Income ............. NA 0.70% NA 1.17% 1.92% 1.92%
Kentucky Tax-Free Income ............. NA 0.70% 1.00% 1.17% 1.92% 1.92%
If in the following two years the operating expenses of a share class that
previously received a waiver or reimbursement from BlackRock are less than the
expense limit for that share class, the share class is required to repay
BlackRock up to the amount of fees waived or expenses reimbursed under the
agreement if: (1) the Portfolio of which
55
BLACKROCK FUNDS
NOTES TO FINANCIAL STATEMENTS (Unaudited) (CONTINUED)
the share class is a part has more than $50 million in assets, (2) BlackRock
continues to be the Portfolio's investment adviser and (3) the Board of
Trustees of the Fund has approved the payments to BlackRock at the previous
quarterly meeting.
At March 31, 2005, the amounts subject to possible future reimbursement
under the expense limitation agreement are as follows:
EXPIRING EXPIRING EXPIRING TOTAL WAIVERS SUBJECT
JANAURY 31, 2006 JANUARY 31, 2007 JANUARY 31, 2008 TO REIMBURSEMENT
------------------ ------------------ ------------------ ----------------------
UltraShort Municipal ................. $ - $ 269,648 $ 31,213 $ 300,861
Tax-Free Income ...................... 623,251 983,261 158,263 1,764,775
Pennsylvania Tax-Free Income ......... 1,383,044 1,357,799 218,649 2,959,492
New Jersey Tax-Free Income ........... 278,302 406,182 64,114 748,598
Ohio Tax-Free Income ................. 174,280 259,460 39,609 473,349
Delaware Tax-Free Income ............. 91,563 138,239 17,314 247,116
Kentucky Tax-Free Income ............. 138,922 171,865 26,359 337,146
BlackRock pays BFM fees for its sub-advisory services.
PFPC Inc. ("PFPC"), an indirect wholly-owned subsidiary of The PNC
Financial Services Group, Inc., and BlackRock act as co-administrators for the
Fund. For these services, the co-administrators receive a combined
administration fee computed daily and payable monthly, based on a percentage of
the average daily net assets of each Portfolio, at the following annual rates:
..085% of the first $500 million, .075% of the next $500 million and .065% of
assets in excess of $1 billion. In addition, each of the classes, with the
exception of the BlackRock Class, is charged an administration fee based on the
following percentage of average daily net assets of each respective class:
..145% of the first $500 million, .135% of the next $500 million and .125% of
assets in excess of $1 billion. The BlackRock Class is charged an
administration fee based on the following percentage of average daily net
assets: .035% of the first $500 million, .025% of the next $500 million and
..015% of assets in excess of $1 billion. In addition, PFPC and BlackRock may
have, at their discretion, voluntarily waived all or any portion of their
administration fees for any Portfolio or share class.
For the six months ended March 31, 2005, administration fees and waivers
for each Portfolio were as follows:
GROSS NET
ADMINISTRATION ADMINISTRATION
FEE WAIVER FEE
---------------- ---------- ---------------
UltraShort Municipal ................. $ 35,302 $ 9,479 $ 25,823
Tax-Free Income ...................... 434,939 29,986 404,953
Pennsylvania Tax-Free Income ......... 767,848 448,842 319,006
New Jersey Tax-Free Income ........... 215,022 116,316 98,706
Ohio Tax-Free Income ................. 139,345 71,952 67,393
Delaware Tax-Free Income ............. 106,443 41,068 65,375
Kentucky Tax-Free Income ............. 98,937 51,683 47,254
PFPC Trust Co., an indirect subsidiary of The PNC Financial Services
Group, Inc., serves as custodian for each of the Fund's Portfolios. PFPC serves
as transfer and dividend disbursing agent.
Pursuant to the Fund's Amended and Restated Distribution and Service Plan
(the "Plan"), the Fund may pay BlackRock Distributors, Inc. (the "Distributor")
and/or BlackRock or any other affiliate of PNC Financial Services Group, Inc.
fees for distribution and sales support services. Currently, only Investor A
Shares, Investor B Shares, and Investor C Shares bear the expense of
distribution fees under the Plan. In addition, the Fund may pay brokers,
dealers, financial institutions and industry professionals (including PNC
Financial Services Group, Inc. and its affiliates) ("service organizations")
fees for the provision of personal services to shareholders. BlackRock may
receive some of the service fees paid by the Fund in return for providing
services to shareholders. Currently, only Investor A Shares, Investor B Shares,
Investor C Shares and Service Shares bear the expense of service fees under the
Plan.
56
BLACKROCK FUNDS
As of March 31, 2005, affiliated payables were as follows:
PNC BANK
PFPC(1) BLACKROCK(2) AFFILIATES(3)
--------- -------------- --------------
UltraShort Municipal ................. $ 5,818 $ 1,499 $ -
Tax-Free Income ...................... 60,165 145,852 8,492
Pennsylvania Tax-Free Income ......... 98,456 263,786 23,929
New Jersey Tax-Free Income ........... 32,808 68,882 17,100
Ohio Tax-Free Income ................. 18,319 48,762 15,461
Delaware Tax-Free Income ............. 14,631 45,737 22,003
Kentucky Tax-Free Income ............. 13,907 37,147 5,774
(1) - Payables to PFPC and PFPC Trust Co. are for Accounting, Administration,
Custody and Transfer Agent services provided as of March 31, 2005,
including accruals from February 2005 for the Transfer Agent.
(2) - Payables to BlackRock are for Advisory and Administration services
provided as of March 31, 2005.
(3) - Payables to PNC Financial Services Group, Inc. affiliates are for
distribution and sales support services as described under the Plan. The
total payable on behalf of the Fund, as of March 31, 2005, was $5,561,651,
a portion of which is paid to service organizations, including other PNC
Financial Services Group, Inc. affiliates.
(D) Purchases and Sales of Securities
For the six months ended March 31, 2005, purchases and sales of
securities, other than short-term and U.S. government securities, were as
follows:
PURCHASES SALES
--------------- --------------
UltraShort Municipal ................. $ 11,713,590 $ 6,948,270
Tax-Free Income ...................... 164,173,603 187,129,292
Pennsylvania Tax-Free Income ......... 19,858,272 25,647,266
New Jersey Tax-Free Income ........... 14,695,330 9,595,330
Ohio Tax-Free Income ................. 7,301,575 274,500
Delaware Tax-Free Income ............. 4,806,120 910,000
Kentucky Tax-Free Income ............. 3,604,330 9,648,612
57
BLACKROCK FUNDS
NOTES TO FINANCIAL STATEMENTS (Unaudited) (CONTINUED)
(E) Capital Shares
Transactions in capital shares for each period were as follows:
ULTRASHORT MUNICIPAL
------------------------------------------------------------------------
FOR THE SIX MONTHS ENDED FOR THE PERIOD 3/3/041
3/31/05 THROUGH 9/30/04
----------------------------------- ----------------------------------
SHARES VALUE SHARES VALUE
--------------- ----------------- --------------- ----------------
Shares sold:
BlackRock Class ......................... 1,219,826 $ 12,159,683 4,724,012 $ 47,096,1622
Institutional Class ..................... 213,917 2,125,447 2,199,629 21,849,294
Service Class ........................... - - 10 100
Investor A Class ........................ - - 10 100
Shares issued in reinvestment of dividends:
BlackRock Class ......................... 27,998 248,600 14,923 148,416
Institutional Class ..................... 651 6,467 - -
Shares redeemed:
BlackRock Class ......................... (1,795,881) (17,855,375) (1,519,207) (15,113,395)
Institutional Class ..................... (582,835) (5,789,954) (773,181) (7,676,565)
---------- ------------- ---------- -------------
Net increase (decrease) ................... (916,324) $ (9,105,132) 4,646,196 $ 46,304,112
========== ============= ========== =============
TAX-FREE INCOME
------------------------------------------------------------------------
FOR THE SIX MONTHS ENDED FOR THE YEAR ENDED
3/31/05 9/30/04
---------------------------------- -----------------------------------
SHARES VALUE SHARES VALUE
--------------- ---------------- --------------- -----------------
Shares sold:
BlackRock Class ......................... 201,473 $ 2,251,345 9,128,740 $ 102,454,0563
Institutional Class ..................... 1,965,508 21,892,363 5,197,884 58,332,260
Service Class ........................... 8,148 90,932 12,138 134,680
Investor A Class ........................ 179,629 1,998,611 90,300 1,006,406
Investor B Class ........................ 17,005 189,407 85,989 957,137
Investor C Class ........................ 33,334 370,945 203,583 2,287,251
Shares issued in reinvestment of dividends:
BlackRock Class ......................... 196,762 2,191,549 295,571 3,273,698
Institutional Class ..................... 7,286 81,165 22,060 245,557
Service Class ........................... 2,903 32,316 7,420 82,417
Investor A Class ........................ 8,461 94,301 20,632 229,513
Investor B Class ........................ 3,248 36,188 9,385 104,430
Investor C Class ........................ 1,728 19,258 5,870 65,165
Shares redeemed:
BlackRock Class ......................... (128,787) (1,435,346) (376,828) (4,117,585)
Institutional Class ..................... (2,318,129) (25,856,252) (7,311,723) (81,231,082)
Service Class ........................... (32,148) (358,049) (41,170) (456,705)
Investor A Class ........................ (93,345) (1,040,139) (181,146) (2,006,621)
Investor B Class ........................ (93,295) (1,039,649) (205,514) (2,279,774)
Investor C Class ........................ (87,836) (980,772) (175,171) (1,943,626)
---------- ------------- ---------- --------------
Net increase (decrease) ................... (128,055) $ (1,461,827) 6,788,020 $ 77,137,177
========== ============= ========== ==============
1 Commencement of operations.
2 Includes 2,690,750 shares issued in exchange for cash and securities
transferred in-kind with a value of $26,907,505.
3 Includes 8,342,920 shares issued in exchange for cash and securities
transferred in-kind with a value of $93,607,559.
58
BLACKROCK FUNDS
PENNSYLVANIA TAX-FREE INCOME
-----------------------------------------------------------------------------
FOR THE SIX MONTHS ENDED FOR THE YEAR ENDED
3/31/05 9/30/04
------------------------------------ --------------------------------------
SHARES VALUE SHARES VALUE
--------------- ------------------ ---------------- -------------------
Shares sold:
Institutional Class .................... 3,704,666 $ 39,496,099 3,393,820 $ 36,620,210
Service Class .......................... 8,070 85,973 121,865 1,314,949
Investor A Class ....................... 184,272 1,963,128 404,459 4,358,919
Investor B Class ....................... 18,873 200,013 82,825 888,178
Investor C Class ....................... 2,050 21,732 81,677 882,020
Shares issued in reinvestment of dividends:
Institutional Class .................... 43,749 465,468 15,321 164,756
Service Class .......................... 7,195 76,536 14,290 153,757
Investor A Class ....................... 53,252 566,615 92,369 994,378
Investor B Class ....................... 24,197 255,833 47,030 502,847
Investor C Class ....................... 1,896 20,100 4,685 50,309
Shares redeemed:
Institutional Class .................... (4,468,471) (47,584,902) (13,577,018) (145,736,580)
Service Class .......................... (69,120) (736,927) (160,769) (1,734,866)
Investor A Class ....................... (341,817) (3,640,831) (627,889) (6,748,260)
Investor B Class ....................... (300,251) (3,178,485) (574,808) (6,142,499)
Investor C Class ....................... (13,611) (144,557) (88,192) (938,115)
---------- -------------- ----------- ---------------
Net decrease .............................. (1,145,050) $ (12,134,205) (10,770,335) $ (115,369,997)
========== ============== =========== ===============
NEW JERSEY TAX-FREE INCOME
-----------------------------------------------------------------------
FOR THE SIX MONTHS ENDED FOR THE YEAR ENDED
3/31/05 9/30/04
----------------------------------- ---------------------------------
SHARES VALUE SHARES VALUE
--------------- ----------------- --------------- ---------------
Shares sold:
Institutional Class .................... 870,810 $ 10,205,566 7,071,031 $ 83,943,469
Service Class .......................... 13,971 164,051 36,098 424,155
Investor A Class ....................... 31,569 370,270 175,837 2,067,412
Investor B Class ....................... 32,478 380,012 89,465 1,045,404
Investor C Class ....................... 22,096 258,990 201,895 2,365,738
Shares issued in reinvestment of dividends:
Institutional Class .................... 2,173 25,387 995 11,668
Service Class .......................... 19,347 226,294 39,168 457,776
Investor A Class ....................... 7,600 88,879 13,342 155,762
Investor B Class ....................... 10,728 125,482 23,715 277,360
Investor C Class ....................... 2,901 34,005 3,197 37,267
Shares redeemed:
Institutional Class .................... (1,466,258) (17,180,716) (4,662,761) (55,129,130)
Service Class .......................... (44,881) (526,583) (113,893) (1,324,603)
Investor A Class ....................... (47,569) (557,554) (167,909) (1,952,173)
Investor B Class ....................... (54,919) (646,697) (165,180) (1,909,634)
Investor C Class ....................... (53,159) (621,450) (78,058) (899,443)
---------- ------------- ---------- -------------
Net increase (decrease) ................... (653,113) $ (7,654,064) 2,466,942 $ 29,571,028
========== ============= ========== =============
59
BLACKROCK FUNDS
NOTES TO FINANCIAL STATEMENTS (Unaudited) (CONTINUED)
OHIO TAX-FREE INCOME
--------------------------------------------------------------------
FOR THE SIX MONTHS ENDED FOR THE YEAR ENDED
3/31/05 9/30/04
------------------------------ -----------------------------------
SHARES VALUE SHARES VALUE
------------- -------------- --------------- -----------------
Shares sold:
Institutional Class .................... 817,012 $ 9,081,453 1,370,914 $ 14,795,802
Service Class .......................... 1,331 14,501 71,578 778,171
Investor A Class ....................... 195,190 2,118,987 145,363 1,578,175
Investor B Class ....................... 51,047 554,258 96,886 1,053,035
Investor C Class ....................... 138,902 1,511,965 155,647 1,694,055
Shares issued in reinvestment of dividends:
Institutional Class .................... 4,512 48,932 5,107 55,174
Service Class .......................... 1,382 15,004 1,460 15,778
Investor A Class ....................... 8,608 93,329 11,911 128,852
Investor B Class ....................... 3,510 38,075 6,384 69,064
Investor C Class ....................... 1,258 13,655 2,224 24,072
Shares redeemed:
Institutional Class .................... (355,004) (4,062,848) (1,464,476) (15,752,815)
Service Class .......................... - - (75,650) (821,133)
Investor A Class ....................... (29,563) (321,177) (383,242) (4,156,049)
Investor B Class ....................... (60,620) (658,775) (120,222) (1,301,519)
Investor C Class ....................... (58,306) (633,867) (188,841) (2,039,292)
-------- ------------ ---------- -------------
Net increase (decrease) ................... 719,259 $ 7,813,492 (364,957) $ (3,878,630)
======== ============ ========== =============
DELAWARE TAX-FREE INCOME
---------------------------------------------------------------
FOR THE SIX MONTHS ENDED FOR THE YEAR ENDED
3/31/05 9/30/04
------------------------------ ------------------------------
SHARES VALUE SHARES VALUE
------------- -------------- ------------- --------------
Shares sold:
Institutional Class .................... 518,730 $ 5,262,195 907,119 $ 9,185,613
Investor A Class ....................... 207,942 2,105,413 537,513 5,444,902
Investor B Class ....................... 32,012 324,096 133,384 1,344,342
Investor C Class ....................... 86,292 871,205 326,399 3,319,846
Shares issued in reinvestment of dividends:
Institutional Class .................... 2,965 29,917 6,251 63,280
Investor A Class ....................... 13,802 139,277 20,590 207,937
Investor B Class ....................... 3,044 30,732 6,746 68,269
Investor C Class ....................... 2,752 27,781 5,629 56,858
Shares redeemed:
Institutional Class .................... (418,445) (4,222,384) (863,835) (8,735,695)
Investor A Class ....................... (53,894) (544,463) (129,041) (1,313,910)
Investor B Class ....................... (65,963) (665,251) (123,902) (1,246,188)
Investor C Class ....................... (129,811) (1,310,836) (320,378) (3,214,949)
-------- ------------ -------- ------------
Net Increase .............................. 199,426 $ 2,047,682 506,475 $ 5,180,305
======== ============ ======== ============
60
BLACKROCK FUNDS
KENTUCKY TAX-FREE INCOME
------------------------------------------------------------------------
FOR THE SIX MONTHS ENDED FOR THE YEAR ENDED
3/31/05 9/30/04
--------------------------------- ------------------------------------
SHARES VALUE SHARES VALUE
------------- ----------------- --------------- ------------------
Shares sold:
Institutional Class .................... 340,099 $ 3,331,339 494,416 $ 4,824,174
Service Class .......................... 135 1,317 17,525 169,829
Investor A Class ....................... 79,037 770,595 166,891 1,621,801
Investor B Class ....................... 9,865 96,362 56,399 548,160
Investor C Class ....................... 20,262 198,738 19,781 192,586
Shares issued in reinvestment of dividends:
Institutional Class .................... 889 8,683 7,612 74,196
Service Class .......................... 310 3,028 307 2,958
Investor A Class ....................... 6,635 64,764 15,451 149,776
Investor B Class ....................... 3,881 37,900 8,650 83,912
Investor C Class ....................... 1,579 15,458 3,218 31,285
Shares redeemed:
Institutional Class .................... (848,863) (8,286,926) (4,210,095) (40,628,351)
Service Class .......................... (1,204) (11,716) (3,003) (28,979)
Investor A Class ....................... (79,088) (770,472) (100,071) (961,863)
Investor B Class ....................... (7,448) (72,788) (53,053) (513,591)
Investor C Class ....................... (22,613) (221,135) - -
-------- ------------- ---------- --------------
Net decrease .............................. (496,524) $ (4,834,853) (3,575,972) $ (34,434,107)
======== ============= ========== ==============
On March 31, 2005, five shareholders held approximately 82% of the
UltraShort Municipal Portfolio, two shareholders held approximately 75% of the
Tax-Free Income Portfolio, one shareholder held approximately 86% of the
Pennsylvania Tax-Free Income Portfolio, one shareholder held approximately 78%
of the New Jersey Tax-Free Income Portfolio, one shareholder held approximately
75% of the Ohio Tax-Free Income Portfolio, three shareholders held
approximately 69% of the Delaware Tax-Free Income Portfolio and one shareholder
held approximately 82% of the Kentucky Tax-Free Income Portfolio. Some of the
shareholders are comprised of omnibus accounts, which are held on behalf of
several individual shareholders.
61
BLACKROCK FUNDS
NOTES TO FINANCIAL STATEMENTS (Unaudited) (CONTINUED)
(F) At March 31, 2005 net assets consisted of:
PENNSYLVANIA NEW JERSEY
ULTRASHORT TAX-FREE TAX-FREE TAX-FREE
MUNICIPAL INCOME INCOME INCOME
--------------- ---------------- ---------------- ----------------
Capital paid-in ............................................. $ 37,198,980 $ 426,219,519 $ 661,264,813 $ 175,228,863
End of period undistributed net investment income
(distributions in excess of net investment income) ......... - 511,942 788,050 (412,502)
Accumulated net realized loss on investment transactions
and futures contracts ...................................... (60,120) (19,161,789) (43,249,394) (6,627,546)
Net unrealized appreciation/depreciation on investment
transactions and futures contracts ......................... (116,682) 17,601,952 49,348,155 11,399,421
------------ ------------- ------------- -------------
$ 37,022,178 $ 425,171,624 $ 668,151,624 $ 179,588,236
============ ============= ============= =============
OHIO DELAWARE KENTUCKY
TAX-FREE TAX-FREE TAX-FREE
INCOME INCOME INCOME
---------------- --------------- ---------------
Capital paid-in ............................................. $ 118,559,838 $ 88,709,528 $ 82,070,758
End of period undistributed net investment income
(distributions in excess of net investment income) ......... 91,535 (240,613) 186,850
Accumulated net realized loss on investment transactions
and futures contracts ...................................... (3,157,361) (2,291,592) (4,379,434)
Net unrealized appreciation on investment transactions and
futures contracts .......................................... 8,900,325 4,845,476 6,844,062
------------- ------------ ------------
$ 124,394,337 $ 91,022,799 $ 84,722,236
============= ============ ============
(G) Federal Tax Information
No provision is made for Federal taxes as it is the Fund's intention to
have each Portfolio continue to qualify for and elect the tax treatment
applicable to regulated investment companies under Subchapter M of the Internal
Revenue Code of 1986, as amended, and to make the requisite distributions to
its shareholders which will be sufficient to relieve it from federal income and
excise taxes. Short-term capital gain distributions that are reported in the
Statement of Changes in Net Assets are reported as ordinary income for federal
tax purposes. There were no short-term or long-term capital gains distributions
for the period ended September 30, 2004.
Dividends from net investment income and distributions from net realized
capital gains are determined in accordance with U.S. Federal income tax
regulations, which may differ from those amounts determined under accounting
principles generally accepted in the United States.
62
BLACKROCK FUNDS
The estimated tax character of distributions paid during the six months
ended March 31, 2005 and the tax character of distributions paid during the
year ended September 30, 2004 were as follows:
TAX-FREE ORDINARY TOTAL
INCOME INCOME DISTRIBUTIONS
------------- ---------- --------------
UltraShort Municipal
3/31/05 ......................................... $ 346,773 $ - $ 346,773
For the period 3/03/041 through 9/30/04 ......... 228,525 - 228,525
Tax-Free Income
3/31/05 ......................................... 8,830,070 - 8,830,070
9/30/04 ......................................... 18,475,728 - 18,475,728
Pennsylvania Tax-Free Income
3/31/05 ......................................... 16,582,860 - 16,582,860
9/30/04 ......................................... 35,861,484 14,600 35,876,084
New Jersey Tax-Free Income
3/31/05 ......................................... 3,920,200 - 3,920,200
9/30/04 ......................................... 8,362,368 47,469 8,409,837
Ohio Tax-Free Income
3/31/05 ......................................... 2,765,981 - 2,765,981
9/30/04 ......................................... 5,272,616 - 5,272,616
Delaware Tax-Free Income
3/31/05 ......................................... 1,798,973 - 1,798,973
9/30/04 ......................................... 3,997,046 - 3,997,046
Kentucky Tax-Free Income
3/31/05 ......................................... 1,557,933 - 1,557,933
9/30/04 ......................................... 4,721,493 44,470 4,765,963
1 Commencement of operations.
As of March 31, 2005, the estimated tax components of distributable
earnings/(accumulated losses) were as follows:
UNDISTRIBUTED ACCUMULATED POST-
TAX-FREE CAPITAL OCTOBER
INCOME LOSSES LOSSES
--------------- ---------------- --------------
UltraShort Municipal ................. $ 53,492 $ (32,641) $ (27,479)
Tax-Free Income ...................... 1,848,111 (18,307,936) -
Pennsylvania Tax-Free Income ......... 2,902,776 (41,676,650) -
New Jersey Tax-Free Income ........... 83,429 (6,208,597) -
Ohio Tax-Free Income ................. 362,189 (2,886,490) -
Delaware Tax-Free Income ............. 38,644 (2,060,150) -
Kentucky Tax-Free Income ............. 400,697 (4,134,116) -
The estimated Post-October losses represent losses realized on investment
transactions from November 1, 2004 through March 31, 2005 that, in accordance
with Federal income tax regulations, the Portfolios may defer and treat as
having arisen in the following fiscal year. For Federal income tax purposes,
capital loss carryforwards may be carried forward and applied against future
capital gains.
63
BLACKROCK FUNDS
NOTES TO FINANCIAL STATEMENTS (Unaudited) (CONCLUDED)
At September 30, 2004, the Portfolios had capital loss carryforwards
available to offset future realized capital gains through the indicated
expiration dates:
EXPIRING SEPTEMBER 30
-----------------------------------------------------------------
2008 2009 2010 2011 2012 TOTAL
------------ ------------ ------------ ------------- ------------ -------------
UltraShort Municipal ................. $ - $ - $ - $ - $ 34,465 $ 34,465
Tax-Free Income ...................... 3,717,571 1,756,215 - 3,984,021 6,841,418 16,299,225
Pennsylvania Tax-Free Income ......... 3,981,394 7,641,061 8,626,794 15,329,699 - 35,578,948
New Jersey Tax-Free Income ........... 733,444 2,652,175 162,686 2,530,579 883,300 6,962,184
Ohio Tax-Free Income ................. 41,989 - - 1,883,560 825,006 2,750,555
Delaware Tax-Free Income ............. 83,140 - - 1,312,264 493,468 1,888,872
Kentucky Tax-Free Income ............. 1,006,045 1,556,368 129,603 2,443,468 - 5,135,484
64
BLACKROCK FUNDS
ADDITIONAL INFORMATION
(A) Board of Trustees' Consideration of the Advisory Contracts. Investment
advisory and subadvisory agreements ("Advisory Contracts") for the Tax-Free
Bond Portfolios (each, a "Portfolio") of BlackRock Funds (the "Fund") were
most recently approved by the Board of Trustees (the "Board" or the
"Trustees") of the Fund at an in-person meeting of the Board held on March
1, 2005, including a majority of the Trustees who are not parties to the
Advisory Contracts or interested persons of any such party (as such term is
defined in the Investment Company Act of 1940) (the "Independent
Trustees"). In determining to approve the Advisory Contracts, the Trustees
met with the relevant investment advisory personnel from BlackRock
Advisors, Inc. and BlackRock Financial Management, Inc. (the "Advisers")
and considered all information they deemed reasonably necessary to evaluate
the terms of the Advisory Contracts. The Board received materials in
advance of the meeting relating to its consideration of the Advisory
Contracts for the Portfolios being considered for approval or renewal,
including: (i) fees and expense ratios of each class of each Portfolio in
comparison to the fees and expense ratios of a peer group of funds, which
consists of funds that have all of the following similar criteria: fund
type, investment classification and objective, load type, asset level and
expense structure and components ("peer group"); (ii) information on the
investment performance of each Portfolio in comparison to the investment
performance of a peer universe of funds, which is broader than a peer group
and consists of funds that have all of the following similar criteria: fund
type, investment classification and objective and load type ("performance
universe"); (iii) the Advisers' economic outlook for the Portfolios and
their general investment outlook for the markets; (iv) information with
respect to profitability of BlackRock, Inc. ("BlackRock") and PNC
Bank-affiliated companies with respect to each Portfolio, including details
regarding the methodology used to calculate profitability; (v) information
regarding fees paid to service providers that are affiliates of the
Advisers; and (vi) information regarding compliance records and regulatory
matters relating to the Advisers. The matters discussed below were
considered separately by the Independent Trustees in an executive session,
during which counsel who is independent of the Advisers and the Fund
provided guidance to the Independent Trustees.
Fees and Expenses. In approving the Advisory Contracts, the Trustees,
including the Independent Trustees, considered the fees and expense ratios
of each class of shares of each Portfolio. They compared the fees, both
before (referred to as "Contractual") and after (referred to as "Actual")
any fee waivers and expense reimbursements, and expense ratios of each
Portfolio against fees and expense ratios of a peer group. Both the peer
group category and the funds within the peer group with respect to the fee
and expense ratio comparisons were selected by Lipper, Inc. ("Lipper"),
which is not affiliated with the Advisers. The Investor A class and
Institutional class were used to represent all of the Portfolios' share
classes for purposes of the Lipper survey, as Lipper differentiated between
retail and institutional funds in selecting funds in the peer group. In
evaluating the Portfolios' advisory fees, the Trustees also took into
account the complexity of investment management for the Portfolios relative
to other types of funds.
In considering data based on information provided by Lipper, the Trustees
noted that of the 7 Portfolios with Advisory Contracts subject to
re-approval, 7 of the 14 share classes of the Portfolios (50%) have
contractual advisory fees higher than the median for their respective peer
groups.1 With regard to the 7 classes that have advisory fees higher than
the peer group median, the Trustees noted that the difference from the
median of their respective peer groups is 5 basis points or less
(Institutional class: Delaware Tax-Free Income, Kentucky Tax-Free Income,
Pennsylvania Tax-Free Income, Tax-Free Income; Investor A class: Delaware
Tax-Free Income, Kentucky Tax-Free Income, Tax-Free Income).
1The Lipper peer group median was chosen as a conservative point of
reference, taking into account that one-half of the population will have
fees/expenses lower than the median.
65
BLACKROCK FUNDS
ADDITIONAL INFORMATION
The Trustees also were provided with information about the services
rendered, and the fee rates offered, to other clients advised by the
Advisers, including closed-end investment companies and accounts that are
not investment companies.
Following consideration of this information, the Trustees, including the
Independent Trustees, concluded that the fees to be paid pursuant to the
Advisory Contracts were fair and reasonable in light of the services
provided.
Nature, Extent and Quality of Services. The Trustees, including the
Independent Trustees, received information concerning the investment
philosophy and investment process used by the Advisers in managing the
Portfolios, as well as a description of the capabilities, personnel and
services of each Adviser and a copy of the current Form ADV of BlackRock
Advisors, Inc. In connection with this, the Trustees considered each of
the Advisers' in-house research capabilities as well as other resources
available to its personnel. The Trustees considered the scope of the
services provided by the Advisers to the Portfolios under the Advisory
Contracts relative to services typically provided by third parties to other
funds. The Trustees noted that the standard of care applicable under the
Advisory Contracts was comparable to that found generally in investment
company advisory agreements. The Trustees concluded that the scope of the
Advisers' services to be provided to the Portfolios was consistent with the
Portfolios' operational requirements, including, in addition to seeking to
meet their investment objectives, compliance with investment restrictions,
tax and reporting requirements and related shareholder services.
The Trustees also considered the quality of the services provided by the
Advisers to the Portfolios. The Trustees evaluated the procedures of the
Advisers designed to fulfill their fiduciary duty to the Portfolios with
respect to possible conflicts of interest, including their respective codes
of ethics (regulating the personal trading of their officers and
employees), the procedures by which each of the Advisers allocate trades
among its various investment advisory clients, the integrity of the systems
in place to ensure compliance with the foregoing and the record of each of
the Advisers in these matters. The Trustees also received information
concerning standards of the Advisers with respect to the execution of
portfolio transactions.
The Trustees also considered information relating to the education,
experience and number of investment professionals and other personnel who
provide services under the applicable Advisory Contract. The Trustees also
took into account the time and attention devoted by senior management of
the Advisers to the Portfolios. The Trustees also considered the business
reputation of each Adviser and its respective financial resources and
concluded that each of the Advisers would be able to meet any reasonably
foreseeable obligation under the Advisory Contracts.
Fund Performance. The Board of Trustees, including the Independent
Trustees, received and considered information about each Portfolio's
investment performance in comparison to the investment performance of its
respective performance universe. The funds included within each
Portfolio's performance universe were selected by Lipper. The Board was
provided with performance data for the one-, three-, five- and ten-year
periods, as applicable, ended November 30, 2004 ("relevant periods"). The
Board also reviewed the investment performance of the Portfolios and the
Advisers' market outlook with respect to the Portfolios.
66
BLACKROCK FUNDS
The Trustees noted that of the 14 classes of Portfolios subject to review
at the Board meeting, 2 classes (14%) had been in existence for less than
five years.2 The Board reviewed the performance record of these classes.
Of the remaining classes that had existed more than five years, 4 classes
(29%) performed at or better than their respective performance universe
medians during at least two of the relevant periods, while 8 classes (57%)
performed below their respective performance universe medians during at
least two of the relevant periods. In regard to each of these 8 classes,
the Trustees noted:
o 3 classes (38% of the underperforming classes) performed below their
respective performance universe medians during at least two of the
relevant periods. However, their underperformance was by no more than
10% of their respective medians for any of the relevant periods
(Institutional class: Kentucky Tax-Free Income, New Jersey Tax-Free
Income; Investor A class: Delaware Tax-Free Income).
o 5 classes (62% of the underperforming classes) performed below their
respective performance universe medians during at least two of the
relevant periods by more than 10% (Institutional class: Pennsylvania
Tax-Free Income, Tax-Free Income; Investor A class: Kentucky Tax-Free
Income, Pennsylvania Tax-Free Income, Tax-Free Income). These 5 classes
consist of classes from 3 different Portfolios. The Board noted the
following with respect to these 3 Portfolios (and specific classes, where
applicable):
o Kentucky Tax-Free Income (Investor A class), Tax-Free Income,
Pennsylvania Tax-Free Income Portfolios - The Advisers informed the
Board that these Portfolios have a bias toward a high interest rate
environment and premium coupon securities, focusing on shorter
durations relative to their performance universes. In the initial
stages of a flattening yield curve, it is expected that these
Portfolios would underperform the longer duration funds within their
respective performance universes. In addition, the underperformance
for one- and five-year periods for the Kentucky Tax-Free Income
Portfolio (Investor A class) was by no more than 10% of its peer
group median, and the ten-year performance of the Pennsylvania
Tax-Free Income Portfolio was either close to or above its
performance universe median depending on share class.
The Trustees discussed other factors relevant to the performance of the
Portfolios. The Trustees determined that, while the performance records of
certain of the Portfolios could be improved, the Advisers were taking steps
to address relative underperformance.
Profitability. The Board of Trustees, including the Independent Trustees,
considered the level of the Advisers' and affiliates' profits in respect of
their relationship with the Portfolios. This consideration included a
broad review of the Advisers' methodology in allocating their costs to the
management of a Portfolio. The Board of Trustees considered the profits
realized by the Advisers and affiliates in connection with the operation of
each Portfolio and whether the amount of profit is a fair profit relative
to their relationship with the Portfolio. The Board of Trustees, including
the Independent Trustees, also considered the Advisers' profit margins in
comparison with available industry data. The Board concluded that each
Adviser's profit is a reasonable profit relative to the services provided
to the Portfolios.
Economies of Scale. The Board of Trustees, including the Independent
Trustees, considered whether there have been economies of scale in respect
of the management of each Portfolio, whether each Portfolio has
appropriately benefited from any economies of scale, and whether there is
potential for realization of any further economies of scale.
2The UltraShort Municipal Portfolio (two classes total) was organized in
2004.
67
BLACKROCK FUNDS
ADDITIONAL INFORMATION
The Board considered that economies of scale were passed on to the
shareholders in the form of breakpoints to the advisory fee rate. The
Board noted that for the fiscal year ended September 30, 2004, none of the
Portfolios had reached their respective specified asset levels to trigger
the breakpoints to their respective advisory fee rates. The Board also
considered the fee waivers and expense reimbursement arrangements by the
Advisers. The Board determined that the advisory fee structure was
reasonable and that no changes were currently necessary.
Other Benefits to the Advisers. The Board of Trustees, including the
Independent Trustees, also took into account not only the advisory fees
payable by the Portfolios, but also other potential benefits to the
Advisers, such as the ability to leverage investment professionals that
also manage other portfolios, raising the profile of BlackRock in the
broker-dealer community, and the engagement of affiliates of the Advisers
as service providers to the Portfolios, including for administrative,
transfer agency, distribution and custodial services. The Board also noted
that the Advisers may benefit from the use of soft dollars for research,
which may be used by the Advisers to manage other accounts.
The Board concluded that other ancillary benefits that the Advisers and
their affiliates could be expected to receive with regard to providing
investment advisory and other services to the Portfolios, such as those
noted above, were consistent with those available to other mutual fund
sponsors.
No single factor was considered in isolation or to be determinative in the
Board's decision to approve the Advisory Contracts. Rather, the Board
concluded, in light of a weighing and balancing of all factors considered,
that it was in the best interests of each Portfolio to approve the
continuation of the Advisory Contracts, including the fees to be charged
for services thereunder.
(B) PricewaterhouseCoopers LLP ("PwC"), the Fund's former independent auditor,
has been hired as an internal audit supporting service provider by The PNC
Financial Services Group, Inc. ("PNC"), the parent company of the Fund's
investment adviser and certain other service providers. In order to provide
certain services to PNC and its affiliates which would have caused PwC to
no longer be independent with respect to the Fund, PwC declined to stand
for re-election as independent auditor of the Fund after the completion of
the fiscal 2003 audit.
The Fund's Audit Committee approved engaging Deloitte & Touche LLP as the
independent auditor to audit the Fund's financial statements for fiscal
year 2005. A majority of the Fund's Board of Trustees, including a majority
of the independent Trustees, approved the appointment of Deloitte & Touche
LLP as the Fund's independent auditor for the Fund's fiscal 2005 audit on
November 12, 2004, subject to the right of the Fund, by a majority vote of
the shareholders at any meeting called for that purpose, to terminate the
appointment without penalty.
(C) As previously disclosed, BlackRock has received subpoenas from various
federal and state governmental and regulatory authorities and various
information requests from the Securities and Exchange Commission in
connection with ongoing industry-wide investigations of mutual fund
matters.
(D) The amounts paid by the Fund to the Chief Compliance Officer (CCO) for the
six months ended March 31, 2005, were $81,903.
68
BLACKROCK FUNDS
Investment Adviser
BlackRock Advisors, Inc.
Wilmington, Delaware 19809
Sub-Adviser
BlackRock Financial Management, Inc.
New York, New York 10022
Custodian
PFPC Trust Co.
Philadelphia, Pennsylvania 19153
Co-Administrator and Transfer Agent
PFPC Inc.
Wilmington, Delaware 19809
Distributor
BlackRock Distributors, Inc.
King of Prussia, Pennsylvania 19406
Co-Administrator
BlackRock Advisors, Inc.
Wilmington, Delaware 19809
Counsel
Simpson Thacher & Bartlett LLP
New York, New York 10017
Independent Registered Public Accounting Firm
Deloitte & Touche LLP
Philadelphia, Pennsylvania 19103
The Fund will mail only one copy of shareholder documents, including
prospectuses, annual and semi-annual reports and proxy statements, to
shareholders with multiple accounts at the same address. This practice is
commonly called "householding" and it is intended to reduce expenses and
eliminate duplicate mailings of shareholder documents. Mailings of your
shareholder documents may be householded indefinitely unless you instruct us
otherwise. If you do not want the mailing of these documents to be combined
with those for other members of your household, please contact the Fund at
(800) 441-7762.
The Fund has delegated proxy voting responsibilities to BlackRock and its
affiliates, subject to the general oversight of the Fund's Board of Trustees. A
description of the policies and procedures that BlackRock and its affiliates
use to determine how to vote proxies relating to portfolio securities is
available without charge, upon request, by calling (800) 441-7762, or on the
website of the Securities and Exchange Commission (the "Commission") at
http://www.sec.gov.
Information on how proxies relating to the Fund's voting securities were voted
(if any) by the Advisor during the most recent 12-month period ended June 30th
is available, upon request and without charge, by calling (800) 441-7762 or on
the website of the Commission at http://www.sec.gov.
The Fund files its complete schedule of portfolio holdings for the first and
third quarters of its fiscal year with the Commission on Form N-Q. The Fund's
Form N-Q is available on the Commission's website at http://www.sec.gov and may
be reviewed and copied at the Commission's Public Reference Room in Washington,
D.C. Information regarding the operation of the Public Reference Room may be
obtained by calling 1-800-SEC-0330. The Fund's Form N-Q may also be obtained
upon request, without charge, by calling (800) 441-7762.
BLACKROCK FUNDS
FUND SPECTRUM
BlackRock Funds is a leading mutual fund company currently managing
approximately $26 billion in the following portfolios designed to fit a broad
range of investment goals. Each portfolio is managed by recognized experts in
equity, fixed income, international, and tax-free investing.
STOCK PORTFOLIOS
- --------------------------------------
Investment Trust Small Cap Core Equity
Large Cap Value Equity Small Cap Growth Equity
Large Cap Growth Equity Global Science & Technology Opportunities
Dividend AchieversTM Global Resources
Legacy All-Cap Global Resources
Mid-Cap Value Equity Health Sciences
Mid-Cap Growth Equity U.S. Opportunities
Aurora International Opportunities
Small/Mid-Cap Growth Index Equity
Small Cap Value Equity
STOCK & BOND PORTFOLIOS
- --------------------------------------
Asset Allocation
BOND PORTFOLIOS
- --------------------------------------
Enhanced Income Government Income
Low Duration Bond Inflation Protected Bond
Intermediate Government Bond GNMA
Intermediate Bond Managed Income
Intermediate PLUS Bond International Bond
Core Bond Total Return High Yield Bond
Core PLUS Total Return
TAX-FREE BOND PORTFOLIOS
- --------------------------------------
UltraShort Municipal Ohio Tax-Free Income
Tax-Free Income Delaware Tax-Free Income
Pennsylvania Tax-Free Income Kentucky Tax-Free Income
New Jersey Tax-Free Income
MONEY MARKET PORTFOLIOS
- --------------------------------------
Money Market North Carolina Municipal Money Market
U.S. Treasury Money Market Ohio Municipal Money Market
Municipal Money Market Pennsylvania Municipal Money Market
New Jersey Municipal Money Market Virginia Municipal Money Market
SHAREHOLDER PRIVILEGES
ACCOUNT INFORMATION
Call us at 1-800-441-7762 to get information about your account balances,
recent transactions and share prices. You can also reach us on the web at
www.blackrock.com.
AUTOMATIC INVESTMENT PLANS
Investor Class shareholders who want to invest regularly can arrange to have
$50 or more automatically deducted from their checking or savings account and
invested in any of the BlackRock portfolios.
SYSTEMATIC WITHDRAWAL PLANS
Investor Class shareholders can establish a systematic withdrawal plan and
receive periodic payments of $50 or more from their BlackRock portfolios, as
long as their account is at least $10,000.
RETIREMENT PLANS
Shareholders may make investments in conjunction with Traditional, Rollover,
Roth, Coverdell and Simple IRA's.
ADDITIONAL INFORMATION ABOUT THE BLACKROCK FUNDS
For additional reports or additional information, as well as more current
information about portfolio holdings and characteristics, BlackRock Fund
shareholders and prospective investors may call 1-800-441-7762.
Shares of the Fund are not deposits or obligations of, or guaranteed or
endorsed by PNC Bank, National Association or any other bank and shares are not
federally insured by, guaranteed by, obligations of or otherwise supported by
the U.S. Government, the Federal Deposit Insurance Corporation, the Federal
Reserve Board, or any other governmental agency. Investments in shares of the
fund involve investment risks, including the possible loss of the principal
amount invested.
[GRAPHIC OMITTED]
BND-SEMI2
ALTERNATIVES BLACKROCK SOLUTIONS EQUITIES FIXED
INCOME LIQUIDITYREAL ESTATE BlackRock Funds
Strategic Portfolio
Semi-Annual Report to Shareholders
March 31, 2005 (Unaudited)
[GRAPHIC OMITTED]
[GRAPHIC OMITTED]
[GRAPHIC OMITTED]
NOT FDIC INSURED
MAY LOSE VALUE
NO BANK GUARANTEE
[THIS PAGE INTENTIONALLY LEFT BLANK.]
BLACKROCK STRATEGIC PORTFOLIO I
Total Net Assets (3/31/05): $67.8 million
Performance Benchmark
Citigroup Non-U.S. World Government Bond Index (Hedged)
Investment Approach
Seeks to maximize total return through the investment in a portfolio of
investment grade fixed income securities of foreign and U.S. issuers
denominated in foreign currencies, baskets of foreign currencies and the U.S.
dollar. The Portfolio normally invests at least 65% of its total assets in
non-dollar denominated bonds of issuers located outside of the United States.
The Portfolio intends to primarily invest in developed countries, although it
has the ability to invest up to 20% of its total assets in bonds of issuers in
emerging market countries. The Portfolio may also invest in non-U.S.
currencies. Securities are purchased for the Portfolio when the management team
determines that they have the potential for above-average total return. When
determining what securities to purchase and sell, the management team
considers, among other things, the relative risk versus the potential reward of
owning a security; the credit, interest rate and prepayment risk; and general
market conditions. In addition, the management team conducts intense credit
analysis and review of each security purchased or sold.
Recent Portfolio Management Activity
o The Portfolio underperformed the benchmark for the semi-annual period.
o Non-U.S. bond markets dramatically outperformed the U.S bond market
during the first half of the semi-annual period as several macroeconomic themes
came to the forefront. The rebound in U.S. economic growth and the
determination of the Federal Reserve to maintain its measured tightening
process contrasted with more sluggish conditions in Europe and Japan. After
trading in a relatively narrow range for most of the year, the U.S. dollar
broke sharply lower against major currencies in the fourth quarter of 2004. The
trade-weighted dollar index was down 7.5% with the dollar establishing record
lows against the euro and multi-year lows against most major currencies. The
strength of the euro and other currencies exacerbated the slowdown concerns for
those countries, leading to lowered expectations for central bank tightening.
During the fourth quarter, Canadian bonds rallied as the Bank of Canada
abruptly halted their tightening program in light of a stronger Canadian
dollar. The Portfolio reduced its exposure to Canada during the fourth quarter.
o In the second half of the semi-annual period, European bonds were, on
balance, unchanged. In contrast to the U.S. where a combination of solid
economic growth and inflation fears pushed up interest rates, disappointing
economic releases dampened optimism for a significant European rebound. Higher
oil prices and the strong euro continued to hamper manufacturing, resulting in
sluggish GDP growth in the entire Euro-zone, in particular Germany, and rising
unemployment in the major economies. This environment reinforced expectations
that the European Central Bank ("ECB") would continue to hold official rates at
2% throughout most of the year. Growth in the U.K. remained relatively robust,
but the MPC nonetheless kept rates unchanged throughout the quarter. The euro
depreciated 4.4% versus the U.S. dollar during the quarter, and it remains
vulnerable given the cyclical factors of higher relative U.S. growth.
o Japan also experienced disappointing economic news during the first
quarter of 2005, resulting in a modest decline in bond yields. In particular,
the fourth quarter GDP was released as a modest negative number, the third
consecutive quarter of negative growth. The yen remained in a narrow range
throughout the period, but weakened at quarter end versus the resurgent U.S.
dollar. In the Dollar Bloc, Canadian bonds outperformed U.S. bonds as the Bank
of Canada kept official rates unchanged at 2.5% given the persistent strength
of the Canadian dollar and sluggish economic conditions. In contrast, the
Reserve Bank of Australia and the Reserve Bank of New Zealand both raised
official rates 25 basis points, to 5.50% and 6.75%, respectively.
o For the semi-annual period, the Portfolio remained long duration in New
Zealand and Mexico. The Portfolio initiated an exposure to Swedish
inflation-linked bonds given attractive break-even levels and scope for
inflation to build. The Portfolio also held small currency positions throughout
the period with trades on the pound versus euro, yen versus euro and Mexican
peso versus the U.S. dollar.
COMPARISON OF CHANGE IN VALUE OF A $10,000 INVESTMENT IN THE STRATEGIC
PORTFOLIO I AND
THE CITIGROUP NON-U.S. WORLD GOVERNMENT BOND INDEX (HEDGED) FROM INCEPTION.
[LINE CHART]
Institutional Citigroup Non-U.S. World Government Bond Index (Hedged)
------------- -------------------------------------------------------
10/06/1997 $ 10,000 $ 10,000
12/31/1997 10,141 10,203
03/31/1998 10,303 10,515
06/30/1998 10,515 10,758
09/30/1998 11,084 11,319
12/31/1998 11,136 11,381
03/31/1999 11,131 11,590
06/30/1999 11,164 11,517
09/30/1999 11,290 11,572
12/31/1999 11,349 11,708
03/31/2000 11,478 11,962
06/30/2000 11,786 12,179
09/30/2000 12,245 12,378
12/31/2000 13,268 12,834
03/31/2001 13,709 13,186
06/30/2001 13,542 13,236
09/30/2001 14,144 13,524
12/31/2001 14,448 13,617
03/31/2002 14,484 13,563
06/30/2002 15,350 13,869
09/30/2002 15,521 14,326
12/31/2002 16,037 14,550
03/31/2003 16,070 14,742
06/30/2003 16,490 14,935
09/30/2003 16,512 14,819
12/31/2003 16,566 14,823
03/31/2004 16,949 15,071
06/30/2004 16,612 14,909
09/30/2004 16,956 15,263
12/31/2004 17,268 15,591
03/31/2005 17,215 15,784
FOR PERIOD ENDING MARCH 31, 2005
Strategic Portfolio I - Average Annual Return
1 Year 3 Year 5 Year From Inception
- ------------ ---------- ---------- ---------------
1.57% 5.93% 8.44% 7.53%
PAST PERFORMANCE IS NOT PREDICTIVE OF FUTURE RESULTS. The graph and table do
not reflect the deduction of taxes that a shareholder would pay on fund
distributions or the redemption of shares. Although the holdings and sectors
listed above were current as of the periods indicated, the Portfolio is
actively managed and its composition will vary.
1
BLACKROCK STRATEGIC PORTFOLIO I
FUND PROFILE
Credit Quality (% of
long-term investments)1
AAA 73.5 %
AA 4.9
A 14.2
BBB 2.8
Unrated 4.6
-----
Total 100.0%
=====
Countries (% of long-term
investments)
Sweden 45.3 %
Mexico 22.5
United States 18.0
New Zealand 10.0
Canada 4.2
-----
Total 100.0%
=====
Portfolio Statistics
Average maturity (years) 3.50
Effective Duration2 3.79
1 Using the higher of Standard & Poor's ("S&P's") or Moody's Investors Service
("Moody's") rating.
2 Duration measures a Portfolio's price risk. Each year of duration represents
an expected 1% change in the net asset value of the portfolio for every 1%
change in interest rates. Effective duration is typically calculated for
bonds with embedded options and assumes that expected cash flows will
fluctuate as interest rates change.
- --------------------------------------------------------------------------------
EXPENSE EXAMPLE
As a shareholder of the Portfolio, you incur ongoing costs, including advisory
fees and other Portfolio expenses. This Example is intended to help you
understand your ongoing costs (in dollars) of investing in the Portfolio and to
compare these costs with the ongoing costs of investing in other mutual funds.
The Example below is based on an investment of $1,000 invested at the beginning
of the period and held for the entire period October 1, 2004 to March 31, 2005.
The information under "Actual Expenses," together with the amount you invested,
allows you to estimate actual expenses incurred over the reporting period.
Simply divide your account value by $1,000 (for example, an $8,600 account
value divided by $1,000 = 8.60) and multiply the result by the cost shown for
your share class, in the row entitled "Expenses Incurred During Period", to
estimate the expenses incurred on your account during this period.
The information under "Hypothetical Expenses" provides information about
hypothetical account values and hypothetical expenses based on the Portfolio's
actual expense ratio and an assumed rate of return of 5% per year before
expenses, which is not the Portfolio's actual return. The hypothetical account
values and expenses may not be used to estimate the actual ending account
balance or expense you incurred for the period. You may use this information to
compare the ongoing costs of investing in the Portfolio and other funds. To do
so, compare this 5% hypothetical example with the 5% hypothetical examples that
appear in the shareholder reports of the other funds.
Please note that the expenses shown in the table are meant to highlight your
ongoing costs only and do not reflect any transactional costs, such as front
and back end sales charges (loads) or redemption/exchange fees, where
applicable. Therefore, the hypothetical information is useful in comparing
ongoing costs only, and will not help you determine the relative total costs of
owning different funds.
Hypothetical Expenses
Actual Expenses (5% return before expenses)
--------------------- ----------------------------
Institutional Class Institutional Class
--------------------- ----------------------------
Beginning Account Value (10/01/04) $ 1,000.00 $ 1,000.00
Ending Account Value (3/31/05) 1,015.30 1,023.83
Expenses Incurred During Period (10/01/04 - 3/31/05) 1.11 1.11
For the Institutional share class of the Portfolio, expenses are equal to the
annualized expense ratio of 0.22%, multiplied by the average account value over
the period, multiplied by 182/
365 (to reflect the one-half year period).
2
BLACKROCK FUNDS
SCHEDULE OF INVESTMENTS
BLACKROCK STRATEGIC PORTFOLIO I
AS OF MARCH 31, 2005 (UNAUDITED)
PAR
MATURITY (000) VALUE
---------- ---------------- -------------
U.S. GOVERNMENT & AGENCY OBLIGATIONS - 10.4%
U.S. Treasury Notes
3.50%(b)
(Cost $5,971,566) 12/15/09 $ 6,000 $ 5,828,202
-----------
FOREIGN BONDS - 78.7%
Canada - 3.7%
Canada Government Bonds (CND)
3.25% 12/01/06 2,500(c) 2,069,761
-----------
Mexico - 20.2%
Mexican Fixed Rate Bonds (MXP)
8.00% 12/24/08 22,480(c) 1,879,381
9.00% 12/24/09 109,500(c) 9,370,885
===========
11,250,266
-----------
New Zealand - 14.5%
General Electric Capital Corp.
(NZD)
6.62% 02/04/10 4,500(c) 3,162,477
New Zealand Government (NZD)
6.00% 04/15/15 7,100(c) 4,988,892
===========
8,151,369
-----------
Sweden - 40.3%
AB Spintab
6.00% 04/20/09 20,000(c) 3,134,414
Statens Bostadsfinansier (SEK)
5.50% 12/17/08 20,000(c) 3,071,331
Swedish Government (TIP) (SEK)
4.00% 12/01/08 106,471(c) 16,403,879
===========
22,609,624
-----------
TOTAL FOREIGN BONDS
(Cost $43,581,166) 44,081,020
-----------
PAR/SHARES
MATURITY (000) VALUE
---------- ----------- -------------
SHORT TERM INVESTMENTS - 10.9%
Federal Home Loan Bank, Discount
Notes
2.55% 04/01/05 $4,000 $4,000,000
Galileo Money Market Fund 2,133 2,132,871
==========
TOTAL SHORT TERM INVESTMENTS
(Cost $6,132,871) 6,132,871
----------
TOTAL INVESTMENTS IN
SECURITIES - 100.0%
(Cost $55,685,603(a)) $56,042,093
===========
- -------------------
(a) Also cost for Federal income tax purposes. The gross unrealized
appreciation (depreciation) on a tax basis is as follows:
Gross unrealized appreciation $1,033,943
Gross unrealized depreciation (677,453)
----------
$ 356,490
==========
(b) Securities, or a portion thereof, pledged as collateral with a value of
$485,683 on 314 long U.S. Treasury Note futures contracts and 123 short
Euro Bobl futures contracts expiring June 2005. The value of such
contracts on March 31, 2005 was $51,585,540, with an unrealized loss of
$32,198 (including commissions of $691).
(c) In local currency.
KEY TO INVESTMENT ABBREVIATIONS
CND Canadian Dollar
MXP Mexican Peso
NZD New Zealand Dollar
SEK Swedish Krone
TIP Treasury Inflation Protected Security
SEE ACCOMPANYING NOTES TO FINANCIAL STATEMENTS.
3
BLACKROCK FUNDS
STATEMENT OF ASSETS AND LIABILITIES
BLACKROCK STRATEGIC PORTFOLIO I
MARCH 31, 2005 (UNAUDITED)
ASSETS
Investments at value (Cost $55,685,603)................................. $ 56,042,093
Cash denominated in foreign currencies (Cost $1,651,035)................ 1,600,609
Interest receivable .................................................... 931,499
Investments sold receivable ............................................ 11,089,917
Capital shares sold receivable ......................................... 32,289
Prepaid expenses ....................................................... 1,206
Unrealized appreciation on forward foreign currency contracts .......... 1,072,109
Futures margin receivable .............................................. 128,944
=============
TOTAL ASSETS ........................................................ 70,898,666
-------------
LIABILITIES
Investments purchased payable .......................................... 2,089,619
Distributions payable .................................................. 3,033
Administrative fees payable ............................................ 4,745
Transfer agent fees payable ............................................ 3,594
Other accrued expenses payable ......................................... 4,614
Futures margin payable ................................................. 51,002
Unrealized depreciation on forward foreign currency contracts .......... 945,283
=============
TOTAL LIABILITIES ................................................... 3,101,890
-------------
NET ASSETS (Applicable to 7,805,499 Institutional shares outstanding) ... $ 67,796,776
=============
NET ASSET VALUE, OFFERING AND REDEMPTION PRICE
PER INSTITUTIONAL SHARE ($67,796,776/7,805,499)......................... $ 8.69
=============
SEE ACCOMPANYING NOTES TO FINANCIAL STATEMENTS.
4
BLACKROCK FUNDS
STATEMENT OF OPERATIONS
BLACKROCK STRATEGIC PORTFOLIO I
FOR THE SIX MONTHS ENDED MARCH 31, 2005 (UNAUDITED)
Investment income:
Interest ........................................................................... $ 1,579,223
------------
Expenses:
Investment advisory fee ............................................................ 68,378
Administration fee ................................................................. 78,635
Custodian fee ...................................................................... 13,104
Transfer agent fee ................................................................. 11,158
Legal and audit fees ............................................................... 10,400
Trustees' fees ..................................................................... 1,278
Other .............................................................................. 1,290
------------
Total expenses excluding interest expense ........................................ 184,243
Interest expense ................................................................ 10,501
------------
Total expenses ................................................................... 194,744
------------
Less investment advisory fees waived ............................................ (68,378)
Less investment administration fees waived ...................................... (52,767)
Net expenses ..................................................................... 73,599
------------
Net investment income ............................................................... 1,505,624
------------
Realized and unrealized gain (loss) on investments and foreign currency transactions:
Net realized gain (loss) from:
Investment transactions .......................................................... 1,105,946
Futures contracts ................................................................ (164,184)
Foreign currency related transactions ............................................ 794,189
------------
1,735,951
------------
Change in unrealized appreciation/depreciation from:
Investments ...................................................................... (2,600,306)
Futures contracts ................................................................ (42,124)
Foreign currency related transactions ............................................ 473,002
------------
(2,169,428)
------------
Net loss on investments, futures contracts, and foreign currency transactions ....... (433,477)
------------
Net increase in net assets resulting from operations ................................ $ 1,072,147
============
SEE ACCOMPANYING NOTES TO FINANCIAL STATEMENTS.
5
BLACKROCK FUNDS
STATEMENT OF CHANGES IN NET ASSETS
BLACKROCK STRATEGIC PORTFOLIO I
FOR THE
SIX MONTHS ENDED FOR THE
3/31/05 YEAR ENDED
(UNAUDITED) 9/30/04
------------------ ----------------
Increase in net assets:
Operations:
Net investment income ................................................ $ 1,505,624 $ 3,051,524
Net realized gain (loss) on investments, futures contracts and
foreign currency related transactions ............................... 1,735,951 (648,595)
Net change in unrealized appreciation/depreciation on
investments, futures contracts and foreign currency related
transactions ........................................................ (2,169,428) (299,876)
------------- -------------
Net increase in net assets resulting from operations ................. 1,072,147 2,103,053
------------- -------------
Distributions to shareholders from:
Net investment income ................................................ (1,505,478) (1,724,257)
Capital .............................................................. - (1,327,267)
------------- -------------
Total distributions to shareholders .................................. (1,505,478) (3,051,524)
------------- -------------
Capital share transactions:
Shares sold .......................................................... 57,594,099 48,655,002
Shares issued in reinvestment of dividends ........................... 1,493,446 3,172,537
Shares redeemed ...................................................... (58,167,334) (39,691,524)
------------- -------------
920,211 12,136,015
------------- -------------
Total increase in net assets ......................................... 486,880 11,187,544
------------- -------------
Net assets:
Beginning of period .................................................. 67,309,896 56,122,352
------------- -------------
End of period ........................................................ $ 67,796,776 $ 67,309,896
============= =============
End of period distributions in excess of net investment income ......... $ (413,930) $ (414,076)
SEE ACCOMPANYING NOTES TO FINANCIAL STATEMENTS.
6
BLACKROCK FUNDS
FINANCIAL HIGHLIGHTS
FOR A SHARE OUTSTANDING THROUGHOUT EACH PERIOD
FOR THE
SIX MONTHS ENDED FOR THE
3/31/05 YEAR ENDED
(UNAUDITED) 9/30/04
------------------ ------------
Per share operating performance:
Net asset value, beginning of period ............................. $ 8.75 $ 8.85
------- -------
Net investment income ........................................... 0.19 0.331
Net realized and unrealized gain (loss) on investments .......... ( 0.06) ( 0.10)
------- --------
Net increase from investment operations ........................ 0.13 0.23
------- --------
Distributions from net investment income ........................ ( 0.19) ( 0.16)
Distributions from net realized gains ........................... - -
Distributions from capital ...................................... - ( 0.17)
------- --------
Total distributions ............................................ ( 0.19) ( 0.33)
------- --------
Net asset value, end of period .................................. $ 8.69 $ 8.75
======= ========
Total Return ..................................................... 1.53 % 2.69%
Ratios / Supplemental data
Net assets, end of period (in thousands) ......................... $ 67,797 $ 67,310
Ratio of expenses to average net assets .......................... 0.22%2 0.42%
Ratio of expenses to average net assets (excluding interest
expense) ........................................................ 0.18%2 0.23%
Ratio of expenses to average net assets (excluding waivers) ...... 0.57%2 0.71%
Ratio of net investment income to average net assets ............. 4.40%2 3.80%
Ratio of net investment income to average net assets (excluding
waivers) ........................................................ 4.05%2 3.51%
Portfolio turnover ............................................... 106% 203%
FOR THE FOR THE FOR THE FOR THE
YEAR ENDED YEAR ENDED YEAR ENDED YEAR ENDED
9/30/03 9/30/02 9/30/01 9/30/00
------------ ------------ ------------ -----------
Per share operating performance:
Net asset value, beginning of period ............................. $ 8.87 $ 9.20 $ 8.63 $ 8.51
------- ------- ------- --------
Net investment income ........................................... 0.42 0.42 0.72 0.57
Net realized and unrealized gain (loss) on investments .......... 0.13 0.40 0.58 0.12
------- ------- ------- --------
Net increase from investment operations ........................ 0.55 0.82 1.30 0.69
------- ------- ------- --------
Distributions from net investment income ........................ ( 0.57) ( 1.15) ( 0.65) ( 0.57)
Distributions from net realized gains ........................... - - ( 0.08) -
Distributions from capital ...................................... - - - -
-------- -------- -------- --------
Total distributions ............................................ ( 0.57) ( 1.15) ( 0.73) ( 0.57)
-------- -------- -------- --------
Net asset value, end of period .................................. $ 8.85 $ 8.87 $ 9.20 $ 8.63
======== ======== ======== ========
Total Return ..................................................... 6.39% 9.74% 15.51% 8.46%
Ratios / Supplemental data
Net assets, end of period (in thousands) ......................... $ 56,122 $ 31,253 $ 33,297 $ 29,367
Ratio of expenses to average net assets .......................... 0.26% 0.85% 0.27% 0.26%
Ratio of expenses to average net assets (excluding interest
expense) ........................................................ 0.26% 0.26% 0.26% 0.26%
Ratio of expenses to average net assets (excluding waivers) ...... 0.50% 1.15% 0.60% 0.68%
Ratio of net investment income to average net assets ............. 3.89% 4.73% 5.82% 6.67%
Ratio of net investment income to average net assets (excluding
waivers) ........................................................ 3.65% 4.43% 5.49% 6.25%
Portfolio turnover ............................................... 235% 180% 189% 324%
- ---------
1 Calculated using the average shares outstanding method.
2 Annualized.
SEE ACCOMPANYING NOTES TO FINANCIAL STATEMENTS.
7
BLACKROCK FUNDS
NOTES TO FINANCIAL STATEMENTS (Unaudited)
(A) Organization
BlackRock FundsSM (the "Fund") was organized on December 22, 1988 as a
Massachusetts business trust and is registered under the Investment Company Act
of 1940, as amended, as an open-end management investment company. The Fund
currently has 50 investment portfolios. These financial statements relate to
the Fund's Strategic Portfolio I (the "Portfolio"). The Portfolio is authorized
to issue an unlimited number of shares with a par value of $0.001.
Under the Fund's organizational documents, its officers and trustees are
indemnified against certain liabilities arising out of the performance of their
duties to the Fund. In addition, in the normal course of business, the Fund
enters into contracts with its vendors and others that provide for general
indemnifications. The Fund's maximum exposure under these arrangements is
unknown as this would involve future claims that may be made against the Fund.
However, based on experience, the Fund considers the risk of loss from such
claims to be remote.
(B) Summary of Significant Accounting Policies
The following is a summary of significant accounting policies followed by
the Portfolio in preparation of its financial statements.
Investment Valuation - Valuation of investments held by the Portfolio is
as follows: fixed income investments are valued by using market quotations or
prices provided by market makers; a portion of the fixed income investments are
valued utilizing one or more pricing services approved by the Board of
Trustees; an option or futures contract is valued at the last sales price prior
to 4:00 p.m. (Eastern time), as quoted on the principal exchange or board of
trade on which such option or futures contract is traded, or in the absence of
a sale, the mean between the last bid and asked prices prior to 4:00 p.m.
(Eastern time); the amortized cost method of valuation will be used with
respect to debt obligations with sixty days or less remaining to maturity
unless the investment adviser under the supervision of the Board of Trustees
determines that such method does not represent fair value. Any assets which are
denominated in a non-U.S. currency are translated into U.S. dollars at the
prevailing market rates. In the event that application of these methods of
valuation results in a price for an investment which is deemed not to be
representative of the market value of such investment, the investment will be
valued by, under the direction of or in accordance with a method approved by
the Board of Trustees as reflecting fair value ("Fair Value Assets"). The
investment adviser will submit its recommendations regarding the valuation
and/or valuation methodologies for Fair Value Assets to a valuation committee.
Such valuation committee may accept, modify or reject any recommendations. The
pricing of all Fair Value Assets shall be subsequently reported to and ratified
by the Board of Trustees.
When determining the price for a Fair Value Asset, the investment adviser
shall seek to determine the price that the Portfolio might reasonably expect to
receive from the current sale of that asset in an arm's-length transaction.
Fair value determinations shall be based upon all available factors that
BlackRock deems relevant.
Dividends to Shareholders: Dividends from net investment income are
declared by the Portfolio each day on "settled" shares (i.e. shares for which
the Portfolio has received payment) and are paid monthly. Over the course of a
year, substantially all of the Portfolio's net investment income will be
declared as dividends. Net realized capital gains, if any, are distributed at
least annually.
Foreign Currency Translation: The books and records of the Portfolio are
maintained in U.S.dollars. Foreign currency amounts are translated into U.S.
dollars on the following basis:
(I) Market value of investment securities, assets and liabilities at the
current rate of exchange; and
(II) Purchases and sales of investment securities, income and expenses at
the relevant rates of exchange prevailing on the respective dates of such
transactions.
The Portfolio isolates that portion of gains and losses on investment
securities which is due to changes in the foreign exchange rates from that
which is due to changes in market prices of such securities.
The Portfolio reports certain foreign currency related transactions as
components of realized and unrealized gains for financial reporting purposes,
whereas such components are treated as ordinary income for federal income tax
purposes.
Forward Foreign Currency Contracts: The Portfolio enters into forward
foreign currency contracts as a hedge against either specific transactions or
Portfolio positions. These contracts are adjusted by the daily forward exchange
rate of the underlying currency and any gains or losses are recorded as
unrealized until the contract settlement date. Such contracts, which protect
the value of the Portfolio's investment securities against a decline in the
value of currency, do
8
BLACKROCK FUNDS
NOTES TO FINANCIAL STATEMENTS (Unaudited) (CONTINUED)
not eliminate fluctuations in the underlying prices of the securities. They
simply establish an exchange rate at a future date. Also, although such
contracts tend to minimize the risk of loss due to a decline in the value of a
hedged currency, at the same time they tend to limit any potential gain that
might be realized should the value of such foreign currency increase. Risks may
arise upon entering into these contracts from the potential inability of
counterparties to meet the terms of their contracts and from unanticipated
movements in the value of a foreign currency relative to the U.S. dollar.
The aggregate principal amounts of the contracts are not recorded as the
Portfolio intends to settle the contracts prior to delivery. Under the terms of
foreign currency contracts open at March 31, 2005, the Portfolio is obligated
to deliver or receive currency in exchange for U.S. dollars as indicated below:
UNREALIZED
FOREIGN
VALUE AT EXCHANGE
SETTLEMENT DATE CURRENCY AMOUNT CURRENCY SOLD CONTRACT AMOUNT MARCH 31, 2005 GAIN (LOSS)
- ----------------- ----------------- ----------------------------- ----------------- ---------------- ------------
04/22/05 162,225,000 Swedish Krona ............... $ 23,348,992 $ 22,982,857 $ 366,135
04/25/05 101,414,091 Mexican Peso ................ 8,872,702 9,024,024 (151,322)
04/26/05 12,750,329 Euro ........................ 16,715,681 16,548,780 166,901
04/27/05 10,650,000 Euro ........................ 13,879,575 13,823,055 56,520
04/27/05 29,200,000 New Zealand Dollar .......... 20,702,813 20,771,887 (69,074)
04/27/05 6,420,000 Canadian Dollar ............. 5,235,158 5,310,055 (74,897)
04/28/05 10,476,464 Euro ........................ 13,771,504 13,598,122 173,382
------------- ------------- ----------
$ 102,526,425 $ 102,058,780 $ 467,645
============= ============= ==========
UNREALIZED
FOREIGN
VALUE AT EXCHANGE
SETTLEMENT DATE CURRENCY AMOUNT CURRENCY BOUGHT CONTRACT AMOUNT MARCH 31, 2005 GAIN (LOSS)
- ----------------- ----------------- ------------------------------ ----------------- ---------------- ---------------
04/20/05 44,755,000 Mexican Peso ................. $ 3,918,487 $ 3,986,312 $ 67,825
04/22/05 1,725,000 Swedish Krona ................ 248,894 244,385 (4,509)
04/25/05 6,590,000 Mexican Peso ................. 582,567 586,391 3,824
04/26/05 13,352,000 Euro ......................... 17,335,324 17,329,695 (5,629)
04/27/05 17,600,000 New Zealand Dollar ........... 12,501,122 12,520,042 18,920
04/27/05 1,434,194,625 Japanese Yen ................. 13,879,575 13,409,028 (470,547)
04/28/05 7,300,000 Great British Pound .......... 13,771,503 13,767,140 (4,363)
04/28/05 3,900,000 Canadian Dollar .............. 3,155,850 3,225,734 69,884
------------ ------------ -----------
$ 65,393,322 $ 65,068,727 $ (324,595)
============ ============ ===========
Investment Transactions and Investment Income: Investment transactions are
accounted for on the trade date. The cost of investments sold and the related
gain or loss is determined by use of specific identification method for both
financial reporting and federal income purposes. Interest income is recorded on
the accrual basis. Discounts and premiums on debt securities are amortized for
book and tax purposes using the effective yield-to-maturity method over the
term of the instrument.
Reverse Repurchase Agreements: The Portfolio may enter into reverse
repurchase agreements with qualified third party brokers-dealers as determined
by and under the direction of the Portfolio's Board of Trustees. Interest on
the value of the reverse repurchase agreements issued and outstanding is based
upon competitive market rates at the time of issuance. At the time the
Portfolio enters into a reverse repurchase agreement, it identifies for
segregation certain liquid securities having a value not less than the
repurchase price, including accrued interest, of the reverse repurchase
agreement.
Futures Transactions: The Portfolio invests in futures contracts typically
as a substitute for taking a position in the underlying asset and/or as part of
a strategy designed to reduce exposure to other risks, such as interest rate or
currency risk. The Portfolio may also use these instruments for leverage.
These futures contracts obligate a portfolio, at maturity, to take or make
delivery of securities, the cash value of a securities index or a stated
quantity of a foreign currency. Upon entering into a futures contract, the
Portfolio is required to deposit cash or pledge U.S. Government securities of
an initial margin. Subsequent payments, which are dependent on the daily
fluctuations in the value of the underlying security or securities, are made or
received by the Portfolio each day (daily variation margin) and are
9
BLACKROCK FUNDS
NOTES TO FINANCIAL STATEMENTS (Unaudited) (CONTINUED)
recorded as unrealized gains or losses until the contracts are closed. When
contracts are closed, the Portfolio records a realized gain or loss equal to
the difference between the proceeds from (or cost of) the closing transaction
and the Portfolio's basis in the contracts. Risks of entering into futures
contracts include the possibility that there will not be a perfect price
correlation between the futures contracts and the underlying securities.
Second, it is possible that a lack of liquidity for futures contracts could
exist in the secondary market, resulting in an inability to close a futures
position prior to its maturity date. Third, the purchase of a futures contract
involves the risk that a Portfolio could lose more than the original margin
deposit required to initiate a futures transaction.
Option Writing/Purchasing: The Portfolio may write or purchase financial
options contracts for the purpose of hedging its existing portfolio securities,
or securities that the Portfolio intends to purchase, against fluctuations in
value caused by changes in prevailing market interest rates. When the Portfolio
writes or purchases an option an amount equal to the premium received or paid
by the Portfolio is recorded as a liability or an asset and is subsequently
adjusted to the current market value of the option written or purchased.
Premiums received or paid from writing or purchasing options which expire
unexercised are treated by the Portfolio on the expiration date as realized
gains or losses. The difference between the premium and the amount paid or
received on effecting a closing purchase or sale transaction, including
brokerage commissions, is also treated as a realized gain or loss. If an option
is exercised, the premium paid or received is added to the cost of the purchase
or proceeds from the sale in determining whether the Portfolio has realized a
gain or loss on investment transactions. The Portfolio as writer of an option
may have no control over whether the underlying securities may be sold (call)
or purchased (put) and as a result bears the market risk of an unfavorable
change in the price of the security underlying the written option. There were
no options held by the Portfolio at March 31, 2005.
Financing Transactions: The Portfolio may enter into financing
transactions consisting of a sale by the Portfolio of securities, together with
a commitment to repurchase similar securities at a future date. The difference
between the selling price and the future purchase price is an adjustment to
interest income. If the counterparty to whom the Portfolio sells the security
becomes insolvent, a Portfolio's right to repurchase the security may be
restricted. The value of the security may change over the term of the financing
transaction.
Estimates: The preparation of financial statements in conformity with
accounting principles generally accepted in the United States of America
("generally accepted accounting principles") requires the use of management
estimates. Actual results could differ from the estimates.
Other: Securities denominated in currencies other than U.S. dollars are
subject to changes in value due to fluctuations in exchange rates.
Some countries in which the Portfolio invests require governmental
approval for the repatriation of investment income, capital or the proceeds of
sales of securities by foreign investors. In addition, if there is
deterioration in a country's balance of payments or for the other reasons, a
country may impose temporary restrictions on foreign capital remittances
abroad.
The securities exchanges of certain foreign markets are substantially
smaller, less liquid and more volatile than the major securities markets in the
United States. Consequently, acquisition and disposition of securities by the
Portfolio may be inhibited.
(C) Transactions with Affiliates and Related Parties
Pursuant to an Investment Advisory Agreement, BlackRock Financial
Management, Inc. ("BlackRock"), a wholly-owned subsidiary of BlackRock, Inc.,
serves as investment adviser to the Portfolio. For its advisory services,
BlackRock is entitled to receive fees, computed daily and paid monthly, at the
annual rate of 0.20% of the Portfolio's average daily net assets.
10
BLACKROCK FUNDS
NOTES TO FINANCIAL STATEMENTS (Unaudited) (CONTINUED)
BlackRock has contractually agreed to waive or reimburse all of its
advisory fees for the Portfolio until February 1, 2006, and may reimburse the
Portfolio for certain operating expenses. For the six months ended March 31,
2005, advisory fees and waivers for the Portfolio were as follows:
GROSS NET
ADVISORY ADVISORY
FEE WAIVER FEE
- ------------- -------------- ---------
$ 68,378 $ (68,378) $-
In the interest of limiting the expenses of the Portfolio, BlackRock and
the Portfolio have entered into a series of annual expense limitation
agreements. The agreements set a limit on certain operating expenses of the
Portfolio for the next year and require BlackRock to waive or reimburse fees or
expenses if these operating expenses exceed that limit. These expense limits
apply to the aggregate expenses incurred on a share class (excluding: interest,
taxes, brokerage commissions, other expenditures which are capitalized in
accordance with generally accepted accounting principles and other
extraordinary expenses).
Effective February 1, 2005, BlackRock has contractually agreed to waive or
reimburse fees or expenses in order to limit expenses to 0.26% of the
Portfolio's average daily net assets.
At March 31, 2005, the amounts subject to possible future reimbursement
under the expense limitation agreement are as follows:
TOTAL WAIVERS
EXPIRING EXPIRING SUBJECT TO
JANUARY 31, 2007 JANUARY 31, 2008 REIMBURSEMENT
- ------------------ ------------------ --------------
$ 158,645 $ 37,985 $ 196,630
PFPC Inc. ("PFPC"), an indirect subsidiary of The PNC Financial Services
Group, Inc., and BlackRock Advisors, Inc. ("BAI"), act as co-administrators for
the Portfolio. For theses services, the co-administrators receive a combined
administration fee computed daily and payable monthly, based on a percentage of
the average daily net assets of the Portfolio, at the following annual rates:
0.085% of the first $500 million, 0.075% of the next $500 million and 0.065% of
assets in excess of $1 billion. In addition, the Portfolio is charged an
administration fee based on the following percentage of average daily net
assets of the Portfolio's Institutional share class: 0.145% of the first $500
million, 0.135% of the next $500 million and 0.125% of assets in excess of $1
billion.
PFPC and BAI may, at their discretion, waive all or any portion of their
administration fees for the Portfolio's Institutional Share Class. For the six
months ended March 31, 2005, administration fees and waivers for the Portfolio
were as follows:
GROSS NET
ADMINISTRATION ADMINISTRATION
FEE WAIVER FEE
- ---------------- -------------- ---------------
$ 78,635 $ (52,767) $ 25,868
In addition, PFPC Trust Co., an indirect wholly-owned subsidiary of The
PNC Financial Services Group, Inc., serves as custodian for the Portfolio. PFPC
serves as transfer and dividend disbursing agent. The annual transfer agent fee
will not exceed 0.018% of the average daily net assets of the Portfolio plus
per account fees and disbursements.
As of March 31, 2005, affiliated payables were as follows:
STRATEGIC
----------
PFPC(1) ......... $12,184
(1) - payables to PFPC and PFPC Trust Co. are for Accounting, Administration,
Custody and Transfer Agent services provided as of March 31, 2005.
(D) Purchase and Sales of Securities
For the six months ended March 31, 2005, purchases and sales of investment
securities, other than short-term investments and government securities, were
$52,722,633 and $77,647,661, respectively. For the six months ended March 31,
2005, purchases and sales of government securities were $54,053,658 and
$17,100,873, respectively.
11
BLACKROCK FUNDS
NOTES TO FINANCIAL STATEMENTS (Unaudited) (CONTINUED)
(E) Capital Shares
Transactions in capital shares for each period were as follows:
FOR THE
SIX MONTHS FOR THE
ENDED YEAR ENDED
3/31/05 9/30/04
--------------- ---------------
Shares Sold ........................................ 6,555,829 5,536,840
Shares issued in reinvestment of dividends ......... 195,150 361,760
Shares redeemed .................................... (6,614,510) (4,547,851)
---------- ----------
Net increase ....................................... 136,469 1,350,749
========== ==========
On March 31, 2005, five shareholders held approximately 66% of the
outstanding shares of the Portfolio.
(F) At March 31, 2005, net assets consisted of:
Capital paid-in ..................................... $ 66,606,249
End of period distributions in excess of net investment inc(413,930)
Accumulated net realized gain on investment transactions,
futures contracts and foreign currency related transactions . 1,184,552
Net unrealized appreciation on investment transactions,
futures contracts and foreign currency related transactions . 419,905
------------
$ 67,79 6,776
============
(G) Federal Tax Information
No provision is made for Federal taxes as it is the Fund's intention to
have the Portfolio continue to qualify for and elect the tax treatment
applicable to regulated investment companies under Subchapter M of the Internal
Revenue Code of 1986, as amended, and to make the requisite distributions to
its shareholders which will be sufficient to relieve it from federal income and
excise taxes. Short-term capital and foreign currency gain distributions that
are reported in the Statement of Changes in Net Assets are reported as ordinary
income for Federal income tax purposes. There were no short-term or long-term
capital gain distributions for the six month ended March 31, 2005.
Dividends from net investment income and distributions from net realized
capital gains are determined in accordance with U.S. Federal income tax
regulations, which may differ from those amounts determined under accounting
principles generally accepted in the United States.
The estimated tax character of distributions paid during the six months
ended March 31, 2005 and the tax character of distributions paid during the
year ended September 30, 2004 were as follows:
TAX
ORDINARY RETURN TOTAL
DATE INCOME OF CAPITAL DISTRIBUTIONS
- ----------- -------------- ------------ --------------
3/31/05 $ 1,505,478 $ - $ 1,505,478
9/30/04 1,724,257 1,327,267 3,051,524
As of March 31, 2005, the estimated tax components of distributable
earnings/(accumulated losses) were as follows:
UNDISTRIBUTED UNDISTRIBUTED ACCUMULATED POST-
ORDINARY LONG-TERM CAPITAL OCTOBER
INCOME CAPITAL GAIN LOSSES LOSSES
--------------- --------------- ------------- --------
$ 770,228 $ 374,376 $- $-
The estimated Post-October losses represent losses realized on investment
transactions from November 1, 2004 through March 31, 2005 that, in accordance
with Federal income tax regulations, the Portfolio may defer and treat as
12
BLACKROCK FUNDS
NOTES TO FINANCIAL STATEMENTS (Unaudited) (CONCLUDED)
having arisen in the following fiscal year. For Federal income tax purposes,
capital loss carryforwards may be carried forward and applied against future
capital gains.
At September 30, 2004, the Portfolio had capital loss carryforwards
available to offset future realized capital gains through the indicated
expiration dates.
EXPIRING SEPTEMBER 30
--------------------------------------------------------
2009 2010 2011 TOTAL
------------ ----------- ------------ ------------
$ 225,015 $ 95,501 $ 219,062 $ 539,578
13
BLACKROCK FUNDS
ADDITIONAL INFORMATION
(A) Board of Trustees' Consideration of the Advisory Contracts. The
Investment advisory agreement ("Advisory Contract") for the Strategic
Portfolio I (the "Portfolio") of BlackRock Funds (the "Fund") was most
recently approved by the Board of Trustees (the "Board" or the "Trustees")
of the Fund at an in-person meeting of the Board held on March 1, 2005,
including a majority of the Trustees who are not parties to the Advisory
Contract or interested persons of any such party (as such term is defined
in the Investment Company Act of 1940) (the "Independent Trustees"). In
determining to approve the Advisory Contract, the Trustees met with the
relevant investment advisory personnel from BlackRock Financial Management,
Inc. (the "Adviser") and considered all information they deemed reasonably
necessary to evaluate the terms of the Advisory Contract. The Board
received materials in advance of the meeting relating to its consideration
of the Advisory Contract for the Portfolio, including: (i) fees and the
expense ratio of the Portfolio in comparison to the fees and expense ratios
of a peer group of funds, which consists of funds that have all of the
following similar criteria: fund type, investment classification and
objective, load type, asset level and expense structure and components
("peer group"); (ii) information on the investment performance of the
Portfolio in comparison to the investment performance of a peer universe of
funds, which is broader than a peer group and consists of funds that have
all of the following similar criteria: fund type, investment classification
and objective and load type ("performance universe"); (iii) the Adviser's
economic outlook for the Portfolio and its general investment outlook for
the markets; (iv) information with respect to profitability of BlackRock,
Inc. ("BlackRock") and PNC Bank-affiliated companies with respect to the
Portfolio, including details regarding the methodology used to calculate
profitability; (v) information regarding fees paid to service providers
that are affiliates of the Adviser; and (vi) information regarding
compliance records and regulatory matters relating to the Adviser. The
matters discussed below were considered separately by the Independent
Trustees in an executive session, during which counsel who is independent
of the Adviser and the Fund provided guidance to the Independent Trustees.
Fees and Expenses. In approving the Advisory Contract, the Trustees,
including the Independent Trustees, considered the fees and expense ratio
of the Portfolio. They compared the fees, both before (referred to as
"Contractual") and after (referred to as "Actual") any fee waivers and
expense reimbursements, and the expense ratio of the Portfolio against fees
and expense ratios of a peer group. Both the peer group category and the
funds within the peer group with respect to the fee and expense ratio
comparisons were selected by Lipper, Inc. ("Lipper"), which is not
affiliated with the Adviser. In evaluating the Portfolio's advisory fees,
the Trustees also took into account the complexity of investment management
for the Portfolio relative to other types of funds. In considering data
based on information provided by Lipper, the Trustees noted that the
Portfolio has contractual advisory fees lower than the median for its peer
group.1
The Trustees also were provided with information about the services
rendered, and the fee rates offered, to other clients advised by the
Adviser, including closed-end investment companies and accounts that are
not investment companies.
1The Lipper peer group median was chosen as a conservative point of
reference, taking into account that one-half of the population will have
fees/expenses lower than the median.
14
BLACKROCK FUNDS
Following consideration of this information, the Trustees, including the
Independent Trustees, concluded that the fees to be paid pursuant to the
Advisory Contracts were fair and reasonable in light of the services
provided.
Nature, Extent and Quality of Services. The Trustees, including the
Independent Trustees, received information concerning the investment
philosophy and investment process used by the Adviser in managing the
Portfolio, as well as a description of the capabilities, personnel and
services of the Adviser and a copy of the current Form ADV of BlackRock
Advisors, Inc. In connection with this, the Trustees considered the
Adviser's in-house research capabilities as well as other resources
available to its personnel. The Trustees considered the scope of the
services provided by the Adviser to the Portfolio under the Advisory
Contract relative to services typically provided by third parties to other
funds. The Trustees noted that the standard of care applicable under the
Advisory Contract was comparable to that found generally in investment
company advisory agreements. The Trustees concluded that the scope of the
Adviser's services to be provided to the Portfolio was consistent with the
Portfolio's operational requirements, including, in addition to seeking to
meet its investment objective, compliance with investment restrictions, tax
and reporting requirements and related shareholder services.
The Trustees also considered the quality of the services provided by the
Adviser to the Portfolio. The Trustees evaluated the procedures of the
Adviser designed to fulfill its fiduciary duty to the Portfolio with
respect to possible conflicts of interest, including its code of ethics
(regulating the personal trading of its officers and employees), the
procedures by which the Adviser allocates trades among its various
investment advisory clients, the integrity of the systems in place to
ensure compliance with the foregoing and the record of the Adviser in these
matters. The Trustees also received information concerning standards of
the Adviser with respect to the execution of portfolio transactions.
The Trustees also considered information relating to the education,
experience and number of investment professionals and other personnel who
provide services under the Advisory Contract. The Trustees also took into
account the time and attention devoted by senior management of the Adviser
to the Portfolio. The Trustees also considered the business reputation of
the Adviser and its financial resources and concluded that the Adviser
would be able to meet any reasonably foreseeable obligation under the
Advisory Contract.
Fund Performance. The Board of Trustees, including the Independent
Trustees, received and considered information about the Portfolio's
investment performance in comparison to the investment performance of its
performance universe. The funds included within the Portfolio's
performance universe were selected by Lipper. The Board was provided with
performance data for the one-, three-, five- and ten-year periods, as
applicable, ended November 30, 2004 ("relevant periods"). The Board also
reviewed the investment performance of the Portfolio and the Adviser's
market outlook with respect to the Portfolio.
The Trustees noted that the Portfolio performed below its performance
universe median during two of the relevant periods by more than 10%. The
Trustees also noted that in the judgment of the Adviser, the Portfolio's
peer group as selected by Lipper did not accurately reflect the asset class
of the Portfolio. The Portfolio is intended solely for institutional
clients who seek opportunistic indirect exposure to foreign markets, and is
not comparable to other funds in the Lipper Global Income Funds
classification, nor managed against any benchmarks. Despite the recent
decline in performance, the Portfolio outperformed its performance universe
median for the 5-year period.
15
BLACKROCK FUNDS
ADDITIONAL INFORMATION
The Trustees discussed other factors relevant to the performance of the
Portfolio. The Trustees determined that, while the performance record of
the Portfolio could be improved, the Adviser was taking steps to address
relative underperformance.
Profitability. The Board of Trustees, including the Independent Trustees,
considered the level of the Adviser's and affiliates' profits in respect of
their relationship with the Portfolio. This consideration included a broad
review of the Adviser's methodology in allocating its costs to the
management of the Portfolio. The Board of Trustees considered the profits
realized by the Adviser and affiliates in connection with the operation of
the Portfolio and whether the amount of profit is a fair profit relative to
their relationship with the Portfolio. The Board of Trustees, including
the Independent Trustees, also considered the Adviser's profit margins in
comparison with available industry data. The Board concluded that the
Adviser's profit is a reasonable profit relative to the services provided
to the Portfolio.
Economies of Scale. The Board of Trustees, including the Independent
Trustees, considered whether there have been economies of scale in respect
of the management of the Portfolio, whether the Portfolio has appropriately
benefited from any economies of scale, and whether there is potential for
realization of any further economies of scale.
The Board also considered the fee waivers and expense reimbursement
arrangements by the Adviser. The Board determined that the advisory fee
structure was reasonable and that no changes were currently necessary.
Other Benefits to the Advisers. The Board of Trustees, including the
Independent Trustees, also took into account not only the advisory fees
payable by the Portfolio, but also other potential benefits to the Adviser,
such as the ability to leverage investment professionals that also manage
other portfolios, raising the profile of BlackRock in the broker-dealer
community, and the engagement of affiliates of the Adviser as service
providers to the Portfolio, including for administrative, transfer agency,
distribution and custodial services. The Board also noted that the Adviser
may benefit from the use of soft dollars for research, which may be used by
the Adviser to manage other accounts.
The Board concluded that other ancillary benefits that the Adviser and its
affiliates could be expected to receive with regard to providing investment
advisory and other services to the Portfolio, such as those noted above,
were consistent with those available to other mutual fund sponsors.
No single factor was considered in isolation or to be determinative in the
Board's decision to approve the Advisory Contract. Rather, the Board
concluded, in light of a weighing and balancing of all factors considered,
that it was in the best interests of the Portfolio to approve the
continuation of the Advisory Contract, including the fees to be charged for
services thereunder.
(B) PricewaterhouseCoopers LLP ("PwC"), the Fund's former independent auditor,
has been hired as an
internal audit supporting service provider by The PNC Financial Services
Group, Inc. ("PNC"), the parent company of the Fund's investment adviser
and certain other service providers. In order to provide certain services
to PNC and its affiliates which would have caused PwC to no longer be
independent with respect to the Fund, PwC declined to stand for re-election
as independent auditor of the Fund after the completion of the fiscal 2003
audit.
The Fund's Audit Committee approved engaging Deloitte & Touche LLP as the
independent auditor to audit the Fund's financial statements for fiscal
year 2005. A majority of the Fund's Board of Trustees, including a majority
of the independent Trustees, approved the appointment of Deloitte & Touche
LLP as the Fund's independent auditor for the Fund's fiscal 2005 audit on
November 12, 2004, subject to the
16
BLACKROCK FUNDS
right of the Fund, by a majority vote of the shareholders at any meeting
called for that purpose, to terminate the appointment without penalty.
(C) As previously disclosed, BlackRock has received subpoenas from various
federal and state governmental and regulatory authorities and various
information requests from the Securities and Exchange Commission in
connection with ongoing industry-wide investigations of mutual fund
matters.
(D) The amounts paid by the Fund to the Chief Compliance Officer (CCO) for the
six months ended March 31, 2005, were $87,903.
17
[THIS PAGE INTENTIONALLY LEFT BLANK.]
BLACKROCK FUNDS
Investment Adviser
BlackRock Advisors, Inc.
Wilmington, Delaware 19809
Custodian
PFPC Trust Co.
Philadelphia, Pennsylvania 19153
Co-Administrator and Transfer Agent
PFPC Inc.
Wilmington, Delaware 19809
Distributor
BlackRock Distributors, Inc.
King of Prussia, Pennsylvania 19406
Co-Administrator
BlackRock Advisors, Inc.
Wilmington, Delaware 19809
Counsel
Simpson Thacher & Bartlett LLP
New York, New York 10017
Independent Registered Public Accounting Firm
Deloitte & Touche LLP
Philadelphia, Pennsylvania 19103
The Fund has delegated proxy voting responsibilities to BlackRock and its
affiliates, subject to the general oversight of the Fund's Board of Trustees. A
description of the policies and procedures that BlackRock and its affiliates
use to determine how to vote proxies relating to portfolio securities is
available without charge, upon request, by calling 1-800-441-7762, or on the
website of the Securities and Exchange Commission (the "Commission") at
http://www.sec.gov.
Information on how proxies relating to the Fund's voting securities were voted
(if any) by the Advisor during the most recent 12-month period ended June 30th
is available, upon request and without charge, by calling (800) 441-7762 or on
the website of the Commission at http://www.sec.gov.
The Fund files its complete schedule of portfolio holdings for the first and
third quarters of its fiscal year with the Commission on Form N-Q. The Fund's
Form N-Q is available on the Commission's website at http://www.sec.gov and may
be reviewed and copied at the Commission's Public Reference Room in Washington,
D.C. Information regarding the operation of the Public Reference Room may be
obtained by calling 1-800-SEC-0330. The Fund's Form N-Q may also be obtained
upon request, without charge, by calling (800) 441-7762.
This report is for shareholder information. This is not a prospectus intended
for use in the purchase or sale of Fund shares.
Shares of the Fund are not deposits or obligations of, or guaranteed or
endorsed by PNC Bank, National Association or any other bank and shares are not
federally insured by, guaranteed by, obligations of or otherwise supported by
the U.S. Government, the Federal Deposit Insurance Corporation, the Federal
Reserve Board, or any other governmental agency. Investments in shares of the
fund involve investment risks, including the possible loss of the principal
amount invested.
[GRAPHIC OMITTED]
STRAT-SEMI
ALTERNATIVES BLACKROCK SOLUTIONS EQUITIES FIXED
INCOME LIQUIDITYREAL ESTATE BlackRock Funds
Exchange Portfolio
Semi-Annual Report to Shareholders
March 31, 2005 (Unaudited)
[GRAPHIC OMITTED]
[GRAPHIC OMITTED]
[GRAPHIC OMITTED]
NOT FDIC INSURED
MAY LOSE VALUE
NO BANK GUARANTEE
[THIS PAGE INTENTIONALLY LEFT BLANK.]
BLACKROCK FUNDS
EXCHANGE PORTFOLIO
TABLE OF CONTENTS
Shareholder Letter..........................................................1
Portfolio Summary
Exchange Portfolio......................................................2-3
Statement of Net Assets.................................................. ..
Portfolio Financial Statements
Statement of Operations...................................................5
Statement of Changes in Net Assets........................................6
Financial Highlights......................................................7
Notes to Financial Statements............................................8-12
Additional Information..................................................13-15
PRIVACY PRINCIPLES OF BLACKROCK FUNDS
BlackRock Funds is committed to maintaining the privacy of its shareholders and
to safeguarding their nonpublic personal information. The following information
is provided to help you understand what personal information BlackRock Funds
collects, how we protect that information, and why in certain cases we may
share such information with select other parties.
BlackRock Funds does not receive any nonpublic personal information relating to
its shareholders who purchase shares through their broker-dealers. In the case
of shareholders who are record owners of BlackRock Funds, BlackRock Funds
receives nonpublic personal information on account applications or other forms.
With respect to these shareholders, BlackRock Funds also has access to specific
information regarding their transactions in BlackRock Funds.
BlackRock Funds does not disclose any nonpublic personal information about its
shareholders or former shareholders to anyone, except as permitted by law or as
is necessary in order to service our shareholders' accounts (for example, to a
transfer agent).
BlackRock Funds restricts access to nonpublic personal information about its
shareholders to BlackRock employees with a legitimate business need for the
information. BlackRock Funds maintains physical, electronic and procedural
safeguards designed to protect the nonpublic personal information of our
shareholders.
BLACKROCK EXCHANGE PORTFOLIO
March 31, 2005
Dear Shareholder,
We are pleased to present the Semi-Annual Report to Shareholders of the
BlackRock Exchange Portfolio for the period ended March 31, 2005. The
Semi-Annual Report includes important information on the Portfolio, and is
organized as follows:
o Portfolio Summary - discusses recent portfolio management activity and
highlights total returns.
o Fund Profile - displays characteristics of the Portfolio's holdings as of
March 31, 2005.
o Expense Example - discusses costs in a shareholder account and provides
information for a shareholder to estimate his or her expenses by share
class and to compare expenses of each share class to other funds.
o Statement of Net Assets - lists portfolio holdings and includes each
holding's market value and par amount/number of shares as of March 31,
2005. The Statement of Net Assets also contains the net asset value for the
Portfolio.
o Statement of Operations - displays the components of the Portfolio's
investment income and provides a detailed look at the Portfolio's expenses.
The Statement of Operations also lists the aggregate change in value of a
Portfolio's securities due to market fluctuations and security sales.
o Statement of Changes in Net Assets - compares Portfolio information from the
prior period to the current period. Specifically, it details shareholder
distributions by share class, aggregate realized gains and losses, and the
change in net assets from the beginning of the period to the end of the
period.
o Financial Highlights - includes the Portfolio's expense ratios, net asset
values, total returns, distributions per share, and turnover ratios for the
current period and the last five years or since inception.
o Notes to Financial Statements - provides additional information on fees, a
summary of significant accounting policies, a list of affiliated
transactions, and a summary of purchases and sales of securities.
There were two notable recent developments for the BlackRock Funds (the
"Fund").
First, on January 31, 2005, BlackRock, Inc., the parent of BlackRock
Advisors, Inc., the Fund's investment adviser, acquired SSRM Holdings, Inc.,
the parent of State Street Research & Management Company, the investment
adviser to the former State Street Research Funds. The transaction enhances
BlackRock's investment management platform with additional US equity,
alternative investment, and real estate equity management capabilities. In
addition, the scale and scope of BlackRock's open-end and closed-end mutual
funds and distribution capabilities has expanded significantly. We believe that
we can incorporate the best of both organizations to deliver high quality
products to both institutional and individual investors.
Second, a proxy statement was recently sent to shareholders of all
portfolios of the Fund asking them to consider and vote upon the election of
nine trustees to the board of trustees of the Fund (the "Board"). Five of the
nine nominees were already serving as trustees of the Fund and the additional
nominees had previously served as trustees of the State Street Research Funds.
Due to the increased size and complexity of the Fund resulting from the
reorganization with the State Street Research Funds, and an increase in the
responsibilities of boards of trustees of funds generally, the current Board
believed it was in the best interest of the Fund to increase the size of the
Board. On April 29, 2005, the special meeting of shareholders was held, at
which all of the nominees included in the proxy were duly elected to the Board.
We hope you find the report informative, and we thank you for making
BlackRock part of your investment strategy.
Sincerely,
[GRAPHIC OMITTED]
Anne Ackerley
Managing Director
BlackRock Advisors,Inc.
1
BLACKROCK EXCHANGE PORTFOLIO
Total Net Assets (3/31/05): $287.2 million
Performance Benchmark
S&P 500(Reg. TM) Index
Investment Approach
Seeks long-term growth of capital and consequent long-term growth of
income by investing largely in a diversified and supervised portfolio of common
stocks, or securities convertible into common stocks, believed by management to
have growth potential over the years. In pursuing the Portfolio's investment
objective, the management team seeks to minimize the recognition of capital
gains.
Recent Portfolio Management Activity
o On January 31, 2005, BlackRock, Inc., the parent of BlackRock Advisors,
Inc. (BAI), acquired SSRM Holdings, Inc., the parent of State Street Research &
Management Company (SSRM), the investment adviser to the State Street Research
mutual funds. In connection with the transaction, the BlackRock Exchange
Portfolio (the Portfolio) reorganized with the State Street Research Exchange
Fund (the SSR Fund). The SSR Fund transferred substantially all of its assets
and liabilities to the Portfolio in exchange for shares of the Portfolio, which
were then distributed to the SSR Fund shareholders. For periods prior to
January 31, 2005, the performance information shown reflects the performance of
the SSR Fund, which had substantially similar investment goals and strategies
as the Portfolio.
o The Portfolio underperformed the benchmark for the semi-annual period.
o U.S. equity markets lost ground during the first quarter of 2005, as
the S&P 500(Reg. TM) Index sustained its largest quarterly loss in two years,
declining 2.2%. Investors became increasingly concerned about the impact that
higher commodity prices might have on the economy and feared that inflationary
pressures are on the rise. Market weakness during the first quarter was not
enough to offset gains from the fourth quarter of 2004 as the S&P 500(Reg. TM)
Index gained 6.9% during the six-month period. In this environment (for the
6-month period) mid-capitalization stocks outperformed their large- and
small-capitalization counterparts, while value stocks continued to outperform
growth stocks.
o During the period, security selection detracted from the Portfolio's
performance versus its benchmark. In particular, weakness among consumer
staples, financials and health care had a negative impact on performance.
Security selection in industrials and telecommunication services aided
performance. Positions in beverages, food and staples retailing and household
products detracted from relative returns in consumer staples. Specifically the
Portfolio's exposure to Anheuser-Busch, Wal-Mart and Procter & Gamble
contributed to relative underperformance. While the Portfolio's underweight to
the financials sector helped relative performance, weakness among specific
consumer finance, insurance, and thrifts and mortgage finance holdings
detracted from returns. Overweight positions in American Express, American
International Group and Fannie Mae were the major drivers of underperformance
in the sector. Select disappointments within health care hurt returns. Within
health care equipment and supplies, the Portfolio's position in drug industry
servicing firm Millipore detracted from returns, while shares of Wyeth declined
among its pharmaceutical holdings.
o The Portfolio produced strong absolute gains within the energy sector,
bolstered by its overweight to the group. However, security selection results
hurt relative returns, as the Portfolio's positions within both the oil and gas
and energy equipment and services industries lagged those within the benchmark.
Strong performance in the Portfolio's aerospace and defense and machinery
holdings was the key driver of its strong relative gains in the industrials
sector. Within these industries, Portfolio overweights in Boeing and
Caterpillar aided returns.
o At the end of the period, relative to the S&P 500(Reg. TM), the
Portfolio was overweight in the consumer staples, energy and health care
sectors and was underweight in the consumer discretionary and financials
sectors.
COMPARISON OF CHANGE IN VALUE OF A $10,000 INVESTMENT IN THE EXCHANGE PORTFOLIO
AND
THE S&P 500(REG. TM) INDEX FOR THE PAST TEN YEARS.
[LINE CHART]
Exchange Portfolio S&P 500256 Index
------------------ ----------------
03/31/1995 $ 10,000 $ 10,000
06/30/1995 10,903 10,955
09/30/1995 11,642 11,825
12/31/1995 12,317 12,537
03/31/1996 13,332 13,210
06/30/1996 13,870 13,803
09/30/1996 14,523 14,230
12/31/1996 15,527 15,416
03/31/1997 16,029 15,829
06/30/1997 19,120 18,593
09/30/1997 20,127 19,985
12/31/1997 20,450 20,559
03/31/1998 23,137 23,427
06/30/1998 24,281 24,201
09/30/1998 21,701 21,793
12/31/1998 26,195 26,434
03/31/1999 28,205 27,751
06/30/1999 30,095 29,707
09/30/1999 28,241 27,853
12/31/1999 31,065 31,997
03/31/2000 31,303 32,731
06/30/2000 30,587 31,861
09/30/2000 30,487 31,553
12/31/2000 29,782 29,084
03/31/2001 25,727 25,636
06/30/2001 26,767 27,136
09/30/2001 23,835 23,153
12/31/2001 26,698 25,627
03/31/2002 27,407 25,698
06/30/2002 23,548 22,255
09/30/2002 20,056 18,410
12/31/2002 21,685 19,964
03/31/2003 21,307 19,335
06/30/2003 23,866 22,312
09/30/2003 24,280 22,902
12/31/2003 26,215 25,690
03/31/2004 26,703 26,125
06/30/2004 27,035 26,575
09/30/2004 26,637 26,078
12/31/2004 28,215 28,486
03/31/2005 27,445 27,874
FOR PERIOD ENDING MARCH 31, 2005
Exchange Portfolio - Average Annual Return
1 Year 3 Year 5 Year 10 Year
- ------------ ---------- ------------- -----------
2.82% 0.05% (2.61)% 10.63%
THE INCEPTION DATE OF THE PORTFOLIO WAS 12/17/76.
PAST PERFORMANCE IS NOT PREDICTIVE OF FUTURE RESULTS. The graph and table do
not reflect the deduction of taxes that a shareholder would pay on fund
distributions or the redemption of shares. Although the holdings and sectors
listed above were current as of the periods indicated, the Portfolio is
actively managed and its composition will vary.
2
BLACKROCK EXCHANGE PORTFOLIO
FUND PROFILE
Top Ten Holdings (% of long-term investments)
Exxon Mobil Corp. 6.6 %
American Express Co. 5.5
Target Corp. 4.8
The Procter & Gamble Co. 4.6
General Electric Co. 4.4
SLM Corp. 4.1
Wal-Mart Stores, Inc. 4.0
Berkshire Hathaway, Inc. - Class B 3.7
First Data Corp. 3.7
Microsoft Corp. 3.4
=====
Total 44.8%
=====
Top Ten Industries (% of long-term
investments)
Oil & Gas 12.9 %
Finance 11.4
Pharmaceuticals 10.2
Retail Merchandising 8.8
Computer & Office Equipment 8.0
Computer Software & Services 7.1
Soaps & Cosmetics 4.6
Beverages & Bottling 4.5
Aerospace 4.5
Manufacturing 4.4
----
Total 76.4%
====
- --------------------------------------------------------------------------------
EXPENSE EXAMPLE
As a shareholder of the Portfolio, you incur ongoing costs, including advisory
fees, and other Portfolio expenses. This Example is intended to help you
understand your ongoing costs (in dollars) of investing in the Portfolio and to
compare these costs with the ongoing costs of investing in other mutual funds.
The Example below is based on an investment of $1,000 invested at the beginning
of the period and held for the entire period October 1, 2004 to March 31, 2005.
The information under "Actual Expenses," together with the amount you invested,
allows you to estimate actual expenses incurred over the reporting period.
Simply divide your account value by $1,000 (for example, an $8,600 account
value divided by $1,000 = 8.60) and multiply the result by the cost shown for
your share class, in the row entitled "Expenses Incurred During Period", to
estimate the expenses incurred on your account during this period.
The information under "Hypothetical Expenses" provides information about
hypothetical account values and hypothetical expenses based on the Portfolio's
actual expense ratio and an assumed rate of return of 5% per year before
expenses, which is not the Portfolio's actual return. The hypothetical account
values and expenses may not be used to estimate the actual ending account
balance or expense you incurred for the period. You may use this information to
compare the ongoing costs of investing in the Portfolio and other funds. To do
so, compare this 5% hypothetical example with the 5% hypothetical examples that
appear in the shareholder reports of the other funds.
Please note that the expenses shown in the table are meant to highlight your
ongoing costs only and do not reflect any transactional costs, such as front
and back end sales charges (loads) or redemption/exchange fees, where
applicable. Therefore, the hypothetical information is useful in comparing
ongoing costs only, and will not help you determine the relative total costs of
owning different funds.
Hypothetical Expenses
Actual Expenses (5% return before expenses)
----------------- ----------------------------
BlackRock Class BlackRock Class
----------------- ----------------------------
Beginning Account Value (10/1/04) $ 1,000.00 $ 1,000.00
Ending Account Value (3/31/05) 1,030.20 1,021.72
Expenses Incurred During Period (10/1/04 - 3/31/05) 3.29 3.28
For the BlackRock share class of the Portfolio, expenses are equal to the
annualized expense ratio of 0.65%, multiplied by the average account value over
the period, multiplied by 182/
365 (to reflect the one-half year period).
For the period October 1, 2004 through January 30, 2005, the "Actual Expenses"
table reflects the expenses of the State Street Research Exchange Fund prior to
its reorganization with the Portfolio on that date. Restated to reflect the
Portfolio's current expenses for the entire semi-annual period, (i) "Ending
Account Value" on March 31, 2005 would have been $1,030.00 and (ii) "Expenses
Incurred During Period" for the period October 1, 2004 through March 31, 2005
would have been 3.04.
3
BLACKROCK FUNDS
STATEMENT OF NET ASSETS
BLACKROCK EXCHANGE PORTFOLIO
AS OF MARCH 31, 2005 (UNAUDITED)
NUMBER
OF SHARES VALUE
----------- --------------
COMMON STOCKS - 98.5%
Aerospace - 4.4%
The Boeing Co. 131,800 $ 7,705,028
General Dynamics Corp. 46,500 4,977,825
============
12,682,853
------------
Banks - 1.5%
J.P. Morgan Chase & 124,728 4,315,589
------------
Co., Inc.
Beverages & Bottling - 4.4%
Anheuser-Busch Cos., 192,315 9,113,808
Inc.
The Coca-Cola Co. 87,735 3,655,917
============
12,769,725
------------
Computer & Office Equipment - 7.9%
Dell, Inc.(b) 170,500 6,550,610
Hewlett-Packard Co. 349,270 7,662,984
International Business
Machines
Corp. 92,371 8,440,862
============
22,654,456
------------
Computer Software & Services - 7.0%
First Data Corp. 266,480 10,475,329
Microsoft Corp. 399,890 9,665,341
============
20,140,670
------------
Conglomerates - 3.7%
Berkshire Hathaway, 3,687 10,530,072
------------
Inc. - Class B
Electronics - 1.8%
Agilent Technologies, 29,749 660,428
Inc.(b)
Intel Corp. 200,000 4,646,000
============
5,306,428
------------
Finance - 11.2%
American Express Co. 305,626 15,700,008
Fannie Mae 88,105 4,797,317
SLM Corp. 233,200 11,622,688
============
32,120,013
------------
Food & Agriculture - 0.1%
General Mills, Inc. 8,497 417,628
------------
Insurance - 2.1%
American International 106,800 5,917,788
------------
Group, Inc.
Machinery & Heavy Equipment - 3.0%
Caterpillar, Inc. 93,884 8,584,753
------------
Manufacturing - 4.3%
General Electric Co. 344,970 12,439,618
------------
Medical & Medical Services - 2.5%
Medco Health Solutions, 11,124 551,417
Inc.(b)
Millipore Corp.(b) 150,000 6,510,000
============
7,061,417
------------
Medical Instruments & Supplies - 4.0%
Johnson & Johnson 124,195 8,340,936
Medtronic, Inc. 60,000 3,057,000
============
11,397,936
------------
Oil & Gas - 12.7%
BP PLC 147,629 9,212,050
Exxon Mobil Corp. 312,469 18,623,152
Schlumberger Ltd. 109,238 7,699,094
Transocean, Inc.(b) 21,148 1,088,276
============
36,622,572
------------
NUMBER
OF SHARES VALUE
----------- --------------
COMMON STOCKS (Continued)
Pharmaceuticals - 10.0%
AstraZeneca PLC - ADR 76,000 $ 3,004,280
Merck & Co., Inc. 83,999 2,719,048
Novartis AG - ADR
185,384 8,672,264
Pfizer, Inc.
316,146 8,305,154
Wyeth 145,544 6,139,046
============
28,839,792
------------
Retail Merchandising -
8.7%
Target Corp. 273,222 13,666,564
Wal-Mart Stores, Inc.
223,200 11,184,552
============
24,851,116
------------
Soaps & Cosmetics - 4.5%
The Procter & Gamble 246,400 13,059,200
------------
Co.
Telecommunications - 2.9%
Vodafone Group PLC - SP ADR
309,500 8,220,320
------------
Tobacco - 1.8%
Altria Group, Inc. 77,000 5,035,030
------------
TOTAL COMMON STOCKS
(Cost $91,642,125)
282,966,976
------------
SHORT TERM INVESTMENTS - 1.4%
Galileo Money Market Fund
(Cost $3,970,721) 3,970,721 3,970,721
------------
TOTAL INVESTMENTS IN
SECURITIES - 99.9%
(Cost $95,612,846(a)) 286,937,697
OTHER ASSETS IN EXCESS OF
LIABILITIES - 0.1% 311,964
-----------
NET ASSETS - 100.0% $287,249,661
============
NET ASSET VALUE, OFFERING AND
REDEMPTION PRICE PER
BLACKROCK SHARE
($287,249,661/568,236) $ 505.51
========
- -------------------
(a) Cost for Federal income tax purposes is $88,180,430. The gross
unrealized appreciation (depreciation) on a tax basis is as
follows:
Gross unrealized appreciation $201,058,966
Gross unrealized depreciation (2,301,699)
------------
$198,757,267
============
(b) Non-income producing security.
INVESTMENT ABBREVIATIONS
ADR American Depository Receipts
SEE ACCOMPANYING NOTES TO FINANCIAL STATEMENTS.
4
BLACKROCK FUNDS
STATEMENT OF OPERATIONS
BLACKROCK EXCHANGE PORTFOLIO
FOR THE THREE MONTHS ENDED MARCH 31, 2005 (UNAUDITED)
Investment income:
Interest ......................................................... $ 10,093
Dividends ........................................................ 1,349,780
Foreign taxes witheld ............................................ (76)
------------
Total investment income ....................................... 1,359,797
------------
Expenses:
Investment advisory fee .......................................... 359,554
Administration fee ............................................... 66,881
Custodian fee .................................................... 10,634
Transfer agent fee ............................................... 31,421
Legal and audit fee .............................................. 17,645
Printing fee ..................................................... 24,748
Registration fees and expenses ................................... 8,680
Trustees' fees ................................................... 1,392
Other ............................................................ 479
------------
Total expenses ................................................. 521,434
------------
Less investment advisory fees waived .......................... (65,896)
Less administration fees waived ............................... (17,479)
------------
Net expenses ................................................... 438,059
------------
Net investment income ............................................. 921,738
------------
Realized and unrealized loss on investments:
Net realized loss from:
Investment transactions ........................................ (329,121)
Change in unrealized appreciation/depreciation from:
Investments .................................................... (8,746,215)
------------
Net loss on investments and foreign currency transactions ......... (9,075,336)
------------
Net decrease in net assets resulting from operations .............. $ (8,153,598)
============
SEE ACCOMPANYING NOTES TO FINANCIAL STATEMENTS.
5
BLACKROCK FUNDS
STATEMENT OF CHANGES IN NET ASSETS
BLACKROCK EXCHANGE PORTFOLIO
FOR THE
THREE MONTHS FOR THE
1/1/05-3/31/05 YEAR ENDED
(UNAUDITED) 12/31/04
---------------- ----------------
Increase in net assets:
Operations:
Net investment income .................................................. $ 921,738 $ 4,448,556
Net increase from payment by affiliate (Note D) ........................ - 98,840
Net realized gain (loss) on investments ................................ (329,121) 26,685,441
Change in unrealized depreciation of investments ....................... (8,746,215) (9,213,483)
------------- -------------
Net increase (decrease) in net assets resulting from operations ........ (8,153,598) 22,019,354
------------- -------------
Distributions to shareholders from:
Net investment income .................................................. (568,002) (4,387,534)
------------- -------------
Capital share transactions:
Shares sold ............................................................ 224,015
Shares issued in reinvestment of dividends ............................. 134,902 911,070
Shares redeemed ........................................................ (3,739,577) (28,889,729)
------------- -------------
(3,380,660) (27,978,659)
------------- -------------
Total decrease in net assets ........................................... (12,102,260) (10,346,839)
Net assets:
Beginning of period .................................................... 299,351,921 309,698,760
------------- -------------
End of period .......................................................... $ 287,249,661 $ 299,351,921
============= =============
End of period undistributed net investment income ........................ $ 414,758 $ 61,022
SEE ACCOMPANYING NOTES TO FINANCIAL STATEMENTS.
6
BLACKROCK FUNDS
FINANCIAL HIGHLIGHTS
FOR A SHARE OUTSTANDING THROUGHOUT EACH PERIOD
FOR THE
THREE MONTHS FOR THE
1/1/05 - 3/31/05 YEAR ENDED
(UNAUDITED) 12/31/04
------------------ -------------
Per share operating performance:
Net asset value, beginning of period .............................. $ 520.73 $ 490.99
--------- ---------
Net investment income ............................................ 1.62 7.61
Net realized and unrealized gain (loss) on investments ........... ( 15.84) 29.63
Distributions from net investment income ......................... ( 1.00) ( 7.50)
--------- ---------
Net asset value, end of period ................................... $ 505.51 $ 520.73
========= =========
Total Return ...................................................... ( 2.74) % 7.63%
Ratios / Supplemental data
Net assets, end of period (in thousands) .......................... $ 287,250 $ 299,352
Ratio of expenses to average net assets ........................... 0.61%1 0.61%
Ratio of expenses to average net assets (excluding waivers) ....... 0.72%1 0.61%
Ratio of net investment income to average net assets .............. 1.27%1 1.47%
Ratio of net investment income to average net assets (excluding
waivers) ......................................................... 1.16%1 1.47%
Portfolio turnover ................................................ - 4%
After provision for federal tax on retained capital gains
at end of period ................................................. - -
FOR THE FOR THE FOR THE FOR THE
YEAR ENDED YEAR ENDED YEAR ENDED YEAR ENDED
12/31/03 12/31/02 12/31/01 12/31/00
------------- -------------- -------------- -------------
Per share operating performance:
Net asset value, beginning of period .............................. $ 411.01 $ 511.71 $ 575.76 $ 616.80
--------- --------- --------- ---------
Net investment income ............................................ 5.40 4.74 4.22 4.75
Net realized and unrealized gain (loss) on investments ........... 80.08 ( 100.64) ( 64.02) ( 41.19)
Distributions from net investment income ......................... ( 5.50) ( 4.80) ( 4.25) ( 4.60)
--------- --------- --------- ---------
Net asset value, end of period ................................... $ 490.99 $ 411.01 $ 511.71 $ 575.76
========= ========= ========= =========
Total Return ...................................................... 20.89% ( 18.78)% ( 10.35)% ( 4.13)%
Ratios / Supplemental data
Net assets, end of period (in thousands) .......................... $ 309,699 $ 268,503 $ 367,640 $ 437,804
Ratio of expenses to average net assets ........................... 0.59% 0.60% 0.57% 0.55%
Ratio of expenses to average net assets (excluding waivers) ....... 0.59% 0.60% 0.57% 0.55%
Ratio of net investment income to average net assets .............. 1.20% 1.00% 0.81% 0.78%
Ratio of net investment income to average net assets (excluding
waivers) ......................................................... 1.20% 1.00% 0.81% 0.78%
Portfolio turnover ................................................ 5% 3% 1% 11%
After provision for federal tax on retained capital gains
at end of period ................................................. - - - 11.01%
- ---------
1 Annualized.
SEE ACCOMPANYING NOTES TO FINANCIAL STATEMENTS.
7
BLACKROCK FUNDS
NOTES TO FINANCIAL STATEMENTS (Unaudited)
(A) Organization
BlackRock FundsSM (the "Fund") was organized on December 22, 1988 as a
Massachusetts business trust and is registered under the Investment Company Act
of 1940, as amended, as an open-end management investment company. The Fund
currently has 50 portfolios, one of which, BlackRock Exchange Portfolio, is
included in these financial statements (the "Portfolio"). The Portfolio is
authorized to issue an unlimited number of shares with a par value of $0.001.
Under the Fund's organizational documents, its officers and trustees are
indemnified against certain liabilities arising out of the performance of their
duties to the Fund. In addition, in the normal course of business, the Fund
enters into contracts with its vendors and others that provide for general
indemnifications. The Fund's maximum exposure under these arrangements is
unknown as this would involve future claims that may be made against the Fund.
However, based on experience, the Fund considers the risk of loss from such
claims to be remote.
(B) Fund Reorganization
On January 31, 2005, BlackRock, Inc., the parent of BlackRock Advisors,
Inc. ("BlackRock"), acquired SSRM Holdings, Inc., the parent of State Street
Research & Management Company ("SSRM"), the investment adviser to the former
State Street Research mutual funds. In connection with the transaction the
BlackRock Exchange Portfolio reorganized with the State Street Research
Exchange Fund.
On January 31, 2005, the BlackRock Exchange Portfolio acquired all of the
assets and certain stated liabilities of the State Street Research Exchange
Fund. The reorganization was pursuant to an Agreement and Plan of
Reorganization, which was approved by the State Street Research shareholders on
January 25, 2005. In connection with the reorganization, the BlackRock Exchange
Portfolio inherited the financial statements and performance history of the
State Street Research Exchange Fund. Under the Agreement and Plan of
Reorganization, 572,959 shares of the State Street Research Exchange Fund were
exchanged for 572,959 BlackRock Class shares of the BlackRock Exchange
Portfolio. The BlackRock Exchange Portfolio commenced operations on this date
as a result of this tax free reorganization.
Accordingly, the information presented in the financial statements and
related notes reflects operations of the predecessor State Street Research fund
prior to January 31, 2005 and represents operations of the reorganized
BlackRock fund following the consummation of the reorganization.
(C) Summary of Significant Accounting Policies
The following is a summary of significant accounting policies followed by
the Portfolio in the preparation of its financial statements.
Investment Valuation - Valuation of investments held by the Portfolio is
as follows: investments traded on a national securities exchange or on the
NASDAQ National Market System are valued at the last reported sale price that
day or the NASDAQ official closing price, if applicable; investments traded on
a national securities exchange for which there were no sales on that day and
investments traded on other over-the-counter markets for which market
quotations are readily available are valued at the mean of the bid and asked
prices; and an option or futures contract is valued at the last sales price
prior to 4:00 p.m. (Eastern time), as quoted on the principal exchange or board
of trade on which such option or contract is traded, or in the absence of a
sale, the mean between the last bid and asked prices prior to 4:00 p.m.
(Eastern time). The amortized cost method of valuation will be used with
respect to debt obligations with sixty days or less remaining to maturity
unless the investment adviser under the supervision of the Board of Trustees
determines such method does not represent fair value. Any assets which are
denominated in a non-U.S. currency are translated into U.S. dollars at the
prevailing market rates. In the event that application of these methods of
valuation results in a price for an investment which is deemed not to be
representative of the market value of such investment, the investment will be
valued by, under the direction of or in accordance with a method approved by
the Board of Trustees as reflecting fair value ("Fair Value Assets"). The
investment adviser will submit its recommendations regarding the valuation
and/or valuation methodologies for Fair Value Assets to a valuation committee.
Such valuation committee may accept, modify or reject any recommendations. The
pricing of all Fair Value Assets shall be subsequently reported to and ratified
by the Board of Trustees.
When determining the price for a Fair Value Asset, the investment adviser
shall seek to determine the price that the Portfolio might reasonably expect to
receive from the current sale of that asset in an arm's-length transaction.
Fair value determinations shall be based upon all available factors that
BlackRock deems relevant.
8
BLACKROCK FUNDS
NOTES TO FINANCIAL STATEMENTS (Unaudited) (CONTINUED)
Dividends to Shareholders - Dividends from net investment income, which
are recorded on the ex-dividend date, are declared and paid quarterly for the
Portfolio. Net realized short-term capital gains, if any, are distributed
annually. The Portfolio's current practice is to retain long-term capital
gains and to pay Federal taxes thereon at corporate capital gain tax rates on
behalf of the shareholders.
Investment Transactions and Investment Income - Investment transactions
are accounted for on the trade date. The cost of investments sold and the
related gain or loss thereon is determined by use of the specific
identification method for both financial reporting and federal income tax
purposes. Interest income is recorded on the accrual basis. Discounts and
premiums on debt securities are accreted or amortized, respectively, for book
and tax purposes using the effective yield-to-maturity method over the term of
the instrument. Dividends are recorded on the ex-dividend date. Paydown gains
and losses on mortgage and asset-backed securities are presented as an
adjustment to interest income.
Repurchase Agreements - Money market instruments may be purchased from
banks and non-bank dealers subject to the seller's agreement to repurchase them
at an agreed upon date and price. Collateral for repurchase agreements may have
longer maturities than the maximum permissible remaining maturity of portfolio
investments. The seller is required on a daily basis to maintain the value of
the securities subject to the agreement at not less than the repurchase price.
The agreements are conditioned upon the collateral being deposited under the
Federal Reserve book-entry system or held in a separate account by the
Portfolio's custodian or an authorized securities depository.
Estimates - The preparation of financial statements in conformity with
accounting principles generally accepted in the United States of America
("generally accepted accounting principles") requires the use of management
estimates. Actual results could differ from these estimates.
Other - Securities denominated in currencies other than U.S. dollars are
subject to changes in value due to fluctuations in exchange rates.
Some countries in which the Portfolio invests require governmental
approval for the repatriation of investment income, capital or the proceeds of
sales of securities by foreign investors. In addition, if there is a
deterioration in a country's balance of payments or for other reasons, a
country may impose temporary restrictions on foreign capital remittances
abroad.
The securities exchanges of certain foreign markets are substantially
smaller, less liquid and more volatile than the major securities markets in the
United States. Consequently, acquisition and disposition of securities by the
Portfolio may be inhibited. In addition, a significant proportion of the
aggregate market value of equity securities listed on the major securities
exchanges in emerging markets are held by a smaller number of investors. This
may limit the number of shares available for acquisition or disposition by the
Portfolio.
Expenses that are directly related to the Portfolio are charged directly
to the Portfolio. Other operating expenses are prorated to the Portfolio on the
basis of relative net assets.
(D) Transactions with Affiliates and Related Parties
Prior to January 31, 2005, State Street Research Exchange Fund entered in
an agreement with the SSRM to provide management advisory, statistical and
research facilities and services. Fees were earned monthly at the annual rate
of 0.50% of net assets.
Effective January 31, 2005, pursuant to an Investment Advisory Agreement,
BlackRock, a wholly-owned subsidiary of BlackRock, Inc., serves as investment
adviser. BlackRock, Inc. is an indirect majority-owned subsidiary of The PNC
Financial Services Group, Inc. For its advisory services, BlackRock is
entitled to receive fees computed daily and payable monthly at the annual rate
of 0.50% of average daily net assets.
For the three months ended March 31, 2005, advisory fees and waivers for
the Portfolio were as follows:
GROSS NET
ADVISORY ADVISORY
FEE WAIVER FEE
- -------------- -------------- ------------
$ 359,554 $ (65,896) $ 293,658
This Portfolio's advisory fees are paid to BlackRock as of January 31,
2005. Prior to that date the fees were paid to SSRM. See (Note B) above for
more information on the fund reorganization.
9
BLACKROCK FUNDS
NOTES TO FINANCIAL STATEMENTS (Unaudited) (CONTINUED)
In the interest of limiting the expenses of the Portfolio, BlackRock and
the Portfolio have entered into a series of annual expense limitation
agreements. The agreements set a limit on certain operating expenses of the
Portfolio for the next year and require BlackRock to waive or reimburse fees or
expenses if these operating expenses exceed that limit. These expense limits
apply to the aggregate expenses incurred on a share class (excluding: interest,
taxes, brokerage commissions, other expenditures which are capitalized in
accordance with generally accepted accounting principles and other
extraordinary expenses).
Effective February 1, 2005, BlackRock has contractually agreed to waive or
reimburse fees or expenses in order to limit expenses to 0.60% of average daily
net assets.
At March 31, 2005, the amounts subject to possible future reimbursement
under the expense limitation agreement are as follows:
TOTAL WAIVERS
EXPIRING EXPIRING SUBJECT TO
JANUARY 31, 2007 JANUARY 31, 2008 REIMBURSEMENT
------------------ ------------------ --------------
$ 3,839 $ 79,536 $ 83,375
Prior to January 31, 2005, the Portfolio paid SSRM for certain
administrative costs incurred in providing other assistance and services to the
Portfolio. The fee was based on actual costs allocated equally among the State
Street Research funds. Effective January 31, 2005, PFPC Inc. ("PFPC"), an
indirect wholly-owned subsidiary of The PNC Financial Services Group, Inc., and
BlackRock act as co-administrators for the Portfolio. For these services, the
co-administrators receive a combined administration fee computed daily and
payable monthly, based on a percentage of the average daily net assets of the
Portfolio, at the following annual rates: 0.085% of the first $500 million,
0.075% of the next $500 million and 0.065% of assets in excess of $1 billion.
In addition, the Portfolio is charged an administration fee based on the
following percentage of average daily net assets of each respective class:
0.035% of the first $500 million, 0.025% of the next $500 million and 0.015% of
assets in excess of $1 billion.
PFPC and BlackRock may, at their discretion, waive all or any portion of
their administration fees for the Portfolio.
For the three months ended March 31, 2005, administration fees and waivers
for the Portfolio were as follows:
GROSS NET
ADMINISTRATION ADMINISTRATION
FEE WAIVER FEE
- ---------------- -------------- ---------------
$ 66,881 $ (17,479) $ 49,402
Prior to January 31, 2005, State Street Bank Bank and Trust Company
served as the Portfolio's custodian and record keeper. Effective January 31,
2005, PFPC Trust Co., an indirect subsidiary of The PNC Financial Services
Group, Inc., serves as custodian for the Portfolio. Prior to January 31, 2005,
Boston Financial Data Services, Inc. served as the State Street Research Funds'
transfer agent. Effective January 31, 2005, PFPC serves as transfer and
dividend disbursing agent. Prior to January 31, 2005, State Street Research
Service Center, a division of State Street Research Investment Services, Inc.,
the State Street Research Funds' principal underwriter, provided certain
shareholder services to the State Street Research Funds, such as responding to
inquiries and instructions from investors with respect to the purchase and
redemption of shares of the funds. For the period ended January 31, 2005, the
State Street Research Exchange Fund paid $382. Subsequent to January 31, 2005,
BlackRock operated an Investor Service center on behalf of the fund.
10
BLACKROCK FUNDS
NOTES TO FINANCIAL STATEMENTS (Unaudited) (CONTINUED)
As of March 31, 2005, affiliated payables were as follows:
PFPC(1) .............. $48,286
BlackRock(2) ......... 97,313
(1) - payables to PFPC and PFPC Trust Co. are for Accounting, Administration,
Custody and Transfer Agent services provided as of March 31, 2005.
(2) - payables to BlackRock are for Advisory and Administration services
provided as of March 31, 2005.
During the year ended December 31, 2004, SSRM conducted an internal review
regarding the use of fund brokerage commissions in consideration of the
distribution of shares. In connection with this review, SSRM determined to
reimburse the fund the entire amount of any such identified brokerage
commissions, and reviewed this matter with the Board of Trustees of the fund.
This amount is shown in the total amount of $98,840 as "Net increase from
payment by affiliate" on the Statement of Changes in Net Assets.
(E) Purchases and Sales of Securities
For the three months ended March 31, 2005, purchases and sales of
securities, other than short-term investments and U.S. government securities,
including $1,801,940 representing redemptions in kinds, were $0 and $5,131,110,
respectively. There were no purchases or sales of U.S. government securities
for the three months ended March 31, 2005.
(F) Capital Shares
Transactions in capital shares for each period were as follows:
FOR THE FOR THE
THREE MONTHS YEAR ENDED
1/1/05 - 3/31/05 12/31/04
------------------ -----------
Shares Sold ........................................ 433 -
Shares issued in reinvestment of dividends ......... 269 1,790
Shares redeemed .................................... (7,334) (57,683)
------ -------
Net decrease ....................................... (6,632) (55,893)
====== =======
On March 31, 2005, two shareholders held approximately 14% of the
outstanding shares of the Portfolio.
(G) At March 31, 2005, net assets consisted of:
Capital paid-in ......................................... $ 103,722,257
End of period undistributed net investment income ....... 414,758
Accumulated net realized loss on investment transactions (8,212,204)
Net unrealized appreciation on investment transactions .. 191,324,850
-------------
$ 287,249,661
=============
(H) Federal Tax Information
No provision for Federal income taxes is necessary with respect to net
investment income because it is the Portfolio's intention to qualify under
Subchapter M of the Internal Revenue Code of 1986, as amended, and to make the
requisite income distributions to its shareholders which will be sufficient to
relieve it from federal income and excise taxes. The Portfolio retains and
designates as undistributable gains all of its taxable net long-term capital
gains and pays federal income taxes thereon on behalf of the shareholders.
Dividends from net investment income and distributions from net realized
capital gains are determined in accordance with U.S. Federal income tax
regulations, which may differ from those amounts determined under accounting
principles generally accepted in the United States.
11
BLACKROCK FUNDS
NOTES TO FINANCIAL STATEMENTS (Unaudited) (CONCLUDED)
The estimated tax character of distributions paid during the three months
ended March 31, 2005 and the tax character of distributions paid during the
fiscal year ended December 31, 2004, were as follows:
ORDINARY
INCOME
------------
3/31/05 .......... $ 568,002
12/31/04 ......... 4,387,534
As of March 31, 2005, the estimated tax components of distributable
earnings/(accumulated losses) were as follows:
UNDISTRIBUTED ACCUMULATED
ORDINARY CAPITAL
INCOME LOSSES
- --------------- ------------------
$ 414,758 $ (10,317,091)
For Federal income tax purposes, capital loss carryforwards may be carried
forward and applied against future capital gains.
At December 31, 2004, the Portfolio had capital loss carryforwards
available to offset future realized capital gains through the indicated
expiration dates:
EXPIRING DECEMBER 31
- ------------------------------------------------
2009 2010 TOTAL
- -------------- -------------- --------------
$ 770,500 $ 7,112,583 $ 7,883,083
12
BLACKROCK FUNDS
ADDITIONAL INFORMATION
(A) Board of Trustees' Consideration of the Advisory Contracts. The
Investment advisory agreement ("Advisory Contract") for the Exchange
Portfolio (the "Portfolio") of BlackRock Funds (the "Fund") was most
recently approved by the Board of Trustees (the "Board" or the "Trustees")
of the Fund at an in-person meeting of the Board held on March 1, 2005,
including a majority of the Trustees who are not parties to the Advisory
Contract or interested persons of any such party (as such term is defined
in the Investment Company Act of 1940) (the "Independent Trustees"). In
determining to approve the Advisory Contract, the Trustees met with the
relevant investment advisory personnel from BlackRock Advisors, Inc. (the
"Adviser") and considered all information they deemed reasonably necessary
to evaluate the terms of the Advisory Contract. The Board received
materials in advance of the meeting relating to its consideration of the
Advisory Contract for the Portfolio, including: (i) fees and the expense
ratio of the Portfolio in comparison to the fees and expense ratios of a
peer group of funds, which consists of funds that have all of the following
similar criteria: fund type, investment classification and objective, load
type, asset level and expense structure and components ("peer group"); (ii)
information on the investment performance of the Portfolio in comparison to
the investment performance of a peer universe of funds, which is broader
than a peer group and consists of funds that have all of the following
similar criteria: fund type, investment classification and objective and
load type ("performance universe"); (iii) the Adviser's economic outlook
for the Portfolio and its general investment outlook for the markets; (iv)
information with respect to profitability of BlackRock, Inc. ("BlackRock")
and PNC Bank-affiliated companies with respect to the Portfolio, including
details regarding the methodology used to calculate profitability; (v)
information regarding fees paid to service providers that are affiliates of
the Adviser; and (vi) information regarding compliance records and
regulatory matters relating to the Adviser. The matters discussed below
were considered separately by the Independent Trustees in an executive
session, during which counsel who is independent of the Adviser and the
Fund provided guidance to the Independent Trustees.
Fees and Expenses. In approving the Advisory Contract, the Trustees,
including the Independent Trustees, considered the fees and expense ratio
of the Portfolio. They compared the fees, both before (referred to as
"Contractual") and after (referred to as "Actual") any fee waivers and
expense reimbursements, and the expense ratio of the Portfolio against fees
and expense ratios of a peer group. Both the peer group category and the
funds within the peer group with respect to the fee and expense ratio
comparisons were selected by Lipper, Inc. ("Lipper"), which is not
affiliated with the Adviser. Taking into account the recent reorganization
of a State Street Research mutual fund with the Portfolio, Lipper used the
Portfolio's proforma expense information provided by PFPC Inc., the Fund's
administrator, to reflect post-reorganization data for each of the expense
categories.1 In evaluating the Portfolio's advisory fees, the Trustees
also took into account the complexity of investment management for the
Portfolio relative to other types of funds. In considering data based on
information provided by Lipper, the Trustees noted that the Portfolio has
contractual advisory fees lower than the median for its peer group.2
The Trustees also were provided with information about the services
rendered, and the fee rates offered, to other clients advised by the
Adviser, including closed-end investment companies and accounts that are
not investment companies.
1The post-reorganization proforma data reflected expense caps, the
elimination of shareholder processing fees, increased transfer agency fees,
costs associated with new shareholder administrative services arrangements
and increased asset levels resulting from the reorganization of the State
Street Research mutual fund with the Portfolio.
2The Lipper peer group median was chosen as a conservative point of
reference, taking into account that one-half of the population will have
fees/expenses lower than the median.
13
BLACKROCK FUNDS
ADDITIONAL INFORMATION
Following consideration of this information, the Trustees, including the
Independent Trustees, concluded that the fees to be paid pursuant to the
Advisory Contracts were fair and reasonable in light of the services
provided.
Nature, Extent and Quality of Services. The Trustees, including the
Independent Trustees, received information concerning the investment
philosophy and investment process used by the Adviser in managing the
Portfolio, as well as a description of the capabilities, personnel and
services of the Adviser and a copy of the current Form ADV of the Adviser.
In connection with this, the Trustees considered the Adviser's in-house
research capabilities as well as other resources available to its
personnel. The Trustees considered the scope of the services provided by
the Adviser to the Portfolio under the Advisory Contract relative to
services typically provided by third parties to other funds. The Trustees
noted that the standard of care applicable under the Advisory Contract was
comparable to that found generally in investment company advisory
agreements. The Trustees concluded that the scope of the Adviser's
services to be provided to the Portfolio was consistent with the
Portfolio's operational requirements, including, in addition to seeking to
meet its investment objective, compliance with investment restrictions, tax
and reporting requirements and related shareholder services.
The Trustees also considered the quality of the services provided by the
Adviser to the Portfolio. The Trustees evaluated the procedures of the
Adviser designed to fulfill its fiduciary duty to the Portfolio with
respect to possible conflicts of interest, including its code of ethics
(regulating the personal trading of its officers and employees), the
procedures by which the Adviser allocates trades among its various
investment advisory clients, the integrity of the systems in place to
ensure compliance with the foregoing and the record of the Adviser in these
matters. The Trustees also received information concerning standards of
the Adviser with respect to the execution of portfolio transactions.
The Trustees also considered information relating to the education,
experience and number of investment professionals and other personnel who
provide services under the Advisory Contract. The Trustees also took into
account the time and attention devoted by senior management of the Adviser
to the Portfolio. The Trustees also considered the business reputation of
the Adviser and its financial resources and concluded that the Adviser
would be able to meet any reasonably foreseeable obligation under the
Advisory Contract.
Fund Performance. The Board of Trustees, including the Independent
Trustees, received and considered information about the Portfolio's
investment performance in comparison to the investment performance of its
performance universe. The funds included within the Portfolio's
performance universe were selected by Lipper. The Board was provided with
performance data for the one-, three-, five- and ten-year periods, as
applicable, ended November 30, 2004 ("relevant periods"). The Board also
reviewed the investment performance of the Portfolio and the Adviser's
market outlook with respect to the Portfolio.
The Trustees noted that the Portfolio performed at or better than its
performance universe median during the relevant periods. The Trustees also
discussed other factors relevant to the performance of the Portfolio.
14
BLACKROCK FUNDS
Profitability. The Board of Trustees, including the Independent Trustees,
considered the level of the Adviser's and affiliates' profits in respect of
their relationship with the Portfolio. This consideration included a broad
review of the Adviser's methodology in allocating its costs to the
management of the Portfolio. The Board of Trustees considered the profits
realized by the Adviser and affiliates in connection with the operation of
the Portfolio and whether the amount of profit is a fair profit relative to
their relationship with the Portfolio. The Board of Trustees, including
the Independent Trustees, also considered the Adviser's profit margins in
comparison with available industry data. The Board concluded that the
Adviser's profit is a reasonable profit relative to the services provided
to the Portfolio.
Economies of Scale. The Board of Trustees, including the Independent
Trustees, considered whether there have been economies of scale in respect
of the management of the Portfolio, whether the Portfolio has appropriately
benefited from any economies of scale, and whether there is potential for
realization of any further economies of scale.
The Board also considered the fee waivers and expense reimbursement
arrangements by the Adviser. The Board determined that the advisory fee
structure was reasonable and that no changes were currently necessary.
Other Benefits to the Advisers. The Board of Trustees, including the
Independent Trustees, also took into account not only the advisory fees
payable by the Portfolio, but also other potential benefits to the Adviser,
such as the ability to leverage investment professionals that also manage
other portfolios, raising the profile of BlackRock in the broker-dealer
community, and the engagement of affiliates of the Adviser as service
providers to the Portfolio, including for administrative, transfer agency,
distribution and custodial services. The Board also noted that the Adviser
may benefit from the use of soft dollars for research, which may be used by
the Adviser to manage other accounts.
The Board concluded that other ancillary benefits that the Adviser and its
affiliates could be expected to receive with regard to providing investment
advisory and other services to the Portfolio, such as those noted above,
were consistent with those available to other mutual fund sponsors.
No single factor was considered in isolation or to be determinative in the
Board's decision to approve the Advisory Contract. Rather, the Board
concluded, in light of a weighing and balancing of all factors considered,
that it was in the best interests of the Portfolio to approve the
continuation of the Advisory Contract, including the fees to be charged for
services thereunder.
(B) The Fund's Audit Committee approved engaging Deloitte & Touche LLP as the
independent auditor to audit the Fund's financial statements for fiscal
year 2005. A majority of the Fund's Board of Trustees, including a majority
of the independent Trustees, approved the appointment of Deloitte & Touche
LLP as the Fund's independent auditor for the Fund's fiscal 2005 audit on
November 12, 2004, subject to the right of the Fund, by a majority vote of
the shareholders at any meeting called for that purpose, to terminate the
appointment without penalty.
(C) As previously disclosed, BlackRock has received subpoenas from various
federal and state governmental and regulatory authorities and various
information requests from the Securities and Exchange Commission in
connection with ongoing industry-wide investigations of mutual fund
matters.
(D) The amounts paid by the Fund to the Chief Compliance Officer (CCO) for the
six months ended March 31, 2005, were $87,903.
15
[THIS PAGE INTENTIONALLY LEFT BLANK.]
BLACKROCK FUNDS
Investment Adviser
BlackRock Advisors, Inc.
Wilmington, Delaware 19809
Custodian
PFPC Trust Co.
Philadelphia, Pennsylvania 19153
Co-Administrator and Transfer Agent
PFPC Inc.
Wilmington, Delaware 19809
Distributor
BlackRock Distributors, Inc.
King of Prussia, Pennsylvania 19406
Co-Administrator
BlackRock Advisors, Inc.
Wilmington, Delaware 19809
Counsel
Simpson Thacher & Bartlett LLP
New York, New York 10017
Independent Registered Public Accounting Firm
Deloitte & Touche LLP
Philadelphia, Pennsylvania 19103
The Fund will mail only one copy of shareholder documents, including
prospectuses, annual and semi-annual reports and proxy statements, to
shareholders with multiple accounts at the same address. This practice is
commonly called "householding" and it is intended to reduce expenses and
eliminate duplicate mailings of shareholder documents. Mailings of your
shareholder documents may be householded indefinitely unless you instruct us
otherwise. If you do not want the mailing of these documents to be combined
with those for other members of your household, please contact the Fund at
(800) 441-7762.
The Fund has delegated proxy voting responsibilities to BlackRock and its
affiliates, subject to the general oversight of the Fund's Board of Trustees. A
description of the policies and procedures that BlackRock and its affiliates
use to determine how to vote proxies relating to portfolio securities is
available without charge, upon request, by calling 1-800-441-7762, or on the
website of the Securities and Exchange Commission (the "Commission") at
http://www.sec.gov.
Information on how proxies relating to the Fund's voting securities were voted
(if any) by BlackRock during the most recent 12-month period ended June 30th is
available, upon request and without charge, by calling (800) 441-7762 or on the
website of the Commission at http://www.sec.gov.
The Fund files its complete schedule of portfolio holdings for the first and
third quarters of its fiscal year with the Commission on Form N-Q. The Fund's
Form N-Q is available on the Commission's website at http://www.sec.gov and may
be reviewed and copied at the Commission's Public Reference Room in Washington,
D.C. Information regarding the operation of the Public Reference Room may be
obtained by calling 1-800-SEC-0330. The Fund's Form N-Q may also be obtained
upon request, without charge, by calling (800) 441-7762.
This report is for shareholder information. This is not a prospectus intended
for use in the purchase or sale of Fund shares.
Shares of the Fund are not deposits or obligations of, or guaranteed or
endorsed by PNC Bank, National Association or any other bank and shares are not
federally insured by, guaranteed by, obligations of or otherwise supported by
the U.S. Government, the Federal Deposit Insurance Corporation, the Federal
Reserve Board, or any other governmental agency. Investments in shares of the
fund involve investment risks, including the possible loss of the principal
amount invested.
[GRAPHIC OMITTED]
EX-SEMI
Not applicable.
| Item 3. | Audit Committee Financial Expert. |
Not applicable.
| Item 4. | Principal Accountant Fees and Services. |
Not applicable.
| Item 5. | Audit Committee of Listed registrants. |
Not applicable.
| Item 6. | Schedule of Investments. |
Schedule of Investments in securities of unaffiliated issuers as of the close of the reporting period is included as part of the report to shareholders filed under Item 1 of this form.
| Item 7. | Disclosure of Proxy Voting Policies and Procedures for Closed-End Management Investment Companies. |
Not applicable.
| Item 8. | Portfolio Managers of Closed-End Management Investment Companies. |
Not applicable.
| Item 9. | Purchases of Equity Securities by Closed-End Management Investment Company and Affiliated Purchasers. |
Not applicable.
| Item 10. | Submission of Matters to a Vote of Security Holders. |
There have been no material changes to the procedures by which the shareholders may recommend nominees to the registrant’s board of trustees.
| Item 11. | Controls and Procedures. |
| | (a) | The Registrant’s principal executive officer and principal financial officer have evaluated the Registrant’s disclosure controls and procedures within 90 days of this filing and have concluded, as of that date, that the Registrant’s disclosure controls and procedures were reasonably designed to ensure that information required to be disclosed by the Registrant in this Form N-CSR was recorded, processed, summarized, and reported within the required time periods and that information required to be disclosed by the Registrant in this Form N-CSR was accumulated and communicated to the Registrant’s management, including its principal executive and principal financial officers, as appropriate to allow timely decisions regarding required disclosure. |
| | (b) | There was no change in the Registrant’s internal control over financial reporting (as defined in Rule 30a-3(d) under the 1940 Act (17 CFR 270.30a-3(d)) that occurred during the Registrant’s second fiscal quarter of the period covered by this report that has materially affected, or is reasonably likely to materially affect, the Registrant’s internal control over financial reporting. |
| | | |
| (a | )(1) | | Not applicable. |
| |
| (a | )(2) | | Certifications pursuant to Rule 30a-2(a) under the 1940 Act and Section 302 of the Sarbanes-Oxley Act of 2002 are attached as Exhibit 12(a)(2) hereto. |
| |
| (b | ) | | Certifications pursuant to Rule 30a-2(b) under the 1940 Act and Section 906 of the Sarbanes-Oxley Act of 2002 are attached as Exhibit 12(b) hereto. |
SIGNATURES
Pursuant to the requirements of the Securities Exchange Act of 1934 and the Investment Company Act of 1940, the registrant has duly caused this report to be signed on its behalf by the undersigned, thereunto duly authorized.
| | |
(registrant) BlackRock FundsSM |
| |
By (Signature and Title)* | | /s/ HENRY GABBAY |
| | | Henry Gabbay, President |
| | | (principal executive officer) |
Date June 1, 2005
Pursuant to the requirements of the Securities Exchange Act of 1934 and the Investment Company Act of 1940, this report has been signed below by the following persons on behalf of the registrant and in the capacities and on the dates indicated.
| | |
| |
By (Signature and Title)* | | /s/ HENRY GABBAY |
| | | Henry Gabbay, President |
| | | (principal executive officer) |
Date June 1, 2005
| | |
| |
By (Signature and Title)* | | /s/ WILLIAM MCGINLEY |
| | | William McGinley, Treasurer |
| | | (principal financial officer) |
Date May 27, 2005
| * | Print the name and title of each signing officer under his or her signature. |