UNITED STATES
SECURITIES AND EXCHANGE COMMISSION
Washington, D.C. 20549
FORM N-CSR
CERTIFIED SHAREHOLDER REPORT OF REGISTERED MANAGEMENT
INVESTMENT COMPANIES
Investment Company Act file number: 811-05742
| Name of Fund: | BlackRock FundsSM |
| BlackRock Advantage International Fund |
| BlackRock Advantage Large Cap Growth Fund |
| BlackRock Advantage Small Cap Core Fund |
| BlackRock Energy Opportunities Fund |
| BlackRock High Equity Income Fund |
| BlackRock International Dividend Fund |
| Fund Address: | 100 Bellevue Parkway, Wilmington, DE 19809 |
Name and address of agent for service: John M. Perlowski, Chief Executive Officer, BlackRock FundsSM, 55 East 52nd Street, New York, NY 10055
Registrant’s telephone number, including area code: (800) 441-7762
Date of fiscal year end: 05/31/2021
Date of reporting period: 05/31/2021
Item 1 – Report to Stockholders
(a) The Report to Shareholders is attached herewith.
| MAY 31, 2021 |

2021 Annual Report
| ||
BlackRock FundsSM
· BlackRock Advantage International Fund
· BlackRock Advantage Large Cap Growth Fund
· BlackRock Advantage Small Cap Core Fund
Not FDIC Insured • May Lose Value • No Bank Guarantee
|
Dear Shareholder,
The 12-month reporting period as of May 31, 2021 was a remarkable period of adaptation and recovery, as the global economy dealt with the implications of the coronavirus (or “COVID-19”) pandemic. The United States, along with most of the world, began the reporting period in a severe recession, prompted by pandemic-related restrictions that disrupted many aspects of daily life. However, easing restrictions and robust government intervention led to a strong rebound, and the economy grew at a significant pace for most of the reporting period, recovering much of the output lost at the beginning of the pandemic.
Equity prices rose with the broader economy, as investors became increasingly optimistic about the economic outlook. Stocks rose through the summer of 2020, fed by strong fiscal and monetary support and positive economic indicators. The implementation of mass vaccination campaigns and passage of an additional $1.9 trillion of fiscal stimulus further boosted stocks, and many equity indices neared or surpassed all-time highs late in the reporting period. In the United States, both large- and small-capitalization stocks posted a significant advance. International equities also gained, as both developed countries and emerging markets rebounded substantially.
The 10-year U.S. Treasury yield (which is inversely related to bond prices) had fallen sharply prior to the beginning of the reporting period, which meant bonds were priced for extreme risk avoidance and economic disruption. Despite expectations of doom and gloom, the economy expanded rapidly, stoking inflation concerns late in the reporting period, which led to higher yields and a negative overall return for most U.S. Treasuries. In the corporate bond market, support from the U.S. Federal Reserve (the “Fed”) assuaged credit concerns and led to substantial returns for high-yield corporate bonds, although investment-grade corporates declined slightly.
The Fed remained committed to accommodative monetary policy by maintaining near zero interest rates and by announcing that inflation could exceed its 2% target for a sustained period without triggering a rate increase. To stabilize credit markets, the Fed also continued purchasing significant quantities of bonds, as did other influential central banks around the world, including the European Central Bank and the Bank of Japan.
Looking ahead, while coronavirus-related disruptions have clearly hindered worldwide economic growth, we believe that the global expansion will continue to accelerate as vaccination efforts ramp up and pent-up consumer demand leads to higher spending. While we expect inflation to increase somewhat as the expansion continues, we believe the recent uptick owes more to temporary supply disruptions than a lasting change in fundamentals. The change in Fed policy also means that moderate inflation is less likely to be followed by interest rate hikes that could threaten the economic expansion.
Overall, we favor a positive stance toward risk, with an overweight in equities. We see U.S. and Asian equities outside of Japan benefiting from structural growth trends in technology, while emerging markets should be particularly helped by a vaccine-led economic expansion and more stable U.S. trade policy. While we are underweight long-term on credit, global high-yield and Asian bonds present attractive opportunities, as do emerging market bonds denominated in local currencies. We believe that international diversification and a focus on sustainability can help provide portfolio resilience, and the disruption created by the coronavirus appears to be accelerating the shift toward sustainable investments.
In this environment, our view is that investors need to think globally, extend their scope across a broad array of asset classes, and be nimble as market conditions change. We encourage you to talk with your financial advisor and visit blackrock.com for further insight about investing in today’s markets.
Sincerely,

Rob Kapito
President, BlackRock Advisors, LLC

Rob Kapito
President, BlackRock Advisors, LLC
| Total Returns as of May 31, 2021 | ||||
| 6-Month | 12-Month | |||
U.S. large cap equities (S&P 500® Index) | 16.95% | 40.32% | ||
U.S. small cap equities (Russell 2000® Index) | 25.28 | 64.56 | ||
International equities (MSCI Europe, Australasia, Far East Index) | 15.19 | 38.41 | ||
Emerging market equities (MSCI Emerging Markets Index) | 15.15 | 51.00 | ||
3-month Treasury bills (ICE BofA 3-Month U.S. Treasury Bill Index) | 0.04 | 0.11 | ||
U.S. Treasury securities (ICE BofA 10-Year U.S. Treasury Index) | (6.07) | (7.30) | ||
U.S. investment grade bonds (Bloomberg Barclays U.S. Aggregate Bond Index) | (2.16) | (0.40) | ||
Tax-exempt municipal bonds (S&P Municipal Bond Index) | 1.54 | 4.70 | ||
U.S. high yield bonds (Bloomberg Barclays U.S. Corporate High Yield 2% Issuer Capped Index) | 4.18 | 14.90 | ||
Past performance is not an indication of future results. Index performance is shown for illustrative purposes only. You cannot invest directly in an index. | ||||
| 2 | THIS PAGE IS NOT PART OF YOUR FUND REPORT |
| Page | ||
| 2 | ||
Annual Report: | ||
| 4 | ||
| 15 | ||
| 15 | ||
| 16 | ||
Financial Statements: | ||
| 17 | ||
| 39 | ||
| 41 | ||
| 42 | ||
| 45 | ||
| 60 | ||
| 74 | ||
| 75 | ||
| 76 | ||
| 79 | ||
| 83 | ||
| 85 | ||

| 3 |
| Fund Summary as of May 31, 2021 | BlackRock Advantage International Fund |
Investment Objective
BlackRock Advantage International Fund’s (the “Fund”) investment objective is to provide long-term capital appreciation.
Portfolio Management Commentary
How did the Fund perform?
For the 12-month period ended May 31, 2021, all of the Fund’s share classes outperformed its benchmark, the MSCI EAFE® Index, except for Investor C Shares, which underperformed the benchmark.
What factors influenced performance?
The Fund performed well against the changeable market backdrop. Global equities performed well overall, hitting new highs in the second half of 2020 amid accommodative policy support and improving macro data. However, the rise belies the volatility observed within market leadership. Notably, after the better-than-expected vaccine efficacy news, momentum styles, which had driven market gains to that point, experienced the sharpest drawdown since the Global Financial Crisis. As investors brought forward expectations of a robust economic recovery due to vaccine development, they increasingly sought out contrarian opportunities. Later in the period, global equities delivered strong gains again as a strong reflationary tone prevailed in early 2021 and investors continued to expect a robust economic recovery. This outlook was bolstered by accelerated, albeit uneven across geographies, vaccine distribution, and sustained policy support. This ultimately benefited reflationary trades, especially energy and financials stocks, with value outperforming growth and momentum. The period also saw the emergence of volatility around “smart money” hedge fund positions, notably in January as several common short positions ran against strong retail trading.
Capturing reflationary themes became a dominant driver of outperformance in the portfolio for 2021. This was highlighted through the portfolio’s fundamental insights, which performed well amid the market style shift. In particular, traditional fundamental measures that evaluate balance sheet information aided the Fund’s returns. Earlier in the period, sentiment-based insights were able to correctly position the portfolio as economies began to reopen. Faster-moving measures that capture internet search trends, credit card transactions and mobile application usage all performed well amid this market trend, helping to motivate an overweight to retail names that performed well given the broader reopening theme. Interestingly, insights related to environmental, social and governance (“ESG”) factors were the top performing during the period, despite the sharp reflationary tone. Specifically, an insight that seeks to identify companies likely to benefit from the European Union’s sustainability-focused fiscal package was a top contributor.
Despite broad-based outperformance, select dynamic insights detracted from the Fund’s returns in the period. A dynamic signal that seeks to combine data optimally was a top detractor for the period, motivating an underweight to the metals & mining sector, which benefited from the style leadership shift in early 2021. Additionally, an insight that helps to time preferences for companies based on balance sheet leverage ran against the market rotation toward risk against the reflationary backdrop. Elsewhere, macro thematic positioning struggled in the period. In particular, an underweight stance to U.K. equities weighed on performance as the United Kingdom rolled out COVID-19 vaccines quickly and reopened faster than other economies in Europe.
Describe recent portfolio activity.
Over the course of the period, the portfolio maintained a balanced allocation of risk across all major return drivers. There were, however, several new signals added within the stock selection group of insights. The Fund built upon its alternative data capabilities by adding an insight that captures brand sentiment around retail names. Additionally, given the dynamism of the current environment, the Fund instituted enhanced signal constructs to best identify emerging trends, such as sentiment around vaccine distribution and the impact on economic reopening.
Describe portfolio positioning at period end.
At period end, the Fund’s positioning with respect to sector allocation was largely neutral relative to the MSCI EAFE® Index. The Fund was slightly overweight in industrials and consumer discretionary and slightly underweight in health care and utilities.
The views expressed reflect the opinions of BlackRock as of the date of this report and are subject to change based on changes in market, economic or other conditions. These views are not intended to be a forecast of future events and are no guarantee of future results.
| 4 | 2 0 2 1 BLACK ROCK ANNUAL REPORT TO SHAREHOLDERS |
| Fund Summary as of May 31, 2021 (continued) | BlackRock Advantage International Fund |
TOTAL RETURN BASED ON A $10,000 INVESTMENT
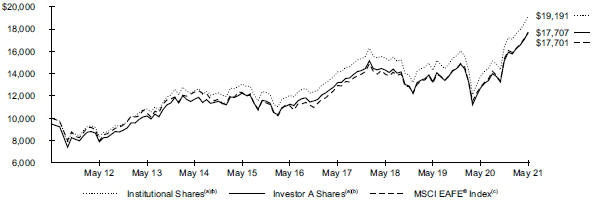
| (a) | Assuming maximum sales charges, if any, transaction costs and other operating expenses, including investment advisory fees and administration fees, if any. Institutional Shares do not have a sales charge. |
| (b) | Under normal circumstances, the Fund seeks to invest at least 80% of its net assets plus the amount of any borrowings for investment purposes in non-U.S. equity securities and equity-like instruments of companies that are components of, or have characteristics similar to, the companies included in the MSCI EAFE® Index and derivatives that are tied economically to securities of the MSCI EAFE® Index. The Fund’s total returns prior to June 12, 2017 are the returns of the Fund when it followed different investments strategies under the name BlackRock Global Opportunities Portfolio. |
| (c) | A free-float adjusted, market capitalization weighted index designed to measure equity performance of developed markets, excluding the United States and Canada. |
Performance Summary for the Period Ended May 31, 2021
| Average Annual Total Returns(a)(b) | ||||||||||||||||||||||||||||||||
| 1 Year | 5 Years | 10 Years | ||||||||||||||||||||||||||||||
| 6-Month Total Returns | Without Sales Charge | With Sales Charge | Without Sales Charge | With Sales Charge | Without Sales Charge | With Sales Charge | ||||||||||||||||||||||||||
Institutional | 16.83 | % | 39.57 | % | N/A | 9.76 | % | N/A | 6.74 | % | N/A | |||||||||||||||||||||
Investor A | 16.70 | 39.21 | 31.91 | % | 9.48 | 8.31 | % | 6.45 | 5.88 | % | ||||||||||||||||||||||
Investor C | 16.24 | 38.21 | 37.21 | 8.67 | 8.67 | 5.78 | 5.78 | |||||||||||||||||||||||||
Class K | 16.86 | 39.64 | N/A | 9.79 | N/A | 6.75 | N/A | |||||||||||||||||||||||||
Class R | 16.56 | 38.91 | N/A | 9.18 | N/A | 6.11 | N/A | |||||||||||||||||||||||||
MSCI EAFE® Index | 15.19 | 38.41 | N/A | 9.77 | N/A | 5.88 | N/A | |||||||||||||||||||||||||
| (a) | Assuming maximum sales charges, if any. Average annual total returns with and without sales charges reflect reductions for distribution and service fees. See “About Fund Performance” for a detailed description of share classes, including any related sales charges and fees, and how performance was calculated for certain share classes. |
| (b) | Under normal circumstances, the Fund seeks to invest at least 80% of its net assets plus the amount of any borrowings for investment purposes in non-U.S. equity securities and equity-like instruments of companies that are components of, or have characteristics similar to, the companies included in the MSCI EAFE® Index and derivatives that are tied economically to securities of the MSCI EAFE® Index. The Fund’s total returns prior to June 12, 2017 are the returns of the Fund when it followed different investments strategies under the name BlackRock Global Opportunities Portfolio. |
N/A - Not applicable as share class and index do not have a sales charge.
Past performance is not an indication of future results.
Performance results may include adjustments made for financial reporting purposes in accordance with U.S. generally accepted accounting principles.
FUND SUMMARY | 5 |
| Fund Summary as of May 31, 2021 (continued) | BlackRock Advantage International Fund |
Expense Example
| Actual | Hypothetical(a) | |||||||||||||||||||||||||||||||
|
|
|
| |||||||||||||||||||||||||||||
| | Beginning Account Value (12/01/20) | | | Ending Account Value (05/31/21) | | | Expenses Paid During the Period | (b) | | Beginning Account Value (12/01/20) | | | Ending Account Value (05/31/21) | | | Expenses Paid During the Period | (b) | | Annualized Expense Ratio | | ||||||||||||
Institutional | $ 1,000.00 | $ 1,168.30 | $ 2.70 | $ 1,000.00 | $ 1,022.44 | $ 2.52 | 0.50 | % | ||||||||||||||||||||||||
Investor A | 1,000.00 | 1,167.00 | 4.05 | 1,000.00 | 1,021.19 | 3.78 | 0.75 | |||||||||||||||||||||||||
Investor C | 1,000.00 | 1,162.40 | 8.09 | 1,000.00 | 1,017.45 | 7.54 | 1.50 | |||||||||||||||||||||||||
Class K | 1,000.00 | 1,168.60 | 2.43 | 1,000.00 | 1,022.69 | 2.27 | 0.45 | |||||||||||||||||||||||||
Class R | 1,000.00 | 1,165.60 | 5.40 | 1,000.00 | 1,019.95 | 5.04 | 1.00 | |||||||||||||||||||||||||
| (a) | Hypothetical 5% annual return before expenses is calculated by prorating the number of days in the most recent fiscal half year divided by 365. |
| (b) | For each class of the Fund, expenses are equal to the annualized expense ratio for the class, multiplied by the average account value over the period, multiplied by 182/365 (to reflect the one-half year period shown). |
See “Disclosure of Expenses” for further information on how expenses were calculated.
| 6 | 2 0 2 1 BLACK ROCK ANNUAL REPORT TO SHAREHOLDERS |
| Fund Summary as of May 31, 2021 (continued) | BlackRock Advantage International Fund |
Portfolio Information
TEN LARGEST HOLDINGS
|
| |||
| Security(a) | Percent of Net Assets | |||
Novo Nordisk A/S, Class B | 2 | % | ||
Siemens AG, Registered Shares | 1 | |||
Nestlé SA, Registered Shares | 1 | |||
LVMH Moet Hennessy Louis Vuitton SE | 1 | |||
Keyence Corp. | 1 | |||
British American Tobacco PLC | 1 | |||
ASML Holding NV | 1 | |||
Kering SA | 1 | |||
BNP Paribas SA | 1 | |||
Recruit Holdings Co. Ltd. | 1 | |||
GEOGRAPHIC ALLOCATION
|
| |||
| Country | Percent of Net Assets | |||
Japan | 23 | % | ||
United Kingdom | 12 | |||
France | 12 | |||
Germany | 9 | |||
Switzerland | 8 | |||
Australia | 7 | |||
Netherlands | 6 | |||
Sweden | 4 | |||
Denmark | 3 | |||
United States | 3 | |||
Hong Kong | 3 | |||
Finland | 2 | |||
China | 1 | |||
Spain | 1 | |||
Israel | 1 | |||
Italy | 1 | |||
Singapore | 1 | |||
Belgium | 1 | |||
Ireland | 1 | |||
Other Assets Less Liabilities | 1 | |||
| (a) | Excludes short-term securities. |
FUND SUMMARY | 7 |
| Fund Summary as of May 31, 2021 | BlackRock Advantage Large Cap Growth Fund |
Investment Objective
BlackRock Advantage Large Cap Growth Fund’s (the “Fund”) investment objective is to seek long-term capital appreciation.
Portfolio Management Commentary
How did the Fund perform?
For the 12-month period ended May 31, 2021, the Fund underperformed its benchmark, the Russell 1000® Growth Index.
What factors influenced performance?
The Fund struggled to keep pace against the backdrop of sharp market rotations and underperformed in the 12-month period. The period began with the early stages of economic reopening before heading into a more turbulent fall. Markets struggled in October 2020, as investor attention shifted away from earnings results and instead focused on macro headlines. The impending U.S. election, COVID-19 virus trends and expectations for future fiscal policy became the dominant themes. However, in November 2020 the market experienced a sharp rotation after the announcement of strong efficacy data from vaccine developers. This motivated a robust cyclical rally given stronger economic recovery expectations. The subsequent rotation out of momentum styles, which had led the market to that point in 2020, was one of the strongest on record as investors moved toward previous market laggards. This trend accelerated in 2021 as the reflation rally gathered steam. The prospect of additional fiscal policy support after the Georgia senate election results and aggressive vaccine distribution led to a strong investor preference for cyclicality and valuation-based exposures amid more robust economic reopening.
A feature within the large cap growth market during much of the period was the concentration of performance leadership within the benchmark index to a handful of securities. Ultimately, this became the primary driver of the Fund’s relative underperformance. As the Fund’s mandate takes a very risk-aware, diversified approach, the concentration of returns around a relatively small number of securities ran against the Fund’s discipline. This led to underweight positions across those names in aggregate, which weighed on performance.
The portfolio struggled primarily across the second half of 2020 amid the sizable momentum rotation, which prompted a reversal of dominant market trends at that time. This adversely impacted insights that captured COVID-related themes such as vaccine development. Importantly, these insights had been some of the strongest performing until that time. Additionally, a style-timing insight that took a more conservative stance toward momentum was a top detractor in the period. Despite the challenging performance after positive vaccine news in November 2020, performance for the generic momentum style was strong throughout 2020. Other macro thematic measures that look toward job hiring and construction activity lagged given the broader reopening theme, as these insights motivated an underweight to retail names.
Performance improved in 2021, led by fundamental measures. Insights that evaluate attractively priced growth companies performed well supported by the reflationary tone. Other stability related insights, such as those with a preference for high earnings yield, also provided ballast against the changeable market backdrop. Interestingly, insights related to environmental, social and governance (“ESG”) factors were also top performing measures during the period, despite the sharp reflationary tone. Namely, an insight that looks to capture investor flows into ESG-related positions was one of the best-performing insights as it was able to follow the broader sustainability market trend.
Describe recent portfolio activity.
Over the course of the period, the portfolio maintained a balanced allocation of risk across all major return drivers. There were, however, several new signals added within the stock selection group of insights. The Fund built upon its alternative data capabilities by adding an insight that captures brand sentiment around retail names. Additionally, given the dynamism of the current environment, the Fund has instituted enhanced signal constructs to best identify emerging trends, such as sentiment around vaccine distribution and the impact on economic reopening.
Describe portfolio positioning at period end.
Relative to the Russell 1000® Growth Index, the Fund was positioned essentially neutrally from a sector perspective. The Fund had slight overweight positions in the energy and industrials sectors and slight underweight positions in the health care and communication services sectors.
The views expressed reflect the opinions of BlackRock as of the date of this report and are subject to change based on changes in market, economic or other conditions. These views are not intended to be a forecast of future events and are no guarantee of future results.
| 8 | 2 0 2 1 BLACK ROCK ANNUAL REPORT TO SHAREHOLDERS |
| Fund Summary as of May 31, 2021 (continued) | BlackRock Advantage Large Cap Growth Fund |
TOTAL RETURN BASED ON A $10,000 INVESTMENT
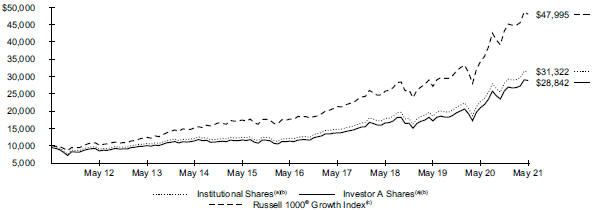
| (a) | Assuming maximum sales charges, if any, transaction costs and other operating expenses, including investment advisory fees and administration fees, if any. Institutional Shares do not have a sales charge. |
| (b) | Under normal circumstances, the Fund seeks to invest at least 80% of its net assets plus the amount of any borrowings for investment purposes in large cap equity securities of U.S. issuers and derivatives that have similar economic characteristics to such securities. The Fund’s total returns prior to June 12, 2017 are the returns of the Fund when it followed different investment strategies under the name BlackRock Flexible Equity Fund. |
| (c) | An unmanaged index that measures the performance of the large-cap growth segment of the U.S. equity universe and consists of those Russell 1000® securities with higher price-to-book ratios and higher forecasted growth values. |
Performance Summary for the Period Ended May 31, 2021
| Average Annual Total Returns(a)(b) | ||||||||||||||||||||||||||||||
|
| |||||||||||||||||||||||||||||
| 1 Year | 5 Years | 10 Years | ||||||||||||||||||||||||||||
|
|
|
|
|
| |||||||||||||||||||||||||
6-Month Returns | Without Sales Charge | With Sales Charge | Without Sales Charge | With Sales Charge | Without Sales Charge | With Sales Charge | ||||||||||||||||||||||||
Institutional | 11.70 | % | 37.54 | % | N/A | 20.83 | % | N/A | 12.09 | % | N/A | |||||||||||||||||||
Service | 11.58 | 37.20 | N/A | 20.50 | N/A | 11.77 | N/A | |||||||||||||||||||||||
Investor A | 11.62 | 37.28 | 30.07 | % | 20.52 | 19.22 | % | 11.77 | 11.17 | % | ||||||||||||||||||||
Investor C | 11.15 | 36.25 | 35.25 | 19.60 | 19.60 | 11.08 | 11.08 | |||||||||||||||||||||||
Class K | 11.73 | 37.60 | N/A | 20.75 | N/A | 11.88 | N/A | |||||||||||||||||||||||
Class R |
| 11.47 | 36.93 | N/A | 20.18 | N/A | 11.42 | N/A | ||||||||||||||||||||||
Russell 1000® Growth Index | 11.21 | 39.92 | N/A | 22.07 | N/A | 16.98 | N/A | |||||||||||||||||||||||
| (a) | Assuming maximum sales charges, if any. Average annual total returns with and without sales charges reflect reductions for distribution and service fees. See “About Fund Performance” for a detailed description of share classes, including any related sales charges and fees, and how performance was calculated for certain share classes. |
| (b) | Under normal circumstances, the Fund seeks to invest at least 80% of its net assets plus the amount of any borrowings for investment purposes in large cap equity securities of U.S. issuers and derivatives that have similar economic characteristics to such securities. The Fund’s total returns prior to June 12, 2017 are the returns of the Fund when it followed different investment strategies under the name BlackRock Flexible Equity Fund. |
N/A - Not applicable as share class and index do not have a sales charge.
Past performance is not an indication of future results.
Performance results may include adjustments made for financial reporting purposes in accordance with U.S. generally accepted accounting principles.
FUND SUMMARY | 9 |
| Fund Summary as of May 31, 2021 (continued) | BlackRock Advantage Large Cap Growth Fund |
Expense Example
| Actual | Hypothetical(a) | |||||||||||||||||||||||||||||||
|
|
|
| |||||||||||||||||||||||||||||
| | Beginning Account Value (12/01/20) | | | Ending Account Value (05/31/21) | | | Expenses Paid During the Period | (b) | | Beginning Account Value (12/01/20) | | | Ending Account Value (05/31/21) | | | Expenses Paid During the Period | (b) | | Annualized Expense Ratio | | ||||||||||||
Institutional | $ 1,000.00 | $ 1,117.00 | $ 3.27 | $ 1,000.00 | $ 1,021.84 | $ 3.13 | 0.62 | % | ||||||||||||||||||||||||
Service | 1,000.00 | 1,115.80 | 4.59 | 1,000.00 | 1,020.59 | 4.38 | 0.87 | |||||||||||||||||||||||||
Investor A | 1,000.00 | 1,116.20 | 4.59 | 1,000.00 | 1,020.59 | 4.38 | 0.87 | |||||||||||||||||||||||||
Investor C | 1,000.00 | 1,111.50 | 8.53 | 1,000.00 | 1,016.85 | 8.15 | 1.62 | |||||||||||||||||||||||||
Class K | 1,000.00 | 1,117.30 | 3.01 | 1,000.00 | 1,022.09 | 2.87 | 0.57 | |||||||||||||||||||||||||
Class R | 1,000.00 | 1,114.70 | 5.90 | 1,000.00 | 1,019.35 | 5.64 | 1.12 | |||||||||||||||||||||||||
| (a) | Hypothetical 5% annual return before expenses is calculated by prorating the number of days in the most recent fiscal half year divided by 365. |
| (b) | For each class of the Fund, expenses are equal to the annualized expense ratio for the class, multiplied by the average account value over the period, multiplied by 182/365 (to reflect the one-half year period shown). |
See “Disclosure of Expenses” for further information on how expenses were calculated.
| 10 | 2 0 2 1 BLACK ROCK ANNUAL REPORT TO SHAREHOLDERS |
| Fund Summary as of May 31, 2021 (continued) | BlackRock Advantage Large Cap Growth Fund |
Portfolio Information
| TEN LARGEST HOLDINGS |
| |||
| Security(a) | Percent of Net Assets | |||
Apple Inc. | 10 | % | ||
Microsoft Corp. | 8 | |||
Amazon.com, Inc. | 7 | |||
Facebook, Inc., Class A | 4 | |||
Alphabet, Inc., Class C | 3 | |||
Adobe, Inc. | 3 | |||
Tesla, Inc. | 2 | |||
Visa, Inc., Class A | 2 | |||
Alphabet, Inc., Class A | 2 | |||
PayPal Holdings, Inc. | 2 | |||
| SECTOR ALLOCATION |
| |||
| Sector(b) | Percent of Net Assets | |||
Information Technology | 44 | % | ||
Consumer Discretionary | 16 | |||
Health Care | 13 | |||
Communication Services | 11 | |||
Industrials | 6 | |||
Consumer Staples | 5 | |||
Financials | 2 | |||
Energy | 1 | |||
Real Estate | 1 | |||
Short-Term Securities | 1 | |||
| (a) | Excludes short-term securities. |
| (b) | For Fund compliance purposes, the Fund’s sector classifications refer to one or more of the sector sub-classifications used by one or more widely recognized market indexes or ratings group indexes, and/or as defined by the investment adviser. These definitions may not apply for purposes of this report, which may combine such sector sub-classifications for reporting ease. |
FUND SUMMARY | 11 |
| Fund Summary as of May 31, 2021 | BlackRock Advantage Small Cap Core Fund |
Investment Objective
BlackRock Advantage Small Cap Core Fund’s (the “Fund”) investment objective is to seek capital appreciation over the long term.
Portfolio Management Commentary
How did the Fund perform?
For the 12-month period ended May 31, 2021, the Fund underperformed its benchmark, the Russell 2000® Index.
What factors influenced performance?
The Fund’s performance was challenged against the backdrop of sharp market rotations. The period began with the early stages of economic reopening before heading into a more turbulent fall. Markets struggled in October 2020, as investor attention shifted away from earnings results and instead focused on macro headlines. The impending U.S. election, COVID-19 virus trends and expectations for future fiscal policy became the dominant themes. However, in November 2020 the market experienced a sharp rotation after the announcement of strong efficacy data from vaccine developers. This motivated a robust cyclical rally given stronger economic recovery expectations. The subsequent rotation out of momentum styles, which had led the market to that point in 2020, was one of the strongest on record as investors moved toward previous market laggards. This trend accelerated in 2021 as the reflation rally gathered steam. The prospect of additional fiscal policy support after the Georgia senate election results and aggressive vaccine distribution led to a strong investor preference for cyclicality and valuation-based exposures amid more robust economic reopening.
A distinct theme that emerged later in the period concerned the overall sentiment of retail investors. Specifically, so-called “meme” stocks experienced unprecedented levels of price volatility, most notably GameStop. The majority of the Fund’s underperformance was attributable to underweight positions across those names, which experienced sharply rising share prices driven by retail traders. While the Fund was underweight to GameStop due to weak expectations across company fundamentals, investor demand for the stock created a frenzy, which drove the name into a top ten constituent within the benchmark index. While the Fund ultimately increased exposure to GameStop to reduce the underweight relative to the benchmark, it remained underweight as the realized risk of the stock ran against the Fund’s risk-managed approach. Overall, this positioning weighed on the Fund’s valuation-based measures as the stock had been a deep value name entering 2021, resulting in losses across that signal composite.
Elsewhere, more defensively oriented traditional quality insights struggled during the fall of 2020. In September and October, these measures had coalesced around key persistent market drivers during the COVID-induced lockdown such as working from home, vaccine development and the shift to online shopping. Many of these themes began to reverse in September amid the technology selloff as investors took profits heading into the election. Overall, signals that prefer stocks with lower volatility and balance sheet strength lagged, with noted weakness across biotechnology stocks.
Despite the overall underperformance, parts of the stock selection model added to relative performance during the period. This was highlighted by persistent strength from measures related to environmental, social and governance (“ESG”) factors. Notably, an insight that looks to capture investor flows into ESG-related positions was one of the top performers as it successfully captured the increased preference for the discipline. Employee-based insights, such as looking at employer-provided benefits, also displayed strength in 2021. This insight correctly captured the reopening market theme across retail stocks. Finally, trend-based measures performed well as they successfully captured emerging reflationary themes. These include insights that looked at vaccine distribution, hiring activity and company linkages, which were additive across consumer discretionary, energy and industrials stocks, respectively.
Describe recent portfolio activity.
Over the course of the period, the portfolio maintained a balanced allocation of risk across all major return drivers. There were, however, several new signals added within the stock selection group of insights. In this vein, the Fund built upon its alternative data capabilities by adding an insight that captures brand sentiment around retail names. Additionally, given the dynamism of the current environment, the Fund has instituted enhanced signal constructs to best identify emerging trends, such as sentiment around vaccine distribution and the impact on economic reopening. Finally, given the increasing importance of retail investor sentiment within the market, new insights were developed to help capture those trends.
Describe Fund positioning at period end.
Relative to the Russell 2000® Index, the Fund remained largely sector neutral at period end. The Fund ended the period with slight overweight positions in information technology and industrials, and slight underweights in health care and real estate stocks.
The views expressed reflect the opinions of BlackRock as of the date of this report and are subject to change based on changes in market, economic or other conditions. These views are not intended to be a forecast of future events and are no guarantee of future results.
| 12 | 2 0 2 1 BLACK ROCK ANNUAL REPORT TO SHAREHOLDERS |
| Fund Summary as of May 31, 2021 (continued) | BlackRock Advantage Small Cap Core Fund |
TOTAL RETURN BASED ON A $10,000 INVESTMENT
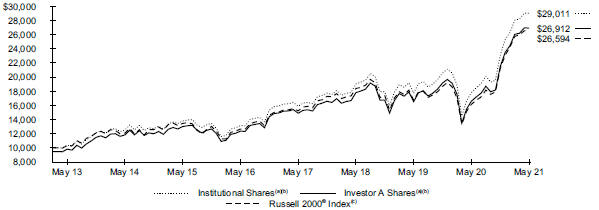
The Fund commenced operations on March 14, 2013.
| (a) | Assuming maximum sales charges, if any, transaction costs and other operating expenses, including investment advisory fees and administration fees, if any. Institutional Shares do not have a sales charge. |
| (b) | Under normal circumstances, the Fund seeks to invest at least 80% of its net assets plus any borrowings for investment purposes in equity securities or other financial instruments that are components of, or have market capitalizations similar to, the securities included in the Russell 2000® Index. |
| (c) | An unmanaged index that is a subset of the Russell 3000® Index representing approximately 10% of the total market capitalization of that index. It includes approximately 2,000 of the smallest securities based on a combination of their market cap and current index membership. |
Performance Summary for the Period Ended May 31, 2021
| Average Annual Total Returns(a) | ||||||||||||||||||||||||||||||||
| 1 Year | 5 Years | Since Inception(b) | ||||||||||||||||||||||||||||||
6-Month Total Returns | Without Sales | With Sales Charge | Without Sales Charge | With Sales Charge | Without Sales Charge | With Sales Charge | ||||||||||||||||||||||||||
Institutional | 25.47 | % | 62.61 | % | N/A | 17.14 | % | N/A | 13.85 | % | N/A | |||||||||||||||||||||
Investor A | 25.23 | 62.05 | 53.55 | % | 16.83 | 15.58 | % | 13.55 | 12.81 | % | ||||||||||||||||||||||
Investor C | 24.84 | 60.90 | 59.90 | 15.95 | 15.95 | 12.71 | 12.71 | |||||||||||||||||||||||||
Class K | 25.48 | 62.63 | N/A | 17.17 | N/A | 13.87 | N/A | |||||||||||||||||||||||||
Russell 2000® Index | 25.28 | 64.56 | N/A | 16.01 | N/A | 12.65 | N/A | |||||||||||||||||||||||||
| (a) | Assuming maximum sales charges, if any. Average annual total returns with and without sales charges reflect reductions for distribution and service fees. See “About Fund Performance” for a detailed description of share classes, including any related sales charges and fees, and how performance was calculated for certain share classes. |
| (b) | The Fund commenced operations on March 14, 2013. |
N/A - Not applicable as share class and index do not have a sales charge.
Past performance is not an indication of future results.
Performance results may include adjustments made for financial reporting purposes in accordance with U.S. generally accepted accounting principles.
Expense Example
| Actual | Hypothetical(a) | |||||||||||||||||||||||||||||||
| | Beginning Account Value (12/01/20) |
| | Ending Account Value (05/31/21) |
| | Expenses Paid During the Period |
(b) | | Beginning Account Value (12/01/20) |
| | Ending Account Value (05/31/21) |
| | Expenses Paid During the Period |
(b) | | Annualized Expense Ratio |
| ||||||||||||
Institutional | $ 1,000.00 | $ 1,254.70 | $ 2.81 | $ 1,000.00 | $ 1,022.44 | $ 2.52 | 0.50 | % | ||||||||||||||||||||||||
Investor A | 1,000.00 | 1,252.30 | 4.21 | 1,000.00 | 1,021.19 | 3.78 | 0.75 | |||||||||||||||||||||||||
Investor C | 1,000.00 | 1,248.40 | 8.41 | 1,000.00 | 1,017.45 | 7.54 | 1.50 | |||||||||||||||||||||||||
Class K | 1,000.00 | 1,254.80 | 2.53 | 1,000.00 | 1,022.69 | 2.27 | 0.45 | |||||||||||||||||||||||||
| (a) | Hypothetical 5% annual return before expenses is calculated by prorating the number of days in the most recent fiscal half year divided by 365. |
| (b) | For each class of the Fund, expenses are equal to the annualized expense ratio for the class, multiplied by the average account value over the period, multiplied by 182/365 (to reflect the one-half year period shown). |
See “Disclosure of Expenses” for further information on how expenses were calculated.
FUND SUMMARY | 13 |
| Fund Summary as of May 31, 2021 (continued) | BlackRock Advantage Small Cap Core Fund |
Portfolio Information
| TEN LARGEST HOLDINGS |
| |||
| Security(a) | Percent of Net Assets | |||
Southwest Gas Holdings, Inc. | 1 | % | ||
MDC Holdings, Inc. | 1 | |||
Silicon Laboratories, Inc. | 1 | |||
Stifel Financial Corp. | 1 | |||
SiteOne Landscape Supply, Inc. | 1 | |||
HB Fuller Co | 1 | |||
Builders FirstSource, Inc. | 1 | |||
First Interstate BancSystem, Inc., Class A | 1 | |||
Lithia Motors, Inc., Class A | 1 | |||
International Game Technology PLC | 1 | |||
| SECTOR ALLOCATION |
| |||
| Sector(b) | Percent of Net Assets | |||
Health Care | 17 | % | ||
Industrials | 16 | |||
Financials | 16 | |||
Consumer Discretionary | 15 | |||
Information Technology | 14 | |||
Materials | 6 | |||
Real Estate | 5 | |||
Energy | 3 | |||
Consumer Staples | 3 | |||
Utilities | 2 | |||
Communication Services | 2 | |||
Short-Term Securities | 5 | |||
Liabilities in Excess of Other Assets | (4 | ) | ||
| (a) | Excludes short-term securities. |
| (b) | For Fund compliance purposes, the Fund’s sector classifications refer to one or more of the sector sub-classifications used by one or more widely recognized market indexes or ratings group indexes, and/or as defined by the investment adviser. These definitions may not apply for purposes of this report, which may combine such sector sub-classifications for reporting ease. |
| 14 | 2 0 2 1 BLACK ROCK ANNUAL REPORT TO SHAREHOLDERS |
Institutional and Class K Shares are not subject to any sales charge. These shares bear no ongoing distribution or service fees and are available only to certain eligible investors. BlackRock Advantage International Fund’s Class K Shares performance shown prior to the Class K Shares inception date of January 25, 2018 is that of Institutional Shares. BlackRock Advantage Large Cap Growth Fund’s Class K Shares performance shown prior to the Class K Shares inception date of January 25, 2018 is that of Investor AShares. BlackRock Advantage Small Cap Core Fund’s Class K Shares performance shown prior to the Class K Shares inception date of March 28, 2016 is that of Institutional Shares. The performance of each Fund’s Class K Shares would be substantially similar to Investor A Shares or Institutional Shares, as applicable, because Investor A Shares or Institutional Shares, as applicable, of a Fund invest in the same portfolio of securities and performance would only differ to the extent that Class K Shares and Investor A Shares or Institutional Shares, as applicable, have different expenses. The actual returns of Class K Shares would have been higher than those of Investor A Shares or Institutional Shares, as applicable, because Class K Shares have lower expenses than Investor A Shares and Institutional Shares.
Service Shares (available only in BlackRock Advantage Large Cap Growth Fund) are not subject to any sales charge. These shares are subject to a service fee of 0.25% per year (but no distribution fee) and are only available to certain eligible investors. Effective on or about the close of business on July 6, 2021, BlackRock Advantage Large Cap Growth Fund’s Service Shares will be converted into Investor A Shares.
Investor A Shares are subject to a maximum initial sales charge (front-end load) of 5.25% and a service fee of 0.25% per year (but no distribution fee). Certain redemptions of these shares may be subject to a contingent deferred sales charge (“CDSC”) where no initial sales charge was paid at the time of purchase. These shares are generally available through financial intermediaries.
Investor C Shares are subject to a 1.00% CDSC if redeemed within one year of purchase. In addition, these shares are subject to a distribution fee of 0.75% per year and a service fee of 0.25% per year. These shares are generally available through financial intermediaries. These shares automatically convert to Investor A Shares after approximately eight years.
Class R Shares (available only in BlackRock Advantage International Fund and BlackRock Advantage Large Cap Growth Fund) are not subject to any sales charge. These shares are subject to a distribution fee of 0.25% per year and a service fee of 0.25% per year. These shares are available only to certain employer-sponsored retirement plans. BlackRock Advantage International Fund’s Class R Shares performance shown prior to the Class R Shares inception date of September 12, 2011 is that of Institutional Shares (which have no distribution or service fees) and was restated to reflect Class R Shares fees.
Past performance is not an indication of future results. Financial markets have experienced extreme volatility and trading in many instruments has been disrupted. These circumstances may continue for an extended period of time, and may continue to affect adversely the value and liquidity of the fund’s investments. As a result, current performance may be lower or higher than the performance data quoted. Refer to blackrock.com to obtain performance data current to the most recent month-end. Performance results do not reflect the deduction of taxes that a shareholder would pay on Fund distributions or the redemption of Fund shares. Figures shown in the performance tables on the previous pages assume reinvestment of all distributions, if any, at net asset value (“NAV”) on the ex-dividend date or payable date, as applicable. Investment return and principal value of shares will fluctuate so that shares, when redeemed, may be worth more or less than their original cost. Distributions paid to each class of shares will vary because of the different levels of service, distribution and transfer agency fees applicable to each class, which are deducted from the income available to be paid to shareholders.
BlackRock Advisors, LLC (the “Manager”), each Fund’s investment adviser, has contractually and/or voluntarily agreed to waive and/or reimburse a portion of each Fund’s expenses. Without such waiver(s) and/or reimbursement(s), each Fund’s performance would have been lower. With respect to each Fund’s voluntary waiver(s), if any, the Manager is under no obligation to waive and/or reimburse or to continue waiving and/or reimbursing its fees and such voluntary waiver(s) may be reduced or discontinued at any time. With respect to each Fund’s contractual waiver(s), if any, the Manager is under no obligation to continue waiving and/or reimbursing its fees after the applicable termination date of such agreement. See the Notes to Financial Statements for additional information on waivers and/or reimbursements.
Shareholders of each Fund may incur the following charges: (a) transactional expenses, such as sales charges; and (b) operating expenses, including investment advisory fees, administration fees, service and distribution fees, including 12b-1 fees, acquired fund fees and expenses and other fund expenses. The expense examples shown (which are based on a hypothetical investment of $1,000 invested on December 1, 2020 and held through May 31, 2021) are intended to assist shareholders both in calculating expenses based on an investment in each Fund and in comparing these expenses with similar costs of investing in other mutual funds.
The expense examples provide information about actual account values and actual expenses. In order to estimate the expenses a shareholder paid during the period covered by this report, shareholders can divide their account value by $1,000 and then multiply the result by the number corresponding to their Fund and share class under the heading entitled “Expenses Paid During the Period.”
The expense examples also provide information about hypothetical account values and hypothetical expenses based on a Fund’s actual expense ratio and an assumed rate of return of 5% per year before expenses. In order to assist shareholders in comparing the ongoing expenses of investing in these Funds and other funds, compare the 5% hypothetical examples with the 5% hypothetical examples that appear in shareholder reports of other funds.
The expenses shown in the expense examples are intended to highlight shareholders’ ongoing costs only and do not reflect transactional expenses, such as sales charges, if any. Therefore, the hypothetical examples are useful in comparing ongoing expenses only, and will not help shareholders determine the relative total expenses of owning different funds. If these transactional expenses were included, shareholder expenses would have been higher.
ABOUT FUND PERFORMANCE | 15 |
Derivative Financial Instruments
The Funds may invest in various derivative financial instruments. These instruments are used to obtain exposure to a security, commodity, index, market and/or other assets without owning or taking physical custody of securities, commodities and/or other referenced assets or to manage market, equity, credit, interest rate, foreign currency exchange rate, commodity and/or other risks. Derivative financial instruments may give rise to a form of economic leverage and involve risks, including the imperfect correlation between the value of a derivative financial instrument and the underlying asset, possible default of the counterparty to the transaction or illiquidity of the instrument. The Funds’ successful use of a derivative financial instrument depends on the investment adviser’s ability to predict pertinent market movements accurately, which cannot be assured. The use of these instruments may result in losses greater than if they had not been used, may limit the amount of appreciation a Fund can realize on an investment and/or may result in lower distributions paid to shareholders. The Funds’ investments in these instruments, if any, are discussed in detail in the Notes to Financial Statements.
| 16 | 2 0 2 1 BLACK ROCK ANNUAL REPORT TO SHAREHOLDERS |
May 31, 2021 | BlackRock Advantage International Fund (Percentages shown are based on Net Assets) |
| Security | Shares | Value | ||||||
Common Stocks |
| |||||||
Australia — 7.3% |
| |||||||
AGL Energy Ltd. | 51,841 | $ | 325,126 | |||||
Altium Ltd. | 8,956 | 195,051 | ||||||
Alumina Ltd. | 265,694 | 350,906 | ||||||
Appen Ltd. | 18,314 | 189,100 | ||||||
Aristocrat Leisure Ltd. | 258,838 | 8,171,928 | ||||||
ASX Ltd. | 1,601 | 94,185 | ||||||
Aurizon Holdings Ltd. | 116,512 | 325,189 | ||||||
Bendigo & Adelaide Bank Ltd. | 247,044 | 1,970,672 | ||||||
BHP Group Ltd. | 320,057 | 11,805,081 | ||||||
BHP Group PLC | 108,119 | 3,267,038 | ||||||
BlueScope Steel Ltd. | 17,486 | 285,785 | ||||||
Brambles Ltd. | 6,299 | 52,556 | ||||||
carsales.com Ltd. | 64,765 | 962,417 | ||||||
Challenger Ltd. | 47,026 | 188,961 | ||||||
Cochlear Ltd. | 11,923 | 2,086,897 | ||||||
Commonwealth Bank of Australia | 117,185 | 9,003,302 | ||||||
Computershare Ltd. | 27,919 | 337,868 | ||||||
CSL Ltd. | 27,462 | 6,146,824 | ||||||
Domain Holdings Australia Ltd.(a) | 17,688 | 66,980 | ||||||
Downer EDI Ltd. | 959 | 4,110 | ||||||
Ensogo Ltd.(a)(b) | 122,284 | 1 | ||||||
Glencore PLC | 777,912 | 3,543,470 | ||||||
Goodman Group | 107,701 | 1,613,328 | ||||||
Iluka Resources Ltd. | 370,426 | 2,201,969 | ||||||
IOOF Holdings Ltd. | 491,734 | 1,495,431 | ||||||
Magellan Financial Group Ltd. | 7,830 | 288,520 | ||||||
Medibank Pvt Ltd. | 1,807,024 | 4,360,442 | ||||||
Mineral Resources Ltd. | 13,688 | 478,481 | ||||||
Mirvac Group | 43,178 | 92,721 | ||||||
Platinum Asset Management Ltd. | 45 | 160 | ||||||
Qantas Airways Ltd.(a) | 545,791 | 1,977,881 | ||||||
REA Group Ltd. | 52,853 | 6,662,461 | ||||||
Rio Tinto Ltd. | 6,063 | 578,145 | ||||||
Rio Tinto PLC | 35,572 | 3,063,019 | ||||||
Scentre Group | 2,138,661 | 4,475,072 | ||||||
SEEK Ltd. | 80,450 | 1,892,081 | ||||||
South32 Ltd. | 64,377 | 147,694 | ||||||
Stockland | 177,438 | 637,702 | ||||||
Tabcorp Holdings Ltd. | 121,269 | 476,530 | ||||||
Technology One Ltd. | 19,192 | 136,195 | ||||||
Treasury Wine Estates Ltd. | 90,547 | 811,950 | ||||||
Westpac Banking Corp. | 239,068 | 4,861,258 | ||||||
WiseTech Global Ltd. | 56,127 | 1,218,594 | ||||||
|
| |||||||
| 86,843,081 | ||||||||
| Austria — 0.2% | ||||||||
Raiffeisen Bank International AG | 113,567 | 2,704,886 | ||||||
|
| |||||||
| Belgium — 0.8% | ||||||||
Ageas SA | 729 | 47,698 | ||||||
Anheuser-Busch InBev SA | 117,957 | 8,880,498 | ||||||
UCB SA | 661 | 61,844 | ||||||
|
| |||||||
| 8,990,040 | ||||||||
| China — 1.3% | ||||||||
BOC Hong Kong Holdings Ltd. | 1,145,000 | 4,135,641 | ||||||
Budweiser Brewing Co. APAC Ltd.(c) | 72,000 | 244,204 | ||||||
Prosus NV | 81,881 | 8,503,447 | ||||||
Yangzijiang Shipbuilding Holdings Ltd. | 1,781,800 | 2,019,928 | ||||||
|
| |||||||
| 14,903,220 | ||||||||
| Denmark — 3.3% | ||||||||
AP Moller - Maersk A/S, Class A | 738 | 1,950,797 | ||||||
| Security | Shares | Value | ||||||
| Denmark (continued) | ||||||||
AP Moller - Maersk A/S, Class B | 2,179 | $ | 6,018,986 | |||||
Chr Hansen Holding A/S | 39,451 | 3,541,529 | ||||||
Coloplast A/S, Class B | 19,176 | 3,026,956 | ||||||
Genmab A/S(a) | 3,506 | 1,418,345 | ||||||
GN Store Nord AS | 34,574 | 2,935,108 | ||||||
Netcompany Group A/S(c) | 6,185 | 717,630 | ||||||
Novo Nordisk A/S, Class B | 234,806 | 18,578,507 | ||||||
Pandora A/S | 464 | 62,747 | ||||||
SimCorp A/S | 5,812 | 788,999 | ||||||
|
| |||||||
| 39,039,604 | ||||||||
| Finland — 1.7% | ||||||||
Kone Oyj, Class B | 106,261 | 8,594,995 | ||||||
Nokia Oyj(a) | 1 | 5 | ||||||
Nordea Bank Abp | 992,262 | 10,643,816 | ||||||
Sampo Oyj, A Shares | 7,335 | 341,804 | ||||||
TietoEVRY Oyj | 7,067 | 228,439 | ||||||
UPM-Kymmene Oyj | 23,925 | 912,000 | ||||||
|
| |||||||
| 20,721,059 | ||||||||
| France — 11.7% | ||||||||
Air France-KLM(a) | 124,724 | 706,241 | ||||||
Air Liquide SA | 1,145 | 194,735 | ||||||
ALD SA(c) | 19 | 292 | ||||||
Amundi SA(c) | 63,137 | 5,613,500 | ||||||
Arkema SA | 201 | 26,493 | ||||||
Atos SE | 67,843 | 4,550,263 | ||||||
AXA SA | 234,839 | 6,486,351 | ||||||
BNP Paribas SA | 205,318 | 14,032,378 | ||||||
Casino Guichard Perrachon SA(a) | 60,740 | 1,961,207 | ||||||
CNP Assurances | 80,286 | 1,456,526 | ||||||
Credit Agricole SA | 153,778 | 2,295,501 | ||||||
Dassault Systemes SE | 38,215 | 8,798,616 | ||||||
Engie SA | 321,912 | 4,783,196 | ||||||
Eutelsat Communications SA | 5,742 | 73,080 | ||||||
Hermes International | 8,794 | 12,395,736 | ||||||
Kering SA | 15,406 | 14,100,565 | ||||||
Klepierre SA | 4,099 | 118,551 | ||||||
Legrand SA | 13,846 | 1,450,495 | ||||||
L’Oreal SA | 10,852 | 4,888,907 | ||||||
LVMH Moet Hennessy Louis Vuitton SE | 19,251 | 15,351,638 | ||||||
Natixis SA(a) | 25,917 | 128,597 | ||||||
Orange SA | 15,494 | 197,275 | ||||||
Pernod Ricard SA | 31,764 | 6,998,927 | ||||||
Remy Cointreau SA | 296 | 61,851 | ||||||
Renault SA(a) | 959 | 39,701 | ||||||
Rexel SA | 400,190 | 8,166,673 | ||||||
Rubis SCA | 20,870 | 1,009,477 | ||||||
Sanofi | 9,716 | 1,033,533 | ||||||
Schneider Electric SE | 80,505 | 12,740,829 | ||||||
SCOR SE(a) | 50,989 | 1,658,747 | ||||||
Société Générale SA | 23,678 | 759,338 | ||||||
Sodexo SA(a) | 16,374 | 1,586,278 | ||||||
TOTAL SE | 35,812 | 1,660,661 | ||||||
Unibail-Rodamco-Westfield(a) | 9,549 | 831,537 | ||||||
Valeo SA | 56,245 | 1,840,932 | ||||||
|
| |||||||
| 137,998,627 | ||||||||
| Germany — 8.5% | ||||||||
adidas AG | 14,012 | 5,112,850 | ||||||
Allianz SE, Registered Shares | 1,221 | 321,771 | ||||||
Aroundtown SA | 211,978 | 1,780,272 | ||||||
Aurubis AG | 6,599 | 631,066 | ||||||
BASF SE | 17,293 | 1,410,023 | ||||||
SCHEDULES OF INVESTMENTS | 17 |
Schedule of Investments (continued) May 31, 2021 | BlackRock Advantage International Fund (Percentages shown are based on Net Assets) |
| Security | Shares | Value | ||||||
| Germany (continued) | ||||||||
Bayer AG, Registered Shares | 29,386 | $ | 1,850,024 | |||||
Bayerische Motoren Werke AG | 6,886 | 730,304 | ||||||
Bayerische Motoren Werke AG, Preference Shares | 1,081 | 97,929 | ||||||
Beiersdorf AG | 51,181 | 6,061,370 | ||||||
Continental AG(a) | 1,507 | 222,843 | ||||||
Daimler AG, Registered Shares | 101,816 | 9,488,050 | ||||||
Deutsche Boerse AG | 21,906 | 3,581,677 | ||||||
Deutsche Post AG, Registered Shares | 197,491 | 13,478,101 | ||||||
DWS Group GmbH & Co. KGaA(c) | 6,581 | 314,293 | ||||||
E.ON SE | 721,098 | 8,718,302 | ||||||
Evonik Industries AG | 18,571 | 664,276 | ||||||
Freenet AG | 14,962 | 411,529 | ||||||
Fresenius Medical Care AG & Co. KGaA | 932 | 74,491 | ||||||
Hannover Rueck SE | 9,466 | 1,656,646 | ||||||
HelloFresh SE(a) | 44,766 | 4,092,463 | ||||||
Henkel AG & Co. KGaA | 6,914 | 682,717 | ||||||
Henkel AG & Co. KGaA, Preference Shares | 43,648 | 5,007,617 | ||||||
Nemetschek SE | 5,507 | 407,250 | ||||||
Rheinmetall AG | 8,956 | 929,933 | ||||||
SAP SE | 36,678 | 5,092,205 | ||||||
Schaeffler AG, Preference Shares | 163,050 | 1,530,312 | ||||||
Scout24 AG(c) | 22,960 | 1,864,949 | ||||||
Siemens AG, Registered Shares | 106,888 | 17,341,289 | ||||||
thyssenkrupp AG(a) | 25 | 296 | ||||||
Volkswagen AG | 601 | 214,372 | ||||||
Volkswagen AG, Preference Shares | 10,036 | 2,803,943 | ||||||
Vonovia SE | 7,578 | 473,945 | ||||||
Zalando SE(a)(c) | 29,666 | 3,171,532 | ||||||
|
| |||||||
| 100,218,640 | ||||||||
| Hong Kong — 3.0% | ||||||||
AIA Group Ltd. | 953,200 | 12,160,969 | ||||||
ASM Pacific Technology Ltd. | 24,000 | 316,715 | ||||||
Cathay Pacific Airways Ltd.(a) | 473,000 | 406,246 | ||||||
CK Asset Holdings Ltd. | 291,500 | 1,928,215 | ||||||
Dah Sing Financial Holdings Ltd. | 17,600 | 62,638 | ||||||
Haitong International Securities Group Ltd. | 147,000 | 44,825 | ||||||
Henderson Land Development Co. Ltd. | 143,420 | 684,817 | ||||||
Hongkong Land Holdings Ltd. | 87,400 | 428,059 | ||||||
Kerry Properties Ltd. | 590,000 | 1,897,644 | ||||||
Link REIT | 259,800 | 2,471,454 | ||||||
MTR Corp. Ltd. | 341,500 | 1,897,974 | ||||||
New World Development Co. Ltd. | 258,000 | 1,389,078 | ||||||
NWS Holdings Ltd. | 268,000 | 301,210 | ||||||
Sun Hung Kai Properties Ltd. | 156,500 | 2,401,504 | ||||||
Swire Properties Ltd. | 1,044,600 | 3,073,097 | ||||||
Techtronic Industries Co. Ltd. | 227,000 | 4,180,572 | ||||||
WH Group Ltd.(c) | 330,500 | 281,947 | ||||||
Wharf Real Estate Investment Co. Ltd. | 190,000 | 1,111,654 | ||||||
|
| |||||||
| 35,038,618 | ||||||||
| India — 0.0% | ||||||||
Jasper Infotech Private Ltd. (Acquired 05/07/14, cost $ 804,375)(a)(b)(d) | 1,080 | 178,060 | ||||||
|
| |||||||
| Ireland — 0.4% | ||||||||
AIB Group PLC(a) | 27,038 | 90,095 | ||||||
CRH PLC | 3,199 | 166,440 | ||||||
Flutter Entertainment PLC(a) | 7,783 | 1,447,371 | ||||||
Kerry Group PLC, Class A | 6,041 | 816,740 | ||||||
Kingspan Group PLC | 15,338 | 1,440,782 | ||||||
Smurfit Kappa Group PLC | 7,924 | 420,875 | ||||||
|
| |||||||
| 4,382,303 | ||||||||
| Security | Shares | Value | ||||||
| Israel — 1.0% | ||||||||
Bank Hapoalim BM(a) | 355,171 | $ | 3,012,742 | |||||
Bank Leumi Le-Israel BM(a) | 7,123 | 55,683 | ||||||
First International Bank Of Israel Ltd.(a) | 5,377 | 171,291 | ||||||
ICL Group Ltd. | 22,619 | 163,922 | ||||||
Israel Discount Bank Ltd., Class A(a) | 379,094 | 1,883,320 | ||||||
Mizrahi Tefahot Bank Ltd.(a) | 5,889 | 175,450 | ||||||
Nice Ltd.(a)(e) | 19,099 | 4,174,171 | ||||||
Plus500 Ltd. | 1,851 | 39,694 | ||||||
Teva Pharmaceutical Industries Ltd.(a) | 216,617 | 2,291,547 | ||||||
|
| |||||||
| 11,967,820 | ||||||||
| Italy — 0.9% | ||||||||
Amplifon SpA | 4,017 | 191,406 | ||||||
Assicurazioni Generali SpA | 97,789 | 2,011,302 | ||||||
Banca Generali SpA(a) | 14,454 | 591,154 | ||||||
Hera SpA | 15,953 | 68,102 | ||||||
Interpump Group SpA | 455 | 26,025 | ||||||
Intesa Sanpaolo SpA | 447,941 | 1,323,737 | ||||||
Leonardo SpA(a) | 162,814 | 1,416,366 | ||||||
Mediaset SpA(a) | 11 | 40 | ||||||
Mediobanca Banca di Credito Finanziario SpA(a) | 163,179 | 1,948,154 | ||||||
Pirelli & C SpA(a)(c) | 256,475 | 1,523,909 | ||||||
Telecom Italia SpA | 518,108 | 277,961 | ||||||
Unipol Gruppo SpA | 293,782 | 1,645,860 | ||||||
|
| |||||||
| 11,024,016 | ||||||||
| Japan — 23.2% | ||||||||
Advantest Corp. | 1,400 | 126,752 | ||||||
Aisin Corp. | 52,900 | 2,323,075 | ||||||
Alfresa Holdings Corp. | 4,900 | 75,866 | ||||||
Alps Alpine Co. Ltd. | 137,000 | 1,473,573 | ||||||
Amada Co. Ltd. | 96,600 | 1,028,846 | ||||||
ANA Holdings, Inc.(a) | 2,500 | 60,889 | ||||||
Asahi Kasei Corp. | 138,200 | 1,526,481 | ||||||
Asics Corp. | 6,900 | 165,701 | ||||||
Astellas Pharma, Inc. | 212,900 | 3,500,523 | ||||||
Bandai Namco Holdings, Inc. | 26,500 | 1,900,043 | ||||||
Benesse Holdings, Inc. | 84,100 | 1,935,387 | ||||||
Bridgestone Corp. | 93,500 | 4,116,346 | ||||||
Canon Marketing Japan, Inc. | 1,200 | 28,074 | ||||||
Canon, Inc. | 220,290 | 5,165,787 | ||||||
Casio Computer Co. Ltd. | 39,800 | 692,158 | ||||||
Credit Saison Co. Ltd. | 10,700 | 132,168 | ||||||
Dai Nippon Printing Co. Ltd. | 8,000 | 172,785 | ||||||
Dai-ichi Life Holdings, Inc. | 12,600 | 257,487 | ||||||
Daikin Industries Ltd. | 3,900 | 770,932 | ||||||
Daito Trust Construction Co. Ltd. | 1,300 | 137,305 | ||||||
Daiwa House Industry Co. Ltd. | 83,000 | 2,436,465 | ||||||
Denso Corp. | 32,500 | 2,233,591 | ||||||
DIC Corp. | 36,900 | 944,740 | ||||||
Dip Corp. | 13,600 | 403,440 | ||||||
Disco Corp. | 4,700 | 1,446,844 | ||||||
Ebara Corp. | 2,400 | 118,732 | ||||||
Eisai Co. Ltd. | 11,000 | 740,864 | ||||||
Electric Power Development Co. Ltd. | 12,000 | 169,609 | ||||||
FANUC Corp. | 31,000 | 7,460,803 | ||||||
Fast Retailing Co. Ltd. | 9,500 | 7,757,870 | ||||||
FUJIFILM Holdings Corp. | 66,300 | 4,634,380 | ||||||
Fuyo General Lease Co. Ltd. | 900 | 59,770 | ||||||
GMO internet, Inc. | 7,700 | 207,929 | ||||||
Haseko Corp. | 4,100 | 57,579 | ||||||
Honda Motor Co. Ltd. | 6,900 | 211,723 | ||||||
Hoya Corp. | 400 | 52,663 | ||||||
Idemitsu Kosan Co. Ltd. | 20,500 | 485,396 | ||||||
| 18 | 2 0 2 1 BLACK ROCK ANNUAL REPORT TO SHAREHOLDERS |
Schedule of Investments (continued) May 31, 2021 | BlackRock Advantage International Fund (Percentages shown are based on Net Assets) |
| Security | Shares | Value | ||||||
| Japan (continued) | ||||||||
Inpex Corp. | 191,200 | $ | 1,318,423 | |||||
Isuzu Motors Ltd. | 27,100 | 357,680 | ||||||
Itoham Yonekyu Holdings, Inc. | 14,700 | 95,300 | ||||||
Japan Airlines Co. Ltd.(a) | 1,500 | 34,337 | ||||||
Japan Post Bank Co. Ltd. | 53,500 | 455,921 | ||||||
Japan Post Holdings Co. Ltd. | 525,200 | 4,374,400 | ||||||
Japan Tobacco, Inc. | 264,800 | 5,239,400 | ||||||
Kakaku.com, Inc. | 9,400 | 286,862 | ||||||
Kamigumi Co. Ltd. | 1,400 | 27,781 | ||||||
Kandenko Co. Ltd. | 19,900 | 164,947 | ||||||
Kansai Paint Co. Ltd. | 6,100 | 164,926 | ||||||
KDDI Corp. | 133,500 | 4,534,228 | ||||||
Keyence Corp. | 30,800 | 15,207,703 | ||||||
Kinden Corp. | 1,600 | 26,972 | ||||||
Kirin Holdings Co. Ltd. | 504,900 | 10,207,126 | ||||||
Koito Manufacturing Co. Ltd. | 7,200 | 469,878 | ||||||
Komatsu Ltd. | 26,400 | 775,886 | ||||||
Konica Minolta, Inc. | 192,300 | 1,052,093 | ||||||
Kose Corp. | 6,100 | 958,370 | ||||||
Kubota Corp. | 66,300 | 1,512,284 | ||||||
Kyoritsu Maintenance Co. Ltd. | 2,800 | 94,141 | ||||||
Kyowa Exeo Corp. | 10,500 | 258,678 | ||||||
Lawson, Inc. | 1,900 | 85,783 | ||||||
Lintec Corp. | 31,000 | 686,847 | ||||||
M3, Inc. | 16,100 | 1,091,884 | ||||||
Maeda Corp. | 40,300 | 352,504 | ||||||
Mitsubishi Chemical Holdings Corp. | 45,800 | 367,633 | ||||||
Mitsubishi Corp. | 109,300 | 2,985,604 | ||||||
Mitsubishi Estate Co. Ltd. | 7,300 | 118,629 | ||||||
Mitsubishi HC Capital, Inc. | 572,400 | 3,193,579 | ||||||
Mitsubishi Heavy Industries Ltd. | 34,900 | 1,059,259 | ||||||
Mitsubishi Materials Corp. | 33,100 | 703,287 | ||||||
Mitsui & Co. Ltd. | 35,400 | 783,059 | ||||||
Mitsui Mining & Smelting Co. Ltd. | 1,300 | 38,561 | ||||||
Morinaga & Co. Ltd. | 12,200 | 377,010 | ||||||
MS&AD Insurance Group Holdings, Inc. | 128,900 | 3,944,985 | ||||||
Murata Manufacturing Co. Ltd. | 34,000 | 2,578,188 | ||||||
Nexon Co. Ltd. | 100,600 | 2,372,997 | ||||||
NGK Spark Plug Co. Ltd. | 37,900 | 597,753 | ||||||
Nidec Corp. | 52,000 | 5,976,918 | ||||||
Nihon M&A Center, Inc. | 8,400 | 200,936 | ||||||
Nihon Unisys Ltd. | 5,500 | 159,379 | ||||||
Nikon Corp. | 157,700 | 1,619,450 | ||||||
Nintendo Co. Ltd. | 8,400 | 5,198,768 | ||||||
Nippon Paint Holdings Co. Ltd. | 194,200 | 2,820,939 | ||||||
Nippon Shinyaku Co. Ltd. | 4,900 | 351,001 | ||||||
Nippon Telegraph & Telephone Corp. | 330,200 | 8,844,686 | ||||||
Nippon Yusen KK | 20,200 | 835,517 | ||||||
Nissan Motor Co. Ltd.(a) | 33,200 | 163,682 | ||||||
Nomura Holdings, Inc. | 688,400 | 3,782,310 | ||||||
Nomura Research Institute Ltd. | 25,000 | 797,155 | ||||||
Obayashi Corp. | 45,700 | 385,653 | ||||||
Obic Co. Ltd. | 2,800 | 524,861 | ||||||
Omron Corp. | 14,300 | 1,129,916 | ||||||
Oracle Corp. Japan(a) | 1,800 | 163,909 | ||||||
Oriental Land Co. Ltd. | 5,400 | 806,035 | ||||||
Otsuka Corp. | 14,600 | 781,574 | ||||||
Persol Holdings Co. Ltd. | 18,200 | 346,017 | ||||||
Pigeon Corp. | 15,100 | 425,766 | ||||||
Recruit Holdings Co. Ltd. | 270,100 | 13,780,543 | ||||||
Relo Group, Inc. | 6,500 | 132,281 | ||||||
Resona Holdings, Inc. | 155,900 | 667,393 | ||||||
| Security | Shares | Value | ||||||
| Japan (continued) | ||||||||
Resorttrust, Inc. | 10,100 | $ | 160,114 | |||||
Ricoh Co. Ltd. | 314,700 | 3,737,946 | ||||||
Sanwa Holdings Corp. | 7,700 | 93,525 | ||||||
Sawai Group Holdings Co. Ltd. | 5,600 | 244,837 | ||||||
SCREEN Holdings Co. Ltd. | 8,900 | 850,632 | ||||||
SCSK Corp. | 1,800 | 104,491 | ||||||
Secom Co. Ltd. | 1,400 | 109,676 | ||||||
Sekisui House Ltd. | 12,300 | 256,363 | ||||||
Seven Bank Ltd. | 14,000 | 29,098 | ||||||
Shimadzu Corp. | 2,600 | 91,247 | ||||||
Shimano, Inc. | 7,000 | 1,586,184 | ||||||
Shimizu Corp. | 13,500 | 110,794 | ||||||
Shin-Etsu Chemical Co. Ltd. | 300 | 51,833 | ||||||
Shinsei Bank Ltd. | 22,200 | 345,606 | ||||||
Shiseido Co. Ltd. | 29,700 | 2,152,027 | ||||||
SMC Corp. | 10,100 | 6,053,101 | ||||||
SoftBank Corp. | 189,500 | 2,437,314 | ||||||
SoftBank Group Corp. | 103,600 | 7,823,428 | ||||||
Sompo Holdings, Inc. | 14,400 | 580,459 | ||||||
Sony Group Corp. | 11,700 | 1,154,884 | ||||||
Subaru Corp. | 137,800 | 2,684,786 | ||||||
Sumitomo Chemical Co. Ltd. | 1,759,200 | 9,663,286 | ||||||
Sumitomo Corp. | 19,600 | 274,234 | ||||||
Sumitomo Forestry Co. Ltd. | 2,600 | 52,748 | ||||||
Sumitomo Heavy Industries Ltd. | 3,300 | 102,309 | ||||||
Sumitomo Metal Mining Co. Ltd. | 5,900 | 265,844 | ||||||
Sumitomo Mitsui Financial Group, Inc. | 325,500 | 11,779,424 | ||||||
Sumitomo Rubber Industries Ltd. | 457,600 | 5,925,956 | ||||||
Suntory Beverage & Food Ltd. | 59,000 | 2,174,122 | ||||||
Sysmex Corp. | 11,700 | 1,195,137 | ||||||
T&D Holdings, Inc. | 37,700 | 514,548 | ||||||
Taiheiyo Cement Corp. | 1,700 | 39,226 | ||||||
Taisei Corp. | 13,500 | 472,178 | ||||||
Takeda Pharmaceutical Co. Ltd. | 299,300 | 10,180,968 | ||||||
Tokio Marine Holdings, Inc. | 126,400 | 5,994,708 | ||||||
Tokyo Electron Ltd. | 17,400 | 7,750,219 | ||||||
Tokyo Gas Co. Ltd. | 12,200 | 241,821 | ||||||
Toshiba Corp. | 25,600 | 1,077,808 | ||||||
Toyoda Gosei Co. Ltd. | 13,600 | 346,840 | ||||||
Toyota Motor Corp. | 55,500 | 4,626,132 | ||||||
Trend Micro, Inc. | 5,300 | 268,775 | ||||||
Unicharm Corp. | 39,900 | 1,578,560 | ||||||
Welcia Holdings Co. Ltd. | 63,900 | 1,954,167 | ||||||
Yakult Honsha Co. Ltd. | 6,100 | 330,339 | ||||||
Yamada Holdings Co. Ltd. | 230,600 | 1,122,183 | ||||||
Yaskawa Electric Corp. | 18,600 | 905,730 | ||||||
Yokohama Rubber Co. Ltd. | 7,400 | 149,394 | ||||||
Z Holdings Corp. | 223,900 | 1,054,097 | ||||||
|
| |||||||
| 274,561,261 | ||||||||
| Luxembourg — 0.2% | ||||||||
RTL Group SA | 32,616 | 1,941,617 | ||||||
SES SA | 29,945 | 258,580 | ||||||
|
| |||||||
| 2,200,197 | ||||||||
| Netherlands — 6.1% | ||||||||
ABN AMRO Group NV, CVA(a)(c) | 12,435 | 166,118 | ||||||
Adyen NV(a)(c) | 2,150 | 4,970,535 | ||||||
Aegon NV | 1,342,541 | 6,333,328 | ||||||
Akzo Nobel NV | 2,575 | 331,634 | ||||||
Argenx SE(a) | 821 | 226,627 | ||||||
ASML Holding NV | 21,669 | 14,501,852 | ||||||
EXOR NV | 1,883 | 161,701 | ||||||
Flow Traders(c) | 27,994 | 1,224,637 | ||||||
SCHEDULES OF INVESTMENTS | 19 |
Schedule of Investments (continued) May 31, 2021 | BlackRock Advantage International Fund (Percentages shown are based on Net Assets) |
| Security | Shares | Value | ||||||
| Netherlands (continued) | ||||||||
Heineken NV | 2,727 | $ | 325,563 | |||||
JDE Peet’s NV(a) | 13,274 | 523,620 | ||||||
Koninklijke Ahold Delhaize NV | 156,910 | 4,533,682 | ||||||
Koninklijke Philips NV | 58,017 | 3,265,390 | ||||||
NN Group NV | 85,302 | 4,332,299 | ||||||
PostNL NV | 185,098 | 1,088,982 | ||||||
Randstad NV | 115,863 | 9,030,876 | ||||||
Royal Dutch Shell PLC, A Shares | 514,642 | 9,823,746 | ||||||
Royal Dutch Shell PLC, B Shares | 498,587 | 9,066,304 | ||||||
Signify NV(c) | 36,504 | 2,266,220 | ||||||
|
| |||||||
| 72,173,114 | ||||||||
| New Zealand — 0.3% | ||||||||
a2 Milk Co. Ltd.(a) | 156,729 | 667,464 | ||||||
Air New Zealand Ltd.(a) | 8,210 | 9,971 | ||||||
Fisher & Paykel Healthcare Corp. Ltd. | 66,547 | 1,440,779 | ||||||
Spark New Zealand Ltd. | 13,054 | 43,017 | ||||||
Xero Ltd.(a) | 17,597 | 1,796,380 | ||||||
|
| |||||||
| 3,957,611 | ||||||||
| Norway — 0.1% | ||||||||
DNB ASA | 32,446 | 717,762 | ||||||
Tomra Systems ASA | 9 | 463 | ||||||
|
| |||||||
| 718,225 | ||||||||
| Singapore — 0.8% | ||||||||
DBS Group Holdings Ltd. | 118,700 | 2,692,913 | ||||||
Jardine Cycle & Carriage Ltd. | 249,100 | 4,143,691 | ||||||
Oversea-Chinese Banking Corp. Ltd. | 53,700 | 501,728 | ||||||
Singapore Airlines Ltd.(a) | 133,200 | 501,602 | ||||||
United Overseas Bank Ltd. | 77,800 | 1,532,983 | ||||||
Venture Corp. Ltd. | 5,800 | 83,438 | ||||||
|
| |||||||
| 9,456,355 | ||||||||
| South Africa — 0.3% | ||||||||
Anglo American PLC | 70,863 | 3,148,172 | ||||||
|
| |||||||
| Spain — 1.2% | ||||||||
Acciona SA | 3,681 | 622,196 | ||||||
Banco Bilbao Vizcaya Argentaria SA | 356,149 | 2,238,791 | ||||||
Banco de Sabadell SA(a) | 57,738 | 44,297 | ||||||
Banco Santander SA | 252,239 | 1,057,113 | ||||||
CaixaBank SA | 140,057 | 480,855 | ||||||
Endesa SA | 29,364 | 801,012 | ||||||
Grifols SA | 2,057 | 57,438 | ||||||
Iberdrola SA | 426,851 | 5,739,827 | ||||||
Mediaset Espana Comunicacion SA(a) | 24 | 170 | ||||||
Naturgy Energy Group SA | 26,631 | 698,132 | ||||||
Repsol SA | 118,877 | 1,589,532 | ||||||
Telefonica SA | 79,940 | 393,224 | ||||||
|
| |||||||
| 13,722,587 | ||||||||
| Sweden — 4.0% | ||||||||
Assa Abloy AB, Class B | 239,343 | 7,363,367 | ||||||
Atlas Copco AB, A Shares | 123,482 | 7,491,326 | ||||||
Atlas Copco AB, B Shares | 67,673 | 3,493,820 | ||||||
Elekta AB, B Shares | 17,048 | 250,900 | ||||||
Epiroc AB, B Shares(a) | 5,721 | 2,070 | ||||||
Epiroc AB, Class B | 5,721 | 114,075 | ||||||
EQT AB | 5,424 | 196,421 | ||||||
Evolution AB(c) | 19,645 | 3,762,938 | ||||||
Hennes & Mauritz AB, B Shares(a) | 39,939 | 1,020,999 | ||||||
Hexagon AB, B Shares | 15,358 | 218,918 | ||||||
Intrum AB | 2,526 | 88,061 | ||||||
Investor AB, B Shares | 28,132 | 650,288 | ||||||
Kinnevik AB, B Shares(a) | 86,366 | 1,645,622 | ||||||
| Security | Shares | Value | ||||||
| Sweden (continued) | ||||||||
Kinnevik AB, Class B | 86,366 | $ | 3,299,735 | |||||
L E Lundbergforetagen AB, B Shares | 30,127 | 1,895,093 | ||||||
Loomis AB | 1,480 | 46,809 | ||||||
Pandox AB(a) | 40,834 | 730,722 | ||||||
Saab AB, Class B | 108,324 | 3,135,731 | ||||||
Samhallsbyggnadsbolaget i Norden AB | 139,296 | 608,512 | ||||||
SKF AB, B Shares | 57,666 | 1,558,087 | ||||||
Swedish Match AB | 218,954 | 2,030,808 | ||||||
Telefonaktiebolaget LM Ericsson, B Shares | 621,633 | 8,246,338 | ||||||
Trelleborg AB, B Shares | 2,858 | 73,595 | ||||||
|
| |||||||
| 47,924,235 | ||||||||
| Switzerland — 7.8% | ||||||||
Adecco Group AG, Registered Shares | 88,529 | 6,099,798 | ||||||
Cie Financiere Richemont SA, Registered Shares | 111,753 | 13,633,319 | ||||||
Credit Suisse Group AG, Registered Shares | 66,806 | 728,195 | ||||||
Givaudan SA, Registered Shares | 2,686 | 11,988,319 | ||||||
Holcim Ltd. | 1,075 | 63,927 | ||||||
Kuehne + Nagel International AG, Registered Shares | 5,431 | 1,833,381 | ||||||
Landis+Gyr Group AG | 2,058 | 151,086 | ||||||
Nestlé SA, Registered Shares | 133,367 | 16,419,113 | ||||||
Novartis AG, Registered Shares | 81,355 | 7,141,471 | ||||||
Roche Holding AG | 35,005 | 12,175,169 | ||||||
Roche Holding AG | 7,375 | 2,764,502 | ||||||
Sika AG, Registered Shares | 38,481 | 12,383,559 | ||||||
Sonova Holding AG, Registered Shares(a) | 936 | 332,890 | ||||||
Straumann Holding AG, Registered Shares | 515 | 806,085 | ||||||
Sulzer AG, Registered Shares | 2 | 255 | ||||||
Swatch Group AG | 407 | 147,503 | ||||||
Swatch Group AG, Registered Shares | 1,644 | 114,008 | ||||||
Swiss Life Holding AG, Registered Shares | 75 | 38,908 | ||||||
Swiss Re AG | 23,403 | 2,249,258 | ||||||
Tecan Group AG, Registered Shares | 1,278 | 635,272 | ||||||
UBS Group AG, Registered Shares | 151,431 | 2,457,090 | ||||||
|
| |||||||
| 92,163,108 | ||||||||
| United Kingdom — 11.9% | ||||||||
3i Group PLC | 38,944 | 684,583 | ||||||
Abcam PLC(a) | 12,220 | 245,970 | ||||||
ASOS PLC(a) | 707 | 48,945 | ||||||
AstraZeneca PLC | 120,305 | 13,722,942 | ||||||
Auto Trader Group PLC(a)(c) | 19,756 | 157,131 | ||||||
Aviva PLC | 199,568 | 1,163,758 | ||||||
Babcock International Group PLC(a) | 112,762 | 477,977 | ||||||
Barclays PLC | 81,877 | 212,912 | ||||||
Barratt Developments PLC | 31,500 | 336,390 | ||||||
Bellway PLC | 19,238 | 975,604 | ||||||
BP PLC | 1,552,353 | 6,778,020 | ||||||
British American Tobacco PLC | 383,898 | 14,810,316 | ||||||
British Land Co. PLC | 15,406 | 111,323 | ||||||
BT Group PLC(a) | 124 | 307 | ||||||
Burberry Group PLC(a) | 73,127 | 2,213,059 | ||||||
Centrica PLC(a) | 397,166 | 307,822 | ||||||
Close Brothers Group PLC | 15 | 349 | ||||||
Compass Group PLC(a) | 59,566 | 1,353,108 | ||||||
Diageo PLC | 130,830 | 6,316,256 | ||||||
Direct Line Insurance Group PLC | 194,648 | 823,764 | ||||||
Dunelm Group PLC | 98,961 | 2,060,965 | ||||||
Entain PLC(a) | 14,063 | 328,593 | ||||||
Experian PLC | 120,997 | 4,642,738 | ||||||
GlaxoSmithKline PLC | 120,483 | 2,301,771 | ||||||
Greggs PLC(a) | 10,258 | 363,064 | ||||||
Halma PLC | 6,473 | 239,004 | ||||||
| 20 | 2 0 2 1 BLACK ROCK ANNUAL REPORT TO SHAREHOLDERS |
Schedule of Investments (continued) May 31, 2021 | BlackRock Advantage International Fund (Percentages shown are based on Net Assets) |
| Security | Shares | Value | ||||||
| United Kingdom (continued) | ||||||||
HomeServe PLC | 35,383 | $ | 468,639 | |||||
Howden Joinery Group PLC | 200,682 | 2,268,844 | ||||||
HSBC Holdings PLC | 1,598,132 | 10,345,850 | ||||||
IG Group Holdings PLC | 9,456 | 114,942 | ||||||
Imperial Brands PLC | 141,407 | 3,210,633 | ||||||
InterContinental Hotels Group PLC(a) | 4,501 | 313,007 | ||||||
ITV PLC(a) | 379,247 | 686,818 | ||||||
J Sainsbury PLC | 663,753 | 2,499,279 | ||||||
JD Sports Fashion PLC(a) | 209,227 | 2,799,578 | ||||||
JET2 PLC(a) | 80,568 | 1,543,609 | ||||||
Johnson Matthey PLC | 38,228 | 1,647,871 | ||||||
Kingfisher PLC(a) | 939,986 | 4,771,253 | ||||||
Lloyds Banking Group PLC | 13,175,934 | 9,317,896 | ||||||
Marks & Spencer Group PLC(a) | 457,256 | 1,066,728 | ||||||
Meggitt PLC(a) | 59,832 | 429,250 | ||||||
Micro Focus International PLC | 565,804 | 4,156,273 | ||||||
Natwest Group PLC | 12,752 | 37,351 | ||||||
Prudential PLC | 109,220 | 2,327,773 | ||||||
Redrow PLC | 50,333 | 484,509 | ||||||
RELX PLC | 92,329 | 2,402,504 | ||||||
Rentokil Initial PLC | 16,677 | 111,854 | ||||||
Rightmove PLC | 707,491 | 6,043,278 | ||||||
Royal Mail PLC(a) | 407,829 | 3,338,429 | ||||||
Smith & Nephew PLC | 7,681 | 167,342 | ||||||
Smiths Group PLC | 144,775 | 3,177,001 | ||||||
SSE PLC | 73,935 | 1,615,035 | ||||||
Standard Chartered PLC | 248,234 | 1,786,514 | ||||||
Subsea 7 SA | 39 | 380 | ||||||
Tate & Lyle PLC | 11,587 | 126,126 | ||||||
Taylor Wimpey PLC | 108,306 | 261,875 | ||||||
Tesco PLC | 749,403 | 2,374,937 | ||||||
Travis Perkins PLC(a) | 38,926 | 905,572 | ||||||
Unilever PLC | 109,588 | 6,575,375 | ||||||
Vistry Group PLC | 15,199 | 284,935 | ||||||
Whitbread PLC(a) | 13,263 | 596,989 | ||||||
Wm Morrison Supermarkets PLC | 895,437 | 2,249,344 | ||||||
|
| |||||||
| 141,184,264 | ||||||||
| United States — 0.3% | ||||||||
Ferguson PLC | 7,309 | 992,891 | ||||||
James Hardie Industries PLC | 28,895 | 957,640 | ||||||
Palantir Technologies, Inc., Class A(a) | 4 | 92 | ||||||
Stellantis NV | 107,937 | 2,146,290 | ||||||
|
| |||||||
| 4,096,913 | ||||||||
|
| |||||||
Total Common Stocks — 96.3% | 1,139,316,016 | |||||||
|
| |||||||
| Security | Shares | Value | ||||||
Rights |
| |||||||
Singapore — 0.0% |
| |||||||
Singapore Airlines Ltd. (Expires 06/16/21, Strike Price SGD 4.84)(a)(b) | 240,559 | $ | 2 | |||||
|
| |||||||
Total Rights — 0.0% | 2 | |||||||
|
| |||||||
Total Long-Term Investments — 96.3% (Cost: $953,849,048) | 1,139,316,018 | |||||||
|
| |||||||
Short-Term Securities(f)(g) |
| |||||||
Money Market Funds — 2.6% |
| |||||||
BlackRock Liquidity Funds, T-Fund, Institutional Class, 0.01% | 31,337,962 | 31,337,962 | ||||||
SL Liquidity Series, LLC, Money Market Series, 0.12%(h) | 125,005 | 125,042 | ||||||
|
| |||||||
Total Short-Term Securities — 2.6% (Cost: $31,463,004) | 31,463,004 | |||||||
|
| |||||||
Total Investments — 98.9% | 1,170,779,022 | |||||||
Other Assets Less Liabilities — 1.1% | 12,487,486 | |||||||
|
| |||||||
Net Assets — 100.0% | $ | 1,183,266,508 | ||||||
|
| |||||||
| (a) | Non-income producing security. |
| (b) | Security is valued using significant unobservable inputs and is classified as Level 3 in the fair value hierarchy. |
| (c) | Security exempt from registration pursuant to Rule 144A under the Securities Act of 1933, as amended. These securities may be resold in transactions exempt from registration to qualified institutional investors. |
| (d) | Restricted security as to resale, excluding 144A securities. The Fund held restricted securities with a current value of $178,060, representing 0.0% of its net assets as of period end, and an original cost of $804,375. |
| (e) | All or a portion of this security is on loan. |
| (f) | Affiliate of the Fund. |
| (g) | Annualized 7-day yield as of period end. |
| (h) | All or a portion of this security was purchased with the cash collateral from loaned securities. |
SCHEDULES OF INVESTMENTS | 21 |
Schedule of Investments (continued) May 31, 2021 | BlackRock Advantage International Fund |
Affiliates
Investments in issuers considered to be affiliate(s) of the Fund during the period ended May 31, 2021 for purposes of Section 2(a)(3) of the Investment Company Act of 1940, as amended, were as follows:
| ||||||||||||||||||||||||||||||||||||||||||||||||||||||
| Affiliated Issuer | Value at 05/31/20 | Purchases at Cost | Proceeds from Sale | Net Realized | Change in Unrealized Appreciation (Depreciation) | Value at 05/31/21 | Shares Held at 05/31/21 | Income | Capital Gain | |||||||||||||||||||||||||||||||||||||||||||||
| ||||||||||||||||||||||||||||||||||||||||||||||||||||||
| BlackRock Liquidity Funds, T-Fund, Institutional Class | $ | 22,359,927 | $ | 8,978,035(a | ) | $ — | $ | — | $ | — | $ | 31,337,962 | 31,337,962 | $ | 9,659 | $ | — | ||||||||||||||||||||||||||||||||||||
SL Liquidity Series, LLC, Money Market Series | 96,216 | 35,907(a | ) | — | (6,770 | ) | (311 | ) | 125,042 | 125,005 | 105,634(b | ) | — | |||||||||||||||||||||||||||||||||||||||||
|
|
|
|
|
|
|
|
|
| |||||||||||||||||||||||||||||||||||||||||||||
| $ | (6,770 | ) | $ | (311 | ) | $ | 31,463,004 | $ | 115,293 | $ | — | |||||||||||||||||||||||||||||||||||||||||||
|
|
|
|
|
|
|
|
|
| |||||||||||||||||||||||||||||||||||||||||||||
| (a) | Represents net amount purchased (sold). |
| (b) | All or a portion represents securities lending income earned from the reinvestment of cash collateral from loaned securities, net of fees and collateral investment expenses, and other payments to and from borrowers of securities. |
Futures Contracts
| Description | Number of Contracts | Expiration Date | Notional Amount (000) | Value/ Unrealized Appreciation (Depreciation) | ||||||||||||||||||||
Long Contracts | ||||||||||||||||||||||||
MSCI EAFE Index | 330 | 06/18/21 | $ | 38,561 | $ | 1,528,183 | �� | |||||||||||||||||
|
| |||||||||||||||||||||||
Derivative Financial Instruments Categorized by Risk Exposure
As of period end, the fair values of derivative financial instruments located in the Statements of Assets and Liabilities were as follows:
| Commodity Contracts | Credit Contracts | Equity Contracts | Foreign Currency Exchange Contracts | Interest Rate | Other Contracts | Total | ||||||||||||||||||||||||||||||||||||||||||||||||||
Assets — Derivative Financial Instruments | ||||||||||||||||||||||||||||||||||||||||||||||||||||||||
Futures contracts | ||||||||||||||||||||||||||||||||||||||||||||||||||||||||
Unrealized appreciation(a) | $ | — | $ | — | $ | 1,528,183 | $ | — | $ | — | $ | — | $ | 1,528,183 | ||||||||||||||||||||||||||||||||||||||||||
|
|
|
|
|
|
|
|
|
|
|
|
|
| |||||||||||||||||||||||||||||||||||||||||||
| (a) | Net cumulative unrealized appreciation (depreciation) on futures contracts, if any, are reported in the Schedule of Investments. In the Statement of Assets and Liabilities, only current day’s variation margin is reported in receivables or payables and the net cumulative unrealized appreciation (depreciation) is included in accumulated earnings (loss). |
For the period ended May 31, 2021, the effect of derivative financial instruments in the Statement of Operations was as follows:
| Commodity Contracts | Credit Contracts | Equity Contracts | Foreign Currency Exchange Contracts | Interest Rate Contracts | Other Contracts | Total | ||||||||||||||||||||||||||||||||||||||||||||||||||
Net Realized Gain (Loss) from | ||||||||||||||||||||||||||||||||||||||||||||||||||||||||
Futures contracts | $ | — | $ | — | $ | 10,985,090 | $ | — | $ | — | $ | — | $ | 10,985,090 | ||||||||||||||||||||||||||||||||||||||||||
|
|
|
|
|
|
|
|
|
|
|
|
|
| |||||||||||||||||||||||||||||||||||||||||||
Net Change in Unrealized Appreciation (Depreciation) on | ||||||||||||||||||||||||||||||||||||||||||||||||||||||||
Futures contracts | $ | — | $ | — | $ | (443,180 | ) | $ | — | $ | — | $ | — | $ | (443,180 | ) | ||||||||||||||||||||||||||||||||||||||||
|
|
|
|
|
|
|
|
|
|
|
|
|
| |||||||||||||||||||||||||||||||||||||||||||
Average Quarterly Balances of Outstanding Derivative Financial Instruments
Futures contracts | ||||
Average notional value of contracts — long | $ | 33,747,540 | ||
For more information about the Fund’s investment risks regarding derivative financial instruments, refer to the Notes to Financial Statements.
| 22 | 2 0 2 1 BLACK ROCK ANNUAL REPORT TO SHAREHOLDERS |
Schedule of Investments (continued) May 31, 2021 | BlackRock Advantage International Fund |
Fair Value Hierarchy as of Period End
Various inputs are used in determining the fair value of financial instruments. For a description of the input levels and information about the Fund’s policy regarding valuation of financial instruments, refer to the Notes to Financial Statements.
The following table summarizes the Fund’s financial instruments categorized in the fair value hierarchy. The breakdown of the Fund’s financial instruments into major categories is disclosed in the Schedule of Investments above.
| ||||||||||||||||
| Level 1 | Level 2 | Level 3 | Total | |||||||||||||
| ||||||||||||||||
Assets | ||||||||||||||||
Investments | ||||||||||||||||
Long-Term Investments | ||||||||||||||||
Common Stocks | ||||||||||||||||
Australia | $ | — | $ | 86,843,080 | $ | 1 | $ | 86,843,081 | ||||||||
Austria | — | 2,704,886 | — | 2,704,886 | ||||||||||||
Belgium | — | 8,990,040 | — | 8,990,040 | ||||||||||||
China | — | 14,903,220 | — | 14,903,220 | ||||||||||||
Denmark | 18,578,507 | 20,461,097 | — | 39,039,604 | ||||||||||||
Finland | — | 20,721,059 | — | 20,721,059 | ||||||||||||
France | — | 137,998,627 | — | 137,998,627 | ||||||||||||
Germany | — | 100,218,640 | — | 100,218,640 | ||||||||||||
Hong Kong | — | 35,038,618 | — | 35,038,618 | ||||||||||||
India | — | — | 178,060 | 178,060 | ||||||||||||
Ireland | — | 4,382,303 | — | 4,382,303 | ||||||||||||
Israel | — | 11,967,820 | — | 11,967,820 | ||||||||||||
Italy | — | 11,024,016 | — | 11,024,016 | ||||||||||||
Japan | — | 274,561,261 | — | 274,561,261 | ||||||||||||
Luxembourg | — | 2,200,197 | — | 2,200,197 | ||||||||||||
Netherlands | 1,224,637 | 70,948,477 | — | 72,173,114 | ||||||||||||
New Zealand | — | 3,957,611 | — | 3,957,611 | ||||||||||||
Norway | — | 718,225 | — | 718,225 | ||||||||||||
Singapore | — | 9,456,355 | — | 9,456,355 | ||||||||||||
South Africa | — | 3,148,172 | — | 3,148,172 | ||||||||||||
Spain | 170 | 13,722,417 | — | 13,722,587 | ||||||||||||
Sweden | 1,866,610 | 46,057,625 | — | 47,924,235 | ||||||||||||
Switzerland | — | 92,163,108 | — | 92,163,108 | ||||||||||||
United Kingdom | 245,970 | 140,938,294 | — | 141,184,264 | ||||||||||||
United States | 92 | 4,096,821 | — | 4,096,913 | ||||||||||||
Rights | — | — | 2 | 2 | ||||||||||||
Short-Term Securities | ||||||||||||||||
Money Market Funds | 31,337,962 | — | — | 31,337,962 | ||||||||||||
|
|
|
|
|
|
|
| |||||||||
| $ | 53,253,948 | $ | 1,117,221,969 | $ | 178,063 | 1,170,653,980 | ||||||||||
|
|
|
|
|
|
|
| |||||||||
Investments valued at NAV(a) | 125,042 | |||||||||||||||
|
| |||||||||||||||
| $ | 1,170,779,022 | |||||||||||||||
|
| |||||||||||||||
Derivative Financial Instruments(b) | ||||||||||||||||
Assets | ||||||||||||||||
Equity Contracts | $ | 1,528,183 | $ | — | $ | — | $ | 1,528,183 | ||||||||
|
|
|
|
|
|
|
| |||||||||
| (a) | Certain investments of the Fund were fair valued using NAV per share as no quoted market value is available and therefore have been excluded from the fair value hierarchy. |
| (b) | Derivative financial instruments are futures contracts. Futures contracts are valued at the unrealized appreciation (depreciation) on the instrument. |
See notes to financial statements.
SCHEDULES OF INVESTMENTS | 23 |
Schedule of Investments May 31, 2021 | BlackRock Advantage Large Cap Growth Fund (Percentages shown are based on Net Assets) |
| Security | Shares | Value | ||||||
Common Stocks | ||||||||
Aerospace & Defense — 0.5% | ||||||||
Lockheed Martin Corp. | 12,777 | $ | 4,883,369 | |||||
|
| |||||||
| Air Freight & Logistics — 1.3% | ||||||||
CH Robinson Worldwide, Inc. | 18,885 | 1,832,223 | ||||||
Expeditors International of Washington, Inc. | 91,758 | 11,533,063 | ||||||
|
| |||||||
| 13,365,286 | ||||||||
| Auto Components — 0.5% | ||||||||
BorgWarner, Inc. | 93,383 | 4,789,614 | ||||||
|
| |||||||
| Automobiles — 2.3% | ||||||||
Tesla, Inc.(a) | 38,656 | 24,168,504 | ||||||
|
| |||||||
| Beverages — 0.9% | ||||||||
Boston Beer Co., Inc., Class A(a) | 146 | 154,491 | ||||||
Coca-Cola Co. | 13,088 | 723,636 | ||||||
PepsiCo, Inc. | 59,811 | 8,848,439 | ||||||
|
| |||||||
| 9,726,566 | ||||||||
| Biotechnology — 2.4% | ||||||||
AbbVie, Inc. | 9,963 | 1,127,812 | ||||||
Amgen, Inc. | 23,917 | 5,690,811 | ||||||
BioMarin Pharmaceutical, Inc.(a) | 9,846 | 761,096 | ||||||
Gilead Sciences, Inc. | 54,600 | 3,609,606 | ||||||
Moderna, Inc.(a) | 10,538 | 1,949,635 | ||||||
Regeneron Pharmaceuticals, Inc.(a) | 2,149 | 1,079,722 | ||||||
Vertex Pharmaceuticals, Inc.(a) | 54,373 | 11,343,839 | ||||||
|
| |||||||
| 25,562,521 | ||||||||
| Building Products — 1.0% | ||||||||
Allegion PLC | 10,403 | 1,461,414 | ||||||
Carrier Global Corp. | 53,424 | 2,453,764 | ||||||
Trane Technologies PLC | 37,486 | 6,987,390 | ||||||
|
| |||||||
| 10,902,568 | ||||||||
| Capital Markets — 1.3% | ||||||||
Charles Schwab Corp. | 1,883 | 139,060 | ||||||
Morgan Stanley | 140,842 | 12,809,580 | ||||||
Morningstar, Inc. | 977 | 230,562 | ||||||
|
| |||||||
| 13,179,202 | ||||||||
| Chemicals — 0.1% | ||||||||
Cabot Corp. | 1 | 63 | ||||||
Sherwin-Williams Co. | 4,254 | 1,206,137 | ||||||
|
| |||||||
| 1,206,200 | ||||||||
| Commercial Services & Supplies — 1.2% | ||||||||
Cintas Corp. | 1,701 | 601,372 | ||||||
Copart, Inc.(a) | 72,335 | 9,331,938 | ||||||
Driven Brands Holdings, Inc.(a) | 10,273 | 304,286 | ||||||
IAA, Inc.(a) | 48,595 | 2,768,457 | ||||||
|
| |||||||
| 13,006,053 | ||||||||
| Construction & Engineering — 0.1% | ||||||||
Quanta Services, Inc. | 13,243 | 1,262,720 | ||||||
|
| |||||||
| Containers & Packaging — 0.2% | ||||||||
Crown Holdings, Inc. | 24,105 | 2,488,600 | ||||||
|
| |||||||
| Distributors — 0.7% | ||||||||
Genuine Parts Co. | 15,044 | 1,972,569 | ||||||
Pool Corp. | 11,239 | 4,906,386 | ||||||
|
| |||||||
| 6,878,955 | ||||||||
| Diversified Consumer Services — 0.2% | ||||||||
Bright Horizons Family Solutions, Inc.(a) | 4,027 | 556,652 | ||||||
| Security | Shares | Value | ||||||
| Diversified Consumer Services (continued) | ||||||||
Chegg, Inc.(a) | 8,297 | $ | 638,122 | |||||
Terminix Global Holdings, Inc.(a) | 17,137 | 845,540 | ||||||
|
| |||||||
| 2,040,314 | ||||||||
| Diversified Financial Services — 0.6% | ||||||||
Voya Financial, Inc. | 99,653 | 6,529,265 | ||||||
|
| |||||||
| Electric Utilities — 0.1% | ||||||||
Eversource Energy | 14,175 | 1,150,868 | ||||||
|
| |||||||
| Electronic Equipment, Instruments & Components — 0.3% | ||||||||
Flex Ltd.(a) | 96,821 | 1,768,920 | ||||||
Zebra Technologies Corp., Class A(a) | 2,598 | 1,291,336 | ||||||
|
| |||||||
| 3,060,256 | ||||||||
| Energy Equipment & Services — 0.7% | ||||||||
Schlumberger NV | 233,463 | 7,314,396 | ||||||
|
| |||||||
| Entertainment — 2.3% | ||||||||
Activision Blizzard, Inc. | 2,461 | 239,332 | ||||||
Electronic Arts, Inc. | 3,384 | 483,675 | ||||||
Lions Gate Entertainment Corp., Class B(a) | 45,214 | 785,819 | ||||||
Live Nation Entertainment, Inc.(a) | 7,819 | 704,570 | ||||||
Netflix, Inc.(a) | 16,406 | 8,249,101 | ||||||
Roku, Inc.(a) | 11,363 | 3,939,666 | ||||||
Spotify Technology SA(a) | 19,474 | 4,704,334 | ||||||
Take-Two Interactive Software, Inc.(a) | 11,323 | 2,101,096 | ||||||
Walt Disney Co.(a) | 8,565 | 1,530,137 | ||||||
Zynga, Inc., Class A(a) | 166,203 | 1,801,641 | ||||||
|
| |||||||
| 24,539,371 | ||||||||
| Equity Real Estate Investment Trusts (REITs) — 0.9% | ||||||||
Equinix, Inc. | 11,913 | 8,776,546 | ||||||
Prologis, Inc. | 3,954 | 465,939 | ||||||
|
| |||||||
| 9,242,485 | ||||||||
| Food & Staples Retailing — 1.9% | ||||||||
Costco Wholesale Corp. | 52,197 | 19,744,559 | ||||||
|
| |||||||
| Food Products — 1.1% | ||||||||
Hershey Co. | 34,971 | 6,051,732 | ||||||
Kellogg Co. | 34,829 | 2,280,951 | ||||||
McCormick & Co., Inc. | 32,212 | 2,868,801 | ||||||
|
| |||||||
| 11,201,484 | ||||||||
| Gas Utilities — 0.0% | ||||||||
Atmos Energy Corp. | 1,279 | 126,838 | ||||||
|
| |||||||
| Health Care Equipment & Supplies — 3.1% | ||||||||
ABIOMED, Inc.(a) | 579 | 164,772 | ||||||
Align Technology, Inc.(a) | 15,459 | 9,123,129 | ||||||
Dexcom, Inc.(a) | 15,563 | 5,748,817 | ||||||
Edwards Lifesciences Corp.(a) | 12,557 | 1,204,216 | ||||||
IDEXX Laboratories, Inc.(a) | 21,981 | 12,267,816 | ||||||
Insulet Corp.(a) | 11,313 | 3,050,777 | ||||||
West Pharmaceutical Services, Inc. | 1,779 | 618,220 | ||||||
|
| |||||||
| 32,177,747 | ||||||||
| Health Care Providers & Services — 2.5% | ||||||||
AmerisourceBergen Corp. | 30,846 | 3,539,270 | ||||||
Anthem, Inc. | 4,924 | 1,960,835 | ||||||
Cardinal Health, Inc. | 11,351 | 636,451 | ||||||
McKesson Corp. | 33,120 | 6,371,957 | ||||||
UnitedHealth Group, Inc. | 32,722 | 13,478,846 | ||||||
|
| |||||||
| 25,987,359 | ||||||||
| Health Care Technology — 0.0% | ||||||||
Cerner Corp. | 5,150 | 402,988 | ||||||
|
| |||||||
| 24 | 2 0 2 1 BLACK ROCK ANNUAL REPORT TO SHAREHOLDERS |
Schedule of Investments (continued) May 31, 2021 | BlackRock Advantage Large Cap Growth Fund (Percentages shown are based on Net Assets) |
| Security | Shares | Value | ||||||
Hotels, Restaurants & Leisure — 2.6% |
| |||||||
Aramark | 11,970 | $ | 447,080 | |||||
Chipotle Mexican Grill, Inc.(a) | 6,675 | 9,157,967 | ||||||
International Game Technology PLC(a) | 47,724 | 1,157,784 | ||||||
MGM Resorts International | 52,545 | 2,252,604 | ||||||
Travel + Leisure Co. | 50,243 | 3,273,332 | ||||||
Vail Resorts, Inc.(a) | 1,823 | 595,902 | ||||||
Wendy’s Co. | 209,533 | 4,865,356 | ||||||
Wyndham Hotels & Resorts, Inc. | 65,122 | 4,888,057 | ||||||
Wynn Resorts Ltd.(a) | 4,274 | 563,612 | ||||||
|
| |||||||
| 27,201,694 | ||||||||
| Household Durables — 0.1% | ||||||||
iRobot Corp.(a) | 10,083 | 985,109 | ||||||
|
| |||||||
| Household Products — 0.7% | ||||||||
Colgate-Palmolive Co. | 91,556 | 7,670,562 | ||||||
|
| |||||||
| Independent Power and Renewable Electricity Producers — 0.0% | ||||||||
Sunnova Energy International, Inc.(a) | 17,279 | 504,547 | ||||||
|
| |||||||
| Industrial Conglomerates — 0.4% | ||||||||
Roper Technologies, Inc. | 8,223 | 3,700,432 | ||||||
|
| |||||||
| Insurance — 0.3% | ||||||||
Marsh & McLennan Cos., Inc. | 3,631 | 502,349 | ||||||
Progressive Corp. | 27,443 | 2,719,052 | ||||||
|
| |||||||
| 3,221,401 | ||||||||
| Interactive Media & Services — 8.9% | ||||||||
Alphabet, Inc., Class A | 9,648 | 22,738,889 | ||||||
Alphabet, Inc., Class C(a) | 12,054 | 29,068,944 | ||||||
Facebook, Inc., Class A | 125,206 | 41,158,968 | ||||||
Twitter, Inc.(a) | 3,470 | 201,260 | ||||||
|
| |||||||
| 93,168,061 | ||||||||
| Internet & Direct Marketing Retail — 6.8% | ||||||||
Amazon.com, Inc. | 21,415 | 69,022,044 | ||||||
Etsy, Inc.(a) | 12,507 | 2,060,278 | ||||||
|
| |||||||
| 71,082,322 | ||||||||
| IT Services — 9.4% | ||||||||
Accenture PLC, Class A | 56,530 | 15,950,505 | ||||||
Automatic Data Processing, Inc. | 47,708 | 9,351,722 | ||||||
Fiserv, Inc.(a) | 64,997 | 7,487,654 | ||||||
GoDaddy, Inc., Class A(a) | 16,518 | 1,337,297 | ||||||
Mastercard, Inc., Class A | 47,370 | 17,080,675 | ||||||
PayPal Holdings, Inc.(a) | 84,008 | 21,843,760 | ||||||
Square, Inc., Class A(a) | 8,788 | 1,955,506 | ||||||
Visa, Inc., Class A | 103,367 | 23,495,319 | ||||||
|
| |||||||
| 98,502,438 | ||||||||
| Life Sciences Tools & Services — 1.8% | ||||||||
Agilent Technologies, Inc. | 57,650 | 7,963,195 | ||||||
Bio-Rad Laboratories, Inc., Class A(a) | 3,663 | 2,206,481 | ||||||
Bruker Corp. | 65,094 | 4,520,127 | ||||||
Illumina, Inc.(a) | 562 | 227,970 | ||||||
Mettler-Toledo International, Inc.(a) | 91 | 118,386 | ||||||
PPD, Inc.(a) | 15,113 | 697,012 | ||||||
Repligen Corp.(a) | 2,192 | 400,281 | ||||||
Sotera Health Co.(a) | 23,539 | 567,290 | ||||||
Thermo Fisher Scientific, Inc. | 4,846 | 2,275,197 | ||||||
|
| |||||||
| 18,975,939 | ||||||||
| Machinery — 0.6% | ||||||||
Deere & Co. | 13,604 | 4,912,405 | ||||||
Xylem, Inc. | 9,334 | 1,102,532 | ||||||
|
| |||||||
| 6,014,937 | ||||||||
| Security | Shares | Value | ||||||
| Media — 0.1% | ||||||||
Discovery, Inc., Class A(a) | 7,824 | $ | 251,228 | |||||
New York Times Co., Class A | 18,140 | 776,755 | ||||||
|
| |||||||
| 1,027,983 | ||||||||
| Multiline Retail — 0.7% | ||||||||
Target Corp. | 32,426 | 7,358,108 | ||||||
|
| |||||||
| Oil, Gas & Consumable Fuels — 0.3% | ||||||||
Antero Midstream Corp. | 49,786 | 477,945 | ||||||
Cheniere Energy, Inc.(a) | 16,241 | 1,378,861 | ||||||
Hess Corp. | 3,102 | 260,010 | ||||||
Kinder Morgan, Inc. | 30,732 | 563,625 | ||||||
Phillips 66 | 6,997 | 589,287 | ||||||
|
| |||||||
| 3,269,728 | ||||||||
| Personal Products — 0.2% | ||||||||
Herbalife Nutrition Ltd.(a) | 44,161 | 2,321,544 | ||||||
|
| |||||||
| Pharmaceuticals — 2.7% | ||||||||
Bristol-Myers Squibb Co. | 149,004 | 9,792,543 | ||||||
Johnson & Johnson | 86,038 | 14,561,931 | ||||||
Zoetis, Inc. | 22,882 | 4,042,792 | ||||||
|
| |||||||
| 28,397,266 | ||||||||
| Professional Services — 0.2% | ||||||||
Booz Allen Hamilton Holding Corp. | 8,089 | 686,999 | ||||||
IHS Markit Ltd. | 14,118 | 1,486,766 | ||||||
|
| |||||||
| 2,173,765 | ||||||||
| Real Estate Management & Development — 0.1% | ||||||||
CBRE Group, Inc., Class A(a) | 11,492 | 1,008,768 | ||||||
|
| |||||||
| Road & Rail — 0.2% | ||||||||
Landstar System, Inc. | 13,293 | 2,266,456 | ||||||
Schneider National, Inc., Class B | 10,144 | 248,427 | ||||||
|
| |||||||
| 2,514,883 | ||||||||
| Semiconductors & Semiconductor Equipment — 6.2% | ||||||||
Advanced Micro Devices, Inc.(a) | 106,259 | 8,509,221 | ||||||
Applied Materials, Inc. | 116,140 | 16,042,418 | ||||||
CMC Materials, Inc. | 1 | 154 | ||||||
Intel Corp. | 146,222 | 8,352,201 | ||||||
NVIDIA Corp. | 23,253 | 15,109,335 | ||||||
QUALCOMM, Inc. | 125,743 | 16,917,463 | ||||||
Xilinx, Inc. | 5,224 | 663,448 | ||||||
|
| |||||||
| 65,594,240 | ||||||||
| Software — 17.6% | ||||||||
Adobe, Inc.(a) | 52,529 | 26,505,083 | ||||||
Autodesk, Inc.(a) | 10,362 | 2,962,081 | ||||||
Cadence Design Systems, Inc.(a) | 44,710 | 5,677,723 | ||||||
DocuSign, Inc.(a) | 5,511 | 1,111,128 | ||||||
FreedomPay, Inc.(a)(b) | 43,051 | 0 | ||||||
HubSpot, Inc.(a) | 8,839 | 4,458,215 | ||||||
Intuit, Inc. | 43,490 | 19,096,024 | ||||||
Microsoft Corp. | 345,660 | 86,304,389 | ||||||
PTC, Inc.(a) | 62,576 | 8,393,945 | ||||||
salesforce.com, Inc.(a) | 8,300 | 1,976,230 | ||||||
ServiceNow, Inc.(a) | 21,097 | 9,997,446 | ||||||
Slack Technologies, Inc., Class A(a) | 7,565 | 333,163 | ||||||
Splunk, Inc.(a) | 23,030 | 2,791,236 | ||||||
UiPath, Inc., Class A(a)(c) | 15,893 | 1,268,579 | ||||||
VMware, Inc., Class A(a) | 35,258 | 5,566,886 | ||||||
Workday, Inc., Class A(a) | 19,479 | 4,455,237 | ||||||
Zendesk, Inc.(a) | 24,048 | 3,286,400 | ||||||
Zoom Video Communications, Inc., Class A(a) | 901 | 298,708 | ||||||
|
| |||||||
| 184,482,473 | ||||||||
SCHEDULES OF INVESTMENTS | 25 |
Schedule of Investments (continued) May 31, 2021 | BlackRock Advantage Large Cap Growth Fund (Percentages shown are based on Net Assets) |
| Security | Shares | Value | ||||||
| ||||||||
| Specialty Retail — 1.3% | ||||||||
Home Depot, Inc. | 11,747 | $ | 3,746,236 | |||||
Lithia Motors, Inc., Class A | 1,939 | 682,508 | ||||||
Lowe’s Cos., Inc. | 37,136 | 7,235,207 | ||||||
TJX Cos., Inc. | 25,567 | 1,726,795 | ||||||
|
| |||||||
| 13,390,746 | ||||||||
| Technology Hardware, Storage & Peripherals — 10.6% | ||||||||
Apple Inc. | 804,418 | 100,238,527 | ||||||
Dell Technologies, Inc., Class C(a) | 60,135 | 5,931,716 | ||||||
Hewlett Packard Enterprise Co. | 243,082 | 3,879,589 | ||||||
NetApp, Inc. | 13,456 | 1,041,091 | ||||||
|
| |||||||
| 111,090,923 | ||||||||
| Textiles, Apparel & Luxury Goods — 0.7% | ||||||||
NIKE, Inc., Class B | 50,685 | 6,916,475 | ||||||
|
| |||||||
| Thrifts & Mortgage Finance — 0.0% | ||||||||
Essent Group Ltd. | 10,573 | 505,812 | ||||||
|
| |||||||
| Trading Companies & Distributors — 0.3% | ||||||||
SiteOne Landscape Supply, Inc.(a) | 10,616 | 1,826,377 | ||||||
WW Grainger, Inc. | 2,468 | 1,140,611 | ||||||
|
| |||||||
| 2,966,988 | ||||||||
|
| |||||||
Total Long-Term Investments — 99.0% |
| 1,038,985,232 | ||||||
|
| |||||||
| Security | Shares | Value | ||||||
| ||||||||
Short-Term Securities(d)(e) |
| |||||||
Money Market Funds — 1.1% |
| |||||||
BlackRock Liquidity Funds, T-Fund, Institutional Class, 0.01% | 10,090,174 | $ | 10,090,174 | |||||
SL Liquidity Series, LLC, Money Market Series, 0.12%(f) | 1,340,921 | 1,341,323 | ||||||
|
| |||||||
Total Short-Term Securities — 1.1% |
| 11,431,497 | ||||||
|
| |||||||
Total Investments — 100.1% |
| 1,050,416,729 | ||||||
Liabilities in Excess of Other Assets — (0.1)% |
| (1,044,618 | ) | |||||
|
| |||||||
Net Assets — 100.0% |
| $ | 1,049,372,111 | |||||
|
| |||||||
| (a) | Non-income producing security. |
| (b) | Security is valued using significant unobservable inputs and is classified as Level 3 in the fair value hierarchy. |
| (c) | All or a portion of this security is on loan. |
| (d) | Affiliate of the Fund. |
| (e) | Annualized 7-day yield as of period end. |
| (f) | All or a portion of this security was purchased with the cash collateral from loaned securities. |
Affiliates
Investments in issuers considered to be affiliate(s) of the Fund during the period ended May 31, 2021 for purposes of Section 2(a)(3) of the Investment Company Act of 1940, as amended, were as follows:
| Affiliated Issuer | Value at 05/31/20 | Purchases at Cost | Proceeds from Sale | Net Realized Gain (Loss) | Change in Unrealized Appreciation (Depreciation) | Value at 05/31/21 | Shares Held at 05/31/21 | Income | Capital Gain | |||||||||||||||||||||||||||||||||||||||||||
| BlackRock Liquidity Funds, T-Fund, Institutional Class | $ | 24,850,774 | $ — | $ | (14,760,600 | )(a) | $ | — | $ | — | $ | 10,090,174 | 10,090,174 | $ | 11,075 | $ | — | ||||||||||||||||||||||||||||||||||
SL Liquidity Series, LLC, Money Market Series | 2,793,823 | — | (1,447,996 | )(a) | (3,350 | ) | (1,154 | ) | 1,341,323 | 1,340,921 | 85,648(b | ) | — | |||||||||||||||||||||||||||||||||||||||
|
|
|
|
|
|
|
|
|
| |||||||||||||||||||||||||||||||||||||||||||
| $ | (3,350 | ) | $ | (1,154 | ) | $ | 11,431,497 | $ | 96,723 | $ | — | |||||||||||||||||||||||||||||||||||||||||
|
|
|
|
|
|
|
|
|
| |||||||||||||||||||||||||||||||||||||||||||
| (a) | Represents net amount purchased (sold). |
| (b) | All or a portion represents securities lending income earned from the reinvestment of cash collateral from loaned securities, net of fees and collateral investment expenses, and other payments to and from borrowers of securities. |
For Fund compliance purposes, the Fund’s industry classifications refer to one or more of the industry sub-classifications used by one or more widely recognized market indexes or rating group indexes, and/or as defined by the investment adviser. These definitions may not apply for purposes of this report, which may combine such industry sub-classifications for reporting ease.
Derivative Financial Instruments Outstanding as of Period End
Futures Contracts
| Description | Number of Contracts | Expiration Date | Notional Amount (000) | Value/ Unrealized | ||||||||||||||||||||||||||||
Long Contracts | ||||||||||||||||||||||||||||||||
NASDAQ 100 E-Mini Index | 43 | 06/18/21 | $ 11,770 | $ | 81,775 | |||||||||||||||||||||||||||
|
| |||||||||||||||||||||||||||||||
| 26 | 2 0 2 1 BLACK ROCK ANNUAL REPORT TO SHAREHOLDERS |
Schedule of Investments (continued) May 31, 2021 | BlackRock Advantage Large Cap Growth Fund |
Derivative Financial Instruments Categorized by Risk Exposure
As of period end, the fair values of derivative financial instruments located in the Statements of Assets and Liabilities were as follows:
| Commodity Contracts | Credit Contracts | Equity Contracts | Foreign Currency Exchange Contracts | Interest Rate Contracts | Other Contracts | Total | ||||||||||||||||||||||||||||||||||||||
Assets — Derivative Financial Instruments |
| |||||||||||||||||||||||||||||||||||||||||||
Futures contracts | ||||||||||||||||||||||||||||||||||||||||||||
Unrealized appreciation(a) | $ | — | $ | — | $ 81,775 | $ — | $ | — | $ — | $ | 81,775 | |||||||||||||||||||||||||||||||||
|
|
|
|
|
|
|
|
|
|
| ||||||||||||||||||||||||||||||||||
| (a) | Net cumulative unrealized appreciation (depreciation) on futures contracts, if any, are reported in the Schedule of Investments. In the Statement of Assets and Liabilities, only current day’s variation margin is reported in receivables or payables and the net cumulative unrealized appreciation (depreciation) is included in accumulated earnings (loss). |
For the period ended May 31, 2021, the effect of derivative financial instruments in the Statement of Operations was as follows:
| Commodity Contracts | Credit Contracts | Equity Contracts | Foreign Currency Exchange Contracts | Interest Rate Contracts | Other Contracts | Total | ||||||||||||||||||||||||||||||||||||||
Net Realized Gain (Loss) from |
| |||||||||||||||||||||||||||||||||||||||||||
Futures contracts | $ | — | $ | — | $ 11,937,941 | $ — | $ | — | $ — | $ | 11,937,941 | |||||||||||||||||||||||||||||||||
|
|
|
|
|
|
|
|
|
|
| ||||||||||||||||||||||||||||||||||
Net Change in Unrealized Appreciation (Depreciation) on | ||||||||||||||||||||||||||||||||||||||||||||
Futures contracts | $ | — | $ | — | $ (1,526,893) | $ — | $ | — | $ — | $ | (1,526,893 | ) | ||||||||||||||||||||||||||||||||
|
|
|
|
|
|
|
|
|
|
| ||||||||||||||||||||||||||||||||||
Average Quarterly Balances of Outstanding Derivative Financial Instruments
Futures contracts | ||||
Average notional value of contracts — long | $ | 28,121,205 | ||
For more information about the Fund’s investment risks regarding derivative financial instruments, refer to the Notes to Financial Statements.
Fair Value Hierarchy as of Period End
Various inputs are used in determining the fair value of financial instruments. For a description of the input levels and information about the Fund’s policy regarding valuation of financial instruments, refer to the Notes to Financial Statements.
The following table summarizes the Fund’s financial instruments categorized in the fair value hierarchy. The breakdown of the Fund’s financial instruments into major categories is disclosed in the Schedule of Investments above.
| ||||||||||||||||||||
| Level 1 | Level 2 | Level 3 | Total | |||||||||||||||||
| ||||||||||||||||||||
Assets | ||||||||||||||||||||
Investments | ||||||||||||||||||||
Long-Term Investments | ||||||||||||||||||||
Common Stocks | $ | 1,038,985,232 | $ — | $ — | $ | 1,038,985,232 | ||||||||||||||
Short-Term Securities | ||||||||||||||||||||
Money Market Funds | 10,090,174 | — | — | 10,090,174 | ||||||||||||||||
|
|
|
|
|
| |||||||||||||||
| $ | 1,049,075,406 | $ — | $ — | 1,049,075,406 | ||||||||||||||||
|
|
|
|
|
| |||||||||||||||
Investments valued at NAV(a) | 1,341,323 | |||||||||||||||||||
|
| |||||||||||||||||||
| $ | 1,050,416,729 | |||||||||||||||||||
|
| |||||||||||||||||||
Derivative Financial Instruments(b) | ||||||||||||||||||||
Assets | ||||||||||||||||||||
Equity Contracts | $ | 81,775 | $ — | $ — | $ | 81,775 | ||||||||||||||
|
|
|
|
|
| |||||||||||||||
| (a) | Certain investments of the Fund were fair valued using NAV per share as no quoted market value is available and therefore have been excluded from the fair value hierarchy. |
| (b) | Derivative financial instruments are futures contracts. Futures contracts are valued at the unrealized appreciation (depreciation) on the instrument. |
See notes to financial statements.
SCHEDULES OF INVESTMENTS | 27 |
Schedule of Investments May 31, 2021 | BlackRock Advantage Small Cap Core Fund (Percentages shown are based on Net Assets) |
| Security | Shares | Value | ||||||
Common Stocks |
| |||||||
Aerospace & Defense — 0.5% |
| |||||||
Aerojet Rocketdyne Holdings, Inc.(a) | 149,080 | $ | 7,222,926 | |||||
Astronics Corp.(a) | 71,267 | 1,208,688 | ||||||
HEICO Corp., Class A | 8,358 | 1,107,101 | ||||||
Mercury Systems, Inc.(a) | 27,552 | 1,803,278 | ||||||
Moog, Inc., Class A | 52,154 | 4,704,291 | ||||||
PAE, Inc.(a) | 483,048 | 3,922,350 | ||||||
|
| |||||||
| 19,968,634 | ||||||||
| Air Freight & Logistics — 0.8% | ||||||||
Echo Global Logistics, Inc.(a) | 314,298 | 10,736,420 | ||||||
Forward Air Corp. | 89,923 | 8,712,639 | ||||||
Hub Group, Inc., Class A(a) | 235,465 | 16,437,812 | ||||||
Radiant Logistics, Inc.(a)(b) | 23,831 | 183,260 | ||||||
|
| |||||||
| 36,070,131 | ||||||||
| Airlines — 0.7% | ||||||||
Hawaiian Holdings, Inc.(a) | 186,463 | 4,810,745 | ||||||
Mesa Air Group, Inc.(a) | 93,800 | 911,736 | ||||||
Spirit Airlines, Inc.(a) | 688,142 | 24,573,551 | ||||||
|
| |||||||
| 30,296,032 | ||||||||
| Auto Components — 1.3% | ||||||||
Cooper-Standard Holdings, Inc.(a) | 94,509 | 2,812,588 | ||||||
Dana, Inc. | 213,870 | 5,802,293 | ||||||
Fox Factory Holding Corp.(a) | 63,395 | 9,856,654 | ||||||
Gentherm, Inc.(a) | 13,490 | 978,430 | ||||||
Goodyear Tire & Rubber Co.(a) | 379,937 | 7,534,151 | ||||||
LCI Industries | 132,792 | 19,792,647 | ||||||
Modine Manufacturing Co.(a) | 68,476 | 1,204,493 | ||||||
Tenneco, Inc., Class A(a) | 62,472 | 979,561 | ||||||
Visteon Corp.(a)(b) | 65,091 | 7,971,044 | ||||||
|
| |||||||
| 56,931,861 | ||||||||
| Automobiles — 0.2% | ||||||||
Winnebago Industries, Inc. | 96,655 | 7,148,604 | ||||||
|
| |||||||
| Banks — 7.4% | ||||||||
ACNB Corp. | 12,045 | 346,896 | ||||||
BancFirst Corp. | 98,537 | 6,796,097 | ||||||
Bancorp, Inc.(a)(b) | 190,539 | 4,618,665 | ||||||
BancorpSouth Bank | 281,062 | 8,594,876 | ||||||
Bank of Commerce Holdings | 50,450 | 744,138 | ||||||
BankFinancial Corp. | 44,805 | 495,095 | ||||||
Bankwell Financial Group, Inc. | 5,740 | 163,934 | ||||||
Banner Corp. | 66,782 | 3,908,751 | ||||||
Berkshire Hills Bancorp, Inc. | 122,115 | 3,388,691 | ||||||
Cadence BanCorp. | 113,536 | 2,540,936 | ||||||
Capital City Bank Group, Inc. | 152,064 | 4,075,315 | ||||||
Capstar Financial Holdings, Inc. | 52,415 | 1,147,364 | ||||||
Carter Bankshares, Inc.(a) | 27,570 | 429,265 | ||||||
Cathay General Bancorp | 124,319 | 5,181,616 | ||||||
CIT Group, Inc. | 146,931 | 7,784,404 | ||||||
Community Bankers Trust Corp. | 7,421 | 65,602 | ||||||
Community Trust Bancorp, Inc. | 57,688 | 2,548,656 | ||||||
Customers Bancorp, Inc.(a) | 15,485 | 586,107 | ||||||
CVB Financial Corp. | 52,316 | 1,160,369 | ||||||
Dime Community Bancshares, Inc. | 14,196 | 492,743 | ||||||
Equity Bancshares, Inc., Class A(a) | 9,099 | 298,993 | ||||||
Farmers National Banc Corp. | 23,979 | 417,235 | ||||||
Financial Institutions, Inc. | 25,507 | 819,540 | ||||||
First BanCorp. | 149,870 | 1,916,837 | ||||||
First Busey Corp. | 37,455 | 1,003,419 | ||||||
First Commonwealth Financial Corp. | 74,596 | 1,130,129 | ||||||
First Community Bankshares, Inc. | 72,835 | 2,269,539 | ||||||
| Security | Shares | Value | ||||||
| Banks (continued) | ||||||||
First Financial Bankshares, Inc. | 20,147 | $ | 1,014,401 | |||||
First Financial Corp. | 30,813 | 1,398,294 | ||||||
First Financial Northwest, Inc. | 135,787 | 1,974,343 | ||||||
First Horizon Corp. | 188,347 | 3,591,777 | ||||||
First Interstate BancSystem, Inc., Class A | 772,367 | 36,355,315 | ||||||
First United Corp. | 33,701 | 612,684 | ||||||
Fulton Financial Corp. | 605,946 | 10,501,044 | ||||||
Glacier Bancorp, Inc. | 190,279 | 11,083,752 | ||||||
Hancock Whitney Corp. | 221,666 | 10,974,684 | ||||||
HBT Financial, Inc. | 160,708 | 2,923,279 | ||||||
Heartland Financial USA, Inc. | 405,955 | 20,196,261 | ||||||
Heritage Commerce Corp. | 238,566 | 2,829,393 | ||||||
Independent Bank Corp. | 106,798 | 2,488,393 | ||||||
Independent Bank Group, Inc. | 12,163 | 957,836 | ||||||
International Bancshares Corp. | 18,441 | 855,662 | ||||||
Investors Bancorp, Inc. | 1,609,306 | 23,946,473 | ||||||
Lakeland Bancorp, Inc. | 118,103 | 2,245,138 | ||||||
Lakeland Financial Corp. | 15,701 | 968,909 | ||||||
Level One Bancorp, Inc. | 37,756 | 1,046,219 | ||||||
Macatawa Bank Corp. | 4,906 | 47,098 | ||||||
Mercantile Bank Corp. | 60,215 | 1,944,945 | ||||||
Mid Penn Bancorp, Inc. | 90,600 | 2,554,920 | ||||||
Midland States Bancorp, Inc. | 96,471 | 2,687,682 | ||||||
National Bank Holdings Corp., Class A | 1,412 | 55,915 | ||||||
Northrim BanCorp, Inc. | 90,983 | 3,962,310 | ||||||
OceanFirst Financial Corp. | 356,542 | �� | 7,883,144 | |||||
Pacific Mercantile Bancorp(a) | 195,021 | 1,661,579 | ||||||
Peapack-Gladstone Financial Corp. | 101,902 | 3,385,184 | ||||||
Preferred Bank/Los Angeles CA | 11,314 | 772,633 | ||||||
Primis Financial Corp. | 58,302 | 858,788 | ||||||
QCR Holdings, Inc. | 7,200 | 344,232 | ||||||
Republic Bancorp, Inc., Class A | 38,426 | 1,784,888 | ||||||
Republic First Bancorp, Inc.(a) | 1,430,466 | 5,893,520 | ||||||
Sandy Spring Bancorp, Inc. | 323,172 | 15,014,571 | ||||||
Sierra Bancorp | 94,257 | 2,612,804 | ||||||
Simmons First National Corp., Class A | 28,041 | 855,251 | ||||||
SmartFinancial, Inc. | 38,659 | 937,481 | ||||||
South Plains Financial, Inc. | 45,542 | 1,068,415 | ||||||
South State Corp. | 75,347 | 6,691,567 | ||||||
Synovus Financial Corp. | 36,472 | 1,791,505 | ||||||
Texas Capital Bancshares, Inc.(a) | 183,180 | 12,617,438 | ||||||
TriCo Bancshares | 24,011 | 1,151,327 | ||||||
TriState Capital Holdings, Inc.(a)(b) | 336,042 | 7,725,606 | ||||||
UMB Financial Corp. | 14,038 | 1,357,615 | ||||||
United Community Banks, Inc. | 108,070 | 3,737,061 | ||||||
United Security Bancshares | 1,880 | 15,980 | ||||||
Univest Financial Corp. | 107,183 | 3,125,456 | ||||||
Washington Trust Bancorp, Inc. | 70,219 | 3,861,343 | ||||||
WesBanco, Inc. | 475,071 | 18,489,763 | ||||||
Wintrust Financial Corp. | 31,144 | 2,504,601 | ||||||
|
| |||||||
| 316,283,691 | ||||||||
| Biotechnology — 7.5% | ||||||||
89bio, Inc.(a) | 41,155 | 777,829 | ||||||
ACADIA Pharmaceuticals, Inc.(a) | 44,793 | 1,000,676 | ||||||
Adverum Biotechnologies, Inc.(a) | 344,143 | 1,190,735 | ||||||
Agenus, Inc.(a) | 520,031 | 2,215,332 | ||||||
Akebia Therapeutics, Inc.(a)(b) | 263,155 | 923,674 | ||||||
Akero Therapeutics, Inc.(a) | 49,183 | 1,287,611 | ||||||
Alector, Inc.(a)(b) | 265,993 | 4,734,675 | ||||||
Allakos, Inc.(a) | 5,570 | 565,021 | ||||||
Allogene Therapeutics, Inc.(a)(b) | 79,052 | 2,031,636 | ||||||
Allovir, Inc.(a) | 17,276 | 404,949 | ||||||
| 28 | 2 0 2 1 BLACK ROCK ANNUAL REPORT TO SHAREHOLDERS |
Schedule of Investments (continued) May 31, 2021 | BlackRock Advantage Small Cap Core Fund (Percentages shown are based on Net Assets) |
| Security | Shares | Value | ||||||
| Biotechnology (continued) | ||||||||
Amicus Therapeutics, Inc.(a) | 177,173 | $ | 1,640,622 | |||||
Anika Therapeutics, Inc.(a) | 27,944 | 1,303,588 | ||||||
Apellis Pharmaceuticals, Inc.(a) | 15,313 | 861,816 | ||||||
Applied Therapeutics, Inc.(a) | 9,204 | 176,993 | ||||||
Aptinyx, Inc.(a)(b) | 180,087 | 457,421 | ||||||
Arcus Biosciences, Inc.(a) | 116,990 | 2,903,692 | ||||||
Arcutis Biotherapeutics, Inc.(a) | 55,743 | 1,468,828 | ||||||
Arena Pharmaceuticals, Inc.(a) | 8,484 | 518,457 | ||||||
Arrowhead Pharmaceuticals, Inc.(a) | 73,831 | 5,360,131 | ||||||
Assembly Biosciences, Inc.(a)(b) | 28,778 | 114,249 | ||||||
Atara Biotherapeutics, Inc.(a) | 369,280 | 5,007,437 | ||||||
Athenex, Inc.(a) | 169,138 | 793,257 | ||||||
Athersys, Inc.(a)(b) | 318,623 | 532,100 | ||||||
Avidity Biosciences, Inc.(a) | 85,805 | 2,037,011 | ||||||
Avrobio, Inc.(a) | 175,280 | 1,575,767 | ||||||
Beyondspring, Inc.(a) | 14,359 | 148,903 | ||||||
BioAtla, Inc.(a)(b) | 42,789 | 1,842,066 | ||||||
BioCryst Pharmaceuticals, Inc.(a) | 278,246 | 4,387,939 | ||||||
Biohaven Pharmaceutical Holding Co. Ltd.(a) | 9,409 | 818,583 | ||||||
Bioxcel Therapeutics, Inc.(a) | 37,906 | 1,252,035 | ||||||
Black Diamond Therapeutics, Inc.(a) | 179,513 | 2,355,211 | ||||||
Blueprint Medicines Corp.(a)(b) | 31,468 | 2,874,602 | ||||||
Bridgebio Pharma, Inc.(a)(b) | 163,880 | 9,701,696 | ||||||
Brooklyn ImmunoTherapeutics, Inc.(a)(b) | 71,644 | 1,031,674 | ||||||
C4 Therapeutics, Inc.(a) | 25,677 | 948,765 | ||||||
Calithera Biosciences, Inc.(a) | 116,699 | 266,074 | ||||||
CareDx, Inc.(a)(b) | 7,029 | 565,132 | ||||||
ChemoCentryx, Inc.(a) | 45,911 | 465,997 | ||||||
Clovis Oncology, Inc.(a) | 156,119 | 800,890 | ||||||
Coherus Biosciences, Inc.(a) | 584,153 | 7,687,453 | ||||||
Crinetics Pharmaceuticals, Inc.(a) | 27,426 | 481,326 | ||||||
Cue Biopharma, Inc.(a) | 57,322 | 821,997 | ||||||
Deciphera Pharmaceuticals, Inc.(a)(b) | 99,732 | 3,364,958 | ||||||
Denali Therapeutics, Inc.(a) | 38,606 | 2,454,956 | ||||||
Dynavax Technologies Corp.(a)(b) | 130,286 | 1,068,345 | ||||||
Dyne Therapeutics, Inc.(a) | 63,241 | 1,208,536 | ||||||
Editas Medicine, Inc.(a)(b) | 110,798 | 3,761,592 | ||||||
Emergent BioSolutions, Inc.(a) | 146,380 | 8,877,947 | ||||||
Enanta Pharmaceuticals, Inc.(a) | 85,655 | 4,167,972 | ||||||
Epizyme, Inc.(a) | 72,971 | 600,551 | ||||||
Fate Therapeutics, Inc.(a) | 55,814 | 4,275,352 | ||||||
FibroGen, Inc.(a)(b) | 177,281 | 3,767,221 | ||||||
Flexion Therapeutics, Inc.(a) | 188,752 | 1,579,854 | ||||||
Frequency Therapeutics, Inc.(a) | 98,963 | 875,823 | ||||||
G1 Therapeutics, Inc.(a) | 152,110 | 3,303,829 | ||||||
Gossamer Bio, Inc.(a) | 155,693 | 1,318,720 | ||||||
Halozyme Therapeutics, Inc.(a) | 209,989 | 8,695,644 | ||||||
Harpoon Therapeutics, Inc.(a) | 102,679 | 2,117,241 | ||||||
Heron Therapeutics, Inc.(a)(b) | 289,136 | 3,836,835 | ||||||
Homology Medicines, Inc.(a) | 25,471 | 169,127 | ||||||
IGM Biosciences, Inc.(a) | 5,512 | 411,471 | ||||||
Inovio Pharmaceuticals, Inc.(a)(b) | 552,443 | 4,170,945 | ||||||
Inozyme Pharma, Inc.(a) | 21,346 | 349,221 | ||||||
Insmed, Inc.(a)(b) | 154,480 | 3,800,208 | ||||||
Intellia Therapeutics, Inc.(a) | 15,866 | 1,188,998 | ||||||
Intercept Pharmaceuticals, Inc.(a) | 98,270 | 1,634,230 | ||||||
Invitae Corp.(a) | 281,371 | 8,097,857 | ||||||
iTeos Therapeutics, Inc.(a) | 11,328 | 232,677 | ||||||
Kadmon Holdings, Inc.(a) | 2,358 | 9,055 | ||||||
Karuna Therapeutics, Inc.(a)(b) | 15,986 | 1,787,555 | ||||||
Karyopharm Therapeutics, Inc.(a) | 979,756 | 9,092,136 | ||||||
Kiniksa Pharmaceuticals Ltd., Class A(a) | 30,110 | 410,399 | ||||||
| Security | Shares | Value | ||||||
| Biotechnology (continued) | ||||||||
Kodiak Sciences, Inc.(a) | 7,394 | $ | 618,286 | |||||
Kymera Therapeutics, Inc.(a) | 31,482 | 1,513,969 | ||||||
Ligand Pharmaceuticals, Inc.(a) | 11,321 | 1,332,482 | ||||||
MacroGenics, Inc.(a) | 249,661 | 8,036,588 | ||||||
Madrigal Pharmaceuticals, Inc.(a) | 34,040 | 3,822,692 | ||||||
Magenta Therapeutics, Inc.(a) | 24,900 | 307,515 | ||||||
MannKind Corp.(a) | 470,659 | 2,080,313 | ||||||
Mirati Therapeutics, Inc.(a)(b) | 66,301 | 10,485,503 | ||||||
Mirum Pharmaceuticals, Inc.(a) | 64,305 | 1,063,605 | ||||||
Myriad Genetics, Inc.(a) | 144,301 | 4,134,224 | ||||||
Natera, Inc.(a) | 205,983 | 19,391,240 | ||||||
NextCure, Inc.(a) | 285,934 | 2,244,582 | ||||||
Novavax, Inc.(a)(b) | 101,476 | 14,979,887 | ||||||
OPKO Health, Inc.(a) | 818,109 | 3,125,176 | ||||||
Organogenesis Holdings, Inc.(a) | 24,556 | 437,833 | ||||||
Oyster Point Pharma, Inc.(a)(b) | 123,447 | 2,212,170 | ||||||
Passage Bio, Inc.(a) | 162,706 | 2,155,854 | ||||||
Poseida Therapeutics, Inc.(a)(b) | 166,202 | 1,404,407 | ||||||
Precision BioSciences, Inc.(a) | 25,758 | 271,232 | ||||||
PTC Therapeutics, Inc.(a) | 51,582 | 2,025,625 | ||||||
Puma Biotechnology, Inc.(a) | 84,684 | 893,416 | ||||||
Radius Health, Inc.(a)(b) | 61,564 | 1,187,570 | ||||||
REGENXBIO, Inc.(a) | 57,476 | 2,027,179 | ||||||
Relay Therapeutics, Inc.(a)(b) | 114,535 | 3,678,864 | ||||||
Replimune Group, Inc.(a) | 14,810 | 577,146 | ||||||
REVOLUTION Medicines, Inc.(a) | 46,662 | 1,395,660 | ||||||
Rigel Pharmaceuticals, Inc.(a)(b) | 785,009 | 2,920,233 | ||||||
Seres Therapeutics, Inc.(a)(b) | 204,304 | 4,312,857 | ||||||
Solid Biosciences, Inc.(a) | 93,566 | 355,551 | ||||||
Sorrento Therapeutics, Inc.(a)(b) | 541,007 | 4,068,373 | ||||||
Spectrum Pharmaceuticals, Inc.(a) | 1,284,257 | 4,430,687 | ||||||
SpringWorks Therapeutics, Inc.(a) | 15,305 | 1,247,970 | ||||||
Sutro Biopharma, Inc.(a) | 142,383 | 2,649,748 | ||||||
Taysha Gene Therapies, Inc.(a)(b) | 28,653 | 644,692 | ||||||
TCR2 Therapeutics, Inc.(a) | 15,227 | 291,597 | ||||||
TG Therapeutics, Inc.(a)(b) | 61,673 | 2,150,538 | ||||||
Travere Therapeutics, Inc.(a) | 156,537 | 2,374,666 | ||||||
Turning Point Therapeutics, Inc.(a) | 38,895 | 2,574,071 | ||||||
Twist Bioscience Corp.(a) | 75,056 | 8,054,259 | ||||||
Ultragenyx Pharmaceutical, Inc.(a)(b) | 118,589 | 12,061,687 | ||||||
UroGen Pharma Ltd.(a) | 45,934 | 809,357 | ||||||
Veracyte, Inc.(a) | 216,681 | 8,461,393 | ||||||
Vir Biotechnology, Inc.(a) | 79,204 | 3,319,440 | ||||||
Xencor, Inc.(a) | 41,861 | 1,609,974 | ||||||
Y-mAbs Therapeutics, Inc.(a) | 56,060 | 2,008,630 | ||||||
|
| |||||||
| 318,711,846 | ||||||||
| Building Products — 1.8% | ||||||||
Advanced Drainage Systems, Inc. | 69,539 | 7,887,113 | ||||||
Builders FirstSource, Inc.(a)(b) | 830,192 | 36,976,752 | ||||||
Cornerstone Building Brands, Inc.(a) | 40,251 | 682,657 | ||||||
Gibraltar Industries, Inc.(a) | 47,286 | 3,756,873 | ||||||
Griffon Corp. | 22,813 | 599,754 | ||||||
JELD-WEN Holding, Inc.(a) | 143,320 | 4,014,393 | ||||||
Masonite International Corp.(a) | 12,716 | 1,520,198 | ||||||
Resideo Technologies, Inc.(a) | 229,114 | 6,850,508 | ||||||
Trex Co., Inc.(a) | 109,608 | 10,676,915 | ||||||
UFP Industries, Inc. | 53,323 | 4,240,245 | ||||||
|
| |||||||
| 77,205,408 | ||||||||
| Capital Markets — 3.2% | ||||||||
Artisan Partners Asset Management, Inc., Class A | 115,503 | 5,899,893 | ||||||
AssetMark Financial Holdings, Inc.(a) | 372,016 | 9,694,737 | ||||||
B Riley Financial, Inc. | 104,315 | 7,681,756 | ||||||
SCHEDULES OF INVESTMENTS | 29 |
Schedule of Investments (continued) May 31, 2021 | BlackRock Advantage Small Cap Core Fund (Percentages shown are based on Net Assets) |
| Security | Shares | Value | ||||||
| Capital Markets (continued) | ||||||||
Cohen & Steers, Inc. | 182,328 | $ | 13,333,647 | |||||
Cowen, Inc., Class A | 189,072 | 7,436,202 | ||||||
Donnelley Financial Solutions, Inc.(a) | 102,909 | 3,067,717 | ||||||
Hamilton Lane, Inc., Class A | 220,449 | 19,921,976 | ||||||
Houlihan Lokey, Inc. | 194,048 | 14,532,255 | ||||||
Oppenheimer Holdings, Inc., Class A | 31,995 | 1,598,790 | ||||||
Stifel Financial Corp. | 623,486 | 43,195,110 | ||||||
Virtus Investment Partners, Inc. | 36,622 | 10,299,205 | ||||||
WisdomTree Investments, Inc. | 227,971 | 1,527,406 | ||||||
|
| |||||||
| 138,188,694 | ||||||||
| Chemicals — 2.2% | ||||||||
Amyris, Inc.(a) | 55,399 | 788,328 | ||||||
Avient Corp. | 363,492 | 18,894,314 | ||||||
Balchem Corp. | 40,983 | 5,368,773 | ||||||
HB Fuller Co. | 549,954 | 38,012,820 | ||||||
Innospec, Inc. | 29,510 | 2,983,756 | ||||||
Kronos Worldwide, Inc. | 41,099 | 667,448 | ||||||
Livent Corp.(a) | 427,003 | 8,330,829 | ||||||
PQ Group Holdings, Inc. | 49,327 | 806,003 | ||||||
Stepan Co. | 27,850 | 3,750,281 | ||||||
Trinseo SA | 189,226 | 12,288,336 | ||||||
|
| |||||||
| 91,890,888 | ||||||||
| Commercial Services & Supplies — 2.3% | ||||||||
ABM Industries, Inc. | 307,031 | 15,317,777 | ||||||
ACCO Brands Corp. | 807,931 | 7,360,251 | ||||||
BrightView Holdings, Inc.(a) | 187,684 | 3,256,317 | ||||||
Brink’s Co. | 105,256 | 7,937,355 | ||||||
CECO Environmental Corp.(a) | 8,000 | 61,040 | ||||||
Cimpress PLC(a) | 39,775 | 3,950,055 | ||||||
Deluxe Corp. | 108,949 | 4,963,717 | ||||||
Ennis, Inc. | 42,219 | 884,910 | ||||||
Herman Miller, Inc. | 275,889 | 13,187,494 | ||||||
KAR Auction Services, Inc.(a) | 239,974 | 4,305,134 | ||||||
Kimball International, Inc., Class B | 474,368 | 6,318,582 | ||||||
Knoll, Inc. | 47,732 | 1,241,032 | ||||||
Matthews International Corp., Class A | 134,790 | 5,266,245 | ||||||
McGrath RentCorp | 128,020 | 10,975,155 | ||||||
RR Donnelley & Sons Co.(a) | 470,346 | 3,014,918 | ||||||
Steelcase, Inc., Class A | 341,602 | 4,942,981 | ||||||
Tetra Tech, Inc. | 50,081 | 5,983,177 | ||||||
|
| |||||||
| 98,966,140 | ||||||||
| Communications Equipment — 0.3% | ||||||||
Calix, Inc.(a) | 190,260 | 8,430,421 | ||||||
Casa Systems, Inc.(a) | 103,122 | 895,099 | ||||||
Ciena Corp.(a) | 38,984 | 2,061,084 | ||||||
Extreme Networks, Inc.(a) | 62,725 | 717,574 | ||||||
TESSCO Technologies, Inc.(a) | 77,324 | 575,290 | ||||||
|
| |||||||
| 12,679,468 | ||||||||
| Construction & Engineering — 2.2% | ||||||||
Ameresco, Inc., Class A(a) | 89,870 | 4,831,411 | ||||||
EMCOR Group, Inc. | 231,844 | 29,237,847 | ||||||
Fluor Corp.(a) | 114,392 | 2,116,252 | ||||||
MasTec, Inc.(a)(b) | 201,612 | 23,453,524 | ||||||
Matrix Service Co.(a) | 50,835 | 554,101 | ||||||
MYR Group, Inc.(a) | 86,239 | 7,506,243 | ||||||
Primoris Services Corp. | 344,943 | 10,965,738 | ||||||
Tutor Perini Corp.(a) | 151,703 | 2,348,362 | ||||||
WillScot Mobile Mini Holdings Corp.(a)(b) | 441,114 | 12,792,306 | ||||||
|
| |||||||
| 93,805,784 | ||||||||
| Security | Shares | Value | ||||||
| Construction Materials — 0.5% | ||||||||
Forterra, Inc.(a) | 59,662 | $ | 1,394,897 | |||||
Summit Materials, Inc., Class A(a) | 268,844 | 9,361,148 | ||||||
U.S. Concrete, Inc.(a) | 168,015 | 9,575,175 | ||||||
|
| |||||||
| 20,331,220 | ||||||||
| Consumer Finance — 0.8% | ||||||||
Encore Capital Group, Inc.(a) | 104,644 | 4,843,971 | ||||||
FirstCash, Inc. | 48,528 | 3,868,652 | ||||||
LendingClub Corp.(a) | 91,636 | 1,400,198 | ||||||
PRA Group, Inc.(a) | 61,300 | 2,386,409 | ||||||
PROG Holdings, Inc. | 319,742 | 16,856,798 | ||||||
Regional Management Corp. | 63,050 | 2,946,957 | ||||||
|
| |||||||
| 32,302,985 | ||||||||
| Containers & Packaging — 0.0% | ||||||||
Ranpak Holdings Corp.(a) | 42,697 | 942,750 | ||||||
|
| |||||||
| Diversified Consumer Services — 0.2% | ||||||||
Perdoceo Education Corp.(a) | 164,454 | 2,004,694 | ||||||
Strategic Education, Inc. | 100,408 | 7,112,903 | ||||||
|
| |||||||
| 9,117,597 | ||||||||
| Diversified Financial Services — 0.3% | ||||||||
Cannae Holdings, Inc.(a) | 302,910 | 10,859,324 | ||||||
|
| |||||||
| Diversified Telecommunication Services — 0.3% | ||||||||
ATN International, Inc. | 2,906 | 137,367 | ||||||
Liberty Latin America Ltd., Class C(a) | 310,363 | 4,463,020 | ||||||
Ooma, Inc.(a) | 56,956 | 1,105,516 | ||||||
Radius Global Infrastructure, Inc., | 308,480 | 4,935,680 | ||||||
|
| |||||||
| 10,641,583 | ||||||||
| Electric Utilities — 0.2% | ||||||||
PNM Resources, Inc. | 82,074 | 4,031,475 | ||||||
Portland General Electric Co. | 128,906 | 6,179,754 | ||||||
|
| |||||||
| 10,211,229 | ||||||||
| Electrical Equipment — 1.1% | ||||||||
Bloom Energy Corp., Class A(a) | 157,643 | 3,810,231 | ||||||
EnerSys | 8,164 | 769,375 | ||||||
Generac Holdings, Inc.(a)(b) | 38,066 | 12,513,056 | ||||||
LSI Industries, Inc. | 73,401 | 682,629 | ||||||
Plug Power, Inc.(a)(b) | 453,506 | 13,922,634 | ||||||
Sunrun, Inc.(a)(b) | 283,612 | 12,683,129 | ||||||
TPI Composites, Inc.(a) | 87,525 | 4,227,458 | ||||||
|
| |||||||
| 48,608,512 | ||||||||
| Electronic Equipment, Instruments & Components — 2.4% | ||||||||
Benchmark Electronics, Inc. | 119,697 | 3,704,622 | ||||||
ePlus, Inc.(a) | 104,945 | 9,924,649 | ||||||
FARO Technologies, Inc.(a) | 130,581 | 9,878,453 | ||||||
II-VI, Inc.(a) | 14,820 | 998,423 | ||||||
Insight Enterprises, Inc.(a)(b) | 120,669 | 12,607,497 | ||||||
Itron, Inc.(a) | 45,593 | 4,347,292 | ||||||
Knowles Corp.(a) | 686,469 | 14,100,073 | ||||||
Methode Electronics, Inc. | 166,020 | 8,032,048 | ||||||
Novanta, Inc.(a) | 6,501 | 903,444 | ||||||
OSI Systems, Inc.(a) | 199,936 | 19,265,833 | ||||||
PAR Technology Corp.(a)(b) | 81,028 | 5,425,635 | ||||||
PC Connection, Inc. | 184,930 | 9,022,735 | ||||||
ScanSource, Inc.(a) | 141,789 | 4,328,818 | ||||||
|
| |||||||
| 102,539,522 | ||||||||
| Energy Equipment & Services — 0.9% | ||||||||
Archrock, Inc. | 564,003 | 5,188,828 | ||||||
Cactus, Inc., Class A | 156,112 | 5,470,164 | ||||||
ChampionX Corp.(a) | 467,435 | 12,387,027 | ||||||
| 30 | 2 0 2 1 BLACK ROCK ANNUAL REPORT TO SHAREHOLDERS |
Schedule of Investments (continued) May 31, 2021 | BlackRock Advantage Small Cap Core Fund (Percentages shown are based on Net Assets) |
| Security | Shares | Value | ||||||
| Energy Equipment & Services (continued) | ||||||||
Dril-Quip, Inc., Class A(a) | 22,441 | $ | 752,447 | |||||
Helix Energy Solutions Group, Inc.(a) | 187,695 | 981,645 | ||||||
Liberty Oilfield Services, Inc., Class A(a) | 140,431 | 2,100,848 | ||||||
Natural Gas Services Group, Inc.(a) | 4,900 | 50,617 | ||||||
Oceaneering International, Inc.(a) | 423,961 | 6,049,923 | ||||||
Oil States International, Inc.(a) | 114,907 | 738,852 | ||||||
Patterson-UTI Energy, Inc. | 224,015 | 1,875,006 | ||||||
Solaris Oilfield Infrastructure, Inc., Class A | 141,390 | 1,412,486 | ||||||
|
| |||||||
| 37,007,843 | ||||||||
| Entertainment — 0.9% | ||||||||
AMC Entertainment Holdings, Inc., Class A(a)(b) | 448,021 | 11,702,308 | ||||||
Cinemark Holdings, Inc.(a) | 851,738 | 19,300,383 | ||||||
Eros STX Global Corp.(a) | 2,140,859 | 2,569,031 | ||||||
Gaia, Inc.(a) | 37,818 | 439,067 | ||||||
IMAX Corp.(a) | 82,606 | 1,785,116 | ||||||
Marcus Corp.(a) | 106,617 | 2,250,685 | ||||||
|
| |||||||
| 38,046,590 | ||||||||
| Equity Real Estate Investment Trusts (REITs) — 3.2% | ||||||||
Acadia Realty Trust | 657,850 | 14,275,345 | ||||||
Alexander & Baldwin, Inc. | 152,180 | 2,923,378 | ||||||
Apartment Investment and Management Co., Class A | 1,279,988 | 9,023,915 | ||||||
Armada Hoffler Properties, Inc. | 181,350 | 2,406,514 | ||||||
Braemar Hotels & Resorts, Inc.(a) | 887,628 | 5,458,912 | ||||||
Broadstone Net Lease, Inc. | 97,742 | 2,134,685 | ||||||
CareTrust REIT, Inc. | 62,797 | 1,461,914 | ||||||
City Office REIT, Inc. | 344,605 | 3,983,634 | ||||||
Colony Capital, Inc.(a) | 1,089,678 | 7,486,088 | ||||||
CorePoint Lodging, Inc.(a) | 425,197 | 4,460,317 | ||||||
DiamondRock Hospitality Co.(a) | 345,470 | 3,344,150 | ||||||
Easterly Government Properties, Inc. | 31,207 | 646,921 | ||||||
Essential Properties Realty Trust, Inc. | 50,903 | 1,303,117 | ||||||
First Industrial Realty Trust, Inc. | 160,197 | 8,112,376 | ||||||
Four Corners Property Trust, Inc. | 357,497 | 9,924,117 | ||||||
Gladstone Land Corp. | 29,993 | 693,738 | ||||||
Global Net Lease, Inc. | 163,078 | 3,186,544 | ||||||
Macerich Co. | 515,997 | 8,209,512 | ||||||
National Storage Affiliates Trust | 235,617 | 10,861,944 | ||||||
NexPoint Residential Trust, Inc. | 100,202 | 5,194,472 | ||||||
Plymouth Industrial REIT, Inc. | 128,365 | 2,456,906 | ||||||
QTS Realty Trust, Inc., Class A | 129,001 | 8,176,083 | ||||||
Retail Properties of America, Inc., Class A | 129,027 | 1,554,775 | ||||||
Retail Value, Inc. | 240,510 | 4,223,356 | ||||||
RPT Realty | 82,590 | 1,053,023 | ||||||
Ryman Hospitality Properties, Inc.(a) | 41,323 | 3,095,506 | ||||||
Seritage Growth Properties, Class A(a) | 92,313 | 1,558,243 | ||||||
SITE Centers Corp. | 377,671 | 5,653,735 | ||||||
Terreno Realty Corp. | 74,925 | 4,766,728 | ||||||
Washington Real Estate Investment Trust | 30,277 | 716,051 | ||||||
|
| |||||||
| 138,345,999 | ||||||||
| Food & Staples Retailing — 1.0% | ||||||||
Andersons, Inc. | 59,645 | 1,853,767 | ||||||
BJ’s Wholesale Club Holdings, Inc.(a) | 95,666 | 4,284,880 | ||||||
Chefs’ Warehouse, Inc.(a)(b) | 95,291 | 2,931,151 | ||||||
Performance Food Group Co.(a) | 437,637 | 21,938,743 | ||||||
PriceSmart, Inc. | 58,892 | 5,200,164 | ||||||
Rite Aid Corp.(a)(b) | 119,823 | 2,189,166 | ||||||
SpartanNash Co. | 45,403 | 952,101 | ||||||
Weis Markets, Inc. | 64,481 | 3,280,793 | ||||||
|
| |||||||
| 42,630,765 | ||||||||
| Security | Shares | Value | ||||||
| Food Products — 1.3% | ||||||||
Darling Ingredients, Inc.(a) | 141,662 | $ | 9,698,180 | |||||
Freshpet, Inc.(a)(b) | 92,667 | 16,385,379 | ||||||
Hostess Brands, Inc.(a) | 597,091 | 9,362,387 | ||||||
John B. Sanfilippo & Son, Inc. | 24,239 | 2,261,741 | ||||||
Sanderson Farms, Inc. | 15,242 | 2,480,635 | ||||||
Seneca Foods Corp., Class A(a) | 75,494 | 3,490,843 | ||||||
Simply Good Foods Co(a) | 40,103 | 1,384,757 | ||||||
Vital Farms, Inc.(a) | 416,790 | 8,873,459 | ||||||
|
| |||||||
| 53,937,381 | ||||||||
| Gas Utilities — 1.3% | ||||||||
New Jersey Resources Corp. | 249,740 | 10,668,893 | ||||||
Southwest Gas Holdings, Inc. | 706,972 | 46,667,222 | ||||||
|
| |||||||
| 57,336,115 | ||||||||
| Health Care Equipment & Supplies — 3.6% | ||||||||
Accuray, Inc.(a) | 385,489 | 1,642,183 | ||||||
Alphatec Holdings, Inc.(a) | 68,596 | 994,642 | ||||||
AtriCure, Inc.(a) | 50,754 | 3,792,846 | ||||||
Atrion Corp. | 5,349 | 3,321,729 | ||||||
Axonics, Inc.(a) | 11,202 | 646,243 | ||||||
Cantel Medical Corp.(a) | 103,199 | 8,393,175 | ||||||
Cardiovascular Systems, Inc.(a) | 135,004 | 5,290,807 | ||||||
Cerus Corp.(a)(b) | 191,832 | 1,110,707 | ||||||
CONMED Corp. | 38,835 | 5,347,191 | ||||||
CryoLife, Inc.(a) | 170,018 | 4,898,219 | ||||||
CryoPort, Inc.(a)(b) | 19,020 | 1,063,598 | ||||||
Globus Medical, Inc., Class A(a) | 72,164 | 5,200,138 | ||||||
Heska Corp.(a) | 73,528 | 14,569,573 | ||||||
Inogen, Inc.(a) | 30,940 | 1,912,401 | ||||||
Integer Holdings Corp.(a) | 62,731 | 5,675,274 | ||||||
Intersect ENT, Inc.(a) | 84,641 | 1,493,914 | ||||||
LeMaitre Vascular, Inc. | 105,711 | 5,413,460 | ||||||
LivaNova PLC(a) | 80,553 | 6,729,398 | ||||||
Meridian Bioscience, Inc.(a) | 46,865 | 972,917 | ||||||
Mesa Laboratories, Inc. | 24,407 | 6,005,586 | ||||||
Natus Medical, Inc.(a) | 194,935 | 5,224,258 | ||||||
Neogen Corp.(a) | 51,798 | 4,781,473 | ||||||
Nevro Corp.(a) | 176,004 | 26,523,803 | ||||||
Novocure Ltd.(a) | 5,215 | 1,063,860 | ||||||
NuVasive, Inc.(a) | 35,692 | 2,434,194 | ||||||
OraSure Technologies, Inc.(a) | 744,488 | 7,154,530 | ||||||
Orthofix Medical, Inc.(a) | 3,855 | 156,899 | ||||||
SeaSpine Holdings Corp.(a) | 31,050 | 632,799 | ||||||
Shockwave Medical, Inc.(a) | 23,912 | 4,301,769 | ||||||
SI-BONE, Inc.(a) | 3,227 | 97,359 | ||||||
Silk Road Medical, Inc.(a) | 77,227 | 3,751,688 | ||||||
STAAR Surgical Co.(a) | 31,063 | 4,536,130 | ||||||
Tactile Systems Technology, Inc.(a) | 133,666 | 7,187,221 | ||||||
Varex Imaging Corp.(a) | 62,205 | 1,560,723 | ||||||
|
| |||||||
| 153,880,707 | ||||||||
| Health Care Providers & Services — 1.9% | ||||||||
1Life Healthcare, Inc.(a) | 192,075 | 7,106,775 | ||||||
AMN Healthcare Services, Inc.(a) | 85,643 | 7,596,534 | ||||||
Apria, Inc.(a) | 24,869 | 757,261 | ||||||
CorVel Corp.(a) | 24,268 | 3,023,793 | ||||||
Covetrus, Inc.(a) | 49,135 | 1,363,005 | ||||||
Hanger, Inc.(a) | 40,907 | 1,056,628 | ||||||
Innovage Holding Corp.(a) | 91,008 | 1,947,571 | ||||||
LHC Group, Inc.(a) | 36,608 | 7,206,285 | ||||||
Magellan Health, Inc.(a) | 29,868 | 2,813,267 | ||||||
Option Care Health, Inc.(a) | 70,735 | 1,297,280 | ||||||
Owens & Minor, Inc. | 98,645 | 4,410,418 | ||||||
SCHEDULES OF INVESTMENTS | 31 |
Schedule of Investments (continued) May 31, 2021 | BlackRock Advantage Small Cap Core Fund (Percentages shown are based on Net Assets) |
| Security | Shares | Value | ||||||
| Health Care Providers & Services (continued) | ||||||||
Patterson Cos., Inc. | 389,744 | $ | 12,682,270 | |||||
PetIQ, Inc.(a) | 86,771 | 3,566,288 | ||||||
Privia Health Group, Inc.(a)(b) | 109,746 | 3,591,987 | ||||||
R1 RCM, Inc.(a) | 58,582 | 1,356,173 | ||||||
Select Medical Holdings Corp. | 186,745 | 7,482,872 | ||||||
Tenet Healthcare Corp.(a) | 97,159 | 6,500,909 | ||||||
Triple-S Management Corp., Class B(a) | 30,484 | 771,245 | ||||||
U.S. Physical Therapy, Inc. | 54,996 | 6,399,334 | ||||||
Viemed Healthcare, Inc.(a) | 109,897 | 858,295 | ||||||
|
| |||||||
| 81,788,190 | ||||||||
| Health Care Technology — 1.6% | ||||||||
Allscripts Healthcare Solutions, Inc.(a)(b) | 799,250 | 13,898,958 | ||||||
Castlight Health, Inc., Class B(a) | 47,000 | 85,540 | ||||||
Evolent Health, Inc., Class A(a)(b) | 79,533 | 1,545,326 | ||||||
Health Catalyst, Inc.(a)(b) | 48,666 | 2,612,878 | ||||||
Inovalon Holdings, Inc., Class A(a) | 388,872 | 12,195,026 | ||||||
Inspire Medical Systems, Inc.(a) | 20,562 | 3,995,197 | ||||||
NextGen Healthcare, Inc.(a) | 32,689 | 536,753 | ||||||
Omnicell, Inc.(a) | 101,328 | 14,084,592 | ||||||
Phreesia, Inc.(a) | 193,548 | 9,580,626 | ||||||
Tabula Rasa HealthCare, Inc.(a) | 27,053 | 1,168,960 | ||||||
Teladoc Health, Inc.(a) | 17,126 | 2,578,833 | ||||||
Vocera Communications, Inc.(a) | 207,778 | 7,006,274 | ||||||
|
| |||||||
| 69,288,963 | ||||||||
| Hotels, Restaurants & Leisure — 4.3% | ||||||||
Accel Entertainment, Inc.(a)(b) | 233,223 | 3,059,886 | ||||||
Caesars Entertainment, Inc.(a)(b) | 214,889 | 23,089,823 | ||||||
Cheesecake Factory, Inc.(a) | 228,657 | 13,449,605 | ||||||
Churchill Downs, Inc. | 51,080 | 10,191,992 | ||||||
Chuy’s Holdings, Inc.(a) | 34,295 | 1,421,528 | ||||||
Cracker Barrel Old Country Store, Inc. | 39,236 | 6,188,302 | ||||||
Dave & Buster’s Entertainment, Inc.(a) | 78,703 | 3,327,563 | ||||||
Dine Brands Global, Inc.(a) | 103,610 | 9,837,769 | ||||||
Hilton Grand Vacations, Inc.(a) | 74,594 | 3,411,184 | ||||||
International Game Technology PLC(a) | 1,329,735 | 32,259,371 | ||||||
Jack in the Box, Inc. | 41,028 | 4,660,781 | ||||||
Marriott Vacations Worldwide Corp.(a) | 46,563 | 8,022,339 | ||||||
Penn National Gaming, Inc.(a) | 236,064 | 19,350,166 | ||||||
PlayAGS, Inc.(a) | 112,983 | 1,150,167 | ||||||
Scientific Games Corp.(a) | 25,848 | 1,875,014 | ||||||
SeaWorld Entertainment, Inc.(a) | 293,876 | 15,995,671 | ||||||
Shake Shack, Inc., Class A(a) | 107,678 | 10,119,578 | ||||||
Texas Roadhouse, Inc. | 26,645 | 2,683,418 | ||||||
Wingstop, Inc. | 96,945 | 13,832,112 | ||||||
|
| |||||||
| 183,926,269 | ||||||||
| Household Durables — 2.2% | ||||||||
Ethan Allen Interiors, Inc. | 78,202 | 2,257,692 | ||||||
GoPro, Inc., Class A(a) | 79,259 | 889,286 | ||||||
Green Brick Partners, Inc.(a) | 195,076 | 4,553,074 | ||||||
Hooker Furniture Corp. | 38,792 | 1,390,693 | ||||||
iRobot Corp.(a)(b) | 132,705 | 12,965,278 | ||||||
KB Home | 173,125 | 8,103,981 | ||||||
LGI Homes, Inc.(a)(b) | 38,099 | 6,888,680 | ||||||
Lovesac Co.(a) | 10,585 | 878,767 | ||||||
M/I Homes, Inc.(a) | 19,723 | 1,390,866 | ||||||
MDC Holdings, Inc. | 761,712 | 44,141,210 | ||||||
Meritage Homes Corp.(a) | 43,722 | 4,707,548 | ||||||
Sonos, Inc.(a) | 119,560 | 4,423,720 | ||||||
|
| |||||||
| 92,590,795 | ||||||||
| Household Products — 0.3% | ||||||||
Central Garden & Pet Co., Class A(a) | 274,867 | 13,867,040 | ||||||
|
| |||||||
| Security | Shares | Value | ||||||
| Independent Power and Renewable Electricity Producers — 0.5% | ||||||||
Brookfield Renewable Corp., Class A | 224,308 | $ | 9,582,438 | |||||
Clearway Energy, Inc., Class A | 185,597 | 4,664,053 | ||||||
Ormat Technologies, Inc. | 29,168 | 2,014,050 | ||||||
Sunnova Energy International, Inc.(a)(b) | 244,201 | 7,130,669 | ||||||
|
| |||||||
| 23,391,210 | ||||||||
| Insurance — 0.8% | ||||||||
Argo Group International Holdings Ltd. | 16,109 | 864,087 | ||||||
Donegal Group, Inc., Class A | 91,016 | 1,391,635 | ||||||
eHealth, Inc.(a) | 57,016 | 3,720,294 | ||||||
Enstar Group Ltd.(a) | 3,320 | 842,915 | ||||||
Genworth Financial, Inc., Class A(a) | 743,011 | 3,120,646 | ||||||
Heritage Insurance Holdings, Inc. | 207,168 | 1,725,709 | ||||||
Kinsale Capital Group, Inc. | 14,387 | 2,394,860 | ||||||
Protective Insurance Corp., Class B | 22,275 | 519,008 | ||||||
RLI Corp. | 35,922 | 3,789,053 | ||||||
Selectquote, Inc.(a) | 82,640 | 1,679,245 | ||||||
Trupanion, Inc.(a) | 163,514 | 14,744,057 | ||||||
Universal Insurance Holdings, Inc. | 29,194 | 411,635 | ||||||
|
| |||||||
| 35,203,144 | ||||||||
| Interactive Media & Services — 0.1% | ||||||||
Bumble, Inc., Class A(a) | 36,473 | 1,740,492 | ||||||
Cars.com, Inc.(a) | 39,745 | 580,674 | ||||||
EverQuote, Inc., Class A(a) | 25,901 | 816,659 | ||||||
TrueCar, Inc.(a) | 158,931 | 939,282 | ||||||
|
| |||||||
| 4,077,107 | ||||||||
| Internet & Direct Marketing Retail — 0.9% | ||||||||
1-800-Flowers.com, Inc., Class A(a) | 303,107 | 9,235,670 | ||||||
Lands’ End, Inc.(a) | 68,427 | 1,752,415 | ||||||
Overstock.com, Inc.(a)(b) | 132,506 | 11,319,988 | ||||||
RealReal, Inc.(a) | 110,827 | 1,936,148 | ||||||
Stamps.com, Inc.(a) | 41,208 | 7,733,917 | ||||||
Stitch Fix, Inc., Class A(a) | 90,523 | 4,839,360 | ||||||
|
| |||||||
| 36,817,498 | ||||||||
| IT Services — 1.3% | ||||||||
BM Technologies, Inc.(a) | 2,644 | 31,887 | ||||||
Cardtronics PLC, Class A(a) | 39,587 | 1,541,122 | ||||||
Conduent, Inc.(a) | 1,468,816 | 11,133,625 | ||||||
CSG Systems International, Inc. | 124,354 | 5,476,550 | ||||||
Grid Dynamics Holdings, Inc.(a) | 88,783 | 1,364,595 | ||||||
Hackett Group, Inc. | 153,271 | 2,729,756 | ||||||
International Money Express, Inc.(a) | 78,670 | 1,201,291 | ||||||
Limelight Networks, Inc.(a) | 327,420 | 1,015,002 | ||||||
LiveRamp Holdings, Inc.(a) | 80,175 | 4,027,992 | ||||||
Maximus, Inc. | 219,703 | 20,359,877 | ||||||
Paymentus Holdings, Inc., Class A(a) | 140,056 | 4,271,708 | ||||||
Verra Mobility Corp.(a)(b) | 113,936 | 1,623,588 | ||||||
|
| |||||||
| 54,776,993 | ||||||||
| Leisure Products — 0.2% | ||||||||
Malibu Boats, Inc., Class A(a)(b) | 71,361 | 5,596,130 | ||||||
YETI Holdings, Inc.(a)(b) | 16,196 | 1,418,769 | ||||||
|
| |||||||
| 7,014,899 | ||||||||
| Life Sciences Tools & Services — 1.6% | ||||||||
Codexis, Inc.(a)(b) | 304,486 | 6,241,963 | ||||||
Luminex Corp. | 157,348 | 5,804,568 | ||||||
Medpace Holdings, Inc.(a) | 88,752 | 14,826,909 | ||||||
NanoString Technologies, Inc.(a) | 167,863 | 9,314,718 | ||||||
NeoGenomics, Inc.(a)(b) | 365,731 | 15,005,943 | ||||||
Pacific Biosciences of California, Inc.(a) | 235,282 | 6,364,378 | ||||||
Personalis, Inc.(a) | 252,836 | 5,686,282 | ||||||
Quanterix Corp.(a) | 40,410 | 2,080,711 | ||||||
| 32 | 2 0 2 1 BLACK ROCK ANNUAL REPORT TO SHAREHOLDERS |
Schedule of Investments (continued) May 31, 2021 | BlackRock Advantage Small Cap Core Fund (Percentages shown are based on Net Assets) |
| Security | Shares | Value | ||||||
| Life Sciences Tools & Services (continued) | ||||||||
Repligen Corp.(a) | 17,499 | $ | 3,195,492 | |||||
Seer, Inc.(a)(b) | 16,943 | 501,174 | ||||||
|
| |||||||
| 69,022,138 | ||||||||
| Machinery — 2.6% | ||||||||
Altra Industrial Motion Corp. | 260,131 | 17,088,005 | ||||||
Chart Industries, Inc.(a) | 46,794 | 6,829,116 | ||||||
CIRCOR International, Inc.(a)(b) | 19,570 | 736,419 | ||||||
ESCO Technologies, Inc. | 132,266 | 12,517,654 | ||||||
Evoqua Water Technologies Corp.(a) | 100,324 | 3,122,083 | ||||||
Franklin Electric Co., Inc. | 276,449 | 23,191,307 | ||||||
Gates Industrial Corp. PLC(a) | 73,122 | 1,327,896 | ||||||
Hillenbrand, Inc. | 41,477 | 1,891,351 | ||||||
Hyster-Yale Materials Handling, Inc. | 22,163 | 1,675,301 | ||||||
John Bean Technologies Corp. | 75,225 | 10,834,657 | ||||||
Kennametal, Inc. | 118,232 | 4,434,882 | ||||||
Manitowoc Co., Inc.(a) | 372,550 | 9,619,241 | ||||||
Meritor, Inc.(a) | 41,112 | 1,068,912 | ||||||
Proto Labs, Inc.(a)(b) | 33,371 | 2,983,034 | ||||||
Wabash National Corp. | 122,802 | 1,958,692 | ||||||
Welbilt, Inc.(a) | 405,016 | 10,007,945 | ||||||
|
| |||||||
| 109,286,495 | ||||||||
| Media — 0.9% | ||||||||
Cardlytics, Inc.(a) | 75,619 | 8,057,204 | ||||||
comScore, Inc.(a) | 151,550 | 606,200 | ||||||
Entravision Communications Corp., Class A | 337,759 | 1,577,334 | ||||||
EW Scripps Co, Class A | 70,665 | 1,498,805 | ||||||
iHeartMedia, Inc., Class A(a) | 581,127 | 13,487,958 | ||||||
Magnite, Inc.(a) | 90,954 | 2,701,334 | ||||||
Meredith Corp.(a) | 96,425 | 3,247,594 | ||||||
Scholastic Corp. | 27,455 | 924,684 | ||||||
Sinclair Broadcast Group, Inc., Class A | 80,275 | 2,704,465 | ||||||
TEGNA, Inc. | 238,480 | 4,624,127 | ||||||
|
| |||||||
| 39,429,705 | ||||||||
| Metals & Mining — 2.2% | ||||||||
Caledonia Mining Corp. PLC | 1,611 | 23,714 | ||||||
Cleveland-Cliffs, Inc.(b) | 805,697 | 16,210,624 | ||||||
Commercial Metals Co. | 432,576 | 13,613,167 | ||||||
Materion Corp. | 87,679 | 6,913,489 | ||||||
Novagold Resources, Inc.(a)(b) | 589,150 | 6,044,679 | ||||||
Olympic Steel, Inc. | 37,790 | 1,350,993 | ||||||
Ryerson Holding Corp.(a) | 123,041 | 2,037,559 | ||||||
Schnitzer Steel Industries, Inc., Class A | 351,375 | 19,142,910 | ||||||
United States Steel Corp. | 604,494 | 15,674,529 | ||||||
Worthington Industries, Inc. | 205,128 | 13,614,345 | ||||||
|
| |||||||
| 94,626,009 | ||||||||
| Mortgage Real Estate Investment Trusts (REITs) — 0.7% | ||||||||
Arbor Realty Trust, Inc. | 625,203 | 11,403,703 | ||||||
Blackstone Mortgage Trust, Inc., Class A | 79,288 | 2,539,595 | ||||||
Ellington Financial, Inc. | 624,213 | 11,785,142 | ||||||
Granite Point Mortgage Trust, Inc. | 108,098 | 1,554,449 | ||||||
Great Ajax Corp. | 58,793 | 740,792 | ||||||
KKR Real Estate Finance Trust, Inc. | 54,251 | 1,159,886 | ||||||
Ladder Capital Corp. | 104,639 | 1,224,276 | ||||||
Two Harbors Investment Corp. | 172,974 | 1,243,683 | ||||||
|
| |||||||
| 31,651,526 | ||||||||
| Multiline Retail — 0.3% | ||||||||
Big Lots, Inc. | 93,004 | 5,667,664 | ||||||
Dillard’s, Inc., Class A | 44,967 | 5,931,597 | ||||||
Franchise Group, Inc. | 81,510 | 3,010,979 | ||||||
|
| |||||||
| 14,610,240 | ||||||||
| Security | Shares | Value | ||||||
| Multi-Utilities — 0.1% | ||||||||
NorthWestern Corp. | 84,472 | $ | 5,351,301 | |||||
|
| |||||||
| Oil, Gas & Consumable Fuels — 2.2% | ||||||||
Antero Resources Corp.(a) | 275,031 | 3,550,650 | ||||||
Ardmore Shipping Corp.(a) | 47,834 | 214,775 | ||||||
Brigham Minerals, Inc., Class A | 692,644 | 12,564,562 | ||||||
Clean Energy Fuels Corp.(a) | 35,032 | 277,453 | ||||||
CNX Resources Corp.(a)(b) | 175,734 | 2,393,497 | ||||||
CVR Energy, Inc. | 401,042 | 8,321,622 | ||||||
Delek U.S. Holdings, Inc. | 562,352 | 12,534,826 | ||||||
Evolution Petroleum Corp. | 294,742 | 1,087,598 | ||||||
Green Plains, Inc.(a) | 102,505 | 3,268,884 | ||||||
Laredo Petroleum, Inc.(a) | 59,464 | 3,339,498 | ||||||
Magnolia Oil & Gas Corp., Class A(a)(b) | 540,864 | 6,987,963 | ||||||
Matador Resources Co. | 91,022 | 2,788,914 | ||||||
Nordic American Tankers Ltd. | 370,840 | 1,290,523 | ||||||
Ovintiv, Inc. | 65,165 | 1,735,344 | ||||||
Par Pacific Holdings, Inc.(a) | 373,428 | 5,198,118 | ||||||
PBF Energy, Inc., Class A(a) | 620,854 | 10,020,584 | ||||||
PDC Energy, Inc.(a)(b) | 108,681 | 4,588,512 | ||||||
REX American Resources Corp.(a) | 4,297 | 412,641 | ||||||
Scorpio Tankers, Inc. | 364,173 | 8,150,192 | ||||||
SM Energy Co. | 27,944 | 556,086 | ||||||
Talos Energy, Inc.(a)(b) | 189,908 | 2,692,895 | ||||||
W&T Offshore, Inc.(a) | 195,256 | 730,257 | ||||||
World Fuel Services Corp. | 55,677 | 1,710,954 | ||||||
|
| |||||||
| 94,416,348 | ||||||||
| Paper & Forest Products — 0.9% | ||||||||
Boise Cascade Co. | 94,724 | 6,250,837 | ||||||
Domtar Corp.(a) | 50,974 | 2,764,320 | ||||||
Louisiana-Pacific Corp. | 417,651 | 28,070,324 | ||||||
Neenah, Inc. | 18,334 | 970,418 | ||||||
|
| |||||||
| 38,055,899 | ||||||||
| Personal Products — 0.0% | ||||||||
USANA Health Sciences, Inc.(a) | 18,749 | 1,982,519 | ||||||
|
| |||||||
| Pharmaceuticals — 0.6% | ||||||||
Amphastar Pharmaceuticals, Inc.(a) | 242,354 | 4,585,338 | ||||||
Arvinas, Inc.(a) | 35,710 | 2,597,545 | ||||||
Athira Pharma, Inc.(a) | 28,008 | 558,480 | ||||||
BioDelivery Sciences International, Inc.(a) | 190,382 | 672,048 | ||||||
Collegium Pharmaceutical, Inc.(a)(b) | 18,972 | 453,241 | ||||||
Endo International PLC(a) | 340,825 | 2,000,643 | ||||||
Harmony Biosciences Holdings, Inc.(a) | 22,044 | 704,526 | ||||||
KemPharm, Inc.(a) | 47,744 | 488,899 | ||||||
NGM Biopharmaceuticals, Inc.(a) | 71,952 | 1,083,597 | ||||||
Phibro Animal Health Corp., Class A | 10,975 | 309,385 | ||||||
Prestige Consumer Healthcare, Inc.(a)(b) | 95,457 | 4,760,441 | ||||||
Provention Bio, Inc.(a) | 37,220 | 283,244 | ||||||
Relmada Therapeutics, Inc.(a) | 26,749 | 925,248 | ||||||
Supernus Pharmaceuticals, Inc.(a) | 31,804 | 949,349 | ||||||
Theravance Biopharma, Inc.(a)(b) | 84,992 | 1,468,662 | ||||||
Zogenix, Inc.(a) | 188,445 | 3,307,210 | ||||||
|
| |||||||
| 25,147,856 | ||||||||
| Professional Services — 1.7% | ||||||||
ASGN, Inc.(a) | 140,747 | 14,509,608 | ||||||
Forrester Research, Inc.(a) | 50,993 | 2,188,110 | ||||||
Franklin Covey Co.(a) | 109,651 | 3,399,181 | ||||||
Heidrick & Struggles International, Inc. | 19,922 | 857,443 | ||||||
Insperity, Inc. | 116,212 | 10,713,584 | ||||||
KBR, Inc. | 147,072 | 5,991,713 | ||||||
Kelly Services, Inc., Class A(a) | 144,037 | 3,697,430 | ||||||
SCHEDULES OF INVESTMENTS | 33 |
Schedule of Investments (continued) May 31, 2021 | BlackRock Advantage Small Cap Core Fund (Percentages shown are based on Net Assets) |
| Security | Shares | Value | ||||||
| Professional Services (continued) | ||||||||
Kforce, Inc. | 143,244 | $ | 8,982,831 | |||||
ManTech International Corp., Class A | 32,259 | 2,806,856 | ||||||
TriNet Group, Inc.(a) | 233,694 | 17,606,506 | ||||||
|
| |||||||
| 70,753,262 | ||||||||
| Real Estate Management & Development — 1.8% | ||||||||
Cushman & Wakefield PLC(a) | 119,416 | 2,270,098 | ||||||
FRP Holdings, Inc.(a) | 34,501 | 1,977,942 | ||||||
Kennedy-Wilson Holdings, Inc. | 418,687 | 8,306,750 | ||||||
Marcus & Millichap, Inc.(a) | 570,823 | 22,433,344 | ||||||
Newmark Group, Inc., Class A | 1,076,615 | 13,888,334 | ||||||
RE/MAX Holdings, Inc., Class A | 177,526 | 6,215,185 | ||||||
Realogy Holdings Corp.(a) | 818,647 | 14,498,239 | ||||||
Redfin Corp.(a)(b) | 49,258 | 2,907,700 | ||||||
RMR Group, Inc., Class A | 73,760 | 2,885,491 | ||||||
|
| |||||||
| 75,383,083 | ||||||||
| Road & Rail — 0.8% | ||||||||
Covenant Logistics Group, Inc.(a) | 150,429 | 3,386,157 | ||||||
Marten Transport Ltd. | 143,254 | 2,443,913 | ||||||
Universal Logistics Holdings, Inc. | 64,379 | 1,609,475 | ||||||
Werner Enterprises, Inc. | 545,534 | 26,180,177 | ||||||
|
| |||||||
| 33,619,722 | ||||||||
| Semiconductors & Semiconductor Equipment — 3.7% | ||||||||
Brooks Automation, Inc. | 111,423 | 11,375,174 | ||||||
Cirrus Logic, Inc.(a) | 158,548 | 12,377,842 | ||||||
CMC Materials, Inc. | 30,658 | 4,731,449 | ||||||
Ichor Holdings Ltd.(a) | 269,165 | 15,143,223 | ||||||
Lattice Semiconductor Corp.(a)(b) | 373,790 | 19,837,035 | ||||||
Maxeon Solar Technologies Ltd.(a) | 37,964 | 592,998 | ||||||
MaxLinear, Inc.(a) | 33,624 | 1,278,384 | ||||||
Onto Innovation, Inc.(a) | 14,870 | 1,067,220 | ||||||
Power Integrations, Inc. | 298,661 | 24,546,948 | ||||||
Rambus, Inc.(a) | 34,909 | 682,820 | ||||||
Silicon Laboratories, Inc.(a) | 320,987 | 43,833,985 | ||||||
SunPower Corp.(a) | 49,704 | 1,162,577 | ||||||
Synaptics, Inc.(a) | 116,888 | 14,766,461 | ||||||
Ultra Clean Holdings, Inc.(a) | 92,715 | 5,222,636 | ||||||
|
| |||||||
| 156,618,752 | ||||||||
| Software — 5.6% | ||||||||
8x8, Inc.(a) | 263,743 | 6,211,148 | ||||||
A10 Networks, Inc.(a) | 72,706 | 707,429 | ||||||
ACI Worldwide, Inc.(a) | 412,403 | 15,778,539 | ||||||
Alarm.com Holdings, Inc.(a) | 47,359 | 3,877,755 | ||||||
Alkami Technology, Inc.(a)(b) | 18,131 | 603,218 | ||||||
Altair Engineering, Inc., Class A(a) | 63,602 | 4,284,867 | ||||||
Appian Corp.(a) | 70,067 | 6,339,662 | ||||||
Avaya Holdings Corp.(a) | 77,639 | 2,226,687 | ||||||
Benefitfocus, Inc.(a) | 85,974 | 1,271,555 | ||||||
Blackline, Inc.(a) | 31,099 | 3,233,363 | ||||||
Bottomline Technologies DE, Inc.(a) | 115,240 | 4,307,671 | ||||||
Box, Inc., Class A(a) | 752,024 | 17,529,679 | ||||||
Cerence, Inc.(a) | 48,280 | 4,592,876 | ||||||
Cloudera, Inc.(a) | 332,774 | 4,279,474 | ||||||
CommVault Systems, Inc.(a) | 167,918 | 12,790,314 | ||||||
Cornerstone OnDemand, Inc.(a) | 42,036 | 1,848,323 | ||||||
Domo, Inc., Class B(a) | 32,866 | 2,185,589 | ||||||
Envestnet, Inc.(a) | 82,199 | 5,915,862 | ||||||
Five9, Inc.(a) | 11,972 | 2,120,241 | ||||||
J2 Global, Inc.(a)(b) | 15,456 | 1,924,736 | ||||||
LivePerson, Inc.(a)(b) | 108,145 | 5,942,568 | ||||||
Mimecast Ltd.(a) | 103,862 | 5,192,061 | ||||||
Model N, Inc.(a) | 48,114 | 1,716,226 | ||||||
| Security | Shares | Value | ||||||
| Software (continued) | ||||||||
Olo, Inc., Class A(a) | 57,243 | $ | 1,937,676 | |||||
ON24, Inc.(a) | 36,883 | 1,186,895 | ||||||
Paylocity Holding Corp.(a) | 18,354 | 3,117,060 | ||||||
Ping Identity Holding Corp.(a) | 61,860 | 1,491,445 | ||||||
Procore Technologies, Inc.(a) | 30,642 | 2,648,082 | ||||||
Progress Software Corp. | 242,755 | 10,819,590 | ||||||
PROS Holdings, Inc.(a)(b) | 187,075 | 8,300,518 | ||||||
Q2 Holdings, Inc.(a)(b) | 31,550 | 2,995,042 | ||||||
QAD, Inc., Class A | 63,840 | 4,562,006 | ||||||
Rapid7, Inc.(a)(b) | 134,352 | 11,238,545 | ||||||
RingCentral, Inc., Class A(a) | 15,724 | 4,127,078 | ||||||
Sailpoint Technologies Holdings, Inc.(a)(b) | 149,148 | 6,939,856 | ||||||
Sprout Social, Inc., Class A(a) | 187,977 | 13,049,363 | ||||||
SPS Commerce, Inc.(a) | 50,994 | 4,786,297 | ||||||
Sumo Logic, Inc.(a) | 18,337 | 344,736 | ||||||
SVMK, Inc.(a) | 29,383 | 571,499 | ||||||
Tenable Holdings, Inc.(a) | 225,589 | 9,429,620 | ||||||
Varonis Systems, Inc.(a) | 471,715 | 22,783,834 | ||||||
Verint Systems, Inc.(a) | 105,188 | 4,850,219 | ||||||
Yext, Inc.(a) | 452,541 | 6,548,268 | ||||||
Zuora, Inc., Class A(a) | 81,565 | 1,261,811 | ||||||
|
| |||||||
| 237,869,283 | ||||||||
| Specialty Retail — 4.1% | ||||||||
Aaron’s Co., Inc. | 80,039 | 2,879,003 | ||||||
American Eagle Outfitters, Inc. | 769,319 | 27,256,972 | ||||||
America’s Car-Mart, Inc.(a) | 14,989 | 2,464,042 | ||||||
Asbury Automotive Group, Inc.(a) | 33,646 | 6,671,665 | ||||||
At Home Group, Inc.(a) | 79,703 | 2,992,051 | ||||||
Bed Bath & Beyond, Inc.(a) | 159,370 | 4,460,766 | ||||||
Buckle, Inc. | 63,203 | 2,662,110 | ||||||
Camping World Holdings, Inc., Class A | 159,075 | 7,061,339 | ||||||
Conn’s, Inc.(a) | 71,531 | 1,658,804 | ||||||
Designer Brands, Inc., Class A(a) | 196,062 | 3,429,124 | ||||||
GameStop Corp., Class A(a)(b) | 53,327 | 11,838,594 | ||||||
Group 1 Automotive, Inc. | 54,113 | 8,629,941 | ||||||
Guess?, Inc. | 17,993 | 528,455 | ||||||
Haverty Furniture Cos., Inc. | 23,868 | 1,096,496 | ||||||
Hibbett Sports, Inc.(a) | 25,952 | 2,199,692 | ||||||
Lithia Motors, Inc., Class A | 94,407 | 33,230,320 | ||||||
MarineMax, Inc.(a)(b) | 234,403 | 12,055,346 | ||||||
National Vision Holdings, Inc.(a) | 21,481 | 1,066,961 | ||||||
Rent-A-Center, Inc. | 208,688 | 12,899,005 | ||||||
Shoe Carnival, Inc. | 46,178 | 3,117,477 | ||||||
Signet Jewelers Ltd.(a) | 138,218 | 8,373,247 | ||||||
Sleep Number Corp.(a) | 29,960 | 3,340,240 | ||||||
Sonic Automotive, Inc., Class A | 31,835 | 1,535,402 | ||||||
Tilly’s, Inc., Class A(a) | 127,733 | 1,744,833 | ||||||
Urban Outfitters, Inc.(a) | 276,883 | 10,842,738 | ||||||
Zumiez, Inc.(a) | 60,072 | 2,632,355 | ||||||
|
| |||||||
| 176,666,978 | ||||||||
| Technology Hardware, Storage & Peripherals — 0.1% | ||||||||
3D Systems Corp.(a) | 34,523 | 1,015,321 | ||||||
Super Micro Computer, Inc.(a) | 19,305 | 670,656 | ||||||
Turtle Beach Corp.(a) | 24,697 | 817,471 | ||||||
|
| |||||||
| 2,503,448 | ||||||||
| Textiles, Apparel & Luxury Goods — 1.6% | ||||||||
Crocs, Inc.(a) | 244,765 | 24,780,009 | ||||||
Culp, Inc. | 48,129 | 785,465 | ||||||
Deckers Outdoor Corp.(a) | 62,311 | 20,901,602 | ||||||
Fossil Group, Inc.(a)(b) | 108,726 | 1,535,211 | ||||||
G-III Apparel Group Ltd.(a) | 145,806 | 4,817,430 | ||||||
| 34 | 2 0 2 1 BLACK ROCK ANNUAL REPORT TO SHAREHOLDERS |
Schedule of Investments (continued) May 31, 2021 | BlackRock Advantage Small Cap Core Fund (Percentages shown are based on Net Assets) |
| Security | Shares | Value | ||||||
| Textiles, Apparel & Luxury Goods (continued) | ||||||||
Kontoor Brands, Inc. | 31,682 | $ | 2,028,282 | |||||
Oxford Industries, Inc. | 91,680 | 8,778,360 | ||||||
Steven Madden Ltd. | 115,998 | 4,802,317 | ||||||
Unifi, Inc.(a) | 9,600 | 264,288 | ||||||
Vera Bradley, Inc.(a) | 105,528 | 1,211,461 | ||||||
|
| |||||||
| 69,904,425 | ||||||||
| Thrifts & Mortgage Finance — 2.7% | ||||||||
Essent Group Ltd. | 399,865 | 19,129,542 | ||||||
Federal Agricultural Mortgage Corp., Class C | 94,150 | 9,552,459 | ||||||
Flagstar Bancorp, Inc. | 77,857 | 3,565,851 | ||||||
Merchants Bancorp | 113,222 | 4,862,885 | ||||||
Mr Cooper Group, Inc.(a) | 192,501 | 6,658,609 | ||||||
NMI Holdings, Inc., Class A(a) | 139,238 | 3,368,167 | ||||||
Northwest Bancshares, Inc. | 132,939 | 1,882,416 | ||||||
PennyMac Financial Services, Inc. | 66,217 | 4,145,846 | ||||||
Premier Financial Corp. | 121,778 | 3,714,229 | ||||||
Provident Bancorp, Inc. | 49,769 | 840,101 | ||||||
Provident Financial Services, Inc. | 38,343 | 968,544 | ||||||
Radian Group, Inc. | 399,345 | 9,324,706 | ||||||
Riverview Bancorp, Inc. | 251,464 | 1,727,558 | ||||||
Southern Missouri Bancorp, Inc. | 20,688 | 914,410 | ||||||
TFS Financial Corp. | 725,073 | 16,067,618 | ||||||
Walker & Dunlop, Inc. | 123,438 | 12,533,894 | ||||||
Washington Federal, Inc. | 386,252 | 12,877,642 | ||||||
WSFS Financial Corp. | 19,607 | 1,043,288 | ||||||
|
| |||||||
| 113,177,765 | ||||||||
| Trading Companies & Distributors — 2.1% | ||||||||
Applied Industrial Technologies, Inc. | 160,729 | 15,745,013 | ||||||
GMS, Inc.(a) | 17,884 | 818,908 | ||||||
H&E Equipment Services, Inc. | 98,976 | 3,701,702 | ||||||
Herc Holdings, Inc.(a) | 116,535 | 13,403,856 | ||||||
MRC Global, Inc.(a) | 66,455 | 713,727 | ||||||
SiteOne Landscape Supply, Inc.(a)(b) | 229,899 | 39,551,824 | ||||||
Triton International Ltd. | 215,191 | 11,674,112 | ||||||
Veritiv Corp.(a) | 21,104 | 1,296,208 | ||||||
WESCO International, Inc.(a)(b) | 10,481 | 1,116,960 | ||||||
|
| |||||||
| 88,022,310 | ||||||||
| Wireless Telecommunication Services — 0.0% | ||||||||
Spok Holdings, Inc. | 6,677 | 77,921 | ||||||
|
| |||||||
Total Common Stocks — 98.8% |
| 4,215,806,396 | ||||||
|
| |||||||
Preferred Securities | ||||||||
Preferred Stocks — 0.0% | ||||||||
Trading Companies & Distributors — 0.0% | ||||||||
WESCO International, Inc., Series A, | 14,500 | 455,880 | ||||||
|
| |||||||
Total Preferred Securities — 0.0% |
| 455,880 | ||||||
|
| |||||||
| Security | Shares | Value | ||||||
Rights | ||||||||
Biotechnology — 0.0% | ||||||||
Alder Biopharmaceuticals, Inc., CVR(a)(e) | 38,614 | $ | 33,981 | |||||
|
| |||||||
Household Durables — 0.0% | ||||||||
ZAGG, Inc., CVR(a)(b) | 122,846 | 11,056 | ||||||
|
| |||||||
Total Rights — 0.0% | 45,037 | |||||||
|
| |||||||
Total Long-Term Investments — 98.8% |
| 4,216,307,313 | ||||||
|
| |||||||
Short-Term Securities(f)(g) | ||||||||
Money Market Funds — 5.2% | ||||||||
BlackRock Liquidity Funds, T-Fund, Institutional Class, 0.01% | 51,282,606 | 51,282,606 | ||||||
SL Liquidity Series, LLC, Money Market Series, 0.12%(h) | 170,580,430 | 170,631,604 | ||||||
|
| |||||||
Total Short-Term Securities — 5.2% |
| 221,914,210 | ||||||
|
| |||||||
Total Investments — 104.0% |
| 4,438,221,523 | ||||||
Liabilities in Excess of Other Assets — (4.0)% |
| (171,780,673 | ) | |||||
|
| |||||||
Net Assets — 100.0% | $ | 4,266,440,850 | ||||||
|
| |||||||
| (a) | Non-income producing security. |
| (b) | All or a portion of this security is on loan. |
| (c) | Perpetual security with no stated maturity date. |
| (d) | Variable rate security. Interest rate resets periodically. The rate shown is the effective interest rate as of period end. Security description also includes the reference rate and spread if published and available. |
| (e) | Security is valued using significant unobservable inputs and is classified as Level 3 in the fair value hierarchy. |
| (f) | Affiliate of the Fund. |
| (g) | Annualized 7-day yield as of period end. |
| (h) | All or a portion of this security was purchased with the cash collateral from loaned securities. |
SCHEDULES OF INVESTMENTS | 35 |
Schedule of Investments (continued) May 31, 2021 | BlackRock Advantage Small Cap Core Fund |
Affiliates
Investments in issuers considered to be affiliate(s) of the Fund during the year ended May 31, 2021 for purposes of Section 2(a)(3) of the Investment Company Act of 1940, as amended, were as follows:
| Affiliated Issuer | Value at 05/31/20 | Purchases at Cost | Proceeds from Sale | Net Realized Gain (Loss) | Change in Unrealized Appreciation (Depreciation) | Value at 05/31/21 | Shares Held at 05/31/21 | Income | Capital Gain Distributions from Underlying Funds | |||||||||||||||||||||||||||||||||||||||||||
| BlackRock Liquidity Funds, T-Fund, Institutional Class | $ | 43,962,860 | $ | 7,319,746(a | ) | $ — | $ | — | $ | — | $ | 51,282,606 | 51,282,606 | $ | 29,650 | $ | — | ||||||||||||||||||||||||||||||||||
SL Liquidity Series, LLC, Money Market Series | 62,801,371 | 107,888,768(a | ) | — | (19,866 | ) | (38,669 | ) | 170,631,604 | 170,580,430 | 1,226,298 | (b) | — | |||||||||||||||||||||||||||||||||||||||
|
|
|
|
|
|
|
|
|
| |||||||||||||||||||||||||||||||||||||||||||
| $ | (19,866 | ) | $ | (38,669 | ) | $ | 221,914,210 | $ | 1,255,948 | $ | — | |||||||||||||||||||||||||||||||||||||||||
|
|
|
|
|
|
|
|
|
| |||||||||||||||||||||||||||||||||||||||||||
| (a) | Represents net amount purchased (sold). |
| (b) | All or a portion represents securities lending income earned from the reinvestment of cash collateral from loaned securities, net of fees and collateral investment expenses, and other payments to and from borrowers of securities. |
For Fund compliance purposes, the Fund’s industry classifications refer to one or more of the industry sub-classifications used by one or more widely recognized market indexes or rating group indexes, and/or as defined by the investment adviser. These definitions may not apply for purposes of this report, which may combine such industry sub-classifications for reporting ease.
Derivative Financial Instruments Outstanding as of Period End
Futures Contracts
| Description | Number of Contracts | Expiration Date | Notional Amount (000) | Value/ Unrealized Appreciation (Depreciation) | ||||||||||||||||||||
Long Contracts | ||||||||||||||||||||||||
Russell 2000 E-Mini Index | 412 | 06/18/21 | $ | 46,733 | $ | 1,147,910 | ||||||||||||||||||
|
| |||||||||||||||||||||||
Derivative Financial Instruments Categorized by Risk Exposure
As of period end, the fair values of derivative financial instruments located in the Statements of Assets and Liabilities were as follows:
Commodity Contracts | Credit Contracts | Equity Contracts | Foreign Currency Exchange Contracts | Interest Rate Contracts | Other Contracts | Total | ||||||||||||||||||||||||||||||||||||||||||
Assets — Derivative Financial Instruments | ||||||||||||||||||||||||||||||||||||||||||||||||
Futures contracts | ||||||||||||||||||||||||||||||||||||||||||||||||
Unrealized appreciation(a) | $ | — | $ | — | $ | 1,147,910 | $ | — | $ | — | $ | — | $ | 1,147,910 | ||||||||||||||||||||||||||||||||||
|
|
|
|
|
|
|
|
|
|
|
|
|
| |||||||||||||||||||||||||||||||||||
| (a) | Net cumulative unrealized appreciation (depreciation) on futures contracts, if any, are reported in the Schedule of Investments. In the Statement of Assets and Liabilities, only current day’s variation margin is reported in receivables or payables and the net cumulative unrealized appreciation (depreciation) is included in accumulated earnings (loss). |
For the year ended May 31, 2021, the effect of derivative financial instruments in the Statement of Operations was as follows:
Commodity Contracts | Credit Contracts | Equity Contracts | Foreign Currency Exchange Contracts | Interest Rate Contracts | Other Contracts | Total | ||||||||||||||||||||||||||||||||||||||||||
Net Realized Gain (Loss) from | ||||||||||||||||||||||||||||||||||||||||||||||||
Futures contracts | $ | — | $ | — | $ | 43,253,997 | $ | — | $ | — | $ | — | $ | 43,253,997 | ||||||||||||||||||||||||||||||||||
|
|
|
|
|
|
|
|
|
|
|
|
|
| |||||||||||||||||||||||||||||||||||
Net Change in Unrealized Appreciation (Depreciation) on | ||||||||||||||||||||||||||||||||||||||||||||||||
Futures contracts | $ | — | $ | — | $ | (709,790 | ) | $ | — | $ | — | $ | — | $ | (709,790 | ) | ||||||||||||||||||||||||||||||||
|
|
|
|
|
|
|
|
|
|
|
|
|
| |||||||||||||||||||||||||||||||||||
| 36 | 2 0 2 1 BLACK ROCK ANNUAL REPORT TO SHAREHOLDERS |
Schedule of Investments (continued) May 31, 2021 | BlackRock Advantage Small Cap Core Fund |
Average Quarterly Balances of Outstanding Derivative Financial Instruments
| ||||
Futures contracts | ||||
Average notional value of contracts — long | $ | 72,824,834 | ||
| ||||
For more information about the Fund’s investment risks regarding derivative financial instruments, refer to the Notes to Financial Statements.
Fair Value Hierarchy as of Period End
Various inputs are used in determining the fair value of financial instruments. For a description of the input levels and information about the Fund’s policy regarding valuation of financial instruments, refer to the Notes to Financial Statements.
The following table summarizes the Fund’s financial instruments categorized in the fair value hierarchy. The breakdown of the Fund’s financial instruments into major categories is disclosed in the Schedule of Investments above.
| ||||||||||||||||||||||||
| Level 1 | Level 2 | Level 3 | Total | |||||||||||||||||||||
| ||||||||||||||||||||||||
Assets | ||||||||||||||||||||||||
Investments | ||||||||||||||||||||||||
Long-Term Investments | ||||||||||||||||||||||||
Common Stocks | ||||||||||||||||||||||||
Aerospace & Defense | $ | 19,968,634 | $ | — | $ — | $ | 19,968,634 | |||||||||||||||||
Air Freight & Logistics | 36,070,131 | — | — | 36,070,131 | ||||||||||||||||||||
Airlines | 30,296,032 | — | — | 30,296,032 | ||||||||||||||||||||
Auto Components | 56,931,861 | — | — | 56,931,861 | ||||||||||||||||||||
Automobiles | 7,148,604 | — | — | 7,148,604 | ||||||||||||||||||||
Banks | 316,283,691 | — | — | 316,283,691 | ||||||||||||||||||||
Biotechnology | 318,711,846 | — | — | 318,711,846 | ||||||||||||||||||||
Building Products | 77,205,408 | — | — | 77,205,408 | ||||||||||||||||||||
Capital Markets | 138,188,694 | — | — | 138,188,694 | ||||||||||||||||||||
Chemicals | 91,890,888 | — | — | 91,890,888 | ||||||||||||||||||||
Commercial Services & Supplies | 98,966,140 | — | — | 98,966,140 | ||||||||||||||||||||
Communications Equipment | 12,679,468 | — | — | 12,679,468 | ||||||||||||||||||||
Construction & Engineering | 93,805,784 | — | — | 93,805,784 | ||||||||||||||||||||
Construction Materials | 20,331,220 | — | — | 20,331,220 | ||||||||||||||||||||
Consumer Finance | 32,302,985 | — | — | 32,302,985 | ||||||||||||||||||||
Containers & Packaging | 942,750 | — | — | 942,750 | ||||||||||||||||||||
Diversified Consumer Services | 9,117,597 | — | — | 9,117,597 | ||||||||||||||||||||
Diversified Financial Services | 10,859,324 | — | — | 10,859,324 | ||||||||||||||||||||
Diversified Telecommunication Services | 10,641,583 | — | — | 10,641,583 | ||||||||||||||||||||
Electric Utilities | 10,211,229 | — | — | 10,211,229 | ||||||||||||||||||||
Electrical Equipment | 48,608,512 | — | — | 48,608,512 | ||||||||||||||||||||
Electronic Equipment, Instruments & Components | 102,539,522 | — | — | 102,539,522 | ||||||||||||||||||||
Energy Equipment & Services | 37,007,843 | — | — | 37,007,843 | ||||||||||||||||||||
Entertainment | 38,046,590 | — | — | 38,046,590 | ||||||||||||||||||||
Equity Real Estate Investment Trusts (REITs) | 138,345,999 | — | — | 138,345,999 | ||||||||||||||||||||
Food & Staples Retailing | 42,630,765 | — | — | 42,630,765 | ||||||||||||||||||||
Food Products | 53,937,381 | — | — | 53,937,381 | ||||||||||||||||||||
Gas Utilities | 57,336,115 | — | — | 57,336,115 | ||||||||||||||||||||
Health Care Equipment & Supplies | 153,880,707 | — | — | 153,880,707 | ||||||||||||||||||||
Health Care Providers & Services | 81,788,190 | — | — | 81,788,190 | ||||||||||||||||||||
Health Care Technology | 69,288,963 | — | — | 69,288,963 | ||||||||||||||||||||
Hotels, Restaurants & Leisure | 183,926,269 | — | — | 183,926,269 | ||||||||||||||||||||
Household Durables | 92,590,795 | — | — | 92,590,795 | ||||||||||||||||||||
Household Products | 13,867,040 | — | — | 13,867,040 | ||||||||||||||||||||
Independent Power and Renewable Electricity Producers | 23,391,210 | — | — | 23,391,210 | ||||||||||||||||||||
Insurance | 35,203,144 | — | — | 35,203,144 | ||||||||||||||||||||
Interactive Media & Services | 4,077,107 | — | — | 4,077,107 | ||||||||||||||||||||
Internet & Direct Marketing Retail | 36,817,498 | — | — | 36,817,498 | ||||||||||||||||||||
IT Services | 54,745,106 | 31,887 | — | 54,776,993 | ||||||||||||||||||||
Leisure Products | 7,014,899 | — | — | 7,014,899 | ||||||||||||||||||||
Life Sciences Tools & Services | 69,022,138 | — | — | 69,022,138 | ||||||||||||||||||||
Machinery | 109,286,495 | — | — | 109,286,495 | ||||||||||||||||||||
Media | 39,429,705 | — | — | 39,429,705 | ||||||||||||||||||||
Metals & Mining | 94,626,009 | — | — | 94,626,009 | ||||||||||||||||||||
Mortgage Real Estate Investment Trusts (REITs) | 31,651,526 | — | — | 31,651,526 | ||||||||||||||||||||
Multiline Retail | 14,610,240 | — | — | 14,610,240 | ||||||||||||||||||||
Multi-Utilities | 5,351,301 | — | — | 5,351,301 | ||||||||||||||||||||
SCHEDULES OF INVESTMENTS | 37 |
Schedule of Investments (continued) May 31, 2021 | BlackRock Advantage Small Cap Core Fund |
| ||||||||||||||||||||||||
| Level 1 | Level 2 | Level 3 | Total | |||||||||||||||||||||
| ||||||||||||||||||||||||
Common Stocks (continued) | ||||||||||||||||||||||||
Oil, Gas & Consumable Fuels | $ | 94,416,348 | $ | — | $ | — | $ | 94,416,348 | ||||||||||||||||
Paper & Forest Products | 38,055,899 | — | — | 38,055,899 | ||||||||||||||||||||
Personal Products | 1,982,519 | — | — | 1,982,519 | ||||||||||||||||||||
Pharmaceuticals | 25,147,856 | — | — | 25,147,856 | ||||||||||||||||||||
Professional Services | 70,753,262 | — | — | 70,753,262 | ||||||||||||||||||||
Real Estate Management & Development | 75,383,083 | — | — | 75,383,083 | ||||||||||||||||||||
Road & Rail | 33,619,722 | — | — | 33,619,722 | ||||||||||||||||||||
Semiconductors & Semiconductor Equipment | 156,618,752 | — | — | 156,618,752 | ||||||||||||||||||||
Software | 237,869,283 | — | — | 237,869,283 | ||||||||||||||||||||
Specialty Retail | 176,666,978 | — | — | 176,666,978 | ||||||||||||||||||||
Technology Hardware, Storage & Peripherals | 2,503,448 | — | — | 2,503,448 | ||||||||||||||||||||
Textiles, Apparel & Luxury Goods | 69,904,425 | — | — | 69,904,425 | ||||||||||||||||||||
Thrifts & Mortgage Finance | 113,177,765 | — | — | 113,177,765 | ||||||||||||||||||||
Trading Companies & Distributors | 88,022,310 | — | — | 88,022,310 | ||||||||||||||||||||
Wireless Telecommunication Services | 77,921 | — | — | 77,921 | ||||||||||||||||||||
Preferred Securities | 455,880 | — | — | 455,880 | ||||||||||||||||||||
Rights | — | 11,056 | 33,981 | 45,037 | ||||||||||||||||||||
Short-Term Securities | ||||||||||||||||||||||||
Money Market Funds | 51,282,606 | — | — | 51,282,606 | ||||||||||||||||||||
|
|
|
|
|
|
|
| |||||||||||||||||
| $ | 4,267,512,995 | $ | 42,943 | $ | 33,981 | 4,267,589,919 | ||||||||||||||||||
|
|
|
|
|
|
|
| |||||||||||||||||
Investments valued at NAV(a) | 170,631,604 | |||||||||||||||||||||||
|
| |||||||||||||||||||||||
| $ | 4,438,221,523 | |||||||||||||||||||||||
|
| |||||||||||||||||||||||
Derivative Financial Instruments(b) | ||||||||||||||||||||||||
Assets | ||||||||||||||||||||||||
Equity Contracts | $ | 1,147,910 | $ | — | $ | — | $ | 1,147,910 | ||||||||||||||||
|
|
|
|
|
|
|
| |||||||||||||||||
| (a) | Certain investments of the Fund were fair valued using NAV per share as no quoted market value is available and therefore have been excluded from the fair value hierarchy. |
| (b) | Derivative financial instruments are futures contracts. Futures contracts are valued at the unrealized appreciation (depreciation) on the instrument. |
See notes to financial statements.
| 38 | 2 0 2 1 BLACK ROCK ANNUAL REPORT TO SHAREHOLDERS |
Statements of Assets and Liabilities
May 31, 2021
BlackRock Advantage International Fund | BlackRock Advantage Large Cap Growth Fund | BlackRock Advantage Small Cap Core Fund | ||||||||||
ASSETS | ||||||||||||
Investments at value — unaffiliated(a)(b) | $ | 1,139,316,018 | $ | 1,038,985,232 | $ | 4,216,307,313 | ||||||
Investments at value — affiliated(c) | 31,463,004 | 11,431,497 | 221,914,210 | |||||||||
Cash pledged for futures contracts | 2,369,000 | 615,000 | 2,791,000 | |||||||||
Foreign currency, at value(d) | 4,563,746 | 88,730 | — | |||||||||
Receivables: | ||||||||||||
Investments sold | 12,706,362 | 9,133,275 | 20,375,333 | |||||||||
Securities lending income — affiliated | 272 | 4,357 | 220,596 | |||||||||
Capital shares sold | 325,838 | 292,478 | 8,876,777 | |||||||||
Dividends — affiliated | 285 | 102 | 543 | |||||||||
Dividends — unaffiliated | 6,113,158 | 754,979 | 2,503,444 | |||||||||
From the Manager | 98,772 | 89,591 | 117,075 | |||||||||
Variation margin on futures contracts | 63,593 | 15,496 | — | |||||||||
Prepaid expenses | 49,674 | 46,588 | 120,938 | |||||||||
|
|
|
|
|
| |||||||
Total assets | 1,197,069,722 | 1,061,457,325 | 4,473,227,229 | |||||||||
|
|
|
|
|
| |||||||
LIABILITIES | ||||||||||||
Collateral on securities loaned, at value | 130,384 | 1,341,324 | 170,625,753 | |||||||||
Payables: | ||||||||||||
Investments purchased | 12,288,648 | 8,881,490 | 30,905,488 | |||||||||
Administration fees | 40,306 | 36,399 | 130,665 | |||||||||
Capital shares redeemed | 423,626 | 875,708 | 2,962,933 | |||||||||
Investment advisory fees | 201,996 | 432,669 | 1,377,960 | |||||||||
Trustees’ and Officer’s fees | 3,073 | 2,976 | 4,557 | |||||||||
Other accrued expenses | 492,515 | 310,064 | 555,245 | |||||||||
Other affiliate fees | 122,234 | 729 | 51,584 | |||||||||
Service and distribution fees | 100,432 | 203,855 | 120,573 | |||||||||
Variation margin on futures contracts | — | — | 51,621 | |||||||||
|
|
|
|
|
| |||||||
Total liabilities | 13,803,214 | 12,085,214 | 206,786,379 | |||||||||
|
|
|
|
|
| |||||||
NET ASSETS | $ | 1,183,266,508 | $ | 1,049,372,111 | $ | 4,266,440,850 | ||||||
|
|
|
|
|
| |||||||
NET ASSETS CONSIST OF | ||||||||||||
Paid-in capital | $ | 969,142,257 | $ | 594,816,601 | $ | 3,262,456,399 | ||||||
Accumulated earnings | 214,124,251 | 454,555,510 | 1,003,984,451 | |||||||||
|
|
|
|
|
| |||||||
NET ASSETS | $ | 1,183,266,508 | $ | 1,049,372,111 | $ | 4,266,440,850 | ||||||
|
|
|
|
|
| |||||||
(a) Investments, at cost — unaffiliated | $ | 953,849,048 | $ | 661,097,625 | $ | 3,398,560,495 | ||||||
(b) Securities loaned, at value | $ | 121,282 | $ | 1,255,888 | $ | 165,096,975 | ||||||
(c) Investments, at cost — affiliated | $ | 31,463,004 | $ | 11,431,497 | $ | 221,888,281 | ||||||
(d) Foreign currency, at cost | $ | 4,552,242 | $ | 84,253 | $ | — | ||||||
FINANCIAL STATEMENTS | 39 |
Statements of Assets and Liabilities (continued)
May 31, 2021
BlackRock Advantage International Fund | BlackRock Advantage Large Cap Growth Fund | BlackRock Advantage Small Cap Core Fund | ||||||||||
NET ASSET VALUE | ||||||||||||
| Institutional | ||||||||||||
Net assets | $ | 616,648,814 | $ | 125,060,963 | $ | 2,802,144,878 | ||||||
|
|
|
|
|
| |||||||
Shares outstanding | 30,999,038 | 5,359,680 | 135,267,734 | |||||||||
|
|
|
|
|
| |||||||
Net asset value | $ | 19.89 | $ | 23.33 | $ | 20.72 | ||||||
|
|
|
|
|
| |||||||
Shares authorized | Unlimited | Unlimited | Unlimited | |||||||||
|
|
|
|
|
| |||||||
Par value | $ | 0.001 | $ | 0.001 | $ | 0.001 | ||||||
|
|
|
|
|
| |||||||
| Service | ||||||||||||
Net assets | N/A | $ | 248,888 | N/A | ||||||||
|
|
|
|
|
| |||||||
Shares outstanding | N/A | 10,882 | N/A | |||||||||
|
|
|
|
|
| |||||||
Net asset value | N/A | $ | 22.87 | N/A | ||||||||
|
|
|
|
|
| |||||||
Shares authorized | N/A | Unlimited | N/A | |||||||||
|
|
|
|
|
| |||||||
Par value | N/A | $ | 0.001 | N/A | ||||||||
|
|
|
|
|
| |||||||
| Investor A | ||||||||||||
Net assets | $ | 456,083,307 | $ | 909,343,918 | $ | 530,664,052 | ||||||
|
|
|
|
|
| |||||||
Shares outstanding | 23,204,506 | 41,099,464 | 25,783,627 | |||||||||
|
|
|
|
|
| |||||||
Net asset value | $ | 19.65 | $ | 22.13 | $ | 20.58 | ||||||
|
|
|
|
|
| |||||||
Shares authorized | Unlimited | Unlimited | Unlimited | |||||||||
|
|
|
|
|
| |||||||
Par value | $ | 0.001 | $ | 0.001 | $ | 0.001 | ||||||
|
|
|
|
|
| |||||||
| Investor C | ||||||||||||
Net assets | $ | 3,664,378 | $ | 12,989,406 | $ | 12,879,917 | ||||||
|
|
|
|
|
| |||||||
Shares outstanding | 191,669 | 705,254 | 641,566 | |||||||||
|
|
|
|
|
| |||||||
Net asset value | $ | 19.12 | $ | 18.42 | $ | 20.08 | ||||||
|
|
|
|
|
| |||||||
Shares authorized | Unlimited | Unlimited | Unlimited | |||||||||
|
|
|
|
|
| |||||||
Par value | $ | 0.001 | $ | 0.001 | $ | 0.001 | ||||||
|
|
|
|
|
| |||||||
| Class K | ||||||||||||
Net assets | $ | 103,453,707 | $ | 1,151,672 | $ | 920,752,003 | ||||||
|
|
|
|
|
| |||||||
Shares outstanding | 5,200,035 | 49,360 | 44,412,353 | |||||||||
|
|
|
|
|
| |||||||
Net asset value | $ | 19.89 | $ | 23.33 | $ | 20.73 | ||||||
|
|
|
|
|
| |||||||
Shares authorized | Unlimited | Unlimited | Unlimited | |||||||||
|
|
|
|
|
| |||||||
Par value | $ | 0.001 | $ | 0.001 | $ | 0.001 | ||||||
|
|
|
|
|
| |||||||
| Class R | ||||||||||||
Net assets | $ | 3,416,302 | $ | 577,264 | N/A | |||||||
|
|
|
|
|
| |||||||
Shares outstanding | 173,636 | 24,918 | N/A | |||||||||
|
|
|
|
|
| |||||||
Net asset value | $ | 19.68 | $ | 23.17 | N/A | |||||||
|
|
|
|
|
| |||||||
Shares authorized | Unlimited | Unlimited | N/A | |||||||||
|
|
|
|
|
| |||||||
Par value | $ | 0.001 | $ | 0.001 | N/A | |||||||
|
|
|
|
|
| |||||||
See notes to financial statements.
| 40 | 2 0 2 1 BLACK ROCK ANNUAL REPORT TO SHAREHOLDERS |
BlackRock Fund | BlackRock Large Cap Growth Fund | BlackRock Advantage Small Cap Core Fund | ||||||||||
INVESTMENT INCOME | ||||||||||||
Dividends — unaffiliated | $ | 27,116,570 | $ | 7,802,592 | $ | 28,431,090 | ||||||
Dividends — affiliated | 9,659 | 11,075 | 29,650 | |||||||||
Securities lending income — affiliated — net | 105,634 | 85,648 | 1,226,298 | |||||||||
Non-cash dividends — unaffiliated | 3,312,619 | — | — | |||||||||
Foreign taxes withheld | (2,651,130 | ) | — | (50,862 | ) | |||||||
|
|
|
|
|
| |||||||
Total investment income | 27,893,352 | 7,899,315 | 29,636,176 | |||||||||
|
|
|
|
|
| |||||||
EXPENSES | ||||||||||||
Investment advisory | 4,579,021 | 5,426,558 | 11,010,459 | |||||||||
Transfer agent — class specific | 1,630,778 | 1,536,336 | 2,054,429 | |||||||||
Service and distribution — class specific | 1,078,734 | 2,207,456 | 1,026,394 | |||||||||
Custodian | 663,748 | 40,160 | 76,934 | |||||||||
Administration | 419,610 | 393,272 | 977,414 | |||||||||
Administration — class specific | 204,189 | 190,539 | 510,177 | |||||||||
Registration | 116,499 | 97,918 | 250,021 | |||||||||
Accounting services | 92,151 | 88,442 | 174,948 | |||||||||
Professional | 90,333 | 93,703 | 103,294 | |||||||||
Printing and postage | 38,205 | 23,603 | 45,645 | |||||||||
Trustees and Officer | 11,848 | 11,942 | 15,656 | |||||||||
Miscellaneous | 116,294 | 25,118 | 45,324 | |||||||||
|
|
|
|
|
| |||||||
Total expenses | 9,041,410 | 10,135,047 | 16,290,695 | |||||||||
Less: | ||||||||||||
Fees waived and/or reimbursed by the Manager | (1,533,140 | ) | (772,062 | ) | (1,193,288 | ) | ||||||
Administration fees waived — class specific | (204,189 | ) | (190,539 | ) | (510,177 | ) | ||||||
Transfer agent fees waived and/or reimbursed — class specific | (1,150,914 | ) | (1,057,998 | ) | (1,025,822 | ) | ||||||
|
|
|
|
|
| |||||||
Total expenses after fees waived and/or reimbursed | 6,153,167 | 8,114,448 | 13,561,408 | |||||||||
|
|
|
|
|
| |||||||
Net investment income (loss) | 21,740,185 | (215,133 | ) | 16,074,768 | ||||||||
|
|
|
|
|
| |||||||
REALIZED AND UNREALIZED GAIN (LOSS) | ||||||||||||
Net realized gain (loss) from: | ||||||||||||
Investments — unaffiliated | 153,589,822 | 131,529,442 | 231,050,823 | |||||||||
Investments — affiliated | (6,770 | ) | (3,350 | ) | (19,866 | ) | ||||||
Futures contracts | 10,985,090 | 11,937,941 | 43,253,997 | |||||||||
Foreign currency transactions | 758,395 | 52 | — | |||||||||
|
|
|
|
|
| |||||||
| 165,326,537 | 143,464,085 | 274,284,954 | ||||||||||
|
|
|
|
|
| |||||||
Net change in unrealized appreciation (depreciation) on: | ||||||||||||
Investments — unaffiliated | 150,342,506 | 150,977,852 | 825,274,427 | |||||||||
Investments — affiliated | (311 | ) | (1,154 | ) | (38,669 | ) | ||||||
Futures contracts | (443,180 | ) | (1,526,893 | ) | (709,790 | ) | ||||||
Foreign currency translations | 78,704 | 8,105 | — | |||||||||
|
|
|
|
|
| |||||||
| 149,977,719 | 149,457,910 | 824,525,968 | ||||||||||
|
|
|
|
|
| |||||||
Net realized and unrealized gain | 315,304,256 | 292,921,995 | 1,098,810,922 | |||||||||
|
|
|
|
|
| |||||||
NET INCREASE IN NET ASSETS RESULTING FROM OPERATIONS | $ | 337,044,441 | $ | 292,706,862 | $ | 1,114,885,690 | ||||||
|
|
|
|
|
| |||||||
See notes to financial statements.
FINANCIAL STATEMENTS | 41 |
Statements of Changes in Net Assets
| BlackRock Advantage International Fund | ||||||||||||
| Year Ended 05/31/21 | Period from 10/01/19 to 05/31/20 | Year Ended 09/30/19 | ||||||||||
INCREASE (DECREASE) IN NET ASSETS | ||||||||||||
OPERATIONS | ||||||||||||
Net investment income | $ | 21,740,185 | $ | 12,306,457 | $ | 21,422,769 | ||||||
Net realized gain (loss) | 165,326,537 | (87,278,149 | ) | (49,752,955 | ) | |||||||
Net change in unrealized appreciation (depreciation) | 149,977,719 | 8,204,938 | 15,989,735 | |||||||||
|
|
|
|
|
| |||||||
Net increase (decrease) in net assets resulting from operations | 337,044,441 | (66,766,754 | ) | (12,340,451 | ) | |||||||
|
|
|
|
|
| |||||||
DISTRIBUTIONS TO SHAREHOLDERS(a) | ||||||||||||
Institutional | (9,738,597 | ) | (12,598,153 | ) | (10,162,498 | ) | ||||||
Investor A | (6,489,037 | ) | (11,082,568 | ) | (7,937,835 | ) | ||||||
Investor C | (48,692 | ) | (158,038 | ) | (88,346 | ) | ||||||
Class K | (915,693 | ) | (1,303,076 | ) | (224,376 | ) | ||||||
Class R | (42,375 | ) | (116,369 | ) | (128,026 | ) | ||||||
|
|
|
|
|
| |||||||
Decrease in net assets resulting from distributions to shareholders | (17,234,394 | ) | (25,258,204 | ) | (18,541,081 | ) | ||||||
|
|
|
|
|
| |||||||
CAPITAL SHARE TRANSACTIONS | ||||||||||||
Net increase (decrease) in net assets derived from capital share transactions | (33,474,739 | ) | 78,972,558 | 196,132,910 | ||||||||
|
|
|
|
|
| |||||||
NET ASSETS | ||||||||||||
Total increase (decrease) in net assets | 286,335,308 | (13,052,400 | ) | 165,251,378 | ||||||||
Beginning of period | 896,931,200 | 909,983,600 | 744,732,222 | |||||||||
|
|
|
|
|
| |||||||
End of period | $ | 1,183,266,508 | $ | 896,931,200 | $ | 909,983,600 | ||||||
|
|
|
|
|
| |||||||
| (a) | Distributions for annual periods determined in accordance with U.S. federal income tax regulations. |
See notes to financial statements.
| 42 | 2 0 2 1 BLACK ROCK ANNUAL REPORT TO SHAREHOLDERS |
Statements of Changes in Net Assets (continued)
| BlackRock Advantage Large Cap Growth Fund | ||||||||||||
Year Ended 05/31/21 | Period from 10/01/19 to 05/31/20 | Year Ended 09/30/19 | ||||||||||
INCREASE (DECREASE) IN NET ASSETS | ||||||||||||
OPERATIONS | ||||||||||||
Net investment income (loss) | $ | (215,133 | ) | $ | 2,107,091 | $ | 4,508,395 | |||||
Net realized gain | 143,464,085 | 9,221,905 | 23,288,382 | |||||||||
Net change in unrealized appreciation (depreciation) | 149,457,910 | 99,325,297 | (25,417,065 | ) | ||||||||
|
|
|
|
|
| |||||||
Net increase in net assets resulting from operations | 292,706,862 | 110,654,293 | 2,379,712 | |||||||||
|
|
|
|
|
| |||||||
DISTRIBUTIONS TO SHAREHOLDERS(a) | ||||||||||||
Institutional | (7,398,742 | ) | (3,224,617 | ) | (5,518,754 | ) | ||||||
Service | (14,155 | ) | (8,241 | ) | (11,470 | ) | ||||||
Investor A | (58,840,915 | ) | (28,134,627 | ) | (54,769,508 | ) | ||||||
Investor C | (1,130,458 | ) | (647,015 | ) | (1,425,491 | ) | ||||||
Class K | (69,077 | ) | (43,395 | ) | (44,757 | ) | ||||||
Class R | (33,436 | ) | (30,985 | ) | (108,589 | ) | ||||||
|
|
|
|
|
| |||||||
Decrease in net assets resulting from distributions to shareholders | (67,486,783 | ) | (32,088,880 | ) | (61,878,569 | ) | ||||||
|
|
|
|
|
| |||||||
CAPITAL SHARE TRANSACTIONS | ||||||||||||
Net increase (decrease) in net assets derived from capital share transactions | 5,020,695 | (55,560,322 | ) | (1,592,425 | ) | |||||||
|
|
|
|
|
| |||||||
NET ASSETS | ||||||||||||
Total increase (decrease) in net assets | 230,240,774 | 23,005,091 | (61,091,282 | ) | ||||||||
Beginning of period | 819,131,337 | 796,126,246 | 857,217,528 | |||||||||
|
|
|
|
|
| |||||||
End of period | $ | 1,049,372,111 | $ | 819,131,337 | $ | 796,126,246 | ||||||
|
|
|
|
|
| |||||||
| (a) | Distributions for annual periods determined in accordance with U.S. federal income tax regulations. |
See notes to financial statements.
FINANCIAL STATEMENTS | 43 |
Statements of Changes in Net Assets (continued)
| BlackRock Advantage Small Cap Core Fund | ||||||||
| Year Ended May 31, | ||||||||
| 2021 | 2020 | |||||||
INCREASE (DECREASE) IN NET ASSETS | ||||||||
OPERATIONS | ||||||||
Net investment income | $ | 16,074,768 | $ | 10,123,877 | ||||
Net realized gain (loss) | 274,284,954 | (11,997,079 | ) | |||||
Net change in unrealized appreciation (depreciation) | 824,525,968 | 11,969,332 | ||||||
|
|
|
| |||||
Net increase in net assets resulting from operations | 1,114,885,690 | 10,096,130 | ||||||
|
|
|
| |||||
DISTRIBUTIONS TO SHAREHOLDERS(a) | ||||||||
Institutional | (38,083,252 | ) | (6,389,241 | ) | ||||
Investor A | (9,371,577 | ) | (1,849,729 | ) | ||||
Investor C | (142,084 | ) | (6,537 | ) | ||||
Class K | (13,303,758 | ) | (1,008,409 | ) | ||||
|
|
|
| |||||
Decrease in net assets resulting from distributions to shareholders | (60,900,671 | ) | (9,253,916 | ) | ||||
|
|
|
| |||||
CAPITAL SHARE TRANSACTIONS | ||||||||
Net increase in net assets derived from capital share transactions | 1,892,937,381 | 457,591,723 | ||||||
|
|
|
| |||||
NET ASSETS | ||||||||
Total increase in net assets | 2,946,922,400 | 458,433,937 | ||||||
Beginning of year | 1,319,518,450 | 861,084,513 | ||||||
|
|
|
| |||||
End of year | $ | 4,266,440,850 | $ | 1,319,518,450 | ||||
|
|
|
| |||||
| (a) | Distributions for annual periods determined in accordance with U.S. federal income tax regulations. |
See notes to financial statements.
| 44 | 2 0 2 1 BLACK ROCK ANNUAL REPORT TO SHAREHOLDERS |
(For a share outstanding throughout each period)
| BlackRock Advantage International Fund | ||||||||||||||||||||||||||||
| Institutional | ||||||||||||||||||||||||||||
| Period from | ||||||||||||||||||||||||||||
| Year Ended | 10/01/19 | Year Ended September 30, | ||||||||||||||||||||||||||
| 05/31/21 | to 05/31/20 | 2019 | 2018 | 2017 | 2016 | |||||||||||||||||||||||
Net asset value, beginning of period | $ | 14.52 | $ | 16.12 | $ | 16.97 | $ | 16.77 | $ | 14.50 | $ | 13.34 | ||||||||||||||||
|
|
|
|
|
|
|
|
|
|
|
| |||||||||||||||||
Net investment income(a) | 0.38 | 0.22 | 0.44 | 0.45 | 0.19 | 0.09 | ||||||||||||||||||||||
Net realized and unrealized gain (loss) | 5.30 | (1.37 | ) | (0.90 | ) | (0.12 | ) | 2.37 | 1.18 | |||||||||||||||||||
|
|
|
|
|
|
|
|
|
|
|
| |||||||||||||||||
Net increase (decrease) from investment operations | 5.68 | (1.15 | ) | (0.46 | ) | 0.33 | 2.56 | 1.27 | ||||||||||||||||||||
|
|
|
|
|
|
|
|
|
|
|
| |||||||||||||||||
Distributions from net investment income(b) | (0.31 | ) | (0.45 | ) | (0.39 | ) | (0.13 | ) | (0.29 | ) | (0.11 | ) | ||||||||||||||||
|
|
|
|
|
|
|
|
|
|
|
| |||||||||||||||||
Net asset value, end of period | $ | 19.89 | $ | 14.52 | $ | 16.12 | $ | 16.97 | $ | 16.77 | $ | 14.50 | ||||||||||||||||
|
|
|
|
|
|
|
|
|
|
|
| |||||||||||||||||
Total Return(c) | ||||||||||||||||||||||||||||
Based on net asset value | 39.57 | % | (7.45 | )%(d) | (2.52 | )% | 1.94 | %(e) | 17.99 | % | 9.60 | % | ||||||||||||||||
|
|
|
|
|
|
|
|
|
|
|
| |||||||||||||||||
Ratios to Average Net Assets | ||||||||||||||||||||||||||||
Total expenses | 0.78 | % | 0.82 | %(f) | 0.88 | % | 0.86 | % | 1.10 | % | 1.21 | % | ||||||||||||||||
|
|
|
|
|
|
|
|
|
|
|
| |||||||||||||||||
Total expenses after fees waived and/or reimbursed | 0.50 | % | 0.50 | %(f) | 0.59 | % | 0.64 | % | 0.86 | % | 1.06 | % | ||||||||||||||||
|
|
|
|
|
|
|
|
|
|
|
| |||||||||||||||||
Net investment income | 2.21 | % | 2.17 | %(f) | 2.78 | % | 2.61 | % | 1.20 | % | 0.68 | % | ||||||||||||||||
|
|
|
|
|
|
|
|
|
|
|
| |||||||||||||||||
Supplemental Data | ||||||||||||||||||||||||||||
Net assets, end of period (000) | $ | 616,649 | $ | 477,944 | $ | 446,831 | $ | 403,149 | $ | 116,595 | $ | 52,490 | ||||||||||||||||
|
|
|
|
|
|
|
|
|
|
|
| |||||||||||||||||
Portfolio turnover rate | 247 | % | 131 | % | 140 | % | 106 | % | 177 | % | 67 | % | ||||||||||||||||
|
|
|
|
|
|
|
|
|
|
|
| |||||||||||||||||
| (a) | Based on average shares outstanding. |
| (b) | Distributions for annual periods determined in accordance with U.S. federal income tax regulations. |
| (c) | Where applicable, assumes the reinvestment of distributions. |
| (d) | Aggregate total return. |
| (e) | Includes the litigation settlement amount. Excluding this amount, the Fund’s total return is 1.82% |
| (f) | Annualized. |
See notes to financial statements.
FINANCIAL HIGHLIGHTS | 45 |
Financial Highlights (continued)
(For a share outstanding throughout each period)
| BlackRock Advantage International Fund (continued) | ||||||||||||||||||||||||||||||||||
| Investor A | ||||||||||||||||||||||||||||||||||
Year Ended 05/31/21 | Period from 10/01/19 to 05/31/20 | Year Ended September 30, | ||||||||||||||||||||||||||||||||
| 2019 | 2018 | 2017 | 2016 | |||||||||||||||||||||||||||||||
Net asset value, beginning of period | $ | 14.35 | $ | 15.93 | $ | 16.78 | $ | 16.60 | $ | 14.35 | $ | 13.20 | ||||||||||||||||||||||
|
|
|
|
|
|
|
|
|
|
|
| |||||||||||||||||||||||
Net investment income(a) | 0.33 | 0.19 | 0.40 | 0.38 | 0.12 | 0.06 | ||||||||||||||||||||||||||||
Net realized and unrealized gain (loss) | 5.24 | (1.35 | ) | (0.90 | ) | (0.10 | ) | 2.38 | 1.16 | |||||||||||||||||||||||||
|
|
|
|
|
|
|
|
|
|
|
| |||||||||||||||||||||||
Net increase (decrease) from investment operations | 5.57 | (1.16 | ) | (0.50 | ) | 0.28 | 2.50 | 1.22 | ||||||||||||||||||||||||||
|
|
|
|
|
|
|
|
|
|
|
| |||||||||||||||||||||||
Distributions from net investment income(b) | (0.27 | ) | (0.42 | ) | (0.35 | ) | (0.10 | ) | (0.25 | ) | (0.07 | ) | ||||||||||||||||||||||
|
|
|
|
|
|
|
|
|
|
|
| |||||||||||||||||||||||
Net asset value, end of period | $ | 19.65 | $ | 14.35 | $ | 15.93 | $ | 16.78 | $ | 16.60 | $ | 14.35 | ||||||||||||||||||||||
|
|
|
|
|
|
|
|
|
|
|
| |||||||||||||||||||||||
Total Return(c) | ||||||||||||||||||||||||||||||||||
Based on net asset value | 39.21 | % | (7.61 | )%(d) | (2.77 | )% | 1.68 | %(e) | 17.71 | % | 9.30 | % | ||||||||||||||||||||||
|
|
|
|
|
|
|
|
|
|
|
| |||||||||||||||||||||||
Ratios to Average Net Assets | ||||||||||||||||||||||||||||||||||
Total expenses | 1.05 | % | 1.08 | %(f) | 1.16 | % | 1.15 | % | 1.42 | % | 1.49 | % | ||||||||||||||||||||||
|
|
|
|
|
|
|
|
|
|
|
| |||||||||||||||||||||||
Total expenses after fees waived and/or reimbursed | 0.75 | % | 0.75 | %(f) | 0.84 | % | 0.89 | % | 1.19 | % | 1.33 | % | ||||||||||||||||||||||
|
|
|
|
|
|
|
|
|
|
|
| |||||||||||||||||||||||
Net investment income | 1.95 | % | 1.85 | %(f) | 2.56 | % | 2.20 | % | 0.82 | % | 0.46 | % | ||||||||||||||||||||||
|
|
|
|
|
|
|
|
|
|
|
| |||||||||||||||||||||||
Supplemental Data | ||||||||||||||||||||||||||||||||||
Net assets, end of period (000) | $ | 456,083 | $ | 366,411 | $ | 404,739 | $ | 302,725 | $ | 169,806 | $ | 153,886 | ||||||||||||||||||||||
|
|
|
|
|
|
|
|
|
|
|
| |||||||||||||||||||||||
Portfolio turnover rate | 247 | % | 131 | % | 140 | % | 106 | % | 177 | % | 67 | % | ||||||||||||||||||||||
|
|
|
|
|
|
|
|
|
|
|
| |||||||||||||||||||||||
| (a) | Based on average shares outstanding. |
| (b) | Distributions for annual periods determined in accordance with U.S. federal income tax regulations. |
| (c) | Where applicable, excludes the effects of any sales charges and assumes the reinvestment of distributions. |
| (d) | Aggregate total return. |
| (e) | Includes the litigation settlement amount. Excluding this amount, the Fund’s total return is 1.56% |
| (f) | Annualized. |
See notes to financial statements.
| 46 | 2 0 2 1 BLACK ROCK ANNUAL REPORT TO SHAREHOLDERS |
Financial Highlights (continued)
(For a share outstanding throughout each period)
| BlackRock Advantage International Fund (continued) | ||||||||||||||||||||||||||||||||||
| Investor C | ||||||||||||||||||||||||||||||||||
| Year Ended | Period from 10/01/19 | Year Ended September 30, | ||||||||||||||||||||||||||||||||
| 05/31/21 | to 05/31/20 | 2019 | 2018 | 2017 | 2016 | |||||||||||||||||||||||||||||
Net asset value, beginning of period |
| $ | 13.95 | $ | 15.43 | $ | 16.11 | $ | 15.96 | $ | 13.81 | $ | 12.74 | |||||||||||||||||||||
|
|
|
|
|
|
|
|
|
|
|
| |||||||||||||||||||||||
Net investment income (loss)(a) | 0.16 | 0.10 | 0.23 | 0.23 | (0.01 | ) | (0.05 | ) | ||||||||||||||||||||||||||
Net realized and unrealized gain (loss) | 5.14 | (1.31 | ) | (0.80 | ) | (0.08 | ) | 2.29 | 1.12 | |||||||||||||||||||||||||
|
|
|
|
|
|
|
|
|
|
|
| |||||||||||||||||||||||
Net increase (decrease) from investment operations | 5.30 | (1.21 | ) | (0.57 | ) | 0.15 | 2.28 | 1.07 | ||||||||||||||||||||||||||
|
|
|
|
|
|
|
|
|
|
|
| |||||||||||||||||||||||
Distributions from net investment income(b) | (0.13 | ) | (0.27 | ) | (0.11 | ) | — | (0.13 | ) | (0.00 | )(c) | |||||||||||||||||||||||
|
|
|
|
|
|
|
|
|
|
|
| |||||||||||||||||||||||
Net asset value, end of period | $ | 19.12 | $ | 13.95 | $ | 15.43 | $ | 16.11 | $ | 15.96 | $ | 13.81 | ||||||||||||||||||||||
|
|
|
|
|
|
|
|
|
|
|
| |||||||||||||||||||||||
Total Return(d) | ||||||||||||||||||||||||||||||||||
Based on net asset value | 38.21 | % | (8.05 | )%(e) | (3.51 | )% | 0.94 | %(f) | 16.70 | % | 8.44 | % | ||||||||||||||||||||||
|
|
|
|
|
|
|
|
|
|
|
| |||||||||||||||||||||||
Ratios to Average Net Assets | ||||||||||||||||||||||||||||||||||
Total expenses | 1.88 | % | 1.84 | %(g) | 1.88 | % | 1.89 | % | 2.22 | %(h) | 2.27 | %(h) | ||||||||||||||||||||||
|
|
|
|
|
|
|
|
|
|
|
| |||||||||||||||||||||||
Total expenses after fees waived and/or reimbursed | 1.50 | % | 1.50 | %(g) | 1.59 | % | 1.64 | % | 2.03 | % | 2.14 | % | ||||||||||||||||||||||
|
|
|
|
|
|
|
|
|
|
|
| |||||||||||||||||||||||
Net investment income (loss) | 0.98 | % | 1.04 | %(g) | 1.52 | % | 1.39 | % | (0.05 | )% | (0.35 | )% | ||||||||||||||||||||||
|
|
|
|
|
|
|
|
|
|
|
| |||||||||||||||||||||||
Supplemental Data | ||||||||||||||||||||||||||||||||||
Net assets, end of period (000) | $ | 3,664 | $ | 6,193 | $ | 9,448 | $ | 23,111 | $ | 24,717 | $ | 43,218 | ||||||||||||||||||||||
|
|
|
|
|
|
|
|
|
|
|
| |||||||||||||||||||||||
Portfolio turnover rate | 247 | % | 131 | % | 140 | % | 106 | % | 177 | % | 67 | % | ||||||||||||||||||||||
|
|
|
|
|
|
|
|
|
|
|
| |||||||||||||||||||||||
| (a) | Based on average shares outstanding. |
| (b) | Distributions for annual periods determined in accordance with U.S. federal income tax regulations. |
| (c) | Amount is greater than $(0.005) per share. |
| (d) | Where applicable, excludes the effects of any sales charges and assumes the reinvestment of distributions. |
| (e) | Aggregate total return. |
| (f) | Includes the litigation settlement amount. Excluding this amount, the Fund’s total return is 0.81% |
| (g) | Annualized. |
| (h) | Includes recoupment of past waived and/or reimbursed fees with no financial impact to the expense ratios. |
See notes to financial statements.
FINANCIAL HIGHLIGHTS | 47 |
Financial Highlights (continued)
(For a share outstanding throughout each period)
| BlackRock Advantage International Fund (continued) | ||||||||||||||||||||||||
| Class K | ||||||||||||||||||||||||
| Period from | Period from | |||||||||||||||||||||||
Year Ended 05/31/21 |
| | 10/01/19 to 05/31/20 |
| | Year Ended 09/30/19 |
| | 01/25/18 to 09/30/18 | (a)
| ||||||||||||||
Net asset value, beginning of period |
| $ | 14.52 | $ | 16.12 | $ | 16.98 | $ | 18.33 | |||||||||||||||
|
|
|
|
|
|
|
| |||||||||||||||||
Net investment income(b) | 0.46 | 0.23 | 0.56 | 0.39 | ||||||||||||||||||||
Net realized and unrealized gain (loss) | 5.23 | (1.37 | ) | (1.03 | ) | (1.74 | ) | |||||||||||||||||
|
|
|
|
|
|
|
| |||||||||||||||||
Net increase (decrease) from investment operations | 5.69 | (1.14 | ) | (0.47 | ) | (1.35 | ) | |||||||||||||||||
|
|
|
|
|
|
|
| |||||||||||||||||
Distributions from net investment income(c) | (0.32 | ) | (0.46 | ) | (0.39 | ) | — | |||||||||||||||||
|
|
|
|
|
|
|
| |||||||||||||||||
Net asset value, end of period | $ | 19.89 | $ | 14.52 | $ | 16.12 | $ | 16.98 | ||||||||||||||||
|
|
|
|
|
|
|
| |||||||||||||||||
Total Return(d) | ||||||||||||||||||||||||
Based on net asset value | 39.64 | % | (7.40 | )%(e) | (2.53 | )% | (7.37 | )%(e)(f) | ||||||||||||||||
|
|
|
|
|
|
|
| |||||||||||||||||
Ratios to Average Net Assets | ||||||||||||||||||||||||
Total expenses | 0.63 | % | 0.65 | %(g) | 0.75 | % | 0.80 | %(g) | ||||||||||||||||
|
|
|
|
|
|
|
| |||||||||||||||||
Total expenses after fees waived and/or reimbursed | 0.45 | % | 0.45 | %(g) | 0.54 | % | 0.59 | %(g) | ||||||||||||||||
|
|
|
|
|
|
|
| |||||||||||||||||
Net investment income | 2.65 | % | 2.20 | %(g) | 3.59 | % | 3.33 | %(g) | ||||||||||||||||
|
|
|
|
|
|
|
| |||||||||||||||||
Supplemental Data | ||||||||||||||||||||||||
Net assets, end of period (000) | $ | 103,454 | $ | 43,073 | $ | 43,721 | $ | 8,175 | ||||||||||||||||
|
|
|
|
|
|
|
| |||||||||||||||||
Portfolio turnover rate | 247 | % | 131 | % | 140 | % | 106 | %(h) | ||||||||||||||||
|
|
|
|
|
|
|
| |||||||||||||||||
| (a) | Commencement of operations. |
| (b) | Based on average shares outstanding. |
| (c) | Distributions for annual periods determined in accordance with U.S. federal income tax regulations. |
| (d) | Where applicable, assumes the reinvestment of distributions. |
| (e) | Aggregate total return. |
| (f) | Includes the litigation settlement amount. Excluding this amount, the Fund’s total return is (7.42)% |
| (g) | Annualized. |
| (h) | Portfolio turnover is representative of the Fund for the entire year. |
See notes to financial statements.
| 48 | 2 0 2 1 BLACK ROCK ANNUAL REPORT TO SHAREHOLDERS |
Financial Highlights (continued)
(For a share outstanding throughout each period)
| BlackRock Advantage International Fund (continued) | ||||||||||||||||||||||||||||||||||||
| Class R | ||||||||||||||||||||||||||||||||||||
| Year Ended | Period from 10/01/19 | Year Ended September 30, | ||||||||||||||||||||||||||||||||||
| 05/31/21 | to 05/31/20 | 2019 | 2018 | 2017 | 2016 | |||||||||||||||||||||||||||||||
Net asset value, beginning of period | $ | 14.36 | $ | 15.91 | $ | 16.74 | $ | 16.53 | $ | 14.29 | $ | 13.12 | ||||||||||||||||||||||||
|
|
|
|
|
|
|
|
|
|
|
| |||||||||||||||||||||||||
Net investment income(a) | 0.28 | 0.15 | 0.34 | 0.32 | 0.07 | 0.01 | ||||||||||||||||||||||||||||||
Net realized and unrealized gain (loss) | 5.26 | (1.34 | ) | (0.88 | ) | (0.08 | ) | 2.36 | 1.16 | |||||||||||||||||||||||||||
|
|
|
|
|
|
|
|
|
|
|
| |||||||||||||||||||||||||
Net increase (decrease) from investment operations | 5.54 | (1.19 | ) | (0.54 | ) | 0.24 | 2.43 | 1.17 | ||||||||||||||||||||||||||||
|
|
|
|
|
|
|
|
|
|
|
| |||||||||||||||||||||||||
Distributions from net investment income(b) | (0.22 | ) | (0.36 | ) | (0.29 | ) | (0.03 | ) | (0.19 | ) | (0.00 | )(c) | ||||||||||||||||||||||||
|
|
|
|
|
|
|
|
|
|
|
| |||||||||||||||||||||||||
Net asset value, end of period | $ | 19.68 | $ | 14.36 | $ | 15.91 | $ | 16.74 | $ | 16.53 | $ | 14.29 | ||||||||||||||||||||||||
|
|
|
|
|
|
|
|
|
|
|
| |||||||||||||||||||||||||
Total Return(d) | ||||||||||||||||||||||||||||||||||||
Based on net asset value | 38.91 | % | (7.75 | )%(e) | (3.04 | )% | 1.44 | %(f) | 17.26 | % | 8.96 | % | ||||||||||||||||||||||||
|
|
|
|
|
|
|
|
|
|
|
| |||||||||||||||||||||||||
Ratios to Average Net Assets | ||||||||||||||||||||||||||||||||||||
Total expenses | 1.36 | % | 1.37 | %(g) | 1.44 | % | 1.45 | % | 1.75 | %(h) | 1.83 | %(h) | ||||||||||||||||||||||||
|
|
|
|
|
|
|
|
|
|
|
| |||||||||||||||||||||||||
Total expenses after fees waived and/or reimbursed | 1.00 | % | 1.00 | %(g) | 1.09 | % | 1.14 | % | 1.55 | % | 1.72 | % | ||||||||||||||||||||||||
|
|
|
|
|
|
|
|
|
|
|
| |||||||||||||||||||||||||
Net investment income | 1.67 | % | 1.47 | %(g) | 2.20 | % | 1.91 | % | 0.46 | % | 0.08 | % | ||||||||||||||||||||||||
|
|
|
|
|
|
|
|
|
|
|
| |||||||||||||||||||||||||
Supplemental Data | ||||||||||||||||||||||||||||||||||||
Net assets, end of period (000) | $ | 3,416 | $ | 3,310 | $ | 5,244 | $ | 7,572 | $ | 7,551 | $ | 8,343 | ||||||||||||||||||||||||
|
|
|
|
|
|
|
|
|
|
|
| |||||||||||||||||||||||||
Portfolio turnover rate | 247 | % | 131 | % | 140 | % | 106 | % | 177 | % | 67 | % | ||||||||||||||||||||||||
|
|
|
|
|
|
|
|
|
|
|
| |||||||||||||||||||||||||
| (a) | Based on average shares outstanding. |
| (b) | Distributions for annual periods determined in accordance with U.S. federal income tax regulations. |
| (c) | Amount is greater than $(0.005) per share. |
| (d) | Where applicable, assumes the reinvestment of distributions. |
| (e) | Aggregate total return. |
| (f) | Includes the litigation settlement amount. Excluding this amount, the Fund’s total return is 1.26% |
| (g) | Annualized. |
| (h) | Includes recoupment of past waived and/or reimbursed fees with no financial impact to the expense ratios. |
See notes to financial statements.
FINANCIAL HIGHLIGHTS | 49 |
Financial Highlights (continued)
(For a share outstanding throughout each period)
| BlackRock Advantage Large Cap Growth Fund | ||||||||||||||||||||||||||||||||
| Institutional | ||||||||||||||||||||||||||||||||
Year Ended | Period from 10/01/19 | Year Ended September 30, | ||||||||||||||||||||||||||||||
| 05/31/21 |
| to 05/31/20 |
| 2019 | 2018 | 2017 | (a) | 2016 | (a) | |||||||||||||||||||||||
Net asset value, beginning of period | $ | 18.23 | $ | 16.49 | $ | 17.89 | $ | 15.20 | $ | 12.32 | $ | 12.07 | ||||||||||||||||||||
|
|
|
|
|
|
|
|
|
|
|
| |||||||||||||||||||||
Net investment income(b) | 0.04 | 0.07 | 0.13 | 0.13 | 0.12 | 0.10 | ||||||||||||||||||||||||||
Net realized and unrealized gain (loss) | 6.59 | 2.40 | (0.22 | ) | 3.52 | 2.87 | 1.06 | |||||||||||||||||||||||||
|
|
|
|
|
|
|
|
|
|
|
| |||||||||||||||||||||
Net increase (decrease) from investment operations | 6.63 | 2.47 | (0.09 | ) | 3.65 | 2.99 | 1.16 | |||||||||||||||||||||||||
|
|
|
|
|
|
|
|
|
|
|
| |||||||||||||||||||||
Distributions(c) | ||||||||||||||||||||||||||||||||
From net investment income | (0.07 | ) | (0.14 | ) | (0.13 | ) | (0.08 | ) | (0.11 | ) | (0.07 | ) | ||||||||||||||||||||
From net realized gain | (1.46 | ) | (0.59 | ) | (1.18 | ) | (0.88 | ) | — | (0.84 | ) | |||||||||||||||||||||
|
|
|
|
|
|
|
|
|
|
|
| |||||||||||||||||||||
Total distributions | (1.53 | ) | (0.73 | ) | (1.31 | ) | (0.96 | ) | (0.11 | ) | (0.91 | ) | ||||||||||||||||||||
|
|
|
|
|
|
|
|
|
|
|
| |||||||||||||||||||||
Net asset value, end of period | $ | 23.33 | $ | 18.23 | $ | 16.49 | $ | 17.89 | $ | 15.20 | $ | 12.32 | ||||||||||||||||||||
|
|
|
|
|
|
|
|
|
|
|
| |||||||||||||||||||||
Total Return(d) | ||||||||||||||||||||||||||||||||
Based on net asset value | 37.54 | % | 15.34 | %(e) | 0.41 | % | 25.31 | % | 24.43 | % | 9.75 | % | ||||||||||||||||||||
|
|
|
|
|
|
|
|
|
|
|
| |||||||||||||||||||||
Ratios to Average Net Assets | ||||||||||||||||||||||||||||||||
Total expenses | 0.83 | % | 0.86 | %(f) | 0.87 | % | 0.86 | % | 1.10 | % | 1.14 | % | ||||||||||||||||||||
|
|
|
|
|
|
|
|
|
|
|
| |||||||||||||||||||||
Total expenses after fees waived and/or reimbursed | 0.62 | % | 0.62 | %(f) | 0.62 | % | 0.62 | % | 0.84 | % | 0.92 | % | ||||||||||||||||||||
|
|
|
|
|
|
|
|
|
|
|
| |||||||||||||||||||||
Net investment income | 0.21 | % | 0.65 | %(f) | 0.82 | % | 0.83 | % | 0.91 | % | 0.86 | % | ||||||||||||||||||||
|
|
|
|
|
|
|
|
|
|
|
| |||||||||||||||||||||
Supplemental Data | ||||||||||||||||||||||||||||||||
Net assets, end of period (000) | $ | 125,061 | $ | 89,737 | $ | 79,564 | $ | 74,886 | $ | 36,574 | $ | 37,417 | ||||||||||||||||||||
|
|
|
|
|
|
|
|
|
|
|
| |||||||||||||||||||||
Portfolio turnover rate | 134 | % | 70 | % | 154 | % | 162 | % | 130 | % | 36 | % | ||||||||||||||||||||
|
|
|
|
|
|
|
|
|
|
|
| |||||||||||||||||||||
| (a) | Consolidated Financial Highlights. |
| (b) | Based on average shares outstanding. |
| (c) | Distributions for annual periods determined in accordance with U.S. federal income tax regulations. |
| (d) | Where applicable, assumes the reinvestment of distributions. |
| (e) | Aggregate total return. |
| (f) | Annualized. |
See notes to financial statements.
| 50 | 2 0 2 1 BLACK ROCK ANNUAL REPORT TO SHAREHOLDERS |
Financial Highlights (continued)
(For a share outstanding throughout each period)
| BlackRock Advantage Large Cap Growth Fund (continued) | ||||||||||||||||||||||||||||||||||||||
| Service | ||||||||||||||||||||||||||||||||||||||
| Year Ended | Period from 10/01/19 | Year Ended September 30, | ||||||||||||||||||||||||||||||||||||
| 05/31/21 | to 05/31/20 |
| 2019 | 2018 | 2017 | (a) | 2016 | (a) | ||||||||||||||||||||||||||||||
Net asset value, beginning of period | $ | 17.89 | $ | 16.18 | $ | 17.57 | $ | 14.95 | $ | 12.12 | $ | 11.86 | ||||||||||||||||||||||||||
|
|
|
|
|
|
|
|
|
|
|
| |||||||||||||||||||||||||||
Net investment income (loss)(b) | (0.01 | ) | 0.04 | 0.09 | 0.09 | 0.08 | 0.06 | |||||||||||||||||||||||||||||||
Net realized and unrealized gain (loss) | 6.46 | 2.36 | (0.22 | ) | 3.46 | 2.82 | 1.05 | |||||||||||||||||||||||||||||||
|
|
|
|
|
|
|
|
|
|
|
| |||||||||||||||||||||||||||
Net increase (decrease) from investment operations | 6.45 | 2.40 | (0.13 | ) | 3.55 | 2.90 | 1.11 | |||||||||||||||||||||||||||||||
|
|
|
|
|
|
|
|
|
|
|
| |||||||||||||||||||||||||||
Distributions(c) | ||||||||||||||||||||||||||||||||||||||
From net investment income | (0.01 | ) | (0.10 | ) | (0.08 | ) | (0.05 | ) | (0.07 | ) | (0.01 | ) | ||||||||||||||||||||||||||
From net realized gain | (1.46 | ) | (0.59 | ) | (1.18 | ) | (0.88 | ) | — | (0.84 | ) | |||||||||||||||||||||||||||
|
|
|
|
|
|
|
|
|
|
|
| |||||||||||||||||||||||||||
Total distributions | (1.47 | ) | (0.69 | ) | (1.26 | ) | (0.93 | ) | (0.07 | ) | (0.85 | ) | ||||||||||||||||||||||||||
|
|
|
|
|
|
|
|
|
|
|
| |||||||||||||||||||||||||||
Net asset value, end of period | $ | 22.87 | $ | 17.89 | $ | 16.18 | $ | 17.57 | $ | 14.95 | $ | 12.12 | ||||||||||||||||||||||||||
|
|
|
|
|
|
|
|
|
|
|
| |||||||||||||||||||||||||||
Total Return(d) | ||||||||||||||||||||||||||||||||||||||
Based on net asset value | 37.20 | % | 15.19 | %(e) | 0.15 | % | 24.96 | % | 24.03 | % | 9.44 | % | ||||||||||||||||||||||||||
|
|
|
|
|
|
|
|
|
|
|
| |||||||||||||||||||||||||||
Ratios to Average Net Assets | ||||||||||||||||||||||||||||||||||||||
Total expenses(f) | 1.10 | % | 1.06 | %(g) | 0.98 | % | 1.03 | % | 1.24 | % | 1.26 | % | ||||||||||||||||||||||||||
|
|
|
|
|
|
|
|
|
|
|
| |||||||||||||||||||||||||||
Total expenses after fees waived and/or reimbursed | 0.87 | % | 0.87 | %(g) | 0.87 | % | 0.87 | % | 1.11 | % | 1.24 | % | ||||||||||||||||||||||||||
|
|
|
|
|
|
|
|
|
|
|
| |||||||||||||||||||||||||||
Net investment income (loss) | (0.03 | )% | 0.39 | %(g) | 0.57 | % | 0.55 | % | 0.59 | % | 0.54 | % | ||||||||||||||||||||||||||
|
|
|
|
|
|
|
|
|
|
|
| |||||||||||||||||||||||||||
Supplemental Data | ||||||||||||||||||||||||||||||||||||||
Net assets, end of period (000) | $ | 249 | $ | 253 | $ | 198 | $ | 160 | $ | 189 | $ | 119 | ||||||||||||||||||||||||||
|
|
|
|
|
|
|
|
|
|
|
| |||||||||||||||||||||||||||
Portfolio turnover rate | 134 | % | 70 | % | 154 | % | 162 | % | 130 | % | 36 | % | ||||||||||||||||||||||||||
|
|
|
|
|
|
|
|
|
|
|
| |||||||||||||||||||||||||||
| (a) | Consolidated Financial Highlights. |
| (b) | Based on average shares outstanding. |
| (c) | Distributions for annual periods determined in accordance with U.S. federal income tax regulations. |
| (d) | Where applicable, assumes the reinvestment of distributions. |
| (e) | Aggregate total return. |
| (f) | Includes recoupment of past waived and/or reimbursed fees. Excluding the recoupment of past waived and/or reimbursed fees, the ratios were as follows: |
| Year Ended | | Period from 10/01/19 | | Year Ended September 30, |
| |||||||||||||||||||||||||||||||||||||||||||||
| 05/31/21 | to 5/31/20 | 2019 | 2018 | 2017 | (a) | 2016 | (a) | |||||||||||||||||||||||||||||||||||||||||||
Expense ratios | N/A | N/A | 0.97 | % | N/A | N/A | 1.21 | % | ||||||||||||||||||||||||||||||||||||||||||
|
|
|
|
|
|
|
|
|
|
|
| |||||||||||||||||||||||||||||||||||||||
| (g) | Annualized. |
See notes to financial statements.
FINANCIAL HIGHLIGHTS | 51 |
Financial Highlights (continued)
(For a share outstanding throughout each period)
| BlackRock Advantage Large Cap Growth Fund (continued) | ||||||||||||||||||||||||||||||||||||
| Investor A | ||||||||||||||||||||||||||||||||||||
| Year Ended | | | Period from 10/01/19 to 05/31/20 |
| Year Ended September 30, | ||||||||||||||||||||||||||||||
| 2019 | 2018 | 2017 | (a) | 2016 | (a) | |||||||||||||||||||||||||||||||
Net asset value, beginning of period | $ | 17.35 | $ | 15.71 | $ | 17.11 | $ | 14.59 | $ | 11.83 | $ | 11.61 | ||||||||||||||||||||||||
|
|
|
|
|
|
|
|
|
|
|
| |||||||||||||||||||||||||
Net investment income (loss)(b) | (0.01 | ) | 0.04 | 0.09 | 0.09 | 0.08 | 0.06 | |||||||||||||||||||||||||||||
Net realized and unrealized gain (loss) | 6.27 | 2.28 | (0.22 | ) | 3.37 | 2.75 | 1.02 | |||||||||||||||||||||||||||||
|
|
|
|
|
|
|
|
|
|
|
| |||||||||||||||||||||||||
Net increase (decrease) from investment operations | 6.26 | 2.32 | (0.13 | ) | 3.46 | 2.83 | 1.08 | |||||||||||||||||||||||||||||
|
|
|
|
|
|
|
|
|
|
|
| |||||||||||||||||||||||||
Distributions(c) | ||||||||||||||||||||||||||||||||||||
From net investment income | (0.02 | ) | (0.09 | ) | (0.09 | ) | (0.06 | ) | (0.07 | ) | (0.02 | ) | ||||||||||||||||||||||||
From net realized gain | (1.46 | ) | (0.59 | ) | (1.18 | ) | (0.88 | ) | — | (0.84 | ) | |||||||||||||||||||||||||
|
|
|
|
|
|
|
|
|
|
|
| |||||||||||||||||||||||||
Total distributions | (1.48 | ) | (0.68 | ) | (1.27 | ) | (0.94 | ) | (0.07 | ) | (0.86 | ) | ||||||||||||||||||||||||
|
|
|
|
|
|
|
|
|
|
|
| |||||||||||||||||||||||||
Net asset value, end of period | $ | 22.13 | $ | 17.35 | $ | 15.71 | $ | 17.11 | $ | 14.59 | $ | 11.83 | ||||||||||||||||||||||||
|
|
|
|
|
|
|
|
|
|
|
| |||||||||||||||||||||||||
Total Return(d) | ||||||||||||||||||||||||||||||||||||
Based on net asset value | 37.28 | % | 15.16 | %(e) | 0.15 | % | 24.98 | % | 24.03 | % | 9.39 | % | ||||||||||||||||||||||||
|
|
|
|
|
|
|
|
|
|
|
| |||||||||||||||||||||||||
Ratios to Average Net Assets | ||||||||||||||||||||||||||||||||||||
Total expenses | 1.08 | % | 1.12 | %(f) | 1.12 | % | 1.12 | % | 1.35 | % | 1.42 | % | ||||||||||||||||||||||||
|
|
|
|
|
|
|
|
|
|
|
| |||||||||||||||||||||||||
Total expenses after fees waived and/or reimbursed | 0.87 | % | 0.87 | %(f) | 0.87 | % | 0.87 | % | 1.13 | % | 1.24 | % | ||||||||||||||||||||||||
|
|
|
|
|
|
|
|
|
|
|
| |||||||||||||||||||||||||
Net investment income (loss) | (0.04 | )% | 0.40 | %(f) | 0.57 | % | 0.58 | % | 0.60 | % | 0.54 | % | ||||||||||||||||||||||||
|
|
|
|
|
|
|
|
|
|
|
| |||||||||||||||||||||||||
Supplemental Data | ||||||||||||||||||||||||||||||||||||
Net assets, end of period (000) | $ | 909,344 | $ | 713,162 | $ | 699,247 | $ | 730,996 | $ | 351,398 | $ | 323,297 | ||||||||||||||||||||||||
|
|
|
|
|
|
|
|
|
|
|
| |||||||||||||||||||||||||
Portfolio turnover rate | 134 | % | 70 | % | 154 | % | 162 | % | 130 | % | 36 | % | ||||||||||||||||||||||||
|
|
|
|
|
|
|
|
|
|
|
| |||||||||||||||||||||||||
| (a) | Consolidated Financial Highlights. |
| (b) | Based on average shares outstanding. |
| (c) | Distributions for annual periods determined in accordance with U.S. federal income tax regulations. |
| (d) | Where applicable, excludes the effects of any sales charges and assumes the reinvestment of distributions. |
| (e) | Aggregate total return. |
| (f) | Annualized. |
See notes to financial statements.
| 52 | 2 0 2 1 BLACK ROCK ANNUAL REPORT TO SHAREHOLDERS |
Financial Highlights (continued)
(For a share outstanding throughout each period)
| BlackRock Advantage Large Cap Growth Fund (continued) | ||||||||||||||||||||||||||||||||||||
| Investor C | ||||||||||||||||||||||||||||||||||||
| Year Ended 05/31/21 | Period from to 05/31/20 | Year Ended September 30, | ||||||||||||||||||||||||||||||||||
| 2019 | 2018 | 2017 | (a) | 2016 | (a) | |||||||||||||||||||||||||||||||
Net asset value, beginning of period | $ | 14.67 | $ | 13.35 | $ | 14.55 | $ | 12.53 | $ | 10.19 | $ | 10.16 | ||||||||||||||||||||||||
|
|
|
|
|
|
|
|
|
|
|
| |||||||||||||||||||||||||
Net investment loss(b) | (0.13 | ) | (0.03 | ) | (0.03 | ) | (0.03 | ) | (0.02 | ) | (0.02 | ) | ||||||||||||||||||||||||
Net realized and unrealized gain (loss) | 5.27 | 1.93 | (0.17 | ) | 2.89 | 2.36 | 0.89 | |||||||||||||||||||||||||||||
|
|
|
|
|
|
|
|
|
|
|
| |||||||||||||||||||||||||
Net increase (decrease) from investment operations | 5.14 | 1.90 | (0.20 | ) | 2.86 | 2.34 | 0.87 | |||||||||||||||||||||||||||||
|
|
|
|
|
|
|
|
|
|
|
| |||||||||||||||||||||||||
Distributions from net realized gain(c) | (1.39 | ) | (0.58 | ) | (1.00 | ) | (0.84 | ) | — | (0.84 | ) | |||||||||||||||||||||||||
|
|
|
|
|
|
|
|
|
|
|
| |||||||||||||||||||||||||
Net asset value, end of period | $ | 18.42 | $ | 14.67 | $ | 13.35 | $ | 14.55 | $ | 12.53 | $ | 10.19 | ||||||||||||||||||||||||
|
|
|
|
|
|
|
|
|
|
|
| |||||||||||||||||||||||||
Total Return(d) | ||||||||||||||||||||||||||||||||||||
Based on net asset value | 36.25 | % | 14.56 | %(e) | (0.59 | )% | 24.09 | % | 22.96 | % | 8.63 | % | ||||||||||||||||||||||||
|
|
|
|
|
|
|
|
|
|
|
| |||||||||||||||||||||||||
Ratios to Average Net Assets | ||||||||||||||||||||||||||||||||||||
Total expenses | 1.84 | % | 1.83 | %(f) | 1.85 | % | 1.87 | % | 2.12 | % | 2.17 | % | ||||||||||||||||||||||||
|
|
|
|
|
|
|
|
|
|
|
| |||||||||||||||||||||||||
Total expenses after fees waived and/or reimbursed | 1.62 | % | 1.62 | %(f) | 1.62 | % | 1.62 | % | 1.91 | % | 2.01 | % | ||||||||||||||||||||||||
|
|
|
|
|
|
|
|
|
|
|
| |||||||||||||||||||||||||
Net investment loss | (0.78 | )% | (0.35 | )%(f) | (0.22 | )% | (0.19 | )% | (0.16 | )% | (0.23 | )% | ||||||||||||||||||||||||
|
|
|
|
|
|
|
|
|
|
|
| |||||||||||||||||||||||||
Supplemental Data | ||||||||||||||||||||||||||||||||||||
Net assets, end of period (000) | $ | 12,989 | $ | 14,728 | $ | 15,277 | $ | 48,702 | $ | 46,804 | $ | 63,586 | ||||||||||||||||||||||||
|
|
|
|
|
|
|
|
|
|
|
| |||||||||||||||||||||||||
Portfolio turnover rate | 134 | % | 70 | % | 154 | % | 162 | % | 130 | % | 36 | % | ||||||||||||||||||||||||
|
|
|
|
|
|
|
|
|
|
|
| |||||||||||||||||||||||||
| (a) | Consolidated Financial Highlights. |
| (b) | Based on average shares outstanding. |
| (c) | Distributions for annual periods determined in accordance with U.S. federal income tax regulations. |
| (d) | Where applicable, excludes the effects of any sales charges and assumes the reinvestment of distributions. |
| (e) | Aggregate total return. |
| (f) | Annualized. |
See notes to financial statements.
FINANCIAL HIGHLIGHTS | 53 |
Financial Highlights (continued)
(For a share outstanding throughout each period)
| BlackRock Advantage Large Cap Growth Fund (continued) | ||||||||||||||||||||||||||||||||
| Class K | ||||||||||||||||||||||||||||||||
| | Year Ended 05/31/21 | | | Period from 10/01/19 to 05/31/20 |
| | Year Ended 09/30/19 | | | Period from 01/25/18 to 09/30/18 | (a)
| |||||||||||||||||||||
Net asset value, beginning of period | $ | 18.23 | $ | 16.49 | $ | 17.89 | $ | 16.37 | ||||||||||||||||||||||||
|
|
|
|
|
|
|
| |||||||||||||||||||||||||
Net investment income(b) | 0.05 | 0.08 | 0.14 | 0.11 | ||||||||||||||||||||||||||||
Net realized and unrealized gain (loss) | 6.59 | 2.40 | (0.23 | ) | 1.41 | |||||||||||||||||||||||||||
|
|
|
|
|
|
|
| |||||||||||||||||||||||||
Net increase (decrease) from investment operations | 6.64 | 2.48 | (0.09 | ) | 1.52 | |||||||||||||||||||||||||||
|
|
|
|
|
|
|
| |||||||||||||||||||||||||
Distributions(c) | ||||||||||||||||||||||||||||||||
From net investment income | (0.08 | ) | (0.15 | ) | (0.13 | ) | — | |||||||||||||||||||||||||
From net realized gain | (1.46 | ) | (0.59 | ) | (1.18 | ) | — | |||||||||||||||||||||||||
|
|
|
|
|
|
|
| |||||||||||||||||||||||||
Total distributions | (1.54 | ) | (0.74 | ) | (1.31 | ) | — | |||||||||||||||||||||||||
|
|
|
|
|
|
|
| |||||||||||||||||||||||||
Net asset value, end of period | $ | 23.33 | $ | 18.23 | $ | 16.49 | $ | 17.89 | ||||||||||||||||||||||||
|
|
|
|
|
|
|
| |||||||||||||||||||||||||
Total Return(d) | ||||||||||||||||||||||||||||||||
Based on net asset value | 37.60 | % | 15.40 | %(e) | 0.47 | % | 9.29 | %(e) | ||||||||||||||||||||||||
|
|
|
|
|
|
|
| |||||||||||||||||||||||||
Ratios to Average Net Assets | ||||||||||||||||||||||||||||||||
Total expenses | 0.69 | % | 0.70 | %(f) | 0.71 | % | 0.72 | %(f) | ||||||||||||||||||||||||
|
|
|
|
|
|
|
| |||||||||||||||||||||||||
Total expenses after fees waived and/or reimbursed | 0.57 | % | 0.57 | %(f) | 0.57 | % | 0.57 | %(f) | ||||||||||||||||||||||||
|
|
|
|
|
|
|
| |||||||||||||||||||||||||
Net investment income | 0.25 | % | 0.72 | %(f) | 0.85 | % | 0.93 | %(f) | ||||||||||||||||||||||||
|
|
|
|
|
|
|
| |||||||||||||||||||||||||
Supplemental Data | ||||||||||||||||||||||||||||||||
Net assets, end of period (000) | $ | 1,152 | $ | 715 | $ | 973 | $ | 609 | ||||||||||||||||||||||||
|
|
|
|
|
|
|
| |||||||||||||||||||||||||
Portfolio turnover rate | 134 | % | 70 | % | 154 | % | 162 | %(g) | ||||||||||||||||||||||||
|
|
|
|
|
|
|
| |||||||||||||||||||||||||
| (a) | Commencement of operations. |
| (b) | Based on average shares outstanding. |
| (c) | Distributions for annual periods determined in accordance with U.S. federal income tax regulations. |
| (d) | Where applicable, assumes the reinvestment of distributions. |
| (e) | Aggregate total return. |
| (f) | Annualized. |
| (g) | Portfolio turnover is representative of the Fund for the entire year. |
See notes to financial statements.
| 54 | 2 0 2 1 BLACK ROCK ANNUAL REPORT TO SHAREHOLDERS |
Financial Highlights (continued)
(For a share outstanding throughout each period)
| BlackRock Advantage Large Cap Growth Fund (continued) | ||||||||||||||||||||||||||||||||||||
| Class R | ||||||||||||||||||||||||||||||||||||
| | Year Ended 05/31/21 | | | Period from 10/01/19 to 05/31/20 |
| Year Ended September 30, | ||||||||||||||||||||||||||||||
| 2019 | 2018 | 2017 | (a) | 2016 | (a) | |||||||||||||||||||||||||||||||
Net asset value, beginning of period | $ | 18.10 | $ | 16.32 | $ | 17.69 | $ | 15.01 | $ | 12.17 | $ | 11.94 | ||||||||||||||||||||||||
|
|
|
|
|
|
|
|
|
|
|
| |||||||||||||||||||||||||
Net investment income (loss)(b) | (0.06 | ) | 0.02 | 0.05 | 0.05 | 0.04 | 0.02 | |||||||||||||||||||||||||||||
Net realized and unrealized gain (loss) | 6.55 | 2.38 | (0.23 | ) | 3.49 | 2.84 | 1.05 | |||||||||||||||||||||||||||||
|
|
|
|
|
|
|
|
|
|
|
| |||||||||||||||||||||||||
Net increase (decrease) from investment operations | 6.49 | 2.40 | (0.18 | ) | 3.54 | 2.88 | 1.07 | |||||||||||||||||||||||||||||
|
|
|
|
|
|
|
|
|
|
|
| |||||||||||||||||||||||||
Distributions(c) | ||||||||||||||||||||||||||||||||||||
From net investment income | — | (0.03 | ) | (0.01 | ) | — | (0.04 | ) | — | |||||||||||||||||||||||||||
From net realized gain | (1.42 | ) | (0.59 | ) | (1.18 | ) | (0.86 | ) | — | (0.84 | ) | |||||||||||||||||||||||||
|
|
|
|
|
|
|
|
|
|
|
| |||||||||||||||||||||||||
Total distributions | (1.42 | ) | (0.62 | ) | (1.19 | ) | (0.86 | ) | (0.04 | ) | (0.84 | ) | ||||||||||||||||||||||||
|
|
|
|
|
|
|
|
|
|
|
| |||||||||||||||||||||||||
Net asset value, end of period | $ | 23.17 | $ | 18.10 | $ | 16.32 | $ | 17.69 | $ | 15.01 | $ | 12.17 | ||||||||||||||||||||||||
|
|
|
|
|
|
|
|
|
|
|
| |||||||||||||||||||||||||
Total Return(d) | ||||||||||||||||||||||||||||||||||||
Based on net asset value | 36.93 | % | 14.99 | %(e) | (0.15 | )% | 24. 68 | % | 23.68 | % | 9.04 | % | ||||||||||||||||||||||||
|
|
|
|
|
|
|
|
|
|
|
| |||||||||||||||||||||||||
Ratios to Average Net Assets | ||||||||||||||||||||||||||||||||||||
Total expenses | 1.36 | % | 1.46 | %(f) | 1.42 | % | 1.40 | % | 1.66 | % | 1.74 | % | ||||||||||||||||||||||||
|
|
|
|
|
|
|
|
|
|
|
| |||||||||||||||||||||||||
Total expenses after fees waived and/or reimbursed | 1.12 | % | 1.12 | %(f) | 1.12 | % | 1.12 | % | 1.45 | % | 1.60 | % | ||||||||||||||||||||||||
|
|
|
|
|
|
|
|
|
|
|
| |||||||||||||||||||||||||
Net investment income (loss) | (0.30 | )% | 0.16 | %(f) | 0.33 | % | 0.30 | % | 0.28 | % | 0.20 | % | ||||||||||||||||||||||||
|
|
|
|
|
|
|
|
|
|
|
| |||||||||||||||||||||||||
Supplemental Data | ||||||||||||||||||||||||||||||||||||
Net assets, end of period (000) | $ | 577 | $ | 536 | $ | 867 | $ | 1,864 | $ | 2,332 | $ | 1,875 | ||||||||||||||||||||||||
|
|
|
|
|
|
|
|
|
|
|
| |||||||||||||||||||||||||
Portfolio turnover rate | 134 | % | 70 | % | 154 | % | 162 | % | 130 | % | 36 | % | ||||||||||||||||||||||||
|
|
| �� |
|
|
|
|
|
|
|
| |||||||||||||||||||||||||
| (a) | Consolidated Financial Highlights. |
| (b) | Based on average shares outstanding. |
| (c) | Distributions for annual periods determined in accordance with U.S. federal income tax regulations. |
| (d) | Where applicable, assumes the reinvestment of distributions. |
| (e) | Aggregate total return. |
| (f) | Annualized. |
See notes to financial statements.
FINANCIAL HIGHLIGHTS | 55 |
Financial Highlights (continued)
(For a share outstanding throughout each period)
| BlackRock Advantage Small Cap Core Fund | ||||||||||||||||||||||||||
| Institutional | ||||||||||||||||||||||||||
| Year Ended May 31, | ||||||||||||||||||||||||||
| 2021 | 2020 | 2019 | 2018 | 2017 | ||||||||||||||||||||||
Net asset value, beginning of year | $ | 13.09 | $ | 13.13 | $ | 14.80 | $ | 12.70 | $ | 10.59 | ||||||||||||||||
|
|
|
|
|
|
|
|
|
| |||||||||||||||||
Net investment income(a) | 0.12 | 0.14 | 0.13 | 0.11 | 0.10 | |||||||||||||||||||||
Net realized and unrealized gain (loss) |
| 7.97 | (0.05 | ) | (1.13 | ) | 2.37 | 2.10 | ||||||||||||||||||
|
|
|
|
|
|
|
|
|
| |||||||||||||||||
Net increase (decrease) from investment operations | 8.09 | 0.09 | (1.00 | ) | 2.48 | 2.20 | ||||||||||||||||||||
|
|
|
|
|
|
|
|
|
| |||||||||||||||||
Distributions(b) | ||||||||||||||||||||||||||
From net investment income | (0.10 | ) | (0.13 | ) | (0.11 | ) | (0.09 | ) | (0.06 | ) | ||||||||||||||||
From net realized gain | (0.36 | ) | (0.00 | )(c) | (0.56 | ) | (0.29 | ) | (0.03 | ) | ||||||||||||||||
|
|
|
|
|
|
|
|
|
| |||||||||||||||||
Total distributions | (0.46 | ) | (0.13 | ) | (0.67 | ) | (0.38 | ) | (0.09 | ) | ||||||||||||||||
|
|
|
|
|
|
|
|
|
| |||||||||||||||||
Net asset value, end of year | $ | 20.72 | $ | 13.09 | $ | 13.13 | $ | 14.80 | $ | 12.70 | ||||||||||||||||
|
|
|
|
|
|
|
|
|
| |||||||||||||||||
Total Return(d) | ||||||||||||||||||||||||||
Based on net asset value | 62.61 | % | 0.61 | % | (6.89 | )% | 19.82 | % | 20.84 | % | ||||||||||||||||
|
|
|
|
|
|
|
|
|
| |||||||||||||||||
Ratios to Average Net Assets | ||||||||||||||||||||||||||
Total expenses | 0.60 | %(e) | 0.64 | % | 0.70 | % | 0.66 | % | 1.05 | % | ||||||||||||||||
|
|
|
|
|
|
|
|
|
| |||||||||||||||||
Total expenses after fees waived and/or reimbursed | 0.50 | %(e) | 0.50 | % | 0.49 | % | 0.50 | % | 0.54 | % | ||||||||||||||||
|
|
|
|
|
|
|
|
|
| |||||||||||||||||
Net investment income | 0.65 | %(e) | 0.99 | % | 0.95 | % | 0.83 | % | 0.78 | % | ||||||||||||||||
|
|
|
|
|
|
|
|
|
| |||||||||||||||||
Supplemental Data | ||||||||||||||||||||||||||
Net assets, end of year (000) | $ | 2,802,145 | $ | 847,753 | $ | 551,833 | $ | 356,274 | $ | 56,603 | ||||||||||||||||
|
|
|
|
|
|
|
|
|
| |||||||||||||||||
Portfolio turnover rate | 63 | % | 101 | % | 100 | % | 104 | % | 127 | % | ||||||||||||||||
|
|
|
|
|
|
|
|
|
| |||||||||||||||||
| (a) | Based on average shares outstanding. |
| (b) | Distributions for annual periods determined in accordance with U.S. federal income tax regulations. |
| (c) | Amount is greater than $(0.005) per share. |
| (d) | Where applicable, assumes the reinvestment of distributions. |
| (e) | Excludes expenses incurred indirectly as a result of investments in underlying funds of 0.01% |
See notes to financial statements.
| 56 | 2 0 2 1 BLACK ROCK ANNUAL REPORT TO SHAREHOLDERS |
Financial Highlights (continued)
(For a share outstanding throughout each period)
| BlackRock Advantage Small Cap Core Fund (continued) | ||||||||||||||||||||||||||||
| Investor A | ||||||||||||||||||||||||||||
| Year Ended May 31, | ||||||||||||||||||||||||||||
| 2021 | 2020 | 2019 | 2018 | 2017 | ||||||||||||||||||||||||
Net asset value, beginning of year | $ | 13.02 | $ | 13.05 | $ | 14.73 | $ | 12.66 | $ | 10.56 | ||||||||||||||||||
|
|
|
|
|
|
|
|
|
| |||||||||||||||||||
Net investment income(a) | 0.08 | 0.10 | 0.09 | 0.09 | 0.06 | |||||||||||||||||||||||
Net realized and unrealized gain (loss) | 7.91 | (0.03 | ) | (1.13 | ) | 2.34 | 2.10 | |||||||||||||||||||||
|
|
|
|
|
|
|
|
|
| |||||||||||||||||||
Net increase (decrease) from investment operations | 7.99 | 0.07 | (1.04 | ) | 2.43 | 2.16 | ||||||||||||||||||||||
|
|
|
|
|
|
|
|
|
| |||||||||||||||||||
Distributions(b) | ||||||||||||||||||||||||||||
From net investment income | (0.07 | ) | (0.10 | ) | (0.08 | ) | (0.07 | ) | (0.03 | ) | ||||||||||||||||||
From net realized gain | (0.36 | ) | (0.00 | )(c) | (0.56 | ) | (0.29 | ) | (0.03 | ) | ||||||||||||||||||
|
|
|
|
|
|
|
|
|
| |||||||||||||||||||
Total distributions | (0.43 | ) | (0.10 | ) | (0.64 | ) | (0.36 | ) | (0.06 | ) | ||||||||||||||||||
|
|
|
|
|
|
|
|
|
| |||||||||||||||||||
Net asset value, end of year | $ | 20.58 | $ | 13.02 | $ | 13.05 | $ | 14.73 | $ | 12.66 | ||||||||||||||||||
|
|
|
|
|
|
|
|
|
| |||||||||||||||||||
Total Return(d) | ||||||||||||||||||||||||||||
Based on net asset value | 62.05 | % | 0.45 | % | (7.16 | )% | 19.51 | % | 20.51 | % | ||||||||||||||||||
|
|
|
|
|
|
|
|
|
| |||||||||||||||||||
Ratios to Average Net Assets | ||||||||||||||||||||||||||||
Total expenses | 0.95 | %(e) | 1.01 | % | 1.03 | % | 1.08 | % | 1.39 | % | ||||||||||||||||||
|
|
|
|
|
|
|
|
|
| |||||||||||||||||||
Total expenses after fees waived and/or reimbursed | 0.75 | %(e) | 0.75 | % | 0.75 | % | 0.75 | % | 0.83 | % | ||||||||||||||||||
|
|
|
|
|
|
|
|
|
| |||||||||||||||||||
Net investment income | 0.45 | %(e) | 0.75 | % | 0.69 | % | 0.64 | % | 0.51 | % | ||||||||||||||||||
|
|
|
|
|
|
|
|
|
| |||||||||||||||||||
Supplemental Data | ||||||||||||||||||||||||||||
Net assets, end of year (000) | $ | 530,664 | $ | 277,926 | $ | 248,574 | $ | 79,515 | $ | 6,389 | ||||||||||||||||||
|
|
|
|
|
|
|
|
|
| |||||||||||||||||||
Portfolio turnover rate | 63 | % | 101 | % | 100 | % | 104 | % | 127 | % | ||||||||||||||||||
|
|
|
|
|
|
|
|
|
| |||||||||||||||||||
| (a) | Based on average shares outstanding. |
| (b) | Distributions for annual periods determined in accordance with U.S. federal income tax regulations. |
| (c) | Amount is greater than $(0.005) per share. |
| (d) | Where applicable, excludes the effects of any sales charges and assumes the reinvestment of distributions. |
| (e) | Excludes expenses incurred indirectly as a result of investments in underlying funds of 0.01% |
See notes to financial statements.
FINANCIAL HIGHLIGHTS | 57 |
Financial Highlights (continued)
(For a share outstanding throughout each period)
| BlackRock Advantage Small Cap Core Fund (continued) | ||||||||||||||||||||||||||
| Investor C | ||||||||||||||||||||||||||
| Year Ended May 31, | ||||||||||||||||||||||||||
| 2021 | 2020 | 2019 | 2018 | 2017 | ||||||||||||||||||||||
Net asset value, beginning of year | $ | 12.74 | $ | 12.80 | $ | 14.48 | $ | 12.44 | $ | 10.44 | ||||||||||||||||
|
|
|
|
|
|
|
|
|
| |||||||||||||||||
Net investment income (loss)(a) | (0.05 | ) | 0.00 | (b) | (0.01 | ) | (0.02 | ) | (0.03 | ) | ||||||||||||||||
Net realized and unrealized gain (loss) | 7.74 | (0.04 | ) | (1.10 | ) | 2.31 | 2.06 | |||||||||||||||||||
|
|
|
|
|
|
|
|
|
| |||||||||||||||||
Net increase (decrease) from investment operations | 7.69 | (0.04 | ) | (1.11 | ) | 2.29 | 2.03 | |||||||||||||||||||
|
|
|
|
|
|
|
|
|
| |||||||||||||||||
Distributions(c) | ||||||||||||||||||||||||||
From net investment income | — | (0.02 | ) | (0.01 | ) | — | — | |||||||||||||||||||
From net realized gain | (0.35 | ) | (0.00 | )(d) | (0.56 | ) | (0.25 | ) | (0.03 | ) | ||||||||||||||||
|
|
|
|
|
|
|
|
|
| |||||||||||||||||
Total distributions | (0.35 | ) | (0.02 | ) | (0.57 | ) | (0.25 | ) | (0.03 | ) | ||||||||||||||||
|
|
|
|
|
|
|
|
|
| |||||||||||||||||
Net asset value, end of year | $ | 20.08 | $ | 12.74 | $ | 12.80 | $ | 14.48 | $ | 12.44 | ||||||||||||||||
|
|
|
|
|
|
|
|
|
| |||||||||||||||||
Total Return(e) | ||||||||||||||||||||||||||
Based on net asset value | 60.90 | % | (0.33 | )% | (7.83 | )% | 18.65 | % | 19.47 | % | ||||||||||||||||
|
|
|
|
|
|
|
|
|
| |||||||||||||||||
Ratios to Average Net Assets | ||||||||||||||||||||||||||
Total expenses | 1.70 | %(f) | 1.71 | % | 1.81 | % | 1.94 | % | 2.22 | % | ||||||||||||||||
|
|
|
|
|
|
|
|
|
| |||||||||||||||||
Total expenses after fees waived and/or reimbursed | 1.50 | %(f) | 1.50 | % | 1.50 | % | 1.50 | % | 1.57 | % | ||||||||||||||||
|
|
|
|
|
|
|
|
|
| |||||||||||||||||
Net investment income (loss) | (0.32 | )%(f) | 0.01 | % | (0.06 | )% | (0.16 | )% | (0.25 | )% | ||||||||||||||||
|
|
|
|
|
|
|
|
|
| |||||||||||||||||
Supplemental Data | ||||||||||||||||||||||||||
Net assets, end of year (000) | $ | 12,880 | $ | 4,955 | $ | 4,363 | $ | 1,373 | $ | 764 | ||||||||||||||||
|
|
|
|
|
|
|
|
|
| |||||||||||||||||
Portfolio turnover rate | 63 | % | 101 | % | 100 | % | 104 | % | 127 | % | ||||||||||||||||
|
|
|
|
|
|
|
|
|
| |||||||||||||||||
| (a) | Based on average shares outstanding. |
| (b) | Amount is less than $0.005 per share. |
| (c) | Distributions for annual periods determined in accordance with U.S. federal income tax regulations. |
| (d) | Amount is greater than $(0.005) per share. |
| (e) | Where applicable, excludes the effects of any sales charges and assumes the reinvestment of distributions. |
| (f) | Excludes expenses incurred indirectly as a result of investments in underlying funds of 0.01% |
See notes to financial statements.
| 58 | 2 0 2 1 BLACK ROCK ANNUAL REPORT TO SHAREHOLDERS |
Financial Highlights (continued)
(For a share outstanding throughout each period)
| BlackRock Advantage Small Cap Core Fund (continued) | ||||||||||||||||||||||||||
| Class K | ||||||||||||||||||||||||||
| Year Ended May 31, | ||||||||||||||||||||||||||
| 2021 | 2020 | 2019 | 2018 | 2017 | ||||||||||||||||||||||
Net asset value, beginning of year | $ | 13.10 | $ | 13.13 | $ | 14.81 | $ | 12.70 | $ | 10.60 | ||||||||||||||||
|
|
|
|
|
|
|
|
|
| |||||||||||||||||
Net investment income(a) | 0.13 | 0.14 | 0.14 | 0.12 | 0.12 | |||||||||||||||||||||
Net realized and unrealized gain (loss) | 7.97 | (0.03 | ) | (1.15 | ) | 2.37 | 2.07 | |||||||||||||||||||
|
|
|
|
|
|
|
|
|
| |||||||||||||||||
Net increase (decrease) from investment operations | 8.10 | 0.11 | (1.01 | ) | 2.49 | 2.19 | ||||||||||||||||||||
|
|
|
|
|
|
|
|
|
| |||||||||||||||||
Distributions(b) | ||||||||||||||||||||||||||
From net investment income | (0.11 | ) | (0.14 | ) | (0.11 | ) | (0.09 | ) | (0.06 | ) | ||||||||||||||||
From net realized gain | (0.36 | ) | (0.00 | )(c) | (0.56 | ) | (0.29 | ) | (0.03 | ) | ||||||||||||||||
|
|
|
|
|
|
|
|
|
| |||||||||||||||||
Total distributions | (0.47 | ) | (0.14 | ) | (0.67 | ) | (0.38 | ) | (0.09 | ) | ||||||||||||||||
|
|
|
|
|
|
|
|
|
| |||||||||||||||||
Net asset value, end of year | $ | 20.73 | $ | 13.10 | $ | 13.13 | $ | 14.81 | $ | 12.70 | ||||||||||||||||
|
|
|
|
|
|
|
|
|
| |||||||||||||||||
Total Return(d) | ||||||||||||||||||||||||||
Based on net asset value | 62.63 | % | 0.73 | % | (6.93 | )% | 19.94 | % | 20.74 | % | ||||||||||||||||
|
|
|
|
|
|
|
|
|
| |||||||||||||||||
Ratios to Average Net Assets | ||||||||||||||||||||||||||
Total expenses | 0.52 | %(e) | 0.56 | % | 0.61 | % | 0.65 | % | 1.62 | % | ||||||||||||||||
|
|
|
|
|
|
|
|
|
| |||||||||||||||||
Total expenses after fees waived and/or reimbursed | 0.45 | %(e) | 0.45 | % | 0.45 | % | 0.45 | % | 0.45 | % | ||||||||||||||||
|
|
|
|
|
|
|
|
|
| |||||||||||||||||
Net investment income | 0.71 | %(e) | 0.99 | % | 1.00 | % | 0.90 | % | 0.95 | % | ||||||||||||||||
|
|
|
|
|
|
|
|
|
| |||||||||||||||||
Supplemental Data | ||||||||||||||||||||||||||
Net assets, end of year (000) | $ | 920,752 | $ | 188,885 | $ | 56,316 | $ | 68,375 | $ | 58,557 | ||||||||||||||||
|
|
|
|
|
|
|
|
|
| |||||||||||||||||
Portfolio turnover rate | 63 | % | 101 | % | 100 | % | 104 | % | 127 | % | ||||||||||||||||
|
|
|
|
|
|
|
|
|
| |||||||||||||||||
| (a) | Based on average shares outstanding. |
| (b) | Distributions for annual periods determined in accordance with U.S. federal income tax regulations. |
| (c) | Amount is greater than $(0.005) per share. |
| (d) | Where applicable, assumes the reinvestment of distributions. |
| (e) | Excludes expenses incurred indirectly as a result of investments in underlying funds of 0.01% |
See notes to financial statements.
FINANCIAL HIGHLIGHTS | 59 |
| 1. | ORGANIZATION |
BlackRock FundsSM (the “Trust”) is registered under the Investment Company Act of 1940, as amended (the “1940 Act”), as an open-end management investment company. The Trust is organized as a Massachusetts business trust. The following, each of which is a series of the Trust, are referred to herein collectively as the “Funds” or individually as a “Fund”:
| Fund Name | Herein Referred To As | Diversification Classification | ||
BlackRock Advantage International Fund | Advantage International | Diversified | ||
BlackRock Advantage Large Cap Growth Fund | Advantage Large Cap Growth | Diversified | ||
BlackRock Advantage Small Cap Core Fund | Advantage Small Cap Core | Diversified | ||
Each Fund offers multiple classes of shares. All classes of shares have identical voting, dividend, liquidation and other rights and are subject to the same terms and conditions, except that certain classes bear expenses related to the shareholder servicing and distribution of such shares. Institutional, Service and Class K Shares are sold only to certain eligible investors. Service, Investor A, Investor C and Class R Shares bear certain expenses related to shareholder servicing of such shares, and Investor C and Class R Shares also bear certain expenses related to the distribution of such shares. Investor A and Investor C Shares are generally available through financial intermediaries. Class R Shares are sold only to certain employer-sponsored retirement plans. Each class has exclusive voting rights with respect to matters relating to its shareholder servicing and distribution expenditures (except that Investor C shareholders may vote on material changes to the Investor A Shares distribution and service plan).
| Share Class | Initial Sales Charge | CDSC | Conversion Privilege | |||
Institutional, Service, Class K and Class R Shares | No | No | None | |||
Investor A Shares | Yes | No(a) | None | |||
Investor C Shares | No | Yes(b) | To Investor A Shares after approximately 8 years | |||
| (a) | Investor A Shares may be subject to a contingent deferred sales charge (“CDSC”) for certain redemptions where no initial sales charge was paid at the time of purchase. |
| (b) | A CDSC of 1.00% is assessed on certain redemptions of Investor C Shares made within one year after purchase. |
Effective on or about the close of business on July 6, 2021, Advantage Large Cap Growth’s Service Shares will be converted into Investor A Shares.
The Funds, together with certain other registered investment companies advised by BlackRock Advisors, LLC (the “Manager”) or its affiliates, are included in a complex of equity, multi-asset, index and money market funds referred to as the BlackRock Multi-Asset Complex.
Prior Year Reorganization: The Board of Trustees of the Trust (the “Board”) on behalf of Advantage International (the “Acquiring Fund”) and the Board of Trustees of State Farm Mutual Fund Trust on behalf of State Farm International Equity Fund (the “Target Fund”) and shareholders approved the reorganization of the Target Fund into the Acquiring Fund . As a result, the Acquiring Fund acquired all of the assets and assumed certain of the liabilities of the Target Fund in exchange for an equal aggregate value of newly-issued shares of the Acquiring Fund.
Each shareholder of the Target Fund received shares of the Acquiring Fund in an amount equal to the aggregate net asset value (“NAV”) of such shareholder’s Target Fund shares, as determined at the close of business on November 16, 2018, less the costs of the Target Fund’s reorganization.
The reorganization was accomplished by a tax-free exchange of shares of the Acquiring Fund in the following amounts and at the following conversion ratios:
| Target Fund’s Share Class | Shares Prior to Reorganization | Conversion Ratio | Acquiring Fund’s Share Class | Shares of Acquiring Fund | ||||||||||||
Class A | 2,038,749 | 0.72388825 | Investor A | 1,475,826 | ||||||||||||
Class B | 30,592 | 0.72323294 | Investor A | 22,125 | ||||||||||||
Institutional | 1,548,107 | 0.72329278 | Institutional | 1,119,735 | ||||||||||||
Class R-1 | 71,547 | 0.71993693 | Investor A | 51,509 | ||||||||||||
Class R-2 | 324,627 | 0.72254519 | Investor A | 234,558 | ||||||||||||
Class R-3 | 99,013 | 0.72435088 | Institutional | 71,720 | ||||||||||||
Legacy Class B | 19,795 | 0.74049155 | Investor A | 14,658 | ||||||||||||
Premier | 2,955,714 | 0.73171950 | Investor A | 2,162,754 | ||||||||||||
The Target Fund’s net assets and composition of net assets on November 16, 2018, the valuation date of the reorganization, were as follows:
| ||||
| Amounts | ||||
| ||||
Net assets | $ | 79,635,612 | ||
|
| |||
Paid-in capital | $ | 80,326,765 | ||
Accumulated loss | (691,153 | ) | ||
| ||||
For financial reporting purposes, assets received and shares issued by the Acquiring Fund were recorded at fair value. However, the cost basis of the investments received from the Target Fund was carried forward to align ongoing reporting of the Acquiring Fund’s realized and unrealized gains and losses with amounts distributable to shareholders for tax purposes.
| 60 | 2 0 2 1 BLACK ROCK ANNUAL REPORT TO SHAREHOLDERS |
Notes to Financial Statements (continued)
The net assets of the Acquiring Fund before the reorganization were $702,389,703.The aggregate net assets of the Acquiring Fund immediately after the reorganization amounted to $782,025,315. The Target Fund’s fair value and cost of financial instruments prior to the reorganization were as follows:
| ||||||||
| Target Fund | Fair Value of Investments | Cost of Investments | ||||||
| ||||||||
State Farm International Equity Fund | $ | 77,948,036 | $ | 77,740,666 | ||||
| ||||||||
The purpose of the transaction was to combine the assets of the Target Fund with the assets of the Acquiring Fund. The reorganization was a tax-free event and was effective on November 19, 2018.
Assuming the reorganization had been completed on October 1, 2018, the beginning of the fiscal reporting period of the Acquiring Fund, the pro forma results of operations for the year ended September 30, 2019, are as follows:
| • | Net investment income: $21,454,038. |
| • | Net realized and change in unrealized loss on investments: $(41,599,331). |
| • | Net decrease in net assets resulting from operations: $(20,145,293). |
Because the combined investment portfolios have been managed as a single integrated portfolio since the reorganization was completed, it is not practicable to separate the amounts of revenue and earnings of the Target Fund that have been included in the Acquiring Fund’s Statements of Operations since November 19, 2018.
Reorganization costs incurred by the Acquiring Fund in connection with the reorganization were expensed by the Acquiring Fund.
| 2. | SIGNIFICANT ACCOUNTING POLICIES |
The financial statements are prepared in conformity with accounting principles generally accepted in the United States of America (“U.S. GAAP”), which may require management to make estimates and assumptions that affect the reported amounts of assets and liabilities in the financial statements, disclosure of contingent assets and liabilities at the date of the financial statements and the reported amounts of increases and decreases in net assets from operations during the reporting period. Actual results could differ from those estimates. Each Fund is considered an investment company under U.S. GAAP and follows the accounting and reporting guidance applicable to investment companies. Below is a summary of significant accounting policies:
Investment Transactions and Income Recognition: For financial reporting purposes, investment transactions are recorded on the dates the transactions are executed. Realized gains and losses on investment transactions are determined using the specific identification method. Dividend income and capital gain distributions, if any, are recorded on the ex-dividend dates. Non-cash dividends, if any, are recorded on the ex-dividend dates at fair value. Dividends from foreign securities where the ex-dividend dates may have passed are subsequently recorded when the Funds are informed of the ex-dividend dates. Under the applicable foreign tax laws, a withholding tax at various rates may be imposed on capital gains, dividends and interest. Upon notification from issuers, a portion of the dividend income received from a real estate investment trust may be redesignated as a reduction of cost of the related investment and/or realized gain. Income, expenses and realized and unrealized gains and losses are allocated daily to each class based on its relative net assets.
Foreign Currency Translation: Each Fund’s books and records are maintained in U.S. dollars. Securities and other assets and liabilities denominated in foreign currencies are translated into U.S. dollars using exchange rates determined as of the close of trading on the New York Stock Exchange (“NYSE”). Purchases and sales of investments are recorded at the rates of exchange prevailing on the respective dates of such transactions. Generally, when the U.S. dollar rises in value against a foreign currency, the investments denominated in that currency will lose value; the opposite effect occurs if the U.S. dollar falls in relative value.
Each Fund does not isolate the effect of fluctuations in foreign exchange rates from the effect of fluctuations in the market prices of investments for financial reporting purposes. Accordingly, the effects of changes in exchange rates on investments are not segregated in the Statements of Operations from the effects of changes in market prices of those investments, but are included as a component of net realized and unrealized gain (loss) from investments. Each Fund reports realized currency gains (losses) on foreign currency related transactions as components of net realized gain (loss) for financial reporting purposes, whereas such components are generally treated as ordinary income for U.S. federal income tax purposes.
ForeignTaxes: The Funds may be subject to foreign taxes (a portion of which may be reclaimable) on income, stock dividends, capital gains on investments, or certain foreign currency transactions. All foreign taxes are recorded in accordance with the applicable foreign tax regulations and rates that exist in the foreign jurisdictions in which each Fund invests. These foreign taxes, if any, are paid by each Fund and are reflected in its Statements of Operations as follows: foreign taxes withheld at source are presented as a reduction of income, foreign taxes on securities lending income are presented as a reduction of securities lending income, foreign taxes on stock dividends are presented as “Foreign taxes withheld”, and foreign taxes on capital gains from sales of investments and foreign taxes on foreign currency transactions are included in their respective net realized gain (loss) categories. Foreign taxes payable or deferred as of May 31, 2021, if any, are disclosed in the Statements of Assets and Liabilities.
The Funds file withholding tax reclaims in certain jurisdictions to recover a portion of amounts previously withheld. The Funds may record a reclaim receivable based on collectability, which includes factors such as the jurisdiction’s applicable laws, payment history and market convention. The Statements of Operations include tax reclaims recorded as well as professional and other fees, if any, associated with recovery of foreign withholding taxes.
Segregation and Collateralization: In cases where a Fund enters into certain investments (e.g., futures contracts) that would be treated as “senior securities” for 1940 Act purposes, a Fund may segregate or designate on its books and records cash or liquid assets having a market value at least equal to the amount of its future obligations under such investments. Doing so allows the investment to be excluded from treatment as a “senior security.” Furthermore, if required by an exchange or counterparty agreement, the Funds may be required to deliver/deposit cash and/or securities to/with an exchange, or broker-dealer or custodian as collateral for certain investments or obligations.
NOTES TO FINANCIAL STATEMENTS | 61 |
Notes to Financial Statements (continued)
Distributions: Distributions paid by the Funds are recorded on the ex-dividend dates. The character and timing of distributions are determined in accordance with U.S. federal income tax regulations, which may differ from U.S. GAAP.
Indemnifications: In the normal course of business, a Fund enters into contracts that contain a variety of representations that provide general indemnification. A Fund’s maximum exposure under these arrangements is unknown because it involves future potential claims against a Fund, which cannot be predicted with any certainty.
Other: Expenses directly related to a Fund or its classes are charged to that Fund or the applicable class. Expenses directly related to the Funds and other shared expenses prorated to the Funds are allocated daily to each class based on their relative net assets or other appropriate methods. Other operating expenses shared by several funds, including other funds managed by the Manager, are prorated among those funds on the basis of relative net assets or other appropriate methods.
The Funds have an arrangement with their custodian whereby credits are earned on uninvested cash balances, which could be used to reduce custody fees and/or overdraft charges. The Funds may incur charges on overdrafts, subject to certain conditions.
| 3. | INVESTMENT VALUATION AND FAIR VALUE MEASUREMENTS |
Investment Valuation Policies: Each Fund’s investments are valued at fair value (also referred to as “market value” within the financial statements) each day that the Fund is open for business and, for financial reporting purposes, as of the report date. U.S. GAAP defines fair value as the price a fund would receive to sell an asset or pay to transfer a liability in an orderly transaction between market participants at the measurement date. Each Fund determines the fair values of its financial instruments using various independent dealers or pricing services under policies approved by the Board. If a security’s market price is not readily available or does not otherwise accurately represent the fair value of the security, the security will be valued in accordance with a policy approved by the Board as reflecting fair value. The BlackRock Global Valuation Methodologies Committee (the “Global Valuation Committee”) is the committee formed by management to develop global pricing policies and procedures and to oversee the pricing function for all financial instruments.
Fair Value Inputs and Methodologies: The following methods and inputs are used to establish the fair value of each Fund’s assets and liabilities:
| • | Equity investments traded on a recognized securities exchange are valued at that day’s official closing price, as applicable, on the exchange where the stock is primarily traded. Equity investments traded on a recognized exchange for which there were no sales on that day may be valued at the last available bid (long positions) or ask (short positions) price. |
Generally, trading in foreign instruments is substantially completed each day at various times prior to the close of trading on the NYSE. Occasionally, events affecting the values of such instruments may occur between the foreign market close and the close of trading on the NYSE that may not be reflected in the computation of the Funds’ net assets. Each business day, the Funds use a pricing service to assist with the valuation of certain foreign exchange-traded equity securities and foreign exchange-traded and over-the-counter (“OTC”) options (the “Systematic Fair Value Price”). Using current market factors, the Systematic Fair Value Price is designed to value such foreign securities and foreign options at fair value as of the close of trading on the NYSE, which follows the close of the local markets.
| • | Investments in open-end U.S. mutual funds (including money market funds) are valued at that day’s published NAV. |
| • | The Funds value their investment in SL Liquidity Series, LLC, Money Market Series (the “Money Market Series”) at fair value, which is ordinarily based upon their pro rata ownership in the underlying fund’s net assets. |
| • | Futures contracts are valued based on that day’s last reported settlement or trade price on the exchange where the contract is traded. |
If events (e.g., a market closure, market volatility, company announcement or a natural disaster) occur that are expected to materially affect the value of such investment, or in the event that application of these methods of valuation results in a price for an investment that is deemed not to be representative of the market value of such investment, or if a price is not available, the investment will be valued by the Global Valuation Committee, or its delegate, in accordance with a policy approved by the Board as reflecting fair value (“Fair Valued Investments”). The fair valuation approaches that may be used by the Global Valuation Committee include market approach, income approach and cost approach. Valuation techniques such as discounted cash flow, use of market comparables and matrix pricing are types of valuation approaches and are typically used in determining fair value. When determining the price for Fair Valued Investments, the Global Valuation Committee, or its delegate, seeks to determine the price that each Fund might reasonably expect to receive or pay from the current sale or purchase of that asset or liability in an arm’s-length transaction. Fair value determinations shall be based upon all available factors that the Global Valuation Committee, or its delegate, deems relevant and consistent with the principles of fair value measurement. The pricing of all Fair Valued Investments is subsequently reported to the Board or a committee thereof on a quarterly basis.
| 62 | 2 0 2 1 BLACK ROCK ANNUAL REPORT TO SHAREHOLDERS |
Notes to Financial Statements (continued)
For investments in equity or debt issued by privately held companies or funds (“Private Company” or collectively, the “Private Companies”) and other Fair Valued Investments, the fair valuation approaches that are used by the Global Valuation Committee and third party pricing services utilize one or a combination of, but not limited to, the following inputs.
| Standard Inputs Generally Considered By Third Party Pricing Services | ||||
Market approach | (i) | recent market transactions, including subsequent rounds of financing, in the underlying investment or comparable issuers; | ||
| (ii) | recapitalizations and other transactions across the capital structure; and | |||
| (iii) | market multiples of comparable issuers. | |||
Income approach | (i) | future cash flows discounted to present and adjusted as appropriate for liquidity, credit, and/or market risks; | ||
| (ii) | quoted prices for similar investments or assets in active markets; and | |||
| (iii) | other risk factors, such as interest rates, yield curves, volatilities, prepayment speeds, loss severities, credit risks, recovery rates, liquidation amounts and/or default rates. | |||
Cost approach | (i) | audited or unaudited financial statements, investor communications and financial or operational metrics issued by the Private Company; | ||
| (ii) | changes in the valuation of relevant indices or publicly traded companies comparable to the Private Company; | |||
| (iii) | relevant news and other public sources; and | |||
| (iv) | known secondary market transactions in the Private Company’s interests and merger or acquisition activity in companies comparable to the Private Company. | |||
Investments in series of preferred stock issued by Private Companies are typically valued utilizing market approach in determining the enterprise value of the company. Such investments often contain rights and preferences that differ from other series of preferred and common stock of the same issuer. Enterprise valuation techniques such as an option pricing model (“OPM”), a probability weighted expected return model (“PWERM”), current value method or a hybrid of those techniques are used, as deemed appropriate under the circumstances. The use of these valuation techniques involve a determination of the exit scenarios of the investment in order to appropriately allocate the enterprise value of the company among the various parts of its capital structure.
The Private Companies are not subject to the public company disclosure, timing, and reporting standards applicable to other investments held by a Fund. Typically, the most recently available information by a Private Company is as of a date that is earlier than the date a Fund is calculating its NAV. This factor may result in a difference between the value of the investment and the price a Fund could receive upon the sale of the investment.
Fair Value Hierarchy: Various inputs are used in determining the fair value of financial instruments. These inputs to valuation techniques are categorized into a fair value hierarchy consisting of three broad levels for financial reporting purposes as follows:
| • | Level 1 – Unadjusted price quotations in active markets/exchanges for identical assets or liabilities that each Fund has the ability to access; |
| • | Level 2 – Other observable inputs (including, but not limited to, quoted prices for similar assets or liabilities in markets that are active, quoted prices for identical or similar assets or liabilities in markets that are not active, inputs other than quoted prices that are observable for the assets or liabilities (such as interest rates, yield curves, volatilities, prepayment speeds, loss severities, credit risks and default rates) or other market–corroborated inputs); and |
| • | Level 3 – Unobservable inputs based on the best information available in the circumstances, to the extent observable inputs are not available (including the Global Valuation Committee’s assumptions used in determining the fair value of financial instruments). |
The hierarchy gives the highest priority to unadjusted quoted prices in active markets for identical assets or liabilities (Level 1 measurements) and the lowest priority to unobservable inputs (Level 3 measurements). Accordingly, the degree of judgment exercised in determining fair value is greatest for instruments categorized in Level 3. The inputs used to measure fair value may fall into different levels of the fair value hierarchy. In such cases, for disclosure purposes, the fair value hierarchy classification is determined based on the lowest level input that is significant to the fair value measurement in its entirety. Investments classified within Level 3 have significant unobservable inputs used by the Global Valuation Committee in determining the price for Fair Valued Investments. Level 3 investments include equity or debt issued by Private Companies that may not have a secondary market and/or may have a limited number of investors. The categorization of a value determined for financial instruments is based on the pricing transparency of the financial instruments and is not necessarily an indication of the risks associated with investing in those securities.
As of May 31, 2021, certain investments of the Funds were fair valued using NAV per share as no quoted market value is available and therefore have been excluded from the fair value hierarchy.
| 4. | SECURITIES AND OTHER INVESTMENTS |
Preferred Stocks: Preferred stock has a preference over common stock in liquidation (and generally in receiving dividends as well), but is subordinated to the liabilities of the issuer in all respects. As a general rule, the market value of preferred stock with a fixed dividend rate and no conversion element varies inversely with interest rates and perceived credit risk, while the market price of convertible preferred stock generally also reflects some element of conversion value. Because preferred stock is junior to debt securities and other obligations of the issuer, deterioration in the credit quality of the issuer will cause greater changes in the value of a preferred stock than in a more senior debt security with similar stated yield characteristics. Unlike interest payments on debt securities, preferred stock dividends are payable only if declared by the issuer’s board of directors. Preferred stock also may be subject to optional or mandatory redemption provisions.
Securities Lending: The Funds may lend their securities to approved borrowers, such as brokers, dealers and other financial institutions. The borrower pledges and maintains with the Funds collateral consisting of cash, an irrevocable letter of credit issued by a bank, or securities issued or guaranteed by the U.S. Government. The initial collateral received by each Fund is required to have a value of at least 102% of the current value of the loaned securities for securities traded on U.S. exchanges and a value of at least 105% for all other securities. The collateral is maintained thereafter at a value equal to at least 100% of the current market value of the securities on loan. The market value of
NOTES TO FINANCIAL STATEMENTS | 63 |
Notes to Financial Statements (continued)
the loaned securities is determined at the close of each business day of the Fund and any additional required collateral is delivered to the Fund, or excess collateral returned by the Fund, on the next business day. During the term of the loan, the Funds are entitled to all distributions made on or in respect of the loaned securities, but do not receive interest income on securities received as collateral. Loans of securities are terminable at any time and the borrower, after notice, is required to return borrowed securities within the standard time period for settlement of securities transactions.
As of period end, any securities on loan were collateralized by cash and/or U.S. Government obligations. Cash collateral invested by the securities lending agent, BlackRock Investment Management, LLC (“BIM”), if any, is disclosed in the Schedules of Investments. Any non-cash collateral received cannot be sold, re-invested or pledged by the Fund, except in the event of borrower default. The securities on loan, if any, are disclosed in the Funds’ Schedules of Investments. The market value of any securities on loan and the value of any related collateral are shown separately in the Statements of Assets and Liabilities as a component of investments at value – unaffiliated and collateral on securities loaned at value, respectively.
Securities lending transactions are entered into by the Funds under Master Securities Lending Agreements (each, an “MSLA”), which provide the right, in the event of default (including bankruptcy or insolvency), for the non-defaulting party to liquidate the collateral and calculate a net exposure to the defaulting party or request additional collateral. In the event that a borrower defaults, the Funds, as lender, would offset the market value of the collateral received against the market value of the securities loaned. When the value of the collateral is greater than that of the market value of the securities loaned, the lender is left with a net amount payable to the defaulting party. However, bankruptcy or insolvency laws of a particular jurisdiction may impose restrictions on or prohibitions against such a right of offset in the event of an MSLA counterparty’s bankruptcy or insolvency. Under the MSLA, absent an event of default, the borrower can resell or re-pledge the loaned securities, and the Funds can reinvest cash collateral received in connection with loaned securities. Upon an event of default, the parties’ obligations to return the securities or collateral to the other party are extinguished, and the parties can resell or re-pledge the loaned securities or the collateral received in connection with the loaned securities in order to satisfy the defaulting party’s net payment obligation for all transactions under the MSLA. The defaulting party remains liable for any deficiency.
As of period end, the following table is a summary of the Funds’ securities on loan by counterparty which are subject to offset under an MSLA:
| ||||||||||||||||||||||||||||
| Securities | Cash | Net | ||||||||||||||||||||||||||
| Fund Name/Counterparty | Loaned at Value | Collateral Received(a) | Amount | |||||||||||||||||||||||||
| ||||||||||||||||||||||||||||
Advantage International | ||||||||||||||||||||||||||||
Morgan Stanley & Co. LLC | $ | 121,282 | $ | (121,282 | ) | $ | — | |||||||||||||||||||||
|
|
|
|
|
| |||||||||||||||||||||||
Advantage Large Cap Growth | ||||||||||||||||||||||||||||
Citigroup Global Markets, Inc. | $ | 1,255,888 | $ | (1,255,888 | ) | $ | — | |||||||||||||||||||||
|
|
|
|
|
| |||||||||||||||||||||||
Advantage Small Cap Core(b) | ||||||||||||||||||||||||||||
Barclays Capital, Inc. | $ | 15,719,575 | $ | (15,719,575 | ) | $ | — | |||||||||||||||||||||
BofA Securities, Inc. | 3,656,800 | (3,656,800 | ) | — | ||||||||||||||||||||||||
Citigroup Global Markets, Inc. | 32,992,461 | (32,992,461 | ) | — | ||||||||||||||||||||||||
Credit Suisse Securities (USA) LLC | 3,376,738 | (3,376,738 | ) | — | ||||||||||||||||||||||||
Deutsche Bank Securities, Inc. | 4,957,904 | (4,957,904 | ) | — | ||||||||||||||||||||||||
J.P. Morgan Securities LLC | 51,806,311 | (51,806,311 | ) | — | ||||||||||||||||||||||||
Jefferies LLC | 1,398,600 | (1,398,600 | ) | — | ||||||||||||||||||||||||
Morgan Stanley & Co. LLC | 28,011,127 | (28,011,127 | ) | — | ||||||||||||||||||||||||
National Financial Services LLC | 5,617,518 | (5,617,518 | ) | — | ||||||||||||||||||||||||
State Street Bank & Trust Co | 11,436,132 | (11,436,132 | ) | — | ||||||||||||||||||||||||
TD Prime Services LLC | 6,123,809 | (6,123,809 | ) | — | ||||||||||||||||||||||||
|
|
|
|
|
| |||||||||||||||||||||||
| $ | 165,096,975 | $ | (165,096,975 | ) | $ | — | ||||||||||||||||||||||
|
|
|
|
|
| |||||||||||||||||||||||
| (a) | Collateral received in excess of the market value of securities on loan is not presented in this table. The total cash collateral received by each Fund is disclosed in the Funds’ Statements of Assets and Liabilities. |
| (b) | Securities loaned with a value of $117,723 have been sold and are pending settlement as of May 31, 2021. |
The risks of securities lending include the risk that the borrower may not provide additional collateral when required or may not return the securities when due. To mitigate these risks, the Funds benefit from a borrower default indemnity provided by BIM. BIM’s indemnity allows for full replacement of the securities loaned to the extent the collateral received does not cover the value on the securities loaned in the event of borrower default. Each Fund could incur a loss if the value of an investment purchased with cash collateral falls below the market value of loaned securities or if the value of an investment purchased with cash collateral falls below the value of the original cash collateral received. Such losses are borne entirely by the Funds.
| 5. | DERIVATIVE FINANCIAL INSTRUMENTS |
The Funds engage in various portfolio investment strategies using derivative contracts both to increase the returns of the Funds and/or to manage their exposure to certain risks such as credit risk, equity risk, interest rate risk, foreign currency exchange rate risk, commodity price risk or other risks (e.g., inflation risk). Derivative financial instruments categorized by risk exposure are included in the Schedules of Investments. These contracts may be transacted on an exchange or OTC.
Futures Contracts: Futures contracts are purchased or sold to gain exposure to, or manage exposure to, changes in interest rates (interest rate risk) and changes in the value of equity securities (equity risk) or foreign currencies (foreign currency exchange rate risk).
Futures contracts are exchange-traded agreements between the Funds and a counterparty to buy or sell a specific quantity of an underlying instrument at a specified price and on a specified date. Depending on the terms of a contract, it is settled either through physical delivery of the underlying instrument on the settlement date or by payment of a cash amount on the settlement date. Upon entering into a futures contract, the Funds are required to deposit initial margin with the broker in the form of cash or securities in an amount that varies depending on a contract’s size and risk profile. The initial margin deposit must then be maintained at an established level over the life of the contract. Amounts pledged, which are considered restricted, are included in cash pledged for futures contracts in the Statements of Assets and Liabilities.
| 64 | 2 0 2 1 BLACK ROCK ANNUAL REPORT TO SHAREHOLDERS |
Notes to Financial Statements (continued)
Securities deposited as initial margin are designated in the Schedules of Investments and cash deposited, if any, are shown as cash pledged for futures contracts in the Statements of Assets and Liabilities. Pursuant to the contract, the Funds agree to receive from or pay to the broker an amount of cash equal to the daily fluctuation in market value of the contract (“variation margin”). Variation margin is recorded as unrealized appreciation (depreciation) and, if any, shown as variation margin receivable (or payable) on futures contracts in the Statements of Assets and Liabilities. When the contract is closed, a realized gain or loss is recorded in the Statements of Operations equal to the difference between the notional amount of the contract at the time it was opened and the notional amount at the time it was closed. The use of futures contracts involves the risk of an imperfect correlation in the movements in the price of futures contracts and interest rates, foreign currency exchange rates or underlying assets.
| 6. | INVESTMENT ADVISORY AGREEMENT AND OTHER TRANSACTIONS WITH AFFILIATES |
Investment Advisory: The Trust, on behalf of the Funds, entered into an Investment Advisory Agreement with the Manager, the Funds’ investment adviser and an indirect, wholly-owned subsidiary of BlackRock, Inc. (“BlackRock”), to provide investment advisory services. The Manager is responsible for the management of each Fund’s portfolio and provides the personnel, facilities, equipment and certain other services necessary to the operations of each Fund.
For such services, each Fund pays the Manager a monthly fee at an annual rate equal to the following percentages of the average daily value of each Fund’s net assets:
| Investment Advisory Fees | ||||||||||||
| Average Daily Net Assets | Advantage International | Advantage Large Cap Growth | Advantage Small Cap Core | |||||||||
First $1 billion | 0.45 | % | 0.57 | % | 0.45 | % | ||||||
$1 billion - $3 billion | 0.42 | 0.54 | 0.42 | |||||||||
$3 billion - $5 billion | 0.41 | 0.51 | 0.41 | |||||||||
$5 billion - $10 billion | 0.39 | 0.50 | 0.39 | |||||||||
Greater than $10 billion | 0.38 | 0.48 | 0.38 | |||||||||
Service and Distribution Fees: The Trust, on behalf of the Funds, entered into a Distribution Agreement and a Distribution and Service Plan with BlackRock Investments, LLC (“BRIL”), an affiliate of the Manager. Pursuant to the Distribution and Service Plan and in accordance with Rule 12b-1 under the 1940 Act, each Fund pays BRIL ongoing service and distribution fees. The fees are accrued daily and paid monthly at annual rates based upon the average daily net assets of the relevant share class of each Fund as follows:
| Advantage International | Advantage Large Cap Growth | Advantage Small Cap Core | ||||||||||||||||||||||
| Share Class | Service Fees | Distribution Fees | Service Fees | Distribution Fees | Service Fees | Distribution Fees | ||||||||||||||||||
Service | N/A | N/A | 0.25 | % | N/A | N/A | N/A | |||||||||||||||||
Investor A | 0.25 | % | N/A | 0.25 | N/A | 0.25 | % | N/A | ||||||||||||||||
Investor C | 0.25 | 0.75 | % | 0.25 | 0.75 | % | 0.25 | 0.75 | % | |||||||||||||||
Class R | 0.25 | 0.25 | 0.25 | 0.25 | N/A | N/A | ||||||||||||||||||
BRIL and broker-dealers, pursuant to sub-agreements with BRIL, provide shareholder servicing and distribution services to the Funds. The ongoing service and/or distribution fee compensates BRIL and each broker-dealer for providing shareholder servicing and/or distribution related services to shareholders.
For the year ended May 31, 2021, the following table shows the class specific service and distribution fees borne directly by each share class of each Fund:
| ||||||||||||||||||||
| Fund Name | Service | Investor A | Investor C | Class R | Total | |||||||||||||||
| ||||||||||||||||||||
Advantage International | $ | — | $ | 1,015,477 | $ | 47,203 | $ | 16,054 | $ | 1,078,734 | ||||||||||
Advantage Large Cap Growth | 529 | 2,069,350 | 134,949 | 2,628 | 2,207,456 | |||||||||||||||
Advantage Small Cap Core | — | 950,247 | 76,147 | — | 1,026,394 | |||||||||||||||
| ||||||||||||||||||||
Administration: The Trust, on behalf of the Funds, entered into an Administration Agreement with the Manager, an indirect, wholly-owned subsidiary of BlackRock, to provide administrative services. For these services, the Manager receives an administration fee computed daily and payable monthly, based on a percentage of the average daily net assets of each Fund. The administration fee, which is shown as administration in the Statements of Operations, is paid at the annual rates below.
| Average Daily Net Assets | Administration Fees | |||
First $500 million | 0.0425 | % | ||
$500 million - $1 billion | 0.0400 | |||
$1 billion - $2 billion | 0.0375 | |||
$2 billion - $4 billion | 0.0350 | |||
$4 billion - $13 billion | 0.0325 | |||
Greater than $13 billion | 0.0300 | |||
In addition, the Manager charges each of the share classes an administration fee, which is shown as administration — class specific in the Statements of Operations, at an annual rate of 0.02% of the average daily net assets of each respective class.
NOTES TO FINANCIAL STATEMENTS | 65 |
Notes to Financial Statements (continued)
For the year ended May 31, 2021, the following table shows the class specific administration fees borne directly by each share class of each Fund:
| ||||||||||||||||||||||||||||||||||||||||
| Fund Name | Institutional | Service | Investor A | Investor C | Class K | Class R | Total | |||||||||||||||||||||||||||||||||
| ||||||||||||||||||||||||||||||||||||||||
Advantage International | $ | 108,759 | $ | — | $ | 81,314 | $ | 947 | $ | 12,526 | $ | 643 | $ | 204,189 | ||||||||||||||||||||||||||
Advantage Large Cap Growth | 21,820 | 42 | 165,666 | 2,707 | 199 | 105 | 190,539 | |||||||||||||||||||||||||||||||||
Advantage Small Cap Core | 332,380 | — | 75,990 | 1,521 | 100,286 | — | 510,177 | |||||||||||||||||||||||||||||||||
| ||||||||||||||||||||||||||||||||||||||||
Transfer Agent: Pursuant to written agreements, certain financial intermediaries, some of which may be affiliates, provide the Funds with sub-accounting, recordkeeping, sub-transfer agency and other administrative services with respect to servicing of underlying investor accounts. For these services, these entities receive an asset-based fee or an annual fee per shareholder account, which will vary depending on share class and/or net assets. For the year ended May 31, 2021, the Funds paid the following amounts to affiliates of BlackRock in return for these services, which are included in transfer agent — class specific in the Statements of Operations:
| ||||||||||||
| Fund Name | Institutional | Total | ||||||||||
| ||||||||||||
Advantage International | $ | 566,233 | $ | 566,233 | ||||||||
Advantage Small Cap Core | 201,565 | 201,565 | ||||||||||
| ||||||||||||
The Manager maintains a call center that is responsible for providing certain shareholder services to the Funds. Shareholder services include responding to inquiries and processing purchases and sales based upon instructions from shareholders. For the year ended May 31, 2021, each Fund reimbursed the Manager the following amounts for costs incurred in running the call center, which are included in transfer agent — class specific in the Statements of Operations:
| ||||||||||||||||||||||||||||||||||||||||||||||||||||
| Fund Name | Institutional | Service | Investor A | Investor C | Class K | Class R | Total | |||||||||||||||||||||||||||||||||||||||||||||
| ||||||||||||||||||||||||||||||||||||||||||||||||||||
Advantage International | $ | 5,695 | $ | — | $ | 15,389 | $ | 1,666 | $ | 123 | $ | 72 | $ | 22,945 | ||||||||||||||||||||||||||||||||||||||
Advantage Large Cap Growth | 2,156 | 17 | 86,833 | 2,632 | 20 | 24 | 91,682 | |||||||||||||||||||||||||||||||||||||||||||||
Advantage Small Cap Core | 5,058 | — | 13,322 | 3,640 | 956 | — | 22,976 | |||||||||||||||||||||||||||||||||||||||||||||
| ||||||||||||||||||||||||||||||||||||||||||||||||||||
For the year ended May 31, 2021, the following table shows the class specific transfer agent fees borne directly by each share class of each Fund:
| ||||||||||||||||||||||||||||
| Fund Name | Institutional | Service | Investor A | Investor C | Class K | Class R | Total | |||||||||||||||||||||
| ||||||||||||||||||||||||||||
Advantage International | $ | 859,375 | $ | — | $ | 747,717 | $ | 12,339 | $ | 3,718 | $ | 7,629 | $ | 1,630,778 | ||||||||||||||
Advantage Large Cap Growth | 172,312 | 385 | 1,339,958 | 22,488 | 216 | 977 | 1,536,336 | |||||||||||||||||||||
Advantage Small Cap Core | 1,319,764 | — | 700,097 | 13,754 | 20,814 | — | 2,054,429 | |||||||||||||||||||||
| ||||||||||||||||||||||||||||
Other Fees: For the year ended May 31, 2021, affiliates earned underwriting discounts, direct commissions and dealer concessions on sales of each Fund’s Investor A Shares as follows:
| ||||
| Fund Name | Amounts | |||
| ||||
Advantage International | $ | 5,653 | ||
Advantage Large Cap Growth | 10,941 | |||
Advantage Small Cap Core | 38,534 | |||
| ||||
For the year ended May 31, 2021, affiliates received CDSCs as follows:
| ||||||||||||||||||||||||
| Share Class | Advantage | Advantage Large Cap Growth | Advantage Core | |||||||||||||||||||||
| ||||||||||||||||||||||||
Investor A | $ | 2,874 | $ | 1,271 | $ | 3,595 | ||||||||||||||||||
Investor C | 2,376 | 766 | 1,837 | |||||||||||||||||||||
|
|
|
|
|
| |||||||||||||||||||
| $ | 5,250 | $ | 2,037 | $ | 5,432 | |||||||||||||||||||
|
|
|
|
|
| |||||||||||||||||||
Expense Limitations, Waivers and Reimbursements: With respect to each Fund, the Manager contractually agreed to waive its investment advisory fees by the amount of investment advisory fees each Fund pays to the Manager indirectly through its investment in affiliated money market funds (the “affiliated money market fund waiver”) through September 30, 2021. The contractual agreement may be terminated upon 90 days’ notice by a majority of the trustees who are not “interested persons” of the Trust, as defined in the 1940 Act (“Independent Trustees”), or by a vote of a majority of the outstanding voting securities of a Fund. The amount of waivers and/or reimbursements of fees and expenses made pursuant to the expense limitation described below will be reduced by the amount of the affiliated money market fund waiver. These amounts are included in fees waived and/or reimbursed by the Manager in the Statements of Operations. For the year ended May 31, 2021, the amounts waived were as follows:
| ||||||||
| Fund Name | Amounts Waived | |||||||
| ||||||||
Advantage International | $ | 15,348 | ||||||
Advantage Large Cap Growth | 17,005 | |||||||
Advantage Small Cap Core | 52,318 | |||||||
| ||||||||
The Manager has contractually agreed to waive its investment advisory fee with respect to any portion of each Fund’s assets invested in affiliated equity and fixed-income mutual funds and affiliated exchange-traded funds that have a contractual management fee through September 30, 2021. The contractual agreement may be terminated upon 90 days’ notice by a majority of the Independent Trustees or by a vote of a majority of the outstanding voting securities of a Fund. For the year ended ended May 31, 2021, there were no fees waived by the Manager pursuant to this arrangement.
| 66 | 2 0 2 1 BLACK ROCK ANNUAL REPORT TO SHAREHOLDERS |
Notes to Financial Statements (continued)
With respect to each Fund, the Manager contractually agreed to waive and/or reimburse fees or expenses in order to limit expenses, excluding interest expense, dividend expense, tax expense, acquired fund fees and expenses, and certain other fund expenses, which constitute extraordinary expenses not incurred in the ordinary course of each Fund’s business (“expense limitation”). The expense limitations as a percentage of average daily net assets are as follows:
| Fund Name | Institutional | Service | Investor A | Investor C | Class K | Class R | ||||||||||||||||||
Advantage International | 0.50 | % | N/A | 0.75 | % | 1.50 | % | 0.45 | % | 1.00 | % | |||||||||||||
Advantage Large Cap Growth | 0.62 | 0.87 | 0.87 | 1.62 | 0.57 | 1.12 | ||||||||||||||||||
Advantage Small Cap Core | 0.50 | N/A | 0.75 | 1.50 | 0.45 | N/A | ||||||||||||||||||
The Manager has agreed not to reduce or discontinue these contractual expense limitations through September 30, 2021 (or September 30, 2031 with respect to Advantage Large Cap Growth Class R Shares), unless approved by the Board, including a majority of the Independent Trustees or by a vote of a majority of the outstanding voting securities of a Fund.
For the year ended May 31, 2021, the Manager waived and/or reimbursed investment advisory fees, which is included in fees waived and/or reimbursed by the Manager in the Statements of Operations, as follows:
| ||||||||
| Fund Name | Amounts Waived | |||||||
| ||||||||
Advantage International | $ | 1,517,792 | ||||||
Advantage Large Cap Growth | 755,057 | |||||||
Advantage Small Cap Core | 1,140,970 | |||||||
| ||||||||
In addition, these amounts waived and/or reimbursed by the Manager are included in administration fees waived — class specific and transfer agent fees waived and/or reimbursed — class specific, respectively, in the Statements of Operations. For the year ended May 31, 2021, class specific expense waivers and/or reimbursements were as follows:
| ||||||||||||||||||||||||||||||||||||||||
| Administration Fees Waived | ||||||||||||||||||||||||||||||||||||||||
|
| |||||||||||||||||||||||||||||||||||||||
| Fund Name | Institutional | Service | Investor A | Investor C | Class K | Class R | Total | |||||||||||||||||||||||||||||||||
| ||||||||||||||||||||||||||||||||||||||||
Advantage International | $ | 108,759 | $ | — | $ | 81,314 | $ | 947 | $ | 12,526 | $ | 643 | $ | 204,189 | ||||||||||||||||||||||||||
Advantage Large Cap Growth | 21,820 | 42 | 165,666 | 2,707 | 199 | 105 | 190,539 | |||||||||||||||||||||||||||||||||
Advantage Small Cap Core | 332,380 | — | 75,990 | 1,521 | 100,286 | — | 510,177 | |||||||||||||||||||||||||||||||||
| ||||||||||||||||||||||||||||||||||||||||
| ||||||||||||||||||||||||||||||||||||
| Transfer Agent Fees Waived and/or Reimbursed | ||||||||||||||||||||||||||||||||||||
|
| |||||||||||||||||||||||||||||||||||
| Fund Name | Institutional | Service | Investor A | Investor C | Class K | Class R | Total | |||||||||||||||||||||||||||||
| ||||||||||||||||||||||||||||||||||||
Advantage International | $ | 587,467 | $ | — | $ | 543,865 | $ | 9,855 | $ | 3,718 | $ | 6,009 | $ | 1,150,914 | ||||||||||||||||||||||
Advantage Large Cap Growth | 117,658 | 279 | 923,789 | 15,347 | 215 | 710 | 1,057,998 | |||||||||||||||||||||||||||||
Advantage Small Cap Core | 486,459 | — | 508,819 | 9,730 | 20,814 | — | 1,025,822 | |||||||||||||||||||||||||||||
| ||||||||||||||||||||||||||||||||||||
Securities Lending: The U.S. Securities and Exchange Commission (“SEC”) has issued an exemptive order which permits BIM, an affiliate of the Manager, to serve as securities lending agent for the Funds, subject to applicable conditions. As securities lending agent, BIM bears all operational costs directly related to securities lending. The Funds are responsible for expenses in connection with the investment of cash collateral received for securities on loan (the “collateral investment expenses”). The cash collateral is invested in a private investment company, Money Market Series, managed by the Manager or its affiliates. However, BIM has agreed to cap the collateral investment expenses of the Money Market Series to an annual rate of 0.04%. The investment adviser to the Money Market Series will not charge any advisory fees with respect to shares purchased by the Funds. The Money Market Series may, under certain circumstances, impose a liquidity fee of up to 2% of the value withdrawn or temporarily restrict withdrawals for up to 10 business days during a 90 day period, in the event that the private investment company’s weekly liquid assets fall below certain thresholds. The Money Market Series seeks current income consistent with maintaining liquidity and preserving capital. Although the Money Market Series is not registered under the 1940 Act, its investments may follow the parameters of investments by a money market fund that is subject to Rule 2a-7 under the 1940 Act.
Securities lending income is equal to the total of income earned from the reinvestment of cash collateral, net of fees and other payments to and from borrowers of securities, and less the collateral investment expenses. Each Fund retains a portion of securities lending income and remits a remaining portion to BIM as compensation for its services as securities lending agent.
Pursuant to the current securities lending agreement, Advantage Large Cap Growth and Advantage Small Cap Core retains 77% of securities lending income (which excludes collateral investment expenses), and this amount retained can never be less than 70% of the total of securities lending income plus the collateral investment expenses. Pursuant to the current securities lending agreement, Advantage International retains 82% of securities lending income (which excludes collateral investment expenses), and this amount retained can never be less than 70% of the total of securities lending income plus the collateral investment expenses.
In addition, commencing the business day following the date that the aggregate securities lending income earned across the BlackRock Multi-Asset Complex in a calendar year exceeds a specified threshold, Advantage Large Cap Growth and Advantage Small Cap Core, pursuant to the securities lending agreement, will retain for the remainder of that calendar year securities lending income in an amount equal to 81% of securities lending income (which excludes collateral investment expenses), and this amount retained can never be less than 70% of the total of securities lending income plus the collateral investment expenses. Advantage International, pursuant to the securities lending agreement, will retain for the remainder of that calendar year securities lending income in an amount equal to 85% of securities lending income (which excludes collateral investment expenses), and this amount retained can never be less than 70% of the total of securities lending income plus the collateral investment expenses.
NOTES TO FINANCIAL STATEMENTS | 67 |
Notes to Financial Statements (continued)
Prior to January 1, 2021, Advantage Large Cap Growth and Advantage Small Cap Core retained 75% of securities lending income (which excluded collateral investment expenses) and the amount retained could never be less than 70% of the total of securities lending income plus the collateral investment expenses. In addition, commencing the business day following the date that the aggregate securities lending income earned across the BlackRock Multi-Asset Complex in a calendar year exceeded a specified threshold, the Fund would retain for the remainder of that calendar year 80% of securities lending income (which excluded collateral investment expenses), and the amount retained could never be less than 70% of the total of securities lending income plus the collateral investment expenses.
The share of securities lending income earned by each Fund is shown as securities lending income — affiliated — net in the Statements of Operations. For the year ended May 31, 2021, each Fund paid BIM the following amounts for securities lending agent services:
| ||||||||
| Fund Name | Amounts | |||||||
| ||||||||
Advantage International | $ | 20,309 | ||||||
Advantage Large Cap Growth | 23,873 | |||||||
Advantage Small Cap Core | 337,678 | |||||||
| ||||||||
Interfund Lending: In accordance with an exemptive order (the “Order”) from the SEC, Advantage International and Advantage Small Cap Core may participate in a joint lending and borrowing facility for temporary purposes (the “Interfund Lending Program”), subject to compliance with the terms and conditions of the Order, and to the extent permitted by each Fund’s investment policies and restrictions. Advantage International is currently permitted to borrow under the Interfund Lending Program. In addition, Advantage Small Cap Core is currently permitted to borrow and lend under the Interfund Lending Program.
A lending BlackRock fund may lend in aggregate up to 15% of its net assets, but may not lend more than 5% of its net assets to any one borrowing fund through the Interfund Lending Program. A borrowing BlackRock fund may not borrow through the Interfund Lending Program or from any other source more than 33 1/3% of its total assets (or any lower threshold provided for by the fund’s investment restrictions). If a borrowing BlackRock fund’s total outstanding borrowings exceed 10% of its total assets, each of its outstanding interfund loans will be subject to collateralization of at least 102% of the outstanding principal value of the loan. All interfund loans are for temporary or emergency purposes and the interest rate to be charged will be the average of the highest current overnight repurchase agreement rate available to a lending fund and the bank loan rate, as calculated according to a formula established by the Board.
During the year ended May 31, 2021, Advantage International and Advantage Small Cap Core did not participate in the Interfund Lending Program.
Trustees and Officers: Certain trustees and/or officers of the Trust are directors and/or officers of BlackRock or its affiliates. The Funds reimburse the Manager for a portion of the compensation paid to the Trust’s Chief Compliance Officer, which is included in Trustees and Officer in the Statements of Operations.
| 7. | PURCHASES AND SALES |
For the year ended May 31, 2021, purchases and sales of investments, excluding short-term investments, were as follows:
| ||||||||
| Fund Name | Purchases | Sales | ||||||
| ||||||||
Advantage International | $ | 2,401,390,693 | $ | 2,426,402,587 | ||||
Advantage Large Cap Growth | 1,228,934,516 | 1,263,365,779 | ||||||
Advantage Small Cap Core | 3,455,820,759 | 1,553,294,861 | ||||||
| ||||||||
| 8. | INCOME TAX INFORMATION |
It is each Fund’s policy to comply with the requirements of the Internal Revenue Code of 1986, as amended, applicable to regulated investment companies, and to distribute substantially all of its taxable income to its shareholders. Therefore, no U.S. federal income tax provision is required.
Each Fund files U.S. federal and various state and local tax returns. No income tax returns are currently under examination. The statute of limitations on each Fund’s U.S. federal tax returns generally remains open for a period of three fiscal years after they are filed. The statutes of limitations on each Fund’s state and local tax returns may remain open for an additional year depending upon the jurisdiction.
Management has analyzed tax laws and regulations and their application to the Funds as of May 31, 2021, inclusive of the open tax return years, and does not believe that there are any uncertain tax positions that require recognition of a tax liability in the Funds’ financial statements.
U.S. GAAP requires that certain components of net assets be adjusted to reflect permanent differences between financial and tax reporting. These reclassifications have no effect on net assets or NAVs per share. As of period end, the following permanent differences attributable to the certain deemed distributions were reclassified to the following accounts:
| ||||||||
Advantage Small Cap Core | ||||||||
| ||||||||
Paid-in capital | $ | 17,228,514 | ||||||
Accumulated earnings (loss) | (17,228,514 | ) | ||||||
| ||||||||
| 68 | 2 0 2 1 BLACK ROCK ANNUAL REPORT TO SHAREHOLDERS |
Notes to Financial Statements (continued)
The tax character of distributions paid was as follows:
| Advantage | Advantage Large Cap | Advantage Small Cap | ||||||||||||||
| Period | International | Growth | Core | (a) | ||||||||||||
Ordinary income | 05/31/21 | $ | 17,234,394 | $ | 18,919,073 | $ | 68,728,891 | |||||||||
| 05/31/20 | 25,258,204 | 9,531,500 | 9,116,585 | |||||||||||||
| 09/30/19 | 18,541,081 | 51,815,343 | — | |||||||||||||
Long-term capital gains(b) | 05/31/21 | — | 48,567,710 | 9,400,294 | ||||||||||||
| 05/31/20 | — | 22,557,380 | 137,331 | |||||||||||||
| 09/30/19 | — | 10,063,226 | — | |||||||||||||
|
|
|
|
|
| |||||||||||
Total | 05/31/21 | $ | 17,234,394 | $ | 67,486,783 | $ | 78,129,185 | |||||||||
|
|
|
|
|
| |||||||||||
| 05/31/20 | $ | 25,258,204 | $ | 32,088,880 | $ | 9,253,916 | ||||||||||
|
|
|
|
|
| |||||||||||
| 09/30/19 | $ | 18,541,081 | $ | 61,878,569 | $ | — | ||||||||||
|
|
|
|
|
| |||||||||||
| (a) | Distribution amounts may include a portion of the proceeds from redeemed shares. |
| (b) | The Funds designate these amounts paid during the fiscal year ended May 31, 2021 as capital gain dividends, subject to a long-term capital gains tax rate of not greater than 20%. |
As of period end, the tax components of accumulated earnings were as follows:
| ||||||||||||
| Advantage International | Advantage Large Cap Growth | Advantage Small Cap Core | ||||||||||
| ||||||||||||
Undistributed ordinary income | $ | 49,266,769 | $ | 47,751,600 | $ | 152,810,957 | ||||||
Undistributed long-term capital gains | — | 32,659,431 | 61,898,574 | |||||||||
Net unrealized gains(a) | 164,857,482 | 374,144,479 | 789,274,920 | |||||||||
|
|
|
|
|
| |||||||
| $ | 214,124,251 | $ | 454,555,510 | $ | 1,003,984,451 | |||||||
|
|
|
|
|
| |||||||
| ||||||||||||
| (a) | The differences between book-basis and tax-basis net unrealized gains were attributable primarily to the tax deferral of losses on wash sales, the realization for tax purposes of unrealized gains on investments in passive foreign investment companies, the realization for tax purposes of unrealized gains/losses on certain futures contracts and foreign currency contracts and the timing and recognition of partnership income. |
During the year ended May 31, 2021, Advantage International Fund utilized $115,875,228 of its respective capital loss carryforward.
As of May 31, 2021, gross unrealized appreciation and depreciation based on cost of investments (including short positions and derivatives, if any) for U.S. federal income tax purposes were as follows:
| ||||||||||||
| Advantage International | Advantage Large Cap Growth | Advantage Small Cap Core | ||||||||||
| ||||||||||||
Tax cost | $ | 1,006,062,956 | $ | 676,280,896 | $ | 3,649,071,773 | ||||||
|
|
|
|
|
| |||||||
Gross unrealized appreciation | $ | 175,547,520 | $ | 377,384,772 | $ | 900,769,367 | ||||||
Gross unrealized depreciation | (10,827,688 | ) | (3,248,939 | ) | (111,619,617 | ) | ||||||
|
|
|
|
|
| |||||||
Net unrealized appreciation (depreciation) | $ | 164,719,832 | $ | 374,135,833 | $ | 789,149,750 | ||||||
|
|
|
|
|
| |||||||
| 9. | BANK BORROWINGS |
The Trust, on behalf of the Funds, along with certain other funds managed by the Manager and its affiliates (“Participating Funds”), is a party to a 364-day, $2.25 billion credit agreement with a group of lenders. Under this agreement, the Funds may borrow to fund shareholder redemptions. Excluding commitments designated for certain individual funds, the Participating Funds, including the Funds, can borrow up to an aggregate commitment amount of $1.75 billion at any time outstanding, subject to asset coverage and other limitations as specified in the agreement. The credit agreement has the following terms: a fee of 0.10% per annum on unused commitment amounts and interest at a rate equal to the higher of (a) one-month LIBOR (but, in any event, not less than 0.00%) on the date the loan is made plus 0.80% per annum or (b) the Fed Funds rate (but, in any event, not less than 0.00%) in effect from time to time plus 0.80% per annum on amounts borrowed. The agreement expires in April 2022 unless extended or renewed. These fees were allocated among such funds based upon portions of the aggregate commitment available to them and relative net assets of Participating Funds. During the year ended May 31, 2021, the Funds did not borrow under the credit agreement.
| 10. | PRINCIPAL RISKS |
In the normal course of business, the Funds invest in securities or other instruments and may enter into certain transactions, and such activities subject each Fund to various risks, including among others, fluctuations in the market (market risk) or failure of an issuer to meet all of its obligations. The value of securities or other instruments may also be affected by various factors, including, without limitation: (i) the general economy; (ii) the overall market as well as local, regional or global political and/or social instability;
NOTES TO FINANCIAL STATEMENTS | 69 |
Notes to Financial Statements (continued)
(iii) regulation, taxation or international tax treaties between various countries; or (iv) currency, interest rate and price fluctuations. Local, regional or global events such as war, acts of terrorism, the spread of infectious illness or other public health issues, recessions, or other events could have a significant impact on the Funds and their investments. Each Fund’s prospectus provides details of the risks to which each Fund is subject.
The Funds may be exposed to additional risks when reinvesting cash collateral in money market funds that do not seek to maintain a stable NAV per share of $1.00, which may be subject to redemption gates or liquidity fees under certain circumstances.
Market Risk: An outbreak of respiratory disease caused by a novel coronavirus has developed into a global pandemic and has resulted in closing borders, quarantines, disruptions to supply chains and customer activity, as well as general concern and uncertainty. The impact of this pandemic, and other global health crises that may arise in the future, could affect the economies of many nations, individual companies and the market in general in ways that cannot necessarily be foreseen at the present time. This pandemic may result in substantial market volatility and may adversely impact the prices and liquidity of a fund’s investments. The duration of this pandemic and its effects cannot be determined with certainty.
Valuation Risk: The market values of equities, such as common stocks and preferred securities or equity related investments, such as futures and options, may decline due to general market conditions which are not specifically related to a particular company. They may also decline due to factors which affect a particular industry or industries. A Fund may invest in illiquid investments. An illiquid investment is any investment that a Fund reasonably expects cannot be sold or disposed of in current market conditions in seven calendar days or less without the sale or disposition significantly changing the market value of the investment. A Fund may experience difficulty in selling illiquid investments in a timely manner at the price that it believes the investments are worth. Prices may fluctuate widely over short or extended periods in response to company, market or economic news. Markets also tend to move in cycles, with periods of rising and falling prices. This volatility may cause each Fund’s NAV to experience significant increases or decreases over short periods of time. If there is a general decline in the securities and other markets, the NAV of a Fund may lose value, regardless of the individual results of the securities and other instruments in which a Fund invests.
The price a Fund could receive upon the sale of any particular portfolio investment may differ from a Fund’s valuation of the investment, particularly for securities that trade in thin or volatile markets or that are valued using a fair valuation technique or a price provided by an independent pricing service. Changes to significant unobservable inputs and assumptions (i.e., publicly traded company multiples, growth rate, time to exit) due to the lack of observable inputs may significantly impact the resulting fair value and therefore a Fund’s results of operations. As a result, the price received upon the sale of an investment may be less than the value ascribed by a Fund, and a Fund could realize a greater than expected loss or lesser than expected gain upon the sale of the investment. A Fund’s ability to value its investments may also be impacted by technological issues and/or errors by pricing services or other third party service providers.
Counterparty Credit Risk: The Funds may be exposed to counterparty credit risk, or the risk that an entity may fail to or be unable to perform on its commitments related to unsettled or open transactions, including making timely interest and/or principal payments or otherwise honoring its obligations. The Funds manage counterparty credit risk by entering into transactions only with counterparties that the Manager believes have the financial resources to honor their obligations and by monitoring the financial stability of those counterparties. Financial assets, which potentially expose the Funds to market, issuer and counterparty credit risks, consist principally of financial instruments and receivables due from counterparties. The extent of the Fund’s exposure to market, issuer and counterparty credit risks with respect to these financial assets is approximately their value recorded in the Statements of Assets and Liabilities, less any collateral held by the Funds.
A derivative contract may suffer a mark-to-market loss if the value of the contract decreases due to an unfavorable change in the market rates or values of the underlying instrument. Losses can also occur if the counterparty does not perform under the contract.
With exchange-traded futures, there is less counterparty credit risk to the Funds since the exchange or clearinghouse, as counterparty to such instruments, guarantees against a possible default. The clearinghouse stands between the buyer and the seller of the contract; therefore, credit risk is limited to failure of the clearinghouse. While offset rights may exist under applicable law, a Fund does not have a contractual right of offset against a clearing broker or clearinghouse in the event of a default (including the bankruptcy or insolvency). Additionally, credit risk exists in exchange-traded futures with respect to initial and variation margin that is held in a clearing broker’s customer accounts. While clearing brokers are required to segregate customer margin from their own assets, in the event that a clearing broker becomes insolvent or goes into bankruptcy and at that time there is a shortfall in the aggregate amount of margin held by the clearing broker for all its clients, typically the shortfall would be allocated on a pro rata basis across all the clearing broker’s customers, potentially resulting in losses to the Funds.
Concentration Risk: A diversified portfolio, where this is appropriate and consistent with a fund’s objectives, minimizes the risk that a price change of a particular investment will have a material impact on the NAV of a fund. The investment concentrations within each Fund’s portfolio are disclosed in its Schedule of Investments.
Certain Funds invest a significant portion of their assets in securities within a single or limited number of market sectors. When a Fund concentrates its investments in this manner, it assumes the risk that economic, regulatory, political and social conditions affecting such sectors may have a significant impact on the Fund and could affect the income from, or the value or liquidity of, the Fund’s portfolio. Investment percentages in specific sectors are presented in the Schedules of Investments.
Advantage International invests a significant portion of its assets in securities of issuers located in Europe or with significant exposure to European issuers or countries. The European financial markets have recently experienced volatility and adverse trends due to concerns about economic downturns in, or rising government debt levels of, several European countries. These events may spread to other countries in Europe and may affect the value and liquidity of certain of the Fund’s investments.
Responses to the financial problems by European governments, central banks and others, including austerity measures and reforms, may not work, may result in social unrest and may limit future growth and economic recovery or have other unintended consequences. Further defaults or restructurings by governments and others of their debt could have additional adverse effects on economies, financial markets and asset valuations around the world. In addition, the United Kingdom has withdrawn from the European Union, and one or more other countries may withdraw from the European Union and/or abandon the Euro, the common currency of the European Union. The impact of these actions, especially if they occur in a disorderly fashion, is not clear but could be significant and far reaching.
| 70 | 2 0 2 1 BLACK ROCK ANNUAL REPORT TO SHAREHOLDERS |
Notes to Financial Statements (continued)
Advantage International invests a significant portion of its assets in securities of issuers located in Asia or with significant exposure to Asian issuers or countries. The Asian financial markets have recently experienced volatility and adverse trends due to concerns in several Asian countries regarding monetary policy, government intervention in the markets, rising government debt levels or economic downturns. These events may spread to other countries in Asia and may affect the value and liquidity of certain of the Fund’s investments.
LIBOR Transition Risk: The United Kingdom’s Financial Conduct Authority announced a phase out of the London Interbank Offered Rate (“LIBOR”). Although many LIBOR rates will be phased out by the end of 2021, a selection of widely used USD LIBOR rates will continue to be published through June 2023 in order to assist with the transition. The Funds may be exposed to financial instruments tied to LIBOR to determine payment obligations, financing terms, hedging strategies or investment value. The transition process away from LIBOR might lead to increased volatility and illiquidity in markets for, and reduce the effectiveness of new hedges placed against, instruments whose terms currently include LIBOR. The ultimate effect of the LIBOR transition process on the Funds is uncertain.
| 11. | CAPITAL SHARE TRANSACTIONS |
Transactions in capital shares for each class were as follows:
| Year Ended 05/31/21 | Period from 10/01/19 to 05/31/20 | Year Ended 09/30/19 | ||||||||||||||||||||||
| Fund Name/Share Class | Shares | Amounts | Shares | Amounts | Shares | Amounts | ||||||||||||||||||
Advantage International | ||||||||||||||||||||||||
Institutional | ||||||||||||||||||||||||
Shares sold | 4,418,893 | $ | 75,694,033 | 10,053,656 | $ | 149,989,026 | 7,187,213 | $ | 112,138,877 | |||||||||||||||
Shares issued in reinvestment of distributions | 588,425 | 9,609,172 | 752,851 | 12,406,978 | 679,659 | 10,004,600 | ||||||||||||||||||
Shares issued in reorganization(a) | — | — | — | — | 1,191,455 | 18,579,616 | ||||||||||||||||||
Shares redeemed | (6,928,355 | ) | (117,200,787 | ) | (5,606,234 | ) | (84,809,969 | ) | (5,091,175 | ) | (79,480,738 | ) | ||||||||||||
|
|
|
|
|
|
|
|
|
|
|
| |||||||||||||
| (1,921,037 | ) | $ | (31,897,582 | ) | 5,200,273 | $ | 77,586,035 | 3,967,152 | $ | 61,242,355 | ||||||||||||||
|
|
|
|
|
|
|
|
|
|
|
| |||||||||||||
Investor A | ||||||||||||||||||||||||
Shares sold and automatic conversion of shares | 2,612,796 | $ | 44,063,358 | 7,354,726 | $ | 109,718,575 | 7,413,242 | $ | 114,556,452 | |||||||||||||||
Shares issued in reinvestment of distributions | 378,577 | 6,105,755 | 641,324 | 10,459,991 | 506,134 | 7,379,502 | ||||||||||||||||||
Shares issued in reorganization(a) | — | — | — | — | 3,961,430 | 61,055,996 | ||||||||||||||||||
Shares redeemed | (5,322,583 | ) | (88,079,685 | ) | (7,868,559 | ) | (118,716,806 | ) | (4,512,726 | ) | (69,568,154 | ) | ||||||||||||
|
|
|
|
|
|
|
|
|
|
|
| |||||||||||||
| (2,331,210 | ) | $ | (37,910,572 | ) | 127,491 | $ | 1,461,760 | 7,368,080 | $ | 113,423,796 | ||||||||||||||
|
|
|
|
|
|
|
|
|
|
|
| |||||||||||||
Investor C | ||||||||||||||||||||||||
Shares sold | 24,076 | $ | 395,881 | 35,703 | $ | 520,481 | 104,380 | $ | 1,581,801 | |||||||||||||||
Shares issued in reinvestment of distributions | 3,050 | 47,061 | 9,703 | 154,382 | 6,077 | 86,360 | ||||||||||||||||||
Shares redeemed and automatic conversion of shares | (279,526 | ) | (4,502,352 | ) | (213,615 | ) | (3,108,992 | ) | (932,769 | ) | (14,025,339 | ) | ||||||||||||
|
|
|
|
|
|
|
|
|
|
|
| |||||||||||||
| (252,400 | ) | $ | (4,059,410 | ) | (168,209 | ) | $ | (2,434,129 | ) | (822,312 | ) | $ | (12,357,178 | ) | ||||||||||
|
|
|
|
|
|
|
|
|
|
|
| |||||||||||||
Class K | ||||||||||||||||||||||||
Shares sold | 2,866,712 | $ | 52,229,496 | 839,709 | $ | 12,679,206 | 2,442,351 | $ | 39,126,033 | |||||||||||||||
Shares issued in reinvestment of distributions | 56,053 | 915,693 | 78,765 | 1,298,043 | 14,952 | 220,087 | ||||||||||||||||||
Shares redeemed | (689,214 | ) | (11,849,959 | ) | (663,551 | ) | (10,063,996 | ) | (227,253 | ) | (3,579,204 | ) | ||||||||||||
|
|
|
|
|
|
|
|
|
|
|
| |||||||||||||
| 2,233,551 | $ | 41,295,230 | 254,923 | $ | 3,913,253 | 2,230,050 | $ | 35,766,916 | ||||||||||||||||
|
|
|
|
|
|
|
|
|
|
|
| |||||||||||||
Class R | ||||||||||||||||||||||||
Shares sold | 55,185 | $ | 916,332 | 43,569 | $ | 623,878 | 74,667 | $ | 1,148,306 | |||||||||||||||
Shares issued in reinvestment of distributions | 2,631 | 42,375 | 7,122 | 116,369 | 8,775 | 128,026 | ||||||||||||||||||
Shares redeemed | (114,704 | ) | (1,861,112 | ) | (149,798 | ) | (2,294,608 | ) | (206,197 | ) | (3,219,311 | ) | ||||||||||||
|
|
|
|
|
|
|
|
|
|
|
| |||||||||||||
| (56,888 | ) | $ | (902,405 | ) | (99,107 | ) | $ | (1,554,361 | ) | (122,755 | ) | $ | (1,942,979 | ) | ||||||||||
|
|
|
|
|
|
|
|
|
|
|
| |||||||||||||
| (2,327,984 | ) | $ | (33,474,739 | ) | 5,315,371 | $ | 78,972,558 | 12,620,215 | $ | 196,132,910 | ||||||||||||||
|
|
|
|
|
|
|
|
|
|
|
| |||||||||||||
Advantage Large Cap Growth | ||||||||||||||||||||||||
Institutional | ||||||||||||||||||||||||
Shares sold | 1,461,480 | $ | 30,690,873 | 1,664,670 | $ | 28,270,459 | 1,417,588 | $ | 22,049,536 | |||||||||||||||
Shares issued in reinvestment of distributions | 349,606 | 7,263,426 | 187,678 | 3,149,241 | 368,193 | 5,382,985 | ||||||||||||||||||
Shares redeemed | (1,374,733 | ) | (28,731,360 | ) | (1,755,297 | ) | (29,497,286 | ) | (1,146,041 | ) | (18,321,402 | ) | ||||||||||||
|
|
|
|
|
|
|
|
|
|
|
| |||||||||||||
| 436,353 | $ | 9,222,939 | 97,051 | $ | 1,922,414 | 639,740 | $ | 9,111,119 | ||||||||||||||||
|
|
|
|
|
|
|
|
|
|
|
| |||||||||||||
NOTES TO FINANCIAL STATEMENTS | 71 |
Notes to Financial Statements (continued)
| Year Ended 05/31/21 | Period from 10/01/19 to 05/31/20 | Year Ended 09/30/19 | ||||||||||||||||||||||
| Fund Name/Share Class | Shares | Amounts | Shares | Amounts | Shares | Amounts | ||||||||||||||||||
Advantage Large Cap Growth (continued) | ||||||||||||||||||||||||
Service | ||||||||||||||||||||||||
Shares sold | 910 | $ | 20,367 | 2,000 | $ | 30,700 | 5,103 | $ | 72,800 | |||||||||||||||
Shares issued in reinvestment of distributions | 693 | 14,155 | 500 | 8,241 | 798 | 11,470 | ||||||||||||||||||
Shares redeemed | (4,884 | ) | (90,744 | ) | (599 | ) | (9,940 | ) | (2,748 | ) | (38,251 | ) | ||||||||||||
|
|
|
|
|
|
|
|
|
|
|
| |||||||||||||
| (3,281 | ) | $ | (56,222 | ) | 1,901 | $ | 29,001 | 3,153 | $ | 46,019 | ||||||||||||||
|
|
|
|
|
|
|
|
|
|
|
| |||||||||||||
Investor A | ||||||||||||||||||||||||
Shares sold and automatic conversion of shares | 4,204,268 | $ | 84,126,461 | 4,446,628 | $ | 70,607,642 | 6,662,252 | $ | 98,680,539 | |||||||||||||||
Shares issued in reinvestment of distributions | 2,931,766 | 57,897,081 | 1,731,744 | 27,690,590 | 3,864,428 | 53,947,453 | ||||||||||||||||||
Shares redeemed | (7,138,589 | ) | (141,394,298 | ) | (9,579,253 | ) | (153,256,890 | ) | (8,739,543 | ) | (133,123,440 | ) | ||||||||||||
|
|
|
|
|
|
|
|
|
|
|
| |||||||||||||
| (2,555 | ) | $ | 629,244 | (3,400,881 | ) | $ | (54,958,658 | ) | 1,787,137 | $ | 19,504,552 | |||||||||||||
|
|
|
|
|
|
|
|
|
|
|
| |||||||||||||
Investor C | ||||||||||||||||||||||||
Shares sold | 115,840 | $ | 1,976,790 | 106,476 | $ | 1,432,407 | 184,277 | $ | 1,733,438 | |||||||||||||||
Shares issued in reinvestment of distributions | 67,831 | 1,118,035 | 47,034 | 638,252 | 70,938 | 1,408,299 | ||||||||||||||||||
Shares redeemed | (482,173 | ) | (7,987,888 | ) | — | — | — | — | ||||||||||||||||
Shares redeemed and automatic conversion of shares | — | — | (294,141 | ) | (3,931,007 | ) | (2,457,686 | ) | (32,944,701 | ) | ||||||||||||||
|
|
|
|
|
|
|
|
|
|
|
| |||||||||||||
| (298,502 | ) | $ | (4,893,063 | ) | (140,631 | ) | $ | (1,860,348 | ) | (2,202,471 | ) | $ | (29,802,964 | ) | ||||||||||
|
|
|
|
|
|
|
|
|
|
|
| |||||||||||||
Class K | ||||||||||||||||||||||||
Shares sold | 12,572 | $ | 271,639 | 7,318 | $ | 111,250 | 25,965 | $ | 399,000 | |||||||||||||||
Shares issued in reinvestment of distributions | 2,409 | 50,244 | 2,052 | 34,414 | 1,964 | 28,695 | ||||||||||||||||||
Shares redeemed | (4,868 | ) | (105,833 | ) | (29,155 | ) | (438,862 | ) | (2,941 | ) | (48,101 | ) | ||||||||||||
|
|
|
|
|
|
|
|
|
|
|
| |||||||||||||
| 10,113 | $ | 216,050 | (19,785 | ) | $ | (293,198 | ) | 24,988 | $ | 379,594 | ||||||||||||||
|
|
|
|
|
|
|
|
|
|
|
| |||||||||||||
Class R | ||||||||||||||||||||||||
Shares sold | 8,442 | $ | 172,132 | 12,423 | $ | 196,016 | 13,537 | $ | 208,300 | |||||||||||||||
Shares issued in reinvestment of distributions | 1,626 | 33,436 | 1,855 | 30,985 | 7,473 | 108,590 | ||||||||||||||||||
Shares redeemed | (14,754 | ) | (303,821 | ) | (37,771 | ) | (626,534 | ) | (73,310 | ) | (1,147,635 | ) | ||||||||||||
|
|
|
|
|
|
|
|
|
|
|
| |||||||||||||
| (4,686 | ) | $ | (98,253 | ) | (23,493 | ) | $ | (399,533 | ) | (52,300 | ) | $ | (830,745 | ) | ||||||||||
|
|
|
|
|
|
|
|
|
|
|
| |||||||||||||
| 137,442 | $ | 5,020,695 | (3,485,838 | ) | $ | (55,560,322 | ) | 200,247 | $ | (1,592,425 | ) | |||||||||||||
|
|
|
|
|
|
|
|
|
|
|
| |||||||||||||
| Year Ended 05/31/21 | Year Ended 05/31/20 | |||||||||||||||||||||||
| Shares | Amounts | Shares | Amounts | |||||||||||||||||||||
Advantage Small Cap Core | ||||||||||||||||||||||||
Institutional | ||||||||||||||||||||||||
Shares sold | 95,126,663 | $ | 1,715,369,624 | 40,948,676 | $ | 521,146,487 | ||||||||||||||||||
Shares issued in reinvestment of distributions | 2,243,133 | 38,062,870 | 431,317 | 6,386,298 | ||||||||||||||||||||
Shares redeemed | (26,844,843 | ) | (470,870,066 | ) | (18,677,824 | ) | (236,251,203 | ) | ||||||||||||||||
|
|
|
|
|
|
|
| |||||||||||||||||
| 70,524,953 | $ | 1,282,562,428 | 22,702,169 | $ | 291,281,582 | |||||||||||||||||||
|
|
|
|
|
|
|
| |||||||||||||||||
Investor A | ||||||||||||||||||||||||
Shares sold and automatic conversion of shares | 11,731,048 | $ | 215,365,974 | 7,452,876 | $ | 95,188,119 | ||||||||||||||||||
Shares issued in reinvestment of distributions | 552,682 | 9,366,268 | 125,295 | 1,848,839 | ||||||||||||||||||||
Shares redeemed | (7,853,782 | ) | (138,001,515 | ) | (5,273,975 | ) | (72,027,825 | ) | ||||||||||||||||
|
|
|
|
|
|
|
| |||||||||||||||||
| 4,429,948 | $ | 86,730,727 | 2,304,196 | $ | 25,009,133 | |||||||||||||||||||
|
|
|
|
|
|
|
| |||||||||||||||||
| 72 | 2 0 2 1 BLACK ROCK ANNUAL REPORT TO SHAREHOLDERS |
Notes to Financial Statements (continued)
| Year Ended 05/31/21 | Year Ended 05/31/20 | |||||||||||||||||||||||
| Fund Name/Share Class | Shares | Amounts | Shares | Amounts | ||||||||||||||||||||
Advantage Small Cap Core (continued) | ||||||||||||||||||||||||
Investor C | ||||||||||||||||||||||||
Shares sold | 344,270 | $ | 6,419,970 | 194,007 | $ | 2,542,061 | ||||||||||||||||||
Shares issued in reinvestment of distributions | 8,469 | 141,691 | 445 | 6,537 | ||||||||||||||||||||
Shares redeemed and automatic conversion of shares | (100,236 | ) | (1,695,653 | ) | (146,329 | ) | (1,866,475 | ) | ||||||||||||||||
|
|
|
|
|
|
|
| |||||||||||||||||
| 252,503 | $ | 4,866,008 | 48,123 | $ | 682,123 | |||||||||||||||||||
|
|
|
|
|
|
|
| |||||||||||||||||
Class K | ||||||||||||||||||||||||
Shares sold | 35,035,616 | $ | 609,698,614 | 17,939,631 | $ | 258,512,762 | ||||||||||||||||||
Shares issued in reinvestment of distributions | 780,524 | 13,303,758 | 67,762 | 1,006,554 | ||||||||||||||||||||
Shares redeemed | (5,819,626 | ) | (104,224,154 | ) | (7,879,299 | ) | (118,900,431 | ) | ||||||||||||||||
|
|
|
|
|
|
|
| |||||||||||||||||
| 29,996,514 | $ | 518,778,218 | 10,128,094 | $ | 140,618,885 | |||||||||||||||||||
|
|
|
|
|
|
|
| |||||||||||||||||
| 105,203,918 | $ | 1,892,937,381 | 35,182,582 | $ | 457,591,723 | |||||||||||||||||||
|
|
|
|
|
|
|
| |||||||||||||||||
| (a) | See Note 1 regarding the reorganization. |
As of May 31, 2021, BlackRock Financial Management, Inc., an affiliate of the Funds, owned 12,217 Class K Shares of Advantage Large Cap Growth.
| 12. | SUBSEQUENT EVENTS |
Management has evaluated the impact of all subsequent events on the Funds through the date the financial statements were issued and has determined that there were no subsequent events requiring adjustment or additional disclosure in the financial statements.
NOTES TO FINANCIAL STATEMENTS | 73 |
Report of Independent Registered Public Accounting Firm
To the Shareholders of BlackRock Advantage International Fund, BlackRock Advantage Large Cap Growth Fund, and BlackRock Advantage Small Cap Core Fund and the Board of Trustees of BlackRock FundsSM:
Opinion on the Financial Statements and Financial Highlights
We have audited the accompanying statements of assets and liabilities of BlackRock Advantage International Fund, BlackRock Advantage Large Cap Growth Fund, and BlackRock Advantage Small Cap Core Fund of BlackRock FundsSM (the “Funds”), including the schedules of investments, as of May 31, 2021, the related statements of operations for the year then ended, the statements of changes in net assets and the financial highlights for the periods indicated in the table below, and the related notes. In our opinion, the financial statements and financial highlights present fairly, in all material respects, the financial position of the Funds as of May 31, 2021, and the results of their operations for the year then ended, the changes in their net assets and the financial highlights for the periods indicated in the table below, in conformity with accounting principles generally accepted in the United States of America.
| Fund | Statements of Changes in Net Assets | Financial Highlights | ||
BlackRock Advantage International Fund | For the year ended May 31, 2021, for the period from October 1, 2019 through May 31, 2020, and for the year ended September 30, 2019 | For the year ended May 31, 2021, for the period from October 1, 2019 through May 31, 2020, and for each of the four years in the period ended September 30, 2019 | ||
BlackRock Advantage Large Cap Growth Fund | For the year ended May 31, 2021, for the period from October 1, 2019 through May 31, 2020, and for the year ended September 30, 2019 | For the year ended May 31, 2021, for the period from October 1, 2019 through May 31, 2020, and for each of the four years in the period ended September 30, 2019 | ||
BlackRock Advantage Small Cap Core Fund | For each of the two years in the period ended May 31, 2021 | For each of the five years in the period ended May 31, 2021 | ||
Basis for Opinion
These financial statements and financial highlights are the responsibility of the Funds’ management. Our responsibility is to express an opinion on the Funds’ financial statements and financial highlights based on our audits. We are a public accounting firm registered with the Public Company Accounting Oversight Board (United States) (PCAOB) and are required to be independent with respect to the Funds in accordance with the U.S. federal securities laws and the applicable rules and regulations of the Securities and Exchange Commission and the PCAOB.
We conducted our audits in accordance with the standards of the PCAOB. Those standards require that we plan and perform the audit to obtain reasonable assurance about whether the financial statements and financial highlights are free of material misstatement, whether due to error or fraud. The Funds are not required to have, nor were we engaged to perform, an audit of their internal control over financial reporting. As part of our audits we are required to obtain an understanding of internal control over financial reporting but not for the purpose of expressing an opinion on the effectiveness of the Funds’ internal control over financial reporting. Accordingly, we express no such opinion.
Our audits included performing procedures to assess the risks of material misstatement of the financial statements and financial highlights, whether due to error or fraud, and performing procedures that respond to those risks. Such procedures included examining, on a test basis, evidence regarding the amounts and disclosures in the financial statements and financial highlights. Our audits also included evaluating the accounting principles used and significant estimates made by management, as well as evaluating the overall presentation of the financial statements and financial highlights. Our procedures included confirmation of securities owned as of May 31, 2021, by correspondence with the custodian and brokers; when replies were not received from brokers, we performed other auditing procedures. We believe that our audits provide a reasonable basis for our opinion.
Deloitte & Touche LLP
Boston, Massachusetts
July 21, 2021
We have served as the auditor of one or more BlackRock investment companies since 1992.
| 74 | 2 0 2 1 BLACK ROCK ANNUAL REPORT TO SHAREHOLDERS |
Important Tax Information (unaudited)
The following maximum amounts are hereby designated as qualified dividend income for individuals for the fiscal year ended May 31, 2021:
| ||||||||
| Fund Name |
| Qualified Dividend Income | ||||||
| ||||||||
Advantage International | $ 25,991,445 | |||||||
Advantage Large Cap Growth | 7,182,559 | |||||||
Advantage Small Cap Core | 25,233,442 | |||||||
| ||||||||
The following maximum amounts are hereby designated as qualified business income for individuals for the fiscal year ended May 31,2021:
| ||||||||
| Fund Name |
| Qualified Business Income | ||||||
| ||||||||
Advantage Large Cap Growth | $ 302,141 | |||||||
Advantage Small Cap Core | 1,778,007 | |||||||
| ||||||||
For the fiscal year ended May 31, 2021, the Funds passed through to their shareholders foreign source income earned and foreign taxes paid by the underlying funds:
| ||||||||
| Fund Name | Foreign Source Income Earned | Foreign Taxes Paid | ||||||
| ||||||||
Advantage International | $23,670,782 | $ 2,333,777 | ||||||
| ||||||||
For corporate shareholders, the percentage of ordinary income distributions paid during the fiscal year ended May 31, 2021 that qualified for the dividends-received deduction were as follows:
| ||||||||
| Fund Name |
| Dividends-Received Deduction | ||||||
| ||||||||
Advantage Large Cap Growth | 27.34% | |||||||
Advantage Small Cap Core | 26.26 | |||||||
| ||||||||
For the fiscal year ended May 31, 2021, the Funds hereby designate the following maximum amounts allowable as interest-related and qualified short-term gains eligible for exemption from U.S. withholding tax for nonresident aliens and foreign corporations:
| ||||||||
| Fund Name |
| Short-Term Capital Gain Dividends | ||||||
| ||||||||
Advantage Large Cap Growth | $ 17,730,503 | |||||||
Advantage Small Cap Core | 44,122,180 | |||||||
| ||||||||
| 75 |
Disclosure of Investment Advisory Agreement
The Board of Trustees (the “Board,” the members of which are referred to as “Board Members”) of BlackRock Funds (the “Trust”) met on April 7, 2021 (the “April Meeting”) and May 10-12, 2021 (the “May Meeting”) to consider the approval to continue the investment advisory agreement (the “Agreement”) between the Trust, on behalf of BlackRock Advantage International Fund (“Advantage International Fund”), BlackRock Advantage Large Cap Growth Fund (“Advantage Large Cap Growth Fund”) and BlackRock Advantage Small Cap Core Fund (“Advantage Small Cap Core Fund,” and together with Advantage International Fund and Advantage Large Cap Growth Fund, the “Funds”), and BlackRock Advisors, LLC (the “Manager” or “BlackRock”), each Fund’s investment advisor.
The Approval Process
Consistent with the requirements of the Investment Company Act of 1940 (the “1940 Act”), the Board considers the approval of the continuation of the Agreement for each Fund on an annual basis. The Board members whom are not “interested persons” of the Trust, as defined in the 1940 Act, are considered independent Board members (the “Independent Board Members”). The Board’s consideration entailed a year-long deliberative process during which the Board and its committees assessed BlackRock’s various services to each Fund, including through the review of written materials and oral presentations, and the review of additional information provided in response to requests from the Independent Board Members. The Board had four quarterly meetings per year, each typically extending for two days, as well as additional ad hoc meetings and executive sessions throughout the year, as needed. The committees of the Board similarly met throughout the year. The Board also had a fifth one-day meeting to consider specific information surrounding the renewal of the Agreement. In particular, the Board assessed, among other things, the nature, extent and quality of the services provided to the Fund by BlackRock, BlackRock’s personnel and affiliates, including (as applicable): investment management services; accounting oversight; administrative and shareholder services; oversight of the Fund’s service providers; risk management and oversight; and legal, regulatory and compliance services. Throughout the year, including during the contract renewal process, the Independent Board Members were advised by independent legal counsel, and met with independent legal counsel in various executive sessions outside of the presence of BlackRock’s management.
During the year, the Board, acting directly and through its committees, considered information that was relevant to its annual consideration of the renewal of the Agreement, including the services and support provided by BlackRock to the Fund and its shareholders. BlackRock also furnished additional information to the Board in response to specific questions from the Board. Among the matters the Board considered were: (a) investment performance for one-year, three-year, five-year, and/or since inception periods, as applicable, against peer funds, an applicable benchmark, and other performance metrics, as applicable, as well as BlackRock senior management’s and portfolio managers’ analyses of the reasons for any outperformance or underperformance relative to its peers, benchmarks, and other performance metrics, as applicable; (b) fees, including advisory, administration, if applicable, and other amounts paid to BlackRock and its affiliates by the Fund for services; (c) Fund operating expenses and how BlackRock allocates expenses to the Fund; (d) the resources devoted to risk oversight of, and compliance reports relating to, implementation of the Fund’s investment objective, policies and restrictions, and meeting regulatory requirements; (e) BlackRock’s and the Trust’s adherence to applicable compliance policies and procedures; (f) the nature, character and scope of non-investment management services provided by BlackRock and its affiliates and the estimated cost of such services, as available; (g) BlackRock’s and other service providers’ internal controls and risk and compliance oversight mechanisms; (h) BlackRock’s implementation of the proxy voting policies approved by the Board; (i) the use of brokerage commissions and execution quality of portfolio transactions; (j) BlackRock’s implementation of the Fund’s valuation and liquidity procedures; (k) an analysis of management fees paid to BlackRock for products with similar investment mandates across the open-end fund, exchange-traded fund (“ETF”), closed-end fund, sub-advised mutual fund, separately managed account, collective investment trust, and institutional separate account product channels, as applicable, and the similarities and differences between these products and the services provided as compared to the Fund; (l) BlackRock’s compensation methodology for its investment professionals and the incentives and accountability it creates, along with investment professionals’ investments in the fund(s) they manage; and (m) periodic updates on BlackRock’s business.
Prior to and in preparation for the April Meeting, the Board received and reviewed materials specifically relating to the renewal of the Agreement. The Independent Board Members continuously engaged in a process with their independent legal counsel and BlackRock to review the nature and scope of the information provided to the Board to better assist its deliberations. The materials provided in connection with the April Meeting included, among other things: (a) information independently compiled and prepared by Broadridge Financial Solutions, Inc. (“Broadridge”), based on either a Lipper classification or Morningstar category, regarding each Fund’s fees and expenses as compared with a peer group of funds as determined by Broadridge (“Expense Peers”) and the investment performance of each Fund as compared with a peer group of funds (“Performance Peers”); (b) information on the composition of the Expense Peers and Performance Peers and a description of Broadridge’s methodology; (c) information on the estimated profits realized by BlackRock and its affiliates pursuant to the Agreement and a discussion of fall-out benefits to BlackRock and its affiliates; (d) a general analysis provided by BlackRock concerning investment management fees received in connection with other types of investment products, such as institutional accounts, sub-advised mutual funds, ETFs, closed-end funds, open-end funds, and separately managed accounts under similar investment mandates, as well as the performance of such other products, as applicable; (e) a review of non-management fees; (f) the existence, impact and sharing of potential economies of scale, if any, with the Funds; (g) a summary of aggregate amounts paid by each Fund to BlackRock; (h) sales and redemption data regarding each Fund’s shares; and (i) various additional information requested by the Board as appropriate regarding BlackRock’s and the Funds’ operations.
At the April Meeting, the Board reviewed materials relating to its consideration of the Agreement. As a result of the discussions that occurred during the April Meeting, and as a culmination of the Board’s year-long deliberative process, the Board presented BlackRock with questions and requests for additional information. BlackRock responded to these questions and requests with additional written information in advance of the May Meeting.
At the May Meeting, the Board concluded its assessment of, among other things: (a) the nature, extent and quality of the services provided by BlackRock; (b) the investment performance of each Fund as compared to its Performance Peers and to other metrics, as applicable; (c) the advisory fee and the estimated cost of the services and estimated profits realized by BlackRock and its affiliates from their relationship with the Funds; (d) each Fund’s fees and expenses compared to its Expense Peers; (e) the existence and sharing of potential economies of scale; (f) any fall-out benefits to BlackRock and its affiliates as a result of BlackRock’s relationship with the Funds; and (g) other factors deemed relevant by the Board Members.
The Board also considered other matters it deemed important to the approval process, such as other payments made to BlackRock or its affiliates relating to securities lending and cash management, and BlackRock’s services related to the valuation and pricing of Fund portfolio holdings. The Board noted the willingness of BlackRock’s personnel to engage in open, candid discussions with the Board. The members of the Board gave attention to all of the information that was furnished, and each Board Member placed varying degrees of importance on the various pieces of information that were provided to them. The Board evaluated the information available to it on a fund by fund basis. The following paragraphs provide more information about some of the primary factors that were relevant to the Board’s decision. The Board Members did not identify any particular information, or any single factor as determinative, and each Board Member may have attributed different weights to the various items and factors considered.
| 76 | 2 0 2 1 BLACK ROCK ANNUAL REPORT TO SHAREHOLDERS |
Disclosure of Investment Advisory Agreement (continued)
A. Nature, Extent and Quality of the Services Provided by BlackRock
The Board, including the Independent Board Members, reviewed the nature, extent and quality of services provided by BlackRock, including the investment advisory services and the resulting performance of each Fund. Throughout the year, the Board compared each Fund’s performance to the performance of a comparable group of mutual funds, relevant benchmark, and performance metrics, as applicable. The Board met with BlackRock’s senior management personnel responsible for investment activities, including the senior investment officers. The Board also reviewed the materials provided by each Fund’s portfolio management team discussing the Fund’s performance, investment strategies and outlook.
The Board considered, among other factors, with respect to BlackRock: the number, education and experience of investment personnel generally and each Fund’s portfolio management team; research capabilities; investments by portfolio managers in the funds they manage; portfolio trading capabilities; use of technology; commitment to compliance; credit analysis capabilities; risk analysis and oversight capabilities; and the approach to training and retaining portfolio managers and other research, advisory and management personnel. The Board also considered BlackRock’s overall risk management program, including the continued efforts of BlackRock and its affiliates to address cybersecurity risks and the role of BlackRock’s Risk & Quantitative Analysis Group. The Board engaged in a review of BlackRock’s compensation structure with respect to each Fund’s portfolio management team and BlackRock’s ability to attract and retain high-quality talent and create performance incentives.
In addition to investment advisory services, the Board considered the nature and quality of the administrative and other non-investment advisory services provided to each Fund. BlackRock and its affiliates provide the Funds with certain administrative, shareholder and other services (in addition to any such services provided to the Funds by third-parties) and officers and other personnel as are necessary for the operations of the Funds. In particular, BlackRock and its affiliates provide the Funds with administrative services including, among others: (i) responsibility for disclosure documents, such as the prospectus, the summary prospectus (as applicable), the statement of additional information and periodic shareholder reports; (ii) oversight of daily accounting and pricing; (iii) responsibility for periodic filings with regulators; (iv) overseeing and coordinating the activities of third-party service providers, including, among others, each Fund’s custodian, fund accountant, transfer agent, and auditor; (v) organizing Board meetings and preparing the materials for such Board meetings; (vi) providing legal and compliance support; (vii) furnishing analytical and other support to assist the Board in its consideration of strategic issues such as the merger, consolidation or repurposing of certain open-end funds; and (viii) performing or managing administrative functions necessary for the operation of the Funds, such as tax reporting, expense management, fulfilling regulatory filing requirements, overseeing each Fund’s distribution partners, and shareholder call center and other services. The Board reviewed the structure and duties of BlackRock’s fund administration, shareholder services, and legal and compliance departments and considered BlackRock’s policies and procedures for assuring compliance with applicable laws and regulations. The Board considered the operation of BlackRock’s business continuity plans, including in light of the ongoing COVID-19 pandemic.
B. The Investment Performance of the Funds and BlackRock
The Board, including the Independent Board Members, reviewed and considered the performance history of each Fund throughout the year and at the April Meeting. In preparation for the April Meeting, the Board was provided with reports independently prepared by Broadridge, which included an analysis of each Fund’s performance as of December 31, 2020, as compared to its Performance Peers. Broadridge ranks funds in quartiles, ranging from first to fourth, where first is the most desirable quartile position and fourth is the least desirable. In connection with its review, with respect to each Fund, the Board received and reviewed information regarding the investment performance of the Fund as compared to its Performance Peers. The Board and its Performance Oversight Committee regularly review, and meet with Fund management to discuss, the performance of each Fund throughout the year.
In evaluating performance, the Board focused particular attention on funds with less favorable performance records. The Board also noted that while it found the data provided by Broadridge generally useful, it recognized the limitations of such data, including in particular, that notable differences may exist between a fund and its Performance Peers (for example, the investment objectives and strategies). Further, the Board recognized that the performance data reflects a snapshot of a period as of a particular date and that selecting a different performance period could produce significantly different results. The Board also acknowledged that long-term performance could be impacted by even one period of significant outperformance or underperformance, and that a single investment theme could have the ability to disproportionately affect long-term performance.
The Board noted that for each of the one-, three- and five-year periods reported, Advantage Small Cap Core Fund ranked in the first quartiles against its Performance Peers.
The Board noted that for the one-, three- and five-year periods reported, Advantage Large Cap Growth Fund ranked in the second, third and second quartiles, respectively, against its Performance Peers. The Board and BlackRock reviewed the Fund’s underperformance relative to its Performance Peers during the applicable period.
The Board noted that for each of the one-, three- and five-year periods reported, Advantage International Fund ranked in the third quartile against its Performance Peers. The Board and BlackRock reviewed the Fund’s underperformance relative to its Performance Peers during the applicable periods.
C. Consideration of the Advisory/Management Fees and the Estimated Cost of the Services and Estimated Profits Realized by BlackRock and its Affiliates from their Relationship with the Funds
The Board, including the Independent Board Members, reviewed each Fund’s contractual management fee rate compared with those of its Expense Peers. The contractual management fee rate represents a combination of the advisory fee and any administrative fees, before taking into account any reimbursements or fee waivers. The Board also compared each Fund’s total expense ratio, as well as its actual management fee rate, to those of its Expense Peers. The total expense ratio represents a fund’s total net operating expenses, including any 12b-1 or non-12b-1 service fees. The total expense ratio gives effect to any expense reimbursements or fee waivers, and the actual management fee rate gives effect to any management fee reimbursements or waivers. The Board considered the services provided and the fees charged by BlackRock and its affiliates to other types of clients with similar investment mandates, as applicable, including institutional accounts and sub-advised mutual funds (including mutual funds sponsored by third parties).
DISCLOSURE OF INVESTMENT ADVISORY AGREEMENT | 77 |
Disclosure of Investment Advisory Agreement (continued)
The Board received and reviewed statements relating to BlackRock’s financial condition. The Board reviewed BlackRock’s profitability methodology and was also provided with an estimated profitability analysis that detailed the revenues earned and the expenses incurred by BlackRock for services provided to each Fund. The Board reviewed BlackRock’s estimated profitability with respect to each Fund and other funds the Board currently oversees for the year ended December 31, 2020 compared to available aggregate estimated profitability data provided for the prior two years. The Board reviewed BlackRock’s estimated profitability with respect to certain other U.S. fund complexes managed by the Manager and/or its affiliates. The Board reviewed BlackRock’s assumptions and methodology of allocating expenses in the estimated profitability analysis, noting the inherent limitations in allocating costs among various advisory products. The Board recognized that profitability may be affected by numerous factors including, among other things, fee waivers and expense reimbursements by the Manager, the types of funds managed, precision of expense allocations and business mix. The Board thus recognized that calculating and comparing profitability at the individual fund level is difficult.
The Board noted that, in general, individual fund or product line profitability of other advisors is not publicly available. The Board reviewed BlackRock’s overall operating margin, in general, compared to that of certain other publicly-traded asset management firms. The Board considered the differences between BlackRock and these other firms, including the contribution of technology at BlackRock, BlackRock’s expense management, and the relative product mix.
The Board considered whether BlackRock has the financial resources necessary to attract and retain high quality investment management personnel to perform its obligations under the Agreement and to continue to provide the high quality of services that is expected by the Board. The Board further considered factors including but not limited to BlackRock’s commitment of time, assumption of risk, and liability profile in servicing the Funds, including in contrast to what is required of BlackRock with respect to other products with similar investment mandates across the open-end fund, ETF, closed-end fund, sub-advised mutual fund, separately managed account, collective investment trust, and institutional separate account product channels, as applicable.
The Board noted that each Fund’s contractual management fee rate ranked in the first quartile, and that the actual management fee rate and total expense ratio each ranked in the first quartile relative to the Fund’s Expense Peers.
The Board also noted that each Fund has an advisory fee arrangement that includes breakpoints that adjust the fee rate downward as the size of the Fund increases above certain contractually specified levels. The Board noted that if the size of a Fund were to decrease, the Fund could lose the benefit of one or more breakpoints. The Board further noted that BlackRock and the Board have contractually agreed to a cap on each Fund’s total expenses as a percentage of the Fund’s average daily net assets on a class-by-class basis.
D. Economies of Scale
The Board, including the Independent Board Members, considered the extent to which economies of scale might be realized as the assets of the Funds increase, including the existence of fee waivers and/or expense caps, as applicable, noting that any contractual fee waivers and contractual expense caps had been approved by the Board. In its consideration, the Board further considered the continuation and/or implementation of fee waivers and/or expense caps, as applicable. The Board also considered the extent to which the Funds benefit from such economies of scale in a variety of ways and whether there should be changes in the advisory fee rate or breakpoint structure in order to enable the Funds to more fully participate in these economies of scale. The Board considered each Fund’s asset levels and whether the current fee schedule was appropriate.
E. Other Factors Deemed Relevant by the Board Members
The Board, including the Independent Board Members, also took into account other ancillary or “fall-out” benefits that BlackRock or its affiliates may derive from BlackRock’s respective relationships with the Funds, both tangible and intangible, such as BlackRock’s ability to leverage its investment professionals who manage other portfolios and its risk management personnel, an increase in BlackRock’s profile in the investment advisory community, and the engagement of BlackRock’s affiliates as service providers to the Funds, including for administrative, distribution, securities lending and cash management services. The Board also considered BlackRock’s overall operations and its efforts to expand the scale of, and improve the quality of, its operations. The Board also noted that, subject to applicable law, BlackRock may use and benefit from third-party research obtained by soft dollars generated by certain registered fund transactions to assist in managing all or a number of its other client accounts.
In connection with its consideration of the Agreement, the Board also received information regarding BlackRock’s brokerage and soft dollar practices. The Board received reports from BlackRock which included information on brokerage commissions and trade execution practices throughout the year.
The Board noted the competitive nature of the open-end fund marketplace, and that shareholders are able to redeem their Fund shares if they believe that the pertinent Fund’s fees and expenses are too high or if they are dissatisfied with the performance of the Fund.
Conclusion
The Board, including the Independent Board Members, unanimously approved the Agreement between the Manager and the Trust, on behalf of each Fund, for a one-year term ending June 30, 2022. Based upon its evaluation of all of the aforementioned factors in their totality, as well as other information, the Board, including the Independent Board Members, was satisfied that the terms of the Agreement were fair and reasonable and, in the best interest of each Fund and its shareholders. In arriving at its decision to approve the Agreement, the Board did not identify any single factor or group of factors as all-important or controlling, but considered all factors together, and different Board Members may have attributed different weights to the various factors considered. The Independent Board Members were also assisted by the advice of independent legal counsel in making this determination.
| 78 | 2 0 2 1 BLACK ROCK ANNUAL REPORT TO SHAREHOLDERS |
Trustee and Officer Information
| Independent Trustees(a) | ||||||||
Name Year of Birth(b) | Position(s) Held (Length of Service)(c) | Principal Occupation(s) During Past Five Years | Number of BlackRock-Advised Registered Investment Companies (“RICs”) Consisting of Investment Portfolios (“Portfolios”) Overseen | Public Company Investment Company Directorships Held During Past Five Years | ||||
Mark Stalnecker 1951 | Chair of the Board (Since 2019) and Trustee (Since 2015) | Chief Investment Officer, University of Delaware from 1999 to 2013; Trustee and Chair of the Finance and Investment Committees, Winterthur Museum and Country Estate from 2005 to 2016; Member of the Investment Committee, Delaware Public Employees’ Retirement System since 2002; Member of the Investment Committee, Christiana Care Health System from 2009 to 2017; Member of the Investment Committee, Delaware Community Foundation from 2013 to 2014; Director and Chair of the Audit Committee, SEI Private Trust Co. from 2001 to 2014. | 30 RICs consisting of 152 Portfolios | None | ||||
Bruce R. Bond 1946 | Trustee (Since 2019) | Board Member, Amsphere Limited (software) since 2018; Trustee and Member of the Governance Committee, State Street Research Mutual Funds from 1997 to 2005; Board Member of Governance, Audit and Finance Committee, Avaya Inc. (computer equipment) from 2003 to 2007. | 30 RICs consisting of 152 Portfolios | None | ||||
Susan J. Carter 1956 | Trustee (Since 2016) | Director, Pacific Pension Institute from 2014 to 2018; Advisory Board Member, Center for Private Equity and Entrepreneurship at Tuck School of Business since 1997; Senior Advisor, Commonfund Capital, Inc. (“CCI”) (investment adviser) in 2015; Chief Executive Officer, CCI from 2013 to 2014; President & Chief Executive Officer, CCI from 1997 to 2013; Advisory Board Member, Girls Who Invest from 2015 to 2018 and Board Member thereof since 2018; Advisory Board Member, Bridges Fund Management since 2016; Trustee, Financial Accounting Foundation since 2017; Practitioner Advisory Board Member, Private Capital Research Institute (“PCRI”) since 2017; Lecturer in the Practice of Management, Yale School of Management since 2019; Advisor to Finance Committee, Altman Foundation since 2020. | 30 RICs consisting of 152 Portfolios | None | ||||
Collette Chilton 1958 | Trustee (Since 2015) | Chief Investment Officer, Williams College since 2006; Chief Investment Officer, Lucent Asset Management Corporation from 1998 to 2006; Director, Boys and Girls Club of Boston since 2017; Director, B1 Capital since 2018; Director, David and Lucile Packard Foundation since 2020. | 30 RICs consisting of 152 Portfolios | None | ||||
Neil A. Cotty 1954 | Trustee (Since 2016) | Bank of America Corporation from 1996 to 2015, serving in various senior finance leadership roles, including Chief Accounting Officer, from 2009 to 2015, Chief Financial Officer of Global Banking, Markets and Wealth Management from 2008 to 2009, Chief Accounting Officer from 2004 to 2008, Chief Financial Officer of Consumer Bank from 2003 to 2004, Chief Financial Officer of Global Corporate Investment Bank from 1999 to 2002. | 30 RICs consisting of 152 Portfolios | None | ||||
Lena G. Goldberg 1949 | Trustee (Since 2019) | Senior Lecturer, Harvard Business School, since 2008; Director, Charles Stark Draper Laboratory, Inc. since 2013; FMR LLC/Fidelity Investments (financial services) from 1996 to 2008, serving in various senior roles including Executive Vice President - Strategic Corporate Initiatives and Executive Vice President and General Counsel; Partner, Sullivan & Worcester LLP from 1985 to 1996 and Associate thereof from 1979 to 1985. | 30 RICs consisting of 152 Portfolios | None | ||||
Henry R. Keizer 1956 | Trustee (Since 2019) | Director, Park Indemnity Ltd. (captive insurer) since 2010; Director, MUFG Americas Holdings Corporation and MUFG Union Bank, N.A. (financial and bank holding company) from 2014 to 2016; Director, American Institute of Certified Public Accountants from 2009 to 2011; Director, KPMG LLP (audit, tax and advisory services) from 2004 to 2005 and 2010 to 2012; Director, KPMG International in 2012, Deputy Chairman and Chief Operating Officer thereof from 2010 to 2012 and U.S. Vice Chairman of Audit thereof from 2005 to 2010; Global Head of Audit, KPMGI (consortium of KPMG firms) from 2006 to 2010; Director, YMCA of Greater New York from 2006 to 2010. | 30 RICs consisting of 152 Portfolios | Hertz Global Holdings (car rental); Sealed Air Corp. (packaging); Montpelier Re Holdings, Ltd. (publicly held property and casualty reinsurance) from 2013 until 2015; WABCO (commercial vehicle safety systems) from 2015 to 2020. | ||||
TRUSTEE AND OFFICER INFORMATION | 79 |
Trustee and Officer Information (continued)
| Independent Trustees(a) | ||||||||
Name Year of Birth(b) | Position(s) Held (Length of Service)(c) | Principal Occupation(s) During Past Five Years | Number of BlackRock-Advised Registered Investment Companies (“RICs”) Consisting of Investment Portfolios (“Portfolios”) Overseen | Public Company and Other Investment Company Directorships Held During Past Five Years | ||||
Cynthia A. Montgomery 1952 | Trustee (Since 2007) | Professor, Harvard Business School since 1989. | 30 RICs consisting of 152 Portfolios | Newell Rubbermaid, Inc. (manufacturing) from 1995 to 2016. | ||||
Donald C. Opatrny 1952 | Trustee (Since 2019) | Trustee, Vice Chair, Member of the Executive Committee and Chair of the Investment Committee, Cornell University from 2004 to 2019; President, Trustee and Member of the Investment Committee, The Aldrich Contemporary Art Museum from 2007 to 2014; Member of the Board and Investment Committee, University School from 2007 to 2018; Member of the Investment Committee, Mellon Foundation from 2009 to 2015;Trustee, Artstor (a Mellon Foundation affiliate) from 2010 to 2015; President and Trustee, the Center for the Arts, Jackson Hole from 2011 to 2018; Director, Athena Capital Advisors LLC (investment management firm) since 2013; Trustee and Chair of the Investment Committee, Community Foundation of Jackson Hole since 2014; Member of Affordable Housing Supply Board of Jackson, Wyoming since 2017; Member, Investment Funds Committee, State of Wyoming since 2017; Trustee, Phoenix Art Museum since 2018; Trustee, Arizona Community Foundation and Member of Investment Committee since 2020. | 30 RICs consisting of 152 Portfolios | None | ||||
Joseph P. Platt 1947 | Trustee (Since 2007) | General Partner, Thorn Partners, LP (private investments) since 1998; Director, WQED Multi-Media (public broadcasting not-for-profit) since 2001; Chair, Basic Health International (non-profit) since 2015. | 30 RICs consisting of 152 Portfolios | Greenlight Capital Re, Ltd. (reinsurance company); Consol Energy Inc. | ||||
Kenneth L. Urish 1951 | Trustee (Since 2007) | Managing Partner, Urish Popeck & Co., LLC (certified public accountants and consultants) since 1976; Past-Chairman of the Professional Ethics Committee of the Pennsylvania Institute of Certified Public Accountants and Committee Member thereof since 2007; Member of External Advisory Board, The Pennsylvania State University Accounting Department since founding in 2001; Principal, UP Strategic Wealth Investment Advisors, LLC since 2013; Trustee, The Holy Family Institute from 2001 to 2010; President and Trustee, Pittsburgh Catholic Publishing Associates from 2003 to 2008; Director, Inter-Tel from 2006 to 2007; Member, Advisory Board, ESG Competent Boards since 2020. | 30 RICs consisting of 152 Portfolios | None | ||||
Claire A. Walton 1957 | Trustee (Since 2016) | Chief Operating Officer and Chief Financial Officer of Liberty Square Asset Management, LP from 1998 to 2015; General Partner of Neon Liberty Capital Management, LLC since 2003; Director, Boston Hedge Fund Group from 2009 to 2018; Director, Woodstock Ski Runners since 2013; Director, Massachusetts Council on Economic Education from 2013 to 2015. | 30 RICs consisting of 152 Portfolios | None | ||||
| 80 | 2 0 2 1 BLACK ROCK ANNUAL REPORT TO SHAREHOLDERS |
Trustee and Officer Information (continued)
| Interested Trustees(a)(d) | ||||||||
Name Year of Birth(b) | Position(s) Held (Length of Service)(c) | Principal Occupation(s) During Past Five Years | Number of BlackRock-Advised Registered Investment Companies (“RICs”) Consisting of Investment Portfolios (“Portfolios”) Overseen | Public Company and Other Investment Company Directorships Held During Past | ||||
Robert Fairbairn 1965 | Trustee (Since 2018) | Vice Chairman of BlackRock, Inc. since 2019; Member of BlackRock’s Global Executive and Global Operating Committees; Co-Chair of BlackRock’s Human Capital Committee; Senior Managing Director of BlackRock, Inc. from 2010 to 2019; oversaw BlackRock’s Strategic Partner Program and Strategic Product Management Group from 2012 to 2019; Member of the Board of Managers of BlackRock Investments, LLC from 2011 to 2018; Global Head of BlackRock’s Retail and iShares® businesses from 2012 to 2016. | 103 RICs consisting of 251 Portfolios | None | ||||
John M. Perlowski(e) 1964 | Trustee (Since 2015), President, and Chief Executive Officer (Since 2010) | Managing Director of BlackRock, Inc. since 2009; Head of BlackRock Global Accounting and Product Services since 2009; Advisory Director of Family Resource Network (charitable foundation) since 2009. | 105 RICs consisting of 253 Portfolios | None | ||||
| (a) | The address of each Trustee is c/o BlackRock, Inc., 55 East 52nd Street, New York, New York 10055. |
| (b) | Independent Trustees serve until their resignation, retirement, removal or death, or until December 31 of the year in which they turn 75. The Board may determine to extend the terms of Independent Trustees on a case-by-case basis, as appropriate. |
| (c) | Following the combination of Merrill Lynch Investment Managers, L.P. (“MLIM”) and BlackRock, Inc. in September 2006, the various legacy MLIM and legacy BlackRock fund boards were realigned and consolidated into three new fund boards in 2007. Furthermore, effective January 1, 2019, three BlackRock Fund Complexes were realigned and consolidated into two BlackRock Fund Complexes. As a result, although the chart shows the year that each Independent Trustee joined the Board, certain Independent Trustees first became members of the boards of other BlackRock-advised Funds, legacy MLIM funds or legacy BlackRock funds as follows: Bruce R. Bond, 2005; Cynthia A. Montgomery, 1994; Joseph P. Platt, 1999; Kenneth L. Urish, 1999; Lena G. Goldberg, 2016; Henry R. Keizer, 2016; Donald C. Opatrny, 2015. |
| (d) | Mr. Fairbairn and Mr. Perlowski are both “interested persons,” as defined in the 1940 Act, of the Trust based on their positions with BlackRock, Inc. and its affiliates. Mr. Fairbairn and Mr. Perlowski are also board members of the BlackRock Fixed-Income Complex. |
| (e) | Mr. Perlowski is also a trustee of the BlackRock Credit Strategies Fund and BlackRock Private Investments Fund. |
TRUSTEE AND OFFICER INFORMATION | 81 |
Trustee and Officer Information (continued)
| Officers Who Are Not Trustees(a) | ||||
Name Year of Birth(b) | Position(s) Held (Length of Service) | Principal Occupation(s) During Past Five Years | ||
Thomas Callahan 1968 | Vice President (Since 2016) | Managing Director of BlackRock, Inc. since 2013; Member of the Board of Managers of BlackRock Investments, LLC (principal underwriter) since 2019 and Managing Director thereof since 2017; Head of BlackRock’s Global Cash Management Business since 2016; Co-Head of the Global Cash Management Business from 2014 to 2016; Deputy Head of the Global Cash Management Business from 2013 to 2014; Member of the Cash Management Group Executive Committee since 2013; Chief Executive Officer of NYSE Liffe U.S. from 2008 to 2013. | ||
Jennifer McGovern 1977 | Vice President (Since 2014) | Managing Director of BlackRock, Inc. since 2016; Director of BlackRock, Inc. from 2011 to 2015; Head of Americas Product Development and Governance for BlackRock’s Global Product Group since 2019; Head of Product Structure and Oversight for BlackRock’s U.S. Wealth Advisory Group from 2013 to 2019. | ||
Trent Walker 1974 | Chief Financial Officer (Since 2021) | Managing Director of BlackRock, Inc. since September 2019; Executive Vice President of PIMCO from 2016 to 2019; Senior Vice President of PIMCO from 2008 to 2015; Treasurer from 2013 to 2019 and Assistant Treasurer from 2007 to 2017 of PIMCO Funds, PIMCO Variable Insurance Trust, PIMCO ETF Trust, PIMCO Equity Series, PIMCO Equity Series VIT, PIMCO Managed Accounts Trust, 2 PIMCO-sponsored interval funds and 21 PIMCO-sponsored closed-end funds. | ||
Jay M. Fife 1970 | Treasurer (Since 2007) | Managing Director of BlackRock, Inc. since 2007. | ||
Charles Park 1967 | Chief Compliance Officer (Since 2014) | Anti-Money Laundering Compliance Officer for certain BlackRock-advised Funds from 2014 to 2015; Chief Compliance Officer of BlackRock Advisors, LLC and the BlackRock-advised Funds in the BlackRock Multi-Asset Complex and the BlackRock Fixed-Income Complex since 2014; Principal of and Chief Compliance Officer for iShares® Delaware Trust Sponsor LLC since 2012 and BlackRock Fund Advisors (“BFA”) since 2006; Chief Compliance Officer for the BFA-advised iShares® exchange traded funds since 2006; Chief Compliance Officer for BlackRock Asset Management International Inc. since 2012. | ||
Lisa Belle 1968 | Anti-Money Laundering Compliance Officer (Since 2019) | Managing Director of BlackRock, Inc. since 2019; Global Financial Crime Head of Asset and Wealth Management of JP Morgan from 2013 to 2019; Managing Director of RBS Securities from 2012 to 2013; Head of Financial Crimes for Barclays Wealth Americas from 2010 to 2012. | ||
Janey Ahn 1975 | Secretary (Since 2019) | Managing Director of BlackRock, Inc. since 2018; Director of BlackRock, Inc. from 2009 to 2017. | ||
| (a) | The address of each Officer is c/o BlackRock, Inc., 55 East 52nd Street, New York, New York 10055. |
| (b) | Officers of the Trust serve at the pleasure of the Board. |
Further information about the Trust’s Trustees and Officers is available in the Trust’s Statement of Additional Information, which can be obtained without charge by calling (800) 441-7762.
Neal J. Andrews retired as the Chief Financial Officer effective December 31, 2020, and Trent Walker was elected as the Chief Financial Officer effective January 1, 2021.
| 82 | 2 0 2 1 BLACK ROCK ANNUAL REPORT TO SHAREHOLDERS |
Regulation Regarding Derivatives
On October 28, 2020, the Securities and Exchange Commission (the “SEC”) adopted new regulations governing the use of derivatives by registered investment companies (“Rule 18f-4”). The Funds will be required to implement and comply with Rule 18f-4 by August 19, 2022. Once implemented, Rule 18f-4 will impose limits on the amount of derivatives a fund can enter into, eliminate the asset segregation framework currently used by funds to comply with Section 18 of the 1940 Act, treat derivatives as senior securities and require funds whose use of derivatives is more than a limited specified exposure amount to establish and maintain a comprehensive derivatives risk management program and appoint a derivatives risk manager.
General Information
Quarterly performance, semi-annual and annual reports, current net asset value and other information regarding the Funds may be found on BlackRock’s website, which can be accessed at blackrock.com. Any reference to BlackRock’s website in this report is intended to allow investors public access to information regarding the Funds and does not, and is not intended to, incorporate BlackRock’s website in this report.
Householding
The Funds will mail only one copy of shareholder documents, including prospectuses, annual and semi-annual reports, Rule 30e-3 notices and proxy statements, to shareholders with multiple accounts at the same address. This practice is commonly called “householding” and is intended to reduce expenses and eliminate duplicate mailings of shareholder documents. Mailings of your shareholder documents may be householded indefinitely unless you instruct us otherwise. If you do not want the mailing of these documents to be combined with those for other members of your household, please call the Funds at (800) 441-7762.
Availability of Quarterly Schedule of Investments
The Funds file their complete schedules of portfolio holdings with the SEC for the first and third quarters of each fiscal year as an exhibit to their reports on Form N-PORT. The Funds’ Forms N-PORT are available on the SEC’s website at sec.gov. Additionally, each Fund makes its portfolio holdings for the first and third quarters of each fiscal year available at blackrock.com/fundreports.
Availability of Proxy Voting Policies, Procedures and Voting Records
A description of the policies and procedures that the Funds use to determine how to vote proxies relating to portfolio securities and information about how the Funds voted proxies relating to securities held in the Funds’ portfolios during the most recent 12-month period ended June 30 is available without charge, upon request (1) by calling (800) 441-7762; (2) on the BlackRock website at blackrock.com; and (3) on the SEC’s website at sec.gov.
BlackRock’s Mutual Fund Family
BlackRock offers a diverse lineup of open-end mutual funds crossing all investment styles and managed by experts in equity, fixed-income and tax-exempt investing. Visit blackrock.com for more information.
Shareholder Privileges
Account Information
Call us at (800) 441-7762 from 8:00 AM to 6:00 PM ET on any business day to get information about your account balances, recent transactions and share prices. You can also visit blackrock.com for more information.
Automatic Investment Plans
Investor class shareholders who want to invest regularly can arrange to have $50 or more automatically deducted from their checking or savings account and invested in any of the BlackRock funds.
Systematic Withdrawal Plans
Investor class shareholders can establish a systematic withdrawal plan and receive periodic payments of $50 or more from their BlackRock funds, as long as their account balance is at least $10,000.
Retirement Plans
Shareholders may make investments in conjunction with Traditional, Rollover, Roth, Coverdell, Simple IRAs, SEP IRAs and 403(b) Plans.
ADDITIONAL INFORMATION | 83 |
Additional Information (continued)
BlackRock Privacy Principles
BlackRock is committed to maintaining the privacy of its current and former fund investors and individual clients (collectively, “Clients”) and to safeguarding their non-public personal information. The following information is provided to help you understand what personal information BlackRock collects, how we protect that information and why in certain cases we share such information with select parties.
If you are located in a jurisdiction where specific laws, rules or regulations require BlackRock to provide you with additional or different privacy-related rights beyond what is set forth below, then BlackRock will comply with those specific laws, rules or regulations.
BlackRock obtains or verifies personal non-public information from and about you from different sources, including the following: (i) information we receive from you or, if applicable, your financial intermediary, on applications, forms or other documents; (ii) information about your transactions with us, our affiliates, or others; (iii) information we receive from a consumer reporting agency; and (iv) from visits to our websites.
BlackRock does not sell or disclose to non-affiliated third parties any non-public personal information about its Clients, except as permitted by law or as is necessary to respond to regulatory requests or to service Client accounts. These non-affiliated third parties are required to protect the confidentiality and security of this information and to use it only for its intended purpose.
We may share information with our affiliates to service your account or to provide you with information about other BlackRock products or services that may be of interest to you. In addition, BlackRock restricts access to non-public personal information about its Clients to those BlackRock employees with a legitimate business need for the information. BlackRock maintains physical, electronic and procedural safeguards that are designed to protect the non-public personal information of its Clients, including procedures relating to the proper storage and disposal of such information.
Fund and Service Providers
Investment Adviser and Administrator
BlackRock Advisors, LLC
Wilmington, DE 19809
Accounting Agent and Transfer Agent
BNY Mellon Investment Servicing (US) Inc.
Wilmington, DE 19809
Custodian
The Bank of New York Mellon
New York, NY 10286
Independent Registered Public Accounting Firm
Deloitte & Touche LLP
Boston, MA 02116
Distributor
BlackRock Investments, LLC
New York, NY 10022
Legal Counsel
Sidley Austin LLP
New York, NY 10019
Address of the Trust
100 Bellevue Parkway
Wilmington, DE 19809
| 84 | 2 0 2 1 BLACK ROCK ANNUAL REPORT TO SHAREHOLDERS |
Glossary of Terms Used in this Report
| Portfolio Abbreviation | ||
| CVR | Contingent Value Rights | |
| REIT | Real Estate Investment Trust | |
GLOSSARY OF TERMS USED IN THIS REPORT | 85 |
Want to know more?
blackrock.com | 800-441-7762
This report is intended for current holders. It is not authorized for use as an offer of sale or a solicitation of an offer to buy shares of the Funds unless preceded or accompanied by the Funds’ current prospectus. Past performance results shown in this report should not be considered a representation of future performance. Investment returns and principal value of shares will fluctuate so that shares, when redeemed, may be worth more or less than their original cost. Statements and other information herein are as dated and are subject to change.
SC2-5/21-AR
|  |
| MAY 31, 2021 |

2021 Annual Report
| ||
BlackRock FundsSM
| 🌑 | BlackRock Energy Opportunities Fund |
| 🌑 | BlackRock High Equity Income Fund |
| 🌑 | BlackRock International Dividend Fund |
Not FDIC Insured • May Lose Value • No Bank Guarantee
|
Dear Shareholder,
The 12-month reporting period as of May 31, 2021 was a remarkable period of adaptation and recovery, as the global economy dealt with the implications of the coronavirus (or “COVID-19”) pandemic. The United States, along with most of the world, began the reporting period in a severe recession, prompted by pandemic-related restrictions that disrupted many aspects of daily life. However, easing restrictions and robust government intervention led to a strong rebound, and the economy grew at a significant pace for most of the reporting period, recovering much of the output lost at the beginning of the pandemic.
Equity prices rose with the broader economy, as investors became increasingly optimistic about the economic outlook. Stocks rose through the summer of 2020, fed by strong fiscal and monetary support and positive economic indicators. The implementation of mass vaccination campaigns and passage of an additional $1.9 trillion of fiscal stimulus further boosted stocks, and many equity indices neared or surpassed all-time highs late in the reporting period. In the United States, both large- and small-capitalization stocks posted a significant advance. International equities also gained, as both developed countries and emerging markets rebounded substantially.
The 10-year U.S. Treasury yield (which is inversely related to bond prices) had fallen sharply prior to the beginning of the reporting period, which meant bonds were priced for extreme risk avoidance and economic disruption. Despite expectations of doom and gloom, the economy expanded rapidly, stoking inflation concerns late in the reporting period, which led to higher yields and a negative overall return for most U.S. Treasuries. In the corporate bond market, support from the U.S. Federal Reserve (the “Fed”) assuaged credit concerns and led to substantial returns for high-yield corporate bonds, although investment-grade corporates declined slightly.
The Fed remained committed to accommodative monetary policy by maintaining near zero interest rates and by announcing that inflation could exceed its 2% target for a sustained period without triggering a rate increase. To stabilize credit markets, the Fed also continued purchasing significant quantities of bonds, as did other influential central banks around the world, including the European Central Bank and the Bank of Japan.
Looking ahead, while coronavirus-related disruptions have clearly hindered worldwide economic growth, we believe that the global expansion will continue to accelerate as vaccination efforts ramp up and pent-up consumer demand leads to higher spending. While we expect inflation to increase somewhat as the expansion continues, we believe the recent uptick owes more to temporary supply disruptions than a lasting change in fundamentals. The change in Fed policy also means that moderate inflation is less likely to be followed by interest rate hikes that could threaten the economic expansion.
Overall, we favor a positive stance toward risk, with an overweight in equities. We see U.S. and Asian equities outside of Japan benefiting from structural growth trends in technology, while emerging markets should be particularly helped by a vaccine-led economic expansion and more stable U.S. trade policy. While we are underweight long-term on credit, global high-yield and Asian bonds present attractive opportunities, as do emerging market bonds denominated in local currencies. We believe that international diversification and a focus on sustainability can help provide portfolio resilience, and the disruption created by the coronavirus appears to be accelerating the shift toward sustainable investments.
In this environment, our view is that investors need to think globally, extend their scope across a broad array of asset classes, and be nimble as market conditions change. We encourage you to talk with your financial advisor and visit blackrock.com for further insight about investing in today’s markets.
Sincerely,

Rob Kapito
President, BlackRock Advisors, LLC

Rob Kapito
President, BlackRock Advisors, LLC
| Total Returns as of May 31, 2021 | ||||
| 6-Month | 12-Month | |||
U.S. large cap equities | 16.95% | 40.32% | ||
U.S. small cap equities | 25.28 | 64.56 | ||
International equities (MSCI Europe, Australasia, Far East Index) | 15.19 | 38.41 | ||
Emerging market equities (MSCI Emerging Markets Index) | 15.15 | 51.00 | ||
3-month Treasury bills | 0.04 | 0.11 | ||
U.S. Treasury securities | (6.07) | (7.30) | ||
U.S. investment grade bonds (Bloomberg Barclays U.S. Aggregate Bond Index) | (2.16) | (0.40) | ||
Tax-exempt municipal bonds (S&P Municipal Bond Index) | 1.54 | 4.70 | ||
U.S. high yield bonds (Bloomberg Barclays U.S. Corporate High Yield 2% Issuer Capped Index) | 4.18 | 14.90 | ||
Past performance is not an indication of future results. Index performance is shown for illustrative purposes only. You cannot invest directly in an index. | ||||
| 2 | THIS PAGE IS NOT PART OF YOUR FUND REPORT |
| Page | ||
| 2 | ||
Annual Report: | ||
| 4 | ||
| 13 | ||
| 13 | ||
Financial Statements: | ||
| 14 | ||
| 24 | ||
| 26 | ||
| 27 | ||
| 30 | ||
| 44 | ||
| 57 | ||
| 58 | ||
Disclosure of Investment Advisory Agreements and Sub-Advisory Agreements | 59 | |
| 63 | ||
| 67 | ||
| 69 | ||

| 3 |
| Fund Summary as of May 31, 2021 | BlackRock Energy Opportunities Fund |
Investment Objective
BlackRock Energy Opportunities Fund’s (the “Fund”) investment objective is to provide long-term growth of capital.
Portfolio Management Commentary
How did the Fund perform?
For the 12-month period ended May 31, 2021, the Fund underperformed its benchmark, the MSCI World Energy Index.
What factors influenced performance?
Energy stocks delivered strong returns in the annual period. After falling sharply in early 2020 due to concerns about the potential impact of COVID-19 on energy demand, oil prices and the related equities continued to trend lower through the end of October 2020. The outlook changed considerably in early November 2020, however, when the release of a vaccine for the coronavirus provided a path to a re-opening of the global economy. Energy stocks responded in kind, staging an impressive rally that allowed the MSCI World Energy Index to recapture its earlier losses and finish the period with a gain.
While the Fund delivered a robust absolute return, it did not keep pace with the benchmark. The Fund’s overweight position in the exploration and production (“E&P”) sub-sector contributed to relative performance, as did stock selection within the refining and marketing category. On the other hand, an underweight in the integrated sub-sector detracted from Fund performance.
Among individual holdings, an out-of-benchmark position in Petroleo Brasileiro SA (Petrobras) was the largest detractor from relative performance. Shares of the Brazilian state-owned integrated oil producer declined following an unexpected change in its chief executive officer, which the market saw as the first step in deeper government influence in its longer-term strategy. CNOOC Ltd. also lagged after the United States cited a number of companies for their links to the Chinese military. An underweight position in Occidental Petroleum Corp. detracted from relative performance as well.
An underweight in Exxon Mobil Corp., a large index component that did not keep pace with its sector peers, was the largest contributor to relative performance. Positions in E&P stocks that benefited from the oil price recovery, including Hess Corp. and Pioneer Natural Resources Co., also contributed positively.
Describe recent portfolio activity.
Early in the period, the investment adviser sought to capitalize on the energy sector’s weak performance by purchasing what it believed were higher-quality, financially strong companies trading near historically low valuations. It primarily added to existing positions in large-cap international companies that it saw as being in the best position to take advantage of an eventual recovery.
As the reporting period progressed, the investment adviser added E&P stocks that were delivering operational results, which were in line with, or ahead of, expectations. It also increased the Fund’s weighting in refining stocks to capitalize on an anticipated boost in gasoline demand stemming from the re-opening. The investment adviser funded these new purchases by reducing the portfolio’s holdings in the more defensive distribution industry.
Describe portfolio positioning at period end.
The Fund was overweight in the exploration and production industry, and it was underweight in the integrated, distribution, oil services and refining/marketing industries. The investment adviser maintained a bias toward higher-quality oil producers that it believes will gain the largest benefit from continued strength in oil prices. In contrast, the investment adviser tilted away from the oil services sub-sector, where many companies are likely to continue to face headwinds from industry overcapacity.
The views expressed reflect the opinions of BlackRock as of the date of this report and are subject to change based on changes in market, economic or other conditions. These views are not intended to be a forecast of future events and are no guarantee of future results.
| 4 | 2 0 2 1 BLACK ROCK ANNUAL REPORT TO SHAREHOLDERS |
| Fund Summary as of May 31, 2021 (continued) | BlackRock Energy Opportunities Fund |
TOTAL RETURN BASED ON A $10,000 INVESTMENT
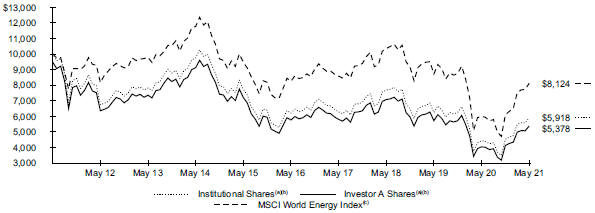
| (a) | Assuming maximum sales charges, if any, transaction costs and other operating expenses, including investment advisory fees and administration fees, if any. Institutional Shares do not have a sales charge. |
| (b) | Under normal market conditions, the Fund invests at least 80% of its total assets in equity securities of global energy and natural resources companies and companies in associated businesses, as well as utilities (such as gas, water, cable, electrical and telecommunications utilities). |
| (c) | The MSCI World Energy Index is designed to capture the large and mid-cap segments across developed markets countries. |
Performance Summary for the Period Ended May 31, 2021
| Average Annual Total Returns(a) | ||||||||||||||||||||||||||||||||||||||||
|
| |||||||||||||||||||||||||||||||||||||||
| 1 Year | 5 Years | 10 Years | ||||||||||||||||||||||||||||||||||||||
|
|
|
|
|
| |||||||||||||||||||||||||||||||||||
6-Month Total Returns | Without Sales Charge | With Sales Charge | Without Sales Charge | With Sales Charge | Without Sales Charge | With Sales Charge | ||||||||||||||||||||||||||||||||||
Institutional | 30.70 | % | 33.50 | % | N/A | (0.97 | )% | N/A | (5.11 | )% | N/A | |||||||||||||||||||||||||||||
Service | 30.30 | 32.90 | N/A | (1.38 | ) | N/A | (5.49 | ) | N/A | |||||||||||||||||||||||||||||||
Investor A | 30.35 | 33.00 | 26.02 | % | (1.38 | ) | (2.44 | )% | (5.51 | ) | (6.01 | )% | ||||||||||||||||||||||||||||
Investor C | 29.78 | 31.89 | 30.89 | (2.10 | ) | (2.10 | ) | (6.05 | ) | (6.05 | ) | |||||||||||||||||||||||||||||
MSCI World Energy Index | 33.27 | 35.43 | N/A | (0.31 | ) | N/A | (2.06 | ) | N/A | |||||||||||||||||||||||||||||||
| (a) | Assuming maximum sales charges, if any. Average annual total returns with and without sales charges reflect reductions for distribution and service fees. See “About Fund Performance” for a detailed description of share classes, including any related sales charges and fees. |
N/A - Not applicable as share class and index do not have a sales charge.
Past performance is not an indication of future results.
Performance results may include adjustments made for financial reporting purposes in accordance with U.S. generally accepted accounting principles.
Expense Example
| Actual | Hypothetical | |||||||||||||||||||||||||||||||
|
|
|
| |||||||||||||||||||||||||||||
| | Beginning Account Value (12/01/20) |
| | Ending Account Value (05/31/21) |
| | Expenses Paid During the Period |
(a) | | Beginning Account Value | | | Ending Account Value (05/31/21) |
| | Expenses Paid During the Period |
(a) | | Annualized Expense Ratio |
| ||||||||||||
Institutional | $ 1,000.00 | $ 1,307.00 | $ 5.23 | $ 1,000.00 | $ 1,020.39 | $ 4.58 | 0.91 | % | ||||||||||||||||||||||||
Service | 1,000.00 | 1,303.00 | 7.58 | 1,000.00 | 1,018.35 | 6.64 | 1.32 | |||||||||||||||||||||||||
Investor A | 1,000.00 | 1,303.50 | 7.58 | 1,000.00 | 1,018.35 | 6.64 | 1.32 | |||||||||||||||||||||||||
Investor C | 1,000.00 | 1,297.80 | 11.69 | 1,000.00 | 1,014.76 | 10.25 | 2.04 | |||||||||||||||||||||||||
| (a) | For each class of the Fund, expenses are equal to the annualized expense ratio for the class, multiplied by the average account value over the period, multiplied by 182/365 (to reflect the one-half year period shown). |
See “Disclosure of Expenses” for further information on how expenses were calculated.
FUND SUMMARY | 5 |
| Fund Summary as of May 31, 2021 (continued) | BlackRock Energy Opportunities Fund |
Portfolio Information
TEN LARGEST HOLDINGS
| Security(a) | Percent of Net Assets | |||
Chevron Corp. | 13 | % | ||
Royal Dutch Shell PLC, B Shares | 10 | |||
TOTAL SE | 8 | |||
Exxon Mobil Corp. | 7 | |||
ConocoPhillips | 7 | |||
Canadian Natural Resources Ltd. | 4 | |||
Suncor Energy, Inc. | 4 | |||
Pioneer Natural Resources Co. | 4 | |||
Hess Corp. | 4 | |||
Valero Energy Corp. | 4 | |||
INDUSTRY ALLOCATION
| Industry(b) | Percent of Net Assets | |||
Oil, Gas & Consumable Fuels | 96 | % | ||
Energy Equipment & Services | 2 | |||
Short-Term Securities | 1 | |||
Other Assets | 1 | |||
| (a) | Excludes short-term securities. |
| (b) | For Fund compliance purposes, the Fund’s industry classifications refer to one or more of the industry sub-classifications used by one or more widely recognized market indexes or ratings group indexes, and/or as defined by the investment adviser. These definitions may not apply for purposes of this report, which may combine such industry sub-classifications for reporting ease. |
| 6 | 2 0 2 1 BLACK ROCK ANNUAL REPORT TO SHAREHOLDERS |
| Fund Summary as of May 31, 2021 | BlackRock High Equity Income Fund |
Investment Objective
BlackRock High Equity Income Fund’s (the “Fund”) investment objective is to seek high current income while maintaining prospects for capital appreciation.
Portfolio Management Commentary
How did the Fund perform?
For the 12-month period ended May 31, 2021, the Fund underperformed its benchmark, the Russell 1000® Value Index.
What factors influenced performance?
The largest detractor from the Fund’s relative performance came from investment decisions in the communication services sector. Notably, an overweight allocation to the diversified telecommunication (“telecom”) services industry hurt relative returns, as did an underweight allocation to interactive media & services that resulted from a lack of dividend-paying stocks in the industry. Stock selection in the wireless telecom services industry also weighed on results in the sector. Elsewhere, among utilities, stock selection in the electric utilities industry held back relative performance. Other meaningful detractors during the period included stock selection and an overweight allocation to health care stocks and an underweight allocation to industrials. Lastly, the use of equity-linked notes enhanced portfolio yield but detracted from relative performance during the period.
Conversely, the largest contribution to the Fund’s performance at the sector level came from investment decisions in the information technology sector. In particular, strong stock selection in the software industry and a combination of stock selection and an underweight allocation to semiconductors & semiconductor equipment companies boosted relative returns. Within the consumer discretionary sector, an overweight allocation to automobiles and a combination of stock selection and an underweight allocation to household durables proved beneficial. Other modest contributors included the Fund’s underweight allocation to real estate and overweight allocation to the energy sector.
Describe recent portfolio activity.
The Fund increased its exposure to the financials and industrials sectors during the period. Conversely, the Fund reduced its exposure to the energy and communication services sectors.
Describe portfolio positioning at period end.
The Fund ended the period with its largest absolute allocations in the financials, health care and consumer staples sectors. Relative to the benchmark, the Fund’s largest overweight positions were in financials, health care and consumer staples, while the largest relative underweights were in the industrials, materials and real estate sectors.
The views expressed reflect the opinions of BlackRock as of the date of this report and are subject to change based on changes in market, economic or other conditions. These views are not intended to be a forecast of future events and are no guarantee of future results.
FUND SUMMARY | 7 |
| Fund Summary as of May 31, 2021 (continued) | BlackRock High Equity Income Fund |
TOTAL RETURN BASED ON A $10,000 INVESTMENT
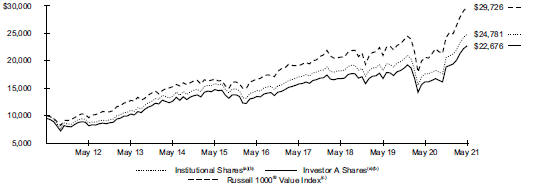
| (a) | Assuming maximum sales charges, if any, transaction costs and other operating expenses, including investment advisory fees and administration fees, if any. Institutional Shares do not have a sales charge. |
| (b) | Under normal circumstances, the Fund will invest at least 80% of its net assets, plus the amount of any borrowings for investment purposes, in equity securities and equity-related instruments, including equity-linked notes. The Fund may invest in securities of companies with any market capitalization, but will generally focus on large cap securities. The Fund’s total returns prior to June 12, 2017 are the returns of the Fund when it followed different investment strategies under the name BlackRock U.S. Opportunities Portfolio. |
| (c) | Russell 1000® Value Index measures the performance of the large-cap value segment of the U.S. equity universe. It includes those Russell 1000® companies with lower price-to-book ratios and lower expected growth values. |
Performance Summary for the Period Ended May 31, 2021
| Average Annual Total Returns(a)(b) | ||||||||||||||||||||||||||||||||||||
|
| |||||||||||||||||||||||||||||||||||
| 1 Year | 5 Years | 10 Years | ||||||||||||||||||||||||||||||||||
|
|
|
|
|
| |||||||||||||||||||||||||||||||
6-Month Total Returns | Without Sales Charge | With Sales Charge | Without Sales Charge | With Sales Charge | Without Sales Charge | With Sales Charge | ||||||||||||||||||||||||||||||
Institutional | 20.62 | % | 40.81 | % | N/A | 11.26 | % | N/A | 9.50 | % | N/A | |||||||||||||||||||||||||
Service | 20.52 | 40.46 | N/A | 10.97 | N/A | 9.13 | N/A | |||||||||||||||||||||||||||||
Investor A | 20.45 | 40.44 | 33.07 | % | 10.97 | 9.78 | % | 9.12 | 8.53 | % | ||||||||||||||||||||||||||
Investor C | 20.02 | 39.41 | 38.41 | 10.15 | 10.15 | 8.47 | 8.47 | |||||||||||||||||||||||||||||
Class K | 20.70 | 40.93 | N/A | 11.28 | N/A | 9.51 | N/A | |||||||||||||||||||||||||||||
Russell 1000® Value Index | 22.94 | 44.38 | N/A | 12.33 | N/A | 11.51 | N/A | |||||||||||||||||||||||||||||
| (a) | Assuming maximum sales charges, if any. Average annual total returns with and without sales charges reflect reductions for distribution and service fees. See “About Fund Performance” for a detailed description of share classes, including any related sales charges and fees, and how performance was calculated for certain share classes. |
| (b) | Under normal circumstances, the Fund will invest at least 80% of its net assets, plus the amount of any borrowings for investment purposes, in equity securities and equity-related instruments, including equity-linked notes. The Fund may invest in securities of companies with any market capitalization, but will generally focus on large cap securities. The Fund’s total returns prior to June 12, 2017, are the returns of the Fund when it followed different investment strategies under the name BlackRock U.S. Opportunities Portfolio. |
N/A - Not applicable as share class and index do not have a sales charge.
Past performance is not an indication of future results.
Performance results may include adjustments made for financial reporting purposes in accordance with U.S. generally accepted accounting principles.
| 8 | 2 0 2 1 BLACK ROCK ANNUAL REPORT TO SHAREHOLDERS |
| Fund Summary as of May 31, 2021 (continued) | BlackRock High Equity Income Fund |
Expense Example
| Actual | Hypothetical(a) | |||||||||||||||||||||||||||||||||||
|
|
|
| |||||||||||||||||||||||||||||||||
| | Beginning Account Value (12/01/20) | | | Ending Account Value (05/31/21) | | | Expenses Paid During the Period |
(b) | | Beginning Account Value (12/01/20) | | | Ending Account Value (05/31/21) | | | Expenses Paid During the Period | (b) | | Annualized Expense Ratio |
| ||||||||||||||||
Institutional | $ 1,000.00 | $ 1,206.20 | $4.68 | $ 1,000.00 | $ 1,020.71 | $ 4.29 | 0.85 | % | ||||||||||||||||||||||||||||
Service | 1,000.00 | 1,205.20 | 6.08 | 1,000.00 | 1,019.45 | 5.57 | 1.10 | |||||||||||||||||||||||||||||
Investor A | 1,000.00 | 1,204.50 | 6.08 | 1,000.00 | 1,019.45 | 5.57 | 1.10 | |||||||||||||||||||||||||||||
Investor C | 1,000.00 | 1,200.20 | 10.20 | 1,000.00 | 1,015.71 | 9.35 | 1.85 | |||||||||||||||||||||||||||||
| Class K | 1,000.00 | 1,207.00 | 4.43 | 1,000.00 | 1,020.94 | 4.05 | 0.80 | |||||||||||||||||||||||||||||
| (a) | Hypothetical 5% annual return before expenses is calculated by prorating the number of days in the most recent fiscal half year divided by 365. |
| (b) | For each class of the Fund, expenses are equal to the annualized expense ratio for the class, multiplied by the average account value over the period, multiplied by 182/365 (to reflect the one-half year period shown). |
See “Disclosure of Expenses” for further information on how expenses were calculated.
Portfolio Information
TEN LARGEST HOLDINGS
| Security(a) | Percent of Net Assets | |||
BAE Systems PLC | 3 | % | ||
Wells Fargo & Co. | 2 | |||
Cisco Systems, Inc. | 2 | |||
Apollo Global Management, Inc. | 2 | |||
General Motors Co. | 2 | |||
AT&T Inc. | 2 | |||
Raytheon Technologies Corp. | 2 | |||
Vodafone Group PLC | 2 | |||
BP PLC | 2 | |||
British American Tobacco PLC | 2 | |||
SECTOR ALLOCATION
| Sector(b) | Percent of Net Assets | |||
Financials | 29 | % | ||
Health Care | 18 | |||
Consumer Staples | 11 | |||
Information Technology | 9 | |||
Communication Services | 7 | |||
Utilities | 7 | |||
Industrials | 7 | |||
Energy | 7 | |||
Consumer Discretionary | 5 | |||
Real Estate | 1 | |||
Materials | 1 | |||
Short-Term Securities | 2 | |||
Liabilities in Excess of Other Assets | (4 | ) | ||
| (a) | Excludes short-term securities. |
| (b) | For Fund compliance purposes, the Fund’s sector classifications refer to one or more of the sector sub-classifications used by one or more widely recognized market indexes or ratings group indexes, and/or as defined by the investment adviser. These definitions may not apply for purposes of this report, which may combine such sector sub-classifications for reporting ease. |
FUND SUMMARY | 9 |
| Fund Summary as of May 31, 2021 | BlackRock International Dividend Fund |
Investment Objective
BlackRock International Dividend Fund’s (the “Fund”) investment objective is to seek long-term total return and current income.
Portfolio Management Commentary
How did the Fund perform?
For the 12-month period ended May 31, 2021, the Fund underperformed its benchmark, the MSCI All Country World Index (“ACWI”) ex USA.
What factors influenced performance?
During the period, the Fund’s overweight exposures to the consumer staples and health care sectors were the largest detractors from returns as investors favored more cyclical sectors. An underweight to materials sector also detracted. At the individual security level, overweight positions to U.K. cigarette and tobacco producer British American Tobacco PLC, French pharmaceutical developer Sanofi and U.K. household products manufacturer Reckitt Benckiser Group PLC detracted most from relative performance as these and other defensive stocks lagged during the second half of the period in part because of positive vaccine news. Shares of British American Tobacco sold off during the third quarter of 2020 as U.K.-listed dividend stocks were out of favor. A merger announcement weighed on Sanofi’s share price. Lastly, investors have become increasingly cautious regarding the outlook for Reckitt Benckiser as the company’s hygiene business has continued to deliver the majority of its sales growth, while its health and nutrition divisions reported falling sales over multiple quarters.
Conversely, the largest contribution to relative performance came from an underweight to the utilities sector. Security selection within financials and a lack of exposure to energy also added to relative performance. The largest individual contributors to relative returns came from the Fund’s positions in Spanish bank Bankinter SA, Taiwan Semiconductor Manufacturing Company Ltd. (TSMC) and German package delivery firm Deutsche Post AG. Shares of Bankinter benefited from investor rotation among names positioned to benefit from the yield curve steepening that occurred during the first quarter of 2021. TSMC performed well as the company reported 25% net revenue growth based on strong demand for its 5-nanometer chips. Finally, Deutsche Post reported strong financial results for the third quarter of 2020, with revenue growth accelerating meaningfully.
Describe recent portfolio activity.
The Fund’s investment adviser was especially active in adjusting the portfolio during the second half of the period due to COVID-19 impacts. An overweight to financials was increased as the Fund added to a number of existing positions across bank and insurance stocks. In addition, the Fund’s overweight to information technology (“IT”) was increased through the initiation of positions in Spanish travel transaction processor Amadeus IT Group SA, U.S. credit card company Visa, Inc. and TSMC. The Fund also increased its position sizes within IT, most notably across the IT services sub-sector. In contrast, exposure to health care was reduced across pharmaceuticals and health care providers & services stocks. Lastly, exposure to communication services was decreased by exiting Rogers Communications, Inc. and Tele2 AB, and trimming the Fund’s position in TELUS Corp. (Canada).
Describe portfolio positioning at period end.
At period end, the Fund was overweight in the health care and consumer staples sectors. The Fund had no exposure to energy or real estate, and limited exposure to utilities stocks. Regionally, the Fund was overweight the United Kingdom, France and the United States.
The views expressed reflect the opinions of BlackRock as of the date of this report and are subject to change based on changes in market, economic or other conditions. These views are not intended to be a forecast of future events and are no guarantee of future results.
| 10 | 2 0 2 1 BLACK ROCK ANNUAL REPORT TO SHAREHOLDERS |
| Fund Summary as of May 31, 2021 (continued) | BlackRock International Dividend Fund |
TOTAL RETURN BASED ON A $10,000 INVESTMENT
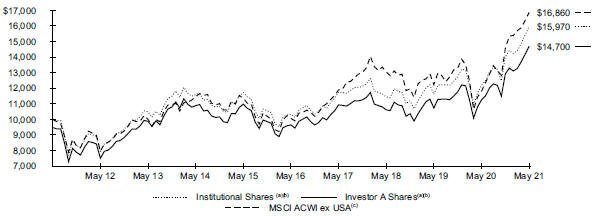
| (a) | Assuming maximum sales charges, if any, transaction costs and other operating expenses, including investment advisory fees and administration fees, if any. Institutional Shares do not have a sales charge. |
| (b) | Under normal circumstances, the Fund will invest at least 80% of its net assets, plus the amount of any borrowings for investment purposes, in dividend-paying equity securities issued by foreign companies of any market capitalization and derivatives that have similar economic characteristics to such securities. The Fund’s total returns prior to June 12, 2017 are the returns of the Fund when it followed different investment strategies under the name BlackRock International Opportunities Portfolio. |
| (c) | The MSCI ACWI ex USA. is a free float-adjusted market capitalization weighted index designed to measure the combined equity market performance of developed and emerging market countries, excluding the United States. |
Performance Summary for the Period Ended May 31, 2021
| Average Annual Total Returns(a)(b) | ||||||||||||||||||||||||||||
|
| |||||||||||||||||||||||||||
| 1 Year | 5 Years | 10 Years | ||||||||||||||||||||||||||
|
|
|
|
|
| |||||||||||||||||||||||
6-Month Total Returns | Without Sales Charge | With Sales Charge | Without Sales Charge | With Sales Charge | Without Sales Charge | With Sales Charge | ||||||||||||||||||||||
Institutional | 13.96 | % | 30.98 | % | N/A | 9.09 | % | N/A | 4.79 | % | N/A | |||||||||||||||||
Service | 13.77 | 30.64 | N/A | 8.80 | N/A | 4.45 | N/A | |||||||||||||||||||||
Investor A | 13.81 | 30.67 | 23.80 | % | 8.80 | 7.63 | % | 4.49 | 3.93 | % | ||||||||||||||||||
Investor C | 13.39 | 29.70 | 28.70 | 7.99 | 7.99 | 3.87 | 3.87 | |||||||||||||||||||||
Class K | 13.95 | 31.04 | N/A | 9.12 | N/A | 4.81 | N/A | |||||||||||||||||||||
MSCI All Country World Index ex USA | 15.81 | 42.78 | N/A | 10.88 | N/A | 5.36 | N/A | |||||||||||||||||||||
| (a) | Assuming maximum sales charges, if any. Average annual total returns with and without sales charges reflect reductions for distribution and service fees. See “About Fund Performance” for a detailed description of share classes, including any related sales charges and fees, and how performance was calculated for certain share classes. |
| (b) | Under normal circumstances, the Fund will invest at least 80% of its net assets, plus the amount of any borrowings for investment purposes, in dividend-paying equity securities issued by foreign companies of any market capitalization and derivatives that have similar economic characteristics to such securities. The Fund’s total returns prior to June 12, 2017 are the returns of the Fund when it followed different investment strategies under the name BlackRock International Opportunities Portfolio. |
N/A - Not applicable as share class and index do not have a sales charge.
Past performance is not an indication of future results.
Performance results may include adjustments made for financial reporting purposes in accordance with U.S. generally accepted accounting principles.
FUND SUMMARY | 11 |
| Fund Summary as of May 31, 2021 (continued) | BlackRock International Dividend Fund |
Expense Example
| Actual | Hypothetical(a) | |||||||||||||||||||||||||||||
|
|
|
| |||||||||||||||||||||||||||
| | Beginning Account Value (12/01/20) |
| | Ending Account Value (05/31/21) |
| | Expenses Paid During the Period |
(b) | | Beginning Account Value (12/01/20) |
| | Ending Account Value (05/31/21) |
| | Expenses Paid During the Period |
(b) | | Annualized Expense Ratio |
| ||||||||||
Institutional | $ 1,000.00 | $ 1,139.60 | $ 4.48 | $ 1,000.00 | $ 1,020.74 | $ 4.23 | 0.84 | % | ||||||||||||||||||||||
Service | 1,000.00 | 1,137.70 | 5.81 | 1,000.00 | 1,019.50 | 5.49 | 1.09 | |||||||||||||||||||||||
Investor A | 1,000.00 | 1,138.10 | 5.81 | 1,000.00 | 1,019.50 | 5.49 | 1.09 | |||||||||||||||||||||||
Investor C | 1,000.00 | 1,133.90 | 9.79 | 1,000.00 | 1,015.76 | 9.25 | 1.84 | |||||||||||||||||||||||
Class K | 1,000.00 | 1,139.50 | 4.21 | 1,000.00 | 1,020.99 | 3.98 | 0.79 | |||||||||||||||||||||||
| (a) | Hypothetical 5% annual return before expenses is calculated by prorating the number of days in the most recent fiscal half year divided by 365. |
| (b) | For each class of the Fund, expenses are equal to the annualized expense ratio for the class, multiplied by the average account value over the period, multiplied by 182/365 (to reflect the one-half year period shown). |
See “Disclosure of Expenses” for further information on how expenses were calculated.
Portfolio Information
TEN LARGEST HOLDINGS
| Security(a) | Percent of Net Assets | |
Sanofi | 5% | |
Reckitt Benckiser Group PLC | 5 | |
Diageo PLC | 5 | |
Taiwan Semiconductor Manufacturing Co. Ltd. | 5 | |
Ferguson PLC | 4 | |
TELUS Corp. | 4 | |
Amadeus IT Group SA | 4 | |
RELX PLC | 4 | |
Prudential PLC | 4 | |
Unilever PLC | 4 | |
GEOGRAPHIC ALLOCATION
| Country | Percent of Net Assets | |
United Kingdom | 29% | |
France | 17 | |
United States | 14 | |
China | 8 | |
Spain | 6 | |
Taiwan | 5 | |
Canada | 4 | |
Singapore | 4 | |
India | 4 | |
Denmark | 3 | |
Netherlands | 3 | |
Australia | 2 | |
Mexico | 1 | |
| (a) | Excludes short-term securities. |
| 12 | 2 0 2 1 BLACK ROCK ANNUAL REPORT TO SHAREHOLDERS |
Institutional and Class K Shares (Class K Shares are available only for BlackRock High Equity Income Fund and BlackRock International Dividend Fund) are not subject to any sales charge. These shares bear no ongoing distribution or service fees and are available only to certain eligible investors. BlackRock High Equity Income Fund’s Class K Shares performance shown prior to the Class K Shares inception date of April 21, 2020 is that of Institutional Shares. BlackRock International Dividend Fund’s Class K Shares performance shown prior to the Class K Shares inception date of January 25, 2018 is that of Institutional Shares. The performance of each Fund’s Class K Shares would be substantially similar to Institutional Shares, because the share classes of a Fund invest in the same portfolio of securities and performance would only differ to the extent that Class K Shares and Institutional Shares have different expenses. The actual returns of Class K Shares would have been higher than those of Institutional Shares because Class K Shares have lower expenses than Institutional Shares.
Service Shares are not subject to any sales charge. These shares are subject to a service fee of 0.25% per year (but no distribution fee) and are only available to certain eligible investors. Effective on or about the close of business on July 6, 2021, BlackRock Energy Opportunities Fund and BlackRock International Dividend Fund’s Service Shares will be converted into Investor A Shares. Effective on or about the close of business on August 18, 2021, BlackRock High Equity Income Fund’s Service Shares will be converted into Investor A Shares.
Investor A Shares are subject to a maximum initial sales charge (front-end load) of 5.25% and a service fee of 0.25% per year (but no distribution fee). Certain redemptions of these shares may be subject to a contingent deferred sales charge (“CDSC”) where no initial sales charge was paid at the time of purchase. These shares are generally available through financial intermediaries.
Investor C Shares are subject to a 1.00% CDSC if redeemed within one year of purchase. In addition, these shares are subject to a distribution fee of 0.75% per year and a service fee of 0.25% per year. These shares are generally available through financial intermediaries. These shares automatically convert to Investor A Shares after approximately eight years.
Past performance is not an indication of future results. Financial markets have experienced extreme volatility and trading in many instruments has been disrupted. These circumstances may continue for an extended period of time, and may continue to affect adversely the value and liquidity of the fund’s investments. As a result, current performance may be lower or higher than the performance data quoted. Refer to blackrock.com to obtain performance data current to the most recent month-end. Performance results do not reflect the deduction of taxes that a shareholder would pay on Fund distributions or the redemption of Fund shares. Figures shown in the performance tables on the previous pages assume reinvestment of all distributions, if any, at net asset value (“NAV”) on the ex-dividend date or payable date, as applicable. Investment return and principal value of shares will fluctuate so that shares, when redeemed, may be worth more or less than their original cost. Distributions paid to each class of shares will vary because of the different levels of service, distribution and transfer agency fees applicable to each class, which are deducted from the income available to be paid to shareholders.
BlackRock Advisors, LLC (the “Manager”), each Fund’s investment adviser, has contractually and/or voluntarily agreed to waive and/or reimburse a portion of each Fund’s expenses. Without such waivers and/or reimbursements, each Fund’s performance would have been lower. With respect to each Fund’s voluntary waivers, if any, the Manager is under no obligation to waive and/or reimburse or to continue waiving and/or reimbursing its fees and such voluntary waivers may be reduced or discontinued at any time. With respect to each Fund’s contractual waivers, if any, the Manager is under no obligation to continue waiving and/or reimbursing its fees after the applicable termination date of such agreement. See the Notes of the Notes to Financial Statements for additional information on waivers and/or reimbursements.
Shareholders of each Fund may incur the following charges: (a) transactional expenses, such as sales charges; and (b) operating expenses, including investment advisory fees, administration fees, service and distribution fees, including 12b-1 fees, acquired fund fees and expenses and other fund expenses. The expense examples shown (which are based on a hypothetical investment of $1,000 invested on December 1, 2020 and held through May 31, 2021) are intended to assist shareholders both in calculating expenses based on an investment in each Fund and in comparing these expenses with similar costs of investing in other mutual funds.
The expense examples provide information about actual account values and actual expenses. In order to estimate the expenses a shareholder paid during the period covered by this report, shareholders can divide their account value by $1,000 and then multiply the result by the number corresponding to their Fund and share class under the heading entitled “Expenses Paid During the Period.”
The expense examples also provide information about hypothetical account values and hypothetical expenses based on a Fund’s actual expense ratio and an assumed rate of return of 5% per year before expenses. In order to assist shareholders in comparing the ongoing expenses of investing in these Funds and other funds, compare the 5% hypothetical examples with the 5% hypothetical examples that appear in shareholder reports of other funds.
The expenses shown in the expense examples are intended to highlight shareholders’ ongoing costs only and do not reflect transactional expenses, such as sales charges, if any. Therefore, the hypothetical examples are useful in comparing ongoing expenses only, and will not help shareholders determine the relative total expenses of owning different funds. If these transactional expenses were included, shareholder expenses would have been higher.
ABOUT FUND PERFORMANCE | 13 |
May 31, 2021 | BlackRock Energy Opportunities Fund (Percentages shown are based on Net Assets) |
| Security | Shares | Value | ||||||
Common Stocks |
| |||||||
| Energy Equipment & Services — 2.0% | ||||||||
Baker Hughes Co. | 139,155 | $ | 3,395,382 | |||||
Poseidon Concepts Corp.(a) | 35,081 | 25 | ||||||
|
| |||||||
| 3,395,407 | ||||||||
| Food Products — 0.7% | ||||||||
Darling Ingredients, Inc.(a) | 17,309 | 1,184,974 | ||||||
|
| |||||||
| Oil, Gas & Consumable Fuels — 95.9% | ||||||||
Aker BP ASA | 92,149 | 2,699,873 | ||||||
ARC Resources Ltd. | 290,685 | 2,235,298 | ||||||
BP PLC | 984,877 | 4,300,257 | ||||||
Cairn Energy PLC | 567,217 | 1,307,760 | ||||||
Canadian Natural Resources Ltd. | 213,619 | 7,490,192 | ||||||
Chevron Corp. | 213,666 | 22,176,394 | ||||||
CNOOC Ltd. | 1,489,000 | 1,614,732 | ||||||
ConocoPhillips | 202,367 | 11,279,937 | ||||||
Devon Energy Corp. | 171,045 | 4,542,955 | ||||||
EOG Resources, Inc. | 27,394 | 2,200,834 | ||||||
Equinor ASA | 196,537 | 4,236,224 | ||||||
Exxon Mobil Corp. | 195,609 | 11,417,697 | ||||||
Hess Corp. | 73,913 | 6,195,388 | ||||||
Kinder Morgan, Inc. | 236,440 | 4,336,310 | ||||||
Kosmos Energy Ltd.(a) | 507,537 | 1,613,968 | ||||||
Longview Energy Co. (Acquired 08/13/04, | 85,400 | 1 | ||||||
LUKOIL PJSC, ADR | 21,148 | 1,721,394 | ||||||
Marathon Petroleum Corp. | 94,942 | 5,867,416 | ||||||
Oil Search Ltd. | 371,752 | 1,040,984 | ||||||
Pioneer Natural Resources Co. | 41,324 | 6,289,100 | ||||||
Royal Dutch Shell PLC, B Shares | 896,339 | 16,299,024 | ||||||
Santos Ltd. | 477,670 | 2,489,206 | ||||||
| Security | Shares | Value | ||||||
| Oil, Gas & Consumable Fuels (continued) | ||||||||
Suncor Energy, Inc. | 288,657 | $ | 6,704,507 | |||||
TC Energy Corp. | 103,519 | 5,220,079 | ||||||
TOTAL SE | 301,979 | 14,003,260 | ||||||
Tourmaline Oil Corp. | 97,077 | 2,366,458 | ||||||
Valero Energy Corp. | 76,084 | 6,117,154 | ||||||
Williams Cos., Inc. | 181,610 | 4,783,607 | ||||||
|
| |||||||
| 160,550,009 | ||||||||
|
| |||||||
Total Long-Term Investments — 98.6% |
| 165,130,390 | ||||||
|
| |||||||
Short-Term Securities(d)(e) |
| |||||||
| Money Market Funds — 0.8% | ||||||||
BlackRock Liquidity Funds, T-Fund, Institutional Class, 0.01% | 1,311,781 | 1,311,781 | ||||||
|
| |||||||
Total Short-Term Securities — 0.8% |
| 1,311,781 | ||||||
|
| |||||||
Total Investments — 99.4% |
| 166,442,171 | ||||||
Other Assets Less Liabilities — 0.6% |
| 1,020,508 | ||||||
|
| |||||||
Net Assets — 100.0% |
| $ | 167,462,679 | |||||
|
| |||||||
| (a) | Non-income producing security. |
| (b) | Security is valued using significant unobservable inputs and is classified as Level 3 in the fair value hierarchy. |
| (c) | Restricted security as to resale, excluding 144A securities. The Fund held restricted securities with a current value of $1, representing 0.0% of its net assets as of period end, and an original cost of $1,143,119. |
| (d) | Affiliate of the Fund. |
| (e) | Annualized 7-day yield as of period end. |
Affiliates
Investments in issuers considered to be affiliate(s) of the Fund during the year ended May 31, 2021 for purposes of Section 2(a)(3) of the Investment Company Act of 1940, as amended, were as follows:
| Affiliated Issuer | Value at 05/31/20 | Purchases at Cost | Proceeds from Sale | Net Realized Gain (Loss) | Change in Unrealized Appreciation (Depreciation) | Value at 05/31/21 | Shares Held at 05/31/21 | Income | Capital Gain Distributions from Underlying Funds | |||||||||||||||||||||||||||||||||
BlackRock Liquidity Funds, T-Fund, | $ | 4,933,763 | $ — | $ (3,621,982 | )(a) | $ | — | $ | — | $ | 1,311,781 | 1,311,781 | $ | 1,283 | $ | — | ||||||||||||||||||||||||||
SL Liquidity Series, LLC, Money | — | 66 | (a) | — | (66 | ) | — | — | — | 14 | (c) | — | ||||||||||||||||||||||||||||||
|
|
|
|
|
|
|
|
|
| |||||||||||||||||||||||||||||||||
| $ | (66 | ) | $ | — | $ | 1,311,781 | $ | 1,297 | $ | — | ||||||||||||||||||||||||||||||||
|
|
|
|
|
|
|
|
|
| |||||||||||||||||||||||||||||||||
| (a) | Represents net amount purchased (sold). |
| (b) | As of period end, the entity is no longer held. |
| (c) | All or a portion represents securities lending income earned from the reinvestment of cash collateral from loaned securities, net of fees and collateral investment expenses, and other payments to and from borrowers of securities. |
For Fund compliance purposes, the Fund’s industry classifications refer to one or more of the industry sub-classifications used by one or more widely recognized market indexes or rating group indexes, and/or as defined by the investment adviser. These definitions may not apply for purposes of this report, which may combine such industry sub-classifications for reporting ease.
| 14 | 2 0 2 1 BLACK ROCK ANNUAL REPORT TO SHAREHOLDERS |
Schedule of Investments (continued) May 31, 2021 | BlackRock Energy Opportunities Fund |
Fair Value Hierarchy as of Period End
Various inputs are used in determining the fair value of financial instruments. For a description of the input levels and information about the Fund’s policy regarding valuation of financial instruments, refer to the Notes to Financial Statements.
The following table summarizes the Fund’s financial instruments categorized in the fair value hierarchy. The breakdown of the Fund’s financial instruments into major categories is disclosed in the Schedule of Investments above.
| Level 1 | Level 2 | Level 3 | Total | |||||||||||||||
Assets | ||||||||||||||||||
Investments | ||||||||||||||||||
Long-Term Investments | ||||||||||||||||||
Common Stocks | ||||||||||||||||||
Energy Equipment & Services | $ | 3,395,382 | $ | 25 | $ | — | $ | 3,395,407 | ||||||||||
Food Products | 1,184,974 | — | — | 1,184,974 | ||||||||||||||
Oil, Gas & Consumable Fuels | 110,837,294 | 49,712,714 | 1 | 160,550,009 | ||||||||||||||
Short-Term Securities | ||||||||||||||||||
Money Market Funds | 1,311,781 | — | — | 1,311,781 | ||||||||||||||
|
|
|
|
|
|
|
| |||||||||||
| $ | 116,729,431 | $ | 49,712,739 | $ | 1 | $ | 166,442,171 | |||||||||||
|
|
|
|
|
|
|
| |||||||||||
See notes to financial statements.
SCHEDULES OF INVESTMENTS | 15 |
Schedule of Investments May 31, 2021 | BlackRock High Equity Income Fund (Percentages shown are based on Net Assets) |
| Security | Shares | Value | ||||||
Common Stocks | ||||||||
| Aerospace & Defense — 4.5% | ||||||||
BAE Systems PLC | 1,793,629 | $ | 13,363,534 | |||||
Huntington Ingalls Industries, Inc. | 8,352 | 1,805,786 | ||||||
Raytheon Technologies Corp. | 93,753 | 8,316,828 | ||||||
|
| |||||||
| 23,486,148 | ||||||||
| Automobiles — 2.0% | ||||||||
General Motors Co.(a) | 172,100 | 10,207,251 | ||||||
|
| |||||||
| Banks — 5.0% | ||||||||
Citigroup, Inc. | 64,876 | 5,106,390 | ||||||
Comerica, Inc. | 55,182 | 4,331,235 | ||||||
U.S. Bancorp | 60,406 | 3,671,477 | ||||||
Wells Fargo & Co. | 271,636 | 12,690,833 | ||||||
|
| |||||||
| 25,799,935 | ||||||||
| Beverages — 1.0% | ||||||||
Coca-Cola Co. | 89,928 | 4,972,119 | ||||||
|
| |||||||
| Biotechnology — 0.9% | ||||||||
Acerta Pharma BV, Series B (Acquired 05/06/15, cost $1,815,300)(a)(b)(c) | 31,555,035 | 4,445,158 | ||||||
|
| |||||||
| Capital Markets — 3.6% | ||||||||
Apollo Global Management, Inc. | 187,795 | 10,768,165 | ||||||
Intercontinental Exchange, Inc. | 33,678 | 3,801,573 | ||||||
Morgan Stanley | 47,349 | 4,306,391 | ||||||
|
| |||||||
| 18,876,129 | ||||||||
| Chemicals — 0.5% | ||||||||
Corteva, Inc. | 52,655 | 2,395,803 | ||||||
|
| |||||||
| Communications Equipment — 2.2% | ||||||||
Cisco Systems, Inc. | 214,092 | 11,325,467 | ||||||
|
| |||||||
| Consumer Finance — 1.0% | ||||||||
Capital One Financial Corp. | 31,356 | 5,041,418 | ||||||
|
| |||||||
| Diversified Financial Services — 0.8% | ||||||||
Equitable Holdings, Inc. | 127,814 | 4,058,095 | ||||||
|
| |||||||
| Diversified Telecommunication Services — 3.1% | ||||||||
AT&T Inc. | 284,729 | 8,379,575 | ||||||
Verizon Communications, Inc. | 134,568 | 7,601,746 | ||||||
|
| |||||||
| 15,981,321 | ||||||||
| Electric Utilities — 2.3% | ||||||||
American Electric Power Co., Inc. | 38,897 | 3,345,142 | ||||||
Edison International | 72,742 | 4,064,095 | ||||||
FirstEnergy Corp. | 36,137 | 1,369,954 | ||||||
Southern Co. | 46,322 | 2,960,902 | ||||||
|
| |||||||
| 11,740,093 | ||||||||
| Equity Real Estate Investment Trusts (REITs) — 0.7% | ||||||||
PotlatchDeltic Corp. | 31,983 | 1,925,377 | ||||||
Rayonier, Inc. | 51,123 | 1,952,387 | ||||||
|
| |||||||
| 3,877,764 | ||||||||
| Food Products — 1.3% | ||||||||
Danone SA | 69,607 | 4,962,187 | ||||||
Kraft Heinz Co. | 37,594 | 1,638,722 | ||||||
|
| |||||||
| 6,600,909 | ||||||||
| Health Care Equipment & Supplies — 2.0% | ||||||||
Medtronic PLC | 48,425 | 6,130,121 | ||||||
Zimmer Biomet Holdings, Inc. | 24,850 | 4,183,000 | ||||||
|
| |||||||
| 10,313,121 | ||||||||
| Health Care Providers & Services — 3.8% | ||||||||
Anthem, Inc. | 14,682 | 5,846,666 | ||||||
| Security | Shares | Value | ||||||
| Health Care Providers & Services (continued) | ||||||||
Cardinal Health, Inc. | 36,798 | $ | 2,063,264 | |||||
CVS Health Corp. | 86,061 | 7,439,113 | ||||||
Quest Diagnostics, Inc. | 12,983 | 1,709,471 | ||||||
UnitedHealth Group, Inc. | 5,878 | 2,421,266 | ||||||
|
| |||||||
| 19,479,780 | ||||||||
| Household Products — 1.3% | ||||||||
Kimberly-Clark Corp. | 51,250 | 6,694,787 | ||||||
|
| |||||||
| Industrial Conglomerates — 0.0% | ||||||||
Siemens AG, Registered Shares | 1,276 | 207,016 | ||||||
|
| |||||||
| Insurance — 7.7% | ||||||||
American International Group, Inc. | 144,874 | 7,655,142 | ||||||
Arthur J. Gallagher & Co. | 22,804 | 3,343,295 | ||||||
CNA Financial Corp. | 56,319 | 2,692,611 | ||||||
Fidelity National Financial, Inc. | 103,267 | 4,852,516 | ||||||
MetLife, Inc. | 78,606 | 5,137,688 | ||||||
Prudential Financial, Inc. | 56,125 | 6,003,691 | ||||||
Prudential PLC | 243,610 | 5,191,988 | ||||||
Swiss Re AG | 55,263 | 5,311,317 | ||||||
|
| |||||||
| 40,188,248 | ||||||||
| IT Services — 1.8% | ||||||||
Cognizant Technology Solutions Corp., Class A | 82,140 | 5,877,938 | ||||||
Fidelity National Information Services, Inc. | 22,202 | 3,307,654 | ||||||
|
| |||||||
| 9,185,592 | ||||||||
| Machinery — 0.2% | ||||||||
Stanley Black & Decker, Inc. | 5,310 | 1,151,208 | ||||||
|
| |||||||
| Multiline Retail — 0.7% | ||||||||
Dollar General Corp. | 17,331 | 3,517,500 | ||||||
|
| |||||||
| Multi-Utilities — 2.1% | ||||||||
Ameren Corp. | 36,412 | 3,065,890 | ||||||
Consolidated Edison, Inc. | 28,093 | 2,169,903 | ||||||
NiSource, Inc. | 72,941 | 1,859,996 | ||||||
Public Service Enterprise Group, Inc. | 64,306 | 3,994,689 | ||||||
|
| |||||||
| 11,090,478 | ||||||||
| Oil, Gas & Consumable Fuels — 4.3% | ||||||||
BP PLC | 1,845,102 | 8,056,246 | ||||||
ConocoPhillips | 73,501 | 4,096,946 | ||||||
Marathon Petroleum Corp. | 85,037 | 5,255,287 | ||||||
Williams Cos., Inc. | 184,500 | 4,859,730 | ||||||
|
| |||||||
| 22,268,209 | ||||||||
| Personal Products — 1.3% | ||||||||
Unilever PLC, ADR | 116,650 | 6,995,500 | ||||||
|
| |||||||
| Pharmaceuticals — 5.5% | ||||||||
AstraZeneca PLC | 56,824 | 6,481,796 | ||||||
Bayer AG, Registered Shares | 106,799 | 6,723,633 | ||||||
Johnson & Johnson | 26,732 | 4,524,391 | ||||||
Pfizer, Inc. | 96,441 | 3,735,160 | ||||||
Sanofi | 67,768 | 7,208,772 | ||||||
|
| |||||||
| 28,673,752 | ||||||||
| Professional Services — 0.3% | ||||||||
Robert Half International, Inc. | 20,049 | 1,780,151 | ||||||
|
| |||||||
| Software — 1.1% | ||||||||
SS&C Technologies Holdings, Inc. | 80,380 | 5,937,671 | ||||||
|
| |||||||
| Specialty Retail — 0.3% | ||||||||
Ross Stores, Inc. | 12,526 | 1,583,161 | ||||||
|
| |||||||
| Technology Hardware, Storage & Peripherals — 0.9% | ||||||||
Samsung Electronics Co. Ltd., GDR | 2,586 | 4,672,684 | ||||||
|
| |||||||
| 16 | 2 0 2 1 BLACK ROCK ANNUAL REPORT TO SHAREHOLDERS |
Schedule of Investments (continued) May 31, 2021 | BlackRock High Equity Income Fund (Percentages shown are based on Net Assets) |
| Security |
Shares | Value | ||||||||||
| Textiles, Apparel & Luxury Goods — 1.0% | ||||||||||||
Gildan Activewear, Inc. | 146,830 | $ | 5,309,373 | |||||||||
|
| |||||||||||
| Tobacco — 2.5% | ||||||||||||
Altria Group, Inc. | 100,272 | 4,935,388 | ||||||||||
British American Tobacco PLC | 202,910 | 7,828,020 | ||||||||||
|
| |||||||||||
| 12,763,408 | ||||||||||||
| Wireless Telecommunication Services — 1.6% | ||||||||||||
Vodafone Group PLC | 4,461,178 | 8,087,917 | ||||||||||
|
| |||||||||||
Total Common Stocks — 67.3% |
| 348,707,166 | ||||||||||
|
| |||||||||||
Par (000) | ||||||||||||
Equity-Linked Notes | ||||||||||||
| Aerospace & Defense — 0.7% | ||||||||||||
CIBC World Markets Corp. (Raytheon Technologies Corp.) 17.45% 06/14/21 | USD | 32,300 | 2,770,659 | |||||||||
SG Americas Securities LLC (Huntington Ingalls Industries, Inc.) 20.33% 07/15/21(b) | 4,400 | 943,228 | ||||||||||
|
| |||||||||||
| 3,713,887 | ||||||||||||
| Automobiles — 1.0% | ||||||||||||
Citigroup Global Markets, Inc. (General Motors Co.) 23.04% 06/07/21(b) | 87,500 | 5,159,875 | ||||||||||
|
| |||||||||||
| Banks — 3.2% | ||||||||||||
Barclays Capital, Inc. (Citigroup, Inc.) 18.10% 07/15/21 | 34,800 | 2,732,148 | ||||||||||
JP Morgan Securities LLC (Comerica, Inc.) 20.94% 07/15/21 | 29,700 | 2,287,770 | ||||||||||
RBC Capital Markets LLC (Wells Fargo & Co.) 25.85% 06/07/21 |
| 141,900 | 6,660,400 | |||||||||
TD Securities (USA) LLC (U.S. Bancorp) 14.76% 06/25/21 | 76,400 | 4,657,819 | ||||||||||
|
| |||||||||||
| 16,338,137 | ||||||||||||
| Beverages — 0.5% | ||||||||||||
TD Securities, Inc. (Coca-Cola Co.) 17.54% 06/18/21 | 45,700 | 2,478,055 | ||||||||||
|
| |||||||||||
| Capital Markets — 1.6% | ||||||||||||
Barclays Capital, Inc. (Apollo Global Management, Inc.) 22.28% 06/25/21 | 60,000 | 3,425,557 | ||||||||||
JP Morgan Securities LLC (Morgan Stanley) 16.13% 07/06/21(b) |
| 25,100 | 2,248,807 | |||||||||
SG Americas Securities LLC (Intercontinental Exchange, Inc.) 8.90% 06/01/21 | 7,000 | 784,731 | ||||||||||
SG Americas Securities LLC (Intercontinental Exchange, Inc.) 10.89% 07/12/21 | 18,000 | 2,016,360 | ||||||||||
|
| |||||||||||
| 8,475,455 | ||||||||||||
| Chemicals — 0.5% | ||||||||||||
BMO Capital Markets Corp. (Corteva, Inc.) 20.15% 07/01/21 | 58,400 | 2,684,434 | ||||||||||
|
| |||||||||||
| Communications Equipment — 1.2% | ||||||||||||
BMO Capital Markets Corp. (Cisco Systems, Inc.) 11.59% 07/06/21(b) | 113,500 | 6,026,169 | ||||||||||
|
| |||||||||||
| Consumer Finance — 0.5% | ||||||||||||
Goldman Sachs & Co. LLC (Capital One Financial Corp.) 18.80% 07/08/21(b) | 16,800 | 2,684,640 | ||||||||||
|
| |||||||||||
| Security | Par (000) | Value | ||||||||||
| Diversified Financial Services — 0.7% | ||||||||||||
Citigroup Global Markets, Inc. (Equitable Holdings, Inc.) 17.29% 07/08/21(b) | USD | 68,700 | $ | 2,221,071 | ||||||||
RBC Capital Markets LLC (Blackstone Group, Inc.) 22.46% 06/07/21 | 17,200 | 1,562,424 | ||||||||||
|
| |||||||||||
| 3,783,495 | ||||||||||||
| Diversified Telecommunication Services — 1.6% | ||||||||||||
BMO Capital Markets Corp. (Verizon Communications, Inc.) | 119,500 | 6,754,738 | ||||||||||
JP Morgan Securities LLC (AT&T Inc.) 7.58% 06/14/21 | 56,600 | 1,671,863 | ||||||||||
|
| |||||||||||
| 8,426,601 | ||||||||||||
| Electric Utilities — 1.2% | ||||||||||||
BMO Capital Markets Corp. (Edison International) 20.41% 07/06/21(b) | 38,600 | 2,182,714 | ||||||||||
Goldman Sachs & Co. LLC (Southern Co.) 18.02% 07/01/21 | 13,900 | 902,469 | ||||||||||
SG Americas Securities LLC (American Electric Power Co., Inc.) 13.10% 06/01/21 | 10,100 | 865,003 | ||||||||||
SG Americas Securities LLC (American Electric Power Co., Inc.) 10.07% 07/12/21 | 20,900 | 1,787,995 | ||||||||||
SG Americas Securities LLC (PPL Corp.) 10.36% 06/01/21 | 15,900 | 462,290 | ||||||||||
|
| |||||||||||
| 6,200,471 | ||||||||||||
| Equity Real Estate Investment Trusts (REITs) — 0.4% | ||||||||||||
RBC Capital Markets LLC (PotlatchDeltic Corp.) 21.61% 06/18/21 | 16,200 | 970,130 | ||||||||||
RBC Capital Markets LLC (Rayonier, Inc.) 17.57% 06/18/21 | 26,000 | 965,520 | ||||||||||
|
| |||||||||||
| 1,935,650 | ||||||||||||
| Food Products — 1.0% | ||||||||||||
BOFA Securities, Inc. (Kraft Heinz Co.) 17.90% 06/25/21 | 64,900 | 2,807,942 | ||||||||||
Credit Suisse Securities (USA) LLC (Danone SA) 28.20% 06/10/21 | EUR | 35,400 | 2,522,528 | |||||||||
|
| |||||||||||
| 5,330,470 | ||||||||||||
| Health Care Equipment & Supplies — 1.0% | ||||||||||||
BOFA Securities, Inc. (Medtronic PLC) 19.62% 06/18/21 | USD | 24,600 | 3,112,660 | |||||||||
RBC Capital Markets LLC (Zimmer Biomet Holdings, Inc.) 18.95% 06/18/21 | 12,500 | 2,127,458 | ||||||||||
|
| |||||||||||
| 5,240,118 | ||||||||||||
| Health Care Providers & Services — 1.9% | ||||||||||||
BNP Paribas Securities Corporation (Cardinal Health, Inc.) | 19,800 | 1,102,860 | ||||||||||
BOFA Securities, Inc. (Anthem, Inc.) 24.74% 06/07/21 | 7,700 | 3,003,237 | ||||||||||
Goldman Sachs & Co. LLC (UnitedHealth Group, Inc.) 15.70% 07/01/21 | 3,100 | 1,283,709 | ||||||||||
JP Morgan Securities LLC (CVS Health Corp.) 13.34% 06/14/21 | 43,800 | 3,440,417 | ||||||||||
JP Morgan Securities LLC (Quest Diagnostics, Inc.) 22.45% 07/15/21 | 6,900 | 902,865 | ||||||||||
|
| |||||||||||
| 9,733,088 | ||||||||||||
| Household Products — 0.3% | ||||||||||||
Credit Suisse Securities (USA) LLC (Kimberly-Clark Corp.) 24.99% 06/07/21 | 11,400 | 1,486,019 | ||||||||||
|
| |||||||||||
| Industrial Conglomerates — 0.5% | ||||||||||||
HSBC Securities (USA), Inc. (Siemens AG) 13.00% 06/04/21 | EUR | 16,400 | 2,660,182 | |||||||||
|
| |||||||||||
SCHEDULES OF INVESTMENTS | 17 |
Schedule of Investments (continued) May 31, 2021 | BlackRock High Equity Income Fund (Percentages shown are based on Net Assets) |
| Security | Par (000) | Value | ||||||||||
| Insurance — 4.9% | ||||||||||||
BNP Paribas Securities Corporation (CNA Financial Corp.) 19.21% 07/08/21(b) | USD | 30,300 | $ | 1,426,524 | ||||||||
BNP Paribas Securities Corporation (MetLife, Inc.) 18.04% 07/01/21 | 41,600 | 2,724,447 | ||||||||||
BOFA Securities, Inc. (American International Group, Inc.) 21.83% 06/25/21 | 115,105 | 5,824,695 | ||||||||||
Citigroup Global Markets, Inc. (Fidelity National Financial, Inc.) 18.33% 06/01/21 | 56,600 | 2,516,274 | ||||||||||
Credit Suisse Securities (USA) LLC (Fidelity National Financial, Inc.) 14.35% 07/12/21 | 55,600 | 2,590,960 | ||||||||||
SG Americas Securities LLC (Arthur J. Gallagher & Co.) 11.51% 06/01/21 | 18,200 | 2,443,259 | ||||||||||
SG Americas Securities LLC (Arthur J. Gallagher & Co.) 13.88% 07/12/21 | 12,200 | 1,786,924 | ||||||||||
SG Americas Securities LLC (Prudential Financial, Inc.) 19.55% 06/01/21 | 29,800 | 2,944,237 | ||||||||||
SG Americas Securities LLC (Prudential Financial, Inc.) 15.66% 07/12/21 | 30,200 | 3,217,417 | ||||||||||
|
| |||||||||||
| 25,474,737 | ||||||||||||
| IT Services — 0.7% | ||||||||||||
BMO Capital Markets Corp. (Fidelity National Information Services, Inc.) 14.58% 06/14/21 | 11,300 | 1,681,505 | ||||||||||
BNP Paribas Securities Corporation (Cognizant Technology Solutions Corp.) 19.34% 07/01/21(b) | 24,200 | 1,721,104 | ||||||||||
|
| |||||||||||
| 3,402,609 | ||||||||||||
| Machinery — 0.1% | ||||||||||||
Goldman Sachs & Co. LLC (Stanley Black & Decker, Inc.) 21.79% 07/01/21 | 2,800 | 606,259 | ||||||||||
|
| |||||||||||
| Multiline Retail — 0.4% | ||||||||||||
Goldman Sachs & Co. LLC (Dollar General Corp.) 15.66% 07/12/21 | 9,300 | 1,900,827 | ||||||||||
|
| |||||||||||
| Multi-Utilities — 1.4% | ||||||||||||
Goldman Sachs & Co. LLC (NiSource, Inc.) 13.80% 07/06/21(b) | 38,700 | 983,367 | ||||||||||
RBC Capital Markets LLC (Consolidated Edison, Inc.) 15.34% 06/14/21 | 14,200 | 1,100,964 | ||||||||||
SG Americas Securities LLC (Ameren Corp.) 9.99% 06/01/21 | 19,300 | 1,616,128 | ||||||||||
SG Americas Securities LLC (Ameren Corp.) 16.18% 07/12/21 | 19,300 | 1,614,831 | ||||||||||
TD Securities, Inc. (Public Service Enterprise Group, Inc.) 19.17% 06/18/21 | 32,700 | 2,024,932 | ||||||||||
|
| |||||||||||
| 7,340,222 | ||||||||||||
| Oil, Gas & Consumable Fuels — 2.3% | ||||||||||||
Credit Suisse Securities (USA) LLC (BP PLC) 18.30% 06/04/21 | GBP | 624,900 | 2,720,027 | |||||||||
JP Morgan Securities LLC (ConocoPhillips) 21.72% 07/01/21 | USD | 38,900 | 2,171,586 | |||||||||
SG Americas Securities LLC (Kinder Morgan, Inc.) 22.55% 06/01/21 | 71,100 | 1,266,163 | ||||||||||
TD Securities (USA) LLC (Marathon Petroleum Corp.) 34.59% 06/25/21 | 55,600 | 3,419,035 | ||||||||||
TD Securities (USA) LLC (Williams Cos., Inc.) 22.16% 06/25/21 | 96,300 | 2,471,301 | ||||||||||
|
| |||||||||||
| 12,048,112 | ||||||||||||
| Security | Par (000) | Value | ||||||||||
| Personal Products — 1.4% | ||||||||||||
Citigroup Global Markets, Inc. (Unilever PLC) 12.99% 06/01/21 | USD | 60,700 | $ | 3,582,427 | ||||||||
SG Americas Securities LLC (Unilever PLC) 9.22% 07/12/21 | 62,700 | 3,735,842 | ||||||||||
|
| |||||||||||
| 7,318,269 | ||||||||||||
| Pharmaceuticals — 2.8% | ||||||||||||
Credit Suisse Securities (USA) LLC (Sanofi) 28.25% 06/10/21 | EUR | 34,500 | 3,631,986 | |||||||||
Goldman Sachs & Co. LLC (Pfizer, Inc.) 11.23% 07/06/21(b) | USD | 51,100 | 1,992,389 | |||||||||
JP Morgan Securities LLC (Johnson & Johnson) 12.89% 06/14/21 | 13,500 | 2,266,362 | ||||||||||
RBC Capital Markets LLC (AstraZeneca PLC) 12.41% 06/04/21 | GBP | 28,800 | 3,062,166 | |||||||||
RBC Capital Markets LLC (Bayer AG) 41.43% 06/10/21 | EUR | 54,300 | 3,452,084 | |||||||||
|
| |||||||||||
| 14,404,987 | ||||||||||||
| Professional Services — 0.2% | ||||||||||||
JP Morgan Securities LLC (Robert Half International, Inc.) 18.72% 07/15/21 | USD | 10,700 | 940,770 | |||||||||
|
| |||||||||||
| Road & Rail — 0.2% | ||||||||||||
BOFA Securities, Inc. (Union Pacific Corp.) 24.95% 06/07/21 | 3,800 | 842,467 | ||||||||||
|
| |||||||||||
| Software — 0.5% | ||||||||||||
JP Morgan Securities LLC (Open Text Corp.) 16.61% 06/14/21 | 22,200 | 1,046,153 | ||||||||||
JP Morgan Securities LLC (SS&C Technologies Holdings, Inc.) 15.44% 06/14/21 | 23,100 | 1,712,774 | ||||||||||
|
| |||||||||||
| 2,758,927 | ||||||||||||
| Specialty Retail — 0.2% | ||||||||||||
JP Morgan Securities LLC (Ross Stores, Inc.) 21.80% 07/15/21 | 6,600 | 817,542 | ||||||||||
|
| |||||||||||
| Technology Hardware, Storage & Peripherals — 0.4% | ||||||||||||
HSBC Bank USA N.A. (Samsung Electronics Co. Ltd.) 18.10% 06/10/21 | 1,200 | 2,172,049 | ||||||||||
|
| |||||||||||
| Tobacco — 0.7% | ||||||||||||
BOFA Securities, Inc. (Altria Group, Inc.) 22.73% 06/07/21 | 51,000 | 2,448,639 | ||||||||||
RBC Capital Markets LLC (British American Tobacco PLC) 12.52% 06/04/21 | GBP | 34,600 | 1,336,008 | |||||||||
|
| |||||||||||
| 3,784,647 | ||||||||||||
| Wireless Telecommunication Services — 0.8% | ||||||||||||
Credit Suisse Securities (USA) LLC (Vodafone Group PLC) 15.55% 06/10/21 | 2,270,800 | 4,140,685 | ||||||||||
|
| |||||||||||
Total Equity-Linked Notes — 34.8% |
| 180,309,855 | ||||||||||
|
| |||||||||||
Total Long-Term Investments — 102.1% |
| 529,017,021 | ||||||||||
|
| |||||||||||
| 18 | 2 0 2 1 BLACK ROCK ANNUAL REPORT TO SHAREHOLDERS |
Schedule of Investments (continued) May 31, 2021 | BlackRock High Equity Income Fund (Percentages shown are based on Net Assets) |
| Security | Shares | Value | ||||||
| ||||||||
Short-Term Securities(d)(e) | ||||||||
| Money Market Funds — 2.3% | ||||||||
BlackRock Liquidity Funds, T-Fund, Institutional Class, 0.01% | 11,867,334 | $ | 11,867,334 | |||||
|
| |||||||
Total Short-Term Securities — 2.3% |
| 11,867,334 | ||||||
|
| |||||||
Total Investments — 104.4% |
| 540,884,355 | ||||||
Liabilities in Excess of Other Assets — (4.4)% |
| (22,842,759 | ) | |||||
|
| |||||||
Net Assets — 100.0% | $ | 518,041,596 | ||||||
|
| |||||||
| (a) | Non-income producing security. |
| (b) | Security is valued using significant unobservable inputs and is classified as Level 3 in the fair value hierarchy. |
| (c) | Restricted security as to resale, excluding 144A securities. The Fund held restricted securities with a current value of $4,445,158, representing 0.9% of its net assets as of period end, and an original cost of $1,815,300. |
| (d) | Affiliate of the Fund. |
| (e) | Annualized 7-day yield as of period end. |
Affiliates
Investments in issuers considered to be affiliate(s) of the Fund during the year ended May 31, 2021 for purposes of Section 2(a)(3) of the Investment Company Act of 1940, as amended, were as follows:
| Affiliated Issuer | Value at 05/31/20 | Purchases at Cost | Proceeds from Sale | Net Realized Gain (Loss) | Change in Unrealized Appreciation (Depreciation) | Value at 05/31/21 | Shares Held at 05/31/21 | Income | Capital Gain | |||||||||||||||||||||||||||||||||||||||
BlackRock Liquidity Funds, T-Fund, | ||||||||||||||||||||||||||||||||||||||||||||||||
Institutional Class | $ | 529,567 | $ | 11,337,767 | (a) | $ | — | $ | — | $ | — | $ | 11,867,334 | 11,867,334 | $ | 3,529 | $ | — | ||||||||||||||||||||||||||||||
SL Liquidity Series, LLC, Money | ||||||||||||||||||||||||||||||||||||||||||||||||
Market Series(b) | 939,602 | — | (939,474 | )(a) | (13 | ) | (115 | ) | — | — | 1,581 | (c) | — | |||||||||||||||||||||||||||||||||||
|
|
|
|
|
|
|
|
|
| |||||||||||||||||||||||||||||||||||||||
| $ | (13 | ) | $ | (115 | ) | $ | 11,867,334 | $ | 5,110 | $ | — | |||||||||||||||||||||||||||||||||||||
|
|
|
|
|
|
|
|
|
| |||||||||||||||||||||||||||||||||||||||
| (a) | Represents net amount purchased (sold). |
| (b) | As of period end, the entity is no longer held. |
| (c) | All or a portion represents securities lending income earned from the reinvestment of cash collateral from loaned securities, net of fees and collateral investment expenses, and other payments to and from borrowers of securities. |
For Fund compliance purposes, the Fund’s industry classifications refer to one or more of the industry sub-classifications used by one or more widely recognized market indexes or rating group indexes, and/or as defined by the investment adviser. These definitions may not apply for purposes of this report, which may combine such industry sub-classifications for reporting ease.
Fair Value Hierarchy as of Period End
Various inputs are used in determining the fair value of financial instruments. For a description of the input levels and information about the Fund’s policy regarding valuation of financial instruments, refer to the Notes to Financial Statements.
The following table summarizes the Fund’s financial instruments categorized in the disclosure hierarchy. The breakdown of the Fund’s financial instruments into major categories is disclosed in the Schedule of Investments above.
| ||||||||||||||||
| Level 1 | Level 2 | Level 3 | Total | |||||||||||||
| ||||||||||||||||
Assets | ||||||||||||||||
Investments | ||||||||||||||||
Long-Term Investments | ||||||||||||||||
Common Stocks | ||||||||||||||||
Aerospace & Defense | $ | 10,122,614 | $ | 13,363,534 | $ — | $ 23,486,148 | ||||||||||
Automobiles | 10,207,251 | — | — | 10,207,251 | ||||||||||||
Banks | 25,799,935 | — | — | 25,799,935 | ||||||||||||
Beverages | 4,972,119 | — | — | 4,972,119 | ||||||||||||
SCHEDULES OF INVESTMENTS | 19 |
Schedule of Investments (continued) May 31, 2021 | BlackRock High Equity Income Fund |
| ||||||||||||||||
| Level 1 | Level 2 | Level 3 | Total | |||||||||||||
| ||||||||||||||||
Common Stocks (continued) | ||||||||||||||||
Biotechnology | $ | — | $ | — | $ | 4,445,158 | $ | 4,445,158 | ||||||||
Capital Markets | 18,876,129 | — | — | 18,876,129 | ||||||||||||
Chemicals | 2,395,803 | — | — | 2,395,803 | ||||||||||||
Communications Equipment | 11,325,467 | — | — | 11,325,467 | ||||||||||||
Consumer Finance | 5,041,418 | — | — | 5,041,418 | ||||||||||||
Diversified Financial Services | 4,058,095 | — | — | 4,058,095 | ||||||||||||
Diversified Telecommunication Services | 15,981,321 | — | — | 15,981,321 | ||||||||||||
Electric Utilities | 11,740,093 | — | — | 11,740,093 | ||||||||||||
Equity Real Estate Investment Trusts (REITs) | 3,877,764 | — | — | 3,877,764 | ||||||||||||
Food Products | 1,638,722 | 4,962,187 | — | 6,600,909 | ||||||||||||
Health Care Equipment & Supplies | 10,313,121 | — | — | 10,313,121 | ||||||||||||
Health Care Providers & Services | 19,479,780 | — | — | 19,479,780 | ||||||||||||
Household Products | 6,694,787 | — | — | 6,694,787 | ||||||||||||
Industrial Conglomerates | — | 207,016 | — | 207,016 | ||||||||||||
Insurance | 29,684,943 | 10,503,305 | — | 40,188,248 | ||||||||||||
IT Services | 9,185,592 | — | — | 9,185,592 | ||||||||||||
Machinery | 1,151,208 | — | — | 1,151,208 | ||||||||||||
Multiline Retail | 3,517,500 | — | — | 3,517,500 | ||||||||||||
Multi-Utilities | 11,090,478 | — | — | 11,090,478 | ||||||||||||
Oil, Gas & Consumable Fuels | 14,211,963 | 8,056,246 | — | 22,268,209 | ||||||||||||
Personal Products | 6,995,500 | — | — | 6,995,500 | ||||||||||||
Pharmaceuticals | 8,259,551 | 20,414,201 | — | 28,673,752 | ||||||||||||
Professional Services | 1,780,151 | — | — | 1,780,151 | ||||||||||||
Software | 5,937,671 | — | — | 5,937,671 | ||||||||||||
Specialty Retail | 1,583,161 | — | — | 1,583,161 | ||||||||||||
Technology Hardware, Storage & Peripherals | — | 4,672,684 | — | 4,672,684 | ||||||||||||
Textiles, Apparel & Luxury Goods | 5,309,373 | — | — | 5,309,373 | ||||||||||||
Tobacco | 4,935,388 | 7,828,020 | — | 12,763,408 | ||||||||||||
Wireless Telecommunication Services | — | 8,087,917 | — | 8,087,917 | ||||||||||||
Equity-Linked Notes | — | 144,862,369 | 35,447,486 | 180,309,855 | ||||||||||||
Short-Term Securities | ||||||||||||||||
Money Market Funds | 11,867,334 | — | — | 11,867,334 | ||||||||||||
|
|
|
|
|
|
|
| |||||||||
| $ | 278,034,232 | $ | 222,957,479 | $ | 39,892,644 | $ | 540,884,355 | |||||||||
|
|
|
|
|
|
|
| |||||||||
A reconciliation of Level 3 investments is presented when the Fund had a significant amount of Level 3 investments at the beginning and/or end of the period in relation to net assets. The following table is a reconciliation of Level 3 investments for which significant unobservable inputs were used in determining fair value:
| ||||||||||||||||
| Common Stocks | Preferred Stocks | Equity-Linked Notes | Total | |||||||||||||
| ||||||||||||||||
| Assets | ||||||||||||||||
Opening Balance, as of May 31, 2020 | $ | 4,152,327 | $ | 4,566,570 | $ | — | $ | 8,718,897 | ||||||||
Transfers into Level 3 | — | — | — | — | ||||||||||||
Transfers out of Level 3 | — | (4,566,570 | ) | — | (4,566,570 | ) | ||||||||||
Accrued discounts/premiums | — | — | — | — | ||||||||||||
Net realized gain (loss) | — | — | — | — | ||||||||||||
Net change in unrealized appreciation (depreciation)(a)(b) | 292,831 | — | 129,523 | 422,354 | ||||||||||||
Purchases | — | — | 35,317,963 | 35,317,963 | ||||||||||||
Sales | — | — | — | — | ||||||||||||
|
|
|
|
|
|
|
| |||||||||
Closing Balance, as of May 31, 2021 | $ | 4,445,158 | $ | — | $ | 35,447,486 | $ | 39,892,644 | ||||||||
|
|
|
|
|
|
|
| |||||||||
Net change in unrealized appreciation (depreciation) on investments still held at May 31, 2021(b) | $ | 292,831 | $ | — | $ | 129,523 | $ | 422,354 | ||||||||
|
|
|
|
|
|
|
| |||||||||
| (a) | Included in the related net change in unrealized appreciation (depreciation) in the Statements of Operations. |
| (b) | Any difference between net change in unrealized appreciation (depreciation) and net change in unrealized appreciation (depreciation) on investments still held at May 31, 2021, is generally due to investments no longer held or categorized as Level 3 at period end. |
See notes to financial statements.
| 20 | 2 0 2 1 BLACK ROCK ANNUAL REPORT TO SHAREHOLDERS |
Schedule of Investments May 31, 2021 | BlackRock International Dividend Fund (Percentages shown are based on Net Assets) |
| Security | Shares | Value | ||||||
Common Stocks | ||||||||
Australia — 1.9% | ||||||||
Ansell Ltd. | 145,182 | $ | 4,624,317 | |||||
|
| |||||||
| Canada — 4.4% | ||||||||
TELUS Corp. | 476,531 | 10,689,504 | ||||||
|
| |||||||
| China — 5.9% | ||||||||
China Feihe Ltd.(a) | 3,167,000 | 8,858,999 | ||||||
ENN Energy Holdings Ltd. | 304,100 | 5,582,174 | ||||||
|
| |||||||
| 14,441,173 | ||||||||
| Denmark — 3.4% | ||||||||
Novo Nordisk A/S, Class B | 105,158 | 8,320,395 | ||||||
|
| |||||||
| France — 16.6% | ||||||||
Air Liquide SA | 20,809 | 3,539,077 | ||||||
EssilorLuxottica SA | 55,076 | 9,557,017 | ||||||
LVMH Moet Hennessy Louis Vuitton SE | 10,707 | 8,538,257 | ||||||
Sanofi | 113,639 | 12,088,267 | ||||||
Schneider Electric SE | 43,905 | 6,948,464 | ||||||
|
| |||||||
| 40,671,082 | ||||||||
| India — 3.8% | ||||||||
HDFC Bank Ltd.(b) | 373,955 | 7,794,881 | ||||||
Jasper Infotech Private Ltd. (Acquired 05/07/14, cost $7,423,816)(b)(c)(d) | 9,970 | 1,643,754 | ||||||
|
| |||||||
| 9,438,635 | ||||||||
| Mexico — 0.8% | ||||||||
Wal-Mart de Mexico SAB de CV | 637,100 | 2,092,918 | ||||||
|
| |||||||
| Netherlands — 3.0% | ||||||||
Koninklijke Philips NV | 128,751 | 7,246,536 | ||||||
|
| |||||||
| Singapore — 4.3% | ||||||||
DBS Group Holdings Ltd. | 213,400 | 4,841,344 | ||||||
United Overseas Bank Ltd. | 284,000 | 5,595,981 | ||||||
|
| |||||||
| 10,437,325 | ||||||||
| Spain — 6.0% | ||||||||
Amadeus IT Group SA(b) | 139,717 | 10,557,312 | ||||||
Bankinter SA | 713,293 | 4,092,752 | ||||||
|
| |||||||
| 14,650,064 | ||||||||
| Taiwan — 4.5% | ||||||||
Taiwan Semiconductor Manufacturing Co. Ltd. | 512,000 | 11,076,051 | ||||||
|
| |||||||
| United Kingdom — 28.9% | ||||||||
AstraZeneca PLC | 85,018 | 9,697,827 | ||||||
BAE Systems PLC | 913,899 | 6,809,056 | ||||||
Diageo PLC | 233,828 | 11,288,828 | ||||||
Prudential PLC | 488,230 | 10,405,501 | ||||||
Reckitt Benckiser Group PLC | 132,056 | 11,935,307 | ||||||
| Security | Shares | Value | ||||||
| United Kingdom (continued) | ||||||||
RELX PLC | 400,501 | $ | 10,482,899 | |||||
Unilever PLC | 173,210 | 10,392,750 | ||||||
|
| |||||||
| 71,012,168 | ||||||||
| United States — 13.0% | ||||||||
Estee Lauder Cos., Inc., Class A | 28,139 | 8,625,166 | ||||||
Ferguson PLC | 80,163 | 10,889,749 | ||||||
Otis Worldwide Corp. | 69,519 | 5,445,423 | ||||||
Visa, Inc., Class A | 30,959 | 7,036,981 | ||||||
|
| |||||||
| 31,997,319 | ||||||||
|
| |||||||
Total Common Stocks — 96.5% | 236,697,487 | |||||||
|
| |||||||
Preferred Securities | ||||||||
| Preferred Stocks — 2.0% | ||||||||
| China — 2.0% | ||||||||
Xiaoju Kuaizhi, Inc., Series A-17 (Acquired 07/28/15, cost $2,770,046)(b)(c)(d) | 101,000 | 5,051,010 | ||||||
|
| |||||||
Total Preferred Securities — 2.0% |
| 5,051,010 | ||||||
|
| |||||||
Total Long-Term Investments — 98.5% |
| 241,748,497 | ||||||
|
| |||||||
Short-Term Securities(e)(f) | ||||||||
| Money Market Funds — 1.3% | ||||||||
BlackRock Liquidity Funds, T-Fund, Institutional Class, 0.01% | 3,151,672 | 3,151,672 | ||||||
|
| |||||||
Total Short-Term Securities — 1.3% | 3,151,672 | |||||||
|
| |||||||
Total Investments — 99.8% |
| 244,900,169 | ||||||
Other Assets Less Liabilities — 0.2% |
| 401,456 | ||||||
|
| |||||||
Net Assets — 100.0% | $ | 245,301,625 | ||||||
|
| |||||||
| (a) | Security exempt from registration pursuant to Rule 144A under the Securities Act of 1933, as amended. These securities may be resold in transactions exempt from registration to qualified institutional investors. |
| (b) | Non-income producing security. |
| (c) | Security is valued using significant unobservable inputs and is classified as Level 3 in the fair value hierarchy. |
| (d) | Restricted security as to resale, excluding 144A securities. The Fund held restricted securities with a current value of $6,694,764, representing 2.7% of its net assets as of period end, and an original cost of $10,193,862. |
| (e) | Affiliate of the Fund. |
| (f) | Annualized 7-day yield as of period end. |
SCHEDULES OF INVESTMENTS | 21 |
Schedule of Investments (continued) May 31, 2021 | BlackRock International Dividend Fund |
Affiliates
Investments in issuers considered to be affiliate(s) of the Fund during the year ended May 31, 2021 for purposes of Section 2(a)(3) of the Investment Company Act of 1940, as amended, were as follows:
| ||||||||||||||||||||||||||||||||||||||||||||||||||||||
| Affiliated Issuer | Value at 05/31/20 | Purchases at Cost | Proceeds from Sale | Net Realized Gain (Loss) | Change in Unrealized Appreciation (Depreciation) | Value at 05/31/21 | Shares Held at 05/31/21 | Income | Capital Gain Distributions from Underlying Funds | |||||||||||||||||||||||||||||||||||||||||||||
| ||||||||||||||||||||||||||||||||||||||||||||||||||||||
| BlackRock Liquidity Funds, T-Fund, Institutional Class | $ | 2,002,612 | $ | 1,149,060 | (a) | $ — | $ | — | $ | — | $ | 3,151,672 | 3,151,672 | $ | 339 | $ | — | ||||||||||||||||||||||||||||||||||||
|
|
|
|
|
|
|
|
|
| |||||||||||||||||||||||||||||||||||||||||||||
| (a) | Represents net amount purchased (sold). |
Fair Value Hierarchy as of Period End
Various inputs are used in determining the fair value of financial instruments. For a description of the input levels and information about the Fund’s policy regarding valuation of financial instruments, refer to the Notes to Financial Statements.
The following table summarizes the Fund’s financial instruments categorized in the fair value hierarchy. The breakdown of the Fund’s financial instruments into major categories is disclosed in the Schedule of Investments above.
| ||||||||||||||||
| Level 1 | Level 2 | Level 3 | Total | |||||||||||||
| ||||||||||||||||
Assets | ||||||||||||||||
Investments | ||||||||||||||||
Long-Term Investments | ||||||||||||||||
Common Stocks | ||||||||||||||||
Australia | $ | — | $ | 4,624,317 | $ | — | $ | 4,624,317 | ||||||||
Canada | 10,689,504 | — | — | 10,689,504 | ||||||||||||
China | — | 14,441,173 | — | 14,441,173 | ||||||||||||
Denmark | 8,320,395 | — | — | 8,320,395 | ||||||||||||
France | — | 40,671,082 | — | 40,671,082 | ||||||||||||
India | — | 7,794,881 | 1,643,754 | 9,438,635 | ||||||||||||
Mexico | 2,092,918 | — | — | 2,092,918 | ||||||||||||
Netherlands | — | 7,246,536 | — | 7,246,536 | ||||||||||||
Singapore | — | 10,437,325 | — | 10,437,325 | ||||||||||||
Spain | — | 14,650,064 | — | 14,650,064 | ||||||||||||
Taiwan | — | 11,076,051 | — | 11,076,051 | ||||||||||||
United Kingdom | — | 71,012,168 | — | 71,012,168 | ||||||||||||
United States | 21,107,570 | 10,889,749 | — | 31,997,319 | ||||||||||||
Preferred Securities | — | — | 5,051,010 | 5,051,010 | ||||||||||||
Short-Term Securities | ||||||||||||||||
Money Market Funds | 3,151,672 | — | — | 3,151,672 | ||||||||||||
|
|
|
|
|
|
|
| |||||||||
| $ | 45,362,059 | $ | 192,843,346 | $ | 6,694,764 | $ | 244,900,169 | |||||||||
|
|
|
|
|
|
|
| |||||||||
| 22 | 2 0 2 1 BLACK ROCK ANNUAL REPORT TO SHAREHOLDERS |
Schedule of Investments (continued) May 31, 2021 | BlackRock International Dividend Fund |
A reconciliation of Level 3 investments is presented when the Fund had a significant amount of Level 3 investments at the beginning and/or end of the period in relation to net assets. The following table is a reconciliation of Level 3 investments for which significant unobservable inputs were used in determining fair value:
| ||||||||||||
Common Stocks | Preferred Stocks | Total | ||||||||||
| ||||||||||||
Assets | ||||||||||||
Opening Balance, as of May 31, 2020 | $ | 2,094,797 | $ | 5,139,890 | $ | 7,234,687 | ||||||
Transfers into Level 3 | — | — | — | |||||||||
Transfers out of Level 3 | — | — | — | |||||||||
Net realized gain (loss) | — | — | — | |||||||||
Net change in unrealized appreciation (depreciation)(a)(b) | (451,043 | ) | (88,880 | ) | (539,923 | ) | ||||||
Purchases | — | — | — | |||||||||
Sales | — | — | — | |||||||||
|
|
|
|
|
| |||||||
Closing Balance, as of May 31, 2021 | $ | 1,643,754 | $ | 5,051,010 | $ | 6,694,764 | ||||||
|
|
|
|
|
| |||||||
Net change in unrealized appreciation (depreciation) on investments still held at May 31, 2021(b) | $ | (451,043 | ) | $ | (88,880 | ) | $ | (539,923 | ) | |||
|
|
|
|
|
| |||||||
| (a) | Included in the related net change in unrealized appreciation (depreciation) in the Statements of Operations. |
| (b) | Any difference between net change in unrealized appreciation (depreciation) and net change in unrealized appreciation (depreciation) on investments still held at May 31, 2021, is generally due to investments no longer held or categorized as Level 3 at period end. |
The following table summarizes the valuation approaches used and unobservable inputs utilized by the BlackRock Global Valuation Methodologies Committee (the “Global Valuation Committee”) to determine the value of certain of the Fund’s Level 3 investments as of period end.
| ||||||||||||||||
| Value | Valuation Approach | Unobservable Inputs | Range of Unobservable Inputs Utilized(a) | |||||||||||||
| ||||||||||||||||
Assets | ||||||||||||||||
Common Stocks | $ | 1,643,754 | Market | Revenue Multiple | 7.25x | |||||||||||
Preferred Securities(b) | 5,051,010 | Market | Recent Transactions | — | ||||||||||||
|
| |||||||||||||||
| $ | 6,694,764 | |||||||||||||||
|
| |||||||||||||||
| (a) | A significant change in unobservable input would have resulted in a correlated (inverse) significant change to value. |
| (b) | For the period ended May 31, 2021, the valuation technique for investments classified as Preferred Stocks amounting to $5,051,010 changed to Transaction Price Approach. The investments were previously valued utilizing Current Value Method. The change was due to consideration of the information that was available at the time the investments were valued. |
See notes to financial statements.
SCHEDULES OF INVESTMENTS | 23 |
Statements of Assets and Liabilities
May 31, 2021
BlackRock Energy Opportunities Fund | BlackRock High Equity Income Fund | BlackRock International Dividend Fund | ||||||||||||||||||
ASSETS | ||||||||||||||||||||
Investments at value — unaffiliated(a) | $ | 165,130,390 | $ | 529,017,021 | $ | 241,748,497 | ||||||||||||||
Investments at value — affiliated(b) | 1,311,781 | 11,867,334 | 3,151,672 | |||||||||||||||||
Cash | 31,997 | 3,520 | — | |||||||||||||||||
Foreign currency, at value(c) | 16,900 | — | — | |||||||||||||||||
Receivables: | ||||||||||||||||||||
Investments sold | 364,026 | 4,578,459 | — | |||||||||||||||||
Capital shares sold | 278,336 | 856,878 | 153,543 | |||||||||||||||||
Dividends — affiliated | 17 | 225 | 5 | |||||||||||||||||
Dividends — unaffiliated | 1,017,338 | 1,396,385 | 2,064,882 | |||||||||||||||||
Interest — unaffiliated | — | 1,102,218 | — | |||||||||||||||||
From the Manager | 19,580 | 35,118 | 21,389 | |||||||||||||||||
Prepaid expenses | 42,811 | 68,546 | 36,299 | |||||||||||||||||
|
|
|
|
|
|
| ||||||||||||||
Total assets | 168,213,176 | 548,925,704 | 247,176,287 | |||||||||||||||||
|
|
|
|
|
|
| ||||||||||||||
LIABILITIES | ||||||||||||||||||||
Payables: | ||||||||||||||||||||
Investments purchased | 135,698 | 28,825,228 | 1,162,385 | |||||||||||||||||
Administration fees | 6,082 | 18,390 | 8,703 | |||||||||||||||||
Capital shares redeemed | 205,398 | 999,183 | 206,484 | |||||||||||||||||
Deferred foreign capital gain tax | — | — | 121,909 | |||||||||||||||||
Income dividend distributions | — | 339,300 | — | |||||||||||||||||
Investment advisory fees | 104,067 | 308,628 | 131,149 | |||||||||||||||||
Trustees’ and Officer’s fees | 2,165 | 2,456 | 2,357 | |||||||||||||||||
Other accrued expenses | 54,726 | 102,019 | 56,122 | |||||||||||||||||
Other affiliate fees | 7,303 | 779 | 6,546 | |||||||||||||||||
Professional fees | 40,010 | 80,587 | 43,765 | |||||||||||||||||
Service and distribution fees | 32,971 | 65,641 | 33,632 | |||||||||||||||||
Transfer agent fees | 162,077 | 141,897 | 101,610 | |||||||||||||||||
|
|
|
|
|
|
| ||||||||||||||
Total liabilities | 750,497 | 30,884,108 | 1,874,662 | |||||||||||||||||
|
|
|
|
|
|
| ||||||||||||||
NET ASSETS | $ | 167,462,679 | $ | 518,041,596 | $ | 245,301,625 | ||||||||||||||
|
|
|
|
|
|
| ||||||||||||||
NET ASSETS CONSIST OF | ||||||||||||||||||||
Paid-in capital | $ | 473,250,709 | $ | 461,891,694 | $ | 195,500,109 | ||||||||||||||
Accumulated earnings (loss) | (305,788,030 | ) | 56,149,902 | 49,801,516 | ||||||||||||||||
|
|
|
|
|
|
| ||||||||||||||
NET ASSETS | $ | 167,462,679 | $ | 518,041,596 | $ | 245,301,625 | ||||||||||||||
|
|
|
|
|
|
| ||||||||||||||
(a) Investments, at cost — unaffiliated | $ | 133,760,772 | $ | 463,061,067 | $ | 197,340,358 | ||||||||||||||
(b) Investments, at cost — affiliated | $ | 1,311,781 | $ | 11,867,334 | $ | 3,151,672 | ||||||||||||||
(c) Foreign currency, at cost | $ | 17,049 | $ | — | $ | — | ||||||||||||||
| 24 | 2 0 2 1 BLACK ROCK ANNUAL REPORT TO SHAREHOLDERS |
Statements of Assets and Liabilities (continued)
May 31, 2021
BlackRock Energy Opportunities Fund | BlackRock High Equity Income Fund | BlackRock International Dividend Fund | ||||||||||||||||||
NET ASSET VALUE | ||||||||||||||||||||
| Institutional | ||||||||||||||||||||
Net assets | $ | 52,377,069 | $ | 277,652,592 | $ | 101,899,267 | ||||||||||||||
|
|
|
|
|
| |||||||||||||||
Shares outstanding | 6,125,319 | 9,256,646 | 2,802,830 | |||||||||||||||||
|
|
|
|
|
| |||||||||||||||
Net asset value | $ | 8.55 | $ | 29.99 | $ | 36.36 | ||||||||||||||
|
|
|
|
|
| |||||||||||||||
Shares authorized | Unlimited | Unlimited | Unlimited | |||||||||||||||||
|
|
|
|
|
| |||||||||||||||
Par value | $ | 0.001 | $ | 0.001 | $ | 0.001 | ||||||||||||||
|
|
|
|
|
| |||||||||||||||
| Service | ||||||||||||||||||||
Net assets | $ | 528,918 | $ | 9,443,737 | $ | 3,782,392 | ||||||||||||||
|
|
|
|
|
| |||||||||||||||
Shares outstanding | 63,243 | 351,114 | 110,099 | |||||||||||||||||
|
|
|
|
|
| |||||||||||||||
Net asset value | $ | 8.36 | $ | 26.90 | $ | 34.35 | ||||||||||||||
|
|
|
|
|
| |||||||||||||||
Shares authorized | Unlimited | Unlimited | Unlimited | |||||||||||||||||
|
|
|
|
|
| |||||||||||||||
Par value | $ | 0.001 | $ | 0.001 | $ | 0.001 | ||||||||||||||
|
|
|
|
|
| |||||||||||||||
| Investor A | ||||||||||||||||||||
Net assets | $ | 103,857,659 | $ | 208,207,013 | $ | 128,076,779 | ||||||||||||||
|
|
|
|
|
| |||||||||||||||
Shares outstanding | 12,497,156 | 8,274,281 | 3,791,873 | |||||||||||||||||
|
|
|
|
|
| |||||||||||||||
Net asset value | $ | 8.31 | $ | 25.16 | $ | 33.78 | ||||||||||||||
|
|
|
|
|
| |||||||||||||||
Shares authorized | Unlimited | Unlimited | Unlimited | |||||||||||||||||
|
|
|
|
|
| |||||||||||||||
Par value | $ | 0.001 | $ | 0.001 | $ | 0.001 | ||||||||||||||
|
|
|
|
|
| |||||||||||||||
| Investor C | ||||||||||||||||||||
Net assets | $ | 10,699,033 | $ | 22,379,294 | $ | 5,607,361 | ||||||||||||||
|
|
|
|
|
| |||||||||||||||
Shares outstanding | 1,335,106 | 1,421,081 | 191,172 | |||||||||||||||||
|
|
|
|
|
| |||||||||||||||
Net asset value | $ | 8.01 | $ | 15.75 | $ | 29.33 | ||||||||||||||
|
|
|
|
|
| |||||||||||||||
Shares authorized | Unlimited | Unlimited | Unlimited | |||||||||||||||||
|
|
|
|
|
| |||||||||||||||
Par value | $ | 0.001 | $ | 0.001 | $ | 0.001 | ||||||||||||||
|
|
|
|
|
| |||||||||||||||
| Class K | ||||||||||||||||||||
Net assets | N/A | $ | 358,960 | $ | 5,935,826 | |||||||||||||||
|
|
|
|
|
| |||||||||||||||
Shares outstanding | N/A | 11,967 | 163,243 | |||||||||||||||||
|
|
|
|
|
| |||||||||||||||
Net asset value | N/A | $ | 30.00 | $ | 36.36 | |||||||||||||||
|
|
|
|
|
| |||||||||||||||
Shares authorized | N/A | Unlimited | Unlimited | |||||||||||||||||
|
|
|
|
|
| |||||||||||||||
Par value | N/A | $ | 0.001 | $ | 0.001 | |||||||||||||||
|
|
|
|
|
| |||||||||||||||
See notes to financial statements.
FINANCIAL STATEMENTS | 25 |
BlackRock Energy Opportunities Fund | BlackRock High Equity Income Fund | BlackRock International Dividend Fund | ||||||||||||||||||
INVESTMENT INCOME | ||||||||||||||||||||
Dividends — unaffiliated | $ | 6,519,442 | $ | 10,379,366 | $ | 6,505,480 | ||||||||||||||
Dividends — affiliated | 1,283 | 3,529 | 339 | |||||||||||||||||
Interest — unaffiliated | — | 18,999,685 | — | |||||||||||||||||
Securities lending income — affiliated — net | 14 | 1,581 | — | |||||||||||||||||
Non-cash dividends — unaffiliated | — | — | 1,427,444 | |||||||||||||||||
Foreign taxes withheld | (422,579 | ) | (313,634 | ) | (489,895 | ) | ||||||||||||||
|
|
|
|
|
| |||||||||||||||
Total investment income | 6,098,160 | 29,070,527 | 7,443,368 | |||||||||||||||||
|
|
|
|
|
| |||||||||||||||
EXPENSES | ||||||||||||||||||||
Investment advisory | 986,256 | 3,036,515 | 1,709,898 | |||||||||||||||||
Transfer agent — class specific | 420,374 | 565,072 | 357,939 | |||||||||||||||||
Service and distribution — class specific | 295,083 | 676,976 | 366,787 | |||||||||||||||||
Professional | 116,615 | 99,113 | 76,691 | |||||||||||||||||
Registration | 113,156 | 85,975 | 91,367 | |||||||||||||||||
Printing and postage | 60,908 | 28,721 | 30,849 | |||||||||||||||||
Administration | 55,888 | 159,299 | 91,988 | |||||||||||||||||
Custodian | 43,935 | 43,114 | 45,254 | |||||||||||||||||
Accounting services | 43,664 | 56,887 | 48,303 | |||||||||||||||||
Administration — class specific | 26,292 | 74,831 | 43,296 | |||||||||||||||||
Trustees and Officer | 9,304 | 9,876 | 9,634 | |||||||||||||||||
Offering | — | 78,122 | — | |||||||||||||||||
Miscellaneous | 13,473 | 23,528 | 26,403 | |||||||||||||||||
|
|
|
|
|
| |||||||||||||||
Total expenses | 2,184,948 | 4,938,029 | 2,898,409 | |||||||||||||||||
Less: | ||||||||||||||||||||
Fees waived and/or reimbursed by the Manager | (246,480 | ) | (627,762 | ) | (420,479 | ) | ||||||||||||||
Administration fees waived — class specific | (26,292 | ) | (74,558 | ) | (43,296 | ) | ||||||||||||||
Transfer agent fees waived and/or reimbursed — class specific | (279,143 | ) | (374,727 | ) | (251,794 | ) | ||||||||||||||
|
|
|
|
|
| |||||||||||||||
Total expenses after fees waived and/or reimbursed | 1,633,033 | 3,860,982 | 2,182,840 | |||||||||||||||||
|
|
|
|
|
| |||||||||||||||
Net investment income | 4,465,127 | 25,209,545 | 5,260,528 | |||||||||||||||||
|
|
|
|
|
| |||||||||||||||
REALIZED AND UNREALIZED GAIN (LOSS) | ||||||||||||||||||||
Net realized gain (loss) from: | ||||||||||||||||||||
Investments — unaffiliated | (21,250,931 | ) | 32,051,856 | 16,521,040 | ||||||||||||||||
Investments — affiliated | (66 | ) | (13 | ) | — | |||||||||||||||
Foreign currency transactions | (9,239 | ) | (243,587 | ) | 52,579 | |||||||||||||||
|
|
|
|
|
| |||||||||||||||
| (21,260,236 | ) | 31,808,256 | 16,573,619 | |||||||||||||||||
|
|
|
|
|
| |||||||||||||||
Net change in unrealized appreciation (depreciation) on: | ||||||||||||||||||||
Investments — unaffiliated | 55,035,663 | 72,705,564 | 36,104,174 | (a) | ||||||||||||||||
Investments — affiliated | — | (115 | ) | — | ||||||||||||||||
Foreign currency translations | 4,203 | 20,815 | 83,893 | |||||||||||||||||
|
|
|
|
|
| |||||||||||||||
| 55,039,866 | 72,726,264 | 36,188,067 | ||||||||||||||||||
|
|
|
|
|
| |||||||||||||||
Net realized and unrealized gain | 33,779,630 | 104,534,520 | 52,761,686 | |||||||||||||||||
|
|
|
|
|
| |||||||||||||||
NET INCREASE IN NET ASSETS RESULTING FROM OPERATIONS | $ | 38,244,757 | $ | 129,744,065 | $ | 58,022,214 | ||||||||||||||
|
|
|
|
|
| |||||||||||||||
| (a) | Net of $(121,909) foreign capital gain tax. |
See notes to financial statements.
| 26 | 2 0 2 1 BLACK ROCK ANNUAL REPORT TO SHAREHOLDERS |
Statements of Changes in Net Assets
| BlackRock Energy Opportunities Fund | ||||||||||||
| Year Ended 05/31/21 | Period from to 05/31/20 | Year Ended 09/30/19 | ||||||||||
INCREASE (DECREASE) IN NET ASSETS | ||||||||||||
OPERATIONS | ||||||||||||
Net investment income | $ | 4,465,127 | $ | 2,325,284 | $ | 1,667,707 | ||||||
Net realized loss | (21,260,236 | ) | (16,835,624 | ) | (2,066,863 | ) | ||||||
Net change in unrealized appreciation (depreciation) | 55,039,866 | (29,543,343 | ) | (15,753,878 | ) | |||||||
|
|
|
|
|
| |||||||
Net increase (decrease) in net assets resulting from operations | 38,244,757 | (44,053,683 | ) | (16,153,034 | ) | |||||||
|
|
|
|
|
| |||||||
DISTRIBUTIONS TO SHAREHOLDERS(a) | ||||||||||||
Institutional | (1,396,143 | ) | (816,189 | ) | (495,974 | ) | ||||||
Service | (10,044 | ) | (13,464 | ) | (12,604 | ) | ||||||
Investor A | (2,563,626 | ) | (914,901 | ) | (998,577 | ) | ||||||
Investor C | (271,498 | ) | (141,501 | ) | (71,490 | ) | ||||||
|
|
|
|
|
| |||||||
Decrease in net assets resulting from distributions to shareholders | (4,241,311 | ) | (1,886,055 | ) | (1,578,645 | ) | ||||||
|
|
|
|
|
| |||||||
CAPITAL SHARE TRANSACTIONS | ||||||||||||
Net increase (decrease) in net assets derived from capital share transactions | 10,479,845 | 102,761,416 | (2,487,880 | ) | ||||||||
|
|
|
|
|
| |||||||
NET ASSETS | ||||||||||||
Total increase (decrease) in net assets | 44,483,291 | 56,821,678 | (20,219,559 | ) | ||||||||
Beginning of period | 122,979,388 | 66,157,710 | 86,377,269 | |||||||||
|
|
|
|
|
| |||||||
End of period | $ | 167,462,679 | $ | 122,979,388 | $ | 66,157,710 | ||||||
|
|
|
|
|
| |||||||
| (a) | Distributions for annual periods determined in accordance with U.S. federal income tax regulations. |
See notes to financial statements.
FINANCIAL STATEMENTS | 27 |
Statements of Changes in Net Assets (continued)
| BlackRock High Equity Income Fund | ||||||||||||
| Year Ended 05/31/21 | Period from 10/01/19 to 05/31/20 | Year Ended 09/30/19 | ||||||||||
INCREASE (DECREASE) IN NET ASSETS | ||||||||||||
OPERATIONS | ||||||||||||
Net investment income | $ | 25,209,545 | $ | 13,688,946 | $ | 20,175,928 | ||||||
Net realized gain (loss) | 31,808,256 | (24,514,750 | ) | (6,503,553 | ) | |||||||
Net change in unrealized appreciation (depreciation) | 72,726,264 | (31,402,895 | ) | (11,344,379 | ) | |||||||
|
|
|
|
|
| |||||||
Net increase (decrease) in net assets resulting from operations | 129,744,065 | (42,228,699 | ) | 2,327,996 | ||||||||
|
|
|
|
|
| |||||||
DISTRIBUTIONS TO SHAREHOLDERS(a) | ||||||||||||
Institutional | (11,401,673 | ) | (6,556,434 | ) | (14,273,425 | ) | ||||||
Service | (560,226 | ) | (459,139 | ) | (938,768 | ) | ||||||
Investor A | (12,045,159 | ) | (9,928,356 | ) | (19,307,342 | ) | ||||||
Investor C | (1,190,563 | ) | (2,032,197 | ) | (7,759,253 | ) | ||||||
Class K | (21,194 | ) | (2,364 | ) | — | |||||||
|
|
|
|
|
| |||||||
Decrease in net assets resulting from distributions to shareholders | (25,218,815 | ) | (18,978,490 | ) | (42,278,788 | ) | ||||||
|
|
|
|
|
| |||||||
CAPITAL SHARE TRANSACTIONS | ||||||||||||
Net increase (decrease) in net assets derived from capital share transactions | 79,873,208 | (18,173,074 | ) | (115,715,731 | ) | |||||||
|
|
|
|
|
| |||||||
NET ASSETS | ||||||||||||
Total increase (decrease) in net assets | 184,398,458 | (79,380,263 | ) | (155,666,523 | ) | |||||||
Beginning of period | 333,643,138 | 413,023,401 | 568,689,924 | |||||||||
|
|
|
|
|
| |||||||
End of period | $ | 518,041,596 | $ | 333,643,138 | $ | 413,023,401 | ||||||
|
|
|
|
|
| |||||||
| (a) | Distributions for annual periods determined in accordance with U.S. federal income tax regulations. |
See notes to financial statements.
| 28 | 2 0 2 1 BLACK ROCK ANNUAL REPORT TO SHAREHOLDERS |
Statements of Changes in Net Assets (continued)
| BlackRock International Dividend Fund | ||||||||||||
Year Ended 05/31/21 | Period from 10/01/19 to 05/31/20 | Year Ended 09/30/19 | ||||||||||
INCREASE (DECREASE) IN NET ASSETS | ||||||||||||
OPERATIONS | ||||||||||||
Net investment income | $ | 5,260,528 | $ | 2,845,021 | $ | 5,666,032 | ||||||
Net realized gain (loss) | 16,573,619 | (11,478,140 | ) | (1,208,872 | ) | |||||||
Net change in unrealized appreciation (depreciation) | 36,188,067 | 9,420,449 | 1,987,148 | |||||||||
|
|
|
|
|
| |||||||
Net increase in net assets resulting from operations | 58,022,214 | 787,330 | 6,444,308 | |||||||||
|
|
|
|
|
| |||||||
DISTRIBUTIONS TO SHAREHOLDERS(a) | ||||||||||||
Institutional | (1,390,588 | ) | (1,285,194 | ) | (4,812,078 | ) | ||||||
Service | (55,023 | ) | (48,355 | ) | (201,787 | ) | ||||||
Investor A | (1,737,743 | ) | (1,779,666 | ) | (7,373,881 | ) | ||||||
Investor C | (87,622 | ) | (150,614 | ) | (1,251,082 | ) | ||||||
Class K | (81,044 | ) | (60,650 | ) | (190,815 | ) | ||||||
|
|
|
|
|
| |||||||
Decrease in net assets resulting from distributions to shareholders | (3,352,020 | ) | (3,324,479 | ) | (13,829,643 | ) | ||||||
|
|
|
|
|
| |||||||
CAPITAL SHARE TRANSACTIONS | ||||||||||||
Net decrease in net assets derived from capital share transactions | (1,214,166 | ) | (36,475,196 | ) | (49,101,794 | ) | ||||||
|
|
|
|
|
| |||||||
NET ASSETS | ||||||||||||
Total increase (decrease) in net assets | 53,456,028 | (39,012,345 | ) | (56,487,129 | ) | |||||||
Beginning of period | 191,845,597 | 230,857,942 | 287,345,071 | |||||||||
|
|
|
|
|
| |||||||
End of period | $ | 245,301,625 | $ | 191,845,597 | $ | 230,857,942 | ||||||
|
|
|
|
|
| |||||||
| (a) | Distributions for annual periods determined in accordance with U.S. federal income tax regulations. |
See notes to financial statements.
FINANCIAL STATEMENTS | 29 |
(For a share outstanding throughout each period)
| BlackRock Energy Opportunities Fund | ||||||||||||||||||||||||||||
| Institutional | ||||||||||||||||||||||||||||
| Period from | Year Ended September 30, | |||||||||||||||||||||||||||
| Year Ended | 10/01/19 | |||||||||||||||||||||||||||
| 05/31/21 | to 05/31/20 | 2019 | 2018 | 2017 | 2016 | |||||||||||||||||||||||
Net asset value, beginning of period | $ | 6.64 | $ | 9.66 | $ | 12.34 | $ | 11.13 | $ | 11.06 | $ | 9.91 | ||||||||||||||||
|
|
|
|
|
|
|
|
|
|
|
| |||||||||||||||||
Net investment income(a) | 0.26 | 0.21 | 0.29 | 0.23 | 0.31 | (b) | 0.22 | |||||||||||||||||||||
Net realized and unrealized gain (loss) | 1.90 | (2.93 | ) | (2.66 | ) | 1.30 | 0.04 | 1.17 | ||||||||||||||||||||
|
|
|
|
|
|
|
|
|
|
|
| |||||||||||||||||
Net increase (decrease) from investment operations | 2.16 | (2.72 | ) | (2.37 | ) | 1.53 | 0.35 | 1.39 | ||||||||||||||||||||
|
|
|
|
|
|
|
|
|
|
|
| |||||||||||||||||
Distributions from net investment income(c) | (0.25 | ) | (0.30 | ) | (0.31 | ) | (0.32 | ) | (0.28 | ) | (0.24 | ) | ||||||||||||||||
|
|
|
|
|
|
|
|
|
|
|
| |||||||||||||||||
Net asset value, end of period | $ | 8.55 | $ | 6.64 | $ | 9.66 | $ | 12.34 | $ | 11.13 | $ | 11.06 | ||||||||||||||||
|
|
|
|
|
|
|
|
|
|
|
| |||||||||||||||||
Total Return(d) | ||||||||||||||||||||||||||||
Based on net asset value | 33.50 | % | (29.02 | )%(e) | (19.24 | )% | 14.08 | % | 2.98 | % | 14.33 | % | ||||||||||||||||
|
|
|
|
|
|
|
|
|
|
|
| |||||||||||||||||
Ratios to Average Net Assets | ||||||||||||||||||||||||||||
Total expenses | 1.33 | % | 1.40 | %(f)(g) | 1.30 | % | 1.29 | % | 1.25 | % | 1.18 | % | ||||||||||||||||
|
|
|
|
|
|
|
|
|
|
|
| |||||||||||||||||
Total expenses after fees waived and/or reimbursed | 0.91 | % | 0.91 | %(f)(g) | 0.91 | % | 0.92 | % | 0.91 | % | 0.95 | % | ||||||||||||||||
|
|
|
|
|
|
|
|
|
|
|
| |||||||||||||||||
Net investment income | 3.75 | % | 3.89 | %(f) | 2.91 | % | 1.97 | % | 2.89 | %(b) | 2.16 | % | ||||||||||||||||
|
|
|
|
|
|
|
|
|
|
|
| |||||||||||||||||
Supplemental Data | ||||||||||||||||||||||||||||
Net assets, end of period (000) | $ | 52,377 | $ | 38,779 | $ | 23,579 | $ | 22,255 | $ | 18,703 | $ | 25,123 | ||||||||||||||||
|
|
|
|
|
|
|
|
|
|
|
| |||||||||||||||||
Portfolio turnover rate | 79 | % | 39 | % | 37 | % | 37 | % | 14 | % | 66 | % | ||||||||||||||||
|
|
|
|
|
|
|
|
|
|
|
| |||||||||||||||||
| (a) | Based on average shares outstanding. |
| (b) | Net investment income per share and the ratio of net investment income to average net assets includes $0.10 per share and 0.92%, respectively, resulting from a special dividend. |
| (c) | Distributions for annual periods determined in accordance with U.S. federal income tax regulations. |
| (d) | Where applicable, assumes the reinvestment of distributions. |
| (e) | Aggregate total return. |
| (f) | Annualized. |
| (g) | Reorganization, Audit and Printing costs were not annualized in the calculation of the expense ratios. If these expenses were annualized, the total expenses and total expenses after fees waived and/or reimbursed would have been 1.47% and 0.91%, respectively. |
See notes to financial statements.
| 30 | 2 0 2 1 BLACK ROCK ANNUAL REPORT TO SHAREHOLDERS |
Financial Highlights (continued)
(For a share outstanding throughout each period)
| BlackRock Energy Opportunities Fund (continued) | ||||||||||||||||||||||||||||||
| Service | ||||||||||||||||||||||||||||||
Year Ended 05/31/21 |
Period from 10/01/19 to 05/31/20 | Year Ended September 30, | ||||||||||||||||||||||||||||
| 2019 | 2018 | 2017 | 2016 | |||||||||||||||||||||||||||
Net asset value, beginning of period | $ | 6.50 | $ | 9.44 | $ | 12.05 | $ | 10.88 | $ | 10.81 | $ | 9.65 | ||||||||||||||||||
|
|
|
|
|
|
|
|
|
|
|
| |||||||||||||||||||
Net investment income(a) | 0.23 | 0.17 | 0.23 | 0.17 | 0.25 | (b) | 0.17 | |||||||||||||||||||||||
Net realized and unrealized gain (loss) | 1.85 | (2.85 | ) | (2.59 | ) | 1.28 | 0.04 | 1.14 | ||||||||||||||||||||||
|
|
|
|
|
|
|
|
|
|
|
| |||||||||||||||||||
Net increase (decrease) from investment operations | 2.08 | (2.68 | ) | (2.36 | ) | 1.45 | 0.29 | 1.31 | ||||||||||||||||||||||
|
|
|
|
|
|
|
|
|
|
|
| |||||||||||||||||||
Distributions from net investment income(c) | (0.22 | ) | (0.26 | ) | (0.25 | ) | (0.28 | ) | (0.22 | ) | (0.15 | ) | ||||||||||||||||||
|
|
|
|
|
|
|
|
|
|
|
| |||||||||||||||||||
Net asset value, end of period | $ | 8.36 | $ | 6.50 | $ | 9.44 | $ | 12.05 | $ | 10.88 | $ | 10.81 | ||||||||||||||||||
|
|
|
|
|
|
|
|
|
|
|
| |||||||||||||||||||
Total Return(d) | ||||||||||||||||||||||||||||||
Based on net asset value | 32.90 | % | (29.17 | )%(e) | (19.63 | )% | 13.63 | % | 2.58 | % | 13.77 | % | ||||||||||||||||||
|
|
|
|
|
|
|
|
|
|
|
| |||||||||||||||||||
Ratios to Average Net Assets | ||||||||||||||||||||||||||||||
Total expenses(f) | 1.60 | % | 1.70 | %(g)(h) | 1.57 | % | 1.55 | % | 1.50 | % | 1.51 | % | ||||||||||||||||||
|
|
|
|
|
|
|
|
|
|
|
| |||||||||||||||||||
Total expenses after fees waived and/or reimbursed | 1.32 | % | 1.32 | %(g)(h) | 1.33 | % | 1.34 | % | 1.33 | % | 1.36 | % | ||||||||||||||||||
|
|
|
|
|
|
|
|
|
|
|
| |||||||||||||||||||
Net investment income | 3.26 | % | 3.11 | %(g) | 2.34 | % | 1.51 | % | 2.35 | %(b) | 1.67 | % | ||||||||||||||||||
|
|
|
|
|
|
|
|
|
|
|
| |||||||||||||||||||
Supplemental Data | ||||||||||||||||||||||||||||||
Net assets, end of period (000) | $ | 529 | $ | 315 | $ | 451 | $ | 599 | $ | 628 | $ | 787 | ||||||||||||||||||
|
|
|
|
|
|
|
|
|
|
|
| |||||||||||||||||||
Portfolio turnover rate | 79 | % | 39 | % | 37 | % | 37 | % | 14 | % | 66 | % | ||||||||||||||||||
|
|
|
|
|
|
|
|
|
|
|
| |||||||||||||||||||
| (a) | Based on average shares outstanding. |
| (b) | Net investment income per share and the ratio of net investment income to average net assets includes $0.10 per share and 0.92%, respectively, resulting from a special dividend. |
| (c) | Distributions for annual periods determined in accordance with U.S. federal income tax regulations. |
| (d) | Where applicable, assumes the reinvestment of distributions. |
| (e) | Aggregate total return. |
| (f) | Includes recoupment of past waived and/or reimbursed fees. Excluding the recoupment of past waived and/or reimbursed fees, the ratios were as follows: |
Year Ended 05/31/21 | Period from 10/01/19 to 5/31/20 | Year Ended September 30,
| ||||||||||||||||||||||
2019 |
2018 |
2017 |
2016 | |||||||||||||||||||||
Expense ratios | N/A | 1.70 | % | 1.55 | % | N/A | N/A | N/A | ||||||||||||||||
| (g) | Annualized. |
| (h) | Reorganization, Audit and Printing costs were not annualized in the calculation of the expense ratios. If these expenses were annualized, the total expenses and total expenses after fees waived and/or reimbursed would have been 1.79% and 1.32%, respectively. |
See notes to financial statements.
FINANCIAL HIGHLIGHTS | 31 |
Financial Highlights (continued)
(For a share outstanding throughout each period)
| BlackRock Energy Opportunities Fund (continued) | ||||||||||||||||||||||||||||||
| Investor A | ||||||||||||||||||||||||||||||
|
| Year Ended 05/31/21 |
Period from 10/01/19 to 05/31/20 | Year Ended September 30, | |||||||||||||||||||||||||||
| 2019 | 2018 | 2017 | 2016 | |||||||||||||||||||||||||||
Net asset value, beginning of period | $ | 6.46 | $ | 9.39 | $ | 11.99 | $ | 10.83 | $ | 10.76 | $ | 9.63 | ||||||||||||||||||
|
|
|
|
|
|
|
|
|
|
|
| |||||||||||||||||||
Net investment income(a) | 0.23 | 0.18 | 0.24 | 0.17 | 0.26 | (b) | 0.17 | |||||||||||||||||||||||
Net realized and unrealized gain (loss) | 1.84 | (2.85 | ) | (2.59 | ) | 1.27 | 0.03 | 1.14 | ||||||||||||||||||||||
|
|
|
|
|
|
|
|
|
|
|
| |||||||||||||||||||
Net increase (decrease) from investment operations | 2.07 | (2.67 | ) | (2.35 | ) | 1.44 | 0.29 | 1.31 | ||||||||||||||||||||||
|
|
|
|
|
|
|
|
|
|
|
| |||||||||||||||||||
Distributions from net investment income(c) | (0.22 | ) | (0.26 | ) | (0.25 | ) | (0.28 | ) | (0.22 | ) | (0.18 | ) | ||||||||||||||||||
|
|
|
|
|
|
|
|
|
|
|
| |||||||||||||||||||
Net asset value, end of period | $ | 8.31 | $ | 6.46 | $ | 9.39 | $ | 11.99 | $ | 10.83 | $ | 10.76 | ||||||||||||||||||
|
|
|
|
|
|
|
|
|
|
|
| |||||||||||||||||||
Total Return(d) | ||||||||||||||||||||||||||||||
Based on net asset value | 33.00 | % | (29.23 | )%(e) | (19.61 | )% | 13.59 | % | 2.57 | % | 13.88 | % | ||||||||||||||||||
|
|
|
|
|
|
|
|
|
|
|
| |||||||||||||||||||
Ratios to Average Net Assets | ||||||||||||||||||||||||||||||
Total expenses | 1.73 | % | 1.94 | %(f)(g) | 1.66 | % | 1.65 | % | 1.60 | % | 1.55 | % | ||||||||||||||||||
|
|
|
|
|
|
|
|
|
|
|
| |||||||||||||||||||
Total expenses after fees waived and/or reimbursed | 1.32 | % | 1.32 | %(f)(g) | 1.33 | % | 1.34 | % | 1.33 | % | 1.36 | % | ||||||||||||||||||
|
|
|
|
|
|
|
|
|
|
|
| |||||||||||||||||||
Net investment income | 3.30 | % | 3.65 | %(f) | 2.44 | % | 1.52 | % | 2.42 | %(b) | 1.72 | % | ||||||||||||||||||
|
|
|
|
|
|
|
|
|
|
|
| |||||||||||||||||||
Supplemental Data | ||||||||||||||||||||||||||||||
Net assets, end of period (000) | $ | 103,858 | $ | 72,733 | $ | 34,574 | $ | 41,644 | $ | 43,765 | $ | 59,065 | ||||||||||||||||||
|
|
|
|
|
|
|
|
|
|
|
| |||||||||||||||||||
Portfolio turnover rate | 79 | % | 39 | % | 37 | % | 37 | % | 14 | % | 66 | % | ||||||||||||||||||
|
|
|
|
|
|
|
|
|
|
|
| |||||||||||||||||||
| (a) | Based on average shares outstanding. |
| (b) | Net investment income per share and the ratio of net investment income to average net assets includes $0.10 per share and 0.92%, respectively, resulting from a special dividend. |
| (c) | Distributions for annual periods determined in accordance with U.S. federal income tax regulations. |
| (d) | Where applicable, excludes the effects of any sales charges and assumes the reinvestment of distributions. |
| (e) | Aggregate total return. |
| (f) | Annualized. |
| (g) | Reorganization, Audit and Printing costs were not annualized in the calculation of the expense ratios. If these expenses were annualized, the total expenses and total expenses after fees waived and/or reimbursed would have been 2.00% and 1.32%, respectively. |
See notes to financial statements.
| 32 | 2 0 2 1 BLACK ROCK ANNUAL REPORT TO SHAREHOLDERS |
Financial Highlights (continued)
(For a share outstanding throughout each period)
| BlackRock Energy Opportunities Fund (continued) | ||||||||||||||||||||||||||||||
| Investor C | ||||||||||||||||||||||||||||||
Year Ended 05/31/21 |
Period from 10/01/19 to 05/31/20 | Year Ended September 30, | ||||||||||||||||||||||||||||
| 2019 | 2018 | 2017 | 2016 | |||||||||||||||||||||||||||
Net asset value, beginning of period | $ | 6.24 | $ | 9.03 | $ | 11.39 | $ | 10.30 | $ | 10.23 | $ | 9.14 | ||||||||||||||||||
|
|
|
|
|
|
|
|
|
|
|
| |||||||||||||||||||
Net investment income(a) | 0.17 | 0.14 | 0.14 | 0.09 | 0.17 | (b) | 0.09 | |||||||||||||||||||||||
Net realized and unrealized gain (loss) | 1.77 | (2.75 | ) | (2.44 | ) | 1.22 | 0.03 | 1.08 | ||||||||||||||||||||||
|
|
|
|
|
|
|
|
|
|
|
| |||||||||||||||||||
Net increase (decrease) from investment operations | 1.94 | (2.61 | ) | (2.30 | ) | 1.31 | 0.20 | 1.17 | ||||||||||||||||||||||
|
|
|
|
|
|
|
|
|
|
|
| |||||||||||||||||||
Distributions from net investment income(c) | (0.17 | ) | (0.18 | ) | (0.06 | ) | (0.22 | ) | (0.13 | ) | (0.08 | ) | ||||||||||||||||||
|
|
|
|
|
|
|
|
|
|
|
| |||||||||||||||||||
Net asset value, end of period | $ | 8.01 | $ | 6.24 | $ | 9.03 | $ | 11.39 | $ | 10.30 | $ | 10.23 | ||||||||||||||||||
|
|
|
|
|
|
|
|
|
|
|
| |||||||||||||||||||
Total Return(d) | ||||||||||||||||||||||||||||||
Based on net asset value | 31.89 | % | (29.51 | )%(e) | (20.21 | )% | 12.90 | % | 1.84 | % | 12.91 | % | ||||||||||||||||||
|
|
|
|
|
|
|
|
|
|
|
| |||||||||||||||||||
Ratios to Average Net Assets | ||||||||||||||||||||||||||||||
Total expenses(f) | 2.53 | % | 2.61 | %(g)(h) | 2.35 | % | 2.36 | % | 2.32 | % | 2.28 | % | ||||||||||||||||||
|
|
|
|
|
|
|
|
|
|
|
| |||||||||||||||||||
Total expenses after fees waived and/or reimbursed | 2.04 | % | 2.04 | %(g)(h) | 2.05 | % | 2.06 | % | 2.05 | % | 2.09 | % | ||||||||||||||||||
|
|
|
|
|
|
|
|
|
|
|
| |||||||||||||||||||
Net investment income | 2.60 | % | 2.77 | %(g) | 1.48 | % | 0.80 | % | 1.66 | %(b) | 1.00 | % | ||||||||||||||||||
|
|
|
|
|
|
|
|
|
|
|
| |||||||||||||||||||
Supplemental Data | ||||||||||||||||||||||||||||||
Net assets, end of period (000) | $ | 10,699 | $ | 11,152 | $ | 7,554 | $ | 21,878 | $ | 23,996 | $ | 31,847 | ||||||||||||||||||
|
|
|
|
|
|
|
|
|
|
|
| |||||||||||||||||||
Portfolio turnover rate | 79 | % | 39 | % | 37 | % | 37 | % | 14 | % | 66 | % | ||||||||||||||||||
|
|
|
|
|
|
|
|
|
|
|
| |||||||||||||||||||
| (a) | Based on average shares outstanding. |
| (b) | Net investment income per share and the ratio of net investment income to average net assets includes $0.10 per share and 0.92%, respectively, resulting from a special dividend. |
| (c) | Distributions for annual periods determined in accordance with U.S. federal income tax regulations. |
| (d) | Where applicable, excludes the effects of any sales charges and assumes the reinvestment of distributions. |
| (e) | Aggregate total return. |
| (f) | Includes recoupment of past waived and/or reimbursed fees. Excluding the recoupment of past waived and/or reimbursed fees, the ratios were as follows: |
Year Ended 05/31/21 |
Period from 10/01/19 to 5/31/20 | Year Ended September 30,
| ||||||||||||||||||||||
2019 |
2018 |
2017 |
2016 | |||||||||||||||||||||
Expense ratios | N/A | 2.61 | % | 2.35 | % | N/A | N/A | 2.27 | % | |||||||||||||||
| (g) | Annualized. |
| (h) | Reorganization, Audit and Printing costs were not annualized in the calculation of the expense ratios. If these expenses were annualized, the total expenses and total expenses after fees waived and/or reimbursed would have been 2.67% and 2.04%, respectively. |
See notes to financial statements.
FINANCIAL HIGHLIGHTS | 33 |
Financial Highlights
(For a share outstanding throughout each period)
| BlackRock High Equity Income Fund | ||||||||||||||||||||||||||||||
| Institutional | ||||||||||||||||||||||||||||||
|
| Year Ended 05/31/21 |
Period from 10/01/19 to 05/31/20 | Year Ended September 30, | |||||||||||||||||||||||||||
| 2019 | 2018 | 2017 | 2016 | |||||||||||||||||||||||||||
Net asset value, beginning of period | $ | 22.81 | $ | 26.57 | $ | 28.16 | $ | 27.33 | $ | 37.84 | $ | 37.71 | ||||||||||||||||||
| �� |
|
|
|
|
|
|
|
|
|
|
|
| ||||||||||||||||||
Net investment income(a) | 1.81 | 0.94 | 1.24 | 1.32 | 0.16 | 0.24 | ||||||||||||||||||||||||
Net realized and unrealized gain (loss) | 7.13 | (3.54 | ) | (0.73 | ) | 0.75 | 5.09 | 2.81 | ||||||||||||||||||||||
|
|
|
|
|
|
|
|
|
|
|
| |||||||||||||||||||
Net increase (decrease) from investment operations | 8.94 | (2.60 | ) | 0.51 | 2.07 | 5.25 | 3.05 | |||||||||||||||||||||||
|
|
|
|
|
|
|
|
|
|
|
| |||||||||||||||||||
Distributions(b) | ||||||||||||||||||||||||||||||
From net investment income | (1.76 | ) | (1.16 | ) | (1.05 | ) | (1.05 | ) | (0.23 | ) | — | |||||||||||||||||||
From net realized gain | — | — | (1.05 | ) | (0.19 | ) | (15.53 | ) | (2.92 | ) | ||||||||||||||||||||
|
|
|
|
|
|
|
|
|
|
|
| |||||||||||||||||||
Total distributions | (1.76 | ) | (1.16 | ) | (2.10 | ) | (1.24 | ) | (15.76 | ) | (2.92 | ) | ||||||||||||||||||
|
|
|
|
|
|
|
|
|
|
|
| |||||||||||||||||||
Net asset value, end of period | $ | 29.99 | $ | 22.81 | $ | 26.57 | $ | 28.16 | $ | 27.33 | $ | 37.84 | ||||||||||||||||||
|
|
|
|
|
|
|
|
|
|
|
| |||||||||||||||||||
Total Return(c) | ||||||||||||||||||||||||||||||
Based on net asset value | 40.81 | % | (9.94 | )%(d) | 2.27 | % | 7.81 | % | 15.40 | % | 8.64 | % | ||||||||||||||||||
|
|
|
|
|
|
|
|
|
|
|
| |||||||||||||||||||
Ratios to Average Net Assets | ||||||||||||||||||||||||||||||
Total expenses | 1.12 | % | 1.12 | %(e) | 1.12 | % | 1.09 | % | 1.19 | % | 1.19 | %(f) | ||||||||||||||||||
|
|
|
|
|
|
|
|
|
|
|
| |||||||||||||||||||
Total expenses after fees waived and/or reimbursed | 0.85 | % | 0.85 | %(e) | 0.85 | % | 0.85 | % | 0.97 | % | 0.91 | %(f) | ||||||||||||||||||
|
|
|
|
|
|
|
|
|
|
|
| |||||||||||||||||||
Net investment income | 6.93 | % | 5.63 | %(e) | 4.80 | % | 4.79 | % | 0.46 | % | 0.67 | %(f) | ||||||||||||||||||
|
|
|
|
|
|
|
|
|
|
|
| |||||||||||||||||||
Supplemental Data | ||||||||||||||||||||||||||||||
Net assets, end of period (000) | $ | 277,653 | $ | 128,474 | $ | 151,747 | $ | 248,847 | $ | 462,487 | $ | 686,845 | ||||||||||||||||||
|
|
|
|
|
|
|
|
|
|
|
| |||||||||||||||||||
Portfolio turnover rate | 146 | % | 76 | % | 79 | % | 75 | % | 154 | % | 72 | % | ||||||||||||||||||
|
|
|
|
|
|
|
|
|
|
|
| |||||||||||||||||||
| (a) | Based on average shares outstanding. |
| (b) | Distributions for annual periods determined in accordance with U.S. federal income tax regulations. |
| (c) | Where applicable, assumes the reinvestment of distributions. |
| (d) | Aggregate total return. |
| (e) | Annualized. |
| (f) | Ratios do not include expenses incurred indirectly as a result of investments in underlying funds of approximately 0.01%. |
See notes to financial statements.
| 34 | 2 0 2 1 BLACK ROCK ANNUAL REPORT TO SHAREHOLDERS |
Financial Highlights (continued)
(For a share outstanding throughout each period)
| BlackRock High Equity Income Fund (continued) | ||||||||||||||||||||||||||||||
| Service | ||||||||||||||||||||||||||||||
|
| Year Ended 05/31/21 |
Period from 10/01/19 to 05/31/20 | Year Ended September 30, | |||||||||||||||||||||||||||
| 2019 | 2018 | 2017 | 2016 | |||||||||||||||||||||||||||
Net asset value, beginning of period | $ | 20.46 | $ | 23.91 | $ | 25.56 | $ | 24.87 | $ | 35.61 | $ | 35.80 | ||||||||||||||||||
|
|
|
|
|
|
|
|
|
|
|
| |||||||||||||||||||
Net investment income(a) | 1.52 | 0.80 | 1.06 | 1.15 | 0.10 | 0.09 | ||||||||||||||||||||||||
Net realized and unrealized gain (loss) | 6.44 | (3.17 | ) | (0.66 | ) | 0.67 | 4.73 | 2.64 | ||||||||||||||||||||||
|
|
|
|
|
|
|
|
|
|
|
| |||||||||||||||||||
Net increase (decrease) from investment operations. | 7.96 | (2.37 | ) | 0.40 | 1.82 | 4.83 | 2.73 | |||||||||||||||||||||||
|
|
|
|
|
|
|
|
|
|
|
| |||||||||||||||||||
Distributions(b) | ||||||||||||||||||||||||||||||
From net investment income | (1.52 | ) | (1.08 | ) | (1.00 | ) | (0.94 | ) | (0.04 | ) | — | |||||||||||||||||||
From net realized gain | — | — | (1.05 | ) | (0.19 | ) | (15.53 | ) | (2.92 | ) | ||||||||||||||||||||
|
|
|
|
|
|
|
|
|
|
|
| |||||||||||||||||||
Total distributions | (1.52 | ) | (1.08 | ) | (2.05 | ) | (1.13 | ) | (15.57 | ) | (2.92 | ) | ||||||||||||||||||
|
|
|
|
|
|
|
|
|
|
|
| |||||||||||||||||||
Net asset value, end of period | $ | 26.90 | $ | 20.46 | $ | 23.91 | $ | 25.56 | $ | 24.87 | $ | 35.61 | ||||||||||||||||||
|
|
|
|
|
|
|
|
|
|
|
| |||||||||||||||||||
Total Return(c) | ||||||||||||||||||||||||||||||
Based on net asset value | 40.46 | % | (10.08 | )%(d) | 2.05 | % | 7.54 | % | 15.09 | % | 8.18 | % | ||||||||||||||||||
|
|
|
|
|
|
|
|
|
|
|
| |||||||||||||||||||
Ratios to Average Net Assets | ||||||||||||||||||||||||||||||
Total expenses(e) | 1.37 | % | 1.36 | %(f) | 1.31 | % | 1.32 | % | 1.37 | %(g) | 1.43 | %(h) | ||||||||||||||||||
|
|
|
|
|
|
|
|
|
|
|
| |||||||||||||||||||
Total expenses after fees waived and/or reimbursed | 1.10 | % | 1.10 | %(f) | 1.10 | % | 1.10 | % | 1.25 | % | 1.31 | %(h) | ||||||||||||||||||
|
|
|
|
|
|
|
|
|
|
|
| |||||||||||||||||||
Net investment income | 6.64 | % | 5.30 | %(f) | 4.56 | % | 4.58 | % | 0.29 | % | 0.27 | %(h) | ||||||||||||||||||
|
|
|
|
|
|
|
|
|
|
|
| |||||||||||||||||||
Supplemental Data | ||||||||||||||||||||||||||||||
Net assets, end of period (000) | $ | 9,444 | $ | 8,023 | $ | 10,024 | $ | 12,348 | $ | 18,087 | $ | 24,305 | ||||||||||||||||||
|
|
|
|
|
|
|
|
|
|
|
| |||||||||||||||||||
Portfolio turnover rate | 146 | % | 76 | % | 79 | % | 75 | % | 154 | % | 72 | % | ||||||||||||||||||
|
|
|
|
|
|
|
|
|
|
|
| |||||||||||||||||||
| (a) | Based on average shares outstanding. |
| (b) | Distributions for annual periods determined in accordance with U.S. federal income tax regulations. |
| (c) | Where applicable, assumes the reinvestment of distributions. |
| (d) | Aggregate total return. |
| (e) | Includes recoupment of past waived and/or reimbursed fees. Excluding the recoupment of past waived and/or reimbursed fees, the ratios were as follows: |
Year Ended 05/31/21 | Period from 10/01/19 to 5/31/20 | Year Ended September 30,
| ||||||||||||||||||||||
2019 |
2018 |
2017 |
2016 | |||||||||||||||||||||
Expense ratios | N/A | N/A | N/A | N/A | 1.37 | % | 1.30 | % | ||||||||||||||||
| (f) | Annualized. |
| (g) | Includes recoupment of past waived and/or reimbursed fees with no financial impact to the expense ratios. |
| (h) | Ratios do not include expenses incurred indirectly as a result of investments in underlying funds of approximately 0.01%. |
See notes to financial statements.
FINANCIAL HIGHLIGHTS | 35 |
Financial Highlights (continued)
(For a share outstanding throughout each period)
BlackRock High Equity Income Fund (continued)
| ||||||||||||||||||||||||
Investor A
| ||||||||||||||||||||||||
Year Ended 05/31/21 | Period from 10/01/19 to 05/31/20 | Year Ended September 30, | ||||||||||||||||||||||
2019 |
2018 |
2017 |
2016 | |||||||||||||||||||||
Net asset value, beginning of period | $ | 19.14 | $ | 22.43 | $ | 24.12 | $ | 23.53 | $ | 34.47 | $ | 34.74 | ||||||||||||
|
|
|
|
|
|
|
|
|
|
|
| |||||||||||||
Net investment income(a) | 1.42 | 0.75 | 1.00 | 1.08 | 0.11 | 0.09 | ||||||||||||||||||
Net realized and unrealized gain (loss) | 6.03 | (2.98 | ) | (0.64 | ) | 0.65 | 4.54 | 2.56 | ||||||||||||||||
|
|
|
|
|
|
|
|
|
|
|
| |||||||||||||
Net increase (decrease) from investment operations | 7.45 | (2.23 | ) | 0.36 | 1.73 | 4.65 | 2.65 | |||||||||||||||||
|
|
|
|
|
|
|
|
|
|
|
| |||||||||||||
Distributions(b) | ||||||||||||||||||||||||
From net investment income | (1.43 | ) | (1.06 | ) | (1.00 | ) | (0.95 | ) | (0.06 | ) | — | |||||||||||||
From net realized gain | — | — | (1.05 | ) | (0.19 | ) | (15.53 | ) | (2.92 | ) | ||||||||||||||
|
|
|
|
|
|
|
|
|
|
|
| |||||||||||||
Total distributions | (1.43 | ) | (1.06 | ) | (2.05 | ) | (1.14 | ) | (15.59 | ) | (2.92 | ) | ||||||||||||
|
|
|
|
|
|
|
|
|
|
|
| |||||||||||||
Net asset value, end of period | $ | 25.16 | $ | 19.14 | $ | 22.43 | $ | 24.12 | $ | 23.53 | $ | 34.47 | ||||||||||||
|
|
|
|
|
|
|
|
|
|
|
| |||||||||||||
Total Return(c) | ||||||||||||||||||||||||
Based on net asset value | 40.44 | % | (10.09 | )%(d) | 2.02 | % | 7.58 | % | 15.06 | % | 8.20 | % | ||||||||||||
|
|
|
|
|
|
|
|
|
|
|
| |||||||||||||
Ratios to Average Net Assets | ||||||||||||||||||||||||
Total expenses | 1.40 | % | 1.40 | %(e) | 1.37 | % | 1.38 | % | 1.45 | % | 1.47 | %(f) | ||||||||||||
|
|
|
|
|
|
|
|
|
|
|
| |||||||||||||
Total expenses after fees waived and/or reimbursed | 1.10 | % | 1.10 | %(e) | 1.10 | % | 1.10 | % | 1.25 | % | 1.31 | %(f) | ||||||||||||
|
|
|
|
|
|
|
|
|
|
|
| |||||||||||||
Net investment income | 6.64 | % | 5.35 | %(e) | 4.55 | % | 4.57 | % | 0.36 | % | 0.27 | %(f) | ||||||||||||
|
|
|
|
|
|
|
|
|
|
|
| |||||||||||||
Supplemental Data | ||||||||||||||||||||||||
Net assets, end of period (000) | $ | 208,207 | $ | 172,696 | $ | 215,121 | $ | 214,095 | $ | 278,649 | $ | 377,271 | ||||||||||||
|
|
|
|
|
|
|
|
|
|
|
| |||||||||||||
Portfolio turnover rate | 146 | % | 76 | % | 79 | % | 75 | % | 154 | % | 72 | % | ||||||||||||
|
|
|
|
|
|
|
|
|
|
|
| |||||||||||||
| (a) | Based on average shares outstanding. |
| (b) | Distributions for annual periods determined in accordance with U.S. federal income tax regulations. |
| (c) | Where applicable, excludes the effects of any sales charges and assumes the reinvestment of distributions. |
| (d) | Aggregate total return. |
| (e) | Annualized. |
| (f) | Ratios do not include expenses incurred indirectly as a result of investments in underlying funds of approximately 0.01%. |
See notes to financial statements.
| 36 | 2 0 2 1 BLACK ROCK ANNUAL REPORT TO SHAREHOLDERS |
Financial Highlights (continued)
(For a share outstanding throughout each period)
BlackRock High Equity Income Fund (continued)
| ||||||||||||||||||||||||
Investor C
| ||||||||||||||||||||||||
Year Ended 05/31/21 | Period from 10/01/19 to 05/31/20 | Year Ended September 30, | ||||||||||||||||||||||
2019 |
2018 |
2017 |
2016 | |||||||||||||||||||||
Net asset value, beginning of period | $ | 11.98 | $ | 14.35 | $ | 16.19 | $ | 16.13 | $ | 28.15 | $ | 29.10 | ||||||||||||
|
|
|
|
|
|
|
|
|
|
|
| |||||||||||||
Net investment income (loss)(a) | 0.78 | 0.41 | 0.55 | 0.61 | (0.12 | ) | (0.13 | ) | ||||||||||||||||
Net realized and unrealized gain (loss) | 3.78 | (1.88 | ) | (0.45 | ) | 0.44 | 3.63 | 2.10 | ||||||||||||||||
|
|
|
|
|
|
|
|
|
|
|
| |||||||||||||
Net increase (decrease) from investment operations | 4.56 | (1.47 | ) | 0.10 | 1.05 | 3.51 | 1.97 | |||||||||||||||||
|
|
|
|
|
|
|
|
|
|
|
| |||||||||||||
Distributions(b) | ||||||||||||||||||||||||
From net investment income | (0.79 | ) | (0.90 | ) | (0.89 | ) | (0.80 | ) | — | — | ||||||||||||||
From net realized gain | — | — | (1.05 | ) | (0.19 | ) | (15.53 | ) | (2.92 | ) | ||||||||||||||
|
|
|
|
|
|
|
|
|
|
|
| |||||||||||||
Total distributions | (0.79 | ) | (0.90 | ) | (1.94 | ) | (0.99 | ) | (15.53 | ) | (2.92 | ) | ||||||||||||
|
|
|
|
|
|
|
|
|
|
|
| |||||||||||||
Net asset value, end of period | $ | 15.75 | $ | 11.98 | $ | 14.35 | $ | 16.19 | $ | 16.13 | $ | 28.15 | ||||||||||||
|
|
|
|
|
|
|
|
|
|
|
| |||||||||||||
Total Return(c) | ||||||||||||||||||||||||
Based on net asset value | 39.41 | % | (10.52 | )%(d) | 1.30 | % | 6.75 | % | 14.23 | % | 7.38 | % | ||||||||||||
|
|
|
|
|
|
|
|
|
|
|
| |||||||||||||
Ratios to Average Net Assets | ||||||||||||||||||||||||
Total expenses | 2.18 | % | 2.16 | %(e) | 2.12 | % | 2.10 | % | 2.18 | % | 2.20 | %(f)(g) | ||||||||||||
|
|
|
|
|
|
|
|
|
|
|
| |||||||||||||
Total expenses after fees waived and/or reimbursed | 1.85 | % | 1.85 | %(e) | 1.85 | % | 1.85 | % | 2.00 | % | 2.05 | %(f) | ||||||||||||
|
|
|
|
|
|
|
|
|
|
|
| |||||||||||||
Net investment income (loss) | 5.85 | % | 4.57 | %(e) | 3.84 | % | 3.82 | % | (0.48 | )% | (0.47 | )%(f) | ||||||||||||
|
|
|
|
|
|
|
|
|
|
|
| |||||||||||||
Supplemental Data | ||||||||||||||||||||||||
Net assets, end of period (000) | $ | 22,379 | $ | 24,163 | $ | 36,132 | $ | 93,399 | $ | 123,321 | $ | 173,249 | ||||||||||||
|
|
|
|
|
|
|
|
|
|
|
| |||||||||||||
Portfolio turnover rate | 146 | % | 76 | % | 79 | % | 75 | % | 154 | % | 72 | % | ||||||||||||
|
|
|
|
|
|
|
|
|
|
|
| |||||||||||||
| (a) | Based on average shares outstanding. |
| (b) | Distributions for annual periods determined in accordance with U.S. federal income tax regulations. |
| (c) | Where applicable, excludes the effects of any sales charges and assumes the reinvestment of distributions. |
| (d) | Aggregate total return. |
| (e) | Annualized. |
| (f) | Ratios do not include expenses incurred indirectly as a result of investments in underlying funds of approximately 0.01%. |
| (g) | Includes recoupment of past waived and/or reimbursed fees with no financial impact to the expense ratios. |
See notes to financial statements.
FINANCIAL HIGHLIGHTS | 37 |
Financial Highlights (continued)
(For a share outstanding throughout each period)
BlackRock High Equity Income Fund (continued)
| ||||||||||||||||
Class K
| ||||||||||||||||
Period from | ||||||||||||||||
| Year Ended | 04/21/20 | (a) | ||||||||||||||
| 05/31/21 | to 05/31/20 | |||||||||||||||
Net asset value, beginning of period | $ | 22.81 | $ | 21.04 | ||||||||||||
|
|
|
| |||||||||||||
Net investment income(b) | 1.78 | 0.20 | ||||||||||||||
Net realized and unrealized gain | 7.19 | 1.77 | ||||||||||||||
|
|
|
| |||||||||||||
Net increase from investment operations | 8.97 | 1.97 | ||||||||||||||
|
|
|
| |||||||||||||
Distributions from net investment income(c) | (1.78 | ) | (0.20 | ) | ||||||||||||
|
|
|
| |||||||||||||
Net asset value, end of period | $ | 30.00 | $ | 22.81 | ||||||||||||
|
|
|
| |||||||||||||
Total Return(d) | ||||||||||||||||
Based on net asset value | 40.93 | % | 9.35 | %(e) | ||||||||||||
|
|
|
| |||||||||||||
Ratios to Average Net Assets | ||||||||||||||||
Total expenses | 1.01 | % | 0.99 | %(f) | ||||||||||||
|
|
|
| |||||||||||||
Total expenses after fees waived and/or reimbursed | 0.80 | % | 0.80 | %(f) | ||||||||||||
|
|
|
| |||||||||||||
Net investment income | 6.94 | % | 8.28 | %(f) | ||||||||||||
|
|
|
| |||||||||||||
Supplemental Data | ||||||||||||||||
Net assets, end of period (000) | $ | 359 | $ | 288 | ||||||||||||
|
|
|
| |||||||||||||
Portfolio turnover rate | 146 | % | 76 | %(g) | ||||||||||||
|
|
|
| |||||||||||||
| (a) | Commencement of operations. |
| (b) | Based on average shares outstanding. |
| (c) | Distributions for annual periods determined in accordance with U.S. federal income tax regulations. |
| (d) | Where applicable, assumes the reinvestment of distributions. |
| (e) | Aggregate total return. |
| (f) | Annualized. |
| (g) | Portfolio turnover is representative of the Fund for the entire year. |
See notes to financial statements.
| 38 | 2 0 2 1 BLACK ROCK ANNUAL REPORT TO SHAREHOLDERS |
Financial Highlights
(For a share outstanding throughout each period)
BlackRock International Dividend Fund
| ||||||||||||||||||||||||
Institutional
| ||||||||||||||||||||||||
Year Ended 05/31/21 | Period from 10/01/19 to 05/31/20 | Year Ended September 30,
| ||||||||||||||||||||||
2019 |
2018 |
2017 |
2016 | |||||||||||||||||||||
Net asset value, beginning of period | $ | 28.23 | $ | 28.67 | $ | 29.16 | $ | 31.36 | $ | 33.58 | $ | 31.10 | ||||||||||||
|
|
|
|
|
|
|
|
|
|
|
| |||||||||||||
Net investment income(a) | 0.85 | 0.42 | 0.70 | 0.76 | 0.49 | 0.36 | ||||||||||||||||||
Net realized and unrealized gain (loss) | 7.81 | (0.40 | ) | 0.32 | (1.57 | ) | 2.85 | 2.18 | ||||||||||||||||
|
|
|
|
|
|
|
|
|
|
|
| |||||||||||||
Net increase (decrease) from investment operations | 8.66 | 0.02 | 1.02 | (0.81 | ) | 3.34 | 2.54 | |||||||||||||||||
|
|
|
|
|
|
|
|
|
|
|
| |||||||||||||
Distributions(b) | ||||||||||||||||||||||||
From net investment income | (0.53 | ) | (0.39 | ) | (0.66 | ) | (0.98 | ) | (1.47 | ) | (0.06 | ) | ||||||||||||
From net realized gain | — | (0.07 | ) | (0.85 | ) | (0.41 | ) | (4.09 | ) | — | ||||||||||||||
|
|
|
|
|
|
|
|
|
|
|
| |||||||||||||
Total distributions | (0.53 | ) | (0.46 | ) | (1.51 | ) | (1.39 | ) | (5.56 | ) | (0.06 | ) | ||||||||||||
|
|
|
|
|
|
|
|
|
|
|
| |||||||||||||
Net asset value, end of period | $ | 36.36 | $ | 28.23 | $ | 28.67 | $ | 29.16 | $ | 31.36 | $ | 33.58 | ||||||||||||
|
|
|
|
|
|
|
|
|
|
|
| |||||||||||||
Total Return(c) | ||||||||||||||||||||||||
Based on net asset value | 30.98 | % | 0.08 | %(d) | 3.86 | % | (2.67 | )%(e) | 10.61 | % | 8.20 | % | ||||||||||||
|
|
|
|
|
|
|
|
|
|
|
| |||||||||||||
Ratios to Average Net Assets | ||||||||||||||||||||||||
Total expenses | 1.13 | % | 1.17 | %(f)(g) | 1.15 | % | 1.14 | % | 1.23 | %(h) | 1.26 | %(h)(i) | ||||||||||||
|
|
|
|
|
|
|
|
|
|
|
| |||||||||||||
Total expenses after fees waived and/or reimbursed | 0.84 | % | 0.84 | %(f)(g) | 0.84 | % | 0.84 | % | 1.01 | % | 1.06 | %(i) | ||||||||||||
|
|
|
|
|
|
|
|
|
|
|
| |||||||||||||
Net investment income | 2.63 | % | 2.23 | %(f) | 2.52 | % | 2.50 | % | 1.51 | % | 1.15 | %(i) | ||||||||||||
|
|
|
|
|
|
|
|
|
|
|
| |||||||||||||
Supplemental Data | ||||||||||||||||||||||||
Net assets, end of period (000) | $ | 101,899 | $ | 74,681 | $ | 83,814 | $ | 102,541 | $ | 198,206 | $ | 353,512 | ||||||||||||
|
|
|
|
|
|
|
|
|
|
|
| |||||||||||||
Portfolio turnover rate. | 83 | % | 29 | % | 22 | % | 25 | % | 130 | % | 47 | % | ||||||||||||
|
|
|
|
|
|
|
|
|
|
|
| |||||||||||||
| (a) | Based on average shares outstanding. |
| (b) | Distributions for annual periods determined in accordance with U.S. federal income tax regulations. |
| (c) | Where applicable, assumes the reinvestment of distributions. |
| (d) | Aggregate total return. |
| (e) | Includes the litigation settlement amount. Excluding this amount, the Fund’s total return is (2.81)%. |
| (f) | Annualized. |
| (g) | Audit and Printing costs were not annualized in the calculation of the expense ratios. If these expenses were annualized, the total expenses and total expenses after fees waived and/or reimbursed would have been 1.19% and 0.84%, respectively. |
| (h) | Includes recoupment of past waived and/or reimbursed fees with no financial impact to the expense ratios. |
| (i) | Ratios do not include expenses incurred indirectly as a result of investments in underlying funds of approximately 0.01%. |
See notes to financial statements.
FINANCIAL HIGHLIGHTS | 39 |
Financial Highlights (continued)
(For a share outstanding throughout each period)
BlackRock International Dividend Fund (continued)
| ||||||||||||||||||||||||||||||||
Service
| ||||||||||||||||||||||||||||||||
Year Ended 05/31/21 | Period from 10/01/19 to 05/31/20 | Year Ended September 30,
| ||||||||||||||||||||||||||||||
2019 |
2018 |
2017 |
2016 | |||||||||||||||||||||||||||||
Net asset value, beginning of period | $ | 26.70 | $ | 27.14 | $ | 27.68 | $ | 29.76 | $ | 32.05 | $ | 29.72 | ||||||||||||||||||||
|
|
|
|
|
|
|
|
|
|
|
| |||||||||||||||||||||
Net investment income(a) | 0.69 | 0.36 | 0.59 | 0.65 | 0.35 | 0.23 | ||||||||||||||||||||||||||
Net realized and unrealized gain (loss) | 7.41 | (0.39 | ) | 0.31 | (1.49 | ) | 2.75 | 2.10 | ||||||||||||||||||||||||
|
|
|
|
|
|
|
|
|
|
|
| |||||||||||||||||||||
Net increase (decrease) from investment operations | 8.10 | (0.03 | ) | 0.90 | (0.84 | ) | 3.10 | 2.33 | ||||||||||||||||||||||||
|
|
|
|
|
|
|
|
|
|
|
| |||||||||||||||||||||
Distributions(b) | ||||||||||||||||||||||||||||||||
From net investment income | (0.45 | ) | (0.34 | ) | (0.59 | ) | (0.83 | ) | (1.30 | ) | — | |||||||||||||||||||||
From net realized gain | — | (0.07 | ) | (0.85 | ) | (0.41 | ) | (4.09 | ) | — | ||||||||||||||||||||||
|
|
|
|
|
|
|
|
|
|
|
| |||||||||||||||||||||
Total distributions | (0.45 | ) | (0.41 | ) | (1.44 | ) | (1.24 | ) | (5.39 | ) | — | |||||||||||||||||||||
|
|
|
|
|
|
|
|
|
|
|
| |||||||||||||||||||||
Net asset value, end of period | $ | 34.35 | $ | 26.70 | $ | 27.14 | $ | 27.68 | $ | 29.76 | $ | 32.05 | ||||||||||||||||||||
|
|
|
|
|
|
|
|
|
|
|
| |||||||||||||||||||||
Total Return(c) | ||||||||||||||||||||||||||||||||
Based on net asset value | 30.64 | % | (0.10 | )%(d) | 3.62 | % | (2.90 | )%(e) | 10.29 | % | 7.84 | % | ||||||||||||||||||||
|
|
|
|
|
|
|
|
|
|
|
| |||||||||||||||||||||
Ratios to Average Net Assets | ||||||||||||||||||||||||||||||||
Total expenses(f) | 1.38 | % | 1.41 | %(g)(h) | 1.33 | % | 1.37 | % | 1.48 | % | 1.54 | %(i) | ||||||||||||||||||||
|
|
|
|
|
|
|
|
|
|
|
| |||||||||||||||||||||
Total expenses after fees waived and/or reimbursed | 1.09 | % | 1.09 | %(g)(h) | 1.09 | % | 1.09 | % | 1.32 | % | 1.38 | %(i) | ||||||||||||||||||||
|
|
|
|
|
|
|
|
|
|
|
| |||||||||||||||||||||
Net investment income | 2.26 | % | 2.01 | %(g) | 2.25 | % | 2.27 | % | 1.13 | % | 0.76 | %(i) | ||||||||||||||||||||
|
|
|
|
|
|
|
|
|
|
|
| |||||||||||||||||||||
Supplemental Data | ||||||||||||||||||||||||||||||||
Net assets, end of period (000) | $ | 3,782 | $ | 3,239 | $ | 3,196 | $ | 4,434 | $ | 7,142 | $ | 12,706 | ||||||||||||||||||||
|
|
|
|
|
|
|
|
|
|
|
| |||||||||||||||||||||
Portfolio turnover rate | 83 | % | 29 | % | 22 | % | 25 | % | 130 | % | 47 | % | ||||||||||||||||||||
|
|
|
|
|
|
|
|
|
|
|
| |||||||||||||||||||||
| (a) | Based on average shares outstanding. |
| (b) | Distributions for annual periods determined in accordance with U.S. federal income tax regulations. |
| (c) | Where applicable, assumes the reinvestment of distributions. |
| (d) | Aggregate total return. |
| (e) | Includes the litigation settlement amount. Excluding this amount, the Fund’s total return is (3.04)%. |
| (f) | Includes recoupment of past waived and/or reimbursed fees. Excluding the recoupment of past waived and/or reimbursed fees, the ratios were as follows: |
Year Ended 05/31/21 | Period from 10/01/19 to 5/31/20 | Year Ended September 30,
| ||||||||||||||||||||||
2019 |
2018 |
2017 |
2016 | |||||||||||||||||||||
Expense ratios | N/A | 1.41 | % | N/A | N/A | N/A | 1.53 | % | ||||||||||||||||
| (g) | Annualized. |
| (h) | Audit and Printing costs were not annualized in the calculation of the expense ratios. If these expenses were annualized, the total expenses and total expenses after fees waived and/or reimbursed would have been 1.43% and 1.09%, respectively. |
| (i) | Ratios do not include expenses incurred indirectly as a result of investments in underlying funds of approximately 0.01%. |
See notes to financial statements.
| 40 | 2 0 2 1 BLACK ROCK ANNUAL REPORT TO SHAREHOLDERS |
Financial Highlights (continued)
(For a share outstanding throughout each period)
| BlackRock International Dividend Fund (continued) | ||||||||||||||||||||||||||||||||||||
| Investor A | ||||||||||||||||||||||||||||||||||||
| Period from | ||||||||||||||||||||||||||||||||||||
| Year Ended | 10/01/19 | Year Ended September 30, | ||||||||||||||||||||||||||||||||||
| 05/31/21 | to 05/31/20 | 2019 | 2018 | 2017 | 2016 | |||||||||||||||||||||||||||||||
Net asset value, beginning of period | $ | 26.26 | $ | 26.69 | $ | 27.26 | $ | 29.30 | $ | 31.68 | $ | 29.38 | ||||||||||||||||||||||||
|
|
|
|
|
|
|
|
|
|
|
| |||||||||||||||||||||||||
Net investment income(a) | 0.70 | 0.34 | 0.60 | 0.61 | 0.37 | 0.24 | ||||||||||||||||||||||||||||||
Net realized and unrealized gain (loss) | 7.28 | (0.37 | ) | 0.27 | (1.43 | ) | 2.69 | 2.06 | ||||||||||||||||||||||||||||
|
|
|
|
|
|
|
|
|
|
|
| |||||||||||||||||||||||||
Net increase (decrease) from investment operations | 7.98 | (0.03 | ) | 0.87 | (0.82 | ) | 3.06 | 2.30 | ||||||||||||||||||||||||||||
|
|
|
|
|
|
|
|
|
|
|
| |||||||||||||||||||||||||
Distributions(b) | ||||||||||||||||||||||||||||||||||||
From net investment income | (0.46 | ) | (0.33 | ) | (0.59 | ) | (0.81 | ) | (1.35 | ) | — | |||||||||||||||||||||||||
From net realized gain | — | (0.07 | ) | (0.85 | ) | (0.41 | ) | (4.09 | ) | — | ||||||||||||||||||||||||||
|
|
|
|
|
|
|
|
|
|
|
| |||||||||||||||||||||||||
Total distributions | (0.46 | ) | (0.40 | ) | (1.44 | ) | (1.22 | ) | (5.44 | ) | — | |||||||||||||||||||||||||
|
|
|
|
|
|
|
|
|
|
|
| |||||||||||||||||||||||||
Net asset value, end of period | $ | 33.78 | $ | 26.26 | $ | 26.69 | $ | 27.26 | $ | 29.30 | $ | 31.68 | ||||||||||||||||||||||||
|
|
|
|
|
|
|
|
|
|
|
| |||||||||||||||||||||||||
Total Return(c) | ||||||||||||||||||||||||||||||||||||
Based on net asset value | 30.67 | % | (0.08 | )%(d) | 3.57 | % | (2.89 | )%(e) | 10.27 | % | 7.83 | % | ||||||||||||||||||||||||
|
|
|
|
|
|
|
|
|
|
|
| |||||||||||||||||||||||||
Ratios to Average Net Assets | ||||||||||||||||||||||||||||||||||||
Total expenses | 1.45 | % | 1.48 | %(f)(g) | 1.43 | % | 1.44 | % | 1.54 | %(h) | 1.57 | %(h)(i) | ||||||||||||||||||||||||
|
|
|
|
|
|
|
|
|
|
|
| |||||||||||||||||||||||||
Total expenses after fees waived and/or reimbursed | 1.09 | % | 1.09 | %(f)(g) | 1.09 | % | 1.09 | % | 1.30 | % | 1.39 | %(i) | ||||||||||||||||||||||||
|
|
|
|
|
|
|
|
|
|
|
| |||||||||||||||||||||||||
Net investment income | 2.34 | % | 1.92 | %(f) | 2.30 | % | 2.14 | % | 1.20 | % | 0.81 | %(i) | ||||||||||||||||||||||||
|
|
|
|
|
|
|
|
|
|
|
| |||||||||||||||||||||||||
Supplemental Data | ||||||||||||||||||||||||||||||||||||
Net assets, end of period (000) | $ | 128,077 | $ | 100,753 | $ | 125,196 | $ | 140,473 | $ | 325,103 | $ | 350,855 | ||||||||||||||||||||||||
|
|
|
|
|
|
|
|
|
|
|
| |||||||||||||||||||||||||
Portfolio turnover rate | 83 | % | 29 | % | 22 | % | 25 | % | 130 | % | 47 | % | ||||||||||||||||||||||||
|
|
|
|
|
|
|
|
|
|
|
| |||||||||||||||||||||||||
| (a) | Based on average shares outstanding. |
| (b) | Distributions for annual periods determined in accordance with U.S. federal income tax regulations. |
| (c) | Where applicable, excludes the effects of any sales charges and assumes the reinvestment of distributions. |
| (d) | Aggregate total return. |
| (e) | Includes the litigation settlement amount. Excluding this amount, the Fund’s total return is (3.03)%. |
| (f) | Annualized. |
| (g) | Audit and Printing costs were not annualized in the calculation of the expense ratios. If these expenses were annualized, the total expenses and total expenses after fees waived and/or reimbursed would have been 1.51% and 1.09%, respectively. |
| (h) | Includes recoupment of past waived and/or reimbursed fees with no financial impact to the expense ratios. |
| (i) | Ratios do not include expenses incurred indirectly as a result of investments in underlying funds of approximately 0.01%. |
See notes to financial statements.
FINANCIAL HIGHLIGHTS | 41 |
Financial Highlights (continued)
(For a share outstanding throughout each period)
| BlackRock International Dividend Fund (continued) | ||||||||||||||||||||||||||||||||||||
| Investor C | ||||||||||||||||||||||||||||||||||||
| Period from | ||||||||||||||||||||||||||||||||||||
| Year Ended | 10/01/19 | Year Ended September 30, | ||||||||||||||||||||||||||||||||||
| 05/31/21 | to 05/31/20 | 2019 | 2018 | 2017 | 2016 | |||||||||||||||||||||||||||||||
Net asset value, beginning of period | $ | 22.85 | $ | 23.25 | $ | 23.94 | $ | 25.81 | $ | 28.39 | $ | 26.52 | ||||||||||||||||||||||||
|
|
|
|
|
|
|
|
|
|
|
| |||||||||||||||||||||||||
Net investment income(a) | 0.33 | 0.18 | 0.32 | 0.39 | 0.12 | 0.02 | ||||||||||||||||||||||||||||||
Net realized and unrealized gain (loss) | 6.41 | (0.32 | ) | 0.26 | (1.30 | ) | 2.42 | 1.85 | ||||||||||||||||||||||||||||
|
|
|
|
|
|
|
|
|
|
|
| |||||||||||||||||||||||||
Net increase (decrease) from investment operations | 6.74 | (0.14 | ) | 0.58 | (0.91 | ) | 2.54 | 1.87 | ||||||||||||||||||||||||||||
|
|
|
|
|
|
|
|
|
|
|
| |||||||||||||||||||||||||
Distributions(b) | ||||||||||||||||||||||||||||||||||||
From net investment income | (0.26 | ) | (0.19 | ) | (0.42 | ) | (0.55 | ) | (1.03 | ) | — | |||||||||||||||||||||||||
From net realized gain | — | (0.07 | ) | (0.85 | ) | (0.41 | ) | (4.09 | ) | — | ||||||||||||||||||||||||||
|
|
|
|
|
|
|
|
|
|
|
| |||||||||||||||||||||||||
Total distributions | (0.26 | ) | (0.26 | ) | (1.27 | ) | (0.96 | ) | (5.12 | ) | — | |||||||||||||||||||||||||
|
|
|
|
|
|
|
|
|
|
|
| |||||||||||||||||||||||||
Net asset value, end of period | $ | 29.33 | $ | 22.85 | $ | 23.25 | $ | 23.94 | $ | 25.81 | $ | 28.39 | ||||||||||||||||||||||||
|
|
|
|
|
|
|
|
|
|
|
| |||||||||||||||||||||||||
Total Return(c) | ||||||||||||||||||||||||||||||||||||
Based on net asset value | 29.70 | % | (0.58 | )%(d) | 2.80 | % | (3.63 | )%(e) | 9.46 | % | 7.05 | % | ||||||||||||||||||||||||
|
|
|
|
|
|
|
|
|
|
|
| |||||||||||||||||||||||||
Ratios to Average Net Assets | ||||||||||||||||||||||||||||||||||||
Total expenses | 2.28 | % | 2.27 | %(f)(g) | 2.20 | % | 2.19 | % | 2.30 | %(h) | 2.35 | %(h)(i) | ||||||||||||||||||||||||
|
|
|
|
|
|
|
|
|
|
|
| |||||||||||||||||||||||||
Total expenses after fees waived and/or reimbursed | 1.84 | % | 1.84 | %(f)(g) | 1.84 | % | 1.84 | % | 2.05 | % | 2.13 | %(i) | ||||||||||||||||||||||||
|
|
|
|
|
|
|
|
|
|
|
| |||||||||||||||||||||||||
Net investment income | 1.31 | % | 1.15 | %(f) | 1.39 | % | 1.57 | % | 0.44 | % | 0.07 | %(i) | ||||||||||||||||||||||||
|
|
|
|
|
|
|
|
|
|
|
| |||||||||||||||||||||||||
Supplemental Data | ||||||||||||||||||||||||||||||||||||
Net assets, end of period (000) | $ | 5,607 | $ | 9,906 | $ | 14,805 | $ | 36,239 | $ | 53,884 | $ | 76,630 | ||||||||||||||||||||||||
|
|
|
|
|
|
|
|
|
|
|
| |||||||||||||||||||||||||
Portfolio turnover rate | 83 | % | 29 | % | 22 | % | 25 | % | 130 | % | 47 | % | ||||||||||||||||||||||||
|
|
|
|
|
|
|
|
|
|
|
| |||||||||||||||||||||||||
| (a) | Based on average shares outstanding. |
| (b) | Distributions for annual periods determined in accordance with U.S. federal income tax regulations. |
| (c) | Where applicable, excludes the effects of any sales charges and assumes the reinvestment of distributions. |
| (d) | Aggregate total return. |
| (e) | Includes the litigation settlement amount. Excluding this amount, the Fund’s total return is (3.79)%. |
| (f) | Annualized. |
| (g) | Audit and Printing costs were not annualized in the calculation of the expense ratios. If these expenses were annualized, the total expenses and total expenses after fees waived and/or reimbursed would have been 2.29% and 1.84%, respectively. |
| (h) | Includes recoupment of past waived and/or reimbursed fees with no financial impact to the expense ratios. |
| (i) | Ratios do not include expenses incurred indirectly as a result of investments in underlying funds of approximately 0.01%. |
See notes to financial statements.
| 42 | 2 0 2 1 BLACK ROCK ANNUAL REPORT TO SHAREHOLDERS |
Financial Highlights (continued)
(For a share outstanding throughout each period)
| BlackRock International Dividend Fund (continued) | ||||||||||||||||||||||||||||||||
| Class K | ||||||||||||||||||||||||||||||||
|
|
| Period from |
| Period from | ||||||||||||||||||||||||||||
| Year Ended |
|
|
| 10/01/19 | Year Ended | 01/25/18 | (a) | |||||||||||||||||||||||||
| 05/31/21 | to 05/31/20 | 09/30/19 | to 09/30/18 | |||||||||||||||||||||||||||||
Net asset value, beginning of period | $ | 28.23 | $ | 28.68 | $ | 29.17 | $ | 32.08 | ||||||||||||||||||||||||
|
|
|
|
|
|
|
| |||||||||||||||||||||||||
Net investment income(b) | 0.87 | 0.44 | 0.73 | 0.56 | ||||||||||||||||||||||||||||
Net realized and unrealized gain (loss) | 7.80 | (0.42 | ) | 0.30 | (2.91 | ) | ||||||||||||||||||||||||||
|
|
|
|
|
|
|
| |||||||||||||||||||||||||
Net increase (decrease) from investment operations | 8.67 | 0.02 | 1.03 | (2.35 | ) | |||||||||||||||||||||||||||
|
|
|
|
|
|
|
| |||||||||||||||||||||||||
Distributions(c) | ||||||||||||||||||||||||||||||||
From net investment income | (0.54 | ) | (0.40 | ) | (0.67 | ) | (0.56 | ) | ||||||||||||||||||||||||
From net realized gain | — | (0.07 | ) | (0.85 | ) | — | ||||||||||||||||||||||||||
|
|
|
|
|
|
|
| |||||||||||||||||||||||||
Total distributions | (0.54 | ) | (0.47 | ) | (1.52 | ) | (0.56 | ) | ||||||||||||||||||||||||
|
|
|
|
|
|
|
| |||||||||||||||||||||||||
Net asset value, end of period | $ | 36.36 | $ | 28.23 | $ | 28.68 | $ | 29.17 | ||||||||||||||||||||||||
|
|
|
|
|
|
|
| |||||||||||||||||||||||||
Total Return(d) | ||||||||||||||||||||||||||||||||
Based on net asset value | 31.04 | % | 0.09 | %(e) | 3.92 | % | (7.33 | )%(e)(f) | ||||||||||||||||||||||||
|
|
|
|
|
|
|
| |||||||||||||||||||||||||
Ratios to Average Net Assets | ||||||||||||||||||||||||||||||||
Total expenses | 1.03 | % | 1.08 | %(g)(h) | 1.04 | % | 1.02 | %(g)(i) | ||||||||||||||||||||||||
|
|
|
|
|
|
|
| |||||||||||||||||||||||||
Total expenses after fees waived and/or reimbursed | 0.79 | % | 0.79 | %(g)(h) | 0.79 | % | 0.79 | %(g) | ||||||||||||||||||||||||
|
|
|
|
|
|
|
| |||||||||||||||||||||||||
Net investment income | 2.68 | % | 2.28 | %(g) | 2.63 | % | 2.81 | %(g) | ||||||||||||||||||||||||
|
|
|
|
|
|
|
| |||||||||||||||||||||||||
Supplemental Data | ||||||||||||||||||||||||||||||||
Net assets, end of period (000) | $ | 5,936 | $ | 3,266 | $ | 3,847 | $ | 3,659 | ||||||||||||||||||||||||
|
|
|
|
|
|
|
| |||||||||||||||||||||||||
Portfolio turnover rate | 83 | % | 29 | % | 22 | % | 25 | %(j) | ||||||||||||||||||||||||
|
|
|
|
|
|
|
| |||||||||||||||||||||||||
| (a) | Commencement of operations. |
| (b) | Based on average shares outstanding. |
| (c) | Distributions for annual periods determined in accordance with U.S. federal income tax regulations. |
| (d) | Where applicable, assumes the reinvestment of distributions. |
| (e) | Aggregate total return. |
| (f) | Includes the litigation settlement amount. Excluding this amount, the Fund’s total return is (7.45)%. |
| (g) | Annualized. |
| (h) | Audit and Printing costs were not annualized in the calculation of the expense ratios. If these expenses were annualized, the total expenses and total expenses after fees waived and/or reimbursed would have been 1.10% and 0.79%, respectively. |
| (i) | Offering and board realignment consolidation costs were not annualized in the calculation of the expense ratio. If these expenses were annualized, the total expense ratio would have been 1.03%. |
| (j) | Portfolio turnover is representative of the Fund for the entire year. |
See notes to financial statements.
FINANCIAL HIGHLIGHTS | 43 |
| 1. | ORGANIZATION |
BlackRock FundsSM (the “Trust”) is registered under the Investment Company Act of 1940, as amended (the “1940 Act”), as an open-end management investment company. The Trust is organized as a Massachusetts business trust. The following, each of which is a series of the Trust, are referred to herein collectively as the “Funds” or individually as a “Fund”:
| ||||||||
| Fund Name | Herein Referred To As | Diversification Classification | ||||||
| ||||||||
BlackRock Energy Opportunities Fund | Energy Opportunities | Non-Diversified | ||||||
BlackRock High Equity Income Fund | High Equity Income | Diversified | ||||||
BlackRock International Dividend Fund | International Dividend | Diversified | ||||||
| ||||||||
Each Fund offers multiple classes of shares. All classes of shares have identical voting, dividend, liquidation and other rights and are subject to the same terms and conditions, except that certain classes bear expenses related to the shareholder servicing and distribution of such shares. Institutional and Class K Shares are sold only to certain eligible investors. Service, Investor A and Investor C Shares bear certain expenses related to shareholder servicing of such shares, and Investor C Shares also bear certain expenses related to the distribution of such shares. Investor A and Investor C Shares are generally available through financial intermediaries. Each class has exclusive voting rights with respect to matters relating to its shareholder servicing and distribution expenditures (except that Investor C shareholders may vote on material changes to the Investor A Shares distribution and service plan).
| ||||||||||||
| Share Class | Initial Sales Charge | CDSC | Conversion Privilege | |||||||||
| ||||||||||||
Institutional, Service and Class K Shares | No | No | None | |||||||||
Investor A Shares | Yes | No | (a) | None | ||||||||
Investor C Shares | No | Yes | (b) | To Investor A Shares after approximately 8 years | ||||||||
| ||||||||||||
| (a) | Investor A Shares may be subject to a contingent deferred sales charge (“CDSC”) for certain redemptions where no initial sales charge was paid at the time of purchase. |
| (b) | A CDSC of 1.00% is assessed on certain redemptions of Investor C Shares made within one year after purchase. |
Effective on or about the close of business on July 6, 2021, Energy Opportunities and International Dividend’s Service Shares will be converted into Investor A Shares. Effective on or about the close of business on August 18, 2021, High Equity Income Service Shares will be converted into Investor A Shares.
The Funds, together with certain other registered investment companies advised by BlackRock Advisors, LLC (the “Manager”) or its affiliates, are included in a complex of equity, multi-asset, index and money market funds referred to as the BlackRock Multi-Asset Complex.
Prior Year Reorganization: The Board of Trustees (the “Board”) of Energy Opportunities (the “Acquiring Fund”) approved the reorganization of BlackRock Energy & Resources Portfolio (the “Target Fund” ) into the Acquiring Fund. As a result, the Acquiring Fund acquired substantially all of the assets and assumed certain liabilities of the Target Fund in exchange for an equal aggregate value of newly-issued shares of the Acquiring Fund.
Each shareholder of the Target Fund received shares of the Acquiring Fund in an amount equal to the aggregate net asset value (“NAV”) of such shareholder’s Target Fund shares, as determined at the close of business on January 10, 2020, less the costs of the Target Fund’s reorganization.
The reorganization was accomplished by a tax-free exchange of shares of the Acquiring Fund in the following amounts and at the following conversion ratios:
| ||||||||||||||||
| Target Fund’s Share Class | Shares Prior to Reorganization | Conversion Ratio | Acquiring Fund’s Share Class | Shares of Acquiring Fund | ||||||||||||
| ||||||||||||||||
Institutional | 666,762 | 1.64341300 | Institutional | 1,095,766 | ||||||||||||
Investor A | 4,649,385 | 1.44165000 | Investor A | 6,702,786 | ||||||||||||
Investor C | 861,498 | 1.03784900 | Investor C | 894,104 | ||||||||||||
| ||||||||||||||||
The Target Fund’s net assets and composition of net assets on January 10, 2020, the valuation date of the reorganization, were as follows:
| ||||
| Target Fund | ||||
| ||||
Net assets | $ 84,426,614 | |||
|
| |||
Paid-in capital | $ 344,108,684 | |||
Accumulated loss | (259,682,070 | ) | ||
| ||||
For financial reporting purposes, assets received and shares issued by the Acquiring Fund were recorded at fair value. However, the cost basis of the investments received from the Target Fund was carried forward to align ongoing reporting of the Acquiring Fund’s realized and unrealized gains and losses with amounts distributable to shareholders for tax purposes.
The net assets of the Acquiring Fund before the reorganization were $72,886,652. The aggregate net assets of the Acquiring Fund immediately after the reorganization amounted to $157,313,266. The Target Fund’s fair value and cost of financial instruments prior to the reorganization were as follows:
| ||||||||
| Target Fund | Fair Value of Investments | Cost of Investments | ||||||
| ||||||||
BlackRock Energy & Resources Portfolio | $ | 84,656,807 | $ | 81,991,609 | ||||
| ||||||||
| 44 | 2 0 2 1 BLACK ROCK ANNUAL REPORT TO SHAREHOLDERS |
Notes to Financial Statements (continued)
The purpose of this transaction was to combine the two funds managed by the Manager with substantially similar (but not identical) investment objectives, investment policies, strategies, risks and restrictions. The reorganization was a tax-free event and was effective on January 13, 2020.
Assuming the reorganization had been completed on October 1, 2019, the beginning of the fiscal reporting period of the Acquiring Fund, the pro forma results of operations for the period ended May 31, 2020, are as follows:
• Net investment income: $2,510,797
• Net realized and change in unrealized loss on investments: $(41,741,062)
• Net decrease in net assets resulting from operations: $(39,230,265)
Because the combined investment portfolios have been managed as a single integrated portfolio since the reorganization was completed, it is not practicable to separate the amounts of revenue and earnings of the Target Fund that have been included in the Acquiring Fund’s Statements of Operations since January 13, 2020.
Reorganization costs incurred by the Acquiring Fund in connection with the reorganization were expensed by the Acquiring Fund.
| 2. | SIGNIFICANT ACCOUNTING POLICIES |
The financial statements are prepared in conformity with accounting principles generally accepted in the United States of America (“U.S. GAAP”), which may require management to make estimates and assumptions that affect the reported amounts of assets and liabilities in the financial statements, disclosure of contingent assets and liabilities at the date of the financial statements and the reported amounts of increases and decreases in net assets from operations during the reporting period. Actual results could differ from those estimates. Each Fund is considered an investment company under U.S. GAAP and follows the accounting and reporting guidance applicable to investment companies. Below is a summary of significant accounting policies:
Investment Transactions and Income Recognition: For financial reporting purposes, investment transactions are recorded on the dates the transactions are executed. Realized gains and losses on investment transactions are determined using the specific identification method. Dividend income and capital gain distributions, if any, are recorded on the ex-dividend dates. Non-cash dividends, if any, are recorded on the ex-dividend dates at fair value. Dividends from foreign securities where the ex-dividend dates may have passed are subsequently recorded when the Funds are informed of the ex-dividend dates. Under the applicable foreign tax laws, a withholding tax at various rates may be imposed on capital gains, dividends and interest. Interest income, including amortization and accretion of premiums and discounts on debt securities, is recognized daily on an accrual basis. Income, expenses and realized and unrealized gains and losses are allocated daily to each class based on its relative net assets.
Foreign Currency Translation: Each Fund’s books and records are maintained in U.S. dollars. Securities and other assets and liabilities denominated in foreign currencies are translated into U.S. dollars using exchange rates determined as of the close of trading on the New York Stock Exchange (“NYSE”). Purchases and sales of investments are recorded at the rates of exchange prevailing on the respective dates of such transactions. Generally, when the U.S. dollar rises in value against a foreign currency, the investments denominated in that currency will lose value; the opposite effect occurs if the U.S. dollar falls in relative value.
Each Fund does not isolate the effect of fluctuations in foreign exchange rates from the effect of fluctuations in the market prices of investments for financial reporting purposes. Accordingly, the effects of changes in exchange rates on investments are not segregated in the Statements of Operations from the effects of changes in market prices of those investments, but are included as a component of net realized and unrealized gain (loss) from investments. Each Fund reports realized currency gains (losses) on foreign currency related transactions as components of net realized gain (loss) for financial reporting purposes, whereas such components are generally treated as ordinary income for U.S. federal income tax purposes.
Foreign Taxes: The Funds may be subject to foreign taxes (a portion of which may be reclaimable) on income, stock dividends, capital gains on investments, or certain foreign currency transactions. All foreign taxes are recorded in accordance with the applicable foreign tax regulations and rates that exist in the foreign jurisdictions in which each Fund invests. These foreign taxes, if any, are paid by each Fund and are reflected in its Statements of Operations as follows: foreign taxes withheld at source are presented as a reduction of income, foreign taxes on securities lending income are presented as a reduction of securities lending income, foreign taxes on stock dividends are presented as “Foreign taxes withheld”, and foreign taxes on capital gains from sales of investments and foreign taxes on foreign currency transactions are included in their respective net realized gain (loss) categories. Foreign taxes payable or deferred as of May 31, 2021, if any, are disclosed in the Statements of Assets and Liabilities.
The Funds file withholding tax reclaims in certain jurisdictions to recover a portion of amounts previously withheld. The Funds may record a reclaim receivable based on collectability, which includes factors such as the jurisdiction’s applicable laws, payment history and market convention. The Statements of Operations includes tax reclaims recorded as well as professional and other fees, if any, associated with recovery of foreign withholding taxes.
Distributions: Distributions paid by the Funds are recorded on the ex-dividend dates. The character and timing of distributions are determined in accordance with U.S. federal income tax regulations, which may differ from U.S. GAAP.
Offering Costs: Offering costs are amortized over a 12-month period beginning with the commencement of operations of a class of shares.
Indemnifications: In the normal course of business, a Fund enters into contracts that contain a variety of representations that provide general indemnification. A Fund’s maximum exposure under these arrangements is unknown because it involves future potential claims against a Fund, which cannot be predicted with any certainty.
Other: Expenses directly related to a Fund or its classes are charged to that Fund or the applicable class. Expenses directly related to the Funds and other shared expenses prorated to the Funds are allocated daily to each class based on their relative net assets or other appropriate methods. Other operating expenses shared by several funds, including other funds managed by the Manager, are prorated among those funds on the basis of relative net assets or other appropriate methods.
NOTES TO FINANCIAL STATEMENTS | 45 |
Notes to Financial Statements (continued)
The Funds have an arrangement with their custodian whereby credits are earned on uninvested cash balances, which could be used to reduce custody fees and/or overdraft charges. The Funds may incur charges on overdrafts, subject to certain conditions.
| 3. | INVESTMENT VALUATION AND FAIR VALUE MEASUREMENTS |
Investment Valuation Policies: Each Fund’s investments are valued at fair value (also referred to as “market value” within the financial statements) each day that the Fund is open for business and, for financial reporting purposes, as of the report date. U.S. GAAP defines fair value as the price a fund would receive to sell an asset or pay to transfer a liability in an orderly transaction between market participants at the measurement date. Each Fund determines the fair values of its financial instruments using various independent dealers or pricing services under policies approved by the Board. If a security’s market price is not readily available or does not otherwise accurately represent the fair value of the security, the security will be valued in accordance with a policy approved by the Board as reflecting fair value. The BlackRock Global Valuation Methodologies Committee (the “Global Valuation Committee”) is the committee formed by management to develop global pricing policies and procedures and to oversee the pricing function for all financial instruments.
Fair Value Inputs and Methodologies: The following methods and inputs are used to establish the fair value of each Fund’s assets and liabilities:
| • | Equity investments traded on a recognized securities exchange are valued at that day’s official closing price, as applicable, on the exchange where the stock is primarily traded. Equity investments traded on a recognized exchange for which there were no sales on that day may be valued at the last available bid (long positions) or ask (short positions) price. |
Generally, trading in foreign instruments is substantially completed each day at various times prior to the close of trading on the NYSE. Occasionally, events affecting the values of such instruments may occur between the foreign market close and the close of trading on the NYSE that may not be reflected in the computation of the Fund’s net assets. Each business day, the Funds use a pricing service to assist with the valuation of certain foreign exchange-traded equity securities and foreign exchange- traded and over-the-counter (“OTC”) options (the “Systematic Fair Value Price”). Using current market factors, the Systematic Fair Value Price is designed to value such foreign securities and foreign options at fair value as of the close of trading on the NYSE, which follows the close of the local markets.
| • | Fixed-income investments for which market quotations are readily available are generally valued using the last available bid price or current market quotations provided by independent dealers or third party pricing services. Pricing services generally value fixed-income securities assuming orderly transactions of an institutional round lot size, but a fund may hold or transact in such securities in smaller, odd lot sizes. Odd lots may trade at lower prices than institutional round lots. The pricing services may use matrix pricing or valuation models that utilize certain inputs and assumptions to derive values, including transaction data (e.g., recent representative bids and offers), market data, credit quality information, perceived market movements, news, and other relevant information. Certain fixed-income securities, including asset-backed and mortgage related securities may be valued based on valuation models that consider the estimated cash flows of each tranche of the entity, establish a benchmark yield and develop an estimated tranche specific spread to the benchmark yield based on the unique attributes of the tranche. The amortized cost method of valuation may be used with respect to debt obligations with sixty days or less remaining to maturity unless the Manager determines such method does not represent fair value. |
| • | Investments in open-end U.S. mutual funds (including money market funds) are valued at that day’s published NAV. |
If events (e.g., a market closure, market volatility, company announcement or a natural disaster) occur that are expected to materially affect the value of such investment, or in the event that application of these methods of valuation results in a price for an investment that is deemed not to be representative of the market value of such investment, or if a price is not available, the investment will be valued by the Global Valuation Committee, or its delegate, in accordance with a policy approved by the Board as reflecting fair value (“Fair Valued Investments”). The fair valuation approaches that may be used by the Global Valuation Committee include market approach, income approach and cost approach. Valuation techniques such as discounted cash flow, use of market comparables and matrix pricing are types of valuation approaches and are typically used in determining fair value. When determining the price for Fair Valued Investments, the Global Valuation Committee, or its delegate, seeks to determine the price that each Fund might reasonably expect to receive or pay from the current sale or purchase of that asset or liability in an arm’s-length transaction. Fair value determinations shall be based upon all available factors that the Global Valuation Committee, or its delegate, deems relevant and consistent with the principles of fair value measurement. The pricing of all Fair Valued Investments is subsequently reported to the Board or a committee thereof on a quarterly basis.
For investments in equity or debt issued by privately held companies or funds (“Private Company” or collectively, the “Private Companies”) and other Fair Valued Investments, the fair valuation approaches that are used by the Global Valuation Committee and third party pricing services utilize one or a combination of, but not limited to, the following inputs.
| Standard Inputs Generally Considered By Third Party Pricing Services | ||
Market approach | (i) recent market transactions, including subsequent rounds of financing, in the underlying investment or comparable issuers; | |
(ii) recapitalizations and other transactions across the capital structure; and | ||
(iii) market multiples of comparable issuers. | ||
Income approach | (i) future cash flows discounted to present and adjusted as appropriate for liquidity, credit, and/or market risks; | |
(ii) quoted prices for similar investments or assets in active markets; and | ||
(iii) other risk factors, such as interest rates, yield curves, volatilities, prepayment speeds, loss severities, credit risks, recovery rates, liquidation amounts and/or default rates. | ||
Cost approach. | (i) audited or unaudited financial statements, investor communications and financial or operational metrics issued by the Private Company; | |
(ii) changes in the valuation of relevant indices or publicly traded companies comparable to the Private Company; | ||
(iii) relevant news and other public sources; and | ||
(iv) known secondary market transactions in the Private Company’s interests and merger or acquisition activity in companies comparable to the Private Company. | ||
| 46 | 2 0 2 1 BLACK ROCK ANNUAL REPORT TO SHAREHOLDERS |
Notes to Financial Statements (continued)
Investments in series of preferred stock issued by Private Companies are typically valued utilizing market approach in determining the enterprise value of the company. Such investments often contain rights and preferences that differ from other series of preferred and common stock of the same issuer. Enterprise valuation techniques such as an option pricing model (“OPM”), a probability weighted expected return model (“PWERM”), current value method or a hybrid of those techniques are used, as deemed appropriate under the circumstances. The use of these valuation techniques involve a determination of the exit scenarios of the investment in order to appropriately allocate the enterprise value of the company among the various parts of its capital structure.
The Private Companies are not subject to the public company disclosure, timing, and reporting standards applicable to other investments held by a Fund. Typically, the most recently available information by a Private Company is as of a date that is earlier than the date a Fund is calculating its NAV. This factor may result in a difference between the value of the investment and the price a Fund could receive upon the sale of the investment.
Fair Value Hierarchy: Various inputs are used in determining the fair value of financial instruments. These inputs to valuation techniques are categorized into a fair value hierarchy consisting of three broad levels for financial reporting purposes as follows:
| • | Level 1 – Unadjusted price quotations in active markets/exchanges for identical assets or liabilities that each Fund has the ability to access; |
| • | Level 2 – Other observable inputs (including, but not limited to, quoted prices for similar assets or liabilities in markets that are active, quoted prices for identical or similar assets or liabilities in markets that are not active, inputs other than quoted prices that are observable for the assets or liabilities (such as interest rates, yield curves, volatilities, prepayment speeds, loss severities, credit risks and default rates) or other market–corroborated inputs); and |
| • | Level 3 – Unobservable inputs based on the best information available in the circumstances, to the extent observable inputs are not available (including the Global Valuation Committee’s assumptions used in determining the fair value of financial instruments). |
The hierarchy gives the highest priority to unadjusted quoted prices in active markets for identical assets or liabilities (Level 1 measurements) and the lowest priority to unobservable inputs (Level 3 measurements). Accordingly, the degree of judgment exercised in determining fair value is greatest for instruments categorized in Level 3. The inputs used to measure fair value may fall into different levels of the fair value hierarchy. In such cases, for disclosure purposes, the fair value hierarchy classification is determined based on the lowest level input that is significant to the fair value measurement in its entirety. Investments classified within Level 3 have significant unobservable inputs used by the Global Valuation Committee in determining the price for Fair Valued Investments. Level 3 investments include equity or debt issued by privately held companies or funds that may not have a secondary market and/or may have a limited number of investors. The categorization of a value determined for financial instruments is based on the pricing transparency of the financial instruments and is not necessarily an indication of the risks associated with investing in those securities.
| 4. | SECURITIES AND OTHER INVESTMENTS |
Equity-Linked Notes: Equity-linked notes seek to generate income and provide exposure to the performance of an underlying security, group of securities or exchange-traded funds (the “underlying reference instrument”). In an equity-linked note, a fund purchases a note from a bank or broker-dealer and in return, the issuer provides for interest payments during the term of the note. At maturity or when the security is sold, a fund will either settle by taking physical delivery of the underlying reference instrument or by receipt of a cash settlement amount equal to the value of the note at termination or maturity. The use of equity-linked notes involves the risk that the value of the note changes unfavorably due to movements in the value of the underlying reference instrument. Equity-linked notes are considered general unsecured contractual obligations of the bank or broker-dealer. A fund must rely on the creditworthiness of the issuer for its investment returns.
Preferred Stocks: Preferred stock has a preference over common stock in liquidation (and generally in receiving dividends as well), but is subordinated to the liabilities of the issuer in all respects. As a general rule, the market value of preferred stock with a fixed dividend rate and no conversion element varies inversely with interest rates and perceived credit risk, while the market price of convertible preferred stock generally also reflects some element of conversion value. Because preferred stock is junior to debt securities and other obligations of the issuer, deterioration in the credit quality of the issuer will cause greater changes in the value of a preferred stock than in a more senior debt security with similar stated yield characteristics. Unlike interest payments on debt securities, preferred stock dividends are payable only if declared by the issuer’s board of directors. Preferred stock also may be subject to optional or mandatory redemption provisions.
Securities Lending: Certain Funds may lend their securities to approved borrowers, such as brokers, dealers and other financial institutions. The borrower pledges and maintains with the Fund collateral consisting of cash, an irrevocable letter of credit issued by a bank, or securities issued or guaranteed by the U.S. Government. The initial collateral received by each Fund is required to have a value of at least 102% of the current value of the loaned securities for securities traded on U.S. exchanges and a value of at least 105% for all other securities. The collateral is maintained thereafter at a value equal to at least 100% of the current market value of the securities on loan. The market value of the loaned securities is determined at the close of each business day of the Fund and any additional required collateral is delivered to the Fund, or excess collateral returned by the Fund, on the next business day. During the term of the loan, the Funds are entitled to all distributions made on or in respect of the loaned securities, but do not receive interest income on securities received as collateral. Loans of securities are terminable at any time and the borrower, after notice, is required to return borrowed securities within the standard time period for settlement of securities transactions.
As of period end, any securities on loan were collateralized by cash and/or U.S. Government obligations. Cash collateral invested by the securities lending agent, BlackRock Investment Management, LLC (“BIM”), if any, is disclosed in the Schedules of Investments. Any non-cash collateral received cannot be sold, re-invested or pledged by the Fund, except in the event of borrower default. The securities on loan, if any, are disclosed in the Funds’ Schedules of Investments. The market value of any securities on loan and the value of any related collateral are shown separately in the Statements of Assets and Liabilities as a component of investments at value – unaffiliated and collateral on securities loaned at value, respectively.
Securities lending transactions are entered into by the Funds under Master Securities Lending Agreements (each, an “MSLA”), which provide the right, in the event of default (including bankruptcy or insolvency), for the non-defaulting party to liquidate the collateral and calculate a net exposure to the defaulting party or request additional collateral. In the event that a borrower defaults, the Funds, as lender, would offset the market value of the collateral received against the market value of the securities loaned. When the value of the collateral is greater than that of the market value of the securities loaned, the lender is left with a net amount payable to the defaulting party. However, bankruptcy
NOTES TO FINANCIAL STATEMENTS | 47 |
Notes to Financial Statements (continued)
or insolvency laws of a particular jurisdiction may impose restrictions on or prohibitions against such a right of offset in the event of an MSLA counterparty’s bankruptcy or insolvency. Under the MSLA, absent an event of default, the borrower can resell or re-pledge the loaned securities, and the Funds can reinvest cash collateral received in connection with loaned securities. Upon an event of default, the parties’ obligations to return the securities or collateral to the other party are extinguished, and the parties can resell or re-pledge the loaned securities or the collateral received in connection with the loaned securities in order to satisfy the defaulting party’s net payment obligation for all transactions under the MSLA. The defaulting party remains liable for any deficiency.
The risks of securities lending include the risk that the borrower may not provide additional collateral when required or may not return the securities when due. To mitigate these risks, the Funds benefit from a borrower default indemnity provided by BIM. BIM’s indemnity allows for full replacement of the securities loaned to the extent the collateral received does not cover the value on the securities loaned in the event of borrower default. Each Fund could incur a loss if the value of an investment purchased with cash collateral falls below the market value of loaned securities or if the value of an investment purchased with cash collateral falls below the value of the original cash collateral received. Such losses are borne entirely by the Funds.
| 5. | INVESTMENT ADVISORY AGREEMENT AND OTHER TRANSACTIONS WITH AFFILIATES |
Investment Advisory: The Trust, on behalf of the Funds, entered into an Investment Advisory Agreement with the Manager, the Funds’ investment adviser and an indirect, wholly-owned subsidiary of BlackRock, Inc. (“BlackRock”), to provide investment advisory services. The Manager is responsible for the management of each Fund’s portfolio and provides the personnel, facilities, equipment and certain other services necessary to the operations of each Fund.
For such services, each Fund pays the Manager a monthly fee at an annual rate equal to the following percentages of the average daily value of each Fund’s net assets:
| Investment Advisory Fees | ||||||
| Average Daily Net Assets | Energy Opportunities | |||||
First $1 billion | 0.750% | |||||
$1 billion - $2 billion | 0.700 | |||||
$2 billion - $3 billion | 0.675 | |||||
Greater than $3 billion | 0.650 | |||||
| Investment Advisory Fees | ||||||||||
| Average Daily Net Assets |
| High Equity Income | International Dividend | |||||||
First $1 billion | 0.810% | 0.790% | ||||||||
$1 billion - $3 billion | 0.760 | 0.740 | ||||||||
$3 billion - $5 billion | 0.730 | 0.710 | ||||||||
$5 billion - $10 billion | 0.700 | 0.690 | ||||||||
Greater than $10 billion | 0.680 | 0.670 | ||||||||
With respect to Energy Opportunities and International Dividend, the Manager entered into separate sub-advisory agreements with BlackRock International Limited (“BIL”), an affiliate of the Manager. The Manager pays BIL, for services it provides for that portion of each applicable Fund for which BIL acts as sub-adviser, a monthly fee that is equal to a percentage of the investment advisory fees paid by each Fund to the Manager.
Service and Distribution Fees: The Trust, on behalf of the Funds, entered into a Distribution Agreement and a Distribution and Service Plan with BlackRock Investments, LLC (“BRIL”), an affiliate of the Manager. Pursuant to the Distribution and Service Plan and in accordance with Rule 12b-1 under the 1940 Act, each Fund pays BRIL ongoing service and distribution fees. The fees are accrued daily and paid monthly at annual rates based upon the average daily net assets of the relevant share class of each Fund as follows:
| Share Class | Service Fees | Distribution Fees | ||||||
Service | 0.25% | N/A | ||||||
Investor A | 0.25 | N/A | ||||||
Investor C | 0.25 | 0.75% | ||||||
BRIL and broker-dealers, pursuant to sub-agreements with BRIL, provide shareholder servicing and distribution services to the Funds. The ongoing service and/or distribution fee compensates BRIL and each broker-dealer for providing shareholder servicing and/or distribution related services to shareholders.
For the year ended May 31, 2021, the following table shows the class specific service and distribution fees borne directly by each share class of each Fund:
| Fund Name | Service | Investor A | Investor C | Total | ||||||||||||
Energy Opportunities | $ | 844 | $ | 199,366 | $ | 94,873 | $ | 295,083 | ||||||||
High Equity Income | 20,938 | 453,325 | 202,713 | 676,976 | ||||||||||||
International Dividend | 9,081 | 285,137 | 72,569 | 366,787 | ||||||||||||
| 48 | 2 0 2 1 BLACK ROCK ANNUAL REPORT TO SHAREHOLDERS |
Notes to Financial Statements (continued)
Administration: The Trust, on behalf of the Funds, entered into an Administration Agreement with the Manager, an indirect, wholly-owned subsidiary of BlackRock, to provide administrative services. For these services, the Manager receives an administration fee computed daily and payable monthly, based on a percentage of the average daily net assets of each Fund. The administration fee, which is shown as administration in the Statements of Operations, is paid at the annual rates below.
| ||||
| Average Daily Net Assets | Administration Fees | |||
| ||||
First $500 million | 0.0425% | |||
$500 million - $1 billion | 0.0400 | |||
$1 billion - $2 billion | 0.0375 | |||
$2 billion - $4 billion | 0.0350 | |||
$4 billion - $13 billion | 0.0325 | |||
Greater than $13 billion | 0.0300 | |||
| ||||
In addition, the Manager charges each of the share classes an administration fee, which is shown as administration — class specific in the Statements of Operations, at an annual rate of 0.02% of the average daily net assets of each respective class.
For the year ended May 31, 2021, the following table shows the class specific administration fees borne directly by each share class of each Fund:
| ||||||||||||||||||||||||
| Fund Name | Institutional | Service | Investor A | Investor C | Class K | Total | ||||||||||||||||||
| ||||||||||||||||||||||||
Energy Opportunities | $ 8,361 | $ 68 | $ 15,958 | $ 1,905 | $ — | $ 26,292 | ||||||||||||||||||
High Equity Income | 32,728 | 1,688 | 36,288 | 4,066 | 61 | 74,831 | ||||||||||||||||||
International Dividend | 17,315 | 727 | 22,832 | 1,456 | 966 | 43,296 | ||||||||||||||||||
| ||||||||||||||||||||||||
Transfer Agent: Pursuant to written agreements, certain financial intermediaries, some of which may be affiliates, provide the Funds with sub-accounting, recordkeeping, sub-transfer agency and other administrative services with respect to servicing of underlying investor accounts. For these services, these entities receive an asset-based fee or an annual fee per shareholder account, which will vary depending on share class and/or net assets. For the year ended May 31, 2021, the Funds paid the following amounts to affiliates of BlackRock in return for these services, which are included in transfer agent — class specific in the Statements of Operations:
| ||||||||||||
| Fund Name | Institutional | Investor A | Total | |||||||||
| ||||||||||||
High Equity Income | $ 19 | $ — | $ 19 | |||||||||
International Dividend | 7 | 62 | 69 | |||||||||
| ||||||||||||
The Manager maintains a call center that is responsible for providing certain shareholder services to the Funds. Shareholder services include responding to inquiries and processing purchases and sales based upon instructions from shareholders. For the year ended May 31, 2021, each Fund reimbursed the Manager the following amounts for costs incurred in running the call center, which are included in transfer agent — class specific in the Statements of Operations:
| ||||||||||||||||||||||||
| Fund Name | Institutional | Service | Investor A | Investor C | Class K | Total | ||||||||||||||||||
| ||||||||||||||||||||||||
Energy Opportunities | $ 2,277 | $ 1 | $ 40,468 | $ 4,714 | $ — | $ 47,460 | ||||||||||||||||||
High Equity Income | 1,060 | 15 | 22,985 | 4,181 | 20 | 28,261 | ||||||||||||||||||
International Dividend | 1,448 | — | 13,229 | 2,192 | 8 | 16,877 | ||||||||||||||||||
| ||||||||||||||||||||||||
For the year ended May 31, 2021, the following table shows the class specific transfer agent fees borne directly by each share class of each Fund:
| ||||||||||||||||||||||||
| Fund Name | Institutional | Service | Investor A | Investor C | Class K | Total | ||||||||||||||||||
| ||||||||||||||||||||||||
Energy Opportunities | $ 89,524 | $ 813 | $ 290,777 | $ 39,260 | $ — | $ 420,374 | ||||||||||||||||||
High Equity Income | 221,046 | 11,442 | 292,541 | 39,964 | 79 | 565,072 | ||||||||||||||||||
International Dividend | 109,322 | 4,432 | 223,178 | 19,916 | 1,091 | 357,939 | ||||||||||||||||||
| ||||||||||||||||||||||||
Other Fees: For the year ended May 31, 2021, affiliates earned underwriting discounts, direct commissions and dealer concessions on sales of each Fund’s Investor A Shares as follows:
| ||||
| Fund Name | Amounts | |||
| ||||
Energy Opportunities | $ 6,695 | |||
High Equity Income | 9,939 | |||
International Dividend | 3,466 | |||
| ||||
For the year ended May 31, 2021, affiliates received CDSCs as follows:
| ||||||
| Share Class | Energy Opportunities | High Equity Income | International Dividend | |||
| ||||||
| Investor A | $ 226 | $ 302 | $ 674 | |||
| Investor C | 5,946 | 918 | 500 | |||
$ 6,172 | $ 1,220 | $ 1,174 | ||||
NOTES TO FINANCIAL STATEMENTS | 49 |
Notes to Financial Statements (continued)
Expense Limitations, Waivers and Reimbursements: With respect to each Fund, the Manager contractually agreed to waive its investment advisory fees by the amount of investment advisory fees each Fund pays to the Manager indirectly through its investment in affiliated money market funds (the “affiliated money market fund waiver”) through September 30, 2022 for High Equity Income and through September 30, 2021 for Energy Opportunities and International Dividend. The contractual agreement may be terminated upon 90 days’ notice by a majority of the trustees who are not “interested persons” of the Trust, as defined in the 1940 Act (“Independent Trustees”), or by a vote of a majority of the outstanding voting securities of each Fund. The amount of waivers and/or reimbursements of fees and expenses made pursuant to the expense limitation described below will be reduced by the amount of the affiliated money market fund waiver. This amount is included in fees waived and/or reimbursed by the Manager in the Statements of Operations. For the year ended May 31, 2021, the amounts waived were as follows:
| ||||
| Fund Name | Amounts Waived | |||
| ||||
Energy Opportunities | $ 1,593 | |||
High Equity Income | 5,463 | |||
International Dividend | 602 | |||
| ||||
The Manager has contractually agreed to waive its investment advisory fee with respect to any portion of each Fund’s assets invested in affiliated equity and fixed-income mutual funds and affiliated exchange-traded funds that have a contractual management fee through, September 30, 2022 for High Equity Income and through September 30, 2021 for Energy Opportunities and International Dividend. The contractual agreement may be terminated upon 90 days’ notice by a majority of the Independent Trustees, or by a vote of a majority of the outstanding voting securities of a Fund. For the year ended May 31, 2021, there were no fees waived by the Manager pursuant to this arrangement.
With respect to each Fund, the Manager contractually agreed to waive and/or reimburse fees or expenses in order to limit expenses, excluding interest expense, dividend expense, tax expense, acquired fund fees and expenses, and certain other fund expenses, which constitute extraordinary expenses not incurred in the ordinary course of each Fund’s business (“expense limitation”). The expense limitations as a percentage of average daily net assets are as follows:
| ||||||||||||||||||||
| Fund Name | Institutional | Service | Investor A | Investor C | Class K | |||||||||||||||
| ||||||||||||||||||||
Energy Opportunities | 0.91 | % | 1.32 | % | 1.32 | % | 2.04 | % | 0.91% | (a) | ||||||||||
High Equity Income | 0.85 | 1.10 | 1.10 | 1.85 | 0.80 | |||||||||||||||
International Dividend | 0.84 | 1.09 | 1.09 | 1.84 | 0.79 | |||||||||||||||
| ||||||||||||||||||||
| (a) | There were no shares outstanding as of May 31, 2021. |
The Manager has agreed not to reduce or discontinue these contractual expense limitations through September 30, 2021, with the exception of High Equity Income, which is through September 30, 2022, unless approved by the Board, including a majority of the Independent Trustees or by a vote of a majority of the outstanding voting securities of the Funds. For the year ended May 31, 2021, the amounts included in fees waived and/or reimbursed by the Manager in the Statements of Operations were as follows:
| ||||
| Fund Name | Amounts Waived | |||
| ||||
Energy Opportunities | $ 244,887 | |||
High Equity Income | 622,299 | |||
International Dividend | 419,877 | |||
| ||||
In addition, these amounts waived and/or reimbursed by the Manager are included in administration fees waived — class specific and transfer agent fees waived and/or reimbursed — class specific, respectively, in the Statements of Operations. For the year ended May 31, 2021, class specific expense waivers and/or reimbursements were as follows:
| ||||||||||||||||||||||||
| Administration Fees Waived | ||||||||||||||||||||||||
|
| |||||||||||||||||||||||
| Fund Name | Institutional | Service | Investor A | Investor C | Class K | Total | ||||||||||||||||||
| ||||||||||||||||||||||||
Energy Opportunities | $ 8,361 | $ 68 | $ 15,958 | $ 1,905 | $ — | $ 26,292 | ||||||||||||||||||
High Equity Income | 32,455 | 1,688 | 36,288 | 4,066 | 61 | 74,558 | ||||||||||||||||||
International Dividend | 17,315 | 727 | 22,832 | 1,456 | 966 | 43,296 | ||||||||||||||||||
| ||||||||||||||||||||||||
| ||||||||||||||||||||||||
| Transfer Agent Fees Waived and/or Reimbursed | ||||||||||||||||||||||||
|
| |||||||||||||||||||||||
| Fund Name | Institutional | Service | Investor A | Investor C | Class K | Total | ||||||||||||||||||
| ||||||||||||||||||||||||
Energy Opportunities | $ 89,523 | $ 271 | $ 162,965 | $ 26,384 | $ — | $ 279,143 | ||||||||||||||||||
High Equity Income | 135,709 | 7,107 | 202,706 | 29,125 | 80 | 374,727 | ||||||||||||||||||
International Dividend | 66,032 | 2,606 | 166,011 | 16,054 | 1,091 | 251,794 | ||||||||||||||||||
| ||||||||||||||||||||||||
Securities Lending: The U.S. Securities and Exchange Commission (“SEC”) has issued an exemptive order which permits BIM, an affiliate of the Manager, to serve as securities lending agent for the Funds, subject to applicable conditions. As securities lending agent, BIM bears all operational costs directly related to securities lending. The Funds are responsible for expenses in connection with the investment of cash collateral received for securities on loan (the “collateral investment expenses”). The cash collateral is invested in a private investment company, SL Liquidity Series, LLC (the “Money Market Series”), managed by the Manager or its affiliates. However, BIM has agreed to cap the collateral investment expenses of the Money Market Series to an annual rate of 0.04%. The investment adviser to the Money Market Series will not charge any advisory fees with respect to shares purchased by the Funds. The Money Market Series may, under certain circumstances, impose a liquidity fee of up to 2% of the value withdrawn or temporarily restrict withdrawals for up to 10 business days during a 90 day period, in the event that the private investment company’s weekly liquid assets fall below certain thresholds. The Money Market Series seeks current income consistent with maintaining liquidity and preserving capital. Although the Money Market Series is not registered under the 1940 Act, its investments may follow the parameters of investments by a money market fund that is subject to Rule 2a-7 under the 1940 Act.
| 50 | 2 0 2 1 BLACK ROCK ANNUAL REPORT TO SHAREHOLDERS |
Notes to Financial Statements (continued)
Securities lending income is equal to the total of income earned from the reinvestment of cash collateral, net of fees and other payments to and from borrowers of securities, and less the collateral investment expenses. Each Fund retains a portion of securities lending income and remits a remaining portion to BIM as compensation for its services as securities lending agent.
Pursuant to the current securities lending agreement, High Equity Income retains 77% of securities lending income (which excludes collateral investment expenses), and this amount retained can never be less than 70% of the total of securities lending income plus the collateral investment expenses. Pursuant to the current securities lending agreement, Energy Opportunities and International Dividend retain 82% of securities lending income (which excludes collateral investment expenses), and this amount retained can never be less than 70% of the total of securities lending income plus the collateral investment expenses.
In addition, commencing the business day following the date that the aggregate securities lending income earned across the BlackRock Multi-Asset Complex in a calendar year exceeds a specified threshold, High Equity Income pursuant to the securities lending agreement, will retain for the remainder of that calendar year securities lending income in an amount equal to 81% of securities lending income (which excludes collateral investment expenses), and this amount retained can never be less than 70% of the total of securities lending income plus the collateral investment expenses. Energy Opportunities and International Dividend, pursuant to the securities lending agreement, will retain for the remainder of that calendar year securities lending income in an amount equal to 85% of securities lending income (which excludes collateral investment expenses), and this amount retained can never be less than 70% of the total of securities lending income plus the collateral investment expenses.
The share of securities lending income earned by each Fund is shown as securities lending income — affiliated — net in the Statements of Operations. For the year ended May 31, 2021, each Fund paid BIM the following amounts for securities lending agent services:
| ||||
| Fund Name | Amounts | |||
| ||||
Energy Opportunities | $ 2 | |||
High Equity Income | 417 | |||
| ||||
Trustees and Officers: Certain trustees and/or officers of the Trust are directors and/or officers of BlackRock or its affiliates. The Funds reimburse the Manager for a portion of the compensation paid to the Trust’s Chief Compliance Officer, which is included in Trustees and Officer in the Statements of Operations.
Other Transactions: The Funds may purchase securities from, or sell securities to, an affiliated fund provided the affiliation is due solely to having a common investment adviser, common officers, or common trustees. For the year ended May 31, 2021, the purchase and sale transactions and any net realized gains (losses) with an affiliated fund in compliance with Rule 17a-7 under the 1940 Act were as follows:
| ||||||||||||
| Fund Name | Purchases | Sales | Net Realized Gain | |||||||||
| ||||||||||||
International Dividend | $ | 711,704 | $ — | $ — | ||||||||
| ||||||||||||
| 6. | PURCHASES AND SALES |
For the year ended May 31, 2021, purchases and sales of investments, excluding short-term investments and equity-linked notes, were as follows:
| ||||||||
| Fund Name | Purchases | Sales | ||||||
| ||||||||
Energy Opportunities | $ | 114,127,732 | $ | 99,840,217 | ||||
High Equity Income | 389,677,189 | 413,129,087 | ||||||
International Dividend | 176,117,427 | 178,196,152 | ||||||
| ||||||||
| 7. | INCOME TAX INFORMATION |
It is each Fund’s policy to comply with the requirements of the Internal Revenue Code of 1986, as amended, applicable to regulated investment companies, and to distribute substantially all of its taxable income to its shareholders. Therefore, no U.S. federal income tax provision is required.
Each Fund files U.S. federal and various state and local tax returns. No income tax returns are currently under examination. The statute of limitations on each Fund’s U.S. federal tax returns generally remains open for a period of three fiscal years after they are filed. The statutes of limitations on each Fund’s state and local tax returns may remain open for an additional year depending upon the jurisdiction.
Management has analyzed tax laws and regulations and their application to the Funds as of May 31, 2021, inclusive of the open tax return years, and does not believe that there are any uncertain tax positions that require recognition of a tax liability in the Funds’ financial statements.
U.S. GAAP requires that certain components of net assets be adjusted to reflect permanent differences between financial and tax reporting. These reclassifications have no effect on net assets or net asset values per share. As of period end, the following permanent differences attributable to non-deductible expenses were reclassified to the following accounts:
| ||||
High Equity Income | ||||
| ||||
Paid-in capital | $ | (78,122 | ) | |
Accumulated earnings (loss) | 78,122 | |||
| ||||
NOTES TO FINANCIAL STATEMENTS | 51 |
Notes to Financial Statements (continued)
The tax character of distributions paid was as follows:
| ||||||||||||||||
| Period | Energy Opportunities | High Equity Income | International Dividend | |||||||||||||
| ||||||||||||||||
Ordinary income | 05/31/21 | $ | 4,241,311 | $ | 25,218,815 | $ | 3,352,020 | |||||||||
| 05/31/20 | 1,886,055 | 18,978,490 | 2,735,014 | |||||||||||||
| 09/30/19 | 1,578,645 | 23,585,242 | 5,522,189 | |||||||||||||
Long-term capital gains | 05/31/21 | — | — | — | ||||||||||||
| 05/31/20 | — | — | 589,465 | |||||||||||||
| 09/30/19 | — | 18,693,546 | 8,307,454 | |||||||||||||
|
|
|
|
|
| |||||||||||
Total | 05/31/21 | $ | 4,241,311 | $ | 25,218,815 | $ | 3,352,020 | |||||||||
|
|
|
|
|
| |||||||||||
| 05/31/20 | $ | 1,886,055 | $ | 18,978,490 | $ | 3,324,479 | ||||||||||
|
|
|
|
|
| |||||||||||
| 09/30/19 | $ | 1,578,645 | $ | 42,278,788 | $ | 13,829,643 | ||||||||||
|
|
|
|
|
| |||||||||||
| ||||||||||||||||
As of period end, the tax components of accumulated net earnings (losses) were as follows:
| ||||||||||||
Energy Opportunities | High Equity Income | International Dividend | ||||||||||
| ||||||||||||
Undistributed ordinary income | $ | 2,136,414 | $ | 32,571 | $ | 6,232,527 | ||||||
Undistributed long-term capital gains | — | 1,651,443 | — | |||||||||
Non-expiring capital loss carryforwards(a) | (319,877,153 | ) | — | — | ||||||||
Net unrealized gains(b) | 11,952,709 | 54,465,888 | 43,568,989 | |||||||||
|
|
|
|
|
| |||||||
| $ | (305,788,030 | ) | $ | 56,149,902 | $ | 49,801,516 | ||||||
|
|
|
|
|
| |||||||
| ||||||||||||
| (a) | Amounts available to offset future realized capital gains. |
| (b) | The difference between book-basis and tax-basis net unrealized gains (losses) was attributable primarily to the tax deferral of losses on wash sales and the realization for tax purposes of unrealized gains on investments in passive foreign investment companies. |
During the year ended May 31, 2021, the Funds listed below utilized the following amounts of their respective capital loss carryforward:
| High Equity Income | International Dividend | |||||
Amount utilized | $ 29,124,037 | $ 11,180,830 | ||||
| ||||||
As of May 31, 2021, gross unrealized appreciation and depreciation based on cost of investments (including short positions and derivatives, if any) for U.S. federal income tax purposes were as follows:
| ||||||||||||
Energy Opportunities | High Equity Income | International Dividend | ||||||||||
| ||||||||||||
Tax cost | $ | 154,494,776 | $ | 486,444,215 | $ | 201,284,028 | ||||||
|
|
|
|
|
| |||||||
Gross unrealized appreciation | $ | 15,174,635 | $ | 56,288,219 | $ | 50,370,762 | ||||||
Gross unrealized depreciation | (3,227,240 | ) | (1,848,079 | ) | (6,754,621 | ) | ||||||
|
|
|
|
|
| |||||||
Net unrealized appreciation (depreciation) | $ | 11,947,395 | $ | 54,440,140 | $ | 43,616,141 | ||||||
|
|
|
|
|
| |||||||
| 8. | BANK BORROWINGS |
The Trust, on behalf of the Funds, along with certain other funds managed by the Manager and its affiliates (“Participating Funds”), is a party to a 364-day, $2.25 billion credit agreement with a group of lenders. Under this agreement, the Funds may borrow to fund shareholder redemptions. Excluding commitments designated for certain individual funds, the Participating Funds, including the Funds, can borrow up to an aggregate commitment amount of $1.75 billion at any time outstanding, subject to asset coverage and other limitations as specified in the agreement. The credit agreement has the following terms: a fee of 0.10% per annum on unused commitment amounts and interest at a rate equal to the higher of (a) one-month LIBOR (but, in any event, not less than 0.00%) on the date the loan is made plus 0.80% per annum or (b) the Fed Funds rate (but, in any event, not less than 0.00%) in effect from time to time plus 0.80% per annum on amounts borrowed. The agreement expires in April 2022 unless extended or renewed. These fees were allocated among such funds based upon portions of the aggregate commitment available to them and relative net assets of Participating Funds. During the year ended May 31, 2021, the Funds did not borrow under the credit agreement.
| 9. | PRINCIPAL RISKS |
In the normal course of business, the Funds invest in securities or other instruments and may enter into certain transactions, and such activities subject each Fund to various risks, including among others, fluctuations in the market (market risk) or failure of an issuer to meet all of its obligations. The value of securities or other instruments may also
| 52 | 2 0 2 1 BLACK ROCK ANNUAL REPORT TO SHAREHOLDERS |
Notes to Financial Statements (continued)
be affected by various factors, including, without limitation: (i) the general economy; (ii) the overall market as well as local, regional or global political and/or social instability; (iii) regulation, taxation or international tax treaties between various countries; or (iv) currency, interest rate and price fluctuations. Local, regional or global events such as war, acts of terrorism, the spread of infectious illness or other public health issues, recessions, or other events could have a significant impact on the Funds and their investments. Each Fund’s prospectus provides details of the risks to which each Fund is subject.
The Funds may be exposed to additional risks when reinvesting cash collateral in money market funds that do not seek to maintain a stable NAV per share of $1.00, which may be subject to redemption gates or liquidity fees under certain circumstances.
Market Risk: An outbreak of respiratory disease caused by a novel coronavirus has developed into a global pandemic and has resulted in closing borders, quarantines, disruptions to supply chains and customer activity, as well as general concern and uncertainty. The impact of this pandemic, and other global health crises that may arise in the future, could affect the economies of many nations, individual companies and the market in general in ways that cannot necessarily be foreseen at the present time. This pandemic may result in substantial market volatility and may adversely impact the prices and liquidity of a fund’s investments. The duration of this pandemic and its effects cannot be determined with certainty.
Valuation Risk: The market values of equities, such as common stocks and preferred securities or equity related investments, such as futures and options, may decline due to general market conditions which are not specifically related to a particular company. They may also decline due to factors which affect a particular industry or industries. A Fund may invest in illiquid investments. An illiquid investment is any investment that a Fund reasonably expects cannot be sold or disposed of in current market conditions in seven calendar days or less without the sale or disposition significantly changing the market value of the investment. A Fund may experience difficulty in selling illiquid investments in a timely manner at the price that it believes the investments are worth. Prices may fluctuate widely over short or extended periods in response to company, market or economic news. Markets also tend to move in cycles, with periods of rising and falling prices. This volatility may cause each Fund’s NAV to experience significant increases or decreases over short periods of time. If there is a general decline in the securities and other markets, the NAV of a Fund may lose value, regardless of the individual results of the securities and other instruments in which a Fund invests.
The price a Fund could receive upon the sale of any particular portfolio investment may differ from a Fund’s valuation of the investment, particularly for securities that trade in thin or volatile markets or that are valued using a fair valuation technique or a price provided by an independent pricing service. Changes to significant unobservable inputs and assumptions (i.e., publicly traded company multiples, growth rate, time to exit) due to the lack of observable inputs may significantly impact the resulting fair value and therefore a Fund’s results of operations. As a result, the price received upon the sale of an investment may be less than the value ascribed by a Fund, and a Fund could realize a greater than expected loss or lesser than expected gain upon the sale of the investment. A Fund’s ability to value its investments may also be impacted by technological issues and/or errors by pricing services or other third party service providers.
Counterparty Credit Risk: The Funds may be exposed to counterparty credit risk, or the risk that an entity may fail to or be unable to perform on its commitments related to unsettled or open transactions, including making timely interest and/or principal payments or otherwise honoring its obligations. The Funds manage counterparty credit risk by entering into transactions only with counterparties that the Manager believes have the financial resources to honor their obligations and by monitoring the financial stability of those counterparties. Financial assets, which potentially expose the Funds to market, issuer and counterparty credit risks, consist principally of financial instruments and receivables due from counterparties. The extent of the Funds’ exposure to market, issuer and counterparty credit risks with respect to these financial assets is approximately their value recorded in the Statements of Assets and Liabilities, less any collateral held by the Funds.
Concentration Risk: A diversified portfolio, where this is appropriate and consistent with a fund’s objectives, minimizes the risk that a price change of a particular investment will have a material impact on the NAV of a fund. The investment concentrations within each Fund’s portfolio are disclosed in its Schedule of Investments.
Certain Funds invest a significant portion of their assets in securities within a single or limited number of market sectors. When a Fund concentrates its investments in this manner, it assumes the risk that economic, regulatory, political and social conditions affecting such sectors may have a significant impact on the Fund and could affect the income from, or the value or liquidity of, the Fund’s portfolio. Investment percentages in specific sectors are presented in the Schedules of Investments.
International Dividend invests a substantial amount of its assets in issuers located in a single country or a limited number of countries. When the Fund concentrates its investments in this manner, it assumes the risk that economic, regulatory, political and social conditions in those countries may have a significant impact on its investment performance and could affect the income from, or the value or liquidity of, the Fund’s portfolio. Foreign issuers may not be subject to the same uniform accounting, auditing and financial reporting standards and practices as used in the United States. Foreign securities markets may also be more volatile and less liquid than U.S. securities and may be less subject to governmental supervision not typically associated with investing in U.S. securities. Investment percentages in specific countries are presented in the Schedule of Investments.
International Dividend invests a significant portion of its assets in securities of issuers located in Europe or with significant exposure to European issuers or countries. The European financial markets have recently experienced volatility and adverse trends due to concerns about economic downturns in, or rising government debt levels of, several European countries. These events may spread to other countries in Europe and may affect the value and liquidity of certain of International Dividend’s investments.
Responses to the financial problems by European governments, central banks and others, including austerity measures and reforms, may not work, may result in social unrest and may limit future growth and economic recovery or have other unintended consequences. Further defaults or restructurings by governments and others of their debt could have additional adverse effects on economies, financial markets and asset valuations around the world. In addition, the United Kingdom has withdrawn from the European Union, and one or more other countries may withdraw from the European Union and/or abandon the Euro, the common currency of the European Union. The impact of these actions, especially if they occur in a disorderly fashion, is not clear but could be significant and far reaching.
LIBOR Transition Risk: The United Kingdom’s Financial Conduct Authority announced a phase out of the London Interbank Offered Rate (“LIBOR”). Although many LIBOR rates will be phased out by the end of 2021, a selection of widely used USD LIBOR rates will continue to be published through June 2023 in order to assist with the transition. The Funds may be exposed to financial instruments tied to LIBOR to determine payment obligations, financing terms, hedging strategies or investment value. The transition process away from LIBOR might lead to increased volatility and illiquidity in markets for, and reduce the effectiveness of new hedges placed against, instruments whose terms currently include LIBOR. The ultimate effect of the LIBOR transition process on the Funds is uncertain.
NOTES TO FINANCIAL STATEMENTS | 53 |
Notes to Financial Statements (continued)
| 10. | CAPITAL SHARE TRANSACTIONS |
Transactions in capital shares for each class were as follows:
| Year Ended 05/31/21 | Period from 10/01/19 to 05/31/20 | Year Ended 09/30/19 | ||||||||||||||||||||||
| Fund Name/Share Class | Shares | Amounts | Shares | Amounts | Shares | Amounts | ||||||||||||||||||
Energy Opportunities | ||||||||||||||||||||||||
Institutional | ||||||||||||||||||||||||
Shares sold | 6,008,928 | $ | 43,112,500 | 5,065,828 | $ | 33,290,855 | 2,483,977 | $ | 24,371,687 | |||||||||||||||
Shares issued in reinvestment of distributions | 204,277 | 1,385,203 | 87,022 | 810,172 | 49,857 | 489,099 | ||||||||||||||||||
Shares issued in reorganization | — | — | 1,095,766 | 10,918,076 | — | — | ||||||||||||||||||
Shares redeemed | (5,927,425 | ) | (40,789,727 | ) | (2,850,173 | ) | (19,099,849 | ) | (1,895,756 | ) | (19,174,792 | ) | ||||||||||||
|
|
|
|
|
|
|
|
|
|
|
| |||||||||||||
| 285,780 | $ | 3,707,976 | 3,398,443 | $ | 25,919,254 | 638,078 | $ | 5,685,994 | ||||||||||||||||
|
|
|
|
|
|
|
|
|
|
|
| |||||||||||||
Service | ||||||||||||||||||||||||
Shares sold | 45,792 | $ | 344,909 | 15,017 | $ | 122,595 | 24,220 | $ | 243,144 | |||||||||||||||
Shares issued in reinvestment of distributions | 1,509 | 10,043 | 1,476 | 13,464 | 1,310 | 12,604 | ||||||||||||||||||
Shares redeemed | (32,526 | ) | (228,417 | ) | (15,756 | ) | (136,156 | ) | (27,520 | ) | (270,216 | ) | ||||||||||||
|
|
|
|
|
|
|
|
|
|
|
| |||||||||||||
| 14,775 | $ | 126,535 | 737 | $ | (97 | ) | (1,990 | ) | $ | (14,468 | ) | |||||||||||||
|
|
|
|
|
|
|
|
|
|
|
| |||||||||||||
Investor A | ||||||||||||||||||||||||
Shares sold and automatic conversion of shares | 6,544,958 | $ | 45,930,722 | 3,010,887 | $ | 19,388,660 | 1,317,090 | $ | 13,255,143 | |||||||||||||||
Shares issued in reinvestment of distributions | 380,440 | 2,516,327 | 98,657 | 894,817 | 102,248 | 978,518 | ||||||||||||||||||
Shares issued in reorganization | — | — | 6,702,786 | 65,103,473 | — | — | ||||||||||||||||||
Shares redeemed | (5,683,012 | ) | (39,067,805 | ) | (2,238,892 | ) | (16,712,188 | ) | (1,210,425 | ) | (11,796,567 | ) | ||||||||||||
|
|
|
|
|
|
|
|
|
|
|
| |||||||||||||
| 1,242,386 | $ | 9,379,244 | 7,573,438 | $ | 68,674,762 | 208,913 | $ | 2,437,094 | ||||||||||||||||
|
|
|
|
|
|
|
|
|
|
|
| |||||||||||||
Investor C | ||||||||||||||||||||||||
Shares sold | 492,038 | $ | 3,402,767 | 584,542 | $ | 3,535,677 | 57,281 | $ | 536,851 | |||||||||||||||
Shares issued in reinvestment of distributions | 41,499 | 264,559 | 15,328 | 134,730 | 7,437 | 68,863 | ||||||||||||||||||
Shares issued in reorganization | — | — | 894,104 | 8,405,065 | — | — | ||||||||||||||||||
Shares redeemed and automatic conversion of shares | (986,487 | ) | (6,401,236 | ) | (542,412 | ) | (3,907,975 | ) | (1,149,546 | ) | (11,202,214 | ) | ||||||||||||
|
|
|
|
|
|
|
|
|
|
|
| |||||||||||||
| (452,950 | ) | $ | (2,733,910 | ) | 951,562 | $ | 8,167,497 | (1,084,828 | ) | $ | (10,596,500 | ) | ||||||||||||
|
|
|
|
|
|
|
|
|
|
|
| |||||||||||||
| 1,089,991 | $ | 10,479,845 | 11,924,180 | $ | 102,761,416 | (239,827 | ) | $ | (2,487,880 | ) | ||||||||||||||
|
|
|
|
|
|
|
|
|
|
|
| |||||||||||||
High Equity Income | ||||||||||||||||||||||||
Institutional | ||||||||||||||||||||||||
Shares sold | 6,556,129 | $ | 178,848,517 | 1,234,208 | $ | 30,999,399 | 1,620,135 | $ | 41,789,821 | |||||||||||||||
Shares issued in reinvestment of distributions | 410,070 | 10,722,278 | 268,023 | 6,437,855 | 551,850 | 14,113,022 | ||||||||||||||||||
Shares redeemed | (3,341,268 | ) | (86,740,071 | ) | (1,581,496 | ) | (37,167,927 | ) | (5,297,435 | ) | (138,484,099 | ) | ||||||||||||
|
|
|
|
|
|
|
|
|
|
|
| |||||||||||||
| 3,624,931 | $ | 102,830,724 | (79,265 | ) | $ | 269,327 | (3,125,450 | ) | $ | (82,581,256 | ) | |||||||||||||
|
|
|
|
|
|
|
|
|
|
|
| |||||||||||||
Service | ||||||||||||||||||||||||
Shares sold | 22,842 | $ | 530,839 | 93,228 | $ | 2,240,316 | 53,252 | $ | 1,231,694 | |||||||||||||||
Shares issued in reinvestment of distributions | 24,456 | 559,123 | 21,143 | 458,397 | 40,695 | 937,357 | ||||||||||||||||||
Shares redeemed | (88,364 | ) | (1,987,140 | ) | (141,512 | ) | (3,082,149 | ) | (157,690 | ) | (3,664,934 | ) | ||||||||||||
|
|
|
|
|
|
|
|
|
|
|
| |||||||||||||
| (41,066 | ) | $ | (897,178 | ) | (27,141 | ) | $ | (383,436 | ) | (63,743 | ) | $ | (1,495,883 | ) | ||||||||||
|
|
|
|
|
|
|
|
|
|
|
| |||||||||||||
Investor A | ||||||||||||||||||||||||
Shares sold and automatic conversion of shares | 1,234,541 | $ | 27,448,383 | 766,121 | $ | 16,215,908 | 2,710,471 | $ | 60,252,847 | |||||||||||||||
Shares issued in reinvestment of distributions | 550,597 | 11,790,212 | 481,834 | 9,769,745 | 879,629 | 19,031,831 | ||||||||||||||||||
Shares redeemed | (2,534,707 | ) | (54,062,308 | ) | (1,816,723 | ) | (37,760,664 | ) | (2,874,581 | ) | (62,930,089 | ) | ||||||||||||
|
|
|
|
|
|
|
|
|
|
|
| |||||||||||||
| (749,569 | ) | $ | (14,823,713 | ) | (568,768 | ) | $ | (11,775,011 | ) | 715,519 | $ | 16,354,589 | ||||||||||||
|
|
|
|
|
|
|
|
|
|
|
| |||||||||||||
| 54 | 2 0 2 1 BLACK ROCK ANNUAL REPORT TO SHAREHOLDERS |
Notes to Financial Statements (continued)
| Year Ended 05/31/21 | Period from 10/01/19 to 05/31/20 | Year Ended 09/30/19 | ||||||||||||||||||||||
| Fund Name/Share Class | Shares | Amounts | Shares | Amounts | Shares | Amounts | ||||||||||||||||||
High Equity Income (continued) | ||||||||||||||||||||||||
Investor C | ||||||||||||||||||||||||
Shares sold | 339,662 | $ | 4,803,157 | 249,452 | $ | 3,461,843 | 481,593 | $ | 6,896,158 | |||||||||||||||
Shares issued in reinvestment of distributions | 88,507 | 1,179,047 | 155,445 | 2,003,623 | 541,742 | 7,642,459 | ||||||||||||||||||
Shares redeemed and automatic conversions of shares | (1,024,494 | ) | (13,203,980 | ) | (905,943 | ) | (12,015,621 | ) | (4,273,236 | ) | (62,531,798 | ) | ||||||||||||
|
|
|
|
|
|
|
|
|
|
|
| |||||||||||||
| (596,325 | ) | $ | (7,221,776 | ) | (501,046 | ) | $ | (6,550,155 | ) | (3,249,901 | ) | $ | (47,993,181 | ) | ||||||||||
|
|
|
|
|
|
|
|
|
|
|
| |||||||||||||
Class K | ||||||||||||||||||||||||
Shares sold | 81 | $ | 1,865 | 12,615 | (a) | $ | 266,201 | (a) | — | $ | — | |||||||||||||
Shares issued in reinvestment of distributions | 4 | 95 | 2 | (a) | 38 | (a) | — | — | ||||||||||||||||
Shares redeemed | (733 | ) | (16,809 | ) | (2 | )(a) | (38 | )(a) | — | — | ||||||||||||||
|
|
|
|
|
|
|
|
|
|
|
| |||||||||||||
| (648 | ) | $ | (14,849 | ) | 12,615 | $ | 266,201 | — | $ | — | ||||||||||||||
|
|
|
|
|
|
|
|
|
|
|
| |||||||||||||
| 2,237,323 | $ | 79,873,208 | (1,163,605 | ) | $ | (18,173,074 | ) | (5,723,575 | ) | $ | (115,715,731 | ) | ||||||||||||
|
|
|
|
|
|
|
|
|
|
|
| |||||||||||||
International Dividend | ||||||||||||||||||||||||
Institutional | ||||||||||||||||||||||||
Shares sold | 791,001 | $ | 25,700,909 | 383,884 | $ | 10,400,289 | 664,263 | $ | 18,644,829 | |||||||||||||||
Shares issued in reinvestment of distributions | 42,445 | 1,329,245 | 43,702 | 1,226,610 | 165,910 | 4,496,962 | ||||||||||||||||||
Shares redeemed | (676,346 | ) | (21,795,843 | ) | (705,271 | ) | (19,935,519 | ) | (1,423,038 | ) | (39,171,088 | ) | ||||||||||||
|
|
|
|
|
|
|
|
|
|
|
| |||||||||||||
| 157,100 | $ | 5,234,311 | (277,685 | ) | $ | (8,308,620 | ) | (592,865 | ) | $ | (16,029,297 | ) | ||||||||||||
|
|
|
|
|
|
|
|
|
|
|
| |||||||||||||
Service | ||||||||||||||||||||||||
Shares sold | 11,299 | $ | 341,101 | 10,686 | $ | 285,762 | 9,711 | $ | 257,339 | |||||||||||||||
Shares issued in reinvestment of distributions | 1,805 | 53,187 | 1,756 | 46,603 | 7,635 | 195,594 | ||||||||||||||||||
Shares redeemed | (24,333 | ) | (758,377 | ) | (8,898 | ) | (234,545 | ) | (59,704 | ) | (1,556,385 | ) | ||||||||||||
|
|
|
|
|
|
|
|
|
|
|
| |||||||||||||
| (11,229 | ) | $ | (364,089 | ) | 3,544 | $ | 97,820 | (42,358 | ) | $ | (1,103,452 | ) | ||||||||||||
|
|
|
|
|
|
|
|
|
|
|
| |||||||||||||
Investor A | ||||||||||||||||||||||||
Shares sold and automatic conversion of shares | 631,204 | $ | 18,830,973 | 281,795 | $ | 7,501,342 | — | $ | — | |||||||||||||||
Shares issued in reinvestment of distributions | 58,310 | 1,691,014 | 66,211 | 1,737,096 | 285,028 | 7,196,565 | ||||||||||||||||||
Shares issued from conversion(b) | — | — | — | — | 889,911 | 23,000,163 | ||||||||||||||||||
Shares redeemed | (734,694 | ) | (21,864,689 | ) | (1,201,472 | ) | (32,299,675 | ) | (1,638,441 | ) | (42,437,755 | ) | ||||||||||||
|
|
|
|
|
|
|
|
|
|
|
| |||||||||||||
| (45,180 | ) | $ | (1,342,702 | ) | (853,466 | ) | $ | (23,061,237 | ) | (463,502 | ) | $ | (12,241,027 | ) | ||||||||||
|
|
|
|
|
|
|
|
|
|
|
| |||||||||||||
Investor C | ||||||||||||||||||||||||
Shares sold | 27,576 | $ | 716,930 | 23,737 | $ | 555,488 | 45,047 | $ | 998,328 | |||||||||||||||
Shares issued in reinvestment of distributions | 3,513 | 86,853 | 6,416 | 147,783 | 56,149 | 1,232,770 | ||||||||||||||||||
Shares redeemed and automatic conversion of shares | (273,507 | ) | (6,974,438 | ) | (233,349 | ) | (5,373,215 | ) | (978,393 | ) | (22,187,137 | ) | ||||||||||||
|
|
|
|
|
|
|
|
|
|
|
| |||||||||||||
| (242,418 | ) | $ | (6,170,655 | ) | (203,196 | ) | $ | (4,669,944 | ) | (877,197 | ) | $ | (19,956,039 | ) | ||||||||||
|
|
|
|
|
|
|
|
|
|
|
| |||||||||||||
Class K | ||||||||||||||||||||||||
Shares sold | 113,878 | $ | 3,642,996 | 14,731 | $ | 413,583 | 40,090 | $ | 1,112,479 | |||||||||||||||
Shares issued in reinvestment of distributions | 2,580 | 81,044 | 2,087 | 58,541 | 6,665 | 181,244 | ||||||||||||||||||
Shares redeemed | (68,888 | ) | (2,295,071 | ) | (35,288 | ) | (1,005,339 | ) | (38,053 | ) | (1,065,702 | ) | ||||||||||||
|
|
|
|
|
|
|
|
|
|
|
| |||||||||||||
| 47,570 | $ | 1,428,969 | (18,470 | ) | $ | (533,215 | ) | 8,702 | $ | 228,021 | ||||||||||||||
|
|
|
|
|
|
|
|
|
|
|
| |||||||||||||
| (94,157 | ) | $ | (1,214,166 | ) | (1,349,273 | ) | $ | (36,475,196 | ) | (1,967,220 | ) | $ | (49,101,794 | ) | ||||||||||
|
|
|
|
|
|
|
|
|
|
|
| |||||||||||||
| (a) | For the period from April 21, 2020 (inception date) to May 31, 2020. |
| (b) | On December 27, 2017, the Fund’s Investor B Shares converted into Investor A Shares. |
As of May 31, 2021, BlackRock Financial Management, Inc., an affiliate of the Fund, owned 11,882 Class K Shares of High Equity Income.
NOTES TO FINANCIAL STATEMENTS | 55 |
Notes to Financial Statements (continued)
| 11. | SUBSEQUENT EVENTS |
Management has evaluated the impact of all subsequent events on the Funds through the date the financial statements were issued and has determined that there were no subsequent events requiring adjustment or additional disclosure in the financial statements.
| 56 | 2 0 2 1 BLACK ROCK ANNUAL REPORT TO SHAREHOLDERS |
Report of Independent Registered Public Accounting Firm
To the Shareholders of BlackRock Energy Opportunities Fund, BlackRock High Equity Income Fund, and BlackRock International Dividend Fund and the Board of Trustees of BlackRock FundsSM:
Opinion on the Financial Statements and Financial Highlights
We have audited the accompanying statements of assets and liabilities of BlackRock Energy Opportunities Fund, BlackRock High Equity Income Fund, and BlackRock International Dividend Fund of BlackRock FundsSM (the “Funds”), including the schedules of investments, as of May 31, 2021, the related statements of operations for the year then ended, the statements of changes in net assets for the year then ended, for the period from October 1, 2019 through May 31, 2020, and for the year ended September 30, 2019, the financial highlights for the year then ended, for the period from October 1, 2019 through May 31, 2020, and for each of the four years in the period ended September 30, 2019, and the related notes. In our opinion, the financial statements and financial highlights present fairly, in all material respects, the financial position of the Funds as of May 31, 2021, and the results of their operations for the year then ended, the changes in their net assets for the year then ended, for the period from September 1, 2019 through May 31, 2020, and for the year ended September 30, 2019, and the financial highlights for the year then ended, for the period from October 1, 2019 through May 31, 2020, and for each of the four years in the period ended September 30, 2019, in conformity with accounting principles generally accepted in the United States of America.
Basis for Opinion
These financial statements and financial highlights are the responsibility of the Funds’ management. Our responsibility is to express an opinion on the Funds’ financial statements and financial highlights based on our audits. We are a public accounting firm registered with the Public Company Accounting Oversight Board (United States) (PCAOB) and are required to be independent with respect to the Funds in accordance with the U.S. federal securities laws and the applicable rules and regulations of the Securities and Exchange Commission and the PCAOB.
We conducted our audits in accordance with the standards of the PCAOB. Those standards require that we plan and perform the audit to obtain reasonable assurance about whether the financial statements and financial highlights are free of material misstatement, whether due to error or fraud. The Funds are not required to have, nor were we engaged to perform, an audit of their internal control over financial reporting. As part of our audits we are required to obtain an understanding of internal control over financial reporting but not for the purpose of expressing an opinion on the effectiveness of the Funds’ internal control over financial reporting. Accordingly, we express no such opinion.
Our audits included performing procedures to assess the risks of material misstatement of the financial statements and financial highlights, whether due to error or fraud, and performing procedures that respond to those risks. Such procedures included examining, on a test basis, evidence regarding the amounts and disclosures in the financial statements and financial highlights. Our audits also included evaluating the accounting principles used and significant estimates made by management, as well as evaluating the overall presentation of the financial statements and financial highlights. Our procedures included confirmation of securities owned as of May 31, 2021, by correspondence with the custodian and brokers; when replies were not received from brokers, we performed other auditing procedures. We believe that our audits provide a reasonable basis for our opinion.
Deloitte & Touche LLP
Boston, Massachusetts
July 21, 2021
We have served as the auditor of one or more BlackRock investment companies since 1992.
REPORT OF INDEPENDENT REGISTERED PUBLIC ACCOUNTING FIRM | 57 |
| Important Tax Information (unaudited) |
The following maximum amounts are hereby designated as qualified dividend income for individuals for the fiscal year ended May 31, 2021:
| ||||
| Fund Name | Qualified Dividend Income | |||
| ||||
Energy Opportunities | $ 6,422,614 | |||
High Equity Income | 9,491,159 | |||
International Dividend | 7,101,584 | |||
| ||||
For the fiscal year ended May 31, 2021, the Funds intend to pass through to their shareholders the following amounts of foreign source income and foreign taxes:
| ||||||||
| Fund Name | Foreign Source Income Earned | Foreign Taxes Paid | ||||||
| ||||||||
International Dividend | $ 5,388,895 | $ 430,764 | ||||||
| ||||||||
For corporate shareholders, the percentage of ordinary income distributions paid during the fiscal year ended May 31, 2021 that qualified for the dividends-received deduction were as follows:
| Fund Name | Dividends-Received Deduction | |||
Energy Opportunities | 61.69% | |||
High Equity Income | 25.58 | |||
International Dividend | 1.72 | |||
| 58 | 2 0 2 1 BLACK ROCK ANNUAL REPORT TO SHAREHOLDERS |
Disclosure of Investment Advisory Agreement and Sub-Advisory Agreements
The Board of Trustees (the “Board,” the members of which are referred to as “Board Members”) of BlackRock Funds (the “Trust”) met on April 7, 2021 (the “April Meeting”) and May 10-12, 2021 (the “May Meeting”) to consider the approval to continue the investment advisory agreement (the “Advisory Agreement”) between the Trust, on behalf of BlackRock Energy Opportunities Fund (“Energy Opportunities Fund”), BlackRock High Equity Income Fund (“High Equity Income Fund”) and BlackRock International Dividend Fund (“International Dividend Fund” and, together with Energy Opportunities Fund and High Equity Income Fund, the “Funds”), and BlackRock Advisors, LLC (the “Manager”), each Fund’s investment advisor. The Board also considered the approval of the sub-advisory agreement between the Manager and BlackRock International Limited (the “Sub-Advisor”) with respect to Energy Opportunities Fund (the “Energy Opportunities Fund Sub-Advisory Agreement”) and the sub-advisory agreement between the Manager and the Sub-Advisor with respect to International Dividend Fund (the “International Dividend Fund Sub-Advisory Agreement” and, together with the Energy Opportunities Agreement, the “Sub-Advisory Agreements”). The Manager and the Sub-Advisor are referred to herein as “BlackRock.” The Advisory Agreement and the Sub-Advisory Agreements are referred to herein as the “Agreements.”
The Approval Process
Consistent with the requirements of the Investment Company Act of 1940 (the “1940 Act”), the Board considers the approval of the continuation of the Agreements for each Fund on an annual basis. The Board members whom are not “interested persons” of the Trust, as defined in the 1940 Act, are considered independent Board members (the “Independent Board Members”). The Board’s consideration entailed a year-long deliberative process during which the Board and its committees assessed BlackRock’s various services to each Fund, including through the review of written materials and oral presentations, and the review of additional information provided in response to requests from the Independent Board Members. The Board had four quarterly meetings per year, each typically extending for two days, as well as additional ad hoc meetings and executive sessions throughout the year, as needed. The committees of the Board similarly met throughout the year. The Board also had a fifth one-day meeting to consider specific information surrounding the renewal of the Agreements. In particular, the Board assessed, among other things, the nature, extent and quality of the services provided to the Fund by BlackRock, BlackRock’s personnel and affiliates, including (as applicable): investment management services; accounting oversight; administrative and shareholder services; oversight of the Fund’s service providers; risk management and oversight; and legal, regulatory and compliance services. Throughout the year, including during the contract renewal process, the Independent Board Members were advised by independent legal counsel, and met with independent legal counsel in various executive sessions outside of the presence of BlackRock’s management.
During the year, the Board, acting directly and through its committees, considered information that was relevant to its annual consideration of the renewal of the Agreements, including the services and support provided by BlackRock to the Fund and its shareholders. BlackRock also furnished additional information to the Board in response to specific questions from the Board. Among the matters the Board considered were: (a) investment performance for one-year, three-year, five-year, and/or since inception periods, as applicable, against peer funds, an applicable benchmark, and other performance metrics, as applicable, as well as BlackRock senior management’s and portfolio managers’ analyses of the reasons for any outperformance or underperformance relative to its peers, benchmarks, and other performance metrics, as applicable; (b) fees, including advisory, administration, if applicable, and other amounts paid to BlackRock and its affiliates by the Fund for services; (c) Fund operating expenses and how BlackRock allocates expenses to the Fund; (d) the resources devoted to risk oversight of, and compliance reports relating to, implementation of the Fund’s investment objective, policies and restrictions, and meeting regulatory requirements; (e) BlackRock’s and the Trust’s adherence to applicable compliance policies and procedures; (f) the nature, character and scope of non-investment management services provided by BlackRock and its affiliates and the estimated cost of such services, as available; (g) BlackRock’s and other service providers’ internal controls and risk and compliance oversight mechanisms; (h) BlackRock’s implementation of the proxy voting policies approved by the Board; (i) the use of brokerage commissions and execution quality of portfolio transactions; (j) BlackRock’s implementation of the Fund’s valuation and liquidity procedures; (k) an analysis of management fees paid to BlackRock for products with similar investment mandates across the open-end fund, exchange-traded fund (“ETF”), closed-end fund, sub-advised mutual fund, separately managed account, collective investment trust, and institutional separate account product channels, as applicable, and the similarities and differences between these products and the services provided as compared to the Fund; (l) BlackRock’s compensation methodology for its investment professionals and the incentives and accountability it creates, along with investment professionals’ investments in the fund(s) they manage; and (m) periodic updates on BlackRock’s business.
Prior to and in preparation for the April Meeting, the Board received and reviewed materials specifically relating to the renewal of the Agreements. The Independent Board Members continuously engaged in a process with their independent legal counsel and BlackRock to review the nature and scope of the information provided to the Board to better assist its deliberations. The materials provided in connection with the April Meeting included, among other things: (a) information independently compiled and prepared by Broadridge Financial Solutions, Inc. (“Broadridge”), based on either a Lipper classification or Morningstar category, regarding each Fund’s fees and expenses as compared with a peer group of funds as determined by Broadridge (“Expense Peers”) and the investment performance of each Fund as compared with a peer group of funds (“Performance Peers”); (b) information on the composition of the Expense Peers and Performance Peers and a description of Broadridge’s methodology; (c) information on the estimated profits realized by BlackRock and its affiliates pursuant to the Agreements and a discussion of fall-out benefits to BlackRock and its affiliates; (d) a general analysis provided by BlackRock concerning investment management fees received in connection with other types of investment products, such as institutional accounts, sub-advised mutual funds, ETFs, closed-end funds, open-end funds, and separately managed accounts under similar investment mandates, as well as the performance of such other products, as applicable; (e) a review of non-management fees; (f) the existence, impact and sharing of potential economies of scale, if any, with the Funds; (g) a summary of aggregate amounts paid by each Fund to BlackRock; (h) sales and redemption data regarding each Fund’s shares; and (i) various additional information requested by the Board as appropriate regarding BlackRock’s and the Funds’ operations.
At the April Meeting, the Board reviewed materials relating to its consideration of the Agreements. As a result of the discussions that occurred during the April Meeting, and as a culmination of the Board’s year-long deliberative process, the Board presented BlackRock with questions and requests for additional information. BlackRock responded to these questions and requests with additional written information in advance of the May Meeting.
At the May Meeting, the Board concluded its assessment of, among other things: (a) the nature, extent and quality of the services provided by BlackRock; (b) the investment performance of each Fund as compared to its Performance Peers and to other metrics, as applicable; (c) the advisory fee and the estimated cost of the services and estimated profits realized by BlackRock and its affiliates from their relationship with the Funds; (d) each Fund’s fees and expenses compared to its Expense Peers; (e) the existence and sharing of potential economies of scale; (f) any fall-out benefits to BlackRock and its affiliates as a result of BlackRock’s relationship with the Funds; and (g) other factors deemed relevant by the Board Members.
DISCLOSURE OF INVESTMENT ADVISORY AGREEMENT AND SUB - ADVISORY AGREEMENTS | 59 |
Disclosure of Investment Advisory Agreement and Sub-Advisory Agreements (continued)
The Board also considered other matters it deemed important to the approval process, such as other payments made to BlackRock or its affiliates relating to securities lending and cash management, and BlackRock’s services related to the valuation and pricing of Fund portfolio holdings. The Board noted the willingness of BlackRock’s personnel to engage in open, candid discussions with the Board. The members of the Board gave attention to all of the information that was furnished, and each Board Member placed varying degrees of importance on the various pieces of information that were provided to them. The Board evaluated the information available to it on a fund by fund basis. The following paragraphs provide more information about some of the primary factors that were relevant to the Board’s decision. The Board Members did not identify any particular information, or any single factor as determinative, and each Board Member may have attributed different weights to the various items and factors considered.
A: Nature, Extent and Quality of the Services Provided by BlackRock
The Board, including the Independent Board Members, reviewed the nature, extent and quality of services provided by BlackRock, including the investment advisory services and the resulting performance of each Fund. Throughout the year, the Board compared each Fund’s performance to the performance of a comparable group of mutual funds, relevant benchmark, and performance metrics, as applicable. The Board met with BlackRock’s senior management personnel responsible for investment activities, including the senior investment officers. The Board also reviewed the materials provided by each Fund’s portfolio management team discussing the Fund’s performance, investment strategies and outlook.
The Board considered, among other factors, with respect to BlackRock: the number, education and experience of investment personnel generally and each Fund’s portfolio management team; research capabilities; investments by portfolio managers in the funds they manage; portfolio trading capabilities; use of technology; commitment to compliance; credit analysis capabilities; risk analysis and oversight capabilities; and the approach to training and retaining portfolio managers and other research, advisory and management personnel. The Board also considered BlackRock’s overall risk management program, including the continued efforts of BlackRock and its affiliates to address cybersecurity risks and the role of BlackRock’s Risk & Quantitative Analysis Group. The Board engaged in a review of BlackRock’s compensation structure with respect to each Fund’s portfolio management team and BlackRock’s ability to attract and retain high-quality talent and create performance incentives.
In addition to investment advisory services, the Board considered the nature and quality of the administrative and other non-investment advisory services provided to each Fund. BlackRock and its affiliates provide the Funds with certain administrative, shareholder and other services (in addition to any such services provided to the Funds by third-parties) and officers and other personnel as are necessary for the operations of the Funds. In particular, BlackRock and its affiliates provide the Funds with administrative services including, among others: (i) responsibility for disclosure documents, such as the prospectus, the summary prospectus (as applicable), the statement of additional information and periodic shareholder reports; (ii) oversight of daily accounting and pricing; (iii) responsibility for periodic filings with regulators; (iv) overseeing and coordinating the activities of third-party service providers, including, among others, each Fund’s custodian, fund accountant, transfer agent, and auditor; (v) organizing Board meetings and preparing the materials for such Board meetings; (vi) providing legal and compliance support; (vii) furnishing analytical and other support to assist the Board in its consideration of strategic issues such as the merger, consolidation or repurposing of certain open-end funds; and (viii) performing or managing administrative functions necessary for the operation of the Funds, such as tax reporting, expense management, fulfilling regulatory filing requirements, overseeing each Fund’s distribution partners, and shareholder call center and other services. The Board reviewed the structure and duties of BlackRock’s fund administration, shareholder services, and legal and compliance departments and considered BlackRock’s policies and procedures for assuring compliance with applicable laws and regulations. The Board considered the operation of BlackRock’s business continuity plans, including in light of the ongoing COVID-19 pandemic.
B: The Investment Performance of the Funds and BlackRock
The Board, including the Independent Board Members, reviewed and considered the performance history of each Fund throughout the year and at the April Meeting. In preparation for the April Meeting, the Board was provided with reports independently prepared by Broadridge, which included an analysis of each Fund’s performance as of December 31, 2020, as compared to its Performance Peers. Broadridge ranks funds in quartiles, ranging from first to fourth, where first is the most desirable quartile position and fourth is the least desirable. In connection with its review, with respect to each Fund, the Board received and reviewed information regarding the investment performance of the Fund as compared to its Performance Peers. The Board and its Performance Oversight Committee regularly review, and meet with Fund management to discuss, the performance of each Fund throughout the year.
In evaluating performance, the Board focused particular attention on funds with less favorable performance records. The Board also noted that while it found the data provided by Broadridge generally useful, it recognized the limitations of such data, including in particular, that notable differences may exist between a fund and its Performance Peers (for example, the investment objectives and strategies). Further, the Board recognized that the performance data reflects a snapshot of a period as of a particular date and that selecting a different performance period could produce significantly different results. The Board also acknowledged that long-term performance could be impacted by even one period of significant outperformance or underperformance, and that a single investment theme could have the ability to disproportionately affect long-term performance.
The Board noted that for the one-, three- and five-year periods reported, International Dividend Fund ranked in the first, first and second quartiles, respectively, against its Performance Peers.
The Board noted that for the one-, three- and five-year periods reported, Energy Opportunities Fund ranked in the second, first and first quartiles, respectively, against its Performance Peers.
The Board noted that for the one-, three- and five-year periods reported, High Equity Income Fund ranked in the fourth, third and first quartiles, respectively, against its Performance Peers. The Board and BlackRock reviewed the Fund’s underperformance relative to its Performance Peers during the applicable periods.
C: Consideration of the Advisory/Management Fees and the Estimated Cost of the Services and Estimated Profits Realized by BlackRock and its Affiliates from their Relationship with the Funds
The Board, including the Independent Board Members, reviewed each Fund’s contractual management fee rate compared with those of its Expense Peers. The contractual management fee rate represents a combination of the advisory fee and any administrative fees, before taking into account any reimbursements or fee waivers. The Board also compared each Fund’s total expense ratio, as well as its actual management fee rate, to those of its Expense Peers. The total expense ratio represents a fund’s total net
| 60 | 2 0 2 1 BLACK ROCK ANNUAL REPORT TO SHAREHOLDERS |
Disclosure of Investment Advisory Agreement and Sub-Advisory Agreements (continued)
operating expenses, including any 12b-1 or non-12b-1 service fees. The total expense ratio gives effect to any expense reimbursements or fee waivers, and the actual management fee rate gives effect to any management fee reimbursements or waivers. The Board considered the services provided and the fees charged by BlackRock and its affiliates to other types of clients with similar investment mandates, as applicable, including institutional accounts and sub-advised mutual funds (including mutual funds sponsored by third parties).
The Board received and reviewed statements relating to BlackRock’s financial condition. The Board reviewed BlackRock’s profitability methodology and was also provided with an estimated profitability analysis that detailed the revenues earned and the expenses incurred by BlackRock for services provided to each Fund. The Board reviewed BlackRock’s estimated profitability with respect to each Fund and other funds the Board currently oversees for the year ended December 31, 2020 compared to available aggregate estimated profitability data provided for the prior two years. The Board reviewed BlackRock’s estimated profitability with respect to certain other U.S. fund complexes managed by the Manager and/or its affiliates. The Board reviewed BlackRock’s assumptions and methodology of allocating expenses in the estimated profitability analysis, noting the inherent limitations in allocating costs among various advisory products. The Board recognized that profitability may be affected by numerous factors including, among other things, fee waivers and expense reimbursements by the Manager, the types of funds managed, precision of expense allocations and business mix. The Board thus recognized that calculating and comparing profitability at the individual fund level is difficult.
The Board noted that, in general, individual fund or product line profitability of other advisors is not publicly available. The Board reviewed BlackRock’s overall operating margin, in general, compared to that of certain other publicly-traded asset management firms. The Board considered the differences between BlackRock and these other firms, including the contribution of technology at BlackRock, BlackRock’s expense management, and the relative product mix.
The Board considered whether BlackRock has the financial resources necessary to attract and retain high quality investment management personnel to perform its obligations under the Agreements and to continue to provide the high quality of services that is expected by the Board. The Board further considered factors including but not limited to BlackRock’s commitment of time, assumption of risk, and liability profile in servicing the Funds, including in contrast to what is required of BlackRock with respect to other products with similar investment mandates across the open-end fund, ETF, closed-end fund, sub-advised mutual fund, separately managed account, collective investment trust, and institutional separate account product channels, as applicable.
The Board noted that High Equity Income Fund’s contractual management fee rate ranked in the second quartile, and that the actual management fee rate and total expense ratio each ranked in the second quartile relative to the Fund’s Expense Peers.
The Board noted that each of Energy Opportunities Fund’s and International Dividend Fund’s contractual management fee rate ranked in the third quartile, and that the actual management fee rate and total expense ratio each ranked in the first quartile relative to the Fund’s Expense Peers.
The Board also noted that each Fund has an advisory fee arrangement that includes breakpoints that adjust the fee rate downward as the size of the Fund increases above certain contractually specified levels. The Board noted that if the size of a Fund were to decrease, the Fund could lose the benefit of one or more breakpoints. The Board further noted that BlackRock and the Board have contractually agreed to a cap on each Fund’s total operating expenses as a percentage of the Fund’s average daily net assets on a class-by-class basis.
D: Economies of Scale
The Board, including the Independent Board Members, considered the extent to which economies of scale might be realized as the assets of the Funds increase, including the existence of fee waivers and/or expense caps, as applicable, noting that any contractual fee waivers and contractual expense caps had been approved by the Board. In its consideration, the Board further considered the continuation and/or implementation of fee waivers and/or expense caps, as applicable. The Board also considered the extent to which the Funds benefit from such economies of scale in a variety of ways and whether there should be changes in the advisory fee rate or breakpoint structure in order to enable the Funds to more fully participate in these economies of scale. The Board considered each Fund’s asset levels and whether the current fee schedule was appropriate.
E: Other Factors Deemed Relevant by the Board Members
The Board, including the Independent Board Members, also took into account other ancillary or “fall-out” benefits that BlackRock or its affiliates may derive from BlackRock’s respective relationships with the Funds, both tangible and intangible, such as BlackRock’s ability to leverage its investment professionals who manage other portfolios and its risk management personnel, an increase in BlackRock’s profile in the investment advisory community, and the engagement of BlackRock’s affiliates as service providers to the Funds, including for administrative, distribution, securities lending and cash management services. The Board also considered BlackRock’s overall operations and its efforts to expand the scale of, and improve the quality of, its operations. The Board also noted that, subject to applicable law, BlackRock may use and benefit from third-party research obtained by soft dollars generated by certain registered fund transactions to assist in managing all or a number of its other client accounts.
In connection with its consideration of the Agreements, the Board also received information regarding BlackRock’s brokerage and soft dollar practices. The Board received reports from BlackRock which included information on brokerage commissions and trade execution practices throughout the year.
The Board noted the competitive nature of the open-end fund marketplace, and that shareholders are able to redeem their Fund shares if they believe that the pertinent Fund’s fees and expenses are too high or if they are dissatisfied with the performance of the Fund.
Conclusion
The Board, including the Independent Board Members, unanimously approved the continuation of the Advisory Agreement between the Manager and the Trust, on behalf of each Fund, for a one-year term ending June 30, 2022, and the International Dividend Fund Sub-Advisory Agreement between the Manager and the Sub-Advisor with respect to International Dividend Fund and the Energy Opportunities Fund Sub-Advisory Agreement between the Manager and the Sub-Advisor with respect to Energy Opportunities Fund each for a one-year term ending June 30, 2022. Based upon its evaluation of all of the aforementioned factors in their totality, as well as other information, the Board, including the Independent Board Members, was satisfied that the terms of the Agreements were fair and reasonable and, in the best interest of each Fund and its shareholders. In arriving at its decision to approve the Agreements, the Board did not identify any single factor or group of factors as all-important or controlling, but considered all factors
DISCLOSURE OF INVESTMENT ADVISORY AGREEMENT AND SUB - ADVISORY AGREEMENTS | 61 |
Disclosure of Investment Advisory Agreement and Sub-Advisory Agreements (continued)
together, and different Board Members may have attributed different weights to the various factors considered. The Independent Board Members were also assisted by the advice of independent legal counsel in making this determination.
| 62 | 2 0 2 1 BLACK ROCK ANNUAL REPORT TO SHAREHOLDERS |
Trustee and Officer Information
| Independent Trustees(a) | ||||||||
Name Year of Birth(b) | Position(s) Held (Length of Service)(c) | Principal Occupation(s) During Past Five Years | Number of BlackRock-Advised Registered Investment Companies (“RICs”) Consisting of Investment Portfolios (“Portfolios”) Overseen | Public Company and Other Investment Company Directorships Held During Past Five Years | ||||
| Mark Stalnecker 1951 | Chair of the Board (Since 2019) and Trustee (Since 2015) | Chief Investment Officer, University of Delaware from 1999 to 2013; Trustee and Chair of the Finance and Investment Committees, Winterthur Museum and Country Estate from 2005 to 2016; Member of the Investment Committee, Delaware Public Employees’ Retirement System since 2002; Member of the Investment Committee, Christiana Care Health System from 2009 to 2017; Member of the Investment Committee, Delaware Community Foundation from 2013 to 2014; Director and Chair of the Audit Committee, SEI Private Trust Co. from 2001 to 2014. | 30 RICs consisting of 152 Portfolios | None | ||||
| Bruce R. Bond 1946 | Trustee (Since 2019) | Board Member, Amsphere Limited (software) since 2018; Trustee and Member of the Governance Committee, State Street Research Mutual Funds from 1997 to 2005; Board Member of Governance, Audit and Finance Committee, Avaya Inc. (computer equipment) from 2003 to 2007. | 30 RICs consisting of 152 Portfolios | None | ||||
| Susan J. Carter 1956 | Trustee (Since 2016) | Director, Pacific Pension Institute from 2014 to 2018; Advisory Board Member, Center for Private Equity and Entrepreneurship at Tuck School of Business since 1997; Senior Advisor, Commonfund Capital, Inc. (“CCI”) (investment adviser) in 2015; Chief Executive Officer, CCI from 2013 to 2014; President & Chief Executive Officer, CCI from 1997 to 2013; Advisory Board Member, Girls Who Invest from 2015 to 2018 and Board Member thereof since 2018; Advisory Board Member, Bridges Fund Management since 2016; Trustee, Financial Accounting Foundation since 2017; Practitioner Advisory Board Member, Private Capital Research Institute (“PCRI”) since 2017; Lecturer in the Practice of Management, Yale School of Management since 2019; Advisor to Finance Committee, Altman Foundation since 2020. | 30 RICs consisting of 152 Portfolios | None | ||||
| Collette Chilton 1958 | Trustee (Since 2015) | Chief Investment Officer, Williams College since 2006; Chief Investment Officer, Lucent Asset Management Corporation from 1998 to 2006; Director, Boys and Girls Club of Boston since 2017; Director, B1 Capital since 2018; Director, David and Lucile Packard Foundation since 2020. | 30 RICs consisting of 152 Portfolios | None | ||||
| Neil A. Cotty 1954 | Trustee (Since 2016) | Bank of America Corporation from 1996 to 2015, serving in various senior finance leadership roles, including Chief Accounting Officer from 2009 to 2015, Chief Financial Officer of Global Banking, Markets and Wealth Management from 2008 to 2009, Chief Accounting Officer from 2004 to 2008, Chief Financial Officer of Consumer Bank from 2003 to 2004, Chief Financial Officer of Global Corporate Investment Bank from 1999 to 2002. | 30 RICs consisting of 152 Portfolios | None | ||||
| Lena G. Goldberg 1949 | Trustee (Since 2019) | Senior Lecturer, Harvard Business School, since 2008; Director, Charles Stark Draper Laboratory, Inc. since 2013; FMR LLC/Fidelity Investments (financial services) from 1996 to 2008, serving in various senior roles including Executive Vice President - Strategic Corporate Initiatives and Executive Vice President and General Counsel; Partner, Sullivan & Worcester LLP from 1985 to 1996 and Associate thereof from 1979 to 1985. | 30 RICs consisting of 152 Portfolios | None | ||||
| Henry R. Keizer 1956 | Trustee (Since 2019) | Director, Park Indemnity Ltd. (captive insurer) since 2010; Director, MUFG Americas Holdings Corporation and MUFG Union Bank, N.A. (financial and bank holding company) from 2014 to 2016; Director, American Institute of Certified Public Accountants from 2009 to 2011; Director, KPMG LLP (audit, tax and advisory services) from 2004 to 2005 and 2010 to 2012; Director, KPMG International in 2012, Deputy Chairman and Chief Operating Officer thereof from 2010 to 2012 and U.S. Vice Chairman of Audit thereof from 2005 to 2010; Global Head of Audit, KPMGI (consortium of KPMG firms) from 2006 to 2010; Director, YMCA of Greater New York from 2006 to 2010. | 30 RICs consisting of 152 Portfolios | Hertz Global Holdings (car rental); Sealed Air Corp. (packaging); Montpelier Re Holdings, Ltd. (publicly held property and casualty reinsurance) from 2013 until 2015; WABCO (commercial vehicle safety systems) from 2015 to 2020 | ||||
TRUSTEE AND OFFICER INFORMATION | 63 |
Trustee and Officer Information (continued)
| Independent Trustees(a) | ||||||||
Name Year of Birth(b) | Position(s) Held (Length of Service)(c) | Principal Occupation(s) During Past Five Years | Number of BlackRock-Advised Registered Investment Companies (“RICs”) Consisting of Investment Portfolios (“Portfolios”) Overseen | Public Company and Other Investment Company Directorships Held During Past Five Years | ||||
| Cynthia A. Montgomery 1952 | Trustee (Since 2007) | Professor, Harvard Business School since 1989. | 30 RICs consisting of 152 Portfolios | Newell Rubbermaid, Inc. (manufacturing) from 1995 to 2016. | ||||
| Donald C. Opatrny 1952 | Trustee (Since 2019) | Trustee, Vice Chair, Member of the Executive Committee and Chair of the Investment Committee, Cornell University from 2004 to 2019; President, Trustee and Member of the Investment Committee, The Aldrich Contemporary Art Museum from 2007 to 2014; Member of the Board and Investment Committee, University School from 2007 to 2018; Member of the Investment Committee, Mellon Foundation from 2009 to 2015; Trustee, Artstor (a Mellon Foundation affiliate) from 2010 to 2015; President and Trustee, the Center for the Arts, Jackson Hole from 2011 to 2018; Director, Athena Capital Advisors LLC (investment management firm) since 2013; Trustee and Chair of the Investment Committee, Community Foundation of Jackson Hole since 2014; Member of Affordable Housing Supply Board of Jackson, Wyoming since 2017; Member, Investment Funds Committee, State of Wyoming since 2017; Trustee, Phoenix Art Museum since 2018; Trustee, Arizona Community Foundation and Member of Investment Committee since 2020. | 30 RICs consisting of 152 Portfolios | None | ||||
| Joseph P. Platt 1947 | Trustee (Since 2007) | General Partner, Thorn Partners, LP (private investments) since 1998; Director, WQED Multi-Media (public broadcasting not-for-profit) since 2001; Chair, Basic Health International (non-profit) since 2015. | 30 RICs consisting of 152 Portfolios | Greenlight Capital Re, Ltd. (reinsurance company); Consol Energy Inc. | ||||
| Kenneth L. Urish 1951 | Trustee (Since 2007) | Managing Partner, Urish Popeck & Co., LLC (certified public accountants and consultants) since 1976; Past-Chairman of the Professional Ethics Committee of the Pennsylvania Institute of Certified Public Accountants and Committee Member thereof since 2007; Member of External Advisory Board, The Pennsylvania State University Accounting Department since founding in 2001; Principal, UP Strategic Wealth Investment Advisors, LLC since 2013; Trustee, The Holy Family Institute from 2001 to 2010; President and Trustee, Pittsburgh Catholic Publishing Associates from 2003 to 2008; Director, Inter-Tel from 2006 to 2007; Member, Advisory Board, ESG Competent Boards since 2020. | 30 RICs consisting of 152 Portfolios | None | ||||
| Claire A. Walton 1957 | Trustee (Since 2016) | Chief Operating Officer and Chief Financial Officer of Liberty Square Asset Management, LP from 1998 to 2015; General Partner of Neon Liberty Capital Management, LLC since 2003; Director, Boston Hedge Fund Group from 2009 to 2018; Director, Woodstock Ski Runners since 2013; Director, Massachusetts Council on Economic Education from 2013 to 2015. | 30 RICs consisting of 152 Portfolios | None | ||||
| 64 | 2 0 2 1 BLACK ROCK ANNUAL REPORT TO SHAREHOLDERS |
Trustee and Officer Information (continued)
| Interested Trustees(a)(d) | ||||||||
Name Year of Birth(b) | Position(s) Held (Length of Service)(c) | Principal Occupation(s) During Past Five Years | Number of BlackRock-Advised Registered Investment Companies (“RICs”) Consisting of Investment Portfolios (“Portfolios”) Overseen | Public Company and Other Investment Company Directorships Held During Past Five Years | ||||
| Robert Fairbairn 1965 | Trustee (Since 2018) | Vice Chairman of BlackRock, Inc. since 2019; Member of BlackRock’s Global Executive and Global Operating Committees; Co-Chair of BlackRock’s Human Capital Committee; Senior Managing Director of BlackRock, Inc. from 2010 to 2019; oversaw BlackRock’s Strategic Partner Program and Strategic Product Management Group from 2012 to 2019; Member of the Board of Managers of BlackRock Investments, LLC from 2011 to 2018; Global Head of BlackRock’s Retail and iShares® businesses from 2012 to 2016. | 103 RICs consisting of 251 Portfolios | None | ||||
| John M. Perlowski(e) 1964 | Trustee (Since 2015), President and Chief Executive Officer (Since 2010) | Managing Director of BlackRock, Inc. since 2009; Head of BlackRock Global Accounting and Product Services since 2009; Advisory Director of Family Resource Network (charitable foundation) since 2009. | 105 RICs consisting of 253 Portfolios | None | ||||
| (a) | The address of each Trustee is c/o BlackRock, Inc., 55 East 52nd Street, New York, New York 10055. |
| (b) | Each Independent Trustee holds office until his or her successor is duly elected and qualifies or until his or her earlier death, resignation, retirement or removal as provided by the Fund’s by-laws or charter or statute, or until December 31 of the year in which he or she turns 75. Trustees who are “interested persons,” as defined in the 1940 Act, serve until their successor is duly elected and qualifies or until their earlier death, resignation, retirement or removal as provided by the Trust’s by-laws or statute, or until December 31 of the year in which they turn 72. The Board may determine to extend the terms of Independent Trustees on a case-by-case basis, as appropriate. |
| (c) | Following the combination of Merrill Lynch Investment Managers, L.P. (“MLIM”) and BlackRock, Inc. in September 2006, the various legacy MLIM and legacy BlackRock fund boards were realigned and consolidated into three new fund boards in 2007. In addition, effective January 1, 2019, three BlackRock Fund Complexes were realigned and consolidated into two BlackRock Fund Complexes. As a result, although the chart shows the year that each Independent Trustee joined the Board, certain Independent Trustees first became members of the boards of other BlackRock-advised Funds, legacy MLIM funds or legacy BlackRock funds as follows: Bruce R. Bond, 2005; Susan J. Carter, 2016; Collette Chilton, 2015; Neil A. Cotty, 2016; Robert M. Hernandez, 1996; Cynthia A. Montgomery, 1994; Joseph P. Platt, 1999; Mark Stalnecker, 2015; Kenneth L. Urish, 1999; Claire A. Walton, 2016. |
| (d) | Mr. Fairbairn and Mr. Perlowski are both “interested persons,” as defined in the 1940 Act, of the Trust based on their positions with BlackRock, Inc. and its affiliates. Mr. Fairbairn and Mr. Perlowski are also board members of the BlackRock Fixed-Income Complex. |
| (e) | Mr. Perlowski is also a trustee of the BlackRock Credit Strategies Fund and BlackRock Private Investments Fund. |
TRUSTEE AND OFFICER INFORMATION | 65 |
Trustee and Officer Information (continued)
| Officers Who Are Not Trustees(a) | ||||
Name Year of Birth(b) | Position(s) Held (Length of Service) | Principal Occupation(s) During Past Five Years | ||
| Thomas Callahan 1968 | Vice President (Since 2016) | Managing Director of BlackRock, Inc. since 2013; Member of the Board of Managers of BlackRock Investments, LLC (principal underwriter) since 2019 and Managing Director thereof since 2017; Head of BlackRock’s Global Cash Management Business since 2016; Co-Head of the Global Cash Management Business from 2014 to 2016; Deputy Head of the Global Cash Management Business from 2013 to 2014; Member of the Cash Management Group Executive Committee since 2013; Chief Executive Officer of NYSE Liffe U.S. from 2008 to 2013. | ||
| Jennifer McGovern 1977 | Vice President (Since 2014) | Managing Director of BlackRock, Inc. since 2016; Director of BlackRock, Inc. from 2011 to 2015; Head of Americas Product Development and Governance for BlackRock’s Global Product Group since 2019; Head of Product Structure and Oversight for BlackRock’s U.S. Wealth Advisory Group from 2013 to 2019. | ||
| Trent Walker 1974 | Chief Financial Officer (Since 2021) | Managing Director of BlackRock, Inc. since September 2019; Executive Vice President of PIMCO from 2016 to 2019; Senior Vice President of PIMCO from 2008 to 2015; Treasurer from 2013 to 2019 and Assistant Treasurer from 2007 to 2017 of PIMCO Funds, PIMCO Variable Insurance Trust, PIMCO ETF Trust, PIMCO Equity Series, PIMCO Equity Series VIT, PIMCO Managed Accounts Trust, 2 PIMCO-sponsored interval funds and 21 PIMCO-sponsored closed-end funds. | ||
| Jay M. Fife 1970 | Treasurer (Since 2007) | Managing Director of BlackRock, Inc. since 2007. | ||
| Charles Park 1967 | Chief Compliance Officer (Since 2014) | Anti-Money Laundering Compliance Officer for certain BlackRock-advised Funds from 2014 to 2015; Chief Compliance Officer of BlackRock Advisors, LLC and the BlackRock-advised Funds in the BlackRock Multi-Asset Complex and the BlackRock Fixed-Income Complex since 2014; Principal of and Chief Compliance Officer for iShares® Delaware Trust Sponsor LLC since 2012 and BlackRock Fund Advisors (“BFA”) since 2006; Chief Compliance Officer for the BFA-advised iShares® exchange traded funds since 2006; Chief Compliance Officer for BlackRock Asset Management International Inc. since 2012. | ||
| Lisa Belle 1968 | Anti-Money Laundering Compliance Officer (Since 2019) | Managing Director of BlackRock, Inc. since 2019; Global Financial Crime Head for Asset and Wealth Management of JP Morgan from 2013 to 2019; Managing Director of RBS Securities from 2012 to 2013; Head of Financial Crimes for Barclays Wealth Americas from 2010 to 2012. | ||
| Janey Ahn 1975 | Secretary (Since 2019) | Managing Director of BlackRock, Inc. since 2018; Director of BlackRock, Inc. from 2009 to 2017. | ||
| (a) | The address of each Officer is c/o BlackRock, Inc., 55 East 52nd Street, New York, New York 10055. |
| (b) | Officers of the Trust serve at the pleasure of the Board. |
Further information about the Trust’s Trustees and Officers is available in the Trust’s Statement of Additional Information, which can be obtained without charge by calling (800) 441-7762.
| 66 | 2 0 2 1 BLACK ROCK ANNUAL REPORT TO SHAREHOLDERS |
General Information
Quarterly performance, semi-annual and annual reports, current net asset value and other information regarding the Funds may be found on BlackRock’s website, which can be accessed at blackrock.com. Any reference to BlackRock’s website in this report is intended to allow investors public access to information regarding the Funds and does not, and is not intended to, incorporate BlackRock’s website in this report.
Householding
The Funds will mail only one copy of shareholder documents, including prospectuses, annual and semi-annual reports, Rule 30e-3 notices and proxy statements, to shareholders with multiple accounts at the same address. This practice is commonly called “householding” and is intended to reduce expenses and eliminate duplicate mailings of shareholder documents. Mailings of your shareholder documents may be householded indefinitely unless you instruct us otherwise. If you do not want the mailing of these documents to be combined with those for other members of your household, please call the Funds at (800) 441-7762.
Availability of Quarterly Schedule of Investments
The Funds file their complete schedules of portfolio holdings with the SEC for the first and third quarters of each fiscal year as an exhibit to their reports on Form N-PORT. The Funds’ Forms N-PORT are available on the SEC’s website at sec.gov. Additionally, each Fund makes its portfolio holdings for the first and third quarters of each fiscal year available at blackrock.com/fundreports.
Availability of Proxy Voting Policies, Procedures and Voting Records
A description of the policies and procedures that the Funds use to determine how to vote proxies relating to portfolio securities and information about how the Funds voted proxies relating to securities held in the Funds’ portfolios during the most recent 12-month period ended June 30 is available without charge, upon request (1) by calling (800) 441-7762; (2) on the BlackRock website at blackrock.com; and (3) on the SEC’s website at sec.gov.
BlackRock’s Mutual Fund Family
BlackRock offers a diverse lineup of open-end mutual funds crossing all investment styles and managed by experts in equity, fixed-income and tax-exempt investing. Visit blackrock.com for more information.
Shareholder Privileges
Account Information
Call us at (800) 441-7762 from 8:00 AM to 6:00 PM ET on any business day to get information about your account balances, recent transactions and share prices. You can also visit blackrock.com for more information.
Automatic Investment Plans
Investor class shareholders who want to invest regularly can arrange to have $50 or more automatically deducted from their checking or savings account and invested in any of the BlackRock funds.
Systematic Withdrawal Plans
Investor class shareholders can establish a systematic withdrawal plan and receive periodic payments of $50 or more from their BlackRock funds, as long as their account balance is at least $10,000.
Retirement Plans
Shareholders may make investments in conjunction with Traditional, Rollover, Roth, Coverdell, Simple IRAs, SEP IRAs and 403(b) Plans.
ADDITIONAL INFORMATION | 67 |
Additional Information (continued)
BlackRock Privacy Principles
BlackRock is committed to maintaining the privacy of its current and former fund investors and individual clients (collectively, “Clients”) and to safeguarding their non-public personal information. The following information is provided to help you understand what personal information BlackRock collects, how we protect that information and why in certain cases we share such information with select parties.
If you are located in a jurisdiction where specific laws, rules or regulations require BlackRock to provide you with additional or different privacy-related rights beyond what is set forth below, then BlackRock will comply with those specific laws, rules or regulations.
BlackRock obtains or verifies personal non-public information from and about you from different sources, including the following: (i) information we receive from you or, if applicable, your financial intermediary, on applications, forms or other documents; (ii) information about your transactions with us, our affiliates, or others; (iii) information we receive from a consumer reporting agency; and (iv) from visits to our websites.
BlackRock does not sell or disclose to non-affiliated third parties any non-public personal information about its Clients, except as permitted by law or as is necessary to respond to regulatory requests or to service Client accounts. These non-affiliated third parties are required to protect the confidentiality and security of this information and to use it only for its intended purpose.
We may share information with our affiliates to service your account or to provide you with information about other BlackRock products or services that may be of interest to you. In addition, BlackRock restricts access to non-public personal information about its Clients to those BlackRock employees with a legitimate business need for the information. BlackRock maintains physical, electronic and procedural safeguards that are designed to protect the non-public personal information of its Clients, including procedures relating to the proper storage and disposal of such information.
Fund and Service Providers
| Investment Adviser and Administrator | Independent Registered Public Accounting Firm | |
| BlackRock Advisors, LLC | Deloitte & Touche LLP | |
| Wilmington, DE 19809 | Boston, MA 02116 | |
| Sub-Adviser(a) | Distributor | |
| BlackRock International Limited | BlackRock Investments, LLC | |
| Edinburgh, EH3 8BL | New York, NY 10022 | |
| United Kingdom | ||
| Legal Counsel | ||
| Accounting Agent and Transfer Agent | Sidley Austin LLP | |
| BNY Mellon Investment Servicing (US) Inc. | New York, NY 10019-6018 | |
| Wilmington, DE 19809 | ||
| Address of the Trust | ||
| Custodian | 100 Bellevue Parkway | |
| The Bank of New York Mellon | Wilmington, DE 19809 | |
| New York, NY 10286 | ||
(a) BlackRock Energy Opportunities Fund and BlackRock International Dividend Fund.
| 68 | 2 0 2 1 BLACK ROCK ANNUAL REPORT TO SHAREHOLDERS |
Glossary of Terms Used in this Report
| Currency Abbreviation | ||
| EUR | Euro | |
| GBP | British Pound | |
| USD | United States Dollar | |
| Portfolio Abbreviation | ||
| ADR | American Depositary Receipt | |
| GDR | Global Depositary Receipt | |
GLOSSARY OF TERMS USED IN THIS REPORT | 69 |
Want to know more?
blackrock.com | 800-441-7762
This report is intended for current holders. It is not authorized for use as an offer of sale or a solicitation of an offer to buy shares of the Funds unless preceded or accompanied by the Funds’ current prospectus. Past performance results shown in this report should not be considered a representation of future performance. Investment returns and principal value of shares will fluctuate so that shares, when redeemed, may be worth more or less than their original cost. Statements and other information herein are as dated and are subject to change.
EHI-5/21-AR
|  |
(b) Not Applicable
| Item 3 – | Audit Committee Financial Expert – The registrant’s board of directors (the “board of directors”), has determined that (i) the registrant has the following audit committee financial experts serving on its audit committee and (ii) each audit committee financial expert is independent: |
Neil A. Cotty
Henry R. Keizer
Kenneth L. Urish
Under applicable securities laws, a person determined to be an audit committee financial expert will not be deemed an “expert” for any purpose, including without limitation for the purposes of Section 11 of the Securities Act of 1933, as a result of being designated or identified as an audit committee financial expert. The designation or identification of a person as an audit committee financial expert does not impose on such person any duties, obligations, or liabilities greater than the duties, obligations, and liabilities imposed on such person as a member of the audit committee and board of directors in the absence of such designation or identification. The designation or identification of a person as an audit committee financial expert does not affect the duties, obligations, or liability of any other member of the audit committee or board of directors.
| Item 4 – | Principal Accountant Fees and Services |
The following table presents fees billed by Deloitte & Touche LLP (“D&T”) in each of the last two fiscal years for the services rendered to the Fund:
| (a) Audit Fees | (b) Audit-Related Fees1 | (c) Tax Fees2 | (d) All Other Fees | |||||||||||||
| Entity Name | Current Fiscal Year End | Previous Fiscal Year End3 | Current Fiscal Year End | Previous Fiscal Year End3 | Current Fiscal Year End | Previous Fiscal Year End3 | Current Fiscal Year End | Previous Fiscal Year End3 | ||||||||
| BlackRock Advantage International Fund | $32,118 | $33,150 | $207 | $0 | $15,800 | $13,700 | $0 | $0 | ||||||||
| BlackRock Advantage Large Cap Growth Fund | $18,382 | $18,972 | $207 | $0 | $14,800 | $12,700 | $0 | $0 | ||||||||
| BlackRock Advantage Small Cao Core Fund | $29,694 | $30,600 | $207 | $0 | $14,800 | $14,800 | $0 | $0 | ||||||||
| BlackRock Energy Opportunities Fund | $17,877 | $18,462 | $207 | $6,500 | $16,900 | $25,800 | $0 | $0 | ||||||||
| BlackRock High Equity Income Fund | $21,513 | $22,134 | $207 | $4,000 | $14,800 | $12,700 | $0 | $0 | ||||||||
| BlackRock International Dividend Fund | $24,543 | $25,296 | $207 | $0 | $15,800 | $13,700 | $0 | $0 | ||||||||
2
The following table presents fees billed by D&T that were required to be approved by the registrant’s audit committee (the “Committee”) for services that relate directly to the operations or financial reporting of the Fund and that are rendered on behalf of BlackRock Advisors, LLC (the “Investment Adviser” or “BlackRock”) and entities controlling, controlled by, or under common control with BlackRock (not including any sub-adviser whose role is primarily portfolio management and is subcontracted with or overseen by another investment adviser) that provide ongoing services to the Fund (“Affiliated Service Providers”):
| Current Fiscal Year End | Previous Fiscal Year End3 | |||
(b) Audit-Related Fees1 | $0 | $0 | ||
(c) Tax Fees2 | $0 | $0 | ||
(d) All Other Fees4 | $2,032,000 | $1,984,000 |
1 The nature of the services includes assurance and related services reasonably related to the performance of the audit or review of financial statements not included in Audit Fees, including accounting consultations, agreed-upon procedure reports, attestation reports, comfort letters, out-of-pocket expenses and internal control reviews not required by regulators.
2 The nature of the services includes tax compliance and/or tax preparation, including services relating to the filing or amendment of federal, state or local income tax returns, regulated investment company qualification reviews, taxable income and tax distribution calculations.
3Certain funds of the registrant changed their fiscal year end from September 30 to May 31 effective May 31, 2020 whereby this fiscal year consists of the eight months ended May 31, 2020.
4 Non-audit fees of $2,032,000 and $1,984,000 for the current fiscal year and previous fiscal year, respectively, were paid to the Fund’s principal accountant in their entirety by BlackRock, in connection with services provided to the Affiliated Service Providers of the Fund and of certain other funds sponsored and advised by BlackRock or its affiliates for a service organization review and an accounting research tool subscription. These amounts represent aggregate fees paid by BlackRock and were not allocated on a per fund basis.
(e)(1) Audit Committee Pre-Approval Policies and Procedures:
The Committee has adopted policies and procedures with regard to the pre-approval of services. Audit, audit-related and tax compliance services provided to the registrant on an annual basis require specific pre-approval by the Committee. The Committee also must approve other non-audit services provided to the registrant and those non-audit services provided to the Investment Adviser and Affiliated Service Providers that relate directly to the operations and the financial reporting of the registrant. Certain of these non-audit services that the Committee believes are (a) consistent with the SEC’s auditor independence rules and (b) routine and recurring services that will not impair the independence of the independent accountants may be approved by the Committee without consideration on a specific case-by-case basis (“general pre-approval”). The term of any general pre-approval is 12 months from the date of the pre-approval, unless the Committee provides for a different period. Tax or other non-audit services provided to the registrant which have a direct impact on the operations or financial reporting of the registrant will only be deemed pre-approved provided that any individual project does not exceed $10,000 attributable to the registrant or $50,000 per project. For this purpose, multiple projects will be aggregated to determine if they exceed the previously mentioned cost levels.
Any proposed services exceeding the pre-approved cost levels will require specific pre-approval by the Committee, as will any other services not subject to general pre-approval (e.g., unanticipated but permissible services). The Committee is informed of each service approved subject to general pre-approval at the next regularly scheduled in-person board meeting. At this meeting, an analysis of such services is presented to the Committee for ratification. The Committee may delegate to the Committee Chairman the authority to approve the provision of and fees for any specific engagement of permitted non-audit services, including services exceeding pre-approved cost levels.
3
(e)(2) None of the services described in each of Items 4(b) through (d) were approved by the Committee pursuant to the de minimis exception in paragraph (c)(7)(i)(C) of Rule 2-01 of Regulation S-X.
(f) Not Applicable
(g) The aggregate non-audit fees, defined as the sum of the fees shown under “Audit-Related Fees,” “Tax Fees” and “All Other Fees,” paid to the accountant for services rendered by the accountant to the registrant, the Investment Adviser and the Affiliated Service Providers were:
| Entity Name | Current Fiscal Year End | Previous Fiscal Year End1 | ||
| BlackRock Advantage International Fund | $16,007 | $13,700 | ||
| BlackRock Advantage Large Cap Growth Fund | $15,007 | $12,700 | ||
| BlackRock Advantage Small Cap Core Fund | $15,007 | $14,800 | ||
| BlackRock Energy Opportunities Fund | $17,107 | $32,300 | ||
| BlackRock High Equity Income Fund | $15,007 | $16,700 | ||
| BlackRock International Dividend Fund | $16,007 | $13,700 |
1Certain funds of the registrant changed their fiscal year end from September 30 to May 31 effective May 31, 2020 whereby this fiscal year consists of the eight months ended May 31, 2020.
Additionally, the amounts billed by D&T in connection with services provided to the Affiliated Service Providers of the Fund and of other funds sponsored and advised by BlackRock or its affiliates during the current and previous fiscal years for a service organization review and an accounting research tool subscription were:
| Current Fiscal Year End | Previous Fiscal Year End 1 | |
$2,032,000 | $1,984,000 |
1Certain funds of the registrant changed their fiscal year end from September 30 to May 31 effective May 31, 2020 whereby this fiscal year consists of the eight months ended May 31, 2020.
These amounts represent aggregate fees paid by BlackRock and were not allocated on a per fund basis.
(h) The Committee has considered and determined that the provision of non-audit services that were rendered to the Investment Adviser and the Affiliated Service Providers that were not pre-approved pursuant to paragraph (c)(7)(ii) of Rule 2-01 of Regulation S-X is compatible with maintaining the principal accountant’s independence.
| Item 5 – | Audit Committee of Listed Registrant – Not Applicable |
| Item 6 – | Investments |
(a) The registrant’s Schedule of Investments is included as part of the Report to Stockholders filed under Item 1(a) of this Form.
(b) Not Applicable due to no such divestments during the semi-annual period covered since the previous Form N-CSR filing.
4
| Item 7 – | Disclosure of Proxy Voting Policies and Procedures for Closed-End Management Investment Companies – Not Applicable |
| Item 8 – | Portfolio Managers of Closed-End Management Investment Companies – Not Applicable |
| Item 9 – | Purchases of Equity Securities by Closed-End Management Investment Company and Affiliated Purchasers – Not Applicable |
| Item 10 – | Submission of Matters to a Vote of Security Holders – There have been no material changes to these procedures. |
| Item 11 – | Controls and Procedures |
(a) The registrant’s principal executive and principal financial officers, or persons performing similar functions, have concluded that the registrant’s disclosure controls and procedures (as defined in Rule 30a-3(c) under the Investment Company Act of 1940, as amended (the “1940 Act”)) are effective as of a date within 90 days of the filing of this report based on the evaluation of these controls and procedures required by Rule 30a-3(b) under the 1940 Act and Rule 15d-15(b) under the Securities Exchange Act of 1934, as amended.
(b) There were no changes in the registrant’s internal control over financial reporting (as defined in Rule 30a-3(d) under the 1940 Act) that occurred during the period covered by this report that have materially affected, or are reasonably likely to materially affect, the registrant’s internal control over financial reporting.
| Item 12 – | Disclosure of Securities Lending Activities for Closed-End Management Investment Companies – Not Applicable |
| Item 13 – | Exhibits attached hereto |
(a)(1) Code of Ethics – See Item 2
(a)(2) Section 302 Certifications are attached
(a)(3) Not Applicable
(a)(4) Not Applicable
(b) Section 906 Certifications are attached
5
Pursuant to the requirements of the Securities Exchange Act of 1934 and the Investment Company Act of 1940, the registrant has duly caused this report to be signed on its behalf by the undersigned, thereunto duly authorized.
BlackRock FundsSM
| By: | /s/ John M. Perlowski | |||
| John M. Perlowski | ||||
| Chief Executive Officer (principal executive officer) of | ||||
| BlackRock FundsSM |
Date: August 4, 2021
Pursuant to the requirements of the Securities Exchange Act of 1934 and the Investment Company Act of 1940, this report has been signed below by the following persons on behalf of the registrant and in the capacities and on the dates indicated.
| By: | /s/ John M. Perlowski | |||
| John M. Perlowski | ||||
| Chief Executive Officer (principal executive officer) of | ||||
| BlackRock FundsSM |
Date: August 4, 2021
| By: | /s/ Trent Walker | |||
Trent Walker | ||||
| Chief Financial Officer (principal financial officer) of | ||||
| BlackRock FundsSM |
Date: August 4, 2021
6