UNITED STATES
SECURITIES AND EXCHANGE COMMISSION
Washington, D.C. 20549
FORM N-CSR
CERTIFIED SHAREHOLDER REPORT OF REGISTERED MANAGEMENT
INVESTMENT COMPANIES
Investment Company Act file number: 811-05742
| Name of Fund: | BlackRock Funds |
| BlackRock Advantage Emerging Markets Fund |
| BlackRock Global Long/Short Equity Fund |
| Fund Address: | 100 Bellevue Parkway, Wilmington, DE 19809 |
Name and address of agent for service: John M. Perlowski, Chief Executive Officer, BlackRock Funds, 55 East 52nd Street, New York, NY 10055
Registrant’s telephone number, including area code: (800) 441-7762
Date of fiscal year end: 04/30/2022
Date of reporting period: 04/30/2022
Item 1 – Report to Stockholders
| (a) | The Report to Shareholders is attached herewith. |
| APRIL 30, 2022 |

2022 Annual Report
| ||
BlackRock FundsSM
| · | BlackRock Advantage Emerging Markets Fund |
| · | BlackRock Global Long/Short Equity Fund |
Not FDIC Insured • May Lose Value • No Bank Guarantee
|
Dear Shareholder,
The 12-month reporting period as of April 30, 2022 saw the emergence of significant challenges that disrupted the economic recovery and strong financial markets which characterized 2021. The U.S. economy shrank in the first quarter of 2022, ending the run of robust growth which followed reopening and the development of the COVID-19 vaccines. Rapid changes in consumer spending led to supply constraints and elevated inflation, which reached a 40-year high. Moreover, while the foremost effect of Russia’s invasion of Ukraine has been a severe humanitarian crisis, the invasion has presented challenges for both investors and policymakers.
Equity prices were mixed but mostly down, as persistently high inflation drove investors’ expectations for higher interest rates, particularly weighing on relatively high valuation growth stocks and economically sensitive small-capitalization stocks. Overall, small-capitalization U.S. stocks declined, while large-capitalization U.S. stocks were nearly flat. Both emerging market stocks and international equities from developed markets fell significantly, pressured by rising interest rates and a strengthening U.S. dollar.
The 10-year U.S. Treasury yield (which is inversely related to bond prices) rose during the reporting period as increasing inflation drove investors’ expectations for higher interest rates. The corporate bond market also faced inflationary headwinds, and increasing uncertainty led to higher corporate bond spreads (the difference in yield between U.S. Treasuries and similarly-dated corporate bonds).
The U.S. Federal Reserve (the “Fed”), acknowledging that inflation is growing faster than expected, raised interest rates in March 2022, the first increase of this business cycle. Furthermore, the Fed wound down its bond-buying programs and raised the prospect of reversing the flow and reducing its balance sheet. Continued high inflation and the Fed’s new tone led many analysts to anticipate that the Fed will continue to raise interest rates multiple times throughout the year.
Looking ahead, however, the horrific war in Ukraine has significantly clouded the outlook for the global economy, leading to major volatility in energy and metal markets. Sanctions on Russia, Europe’s top energy supplier, and general wartime disruption are likely to drive already-high commodity prices even higher. We believe sharp increases in energy prices will exacerbate inflationary pressure while also constraining economic growth. Combating inflation without stifling a recovery, while buffering against ongoing supply and price shocks amid the ebb and flow of the pandemic, will be an especially challenging environment for setting effective monetary policy. Despite the likelihood of more rate increases on the horizon, we believe the Fed will err on the side of protecting employment, even at the expense of higher inflation.
In this environment, we favor an overweight to equities, as valuations have become more attractive and inflation-adjusted interest rates remain low. Sectors that are better poised to manage the transition to a lower-carbon world, such as technology and healthcare, are particularly attractive in the long term. We favor U.S. equities due to strong earnings momentum, while Japanese equities should benefit from supportive monetary and fiscal policy. We are underweight credit overall, but inflation-protected U.S. Treasuries, Asian fixed income, and emerging market local-currency bonds offer potential opportunities for additional yield. We believe that international diversification and a focus on sustainability and quality can help provide portfolio resilience.
Overall, our view is that investors need to think globally, extend their scope across a broad array of asset classes, and be nimble as market conditions change. We encourage you to talk with your financial advisor and visit blackrock.com for further insight about investing in today’s markets.
Sincerely,

Rob Kapito
President, BlackRock Advisors, LLC

Rob Kapito
President, BlackRock Advisors, LLC
| Total Returns as of April 30, 2022 | ||||
| 6-Month | 12-Month | |||
U.S. large cap equities | (9.65)% | 0.21% | ||
U.S. small cap equities | (18.38) | (16.87) | ||
International equities | (11.80) | (8.15) | ||
Emerging market equities | (14.15) | (18.33) | ||
3-month Treasury bills | 0.07 | 0.08 | ||
U.S. Treasury securities | (10.29) | (8.86) | ||
U.S. investment grade bonds | (9.47) | (8.51) | ||
Tax-exempt municipal bonds | (7.90) | (7.88) | ||
U.S. high yield bonds | (7.40) | (5.22) | ||
Past performance is not an indication of future results. Index performance is shown for illustrative purposes only. You cannot invest directly in an index. | ||||
| 2 | THIS PAGE IS NOT PART OF YOUR FUND REPORT |
| Page | ||||
| 2 | ||||
Annual Report: | ||||
| 4 | ||||
| 10 | ||||
| 10 | ||||
| 10 | ||||
Financial Statements: | ||||
| 11 | ||||
| 118 | ||||
| 120 | ||||
| 121 | ||||
| 122 | ||||
| 130 | ||||
| 144 | ||||
| 145 | ||||
| 146 | ||||
| 147 | ||||
| 151 | ||||
| 153 | ||||

| 3 |
| Fund Summary as of April 30, 2022 | BlackRock Advantage Emerging Markets Fund |
Investment Objective
BlackRock Advantage Emerging Markets Fund’s (the “Fund”) investment objective is to seek long-term capital appreciation.
Portfolio Management Commentary
How did the Fund perform?
During the 12-month period ended April 30, 2022, the Fund underperformed its benchmark, the MSCI Emerging Markets Index.
What factors influenced performance?
Overall, the Fund struggled against a highly changeable macroeconomic and market backdrop. Emerging market (“EM”) equities faced macroeconomic and policy concerns in China in the summer of 2021, and electricity shortages, a potential debt default from Chinese real estate developer Evergrande, and ongoing regulatory uncertainty kept EM markets under pressure. The period also saw considerable volatility across market style preferences. Early in the period, investors preferred value styles, continuing the strong reflationary market tone from earlier in 2021. However, a surprisingly hawkish pivot from the Fed in June 2021 prompted a market rotation back toward secular growth positions. This pro-growth theme persisted until another sharp market rotation in September 2021, with a more hawkish Fed prompting investors to move back toward value stocks. The simultaneous sharp rise in commodities prices caused further inflationary pressure. Ultimately, this rotation proved short-lived, as the market returned to a pro-growth stance in October 2021. EM equities ultimately ended 2021 with negative returns amid the spread of the COVID-19 omicron variant. Despite positive performance from commodities that benefited many EM economies, flaring United States-China relations on issues including short-supply computer chips dragged on equities. Value and momentum styles continued to outperform growth. In early 2022, EM equities added to losses amid the Russian invasion of Ukraine. Russian assets were ultimately priced at a fair value of zero and removed from the MSCI Index. Additionally, heightened geopolitical tensions and sanctions caused commodity prices to spike, led by energy and with grains, precious metals, and ultimately the entire asset class following suit. This commodity spike spurred further inflationary concerns. Egypt declined the most during this part of the period amid increased costs as a major wheat importer. China also lagged as COVID-19 case counts spiked and the government imposed new lockdowns
The divergence of commodity importers versus exporters drove performance, with Latin American markets benefiting. For the period, energy and utilities were the only sectors positively contributing to returns of the MSCI EM Index, whereas information technology (“IT”), financials, and materials led losses. From a country perspective, India, Saudi Arabia, and the United Arab Emirates pushed the index higher, whereas China, Korea, Taiwan, and South Africa drove losses.
Macro thematic positioning proved to be the most substantial detractor from relative performance. The Fund was underweight to Indian stocks due to country-specific valuations and trends, but strong performance in the oil and gas industry within energy and the renewable electricity industry within utilities detracted from performance. Additionally, an underweight to Saudi Arabian equities weighed on return, as did an overweight position in Taiwanese semiconductor stocks, which detracted as sustained regulatory pressure on the sector caused weakening sentiment. Lastly, the Fund was overweight in Chinese equities, which detracted amid policy concerns, tense international relations, and a poor response to the COVID-19 pandemic within the country.
Stock selection also hurt performance as China-specific insights struggled in a difficult environment amid macroeconomic and geopolitical concerns. Specifically, measures that evaluate hiring trends drove losses in the period, as the pro-growth quality positioning struggled amid eroding economic expectations. Similarly, the Fund’s Environmental, Social, and Governance (“ESG”) related measures, which lean in a pro-growth direction, declined. Environmental measures especially struggled, given their negative sensitivity to the sharp run-up in commodities prices.
Conversely, select sentiment and fundamental measures proved to be key contributors to performance, providing some portfolio ballast. Specifically, insights designed to gauge sentiment from company CFOs was a top contributor, as it helped motivate a favorable overweight to the household durables and tobacco industries. An insight that captured sentiment with faster moving alternative data measures that evaluate credit card trends helped to correctly capture positive corporate earnings. Elsewhere, certain fundamental measures also added to performance. In particular, traditional value metrics that evaluate company earnings and cash flows performed well in the context of the value style preference seen at various times during the period. Other fundamental insights evaluating managerial quality also benefited, particularly in the beverage industry.
The Fund’s cash balance at period-end was 5.7%. The cash balance did not materially affect relative performance during the period.
Describe recent portfolio activity.
Over the course of the period, the portfolio maintained a balanced allocation of risk across all major return drivers. There were, however, several new signals added within the stock selection model. The Fund built upon its alternative data capabilities with enhanced signal constructs to identify emerging trends such as sentiment around supply chain disruptions, wage inflation, consumer behavior changes, and business sensitivity to the invasion of Ukraine. Additionally, new macro-thematic insights were added that use historical observations of recession-inflation and monetary policy normalization to motivate top-down positioning.
Describe portfolio positioning at period end.
Relative to the benchmark, the Fund ended the period with largely neutral positioning from a sector and country positioning perspective. The Fund had slight overweight positions in the IT and utilities sectors, and maintained slight underweights in consumer staples and communication services stocks. From a geographical perspective, the Fund had slight overweights to Thailand and maintained a slight underweight position to Saudi Arabia.
The views expressed reflect the opinions of BlackRock as of the date of this report and are subject to change based on changes in market, economic or other conditions. These views are not intended to be a forecast of future events and are no guarantee of future results.
| 4 | 2 0 2 2 BLACK ROCK ANNUAL REPORT TO SHAREHOLDERS |
| Fund Summary as of April 30, 2022 (continued) | BlackRock Advantage Emerging Markets Fund |
TOTAL RETURN BASED ON A $10,000 INVESTMENT
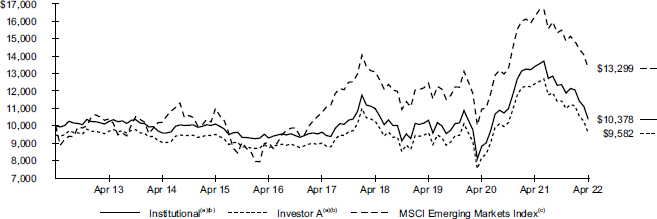
| (a) | Assuming maximum sales charges, if any, transaction costs and other operating expenses, including investment advisory fees. Institutional Shares do not have a sales charge. |
| (b) | Under normal circumstances, the Fund seeks to invest at least 80% of its net assets plus the amount of any borrowings for investment purposes in equity securities issued by, or tied economically to, companies in emerging markets and derivatives that have similar economic characteristics to such securities. The Fund’s total returns prior to June 12, 2017 are the returns of the Fund when it followed different investment strategies under the name BlackRock Emerging Markets Long/Short Equity Fund. |
| (c) | An index that captures large- and mid-cap representation across Emerging Markets countries. The index covers approximately 85% of the free float-adjusted market capitalization in each country. |
Performance
| Average Annual Total Returns(a)(b) | ||||||||||||||||||||||||
| 1 Year | 5 Years | 10 Years | ||||||||||||||||||||||
| Without Sales Charge | With Sales Charge | Without Sales Charge | With Sales Charge | Without Sales Charge | With Sales Charge | |||||||||||||||||||
Institutional | (22.62 | )% | N/A | 1.50 | % | N/A | 0.37 | % | N/A | |||||||||||||||
Investor A | (22.83 | ) | (26.88 | )% | 1.23 | 0.14 | % | 0.11 | (0.43 | )% | ||||||||||||||
Investor C | (23.40 | ) | (24.16 | ) | 0.47 | 0.47 | (0.49 | ) | (0.49 | ) | ||||||||||||||
Class K | (22.59 | ) | N/A | 1.54 | N/A | 0.39 | N/A | |||||||||||||||||
MSCI Emerging Markets Index | (18.33 | ) | N/A | 4.32 | N/A | 2.89 | N/A | |||||||||||||||||
| (a) | Assuming maximum sales charges, if any. Average annual total returns with and without sales charges reflect reductions for distribution and service fees. See “About Fund Performance” for a detailed description of share classes, including any related sales charges and fees, and how performance was calculated for certain share classes. |
| (b) | Under normal circumstances, the Fund seeks to invest at least 80% of its net assets plus the amount of any borrowings for investment purposes in equity securities issued by, or tied economically to, companies in emerging markets and derivatives that have similar economic characteristics to such securities. The Fund’s total returns prior to June 12, 2017 are the returns of the Fund when it followed different investment strategies under the name BlackRock Emerging Markets Long/Short Equity Fund. |
N/A — Not applicable as the share class and index do not have a sales charge.
Past performance is not an indication of future results.
Performance results may include adjustments made for financial reporting purposes in accordance with U.S. generally accepted accounting principles.
Expense Example
| Actual | Hypothetical 5% Return | |||||||||||||||||||||||||||||
|
|
|
| |||||||||||||||||||||||||||
| | Beginning Account Value (11/01/21) | | | Ending Account Value (04/30/22) | | | Expenses Paid During the Period | (a) | | Beginning Account Value (11/01/21) | | | Ending Account Value (04/30/22) | | | Expenses Paid During the Period | (a) | | Annualized Expense Ratio | | ||||||||||
Institutional | $ 1,000.00 | $ 839.90 | $ 3.88 | $ 1,000.00 | $ 1,020.58 | $ 4.26 | 0.85 | % | ||||||||||||||||||||||
Investor A | 1,000.00 | 838.50 | 5.24 | 1,000.00 | 1,019.09 | 5.76 | 1.15 | |||||||||||||||||||||||
Investor C | 1,000.00 | 835.70 | 8.65 | 1,000.00 | 1,015.37 | 9.49 | 1.90 | |||||||||||||||||||||||
Class K | 1,000.00 | 840.10 | 3.70 | 1,000.00 | 1,020.78 | 4.06 | 0.81 | |||||||||||||||||||||||
| (a) | For each class of the Fund, expenses are equal to the annualized expense ratio for the class, multiplied by the average account value over the period, multiplied by 181/365 (to reflect the one-half year period shown). |
See “Disclosure of Expenses” for further information on how expenses were calculated.
FUND SUMMARY | 5 |
| Fund Summary as of April 30, 2022 (continued) | BlackRock Advantage Emerging Markets Fund |
Portfolio Information
GEOGRAPHIC ALLOCATION
| ||||
| Country/Geographic Region | Percent of Net Assets | |||
China | 28 | % | ||
Taiwan | 16 | |||
India | 12 | |||
South Korea | 11 | |||
South Africa | 6 | |||
United States | 5 | |||
Saudi Arabia | 5 | |||
Brazil | 4 | |||
Mexico | 2 | |||
Thailand | 2 | |||
Indonesia | 2 | |||
Malaysia | 1 | |||
United Arab Emirates | 1 | |||
Greece | 1 | |||
Hong Kong | 1 | |||
Hungary | 1 | |||
Other# | — | (a) | ||
Other Assets Less Liabilities | 2 | |||
| (a) | Rounds to less than 1% of net assets. |
| # | Includes holdings within countries/geographic regions that are less than 1% of net assets. Please refer to the Schedule of Investments for such countries/geographic regions. |
| 6 | 2 0 2 2 BLACK ROCK ANNUAL REPORT TO SHAREHOLDERS |
| Fund Summary as of April 30, 2022 | BlackRock Global Long/Short Equity Fund |
Investment Objective
BlackRock Global Long/Short Equity Fund’s (the “Fund”) investment objective is to seek total return over the long term.
Portfolio Management Commentary
How did the Fund perform?
For the 12-month period ended April 30, 2022, the Fund underperformed its benchmark, the ICE BofA 3-Month U.S. Treasury Bill Index.
What factors influenced performance?
Overall, the Fund struggled against a highly changeable macroeconomic and market backdrop. Markets went through multiple rotations in the first half of the period, as leadership shifted between valuation and secular growth preferences for much of 2021. However, value styles became the dominant market driver in early 2022 amid inflationary pressures and expected monetary policy normalization. The relatively orderly market reaction to 40-year highs in inflation turned disorderly with Russia’s invasion of Ukraine in February 2022, which brought a fresh surge in commodity prices that further weighed on global markets and already-stretched supply chains. Adding to the economic challenges, China’s zero-COVID policy resulted in rolling lockdowns which adversely affected industrial production. Simultaneously, bond yields surged as central bankers began raising rates across the globe. Investors began to price in prospects for stagflation amid concerns that monetary policy error would stifle growth.
Unsurprisingly given the numerous macroeconomic events investors contended with, fundamental insights led declines for the period. This was highlighted by losses across growth-oriented quality insights, with notable weakness across Environmental, Social, and Governance (“ESG”) measures. Having provided differentiated returns for the past few years, these measures proved overly sensitive to rising commodities prices, with environmental transition measures struggling. This included losses across insights that capture carbon intensity as a measure of operational efficiency, as well as more forward-looking insights such as looking at “green” patent filings. Additionally, an insight that identifies investor flows into preferred ESG positions declined, as it failed to capture the market shift toward energy producers and defense companies.
Fundamental valuation measures were inconsistent. This was highlighted by weakness across European value stocks in 2022. Insights that specifically identified market laggards over the past few years motivated long positions across European banks, yet despite correct positioning for rising rates and inflation, these positions experienced a strong reversal in March 2022 as sentiment toward the region declined sharply because of the Russian invasion of Ukraine. Similar value insights performed well in other regions, such as the United States, but not to a sufficient extent to offset weakness in Europe.
Lastly among detractors, a slight net long position of approximately 9% over the past 12 months weighed slightly on relative performance, as broader equity markets declined during that period. Of note, this posture was reduced to close to market-neutral toward the end of the period.
Macro-thematic insights delivered mixed results from top-down positioning. Several recently added signals that seek to identify themes such as monetary policy normalization and recession-inflation were notably strong performers toward period-end. Collectively, these insights correctly motivated long positions across the materials and industrials sectors and short positions in information technology stocks. However, style timing preferences earlier in the period offset that positive performance. This was driven by a pro-value tilt during the summer of 2021 that ran against the market’s secular growth preference. Additionally, positioning proved overly conservative given supply chain challenges during the fall of 2021, which also detracted from performance.
Sentiment stock selection broadly contributed to relative performance. Trend-based measures performed well against the evolving market environment. Early in the period, higher frequency alternative data that capture company sensitivity to several economic reopening themes, such as vaccine rollouts, supply chain challenges, and consumer spending, performed well across biotechnology and retail companies in the United States. As the reopening theme quickly gave way to inflation concerns, sentiment measures correctly positioned the portfolio. Notably, insights that identify exposure to inflationary pressure through labor tightness and wage growth, as well as those using geospatial consumer transaction data to capture spending behavior changes, were additive.
The Fund was fully invested throughout the period. The Fund’s cash exposure had no material impact on performance, as cash was principally held in conjunction with the Fund taking long and short positions via the use of derivatives, such as total return swap contracts.
Describe recent portfolio activity.
Over the course of the period, the portfolio maintained a balanced allocation of risk across all major return drivers. There were, however, several new signals added within the stock selection group of insights. The Fund built upon its alternative data capabilities with enhanced signal constructs to identify emerging trends such as sentiment around supply chain disruptions, wage inflation, consumer behavior changes, and business sensitivity to the invasion of Ukraine. Additionally, new macro-thematic insights were added that use historical observations of stagflation and monetary policy normalization to motivate top-down positioning.
Describe portfolio positioning at period end.
Market-timing models continued to deteriorate, resulting in the Fund’s net market position moving closer to zero. Elsewhere, top-down signals reflected a combination of rising inflationary pressures, softening growth, and continued tightening of financial conditions. This motivated long positions in higher-quality growth names such as software and pharmaceutical stocks, alongside segments of the market that can either benefit or remain resilient to rising input costs. These include long positions across energy, precious metals, defense, and tobacco stocks.
The short side of the portfolio was dominated by richly valued growth names, with an increasingly negative stance toward consumer-facing stocks. The latter includes food producers with high exposure to rising input costs and retail stocks exposed to deteriorating consumption patterns.
The views expressed reflect the opinions of BlackRock as of the date of this report and are subject to change based on changes in market, economic or other conditions. These views are not intended to be a forecast of future events and are no guarantee of future results.
FUND SUMMARY | 7 |
| Fund Summary as of April 30, 2022 (continued) | BlackRock Global Long/Short Equity Fund |
TOTAL RETURN BASED ON A $10,000 INVESTMENT
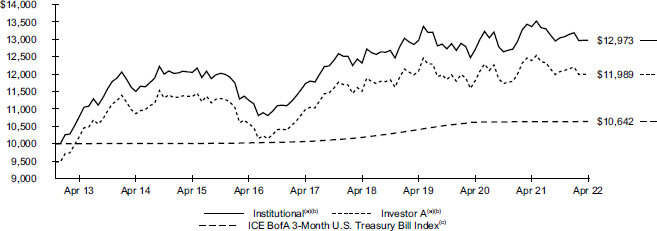
The Fund commenced operations on December 20, 2012.
| (a) | Assuming maximum sales charges, if any, transaction costs and other operating expenses, including investment advisory fees. Institutional Shares do not have a sales charge. |
| (b) | Under normal circumstances, the Fund invests at least 80% of its total assets in equity instruments and related derivative instruments issued by, or tied economically to, companies located in developed markets. |
| (c) | An unmanaged index that measures returns of 3-month Treasury Bills. On 3/1/2021 the Fund began to track the 4pm pricing variant of the ICE BofA 3-Month U.S. Treasury Bill Index (the “Index”). Historical index data prior to 3/1/2021 is for the 3pm pricing variant of the Index. Index data on and after 3/1/2021 is for the 4pm pricing variant of the Index. |
Performance
| Average Annual Total Returns(a) | ||||||||||||||||||||||||||||||||||
|
| |||||||||||||||||||||||||||||||||
| 1 Year | 5 Years | Since Inception(b) | ||||||||||||||||||||||||||||||||
|
|
|
|
|
| |||||||||||||||||||||||||||||
Without Sales Charge | With Sales Charge | Without Sales Charge | With Sales Charge | Without Sales Charge | With Sales Charge | |||||||||||||||||||||||||||||
Institutional | (2.94 | )% | N/A | 2.04 | % | N/A | 2.82 | % | N/A | |||||||||||||||||||||||||
Investor A | (3.23 | ) | (8.31 | )% | 1.76 | 0.67 | % | 2.55 | 1.96 | % | ||||||||||||||||||||||||
Investor C | (3.95 | ) | (4.89 | ) | 1.00 | 1.00 | 1.90 | 1.90 | ||||||||||||||||||||||||||
Class K | (2.85 | ) | N/A | 2.09 | N/A | 2.86 | N/A | |||||||||||||||||||||||||||
ICE BofA 3-Month U.S. Treasury Bill Index | 0.08 | N/A | 1.12 | N/A | 0.67 | N/A | ||||||||||||||||||||||||||||
| (a) | Assuming maximum sales charges, if any. Average annual total returns with and without sales charges reflect reductions for distribution and service fees. See “About Fund Performance” for a detailed description of share classes, including any related sales charges and fees, and how performance was calculated for certain share classes. |
| (b) | The Fund commenced operations on December 20, 2012. |
N/A — Not applicable as the share class and index do not have a sales charge.
Past performance is not an indication of future results.
Performance results may include adjustments made for financial reporting purposes in accordance with U.S. generally accepted accounting principles.
Expense Example
| Actual | Hypothetical 5% Return | |||||||||||||||||||||||||||||
|
|
|
| |||||||||||||||||||||||||||
| | Beginning Account Value (11/01/21) | | | Ending Account Value (04/30/22) | | | Expenses Paid During the Period | (a) | | Beginning Account Value (11/01/21) | | | Ending Account Value (04/30/22) | | | Expenses Paid During the Period | (a) | | Annualized Expense Ratio | | ||||||||||
Institutional | $ 1,000.00 | $ 994.80 | $ 6.63 | $ 1,000.00 | $ 1,018.15 | $ 6.71 | 1.34 | % | ||||||||||||||||||||||
Investor A | 1,000.00 | 993.00 | 7.86 | 1,000.00 | 1,016.91 | 7.95 | 1.59 | |||||||||||||||||||||||
Investor C | 1,000.00 | 988.80 | 11.54 | 1,000.00 | 1,013.19 | 11.68 | 2.34 | |||||||||||||||||||||||
Class K | 1,000.00 | 994.80 | 6.38 | 1,000.00 | 1,018.40 | 6.46 | 1.29 | |||||||||||||||||||||||
| (a) | For each class of the Fund, expenses are equal to the annualized expense ratio for the class, multiplied by the average account value over the period, multiplied by 181/365 (to reflect the one-half year period shown). |
See “Disclosure of Expenses” for further information on how expenses were calculated.
| 8 | 2 0 2 2 BLACK ROCK ANNUAL REPORT TO SHAREHOLDERS |
| Fund Summary as of April 30, 2022 (continued) | BlackRock Global Long/Short Equity Fund |
Portfolio Information
| GEOGRAPHIC ALLOCATION | ||||||||||||
| Percent of Total Investments(a) | ||||||||||||
| Country/Geographic Region | Long | Short | Total | |||||||||
United States | 22% | 22% | 44% | |||||||||
Japan | 9 | 9 | 18 | |||||||||
United Kingdom | 3 | 3 | 6 | |||||||||
Canada | 3 | 2 | 5 | |||||||||
Australia | 2 | 2 | 4 | |||||||||
Germany | 2 | 1 | 3 | |||||||||
France | 2 | 1 | 3 | |||||||||
Sweden | 1 | 1 | 2 | |||||||||
Switzerland | 1 | 1 | 2 | |||||||||
Italy | 1 | 1 | 2 | |||||||||
Other# | 4 | 7 | 11 | |||||||||
| 50% | 50% | 100% | ||||||||||
|
|
| ||||||||||
| (a) | Total investments include the gross values of long and short equity securities of the underlying derivative contracts utilized by the Fund and exclude short-term securities. |
| # | Includes holdings within countries/geographic regions that are less than 1% of net assets. Please refer to the Schedule of Investments for such countries/geographic regions. |
FUND SUMMARY | 9 |
Institutional and Class K Shares are not subject to any sales charge. These shares bear no ongoing distribution or service fees and are available only to certain eligible investors. Class K Shares performance of BlackRock Global Long/Short Equity Fund shown prior to the Class K Shares inception date of March 28, 2016 is that of Institutional Shares. Class K Shares performance of BlackRock Advantage Emerging Markets Fund shown prior to the Class K Shares inception date of January 25, 2018 is that of Institutional Shares. The performance of each Fund’s Class K Shares would be substantially similar to Institutional Shares because Class K Shares and Institutional Shares invest in the same portfolio of securities and performance would only differ to the extent that Class K Shares and Institutional Shares have different expenses. The actual returns of Class K Shares would have been higher than those of the Institutional Shares because Class K Shares have lower expenses than the Institutional Shares.
Investor A Shares are subject to a maximum initial sales charge (front-end load) of 5.25% and a service fee of 0.25% per year (but no distribution fee). Certain redemptions of these shares may be subject to a contingent deferred sales charge (“CDSC”) where no initial sales charge was paid at the time of purchase. These shares are generally available through financial intermediaries.
Investor C Shares are subject to a 1.00% CDSC if redeemed within one year of purchase. In addition, these shares are subject to a distribution fee of 0.75% per year and a service fee of 0.25% per year. These shares are generally available through financial intermediaries. These shares automatically convert to Investor A Shares after approximately eight years.
Past performance is not an indication of future results. Financial markets have experienced extreme volatility and trading in many instruments has been disrupted. These circumstances may continue for an extended period of time and may continue to affect adversely the value and liquidity of each Fund’s investments. As a result, current performance may be lower or higher than the performance data quoted. Refer to blackrock.com to obtain performance data current to the most recent month-end. Performance results do not reflect the deduction of taxes that a shareholder would pay on Fund distributions or the redemption of Fund shares. Figures shown in the performance table(s) assume reinvestment of all distributions, if any, at net asset value (“NAV”) on the ex-dividend date or payable date, as applicable. Investment return and principal value of shares will fluctuate so that shares, when redeemed, may be worth more or less than their original cost. Distributions paid to each class of shares will vary because of the different levels of service, distribution and transfer agency fees applicable to each class, which are deducted from the income available to be paid to shareholders.
BlackRock Advisors, LLC (the “Manager”), each Fund’s investment adviser, has contractually and/or voluntarily agreed to waive and/or reimburse a portion of each Fund’s expenses. Without such waiver(s) and/or reimbursement(s), each Fund’s performance would have been lower. With respect to each Fund’s voluntary waiver(s), if any, the Manager is under no obligation to waive and/or reimburse or to continue waiving and/or reimbursing its fees and such voluntary waiver(s) may be reduced or discontinued at any time. With respect to each Fund’s contractual waiver(s), if any, the Manager is under no obligation to continue waiving and/or reimbursing its fees after the applicable termination date of such agreement. See the Notes to Financial Statements for additional information on waivers and/or reimbursements.
Shareholders of each Fund may incur the following charges: (a) transactional expenses, such as sales charges; and (b) operating expenses, including investment advisory fees, administration fees, service and distribution fees, including 12b-1 fees, acquired fund fees and expenses, and other fund expenses. The expense examples shown (which are based on a hypothetical investment of $1,000 invested at the beginning of the period (or from the commencement of operations if less than 6 months) and held through the end of the period) are intended to assist shareholders both in calculating expenses based on an investment in each Fund and in comparing these expenses with similar costs of investing in other mutual funds.
The expense examples provide information about actual account values and actual expenses. Annualized expense ratios reflect contractual and voluntary fee waivers, if any. In order to estimate the expenses a shareholder paid during the period covered by this report, shareholders can divide their account value by $1,000 and then multiply the result by the number corresponding to their Fund and share class under the heading entitled “Expenses Paid During the Period.”
The expense examples also provide information about hypothetical account values and hypothetical expenses based on a Fund’s actual expense ratio and an assumed rate of return of 5% per year before expenses. In order to assist shareholders in comparing the ongoing expenses of investing in these Funds and other funds, compare the 5% hypothetical examples with the 5% hypothetical examples that appear in shareholder reports of other funds.
The expenses shown in the expense examples are intended to highlight shareholders’ ongoing costs only and do not reflect transactional expenses, such as sales charges, if any. Therefore, the hypothetical examples are useful in comparing ongoing expenses only and will not help shareholders determine the relative total expenses of owning different funds. If these transactional expenses were included, shareholder expenses would have been higher.
Derivative Financial Instruments
The Funds may invest in various derivative financial instruments. These instruments are used to obtain exposure to a security, commodity, index, market, and/or other assets without owning or taking physical custody of securities, commodities and/or other referenced assets or to manage market, equity, credit, interest rate, foreign currency exchange rate, commodity and/or other risks. Derivative financial instruments may give rise to a form of economic leverage and involve risks, including the imperfect correlation between the value of a derivative financial instrument and the underlying asset, possible default of the counterparty to the transaction or illiquidity of the instrument. The Funds’ successful use of a derivative financial instrument depends on the investment adviser’s ability to predict pertinent market movements accurately, which cannot be assured. The use of these instruments may result in losses greater than if they had not been used, may limit the amount of appreciation a Fund can realize on an investment and/or may result in lower distributions paid to shareholders. The Funds’ investments in these instruments, if any, are discussed in detail in the Notes to Financial Statements.
| 10 | 2 0 2 2 BLACK ROCK ANNUAL REPORT TO SHAREHOLDERS |
April 30, 2022 | BlackRock Advantage Emerging Markets Fund (Percentages shown are based on Net Assets) |
| Security | Shares | Value | ||||||
Common Stocks |
| |||||||
| Brazil — 3.5% | ||||||||
Ambev SA | 298,295 | $ | 876,069 | |||||
Ambev SA, ADR | 62,309 | 181,319 | ||||||
Banco do Brasil SA | 21,761 | 146,219 | ||||||
Cia de Saneamento de Minas Gerais-COPASA | 149,715 | 413,659 | ||||||
CPFL Energia SA | 143,680 | 1,050,584 | ||||||
Embraer SA(a) | 41,741 | 119,973 | ||||||
Energisa SA | 32,699 | 315,088 | ||||||
Fleury SA | 22,133 | 64,555 | ||||||
Light SA | 43,192 | 78,016 | ||||||
Marfrig Global Foods SA | 56,773 | 215,312 | ||||||
Sao Martinho SA | 16,665 | 156,438 | ||||||
Ultrapar Participacoes SA | 55,417 | 146,502 | ||||||
Vale SA | 71,471 | 1,204,062 | ||||||
|
| |||||||
| 4,967,796 | ||||||||
| China — 28.0% | ||||||||
360 DigiTech, Inc. | 3,174 | 45,801 | ||||||
3SBio, Inc.(a)(b) | 849,000 | 598,963 | ||||||
51job, Inc., ADR(a)(c) | 1,431 | 87,076 | ||||||
Alibaba Group Holding Ltd.(a) | 303,720 | 3,704,679 | ||||||
A-Living Smart City Services Co. Ltd., Class H(b) | 99,250 | 156,971 | ||||||
Aluminum Corp. of China Ltd., Class A(a) | 264,800 | 186,352 | ||||||
Aluminum Corp. of China Ltd., Class H(a) | 144,000 | 66,035 | ||||||
Angang Steel Co. Ltd., Class H | 1,396,000 | 610,655 | ||||||
Anhui Conch Cement Co. Ltd., Class H | 23,500 | 127,700 | ||||||
Anhui Gujing Distillery Co. Ltd., Class A | 2,100 | 61,348 | ||||||
Anta Sports Products Ltd. | 35,000 | 402,237 | ||||||
Asymchem Laboratories Tianjin Co. Ltd., Class A | 4,100 | 163,503 | ||||||
Autohome, Inc., ADR | 1,514 | 44,012 | ||||||
BAIC Motor Corp. Ltd., Class H(b) | 976,500 | 304,943 | ||||||
Baidu, Inc., Class A(a) | 49,042 | 781,911 | ||||||
Bank of China Ltd., Class H | 832,000 | 326,462 | ||||||
Bank of Communications Co. Ltd., Class A | 548,800 | 417,974 | ||||||
Bank of Ningbo Co. Ltd., Class A | 7,466 | 40,434 | ||||||
BeiGene Ltd., ADR(a) | 466 | 74,560 | ||||||
Beijing Enterprises Holdings Ltd. | 124,500 | 420,890 | ||||||
Beijing Wantai Biological Pharmacy Enterprise Co. Ltd., Class A | 17,400 | 422,682 | ||||||
BOE Technology Group Co. Ltd., Class A | 1,431,320 | 813,043 | ||||||
BYD Co. Ltd., Class A | 27,100 | 977,709 | ||||||
BYD Co. Ltd., Class H | 10,500 | 305,568 | ||||||
BYD Electronic International Co. Ltd. | 41,500 | 82,724 | ||||||
Chacha Food Co. Ltd., Class A | 8,200 | 65,252 | ||||||
China Construction Bank Corp., Class H | 1,853,000 | 1,320,075 | ||||||
China Hongqiao Group Ltd. | 344,500 | 428,637 | ||||||
China Merchants Bank Co. Ltd., Class H | 146,500 | 882,991 | ||||||
China Minsheng Banking Corp. Ltd., Class H | 113,000 | 42,849 | ||||||
China Petroleum & Chemical Corp., Class H | 958,000 | 468,914 | ||||||
China Resources Cement Holdings Ltd. | 70,000 | 58,082 | ||||||
China Resources Gas Group Ltd. | 96,000 | 360,709 | ||||||
China State Construction Engineering Corp. Ltd., Class A | 48,500 | 45,653 | ||||||
China Yongda Automobiles Services Holdings Ltd. | 443,000 | 410,784 | ||||||
CITIC Ltd. | 134,000 | 138,624 | ||||||
CITIC Securities Co. Ltd., Class A | 73,625 | 215,853 | ||||||
CITIC Securities Co. Ltd., Class H | 22,000 | 48,337 | ||||||
Contemporary Amperex Technology Co. Ltd., Class A | 4,787 | 290,131 | ||||||
Country Garden Holdings Co. Ltd. | 1,108,000 | 766,377 | ||||||
CSPC Pharmaceutical Group Ltd. | 422,720 | 432,166 | ||||||
Do-Fluoride New Materials Co. Ltd., Class A | 32,600 | 152,799 | ||||||
| Security | Shares | Value | ||||||
| China (continued) | ||||||||
Enn Energy Holdings Ltd. | 40,200 | $ | 538,482 | |||||
Fuyao Glass Industry Group Co. Ltd., Class H(b) | 18,800 | 76,811 | ||||||
Geely Automobile Holdings Ltd. | 229,000 | 354,077 | ||||||
Great Wall Motor Co. Ltd., Class H | 242,500 | 339,603 | ||||||
Hangzhou Tigermed Consulting Co. Ltd., Class H(b) | 12,300 | 119,205 | ||||||
Hello Group, Inc., ADR | 18,111 | 96,351 | ||||||
Huazhu Group Ltd., ADR | 1,275 | 38,556 | ||||||
Hundsun Technologies, Inc., Class A | 20,200 | 115,133 | ||||||
Industrial & Commercial Bank of China Ltd., Class H | 1,102,000 | 664,293 | ||||||
Industrial Bank Co. Ltd., Class A | 24,500 | 74,911 | ||||||
JD.com, Inc., Class A(a) | 35,910 | 1,119,621 | ||||||
Jiangsu King’s Luck Brewery JSC Ltd., Class A | 13,500 | 90,449 | ||||||
Joinn Laboratories China Co. Ltd., Class H(b) | 20 | 146 | ||||||
KE Holdings, Inc., ADR(a) | 7,112 | 100,848 | ||||||
Kunlun Energy Co. Ltd. | 76,000 | 63,071 | ||||||
Kweichow Moutai Co. Ltd., Class A | 3,927 | 1,077,946 | ||||||
Lenovo Group Ltd. | 332,000 | 322,373 | ||||||
Li Auto, Inc., ADR(a) | 7,111 | 159,500 | ||||||
Li Ning Co. Ltd. | 27,500 | 214,340 | ||||||
Lufax Holding Ltd., ADR | 24,647 | 136,791 | ||||||
Luzhou Laojiao Co. Ltd., Class A | 4,200 | 132,141 | ||||||
Maanshan Iron & Steel Co. Ltd., Class H | 938,000 | 366,763 | ||||||
Meituan, Class B(a)(b) | 27,900 | 597,796 | ||||||
NAURA Technology Group Co. Ltd., Class A | 2,200 | 77,781 | ||||||
NavInfo Co. Ltd., Class A(a) | 41,100 | 76,241 | ||||||
NetEase, Inc. | 41,270 | 790,538 | ||||||
NIO, Inc., ADR(a)(c) | 23,502 | 392,483 | ||||||
PetroChina Co. Ltd., Class A | 1,478,100 | 1,187,695 | ||||||
PetroChina Co. Ltd., Class H | 940,000 | 446,212 | ||||||
Pharmaron Beijing Co. Ltd., Class A | 6,500 | 121,923 | ||||||
Pharmaron Beijing Co. Ltd., Class H(b) | 12,200 | 153,262 | ||||||
Pinduoduo, Inc., ADR(a) | 7,196 | 310,076 | ||||||
Ping An Insurance Group Co. of China Ltd., Class H | 256,000 | 1,618,103 | ||||||
Postal Savings Bank of China Co. Ltd., Class A | 187,200 | 151,308 | ||||||
Powerlong Real Estate Holdings Ltd. | 42,000 | 14,242 | ||||||
RiseSun Real Estate Development Co. Ltd., Class A | 1 | 1 | ||||||
SF Holding Co. Ltd., Class A | 15,600 | 119,621 | ||||||
Shandong Nanshan Aluminum Co. Ltd., Class A | 166,100 | 80,288 | ||||||
Shanghai Putailai New Energy Technology Co. Ltd., Class A | 5,800 | 102,021 | ||||||
Shanxi Taigang Stainless Steel Co. Ltd., Class A | 59,500 | 52,779 | ||||||
Shenzhen Capchem Technology Co. Ltd., Class A | 4,871 | 48,385 | ||||||
Shimao Services Holdings Ltd.(b) | 130,000 | 68,612 | ||||||
Silergy Corp. | 2,000 | 178,065 | ||||||
Sinopec Shanghai Petrochemical Co. Ltd., Class H | 836,000 | 156,412 | ||||||
Sunac China Holdings Ltd.(d) | 254,000 | 139,625 | ||||||
Sunny Optical Technology Group Co. Ltd. | 11,400 | 166,142 | ||||||
Tencent Holdings Ltd. | 96,700 | 4,556,976 | ||||||
Tingyi Cayman Islands Holding Corp. | 148,000 | 270,124 | ||||||
Trip.com Group Ltd., ADR(a) | 8,582 | 202,964 | ||||||
Uni-President China Holdings Ltd. | 278,000 | 243,612 | ||||||
Vipshop Holdings Ltd., ADR(a) | 15,248 | 116,800 | ||||||
WuXi AppTec Co. Ltd., Class A | 8,900 | 137,158 | ||||||
WuXi AppTec Co. Ltd., Class H(b) | 47,580 | 647,173 | ||||||
Wuxi Biologics Cayman, Inc.(a)(b) | 75,000 | 553,561 | ||||||
Wuxi Lead Intelligent Equipment Co. Ltd., Class A | 6,300 | 41,261 | ||||||
XPeng, Inc., ADR(a) | 6,079 | 149,604 | ||||||
Yum China Holdings, Inc. | 8,285 | 346,313 | ||||||
Zijin Mining Group Co. Ltd., Class A | 308,600 | 507,764 | ||||||
Zijin Mining Group Co. Ltd., Class H | 416,000 | 605,741 | ||||||
SCHEDULE OF INVESTMENTS | 11 |
Schedule of Investments (continued) April 30, 2022 | BlackRock Advantage Emerging Markets Fund (Percentages shown are based on Net Assets) |
| Security | Shares | Value | ||||||
| China (continued) | ||||||||
Zoomlion Heavy Industry Science and Technology Co. Ltd., Class H | 588,000 | $ | 343,807 | |||||
ZTE Corp., Class A | 19,500 | 70,202 | ||||||
ZTE Corp., Class H | 45,600 | 95,742 | ||||||
|
| |||||||
| 39,492,289 | ||||||||
| Colombia — 0.1% | ||||||||
Bancolombia SA, ADR | 3,070 | 119,024 | ||||||
Tecnoglass, Inc. | 2,132 | 47,608 | ||||||
|
| |||||||
| 166,632 | ||||||||
| Greece — 0.8% | ||||||||
Hellenic Telecommunications Organization SA | 29,986 | 576,872 | ||||||
JUMBO SA | 8,538 | 138,383 | ||||||
OPAP SA | 24,653 | 365,416 | ||||||
|
| |||||||
| 1,080,671 | ||||||||
| Hong Kong — 0.6% | ||||||||
Beijing Enterprises Water Group Ltd. | 56,000 | 18,115 | ||||||
China Gas Holdings Ltd. | 44,200 | 53,878 | ||||||
Nine Dragons Paper Holdings Ltd. | 556,000 | 491,023 | ||||||
SSY Group Ltd. | 502,000 | 246,593 | ||||||
|
| |||||||
| 809,609 | ||||||||
| Hungary — 0.4% | ||||||||
MOL Hungarian Oil & Gas PLC | 39,239 | 332,712 | ||||||
OTP Bank Nyrt | 9,108 | 271,686 | ||||||
|
| |||||||
| 604,398 | ||||||||
| India — 11.8% | ||||||||
Adani Green Energy Ltd.(a) | 1,699 | 63,579 | ||||||
APL Apollo Tubes Ltd.(a) | 11,029 | 147,082 | ||||||
Apollo Hospitals Enterprise Ltd. | 1,987 | 115,061 | ||||||
Asian Paints Ltd. | 10,529 | 443,820 | ||||||
AU Small Finance Bank Ltd.(a)(b) | 7,679 | 138,301 | ||||||
Axis Bank Ltd.(a) | 57,943 | 546,202 | ||||||
Bajaj Finance Ltd. | 7,497 | 646,256 | ||||||
Bandhan Bank Ltd.(b) | 24,856 | 107,784 | ||||||
Bharti Airtel Ltd.(a) | 28,550 | 274,003 | ||||||
Birlasoft Ltd. | 45,455 | 242,203 | ||||||
Dr. Lal PathLabs Ltd.(b) | 2,039 | 68,792 | ||||||
HCL Technologies Ltd. | 17,928 | 251,109 | ||||||
HDFC Bank Ltd. | 43,149 | 773,568 | ||||||
HDFC Bank Ltd., ADR | 20,549 | 1,134,510 | ||||||
HDFC Life Insurance Co. Ltd.(b) | 62,776 | 475,993 | ||||||
Hindustan Zinc Ltd. | 11,165 | 46,639 | ||||||
ICICI Bank Ltd. | 99,525 | 956,740 | ||||||
ICICI Bank Ltd., ADR | 20,081 | 382,342 | ||||||
Indian Energy Exchange Ltd.(b) | 18,739 | 51,952 | ||||||
IndusInd Bank Ltd. | 3,182 | 40,249 | ||||||
Infosys Ltd. | 74,385 | 1,507,574 | ||||||
Infosys Ltd., ADR | 20,226 | 401,891 | ||||||
Inox Leisure Ltd.(a) | 9,478 | 61,471 | ||||||
ITC Ltd. | 70,908 | 238,989 | ||||||
JK Cement Ltd. | 1,148 | 39,593 | ||||||
Kajaria Ceramics Ltd. | 5,105 | 68,665 | ||||||
Kotak Mahindra Bank Ltd. | 68,766 | 1,594,693 | ||||||
KPIT Technologies Ltd. | 9,740 | 69,578 | ||||||
Macrotech Developers Ltd.(a) | 5,261 | 68,945 | ||||||
Metropolis Healthcare Ltd.(b) | 2,625 | 81,530 | ||||||
Mindtree Ltd. | 2,057 | 94,127 | ||||||
Mphasis Ltd. | 2,989 | 109,759 | ||||||
Persistent Systems Ltd. | 1,128 | 63,221 | ||||||
| Security | Shares | Value | ||||||
| India (continued) | ||||||||
Power Finance Corp. Ltd. | 27,972 | $ | 42,794 | |||||
Prestige Estates Projects Ltd. | 8,781 | 53,993 | ||||||
PVR Ltd.(a) | 17,645 | 417,182 | ||||||
Radico Khaitan Ltd. | 4,352 | 50,853 | ||||||
RBL Bank Ltd.(a)(b) | 64,075 | 99,535 | ||||||
Reliance Industries Ltd. | 65,918 | 2,388,369 | ||||||
SRF Ltd. | 6,230 | 202,615 | ||||||
State Bank of India | 63,597 | 408,460 | ||||||
Strides Pharma Science Ltd. | 10,006 | 42,736 | ||||||
Sun Pharmaceutical Industries Ltd. | 5,901 | 71,331 | ||||||
Tata Consultancy Services Ltd. | 17,776 | 819,266 | ||||||
Tech Mahindra Ltd. | 32,021 | 522,971 | ||||||
Triveni Engineering & Industries Ltd. | 21,089 | 87,665 | ||||||
United Spirits Ltd.(a) | 14,402 | 161,467 | ||||||
|
| |||||||
| 16,675,458 | ||||||||
| Indonesia — 1.6% | ||||||||
Bank Central Asia Tbk PT | 1,116,200 | 626,045 | ||||||
Bank Mandiri Persero Tbk PT | 479,600 | 294,491 | ||||||
Bank Rakyat Indonesia Persero Tbk PT | 2,156,300 | 718,451 | ||||||
Perusahaan Gas Negara Tbk PT(a) | 6,027,800 | 600,077 | ||||||
Telkom Indonesia Persero Tbk PT | 156,700 | 49,938 | ||||||
|
| |||||||
| 2,289,002 | ||||||||
| Malaysia — 1.3% | ||||||||
CIMB Group Holdings BHD | 548,000 | 653,196 | ||||||
Inari Amertron BHD | 87,300 | 55,950 | ||||||
Malayan Banking BHD | 88,100 | 183,232 | ||||||
Petronas Chemicals Group BHD | 4,600 | 10,799 | ||||||
Public Bank BHD | 204,800 | 220,129 | ||||||
RHB Bank BHD | 233,900 | 335,104 | ||||||
Sime Darby BHD | 425,900 | 227,649 | ||||||
Sime Darby Plantation BHD | 170,600 | 204,680 | ||||||
|
| |||||||
| 1,890,739 | ||||||||
| Mexico — 2.3% | ||||||||
Alfa SAB de CV, Class A | 216,018 | 144,707 | ||||||
Arca Continental SAB de CV | 67,135 | 426,007 | ||||||
Cemex SAB de CV(a) | 291,622 | 128,330 | ||||||
Coca-Cola Femsa SAB de CV | 51,708 | 281,947 | ||||||
Coca-Cola Femsa SAB de CV, ADR | 9,103 | 497,024 | ||||||
Fomento Economico Mexicano SAB de CV | 39,777 | 299,090 | ||||||
Grupo Bimbo SAB de CV, Series A | 155,218 | 478,436 | ||||||
Grupo Financiero Banorte SAB de CV, Class O | 69,038 | 455,743 | ||||||
Orbia Advance Corp. SAB de CV | 41,235 | 99,215 | ||||||
Wal-Mart de Mexico SAB de CV | 137,159 | 485,012 | ||||||
|
| |||||||
| 3,295,511 | ||||||||
| Peru — 0.2% | ||||||||
Credicorp Ltd. | 805 | 111,807 | ||||||
Hochschild Mining PLC | 60,787 | 89,294 | ||||||
Southern Copper Corp. | 1,878 | 116,943 | ||||||
|
| |||||||
| 318,044 | ||||||||
| Philippines — 0.3% | ||||||||
International Container Terminal Services, Inc. | 93,940 | 385,717 | ||||||
Manila Electric Co. | 11,310 | 76,136 | ||||||
|
| |||||||
| 461,853 | ||||||||
| Romania — 0.3% | ||||||||
NEPI Rockcastle PLC | 57,559 | 352,175 | ||||||
|
| |||||||
| Russia(d) — 0.0% | ||||||||
Alrosa AO(a) | 1,407,496 | 197 | ||||||
| 12 | 2 0 2 2 BLACK ROCK ANNUAL REPORT TO SHAREHOLDERS |
Schedule of Investments (continued) April 30, 2022 | BlackRock Advantage Emerging Markets Fund (Percentages shown are based on Net Assets) |
| Security | Shares | Value | ||||||
| Russia (continued) | ||||||||
LUKOIL PJSC | 15,098 | $ | 2 | |||||
LUKOIL PJSC, ADR | 8,429 | 84 | ||||||
Novatek PJSC, GDR, Registered Shares | 2,965 | 30 | ||||||
|
| |||||||
| 313 | ||||||||
| Saudi Arabia — 4.7% | ||||||||
ACWA Power Co.(a) | 1,036 | 39,236 | ||||||
Al Rajhi Bank | 49,769 | 2,331,485 | ||||||
Dr. Sulaiman Al Habib Medical Services Group Co. | 10,094 | 535,762 | ||||||
Etihad Etisalat Co. | 5,093 | 58,727 | ||||||
Rabigh Refining & Petrochemical Co.(a) | 14,753 | 112,245 | ||||||
Saudi Arabian Mining Co.(a) | 16,585 | 603,970 | ||||||
Saudi Arabian Oil Co.(b) | 48,905 | 584,404 | ||||||
Saudi Basic Industries Corp. | 66,218 | 2,293,901 | ||||||
|
| |||||||
| 6,559,730 | ||||||||
| Singapore — 0.0% | ||||||||
JOYY, Inc., ADR | 1,057 | 41,826 | ||||||
|
| |||||||
| South Africa — 5.5% | ||||||||
Absa Group Ltd. | 19,827 | 214,202 | ||||||
Anglo American Platinum Ltd. | 411 | 45,666 | ||||||
AngloGold Ashanti Ltd. | 8,332 | 170,623 | ||||||
AngloGold Ashanti Ltd., ADR | 1,976 | 40,350 | ||||||
Aspen Pharmacare Holdings Ltd. | 4,852 | 52,270 | ||||||
AVI Ltd. | 73,961 | 322,070 | ||||||
Bidvest Group Ltd. | 11,866 | 162,666 | ||||||
Capitec Bank Holdings Ltd. | 5,074 | 708,278 | ||||||
FirstRand Ltd. | 222,177 | 956,845 | ||||||
Foschini Group Ltd. | 85,913 | 755,741 | ||||||
Gold Fields Ltd. | 18,236 | 247,090 | ||||||
Impala Platinum Holdings Ltd. | 5,422 | 70,136 | ||||||
Life Healthcare Group Holdings Ltd. | 123,026 | 167,644 | ||||||
MTN Group Ltd. | 31,383 | 332,848 | ||||||
Nedbank Group Ltd. | 18,313 | 255,729 | ||||||
Netcare Ltd. | 257,806 | 248,950 | ||||||
Old Mutual Ltd. | 390,781 | 313,504 | ||||||
Pepkor Holdings Ltd.(b) | 68,218 | 92,527 | ||||||
Sasol Ltd.(a) | 10,291 | 252,098 | ||||||
Shoprite Holdings Ltd. | 41,542 | 600,034 | ||||||
Standard Bank Group Ltd. | 78,866 | 835,783 | ||||||
Truworths International Ltd. | 117,105 | 417,032 | ||||||
Woolworths Holdings Ltd. | 145,183 | 543,498 | ||||||
|
| |||||||
| 7,805,584 | ||||||||
| South Korea — 11.3% | ||||||||
Amorepacific Corp. | 3,199 | 455,236 | ||||||
Celltrion, Inc. | 2,005 | 277,442 | ||||||
CJ CheilJedang Corp. | 1,840 | 578,626 | ||||||
CJ Logistics Corp.(a) | 1,340 | 129,756 | ||||||
Doosan Bobcat, Inc. | 10,706 | 347,872 | ||||||
Doosan Co. Ltd. | 603 | 42,275 | ||||||
Fila Holdings Corp. | 2,231 | 57,004 | ||||||
Hankook Tire & Technology Co. Ltd. | 1,514 | 41,554 | ||||||
Hugel, Inc.(a) | 516 | 50,796 | ||||||
Hyundai Construction Equipment Co. Ltd. | 8,750 | 255,300 | ||||||
Hyundai Glovis Co. Ltd. | 380 | 62,259 | ||||||
Hyundai Mobis Co. Ltd. | 3,337 | 542,887 | ||||||
Hyundai Motor Co. | 2,650 | 384,482 | ||||||
Kakao Corp. | 3,865 | 269,984 | ||||||
Kolon Industries, Inc. | 3,967 | 193,221 | ||||||
Korea Gas Corp. | 18,254 | 596,688 | ||||||
LG Chem Ltd. | 2,559 | 1,048,077 | ||||||
LG Display Co. Ltd. | 4,578 | 59,817 | ||||||
| Security | Shares | Value | ||||||
| South Korea (continued) | ||||||||
LG Electronics, Inc. | 2,217 | $ | 200,787 | |||||
LG Household & Health Care Ltd. | 467 | 334,456 | ||||||
Mando Corp. | 1,112 | 47,176 | ||||||
NAVER Corp. | 3,384 | 753,816 | ||||||
NHN Corp.(a) | 6,595 | 182,039 | ||||||
Pan Ocean Co. Ltd. | 18,602 | 97,241 | ||||||
POSCO Holdings, Inc. | 5,473 | 1,249,633 | ||||||
POSCO Holdings, Inc., ADR | 3,985 | 225,989 | ||||||
Samsung Electro-Mechanics Co. Ltd. | 1,753 | 226,900 | ||||||
Samsung Electronics Co. Ltd. | 115,502 | 6,155,511 | ||||||
Samsung Electronics Co. Ltd., GDR, Registered Shares | 123 | 160,670 | ||||||
Shinhan Financial Group Co. Ltd. | 16,508 | 548,472 | ||||||
Shinsegae, Inc. | 454 | 88,464 | ||||||
SK Innovation Co. Ltd.(a) | 869 | 138,307 | ||||||
S-Oil Corp. | 1,849 | 151,281 | ||||||
|
| |||||||
| 15,954,018 | ||||||||
| Taiwan — 15.9% | ||||||||
Accton Technology Corp. | 13,000 | 101,398 | ||||||
ACES Electronic Co. Ltd. | 19,000 | 26,327 | ||||||
Advantech Co. Ltd. | 60,000 | 745,840 | ||||||
ASPEED Technology, Inc. | 2,000 | 175,666 | ||||||
Bizlink Holding, Inc. | 64,000 | 640,452 | ||||||
Chailease Holding Co. Ltd. | 34,000 | 270,191 | ||||||
Compeq Manufacturing Co. Ltd. | 95,000 | 144,960 | ||||||
CTBC Financial Holding Co. Ltd. | 1,807,000 | 1,777,399 | ||||||
Delta Electronics, Inc. | 61,000 | 509,203 | ||||||
E Ink Holdings, Inc. | 19,000 | 108,629 | ||||||
Eva Airways Corp. | 110,000 | 129,226 | ||||||
Evergreen Marine Corp. Taiwan Ltd. | 53,000 | 254,767 | ||||||
Formosa Plastics Corp. | 83,000 | 295,069 | ||||||
Fubon Financial Holding Co. Ltd. | 49,000 | 123,035 | ||||||
General Interface Solution Holding Ltd. | 17,000 | 52,286 | ||||||
Global Unichip Corp. | 7,000 | 95,859 | ||||||
Hiwin Technologies Corp. | 86,180 | 638,178 | ||||||
Hon Hai Precision Industry Co. Ltd. | 82,000 | 280,939 | ||||||
Kinsus Interconnect Technology Corp. | 51,000 | 287,499 | ||||||
Largan Precision Co. Ltd. | 2,000 | 113,495 | ||||||
Lotes Co. Ltd. | 1,000 | 24,456 | ||||||
Makalot Industrial Co. Ltd. | 7,000 | 43,061 | ||||||
MediaTek, Inc. | 28,000 | 771,903 | ||||||
momo.com, Inc. | 6,000 | 158,383 | ||||||
Nan Ya Plastics Corp. | 249,000 | 727,473 | ||||||
Nanya Technology Corp. | 218,000 | 477,034 | ||||||
Parade Technologies Ltd. | 3,000 | 142,670 | ||||||
Pegatron Corp. | 25,000 | 59,228 | ||||||
Pegavision Corp. | 5,000 | 68,208 | ||||||
Phison Electronics Corp. | 9,000 | 116,003 | ||||||
Primax Electronics Ltd. | 73,000 | 136,580 | ||||||
Realtek Semiconductor Corp. | 87,000 | 1,180,548 | ||||||
Taiwan Semiconductor Manufacturing Co. Ltd. | 507,000 | 9,167,901 | ||||||
Taiwan Semiconductor Manufacturing Co. Ltd., ADR | 12,082 | 1,122,780 | ||||||
Taiwan Union Technology Corp. | 58,000 | 149,767 | ||||||
Tong Hsing Electronic Industries Ltd. | 12,000 | 93,146 | ||||||
Unimicron Technology Corp. | 38,000 | 266,537 | ||||||
United Microelectronics Corp. | 304,000 | 482,931 | ||||||
Vanguard International Semiconductor Corp. | 76,000 | 267,409 | ||||||
Voltronic Power Technology Corp. | 3,000 | 131,253 | ||||||
WT Microelectronics Co. Ltd. | 18,000 | 43,381 | ||||||
|
| |||||||
| 22,401,070 | ||||||||
| Thailand — 2.0% | ||||||||
Advanced Info Service PCL, NVDR | 36,400 | 227,577 | ||||||
SCHEDULE OF INVESTMENTS | 13 |
Schedule of Investments (continued) April 30, 2022 | BlackRock Advantage Emerging Markets Fund (Percentages shown are based on Net Assets) |
| Security | Shares | Value | ||||||
Thailand (continued) | ||||||||
Bangchak Corp. PCL, NVDR | 92,600 | $ | 90,027 | |||||
Bangkok Bank PCL, NVDR | 72,900 | 274,964 | ||||||
CP ALL PCL, NVDR | 72,900 | 137,448 | ||||||
Energy Absolute PCL, NVDR | 84,200 | 216,023 | ||||||
Home Product Center PCL, NVDR | 791,200 | 343,986 | ||||||
Mega Lifesciences PCL, NVDR | 121,100 | 172,230 | ||||||
PTT Exploration & Production PCL, NVDR | 175,400 | 767,447 | ||||||
PTT PCL, NVDR | 366,800 | 398,648 | ||||||
Thai Union Group PCL, NVDR | 398,800 | 196,128 | ||||||
|
| |||||||
| 2,824,478 | ||||||||
| Turkey — 0.3% | ||||||||
Kardemir Karabuk Demir Celik Sanayi ve Ticaret A/S, Class D(a) | 155,075 | 156,999 | ||||||
Migros Ticaret A/S(a) | 17,166 | 52,487 | ||||||
Turk Hava Yollari AO(a) | 54,583 | 151,674 | ||||||
Turkcell Iletisim Hizmetleri A/S | 27,428 | 39,974 | ||||||
|
| |||||||
| 401,134 | ||||||||
| United Arab Emirates — 1.2% | ||||||||
Abu Dhabi Commercial Bank PJSC | 56,786 | 156,975 | ||||||
Abu Dhabi Islamic Bank PJSC | 28,640 | 68,215 | ||||||
Aldar Properties PJSC | 221,657 | 339,623 | ||||||
Dubai Islamic Bank PJSC | 55,861 | 97,710 | ||||||
Emaar Properties PJSC | 50,986 | 87,943 | ||||||
Emirates NBD Bank PJSC | 49,810 | 205,773 | ||||||
Emirates Telecommunications Group Co. PJSC | 35,472 | 339,281 | ||||||
First Abu Dhabi Bank PJSC | 53,263 | 325,403 | ||||||
|
| |||||||
| 1,620,923 | ||||||||
|
| |||||||
Total Common Stocks — 92.1% | 130,013,253 | |||||||
|
| |||||||
| Preferred Securities | ||||||||
| Preferred Stocks — 0.9% | ||||||||
| Brazil — 0.9% | ||||||||
Banco Bradesco SA, Preference Shares | 132,630 | 482,346 | ||||||
| Security | Shares | Value | ||||||
Brazil (continued) | ||||||||
Itau Unibanco Holding SA, Preference Shares | 11,430 | $ | 55,185 | |||||
Petroleo Brasileiro SA, Preference Shares | 107,590 | 658,952 | ||||||
|
| |||||||
| 1,196,483 | ||||||||
|
| |||||||
Total Preferred Securities — 0.9% |
| 1,196,483 | ||||||
|
| |||||||
Total Long-Term Investments — 93.0% |
| 131,209,736 | ||||||
|
| |||||||
Short-Term Securities | ||||||||
| Money Market Funds — 5.2% | ||||||||
BlackRock Liquidity Funds, T-Fund, Institutional Class, 0.29%(e)(f) | 7,133,591 | 7,133,591 | ||||||
SL Liquidity Series, LLC, Money Market Series, 0.47%(e)(f)(g) | 254,907 | 254,881 | ||||||
|
| |||||||
Total Short-Term Securities — 5.2% |
| 7,388,472 | ||||||
|
| |||||||
Total Investments — 98.2% |
| 138,598,208 | ||||||
Other Assets Less Liabilities — 1.8% | 2,536,080 | |||||||
|
| |||||||
Net Assets — 100.0% | $ | 141,134,288 | ||||||
|
| |||||||
| (a) | Non-income producing security. |
| (b) | Security exempt from registration pursuant to Rule 144A under the Securities Act of 1933, as amended. These securities may be resold in transactions exempt from registration to qualified institutional investors. |
| (c) | All or a portion of this security is on loan. |
| (d) | Security is valued using significant unobservable inputs and is classified as Level 3 in the fair value hierarchy. |
| (e) | Affiliate of the Fund. |
| (f) | Annualized 7-day yield as of period end. |
| (g) | All or a portion of this security was purchased with the cash collateral from loaned securities. |
Affiliates
Investments in issuers considered to be affiliate(s) of the Fund during the year ended April 30, 2022 for purposes of Section 2(a)(3) of the Investment Company Act of 1940, as amended, were as follows:
| Affiliated Issuer | Value at 04/30/21 | Purchases at Cost | Proceeds from Sales | Net Realized Gain (Loss) | Change in | Value at 04/30/22 | Shares Held at 04/30/22 | Income | Capital Gain Distributions from Underlying Funds | |||||||||||||||||||||||||||||||||||
BlackRock Liquidity Funds, T-Fund, Institutional Class | $ | 13,397,402 | $ | — | $ | (6,263,811 | )(a) | $ | — | $ | — | $ | 7,133,591 | 7,133,591 | $ | 2,206 | $ | — | ||||||||||||||||||||||||||
SL Liquidity Series, LLC, Money Market Series | — | 254,889 | (a) | — | (8 | ) | — | 254,881 | 254,907 | 3,475 | (b) | — | ||||||||||||||||||||||||||||||||
|
|
|
|
|
|
|
|
|
| |||||||||||||||||||||||||||||||||||
| $ | (8 | ) | $ | — | $ | 7,388,472 | $ | 5,681 | $ | — | ||||||||||||||||||||||||||||||||||
|
|
|
|
|
|
|
|
|
| |||||||||||||||||||||||||||||||||||
| (a) | Represents net amount purchased (sold). |
| (b) | All or a portion represents securities lending income earned from the reinvestment of cash collateral from loaned securities, net of fees and collateral investment expenses, and other payments to and from borrowers of securities. |
| 14 | 2 0 2 2 BLACK ROCK ANNUAL REPORT TO SHAREHOLDERS |
Schedule of Investments (continued) April 30, 2022 | BlackRock Advantage Emerging Markets Fund |
Derivative Financial Instruments Outstanding as of Period End
Futures Contracts
| Description | Number of Contracts | Expiration Date | Notional Amount (000) | Value/ Unrealized Appreciation (Depreciation) | ||||||||||||
Long Contracts | ||||||||||||||||
MSCI Emerging Markets Index | 144 | 06/17/22 | $ | 7,613 | $ | (383,037 | ) | |||||||||
|
| |||||||||||||||
Derivative Financial Instruments Categorized by Risk Exposure
As of period end, the fair values of derivative financial instruments located in the Statements of Assets and Liabilities were as follows:
| Commodity Contracts | Credit Contracts | Equity Contracts | Foreign Currency Exchange Contracts | Interest Rate Contracts | Other Contracts | Total | ||||||||||||||||||||||
Liabilities — Derivative Financial Instruments | ||||||||||||||||||||||||||||
Futures contracts | ||||||||||||||||||||||||||||
Unrealized depreciation on futures contracts(a) | $ | — | $ | — | $ | 383,037 | $ | — | $ | — | $ | — | $ | 383,037 | ||||||||||||||
|
|
|
|
|
|
|
|
|
|
|
|
|
| |||||||||||||||
| (a) | Net cumulative unrealized appreciation (depreciation) on futures contracts and centrally cleared swaps, if any, are reported in the Schedule of Investments. In the Statements of Assets and Liabilities, only current day’s variation margin is reported in receivables or payables and the net cumulative unrealized appreciation (depreciation) is included in accumulated earnings (loss). |
For the period ended April 30, 2022, the effect of derivative financial instruments in the Statements of Operations was as follows:
| Commodity Contracts | Credit Contracts | Equity Contracts | Foreign Currency Exchange Contracts | Interest Rate Contracts | Other Contracts | Total | ||||||||||||||||||||||
Net Realized Gain (Loss) from: | ||||||||||||||||||||||||||||
Futures contracts | $ | — | $ | — | $ | (1,502,287 | ) | $ | — | $ | — | $ | — | $ | (1,502,287 | ) | ||||||||||||
|
|
|
|
|
|
|
|
|
|
|
|
|
| |||||||||||||||
Net Change in Unrealized Appreciation (Depreciation) on: | ||||||||||||||||||||||||||||
Futures contracts | $ | — | $ | — | $ | (444,244 | ) | $ | — | $ | — | $ | — | $ | (444,244 | ) | ||||||||||||
|
|
|
|
|
|
|
|
|
|
|
|
|
| |||||||||||||||
Average Quarterly Balances of Outstanding Derivative Financial Instruments
| ||||
Futures contracts: | ||||
Average notional value of contracts — long | $ | 9,425,150 | ||
| ||||
For more information about the Fund’s investment risks regarding derivative financial instruments, refer to the Notes to Financial Statements.
Fair Value Hierarchy as of Period End
Various inputs are used in determining the fair value of financial instruments. For a description of the input levels and information about the Fund’s policy regarding valuation of financial instruments, refer to the Notes to Financial Statements.
The following table summarizes the Fund’s financial instruments categorized in the fair value hierarchy. The breakdown of the Fund’s financial instruments into major categories is disclosed in the Schedule of Investments above.
| ||||||||||||||||||||||
| Level 1 | Level 2 | Level 3 | Total | |||||||||||||||||||
| ||||||||||||||||||||||
Assets | ||||||||||||||||||||||
Investments | ||||||||||||||||||||||
Long-Term Investments | ||||||||||||||||||||||
Common Stocks | ||||||||||||||||||||||
Brazil | $ | 4,967,796 | $ | — | $ | — | $ | 4,967,796 | ||||||||||||||
China | 2,724,417 | 36,628,247 | 139,625 | 39,492,289 | ||||||||||||||||||
Colombia | 166,632 | — | — | 166,632 | ||||||||||||||||||
Greece | — | 1,080,671 | — | 1,080,671 | ||||||||||||||||||
Hong Kong | — | 809,609 | — | 809,609 | ||||||||||||||||||
Hungary | — | 604,398 | — | 604,398 | ||||||||||||||||||
SCHEDULE OF INVESTMENTS | 15 |
Schedule of Investments (continued) April 30, 2022 | BlackRock Advantage Emerging Markets Fund |
Fair Value Hierarchy as of Period End (continued)
| ||||||||||||||||||||||
| Level 1 | Level 2 | Level 3 | Total | |||||||||||||||||||
| ||||||||||||||||||||||
Common Stocks (continued) | ||||||||||||||||||||||
India | $ | 1,918,743 | $ | 14,756,715 | $ | — | $ | 16,675,458 | ||||||||||||||
Indonesia | 49,938 | 2,239,064 | — | 2,289,002 | ||||||||||||||||||
Malaysia | 10,799 | 1,879,940 | — | 1,890,739 | ||||||||||||||||||
Mexico | 3,295,511 | — | — | 3,295,511 | ||||||||||||||||||
Peru | 228,750 | 89,294 | — | 318,044 | ||||||||||||||||||
Philippines | — | 461,853 | — | 461,853 | ||||||||||||||||||
Romania | — | 352,175 | — | 352,175 | ||||||||||||||||||
Russia | — | — | 313 | 313 | ||||||||||||||||||
Saudi Arabia | 58,727 | 6,501,003 | — | 6,559,730 | ||||||||||||||||||
Singapore | 41,826 | — | — | 41,826 | ||||||||||||||||||
South Africa | 2,142,250 | 5,663,334 | — | 7,805,584 | ||||||||||||||||||
South Korea | 225,989 | 15,728,029 | — | 15,954,018 | ||||||||||||||||||
Taiwan | 1,122,780 | 21,278,290 | — | 22,401,070 | ||||||||||||||||||
Thailand | — | 2,824,478 | — | 2,824,478 | ||||||||||||||||||
Turkey | 244,135 | 156,999 | — | 401,134 | ||||||||||||||||||
United Arab Emirates | 325,403 | 1,295,520 | — | 1,620,923 | ||||||||||||||||||
Preferred Securities | ||||||||||||||||||||||
Preferred Stocks | 1,196,483 | — | — | 1,196,483 | ||||||||||||||||||
Short-Term Securities | ||||||||||||||||||||||
Money Market Funds | 7,133,591 | — | — | 7,133,591 | ||||||||||||||||||
|
|
|
|
|
|
|
| |||||||||||||||
| $ | 25,853,770 | $ | 112,349,619 | $ | 139,938 | 138,343,327 | ||||||||||||||||
|
|
|
|
|
|
|
| |||||||||||||||
Investments Valued at NAV(a) | 254,881 | |||||||||||||||||||||
|
| |||||||||||||||||||||
| $ | 138,598,208 | |||||||||||||||||||||
|
| |||||||||||||||||||||
Derivative Financial Instruments(b) | ||||||||||||||||||||||
Liabilities | ||||||||||||||||||||||
Equity Contracts | $ | (383,037 | ) | $ | — | $ | — | $ | (383,037 | ) | ||||||||||||
|
|
|
|
|
|
|
| |||||||||||||||
| (a) | Certain investments of the Fund were fair valued using NAV per share as no quoted market value is available and therefore have been excluded from the fair value hierarchy. |
| (b) | Derivative financial instruments are futures contracts. Futures contracts are valued at the unrealized appreciation (depreciation) on the instrument. |
See notes to financial statements.
| 16 | 2 0 2 2 BLACK ROCK ANNUAL REPORT TO SHAREHOLDERS |
Schedule of Investments April 30, 2022 | BlackRock Global Long/Short Equity Fund (Percentages shown are based on Net Assets) |
| Security |
Shares | Value | ||||||
Common Stocks | ||||||||
| Netherlands — 0.1% | ||||||||
Climate Transition Capital Acquisition I BV(a) | 40,590 | $ | 419,640 | |||||
|
| |||||||
| United States(a) — 0.0% | ||||||||
Excelerate Energy, Inc., Class A | 1,966 | 53,102 | ||||||
Palantir Technologies, Inc., Class A | 4 | 41 | ||||||
|
| |||||||
| 53,143 | ||||||||
|
| |||||||
Total Common Stocks — 0.1% | 472,783 | |||||||
|
| |||||||
Preferred Securities | ||||||||
| Preferred Stocks — 0.5%(b) | ||||||||
| United States — 0.5% | ||||||||
AliphCom | ||||||||
Series 6, (Acquired 12/15/15, Cost: $—)(c) | 8,264 | — | ||||||
Series 8, | 823,530 | 8 | ||||||
Illumio, Inc., Series C, (Acquired 03/10/15, Cost: $1,500,001)(c) | 466,730 | 3,323,118 | ||||||
|
| |||||||
| 3,323,126 | ||||||||
|
| |||||||
Total Preferred Securities — 0.5% | 3,323,126 | |||||||
|
| |||||||
| Par (000) | ||||||||
U.S. Treasury Obligations | ||||||||
U.S. Treasury Floating Rate Note(d) | ||||||||
(3 mo.Treasury money market yield - 0.02%), 0.88%, 01/31/24 | $ | 3,395 | 3,399,304 | |||||
(3 mo.Treasury money market yield + 0.04%), 0.93%, 10/31/23 | 3,130 | 3,135,761 | ||||||
|
| |||||||
Total U.S. Treasury Obligations — 1.1% | 6,535,065 | |||||||
|
| |||||||
| Shares | ||||||||
Warrants | ||||||||
| Netherlands — 0.0% | ||||||||
Climate Transition Capital Acquisition I BV, | 13,530 | 2,141 | ||||||
|
| |||||||
Total Warrants — 0.0% | 2,141 | |||||||
|
| |||||||
Total Long-Term Investments — 1.7% | 10,333,115 | |||||||
|
| |||||||
Short-Term Securities | ||||||||
| Money Market Funds — 6.1% | ||||||||
BlackRock Liquidity Funds, T-Fund, Institutional Class, 0.29%(e)(f) | 36,355,831 | 36,355,831 | ||||||
|
| |||||||
| Security | Par (000) | Value | ||||||
| U.S. Treasury Obligations — 85.3% | ||||||||
U.S. Cash Management Bills(g) | $ | 9,195 | $ | 9,194,977 | ||||
0.23%, 05/17/22 | 955 | 954,926 | ||||||
0.28%, 05/31/22 | 2,115 | 2,114,434 | ||||||
0.98%, 08/16/22 | 15,000 | 14,956,374 | ||||||
1.13%, 08/30/22 | 14,095 | 14,043,516 | ||||||
U.S. Treasury Bills(g) | 700 | 699,998 | ||||||
0.13%, 05/03/22 | 1,495 | 1,494,996 | ||||||
0.25%, 05/03/22 | 7,000 | 6,999,983 | ||||||
0.24%, 05/05/22 - 05/12/22 | 14,595 | 14,594,624 | ||||||
0.22%, 05/10/22 | 4,885 | 4,884,878 | ||||||
0.16%, 05/12/22 | 20,000 | 19,999,319 | ||||||
0.20%, 05/17/22 | 3,895 | 3,894,696 | ||||||
0.26%, 05/17/22 | 30,000 | 29,997,656 | ||||||
0.17%, 05/19/22 | 10,000 | 9,998,961 | ||||||
0.28%, 05/19/22 - 05/31/22 | 8,885 | 8,883,932 | ||||||
0.45%, 05/19/22 - 06/16/22 | 20,105 | 20,095,424 | ||||||
0.30%, 05/24/22 | 25,000 | 24,995,608 | ||||||
0.33%, 05/24/22 | 10,000 | 9,998,243 | ||||||
0.41%, 05/31/22 | 7,000 | 6,998,125 | ||||||
0.51%, 06/07/22 | 15,000 | 14,993,763 | ||||||
0.37%, 06/09/22 | 20,000 | 19,990,830 | ||||||
0.39%, 06/09/22 | 40,050 | 40,031,637 | ||||||
0.50%, 06/14/22 - 06/21/22 | 25,000 | 24,984,181 | ||||||
0.46%, 06/16/22 | 8,000 | 7,995,556 | ||||||
0.49%, 06/21/22 | 10,000 | 9,992,199 | ||||||
0.66%, 06/21/22 | 40,000 | 39,968,796 | ||||||
0.52%, 06/23/22 - 07/05/22 | 45,875 | 45,822,976 | ||||||
0.63%, 06/28/22 | 25,000 | 24,975,359 | ||||||
0.55%, 07/05/22 | 5,000 | 4,993,585 | ||||||
0.70%, 08/04/22 | 475 | 473,862 | ||||||
0.78%, 08/18/22 | 1,505 | 1,500,493 | ||||||
0.68%, 09/01/22 | 3,685 | 3,671,659 | ||||||
0.08%, 09/08/22 | 1,362 | 1,356,821 | ||||||
1.07%, 09/29/22 | 2,675 | 2,662,173 | ||||||
1.40%, 10/27/22 | 14,890 | 14,789,026 | ||||||
0.64%, 01/26/23 | 2,475 | 2,444,969 | ||||||
1.17%, 02/23/23 | 2,165 | 2,134,139 | ||||||
U.S. Treasury Floating Rate Note(d) | ||||||||
(3 mo.Treasury money market yield + 0.06%), 0.95%, 10/31/22 | 20,000 | 20,019,357 | ||||||
(3 mo.Treasury money market yield + 0.05%), 0.94%, 01/31/23 | 14,633 | 14,648,694 | ||||||
U.S. Treasury Notes | 585 | 585,373 | ||||||
0.13%, 06/30/22 - 03/31/23 | 3,925 | 3,861,855 | ||||||
1.63%, 12/15/22 | 2,000 | 2,000,000 | ||||||
1.38%, 02/15/23 | 5,000 | 4,980,078 | ||||||
|
| |||||||
| 513,678,051 | ||||||||
|
| |||||||
Total Short-Term Securities — 91.4% | 550,033,882 | |||||||
|
| |||||||
Total Investments — 93.1% |
| 560,366,997 | ||||||
Other Assets Less Liabilities — 6.9% | 41,829,820 | |||||||
|
| |||||||
Net Assets — 100.0% | $ | 602,196,817 | ||||||
|
| |||||||
| (a) | Non-income producing security. |
| (b) | Security is valued using significant unobservable inputs and is classified as Level 3 in the fair value hierarchy. |
SCHEDULE OF INVESTMENTS | 17 |
Schedule of Investments (continued) April 30, 2022 | BlackRock Global Long/Short Equity Fund |
| (c) | Restricted security as to resale, excluding 144A securities. The Fund held restricted securities with a current value of $3,323,118, representing 0.6% of its net assets as of period end, and an original cost of $1,500,001. |
| (d) | Variable rate security. Interest rate resets periodically. The rate shown is the effective interest rate as of period end. Security description also includes the reference rate and spread if published and available. |
| (e) | Affiliate of the Fund. |
| (f) | Annualized 7-day yield as of period end. |
| (g) | Rates are discount rates or a range of discount rates as of period end. |
Affiliates
Investments in issuers considered to be affiliate(s) of the Fund during the year ended April 30, 2022 for purposes of Section 2(a)(3) of the Investment Company Act of 1940, as amended, were as follows:
| Affiliated Issuer | Value at 04/30/21 | Purchases at Cost | Proceeds from Sales | Net Realized Gain (Loss) | Change in Unrealized Appreciation (Depreciation) | Value at 04/30/22 | Shares Held at 04/30/22 | Income | Capital Gain Distributions from Underlying Funds | |||||||||||||||||||||||||||
BlackRock Liquidity Funds, T-Fund, Institutional Class | $ | 18,454,009 | $ | 17,901,822 | (a) | $ | — | $ | — | $ | — | $ | 36,355,831 | 36,355,831 | $ | 11,465 | $ | — | ||||||||||||||||||
|
|
|
|
|
|
|
|
|
| |||||||||||||||||||||||||||
| (a) | Represents net amount purchased (sold). |
Derivative Financial Instruments Outstanding as of Period End
Futures Contracts
| Description | Number of Contracts | Expiration Date | Notional Amount (000) | Value/ Unrealized Appreciation (Depreciation) | ||||||||||||
Long Contracts | ||||||||||||||||
TOPIX Index | 94 | 06/09/22 | $ | 13,726 | $ | (487,733 | ) | |||||||||
S&P 500 E-Mini Index | 68 | 06/17/22 | 14,034 | (123,607 | ) | |||||||||||
|
| |||||||||||||||
| $ | (611,340 | ) | ||||||||||||||
|
| |||||||||||||||
OTC Total Return Swaps
| Reference Entity | Payment Frequency | Counterparty(a) | Termination Date | Net Notional | Accrued Unrealized Appreciation (Depreciation) | Net Value of Reference Entity | Gross Notional Amount Net Asset Percentage | |||||||||||||||||
Equity Securities Long/Short | At Termination | Bank of America N.A.(b) | 02/15/23 – 06/15/23 | $ | (8,586,443 | ) | $ | 3,245,734 | (c) | $ | (1,032,216 | ) | 60.7 | % | ||||||||||
At Termination | Bank of America N.A.(d) | 02/15/23 – 06/15/23 | (6,816,197 | ) | 3,033,508 | (e) | (89,684 | ) | 40.4 | |||||||||||||||
At Termination | BNP Paribas SA(f) | 12/12/22 – 12/19/22 | (6,862,838 | ) | 6,902,033 | (g) | (362,256 | ) | 125.9 | |||||||||||||||
At Termination | Goldman Sachs & Co.(h) | 02/27/23 – 02/28/23 | (11,083,575 | ) | 12,066,813 | (i) | (1,995,792 | ) | 142.2 | |||||||||||||||
At Termination | Goldman Sachs & Co.(j) | 02/27/23 – 02/28/23 | (5,650,977 | ) | 7,560,189 | (k) | 688,223 | 64.4 | ||||||||||||||||
At Termination | UBS AG(l) | 07/08/22 – 01/20/27 | (7,073,429 | ) | 4,809,090 | (m) | 1,117,689 | 54.2 | ||||||||||||||||
|
|
|
| |||||||||||||||||||||
| $ | 37,617,367 | $ | (1,674,036 | ) | ||||||||||||||||||||
|
|
|
| |||||||||||||||||||||
| (a) | The Fund receives the total return on a portfolio of long positions underlying the total return swap. The Fund pays the total return on a portfolio of short positions underlying the total return swap. In addition, the Fund pays or receives a variable rate of interest, based on a specified benchmark. The benchmark and spread are determined based upon the country and/or currency of the individual underlying positions. |
| (c) | Amount includes $(4,308,493) of net dividends and financing fees. |
| (e) | Amount includes $(3,693,005) of net dividends and financing fees. |
| (g) | Amount includes $401,451 of net dividends and financing fees. |
| (i) | Amount includes $2,979,030 of net dividends and financing fees. |
| (k) | Amount includes $1,220,989 of net dividends and financing fees. |
| (m) | Amount includes $(3,382,028) of net dividends and financing fees. |
The following are the specified benchmarks (plus or minus a range) used in determining the variable rate of interest:
| 18 | 2 0 2 2 BLACK ROCK ANNUAL REPORT TO SHAREHOLDERS |
Schedule of Investments (continued) April 30, 2022 | BlackRock Global Long/Short Equity Fund |
OTC Total Return Swaps (continued)
| ||||||
| (b) | (d) | (f) | ||||
Range: | 0-175 basis points | 0-1,196 basis points | 0-625 basis points | |||
Benchmarks: | AUD - 1D Overnight Reserve Bank of Australia Rate (AONIA) | AUD - 1D Overnight Reserve Bank of Australia Rate (AONIA) | AUD - 1D Overnight Reserve Bank of Australia Rate (AONIA) | |||
| Bank of Canada Overnight Rate Target(CABROVER) | Bank of Canada Overnight Rate Target (CABROVER) | Bank of Canada Overnight Rate Target (CABROVER) | ||||
| CHF - Swiss Average Rate O/N (SSARON) | CHF - Swiss Average Rate O/N (SSARON) | CHF - Swiss Average Rate O/N (SSARON) | ||||
| DKK - 1W Copenhagen Interbank Swap Rate (CIBOR) | DKK - 1W Copenhagen Interbank Swap Rate (CIBOR) | DKK - Annualized Overnight Deposit MID Rate | ||||
| EUR - 1D Euro Short Term Rate (ESTR) | ||||||
| EUR - 1D Euro Short Term Rate (ESTR) | EUR - 1D Euro Short Term Rate (ESTR) | GBP - 1D Sterling Overnight Index Average (SONIA) | ||||
| GBP - 1D Sterling Overnight Index Average (SONIA) | GBP - 1D Sterling Overnight Index Average (SONIA) | |||||
| HKD - 1D Overnight Index Swap Rate (HKDONOIS) | ||||||
| HKD - 1D Overnight Index Swap Rate (HKDONOIS) | HKD - 1D Overnight Index Swap Rate (HKDONOIS) | |||||
| ILS - 1M Tel Aviv Interbank Offer Rate (TELBOR) | ||||||
| ILS - 1M Tel Aviv Interbank Offer Rate (TELBOR) | ILS - 1M Tel Aviv Interbank Offer Rate (TELBOR) | JPY - 1D Overnight Tokyo Average Rate (TONA) | ||||
| JPY - Provisional 1D Overnight Tokyo Average Rate (TONA) | JPY - Provisional 1D Overnight Tokyo Average Rate (TONA) | NOK - Norwegian Overnight Weighted Average (NOWA) | ||||
| NOK - 1W Norway Interbank Offer Rate (NIBOR) | NOK - 1W Norway Interbank Offer Rate (NIBOR) | NZD - 1D New Zealand Official Overnight Deposit | ||||
| NZD - 1M New Zealand Bank Bill Rate (BBR) | NZD - 1M New Zealand Bank Bill Rate (BBR) | Rate (NZOCO) | ||||
| SEK - 1W Stockholm Interbank Offer Rate (STIBOR) | SEK - 1W Stockholm Interbank Offer Rate (STIBOR) | SEK - 1W Stockholm Interbank Offer Rate (STIBOR) | ||||
| SGD - Overnight Rate Average (SORA) | SGD - Overnight Rate Average (SORA) | SGD - Overnight Rate Average (SORA) | ||||
| USD - 1D Overnight Bank Funding Rate (OBFR01) | USD - 1D Overnight Bank Funding Rate (OBFR01) | USD - 1D Overnight Bank Funding Rate (OBFR01) | ||||
| (h) | (j) | (l) | ||||
| 0-1,300 basis points | 15-1,350 basis points | 20-170 basis points | ||||
| AUD - 1D Overnight Reserve Bank of Australia Rate (AONIA) | AUD - 1D Overnight Reserve Bank of Australia Rate (AONIA) | AUD - 1D Overnight Reserve Bank of Australia Rate (AONIA) | ||||
| CAD - 1D Overnight Bank of Canada Repo Rate (CORRA) | CAD - 1D Overnight Bank of Canada Repo Rate (CORRA) | CAD - 1D Overnight Bank of Canada Repo Rate (CORRA) | ||||
| CHF - Swiss Average Rate O/N (SSARON) | CHF - Swiss Average Rate O/N (SSARON) | CHF - Swiss Average Rate O/N (SSARON) | ||||
| DKK - Danish Tom/Next Reference Rate (DETNT/N) | DKK - Danish Tom/Next Reference Rate (DETNT/N) | DKK - 1W Copenhagen Interbank Swap Rate (CIBOR) | ||||
| EUR - 1D Euro Short Term Rate (ESTR) | EUR - 1D Euro Short Term Rate (ESTR) | EUR - 1D Euro Short Term Rate (ESTR) | ||||
| GBP - 1D Sterling Overnight Index Average (SONIA) | GBP - 1D Sterling Overnight Index Average (SONIA) | GBP - 1D Sterling Overnight Index Average (SONIA) | ||||
| HKD - 1D Overnight Index Swap Rate (HKDONOIS) | HKD - 1D Overnight Index Swap Rate (HKDONOIS) | HKD - 1D Overnight Index Swap Rate (HKDONOIS) | ||||
| ILS - 1D Overnight Tel Aviv Interbank Offer Rate (TELBOR) | ILS - 1D Overnight Tel Aviv Interbank Offer Rate (TELBOR) | ILS - 1D Overnight Tel Aviv Interbank Offer Rate (TELBOR) | ||||
| JPY - Provisional 1D Overnight Tokyo Average Rate (TONA) | JPY - Provisional 1D Overnight Tokyo Average Rate (TONA) | JPY - Provisional 1D Overnight Tokyo Average Rate (TONA) | ||||
| NOK - Norwegian Overnight Weighted Average (NOWA) | NOK - Norwegian Overnight Weighted Average (NOWA) | NOK - Norwegian Overnight Weighted Average (NOWA) | ||||
| NZD - 1D New Zealand Official Overnight Deposit Rate (NZOCO) | NZD - 1D New Zealand Official Overnight Deposit Rate (NZOCO) | NZD - 1M New Zealand Bank Bill Rate (BBR) | ||||
| SEK - TN Stockholm Interbank Offer Rate (STIBOR) | ||||||
| SEK - 1D Overnight Stockholm Interbank Offer Rate (STIBOR) | SEK - 1D Overnight Stockholm Interbank Offer Rate (STIBOR) | |||||
| SGD - Overnight Rate Average (SORA) | ||||||
| SGD - Overnight Rate Average (SORA) | SGD - Overnight Rate Average (SORA) | USD - 1D Overnight Bank Funding Rate (OBFR01) | ||||
| USD - 1D Overnight Fed Funds Effective Rate (FEDL01) | USD - 1D Overnight Fed Funds Effective Rate (FEDL01) | |||||
SCHEDULE OF INVESTMENTS | 19 |
Schedule of Investments (continued) April 30, 2022 | BlackRock Global Long/Short Equity Fund
|
The following table represents the individual long and short positions and related values of the equity securities underlying the total return swap with Bank of America N.A. as of period end, termination dates February 15, 2023 and June 15, 2023:
| Security | Shares | Value | % of Basket Value | |||||||||
Reference Entity — Long | ||||||||||||
| Common Stocks | ||||||||||||
| Argentina | ||||||||||||
MercadoLibre, Inc. | 172 | $ | 167,464 | (16.2 | )% | |||||||
|
|
|
| |||||||||
| Australia | ||||||||||||
Altium Ltd. | 4,191 | 94,412 | (9.1 | ) | ||||||||
AMP Ltd. | 195,166 | 157,679 | (15.3 | ) | ||||||||
Atlas Arteria Ltd. | 31,072 | 150,950 | (14.6 | ) | ||||||||
Aurizon Holdings Ltd. | 64,246 | 181,438 | (17.6 | ) | ||||||||
Australia & New Zealand Banking Group Ltd. | 6,311 | 120,093 | (11.6 | ) | ||||||||
Boral Ltd. | 166,715 | 415,892 | (40.3 | ) | ||||||||
carsales.com Ltd. | 5,320 | 78,540 | (7.6 | ) | ||||||||
Commonwealth Bank of Australia | 1,513 | 109,970 | (10.7 | ) | ||||||||
CSR Ltd. | 37,701 | 161,458 | (15.6 | ) | ||||||||
Deterra Royalties Ltd. | 39,957 | 135,362 | (13.1 | ) | ||||||||
Domain Holdings Australia Ltd. | 49,275 | 120,001 | (11.6 | ) | ||||||||
Domino’s Pizza Enterprises Ltd. | 1,331 | 69,773 | (6.8 | ) | ||||||||
Flight Centre Travel Group Ltd. | 1,020 | 15,929 | (1.5 | ) | ||||||||
Glencore PLC | 10,720 | 66,053 | (6.4 | ) | ||||||||
Goodman Group | 3,074 | 51,163 | (5.0 | ) | ||||||||
Harvey Norman Holdings Ltd. | 58,573 | 208,641 | (20.2 | ) | ||||||||
IDP Education Ltd. | 6,700 | 124,294 | (12.0 | ) | ||||||||
IGO Ltd. | 1,089 | 9,902 | (1.0 | ) | ||||||||
Iluka Resources Ltd. | 9,655 | 75,627 | (7.3 | ) | ||||||||
Insignia Financial Ltd. | 120,335 | 289,266 | (28.0 | ) | ||||||||
JB Hi-Fi Ltd. | 411 | 15,222 | (1.5 | ) | ||||||||
Macquarie Group Ltd. | 1,905 | 274,249 | (26.6 | ) | ||||||||
Magellan Financial Group Ltd. | 5,445 | 61,599 | (6.0 | ) | ||||||||
Medibank Pvt Ltd. | 93,373 | 209,822 | (20.3 | ) | ||||||||
Metcash Ltd. | 3,082 | 10,346 | (1.0 | ) | ||||||||
Mirvac Group | 49,657 | 83,925 | (8.1 | ) | ||||||||
Origin Energy Ltd. | 10,116 | 48,386 | (4.7 | ) | ||||||||
Orora Ltd. | 47,331 | 132,637 | (12.8 | ) | ||||||||
OZ Minerals Ltd. | 26,379 | 457,885 | (44.4 | ) | ||||||||
Pilbara Minerals Ltd. | 17,178 | 33,320 | (3.2 | ) | ||||||||
Pro Medicus Ltd. | 968 | 31,657 | (3.1 | ) | ||||||||
Qube Holdings Ltd. | 28,723 | 59,355 | (5.8 | ) | ||||||||
REA Group Ltd. | 2,680 | 240,096 | (23.3 | ) | ||||||||
Scentre Group | 17,745 | 36,972 | (3.6 | ) | ||||||||
SEEK Ltd. | 7,130 | 139,715 | (13.5 | ) | ||||||||
South32 Ltd. | 3,495 | 11,640 | (1.1 | ) | ||||||||
Star Entertainment Grp Ltd. | 140,911 | 311,227 | (30.2 | ) | ||||||||
Telstra Corp. Ltd. | 9,524 | 27,035 | (2.6 | ) | ||||||||
Wesfarmers Ltd. | 292 | 10,104 | (1.0 | ) | ||||||||
WiseTech Global Ltd. | 3,892 | 120,663 | (11.7 | ) | ||||||||
|
|
|
| |||||||||
| 4,952,298 | ||||||||||||
| Austria | ||||||||||||
ANDRITZ AG | 3,500 | 148,789 | (14.4 | ) | ||||||||
Erste Group Bank AG | 23,474 | 730,881 | (70.8 | ) | ||||||||
Raiffeisen Bank International AG | 3,157 | 36,568 | (3.6 | ) | ||||||||
|
|
|
| |||||||||
| 916,238 | ||||||||||||
| Belgium | ||||||||||||
Ackermans & van Haaren NV | 1,461 | 260,462 | (25.2 | ) | ||||||||
KBC Group NV | 758 | 51,568 | (5.0 | ) | ||||||||
| Security | Shares | Value | % of Basket Value | |||||||||
| Belgium (continued) | ||||||||||||
Telenet Group Holding NV | 5,723 | $ | 170,559 | (16.5 | )% | |||||||
Umicore SA | 3,213 | 123,519 | (12.0 | ) | ||||||||
Warehouses De Pauw CVA | 11,005 | 423,364 | (41.0 | ) | ||||||||
|
|
|
| |||||||||
| 1,029,472 | ||||||||||||
| Bermuda | ||||||||||||
Hiscox Ltd. | 11,436 | 135,794 | (13.2 | ) | ||||||||
RenaissanceRe Holdings Ltd. | 1,726 | 247,716 | (24.0 | ) | ||||||||
|
|
|
| |||||||||
| 383,510 | ||||||||||||
| Canada | ||||||||||||
Air Canada | 12,379 | 216,812 | (21.0 | ) | ||||||||
Alamos Gold Inc., Class A | 67,176 | 521,867 | (50.6 | ) | ||||||||
ARC Resources Ltd. | 17,478 | 242,310 | (23.5 | ) | ||||||||
Aritzia Inc. | 3,494 | 124,431 | (12.0 | ) | ||||||||
Atco Ltd., Class I | 4,613 | 164,354 | (15.9 | ) | ||||||||
Boralex, Inc., Class A | 4,196 | 125,784 | (12.2 | ) | ||||||||
Brookfield Infrastructure Corp., Class A | 4,247 | 301,338 | (29.2 | ) | ||||||||
CAE, Inc. | 4,066 | 96,693 | (9.4 | ) | ||||||||
Canada Goose Holdings, Inc. | 6,447 | 140,351 | (13.6 | ) | ||||||||
Canadian Utilities Ltd., Class A | 7,829 | 235,361 | (22.8 | ) | ||||||||
Cargojet, Inc. | 424 | 49,537 | (4.8 | ) | ||||||||
CGI, Inc. | 4,356 | 347,354 | (33.6 | ) | ||||||||
CI Financial Corp. | 5,541 | 72,247 | (7.0 | ) | ||||||||
Descartes Systems Group Inc. | 3,688 | 229,063 | (22.2 | ) | ||||||||
Enbridge, Inc. | 9,560 | 417,183 | (40.4 | ) | ||||||||
Enerplus Corp. | 19,579 | 239,889 | (23.2 | ) | ||||||||
Equinox Gold Corp. | 26,510 | 189,025 | (18.3 | ) | ||||||||
Franco-Nevada Corp. | 2,538 | 383,826 | (37.2 | ) | ||||||||
GFL Environmental, Inc. | 10,550 | 317,818 | (30.8 | ) | ||||||||
Hydro One Ltd. | 9,028 | 244,068 | (23.6 | ) | ||||||||
IGM Financial, Inc. | 3,215 | 101,882 | (9.9 | ) | ||||||||
Imperial Oil Ltd. | 5,972 | 300,680 | (29.1 | ) | ||||||||
Innergex Renewable Energy Inc. | 23,352 | 312,657 | (30.3 | ) | ||||||||
Ivanhoe Mines Ltd., Class A | 14,883 | 119,328 | (11.6 | ) | ||||||||
Keyera Corp. | 2,603 | 64,576 | (6.3 | ) | ||||||||
Lundin Mining Corp. | 2,482 | 22,663 | (2.2 | ) | ||||||||
Northland Power, Inc. | 700 | 21,126 | (2.0 | ) | ||||||||
Osisko Gold Royalties Ltd. | 1,147 | 14,116 | (1.4 | ) | ||||||||
Parex Resources, Inc. | 6,443 | 125,585 | (12.2 | ) | ||||||||
Shopify, Inc., Class A | 569 | 243,399 | (23.6 | ) | ||||||||
SSR Mining, Inc. | 536 | 11,791 | (1.1 | ) | ||||||||
Stantec, Inc. | 3,890 | 178,565 | (17.3 | ) | ||||||||
TC Energy Corp. | 1,833 | 96,954 | (9.4 | ) | ||||||||
TELUS Corp. | 15,770 | 394,542 | (38.2 | ) | ||||||||
TFI International, Inc. | 1,616 | 129,994 | (12.6 | ) | ||||||||
Whitecap Resources, Inc. | 15,738 | 129,001 | (12.5 | ) | ||||||||
WSP Global, Inc. | 1,730 | 201,758 | (19.5 | ) | ||||||||
Yamana Gold, Inc. | 35,305 | 194,849 | (18.9 | ) | ||||||||
|
|
|
| |||||||||
| 7,322,777 | ||||||||||||
| China | ||||||||||||
Budweiser Brewing Co. APAC Ltd. | 24,900 | 61,956 | (6.0 | ) | ||||||||
Chow Tai Fook Jewellery Group Ltd. | 55,400 | 92,891 | (9.0 | ) | ||||||||
|
|
|
| |||||||||
| 154,847 | ||||||||||||
| Denmark | ||||||||||||
Demant A/S | 4,351 | 191,198 | (18.5 | ) | ||||||||
Genmab A/S | 399 | 140,305 | (13.6 | ) | ||||||||
GN Store Nord A/S | 2,586 | 97,052 | (9.4 | ) | ||||||||
H Lundbeck A/S | 5,606 | 128,479 | (12.4 | ) | ||||||||
ISS A/S | 4,528 | 74,323 | (7.2 | ) | ||||||||
| 20 | 2 0 2 2 BLACK ROCK ANNUAL REPORT TO SHAREHOLDERS |
Schedule of Investments (continued) April 30, 2022 | BlackRock Global Long/Short Equity Fund |
| Security | Shares | Value | % of Basket Value | |||||||||
| Denmark (continued) | ||||||||||||
Jyske Bank A/S | 3,482 | $ | 192,534 | (18.7 | )% | |||||||
SimCorp A/S | 1,118 | 78,267 | (7.6 | ) | ||||||||
Tryg A/S | 7,913 | 188,148 | (18.2 | ) | ||||||||
|
|
|
| |||||||||
| 1,090,306 | ||||||||||||
| Finland | ||||||||||||
Kesko OYJ, B Shares | 14,902 | 375,179 | (36.3 | ) | ||||||||
Metso Outotec OYJ | 25,108 | 213,793 | (20.7 | ) | ||||||||
Nokia OYJ | 18,846 | 95,551 | (9.3 | ) | ||||||||
Nokian Renkaat OYJ | 10,916 | 146,586 | (14.2 | ) | ||||||||
Nordea Bank Abp | 2,483 | 24,756 | (2.4 | ) | ||||||||
Outokumpu OYJ | 21,432 | 105,215 | (10.2 | ) | ||||||||
Valmet OYJ | 13,815 | 369,977 | (35.8 | ) | ||||||||
Wartsila OYJ Abp | 31,599 | 253,735 | (24.6 | ) | ||||||||
|
|
|
| |||||||||
| 1,584,792 | ||||||||||||
| France | ||||||||||||
Accor SA | 6,223 | �� | 204,448 | (19.8 | ) | |||||||
Aeroports de Paris | 1,048 | 148,240 | (14.4 | ) | ||||||||
Air France-KLM | 18,396 | 75,778 | (7.3 | ) | ||||||||
Air Liquide SA | 11,954 | 2,068,141 | (200.4 | ) | ||||||||
Amundi SA | 263 | 15,814 | (1.5 | ) | ||||||||
Arkema SA | 861 | 98,106 | (9.5 | ) | ||||||||
Atos SE | 10,209 | 248,707 | (24.1 | ) | ||||||||
AXA SA | 4,652 | 123,069 | (11.9 | ) | ||||||||
Carrefour SA | 3,388 | 71,851 | (7.0 | ) | ||||||||
Cie Plastic Omnium SA | 17,810 | 288,303 | (27.9 | ) | ||||||||
Covivio | 4,414 | 314,354 | (30.5 | ) | ||||||||
Dassault Aviation SA | 206 | 34,568 | (3.3 | ) | ||||||||
Dassault Systemes SE | 3,686 | 163,011 | (15.8 | ) | ||||||||
Edenred | 7,995 | 401,526 | (38.9 | ) | ||||||||
Eurazeo SE | 1,684 | 129,397 | (12.5 | ) | ||||||||
Exclusive Networks SA | 27,644 | 527,268 | (51.1 | ) | ||||||||
ICADE | 2,467 | 147,294 | (14.3 | ) | ||||||||
Klepierre SA | 6,674 | 159,747 | (15.5 | ) | ||||||||
Legrand SA | 2,323 | 205,851 | (19.9 | ) | ||||||||
Orange SA | 4,109 | 48,919 | (4.7 | ) | ||||||||
Publicis Groupe SA | 186 | 11,167 | (1.1 | ) | ||||||||
Remy Cointreau SA | 617 | 122,310 | (11.9 | ) | ||||||||
Rubis SCA | 2,023 | 53,807 | (5.2 | ) | ||||||||
SCOR SE | 1,211 | 34,240 | (3.3 | ) | ||||||||
Ubisoft Entertainment SA | 6,074 | 274,623 | (26.6 | ) | ||||||||
Wendel SE | 964 | 96,047 | (9.3 | ) | ||||||||
|
|
|
| |||||||||
| 6,066,586 | ||||||||||||
| Germany | ||||||||||||
1&1 AG | 3,138 | 66,128 | (6.4 | ) | ||||||||
Bayerische Motoren Werke AG | 4,890 | 399,346 | (38.7 | ) | ||||||||
Beiersdorf AG | 740 | 74,326 | (7.2 | ) | ||||||||
Commerzbank AG | 3,248 | 21,204 | (2.1 | ) | ||||||||
Covestro AG | 963 | 41,462 | (4.0 | ) | ||||||||
CTS Eventim AG & Co. KGaA | 1,054 | 72,342 | (7.0 | ) | ||||||||
Deutsche Bank AG | 16,185 | 164,358 | (15.9 | ) | ||||||||
E.ON SE | 29,762 | 309,732 | (30.0 | ) | ||||||||
Freenet AG | 33,719 | 932,945 | (90.4 | ) | ||||||||
Hannover Rueck SE | 564 | 87,663 | (8.5 | ) | ||||||||
Hella GmbH & Co. KGaA | 2,856 | 180,306 | (17.5 | ) | ||||||||
KION Group AG | 1,669 | 92,840 | (9.0 | ) | ||||||||
LANXESS AG | 2,179 | 84,232 | (8.2 | ) | ||||||||
METRO AG | 1,766 | 15,512 | (1.5 | ) | ||||||||
Nemetschek SE | 4,470 | 354,714 | (34.4 | ) | ||||||||
Nordex SE | 7,007 | 101,126 | (9.8 | ) | ||||||||
ProSiebenSat.1 Media SE | 24,523 | 282,156 | (27.3 | ) | ||||||||
| Security | Shares | Value | % of Basket Value | |||||||||
| Germany (continued) | ||||||||||||
Rational AG | 755 | $ | 460,584 | (44.6 | )% | |||||||
Rheinmetall AG | 1,205 | 271,636 | (26.3 | ) | ||||||||
Rwe AG | 12,324 | 511,685 | (49.6 | ) | ||||||||
Salzgitter AG | 4,702 | 195,178 | (18.9 | ) | ||||||||
Scout24 AG | 1,656 | 104,739 | (10.1 | ) | ||||||||
TAG Immobilien AG | 3,065 | 61,255 | (5.9 | ) | ||||||||
Talanx AG | 3,623 | 150,643 | (14.6 | ) | ||||||||
TeamViewer AG | 13,959 | 167,495 | (16.2 | ) | ||||||||
Traton SE | 2,476 | 41,264 | (4.0 | ) | ||||||||
TUI AG | 18,019 | 51,372 | (5.0 | ) | ||||||||
|
|
|
| |||||||||
| 5,296,243 | ||||||||||||
| Hong Kong | ||||||||||||
ASM Pacific Technology Ltd. | 24,000 | 241,867 | (23.4 | ) | ||||||||
Bank of East Asia Ltd. | 53,000 | 78,425 | (7.6 | ) | ||||||||
Cathay Pacific Airways Ltd. | 276,000 | 275,759 | (26.7 | ) | ||||||||
Dah Sing Banking Group Ltd. | 264,800 | 222,534 | (21.6 | ) | ||||||||
Dairy Farm International Holdings Ltd. | 93,000 | 251,179 | (24.3 | ) | ||||||||
Haitong International Securities Group Ltd. | 159,000 | 25,170 | (2.4 | ) | ||||||||
HK Electric Investments & HK Electric Investments Ltd., Class SS | 62,500 | 61,727 | (6.0 | ) | ||||||||
Hutchison Port Holdings Trust, Class U | 686,400 | 163,608 | (15.8 | ) | ||||||||
Hutchison Telecommunications Hong Kong Holdings Ltd. | 174,000 | 29,048 | (2.8 | ) | ||||||||
Hysan Development Co. Ltd. | 47,000 | 138,658 | (13.4 | ) | ||||||||
Kerry Properties Ltd. | 27,500 | 74,364 | (7.2 | ) | ||||||||
Link REIT | 9,800 | 84,650 | (8.2 | ) | ||||||||
Melco Resorts & Entertainment Ltd., ADR | 13,848 | 79,211 | (7.7 | ) | ||||||||
Pacific Basin Shipping Ltd. | 119,000 | 54,598 | (5.3 | ) | ||||||||
Shangri-La Asia Ltd. | 16,000 | 12,114 | (1.2 | ) | ||||||||
SITC International Holdings Co. Ltd. | 63,000 | 209,441 | (20.3 | ) | ||||||||
SJM Holdings Ltd. | 145,000 | 60,909 | (5.9 | ) | ||||||||
Sun Hung Kai Properties Ltd. | 18,000 | 207,308 | (20.1 | ) | ||||||||
Swire Pacific Ltd., Class A | 73,500 | 418,649 | (40.6 | ) | ||||||||
Swire Properties Ltd. | 14,800 | 35,469 | (3.4 | ) | ||||||||
WH Group Ltd. | 179,000 | 123,617 | (12.0 | ) | ||||||||
Wharf Real Estate Investment Co. Ltd. | 14,000 | 65,976 | (6.4 | ) | ||||||||
Yue Yuen Industrial Holdings Ltd. | 38,500 | 56,629 | (5.5 | ) | ||||||||
|
|
|
| |||||||||
| 2,970,910 | ||||||||||||
| Ireland | ||||||||||||
Adient PLC | 7,563 | 258,201 | (25.0 | ) | ||||||||
Aptiv PLC | 2,198 | 233,867 | (22.7 | ) | ||||||||
Experian PLC | 1,022 | 35,294 | (3.4 | ) | ||||||||
Glanbia PLC | 45,333 | 544,238 | (52.7 | ) | ||||||||
Icon PLC | 99 | 22,395 | (2.2 | ) | ||||||||
James Hardie Industries PLC | 3,937 | 113,497 | (11.0 | ) | ||||||||
Jazz Pharmaceuticals PLC | 73 | 11,696 | (1.1 | ) | ||||||||
Kingspan Group PLC | 584 | 54,363 | (5.3 | ) | ||||||||
Trane Technologies PLC | 1,715 | 239,911 | (23.2 | ) | ||||||||
|
|
|
| |||||||||
| 1,513,462 | ||||||||||||
| Israel | ||||||||||||
Airport City Ltd. | 5,107 | 113,696 | (11.0 | ) | ||||||||
Alony Hetz Properties & Investments Ltd. | 8,375 | 137,068 | (13.3 | ) | ||||||||
Amot Investments Ltd. | 3,766 | 28,587 | (2.8 | ) | ||||||||
Bezeq The Israeli Telecommunication Corp. Ltd. | 27,878 | 44,195 | (4.3 | ) | ||||||||
Big Shopping Centers Ltd. | 527 | 79,640 | (7.7 | ) | ||||||||
Check Point Software Technologies Ltd. | 2,065 | 260,789 | (25.3 | ) | ||||||||
Enlight Renewable Energy Ltd. | 8,591 | 18,431 | (1.8 | ) | ||||||||
Fattal Holdings 1998 Ltd. | 329 | 47,453 | (4.6 | ) | ||||||||
Harel Insurance Investments & Financial Services Ltd. | 14,405 | 176,560 | (17.1 | ) | ||||||||
SCHEDULE OF INVESTMENTS | 21 |
Schedule of Investments (continued) April 30, 2022 | BlackRock Global Long/Short Equity Fund |
| Security | Shares | Value | % of Basket Value | |||||||||
| Israel (continued) | ||||||||||||
Israel Corp. Ltd. | 238 | $ | 133,724 | (12.9 | )% | |||||||
Melisron Ltd. | 370 | 30,013 | (2.9 | ) | ||||||||
Monday.com Ltd. | 397 | 51,372 | (5.0 | ) | ||||||||
Nova Measuring Instruments Ltd. | 3,382 | 333,499 | (32.3 | ) | ||||||||
OPC Energy Ltd. | 18,716 | 205,865 | (19.9 | ) | ||||||||
Paz Oil Co. Ltd. | 1,196 | 185,361 | (18.0 | ) | ||||||||
Phoenix Holdings Ltd. | 5,557 | 69,909 | (6.8 | ) | ||||||||
SolarEdge Technologies, Inc. | 316 | 79,129 | (7.7 | ) | ||||||||
Teva Pharmaceutical Industries Ltd., ADR | 2,069 | 18,021 | (1.7 | ) | ||||||||
|
|
|
| |||||||||
| 2,013,312 | ||||||||||||
| Italy | ||||||||||||
A2A SpA | 31,551 | 53,907 | (5.2 | ) | ||||||||
Amplifon SpA | 5,001 | 199,514 | (19.3 | ) | ||||||||
Azimut Holding SpA | 418 | 8,872 | (0.9 | ) | ||||||||
Banca Generali SpA | 6,216 | 205,508 | (19.9 | ) | ||||||||
Banca Mediolanum SpA | 33,430 | 242,680 | (23.5 | ) | ||||||||
Buzzi Unicem SpA | 6,073 | 112,464 | (10.9 | ) | ||||||||
Davide Campari-Milano NV | 7,172 | 80,923 | (7.8 | ) | ||||||||
De’ Longhi SpA | 1,849 | 44,838 | (4.4 | ) | ||||||||
Enel SpA | 72,602 | 472,123 | (45.7 | ) | ||||||||
Ferrari NV | 190 | 40,005 | (3.9 | ) | ||||||||
Interpump Group SpA | 3,553 | 143,647 | (13.9 | ) | ||||||||
Italgas SpA | 64,436 | 417,202 | (40.4 | ) | ||||||||
Leonardo SpA | 35,549 | 365,849 | (35.5 | ) | ||||||||
Mediobanca Banca di Credito Finanziario SpA | 30,492 | 305,617 | (29.6 | ) | ||||||||
Moncler SpA | 13,377 | 696,857 | (67.5 | ) | ||||||||
PRADA SpA | 47,800 | 297,418 | (28.8 | ) | ||||||||
Reply SpA | 3,409 | 501,863 | (48.6 | ) | ||||||||
UniCredit SpA | 15,466 | 143,139 | (13.9 | ) | ||||||||
UnipolSai Assicurazioni SpA | 64,518 | 181,478 | (17.6 | ) | ||||||||
|
|
|
| |||||||||
| 4,513,904 | ||||||||||||
| Japan | ||||||||||||
ABC-Mart, Inc. | 14,100 | 584,726 | (56.6 | ) | ||||||||
Acom Co. Ltd. | 74,600 | 191,851 | (18.6 | ) | ||||||||
Activia Properties, Inc. | 49 | 156,580 | (15.2 | ) | ||||||||
Advantest Corp. | 1,400 | 95,547 | (9.3 | ) | ||||||||
AEON Financial Service Co. Ltd. | 27,000 | 248,222 | (24.0 | ) | ||||||||
Aica Kogyo Co. Ltd. | 9,200 | 212,963 | (20.6 | ) | ||||||||
Alfresa Holdings Corp. | 9,100 | 123,748 | (12.0 | ) | ||||||||
Amada Co. Ltd. | 31,400 | 243,820 | (23.6 | ) | ||||||||
Amano Corp. | 4,700 | 90,481 | (8.8 | ) | ||||||||
Anritsu Corp. | 12,900 | 162,211 | (15.7 | ) | ||||||||
Aozora Bank Ltd. | 13,600 | 272,279 | (26.4 | ) | ||||||||
Asahi Group Holdings Ltd. | 8,100 | 305,312 | (29.6 | ) | ||||||||
Astellas Pharma, Inc. | 14,600 | 222,295 | (21.5 | ) | ||||||||
Azbil Corp. | 4,700 | 142,702 | (13.8 | ) | ||||||||
Bandai Namco Holdings, Inc. | 5,500 | 372,366 | (36.1 | ) | ||||||||
Benesse Holdings, Inc. | 6,700 | 117,229 | (11.4 | ) | ||||||||
Capcom Co. Ltd. | 13,600 | 358,865 | (34.8 | ) | ||||||||
Chubu Electric Power Co., Inc. | 50,900 | 513,839 | (49.8 | ) | ||||||||
Chugoku Bank Ltd. | 7,600 | 55,887 | (5.4 | ) | ||||||||
Chugoku Electric Power Co., Inc. | 15,800 | 104,067 | (10.1 | ) | ||||||||
Coca-Cola Bottlers Japan Holdings, Inc. | 15,400 | 172,641 | (16.7 | ) | ||||||||
COMSYS Holdings Corp. | 13,600 | 282,366 | (27.4 | ) | ||||||||
Cosmo Energy Holdings Co. Ltd. | 500 | 12,422 | (1.2 | ) | ||||||||
Cosmos Pharmaceutical Corp. | 2,000 | 184,375 | (17.9 | ) | ||||||||
Daifuku Co. Ltd. | 3,400 | 209,061 | (20.3 | ) | ||||||||
Daito Trust Construction Co. Ltd. | 1,500 | 144,468 | (14.0 | ) | ||||||||
Daiwa House Industry Co. Ltd. | 7,500 | 180,301 | (17.5 | ) | ||||||||
| Security | Shares | Value | % of Basket Value | |||||||||
| Japan (continued) | ||||||||||||
Denso Corp. | 100 | $ | 6,095 | (0.6 | )% | |||||||
Dentsu Group, Inc. | 9,000 | 324,375 | (31.4 | ) | ||||||||
DMG Mori Co. Ltd. | 9,600 | 120,484 | (11.7 | ) | ||||||||
Ebara Corp. | 2,800 | 128,597 | (12.5 | ) | ||||||||
Electric Power Development Co. Ltd. | 16,500 | 226,096 | (21.9 | ) | ||||||||
FP Corp. | 8,500 | 192,247 | (18.6 | ) | ||||||||
Freee KK | 2,800 | 80,789 | (7.8 | ) | ||||||||
Furukawa Electric Co. Ltd. | 3,100 | 50,341 | (4.9 | ) | ||||||||
GMO Payment Gateway, Inc. | 1,400 | 117,460 | (11.4 | ) | ||||||||
H.U. Group Holdings, Inc. | 5,400 | 120,325 | (11.7 | ) | ||||||||
Hamamatsu Photonics KK | 3,000 | 134,230 | (13.0 | ) | ||||||||
Hirose Electric Co. Ltd. | 2,100 | 266,435 | (25.8 | ) | ||||||||
Hisamitsu Pharmaceutical Co., Inc. | 7,300 | 199,996 | (19.4 | ) | ||||||||
Hitachi Construction Machinery Co. Ltd. | 4,700 | 106,414 | (10.3 | ) | ||||||||
Hoshizaki Corp. | 100 | 6,334 | (0.6 | ) | ||||||||
Hoya Corp. | 2,000 | 198,484 | (19.2 | ) | ||||||||
Information Services International-Dentsu Ltd. | 5,600 | 160,822 | (15.6 | ) | ||||||||
Internet Initiative Japan, Inc. | 2,700 | 84,270 | (8.2 | ) | ||||||||
Itochu Techno-Solutions Corp. | 9,200 | 215,425 | (20.9 | ) | ||||||||
Izumi Co. Ltd. | 3,300 | 71,721 | (6.9 | ) | ||||||||
J Front Retailing Co. Ltd. | 25,800 | 193,336 | (18.7 | ) | ||||||||
Japan Exchange Group, Inc. | 4,600 | 68,496 | (6.6 | ) | ||||||||
Japan Post Bank Co. Ltd. | 20,700 | 156,167 | (15.1 | ) | ||||||||
Japan Prime Realty Investment Corp. | 47 | 142,587 | (13.8 | ) | ||||||||
Japan Tobacco, Inc. | 4,100 | 69,748 | (6.8 | ) | ||||||||
Kakaku.com, Inc. | 20,500 | 429,307 | (41.6 | ) | ||||||||
Kamigumi Co. Ltd. | 9,800 | 166,393 | (16.1 | ) | ||||||||
Kandenko Co. Ltd. | 27,700 | 175,662 | (17.0 | ) | ||||||||
Kao Corp. | 12,400 | 496,973 | (48.1 | ) | ||||||||
Kawasaki Kisen Kaisha Ltd. | 4,100 | 214,356 | (20.8 | ) | ||||||||
Keisei Electric Railway Co. Ltd. | 9,100 | 223,127 | (21.6 | ) | ||||||||
Kewpie Corp. | 5,300 | 89,261 | (8.6 | ) | ||||||||
Keyence Corp. | 300 | 120,601 | (11.7 | ) | ||||||||
Kikkoman Corp. | 500 | 28,101 | (2.7 | ) | ||||||||
Kintetsu Group Holdings Co. Ltd. | 10,600 | 303,915 | (29.4 | ) | ||||||||
Koito Manufacturing Co. Ltd. | 8,000 | 293,556 | (28.4 | ) | ||||||||
Kokuyo Co. Ltd. | 7,100 | 92,472 | (9.0 | ) | ||||||||
Konami Holdings Corp. | 2,700 | 166,032 | (16.1 | ) | ||||||||
Kusuri no Aoki Holdings Co. Ltd. | 4,400 | 194,938 | (18.9 | ) | ||||||||
Kyocera Corp. | 11,600 | 609,080 | (59.0 | ) | ||||||||
Kyowa Kirin Co. Ltd. | 15,100 | 318,259 | (30.8 | ) | ||||||||
Kyudenko Corp. | 5,000 | 113,389 | (11.0 | ) | ||||||||
Lasertec Corp. | 700 | 93,521 | (9.1 | ) | ||||||||
Lion Corp. | 37,100 | 382,257 | (37.0 | ) | ||||||||
Lixil Corp. | 10,500 | 184,677 | (17.9 | ) | ||||||||
Mani Inc. | 13,600 | 155,312 | (15.0 | ) | ||||||||
Marubeni Corp. | 14,200 | 155,002 | (15.0 | ) | ||||||||
Maruwa Unyu Kikan Co. Ltd. | 16,600 | 193,805 | (18.8 | ) | ||||||||
Mitsubishi Chemical Holdings Corp. | 55,700 | 339,639 | (32.9 | ) | ||||||||
Mitsubishi HC Capital, Inc. | 32,700 | 147,133 | (14.3 | ) | ||||||||
Mitsubishi Logistics Corp. | 5,900 | 135,980 | (13.2 | ) | ||||||||
Mitsubishi Materials Corp. | 10,300 | 161,125 | (15.6 | ) | ||||||||
Mitsui Fudosan Co. Ltd. | 4,400 | 93,252 | (9.0 | ) | ||||||||
Mitsui Mining & Smelting Co. Ltd. | 5,600 | 141,600 | (13.7 | ) | ||||||||
Mitsui OSK Lines Ltd. | 1,600 | 37,458 | (3.6 | ) | ||||||||
MS&AD Insurance Group Holdings, Inc. | 3,000 | 89,302 | (8.7 | ) | ||||||||
Murata Manufacturing Co. Ltd. | 1,000 | 59,607 | (5.8 | ) | ||||||||
Nagoya Railroad Co. Ltd. | 4,800 | 77,093 | (7.5 | ) | ||||||||
Nankai Electric Railway Co. Ltd. | 30,400 | 542,726 | (52.6 | ) | ||||||||
Nichirei Corp. | 16,600 | 304,784 | (29.5 | ) | ||||||||
Nihon Kohden Corp. | 7,200 | 172,844 | (16.7 | ) | ||||||||
| 22 | 2 0 2 2 BLACK ROCK ANNUAL REPORT TO SHAREHOLDERS |
Schedule of Investments (continued) April 30, 2022 | BlackRock Global Long/Short Equity Fund |
| Security | Shares | Value | % of Basket Value | |||||||||
| Japan (continued) | ||||||||||||
Nippon Express Holdings, Inc. | 1,500 | $ | 87,946 | (8.5 | )% | |||||||
Nippon Steel Corp. | 4,900 | 77,805 | (7.5 | ) | ||||||||
Nippon Television Holdings, Inc. | 14,500 | 139,174 | (13.5 | ) | ||||||||
Nippon Yusen KK | 1,500 | 108,216 | (10.5 | ) | ||||||||
Nipro Corp. | 2,400 | 18,911 | (1.8 | ) | ||||||||
Nissan Chemical Corp. | 3,600 | 190,161 | (18.4 | ) | ||||||||
Nissin Foods Holdings Co. Ltd. | 6,200 | 431,288 | (41.8 | ) | ||||||||
Nitori Holdings Co. Ltd. | 1,900 | 195,471 | (18.9 | ) | ||||||||
Nitto Denko Corp. | 2,700 | 181,226 | (17.6 | ) | ||||||||
NOK Corp. | 10,300 | 87,635 | (8.5 | ) | ||||||||
Nomura Research Institute Ltd. | 4,300 | 121,589 | (11.8 | ) | ||||||||
NTT Data Corp. | 6,000 | 110,627 | (10.7 | ) | ||||||||
Obayashi Corp. | 13,400 | 92,154 | (8.9 | ) | ||||||||
OBIC Business Consultants Co. Ltd. | 2,200 | 79,072 | (7.7 | ) | ||||||||
Obic Co. Ltd. | 2,800 | 413,670 | (40.1 | ) | ||||||||
Omron Corp. | 1,400 | 82,536 | (8.0 | ) | ||||||||
Otsuka Corp. | 9,400 | 308,058 | (29.8 | ) | ||||||||
Otsuka Holdings Co. Ltd. | 3,200 | 107,528 | (10.4 | ) | ||||||||
PALTAC Corp. | 3,900 | 142,147 | (13.8 | ) | ||||||||
Park24 Co. Ltd. | 17,800 | 253,481 | (24.6 | ) | ||||||||
Penta-Ocean Construction Co. Ltd. | 30,600 | 149,725 | (14.5 | ) | ||||||||
PeptiDream, Inc. | 2,100 | 33,871 | (3.3 | ) | ||||||||
Pigeon Corp. | 18,400 | 313,812 | (30.4 | ) | ||||||||
Pola Orbis Holdings, Inc. | 9,000 | 103,762 | (10.1 | ) | ||||||||
Relo Group, Inc. | 8,200 | 117,134 | (11.3 | ) | ||||||||
Resorttrust, Inc. | 8,700 | 146,365 | (14.2 | ) | ||||||||
Sankyu Inc. | 5,000 | 152,445 | (14.8 | ) | ||||||||
Santen Pharmaceutical Co. Ltd. | 28,600 | 232,652 | (22.5 | ) | ||||||||
Sapporo Holdings Ltd. | 4,100 | 85,338 | (8.3 | ) | ||||||||
Sawai Group Holdings Co. Ltd. | 4,900 | 164,369 | (15.9 | ) | ||||||||
SBI Holdings, Inc. | 7,800 | 174,463 | (16.9 | ) | ||||||||
SCSK Corp. | 12,600 | 200,319 | (19.4 | ) | ||||||||
Sega Sammy Holdings, Inc. | 1,000 | 17,720 | (1.7 | ) | ||||||||
Seino Holdings Co. Ltd. | 9,400 | 76,788 | (7.4 | ) | ||||||||
Sekisui House REIT, Inc. | 448 | 262,148 | (25.4 | ) | ||||||||
SG Holdings Co. Ltd. | 7,400 | 130,408 | (12.6 | ) | ||||||||
Shimizu Corp. | 30,300 | 158,882 | (15.4 | ) | ||||||||
Shin-Etsu Chemical Co. Ltd. | 1,100 | 151,178 | (14.6 | ) | ||||||||
Shionogi & Co. Ltd. | 3,000 | 166,878 | (16.2 | ) | ||||||||
Skylark Co. Ltd. | 40,500 | 480,560 | (46.6 | ) | ||||||||
SMS Co. Ltd. | 4,000 | 93,875 | (9.1 | ) | ||||||||
Softbank Corp. | 39,100 | 455,040 | (44.1 | ) | ||||||||
Sony Group Corp. | 2,900 | 250,273 | (24.2 | ) | ||||||||
Sotetsu Holdings Inc. | 6,600 | 113,144 | (11.0 | ) | ||||||||
Square Enix Holdings Co. Ltd. | 1,500 | 59,889 | (5.8 | ) | ||||||||
Subaru Corp. | 800 | 12,140 | (1.2 | ) | ||||||||
Sumitomo Chemical Co. Ltd. | 2,500 | 10,631 | (1.0 | ) | ||||||||
Sumitomo Dainippon Pharma Co. Ltd. | 14,800 | 131,833 | (12.8 | ) | ||||||||
Sumitomo Forestry Co. Ltd. | 23,200 | 354,933 | (34.4 | ) | ||||||||
Sumitomo Heavy Industries Ltd. | 6,600 | 139,665 | (13.5 | ) | ||||||||
Sumitomo Metal Mining Co. Ltd. | 600 | 26,314 | (2.6 | ) | ||||||||
Sumitomo Mitsui Trust Holdings, Inc. | 20,300 | 630,061 | (61.0 | ) | ||||||||
Sumitomo Rubber Industries Ltd. | 26,900 | 233,163 | (22.6 | ) | ||||||||
Sundrug Co. Ltd. | 12,600 | 293,354 | (28.4 | ) | ||||||||
Suzuki Motor Corp. | 3,100 | 93,450 | (9.1 | ) | ||||||||
Taiheiyo Cement Corp. | 8,400 | 135,908 | (13.2 | ) | ||||||||
Takara Bio Inc. | 5,600 | 90,070 | (8.7 | ) | ||||||||
Takashimaya Co. Ltd. | 13,600 | 124,049 | (12.0 | ) | ||||||||
Takeda Pharmaceutical Co. Ltd. | 400 | 11,607 | (1.1 | ) | ||||||||
Terumo Corp. | 17,200 | 511,960 | (49.6 | ) | ||||||||
TIS, Inc. | 13,600 | 305,447 | (29.6 | ) | ||||||||
| Security | Shares | Value | % of Basket Value | |||||||||
| Japan (continued) | ||||||||||||
Tokio Marine Holdings, Inc. | 7,700 | $ | 416,329 | (40.3 | )% | |||||||
Tokyo Electron Ltd. | 700 | 295,362 | (28.6 | ) | ||||||||
Tokyo Ohka Kogyo Co. Ltd. | 500 | 27,168 | (2.6 | ) | ||||||||
Toray Industries, Inc. | 12,500 | 59,241 | (5.7 | ) | ||||||||
Tosoh Corp. | 9,700 | 133,943 | (13.0 | ) | ||||||||
TOTO Ltd. | 2,700 | 90,987 | (8.8 | ) | ||||||||
Toyo Seikan Group Holdings Ltd. | 25,000 | 270,410 | (26.2 | ) | ||||||||
Toyo Suisan Kaisha Ltd. | 4,300 | 132,768 | (12.9 | ) | ||||||||
Toyota Tsusho Corp. | 1,900 | 68,262 | (6.6 | ) | ||||||||
Trend Micro, Inc. | 300 | 16,727 | (1.6 | ) | ||||||||
Tsumura & Co. | 5,700 | 140,247 | (13.6 | ) | ||||||||
Tsuruha Holdings, Inc. | 3,000 | 153,324 | (14.9 | ) | ||||||||
Unicharm Corp. | 18,900 | 657,569 | (63.7 | ) | ||||||||
Ushio, Inc. | 5,100 | 66,124 | (6.4 | ) | ||||||||
Welcia Holdings Co. Ltd. | 5,300 | 108,645 | (10.5 | ) | ||||||||
Yakult Honsha Co. Ltd. | 9,700 | 502,272 | (48.7 | ) | ||||||||
Yamada Holdings Co. Ltd. | 165,700 | 494,794 | (47.9 | ) | ||||||||
Yamaguchi Financial Group, Inc. | 44,800 | 245,646 | (23.8 | ) | ||||||||
Yaoko Co. Ltd. | 7,400 | 391,480 | (37.9 | ) | ||||||||
Yokohama Rubber Co. Ltd. | 21,900 | 293,210 | (28.4 | ) | ||||||||
Z Holdings Corp. | 24,100 | 94,613 | (9.2 | ) | ||||||||
ZOZO, Inc. | 200 | 4,188 | (0.4 | ) | ||||||||
|
|
|
| |||||||||
| 31,992,064 | ||||||||||||
| Jordan | ||||||||||||
Hikma Pharmaceuticals PLC | 7,386 | 173,500 | (16.8 | ) | ||||||||
|
|
|
| |||||||||
| Luxembourg | ||||||||||||
Aroundtown SA | 36,876 | 185,432 | (18.0 | ) | ||||||||
L’Occitane International SA | 45,250 | 141,839 | (13.7 | ) | ||||||||
RTL Group SA | 4,359 | 226,657 | (22.0 | ) | ||||||||
|
|
|
| |||||||||
| 553,928 | ||||||||||||
| Macau | ||||||||||||
MGM China Holdings Ltd. | 108,400 | 62,047 | (6.0 | ) | ||||||||
Wynn Macau Ltd. | 90,000 | 55,280 | (5.4 | ) | ||||||||
|
|
|
| |||||||||
| 117,327 | ||||||||||||
| Netherlands | ||||||||||||
ASR Nederland NV | 5,718 | 259,875 | (25.2 | ) | ||||||||
CTP NV | 2,959 | 41,896 | (4.1 | ) | ||||||||
Heineken Holding NV | 5,137 | 401,006 | (38.9 | ) | ||||||||
IMCD NV | 2,516 | 400,604 | (38.8 | ) | ||||||||
ING Groep NV | 30,572 | 289,645 | (28.1 | ) | ||||||||
OCI NV | 2,462 | 93,291 | (9.0 | ) | ||||||||
PostNL NV | 59,010 | 193,362 | (18.7 | ) | ||||||||
QIAGEN NV | 2,012 | 92,788 | (9.0 | ) | ||||||||
Randstad NV | 1,044 | 55,206 | (5.3 | ) | ||||||||
|
|
|
| |||||||||
| 1,827,673 | ||||||||||||
| New Zealand | ||||||||||||
a2 Milk Co. Ltd. | 3,063 | 9,514 | (0.9 | ) | ||||||||
Air New Zealand Ltd. | 40,656 | 23,074 | (2.2 | ) | ||||||||
Fisher & Paykel Healthcare Corp. Ltd. | 5,400 | 74,207 | (7.2 | ) | ||||||||
|
|
|
| |||||||||
| 106,795 | ||||||||||||
| Norway | ||||||||||||
Adevinta ASA | 9,167 | 70,819 | (6.8 | ) | ||||||||
AutoStore Holdings Ltd. | 198,723 | 443,212 | (42.9 | ) | ||||||||
Equinor ASA | 3,825 | 130,928 | (12.7 | ) | ||||||||
NEL ASA | 7,901 | 11,228 | (1.1 | ) | ||||||||
Nordic Semiconductor ASA | 10,379 | 206,347 | (20.0 | ) | ||||||||
SCHEDULE OF INVESTMENTS | 23 |
Schedule of Investments (continued) April 30, 2022 | BlackRock Global Long/Short Equity Fund |
| Security | Shares | Value | % of Basket Value | |||||||||
| Norway (continued) | ||||||||||||
Schibsted ASA, Class A | 4,055 | $ | 84,502 | (8.2 | )% | |||||||
Schibsted ASA, Class B | 2,291 | 44,333 | (4.3 | ) | ||||||||
|
|
|
| |||||||||
| 991,369 | ||||||||||||
| Portugal | ||||||||||||
Jeronimo Martins SGPS SA | 16,038 | 333,857 | (32.3 | ) | ||||||||
|
|
|
| |||||||||
| Puerto Rico | ||||||||||||
Popular, Inc. | 9,444 | 736,538 | (71.4 | ) | ||||||||
|
|
|
| |||||||||
| Singapore | ||||||||||||
ComfortDelGro Corp. Ltd. | 94,400 | 99,719 | (9.7 | ) | ||||||||
Jardine Cycle & Carriage Ltd. | 6,600 | 137,560 | (13.3 | ) | ||||||||
Mapletree Commercial Trust | 244,200 | 328,430 | (31.8 | ) | ||||||||
NetLink NBN Trust | 26,200 | 18,945 | (1.8 | ) | ||||||||
Olam Group Ltd. | 20,900 | 25,540 | (2.5 | ) | ||||||||
SATS Ltd. | 400 | 1,306 | (0.1 | ) | ||||||||
SIA Engineering Co. Ltd. | 9,600 | 18,437 | (1.8 | ) | ||||||||
StarHub Ltd. | 95,300 | 86,440 | (8.4 | ) | ||||||||
United Overseas Bank Ltd. | 9,900 | 211,922 | (20.5 | ) | ||||||||
Wing Tai Holdings Ltd. | 9,100 | 11,421 | (1.1 | ) | ||||||||
|
|
|
| |||||||||
| 939,720 | ||||||||||||
| Spain | ||||||||||||
Bankinter SA | 20,301 | 119,469 | (11.6 | ) | ||||||||
Cellnex Telecom SA | 452 | 21,068 | (2.0 | ) | ||||||||
Iberdrola SA | 3,337 | 38,345 | (3.7 | ) | ||||||||
Inmobiliaria Colonial Socimi SA | 34,301 | 285,226 | (27.6 | ) | ||||||||
Merlin Properties Socimi SA | 9,810 | 106,572 | (10.3 | ) | ||||||||
Naturgy Energy Group SA | 737 | 22,171 | (2.2 | ) | ||||||||
|
|
|
| |||||||||
| 592,851 | ||||||||||||
| Sweden | ||||||||||||
Alfa Laval AB | 143 | 3,981 | (0.4 | ) | ||||||||
Boliden AB | 4,004 | 173,618 | (16.8 | ) | ||||||||
Castellum AB | 23,857 | 472,448 | (45.8 | ) | ||||||||
Epiroc AB, Class B | 3,898 | 68,004 | (6.6 | ) | ||||||||
EQT AB | 1,467 | 41,519 | (4.0 | ) | ||||||||
Essity AB, Class B | 6,674 | 176,000 | (17.1 | ) | ||||||||
Hexagon AB, B Shares | 729 | 9,406 | (0.9 | ) | ||||||||
Holmen AB, B Shares | 8,115 | 469,037 | (45.4 | ) | ||||||||
Indutrade AB | 16,011 | 377,665 | (36.6 | ) | ||||||||
Investment AB Latour, B Shares | 3,692 | 97,810 | (9.5 | ) | ||||||||
Lifco AB, B Shares | 6,501 | 136,363 | (13.2 | ) | ||||||||
Lundin Energy AB | 2,660 | 109,980 | (10.7 | ) | ||||||||
Nibe Industrier AB, B Shares | 13,544 | 132,791 | (12.9 | ) | ||||||||
Saab AB, Class B | 1,353 | 57,230 | (5.5 | ) | ||||||||
Sagax AB, Class B | 5,945 | 151,862 | (14.7 | ) | ||||||||
Spotify Technology SA | 5,220 | 530,613 | (51.4 | ) | ||||||||
SSAB AB, A Shares | 8,938 | 56,766 | (5.5 | ) | ||||||||
Storskogen Group AB, Class B | 86,222 | 181,867 | (17.6 | ) | ||||||||
Swedish Match AB | 83,617 | 665,991 | (64.5 | ) | ||||||||
Tele2 AB, B Shares | 5,987 | 79,353 | (7.7 | ) | ||||||||
|
|
|
| |||||||||
| 3,992,304 | ||||||||||||
| Switzerland | ||||||||||||
Adecco Group AG | 4,213 | 162,579 | (15.7 | ) | ||||||||
Barry Callebaut AG | 24 | 55,237 | (5.3 | ) | ||||||||
Belimo Holding AG | 55 | 27,182 | (2.6 | ) | ||||||||
Chocoladefabriken Lindt & Spruengli AG, Registered Shares | 2 | 237,265 | (23.0 | ) | ||||||||
Chocoladefabriken Lindt & Spruengli AG, Participation Certificates | 23 | 257,945 | (25.0 | ) | ||||||||
| Security | Shares | Value | % of Basket Value | |||||||||
| Switzerland (continued) | ||||||||||||
Cie Financiere Richemont SA, Class A | 1,747 | $ | 202,985 | (19.7 | )% | |||||||
Flughafen Zurich AG | 5,256 | 888,783 | (86.1 | ) | ||||||||
Idorsia Ltd. | 7,017 | 119,769 | (11.6 | ) | ||||||||
Logitech International SA | 946 | 61,564 | (6.0 | ) | ||||||||
Lonza Group AG | 120 | 70,756 | (6.9 | ) | ||||||||
SIG Combibloc Group AG | 13,893 | 290,857 | (28.2 | ) | ||||||||
Sika AG | 1,014 | 309,734 | (30.0 | ) | ||||||||
Straumann Holding AG | 1,238 | 145,950 | (14.1 | ) | ||||||||
Swatch Group AG | 37 | 9,496 | (0.9 | ) | ||||||||
Swiss Prime Site AG | 5,006 | 489,309 | (47.4 | ) | ||||||||
UBS Group AG | 7,998 | 135,779 | (13.2 | ) | ||||||||
|
|
|
| |||||||||
| 3,465,190 | ||||||||||||
| United Kingdom | ||||||||||||
Abrdn PLC | 5,133 | 12,053 | (1.2 | ) | ||||||||
BAE Systems PLC | 6,717 | 62,043 | (6.0 | ) | ||||||||
Baltic Classifieds Group PLC | 87,726 | 143,751 | (13.9 | ) | ||||||||
Barclays PLC | 198,287 | 364,479 | (35.3 | ) | ||||||||
Barratt Developments PLC | 32,075 | 196,236 | (19.0 | ) | ||||||||
Beazley PLC | 5,857 | 31,787 | (3.1 | ) | ||||||||
Bellway PLC | 12,348 | 375,037 | (36.3 | ) | ||||||||
Capri Holdings Ltd. | 1,647 | 78,562 | (7.6 | ) | ||||||||
Croda International PLC | 109 | 10,587 | (1.0 | ) | ||||||||
Darktrace PLC | 4,310 | 23,537 | (2.3 | ) | ||||||||
Dechra Pharmaceuticals PLC | 3,156 | 143,015 | (13.8 | ) | ||||||||
Direct Line Insurance Group PLC | 71,519 | 226,993 | (22.0 | ) | ||||||||
Electrocomponents PLC | 14,549 | 189,900 | (18.4 | ) | ||||||||
Halma PLC | 13,717 | 426,899 | (41.4 | ) | ||||||||
Hargreaves Lansdown PLC | 14,038 | 160,712 | (15.6 | ) | ||||||||
Imperial Brands PLC | 5,370 | 111,779 | (10.8 | ) | ||||||||
Intertek Group PLC | 8,874 | 552,983 | (53.6 | ) | ||||||||
Janus Henderson Group PLC | 1,111 | 33,863 | (3.3 | ) | ||||||||
Liberty Global PLC, Class A | 5,169 | 117,646 | (11.4 | ) | ||||||||
Linde PLC | 747 | 233,034 | (22.6 | ) | ||||||||
M&G PLC | 43,547 | 115,615 | (11.2 | ) | ||||||||
Melrose Industries PLC | 25,116 | 37,298 | (3.6 | ) | ||||||||
Moneysupermarket.com Group PLC | 2 | 4 | (0.0 | ) | ||||||||
Nomad Foods Ltd. | 54,636 | 1,008,581 | (97.7 | ) | ||||||||
Phoenix Group Holdings PLC | 9,932 | 75,229 | (7.3 | ) | ||||||||
Quilter PLC | 74,496 | 122,716 | (11.9 | ) | ||||||||
Smiths Group PLC | 3,153 | 57,698 | (5.6 | ) | ||||||||
SSE PLC | 442 | 10,266 | (1.0 | ) | ||||||||
SSP Group PLC | 25,152 | 74,239 | (7.2 | ) | ||||||||
THG PLC | 78,397 | 105,256 | (10.2 | ) | ||||||||
Tritax Big Box REIT PLC | 102,296 | 312,276 | (30.2 | ) | ||||||||
Weir Group PLC | 518 | 9,958 | (1.0 | ) | ||||||||
Whitbread PLC | 2,516 | 89,123 | (8.6 | ) | ||||||||
|
|
|
| |||||||||
| 5,513,155 | ||||||||||||
| United States | ||||||||||||
A O Smith Corp. | 817 | 47,737 | (4.6 | ) | ||||||||
AbbVie, Inc. | 1,402 | 205,926 | (19.9 | ) | ||||||||
ABIOMED, Inc. | 1,581 | 453,083 | (43.9 | ) | ||||||||
Adobe, Inc. | 1,049 | 415,352 | (40.2 | ) | ||||||||
Advanced Micro Devices, Inc. | 5,891 | 503,798 | (48.8 | ) | ||||||||
Aflac, Inc. | 2,082 | 119,257 | (11.5 | ) | ||||||||
Agilent Technologies, Inc. | 1,467 | 174,969 | (16.9 | ) | ||||||||
Airbnb, Inc., Class A | 872 | 133,599 | (12.9 | ) | ||||||||
Alaska Air Group, Inc. | 199 | 10,824 | (1.0 | ) | ||||||||
Alcoa Corp. | 898 | 60,884 | (5.9 | ) | ||||||||
Alexandria Real Estate Equities, Inc. | 3,741 | 681,461 | (66.0 | ) | ||||||||
Alphabet, Inc., Class C | 10 | 22,993 | (2.2 | ) | ||||||||
| 24 | 2 0 2 2 BLACK ROCK ANNUAL REPORT TO SHAREHOLDERS |
Schedule of Investments (continued) April 30, 2022 | BlackRock Global Long/Short Equity Fund |
| Security | Shares | Value | % of Basket Value | |||||||||
| United States (continued) | ||||||||||||
AMC Entertainment Holdings, Inc., Class A | 12,115 | $ | 185,360 | (18.0 | )% | |||||||
American Express Co. | 394 | 68,836 | (6.7 | ) | ||||||||
American Water Works Co., Inc. | 1,458 | 224,649 | (21.8 | ) | ||||||||
AMETEK, Inc. | 107 | 13,510 | (1.3 | ) | ||||||||
AMN Healthcare Services, Inc. | 2,530 | 247,308 | (24.0 | ) | ||||||||
Amphenol Corp., Class A | 12,390 | 885,885 | (85.8 | ) | ||||||||
ANSYS, Inc. | 45 | 12,406 | (1.2 | ) | ||||||||
Antero Midstream Corp. | 34,112 | 350,330 | (33.9 | ) | ||||||||
Aon PLC, Class A | 117 | 33,695 | (3.3 | ) | ||||||||
APA Corp. | 1,763 | 72,160 | (7.0 | ) | ||||||||
Applied Materials, Inc. | 1,429 | 157,690 | (15.3 | ) | ||||||||
Arista Networks, Inc. | 899 | 103,897 | (10.1 | ) | ||||||||
Asbury Automotive Group, Inc. | 324 | 59,522 | (5.8 | ) | ||||||||
ASGN, Inc. | 5,620 | 637,589 | (61.8 | ) | ||||||||
Atlassian Corp. PLC, Class A | 1,191 | 267,773 | (25.9 | ) | ||||||||
Autodesk, Inc. | 785 | 148,585 | (14.4 | ) | ||||||||
AvalonBay Communities, Inc. | 4,327 | 984,306 | (95.4 | ) | ||||||||
Avantor, Inc. | 4,046 | 128,987 | (12.5 | ) | ||||||||
Axon Enterprise, Inc. | 3,812 | 427,706 | (41.4 | ) | ||||||||
Ball Corp. | 130 | 10,551 | (1.0 | ) | ||||||||
Bank of New York Mellon Corp. | 12,186 | 512,543 | (49.7 | ) | ||||||||
Baxter International, Inc. | 3,891 | 276,494 | (26.8 | ) | ||||||||
BioMarin Pharmaceutical, Inc. | 1,343 | 109,253 | (10.6 | ) | ||||||||
BJ’s Wholesale Club Holdings, Inc. | 911 | 58,623 | (5.7 | ) | ||||||||
Black Hills Corp. | 2,027 | 148,458 | (14.4 | ) | ||||||||
Blackline, Inc. | 3,014 | 202,089 | (19.6 | ) | ||||||||
Block, Inc. | 798 | 79,433 | (7.7 | ) | ||||||||
Blueprint Medicines Corp. | 1,007 | 58,758 | (5.7 | ) | ||||||||
Boeing Co. | 14,833 | 2,207,744 | (213.9 | ) | ||||||||
Booking Holdings, Inc. | 168 | 371,332 | (36.0 | ) | ||||||||
Booz Allen Hamilton Holding Corp. | 20,765 | 1,695,047 | (164.2 | ) | ||||||||
BorgWarner, Inc. | 1,253 | 46,148 | (4.5 | ) | ||||||||
Boston Properties, Inc. | 3,456 | 406,426 | (39.4 | ) | ||||||||
Brighthouse Financial, Inc. | 1,066 | 54,750 | (5.3 | ) | ||||||||
Brixmor Property Group, Inc. | 6,366 | 161,569 | (15.6 | ) | ||||||||
Brown & Brown, Inc. | 2,207 | 136,790 | (13.2 | ) | ||||||||
BWX Technologies, Inc. | 372 | 19,314 | (1.9 | ) | ||||||||
CACI International, Inc., Class A | 604 | 160,241 | (15.5 | ) | ||||||||
Camden Property Trust | 1,341 | 210,390 | (20.4 | ) | ||||||||
Carnival Corp. | 6,178 | 106,879 | (10.4 | ) | ||||||||
Catalent, Inc. | 373 | 33,779 | (3.3 | ) | ||||||||
Cboe Global Markets, Inc. | 2,035 | 229,914 | (22.3 | ) | ||||||||
ChampionX Corp. | 568 | 11,985 | (1.2 | ) | ||||||||
Charles River Laboratories International, Inc. | 1,475 | 356,227 | (34.5 | ) | ||||||||
Charles Schwab Corp. | 7,582 | 502,914 | (48.7 | ) | ||||||||
Cheniere Energy, Inc. | 6,483 | 880,456 | (85.3 | ) | ||||||||
Chesapeake Energy Corp. | 6,237 | 511,559 | (49.6 | ) | ||||||||
Chevron Corp. | 1,013 | 158,707 | (15.4 | ) | ||||||||
Choice Hotels International, Inc. | 1,927 | 270,666 | (26.2 | ) | ||||||||
Cisco Systems, Inc. | 3,287 | 160,997 | (15.6 | ) | ||||||||
Citigroup, Inc. | 7,785 | 375,315 | (36.4 | ) | ||||||||
Clorox Co. | 544 | 78,048 | (7.6 | ) | ||||||||
CMS Energy Corp. | 2,530 | 173,786 | (16.8 | ) | ||||||||
Coca-Cola Co. | 1,983 | 128,122 | (12.4 | ) | ||||||||
Cognex Corp. | 955 | 64,587 | (6.3 | ) | ||||||||
Colgate-Palmolive Co. | 680 | 52,394 | (5.1 | ) | ||||||||
ConocoPhillips | 3,419 | 326,583 | (31.6 | ) | ||||||||
Continental Resources, Inc. | 14,837 | 824,492 | (79.9 | ) | ||||||||
CoStar Group, Inc. | 2,950 | 187,679 | (18.2 | ) | ||||||||
Coupa Software, Inc. | 354 | 30,550 | (3.0 | ) | ||||||||
Crocs, Inc. | 6,449 | 428,407 | (41.5 | ) | ||||||||
Crown Castle International Corp. | 944 | 174,838 | (16.9 | ) | ||||||||
| Security | Shares | Value | % of Basket Value | |||||||||
| United States (continued) | ||||||||||||
Cummins, Inc. | 1,029 | $ | 194,677 | (18.9 | )% | |||||||
Danaher Corp. | 517 | 129,834 | (12.6 | ) | ||||||||
DaVita, Inc. | 1,285 | 139,255 | (13.5 | ) | ||||||||
Dentsply Sirona, Inc. | 657 | 26,273 | (2.5 | ) | ||||||||
Dick’s Sporting Goods, Inc. | 3,014 | 290,610 | (28.2 | ) | ||||||||
DocuSign, Inc. | 2,620 | 212,220 | (20.6 | ) | ||||||||
Dominion Energy, Inc. | 2,218 | 181,078 | (17.5 | ) | ||||||||
Domino’s Pizza, Inc. | 2,414 | 815,932 | (79.0 | ) | ||||||||
Duke Realty Corp. | 4,356 | 238,491 | (23.1 | ) | ||||||||
East West Bancorp, Inc. | 2,078 | 148,161 | (14.3 | ) | ||||||||
eBay, Inc. | 1,192 | 61,889 | (6.0 | ) | ||||||||
Edison International | 5,566 | 382,885 | (37.1 | ) | ||||||||
Elanco Animal Health, Inc. | 1,568 | 39,686 | (3.8 | ) | ||||||||
Eli Lilly & Co. | 326 | 95,234 | (9.2 | ) | ||||||||
Emerson Electric Co. | 2,220 | 200,200 | (19.4 | ) | ||||||||
EOG Resources, Inc. | 5,557 | 648,835 | (62.9 | ) | ||||||||
EQT Corp. | 2,070 | 82,283 | (8.0 | ) | ||||||||
Equifax, Inc. | 1,627 | 331,127 | (32.1 | ) | ||||||||
Equinix, Inc. | 167 | 120,086 | (11.6 | ) | ||||||||
Equitable Holdings, Inc. | 3,179 | 91,651 | (8.9 | ) | ||||||||
Equity Residential | 9,809 | 799,434 | (77.4 | ) | ||||||||
Erie Indemnity Co., Class A | 520 | 83,346 | (8.1 | ) | ||||||||
Essential Utilities, Inc. | 4,244 | 189,961 | (18.4 | ) | ||||||||
Etsy, Inc. | 4,615 | 430,072 | (41.7 | ) | ||||||||
Evoqua Water Technologies Corp. | 2,256 | 94,053 | (9.1 | ) | ||||||||
Expedia Group, Inc. | 4,394 | 767,852 | (74.4 | ) | ||||||||
Expeditors International of Washington, Inc. | 470 | 46,563 | (4.5 | ) | ||||||||
Fair Isaac Corp. | 36 | 13,446 | (1.3 | ) | ||||||||
Fate Therapeutics, Inc. | 4,998 | 142,743 | (13.8 | ) | ||||||||
Federal Realty Investment Trust | 4,415 | 516,820 | (50.1 | ) | ||||||||
First Industrial Realty Trust, Inc. | 3,764 | 218,312 | (21.1 | ) | ||||||||
Five Below, Inc. | 553 | 86,876 | (8.4 | ) | ||||||||
Floor & Decor Holdings, Inc., Class A | 2,977 | 237,326 | (23.0 | ) | ||||||||
Fortinet, Inc. | 440 | 127,164 | (12.3 | ) | ||||||||
Fox Corp., Class A | 6,017 | 215,649 | (20.9 | ) | ||||||||
Fox Corp., Class B | 10,825 | 359,823 | (34.9 | ) | ||||||||
FTI Consulting, Inc. | 2,361 | 372,353 | (36.1 | ) | ||||||||
Garmin Ltd. | 4,218 | 462,883 | (44.8 | ) | ||||||||
Global Payments, Inc. | 77 | 10,547 | (1.0 | ) | ||||||||
Globe Life, Inc. | 552 | 54,140 | (5.2 | ) | ||||||||
Globus Medical, Inc., Class A | 4,049 | 268,125 | (26.0 | ) | ||||||||
Goodyear Tire & Rubber Co. | 3,225 | 42,957 | (4.2 | ) | ||||||||
Guidewire Software, Inc. | 648 | 56,337 | (5.5 | ) | ||||||||
H&R Block, Inc. | 1,473 | 38,401 | (3.7 | ) | ||||||||
Halozyme Therapeutics, Inc. | 5,563 | 221,964 | (21.5 | ) | ||||||||
Hanesbrands, Inc. | 17,367 | 230,286 | (22.3 | ) | ||||||||
Hannon Armstrong Sustainable Infrastructure Capital, Inc. | 1,605 | 64,184 | (6.2 | ) | ||||||||
Harley-Davidson, Inc. | 1,644 | 59,924 | (5.8 | ) | ||||||||
Hartford Financial Services Group, Inc. | 3,213 | 224,685 | (21.8 | ) | ||||||||
Healthcare Realty Trust, Inc. | 695 | 18,821 | (1.8 | ) | ||||||||
HealthEquity, Inc. | 6,113 | 380,962 | (36.9 | ) | ||||||||
HEICO Corp. | 131 | 18,501 | (1.8 | ) | ||||||||
HEICO Corp., Class A | 11,583 | 1,351,041 | (130.9 | ) | ||||||||
Helmerich & Payne, Inc. | 355 | 16,341 | (1.6 | ) | ||||||||
Herbalife Nutrition Ltd. | 18,468 | 490,879 | (47.6 | ) | ||||||||
Hewlett Packard Enterprise Co. | 40,422 | 622,903 | (60.3 | ) | ||||||||
Hexcel Corp. | 4,025 | 218,799 | (21.2 | ) | ||||||||
Home Depot, Inc. | 1,046 | 314,218 | (30.4 | ) | ||||||||
Honeywell International, Inc. | 1,962 | 379,667 | (36.8 | ) | ||||||||
Horizon Therapeutics PLC | 2,814 | 277,348 | (26.9 | ) | ||||||||
HubSpot, Inc. | 245 | 92,960 | (9.0 | ) | ||||||||
SCHEDULE OF INVESTMENTS | 25 |
Schedule of Investments (continued) April 30, 2022 | BlackRock Global Long/Short Equity Fund |
| Security | Shares | Value | % of Basket Value | |||||||||
| United States (continued) | ||||||||||||
Huntington Bancshares, Inc. | 16,624 | $ | 218,606 | (21.2 | )% | |||||||
Huntington Ingalls Industries, Inc. | 2,898 | 616,521 | (59.7 | ) | ||||||||
Huntsman Corp. | 1,812 | 61,372 | (5.9 | ) | ||||||||
IDACORP, Inc. | 7,739 | 813,988 | (78.9 | ) | ||||||||
II-VI, Inc. | 1,628 | 99,650 | (9.6 | ) | ||||||||
Illinois Tool Works, Inc. | 2,557 | 504,010 | (48.8 | ) | ||||||||
Illumina, Inc. | 559 | 165,827 | (16.1 | ) | ||||||||
Integra LifeSciences Holdings Corp. | 476 | 29,112 | (2.8 | ) | ||||||||
Intellia Therapeutics, Inc. | 947 | 46,431 | (4.5 | ) | ||||||||
International Game Technology PLC | 927 | 20,236 | (2.0 | ) | ||||||||
Iridium Communications, Inc. | 5,408 | 193,120 | (18.7 | ) | ||||||||
Iron Mountain, Inc. | 192 | 10,316 | (1.0 | ) | ||||||||
Jacobs Engineering Group, Inc. | 1,619 | 224,312 | (21.7 | ) | ||||||||
JetBlue Airways Corp. | 37,049 | 407,910 | (39.5 | ) | ||||||||
Johnson Controls International PLC | 1,167 | 69,868 | (6.8 | ) | ||||||||
JPMorgan Chase & Co. | 3,285 | 392,098 | (38.0 | ) | ||||||||
Kellogg Co. | 6,869 | 470,527 | (45.6 | ) | ||||||||
Keurig Dr Pepper, Inc. | 3,254 | 121,700 | (11.8 | ) | ||||||||
KeyCorp | 1,119 | 21,608 | (2.1 | ) | ||||||||
Keysight Technologies, Inc. | 1,548 | 217,138 | (21.0 | ) | ||||||||
Kinder Morgan, Inc. | 8,471 | 153,749 | (14.9 | ) | ||||||||
Kirby Corp. | 3,671 | 239,349 | (23.2 | ) | ||||||||
Kite Realty Group Trust | 4,971 | 110,853 | (10.7 | ) | ||||||||
KLA Corp. | 1,061 | 338,735 | (32.8 | ) | ||||||||
Lattice Semiconductor Corp. | 1,759 | 84,502 | (8.2 | ) | ||||||||
Lear Corp. | 2,310 | 295,541 | (28.6 | ) | ||||||||
Leggett & Platt, Inc. | 14,643 | 521,730 | (50.5 | ) | ||||||||
Leidos Holdings, Inc. | 5,463 | 565,475 | (54.8 | ) | ||||||||
Leslie’s, Inc. | 6,284 | 123,166 | (11.9 | ) | ||||||||
Levi Strauss & Co., Class A | 12,330 | 223,296 | (21.6 | ) | ||||||||
Liberty Media Corp. - Liberty Formula One, Class C | 11,690 | 728,638 | (70.6 | ) | ||||||||
Liberty Media Corp. - Liberty SiriusXM, Class C | 1,537 | 64,370 | (6.2 | ) | ||||||||
Lincoln Electric Holdings, Inc. | 596 | 80,299 | (7.8 | ) | ||||||||
Lincoln National Corp. | 1,255 | 75,488 | (7.3 | ) | ||||||||
Lithia Motors, Inc. | 102 | 28,879 | (2.8 | ) | ||||||||
Live Nation Entertainment, Inc. | 352 | 36,918 | (3.6 | ) | ||||||||
Livent Corp. | 2,681 | 57,266 | (5.5 | ) | ||||||||
Lockheed Martin Corp. | 628 | 271,371 | (26.3 | ) | ||||||||
Lumen Technologies, Inc. | 29,318 | 294,939 | (28.6 | ) | ||||||||
Lumentum Holdings, Inc. | 802 | 65,130 | (6.3 | ) | ||||||||
MACOM Technology Solutions Holdings, Inc., Class H | 10,984 | 559,635 | (54.2 | ) | ||||||||
ManpowerGroup, Inc. | 1,346 | 121,409 | (11.8 | ) | ||||||||
Marathon Oil Corp. | 2,972 | 74,062 | (7.2 | ) | ||||||||
MarketAxess Holdings, Inc. | 978 | 257,811 | (25.0 | ) | ||||||||
Marriott Vacations Worldwide Corp. | 166 | 24,789 | (2.4 | ) | ||||||||
Martin Marietta Materials, Inc. | 334 | 118,309 | (11.5 | ) | ||||||||
Marvell Technology, Inc. | 254 | 14,752 | (1.4 | ) | ||||||||
Masimo Corp. | 709 | 80,096 | (7.8 | ) | ||||||||
Matson, Inc. | 458 | 39,397 | (3.8 | ) | ||||||||
MaxLinear, Inc. | 2,467 | 118,095 | (11.4 | ) | ||||||||
Medical Properties Trust, Inc. | 4,932 | 90,699 | (8.8 | ) | ||||||||
Merck & Co., Inc. | 1,352 | 119,909 | (11.6 | ) | ||||||||
Meta Platforms, Inc., Class A | 412 | 82,594 | (8.0 | ) | ||||||||
MetLife, Inc. | 6,105 | 400,976 | (38.8 | ) | ||||||||
MGIC Investment Corp. | 21,974 | 286,980 | (27.8 | ) | ||||||||
Microchip Technology, Inc. | 6,960 | 453,792 | (44.0 | ) | ||||||||
Microsoft Corp. | 4,584 | 1,272,152 | (123.2 | ) | ||||||||
MicroStrategy, Inc., Class A | 26 | 9,208 | (0.9 | ) | ||||||||
Mid-America Apartment Communities, Inc. | 520 | 102,274 | (9.9 | ) | ||||||||
Monolithic Power Systems, Inc. | 31 | 12,159 | (1.2 | ) | ||||||||
| Security | Shares | Value | % of Basket Value | |||||||||
| United States (continued) | ||||||||||||
MP Materials Corp. | 3,013 | $ | 114,615 | (11.1 | )% | |||||||
National Vision Holdings, Inc. | 9,269 | 348,978 | (33.8 | ) | ||||||||
NetApp, Inc. | 243 | 17,800 | (1.7 | ) | ||||||||
Netflix, Inc. | 3,404 | 647,985 | (62.8 | ) | ||||||||
New Relic, Inc. | 288 | 18,222 | (1.8 | ) | ||||||||
New York Community Bancorp, Inc. | 11,745 | 108,524 | (10.5 | ) | ||||||||
New York Times Co., Class A | 1,804 | 69,129 | (6.7 | ) | ||||||||
Nexstar Media Group, Inc., Class A | 2,322 | 367,851 | (35.6 | ) | ||||||||
Norfolk Southern Corp. | 3,463 | 893,038 | (86.5 | ) | ||||||||
Northrop Grumman Corp. | 337 | 148,078 | (14.3 | ) | ||||||||
NortonLifeLock, Inc. | 1,250 | 31,300 | (3.0 | ) | ||||||||
Norwegian Cruise Line Holdings Ltd. | 756 | 15,143 | (1.5 | ) | ||||||||
NRG Energy, Inc. | 940 | 33,746 | (3.3 | ) | ||||||||
NVIDIA Corp. | 190 | 35,239 | (3.4 | ) | ||||||||
Okta, Inc. | 750 | 89,483 | (8.7 | ) | ||||||||
Old National Bancorp | 15,178 | 230,099 | (22.3 | ) | ||||||||
Omnicell, Inc. | 2,594 | 283,187 | (27.4 | ) | ||||||||
Oracle Corp. | 2,657 | 195,024 | (18.9 | ) | ||||||||
O’Reilly Automotive, Inc. | 57 | 34,573 | (3.3 | ) | ||||||||
Ormat Technologies, Inc. | 4,936 | 383,527 | (37.2 | ) | ||||||||
Outfront Media, Inc. | 1,958 | 50,125 | (4.9 | ) | ||||||||
PacWest Bancorp | 8,830 | 290,419 | (28.1 | ) | ||||||||
Palo Alto Networks, Inc. | 1,372 | 770,076 | (74.6 | ) | ||||||||
Papa John’s International, Inc. | 514 | 46,800 | (4.5 | ) | ||||||||
PayPal Holdings, Inc. | 493 | 43,350 | (4.2 | ) | ||||||||
Penn National Gaming, Inc. | 2,057 | 75,225 | (7.3 | ) | ||||||||
Penske Automotive Group, Inc. | 141 | 14,780 | (1.4 | ) | ||||||||
Pentair PLC | 2,574 | 130,631 | (12.7 | ) | ||||||||
Penumbra, Inc. | 2,240 | 386,534 | (37.4 | ) | ||||||||
Performance Food Group Co. | 493 | 24,280 | (2.3 | ) | ||||||||
Perrigo Co. PLC | 1,954 | 67,022 | (6.5 | ) | ||||||||
Pinnacle Financial Partners, Inc. | 4,782 | 370,844 | (35.9 | ) | ||||||||
Planet Fitness, Inc., Class A | 8,582 | 686,817 | (66.5 | ) | ||||||||
PNC Financial Services Group, Inc. | 1,457 | 242,008 | (23.4 | ) | ||||||||
Portland General Electric Co. | 618 | 29,250 | (2.8 | ) | ||||||||
Power Integrations, Inc. | 778 | 62,240 | (6.0 | ) | ||||||||
PPG Industries, Inc. | 71 | 9,087 | (0.9 | ) | ||||||||
Principal Financial Group, Inc. | 10,496 | 715,197 | (69.3 | ) | ||||||||
Public Service Enterprise Group, Inc. | 2,872 | 200,064 | (19.4 | ) | ||||||||
PulteGroup, Inc. | 708 | 29,566 | (2.9 | ) | ||||||||
PVH Corp. | 44 | 3,202 | (0.3 | ) | ||||||||
Qualcomm, Inc. | 3,470 | 484,724 | (47.0 | ) | ||||||||
Qualys, Inc. | 1,254 | 170,895 | (16.6 | ) | ||||||||
Ralph Lauren Corp. | 1,074 | 112,061 | (10.9 | ) | ||||||||
Raytheon Technologies Corp. | 8,696 | 825,337 | (80.0 | ) | ||||||||
Regency Centers Corp. | 7,134 | 491,033 | (47.6 | ) | ||||||||
Regeneron Pharmaceuticals, Inc. | 121 | 79,752 | (7.7 | ) | ||||||||
Reliance Steel & Aluminum Co. | 394 | 78,111 | (7.6 | ) | ||||||||
Repligen Corp. | 518 | 81,450 | (7.9 | ) | ||||||||
Republic Services, Inc. | 98 | 13,158 | (1.3 | ) | ||||||||
Rexford Industrial Realty, Inc. | 541 | 42,220 | (4.1 | ) | ||||||||
RingCentral, Inc., Class A | 132 | 11,200 | (1.1 | ) | ||||||||
Robert Half International, Inc. | 482 | 47,385 | (4.6 | ) | ||||||||
Roku, Inc. | 2,137 | 198,527 | (19.2 | ) | ||||||||
Roper Technologies, Inc. | 723 | 339,752 | (32.9 | ) | ||||||||
Royal Caribbean Cruises Ltd. | 2,318 | 180,178 | (17.5 | ) | ||||||||
Ryder System, Inc. | 711 | 49,699 | (4.8 | ) | ||||||||
S&P Global, Inc. | 991 | 373,112 | (36.1 | ) | ||||||||
salesforce.com, Inc. | 1,224 | 215,351 | (20.9 | ) | ||||||||
Schlumberger NV | 2,895 | 112,934 | (10.9 | ) | ||||||||
Science Applications International Corp. | 1,430 | 119,019 | (11.5 | ) | ||||||||
Semtech Corp. | 203 | 12,099 | (1.2 | ) | ||||||||
| 26 | 2 0 2 2 BLACK ROCK ANNUAL REPORT TO SHAREHOLDERS |
Schedule of Investments (continued) April 30, 2022 | BlackRock Global Long/Short Equity Fund |
| Security | Shares | Value | % of Basket Value | |||||||||
| United States (continued) | ||||||||||||
Service Corp. International | 960 | $ | 62,986 | (6.1 | )% | |||||||
ServiceNow, Inc. | 11 | 5,259 | (0.5 | ) | ||||||||
Sirius XM Holdings, Inc. | 45,883 | 275,298 | (26.7 | ) | ||||||||
SL Green Realty Corp. | 930 | 64,375 | (6.2 | ) | ||||||||
SM Energy Co. | 291 | 10,339 | (1.0 | ) | ||||||||
Southern Co. | 3,738 | 274,332 | (26.6 | ) | ||||||||
Spirit AeroSystems Holdings, Inc., Class A | 3,594 | 151,092 | (14.6 | ) | ||||||||
STAAR Surgical Co. | 2,157 | 123,143 | (11.9 | ) | ||||||||
Stifel Financial Corp. | 2,041 | 126,236 | (12.2 | ) | ||||||||
Stryker Corp. | 777 | 187,459 | (18.2 | ) | ||||||||
Switch, Inc., Class A | 759 | 22,664 | (2.2 | ) | ||||||||
Syneos Health, Inc. | 6,259 | 457,470 | (44.3 | ) | ||||||||
Sysco Corp. | 1,360 | 116,253 | (11.3 | ) | ||||||||
Tandem Diabetes Care, Inc. | 559 | 53,932 | (5.2 | ) | ||||||||
Teledyne Technologies, Inc. | 771 | 332,725 | (32.2 | ) | ||||||||
Teleflex, Inc. | 769 | 219,642 | (21.3 | ) | ||||||||
Teradata Corp. | 1,137 | 47,015 | (4.6 | ) | ||||||||
Teradyne, Inc. | 1,096 | 115,584 | (11.2 | ) | ||||||||
Tetra Tech, Inc. | 1,550 | 215,884 | (20.9 | ) | ||||||||
Textron, Inc. | 30,753 | 2,129,645 | (206.3 | ) | ||||||||
Timken Co. | 6,767 | 390,050 | (37.8 | ) | ||||||||
TransDigm Group, Inc. | 372 | 221,269 | (21.4 | ) | ||||||||
Travel + Leisure Co. | 26,067 | 1,446,197 | (140.1 | ) | ||||||||
TripAdvisor, Inc. | 5,411 | 138,900 | (13.5 | ) | ||||||||
Twilio, Inc., Class A | 4,801 | 536,848 | (52.0 | ) | ||||||||
UDR, Inc. | 5,962 | 317,238 | (30.7 | ) | ||||||||
Ulta Beauty, Inc. | 742 | 294,426 | (28.5 | ) | ||||||||
Ultragenyx Pharmaceutical, Inc. | 1,236 | 87,373 | (8.5 | ) | ||||||||
United Therapeutics Corp. | 1,498 | 265,985 | (25.8 | ) | ||||||||
UnitedHealth Group, Inc. | 546 | 277,668 | (26.9 | ) | ||||||||
Valero Energy Corp. | 1,737 | 193,641 | (18.8 | ) | ||||||||
Veeva Systems, Inc., Class A | 1,253 | 227,983 | (22.1 | ) | ||||||||
VF Corp. | 392 | 20,384 | (2.0 | ) | ||||||||
ViacomCBS, Inc., Class B | 5,096 | 148,396 | (14.4 | ) | ||||||||
Viatris, Inc. | 76,219 | 787,342 | (76.3 | ) | ||||||||
W.W. Grainger, Inc. | 289 | 144,509 | (14.0 | ) | ||||||||
Walt Disney Co. | 2,500 | 279,075 | (27.0 | ) | ||||||||
Waters Corp. | 1,387 | 420,289 | (40.7 | ) | ||||||||
Watsco, Inc. | 107 | 28,545 | (2.8 | ) | ||||||||
Western Alliance Bancorp | 1,342 | 102,140 | (9.9 | ) | ||||||||
WEX, Inc. | 403 | 66,995 | (6.5 | ) | ||||||||
Willis Towers Watson PLC | 248 | 53,285 | (5.2 | ) | ||||||||
Wintrust Financial Corp. | 4,174 | 364,474 | (35.3 | ) | ||||||||
Workday, Inc., Class A | 1,683 | 347,876 | (33.7 | ) | ||||||||
World Wrestling Entertainment, Inc., Class A | 7,233 | 422,335 | (40.9 | ) | ||||||||
XPO Logistics, Inc. | 2,132 | 114,680 | (11.1 | ) | ||||||||
Zions Bancorp NA | 4,109 | 232,200 | (22.5 | ) | ||||||||
Zoetis, Inc. | 460 | 81,535 | (7.9 | ) | ||||||||
|
|
|
| |||||||||
| 74,541,155 | ||||||||||||
| Preferred Stocks | ||||||||||||
| Germany | ||||||||||||
Fuchs Petrolub SE, Preference Shares | 6,851 | 216,089 | (20.9 | ) | ||||||||
Porsche Automobil Holding SE, Preference Shares | 1,662 | 139,460 | (13.5 | ) | ||||||||
|
|
|
| |||||||||
| 355,549 | ||||||||||||
| Security | Shares | Value | % of Basket Value | |||||||||
| Germany (continued) | ||||||||||||
| Warrants | ||||||||||||
| Australia | ||||||||||||
Magellan Financial Group Ltd. | 679 | $ | 751 | (0.1 | )% | |||||||
|
|
|
| |||||||||
Total Reference Entity — Long | 166,209,847 | |||||||||||
|
| |||||||||||
| Reference Entity — Short | ||||||||||||
| Common Stocks | ||||||||||||
| Australia | ||||||||||||
Newcrest Mining Ltd. NPV | (5,530 | ) | (104,517 | ) | 10.1 | |||||||
|
|
|
| |||||||||
| Austria | ||||||||||||
BAWAG Group AG | (4,452 | ) | (211,398 | ) | 20.5 | |||||||
Telekom Austria AG | (6,448 | ) | (45,973 | ) | 4.5 | |||||||
Verbund AG | (804 | ) | (85,939 | ) | 8.3 | |||||||
|
|
|
| |||||||||
| (343,310 | ) | |||||||||||
| Belgium | ||||||||||||
Ageas SA | (481 | ) | (23,016 | ) | 2.2 | |||||||
Sofina SA | (2,181 | ) | (668,383 | ) | 64.8 | |||||||
|
|
|
| |||||||||
| (691,399 | ) | |||||||||||
| Bermuda | ||||||||||||
Signet Jewelers Ltd. | (3,608 | ) | (253,282 | ) | 24.5 | |||||||
Triton International Ltd. | (3,180 | ) | (194,266 | ) | 18.8 | |||||||
|
|
|
| |||||||||
| (447,548 | ) | |||||||||||
| Canada | ||||||||||||
Alimentation Couche-Tard, Inc. | (323 | ) | (14,379 | ) | 1.4 | |||||||
Allied Properties Real Estate Investment Trust | (8,778 | ) | (285,141 | ) | 27.6 | |||||||
Ballard Power Systems, Inc. | (33,015 | ) | (274,215 | ) | 26.6 | |||||||
Brookfield Asset Management, Inc., Class A | (3,019 | ) | (150,592 | ) | 14.6 | |||||||
Canadian Tire Corp. Ltd., Class A | (7,037 | ) | (969,289 | ) | 93.9 | |||||||
Capital Power Corp. | (1,348 | ) | (44,302 | ) | 4.3 | |||||||
Constellation Software, Inc. | (169 | ) | (265,984 | ) | 25.8 | |||||||
Dollarama, Inc. | (16,997 | ) | (944,947 | ) | 91.5 | |||||||
Dream Industrial Real Estate Investment Trust | (36,889 | ) | (429,580 | ) | 41.6 | |||||||
Element Fleet Management Corp. | (37,560 | ) | (335,354 | ) | 32.5 | |||||||
Empire Co. Ltd. | (27,093 | ) | (894,840 | ) | 86.7 | |||||||
Fairfax Financial Holdings Ltd. | (455 | ) | (250,006 | ) | 24.2 | |||||||
Finning International, Inc. | (15,219 | ) | (428,144 | ) | 41.5 | |||||||
First Quantum Minerals Ltd. | (5,122 | ) | (146,844 | ) | 14.2 | |||||||
Great-West Lifeco, Inc. | (1,068 | ) | (29,463 | ) | 2.8 | |||||||
H&R Real Estate Investment Trust | (22,636 | ) | (225,188 | ) | 21.8 | |||||||
iA Financial Corp., Inc. | (18,104 | ) | (946,597 | ) | 91.7 | |||||||
Loblaw Cos. Ltd. | (10,173 | ) | (930,548 | ) | 90.1 | |||||||
MEG Energy Corp. | (16,536 | ) | (248,429 | ) | 24.1 | |||||||
Metro, Inc. | (6,907 | ) | (379,639 | ) | 36.8 | |||||||
National Bank of Canada | (429 | ) | (29,961 | ) | 2.9 | |||||||
Nuvei Corp. | (3,574 | ) | (199,865 | ) | 19.4 | |||||||
Onex Corp. | (6,040 | ) | (362,922 | ) | 35.1 | |||||||
Parkland Corp. | (16,200 | ) | (460,155 | ) | 44.6 | |||||||
Quebecor, Inc., Class B | (7,440 | ) | (175,076 | ) | 17.0 | |||||||
RioCan Real Estate Investment Trust | (23,639 | ) | (441,627 | ) | 42.8 | |||||||
Royal Bank of Canada | (457 | ) | (46,157 | ) | 4.5 | |||||||
Saputo, Inc. | (5,246 | ) | (112,136 | ) | 10.9 | |||||||
SmartCentres Real Estate Investment Trust | (5,527 | ) | (134,620 | ) | 13.0 | |||||||
Stelco Holdings, Inc. | (8,865 | ) | (323,574 | ) | 31.3 | |||||||
Topicus.com, Inc. | (1,024 | ) | (63,689 | ) | 6.2 | |||||||
Toromont Industries Ltd. | (1,000 | ) | (88,032 | ) | 8.5 | |||||||
|
|
|
| |||||||||
| (10,631,295 | ) | |||||||||||
SCHEDULE OF INVESTMENTS | 27 |
Schedule of Investments (continued) April 30, 2022 | BlackRock Global Long/Short Equity Fund |
| Security | Shares | Value | % of Basket Value | |||||||||
| Denmark | ||||||||||||
Ambu A/S, Class B | (5,945 | ) | $ | (78,251 | ) | 7.6 | % | |||||
AP Moller - Maersk A/S, Class A | (9 | ) | (25,476 | ) | 2.4 | |||||||
Chr Hansen Holding A/S | (5,341 | ) | (416,116 | ) | 40.3 | |||||||
Danske Bank A/S | (27,907 | ) | (428,061 | ) | 41.5 | |||||||
Pandora A/S | (1,927 | ) | (169,203 | ) | 16.4 | |||||||
Rockwool International A/S, B Shares | (2,610 | ) | (729,965 | ) | 70.7 | |||||||
Royal Unibrew A/S | (2,085 | ) | (179,708 | ) | 17.4 | |||||||
|
|
|
| |||||||||
| (2,026,780 | ) | |||||||||||
| Finland | ||||||||||||
Huhtamaki OYJ | (2,766 | ) | (104,556 | ) | 10.1 | |||||||
Kojamo OYJ | (9,658 | ) | (192,128 | ) | 18.6 | |||||||
Orion OYJ, Class B | (18,171 | ) | (712,712 | ) | 69.1 | |||||||
QT Group OYJ | (1,615 | ) | (140,708 | ) | 13.7 | |||||||
Stora Enso OYJ, B Shares | (29,858 | ) | (587,590 | ) | 56.9 | |||||||
UPM-Kymmene OYJ | (10,628 | ) | (367,647 | ) | 35.6 | |||||||
|
|
|
| |||||||||
| (2,105,341 | ) | |||||||||||
| France | ||||||||||||
Airbus SE | (11,340 | ) | (1,241,411 | ) | 120.3 | |||||||
BioMerieux | (3,858 | ) | (367,289 | ) | 35.6 | |||||||
Bollore SA | (25,683 | ) | (119,848 | ) | 11.6 | |||||||
Cie Generale des Etablissements Michelin SCA | (2,250 | ) | (278,685 | ) | 27.0 | |||||||
Constellium SE | (14,619 | ) | (243,991 | ) | 23.6 | |||||||
Danone SA | (4,437 | ) | (268,311 | ) | 26.0 | |||||||
Eramet SA | (1,023 | ) | (136,348 | ) | 13.2 | |||||||
EssilorLuxottica SA | (926 | ) | (157,649 | ) | 15.3 | |||||||
Getlink SE | (677 | ) | (12,484 | ) | 1.2 | |||||||
Ipsen SA | (934 | ) | (96,822 | ) | 9.4 | |||||||
JCDecaux SA | (1,539 | ) | (32,262 | ) | 3.1 | |||||||
Neoen SA | (2,354 | ) | (94,056 | ) | 9.1 | |||||||
Pernod Ricard SA | (1,154 | ) | (238,167 | ) | 23.1 | |||||||
Sartorius Stedim Biotech | (196 | ) | (64,137 | ) | 6.2 | |||||||
SEB SA | (3,122 | ) | (374,912 | ) | 36.3 | |||||||
Sodexo SA | (2,235 | ) | (168,129 | ) | 16.3 | |||||||
SOITEC | (1,103 | ) | (197,585 | ) | 19.1 | |||||||
Unibail-Rodamco-Westfield | (515 | ) | (36,346 | ) | 3.5 | |||||||
Veolia Environnement SA | (14,132 | ) | (412,323 | ) | 39.9 | |||||||
Worldline SA | (6,414 | ) | (252,354 | ) | 24.5 | |||||||
|
|
|
| |||||||||
| (4,793,109 | ) | |||||||||||
| Germany | ||||||||||||
Adidas AG | (2,924 | ) | (589,652 | ) | 57.1 | |||||||
AIXTRON SE | (937 | ) | (24,022 | ) | 2.3 | |||||||
Auto1 Group SE | (6,566 | ) | (68,747 | ) | 6.7 | |||||||
BASF SE | (5,803 | ) | (305,603 | ) | 29.6 | |||||||
Bayerische Motoren Werke AG | (108 | ) | (7,956 | ) | 0.8 | |||||||
Bechtle AG | (6,009 | ) | (277,674 | ) | 26.9 | |||||||
Brenntag SE | (6,197 | ) | (478,182 | ) | 46.3 | |||||||
Carl Zeiss Meditec AG | (1,807 | ) | (226,968 | ) | 22.0 | |||||||
Daimler Truck Holding AG | (4,774 | ) | (128,395 | ) | 12.4 | |||||||
Delivery Hero SE | (4,768 | ) | (167,609 | ) | 16.2 | |||||||
Deutsche Wohnen SE | (2,089 | ) | (59,829 | ) | 5.8 | |||||||
Evotec SE | (3,017 | ) | (73,459 | ) | 7.1 | |||||||
Fielmann AG | (4,238 | ) | (214,239 | ) | 20.8 | |||||||
flatexDEGIRO AG | (24,384 | ) | (416,468 | ) | 40.3 | |||||||
Knorr-Bremse AG | (898 | ) | (64,041 | ) | 6.2 | |||||||
Puma SE | (584 | ) | (42,970 | ) | 4.2 | |||||||
Siemens Healthineers AG | (937 | ) | (50,101 | ) | 4.9 | |||||||
Uniper SE | (410 | ) | (10,539 | ) | 1.0 | |||||||
United Internet AG | (12,823 | ) | (412,527 | ) | 40.0 | |||||||
Vantage Towers AG | (5,376 | ) | (182,793 | ) | 17.7 | |||||||
| Security | Shares | Value | % of Basket Value | |||||||||
| Germany (continued) | ||||||||||||
Volkswagen AG | (1,059 | ) | $ | (229,656 | ) | 22.3 | % | |||||
Wacker Chemie AG | (53 | ) | (8,409 | ) | 0.8 | |||||||
Zalando SE | (6,423 | ) | (252,721 | ) | 24.5 | |||||||
|
|
|
| |||||||||
| (4,292,560 | ) | |||||||||||
| Hong Kong | ||||||||||||
Guotai Junan International Holdings Ltd. | (17,000 | ) | (1,847 | ) | 0.2 | |||||||
Hongkong Land Holdings Ltd. | (149,100 | ) | (695,546 | ) | 67.4 | |||||||
Sino Land Co. Ltd. | (12,077 | ) | (15,963 | ) | 1.5 | |||||||
|
|
|
| |||||||||
| (713,356 | ) | |||||||||||
| Ireland | ||||||||||||
AerCap Holdings NV | (264 | ) | (12,331 | ) | 1.2 | |||||||
Allegion PLC | (2,747 | ) | (313,817 | ) | 30.4 | |||||||
CRH PLC | (3,608 | ) | (142,606 | ) | 13.8 | |||||||
DCC PLC | (3,422 | ) | (259,281 | ) | 25.1 | |||||||
Smurfit Kappa Group PLC | (1,069 | ) | (45,877 | ) | 4.5 | |||||||
|
|
|
| |||||||||
| (773,912 | ) | |||||||||||
| Isle of Man | ||||||||||||
GVC Holdings PLC | (12,525 | ) | (235,349 | ) | 22.8 | |||||||
|
|
|
| |||||||||
| Israel | ||||||||||||
Ashtrom Group Ltd. | (4,809 | ) | (134,105 | ) | 13.0 | |||||||
Fiverr International Ltd. | (5,626 | ) | (299,584 | ) | 29.0 | |||||||
Global-e Online Ltd. | (989 | ) | (22,292 | ) | 2.2 | |||||||
ironSource Ltd., Class A | (39,159 | ) | (149,979 | ) | 14.5 | |||||||
Kornit Digital Ltd. | (827 | ) | (54,995 | ) | 5.3 | |||||||
Mivne Real Estate KD Ltd. | (61,534 | ) | (230,555 | ) | 22.3 | |||||||
Shapir Engineering and Industry Ltd. | (1,759 | ) | (16,458 | ) | 1.6 | |||||||
Shikun & Binui Ltd. | (31,886 | ) | (187,983 | ) | 18.2 | |||||||
Wix.com Ltd. | (898 | ) | (67,763 | ) | 6.6 | |||||||
ZIM Integrated Shipping Services Ltd. | (1,499 | ) | (83,389 | ) | 8.1 | |||||||
|
|
|
| |||||||||
| (1,247,103 | ) | |||||||||||
| Italy | ||||||||||||
Banco BPM SpA | (201,237 | ) | (634,037 | ) | 61.4 | |||||||
DiaSorin SpA | (2,981 | ) | (390,486 | ) | 37.8 | |||||||
Eni SpA | (13,079 | ) | (182,828 | ) | 17.7 | |||||||
FinecoBank Banca Fineco SpA | (27,745 | ) | (385,693 | ) | 37.4 | |||||||
Infrastrutture Wireless Italiane SpA | (43,956 | ) | (469,025 | ) | 45.4 | |||||||
Intesa Sanpaolo SpA | (165,385 | ) | (337,008 | ) | 32.7 | |||||||
Nexi SpA | (366 | ) | (3,590 | ) | 0.4 | |||||||
Pirelli & C SpA | (2,596 | ) | (12,866 | ) | 1.3 | |||||||
Poste Italiane SpA | (84,168 | ) | (824,774 | ) | 79.9 | |||||||
Prysmian SpA | (3,361 | ) | (109,316 | ) | 10.6 | |||||||
Snam SpA | (16,457 | ) | (90,260 | ) | 8.7 | |||||||
Terna Rete Elettrica Nazionale SpA | (181,213 | ) | (1,477,988 | ) | 143.2 | |||||||
Unipol Gruppo SpA | (26,185 | ) | (142,777 | ) | 13.8 | |||||||
|
|
|
| |||||||||
| (5,060,648 | ) | |||||||||||
| Japan | ||||||||||||
Advance Residence Investment Corp. | (99 | ) | (271,959 | ) | 26.3 | |||||||
Aeon Mall Co. Ltd. | (15,900 | ) | (193,464 | ) | 18.7 | |||||||
AEON REIT Investment Corp. | (8 | ) | (9,185 | ) | 0.9 | |||||||
AGC, Inc. | (500 | ) | (18,745 | ) | 1.8 | |||||||
Ain Holdings, Inc. | (6,300 | ) | (282,585 | ) | 27.4 | |||||||
Air Water, Inc. | (9,400 | ) | (124,765 | ) | 12.1 | |||||||
Ariake Japan Co. Ltd. | (5,700 | ) | (228,692 | ) | 22.2 | |||||||
Asahi Intecc Co. Ltd. | (5,200 | ) | (100,484 | ) | 9.7 | |||||||
Asics Corp. | (4,400 | ) | (69,418 | ) | 6.7 | |||||||
ASKUL Corp. | (10,900 | ) | (133,476 | ) | 12.9 | |||||||
Benefit One, Inc. | (2,200 | ) | (33,357 | ) | 3.2 | |||||||
Bic Camera, Inc. | (35,700 | ) | (301,322 | ) | 29.2 | |||||||
| 28 | 2 0 2 2 BLACK ROCK ANNUAL REPORT TO SHAREHOLDERS |
Schedule of Investments (continued) April 30, 2022 | BlackRock Global Long/Short Equity Fund |
| Security | Shares | Value | % of Basket Value | |||||||||
| Japan (continued) | ||||||||||||
Canon Marketing Japan, Inc. | (5,100 | ) | $ | (110,975 | ) | 10.8 | % | |||||
Chiba Bank Ltd. | (53,600 | ) | (308,912 | ) | 29.9 | |||||||
Concordia Financial Group Ltd. | (148,400 | ) | (540,043 | ) | 52.3 | |||||||
Credit Saison Co. Ltd. | (5,000 | ) | (56,317 | ) | 5.5 | |||||||
CyberAgent, Inc. | (21,100 | ) | (222,919 | ) | 21.6 | |||||||
Dai Nippon Printing Co. Ltd. | (12,400 | ) | (259,136 | ) | 25.1 | |||||||
Daicel Corp. | (6,100 | ) | (37,289 | ) | 3.6 | |||||||
Daido Steel Co. Ltd. | (3,800 | ) | (108,394 | ) | 10.5 | |||||||
Daiichikosho Co. Ltd. | (3,000 | ) | (81,825 | ) | 7.9 | |||||||
Daio Paper Corp. | (4,700 | ) | (56,044 | ) | 5.4 | |||||||
Daiwa Office Investment Corp. | (92 | ) | (520,836 | ) | 50.5 | |||||||
DeNA Co. Ltd. | (45,500 | ) | (659,480 | ) | 63.9 | |||||||
Denka Co. Ltd. | (12,600 | ) | (337,781 | ) | 32.7 | |||||||
DIC Corp. | (2,400 | ) | (45,765 | ) | 4.4 | |||||||
Dowa Holdings Co. Ltd. | (3,100 | ) | (131,876 | ) | 12.8 | |||||||
Ezaki Glico Co. Ltd. | (3,000 | ) | (86,006 | ) | 8.3 | |||||||
Fancl Corp. | (11,700 | ) | (223,973 | ) | 21.7 | |||||||
Fast Retailing Co. Ltd. | (600 | ) | (276,244 | ) | 26.8 | |||||||
Fuji Oil Holdings, Inc. | (14,700 | ) | (208,620 | ) | 20.2 | |||||||
Fukuoka Financial Group, Inc. | (21,000 | ) | (383,697 | ) | 37.2 | |||||||
Fukuyama Transporting Co. Ltd. | (8,600 | ) | (240,711 | ) | 23.3 | |||||||
Fuyo General Lease Co. Ltd. | (800 | ) | (43,284 | ) | 4.2 | |||||||
GLP J-REIT | (190 | ) | (256,381 | ) | 24.8 | |||||||
GMO internet, Inc. | (9,700 | ) | (193,856 | ) | 18.8 | |||||||
Goldwin, Inc. | (1,800 | ) | (90,284 | ) | 8.7 | |||||||
GS Yuasa Corp. | (21,200 | ) | (367,616 | ) | 35.6 | |||||||
GungHo Online Entertainment, Inc. | (49,800 | ) | (1,016,037 | ) | 98.4 | |||||||
Hachijuni Bank Ltd. | (228,800 | ) | (754,523 | ) | 73.1 | |||||||
Hakuhodo DY Holdings, Inc. | (13,700 | ) | (161,681 | ) | 15.7 | |||||||
Hankyu Hanshin Holdings, Inc. | (23,100 | ) | (609,646 | ) | 59.1 | |||||||
Heiwa Corp. | (7,600 | ) | (114,271 | ) | 11.1 | |||||||
Hikari Tsushin, Inc. | (800 | ) | (93,675 | ) | 9.1 | |||||||
Hino Motors Ltd. | (53,900 | ) | (278,231 | ) | 27.0 | |||||||
Hirogin Holdings, Inc. | (132,400 | ) | (652,356 | ) | 63.2 | |||||||
Hitachi Transport System Ltd. | (8,400 | ) | (551,372 | ) | 53.4 | |||||||
Horiba Ltd. | (4,700 | ) | (228,671 | ) | 22.2 | |||||||
House Foods Group, Inc. | (8,200 | ) | (191,916 | ) | 18.6 | |||||||
Ibiden Co. Ltd. | (3,800 | ) | (142,013 | ) | 13.8 | |||||||
Idemitsu Kosan Co. Ltd. | (4,100 | ) | (108,056 | ) | 10.5 | |||||||
Iida Group Holdings Co. Ltd. | (4,300 | ) | (68,390 | ) | 6.6 | |||||||
Industrial & Infrastructure Fund Investment Corp. | (300 | ) | (430,465 | ) | 41.7 | |||||||
INFRONEER Holdings, Inc. | (119,812 | ) | (872,717 | ) | 84.5 | |||||||
Isetan Mitsukoshi Holdings Ltd. | (3,200 | ) | (23,749 | ) | 2.3 | |||||||
Isuzu Motors Ltd. | (7,200 | ) | (83,994 | ) | 8.1 | |||||||
Ito En Ltd. | (4,800 | ) | (197,258 | ) | 19.1 | |||||||
Itoham Yonekyu Holdings, Inc. | (45,500 | ) | (229,004 | ) | 22.2 | |||||||
Iwatani Corp. | (9,300 | ) | (370,017 | ) | 35.8 | |||||||
Iyo Bank Ltd. | (25,500 | ) | (123,647 | ) | 12.0 | |||||||
Japan Airlines Co. Ltd. | (16,700 | ) | (275,708 | ) | 26.7 | |||||||
Japan Airport Terminal Co. Ltd. | (11,200 | ) | (464,089 | ) | 45.0 | |||||||
Japan Aviation Electronics Industry Ltd. | (10,600 | ) | (148,221 | ) | 14.4 | |||||||
Japan Hotel REIT Investment Corp. | (1,472 | ) | (747,609 | ) | 72.4 | |||||||
Japan Logistics Fund, Inc. | (58 | ) | (141,549 | ) | 13.7 | |||||||
Japan Metropolitan Fund Invest | (810 | ) | (643,811 | ) | 62.4 | |||||||
Japan Real Estate Investment Corp. | (116 | ) | (561,423 | ) | 54.4 | |||||||
JCR Pharmaceuticals Co. Ltd. | (7,700 | ) | (143,103 | ) | 13.9 | |||||||
JMDC, Inc. | (400 | ) | (19,289 | ) | 1.9 | |||||||
JTEKT Corp. | (12,300 | ) | (85,755 | ) | 8.3 | |||||||
Kadokawa Dwango | (42,400 | ) | (1,062,882 | ) | 103.0 | |||||||
Kagome Co. Ltd. | (15,600 | ) | (390,406 | ) | 37.8 | |||||||
Kaken Pharmaceutical Co. Ltd. | (1,200 | ) | (36,363 | ) | 3.5 | |||||||
Kaneka Corp. | (4,700 | ) | (125,760 | ) | 12.2 | |||||||
| Security | Shares | Value | % of Basket Value | |||||||||
| Japan (continued) | ||||||||||||
Kawasaki Heavy Industries Ltd. | (26,400 | ) | $ | (469,466 | ) | 45.5 | % | |||||
Keihan Holdings Co. Ltd. | (6,800 | ) | (145,042 | ) | 14.1 | |||||||
Keikyu Corp. | (37,200 | ) | (374,697 | ) | 36.3 | |||||||
Keio Corp. | (4,900 | ) | (187,928 | ) | 18.2 | |||||||
Kenedix Office Investment Corp. | (27 | ) | (141,121 | ) | 13.7 | |||||||
Kinden Corp. | (16,300 | ) | (193,147 | ) | 18.7 | |||||||
Kirin Holdings Co. Ltd. | (14,000 | ) | (204,088 | ) | 19.8 | |||||||
Kobe Steel Ltd. | (44,100 | ) | (191,189 | ) | 18.5 | |||||||
Koei Tecmo Holdings Co. Ltd. | (7,300 | ) | (223,855 | ) | 21.7 | |||||||
Kose Corp. | (100 | ) | (10,266 | ) | 1.0 | |||||||
Kotobuki Spirits Co. Ltd. | (4,900 | ) | (257,922 | ) | 25.0 | |||||||
K’s Holdings Corp. | (3,300 | ) | (32,680 | ) | 3.2 | |||||||
Kubota Corp. | (12,000 | ) | (203,864 | ) | 19.8 | |||||||
Kurita Water Industries Ltd. | (3,700 | ) | (126,230 | ) | 12.2 | |||||||
Kyushu Financial Group, Inc. | (84,400 | ) | (259,011 | ) | 25.1 | |||||||
Kyushu Railway Co. | (25,600 | ) | (501,779 | ) | 48.6 | |||||||
LaSalle Logiport REIT | (96 | ) | (129,879 | ) | 12.6 | |||||||
Lintec Corp. | (11,800 | ) | (219,806 | ) | 21.3 | |||||||
Mabuchi Motor Co. Ltd. | (10,400 | ) | (277,768 | ) | 26.9 | |||||||
Marui Group Co. Ltd. | (6,500 | ) | (111,914 | ) | 10.8 | |||||||
Maruichi Steel Tube Ltd. | (5,800 | ) | (123,786 | ) | 12.0 | |||||||
Matsui Securities Co. Ltd. | (48,700 | ) | (301,201 | ) | 29.2 | |||||||
Matsumotokiyoshi Holdings Co. Ltd. | (8,500 | ) | (280,970 | ) | 27.2 | |||||||
Medipal Holdings Corp. | (19,700 | ) | (324,427 | ) | 31.4 | |||||||
MEIJI Holdings Co. Ltd. | (2,100 | ) | (104,678 | ) | 10.1 | |||||||
Menicon Co. Ltd. | (7,200 | ) | (153,788 | ) | 14.9 | |||||||
MINEBEA MITSUMI, Inc. | (39,600 | ) | (759,772 | ) | 73.6 | |||||||
Mitsubishi Estate Co. Ltd. | (15,400 | ) | (224,325 | ) | 21.7 | |||||||
Mitsubishi Gas Chemical Co., Inc. | (5,500 | ) | (80,316 | ) | 7.8 | |||||||
Mitsui High-Tec, Inc. | (1,400 | ) | (120,940 | ) | 11.7 | |||||||
Miura Co. Ltd. | (9,700 | ) | (202,611 | ) | 19.6 | |||||||
Money Forward, Inc. | (1,400 | ) | (47,602 | ) | 4.6 | |||||||
Mori Hills REIT Investment Corp. | (455 | ) | (516,033 | ) | 50.0 | |||||||
Morinaga & Co. Ltd. | (8,900 | ) | (275,977 | ) | 26.7 | |||||||
Nabtesco Corp. | (8,400 | ) | (191,584 | ) | 18.6 | |||||||
Nagase & Co. Ltd. | (4,500 | ) | (64,485 | ) | 6.2 | |||||||
NEC Networks & System Integration Corp. | (5,300 | ) | (75,256 | ) | 7.3 | |||||||
Nexon Co. Ltd. | (4,000 | ) | (91,084 | ) | 8.8 | |||||||
NGK Insulators Ltd. | (4,400 | ) | (59,187 | ) | 5.7 | |||||||
NH Foods Ltd. | (7,900 | ) | (249,485 | ) | 24.2 | |||||||
NHK Spring Co. Ltd. | (21,300 | ) | (137,575 | ) | 13.3 | |||||||
Nidec Corp. | (7,600 | ) | (491,333 | ) | 47.6 | |||||||
Nifco, Inc. | (1,900 | ) | (40,116 | ) | 3.9 | |||||||
Nihon Unisys Ltd. | (10,800 | ) | (272,862 | ) | 26.4 | |||||||
Nippon Accommodations Fund, Inc. | (79 | ) | (388,989 | ) | 37.7 | |||||||
Nippon Building Fund, Inc. | (107 | ) | (555,469 | ) | 53.8 | |||||||
Nippon Electric Glass Co. Ltd. | (35,500 | ) | (714,630 | ) | 69.2 | |||||||
Nippon Kayaku Co. Ltd. | (2,300 | ) | (20,045 | ) | 1.9 | |||||||
Nippon Shinyaku Co. Ltd. | (1,800 | ) | (121,741 | ) | 11.8 | |||||||
Nippon Shokubai Co. Ltd. | (3,600 | ) | (144,833 | ) | 14.0 | |||||||
Nishi-Nippon Railroad Co. Ltd. | (48,200 | ) | (964,232 | ) | 93.4 | |||||||
Nisshin Seifun Group, Inc. | (8,900 | ) | (118,644 | ) | 11.5 | |||||||
Noevir Holdings Co. Ltd. | (5,500 | ) | (215,650 | ) | 20.9 | |||||||
NOF Corp. | (4,300 | ) | (161,398 | ) | 15.6 | |||||||
Nomura Holdings, Inc. | (20,000 | ) | (77,009 | ) | 7.5 | |||||||
Nomura Real Estate Master Fund, Inc. | (301 | ) | (377,917 | ) | 36.6 | |||||||
NS Solutions Corp. | (3,100 | ) | (92,484 | ) | 9.0 | |||||||
Odakyu Electric Railway Co. Ltd. | (1,600 | ) | (24,229 | ) | 2.3 | |||||||
Oji Holdings Corp. | (5,100 | ) | (24,159 | ) | 2.3 | |||||||
OKUMA Corp. | (2,900 | ) | (103,650 | ) | 10.0 | |||||||
Open House Co. Ltd. | (11,400 | ) | (441,119 | ) | 42.7 | |||||||
Oracle Corp. Japan | (5,600 | ) | (359,864 | ) | 34.9 | |||||||
SCHEDULE OF INVESTMENTS | 29 |
Schedule of Investments (continued) April 30, 2022 | BlackRock Global Long/Short Equity Fund |
| Security | Shares | Value | % of Basket Value | |||||||||
| Japan (continued) | ||||||||||||
Orient Corp. | (904,800 | ) | $ | (868,508 | ) | 84.1 | % | |||||
Oriental Land Co. Ltd. | (800 | ) | (121,016 | ) | 11.7 | |||||||
Orix JREIT, Inc. | (447 | ) | (604,219 | ) | 58.5 | |||||||
Osaka Gas Co. Ltd. | (52,100 | ) | (939,019 | ) | 91.0 | |||||||
OSG Corp. | (4,100 | ) | (51,506 | ) | 5.0 | |||||||
Pan Pacific International Holdings Corp. | (2,700 | ) | (41,346 | ) | 4.0 | |||||||
Rakus Co. Ltd. | (4,700 | ) | (57,602 | ) | 5.6 | |||||||
Rengo Co. Ltd. | (69,300 | ) | (410,294 | ) | 39.8 | |||||||
Resona Holdings Inc. | (6,500 | ) | (28,265 | ) | 2.7 | |||||||
Rohto Pharmaceutical Co. Ltd. | (1,200 | ) | (32,045 | ) | 3.1 | |||||||
Sankyo Co. Ltd. | (20,800 | ) | (598,520 | ) | 58.0 | |||||||
Sansan, Inc. | (30,400 | ) | (290,037 | ) | 28.1 | |||||||
Sanwa Holdings Corp. | (3,700 | ) | (33,708 | ) | 3.3 | |||||||
Secom Co. Ltd. | (5,600 | ) | (393,985 | ) | 38.2 | |||||||
Seibu Holdings, Inc. | (6,300 | ) | (62,591 | ) | 6.1 | |||||||
Sharp Corp. | (39,300 | ) | (332,529 | ) | 32.2 | |||||||
SHIFT, Inc. | (700 | ) | (132,650 | ) | 12.9 | |||||||
Shikoku Electric Power Co., Inc. | (48,500 | ) | (278,851 | ) | 27.0 | |||||||
Shimamura Co. Ltd. | (1,900 | ) | (168,508 | ) | 16.3 | |||||||
Shinsei Bank Ltd. | (3,800 | ) | (66,637 | ) | 6.5 | |||||||
Ship Healthcare Holdings, Inc. | (16,600 | ) | (277,285 | ) | 26.9 | |||||||
Shiseido Co. Ltd. | (5,200 | ) | (245,811 | ) | 23.8 | |||||||
Shizuoka Bank Ltd. | (46,600 | ) | (301,505 | ) | 29.2 | |||||||
SHO-BOND Holdings Co. Ltd. | (7,300 | ) | (306,819 | ) | 29.7 | |||||||
Shochiku Co. Ltd. | (1,800 | ) | (183,709 | ) | 17.8 | |||||||
Showa Denko KK | (30,900 | ) | (601,263 | ) | 58.3 | |||||||
Sohgo Security Services Co. Ltd. | (10,000 | ) | (277,788 | ) | 26.9 | |||||||
Stanley Electric Co. Ltd. | (6,900 | ) | (118,977 | ) | 11.5 | |||||||
Sugi Holdings Co. Ltd. | (2,800 | ) | (120,009 | ) | 11.6 | |||||||
Sumitomo Bakelite Co. Ltd. | (2,600 | ) | (85,309 | ) | 8.3 | |||||||
Sushiro Global Holdings Ltd. | (2,700 | ) | (64,073 | ) | 6.2 | |||||||
Suzuken Co. Ltd./Aichi Japan | (5,800 | ) | (171,200 | ) | 16.6 | |||||||
Taisho Pharmaceutical Holdings Co. Ltd. | (4,000 | ) | (157,552 | ) | 15.3 | |||||||
Taiyo Nippon Sanso Corp. | (4,900 | ) | (88,178 | ) | 8.5 | |||||||
Taiyo Yuden Co. Ltd. | (1,700 | ) | (66,789 | ) | 6.5 | |||||||
Takara Holdings, Inc. | (19,300 | ) | (162,562 | ) | 15.7 | |||||||
TechnoPro Holdings Inc. | (6,200 | ) | (157,902 | ) | 15.3 | |||||||
THK Co. Ltd. | (8,600 | ) | (170,421 | ) | 16.5 | |||||||
Tobu Railway Co. Ltd. | (11,200 | ) | (251,756 | ) | 24.4 | |||||||
Toda Corp. | (22,200 | ) | (127,551 | ) | 12.4 | |||||||
Toho Gas Co. Ltd. | (6,700 | ) | (157,176 | ) | 15.2 | |||||||
Tokai Carbon Co. Ltd. | (52,100 | ) | (430,808 | ) | 41.7 | |||||||
Tokyo Century Corp. | (2,000 | ) | (61,604 | ) | 6.0 | |||||||
Tokyu Corp. | (59,300 | ) | (725,168 | ) | 70.3 | |||||||
Toppan Inc. | (13,800 | ) | (228,109 | ) | 22.1 | |||||||
Toshiba Corp. | (11,400 | ) | (473,423 | ) | 45.9 | |||||||
Toshiba TEC Corp. | (1,300 | ) | (44,066 | ) | 4.3 | |||||||
Toyo Tire Corp. | (5,500 | ) | (63,085 | ) | 6.1 | |||||||
Toyoda Gosei Co. Ltd. | (2,100 | ) | (30,580 | ) | 3.0 | |||||||
Toyota Boshoku Corp. | (9,500 | ) | (151,406 | ) | 14.7 | |||||||
Toyota Industries Corp. | (1,900 | ) | (113,956 | ) | 11.0 | |||||||
TS Tech Co. Ltd. | (7,000 | ) | (73,049 | ) | 7.1 | |||||||
Ube Industries Ltd. | (4,700 | ) | (72,873 | ) | 7.1 | |||||||
Ulvac, Inc. | (8,200 | ) | (321,316 | ) | 31.1 | |||||||
United Urban Investment Corp. | (157 | ) | (171,779 | ) | 16.6 | |||||||
USS Co. Ltd. | (4,900 | ) | (81,575 | ) | 7.9 | |||||||
West Japan Railway Co. | (4,600 | ) | (170,747 | ) | 16.5 | |||||||
Yamazaki Baking Co. Ltd. | (15,500 | ) | (191,613 | ) | 18.6 | |||||||
| Security | Shares | Value | % of Basket Value | |||||||||
| Japan (continued) | ||||||||||||
Yokogawa Electric Corp. | (15,700 | ) | $ | (250,297 | ) | 24.2 | % | |||||
Zenkoku Hosho Co. Ltd. | (11,900 | ) | (417,644 | ) | 40.5 | |||||||
Zeon Corp. | (12,700 | ) | (135,239 | ) | 13.1 | |||||||
|
|
|
| |||||||||
| (47,934,288 | ) | |||||||||||
| Luxembourg | ||||||||||||
Grand City Properties SA | (37,350 | ) | (659,416 | ) | 63.9 | |||||||
Tenaris SA | (65,705 | ) | (1,004,116 | ) | 97.3 | |||||||
|
|
|
| |||||||||
| (1,663,532 | ) | |||||||||||
| Netherlands | ||||||||||||
Aegon NV | (84,869 | ) | (440,019 | ) | 42.6 | |||||||
Argenx SE | (1,154 | ) | (332,477 | ) | 32.2 | |||||||
ASM International NV | (333 | ) | (100,064 | ) | 9.7 | |||||||
ASML Holding NV | (145 | ) | (82,293 | ) | 8.0 | |||||||
Euronext NV | (7,946 | ) | (636,650 | ) | 61.7 | |||||||
Iveco Group NV | (27,055 | ) | (159,175 | ) | 15.4 | |||||||
Just Eat Takeaway.com NV | (15,264 | ) | (414,609 | ) | 40.2 | |||||||
Koninklijke Philips NV | (2,101 | ) | (54,902 | ) | 5.3 | |||||||
NN Group NV | (7,050 | ) | (345,320 | ) | 33.4 | |||||||
SBM Offshore NV | (17,449 | ) | (252,856 | ) | 24.5 | |||||||
Shop Apotheke Europe NV | (922 | ) | (76,036 | ) | 7.4 | |||||||
Universal Music Group NV | (24,551 | ) | (569,741 | ) | 55.2 | |||||||
|
|
|
| |||||||||
| (3,464,142 | ) | |||||||||||
| New Zealand | ||||||||||||
Fletcher Building Ltd. | (4,004 | ) | (15,950 | ) | 1.5 | |||||||
|
|
|
| |||||||||
| Norway | ||||||||||||
Aker ASA, A Shares | (2,101 | ) | (171,254 | ) | 16.6 | |||||||
Gjensidige Forsikring ASA | (8,685 | ) | (185,680 | ) | 18.0 | |||||||
Leroy Seafood Group ASA | (17,922 | ) | (168,203 | ) | 16.3 | |||||||
Mowi ASA | (3,626 | ) | (102,424 | ) | 9.9 | |||||||
Orkla ASA | (27,437 | ) | (222,641 | ) | 21.6 | |||||||
Scatec ASA | (20,242 | ) | (244,658 | ) | 23.7 | |||||||
Storebrand ASA | (3,049 | ) | (26,484 | ) | 2.5 | |||||||
Var Energi | (60,356 | ) | (258,011 | ) | 25.0 | |||||||
Yara International ASA | (4,236 | ) | (215,393 | ) | 20.9 | |||||||
|
|
|
| |||||||||
| (1,594,748 | ) | |||||||||||
| Poland | ||||||||||||
InPost SA | (15,342 | ) | (94,060 | ) | 9.1 | |||||||
|
|
|
| |||||||||
| Portugal | ||||||||||||
Galp Energia SGPS SA | (13,033 | ) | (158,633 | ) | 15.4 | |||||||
|
|
|
| |||||||||
| Singapore | ||||||||||||
Ascendas Real Estate Investment Trust | (38,900 | ) | (80,036 | ) | 7.8 | |||||||
City Developments Ltd. | (8,500 | ) | (52,489 | ) | 5.1 | |||||||
Frasers Logistics & Commercial Trust | (14,700 | ) | (15,308 | ) | 1.5 | |||||||
Grab Holdings Ltd., Class A | (69,276 | ) | (204,364 | ) | 19.8 | |||||||
Kenon Holdings Ltd. | (13,088 | ) | (747,485 | ) | 72.4 | |||||||
Mapletree Logistics Trust | (34,000 | ) | (43,667 | ) | 4.2 | |||||||
|
|
|
| |||||||||
| (1,143,349 | ) | |||||||||||
| South Africa | ||||||||||||
Investec PLC | (19,162 | ) | (112,862 | ) | 10.9 | |||||||
|
|
|
| |||||||||
| Spain | ||||||||||||
Acerinox SA | (9,369 | ) | (98,648 | ) | 9.6 | |||||||
Aena SME SA | (360 | ) | (51,088 | ) | 4.9 | |||||||
Banco de Sabadell SA | (22,141 | ) | (17,183 | ) | 1.7 | |||||||
Corp. ACCIONA Energias Renovables SA | (3,568 | ) | (131,899 | ) | 12.8 | |||||||
| 30 | 2 0 2 2 BLACK ROCK ANNUAL REPORT TO SHAREHOLDERS |
Schedule of Investments (continued) April 30, 2022 | BlackRock Global Long/Short Equity Fund |
| Security | Shares | Value | % of Basket Value | |||||||||
| Spain (continued) | ||||||||||||
EDP Renovaveis SA | (10,315 | ) | $ | (244,127 | ) | 23.6 | % | |||||
Fluidra SA | (6,465 | ) | (174,970 | ) | 16.9 | |||||||
Mapfre SA | (238,593 | ) | (435,398 | ) | 42.2 | |||||||
Red Electrica Corp. SA | (13,991 | ) | (281,698 | ) | 27.3 | |||||||
Repsol SA | (41,843 | ) | (624,209 | ) | 60.5 | |||||||
Siemens Gamesa Renewable Energy SA | (4,789 | ) | (76,282 | ) | 7.4 | |||||||
|
|
|
| |||||||||
| (2,135,502 | ) | |||||||||||
| Sweden | ||||||||||||
Avanza Bank Holding AB | (5,968 | ) | (151,120 | ) | 14.6 | |||||||
Axfood AB | (15,006 | ) | (444,857 | ) | 43.1 | |||||||
Beijer Ref AB | (3,769 | ) | (61,374 | ) | 5.9 | |||||||
Embracer Group AB | (21,962 | ) | (146,794 | ) | 14.2 | |||||||
Fastighets AB Balder, Class B | (853 | ) | (42,281 | ) | 4.1 | |||||||
Getinge AB, B Shares | (2,522 | ) | (72,956 | ) | 7.1 | |||||||
Husqvarna AB, B Shares | (36,533 | ) | (349,223 | ) | 33.8 | |||||||
Investor AB, Class A | (10,937 | ) | (228,436 | ) | 22.1 | |||||||
Kinnevik AB, Class B | (9,603 | ) | (187,954 | ) | 18.2 | |||||||
L E Lundbergforetagen AB, B Shares | (2,218 | ) | (103,728 | ) | 10.1 | |||||||
Sandvik AB | (1,045 | ) | (19,780 | ) | 1.9 | |||||||
Securitas AB, B Shares | (30,331 | ) | (358,112 | ) | 34.7 | |||||||
Sinch AB | (26,773 | ) | (118,320 | ) | 11.5 | |||||||
Skandinaviska Enskilda Banken AB, Class A | (13,303 | ) | (149,181 | ) | 14.5 | |||||||
SKF AB, B Shares | (3,234 | ) | (52,820 | ) | 5.1 | |||||||
Svenska Cellulosa AB SCA, Class B | (13,897 | ) | (268,946 | ) | 26.1 | |||||||
Sweco AB, B Shares | (12,195 | ) | (172,110 | ) | 16.7 | |||||||
Swedish Orphan Biovitrum AB | (14,136 | ) | (297,376 | ) | 28.8 | |||||||
Thule Group AB | (2,238 | ) | (77,630 | ) | 7.5 | |||||||
Volvo AB, A Shares | (29,828 | ) | (490,391 | ) | 47.5 | |||||||
Volvo Car AB, B Shares | (72,859 | ) | (534,506 | ) | 51.8 | |||||||
|
|
|
| |||||||||
| (4,327,895 | ) | |||||||||||
| Switzerland | ||||||||||||
ABB Ltd. | (24,115 | ) | (723,497 | ) | 70.1 | |||||||
Bachem Holding AG, Class B | (660 | ) | (287,989 | ) | 27.9 | |||||||
BKW AG | (2,846 | ) | (346,447 | ) | 33.6 | |||||||
Chubb Ltd. | (766 | ) | (158,141 | ) | 15.3 | |||||||
CRISPR Therapeutics AG | (2,565 | ) | (127,275 | ) | 12.3 | |||||||
EMS-Chemie Holding AG | (122 | ) | (108,839 | ) | 10.5 | |||||||
Fischer (Georg) Reg | (640 | ) | (34,733 | ) | 3.4 | |||||||
Givaudan SA | (16 | ) | (63,592 | ) | 6.2 | |||||||
Helvetia Holding AG | (168 | ) | (21,589 | ) | 2.1 | |||||||
Kuehne + Nagel International AG | (332 | ) | (92,876 | ) | 9.0 | |||||||
Novartis AG | (5,337 | ) | (471,627 | ) | 45.7 | |||||||
Partners Group Holding AG | (74 | ) | (78,403 | ) | 7.6 | |||||||
PSP Swiss Property AG, Registered Shares | (440 | ) | (55,454 | ) | 5.4 | |||||||
Roche Holding AG | (1,575 | ) | (632,749 | ) | 61.3 | |||||||
Schindler Holding AG, Participation Certificates | (2,591 | ) | (497,797 | ) | 48.2 | |||||||
Schindler Holding AG, Registered Shares | (2,020 | ) | (387,788 | ) | 37.6 | |||||||
SGS SA | (162 | ) | (416,262 | ) | 40.3 | |||||||
Swatch Group AG | (12,416 | ) | (612,533 | ) | 59.3 | |||||||
Swisscom AG | (591 | ) | (349,459 | ) | 33.9 | |||||||
Tecan Group AG | (36 | ) | (10,819 | ) | 1.0 | |||||||
|
|
|
| |||||||||
| (5,477,869 | ) | |||||||||||
| United Kingdom | ||||||||||||
3i Group PLC | (2,158 | ) | (35,316 | ) | 3.4 | |||||||
AstraZeneca PLC | (83 | ) | (11,155 | ) | 1.1 | |||||||
Berkeley Group Holdings PLC | (1,907 | ) | (96,716 | ) | 9.4 | |||||||
Clarivate PLC | (652 | ) | (10,223 | ) | 1.0 | |||||||
CNH Industrial NV | (37,031 | ) | (524,592 | ) | 50.8 | |||||||
ConvaTec Group PLC | (5,521 | ) | (14,605 | ) | 1.4 | |||||||
| Security | Shares | Value | % of Basket Value | |||||||||
| United Kingdom (continued) | ||||||||||||
Diageo PLC | (772 | ) | $ | (38,514 | ) | 3.7 | % | |||||
Dr. Martens PLC | (75,728 | ) | (198,000 | ) | 19.2 | |||||||
DS Smith PLC | (60,635 | ) | (249,165 | ) | 24.1 | |||||||
Future PLC | (4,782 | ) | (130,970 | ) | 12.7 | |||||||
Games Workshop Group PLC | (8,990 | ) | (830,837 | ) | 80.5 | |||||||
Greggs PLC | (7,125 | ) | (207,878 | ) | 20.1 | |||||||
Harbour Energy PLC | (920 | ) | (5,769 | ) | 0.6 | |||||||
Howden Joinery Group PLC | (11,864 | ) | (112,323 | ) | 10.9 | |||||||
Intermediate Capital Group PLC | (12,469 | ) | (238,613 | ) | 23.1 | |||||||
JET2 PLC | (17,132 | ) | (263,096 | ) | 25.5 | |||||||
Land Securities Group PLC | (47,386 | ) | (444,413 | ) | 43.1 | |||||||
Mondi PLC | (11,554 | ) | (217,053 | ) | 21.0 | |||||||
Pennon Group PLC | (43,716 | ) | (607,489 | ) | 58.9 | |||||||
Rentokil Initial PLC | (52,515 | ) | (360,687 | ) | 34.9 | |||||||
Rightmove PLC | (1,588 | ) | (12,207 | ) | 1.2 | |||||||
Royal Mail PLC | (74,948 | ) | (321,249 | ) | 31.1 | |||||||
Shell PLC | (3,779 | ) | (101,451 | ) | 9.8 | |||||||
Standard Chartered PLC | (576 | ) | (3,938 | ) | 0.4 | |||||||
WH Smith PLC | (19,098 | ) | (343,597 | ) | 33.3 | |||||||
Wise PLC, Class A | (123,051 | ) | (603,007 | ) | 58.4 | |||||||
|
|
|
| |||||||||
| (5,982,863 | ) | |||||||||||
| United States | ||||||||||||
3M Co. | (8,473 | ) | (1,221,976 | ) | 118.4 | |||||||
Abbott Laboratories | (5,233 | ) | (593,945 | ) | 57.5 | |||||||
Acuity Brands, Inc. | (1,963 | ) | (338,578 | ) | 32.8 | |||||||
Advance Auto Parts, Inc. | (1,947 | ) | (388,680 | ) | 37.7 | |||||||
Affirm Holdings, Inc. | (3,386 | ) | (97,178 | ) | 9.4 | |||||||
AGCO Corp. | (3,834 | ) | (488,452 | ) | 47.3 | |||||||
Agilon Health, Inc. | (15,247 | ) | (270,939 | ) | 26.2 | |||||||
Air Lease Corp. | (4,572 | ) | (184,160 | ) | 17.8 | |||||||
Albertsons Cos., Inc., Class A | (20,270 | ) | (634,046 | ) | 61.4 | |||||||
Alight, Inc., Class A | (14,807 | ) | (127,192 | ) | 12.3 | |||||||
Alteryx, Inc., Class A | (3,559 | ) | (228,488 | ) | 22.1 | |||||||
Amedisys, Inc. | (419 | ) | (53,485 | ) | 5.2 | |||||||
Amgen, Inc. | (1,343 | ) | (313,174 | ) | 30.3 | |||||||
Amkor Technology, Inc. | (10,841 | ) | (203,919 | ) | 19.8 | |||||||
Antero Resources Corp. | (5,253 | ) | (184,906 | ) | 17.9 | |||||||
Apollo Global Management, Inc. | (12,700 | ) | (631,952 | ) | 61.2 | |||||||
Appian Corp. | (669 | ) | (31,978 | ) | 3.1 | |||||||
AppLovin Corp., Class A | (21,707 | ) | (828,122 | ) | 80.2 | |||||||
Archer-Daniels-Midland Co. | (12,707 | ) | (1,138,039 | ) | 110.3 | |||||||
Armstrong World Industries, Inc. | (953 | ) | (80,681 | ) | 7.8 | |||||||
Arthur J. Gallagher & Co. | (874 | ) | (147,260 | ) | 14.3 | |||||||
Assurant, Inc. | (4,654 | ) | (846,470 | ) | 82.0 | |||||||
Automatic Data Processing, Inc. | (632 | ) | (137,890 | ) | 13.4 | |||||||
AutoNation, Inc. | (1,599 | ) | (185,340 | ) | 18.0 | |||||||
Avis Budget Group, Inc. | (374 | ) | (100,109 | ) | 9.7 | |||||||
AZEK Co., Inc. | (13,046 | ) | (277,097 | ) | 26.8 | |||||||
Bath & Body Works, Inc. | (11,009 | ) | (582,266 | ) | 56.4 | |||||||
Beam Therapeutics, Inc. | (4,493 | ) | (168,622 | ) | 16.3 | |||||||
Berkshire Hathaway, Inc., Class B | (2,105 | ) | (679,557 | ) | 65.8 | |||||||
Bill.Com Holdings, Inc. | (638 | ) | (108,913 | ) | 10.5 | |||||||
Biohaven Pharmaceutical Holding Co. Ltd. | (1,144 | ) | (102,010 | ) | 9.9 | |||||||
Blackstone Mortgage Trust, Inc., Class A | (803 | ) | (24,122 | ) | 2.3 | |||||||
Blue Owl Capital, Inc. | (23,293 | ) | (277,885 | ) | 26.9 | |||||||
Boston Beer Co., Inc., Class A | (65 | ) | (24,375 | ) | 2.4 | |||||||
Box, Inc., Class A | (4,842 | ) | (148,262 | ) | 14.4 | |||||||
Boyd Gaming Corp. | (235 | ) | (14,236 | ) | 1.4 | |||||||
Bright Horizons Family Solutions, Inc. | (1,465 | ) | (167,362 | ) | 16.2 | |||||||
Broadcom, Inc. | (493 | ) | (273,314 | ) | 26.5 | |||||||
Broadridge Financial Solutions, Inc. | (231 | ) | (33,294 | ) | 3.2 | |||||||
SCHEDULE OF INVESTMENTS | 31 |
Schedule of Investments (continued) April 30, 2022 | BlackRock Global Long/Short Equity Fund |
| Security | Shares | Value | % of Basket Value | |||||||||
| United States (continued) | ||||||||||||
Brunswick Corp. | (1,465 | ) | $ | (110,769 | ) | 10.7 | % | |||||
Bunge Ltd. | (1,021 | ) | (115,496 | ) | 11.2 | |||||||
Caesars Entertainment, Inc. | (1,723 | ) | (114,200 | ) | 11.1 | |||||||
Campbell Soup Co. | (6,640 | ) | (313,541 | ) | 30.4 | |||||||
Casey’s General Stores, Inc. | (1,118 | ) | (225,053 | ) | 21.8 | |||||||
Caterpillar, Inc. | (1,327 | ) | (279,387 | ) | 27.1 | |||||||
Chemours Co. | (2,733 | ) | (90,380 | ) | 8.8 | |||||||
Church & Dwight Co., Inc. | (2,318 | ) | (226,144 | ) | 21.9 | |||||||
Churchill Downs, Inc. | (189 | ) | (38,356 | ) | 3.7 | |||||||
CME Group, Inc. | (1,840 | ) | (403,586 | ) | 39.1 | |||||||
Coca-Cola Co. | (1,520 | ) | (75,924 | ) | 7.4 | |||||||
Coherent, Inc. | (137 | ) | (36,702 | ) | 3.6 | |||||||
Coinbase Global, Inc., Class A | (4,620 | ) | (520,720 | ) | 50.4 | |||||||
Columbia Sportswear Co. | (293 | ) | (24,073 | ) | 2.3 | |||||||
Conagra Brands, Inc. | (17,288 | ) | (603,870 | ) | 58.5 | |||||||
Concentrix Corp. | (199 | ) | (31,339 | ) | 3.0 | |||||||
Confluent, Inc., Class A | (351 | ) | (10,965 | ) | 1.1 | |||||||
Consolidated Edison, Inc. | (1,096 | ) | (101,643 | ) | 9.8 | |||||||
Corning, Inc. | (10,267 | ) | (361,296 | ) | 35.0 | |||||||
Coty, Inc., Class A | (17,644 | ) | (143,093 | ) | 13.9 | |||||||
Cousins Properties, Inc. | (6,324 | ) | (227,032 | ) | 22.0 | |||||||
Crane Co. | (1,040 | ) | (100,079 | ) | 9.7 | |||||||
Crown Holdings, Inc. | (512 | ) | (56,340 | ) | 5.5 | |||||||
Cullen/Frost Bankers, Inc. | (3,658 | ) | (483,917 | ) | 46.9 | |||||||
Curtiss-Wright Corp. | (1,251 | ) | (178,780 | ) | 17.3 | |||||||
D.R. Horton, Inc. | (3,173 | ) | (220,809 | ) | 21.4 | |||||||
Darden Restaurants, Inc. | (287 | ) | (37,807 | ) | 3.7 | |||||||
Darling Ingredients, Inc. | (811 | ) | (59,519 | ) | 5.8 | |||||||
Datadog, Inc., Class A | (1,109 | ) | (133,945 | ) | 13.0 | |||||||
Dell Technologies, Inc., Class C | (1,019 | ) | (47,903 | ) | 4.6 | |||||||
Delta Air Lines, Inc. | (11,513 | ) | (495,404 | ) | 48.0 | |||||||
Diamondback Energy, Inc. | (186 | ) | (23,479 | ) | 2.3 | |||||||
DigitalOcean Holdings, Inc. | (1,561 | ) | (61,550 | ) | 6.0 | |||||||
Discover Financial Services | (2,699 | ) | (303,530 | ) | 29.4 | |||||||
DISH Network Corp., Class A | (9,506 | ) | (271,016 | ) | 26.3 | |||||||
Dollar General Corp. | (3,340 | ) | (793,350 | ) | 76.9 | |||||||
Dollar Tree, Inc. | (224 | ) | (36,389 | ) | 3.5 | |||||||
Dover Corp. | (5,601 | ) | (746,613 | ) | 72.3 | |||||||
Dow, Inc. | (15,856 | ) | (1,054,424 | ) | 102.1 | |||||||
Doximity, Inc., Class A | (4,148 | ) | (165,381 | ) | 16.0 | |||||||
DTE Energy Co. | (369 | ) | (48,354 | ) | 4.7 | |||||||
Duke Energy Corp. | (1,201 | ) | (132,302 | ) | 12.8 | |||||||
DuPont de Nemours, Inc. | (2,949 | ) | (194,428 | ) | 18.8 | |||||||
Eagle Materials, Inc. | (3,106 | ) | (383,032 | ) | 37.1 | |||||||
Eastman Chemical Co. | (2,976 | ) | (305,546 | ) | 29.6 | |||||||
Electronic Arts, Inc. | (362 | ) | (42,734 | ) | 4.1 | |||||||
EMCOR Group, Inc. | (875 | ) | (93,170 | ) | 9.0 | |||||||
Endeavor Group Holdings, Inc., Class A | (17,787 | ) | (404,654 | ) | 39.2 | |||||||
Enovis Corp. | (2,711 | ) | (175,863 | ) | 17.0 | |||||||
Entegris, Inc. | (152 | ) | (16,931 | ) | 1.6 | |||||||
Essent Group Ltd. | (4,307 | ) | (174,563 | ) | 16.9 | |||||||
Essex Property Trust, Inc. | (61 | ) | (20,085 | ) | 1.9 | |||||||
Eversource Energy | (5,109 | ) | (446,527 | ) | 43.3 | |||||||
Exact Sciences Corp. | (490 | ) | (26,975 | ) | 2.6 | |||||||
Extra Space Storage, Inc. | (524 | ) | (99,560 | ) | 9.6 | |||||||
Fidelity National Information Services, Inc. | (1,495 | ) | (148,229 | ) | 14.4 | |||||||
First Citizens BancShares, Inc., Class A | (672 | ) | (429,663 | ) | 41.6 | |||||||
First Interstate Bancsystem, Inc., Class A | (1,146 | ) | (37,268 | ) | 3.6 | |||||||
First Republic Bank | (5,978 | ) | (892,037 | ) | 86.4 | |||||||
Fiserv, Inc. | (2,360 | ) | (231,091 | ) | 22.4 | |||||||
Five9, Inc. | (3,335 | ) | (367,183 | ) | 35.6 | |||||||
FleetCor Technologies, Inc. | (41 | ) | (10,230 | ) | 1.0 | |||||||
| Security | Shares | Value | % of Basket Value | |||||||||
| United States (continued) | ||||||||||||
Flex Ltd. | (2,229 | ) | $ | (36,756 | ) | 3.6 | % | |||||
Flowserve Corp. | (13,533 | ) | (442,664 | ) | 42.9 | |||||||
FNB Corp. | (41,538 | ) | (478,518 | ) | 46.4 | |||||||
Fortune Brands Home & Security, Inc. | (205 | ) | (14,606 | ) | 1.4 | |||||||
Freeport-McMoRan, Inc. | (8,308 | ) | (336,889 | ) | 32.6 | |||||||
Freshpet, Inc. | (2,945 | ) | (274,916 | ) | 26.6 | |||||||
Gaming and Leisure Properties, Inc. | (696 | ) | (30,888 | ) | 3.0 | |||||||
Generac Holdings, Inc. | (253 | ) | (55,503 | ) | 5.4 | |||||||
General Mills, Inc. | (16,692 | ) | (1,180,625 | ) | 114.4 | |||||||
General Motors Co. | (8,526 | ) | (323,221 | ) | 31.3 | |||||||
Genuine Parts Co. | (533 | ) | (69,317 | ) | 6.7 | |||||||
Gilead Sciences, Inc. | (2,957 | ) | (175,468 | ) | 17.0 | |||||||
GoDaddy, Inc., Class A | (5,023 | ) | (405,909 | ) | 39.3 | |||||||
Goldman Sachs Group, Inc. | (940 | ) | (287,161 | ) | 27.8 | |||||||
Graco, Inc. | (694 | ) | (43,042 | ) | 4.2 | |||||||
Graphic Packaging Holding Co. | (1,640 | ) | (35,752 | ) | 3.5 | |||||||
GXO Logistics, Inc. | (709 | ) | (41,966 | ) | 4.1 | |||||||
Hasbro, Inc. | (5,025 | ) | (442,501 | ) | 42.9 | |||||||
Hershey Co. | (90 | ) | (20,319 | ) | 2.0 | |||||||
Hess Corp. | (2,832 | ) | (291,894 | ) | 28.3 | |||||||
HF Sinclair Corp. | (5,678 | ) | (215,878 | ) | 20.9 | |||||||
Hilton Grand Vacations, Inc. | (10,362 | ) | (485,252 | ) | 47.0 | |||||||
Hilton Worldwide Holdings, Inc. | (1,433 | ) | (222,531 | ) | 21.6 | |||||||
Hormel Foods Corp. | (4,248 | ) | (222,553 | ) | 21.6 | |||||||
Howmet Aerospace, Inc. | (8,005 | ) | (273,131 | ) | 26.5 | |||||||
HP, Inc. | (187 | ) | (6,850 | ) | 0.7 | |||||||
Hubbell, Inc. | (2,055 | ) | (401,465 | ) | 38.9 | |||||||
Hudson Pacific Properties, Inc. | (21,444 | ) | (499,216 | ) | 48.4 | |||||||
IAA, Inc. | (2,373 | ) | (86,970 | ) | 8.4 | |||||||
IAC/InterActiveCorp | (4,531 | ) | (375,529 | ) | 36.4 | |||||||
IDEX Corp. | (2,911 | ) | (552,566 | ) | 53.5 | |||||||
Insulet Corp. | (115 | ) | (27,484 | ) | 2.7 | |||||||
Intel Corp. | (974 | ) | (42,457 | ) | 4.1 | |||||||
International Business Machines Corp. | (7,629 | ) | (1,008,630 | ) | 97.7 | |||||||
Intra-Cellular Therapies, Inc. | (794 | ) | (40,184 | ) | 3.9 | |||||||
Intuitive Surgical, Inc. | (1,870 | ) | (447,491 | ) | 43.4 | |||||||
Invesco Ltd. | (862 | ) | (15,844 | ) | 1.5 | |||||||
iRhythm Technologies, Inc. | (976 | ) | (120,409 | ) | 11.7 | |||||||
J.M. Smucker Co. | (1,961 | ) | (268,520 | ) | 26.0 | |||||||
Jabil, Inc. | (218 | ) | (12,585 | ) | 1.2 | |||||||
Jack Henry & Associates, Inc. | (811 | ) | (153,749 | ) | 14.9 | |||||||
Johnson & Johnson | (867 | ) | (156,459 | ) | 15.2 | |||||||
Juniper Networks, Inc. | (8,457 | ) | (266,565 | ) | 25.8 | |||||||
KBR, Inc. | (587 | ) | (28,898 | ) | 2.8 | |||||||
Kimberly-Clark Corp. | (1,931 | ) | (268,081 | ) | 26.0 | |||||||
Kraft Heinz Co. | (3,082 | ) | (131,386 | ) | 12.7 | |||||||
L3Harris Technologies, Inc. | (442 | ) | (102,659 | ) | 9.9 | |||||||
Lamb Weston Holdings, Inc. | (290 | ) | (19,169 | ) | 1.9 | |||||||
Liberty Broadband Corp., Class A | (346 | ) | (37,250 | ) | 3.6 | |||||||
LKQ Corp. | (15,466 | ) | (767,578 | ) | 74.4 | |||||||
Louisiana-Pacific Corp. | (5,172 | ) | (333,697 | ) | 32.3 | |||||||
Lyft, Inc., Class A | (3,547 | ) | (115,632 | ) | 11.2 | |||||||
Macy’s, Inc. | (10,569 | ) | (255,453 | ) | 24.7 | |||||||
Magnolia Oil & Gas Corp., Class A | (2,809 | ) | (65,281 | ) | 6.3 | |||||||
Marathon Petroleum Corp. | (1,401 | ) | (122,251 | ) | 11.8 | |||||||
Maravai LifeSciences Holdings, Inc., Class A | (632 | ) | (19,421 | ) | 1.9 | |||||||
Marriott International, Inc., Class A | (1,574 | ) | (279,416 | ) | 27.1 | |||||||
Masco Corp. | (701 | ) | (36,936 | ) | 3.6 | |||||||
Maximus, Inc. | (595 | ) | (43,364 | ) | 4.2 | |||||||
MDU Resources Group, Inc. | (19,700 | ) | (507,472 | ) | 49.2 | |||||||
Medpace Holdings, Inc. | (1,791 | ) | (239,224 | ) | 23.2 | |||||||
MGM Resorts International | (1,896 | ) | (77,812 | ) | 7.5 | |||||||
| 32 | 2 0 2 2 BLACK ROCK ANNUAL REPORT TO SHAREHOLDERS |
Schedule of Investments (continued) April 30, 2022 | BlackRock Global Long/Short Equity Fund |
| Security | Shares | Value | % of Basket Value | |||||||||
| United States (continued) | ||||||||||||
Micron Technology, Inc. | (950 | ) | $ | (64,781 | ) | 6.3 | % | |||||
Middleby Corp. | (124 | ) | (19,082 | ) | 1.8 | |||||||
Mirati Therapeutics, Inc. | (135 | ) | (8,342 | ) | 0.8 | |||||||
MKS Instruments, Inc. | (1,872 | ) | (213,371 | ) | 20.7 | |||||||
Mondelez International, Inc., Class A | (235 | ) | (15,153 | ) | 1.5 | |||||||
Morgan Stanley | (7,538 | ) | (607,487 | ) | 58.9 | |||||||
Motorola Solutions, Inc. | (96 | ) | (20,514 | ) | 2.0 | |||||||
MSC Industrial Direct Co., Inc., Class A | (5,904 | ) | (489,205 | ) | 47.4 | |||||||
Murphy Oil Corp. | (579 | ) | (22,048 | ) | 2.1 | |||||||
National Fuel Gas Co. | (394 | ) | (27,631 | ) | 2.7 | |||||||
New Fortress Energy, Inc. | (6,781 | ) | (262,967 | ) | 25.5 | |||||||
NextEra Energy, Inc. | (1,693 | ) | (120,237 | ) | 11.6 | |||||||
Northern Trust Corp. | (198 | ) | (20,404 | ) | 2.0 | |||||||
Novavax, Inc. | (5,783 | ) | (260,640 | ) | 25.2 | |||||||
Nucor Corp. | (3,666 | ) | (567,423 | ) | 55.0 | |||||||
Oak Street Health, Inc. | (3,467 | ) | (62,718 | ) | 6.1 | |||||||
Olaplex Holdings, Inc. | (16,173 | ) | (237,743 | ) | 23.0 | |||||||
Olin Corp. | (1,980 | ) | (113,652 | ) | 11.0 | |||||||
Omnicom Group, Inc. | (4,673 | ) | (355,755 | ) | 34.5 | |||||||
OneMain Holdings, Inc. | (562 | ) | (25,813 | ) | 2.5 | |||||||
Otis Worldwide Corp. | (2,637 | ) | (192,079 | ) | 18.6 | |||||||
Owens Corning | (592 | ) | (53,831 | ) | 5.2 | |||||||
Packaging Corp. of America | (511 | ) | (82,358 | ) | 8.0 | |||||||
PDC Energy, Inc. | (290 | ) | (20,225 | ) | 2.0 | |||||||
Peloton Interactive, Inc., Class A | (1,114 | ) | (19,562 | ) | 1.9 | |||||||
Petco Health & Wellness Co., Inc. | (15,077 | ) | (290,383 | ) | 28.1 | |||||||
Phillips Edison & Co., Inc. | (14,433 | ) | (488,701 | ) | 47.3 | |||||||
Pioneer Natural Resources Co. | (1,701 | ) | (395,431 | ) | 38.3 | |||||||
Polaris, Inc. | (306 | ) | (29,052 | ) | 2.8 | |||||||
Post Holdings, Inc. | (484 | ) | (36,005 | ) | 3.5 | |||||||
Procore Technologies, Inc. | (2,063 | ) | (114,435 | ) | 11.1 | |||||||
Procter & Gamble Co. | (356 | ) | (57,156 | ) | 5.5 | |||||||
Progressive Corp. | (1,771 | ) | (190,135 | ) | 18.4 | |||||||
Progyny, Inc. | (21 | ) | (807 | ) | 0.1 | |||||||
Prologis, Inc. | (2,519 | ) | (403,771 | ) | 39.1 | |||||||
Prudential Financial, Inc. | (495 | ) | (53,712 | ) | 5.2 | |||||||
Qualtrics International, Inc., Class A | (2,457 | ) | (45,553 | ) | 4.4 | |||||||
Quest Diagnostics, Inc. | (55 | ) | (7,361 | ) | 0.7 | |||||||
R1 RCM, Inc. | (26,335 | ) | (593,064 | ) | 57.5 | |||||||
Raymond James Financial, Inc. | (298 | ) | (29,043 | ) | 2.8 | |||||||
Rayonier, Inc. | (3,355 | ) | (144,936 | ) | 14.0 | |||||||
Red Rock Resorts, Inc., Class A | (2,936 | ) | (129,067 | ) | 12.5 | |||||||
RH | (1,584 | ) | (532,414 | ) | 51.6 | |||||||
Ryman Hospitality Properties, Inc. | (1,107 | ) | (103,482 | ) | 10.0 | |||||||
Saia, Inc. | (388 | ) | (79,912 | ) | 7.7 | |||||||
Scientific Games Corp., Class A | (6,839 | ) | (383,394 | ) | 37.1 | |||||||
Seagate Technology Holdings PLC | (1,358 | ) | (111,410 | ) | 10.8 | |||||||
SeaWorld Entertainment, Inc. | (280 | ) | (18,883 | ) | 1.8 | |||||||
Sempra Energy | (1,935 | ) | (312,232 | ) | 30.2 | |||||||
SentinelOne, Inc., Class A | (1,401 | ) | (46,611 | ) | 4.5 | |||||||
Sherwin-Williams Co. | (40 | ) | (10,998 | ) | 1.1 | |||||||
Shift4 Payments, Inc., Class A | (647 | ) | (33,942 | ) | 3.3 | |||||||
Shockwave Medical, Inc. | (28 | ) | (4,232 | ) | 0.4 | |||||||
Silvergate Capital Corp., Class A | (128 | ) | (14,971 | ) | 1.4 | |||||||
SiTime Corp. | (173 | ) | (29,163 | ) | 2.8 | |||||||
Six Flags Entertainment Corp. | (3,634 | ) | (139,073 | ) | 13.5 | |||||||
Skechers USA, Inc., Class A | (22,581 | ) | (864,852 | ) | 83.8 | |||||||
SLM Corp. | (20,186 | ) | (337,712 | ) | 32.7 | |||||||
Snowflake, Inc., Class A | (1,341 | ) | (229,901 | ) | 22.3 | |||||||
Sonoco Products Co. | (9,364 | ) | (579,725 | ) | 56.2 | |||||||
| Security | Shares | Value | % of Basket Value | |||||||||
| United States (continued) | ||||||||||||
Sonos, Inc. | (1,511 | ) | $ | (34,481 | ) | 3.3 | % | |||||
Southwestern Energy Co. | (27,085 | ) | (203,138 | ) | 19.7 | |||||||
Sprout Social, Inc., Class A | (302 | ) | (18,507 | ) | 1.8 | |||||||
SS&C Technologies Holdings, Inc. | (1,353 | ) | (87,485 | ) | 8.5 | |||||||
Stanley Black & Decker, Inc. | (867 | ) | (104,170 | ) | 10.1 | |||||||
Starbucks Corp. | (4,070 | ) | (303,785 | ) | 29.4 | |||||||
Steel Dynamics, Inc. | (1,405 | ) | (120,479 | ) | 11.7 | |||||||
Synaptics, Inc. | (1,818 | ) | (269,864 | ) | 26.1 | |||||||
SYNNEX Corp. | (591 | ) | (59,153 | ) | 5.7 | |||||||
Synopsys, Inc. | (338 | ) | (96,935 | ) | 9.4 | |||||||
Synovus Financial Corp. | (3,616 | ) | (150,209 | ) | 14.6 | |||||||
T. Rowe Price Group, Inc. | (1,053 | ) | (129,561 | ) | 12.6 | |||||||
Tapestry, Inc. | (435 | ) | (14,320 | ) | 1.4 | |||||||
Tempur Sealy International, Inc. | (12,440 | ) | (337,248 | ) | 32.7 | |||||||
Thor Industries, Inc. | (186 | ) | (14,238 | ) | 1.4 | |||||||
T-Mobile US, Inc. | (314 | ) | (38,666 | ) | 3.7 | |||||||
Toast, Inc., Class A | (1,998 | ) | (37,223 | ) | 3.6 | |||||||
Toro Co. | (1,511 | ) | (121,076 | ) | 11.7 | |||||||
Trade Desk, Inc., Class A | (779 | ) | (45,899 | ) | 4.4 | |||||||
TransUnion | (973 | ) | (85,157 | ) | 8.2 | |||||||
Trimble, Inc. | (386 | ) | (25,746 | ) | 2.5 | |||||||
Trupanion, Inc. | (2,586 | ) | (164,521 | ) | 15.9 | |||||||
Tyson Foods, Inc., Class A | (4,285 | ) | (399,191 | ) | 38.7 | |||||||
Uber Technologies, Inc. | (380 | ) | (11,962 | ) | 1.2 | |||||||
UGI Corp. | (1,839 | ) | (63,078 | ) | 6.1 | |||||||
Umpqua Holdings Corp. | (2,412 | ) | (39,894 | ) | 3.9 | |||||||
Under Armour, Inc., Class A | (6,003 | ) | (92,206 | ) | 8.9 | |||||||
Unity Software, Inc. | (5,814 | ) | (386,108 | ) | 37.4 | |||||||
Univar Solutions, Inc. | (5,002 | ) | (145,658 | ) | 14.1 | |||||||
Vail Resorts, Inc. | (1,372 | ) | (348,708 | ) | 33.8 | |||||||
Valley National Bancorp | (15,765 | ) | (188,865 | ) | 18.3 | |||||||
VeriSign, Inc. | (1,124 | ) | (200,848 | ) | 19.5 | |||||||
Verizon Communications, Inc. | (1,827 | ) | (84,590 | ) | 8.2 | |||||||
Vertex Pharmaceuticals, Inc. | (31 | ) | (8,470 | ) | 0.8 | |||||||
Vertiv Holdings Co. | (2,930 | ) | (36,713 | ) | 3.6 | |||||||
VICI Properties, Inc. | (9,333 | ) | (278,217 | ) | 27.0 | |||||||
Victoria’s Secret & Co. | (1,188 | ) | (55,979 | ) | 5.4 | |||||||
Vontier Corp. | (3,499 | ) | (89,644 | ) | 8.7 | |||||||
Vulcan Materials Co. | (166 | ) | (28,600 | ) | 2.8 | |||||||
W.R. Berkley Corp. | (1,246 | ) | (82,847 | ) | 8.0 | |||||||
Walgreens Boots Alliance, Inc. | (8,128 | ) | (344,627 | ) | 33.4 | |||||||
Warby Parker, Inc., Class A | (1,392 | ) | (32,420 | ) | 3.1 | |||||||
Waste Management, Inc. | (353 | ) | (58,047 | ) | 5.6 | |||||||
Wayfair, Inc., Class A | (949 | ) | (73,016 | ) | 7.1 | |||||||
Webster Financial Corp. | (4,329 | ) | (216,407 | ) | 21.0 | |||||||
WEC Energy Group, Inc. | (338 | ) | (33,817 | ) | 3.3 | |||||||
Western Digital Corp. | (1,418 | ) | (75,253 | ) | 7.3 | |||||||
WeWork, Inc., Class A | (36,968 | ) | (259,146 | ) | 25.1 | |||||||
Weyerhaeuser Co. | (24,159 | ) | (995,834 | ) | 96.5 | |||||||
Williams-Sonoma, Inc. | (1,412 | ) | (184,238 | ) | 17.8 | |||||||
WillScot Mobile Mini Holdings Corp. | (8,295 | ) | (291,154 | ) | 28.2 | |||||||
Wingstop, Inc. | (208 | ) | (19,086 | ) | 1.8 | |||||||
Xcel Energy, Inc. | (682 | ) | (49,963 | ) | 4.8 | |||||||
Yum! Brands, Inc. | (1,726 | ) | (201,959 | ) | 19.6 | |||||||
Zebra Technologies Corp., Class A | (35 | ) | (12,938 | ) | 1.3 | |||||||
Zillow Group, Inc., Class A | (6,007 | ) | (232,171 | ) | 22.5 | |||||||
Zillow Group, Inc., Class C | (2,120 | ) | (84,418 | ) | 8.2 | |||||||
SCHEDULE OF INVESTMENTS | 33 |
Schedule of Investments (continued) April 30, 2022 | BlackRock Global Long/Short Equity Fund |
| Security | Shares | Value | % of Basket Value | |||||||||
| United States (continued) | ||||||||||||
ZoomInfo Technologies, Inc., Class A | (1,282 | ) | $ | (60,767 | ) | 5.9 | % | |||||
Zurn Water Solutions Corp. | (1,063 | ) | (33,187 | ) | 3.2 | |||||||
|
|
|
| |||||||||
| (59,670,143 | ) | |||||||||||
Rights |
| |||||||||||
Sweden |
| |||||||||||
Axfood AB Right | (15,006 | ) | — | 0.0 | ||||||||
|
|
|
| |||||||||
Total Reference Entity — Short | (167,242,063 | ) | ||||||||||
|
| |||||||||||
Net Value of Reference Entity — Bank of America N.A. |
| $ | (1,032,216 | ) | ||||||||
|
| |||||||||||
The following table represents the individual long and short positions and related values of the equity securities underlying the total return swap with Bank of America N.A. as of period end, termination dates February 15, 2023 and June 15, 2023:
| Security | Shares | Value | % of Basket Value | |||||||||
Reference Entity — Long |
| |||||||||||
Common Stocks |
| |||||||||||
| Australia | ||||||||||||
Abacus Property Group | 41,628 | $ | 95,536 | (106.5 | )% | |||||||
ARB Corp. Ltd. | 262 | 7,262 | (8.1 | ) | ||||||||
Aussie Broadband Ltd. | 28,179 | 109,584 | (122.2 | ) | ||||||||
Australian Ethical Investment Ltd. | 56,549 | 229,776 | (256.2 | ) | ||||||||
Blackmores Ltd. | 265 | 13,419 | (15.0 | ) | ||||||||
BWP Trust | 10,482 | 30,467 | (34.0 | ) | ||||||||
Centuria Industrial REIT | 45,453 | 126,669 | (141.2 | ) | ||||||||
Charter Hall Education Trust | 84,129 | 238,155 | (265.6 | ) | ||||||||
Charter Hall Long Wale REIT | 53,317 | 200,102 | (223.1 | ) | ||||||||
Charter Hall Retail REIT | 49,207 | 153,711 | (171.4 | ) | ||||||||
Data#3 Ltd. | 3,095 | 12,569 | (14.0 | ) | ||||||||
Dexus Industria REIT | 30,829 | 73,755 | (82.2 | ) | ||||||||
Dicker Data Ltd. | 3,416 | 31,588 | (35.2 | ) | ||||||||
Elders Ltd. | 2,347 | 23,595 | (26.3 | ) | ||||||||
GrainCorp Ltd., Class A | 24,146 | 174,488 | (194.6 | ) | ||||||||
Growthpoint Properties Australia Ltd. | 17,004 | 52,301 | (58.3 | ) | ||||||||
GWA Group Ltd. | 73,529 | 117,448 | (131.0 | ) | ||||||||
HomeCo Daily Needs REIT | 107,749 | 108,485 | (121.0 | ) | ||||||||
Imdex Ltd. | 122,844 | 215,510 | (240.3 | ) | ||||||||
Imugene Ltd. | 41,660 | 6,234 | (7.0 | ) | ||||||||
Johns Lyng Group Ltd. | 68,471 | 428,546 | (477.8 | ) | ||||||||
Jumbo Interactive Ltd. | 8,330 | 101,275 | (112.9 | ) | ||||||||
Kogan.com Ltd. | 11,703 | 31,812 | (35.5 | ) | ||||||||
Lifestyle Communities Ltd. | 8,291 | 87,382 | (97.4 | ) | ||||||||
Lovisa Holdings Ltd. | 3,167 | 36,260 | (40.4 | ) | ||||||||
Monadelphous Group Ltd. | 13,570 | 101,086 | (112.7 | ) | ||||||||
Nanosonics Ltd. | 40,301 | 111,363 | (124.2 | ) | ||||||||
National Storage REIT | 27,382 | 49,596 | (55.3 | ) | ||||||||
Netwealth Group Ltd. | 3,625 | 32,823 | (36.6 | ) | ||||||||
Objective Corp. Ltd. | 8,957 | 106,781 | (119.1 | ) | ||||||||
Pendal Group Ltd. | 56,035 | 206,283 | (230.0 | ) | ||||||||
Pinnacle Investment Management Group Ltd. | 62,826 | 410,608 | (457.8 | ) | ||||||||
PolyNovo Ltd. | 18,783 | 12,297 | (13.7 | ) | ||||||||
Sandfire Resources NL | 7,377 | 29,238 | (32.6 | ) | ||||||||
Silver Lake Resources Ltd. | 14,274 | 18,646 | (20.8 | ) | ||||||||
St Barbara Ltd. | 248,632 | 232,413 | (259.2 | ) | ||||||||
Tassal Group Ltd. | 41,619 | 110,353 | (123.0 | ) | ||||||||
Technology One Ltd. | 5,617 | 40,534 | (45.2 | ) | ||||||||
| Security | Shares | Value | % of Basket Value | |||||||||
| Australia (continued) | ||||||||||||
United Malt Grp Ltd. | 12,401 | $ | 36,234 | (40.4 | )% | |||||||
Waypoint REIT | 78,446 | 147,877 | (164.9 | ) | ||||||||
Webjet Ltd. | 43,382 | 179,999 | (200.7 | ) | ||||||||
|
|
|
| |||||||||
| 4,532,060 | ||||||||||||
| Austria | ||||||||||||
AT&S Austria Technologie & Systemtechnik AG | 1,274 | 65,236 | (72.7 | ) | ||||||||
DO & Co. AG | 79 | 6,952 | (7.8 | ) | ||||||||
Oesterreichische Post AG | 7,272 | 234,257 | (261.2 | ) | ||||||||
Palfinger AG | 2,064 | 52,258 | (58.3 | ) | ||||||||
Porr AG | 976 | 12,361 | (13.8 | ) | ||||||||
Rhi Magnesita NV | 1,445 | 42,990 | (47.9 | ) | ||||||||
S&T AG | 9,106 | 153,948 | (171.7 | ) | ||||||||
Vienna Insurance Group AG Wiener Versicherung Gruppe | 1,041 | 25,822 | (28.8 | ) | ||||||||
Wienerberger AG | 5,072 | 143,172 | (159.6 | ) | ||||||||
|
|
|
| |||||||||
| 736,996 | ||||||||||||
| Bahamas | ||||||||||||
OneSpaWorld Holdings Ltd. | 8,027 | 80,591 | (89.9 | ) | ||||||||
|
|
|
| |||||||||
| Belgium | ||||||||||||
Barco NV | 1,280 | 28,825 | (32.1 | ) | ||||||||
Euronav NV | 810 | 9,366 | (10.5 | ) | ||||||||
Melexis NV | 981 | 84,204 | (93.9 | ) | ||||||||
Shurgard Self Storage SA | 3,625 | 209,766 | (233.9 | ) | ||||||||
Tessenderlo Group SA | 828 | 28,987 | (32.3 | ) | ||||||||
|
|
|
| |||||||||
| 361,148 | ||||||||||||
| Bermuda | ||||||||||||
Argo Group International Holdings Ltd. | 2,958 | 126,602 | (141.2 | ) | ||||||||
|
|
|
| |||||||||
| Canada | ||||||||||||
Aecon Group Inc. | 14,405 | 167,861 | (187.2 | ) | ||||||||
AirBoss of America Corp. | 264 | 6,395 | (7.1 | ) | ||||||||
Altius Minerals Corp. | 12,109 | 202,092 | (225.3 | ) | ||||||||
Boardwalk Real Estate Investment Trust | 3,577 | 156,958 | (175.0 | ) | ||||||||
Bombardier, Inc., Class B | 202,136 | 198,257 | (221.1 | ) | ||||||||
BSR Real Estate Investment Trust | 5,339 | 103,897 | (115.9 | ) | ||||||||
Canada Goose Holdings, Inc. | 11,859 | 258,477 | (288.2 | ) | ||||||||
Canadian Western Bank | 3,914 | 98,745 | (110.1 | ) | ||||||||
Chorus Aviation Inc. | 6,100 | 18,329 | (20.4 | ) | ||||||||
Cineplex Inc. | 9,094 | 93,159 | (103.9 | ) | ||||||||
CT Real Estate Investment Trust | 17,086 | 236,077 | (263.2 | ) | ||||||||
Eldorado Gold Corp. | 28,658 | 278,404 | (310.4 | ) | ||||||||
Enerflex Ltd. | 6,040 | 41,657 | (46.5 | ) | ||||||||
Equitable Group, Inc. | 5,167 | 231,875 | (258.5 | ) | ||||||||
Evertz Technologies Ltd. | 7,733 | 84,695 | (94.4 | ) | ||||||||
First National Financial Corp. | 579 | 16,370 | (18.3 | ) | ||||||||
Headwater Exploration, Inc. | 2,000 | 10,322 | (11.5 | ) | ||||||||
Kelt Exploration Ltd. | 26,312 | 135,795 | (151.4 | ) | ||||||||
Killam Apartment Real Estate Investment Trust | 19,864 | 312,499 | (348.4 | ) | ||||||||
Laurentian Bank of Canada | 1,147 | 34,884 | (38.9 | ) | ||||||||
Morguard North American Residential Real Estate Investment Trust | 437 | 6,276 | (7.0 | ) | ||||||||
NorthWest Healthcare Properties Real Estate Investment Trust | 47,133 | 486,134 | (542.1 | ) | ||||||||
Novagold Resources Inc. | 59,612 | 371,690 | (414.4 | ) | ||||||||
Osisko Mining Inc. | 5,046 | 15,908 | (17.7 | ) | ||||||||
Pason Systems Inc. | 6,893 | 86,977 | (97.0 | ) | ||||||||
PrairieSky Royalty Ltd. | 1,769 | 24,277 | (27.1 | ) | ||||||||
Premium Brands Holdings Corp. | 2,728 | 222,716 | (248.3 | ) | ||||||||
Richelieu Hardware Ltd. | 3,519 | 99,901 | (111.4 | ) | ||||||||
| 34 | 2 0 2 2 BLACK ROCK ANNUAL REPORT TO SHAREHOLDERS |
Schedule of Investments (continued) April 30, 2022 | BlackRock Global Long/Short Equity Fund |
| Security | Shares | Value | % of Basket Value | |||||||||
| Canada (continued) | ||||||||||||
Rogers Sugar Inc. | 11,278 | $ | 53,640 | (59.8 | )% | |||||||
Seabridge Gold Inc. | 9,612 | 169,921 | (189.5 | ) | ||||||||
Secure Energy Services Inc. | 1,489 | 7,638 | (8.5 | ) | ||||||||
Silvercorp Metals Inc. | 13,917 | 42,033 | (46.9 | ) | ||||||||
Slate Grocery REIT, Class U | 10,961 | 134,810 | (150.3 | ) | ||||||||
Spin Master Corp. | 227 | 8,165 | (9.1 | ) | ||||||||
SunOpta Inc. | 12,508 | 68,934 | (76.9 | ) | ||||||||
Tamarack Valley Energy Ltd. | 12,323 | 48,250 | (53.8 | ) | ||||||||
Topaz Energy Corp. | 22,860 | 405,008 | (451.6 | ) | ||||||||
Tucows, Inc., Class A | 208 | 11,985 | (13.4 | ) | ||||||||
|
|
|
| |||||||||
| 4,951,011 | ||||||||||||
| Denmark | ||||||||||||
Alk Abello A/S | 8,882 | 193,750 | (216.0 | ) | ||||||||
D/S Norden A/S | 853 | 31,694 | (35.3 | ) | ||||||||
Drilling Co. of 1972 AS | 135 | 6,778 | (7.6 | ) | ||||||||
FLSmidth & Co. A/S | 12,366 | 338,977 | (378.0 | ) | ||||||||
INVISIO AB | 310 | 5,518 | (6.1 | ) | ||||||||
Nilfisk Holding A/S | 3,277 | 91,736 | (102.3 | ) | ||||||||
NKT Holding A/S | 1,650 | 78,638 | (87.7 | ) | ||||||||
Per Aarsleff Holding A/S | 4,729 | 181,484 | (202.4 | ) | ||||||||
|
|
|
| |||||||||
| 928,575 | ||||||||||||
| Finland | ||||||||||||
Cargotec OYJ, Class B | 6,106 | 211,417 | (235.7 | ) | ||||||||
Citycon OYJ | 3,229 | 22,950 | (25.6 | ) | ||||||||
Konecranes Oyj | 3,089 | 86,813 | (96.8 | ) | ||||||||
Musti Group OYJ | 3,621 | 85,197 | (95.0 | ) | ||||||||
Rovio Entertainment OYJ | 5,605 | 51,270 | (57.2 | ) | ||||||||
Talenom OYJ | 344 | 3,774 | (4.2 | ) | ||||||||
TietoEVRY OYJ | 543 | 13,622 | (15.2 | ) | ||||||||
Uponor OYJ | 4,297 | 75,502 | (84.2 | ) | ||||||||
YIT OYJ | 78,126 | 314,466 | (350.6 | ) | ||||||||
|
|
|
| |||||||||
| 865,011 | ||||||||||||
| France | ||||||||||||
Albioma SA | 729 | 38,751 | (43.2 | ) | ||||||||
Alten SA | 304 | 40,799 | (45.5 | ) | ||||||||
Coface SA | 5,672 | 67,997 | (75.8 | ) | ||||||||
Elior Group SA | 19,192 | 58,600 | (65.3 | ) | ||||||||
Esker SA | 1,327 | 223,525 | (249.2 | ) | ||||||||
ID Logistics Group | 446 | 143,034 | (159.5 | ) | ||||||||
Imerys SA | 2,140 | 84,189 | (93.9 | ) | ||||||||
Interparfums SA | 263 | 14,593 | (16.3 | ) | ||||||||
Korian SA | 5,023 | 105,488 | (117.6 | ) | ||||||||
Nexity SA | 5,088 | 154,503 | (172.3 | ) | ||||||||
SES-imagotag SA | 180 | 16,558 | (18.5 | ) | ||||||||
SMCP SA | 19,234 | 124,981 | (139.4 | ) | ||||||||
Societe BIC SA | 3,160 | 188,554 | (210.2 | ) | ||||||||
Technip Energies N.V | 1,745 | 21,205 | (23.7 | ) | ||||||||
Television Francaise 1 | 2,299 | 19,471 | (21.7 | ) | ||||||||
Vicat SA | 7,114 | 213,925 | (238.5 | ) | ||||||||
Vilmorin & Cie SA | 77 | 3,659 | (4.1 | ) | ||||||||
Virbac SA | 116 | 46,835 | (52.2 | ) | ||||||||
|
|
|
| |||||||||
| 1,566,667 | ||||||||||||
| Germany | ||||||||||||
Adesso SE | 908 | 177,966 | (198.4 | ) | ||||||||
Atoss Software AG | 301 | 43,737 | (48.8 | ) | ||||||||
CANCOM SE | 2,387 | 115,262 | (128.5 | ) | ||||||||
Datagroup SE | 179 | 14,892 | (16.6 | ) | ||||||||
Dermapharm Holding SE | 407 | 23,012 | (25.7 | ) | ||||||||
| Security | Shares | Value | % of Basket Value | |||||||||
| Germany (continued) | ||||||||||||
Deutsche Pfandbriefbank AG | 736 | $ | 9,263 | (10.3 | )% | |||||||
Duerr AG | 2,127 | 55,280 | (61.6 | ) | ||||||||
Eckert & Ziegler Strahlen- und Medizintechnik AG | 1,651 | 82,849 | (92.4 | ) | ||||||||
ElringKlinger AG | 11,713 | 97,104 | (108.3 | ) | ||||||||
GFT Technologies SE | 2,985 | 118,566 | (132.2 | ) | ||||||||
Hensoldt AG | 8,395 | 233,792 | (260.7 | ) | ||||||||
Kloeckner & Co. SE | 2,961 | 38,143 | (42.5 | ) | ||||||||
Krones AG | 1,842 | 142,227 | (158.6 | ) | ||||||||
Nagarro SE | 606 | 85,205 | (95.0 | ) | ||||||||
Norma Group SE | 1,878 | 46,330 | (51.7 | ) | ||||||||
Pfeiffer Vacuum Technology AG | 308 | 54,829 | (61.1 | ) | ||||||||
SMA Solar Technology AG | 1,212 | 55,157 | (61.5 | ) | ||||||||
Software AG | 2,565 | 78,950 | (88.0 | ) | ||||||||
Steico SE | 818 | 82,075 | (91.5 | ) | ||||||||
Suedzucker AG | 3,117 | 40,595 | (45.3 | ) | ||||||||
|
|
|
| |||||||||
| 1,595,234 | ||||||||||||
| Hong Kong | ||||||||||||
Cowell e Holdings, Inc. | 5,000 | 5,597 | (6.3 | ) | ||||||||
EC Healthcare | 89,000 | 89,450 | (99.7 | ) | ||||||||
Health & Happiness H&H International Holdings Ltd. | 153,000 | 168,158 | (187.5 | ) | ||||||||
Luk Fook Holdings International Ltd. | 16,000 | 36,623 | (40.8 | ) | ||||||||
Nissin Foods Co. Ltd. | 115,000 | 75,606 | (84.3 | ) | ||||||||
SA Sa International Holdings Ltd. | 604,000 | 107,960 | (120.4 | ) | ||||||||
|
|
|
| |||||||||
| 483,394 | ||||||||||||
| Ireland | ||||||||||||
Cimpress PLC | 627 | 31,670 | (35.3 | ) | ||||||||
Dalata Hotel Group PLC | 1,409 | 6,466 | (7.2 | ) | ||||||||
Grafton Group PLC | 5,813 | 70,403 | (78.5 | ) | ||||||||
Keywords Studios PLC | 6,295 | 190,292 | (212.2 | ) | ||||||||
Origin Enterprises PLC | 2,166 | 9,630 | (10.7 | ) | ||||||||
Prothena Corp. PLC | 226 | 6,590 | (7.4 | ) | ||||||||
Uniphar PLC | 21,403 | 88,510 | (98.7 | ) | ||||||||
|
|
|
| |||||||||
| 403,561 | ||||||||||||
| Israel | ||||||||||||
Caesarstone Ltd. | 714 | 7,018 | (7.8 | ) | ||||||||
Cognyte Software Ltd. | 3,192 | 21,642 | (24.1 | ) | ||||||||
Israel Canada T.R Ltd. | 5,603 | 27,703 | (30.9 | ) | ||||||||
Isras Investment Co. Ltd. | 222 | 54,110 | (60.3 | ) | ||||||||
Mega Or Holdings Ltd. | 216 | 8,225 | (9.2 | ) | ||||||||
Radware Ltd. | 4,915 | 142,093 | (158.4 | ) | ||||||||
Reit 1 Ltd. | 3,401 | 22,063 | (24.6 | ) | ||||||||
Retailors Ltd. | 283 | 6,876 | (7.7 | ) | ||||||||
Taboola.com Ltd. | 16,559 | 71,369 | (79.6 | ) | ||||||||
YH Dimri Construction & Development Ltd. | 93 | 8,351 | (9.3 | ) | ||||||||
|
|
|
| |||||||||
| 369,450 | ||||||||||||
| Italy | ||||||||||||
Biesse SpA | 2,248 | 35,071 | (39.1 | ) | ||||||||
Brunello Cucinelli SpA | 708 | 36,238 | (40.4 | ) | ||||||||
Datalogic SpA | 5,488 | 53,325 | (59.5 | ) | ||||||||
El.En. SpA | 1,217 | 16,962 | (18.9 | ) | ||||||||
OVS SpA | 48,506 | 92,543 | (103.2 | ) | ||||||||
Pharmanutra SpA | 719 | 48,679 | (54.3 | ) | ||||||||
Saipem SpA | 18,340 | 20,756 | (23.1 | ) | ||||||||
Sanlorenzo SpA/Ameglia | 1,302 | 46,040 | (51.3 | ) | ||||||||
Seco SpA | 1,018 | 6,244 | (7.0 | ) | ||||||||
Tinexta SpA | 5,194 | 129,940 | (144.9 | ) | ||||||||
SCHEDULE OF INVESTMENTS | 35 |
Schedule of Investments (continued) April 30, 2022 | BlackRock Global Long/Short Equity Fund |
| Security | Shares | Value | % of Basket Value | |||||||||
| Italy (continued) | ||||||||||||
Webuild SpA | 159,355 | $ | 270,931 | (302.1 | )% | |||||||
Wiit SpA | 2,655 | 70,928 | (79.1 | ) | ||||||||
|
|
|
| |||||||||
| 827,657 | ||||||||||||
| Ivory Coast | ||||||||||||
Fabrinet | 221 | 21,700 | (24.2 | ) | ||||||||
|
|
|
| |||||||||
| Japan | ||||||||||||
77 Bank Ltd. | 15,200 | 188,473 | (210.2 | ) | ||||||||
Adastria Co. Ltd. | 2,900 | 48,062 | (53.6 | ) | ||||||||
Aeon Delight Co. Ltd. | 2,600 | 55,572 | (62.0 | ) | ||||||||
Ai Holdings Corp. | 13,800 | 181,170 | (202.0 | ) | ||||||||
Aichi Steel Corp. | 12,800 | 221,549 | (247.0 | ) | ||||||||
Anicom Holdings, Inc. | 37,100 | 175,005 | (195.1 | ) | ||||||||
AOKI Holdings Inc. | 21,800 | 102,604 | (114.4 | ) | ||||||||
Arata Corp. | 1,100 | 30,393 | (33.9 | ) | ||||||||
Arcland Service Holdings Co. Ltd. | 8,400 | 145,162 | (161.9 | ) | ||||||||
Arcs Co. Ltd. | 500 | 7,916 | (8.8 | ) | ||||||||
ARTERIA Networks Corp. | 6,600 | 67,602 | (75.4 | ) | ||||||||
Avex, Inc. | 19,300 | 207,470 | (231.3 | ) | ||||||||
Belc Co. Ltd. | 500 | 21,294 | (23.7 | ) | ||||||||
Bell System24 Holdings, Inc. | 17,300 | 200,067 | (223.1 | ) | ||||||||
Belluna Co. Ltd. | 9,000 | 50,554 | (56.4 | ) | ||||||||
Bengo4.com Inc. | 4,300 | 110,653 | (123.4 | ) | ||||||||
Canon Electronics Inc. | 17,800 | 203,839 | (227.3 | ) | ||||||||
CI Takiron Corp. | 3,700 | 15,765 | (17.6 | ) | ||||||||
Comture Corp. | 17,300 | 373,669 | (416.7 | ) | ||||||||
CRE Logistics REIT Inc. | 8 | 12,234 | (13.6 | ) | ||||||||
Cybozu, Inc. | 7,200 | 71,152 | (79.3 | ) | ||||||||
Daiho Corp. | 1,800 | 61,620 | (68.7 | ) | ||||||||
Daiken Corp. | 8,800 | 142,277 | (158.6 | ) | ||||||||
Daiseki Co. Ltd. | 10,200 | 366,855 | (409.1 | ) | ||||||||
Dexerials Corp. | 2,500 | 54,818 | (61.1 | ) | ||||||||
Digital Arts, Inc. | 1,300 | 72,631 | (81.0 | ) | ||||||||
Dip Corp. | 1,200 | 39,123 | (43.6 | ) | ||||||||
Direct Marketing MiX, Inc. | 13,700 | 168,169 | (187.5 | ) | ||||||||
Doshisha Co. Ltd. | 17,200 | 202,603 | (225.9 | ) | ||||||||
Doutor Nichires Holdings Co. Ltd. | 39,200 | 450,529 | (502.4 | ) | ||||||||
Earth Corp. | 200 | 8,452 | (9.4 | ) | ||||||||
EDION Corp. | 2,300 | 20,698 | (23.1 | ) | ||||||||
Elan Corp. | 28,000 | 218,636 | (243.8 | ) | ||||||||
Elecom Co. Ltd. | 800 | 9,593 | (10.7 | ) | ||||||||
en-japan, Inc. | 13,900 | 326,593 | (364.2 | ) | ||||||||
euglena Co. Ltd. | 3,000 | 19,849 | (22.1 | ) | ||||||||
FCC Co. Ltd. | 35,000 | 349,611 | (389.8 | ) | ||||||||
Fuji Machine Manufacturing Co. Ltd. | 1,900 | 31,701 | (35.4 | ) | ||||||||
Fuji Seal International, Inc. | 15,900 | 211,168 | (235.5 | ) | ||||||||
Fujimi, Inc. | 8,100 | 353,156 | (393.8 | ) | ||||||||
Fukui Computer Holdings Inc. | 2,700 | 67,395 | (75.2 | ) | ||||||||
Fukuoka REIT Corp. | 28 | 35,019 | (39.0 | ) | ||||||||
FULLCAST Holdings Co. Ltd. | 5,200 | 99,492 | (110.9 | ) | ||||||||
Funai Soken Holdings Inc. | 19,000 | 318,634 | (355.3 | ) | ||||||||
Fuso Chemical Co. Ltd. | 5,300 | 155,998 | (173.9 | ) | ||||||||
Giken Ltd. | 6,500 | 178,362 | (198.9 | ) | ||||||||
GMO GlobalSign Holdings KK | 400 | 16,863 | (18.8 | ) | ||||||||
Gunma Bank Ltd. | 4,800 | 13,798 | (15.4 | ) | ||||||||
Halows Co. Ltd. | 3,700 | 88,426 | (98.6 | ) | ||||||||
Hanwa Co. Ltd. | 400 | 9,777 | (10.9 | ) | ||||||||
Hazama Ando Corp. | 1,300 | 9,032 | (10.1 | ) | ||||||||
Heiwa Real Estate Co. Ltd. | 300 | 9,464 | (10.6 | ) | ||||||||
Heiwado Co. Ltd. | 5,900 | 89,008 | (99.2 | ) | ||||||||
| Security | Shares | Value | % of Basket Value | |||||||||
| Japan (continued) | ||||||||||||
Hoshino Resorts REIT, Inc. | 8 | $ | 41,269 | (46.0 | )% | |||||||
IBJ Leasing Co. Ltd. | 11,500 | 266,578 | (297.2 | ) | ||||||||
Infocom Corp. | 13,700 | 233,526 | (260.4 | ) | ||||||||
Infomart Corp. | 20,200 | 100,603 | (112.2 | ) | ||||||||
Iriso Electronics Co. Ltd. | 6,100 | 142,539 | (158.9 | ) | ||||||||
Jafco Co. Ltd. | 13,800 | 166,375 | (185.5 | ) | ||||||||
Japan Elevator Service Holdings Co. Ltd. | 15,600 | 203,874 | (227.3 | ) | ||||||||
Japan Lifeline Co. Ltd. | 55,200 | 460,109 | (513.0 | ) | ||||||||
Japan Wool Textile Co. Ltd. | 6,800 | 50,828 | (56.7 | ) | ||||||||
JCU Corp. | 1,400 | 35,658 | (39.8 | ) | ||||||||
JINS Inc. | 1,600 | 52,733 | (58.8 | ) | ||||||||
JSP Corp. | 4,400 | 50,852 | (56.7 | ) | ||||||||
Kanamoto Co. Ltd. | 26,000 | 388,528 | (433.2 | ) | ||||||||
Kanematsu Corp. | 3,100 | 32,039 | (35.7 | ) | ||||||||
KH Neochem Co. Ltd. | 2,000 | 37,834 | (42.2 | ) | ||||||||
KOMEDA Holdings Co. Ltd. | 23,600 | 406,556 | (453.3 | ) | ||||||||
Konoike Transport Co. Ltd. | 24,700 | 219,238 | (244.5 | ) | ||||||||
Kumagai Gumi Co. Ltd. | 600 | 12,521 | (14.0 | ) | ||||||||
Kura Sushi, Inc. | 7,900 | 195,632 | (218.1 | ) | ||||||||
Kyokuto Kaihatsu Kogyo Co. Ltd. | 15,800 | 159,293 | (177.6 | ) | ||||||||
Kyoritsu Maintenance Co. Ltd. | 3,100 | 112,887 | (125.9 | ) | ||||||||
Life Corp. | 2,700 | 61,592 | (68.7 | ) | ||||||||
LITALICO, Inc. | 7,900 | 162,969 | (181.7 | ) | ||||||||
M&A Capital Partners Co. Ltd. | 1,600 | 49,697 | (55.4 | ) | ||||||||
Maeda Kosen Co. Ltd. | 16,200 | 370,386 | (413.0 | ) | ||||||||
Makino Milling Machine Co. Ltd. | 1,500 | 46,220 | (51.5 | ) | ||||||||
Mandom Corp. | 9,000 | 89,485 | (99.8 | ) | ||||||||
Maruzen Showa Unyu Co. Ltd. | 2,200 | 53,701 | (59.9 | ) | ||||||||
Matsuda Sangyo Co. Ltd. | 400 | 7,024 | (7.8 | ) | ||||||||
Megachips Corp. | 2,200 | 56,362 | (62.8 | ) | ||||||||
Megmilk Snow Brand Co. Ltd. | 3,900 | 58,133 | (64.8 | ) | ||||||||
Micronics Japan Co. Ltd. | 5,900 | 69,049 | (77.0 | ) | ||||||||
Midac Holdings Co. Ltd. | 7,200 | 116,088 | (129.4 | ) | ||||||||
Milbon Co. Ltd. | 9,100 | 381,025 | (424.9 | ) | ||||||||
Mirai Corp. | 46 | 17,868 | (19.9 | ) | ||||||||
Mirait Holdings Corp. | 500 | 7,007 | (7.8 | ) | ||||||||
Mitsubishi Pencil Co. Ltd. | 9,500 | 92,226 | (102.8 | ) | ||||||||
Mitsubishi Research Institute, Inc. | 600 | 18,064 | (20.1 | ) | ||||||||
Mixi, Inc. | 1,000 | 17,202 | (19.2 | ) | ||||||||
Monogatari Corp. | 4,200 | 175,140 | (195.3 | ) | ||||||||
Morita Holdings Corp. | 13,300 | 127,647 | (142.3 | ) | ||||||||
Nakanishi, Inc. | 13,400 | 219,023 | (244.2 | ) | ||||||||
Nextage Co. Ltd. | 9,200 | 140,608 | (156.8 | ) | ||||||||
Nichiha Corp. | 3,300 | 59,663 | (66.5 | ) | ||||||||
Nihon Parkerizing Co. Ltd. | 5,600 | 39,610 | (44.2 | ) | ||||||||
Nippn Corp. | 20,600 | 267,934 | (298.8 | ) | ||||||||
Nippon Ceramic Co. Ltd. | 900 | 16,431 | (18.3 | ) | ||||||||
Nippon Paper Industries Co. Ltd. | 10,500 | 83,400 | (93.0 | ) | ||||||||
Nippon REIT Investment Corp. | 38 | 108,923 | (121.5 | ) | ||||||||
Nippon Soda Co. Ltd. | 1,200 | 31,736 | (35.4 | ) | ||||||||
Nissan Shatai Co. Ltd. | 36,700 | 160,054 | (178.5 | ) | ||||||||
Nittetsu Mining Co. Ltd. | 200 | 9,955 | (11.1 | ) | ||||||||
Nitto Kogyo Corp. | 20,400 | 240,194 | (267.8 | ) | ||||||||
Noritsu Koki Co. Ltd. | 2,700 | 44,773 | (49.9 | ) | ||||||||
NS United Kaiun Kaisha Ltd. | 1,900 | 52,217 | (58.2 | ) | ||||||||
Obara Group Inc. | 10,900 | 243,941 | (272.0 | ) | ||||||||
Oki Electric Industry Co. Ltd. | 95,100 | 616,036 | (686.9 | ) | ||||||||
Okinawa Cellular Telephone Co. | 3,300 | 126,988 | (141.6 | ) | ||||||||
Okumura Corp. | 1,300 | 30,689 | (34.2 | ) | ||||||||
One REIT Inc. | 9 | 19,105 | (21.3 | ) | ||||||||
Osaka Organic Chemical Industry Ltd. | 10,900 | 235,052 | (262.1 | ) | ||||||||
| 36 | 2 0 2 2 BLACK ROCK ANNUAL REPORT TO SHAREHOLDERS |
Schedule of Investments (continued) April 30, 2022 | BlackRock Global Long/Short Equity Fund |
| Security | Shares | Value | % of Basket Value | |||||||||
| Japan (continued) | ||||||||||||
Outsourcing Inc. | 19,700 | $ | 195,375 | (217.9 | )% | |||||||
Pack Corp. | 3,800 | 69,548 | (77.6 | ) | ||||||||
Prestige International Inc. | 24,100 | 115,813 | (129.1 | ) | ||||||||
Raksul Inc. | 4,600 | 95,049 | (106.0 | ) | ||||||||
Round One Corp. | 600 | 6,678 | (7.4 | ) | ||||||||
Saizeriya Co. Ltd. | 3,400 | 62,355 | (69.5 | ) | ||||||||
Sakai Moving Service Co. Ltd. | 5,700 | 194,505 | (216.9 | ) | ||||||||
SAMTY Co. Ltd. | 18,200 | 293,953 | (327.8 | ) | ||||||||
Sanken Electric Co. Ltd. | 2,800 | 103,408 | (115.3 | ) | ||||||||
Sanrio Co. Ltd. | 300 | 6,293 | (7.0 | ) | ||||||||
Sato Holdings Corp. | 16,600 | 228,252 | (254.5 | ) | ||||||||
Seria Co. Ltd. | 2,000 | 39,112 | (43.6 | ) | ||||||||
Shizuoka Gas Co. Ltd. | 4,700 | 33,690 | (37.6 | ) | ||||||||
Shoei Co. Ltd. | 8,800 | 326,474 | (364.0 | ) | ||||||||
Siix Corp. | 14,400 | 109,999 | (122.7 | ) | ||||||||
SKY Perfect JSAT Holdings Inc. | 2,900 | 9,394 | (10.5 | ) | ||||||||
Sodick Co. Ltd. | 17,400 | 97,360 | (108.6 | ) | ||||||||
Sosei Group Corp. | 700 | 6,836 | (7.6 | ) | ||||||||
S-Pool Inc. | 69,300 | 692,489 | (772.1 | ) | ||||||||
Strike Co. Ltd. | 15,100 | 459,834 | (512.7 | ) | ||||||||
Sumitomo Mitsui Construction Co. Ltd. | 79,900 | 259,239 | (289.1 | ) | ||||||||
Sumitomo Osaka Cement Co. Ltd. | 2,100 | 58,721 | (65.5 | ) | ||||||||
Systena Corp. | 50,700 | 159,363 | (177.7 | ) | ||||||||
Taikisha Ltd. | 4,700 | 115,975 | (129.3 | ) | ||||||||
Takamatsu Construction Group Co. Ltd. | 15,800 | 263,162 | (293.4 | ) | ||||||||
Takara Leben Real Estate Investment Corp. | 18 | 16,776 | (18.7 | ) | ||||||||
Takuma Co. Ltd. | 18,700 | 209,568 | (233.7 | ) | ||||||||
T-Gaia Corp. | 1,200 | 15,210 | (17.0 | ) | ||||||||
Toa Corp/Tokyo | 7,200 | 157,382 | (175.5 | ) | ||||||||
Tokai Corp/Gifu | 1,200 | 15,900 | (17.7 | ) | ||||||||
Token Corp. | 200 | 13,313 | (14.8 | ) | ||||||||
Tokuyama Corp. | 1,200 | 15,960 | (17.8 | ) | ||||||||
Tokyotokeiba Co. Ltd. | 3,200 | 108,891 | (121.4 | ) | ||||||||
Tokyu REIT, Inc. | 45 | 63,083 | (70.3 | ) | ||||||||
Toridoll Holdings Corp. | 300 | 5,441 | (6.1 | ) | ||||||||
Tosei Corp. | 14,800 | 124,533 | (138.9 | ) | ||||||||
Totetsu Kogyo Co. Ltd. | 4,900 | 88,576 | (98.8 | ) | ||||||||
Toyo Gosei Co. Ltd. | 1,100 | 80,909 | (90.2 | ) | ||||||||
Toyo Ink SC Holdings Co. Ltd. | 3,100 | 46,160 | (51.5 | ) | ||||||||
Toyobo Co. Ltd. | 10,400 | 85,505 | (95.3 | ) | ||||||||
TPR Co. Ltd. | 21,400 | 205,101 | (228.7 | ) | ||||||||
Tri Chemical Laboratories Inc. | 5,700 | 107,053 | (119.4 | ) | ||||||||
Trusco Nakayama Corp. | 13,500 | 210,525 | (234.7 | ) | ||||||||
Trust Tech Inc. | 6,700 | 77,155 | (86.0 | ) | ||||||||
Tsukishima Kikai Co. Ltd. | 1,400 | 11,058 | (12.3 | ) | ||||||||
TV Asahi Holdings Corp. | 2,200 | 25,129 | (28.0 | ) | ||||||||
UACJ Corp. | 6,600 | 110,418 | (123.1 | ) | ||||||||
United Arrows Ltd. | 2,300 | 30,921 | (34.5 | ) | ||||||||
UT Group Co. Ltd. | 1,500 | 33,729 | (37.6 | ) | ||||||||
ValueCommerce Co. Ltd. | 7,800 | 227,928 | (254.1 | ) | ||||||||
Wacom Co. Ltd. | 19,400 | 140,265 | (156.4 | ) | ||||||||
Wakita & Co. Ltd. | 12,000 | 99,852 | (111.3 | ) | ||||||||
YA-MAN Ltd. | 14,000 | 133,439 | (148.8 | ) | ||||||||
Yokogawa Bridge Holdings Corp. | 16,900 | 247,847 | (276.4 | ) | ||||||||
Yuasa Trading Co. Ltd. | 7,400 | 165,105 | (184.1 | ) | ||||||||
Yurtec Corp. | 9,800 | 51,763 | (57.7 | ) | ||||||||
Zojirushi Corp. | 7,400 | 78,252 | (87.3 | ) | ||||||||
Zuken, Inc. | 12,300 | 284,788 | (317.5 | ) | ||||||||
|
|
|
| |||||||||
| 22,072,656 | ||||||||||||
| Security | Shares | Value | % of Basket Value | |||||||||
| Jersey | ||||||||||||
Centamin PLC | 137,564 | $ | 157,665 | (175.8 | )% | |||||||
|
|
|
| |||||||||
| Luxembourg | ||||||||||||
Befesa SA | 978 | 61,077 | (68.1 | ) | ||||||||
Millicom International Cellular SA, SDR | 18,966 | 427,584 | (476.8 | ) | ||||||||
|
|
|
| |||||||||
| 488,661 | ||||||||||||
| Malaysia | ||||||||||||
Frencken Group Ltd. | 35,400 | 35,911 | (40.0 | ) | ||||||||
|
|
|
| |||||||||
| Netherlands | ||||||||||||
AMG Advanced Metallurgical Group NV | 1,729 | 67,607 | (75.4 | ) | ||||||||
Arcadis NV | 2,820 | 117,661 | (131.2 | ) | ||||||||
Basic-Fit NV | 5,620 | 235,462 | (262.5 | ) | ||||||||
Koninklijke BAM Groep NV | 2,392 | 6,621 | (7.4 | ) | ||||||||
Wereldhave NV | 5,628 | 91,794 | (102.4 | ) | ||||||||
|
|
|
| |||||||||
| 519,145 | ||||||||||||
| New Zealand | ||||||||||||
a2 Milk Co. Ltd. | 38,807 | 122,967 | (137.1 | ) | ||||||||
Summerset Group Holdings Ltd. | 19,685 | 148,267 | (165.3 | ) | ||||||||
|
|
|
| |||||||||
| 271,234 | ||||||||||||
| Norway | ||||||||||||
Borregaard ASA | 14,220 | 271,245 | (302.4 | ) | ||||||||
Elkem ASA | 32,494 | 134,945 | (150.5 | ) | ||||||||
FLEX Liquified Natural Gas Ltd. | 332 | 9,352 | (10.4 | ) | ||||||||
Frontline Ltd. | 941 | 7,793 | (8.7 | ) | ||||||||
Kongsberg Gruppen ASA | 9,351 | 401,650 | (447.9 | ) | ||||||||
MPC Container Ships | 27,253 | 81,118 | (90.4 | ) | ||||||||
Selvaag Bolig ASA | 13,392 | 63,752 | (71.1 | ) | ||||||||
|
|
|
| |||||||||
| 969,855 | ||||||||||||
| Portugal | ||||||||||||
Altri SGPS SA | 1,387 | 9,205 | (10.3 | ) | ||||||||
Navigator Co. SA | 69,437 | 284,846 | (317.6 | ) | ||||||||
|
|
|
| |||||||||
| 294,051 | ||||||||||||
| Singapore | ||||||||||||
AIMS APAC REIT | 92,400 | 94,486 | (105.3 | ) | ||||||||
Ascendas India Trust | 53,100 | 47,976 | (53.5 | ) | ||||||||
Far East Hospitality Trust | 131,800 | 63,490 | (70.8 | ) | ||||||||
First Resources Ltd. | 12,100 | 18,455 | (20.6 | ) | ||||||||
Sasseur Real Estate Investment Trust | 178,400 | 107,715 | (120.1 | ) | ||||||||
Sheng Siong Group Ltd. | 62,800 | 69,343 | (77.3 | ) | ||||||||
|
|
|
| |||||||||
| 401,465 | ||||||||||||
| South Sandwich Islands | ||||||||||||
UK Commercial Property REIT Ltd. | 51,794 | 57,066 | (63.6 | ) | ||||||||
|
|
|
| |||||||||
| Spain | ||||||||||||
Ence Energia y Celulosa SA | 55,002 | 206,036 | (229.7 | ) | ||||||||
Indra Sistemas SA | 23,884 | 243,392 | (271.4 | ) | ||||||||
Laboratorios Farmaceuticos Rovi SA | 951 | 64,935 | (72.4 | ) | ||||||||
Melia Hotels International SA | 37,982 | 314,123 | (350.3 | ) | ||||||||
Sacyr SA | 15,433 | 41,571 | (46.3 | ) | ||||||||
Unicaja Banco SA | 12,033 | 11,335 | (12.6 | ) | ||||||||
Viscofan SA | 1,439 | 79,439 | (88.6 | ) | ||||||||
|
|
|
| |||||||||
| 960,831 | ||||||||||||
| Sweden | ||||||||||||
AAK AB | 13,057 | 226,549 | (252.6 | ) | ||||||||
AcadeMedia AB | 12,815 | 72,342 | (80.7 | ) | ||||||||
AddTech AB, B Shares | 32,788 | 578,393 | (644.9 | ) | ||||||||
AF AB | 4,116 | 68,234 | (76.1 | ) | ||||||||
SCHEDULE OF INVESTMENTS | 37 |
Schedule of Investments (continued) April 30, 2022 | BlackRock Global Long/Short Equity Fund |
| Security | Shares | Value | % of Basket Value | |||||||||
| Sweden (continued) | ||||||||||||
Arjo AB, B Shares | 31,333 | $ | 236,127 | (263.3 | )% | |||||||
Betsson AB, Class B | 15,477 | 95,074 | (106.0 | ) | ||||||||
Biotage AB | 15,471 | 320,482 | (357.3 | ) | ||||||||
Bonava AB, B Shares | 9,732 | 47,244 | (52.7 | ) | ||||||||
Bufab AB | 2,152 | 71,393 | (79.6 | ) | ||||||||
Catena AB | 200 | 10,459 | (11.7 | ) | ||||||||
Cloetta AB, B Shares | 78,181 | 197,566 | (220.3 | ) | ||||||||
Coor Service Management Holding AB | 733 | 6,646 | (7.4 | ) | ||||||||
Corem Property Group AB, Class B | 2,374 | 5,026 | (5.6 | ) | ||||||||
Dios Fastigheter AB | 6,132 | 54,752 | (61.1 | ) | ||||||||
Dometic Group AB | 4,371 | 37,434 | (41.7 | ) | ||||||||
Fabege AB | 9,847 | 119,524 | (133.3 | ) | ||||||||
Fingerprint Cards AB, Class B | 57,382 | 66,090 | (73.7 | ) | ||||||||
GARO AB | 1,619 | 24,231 | (27.0 | ) | ||||||||
Hexatronic Group AB | 3,615 | 152,944 | (170.5 | ) | ||||||||
HMS Networks AB | 2,058 | 84,234 | (93.9 | ) | ||||||||
Hufvudstaden AB, A Shares | 526 | 6,815 | (7.6 | ) | ||||||||
JM AB | 2,866 | 66,191 | (73.8 | ) | ||||||||
Loomis AB | 2,957 | 73,676 | (82.2 | ) | ||||||||
Nyfosa AB | 6,168 | 67,981 | (75.8 | ) | ||||||||
SAS AB | 74,585 | 7,732 | (8.6 | ) | ||||||||
Scandic Hotels Group AB | 7,354 | 28,302 | (31.6 | ) | ||||||||
Stillfront Group AB | 16,184 | 32,685 | (36.4 | ) | ||||||||
Troax Group AB | 1,025 | 22,765 | (25.4 | ) | ||||||||
|
|
|
| |||||||||
| 2,780,891 | ||||||||||||
| Switzerland | ||||||||||||
Bossard Holding AG, Class A | 679 | 146,991 | (163.9 | ) | ||||||||
Comet Holding AG | 616 | 133,163 | (148.5 | ) | ||||||||
Ferrexpo PLC | 3,398 | 6,978 | (7.8 | ) | ||||||||
Gurit Holding AG | 140 | 178,475 | (199.0 | ) | ||||||||
Inficon Holding AG | 68 | 61,912 | (69.0 | ) | ||||||||
IWG PLC | 7,630 | 23,164 | (25.8 | ) | ||||||||
Kardex AG | 293 | 55,761 | (62.2 | ) | ||||||||
Landis+Gyr Group AG | 631 | 35,216 | (39.3 | ) | ||||||||
Medartis Holding AG | 720 | 76,237 | (85.0 | ) | ||||||||
Softwareone Holding AG | 2,092 | 28,285 | (31.5 | ) | ||||||||
Stadler Rail AG | 410 | 14,963 | (16.7 | ) | ||||||||
Sulzer AG | 1,306 | 97,855 | (109.1 | ) | ||||||||
u-Blox Holding AG | 3,466 | 287,943 | (321.1 | ) | ||||||||
Valiant Holding AG | 547 | 54,639 | (60.9 | ) | ||||||||
Ypsomed Holding AG | 1,133 | 161,911 | (180.5 | ) | ||||||||
|
|
|
| |||||||||
| 1,363,493 | ||||||||||||
| United Kingdom | ||||||||||||
AG Barr PLC | 4,653 | 33,847 | (37.7 | ) | ||||||||
AJ Bell PLC | 2,035 | 6,306 | (7.0 | ) | ||||||||
Alpha Fx Group PLC | 392 | 10,154 | (11.3 | ) | ||||||||
Ascential PLC | 39,902 | 158,201 | (176.4 | ) | ||||||||
Ashmore Group PLC | 5,938 | 16,415 | (18.3 | ) | ||||||||
Aston Martin Lagonda Global Holdings PLC | 9,054 | 94,859 | (105.8 | ) | ||||||||
Babcock International Group PLC | 17,047 | 65,085 | (72.6 | ) | ||||||||
Bank of Georgia Group PLC | 21,404 | 330,510 | (368.5 | ) | ||||||||
Big Yellow Group PLC | 25,305 | 457,311 | (509.9 | ) | ||||||||
Bodycote PLC | 5,444 | 42,223 | (47.1 | ) | ||||||||
boohoo Group PLC | 18,638 | 18,869 | (21.0 | ) | ||||||||
Britvic PLC | 11,799 | 127,150 | (141.8 | ) | ||||||||
Bytes Technology Group PLC | 27,969 | 157,279 | (175.4 | ) | ||||||||
Capital & Counties Properties PLC | 15,290 | 31,592 | (35.2 | ) | ||||||||
Capricorn Energy PLC | 59,952 | 154,199 | (171.9 | ) | ||||||||
Chemring Group PLC | 1,713 | 7,481 | (8.3 | ) | ||||||||
| Security | Shares | Value | % of Basket Value | |||||||||
| United Kingdom (continued) | ||||||||||||
Craneware PLC | 6,871 | $ | 147,959 | (165.0 | )% | |||||||
Cranswick PLC | 1,023 | 40,679 | (45.4 | ) | ||||||||
Currys PLC | 81,010 | 93,926 | (104.7 | ) | ||||||||
Diploma PLC | 14,673 | 503,266 | (561.2 | ) | ||||||||
dotdigital group PLC | 76,216 | 83,091 | (92.6 | ) | ||||||||
Euromoney Institutional Investor PLC | 513 | 6,326 | (7.1 | ) | ||||||||
GB Group PLC | 21,753 | 157,644 | (175.8 | ) | ||||||||
Genus PLC | 3,268 | 102,677 | (114.5 | ) | ||||||||
Great Portland Estates PLC | 792 | 6,727 | (7.5 | ) | ||||||||
Hammerson PLC | 1,027,560 | 370,982 | (413.7 | ) | ||||||||
Helios Towers PLC | 4,810 | 6,780 | (7.6 | ) | ||||||||
Hill & Smith Holdings PLC | 7,750 | 134,039 | (149.5 | ) | ||||||||
Hotel Chocolat Group Ltd. | 4,319 | 20,230 | (22.6 | ) | ||||||||
Hunting PLC | 46,946 | 171,194 | (190.9 | ) | ||||||||
Impax Asset Management Group PLC | 4,232 | 45,768 | (51.0 | ) | ||||||||
IntegraFin Holdings PLC | 22,083 | 99,583 | (111.0 | ) | ||||||||
Judges Scientific PLC | 2,061 | 173,638 | (193.6 | ) | ||||||||
Kainos Group PLC | 3,990 | 61,110 | (68.1 | ) | ||||||||
Lancashire Holdings Ltd. | 8,700 | 46,109 | (51.4 | ) | ||||||||
Learning Technologies Group PLC | 11,574 | 19,109 | (21.3 | ) | ||||||||
Luceco PLC | 49,332 | 118,058 | (131.6 | ) | ||||||||
Luxfer Holdings PLC | 380 | 6,133 | (6.8 | ) | ||||||||
Morgan Advanced Materials PLC | 55,279 | 193,861 | (216.2 | ) | ||||||||
National Express Group PLC | 11,939 | 37,007 | (41.3 | ) | ||||||||
Pets at Home Group PLC | 14,696 | 57,044 | (63.6 | ) | ||||||||
Polypipe Group PLC | 9,255 | 52,246 | (58.3 | ) | ||||||||
PZ Cussons PLC | 7,563 | 19,406 | (21.6 | ) | ||||||||
Redrow PLC | 47,240 | 309,672 | (345.3 | ) | ||||||||
Restaurant Group PLC | 216,937 | 166,054 | (185.2 | ) | ||||||||
RWS Holdings PLC | 45,246 | 247,801 | (276.3 | ) | ||||||||
Safestore Holdings PLC | 5,973 | 93,966 | (104.8 | ) | ||||||||
Serica Energy PLC | 37,535 | 164,902 | (183.9 | ) | ||||||||
SIG PLC | 218,770 | 113,101 | (126.1 | ) | ||||||||
Softcat PLC | 5,383 | 95,071 | (106.0 | ) | ||||||||
Spirent Communications PLC | 21,605 | 62,468 | (69.6 | ) | ||||||||
SThree PLC | 60,345 | 278,185 | (310.2 | ) | ||||||||
Subsea 7 SA | 11,865 | 97,249 | (108.4 | ) | ||||||||
Vesuvius PLC | 15,802 | 64,260 | (71.6 | ) | ||||||||
Victrex PLC | 306 | 6,978 | (7.8 | ) | ||||||||
Virgin Money UK PLC | 51,448 | 111,621 | (124.5 | ) | ||||||||
Watkin Jones PLC | 5,546 | 17,260 | (19.2 | ) | ||||||||
Wickes Group PLC | 72,623 | 173,130 | (193.0 | ) | ||||||||
Workspace Group PLC | 13,364 | 111,837 | (124.7 | ) | ||||||||
YouGov PLC | 5,972 | 94,244 | (105.1 | ) | ||||||||
|
|
|
| |||||||||
| 6,693,872 | ||||||||||||
| United States | ||||||||||||
1-800-Flowers.com, Inc., Class A | 8,043 | 82,039 | (91.5 | ) | ||||||||
1Life Healthcare, Inc. | 5,371 | 37,866 | (42.2 | ) | ||||||||
2U, Inc. | 7,232 | 72,175 | (80.5 | ) | ||||||||
8x8, Inc. | 4,858 | 44,548 | (49.7 | ) | ||||||||
A10 Networks, Inc. | 11,445 | 163,435 | (182.2 | ) | ||||||||
AAR Corp. | 959 | 45,054 | (50.2 | ) | ||||||||
Academy Sports & Outdoors, Inc. | 1,746 | 65,231 | (72.7 | ) | ||||||||
ACADIA Pharmaceuticals, Inc. | 2,660 | 49,050 | (54.7 | ) | ||||||||
Acadia Realty Trust | 7,427 | 155,373 | (173.2 | ) | ||||||||
ACCO Brands Corp. | 47,141 | 345,544 | (385.3 | ) | ||||||||
ACM Research, Inc., Class A | 2,072 | 31,308 | (34.9 | ) | ||||||||
ACV Auctions, Inc., Class A | 5,041 | 67,297 | (75.0 | ) | ||||||||
AdaptHealth Corp. | 476 | 6,026 | (6.7 | ) | ||||||||
Adaptive Biotechnologies Corp. | 11,614 | 95,815 | (106.8 | ) | ||||||||
| 38 | 2 0 2 2 BLACK ROCK ANNUAL REPORT TO SHAREHOLDERS |
Schedule of Investments (continued) April 30, 2022 | BlackRock Global Long/Short Equity Fund |
| Security | Shares | Value | % of Basket Value | |||||||||
| United States (continued) | ||||||||||||
Addus HomeCare Corp. | 3,203 | $ | 269,949 | (301.0 | )% | |||||||
ADT, Inc. | 1,387 | 9,501 | (10.6 | ) | ||||||||
Advantage Solutions, Inc. | 5,802 | 29,184 | (32.5 | ) | ||||||||
Aerojet Rocketdyne Holdings, Inc. | 5,728 | 229,005 | (255.3 | ) | ||||||||
AeroVironment, Inc. | 1,359 | 109,155 | (121.7 | ) | ||||||||
Air Transport Services Group, Inc. | 548 | 17,152 | (19.1 | ) | ||||||||
Alarm.com Holdings, Inc. | 2,622 | 160,152 | (178.6 | ) | ||||||||
Alector, Inc. | 600 | 5,760 | (6.4 | ) | ||||||||
Alexander & Baldwin, Inc. | 2,274 | 48,209 | (53.8 | ) | ||||||||
Alignment Healthcare, Inc. | 7,103 | 68,260 | (76.1 | ) | ||||||||
Allakos, Inc. | 1,797 | 6,775 | (7.6 | ) | ||||||||
Allegiant Travel Co. | 846 | 131,291 | (146.4 | ) | ||||||||
Allegro MicroSystems, Inc. | 1,113 | 27,057 | (30.2 | ) | ||||||||
ALLETE, Inc. | 6,613 | 392,415 | (437.6 | ) | ||||||||
Alliance Data Systems Corp. | 5,080 | 278,384 | (310.4 | ) | ||||||||
Allison Transmission Holdings, Inc. | 706 | 26,433 | (29.5 | ) | ||||||||
Allogene Therapeutics, Inc. | 35,393 | 295,532 | (329.5 | ) | ||||||||
Allovir, Inc. | 6,202 | 28,219 | (31.5 | ) | ||||||||
Altair Engineering, Inc., Class A | 727 | 39,491 | (44.0 | ) | ||||||||
Alto Ingredients, Inc. | 12,271 | 70,804 | (78.9 | ) | ||||||||
Altra Industrial Motion Corp. | 7,001 | 273,039 | (304.4 | ) | ||||||||
Amalgamated Financial Corp. | 2,427 | 42,691 | (47.6 | ) | ||||||||
AMC Networks, Inc., Class A | 3,195 | 104,253 | (116.2 | ) | ||||||||
Ameresco, Inc., Class A | 3,791 | 191,218 | (213.2 | ) | ||||||||
American Assets Trust, Inc. | 9,287 | 339,904 | (379.0 | ) | ||||||||
American Eagle Outfitters, Inc. | 16,196 | 244,722 | (272.9 | ) | ||||||||
American Equity Investment Life Holding Co. | 611 | 23,047 | (25.7 | ) | ||||||||
American States Water Co. | 2,013 | 158,343 | (176.6 | ) | ||||||||
American Woodmark Corp. | 749 | 35,091 | (39.1 | ) | ||||||||
AMERISAFE, Inc. | 1,702 | 78,888 | (88.0 | ) | ||||||||
Amneal Pharmaceuticals, Inc. | 1,591 | 6,141 | (6.8 | ) | ||||||||
Amphastar Pharmaceuticals, Inc. | 673 | 23,871 | (26.6 | ) | ||||||||
Anika Therapeutics, Inc. | 685 | 14,748 | (16.4 | ) | ||||||||
Annexon, Inc. | 4,581 | 11,682 | (13.0 | ) | ||||||||
Apartment Investment and Management Co., Class A | 30,812 | 194,116 | (216.4 | ) | ||||||||
Appfolio, Inc., Class A | 63 | 6,543 | (7.3 | ) | ||||||||
Applied Industrial Technologies, Inc. | 161 | 16,855 | (18.8 | ) | ||||||||
Arbor Realty Trust, Inc. | 20,483 | 350,259 | (390.5 | ) | ||||||||
Archrock, Inc. | 974 | 8,484 | (9.5 | ) | ||||||||
Arconic Corp. | 897 | 22,569 | (25.2 | ) | ||||||||
Arcosa, Inc. | 132 | 7,066 | (7.9 | ) | ||||||||
Ares Management Corp., Class A | 4,004 | 265,145 | (295.6 | ) | ||||||||
Argan, Inc. | 420 | 15,448 | (17.2 | ) | ||||||||
Armada Hoffler Properties, Inc. | 17,793 | 241,095 | (268.8 | ) | ||||||||
Artisan Partners Asset Management, Inc., Class A | 1,044 | 33,554 | (37.4 | ) | ||||||||
Artivion, Inc. | 5,098 | 103,438 | (115.3 | ) | ||||||||
Arvinas, Inc. | 1,009 | 55,465 | (61.8 | ) | ||||||||
Aspen Aerogels, Inc. | 2,098 | 45,317 | (50.5 | ) | ||||||||
Assetmark Financial Holdings, Inc. | 268 | 5,154 | (5.7 | ) | ||||||||
Associated Banc-Corp. | 10,334 | 206,163 | (229.9 | ) | ||||||||
Astec Industries, Inc. | 6,428 | 251,335 | (280.2 | ) | ||||||||
Avaya Holdings Corp. | 11,466 | 106,060 | (118.3 | ) | ||||||||
Avid Bioservices, Inc. | 1,614 | 21,724 | (24.2 | ) | ||||||||
Avient Corp. | 1,193 | 58,743 | (65.5 | ) | ||||||||
Axcelis Technologies, Inc. | 963 | 52,435 | (58.5 | ) | ||||||||
AZZ, Inc. | 1,395 | 63,668 | (71.0 | ) | ||||||||
Badger Meter, Inc. | 486 | 39,215 | (43.7 | ) | ||||||||
Banc of California, Inc. | 6,435 | 116,087 | (129.4 | ) | ||||||||
Bandwidth, Inc., Class A | 6,875 | 152,075 | (169.6 | ) | ||||||||
Bar Harbor Bankshares | 1,722 | 44,961 | (50.1 | ) | ||||||||
| Security | Shares | Value | % of Basket Value | |||||||||
| United States (continued) | ||||||||||||
Barrett Business Services, Inc. | 1,746 | $ | 125,660 | (140.1 | )% | |||||||
Beauty Health Co. | 968 | 12,681 | (14.1 | ) | ||||||||
Berry Corp. | 4,498 | 49,343 | (55.0 | ) | ||||||||
BGC Partners, Inc., Class A | 2,083 | 7,561 | (8.4 | ) | ||||||||
BJ’s Restaurants, Inc. | 2,607 | 72,449 | (80.8 | ) | ||||||||
Blackbaud, Inc. | 2,007 | 116,426 | (129.8 | ) | ||||||||
Bloom Energy Corp., Class A | 6,361 | 118,060 | (131.6 | ) | ||||||||
Bloomin’ Brands, Inc. | 4,451 | 97,877 | (109.1 | ) | ||||||||
Boot Barn Holdings, Inc. | 2,390 | 215,243 | (240.0 | ) | ||||||||
Bridgebio Pharma, Inc. | 6,548 | 52,515 | (58.6 | ) | ||||||||
Brigham Minerals, Inc., Class A | 7,750 | 192,045 | (214.1 | ) | ||||||||
Brightsphere Investment Group, Inc. | 6,162 | 123,486 | (137.7 | ) | ||||||||
Brookdale Senior Living, Inc. | 2,857 | 17,656 | (19.7 | ) | ||||||||
BTRS Holdings, Inc., Class 1 | 10,297 | 69,196 | (77.2 | ) | ||||||||
Byline Bancorp, Inc. | 3,564 | 83,611 | (93.2 | ) | ||||||||
California Resources Corp. | 402 | 16,164 | (18.0 | ) | ||||||||
Calix, Inc. | 3,440 | 137,290 | (153.1 | ) | ||||||||
Callon Petroleum Co. | 1,385 | 71,009 | (79.2 | ) | ||||||||
Camden National Corp. | 2,340 | 104,715 | (116.8 | ) | ||||||||
Camping World Holdings, Inc., Class A | 252 | 6,471 | (7.2 | ) | ||||||||
Cannae Holdings, Inc. | 7,637 | 171,069 | (190.7 | ) | ||||||||
Capital City Bank Group, Inc. | 2,266 | 58,032 | (64.7 | ) | ||||||||
Cardiovascular Systems, Inc. | 14,524 | 271,599 | (302.8 | ) | ||||||||
Cardlytics, Inc. | 185 | 6,314 | (7.0 | ) | ||||||||
CareDx, Inc. | 414 | 12,602 | (14.1 | ) | ||||||||
Casella Waste Systems, Inc., Class A | 599 | 49,262 | (54.9 | ) | ||||||||
Castle Biosciences, Inc. | 319 | 7,126 | (7.9 | ) | ||||||||
Catalyst Pharmaceuticals, Inc. | 955 | 7,277 | (8.1 | ) | ||||||||
Cathay General Bancorp | 199 | 7,978 | (8.9 | ) | ||||||||
CBTX, Inc. | 264 | 7,529 | (8.4 | ) | ||||||||
Centerspace | 4,809 | 443,678 | (494.7 | ) | ||||||||
Central Garden & Pet Co., Class A | 8,185 | 338,695 | (377.7 | ) | ||||||||
Century Communities, Inc. | 185 | 9,753 | (10.9 | ) | ||||||||
Cerence, Inc. | 332 | 9,794 | (10.9 | ) | ||||||||
Cerus Corp. | 1,382 | 6,385 | (7.1 | ) | ||||||||
CEVA, Inc. | 1,361 | 49,459 | (55.1 | ) | ||||||||
ChannelAdvisor Corp. | 9,340 | 135,523 | (151.1 | ) | ||||||||
Chatham Lodging Trust | 19,005 | 272,912 | (304.3 | ) | ||||||||
Chefs’ Warehouse, Inc. | 208 | 7,613 | (8.5 | ) | ||||||||
ChemoCentryx, Inc. | 2,991 | 55,214 | (61.6 | ) | ||||||||
Chuy’s Holdings, Inc. | 2,756 | 68,928 | (76.9 | ) | ||||||||
Cinemark Holdings, Inc. | 16,047 | 254,505 | (283.8 | ) | ||||||||
Clean Energy Fuels Corp. | 10,214 | 59,854 | (66.7 | ) | ||||||||
Clear Secure, Inc., Class A | 1,805 | 54,908 | (61.2 | ) | ||||||||
Clearway Energy, Inc., Class A | 452 | 12,846 | (14.3 | ) | ||||||||
CNO Financial Group, Inc. | 16,455 | 397,224 | (442.9 | ) | ||||||||
Codexis, Inc. | 1,364 | 16,409 | (18.3 | ) | ||||||||
Coeur Mining, Inc. | 6,611 | 23,998 | (26.8 | ) | ||||||||
Cohen & Steers, Inc. | 1,053 | 81,808 | (91.2 | ) | ||||||||
Coherus Biosciences, Inc. | 6,643 | 60,053 | (67.0 | ) | ||||||||
Cohu, Inc. | 385 | 10,226 | (11.4 | ) | ||||||||
CommScope Holding Co., Inc. | 13,158 | 79,343 | (88.5 | ) | ||||||||
ConnectOne Bancorp, Inc. | 3,538 | 98,569 | (109.9 | ) | ||||||||
Construction Partners, Inc., Class A | 2,862 | 73,868 | (82.4 | ) | ||||||||
Corcept Therapeutics, Inc. | 1,344 | 28,909 | (32.2 | ) | ||||||||
CorVel Corp. | 683 | 105,920 | (118.1 | ) | ||||||||
Cowen, Inc., Class A | 7,947 | 181,589 | (202.5 | ) | ||||||||
Cross Country Healthcare, Inc. | 1,232 | 23,088 | (25.7 | ) | ||||||||
CrossFirst Bankshares, Inc. | 6,111 | 78,282 | (87.3 | ) | ||||||||
CSW Industrials, Inc. | 157 | 16,565 | (18.5 | ) | ||||||||
Cutera, Inc. | 6,284 | 341,284 | (380.5 | ) | ||||||||
Dave & Buster’s Entertainment, Inc. | 827 | 37,628 | (42.0 | ) | ||||||||
SCHEDULE OF INVESTMENTS | 39 |
Schedule of Investments (continued) April 30, 2022 | BlackRock Global Long/Short Equity Fund |
| Security | Shares | Value | % of Basket Value | |||||||||
| United States (continued) | ||||||||||||
Deciphera Pharmaceuticals, Inc. | 10,340 | $ | 104,641 | (116.7 | )% | |||||||
Delek US Holdings, Inc. | 417 | 10,091 | (11.3 | ) | ||||||||
Deluxe Corp. | 3,142 | 85,085 | (94.9 | ) | ||||||||
Denali Therapeutics, Inc. | 692 | 16,470 | (18.4 | ) | ||||||||
Denbury, Inc. | 215 | 13,756 | (15.3 | ) | ||||||||
Dime Community Bancshares, Inc. | 2,790 | 87,718 | (97.8 | ) | ||||||||
Diodes, Inc. | 137 | 10,005 | (11.2 | ) | ||||||||
Dorian LPG Ltd. | 5,497 | 80,916 | (90.2 | ) | ||||||||
Douglas Dynamics, Inc. | 373 | 11,548 | (12.9 | ) | ||||||||
Ducommun, Inc. | 926 | 47,291 | (52.7 | ) | ||||||||
Duolingo, Inc. | 71 | 6,139 | (6.8 | ) | ||||||||
Dyne Therapeutics, Inc. | 11,943 | 95,305 | (106.3 | ) | ||||||||
Eagle Pharmaceuticals, Inc. | 146 | 6,443 | (7.2 | ) | ||||||||
Easterly Government Properties, Inc. | 13,339 | 254,108 | (283.3 | ) | ||||||||
EchoStar Corp., Class A | 9,890 | 230,931 | (257.5 | ) | ||||||||
Ecovyst, Inc. | 29,614 | 297,917 | (332.2 | ) | ||||||||
elf Beauty, Inc. | 6,438 | 156,637 | (174.7 | ) | ||||||||
Emergent BioSolutions, Inc. | 6,916 | 223,940 | (249.7 | ) | ||||||||
Enanta Pharmaceuticals, Inc. | 927 | 59,699 | (66.6 | ) | ||||||||
Energizer Holdings, Inc. | 3,927 | 118,949 | (132.6 | ) | ||||||||
Energy Recovery, Inc. | 806 | 14,927 | (16.6 | ) | ||||||||
EnPro Industries, Inc. | 1,490 | 138,883 | (154.9 | ) | ||||||||
Enterprise Financial Services Corp. | 167 | 7,376 | (8.2 | ) | ||||||||
ePlus, Inc. | 657 | 37,107 | (41.4 | ) | ||||||||
Equitrans Midstream Corp. | 4,346 | 34,160 | (38.1 | ) | ||||||||
ESCO Technologies, Inc. | 2,022 | 126,274 | (140.8 | ) | ||||||||
Essential Properties Realty Trust, Inc. | 12,630 | 303,120 | (338.0 | ) | ||||||||
Ethan Allen Interiors, Inc. | 5,374 | 127,579 | (142.3 | ) | ||||||||
Everi Holdings, Inc. | 347 | 6,024 | (6.7 | ) | ||||||||
Evolent Health, Inc., Class A | 7,390 | 203,373 | (226.8 | ) | ||||||||
EW Scripps Co., Class A | 15,221 | 250,538 | (279.4 | ) | ||||||||
eXp World Holdings, Inc. | 8,104 | 108,513 | (121.0 | ) | ||||||||
F45 Training Holdings, Inc. | 601 | 5,283 | (5.9 | ) | ||||||||
FB Financial Corp. | 1,850 | 71,280 | (79.5 | ) | ||||||||
Federal Agricultural Mortgage Corp., Class C | 317 | 32,470 | (36.2 | ) | ||||||||
FibroGen, Inc. | 11,151 | 103,704 | (115.6 | ) | ||||||||
Figs, Inc., Class A | 3,655 | 57,237 | (63.8 | ) | ||||||||
Financial Institutions, Inc. | 2 | 56 | (0.1 | ) | ||||||||
First Advantage Corp. | 780 | 13,541 | (15.1 | ) | ||||||||
First Bancshares, Inc. | 10,927 | 351,740 | (392.2 | ) | ||||||||
First Busey Corp. | 871 | 19,571 | (21.8 | ) | ||||||||
First Financial Corp. | 5,729 | 244,170 | (272.3 | ) | ||||||||
First Foundation, Inc. | 15,589 | 346,388 | (386.2 | ) | ||||||||
First Merchants Corp. | 3,727 | 146,061 | (162.9 | ) | ||||||||
First of Long Island Corp. | 2,501 | 41,967 | (46.8 | ) | ||||||||
Flushing Financial Corp. | 11,972 | 257,398 | (287.0 | ) | ||||||||
Focus Financial Partners, Inc., Class A | 3,649 | 143,953 | (160.5 | ) | ||||||||
Foot Locker, Inc. | 2,004 | 58,737 | (65.5 | ) | ||||||||
FormFactor, Inc. | 443 | 16,883 | (18.8 | ) | ||||||||
Forrester Research, Inc. | 2,161 | 120,346 | (134.2 | ) | ||||||||
Fox Factory Holding Corp. | 444 | 36,355 | (40.5 | ) | ||||||||
Franchise Group, Inc. | 3,169 | 118,172 | (131.8 | ) | ||||||||
Frontier Group Holdings, Inc. | 12,236 | 129,824 | (144.8 | ) | ||||||||
fuboTV, Inc. | 3,986 | 15,107 | (16.8 | ) | ||||||||
Fulton Financial Corp. | 17,753 | 269,313 | (300.3 | ) | ||||||||
Funko, Inc., Class A | 4,482 | 73,012 | (81.4 | ) | ||||||||
Genco Shipping & Trading Ltd. | 2,192 | 48,290 | (53.8 | ) | ||||||||
Getty Realty Corp. | 2,527 | 68,002 | (75.8 | ) | ||||||||
Gibraltar Industries, Inc. | 5,756 | 217,807 | (242.9 | ) | ||||||||
G-III Apparel Group Ltd. | 5,369 | 142,171 | (158.5 | ) | ||||||||
Gogo, Inc. | 908 | 16,716 | (18.6 | ) | ||||||||
Golden Entertainment, Inc. | 724 | 34,723 | (38.7 | ) | ||||||||
| Security | Shares | Value | % of Basket Value | |||||||||
| United States (continued) | ||||||||||||
Goosehead Insurance, Inc., Class A | 713 | $ | 40,990 | (45.7 | )% | |||||||
GoPro, Inc., Class A | 15,433 | 137,662 | (153.5 | ) | ||||||||
Granite Construction, Inc. | 1,824 | 54,082 | (60.3 | ) | ||||||||
Gray Television, Inc. | 4,629 | 85,729 | (95.6 | ) | ||||||||
Green Brick Partners, Inc. | 7,415 | 146,075 | (162.9 | ) | ||||||||
Griffon Corp. | 10,115 | 189,252 | (211.0 | ) | ||||||||
Group 1 Automotive, Inc. | 949 | 165,259 | (184.3 | ) | ||||||||
Gulfport Energy Corp. | 912 | 85,710 | (95.6 | ) | ||||||||
H&E Equipment Services, Inc. | 6,755 | 239,667 | (267.2 | ) | ||||||||
Hackett Group, Inc. | 542 | 12,732 | (14.2 | ) | ||||||||
Harmonic, Inc. | 3,441 | 28,560 | (31.8 | ) | ||||||||
Harmony Biosciences Holdings, Inc. | 3,702 | 166,738 | (185.9 | ) | ||||||||
Harsco Corp. | 9,864 | 100,810 | (112.4 | ) | ||||||||
Haverty Furniture Cos., Inc. | 13,801 | 342,679 | (382.1 | ) | ||||||||
Hawkins, Inc. | 341 | 12,712 | (14.2 | ) | ||||||||
Hayward Holdings, Inc. | 4,932 | 78,419 | (87.4 | ) | ||||||||
Heartland Express, Inc. | 4,694 | 64,777 | (72.2 | ) | ||||||||
Heartland Financial USA, Inc. | 3,526 | 154,333 | (172.1 | ) | ||||||||
Hecla Mining Co. | 20,003 | 104,216 | (116.2 | ) | ||||||||
Hemisphere Media Group, Inc. | 8,395 | 32,657 | (36.4 | ) | ||||||||
Heritage Commerce Corp. | 3,605 | 40,484 | (45.1 | ) | ||||||||
Heritage-Crystal Clean, Inc. | 262 | 7,153 | (8.0 | ) | ||||||||
Heska Corp. | 1,873 | 205,730 | (229.4 | ) | ||||||||
Hess Midstream LP, Class A | 1,805 | 53,085 | (59.2 | ) | ||||||||
Hilltop Holdings, Inc. | 5,900 | 150,391 | (167.7 | ) | ||||||||
Holley, Inc. | 10,388 | 109,490 | (122.1 | ) | ||||||||
Horizon Bancorp, Inc. | 8,706 | 152,181 | (169.7 | ) | ||||||||
Hub Group, Inc., Class A | 4,031 | 270,722 | (301.9 | ) | ||||||||
Ideaya Biosciences, Inc. | 3,814 | 36,576 | (40.8 | ) | ||||||||
ImmunoGen, Inc. | 32,133 | 155,202 | (173.1 | ) | ||||||||
Impinj, Inc. | 410 | 20,197 | (22.5 | ) | ||||||||
Independent Bank Corp. | 14,971 | 295,528 | (329.5 | ) | ||||||||
Independent Bank Group, Inc. | 2,256 | 152,957 | (170.6 | ) | ||||||||
Infinera Corp. | 2,760 | 21,224 | (23.7 | ) | ||||||||
Ingevity Corp. | 4,388 | 262,841 | (293.1 | ) | ||||||||
Innospec, Inc. | 991 | 94,452 | (105.3 | ) | ||||||||
Innoviva, Inc. | 6,999 | 119,403 | (133.1 | ) | ||||||||
Installed Building Products, Inc. | 873 | 70,250 | (78.3 | ) | ||||||||
Integer Holdings Corp. | 568 | 42,697 | (47.6 | ) | ||||||||
Intercept Pharmaceuticals, Inc. | 13,235 | 207,922 | (231.8 | ) | ||||||||
International Money Express, Inc. | 5,140 | 102,132 | (113.9 | ) | ||||||||
International Seaways, Inc. | 14,877 | 314,351 | (350.5 | ) | ||||||||
Invitae Corp. | 22,804 | 121,089 | (135.0 | ) | ||||||||
iRobot Corp. | 3,013 | 152,608 | (170.2 | ) | ||||||||
Ironwood Pharmaceuticals, Inc. | 6,951 | 83,412 | (93.0 | ) | ||||||||
iStar, Inc. | 4,601 | 77,481 | (86.4 | ) | ||||||||
Itron, Inc. | 11,017 | 526,392 | (586.9 | ) | ||||||||
J&J Snack Foods Corp. | 2,153 | 322,304 | (359.4 | ) | ||||||||
Janus International Group, Inc. | 826 | 7,814 | (8.7 | ) | ||||||||
John B Sanfilippo & Son, Inc. | 535 | 41,537 | (46.3 | ) | ||||||||
Joint Corp. | 5,417 | 165,327 | (184.3 | ) | ||||||||
Kadant, Inc. | 832 | 153,920 | (171.6 | ) | ||||||||
Karuna Therapeutics, Inc. | 153 | 17,053 | (19.0 | ) | ||||||||
Karyopharm Therapeutics, Inc. | 1,373 | 8,375 | (9.3 | ) | ||||||||
KB Home | 4,406 | 142,887 | (159.3 | ) | ||||||||
Kforce, Inc. | 451 | 31,593 | (35.2 | ) | ||||||||
Kontoor Brands, Inc. | 3,091 | 122,805 | (136.9 | ) | ||||||||
Kratos Defense & Security Solutions, Inc. | 7,397 | 112,212 | (125.1 | ) | ||||||||
Krispy Kreme, Inc. | 7,390 | 98,139 | (109.4 | ) | ||||||||
Kymera Therapeutics, Inc. | 537 | 16,835 | (18.8 | ) | ||||||||
Lakeland Bancorp, Inc. | 1,453 | 21,839 | (24.4 | ) | ||||||||
Laredo Petroleum, Inc. | 1,016 | 72,349 | (80.7 | ) | ||||||||
| 40 | 2 0 2 2 BLACK ROCK ANNUAL REPORT TO SHAREHOLDERS |
Schedule of Investments (continued) April 30, 2022 | BlackRock Global Long/Short Equity Fund |
| Security | Shares | Value | % of Basket Value | |||||||||
| United States (continued) | ||||||||||||
LeMaitre Vascular, Inc. | 2,134 | $ | 92,210 | (102.8 | )% | |||||||
LendingClub Corp. | 6,798 | 103,669 | (115.6 | ) | ||||||||
LGI Homes, Inc. | 731 | 68,502 | (76.4 | ) | ||||||||
Liberty Latin America Ltd., Class A | 641 | 5,923 | (6.6 | ) | ||||||||
Liberty Media Corp. - Liberty Braves, Class A | 1,269 | 33,337 | (37.2 | ) | ||||||||
Ligand Pharmaceuticals, Inc. | 306 | 28,415 | (31.7 | ) | ||||||||
Limelight Networks, Inc. | 9,135 | 32,612 | (36.4 | ) | ||||||||
Lions Gate Entertainment Corp., Class A | 21,650 | 292,058 | (325.7 | ) | ||||||||
Lions Gate Entertainment Corp., Class B | 1,649 | 20,728 | (23.1 | ) | ||||||||
Live Oak Bancshares, Inc. | 773 | 32,721 | (36.5 | ) | ||||||||
LivePerson, Inc. | 10,612 | 240,043 | (267.7 | ) | ||||||||
LiveRamp Holdings, Inc. | 1,840 | 57,629 | (64.3 | ) | ||||||||
Luther Burbank Corp. | 9,243 | 122,655 | (136.8 | ) | ||||||||
Malibu Boats, Inc., Class A | 9,448 | 475,140 | (529.8 | ) | ||||||||
Marcus Corp. | 18,531 | 291,493 | (325.0 | ) | ||||||||
MarineMax, Inc. | 6,150 | 251,658 | (280.6 | ) | ||||||||
Marten Transport Ltd. | 6,784 | 117,906 | (131.5 | ) | ||||||||
McGrath RentCorp | 208 | 17,360 | (19.4 | ) | ||||||||
MDC Holdings, Inc. | 647 | 23,881 | (26.6 | ) | ||||||||
Media Gen, Inc. | 3,231 | — | 0.0 | |||||||||
Mercantile Bank Corp. | 502 | 15,763 | (17.6 | ) | ||||||||
Merchants Bancorp | 5,018 | 118,023 | (131.6 | ) | ||||||||
Merit Medical Systems, Inc. | 572 | 35,470 | (39.6 | ) | ||||||||
MFA Financial, Inc. | 8,364 | 119,187 | (132.9 | ) | ||||||||
MGP Ingredients, Inc. | 3,182 | 290,612 | (324.0 | ) | ||||||||
Midland States Bancorp, Inc. | 12,983 | 342,232 | (381.6 | ) | ||||||||
MidWestOne Financial Group, Inc. | 6,715 | 200,644 | (223.7 | ) | ||||||||
Model N, Inc. | 5,675 | 146,642 | (163.5 | ) | ||||||||
Modine Manufacturing Co. | 15,888 | 125,515 | (140.0 | ) | ||||||||
ModivCare, Inc. | 1,160 | 120,605 | (134.5 | ) | ||||||||
Moelis & Co., Class A | 8,670 | 383,734 | (427.9 | ) | ||||||||
Momentive Global, Inc. | 1,784 | 28,223 | (31.5 | ) | ||||||||
Montrose Environmental Group, Inc. | 3,407 | 154,576 | (172.4 | ) | ||||||||
MRC Global, Inc. | 11,479 | 137,633 | (153.5 | ) | ||||||||
Nabors Industries Ltd. | 681 | 105,296 | (117.4 | ) | ||||||||
Napco Security Technologies, Inc. | 1,127 | 19,722 | (22.0 | ) | ||||||||
National Beverage Corp. | 149 | 6,568 | (7.3 | ) | ||||||||
National Instruments Corp. | 3,587 | 129,634 | (144.5 | ) | ||||||||
NeoGenomics, Inc. | 13,640 | 128,898 | (143.7 | ) | ||||||||
Nevro Corp. | 2,208 | 136,212 | (151.9 | ) | ||||||||
NexPoint Residential Trust, Inc. | 2,118 | 188,841 | (210.6 | ) | ||||||||
NextEra Energy Partners LP | 428 | 28,530 | (31.8 | ) | ||||||||
NGM Biopharmaceuticals, Inc. | 13,430 | 167,606 | (186.9 | ) | ||||||||
Nicolet Bankshares, Inc. | 272 | 22,135 | (24.7 | ) | ||||||||
NMI Holdings, Inc., Class A | 9,823 | 180,547 | (201.3 | ) | ||||||||
Noble Corp. | 1,219 | 38,923 | (43.4 | ) | ||||||||
Northern Oil and Gas, Inc. | 400 | 9,992 | (11.1 | ) | ||||||||
Northfield Bancorp, Inc. | 535 | 7,003 | (7.8 | ) | ||||||||
Northwest Natural Holding Co. | 3,505 | 167,644 | (186.9 | ) | ||||||||
NorthWestern Corp. | 3,670 | 208,052 | (232.0 | ) | ||||||||
Nurix Therapeutics, Inc. | 2,135 | 23,634 | (26.4 | ) | ||||||||
NuVasive, Inc. | 1,058 | 54,424 | (60.7 | ) | ||||||||
NV5 Global, Inc. | 2,287 | 273,983 | (305.5 | ) | ||||||||
Oasis Petroleum, Inc. | 403 | 53,462 | (59.6 | ) | ||||||||
Oceaneering International, Inc. | 1,214 | 13,755 | (15.3 | ) | ||||||||
OceanFirst Financial Corp. | 24,210 | 453,453 | (505.6 | ) | ||||||||
Office Properties Income Trust | 344 | 7,437 | (8.3 | ) | ||||||||
Olema Pharmaceuticals, Inc. | 9,732 | 24,817 | (27.7 | ) | ||||||||
Ollie’s Bargain Outlet Holdings, Inc. | 916 | 44,014 | (49.1 | ) | ||||||||
Olo, Inc., Class A | 14,096 | 150,686 | (168.0 | ) | ||||||||
Oportun Financial Corp. | 6,941 | 80,446 | (89.7 | ) | ||||||||
Organogenesis Holdings, Inc. | 1,323 | 8,520 | (9.5 | ) | ||||||||
| Security | Shares | Value | % of Basket Value | |||||||||
| United States (continued) | ||||||||||||
Origin Bancorp, Inc. | 2,393 | $ | 90,168 | (100.5 | )% | |||||||
Origin Materials, Inc. | 1,983 | 12,870 | (14.4 | ) | ||||||||
Orthofix Medical, Inc. | 2,569 | 79,639 | (88.8 | ) | ||||||||
OSI Systems, Inc. | 80 | 6,328 | (7.1 | ) | ||||||||
Outfront Media, Inc. | 1,481 | 37,914 | (42.3 | ) | ||||||||
Overstock.com, Inc. | 3,210 | 107,728 | (120.1 | ) | ||||||||
Pacific Biosciences of California, Inc. | 4,615 | 29,259 | (32.6 | ) | ||||||||
PagerDuty, Inc. | 3,949 | 112,823 | (125.8 | ) | ||||||||
Palomar Holdings, Inc. | 460 | 25,047 | (27.9 | ) | ||||||||
Par Pacific Holdings, Inc. | 14,473 | 212,319 | (236.7 | ) | ||||||||
PAR Technology Corp. | 4,829 | 159,550 | (177.9 | ) | ||||||||
Paramount Group, Inc. | 2,823 | 26,847 | (29.9 | ) | ||||||||
Party City Holdco, Inc. | 3,996 | 12,348 | (13.8 | ) | ||||||||
Passage Bio, Inc. | 18,970 | 36,991 | (41.2 | ) | ||||||||
Patrick Industries, Inc. | 1,457 | 90,698 | (101.1 | ) | ||||||||
Peapack Gladstone Financial Corp. | 761 | 23,583 | (26.3 | ) | ||||||||
Perella Weinberg Partners | 2,403 | 18,527 | (20.7 | ) | ||||||||
Perficient, Inc. | 1,240 | 123,268 | (137.4 | ) | ||||||||
Personalis, Inc. | 7,972 | 44,643 | (49.8 | ) | ||||||||
PetIQ, Inc. | 7,141 | 142,106 | (158.5 | ) | ||||||||
PGT Innovations, Inc. | 421 | 7,481 | (8.3 | ) | ||||||||
Phibro Animal Health Corp., Class A | 5,199 | 93,530 | (104.3 | ) | ||||||||
Piedmont Lithium, Inc. | 2,307 | 150,901 | (168.3 | ) | ||||||||
Piper Sandler Cos | 266 | 30,585 | (34.1 | ) | ||||||||
PJT Partners, Inc., Class A | 3,824 | 252,346 | (281.4 | ) | ||||||||
Plains GP Holdings LP, Class A | 23,959 | 267,622 | (298.4 | ) | ||||||||
Playa Hotels & Resorts NV | 6,583 | 62,144 | (69.3 | ) | ||||||||
Plymouth Industrial REIT, Inc. | 5,588 | 134,783 | (150.3 | ) | ||||||||
Poshmark, Inc., Class A | 12,312 | 135,924 | (151.6 | ) | ||||||||
PRA Group, Inc. | 2,031 | 85,363 | (95.2 | ) | ||||||||
Premier Financial Corp. | 19,761 | 524,457 | (584.8 | ) | ||||||||
Prestige Consumer Healthcare, Inc. | 5,983 | 327,031 | (364.6 | ) | ||||||||
Primoris Services Corp. | 1,555 | 36,045 | (40.2 | ) | ||||||||
Privia Health Group, Inc. | 3,155 | 69,378 | (77.4 | ) | ||||||||
PROG Holdings, Inc. | 4,247 | 112,418 | (125.4 | ) | ||||||||
ProPetro Holding Corp. | 5,703 | 80,640 | (89.9 | ) | ||||||||
Proto Labs, Inc. | 831 | 35,409 | (39.5 | ) | ||||||||
PTC Therapeutics, Inc. | 437 | 15,439 | (17.2 | ) | ||||||||
PubMatic, Inc., Class A | 292 | 6,590 | (7.3 | ) | ||||||||
QCR Holdings, Inc. | 1,129 | 61,293 | (68.3 | ) | ||||||||
Quaker Chemical Corp. | 629 | 102,345 | (114.1 | ) | ||||||||
Quanex Building Products Corp. | 519 | 9,975 | (11.1 | ) | ||||||||
Qurate Retail, Inc., Series A | 23,152 | 97,470 | (108.7 | ) | ||||||||
Ranpak Holdings Corp. | 8,785 | 132,478 | (147.7 | ) | ||||||||
Ready Capital Corp. | 1,087 | 15,838 | (17.7 | ) | ||||||||
Redwood Trust, Inc. | 33,311 | 323,117 | (360.3 | ) | ||||||||
Replimune Group, Inc. | 1,982 | 33,238 | (37.1 | ) | ||||||||
Revolution Medicines, Inc. | 1,362 | 27,199 | (30.3 | ) | ||||||||
RLI Corp. | 467 | 53,602 | (59.8 | ) | ||||||||
RLJ Lodging Trust | 4,801 | 67,310 | (75.1 | ) | ||||||||
RMR Group, Inc., Class A | 261 | 7,120 | (7.9 | ) | ||||||||
Rocket Pharmaceuticals, Inc. | 9,363 | 96,252 | (107.3 | ) | ||||||||
RPT Realty | 6,393 | 84,963 | (94.7 | ) | ||||||||
Rush Enterprises, Inc., Class A | 6,205 | 315,710 | (352.0 | ) | ||||||||
Rush Enterprises, Inc., Class B | 4,765 | 230,864 | (257.4 | ) | ||||||||
Ryan Specialty Group Holdings, Inc., Class A | 4,660 | 172,373 | (192.2 | ) | ||||||||
Ryerson Holding Corp. | 1,627 | 59,890 | (66.8 | ) | ||||||||
Sabra Health Care REIT, Inc. | 2,830 | 33,054 | (36.9 | ) | ||||||||
Sabre Corp. | 1,212 | 12,690 | (14.2 | ) | ||||||||
Safehold, Inc. | 2,320 | 99,876 | (111.4 | ) | ||||||||
Sana Biotechnology, Inc. | 25,864 | 195,273 | (217.7 | ) | ||||||||
Sangamo Therapeutics, Inc. | 7,489 | 31,079 | (34.7 | ) | ||||||||
SCHEDULE OF INVESTMENTS | 41 |
Schedule of Investments (continued) April 30, 2022 | BlackRock Global Long/Short Equity Fund |
| Security | Shares | Value | % of Basket Value | |||||||||
| United States (continued) | ||||||||||||
Select Medical Holdings Corp. | 583 | $ | 13,182 | (14.7 | )% | |||||||
Sensient Technologies Corp. | 2,453 | 207,524 | (231.4 | ) | ||||||||
Shake Shack, Inc., Class A | 4,565 | 263,994 | (294.4 | ) | ||||||||
Shutterstock, Inc. | 1,200 | 90,864 | (101.3 | ) | ||||||||
Simply Good Foods Co. | 1,273 | 53,020 | (59.1 | ) | ||||||||
Simpson Manufacturing Co., Inc. | 456 | 47,274 | (52.7 | ) | ||||||||
Simulations Plus, Inc. | 2,010 | 93,787 | (104.6 | ) | ||||||||
SMART Global Holdings, Inc. | 3,659 | 82,913 | (92.5 | ) | ||||||||
Sonic Automotive, Inc., Class A | 930 | 39,571 | (44.1 | ) | ||||||||
Sorrento Therapeutics, Inc. | 14,488 | 21,877 | (24.4 | ) | ||||||||
SPS Commerce, Inc. | 138 | 16,509 | (18.4 | ) | ||||||||
SPX Corp. | 2,781 | 116,524 | (129.9 | ) | ||||||||
Stagwell, Inc. | 1,137 | 7,709 | (8.6 | ) | ||||||||
Standard Motor Products, Inc. | 1,092 | 46,607 | (52.0 | ) | ||||||||
Stepan Co. | 199 | 20,320 | (22.7 | ) | ||||||||
Stitch Fix, Inc., Class A | 4,978 | 47,291 | (52.7 | ) | ||||||||
StoneX Group, Inc. | 915 | 62,019 | (69.2 | ) | ||||||||
Summit Hotel Properties, Inc. | 4,544 | 44,849 | (50.0 | ) | ||||||||
Summit Materials, Inc., Class A | 7,249 | 201,522 | (224.7 | ) | ||||||||
SunCoke Energy, Inc. | 3,058 | 25,443 | (28.4 | ) | ||||||||
Sunnova Energy International, Inc. | 9,635 | 166,396 | (185.5 | ) | ||||||||
SunPower Corp. | 9,447 | 155,970 | (173.9 | ) | ||||||||
Super Micro Computer, Inc. | 2,493 | 104,955 | (117.0 | ) | ||||||||
Sutro Biopharma, Inc. | 356 | 2,140 | (2.4 | ) | ||||||||
Sylvamo Corp. | 6,687 | 298,575 | (332.9 | ) | ||||||||
Syndax Pharmaceuticals, Inc. | 1,238 | 20,761 | (23.2 | ) | ||||||||
Tactile Systems Technology, Inc. | 4,512 | 76,163 | (84.9 | ) | ||||||||
Talos Energy, Inc. | 622 | 11,302 | (12.6 | ) | ||||||||
Tanger Factory Outlet Centers, Inc. | 645 | 10,404 | (11.6 | ) | ||||||||
Targa Resources Corp. | 1,407 | 103,288 | (115.2 | ) | ||||||||
Taylor Morrison Home Corp. | 6,846 | 179,297 | (199.9 | ) | ||||||||
Texas Capital Bancshares, Inc. | 7,286 | 374,209 | (417.3 | ) | ||||||||
TowneBank | 12,374 | 341,151 | (380.4 | ) | ||||||||
TPG RE Finance Trust, Inc. | 567 | 5,982 | (6.7 | ) | ||||||||
Transocean Ltd. | 19,015 | 71,496 | (79.7 | ) | ||||||||
Tri Pointe Homes, Inc. | 5,268 | 108,890 | (121.4 | ) | ||||||||
Trico Bancshares | 2,191 | 82,272 | (91.7 | ) | ||||||||
Trinity Industries, Inc. | 5,190 | 143,971 | (160.5 | ) | ||||||||
Triumph Group, Inc. | 618 | 13,930 | (15.5 | ) | ||||||||
TTEC Holdings, Inc. | 693 | 51,150 | (57.0 | ) | ||||||||
Turning Point Brands, Inc. | 14,673 | 460,585 | (513.6 | ) | ||||||||
Tutor Perini Corp. | 14,896 | 138,086 | (154.0 | ) | ||||||||
U.S. Physical Therapy, Inc. | 748 | 77,620 | (86.5 | ) | ||||||||
UFP Industries, Inc. | 100 | 7,737 | (8.6 | ) | ||||||||
UMB Financial Corp. | 4,518 | 407,433 | (454.3 | ) | ||||||||
UMH Properties, Inc. | 15,111 | 355,411 | (396.3 | ) | ||||||||
United Fire Group, Inc. | 3,432 | 100,523 | (112.1 | ) | ||||||||
Unitil Corp. | 3,181 | 162,231 | (180.9 | ) | ||||||||
Univest Financial Corp. | 5,646 | 142,279 | (158.6 | ) | ||||||||
Upland Software, Inc. | 9,327 | 139,159 | (155.2 | ) | ||||||||
Urban Edge Properties | 557 | 10,410 | (11.6 | ) | ||||||||
Urban Outfitters, Inc. | 17,061 | 406,052 | (452.8 | ) | ||||||||
Valaris Ltd. | 1,244 | 63,133 | (70.4 | ) | ||||||||
Varex Imaging Corp. | 1,049 | 20,823 | (23.2 | ) | ||||||||
Vector Group Ltd. | 7,540 | 95,909 | (106.9 | ) | ||||||||
Vectrus, Inc. | 1,983 | 71,586 | (79.8 | ) | ||||||||
Veeco Instruments, Inc. | 5,926 | 135,824 | (151.4 | ) | ||||||||
Veracyte, Inc. | 3,058 | 62,597 | (69.8 | ) | ||||||||
Vericel Corp. | 267 | 7,609 | (8.5 | ) | ||||||||
Veris Residential, Inc. | 4,927 | 78,881 | (88.0 | ) | ||||||||
Veritex Holdings, Inc. | 9,942 | 326,595 | (364.2 | ) | ||||||||
| Security | Shares | Value | % of Basket Value | |||||||||
| United States (continued) | ||||||||||||
Veritiv Corp. | 458 | $ | 64,367 | (71.8 | )% | |||||||
Vertex Inc., Class A | 8,250 | 117,397 | (130.9 | ) | ||||||||
Victory Capital Holdings Inc., Class A | 27,596 | 744,816 | (830.5 | ) | ||||||||
Vishay Intertechnology, Inc. | 20,848 | 388,398 | (433.1 | ) | ||||||||
Vista Outdoor, Inc. | 300 | 10,569 | (11.8 | ) | ||||||||
Vital Farms, Inc. | 373 | 4,289 | (4.8 | ) | ||||||||
Walker & Dunlop, Inc. | 1,976 | 236,646 | (263.9 | ) | ||||||||
Warrior Met Coal, Inc. | 5,738 | 195,494 | (218.0 | ) | ||||||||
Washington Federal, Inc. | 6,683 | 203,364 | (226.8 | ) | ||||||||
Watts Water Technologies, Inc., Class A | 779 | 99,291 | (110.7 | ) | ||||||||
WD-40 Co. | 625 | 114,987 | (128.2 | ) | ||||||||
Werner Enterprises, Inc. | 10,033 | 397,608 | (443.3 | ) | ||||||||
WesBanco, Inc. | 1,140 | 36,754 | (41.0 | ) | ||||||||
Willdan Group, Inc. | 484 | 13,010 | (14.5 | ) | ||||||||
Yext, Inc. | 13,321 | 77,129 | (86.0 | ) | ||||||||
Y-mAbs Therapeutics, Inc. | 8,888 | 74,659 | (83.2 | ) | ||||||||
ZimVie, Inc. | 295 | 6,637 | (7.4 | ) | ||||||||
ZipRecruiter, Inc., Class A | 3,796 | 85,448 | (95.3 | ) | ||||||||
|
|
|
| |||||||||
| 50,468,146 | ||||||||||||
| Preferred Stocks | ||||||||||||
| Germany | ||||||||||||
Schaeffler AG, Preference Shares | 7,794 | 41,856 | (46.6 | ) | ||||||||
|
|
|
| |||||||||
Total Reference Entity — Long | 105,426,455 | |||||||||||
|
| |||||||||||
Reference Entity — Short | ||||||||||||
| Common Stocks | ||||||||||||
| Australia | ||||||||||||
Bega Cheese Ltd. | (11,422 | ) | (40,310 | ) | 44.9 | |||||||
Breville Group Ltd. | (630 | ) | (10,441 | ) | 11.6 | |||||||
BWX Ltd. | (17,360 | ) | (22,837 | ) | 25.5 | |||||||
Cromwell Property Group | (90,818 | ) | (54,506 | ) | 60.8 | |||||||
GUD Holdings Ltd. | (1,835 | ) | (16,647 | ) | 18.6 | |||||||
Integral Diagnostics Ltd. | (2,241 | ) | (6,239 | ) | 7.0 | |||||||
IRESS Ltd. | (3,789 | ) | (29,147 | ) | 32.5 | |||||||
OceanaGold Corp. | (10,532 | ) | (26,235 | ) | 29.3 | |||||||
Sigma Healthcare Ltd. | (19,357 | ) | (6,838 | ) | 7.6 | |||||||
SolGold PLC | (476,503 | ) | (171,964 | ) | 191.7 | |||||||
Super Retail Group Ltd. | (4,511 | ) | (33,377 | ) | 37.2 | |||||||
Tyro Payments Ltd. | (5,328 | ) | (4,554 | ) | 5.1 | |||||||
|
|
|
| |||||||||
| (423,095 | ) | |||||||||||
| Austria | ||||||||||||
CA Immobilien Anlagen AG | (40,631 | ) | (1,147,527 | ) | 1,279.5 | |||||||
FACC AG | (1,883 | ) | (15,536 | ) | 17.3 | |||||||
Semperit AG Holding | (17,877 | ) | (432,355 | ) | 482.1 | |||||||
|
|
|
| |||||||||
| (1,595,418 | ) | |||||||||||
| Belgium | ||||||||||||
Aedifica SA | (3,927 | ) | (465,479 | ) | 519.0 | |||||||
Befimmo SA | (28,212 | ) | (1,408,268 | ) | 1,570.3 | |||||||
bpost SA | (3,904 | ) | (23,654 | ) | 26.4 | |||||||
Cofinimmo SA | (1,548 | ) | (207,873 | ) | 231.8 | |||||||
Gimv NV | (5,153 | ) | (295,695 | ) | 329.7 | |||||||
KBC Ancora | (2,137 | ) | (86,460 | ) | 96.4 | |||||||
Ontex Group NV | (31,557 | ) | (218,639 | ) | 243.8 | |||||||
Orange Belgium SA | (1,790 | ) | (34,694 | ) | 38.7 | |||||||
X-Fab Silicon Foundries SE | (991 | ) | (7,016 | ) | 7.8 | |||||||
Xior Student Housing NV | (1,597 | ) | (85,306 | ) | 95.1 | |||||||
|
|
|
| |||||||||
| (2,833,084 | ) | |||||||||||
| 42 | 2 0 2 2 BLACK ROCK ANNUAL REPORT TO SHAREHOLDERS |
Schedule of Investments (continued) April 30, 2022 | BlackRock Global Long/Short Equity Fund |
| Security | Shares | Value | % of Basket Value | |||||||||
| Bermuda | ||||||||||||
Enstar Group Ltd. | (105 | ) | $ | (24,754 | ) | 27.6 | % | |||||
|
|
|
| |||||||||
| Canada | ||||||||||||
Absolute Software Corp. | (5,237 | ) | (40,154 | ) | 44.8 | |||||||
AG Growth International, Inc. | (2,964 | ) | (89,729 | ) | 100.1 | |||||||
Altus Group Ltd. | (1,261 | ) | (47,224 | ) | 52.7 | |||||||
Artis Real Estate Investment Trust | (849 | ) | (8,664 | ) | 9.7 | |||||||
ATS Automation Tooling Systems, Inc. | (2,963 | ) | (86,469 | ) | 96.4 | |||||||
Birchcliff Energy Ltd. | (11,222 | ) | (82,113 | ) | 91.6 | |||||||
Boyd Group Services, Inc. | (1,234 | ) | (152,731 | ) | 170.3 | |||||||
Canaccord Genuity Group, Inc. | (857 | ) | (7,538 | ) | 8.4 | |||||||
Canacol Energy Ltd. | (3,066 | ) | (6,802 | ) | 7.6 | |||||||
Canfor Corp. | (21,670 | ) | (412,939 | ) | 460.4 | |||||||
Cascades, Inc. | (11,557 | ) | (113,622 | ) | 126.7 | |||||||
Choice Properties Real Estate Investment Trust | (2,246 | ) | (26,540 | ) | 29.6 | |||||||
City Office REIT, Inc. | (738 | ) | (10,952 | ) | 12.2 | |||||||
Cogeco Communications Inc. | (1,226 | ) | (100,683 | ) | 112.3 | |||||||
Cogeco, Inc. | (3,701 | ) | (220,392 | ) | 245.7 | |||||||
Converge Technology Solutions Corp. | (11,688 | ) | (78,517 | ) | 87.6 | |||||||
Dream Office Real Estate Investment Trust | (715 | ) | (14,471 | ) | 16.1 | |||||||
Dye & Durham Ltd. | (9,339 | ) | (154,190 | ) | 171.9 | |||||||
ECN Capital Corp. | (8,263 | ) | (37,435 | ) | 41.7 | |||||||
Enthusiast Gaming Holdings, Inc. | (48,808 | ) | (94,223 | ) | 105.1 | |||||||
Exchange Income Corp. | (7,877 | ) | (254,156 | ) | 283.4 | |||||||
Extendicare, Inc. | (125,854 | ) | (712,224 | ) | 794.1 | |||||||
Fiera Capital Corp. | (2,608 | ) | (19,916 | ) | 22.2 | |||||||
GDI Integrated Facility Services, Inc. | (1,835 | ) | (61,907 | ) | 69.0 | |||||||
HLS Therapeutics, Inc. | (30,956 | ) | (330,127 | ) | 368.1 | |||||||
Hut 8 Mining Corp. | (46,669 | ) | (166,383 | ) | 185.5 | |||||||
Interfor Corp. | (7,756 | ) | (221,091 | ) | 246.5 | |||||||
Largo, Inc. | (5,958 | ) | (49,810 | ) | 55.5 | |||||||
Lassonde Industries, Inc., Class A | (1,828 | ) | (195,600 | ) | 218.1 | |||||||
LifeWorks, Inc. | (7,092 | ) | (104,339 | ) | 116.3 | |||||||
Linamar Corp. | (309 | ) | (12,238 | ) | 13.6 | |||||||
Maple Leaf Foods, Inc. | (1,879 | ) | (41,379 | ) | 46.1 | |||||||
Martinrea International, Inc. | (17,595 | ) | (105,051 | ) | 117.1 | |||||||
MDA Ltd. | (6,745 | ) | (46,414 | ) | 51.8 | |||||||
Meta Materials, Inc. | (14,468 | ) | (17,362 | ) | 19.4 | |||||||
MTY Food Group, Inc. | (8,037 | ) | (324,883 | ) | 362.3 | |||||||
Mullen Group Ltd. | (5,144 | ) | (49,212 | ) | 54.9 | |||||||
Neighbourly Pharmacy, Inc. | (1,047 | ) | (19,764 | ) | 22.0 | |||||||
North West Co., Inc. | (22,340 | ) | (623,082 | ) | 694.8 | |||||||
Orla Mining Ltd. | (6,855 | ) | (29,082 | ) | 32.4 | |||||||
Peyto Exploration & Development Corp. | (3,557 | ) | (36,244 | ) | 40.4 | |||||||
Sleep Country Canada Holdings, Inc. | (11,931 | ) | (231,812 | ) | 258.5 | |||||||
Stella-Jones, Inc. | (2,022 | ) | (55,876 | ) | 62.3 | |||||||
Superior Plus Corp. | (15,964 | ) | (140,795 | ) | 157.0 | |||||||
Timbercreek Financial Corp. | (32,822 | ) | (232,755 | ) | 259.5 | |||||||
TransAlta Renewables, Inc. | (10,779 | ) | (149,521 | ) | 166.7 | |||||||
Winpak Ltd. | (7,123 | ) | (235,594 | ) | 262.7 | |||||||
Xenon Pharmaceuticals, Inc. | (1,992 | ) | (56,314 | ) | 62.8 | |||||||
|
|
|
| |||||||||
| (6,308,319 | ) | |||||||||||
| Cayman Islands | ||||||||||||
Theravance Biopharma, Inc. | (3,045 | ) | (29,384 | ) | 32.8 | |||||||
|
|
|
| |||||||||
| Costa Rica | ||||||||||||
Establishment Labs Holdings, Inc. | (157 | ) | (11,109 | ) | 12.4 | |||||||
|
|
|
| |||||||||
| Denmark | ||||||||||||
Chemometec A/S | (540 | ) | (61,043 | ) | 68.1 | |||||||
Dfds A/S | (3,779 | ) | (146,348 | ) | 163.2 | |||||||
| Security | Shares | Value | % of Basket Value | |||||||||
| Denmark (continued) | ||||||||||||
Matas A/S | (3,406 | ) | $ | (47,410 | ) | 52.9 | % | |||||
Netcompany Group A/S | (3,506 | ) | (194,976 | ) | 217.4 | |||||||
Ringkjoebing Landbobank A/S | (7,504 | ) | (920,202 | ) | 1,026.0 | |||||||
Scandinavian Tobacco Group A/S | (4,851 | ) | (101,123 | ) | 112.7 | |||||||
Sydbank A/S | (3,955 | ) | (135,945 | ) | 151.6 | |||||||
Topdanmark A/S | (1,243 | ) | (69,949 | ) | 78.0 | |||||||
Zealand Pharma A/S | (7,679 | ) | (86,581 | ) | 96.5 | |||||||
|
|
|
| |||||||||
| (1,763,577 | ) | |||||||||||
| Finland | ||||||||||||
Aktia Bank OYJ | (12,553 | ) | (127,284 | ) | 141.9 | |||||||
Kamux Corp. | (2,359 | ) | (23,873 | ) | 26.6 | |||||||
Kemira OYJ | (4,864 | ) | (63,802 | ) | 71.1 | |||||||
Metsa Board OYJ, Class B | (37,344 | ) | (402,449 | ) | 448.8 | |||||||
Remedy Entertainment OYJ | (477 | ) | (15,702 | ) | 17.5 | |||||||
Sanoma OYJ | (31,584 | ) | (398,970 | ) | 444.9 | |||||||
|
|
|
| |||||||||
| (1,032,080 | ) | |||||||||||
| France | ||||||||||||
ABC arbitrage | (792 | ) | (6,099 | ) | 6.8 | |||||||
Altarea SCA | (370 | ) | (56,631 | ) | 63.1 | |||||||
Aramis Group SAS | (15,529 | ) | (90,427 | ) | 100.8 | |||||||
Cellectis SA | (3,488 | ) | (12,379 | ) | 13.8 | |||||||
Derichebourg SA | (19,111 | ) | (172,464 | ) | 192.3 | |||||||
Eutelsat Communications SA | (1,365 | ) | (15,170 | ) | 16.9 | |||||||
Maisons du Monde SA | (12,818 | ) | (218,608 | ) | 243.8 | |||||||
McPhy Energy SA | (341 | ) | (6,229 | ) | 6.9 | |||||||
Mercialys SA | (9,630 | ) | (92,996 | ) | 103.7 | |||||||
Metropole Television SA | (4,164 | ) | (77,272 | ) | 86.2 | |||||||
Sopra Steria Group SACA | (144 | ) | (25,521 | ) | 28.5 | |||||||
SPIE SA | (509 | ) | (11,980 | ) | 13.4 | |||||||
Trigano SA | (1,256 | ) | (161,825 | ) | 180.4 | |||||||
Verallia SA | (1,465 | ) | (40,272 | ) | 44.9 | |||||||
Voltalia SA | (10,930 | ) | (230,855 | ) | 257.4 | |||||||
|
|
|
| |||||||||
| (1,218,728 | ) | |||||||||||
| Germany | ||||||||||||
Aareal Bank AG | (1,894 | ) | (64,536 | ) | 72.0 | |||||||
AURELIUS Equity Opportunities SE & Co. KGaA | (296 | ) | (7,886 | ) | 8.8 | |||||||
BayWa AG | (2,772 | ) | (132,191 | ) | 147.4 | |||||||
CECONOMY AG | (29,902 | ) | (102,449 | ) | 114.2 | |||||||
Hamborner REIT AG | (20,991 | ) | (195,915 | ) | 218.4 | |||||||
Heidelberger Druckmaschinen AG | (2,439 | ) | (5,389 | ) | 6.0 | |||||||
Home24 SE | (14,811 | ) | (86,765 | ) | 96.7 | |||||||
Hornbach Holding AG & Co. KGaA | (1,924 | ) | (230,310 | ) | 256.8 | |||||||
Indus Holding AG | (3,985 | ) | (113,365 | ) | 126.4 | |||||||
Instone Real Estate Group AG | (6,667 | ) | (102,352 | ) | 114.1 | |||||||
New Work SE | (55 | ) | (9,399 | ) | 10.5 | |||||||
PATRIZIA AG | (1,750 | ) | (30,018 | ) | 33.5 | |||||||
PNE AG | (311 | ) | (3,950 | ) | 4.4 | |||||||
Secunet Security Networks AG | (102 | ) | (43,185 | ) | 48.2 | |||||||
SGL Carbon SE | (21,101 | ) | (115,858 | ) | 129.2 | |||||||
Takkt AG | (6,795 | ) | (109,783 | ) | 122.4 | |||||||
Westwing Group AG | (10,351 | ) | (117,715 | ) | 131.3 | |||||||
Zeal Network SE | (1,283 | ) | (49,944 | ) | 55.7 | |||||||
|
|
|
| |||||||||
| (1,521,010 | ) | |||||||||||
| Hong Kong | ||||||||||||
Hongkong & Shanghai Hotels Ltd. | (40,500 | ) | (40,206 | ) | 44.8 | |||||||
SCHEDULE OF INVESTMENTS | 43 |
Schedule of Investments (continued) April 30, 2022 | BlackRock Global Long/Short Equity Fund |
| Security | Shares | Value | % of Basket Value | |||||||||
| Hong Kong (continued) | ||||||||||||
Prosperity REIT | (223,000 | ) | $ | (76,446 | ) | 85.3 | % | |||||
SUNeVision Holdings Ltd. | (1,000 | ) | (831 | ) | 0.9 | |||||||
|
|
|
| |||||||||
| (117,483 | ) | |||||||||||
| Ireland | ||||||||||||
C&C Group PLC | (34,085 | ) | (88,978 | ) | 99.2 | |||||||
Cairn Homes PLC | (119,996 | ) | (144,697 | ) | 161.4 | |||||||
COSMO Pharmaceuticals NV | (1,263 | ) | (72,231 | ) | 80.5 | |||||||
Glenveagh Properties PLC | (19,812 | ) | (23,908 | ) | 26.7 | |||||||
Hibernia REIT PLC | (59,909 | ) | (102,512 | ) | 114.3 | |||||||
|
|
|
| |||||||||
| (432,326 | ) | |||||||||||
| Israel | ||||||||||||
Cellcom Israel Ltd. | (26,889 | ) | (155,983 | ) | 173.9 | |||||||
Doral Group Renewable Energy Resources Ltd. | (104,434 | ) | (400,830 | ) | 446.9 | |||||||
Gilat Satellite Networks Ltd. | (8,726 | ) | (63,801 | ) | 71.2 | |||||||
JFrog Ltd. | (519 | ) | (10,832 | ) | 12.1 | |||||||
Nano Dimension Ltd., ADR | (109,265 | ) | (310,313 | ) | 346.0 | |||||||
Naphtha Israel Petroleum Corp. Ltd. | (29,630 | ) | (235,440 | ) | 262.5 | |||||||
NEOGAMES SA | (8,088 | ) | (105,710 | ) | 117.9 | |||||||
Perion Network Ltd. | (8,037 | ) | (171,840 | ) | 191.6 | |||||||
Plus500 Ltd. | (18,389 | ) | (358,087 | ) | 399.3 | |||||||
Riskified Ltd., Class A | (28,380 | ) | (148,427 | ) | 165.5 | |||||||
|
|
|
| |||||||||
| (1,961,263 | ) | |||||||||||
| Italy | ||||||||||||
Anima Holding SpA | (2,145 | ) | (10,452 | ) | 11.7 | |||||||
Banca Popolare di Sondrio SCPA | (91,887 | ) | (364,924 | ) | 406.9 | |||||||
Credito Emiliano SpA | (73,839 | ) | (451,093 | ) | 503.0 | |||||||
Digital Bros SpA | (2,585 | ) | (65,663 | ) | 73.2 | |||||||
doValue SpA | (49,661 | ) | (422,256 | ) | 470.8 | |||||||
Enav SpA | (34,127 | ) | (157,546 | ) | 175.7 | |||||||
Fila SpA | (2,179 | ) | (21,673 | ) | 24.2 | |||||||
Freni Brembo SpA | (7,800 | ) | (78,068 | ) | 87.0 | |||||||
Gruppo MutuiOnline SpA | (3,732 | ) | (114,283 | ) | 127.4 | |||||||
GVS SpA | (39,565 | ) | (329,544 | ) | 367.4 | |||||||
Illimity Bank SpA | (602 | ) | (7,881 | ) | 8.8 | |||||||
RAI Way SpA | (34,301 | ) | (201,670 | ) | 224.9 | |||||||
Zignago Vetro SpA | (171 | ) | (2,097 | ) | 2.3 | |||||||
|
|
|
| |||||||||
| (2,227,150 | ) | |||||||||||
| Japan | ||||||||||||
ADEKA Corp. | (47,200 | ) | (905,210 | ) | 1,009.3 | |||||||
Aeon Hokkaido Corp. | (31,700 | ) | (254,157 | ) | 283.4 | |||||||
Aichi Corp. | (14,300 | ) | (99,506 | ) | 111.0 | |||||||
Aiful Corp. | (79,100 | ) | (225,460 | ) | 251.4 | |||||||
Airtrip Corp. | (25,200 | ) | (614,151 | ) | 684.8 | |||||||
Alpen Co. Ltd. | (17,300 | ) | (262,234 | ) | 292.4 | |||||||
Alpha Systems, Inc. | (1,200 | ) | (35,475 | ) | 39.6 | |||||||
Arcland Sakamoto Co. Ltd. | (1,800 | ) | (21,546 | ) | 24.0 | |||||||
Atom Corp. | (23,900 | ) | (136,191 | ) | 151.9 | |||||||
Autobacs Seven Co. Ltd. | (5,200 | ) | (54,751 | ) | 61.0 | |||||||
Awa Bank Ltd. | (11,600 | ) | (191,462 | ) | 213.5 | |||||||
Axial Retailing, Inc. | (500 | ) | (13,094 | ) | 14.6 | |||||||
BML, Inc. | (38,700 | ) | (995,967 | ) | 1,110.5 | |||||||
Bunka Shutter Co. Ltd. | (2,400 | ) | (18,037 | ) | 20.1 | |||||||
Bushiroad, Inc. | (15,400 | ) | (181,436 | ) | 202.3 | |||||||
CellSource Co. Ltd. | (7,500 | ) | (217,007 | ) | 242.0 | |||||||
Central Glass Co. Ltd. | (3,100 | ) | (57,083 | ) | 63.6 | |||||||
Chiyoda Corp. | (45,600 | ) | (150,770 | ) | 168.1 | |||||||
Citizen Watch Co. Ltd. | (2,000 | ) | (7,548 | ) | 8.4 | |||||||
Comforia Residential REIT, Inc. | (4 | ) | (9,967 | ) | 11.1 | |||||||
| Security | Shares | Value | % of Basket Value | |||||||||
| Japan (continued) | ||||||||||||
Daiichi Jitsugyo Co. Ltd. | (11,300 | ) | $ | (328,114 | ) | 365.9 | % | |||||
Daishi Hokuetsu Financial Group, Inc. | (21,600 | ) | (417,795 | ) | 465.9 | |||||||
Daiwabo Holdings Co. Ltd. | (13,400 | ) | (173,393 | ) | 193.3 | |||||||
Demae-Can Co. Ltd. | (29,600 | ) | (121,823 | ) | 135.8 | |||||||
Digital Garage, Inc. | (600 | ) | (19,857 | ) | 22.1 | |||||||
DTS Corp. | (1,700 | ) | (37,300 | ) | 41.6 | |||||||
Duskin Co. Ltd. | (11,000 | ) | (234,648 | ) | 261.6 | |||||||
EM Systems Co. Ltd. | (37,100 | ) | (263,763 | ) | 294.1 | |||||||
eRex Co. Ltd. | (7,700 | ) | (116,552 | ) | 130.0 | |||||||
ESPEC Corp. | (2,000 | ) | (26,553 | ) | 29.6 | |||||||
Exedy Corp. | (10,100 | ) | (120,272 | ) | 134.1 | |||||||
Financial Products Group Co. Ltd. | (2,700 | ) | (16,523 | ) | 18.4 | |||||||
Fuji Soft, Inc. | (1,200 | ) | (63,957 | ) | 71.3 | |||||||
Fujikura Ltd. | (45,400 | ) | (214,764 | ) | 239.5 | |||||||
Fukushima Galilei Co. Ltd. | (6,100 | ) | (176,675 | ) | 197.0 | |||||||
Geo Holdings Corp. | (700 | ) | (6,788 | ) | 7.6 | |||||||
GLOBERIDE, Inc. | (17,500 | ) | (353,115 | ) | 393.7 | |||||||
GMO Financial Gate, Inc. | (1,400 | ) | (137,322 | ) | 153.1 | |||||||
GNI Group Ltd. | (3,500 | ) | (30,706 | ) | 34.2 | |||||||
G-Tekt Corp. | (1,600 | ) | (15,400 | ) | 17.2 | |||||||
H2O Retailing Corp. | (1,900 | ) | (12,428 | ) | 13.9 | |||||||
Hankyu Hanshin REIT, Inc. | (244 | ) | (277,285 | ) | 309.2 | |||||||
HEALIOS KK | (7,100 | ) | (40,380 | ) | 45.0 | |||||||
Hennge KK | (1,100 | ) | (8,631 | ) | 9.6 | |||||||
Hiday Hidaka Corp. | (4,100 | ) | (58,667 | ) | 65.4 | |||||||
Hirata Corp. | (1,800 | ) | (66,140 | ) | 73.7 | |||||||
Hitachi Zosen Corp. | (2,900 | ) | (15,649 | ) | 17.5 | |||||||
Hogy Medical Co. Ltd. | (1,200 | ) | (29,968 | ) | 33.4 | |||||||
Hokkaido Electric Power Co., Inc. | (3,800 | ) | (14,106 | ) | 15.7 | |||||||
Hokkoku Financial Holdings, Inc. | (1,700 | ) | (49,041 | ) | 54.7 | |||||||
Hokuetsu Corp. | (115,700 | ) | (592,734 | ) | 660.9 | |||||||
Hokuhoku Financial Group, Inc. | (14,500 | ) | (98,120 | ) | 109.4 | |||||||
Hokuriku Electric Power Co. | (34,600 | ) | (137,257 | ) | 153.0 | |||||||
Hokuto Corp. | (4,400 | ) | (69,110 | ) | 77.1 | |||||||
Hosiden Corp. | (1,600 | ) | (15,258 | ) | 17.0 | |||||||
Hosokawa Micron Corp. | (2,900 | ) | (54,978 | ) | 61.3 | |||||||
Hyakugo Bank Ltd. | (146,200 | ) | (386,925 | ) | 431.4 | |||||||
Ichibanya Co. Ltd. | (3,800 | ) | (141,195 | ) | 157.4 | |||||||
Ichigo, Inc. | (128,800 | ) | (288,837 | ) | 322.1 | |||||||
Idec Corp. | (6,300 | ) | (111,202 | ) | 124.0 | |||||||
Inaba Denki Sangyo Co. Ltd. | (3,300 | ) | (64,721 | ) | 72.2 | |||||||
Inabata & Co. Ltd. | (3,800 | ) | (62,182 | ) | 69.3 | |||||||
Invincible Investment Corp. | (332 | ) | (108,257 | ) | 120.7 | |||||||
Itochu-Shokuhin Co. Ltd. | (2,800 | ) | (106,910 | ) | 119.2 | |||||||
Jaccs Co. Ltd. | (21,400 | ) | (541,160 | ) | 603.4 | |||||||
Japan Material Co. Ltd. | (2,000 | ) | (30,216 | ) | 33.7 | |||||||
Japan Petroleum Exploration Co. Ltd. | (600 | ) | (11,960 | ) | 13.3 | |||||||
JM Holdings Co. Ltd. | (1,100 | ) | (13,765 | ) | 15.3 | |||||||
Joyful Honda Co. Ltd. | (2,000 | ) | (23,986 | ) | 26.7 | |||||||
Kameda Seika Co. Ltd. | (13,400 | ) | (436,149 | ) | 486.3 | |||||||
Kanematsu Electronics Ltd. | (5,400 | ) | (161,356 | ) | 179.9 | |||||||
Kanto Denka Kogyo Co. Ltd. | (27,700 | ) | (208,974 | ) | 233.0 | |||||||
Kappa Create Co. Ltd. | (21,100 | ) | (217,651 | ) | 242.7 | |||||||
Katakura Industries Co. Ltd. | (9,100 | ) | (176,675 | ) | 197.0 | |||||||
Keiyo Bank Ltd. | (28,800 | ) | (109,753 | ) | 122.4 | |||||||
Keiyo Co. Ltd. | (96,100 | ) | (678,250 | ) | 756.3 | |||||||
KFC Holdings Japan Ltd. | (19,300 | ) | (422,904 | ) | 471.5 | |||||||
Kintetsu World Express, Inc. | (7,100 | ) | (169,140 | ) | 188.6 | |||||||
Kisoji Co. Ltd. | (11,900 | ) | (189,342 | ) | 211.1 | |||||||
Kissei Pharmaceutical Co. Ltd. | (500 | ) | (9,894 | ) | 11.0 | |||||||
Ki-Star Real Estate Co. Ltd. | (3,900 | ) | (160,869 | ) | 179.4 | |||||||
| 44 | 2 0 2 2 BLACK ROCK ANNUAL REPORT TO SHAREHOLDERS |
Schedule of Investments (continued) April 30, 2022 | BlackRock Global Long/Short Equity Fund |
| Security | Shares | Value | % of Basket Value | |||||||||
| Japan (continued) | ||||||||||||
Kitanotatsujin Corp. | (43,200 | ) | $ | (56,848 | ) | 63.4 | % | |||||
Kiyo Bank Ltd. | (30,300 | ) | (332,354 | ) | 370.6 | |||||||
Koa Corp. | (8,800 | ) | (102,567 | ) | 114.4 | |||||||
Kohnan Shoji Co. Ltd. | (2,600 | ) | (75,297 | ) | 84.0 | |||||||
Koshidaka Holdings Co. Ltd. | (1,200 | ) | (7,161 | ) | 8.0 | |||||||
Kureha Corp. | (5,400 | ) | (405,705 | ) | 452.4 | |||||||
KYB Corp. | (12,600 | ) | (285,201 | ) | 318.0 | |||||||
KYORIN Holdings, Inc. | (39,100 | ) | (568,607 | ) | 634.0 | |||||||
Leopalace21 Corp. | (276,000 | ) | (415,159 | ) | 462.9 | |||||||
Maruha Nichiro Corp. | (10,600 | ) | (195,083 | ) | 217.5 | |||||||
Maruwa Co. Ltd/Aichi | (200 | ) | (23,319 | ) | 26.0 | |||||||
Matsuya Co. Ltd. | (77,500 | ) | (425,122 | ) | 474.0 | |||||||
Matsuyafoods Holdings Co. Ltd. | (10,000 | ) | (291,941 | ) | 325.5 | |||||||
MCJ Co. Ltd. | (3,100 | ) | (20,276 | ) | 22.6 | |||||||
Medley, Inc. | (24,200 | ) | (446,970 | ) | 498.4 | |||||||
MedPeer, Inc. | (6,000 | ) | (137,342 | ) | 153.1 | |||||||
Meidensha Corp. | (400 | ) | (7,244 | ) | 8.1 | |||||||
Meiko Electronics Co. Ltd. | (1,400 | ) | (37,024 | ) | 41.3 | |||||||
Meitec Corp. | (3,100 | ) | (164,548 | ) | 183.5 | |||||||
Mie Kotsu Group Holdings, Inc. | (47,000 | ) | (166,210 | ) | 185.3 | |||||||
Mitani Sekisan Co. Ltd. | (2,400 | ) | (95,651 | ) | 106.7 | |||||||
Mitsubishi Shokuhin Co. Ltd. | (300 | ) | (7,436 | ) | 8.3 | |||||||
Mitsuuroko Group Holdings Co. Ltd. | (2,100 | ) | (16,242 | ) | 18.1 | |||||||
Mochida Pharmaceutical Co. Ltd. | (2,400 | ) | (68,362 | ) | 76.2 | |||||||
Modec, Inc. | (14,800 | ) | (138,767 | ) | 154.7 | |||||||
MOS Food Services, Inc. | (3,400 | ) | (77,908 | ) | 86.9 | |||||||
Musashi Seimitsu Industry Co. Ltd. | (21,600 | ) | (219,511 | ) | 244.8 | |||||||
Musashino Bank Ltd. | (9,300 | ) | (127,208 | ) | 141.8 | |||||||
Nanto Bank Ltd. | (7,600 | ) | (118,906 | ) | 132.6 | |||||||
Nichiden Corp. | (8,300 | ) | (138,294 | ) | 154.2 | |||||||
Nihon Chouzai Co. Ltd. | (3,100 | ) | (30,159 | ) | 33.6 | |||||||
Nippon Carbon Co. Ltd. | (8,800 | ) | (282,714 | ) | 315.2 | |||||||
Nippon Kanzai Co. Ltd. | (2,500 | ) | (53,720 | ) | 59.9 | |||||||
Nippon Light Metal Holdings Co. Ltd. | (1,000 | ) | (12,812 | ) | 14.3 | |||||||
Nippon Road Co. Ltd. | (1,500 | ) | (83,619 | ) | 93.2 | |||||||
Nippon Sheet Glass Co. Ltd. | (61,900 | ) | (187,203 | ) | 208.7 | |||||||
Nippon Steel Trading Corp. | (200 | ) | (8,139 | ) | 9.1 | |||||||
Nishimatsuya Chain Co. Ltd. | (6,500 | ) | (79,776 | ) | 89.0 | |||||||
Nissei ASB Machine Co. Ltd. | (600 | ) | (13,682 | ) | 15.3 | |||||||
Nisshinbo Holdings, Inc. | (14,100 | ) | (105,497 | ) | 117.6 | |||||||
Nissin Electric Co. Ltd. | (16,700 | ) | (178,067 | ) | 198.6 | |||||||
Noritake Co. Ltd/Nagoya Japan | (200 | ) | (6,351 | ) | 7.1 | |||||||
Noritz Corp. | (1,400 | ) | (16,213 | ) | 18.1 | |||||||
North Pacific Bank Ltd. | (13,700 | ) | (25,977 | ) | 29.0 | |||||||
NTT UD REIT Investment Corp. | (27 | ) | (31,187 | ) | 34.8 | |||||||
Ogaki Kyoritsu Bank Ltd. | (21,300 | ) | (312,178 | ) | 348.1 | |||||||
Ohsho Food Service Corp. | (1,900 | ) | (89,216 | ) | 99.5 | |||||||
Oisix ra daichi, Inc. | (3,500 | ) | (71,925 | ) | 80.2 | |||||||
Open Door, Inc. | (500 | ) | (7,224 | ) | 8.1 | |||||||
Organo Corp. | (100 | ) | (6,862 | ) | 7.7 | |||||||
PAL GROUP Holdings Co. Ltd. | (1,400 | ) | (15,624 | ) | 17.4 | |||||||
Pasona Group, Inc. | (4,300 | ) | (68,180 | ) | 76.0 | |||||||
Pilot Corp. | (13,700 | ) | (556,616 | ) | 620.6 | |||||||
Piolax, Inc. | (9,300 | ) | (108,498 | ) | 121.0 | |||||||
Plaid, Inc. | (27,500 | ) | (246,321 | ) | 274.7 | |||||||
Plenus Co. Ltd. | (10,900 | ) | (160,109 | ) | 178.5 | |||||||
Pressance Corp. | (24,800 | ) | (297,718 | ) | 332.0 | |||||||
Qol Holdings Co. Ltd. | (29,200 | ) | (245,782 | ) | 274.1 | |||||||
Raito Kogyo Co. Ltd. | (400 | ) | (5,972 | ) | 6.7 | |||||||
Riken Keiki Co. Ltd. | (7,300 | ) | (229,777 | ) | 256.2 | |||||||
Riken Vitamin Co. Ltd. | (1,000 | ) | (13,145 | ) | 14.7 | |||||||
| Security | Shares | Value | % of Basket Value | |||||||||
| Japan (continued) | ||||||||||||
Ringer Hut Co. Ltd. | (4,000 | ) | $ | (69,191 | ) | 77.2 | % | |||||
Riso Kagaku Corp. | (7,400 | ) | (138,949 | ) | 154.9 | |||||||
Roland Corp. | (2,400 | ) | (82,824 | ) | 92.4 | |||||||
RS Technologies Co. Ltd. | (5,000 | ) | (230,235 | ) | 256.7 | |||||||
Saibu Gas Co. Ltd. | (17,700 | ) | (290,509 | ) | 323.9 | |||||||
Sakata Seed Corp. | (1,100 | ) | (37,039 | ) | 41.3 | |||||||
SanBio Co. Ltd. | (13,700 | ) | (116,533 | ) | 129.9 | |||||||
San-In Godo Bank Ltd. | (2,400 | ) | (11,915 | ) | 13.3 | |||||||
Sanki Engineering Co. Ltd. | (2,100 | ) | (23,788 | ) | 26.5 | |||||||
Septeni Holdings Co. Ltd. | (36,800 | ) | (186,283 | ) | 207.7 | |||||||
Shiga Bank Ltd. | (12,900 | ) | (242,578 | ) | 270.5 | |||||||
Shima Seiki Manufacturing Ltd. | (9,600 | ) | (136,968 | ) | 152.7 | |||||||
Shinmaywa Industries Ltd. | (900 | ) | (6,313 | ) | 7.0 | |||||||
Showa Sangyo Co. Ltd. | (800 | ) | (16,183 | ) | 18.0 | |||||||
Sinko Industries Ltd. | (6,600 | ) | (82,954 | ) | 92.5 | |||||||
SRE Holdings Corp. | (5,000 | ) | (103,146 | ) | 115.0 | |||||||
Starts Proceed Investment Corp. | (76 | ) | (136,154 | ) | 151.8 | |||||||
Tadano Ltd. | (43,400 | ) | (308,304 | ) | 343.8 | |||||||
Taiyo Holdings Co. Ltd. | (4,700 | ) | (112,129 | ) | 125.0 | |||||||
Takasago International Corp. | (6,900 | ) | (139,150 | ) | 155.2 | |||||||
Taki Chemical Co. Ltd. | (2,300 | ) | (90,783 | ) | 101.2 | |||||||
Tama Home Co. Ltd. | (27,200 | ) | (530,767 | ) | 591.8 | |||||||
TechMatrix Corp. | (5,800 | ) | (89,492 | ) | 99.8 | |||||||
Tenma Corp. | (1,500 | ) | (25,532 | ) | 28.5 | |||||||
TKC Corp. | (600 | ) | (15,760 | ) | 17.6 | |||||||
TOC Co. Ltd. | (9,100 | ) | (46,871 | ) | 52.3 | |||||||
Tocalo Co. Ltd. | (7,800 | ) | (77,881 | ) | 86.8 | |||||||
Toei Co. Ltd. | (3,700 | ) | (490,745 | ) | 547.2 | |||||||
Toho Holdings Co. Ltd. | (2,500 | ) | (40,582 | ) | 45.3 | |||||||
Toho Titanium Co. Ltd. | (2,800 | ) | (31,999 | ) | 35.7 | |||||||
TOKAI Holdings Corp. | (16,400 | ) | (110,234 | ) | 122.9 | |||||||
Tokyo Seimitsu Co. Ltd. | (3,600 | ) | (123,843 | ) | 138.1 | |||||||
Tokyu Construction Co. Ltd. | (2,400 | ) | (11,130 | ) | 12.4 | |||||||
TOMONY Holdings, Inc. | (106,100 | ) | (268,353 | ) | 299.2 | |||||||
Tomy Co. Ltd. | (44,000 | ) | (417,453 | ) | 465.5 | |||||||
Toyo Tanso Co. Ltd. | (7,400 | ) | (160,799 | ) | 179.3 | |||||||
Transcosmos, Inc. | (3,400 | ) | (80,160 | ) | 89.4 | |||||||
TRE Holdings Corp. | (2,900 | ) | (46,397 | ) | 51.7 | |||||||
Tsugami Corp. | (20,400 | ) | (189,974 | ) | 211.8 | |||||||
Uchida Yoko Co. Ltd. | (1,700 | ) | (64,157 | ) | 71.5 | |||||||
Universal Entertainment Corp. | (1,600 | ) | (28,628 | ) | 31.9 | |||||||
Uzabase Inc. | (6,800 | ) | (39,576 | ) | 44.1 | |||||||
Visional, Inc. | (2,100 | ) | (115,567 | ) | 128.9 | |||||||
VT Holdings Co. Ltd. | (16,800 | ) | (59,473 | ) | 66.3 | |||||||
WealthNavi, Inc. | (5,000 | ) | (65,032 | ) | 72.5 | |||||||
West Holdings Corp. | (600 | ) | (23,667 | ) | 26.4 | |||||||
World Holdings Co. Ltd. | (4,500 | ) | (84,732 | ) | 94.5 | |||||||
Xebio Holdings Co. Ltd. | (4,700 | ) | (33,196 | ) | 37.0 | |||||||
Yodogawa Steel Works Ltd. | (2,900 | ) | (54,893 | ) | 61.2 | |||||||
Yokowo Co. Ltd. | (29,600 | ) | (580,864 | ) | 647.7 | |||||||
Yoshinoya Holdings Co. Ltd. | (6,000 | ) | (109,161 | ) | 121.7 | |||||||
|
|
|
| |||||||||
| (28,999,769 | ) | |||||||||||
| Jersey | ||||||||||||
Breedon Group PLC | (19,083 | ) | (19,005 | ) | 21.2 | |||||||
JTC PLC | (1,636 | ) | (15,886 | ) | 17.7 | |||||||
|
|
|
| |||||||||
| (34,891 | ) | |||||||||||
| Luxembourg | ||||||||||||
Global Fashion Group SA | (3,405 | ) | (6,484 | ) | 7.2 | |||||||
|
|
|
| |||||||||
SCHEDULE OF INVESTMENTS | 45 |
Schedule of Investments (continued) April 30, 2022 | BlackRock Global Long/Short Equity Fund |
| Security | Shares | Value | % of Basket Value | |||||||||
| Malta | ||||||||||||
Kindred Group PLC | (50,011 | ) | $ | (438,466 | ) | 488.9 | % | |||||
|
|
|
| |||||||||
| Netherlands | ||||||||||||
Boskalis Westminster | (10,169 | ) | (353,173 | ) | 393.8 | |||||||
CM.com NV | (437 | ) | (7,263 | ) | 8.1 | |||||||
Corbion NV | (194 | ) | (6,726 | ) | 7.5 | |||||||
Core Laboratories NV | (2,035 | ) | (52,910 | ) | 59.0 | |||||||
Eurocommercial Properties NV | (2,255 | ) | (54,562 | ) | 60.8 | |||||||
NSI NV | (2,579 | ) | (101,211 | ) | 112.9 | |||||||
SIF Holding NV | (672 | ) | (7,649 | ) | 8.5 | |||||||
Van Lanschot Kempen NV | (754 | ) | (19,635 | ) | 21.9 | |||||||
Vastned Retail NV | (61 | ) | (1,557 | ) | 1.7 | |||||||
|
|
|
| |||||||||
| (604,686 | ) | |||||||||||
| New Zealand | ||||||||||||
Synlait Milk Ltd. | (84,534 | ) | (192,650 | ) | 214.8 | |||||||
|
|
|
| |||||||||
| Norway | ||||||||||||
Aker Carbon Capture ASA | (26,323 | ) | (53,179 | ) | 59.3 | |||||||
Aker Solutions ASA | (57,347 | ) | (198,154 | ) | 220.9 | |||||||
Bonheur ASA | (5,331 | ) | (198,243 | ) | 221.0 | |||||||
Fjordkraft Holding ASA | (2,368 | ) | (5,344 | ) | 6.0 | |||||||
FREYR Battery SA | (15,321 | ) | (137,583 | ) | 153.4 | |||||||
Hexagon Composites ASA | (4,958 | ) | (19,598 | ) | 21.9 | |||||||
Hexagon Purus Holding | (54,964 | ) | (208,021 | ) | 232.0 | |||||||
Pexip Holding ASA | (16,292 | ) | (35,730 | ) | 39.8 | |||||||
Quantafuel ASA | (50,048 | ) | (82,684 | ) | 92.2 | |||||||
SpareBank 1 SR-Bank ASA | (24,359 | ) | (310,181 | ) | 345.9 | |||||||
TGS NOPEC Geophysical Co. ASA | (1,178 | ) | (18,173 | ) | 20.3 | |||||||
Wallenius Wilhelmsen ASA | (8,951 | ) | (56,183 | ) | 62.6 | |||||||
|
|
|
| |||||||||
| (1,323,073 | ) | |||||||||||
| Peru | ||||||||||||
Hochschild Mining PLC | (71,800 | ) | (105,472 | ) | 117.6 | |||||||
|
|
|
| |||||||||
| Portugal | ||||||||||||
NOS SGPS SA | (15,247 | ) | (64,477 | ) | 71.9 | |||||||
REN - Redes Energeticas Nacionais SGPS SA | (111,361 | ) | (339,518 | ) | 378.6 | |||||||
|
|
|
| |||||||||
| (403,995 | ) | |||||||||||
| Puerto Rico | ||||||||||||
EVERTEC, Inc. | (4,641 | ) | (182,855 | ) | 203.9 | |||||||
First BanCorp, Puerto Rico | (12,177 | ) | (165,729 | ) | 184.8 | |||||||
|
|
|
| |||||||||
| (348,584 | ) | |||||||||||
| Singapore | ||||||||||||
BW Energy Ltd. | (32,707 | ) | (95,202 | ) | 106.1 | |||||||
Kulicke & Soffa Industries, Inc. | (5,954 | ) | (276,325 | ) | 308.1 | |||||||
OUE Ltd. | (10,500 | ) | (10,326 | ) | 11.5 | |||||||
Razer, Inc. | (319,000 | ) | (115,336 | ) | 128.6 | |||||||
Yanlord Land Group Ltd. | (1,600 | ) | (1,402 | ) | 1.6 | |||||||
|
|
|
| |||||||||
| (498,591 | ) | |||||||||||
| South Africa | ||||||||||||
Mediclinic International PLC | (71,744 | ) | (332,601 | ) | 370.9 | |||||||
|
|
|
| |||||||||
| South Sandwich Islands | ||||||||||||
Burford Capital Ltd. | (82,995 | ) | (709,661 | ) | 791.3 | |||||||
|
|
|
| |||||||||
| Spain | ||||||||||||
Applus Services SA | (8,343 | ) | (65,307 | ) | 72.8 | |||||||
Cia de Distribucion Integral Logista Holdings SA | (487 | ) | (8,973 | ) | 10.0 | |||||||
CIE Automotive SA | (4,265 | ) | (92,985 | ) | 103.7 | |||||||
Construcciones y Auxiliar de Ferrocarriles SA | (7,883 | ) | (241,694 | ) | 269.5 | |||||||
Corp. Financiera Alba SA | (1,231 | ) | (72,745 | ) | 81.1 | |||||||
| Security | Shares | Value | % of Basket Value | |||||||||
| Spain (continued) | ||||||||||||
Ebro Foods SA | (1,646 | ) | $ | (29,594 | ) | 33.0 | % | |||||
Global Dominion Access SA | (16,299 | ) | (67,393 | ) | 75.1 | |||||||
Grupo Catalana Occidente SA | (2 | ) | (58 | ) | 0.1 | |||||||
Metrovacesa SA | (338 | ) | (2,710 | ) | 3.0 | |||||||
Soltec Power Holdings SA | (48,956 | ) | (209,186 | ) | 233.3 | |||||||
|
|
|
| |||||||||
| (790,645 | ) | |||||||||||
| Sweden | ||||||||||||
BHG Group AB | (50,538 | ) | (347,970 | ) | 388.0 | |||||||
BICO Group AB | (6,095 | ) | (61,123 | ) | 68.2 | |||||||
Boozt AB | (41,127 | ) | (431,852 | ) | 481.5 | |||||||
Bure Equity AB | (696 | ) | (16,413 | ) | 18.3 | |||||||
Cint Group AB | (17,842 | ) | (145,922 | ) | 162.7 | |||||||
Desenio Group AB | (57,696 | ) | (32,112 | ) | 35.8 | |||||||
Duni AB | (7,137 | ) | (65,341 | ) | 72.9 | |||||||
Electrolux Professional AB, Class B | (5,817 | ) | (32,605 | ) | 36.4 | |||||||
Granges AB | (34,063 | ) | (279,755 | ) | 311.9 | |||||||
Hexpol AB | (5,123 | ) | (43,987 | ) | 49.1 | |||||||
Intrum AB | (3,890 | ) | (94,033 | ) | 104.9 | |||||||
Karo Pharma AB | (10,530 | ) | (60,588 | ) | 67.6 | |||||||
MIPS AB | (190 | ) | (13,494 | ) | 15.0 | |||||||
Munters Group AB | (12,403 | ) | (74,096 | ) | 82.6 | |||||||
NCC AB, B Shares | (1,724 | ) | (21,361 | ) | 23.8 | |||||||
New Wave Group AB, B Shares | (461 | ) | (8,103 | ) | 9.0 | |||||||
Nordic Entertainment Group AB, Class B | (314 | ) | (10,311 | ) | 11.5 | |||||||
Pandox AB | (587 | ) | (8,178 | ) | 9.1 | |||||||
Paradox Interactive AB | (5,263 | ) | (87,794 | ) | 97.9 | |||||||
Ratos AB, B Shares | (1,396 | ) | (7,211 | ) | 8.0 | |||||||
Samhallsbyggnadsbolaget i Norden AB | (16,722 | ) | (43,867 | ) | 48.9 | |||||||
SSAB AB, B Shares | (2,450 | ) | (14,408 | ) | 16.1 | |||||||
Tobii Dynavox AB | (14,139 | ) | (36,610 | ) | 40.8 | |||||||
Vimian Group AB | (827 | ) | (5,133 | ) | 5.7 | |||||||
Wallenstam AB, B Shares | (2,752 | ) | (30,428 | ) | 33.9 | |||||||
Wihlborgs Fastigheter AB | (6,367 | ) | (110,389 | ) | 123.1 | |||||||
Xvivo Perfusion AB | (393 | ) | (8,472 | ) | 9.4 | |||||||
|
|
|
| |||||||||
| (2,091,556 | ) | |||||||||||
| Switzerland | ||||||||||||
Bobst Group SA | (330 | ) | (27,835 | ) | 31.0 | |||||||
Burckhardt Compression Holding AG | (26 | ) | (13,264 | ) | 14.8 | |||||||
Cembra Money Bank AG | (3,303 | ) | (238,328 | ) | 265.7 | |||||||
dormakaba Holding AG | (16 | ) | (7,426 | ) | 8.3 | |||||||
EFG International AG | (866 | ) | (6,528 | ) | 7.3 | |||||||
Forbo Holding AG | (217 | ) | (317,662 | ) | 354.2 | |||||||
Galenica AG | (8,302 | ) | (611,338 | ) | 681.7 | |||||||
Interroll Holding AG | (6 | ) | (18,188 | ) | 20.3 | |||||||
Komax Holding AG | (23 | ) | (6,042 | ) | 6.7 | |||||||
Leonteq AG | (158 | ) | (10,749 | ) | 12.0 | |||||||
Medmix AG | (194 | ) | (6,515 | ) | 7.3 | |||||||
Meyer Burger Technology AG | (1,175,921 | ) | (557,195 | ) | 621.3 | |||||||
Mobilezone Holding AG | (5,475 | ) | (88,652 | ) | 98.8 | |||||||
Mobimo Holding AG | (294 | ) | (84,082 | ) | 93.7 | |||||||
Montana Aerospace AG | (1,630 | ) | (24,850 | ) | 27.7 | |||||||
OC Oerlikon Corp. AG | (1,202 | ) | (8,571 | ) | 9.6 | |||||||
Peach Property Group AG | (109 | ) | (5,611 | ) | 6.2 | |||||||
PolyPeptide Group AG | (470 | ) | (41,130 | ) | 45.9 | |||||||
Rieter Holding AG | (50 | ) | (6,797 | ) | 7.6 | |||||||
SFS Group AG | (678 | ) | (84,908 | ) | 94.7 | |||||||
Siegfried Holding AG | (11 | ) | (7,974 | ) | 8.9 | |||||||
St Galler Kantonalbank AG | (519 | ) | (250,289 | ) | 279.1 | |||||||
| 46 | 2 0 2 2 BLACK ROCK ANNUAL REPORT TO SHAREHOLDERS |
Schedule of Investments (continued) April 30, 2022 | BlackRock Global Long/Short Equity Fund |
| Security | Shares | Value | % of Basket Value | |||||||||
| Switzerland (continued) | ||||||||||||
Zehnder Group AG | (1,324 | ) | $ | (103,531 | ) | 115.4 | % | |||||
Zur Rose Group AG | (299 | ) | (36,697 | ) | 40.9 | |||||||
|
|
|
| |||||||||
| (2,564,162 | ) | |||||||||||
| United Kingdom | ||||||||||||
Abcam PLC | (8,045 | ) | (124,836 | ) | 139.2 | |||||||
AO World PLC | (160,948 | ) | (150,971 | ) | 168.3 | |||||||
Assura PLC | (252,541 | ) | (209,271 | ) | 233.3 | |||||||
Auction Technology Group PLC | (11,548 | ) | (127,079 | ) | 141.7 | |||||||
Biffa PLC | (33,435 | ) | (145,016 | ) | 161.7 | |||||||
Bridgepoint Group PLC | (99,237 | ) | (382,094 | ) | 426.0 | |||||||
Central Asia Metals PLC | (1,933 | ) | (6,477 | ) | 7.2 | |||||||
Ceres Power Holdings PLC | (843 | ) | (7,692 | ) | 8.6 | |||||||
Clipper Logistics PLC | (3,612 | ) | (39,060 | ) | 43.6 | |||||||
Close Brothers Group PLC | (1,252 | ) | (17,360 | ) | 19.4 | |||||||
CMC Markets PLC | (37,448 | ) | (136,558 | ) | 152.3 | |||||||
ContourGlobal PLC | (35,360 | ) | (84,987 | ) | 94.8 | |||||||
Countryside Properties PLC | (43,127 | ) | (134,655 | ) | 150.1 | |||||||
Crest Nicholson Holdings PLC | (5,702 | ) | (17,941 | ) | 20.0 | |||||||
Elementis PLC | (83,065 | ) | (126,175 | ) | 140.7 | |||||||
Empiric Student Property PLC | (66,480 | ) | (76,072 | ) | 84.8 | |||||||
Essentra PLC | (52,475 | ) | (205,647 | ) | 229.3 | |||||||
Eurasia Mining PLC | (1,855,752 | ) | (189,015 | ) | 210.8 | |||||||
Frasers Group PLC | (31,508 | ) | (267,609 | ) | 298.4 | |||||||
Frontier Developments PLC | (542 | ) | (8,751 | ) | 9.8 | |||||||
Funding Circle Holdings PLC | (7,094 | ) | (6,512 | ) | 7.3 | |||||||
Greatland Gold PLC | (2,934,693 | ) | (489,897 | ) | 546.2 | |||||||
Halfords Group PLC | (107,358 | ) | (305,634 | ) | 340.8 | |||||||
Hays PLC | (66,339 | ) | (101,886 | ) | 113.6 | |||||||
Ibstock PLC | (13,189 | ) | (31,135 | ) | 34.7 | |||||||
Ideagen PLC | (8,791 | ) | (25,977 | ) | 29.0 | |||||||
IG Design Group PLC | (63,207 | ) | (53,887 | ) | 60.1 | |||||||
Inchcape PLC | (14,929 | ) | (133,580 | ) | 148.9 | |||||||
Indivior PLC | (5,264 | ) | (20,731 | ) | 23.1 | |||||||
IP Group PLC | (118,320 | ) | (122,006 | ) | 136.0 | |||||||
IQE PLC | (67,618 | ) | (25,550 | ) | 28.5 | |||||||
Jupiter Fund Management PLC | (23,762 | ) | (53,038 | ) | 59.1 | |||||||
Just Group PLC | (126,320 | ) | (133,444 | ) | 148.8 | |||||||
Kape Technologies PLC | (21,565 | ) | (92,725 | ) | 103.4 | |||||||
Keller Group PLC | (15,208 | ) | (160,262 | ) | 178.7 | |||||||
Kier Group PLC | (4,191 | ) | (4,179 | ) | 4.7 | |||||||
Liontrust Asset Management PLC | (4,882 | ) | (70,855 | ) | 79.0 | |||||||
Mitie Group PLC | (361,656 | ) | (243,808 | ) | 271.8 | |||||||
Moneysupermarket.com Group PLC | (52,470 | ) | (114,944 | ) | 128.2 | |||||||
Morgan Sindall Group PLC | (1,000 | ) | (26,962 | ) | 30.1 | |||||||
Naked Wines PLC | (7,756 | ) | (35,102 | ) | 39.1 | |||||||
NCC Group PLC | (19,427 | ) | (44,704 | ) | 49.8 | |||||||
OSB Group PLC | (14,072 | ) | (98,229 | ) | 109.5 | |||||||
Oxford Biomedica PLC | (45,128 | ) | (323,453 | ) | 360.7 | |||||||
Petrofac Ltd. | (43,410 | ) | (73,178 | ) | 81.6 | |||||||
Polar Capital Holdings PLC | (4,791 | ) | (33,393 | ) | 37.2 | |||||||
Primary Health Properties PLC | (50,602 | ) | (91,767 | ) | 102.3 | |||||||
Provident Financial PLC | (11,202 | ) | (35,854 | ) | 40.0 | |||||||
QinetiQ Group PLC | (6,744 | ) | (28,612 | ) | 31.9 | |||||||
Rank Group PLC | (73,882 | ) | (100,335 | ) | 111.9 | |||||||
Rathbone Brothers PLC | (366 | ) | (9,665 | ) | 10.8 | |||||||
Reach PLC | (46,045 | ) | (94,144 | ) | 105.0 | |||||||
Redde Northgate PLC | (28,947 | ) | (143,197 | ) | 159.7 | |||||||
Renewi PLC | (41,666 | ) | (361,511 | ) | 403.1 | |||||||
Rotork PLC | (26,146 | ) | (95,394 | ) | 106.4 | |||||||
Sabre Insurance Group PLC | (16,154 | ) | (42,657 | ) | 47.6 | |||||||
Savills PLC | (7,822 | ) | (105,226 | ) | 117.3 | |||||||
| Security | Shares | Value | % of Basket Value | |||||||||
| United Kingdom (continued) | ||||||||||||
Serco Group PLC | (20,155 | ) | $ | (38,115 | ) | 42.5 | % | |||||
Shaftesbury PLC | (53,773 | ) | (402,681 | ) | 449.0 | |||||||
Target Healthcare REIT PLC | (12,295 | ) | (17,160 | ) | 19.1 | |||||||
Telecom Plus PLC | (548 | ) | (11,305 | ) | 12.6 | |||||||
TI Fluid Systems PLC | (75,444 | ) | (153,317 | ) | 170.9 | |||||||
TP ICAP Group PLC | (37,586 | ) | (62,292 | ) | 69.5 | |||||||
Trainline PLC | (28,341 | ) | (101,068 | ) | 112.7 | |||||||
Trustpilot Group PLC | (27,177 | ) | (35,200 | ) | 39.2 | |||||||
Tullow Oil PLC | (98,015 | ) | (68,250 | ) | 76.1 | |||||||
Tyman PLC | (36,905 | ) | (126,761 | ) | 141.3 | |||||||
Victoria PLC | (18,039 | ) | (144,652 | ) | 161.3 | |||||||
Victorian Plumbing Group PLC | (78,103 | ) | (58,926 | ) | 65.7 | |||||||
Vistry Group PLC | (3,765 | ) | (39,281 | ) | 43.8 | |||||||
Volex PLC | (2,684 | ) | (8,696 | ) | 9.7 | |||||||
Volution Group PLC | (12,060 | ) | (61,429 | ) | 68.5 | |||||||
Yellow Cake PLC | (10,861 | ) | (53,306 | ) | 59.4 | |||||||
|
|
|
| |||||||||
| (7,773,138 | ) | |||||||||||
| United States | ||||||||||||
4D Molecular Therapeutics, Inc. | (1,349 | ) | (16,067 | ) | 17.9 | |||||||
AAON, Inc. | (854 | ) | (41,624 | ) | 46.4 | |||||||
Abercrombie & Fitch Co., Class A | (1,095 | ) | (37,865 | ) | 42.2 | |||||||
Aclaris Therapeutics, Inc. | (1,649 | ) | (20,316 | ) | 22.7 | |||||||
Acushnet Holdings Corp. | (231 | ) | (9,411 | ) | 10.5 | |||||||
Adtalem Global Education, Inc. | (379 | ) | (11,108 | ) | 12.4 | |||||||
AdvanSix, Inc. | (158 | ) | (7,037 | ) | 7.8 | |||||||
Aeva Technologies, Inc. | (57,379 | ) | (188,203 | ) | 209.9 | |||||||
Agenus, Inc. | (11,685 | ) | (21,617 | ) | 24.1 | |||||||
Agiliti, Inc. | (3,182 | ) | (62,813 | ) | 70.0 | |||||||
Agilysys, Inc. | (1,020 | ) | (37,546 | ) | 41.9 | |||||||
Agios Pharmaceuticals, Inc. | (456 | ) | (10,018 | ) | 11.2 | |||||||
Alaunos Therapeutics, Inc. | (3,584 | ) | (1,905 | ) | 2.1 | |||||||
Albany International Corp., Class A | (412 | ) | (32,227 | ) | 35.9 | |||||||
Albireo Pharma, Inc. | (1,608 | ) | (51,167 | ) | 57.1 | |||||||
Alexander’s, Inc. | (1,006 | ) | (249,659 | ) | 278.4 | |||||||
Alkami Technology, Inc. | (6,045 | ) | (79,190 | ) | 88.3 | |||||||
Allegheny Technologies, Inc. | (776 | ) | (21,092 | ) | 23.5 | |||||||
Allscripts Healthcare Solutions, Inc. | (13,391 | ) | (276,658 | ) | 308.5 | |||||||
Alpha & Omega Semiconductor Ltd. | (212 | ) | (9,095 | ) | 10.1 | |||||||
ALX Oncology Holdings, Inc. | (649 | ) | (8,294 | ) | 9.2 | |||||||
Ambac Financial Group, Inc. | (34,858 | ) | (269,452 | ) | 300.4 | |||||||
Amerant Bancorp, Inc. | (358 | ) | (9,519 | ) | 10.6 | |||||||
AMMO, Inc. | (93,363 | ) | (378,120 | ) | 421.6 | |||||||
Andersons, Inc. | (229 | ) | (11,503 | ) | 12.8 | |||||||
API Group Corp. | (5,962 | ) | (110,655 | ) | 123.4 | |||||||
Apollo Commercial Real Estate Finance, Inc. | (3,586 | ) | (43,175 | ) | 48.1 | |||||||
Apollo Medical Holdings, Inc. | (498 | ) | (18,167 | ) | 20.3 | |||||||
Apple Hospitality REIT, Inc. | (7,779 | ) | (137,611 | ) | 153.4 | |||||||
ArcBest Corp. | (181 | ) | (13,061 | ) | 14.6 | |||||||
Arcturus Therapeutics Holdings, Inc. | (291 | ) | (5,640 | ) | 6.3 | |||||||
Arcus Biosciences, Inc. | (6,109 | ) | (147,899 | ) | 164.9 | |||||||
Arcutis Biotherapeutics, Inc. | (310 | ) | (6,259 | ) | 7.0 | |||||||
Array Technologies, Inc. | (1,377 | ) | (8,992 | ) | 10.0 | |||||||
Atea Pharmaceuticals, Inc. | (2,091 | ) | (12,274 | ) | 13.7 | |||||||
Atlantic Sapphire ASA | (6,501 | ) | (18,097 | ) | 20.2 | |||||||
Atlantic Union Bankshares Corp. | (689 | ) | (23,274 | ) | 26.0 | |||||||
Avid Technology, Inc. | (369 | ) | (11,701 | ) | 13.0 | |||||||
Avista Corp. | (4,202 | ) | (170,475 | ) | 190.1 | |||||||
B. Riley Financial, Inc. | (1,824 | ) | (82,372 | ) | 91.8 | |||||||
Balchem Corp. | (297 | ) | (36,590 | ) | 40.8 | |||||||
BancFirst Corp. | (3,964 | ) | (324,057 | ) | 361.3 | |||||||
BankUnited, Inc. | (544 | ) | (20,422 | ) | 22.8 | |||||||
SCHEDULE OF INVESTMENTS | 47 |
Schedule of Investments (continued) April 30, 2022 | BlackRock Global Long/Short Equity Fund |
| Security | Shares | Value | % of Basket Value | |||||||||
| United States (continued) | ||||||||||||
Banner Corp. | (9,243 | ) | $ | (496,349 | ) | 553.4 | % | |||||
BARK, Inc. | (14,017 | ) | (43,313 | ) | 48.3 | |||||||
Barnes Group, Inc. | (2,096 | ) | (70,384 | ) | 78.5 | |||||||
Beachbody Co., Inc. | (3,783 | ) | (6,204 | ) | 6.9 | |||||||
Beacon Roofing Supply, Inc. | (3,456 | ) | (206,081 | ) | 229.8 | |||||||
Bed Bath & Beyond, Inc. | (8,011 | ) | (109,030 | ) | 121.6 | |||||||
Belden, Inc. | (2,154 | ) | (111,211 | ) | 124.0 | |||||||
BellRing Brands, Inc. | (3,372 | ) | (72,262 | ) | 80.6 | |||||||
Berkshire Grey, Inc. | (9,856 | ) | (23,950 | ) | 26.7 | |||||||
Berkshire Hills Bancorp, Inc. | (808 | ) | (19,990 | ) | 22.3 | |||||||
BigCommerce Holdings, Inc. | (5,726 | ) | (102,324 | ) | 114.1 | |||||||
BioCryst Pharmaceuticals, Inc. | (2,041 | ) | (18,961 | ) | 21.1 | |||||||
Bionano Genomics, Inc. | (87,866 | ) | (143,222 | ) | 159.7 | |||||||
Bioxcel Therapeutics, Inc. | (3,076 | ) | (40,326 | ) | 45.0 | |||||||
Bluebird Bio, Inc. | (8,296 | ) | (30,114 | ) | 33.6 | |||||||
Boise Cascade Co. | (986 | ) | (74,522 | ) | 83.1 | |||||||
BOK Financial Corp. | (187 | ) | (15,508 | ) | 17.3 | |||||||
Brady Corp., Class A | (2,430 | ) | (108,743 | ) | 121.3 | |||||||
Brandywine Realty Trust | (519 | ) | (6,057 | ) | 6.8 | |||||||
Brightcove, Inc. | (12,292 | ) | (86,659 | ) | 96.6 | |||||||
Brinker International, Inc. | (2,837 | ) | (103,068 | ) | 114.9 | |||||||
Brink’s Co. | (364 | ) | (21,458 | ) | 23.9 | |||||||
Broadmark Realty Capital, Inc. | (30,473 | ) | (237,994 | ) | 265.4 | |||||||
Broadstone Net Lease, Inc. | (21,599 | ) | (446,883 | ) | 498.3 | |||||||
BRP Group, Inc., Class A | (1,657 | ) | (38,310 | ) | 42.7 | |||||||
Buckle, Inc. | (2,127 | ) | (66,065 | ) | 73.7 | |||||||
Butterfly Network, Inc. | (2,119 | ) | (7,056 | ) | 7.9 | |||||||
Cabot Corp. | (2,220 | ) | (146,187 | ) | 163.0 | |||||||
Cactus, Inc., Class A | (1,142 | ) | (57,020 | ) | 63.6 | |||||||
Caleres, Inc. | (463 | ) | (10,617 | ) | 11.8 | |||||||
Canoo, Inc. | (27,214 | ) | (130,627 | ) | 145.7 | |||||||
Cara Therapeutics, Inc. | (594 | ) | (5,180 | ) | 5.8 | |||||||
Caribou Biosciences, Inc. | (1,040 | ) | (7,696 | ) | 8.6 | |||||||
CarLotz, Inc. | (124,229 | ) | (110,303 | ) | 123.0 | |||||||
Carpenter Technology Corp. | (5,518 | ) | (210,677 | ) | 234.9 | |||||||
Casa Systems, Inc. | (1,376 | ) | (6,742 | ) | 7.5 | |||||||
Catchmark Timber Trust, Inc., Class A | (849 | ) | (6,970 | ) | 7.8 | |||||||
Celldex Therapeutics, Inc. | (1,320 | ) | (40,326 | ) | 45.0 | |||||||
Centrus Energy Corp., Class A | (440 | ) | (12,214 | ) | 13.6 | |||||||
Cerevel Therapeutics Holdings, Inc. | (2,182 | ) | (63,889 | ) | �� | 71.2 | ||||||
Certara, Inc. | (9,978 | ) | (183,096 | ) | 204.2 | |||||||
Children’s Place, Inc. | (482 | ) | (22,331 | ) | 24.9 | |||||||
Chimerix, Inc. | (10,343 | ) | (45,509 | ) | 50.7 | |||||||
CIRCOR International, Inc. | (4,012 | ) | (78,836 | ) | 87.9 | |||||||
Citi Trends, Inc. | (1,177 | ) | (32,921 | ) | 36.7 | |||||||
Clearfield, Inc. | (1,389 | ) | (80,881 | ) | 90.2 | |||||||
Coca-Cola Consolidated, Inc. | (20 | ) | (8,830 | ) | 9.8 | |||||||
Columbia Financial, Inc. | (463 | ) | (8,774 | ) | 9.8 | |||||||
Comfort Systems USA, Inc. | (515 | ) | (43,476 | ) | 48.5 | |||||||
Community Bank System, Inc. | (1,104 | ) | (71,098 | ) | 79.3 | |||||||
Community Healthcare Trust, Inc. | (2,714 | ) | (99,929 | ) | 111.4 | |||||||
Computer Programs & Systems, Inc. | (253 | ) | (8,076 | ) | 9.0 | |||||||
Comstock Resources, Inc. | (5,364 | ) | (91,349 | ) | 101.9 | |||||||
CONMED Corp. | (1,334 | ) | (177,369 | ) | 197.8 | |||||||
Consensus Cloud Solutions, Inc. | (138 | ) | (7,275 | ) | 8.1 | |||||||
Consolidated Communications Holdings, Inc. | (1,365 | ) | (8,122 | ) | 9.1 | |||||||
Core & Main, Inc., Class A | (267 | ) | (6,344 | ) | 7.1 | |||||||
Corporate Office Properties Trust | (1,841 | ) | (49,136 | ) | 54.8 | |||||||
Couchbase, Inc. | (661 | ) | (11,237 | ) | 12.5 | |||||||
Coursera, Inc. | (4,090 | ) | (76,933 | ) | 85.8 | |||||||
Cracker Barrel Old Country Store, Inc. | (5,555 | ) | (616,549 | ) | 687.5 | |||||||
Crinetics Pharmaceuticals, Inc. | (655 | ) | (13,310 | ) | 14.8 | |||||||
| Security | Shares | Value | % of Basket Value | |||||||||
| United States (continued) | ||||||||||||
CSG Systems International, Inc. | (2,292 | ) | $ | (140,889 | ) | 157.1 | % | |||||
CTS Corp. | (3,921 | ) | (138,686 | ) | 154.6 | |||||||
CVB Financial Corp. | (23,416 | ) | (539,036 | ) | 601.0 | |||||||
Denny’s Corp. | (13,200 | ) | (169,224 | ) | 188.7 | |||||||
Designer Brands, Inc., Class A | (480 | ) | (6,634 | ) | 7.4 | |||||||
Desktop Metal, Inc., Class A | (56,277 | ) | (197,532 | ) | 220.3 | |||||||
DiamondRock Hospitality Co. | (13,677 | ) | (145,250 | ) | 162.0 | |||||||
Diebold Nixdorf, Inc. | (9,191 | ) | (37,683 | ) | 42.0 | |||||||
DigitalBridge Group, Inc. | (2,485 | ) | (17,296 | ) | 19.3 | |||||||
Dine Brands Global, Inc. | (1,116 | ) | (80,006 | ) | 89.2 | |||||||
DMC Global, Inc. | (1,577 | ) | (31,524 | ) | 35.1 | |||||||
Doma Holdings, Inc. | (44,329 | ) | (82,452 | ) | 91.9 | |||||||
Donnelley Financial Solutions, Inc. | (211 | ) | (6,176 | ) | 6.9 | |||||||
Dorman Products, Inc. | (584 | ) | (57,652 | ) | 64.3 | |||||||
Douglas Elliman, Inc. | (15,499 | ) | (93,924 | ) | 104.7 | |||||||
Driven Brands Holdings, Inc. | (2,288 | ) | (63,812 | ) | 71.2 | |||||||
Duckhorn Portfolio, Inc. | (2,108 | ) | (40,937 | ) | 45.6 | |||||||
Dycom Industries, Inc. | (934 | ) | (79,306 | ) | 88.4 | |||||||
Dynavax Technologies Corp. | (7,883 | ) | (69,607 | ) | 77.6 | |||||||
Eastern Bankshares, Inc. | (3,453 | ) | (66,159 | ) | 73.8 | |||||||
Eastman Kodak Co. | (15,465 | ) | (79,954 | ) | 89.2 | |||||||
Ebix, Inc. | (1,497 | ) | (44,611 | ) | 49.7 | |||||||
Edgewell Personal Care Co. | (1,094 | ) | (41,725 | ) | 46.5 | |||||||
Electric Last Mile Solutions, Inc. | (149 | ) | (137 | ) | 0.2 | |||||||
Empire State Realty Trust, Inc., Class A | (12,937 | ) | (111,776 | ) | 124.6 | |||||||
Employers Holdings, Inc. | (2,904 | ) | (114,243 | ) | 127.4 | |||||||
Encore Capital Group, Inc. | (309 | ) | (17,863 | ) | 19.9 | |||||||
Encore Wire Corp. | (2,600 | ) | (293,306 | ) | 327.0 | |||||||
Energy Fuels, Inc. | (1,201 | ) | (9,050 | ) | 10.1 | |||||||
Enerpac Tool Group Corp. | (13,539 | ) | (271,863 | ) | 303.1 | |||||||
Enovix Corp. | (5,950 | ) | (53,788 | ) | 60.0 | |||||||
EPR Properties | (6,269 | ) | (329,248 | ) | 367.1 | |||||||
Equity Commonwealth | (301 | ) | (7,883 | ) | 8.8 | |||||||
EverQuote, Inc., Class A | (895 | ) | (12,423 | ) | 13.9 | |||||||
Evo Payments, Inc., Class A | (3,389 | ) | (76,354 | ) | 85.1 | |||||||
Expro Group Holdings NV | (619 | ) | (9,458 | ) | 10.5 | |||||||
Extreme Networks, Inc. | (5,375 | ) | (51,600 | ) | 57.5 | |||||||
Fastly, Inc., Class A | (7,872 | ) | (125,165 | ) | 139.6 | |||||||
Federal Signal Corp. | (1,542 | ) | (52,474 | ) | 58.5 | |||||||
Federated Hermes, Inc., Class B | (8,696 | ) | (247,662 | ) | 276.1 | |||||||
First Financial Bankshares, Inc. | (2,450 | ) | (97,951 | ) | 109.2 | |||||||
First Hawaiian, Inc. | (5,673 | ) | (133,940 | ) | 149.3 | |||||||
Fluor Corp. | (2,106 | ) | (52,124 | ) | 58.1 | |||||||
Forward Air Corp. | (117 | ) | (11,345 | ) | 12.6 | |||||||
Fresh Del Monte Produce, Inc. | (2,686 | ) | (69,970 | ) | 78.0 | |||||||
Fulcrum Therapeutics, Inc. | (2,248 | ) | (21,626 | ) | 24.1 | |||||||
Fulgent Genetics, Inc. | (4,293 | ) | (235,600 | ) | 262.7 | |||||||
Gannett Co., Inc. | (34,861 | ) | (139,793 | ) | 155.9 | |||||||
Gatos Silver, Inc. | (2,912 | ) | (9,843 | ) | 11.0 | |||||||
GATX Corp. | (375 | ) | (38,771 | ) | 43.2 | |||||||
Generation Bio Co. | (955 | ) | (6,045 | ) | 6.7 | |||||||
Genesco, Inc. | (1,752 | ) | (108,677 | ) | 121.2 | |||||||
Gentherm, Inc. | (93 | ) | (6,270 | ) | 7.0 | |||||||
Geron Corp. | (15,256 | ) | (21,511 | ) | 24.0 | |||||||
Glaukos Corp. | (1,623 | ) | (76,752 | ) | 85.6 | |||||||
Global Medical REIT, Inc. | (4,421 | ) | (65,254 | ) | 72.8 | |||||||
Global Net Lease, Inc. | (3,011 | ) | (42,244 | ) | 47.1 | |||||||
Globalstar, Inc. | (290,842 | ) | (337,377 | ) | 376.2 | |||||||
GoHealth, Inc., Class A | (25,553 | ) | (19,093 | ) | 21.3 | |||||||
Gossamer Bio, Inc. | (1,167 | ) | (8,064 | ) | 9.0 | |||||||
Grand Canyon Education, Inc. | (1,919 | ) | (184,166 | ) | 205.3 | |||||||
Greenbrier Cos., Inc. | (17 | ) | (726 | ) | 0.8 | |||||||
| 48 | 2 0 2 2 BLACK ROCK ANNUAL REPORT TO SHAREHOLDERS |
Schedule of Investments (continued) April 30, 2022 | BlackRock Global Long/Short Equity Fund |
| Security | Shares | Value | % of Basket Value | |||||||||
| United States (continued) | ||||||||||||
Greif, Inc., Class A | (3,529 | ) | $ | (214,140 | ) | 238.8 | % | |||||
Greif, Inc., Class B | (107 | ) | (6,245 | ) | 7.0 | |||||||
Grid Dynamics Holdings, Inc. | (426 | ) | (5,930 | ) | 6.6 | |||||||
GrowGeneration Corp. | (1,322 | ) | (7,813 | ) | 8.7 | |||||||
Guess?, Inc. | (601 | ) | (13,504 | ) | 15.1 | |||||||
Haemonetics Corp. | (1,691 | ) | (85,683 | ) | 95.5 | |||||||
Hamilton Lane, Inc., Class A | (246 | ) | (16,871 | ) | 18.8 | |||||||
Hancock Whitney Corp. | (2,148 | ) | (100,462 | ) | 112.0 | |||||||
Hanger, Inc. | (336 | ) | (5,524 | ) | 6.2 | |||||||
Hawaiian Electric Industries, Inc. | (6,373 | ) | (261,994 | ) | 292.1 | |||||||
HB Fuller Co. | (3,946 | ) | (263,198 | ) | 293.5 | |||||||
Healthcare Services Group, Inc. | (1,790 | ) | (30,591 | ) | 34.1 | |||||||
Heidrick & Struggles International, Inc. | (405 | ) | (12,944 | ) | 14.4 | |||||||
Helios Technologies, Inc. | (112 | ) | (7,524 | ) | 8.4 | |||||||
Hibbett, Inc. | (4,029 | ) | (173,972 | ) | 194.0 | |||||||
Hillenbrand, Inc. | (4,466 | ) | (182,302 | ) | 203.3 | |||||||
Hillman Solutions Corp. | (20,452 | ) | (237,857 | ) | 265.2 | |||||||
Hippo Holdings, Inc. | (77,714 | ) | (146,102 | ) | 162.9 | |||||||
HNI Corp. | (6,093 | ) | (217,155 | ) | 242.1 | |||||||
Honest Co., Inc. | (12,757 | ) | (50,518 | ) | 56.3 | |||||||
Hostess Brands, Inc. | (10,049 | ) | (228,012 | ) | 254.2 | |||||||
Hovnanian Enterprises, Inc., Class A | (1,853 | ) | (85,275 | ) | 95.1 | |||||||
Howard Hughes Corp. | (467 | ) | (46,835 | ) | 52.2 | |||||||
Humanigen, Inc. | (2,119 | ) | (3,984 | ) | 4.4 | |||||||
Huron Consulting Group, Inc. | (168 | ) | (8,699 | ) | 9.7 | |||||||
Hyliion Holdings Corp. | (36,537 | ) | (117,284 | ) | 130.8 | |||||||
Hyzon Motors, Inc. | (20,456 | ) | (81,210 | ) | 90.6 | |||||||
Ichor Holdings Ltd. | (485 | ) | (14,118 | ) | 15.7 | |||||||
Ideanomics, Inc. | (116,059 | ) | (83,470 | ) | 93.1 | |||||||
IES Holdings, Inc. | (184 | ) | (5,391 | ) | 6.0 | |||||||
IGM Biosciences, Inc. | (369 | ) | (6,177 | ) | 6.9 | |||||||
Imago Biosciences, Inc. | (2,361 | ) | (38,602 | ) | 43.0 | |||||||
Independent Bank Corp. | (519 | ) | (40,046 | ) | 44.7 | |||||||
Industrial Logistics Properties Trust | (1,959 | ) | (31,657 | ) | 35.3 | |||||||
Ingles Markets, Inc., Class A | (2,798 | ) | (260,550 | ) | 290.5 | |||||||
Inogen, Inc. | (236 | ) | (5,966 | ) | 6.7 | |||||||
Inovio Pharmaceuticals, Inc. | (18,287 | ) | (49,924 | ) | 55.7 | |||||||
Insight Enterprises, Inc. | (79 | ) | (7,850 | ) | 8.8 | |||||||
Insmed, Inc. | (1,253 | ) | (27,528 | ) | 30.7 | |||||||
Insperity, Inc. | (257 | ) | (27,255 | ) | 30.4 | |||||||
Insteel Industries, Inc. | (227 | ) | (9,629 | ) | 10.7 | |||||||
Interface, Inc. | (466 | ) | (5,914 | ) | 6.6 | |||||||
International Bancshares Corp. | (158 | ) | (6,287 | ) | 7.0 | |||||||
Iovance Biotherapeutics, Inc. | (6,602 | ) | (100,020 | ) | 111.5 | |||||||
JBG SMITH Properties | (2,244 | ) | (59,152 | ) | 66.0 | |||||||
JELD-WEN Holding, Inc. | (1,462 | ) | (30,395 | ) | 33.9 | |||||||
John Bean Technologies Corp. | (794 | ) | (93,605 | ) | 104.4 | |||||||
John Wiley & Sons, Inc., Class A | (18,495 | ) | (941,211 | ) | 1,049.5 | |||||||
Kaman Corp. | (167 | ) | (6,515 | ) | 7.3 | |||||||
KAR Auction Services, Inc. | (8,707 | ) | (127,645 | ) | 142.3 | |||||||
Kennedy-Wilson Holdings, Inc. | (3,602 | ) | (81,225 | ) | 90.6 | |||||||
Kimball International, Inc., Class B | (730 | ) | (5,606 | ) | 6.3 | |||||||
Kiniksa Pharmaceuticals Ltd., Class A | (1,471 | ) | (13,724 | ) | 15.3 | |||||||
KKR Real Estate Finance Trust, Inc. | (9,134 | ) | (173,546 | ) | 193.5 | |||||||
KnowBe4, Inc., Class A | (1,524 | ) | (36,271 | ) | 40.4 | |||||||
Korn Ferry | (100 | ) | (6,144 | ) | 6.9 | |||||||
Krystal Biotech, Inc. | (103 | ) | (6,243 | ) | 7.0 | |||||||
Kyndryl Holdings, Inc. | (26,993 | ) | (320,947 | ) | 357.9 | |||||||
Ladder Capital Corp. | (911 | ) | (10,376 | ) | 11.6 | |||||||
Lancaster Colony Corp. | (412 | ) | (63,934 | ) | 71.3 | |||||||
Latch, Inc. | (7,304 | ) | (24,030 | ) | 26.8 | |||||||
Latham Group, Inc. | (307 | ) | (3,684 | ) | 4.1 | |||||||
| Security | Shares | Value | % of Basket Value | |||||||||
| United States (continued) | ||||||||||||
LCI Industries | (907 | ) | $ | (88,269 | ) | 98.4 | % | |||||
Lindsay Corp. | (1,573 | ) | (212,591 | ) | 237.0 | |||||||
Lordstown Motors Corp., Class A | (77,163 | ) | (168,215 | ) | 187.6 | |||||||
Lovesac Co. | (454 | ) | (19,903 | ) | 22.2 | |||||||
Loyalty Ventures, Inc. | (9,473 | ) | (121,160 | ) | 135.1 | |||||||
Lumber Liquidators Holdings, Inc. | (1,044 | ) | (14,418 | ) | 16.1 | |||||||
Macerich Co. | (5,432 | ) | (68,172 | ) | 76.0 | |||||||
Madrigal Pharmaceuticals, Inc. | (878 | ) | (61,460 | ) | 68.5 | |||||||
Magnite, Inc. | (2,428 | ) | (23,430 | ) | 26.1 | |||||||
ManTech International Corp., Class A | (876 | ) | (70,378 | ) | 78.5 | |||||||
Markforged Holding Corp. | (47,375 | ) | (161,549 | ) | 180.1 | |||||||
Matthews International Corp., Class A | (3,343 | ) | (99,655 | ) | 111.1 | |||||||
MBIA, Inc. | (2,065 | ) | (24,863 | ) | 27.7 | |||||||
MEDNAX, Inc. | (342 | ) | (6,334 | ) | 7.1 | |||||||
Meridian Bioscience, Inc. | (738 | ) | (18,885 | ) | 21.1 | |||||||
Methode Electronics, Inc. | (8,634 | ) | (385,163 | ) | 429.5 | |||||||
Minerals Technologies, Inc. | (1,341 | ) | (85,301 | ) | 95.1 | |||||||
Mission Produce, Inc. | (2,437 | ) | (30,999 | ) | 34.6 | |||||||
Monarch Casino & Resort, Inc. | (317 | ) | (22,238 | ) | 24.8 | |||||||
Moog, Inc., Class A | (114 | ) | (9,105 | ) | 10.2 | |||||||
Movado Group, Inc. | (975 | ) | (35,071 | ) | 39.1 | |||||||
Mr Cooper Group, Inc. | (5,491 | ) | (246,930 | ) | 275.3 | |||||||
Mueller Industries, Inc. | (863 | ) | (46,731 | ) | 52.1 | |||||||
Mueller Water Products, Inc., Class A | (17,093 | ) | (205,629 | ) | 229.3 | |||||||
NanoString Technologies, Inc. | (2,351 | ) | (44,152 | ) | 49.2 | |||||||
National Health Investors, Inc. | (3,041 | ) | (156,703 | ) | 174.7 | |||||||
National HealthCare Corp. | (155 | ) | (10,549 | ) | 11.8 | |||||||
National Presto Industries, Inc. | (480 | ) | (34,142 | ) | 38.1 | |||||||
Navient Corp. | (7,466 | ) | (118,635 | ) | 132.3 | |||||||
Nelnet, Inc., Class A | (1,964 | ) | (161,185 | ) | 179.7 | |||||||
NetScout Systems, Inc. | (5,849 | ) | (180,149 | ) | 200.9 | |||||||
NETSTREIT Corp. | (4,007 | ) | (86,631 | ) | 96.6 | |||||||
New Jersey Resources Corp. | (4,335 | ) | (187,099 | ) | 208.6 | |||||||
Newmark Group, Inc., Class A | (15,009 | ) | (182,359 | ) | 203.3 | |||||||
NewMarket Corp. | (932 | ) | (302,537 | ) | 337.3 | |||||||
NextGen Healthcare, Inc. | (387 | ) | (7,295 | ) | 8.1 | |||||||
NexTier Oilfield Solutions, Inc. | (2,765 | ) | (30,498 | ) | 34.0 | |||||||
Northwest Bancshares, Inc. | (1,058 | ) | (13,415 | ) | 15.0 | |||||||
Nu Skin Enterprises, Inc., Class A | (249 | ) | (10,617 | ) | 11.8 | |||||||
Ocugen, Inc. | (30,357 | ) | (66,482 | ) | 74.1 | |||||||
Ocular Therapeutix, Inc. | (16,133 | ) | (57,595 | ) | 64.2 | |||||||
ODP Corp. | (9,103 | ) | (391,702 | ) | 436.8 | |||||||
O-I Glass, Inc. | (3,877 | ) | (52,262 | ) | 58.3 | |||||||
ON24, Inc. | (13,351 | ) | (169,157 | ) | 188.6 | |||||||
ONE Gas, Inc. | (226 | ) | (19,068 | ) | 21.3 | |||||||
OneSpan, Inc. | (3,276 | ) | (46,290 | ) | 51.6 | |||||||
Open Lending Corp., Class A | (10,594 | ) | (144,502 | ) | 161.1 | |||||||
OPKO Health, Inc. | (95,091 | ) | (256,746 | ) | 286.3 | |||||||
Option Care Health, Inc. | (1,792 | ) | (53,545 | ) | 59.7 | |||||||
Orion Office REIT, Inc. | (4,429 | ) | (59,437 | ) | 66.3 | |||||||
Outset Medical, Inc. | (376 | ) | (13,115 | ) | 14.6 | |||||||
Pacira BioSciences, Inc. | (737 | ) | (54,958 | ) | 61.3 | |||||||
Parsons Corp. | (5,248 | ) | (193,809 | ) | 216.1 | |||||||
Patterson Cos., Inc. | (13,072 | ) | (402,225 | ) | 448.5 | |||||||
Patterson-UTI Energy, Inc. | (5,126 | ) | (84,271 | ) | �� | 94.0 | ||||||
PBF Energy, Inc., Class A | (1,886 | ) | (54,807 | ) | 61.1 | |||||||
PDF Solutions, Inc. | (892 | ) | (20,739 | ) | 23.1 | |||||||
PennyMac Financial Services, Inc. | (578 | ) | (28,068 | ) | 31.3 | |||||||
Perdoceo Education Corp. | (1,681 | ) | (18,794 | ) | 21.0 | |||||||
Pilgrim’s Pride Corp. | (2,861 | ) | (81,109 | ) | 90.4 | |||||||
Ping Identity Holding Corp. | (640 | ) | (16,723 | ) | 18.6 | |||||||
Pitney Bowes, Inc. | (6,199 | ) | (32,669 | ) | 36.4 | |||||||
SCHEDULE OF INVESTMENTS | 49 |
Schedule of Investments (continued) April 30, 2022 | BlackRock Global Long/Short Equity Fund |
| Security | Shares | Value | % of Basket Value | |||||||||
| United States (continued) | ||||||||||||
PLBY Group, Inc. | (24,595 | ) | $ | (217,420 | ) | 242.4 | % | |||||
PotlatchDeltic Corp. | (2,302 | ) | (127,508 | ) | 142.2 | |||||||
PowerSchool Holdings, Inc., Class A | (1,204 | ) | (18,229 | ) | 20.3 | |||||||
Primerica, Inc. | (1,147 | ) | (148,605 | ) | 165.7 | |||||||
ProAssurance Corp. | (407 | ) | (10,000 | ) | 11.1 | |||||||
Progress Software Corp. | (2,600 | ) | (124,748 | ) | 139.1 | |||||||
Proterra, Inc. | (1,230 | ) | (7,638 | ) | 8.5 | |||||||
Provention Bio, Inc. | (295 | ) | (1,325 | ) | 1.5 | |||||||
Pulmonx Corp. | (7,191 | ) | (173,303 | ) | 193.2 | |||||||
Rackspace Technology, Inc. | (2,214 | ) | (21,896 | ) | 24.4 | |||||||
RBC Bearings, Inc. | (38 | ) | (6,397 | ) | 7.1 | |||||||
Realogy Holdings Corp. | (40,767 | ) | (446,806 | ) | 498.2 | |||||||
Reata Pharmaceuticals, Inc., Class A | (1,633 | ) | (41,446 | ) | 46.2 | |||||||
REGENXBIO, Inc. | (1,807 | ) | (50,162 | ) | 55.9 | |||||||
Rekor Systems, Inc. | (54,165 | ) | (160,870 | ) | 179.4 | |||||||
Relay Therapeutics, Inc. | (2,168 | ) | (51,663 | ) | 57.6 | |||||||
Relmada Therapeutics, Inc. | (2,251 | ) | (56,523 | ) | 63.0 | |||||||
Renalytix PLC | (1,346 | ) | (3,597 | ) | 4.0 | |||||||
Rent-A-Center, Inc. | (3,258 | ) | (78,583 | ) | 87.6 | |||||||
Resources Connection, Inc. | (624 | ) | (10,727 | ) | 12.0 | |||||||
Retail Opportunity Investments Corp. | (7,874 | ) | (146,693 | ) | 163.6 | |||||||
REV Group, Inc., Series A | (16,919 | ) | (201,674 | ) | 224.9 | |||||||
Revance Therapeutics, Inc. | (1,663 | ) | (27,240 | ) | 30.4 | |||||||
Reynolds Consumer Products Inc. | (12,088 | ) | (357,684 | ) | 398.8 | |||||||
Rhythm Pharmaceuticals, Inc. | (1,671 | ) | (10,460 | ) | 11.7 | |||||||
Rimini Street, Inc. | (6,144 | ) | (35,389 | ) | 39.5 | |||||||
Romeo Power, Inc. | (85,272 | ) | (93,799 | ) | 104.6 | |||||||
RPC, Inc. | (7,319 | ) | (75,678 | ) | 84.4 | |||||||
Rush Street Interactive, Inc. | (6,481 | ) | (41,154 | ) | 45.9 | |||||||
Ruth’s Hospitality Group, Inc. | (9,473 | ) | (198,649 | ) | 221.5 | |||||||
Safety Insurance Group, Inc. | (1,827 | ) | (157,195 | ) | 175.3 | |||||||
Sally Beauty Holdings, Inc. | (15,396 | ) | (232,788 | ) | 259.6 | |||||||
Sandy Spring Bancorp, Inc. | (433 | ) | (17,004 | ) | 19.0 | |||||||
Schneider National, Inc., Class B | (2,354 | ) | (55,625 | ) | 62.0 | |||||||
Schnitzer Steel Industries, Inc., Class A | (2,883 | ) | (131,551 | ) | 146.7 | |||||||
Scholastic Corp. | (1,045 | ) | (38,508 | ) | 42.9 | |||||||
Schrodinger, Inc. | (1,760 | ) | (43,507 | ) | 48.5 | |||||||
Seer, Inc. | (415 | ) | (3,021 | ) | 3.4 | |||||||
Selective Insurance Group, Inc. | (1,739 | ) | (143,224 | ) | 159.7 | |||||||
Selectquote, Inc. | (11,327 | ) | (23,334 | ) | 26.0 | |||||||
Sema4 Holdings Corp. | (4,688 | ) | (10,079 | ) | 11.2 | |||||||
Shenandoah Telecommunications Co. | (1,160 | ) | (23,432 | ) | 26.1 | |||||||
Shoe Carnival, Inc. | (1,422 | ) | (42,930 | ) | 47.9 | |||||||
SI-BONE, Inc. | (321 | ) | (6,414 | ) | 7.2 | |||||||
SIGA Technologies, Inc. | (23,755 | ) | (163,197 | ) | 182.0 | |||||||
Sight Sciences, Inc. | (866 | ) | (6,045 | ) | 6.7 | |||||||
Signify Health, Inc., Class A | (2,126 | ) | (29,339 | ) | 32.7 | |||||||
Silgan Holdings, Inc. | (6,664 | ) | (295,682 | ) | 329.7 | |||||||
Silk Road Medical, Inc. | (961 | ) | (33,683 | ) | 37.6 | |||||||
Sinclair Broadcast Group, Inc., Class A | (20,170 | ) | (448,581 | ) | 500.2 | |||||||
Skyline Champion Corp. | (546 | ) | (27,868 | ) | 31.1 | |||||||
SkyWater Technology, Inc. | (7,434 | ) | (45,496 | ) | 50.7 | |||||||
Sleep Number Corp. | (1,543 | ) | (62,584 | ) | 69.8 | |||||||
Sotera Health Co. | (12,421 | ) | (253,140 | ) | 282.3 | |||||||
Spectrum Brands Holdings, Inc. | (4,281 | ) | (364,185 | ) | 406.1 | |||||||
Spire, Inc. | (5,226 | ) | (380,191 | ) | 423.9 | |||||||
Sprouts Farmers Market, Inc. | (550 | ) | (16,390 | ) | 18.3 | |||||||
St. Joe Co. | (2,568 | ) | (136,643 | ) | 152.4 | |||||||
Steelcase, Inc., Class A | (548 | ) | (6,428 | ) | 7.2 | |||||||
Stem, Inc. | (14,083 | ) | (100,975 | ) | 112.6 | |||||||
StepStone Group, Inc., Class A | (530 | ) | (13,579 | ) | 15.1 | |||||||
| Security | Shares | Value | % of Basket Value | |||||||||
| United States (continued) | ||||||||||||
Stericycle, Inc. | (1,604 | ) | $ | (80,505 | ) | 89.8 | % | |||||
Steven Madden Ltd. | (1,141 | ) | (46,849 | ) | 52.2 | |||||||
Surgery Partners, Inc. | (302 | ) | (15,450 | ) | 17.2 | |||||||
Tejon Ranch Co. | (3,496 | ) | (64,012 | ) | 71.4 | |||||||
Telephone & Data Systems, Inc. | (7,777 | ) | (142,475 | ) | 158.9 | |||||||
Telos Corp. | (7,374 | ) | (57,443 | ) | 64.0 | |||||||
Tennant Co. | (595 | ) | (38,425 | ) | 42.8 | |||||||
TFS Financial Corp. | (14,918 | ) | (223,621 | ) | 249.3 | |||||||
ThredUp, Inc., Class A | (1,010 | ) | (6,656 | ) | 7.4 | |||||||
Thryv Holdings, Inc. | (1,163 | ) | (30,040 | ) | 33.5 | |||||||
Tootsie Roll Industries, Inc. | (710 | ) | (24,871 | ) | 27.7 | |||||||
TPI Composites, Inc. | (6,713 | ) | (76,797 | ) | 85.6 | |||||||
TransMedics Group, Inc. | (689 | ) | (14,441 | ) | 16.1 | |||||||
Tredegar Corp. | (2,874 | ) | (32,907 | ) | 36.7 | |||||||
TreeHouse Foods, Inc. | (15,410 | ) | (485,415 | ) | 541.2 | |||||||
TriNet Group, Inc. | (1,105 | ) | (98,014 | ) | 109.3 | |||||||
Trinseo PLC | (143 | ) | (6,785 | ) | 7.6 | |||||||
TTM Technologies, Inc. | (671 | ) | (9,360 | ) | 10.4 | |||||||
TuSimple Holdings, Inc., Class A | (10,277 | ) | (106,572 | ) | 118.8 | |||||||
Twist Bioscience Corp. | (162 | ) | (4,672 | ) | 5.2 | |||||||
Two Harbors Investment Corp. | (5,450 | ) | (26,215 | ) | 29.2 | |||||||
U.S. Silica Holdings, Inc. | (12,987 | ) | (241,298 | ) | 269.1 | |||||||
Under Armour, Inc., Class C | (3,971 | ) | (56,348 | ) | 62.8 | |||||||
UniFirst Corp. | (1,915 | ) | (329,955 | ) | 367.9 | |||||||
United Bankshares, Inc. | (10,725 | ) | (356,713 | ) | 397.7 | |||||||
Universal Health Realty Income Trust | (886 | ) | (44,468 | ) | 49.6 | |||||||
Upwork, Inc. | (289 | ) | (6,060 | ) | 6.8 | |||||||
UroGen Pharma Ltd. | (733 | ) | (5,175 | ) | 5.8 | |||||||
Utz Brands, Inc. | (5,939 | ) | (83,859 | ) | 93.5 | |||||||
UWM Holdings Corp. | (15,608 | ) | (57,906 | ) | 64.6 | |||||||
Vaxcyte, Inc. | (8,321 | ) | (201,451 | ) | 224.6 | |||||||
Velodyne Lidar, Inc. | (16,195 | ) | (30,447 | ) | 33.9 | |||||||
Verint Systems, Inc. | (1,409 | ) | (76,875 | ) | 85.7 | |||||||
Verra Mobility Corp. | (3,408 | ) | (47,814 | ) | 53.3 | |||||||
ViaSat, Inc. | (1,151 | ) | (42,368 | ) | 47.2 | |||||||
Vicor Corp. | (1,853 | ) | (112,144 | ) | 125.0 | |||||||
Vir Biotechnology, Inc. | (7,742 | ) | (157,550 | ) | 175.7 | |||||||
Visteon Corp. | (1,008 | ) | (105,548 | ) | 117.7 | |||||||
Volta, Inc. | (33,890 | ) | (70,830 | ) | 79.0 | |||||||
Waterstone Financial, Inc. | (351 | ) | (5,637 | ) | 6.3 | |||||||
Weis Markets, Inc. | (801 | ) | (63,984 | ) | 71.3 | |||||||
Westamerica BanCorp | (1,348 | ) | (79,424 | ) | 88.6 | |||||||
White Mountains Insurance Group Ltd. | (8 | ) | (8,384 | ) | 9.3 | |||||||
Whiting Petroleum Corp. | (3,215 | ) | (234,856 | ) | 261.9 | |||||||
WideOpenWest, Inc. | (2,546 | ) | (51,047 | ) | 56.9 | |||||||
Winnebago Industries, Inc. | (3,819 | ) | (203,094 | ) | 226.5 | |||||||
Wolverine World Wide, Inc. | (397 | ) | (7,869 | ) | 8.8 | |||||||
Worthington Industries, Inc. | (3,984 | ) | (189,519 | ) | 211.3 | |||||||
WSFS Financial Corp. | (3,253 | ) | (130,348 | ) | 145.3 | |||||||
WW International, Inc. | (1,867 | ) | (18,278 | ) | 20.4 | |||||||
XBiotech, Inc. | (528 | ) | (4,097 | ) | 4.6 | |||||||
Xenia Hotels & Resorts, Inc. | (7,097 | ) | (136,901 | ) | 152.6 | |||||||
XL Fleet Corp. | (116,477 | ) | (163,068 | ) | 181.8 | |||||||
Xperi Holding Corp. | (7,089 | ) | (110,588 | ) | 123.3 | |||||||
Zomedica Corp. | (12,729 | ) | (3,144 | ) | 3.5 | |||||||
Zumiez, Inc. | (603 | ) | (22,088 | ) | 24.6 | |||||||
|
|
|
| |||||||||
| (36,725,507 | ) | |||||||||||
| 50 | 2 0 2 2 BLACK ROCK ANNUAL REPORT TO SHAREHOLDERS |
Schedule of Investments (continued) April 30, 2022 | BlackRock Global Long/Short Equity Fund |
| Security | Shares | Value | % of Basket Value | |||||||||
| United States (continued) | ||||||||||||
| Preferred Stocks | ||||||||||||
| Germany | ||||||||||||
Draegerwerk AG & Co. KGaA, Preference Shares | (1,463 | ) | $ | (72,404 | ) | 80.7 | % | |||||
|
|
|
| |||||||||
Rights | ||||||||||||
| Switzerland | ||||||||||||
Mobimo Holding AG Right | (294 | ) | (1,024 | ) | 1.1 | |||||||
|
|
|
| |||||||||
Total Reference Entity — Short | (105,516,139 | ) | ||||||||||
|
| |||||||||||
Net Value of Reference Entity — Bank of America N.A. |
| $ | (89,684 | ) | ||||||||
|
| |||||||||||
The following table represents the individual long and short positions and related values of the equity securities underlying the total return swap with BNP Paribas SA as of period end, termination dates December 12, 2022 and December 19, 2022:
| Security | Shares | Value | % of Basket Value | |||||||||
Reference Entity — Long | ||||||||||||
| Common Stocks | ||||||||||||
| Argentina | ||||||||||||
Globant SA | 252 | $ | 54,430 | (15.0 | )% | |||||||
MercadoLibre, Inc. | 197 | 191,805 | (53.0 | ) | ||||||||
|
|
|
| |||||||||
| 246,235 | ||||||||||||
| Australia | ||||||||||||
AGL Energy Ltd. | 55,510 | 337,439 | (93.1 | ) | ||||||||
Altium Ltd. | 2,987 | 67,289 | (18.6 | ) | ||||||||
Alumina Ltd. | 624,148 | 785,800 | (216.9 | ) | ||||||||
AMP Ltd. | 45,101 | 36,438 | (10.0 | ) | ||||||||
Aristocrat Leisure Ltd. | 44,433 | 1,030,949 | (284.6 | ) | ||||||||
Atlas Arteria Ltd. | 80,232 | 389,773 | (107.6 | ) | ||||||||
Aurizon Holdings Ltd. | 89,047 | 251,479 | (69.4 | ) | ||||||||
BlueScope Steel Ltd. | 7,229 | 102,765 | (28.4 | ) | ||||||||
Boral Ltd. | 82,481 | 205,759 | (56.8 | ) | ||||||||
carsales.com Ltd. | 7,837 | 115,698 | (31.9 | ) | ||||||||
Challenger Ltd. | 4,472 | 22,626 | (6.2 | ) | ||||||||
Charter Hall Group | 27,189 | 292,211 | (80.7 | ) | ||||||||
Commonwealth Bank of Australia | 5,760 | 418,657 | (115.6 | ) | ||||||||
CSR Ltd. | 112,891 | 483,465 | (133.4 | ) | ||||||||
Deterra Royalties Ltd. | 64,344 | 217,977 | (60.2 | ) | ||||||||
Domain Holdings Australia Ltd. | 69,064 | 168,194 | (46.4 | ) | ||||||||
Domino’s Pizza Enterprises Ltd. | 1,458 | 76,430 | (21.1 | ) | ||||||||
Flight Centre Travel Group Ltd. | 76,727 | 1,198,231 | (330.8 | ) | ||||||||
Goodman Group | 3,423 | 56,972 | (15.7 | ) | ||||||||
Harvey Norman Holdings Ltd. | 81,719 | 291,088 | (80.3 | ) | ||||||||
IGO Ltd. | 30,869 | 280,672 | (77.5 | ) | ||||||||
Iluka Resources Ltd. | 26,792 | 209,859 | (57.9 | ) | ||||||||
Insignia Financial Ltd. | 121,170 | 291,273 | (80.4 | ) | ||||||||
JB Hi-Fi Ltd. | 19,843 | 734,912 | (202.9 | ) | ||||||||
Macquarie Group Ltd. | 1,081 | 155,624 | (43.0 | ) | ||||||||
Magellan Financial Group Ltd. | 3,716 | 42,039 | (11.6 | ) | ||||||||
Medibank Pvt Ltd. | 147,124 | 330,609 | (91.3 | ) | ||||||||
Metcash Ltd. | 182,033 | 611,080 | (168.7 | ) | ||||||||
Mirvac Group | 54,208 | 91,616 | (25.3 | ) | ||||||||
Origin Energy Ltd. | 14,889 | 71,216 | (19.6 | ) | ||||||||
Orora Ltd. | 34,284 | 96,075 | (26.5 | ) | ||||||||
OZ Minerals Ltd. | 5,823 | 101,075 | (27.9 | ) | ||||||||
| Security | Shares | Value | % of Basket Value | |||||||||
| Australia (continued) | ||||||||||||
Perpetual Ltd. | 21,135 | $ | 485,888 | (134.1 | )% | |||||||
Pilbara Minerals Ltd. | 35,630 | 69,111 | (19.1 | ) | ||||||||
Platinum Asset Management Ltd. | 201,252 | 263,343 | (72.7 | ) | ||||||||
Pro Medicus Ltd. | 5,202 | 170,125 | (47.0 | ) | ||||||||
QBE Insurance Group Ltd. | 34,548 | 298,055 | (82.3 | ) | ||||||||
Qube Holdings Ltd. | 37,022 | 76,504 | (21.1 | ) | ||||||||
REA Group Ltd. | 1,450 | 129,902 | (35.8 | ) | ||||||||
Scentre Group | 34,043 | 70,929 | (19.6 | ) | ||||||||
SEEK Ltd. | 10,350 | 202,812 | (56.0 | ) | ||||||||
Sonic Healthcare Ltd. | 5,328 | 137,602 | (38.0 | ) | ||||||||
South32 Ltd. | 102,936 | 342,812 | (94.6 | ) | ||||||||
Star Entertainment Grp Ltd. | 101,977 | 225,235 | (62.2 | ) | ||||||||
Stockland | 37,022 | 107,158 | (29.6 | ) | ||||||||
Telstra Corp. Ltd. | 48,964 | 138,992 | (38.4 | ) | ||||||||
Wesfarmers Ltd. | 7,022 | 242,983 | (67.1 | ) | ||||||||
Westpac Banking Corp. | 2,963 | 49,601 | (13.7 | ) | ||||||||
WiseTech Global Ltd. | 3,980 | 123,391 | (34.1 | ) | ||||||||
Woodside Petroleum Ltd. | 8,856 | 192,672 | (53.2 | ) | ||||||||
|
|
|
| |||||||||
| 12,892,405 | ||||||||||||
| Austria | ||||||||||||
ams-OSRAM AG | 8,019 | 98,098 | (27.1 | ) | ||||||||
ANDRITZ AG | 6,734 | 286,269 | (79.0 | ) | ||||||||
Erste Group Bank AG | 4,072 | 126,785 | (35.0 | ) | ||||||||
Raiffeisen Bank International AG | 6,644 | 75,631 | (20.9 | ) | ||||||||
|
|
|
| |||||||||
| 586,783 | ||||||||||||
| Belgium | ||||||||||||
Elia Group SA | 909 | 144,693 | (39.9 | ) | ||||||||
KBC Group NV | 1,087 | 73,951 | (20.4 | ) | ||||||||
Umicore SA | 1,221 | 46,939 | (13.0 | ) | ||||||||
Warehouses De Pauw CVA | 8,612 | 331,305 | (91.5 | ) | ||||||||
|
|
|
| |||||||||
| 596,888 | ||||||||||||
| Bermuda | ||||||||||||
Helen of Troy Ltd. | 189 | 40,542 | (11.2 | ) | ||||||||
Hiscox Ltd. | 31,752 | 377,032 | (104.0 | ) | ||||||||
RenaissanceRe Holdings Ltd. | 242 | 34,732 | (9.6 | ) | ||||||||
|
|
|
| |||||||||
| 452,306 | ||||||||||||
| Canada | ||||||||||||
Air Canada | 2,858 | 50,056 | (13.8 | ) | ||||||||
Alamos Gold Inc., Class A | 69,169 | 537,350 | (148.3 | ) | ||||||||
AltaGas Ltd. | 6,382 | 145,957 | (40.3 | ) | ||||||||
ARC Resources Ltd. | 7,793 | 108,040 | (29.8 | ) | ||||||||
Aritzia Inc. | 5,961 | 212,288 | (58.6 | ) | ||||||||
Atco Ltd., Class I | 7,592 | 270,491 | (74.7 | ) | ||||||||
B2Gold Corp. | 38,319 | 162,565 | (44.9 | ) | ||||||||
Baytex Energy Corp. | 29,520 | 150,972 | (41.7 | ) | ||||||||
BCE, Inc. | 17,679 | 939,926 | (259.5 | ) | ||||||||
Boralex, Inc., Class A | 4,740 | 142,091 | (39.2 | ) | ||||||||
Brookfield Infrastructure Corp., Class A | 2,896 | 205,480 | (56.7 | ) | ||||||||
CAE, Inc. | 11,555 | 274,787 | (75.9 | ) | ||||||||
Canada Goose Holdings, Inc. | 11,732 | 255,406 | (70.5 | ) | ||||||||
Canadian Utilities Ltd., Class A | 28,922 | 869,472 | (240.0 | ) | ||||||||
Cargojet, Inc. | 2,429 | 283,788 | (78.3 | ) | ||||||||
Cenovus Energy Inc. | 3,358 | 62,081 | (17.1 | ) | ||||||||
CGI, Inc. | 11,339 | 904,190 | (249.6 | ) | ||||||||
CI Financial Corp. | 20,944 | 273,080 | (75.4 | ) | ||||||||
Colliers International Group, Inc. | 2,105 | 232,432 | (64.2 | ) | ||||||||
Crescent Point Energy Corp. | 65,032 | 450,539 | (124.4 | ) | ||||||||
Descartes Systems Group Inc. | 7,438 | 461,976 | (127.5 | ) | ||||||||
Emera, Inc. | 20,362 | 983,190 | (271.4 | ) | ||||||||
SCHEDULE OF INVESTMENTS | 51 |
Schedule of Investments (continued) April 30, 2022 | BlackRock Global Long/Short Equity Fund |
| Security | Shares | Value | % of Basket Value | |||||||||
| Canada (continued) | ||||||||||||
Enbridge, Inc. | 6,684 | $ | 291,679 | (80.5 | )% | |||||||
Enerplus Corp. | 37,644 | 461,228 | (127.3 | ) | ||||||||
Equinox Gold Corp. | 4,826 | 34,411 | (9.5 | ) | ||||||||
First Capital Real Estate Investment Trust | 3,465 | 46,177 | (12.7 | ) | ||||||||
First Majestic Silver Corp. | 1,597 | 16,496 | (4.6 | ) | ||||||||
FirstService Corp. | 1,063 | 132,543 | (36.6 | ) | ||||||||
Franco-Nevada Corp. | 4,551 | 688,256 | (190.0 | ) | ||||||||
George Weston Ltd. | 1,537 | 191,214 | (52.8 | ) | ||||||||
GFL Environmental, Inc. | 505 | 15,213 | (4.2 | ) | ||||||||
Hydro One Ltd. | 10,718 | 289,757 | (80.0 | ) | ||||||||
IGM Financial, Inc. | 12,221 | 387,278 | (106.9 | ) | ||||||||
Imperial Oil Ltd. | 5,330 | 268,357 | (74.1 | ) | ||||||||
Innergex Renewable Energy Inc. | 15,671 | 209,817 | (57.9 | ) | ||||||||
Ivanhoe Mines Ltd., Class A | 8,478 | 67,975 | (18.8 | ) | ||||||||
Keyera Corp. | 18,127 | 449,700 | (124.1 | ) | ||||||||
Kinaxis, Inc. | 3,152 | 348,802 | (96.3 | ) | ||||||||
Lululemon Athletica, Inc. | 3,651 | 1,294,754 | (357.4 | ) | ||||||||
Lundin Mining Corp. | 15,682 | 143,191 | (39.5 | ) | ||||||||
NexGen Energy Ltd. | 72,885 | 359,134 | (99.1 | ) | ||||||||
Northland Power, Inc. | 409 | 12,343 | (3.4 | ) | ||||||||
Nutrien Ltd. | 282 | 27,712 | (7.7 | ) | ||||||||
Osisko Gold Royalties Ltd. | 42,662 | 525,035 | (144.9 | ) | ||||||||
Pan American Silver Corp. | 7,975 | 197,722 | (54.6 | ) | ||||||||
Parex Resources, Inc. | 7,109 | 138,566 | (38.3 | ) | ||||||||
Pembina Pipeline Corp. | 490 | 18,541 | (5.1 | ) | ||||||||
Ritchie Bros Auctioneers, Inc. | 3,076 | 169,430 | (46.8 | ) | ||||||||
Shopify, Inc., Class A | 1,517 | 648,922 | (179.1 | ) | ||||||||
SSR Mining, Inc. | 4,334 | 95,340 | (26.3 | ) | ||||||||
Stantec, Inc. | 3,492 | 160,295 | (44.3 | ) | ||||||||
Summit Industrial Income REIT | 22,217 | 351,764 | (97.1 | ) | ||||||||
TC Energy Corp. | 29,286 | 1,549,047 | (427.6 | ) | ||||||||
Teck Resources Ltd., Class B | 3,757 | 148,215 | (40.9 | ) | ||||||||
TELUS Corp. | 19,443 | 486,434 | (134.3 | ) | ||||||||
TFI International, Inc. | 1,826 | 146,887 | (40.5 | ) | ||||||||
TMX Group Ltd. | 2,810 | 286,086 | (79.0 | ) | ||||||||
Turquoise Hill Resources Ltd. | 4,758 | 129,816 | (35.8 | ) | ||||||||
Vermilion Energy Inc. | 13,909 | 271,002 | (74.8 | ) | ||||||||
Wheaton Precious Metals Corp. | 18,503 | 829,333 | (228.9 | ) | ||||||||
Whitecap Resources, Inc. | 12,190 | 99,919 | (27.6 | ) | ||||||||
Yamana Gold, Inc. | 95,361 | 526,299 | (145.3 | ) | ||||||||
|
|
|
| |||||||||
| 20,490,847 | ||||||||||||
| China | ||||||||||||
Budweiser Brewing Co. APAC Ltd. | 6,800 | 16,920 | (4.7 | ) | ||||||||
Chow Tai Fook Jewellery Group Ltd. | 15,200 | 25,486 | (7.0 | ) | ||||||||
|
|
|
| |||||||||
| 42,406 | ||||||||||||
| Denmark | ||||||||||||
Coloplast A/S, Class B | 1,374 | 185,117 | (51.1 | ) | ||||||||
Demant A/S | 1,881 | 82,658 | (22.8 | ) | ||||||||
Genmab A/S | 57 | 20,043 | (5.5 | ) | ||||||||
GN Store Nord A/S | 5,162 | 193,727 | (53.5 | ) | ||||||||
H Lundbeck A/S | 12,453 | 285,400 | (78.8 | ) | ||||||||
ISS A/S | 11,701 | 192,061 | (53.0 | ) | ||||||||
Jyske Bank A/S | 4,723 | 261,154 | (72.1 | ) | ||||||||
Novo Nordisk A/S, Class B | 3,763 | 429,833 | (118.7 | ) | ||||||||
SimCorp A/S | 2,393 | 167,526 | (46.2 | ) | ||||||||
Tryg A/S | 2,128 | 50,598 | (14.0 | ) | ||||||||
|
|
|
| |||||||||
| 1,868,117 | ||||||||||||
| Finland | ||||||||||||
Kesko OYJ, B Shares | 5,687 | 143,178 | (39.5 | ) | ||||||||
| Security | Shares | Value | % of Basket Value | |||||||||
| Finland (continued) | ||||||||||||
Metso Outotec OYJ | 23,195 | $ | 197,504 | (54.5 | )% | |||||||
Nokia OYJ | 66,941 | 339,396 | (93.7 | ) | ||||||||
Nokian Renkaat OYJ | 5,607 | 75,294 | (20.8 | ) | ||||||||
Nordea Bank Abp | 3,345 | 33,350 | (9.2 | ) | ||||||||
Outokumpu OYJ | 58,518 | 287,280 | (79.3 | ) | ||||||||
Valmet OYJ | 7,738 | 207,230 | (57.2 | ) | ||||||||
Wartsila OYJ Abp | 33,067 | 265,523 | (73.3 | ) | ||||||||
|
|
|
| |||||||||
| 1,548,755 | ||||||||||||
| Germany | ||||||||||||
1&1 AG | 3,691 | 77,781 | (21.5 | ) | ||||||||
Bayerische Motoren Werke AG | 7,940 | 648,426 | (179.0 | ) | ||||||||
Beiersdorf AG | 3,995 | 401,260 | (110.8 | ) | ||||||||
Commerzbank AG | 53,501 | 349,272 | (96.4 | ) | ||||||||
Covestro AG | 7,977 | 343,454 | (94.8 | ) | ||||||||
CTS Eventim AG & Co. KGaA | 5,605 | 384,705 | (106.2 | ) | ||||||||
Deutsche Bank AG | 21,794 | 217,925 | (60.2 | ) | ||||||||
E.ON SE | 76,075 | 791,709 | (218.5 | ) | ||||||||
Fraport AG Frankfurt Airport Services Worldwide | 19,718 | 1,053,716 | (290.9 | ) | ||||||||
Freenet AG | 8,377 | 231,777 | (64.0 | ) | ||||||||
GEA Group AG | 96 | 3,737 | (1.0 | ) | ||||||||
Hannover Rueck SE | 3,446 | 535,614 | (147.9 | ) | ||||||||
HeidelbergCement AG | 1,953 | 112,507 | (31.1 | ) | ||||||||
Hochtief AG | 9,315 | 563,729 | (155.6 | ) | ||||||||
HUGO BOSS AG | 1,421 | 79,694 | (22.0 | ) | ||||||||
Infineon Technologies AG | 8,414 | 238,816 | (65.9 | ) | ||||||||
KION Group AG | 2,070 | 115,146 | (31.8 | ) | ||||||||
LANXESS AG | 2,352 | 90,919 | (25.1 | ) | ||||||||
LEG Immobilien SE | 3,018 | 309,437 | (85.4 | ) | ||||||||
Merck KGaA | 3,709 | 688,121 | (189.9 | ) | ||||||||
MTU Aero Engines AG | 357 | 71,995 | (19.9 | ) | ||||||||
Nemetschek SE | 2,401 | 190,530 | (52.6 | ) | ||||||||
Nordex SE | 3,309 | 47,756 | (13.2 | ) | ||||||||
ProSiebenSat.1 Media SE | 5,928 | 68,206 | (18.8 | ) | ||||||||
Rational AG | 228 | 139,090 | (38.4 | ) | ||||||||
Rheinmetall AG | 263 | 59,287 | (16.4 | ) | ||||||||
Rwe AG | 1,854 | 76,977 | (21.2 | ) | ||||||||
Salzgitter AG | 3,093 | 128,389 | (35.4 | ) | ||||||||
Scout24 AG | 5,725 | 362,096 | (100.0 | ) | ||||||||
Siemens AG | 9,988 | 1,228,074 | (339.0 | ) | ||||||||
Solarworld AG | 10 | 4 | (0.0 | ) | ||||||||
Symrise AG | 2,519 | 299,746 | (82.7 | ) | ||||||||
TAG Immobilien AG | 5,656 | 113,038 | (31.2 | ) | ||||||||
Talanx AG | 2,332 | 96,964 | (26.8 | ) | ||||||||
TeamViewer AG | 13,280 | 159,347 | (44.0 | ) | ||||||||
thyssenkrupp AG | 49,851 | 382,309 | (105.5 | ) | ||||||||
Traton SE | 6,693 | 111,542 | (30.8 | ) | ||||||||
TUI AG | 19,544 | 55,720 | (15.4 | ) | ||||||||
|
|
|
| |||||||||
| 10,828,815 | ||||||||||||
| Hong Kong | ||||||||||||
AIA Group Ltd. | 89,600 | 880,209 | (243.0 | ) | ||||||||
ASM Pacific Technology Ltd. | 1,600 | 16,124 | (4.5 | ) | ||||||||
Bank of East Asia Ltd. | 21,200 | 31,370 | (8.7 | ) | ||||||||
Cafe de Coral Holdings Ltd. | 10,000 | 15,700 | (4.3 | ) | ||||||||
Dah Sing Banking Group Ltd. | 125,600 | 105,552 | (29.1 | ) | ||||||||
Dah Sing Financial Holdings Ltd. | 86,800 | 252,582 | (69.7 | ) | ||||||||
Dairy Farm International Holdings Ltd. | 44,900 | 121,268 | (33.5 | ) | ||||||||
First Pacific Co. Ltd/Hong Kong | 146,000 | 58,868 | (16.3 | ) | ||||||||
Haitong International Securities Group Ltd. | 103,000 | 16,305 | (4.5 | ) | ||||||||
Hang Lung Group Ltd. | 40,000 | 78,100 | (21.6 | ) | ||||||||
| 52 | 2 0 2 2 BLACK ROCK ANNUAL REPORT TO SHAREHOLDERS |
Schedule of Investments (continued) April 30, 2022 | BlackRock Global Long/Short Equity Fund |
| Security | Shares | Value | % of Basket Value | |||||||||
| Hong Kong (continued) | ||||||||||||
Hang Lung Properties Ltd. | 93,000 | $ | 177,869 | (49.1 | )% | |||||||
HK Electric Investments & HK Electric Investments Ltd., Class SS | 95,500 | 94,320 | (26.0 | ) | ||||||||
Hutchison Port Holdings Trust, Class U | 139,800 | 33,322 | (9.2 | ) | ||||||||
Hutchison Telecommunications Hong Kong Holdings Ltd. | 64,000 | 10,684 | (2.9 | ) | ||||||||
Hysan Development Co. Ltd. | 79,000 | 233,064 | (64.3 | ) | ||||||||
Johnson Electric Holdings Ltd. | 8,000 | 9,084 | (2.5 | ) | ||||||||
Melco Resorts & Entertainment Ltd., ADR | 13,729 | 78,530 | (21.7 | ) | ||||||||
New World Development Co. Ltd. | 61,000 | 233,312 | (64.4 | ) | ||||||||
Pacific Basin Shipping Ltd. | 690,000 | 316,579 | (87.4 | ) | ||||||||
Shangri-La Asia Ltd. | 38,000 | 28,771 | (7.9 | ) | ||||||||
Shun Tak Holdings Ltd. | 458,000 | 92,781 | (25.6 | ) | ||||||||
SITC International Holdings Co. Ltd. | 9,000 | 29,920 | (8.3 | ) | ||||||||
SJM Holdings Ltd. | 115,000 | 48,307 | (13.3 | ) | ||||||||
Sun Hung Kai Properties Ltd. | 11,500 | 132,447 | (36.6 | ) | ||||||||
Swire Pacific Ltd., Class A | 97,500 | 555,351 | (153.3 | ) | ||||||||
Swire Properties Ltd. | 284,400 | 681,581 | (188.1 | ) | ||||||||
Techtronic Industries Co. Ltd. | 55,000 | 734,145 | (202.7 | ) | ||||||||
United Energy Group Ltd. | 1,746,000 | 205,334 | (56.7 | ) | ||||||||
WH Group Ltd. | 423,500 | 292,469 | (80.7 | ) | ||||||||
Wharf Real Estate Investment Co. Ltd. | 11,000 | 51,838 | (14.3 | ) | ||||||||
Xinyi Glass Holdings Ltd. | 10,000 | 22,128 | (6.1 | ) | ||||||||
Yue Yuen Industrial Holdings Ltd. | 391,500 | 575,852 | (159.0 | ) | ||||||||
|
|
|
| |||||||||
| 6,213,766 | ||||||||||||
| Ireland | ||||||||||||
Adient PLC | 5,586 | 190,706 | (52.7 | ) | ||||||||
Alkermes PLC | 10,011 | 288,817 | (79.7 | ) | ||||||||
Aptiv PLC | 4,585 | 487,844 | (134.7 | ) | ||||||||
Experian PLC | 5,978 | 206,446 | (57.0 | ) | ||||||||
Glanbia PLC | 15,459 | 185,591 | (51.2 | ) | ||||||||
Icon PLC | 961 | 217,388 | (60.0 | ) | ||||||||
James Hardie Industries PLC | 12,878 | 371,250 | (102.5 | ) | ||||||||
Jazz Pharmaceuticals PLC | 1,907 | 305,540 | (84.4 | ) | ||||||||
Kerry Group PLC, Class A | 485 | 53,723 | (14.8 | ) | ||||||||
Kingspan Group PLC | 2,903 | 270,232 | (74.6 | ) | ||||||||
Medtronic PLC | 6,026 | 628,873 | (173.6 | ) | ||||||||
Trane Technologies PLC | 3,572 | 499,687 | (137.9 | ) | ||||||||
|
|
|
| |||||||||
| 3,706,097 | ||||||||||||
| Israel | ||||||||||||
Airport City Ltd. | 10,183 | 226,701 | (62.6 | ) | ||||||||
Alony Hetz Properties & Investments Ltd. | 1,385 | 22,667 | (6.3 | ) | ||||||||
Amot Investments Ltd. | 13,253 | 100,601 | (27.8 | ) | ||||||||
Bank Hapoalim BM | 37,177 | 344,676 | (95.1 | ) | ||||||||
Bayside Land Corp. | 10,950 | 120,519 | (33.3 | ) | ||||||||
Bezeq The Israeli Telecommunication Corp. Ltd. | 173,513 | 275,068 | (75.9 | ) | ||||||||
Big Shopping Centers Ltd. | 672 | 101,552 | (28.0 | ) | ||||||||
Check Point Software Technologies Ltd. | 7,356 | 928,989 | (256.4 | ) | ||||||||
CyberArk Software Ltd. | 695 | 109,212 | (30.2 | ) | ||||||||
Elbit Systems Ltd. | 566 | 122,860 | (33.9 | ) | ||||||||
Enlight Renewable Energy Ltd. | 10,296 | 22,090 | (6.1 | ) | ||||||||
Fattal Holdings 1998 Ltd. | 325 | 46,876 | (12.9 | ) | ||||||||
Harel Insurance Investments & Financial Services Ltd. | 4,563 | 55,928 | (15.4 | ) | ||||||||
Israel Corp. Ltd. | 255 | 143,276 | (39.6 | ) | ||||||||
Israel Discount Bank Ltd., Class A | 87,993 | 519,725 | (143.5 | ) | ||||||||
Melisron Ltd. | 818 | 66,354 | (18.3 | ) | ||||||||
Mizrahi Tefahot Bank Ltd. | 3,332 | 123,250 | (34.0 | ) | ||||||||
Monday.com Ltd. | 1,711 | 221,403 | (61.1 | ) | ||||||||
| Security | Shares | Value | % of Basket Value | |||||||||
| Israel (continued) | ||||||||||||
Nova Measuring Instruments Ltd. | 1,819 | $ | 179,372 | (49.5 | )% | |||||||
OPC Energy Ltd. | 17,656 | 194,206 | (53.6 | ) | ||||||||
Paz Oil Co. Ltd. | 836 | 129,567 | (35.8 | ) | ||||||||
Phoenix Holdings Ltd. | 8,577 | 107,902 | (29.8 | ) | ||||||||
SolarEdge Technologies, Inc. | 82 | 20,534 | (5.7 | ) | ||||||||
Teva Pharmaceutical Industries Ltd., ADR | 55,206 | 480,844 | (132.7 | ) | ||||||||
|
|
|
| |||||||||
| 4,664,172 | ||||||||||||
| Italy | ||||||||||||
A2A SpA | 120,271 | 205,490 | (56.7 | ) | ||||||||
Amplifon SpA | 2,797 | 111,586 | (30.8 | ) | ||||||||
Assicurazioni Generali SpA | 17,813 | 337,255 | (93.1 | ) | ||||||||
Atlantia SpA | 17,423 | 415,635 | (114.7 | ) | ||||||||
Azimut Holding SpA | 5,099 | 108,231 | (29.9 | ) | ||||||||
Banca Generali SpA | 398 | 13,158 | (3.6 | ) | ||||||||
Banca Mediolanum SpA | 64,459 | 467,930 | (129.2 | ) | ||||||||
BPER Banca | 233,734 | 390,475 | (107.8 | ) | ||||||||
Buzzi Unicem SpA | 578 | 10,704 | (3.0 | ) | ||||||||
Davide Campari-Milano NV | 7,995 | 90,209 | (24.9 | ) | ||||||||
De’ Longhi SpA | 4,162 | 100,928 | (27.9 | ) | ||||||||
Enel SpA | 150,144 | 976,370 | (269.5 | ) | ||||||||
Hera SpA | 6,721 | 25,067 | (6.9 | ) | ||||||||
Interpump Group SpA | 1,171 | 47,343 | (13.1 | ) | ||||||||
Italgas SpA | 8,870 | 57,430 | (15.9 | ) | ||||||||
Leonardo SpA | 16,155 | 166,257 | (45.9 | ) | ||||||||
Mediobanca Banca di Credito Finanziario SpA | 20,847 | 208,946 | (57.7 | ) | ||||||||
Moncler SpA | 8,401 | 437,639 | (120.8 | ) | ||||||||
Reply SpA | 2,284 | 336,244 | (92.8 | ) | ||||||||
UniCredit SpA | 4,678 | 43,295 | (11.9 | ) | ||||||||
UnipolSai Assicurazioni SpA | 77,927 | 219,196 | (60.5 | ) | ||||||||
|
|
|
| |||||||||
| 4,769,388 | ||||||||||||
| Japan | ||||||||||||
ABC-Mart, Inc. | 8,500 | 352,495 | (97.3 | ) | ||||||||
Acom Co. Ltd. | 113,600 | 292,148 | (80.6 | ) | ||||||||
Activia Properties, Inc. | 93 | 297,183 | (82.0 | ) | ||||||||
Advantest Corp. | 400 | 27,299 | (7.5 | ) | ||||||||
AEON Financial Service Co. Ltd. | 36,000 | 330,962 | (91.4 | ) | ||||||||
Aica Kogyo Co. Ltd. | 13,100 | 303,241 | (83.7 | ) | ||||||||
Ajinomoto Co., Inc. | 23,200 | 602,772 | (166.4 | ) | ||||||||
Alfresa Holdings Corp. | 9,100 | 123,748 | (34.2 | ) | ||||||||
Alps Alpine Co. Ltd. | 25,300 | 223,971 | (61.8 | ) | ||||||||
Amada Co. Ltd. | 19,500 | 151,417 | (41.8 | ) | ||||||||
Amano Corp. | 5,600 | 107,807 | (29.8 | ) | ||||||||
Anritsu Corp. | 25,700 | 323,165 | (89.2 | ) | ||||||||
Aozora Bank Ltd. | 13,200 | 264,271 | (73.0 | ) | ||||||||
As One Corp. | 1,300 | 69,021 | (19.1 | ) | ||||||||
Asahi Group Holdings Ltd. | 2,200 | 82,924 | (22.9 | ) | ||||||||
Asahi Kasei Corp. | 60,300 | 494,743 | (136.6 | ) | ||||||||
Azbil Corp. | 4,200 | 127,521 | (35.2 | ) | ||||||||
Bandai Namco Holdings, Inc. | 1,600 | 108,325 | (29.9 | ) | ||||||||
Benesse Holdings, Inc. | 32,700 | 572,148 | (157.9 | ) | ||||||||
Calbee, Inc. | 24,700 | 442,436 | (122.1 | ) | ||||||||
Capcom Co. Ltd. | 200 | 5,277 | (1.5 | ) | ||||||||
Casio Computer Co. Ltd. | 45,100 | 467,680 | (129.1 | ) | ||||||||
Chubu Electric Power Co., Inc. | 31,900 | 322,033 | (88.9 | ) | ||||||||
Chugai Pharmaceutical Co. Ltd. | 26,500 | 794,076 | (219.2 | ) | ||||||||
Chugoku Bank Ltd. | 24,300 | 178,691 | (49.3 | ) | ||||||||
Chugoku Electric Power Co., Inc. | 14,100 | 92,870 | (25.6 | ) | ||||||||
Coca-Cola Bottlers Japan Holdings, Inc. | 14,800 | 165,915 | (45.8 | ) | ||||||||
COMSYS Holdings Corp. | 16,700 | 346,729 | (95.7 | ) | ||||||||
Cosmo Energy Holdings Co. Ltd. | 1,800 | 44,720 | (12.3 | ) | ||||||||
SCHEDULE OF INVESTMENTS | 53 |
Schedule of Investments (continued) April 30, 2022 | BlackRock Global Long/Short Equity Fund |
| Security | Shares | Value | % of Basket Value | |||||||||
| Japan (continued) | ||||||||||||
Cosmos Pharmaceutical Corp. | 2,400 | $ | 221,250 | (61.1 | )% | |||||||
Daifuku Co. Ltd. | 1,800 | 110,679 | (30.6 | ) | ||||||||
Daiichi Sankyo Co. Ltd. | 14,400 | 362,576 | (100.1 | ) | ||||||||
Daikin Industries Ltd. | 2,300 | 351,480 | (97.0 | ) | ||||||||
Daito Trust Construction Co. Ltd. | 2,500 | 240,780 | (66.5 | ) | ||||||||
Daiwa House Industry Co. Ltd. | 19,900 | 478,400 | (132.1 | ) | ||||||||
Dentsu Group, Inc. | 7,800 | 281,125 | (77.6 | ) | ||||||||
DMG Mori Co. Ltd. | 48,800 | 612,458 | (169.1 | ) | ||||||||
Ebara Corp. | 5,900 | 270,971 | (74.8 | ) | ||||||||
Eisai Co. Ltd. | 6,500 | 283,081 | (78.1 | ) | ||||||||
Electric Power Development Co. Ltd. | 19,700 | 269,945 | (74.5 | ) | ||||||||
FP Corp. | 3,200 | 72,375 | (20.0 | ) | ||||||||
Freee KK | 2,800 | 80,789 | (22.3 | ) | ||||||||
FUJIFILM Holdings Corp. | 1,300 | 71,463 | (19.7 | ) | ||||||||
Fujitsu Ltd. | 300 | 45,345 | (12.5 | ) | ||||||||
Furukawa Electric Co. Ltd. | 3,600 | 58,461 | (16.1 | ) | ||||||||
H.U. Group Holdings, Inc. | 3,200 | 71,304 | (19.7 | ) | ||||||||
Hamamatsu Photonics KK | 3,500 | 156,601 | (43.2 | ) | ||||||||
Hirose Electric Co. Ltd. | 1,000 | 126,874 | (35.0 | ) | ||||||||
Hisamitsu Pharmaceutical Co., Inc. | 37,400 | 1,024,637 | (282.8 | ) | ||||||||
Hitachi Construction Machinery Co. Ltd. | 4,400 | 99,622 | (27.5 | ) | ||||||||
Hoya Corp. | 2,300 | 228,257 | (63.0 | ) | ||||||||
Hulic Co. Ltd. | 9,900 | 83,590 | (23.1 | ) | ||||||||
IHI Corp. | 1,400 | 31,745 | (8.8 | ) | ||||||||
Information Services International-Dentsu Ltd. | 1,700 | 48,821 | (13.5 | ) | ||||||||
Internet Initiative Japan, Inc. | 18,600 | 580,530 | (160.3 | ) | ||||||||
ITOCHU Corp. | 1,900 | 57,344 | (15.8 | ) | ||||||||
Itochu Techno-Solutions Corp. | 10,800 | 252,891 | (69.8 | ) | ||||||||
Izumi Co. Ltd. | 700 | 15,214 | (4.2 | ) | ||||||||
J Front Retailing Co. Ltd. | 60,200 | 451,116 | (124.5 | ) | ||||||||
Japan Exchange Group, Inc. | 15,700 | 233,779 | (64.5 | ) | ||||||||
Japan Post Bank Co. Ltd. | 81,400 | 614,105 | (169.5 | ) | ||||||||
Japan Post Holdings Co. Ltd. | 93,800 | 657,712 | (181.6 | ) | ||||||||
Japan Prime Realty Investment Corp. | 47 | 142,587 | (39.4 | ) | ||||||||
Japan Tobacco, Inc. | 93,300 | 1,587,199 | (438.1 | ) | ||||||||
JGC Holdings Corp. | 19,300 | 218,402 | (60.3 | ) | ||||||||
Kakaku.com, Inc. | 22,400 | 469,097 | (129.5 | ) | ||||||||
Kamigumi Co. Ltd. | 17,300 | 293,735 | (81.1 | ) | ||||||||
Kandenko Co. Ltd. | 21,300 | 135,076 | (37.3 | ) | ||||||||
Kansai Paint Co. Ltd. | 17,300 | 238,254 | (65.8 | ) | ||||||||
Kao Corp. | 7,600 | 304,596 | (84.1 | ) | ||||||||
Keisei Electric Railway Co. Ltd. | 9,100 | 223,127 | (61.6 | ) | ||||||||
Kewpie Corp. | 8,500 | 143,155 | (39.5 | ) | ||||||||
Keyence Corp. | 500 | 201,002 | (55.5 | ) | ||||||||
Kintetsu Group Holdings Co. Ltd. | 4,800 | 137,622 | (38.0 | ) | ||||||||
Kobe Bussan Co. Ltd. | 34,200 | 833,772 | (230.2 | ) | ||||||||
Koito Manufacturing Co. Ltd. | 10,100 | 370,615 | (102.3 | ) | ||||||||
Kokuyo Co. Ltd. | 15,000 | 195,363 | (53.9 | ) | ||||||||
Konami Holdings Corp. | 7,000 | 430,454 | (118.8 | ) | ||||||||
Konica Minolta, Inc. | 245,700 | 855,114 | (236.1 | ) | ||||||||
Kuraray Co. Ltd. | 28,700 | 229,535 | (63.4 | ) | ||||||||
Kusuri no Aoki Holdings Co. Ltd. | 400 | 17,722 | (4.9 | ) | ||||||||
Kyocera Corp. | 2,000 | 105,014 | (29.0 | ) | ||||||||
Kyowa Exeo Corp. | 9,900 | 164,813 | (45.5 | ) | ||||||||
Kyowa Kirin Co. Ltd. | 9,600 | 202,337 | (55.9 | ) | ||||||||
Kyudenko Corp. | 11,200 | 253,992 | (70.1 | ) | ||||||||
Lawson, Inc. | 6,800 | 250,105 | (69.0 | ) | ||||||||
Lion Corp. | 25,100 | 258,616 | (71.4 | ) | ||||||||
Lixil Corp. | 3,300 | 58,041 | (16.0 | ) | ||||||||
Mani Inc. | 17,800 | 203,276 | (56.1 | ) | ||||||||
Maruwa Unyu Kikan Co. Ltd. | 19,700 | 229,998 | (63.5 | ) | ||||||||
Mercari, Inc. | 1,000 | 16,387 | (4.5 | ) | ||||||||
| Security | Shares | Value | % of Basket Value | |||||||||
| Japan (continued) | ||||||||||||
MISUMI Group, Inc. | 4,500 | $ | 112,834 | (31.1 | )% | |||||||
Mitsubishi Chemical Holdings Corp. | 8,200 | 50,001 | (13.8 | ) | ||||||||
Mitsubishi Corp. | 13,400 | 449,912 | (124.2 | ) | ||||||||
Mitsubishi HC Capital, Inc. | 86,600 | 389,654 | (107.6 | ) | ||||||||
Mitsubishi Logistics Corp. | 13,300 | 306,532 | (84.6 | ) | ||||||||
Mitsubishi Materials Corp. | 7,200 | 112,631 | (31.1 | ) | ||||||||
Mitsubishi Motors Corp. | 242,200 | 605,744 | (167.2 | ) | ||||||||
Mitsui & Co. Ltd. | 6,800 | 164,667 | (45.5 | ) | ||||||||
Mitsui Fudosan Co. Ltd. | 31,800 | 673,961 | (186.0 | ) | ||||||||
Mitsui Mining & Smelting Co. Ltd. | 6,100 | 154,242 | (42.6 | ) | ||||||||
MS&AD Insurance Group Holdings, Inc. | 600 | 17,860 | (4.9 | ) | ||||||||
Murata Manufacturing Co. Ltd. | 1,100 | 65,568 | (18.1 | ) | ||||||||
Nagoya Railroad Co. Ltd. | 400 | 6,424 | (1.8 | ) | ||||||||
Nankai Electric Railway Co. Ltd. | 4,200 | 74,982 | (20.7 | ) | ||||||||
NEC Corp. | 3,700 | 143,545 | (39.6 | ) | ||||||||
NET One Systems Co. Ltd. | 24,700 | 589,411 | (162.7 | ) | ||||||||
Nichirei Corp. | 11,300 | 207,473 | (57.3 | ) | ||||||||
Nihon Kohden Corp. | 12,300 | 295,275 | (81.5 | ) | ||||||||
Nippon Express Holdings, Inc. | 2,300 | 134,851 | (37.2 | ) | ||||||||
Nippon Steel Corp. | 15,600 | 247,706 | (68.4 | ) | ||||||||
Nippon Telegraph & Telephone Corp. | 1,500 | 44,204 | (12.2 | ) | ||||||||
Nippon Television Holdings, Inc. | 24,000 | 230,357 | (63.6 | ) | ||||||||
Nippon Yusen KK | 1,300 | 93,787 | (25.9 | ) | ||||||||
Nipro Corp. | 22,300 | 175,716 | (48.5 | ) | ||||||||
Nissan Chemical Corp. | 2,100 | 110,927 | (30.6 | ) | ||||||||
Nissin Foods Holdings Co. Ltd. | 3,900 | 271,294 | (74.9 | ) | ||||||||
Nitori Holdings Co. Ltd. | 4,800 | 493,821 | (136.3 | ) | ||||||||
Nitto Denko Corp. | 3,800 | 255,059 | (70.4 | ) | ||||||||
NOK Corp. | 14,100 | 119,967 | (33.1 | ) | ||||||||
Nomura Real Estate Holdings, Inc. | 9,400 | 229,038 | (63.2 | ) | ||||||||
Nomura Research Institute Ltd. | 10,500 | 296,902 | (82.0 | ) | ||||||||
NSK Ltd. | 10,500 | 58,104 | (16.0 | ) | ||||||||
NTT Data Corp. | 17,700 | 326,351 | (90.1 | ) | ||||||||
Obayashi Corp. | 48,800 | 335,604 | (92.6 | ) | ||||||||
OBIC Business Consultants Co. Ltd. | 5,400 | 194,086 | (53.6 | ) | ||||||||
Obic Co. Ltd. | 1,200 | 177,287 | (48.9 | ) | ||||||||
Olympus Corp. | 900 | 15,841 | (4.4 | ) | ||||||||
Omron Corp. | 400 | 23,582 | (6.5 | ) | ||||||||
Otsuka Corp. | 8,400 | 275,286 | (76.0 | ) | ||||||||
Otsuka Holdings Co. Ltd. | 16,600 | 557,800 | (154.0 | ) | ||||||||
PALTAC Corp. | 400 | 14,579 | (4.0 | ) | ||||||||
Panasonic Corp. | 1,800 | 16,044 | (4.4 | ) | ||||||||
Park24 Co. Ltd. | 5,200 | 74,051 | (20.4 | ) | ||||||||
Penta-Ocean Construction Co. Ltd. | 24,400 | 119,389 | (33.0 | ) | ||||||||
PeptiDream, Inc. | 7,100 | 114,515 | (31.6 | ) | ||||||||
Pigeon Corp. | 12,600 | 214,893 | (59.3 | ) | ||||||||
Pola Orbis Holdings, Inc. | 36,900 | 425,425 | (117.4 | ) | ||||||||
Rakuten Group, Inc. | 1,800 | 12,654 | (3.5 | ) | ||||||||
Recruit Holdings Co. Ltd. | 6,900 | 250,343 | (69.1 | ) | ||||||||
Relo Group, Inc. | 2,700 | 38,568 | (10.6 | ) | ||||||||
Renesas Electronics Corp. | 17,800 | 190,068 | (52.5 | ) | ||||||||
Resorttrust, Inc. | 2,000 | 33,647 | (9.3 | ) | ||||||||
Ricoh Co. Ltd. | 46,500 | 339,539 | (93.7 | ) | ||||||||
Rinnai Corp. | 1,900 | 121,447 | (33.5 | ) | ||||||||
Ryohin Keikaku Co. Ltd. | 6,600 | 59,315 | (16.4 | ) | ||||||||
Sankyu Inc. | 400 | 12,196 | (3.4 | ) | ||||||||
Santen Pharmaceutical Co. Ltd. | 25,100 | 204,180 | (56.4 | ) | ||||||||
Sapporo Holdings Ltd. | 27,800 | 578,632 | (159.7 | ) | ||||||||
Sawai Group Holdings Co. Ltd. | 6,300 | 211,331 | (58.3 | ) | ||||||||
SBI Holdings, Inc. | 9,900 | 221,434 | (61.1 | ) | ||||||||
SCSK Corp. | 16,800 | 267,092 | (73.7 | ) | ||||||||
Seino Holdings Co Ltd. | 28,200 | 230,365 | (63.6 | ) | ||||||||
| 54 | 2 0 2 2 BLACK ROCK ANNUAL REPORT TO SHAREHOLDERS |
Schedule of Investments (continued) April 30, 2022 | BlackRock Global Long/Short Equity Fund |
| Security | Shares | Value | % of Basket Value | |||||||||
| Japan (continued) | ||||||||||||
Sekisui House Ltd. | 5,900 | $ | 102,471 | (28.3 | )% | |||||||
Sekisui House REIT, Inc. | 288 | 168,524 | (46.5 | ) | ||||||||
SG Holdings Co. Ltd. | 3,600 | 63,442 | (17.5 | ) | ||||||||
Shimadzu Corp. | 29,500 | 964,418 | (266.2 | ) | ||||||||
Shimizu Corp. | 25,400 | 133,188 | (36.8 | ) | ||||||||
Shin-Etsu Chemical Co. Ltd. | 1,500 | 206,152 | (56.9 | ) | ||||||||
Shionogi & Co. Ltd. | 1,200 | 66,751 | (18.4 | ) | ||||||||
Skylark Co. Ltd. | 7,600 | 90,179 | (24.9 | ) | ||||||||
SMS Co. Ltd. | 3,500 | 82,140 | (22.7 | ) | ||||||||
Softbank Corp. | 21,300 | 247,886 | (68.4 | ) | ||||||||
SoftBank Group Corp. | 400 | 16,452 | (4.5 | ) | ||||||||
Sompo Holdings, Inc. | 900 | 36,639 | (10.1 | ) | ||||||||
Sony Group Corp. | 2,300 | 198,492 | (54.8 | ) | ||||||||
Sotetsu Holdings Inc. | 6,500 | 111,430 | (30.8 | ) | ||||||||
Square Enix Holdings Co. Ltd. | 3,100 | 123,770 | (34.2 | ) | ||||||||
Sumitomo Chemical Co. Ltd. | 121,700 | 517,493 | (142.9 | ) | ||||||||
Sumitomo Corp. | 9,200 | 145,577 | (40.2 | ) | ||||||||
Sumitomo Dainippon Pharma Co. Ltd. | 2,300 | 20,488 | (5.7 | ) | ||||||||
Sumitomo Forestry Co. Ltd. | 10,400 | 159,108 | (43.9 | ) | ||||||||
Sumitomo Heavy Industries Ltd. | 4,100 | 86,762 | (23.9 | ) | ||||||||
Sumitomo Mitsui Financial Group, Inc. | 4,900 | 148,048 | (40.9 | ) | ||||||||
Sumitomo Mitsui Trust Holdings, Inc. | 9,400 | 291,753 | (80.5 | ) | ||||||||
Sumitomo Rubber Industries Ltd. | 4,700 | 40,739 | (11.2 | ) | ||||||||
Sundrug Co. Ltd. | 8,100 | 188,585 | (52.1 | ) | ||||||||
Suntory Beverage & Food Ltd. | 6,300 | 248,226 | (68.5 | ) | ||||||||
Suzuki Motor Corp. | 3,000 | 90,435 | (25.0 | ) | ||||||||
Sysmex Corp. | 4,600 | 301,749 | (83.3 | ) | ||||||||
Taiheiyo Cement Corp. | 15,900 | 257,255 | (71.0 | ) | ||||||||
Taisei Corp. | 3,400 | 92,099 | (25.4 | ) | ||||||||
Teijin Ltd. | 42,500 | 454,167 | (125.4 | ) | ||||||||
Terumo Corp. | 7,100 | 211,332 | (58.3 | ) | ||||||||
TIS, Inc. | 2,800 | 62,886 | (17.4 | ) | ||||||||
Tohoku Electric Power Co., Inc. | 62,900 | 349,884 | (96.6 | ) | ||||||||
Tokio Marine Holdings, Inc. | 12,600 | 681,265 | (188.1 | ) | ||||||||
Tokyo Gas Co. Ltd. | 18,300 | 350,526 | (96.8 | ) | ||||||||
Tokyo Ohka Kogyo Co. Ltd. | 6,100 | 331,451 | (91.5 | ) | ||||||||
Toray Industries, Inc. | 41,500 | 196,680 | (54.3 | ) | ||||||||
Tosoh Corp. | 600 | 8,285 | (2.3 | ) | ||||||||
TOTO Ltd. | 3,200 | 107,836 | (29.8 | ) | ||||||||
Toyo Seikan Group Holdings Ltd. | 3,300 | 35,694 | (9.9 | ) | ||||||||
Toyo Suisan Kaisha Ltd. | 7,700 | 237,748 | (65.6 | ) | ||||||||
Toyota Tsusho Corp. | 1,200 | 43,113 | (11.9 | ) | ||||||||
Trend Micro, Inc. | 8,500 | 473,934 | (130.8 | ) | ||||||||
Tsumura & Co. | 3,900 | 95,959 | (26.5 | ) | ||||||||
Tsuruha Holdings, Inc. | 6,600 | 337,313 | (93.1 | ) | ||||||||
Unicharm Corp. | 12,500 | 434,900 | (120.1 | ) | ||||||||
Ushio, Inc. | 5,000 | 64,828 | (17.9 | ) | ||||||||
Welcia Holdings Co. Ltd. | 23,400 | 479,678 | (132.4 | ) | ||||||||
Yamada Holdings Co. Ltd. | 214,700 | 641,111 | (177.0 | ) | ||||||||
Yamaguchi Financial Group, Inc. | 22,200 | 121,726 | (33.6 | ) | ||||||||
Yamaha Corp. | 9,500 | 362,966 | (100.2 | ) | ||||||||
Yamaha Motor Co. Ltd. | 4,500 | 92,906 | (25.6 | ) | ||||||||
Yaoko Co. Ltd. | 2,900 | 153,418 | (42.4 | ) | ||||||||
Yaskawa Electric Corp. | 5,100 | 173,173 | (47.8 | ) | ||||||||
Yokohama Rubber Co. Ltd. | 19,000 | 254,383 | (70.2 | ) | ||||||||
Z Holdings Corp. | 52,900 | 207,677 | (57.3 | ) | ||||||||
Zensho Holdings Co. Ltd. | 900 | 21,224 | (5.9 | ) | ||||||||
ZOZO, Inc. | 7,900 | 165,406 | (45.7 | ) | ||||||||
|
|
|
| |||||||||
| 50,219,627 | ||||||||||||
| Security | Shares | Value | % of Basket Value | |||||||||
| Luxembourg | ||||||||||||
Aroundtown SA | 17,538 | $ | 88,190 | (24.3 | )% | |||||||
L’Occitane International SA | 23,000 | 72,095 | (19.9 | ) | ||||||||
RTL Group SA | 4,734 | 246,156 | (68.0 | ) | ||||||||
|
|
|
| |||||||||
| 406,441 | ||||||||||||
| Macau | ||||||||||||
MGM China Holdings Ltd. | 104,800 | 59,986 | (16.6 | ) | ||||||||
Wynn Macau Ltd. | 131,200 | 80,586 | (22.2 | ) | ||||||||
|
|
|
| |||||||||
| 140,572 | ||||||||||||
| Mexico | ||||||||||||
Fresnillo PLC | 22,039 | 213,254 | (58.9 | ) | ||||||||
|
|
|
| |||||||||
| Netherlands | ||||||||||||
ABN AMRO Bank NV | 24,924 | 309,834 | (85.5 | ) | ||||||||
ASR Nederland NV | 8,103 | 368,271 | (101.7 | ) | ||||||||
CTP NV | 702 | 9,940 | (2.7 | ) | ||||||||
Heineken Holding NV | 5,688 | 444,018 | (122.6 | ) | ||||||||
Heineken NV | 301 | 29,381 | (8.1 | ) | ||||||||
IMCD NV | 3,517 | 559,985 | (154.6 | ) | ||||||||
ING Groep NV | 6,397 | 60,606 | (16.7 | ) | ||||||||
Koninklijke Vopak NV | 6,761 | 181,802 | (50.2 | ) | ||||||||
OCI NV | 4,212 | 159,603 | (44.1 | ) | ||||||||
PostNL NV | 95,438 | 312,728 | (86.3 | ) | ||||||||
QIAGEN NV | 1,913 | 88,222 | (24.4 | ) | ||||||||
Randstad NV | 3,639 | 192,427 | (53.1 | ) | ||||||||
|
|
|
| |||||||||
| 2,716,817 | ||||||||||||
| New Zealand | ||||||||||||
a2 Milk Co. Ltd. | 44,102 | 136,987 | (37.8 | ) | ||||||||
Air New Zealand Ltd. | 92,334 | 52,403 | (14.5 | ) | ||||||||
Contact Energy Ltd. | 58,064 | 305,046 | (84.2 | ) | ||||||||
Fisher & Paykel Healthcare Corp. Ltd. | 6,806 | 93,529 | (25.8 | ) | ||||||||
Infratil Ltd. | 90,102 | 487,599 | (134.6 | ) | ||||||||
Xero Ltd. | 6,748 | 444,977 | (122.8 | ) | ||||||||
|
|
|
| |||||||||
| 1,520,541 | ||||||||||||
| Norway | ||||||||||||
Aker BP ASA | 2,711 | 97,132 | (26.8 | ) | ||||||||
Equinor ASA | 33,231 | 1,123,193 | (310.1 | ) | ||||||||
Nordic Semiconductor ASA | 9,429 | 187,460 | (51.7 | ) | ||||||||
Schibsted ASA, Class A | 6,638 | 138,329 | (38.2 | ) | ||||||||
Schibsted ASA, Class B | 723 | 13,991 | (3.9 | ) | ||||||||
|
|
|
| |||||||||
| 1,560,105 | ||||||||||||
| Portugal | ||||||||||||
EDP - Energias de Portugal SA | 102,021 | 475,485 | (131.3 | ) | ||||||||
Jeronimo Martins SGPS SA | 7,212 | 150,130 | (41.4 | ) | ||||||||
|
|
|
| |||||||||
| 625,615 | ||||||||||||
| Puerto Rico | ||||||||||||
Popular, Inc. | 4,379 | 341,518 | (94.3 | ) | ||||||||
|
|
|
| |||||||||
| Singapore | ||||||||||||
ComfortDelGro Corp. Ltd. | 260,700 | 275,389 | (76.0 | ) | ||||||||
Jardine Cycle & Carriage Ltd. | 900 | 18,758 | (5.2 | ) | ||||||||
Mapletree Commercial Trust | 76,700 | 103,156 | (28.5 | ) | ||||||||
NetLink NBN Trust | 777,900 | 562,493 | (155.3 | ) | ||||||||
SATS Ltd. | 32,900 | 107,421 | (29.6 | ) | ||||||||
Sea Ltd., ADR | 2,736 | 226,431 | (62.5 | ) | ||||||||
Sembcorp Marine Ltd. | 165,700 | 12,993 | (3.6 | ) | ||||||||
SIA Engineering Co. Ltd. | 36,600 | 70,290 | (19.4 | ) | ||||||||
Singapore Post Ltd. | 1,187,100 | 609,606 | (168.3 | ) | ||||||||
SCHEDULE OF INVESTMENTS | 55 |
Schedule of Investments (continued) April 30, 2022 | BlackRock Global Long/Short Equity Fund |
| Security | Shares | Value | % of Basket Value | |||||||||
| Singapore (continued) | ||||||||||||
StarHub Ltd. | 158,800 | $ | 144,037 | (39.8 | )% | |||||||
United Overseas Bank Ltd. | 27,300 | 584,390 | (161.3 | ) | ||||||||
|
|
|
| |||||||||
| 2,714,964 | ||||||||||||
| Spain | ||||||||||||
Acciona SA | 1,094 | 214,148 | (59.1 | ) | ||||||||
Banco Bilbao Vizcaya Argentaria SA | 124,016 | 650,743 | (179.6 | ) | ||||||||
Bankinter SA | 88,768 | 522,389 | (144.2 | ) | ||||||||
Endesa SA | 6,453 | 135,238 | (37.3 | ) | ||||||||
Grifols SA | 15,247 | 255,368 | (70.5 | ) | ||||||||
Inmobiliaria Colonial Socimi SA | 46,205 | 384,212 | (106.1 | ) | ||||||||
Merlin Properties Socimi SA | 26,796 | 291,103 | (80.4 | ) | ||||||||
Naturgy Energy Group SA | 1,949 | 58,630 | (16.2 | ) | ||||||||
Solaria Energia y Medio Ambiente SA | 650 | 14,619 | (4.0 | ) | ||||||||
|
|
|
| |||||||||
| 2,526,450 | ||||||||||||
| Sweden | ||||||||||||
Alfa Laval AB | 12,109 | 337,069 | (93.0 | ) | ||||||||
Autoliv, Inc. | 851 | 62,702 | (17.3 | ) | ||||||||
Castellum AB | 5,303 | 105,017 | (29.0 | ) | ||||||||
Electrolux AB, Class B | 16,549 | 252,379 | (69.7 | ) | ||||||||
Elekta AB, B Shares | 53,231 | 358,525 | (99.0 | ) | ||||||||
Epiroc AB, Class A | 8,046 | 163,117 | (45.0 | ) | ||||||||
Epiroc AB, Class B | 15,027 | 262,159 | (72.4 | ) | ||||||||
EQT AB | 3,692 | 104,490 | (28.8 | ) | ||||||||
Essity AB, Class B | 18,332 | 483,433 | (133.5 | ) | ||||||||
Hexagon AB, B Shares | 10,430 | 134,577 | (37.2 | ) | ||||||||
Holmen AB, B Shares | 14,829 | 857,098 | (236.6 | ) | ||||||||
Indutrade AB | 11,338 | 267,439 | (73.8 | ) | ||||||||
Investment AB Latour, B Shares | 9,336 | 247,334 | (68.3 | ) | ||||||||
Lifco AB, B Shares | 467 | 9,796 | (2.7 | ) | ||||||||
Lundin Energy AB | 5,103 | 210,988 | (58.2 | ) | ||||||||
Nibe Industrier AB, B Shares | 22,142 | 217,089 | (59.9 | ) | ||||||||
Saab AB, Class B | 1,007 | 42,595 | (11.8 | ) | ||||||||
Sagax AB, Class B | 6,799 | 173,677 | (47.9 | ) | ||||||||
Skanska AB, B Shares | 1,786 | 34,116 | (9.4 | ) | ||||||||
Spotify Technology SA | 5,730 | 582,454 | (160.8 | ) | ||||||||
SSAB AB, A Shares | 12,141 | 77,109 | (21.3 | ) | ||||||||
Svenska Handelsbanken AB, A Shares | 1,444 | 14,565 | (4.0 | ) | ||||||||
Swedish Match AB | 47,664 | 379,633 | (104.8 | ) | ||||||||
Tele2 AB, B Shares | 9,024 | 119,607 | (33.0 | ) | ||||||||
|
|
|
| |||||||||
| 5,496,968 | ||||||||||||
| Switzerland | ||||||||||||
Adecco Group AG | 1,068 | 41,214 | (11.4 | ) | ||||||||
Baloise Holding AG | 605 | 105,234 | (29.0 | ) | ||||||||
Barry Callebaut AG | 180 | 414,280 | (114.4 | ) | ||||||||
Chocoladefabriken Lindt & Spruengli AG, Registered Shares | 6 | 711,797 | (196.5 | ) | ||||||||
Chocoladefabriken Lindt & Spruengli AG, Participation Certificates | 56 | 628,039 | (173.4 | ) | ||||||||
Cie Financiere Richemont SA, Class A | 3,363 | 390,749 | (107.9 | ) | ||||||||
Flughafen Zurich AG | 4,534 | 766,693 | (211.6 | ) | ||||||||
Idorsia Ltd. | 15,312 | 261,351 | (72.1 | ) | ||||||||
Julius Baer Group Ltd. | 1,678 | 80,188 | (22.1 | ) | ||||||||
Logitech International SA | 2,010 | 130,808 | (36.1 | ) | ||||||||
Lonza Group AG | 174 | 102,596 | (28.3 | ) | ||||||||
SIG Combibloc Group AG | 8,511 | 178,182 | (49.2 | ) | ||||||||
Sika AG | 5,656 | 1,727,670 | (476.9 | ) | ||||||||
Straumann Holding AG | 2,240 | 264,077 | (72.9 | ) | ||||||||
Swatch Group AG | 3,623 | 929,817 | (256.7 | ) | ||||||||
| Security | Shares | Value | % of Basket Value | |||||||||
| Switzerland (continued) | ||||||||||||
Swiss Prime Site AG | 5,778 | $ | 564,768 | (155.9 | )% | |||||||
Temenos AG | 1,714 | 173,021 | (47.8 | ) | ||||||||
UBS Group AG | 19,127 | 324,712 | (89.6 | ) | ||||||||
|
|
|
| |||||||||
| 7,795,196 | ||||||||||||
| United Kingdom | ||||||||||||
Abrdn PLC | 34,049 | 79,951 | (22.1 | ) | ||||||||
Ashtead Group PLC | 1,994 | 103,104 | (28.5 | ) | ||||||||
ASOS PLC | 7,214 | 125,614 | (34.7 | ) | ||||||||
Atlantica Sustainable Infrastructure PLC | 16,287 | 503,268 | (138.9 | ) | ||||||||
BAE Systems PLC | 48,516 | 448,126 | (123.7 | ) | ||||||||
Barclays PLC | 226,967 | 417,197 | (115.2 | ) | ||||||||
Barratt Developments PLC | 72,986 | 446,531 | (123.3 | ) | ||||||||
Beazley PLC | 127,930 | 694,296 | (191.7 | ) | ||||||||
Bellway PLC | 5,002 | 151,922 | (41.9 | ) | ||||||||
British American Tobacco PLC | 6,896 | 289,028 | (79.8 | ) | ||||||||
British Land Co. PLC | 18,063 | 116,351 | (32.1 | ) | ||||||||
Capri Holdings Ltd. | 1,684 | 80,327 | (22.2 | ) | ||||||||
Centrica PLC | 194,797 | 193,003 | (53.3 | ) | ||||||||
Croda International PLC | 4,847 | 470,772 | (130.0 | ) | ||||||||
Dechra Pharmaceuticals PLC | 9,442 | 427,867 | (118.1 | ) | ||||||||
Derwent London PLC | 2,212 | 83,928 | (23.2 | ) | ||||||||
Direct Line Insurance Group PLC | 100,717 | 319,663 | (88.2 | ) | ||||||||
Drax Group PLC | 59,429 | 600,572 | (165.8 | ) | ||||||||
easyJet PLC | 31,342 | 217,184 | (60.0 | ) | ||||||||
Endeavour Mining PLC | 3,240 | 79,294 | (21.9 | ) | ||||||||
Halma PLC | 5,171 | 158,727 | (43.8 | ) | ||||||||
Hammerson PLC | 40 | 14 | (0.0 | ) | ||||||||
Hargreaves Lansdown PLC | 37,827 | 433,057 | (119.5 | ) | ||||||||
Imperial Brands PLC | 30,327 | 631,273 | (174.3 | ) | ||||||||
InterContinental Hotels Group PLC | 9,947 | 635,014 | (175.3 | ) | ||||||||
International Consolidated Airlines Group SA | 211,222 | 374,341 | (103.3 | ) | ||||||||
Intertek Group PLC | 5,635 | 351,145 | (96.9 | ) | ||||||||
ITV PLC | 62,226 | 57,463 | (15.9 | ) | ||||||||
Janus Henderson Group PLC | 10,235 | 311,963 | (86.1 | ) | ||||||||
Legal & General Group PLC | 41,897 | 130,597 | (36.0 | ) | ||||||||
Liberty Global PLC, Class A | 41,569 | 946,110 | (261.2 | ) | ||||||||
Liberty Global PLC, Class C | 24,846 | 588,850 | (162.5 | ) | ||||||||
Linde PLC | 4,691 | 1,463,404 | (404.0 | ) | ||||||||
Melrose Industries PLC | 104,701 | 152,141 | (42.0 | ) | ||||||||
Natwest Group PLC | 87,481 | 234,693 | (64.8 | ) | ||||||||
Nomad Foods Ltd. | 22,123 | 408,391 | (112.7 | ) | ||||||||
Phoenix Group Holdings PLC | 12,188 | 92,317 | (25.5 | ) | ||||||||
Quilter PLC | 49,365 | 81,318 | (22.4 | ) | ||||||||
Schroders PLC | 9,920 | 350,178 | (96.7 | ) | ||||||||
Segro PLC | 11,036 | 184,766 | (51.0 | ) | ||||||||
Smiths Group PLC | 14,794 | 270,720 | (74.7 | ) | ||||||||
Spectris PLC | 33,040 | 1,208,402 | (333.6 | ) | ||||||||
Spirax-Sarco Engineering PLC | 4,726 | 713,132 | (196.9 | ) | ||||||||
SSE PLC | 2,503 | 58,134 | (16.0 | ) | ||||||||
SSP Group PLC | 33,056 | 97,569 | (26.9 | ) | ||||||||
Tate & Lyle PLC | 109,850 | 1,067,698 | (294.7 | ) | ||||||||
Taylor Wimpey PLC | 102,091 | 160,564 | (44.3 | ) | ||||||||
THG PLC | 14,747 | 19,799 | (5.5 | ) | ||||||||
Travis Perkins PLC | 21,526 | 328,324 | (90.6 | ) | ||||||||
Tritax Big Box REIT PLC | 37,297 | 113,855 | (31.4 | ) | ||||||||
Weir Group PLC | 3,674 | 70,631 | (19.5 | ) | ||||||||
Whitbread PLC | 45,140 | 1,575,695 | (435.0 | ) | ||||||||
|
|
|
| |||||||||
| 19,118,283 | ||||||||||||
| 56 | 2 0 2 2 BLACK ROCK ANNUAL REPORT TO SHAREHOLDERS |
Schedule of Investments (continued) April 30, 2022 | BlackRock Global Long/Short Equity Fund |
| Security | Shares | Value | % of Basket Value | |||||||||
| United States | ||||||||||||
A O Smith Corp. | 2,365 | $ | 138,187 | (38.1 | )% | |||||||
AbbVie, Inc. | 2,566 | 376,894 | (104.0 | ) | ||||||||
ABIOMED, Inc. | 706 | 202,325 | (55.9 | ) | ||||||||
Acadia Healthcare Co., Inc. | 3,277 | 222,443 | (61.4 | ) | ||||||||
Advanced Micro Devices, Inc. | 121 | 10,348 | (2.9 | ) | ||||||||
Aflac, Inc. | 939 | 53,786 | (14.8 | ) | ||||||||
Agilent Technologies, Inc. | 13,048 | 1,556,235 | (429.6 | ) | ||||||||
Airbnb, Inc., Class A | 595 | 91,160 | (25.2 | ) | ||||||||
Alaska Air Group, Inc. | 1,709 | 92,953 | (25.7 | ) | ||||||||
Alcoa Corp. | 357 | 24,205 | (6.7 | ) | ||||||||
Alexandria Real Estate Equities, Inc. | 3,993 | 727,365 | (200.8 | ) | ||||||||
Align Technology, Inc. | 1,148 | 332,817 | (91.9 | ) | ||||||||
Ally Financial, Inc. | 13,454 | 537,622 | (148.4 | ) | ||||||||
Alphabet, Inc., Class A | 21 | 47,926 | (13.2 | ) | ||||||||
Alphabet, Inc., Class C | 31 | 71,279 | (19.7 | ) | ||||||||
Altice USA, Inc., Class A | 63,568 | 589,911 | (162.8 | ) | ||||||||
Altria Group, Inc. | 58,690 | 3,261,403 | (900.3 | ) | ||||||||
Ambarella, Inc. | 2,464 | 202,245 | (55.8 | ) | ||||||||
AMC Entertainment Holdings, Inc., Class A | 7,917 | 121,130 | (33.4 | ) | ||||||||
American Airlines Group, Inc. | 25,561 | 479,780 | (132.4 | ) | ||||||||
American Express Co. | 60 | 10,483 | (2.9 | ) | ||||||||
American International Group, Inc. | 7,021 | 410,799 | (113.4 | ) | ||||||||
American Tower Corp. | 3,942 | 950,101 | (262.3 | ) | ||||||||
American Water Works Co., Inc. | 431 | 66,408 | (18.3 | ) | ||||||||
Ameriprise Financial, Inc. | 432 | 114,692 | (31.7 | ) | ||||||||
AMETEK, Inc. | 6,684 | 843,922 | (233.0 | ) | ||||||||
AMN Healthcare Services, Inc. | 1,859 | 181,717 | (50.2 | ) | ||||||||
Amphenol Corp., Class A | 5,260 | 376,090 | (103.8 | ) | ||||||||
Antero Midstream Corp. | 36,779 | 377,720 | (104.3 | ) | ||||||||
Aon PLC, Class A | 850 | 244,792 | (67.6 | ) | ||||||||
Applied Materials, Inc. | 1,669 | 184,174 | (50.8 | ) | ||||||||
AptarGroup, Inc. | 2,604 | 299,017 | (82.5 | ) | ||||||||
Arch Capital Group Ltd. | 9,027 | 412,263 | (113.8 | ) | ||||||||
Arista Networks, Inc. | 978 | 113,027 | (31.2 | ) | ||||||||
Asbury Automotive Group, Inc. | 1,456 | 267,482 | (73.8 | ) | ||||||||
ASGN, Inc. | 4,501 | 510,638 | (141.0 | ) | ||||||||
Atmos Energy Corp. | 7,381 | 837,005 | (231.1 | ) | ||||||||
Autodesk, Inc. | 111 | 21,010 | (5.8 | ) | ||||||||
AutoZone, Inc. | 52 | 101,684 | (28.1 | ) | ||||||||
AvalonBay Communities, Inc. | 6,102 | 1,388,083 | (383.2 | ) | ||||||||
Avantor, Inc. | 18,604 | 593,096 | (163.7 | ) | ||||||||
Avnet, Inc. | 8,610 | 375,913 | (103.8 | ) | ||||||||
Axalta Coating Systems Ltd. | 18,809 | 477,184 | (131.7 | ) | ||||||||
Axon Enterprise, Inc. | 7,507 | 842,285 | (232.5 | ) | ||||||||
Baker Hughes Co. | 20 | 620 | (0.2 | ) | ||||||||
Ball Corp. | 9,779 | 793,664 | (219.1 | ) | ||||||||
Bank of America Corp. | 16,017 | 571,487 | (157.8 | ) | ||||||||
Bank of New York Mellon Corp. | 18,760 | 789,046 | (217.8 | ) | ||||||||
Baxter International, Inc. | 3,037 | 215,809 | (59.6 | ) | ||||||||
Biogen, Inc. | 447 | 92,726 | (25.6 | ) | ||||||||
BioMarin Pharmaceutical, Inc. | 3,973 | 323,204 | (89.2 | ) | ||||||||
Black Hills Corp. | 403 | 29,516 | (8.1 | ) | ||||||||
Blackline, Inc. | 8,880 | 595,404 | (164.4 | ) | ||||||||
Block, Inc. | 3,339 | 332,364 | (91.7 | ) | ||||||||
Blueprint Medicines Corp. | 3,728 | 217,529 | (60.0 | ) | ||||||||
Boeing Co. | 20,672 | 3,076,820 | (849.4 | ) | ||||||||
Booking Holdings, Inc. | 408 | 901,806 | (248.9 | ) | ||||||||
Booz Allen Hamilton Holding Corp. | 15,086 | 1,231,470 | (339.9 | ) | ||||||||
BorgWarner, Inc. | 16,113 | 593,442 | (163.8 | ) | ||||||||
Boston Properties, Inc. | 2,935 | 345,156 | (95.3 | ) | ||||||||
Brighthouse Financial, Inc. | 8,310 | 426,802 | (117.8 | ) | ||||||||
Bristol-Myers Squibb Co. | 1,191 | 89,647 | (24.7 | ) | ||||||||
| Security | Shares | Value | % of Basket Value | |||||||||
| United States (continued) | ||||||||||||
Brixmor Property Group, Inc. | 24,563 | $ | 623,409 | (172.1 | )% | |||||||
Brown & Brown, Inc. | 3,041 | 188,481 | (52.0 | ) | ||||||||
Bruker Corp. | 16,048 | 922,600 | (254.7 | ) | ||||||||
Builders FirstSource, Inc. | 5,357 | 329,830 | (91.0 | ) | ||||||||
CACI International, Inc., Class A | 939 | 249,117 | (68.8 | ) | ||||||||
Camden Property Trust | 6,651 | 1,043,475 | (288.1 | ) | ||||||||
Capital One Financial Corp. | 1,794 | 223,568 | (61.7 | ) | ||||||||
Carnival Corp. | 78,788 | 1,363,032 | (376.3 | ) | ||||||||
Carnival PLC | 21,674 | 339,810 | (93.8 | ) | ||||||||
Carrier Global Corp. | 1,217 | 46,575 | (12.9 | ) | ||||||||
Catalent, Inc. | 3,244 | 293,777 | (81.1 | ) | ||||||||
Cboe Global Markets, Inc. | 4,122 | 465,704 | (128.6 | ) | ||||||||
ChampionX Corp. | 18,445 | 389,190 | (107.4 | ) | ||||||||
Charles River Laboratories International, Inc. | 2,331 | 562,960 | (155.4 | ) | ||||||||
Charles Schwab Corp. | 6,345 | 420,864 | (116.2 | ) | ||||||||
Chart Industries, Inc. | 463 | 78,164 | (21.6 | ) | ||||||||
Charter Communications, Inc., Class A | 2,544 | 1,090,079 | (300.9 | ) | ||||||||
Chegg, Inc. | 2,048 | 50,668 | (14.0 | ) | ||||||||
Chemed Corp. | 335 | 164,616 | (45.4 | ) | ||||||||
Cheniere Energy, Inc. | 1,167 | 158,490 | (43.8 | ) | ||||||||
Chesapeake Energy Corp. | 18,109 | 1,485,300 | (410.0 | ) | ||||||||
Chevron Corp. | 1,049 | 164,347 | (45.4 | ) | ||||||||
Choice Hotels International, Inc. | 2,909 | 408,598 | (112.8 | ) | ||||||||
Ciena Corp. | 3,350 | 184,820 | (51.0 | ) | ||||||||
Cincinnati Financial Corp. | 2,098 | 257,341 | (71.0 | ) | ||||||||
Cirrus Logic, Inc. | 3,162 | 239,680 | (66.2 | ) | ||||||||
Cisco Systems, Inc. | 7,818 | 382,926 | (105.7 | ) | ||||||||
Citigroup, Inc. | 19,268 | 928,910 | (256.4 | ) | ||||||||
Clean Harbors, Inc. | 1,591 | 166,944 | (46.1 | ) | ||||||||
Clorox Co. | 5,266 | 755,513 | (208.6 | ) | ||||||||
CMS Energy Corp. | 8,792 | 603,922 | (166.7 | ) | ||||||||
Coca-Cola Co. | 7,840 | 506,542 | (139.8 | ) | ||||||||
Colgate-Palmolive Co. | 19,065 | 1,468,958 | (405.5 | ) | ||||||||
ConocoPhillips | 4,350 | 415,512 | (114.7 | ) | ||||||||
Continental Resources, Inc. | 18,433 | 1,024,322 | (282.8 | ) | ||||||||
CoStar Group, Inc. | 6,528 | 415,311 | (114.6 | ) | ||||||||
Costco Wholesale Corp. | 4,399 | 2,339,036 | (645.7 | ) | ||||||||
Coupa Software, Inc. | 5,493 | 474,046 | (130.9 | ) | ||||||||
Credit Acceptance Corp. | 324 | 166,050 | (45.8 | ) | ||||||||
Crocs, Inc. | 4,391 | 291,694 | (80.5 | ) | ||||||||
Crown Castle International Corp. | 9,122 | 1,689,486 | (466.4 | ) | ||||||||
CubeSmart | 7,037 | 334,328 | (92.3 | ) | ||||||||
Cummins, Inc. | 1,914 | 362,110 | (100.0 | ) | ||||||||
Danaher Corp. | 2,476 | 621,798 | (171.6 | ) | ||||||||
DaVita, Inc. | 1,050 | 113,789 | (31.4 | ) | ||||||||
DexCom, Inc. | 233 | 95,199 | (26.3 | ) | ||||||||
Dick’s Sporting Goods, Inc. | 2,935 | 282,993 | (78.1 | ) | ||||||||
Digital Turbine, Inc. | 1,065 | 33,707 | (9.3 | ) | ||||||||
Dominion Energy, Inc. | 282 | 23,022 | (6.4 | ) | ||||||||
Domino’s Pizza, Inc. | 139 | 46,982 | (13.0 | ) | ||||||||
Donaldson Co., Inc. | 6,374 | 312,581 | (86.3 | ) | ||||||||
DraftKings, Inc., Class A | 3,939 | 53,886 | (14.9 | ) | ||||||||
Duke Realty Corp. | 9,166 | 501,839 | (138.5 | ) | ||||||||
East West Bancorp, Inc. | 9,762 | 696,031 | (192.1 | ) | ||||||||
Eaton Corp. PLC | 1,316 | 190,846 | (52.7 | ) | ||||||||
eBay, Inc. | 6,420 | 333,326 | (92.0 | ) | ||||||||
Ecolab, Inc. | 4,610 | 780,657 | (215.5 | ) | ||||||||
Edison International | 1,158 | 79,659 | (22.0 | ) | ||||||||
Elanco Animal Health, Inc. | 842 | 21,311 | (5.9 | ) | ||||||||
Eli Lilly & Co. | 2,793 | 815,919 | (225.2 | ) | ||||||||
EOG Resources, Inc. | 11,314 | 1,321,023 | (364.7 | ) | ||||||||
EPAM Systems, Inc. | 504 | 133,555 | (36.9 | ) | ||||||||
SCHEDULE OF INVESTMENTS | 57 |
Schedule of Investments (continued) April 30, 2022 | BlackRock Global Long/Short Equity Fund |
| Security | Shares | Value | % of Basket Value | |||||||||
| United States (continued) | ||||||||||||
EQT Corp. | 748 | $ | 29,733 | (8.2 | )% | |||||||
Equifax, Inc. | 1,660 | 337,843 | (93.3 | ) | ||||||||
Equinix, Inc. | 1,305 | 938,399 | (259.0 | ) | ||||||||
Equity LifeStyle Properties, Inc. | 4,175 | 322,644 | (89.1 | ) | ||||||||
Equity Residential | 962 | 78,403 | (21.6 | ) | ||||||||
Erie Indemnity Co., Class A | 1,616 | 259,012 | (71.5 | ) | ||||||||
Etsy, Inc. | 4,899 | 456,538 | (126.0 | ) | ||||||||
Evercore, Inc., Class A | 1,574 | 166,451 | (45.9 | ) | ||||||||
Evoqua Water Technologies Corp. | 10,275 | 428,365 | (118.3 | ) | ||||||||
Exelixis, Inc. | 7,215 | 161,183 | (44.5 | ) | ||||||||
Expedia Group, Inc. | 563 | 98,384 | (27.2 | ) | ||||||||
Expeditors International of Washington, Inc. | 7,425 | 735,595 | (203.1 | ) | ||||||||
Exxon Mobil Corp. | 8,103 | 690,781 | (190.7 | ) | ||||||||
F5, Inc. | 427 | 71,484 | (19.7 | ) | ||||||||
FactSet Research Systems, Inc. | 31 | 12,508 | (3.5 | ) | ||||||||
Fair Isaac Corp. | 1,033 | 385,836 | (106.5 | ) | ||||||||
Fate Therapeutics, Inc. | 5,316 | 151,825 | (41.9 | ) | ||||||||
Federal Realty Investment Trust | 5,151 | 602,976 | (166.5 | ) | ||||||||
First Industrial Realty Trust, Inc. | 5,236 | 303,688 | (83.8 | ) | ||||||||
First Solar, Inc. | 978 | 71,423 | (19.7 | ) | ||||||||
Floor & Decor Holdings, Inc., Class A | 5,453 | 434,713 | (120.0 | ) | ||||||||
Fortinet, Inc. | 975 | 281,785 | (77.8 | ) | ||||||||
Fox Corp., Class A | 27,746 | 994,417 | (274.5 | ) | ||||||||
Fox Corp., Class B | 15,112 | 502,323 | (138.7 | ) | ||||||||
FTI Consulting, Inc. | 878 | 138,469 | (38.2 | ) | ||||||||
Gap, Inc. | 24,813 | 308,177 | (85.1 | ) | ||||||||
Garmin Ltd. | 8,489 | 931,583 | (257.2 | ) | ||||||||
General Dynamics Corp. | 16,418 | 3,883,350 | (1,072.0 | ) | ||||||||
General Electric Co. | 15,270 | 1,138,378 | (314.2 | ) | ||||||||
Global Payments, Inc. | 3,634 | 497,785 | (137.4 | ) | ||||||||
Globe Life, Inc. | 690 | 67,675 | (18.7 | ) | ||||||||
Globus Medical, Inc., Class A | 5,343 | 353,813 | (97.7 | ) | ||||||||
Goodyear Tire & Rubber Co. | 31,640 | 421,445 | (116.3 | ) | ||||||||
Guidewire Software, Inc. | 9,271 | 806,021 | (222.5 | ) | ||||||||
H&R Block, Inc. | 1,579 | 41,165 | (11.4 | ) | ||||||||
Halliburton Co. | 904 | 32,200 | (8.9 | ) | ||||||||
Halozyme Therapeutics, Inc. | 2,774 | 110,683 | (30.6 | ) | ||||||||
Hanesbrands, Inc. | 6,346 | 84,148 | (23.2 | ) | ||||||||
Hannon Armstrong Sustainable Infrastructure Capital, Inc. | 4,307 | 172,237 | (47.5 | ) | ||||||||
Harley-Davidson, Inc. | 11,311 | 412,286 | (113.8 | ) | ||||||||
Hartford Financial Services Group, Inc. | 9,505 | 664,685 | (183.5 | ) | ||||||||
Healthcare Realty Trust, Inc. | 2,269 | 61,445 | (17.0 | ) | ||||||||
HealthEquity, Inc. | 3,307 | 206,092 | (56.9 | ) | ||||||||
Healthpeak Properties, Inc. | 1,403 | 46,032 | (12.7 | ) | ||||||||
HEICO Corp. | 4,064 | 573,959 | (158.4 | ) | ||||||||
HEICO Corp., Class A | 4,982 | 581,100 | (160.4 | ) | ||||||||
Helmerich & Payne, Inc. | 4,289 | 197,423 | (54.5 | ) | ||||||||
Henry Schein, Inc. | 3,091 | 250,680 | (69.2 | ) | ||||||||
Herbalife Nutrition Ltd. | 10,751 | 285,762 | (78.9 | ) | ||||||||
Hewlett Packard Enterprise Co. | 466 | 7,181 | (2.0 | ) | ||||||||
Hexcel Corp. | 12,329 | 670,204 | (185.0 | ) | ||||||||
Highwoods Properties, Inc. | 21,756 | 888,515 | (245.3 | ) | ||||||||
Hologic, Inc. | 6,072 | 437,123 | (120.7 | ) | ||||||||
Home Depot, Inc. | 1,002 | 301,001 | (83.1 | ) | ||||||||
Honeywell International, Inc. | 2,747 | 531,572 | (146.7 | ) | ||||||||
Horizon Therapeutics PLC | 2,000 | 197,120 | (54.4 | ) | ||||||||
Houlihan Lokey, Inc. | 443 | 36,897 | (10.2 | ) | ||||||||
HubSpot, Inc. | 647 | 245,491 | (67.8 | ) | ||||||||
Huntington Bancshares, Inc. | 20,938 | 275,335 | (76.0 | ) | ||||||||
Huntington Ingalls Industries, Inc. | 12,934 | 2,751,579 | (759.6 | ) | ||||||||
Huntsman Corp. | 6,182 | 209,384 | (57.8 | ) | ||||||||
| Security | Shares | Value | % of Basket Value | |||||||||
| United States (continued) | ||||||||||||
Hyatt Hotels Corp., Class A | 339 | $ | 32,191 | (8.9 | )% | |||||||
IDACORP, Inc. | 666 | 70,050 | (19.3 | ) | ||||||||
IDEXX Laboratories, Inc. | 1,100 | 473,528 | (130.7 | ) | ||||||||
II-VI, Inc. | 2,769 | 169,490 | (46.8 | ) | ||||||||
Illinois Tool Works, Inc. | 2,342 | 461,632 | (127.4 | ) | ||||||||
Illumina, Inc. | 890 | 264,019 | (72.9 | ) | ||||||||
Incyte Corp. | 370 | 27,735 | (7.7 | ) | ||||||||
Integra LifeSciences Holdings Corp. | 6,211 | 379,865 | (104.9 | ) | ||||||||
Intellia Therapeutics, Inc. | 1,095 | 53,688 | (14.8 | ) | ||||||||
Interactive Brokers Group, Inc., Class A | 58 | 3,454 | (1.0 | ) | ||||||||
Intercontinental Exchange, Inc. | 2,561 | 296,589 | (81.9 | ) | ||||||||
International Game Technology PLC | 30,086 | 656,777 | (181.3 | ) | ||||||||
Interpublic Group of Cos., Inc. | 8,840 | 288,361 | (79.6 | ) | ||||||||
Intuit, Inc. | 854 | 357,613 | (98.7 | ) | ||||||||
Iridium Communications, Inc. | 9,873 | 352,565 | (97.3 | ) | ||||||||
ITT, Inc. | 1,541 | 108,209 | (29.9 | ) | ||||||||
Jacobs Engineering Group, Inc. | 1,578 | 218,632 | (60.4 | ) | ||||||||
JB Hunt Transport Services, Inc. | 1,900 | 324,615 | (89.6 | ) | ||||||||
JetBlue Airways Corp. | 14,122 | 155,483 | (42.9 | ) | ||||||||
Johnson Controls International PLC | 8,663 | 518,654 | (143.2 | ) | ||||||||
Jones Lang LaSalle, Inc. | 1,219 | 266,632 | (73.6 | ) | ||||||||
JPMorgan Chase & Co. | 2,540 | 303,174 | (83.7 | ) | ||||||||
Kellogg Co. | 4,434 | 303,729 | (83.8 | ) | ||||||||
Keurig Dr Pepper, Inc. | 15,730 | 588,302 | (162.4 | ) | ||||||||
KeyCorp | 8,833 | 170,565 | (47.1 | ) | ||||||||
Keysight Technologies, Inc. | 4,060 | 569,496 | (157.2 | ) | ||||||||
Kinder Morgan, Inc. | 9,046 | 164,185 | (45.3 | ) | ||||||||
Kirby Corp. | 4,431 | 288,901 | (79.8 | ) | ||||||||
KLA Corp. | 2,252 | 718,974 | (198.5 | ) | ||||||||
Lamar Advertising Co., Class A | 5,077 | 560,552 | (154.7 | ) | ||||||||
Landstar System, Inc. | 483 | 74,817 | (20.7 | ) | ||||||||
Las Vegas Sands Corp. | 1,350 | 47,831 | (13.2 | ) | ||||||||
Lear Corp. | 5,054 | 646,609 | (178.5 | ) | ||||||||
Leggett & Platt, Inc. | 9,630 | 343,117 | (94.7 | ) | ||||||||
Leidos Holdings, Inc. | 1,877 | 194,288 | (53.6 | ) | ||||||||
Lennox International, Inc. | 1,180 | 251,564 | (69.4 | ) | ||||||||
Leslie’s, Inc. | 10,002 | 196,039 | (54.1 | ) | ||||||||
Levi Strauss & Co., Class A | 24,484 | 443,405 | (122.4 | ) | ||||||||
Liberty Media Corp. - Liberty SiriusXM, Class C | 690 | 28,897 | (8.0 | ) | ||||||||
Life Storage, Inc. | 660 | 87,443 | (24.1 | ) | ||||||||
Lincoln Electric Holdings, Inc. | 3,711 | 499,983 | (138.0 | ) | ||||||||
Lincoln National Corp. | 19,521 | 1,174,188 | (324.1 | ) | ||||||||
Lithia Motors, Inc. | 1,586 | 449,044 | (124.0 | ) | ||||||||
Live Nation Entertainment, Inc. | 1,824 | 191,301 | (52.8 | ) | ||||||||
Livent Corp. | 18,715 | 399,752 | (110.4 | ) | ||||||||
Lockheed Martin Corp. | 6,530 | 2,821,744 | (778.9 | ) | ||||||||
Lowe’s Cos., Inc. | 1,297 | 256,456 | (70.8 | ) | ||||||||
LPL Financial Holdings, Inc. | 2,283 | 428,907 | (118.4 | ) | ||||||||
Lumen Technologies, Inc. | 24,367 | 245,132 | (67.7 | ) | ||||||||
Lumentum Holdings, Inc. | 3,690 | 299,665 | (82.7 | ) | ||||||||
MACOM Technology Solutions Holdings, Inc., Class H | 8,153 | 415,395 | (114.7 | ) | ||||||||
Manhattan Associates, Inc. | 4,090 | 533,950 | (147.4 | ) | ||||||||
ManpowerGroup, Inc. | 558 | 50,332 | (13.9 | ) | ||||||||
Marathon Oil Corp. | 22,574 | 562,544 | (155.3 | ) | ||||||||
MarketAxess Holdings, Inc. | 1,583 | 417,295 | (115.2 | ) | ||||||||
Martin Marietta Materials, Inc. | 1,469 | 520,349 | (143.6 | ) | ||||||||
Marvell Technology, Inc. | 2,066 | 119,993 | (33.1 | ) | ||||||||
Masimo Corp. | 15,587 | 1,760,863 | (486.1 | ) | ||||||||
Matson, Inc. | 544 | 46,795 | (12.9 | ) | ||||||||
MaxLinear, Inc. | 4,132 | 197,799 | (54.6 | ) | ||||||||
Medical Properties Trust, Inc. | 15,419 | 283,555 | (78.3 | ) | ||||||||
| 58 | 2 0 2 2 BLACK ROCK ANNUAL REPORT TO SHAREHOLDERS |
Schedule of Investments (continued) April 30, 2022 | BlackRock Global Long/Short Equity Fund |
| Security | Shares | Value | % of Basket Value | |||||||||
| United States (continued) | ||||||||||||
Merck & Co., Inc. | 4,534 | $ | 402,120 | (111.0 | )% | |||||||
Meritage Homes Corp. | 1,146 | 94,602 | (26.1 | ) | ||||||||
MetLife, Inc. | 18,433 | 1,210,679 | (334.2 | ) | ||||||||
MGIC Investment Corp. | 18,154 | 237,091 | (65.4 | ) | ||||||||
Microchip Technology, Inc. | 3,126 | 203,815 | (56.3 | ) | ||||||||
Microsoft Corp. | 494 | 137,095 | (37.8 | ) | ||||||||
MicroStrategy, Inc., Class A | 26 | 9,208 | (2.5 | ) | ||||||||
Mid-America Apartment Communities, Inc. | 8,908 | 1,752,025 | (483.6 | ) | ||||||||
Molson Coors Beverage Co., Class B | 14,235 | 770,683 | (212.7 | ) | ||||||||
MongoDB, Inc. | 471 | 167,172 | (46.1 | ) | ||||||||
Monolithic Power Systems, Inc. | 1,264 | 495,791 | (136.9 | ) | ||||||||
Moody’s Corp. | 843 | 266,793 | (73.6 | ) | ||||||||
Morningstar, Inc. | 3,736 | 946,067 | (261.2 | ) | ||||||||
Murphy USA, Inc. | 1,709 | 399,222 | (110.2 | ) | ||||||||
National Vision Holdings, Inc. | 6,841 | 257,564 | (71.1 | ) | ||||||||
NetApp, Inc. | 9,452 | 692,359 | (191.1 | ) | ||||||||
Netflix, Inc. | 4,631 | 881,557 | (243.4 | ) | ||||||||
New Relic, Inc. | 2,299 | 145,458 | (40.2 | ) | ||||||||
New York Community Bancorp, Inc. | 52,466 | 484,786 | (133.8 | ) | ||||||||
New York Times Co., Class A | 977 | 37,439 | (10.3 | ) | ||||||||
Newell Brands, Inc. | 15,454 | 357,760 | (98.8 | ) | ||||||||
Nexstar Media Group, Inc., Class A | 412 | 65,269 | (18.0 | ) | ||||||||
Nordson Corp. | 772 | 166,513 | (46.0 | ) | ||||||||
Nordstrom, Inc. | 32,315 | 830,495 | (229.3 | ) | ||||||||
Norfolk Southern Corp. | 959 | 247,307 | (68.3 | ) | ||||||||
Northrop Grumman Corp. | 2,076 | 912,194 | (251.8 | ) | ||||||||
NortonLifeLock, Inc. | 746 | 18,680 | (5.2 | ) | ||||||||
Norwegian Cruise Line Holdings Ltd. | 16,820 | 336,905 | (93.0 | ) | ||||||||
NOV, Inc. | 7,209 | 130,699 | (36.1 | ) | ||||||||
Novocure Ltd. | 1,647 | 126,127 | (34.8 | ) | ||||||||
NRG Energy, Inc. | 10,843 | 389,264 | (107.5 | ) | ||||||||
Nutanix, Inc., Class A | 20,552 | 514,417 | (142.0 | ) | ||||||||
NVIDIA Corp. | 600 | 111,282 | (30.7 | ) | ||||||||
Occidental Petroleum Corp. | 4,200 | 231,378 | (63.9 | ) | ||||||||
Okta, Inc. | 1,369 | 163,335 | (45.1 | ) | ||||||||
Old Dominion Freight Line, Inc. | 405 | 113,449 | (31.3 | ) | ||||||||
Old National Bancorp | 7,408 | 112,305 | (31.0 | ) | ||||||||
Omnicell, Inc. | 4,535 | 495,086 | (136.7 | ) | ||||||||
ONEOK, Inc. | 4,898 | 310,190 | (85.6 | ) | ||||||||
Oracle Corp. | 961 | 70,537 | (19.5 | ) | ||||||||
Ormat Technologies, Inc. | 7,496 | 582,439 | (160.8 | ) | ||||||||
Oshkosh Corp. | 1,015 | 93,827 | (25.9 | ) | ||||||||
Ovintiv Inc. | 6,788 | 347,418 | (95.9 | ) | ||||||||
PACCAR, Inc. | 1,670 | 138,694 | (38.3 | ) | ||||||||
PacWest Bancorp | 4,874 | 160,306 | (44.3 | ) | ||||||||
Palo Alto Networks, Inc. | 337 | 189,151 | (52.2 | ) | ||||||||
Papa John’s International, Inc. | 781 | 71,110 | (19.6 | ) | ||||||||
Park Hotels & Resorts, Inc. | 15,711 | 309,664 | (85.5 | ) | ||||||||
Paycom Software, Inc. | 3,729 | 1,049,602 | (289.7 | ) | ||||||||
Paylocity Holding Corp. | 2,829 | 536,463 | (148.1 | ) | ||||||||
PayPal Holdings, Inc. | 4,911 | 431,824 | (119.2 | ) | ||||||||
Penn National Gaming, Inc. | 1,807 | 66,082 | (18.2 | ) | ||||||||
Penske Automotive Group, Inc. | 6,263 | 656,488 | (181.2 | ) | ||||||||
Pentair PLC | 6,407 | 325,155 | (89.8 | ) | ||||||||
Penumbra, Inc. | 793 | 136,840 | (37.8 | ) | ||||||||
Perrigo Co. PLC | 5,270 | 180,761 | (49.9 | ) | ||||||||
Pfizer, Inc. | 7,431 | 364,639 | (100.7 | ) | ||||||||
PG&E Corp. | 24,061 | 304,372 | (84.0 | ) | ||||||||
Phillips 66 | 7,818 | 678,290 | (187.2 | ) | ||||||||
Pinnacle Financial Partners, Inc. | 4,720 | 366,036 | (101.0 | ) | ||||||||
Planet Fitness, Inc., Class A | 10,202 | 816,466 | (225.4 | ) | ||||||||
Plug Power, Inc. | 7,222 | 151,806 | (41.9 | ) | ||||||||
| Security | Shares | Value | % of Basket Value | |||||||||
| United States (continued) | ||||||||||||
PNC Financial Services Group, Inc. | 3,579 | $ | 594,472 | (164.1 | )% | |||||||
Portland General Electric Co. | 3,989 | 188,799 | (52.1 | ) | ||||||||
Power Integrations, Inc. | 9,187 | 734,960 | (202.9 | ) | ||||||||
PPG Industries, Inc. | 1,345 | 172,147 | (47.5 | ) | ||||||||
Principal Financial Group, Inc. | 7,283 | 496,264 | (137.0 | ) | ||||||||
PTC, Inc. | 3,531 | 403,276 | (111.3 | ) | ||||||||
Public Service Enterprise Group, Inc. | 2,529 | 176,170 | (48.6 | ) | ||||||||
Public Storage | 766 | 284,569 | (78.6 | ) | ||||||||
PulteGroup, Inc. | 12,935 | 540,166 | (149.1 | ) | ||||||||
PVH Corp. | 7,371 | 536,461 | (148.1 | ) | ||||||||
Qorvo, Inc. | 1,467 | 166,915 | (46.1 | ) | ||||||||
Qualys, Inc. | 4,570 | 622,800 | (171.9 | ) | ||||||||
Quidel Corp. | 1,664 | 167,432 | (46.2 | ) | ||||||||
Radian Group, Inc. | 15,193 | 324,978 | (89.7 | ) | ||||||||
Ralph Lauren Corp. | 10,372 | 1,082,214 | (298.7 | ) | ||||||||
Rapid7, Inc. | 7,264 | 693,857 | (191.5 | ) | ||||||||
Raytheon Technologies Corp. | 18,853 | 1,789,338 | (493.9 | ) | ||||||||
Regency Centers Corp. | 1,577 | 108,545 | (30.0 | ) | ||||||||
Reinsurance Group of America, Inc. | 235 | 25,220 | (7.0 | ) | ||||||||
Reliance Steel & Aluminum Co. | 2,124 | 421,083 | (116.2 | ) | ||||||||
Repligen Corp. | 527 | 82,865 | (22.9 | ) | ||||||||
ResMed, Inc. | 787 | 157,376 | (43.4 | ) | ||||||||
Rexford Industrial Realty, Inc. | 1,847 | 144,140 | (39.8 | ) | ||||||||
RingCentral, Inc., Class A | 8,275 | 702,134 | (193.8 | ) | ||||||||
Robert Half International, Inc. | 114 | 11,207 | (3.1 | ) | ||||||||
Roku, Inc. | 6,143 | 570,685 | (157.5 | ) | ||||||||
Roper Technologies, Inc. | 632 | 296,989 | (82.0 | ) | ||||||||
Royal Caribbean Cruises Ltd. | 14,841 | 1,153,591 | (318.4 | ) | ||||||||
Ryder System, Inc. | 7,834 | 547,597 | (151.2 | ) | ||||||||
salesforce.com, Inc. | 345 | 60,699 | (16.8 | ) | ||||||||
Schlumberger NV | 21,742 | 848,155 | (234.1 | ) | ||||||||
Science Applications International Corp. | 2,345 | 195,174 | (53.9 | ) | ||||||||
Seagen, Inc. | 633 | 82,929 | (22.9 | ) | ||||||||
SEI Investments Co. | 196 | 10,921 | (3.0 | ) | ||||||||
Semtech Corp. | 226 | 13,470 | (3.7 | ) | ||||||||
Sensata Technologies Holding PLC | 9,951 | 451,875 | (124.7 | ) | ||||||||
Service Corp. International | 7,028 | 461,107 | (127.3 | ) | ||||||||
ServiceNow, Inc. | 168 | 80,321 | (22.2 | ) | ||||||||
Silicon Laboratories, Inc. | 1,560 | 210,460 | (58.1 | ) | ||||||||
Simon Property Group, Inc. | 3,140 | 370,520 | (102.3 | ) | ||||||||
Sirius XM Holdings, Inc. | 231,494 | 1,388,964 | (383.4 | ) | ||||||||
SiteOne Landscape Supply, Inc. | 3,689 | 520,260 | (143.6 | ) | ||||||||
SL Green Realty Corp. | 5,419 | 375,103 | (103.5 | ) | ||||||||
Snap, Inc., Class A | 15,885 | 452,087 | (124.8 | ) | ||||||||
Spirit AeroSystems Holdings, Inc., Class A | 2,155 | 90,596 | (25.0 | ) | ||||||||
STAAR Surgical Co. | 3,008 | 171,727 | (47.4 | ) | ||||||||
Stifel Financial Corp. | 9,085 | 561,907 | (155.1 | ) | ||||||||
STORE Capital Corp. | 12,072 | 343,207 | (94.7 | ) | ||||||||
Stryker Corp. | 152 | 36,672 | (10.1 | ) | ||||||||
Switch, Inc., Class A | 2,000 | 59,720 | (16.5 | ) | ||||||||
Synchrony Financial | 26,360 | 970,312 | (267.9 | ) | ||||||||
Syneos Health, Inc. | 10,415 | 761,232 | (210.1 | ) | ||||||||
Sysco Corp. | 5 | 427 | (0.1 | ) | ||||||||
Tandem Diabetes Care, Inc. | 3,422 | 330,155 | (91.1 | ) | ||||||||
Teledyne Technologies, Inc. | 529 | 228,290 | (63.0 | ) | ||||||||
Teleflex, Inc. | 1,038 | 296,474 | (81.8 | ) | ||||||||
Tenable Holdings, Inc. | 4,963 | 274,106 | (75.7 | ) | ||||||||
Teradata Corp. | 974 | 40,275 | (11.1 | ) | ||||||||
Teradyne, Inc. | 1,646 | 173,587 | (47.9 | ) | ||||||||
Tesla, Inc. | 78 | 67,919 | (18.7 | ) | ||||||||
Tetra Tech, Inc. | 3,864 | 538,178 | (148.6 | ) | ||||||||
Texas Instruments, Inc. | 675 | 114,919 | (31.7 | ) | ||||||||
SCHEDULE OF INVESTMENTS | 59 |
Schedule of Investments (continued) April 30, 2022 | BlackRock Global Long/Short Equity Fund |
| Security | Shares | Value | % of Basket Value | |||||||||
| United States (continued) | ||||||||||||
Textron, Inc. | 51,674 | $ | 3,578,424 | (987.8 | )% | |||||||
Thermo Fisher Scientific, Inc. | 260 | 143,759 | (39.7 | ) | ||||||||
Timken Co. | 5,976 | 344,457 | (95.1 | ) | ||||||||
TJX Cos., Inc. | 17,274 | 1,058,551 | (292.2 | ) | ||||||||
TransDigm Group, Inc. | 564 | 335,473 | (92.6 | ) | ||||||||
Travel + Leisure Co. | 32,145 | 1,783,405 | (492.3 | ) | ||||||||
Travelers Cos., Inc. | 1,453 | 248,550 | (68.6 | ) | ||||||||
Trex Co., Inc. | 191 | 11,114 | (3.1 | ) | ||||||||
TripAdvisor, Inc. | 6,261 | 160,720 | (44.4 | ) | ||||||||
Truist Financial Corp. | 9,910 | 479,149 | (132.3 | ) | ||||||||
Twilio, Inc., Class A | 3,334 | 372,808 | (102.9 | ) | ||||||||
U.S. Bancorp | 551 | 26,757 | (7.4 | ) | ||||||||
UDR, Inc. | 15,001 | 798,203 | (220.3 | ) | ||||||||
Ulta Beauty, Inc. | 741 | 294,029 | (81.2 | ) | ||||||||
Ultragenyx Pharmaceutical, Inc. | 1,377 | 97,340 | (26.9 | ) | ||||||||
Union Pacific Corp. | 1,953 | 457,568 | (126.3 | ) | ||||||||
United Airlines Holdings, Inc. | 7,260 | 366,630 | (101.2 | ) | ||||||||
United Parcel Service, Inc., Class B | 3,127 | 562,797 | (155.4 | ) | ||||||||
United Rentals, Inc. | 2,025 | 640,953 | (176.9 | ) | ||||||||
United States Steel Corp. | 6,904 | 210,503 | (58.1 | ) | ||||||||
United Therapeutics Corp. | 371 | 65,875 | (18.2 | ) | ||||||||
UnitedHealth Group, Inc. | 373 | 189,689 | (52.4 | ) | ||||||||
Unum Group | 1,044 | 31,863 | (8.8 | ) | ||||||||
Valero Energy Corp. | 7,524 | 838,776 | (231.5 | ) | ||||||||
Valvoline, Inc. | 3,187 | 96,343 | (26.6 | ) | ||||||||
Varonis Systems, Inc. | 3,471 | 149,947 | (41.4 | ) | ||||||||
Veeva Systems, Inc., Class A | 4,290 | 780,565 | (215.5 | ) | ||||||||
Verisk Analytics, Inc. | 1,187 | 242,207 | (66.9 | ) | ||||||||
VF Corp. | 1,933 | 100,516 | (27.7 | ) | ||||||||
ViacomCBS, Inc., Class B | 13,133 | 382,433 | (105.6 | ) | ||||||||
Viatris, Inc. | 9,627 | 99,447 | (27.5 | ) | ||||||||
Visa, Inc., Class A | 5,021 | 1,070,126 | (295.4 | ) | ||||||||
Vistra Corp. | 36,558 | 914,681 | (252.5 | ) | ||||||||
Voya Financial, Inc. | 8,861 | 559,484 | (154.4 | ) | ||||||||
Walt Disney Co. | 5,514 | 615,528 | (169.9 | ) | ||||||||
Waters Corp. | 1,943 | 588,768 | (162.5 | ) | ||||||||
Watsco, Inc. | 44 | 11,738 | (3.2 | ) | ||||||||
Wells Fargo & Co. | 6,957 | 303,534 | (83.8 | ) | ||||||||
Western Alliance Bancorp | 4,063 | 309,235 | (85.4 | ) | ||||||||
Western Union Co. | 64,236 | 1,076,595 | (297.2 | ) | ||||||||
Westrock Co. | 219 | 10,847 | (3.0 | ) | ||||||||
WEX, Inc. | 1,205 | 200,319 | (55.3 | ) | ||||||||
Whirlpool Corp. | 2,907 | 527,679 | (145.7 | ) | ||||||||
Willis Towers Watson PLC | 484 | 103,992 | (28.7 | ) | ||||||||
Wintrust Financial Corp. | 4,528 | 395,385 | (109.1 | ) | ||||||||
Workday, Inc., Class A | 3,740 | 773,058 | (213.4 | ) | ||||||||
World Wrestling Entertainment, Inc., Class A | 7,910 | 461,865 | (127.5 | ) | ||||||||
Wynn Resorts Ltd. | 221 | 15,576 | (4.3 | ) | ||||||||
XPO Logistics, Inc. | 4,816 | 259,053 | (71.5 | ) | ||||||||
Ziff Davis, Inc. | 3,318 | 293,178 | (80.9 | ) | ||||||||
Zions Bancorp NA | 4,879 | 275,712 | (76.1 | ) | ||||||||
Zoetis, Inc. | 1,100 | 194,975 | (53.8 | ) | ||||||||
Zoom Video Communications, Inc., Class A | 674 | 67,110 | (18.5 | ) | ||||||||
Zscaler, Inc. | 1,882 | 381,557 | (105.3 | ) | ||||||||
|
|
|
| |||||||||
| 182,154,350 | ||||||||||||
| Security | Shares | Value | % of Basket Value | |||||||||
| United States (continued) | ||||||||||||
| Preferred Stocks | ||||||||||||
| Germany | ||||||||||||
Fuchs Petrolub SE, Preference Shares | 15,295 | $ | 482,423 | (133.2 | )% | |||||||
Sartorius AG, Preference Shares | 21 | 7,874 | (2.2 | ) | ||||||||
|
|
|
| |||||||||
| 490,297 | ||||||||||||
| Warrants | ||||||||||||
| Australia | ||||||||||||
Magellan Financial Group Ltd. | 465 | 514 | (0.1 | ) | ||||||||
|
|
|
| |||||||||
Total Reference Entity — Long | 346,948,492 | |||||||||||
|
| |||||||||||
Reference Entity — Short |
| |||||||||||
| Common Stocks | ||||||||||||
| Australia | ||||||||||||
Appen Ltd. | (51,925 | ) | (237,190 | ) | 65.5 | |||||||
Beach Energy Ltd. | (450,251 | ) | (513,339 | ) | 141.7 | |||||||
Bendigo & Adelaide Bank Ltd. | (8,891 | ) | (66,903 | ) | 18.5 | |||||||
BHP Group Ltd. | (8,319 | ) | (278,790 | ) | 76.9 | |||||||
Mineral Resources Ltd. | (9,855 | ) | (400,440 | ) | 110.5 | |||||||
Newcrest Mining Ltd. | (12,030 | ) | (225,916 | ) | 62.4 | |||||||
Newcrest Mining Ltd. NPV | (13,589 | ) | (256,833 | ) | 70.9 | |||||||
Orica Ltd. | (11,813 | ) | (135,741 | ) | 37.5 | |||||||
Reece Ltd. | (55,625 | ) | (675,822 | ) | 186.5 | |||||||
Seven Group Holdings Ltd. | (24,241 | ) | (338,208 | ) | 93.3 | |||||||
TPG Telecom Ltd. | (147,198 | ) | (603,406 | ) | 166.6 | |||||||
Vicinity Centres | (1,079,633 | ) | (1,408,720 | ) | 388.9 | |||||||
|
|
|
| |||||||||
| (5,141,308 | ) | |||||||||||
| Austria | ||||||||||||
BAWAG Group AG | (6,288 | ) | (298,579 | ) | 82.4 | |||||||
OMV AG | (15,054 | ) | (769,525 | ) | 212.4 | |||||||
Telekom Austria AG | (6,015 | ) | (42,885 | ) | 11.9 | |||||||
|
|
|
| |||||||||
| (1,110,989 | ) | |||||||||||
| Belgium | ||||||||||||
Anheuser-Busch InBev SA/NV | (2,644 | ) | (152,135 | ) | 42.0 | |||||||
Etablissements Franz Colruyt NV | (665 | ) | (24,419 | ) | 6.7 | |||||||
Galapagos NV | (388 | ) | (22,781 | ) | 6.3 | |||||||
Solvay SA | (2,935 | ) | (275,999 | ) | 76.2 | |||||||
|
|
|
| |||||||||
| (475,334 | ) | |||||||||||
| Bermuda | ||||||||||||
Everest Re Group Ltd. | (1,336 | ) | (367,013 | ) | 101.3 | |||||||
Signet Jewelers Ltd. | (4,232 | ) | (297,086 | ) | 82.0 | |||||||
Triton International Ltd. | (550 | ) | (33,599 | ) | 9.3 | |||||||
|
|
|
| |||||||||
| (697,698 | ) | |||||||||||
| Canada | ||||||||||||
AbCellera Biologics, Inc. | (30,582 | ) | (234,564 | ) | 64.8 | |||||||
Alimentation Couche-Tard, Inc. | (18,254 | ) | (812,631 | ) | 224.3 | |||||||
Allied Properties Real Estate Investment Trust | (25,638 | ) | (832,813 | ) | 229.9 | |||||||
Brookfield Asset Management, Inc., Class A | (1,816 | ) | (90,584 | ) | 25.0 | |||||||
Canadian Apartment Properties REIT | (17,460 | ) | (683,912 | ) | 188.8 | |||||||
Canadian Solar, Inc. | (8,841 | ) | (243,304 | ) | 67.2 | |||||||
Canadian Tire Corp. Ltd., Class A | (3,130 | ) | (431,132 | ) | 119.0 | |||||||
Capital Power Corp. | (16,945 | ) | (556,897 | ) | 153.7 | |||||||
CCL Industries, Inc., Class B | (12,704 | ) | (553,887 | ) | 152.9 | |||||||
Constellation Software, Inc. | (341 | ) | (536,689 | ) | 148.2 | |||||||
Dollarama, Inc. | (179 | ) | (9,952 | ) | 2.7 | |||||||
Dream Industrial Real Estate Investment Trust | (35,178 | ) | (409,655 | ) | 113.1 | |||||||
Element Fleet Management Corp. | (22,936 | ) | (204,784 | ) | 56.5 | |||||||
| 60 | 2 0 2 2 BLACK ROCK ANNUAL REPORT TO SHAREHOLDERS |
Schedule of Investments (continued) April 30, 2022 | BlackRock Global Long/Short Equity Fund |
| Security | Shares | Value | % of Basket Value | |||||||||
| Canada (continued) | ||||||||||||
Empire Co. Ltd. | (13,129 | ) | $ | (433,631 | ) | 119.7 | % | |||||
Fairfax Financial Holdings Ltd. | (1,693 | ) | (930,244 | ) | 256.8 | |||||||
Finning International, Inc. | (2,989 | ) | (84,087 | ) | 23.2 | |||||||
H&R Real Estate Investment Trust | (47,851 | ) | (476,033 | ) | 131.4 | |||||||
iA Financial Corp., Inc. | (8,203 | ) | (428,907 | ) | 118.4 | |||||||
Loblaw Cos. Ltd. | (11,925 | ) | (1,090,808 | ) | 301.1 | |||||||
MEG Energy Corp. | (24,507 | ) | (368,182 | ) | 101.6 | |||||||
Metro, Inc. | (24,581 | ) | (1,351,080 | ) | 373.0 | |||||||
National Bank of Canada | (826 | ) | (57,688 | ) | 15.9 | |||||||
Nuvei Corp. | (4,844 | ) | (270,885 | ) | 74.8 | |||||||
Onex Corp. | (4,691 | ) | (281,865 | ) | 77.8 | |||||||
Parkland Corp. | (9,919 | ) | (281,745 | ) | 77.8 | |||||||
Power Corp. of Canada | (41,940 | ) | (1,234,058 | ) | 340.7 | |||||||
Quebecor, Inc., Class B | (6,178 | ) | (145,379 | ) | 40.1 | |||||||
Saputo, Inc. | (6,054 | ) | (129,407 | ) | 35.7 | |||||||
SmartCentres Real Estate Investment Trust | (17,598 | ) | (428,632 | ) | 118.3 | |||||||
SNC-Lavalin Group Inc. | (1,416 | ) | (31,491 | ) | 8.7 | |||||||
Stelco Holdings, Inc. | (3,565 | ) | (130,123 | ) | 35.9 | |||||||
Sun Life Financial, Inc. | (4,482 | ) | (222,975 | ) | 61.6 | |||||||
Topicus.com, Inc. | (1,042 | ) | (64,808 | ) | 17.9 | |||||||
Toromont Industries Ltd. | (119 | ) | (10,476 | ) | 2.9 | |||||||
Tourmaline Oil Corp. | (418 | ) | (21,527 | ) | 5.9 | |||||||
|
|
|
| |||||||||
| (14,074,835 | ) | |||||||||||
| China | ||||||||||||
Futu Holdings Ltd., ADR | (11,647 | ) | (372,587 | ) | 102.9 | |||||||
Yangzijiang Shipbuilding Holdings Ltd. | (469,200 | ) | (306,117 | ) | 84.5 | |||||||
|
|
|
| |||||||||
| (678,704 | ) | |||||||||||
| Denmark | ||||||||||||
Ambu A/S, Class B | (6,674 | ) | (87,846 | ) | 24.2 | |||||||
AP Moller - Maersk A/S, Class A | (50 | ) | (141,532 | ) | 39.1 | |||||||
AP Moller - Maersk A/S, Class B | (128 | ) | (370,461 | ) | 102.2 | |||||||
Carlsberg A/S, Class B | (887 | ) | (112,679 | ) | 31.1 | |||||||
Chr Hansen Holding A/S | (2,961 | ) | (230,691 | ) | 63.7 | |||||||
Danske Bank A/S | (14,330 | ) | (219,806 | ) | 60.7 | |||||||
Orsted A/S | (3,961 | ) | (438,207 | ) | 121.0 | |||||||
Rockwool International A/S, B Shares | (421 | ) | (117,745 | ) | 32.5 | |||||||
Royal Unibrew A/S | (2,993 | ) | (257,970 | ) | 71.2 | |||||||
Vestas Wind Systems A/S | (7,851 | ) | (200,208 | ) | 55.3 | |||||||
|
|
|
| |||||||||
| (2,177,145 | ) | |||||||||||
| Finland | ||||||||||||
Elisa OYJ | (3,190 | ) | (187,002 | ) | 51.6 | |||||||
Huhtamaki OYJ | (3,127 | ) | (118,201 | ) | 32.6 | |||||||
Kojamo OYJ | (6,265 | ) | (124,631 | ) | 34.4 | |||||||
Kone OYJ, Class B | (1,761 | ) | (84,665 | ) | 23.4 | |||||||
Orion OYJ, Class B | (2,038 | ) | (79,936 | ) | 22.1 | |||||||
UPM-Kymmene OYJ | (51,688 | ) | (1,788,006 | ) | 493.6 | |||||||
|
|
|
| |||||||||
| (2,382,441 | ) | |||||||||||
| France | ||||||||||||
Constellium SE | (9,376 | ) | (156,485 | ) | 43.2 | |||||||
|
|
|
| |||||||||
| Germany | ||||||||||||
Adidas AG | (6,771 | ) | (1,365,434 | ) | 376.9 | |||||||
AIXTRON SE | (3,065 | ) | (78,577 | ) | 21.7 | |||||||
Aurubis AG | (1,507 | ) | (171,255 | ) | 47.3 | |||||||
Auto1 Group SE | (16,833 | ) | (176,244 | ) | 48.7 | |||||||
Bayer AG | (1,666 | ) | (109,741 | ) | 30.3 | |||||||
Bayerische Motoren Werke AG | (2,370 | ) | (174,594 | ) | 48.2 | |||||||
Bechtle AG | (3,278 | ) | (151,475 | ) | 41.8 | |||||||
Brenntag SE | (7,462 | ) | (575,794 | ) | 159.0 | |||||||
| Security | Shares | Value | % of Basket Value | |||||||||
| Germany (continued) | ||||||||||||
Carl Zeiss Meditec AG | (278 | ) | $ | (34,918 | ) | 9.6 | % | |||||
Continental AG | (2,307 | ) | (158,124 | ) | 43.7 | |||||||
Daimler Truck Holding AG | (23,947 | ) | (644,048 | ) | 177.8 | |||||||
Delivery Hero SE | (1,907 | ) | (67,037 | ) | 18.5 | |||||||
Deutsche Lufthansa AG | (18,663 | ) | (138,845 | ) | 38.3 | |||||||
Deutsche Telekom AG | (57,850 | ) | (1,065,663 | ) | 294.2 | |||||||
Deutsche Wohnen SE | (3,438 | ) | (98,464 | ) | 27.2 | |||||||
DWS Group GmbH & Co. KGaA | (3,967 | ) | (130,548 | ) | 36.0 | |||||||
Evotec SE | (5,233 | ) | (127,415 | ) | 35.2 | |||||||
Fielmann AG | (6,702 | ) | (338,799 | ) | 93.5 | |||||||
Fresenius Medical Care AG & Co. KGaA | (9,307 | ) | (578,773 | ) | 159.8 | |||||||
Fresenius SE & Co. KGaA | (10,948 | ) | (386,989 | ) | 106.8 | |||||||
Puma SE | (1,856 | ) | (136,562 | ) | 37.7 | |||||||
Siemens Healthineers AG | (9,979 | ) | (533,577 | ) | 147.3 | |||||||
Siltronic AG | (7,030 | ) | (660,181 | ) | 182.2 | |||||||
SUSE SA | (14,821 | ) | (480,298 | ) | 132.6 | |||||||
Telefonica Deutschland Holding AG | (36,415 | ) | (109,519 | ) | 30.2 | |||||||
Uniper SE | (7,805 | ) | (200,625 | ) | 55.4 | |||||||
Volkswagen AG | (779 | ) | (168,935 | ) | 46.6 | |||||||
Vonovia SE | (19,641 | ) | (782,516 | ) | 216.0 | |||||||
Wacker Chemie AG | (932 | ) | (147,879 | ) | 40.8 | |||||||
|
|
|
| |||||||||
| (9,792,829 | ) | |||||||||||
| Hong Kong | ||||||||||||
Hongkong Land Holdings Ltd. | (38,000 | ) | (177,269 | ) | 48.9 | |||||||
Jardine Matheson Holdings Ltd. | (400 | ) | (21,252 | ) | 5.9 | |||||||
Vitasoy International Holdings Ltd. | (188,000 | ) | (340,858 | ) | 94.1 | |||||||
|
|
|
| |||||||||
| (539,379 | ) | |||||||||||
| Ireland | ||||||||||||
AerCap Holdings NV | (5,043 | ) | (235,559 | ) | 65.0 | |||||||
Allegion PLC | (1,648 | ) | (188,267 | ) | 52.0 | |||||||
Bank of Ireland Group PLC | (16,746 | ) | (101,493 | ) | 28.0 | |||||||
DCC PLC | (12,815 | ) | (970,979 | ) | 268.0 | |||||||
Smurfit Kappa Group PLC | (9,901 | ) | (418,374 | ) | 115.5 | |||||||
|
|
|
| |||||||||
| (1,914,672 | ) | |||||||||||
| Isle of Man | ||||||||||||
GVC Holdings PLC | (27,164 | ) | (510,420 | ) | 140.9 | |||||||
|
|
|
| |||||||||
| Israel | ||||||||||||
Ashtrom Group Ltd. | (40,084 | ) | (1,117,789 | ) | 308.6 | |||||||
Fiverr International Ltd. | (860 | ) | (45,795 | ) | 12.6 | |||||||
Global-e Online Ltd. | (9,465 | ) | (213,341 | ) | 58.9 | |||||||
Inmode Ltd. | (8,296 | ) | (208,313 | ) | 57.5 | |||||||
ironSource Ltd., Class A | (15,792 | ) | (60,483 | ) | 16.7 | |||||||
Kornit Digital Ltd. | (334 | ) | (22,211 | ) | 6.1 | |||||||
Shapir Engineering and Industry Ltd. | (35,642 | ) | (333,474 | ) | 92.1 | |||||||
Shikun & Binui Ltd. | (5,539 | ) | (32,655 | ) | 9.0 | |||||||
Wix.com Ltd. | (3,814 | ) | (287,804 | ) | 79.4 | |||||||
ZIM Integrated Shipping Services Ltd. | (4,373 | ) | (243,270 | ) | 67.2 | |||||||
|
|
|
| |||||||||
| (2,565,135 | ) | |||||||||||
| Italy | ||||||||||||
DiaSorin SpA | (2,098 | ) | (274,821 | ) | 75.9 | |||||||
FinecoBank Banca Fineco SpA | (20,061 | ) | (278,875 | ) | 77.0 | |||||||
Infrastrutture Wireless Italiane SpA | (62,558 | ) | (667,514 | ) | 184.3 | |||||||
Intesa Sanpaolo SpA | (35,205 | ) | (71,738 | ) | 19.8 | |||||||
Nexi SpA | (15,329 | ) | (150,346 | ) | 41.5 | |||||||
Poste Italiane SpA | (9,197 | ) | (90,123 | ) | 24.9 | |||||||
Prysmian SpA | (2,634 | ) | (85,671 | ) | 23.6 | |||||||
Recordati Industria Chimica e Farmaceutica SpA | (7,256 | ) | (349,655 | ) | 96.5 | |||||||
SCHEDULE OF INVESTMENTS | 61 |
Schedule of Investments (continued) April 30, 2022 | BlackRock Global Long/Short Equity Fund |
| Security | Shares | Value | % of Basket Value | |||||||||
| Italy (continued) | ||||||||||||
Snam SpA | (109,656 | ) | $ | (601,419 | ) | 166.0 | % | |||||
Unipol Gruppo SpA | (66,123 | ) | (360,543 | ) | 99.5 | |||||||
|
|
|
| |||||||||
| (2,930,705 | ) | |||||||||||
| Japan | ||||||||||||
Advance Residence Investment Corp. | (18 | ) | (49,447 | ) | 13.6 | |||||||
AEON REIT Investment Corp. | (100 | ) | (114,811 | ) | 31.7 | |||||||
AGC, Inc. | (1,900 | ) | (71,230 | ) | 19.7 | |||||||
Ain Holdings, Inc. | (7,900 | ) | (354,352 | ) | 97.8 | |||||||
Air Water, Inc. | (5,600 | ) | (74,328 | ) | 20.5 | |||||||
Aisin Corp. | (5,700 | ) | (165,588 | ) | 45.7 | |||||||
Ariake Japan Co. Ltd. | (1,300 | ) | (52,158 | ) | 14.4 | |||||||
Asahi Intecc Co. Ltd. | (2,300 | ) | (44,445 | ) | 12.3 | |||||||
Asics Corp. | (2,800 | ) | (44,175 | ) | 12.2 | |||||||
ASKUL Corp. | (15,300 | ) | (187,357 | ) | 51.7 | |||||||
Bank of Kyoto Ltd. | (500 | ) | (21,784 | ) | 6.0 | |||||||
Benefit One, Inc. | (10,400 | ) | (157,689 | ) | 43.5 | |||||||
Bridgestone Corp. | (10,800 | ) | (395,860 | ) | 109.3 | |||||||
Brother Industries Ltd. | (12,000 | ) | (208,555 | ) | 57.6 | |||||||
Canon Marketing Japan, Inc. | (2,700 | ) | (58,752 | ) | 16.2 | |||||||
Central Japan Railway Co. | (2,500 | ) | (314,713 | ) | 86.9 | |||||||
Chiba Bank Ltd. | (12,200 | ) | (70,312 | ) | 19.4 | |||||||
Concordia Financial Group Ltd. | (89,400 | ) | (325,336 | ) | 89.8 | |||||||
Credit Saison Co. Ltd. | (7,000 | ) | (78,844 | ) | 21.8 | |||||||
CyberAgent, Inc. | (2,800 | ) | (29,582 | ) | 8.2 | |||||||
Dai Nippon Printing Co. Ltd. | (7,500 | ) | (156,735 | ) | 43.3 | |||||||
Daicel Corp. | (16,700 | ) | (102,087 | ) | 28.2 | |||||||
Daido Steel Co. Ltd. | (1,600 | ) | (45,640 | ) | 12.6 | |||||||
Dai-ichi Life Holdings, Inc. | (3,200 | ) | (64,077 | ) | 17.7 | |||||||
Daiichikosho Co. Ltd. | (1,200 | ) | (32,730 | ) | 9.0 | |||||||
Daio Paper Corp. | (800 | ) | (9,539 | ) | 2.6 | |||||||
Daiwa House REIT Investment Corp. | (87 | ) | (211,758 | ) | 58.5 | |||||||
Daiwa Securities Group, Inc. | (69,800 | ) | (342,099 | ) | 94.4 | |||||||
DeNA Co. Ltd. | (7,200 | ) | (104,357 | ) | 28.8 | |||||||
Denka Co. Ltd. | (3,400 | ) | (91,147 | ) | 25.2 | |||||||
Descente Ltd. | (1,000 | ) | (19,204 | ) | 5.3 | |||||||
DIC Corp. | (6,900 | ) | (131,574 | ) | 36.3 | |||||||
East Japan Railway Co. | (18,500 | ) | (964,715 | ) | 266.3 | |||||||
ENEOS Holdings, Inc. | (117,900 | ) | (414,844 | ) | 114.5 | |||||||
Ezaki Glico Co. Ltd. | (5,100 | ) | (146,210 | ) | 40.4 | |||||||
Fancl Corp. | (21,300 | ) | (407,746 | ) | 112.6 | |||||||
Fast Retailing Co. Ltd. | (400 | ) | (184,162 | ) | 50.8 | |||||||
Fuji Electric Co. Ltd. | (7,000 | ) | (306,955 | ) | 84.7 | |||||||
Fuji Kyuko Co. Ltd. | (18,100 | ) | (572,763 | ) | 158.1 | |||||||
Fuji Media Holdings, Inc. | (17,900 | ) | (154,599 | ) | 42.7 | |||||||
Fuji Oil Holdings, Inc. | (6,700 | ) | (95,085 | ) | 26.2 | |||||||
Fujitsu General Ltd. | (20,500 | ) | (364,369 | ) | 100.6 | |||||||
Fukuoka Financial Group, Inc. | (11,300 | ) | (206,466 | ) | 57.0 | |||||||
Fukuyama Transporting Co. Ltd. | (800 | ) | (22,392 | ) | 6.2 | |||||||
Fuyo General Lease Co. Ltd. | (700 | ) | (37,873 | ) | 10.5 | |||||||
GMO internet, Inc. | (7,000 | ) | (139,896 | ) | 38.6 | |||||||
Goldwin, Inc. | (5,700 | ) | (285,898 | ) | 78.9 | |||||||
GS Yuasa Corp. | (3,500 | ) | (60,691 | ) | 16.8 | |||||||
Hachijuni Bank Ltd. | (127,800 | ) | (421,451 | ) | 116.3 | |||||||
Hakuhodo DY Holdings, Inc. | (11,900 | ) | (140,439 | ) | 38.8 | |||||||
Haseko Corp. | (19,000 | ) | (208,184 | ) | 57.5 | |||||||
Heiwa Corp. | (7,700 | ) | (115,774 | ) | 32.0 | |||||||
Hikari Tsushin, Inc. | (1,400 | ) | (163,931 | ) | 45.2 | |||||||
Hitachi Ltd. | (6,300 | ) | (298,787 | ) | 82.5 | |||||||
Hitachi Metals Ltd. | (30,400 | ) | (474,382 | ) | 130.9 | |||||||
Horiba Ltd. | (4,800 | ) | (233,536 | ) | 64.5 | |||||||
| Security | Shares | Value | % of Basket Value | |||||||||
| Japan (continued) | ||||||||||||
House Foods Group, Inc. | (8,700 | ) | $ | (203,618 | ) | 56.2 | % | |||||
Ibiden Co. Ltd. | (3,200 | ) | (119,590 | ) | 33.0 | |||||||
Idemitsu Kosan Co. Ltd. | (6,200 | ) | (163,401 | ) | 45.1 | |||||||
Iida Group Holdings Co. Ltd. | (7,600 | ) | (120,875 | ) | 33.4 | |||||||
Industrial & Infrastructure Fund Investment Corp. | (48 | ) | (68,874 | ) | 19.0 | |||||||
Isetan Mitsukoshi Holdings Ltd. | (1,700 | ) | (12,617 | ) | 3.5 | |||||||
Isuzu Motors Ltd. | (4,800 | ) | (55,996 | ) | 15.5 | |||||||
Ito En Ltd. | (900 | ) | (36,986 | ) | 10.2 | |||||||
Iwatani Corp. | (13,000 | ) | (517,228 | ) | 142.8 | |||||||
Iyo Bank Ltd. | (20,000 | ) | (96,978 | ) | 26.8 | |||||||
Japan Airlines Co. Ltd. | (23,800 | ) | (392,925 | ) | 108.5 | |||||||
Japan Airport Terminal Co. Ltd. | (10,200 | ) | (422,652 | ) | 116.7 | |||||||
Japan Aviation Electronics Industry Ltd. | (36,600 | ) | (511,782 | ) | 141.3 | |||||||
Japan Hotel REIT Investment Corp. | (554 | ) | (281,369 | ) | 77.7 | |||||||
Japan Logistics Fund, Inc. | (36 | ) | (87,858 | ) | 24.3 | |||||||
Japan Metropolitan Fund Invest | (225 | ) | (178,836 | ) | 49.4 | |||||||
Japan Post Insurance Co. Ltd. | (9,000 | ) | (145,528 | ) | 40.2 | |||||||
Japan Real Estate Investment Corp. | (25 | ) | (120,996 | ) | 33.4 | |||||||
JCR Pharmaceuticals Co. Ltd. | (5,500 | ) | (102,217 | ) | 28.2 | |||||||
JTEKT Corp. | (3,900 | ) | (27,190 | ) | 7.5 | |||||||
Justsystems Corp. | (21,100 | ) | (917,077 | ) | 253.2 | |||||||
Kagome Co. Ltd. | (5,200 | ) | (130,135 | ) | 35.9 | |||||||
Kajima Corp. | (17,800 | ) | (198,372 | ) | 54.8 | |||||||
Kaken Pharmaceutical Co. Ltd. | (4,500 | ) | (136,360 | ) | 37.6 | |||||||
Kaneka Corp. | (2,900 | ) | (77,597 | ) | 21.4 | |||||||
Kawasaki Heavy Industries Ltd. | (1,500 | ) | (26,674 | ) | 7.4 | |||||||
Keihan Holdings Co. Ltd. | (1,300 | ) | (27,729 | ) | 7.7 | |||||||
Keikyu Corp. | (5,100 | ) | (51,370 | ) | 14.2 | |||||||
Kenedix Office Investment Corp. | (12 | ) | (62,720 | ) | 17.3 | |||||||
Kinden Corp. | (6,100 | ) | (72,282 | ) | 20.0 | |||||||
Kobayashi Pharmaceutical Co. Ltd. | (1,100 | ) | (75,014 | ) | 20.7 | |||||||
Kobe Steel Ltd. | (27,200 | ) | (117,921 | ) | 32.5 | |||||||
Kotobuki Spirits Co. Ltd. | (4,900 | ) | (257,922 | ) | 71.2 | |||||||
K’s Holdings Corp. | (13,700 | ) | (135,673 | ) | 37.4 | |||||||
Kubota Corp. | (4,400 | ) | (74,750 | ) | 20.6 | |||||||
Kurita Water Industries Ltd. | (3,900 | ) | (133,054 | ) | 36.7 | |||||||
Kyushu Electric Power Co., Inc. | (9,800 | ) | (61,509 | ) | 17.0 | |||||||
Kyushu Financial Group, Inc. | (3,900 | ) | (11,969 | ) | 3.3 | |||||||
Lintec Corp. | (6,000 | ) | (111,766 | ) | 30.8 | |||||||
Mabuchi Motor Co. Ltd. | (2,300 | ) | (61,430 | ) | 17.0 | |||||||
Marui Group Co. Ltd. | (4,500 | ) | (77,479 | ) | 21.4 | |||||||
Maruichi Steel Tube Ltd. | (5,300 | ) | (113,114 | ) | 31.2 | |||||||
Matsui Securities Co. Ltd. | (25,000 | ) | (154,621 | ) | 42.7 | |||||||
Matsumotokiyoshi Holdings Co. Ltd. | (1,300 | ) | (42,972 | ) | 11.9 | |||||||
McDonald’s Holdings Co. Japan Ltd. | (27,000 | ) | (1,071,167 | ) | 295.7 | |||||||
Mebuki Financial Group, Inc. | (144,200 | ) | (290,346 | ) | 80.1 | |||||||
Medipal Holdings Corp. | (21,700 | ) | (357,364 | ) | 98.6 | |||||||
MEIJI Holdings Co. Ltd. | (7,900 | ) | (393,790 | ) | 108.7 | |||||||
Menicon Co. Ltd. | (1,600 | ) | (34,175 | ) | 9.4 | |||||||
MINEBEA MITSUMI, Inc. | (11,300 | ) | (216,804 | ) | 59.8 | |||||||
Mitsubishi Electric Corp. | (33,200 | ) | (347,746 | ) | 96.0 | |||||||
Mitsubishi Estate Co. Ltd. | (20,500 | ) | (298,615 | ) | 82.4 | |||||||
Mitsubishi Gas Chemical Co., Inc. | (4,600 | ) | (67,174 | ) | 18.5 | |||||||
Mitsubishi UFJ Financial Group, Inc. | (194,300 | ) | (1,129,538 | ) | 311.8 | |||||||
Mitsui Fudosan Logistics Park, Inc. | (77 | ) | (330,132 | ) | 91.1 | |||||||
Miura Co. Ltd. | (3,700 | ) | (77,284 | ) | 21.3 | |||||||
MonotaRO Co. Ltd. | (1,200 | ) | (20,614 | ) | 5.7 | |||||||
Mori Hills REIT Investment Corp. | (59 | ) | (66,914 | ) | 18.5 | |||||||
Morinaga & Co. Ltd. | (4,000 | ) | (124,035 | ) | 34.2 | |||||||
Morinaga Milk Industry Co. Ltd. | (8,400 | ) | (338,283 | ) | 93.4 | |||||||
| 62 | 2 0 2 2 BLACK ROCK ANNUAL REPORT TO SHAREHOLDERS |
Schedule of Investments (continued) April 30, 2022 | BlackRock Global Long/Short Equity Fund |
| Security | Shares | Value | % of Basket Value | |||||||||
| Japan (continued) | ||||||||||||
Nabtesco Corp. | (800 | ) | $ | (18,246 | ) | 5.0 | % | |||||
Nagase & Co. Ltd. | (6,200 | ) | (88,846 | ) | 24.5 | |||||||
NEC Networks & System Integration Corp. | (2,400 | ) | (34,078 | ) | 9.4 | |||||||
NGK Insulators Ltd. | (14,800 | ) | (199,084 | ) | 55.0 | |||||||
NGK Spark Plug Co. Ltd. | (7,100 | ) | (108,951 | ) | 30.1 | |||||||
NH Foods Ltd. | (6,400 | ) | (202,115 | ) | 55.8 | |||||||
NHK Spring Co. Ltd. | (21,200 | ) | (136,929 | ) | 37.8 | |||||||
Nidec Corp. | (1,200 | ) | (77,579 | ) | 21.4 | |||||||
Nifco, Inc. | (1,000 | ) | (21,114 | ) | 5.8 | |||||||
Nihon Unisys Ltd. | (11,300 | ) | (285,494 | ) | 78.8 | |||||||
Nintendo Co. Ltd. | (1,200 | ) | (547,669 | ) | 151.2 | |||||||
Nippon Accommodations Fund, Inc. | (7 | ) | (34,467 | ) | 9.5 | |||||||
Nippon Building Fund, Inc. | (71 | ) | (368,583 | ) | 101.7 | |||||||
Nippon Kayaku Co. Ltd. | (102,000 | ) | (888,963 | ) | 245.4 | |||||||
Nippon Shinyaku Co. Ltd. | (2,400 | ) | (162,321 | ) | 44.8 | |||||||
Nippon Shokubai Co. Ltd. | (600 | ) | (24,139 | ) | 6.7 | |||||||
Nishi-Nippon Railroad Co. Ltd. | (7,300 | ) | (146,035 | ) | 40.3 | |||||||
Nisshin Seifun Group, Inc. | (9,400 | ) | (125,310 | ) | 34.6 | |||||||
Noevir Holdings Co. Ltd. | (700 | ) | (27,446 | ) | 7.6 | |||||||
NOF Corp. | (1,100 | ) | (41,288 | ) | 11.4 | |||||||
Nomura Holdings, Inc. | (171,500 | ) | (660,353 | ) | 182.3 | |||||||
Nomura Real Estate Master Fund, Inc. | (65 | ) | (81,610 | ) | 22.5 | |||||||
NS Solutions Corp. | (1,600 | ) | (47,733 | ) | 13.2 | |||||||
Odakyu Electric Railway Co. Ltd. | (11,100 | ) | (168,088 | ) | 46.4 | |||||||
Oji Holdings Corp. | (65,600 | ) | (310,747 | ) | 85.8 | |||||||
OKUMA Corp. | (5,200 | ) | (185,855 | ) | 51.3 | |||||||
Open House Co. Ltd. | (8,900 | ) | (344,382 | ) | 95.1 | |||||||
Oracle Corp. Japan | (1,600 | ) | (102,818 | ) | 28.4 | |||||||
Orient Corp. | (41,200 | ) | (39,547 | ) | 10.9 | |||||||
Oriental Land Co. Ltd. | (800 | ) | (121,016 | ) | 33.4 | |||||||
ORIX Corp. | (2,900 | ) | (52,893 | ) | 14.6 | |||||||
Orix JREIT, Inc. | (39 | ) | (52,717 | ) | 14.5 | |||||||
OSG Corp. | (4,000 | ) | (50,250 | ) | 13.9 | |||||||
Pan Pacific International Holdings Corp. | (5,300 | ) | (81,161 | ) | 22.4 | |||||||
Persol Holdings Co. Ltd. | (1,600 | ) | (31,743 | ) | 8.8 | |||||||
Rengo Co. Ltd. | (42,900 | ) | (253,992 | ) | 70.1 | |||||||
RENOVA, Inc. | (5,300 | ) | (65,301 | ) | 18.0 | |||||||
Rohto Pharmaceutical Co. Ltd. | (5,900 | ) | (157,557 | ) | 43.5 | |||||||
Sankyo Co. Ltd. | (15,100 | ) | (434,502 | ) | 119.9 | |||||||
Sansan, Inc. | (4,300 | ) | (41,025 | ) | 11.3 | |||||||
Sanwa Holdings Corp. | (12,500 | ) | (113,878 | ) | 31.4 | |||||||
Secom Co. Ltd. | (3,800 | ) | (267,347 | ) | 73.8 | |||||||
Seibu Holdings, Inc. | (7,400 | ) | (73,519 | ) | 20.3 | |||||||
Sekisui Chemical Co. Ltd. | (2,700 | ) | (36,561 | ) | 10.1 | |||||||
Seven Bank Ltd. | (16,900 | ) | (31,591 | ) | 8.7 | |||||||
SHIFT, Inc. | (200 | ) | (37,900 | ) | 10.5 | |||||||
Shikoku Electric Power Co., Inc. | (14,900 | ) | (85,668 | ) | 23.6 | |||||||
Shimamura Co. Ltd. | (600 | ) | (53,213 | ) | 14.7 | |||||||
Shimano, Inc. | (700 | ) | (124,029 | ) | 34.2 | |||||||
Shinko Electric Industries Co. Ltd. | (18,000 | ) | (775,892 | ) | 214.2 | |||||||
Shinsei Bank Ltd. | (2,300 | ) | (40,333 | ) | 11.1 | |||||||
Ship Healthcare Holdings, Inc. | (1,500 | ) | (25,056 | ) | 6.9 | |||||||
Shiseido Co. Ltd. | (14,100 | ) | (666,527 | ) | 184.0 | |||||||
Shizuoka Bank Ltd. | (47,000 | ) | (304,093 | ) | 83.9 | |||||||
SHO-BOND Holdings Co. Ltd. | (900 | ) | (37,827 | ) | 10.4 | |||||||
Shochiku Co. Ltd. | (1,500 | ) | (153,091 | ) | 42.3 | |||||||
Sohgo Security Services Co. Ltd. | (9,100 | ) | (252,787 | ) | 69.8 | |||||||
Stanley Electric Co. Ltd. | (6,700 | ) | (115,529 | ) | 31.9 | |||||||
Sugi Holdings Co. Ltd. | (4,100 | ) | (175,728 | ) | 48.5 | |||||||
Sumitomo Bakelite Co. Ltd. | (4,400 | ) | (144,369 | ) | 39.8 | |||||||
Sumitomo Electric Industries Ltd. | (69,800 | ) | (750,408 | ) | 207.1 | |||||||
| Security | Shares | Value | % of Basket Value | |||||||||
| Japan (continued) | ||||||||||||
Sushiro Global Holdings Ltd. | (1,200 | ) | $ | (28,477 | ) | 7.9 | % | |||||
Suzuken Co Ltd/Aichi Japan | (1,800 | ) | (53,131 | ) | 14.7 | |||||||
Taisho Pharmaceutical Holdings Co. Ltd. | (1,100 | ) | (43,327 | ) | 12.0 | |||||||
Taiyo Nippon Sanso Corp. | (10,800 | ) | (194,351 | ) | 53.6 | |||||||
Taiyo Yuden Co. Ltd. | (500 | ) | (19,644 | ) | 5.4 | |||||||
Takara Holdings, Inc. | (10,300 | ) | (86,756 | ) | 23.9 | |||||||
TDK Corp. | (11,300 | ) | (349,076 | ) | 96.4 | |||||||
TechnoPro Holdings Inc. | (1,400 | ) | (35,655 | ) | 9.8 | |||||||
THK Co. Ltd. | (21,400 | ) | (424,072 | ) | 117.1 | |||||||
Tobu Railway Co. Ltd. | (5,300 | ) | (119,134 | ) | 32.9 | |||||||
Toda Corp. | (28,500 | ) | (163,747 | ) | 45.2 | |||||||
Toho Gas Co. Ltd. | (1,400 | ) | (32,843 | ) | 9.1 | |||||||
Tokyo Electric Power Co. Holdings, Inc. | (280,500 | ) | (968,218 | ) | 267.3 | |||||||
Tokyo Tatemono Co. Ltd. | (8,700 | ) | (122,661 | ) | 33.9 | |||||||
Tokyu Corp. | (24,800 | ) | (303,275 | ) | 83.7 | |||||||
Tokyu Fudosan Holdings Corp. | (76,400 | ) | (397,560 | ) | 109.7 | |||||||
Toppan Inc. | (2,800 | ) | (46,283 | ) | 12.8 | |||||||
Toshiba Corp. | (7,500 | ) | (311,462 | ) | 86.0 | |||||||
Toshiba TEC Corp. | (1,200 | ) | (40,677 | ) | 11.2 | |||||||
Toyo Tire Corp. | (18,800 | ) | (215,635 | ) | 59.5 | |||||||
Toyoda Gosei Co. Ltd. | (9,300 | ) | (135,427 | ) | 37.4 | |||||||
Toyota Boshoku Corp. | (13,900 | ) | (221,530 | ) | 61.2 | |||||||
Toyota Industries Corp. | (4,600 | ) | (275,893 | ) | 76.2 | |||||||
Toyota Motor Corp. | (86,700 | ) | (1,485,492 | ) | 410.1 | |||||||
TS Tech Co. Ltd. | (7,200 | ) | (75,136 | ) | 20.7 | |||||||
Ube Industries Ltd. | (9,600 | ) | (148,846 | ) | 41.1 | |||||||
Ulvac, Inc. | (2,400 | ) | (94,044 | ) | 26.0 | |||||||
United Urban Investment Corp. | (212 | ) | (231,957 | ) | 64.0 | |||||||
USS Co. Ltd. | (6,700 | ) | (111,542 | ) | 30.8 | |||||||
West Japan Railway Co. | (4,300 | ) | (159,612 | ) | 44.1 | |||||||
Yamato Holdings Co. Ltd. | (50,100 | ) | (937,471 | ) | 258.8 | |||||||
Yamato Kogyo Co. Ltd. | (13,500 | ) | (435,688 | ) | 120.3 | |||||||
Yamazaki Baking Co. Ltd. | (16,500 | ) | (203,975 | ) | 56.3 | |||||||
Yokogawa Electric Corp. | (7,200 | ) | (114,786 | ) | 31.7 | |||||||
Zenkoku Hosho Co. Ltd. | (1,200 | ) | (42,115 | ) | 11.6 | |||||||
Zeon Corp. | (7,900 | ) | (84,125 | ) | 23.2 | |||||||
|
|
|
| |||||||||
| (42,313,336 | ) | |||||||||||
| Luxembourg | ||||||||||||
APERAM SA | (4,116 | ) | (158,867 | ) | 43.9 | |||||||
Tenaris SA | (56,346 | ) | (861,090 | ) | 237.7 | |||||||
|
|
|
| |||||||||
| (1,019,957 | ) | |||||||||||
| Netherlands | ||||||||||||
Adyen NV | (7 | ) | (11,741 | ) | 3.3 | |||||||
Aegon NV | (82,401 | ) | (427,223 | ) | 117.9 | |||||||
Alfen Beheer BV | (5,042 | ) | (453,444 | ) | 125.2 | |||||||
ASM International NV | (873 | ) | (262,330 | ) | 72.4 | |||||||
BE Semiconductor Industries NV | (3,285 | ) | (200,249 | ) | 55.3 | |||||||
EXOR NV | (889 | ) | (61,692 | ) | 17.0 | |||||||
Iveco Group NV | (24,157 | ) | (142,125 | ) | 39.2 | |||||||
Just Eat Takeaway.com NV | (1,520 | ) | (41,287 | ) | 11.4 | |||||||
Koninklijke DSM NV | (3,582 | ) | (602,169 | ) | 166.2 | |||||||
Koninklijke Philips NV | (11,186 | ) | (292,303 | ) | 80.7 | |||||||
NN Group NV | (8,016 | ) | (392,636 | ) | 108.4 | |||||||
Prosus NV | (9,629 | ) | (464,394 | ) | 128.2 | |||||||
SBM Offshore NV | (18,053 | ) | (261,608 | ) | 72.2 | |||||||
Universal Music Group NV | (22,349 | ) | (518,640 | ) | 143.2 | |||||||
|
|
|
| |||||||||
| (4,131,841 | ) | |||||||||||
| New Zealand | ||||||||||||
Auckland International Airport Ltd. | (179,340 | ) | (900,825 | ) | 248.7 | |||||||
Fletcher Building Ltd. | (240,794 | ) | (959,208 | ) | 264.8 | |||||||
SCHEDULE OF INVESTMENTS | 63 |
Schedule of Investments (continued) April 30, 2022 | BlackRock Global Long/Short Equity Fund |
| Security | Shares | Value | % of Basket Value | |||||||||
| New Zealand (continued) | ||||||||||||
Kiwi Property Group Ltd. | (73,548 | ) | $ | (50,164 | ) | 13.9 | % | |||||
Mainfreight Ltd. | (383 | ) | (20,047 | ) | 5.5 | |||||||
Mercury NZ Ltd. | (53,390 | ) | (206,996 | ) | 57.1 | |||||||
Meridian Energy Ltd. | (49,550 | ) | (150,387 | ) | 41.5 | |||||||
Spark New Zealand Ltd. | (210,179 | ) | (664,731 | ) | 183.5 | |||||||
|
|
|
| |||||||||
| (2,952,358 | ) | |||||||||||
| Norway | ||||||||||||
Aker ASA, A Shares | (648 | ) | (52,819 | ) | 14.6 | |||||||
Gjensidige Forsikring ASA | (17,583 | ) | (375,914 | ) | 103.8 | |||||||
Leroy Seafood Group ASA | (12,590 | ) | (118,161 | ) | 32.6 | |||||||
Mowi ASA | (14,914 | ) | (421,276 | ) | 116.3 | |||||||
Orkla ASA | (84,922 | ) | (689,112 | ) | 190.2 | |||||||
Salmar Asa | (3,449 | ) | (282,231 | ) | 77.9 | |||||||
Scatec ASA | (7,404 | ) | (89,489 | ) | 24.7 | |||||||
Storebrand ASA | (34,874 | ) | (302,922 | ) | 83.6 | |||||||
Var Energi | (74,604 | ) | (318,918 | ) | 88.1 | |||||||
Yara International ASA | (7,162 | ) | (364,175 | ) | 100.5 | |||||||
|
|
|
| |||||||||
| (3,015,017 | ) | |||||||||||
| Poland | ||||||||||||
InPost SA | (21,448 | ) | (131,495 | ) | 36.3 | |||||||
|
|
|
| |||||||||
| Portugal | ||||||||||||
Banco Comercial Portugues SA | (69,416 | ) | (10,731 | ) | 3.0 | |||||||
Galp Energia SGPS SA | (93,316 | ) | (1,135,809 | ) | 313.5 | |||||||
|
|
|
| |||||||||
| (1,146,540 | ) | |||||||||||
| Singapore | ||||||||||||
Ascendas Real Estate Investment Trust | (346,900 | ) | (713,739 | ) | 197.0 | |||||||
CapitaLand Integrated Commercial Trust | (564,469 | ) | (945,819 | ) | 261.1 | |||||||
Frasers Logistics & Commercial Trust | (501,600 | ) | (522,346 | ) | 144.2 | |||||||
Genting Singapore Ltd. | (817,300 | ) | (474,517 | ) | 131.0 | |||||||
Grab Holdings Ltd., Class A | (64,782 | ) | (191,107 | ) | 52.8 | |||||||
Keppel DC REIT | (461,800 | ) | (688,446 | ) | 190.0 | |||||||
Mapletree Industrial Trust | (235,100 | ) | (441,772 | ) | 122.0 | |||||||
Mapletree Logistics Trust | (395,300 | ) | (507,692 | ) | 140.2 | |||||||
Sembcorp Industries Ltd. | (459,000 | ) | (972,073 | ) | 268.3 | |||||||
Singapore Airlines Ltd. | (122,700 | ) | (483,642 | ) | 133.5 | |||||||
Singapore Exchange Ltd. | (80,500 | ) | (566,425 | ) | 156.4 | |||||||
Venture Corp. Ltd. | (31,500 | ) | (386,692 | ) | 106.7 | |||||||
Yangzijiang Financial Holdings | (469,200 | ) | (184,905 | ) | 51.0 | |||||||
|
|
|
| |||||||||
| (7,079,175 | ) | |||||||||||
| Spain | ||||||||||||
Acerinox SA | (21,949 | ) | (231,106 | ) | 63.8 | |||||||
ACS Actividades de Construccion y Servicios SA | (31,214 | ) | (799,243 | ) | 220.6 | |||||||
Aena SME SA | (3,331 | ) | (472,701 | ) | 130.5 | |||||||
Banco de Sabadell SA | (13,553 | ) | (10,518 | ) | 2.9 | |||||||
EDP Renovaveis SA | (3,735 | ) | (88,397 | ) | 24.4 | |||||||
Fluidra SA | (8,181 | ) | (221,412 | ) | 61.1 | |||||||
Mapfre SA | (82,319 | ) | (150,220 | ) | 41.5 | |||||||
Red Electrica Corp. SA | (13,394 | ) | (269,678 | ) | 74.4 | |||||||
Siemens Gamesa Renewable Energy SA | (4,069 | ) | (64,813 | ) | 17.9 | |||||||
Telefonica SA | (88,219 | ) | (429,154 | ) | 118.5 | |||||||
|
|
|
| |||||||||
| (2,737,242 | ) | |||||||||||
| Sweden | ||||||||||||
Assa Abloy AB, Class B | (4,112 | ) | (103,919 | ) | 28.7 | |||||||
Atlas Copco AB, Class A | (61,373 | ) | (2,782,459 | ) | 768.1 | |||||||
Atlas Copco AB, Class B | (7,332 | ) | (290,184 | ) | 80.1 | |||||||
Avanza Bank Holding AB | (2,138 | ) | (54,138 | ) | 14.9 | |||||||
| Security | Shares | Value | % of Basket Value | |||||||||
| Sweden (continued) | ||||||||||||
Beijer Ref AB | (4,898 | ) | $ | (79,759 | ) | 22.0 | % | |||||
Embracer Group AB | (4,125 | ) | (27,572 | ) | 7.6 | |||||||
Fastighets AB Balder, Class B | (3,216 | ) | (159,408 | ) | 44.0 | |||||||
H & M Hennes & Mauritz AB, B Shares | (16,116 | ) | (202,885 | ) | 56.0 | |||||||
Husqvarna AB, B Shares | (13,687 | ) | (130,835 | ) | 36.1 | |||||||
Industrivarden AB, A Shares | (16,882 | ) | (432,560 | ) | 119.4 | |||||||
Investor AB, Class A | (30,874 | ) | (644,850 | ) | 178.0 | |||||||
Investor AB, Class B | (35,143 | ) | (676,253 | ) | 186.7 | |||||||
Sandvik AB | (24,569 | ) | (465,050 | ) | 128.4 | |||||||
Securitas AB, B Shares | (41,568 | ) | (490,785 | ) | 135.5 | |||||||
Sinch AB | (68,578 | ) | (303,073 | ) | 83.7 | |||||||
Skandinaviska Enskilda Banken AB, Class A | (67,156 | ) | (753,094 | ) | 207.9 | |||||||
SKF AB, B Shares | (35,746 | ) | (583,828 | ) | 161.2 | |||||||
Svenska Cellulosa AB SCA, Class B | (14,585 | ) | (282,261 | ) | 77.9 | |||||||
Sweco AB, B Shares | (13,073 | ) | (184,501 | ) | 50.9 | |||||||
Telia Co. AB | (203,874 | ) | (846,202 | ) | 233.6 | |||||||
Thule Group AB | (15,692 | ) | (544,310 | ) | 150.3 | |||||||
Trelleborg AB, B Shares | (2,958 | ) | (64,879 | ) | 17.9 | |||||||
Volvo AB, A Shares | (7,940 | ) | (130,539 | ) | 36.0 | |||||||
Volvo AB, B Shares | (22,420 | ) | (357,676 | ) | 98.7 | |||||||
|
|
|
| |||||||||
| (10,591,020) | ||||||||||||
| Switzerland | ||||||||||||
ABB Ltd. | (70,821 | ) | (2,124,767 | ) | 586.5 | |||||||
Bachem Holding AG, Class B | (176 | ) | (76,797 | ) | 21.2 | |||||||
Banque Cantonale Vaudoise | (2,723 | ) | (230,128 | ) | 63.5 | |||||||
Chubb Ltd. | (415 | ) | (85,677 | ) | 23.7 | |||||||
Coca-Cola HBC AG | (10,565 | ) | (214,194 | ) | 59.1 | |||||||
CRISPR Therapeutics AG | (1,719 | ) | (85,297 | ) | 23.5 | |||||||
DKSH Holding AG | (152 | ) | (13,052 | ) | 3.6 | |||||||
EMS-Chemie Holding AG | (136 | ) | (121,329 | ) | 33.5 | |||||||
Fischer (Georg) Reg | (18,740 | ) | (1,017,022 | ) | 280.7 | |||||||
Geberit AG | (1,181 | ) | (673,493 | ) | 185.9 | |||||||
Givaudan SA | (16 | ) | (63,592 | ) | 17.6 | |||||||
Helvetia Holding AG | (3,010 | ) | (386,805 | ) | 106.8 | |||||||
Holcim Ltd. | (6,562 | ) | (320,852 | ) | 88.6 | |||||||
Nestle SA | (11,773 | ) | (1,519,825 | ) | 419.5 | |||||||
Novartis AG | (3,265 | ) | (288,526 | ) | 79.6 | |||||||
On Holding AG, Class A | (23,589 | ) | (589,017 | ) | 162.6 | |||||||
Partners Group Holding AG | (323 | ) | (342,218 | ) | 94.5 | |||||||
PSP Swiss Property AG, Registered Shares | (2,643 | ) | (333,102 | ) | 92.0 | |||||||
Roche Holding AG | (715 | ) | (287,248 | ) | 79.3 | |||||||
Roche Holding AG Genusschein | (2,318 | ) | (859,546 | ) | 237.3 | |||||||
Schindler Holding AG, Participation Certificates | (3,349 | ) | (643,428 | ) | 177.6 | |||||||
Schindler Holding AG, Registered Shares | (1,298 | ) | (249,183 | ) | 68.8 | |||||||
SGS SA | (115 | ) | (295,495 | ) | 81.6 | |||||||
Swiss Re AG | (1,042 | ) | (85,451 | ) | 23.6 | |||||||
Swisscom AG | (2,990 | ) | (1,767,989 | ) | 488.0 | |||||||
Swissquote Group Holding SA | (1,196 | ) | (194,384 | ) | 53.7 | |||||||
|
|
|
| |||||||||
| (12,868,417 | ) | |||||||||||
| United Kingdom | ||||||||||||
3i Group PLC | (50,216 | ) | (821,797 | ) | 226.9 | |||||||
Admiral Group PLC | (2,673 | ) | (84,139 | ) | 23.2 | |||||||
Airtel Africa PLC | (23,906 | ) | (43,742 | ) | 12.1 | |||||||
Amcor PLC | (14,378 | ) | (170,523 | ) | 47.1 | |||||||
Avast PLC | (125,062 | ) | (886,942 | ) | 244.8 | |||||||
Aviva PLC | (61,628 | ) | (330,642 | ) | 91.3 | |||||||
B&M European Value Retail SA | (163,198 | ) | (999,928 | ) | 276.0 | |||||||
Berkeley Group Holdings PLC | (8,404 | ) | (426,221 | ) | 117.7 | |||||||
BP PLC | (202,271 | ) | (976,523 | ) | 269.6 | |||||||
BT Group PLC | (40,848 | ) | (90,584 | ) | 25.0 | |||||||
| 64 | 2 0 2 2 BLACK ROCK ANNUAL REPORT TO SHAREHOLDERS |
Schedule of Investments (continued) April 30, 2022 | BlackRock Global Long/Short Equity Fund |
| Security | Shares | Value | % of Basket Value | |||||||||
| United Kingdom (continued) | ||||||||||||
Bunzl PLC | (6,868 | ) | $ | (264,972 | ) | 73.1 | % | |||||
Burberry Group PLC | (8,195 | ) | (161,732 | ) | 44.6 | |||||||
Clarivate PLC | (25,534 | ) | (400,373 | ) | 110.5 | |||||||
ConvaTec Group PLC | (13,289 | ) | (35,153 | ) | 9.7 | |||||||
Deliveroo PLC | (493,602 | ) | (682,189 | ) | 188.3 | |||||||
Diageo PLC | (8,148 | ) | (406,494 | ) | 112.2 | |||||||
Dr. Martens PLC | (28,506 | ) | (74,532 | ) | 20.6 | |||||||
DS Smith PLC | (30,790 | ) | (126,524 | ) | 34.9 | |||||||
Future PLC | (565 | ) | (15,474 | ) | 4.3 | |||||||
Games Workshop Group PLC | (4,658 | ) | (430,482 | ) | 118.8 | |||||||
GlaxoSmithKline PLC | (59,989 | ) | (1,352,307 | ) | 373.3 | |||||||
Greggs PLC | (11,482 | ) | (334,998 | ) | 92.5 | |||||||
Harbour Energy PLC | (46,607 | ) | (292,273 | ) | 80.7 | |||||||
Howden Joinery Group PLC | (76,466 | ) | (723,943 | ) | 199.8 | |||||||
HSBC Holdings PLC | (186,476 | ) | (1,165,313 | ) | 321.7 | |||||||
Informa PLC | (6,382 | ) | (45,273 | ) | 12.5 | |||||||
Intermediate Capital Group PLC | (14,258 | ) | (272,848 | ) | 75.3 | |||||||
Land Securities Group PLC | (89,389 | ) | (838,341 | ) | 231.4 | |||||||
London Stock Exchange Group PLC | (6,066 | ) | (598,058 | ) | 165.1 | |||||||
LondonMetric Property PLC | (909 | ) | (3,072 | ) | 0.8 | |||||||
Man Group PLC | (7,200 | ) | (21,276 | ) | 5.9 | |||||||
Mondi PLC | (21,995 | ) | (413,197 | ) | 114.1 | |||||||
National Grid PLC | (81,253 | ) | (1,207,174 | ) | 333.2 | |||||||
Next PLC | (4,842 | ) | (362,669 | ) | 100.1 | |||||||
nVent Electric PLC | (10,558 | ) | (356,649 | ) | 98.5 | |||||||
Pennon Group PLC | (12,630 | ) | (175,510 | ) | 48.5 | |||||||
Prudential PLC | (43,594 | ) | (542,678 | ) | 149.8 | |||||||
RELX PLC | (6,362 | ) | (189,527 | ) | 52.3 | |||||||
Renishaw PLC | (3,461 | ) | (182,904 | ) | 50.5 | |||||||
Rightmove PLC | (5,579 | ) | (42,886 | ) | 11.8 | |||||||
Royal Mail PLC | (9,137 | ) | (39,164 | ) | 10.8 | |||||||
Severn Trent PLC | (6,479 | ) | (254,635 | ) | 70.3 | |||||||
Shell PLC | (34,390 | ) | (923,230 | ) | 254.9 | |||||||
Smith & Nephew PLC | (3,415 | ) | (55,352 | ) | 15.3 | |||||||
Standard Chartered PLC | (88,426 | ) | (604,509 | ) | 166.9 | |||||||
Unilever PLC | (6,468 | ) | (300,206 | ) | 82.9 | |||||||
Unilever PLC | (19,307 | ) | (897,585 | ) | 247.8 | |||||||
Vodafone Group PLC | (61,823 | ) | (93,597 | ) | 25.8 | |||||||
WH Smith PLC | (7,551 | ) | (135,852 | ) | 37.5 | |||||||
Wise PLC, Class A | (2,178 | ) | (10,673 | ) | 2.9 | |||||||
WPP PLC | (18,753 | ) | (233,754 | ) | 64.5 | |||||||
|
|
|
| |||||||||
| (20,098,419 | ) | |||||||||||
| United States | ||||||||||||
10X Genomics, Inc., Class A | (3,932 | ) | (187,792 | ) | 51.8 | |||||||
Abbott Laboratories | (6,015 | ) | (682,703 | ) | 188.5 | |||||||
Acuity Brands, Inc. | (6,343 | ) | (1,094,041 | ) | 302.0 | |||||||
Advance Auto Parts, Inc. | (5,006 | ) | (999,348 | ) | 275.9 | |||||||
Advanced Drainage Systems, Inc. | (4,943 | ) | (506,460 | ) | 139.8 | |||||||
AECOM | (3,841 | ) | (271,021 | ) | 74.8 | |||||||
Affiliated Managers Group, Inc. | (131 | ) | (16,450 | ) | 4.5 | |||||||
Affirm Holdings, Inc. | (4,015 | ) | (115,231 | ) | 31.8 | |||||||
AGCO Corp. | (7,801 | ) | (993,847 | ) | 274.3 | |||||||
Agilon Health, Inc. | (1,677 | ) | (29,800 | ) | 8.2 | |||||||
AGNC Investment Corp. | (81,589 | ) | (895,847 | ) | 247.3 | |||||||
Air Lease Corp. | (5,309 | ) | (213,847 | ) | 59.0 | |||||||
Air Products & Chemicals, Inc. | (508 | ) | (118,908 | ) | 32.8 | |||||||
Akamai Technologies, Inc. | (1,637 | ) | (183,802 | ) | 50.7 | |||||||
Albemarle Corp. | (688 | ) | (132,667 | ) | 36.6 | |||||||
Albertsons Cos., Inc., Class A | (9,387 | ) | (293,625 | ) | 81.1 | |||||||
Alight, Inc., Class A | (52,551 | ) | (451,413 | ) | 124.6 | |||||||
| Security | Shares | Value | % of Basket Value | |||||||||
| United States (continued) | ||||||||||||
Alnylam Pharmaceuticals, Inc. | (4,307 | ) | $ | (574,683 | ) | 158.6 | % | |||||
Amazon.com, Inc. | (36 | ) | (89,483 | ) | 24.7 | |||||||
Amedisys, Inc. | (150 | ) | (19,148 | ) | 5.3 | |||||||
AMERCO | (1,514 | ) | (810,717 | ) | 223.8 | |||||||
American Electric Power Co., Inc. | (9,602 | ) | (951,654 | ) | 262.7 | |||||||
American Financial Group, Inc. | (1,447 | ) | (200,381 | ) | 55.3 | |||||||
Americold Realty Trust | (15,214 | ) | (401,345 | ) | 110.8 | |||||||
AmerisourceBergen Corp. | (231 | ) | (34,948 | ) | 9.6 | |||||||
Amkor Technology, Inc. | (13,080 | ) | (246,035 | ) | 67.9 | |||||||
Annaly Capital Management, Inc. | (111,109 | ) | (713,320 | ) | 196.9 | |||||||
Antero Resources Corp. | (11,374 | ) | (400,365 | ) | 110.5 | |||||||
Anthem, Inc. | (368 | ) | (184,710 | ) | 51.0 | |||||||
Apellis Pharmaceuticals, Inc. | (3,476 | ) | (151,310 | ) | 41.8 | |||||||
Apollo Global Management, Inc. | (7,411 | ) | (368,771 | ) | 101.8 | |||||||
Appian Corp. | (3,123 | ) | (149,279 | ) | 41.2 | |||||||
AppLovin Corp., Class A | (9,735 | ) | (371,390 | ) | 102.5 | |||||||
Archer-Daniels-Midland Co. | (14,661 | ) | (1,313,039 | ) | 362.5 | |||||||
Armstrong World Industries, Inc. | (6,324 | ) | (535,390 | ) | 147.8 | |||||||
Arrow Electronics, Inc. | (2,977 | ) | (350,869 | ) | 96.9 | |||||||
Arrowhead Pharmaceuticals, Inc. | (8,865 | ) | (364,440 | ) | 100.6 | |||||||
Arthur J. Gallagher & Co. | (1,032 | ) | (173,882 | ) | 48.0 | |||||||
Asana, Inc., Class A | (3,116 | ) | (83,509 | ) | 23.1 | |||||||
Ashland Global Holdings, Inc. | (5,574 | ) | (585,103 | ) | 161.5 | |||||||
Assurant, Inc. | (7,668 | ) | (1,394,656 | ) | 385.0 | |||||||
Atkore, Inc. | (813 | ) | (78,129 | ) | 21.6 | |||||||
Automatic Data Processing, Inc. | (325 | ) | (70,909 | ) | 19.6 | |||||||
AutoNation, Inc. | (1,545 | ) | (179,081 | ) | 49.4 | |||||||
Avalara, Inc. | (1,014 | ) | (77,135 | ) | 21.3 | |||||||
Avery Dennison Corp. | (2,272 | ) | (410,323 | ) | 113.3 | |||||||
Avis Budget Group, Inc. | (3,783 | ) | (1,012,596 | ) | 279.5 | |||||||
AZEK Co., Inc. | (7,996 | ) | (169,835 | ) | 46.9 | |||||||
Bank OZK | (8,160 | ) | (313,507 | ) | 86.5 | |||||||
Bath & Body Works, Inc. | (16,824 | ) | (889,821 | ) | 245.6 | |||||||
Beam Therapeutics, Inc. | (1,499 | ) | (56,257 | ) | 15.5 | |||||||
Bentley Systems, Inc., Class B | (4,628 | ) | (196,181 | ) | 54.2 | |||||||
Berkshire Hathaway, Inc., Class B | (1,136 | ) | (366,735 | ) | 101.2 | |||||||
Berry Global Group, Inc. | (8,008 | ) | (451,251 | ) | 124.6 | |||||||
Bill.Com Holdings, Inc. | (927 | ) | (158,248 | ) | 43.7 | |||||||
Biohaven Pharmaceutical Holding Co. Ltd. | (1,359 | ) | (121,182 | ) | 33.5 | |||||||
Bio-Rad Laboratories, Inc., Class A | (482 | ) | (246,813 | ) | 68.1 | |||||||
Bio-Techne Corp. | (1,533 | ) | (582,065 | ) | 160.7 | |||||||
Black Knight, Inc. | (5,248 | ) | (345,266 | ) | 95.3 | |||||||
Blue Owl Capital, Inc. | (64,911 | ) | (774,388 | ) | 213.8 | |||||||
Boston Beer Co., Inc., Class A | (807 | ) | (302,625 | ) | 83.5 | |||||||
Boyd Gaming Corp. | (5,146 | ) | (311,745 | ) | 86.1 | |||||||
Bright Horizons Family Solutions, Inc. | (3,144 | ) | (359,171 | ) | 99.1 | |||||||
Broadcom, Inc. | (2,268 | ) | (1,257,357 | ) | 347.1 | |||||||
Broadridge Financial Solutions, Inc. | (2,659 | ) | (383,242 | ) | 105.8 | |||||||
Brown-Forman Corp., Class B | (2,882 | ) | (194,362 | ) | 53.7 | |||||||
Brunswick Corp. | (16,471 | ) | (1,245,372 | ) | 343.8 | |||||||
Bumble, Inc., Class A | (8,787 | ) | (210,800 | ) | 58.2 | |||||||
Bunge Ltd. | (8,899 | ) | (1,006,655 | ) | 277.9 | |||||||
Burlington Stores, Inc. | (4,621 | ) | (940,651 | ) | 259.7 | |||||||
Cable One, Inc. | (57 | ) | (66,473 | ) | 18.3 | |||||||
Cadence Bank | (15,987 | ) | (400,315 | ) | 110.5 | |||||||
Cadence Design Systems, Inc. | (2,197 | ) | (331,417 | ) | 91.5 | |||||||
Caesars Entertainment, Inc. | (8,256 | ) | (547,208 | ) | 151.1 | |||||||
Callaway Golf Co. | (8,636 | ) | (189,474 | ) | 52.3 | |||||||
Campbell Soup Co. | (19,227 | ) | (907,899 | ) | 250.6 | |||||||
Cargurus, Inc. | (8,753 | ) | (286,048 | ) | 79.0 | |||||||
Carlisle Cos., Inc. | (832 | ) | (215,788 | ) | 59.6 | |||||||
SCHEDULE OF INVESTMENTS | 65 |
Schedule of Investments (continued) April 30, 2022 | BlackRock Global Long/Short Equity Fund |
| Security | Shares | Value | % of Basket Value | |||||||||
| United States (continued) | ||||||||||||
Carter’s, Inc. | (1,842 | ) | $ | (155,170 | ) | 42.8 | % | |||||
Casey’s General Stores, Inc. | (863 | ) | (173,722 | ) | 48.0 | |||||||
Caterpillar, Inc. | (1,283 | ) | (270,123 | ) | 74.6 | |||||||
Celanese Corp. | (603 | ) | (88,605 | ) | 24.5 | |||||||
Celsius Holdings, Inc. | (5,443 | ) | (283,036 | ) | 78.1 | |||||||
Centene Corp. | (5,444 | ) | (438,514 | ) | 121.0 | |||||||
CenterPoint Energy, Inc. | (8,867 | ) | (271,419 | ) | 74.9 | |||||||
Ceridian HCM Holding, Inc. | (7,773 | ) | (436,299 | ) | 120.4 | |||||||
CF Industries Holdings, Inc. | (900 | ) | (87,147 | ) | 24.1 | |||||||
ChargePoint Holdings, Inc. | (38,893 | ) | (503,275 | ) | 138.9 | |||||||
Chemours Co. | (4,742 | ) | (156,818 | ) | 43.3 | |||||||
Chewy, Inc., Class A | (3,198 | ) | (92,934 | ) | 25.7 | |||||||
Church & Dwight Co., Inc. | (8,046 | ) | (784,968 | ) | 216.7 | |||||||
Churchill Downs, Inc. | (4,521 | ) | (917,492 | ) | 253.3 | |||||||
Cintas Corp. | (4,313 | ) | (1,713,382 | ) | 473.0 | |||||||
Civitas Resources, Inc. | (35 | ) | (2,052 | ) | 0.6 | |||||||
Cleveland-Cliffs, Inc. | (4,032 | ) | (102,776 | ) | 28.4 | |||||||
Coherent, Inc. | (4,619 | ) | (1,237,430 | ) | 341.6 | |||||||
Coinbase Global, Inc., Class A | (1,846 | ) | (208,063 | ) | 57.4 | |||||||
Columbia Sportswear Co. | (8,551 | ) | (702,550 | ) | 193.9 | |||||||
Comcast Corp., Class A | (2,086 | ) | (82,939 | ) | 22.9 | |||||||
Commerce Bancshares, Inc. | (165 | ) | (11,281 | ) | 3.1 | |||||||
Commercial Metals Co. | (9,483 | ) | (388,803 | ) | 107.3 | |||||||
Conagra Brands, Inc. | (25,883 | ) | (904,093 | ) | 249.6 | |||||||
Concentrix Corp. | (484 | ) | (76,220 | ) | 21.0 | |||||||
Consolidated Edison, Inc. | (5,229 | ) | (484,937 | ) | 133.9 | |||||||
Constellation Brands, Inc., Class A | (702 | ) | (172,755 | ) | 47.7 | |||||||
Constellation Energy Corp. | (15,860 | ) | (939,071 | ) | 259.2 | |||||||
Copart, Inc. | (1,059 | ) | (120,355 | ) | 33.2 | |||||||
Corning, Inc. | (15,135 | ) | (532,601 | ) | 147.0 | |||||||
Coterra Energy, Inc. | (18,010 | ) | (518,508 | ) | 143.1 | |||||||
Coty, Inc., Class A | (44,920 | ) | (364,301 | ) | 100.6 | |||||||
Cousins Properties, Inc. | (14,938 | ) | (536,274 | ) | 148.0 | |||||||
Crane Co. | (5,104 | ) | (491,158 | ) | 135.6 | |||||||
Crown Holdings, Inc. | (5,221 | ) | (574,519 | ) | 158.6 | |||||||
Cullen/Frost Bankers, Inc. | (717 | ) | (94,852 | ) | 26.2 | |||||||
Curtiss-Wright Corp. | (2,379 | ) | (339,983 | ) | 93.9 | |||||||
CVS Health Corp. | (11,895 | ) | (1,143,466 | ) | 315.7 | |||||||
D.R. Horton, Inc. | (10,248 | ) | (713,158 | ) | 196.9 | |||||||
Darden Restaurants, Inc. | (4,642 | ) | (611,491 | ) | 168.8 | |||||||
Darling Ingredients, Inc. | (466 | ) | (34,200 | ) | 9.4 | |||||||
Datadog, Inc., Class A | (3,726 | ) | (450,026 | ) | 124.2 | |||||||
Deere & Co. | (1,097 | ) | (414,172 | ) | 114.3 | |||||||
Dell Technologies, Inc., Class C | (2,830 | ) | (133,038 | ) | 36.7 | |||||||
Delta Air Lines, Inc. | (473 | ) | (20,353 | ) | 5.6 | |||||||
Devon Energy Corp. | (2,108 | ) | (122,622 | ) | 33.8 | |||||||
Diamondback Energy, Inc. | (1,172 | ) | (147,942 | ) | 40.8 | |||||||
DigitalOcean Holdings, Inc. | (15,064 | ) | (593,974 | ) | 164.0 | |||||||
Dillard’s, Inc., Class A | (1,326 | ) | (402,852 | ) | 111.2 | |||||||
Discover Financial Services | (364 | ) | (40,935 | ) | 11.3 | |||||||
DISH Network Corp., Class A | (31,699 | ) | (903,739 | ) | 249.5 | |||||||
Dollar General Corp. | (8,975 | ) | (2,131,832 | ) | 588.5 | |||||||
Dollar Tree, Inc. | (2,718 | ) | (441,539 | ) | 121.9 | |||||||
Douglas Emmett, Inc. | (4,277 | ) | (126,000 | ) | 34.8 | |||||||
Dover Corp. | (2,252 | ) | (300,192 | ) | 82.9 | |||||||
Dow, Inc. | (22,930 | ) | (1,524,845 | ) | 420.9 | |||||||
Doximity, Inc., Class A | (7,344 | ) | (292,805 | ) | 80.8 | |||||||
Dropbox, Inc., Class A | (28,249 | ) | (614,416 | ) | 169.6 | |||||||
DTE Energy Co. | (834 | ) | (109,287 | ) | 30.2 | |||||||
Duke Energy Corp. | (10,165 | ) | (1,119,776 | ) | 309.1 | |||||||
Dun & Bradstreet Holdings, Inc. | (101,527 | ) | (1,603,111 | ) | 442.5 | |||||||
DuPont de Nemours, Inc. | (3,410 | ) | (224,821 | ) | 62.1 | |||||||
| Security | Shares | Value | % of Basket Value | |||||||||
| United States (continued) | ||||||||||||
Dynatrace, Inc. | (4,876 | ) | $ | (187,043 | ) | 51.6 | % | |||||
Eagle Materials, Inc. | (4,455 | ) | (549,391 | ) | 151.7 | |||||||
Eastman Chemical Co. | (4,103 | ) | (421,255 | ) | 116.3 | |||||||
Edwards Lifesciences Corp. | (334 | ) | (35,331 | ) | 9.8 | |||||||
Element Solutions, Inc. | (6,102 | ) | (125,823 | ) | 34.7 | |||||||
EMCOR Group, Inc. | (536 | ) | (57,073 | ) | 15.8 | |||||||
Encompass Health Corp. | (16 | ) | (1,101 | ) | 0.3 | |||||||
Enovis Corp. | (6,706 | ) | (435,018 | ) | 120.1 | |||||||
Entegris, Inc. | (3,062 | ) | (341,076 | ) | 94.2 | |||||||
Envista Holdings Corp. | (11,670 | ) | (462,365 | ) | 127.6 | |||||||
Essent Group Ltd. | (5,354 | ) | (216,998 | ) | 59.9 | |||||||
Essex Property Trust, Inc. | (1,336 | ) | (439,905 | ) | 121.4 | |||||||
Estee Lauder Cos., Inc., Class A | (1,004 | ) | (265,116 | ) | 73.2 | |||||||
Eversource Energy | (30,490 | ) | (2,664,826 | ) | 735.6 | |||||||
Exact Sciences Corp. | (5,602 | ) | (308,390 | ) | 85.1 | |||||||
Exelon Corp. | (38 | ) | (1,778 | ) | 0.5 | |||||||
Fastenal Co. | (2,715 | ) | (150,167 | ) | 41.5 | |||||||
FedEx Corp. | (551 | ) | (109,506 | ) | 30.2 | |||||||
Fidelity National Financial, Inc. | (3,412 | ) | (135,866 | ) | 37.5 | |||||||
Fidelity National Information Services, Inc. | (2,018 | ) | (200,085 | ) | 55.2 | |||||||
Fifth Third Bancorp | (5,532 | ) | (207,616 | ) | 57.3 | |||||||
First Citizens BancShares, Inc., Class A | (493 | ) | (315,214 | ) | 87.0 | |||||||
First Interstate Bancsystem, Inc., Class A | (780 | ) | (25,366 | ) | 7.0 | |||||||
First Republic Bank | (4,389 | ) | (654,927 | ) | 180.8 | |||||||
FirstEnergy Corp. | (14,869 | ) | (643,976 | ) | 177.8 | |||||||
Fiserv, Inc. | (7,435 | ) | (728,035 | ) | 201.0 | |||||||
Five9, Inc. | (1,074 | ) | (118,247 | ) | 32.6 | |||||||
FleetCor Technologies, Inc. | (2,531 | ) | (631,535 | ) | 174.3 | |||||||
Flex Ltd. | (4,009 | ) | (66,108 | ) | 18.2 | |||||||
Flowserve Corp. | (19,044 | ) | (622,929 | ) | 172.0 | |||||||
FMC Corp. | (180 | ) | (23,857 | ) | 6.6 | |||||||
FNB Corp. | (28,898 | ) | (332,905 | ) | 91.9 | |||||||
Fortune Brands Home & Security, Inc. | (3,029 | ) | (215,816 | ) | 59.6 | |||||||
Freeport-McMoRan, Inc. | (7,322 | ) | (296,907 | ) | 82.0 | |||||||
Freshpet, Inc. | (5,157 | ) | (481,406 | ) | 132.9 | |||||||
Freshworks, Inc., Class A | (5,903 | ) | (107,258 | ) | 29.6 | |||||||
Frontier Communications Parent, Inc. | (5,490 | ) | (144,881 | ) | 40.0 | |||||||
Gaming and Leisure Properties, Inc. | (24,139 | ) | (1,071,289 | ) | 295.7 | |||||||
Generac Holdings, Inc. | (700 | ) | (153,566 | ) | 42.4 | |||||||
General Mills, Inc. | (22,052 | ) | (1,559,738 | ) | 430.6 | |||||||
General Motors Co. | (1,948 | ) | (73,849 | ) | 20.4 | |||||||
Gentex Corp. | (6,918 | ) | (203,043 | ) | 56.0 | |||||||
Genuine Parts Co. | (3,880 | ) | (504,594 | ) | 139.3 | |||||||
Gilead Sciences, Inc. | (1,946 | ) | (115,476 | ) | 31.9 | |||||||
Ginkgo Bioworks Holdings, Inc. | (51,997 | ) | (150,791 | ) | 41.6 | |||||||
Gitlab, Inc., Class A | (1,178 | ) | (56,462 | ) | 15.6 | |||||||
GoDaddy, Inc., Class A | (5,292 | ) | (427,647 | ) | 118.0 | |||||||
Goldman Sachs Group, Inc. | (1,394 | ) | (425,853 | ) | 117.6 | |||||||
GoodRx Holdings, Inc., Class A | (2,664 | ) | (36,097 | ) | 10.0 | |||||||
Graco, Inc. | (1,592 | ) | (98,736 | ) | 27.3 | |||||||
GXO Logistics, Inc. | (8,106 | ) | (479,794 | ) | 132.4 | |||||||
Hasbro, Inc. | (11,807 | ) | (1,039,724 | ) | 287.0 | |||||||
HashiCorp, Inc., Class A | (5,820 | ) | (274,006 | ) | 75.6 | |||||||
HCA Healthcare, Inc. | (2,346 | ) | (503,334 | ) | 138.9 | |||||||
Herc Holdings, Inc. | (134 | ) | (17,128 | ) | 4.7 | |||||||
Hershey Co. | (4,387 | ) | (990,453 | ) | 273.4 | |||||||
Hess Corp. | (1,333 | ) | (137,392 | ) | 37.9 | |||||||
HF Sinclair Corp. | (3,518 | ) | (133,754 | ) | 36.9 | |||||||
Hilton Grand Vacations, Inc. | (8,055 | ) | (377,216 | ) | 104.1 | |||||||
Hormel Foods Corp. | (15,716 | ) | (823,361 | ) | 227.3 | |||||||
Host Hotels & Resorts, Inc. | (9,207 | ) | (187,362 | ) | 51.7 | |||||||
Howmet Aerospace, Inc. | (60,923 | ) | (2,078,693 | ) | 573.8 | |||||||
| 66 | 2 0 2 2 BLACK ROCK ANNUAL REPORT TO SHAREHOLDERS |
Schedule of Investments (continued) April 30, 2022 | BlackRock Global Long/Short Equity Fund |
| Security | Shares | Value | % of Basket Value | |||||||||
| United States (continued) | ||||||||||||
HP, Inc. | (5,704 | ) | $ | (208,938 | ) | 57.7 | % | |||||
Hudson Pacific Properties, Inc. | (21,297 | ) | (495,794 | ) | 136.9 | |||||||
IAA, Inc. | (11,625 | ) | (426,056 | ) | 117.6 | |||||||
IAC/InterActiveCorp. | (7,911 | ) | (655,664 | ) | 181.0 | |||||||
ICU Medical, Inc. | (282 | ) | (60,345 | ) | 16.7 | |||||||
IDEX Corp. | (1,195 | ) | (226,835 | ) | 62.6 | |||||||
Inari Medical, Inc. | (5,686 | ) | (458,860 | ) | 126.7 | |||||||
Independence Realty Trust, Inc. | (12,238 | ) | (333,608 | ) | 92.1 | |||||||
Ingersoll Rand, Inc. | (4,190 | ) | (184,192 | ) | 50.8 | |||||||
Ingredion, Inc. | (6,487 | ) | (552,109 | ) | 152.4 | |||||||
Innovative Industrial Properties, Inc. | (5,040 | ) | (728,734 | ) | 201.2 | |||||||
Inspire Medical Systems, Inc. | (609 | ) | (125,308 | ) | 34.6 | |||||||
Intel Corp. | (5,957 | ) | (259,666 | ) | 71.7 | |||||||
International Business Machines Corp. | (10,303 | ) | (1,362,160 | ) | 376.0 | |||||||
International Flavors & Fragrances, Inc. | (408 | ) | (49,490 | ) | 13.7 | |||||||
International Paper Co. | (6,054 | ) | (280,179 | ) | 77.3 | |||||||
Intra-Cellular Therapies, Inc. | (671 | ) | (33,959 | ) | 9.4 | |||||||
Intuitive Surgical, Inc. | (1,921 | ) | (459,695 | ) | 126.9 | |||||||
Invesco Ltd. | (4,841 | ) | (88,978 | ) | 24.6 | |||||||
J.M. Smucker Co. | (8,241 | ) | (1,128,440 | ) | 311.5 | |||||||
Jabil, Inc. | (1,689 | ) | (97,506 | ) | 26.9 | |||||||
Jack Henry & Associates, Inc. | (2,589 | ) | (490,823 | ) | 135.5 | |||||||
Johnson & Johnson | (2,149 | ) | (387,809 | ) | 107.1 | |||||||
Juniper Networks, Inc. | (22,974 | ) | (724,141 | ) | 199.9 | |||||||
KBR, Inc. | (3,574 | ) | (175,948 | ) | 48.6 | |||||||
Kilroy Realty Corp. | (6,016 | ) | (421,120 | ) | 116.2 | |||||||
Kimberly-Clark Corp. | (3,381 | ) | (469,384 | ) | 129.6 | |||||||
Knight-Swift Transportation Holdings, Inc. | (5,145 | ) | (246,394 | ) | 68.0 | |||||||
Kraft Heinz Co. | (499 | ) | (21,272 | ) | 5.9 | |||||||
Lamb Weston Holdings, Inc. | (6,923 | ) | (457,610 | ) | 126.3 | |||||||
Lennar Corp., Class A | (2,652 | ) | (202,852 | ) | 56.0 | |||||||
Liberty Broadband Corp., Class A | (7,209 | ) | (776,121 | ) | 214.2 | |||||||
Liberty Broadband Corp., Class C | (1,906 | ) | (213,129 | ) | 58.8 | |||||||
LKQ Corp. | (22,539 | ) | (1,118,611 | ) | 308.8 | |||||||
Louisiana-Pacific Corp. | (9,339 | ) | (602,552 | ) | 166.3 | |||||||
Lucid Group, Inc. | (27,822 | ) | (503,022 | ) | 138.9 | |||||||
Luminar Technologies, Inc. | (32,586 | ) | (403,089 | ) | 111.3 | |||||||
Lyft, Inc., Class A | (13,040 | ) | (425,104 | ) | 117.3 | |||||||
LyondellBasell Industries NV, Class A | (8,896 | ) | (943,243 | ) | 260.4 | |||||||
M&T Bank Corp. | (358 | ) | (59,657 | ) | 16.5 | |||||||
Macy’s, Inc. | (15,226 | ) | (368,012 | ) | 101.6 | |||||||
Madison Square Garden Sports Corp. | (5,068 | ) | (821,574 | ) | 226.8 | |||||||
Magnolia Oil & Gas Corp., Class A | (12,613 | ) | (293,126 | ) | 80.9 | |||||||
Marathon Petroleum Corp. | (16,102 | ) | (1,405,061 | ) | 387.9 | |||||||
Maravai LifeSciences Holdings, Inc., Class A | (6,780 | ) | (208,349 | ) | 57.5 | |||||||
Markel Corp. | (222 | ) | (300,428 | ) | 82.9 | |||||||
Marqeta, Inc., Class A | (48,118 | ) | (447,497 | ) | 123.5 | |||||||
Marriott International, Inc., Class A | (1,773 | ) | (314,743 | ) | 86.9 | |||||||
Masco Corp. | (3,322 | ) | (175,036 | ) | 48.3 | |||||||
MasTec, Inc. | (146 | ) | (10,513 | ) | 2.9 | |||||||
Match Group, Inc. | (3,245 | ) | (256,842 | ) | 70.9 | |||||||
Mattel, Inc. | (3,943 | ) | (95,854 | ) | 26.5 | |||||||
Maximus, Inc. | (9,722 | ) | (708,539 | ) | 195.6 | |||||||
McCormick & Co., Inc. | (1,043 | ) | (104,895 | ) | 29.0 | |||||||
McDonald’s Corp. | (1,324 | ) | (329,888 | ) | 91.1 | |||||||
MDU Resources Group, Inc. | (39,286 | ) | (1,012,007 | ) | 279.4 | |||||||
Medpace Holdings, Inc. | (2,317 | ) | (309,482 | ) | 85.4 | |||||||
MGM Resorts International | (9,631 | ) | (395,256 | ) | 109.1 | |||||||
Middleby Corp. | (2,637 | ) | (405,808 | ) | 112.0 | |||||||
Mirati Therapeutics, Inc. | (414 | ) | (25,581 | ) | 7.1 | |||||||
MKS Instruments, Inc. | (714 | ) | (81,382 | ) | 22.5 | |||||||
Moderna, Inc. | (714 | ) | (95,969 | ) | 26.5 | |||||||
| Security | Shares | Value | % of Basket Value | |||||||||
| United States (continued) | ||||||||||||
Mohawk Industries, Inc. | (9,596 | ) | $ | (1,353,612 | ) | 373.7 | % | |||||
Molina Healthcare, Inc. | (423 | ) | (132,589 | ) | 36.6 | |||||||
Mondelez International, Inc., Class A | (44,037 | ) | (2,839,506 | ) | 783.8 | |||||||
Monster Beverage Corp. | (7,168 | ) | (614,154 | ) | 169.5 | |||||||
Morgan Stanley | (16,866 | ) | (1,359,231 | ) | 375.2 | |||||||
Motorola Solutions, Inc. | (2,419 | ) | (516,916 | ) | 142.7 | |||||||
MSC Industrial Direct Co., Inc., Class A | (10,645 | ) | (882,045 | ) | 243.5 | |||||||
Murphy Oil Corp. | (320 | ) | (12,186 | ) | 3.4 | |||||||
Nasdaq, Inc. | (549 | ) | (86,396 | ) | 23.8 | |||||||
Natera, Inc. | (2,596 | ) | (91,172 | ) | 25.2 | |||||||
National Fuel Gas Co. | (11,048 | ) | (774,796 | ) | 213.9 | |||||||
National Retail Properties, Inc. | (5,244 | ) | (229,897 | ) | 63.5 | |||||||
NCR Corp. | (977 | ) | (34,224 | ) | 9.4 | |||||||
New Residential Investment Corp. | (97,136 | ) | (1,010,214 | ) | 278.9 | |||||||
News Corp., Class A | (17,596 | ) | (349,457 | ) | 96.5 | |||||||
NextEra Energy, Inc. | (6,196 | ) | (440,040 | ) | 121.5 | |||||||
Northern Trust Corp. | (122 | ) | (12,572 | ) | 3.5 | |||||||
Novavax, Inc. | (914 | ) | (41,194 | ) | 11.4 | |||||||
Nucor Corp. | (6,789 | ) | (1,050,801 | ) | 290.1 | |||||||
Olaplex Holdings, Inc. | (28,984 | ) | (426,065 | ) | 117.6 | |||||||
Old Republic International Corp. | (29,877 | ) | (657,593 | ) | 181.5 | |||||||
Olin Corp. | (12,383 | ) | (710,784 | ) | 196.2 | |||||||
Omega Healthcare Investors, Inc. | (13,657 | ) | (347,980 | ) | 96.1 | |||||||
ON Semiconductor Corp. | (5,348 | ) | (278,684 | ) | 76.9 | |||||||
OneMain Holdings, Inc. | (227 | ) | (10,426 | ) | 2.9 | |||||||
Onto Innovation, Inc. | (1,266 | ) | (90,063 | ) | 24.9 | |||||||
Opendoor Technologies Inc. | (52,369 | ) | (366,059 | ) | 101.0 | |||||||
Organon & Co. | (13,165 | ) | (425,624 | ) | 117.5 | |||||||
Otis Worldwide Corp. | (280 | ) | (20,395 | ) | 5.6 | |||||||
Packaging Corp. of America | (7,494 | ) | (1,207,808 | ) | 333.4 | |||||||
Palantir Technologies, Inc., Class A | (70,596 | ) | (734,198 | ) | 202.7 | |||||||
Parker-Hannifin Corp. | (3,037 | ) | (822,480 | ) | 227.0 | |||||||
Paychex, Inc. | (262 | ) | (33,203 | ) | 9.2 | |||||||
PDC Energy, Inc. | (6,401 | ) | (446,406 | ) | 123.2 | |||||||
Peloton Interactive, Inc., Class A | (3,002 | ) | (52,715 | ) | 14.6 | |||||||
PepsiCo, Inc. | (10,928 | ) | (1,876,447 | ) | 518.0 | |||||||
PerkinElmer, Inc. | (3,952 | ) | (579,403 | ) | 159.9 | |||||||
Petco Health & Wellness Co., Inc. | (995 | ) | (19,164 | ) | 5.3 | |||||||
Phillips Edison & Co., Inc. | (3,432 | ) | (116,208 | ) | 32.1 | |||||||
Pinnacle West Capital Corp. | (8,740 | ) | (622,288 | ) | 171.8 | |||||||
Pinterest, Inc., Class A | (5,772 | ) | (118,441 | ) | 32.7 | |||||||
Pioneer Natural Resources Co. | (4,931 | ) | (1,146,310 | ) | 316.4 | |||||||
Polaris, Inc. | (443 | ) | (42,058 | ) | 11.6 | |||||||
Post Holdings, Inc. | (7,039 | ) | (523,631 | ) | 144.5 | |||||||
Procore Technologies, Inc. | (10,052 | ) | (557,584 | ) | 153.9 | |||||||
Procter & Gamble Co. | (11,333 | ) | (1,819,513 | ) | 502.3 | |||||||
Progressive Corp. | (108 | ) | (11,595 | ) | 3.2 | |||||||
Progyny, Inc. | (3,480 | ) | (133,806 | ) | 36.9 | |||||||
Prologis, Inc. | (2,187 | ) | (350,554 | ) | 96.8 | |||||||
Prosperity Bancshares, Inc. | (7,663 | ) | (501,007 | ) | 138.3 | |||||||
Prudential Financial, Inc. | (1,081 | ) | (117,299 | ) | 32.4 | |||||||
Pure Storage, Inc., Class A | (3,725 | ) | (109,143 | ) | 30.1 | |||||||
Q2 Holdings, Inc. | (3,959 | ) | (204,799 | ) | 56.5 | |||||||
Qualtrics International, Inc., Class A | (17,840 | ) | (330,754 | ) | 91.3 | |||||||
QuantumScape Corp. | (17,235 | ) | (257,491 | ) | 71.1 | |||||||
Quest Diagnostics, Inc. | (5,501 | ) | (736,254 | ) | 203.2 | |||||||
R1 RCM, Inc. | (21,369 | ) | (481,230 | ) | 132.8 | |||||||
Range Resources Corp. | (2,375 | ) | (71,108 | ) | 19.6 | |||||||
Raymond James Financial, Inc. | (4,595 | ) | (447,829 | ) | 123.6 | |||||||
Rayonier, Inc. | (4,145 | ) | (179,064 | ) | 49.4 | |||||||
Red Rock Resorts, Inc., Class A | (2,202 | ) | (96,800 | ) | 26.7 | |||||||
Regal Rexnord Corp. | (123 | ) | (15,651 | ) | 4.3 | |||||||
SCHEDULE OF INVESTMENTS | 67 |
Schedule of Investments (continued) April 30, 2022 | BlackRock Global Long/Short Equity Fund |
| Security | Shares | Value | % of Basket Value | |||||||||
| United States (continued) | ||||||||||||
Regions Financial Corp. | (567 | ) | $ | (11,748 | ) | 3.2 | % | |||||
Revolve Group, Inc. | (797 | ) | (33,681 | ) | 9.3 | |||||||
RH | (1,378 | ) | (463,173 | ) | 127.9 | |||||||
Robinhood Markets, Inc., Class A | (101,623 | ) | (996,414 | ) | 275.1 | |||||||
ROBLOX Corp., Class A | (5,829 | ) | (178,659 | ) | 49.3 | |||||||
Rocket Lab USA, Inc. | (81,432 | ) | (600,968 | ) | 165.9 | |||||||
Rockwell Automation, Inc. | (2,790 | ) | (704,949 | ) | 194.6 | |||||||
Rollins, Inc. | (19,185 | ) | (643,465 | ) | 177.6 | |||||||
Ross Stores, Inc. | (14,013 | ) | (1,398,077 | ) | 385.9 | |||||||
RPM International, Inc. | (7,700 | ) | (638,330 | ) | 176.2 | |||||||
Ryman Hospitality Properties, Inc. | (502 | ) | (46,927 | ) | 13.0 | |||||||
Saia, Inc. | (816 | ) | (168,063 | ) | 46.4 | |||||||
Sarepta Therapeutics, Inc. | (593 | ) | (42,886 | ) | 11.8 | |||||||
Scientific Games Corp., Class A | (4,033 | ) | (226,090 | ) | 62.4 | |||||||
Seagate Technology Holdings PLC | (9,335 | ) | (765,843 | ) | 211.4 | |||||||
SeaWorld Entertainment, Inc. | (1,195 | ) | (80,591 | ) | 22.2 | |||||||
Sempra Energy | (1,485 | ) | (239,620 | ) | 66.1 | |||||||
SentinelOne, Inc., Class A | (9,004 | ) | (299,563 | ) | 82.7 | |||||||
Sherwin-Williams Co. | (1,053 | ) | (289,533 | ) | 79.9 | |||||||
Shift4 Payments, Inc., Class A | (14,013 | ) | (735,122 | ) | 202.9 | |||||||
Shockwave Medical, Inc. | (1,200 | ) | (181,356 | ) | 50.1 | |||||||
Signature Bank | (3,095 | ) | (749,764 | ) | 207.0 | |||||||
Silvergate Capital Corp., Class A | (1,724 | ) | (201,639 | ) | 55.7 | |||||||
SiTime Corp. | (2,334 | ) | (393,442 | ) | 108.6 | |||||||
Six Flags Entertainment Corp. | (17,071 | ) | (653,307 | ) | 180.3 | |||||||
Skechers USA, Inc., Class A | (9,082 | ) | (347,841 | ) | 96.0 | |||||||
Skyworks Solutions, Inc. | (2,212 | ) | (250,620 | ) | 69.2 | |||||||
SLM Corp. | (13,375 | ) | (223,764 | ) | 61.8 | |||||||
Smartsheet, Inc., Class A | (3,287 | ) | (158,861 | ) | 43.9 | |||||||
Snowflake, Inc., Class A | (92 | ) | (15,772 | ) | 4.4 | |||||||
SoFi Technologies, Inc. | (49,223 | ) | (301,245 | ) | 83.2 | |||||||
Sonoco Products Co. | (13,688 | ) | (847,424 | ) | 233.9 | |||||||
Sonos, Inc. | (6,642 | ) | (151,570 | ) | 41.8 | |||||||
South State Corp. | (1,835 | ) | (142,102 | ) | 39.2 | |||||||
Southwest Airlines Co. | (5,106 | ) | (238,552 | ) | 65.9 | |||||||
Southwestern Energy Co. | (92,476 | ) | (693,570 | ) | 191.5 | |||||||
Spirit Realty Capital, Inc. | (15,074 | ) | (654,965 | ) | 180.8 | |||||||
Splunk, Inc. | (2,164 | ) | (264,051 | ) | 72.9 | |||||||
Sprout Social, Inc., Class A | (7,632 | ) | (467,689 | ) | 129.1 | |||||||
SS&C Technologies Holdings, Inc. | (497 | ) | (32,136 | ) | 8.9 | |||||||
STAG Industrial, Inc. | (168 | ) | (6,270 | ) | 1.7 | |||||||
Stanley Black & Decker, Inc. | (2,154 | ) | (258,803 | ) | 71.4 | |||||||
Starbucks Corp. | (6,955 | ) | (519,121 | ) | 143.3 | |||||||
Starwood Property Trust, Inc. | (39,998 | ) | (915,154 | ) | 252.6 | |||||||
Steel Dynamics, Inc. | (10,765 | ) | (923,099 | ) | 254.8 | |||||||
SVB Financial Group | (730 | ) | (355,977 | ) | 98.3 | |||||||
Synaptics, Inc. | (2,094 | ) | (310,833 | ) | 85.8 | |||||||
SYNNEX Corp. | (4,160 | ) | (416,374 | ) | 114.9 | |||||||
Synopsys, Inc. | (1,818 | ) | (521,384 | ) | 143.9 | |||||||
Synovus Financial Corp. | (5,005 | ) | (207,908 | ) | 57.4 | |||||||
T. Rowe Price Group, Inc. | (607 | ) | (74,685 | ) | 20.6 | |||||||
Tapestry, Inc. | (2,168 | ) | (71,371 | ) | 19.7 | |||||||
Target Corp. | (4,829 | ) | (1,104,151 | ) | 304.8 | |||||||
Tempur Sealy International, Inc. | (17,379 | ) | (471,145 | ) | 130.1 | |||||||
Tenet Healthcare Corp. | (468 | ) | (33,935 | ) | 9.4 | |||||||
Terreno Realty Corp. | (6,664 | ) | (484,806 | ) | 133.8 | |||||||
Texas Roadhouse, Inc. | (2,446 | ) | (201,379 | ) | 55.6 | |||||||
Thor Industries, Inc. | (5,776 | ) | (442,153 | ) | 122.1 | |||||||
T-Mobile US, Inc. | (7,210 | ) | (887,839 | ) | 245.1 | |||||||
Toast, Inc., Class A | (29,786 | ) | (554,913 | ) | 153.2 | |||||||
TopBuild Corp. | (897 | ) | (162,483 | ) | 44.9 | |||||||
Toro Co. | (8,556 | ) | (685,592 | ) | 189.3 | |||||||
| Security | Shares | Value | % of Basket Value | |||||||||
| United States (continued) | ||||||||||||
Tractor Supply Co. | (3,163 | ) | $ | (637,186 | ) | 175.9 | % | |||||
Trade Desk, Inc., Class A | (760 | ) | (44,779 | ) | 12.4 | |||||||
Tradeweb Markets, Inc., Class A | (957 | ) | (68,129 | ) | 18.8 | |||||||
TransUnion | (3,923 | ) | (343,341 | ) | 94.8 | |||||||
Trimble, Inc. | (12,087 | ) | (806,203 | ) | 222.5 | |||||||
Trupanion, Inc. | (3,171 | ) | (201,739 | ) | 55.7 | |||||||
Tyler Technologies, Inc. | (65 | ) | (25,656 | ) | 7.1 | |||||||
Tyson Foods, Inc., Class A | (20,905 | ) | (1,947,510 | ) | 537.6 | |||||||
Uber Technologies, Inc. | (23,335 | ) | (734,586 | ) | 202.8 | |||||||
UGI Corp. | (2,660 | ) | (91,238 | ) | 25.2 | |||||||
UiPath, Inc., Class A | (6,840 | ) | (121,957 | ) | 33.7 | |||||||
Umpqua Holdings Corp. | (39,711 | ) | (656,820 | ) | 181.3 | |||||||
Under Armour, Inc., Class A | (8,359 | ) | (128,394 | ) | 35.4 | |||||||
Unity Software, Inc. | (9,236 | ) | (613,363 | ) | 169.3 | |||||||
Univar Solutions, Inc. | (32,873 | ) | (957,262 | ) | 264.2 | |||||||
US Foods Holding Corp. | (3,278 | ) | (123,318 | ) | 34.0 | |||||||
Vail Resorts, Inc. | (293 | ) | (74,469 | ) | 20.6 | |||||||
Valley National Bancorp | (45,517 | ) | (545,294 | ) | 150.5 | |||||||
Valmont Industries, Inc. | (1,814 | ) | (451,341 | ) | 124.6 | |||||||
Ventas, Inc. | (10,577 | ) | (587,552 | ) | 162.2 | |||||||
Verizon Communications, Inc. | (10,056 | ) | (465,593 | ) | 128.5 | |||||||
Vertex Pharmaceuticals, Inc. | (1,311 | ) | (358,191 | ) | 98.9 | |||||||
Vertiv Holdings Co. | (17,960 | ) | (225,039 | ) | 62.1 | |||||||
VICI Properties, Inc. | (27,309 | ) | (814,081 | ) | 224.7 | |||||||
Victoria’s Secret & Co. | (7,630 | ) | (359,526 | ) | 99.2 | |||||||
Virtu Financial, Inc., Class A | (12,332 | ) | (356,148 | ) | 98.3 | |||||||
Vobile Group Ltd. | (440,000 | ) | (222,503 | ) | 61.4 | |||||||
Vontier Corp. | (8,619 | ) | (220,819 | ) | 61.0 | |||||||
Vornado Realty Trust | (11,435 | ) | (442,649 | ) | 122.2 | |||||||
Vulcan Materials Co. | (1,658 | ) | (285,657 | ) | 78.9 | |||||||
W.R. Berkley Corp. | (3,926 | ) | (261,040 | ) | 72.1 | |||||||
Walgreens Boots Alliance, Inc. | (13,504 | ) | (572,570 | ) | 158.1 | |||||||
Walmart, Inc. | (2,630 | ) | (402,364 | ) | 111.1 | |||||||
Warby Parker, Inc., Class A | (29,953 | ) | (697,605 | ) | 192.6 | |||||||
Warner Bros Discovery, Inc. | (30,689 | ) | (557,005 | ) | 153.8 | |||||||
Warner Music Group Corp., Class A | (16,319 | ) | (485,817 | ) | 134.1 | |||||||
Waste Connections, Inc. | (8,516 | ) | (1,174,953 | ) | 324.3 | |||||||
Waste Management, Inc. | (6,697 | ) | (1,101,255 | ) | 304.0 | |||||||
Wayfair, Inc., Class A | (594 | ) | (45,702 | ) | 12.6 | |||||||
Webster Financial Corp. | (14,506 | ) | (725,155 | ) | 200.2 | |||||||
Welltower, Inc. | (8,978 | ) | (815,292 | ) | 225.1 | |||||||
Wendy’s Co. | (26,991 | ) | (533,342 | ) | 147.2 | |||||||
WESCO International, Inc. | (4,639 | ) | (571,803 | ) | 157.8 | |||||||
Western Digital Corp. | (7,134 | ) | (378,601 | ) | 104.5 | |||||||
Westinghouse Air Brake Technologies Corp. | (3,400 | ) | (305,694 | ) | 84.4 | |||||||
WeWork, Inc., Class A | (18,428 | ) | (129,180 | ) | 35.7 | |||||||
Weyerhaeuser Co. | (7,687 | ) | (316,858 | ) | 87.5 | |||||||
Williams Cos., Inc. | (5,646 | ) | (193,601 | ) | 53.4 | |||||||
Williams-Sonoma, Inc. | (1,599 | ) | (208,638 | ) | 57.6 | |||||||
WillScot Mobile Mini Holdings Corp. | (817 | ) | (28,677 | ) | 7.9 | |||||||
Wingstop, Inc. | (2,043 | ) | (187,466 | ) | 51.7 | |||||||
Wolfspeed, Inc. | (2,465 | ) | (226,065 | ) | 62.4 | |||||||
Woodward, Inc. | (2,931 | ) | (323,817 | ) | 89.4 | |||||||
Workiva, Inc. | (2,263 | ) | (218,402 | ) | 60.3 | |||||||
WP Carey, Inc. | (3,221 | ) | (260,160 | ) | 71.8 | |||||||
Wyndham Hotels & Resorts, Inc. | (6,930 | ) | (609,563 | ) | 168.3 | |||||||
YETI Holdings, Inc. | (3,175 | ) | (155,162 | ) | 42.8 | |||||||
Yum! Brands, Inc. | (7,513 | ) | (879,096 | ) | 242.7 | |||||||
Zebra Technologies Corp., Class A | (488 | ) | (180,394 | ) | 49.8 | |||||||
Zillow Group, Inc., Class A | (10,782 | ) | (416,724 | ) | 115.0 | |||||||
Zillow Group, Inc., Class C | (12,802 | ) | (509,776 | ) | 140.7 | |||||||
Zimmer Biomet Holdings, Inc. | (1,098 | ) | (132,584 | ) | 36.6 | |||||||
| 68 | 2 0 2 2 BLACK ROCK ANNUAL REPORT TO SHAREHOLDERS |
Schedule of Investments (continued) April 30, 2022 | BlackRock Global Long/Short Equity Fund |
| Security | Shares | Value | % of Basket Value | |||||||||
| United States (continued) | ||||||||||||
ZoomInfo Technologies, Inc., Class A | (338 | ) | $ | (16,021 | ) | 4.4 | % | |||||
Zurn Water Solutions Corp. | (583 | ) | (18,201 | ) | 5.0 | |||||||
|
|
|
| |||||||||
| (194,077,852 | ) | |||||||||||
|
| |||||||||||
Total Reference Entity — Short |
| (347,310,748 | ) | |||||||||
|
| |||||||||||
Net Value of Reference Entity — BNP Paribas SA |
| $ | (362,256 | ) | ||||||||
|
| |||||||||||
The following table represents the individual long and short positions and related values of the equity securities underlying the total return swap with Goldman Sachs & Co. as of period end, termination dates February 27, 2023 and February 28, 2023:
| Security | Shares | Value | % of Basket Value | |||||||||
Reference Entity — Long | ||||||||||||
| Common Stocks | ||||||||||||
| Argentina | ||||||||||||
Globant SA | 486 | $ | 104,971 | (5.3 | )% | |||||||
MercadoLibre, Inc. | 203 | 197,647 | (9.9 | ) | ||||||||
|
|
|
| |||||||||
| 302,618 | ||||||||||||
| Australia | ||||||||||||
AGL Energy Ltd. | 104,577 | 635,712 | (31.8 | ) | ||||||||
AMP Ltd. | 195,832 | 158,218 | (7.9 | ) | ||||||||
Aristocrat Leisure Ltd. | 15,974 | 370,634 | (18.6 | ) | ||||||||
Aurizon Holdings Ltd. | 107,448 | 303,446 | (15.2 | ) | ||||||||
BHP Group Ltd. | 5,794 | 194,171 | (9.7 | ) | ||||||||
Boral Ltd. | 148,176 | 369,644 | (18.5 | ) | ||||||||
carsales.com Ltd. | 8,770 | 129,472 | (6.5 | ) | ||||||||
Challenger Ltd. | 25,773 | 130,400 | (6.5 | ) | ||||||||
Charter Hall Group | 33,063 | 355,341 | (17.8 | ) | ||||||||
CSR Ltd. | 35,462 | 151,869 | (7.6 | ) | ||||||||
Deterra Royalties Ltd. | 36,802 | 124,674 | (6.2 | ) | ||||||||
Domain Holdings Australia Ltd. | 12,250 | 29,833 | (1.5 | ) | ||||||||
Domino’s Pizza Enterprises Ltd. | 2,693 | 141,170 | (7.1 | ) | ||||||||
Flight Centre Travel Group Ltd. | 7,503 | 117,173 | (5.9 | ) | ||||||||
Glencore PLC | 28,847 | 177,745 | (8.9 | ) | ||||||||
Goodman Group | 18,877 | 314,187 | (15.7 | ) | ||||||||
Harvey Norman Holdings Ltd. | 30,878 | 109,989 | (5.5 | ) | ||||||||
IDP Education Ltd. | 11,269 | 209,056 | (10.5 | ) | ||||||||
IGO Ltd. | 23,939 | 217,662 | (10.9 | ) | ||||||||
Iluka Resources Ltd. | 3,295 | 25,809 | (1.3 | ) | ||||||||
Insignia Financial Ltd. | 234,028 | 562,566 | (28.2 | ) | ||||||||
JB Hi-Fi Ltd. | 2,497 | 92,480 | (4.6 | ) | ||||||||
Macquarie Group Ltd. | 1,713 | 246,609 | (12.4 | ) | ||||||||
Magellan Financial Group Ltd. | 12,642 | 143,019 | (7.2 | ) | ||||||||
Metcash Ltd. | 131,926 | 442,872 | (22.2 | ) | ||||||||
Mirvac Group | 110,740 | 187,161 | (9.4 | ) | ||||||||
Nufarm Ltd. | 24,040 | 108,149 | (5.4 | ) | ||||||||
Origin Energy Ltd. | 30,009 | 143,537 | (7.2 | ) | ||||||||
Orora Ltd. | 73,054 | 204,722 | (10.3 | ) | ||||||||
OZ Minerals Ltd. | 5,547 | 96,284 | (4.8 | ) | ||||||||
Perpetual Ltd. | 7,359 | 169,181 | (8.5 | ) | ||||||||
Pilbara Minerals Ltd. | 37,290 | 72,331 | (3.6 | ) | ||||||||
Platinum Asset Management Ltd. | 125,662 | 164,431 | (8.2 | ) | ||||||||
Pro Medicus Ltd. | 3,571 | 116,785 | (5.8 | ) | ||||||||
QBE Insurance Group Ltd. | 59,481 | 513,159 | (25.7 | ) | ||||||||
Qube Holdings Ltd. | 47,969 | 99,126 | (5.0 | ) | ||||||||
REA Group Ltd. | 1,634 | 146,387 | (7.3 | ) | ||||||||
Scentre Group | 22,326 | 46,516 | (2.3 | ) | ||||||||
| Security | Shares | Value | % of Basket Value | |||||||||
| Australia (continued) | ||||||||||||
SEEK Ltd. | 9,306 | $ | 182,355 | (9.1 | )% | |||||||
Sonic Healthcare Ltd. | 13,701 | 353,845 | (17.7 | ) | ||||||||
South32 Ltd. | 101,599 | 338,359 | (17.0 | ) | ||||||||
Star Entertainment Grp Ltd. | 102,670 | 226,765 | (11.4 | ) | ||||||||
Stockland | 230,716 | 667,791 | (33.5 | ) | ||||||||
Telstra Corp. Ltd. | 28,495 | 80,887 | (4.1 | ) | ||||||||
Wesfarmers Ltd. | 9,323 | 322,604 | (16.2 | ) | ||||||||
Westpac Banking Corp. | 19,868 | 332,590 | (16.7 | ) | ||||||||
WiseTech Global Ltd. | 255 | 7,906 | (0.4 | ) | ||||||||
Woodside Petroleum Ltd. | 904 | 19,667 | (1.0 | ) | ||||||||
|
|
|
| |||||||||
| 10,354,289 | ||||||||||||
| Austria | ||||||||||||
ANDRITZ AG | 1,500 | 63,766 | (3.2 | ) | ||||||||
Erste Group Bank AG | 2,480 | 77,217 | (3.9 | ) | ||||||||
Raiffeisen Bank International AG | 14,589 | 166,071 | (8.3 | ) | ||||||||
voestalpine AG | 599 | 15,836 | (0.8 | ) | ||||||||
|
|
|
| |||||||||
| 322,890 | ||||||||||||
| Belgium | ||||||||||||
Ackermans & van Haaren NV | 2,909 | 518,605 | (26.0 | ) | ||||||||
Azelis Group NV | 6,787 | 167,153 | (8.4 | ) | ||||||||
D’ieteren Group | 555 | 89,085 | (4.5 | ) | ||||||||
Elia Group SA | 1,485 | 236,380 | (11.8 | ) | ||||||||
Groupe Bruxelles Lambert SA | 974 | 91,907 | (4.6 | ) | ||||||||
KBC Group NV | 4,228 | 287,639 | (14.4 | ) | ||||||||
Telenet Group Holding NV | 6,108 | 182,033 | (9.1 | ) | ||||||||
Umicore SA | 7,920 | 304,472 | (15.2 | ) | ||||||||
Warehouses De Pauw CVA | 7,096 | 272,984 | (13.7 | ) | ||||||||
|
|
|
| |||||||||
| 2,150,258 | ||||||||||||
| Bermuda | ||||||||||||
Hiscox Ltd. | 7,744 | 91,954 | (4.6 | ) | ||||||||
RenaissanceRe Holdings Ltd. | 3,901 | 559,872 | (28.1 | ) | ||||||||
|
|
|
| |||||||||
| 651,826 | ||||||||||||
| Canada | ||||||||||||
Air Canada | 7,823 | 137,016 | (6.9 | ) | ||||||||
Alamos Gold Inc., Class A | 6,851 | 53,223 | (2.7 | ) | ||||||||
AltaGas Ltd. | 19,064 | 435,995 | (21.8 | ) | ||||||||
ARC Resources Ltd. | 20,999 | 291,124 | (14.6 | ) | ||||||||
Aritzia Inc. | 7,733 | 275,394 | (13.8 | ) | ||||||||
Atco Ltd., Class I | 4,007 | 142,763 | (7.2 | ) | ||||||||
B2Gold Corp. | 36,234 | 153,719 | (7.7 | ) | ||||||||
BCE, Inc. | 2,455 | 130,523 | (6.5 | ) | ||||||||
Brookfield Infrastructure Corp., Class A | 3,810 | 270,332 | (13.5 | ) | ||||||||
CAE, Inc. | 9,397 | 223,468 | (11.2 | ) | ||||||||
Canada Goose Holdings, Inc. | 12,312 | 268,032 | (13.4 | ) | ||||||||
Canadian Pacific Railway Ltd. | 4,875 | 356,598 | (17.9 | ) | ||||||||
Canadian Utilities Ltd., Class A | 2,096 | 63,011 | (3.2 | ) | ||||||||
Cargojet, Inc. | 868 | 101,411 | (5.1 | ) | ||||||||
Cenovus Energy Inc. | 43,204 | 798,735 | (40.0 | ) | ||||||||
CGI, Inc. | 7,524 | 599,976 | (30.1 | ) | ||||||||
CI Financial Corp. | 2,813 | 36,678 | (1.8 | ) | ||||||||
Crescent Point Energy Corp. | 91,317 | 632,640 | (31.7 | ) | ||||||||
Descartes Systems Group Inc. | 4,104 | 254,901 | (12.8 | ) | ||||||||
Enbridge, Inc. | 34,024 | 1,484,751 | (74.4 | ) | ||||||||
Enerplus Corp. | 13,070 | 160,138 | (8.0 | ) | ||||||||
Equinox Gold Corp. | 1,983 | 14,139 | (0.7 | ) | ||||||||
First Capital Real Estate Investment Trust | 19,736 | 263,014 | (13.2 | ) | ||||||||
FirstService Corp. | 3,335 | 415,833 | (20.8 | ) | ||||||||
Franco-Nevada Corp. | 4,368 | 660,581 | (33.1 | ) | ||||||||
George Weston Ltd. | 822 | 102,263 | (5.1 | ) | ||||||||
SCHEDULE OF INVESTMENTS | 69 |
Schedule of Investments (continued) April 30, 2022 | BlackRock Global Long/Short Equity Fund |
| Security | Shares | Value | % of Basket Value | |||||||||
| Canada (continued) | ||||||||||||
GFL Environmental, Inc. | 6,855 | $ | 206,506 | (10.3 | )% | |||||||
Hydro One Ltd. | 7,936 | 214,547 | (10.8 | ) | ||||||||
IGM Financial, Inc. | 6,499 | 205,950 | (10.3 | ) | ||||||||
Imperial Oil Ltd. | 2,831 | 142,536 | (7.1 | ) | ||||||||
Innergex Renewable Energy Inc. | 38,365 | 513,664 | (25.7 | ) | ||||||||
Ivanhoe Mines Ltd., Class A | 27,580 | 221,129 | (11.1 | ) | ||||||||
Keyera Corp. | 16,661 | 413,331 | (20.7 | ) | ||||||||
Kinaxis, Inc. | 3,686 | 407,895 | (20.4 | ) | ||||||||
Lululemon Athletica, Inc. | 1,567 | 555,705 | (27.8 | ) | ||||||||
Lundin Mining Corp. | 3,069 | 28,023 | (1.4 | ) | ||||||||
NexGen Energy Ltd. | 47,856 | 235,806 | (11.8 | ) | ||||||||
Osisko Gold Royalties Ltd. | 3,577 | 44,022 | (2.2 | ) | ||||||||
Pan American Silver Corp. | 260 | 6,446 | (0.3 | ) | ||||||||
Parex Resources, Inc. | 7,633 | 148,780 | (7.5 | ) | ||||||||
Pembina Pipeline Corp. | 13,149 | 497,546 | (24.9 | ) | ||||||||
Ritchie Bros Auctioneers, Inc. | 740 | 40,760 | (2.0 | ) | ||||||||
Shopify, Inc., Class A | 31 | 13,261 | (0.7 | ) | ||||||||
SSR Mining, Inc. | 12,579 | 276,715 | (13.9 | ) | ||||||||
Stantec, Inc. | 780 | 35,805 | (1.8 | ) | ||||||||
Summit Industrial Income REIT | 6,910 | 109,407 | (5.5 | ) | ||||||||
TC Energy Corp. | 1,604 | 84,842 | (4.3 | ) | ||||||||
Teck Resources Ltd., Class B | 17,635 | 695,708 | (34.9 | ) | ||||||||
TELUS Corp. | 22,259 | 556,887 | (27.9 | ) | ||||||||
TFI International, Inc. | 4,097 | 329,571 | (16.5 | ) | ||||||||
TMX Group Ltd. | 851 | 86,640 | (4.3 | ) | ||||||||
Turquoise Hill Resources Ltd. | 191 | 5,211 | (0.3 | ) | ||||||||
Vermilion Energy Inc. | 6,708 | 130,698 | (6.6 | ) | ||||||||
Wheaton Precious Metals Corp. | 36,012 | 1,614,114 | (80.9 | ) | ||||||||
Whitecap Resources, Inc. | 2,625 | 21,517 | (1.1 | ) | ||||||||
WSP Global, Inc. | 4,234 | 493,783 | (24.7 | ) | ||||||||
Yamana Gold, Inc. | 61,126 | 337,355 | (16.9 | ) | ||||||||
|
|
|
| |||||||||
| 17,000,418 | ||||||||||||
| China | ||||||||||||
Budweiser Brewing Co. APAC Ltd. | 229,900 | 572,036 | (28.6 | ) | ||||||||
Chow Tai Fook Jewellery Group Ltd. | 46,000 | 77,129 | (3.9 | ) | ||||||||
|
|
|
| |||||||||
| 649,165 | ||||||||||||
| Denmark | ||||||||||||
Demant A/S | 6,122 | 269,022 | (13.5 | ) | ||||||||
Genmab A/S | 219 | 77,010 | (3.9 | ) | ||||||||
GN Store Nord A/S | 389 | 14,599 | (0.7 | ) | ||||||||
H Lundbeck A/S | 3,009 | 68,961 | (3.4 | ) | ||||||||
ISS A/S | 8,885 | 145,839 | (7.3 | ) | ||||||||
Jyske Bank A/S | 8,977 | 496,375 | (24.9 | ) | ||||||||
Novo Nordisk A/S, Class B | 5,262 | 601,059 | (30.1 | ) | ||||||||
SimCorp A/S | 2,027 | 141,903 | (7.1 | ) | ||||||||
Tryg A/S | 6,302 | 149,843 | (7.5 | ) | ||||||||
|
|
|
| |||||||||
| 1,964,611 | ||||||||||||
| Finland | ||||||||||||
Kesko OYJ, B Shares | 18,609 | 468,508 | (23.5 | ) | ||||||||
Metso Outotec OYJ | 19,668 | 167,472 | (8.4 | ) | ||||||||
Nokia OYJ | 125,426 | 635,919 | (31.9 | ) | ||||||||
Nokian Renkaat OYJ | 18,639 | 250,295 | (12.5 | ) | ||||||||
Outokumpu OYJ | 60,579 | 297,398 | (14.9 | ) | ||||||||
Valmet OYJ | 592 | 15,854 | (0.8 | ) | ||||||||
Wartsila OYJ Abp | 23,388 | 187,802 | (9.4 | ) | ||||||||
|
|
|
| |||||||||
| 2,023,248 | ||||||||||||
| France | ||||||||||||
Accor SA | 9,462 | 310,861 | (15.6 | ) | ||||||||
| Security | Shares | Value | % of Basket Value | |||||||||
| France (continued) | ||||||||||||
Aeroports de Paris | 1,047 | $ | 148,098 | (7.4 | )% | |||||||
Air France-KLM | 66,319 | 273,185 | (13.7 | ) | ||||||||
Air Liquide SA | 228 | 39,446 | (2.0 | ) | ||||||||
ALD SA | 85,338 | 1,160,425 | (58.1 | ) | ||||||||
Amundi SA | 9,177 | 551,813 | (27.6 | ) | ||||||||
Arkema SA | 2,882 | 328,387 | (16.5 | ) | ||||||||
Atos SE | 20,291 | 494,320 | (24.8 | ) | ||||||||
AXA SA | 22,287 | 589,603 | (29.5 | ) | ||||||||
Capgemini SE | 982 | 199,915 | (10.0 | ) | ||||||||
Carrefour SA | 4,787 | 101,521 | (5.1 | ) | ||||||||
Cie Plastic Omnium SA | 8,127 | 131,558 | (6.6 | ) | ||||||||
Covivio | 938 | 66,802 | (3.3 | ) | ||||||||
Dassault Systemes SE | 1,157 | 51,168 | (2.6 | ) | ||||||||
Edenred | 2,610 | 131,080 | (6.6 | ) | ||||||||
Eiffage SA | 447 | 44,534 | (2.2 | ) | ||||||||
Engie SA | 89,326 | 1,054,089 | (52.8 | ) | ||||||||
Eurazeo SE | 6,772 | 520,354 | �� | (26.1 | ) | |||||||
Gecina SA | 3,078 | 346,731 | (17.4 | ) | ||||||||
Hermes International | 956 | 1,178,802 | (59.1 | ) | ||||||||
ICADE | 6,890 | 411,373 | (20.6 | ) | ||||||||
Kering SA | 1,698 | 903,459 | (45.3 | ) | ||||||||
Klepierre SA | 7,115 | 170,302 | (8.5 | ) | ||||||||
La Francaise des Jeux SAEM | 1,475 | 55,411 | (2.8 | ) | ||||||||
Legrand SA | 7,126 | 631,464 | (31.6 | ) | ||||||||
LVMH Moet Hennessy Louis Vuitton SE | 1,303 | 843,217 | (42.2 | ) | ||||||||
Orange SA | 28,690 | 341,566 | (17.1 | ) | ||||||||
Publicis Groupe SA | 2,240 | 134,482 | (6.7 | ) | ||||||||
Remy Cointreau SA | 5,433 | 1,077,004 | (54.0 | ) | ||||||||
Rubis SCA | 26,937 | 716,457 | (35.9 | ) | ||||||||
Safran SA | 271 | 29,498 | (1.5 | ) | ||||||||
Societe Generale SA | 12,760 | 306,674 | (15.4 | ) | ||||||||
Teleperformance | 1,894 | 679,778 | (34.1 | ) | ||||||||
Thales SA | 13,099 | 1,676,998 | (84.0 | ) | ||||||||
TotalEnergies SE | 14,846 | 728,983 | (36.5 | ) | ||||||||
Ubisoft Entertainment SA | 1,774 | 80,208 | (4.0 | ) | ||||||||
Valeo | 21,094 | 383,512 | (19.2 | ) | ||||||||
Vinci SA | 18,317 | 1,777,369 | (89.1 | ) | ||||||||
Wendel SE | 5,165 | 514,611 | (25.8 | ) | ||||||||
|
|
|
| |||||||||
| 19,185,058 | ||||||||||||
| Germany | ||||||||||||
1&1 AG | 5,007 | 105,514 | (5.3 | ) | ||||||||
Bayerische Motoren Werke AG | 7,094 | 579,337 | (29.0 | ) | ||||||||
Beiersdorf AG | 2,596 | 260,743 | (13.1 | ) | ||||||||
Commerzbank AG | 22,644 | 147,827 | (7.4 | ) | ||||||||
Covestro AG | 5,886 | 253,425 | (12.7 | ) | ||||||||
CTS Eventim AG & Co. KGaA | 2,834 | 194,515 | (9.7 | ) | ||||||||
Daimler AG | 7,005 | 488,957 | (24.5 | ) | ||||||||
E.ON SE | 19,956 | 207,681 | (10.4 | ) | ||||||||
Fraport AG Frankfurt Airport Services Worldwide | 1,797 | 96,030 | (4.8 | ) | ||||||||
Freenet AG | 17,636 | 487,957 | (24.5 | ) | ||||||||
GEA Group AG | 6,371 | 248,000 | (12.4 | ) | ||||||||
Hannover Rueck SE | 2,160 | 335,730 | (16.8 | ) | ||||||||
HeidelbergCement AG | 5,317 | 306,299 | (15.4 | ) | ||||||||
Hochtief AG | 11,055 | 669,031 | (33.5 | ) | ||||||||
HUGO BOSS AG | 1,158 | 64,944 | (3.3 | ) | ||||||||
Infineon Technologies AG | 5,669 | 160,904 | (8.1 | ) | ||||||||
LANXESS AG | 1,747 | 67,532 | (3.4 | ) | ||||||||
LEG Immobilien SE | 646 | 66,235 | (3.3 | ) | ||||||||
Merck KGaA | 447 | 82,931 | (4.2 | ) | ||||||||
| 70 | 2 0 2 2 BLACK ROCK ANNUAL REPORT TO SHAREHOLDERS |
Schedule of Investments (continued) April 30, 2022 | BlackRock Global Long/Short Equity Fund |
| Security | Shares | Value | % of Basket Value | |||||||||
| Germany (continued) | ||||||||||||
Muenchener Rueckversicherungs-Gesellschaft AG in Muenchen | 1,349 | $ | 321,252 | (16.1 | )% | |||||||
Nemetschek SE | 3,363 | 266,869 | (13.4 | ) | ||||||||
Nordex SE | 10,271 | 148,232 | (7.4 | ) | ||||||||
ProSiebenSat.1 Media SE | 1,565 | 18,006 | (0.9 | ) | ||||||||
Rational AG | 384 | 234,257 | (11.7 | ) | ||||||||
Rwe AG | 14,443 | 599,665 | (30.1 | ) | ||||||||
Scout24 AG | 4,324 | 273,486 | (13.7 | ) | ||||||||
Siemens AG | 1,379 | 169,555 | (8.5 | ) | ||||||||
TAG Immobilien AG | 10,574 | 211,326 | (10.6 | ) | ||||||||
Talanx AG | 7,556 | 314,176 | (15.7 | ) | ||||||||
thyssenkrupp AG | 13,415 | 104,443 | (5.2 | ) | ||||||||
Traton SE | 2,734 | 45,563 | (2.3 | ) | ||||||||
TUI AG | 29,671 | 84,592 | (4.2 | ) | ||||||||
|
|
|
| |||||||||
| 7,615,014 | ||||||||||||
| Hong Kong | ||||||||||||
AIA Group Ltd. | 103,600 | 1,017,741 | (51.0 | ) | ||||||||
ASM Pacific Technology Ltd. | 17,500 | 176,361 | (8.8 | ) | ||||||||
Bank of East Asia Ltd. | 147,600 | 218,406 | (10.9 | ) | ||||||||
Cafe de Coral Holdings Ltd. | 60,000 | 94,199 | (4.7 | ) | ||||||||
Cathay Pacific Airways Ltd. | 285,000 | 284,751 | (14.3 | ) | ||||||||
Dah Sing Banking Group Ltd. | 216,000 | 181,523 | (9.1 | ) | ||||||||
Dairy Farm International Holdings Ltd. | 50,100 | 135,312 | (6.8 | ) | ||||||||
First Pacific Co. Ltd/Hong Kong | 310,000 | 124,994 | (6.3 | ) | ||||||||
Haitong International Securities Group Ltd. | 49,000 | 7,757 | (0.4 | ) | ||||||||
Hang Lung Group Ltd. | 7,000 | 13,667 | (0.7 | ) | ||||||||
Hang Lung Properties Ltd. | 58,000 | 110,929 | (5.6 | ) | ||||||||
HK Electric Investments & HK Electric Investments Ltd., Class SS | 196,000 | 193,577 | (9.7 | ) | ||||||||
Hutchison Telecommunications Hong Kong Holdings Ltd. | 128,000 | 21,369 | (1.1 | ) | ||||||||
Hysan Development Co. Ltd. | 6,000 | 17,701 | (0.9 | ) | ||||||||
Link REIT | 61,800 | 533,815 | (26.7 | ) | ||||||||
Melco Resorts & Entertainment Ltd., ADR | 43,411 | 248,311 | (12.4 | ) | ||||||||
Pacific Basin Shipping Ltd. | 98,000 | 44,963 | (2.3 | ) | ||||||||
Shangri-La Asia Ltd. | 18,000 | 13,629 | (0.7 | ) | ||||||||
Shun Tak Holdings Ltd. | 286,000 | 57,938 | (2.9 | ) | ||||||||
SITC International Holdings Co. Ltd. | 72,000 | 239,362 | (12.0 | ) | ||||||||
SJM Holdings Ltd. | 288,000 | 120,978 | (6.1 | ) | ||||||||
Swire Pacific Ltd., Class A | 56,500 | 321,819 | (16.1 | ) | ||||||||
Swire Properties Ltd. | 112,800 | 270,332 | (13.5 | ) | ||||||||
United Energy Group Ltd. | 2,804,000 | 329,757 | (16.5 | ) | ||||||||
WH Group Ltd. | 75,000 | 51,795 | (2.6 | ) | ||||||||
Wharf Real Estate Investment Co. Ltd. | 37,000 | 174,365 | (8.7 | ) | ||||||||
Xinyi Glass Holdings Ltd. | 95,000 | 210,217 | (10.5 | ) | ||||||||
Yue Yuen Industrial Holdings Ltd. | 176,500 | 259,611 | (13.0 | ) | ||||||||
|
|
|
| |||||||||
| 5,475,179 | ||||||||||||
| Ireland | ||||||||||||
Accenture PLC, Class A | 166 | 49,860 | (2.5 | ) | ||||||||
Adient PLC | 17,732 | 605,370 | (30.3 | ) | ||||||||
Alkermes PLC | 12,103 | 349,171 | (17.5 | ) | ||||||||
Aptiv PLC | 4,485 | 477,204 | (23.9 | ) | ||||||||
Experian PLC | 20,381 | 703,845 | (35.3 | ) | ||||||||
Glanbia PLC | 13,997 | 168,039 | (8.4 | ) | ||||||||
Icon PLC | 1,177 | 266,249 | (13.3 | ) | ||||||||
James Hardie Industries PLC | 1,446 | 41,686 | (2.1 | ) | ||||||||
Jazz Pharmaceuticals PLC | 1,712 | 274,297 | (13.7 | ) | ||||||||
Kerry Group PLC, Class A | 9,648 | 1,068,707 | (53.6 | ) | ||||||||
| Security | Shares | Value | % of Basket Value | |||||||||
| Ireland (continued) | ||||||||||||
Kingspan Group PLC | 3,680 | $ | 342,560 | (17.2 | )% | |||||||
Medtronic PLC | 4,634 | 483,604 | (24.2 | ) | ||||||||
Trane Technologies PLC | 4,238 | 592,854 | (29.7 | ) | ||||||||
|
|
|
| |||||||||
| 5,423,446 | ||||||||||||
| Israel | ||||||||||||
Airport City Ltd. | 2,114 | 47,063 | (2.4 | ) | ||||||||
Alony Hetz Properties & Investments Ltd. | 3,396 | 55,580 | (2.8 | ) | ||||||||
Amot Investments Ltd. | 26,459 | 200,845 | (10.1 | ) | ||||||||
Bank Hapoalim BM | 29,182 | 270,552 | (13.6 | ) | ||||||||
Bank Leumi Le-Israel BM | 40,146 | 421,322 | (21.1 | ) | ||||||||
Bayside Land Corp. | 7,600 | 83,648 | (4.2 | ) | ||||||||
Bezeq The Israeli Telecommunication Corp. Ltd. | 559,577 | 887,090 | (44.4 | ) | ||||||||
Big Shopping Centers Ltd. | 462 | 69,817 | (3.5 | ) | ||||||||
Check Point Software Technologies Ltd. | 3,123 | 394,404 | (19.8 | ) | ||||||||
CyberArk Software Ltd. | 386 | 60,656 | (3.0 | ) | ||||||||
Elbit Systems Ltd. | 333 | 72,284 | (3.6 | ) | ||||||||
Enlight Renewable Energy Ltd. | 53,456 | 114,687 | (5.7 | ) | ||||||||
Fattal Holdings 1998 Ltd. | 211 | 30,433 | (1.5 | ) | ||||||||
Harel Insurance Investments & Financial Services Ltd. | 5,946 | 72,880 | (3.7 | ) | ||||||||
Israel Corp. Ltd. | 225 | 126,420 | (6.3 | ) | ||||||||
Israel Discount Bank Ltd., Class A | 181,753 | 1,073,513 | (53.8 | ) | ||||||||
Melisron Ltd. | 1,532 | 124,271 | (6.2 | ) | ||||||||
Mizrahi Tefahot Bank Ltd. | 8,280 | 306,274 | (15.3 | ) | ||||||||
Nova Measuring Instruments Ltd. | 3,165 | 312,101 | (15.6 | ) | ||||||||
OPC Energy Ltd. | 9,861 | 108,465 | (5.4 | ) | ||||||||
Phoenix Holdings Ltd. | 16,939 | 213,100 | (10.7 | ) | ||||||||
SolarEdge Technologies, Inc. | 452 | 113,185 | (5.7 | ) | ||||||||
Teva Pharmaceutical Industries Ltd., ADR | 70,238 | 611,773 | (30.7 | ) | ||||||||
|
|
|
| |||||||||
| 5,770,363 | ||||||||||||
| Italy | ||||||||||||
A2A SpA | 92,941 | 158,795 | (8.0 | ) | ||||||||
Amplifon SpA | 1,258 | 50,188 | (2.5 | ) | ||||||||
Assicurazioni Generali SpA | 20,983 | 397,273 | (19.9 | ) | ||||||||
Atlantia SpA | 22,707 | 541,688 | (27.1 | ) | ||||||||
Azimut Holding SpA | 6,053 | 128,480 | (6.4 | ) | ||||||||
Banca Generali SpA | 3,729 | 123,285 | (6.2 | ) | ||||||||
Banca Mediolanum SpA | 30,582 | 222,005 | (11.1 | ) | ||||||||
BPER Banca | 504,084 | 842,121 | (42.2 | ) | ||||||||
Buzzi Unicem SpA | 6,119 | 113,316 | (5.7 | ) | ||||||||
Davide Campari-Milano NV | 71,219 | 803,577 | (40.3 | ) | ||||||||
De’ Longhi SpA | 1,059 | 25,680 | (1.3 | ) | ||||||||
Enel SpA | 221,521 | 1,440,527 | (72.2 | ) | ||||||||
Hera SpA | 66,151 | 246,716 | (12.4 | ) | ||||||||
Interpump Group SpA | 2,918 | 117,974 | (5.9 | ) | ||||||||
Italgas SpA | 19,781 | 128,075 | (6.4 | ) | ||||||||
Leonardo SpA | 2,025 | 20,840 | (1.0 | ) | ||||||||
Mediobanca Banca di Credito Finanziario SpA | 28,776 | 288,417 | (14.5 | ) | ||||||||
Moncler SpA | 3,251 | 169,357 | (8.5 | ) | ||||||||
PRADA SpA | 181,700 | 1,130,562 | (56.6 | ) | ||||||||
Reply SpA | 4,107 | 604,621 | (30.3 | ) | ||||||||
UnipolSai Assicurazioni SpA | 48,937 | 137,652 | (6.9 | ) | ||||||||
|
|
|
| |||||||||
| 7,691,149 | ||||||||||||
| Japan | ||||||||||||
ABC-Mart, Inc. | 2,000 | 82,940 | (4.2 | ) | ||||||||
Acom Co. Ltd. | 65,500 | 168,448 | (8.4 | ) | ||||||||
Activia Properties, Inc. | 56 | 178,949 | (9.0 | ) | ||||||||
Advantest Corp. | 9,300 | 634,707 | (31.8 | ) | ||||||||
SCHEDULE OF INVESTMENTS | 71 |
Schedule of Investments (continued) April 30, 2022 | BlackRock Global Long/Short Equity Fund |
| Security | Shares | Value | % of Basket Value | |||||||||
| Japan (continued) | ||||||||||||
AEON Financial Service Co. Ltd. | 15,200 | $ | 139,740 | (7.0 | )% | |||||||
Aica Kogyo Co. Ltd. | 1,700 | 39,352 | (2.0 | ) | ||||||||
Ajinomoto Co., Inc. | 4,300 | 111,721 | (5.6 | ) | ||||||||
Alfresa Holdings Corp. | 18,900 | 257,015 | (12.9 | ) | ||||||||
Amada Co. Ltd. | 70,900 | 550,536 | (27.6 | ) | ||||||||
Amano Corp. | 3,800 | 73,154 | (3.7 | ) | ||||||||
Anritsu Corp. | 25,800 | 324,422 | (16.3 | ) | ||||||||
Aozora Bank Ltd. | 9,000 | 180,185 | (9.0 | ) | ||||||||
As One Corp. | 1,000 | 53,093 | (2.7 | ) | ||||||||
Asahi Group Holdings Ltd. | 28,800 | 1,085,553 | (54.4 | ) | ||||||||
Astellas Pharma, Inc. | 14,400 | 219,250 | (11.0 | ) | ||||||||
Azbil Corp. | 4,100 | 124,485 | (6.2 | ) | ||||||||
Bandai Namco Holdings, Inc. | 1,100 | 74,473 | (3.7 | ) | ||||||||
Benesse Holdings, Inc. | 21,900 | 383,182 | (19.2 | ) | ||||||||
Calbee, Inc. | 35,200 | 630,516 | (31.6 | ) | ||||||||
Capcom Co. Ltd. | 6,300 | 166,239 | (8.3 | ) | ||||||||
Casio Computer Co. Ltd. | 12,100 | 125,475 | (6.3 | ) | ||||||||
Chubu Electric Power Co., Inc. | 8,700 | 87,827 | (4.4 | ) | ||||||||
Chugai Pharmaceutical Co. Ltd. | 5,200 | 155,819 | (7.8 | ) | ||||||||
Chugoku Bank Ltd. | 10,000 | 73,536 | (3.7 | ) | ||||||||
Chugoku Electric Power Co., Inc. | 32,400 | 213,403 | (10.7 | ) | ||||||||
Coca-Cola Bottlers Japan Holdings, Inc. | 34,600 | 387,882 | (19.4 | ) | ||||||||
COMSYS Holdings Corp. | 37,400 | 776,506 | (38.9 | ) | ||||||||
Cosmo Energy Holdings Co. Ltd. | 5,500 | 136,644 | (6.8 | ) | ||||||||
Cosmos Pharmaceutical Corp. | 2,500 | 230,469 | (11.5 | ) | ||||||||
Daifuku Co. Ltd. | 5,600 | 344,336 | (17.2 | ) | ||||||||
Daiichi Sankyo Co. Ltd. | 12,700 | 319,772 | (16.0 | ) | ||||||||
Daikin Industries Ltd. | 1,300 | 198,663 | (9.9 | ) | ||||||||
Daito Trust Construction Co. Ltd. | 600 | 57,787 | (2.9 | ) | ||||||||
Daiwa House Industry Co. Ltd. | 8,900 | 213,958 | (10.7 | ) | ||||||||
Dentsu Group, Inc. | 16,100 | 580,271 | (29.1 | ) | ||||||||
DMG Mori Co. Ltd. | 53,700 | 673,955 | (33.8 | ) | ||||||||
Ebara Corp. | 7,600 | 349,048 | (17.5 | ) | ||||||||
Eisai Co. Ltd. | 5,000 | 217,755 | (10.9 | ) | ||||||||
Electric Power Development Co. Ltd. | 2,300 | 31,516 | (1.6 | ) | ||||||||
FP Corp. | 11,000 | 248,790 | (12.5 | ) | ||||||||
FUJIFILM Holdings Corp. | 8,100 | 445,267 | (22.3 | )�� | ||||||||
Fujitsu Ltd. | 500 | 75,575 | (3.8 | ) | ||||||||
Furukawa Electric Co. Ltd. | 12,700 | 206,236 | (10.3 | ) | ||||||||
GMO Payment Gateway, Inc. | 2,800 | 234,920 | (11.8 | ) | ||||||||
H.U. Group Holdings, Inc. | 14,600 | 325,324 | (16.3 | ) | ||||||||
Hamamatsu Photonics KK | 1,700 | 76,063 | (3.8 | ) | ||||||||
Hirose Electric Co. Ltd. | 1,000 | 126,874 | (6.4 | ) | ||||||||
Hisamitsu Pharmaceutical Co., Inc. | 13,400 | 367,116 | (18.4 | ) | ||||||||
Hitachi Construction Machinery Co. Ltd. | 15,300 | 346,413 | (17.4 | ) | ||||||||
Honda Motor Co. Ltd. | 10,600 | 278,818 | (14.0 | ) | ||||||||
Hoshizaki Corp. | 2,000 | 126,685 | (6.3 | ) | ||||||||
Hulic Co. Ltd. | 26,000 | 219,528 | (11.0 | ) | ||||||||
IHI Corp. | 4,700 | 106,571 | (5.3 | ) | ||||||||
Information Services International-Dentsu Ltd. | 3,700 | 106,257 | (5.3 | ) | ||||||||
Internet Initiative Japan, Inc. | 3,200 | 99,876 | (5.0 | ) | ||||||||
ITOCHU Corp. | 800 | 24,145 | (1.2 | ) | ||||||||
Itochu Techno-Solutions Corp. | 7,800 | 182,643 | (9.1 | ) | ||||||||
Izumi Co. Ltd. | 2,700 | 58,681 | (2.9 | ) | ||||||||
J Front Retailing Co. Ltd. | 10,800 | 80,931 | (4.1 | ) | ||||||||
Japan Post Bank Co. Ltd. | 46,700 | 352,318 | (17.6 | ) | ||||||||
Japan Prime Realty Investment Corp. | 81 | 245,734 | (12.3 | ) | ||||||||
Japan Tobacco, Inc. | 107,000 | 1,820,261 | (91.2 | ) | ||||||||
JGC Holdings Corp. | 16,900 | 191,244 | (9.6 | ) | ||||||||
Kakaku.com, Inc. | 5,200 | 108,897 | (5.5 | ) | ||||||||
Kamigumi Co. Ltd. | 23,600 | 400,702 | (20.1 | ) | ||||||||
Kandenko Co. Ltd. | 18,500 | 117,320 | (5.9 | ) | ||||||||
| Security | Shares | Value | % of Basket Value | |||||||||
| Japan (continued) | ||||||||||||
Kansai Paint Co. Ltd. | 20,500 | $ | 282,324 | (14.1 | )% | |||||||
Kao Corp. | 10,300 | 412,808 | (20.7 | ) | ||||||||
Kawasaki Kisen Kaisha Ltd. | 3,500 | 182,987 | (9.2 | ) | ||||||||
Keisei Electric Railway Co. Ltd. | 5,300 | 129,953 | (6.5 | ) | ||||||||
Kewpie Corp. | 12,000 | 202,101 | (10.1 | ) | ||||||||
Keyence Corp. | 1,100 | 442,205 | (22.2 | ) | ||||||||
Kikkoman Corp. | 1,200 | 67,441 | (3.4 | ) | ||||||||
Kintetsu Group Holdings Co. Ltd. | 11,000 | 315,384 | (15.8 | ) | ||||||||
Kobe Bussan Co. Ltd. | 3,000 | 73,138 | (3.7 | ) | ||||||||
Koito Manufacturing Co. Ltd. | 7,300 | 267,870 | (13.4 | ) | ||||||||
Kokuyo Co. Ltd. | 23,400 | 304,766 | (15.3 | ) | ||||||||
Konami Holdings Corp. | 800 | 49,195 | (2.5 | ) | ||||||||
Konica Minolta, Inc. | 20,100 | 69,954 | (3.5 | ) | ||||||||
Kuraray Co. Ltd. | 131,300 | 1,050,103 | (52.6 | ) | ||||||||
Kusuri no Aoki Holdings Co. Ltd. | 4,300 | 190,508 | (9.5 | ) | ||||||||
Kyocera Corp. | 7,800 | 409,554 | (20.5 | ) | ||||||||
Kyowa Exeo Corp. | 8,200 | 136,512 | (6.8 | ) | ||||||||
Kyowa Kirin Co. Ltd. | 10,700 | 225,521 | (11.3 | ) | ||||||||
Kyudenko Corp. | 10,700 | 242,653 | (12.2 | ) | ||||||||
Lawson, Inc. | 38,300 | 1,408,681 | (70.6 | ) | ||||||||
Lion Corp. | 14,700 | 151,460 | (7.6 | ) | ||||||||
Lixil Corp. | 14,600 | 256,789 | (12.9 | ) | ||||||||
Mani Inc. | 21,600 | 246,672 | (12.4 | ) | ||||||||
Marubeni Corp. | 6,400 | 69,860 | (3.5 | ) | ||||||||
Maruwa Unyu Kikan Co. Ltd. | 10,900 | 127,258 | (6.4 | ) | ||||||||
MISUMI Group, Inc. | 300 | 7,522 | (0.4 | ) | ||||||||
Mitsubishi Chemical Holdings Corp. | 94,800 | 578,056 | (29.0 | ) | ||||||||
Mitsubishi Corp. | 3,900 | 130,945 | (6.6 | ) | ||||||||
Mitsubishi HC Capital, Inc. | 60,900 | 274,018 | (13.7 | ) | ||||||||
Mitsubishi Logistics Corp. | 12,500 | 288,094 | (14.4 | ) | ||||||||
Mitsubishi Materials Corp. | 1,200 | 18,772 | (0.9 | ) | ||||||||
Mitsui & Co. Ltd. | 1,900 | 46,010 | (2.3 | ) | ||||||||
Mitsui Chemicals, Inc. | 5,900 | 134,803 | (6.8 | ) | ||||||||
Mitsui Fudosan Co. Ltd. | 1,900 | 40,268 | (2.0 | ) | ||||||||
Mitsui Mining & Smelting Co. Ltd. | 2,700 | 68,271 | (3.4 | ) | ||||||||
Mizuho Financial Group, Inc. | 900 | 10,928 | (0.5 | ) | ||||||||
MS&AD Insurance Group Holdings, Inc. | 38,300 | 1,140,086 | (57.1 | ) | ||||||||
Murata Manufacturing Co. Ltd. | 6,400 | 381,488 | (19.1 | ) | ||||||||
Nagoya Railroad Co. Ltd. | 8,800 | 141,338 | (7.1 | ) | ||||||||
Nankai Electric Railway Co. Ltd. | 15,000 | 267,792 | (13.4 | ) | ||||||||
NEC Corp. | 15,500 | 601,336 | (30.1 | ) | ||||||||
NET One Systems Co. Ltd. | 6,700 | 159,881 | (8.0 | ) | ||||||||
Nichirei Corp. | 12,200 | 223,998 | (11.2 | ) | ||||||||
Nihon Kohden Corp. | 17,800 | 427,309 | (21.4 | ) | ||||||||
Nihon M&A Center Holdings, Inc. | 7,400 | 91,122 | (4.6 | ) | ||||||||
Nikon Corp. | 36,700 | 412,391 | (20.7 | ) | ||||||||
Nippon Express Holdings, Inc. | 3,300 | 193,481 | (9.7 | ) | ||||||||
Nippon Telegraph & Telephone Corp. | 7,800 | 229,861 | (11.5 | ) | ||||||||
Nippon Television Holdings, Inc. | 121,200 | 1,163,303 | (58.3 | ) | ||||||||
Nippon Yusen KK | 1,400 | 101,002 | (5.1 | ) | ||||||||
Nipro Corp. | 16,800 | 132,378 | (6.6 | ) | ||||||||
Nissan Chemical Corp. | 3,100 | 163,750 | (8.2 | ) | ||||||||
Nissan Motor Co. Ltd. | 82,900 | 331,894 | (16.6 | ) | ||||||||
Nissin Foods Holdings Co. Ltd. | 6,400 | 445,200 | (22.3 | ) | ||||||||
Nitori Holdings Co. Ltd. | 900 | 92,591 | (4.6 | ) | ||||||||
Nitto Denko Corp. | 5,400 | 362,453 | (18.2 | ) | ||||||||
NOK Corp. | 22,900 | 194,839 | (9.8 | ) | ||||||||
Nomura Real Estate Holdings, Inc. | 11,600 | 282,643 | (14.2 | ) | ||||||||
Nomura Research Institute Ltd. | 4,400 | 124,416 | (6.2 | ) | ||||||||
NSK Ltd. | 41,000 | 226,883 | (11.4 | ) | ||||||||
NTT Data Corp. | 6,600 | 121,690 | (6.1 | ) | ||||||||
Obayashi Corp. | 106,700 | 733,791 | (36.8 | ) | ||||||||
| 72 | 2 0 2 2 BLACK ROCK ANNUAL REPORT TO SHAREHOLDERS |
Schedule of Investments (continued) April 30, 2022 | BlackRock Global Long/Short Equity Fund |
| Security | Shares | Value | % of Basket Value | |||||||||
| Japan (continued) | ||||||||||||
OBIC Business Consultants Co. Ltd. | 2,500 | $ | 89,855 | (4.5 | )% | |||||||
Obic Co. Ltd. | 1,100 | 162,513 | (8.1 | ) | ||||||||
Omron Corp. | 21,600 | 1,273,408 | (63.8 | ) | ||||||||
Otsuka Corp. | 2,600 | 85,207 | (4.3 | ) | ||||||||
Otsuka Holdings Co. Ltd. | 4,600 | 154,571 | (7.7 | ) | ||||||||
PALTAC Corp. | 2,200 | 80,186 | (4.0 | ) | ||||||||
Panasonic Corp. | 4,700 | 41,892 | (2.1 | ) | ||||||||
Penta-Ocean Construction Co. Ltd. | 27,300 | 133,578 | (6.7 | ) | ||||||||
PeptiDream, Inc. | 8,000 | 129,031 | (6.5 | ) | ||||||||
Pigeon Corp. | 4,700 | 80,159 | (4.0 | ) | ||||||||
Pola Orbis Holdings, Inc. | 7,200 | 83,010 | (4.2 | ) | ||||||||
Relo Group, Inc. | 5,300 | 75,708 | (3.8 | ) | ||||||||
Resorttrust, Inc. | 12,100 | 203,565 | (10.2 | ) | ||||||||
Ricoh Co. Ltd. | 37,000 | 270,171 | (13.5 | ) | ||||||||
Rinnai Corp. | 4,600 | 294,029 | (14.7 | ) | ||||||||
Ryohin Keikaku Co. Ltd. | 7,200 | 64,707 | (3.2 | ) | ||||||||
Sankyu Inc. | 12,400 | 378,064 | (18.9 | ) | ||||||||
Santen Pharmaceutical Co. Ltd. | 37,200 | 302,610 | (15.2 | ) | ||||||||
Sapporo Holdings Ltd. | 28,100 | 584,876 | (29.3 | ) | ||||||||
Sawai Group Holdings Co. Ltd. | 3,600 | 120,761 | (6.0 | ) | ||||||||
SBI Holdings, Inc. | 35,900 | 802,979 | (40.2 | ) | ||||||||
SCSK Corp. | 9,200 | 146,264 | (7.3 | ) | ||||||||
Sega Sammy Holdings, Inc. | 1,100 | 19,492 | (1.0 | ) | ||||||||
Seiko Epson Corp. | 48,500 | 683,245 | (34.2 | ) | ||||||||
Seino Holdings Co Ltd. | 20,500 | 167,464 | (8.4 | ) | ||||||||
Sekisui House Ltd. | 20,700 | 359,516 | (18.0 | ) | ||||||||
Sekisui House REIT, Inc. | 272 | 159,161 | (8.0 | ) | ||||||||
SG Holdings Co. Ltd. | 25,000 | 440,567 | (22.1 | ) | ||||||||
Shimadzu Corp. | 6,200 | 202,691 | (10.2 | ) | ||||||||
Shimizu Corp. | 71,400 | 374,396 | (18.8 | ) | ||||||||
Shin-Etsu Chemical Co. Ltd. | 4,100 | 563,481 | (28.2 | ) | ||||||||
Shionogi & Co. Ltd. | 4,000 | 222,504 | (11.1 | ) | ||||||||
Skylark Co. Ltd. | 41,100 | 487,680 | (24.4 | ) | ||||||||
SMS Co. Ltd. | 1,000 | 23,469 | (1.2 | ) | ||||||||
Softbank Corp. | 7,500 | 87,284 | (4.4 | ) | ||||||||
SoftBank Group Corp. | 4,100 | 168,634 | (8.4 | ) | ||||||||
Sony Group Corp. | 6,500 | 560,957 | (28.1 | ) | ||||||||
Sotetsu Holdings Inc. | 7,900 | 135,430 | (6.8 | ) | ||||||||
Square Enix Holdings Co. Ltd. | 2,300 | 91,829 | (4.6 | ) | ||||||||
Subaru Corp. | 15,200 | 230,655 | (11.6 | ) | ||||||||
Sumitomo Chemical Co. Ltd. | 293,900 | 1,249,723 | (62.6 | ) | ||||||||
Sumitomo Corp. | 4,500 | 71,206 | (3.6 | ) | ||||||||
Sumitomo Dainippon Pharma Co. Ltd. | 4,500 | 40,084 | (2.0 | ) | ||||||||
Sumitomo Forestry Co. Ltd. | 5,600 | 85,673 | (4.3 | ) | ||||||||
Sumitomo Heavy Industries Ltd. | 3,100 | 65,600 | (3.3 | ) | ||||||||
Sumitomo Mitsui Financial Group, Inc. | 13,800 | 416,952 | (20.9 | ) | ||||||||
Sumitomo Mitsui Trust Holdings, Inc. | 1,700 | 52,764 | (2.6 | ) | ||||||||
Sumitomo Rubber Industries Ltd. | 10,900 | 94,479 | (4.7 | ) | ||||||||
Sundrug Co. Ltd. | 13,100 | 304,995 | (15.3 | ) | ||||||||
Suntory Beverage & Food Ltd. | 37,700 | 1,485,418 | (74.4 | ) | ||||||||
Suzuki Motor Corp. | 11,300 | 340,640 | (17.1 | ) | ||||||||
Taiheiyo Cement Corp. | 20,300 | 328,445 | (16.5 | ) | ||||||||
Taisei Corp. | 38,400 | 1,040,179 | (52.1 | ) | ||||||||
Takara Bio Inc. | 8,500 | 136,713 | (6.8 | ) | ||||||||
Takashimaya Co. Ltd. | 11,500 | 104,894 | (5.3 | ) | ||||||||
Takeda Pharmaceutical Co. Ltd. | 9,200 | 266,952 | (13.4 | ) | ||||||||
TBS Holdings, Inc. | 1,200 | 15,747 | (0.8 | ) | ||||||||
Teijin Ltd. | 11,700 | 125,029 | (6.3 | ) | ||||||||
Terumo Corp. | 12,000 | 357,182 | (17.9 | ) | ||||||||
TIS, Inc. | 7,900 | 177,429 | (8.9 | ) | ||||||||
| Security | Shares | Value | % of Basket Value | |||||||||
| Japan (continued) | ||||||||||||
Tohoku Electric Power Co., Inc. | 13,700 | $ | 76,207 | (3.8 | )% | |||||||
Tokyo Electron Ltd. | 1,100 | 464,141 | (23.3 | ) | ||||||||
Tokyo Gas Co. Ltd. | 22,900 | 438,637 | (22.0 | ) | ||||||||
Tokyo Ohka Kogyo Co. Ltd. | 3,400 | 184,743 | (9.3 | ) | ||||||||
Toray Industries, Inc. | 35,000 | 165,875 | (8.3 | ) | ||||||||
Tosoh Corp. | 15,500 | 214,032 | (10.7 | ) | ||||||||
TOTO Ltd. | 900 | 30,329 | (1.5 | ) | ||||||||
Toyo Seikan Group Holdings Ltd. | 17,100 | 184,960 | (9.3 | ) | ||||||||
Toyo Suisan Kaisha Ltd. | 10,100 | 311,851 | (15.6 | ) | ||||||||
Toyota Tsusho Corp. | 6,100 | 219,156 | (11.0 | ) | ||||||||
Trend Micro, Inc. | 21,300 | 1,187,622 | (59.5 | ) | ||||||||
Tsumura & Co. | 3,300 | 81,196 | (4.1 | ) | ||||||||
Tsuruha Holdings, Inc. | 6,100 | 311,759 | (15.6 | ) | ||||||||
Unicharm Corp. | 19,700 | 685,402 | (34.3 | ) | ||||||||
Ushio, Inc. | 2,600 | 33,711 | (1.7 | ) | ||||||||
Welcia Holdings Co. Ltd. | 1,900 | 38,948 | (1.9 | ) | ||||||||
Yakult Honsha Co. Ltd. | 2,200 | 113,917 | (5.7 | ) | ||||||||
Yamada Holdings Co. Ltd. | 139,400 | 416,260 | (20.9 | ) | ||||||||
Yamaguchi Financial Group, Inc. | 19,400 | 106,373 | (5.3 | ) | ||||||||
Yamaha Corp. | 16,500 | 630,415 | (31.6 | ) | ||||||||
Yamaha Motor Co. Ltd. | 1,700 | 35,098 | (1.8 | ) | ||||||||
Yaoko Co. Ltd. | 6,900 | 365,028 | (18.3 | ) | ||||||||
Yaskawa Electric Corp. | 1,600 | 54,329 | (2.7 | ) | ||||||||
Yokohama Rubber Co. Ltd. | 19,400 | 259,739 | (13.0 | ) | ||||||||
Z Holdings Corp. | 58,000 | 227,699 | (11.4 | ) | ||||||||
Zensho Holdings Co. Ltd. | 4,400 | 103,762 | (5.2 | ) | ||||||||
ZOZO, Inc. | 4,300 | 90,031 | (4.5 | ) | ||||||||
|
|
|
| |||||||||
| 59,612,994 | ||||||||||||
| Jordan | ||||||||||||
Hikma Pharmaceuticals PLC | 30,649 | 719,958 | (36.1 | ) | ||||||||
|
|
|
| |||||||||
| Luxembourg | ||||||||||||
Aroundtown SA | 29,714 | 149,418 | (7.5 | ) | ||||||||
Majorel Group Luxembourg SA | 24,918 | 787,303 | (39.4 | ) | ||||||||
RTL Group SA | 6,143 | 319,420 | (16.0 | ) | ||||||||
|
|
|
| |||||||||
| 1,256,141 | ||||||||||||
| Macau | ||||||||||||
Wynn Macau Ltd. | 59,600 | 36,608 | (1.8 | ) | ||||||||
|
|
|
| |||||||||
| Mexico | ||||||||||||
Fresnillo PLC | 755 | 7,305 | (0.4 | ) | ||||||||
|
|
|
| |||||||||
| Netherlands | ||||||||||||
ABN AMRO Bank NV | 29,333 | 364,643 | (18.3 | ) | ||||||||
ASR Nederland NV | 3,586 | 162,979 | (8.2 | ) | ||||||||
CTP NV | 1,615 | 22,866 | (1.1 | ) | ||||||||
Heineken Holding NV | 76 | 5,933 | (0.3 | ) | ||||||||
Heineken NV | 4,952 | 483,369 | (24.2 | ) | ||||||||
IMCD NV | 3,294 | 524,479 | (26.3 | ) | ||||||||
ING Groep NV | 29,472 | 279,224 | (14.0 | ) | ||||||||
Koninklijke Ahold Delhaize NV | 4,137 | 122,025 | (6.1 | ) | ||||||||
Koninklijke Vopak NV | 14,145 | 380,355 | (19.1 | ) | ||||||||
OCI NV | 7,497 | 284,080 | (14.2 | ) | ||||||||
PostNL NV | 81,752 | 267,882 | (13.4 | ) | ||||||||
Randstad NV | 15,614 | 825,655 | (41.4 | ) | ||||||||
Wolters Kluwer NV | 15,728 | 1,588,257 | (79.6 | ) | ||||||||
|
|
|
| |||||||||
| 5,311,747 | ||||||||||||
| New Zealand | ||||||||||||
a2 Milk Co. Ltd. | 35,861 | 111,389 | (5.6 | ) | ||||||||
Air New Zealand Ltd. | 85,618 | 48,591 | (2.4 | ) | ||||||||
SCHEDULE OF INVESTMENTS | 73 |
Schedule of Investments (continued) April 30, 2022 | BlackRock Global Long/Short Equity Fund |
| Security | Shares | Value | % of Basket Value | |||||||||
| New Zealand (continued) | ||||||||||||
Fisher & Paykel Healthcare Corp. Ltd. | 8,596 | $ | 118,127 | (5.9 | )% | |||||||
Infratil Ltd. | 62,942 | 340,620 | (17.1 | ) | ||||||||
Xero Ltd. | 1,704 | 112,365 | (5.6 | ) | ||||||||
|
|
|
| |||||||||
| 731,092 | ||||||||||||
| Norway | ||||||||||||
Adevinta ASA | 2,819 | 21,778 | (1.1 | ) | ||||||||
Aker BP ASA | 12,883 | 461,583 | (23.1 | ) | ||||||||
DNB Bank ASA | 8,452 | 163,777 | (8.2 | ) | ||||||||
Equinor ASA | 12,043 | 407,048 | (20.4 | ) | ||||||||
Nordic Semiconductor ASA | 8,042 | 159,885 | (8.0 | ) | ||||||||
Schibsted ASA, Class A | 13,626 | 283,951 | (14.2 | ) | ||||||||
Telenor ASA | 81,129 | 1,144,200 | (57.4 | ) | ||||||||
|
|
|
| |||||||||
| 2,642,222 | ||||||||||||
| Portugal | ||||||||||||
EDP - Energias de Portugal SA | 83,892 | 390,992 | (19.6 | ) | ||||||||
Jeronimo Martins SGPS SA | 6,175 | 128,543 | (6.4 | ) | ||||||||
|
|
|
| |||||||||
| 519,535 | ||||||||||||
| Singapore | ||||||||||||
ComfortDelGro Corp. Ltd. | 139,000 | 146,832 | (7.3 | ) | ||||||||
Jardine Cycle & Carriage Ltd. | 8,600 | 179,245 | (9.0 | ) | ||||||||
NetLink NBN Trust | 297,600 | 215,192 | (10.8 | ) | ||||||||
Olam Group Ltd. | 14,500 | 17,719 | (0.9 | ) | ||||||||
SATS Ltd. | 60,900 | 198,843 | (10.0 | ) | ||||||||
SIA Engineering Co. Ltd. | 66,800 | 128,290 | (6.4 | ) | ||||||||
Singapore Post Ltd. | 815,400 | 418,729 | (21.0 | ) | ||||||||
StarHub Ltd. | 83,100 | 75,374 | (3.8 | ) | ||||||||
United Overseas Bank Ltd. | 8,400 | 179,812 | (9.0 | ) | ||||||||
Wing Tai Holdings Ltd. | 8,000 | 10,041 | (0.5 | ) | ||||||||
|
|
|
| |||||||||
| 1,570,077 | ||||||||||||
| Spain | ||||||||||||
Acciona SA | 2,819 | 551,812 | (27.7 | ) | ||||||||
Banco Santander SA | 35,387 | 103,413 | (5.2 | ) | ||||||||
Cellnex Telecom SA | 3,112 | 145,051 | (7.3 | ) | ||||||||
Grifols SA | 382 | 6,398 | (0.3 | ) | ||||||||
Iberdrola SA | 4,058 | 46,630 | (2.3 | ) | ||||||||
Industria de Diseno Textil SA | 19,464 | 408,107 | (20.4 | ) | ||||||||
Inmobiliaria Colonial Socimi SA | 31,308 | 260,338 | (13.0 | ) | ||||||||
Merlin Properties Socimi SA | 26,424 | 287,061 | (14.4 | ) | ||||||||
Naturgy Energy Group SA | 2,234 | 67,204 | (3.4 | ) | ||||||||
Solaria Energia y Medio Ambiente SA | 4,840 | 107,403 | (5.4 | ) | ||||||||
|
|
|
| |||||||||
| 1,983,417 | ||||||||||||
| Sweden | ||||||||||||
Alfa Laval AB | 8,978 | 249,914 | (12.5 | ) | ||||||||
Autoliv, Inc. | 1,706 | 125,698 | (6.3 | ) | ||||||||
Boliden AB | 6,239 | 270,530 | (13.6 | ) | ||||||||
Castellum AB | 662 | 13,110 | (0.7 | ) | ||||||||
Elekta AB, B Shares | 31,607 | 212,882 | (10.7 | ) | ||||||||
Epiroc AB, Class A | 9,259 | 187,708 | (9.4 | ) | ||||||||
Epiroc AB, Class B | 8,856 | 154,500 | (7.7 | ) | ||||||||
EQT AB | 3,832 | 108,453 | (5.4 | ) | ||||||||
Essity AB, Class B | 10,443 | 275,392 | (13.8 | ) | ||||||||
Evolution AB | 1,894 | 194,321 | (9.7 | ) | ||||||||
Hexagon AB, B Shares | 7,280 | 93,933 | (4.7 | ) | ||||||||
Holmen AB, B Shares | 4,034 | 233,160 | (11.7 | ) | ||||||||
Industrivarden AB, C Shares | 3,433 | 86,441 | (4.3 | ) | ||||||||
Indutrade AB | 27,363 | 645,434 | (32.3 | ) | ||||||||
Investment AB Latour, B Shares | 7,717 | 204,443 | (10.3 | ) | ||||||||
Lifco AB, B Shares | 5,165 | 108,339 | (5.4 | ) | ||||||||
| Security | Shares | Value | % of Basket Value | |||||||||
| Sweden (continued) | ||||||||||||
Lundin Energy AB | 11,476 | $ | 474,485 | (23.8 | )% | |||||||
Nibe Industrier AB, B Shares | 2,689 | 26,364 | (1.3 | ) | ||||||||
Saab AB, Class B | 24,796 | 1,048,844 | (52.6 | ) | ||||||||
Sagax AB, Class B | 4,207 | 107,465 | (5.4 | ) | ||||||||
Spotify Technology SA | 3,532 | 359,028 | (18.0 | ) | ||||||||
SSAB AB, A Shares | 29,339 | 186,335 | (9.3 | ) | ||||||||
Svenska Handelsbanken AB, A Shares | 119,473 | 1,205,043 | (60.4 | ) | ||||||||
Swedish Match AB | 64,710 | 515,401 | (25.8 | ) | ||||||||
Tele2 AB, B Shares | 23,655 | 313,530 | (15.7 | ) | ||||||||
|
|
|
| |||||||||
| 7,400,753 | ||||||||||||
| Switzerland | ||||||||||||
Adecco Group AG | 5,047 | 194,763 | (9.8 | ) | ||||||||
Barry Callebaut AG | 28 | 64,443 | (3.2 | ) | ||||||||
Belimo Holding AG | 85 | 42,009 | (2.1 | ) | ||||||||
Chocoladefabriken Lindt & Spruengli AG, Registered Shares | 3 | 355,898 | (17.8 | ) | ||||||||
Chocoladefabriken Lindt & Spruengli AG, Participation Certificates | 63 | 706,544 | (35.4 | ) | ||||||||
Cie Financiere Richemont SA, Class A | 5,240 | 608,839 | (30.5 | ) | ||||||||
Credit Suisse Group AG | 17,213 | 116,830 | (5.9 | ) | ||||||||
Dufry AG | 2,932 | 116,700 | (5.9 | ) | ||||||||
Flughafen Zurich AG | 1,109 | 187,530 | (9.4 | ) | ||||||||
Idorsia Ltd. | 16,849 | 287,585 | (14.4 | ) | ||||||||
Julius Baer Group Ltd. | 6,344 | 303,166 | (15.2 | ) | ||||||||
Logitech International SA | 1,618 | 105,297 | (5.3 | ) | ||||||||
Lonza Group AG | 72 | 42,454 | (2.1 | ) | ||||||||
SIG Combibloc Group AG | 12,211 | 255,643 | (12.8 | ) | ||||||||
Sika AG | 973 | 297,211 | (14.9 | ) | ||||||||
Sonova Holding AG | 111 | 40,532 | (2.0 | ) | ||||||||
Straumann Holding AG | 1,870 | 220,457 | (11.1 | ) | ||||||||
Swatch Group AG | 776 | 199,155 | (10.0 | ) | ||||||||
Swiss Life Holding AG | 124 | 72,505 | (3.6 | ) | ||||||||
Swiss Prime Site AG | 1,479 | 144,564 | (7.2 | ) | ||||||||
Temenos AG | 1,402 | 141,526 | (7.1 | ) | ||||||||
UBS Group AG | 8,577 | 145,609 | (7.3 | ) | ||||||||
VAT Group AG | 420 | 129,911 | (6.5 | ) | ||||||||
|
|
|
| |||||||||
| 4,779,171 | ||||||||||||
| United Kingdom | ||||||||||||
Associated British Foods PLC | 29,526 | 590,837 | (29.6 | ) | ||||||||
Atlantica Sustainable Infrastructure PLC | 17,218 | 532,036 | (26.7 | ) | ||||||||
Barclays PLC | 164,705 | 302,751 | (15.2 | ) | ||||||||
Barratt Developments PLC | 19,403 | 118,708 | (5.9 | ) | ||||||||
Bellway PLC | 10,453 | 317,481 | (15.9 | ) | ||||||||
British American Tobacco PLC | 1,339 | 56,121 | (2.8 | ) | ||||||||
Capri Holdings Ltd. | 3,354 | 159,986 | (8.0 | ) | ||||||||
Centrica PLC | 739,585 | 732,773 | (36.7 | ) | ||||||||
Croda International PLC | 12,628 | 1,226,514 | (61.5 | ) | ||||||||
Dechra Pharmaceuticals PLC | 5,018 | 227,392 | (11.4 | ) | ||||||||
Direct Line Insurance Group PLC | 23,455 | 74,443 | (3.7 | ) | ||||||||
Drax Group PLC | 34,243 | 346,050 | (17.3 | ) | ||||||||
easyJet PLC | 15,035 | 104,185 | (5.2 | ) | ||||||||
Endeavour Mining PLC | 13,020 | 318,646 | (16.0 | ) | ||||||||
Farfetch Ltd., Class A | 3,873 | 43,378 | (2.2 | ) | ||||||||
Halma PLC | 1,490 | 45,736 | (2.3 | ) | ||||||||
Hammerson PLC | 45 | 16 | (0.0 | ) | ||||||||
Hargreaves Lansdown PLC | 17,465 | 199,945 | (10.0 | ) | ||||||||
HomeServe PLC | 68,904 | 851,704 | (42.7 | ) | ||||||||
Imperial Brands PLC | 64,458 | 1,341,728 | (67.2 | ) | ||||||||
Intertek Group PLC | 365 | 22,745 | (1.1 | ) | ||||||||
ITV PLC | 273,738 | 252,784 | (12.7 | ) | ||||||||
| 74 | 2 0 2 2 BLACK ROCK ANNUAL REPORT TO SHAREHOLDERS |
Schedule of Investments (continued) April 30, 2022 | BlackRock Global Long/Short Equity Fund |
| Security | Shares | Value | % of Basket Value | |||||||||
| United Kingdom (continued) | ||||||||||||
J Sainsbury PLC | 28,074 | $ | 81,913 | (4.1 | )% | |||||||
Janus Henderson Group PLC | 11,013 | 335,676 | (16.8 | ) | ||||||||
Legal & General Group PLC | 44,761 | 139,524 | (7.0 | ) | ||||||||
Liberty Global PLC, Class A | 8,354 | 190,137 | (9.5 | ) | ||||||||
Liberty Global PLC, Class C | 5,084 | 120,491 | (6.0 | ) | ||||||||
Linde PLC | 1,959 | 611,130 | (30.6 | ) | ||||||||
Melrose Industries PLC | 303,607 | 441,171 | (22.1 | ) | ||||||||
Moneysupermarket.com Group PLC | 3 | 7 | (0.0 | ) | ||||||||
Natwest Group PLC | 120,142 | 322,315 | (16.2 | ) | ||||||||
Nomad Foods Ltd. | 9,550 | 176,293 | (8.8 | ) | ||||||||
Phoenix Group Holdings PLC | 17,757 | 134,499 | (6.7 | ) | ||||||||
Quilter PLC | 108,673 | 179,015 | (9.0 | ) | ||||||||
Schroders PLC | 2,136 | 75,401 | (3.8 | ) | ||||||||
Smiths Group PLC | 17,611 | 322,269 | (16.1 | ) | ||||||||
Spirax-Sarco Engineering PLC | 5,420 | 817,854 | (41.0 | ) | ||||||||
SSE PLC | 9,960 | 231,329 | (11.6 | ) | ||||||||
SSP Group PLC | 66,699 | 196,870 | (9.9 | ) | ||||||||
St James’s Place PLC | 9,239 | 148,467 | (7.4 | ) | ||||||||
Tate & Lyle PLC | 81,339 | 790,583 | (39.6 | ) | ||||||||
Taylor Wimpey PLC | 226,529 | 356,275 | (17.9 | ) | ||||||||
THG PLC | 65,701 | 88,210 | (4.4 | ) | ||||||||
Travis Perkins PLC | 3,693 | 56,327 | (2.8 | ) | ||||||||
Tritax Big Box REIT PLC | 147,460 | 450,147 | (22.6 | ) | ||||||||
United Utilities Group PLC | 918 | 13,192 | (0.7 | ) | ||||||||
Weir Group PLC | 14,398 | 276,794 | (13.9 | ) | ||||||||
Whitbread PLC | 21,256 | 741,980 | (37.2 | ) | ||||||||
|
|
|
| |||||||||
| 15,163,828 | ||||||||||||
| United States | ||||||||||||
AbbVie, Inc. | 247 | 36,279 | (1.8 | ) | ||||||||
ABIOMED, Inc. | 707 | 202,612 | (10.2 | ) | ||||||||
Acadia Healthcare Co., Inc. | 2,246 | 152,458 | (7.6 | ) | ||||||||
Adobe, Inc. | 2,637 | 1,044,120 | (52.3 | ) | ||||||||
Advanced Micro Devices, Inc. | 10,191 | 871,534 | (43.7 | ) | ||||||||
AES Corp. | 22,739 | 464,330 | (23.3 | ) | ||||||||
Aflac, Inc. | 924 | 52,927 | (2.7 | ) | ||||||||
Agilent Technologies, Inc. | 13,243 | 1,579,493 | (79.1 | ) | ||||||||
Alcoa Corp. | 5,435 | 368,493 | (18.5 | ) | ||||||||
Alexandria Real Estate Equities, Inc. | 5,276 | 961,076 | (48.2 | ) | ||||||||
Align Technology, Inc. | 945 | 273,965 | (13.7 | ) | ||||||||
Allstate Corp. | 812 | 102,750 | (5.1 | ) | ||||||||
Ally Financial, Inc. | 2,338 | 93,426 | (4.7 | ) | ||||||||
Alphabet, Inc., Class A | 71 | 162,035 | (8.1 | ) | ||||||||
Ambarella, Inc. | 1,596 | 131,000 | (6.6 | ) | ||||||||
AMC Entertainment Holdings, Inc., Class A | 12,451 | 190,500 | (9.5 | ) | ||||||||
American Express Co. | 815 | 142,389 | (7.1 | ) | ||||||||
American Homes 4 Rent, Class A | 18,533 | 734,092 | (36.8 | ) | ||||||||
American International Group, Inc. | 8,424 | 492,888 | (24.7 | ) | ||||||||
American Tower Corp. | 2,300 | 554,346 | (27.8 | ) | ||||||||
AMETEK, Inc. | 976 | 123,230 | (6.2 | ) | ||||||||
AMN Healthcare Services, Inc. | 6,596 | 644,759 | (32.3 | ) | ||||||||
Amphenol Corp., Class A | 22,659 | 1,620,118 | (81.2 | ) | ||||||||
Antero Midstream Corp. | 27,545 | 282,887 | (14.2 | ) | ||||||||
Aon PLC, Class A | 1,045 | 300,950 | (15.1 | ) | ||||||||
Apple, Inc. | 812 | 132,876 | (6.7 | ) | ||||||||
Arch Capital Group Ltd. | 13,197 | 602,707 | (30.2 | ) | ||||||||
Arista Networks, Inc. | 4,546 | 525,381 | (26.3 | ) | ||||||||
Asbury Automotive Group, Inc. | 2,726 | 500,793 | (25.1 | ) | ||||||||
ASGN, Inc. | 8,257 | 936,757 | (46.9 | ) | ||||||||
Aspen Technology, Inc. | 154 | 24,415 | (1.2 | ) | ||||||||
AT&T, Inc. | 29,665 | 559,482 | (28.0 | ) | ||||||||
| Security | Shares | Value | % of Basket Value | |||||||||
| United States (continued) | ||||||||||||
Atlassian Corp. PLC, Class A | 1,212 | $ | 272,494 | (13.7 | )% | |||||||
Atmos Energy Corp. | 4,242 | 481,043 | (24.1 | ) | ||||||||
Autodesk, Inc. | 4,009 | 758,824 | (38.0 | ) | ||||||||
AvalonBay Communities, Inc. | 3,955 | 899,683 | (45.1 | ) | ||||||||
Avangrid, Inc. | 4,459 | 197,757 | (9.9 | ) | ||||||||
Avantor, Inc. | 3,997 | 127,424 | (6.4 | ) | ||||||||
Axalta Coating Systems Ltd. | 2,077 | 52,693 | (2.6 | ) | ||||||||
Axon Enterprise, Inc. | 3,072 | 344,678 | (17.3 | ) | ||||||||
Baker Hughes Co. | 4,792 | 148,648 | (7.4 | ) | ||||||||
Ball Corp. | 2,031 | 164,836 | (8.3 | ) | ||||||||
Bank of America Corp. | 26,101 | 931,284 | (46.7 | ) | ||||||||
Bank of New York Mellon Corp. | 25,446 | 1,070,259 | (53.6 | ) | ||||||||
Baxter International, Inc. | 371 | 26,363 | (1.3 | ) | ||||||||
Biogen, Inc. | 2,035 | 422,140 | (21.2 | ) | ||||||||
BioMarin Pharmaceutical, Inc. | 2,772 | 225,502 | (11.3 | ) | ||||||||
Black Hills Corp. | 956 | 70,017 | (3.5 | ) | ||||||||
Blackline, Inc. | 151 | 10,125 | (0.5 | ) | ||||||||
Block, Inc. | 809 | 80,528 | (4.0 | ) | ||||||||
Blueprint Medicines Corp. | 6,338 | 369,822 | (18.5 | ) | ||||||||
Boeing Co. | 12,289 | 1,829,095 | (91.6 | ) | ||||||||
Booking Holdings, Inc. | 74 | 163,563 | (8.2 | ) | ||||||||
Booz Allen Hamilton Holding Corp. | 10,841 | 884,951 | (44.3 | ) | ||||||||
BorgWarner, Inc. | 8,086 | 297,807 | (14.9 | ) | ||||||||
Boston Properties, Inc. | 4,188 | 492,509 | (24.7 | ) | ||||||||
Boston Scientific Corp. | 15,910 | 669,970 | (33.6 | ) | ||||||||
Brighthouse Financial, Inc. | 25,685 | 1,319,182 | (66.1 | ) | ||||||||
Brixmor Property Group, Inc. | 17,171 | 435,800 | (21.8 | ) | ||||||||
Brown & Brown, Inc. | 637 | 39,481 | (2.0 | ) | ||||||||
Builders FirstSource, Inc. | 3,099 | 190,805 | (9.6 | ) | ||||||||
BWX Technologies, Inc. | 572 | 29,698 | (1.5 | ) | ||||||||
C.H. Robinson Worldwide, Inc. | 4,215 | 447,422 | (22.4 | ) | ||||||||
CACI International, Inc., Class A | 3,064 | 812,879 | (40.7 | ) | ||||||||
Camden Property Trust | 11,423 | 1,792,154 | (89.8 | ) | ||||||||
Capital One Financial Corp. | 4,060 | 505,957 | (25.4 | ) | ||||||||
Cardinal Health, Inc. | 6,285 | 364,844 | (18.3 | ) | ||||||||
Carnival Corp. | 10,048 | 173,830 | (8.7 | ) | ||||||||
Carnival PLC | 22,135 | 347,038 | (17.4 | ) | ||||||||
Carrier Global Corp. | 2,256 | 86,337 | (4.3 | ) | ||||||||
Catalent, Inc. | 5,630 | 509,853 | (25.5 | ) | ||||||||
Cboe Global Markets, Inc. | 2,826 | 319,281 | (16.0 | ) | ||||||||
CDW Corp. | 1,160 | 189,289 | (9.5 | ) | ||||||||
ChampionX Corp. | 7,279 | 153,587 | (7.7 | ) | ||||||||
Charles River Laboratories International, Inc. | 2,424 | 585,420 | (29.3 | ) | ||||||||
Charles Schwab Corp. | 9,559 | 634,048 | (31.8 | ) | ||||||||
Chart Industries, Inc. | 1,427 | 240,906 | (12.1 | ) | ||||||||
Charter Communications, Inc., Class A | 120 | 51,419 | (2.6 | ) | ||||||||
Chegg, Inc. | 1,269 | 31,395 | (1.6 | ) | ||||||||
Chemed Corp. | 568 | 279,110 | (14.0 | ) | ||||||||
Cheniere Energy, Inc. | 2,739 | 371,984 | (18.6 | ) | ||||||||
Chevron Corp. | 540 | 84,602 | (4.2 | ) | ||||||||
Choice Hotels International, Inc. | 1,832 | 257,323 | (12.9 | ) | ||||||||
Cigna Corp. | 2,427 | 598,935 | (30.0 | ) | ||||||||
Cincinnati Financial Corp. | 2,550 | 312,783 | (15.7 | ) | ||||||||
Cirrus Logic, Inc. | 5,244 | 397,495 | (19.9 | ) | ||||||||
Cisco Systems, Inc. | 22,721 | 1,112,875 | (55.8 | ) | ||||||||
Citigroup, Inc. | 26,437 | 1,274,528 | (63.9 | ) | ||||||||
Clean Harbors, Inc. | 3,844 | 403,351 | (20.2 | ) | ||||||||
Clorox Co. | 306 | 43,902 | (2.2 | ) | ||||||||
CMS Energy Corp. | 7,317 | 502,605 | (25.2 | ) | ||||||||
Coca-Cola Co. | 3,537 | 228,526 | (11.4 | ) | ||||||||
Cognex Corp. | 2,921 | 197,547 | (9.9 | ) | ||||||||
SCHEDULE OF INVESTMENTS | 75 |
Schedule of Investments (continued) April 30, 2022 | BlackRock Global Long/Short Equity Fund |
| Security | Shares | Value | % of Basket Value | |||||||||
| United States (continued) | ||||||||||||
Cognizant Technology Solutions Corp., Class A | 2,786 | $ | 225,387 | (11.3 | )% | |||||||
Colgate-Palmolive Co. | 13,667 | 1,053,042 | (52.8 | ) | ||||||||
Comerica, Inc. | 1,222 | 100,082 | (5.0 | ) | ||||||||
Continental Resources, Inc. | 25,599 | 1,422,536 | (71.3 | ) | ||||||||
Cooper Cos., Inc. | 392 | 141,528 | (7.1 | ) | ||||||||
Corteva, Inc. | 42,002 | 2,423,095 | (121.4 | ) | ||||||||
CoStar Group, Inc. | 4,623 | 294,115 | (14.7 | ) | ||||||||
Costco Wholesale Corp. | 4,752 | 2,526,733 | (126.6 | ) | ||||||||
Coupa Software, Inc. | 38 | 3,279 | (0.2 | ) | ||||||||
Credit Acceptance Corp. | 814 | 417,175 | (20.9 | ) | ||||||||
Crimson Wine Group Ltd. | 1 | 8 | (0.0 | ) | ||||||||
Crocs, Inc. | 2,550 | 169,397 | (8.5 | ) | ||||||||
Crown Castle International Corp. | 811 | 150,205 | (7.5 | ) | ||||||||
CSX Corp. | 20,277 | 696,312 | (34.9 | ) | ||||||||
CubeSmart | 5,002 | 237,645 | (11.9 | ) | ||||||||
Danaher Corp. | 2,760 | 693,119 | (34.7 | ) | ||||||||
DaVita, Inc. | 1,771 | 191,923 | (9.6 | ) | ||||||||
DexCom, Inc. | 147 | 60,061 | (3.0 | ) | ||||||||
Dick’s Sporting Goods, Inc. | 9,829 | 947,712 | (47.5 | ) | ||||||||
Digital Realty Trust, Inc. | 1,458 | 213,043 | (10.7 | ) | ||||||||
Digital Turbine, Inc. | 370 | 11,711 | (0.6 | ) | ||||||||
Dominion Energy, Inc. | 1,373 | 112,092 | (5.6 | ) | ||||||||
Domino’s Pizza, Inc. | 68 | 22,984 | (1.2 | ) | ||||||||
Donaldson Co., Inc. | 6,922 | 339,455 | (17.0 | ) | ||||||||
DraftKings, Inc., Class A | 18,206 | 249,058 | (12.5 | ) | ||||||||
DTE Midstream LLC | 1,547 | 83,151 | (4.2 | ) | ||||||||
Duke Realty Corp. | 3,966 | 217,139 | (10.9 | ) | ||||||||
East West Bancorp, Inc. | 3,074 | 219,176 | (11.0 | ) | ||||||||
Eaton Corp. PLC | 1,731 | 251,030 | (12.6 | ) | ||||||||
eBay, Inc. | 2,634 | 136,757 | (6.9 | ) | ||||||||
Edison International | 3,832 | 263,603 | (13.2 | ) | ||||||||
Elanco Animal Health, Inc. | 20,855 | 527,840 | (26.4 | ) | ||||||||
Eli Lilly & Co. | 494 | 144,312 | (7.2 | ) | ||||||||
Emerson Electric Co. | 251 | 22,635 | (1.1 | ) | ||||||||
Entergy Corp. | 6,555 | 779,062 | (39.0 | ) | ||||||||
EOG Resources, Inc. | 6,296 | 735,121 | (36.8 | ) | ||||||||
EPAM Systems, Inc. | 2,131 | 564,694 | (28.3 | ) | ||||||||
Equifax, Inc. | 2,987 | 607,914 | (30.5 | ) | ||||||||
Equinix, Inc. | 298 | 214,286 | (10.7 | ) | ||||||||
Equity LifeStyle Properties, Inc. | 3,735 | 288,641 | (14.5 | ) | ||||||||
Equity Residential | 15,970 | 1,301,555 | (65.2 | ) | ||||||||
Erie Indemnity Co., Class A | 4,528 | 725,748 | (36.4 | ) | ||||||||
Etsy, Inc. | 7,009 | 653,169 | (32.7 | ) | ||||||||
Euronet Worldwide, Inc. | 135 | 16,423 | (0.8 | ) | ||||||||
Evercore, Inc., Class A | 1,553 | 164,230 | (8.2 | ) | ||||||||
Evoqua Water Technologies Corp. | 7,078 | 295,082 | (14.8 | ) | ||||||||
Exelixis, Inc. | 1,723 | 38,492 | (1.9 | ) | ||||||||
Expedia Group, Inc. | 5,917 | 1,033,996 | (51.8 | ) | ||||||||
Expeditors International of Washington, Inc. | 2,421 | 239,848 | (12.0 | ) | ||||||||
Exxon Mobil Corp. | 12,433 | 1,059,913 | (53.1 | ) | ||||||||
F5, Inc. | 175 | 29,297 | (1.5 | ) | ||||||||
FactSet Research Systems, Inc. | 731 | 294,951 | (14.8 | ) | ||||||||
Fair Isaac Corp. | 736 | 274,903 | (13.8 | ) | ||||||||
Fate Therapeutics, Inc. | 2,579 | 73,656 | (3.7 | ) | ||||||||
Federal Realty Investment Trust | 5,507 | 644,649 | (32.3 | ) | ||||||||
First American Financial Corp. | 216 | 12,595 | (0.6 | ) | ||||||||
First Industrial Realty Trust, Inc. | 15,074 | 874,292 | (43.8 | ) | ||||||||
First Solar, Inc. | 1,542 | 112,612 | (5.6 | ) | ||||||||
Floor & Decor Holdings, Inc., Class A | 452 | 36,033 | (1.8 | ) | ||||||||
Ford Motor Co. | 7,180 | 101,669 | (5.1 | ) | ||||||||
Fortinet, Inc. | 1,497 | 432,648 | (21.7 | ) | ||||||||
Fox Corp., Class A | 54,422 | 1,950,484 | (97.7 | ) | ||||||||
| Security | Shares | Value | % of Basket Value | |||||||||
| United States (continued) | ||||||||||||
Fox Corp., Class B | 5,577 | $ | 185,379 | (9.3 | )% | |||||||
Franklin Resources, Inc. | 9,899 | 243,416 | (12.2 | ) | ||||||||
FTI Consulting, Inc. | 3,246 | 511,927 | (25.6 | ) | ||||||||
Gap, Inc. | 21,567 | 267,862 | (13.4 | ) | ||||||||
Garmin Ltd. | 16,182 | 1,775,813 | (89.0 | ) | ||||||||
Gartner, Inc. | 1,283 | 372,776 | (18.7 | ) | ||||||||
General Dynamics Corp. | 29,062 | 6,874,035 | (344.4 | ) | ||||||||
General Electric Co. | 765 | 57,031 | (2.9 | ) | ||||||||
Globe Life, Inc. | 1,857 | 182,135 | (9.1 | ) | ||||||||
Globus Medical, Inc., Class A | 6,783 | 449,170 | (22.5 | ) | ||||||||
Goodyear Tire & Rubber Co. | 4,154 | 55,331 | (2.8 | ) | ||||||||
Guidewire Software, Inc. | 5,940 | 516,424 | (25.9 | ) | ||||||||
Halliburton Co. | 4,093 | 145,793 | (7.3 | ) | ||||||||
Halozyme Therapeutics, Inc. | 6,527 | 260,427 | (13.0 | ) | ||||||||
Hanesbrands, Inc. | 39,100 | 518,466 | (26.0 | ) | ||||||||
Hannon Armstrong Sustainable Infrastructure Capital, Inc. | 7,955 | 318,120 | (15.9 | ) | ||||||||
Harley-Davidson, Inc. | 11,003 | 401,059 | (20.1 | ) | ||||||||
Hartford Financial Services Group, Inc. | 2,974 | 207,972 | (10.4 | ) | ||||||||
Healthcare Realty Trust, Inc. | 2,738 | 74,145 | (3.7 | ) | ||||||||
HealthEquity, Inc. | 6,186 | 385,512 | (19.3 | ) | ||||||||
Healthpeak Properties, Inc. | 5,355 | 175,698 | (8.8 | ) | ||||||||
HEICO Corp. | 8,593 | 1,213,589 | (60.8 | ) | ||||||||
HEICO Corp., Class A | 15,835 | 1,846,994 | (92.5 | ) | ||||||||
Helmerich & Payne, Inc. | 448 | 20,621 | (1.0 | ) | ||||||||
Henry Schein, Inc. | 936 | 75,910 | (3.8 | ) | ||||||||
Herbalife Nutrition Ltd. | 2,593 | 68,922 | (3.5 | ) | ||||||||
Hewlett Packard Enterprise Co. | 3,101 | 47,786 | (2.4 | ) | ||||||||
Hexcel Corp. | 12,154 | 660,691 | (33.1 | ) | ||||||||
Hologic, Inc. | 1,034 | 74,438 | (3.7 | ) | ||||||||
Home Depot, Inc. | 1,667 | 500,767 | (25.1 | ) | ||||||||
Honeywell International, Inc. | 5,759 | 1,114,424 | (55.8 | ) | ||||||||
Horizon Therapeutics PLC | 1,708 | 168,340 | (8.4 | ) | ||||||||
HubSpot, Inc. | 1,518 | 575,975 | (28.9 | ) | ||||||||
Humana, Inc. | 1,107 | 492,128 | (24.7 | ) | ||||||||
Huntington Bancshares, Inc. | 43,468 | 571,604 | (28.6 | ) | ||||||||
Huntington Ingalls Industries, Inc. | 8,167 | 1,737,448 | (87.1 | ) | ||||||||
Huntsman Corp. | 2,111 | 71,500 | (3.6 | ) | ||||||||
IDACORP, Inc. | 3,541 | 372,442 | (18.7 | ) | ||||||||
IDEXX Laboratories, Inc. | 620 | 266,898 | (13.4 | ) | ||||||||
II-VI, Inc. | 726 | 44,438 | (2.2 | ) | ||||||||
Illinois Tool Works, Inc. | 2,539 | 500,462 | (25.1 | ) | ||||||||
Illumina, Inc. | 1,752 | 519,731 | (26.0 | ) | ||||||||
Incyte Corp. | 2,708 | 202,992 | (10.2 | ) | ||||||||
Integra LifeSciences Holdings Corp. | 9,540 | 583,466 | (29.2 | ) | ||||||||
Intellia Therapeutics, Inc. | 934 | 45,794 | (2.3 | ) | ||||||||
Interactive Brokers Group, Inc., Class A | 5,962 | 355,097 | (17.8 | ) | ||||||||
Intercontinental Exchange, Inc. | 9,698 | 1,123,125 | (56.3 | ) | ||||||||
International Game Technology PLC | 4,412 | 96,314 | (4.8 | ) | ||||||||
Interpublic Group of Cos., Inc. | 7,715 | 251,663 | (12.6 | ) | ||||||||
Intuit, Inc. | 1,038 | 434,663 | (21.8 | ) | ||||||||
Invitation Homes, Inc. | 6,302 | 250,946 | (12.6 | ) | ||||||||
Iridium Communications, Inc. | 19,170 | 684,561 | (34.3 | ) | ||||||||
Iron Mountain, Inc. | 10,319 | 554,440 | (27.8 | ) | ||||||||
ITT, Inc. | 620 | 43,536 | (2.2 | ) | ||||||||
Jacobs Engineering Group, Inc. | 3,997 | 553,784 | (27.7 | ) | ||||||||
JB Hunt Transport Services, Inc. | 2,186 | 373,478 | (18.7 | ) | ||||||||
JetBlue Airways Corp. | 20,936 | 230,505 | (11.5 | ) | ||||||||
Johnson Controls International PLC | 3,812 | 228,224 | (11.4 | ) | ||||||||
Jones Lang LaSalle, Inc. | 1,413 | 309,065 | (15.5 | ) | ||||||||
JPMorgan Chase & Co. | 2,893 | 345,308 | (17.3 | ) | ||||||||
Kellogg Co. | 4,295 | 294,208 | (14.7 | ) | ||||||||
| 76 | 2 0 2 2 BLACK ROCK ANNUAL REPORT TO SHAREHOLDERS |
Schedule of Investments (continued) April 30, 2022 | BlackRock Global Long/Short Equity Fund |
| Security | Shares | Value | % of Basket Value | |||||||||
| United States (continued) | ||||||||||||
Keurig Dr Pepper, Inc. | 9,327 | $ | 348,830 | (17.5 | )% | |||||||
KeyCorp | 520 | 10,041 | (0.5 | ) | ||||||||
Keysight Technologies, Inc. | 6,871 | 963,795 | (48.3 | ) | ||||||||
Kinder Morgan, Inc. | 18,852 | 342,164 | (17.1 | ) | ||||||||
KLA Corp. | 2,076 | 662,784 | (33.2 | ) | ||||||||
Lamar Advertising Co., Class A | 3,051 | 336,861 | (16.9 | ) | ||||||||
Landstar System, Inc. | 4,763 | 737,789 | (37.0 | ) | ||||||||
Las Vegas Sands Corp. | 6,116 | 216,690 | (10.9 | ) | ||||||||
Lattice Semiconductor Corp. | 1,274 | 61,203 | (3.1 | ) | ||||||||
Lear Corp. | 3,384 | 432,949 | (21.7 | ) | ||||||||
Leggett & Platt, Inc. | 7,704 | 274,494 | (13.8 | ) | ||||||||
Leidos Holdings, Inc. | 16,975 | 1,757,082 | (88.0 | ) | ||||||||
Leslie’s, Inc. | 635 | 12,446 | (0.6 | ) | ||||||||
Levi Strauss & Co., Class A | 6,609 | 119,689 | (6.0 | ) | ||||||||
Liberty Latin America Ltd., Class A | 2 | 18 | (0.0 | ) | ||||||||
Liberty Media Corp. - Liberty SiriusXM, Class C | 4,127 | 172,839 | (8.7 | ) | ||||||||
Life Storage, Inc. | 2,833 | 375,344 | (18.8 | ) | ||||||||
Lincoln Electric Holdings, Inc. | 1,871 | 252,080 | (12.6 | ) | ||||||||
Lincoln National Corp. | 8,583 | 516,267 | (25.9 | ) | ||||||||
Lithia Motors, Inc. | 568 | 160,818 | (8.1 | ) | ||||||||
Live Nation Entertainment, Inc. | 452 | 47,406 | (2.4 | ) | ||||||||
Livent Corp. | 13,951 | 297,993 | (14.9 | ) | ||||||||
Lockheed Martin Corp. | 5,759 | 2,488,579 | (124.7 | ) | ||||||||
LPL Financial Holdings, Inc. | 1,231 | 231,268 | (11.6 | ) | ||||||||
Lumen Technologies, Inc. | 56,313 | 566,509 | (28.4 | ) | ||||||||
Lumentum Holdings, Inc. | 7,052 | 572,693 | (28.7 | ) | ||||||||
LXP Industrial Trust | 28,525 | 357,989 | (17.9 | ) | ||||||||
MACOM Technology Solutions Holdings, Inc., Class H | 14,404 | 733,884 | (36.8 | ) | ||||||||
Manhattan Associates, Inc. | 4,231 | 552,357 | (27.7 | ) | ||||||||
ManpowerGroup, Inc. | 6,178 | 557,256 | (27.9 | ) | ||||||||
Marathon Oil Corp. | 18,578 | 462,964 | (23.2 | ) | ||||||||
MarketAxess Holdings, Inc. | 2,847 | 750,498 | (37.6 | ) | ||||||||
Marriott Vacations Worldwide Corp. | 74 | 11,050 | (0.6 | ) | ||||||||
Marsh & McLennan Cos., Inc. | 4,719 | 763,062 | (38.2 | ) | ||||||||
Martin Marietta Materials, Inc. | 2,391 | 846,940 | (42.4 | ) | ||||||||
Marvell Technology, Inc. | 16,721 | 971,156 | (48.7 | ) | ||||||||
Masimo Corp. | 9,604 | 1,084,964 | (54.4 | ) | ||||||||
Mastercard, Inc., Class A | 448 | 162,794 | (8.2 | ) | ||||||||
MaxLinear, Inc. | 4,098 | 196,171 | (9.8 | ) | ||||||||
McKesson Corp. | 1,557 | 482,063 | (24.2 | ) | ||||||||
Medical Properties Trust, Inc. | 15,633 | 287,491 | (14.4 | ) | ||||||||
Merck & Co., Inc. | 10,295 | 913,064 | (45.7 | ) | ||||||||
Meta Platforms, Inc., Class A | 2,151 | 431,211 | (21.6 | ) | ||||||||
MetLife, Inc. | 16,214 | 1,064,936 | (53.4 | ) | ||||||||
Mettler-Toledo International, Inc. | 613 | 783,126 | (39.2 | ) | ||||||||
MGIC Investment Corp. | 32,719 | 427,310 | (21.4 | ) | ||||||||
Microsoft Corp. | 4,569 | 1,267,989 | (63.5 | ) | ||||||||
MicroStrategy, Inc., Class A | 36 | 12,750 | (0.6 | ) | ||||||||
Mid-America Apartment Communities, Inc. | 6,373 | 1,253,442 | (62.8 | ) | ||||||||
Molson Coors Beverage Co., Class B | 225 | 12,182 | (0.6 | ) | ||||||||
Monolithic Power Systems, Inc. | 1,608 | 630,722 | (31.6 | ) | ||||||||
Moody’s Corp. | 669 | 211,725 | (10.6 | ) | ||||||||
Morningstar, Inc. | 1,008 | 255,256 | (12.8 | ) | ||||||||
Murphy USA, Inc. | 653 | 152,541 | (7.6 | ) | ||||||||
National Vision Holdings, Inc. | 4,450 | 167,543 | (8.4 | ) | ||||||||
NetApp, Inc. | 12,014 | 880,025 | (44.1 | ) | ||||||||
Netflix, Inc. | 387 | 73,669 | (3.7 | ) | ||||||||
New Relic, Inc. | 312 | 19,740 | (1.0 | ) | ||||||||
New York Community Bancorp, Inc. | 72,399 | 668,967 | (33.5 | ) | ||||||||
New York Times Co., Class A | 817 | 31,307 | (1.6 | ) | ||||||||
Newmont Corp. | 9,838 | 716,698 | (35.9 | ) | ||||||||
| Security | Shares | Value | % of Basket Value | |||||||||
| United States (continued) | ||||||||||||
Nexstar Media Group, Inc., Class A | 400 | $ | 63,368 | (3.2 | )% | |||||||
Nordson Corp. | 472 | 101,806 | (5.1 | ) | ||||||||
Nordstrom, Inc. | 6,546 | 168,232 | (8.4 | ) | ||||||||
Norfolk Southern Corp. | 912 | 235,187 | (11.8 | ) | ||||||||
Northrop Grumman Corp. | 3,083 | 1,354,670 | (67.9 | ) | ||||||||
NortonLifeLock, Inc. | 3,213 | 80,454 | (4.0 | ) | ||||||||
Norwegian Cruise Line Holdings Ltd. | 23,026 | 461,211 | (23.1 | ) | ||||||||
NOV, Inc. | 9,284 | 168,319 | (8.4 | ) | ||||||||
NRG Energy, Inc. | 3,348 | 120,193 | (6.0 | ) | ||||||||
NVIDIA Corp. | 7,624 | 1,414,023 | (70.8 | ) | ||||||||
Okta, Inc. | 2,717 | 324,165 | (16.2 | ) | ||||||||
Old Dominion Freight Line, Inc. | 752 | 210,650 | (10.6 | ) | ||||||||
Old National Bancorp | 31,798 | 482,058 | (24.2 | ) | ||||||||
Omnicell, Inc. | 97 | 10,589 | (0.5 | ) | ||||||||
ONEOK, Inc. | 2,948 | 186,697 | (9.4 | ) | ||||||||
Oracle Corp. | 197 | 14,460 | (0.7 | ) | ||||||||
Ormat Technologies, Inc. | 5,326 | 413,830 | (20.7 | ) | ||||||||
Ovintiv Inc. | 28,487 | 1,458,000 | (73.1 | ) | ||||||||
PacWest Bancorp | 5,926 | 194,906 | (9.8 | ) | ||||||||
Palo Alto Networks, Inc. | 1,593 | 894,119 | (44.8 | ) | ||||||||
Papa John’s International, Inc. | 851 | 77,484 | (3.9 | ) | ||||||||
Park Hotels & Resorts, Inc. | 27,558 | 543,168 | (27.2 | ) | ||||||||
Paycom Software, Inc. | 1,264 | 355,778 | (17.8 | ) | ||||||||
Paylocity Holding Corp. | 2,296 | 435,390 | (21.8 | ) | ||||||||
PayPal Holdings, Inc. | 18,750 | 1,648,687 | (82.6 | ) | ||||||||
Pegasystems, Inc. | 8,064 | 617,622 | (30.9 | ) | ||||||||
Penn National Gaming, Inc. | 854 | 31,231 | (1.6 | ) | ||||||||
Penske Automotive Group, Inc. | 4,247 | 445,171 | (22.3 | ) | ||||||||
Pentair PLC | 4,834 | 245,326 | (12.3 | ) | ||||||||
Penumbra, Inc. | 2,571 | 443,652 | (22.2 | ) | ||||||||
Perrigo Co. PLC | 789 | 27,063 | (1.4 | ) | ||||||||
PG&E Corp. | 14,837 | 187,688 | (9.4 | ) | ||||||||
Philip Morris International, Inc. | 45,567 | 4,556,700 | (228.3 | ) | ||||||||
Phillips 66 | 4,461 | 387,036 | (19.4 | ) | ||||||||
Pinnacle Financial Partners, Inc. | 2,887 | 223,887 | (11.2 | ) | ||||||||
Planet Fitness, Inc., Class A | 17,762 | 1,421,493 | (71.2 | ) | ||||||||
Plug Power, Inc. | 4,926 | 103,545 | (5.2 | ) | ||||||||
PNC Financial Services Group, Inc. | 1,622 | 269,414 | (13.5 | ) | ||||||||
Portland General Electric Co. | 1,735 | 82,118 | (4.1 | ) | ||||||||
Power Integrations, Inc. | 4,905 | 392,400 | (19.7 | ) | ||||||||
PPG Industries, Inc. | 1,230 | 157,428 | (7.9 | ) | ||||||||
Principal Financial Group, Inc. | 10,832 | 738,092 | (37.0 | ) | ||||||||
Public Service Enterprise Group, Inc. | 6,060 | 422,140 | (21.2 | ) | ||||||||
PulteGroup, Inc. | 2,102 | 87,780 | (4.4 | ) | ||||||||
PVH Corp. | 5,615 | 408,660 | (20.5 | ) | ||||||||
Qorvo, Inc. | 3,906 | 444,425 | (22.3 | ) | ||||||||
Qualys, Inc. | 4,486 | 611,352 | (30.6 | ) | ||||||||
Radian Group, Inc. | 11,612 | 248,381 | (12.4 | ) | ||||||||
Ralph Lauren Corp. | 2,153 | 224,644 | (11.3 | ) | ||||||||
Rapid7, Inc. | 4,721 | 450,950 | (22.6 | ) | ||||||||
Raytheon Technologies Corp. | 12,503 | 1,186,660 | (59.5 | ) | ||||||||
Regency Centers Corp. | 10,103 | 695,389 | (34.8 | ) | ||||||||
Regeneron Pharmaceuticals, Inc. | 18 | 11,864 | (0.6 | ) | ||||||||
Reinsurance Group of America, Inc. | 14,181 | 1,521,905 | (76.3 | ) | ||||||||
Reliance Steel & Aluminum Co. | 4,851 | 961,711 | (48.2 | ) | ||||||||
Repligen Corp. | 3,102 | 487,758 | (24.4 | ) | ||||||||
Republic Services, Inc. | 725 | 97,346 | (4.9 | ) | ||||||||
ResMed, Inc. | 1,944 | 388,742 | (19.5 | ) | ||||||||
Rexford Industrial Realty, Inc. | 1,975 | 154,129 | (7.7 | ) | ||||||||
RingCentral, Inc., Class A | 143 | 12,134 | (0.6 | ) | ||||||||
Roku, Inc. | 5,968 | 554,427 | (27.8 | ) | ||||||||
Roper Technologies, Inc. | 1,291 | 606,667 | (30.4 | ) | ||||||||
SCHEDULE OF INVESTMENTS | 77 |
Schedule of Investments (continued) April 30, 2022 | BlackRock Global Long/Short Equity Fund |
| Security | Shares | Value | % of Basket Value | |||||||||
| United States (continued) | ||||||||||||
Royal Caribbean Cruises Ltd. | 8,695 | $ | 675,862 | (33.9 | )% | |||||||
Ryder System, Inc. | 18,299 | 1,279,100 | (64.1 | ) | ||||||||
salesforce.com, Inc. | 3,557 | 625,819 | (31.4 | ) | ||||||||
SBA Communications Corp. | 1,700 | 590,087 | (29.6 | ) | ||||||||
Schlumberger NV | 9,515 | 371,180 | (18.6 | ) | ||||||||
Science Applications International Corp. | 6,766 | 563,134 | (28.2 | ) | ||||||||
Seagen, Inc. | 1,953 | 255,863 | (12.8 | ) | ||||||||
SEI Investments Co. | 476 | 26,523 | (1.3 | ) | ||||||||
Semtech Corp. | 23,556 | 1,403,938 | (70.3 | ) | ||||||||
Sensata Technologies Holding PLC | 16,711 | 758,847 | (38.0 | ) | ||||||||
Service Corp. International | 99 | 6,495 | (0.3 | ) | ||||||||
ServiceNow, Inc. | 1,511 | 722,409 | (36.2 | ) | ||||||||
Silicon Laboratories, Inc. | 8,530 | 1,150,782 | (57.7 | ) | ||||||||
Simon Property Group, Inc. | 351 | 41,418 | (2.1 | ) | ||||||||
Sirius XM Holdings, Inc. | 40,278 | 241,668 | (12.1 | ) | ||||||||
SiteOne Landscape Supply, Inc. | 5,094 | 718,407 | (36.0 | ) | ||||||||
SL Green Realty Corp. | 12,382 | 857,082 | (42.9 | ) | ||||||||
Snap, Inc., Class A | 16,765 | 477,132 | (23.9 | ) | ||||||||
Snap-on, Inc. | 4,361 | 926,669 | (46.4 | ) | ||||||||
Southern Co. | 929 | 68,179 | (3.4 | ) | ||||||||
Southwest Gas Holdings, Inc. | 3,333 | 293,671 | (14.7 | ) | ||||||||
Spirit AeroSystems Holdings, Inc., Class A | 10,602 | 445,708 | (22.3 | ) | ||||||||
STAAR Surgical Co. | 1,809 | 103,276 | (5.2 | ) | ||||||||
Stifel Financial Corp. | 7,208 | 445,815 | (22.3 | ) | ||||||||
STORE Capital Corp. | 3,636 | 103,371 | (5.2 | ) | ||||||||
Stryker Corp. | 651 | 157,060 | (7.9 | ) | ||||||||
Sun Communities, Inc. | 3,786 | 664,708 | (33.3 | ) | ||||||||
Switch, Inc., Class A | 4,282 | 127,861 | (6.4 | ) | ||||||||
Sysco Corp. | 3,225 | 275,673 | (13.8 | ) | ||||||||
Take-Two Interactive Software, Inc. | 1,176 | 140,544 | (7.0 | ) | ||||||||
Tandem Diabetes Care, Inc. | 1,795 | 173,182 | (8.7 | ) | ||||||||
TE Connectivity Ltd. | 5,805 | 724,348 | (36.3 | ) | ||||||||
Teladoc Health, Inc. | 1,845 | 62,287 | (3.1 | ) | ||||||||
Teleflex, Inc. | 4,335 | 1,238,163 | (62.0 | ) | ||||||||
Tenable Holdings, Inc. | 2,141 | 118,247 | (5.9 | ) | ||||||||
Teradata Corp. | 1,496 | 61,860 | (3.1 | ) | ||||||||
Teradyne, Inc. | 5,462 | 576,023 | (28.9 | ) | ||||||||
Tesla, Inc. | 412 | 358,753 | (18.0 | ) | ||||||||
Tetra Tech, Inc. | 1,804 | 251,261 | (12.6 | ) | ||||||||
Texas Instruments, Inc. | 4,303 | 732,586 | (36.7 | ) | ||||||||
Textron, Inc. | 36,178 | 2,505,326 | (125.5 | ) | ||||||||
Thermo Fisher Scientific, Inc. | 52 | 28,752 | (1.4 | ) | ||||||||
Timken Co. | 3,516 | 202,662 | (10.2 | ) | ||||||||
TJX Cos., Inc. | 1,371 | 84,015 | (4.2 | ) | ||||||||
Toll Brothers, Inc. | 4,665 | 216,316 | (10.8 | ) | ||||||||
TransDigm Group, Inc. | 1,658 | 986,195 | (49.4 | ) | ||||||||
Travel + Leisure Co. | 34,823 | 1,931,980 | (96.8 | ) | ||||||||
Travelers Cos., Inc. | 1,625 | 277,973 | (13.9 | ) | ||||||||
Trex Co., Inc. | 2,203 | 128,193 | (6.4 | ) | ||||||||
TripAdvisor, Inc. | 702 | 18,020 | (0.9 | ) | ||||||||
Twilio, Inc., Class A | 2,366 | 264,566 | (13.3 | ) | ||||||||
UDR, Inc. | 17,857 | 950,171 | (47.6 | ) | ||||||||
Ulta Beauty, Inc. | 629 | 249,587 | (12.5 | ) | ||||||||
Ultragenyx Pharmaceutical, Inc. | 6,712 | 474,471 | (23.8 | ) | ||||||||
Union Pacific Corp. | 3,461 | 810,878 | (40.6 | ) | ||||||||
United States Steel Corp. | 2,529 | 77,109 | (3.9 | ) | ||||||||
United Therapeutics Corp. | 1,202 | 213,427 | (10.7 | ) | ||||||||
UnitedHealth Group, Inc. | 533 | 271,057 | (13.6 | ) | ||||||||
Unum Group | 10,643 | 324,824 | (16.3 | ) | ||||||||
Valero Energy Corp. | 7,531 | 839,556 | (42.1 | ) | ||||||||
Valvoline, Inc. | 1,601 | 48,398 | (2.4 | ) | ||||||||
| Security | Shares | Value | % of Basket Value | |||||||||
| United States (continued) | ||||||||||||
Varonis Systems, Inc. | 7,939 | $ | 342,965 | (17.2 | )% | |||||||
Veeva Systems, Inc., Class A | 5,986 | 1,089,153 | (54.6 | ) | ||||||||
Verisk Analytics, Inc. | 2,718 | 554,608 | (27.8 | ) | ||||||||
VF Corp. | 1,716 | 89,232 | (4.5 | ) | ||||||||
ViacomCBS, Inc., Class B | 10,856 | 316,127 | (15.8 | ) | ||||||||
Viatris, Inc. | 55,524 | 573,563 | (28.7 | ) | ||||||||
Visa, Inc., Class A | 5,024 | 1,070,765 | (53.7 | ) | ||||||||
Voya Financial, Inc. | 17,872 | 1,128,438 | (56.5 | ) | ||||||||
W.W. Grainger, Inc. | 589 | 294,518 | (14.8 | ) | ||||||||
Walt Disney Co. | 1,390 | 155,166 | (7.8 | ) | ||||||||
Watsco, Inc. | 1,276 | 340,411 | (17.1 | ) | ||||||||
Wells Fargo & Co. | 2,777 | 121,161 | (6.1 | ) | ||||||||
West Pharmaceutical Services, Inc. | 486 | 153,119 | (7.7 | ) | ||||||||
Western Alliance Bancorp | 1,892 | 144,000 | (7.2 | ) | ||||||||
Westrock Co. | 15,639 | 774,600 | (38.8 | ) | ||||||||
WEX, Inc. | 2,093 | 347,940 | (17.4 | ) | ||||||||
Whirlpool Corp. | 983 | 178,434 | (8.9 | ) | ||||||||
Willis Towers Watson PLC | 775 | 166,517 | (8.3 | ) | ||||||||
Wintrust Financial Corp. | 6,228 | 543,829 | (27.2 | ) | ||||||||
Workday, Inc., Class A | 5,405 | 1,117,213 | (56.0 | ) | ||||||||
World Wrestling Entertainment, Inc., Class A | 9,411 | 549,508 | (27.5 | ) | ||||||||
Wynn Resorts Ltd. | 7,121 | 501,888 | (25.1 | ) | ||||||||
XPO Logistics, Inc. | 1,503 | 80,846 | (4.1 | ) | ||||||||
Xylem, Inc. | 1,603 | 129,042 | (6.5 | ) | ||||||||
Ziff Davis, Inc. | 1,527 | 134,926 | (6.8 | ) | ||||||||
Zions Bancorp NA | 9,734 | 550,068 | (27.6 | ) | ||||||||
Zoetis, Inc. | 3,931 | 696,770 | (34.9 | ) | ||||||||
|
|
|
| |||||||||
| 204,532,466 | ||||||||||||
| Preferred Stocks | ||||||||||||
| Germany | ||||||||||||
Fuchs Petrolub SE, Preference Shares | 4,613 | 145,500 | (7.3 | ) | ||||||||
Sartorius AG, Preference Shares | 1,088 | 407,923 | (20.4 | ) | ||||||||
|
|
|
| |||||||||
| 553,423 | ||||||||||||
| Warrants | ||||||||||||
| Australia | ||||||||||||
Magellan Financial Group Ltd. | 1,580 | 1,747 | (0.1 | ) | ||||||||
|
|
|
| |||||||||
Total Reference Entity — Long | 393,402,016 | |||||||||||
|
| |||||||||||
Reference Entity — Short |
| |||||||||||
| Common Stocks | ||||||||||||
| Australia | ||||||||||||
Adbri Ltd. | (206,705 | ) | (421,852 | ) | 21.1 | |||||||
Allkem Ltd. | (64,708 | ) | (539,290 | ) | 27.0 | |||||||
ALS Ltd. | (135,846 | ) | (1,230,098 | ) | 61.6 | |||||||
Ampol Ltd. | (56,877 | ) | (1,337,247 | ) | 67.0 | |||||||
Ansell Ltd. | (4,281 | ) | (81,995 | ) | 4.1 | |||||||
APA Group | (100,749 | ) | (809,530 | ) | 40.6 | |||||||
Appen Ltd. | (6,505 | ) | (29,714 | ) | 1.5 | |||||||
ASX Ltd. | (1,573 | ) | (95,103 | ) | 4.8 | |||||||
Bendigo & Adelaide Bank Ltd. | (8,072 | ) | (60,183 | ) | 3.0 | |||||||
Brambles Ltd. | (138,953 | ) | (1,026,073 | ) | 51.4 | |||||||
Chalice Mining Ltd. | (134,396 | ) | (645,197 | ) | 32.3 | |||||||
Champion Iron Ltd. | (9,024 | ) | (45,745 | ) | 2.3 | |||||||
Cleanaway Waste Management Ltd. | (885,328 | ) | (1,984,497 | ) | 99.4 | |||||||
Cochlear Ltd. | (5,883 | ) | (947,559 | ) | 47.5 | |||||||
Coles Group Ltd. | (24,463 | ) | (321,656 | ) | 16.1 | |||||||
Computershare Ltd. | (48,455 | ) | (854,265 | ) | 42.8 | |||||||
Crown Resorts Ltd. | (68,370 | ) | (619,032 | ) | 31.0 | |||||||
CSL Ltd. | (3,327 | ) | (634,958 | ) | 31.8 | |||||||
| 78 | 2 0 2 2 BLACK ROCK ANNUAL REPORT TO SHAREHOLDERS |
Schedule of Investments (continued) April 30, 2022 | BlackRock Global Long/Short Equity Fund |
| Security | Shares | Value | % of Basket Value | |||||||||
| Australia (continued) | ||||||||||||
Downer EDI Ltd. | (4,499 | ) | $ | (17,674 | ) | 0.9 | % | |||||
EBOS Group Ltd. | (697 | ) | (19,011 | ) | 0.9 | |||||||
Endeavour Group Ltd. | (321,808 | ) | (1,761,595 | ) | 88.3 | |||||||
Fortescue Metals Group Ltd. | (10,913 | ) | (164,929 | ) | 8.3 | |||||||
GPT Group | (77,984 | ) | (277,224 | ) | 13.9 | |||||||
Incitec Pivot Ltd. | (51,541 | ) | (139,007 | ) | 7.0 | |||||||
Insurance Australia Group Ltd. | (355,374 | ) | (1,134,812 | ) | 56.8 | |||||||
Lendlease Group | (93,105 | ) | (797,571 | ) | 40.0 | |||||||
Mineral Resources Ltd. | (18,260 | ) | (741,963 | ) | 37.2 | |||||||
National Australia Bank Ltd. | (4,973 | ) | (113,527 | ) | 5.7 | |||||||
Newcrest Mining Ltd. | (26,380 | ) | (495,399 | ) | 24.8 | |||||||
Newcrest Mining Ltd. NPV | (2,318 | ) | (43,810 | ) | 2.2 | |||||||
NEXTDC Ltd. | (89,671 | ) | (696,192 | ) | 34.9 | |||||||
Northern Star Resources Ltd. | (119,352 | ) | (820,400 | ) | 41.1 | |||||||
Orica Ltd. | (69,078 | ) | (793,763 | ) | 39.8 | |||||||
Qantas Airways Ltd. | (4,980 | ) | (19,297 | ) | 1.0 | |||||||
Ramsay Health Care Ltd. | (28,074 | ) | (1,593,122 | ) | 79.8 | |||||||
Reece Ltd. | (24,875 | ) | (302,221 | ) | 15.1 | |||||||
Rio Tinto Ltd. | (2,169 | ) | (171,576 | ) | 8.6 | |||||||
Santos Ltd. | (35,226 | ) | (196,845 | ) | 9.9 | |||||||
Seven Group Holdings Ltd. | (21,718 | ) | (303,008 | ) | 15.2 | |||||||
Shopping Centres Australasia Property Group | (142,313 | ) | (304,585 | ) | 15.3 | |||||||
Suncorp Group Ltd. | (166,335 | ) | (1,335,502 | ) | 66.9 | |||||||
Tabcorp Holdings Ltd. | (269,302 | ) | (1,029,869 | ) | 51.6 | |||||||
Transurban Group | (121,228 | ) | (1,217,324 | ) | 61.0 | |||||||
Vicinity Centres | (18,714 | ) | (24,792 | ) | 1.2 | |||||||
Woolworths Group Ltd. | (44,112 | ) | (1,193,365 | ) | 59.8 | |||||||
Worley Ltd. | (77,824 | ) | (756,840 | ) | 37.9 | |||||||
|
|
|
| |||||||||
| (28,149,217 | ) | |||||||||||
| Austria | ||||||||||||
BAWAG Group AG | (2,984 | ) | (141,692 | ) | 7.1 | |||||||
OMV AG | (8,977 | ) | (458,883 | ) | 23.0 | |||||||
Telekom Austria AG | (1,641 | ) | (11,700 | ) | 0.6 | |||||||
|
|
|
| |||||||||
| (612,275 | ) | |||||||||||
| Belgium | ||||||||||||
Etablissements Franz Colruyt NV | (949 | ) | (34,848 | ) | 1.8 | |||||||
Galapagos NV | (885 | ) | (51,961 | ) | 2.6 | |||||||
Sofina SA | (2,417 | ) | (740,707 | ) | 37.1 | |||||||
UCB SA | (2,724 | ) | (309,644 | ) | 15.5 | |||||||
|
|
|
| |||||||||
| (1,137,160 | ) | |||||||||||
| Bermuda | ||||||||||||
Everest Re Group Ltd. | (419 | ) | (115,104 | ) | 5.8 | |||||||
Signet Jewelers Ltd. | (3,425 | ) | (240,435 | ) | 12.1 | |||||||
Triton International Ltd. | (5,959 | ) | (364,035 | ) | 18.2 | |||||||
|
|
|
| |||||||||
| (719,574 | ) | |||||||||||
| Canada | ||||||||||||
Agnico Eagle Mines Ltd. | (9,400 | ) | (547,178 | ) | 27.4 | |||||||
Algonquin Power & Utilities Corp. | (83,590 | ) | (1,210,271 | ) | 60.6 | |||||||
Bank of Montreal | (16,948 | ) | (1,796,977 | ) | 90.0 | |||||||
Barrick Gold Corp. | (15,433 | ) | (344,184 | ) | 17.2 | |||||||
BlackBerry Ltd. | (13,566 | ) | (77,617 | ) | 3.9 | |||||||
Cameco Corp. | (14,759 | ) | (381,081 | ) | 19.1 | |||||||
Canadian Apartment Properties REIT | (8,520 | ) | (333,730 | ) | 16.7 | |||||||
Canadian Natural Resources Ltd. | (17,731 | ) | (1,097,413 | ) | 55.0 | |||||||
Canadian Solar, Inc. | (11,542 | ) | (317,636 | ) | 15.9 | |||||||
Canadian Tire Corp. Ltd., Class A | (3,861 | ) | (531,821 | ) | 26.7 | |||||||
Centerra Gold, Inc. | (139,344 | ) | (1,289,690 | ) | 64.6 | |||||||
Constellation Software, Inc. | (22 | ) | (34,625 | ) | 1.7 | |||||||
| Security | Shares | Value | % of Basket Value | |||||||||
| Canada (continued) | ||||||||||||
Dollarama, Inc. | (520 | ) | $ | (28,909 | ) | 1.5 | % | |||||
Dream Industrial Real Estate Investment Trust | (36,208 | ) | (421,649 | ) | 21.1 | |||||||
Empire Co. Ltd. | (6,409 | ) | (211,679 | ) | 10.6 | |||||||
Fairfax Financial Holdings Ltd. | (802 | ) | (440,671 | ) | 22.1 | |||||||
Finning International, Inc. | (14,344 | ) | (403,528 | ) | 20.2 | |||||||
Fortis, Inc. | (7,119 | ) | (346,405 | ) | 17.4 | |||||||
Gibson Energy, Inc. | (13,660 | ) | (260,089 | ) | 13.0 | |||||||
Gildan Activewear, Inc. | (5,267 | ) | (178,471 | ) | 8.9 | |||||||
Great-West Lifeco, Inc. | (1,543 | ) | (42,567 | ) | 2.1 | |||||||
H&R Real Estate Investment Trust | (64,591 | ) | (642,566 | ) | 32.2 | |||||||
Hudbay Minerals, Inc. | (43,807 | ) | (280,646 | ) | 14.1 | |||||||
iA Financial Corp., Inc. | (546 | ) | (28,549 | ) | 1.4 | |||||||
Kinross Gold Corp. | (95,440 | ) | (482,159 | ) | 24.2 | |||||||
Lightspeed Commerce, Inc. | (27,978 | ) | (625,266 | ) | 31.3 | |||||||
Loblaw Cos. Ltd. | (7,100 | ) | (649,454 | ) | 32.5 | |||||||
Magna International, Inc. | (20,193 | ) | (1,216,940 | ) | 61.0 | |||||||
MEG Energy Corp. | (12,543 | ) | (188,440 | ) | 9.4 | |||||||
Methanex Corp. | (1,563 | ) | (78,342 | ) | 3.9 | |||||||
Metro, Inc. | (5,712 | ) | (313,957 | ) | 15.7 | |||||||
Nuvei Corp. | (932 | ) | (52,119 | ) | 2.6 | |||||||
Open Text Corp. | (53,091 | ) | (2,126,285 | ) | 106.5 | |||||||
Parkland Corp. | (7,199 | ) | (204,485 | ) | 10.3 | |||||||
Quebecor, Inc., Class B | (14,408 | ) | (339,045 | ) | 17.0 | |||||||
Restaurant Brands International, Inc. | (20,352 | ) | (1,162,677 | ) | 58.3 | |||||||
RioCan Real Estate Investment Trust | (19,163 | ) | (358,006 | ) | 17.9 | |||||||
Rogers Communications, Inc., Class B | (16,347 | ) | (890,486 | ) | 44.6 | |||||||
Royal Bank of Canada | (2,681 | ) | (270,782 | ) | 13.6 | |||||||
Saputo, Inc. | (7,376 | ) | (157,665 | ) | 7.9 | |||||||
Shaw Communications, Inc., Class B | (45,267 | ) | (1,348,161 | ) | 67.6 | |||||||
Stelco Holdings, Inc. | (6,621 | ) | (241,668 | ) | 12.1 | |||||||
Sun Life Financial, Inc. | (118,497 | ) | (5,895,102 | ) | 295.4 | |||||||
Thomson Reuters Corp. | (1,348 | ) | (134,774 | ) | 6.8 | |||||||
Topicus.com, Inc. | (828 | ) | (51,498 | ) | 2.6 | |||||||
Tricon Residential, Inc. | (57,181 | ) | (827,459 | ) | 41.5 | |||||||
West Fraser Timber Co. Ltd. | (1,556 | ) | (136,759 | ) | 6.9 | |||||||
|
|
|
| |||||||||
| (28,999,481 | ) | |||||||||||
| Chile | ||||||||||||
Antofagasta PLC | (5,160 | ) | (98,783 | ) | 5.0 | |||||||
|
|
|
| |||||||||
| China | ||||||||||||
Yangzijiang Shipbuilding Holdings Ltd. | (314,200 | ) | (204,991 | ) | 10.3 | |||||||
|
|
|
| |||||||||
| Denmark | ||||||||||||
Bavarian Nordic A/S | (12,166 | ) | (230,799 | ) | 11.6 | |||||||
|
|
|
| |||||||||
| Finland | ||||||||||||
Elisa OYJ | (6,033 | ) | (353,663 | ) | 17.7 | |||||||
Fortum OYJ | (24,874 | ) | (413,551 | ) | 20.7 | |||||||
Huhtamaki OYJ | (5,139 | ) | (194,256 | ) | 9.7 | |||||||
Kojamo OYJ | (13,501 | ) | (268,578 | ) | 13.5 | |||||||
Orion OYJ, Class B | (1,650 | ) | (64,717 | ) | 3.3 | |||||||
QT Group OYJ | (276 | ) | (24,047 | ) | 1.2 | |||||||
Sampo OYJ, A Shares | (4,455 | ) | (216,323 | ) | 10.8 | |||||||
Stora Enso OYJ, B Shares | (20,253 | ) | (398,569 | ) | 20.0 | |||||||
|
|
|
| |||||||||
| (1,933,704 | ) | |||||||||||
| France | ||||||||||||
Airbus SE | (6,751 | ) | (739,045 | ) | 37.0 | |||||||
Alstom SA | (20,322 | ) | (446,686 | ) | 22.4 | |||||||
BNP Paribas SA | (12,339 | ) | (639,794 | ) | 32.1 | |||||||
Bollore SA | (12,515 | ) | (58,400 | ) | 2.9 | |||||||
Bureau Veritas SA | (6,634 | ) | (190,573 | ) | 9.6 | |||||||
SCHEDULE OF INVESTMENTS | 79 |
Schedule of Investments (continued) April 30, 2022 | BlackRock Global Long/Short Equity Fund |
| Security | Shares | Value | % of Basket Value | |||||||||
| France (continued) | ||||||||||||
Cie de Saint-Gobain | (3,241 | ) | $ | (189,074 | ) | 9.5 | % | |||||
Cie Generale des Etablissements Michelin SCA | (16,823 | ) | (2,083,695 | ) | 104.4 | |||||||
Constellium SE | (9,731 | ) | (162,410 | ) | 8.1 | |||||||
Credit Agricole SA | (27,038 | ) | (291,958 | ) | 14.6 | |||||||
Danone SA | (6,833 | ) | (413,200 | ) | 20.7 | |||||||
Eramet SA | (433 | ) | (57,711 | ) | 2.9 | |||||||
EssilorLuxottica SA | (3,621 | ) | (616,467 | ) | 30.9 | |||||||
Getlink SE | (104,040 | ) | (1,903,839 | ) | 95.4 | |||||||
JCDecaux SA | (471 | ) | (9,874 | ) | 0.5 | |||||||
L’Oreal SA | (72 | ) | (26,194 | ) | 1.3 | |||||||
Neoen SA | (7,486 | ) | (299,109 | ) | 15.0 | |||||||
Renault SA | (7,900 | ) | (193,026 | ) | 9.7 | |||||||
Rexel SA | (5,113 | ) | (104,738 | ) | 5.3 | |||||||
Sartorius Stedim Biotech | (534 | ) | (174,740 | ) | 8.8 | |||||||
Schneider Electric SE | (11,827 | ) | (1,696,809 | ) | 85.0 | |||||||
SEB SA | (6,418 | ) | (770,720 | ) | 38.6 | |||||||
SOITEC | (1,517 | ) | (271,747 | ) | 13.6 | |||||||
Unibail-Rodamco-Westfield | (465 | ) | (32,817 | ) | 1.6 | |||||||
Vallourec SA | (31,879 | ) | (375,636 | ) | 18.8 | |||||||
Veolia Environnement SA | (7,404 | ) | (216,023 | ) | 10.8 | |||||||
Worldline SA | (6,310 | ) | (248,262 | ) | 12.4 | |||||||
|
|
|
| |||||||||
| (12,212,547 | ) | |||||||||||
| Germany | ||||||||||||
Adidas AG | (7,271 | ) | (1,466,264 | ) | 73.5 | |||||||
AIXTRON SE | (2,862 | ) | (73,372 | ) | 3.7 | |||||||
Aurubis AG | (418 | ) | (47,501 | ) | 2.4 | |||||||
Auto1 Group SE | (17,440 | ) | (182,600 | ) | 9.1 | |||||||
Bayerische Motoren Werke AG | (2,607 | ) | (192,054 | ) | 9.6 | |||||||
Bechtle AG | (4,373 | ) | (202,075 | ) | 10.1 | |||||||
Carl Zeiss Meditec AG | (474 | ) | (59,537 | ) | 3.0 | |||||||
Daimler Truck Holding AG | (738 | ) | (19,848 | ) | 1.0 | |||||||
Delivery Hero SE | (5,180 | ) | (182,092 | ) | 9.1 | |||||||
Deutsche Lufthansa AG | (42,414 | ) | (315,542 | ) | 15.8 | |||||||
Deutsche Post AG | (7,037 | ) | (300,638 | ) | 15.1 | |||||||
DWS Group GmbH & Co. KGaA | (2,957 | ) | (97,310 | ) | 4.9 | |||||||
flatexDEGIRO AG | (19,506 | ) | (333,154 | ) | 16.7 | |||||||
Fresenius SE & Co. KGaA | (8,273 | ) | (292,434 | ) | 14.6 | |||||||
Knorr-Bremse AG | (3,170 | ) | (226,067 | ) | 11.3 | |||||||
Puma SE | (2,738 | ) | (201,458 | ) | 10.1 | |||||||
Siemens Healthineers AG | (4,393 | ) | (234,894 | ) | 11.8 | |||||||
Uniper SE | (9,549 | ) | (245,454 | ) | 12.3 | |||||||
United Internet AG | (11,052 | ) | (355,552 | ) | 17.8 | |||||||
Vantage Towers AG | (3,536 | ) | (120,230 | ) | 6.0 | |||||||
VERBIO Vereinigte BioEnergie AG | (676 | ) | (47,904 | ) | 2.4 | |||||||
Volkswagen AG | (668 | ) | (144,863 | ) | 7.3 | |||||||
Vonovia SE | (5,962 | ) | (237,532 | ) | 11.9 | |||||||
|
|
|
| |||||||||
| (5,578,375 | ) | |||||||||||
| Hong Kong | ||||||||||||
BOC Hong Kong Holdings Ltd. | (226,500 | ) | (819,898 | ) | 41.1 | |||||||
Champion REIT | (306,000 | ) | (134,146 | ) | 6.7 | |||||||
CK Asset Holdings Ltd. | (135,500 | ) | (918,573 | ) | 46.0 | |||||||
CK Hutchison Holdings Ltd. | (242,500 | ) | (1,701,847 | ) | 85.3 | |||||||
CK Infrastructure Holdings Ltd. | (110,000 | ) | (739,575 | ) | 37.1 | |||||||
CLP Holdings Ltd. | (218,500 | ) | (2,132,205 | ) | 106.8 | |||||||
Galaxy Entertainment Group Ltd. | (154,000 | ) | (878,750 | ) | 44.0 | |||||||
Guotai Junan International Holdings Ltd. | (259,000 | ) | (28,141 | ) | 1.4 | |||||||
Hang Seng Bank Ltd. | (18,800 | ) | (332,863 | ) | 16.7 | |||||||
Henderson Land Development Co. Ltd. | (130,000 | ) | (525,722 | ) | 26.3 | |||||||
HKT Trust & HKT Ltd. | (560,000 | ) | (803,568 | ) | 40.3 | |||||||
| Security | Shares | Value | % of Basket Value | |||||||||
| Hong Kong (continued) | ||||||||||||
Hong Kong & China Gas Co. Ltd. | (460,000 | ) | $ | (507,343 | ) | 25.4 | % | |||||
Hong Kong Exchanges & Clearing Ltd. | (13,300 | ) | (564,172 | ) | 28.3 | |||||||
Hongkong Land Holdings Ltd. | (78,200 | ) | (364,800 | ) | 18.3 | |||||||
Jardine Matheson Holdings Ltd. | (19,908 | ) | (1,057,712 | ) | 53.0 | |||||||
JS Global Lifestyle Co. Ltd. | (260,000 | ) | (308,441 | ) | 15.5 | |||||||
Kerry Logistics Network Ltd. | (80,500 | ) | (185,121 | ) | 9.3 | |||||||
Man Wah Holdings Ltd. | (371,200 | ) | (347,416 | ) | 17.4 | |||||||
Melco International Development Ltd. | (988,000 | ) | (780,085 | ) | 39.1 | |||||||
NWS Holdings Ltd. | (497,000 | ) | (449,924 | ) | 22.5 | |||||||
PCCW Ltd. | (1,783,000 | ) | (1,010,181 | ) | 50.6 | |||||||
Power Assets Holdings Ltd. | (155,500 | ) | (1,047,302 | ) | 52.5 | |||||||
Sino Land Co. Ltd. | (366,025 | ) | (483,805 | ) | 24.2 | |||||||
VTech Holdings Ltd. | (48,600 | ) | (343,792 | ) | 17.2 | |||||||
|
|
|
| |||||||||
| (16,465,382 | ) | |||||||||||
| Ireland | ||||||||||||
AerCap Holdings NV | (27,947 | ) | (1,305,404 | ) | 65.4 | |||||||
Allegion PLC | (771 | ) | (88,079 | ) | 4.4 | |||||||
Bank of Ireland Group PLC | (37,461 | ) | (227,040 | ) | 11.4 | |||||||
CRH PLC | (2,159 | ) | (85,334 | ) | 4.3 | |||||||
Flutter Entertainment PLC | (9,823 | ) | (987,108 | ) | 49.5 | |||||||
Smurfit Kappa Group PLC | (4,273 | ) | (180,559 | ) | 9.0 | |||||||
|
|
|
| |||||||||
| (2,873,524 | ) | |||||||||||
| Israel | ||||||||||||
Azrieli Group Ltd. | (7,028 | ) | (603,693 | ) | 30.2 | |||||||
First International Bank Of Israel Ltd. | (35,876 | ) | (1,506,523 | ) | 75.5 | |||||||
Fiverr International Ltd. | (4,489 | ) | (239,039 | ) | 12.0 | |||||||
Gazit-Globe Ltd. | (16,327 | ) | (153,061 | ) | 7.7 | |||||||
Global-e Online Ltd. | (4,320 | ) | (97,373 | ) | 4.9 | |||||||
ICL Ltd. | (58,544 | ) | (634,869 | ) | 31.8 | |||||||
Inmode Ltd. | (14,661 | ) | (368,138 | ) | 18.4 | |||||||
ironSource Ltd., Class A | (37,967 | ) | (145,413 | ) | 7.3 | |||||||
Kornit Digital Ltd. | (6,276 | ) | (417,354 | ) | 20.9 | |||||||
Maytronics Ltd. | (20,406 | ) | (362,325 | ) | 18.2 | |||||||
Sapiens International Corp. NV | (3,103 | ) | (72,523 | ) | 3.6 | |||||||
Shapir Engineering and Industry Ltd. | (15,467 | ) | (144,712 | ) | 7.3 | |||||||
Shufersal Ltd. | (129,383 | ) | (1,088,577 | ) | 54.5 | |||||||
Strauss Group Ltd. | (24,347 | ) | (650,822 | ) | 32.6 | |||||||
Wix.com Ltd. | (1,746 | ) | (131,753 | ) | 6.6 | |||||||
ZIM Integrated Shipping Services Ltd. | (3,341 | ) | (185,860 | ) | 9.3 | |||||||
|
|
|
| |||||||||
| (6,802,035 | ) | |||||||||||
| Italy | ||||||||||||
DiaSorin SpA | (3,122 | ) | (408,956 | ) | 20.5 | |||||||
Eni SpA | (73,797 | ) | (1,031,593 | ) | 51.7 | |||||||
FinecoBank Banca Fineco SpA | (15,054 | ) | (209,271 | ) | 10.5 | |||||||
Nexi SpA | (11,352 | ) | (111,339 | ) | 5.6 | |||||||
Poste Italiane SpA | (34,331 | ) | (336,414 | ) | 16.8 | |||||||
Prysmian SpA | (9,885 | ) | (321,509 | ) | 16.1 | |||||||
Recordati Industria Chimica e Farmaceutica SpA | (3,907 | ) | (188,272 | ) | 9.4 | |||||||
Unipol Gruppo SpA | (9,480 | ) | (51,691 | ) | 2.6 | |||||||
|
|
|
| |||||||||
| (2,659,045 | ) | |||||||||||
| Japan | ||||||||||||
Advance Residence Investment Corp. | (28 | ) | (76,918 | ) | 3.9 | |||||||
Aeon Mall Co. Ltd. | (13,600 | ) | (165,479 | ) | 8.3 | |||||||
AEON REIT Investment Corp. | (10 | ) | (11,481 | ) | 0.6 | |||||||
Ain Holdings, Inc. | (4,900 | ) | (219,788 | ) | 11.0 | |||||||
Air Water, Inc. | (9,900 | ) | (131,402 | ) | 6.6 | |||||||
Aisin Corp. | (6,000 | ) | (174,303 | ) | 8.7 | |||||||
Ariake Japan Co. Ltd. | (1,600 | ) | (64,194 | ) | 3.2 | |||||||
| 80 | 2 0 2 2 BLACK ROCK ANNUAL REPORT TO SHAREHOLDERS |
Schedule of Investments (continued) April 30, 2022 | BlackRock Global Long/Short Equity Fund |
| Security | Shares | Value | % of Basket Value | |||||||||
| Japan (continued) | ||||||||||||
Asahi Intecc Co. Ltd. | (8,300 | ) | $ | (160,389 | ) | 8.0 | % | |||||
Asics Corp. | (1,500 | ) | (23,665 | ) | 1.2 | |||||||
ASKUL Corp. | (8,400 | ) | (102,863 | ) | 5.2 | |||||||
Bank of Kyoto Ltd. | (13,100 | ) | (570,736 | ) | 28.6 | |||||||
BayCurrent Consulting, Inc. | (500 | ) | (163,934 | ) | 8.2 | |||||||
Benefit One, Inc. | (7,400 | ) | (112,202 | ) | 5.6 | |||||||
Bic Camera, Inc. | (3,700 | ) | (31,229 | ) | 1.6 | |||||||
Bridgestone Corp. | (1,100 | ) | (40,319 | ) | 2.0 | |||||||
Brother Industries Ltd. | (6,600 | ) | (114,705 | ) | 5.7 | |||||||
Canon Marketing Japan, Inc. | (6,400 | ) | (139,263 | ) | 7.0 | |||||||
Canon, Inc. | (3,900 | ) | (89,736 | ) | 4.5 | |||||||
Central Japan Railway Co. | (2,700 | ) | (339,890 | ) | 17.0 | |||||||
Chiba Bank Ltd. | (11,300 | ) | (65,125 | ) | 3.3 | |||||||
Credit Saison Co. Ltd. | (4,600 | ) | (51,812 | ) | 2.6 | |||||||
CyberAgent, Inc. | (17,300 | ) | (182,772 | ) | 9.2 | |||||||
Daido Steel Co. Ltd. | (2,000 | ) | (57,050 | ) | 2.9 | |||||||
Dai-ichi Life Holdings, Inc. | (10,500 | ) | (210,252 | ) | 10.5 | |||||||
Daio Paper Corp. | (2,000 | ) | (23,849 | ) | 1.2 | |||||||
Daiwa House REIT Investment Corp. | (174 | ) | (423,516 | ) | 21.2 | |||||||
Daiwa Office Investment Corp. | (13 | ) | (73,596 | ) | 3.7 | |||||||
Daiwa Securities Group, Inc. | (31,300 | ) | (153,405 | ) | 7.7 | |||||||
Denka Co. Ltd. | (2,200 | ) | (58,978 | ) | 3.0 | |||||||
Ezaki Glico Co. Ltd. | (2,300 | ) | (65,938 | ) | 3.3 | |||||||
Fuji Electric Co. Ltd. | (3,900 | ) | (171,018 | ) | 8.6 | |||||||
Fuji Media Holdings, Inc. | (11,700 | ) | (101,051 | ) | 5.1 | |||||||
Fuji Oil Holdings, Inc. | (9,700 | ) | (137,661 | ) | 6.9 | |||||||
Fujitsu General Ltd. | (32,300 | ) | (574,103 | ) | 28.8 | |||||||
Fukuoka Financial Group, Inc. | (3,700 | ) | (67,604 | ) | 3.4 | |||||||
Fukuyama Transporting Co. Ltd. | (2,500 | ) | (69,974 | ) | 3.5 | |||||||
Fuyo General Lease Co. Ltd. | (2,600 | ) | (140,673 | ) | 7.0 | |||||||
GLP J-REIT | (21 | ) | (28,337 | ) | 1.4 | |||||||
GMO internet, Inc. | (3,800 | ) | (75,944 | ) | 3.8 | |||||||
Goldwin, Inc. | (8,500 | ) | (426,339 | ) | 21.4 | |||||||
GS Yuasa Corp. | (3,300 | ) | (57,223 | ) | 2.9 | |||||||
Hachijuni Bank Ltd. | (105,400 | ) | (347,582 | ) | 17.4 | |||||||
Hakuhodo DY Holdings, Inc. | (5,600 | ) | (66,089 | ) | 3.3 | |||||||
Haseko Corp. | (19,500 | ) | (213,662 | ) | 10.7 | |||||||
Heiwa Corp. | (1,500 | ) | (22,553 | ) | 1.1 | |||||||
Hikari Tsushin, Inc. | (600 | ) | (70,256 | ) | 3.5 | |||||||
Hino Motors Ltd. | (22,500 | ) | (116,145 | ) | 5.8 | |||||||
Hirogin Holdings, Inc. | (136,800 | ) | (674,036 | ) | 33.8 | |||||||
Hitachi Ltd. | (6,500 | ) | (308,272 | ) | 15.4 | |||||||
Hitachi Transport System Ltd. | (4,800 | ) | (315,070 | ) | 15.8 | |||||||
Horiba Ltd. | (2,300 | ) | (111,903 | ) | 5.6 | |||||||
House Foods Group, Inc. | (5,600 | ) | (131,064 | ) | 6.6 | |||||||
Ibiden Co. Ltd. | (4,000 | ) | (149,487 | ) | 7.5 | |||||||
Idemitsu Kosan Co. Ltd. | (8,200 | ) | (216,111 | ) | 10.8 | |||||||
Iida Group Holdings Co. Ltd. | (5,900 | ) | (93,837 | ) | 4.7 | |||||||
Industrial & Infrastructure Fund Investment Corp. | (43 | ) | (61,700 | ) | 3.1 | |||||||
Isetan Mitsukoshi Holdings Ltd. | (5,900 | ) | (43,787 | ) | 2.2 | |||||||
Isuzu Motors Ltd. | (2,300 | ) | (26,831 | ) | 1.3 | |||||||
Ito En Ltd. | (2,000 | ) | (82,191 | ) | 4.1 | |||||||
Itoham Yonekyu Holdings, Inc. | (14,900 | ) | (74,992 | ) | 3.8 | |||||||
Iwatani Corp. | (11,000 | ) | (437,655 | ) | 21.9 | |||||||
Iyo Bank Ltd. | (26,900 | ) | (130,435 | ) | 6.5 | |||||||
Japan Airlines Co. Ltd. | (32,700 | ) | (539,860 | ) | 27.1 | |||||||
Japan Aviation Electronics Industry Ltd. | (1,000 | ) | (13,983 | ) | 0.7 | |||||||
Japan Hotel REIT Investment Corp. | (42 | ) | (21,331 | ) | 1.1 | |||||||
Japan Logistics Fund, Inc. | (30 | ) | (73,215 | ) | 3.7 | |||||||
Japan Post Insurance Co. Ltd. | (4,900 | ) | (79,232 | ) | 4.0 | |||||||
Japan Real Estate Investment Corp. | (62 | ) | (300,071 | ) | 15.0 | |||||||
Japan Steel Works Ltd. | (33,000 | ) | (928,771 | ) | 46.5 | |||||||
| Security | Shares | Value | % of Basket Value | |||||||||
| Japan (continued) | ||||||||||||
JTEKT Corp. | (13,600 | ) | $ | (94,818 | ) | 4.8 | % | |||||
Justsystems Corp. | (6,300 | ) | (273,819 | ) | 13.7 | |||||||
Kajima Corp. | (20,800 | ) | (231,805 | ) | 11.6 | |||||||
Kaken Pharmaceutical Co. Ltd. | (400 | ) | (12,121 | ) | 0.6 | |||||||
Kaneka Corp. | (7,600 | ) | (203,357 | ) | 10.2 | |||||||
Keihan Holdings Co. Ltd. | (15,600 | ) | (332,744 | ) | 16.7 | |||||||
Keikyu Corp. | (5,300 | ) | (53,384 | ) | 2.7 | |||||||
Keio Corp. | (7,100 | ) | (272,303 | ) | 13.6 | |||||||
Kenedix Office Investment Corp. | (52 | ) | (271,789 | ) | 13.6 | |||||||
Kinden Corp. | (5,300 | ) | (62,802 | ) | 3.1 | |||||||
Kirin Holdings Co. Ltd. | (33,400 | ) | (486,896 | ) | 24.4 | |||||||
Kobayashi Pharmaceutical Co. Ltd. | (2,200 | ) | (150,028 | ) | 7.5 | |||||||
Kobe Steel Ltd. | (11,500 | ) | (49,856 | ) | 2.5 | |||||||
Koei Tecmo Holdings Co. Ltd. | (13,100 | ) | (401,712 | ) | 20.1 | |||||||
Kotobuki Spirits Co. Ltd. | (3,400 | ) | (178,966 | ) | 9.0 | |||||||
K’s Holdings Corp. | (10,000 | ) | (99,031 | ) | 5.0 | |||||||
Kubota Corp. | (8,500 | ) | (144,404 | ) | 7.2 | |||||||
Kyushu Electric Power Co., Inc. | (26,400 | ) | (165,697 | ) | 8.3 | |||||||
Kyushu Financial Group, Inc. | (38,500 | ) | (118,151 | ) | 5.9 | |||||||
Kyushu Railway Co. | (7,400 | ) | (145,046 | ) | 7.3 | |||||||
LaSalle Logiport REIT | (14 | ) | (18,941 | ) | 0.9 | |||||||
Lintec Corp. | (4,300 | ) | (80,099 | ) | 4.0 | |||||||
M3, Inc. | (10,800 | ) | (344,887 | ) | 17.3 | |||||||
Mabuchi Motor Co. Ltd. | (5,600 | ) | (149,568 | ) | 7.5 | |||||||
Marui Group Co. Ltd. | (900 | ) | (15,496 | ) | 0.8 | |||||||
Maruichi Steel Tube Ltd. | (6,400 | ) | (136,591 | ) | 6.8 | |||||||
Matsui Securities Co. Ltd. | (45,300 | ) | (280,172 | ) | 14.0 | |||||||
Matsumotokiyoshi Holdings Co. Ltd. | (2,200 | ) | (72,722 | ) | 3.6 | |||||||
Mebuki Financial Group, Inc. | (28,000 | ) | (56,378 | ) | 2.8 | |||||||
MEIJI Holdings Co. Ltd. | (3,800 | ) | (189,418 | ) | 9.5 | |||||||
Menicon Co. Ltd. | (400 | ) | (8,544 | ) | 0.4 | |||||||
Mitsubishi Electric Corp. | (27,800 | ) | (291,185 | ) | 14.6 | |||||||
Mitsubishi Estate Co. Ltd. | (21,900 | ) | (319,008 | ) | 16.0 | |||||||
Mitsubishi Gas Chemical Co., Inc. | (6,600 | ) | (96,380 | ) | 4.8 | |||||||
Mitsubishi Heavy Industries Ltd. | (17,500 | ) | (598,327 | ) | 30.0 | |||||||
Mitsubishi UFJ Financial Group, Inc. | (27,600 | ) | (160,449 | ) | 8.0 | |||||||
Mitsui Fudosan Logistics Park, Inc. | (165 | ) | (707,425 | ) | 35.4 | |||||||
Mitsui High-Tec, Inc. | (3,400 | ) | (293,711 | ) | 14.7 | |||||||
Miura Co. Ltd. | (3,800 | ) | (79,373 | ) | 4.0 | |||||||
MonotaRO Co. Ltd. | (2,700 | ) | (46,381 | ) | 2.3 | |||||||
Mori Hills REIT Investment Corp. | (99 | ) | (112,280 | ) | 5.6 | |||||||
Morinaga & Co. Ltd. | (3,100 | ) | (96,127 | ) | 4.8 | |||||||
Morinaga Milk Industry Co. Ltd. | (9,500 | ) | (382,582 | ) | 19.2 | |||||||
Nabtesco Corp. | (2,100 | ) | (47,896 | ) | 2.4 | |||||||
Nagase & Co. Ltd. | (3,200 | ) | (45,856 | ) | 2.3 | |||||||
NEC Networks & System Integration Corp. | (1,200 | ) | (17,039 | ) | 0.9 | |||||||
NGK Spark Plug Co. Ltd. | (12,100 | ) | (185,677 | ) | 9.3 | |||||||
NH Foods Ltd. | (2,900 | ) | (91,583 | ) | 4.6 | |||||||
NHK Spring Co. Ltd. | (19,700 | ) | (127,241 | ) | 6.4 | |||||||
Nifco, Inc. | (5,000 | ) | (105,569 | ) | 5.3 | |||||||
Nihon Unisys Ltd. | (9,400 | ) | (237,491 | ) | 11.9 | |||||||
Nippon Accommodations Fund, Inc. | (13 | ) | (64,011 | ) | 3.2 | |||||||
Nippon Building Fund, Inc. | (24 | ) | (124,591 | ) | 6.2 | |||||||
Nippon Kayaku Co. Ltd. | (63,000 | ) | (549,065 | ) | 27.5 | |||||||
Nippon Shinyaku Co. Ltd. | (1,100 | ) | (74,397 | ) | 3.7 | |||||||
Nippon Shokubai Co. Ltd. | (1,900 | ) | (76,440 | ) | 3.8 | |||||||
Nishi-Nippon Railroad Co. Ltd. | (5,300 | ) | (106,025 | ) | 5.3 | |||||||
Nisshin Seifun Group, Inc. | (14,600 | ) | (194,630 | ) | 9.8 | |||||||
Noevir Holdings Co. Ltd. | (1,900 | ) | (74,497 | ) | 3.7 | |||||||
NOF Corp. | (2,600 | ) | (97,590 | ) | 4.9 | |||||||
Nomura Holdings, Inc. | (47,400 | ) | (182,511 | ) | 9.1 | |||||||
Nomura Real Estate Master Fund, Inc. | (25 | ) | (31,388 | ) | 1.6 | |||||||
SCHEDULE OF INVESTMENTS | 81 |
Schedule of Investments (continued) April 30, 2022 | BlackRock Global Long/Short Equity Fund |
| Security | Shares | Value | % of Basket Value | |||||||||
| Japan (continued) | ||||||||||||
NS Solutions Corp. | (6,600 | ) | $ | (196,901 | ) | 9.9 | % | |||||
Oji Holdings Corp. | (157,100 | ) | (744,183 | ) | 37.3 | |||||||
OKUMA Corp. | (2,200 | ) | (78,631 | ) | 3.9 | |||||||
Ono Pharmaceutical Co. Ltd. | (18,800 | ) | (482,982 | ) | 24.2 | |||||||
Orient Corp. | (51,900 | ) | (49,818 | ) | 2.5 | |||||||
ORIX Corp. | (19,600 | ) | (357,484 | ) | 17.9 | |||||||
Orix JREIT, Inc. | (22 | ) | (29,738 | ) | 1.5 | |||||||
OSG Corp. | (8,500 | ) | (106,781 | ) | 5.4 | |||||||
Pan Pacific International Holdings Corp. | (4,900 | ) | (75,035 | ) | 3.8 | |||||||
Persol Holdings Co. Ltd. | (22,500 | ) | (446,392 | ) | 22.4 | |||||||
Rakus Co. Ltd. | (3,800 | ) | (46,572 | ) | 2.3 | |||||||
Rengo Co. Ltd. | (41,800 | ) | (247,479 | ) | 12.4 | |||||||
Resona Holdings Inc. | (18,300 | ) | (79,576 | ) | 4.0 | |||||||
Rohto Pharmaceutical Co. Ltd. | (4,700 | ) | (125,511 | ) | 6.3 | |||||||
Sankyo Co. Ltd. | (3,500 | ) | (100,712 | ) | 5.0 | |||||||
Sansan, Inc. | (5,700 | ) | (54,382 | ) | 2.7 | |||||||
Sanwa Holdings Corp. | (16,900 | ) | (153,963 | ) | 7.7 | |||||||
Secom Co. Ltd. | (5,500 | ) | (386,949 | ) | 19.4 | |||||||
Seibu Holdings, Inc. | (9,300 | ) | (92,396 | ) | 4.6 | |||||||
Sekisui Chemical Co. Ltd. | (9,700 | ) | (131,349 | ) | 6.6 | |||||||
Seven & i Holdings Co. Ltd. | (8,500 | ) | (375,844 | ) | 18.8 | |||||||
Seven Bank Ltd. | (205,200 | ) | (383,583 | ) | 19.2 | |||||||
Sharp Corp. | (20,100 | ) | (170,072 | ) | 8.5 | |||||||
Shikoku Electric Power Co., Inc. | (11,500 | ) | (66,119 | ) | 3.3 | |||||||
Shimamura Co. Ltd. | (1,700 | ) | (150,770 | ) | 7.6 | |||||||
Shimano, Inc. | (600 | ) | (106,311 | ) | 5.3 | |||||||
Shinsei Bank Ltd. | (3,800 | ) | (66,637 | ) | 3.3 | |||||||
Shizuoka Bank Ltd. | (46,000 | ) | (297,623 | ) | 14.9 | |||||||
SHO-BOND Holdings Co. Ltd. | (4,300 | ) | (180,729 | ) | 9.1 | |||||||
Shochiku Co. Ltd. | (2,900 | ) | (295,976 | ) | 14.8 | |||||||
Showa Denko KK | (16,700 | ) | (324,955 | ) | 16.3 | |||||||
Sohgo Security Services Co. Ltd. | (10,600 | ) | (294,455 | ) | 14.8 | |||||||
Stanley Electric Co. Ltd. | (5,200 | ) | (89,664 | ) | 4.5 | |||||||
Sugi Holdings Co. Ltd. | (3,700 | ) | (158,584 | ) | 7.9 | |||||||
Sumitomo Bakelite Co. Ltd. | (1,300 | ) | (42,654 | ) | 2.1 | |||||||
Sumitomo Realty & Development Co. Ltd. | (14,500 | ) | (384,663 | ) | 19.3 | |||||||
Sushiro Global Holdings Ltd. | (4,500 | ) | (106,788 | ) | 5.4 | |||||||
Suzuken Co Ltd/Aichi Japan | (7,300 | ) | (215,476 | ) | 10.8 | |||||||
Taisho Pharmaceutical Holdings Co. Ltd. | (1,100 | ) | (43,327 | ) | 2.2 | |||||||
Taiyo Nippon Sanso Corp. | (2,900 | ) | (52,187 | ) | 2.6 | |||||||
Taiyo Yuden Co. Ltd. | (7,500 | ) | (294,656 | ) | 14.8 | |||||||
TechnoPro Holdings Inc. | (1,200 | ) | (30,562 | ) | 1.5 | |||||||
Tobu Railway Co. Ltd. | (4,900 | ) | (110,143 | ) | 5.5 | |||||||
Toda Corp. | (15,600 | ) | (89,630 | ) | 4.5 | |||||||
Toho Co. Ltd. | (5,700 | ) | (211,512 | ) | 10.6 | |||||||
Toho Gas Co. Ltd. | (3,700 | ) | (86,799 | ) | 4.4 | |||||||
Tokai Carbon Co. Ltd. | (108,800 | ) | (899,652 | ) | 45.1 | |||||||
Tokyo Tatemono Co. Ltd. | (58,100 | ) | (819,148 | ) | 41.0 | |||||||
Tokyu Fudosan Holdings Corp. | (70,600 | ) | (367,379 | ) | 18.4 | |||||||
Toppan Inc. | (25,800 | ) | (426,465 | ) | 21.4 | |||||||
Toshiba TEC Corp. | (6,400 | ) | (216,942 | ) | 10.9 | |||||||
Toyo Tire Corp. | (9,500 | ) | (108,964 | ) | 5.5 | |||||||
Toyoda Gosei Co. Ltd. | (3,900 | ) | (56,792 | ) | 2.8 | |||||||
Toyota Boshoku Corp. | (3,800 | ) | (60,562 | ) | 3.0 | |||||||
Toyota Industries Corp. | (700 | ) | (41,984 | ) | 2.1 | |||||||
TS Tech Co. Ltd. | (15,700 | ) | (163,839 | ) | 8.2 | |||||||
Ube Industries Ltd. | (4,200 | ) | (65,120 | ) | 3.3 | |||||||
Ulvac, Inc. | (3,300 | ) | (129,310 | ) | 6.5 | |||||||
USS Co. Ltd. | (4,500 | ) | (74,916 | ) | 3.8 | |||||||
Yamato Holdings Co. Ltd. | (8,500 | ) | (159,052 | ) | 8.0 | |||||||
Yamato Kogyo Co. Ltd. | (4,800 | ) | (154,911 | ) | 7.8 | |||||||
| Security | Shares | Value | % of Basket Value | |||||||||
| Japan (continued) | ||||||||||||
Yamazaki Baking Co. Ltd. | (15,200 | ) | $ | (187,904 | ) | 9.4 | % | |||||
Yokogawa Electric Corp. | (19,000 | ) | (302,907 | ) | 15.2 | |||||||
Zenkoku Hosho Co. Ltd. | (1,600 | ) | (56,154 | ) | 2.8 | |||||||
Zeon Corp. | (11,500 | ) | (122,461 | ) | 6.1 | |||||||
|
|
|
| |||||||||
| (35,348,122 | ) | |||||||||||
| Luxembourg | ||||||||||||
Eurofins Scientific SE | (7,433 | ) | (690,806 | ) | 34.6 | |||||||
|
|
|
| |||||||||
| Macau | ||||||||||||
Sands China Ltd. | (312,000 | ) | (687,703 | ) | 34.5 | |||||||
|
|
|
| |||||||||
| Netherlands | ||||||||||||
Adyen NV | (421 | ) | (706,141 | ) | 35.4 | |||||||
Akzo Nobel NV | (3,446 | ) | (298,928 | ) | 15.0 | |||||||
Argenx SE | (124 | ) | (35,726 | ) | 1.8 | |||||||
ASM International NV | (216 | ) | (64,906 | ) | 3.3 | |||||||
ASML Holding NV | (223 | ) | (126,561 | ) | 6.3 | |||||||
BE Semiconductor Industries NV | (6,421 | ) | (391,415 | ) | 19.6 | |||||||
Euronext NV | (2,873 | ) | (230,191 | ) | 11.5 | |||||||
EXOR NV | (2,176 | ) | (151,003 | ) | 7.6 | |||||||
Iveco Group NV | (27,987 | ) | (164,658 | ) | 8.3 | |||||||
JDE Peet’s NV | (1,716 | ) | (50,483 | ) | 2.5 | |||||||
Koninklijke KPN NV | (641,528 | ) | (2,213,652 | ) | 110.9 | |||||||
Koninklijke Philips NV | (18,209 | ) | (475,822 | ) | 23.8 | |||||||
NN Group NV | (6,491 | ) | (317,939 | ) | 15.9 | |||||||
SBM Offshore NV | (12,255 | ) | (177,589 | ) | 8.9 | |||||||
Shop Apotheke Europe NV | (6,017 | ) | (496,215 | ) | 24.9 | |||||||
Stellantis NV | (50,012 | ) | (671,444 | ) | 33.6 | |||||||
|
|
|
| |||||||||
| (6,572,673 | ) | |||||||||||
| New Zealand | ||||||||||||
Fletcher Building Ltd. | (2,438 | ) | (9,712 | ) | 0.5 | |||||||
|
|
|
| |||||||||
| Poland | ||||||||||||
InPost SA | (73,607 | ) | (451,275 | ) | 22.6 | |||||||
|
|
|
| |||||||||
| Portugal | ||||||||||||
Banco Comercial Portugues SA | (340,297 | ) | (52,606 | ) | 2.6 | |||||||
Galp Energia SGPS SA | (2,713 | ) | (33,022 | ) | 1.7 | |||||||
|
|
|
| |||||||||
| (85,628 | ) | |||||||||||
| Singapore | ||||||||||||
Ascendas Real Estate Investment Trust | (183,100 | ) | (376,724 | ) | 18.9 | |||||||
Ascott Residence Trust | (95,700 | ) | (79,506 | ) | 4.0 | |||||||
CapitaLand Integrated Commercial Trust | (88,800 | ) | (148,793 | ) | 7.4 | |||||||
DBS Group Holdings Ltd. | (35,800 | ) | (868,530 | ) | 43.5 | |||||||
Genting Singapore Ltd. | (701,300 | ) | (407,168 | ) | 20.4 | |||||||
Keppel Corp. Ltd. | (23,000 | ) | (113,431 | ) | 5.7 | |||||||
Keppel DC REIT | (258,400 | ) | (385,220 | ) | 19.3 | |||||||
Mapletree Industrial Trust | (24,000 | ) | (45,098 | ) | 2.2 | |||||||
Mapletree Logistics Trust | (201,900 | ) | (259,304 | ) | 13.0 | |||||||
Singapore Exchange Ltd. | (55,300 | ) | (389,110 | ) | 19.5 | |||||||
Singapore Technologies Engineering Ltd. | (153,100 | ) | (450,897 | ) | 22.6 | |||||||
Singapore Telecommunications Ltd. | (17,900 | ) | (35,725 | ) | 1.8 | |||||||
Suntec Real Estate Investment Trust | (26,700 | ) | (35,272 | ) | 1.8 | |||||||
Venture Corp. Ltd. | (3,200 | ) | (39,283 | ) | 2.0 | |||||||
Wilmar International Ltd. | (104,400 | ) | (332,795 | ) | 16.7 | |||||||
Yangzijiang Financial Holdings | (314,200 | ) | (123,822 | ) | 6.2 | |||||||
|
|
|
| |||||||||
| (4,090,678 | ) | |||||||||||
| South Africa | ||||||||||||
Investec PLC | (23,089 | ) | (135,992 | ) | 6.8 | |||||||
|
|
|
| |||||||||
| Spain | ||||||||||||
ACS Actividades de Construccion y Servicios SA | (15,517 | ) | (397,317 | ) | 19.9 | |||||||
| 82 | 2 0 2 2 BLACK ROCK ANNUAL REPORT TO SHAREHOLDERS |
Schedule of Investments (continued) April 30, 2022 | BlackRock Global Long/Short Equity Fund |
| Security | Shares | Value | % of Basket Value | |||||||||
| Spain (continued) | ||||||||||||
Aena SME SA | (3,393 | ) | $ | (481,499 | ) | 24.1 | % | |||||
Amadeus IT Group SA | (13,083 | ) | (819,819 | ) | 41.1 | |||||||
CaixaBank SA | (288,603 | ) | (931,580 | ) | 46.7 | |||||||
Corp. ACCIONA Energias Renovables SA | (1,057 | ) | (39,074 | ) | 2.0 | |||||||
Enagas SA | (21,367 | ) | (462,012 | ) | 23.1 | |||||||
Ferrovial SA | (34,969 | ) | (896,757 | ) | 44.9 | |||||||
Fluidra SA | (14,097 | ) | (381,524 | ) | 19.1 | |||||||
Siemens Gamesa Renewable Energy SA | (12,027 | ) | (191,573 | ) | 9.6 | |||||||
|
|
|
| |||||||||
| (4,601,155 | ) | |||||||||||
| Sweden | ||||||||||||
Volvo Car AB, B Shares | (6,470 | ) | (47,465 | ) | 2.4 | |||||||
|
|
|
| |||||||||
| Switzerland | ||||||||||||
ABB Ltd. | (99,508 | ) | (2,985,433 | ) | 149.6 | |||||||
Bachem Holding AG, Class B | (132 | ) | (57,598 | ) | 2.9 | |||||||
Banque Cantonale Vaudoise | (219 | ) | (18,508 | ) | 0.9 | |||||||
Chubb Ltd. | (4,317 | ) | (891,245 | ) | 44.7 | |||||||
Coca-Cola HBC AG | (6,212 | ) | (125,941 | ) | 6.3 | |||||||
CRISPR Therapeutics AG | (8,630 | ) | (428,221 | ) | 21.5 | |||||||
DKSH Holding AG | (497 | ) | (42,675 | ) | 2.1 | |||||||
EMS-Chemie Holding AG | (207 | ) | (184,670 | ) | 9.3 | |||||||
Fischer (Georg) Reg | (260 | ) | (14,110 | ) | 0.7 | |||||||
Geberit AG | (962 | ) | (548,603 | ) | 27.5 | |||||||
Givaudan SA | (30 | ) | (119,236 | ) | 6.0 | |||||||
Helvetia Holding AG | (1,784 | ) | (229,256 | ) | 11.5 | |||||||
Holcim Ltd. | (214 | ) | (10,593 | ) | 0.5 | |||||||
Novartis AG | (8,157 | ) | (720,828 | ) | 36.1 | |||||||
PSP Swiss Property AG, Registered Shares | (5,721 | ) | (721,029 | ) | 36.1 | |||||||
Roche Holding AG | (415 | ) | (166,724 | ) | 8.4 | |||||||
Schindler Holding AG, Participation Certificates | (2,111 | ) | (405,577 | ) | 20.3 | |||||||
Schindler Holding AG, Registered Shares | (3,872 | ) | (743,324 | ) | 37.2 | |||||||
SGS SA | (70 | ) | (179,866 | ) | 9.0 | |||||||
Siemens Energy AG | (11,335 | ) | (218,338 | ) | 10.9 | |||||||
STMicroelectronics NV | (10,915 | ) | (403,278 | ) | 20.2 | |||||||
Swiss Re AG | (897 | ) | (73,560 | ) | 3.7 | |||||||
Tecan Group AG | (80 | ) | (24,041 | ) | 1.2 | |||||||
|
|
|
| |||||||||
| (9,312,654 | ) | |||||||||||
| United Kingdom | ||||||||||||
Admiral Group PLC | (2,057 | ) | (64,749 | ) | 3.2 | |||||||
Airtel Africa PLC | (36,540 | ) | (66,859 | ) | 3.3 | |||||||
Amcor PLC | (65,589 | ) | (777,886 | ) | 39.0 | |||||||
Anglo American PLC | (9,146 | ) | (405,085 | ) | 20.3 | |||||||
AstraZeneca PLC | (1,143 | ) | (152,523 | ) | 7.6 | |||||||
Atotech Ltd. | (29,891 | ) | (636,678 | ) | 31.9 | |||||||
Avast PLC | (113,404 | ) | (804,264 | ) | 40.3 | |||||||
B&M European Value Retail SA | (7,255 | ) | (44,720 | ) | 2.2 | |||||||
Berkeley Group Holdings PLC | (13,972 | ) | (708,611 | ) | 35.5 | |||||||
BP PLC | (40,339 | ) | (194,748 | ) | 9.8 | |||||||
Bunzl PLC | (9,826 | ) | (379,093 | ) | 19.0 | |||||||
Clarivate PLC | (22,715 | ) | (356,171 | ) | 17.8 | |||||||
CNH Industrial NV | (6,478 | ) | (91,769 | ) | 4.6 | |||||||
Deliveroo PLC | (40,607 | ) | (56,121 | ) | 2.8 | |||||||
Diageo PLC | (22,439 | ) | (1,119,456 | ) | 56.1 | |||||||
Dr. Martens PLC | (31,158 | ) | (81,466 | ) | 4.1 | |||||||
DS Smith PLC | (45,299 | ) | (186,146 | ) | 9.3 | |||||||
Future PLC | (4,557 | ) | (124,808 | ) | 6.3 | |||||||
GlaxoSmithKline PLC | (33,517 | ) | (755,560 | ) | 37.9 | |||||||
Greggs PLC | (3,318 | ) | (96,806 | ) | 4.8 | |||||||
Harbour Energy PLC | (82,791 | ) | (519,183 | ) | 26.0 | |||||||
Howden Joinery Group PLC | (34,481 | ) | (326,449 | ) | 16.4 | |||||||
| Security | Shares | Value | % of Basket Value | |||||||||
| United Kingdom (continued) | ||||||||||||
HSBC Holdings PLC | (99,900 | ) | $ | (624,288 | ) | 31.3 | % | |||||
Intermediate Capital Group PLC | (2,826 | ) | (54,080 | ) | 2.7 | |||||||
JD Sports Fashion PLC | (5,567 | ) | (9,173 | ) | 0.5 | |||||||
JET2 PLC | (10,196 | ) | (156,580 | ) | 7.8 | |||||||
Kingfisher PLC | (85,085 | ) | (268,322 | ) | 13.4 | |||||||
London Stock Exchange Group PLC | (1,273 | ) | (125,507 | ) | 6.3 | |||||||
LondonMetric Property PLC | (40,586 | ) | (137,175 | ) | 6.9 | |||||||
Marks & Spencer Group PLC | (326,641 | ) | (557,615 | ) | 27.9 | |||||||
Mondi PLC | (23,402 | ) | (439,629 | ) | 22.0 | |||||||
Next PLC | (1,639 | ) | (122,762 | ) | 6.2 | |||||||
nVent Electric PLC | (14,450 | ) | (488,121 | ) | 24.5 | |||||||
Ocado Group PLC | (10,041 | ) | (114,835 | ) | 5.8 | |||||||
Pearson PLC | (34,180 | ) | (331,881 | ) | 16.6 | |||||||
Prudential PLC | (48,971 | ) | (609,613 | ) | 30.5 | |||||||
Reckitt Benckiser Group PLC | (3,110 | ) | (242,535 | ) | 12.2 | |||||||
RELX PLC | (2,672 | ) | (79,600 | ) | 4.0 | |||||||
Rentokil Initial PLC | (100,112 | ) | (687,596 | ) | 34.5 | |||||||
Rio Tinto PLC | (24,044 | ) | (1,698,856 | ) | 85.1 | |||||||
Sage Group PLC | (13,802 | ) | (126,655 | ) | 6.3 | |||||||
Severn Trent PLC | (19,056 | ) | (748,930 | ) | 37.5 | |||||||
Shell PLC | (86,960 | ) | (2,334,519 | ) | 117.0 | |||||||
Unilever PLC | (8,455 | ) | (393,074 | ) | 19.7 | |||||||
Unilever PLC | (12,458 | ) | (578,227 | ) | 29.0 | |||||||
UNITE Group PLC | (46,336 | ) | (656,128 | ) | 32.9 | |||||||
Vodafone Group PLC | (298,393 | ) | (451,755 | ) | 22.6 | |||||||
WH Smith PLC | (12,780 | ) | (229,928 | ) | 11.5 | |||||||
Wise PLC, Class A | (50,345 | ) | (246,714 | ) | 12.4 | |||||||
|
|
|
| |||||||||
| (20,463,249 | ) | |||||||||||
| United States | ||||||||||||
10X Genomics, Inc., Class A | (4,043 | ) | (193,094 | ) | 9.7 | |||||||
Abbott Laboratories | (1,746 | ) | (198,171 | ) | 9.9 | |||||||
Acuity Brands, Inc. | (2,722 | ) | (469,491 | ) | 23.5 | |||||||
Advance Auto Parts, Inc. | (1,945 | ) | (388,280 | ) | 19.5 | |||||||
Advanced Drainage Systems, Inc. | (4,348 | ) | (445,496 | ) | 22.3 | |||||||
Affirm Holdings, Inc. | (21,995 | ) | (631,256 | ) | 31.6 | |||||||
AGCO Corp. | (8,214 | ) | (1,046,464 | ) | 52.4 | |||||||
Agilon Health, Inc. | (16,862 | ) | (299,638 | ) | 15.0 | |||||||
AGNC Investment Corp. | (46,078 | ) | (505,936 | ) | 25.4 | |||||||
Agree Realty Corp. | (10,000 | ) | (679,200 | ) | 34.0 | |||||||
Air Lease Corp. | (10,757 | ) | (433,292 | ) | 21.7 | |||||||
Air Products & Chemicals, Inc. | (1,128 | ) | (264,031 | ) | 13.2 | |||||||
Akamai Technologies, Inc. | (2,583 | ) | (290,019 | ) | 14.5 | |||||||
Albemarle Corp. | (882 | ) | (170,076 | ) | 8.5 | |||||||
Alight, Inc., Class A | (46,838 | ) | (402,338 | ) | 20.2 | |||||||
Alliant Energy Corp. | (11,223 | ) | (660,025 | ) | 33.1 | |||||||
Alnylam Pharmaceuticals, Inc. | (350 | ) | (46,701 | ) | 2.3 | |||||||
Alteryx, Inc., Class A | (1,579 | ) | (101,372 | ) | 5.1 | |||||||
Amazon.com, Inc. | (134 | ) | (333,074 | ) | 16.7 | |||||||
Amdocs Ltd. | (18,992 | ) | (1,513,472 | ) | 75.8 | |||||||
Amedisys, Inc. | (1,116 | ) | (142,457 | ) | 7.1 | |||||||
American Electric Power Co., Inc. | (12,105 | ) | (1,199,727 | ) | 60.1 | |||||||
American Financial Group, Inc. | (4,693 | ) | (649,887 | ) | 32.6 | |||||||
Americold Realty Trust | (32,712 | ) | (862,943 | ) | 43.2 | |||||||
AmerisourceBergen Corp. | (1,128 | ) | (170,655 | ) | 8.6 | |||||||
Amgen, Inc. | (921 | ) | (214,768 | ) | 10.8 | |||||||
Amkor Technology, Inc. | (5,432 | ) | (102,176 | ) | 5.1 | |||||||
Annaly Capital Management, Inc. | (20,850 | ) | (133,857 | ) | 6.7 | |||||||
Antero Resources Corp. | (8,286 | ) | (291,667 | ) | 14.6 | |||||||
Anthem, Inc. | (434 | ) | (217,838 | ) | 10.9 | |||||||
Apartment Income REIT Corp. | (2,593 | ) | (127,498 | ) | 6.4 | |||||||
Apellis Pharmaceuticals, Inc. | (512 | ) | (22,287 | ) | 1.1 | |||||||
SCHEDULE OF INVESTMENTS | 83 |
Schedule of Investments (continued) April 30, 2022 | BlackRock Global Long/Short Equity Fund |
| Security | Shares | Value | % of Basket Value | |||||||||
| United States (continued) | ||||||||||||
Apollo Global Management, Inc. | (12,797 | ) | $ | (636,779 | ) | 31.9 | % | |||||
Appian Corp. | (1,000 | ) | (47,800 | ) | 2.4 | |||||||
AppLovin Corp., Class A | (11,718 | ) | (447,042 | ) | 22.4 | |||||||
Aramark | (22,829 | ) | (827,551 | ) | 41.5 | |||||||
Archer-Daniels-Midland Co. | (35,884 | ) | (3,213,771 | ) | 161.0 | |||||||
Armstrong World Industries, Inc. | (3,206 | ) | (271,420 | ) | 13.6 | |||||||
Arrow Electronics, Inc. | (5,915 | ) | (697,142 | ) | 34.9 | |||||||
Arrowhead Pharmaceuticals, Inc. | (3,999 | ) | (164,399 | ) | 8.2 | |||||||
Arthur J. Gallagher & Co. | (1,479 | ) | (249,197 | ) | 12.5 | |||||||
Asana, Inc., Class A | (2,217 | ) | (59,416 | ) | 3.0 | |||||||
Ashland Global Holdings, Inc. | (207 | ) | (21,729 | ) | 1.1 | |||||||
Assurant, Inc. | (7,687 | ) | (1,398,112 | ) | 70.1 | |||||||
Atkore, Inc. | (4,652 | ) | (447,057 | ) | 22.4 | |||||||
AutoNation, Inc. | (1,629 | ) | (188,817 | ) | 9.5 | |||||||
Avalara, Inc. | (2,225 | ) | (169,256 | ) | 8.5 | |||||||
Avery Dennison Corp. | (4,079 | ) | (736,667 | ) | 36.9 | |||||||
Avis Budget Group, Inc. | (701 | ) | (187,637 | ) | 9.4 | |||||||
AZEK Co., Inc. | (22,885 | ) | (486,077 | ) | 24.4 | |||||||
Azenta, Inc. | (14,947 | ) | (1,120,427 | ) | 56.1 | |||||||
Bank OZK | (1,230 | ) | (47,257 | ) | 2.4 | |||||||
Bath & Body Works, Inc. | (14,424 | ) | (762,885 | ) | 38.2 | |||||||
Bausch Health Cos., Inc. | (12,948 | ) | (246,029 | ) | 12.3 | |||||||
Beam Therapeutics, Inc. | (2,158 | ) | (80,990 | ) | 4.1 | |||||||
Bentley Systems, Inc., Class B | (2,396 | ) | (101,566 | ) | 5.1 | |||||||
Berkshire Hathaway, Inc., Class B | (5,554 | ) | (1,792,998 | ) | 89.8 | |||||||
Berry Global Group, Inc. | (12,045 | ) | (678,736 | ) | 34.0 | |||||||
Best Buy Co., Inc. | (1,873 | ) | (168,439 | ) | 8.4 | |||||||
Bill.Com Holdings, Inc. | (2,295 | ) | (391,779 | ) | 19.6 | |||||||
Biohaven Pharmaceutical Holding Co. Ltd. | (4,318 | ) | (385,036 | ) | 19.3 | |||||||
Bio-Rad Laboratories, Inc., Class A | (539 | ) | (276,000 | ) | 13.8 | |||||||
Bio-Techne Corp. | (572 | ) | (217,183 | ) | 10.9 | |||||||
Black Knight, Inc. | (3,317 | ) | (218,225 | ) | 10.9 | |||||||
Blackstone Mortgage Trust, Inc., Class A | (6,543 | ) | (196,552 | ) | 9.8 | |||||||
Blue Owl Capital, Inc. | (25,068 | ) | (299,061 | ) | 15.0 | |||||||
Boston Beer Co., Inc., Class A | (574 | ) | (215,250 | ) | 10.8 | |||||||
Boyd Gaming Corp. | (2,308 | ) | (139,819 | ) | 7.0 | |||||||
Bright Horizons Family Solutions, Inc. | (7,091 | ) | (810,076 | ) | 40.6 | |||||||
Broadcom, Inc. | (343 | ) | (190,156 | ) | 9.5 | |||||||
Broadridge Financial Solutions, Inc. | (5,045 | ) | (727,136 | ) | 36.4 | |||||||
Brown-Forman Corp., Class B | (3,888 | ) | (262,207 | ) | 13.1 | |||||||
Brunswick Corp. | (3,380 | ) | (255,562 | ) | 12.8 | |||||||
Bumble, Inc., Class A | (12,780 | ) | (306,592 | ) | 15.4 | |||||||
Bunge Ltd. | (3,079 | ) | (348,296 | ) | 17.5 | |||||||
Burlington Stores, Inc. | (53 | ) | (10,789 | ) | 0.5 | |||||||
Cable One, Inc. | (310 | ) | (361,522 | ) | 18.1 | |||||||
Cadence Bank | (2,666 | ) | (66,757 | ) | 3.3 | |||||||
Cadence Design Systems, Inc. | (1,917 | ) | (289,179 | ) | 14.5 | |||||||
Caesars Entertainment, Inc. | (586 | ) | (38,840 | ) | 1.9 | |||||||
Callaway Golf Co. | (32,381 | ) | (710,439 | ) | 35.6 | |||||||
Campbell Soup Co. | (9,143 | ) | (431,732 | ) | 21.6 | |||||||
Cargurus, Inc. | (8,083 | ) | (264,152 | ) | 13.2 | |||||||
Caterpillar, Inc. | (3,460 | ) | (728,468 | ) | 36.5 | |||||||
CBRE Group, Inc., Class A | (736 | ) | (61,117 | ) | 3.1 | |||||||
Celanese Corp. | (2,235 | ) | (328,411 | ) | 16.5 | |||||||
Celsius Holdings, Inc. | (2,494 | ) | (129,688 | ) | 6.5 | |||||||
Centene Corp. | (3,475 | ) | (279,911 | ) | 14.0 | |||||||
CenterPoint Energy, Inc. | (5,523 | ) | (169,059 | ) | 8.5 | |||||||
ChargePoint Holdings, Inc. | (2,859 | ) | (36,995 | ) | 1.9 | |||||||
Chemours Co. | (3,381 | ) | (111,810 | ) | 5.6 | |||||||
Chewy, Inc., Class A | (7,382 | ) | (214,521 | ) | 10.7 | |||||||
Church & Dwight Co., Inc. | (13,188 | ) | (1,286,621 | ) | 64.5 | |||||||
Churchill Downs, Inc. | (3,307 | ) | (671,123 | ) | 33.6 | |||||||
| Security | Shares | Value | % of Basket Value | |||||||||
| United States (continued) | ||||||||||||
Cintas Corp. | (1,786 | ) | $ | (709,506 | ) | 35.6 | % | |||||
Citizens Financial Group, Inc. | (2,484 | ) | (97,870 | ) | 4.9 | |||||||
Civitas Resources, Inc. | (16,405 | ) | (961,661 | ) | 48.2 | |||||||
Cleveland-Cliffs, Inc. | (943 | ) | (24,037 | ) | 1.2 | |||||||
Cloudflare, Inc., Class A | (2,045 | ) | (176,156 | ) | 8.8 | |||||||
Coca-Cola Co. | (1,720 | ) | (85,914 | ) | 4.3 | |||||||
Coherent, Inc. | (1,468 | ) | (393,277 | ) | 19.7 | |||||||
Coinbase Global, Inc., Class A | (12,450 | ) | (1,403,239 | ) | 70.3 | |||||||
Columbia Sportswear Co. | (11,376 | ) | (934,652 | ) | 46.8 | |||||||
Conagra Brands, Inc. | (20,814 | ) | (727,033 | ) | 36.4 | |||||||
Concentrix Corp. | (4,981 | ) | (784,408 | ) | 39.3 | |||||||
Confluent, Inc., Class A | (8,845 | ) | (276,318 | ) | 13.8 | |||||||
Consolidated Edison, Inc. | (7,430 | ) | (689,058 | ) | 34.5 | |||||||
Constellation Brands, Inc., Class A | (186 | ) | (45,773 | ) | 2.3 | |||||||
Constellation Energy Corp. | (21,057 | ) | (1,246,785 | ) | 62.5 | |||||||
Copart, Inc. | (7,959 | ) | (904,540 | ) | 45.3 | |||||||
Corning, Inc. | (32,486 | ) | (1,143,182 | ) | 57.3 | |||||||
Coterra Energy, Inc. | (15,003 | ) | (431,936 | ) | 21.6 | |||||||
Coty, Inc., Class A | (33,116 | ) | (268,571 | ) | 13.5 | |||||||
Cousins Properties, Inc. | (1,128 | ) | (40,495 | ) | 2.0 | |||||||
Crane Co. | (7,451 | ) | (717,010 | ) | 35.9 | |||||||
Crown Holdings, Inc. | (7,300 | ) | (803,292 | ) | 40.2 | |||||||
Curtiss-Wright Corp. | (3,466 | ) | (495,326 | ) | 24.8 | |||||||
CVS Health Corp. | (11,633 | ) | (1,118,280 | ) | 56.0 | |||||||
D.R. Horton, Inc. | (7,043 | ) | (490,122 | ) | 24.6 | |||||||
Darden Restaurants, Inc. | (20,189 | ) | (2,659,497 | ) | 133.3 | |||||||
Darling Ingredients, Inc. | (10,145 | ) | (744,542 | ) | 37.3 | |||||||
Datadog, Inc., Class A | (1,038 | ) | (125,370 | ) | 6.3 | |||||||
Deckers Outdoor Corp. | (3,162 | ) | (840,301 | ) | 42.1 | |||||||
Dell Technologies, Inc., Class C | (3,579 | ) | (168,249 | ) | 8.4 | |||||||
Delta Air Lines, Inc. | (3,619 | ) | (155,726 | ) | 7.8 | |||||||
DigitalOcean Holdings, Inc. | (4,156 | ) | (163,871 | ) | 8.2 | |||||||
Dillard’s, Inc., Class A | (1,127 | ) | (342,394 | ) | 17.2 | |||||||
Dollar General Corp. | (5,760 | ) | (1,368,173 | ) | 68.6 | |||||||
Dollar Tree, Inc. | (10,604 | ) | (1,722,620 | ) | 86.3 | |||||||
DoorDash, Inc., Class A | (7,210 | ) | (587,110 | ) | 29.4 | |||||||
Douglas Emmett, Inc. | (14,672 | ) | (432,237 | ) | 21.7 | |||||||
Dover Corp. | (611 | ) | (81,446 | ) | 4.1 | |||||||
Dow, Inc. | (10,706 | ) | (711,949 | ) | 35.7 | |||||||
Doximity, Inc., Class A | (1,229 | ) | (49,000 | ) | 2.5 | |||||||
Dropbox, Inc., Class A | (5,226 | ) | (113,666 | ) | 5.7 | |||||||
DTE Energy Co. | (1,404 | ) | (183,980 | ) | 9.2 | |||||||
Duke Energy Corp. | (2,127 | ) | (234,310 | ) | 11.7 | |||||||
DuPont de Nemours, Inc. | (1,998 | ) | (131,728 | ) | 6.6 | |||||||
Dynatrace, Inc. | (7,494 | ) | (287,470 | ) | 14.4 | |||||||
Eagle Materials, Inc. | (1,195 | ) | (147,367 | ) | 7.4 | |||||||
Eastman Chemical Co. | (2,862 | ) | (293,842 | ) | 14.7 | |||||||
Edwards Lifesciences Corp. | (2,728 | ) | (288,568 | ) | 14.5 | |||||||
Elastic NV | (3,390 | ) | (258,115 | ) | 12.9 | |||||||
Electronic Arts, Inc. | (2,543 | ) | (300,201 | ) | 15.0 | |||||||
Element Solutions, Inc. | (42,310 | ) | (872,432 | ) | 43.7 | |||||||
EMCOR Group, Inc. | (622 | ) | (66,231 | ) | 3.3 | |||||||
Encompass Health Corp. | (16,625 | ) | (1,144,299 | ) | 57.3 | |||||||
Enovis Corp. | (4,584 | ) | (297,364 | ) | 14.9 | |||||||
Essent Group Ltd. | (2,723 | ) | (110,363 | ) | 5.5 | |||||||
Essex Property Trust, Inc. | (1,458 | ) | (480,076 | ) | 24.1 | |||||||
Eversource Energy | (20,017 | ) | (1,749,486 | ) | 87.7 | |||||||
Exact Sciences Corp. | (4,355 | ) | (239,743 | ) | 12.0 | |||||||
Exelon Corp. | (41,288 | ) | (1,931,453 | ) | 96.8 | |||||||
Fastenal Co. | (3,356 | ) | (185,620 | ) | 9.3 | |||||||
FedEx Corp. | (6,253 | ) | (1,242,721 | ) | 62.3 | |||||||
Fidelity National Information Services, Inc. | (2,742 | ) | (271,869 | ) | 13.6 | |||||||
| 84 | 2 0 2 2 BLACK ROCK ANNUAL REPORT TO SHAREHOLDERS |
Schedule of Investments (continued) April 30, 2022 | BlackRock Global Long/Short Equity Fund |
| Security | Shares | Value | % of Basket Value | |||||||||
| United States (continued) | ||||||||||||
Fifth Third Bancorp | (16,780 | ) | $ | (629,753 | ) | 31.6 | % | |||||
First Citizens BancShares, Inc., Class A | (1,197 | ) | (765,338 | ) | 38.3 | |||||||
First Interstate Bancsystem, Inc., Class A | (756 | ) | (24,585 | ) | 1.2 | |||||||
First Republic Bank | (2,401 | ) | (358,277 | ) | 18.0 | |||||||
Fiserv, Inc. | (6,235 | ) | (610,531 | ) | 30.6 | |||||||
Five9, Inc. | (3,420 | ) | (376,542 | ) | 18.9 | |||||||
FleetCor Technologies, Inc. | (710 | ) | (177,159 | ) | 8.9 | |||||||
Flex Ltd. | (14,206 | ) | (234,257 | ) | 11.7 | |||||||
Flowers Foods, Inc. | (17,226 | ) | (456,834 | ) | 22.9 | |||||||
Flowserve Corp. | (12,623 | ) | (412,898 | ) | 20.7 | |||||||
FMC Corp. | (3,100 | ) | (410,874 | ) | 20.6 | |||||||
FNB Corp. | (13,669 | ) | (157,467 | ) | 7.9 | |||||||
Fortune Brands Home & Security, Inc. | (363 | ) | (25,864 | ) | 1.3 | |||||||
Freeport-McMoRan, Inc. | (1,455 | ) | (59,000 | ) | 3.0 | |||||||
Freshpet, Inc. | (1,520 | ) | (141,892 | ) | 7.1 | |||||||
Freshworks, Inc., Class A | (44,590 | ) | (810,200 | ) | 40.6 | |||||||
Frontier Communications Parent, Inc. | (40,117 | ) | (1,058,688 | ) | 53.0 | |||||||
Gaming and Leisure Properties, Inc. | (3,364 | ) | (149,294 | ) | 7.5 | |||||||
Generac Holdings, Inc. | (1,155 | ) | (253,384 | ) | 12.7 | |||||||
General Mills, Inc. | (37,377 | ) | (2,643,675 | ) | 132.5 | |||||||
General Motors Co. | (10,474 | ) | (397,069 | ) | 19.9 | |||||||
Genuine Parts Co. | (3,432 | ) | (446,332 | ) | 22.4 | |||||||
Ginkgo Bioworks Holdings, Inc. | (40,141 | ) | (116,409 | ) | 5.8 | |||||||
Gitlab, Inc., Class A | (2,384 | ) | (114,265 | ) | 5.7 | |||||||
GoDaddy, Inc., Class A | (4,175 | ) | (337,382 | ) | 16.9 | |||||||
GoodRx Holdings, Inc., Class A | (30,114 | ) | (408,045 | ) | 20.4 | |||||||
Graphic Packaging Holding Co. | (94,931 | ) | (2,069,496 | ) | 103.7 | |||||||
Guardant Health, Inc. | (6,829 | ) | (421,349 | ) | 21.1 | |||||||
GXO Logistics, Inc. | (1,329 | ) | (78,664 | ) | 3.9 | |||||||
Hasbro, Inc. | (5,862 | ) | (516,208 | ) | 25.9 | |||||||
HCA Healthcare, Inc. | (4,934 | ) | (1,058,590 | ) | 53.0 | |||||||
Healthcare Trust of America, Inc., Class A | (37,859 | ) | (1,153,185 | ) | 57.8 | |||||||
Hershey Co. | (4,393 | ) | (991,808 | ) | 49.7 | |||||||
Hertz Global Holdings, Inc. | (33,936 | ) | (680,756 | ) | 34.1 | |||||||
Hess Corp. | (3,146 | ) | (324,258 | ) | 16.2 | |||||||
HF Sinclair Corp. | (5,278 | ) | (200,670 | ) | 10.1 | |||||||
Hilton Grand Vacations, Inc. | (5,190 | ) | (243,048 | ) | 12.2 | |||||||
Hormel Foods Corp. | (8,785 | ) | (460,246 | ) | 23.1 | |||||||
Host Hotels & Resorts, Inc. | (47,525 | ) | (967,134 | ) | 48.5 | |||||||
Howmet Aerospace, Inc. | (18,985 | ) | (647,768 | ) | 32.5 | |||||||
HP, Inc. | (4,726 | ) | (173,113 | ) | 8.7 | |||||||
Hudson Pacific Properties, Inc. | (14,190 | ) | (330,343 | ) | 16.6 | |||||||
IAA, Inc. | (6,936 | ) | (254,204 | ) | 12.7 | |||||||
IAC/InterActiveCorp | (14,017 | ) | (1,161,729 | ) | 58.2 | |||||||
ICU Medical, Inc. | (100 | ) | (21,399 | ) | 1.1 | |||||||
IDEX Corp. | (3,165 | ) | (600,780 | ) | 30.1 | |||||||
Inari Medical, Inc. | (2,793 | ) | (225,395 | ) | 11.3 | |||||||
Independence Realty Trust, Inc. | (15,767 | ) | (429,808 | ) | 21.5 | |||||||
Ingredion, Inc. | (7,160 | ) | (609,388 | ) | 30.5 | |||||||
Innovative Industrial Properties, Inc. | (309 | ) | (44,678 | ) | 2.2 | |||||||
Inspire Medical Systems, Inc. | (1,990 | ) | (409,462 | ) | 20.5 | |||||||
Insulet Corp. | (143 | ) | (34,176 | ) | 1.7 | |||||||
International Business Machines Corp. | (943 | ) | (124,674 | ) | 6.2 | |||||||
International Flavors & Fragrances, Inc. | (2,957 | ) | (358,684 | ) | 18.0 | |||||||
International Paper Co. | (5,317 | ) | (246,071 | ) | 12.3 | |||||||
Intra-Cellular Therapies, Inc. | (12,783 | ) | (646,948 | ) | 32.4 | |||||||
Intuitive Surgical, Inc. | (1,029 | ) | (246,240 | ) | 12.3 | |||||||
Invesco Ltd. | (10,870 | ) | (199,791 | ) | 10.0 | |||||||
Ionis Pharmaceuticals, Inc. | (254 | ) | (9,337 | ) | 0.5 | |||||||
IQVIA Holdings, Inc. | (3,164 | ) | (689,720 | ) | 34.6 | |||||||
iRhythm Technologies, Inc. | (345 | ) | (42,563 | ) | 2.1 | |||||||
J.M. Smucker Co. | (1,786 | ) | (244,557 | ) | 12.3 | |||||||
| Security | Shares | Value | % of Basket Value | |||||||||
| United States (continued) | ||||||||||||
Jabil, Inc. | (1,302 | ) | $ | (75,164 | ) | 3.8 | % | |||||
Jack Henry & Associates, Inc. | (1,296 | ) | (245,696 | ) | 12.3 | |||||||
Johnson & Johnson | (4,474 | ) | (807,378 | ) | 40.5 | |||||||
Juniper Networks, Inc. | (43,996 | ) | (1,386,754 | ) | 69.5 | |||||||
KBR, Inc. | (1,753 | ) | (86,300 | ) | 4.3 | |||||||
Kilroy Realty Corp. | (4,673 | ) | (327,110 | ) | 16.4 | |||||||
Kimberly-Clark Corp. | (9,043 | ) | (1,255,440 | ) | 62.9 | |||||||
Kimco Realty Corp. | (6,209 | ) | (157,274 | ) | 7.9 | |||||||
Kraft Heinz Co. | (2,702 | ) | (115,186 | ) | 5.8 | |||||||
L3Harris Technologies, Inc. | (2,386 | ) | (554,172 | ) | 27.8 | |||||||
Laboratory Corp. of America Holdings | (695 | ) | (166,995 | ) | 8.4 | |||||||
Lamb Weston Holdings, Inc. | (755 | ) | (49,906 | ) | 2.5 | |||||||
Lennar Corp., Class A | (838 | ) | (64,099 | ) | 3.2 | |||||||
Liberty Broadband Corp., Class A | (4,031 | ) | (433,977 | ) | 21.7 | |||||||
Liberty Broadband Corp., Class C | (3,443 | ) | (384,996 | ) | 19.3 | |||||||
Liberty Media Corp. - Liberty SiriusXM | (2,858 | ) | (119,550 | ) | 6.0 | |||||||
LKQ Corp. | (26,218 | ) | (1,301,199 | ) | 65.2 | |||||||
Loews Corp. | (22,506 | ) | (1,414,277 | ) | 70.9 | |||||||
LyondellBasell Industries NV, Class A | (5,931 | ) | (628,864 | ) | 31.5 | |||||||
M&T Bank Corp. | (2,964 | ) | (493,921 | ) | 24.7 | |||||||
Macy’s, Inc. | (26,647 | ) | (644,058 | ) | 32.3 | |||||||
Magnolia Oil & Gas Corp., Class A | (20,663 | ) | (480,208 | ) | 24.1 | |||||||
Marathon Petroleum Corp. | (4,094 | ) | (357,242 | ) | 17.9 | |||||||
Maravai LifeSciences Holdings, Inc., Class A | (4,092 | ) | (125,747 | ) | 6.3 | |||||||
Markel Corp. | (506 | ) | (684,760 | ) | 34.3 | |||||||
Marqeta, Inc., Class A | (28,807 | ) | (267,905 | ) | 13.4 | |||||||
Marriott International, Inc., Class A | (2,617 | ) | (464,570 | ) | 23.3 | |||||||
Masco Corp. | (4,830 | ) | (254,493 | ) | 12.8 | |||||||
MasTec, Inc. | (1,696 | ) | (122,129 | ) | 6.1 | |||||||
Matador Resources Co. | (9,512 | ) | (464,376 | ) | 23.3 | |||||||
Match Group, Inc. | (344 | ) | (27,228 | ) | 1.4 | |||||||
Mattel, Inc. | (15,215 | ) | (369,877 | ) | 18.5 | |||||||
Maximus, Inc. | (12,119 | ) | (883,233 | ) | 44.3 | |||||||
McDonald’s Corp. | (384 | ) | (95,677 | ) | 4.8 | |||||||
MDU Resources Group, Inc. | (33,889 | ) | (872,981 | ) | 43.7 | |||||||
Micron Technology, Inc. | (6,072 | ) | (414,050 | ) | 20.7 | |||||||
Mirati Therapeutics, Inc. | (3,392 | ) | (209,592 | ) | 10.5 | |||||||
MKS Instruments, Inc. | (959 | ) | (109,307 | ) | 5.5 | |||||||
Moderna, Inc. | (3,964 | ) | (532,801 | ) | 26.7 | |||||||
Mohawk Industries, Inc. | (11,055 | ) | (1,559,418 | ) | 78.1 | |||||||
Molina Healthcare, Inc. | (201 | ) | (63,003 | ) | 3.2 | |||||||
Mondelez International, Inc., Class A | (14,815 | ) | (955,271 | ) | 47.9 | |||||||
Monster Beverage Corp. | (17,143 | ) | (1,468,812 | ) | 73.6 | |||||||
Morgan Stanley | (6,192 | ) | (499,013 | ) | 25.0 | |||||||
Mosaic Co. | (5,508 | ) | (343,809 | ) | 17.2 | |||||||
Motorola Solutions, Inc. | (475 | ) | (101,503 | ) | 5.1 | |||||||
MSC Industrial Direct Co., Inc., Class A | (12,063 | ) | (999,540 | ) | 50.1 | |||||||
Murphy Oil Corp. | (1,116 | ) | (42,497 | ) | 2.1 | |||||||
Natera, Inc. | (2,520 | ) | (88,502 | ) | 4.4 | |||||||
National Fuel Gas Co. | (6,417 | ) | (450,024 | ) | 22.5 | |||||||
National Retail Properties, Inc. | (13,027 | ) | (571,104 | ) | 28.6 | |||||||
National Storage Affiliates Trust | (3,428 | ) | (194,025 | ) | 9.7 | |||||||
nCino, Inc. | (9,882 | ) | (370,476 | ) | 18.6 | |||||||
NCR Corp. | (16,251 | ) | (569,273 | ) | 28.5 | |||||||
New Fortress Energy, Inc. | (11,492 | ) | (445,660 | ) | 22.3 | |||||||
New Residential Investment Corp. | (111,150 | ) | (1,155,960 | ) | 57.9 | |||||||
News Corp., Class A | (21,505 | ) | (427,089 | ) | 21.4 | |||||||
NextEra Energy, Inc. | (1,150 | ) | (81,673 | ) | 4.1 | |||||||
Northern Trust Corp. | (852 | ) | (87,799 | ) | 4.4 | |||||||
Novavax, Inc. | (3,727 | ) | (167,976 | ) | 8.4 | |||||||
Nucor Corp. | (12,576 | ) | (1,946,513 | ) | 97.5 | |||||||
NVR, Inc. | (40 | ) | (175,048 | ) | 8.8 | |||||||
SCHEDULE OF INVESTMENTS | 85 |
Schedule of Investments (continued) April 30, 2022 | BlackRock Global Long/Short Equity Fund |
| Security | Shares | Value | % of Basket Value | |||||||||
| United States (continued) | ||||||||||||
Oak Street Health, Inc. | (21,005 | ) | $ | (379,980 | ) | 19.0 | % | |||||
Olaplex Holdings, Inc. | (16,775 | ) | (246,593 | ) | 12.4 | |||||||
Old Republic International Corp. | (15,911 | ) | (350,201 | ) | 17.5 | |||||||
Olin Corp. | (1,898 | ) | (108,945 | ) | 5.5 | |||||||
Omega Healthcare Investors, Inc. | (14,245 | ) | (362,963 | ) | 18.2 | |||||||
ON Semiconductor Corp. | (8,670 | ) | (451,794 | ) | 22.6 | |||||||
OneMain Holdings, Inc. | (10,897 | ) | (500,499 | ) | 25.1 | |||||||
Onto Innovation, Inc. | (8,353 | ) | (594,232 | ) | 29.8 | |||||||
Opendoor Technologies Inc. | (49,020 | ) | (342,650 | ) | 17.2 | |||||||
Owens Corning | (295 | ) | (26,824 | ) | 1.3 | |||||||
Packaging Corp. of America | (8,786 | ) | (1,416,040 | ) | 71.0 | |||||||
Palantir Technologies, Inc., Class A | (3,474 | ) | (36,130 | ) | 1.8 | |||||||
Parker-Hannifin Corp. | (1,159 | ) | (313,880 | ) | 15.7 | |||||||
PDC Energy, Inc. | (8,870 | ) | (618,594 | ) | 31.0 | |||||||
Peloton Interactive, Inc., Class A | (17,561 | ) | (308,371 | ) | 15.5 | |||||||
PepsiCo, Inc. | (9,892 | ) | (1,698,555 | ) | 85.1 | |||||||
Petco Health & Wellness Co., Inc. | (15,310 | ) | (294,871 | ) | 14.8 | |||||||
Phillips Edison & Co., Inc. | (25,456 | ) | (861,940 | ) | 43.2 | |||||||
Pinnacle West Capital Corp. | (1,300 | ) | (92,560 | ) | 4.6 | |||||||
Pinterest, Inc., Class A | (11,169 | ) | (229,188 | ) | 11.5 | |||||||
Pioneer Natural Resources Co. | (9,492 | ) | (2,206,605 | ) | 110.6 | |||||||
Polaris, Inc. | (1,283 | ) | (121,808 | ) | 6.1 | |||||||
Post Holdings, Inc. | (4,175 | ) | (310,578 | ) | 15.6 | |||||||
PPL Corp. | (5,918 | ) | (167,539 | ) | 8.4 | |||||||
Primo Water Corp. | (56,417 | ) | (825,186 | ) | 41.3 | |||||||
Procore Technologies, Inc. | (12,929 | ) | (717,172 | ) | 35.9 | |||||||
Procter & Gamble Co. | (26,072 | ) | (4,185,860 | ) | 209.7 | |||||||
Progressive Corp. | (12,063 | ) | (1,295,084 | ) | 64.9 | |||||||
Progyny, Inc. | (9,426 | ) | (362,430 | ) | 18.2 | |||||||
Prologis, Inc. | (490 | ) | (78,542 | ) | 3.9 | |||||||
Prosperity Bancshares, Inc. | (2,681 | ) | (175,284 | ) | 8.8 | |||||||
Prudential Financial, Inc. | (5,069 | ) | (550,037 | ) | 27.6 | |||||||
Pure Storage, Inc., Class A | (23 | ) | (674 | ) | 0.0 | |||||||
Q2 Holdings, Inc. | (3,099 | ) | (160,311 | ) | 8.0 | |||||||
Qualtrics International, Inc., Class A | (3,577 | ) | (66,318 | ) | 3.3 | |||||||
Quanta Services, Inc. | (940 | ) | (109,021 | ) | 5.5 | |||||||
Quest Diagnostics, Inc. | (2,063 | ) | (276,112 | ) | 13.8 | |||||||
R1 RCM, Inc. | (14,590 | ) | (328,567 | ) | 16.5 | |||||||
Raymond James Financial, Inc. | (9,534 | ) | (929,184 | ) | 46.6 | |||||||
Rayonier, Inc. | (4,363 | ) | (188,482 | ) | 9.4 | |||||||
Realty Income Corp. | (4,640 | ) | (321,830 | ) | 16.1 | |||||||
Red Rock Resorts, Inc., Class A | (4,139 | ) | (181,950 | ) | 9.1 | |||||||
Regal Rexnord Corp. | (7,902 | ) | (1,005,450 | ) | 50.4 | |||||||
Regions Financial Corp. | (9,920 | ) | (205,542 | ) | 10.3 | |||||||
Revolve Group, Inc. | (4,369 | ) | (184,634 | ) | 9.3 | |||||||
Robinhood Markets, Inc., Class A | (3,342 | ) | (32,768 | ) | 1.6 | |||||||
ROBLOX Corp., Class A | (4,540 | ) | (139,151 | ) | 7.0 | |||||||
Rockwell Automation, Inc. | (421 | ) | (106,374 | ) | 5.3 | |||||||
Rollins, Inc. | (11,775 | ) | (394,933 | ) | 19.8 | |||||||
Ross Stores, Inc. | (11,370 | ) | (1,134,385 | ) | 56.8 | |||||||
Royal Gold, Inc. | (2,598 | ) | (338,987 | ) | 17.0 | |||||||
RPM International, Inc. | (984 | ) | (81,574 | ) | 4.1 | |||||||
Ryman Hospitality Properties, Inc. | (1,509 | ) | (141,061 | ) | 7.1 | |||||||
Saia, Inc. | (1,245 | ) | (256,420 | ) | 12.8 | |||||||
Sarepta Therapeutics, Inc. | (411 | ) | (29,724 | ) | 1.5 | |||||||
Scotts Miracle-Gro Co. | (1,003 | ) | (104,242 | ) | 5.2 | |||||||
Seagate Technology Holdings PLC | (967 | ) | (79,333 | ) | 4.0 | |||||||
Sempra Energy | (2,371 | ) | (382,585 | ) | 19.2 | |||||||
SentinelOne, Inc., Class A | (7,261 | ) | (241,573 | ) | 12.1 | |||||||
Sherwin-Williams Co. | (2,018 | ) | (554,869 | ) | 27.8 | |||||||
Shift4 Payments, Inc., Class A | (507 | ) | (26,597 | ) | 1.3 | |||||||
Shockwave Medical, Inc. | (1,556 | ) | (235,158 | ) | 11.8 | |||||||
| Security | Shares | Value | % of Basket Value | |||||||||
| United States (continued) | ||||||||||||
Signature Bank | (418 | ) | $ | (101,261 | ) | 5.1 | % | |||||
Sims Ltd. | (919 | ) | (13,486 | ) | 0.7 | |||||||
SiTime Corp. | (660 | ) | (111,256 | ) | 5.6 | |||||||
Six Flags Entertainment Corp. | (14,575 | ) | (557,785 | ) | 27.9 | |||||||
Skyworks Solutions, Inc. | (600 | ) | (67,980 | ) | 3.4 | |||||||
SLM Corp. | (13,236 | ) | (221,438 | ) | 11.1 | |||||||
Snowflake, Inc., Class A | (2,837 | ) | (486,375 | ) | 24.4 | |||||||
SoFi Technologies, Inc. | (31,009 | ) | (189,775 | ) | 9.5 | |||||||
Sonoco Products Co. | (7,854 | ) | (486,241 | ) | 24.4 | |||||||
Sonos, Inc. | (5,096 | ) | (116,291 | ) | 5.8 | |||||||
South State Corp. | (5,628 | ) | (435,832 | ) | 21.8 | |||||||
Southwest Airlines Co. | (7,834 | ) | (366,004 | ) | 18.3 | |||||||
Southwestern Energy Co. | (51,726 | ) | (387,945 | ) | 19.4 | |||||||
Spirit Realty Capital, Inc. | (10,866 | ) | (472,128 | ) | 23.7 | |||||||
Splunk, Inc. | (1,871 | ) | (228,299 | ) | 11.4 | |||||||
Sprout Social, Inc., Class A | (3,194 | ) | (195,728 | ) | 9.8 | |||||||
SS&C Technologies Holdings, Inc. | (5,414 | ) | (350,069 | ) | 17.5 | |||||||
STAG Industrial, Inc. | (9,011 | ) | (336,291 | ) | 16.9 | |||||||
Stanley Black & Decker, Inc. | (2,935 | ) | (352,640 | ) | 17.7 | |||||||
Starbucks Corp. | (21,359 | ) | (1,594,236 | ) | 79.9 | |||||||
Starwood Property Trust, Inc. | (15,299 | ) | (350,041 | ) | 17.5 | |||||||
Steel Dynamics, Inc. | (21,364 | ) | (1,831,963 | ) | 91.8 | |||||||
STERIS PLC | (2,594 | ) | (581,186 | ) | 29.1 | |||||||
Sunrun, Inc. | (10,889 | ) | (217,562 | ) | 10.9 | |||||||
Synaptics, Inc. | (382 | ) | (56,704 | ) | 2.8 | |||||||
SYNNEX Corp. | (5,355 | ) | (535,982 | ) | 26.9 | |||||||
Synopsys, Inc. | (1,512 | ) | (433,626 | ) | 21.7 | |||||||
Synovus Financial Corp. | (16,672 | ) | (692,555 | ) | 34.7 | |||||||
T. Rowe Price Group, Inc. | (147 | ) | (18,087 | ) | 0.9 | |||||||
Tapestry, Inc. | (5,192 | ) | (170,921 | ) | 8.6 | |||||||
Target Corp. | (3,659 | ) | (836,630 | ) | 41.9 | |||||||
Tempur Sealy International, Inc. | (30,342 | ) | (822,572 | ) | 41.2 | |||||||
Tenet Healthcare Corp. | (10,846 | ) | (786,443 | ) | 39.4 | |||||||
Terreno Realty Corp. | (3,939 | ) | (286,562 | ) | 14.4 | |||||||
Texas Pacific Land Corp. | (13 | ) | (17,766 | ) | 0.9 | |||||||
Texas Roadhouse, Inc. | (5,517 | ) | (454,215 | ) | 22.8 | |||||||
Thor Industries, Inc. | (2,303 | ) | (176,295 | ) | 8.8 | |||||||
T-Mobile US, Inc. | (8,219 | ) | (1,012,088 | ) | 50.7 | |||||||
Toast, Inc., Class A | (1,044 | ) | (19,450 | ) | 1.0 | |||||||
TopBuild Corp. | (391 | ) | (70,826 | ) | 3.5 | |||||||
Toro Co. | (6,377 | ) | (510,989 | ) | 25.6 | |||||||
Tractor Supply Co. | (6,008 | ) | (1,210,312 | ) | 60.6 | |||||||
Trade Desk, Inc., Class A | (799 | ) | (47,077 | ) | 2.4 | |||||||
Tradeweb Markets, Inc., Class A | (9,462 | ) | (673,600 | ) | 33.8 | |||||||
TransUnion | (2,676 | ) | (234,204 | ) | 11.7 | |||||||
Trimble, Inc. | (13,664 | ) | (911,389 | ) | 45.7 | |||||||
Trupanion, Inc. | (1,974 | ) | (125,586 | ) | 6.3 | |||||||
Tyson Foods, Inc., Class A | (3,075 | ) | (286,467 | ) | 14.4 | |||||||
Uber Technologies, Inc. | (10,143 | ) | (319,302 | ) | 16.0 | |||||||
UGI Corp. | (1,221 | ) | (41,880 | ) | 2.1 | |||||||
UiPath, Inc., Class A | (11,585 | ) | (206,561 | ) | 10.4 | |||||||
Umpqua Holdings Corp. | (2,191 | ) | (36,239 | ) | 1.8 | |||||||
Under Armour, Inc., Class A | (6,795 | ) | (104,371 | ) | 5.2 | |||||||
Unity Software, Inc. | (892 | ) | (59,238 | ) | 3.0 | |||||||
Univar Solutions, Inc. | (25,928 | ) | (755,023 | ) | 37.8 | |||||||
Universal Health Services, Inc., | (6,228 | ) | (763,117 | ) | 38.2 | |||||||
Vail Resorts, Inc. | (881 | ) | (223,915 | ) | 11.2 | |||||||
Valley National Bancorp | (28,511 | ) | (341,562 | ) | 17.1 | |||||||
Valmont Industries, Inc. | (356 | ) | (88,576 | ) | 4.4 | |||||||
Ventas, Inc. | (7,592 | ) | (421,736 | ) | 21.1 | |||||||
Verizon Communications, Inc. | (46,976 | ) | (2,174,989 | ) | 109.0 | |||||||
Vertex Pharmaceuticals, Inc. | (1,135 | ) | (310,105 | ) | 15.5 | |||||||
| 86 | 2 0 2 2 BLACK ROCK ANNUAL REPORT TO SHAREHOLDERS |
Schedule of Investments (continued) April 30, 2022 | BlackRock Global Long/Short Equity Fund |
| Security | Shares | Value | % of Basket Value | |||||||||
| United States (continued) | ||||||||||||
Vertiv Holdings Co. | (38,828 | ) | $ | (486,515 | ) | 24.4 | % | |||||
VICI Properties, Inc. | (50,331 | ) | (1,500,367 | ) | 75.2 | |||||||
Victoria’s Secret & Co. | (4,661 | ) | (219,626 | ) | 11.0 | |||||||
VMware, Inc., Class A | (3,537 | ) | (382,137 | ) | 19.1 | |||||||
Vontier Corp. | (2,349 | ) | (60,181 | ) | 3.0 | |||||||
Vornado Realty Trust | (6,597 | ) | (255,370 | ) | 12.8 | |||||||
Vulcan Materials Co. | (798 | ) | (137,487 | ) | 6.9 | |||||||
W.R. Berkley Corp. | (6,115 | ) | (406,586 | ) | 20.4 | |||||||
Walgreens Boots Alliance, Inc. | (13,632 | ) | (577,997 | ) | 29.0 | |||||||
Walmart, Inc. | (1,218 | ) | (186,342 | ) | 9.3 | |||||||
Warner Bros Discovery, Inc. | (1,949 | ) | (35,374 | ) | 1.8 | |||||||
Warner Music Group Corp., Class A | (6,610 | ) | (196,780 | ) | 9.9 | |||||||
Waste Connections, Inc. | (3,270 | ) | (451,162 | ) | 22.6 | |||||||
Waste Management, Inc. | (4,099 | ) | (674,040 | ) | 33.8 | |||||||
Wayfair, Inc., Class A | (4,013 | ) | (308,760 | ) | 15.5 | |||||||
Webster Financial Corp. | (10,649 | ) | (532,344 | ) | 26.7 | |||||||
WEC Energy Group, Inc. | (1,019 | ) | (101,951 | ) | 5.1 | |||||||
Welltower, Inc. | (4,496 | ) | (408,282 | ) | 20.5 | |||||||
Wendy’s Co. | (17,154 | ) | (338,963 | ) | 17.0 | |||||||
WESCO International, Inc. | (576 | ) | (70,998 | ) | 3.6 | |||||||
Western Digital Corp. | (1,993 | ) | (105,769 | ) | 5.3 | |||||||
Westinghouse Air Brake Technologies Corp. | (6,719 | ) | (604,105 | ) | 30.3 | |||||||
Westlake Chemical Corp. | (1,047 | ) | (132,498 | ) | 6.6 | |||||||
WeWork, Inc., Class A | (20,007 | ) | (140,249 | ) | 7.0 | |||||||
Weyerhaeuser Co. | (12,025 | ) | (495,670 | ) | 24.8 | |||||||
Williams-Sonoma, Inc. | (703 | ) | (91,727 | ) | 4.6 | |||||||
WillScot Mobile Mini Holdings Corp. | (43,869 | ) | (1,539,802 | ) | 77.2 | |||||||
Wingstop, Inc. | (2,836 | ) | (260,231 | ) | 13.0 | |||||||
Woodward, Inc. | (517 | ) | (57,118 | ) | 2.9 | |||||||
Workiva, Inc. | (2,505 | ) | (241,758 | ) | 12.1 | |||||||
WP Carey, Inc. | (10,106 | ) | (816,262 | ) | 40.9 | |||||||
YETI Holdings, Inc. | (4,337 | ) | (211,949 | ) | 10.6 | |||||||
Yum! Brands, Inc. | (575 | ) | (67,281 | ) | 3.4 | |||||||
Zebra Technologies Corp., Class A | (1,127 | ) | (416,607 | ) | 20.9 | |||||||
Zendesk, Inc. | (2,337 | ) | (285,207 | ) | 14.3 | |||||||
Zillow Group, Inc., Class A | (10,201 | ) | (394,269 | ) | 19.8 | |||||||
Zillow Group, Inc., Class C | (10,786 | ) | (429,499 | ) | 21.5 | |||||||
Zimmer Biomet Holdings, Inc. | (1,144 | ) | (138,138 | ) | 6.9 | |||||||
ZoomInfo Technologies, Inc., Class A | (18,036 | ) | (854,906 | ) | 42.8 | |||||||
Zurn Water Solutions Corp. | (3,820 | ) | (119,260 | ) | 6.0 | |||||||
|
|
|
| |||||||||
| (204,034,093 | ) | |||||||||||
| Preferred Stocks | ||||||||||||
| Germany | ||||||||||||
Volkswagen AG, Preference Shares | (1,225 | ) | (189,711 | ) | 9.5 | |||||||
|
|
|
| |||||||||
Total Reference Entity — Short | (395,397,808 | ) | ||||||||||
|
| |||||||||||
Net Value of Reference Entity — Goldman Sachs & Co. |
| $ | (1,995,792 | ) | ||||||||
|
| |||||||||||
The following table represents the individual long and short positions and related values of the equity securities underlying the total return swap with Goldman Sachs & Co. as of period end, termination dates February 27, 2023 and February 28, 2023:
| Security | Shares | Value | % of Basket Value | |||||||||
Reference Entity — Long |
| |||||||||||
| Common Stocks | ||||||||||||
| Australia | ||||||||||||
29Metals Ltd. | 4,958 | $ | 9,382 | 1.4 | % | |||||||
Abacus Property Group | 40,531 | 93,018 | 13.5 | |||||||||
Arena REIT | 6,680 | 22,607 | 3.3 | |||||||||
AUB Group Ltd. | 11,444 | 185,287 | 26.9 | |||||||||
Aussie Broadband Ltd. | 14,565 | 56,641 | 8.2 | |||||||||
Australian Ethical Investment Ltd. | 42,877 | 174,222 | 25.3 | |||||||||
Blackmores Ltd. | 262 | 13,267 | 1.9 | |||||||||
BWP Trust | 3,135 | 9,112 | 1.3 | |||||||||
Centuria Industrial REIT | 43,299 | 120,666 | 17.5 | |||||||||
Charter Hall Education Trust | 55,836 | 158,062 | 23.0 | |||||||||
Charter Hall Long Wale REIT | 179,793 | 674,774 | 98.1 | |||||||||
Charter Hall Retail REIT | 51,097 | 159,615 | 23.2 | |||||||||
Codan Ltd. | 1,714 | 8,548 | 1.2 | |||||||||
Data#3 Ltd. | 10,231 | 41,549 | 6.0 | |||||||||
Dexus Industria REIT | 33,887 | 81,071 | 11.8 | |||||||||
Dicker Data Ltd. | 9,580 | 88,587 | 12.9 | |||||||||
Elders Ltd. | 2,009 | 20,197 | 2.9 | |||||||||
GrainCorp Ltd., Class A | 29,331 | 211,957 | 30.8 | |||||||||
Growthpoint Properties Australia Ltd. | 8,882 | 27,320 | 4.0 | |||||||||
GWA Group Ltd. | 140,675 | 224,701 | 32.7 | |||||||||
HomeCo Daily Needs REIT | 10,435 | 10,506 | 1.5 | |||||||||
Imdex Ltd. | 143,562 | 251,856 | 36.6 | |||||||||
Johns Lyng Group Ltd. | 137,701 | 861,843 | 125.2 | |||||||||
Jumbo Interactive Ltd. | 22,910 | 278,536 | 40.5 | |||||||||
Kogan.com Ltd. | 31,744 | 86,289 | 12.5 | |||||||||
Lifestyle Communities Ltd. | 12,655 | 133,376 | 19.4 | |||||||||
Lovisa Holdings Ltd. | 1,141 | 13,064 | 1.9 | |||||||||
MA Financial Group Ltd. | 1,177 | 5,694 | 0.8 | |||||||||
Monadelphous Group Ltd. | 44,524 | 331,669 | 48.2 | |||||||||
Nanosonics Ltd. | 36,438 | 100,688 | 14.6 | �� | ||||||||
National Storage REIT | 48,312 | 87,505 | 12.7 | |||||||||
Netwealth Group Ltd. | 4,403 | 39,867 | 5.8 | |||||||||
Objective Corp. Ltd. | 4,574 | 54,529 | 7.9 | |||||||||
Pendal Group Ltd. | 36,498 | 134,361 | 19.5 | |||||||||
Pinnacle Investment Management Group Ltd. | 72,726 | 475,311 | 69.1 | |||||||||
Sandfire Resources NL | 19,555 | 77,505 | 11.3 | |||||||||
Silver Lake Resources Ltd. | 19,280 | 25,186 | 3.7 | |||||||||
St Barbara Ltd. | 525,265 | 490,999 | 71.3 | |||||||||
Tassal Group Ltd. | 49,305 | 130,733 | 19.0 | |||||||||
Technology One Ltd. | 2,728 | 19,686 | 2.9 | |||||||||
Temple & Webster Group Ltd. | 1,268 | 5,175 | 0.8 | |||||||||
United Malt Grp Ltd. | 5,996 | 17,520 | 2.5 | |||||||||
Waypoint REIT | 107,885 | 203,372 | 29.6 | |||||||||
Webjet Ltd. | 24,189 | 100,364 | 14.6 | |||||||||
|
|
|
| |||||||||
| 6,316,217 | ||||||||||||
| Austria | ||||||||||||
AT&S Austria Technologie & Systemtechnik AG | 2,546 | 130,370 | 18.9 | |||||||||
Oesterreichische Post AG | 9,141 | 294,465 | 42.8 | |||||||||
Palfinger AG | 1,833 | 46,409 | 6.7 | |||||||||
Porr AG | 6,646 | 84,173 | 12.2 | |||||||||
Rhi Magnesita NV | 1,051 | 31,268 | 4.5 | |||||||||
S&T AG | 21,681 | 366,543 | 53.3 | |||||||||
SCHEDULE OF INVESTMENTS | 87 |
Schedule of Investments (continued) April 30, 2022 | BlackRock Global Long/Short Equity Fund |
| Security | Shares | Value | % of Basket Value | |||||||||
| Austria (continued) | ||||||||||||
Vienna Insurance Group AG Wiener Versicherung Gruppe | 2,543 | $ | 63,079 | 9.2 | % | |||||||
Wienerberger AG | 26,442 | 746,401 | 108.5 | |||||||||
|
|
|
| |||||||||
| 1,762,708 | ||||||||||||
| Bahamas | ||||||||||||
OneSpaWorld Holdings Ltd. | 9,750 | 97,890 | 14.2 | |||||||||
|
|
|
| |||||||||
| Belgium | ||||||||||||
Barco NV | 3,086 | 69,496 | 10.1 | |||||||||
Euronav NV | 4,360 | 50,414 | 7.3 | |||||||||
Melexis NV | 1,391 | 119,396 | 17.4 | |||||||||
Recticel SA | 360 | 7,866 | 1.2 | |||||||||
Shurgard Self Storage SA | 19,555 | 1,131,581 | 164.4 | |||||||||
Tessenderlo Group SA | 532 | 18,624 | 2.7 | |||||||||
VGP NV | 742 | 192,992 | 28.0 | |||||||||
|
|
|
| |||||||||
| 1,590,369 | ||||||||||||
| Bermuda | ||||||||||||
Argo Group International Holdings Ltd. | 2,075 | 88,810 | 12.9 | |||||||||
SiriusPoint Ltd. | 1,190 | 7,473 | 1.1 | |||||||||
|
|
|
| |||||||||
| 96,283 | ||||||||||||
| Canada | ||||||||||||
Aecon Group Inc. | 19,217 | 223,935 | 32.5 | |||||||||
Altius Minerals Corp. | 10,162 | 169,597 | 24.6 | |||||||||
Boardwalk Real Estate Investment Trust | 3,498 | 153,491 | 22.3 | |||||||||
Bombardier, Inc., Class B | 293,286 | 287,658 | 41.8 | |||||||||
Canada Goose Holdings, Inc. | 24,190 | 527,241 | 76.6 | |||||||||
Canadian Western Bank | 10,245 | 258,468 | 37.6 | |||||||||
Cineplex Inc. | 14,064 | 144,072 | 20.9 | |||||||||
CT Real Estate Investment Trust | 16,046 | 221,708 | 32.2 | |||||||||
Eldorado Gold Corp. | 36,135 | 351,041 | 51.0 | |||||||||
Endeavour Silver Corp. | 1,205 | 4,596 | 0.7 | |||||||||
Enerflex Ltd. | 2,971 | 20,490 | 3.0 | |||||||||
Enghouse Systems Ltd. | 2,090 | 58,780 | 8.5 | |||||||||
Equitable Group, Inc. | 5,433 | 243,812 | 35.4 | |||||||||
Evertz Technologies Ltd. | 6,500 | 71,191 | 10.3 | |||||||||
First National Financial Corp. | 767 | 21,685 | 3.2 | |||||||||
Freehold Royalties Ltd. | 83,351 | 971,936 | 141.2 | |||||||||
Home Capital Group Inc. | 360 | 8,979 | 1.3 | |||||||||
K92 Mining, Inc. | 2,005 | 14,281 | 2.1 | |||||||||
Kelt Exploration Ltd. | 25,127 | 129,679 | 18.8 | |||||||||
Killam Apartment Real Estate Investment Trust | 46,813 | 736,458 | 107.0 | |||||||||
Laurentian Bank of Canada | 457 | 13,899 | 2.0 | |||||||||
Morguard Corp. | 3,003 | 295,005 | 42.9 | |||||||||
Morguard North American Residential Real Estate Investment Trust | 1,012 | 14,534 | 2.1 | |||||||||
Novagold Resources Inc. | 8,114 | 50,592 | 7.4 | |||||||||
Osisko Mining Inc. | 2,519 | 7,941 | 1.2 | |||||||||
Pason Systems Inc. | 4,727 | 59,646 | 8.7 | |||||||||
PrairieSky Royalty Ltd. | 41,495 | 569,460 | 82.7 | |||||||||
Premium Brands Holdings Corp. | 2,660 | 217,165 | 31.6 | |||||||||
Real Matters Inc. | 24,504 | 86,980 | 12.6 | |||||||||
Richelieu Hardware Ltd. | 2,703 | 76,736 | 11.1 | |||||||||
Rogers Sugar Inc. | 16,751 | 79,670 | 11.6 | |||||||||
Sandstorm Gold Ltd. | 10,565 | 78,622 | 11.4 | |||||||||
Seabridge Gold Inc. | 11,043 | 195,218 | 28.4 | |||||||||
Silvercorp Metals Inc. | 14,891 | 44,975 | 6.5 | |||||||||
Slate Grocery REIT, Class U | 13,595 | 167,206 | 24.3 | |||||||||
SunOpta Inc. | 8,368 | 46,118 | 6.7 | |||||||||
Tamarack Valley Energy Ltd. | 3,201 | 12,533 | 1.8 | |||||||||
Topaz Energy Corp. | 28,076 | 497,419 | 72.3 | |||||||||
| Security | Shares | Value | % of Basket Value | |||||||||
| Canada (continued) | ||||||||||||
Tucows, Inc., Class A | 784 | $ | 45,174 | 6.6 | % | |||||||
Village Farms International, Inc. | 47,115 | 202,022 | 29.4 | |||||||||
|
|
|
| |||||||||
| 7,380,013 | ||||||||||||
| Denmark | ||||||||||||
Alk Abello A/S | 13,976 | 304,869 | 44.3 | |||||||||
D/S Norden A/S | 1,003 | 37,267 | 5.4 | |||||||||
Drilling Co. of 1972 AS | 317 | 15,808 | 2.3 | |||||||||
FLSmidth & Co. A/S | 4,756 | 130,372 | 18.9 | |||||||||
Nilfisk Holding A/S | 5,313 | 148,732 | 21.6 | |||||||||
NKT Holding A/S | 413 | 19,683 | 2.9 | |||||||||
Per Aarsleff Holding A/S | 4,983 | 191,232 | 27.8 | |||||||||
|
|
|
| |||||||||
| 847,963 | ||||||||||||
| Finland | ||||||||||||
Cargotec OYJ, Class B | 9,590 | 332,049 | 48.2 | |||||||||
Citycon OYJ | 908 | 6,454 | 0.9 | |||||||||
Konecranes OYJ | 5,570 | 156,538 | 22.7 | |||||||||
Musti Group OYJ | 2,276 | 53,551 | 7.8 | |||||||||
Rovio Entertainment OYJ | 1,327 | 12,138 | 1.8 | |||||||||
TietoEVRY OYJ | 319 | 8,003 | 1.2 | |||||||||
Uponor OYJ | 10,714 | 188,254 | 27.4 | |||||||||
YIT OYJ | 62,375 | 251,066 | 36.5 | |||||||||
|
|
|
| |||||||||
| 1,008,053 | ||||||||||||
| France | ||||||||||||
Albioma SA | 393 | 20,890 | 3.0 | |||||||||
Alten SA | 2,937 | 394,168 | 57.3 | |||||||||
Casino Guichard Perrachon SA | 596 | 10,443 | 1.5 | |||||||||
Coface SA | 16,863 | 202,158 | 29.4 | |||||||||
Elior Group SA | 18,781 | 57,345 | 8.3 | |||||||||
Esker SA | 1,148 | 193,373 | 28.1 | |||||||||
Groupe Fnac SA | 131 | 6,545 | 1.0 | |||||||||
Guerbet | 1 | 26 | 0.0 | |||||||||
ID Logistics Group | 768 | 246,301 | 35.8 | |||||||||
Imerys SA | 4,600 | 180,968 | 26.3 | |||||||||
Interparfums SA | 14,406 | 799,326 | 116.1 | |||||||||
Manitou BF SA | 4,598 | 104,322 | 15.2 | |||||||||
Nexity SA | 6,360 | 193,129 | 28.1 | |||||||||
SES-imagotag SA | 965 | 88,767 | 12.9 | |||||||||
SMCP SA | 33,193 | 215,685 | 31.3 | |||||||||
Societe BIC SA | 913 | 54,478 | 7.9 | |||||||||
Technip Energies N.V | 663 | 8,057 | 1.2 | |||||||||
Television Francaise 1 | 8,438 | 71,463 | 10.4 | |||||||||
Vicat SA | 12,454 | 374,505 | 54.4 | |||||||||
Vilmorin & Cie SA | 522 | 24,808 | 3.6 | |||||||||
Virbac SA | 115 | 46,431 | 6.7 | |||||||||
|
|
|
| |||||||||
| 3,293,188 | ||||||||||||
| Germany | ||||||||||||
Adesso SE | 1,022 | 200,310 | 29.1 | |||||||||
Atoss Software AG | 135 | 19,616 | 2.9 | |||||||||
CANCOM SE | 2,065 | 99,714 | 14.5 | |||||||||
Cewe Stiftung & Co. KGAA | 69 | 6,298 | 0.9 | |||||||||
CompuGroup Medical SE & Co. KgaA | 103 | 5,506 | 0.8 | |||||||||
CropEnergies AG | 652 | 8,457 | 1.2 | |||||||||
Datagroup SE | 720 | 59,900 | 8.7 | |||||||||
Deutsche Pfandbriefbank AG | 6,623 | 83,355 | 12.1 | |||||||||
Duerr AG | 7,420 | 192,844 | 28.0 | |||||||||
Eckert & Ziegler Strahlen- und Medizintechnik AG | 1,436 | 72,060 | 10.5 | |||||||||
ElringKlinger AG | 11,418 | 94,659 | 13.8 | |||||||||
Gerresheimer AG | 1,146 | 79,604 | 11.6 | |||||||||
GFT Technologies SE | 3,429 | 136,202 | 19.8 | |||||||||
| 88 | 2 0 2 2 BLACK ROCK ANNUAL REPORT TO SHAREHOLDERS |
Schedule of Investments (continued) April 30, 2022 | BlackRock Global Long/Short Equity Fund |
| Security | Shares | Value | % of Basket Value | |||||||||
| Germany (continued) | ||||||||||||
Hensoldt AG | 13,594 | $ | 378,579 | 55.0 | % | |||||||
Kloeckner & Co. SE | 21,706 | 279,611 | 40.6 | |||||||||
Krones AG | 3,495 | 269,861 | 39.2 | |||||||||
MLP SE | 34,066 | 241,143 | 35.0 | |||||||||
MorphoSys AG | 5,666 | 119,455 | 17.4 | |||||||||
Nagarro SE | 1,146 | 161,130 | 23.4 | |||||||||
Norma Group SE | 3,525 | 86,961 | 12.6 | |||||||||
Pfeiffer Vacuum Technology AG | 613 | 109,123 | 15.9 | |||||||||
SMA Solar Technology AG | 5,262 | 239,467 | 34.8 | |||||||||
Software AG | 1,495 | 46,016 | 6.7 | |||||||||
Steico SE | 284 | 28,496 | 4.1 | |||||||||
Suedzucker AG | 2,285 | 29,759 | 4.3 | |||||||||
|
|
|
| |||||||||
| 3,048,126 | ||||||||||||
| Gibraltar | ||||||||||||
888 Holdings PLC | 103,154 | 247,229 | 35.9 | |||||||||
|
|
|
| |||||||||
| Hong Kong | ||||||||||||
EC Healthcare | 127,000 | 127,642 | 18.5 | |||||||||
Health & Happiness H&H International Holdings Ltd. | 204,500 | 224,760 | 32.7 | |||||||||
Luk Fook Holdings International Ltd. | 51,000 | 116,734 | 17.0 | |||||||||
Nissin Foods Co. Ltd. | 24,000 | 15,779 | 2.3 | |||||||||
SA Sa International Holdings Ltd. | 2,584,000 | 461,869 | 67.1 | |||||||||
Texhong Textile Group Ltd. | 47,000 | 56,521 | 8.2 | |||||||||
|
|
|
| |||||||||
| 1,003,305 | ||||||||||||
| Ireland | ||||||||||||
Cimpress PLC | 4,054 | 204,767 | 29.7 | |||||||||
Grafton Group PLC | 4,322 | 52,345 | 7.6 | |||||||||
Keywords Studios PLC | 6,211 | 187,753 | 27.3 | |||||||||
Origin Enterprises PLC | 12,409 | 55,168 | 8.0 | |||||||||
Uniphar PLC | 19,790 | 81,840 | 11.9 | |||||||||
|
|
|
| |||||||||
| 581,873 | ||||||||||||
| Israel | ||||||||||||
Caesarstone Ltd. | 39,765 | 390,890 | 56.8 | |||||||||
Cognyte Software Ltd. | 12,723 | 86,262 | 12.6 | |||||||||
Electra Consumer Products 1970 Ltd. | 113 | 6,379 | 0.9 | |||||||||
Israel Canada T.R Ltd. | 6,449 | 31,885 | 4.6 | |||||||||
Isras Investment Co. Ltd. | 345 | 84,090 | 12.2 | |||||||||
Matrix IT Ltd. | 278 | 7,006 | 1.0 | |||||||||
Mega Or Holdings Ltd. | 91 | 3,465 | 0.5 | |||||||||
One Software Technologies Ltd. | 749 | 12,340 | 1.8 | |||||||||
Radware Ltd. | 4,069 | 117,635 | 17.1 | |||||||||
Taboola.com Ltd. | 14,151 | 60,991 | 8.9 | |||||||||
YH Dimri Construction & Development Ltd. | 178 | 15,983 | 2.3 | |||||||||
|
|
|
| |||||||||
| 816,926 | ||||||||||||
| Italy | ||||||||||||
Biesse SpA | 1,492 | 23,276 | 3.4 | |||||||||
Brunello Cucinelli SpA | 14,807 | 757,876 | 110.1 | |||||||||
Datalogic SpA | 4,341 | 42,180 | 6.1 | |||||||||
El.En. SpA | 5,014 | 69,883 | 10.2 | |||||||||
OVS SpA | 133,378 | 254,466 | 37.0 | |||||||||
Pharmanutra SpA | 536 | 36,289 | 5.3 | |||||||||
Salvatore Ferragamo SpA | 414 | 7,196 | 1.0 | |||||||||
Sanlorenzo SpA/Ameglia | 1,782 | 63,013 | 9.2 | |||||||||
Sesa SpA | 4,540 | 656,339 | 95.4 | |||||||||
Tinexta SpA | 16,615 | 415,664 | 60.4 | |||||||||
Webuild SpA | 201,221 | 342,110 | 49.7 | |||||||||
Wiit SpA | 1,764 | 47,125 | 6.8 | |||||||||
|
|
|
| |||||||||
| 2,715,417 | ||||||||||||
| Security | Shares | Value | % of Basket Value | |||||||||
| Japan | ||||||||||||
77 Bank Ltd. | 14,300 | $ | 177,313 | 25.8 | % | |||||||
Adastria Co. Ltd. | 56,800 | 941,346 | 136.8 | |||||||||
Aeon Delight Co. Ltd. | 1,600 | 34,198 | 5.0 | |||||||||
Ai Holdings Corp. | 13,200 | 173,293 | 25.2 | |||||||||
Aichi Steel Corp. | 14,800 | 256,166 | 37.2 | |||||||||
Anicom Holdings, Inc. | 63,900 | 301,424 | 43.8 | |||||||||
AOKI Holdings Inc. | 90,600 | 426,418 | 62.0 | |||||||||
Arata Corp. | 1,400 | 38,682 | 5.6 | |||||||||
Arcland Service Holdings Co. Ltd. | 20,500 | 354,265 | 51.5 | |||||||||
ARTERIA Networks Corp. | 12,600 | 129,059 | 18.8 | |||||||||
Avex, Inc. | 25,300 | 271,968 | 39.5 | |||||||||
Belc Co. Ltd. | 8,700 | 370,510 | 53.8 | |||||||||
Bell System24 Holdings, Inc. | 12,500 | 144,557 | 21.0 | |||||||||
Belluna Co. Ltd. | 35,100 | 197,162 | 28.6 | |||||||||
Bengo4.com Inc. | 11,500 | 295,931 | 43.0 | |||||||||
Canon Electronics Inc. | 14,900 | 170,629 | 24.8 | |||||||||
CI Takiron Corp. | 101,200 | 431,190 | 62.7 | |||||||||
Comture Corp. | 18,300 | 395,268 | 57.4 | |||||||||
CRE Logistics REIT Inc. | 19 | 29,056 | 4.2 | |||||||||
Cybozu, Inc. | 22,100 | 218,396 | 31.7 | |||||||||
Daiho Corp. | 3,000 | 102,700 | 14.9 | |||||||||
Daiken Corp. | 11,200 | 181,080 | 26.3 | |||||||||
Daiseki Co. Ltd. | 27,900 | 1,003,456 | 145.8 | |||||||||
Dexerials Corp. | 2,300 | 50,433 | 7.3 | |||||||||
Digital Arts, Inc. | 6,000 | 335,219 | 48.7 | |||||||||
Dip Corp. | 8,600 | 280,384 | 40.7 | |||||||||
Direct Marketing MiX, Inc. | 10,200 | 125,206 | 18.2 | |||||||||
Doshisha Co. Ltd. | 33,100 | 389,894 | 56.7 | |||||||||
Doutor Nichires Holdings Co. Ltd. | 26,600 | 305,716 | 44.4 | |||||||||
Earth Corp. | 800 | 33,810 | 4.9 | |||||||||
EDION Corp. | 8,400 | 75,591 | 11.0 | |||||||||
eGuarantee Inc. | 1,300 | 21,581 | 3.1 | |||||||||
Elan Corp. | 4,500 | 35,138 | 5.1 | |||||||||
en-japan, Inc. | 53,500 | 1,257,031 | 182.6 | |||||||||
euglena Co. Ltd. | 2,300 | 15,217 | 2.2 | |||||||||
FCC Co. Ltd. | 67,200 | 671,254 | 97.5 | |||||||||
Fuji Machine Manufacturing Co. Ltd. | 1,500 | 25,027 | 3.6 | |||||||||
Fuji Seal International, Inc. | 26,400 | 350,618 | 50.9 | |||||||||
Fujimi, Inc. | 4,800 | 209,278 | 30.4 | |||||||||
Fujimori Kogyo Co. Ltd. | 300 | 8,275 | 1.2 | |||||||||
Fukui Computer Holdings Inc. | 500 | 12,481 | 1.8 | |||||||||
Fukuoka REIT Corp. | 12 | 15,008 | 2.2 | |||||||||
FULLCAST Holdings Co. Ltd. | 1,700 | 32,526 | 4.7 | |||||||||
Funai Soken Holdings Inc. | 22,500 | 377,330 | 54.8 | |||||||||
Fuso Chemical Co. Ltd. | 4,300 | 126,564 | 18.4 | |||||||||
Future Corp. | 500 | 7,326 | 1.1 | |||||||||
Genky DrugStores Co. Ltd. | 200 | 5,611 | 0.8 | |||||||||
Giken Ltd. | 24,000 | 658,566 | 95.7 | |||||||||
Glory Ltd. | 21,800 | 350,652 | 51.0 | |||||||||
GMO GlobalSign Holdings KK | 700 | 29,511 | 4.3 | |||||||||
Goldcrest Co. Ltd. | 25,100 | 326,452 | 47.4 | |||||||||
Halows Co. Ltd. | 4,100 | 97,986 | 14.2 | |||||||||
Hanwa Co. Ltd. | 300 | 7,333 | 1.1 | |||||||||
Harmonic Drive Systems, Inc. | 600 | 15,175 | 2.2 | |||||||||
Heiwa Real Estate Co. Ltd. | 900 | 28,391 | 4.1 | |||||||||
Heiwa Real Estate REIT, Inc. | 5 | 5,728 | 0.8 | |||||||||
Heiwado Co. Ltd. | 14,900 | 224,783 | 32.7 | |||||||||
Hoshino Resorts REIT, Inc. | 11 | 56,745 | 8.2 | |||||||||
IBJ Leasing Co. Ltd. | 8,600 | 199,354 | 29.0 | |||||||||
Infocom Corp. | 11,600 | 197,730 | 28.7 | |||||||||
Infomart Corp. | 38,700 | 192,740 | 28.0 | |||||||||
SCHEDULE OF INVESTMENTS | 89 |
Schedule of Investments (continued) April 30, 2022 | BlackRock Global Long/Short Equity Fund |
| Security | Shares | Value | % of Basket Value | |||||||||
| Japan (continued) | ||||||||||||
Iriso Electronics Co. Ltd. | 5,700 | $ | 133,192 | 19.4 | % | |||||||
Jafco Co. Ltd. | 13,600 | 163,964 | 23.8 | |||||||||
Japan Elevator Service Holdings Co. Ltd. | 18,300 | 239,160 | 34.8 | |||||||||
Japan Lifeline Co. Ltd. | 33,100 | 275,898 | 40.1 | |||||||||
Japan Wool Textile Co. Ltd. | 45,800 | 342,342 | 49.7 | |||||||||
JCU Corp. | 5,500 | 140,086 | 20.4 | |||||||||
JINS Inc. | 2,800 | 92,283 | 13.4 | |||||||||
JSP Corp. | 11,200 | 129,442 | 18.8 | |||||||||
Kanamoto Co. Ltd. | 18,700 | 279,441 | 40.6 | |||||||||
Kanematsu Corp. | 2,500 | 25,838 | 3.8 | |||||||||
KH Neochem Co. Ltd. | 1,000 | 18,917 | 2.7 | |||||||||
KOMEDA Holdings Co. Ltd. | 29,900 | 515,086 | 74.8 | |||||||||
Komeri Co. Ltd. | 400 | 8,449 | 1.2 | |||||||||
Konoike Transport Co. Ltd. | 21,900 | 194,385 | 28.2 | |||||||||
Kumagai Gumi Co. Ltd. | 5,300 | 110,605 | 16.1 | |||||||||
Kura Sushi, Inc. | 29,000 | 718,143 | 104.3 | |||||||||
Kyokuto Kaihatsu Kogyo Co. Ltd. | 8,500 | 85,696 | 12.5 | |||||||||
Kyoritsu Maintenance Co. Ltd. | 2,700 | 98,321 | 14.3 | |||||||||
Life Corp. | 15,100 | 344,459 | 50.1 | |||||||||
Link And Motivation Inc. | 24,000 | 84,439 | 12.3 | |||||||||
LITALICO, Inc. | 7,100 | 146,466 | 21.3 | |||||||||
M&A Capital Partners Co. Ltd. | 1,700 | 52,803 | 7.7 | |||||||||
Maeda Kosen Co. Ltd. | 11,900 | 272,074 | 39.5 | |||||||||
Makino Milling Machine Co. Ltd. | 600 | 18,488 | 2.7 | |||||||||
Mandom Corp. | 13,500 | 134,227 | 19.5 | |||||||||
Maruzen Showa Unyu Co. Ltd. | 1,400 | 34,173 | 5.0 | |||||||||
Matsuda Sangyo Co. Ltd. | 400 | 7,024 | 1.0 | |||||||||
Megachips Corp. | 4,300 | 110,162 | 16.0 | |||||||||
Megmilk Snow Brand Co. Ltd. | 9,700 | 144,587 | 21.0 | |||||||||
Micronics Japan Co. Ltd. | 2,500 | 29,258 | 4.3 | |||||||||
Midac Holdings Co. Ltd. | 13,500 | 217,665 | 31.6 | |||||||||
Milbon Co. Ltd. | 9,500 | 397,774 | 57.8 | |||||||||
Mirait Holdings Corp. | 500 | 7,007 | 1.0 | |||||||||
Mitsubishi Pencil Co. Ltd. | 12,200 | 118,437 | 17.2 | |||||||||
Mitsubishi Research Institute, Inc. | 1,400 | 42,150 | 6.1 | |||||||||
Mitsuboshi Belting Ltd. | 11,700 | 179,216 | 26.0 | |||||||||
Mitsui DM Sugar Holdings Co. Ltd. | 17,600 | 261,759 | 38.0 | |||||||||
Mixi, Inc. | 2,800 | 48,167 | 7.0 | |||||||||
Monogatari Corp. | 4,000 | 166,800 | 24.2 | |||||||||
Morita Holdings Corp. | 21,900 | 210,186 | 30.5 | |||||||||
Nakanishi, Inc. | 9,700 | 158,546 | 23.0 | |||||||||
Nextage Co. Ltd. | 2,500 | 38,209 | 5.6 | |||||||||
Nichiha Corp. | 3,500 | 63,279 | 9.2 | |||||||||
Nichi-Iko Pharmaceutical Co. Ltd. | 900 | 5,412 | 0.8 | |||||||||
Nihon Parkerizing Co. Ltd. | 9,000 | 63,658 | 9.2 | |||||||||
Nippn Corp. | 13,000 | 169,084 | 24.6 | |||||||||
Nippon Ceramic Co. Ltd. | 800 | 14,606 | 2.1 | |||||||||
Nippon Gas Co. Ltd. | 33,100 | 469,701 | 68.2 | |||||||||
Nippon Paper Industries Co. Ltd. | 16,400 | 130,263 | 18.9 | |||||||||
Nippon REIT Investment Corp. | 43 | 123,255 | 17.9 | |||||||||
Nippon Soda Co. Ltd. | 2,000 | 52,893 | 7.7 | |||||||||
Nippon Suisan Kaisha Ltd. | 78,200 | 345,277 | 50.2 | |||||||||
Nitto Kogyo Corp. | 23,600 | 277,871 | 40.4 | |||||||||
Noritsu Koki Co. Ltd. | 2,600 | 43,115 | 6.3 | |||||||||
NS United Kaiun Kaisha Ltd. | 1,700 | 46,721 | 6.8 | |||||||||
Obara Group Inc. | 16,900 | 378,220 | 55.0 | |||||||||
Oiles Corp. | 16,900 | 194,174 | 28.2 | |||||||||
Oki Electric Industry Co. Ltd. | 91,600 | 593,364 | 86.2 | |||||||||
Okinawa Cellular Telephone Co. | 2,000 | 76,963 | 11.2 | |||||||||
Okinawa Electric Power Co. Inc. | 800 | 7,964 | 1.2 | |||||||||
Okumura Corp. | 2,100 | 49,574 | 7.2 | |||||||||
One REIT Inc. | 10 | 21,228 | 3.1 | |||||||||
| Security | Shares | Value | % of Basket Value | |||||||||
| Japan (continued) | ||||||||||||
Osaka Organic Chemical Industry Ltd. | 12,100 | $ | 260,930 | 37.9 | % | |||||||
Outsourcing Inc. | 11,100 | 110,084 | 16.0 | |||||||||
Pack Corp. | 3,500 | 64,057 | 9.3 | |||||||||
Prestige International Inc. | 112,100 | 538,699 | 78.3 | |||||||||
Raksul Inc. | 3,700 | 76,452 | 11.1 | |||||||||
Round One Corp. | 1,600 | 17,808 | 2.6 | |||||||||
Saizeriya Co. Ltd. | 5,400 | 99,035 | 14.4 | |||||||||
Sakai Moving Service Co. Ltd. | 6,600 | 225,216 | 32.7 | |||||||||
Sakata INX Corp. | 900 | 6,806 | 1.0 | |||||||||
SAMTY Co. Ltd. | 17,400 | 281,032 | 40.8 | |||||||||
Sanken Electric Co. Ltd. | 4,800 | 177,270 | 25.8 | |||||||||
Sanrio Co. Ltd. | 2,300 | 48,245 | 7.0 | |||||||||
Sato Holdings Corp. | 16,500 | 226,877 | 33.0 | |||||||||
SBS Holdings, Inc. | 300 | 6,961 | 1.0 | |||||||||
Senko Group Holdings Co. Ltd. | 1,000 | 6,763 | 1.0 | |||||||||
Seria Co. Ltd. | 27,400 | 535,832 | 77.9 | |||||||||
Shizuoka Gas Co. Ltd. | 6,800 | 48,744 | 7.1 | |||||||||
Shoei Co. Ltd. | 15,300 | 567,620 | 82.5 | |||||||||
Siix Corp. | 24,600 | 187,915 | 27.3 | |||||||||
SKY Perfect JSAT Holdings Inc. | 4,400 | 14,253 | 2.1 | |||||||||
Sodick Co. Ltd. | 30,300 | 169,541 | 24.6 | |||||||||
Sosei Group Corp. | 1,000 | 9,765 | 1.4 | |||||||||
S-Pool Inc. | 58,400 | 583,569 | 84.8 | |||||||||
Strike Co. Ltd. | 18,700 | 569,463 | 82.7 | |||||||||
Sumitomo Densetsu Co. Ltd. | 3,600 | 61,605 | 9.0 | |||||||||
Sumitomo Mitsui Construction Co. Ltd. | 76,100 | 246,910 | 35.9 | |||||||||
Sumitomo Osaka Cement Co. Ltd. | 6,600 | 184,552 | 26.8 | |||||||||
Systena Corp. | 14,600 | 45,892 | 6.7 | |||||||||
Taikisha Ltd. | 7,800 | 192,469 | 28.0 | |||||||||
Takuma Co. Ltd. | 20,900 | 234,224 | 34.0 | |||||||||
T-Gaia Corp. | 2,700 | 34,222 | 5.0 | |||||||||
Toa Corp/Tokyo | 7,500 | 163,940 | 23.8 | |||||||||
Tokai Corp/Gifu | 1,600 | 21,200 | 3.1 | |||||||||
Tokuyama Corp. | 600 | 7,980 | 1.2 | |||||||||
Tokyo Steel Manufacturing Co. Ltd. | 3,200 | 33,120 | 4.8 | |||||||||
Tokyotokeiba Co. Ltd. | 4,100 | 139,516 | 20.3 | |||||||||
Tokyu REIT, Inc. | 67 | 93,924 | 13.6 | |||||||||
Toridoll Holdings Corp. | 4,000 | 72,543 | 10.5 | |||||||||
Torii Pharmaceutical Co. Ltd. | 300 | 7,539 | 1.1 | |||||||||
Tosei Corp. | 34,500 | 290,296 | 42.2 | |||||||||
Tosho Co. Ltd. | 500 | 6,690 | 1.0 | |||||||||
Totetsu Kogyo Co. Ltd. | 3,300 | 59,653 | 8.7 | |||||||||
Toyo Ink SC Holdings Co. Ltd. | 2,600 | 38,715 | 5.6 | |||||||||
Toyobo Co. Ltd. | 3,100 | 25,487 | 3.7 | |||||||||
TPR Co. Ltd. | 22,600 | 216,602 | 31.5 | |||||||||
Tri Chemical Laboratories Inc. | 9,400 | 176,544 | 25.7 | |||||||||
Trusco Nakayama Corp. | 24,500 | 382,064 | 55.5 | |||||||||
Trust Tech Inc. | 9,700 | 111,703 | 16.2 | |||||||||
Tsukishima Kikai Co. Ltd. | 8,400 | 66,348 | 9.6 | |||||||||
TV Asahi Holdings Corp. | 6,200 | 70,819 | 10.3 | |||||||||
UACJ Corp. | 7,000 | 117,110 | 17.0 | |||||||||
United Arrows Ltd. | 4,200 | 56,465 | 8.2 | |||||||||
UT Group Co. Ltd. | 2,100 | 47,220 | 6.9 | |||||||||
ValueCommerce Co. Ltd. | 6,700 | 195,784 | 28.4 | |||||||||
Vision Inc/Tokyo Japan | 700 | 6,978 | 1.0 | |||||||||
Wacoal Holdings Corp. | 32,500 | 462,921 | 67.3 | |||||||||
Wacom Co. Ltd. | 15,700 | 113,514 | 16.5 | |||||||||
Wakita & Co. Ltd. | 15,300 | 127,311 | 18.5 | |||||||||
YA-MAN Ltd. | 9,500 | 90,548 | 13.2 | |||||||||
Yokogawa Bridge Holdings Corp. | 19,500 | 285,977 | 41.6 | |||||||||
Yuasa Trading Co. Ltd. | 12,100 | 269,970 | 39.2 | |||||||||
Yurtec Corp. | 45,800 | 241,913 | 35.2 | |||||||||
| 90 | 2 0 2 2 BLACK ROCK ANNUAL REPORT TO SHAREHOLDERS |
Schedule of Investments (continued) April 30, 2022 | BlackRock Global Long/Short Equity Fund |
| Security | Shares | Value | % of Basket Value | |||||||||
| Japan (continued) | ||||||||||||
Zojirushi Corp. | 5,700 | $ | 60,275 | 8.8 | % | |||||||
Zuken, Inc. | 22,100 | 511,692 | 74.3 | |||||||||
|
|
|
| |||||||||
| 34,128,849 | ||||||||||||
| Jersey | ||||||||||||
Centamin PLC | 611,210 | 700,519 | 101.8 | |||||||||
|
|
|
| |||||||||
| Luxembourg | ||||||||||||
Befesa SA | 269 | 16,799 | 2.4 | |||||||||
Millicom International Cellular SA, SDR | 17,059 | 384,591 | 55.9 | |||||||||
SES SA | 31,455 | 281,444 | 40.9 | |||||||||
|
|
|
| |||||||||
| 682,834 | ||||||||||||
| Malaysia | ||||||||||||
Frencken Group Ltd. | 22,500 | 22,825 | 3.3 | |||||||||
|
|
|
| |||||||||
| Netherlands | ||||||||||||
AMG Advanced Metallurgical Group NV | 652 | 25,821 | 3.8 | |||||||||
Arcadis NV | 731 | 30,500 | 4.4 | |||||||||
Basic-Fit NV | 6,624 | 277,527 | 40.3 | |||||||||
Koninklijke BAM Groep NV | 2,385 | 6,601 | 1.0 | |||||||||
TomTom NV | 1,076 | 9,290 | 1.3 | |||||||||
Wereldhave NV | 4,432 | 72,287 | 10.5 | |||||||||
|
|
|
| |||||||||
| 422,026 | ||||||||||||
| New Zealand | ||||||||||||
a2 Milk Co. Ltd. | 28,324 | 89,750 | 13.0 | |||||||||
|
|
|
| |||||||||
| Norway | ||||||||||||
Borregaard ASA | 15,134 | 288,679 | 41.9 | |||||||||
Elkem ASA | 28,403 | 117,955 | 17.1 | |||||||||
FLEX Liquified Natural Gas Ltd. | 4,750 | 133,805 | 19.4 | |||||||||
Grieg Seafood ASA | 449 | 6,689 | 1.0 | |||||||||
Kongsberg Gruppen ASA | 22,718 | 975,797 | 141.8 | |||||||||
MPC Container Ships | 16,628 | 49,493 | 7.2 | |||||||||
Selvaag Bolig ASA | 6,026 | 28,687 | 4.2 | |||||||||
SpareBank 1 SMN | 819 | 11,476 | 1.7 | |||||||||
|
|
|
| |||||||||
| 1,612,581 | ||||||||||||
| Portugal | ||||||||||||
Navigator Co. SA | 56,083 | 230,064 | 33.4 | |||||||||
Sonae SGPS SA | 86,816 | 93,726 | 13.6 | |||||||||
|
|
|
| |||||||||
| 323,790 | ||||||||||||
| Singapore | ||||||||||||
AEM Holdings Ltd. | 139,400 | 477,385 | 69.4 | |||||||||
AIMS APAC REIT | 66,400 | 67,899 | 9.9 | |||||||||
Ascendas India Trust | 48,000 | 43,368 | 6.3 | |||||||||
Far East Hospitality Trust | 85,600 | 41,235 | 6.0 | |||||||||
First Resources Ltd. | 36,600 | 55,822 | 8.1 | |||||||||
Sasseur Real Estate Investment Trust | 49,500 | 29,887 | 4.3 | |||||||||
Sheng Siong Group Ltd. | 106,200 | 117,265 | 17.0 | |||||||||
|
|
|
| |||||||||
| 832,861 | ||||||||||||
| South Sandwich Islands | ||||||||||||
BMO Commercial Property Trust Ltd. | 5,843 | 8,624 | 1.3 | |||||||||
UK Commercial Property REIT Ltd. | 40,008 | 44,081 | 6.4 | |||||||||
|
|
|
| |||||||||
| 52,705 | ||||||||||||
| Spain | ||||||||||||
Ence Energia y Celulosa SA | 48,680 | 182,354 | 26.5 | |||||||||
Indra Sistemas SA | 24,718 | 251,891 | 36.6 | |||||||||
Laboratorios Farmaceuticos Rovi SA | 1,199 | 81,869 | 11.9 | |||||||||
Mediaset Espana Comunicacion SA | 1,383 | 6,189 | 0.9 | |||||||||
Melia Hotels International SA | 41,660 | 344,541 | 50.0 | |||||||||
| Security | Shares | Value | % of Basket Value | |||||||||
| Spain (continued) | ||||||||||||
Miquel y Costas & Miquel SA | 1 | $ | 13 | 0.0 | % | |||||||
Sacyr SA | 14,035 | 37,805 | 5.5 | |||||||||
Viscofan SA | 611 | 33,730 | 4.9 | |||||||||
|
|
|
| |||||||||
| 938,392 | ||||||||||||
| Sweden | ||||||||||||
AAK AB | 3,547 | 61,543 | 8.9 | |||||||||
AcadeMedia AB | 33,141 | 187,086 | 27.2 | |||||||||
AddTech AB, B Shares | 31,378 | 553,520 | 80.4 | |||||||||
AF AB | 7,728 | 128,112 | 18.6 | |||||||||
Arjo AB, B Shares | 46,957 | 353,871 | 51.4 | |||||||||
Betsson AB, Class B | 25,742 | 158,131 | 23.0 | |||||||||
Biotage AB | 21,777 | 451,111 | 65.5 | |||||||||
Bonava AB, B Shares | 8,991 | 43,647 | 6.3 | |||||||||
Bravida Holding AB | 1,717 | 17,602 | 2.6 | |||||||||
Bufab AB | 1,747 | 57,957 | 8.4 | |||||||||
Cloetta AB, B Shares | 69,721 | 176,187 | 25.6 | |||||||||
Collector AB | 2,135 | 9,314 | 1.4 | |||||||||
Corem Property Group AB, Class B | 11,853 | 25,097 | 3.6 | |||||||||
Dios Fastigheter AB | 5,941 | 53,046 | 7.7 | |||||||||
Dometic Group AB | 7,685 | 65,815 | 9.6 | |||||||||
Fabege AB | 6,518 | 79,116 | 11.5 | |||||||||
Fingerprint Cards AB, Class B | 108,132 | 124,541 | 18.1 | |||||||||
Fortnox AB | 3,310 | 17,570 | 2.6 | |||||||||
GARO AB | 1,175 | 17,586 | 2.6 | |||||||||
Hexatronic Group AB | 4,108 | 173,802 | 25.3 | |||||||||
HMS Networks AB | 2,892 | 118,369 | 17.2 | |||||||||
Hufvudstaden AB, A Shares | 5,278 | 68,388 | 9.9 | |||||||||
Inwido AB | 680 | 9,388 | 1.4 | |||||||||
JM AB | 1,902 | 43,927 | 6.4 | |||||||||
LeoVegas AB | 1,559 | 6,686 | 1.0 | |||||||||
Loomis AB | 1,109 | 27,631 | 4.0 | |||||||||
Nobia AB | 1,885 | 7,398 | 1.1 | |||||||||
Nyfosa AB | 3,589 | 39,557 | 5.8 | |||||||||
Scandic Hotels Group AB | 140,640 | 541,250 | 78.6 | |||||||||
Stillfront Group AB | 36,933 | 74,590 | 10.8 | |||||||||
Troax Group AB | 8,286 | 184,029 | 26.7 | |||||||||
|
|
|
| |||||||||
| 3,875,867 | ||||||||||||
| Switzerland | ||||||||||||
Aryzta AG | 7,467 | 6,953 | 1.0 | |||||||||
Bossard Holding AG, Class A | 875 | 189,422 | 27.5 | |||||||||
Comet Holding AG | 3,206 | 693,054 | 100.7 | |||||||||
Daetwyler Holding AG | 1,487 | 478,122 | 69.5 | |||||||||
Ferrexpo PLC | 9,486 | 19,479 | 2.8 | |||||||||
Gurit Holding AG | 122 | 155,528 | 22.6 | |||||||||
Inficon Holding AG | 277 | 252,201 | 36.6 | |||||||||
IWG PLC | 18,038 | 54,762 | 8.0 | |||||||||
Kardex AG | 42 | 7,993 | 1.2 | |||||||||
Landis+Gyr Group AG | 1,110 | 61,948 | 9.0 | |||||||||
Medartis Holding AG | 574 | 60,778 | 8.8 | |||||||||
Sensirion Holding AG | 5,515 | 661,440 | 96.1 | |||||||||
Softwareone Holding AG | 2,999 | 40,548 | 5.9 | |||||||||
Stadler Rail AG | 623 | 22,736 | 3.3 | |||||||||
Sulzer AG | 1,743 | 130,599 | 19.0 | |||||||||
u-Blox Holding AG | 5,224 | 433,991 | 63.1 | |||||||||
Valiant Holding AG | 919 | 91,797 | 13.3 | |||||||||
Ypsomed Holding AG | 894 | 127,757 | 18.6 | |||||||||
|
|
|
| |||||||||
| 3,489,108 | ||||||||||||
SCHEDULE OF INVESTMENTS | 91 |
Schedule of Investments (continued) April 30, 2022 | BlackRock Global Long/Short Equity Fund |
| Security | Shares | Value | % of Basket Value | |||||||||
| Ukraine | ||||||||||||
Network International Holdings PLC | 146,752 | $ | 479,428 | 69.7 | % | |||||||
|
|
|
| |||||||||
| United Kingdom | ||||||||||||
AG Barr PLC | 2,876 | 20,921 | 3.0 | |||||||||
AJ Bell PLC | 7,374 | 22,850 | 3.3 | |||||||||
Alliance Pharma PLC | 5,033 | 7,215 | 1.0 | |||||||||
Alpha Fx Group PLC | 249 | 6,450 | 0.9 | |||||||||
Ascential PLC | 26,392 | 104,638 | 15.2 | |||||||||
Ashmore Group PLC | 15,536 | 42,948 | 6.2 | |||||||||
Aston Martin Lagonda Global Holdings PLC | 3,729 | 39,069 | 5.7 | |||||||||
Babcock International Group PLC | 20,042 | 76,519 | 11.1 | |||||||||
Bank of Georgia Group PLC | 19,863 | 306,714 | 44.6 | |||||||||
Big Yellow Group PLC | 19,868 | 359,054 | 52.2 | |||||||||
Bodycote PLC | 8,757 | 67,918 | 9.9 | |||||||||
boohoo Group PLC | 88,827 | 89,926 | 13.1 | |||||||||
Britvic PLC | 10,085 | 108,679 | 15.8 | |||||||||
Bytes Technology Group PLC | 7,284 | 40,960 | 5.9 | |||||||||
Capita PLC | 32,219 | 9,615 | 1.4 | |||||||||
Capital & Counties Properties PLC | 20,008 | 41,340 | 6.0 | |||||||||
Capricorn Energy PLC | 43,733 | 112,483 | 16.3 | |||||||||
Chemring Group PLC | 3,218 | 14,053 | 2.0 | |||||||||
Clarkson PLC | 146 | 6,722 | 1.0 | |||||||||
Craneware PLC | 1,242 | 26,745 | 3.9 | |||||||||
Cranswick PLC | 1,409 | 56,028 | 8.1 | |||||||||
Currys PLC | 206,980 | 239,980 | 34.9 | |||||||||
CVS Group PLC | 35,169 | 793,933 | 115.4 | |||||||||
Diploma PLC | 20,902 | 716,913 | 104.2 | |||||||||
dotdigital group PLC | 85,976 | 93,732 | 13.6 | |||||||||
Fevertree Drinks PLC | 38,394 | 870,574 | 126.5 | |||||||||
GB Group PLC | 23,340 | 169,145 | 24.6 | |||||||||
Genus PLC | 7,016 | 220,435 | 32.0 | |||||||||
Hammerson PLC | 516,886 | 186,612 | 27.1 | |||||||||
Hill & Smith Holdings PLC | 13,156 | 227,538 | 33.1 | |||||||||
Hotel Chocolat Group Ltd. | 8,237 | 38,582 | 5.6 | |||||||||
Hunting PLC | 47,670 | 173,834 | 25.3 | |||||||||
Impax Asset Management Group PLC | 6,560 | 70,945 | 10.3 | |||||||||
IntegraFin Holdings PLC | 12,844 | 57,920 | 8.4 | |||||||||
John Wood Group PLC | 33,859 | 94,145 | 13.7 | |||||||||
Judges Scientific PLC | 1,046 | 88,125 | 12.8 | |||||||||
Kainos Group PLC | 2,195 | 33,618 | 4.9 | |||||||||
Lancashire Holdings Ltd. | 4,918 | 26,065 | 3.8 | |||||||||
Learning Technologies Group PLC | 61,231 | 101,094 | 14.7 | |||||||||
Luceco PLC | 35,780 | 85,626 | 12.4 | |||||||||
Micro Focus International PLC | 48,173 | 227,482 | 33.1 | |||||||||
Morgan Advanced Materials PLC | 48,876 | 171,406 | 24.9 | |||||||||
National Express Group PLC | 18,829 | 58,364 | 8.5 | |||||||||
Pagegroup PLC | 1,269 | 7,765 | 1.1 | |||||||||
Pets at Home Group PLC | 109,971 | 426,864 | 62.0 | |||||||||
Polypipe Group PLC | 6,668 | 37,642 | 5.5 | |||||||||
PZ Cussons PLC | 21,831 | 56,017 | 8.1 | |||||||||
Redrow PLC | 77,540 | 508,298 | 73.9 | |||||||||
Restaurant Group PLC | 433,101 | 331,516 | 48.2 | |||||||||
RWS Holdings PLC | 71,159 | 389,720 | 56.6 | |||||||||
Safestore Holdings PLC | 28,395 | 446,703 | 64.9 | |||||||||
Serica Energy PLC | 18,289 | 80,349 | 11.7 | |||||||||
SIG PLC | 159,924 | 82,679 | 12.0 | |||||||||
Smart Metering Systems PLC | 854 | 8,859 | 1.3 | |||||||||
Softcat PLC | 10,517 | 185,744 | 27.0 | |||||||||
Spirent Communications PLC | 31,227 | 90,289 | 13.1 | |||||||||
SThree PLC | 56,005 | 258,178 | 37.5 | |||||||||
Subsea 7 SA | 18,953 | 155,344 | 22.6 | |||||||||
Team17 Group PLC | 1,690 | 9,244 | 1.3 | |||||||||
| Security | Shares | Value | % of Basket Value | |||||||||
| United Kingdom (continued) | ||||||||||||
TechnipFMC PLC | 3,418 | $ | 23,653 | 3.4 | % | |||||||
Vesuvius PLC | 26,968 | 109,668 | 15.9 | |||||||||
Virgin Money UK PLC | 229,867 | 498,718 | 72.5 | |||||||||
Watkin Jones PLC | 8,963 | 27,895 | 4.1 | |||||||||
Wickes Group PLC | 50,450 | 120,271 | 17.5 | |||||||||
Workspace Group PLC | 16,380 | 137,076 | 19.9 | |||||||||
YouGov PLC | 7,023 | 110,830 | 16.1 | |||||||||
|
|
|
| |||||||||
| 10,410,237 | ||||||||||||
| United States | ||||||||||||
1-800-Flowers.com, Inc., Class A | 24,999 | 254,990 | 37.0 | |||||||||
1Life Healthcare, Inc. | 38,615 | 272,236 | 39.6 | |||||||||
1st Source Corp. | 1,310 | 56,684 | 8.2 | |||||||||
2U, Inc. | 19,532 | 194,929 | 28.3 | |||||||||
8x8, Inc. | 15,413 | 141,337 | 20.5 | |||||||||
A10 Networks, Inc. | 6,153 | 87,865 | 12.8 | |||||||||
AAR Corp. | 4,591 | 215,685 | 31.3 | |||||||||
Academy Sports & Outdoors, Inc. | 2,981 | 111,370 | 16.2 | |||||||||
ACADIA Pharmaceuticals, Inc. | 2,364 | 43,592 | 6.3 | |||||||||
Acadia Realty Trust | 18,155 | 379,803 | 55.2 | |||||||||
Accel Entertainment, Inc. | 15,626 | 184,856 | 26.9 | |||||||||
ACCO Brands Corp. | 84,274 | 617,728 | 89.8 | |||||||||
ACI Worldwide, Inc. | 1,275 | 35,215 | 5.1 | |||||||||
ACM Research, Inc., Class A | 4,491 | 67,859 | 9.9 | |||||||||
ACV Auctions, Inc., Class A | 2,479 | 33,095 | 4.8 | |||||||||
Adaptive Biotechnologies Corp. | 17,047 | 140,638 | 20.4 | |||||||||
Addus HomeCare Corp. | 2,418 | 203,789 | 29.6 | |||||||||
Advantage Solutions, Inc. | 13,500 | 67,905 | 9.9 | |||||||||
Aerojet Rocketdyne Holdings, Inc. | 9,154 | 365,977 | 53.2 | |||||||||
AeroVironment, Inc. | 469 | 37,670 | 5.5 | |||||||||
Alarm.com Holdings, Inc. | 3,705 | 226,301 | 32.9 | |||||||||
Alexander & Baldwin, Inc. | 2,372 | 50,286 | 7.3 | |||||||||
Alignment Healthcare, Inc. | 4,607 | 44,273 | 6.4 | |||||||||
Allegiant Travel Co. | 272 | 42,212 | 6.1 | |||||||||
Allegro MicroSystems, Inc. | 329 | 7,998 | 1.2 | |||||||||
ALLETE, Inc. | 2,109 | 125,148 | 18.2 | |||||||||
Alliance Data Systems Corp. | 5,436 | 297,893 | 43.3 | |||||||||
Allison Transmission Holdings, Inc. | 312 | 11,681 | 1.7 | |||||||||
Allogene Therapeutics, Inc. | 17,356 | 144,923 | 21.1 | |||||||||
Allovir, Inc. | 9,680 | 44,044 | 6.4 | |||||||||
Alpha Metallurgical Resources, Inc. | 803 | 124,256 | 18.1 | |||||||||
Altair Engineering, Inc., Class A | 3,460 | 187,947 | 27.3 | |||||||||
Alto Ingredients, Inc. | 8,769 | 50,597 | 7.3 | |||||||||
Altra Industrial Motion Corp. | 6,707 | 261,573 | 38.0 | |||||||||
AMC Networks, Inc., Class A | 1,842 | 60,104 | 8.7 | |||||||||
Ameresco, Inc., Class A | 5,692 | 287,104 | 41.7 | |||||||||
American Assets Trust, Inc. | 6,560 | 240,096 | 34.9 | |||||||||
American Eagle Outfitters, Inc. | 18,611 | 281,212 | 40.9 | |||||||||
American Equity Investment Life Holding Co. | 937 | 35,344 | 5.1 | |||||||||
American States Water Co. | 2,917 | 229,451 | 33.3 | |||||||||
American Well Corp., Class A | 4,328 | 13,547 | 2.0 | |||||||||
American Woodmark Corp. | 9,749 | 456,741 | 66.4 | |||||||||
America’s Car-Mart, Inc. | 1,356 | 109,633 | 15.9 | |||||||||
AMERISAFE, Inc. | 2,684 | 124,403 | 18.1 | |||||||||
Amphastar Pharmaceuticals, Inc. | 1,166 | 41,358 | 6.0 | |||||||||
Annexon, Inc. | 5,372 | 13,699 | 2.0 | |||||||||
Apartment Investment and Management Co., Class A | 13,600 | 85,680 | 12.4 | |||||||||
Applied Industrial Technologies, Inc. | 841 | 88,044 | 12.8 | |||||||||
Arbor Realty Trust, Inc. | 68,707 | 1,174,890 | 170.7 | |||||||||
Arconic Corp. | 249 | 6,265 | 0.9 | |||||||||
Arcosa, Inc. | 765 | 40,950 | 5.9 | |||||||||
| 92 | 2 0 2 2 BLACK ROCK ANNUAL REPORT TO SHAREHOLDERS |
Schedule of Investments (continued) April 30, 2022 | BlackRock Global Long/Short Equity Fund |
| Security | Shares | Value | % of Basket Value | |||||||||
| United States (continued) | ||||||||||||
Ares Management Corp., Class A | 2,224 | $ | 147,273 | 21.4 | % | |||||||
Argan, Inc. | 626 | 23,024 | 3.3 | |||||||||
Armada Hoffler Properties, Inc. | 33,317 | 451,445 | 65.6 | |||||||||
Arrow Financial Corp. | 470 | 14,711 | 2.1 | |||||||||
Artisan Partners Asset Management, Inc., Class A | 3,223 | 103,587 | 15.0 | |||||||||
Artivion, Inc. | 2,406 | 48,818 | 7.1 | |||||||||
Arvinas, Inc. | 743 | 40,843 | 5.9 | |||||||||
Aspen Aerogels, Inc. | 466 | 10,066 | 1.5 | |||||||||
Assetmark Financial Holdings, Inc. | 31,377 | 603,380 | 87.7 | |||||||||
Associated Banc-Corp. | 23,744 | 473,693 | 68.8 | |||||||||
Astec Industries, Inc. | 4,516 | 176,576 | 25.7 | |||||||||
Avaya Holdings Corp. | 9,218 | 85,266 | 12.4 | |||||||||
Avid Bioservices, Inc. | 3,455 | 46,504 | 6.8 | |||||||||
Avient Corp. | 1,201 | 59,137 | 8.6 | |||||||||
Axcelis Technologies, Inc. | 674 | 36,699 | 5.3 | |||||||||
AZZ, Inc. | 1,386 | 63,257 | 9.2 | |||||||||
Badger Meter, Inc. | 2,600 | 209,794 | 30.5 | |||||||||
Banc of California, Inc. | 20,439 | 368,720 | 53.6 | |||||||||
Bandwidth, Inc., Class A | 8,092 | 178,995 | 26.0 | |||||||||
Bar Harbor Bankshares | 1,558 | 40,679 | 5.9 | |||||||||
Barrett Business Services, Inc. | 2,739 | 197,126 | 28.6 | |||||||||
Beauty Health Co. | 1,650 | 21,615 | 3.1 | |||||||||
Benchmark Electronics, Inc. | 278 | 6,605 | 1.0 | |||||||||
Berry Corp. | 7,177 | 78,732 | 11.4 | |||||||||
BJ’s Restaurants, Inc. | 12,381 | 344,068 | 50.0 | |||||||||
Blackbaud, Inc. | 2,376 | 137,832 | 20.0 | |||||||||
Bloom Energy Corp., Class A | 3,853 | 71,512 | 10.4 | |||||||||
Bloomin’ Brands, Inc. | 2,184 | 48,026 | 7.0 | |||||||||
Boot Barn Holdings, Inc. | 2,733 | 246,134 | 35.8 | |||||||||
Bridgebio Pharma, Inc. | 9,407 | 75,444 | 11.0 | |||||||||
Brigham Minerals, Inc., Class A | 8,706 | 215,735 | 31.3 | |||||||||
Brightsphere Investment Group, Inc. | 7,448 | 149,258 | 21.7 | |||||||||
BTRS Holdings, Inc., Class 1 | 19,747 | 132,700 | 19.3 | |||||||||
Byline Bancorp, Inc. | 8,815 | 206,800 | 30.0 | |||||||||
Calix, Inc. | 7,291 | 290,984 | 42.3 | |||||||||
Callon Petroleum Co. | 2,344 | 120,177 | 17.5 | |||||||||
Camden National Corp. | 2,226 | 99,613 | 14.5 | |||||||||
Cannae Holdings, Inc. | 10,571 | 236,790 | 34.4 | |||||||||
Capital City Bank Group, Inc. | 19,503 | 499,472 | 72.6 | |||||||||
Cardiovascular Systems, Inc. | 8,397 | 157,024 | 22.8 | |||||||||
CareDx, Inc. | 231 | 7,032 | 1.0 | |||||||||
Casella Waste Systems, Inc., Class A | 3,149 | 258,974 | 37.6 | |||||||||
Centennial Resource Development, Inc., Class A | 38,485 | 297,874 | 43.3 | |||||||||
Centerspace | 7,654 | 706,158 | 102.6 | |||||||||
Central Garden & Pet Co., Class A | 4,107 | 169,948 | 24.7 | |||||||||
Century Communities, Inc. | 5,429 | 286,217 | 41.6 | |||||||||
Cerence, Inc. | 7,597 | 224,111 | 32.6 | |||||||||
CEVA, Inc. | 1,184 | 43,027 | 6.2 | |||||||||
ChannelAdvisor Corp. | 14,294 | 207,406 | 30.1 | |||||||||
Chatham Lodging Trust | 15,044 | 216,032 | 31.4 | |||||||||
Cheesecake Factory, Inc. | 183 | 6,755 | 1.0 | |||||||||
Chefs’ Warehouse, Inc. | 4,794 | 175,460 | 25.5 | |||||||||
ChemoCentryx, Inc. | 309 | 5,704 | 0.8 | |||||||||
Chuy’s Holdings, Inc. | 5,526 | 138,205 | 20.1 | |||||||||
Cinemark Holdings, Inc. | 16,486 | 261,468 | 38.0 | |||||||||
Clean Energy Fuels Corp. | 3,009 | 17,633 | 2.6 | |||||||||
Clear Channel Outdoor Holdings, Inc. | 46,740 | 114,980 | 16.7 | |||||||||
Clear Secure, Inc., Class A | 1,010 | 30,724 | 4.5 | |||||||||
Clearwater Paper Corp. | 250 | 8,278 | 1.2 | |||||||||
Clearway Energy, Inc., Class A | 6,035 | 171,515 | 24.9 | |||||||||
Clearway Energy, Inc., Class C | 271 | 8,274 | 1.2 | |||||||||
| Security | Shares | Value | % of Basket Value | |||||||||
| United States (continued) | ||||||||||||
CNO Financial Group, Inc. | 8,179 | $ | 197,441 | 28.7 | % | |||||||
CNX Resources Corp. | 8,134 | 167,154 | 24.3 | |||||||||
Coeur Mining, Inc. | 9,748 | 35,385 | 5.1 | |||||||||
Cogent Communications Holdings, Inc. | 9,124 | 533,754 | 77.6 | |||||||||
Cohen & Steers, Inc. | 1,656 | 128,655 | 18.7 | |||||||||
Coherus Biosciences, Inc. | 20,876 | 188,719 | 27.4 | |||||||||
Cohu, Inc. | 2,664 | 70,756 | 10.3 | |||||||||
CommScope Holding Co., Inc. | 13,630 | 82,189 | 11.9 | |||||||||
Community Trust Bancorp, Inc. | 727 | 28,942 | 4.2 | |||||||||
Compass Minerals International, Inc. | 221 | 13,068 | 1.9 | |||||||||
ConnectOne Bancorp, Inc. | 3,321 | 92,523 | 13.4 | |||||||||
Construction Partners, Inc., Class A | 331 | 8,543 | 1.2 | |||||||||
Corcept Therapeutics, Inc. | 4,781 | 102,839 | 14.9 | |||||||||
CorVel Corp. | 158 | 24,503 | 3.6 | |||||||||
Covetrus, Inc. | 639 | 8,818 | 1.3 | |||||||||
Cowen, Inc., Class A | 6,900 | 157,665 | 22.9 | |||||||||
Cross Country Healthcare, Inc. | 1,331 | 24,943 | 3.6 | |||||||||
CrossFirst Bankshares, Inc. | 6,131 | 78,538 | 11.4 | |||||||||
CryoPort, Inc. | 832 | 18,770 | 2.7 | |||||||||
CSW Industrials, Inc. | 266 | 28,066 | 4.1 | |||||||||
Cutera, Inc. | 3,307 | 179,603 | 26.1 | |||||||||
Dave & Buster’s Entertainment, Inc. | 7,618 | 346,619 | 50.4 | |||||||||
Deciphera Pharmaceuticals, Inc. | 6,299 | 63,746 | 9.3 | |||||||||
Delek US Holdings, Inc. | 5,196 | 125,743 | 18.3 | |||||||||
Deluxe Corp. | 2,322 | 62,880 | 9.1 | |||||||||
Denali Therapeutics, Inc. | 253 | 6,021 | 0.9 | |||||||||
Denbury, Inc. | 317 | 20,282 | 2.9 | |||||||||
Dime Community Bancshares, Inc. | 1,906 | 59,925 | 8.7 | |||||||||
Diodes, Inc. | 1,392 | 101,658 | 14.8 | |||||||||
Donegal Group, Inc., Class A | 20,077 | 271,642 | 39.5 | |||||||||
Dorian LPG Ltd. | 3,108 | 45,750 | 6.6 | |||||||||
Dril-Quip, Inc. | 3,621 | 104,574 | 15.2 | |||||||||
Ducommun, Inc. | 392 | 20,019 | 2.9 | |||||||||
Duolingo, Inc. | 296 | 25,595 | 3.7 | |||||||||
DXP Enterprises, Inc. | 9,735 | 230,038 | 33.4 | |||||||||
Dyne Therapeutics, Inc. | 11,002 | 87,796 | 12.8 | |||||||||
Eagle Pharmaceuticals, Inc. | 165 | 7,281 | 1.1 | |||||||||
Easterly Government Properties, Inc. | 16,675 | 317,659 | 46.2 | |||||||||
EchoStar Corp., Class A | 6,394 | 149,300 | 21.7 | |||||||||
Ecovyst, Inc. | 27,428 | 275,926 | 40.1 | |||||||||
Editas Medicine, Inc. | 6,651 | 88,059 | 12.8 | |||||||||
elf Beauty, Inc. | 6,719 | 163,473 | 23.8 | |||||||||
Emergent BioSolutions, Inc. | 7,177 | 232,391 | 33.8 | |||||||||
Enanta Pharmaceuticals, Inc. | 955 | 61,502 | 8.9 | |||||||||
Energizer Holdings, Inc. | 8,632 | 261,463 | 38.0 | |||||||||
Energy Recovery, Inc. | 354 | 6,556 | 1.0 | |||||||||
EnPro Industries, Inc. | 978 | 91,159 | 13.2 | |||||||||
Ensign Group, Inc. | 74 | 5,944 | 0.9 | |||||||||
ePlus, Inc. | 654 | 36,938 | 5.4 | |||||||||
Equitrans Midstream Corp. | 24,093 | 189,371 | 27.5 | |||||||||
Esab Corp. | 152 | 7,144 | 1.0 | |||||||||
ESCO Technologies, Inc. | 1,142 | 71,318 | 10.4 | |||||||||
Essential Properties Realty Trust, Inc. | 19,833 | 475,992 | 69.2 | |||||||||
Ethan Allen Interiors, Inc. | 5,792 | 137,502 | 20.0 | |||||||||
Everbridge, Inc. | 6,545 | 282,089 | 41.0 | |||||||||
Everi Holdings, Inc. | 5,475 | 95,046 | 13.8 | |||||||||
Evolent Health, Inc., Class A | 3,772 | 103,805 | 15.1 | |||||||||
EW Scripps Co., Class A | 20,381 | 335,471 | 48.7 | |||||||||
eXp World Holdings, Inc. | 3,241 | 43,397 | 6.3 | |||||||||
Exponent, Inc. | 1,179 | 112,960 | 16.4 | |||||||||
F45 Training Holdings, Inc. | 1,041 | 9,150 | 1.3 | |||||||||
FB Financial Corp. | 4,084 | 157,357 | 22.9 | |||||||||
SCHEDULE OF INVESTMENTS | 93 |
Schedule of Investments (continued) April 30, 2022 | BlackRock Global Long/Short Equity Fund |
| Security | Shares | Value | % of Basket Value | |||||||||
| United States (continued) | ||||||||||||
Federal Agricultural Mortgage Corp., Class C | 320 | $ | 32,778 | 4.8 | % | |||||||
FibroGen, Inc. | 10,228 | 95,120 | 13.8 | |||||||||
Figs, Inc., Class A | 8,699 | 136,226 | 19.8 | |||||||||
First Advantage Corp. | 712 | 12,360 | 1.8 | |||||||||
First Bancshares, Inc. | 16,324 | 525,470 | 76.3 | |||||||||
First Busey Corp. | 825 | 18,538 | 2.7 | |||||||||
First Financial Corp. | 26,262 | 1,119,286 | 162.6 | |||||||||
First Foundation, Inc. | 31,101 | 691,064 | 100.4 | |||||||||
First of Long Island Corp. | 3,153 | 52,907 | 7.7 | |||||||||
Flushing Financial Corp. | 9,290 | 199,735 | 29.0 | |||||||||
Focus Financial Partners, Inc., Class A | 3,464 | 136,655 | 19.9 | |||||||||
Foot Locker, Inc. | 1,622 | 47,541 | 6.9 | |||||||||
FormFactor, Inc. | 455 | 17,340 | 2.5 | |||||||||
Forrester Research, Inc. | 10,477 | 583,464 | 84.8 | |||||||||
Franchise Group, Inc. | 4,015 | 149,719 | 21.8 | |||||||||
frontdoor, Inc. | 14,400 | 445,104 | 64.7 | |||||||||
Frontier Group Holdings, Inc. | 12,054 | 127,893 | 18.6 | |||||||||
FRP Holdings, Inc. | 3,217 | 181,793 | 26.4 | |||||||||
fuboTV, Inc. | 11,919 | 45,173 | 6.6 | |||||||||
Fulton Financial Corp. | 8,125 | 123,256 | 17.9 | |||||||||
Funko, Inc., Class A | 13,525 | 220,322 | 32.0 | |||||||||
Gates Industrial Corp. PLC | 506 | 6,452 | 0.9 | |||||||||
Genco Shipping & Trading Ltd. | 1,420 | 31,283 | 4.5 | |||||||||
Getty Realty Corp. | 3,421 | 92,059 | 13.4 | |||||||||
Gibraltar Industries, Inc. | 6,667 | 252,279 | 36.7 | |||||||||
G-III Apparel Group Ltd. | 8,213 | 217,480 | 31.6 | |||||||||
Gladstone Land Corp. | 4,599 | 167,404 | 24.3 | |||||||||
GMS, Inc. | 168 | 8,056 | 1.2 | |||||||||
Gogo, Inc. | 12,016 | 221,215 | 32.1 | |||||||||
Goosehead Insurance, Inc., Class A | 727 | 41,795 | 6.1 | |||||||||
GoPro, Inc., Class A | 9,901 | 88,317 | 12.8 | |||||||||
Granite Construction, Inc. | 2,094 | 62,087 | 9.0 | |||||||||
Green Brick Partners, Inc. | 4,399 | 86,660 | 12.6 | |||||||||
Griffon Corp. | 11,752 | 219,880 | 31.9 | |||||||||
Grocery Outlet Holding Corp. | 2,773 | 93,367 | 13.6 | |||||||||
Group 1 Automotive, Inc. | 1,242 | 216,282 | 31.4 | |||||||||
Gulfport Energy Corp. | 1,494 | 140,406 | 20.4 | |||||||||
H&E Equipment Services, Inc. | 8,848 | 313,927 | 45.6 | |||||||||
Hanover Insurance Group, Inc. | 1,854 | 272,204 | 39.5 | |||||||||
Harmonic, Inc. | 2,580 | 21,414 | 3.1 | |||||||||
Harmony Biosciences Holdings, Inc. | 2,329 | 104,898 | 15.2 | |||||||||
Harsco Corp. | 5,504 | 56,251 | 8.2 | |||||||||
Haverty Furniture Cos., Inc. | 8,907 | 221,161 | 32.1 | |||||||||
Hawaiian Holdings, Inc. | 16,619 | 281,858 | 41.0 | |||||||||
Hawkins, Inc. | 492 | 18,342 | 2.7 | |||||||||
Hayward Holdings, Inc. | 9,487 | 150,843 | 21.9 | |||||||||
Health Catalyst, Inc. | 2,589 | 43,081 | 6.3 | |||||||||
Heartland Express, Inc. | 2,369 | 32,692 | 4.7 | |||||||||
Heartland Financial USA, Inc. | 4,756 | 208,170 | 30.2 | |||||||||
Hecla Mining Co. | 76,051 | 396,226 | 57.6 | |||||||||
Hemisphere Media Group, Inc. | 13,852 | 53,884 | 7.8 | |||||||||
Heritage Commerce Corp. | 2,847 | 31,972 | 4.6 | |||||||||
Heron Therapeutics, Inc. | 19,189 | 86,734 | 12.6 | |||||||||
Heska Corp. | 1,244 | 136,641 | 19.9 | |||||||||
Hess Midstream LP, Class A | 4,087 | 120,199 | 17.5 | |||||||||
Hilltop Holdings, Inc. | 5,657 | 144,197 | 20.9 | |||||||||
Holley, Inc. | 16,603 | 174,996 | 25.4 | |||||||||
Horizon Bancorp, Inc. | 8,360 | 146,133 | 21.2 | |||||||||
Hub Group, Inc., Class A | 3,463 | 232,575 | 33.8 | |||||||||
I3 Verticals, Inc., Class A | 3,718 | 102,059 | 14.8 | |||||||||
Ideaya Biosciences, Inc. | 1,851 | 17,751 | 2.6 | |||||||||
ImmunoGen, Inc. | 20,360 | 98,339 | 14.3 | |||||||||
| Security | Shares | Value | % of Basket Value | |||||||||
| United States (continued) | ||||||||||||
Impinj, Inc. | 1,860 | $ | 91,624 | 13.3 | % | |||||||
Independent Bank Corp. | 15,516 | 306,286 | 44.5 | |||||||||
Independent Bank Group, Inc. | 2,796 | 189,569 | 27.5 | |||||||||
Ingevity Corp. | 6,014 | 360,239 | 52.3 | |||||||||
Innospec, Inc. | 1,944 | 185,283 | 26.9 | |||||||||
Innoviva, Inc. | 508 | 8,666 | 1.3 | |||||||||
Installed Building Products, Inc. | 829 | 66,710 | 9.7 | |||||||||
Integer Holdings Corp. | 208 | 15,635 | 2.3 | |||||||||
Intercept Pharmaceuticals, Inc. | 9,058 | 142,301 | 20.7 | |||||||||
International Money Express, Inc. | 5,760 | 114,451 | 16.6 | |||||||||
International Seaways, Inc. | 5,870 | 124,033 | 18.0 | |||||||||
Invitae Corp. | 11,173 | 59,329 | 8.6 | |||||||||
iRobot Corp. | 7,966 | 403,478 | 58.6 | |||||||||
Ironwood Pharmaceuticals, Inc. | 12,616 | 151,392 | 22.0 | |||||||||
iStar, Inc. | 5,313 | 89,471 | 13.0 | |||||||||
Itron, Inc. | 5,556 | 265,466 | 38.6 | |||||||||
J&J Snack Foods Corp. | 1,877 | 280,987 | 40.8 | |||||||||
John B Sanfilippo & Son, Inc. | 169 | 13,121 | 1.9 | |||||||||
Joint Corp. | 2,493 | 76,086 | 11.1 | |||||||||
Kadant, Inc. | 140 | 25,900 | 3.8 | |||||||||
Karyopharm Therapeutics, Inc. | 833 | 5,081 | 0.7 | |||||||||
Kforce, Inc. | 675 | 47,284 | 6.9 | |||||||||
Kodiak Sciences, Inc. | 4,052 | 24,393 | 3.5 | |||||||||
Kontoor Brands, Inc. | 3,870 | 153,755 | 22.3 | |||||||||
Kratos Defense & Security Solutions, Inc. | 2,798 | 42,446 | 6.2 | |||||||||
Krispy Kreme, Inc. | 7,522 | 99,892 | 14.5 | |||||||||
Kura Oncology, Inc. | 5,255 | 75,409 | 11.0 | |||||||||
Kymera Therapeutics, Inc. | 1,882 | 59,001 | 8.6 | |||||||||
Lakeland Bancorp, Inc. | 1,632 | 24,529 | 3.6 | |||||||||
Laredo Petroleum, Inc. | 1,309 | 93,214 | 13.5 | |||||||||
LeMaitre Vascular, Inc. | 2,520 | 108,889 | 15.8 | |||||||||
LendingClub Corp. | 6,679 | 101,855 | 14.8 | |||||||||
LendingTree, Inc. | 2,428 | 192,832 | 28.0 | |||||||||
LGI Homes, Inc. | 1,096 | 102,706 | 14.9 | |||||||||
Liberty Latin America Ltd., Class C | 721 | 6,662 | 1.0 | |||||||||
Liberty Media Corp. - Liberty Braves, Class A | 276 | 7,251 | 1.1 | |||||||||
Limelight Networks, Inc. | 5,307 | 18,946 | 2.8 | |||||||||
Lindblad Expeditions Holdings, Inc. | 640 | 9,798 | 1.4 | |||||||||
Lions Gate Entertainment Corp., Class A | 19,464 | 262,569 | 38.1 | |||||||||
Lions Gate Entertainment Corp., Class B | 9,748 | 122,532 | 17.8 | |||||||||
Live Oak Bancshares, Inc. | 226 | 9,567 | 1.4 | |||||||||
LivePerson, Inc. | 9,169 | 207,403 | 30.1 | |||||||||
LiveRamp Holdings, Inc. | 2,190 | 68,591 | 10.0 | |||||||||
Luther Burbank Corp. | 19,216 | 254,996 | 37.0 | |||||||||
M/I Homes, Inc. | 11,000 | 487,080 | 70.8 | |||||||||
Malibu Boats, Inc., Class A | 15,358 | 772,354 | 112.2 | |||||||||
MannKind Corp. | 1,934 | 6,053 | 0.9 | |||||||||
Marcus & Millichap, Inc. | 234 | 10,481 | 1.5 | |||||||||
Marcus Corp. | 33,019 | 519,389 | 75.5 | |||||||||
MarineMax, Inc. | 6,250 | 255,750 | 37.2 | |||||||||
Marten Transport Ltd. | 13,386 | 232,649 | 33.8 | |||||||||
Masonite International Corp. | 132 | 10,233 | 1.5 | |||||||||
McGrath RentCorp | 257 | 21,449 | 3.1 | |||||||||
MDC Holdings, Inc. | 2,077 | 76,662 | 11.1 | |||||||||
Mercantile Bank Corp. | 611 | 19,185 | 2.8 | |||||||||
Merchants Bancorp | 1,787 | 42,030 | 6.1 | |||||||||
Merit Medical Systems, Inc. | 1,074 | 66,599 | 9.7 | |||||||||
MFA Financial, Inc. | 6,476 | 92,283 | 13.4 | |||||||||
MGP Ingredients, Inc. | 4,862 | 444,046 | 64.5 | |||||||||
Midland States Bancorp, Inc. | 31,482 | 829,866 | 120.6 | |||||||||
MidWestOne Financial Group, Inc. | 3,157 | 94,331 | 13.7 | |||||||||
MiMedx Group, Inc. | 3,371 | 13,315 | 1.9 | |||||||||
| 94 | 2 0 2 2 BLACK ROCK ANNUAL REPORT TO SHAREHOLDERS |
Schedule of Investments (continued) April 30, 2022 | BlackRock Global Long/Short Equity Fund |
| Security | Shares | Value | % of Basket Value | |||||||||
| United States (continued) | ||||||||||||
Mitek Systems, Inc. | 7,307 | $ | 81,619 | 11.9 | % | |||||||
Model N, Inc. | 13,278 | 343,104 | 49.9 | |||||||||
Modine Manufacturing Co. | 19,119 | 151,040 | 21.9 | |||||||||
ModivCare, Inc. | 189 | 19,650 | 2.9 | |||||||||
Moelis & Co., Class A | 3,579 | 158,407 | 23.0 | |||||||||
Momentive Global, Inc. | 7,559 | 119,583 | 17.4 | |||||||||
Monro, Inc. | 8,998 | 411,479 | 59.8 | |||||||||
Montrose Environmental Group, Inc. | 4,337 | 196,770 | 28.6 | |||||||||
Morphic Holding, Inc. | 194 | 5,880 | 0.9 | |||||||||
MRC Global, Inc. | 60,610 | 726,714 | 105.6 | |||||||||
Myers Industries, Inc. | 341 | 7,478 | 1.1 | |||||||||
Nabors Industries Ltd. | 1,063 | 164,361 | 23.9 | |||||||||
Napco Security Technologies, Inc. | 2,610 | 45,675 | 6.6 | |||||||||
National Instruments Corp. | 10,043 | 362,954 | 52.7 | |||||||||
Neogen Corp. | 385 | 10,164 | 1.5 | |||||||||
NeoGenomics, Inc. | 18,582 | 175,600 | 25.5 | |||||||||
NexPoint Residential Trust, Inc. | 18,791 | 1,675,406 | 243.4 | |||||||||
NGM Biopharmaceuticals, Inc. | 17,588 | 219,498 | 31.9 | |||||||||
Nkarta, Inc. | 4,797 | 88,457 | 12.9 | |||||||||
nLight, Inc. | 1,092 | 14,360 | 2.1 | |||||||||
NMI Holdings, Inc., Class A | 20,451 | 375,889 | 54.6 | |||||||||
Noble Corp. | 1,585 | 50,609 | 7.4 | |||||||||
Northern Oil and Gas, Inc. | 304 | 7,594 | 1.1 | |||||||||
Northfield Bancorp, Inc. | 1,389 | 18,182 | 2.6 | |||||||||
Northwest Natural Holding Co. | 4,626 | 221,262 | 32.1 | |||||||||
NorthWestern Corp. | 8,882 | 503,521 | 73.2 | |||||||||
Nurix Therapeutics, Inc. | 410 | 4,539 | 0.7 | |||||||||
Oasis Petroleum, Inc. | 464 | 61,554 | 8.9 | |||||||||
Oceaneering International, Inc. | 2,308 | 26,150 | 3.8 | |||||||||
Olema Pharmaceuticals, Inc. | 20,033 | 51,084 | 7.4 | |||||||||
Ollie’s Bargain Outlet Holdings, Inc. | 9,600 | 461,280 | 67.0 | |||||||||
Olo, Inc., Class A | 18,397 | 196,664 | 28.6 | |||||||||
Oportun Financial Corp. | 3,097 | 35,894 | 5.2 | |||||||||
Origin Bancorp, Inc. | 19,276 | 726,320 | 105.5 | |||||||||
Origin Materials, Inc. | 1,340 | 8,697 | 1.3 | |||||||||
Orthofix Medical, Inc. | 3,360 | 104,160 | 15.1 | |||||||||
Outfront Media, Inc. | 14,878 | 380,877 | 55.3 | |||||||||
Overstock.com, Inc. | 5,303 | 177,969 | 25.9 | |||||||||
Pacific Biosciences of California, Inc. | 5,055 | 32,049 | 4.7 | |||||||||
PagerDuty, Inc. | 5,377 | 153,621 | 22.3 | |||||||||
Palomar Holdings, Inc. | 681 | 37,080 | 5.4 | |||||||||
Par Pacific Holdings, Inc. | 11,136 | 163,365 | 23.7 | |||||||||
PAR Technology Corp. | 5,935 | 196,092 | 28.5 | |||||||||
Party City Holdco, Inc. | 3,314 | 10,240 | 1.5 | |||||||||
Passage Bio, Inc. | 15,656 | 30,529 | 4.4 | |||||||||
Patrick Industries, Inc. | 1,804 | 112,299 | 16.3 | |||||||||
Paymentus Holdings, Inc., Class A | 648 | 10,731 | 1.6 | |||||||||
Peapack Gladstone Financial Corp. | 256 | 7,933 | 1.2 | |||||||||
Pebblebrook Hotel Trust | 16,274 | 397,411 | 57.7 | |||||||||
Peoples Bancorp, Inc. | 17,007 | 466,332 | 67.8 | |||||||||
Perficient, Inc. | 496 | 49,307 | 7.2 | |||||||||
Personalis, Inc. | 22,633 | 126,745 | 18.4 | |||||||||
PetIQ, Inc. | 6,481 | 128,972 | 18.7 | |||||||||
Phibro Animal Health Corp., Class A | 4,176 | 75,126 | 10.9 | |||||||||
Piedmont Lithium, Inc. | 1,095 | 71,624 | 10.4 | |||||||||
Piper Sandler Cos | 282 | 32,424 | 4.7 | |||||||||
PJT Partners, Inc., Class A | 2,814 | 185,696 | 27.0 | |||||||||
Plains GP Holdings LP, Class A | 14,355 | 160,345 | 23.3 | |||||||||
Playa Hotels & Resorts NV | 3,973 | 37,505 | 5.4 | |||||||||
Plymouth Industrial REIT, Inc. | 18,748 | 452,202 | 65.7 | |||||||||
PMV Pharmaceuticals, Inc. | 3,317 | 48,063 | 7.0 | |||||||||
Poshmark, Inc., Class A | 10,439 | 115,247 | 16.7 | |||||||||
| Security | Shares | Value | % of Basket Value | |||||||||
| United States (continued) | ||||||||||||
Premier Financial Corp. | 16,673 | $ | 442,501 | 64.3 | % | |||||||
Prestige Consumer Healthcare, Inc. | 10,034 | 548,458 | 79.7 | |||||||||
Primoris Services Corp. | 2,285 | 52,966 | 7.7 | |||||||||
PROG Holdings, Inc. | 4,479 | 118,559 | 17.2 | |||||||||
ProPetro Holding Corp. | 3,962 | 56,023 | 8.1 | |||||||||
Proto Labs, Inc. | 478 | 20,368 | 3.0 | |||||||||
PubMatic, Inc., Class A | 391 | 8,825 | 1.3 | |||||||||
QCR Holdings, Inc. | 2,513 | 136,431 | 19.8 | |||||||||
Quaker Chemical Corp. | 3,740 | 608,535 | 88.4 | |||||||||
QuinStreet, Inc. | 29,071 | 276,465 | 40.2 | |||||||||
Qurate Retail, Inc., Series A | 4,716 | 19,854 | 2.9 | |||||||||
Ranpak Holdings Corp. | 12,865 | 194,004 | 28.2 | |||||||||
Ready Capital Corp. | 699 | 10,184 | 1.5 | |||||||||
RealReal, Inc. | 11,773 | 63,810 | 9.3 | |||||||||
Redfin Corp. | 692 | 7,716 | 1.1 | |||||||||
Redwood Trust, Inc. | 15,160 | 147,052 | 21.4 | |||||||||
Replimune Group, Inc. | 2,939 | 49,287 | 7.2 | |||||||||
Revolution Medicines, Inc. | 4,294 | 85,751 | 12.5 | |||||||||
REX American Resources Corp. | 600 | 50,778 | 7.4 | |||||||||
RLI Corp. | 876 | 100,547 | 14.6 | |||||||||
RLJ Lodging Trust | 32,635 | 457,543 | 66.5 | |||||||||
Rocket Pharmaceuticals, Inc. | 19,230 | 197,684 | 28.7 | |||||||||
RPT Realty | 11,851 | 157,500 | 22.9 | |||||||||
Rush Enterprises, Inc., Class A | 4,310 | 219,293 | 31.9 | |||||||||
Rush Enterprises, Inc., Class B | 4,717 | 228,539 | 33.2 | |||||||||
Ryan Specialty Group Holdings, Inc., Class A | 14,234 | 526,516 | 76.5 | |||||||||
Ryerson Holding Corp. | 173 | 6,368 | 0.9 | |||||||||
Sabra Health Care REIT, Inc. | 12,034 | 140,557 | 20.4 | |||||||||
Safehold, Inc. | 1,003 | 43,179 | 6.3 | |||||||||
Sage Therapeutics, Inc. | 215 | 6,777 | 1.0 | |||||||||
Sana Biotechnology, Inc. | 11,129 | 84,024 | 12.2 | |||||||||
Sangamo Therapeutics, Inc. | 4,794 | 19,895 | 2.9 | |||||||||
ScanSource, Inc. | 241 | 8,252 | 1.2 | |||||||||
Select Medical Holdings Corp. | 22,659 | 512,320 | 74.4 | |||||||||
Sensient Technologies Corp. | 543 | 45,938 | 6.7 | |||||||||
Shake Shack, Inc., Class A | 12,049 | 696,794 | 101.2 | |||||||||
Shutterstock, Inc. | 815 | 61,712 | 9.0 | |||||||||
Simply Good Foods Co. | 1,126 | 46,898 | 6.8 | |||||||||
Simpson Manufacturing Co., Inc. | 818 | 84,802 | 12.3 | |||||||||
Simulations Plus, Inc. | 541 | 25,243 | 3.7 | |||||||||
SkyWest, Inc. | 21,516 | 627,191 | 91.1 | |||||||||
SMART Global Holdings, Inc. | 6,141 | 139,155 | 20.2 | |||||||||
Sonic Automotive, Inc., Class A | 490 | 20,849 | 3.0 | |||||||||
Sorrento Therapeutics, Inc. | 8,520 | 12,865 | 1.9 | |||||||||
SPS Commerce, Inc. | 3,895 | 465,959 | 67.7 | |||||||||
SPX Corp. | 1,446 | 60,587 | 8.8 | |||||||||
Standard Motor Products, Inc. | 2,243 | 95,731 | 13.9 | |||||||||
Standex International Corp. | 72 | 6,771 | 1.0 | |||||||||
Stepan Co. | 1,008 | 102,927 | 15.0 | |||||||||
Stitch Fix, Inc., Class A | 41,700 | 396,150 | 57.6 | |||||||||
Stoke Therapeutics, Inc. | 10,440 | 150,754 | 21.9 | |||||||||
StoneX Group, Inc. | 1,183 | 80,184 | 11.6 | |||||||||
Summit Hotel Properties, Inc. | 5,789 | 57,137 | 8.3 | |||||||||
Summit Materials, Inc., Class A | 15,548 | 432,234 | 62.8 | |||||||||
SunCoke Energy, Inc. | 3,190 | 26,541 | 3.9 | |||||||||
Sunnova Energy International, Inc. | 11,174 | 192,975 | 28.0 | |||||||||
SunPower Corp. | 3,554 | 58,677 | 8.5 | |||||||||
Super Micro Computer, Inc. | 1,976 | 83,190 | 12.1 | |||||||||
Sylvamo Corp. | 6,824 | 304,692 | 44.3 | |||||||||
Syndax Pharmaceuticals, Inc. | 528 | 8,855 | 1.3 | |||||||||
Tactile Systems Technology, Inc. | 10,290 | 173,695 | 25.2 | |||||||||
Tanger Factory Outlet Centers, Inc. | 1,145 | 18,469 | 2.7 | |||||||||
SCHEDULE OF INVESTMENTS | 95 |
Schedule of Investments (continued) April 30, 2022 | BlackRock Global Long/Short Equity Fund |
| Security | Shares | Value | % of Basket Value | |||||||||
| United States (continued) | ||||||||||||
Targa Resources Corp. | 7,581 | $ | 556,521 | 80.9 | % | |||||||
Taylor Morrison Home Corp. | 8,988 | 235,396 | 34.2 | |||||||||
TechTarget, Inc. | 3,359 | 226,094 | 32.8 | |||||||||
Texas Capital Bancshares, Inc. | 13,086 | 672,097 | 97.7 | |||||||||
TG Therapeutics, Inc. | 862 | 5,982 | 0.9 | |||||||||
TowneBank | 6,284 | 173,250 | 25.2 | |||||||||
Transocean Ltd. | 50,648 | 190,436 | 27.7 | |||||||||
Travere Therapeutics, Inc. | 439 | 11,032 | 1.6 | |||||||||
Tri Pointe Homes, Inc. | 28,884 | 597,032 | 86.7 | |||||||||
Trico Bancshares | 15,789 | 592,877 | 86.1 | |||||||||
Trinity Industries, Inc. | 1,187 | 32,927 | 4.8 | |||||||||
Triumph Group, Inc. | 3,855 | 86,892 | 12.6 | |||||||||
TrueBlue, Inc. | 363 | 9,282 | 1.3 | |||||||||
TTEC Holdings, Inc. | 138 | 10,186 | 1.5 | |||||||||
Turning Point Brands, Inc. | 13,721 | 430,702 | 62.6 | |||||||||
Tutor Perini Corp. | 18,617 | 172,580 | 25.1 | |||||||||
U.S. Physical Therapy, Inc. | 515 | 53,442 | 7.8 | |||||||||
UMB Financial Corp. | 6,031 | 543,876 | 79.0 | |||||||||
UMH Properties, Inc. | 23,635 | 555,895 | 80.8 | |||||||||
United Fire Group, Inc. | 18,237 | 534,162 | 77.6 | |||||||||
United States Cellular Corp. | 17,264 | 496,858 | 72.2 | |||||||||
Unitil Corp. | 3,690 | 188,190 | 27.3 | |||||||||
Univest Financial Corp. | 2,032 | 51,206 | 7.4 | |||||||||
Upland Software, Inc. | 7,684 | 114,645 | 16.7 | |||||||||
Urban Edge Properties | 3,418 | 63,882 | 9.3 | |||||||||
Urban Outfitters, Inc. | 15,770 | 375,326 | 54.5 | |||||||||
Valaris Ltd. | 1,307 | 66,330 | 9.6 | |||||||||
Varex Imaging Corp. | 274 | 5,439 | 0.8 | |||||||||
Vector Group Ltd. | 4,194 | 53,348 | 7.7 | |||||||||
Vectrus, Inc. | 7,122 | 257,104 | 37.4 | |||||||||
Veeco Instruments, Inc. | 6,147 | 140,889 | 20.5 | |||||||||
Veracyte, Inc. | 4,705 | 96,311 | 14.0 | |||||||||
Veris Residential, Inc. | 4,977 | 79,682 | 11.6 | |||||||||
Veritex Holdings, Inc. | 12,337 | 405,270 | 58.9 | |||||||||
Veritiv Corp. | 785 | 110,324 | 16.0 | |||||||||
Vertex Inc., Class A | 6,175 | 87,870 | 12.8 | |||||||||
Viad Corp. | 1,661 | 54,398 | 7.9 | |||||||||
Victory Capital Holdings Inc., Class A | 23,611 | 637,261 | 92.6 | |||||||||
Virtus Investment Partners, Inc. | 63 | 11,161 | 1.6 | |||||||||
Vishay Intertechnology, Inc. | 8,298 | 154,592 | 22.5 | |||||||||
Vista Outdoor, Inc. | 1,496 | 52,704 | 7.7 | |||||||||
Vital Farms, Inc. | 579 | 6,659 | 1.0 | |||||||||
Walker & Dunlop, Inc. | 1,693 | 202,754 | 29.5 | |||||||||
Warrior Met Coal, Inc. | 753 | 25,655 | 3.7 | |||||||||
Washington Federal, Inc. | 7,097 | 215,962 | 31.4 | |||||||||
Watts Water Technologies, Inc., Class A | 377 | 48,052 | 7.0 | |||||||||
WD-40 Co. | 1,820 | 334,844 | 48.7 | |||||||||
Werner Enterprises, Inc. | 12,068 | 478,255 | 69.5 | |||||||||
WesBanco, Inc. | 865 | 27,888 | 4.0 | |||||||||
Willdan Group, Inc. | 2,758 | 74,135 | 10.8 | |||||||||
Xerox Holdings Corp. | 1,753 | 30,502 | 4.4 | |||||||||
Yext, Inc. | 37,981 | 219,910 | 32.0 | |||||||||
Y-mAbs Therapeutics, Inc. | 10,891 | 91,484 | 13.3 | |||||||||
York Water Co. | 160 | 6,189 | 0.9 | |||||||||
ZimVie, Inc. | 1,177 | 26,482 | 3.8 | |||||||||
| Security | Shares | Value | % of Basket Value | |||||||||
| United States (continued) | ||||||||||||
ZipRecruiter, Inc., Class A | 16,563 | $ | 372,833 | 54.2 | % | |||||||
Zuora, Inc., Class A | 41,320 | 502,864 | 73.1 | |||||||||
|
|
|
| |||||||||
| 78,625,713 | ||||||||||||
Preferred Stocks |
| |||||||||||
| Germany | ||||||||||||
Schaeffler AG, Preference Shares | 88,506 | 475,303 | 69.1 | |||||||||
|
|
|
| |||||||||
Total Reference Entity — Long |
| 167,968,348 | ||||||||||
|
| |||||||||||
Reference Entity — Short |
| |||||||||||
Common Stocks |
| |||||||||||
| Australia | ||||||||||||
Bega Cheese Ltd. | (133,503 | ) | (471,154 | ) | (68.5 | ) | ||||||
Bellevue Gold Ltd. | (8,742 | ) | (5,884 | ) | (0.9 | ) | ||||||
Betmakers Technology Group Ltd. | (973,259 | ) | (388,722 | ) | (56.5 | ) | ||||||
Bravura Solutions Ltd. | (188,410 | ) | (249,882 | ) | (36.3 | ) | ||||||
Breville Group Ltd. | (2,103 | ) | (34,852 | ) | (5.1 | ) | ||||||
Brickworks Ltd. | (4,960 | ) | (82,383 | ) | (12.0 | ) | ||||||
BWX Ltd. | (92,706 | ) | (121,954 | ) | (17.7 | ) | ||||||
Coronado Global Resources, Inc. | (12,544 | ) | (20,208 | ) | (2.9 | ) | ||||||
Credit Corp. Group Ltd. | (6,668 | ) | (127,502 | ) | (18.5 | ) | ||||||
Cromwell Property Group | (1,124,851 | ) | (675,093 | ) | (98.1 | ) | ||||||
De Grey Mining Ltd. | (205,568 | ) | (172,958 | ) | (25.1 | ) | ||||||
Dubber Corp. Ltd. | (69,176 | ) | (49,883 | ) | (7.2 | ) | ||||||
Eagers Automotive Ltd. | (21,794 | ) | (201,449 | ) | (29.3 | ) | ||||||
EML Payments Ltd. | (64,687 | ) | (70,030 | ) | (10.2 | ) | ||||||
G8 Education Ltd. | (146,411 | ) | (112,829 | ) | (16.4 | ) | ||||||
Genworth Mortgage Insurance Australia Ltd. | (6,742 | ) | (14,175 | ) | (2.1 | ) | ||||||
Gold Road Resources Ltd. | (191,229 | ) | (208,866 | ) | (30.3 | ) | ||||||
GUD Holdings Ltd. | (27,366 | ) | (245,812 | ) | (35.7 | ) | ||||||
Hansen Technologies Ltd. | (20,544 | ) | (79,544 | ) | (11.6 | ) | ||||||
Inghams Group Ltd. | (297,627 | ) | (644,387 | ) | (93.6 | ) | ||||||
Integral Diagnostics Ltd. | (2,548 | ) | (7,065 | ) | (1.0 | ) | ||||||
InvoCare Ltd. | (131,413 | ) | (1,127,498 | ) | (163.8 | ) | ||||||
ioneer Ltd. | (37,869 | ) | (17,590 | ) | (2.6 | ) | ||||||
IPH Ltd. | (2,876 | ) | (15,247 | ) | (2.2 | ) | ||||||
IRESS Ltd. | (89,579 | ) | (689,090 | ) | (100.1 | ) | ||||||
Karoon Energy Ltd. | (585,768 | ) | (841,220 | ) | (122.2 | ) | ||||||
Kelsian Group Ltd. | (34,971 | ) | (193,754 | ) | (28.2 | ) | ||||||
Link Administration Holdings Ltd. | (156,351 | ) | (553,575 | ) | (80.4 | ) | ||||||
Mayne Pharma Group Ltd. | (32,773 | ) | (6,549 | ) | (1.0 | ) | ||||||
nib holdings Ltd. | (19,216 | ) | (95,684 | ) | (13.9 | ) | ||||||
Nick Scali Ltd. | (3,121 | ) | (22,264 | ) | (3.2 | ) | ||||||
Nuix Ltd. | (16,729 | ) | (14,509 | ) | (2.1 | ) | ||||||
OceanaGold Corp. | (153,228 | ) | (381,683 | ) | (55.5 | ) | ||||||
Omni Bridgeway Ltd. | (87,931 | ) | (206,592 | ) | (30.0 | ) | ||||||
Pact Group Holdings Ltd. | (8,110 | ) | (13,097 | ) | (1.9 | ) | ||||||
Paladin Energy Ltd. | (636,004 | ) | (350,009 | ) | (50.9 | ) | ||||||
Perenti Global Ltd. | (356,962 | ) | (177,361 | ) | (25.8 | ) | ||||||
Perseus Mining Ltd. | (93,647 | ) | (130,312 | ) | (18.9 | ) | ||||||
PointsBet Holdings Ltd. | (164,372 | ) | (334,960 | ) | (48.7 | ) | ||||||
Premier Investments Ltd. | (13,991 | ) | (247,920 | ) | (36.0 | ) | ||||||
Redbubble Ltd. | (71,634 | ) | (56,263 | ) | (8.2 | ) | ||||||
Regis Resources Ltd. | (7,535 | ) | (11,039 | ) | (1.6 | ) | ||||||
Select Harvests Ltd. | (8,401 | ) | (38,822 | ) | (5.6 | ) | ||||||
Sigma Healthcare Ltd. | (254,236 | ) | (89,815 | ) | (13.1 | ) | ||||||
SmartGroup Corp. Ltd. | (1,035 | ) | (6,482 | ) | (0.9 | ) | ||||||
| 96 | 2 0 2 2 BLACK ROCK ANNUAL REPORT TO SHAREHOLDERS |
Schedule of Investments (continued) April 30, 2022 | BlackRock Global Long/Short Equity Fund |
| Security | Shares | Value | % of Basket Value | |||||||||
| Australia (continued) | ||||||||||||
SolGold PLC | (470,494 | ) | $ | (169,796 | ) | (24.7 | )% | |||||
Steadfast Group Ltd. | (9,291 | ) | (33,637 | ) | (4.9 | ) | ||||||
Super Retail Group Ltd. | (31,461 | ) | (232,783 | ) | (33.8 | ) | ||||||
Tyro Payments Ltd. | (7,231 | ) | (6,181 | ) | (0.9 | ) | ||||||
Uniti Group Ltd. | (206,170 | ) | (711,948 | ) | (103.4 | ) | ||||||
Viva Energy Group Ltd. | (257,522 | ) | (505,258 | ) | (73.4 | ) | ||||||
West African Resources Ltd. | (16,860 | ) | (16,084 | ) | (2.3 | ) | ||||||
|
|
|
| |||||||||
| (11,281,654 | ) | |||||||||||
| Austria | ||||||||||||
FACC AG | (28,338 | ) | (233,801 | ) | (34.0 | ) | ||||||
IMMOFINANZ AG | (18,577 | ) | (449,574 | ) | (65.3 | ) | ||||||
Semperit AG Holding | (10,690 | ) | (258,537 | ) | (37.6 | ) | ||||||
UNIQA Insurance Group AG | (1,048 | ) | (7,990 | ) | (1.1 | ) | ||||||
|
|
|
| |||||||||
| (949,902 | ) | |||||||||||
| Belgium | ||||||||||||
Aedifica SA | (4,567 | ) | (541,340 | ) | (78.7 | ) | ||||||
Biocartis Group NV | (21 | ) | (46 | ) | (0.0 | ) | ||||||
bpost SA | (5,434 | ) | (32,925 | ) | (4.8 | ) | ||||||
Cie d’Entreprises CFE | (71 | ) | (9,276 | ) | (1.3 | ) | ||||||
Cofinimmo SA | (2,507 | ) | (336,653 | ) | (48.9 | ) | ||||||
Gimv NV | (6,126 | ) | (351,529 | ) | (51.1 | ) | ||||||
KBC Ancora | (2,375 | ) | (96,089 | ) | (14.0 | ) | ||||||
Kinepolis Group NV | (1,515 | ) | (83,834 | ) | (12.2 | ) | ||||||
X-Fab Silicon Foundries SE | (923 | ) | (6,534 | ) | (0.9 | ) | ||||||
|
|
|
| |||||||||
| (1,458,226 | ) | |||||||||||
| Bermuda | ||||||||||||
Assured Guaranty Ltd. | (1,118 | ) | (61,658 | ) | (9.0 | ) | ||||||
Enstar Group Ltd. | (182 | ) | (42,906 | ) | (6.2 | ) | ||||||
|
|
|
| |||||||||
| (104,564 | ) | |||||||||||
| Canada | ||||||||||||
Absolute Software Corp. | (4,474 | ) | (34,304 | ) | (5.0 | ) | ||||||
Advantage Energy Ltd. | (972 | ) | (8,119 | ) | (1.2 | ) | ||||||
AG Growth International, Inc. | (5,785 | ) | (175,128 | ) | (25.4 | ) | ||||||
Altus Group Ltd. | (186 | ) | (6,966 | ) | (1.0 | ) | ||||||
ATS Automation Tooling Systems, Inc. | (10,905 | ) | (318,241 | ) | (46.2 | ) | ||||||
Aurinia Pharmaceuticals, Inc. | (554 | ) | (5,701 | ) | (0.8 | ) | ||||||
AutoCanada, Inc. | (286 | ) | (6,657 | ) | (1.0 | ) | ||||||
Boyd Group Services, Inc. | (1,740 | ) | (215,358 | ) | (31.3 | ) | ||||||
Canacol Energy Ltd. | (10,964 | ) | (24,324 | ) | (3.5 | ) | ||||||
Canfor Corp. | (17,367 | ) | (330,942 | ) | (48.1 | ) | ||||||
Cascades, Inc. | (13,519 | ) | (132,912 | ) | (19.3 | ) | ||||||
Celestica, Inc. | (26,691 | ) | (300,018 | ) | (43.6 | ) | ||||||
Choice Properties Real Estate Investment Trust | (2,369 | ) | (27,993 | ) | (4.1 | ) | ||||||
Cogeco Communications Inc. | (393 | ) | (32,274 | ) | (4.7 | ) | ||||||
Cogeco, Inc. | (892 | ) | (53,118 | ) | (7.7 | ) | ||||||
Converge Technology Solutions Corp. | (7,874 | ) | (52,896 | ) | (7.7 | ) | ||||||
Denison Mines Corp. | (58,731 | ) | (75,891 | ) | (11.0 | ) | ||||||
Dream Office Real Estate Investment Trust | (863 | ) | (17,466 | ) | (2.5 | ) | ||||||
DREAM Un Ltd. Corp., Class A | (202 | ) | (7,264 | ) | (1.1 | ) | ||||||
Dye & Durham Ltd. | (9,002 | ) | (148,626 | ) | (21.6 | ) | ||||||
Enthusiast Gaming Holdings, Inc. | (67,537 | ) | (130,379 | ) | (18.9 | ) | ||||||
ERO Copper Corp. | (7,920 | ) | (113,869 | ) | (16.5 | ) | ||||||
Fiera Capital Corp. | (1,527 | ) | (11,661 | ) | (1.7 | ) | ||||||
Hut 8 Mining Corp. | (13,396 | ) | (47,759 | ) | (6.9 | ) | ||||||
IMAX Corp. | (23,276 | ) | (368,226 | ) | (53.5 | ) | ||||||
Interfor Corp. | (6,886 | ) | (196,291 | ) | (28.5 | ) | ||||||
Labrador Iron Ore Royalty Corp. | (11,613 | ) | (314,224 | ) | (45.7 | ) | ||||||
Largo, Inc. | (14,323 | ) | (119,744 | ) | (17.4 | ) | ||||||
| Security | Shares | Value | % of Basket Value | |||||||||
| Canada (continued) | ||||||||||||
Lassonde Industries, Inc., Class A | (53 | ) | $ | (5,671 | ) | (0.8 | )% | |||||
LifeWorks, Inc. | (919 | ) | (13,520 | ) | (2.0 | ) | ||||||
Linamar Corp. | (660 | ) | (26,140 | ) | (3.8 | ) | ||||||
MAG Silver Corp. | (1,387 | ) | (20,449 | ) | (3.0 | ) | ||||||
Maple Leaf Foods, Inc. | (4,710 | ) | (103,722 | ) | (15.1 | ) | ||||||
Martinrea International, Inc. | (6,205 | ) | (37,047 | ) | (5.4 | ) | ||||||
Maverix Metals, Inc. | (1,249 | ) | (5,629 | ) | (0.8 | ) | ||||||
MDA Ltd. | (1,258 | ) | (8,657 | ) | (1.3 | ) | ||||||
Mercer International, Inc. | (19,551 | ) | (313,011 | ) | (45.5 | ) | ||||||
Meta Materials, Inc. | (48,454 | ) | (58,145 | ) | (8.5 | ) | ||||||
Mullen Group Ltd. | (3,178 | ) | (30,403 | ) | (4.4 | ) | ||||||
Neighbourly Pharmacy, Inc. | (614 | ) | (11,590 | ) | (1.7 | ) | ||||||
New Gold, Inc. | (375,384 | ) | (546,427 | ) | (79.4 | ) | ||||||
North West Co., Inc. | (3,171 | ) | (88,442 | ) | (12.9 | ) | ||||||
Pollard Banknote Ltd. | (7,921 | ) | (133,060 | ) | (19.3 | ) | ||||||
Russel Metals, Inc. | (275 | ) | (7,330 | ) | (1.1 | ) | ||||||
SilverCrest Metals, Inc. | (926 | ) | (6,985 | ) | (1.0 | ) | ||||||
Stella-Jones, Inc. | (578 | ) | (15,972 | ) | (2.3 | ) | ||||||
Torex Gold Resources, Inc. | (965 | ) | (10,802 | ) | (1.6 | ) | ||||||
TransAlta Renewables, Inc. | (9,903 | ) | (137,369 | ) | (20.0 | ) | ||||||
Uranium Energy Corp. | (76,000 | ) | (323,000 | ) | (46.9 | ) | ||||||
Westport Fuel Systems, Inc. | (7,014 | ) | (8,463 | ) | (1.2 | ) | ||||||
Westshore Terminals Investment Corp. | (243 | ) | (6,513 | ) | (0.9 | ) | ||||||
Winpak Ltd. | (222 | ) | (7,343 | ) | (1.1 | ) | ||||||
Xenon Pharmaceuticals, Inc. | (617 | ) | (17,443 | ) | (2.5 | ) | ||||||
|
|
|
| |||||||||
| (5,219,484 | ) | |||||||||||
| Cayman Islands | ||||||||||||
Theravance Biopharma, Inc. | (3,661 | ) | (35,329 | ) | (5.1 | ) | ||||||
|
|
|
| |||||||||
| China | ||||||||||||
Fosun Tourism Group | (160,200 | ) | (213,593 | ) | (31.0 | ) | ||||||
|
|
|
| |||||||||
| Costa Rica | ||||||||||||
Establishment Labs Holdings, Inc. | (749 | ) | (52,999 | ) | (7.7 | ) | ||||||
|
|
|
| |||||||||
| Denmark | ||||||||||||
NTG Nordic Transport Group A/S | (113 | ) | (6,136 | ) | (0.9 | ) | ||||||
|
|
|
| |||||||||
| Finland | ||||||||||||
Aktia Bank OYJ | (6,290 | ) | (63,779 | ) | (9.3 | ) | ||||||
Finnair OYJ | (395,614 | ) | (194,991 | ) | (28.3 | ) | ||||||
Kamux Corp. | (6,590 | ) | (66,690 | ) | (9.7 | ) | ||||||
Kemira OYJ | (7,775 | ) | (101,986 | ) | (14.8 | ) | ||||||
Metsa Board OYJ, Class B | (35,567 | ) | (383,298 | ) | (55.7 | ) | ||||||
Remedy Entertainment OYJ | (2,911 | ) | (95,829 | ) | (13.9 | ) | ||||||
Sanoma OYJ | (13,746 | ) | (173,640 | ) | (25.2 | ) | ||||||
Spinnova OYJ | (1,870 | ) | (15,677 | ) | (2.3 | ) | ||||||
Tokmanni Group Corp. | (537 | ) | (6,978 | ) | (1.0 | ) | ||||||
|
|
|
| |||||||||
| (1,102,868 | ) | |||||||||||
| France | ||||||||||||
Altarea SCA | (1,393 | ) | (213,209 | ) | (31.0 | ) | ||||||
Aramis Group SAS | (14,759 | ) | (85,944 | ) | (12.5 | ) | ||||||
Carmila SA | (418 | ) | (6,502 | ) | (0.9 | ) | ||||||
CGG SA | (224,703 | ) | (258,507 | ) | (37.6 | ) | ||||||
Derichebourg SA, A Shares | (10,394 | ) | (93,799 | ) | (13.6 | ) | ||||||
Eutelsat Communications SA | (18,337 | ) | (203,787 | ) | (29.6 | ) | ||||||
Maisons du Monde SA | (5,549 | ) | (94,637 | ) | (13.8 | ) | ||||||
McPhy Energy SA | (2,260 | ) | (41,284 | ) | (6.0 | ) | ||||||
Metropole Television SA | (1,074 | ) | (19,930 | ) | (2.9 | ) | ||||||
Sopra Steria Group SACA | (218 | ) | (38,636 | ) | (5.6 | ) | ||||||
SCHEDULE OF INVESTMENTS | 97 |
Schedule of Investments (continued) April 30, 2022 | BlackRock Global Long/Short Equity Fund |
| Security | Shares | Value | % of Basket Value | |||||||||
| France (continued) | ||||||||||||
SPIE SA | (1,006 | ) | $ | (23,677 | ) | (3.4 | )% | |||||
Trigano SA | (357 | ) | (45,996 | ) | (6.7 | ) | ||||||
Verallia SA | (2,120 | ) | (58,277 | ) | (8.5 | ) | ||||||
|
|
|
| |||||||||
| (1,184,185 | ) | |||||||||||
| Germany | ||||||||||||
About You Holding SE | (813 | ) | (8,817 | ) | (1.3 | ) | ||||||
Amadeus Fire AG | (43 | ) | (6,018 | ) | (0.9 | ) | ||||||
AURELIUS Equity Opportunities SE & Co. KGaA | (697 | ) | (18,569 | ) | (2.7 | ) | ||||||
BayWa AG | (3,224 | ) | (153,746 | ) | (22.3 | ) | ||||||
Bike24 Holding AG | (136 | ) | (879 | ) | (0.1 | ) | ||||||
Bilfinger SE | (268 | ) | (10,786 | ) | (1.6 | ) | ||||||
Hamborner REIT AG | (13,745 | ) | (128,286 | ) | (18.6 | ) | ||||||
Heidelberger Druckmaschinen AG | (3,040 | ) | (6,716 | ) | (1.0 | ) | ||||||
Home24 SE | (31,778 | ) | (186,160 | ) | (27.1 | ) | ||||||
Hornbach Holding AG & Co. KGaA | (522 | ) | (62,485 | ) | (9.1 | ) | ||||||
Indus Holding AG | (1,703 | ) | (48,447 | ) | (7.0 | ) | ||||||
Instone Real Estate Group AG | (4,133 | ) | (63,450 | ) | (9.2 | ) | ||||||
JOST Werke AG | (335 | ) | (12,958 | ) | (1.9 | ) | ||||||
Medios AG | (4,469 | ) | (114,635 | ) | (16.7 | ) | ||||||
Mister Spex SE | (520 | ) | (3,708 | ) | (0.5 | ) | ||||||
PATRIZIA AG | (10,562 | ) | (181,175 | ) | (26.3 | ) | ||||||
PNE AG | (13,524 | ) | (171,783 | ) | (25.0 | ) | ||||||
Secunet Security Networks AG | (98 | ) | (41,492 | ) | (6.0 | ) | ||||||
SGL Carbon SE | (27,827 | ) | (152,788 | ) | (22.2 | ) | ||||||
Takkt AG | (12,567 | ) | (203,038 | ) | (29.5 | ) | ||||||
Vossloh AG | (200 | ) | (7,630 | ) | (1.1 | ) | ||||||
Westwing Group AG | (17,970 | ) | (204,360 | ) | (29.7 | ) | ||||||
|
|
|
| |||||||||
| (1,787,926 | ) | |||||||||||
| Hong Kong | ||||||||||||
Fortune Real Estate Investment Trust | (422,000 | ) | (368,711 | ) | (53.6 | ) | ||||||
Hongkong & Shanghai Hotels Ltd. | (21,500 | ) | (21,344 | ) | (3.1 | ) | ||||||
Prosperity REIT | (692,000 | ) | (237,222 | ) | (34.5 | ) | ||||||
SUNeVision Holdings Ltd. | (160,000 | ) | (132,923 | ) | (19.3 | ) | ||||||
Zensun Enterprises Ltd. | (23,000 | ) | (10,757 | ) | (1.5 | ) | ||||||
|
|
|
| |||||||||
| (770,957 | ) | |||||||||||
| Ireland | ||||||||||||
C&C Group PLC | (15,006 | ) | (39,173 | ) | (5.7 | ) | ||||||
Cairn Homes PLC | (80,431 | ) | (96,988 | ) | (14.1 | ) | ||||||
COSMO Pharmaceuticals NV | (2,931 | ) | (167,623 | ) | (24.4 | ) | ||||||
Glenveagh Properties PLC | (171,230 | ) | (206,628 | ) | (30.0 | ) | ||||||
Greencore Group PLC | (367,230 | ) | (529,192 | ) | (76.9 | ) | ||||||
|
|
|
| |||||||||
| (1,039,604 | ) | |||||||||||
| Israel | ||||||||||||
Camtek Ltd. | (1,558 | ) | (45,854 | ) | (6.7 | ) | ||||||
Ituran Location and Control Ltd. | (3,451 | ) | (77,440 | ) | (11.2 | ) | ||||||
Nano Dimension Ltd., ADR | (23,670 | ) | (67,223 | ) | (9.8 | ) | ||||||
NEOGAMES SA | (2,994 | ) | (39,132 | ) | (5.7 | ) | ||||||
Oramed Pharmaceuticals, Inc. | (7,660 | ) | (39,372 | ) | (5.7 | ) | ||||||
Perion Network Ltd. | (4,089 | ) | (87,427 | ) | (12.7 | ) | ||||||
Plus500 Ltd. | (19,289 | ) | (375,613 | ) | (54.6 | ) | ||||||
Riskified Ltd., Class A | (27,912 | ) | (145,980 | ) | (21.2 | ) | ||||||
Sisram Medical Ltd. | (139,600 | ) | (149,068 | ) | (21.7 | ) | ||||||
Taro Pharmaceutical Industries Ltd. | (2,004 | ) | (78,657 | ) | (11.4 | ) | ||||||
|
|
|
| |||||||||
| (1,105,766 | ) | |||||||||||
| Italy | ||||||||||||
Credito Emiliano SpA | (8,016 | ) | (48,971 | ) | (7.1 | ) | ||||||
Digital Bros SpA | (381 | ) | (9,678 | ) | (1.4 | ) | ||||||
doValue SpA | (5,973 | ) | (50,787 | ) | (7.4 | ) | ||||||
| Security | Shares | Value | % of Basket Value | |||||||||
| Italy (continued) | ||||||||||||
Enav SpA | (6,255 | ) | $ | (28,876 | ) | (4.2 | )% | |||||
Fila SpA | (9,028 | ) | (89,795 | ) | (13.0 | ) | ||||||
Gruppo MutuiOnline SpA | (803 | ) | (24,590 | ) | (3.6 | ) | ||||||
GVS SpA | (4,019 | ) | (33,475 | ) | (4.9 | ) | ||||||
RAI Way SpA | (18,885 | ) | (111,033 | ) | (16.1 | ) | ||||||
Saras SpA | (23,188 | ) | (21,581 | ) | (3.1 | ) | ||||||
Societa Cattolica di Assicurazioni | (28,902 | ) | (187,359 | ) | (27.2 | ) | ||||||
Tod’s SpA | (151 | ) | (5,968 | ) | (0.9 | ) | ||||||
|
|
|
| |||||||||
| (612,113 | ) | |||||||||||
| Japan | ||||||||||||
ADEKA Corp. | (25,000 | ) | (479,455 | ) | (69.7 | ) | ||||||
Aichi Corp. | (14,000 | ) | (97,419 | ) | (14.2 | ) | ||||||
Aiful Corp. | (246,800 | ) | (703,459 | ) | (102.2 | ) | ||||||
Airtrip Corp. | (300 | ) | (7,311 | ) | (1.1 | ) | ||||||
Alpen Co. Ltd. | (1,000 | ) | (15,158 | ) | (2.2 | ) | ||||||
Alpha Systems, Inc. | (3,600 | ) | (106,424 | ) | (15.5 | ) | ||||||
Arcland Sakamoto Co. Ltd. | (2,000 | ) | (23,940 | ) | (3.5 | ) | ||||||
Atom Corp. | (46,200 | ) | (263,265 | ) | (38.3 | ) | ||||||
Autobacs Seven Co. Ltd. | (5,700 | ) | (60,015 | ) | (8.7 | ) | ||||||
Awa Bank Ltd. | (25,000 | ) | (412,634 | ) | (60.0 | ) | ||||||
Axial Retailing, Inc. | (100 | ) | (2,619 | ) | (0.4 | ) | ||||||
BASE, Inc. | (17,700 | ) | (48,133 | ) | (7.0 | ) | ||||||
BML, Inc. | (5,700 | ) | (146,693 | ) | (21.3 | ) | ||||||
Bunka Shutter Co. Ltd. | (900 | ) | (6,764 | ) | (1.0 | ) | ||||||
Bushiroad, Inc. | (1,000 | ) | (11,782 | ) | (1.7 | ) | ||||||
CellSource Co. Ltd. | (1,300 | ) | (37,615 | ) | (5.5 | ) | ||||||
Central Glass Co. Ltd. | (600 | ) | (11,048 | ) | (1.6 | ) | ||||||
COLOPL, Inc. | (103,800 | ) | (511,590 | ) | (74.3 | ) | ||||||
Create Restaurants Holdings, Inc. | (1,200 | ) | (7,505 | ) | (1.1 | ) | ||||||
Daiichi Jitsugyo Co. Ltd. | (1,600 | ) | (46,459 | ) | (6.7 | ) | ||||||
Daishi Hokuetsu Financial Group, Inc. | (36,500 | ) | (705,996 | ) | (102.6 | ) | ||||||
Daiwabo Holdings Co. Ltd. | (3,900 | ) | (50,465 | ) | (7.3 | ) | ||||||
DCM Holdings Co. Ltd. | (800 | ) | (6,605 | ) | (1.0 | ) | ||||||
Digital Garage, Inc. | (800 | ) | (26,476 | ) | (3.8 | ) | ||||||
DTS Corp. | (2,600 | ) | (57,048 | ) | (8.3 | ) | ||||||
Duskin Co. Ltd. | (22,400 | ) | (477,829 | ) | (69.4 | ) | ||||||
DyDo Group Holdings, Inc. | (200 | ) | (7,754 | ) | (1.1 | ) | ||||||
eRex Co. Ltd. | (12,400 | ) | (187,694 | ) | (27.3 | ) | ||||||
ESPEC Corp. | (6,600 | ) | (87,625 | ) | (12.7 | ) | ||||||
Exedy Corp. | (13,100 | ) | (155,996 | ) | (22.7 | ) | ||||||
Ferrotec Holdings Corp. | (6,000 | ) | (110,024 | ) | (16.0 | ) | ||||||
Financial Products Group Co. Ltd. | (2,700 | ) | (16,523 | ) | (2.4 | ) | ||||||
Frontier Real Estate Investment Corp. | (79 | ) | (306,089 | ) | (44.5 | ) | ||||||
Fuji Soft, Inc. | (500 | ) | (26,649 | ) | (3.9 | ) | ||||||
Fujikura Ltd. | (21,300 | ) | (100,760 | ) | (14.6 | ) | ||||||
Fujitec Co. Ltd. | (38,800 | ) | (836,217 | ) | (121.5 | ) | ||||||
Fukushima Galilei Co. Ltd. | (2,800 | ) | (81,097 | ) | (11.8 | ) | ||||||
giftee, Inc. | (51,400 | ) | (404,797 | ) | (58.8 | ) | ||||||
GLOBERIDE, Inc. | (23,400 | ) | (472,165 | ) | (68.6 | ) | ||||||
GMO Financial Gate, Inc. | (1,100 | ) | (107,896 | ) | (15.7 | ) | ||||||
GNI Group Ltd. | (13,000 | ) | (114,050 | ) | (16.6 | ) | ||||||
Gree, Inc. | (2,600 | ) | (19,810 | ) | (2.9 | ) | ||||||
G-Tekt Corp. | (4,900 | ) | (47,163 | ) | (6.9 | ) | ||||||
H2O Retailing Corp. | (2,800 | ) | (18,316 | ) | (2.7 | ) | ||||||
Hankyu Hanshin REIT, Inc. | (145 | ) | (164,780 | ) | (23.9 | ) | ||||||
Hirata Corp. | (3,200 | ) | (117,582 | ) | (17.1 | ) | ||||||
HIS Co. Ltd. | (27,200 | ) | (463,763 | ) | (67.4 | ) | ||||||
Hitachi Zosen Corp. | (1,400 | ) | (7,555 | ) | (1.1 | ) | ||||||
Hogy Medical Co. Ltd. | (2,500 | ) | (62,432 | ) | (9.1 | ) | ||||||
Hokkaido Electric Power Co., Inc. | (3,900 | ) | (14,477 | ) | (2.1 | ) | ||||||
Hokkoku Financial Holdings, Inc. | (8,300 | ) | (239,434 | ) | (34.8 | ) | ||||||
| 98 | 2 0 2 2 BLACK ROCK ANNUAL REPORT TO SHAREHOLDERS |
Schedule of Investments (continued) April 30, 2022 | BlackRock Global Long/Short Equity Fund |
| Security | Shares | Value | % of Basket Value | |||||||||
| Japan (continued) | ||||||||||||
Hokuetsu Corp. | (9,900 | ) | $ | (50,718 | ) | (7.4 | )% | |||||
Hokuhoku Financial Group, Inc. | (18,400 | ) | (124,510 | ) | (18.1 | ) | ||||||
Hokuriku Electric Power Co. | (22,800 | ) | (90,447 | ) | (13.1 | ) | ||||||
Hokuto Corp. | (3,200 | ) | (50,262 | ) | (7.3 | ) | ||||||
Hosiden Corp. | (9,200 | ) | (87,732 | ) | (12.7 | ) | ||||||
Hosokawa Micron Corp. | (10,300 | ) | (195,268 | ) | (28.4 | ) | ||||||
Hyakugo Bank Ltd. | (46,200 | ) | (122,270 | ) | (17.8 | ) | ||||||
Ichibanya Co. Ltd. | (800 | ) | (29,725 | ) | (4.3 | ) | ||||||
Ichigo Office REIT Investment | (11 | ) | (7,061 | ) | (1.0 | ) | ||||||
Ichigo, Inc. | (62,300 | ) | (139,709 | ) | (20.3 | ) | ||||||
Idec Corp. | (2,200 | ) | (38,832 | ) | (5.6 | ) | ||||||
Inaba Denki Sangyo Co. Ltd. | (3,700 | ) | (72,566 | ) | (10.5 | ) | ||||||
Inabata & Co. Ltd. | (9,800 | ) | (160,364 | ) | (23.3 | ) | ||||||
Invincible Investment Corp. | (166 | ) | (54,129 | ) | (7.9 | ) | ||||||
Itochu-Shokuhin Co. Ltd. | (1,000 | ) | (38,182 | ) | (5.5 | ) | ||||||
Jaccs Co. Ltd. | (2,200 | ) | (55,633 | ) | (8.1 | ) | ||||||
Japan Display, Inc. | (806,700 | ) | (415,093 | ) | (60.3 | ) | ||||||
Japan Material Co. Ltd. | (1,400 | ) | (21,152 | ) | (3.1 | ) | ||||||
JIG-SAW, Inc. | (6,200 | ) | (258,248 | ) | (37.5 | ) | ||||||
JM Holdings Co. Ltd. | (800 | ) | (10,011 | ) | (1.5 | ) | ||||||
JTOWER, Inc. | (2,300 | ) | (108,085 | ) | (15.7 | ) | ||||||
Kameda Seika Co. Ltd. | (1,700 | ) | (55,332 | ) | (8.0 | ) | ||||||
Kanematsu Electronics Ltd. | (2,600 | ) | (77,690 | ) | (11.3 | ) | ||||||
Kanto Denka Kogyo Co. Ltd. | (24,500 | ) | (184,833 | ) | (26.9 | ) | ||||||
Kappa Create Co. Ltd. | (600 | ) | (6,189 | ) | (0.9 | ) | ||||||
Katakura Industries Co. Ltd. | (28,700 | ) | (557,206 | ) | (81.0 | ) | ||||||
Kato Sangyo Co. Ltd. | (300 | ) | (7,784 | ) | (1.1 | ) | ||||||
KeePer Technical Laboratory Co. Ltd. | (4,600 | ) | (92,902 | ) | (13.5 | ) | ||||||
Keiyo Bank Ltd. | (19,900 | ) | (75,836 | ) | (11.0 | ) | ||||||
Keiyo Co. Ltd. | (3,500 | ) | (24,702 | ) | (3.6 | ) | ||||||
KFC Holdings Japan Ltd. | (16,200 | ) | (354,976 | ) | (51.6 | ) | ||||||
Kintetsu Department Store Co. Ltd. | (14,000 | ) | (276,709 | ) | (40.2 | ) | ||||||
Kintetsu World Express, Inc. | (2,400 | ) | (57,174 | ) | (8.3 | ) | ||||||
Kisoji Co. Ltd. | (5,000 | ) | (79,556 | ) | (11.6 | ) | ||||||
Ki-Star Real Estate Co. Ltd. | (6,000 | ) | (247,491 | ) | (36.0 | ) | ||||||
Kitanotatsujin Corp. | (1,600 | ) | (2,105 | ) | (0.3 | ) | ||||||
Kiyo Bank Ltd. | (41,400 | ) | (454,107 | ) | (66.0 | ) | ||||||
Koa Corp. | (3,200 | ) | (37,297 | ) | (5.4 | ) | ||||||
Kohnan Shoji Co. Ltd. | (5,300 | ) | (153,489 | ) | (22.3 | ) | ||||||
Koshidaka Holdings Co. Ltd. | (3,100 | ) | (18,500 | ) | (2.7 | ) | ||||||
Kureha Corp. | (7,800 | ) | (586,018 | ) | (85.1 | ) | ||||||
KYB Corp. | (10,400 | ) | (235,404 | ) | (34.2 | ) | ||||||
KYORIN Holdings, Inc. | (33,300 | ) | (484,261 | ) | (70.4 | ) | ||||||
Leopalace21 Corp. | (319,800 | ) | (481,043 | ) | (69.9 | ) | ||||||
Macnica Fuji Electronics Holdings, Inc. | (500 | ) | (10,366 | ) | (1.5 | ) | ||||||
Maruha Nichiro Corp. | (7,400 | ) | (136,190 | ) | (19.8 | ) | ||||||
Maruwa Co. Ltd/Aichi | (2,600 | ) | (303,149 | ) | (44.0 | ) | ||||||
Matsuyafoods Holdings Co. Ltd. | (800 | ) | (23,355 | ) | (3.4 | ) | ||||||
MCJ Co. Ltd. | (6,800 | ) | (44,477 | ) | (6.5 | ) | ||||||
Medley, Inc. | (1,200 | ) | (22,164 | ) | (3.2 | ) | ||||||
MedPeer, Inc. | (13,400 | ) | (306,730 | ) | (44.6 | ) | ||||||
Meidensha Corp. | (800 | ) | (14,487 | ) | (2.1 | ) | ||||||
Meiko Electronics Co. Ltd. | (1,700 | ) | (44,958 | ) | (6.5 | ) | ||||||
Meitec Corp. | (2,800 | ) | (148,624 | ) | (21.6 | ) | ||||||
Mitani Sekisan Co. Ltd. | (3,400 | ) | (135,506 | ) | (19.7 | ) | ||||||
Mitsuuroko Group Holdings Co. Ltd. | (12,000 | ) | (92,811 | ) | (13.5 | ) | ||||||
Mochida Pharmaceutical Co. Ltd. | (900 | ) | (25,636 | ) | (3.7 | ) | ||||||
Modec, Inc. | (9,400 | ) | (88,136 | ) | (12.8 | ) | ||||||
Mori Trust Sogo REIT, Inc. | (7 | ) | (7,622 | ) | (1.1 | ) | ||||||
MOS Food Services, Inc. | (1,900 | ) | (43,537 | ) | (6.3 | ) | ||||||
Musashi Seimitsu Industry Co. Ltd. | (2,600 | ) | (26,423 | ) | (3.8 | ) | ||||||
Musashino Bank Ltd. | (5,800 | ) | (79,334 | ) | (11.5 | ) | ||||||
| Security | Shares | Value | % of Basket Value | |||||||||
| Japan (continued) | ||||||||||||
Nanto Bank Ltd. | (12,600 | ) | $ | (197,133 | ) | (28.6 | )% | |||||
Nihon Chouzai Co. Ltd. | (5,900 | ) | (57,399 | ) | (8.3 | ) | ||||||
Nippon Carbon Co. Ltd. | (3,200 | ) | (102,805 | ) | (14.9 | ) | ||||||
Nippon Kanzai Co. Ltd. | (3,600 | ) | (77,356 | ) | (11.2 | ) | ||||||
Nippon Light Metal Holdings Co. Ltd. | (3,600 | ) | (46,125 | ) | (6.7 | ) | ||||||
Nippon Road Co. Ltd. | (1,700 | ) | (94,768 | ) | (13.8 | ) | ||||||
Nippon Sheet Glass Co. Ltd. | (35,700 | ) | (107,967 | ) | (15.7 | ) | ||||||
Nippon Steel Trading Corp. | (200 | ) | (8,140 | ) | (1.2 | ) | ||||||
Nishimatsu Construction Co. Ltd. | (300 | ) | (8,832 | ) | (1.3 | ) | ||||||
Nissei ASB Machine Co. Ltd. | (400 | ) | (9,121 | ) | (1.3 | ) | ||||||
Nisshinbo Holdings, Inc. | (5,700 | ) | (42,648 | ) | (6.2 | ) | ||||||
Nissin Electric Co. Ltd. | (32,700 | ) | (348,671 | ) | (50.7 | ) | ||||||
North Pacific Bank Ltd. | (256,700 | ) | (486,741 | ) | (70.7 | ) | ||||||
NSD Co. Ltd. | (900 | ) | (15,976 | ) | (2.3 | ) | ||||||
NTT UD REIT Investment Corp. | (14 | ) | (16,171 | ) | (2.3 | ) | ||||||
Ogaki Kyoritsu Bank Ltd. | (15,700 | ) | (230,103 | ) | (33.4 | ) | ||||||
Ohsho Food Service Corp. | (1,400 | ) | (65,738 | ) | (9.6 | ) | ||||||
Oisix ra daichi, Inc. | (1,300 | ) | (26,715 | ) | (3.9 | ) | ||||||
Okinawa Financial Group, Inc. | (6,800 | ) | (116,409 | ) | (16.9 | ) | ||||||
Open Door, Inc. | (6,700 | ) | (96,800 | ) | (14.1 | ) | ||||||
Optim Corp. | (1,800 | ) | (11,922 | ) | (1.7 | ) | ||||||
PAL GROUP Holdings Co. Ltd. | (600 | ) | (6,696 | ) | (1.0 | ) | ||||||
Pasona Group, Inc. | (4,300 | ) | (68,180 | ) | (9.9 | ) | ||||||
Pharma Foods International Co. Ltd. | (21,600 | ) | (283,208 | ) | (41.1 | ) | ||||||
Pilot Corp. | (7,900 | ) | (320,968 | ) | (46.6 | ) | ||||||
Piolax, Inc. | (6,500 | ) | (75,832 | ) | (11.0 | ) | ||||||
PKSHA Technology, Inc. | (14,500 | ) | (206,742 | ) | (30.0 | ) | ||||||
Plaid, Inc. | (1,900 | ) | (17,019 | ) | (2.5 | ) | ||||||
Plenus Co. Ltd. | (4,300 | ) | (63,162 | ) | (9.2 | ) | ||||||
Premier Anti-Aging Co. Ltd. | (16,100 | ) | (462,999 | ) | (67.3 | ) | ||||||
Pressance Corp. | (26,700 | ) | (320,527 | ) | (46.6 | ) | ||||||
Qol Holdings Co. Ltd. | (17,000 | ) | (143,093 | ) | (20.8 | ) | ||||||
Raito Kogyo Co. Ltd. | (800 | ) | (11,945 | ) | (1.7 | ) | ||||||
Riken Keiki Co. Ltd. | (7,600 | ) | (239,220 | ) | (34.8 | ) | ||||||
Riken Vitamin Co. Ltd. | (600 | ) | (7,887 | ) | (1.1 | ) | ||||||
Ringer Hut Co. Ltd. | (2,000 | ) | (34,595 | ) | (5.0 | ) | ||||||
Roland Corp. | (300 | ) | (10,353 | ) | (1.5 | ) | ||||||
Royal Holdings Co. Ltd. | (400 | ) | (6,406 | ) | (0.9 | ) | ||||||
RS Technologies Co. Ltd. | (1,100 | ) | (50,652 | ) | (7.4 | ) | ||||||
Saibu Gas Co. Ltd. | (8,000 | ) | (131,303 | ) | (19.1 | ) | ||||||
Sakata Seed Corp. | (1,100 | ) | (37,039 | ) | (5.4 | ) | ||||||
SanBio Co. Ltd. | (2,100 | ) | (17,863 | ) | (2.6 | ) | ||||||
San-In Godo Bank Ltd. | (28,800 | ) | (142,985 | ) | (20.8 | ) | ||||||
Sanki Engineering Co. Ltd. | (5,600 | ) | (63,435 | ) | (9.2 | ) | ||||||
Seiren Co. Ltd. | (13,700 | ) | (217,137 | ) | (31.5 | ) | ||||||
Septeni Holdings Co. Ltd. | (10,700 | ) | (54,164 | ) | (7.9 | ) | ||||||
Shibuya Corp. | (400 | ) | (7,205 | ) | (1.0 | ) | ||||||
Shiga Bank Ltd. | (7,500 | ) | (141,034 | ) | (20.5 | ) | ||||||
Shima Seiki Manufacturing Ltd. | (2,400 | ) | (34,242 | ) | (5.0 | ) | ||||||
Showa Sangyo Co. Ltd. | (1,100 | ) | (22,252 | ) | (3.2 | ) | ||||||
Sinko Industries Ltd. | (1,200 | ) | (15,083 | ) | (2.2 | ) | ||||||
SRE Holdings Corp. | (15,000 | ) | (309,437 | ) | (45.0 | ) | ||||||
Starts Proceed Investment Corp. | (61 | ) | (109,281 | ) | (15.9 | ) | ||||||
Sun Corp. | (20,700 | ) | (245,507 | ) | (35.7 | ) | ||||||
T Hasegawa Co. Ltd. | (13,700 | ) | (266,797 | ) | (38.8 | ) | ||||||
Tadano Ltd. | (40,500 | ) | (287,703 | ) | (41.8 | ) | ||||||
Takeuchi Manufacturing Co. Ltd. | (400 | ) | (7,335 | ) | (1.1 | ) | ||||||
Taki Chemical Co. Ltd. | (4,900 | ) | (193,406 | ) | (28.1 | ) | ||||||
Tama Home Co. Ltd. | (4,600 | ) | (89,762 | ) | (13.0 | ) | ||||||
Tenma Corp. | (19,800 | ) | (337,017 | ) | (49.0 | ) | ||||||
TKC Corp. | (600 | ) | (15,760 | ) | (2.3 | ) | ||||||
TKP Corp. | (1,000 | ) | (14,543 | ) | (2.1 | ) | ||||||
SCHEDULE OF INVESTMENTS | 99 |
Schedule of Investments (continued) April 30, 2022 | BlackRock Global Long/Short Equity Fund |
| Security | Shares | Value | % of Basket Value | |||||||||
| Japan (continued) | ||||||||||||
TOC Co. Ltd. | (2,200 | ) | $ | (11,331 | ) | (1.6 | )% | |||||
Tocalo Co. Ltd. | (3,400 | ) | (33,948 | ) | (4.9 | ) | ||||||
Toei Co. Ltd. | (1,500 | ) | (198,951 | ) | (28.9 | ) | ||||||
Toho Titanium Co. Ltd. | (700 | ) | (8,000 | ) | (1.2 | ) | ||||||
TOKAI Holdings Corp. | (42,900 | ) | (288,355 | ) | (41.9 | ) | ||||||
Tokyo Seimitsu Co. Ltd. | (3,500 | ) | (120,403 | ) | (17.5 | ) | ||||||
TOMONY Holdings, Inc. | (72,300 | ) | (182,865 | ) | (26.6 | ) | ||||||
Tomy Co. Ltd. | (34,200 | ) | (324,475 | ) | (47.1 | ) | ||||||
Topcon Corp. | (800 | ) | (10,239 | ) | (1.5 | ) | ||||||
Toyo Construction Co. Ltd. | (2,500 | ) | (17,988 | ) | (2.6 | ) | ||||||
Toyo Tanso Co. Ltd. | (9,200 | ) | (199,913 | ) | (29.0 | ) | ||||||
TRE Holdings Corp. | (4,800 | ) | (76,795 | ) | (11.2 | ) | ||||||
Tsugami Corp. | (4,700 | ) | (43,769 | ) | (6.4 | ) | ||||||
Uchida Yoko Co. Ltd. | (2,400 | ) | (90,575 | ) | (13.2 | ) | ||||||
Universal Entertainment Corp. | (4,100 | ) | (73,358 | ) | (10.7 | ) | ||||||
Uzabase Inc. | (6,800 | ) | (39,576 | ) | (5.7 | ) | ||||||
Visional, Inc. | (300 | ) | (16,510 | ) | (2.4 | ) | ||||||
VT Holdings Co. Ltd. | (13,300 | ) | (47,083 | ) | (6.8 | ) | ||||||
WealthNavi, Inc. | (41,500 | ) | (539,764 | ) | (78.4 | ) | ||||||
World Holdings Co. Ltd. | (2,100 | ) | (39,541 | ) | (5.7 | ) | ||||||
Xebio Holdings Co. Ltd. | (4,400 | ) | (31,077 | ) | (4.5 | ) | ||||||
Yodogawa Steel Works Ltd. | (1,100 | ) | (20,821 | ) | (3.0 | ) | ||||||
Yokowo Co. Ltd. | (6,600 | ) | (129,517 | ) | (18.8 | ) | ||||||
Yoshinoya Holdings Co. Ltd. | (14,100 | ) | (256,528 | ) | (37.3 | ) | ||||||
Yukiguni Maitake Co. Ltd. | (2,400 | ) | (19,364 | ) | (2.8 | ) | ||||||
|
|
|
| |||||||||
| (26,806,521 | ) | |||||||||||
| Liechtenstein | ||||||||||||
Implantica AG, SDR | (7,960 | ) | (30,885 | ) | (4.5 | ) | ||||||
|
|
|
| |||||||||
| Luxembourg | ||||||||||||
Global Fashion Group SA | (11,888 | ) | (22,636 | ) | (3.3 | ) | ||||||
Orion Engineered Carbons SA | (1,949 | ) | (29,430 | ) | (4.3 | ) | ||||||
|
|
|
| |||||||||
| (52,066 | ) | |||||||||||
| Malta | ||||||||||||
Kambi Group PLC | (336 | ) | (5,352 | ) | (0.8 | ) | ||||||
Kindred Group PLC | (42,267 | ) | (370,572 | ) | (53.8 | ) | ||||||
|
|
|
| |||||||||
| (375,924 | ) | |||||||||||
| Netherlands | ||||||||||||
Boskalis Westminster | (1,597 | ) | (55,464 | ) | (8.1 | ) | ||||||
CM.com NV | (1,514 | ) | (25,164 | ) | (3.7 | ) | ||||||
Core Laboratories NV | (543 | ) | (14,118 | ) | (2.0 | ) | ||||||
Eurocommercial Properties NV | (1,501 | ) | (36,318 | ) | (5.3 | ) | ||||||
Pharming Group NV | (84,244 | ) | (68,978 | ) | (10.0 | ) | ||||||
SIF Holding NV | (15,039 | ) | (171,187 | ) | (24.9 | ) | ||||||
uniQure NV | (10,560 | ) | (157,767 | ) | (22.9 | ) | ||||||
|
|
|
| |||||||||
| (528,996 | ) | |||||||||||
| New Zealand | ||||||||||||
Chorus Ltd. | (15,292 | ) | (72,549 | ) | (10.6 | ) | ||||||
Z Energy Ltd. | (239,737 | ) | (580,403 | ) | (84.3 | ) | ||||||
|
|
|
| |||||||||
| (652,952 | ) | |||||||||||
| Norway | ||||||||||||
Aker Carbon Capture ASA | (27,357 | ) | (55,267 | ) | (8.0 | ) | ||||||
Aker Solutions ASA | (28,091 | ) | (97,064 | ) | (14.1 | ) | ||||||
Austevoll Seafood ASA | (515 | ) | (8,165 | ) | (1.2 | ) | ||||||
Bonheur ASA | (239 | ) | (8,888 | ) | (1.3 | ) | ||||||
Hexagon Purus Holding | (6,508 | ) | (24,631 | ) | (3.6 | ) | ||||||
Kahoot! ASA | (4,121 | ) | (9,934 | ) | (1.4 | ) | ||||||
Norwegian Air Shuttle ASA | (12,234 | ) | (17,075 | ) | (2.5 | ) | ||||||
| Security | Shares | Value | % of Basket Value | |||||||||
| Norway (continued) | ||||||||||||
Nykode Therapeutics | (9,769 | ) | $ | (38,177 | ) | (5.6 | )% | |||||
Pexip Holding ASA | (9,829 | ) | (21,556 | ) | (3.1 | ) | ||||||
SpareBank 1 SR-Bank ASA | (14,220 | ) | (181,074 | ) | (26.3 | ) | ||||||
|
|
|
| |||||||||
| (461,831 | ) | |||||||||||
| Peru | ||||||||||||
Hochschild Mining PLC | (98,297 | ) | (144,395 | ) | (21.0 | ) | ||||||
|
|
|
| |||||||||
| Portugal | ||||||||||||
NOS SGPS SA | (99,099 | ) | (419,070 | ) | (60.9 | ) | ||||||
REN - Redes Energeticas Nacionais SGPS SA | (163,016 | ) | (497,004 | ) | (72.2 | ) | ||||||
|
|
|
| |||||||||
| (916,074 | ) | |||||||||||
| Puerto Rico | ||||||||||||
EVERTEC, Inc. | (1,927 | ) | (75,924 | ) | (11.0 | ) | ||||||
First BanCorp, Puerto Rico | (3,872 | ) | (52,698 | ) | (7.7 | ) | ||||||
|
|
|
| |||||||||
| (128,622 | ) | |||||||||||
| Singapore | ||||||||||||
BW Energy Ltd. | (2,157 | ) | (6,278 | ) | (0.9 | ) | ||||||
Frasers Hospitality Trust | (46,300 | ) | (21,501 | ) | (3.1 | ) | ||||||
Japfa Ltd. | (1,268,400 | ) | (550,687 | ) | (80.0 | ) | ||||||
Kulicke & Soffa Industries, Inc. | (18,032 | ) | (836,865 | ) | (121.6 | ) | ||||||
Maxeon Solar Technologies Ltd. | (9,197 | ) | (106,501 | ) | (15.5 | ) | ||||||
OUE Commercial Real Estate Investment Trust | (329,900 | ) | (98,604 | ) | (14.3 | ) | ||||||
OUE Ltd. | (120,000 | ) | (118,009 | ) | (17.1 | ) | ||||||
Razer, Inc. | (392,000 | ) | (141,730 | ) | (20.6 | ) | ||||||
Starhill Global REIT | (394,800 | ) | (169,025 | ) | (24.6 | ) | ||||||
Yanlord Land Group Ltd. | (414,500 | ) | (363,168 | ) | (52.8 | ) | ||||||
|
|
|
| |||||||||
| (2,412,368 | ) | |||||||||||
| South Africa | ||||||||||||
Mediclinic International PLC | (37,284 | ) | (172,846 | ) | (25.1 | ) | ||||||
|
|
|
| |||||||||
| South Sandwich Islands | ||||||||||||
Burford Capital Ltd. | (23,084 | ) | (197,383 | ) | (28.7 | ) | ||||||
|
|
|
| |||||||||
| Spain | ||||||||||||
Cia de Distribucion Integral Logista Holdings SA | (38,685 | ) | (712,788 | ) | (103.6 | ) | ||||||
Construcciones y Auxiliar de Ferrocarriles SA | (2,766 | ) | (84,806 | ) | (12.3 | ) | ||||||
Corp. Financiera Alba SA | (758 | ) | (44,794 | ) | (6.5 | ) | ||||||
Ebro Foods SA | (885 | ) | (15,912 | ) | (2.3 | ) | ||||||
Metrovacesa SA | (13,113 | ) | (105,135 | ) | (15.3 | ) | ||||||
|
|
|
| |||||||||
| (963,435 | ) | |||||||||||
| Sweden | ||||||||||||
Bactiguard Holding AB | (732 | ) | (8,613 | ) | (1.2 | ) | ||||||
BHG Group AB | (45,540 | ) | (313,557 | ) | (45.6 | ) | ||||||
BICO Group AB | (11,656 | ) | (116,890 | ) | (17.0 | ) | ||||||
BillerudKorsnas AB | (23,357 | ) | (360,428 | ) | (52.4 | ) | ||||||
Boozt AB | (11,271 | ) | (118,351 | ) | (17.2 | ) | ||||||
Calliditas Therapeutics AB, Class B | (15,367 | ) | (115,939 | ) | (16.8 | ) | ||||||
Camurus AB | (11,301 | ) | (187,248 | ) | (27.2 | ) | ||||||
Cibus Nordic Real Estate AB | (376 | ) | (8,696 | ) | (1.3 | ) | ||||||
Cint Group AB | (7,533 | ) | (61,609 | ) | (8.9 | ) | ||||||
Clas Ohlson AB, B Shares | (42,407 | ) | (481,447 | ) | (70.0 | ) | ||||||
Creades AB, A Shares | (624 | ) | (5,921 | ) | (0.9 | ) | ||||||
Duni AB | (5,969 | ) | (54,648 | ) | (7.9 | ) | ||||||
Dustin Group AB | (2,671 | ) | (19,192 | ) | (2.8 | ) | ||||||
Electrolux Professional AB, Class B | (1,148 | ) | (6,435 | ) | (0.9 | ) | ||||||
Granges AB | (15,992 | ) | (131,340 | ) | (19.1 | ) | ||||||
Hansa Biopharma AB | (34,952 | ) | (193,292 | ) | (28.1 | ) | ||||||
Hemnet Group AB | (671 | ) | (8,371 | ) | (1.2 | ) | ||||||
Intrum AB | (3,720 | ) | (89,924 | ) | (13.1 | ) | ||||||
| 100 | 2 0 2 2 BLACK ROCK ANNUAL REPORT TO SHAREHOLDERS |
Schedule of Investments (continued) April 30, 2022 | BlackRock Global Long/Short Equity Fund |
| Security | Shares | Value | % of Basket Value | |||||||||
| Sweden (continued) | ||||||||||||
Karo Pharma AB | (31,924 | ) | $ | (183,687 | ) | (26.7 | )% | |||||
Munters Group AB | (3,443 | ) | (20,569 | ) | (3.0 | ) | ||||||
Mycronic AB | (380 | ) | (6,645 | ) | (1.0 | ) | ||||||
NCC AB, B Shares | (7,007 | ) | (86,819 | ) | (12.6 | ) | ||||||
New Wave Group AB, B Shares | (2,093 | ) | (36,545 | ) | (5.3 | ) | ||||||
Nordic Entertainment Group AB, Class B | (487 | ) | (15,992 | ) | (2.3 | ) | ||||||
Nordnet AB publ | (487 | ) | (8,535 | ) | (1.2 | ) | ||||||
Pandox AB | (435 | ) | (6,061 | ) | (0.9 | ) | ||||||
Paradox Interactive AB | (42,380 | ) | (706,955 | ) | (102.7 | ) | ||||||
PowerCell Sweden AB | (25,468 | ) | (372,092 | ) | (54.1 | ) | ||||||
Re:NewCell AB | (12,890 | ) | (152,131 | ) | (22.1 | ) | ||||||
Samhallsbyggnadsbolaget i Norden AB | (10,870 | ) | (28,515 | ) | (4.1 | ) | ||||||
SSAB AB, B Shares | (21,243 | ) | (124,922 | ) | (18.1 | ) | ||||||
Wallenstam AB, B Shares | (4,142 | ) | (45,797 | ) | (6.7 | ) | ||||||
Wihlborgs Fastigheter AB | (657 | ) | (11,391 | ) | (1.7 | ) | ||||||
Xvivo Perfusion AB | (218 | ) | (4,699 | ) | (0.7 | ) | ||||||
|
|
|
| |||||||||
| (4,093,256 | ) | |||||||||||
| Switzerland | ||||||||||||
Bobst Group SA | (229 | ) | (19,316 | ) | (2.8 | ) | ||||||
Burckhardt Compression Holding AG | (24 | ) | (12,244 | ) | (1.8 | ) | ||||||
Cembra Money Bank AG | (7,932 | ) | (572,333 | ) | (83.2 | ) | ||||||
dormakaba Holding AG | (41 | ) | (19,030 | ) | (2.8 | ) | ||||||
Forbo Holding AG | (167 | ) | (244,468 | ) | (35.5 | ) | ||||||
Galenica AG | (12,077 | ) | (889,320 | ) | (129.2 | ) | ||||||
Interroll Holding AG | (41 | ) | (124,287 | ) | (18.1 | ) | ||||||
Leonteq AG | (89 | ) | (6,055 | ) | (0.9 | ) | ||||||
Medmix AG | (214 | ) | (7,187 | ) | (1.0 | ) | ||||||
Meyer Burger Technology AG | (497,235 | ) | (235,608 | ) | (34.2 | ) | ||||||
Mobilezone Holding AG | (13,690 | ) | (221,671 | ) | (32.2 | ) | ||||||
Mobimo Holding AG | (1,218 | ) | (348,339 | ) | (50.6 | ) | ||||||
Montana Aerospace AG | (584 | ) | (8,903 | ) | (1.3 | ) | ||||||
PolyPeptide Group AG | (154 | ) | (13,476 | ) | (2.0 | ) | ||||||
SFS Group AG | (1,601 | ) | (200,498 | ) | (29.1 | ) | ||||||
Siegfried Holding AG | (13 | ) | (9,489 | ) | (1.4 | ) | ||||||
St Galler Kantonalbank AG | (577 | ) | (278,259 | ) | (40.4 | ) | ||||||
Zehnder Group AG | (416 | ) | (32,529 | ) | (4.7 | ) | ||||||
Zur Rose Group AG | (1,260 | ) | (154,645 | ) | (22.5 | ) | ||||||
|
|
|
| |||||||||
| (3,397,657 | ) | |||||||||||
| United Kingdom | ||||||||||||
Abcam PLC | (5,062 | ) | (78,548 | ) | (11.4 | ) | ||||||
AO World PLC | (6,714 | ) | (6,298 | ) | (0.9 | ) | ||||||
Assura PLC | (234,354 | ) | (194,200 | ) | (28.2 | ) | ||||||
Auction Technology Group PLC | (7,851 | ) | (86,395 | ) | (12.6 | ) | ||||||
Balfour Beatty PLC | (72,105 | ) | (218,457 | ) | (31.7 | ) | ||||||
Biffa PLC | (18,380 | ) | (79,719 | ) | (11.6 | ) | ||||||
Bridgepoint Group PLC | (71,852 | ) | (276,653 | ) | (40.2 | ) | ||||||
Central Asia Metals PLC | (2,516 | ) | (8,430 | ) | (1.2 | ) | ||||||
Clipper Logistics PLC | (4,451 | ) | (48,133 | ) | (7.0 | ) | ||||||
Close Brothers Group PLC | (6,582 | ) | (91,265 | ) | (13.3 | ) | ||||||
CMC Markets PLC | (35,299 | ) | (128,722 | ) | (18.7 | ) | ||||||
Computacenter PLC | (28,492 | ) | (957,322 | ) | (139.1 | ) | ||||||
Countryside Properties PLC | (19,060 | ) | (59,511 | ) | (8.6 | ) | ||||||
Crest Nicholson Holdings PLC | (4,352 | ) | (13,693 | ) | (2.0 | ) | ||||||
Domino’s Pizza Group PLC | (51,623 | ) | (225,639 | ) | (32.8 | ) | ||||||
Elementis PLC | (132,274 | ) | (200,923 | ) | (29.2 | ) | ||||||
Empiric Student Property PLC | (93,814 | ) | (107,349 | ) | (15.6 | ) | ||||||
Energean PLC | (22,130 | ) | (329,476 | ) | (47.9 | ) | ||||||
Essentra PLC | (86,537 | ) | (339,134 | ) | (49.3 | ) | ||||||
Finablr PLC | (44,203 | ) | (1 | ) | (0.0 | ) | ||||||
| Security | Shares | Value | % of Basket Value | |||||||||
| United Kingdom (continued) | ||||||||||||
Firstgroup PLC | (5,723 | ) | $ | (8,034 | ) | (1.2 | )% | |||||
Frasers Group PLC | (16,238 | ) | (137,915 | ) | (20.0 | ) | ||||||
Funding Circle Holdings PLC | (4,267 | ) | (3,917 | ) | (0.6 | ) | ||||||
GAN Ltd. | (7,336 | ) | (27,363 | ) | (4.0 | ) | ||||||
Go-Ahead Group PLC | (593 | ) | (7,136 | ) | (1.0 | ) | ||||||
Greatland Gold PLC | (689,358 | ) | (115,077 | ) | (16.7 | ) | ||||||
Halfords Group PLC | (110,795 | ) | (315,419 | ) | (45.8 | ) | ||||||
Hays PLC | (75,222 | ) | (115,529 | ) | (16.8 | ) | ||||||
Ibstock PLC | (2,838 | ) | (6,700 | ) | (1.0 | ) | ||||||
Ideagen PLC | (13,823 | ) | (40,847 | ) | (5.9 | ) | ||||||
IG Design Group PLC | (49,765 | ) | (42,427 | ) | (6.2 | ) | ||||||
Inchcape PLC | (24,627 | ) | (220,354 | ) | (32.0 | ) | ||||||
IP Group PLC | (64,754 | ) | (66,772 | ) | (9.7 | ) | ||||||
IQE PLC | (42,145 | ) | (15,925 | ) | (2.3 | ) | ||||||
Jupiter Fund Management PLC | (39,688 | ) | (88,585 | ) | (12.9 | ) | ||||||
Keller Group PLC | (1,509 | ) | (15,902 | ) | (2.3 | ) | ||||||
Liontrust Asset Management PLC | (7,332 | ) | (106,414 | ) | (15.5 | ) | ||||||
Marston’s PLC | (84,704 | ) | (79,937 | ) | (11.6 | ) | ||||||
Mitie Group PLC | (112,087 | ) | (75,563 | ) | (11.0 | ) | ||||||
Moneysupermarket.com Group PLC | (23,173 | ) | (50,764 | ) | (7.4 | ) | ||||||
Morgan Sindall Group PLC | (699 | ) | (18,847 | ) | (2.7 | ) | ||||||
Naked Wines PLC | (20,535 | ) | (92,936 | ) | (13.5 | ) | ||||||
NCC Group PLC | (3,040 | ) | (6,995 | ) | (1.0 | ) | ||||||
OSB Group PLC | (10,995 | ) | (76,750 | ) | (11.2 | ) | ||||||
Oxford Biomedica PLC | (27,319 | ) | (195,808 | ) | (28.4 | ) | ||||||
Petrofac Ltd. | (41,142 | ) | (69,354 | ) | (10.1 | ) | ||||||
Polar Capital Holdings PLC | (5,940 | ) | (41,401 | ) | (6.0 | ) | ||||||
Primary Health Properties PLC | (67,874 | ) | (123,090 | ) | (17.9 | ) | ||||||
Provident Financial PLC | (5,947 | ) | (19,035 | ) | (2.8 | ) | ||||||
QinetiQ Group PLC | (6,740 | ) | (28,595 | ) | (4.2 | ) | ||||||
Rank Group PLC | (14,288 | ) | (19,404 | ) | (2.8 | ) | ||||||
Reach PLC | (12,278 | ) | (25,104 | ) | (3.6 | ) | ||||||
Redde Northgate PLC | (28,367 | ) | (140,328 | ) | (20.4 | ) | ||||||
Renewi PLC | (23,155 | ) | (200,902 | ) | (29.2 | ) | ||||||
Rotork PLC | (17,391 | ) | (63,452 | ) | (9.2 | ) | ||||||
Sabre Insurance Group PLC | (3,133 | ) | (8,273 | ) | (1.2 | ) | ||||||
Saga PLC | (32,970 | ) | (91,624 | ) | (13.3 | ) | ||||||
Savills PLC | (604 | ) | (8,125 | ) | (1.2 | ) | ||||||
Serco Group PLC | (46,064 | ) | (87,111 | ) | (12.7 | ) | ||||||
Shaftesbury PLC | (4,547 | ) | (34,050 | ) | (4.9 | ) | ||||||
Target Healthcare REIT PLC | (13,822 | ) | (19,292 | ) | (2.8 | ) | ||||||
TI Fluid Systems PLC | (104,136 | ) | (211,625 | ) | (30.7 | ) | ||||||
Trainline PLC | (17,735 | ) | (63,245 | ) | (9.2 | ) | ||||||
Trustpilot Group PLC | (41,078 | ) | (53,205 | ) | (7.7 | ) | ||||||
Tullow Oil PLC | (114,972 | ) | (80,057 | ) | (11.6 | ) | ||||||
Victoria PLC | (1,855 | ) | (14,875 | ) | (2.2 | ) | ||||||
Volex PLC | (3,858 | ) | (12,499 | ) | (1.8 | ) | ||||||
Volution Group PLC | (18,364 | ) | (93,539 | ) | (13.6 | ) | ||||||
|
|
|
| |||||||||
| (6,889,969 | ) | |||||||||||
| United States | ||||||||||||
23andMe Holding Co., Class A | (14,362 | ) | (42,942 | ) | (6.2 | ) | ||||||
2seventy bio, Inc. | (12,735 | ) | (171,413 | ) | (24.9 | ) | ||||||
4D Molecular Therapeutics, Inc. | (425 | ) | (5,062 | ) | (0.7 | ) | ||||||
AAON, Inc. | (2,977 | ) | (145,099 | ) | (21.1 | ) | ||||||
Abercrombie & Fitch Co., Class A | (5,850 | ) | (202,293 | ) | (29.4 | ) | ||||||
ABM Industries, Inc. | (21,524 | ) | (1,038,963 | ) | (151.0 | ) | ||||||
Accelerate Diagnostics, Inc. | (37,580 | ) | (36,077 | ) | (5.2 | ) | ||||||
Aclaris Therapeutics, Inc. | (5,066 | ) | (62,413 | ) | (9.1 | ) | ||||||
Aerie Pharmaceuticals, Inc. | (852 | ) | (6,058 | ) | (0.9 | ) | ||||||
Aeva Technologies, Inc. | (1,971 | ) | (6,465 | ) | (0.9 | ) | ||||||
SCHEDULE OF INVESTMENTS | 101 |
Schedule of Investments (continued) April 30, 2022 | BlackRock Global Long/Short Equity Fund |
| Security | Shares | Value | % of Basket Value | |||||||||
| United States (continued) | ||||||||||||
AEye, Inc. | (37,926 | ) | $ | (193,802 | ) | (28.2 | )% | |||||
Agenus, Inc. | (59,079 | ) | (109,296 | ) | (15.9 | ) | ||||||
Agiliti, Inc. | (1,814 | ) | (35,808 | ) | (5.2 | ) | ||||||
Agilysys, Inc. | (527 | ) | (19,399 | ) | (2.8 | ) | ||||||
Alaunos Therapeutics, Inc. | (4,759 | ) | (2,529 | ) | (0.4 | ) | ||||||
Albany International Corp., Class A | (2,075 | ) | (162,306 | ) | (23.6 | ) | ||||||
Albireo Pharma, Inc. | (1,552 | ) | (49,385 | ) | (7.2 | ) | ||||||
Alexander’s, Inc. | (2,010 | ) | (498,822 | ) | (72.5 | ) | ||||||
Alkami Technology, Inc. | (20,142 | ) | (263,860 | ) | (38.3 | ) | ||||||
Allscripts Healthcare Solutions, Inc. | (5,456 | ) | (112,721 | ) | (16.4 | ) | ||||||
Alpha & Omega Semiconductor Ltd. | (13,512 | ) | (579,665 | ) | (84.2 | ) | ||||||
Amerant Bancorp, Inc. | (483 | ) | (12,843 | ) | (1.9 | ) | ||||||
American Public Education, Inc. | (16,342 | ) | (317,688 | ) | (46.2 | ) | ||||||
Amyris, Inc. | (41,987 | ) | (144,015 | ) | (20.9 | ) | ||||||
AnaptysBio, Inc. | (850 | ) | (19,890 | ) | (2.9 | ) | ||||||
Anavex Life Sciences Corp. | (11,054 | ) | (94,954 | ) | (13.8 | ) | ||||||
API Group Corp. | (42,955 | ) | (797,245 | ) | (115.8 | ) | ||||||
Apogee Enterprises, Inc. | (133 | ) | (5,852 | ) | (0.9 | ) | ||||||
Apollo Commercial Real Estate Finance, Inc. | (1,099 | ) | (13,232 | ) | (1.9 | ) | ||||||
Apollo Medical Holdings, Inc. | (5,523 | ) | (201,479 | ) | (29.3 | ) | ||||||
Apple Hospitality REIT, Inc. | (12,492 | ) | (220,983 | ) | (32.1 | ) | ||||||
ArcBest Corp. | (130 | ) | (9,381 | ) | (1.4 | ) | ||||||
Arcturus Therapeutics Holdings, Inc. | (5,621 | ) | (108,935 | ) | (15.8 | ) | ||||||
Arcus Biosciences, Inc. | (2,579 | ) | (62,438 | ) | (9.1 | ) | ||||||
Array Technologies, Inc. | (8,167 | ) | (53,331 | ) | (7.7 | ) | ||||||
Astra Space, Inc. | (14,960 | ) | (47,872 | ) | (7.0 | ) | ||||||
Atara Biotherapeutics, Inc. | (17,868 | ) | (113,640 | ) | (16.5 | ) | ||||||
Atlantic Sapphire ASA | (16,685 | ) | (46,447 | ) | (6.7 | ) | ||||||
Atlantic Union Bankshares Corp. | (3,920 | ) | (132,418 | ) | (19.2 | ) | ||||||
Avid Technology, Inc. | (688 | ) | (21,816 | ) | (3.2 | ) | ||||||
Axonics, Inc. | (5,188 | ) | (268,842 | ) | (39.1 | ) | ||||||
B. Riley Financial, Inc. | (9,467 | ) | (427,530 | ) | (62.1 | ) | ||||||
Balchem Corp. | (121 | ) | (14,907 | ) | (2.2 | ) | ||||||
BancFirst Corp. | (3,414 | ) | (279,094 | ) | (40.6 | ) | ||||||
BARK, Inc. | (123,566 | ) | (381,819 | ) | (55.5 | ) | ||||||
Beachbody Co., Inc. | (15,453 | ) | (25,343 | ) | (3.7 | ) | ||||||
Beacon Roofing Supply, Inc. | (15,985 | ) | (953,186 | ) | (138.5 | ) | ||||||
Belden, Inc. | (6,048 | ) | (312,258 | ) | (45.4 | ) | ||||||
BellRing Brands, Inc. | (249 | ) | (5,336 | ) | (0.8 | ) | ||||||
Berkshire Hills Bancorp, Inc. | (838 | ) | (20,732 | ) | (3.0 | ) | ||||||
Big Lots, Inc. | (325 | ) | (10,043 | ) | (1.5 | ) | ||||||
BioCryst Pharmaceuticals, Inc. | (5,610 | ) | (52,117 | ) | (7.6 | ) | ||||||
Bionano Genomics, Inc. | (71,934 | ) | (117,252 | ) | (17.0 | ) | ||||||
Bioxcel Therapeutics, Inc. | (2,125 | ) | (27,859 | ) | (4.0 | ) | ||||||
Blucora, Inc. | (24,781 | ) | (501,815 | ) | (72.9 | ) | ||||||
Blue Bird Corp. | (16,023 | ) | (256,849 | ) | (37.3 | ) | ||||||
Bluebird Bio, Inc. | (13,938 | ) | (50,595 | ) | (7.4 | ) | ||||||
Boise Cascade Co. | (9,558 | ) | (722,394 | ) | (105.0 | ) | ||||||
BOK Financial Corp. | (3,360 | ) | (278,645 | ) | (40.5 | ) | ||||||
Brady Corp., Class A | (3,114 | ) | (139,352 | ) | (20.2 | ) | ||||||
Brightcove, Inc. | (33,554 | ) | (236,556 | ) | (34.4 | ) | ||||||
BrightSpire Capital, Inc. | (27,481 | ) | (233,588 | ) | (33.9 | ) | ||||||
Brinker International, Inc. | (13,448 | ) | (488,566 | ) | (71.0 | ) | ||||||
Brink’s Co. | (1,801 | ) | (106,169 | ) | (15.4 | ) | ||||||
Bristow Group, Inc. | (14,420 | ) | (430,004 | ) | (62.5 | ) | ||||||
Broadmark Realty Capital, Inc. | (47,084 | ) | (367,726 | ) | (53.4 | ) | ||||||
BRP Group, Inc., Class A | (2,606 | ) | (60,251 | ) | (8.8 | ) | ||||||
Buckle, Inc. | (4,032 | ) | (125,234 | ) | (18.2 | ) | ||||||
Butterfly Network, Inc. | (119,973 | ) | (399,510 | ) | (58.0 | ) | ||||||
C3.AI, Inc., Class A | (364 | ) | (6,184 | ) | (0.9 | ) | ||||||
Cabot Corp. | (837 | ) | (55,116 | ) | (8.0 | ) | ||||||
Cactus, Inc., Class A | (2,001 | ) | (99,910 | ) | (14.5 | ) | ||||||
| Security | Shares | Value | % of Basket Value | |||||||||
| United States (continued) | ||||||||||||
Caleres, Inc. | (2,181 | ) | $ | (50,010 | ) | (7.3 | )% | |||||
Cal-Maine Foods, Inc. | (13,281 | ) | (713,588 | ) | (103.7 | ) | ||||||
Cano Health, Inc. | (1,902 | ) | (10,081 | ) | (1.5 | ) | ||||||
Cara Therapeutics, Inc. | (4,459 | ) | (38,882 | ) | (5.7 | ) | ||||||
CareTrust REIT, Inc. | (368 | ) | (5,965 | ) | (0.9 | ) | ||||||
CarLotz, Inc. | (16,886 | ) | (14,993 | ) | (2.2 | ) | ||||||
Carpenter Technology Corp. | (19,271 | ) | (735,767 | ) | (106.9 | ) | ||||||
Cars.com, Inc. | (33,171 | ) | (368,862 | ) | (53.6 | ) | ||||||
Catchmark Timber Trust, Inc., Class A | (10,194 | ) | (83,693 | ) | (12.2 | ) | ||||||
Cavco Industries, Inc. | (990 | ) | (233,887 | ) | (34.0 | ) | ||||||
CBIZ, Inc. | (241 | ) | (10,095 | ) | (1.5 | ) | ||||||
Celldex Therapeutics, Inc. | (9,911 | ) | (302,781 | ) | (44.0 | ) | ||||||
CEL-SCI Corp. | (1,229 | ) | (3,515 | ) | (0.5 | ) | ||||||
Centrus Energy Corp., Class A | (2,579 | ) | (71,593 | ) | (10.4 | ) | ||||||
Cerevel Therapeutics Holdings, Inc. | (3,202 | ) | (93,755 | ) | (13.6 | ) | ||||||
Certara, Inc. | (3,839 | ) | (70,446 | ) | (10.2 | ) | ||||||
Chimera Investment Corp. | (3,737 | ) | (37,445 | ) | (5.4 | ) | ||||||
Chimerix, Inc. | (11,151 | ) | (49,064 | ) | (7.1 | ) | ||||||
Cipher Mining, Inc. | (35,802 | ) | (108,480 | ) | (15.8 | ) | ||||||
CIRCOR International, Inc. | (10,029 | ) | (197,070 | ) | (28.6 | ) | ||||||
Citi Trends, Inc. | (1,679 | ) | (46,962 | ) | (6.8 | ) | ||||||
Clearfield, Inc. | (1,853 | ) | (107,900 | ) | (15.7 | ) | ||||||
Clover Health Investments Corp. | (7,491 | ) | (20,151 | ) | (2.9 | ) | ||||||
Coca-Cola Consolidated, Inc. | (293 | ) | (129,360 | ) | (18.8 | ) | ||||||
Collegium Pharmaceutical, Inc. | (24,195 | ) | (389,539 | ) | (56.6 | ) | ||||||
Columbia Financial, Inc. | (1,856 | ) | (35,171 | ) | (5.1 | ) | ||||||
Comfort Systems USA, Inc. | (254 | ) | (21,443 | ) | (3.1 | ) | ||||||
Community Bank System, Inc. | (15,520 | ) | (999,488 | ) | (145.2 | ) | ||||||
Community Health Systems, Inc. | (1,132 | ) | (8,682 | ) | (1.3 | ) | ||||||
Community Healthcare Trust, Inc. | (530 | ) | (19,515 | ) | (2.8 | ) | ||||||
CommVault Systems, Inc. | (1,397 | ) | (85,217 | ) | (12.4 | ) | ||||||
Comstock Resources, Inc. | (4,169 | ) | (70,998 | ) | (10.3 | ) | ||||||
CONMED Corp. | (620 | ) | (82,435 | ) | (12.0 | ) | ||||||
Consensus Cloud Solutions, Inc. | (531 | ) | (27,994 | ) | (4.1 | ) | ||||||
Consolidated Communications Holdings, Inc. | (4,780 | ) | (28,441 | ) | (4.1 | ) | ||||||
ContextLogic, Inc., Class A | (123,613 | ) | (210,142 | ) | (30.5 | ) | ||||||
Core & Main, Inc., Class A | (279 | ) | (6,629 | ) | (1.0 | ) | ||||||
CoreCivic, Inc. | (24,545 | ) | (305,094 | ) | (44.3 | ) | ||||||
Corporate Office Properties Trust | (16,141 | ) | (430,803 | ) | (62.6 | ) | ||||||
Couchbase, Inc. | (19,144 | ) | (325,448 | ) | (47.3 | ) | ||||||
Coursera, Inc. | (3,238 | ) | (60,907 | ) | (8.9 | ) | ||||||
Cracker Barrel Old Country Store, Inc. | (7,305 | ) | (810,782 | ) | (117.8 | ) | ||||||
Crescent Energy, Inc., Class A | (24,934 | ) | (391,713 | ) | (56.9 | ) | ||||||
Crinetics Pharmaceuticals, Inc. | (520 | ) | (10,566 | ) | (1.5 | ) | ||||||
CSG Systems International, Inc. | (4,474 | ) | (275,017 | ) | (40.0 | ) | ||||||
CTS Corp. | (4,433 | ) | (156,795 | ) | (22.8 | ) | ||||||
Cullinan Oncology, Inc. | (500 | ) | (4,905 | ) | (0.7 | ) | ||||||
CVB Financial Corp. | (34,786 | ) | (800,774 | ) | (116.4 | ) | ||||||
Dana, Inc. | (24,823 | ) | (367,629 | ) | (53.4 | ) | ||||||
Danimer Scientific, Inc. | (19,829 | ) | (77,730 | ) | (11.3 | ) | ||||||
Denny’s Corp. | (10,083 | ) | (129,264 | ) | (18.8 | ) | ||||||
DermTech, Inc. | (469 | ) | (4,010 | ) | (0.6 | ) | ||||||
Desktop Metal, Inc., Class A | (46,347 | ) | (162,678 | ) | (23.6 | ) | ||||||
Diebold Nixdorf, Inc. | (27,808 | ) | (114,013 | ) | (16.6 | ) | ||||||
DigitalBridge Group, Inc. | (2,096 | ) | (14,588 | ) | (2.1 | ) | ||||||
Dine Brands Global, Inc. | (716 | ) | (51,330 | ) | (7.5 | ) | ||||||
DMC Global, Inc. | (1,633 | ) | (32,644 | ) | (4.7 | ) | ||||||
Donnelley Financial Solutions, Inc. | (460 | ) | (13,464 | ) | (2.0 | ) | ||||||
Dorman Products, Inc. | (1,179 | ) | (116,391 | ) | (16.9 | ) | ||||||
Douglas Elliman, Inc. | (10,584 | ) | (64,139 | ) | (9.3 | ) | ||||||
Driven Brands Holdings, Inc. | (4,589 | ) | (127,987 | ) | (18.6 | ) | ||||||
Duck Creek Technologies, Inc. | (14,273 | ) | (227,369 | ) | (33.0 | ) | ||||||
| 102 | 2 0 2 2 BLACK ROCK ANNUAL REPORT TO SHAREHOLDERS |
Schedule of Investments (continued) April 30, 2022 | BlackRock Global Long/Short Equity Fund |
| Security | Shares | Value | % of Basket Value | |||||||||
| United States (continued) | ||||||||||||
Duckhorn Portfolio, Inc. | (3,542 | ) | $ | (68,786 | ) | (10.0 | )% | |||||
Dycom Industries, Inc. | (3,189 | ) | (270,778 | ) | (39.3 | ) | ||||||
Dynavax Technologies Corp. | (7,239 | ) | (63,920 | ) | (9.3 | ) | ||||||
Dynex Capital, Inc. | (38,842 | ) | (630,406 | ) | (91.6 | ) | ||||||
Eastern Bankshares, Inc. | (42,942 | ) | (822,769 | ) | (119.6 | ) | ||||||
Eastman Kodak Co. | (93,299 | ) | (482,356 | ) | (70.1 | ) | ||||||
Ebix, Inc. | (4,483 | ) | (133,593 | ) | (19.4 | ) | ||||||
Edgewell Personal Care Co. | (12,043 | ) | (459,320 | ) | (66.7 | ) | ||||||
El Pollo Loco Holdings, Inc. | (30,117 | ) | (320,746 | ) | (46.6 | ) | ||||||
Electric Last Mile Solutions, Inc. | (7,222 | ) | (6,644 | ) | (1.0 | ) | ||||||
Empire State Realty Trust, Inc., Class A | (10,383 | ) | (89,709 | ) | (13.0 | ) | ||||||
Employers Holdings, Inc. | (3,185 | ) | (125,298 | ) | (18.2 | ) | ||||||
Encore Wire Corp. | (4,726 | ) | (533,140 | ) | (77.5 | ) | ||||||
Energy Fuels, Inc. | (18,823 | ) | (141,834 | ) | (20.6 | ) | ||||||
Enerpac Tool Group Corp. | (14,149 | ) | (284,112 | ) | (41.3 | ) | ||||||
EnerSys | (4,203 | ) | (275,128 | ) | (40.0 | ) | ||||||
Enova International, Inc. | (577 | ) | (21,580 | ) | (3.1 | ) | ||||||
Enovix Corp. | (4,804 | ) | (43,428 | ) | (6.3 | ) | ||||||
EPR Properties | (11,105 | ) | (583,235 | ) | (84.7 | ) | ||||||
Equity Commonwealth | (3,015 | ) | (78,963 | ) | (11.5 | ) | ||||||
Erasca, Inc. | (2,584 | ) | (18,812 | ) | (2.7 | ) | ||||||
EverQuote, Inc., Class A | (820 | ) | (11,382 | ) | (1.7 | ) | ||||||
Evo Payments, Inc., Class A | (3,429 | ) | (77,255 | ) | (11.2 | ) | ||||||
Evolv Technologies Holdings, Inc. | (11,864 | ) | (25,982 | ) | (3.8 | ) | ||||||
Extreme Networks, Inc. | (10,753 | ) | (103,229 | ) | (15.0 | ) | ||||||
Fastly, Inc., Class A | (2,944 | ) | (46,810 | ) | (6.8 | ) | ||||||
Federal Signal Corp. | (2,804 | ) | (95,420 | ) | (13.9 | ) | ||||||
Federated Hermes, Inc., Class B | (12,363 | ) | (352,098 | ) | (51.2 | ) | ||||||
First Financial Bankshares, Inc. | (2,316 | ) | (92,594 | ) | (13.5 | ) | ||||||
First Hawaiian, Inc. | (2,890 | ) | (68,233 | ) | (9.9 | ) | ||||||
Fluidigm Corp. | (3,556 | ) | (9,423 | ) | (1.4 | ) | ||||||
Four Corners Property Trust, Inc. | (2,569 | ) | (70,545 | ) | (10.3 | ) | ||||||
Franklin Electric Co., Inc. | (478 | ) | (33,431 | ) | (4.9 | ) | ||||||
Franklin Street Properties Corp. | (3,406 | ) | (17,575 | ) | (2.6 | ) | ||||||
Fresh Del Monte Produce, Inc. | (15,245 | ) | (397,132 | ) | (57.7 | ) | ||||||
FuelCell Energy, Inc. | (3,989 | ) | (16,275 | ) | (2.4 | ) | ||||||
Fulcrum Therapeutics, Inc. | (1,824 | ) | (17,547 | ) | (2.5 | ) | ||||||
Fulgent Genetics, Inc. | (9,041 | ) | (496,170 | ) | (72.1 | ) | ||||||
FutureFuel Corp. | (878 | ) | (8,350 | ) | (1.2 | ) | ||||||
Gannett Co., Inc. | (10,045 | ) | (40,280 | ) | (5.9 | ) | ||||||
GATX Corp. | (1,669 | ) | (172,558 | ) | (25.1 | ) | ||||||
Generation Bio Co. | (1,763 | ) | (11,160 | ) | (1.6 | ) | ||||||
Genesco, Inc. | (4,464 | ) | (276,902 | ) | (40.2 | ) | ||||||
Gentherm, Inc. | (12,613 | ) | (850,368 | ) | (123.6 | ) | ||||||
Gevo, Inc. | (75,810 | ) | (281,255 | ) | (40.9 | ) | ||||||
Glacier Bancorp, Inc. | (6,235 | ) | (285,314 | ) | (41.5 | ) | ||||||
Gladstone Commercial Corp. | (9,674 | ) | (203,541 | ) | (29.6 | ) | ||||||
Glatfelter Corp. | (27,056 | ) | (297,616 | ) | (43.2 | ) | ||||||
Glaukos Corp. | (1,373 | ) | (64,929 | ) | (9.4 | ) | ||||||
Global Blood Therapeutics, Inc. | (340 | ) | (10,438 | ) | (1.5 | ) | ||||||
Global Industrial Co. | (6,933 | ) | (213,952 | ) | (31.1 | ) | ||||||
Global Medical REIT, Inc. | (14,945 | ) | (220,588 | ) | (32.1 | ) | ||||||
Global Net Lease, Inc. | (13,295 | ) | (186,529 | ) | (27.1 | ) | ||||||
Globalstar, Inc. | (13,931 | ) | (16,160 | ) | (2.3 | ) | ||||||
GoHealth, Inc., Class A | (5,872 | ) | (4,388 | ) | (0.6 | ) | ||||||
Gossamer Bio, Inc. | (2,582 | ) | (17,842 | ) | (2.6 | ) | ||||||
GrafTech International Ltd. | (30,561 | ) | (277,494 | ) | (40.3 | ) | ||||||
Graham Holdings Co., Class B | (31 | ) | (18,363 | ) | (2.7 | ) | ||||||
Grand Canyon Education, Inc. | (2,273 | ) | (218,140 | ) | (31.7 | ) | ||||||
Great Lakes Dredge & Dock Corp. | (4,369 | ) | (60,336 | ) | (8.8 | ) | ||||||
Greenbrier Cos., Inc. | (1,485 | ) | (63,424 | ) | (9.2 | ) | ||||||
Greif, Inc., Class A | (12,586 | ) | (763,718 | ) | (111.0 | ) | ||||||
| Security | Shares | Value | % of Basket Value | |||||||||
| United States (continued) | ||||||||||||
Grid Dynamics Holdings, Inc. | (700 | ) | $ | (9,744 | ) | (1.4 | )% | |||||
Groupon, Inc. | (445 | ) | (8,682 | ) | (1.3 | ) | ||||||
Haemonetics Corp. | (3,707 | ) | (187,834 | ) | (27.3 | ) | ||||||
Hain Celestial Group, Inc. | (1,922 | ) | (64,464 | ) | (9.4 | ) | ||||||
Hamilton Lane, Inc., Class A | (665 | ) | (45,606 | ) | (6.6 | ) | ||||||
Hancock Whitney Corp. | (4,222 | ) | (197,463 | ) | (28.7 | ) | ||||||
Hawaiian Electric Industries, Inc. | (7,531 | ) | (309,599 | ) | (45.0 | ) | ||||||
HB Fuller Co. | (10,157 | ) | (677,472 | ) | (98.4 | ) | ||||||
Healthcare Services Group, Inc. | (5,158 | ) | (88,150 | ) | (12.8 | ) | ||||||
Heidrick & Struggles International, Inc. | (167 | ) | (5,337 | ) | (0.8 | ) | ||||||
Hibbett, Inc. | (24,542 | ) | (1,059,724 | ) | (154.0 | ) | ||||||
Hillenbrand, Inc. | (31,541 | ) | (1,287,504 | ) | (187.1 | ) | ||||||
Hillman Solutions Corp. | (3,600 | ) | (41,868 | ) | (6.1 | ) | ||||||
Hims & Hers Health, Inc. | (1,333 | ) | (5,612 | ) | (0.8 | ) | ||||||
Hippo Holdings, Inc. | (61,752 | ) | (116,094 | ) | (16.9 | ) | ||||||
HNI Corp. | (10,444 | ) | (372,224 | ) | (54.1 | ) | ||||||
Home BancShares, Inc. | (308 | ) | (6,659 | ) | (1.0 | ) | ||||||
Homology Medicines, Inc. | (2,050 | ) | (3,403 | ) | (0.5 | ) | ||||||
Hostess Brands, Inc. | (3,432 | ) | (77,872 | ) | (11.3 | ) | ||||||
Hovnanian Enterprises, Inc., Class A | (415 | ) | (19,098 | ) | (2.8 | ) | ||||||
Howard Hughes Corp. | (11,029 | ) | (1,106,098 | ) | (160.7 | ) | ||||||
Hydrofarm Holdings Group, Inc. | (796 | ) | (7,602 | ) | (1.1 | ) | ||||||
Hyliion Holdings Corp. | (41,440 | ) | (133,022 | ) | (19.3 | ) | ||||||
Hyzon Motors, Inc. | (48,090 | ) | (190,917 | ) | (27.7 | ) | ||||||
ICF International, Inc. | (95 | ) | (9,387 | ) | (1.4 | ) | ||||||
Ichor Holdings Ltd. | (1,137 | ) | (33,098 | ) | (4.8 | ) | ||||||
Icosavax, Inc. | (11,331 | ) | (82,150 | ) | (11.9 | ) | ||||||
Ideanomics, Inc. | (92,560 | ) | (66,569 | ) | (9.7 | ) | ||||||
Imago Biosciences, Inc. | (3,101 | ) | (50,701 | ) | (7.4 | ) | ||||||
ImmunityBio, Inc. | (20,663 | ) | (75,007 | ) | (10.9 | ) | ||||||
Independent Bank Corp. | (285 | ) | (21,991 | ) | (3.2 | ) | ||||||
Industrial Logistics Properties Trust | (11,058 | ) | (178,697 | ) | (26.0 | ) | ||||||
Ingles Markets, Inc., Class A | (2,763 | ) | (257,291 | ) | (37.4 | ) | ||||||
Inhibrx, Inc. | (735 | ) | (11,650 | ) | (1.7 | ) | ||||||
Inogen, Inc. | (826 | ) | (20,881 | ) | (3.0 | ) | ||||||
Inseego Corp. | (2,950 | ) | (8,408 | ) | (1.2 | ) | ||||||
Insight Enterprises, Inc. | (140 | ) | (13,912 | ) | (2.0 | ) | ||||||
Insmed, Inc. | (3,038 | ) | (66,745 | ) | (9.7 | ) | ||||||
Insperity, Inc. | (404 | ) | (42,844 | ) | (6.2 | ) | ||||||
Insteel Industries, Inc. | (4,056 | ) | (172,056 | ) | (25.0 | ) | ||||||
Interface, Inc. | (27,535 | ) | (349,419 | ) | (50.8 | ) | ||||||
Iovance Biotherapeutics, Inc. | (8,937 | ) | (135,396 | ) | (19.7 | ) | ||||||
IVERIC bio, Inc. | (24,657 | ) | (341,499 | ) | (49.6 | ) | ||||||
Jack in the Box, Inc. | (2,614 | ) | (216,335 | ) | (31.4 | ) | ||||||
Jamf Holding Corp. | (11,955 | ) | (368,214 | ) | (53.5 | ) | ||||||
JELD-WEN Holding, Inc. | (1,925 | ) | (40,021 | ) | (5.8 | ) | ||||||
John Bean Technologies Corp. | (967 | ) | (114,000 | ) | (16.6 | ) | ||||||
Kaiser Aluminum Corp. | (78 | ) | (7,527 | ) | (1.1 | ) | ||||||
Kaman Corp. | (3,117 | ) | (121,594 | ) | (17.7 | ) | ||||||
KAR Auction Services, Inc. | (5,417 | ) | (79,413 | ) | (11.5 | ) | ||||||
Kelly Services, Inc., Class A | (308 | ) | (5,941 | ) | (0.9 | ) | ||||||
Kennametal, Inc. | (2,119 | ) | (54,522 | ) | (7.9 | ) | ||||||
Kennedy-Wilson Holdings, Inc. | (6,721 | ) | (151,559 | ) | (22.0 | ) | ||||||
Kimball Electronics, Inc. | (27,113 | ) | (483,696 | ) | (70.3 | ) | ||||||
Kiniksa Pharmaceuticals Ltd., Class A | (2,195 | ) | (20,479 | ) | (3.0 | ) | ||||||
KKR Real Estate Finance Trust, Inc. | (2,432 | ) | (46,208 | ) | (6.7 | ) | ||||||
Korn Ferry | (14,771 | ) | (907,530 | ) | (131.9 | ) | ||||||
Krystal Biotech, Inc. | (380 | ) | (23,032 | ) | (3.3 | ) | ||||||
Kyndryl Holdings, Inc. | (5,583 | ) | (66,382 | ) | (9.6 | ) | ||||||
Lancaster Colony Corp. | (163 | ) | (25,294 | ) | (3.7 | ) | ||||||
Lantheus Holdings, Inc. | (1,318 | ) | (87,528 | ) | (12.7 | ) | ||||||
Latch, Inc. | (71,136 | ) | (234,037 | ) | (34.0 | ) | ||||||
SCHEDULE OF INVESTMENTS | 103 |
Schedule of Investments (continued) April 30, 2022 | BlackRock Global Long/Short Equity Fund |
| Security | Shares | Value | % of Basket Value | |||||||||
| United States (continued) | ||||||||||||
Latham Group, Inc. | (4,985 | ) | $ | (59,820 | ) | (8.7 | )% | |||||
La-Z-Boy, Inc. | (413 | ) | (10,854 | ) | (1.6 | ) | ||||||
LCI Industries | (1,011 | ) | (98,391 | ) | (14.3 | ) | ||||||
Lexicon Pharmaceuticals, Inc. | (69,502 | ) | (125,799 | ) | (18.3 | ) | ||||||
Liberty Oilfield Services, Inc. | (370 | ) | (5,972 | ) | (0.9 | ) | ||||||
Lindsay Corp. | (2,664 | ) | (360,040 | ) | (52.3 | ) | ||||||
Liquidity Services, Inc. | (1,469 | ) | (21,183 | ) | (3.1 | ) | ||||||
Lordstown Motors Corp., Class A | (108,365 | ) | (236,236 | ) | (34.3 | ) | ||||||
Lovesac Co. | (1,910 | ) | (83,734 | ) | (12.2 | ) | ||||||
Loyalty Ventures, Inc. | (6,542 | ) | (83,672 | ) | (12.2 | ) | ||||||
LTC Properties, Inc. | (32,778 | ) | (1,081,674 | ) | (157.2 | ) | ||||||
Lumber Liquidators Holdings, Inc. | (1,011 | ) | (13,962 | ) | (2.0 | ) | ||||||
Macerich Co. | (1,404 | ) | (17,620 | ) | (2.6 | ) | ||||||
Madison Square Garden Entertainment Corp. | (887 | ) | (64,973 | ) | (9.4 | ) | ||||||
Madrigal Pharmaceuticals, Inc. | (2,465 | ) | (172,550 | ) | (25.1 | ) | ||||||
Magnite, Inc. | (1,103 | ) | (10,644 | ) | (1.5 | ) | ||||||
Manitowoc Co., Inc. | (581 | ) | (7,692 | ) | (1.1 | ) | ||||||
ManTech International Corp., Class A | (1,577 | ) | (126,696 | ) | (18.4 | ) | ||||||
Markforged Holding Corp. | (11,781 | ) | (40,173 | ) | (5.8 | ) | ||||||
Matthews International Corp., Class A | (8,035 | ) | (239,523 | ) | (34.8 | ) | ||||||
MBIA, Inc. | (2,577 | ) | (31,027 | ) | (4.5 | ) | ||||||
MEDNAX, Inc. | (3,535 | ) | (65,468 | ) | (9.5 | ) | ||||||
MeiraGTx Holdings PLC | (474 | ) | (4,877 | ) | (0.7 | ) | ||||||
Meridian Bioscience, Inc. | (19,260 | ) | (492,863 | ) | (71.6 | ) | ||||||
Methode Electronics, Inc. | (30,182 | ) | (1,346,419 | ) | (195.6 | ) | ||||||
MillerKnoll, Inc. | (468 | ) | (14,850 | ) | (2.2 | ) | ||||||
Minerals Technologies, Inc. | (2,182 | ) | (138,797 | ) | (20.2 | ) | ||||||
Mission Produce, Inc. | (1,456 | ) | (18,520 | ) | (2.7 | ) | ||||||
Mister Car Wash, Inc. | (5,092 | ) | (73,325 | ) | (10.7 | ) | ||||||
Monarch Casino & Resort, Inc. | (166 | ) | (11,645 | ) | (1.7 | ) | ||||||
Monte Rosa Therapeutics, Inc. | (469 | ) | (5,112 | ) | (0.7 | ) | ||||||
Moog, Inc., Class A | (1,225 | ) | (97,841 | ) | (14.2 | ) | ||||||
Movado Group, Inc. | (2,323 | ) | (83,558 | ) | (12.1 | ) | ||||||
Mr Cooper Group, Inc. | (4,127 | ) | (185,591 | ) | (27.0 | ) | ||||||
MSA Safety, Inc. | (1,991 | ) | (240,294 | ) | (34.9 | ) | ||||||
Mueller Industries, Inc. | (5,469 | ) | (296,146 | ) | (43.0 | ) | ||||||
Mueller Water Products, Inc., Class A | (34,018 | ) | (409,237 | ) | (59.5 | ) | ||||||
Multiplan Corp. | (1,353 | ) | (5,994 | ) | (0.9 | ) | ||||||
Myriad Genetics, Inc. | (535 | ) | (10,968 | ) | (1.6 | ) | ||||||
N-Able, Inc. | (900 | ) | (9,000 | ) | (1.3 | ) | ||||||
NanoString Technologies, Inc. | (2,332 | ) | (43,795 | ) | (6.4 | ) | ||||||
National Health Investors, Inc. | (13,011 | ) | (670,457 | ) | (97.4 | ) | ||||||
National HealthCare Corp. | (851 | ) | (57,919 | ) | (8.4 | ) | ||||||
National Presto Industries, Inc. | (1,353 | ) | (96,239 | ) | (14.0 | ) | ||||||
Navient Corp. | (12,726 | ) | (202,216 | ) | (29.4 | ) | ||||||
Nelnet, Inc., Class A | (7,732 | ) | (634,565 | ) | (92.2 | ) | ||||||
NetScout Systems, Inc. | (15,250 | ) | (469,700 | ) | (68.2 | ) | ||||||
NETSTREIT Corp. | (1,506 | ) | (32,560 | ) | (4.7 | ) | ||||||
New Jersey Resources Corp. | (6,281 | ) | (271,088 | ) | (39.4 | ) | ||||||
Newmark Group, Inc., Class A | (26,188 | ) | (318,184 | ) | (46.2 | ) | ||||||
NewMarket Corp. | (560 | ) | (181,782 | ) | (26.4 | ) | ||||||
NexTier Oilfield Solutions, Inc. | (1,123 | ) | (12,387 | ) | (1.8 | ) | ||||||
Northwest Bancshares, Inc. | (506 | ) | (6,416 | ) | (0.9 | ) | ||||||
Novanta, Inc. | (51 | ) | (6,564 | ) | (1.0 | ) | ||||||
Nu Skin Enterprises, Inc., Class A | (12,808 | ) | (546,133 | ) | (79.4 | ) | ||||||
Ocugen, Inc. | (4,797 | ) | (10,505 | ) | (1.5 | ) | ||||||
Ocular Therapeutix, Inc. | (61,546 | ) | (219,719 | ) | (31.9 | ) | ||||||
ODP Corp. | (15,250 | ) | (656,207 | ) | (95.3 | ) | ||||||
O-I Glass, Inc. | (4,151 | ) | (55,955 | ) | (8.1 | ) | ||||||
Omeros Corp. | (14,818 | ) | (51,418 | ) | (7.5 | ) | ||||||
One Liberty Properties, Inc. | (7,793 | ) | (223,269 | ) | (32.4 | ) | ||||||
OneSpan, Inc. | (10,926 | ) | (154,384 | ) | (22.4 | ) | ||||||
| Security | Shares | Value | % of Basket Value | |||||||||
| United States (continued) | ||||||||||||
Open Lending Corp., Class A | (5,391 | ) | $ | (73,533 | ) | (10.7 | )% | |||||
OPKO Health, Inc. | (3,905 | ) | (10,544 | ) | (1.5 | ) | ||||||
Option Care Health, Inc. | (12,503 | ) | (373,590 | ) | (54.3 | ) | ||||||
Orion Office REIT, Inc. | (3,663 | ) | (49,157 | ) | (7.1 | ) | ||||||
Outset Medical, Inc. | (12,547 | ) | (437,639 | ) | (63.6 | ) | ||||||
Owens & Minor, Inc. | (6,241 | ) | (221,493 | ) | (32.2 | ) | ||||||
Pacific Premier Bancorp, Inc. | (314 | ) | (9,847 | ) | (1.4 | ) | ||||||
Pacira BioSciences, Inc. | (1,280 | ) | (95,450 | ) | (13.9 | ) | ||||||
Pactiv Evergreen, Inc. | (7,947 | ) | (78,357 | ) | (11.4 | ) | ||||||
Parsons Corp. | (14,418 | ) | (532,457 | ) | (77.4 | ) | ||||||
Patterson Cos., Inc. | (8,350 | ) | (256,929 | ) | (37.3 | ) | ||||||
Patterson-UTI Energy, Inc. | (3,308 | ) | (54,384 | ) | (7.9 | ) | ||||||
PBF Energy, Inc., Class A | (1,626 | ) | (47,252 | ) | (6.9 | ) | ||||||
PC Connection, Inc. | (125 | ) | (6,186 | ) | (0.9 | ) | ||||||
PDF Solutions, Inc. | (313 | ) | (7,277 | ) | (1.1 | ) | ||||||
PennyMac Financial Services, Inc. | (996 | ) | (48,366 | ) | (7.0 | ) | ||||||
Perdoceo Education Corp. | (90,870 | ) | (1,015,927 | ) | (147.6 | ) | ||||||
PetMed Express, Inc. | (318 | ) | (6,964 | ) | (1.0 | ) | ||||||
Pilgrim’s Pride Corp. | (588 | ) | (16,670 | ) | (2.4 | ) | ||||||
Ping Identity Holding Corp. | (1,575 | ) | (41,155 | ) | (6.0 | ) | ||||||
Pitney Bowes, Inc. | (29,190 | ) | (153,831 | ) | (22.4 | ) | ||||||
Plexus Corp. | (10,970 | ) | (890,106 | ) | (129.3 | ) | ||||||
PotlatchDeltic Corp. | (6,542 | ) | (362,361 | ) | (52.7 | ) | ||||||
PowerSchool Holdings, Inc., Class A | (5,101 | ) | (77,229 | ) | (11.2 | ) | ||||||
Praxis Precision Medicines, Inc. | (428 | ) | (3,467 | ) | (0.5 | ) | ||||||
Premier, Inc., Class A | (176 | ) | (6,373 | ) | (0.9 | ) | ||||||
Primerica, Inc. | (1,167 | ) | (151,197 | ) | (22.0 | ) | ||||||
ProAssurance Corp. | (291 | ) | (7,150 | ) | (1.0 | ) | ||||||
Progress Software Corp. | (6,014 | ) | (288,552 | ) | (41.9 | ) | ||||||
Protagonist Therapeutics, Inc. | (270 | ) | (2,454 | ) | (0.4 | ) | ||||||
Proterra, Inc. | (68,211 | ) | (423,590 | ) | (61.5 | ) | ||||||
Provention Bio, Inc. | (71,627 | ) | (321,605 | ) | (46.7 | ) | ||||||
Pulmonx Corp. | (4,400 | ) | (106,040 | ) | (15.4 | ) | ||||||
PureCycle Technologies, Inc. | (49,179 | ) | (383,596 | ) | (55.7 | ) | ||||||
Purple Innovation, Inc. | (63,841 | ) | (263,025 | ) | (38.2 | ) | ||||||
Quotient Technology, Inc. | (50,486 | ) | (268,081 | ) | (39.0 | ) | ||||||
Rackspace Technology, Inc. | (7,319 | ) | (72,385 | ) | (10.5 | ) | ||||||
Radius Health, Inc. | (1,619 | ) | (11,074 | ) | (1.6 | ) | ||||||
RadNet, Inc. | (368 | ) | (7,176 | ) | (1.0 | ) | ||||||
Rambus, Inc. | (11,284 | ) | (281,084 | ) | (40.8 | ) | ||||||
RBC Bearings, Inc. | (73 | ) | (12,290 | ) | (1.8 | ) | ||||||
Reata Pharmaceuticals, Inc., Class A | (815 | ) | (20,685 | ) | (3.0 | ) | ||||||
Recursion Pharmaceuticals, Inc., Class A | (10,016 | ) | (62,099 | ) | (9.0 | ) | ||||||
REGENXBIO, Inc. | (9,228 | ) | (256,169 | ) | (37.2 | ) | ||||||
Relay Therapeutics, Inc. | (1,968 | ) | (46,897 | ) | (6.8 | ) | ||||||
Relmada Therapeutics, Inc. | (1,968 | ) | (49,416 | ) | (7.2 | ) | ||||||
Renalytix PLC | (3,062 | ) | (8,182 | ) | (1.2 | ) | ||||||
Rent-A-Center, Inc. | (12,136 | ) | (292,720 | ) | (42.5 | ) | ||||||
Resideo Technologies, Inc. | (12,278 | ) | (276,132 | ) | (40.1 | ) | ||||||
Resources Connection, Inc. | (479 | ) | (8,234 | ) | (1.2 | ) | ||||||
Retail Opportunity Investments Corp. | (17,172 | ) | (319,914 | ) | (46.5 | ) | ||||||
REV Group, Inc., Series A | (25,600 | ) | (305,152 | ) | (44.3 | ) | ||||||
Revance Therapeutics, Inc. | (5,092 | ) | (83,407 | ) | (12.1 | ) | ||||||
Reynolds Consumer Products Inc. | (12,798 | ) | (378,693 | ) | (55.0 | ) | ||||||
Rhythm Pharmaceuticals, Inc. | (1,332 | ) | (8,338 | ) | (1.2 | ) | ||||||
Rimini Street, Inc. | (36,428 | ) | (209,825 | ) | (30.5 | ) | ||||||
Rite Aid Corp. | (2,510 | ) | (15,989 | ) | (2.3 | ) | ||||||
Romeo Power, Inc. | (216,886 | ) | (238,575 | ) | (34.7 | ) | ||||||
Root, Inc., Class A | (52,620 | ) | (101,557 | ) | (14.8 | ) | ||||||
Rover Group, Inc. | (11,788 | ) | (74,618 | ) | (10.8 | ) | ||||||
Rush Street Interactive, Inc. | (926 | ) | (5,880 | ) | (0.9 | ) | ||||||
Ruth’s Hospitality Group, Inc. | (5,574 | ) | (116,887 | ) | (17.0 | ) | ||||||
| 104 | 2 0 2 2 BLACK ROCK ANNUAL REPORT TO SHAREHOLDERS |
Schedule of Investments (continued) April 30, 2022 | BlackRock Global Long/Short Equity Fund |
| Security | Shares | Value | % of Basket Value | |||||||||
| United States (continued) | ||||||||||||
Safety Insurance Group, Inc. | (6,897 | ) | $ | (593,418 | ) | (86.2 | )% | |||||
Sally Beauty Holdings, Inc. | (5,363 | ) | (81,089 | ) | (11.8 | ) | ||||||
Saul Centers, Inc. | (119 | ) | (6,142 | ) | (0.9 | ) | ||||||
Schneider National, Inc., Class B | (852 | ) | (20,133 | ) | (2.9 | ) | ||||||
Schnitzer Steel Industries, Inc., Class A | (2,280 | ) | (104,036 | ) | (15.1 | ) | ||||||
Scholastic Corp. | (956 | ) | (35,229 | ) | (5.1 | ) | ||||||
Schrodinger, Inc. | (1,965 | ) | (48,575 | ) | (7.1 | ) | ||||||
Schweitzer-Mauduit International, Inc. | (24,374 | ) | (613,250 | ) | (89.1 | ) | ||||||
Seaboard Corp. | (155 | ) | (654,873 | ) | (95.2 | ) | ||||||
Seer, Inc. | (23,881 | ) | (173,854 | ) | (25.3 | ) | ||||||
Selective Insurance Group, Inc. | (1,288 | ) | (106,080 | ) | (15.4 | ) | ||||||
Selectquote, Inc. | (64,909 | ) | (133,713 | ) | (19.4 | ) | ||||||
Seres Therapeutics, Inc. | (7,533 | ) | (35,631 | ) | (5.2 | ) | ||||||
Seritage Growth Properties, Series A | (543 | ) | (5,376 | ) | (0.8 | ) | ||||||
Shenandoah Telecommunications Co. | (751 | ) | (15,170 | ) | (2.2 | ) | ||||||
Shoals Technologies Group, Inc., Class A | (3,722 | ) | (37,146 | ) | (5.4 | ) | ||||||
Shoe Carnival, Inc. | (5,250 | ) | (158,497 | ) | (23.0 | ) | ||||||
SI-BONE, Inc. | (301 | ) | (6,014 | ) | (0.9 | ) | ||||||
SIGA Technologies, Inc. | (45,896 | ) | (315,306 | ) | (45.8 | ) | ||||||
Sight Sciences, Inc. | (18,872 | ) | (131,727 | ) | (19.1 | ) | ||||||
Signify Health, Inc., Class A | (13,569 | ) | (187,252 | ) | (27.2 | ) | ||||||
Silgan Holdings, Inc. | (30,017 | ) | (1,331,854 | ) | (193.5 | ) | ||||||
Silk Road Medical, Inc. | (526 | ) | (18,436 | ) | (2.7 | ) | ||||||
Simmons First National Corp., Class A | (1,298 | ) | (30,983 | ) | (4.5 | ) | ||||||
SITE Centers Corp. | (2,946 | ) | (46,841 | ) | (6.8 | ) | ||||||
Skillz, Inc. | (41,778 | ) | (85,645 | ) | (12.4 | ) | ||||||
Skyline Champion Corp. | (5,417 | ) | (276,484 | ) | (40.2 | ) | ||||||
SkyWater Technology, Inc. | (6,768 | ) | (41,420 | ) | (6.0 | ) | ||||||
Sleep Number Corp. | (568 | ) | (23,038 | ) | (3.3 | ) | ||||||
Sotera Health Co. | (2,308 | ) | (47,037 | ) | (6.8 | ) | ||||||
Spectrum Brands Holdings, Inc. | (3,932 | ) | (334,495 | ) | (48.6 | ) | ||||||
Spire, Inc. | (7,644 | ) | (556,101 | ) | (80.8 | ) | ||||||
SpringWorks Therapeutics, Inc. | (3,461 | ) | (148,512 | ) | (21.6 | ) | ||||||
Sprouts Farmers Market, Inc. | (2,307 | ) | (68,749 | ) | (10.0 | ) | ||||||
St. Joe Co. | (3,805 | ) | (202,464 | ) | (29.4 | ) | ||||||
Stem, Inc. | (44,096 | ) | (316,168 | ) | (45.9 | ) | ||||||
StepStone Group, Inc., Class A | (2,800 | ) | (71,736 | ) | (10.4 | ) | ||||||
Stericycle, Inc. | (1,457 | ) | (73,127 | ) | (10.6 | ) | ||||||
Sterling Construction Co., Inc. | (11,742 | ) | (268,774 | ) | (39.1 | ) | ||||||
Steven Madden Ltd. | (3,413 | ) | (140,138 | ) | (20.4 | ) | ||||||
Stock Yards Bancorp, Inc. | (1,936 | ) | (101,214 | ) | (14.7 | ) | ||||||
Strategic Education, Inc. | (96 | ) | (6,202 | ) | (0.9 | ) | ||||||
Supernus Pharmaceuticals, Inc. | (276 | ) | (7,700 | ) | (1.1 | ) | ||||||
TaskUS, Inc., Class A | (4,162 | ) | (120,240 | ) | (17.5 | ) | ||||||
Tejon Ranch Co. | (2,869 | ) | (52,531 | ) | (7.6 | ) | ||||||
Telephone & Data Systems, Inc. | (1,766 | ) | (32,353 | ) | (4.7 | ) | ||||||
Telos Corp. | (12,989 | ) | (101,184 | ) | (14.7 | ) | ||||||
Tennant Co. | (10,429 | ) | (673,505 | ) | (97.9 | ) | ||||||
TFS Financial Corp. | (30,656 | ) | (459,533 | ) | (66.8 | ) | ||||||
Thermon Group Holdings, Inc. | (2,953 | ) | (44,295 | ) | (6.4 | ) | ||||||
ThredUp, Inc., Class A | (6,367 | ) | (41,959 | ) | (6.1 | ) | ||||||
Tootsie Roll Industries, Inc. | (8,722 | ) | (305,532 | ) | (44.4 | ) | ||||||
TPI Composites, Inc. | (1,285 | ) | (14,700 | ) | (2.1 | ) | ||||||
Traeger, Inc. | (968 | ) | (5,798 | ) | (0.8 | ) | ||||||
TransMedics Group, Inc. | (3,956 | ) | (82,918 | ) | (12.0 | ) | ||||||
Treace Medical Concepts, Inc. | (314 | ) | (6,154 | ) | (0.9 | ) | ||||||
Tredegar Corp. | (60,698 | ) | (694,992 | ) | (101.0 | ) | ||||||
TreeHouse Foods, Inc. | (15,497 | ) | (488,155 | ) | (70.9 | ) | ||||||
TriMas Corp. | (213 | ) | (6,292 | ) | (0.9 | ) | ||||||
TriNet Group, Inc. | (335 | ) | (29,715 | ) | (4.3 | ) | ||||||
| Security | Shares | Value | % of Basket Value | |||||||||
| United States (continued) | ||||||||||||
Tupperware Brands Corp. | (11,183 | ) | $ | (196,597 | ) | (28.6 | )% | |||||
TuSimple Holdings, Inc., Class A | (23,390 | ) | (242,554 | ) | (35.2 | ) | ||||||
U.S. Silica Holdings, Inc. | (5,805 | ) | (107,857 | ) | (15.7 | ) | ||||||
Under Armour, Inc., Class C | (2,682 | ) | (38,058 | ) | (5.5 | ) | ||||||
UniFirst Corp. | (5,228 | ) | (900,784 | ) | (130.9 | ) | ||||||
Unisys Corp. | (39,961 | ) | (567,846 | ) | (82.5 | ) | ||||||
United Bankshares, Inc. | (20,658 | ) | (687,085 | ) | (99.8 | ) | ||||||
United Community Banks, Inc. | (29,372 | ) | (885,272 | ) | (128.6 | ) | ||||||
United Natural Foods, Inc. | (6,718 | ) | (288,404 | ) | (41.9 | ) | ||||||
Uniti Group, Inc. | (52,446 | ) | (649,806 | ) | (94.4 | ) | ||||||
Universal Corp. | (13,586 | ) | (785,950 | ) | (114.2 | ) | ||||||
Universal Health Realty Income Trust | (2,278 | ) | (114,333 | ) | (16.6 | ) | ||||||
USANA Health Sciences, Inc. | (1,211 | ) | (92,835 | ) | (13.5 | ) | ||||||
Utz Brands, Inc. | (3,475 | ) | (49,067 | ) | (7.1 | ) | ||||||
UWM Holdings Corp. | (19,524 | ) | (72,434 | ) | (10.5 | ) | ||||||
Vapotherm, Inc. | (1,214 | ) | (5,390 | ) | (0.8 | ) | ||||||
Vaxart, Inc. | (54,961 | ) | (191,264 | ) | (27.8 | ) | ||||||
Vaxcyte, Inc. | (7,694 | ) | (186,272 | ) | (27.1 | ) | ||||||
Velodyne Lidar, Inc. | (77,137 | ) | (145,018 | ) | (21.1 | ) | ||||||
Verint Systems, Inc. | (5,725 | ) | (312,356 | ) | (45.4 | ) | ||||||
Veritone, Inc. | (14,559 | ) | (157,674 | ) | (22.9 | ) | ||||||
Verra Mobility Corp. | (4,201 | ) | (58,940 | ) | (8.6 | ) | ||||||
Verve Therapeutics, Inc. | (13,029 | ) | (194,393 | ) | (28.2 | ) | ||||||
Vesync Co. Ltd. | (9,000 | ) | (6,549 | ) | (1.0 | ) | ||||||
ViaSat, Inc. | (718 | ) | (26,430 | ) | (3.8 | ) | ||||||
Vicor Corp. | (1,747 | ) | (105,728 | ) | (15.4 | ) | ||||||
View, Inc. | (17,500 | ) | (26,950 | ) | (3.9 | ) | ||||||
Vimeo, Inc. | (25,839 | ) | (263,299 | ) | (38.3 | ) | ||||||
Vir Biotechnology, Inc. | (7,964 | ) | (162,067 | ) | (23.5 | ) | ||||||
Virgin Galactic Holdings Inc. | (26,216 | ) | (196,358 | ) | (28.5 | ) | ||||||
Visteon Corp. | (664 | ) | (69,527 | ) | (10.1 | ) | ||||||
Vivint Smart Home, Inc. | (12,071 | ) | (63,252 | ) | (9.2 | ) | ||||||
Volta, Inc. | (10,779 | ) | (22,528 | ) | (3.3 | ) | ||||||
Vroom, Inc. | (2,685 | ) | (4,189 | ) | (0.6 | ) | ||||||
Vuzix Corp. | (26,166 | ) | (135,278 | ) | (19.7 | ) | ||||||
Wabash National Corp. | (20,671 | ) | (295,802 | ) | (43.0 | ) | ||||||
Washington Real Estate Investment Trust | (360 | ) | (8,672 | ) | (1.3 | ) | ||||||
Waterstone Financial, Inc. | (430 | ) | (6,906 | ) | (1.0 | ) | ||||||
Weis Markets, Inc. | (312 | ) | (24,923 | ) | (3.6 | ) | ||||||
Westamerica BanCorp | (4,346 | ) | (256,066 | ) | (37.2 | ) | ||||||
Wheels Up Experience, Inc. | (71,976 | ) | (219,527 | ) | (31.9 | ) | ||||||
White Mountains Insurance Group Ltd. | (909 | ) | (952,650 | ) | (138.4 | ) | ||||||
Whiting Petroleum Corp. | (3,477 | ) | (253,995 | ) | (36.9 | ) | ||||||
WideOpenWest, Inc. | (4,004 | ) | (80,280 | ) | (11.7 | ) | ||||||
Workhorse Group, Inc. | (114,783 | ) | (345,497 | ) | (50.2 | ) | ||||||
World Fuel Services Corp. | (253 | ) | (6,128 | ) | (0.9 | ) | ||||||
Worthington Industries, Inc. | (4,094 | ) | (194,752 | ) | (28.3 | ) | ||||||
WSFS Financial Corp. | (1,858 | ) | (74,450 | ) | (10.8 | ) | ||||||
WW International, Inc. | (3,306 | ) | (32,366 | ) | (4.7 | ) | ||||||
Xencor, Inc. | (6,708 | ) | (167,566 | ) | (24.3 | ) | ||||||
Xenia Hotels & Resorts, Inc. | (6,485 | ) | (125,096 | ) | (18.2 | ) | ||||||
XL Fleet Corp. | (87,490 | ) | (122,486 | ) | (17.8 | ) | ||||||
Xperi Holding Corp. | (63,809 | ) | (995,420 | ) | (144.6 | ) | ||||||
Yelp, Inc. | (2,138 | ) | (69,549 | ) | (10.1 | ) | ||||||
Zomedica Corp. | (224,978 | ) | (55,570 | ) | (8.1 | ) | ||||||
Zumiez, Inc. | (4,629 | ) | (169,560 | ) | (24.6 | ) | ||||||
|
|
|
| |||||||||
| (92,120,566 | ) | |||||||||||
SCHEDULE OF INVESTMENTS | 105 |
Schedule of Investments (continued) April 30, 2022 | BlackRock Global Long/Short Equity Fund |
| Security | Shares | Value | % of Basket Value | |||||||||
| United States (continued) | ||||||||||||
| Rights | ||||||||||||
| Sweden | ||||||||||||
Karo Pharma Aktiebolag Right | (95,772 | ) | $ | (4,459 | ) | (0.6 | )% | |||||
|
|
|
| |||||||||
| Switzerland | ||||||||||||
Mobimo Holding AG Right | (1,324 | ) | (4,614 | ) | (0.7 | ) | ||||||
|
|
|
| |||||||||
Total Reference Entity — Short | (167,280,125 | ) | ||||||||||
|
| |||||||||||
Net Value of Reference Entity — Goldman Sachs & Co. |
| $ | 688,223 | |||||||||
|
| |||||||||||
The following table represents the individual long and short positions and related values of the equity securities underlying the total return swap with UBS AG as of period end, termination dates July 8, 2022 and January 20, 2027:
| Security | Shares | Value | % of Basket Value | |||||||||
Reference Entity — Long | ||||||||||||
| Common Stocks | ||||||||||||
| Australia | ||||||||||||
Alumina Ltd. | 21,199 | $ | 27,110 | 2.4 | % | |||||||
AMP Ltd. | 122,812 | 99,223 | 8.9 | |||||||||
Aristocrat Leisure Ltd. | 10,184 | 236,292 | 21.1 | |||||||||
Atlas Arteria Ltd. | 120,462 | 585,213 | 52.4 | |||||||||
Boral Ltd. | 53,017 | 132,258 | 11.8 | |||||||||
carsales.com Ltd. | 12,737 | 188,037 | 16.8 | |||||||||
Challenger Ltd. | 33,710 | 170,557 | 15.3 | |||||||||
Charter Hall Group | 17,673 | 189,939 | 17.0 | |||||||||
Commonwealth Bank of Australia | 4,314 | 313,557 | 28.1 | |||||||||
CSR Ltd. | 29,983 | 128,405 | 11.5 | |||||||||
Deterra Royalties Ltd. | 145,091 | 491,523 | 44.0 | |||||||||
Domain Holdings Australia Ltd. | 94,008 | 228,941 | 20.5 | |||||||||
Domino’s Pizza Enterprises Ltd. | 2,035 | 106,677 | 9.5 | |||||||||
Flight Centre Travel Group Ltd. | 10,184 | 159,042 | 14.2 | |||||||||
Glencore PLC | 50,333 | 310,135 | 27.7 | |||||||||
Goodman Group | 18,452 | 307,113 | 27.5 | |||||||||
Harvey Norman Holdings Ltd. | 38,861 | 138,425 | 12.4 | |||||||||
IDP Education Ltd. | 8,456 | 156,871 | 14.0 | |||||||||
IGO Ltd. | 57,612 | 523,829 | 46.9 | |||||||||
Iluka Resources Ltd. | 17,527 | 137,287 | 12.3 | |||||||||
Insignia Financial Ltd. | 48,829 | 117,377 | 10.5 | |||||||||
Macquarie Group Ltd. | 840 | 120,929 | 10.8 | |||||||||
Magellan Financial Group Ltd. | 24,241 | 274,239 | 24.5 | |||||||||
Medibank Pvt Ltd. | 68,492 | 153,911 | 13.8 | |||||||||
Mirvac Group | 1,151 | 1,945 | 0.2 | |||||||||
Origin Energy Ltd. | 34,012 | 162,684 | 14.6 | |||||||||
Orora Ltd. | 5,485 | 15,371 | 1.4 | |||||||||
OZ Minerals Ltd. | 22,485 | 390,293 | 34.9 | |||||||||
Pilbara Minerals Ltd. | 98,463 | 190,988 | 17.1 | |||||||||
Pro Medicus Ltd. | 9,648 | 315,526 | 28.2 | |||||||||
Qube Holdings Ltd. | 145,524 | 300,718 | 26.9 | |||||||||
REA Group Ltd. | 2,434 | 218,057 | 19.5 | |||||||||
Scentre Group | 70,862 | 147,642 | 13.2 | |||||||||
SEEK Ltd. | 1,949 | 38,191 | 3.4 | |||||||||
South32 Ltd. | 3,073 | 10,357 | 0.9 | |||||||||
Star Entertainment Grp Ltd. | 102,956 | 227,397 | 20.3 | |||||||||
Telstra Corp. Ltd. | 83,148 | 236,028 | 21.1 | |||||||||
| Security | Shares | Value | % of Basket Value | |||||||||
| Australia (continued) | ||||||||||||
Wesfarmers Ltd. | 11,355 | $ | 392,918 | 35.2 | % | |||||||
WiseTech Global Ltd. | 7,544 | 233,885 | 20.9 | |||||||||
Woodside Petroleum Ltd. | 6,758 | 147,028 | 13.2 | |||||||||
|
|
|
| |||||||||
| 8,325,918 | ||||||||||||
| Austria | ||||||||||||
ANDRITZ AG | 5,227 | 222,205 | 19.9 | |||||||||
Erste Group Bank AG | 12,940 | 402,897 | 36.1 | |||||||||
Raiffeisen Bank International AG | 15,918 | 181,200 | 16.2 | |||||||||
|
|
|
| |||||||||
| 806,302 | ||||||||||||
| Belgium | ||||||||||||
Ackermans & van Haaren NV | 905 | 161,340 | 14.4 | |||||||||
Groupe Bruxelles Lambert SA | 1,007 | 95,021 | 8.5 | |||||||||
KBC Group NV | 2,784 | 189,401 | 17.0 | |||||||||
Proximus SADP | 36,914 | 645,194 | 57.7 | |||||||||
Telenet Group Holding NV | 10,790 | 321,568 | 28.8 | |||||||||
Umicore SA | 9,479 | 364,405 | 32.6 | |||||||||
Warehouses De Pauw CVA | 7,671 | 295,105 | 26.4 | |||||||||
|
|
|
| |||||||||
| 2,072,034 | ||||||||||||
| Bermuda | ||||||||||||
Hiscox Ltd. | 43,959 | 521,981 | 46.7 | |||||||||
|
|
|
| |||||||||
| Canada | ||||||||||||
Air Canada | 64,473 | 1,129,212 | 101.0 | |||||||||
Alamos Gold Inc., Class A | 14,226 | 110,517 | 9.9 | |||||||||
ARC Resources Ltd. | 6,563 | 90,988 | 8.1 | |||||||||
Aritzia Inc. | 5,424 | 193,164 | 17.3 | |||||||||
Bank of Nova Scotia | 3,914 | 247,853 | 22.2 | |||||||||
Baytex Energy Corp. | 76,920 | 393,387 | 35.2 | |||||||||
BCE, Inc. | 19,065 | �� | 1,013,614 | 90.7 | ||||||||
BRP, Inc. | 1,724 | 139,662 | 12.5 | |||||||||
CAE, Inc. | 56,214 | 1,336,814 | 119.6 | |||||||||
Canadian Utilities Ltd., Class A | 13,440 | 404,042 | 36.1 | |||||||||
Cargojet, Inc. | 666 | 77,811 | 7.0 | |||||||||
Cenovus Energy Inc. | 3,297 | 60,953 | 5.4 | |||||||||
CGI, Inc. | 21,655 | 1,726,804 | 154.5 | |||||||||
CI Financial Corp. | 19,798 | 258,138 | 23.1 | |||||||||
Descartes Systems Group Inc. | 370 | 22,981 | 2.1 | |||||||||
Enbridge, Inc. | 26,635 | 1,162,307 | 104.0 | |||||||||
Equinox Gold Corp. | 9,736 | 69,421 | 6.2 | |||||||||
First Majestic Silver Corp. | 34,762 | 359,080 | 32.1 | |||||||||
Franco-Nevada Corp. | 2,087 | 315,621 | 28.2 | |||||||||
GFL Environmental, Inc. | 718 | 21,630 | 1.9 | |||||||||
Hydro One Ltd. | 19,200 | 519,064 | 46.4 | |||||||||
IGM Financial, Inc. | 9,295 | 294,554 | 26.4 | |||||||||
Imperial Oil Ltd. | 6,347 | 319,561 | 28.6 | |||||||||
Innergex Renewable Energy Inc. | 35,322 | 472,921 | 42.3 | |||||||||
Ivanhoe Mines Ltd., Class A | 36,685 | 294,131 | 26.3 | |||||||||
Kinaxis, Inc. | 131 | 14,496 | 1.3 | |||||||||
Lundin Mining Corp. | 634 | 5,789 | 0.5 | |||||||||
Nutrien Ltd. | 205 | 20,145 | 1.8 | |||||||||
Osisko Gold Royalties Ltd. | 15,153 | 186,486 | 16.7 | |||||||||
Parex Resources, Inc. | 19,164 | 373,539 | 33.4 | |||||||||
Pembina Pipeline Corp. | 2,592 | 98,079 | 8.8 | |||||||||
Shopify, Inc., Class A | 652 | 278,904 | 25.0 | |||||||||
Stantec, Inc. | 5,640 | 258,896 | 23.2 | |||||||||
TC Energy Corp. | 33,068 | 1,749,092 | 156.5 | |||||||||
Teck Resources Ltd., Class B | 1,587 | 62,608 | 5.6 | |||||||||
TELUS Corp. | 51,686 | 1,293,106 | 115.7 | |||||||||
| 106 | 2 0 2 2 BLACK ROCK ANNUAL REPORT TO SHAREHOLDERS |
Schedule of Investments (continued) April 30, 2022 | BlackRock Global Long/Short Equity Fund |
| Security | Shares | Value | % of Basket Value | |||||||||
| Canada (continued) | ||||||||||||
TFI International, Inc. | 5,106 | $ | 410,738 | 36.7 | % | |||||||
Vermilion Energy Inc. | 495 | 9,644 | 0.9 | |||||||||
Wheaton Precious Metals Corp. | 1,299 | 58,223 | 5.2 | |||||||||
Whitecap Resources, Inc. | 51,443 | 421,667 | 37.7 | |||||||||
WSP Global, Inc. | 689 | 80,353 | 7.2 | |||||||||
Yamana Gold, Inc. | 41,429 | 228,647 | 20.5 | |||||||||
|
|
|
| |||||||||
| 16,584,642 | ||||||||||||
| China | ||||||||||||
Budweiser Brewing Co. APAC Ltd. | 205,600 | 511,573 | 45.8 | |||||||||
Chow Tai Fook Jewellery Group Ltd. | 18,200 | 30,517 | 2.7 | |||||||||
|
|
|
| |||||||||
| 542,090 | ||||||||||||
| Denmark | ||||||||||||
Coloplast A/S, Class B | 1,774 | 239,009 | 21.4 | |||||||||
Genmab A/S | 1,057 | 371,685 | 33.3 | |||||||||
GN Store Nord A/S | 6,075 | 227,992 | 20.4 | |||||||||
H Lundbeck A/S | 19,822 | 454,283 | 40.6 | |||||||||
ISS A/S | 880 | 14,444 | 1.3 | |||||||||
Jyske Bank A/S | 4,331 | 239,479 | 21.4 | |||||||||
Novo Nordisk A/S, Class B | 1,674 | 191,215 | 17.1 | |||||||||
SimCorp A/S | 4,196 | 293,748 | 26.3 | |||||||||
Tryg A/S | 38,653 | 919,056 | 82.2 | |||||||||
|
|
|
| |||||||||
| 2,950,911 | ||||||||||||
| Finland | ||||||||||||
Kesko OYJ, B Shares | 2,797 | 70,418 | 6.3 | |||||||||
Nokia OYJ | 58,921 | 298,734 | 26.7 | |||||||||
Nokian Renkaat OYJ | 33,798 | 453,859 | 40.6 | |||||||||
Nordea Bank Abp | 110,941 | 1,106,090 | 99.0 | |||||||||
Outokumpu OYJ | 77,931 | 382,583 | 34.2 | |||||||||
Valmet OYJ | 18,962 | 507,817 | 45.4 | |||||||||
Wartsila OYJ Abp | 93,587 | 751,489 | 67.3 | |||||||||
|
|
|
| |||||||||
| 3,570,990 | ||||||||||||
| France | ||||||||||||
Accor SA | 24,474 | 804,059 | 71.9 | |||||||||
ALD SA | 1,236 | 16,807 | 1.5 | |||||||||
Arkema SA | 2,543 | 289,760 | 25.9 | |||||||||
Atos SE | 7,411 | 180,544 | 16.2 | |||||||||
AXA SA | 13,288 | 351,534 | 31.5 | |||||||||
Bouygues SA | 6,027 | 208,866 | 18.7 | |||||||||
Carrefour SA | 3,292 | 69,815 | 6.3 | |||||||||
Cie Plastic Omnium SA | 23,846 | 386,013 | 34.5 | |||||||||
Covivio | 8,979 | 639,463 | 57.2 | |||||||||
Dassault Aviation SA | 4,423 | 742,202 | 66.4 | |||||||||
Dassault Systemes SE | 3,467 | 153,326 | 13.7 | |||||||||
Edenred | 2,656 | 133,390 | 11.9 | |||||||||
Engie SA | 55,532 | 655,304 | 58.6 | |||||||||
Eurazeo SE | 3,287 | 252,570 | 22.6 | |||||||||
Hermes International | 100 | 123,306 | 11.0 | |||||||||
ICADE | 13,068 | 780,236 | 69.8 | |||||||||
Klepierre SA | 13,349 | 319,517 | 28.6 | |||||||||
Legrand SA | 2,529 | 224,105 | 20.1 | |||||||||
Orange SA | 22,958 | 273,324 | 24.5 | |||||||||
Publicis Groupe SA | 10,311 | 619,038 | 55.4 | |||||||||
Remy Cointreau SA | 495 | 98,126 | 8.8 | |||||||||
SCOR SE | 2,548 | 72,042 | 6.4 | |||||||||
Societe Generale SA | 752 | 18,381 | 1.6 | |||||||||
Thales SA | 11,557 | 1,479,584 | 132.4 | |||||||||
| Security | Shares | Value | % of Basket Value | |||||||||
| France (continued) | ||||||||||||
TotalEnergies SE | 16,510 | $ | 810,690 | 72.5 | % | |||||||
Vinci SA | 6,540 | 634,601 | 56.8 | |||||||||
|
|
|
| |||||||||
| 10,336,603 | ||||||||||||
| Germany | ||||||||||||
1&1 AG | 18,186 | 383,238 | 34.3 | |||||||||
Bayerische Motoren Werke AG | 23,612 | 1,928,292 | 172.5 | |||||||||
Beiersdorf AG | 5,581 | 560,559 | 50.1 | |||||||||
Capital Stage AG | 3,634 | 79,333 | 7.1 | |||||||||
Commerzbank AG | 223,994 | 1,462,306 | 130.8 | |||||||||
Covestro AG | 4,124 | 177,561 | 15.9 | |||||||||
CTS Eventim AG & Co. KGaA | 6,165 | 423,141 | 37.9 | |||||||||
Daimler AG | 1,352 | 94,371 | 8.4 | |||||||||
Deutsche Bank AG | 32,022 | 320,198 | 28.6 | |||||||||
E.ON SE | 45,431 | 472,799 | 42.3 | |||||||||
Fraport AG Frankfurt Airport Services Worldwide | 236 | 12,787 | 1.1 | |||||||||
Freenet AG | 8,916 | 246,690 | 22.1 | |||||||||
Hella GmbH & Co. KGaA | 961 | 60,670 | 5.4 | |||||||||
HelloFresh SE | 5,523 | 236,439 | 21.1 | |||||||||
Hochtief AG | 194 | 11,899 | 1.1 | |||||||||
K+S AG | 943 | 32,023 | 2.9 | |||||||||
LANXESS AG | 940 | 36,337 | 3.2 | |||||||||
LEG Immobilien SE | 8,219 | 842,698 | 75.4 | |||||||||
Merck KGaA | 374 | 69,387 | 6.2 | |||||||||
METRO AG | 20,240 | 177,787 | 15.9 | |||||||||
MTU Aero Engines AG | 2,897 | 584,225 | 52.3 | |||||||||
Nemetschek SE | 6,548 | 519,612 | 46.5 | |||||||||
Nordex SE | 5,012 | 72,334 | 6.5 | |||||||||
ProSiebenSat.1 Media SE | 27,650 | 318,135 | 28.5 | |||||||||
Rational AG | 445 | 271,470 | 24.3 | |||||||||
Rheinmetall AG | 6,305 | 1,421,299 | 127.2 | |||||||||
Rwe AG | 17,084 | 709,317 | 63.5 | |||||||||
Salzgitter AG | 10,389 | 431,242 | 38.6 | |||||||||
Siemens AG | 14,552 | 1,789,241 | 160.1 | |||||||||
TAG Immobilien AG | 15,829 | 316,350 | 28.3 | |||||||||
Talanx AG | 10,933 | 454,590 | 40.7 | |||||||||
TeamViewer AG | 5,212 | 62,539 | 5.6 | |||||||||
thyssenkrupp AG | 14,247 | 109,261 | 9.8 | |||||||||
Traton SE | 8,900 | 148,322 | 13.3 | |||||||||
TUI AG | 25,163 | 71,740 | 6.4 | |||||||||
|
|
|
| |||||||||
| 14,908,192 | ||||||||||||
| Hong Kong | ||||||||||||
ASM Pacific Technology Ltd. | 13,600 | 137,058 | 12.3 | |||||||||
Bank of East Asia Ltd. | 76,000 | 112,459 | 10.1 | |||||||||
Cafe de Coral Holdings Ltd. | 26,000 | 40,819 | 3.7 | |||||||||
Cathay Pacific Airways Ltd. | 52,000 | 51,955 | 4.7 | |||||||||
Dah Sing Banking Group Ltd. | 254,400 | 213,794 | 19.1 | |||||||||
Dah Sing Financial Holdings Ltd. | 90,800 | 264,221 | 23.6 | |||||||||
Dairy Farm International Holdings Ltd. | 67,600 | 182,577 | 16.3 | |||||||||
First Pacific Co. Ltd/Hong Kong | 262,000 | 105,640 | 9.5 | |||||||||
Haitong International Securities Group Ltd. | 96,000 | 15,197 | 1.4 | |||||||||
Hang Lung Group Ltd. | 49,000 | 95,672 | 8.6 | |||||||||
Hang Lung Properties Ltd. | 51,000 | 97,541 | 8.7 | |||||||||
HK Electric Investments & HK Electric Investments Ltd., Class SS | 333,000 | 328,884 | 29.4 | |||||||||
Hutchison Port Holdings Trust, Class U | 433,000 | 103,208 | 9.2 | |||||||||
Hutchison Telecommunications Hong Kong Holdings Ltd. | 66,000 | 11,018 | 1.0 | |||||||||
Hysan Development Co. Ltd. | 94,000 | 277,316 | 24.8 | |||||||||
Kerry Properties Ltd. | 93,500 | 252,836 | 22.6 | |||||||||
SCHEDULE OF INVESTMENTS | 107 |
Schedule of Investments (continued) April 30, 2022 | BlackRock Global Long/Short Equity Fund |
| Security | Shares | Value | % of Basket Value | |||||||||
| Hong Kong (continued) | ||||||||||||
Link REIT | 76,000 | $ | 656,471 | 58.7 | % | |||||||
New World Development Co. Ltd. | 76,000 | 290,684 | 26.0 | |||||||||
Pacific Basin Shipping Ltd. | 261,000 | 119,750 | 10.7 | |||||||||
Shangri-La Asia Ltd. | 130,000 | 98,428 | 8.8 | |||||||||
Shun Tak Holdings Ltd. | 970,000 | 196,502 | 17.6 | |||||||||
SITC International Holdings Co. Ltd. | 5,000 | 16,622 | 1.5 | |||||||||
SJM Holdings Ltd. | 365,000 | 153,323 | 13.7 | |||||||||
Sun Hung Kai Properties Ltd. | 51,000 | 587,371 | 52.6 | |||||||||
Swire Pacific Ltd., Class A | 153,500 | 874,322 | 78.2 | |||||||||
WH Group Ltd. | 99,500 | 68,715 | 6.1 | |||||||||
Wharf Real Estate Investment Co. Ltd. | 52,000 | 245,054 | 21.9 | |||||||||
Yue Yuen Industrial Holdings Ltd. | 57,000 | 83,840 | 7.5 | |||||||||
|
|
|
| |||||||||
| 5,681,277 | ||||||||||||
| Ireland | ||||||||||||
Experian PLC | 53,014 | 1,830,804 | 163.8 | |||||||||
Glanbia PLC | 9,014 | 108,216 | 9.7 | |||||||||
Kingspan Group PLC | 4,849 | 451,379 | 40.4 | |||||||||
|
|
|
| |||||||||
| 2,390,399 | ||||||||||||
| Israel | ||||||||||||
Airport City Ltd. | 3,433 | 76,428 | 6.8 | |||||||||
Alony Hetz Properties & Investments Ltd. | 10,043 | 164,367 | 14.7 | |||||||||
Amot Investments Ltd. | 8,050 | 61,106 | 5.5 | |||||||||
Bayside Land Corp. | 18,706 | 205,884 | 18.4 | |||||||||
Bezeq The Israeli Telecommunication Corp. Ltd. | 9,426 | 14,943 | 1.3 | |||||||||
Big Shopping Centers Ltd. | 812 | 122,708 | 11.0 | |||||||||
Elbit Systems Ltd. | 2,458 | 533,553 | 47.7 | |||||||||
Harel Insurance Investments & Financial Services Ltd. | 128 | 1,569 | 0.1 | |||||||||
Israel Corp. Ltd. | 503 | 282,619 | 25.3 | |||||||||
Melisron Ltd. | 3,610 | 292,832 | 26.2 | |||||||||
Nice Ltd. | 132 | 27,447 | 2.5 | |||||||||
OPC Energy Ltd. | 10,236 | 112,590 | 10.1 | |||||||||
Paz Oil Co. Ltd. | 1,273 | 197,295 | 17.7 | |||||||||
Phoenix Holdings Ltd. | 15,401 | 193,751 | 17.3 | |||||||||
|
|
|
| |||||||||
| 2,287,092 | ||||||||||||
| Italy | ||||||||||||
A2A SpA | 68,419 | 116,898 | 10.4 | |||||||||
Amplifon SpA | 11,209 | 447,181 | 40.0 | |||||||||
Azimut Holding SpA | 11,253 | 238,855 | 21.4 | |||||||||
Banca Generali SpA | 3,032 | 100,241 | 9.0 | |||||||||
Banca Mediolanum SpA | 44,135 | 320,391 | 28.7 | |||||||||
Buzzi Unicem SpA | 6,311 | 116,871 | 10.4 | |||||||||
De’ Longhi SpA | 2,398 | 58,151 | 5.2 | |||||||||
Enel SpA | 190,216 | 1,236,954 | 110.7 | |||||||||
Ferrari NV | 692 | 145,704 | 13.0 | |||||||||
Italgas SpA | 58,098 | 376,165 | 33.6 | |||||||||
Leonardo SpA | 30,590 | 314,814 | 28.2 | |||||||||
Mediobanca Banca di Credito Finanziario SpA | 75,811 | 759,842 | 68.0 | |||||||||
Moncler SpA | 7,834 | 408,102 | 36.5 | |||||||||
Reply SpA | 1,063 | 156,492 | 14.0 | |||||||||
UniCredit SpA | 71,597 | 662,636 | 59.3 | |||||||||
UnipolSai Assicurazioni SpA | 188,702 | 530,788 | 47.5 | |||||||||
|
|
|
| |||||||||
| 5,990,085 | ||||||||||||
| Japan | ||||||||||||
ABC-Mart, Inc. | 4,700 | 194,909 | 17.4 | |||||||||
Acom Co. Ltd. | 262,500 | 675,077 | 60.4 | |||||||||
AEON Financial Service Co. Ltd. | 62,300 | 572,749 | 51.2 | |||||||||
Aica Kogyo Co. Ltd. | 6,700 | 155,093 | 13.9 | |||||||||
| Security | Shares | Value | % of Basket Value | |||||||||
| Japan (continued) | ||||||||||||
Alfresa Holdings Corp. | 20,900 | $ | 284,213 | 25.4 | % | |||||||
Amada Co. Ltd. | 33,400 | 259,350 | 23.2 | |||||||||
Amano Corp. | 20,300 | 390,799 | 35.0 | |||||||||
Anritsu Corp. | 10,900 | 137,062 | 12.3 | |||||||||
Aozora Bank Ltd. | 39,200 | 784,805 | 70.2 | |||||||||
Astellas Pharma, Inc. | 6,000 | 91,354 | 8.2 | |||||||||
Azbil Corp. | 10,300 | 312,729 | 28.0 | |||||||||
Bandai Namco Holdings, Inc. | 400 | 27,081 | 2.4 | |||||||||
Capcom Co. Ltd. | 12,600 | 332,477 | 29.7 | |||||||||
Chugai Pharmaceutical Co. Ltd. | 2,900 | 86,899 | 7.8 | |||||||||
Chugoku Bank Ltd. | 33,400 | 245,609 | 22.0 | |||||||||
Chugoku Electric Power Co., Inc. | 69,100 | 455,128 | 40.7 | |||||||||
Coca-Cola Bottlers Japan Holdings, Inc. | 34,500 | 386,761 | 34.6 | |||||||||
Cosmo Energy Holdings Co. Ltd. | 4,300 | 106,831 | 9.6 | |||||||||
Cosmos Pharmaceutical Corp. | 6,300 | 580,781 | 52.0 | |||||||||
Daifuku Co. Ltd. | 8,400 | 516,504 | 46.2 | |||||||||
Daito Trust Construction Co. Ltd. | 500 | 48,156 | 4.3 | |||||||||
Daiwa House Industry Co. Ltd. | 1,500 | 36,060 | 3.2 | |||||||||
Denso Corp. | 2,400 | 146,269 | 13.1 | |||||||||
Dentsu Group, Inc. | 700 | 25,229 | 2.3 | |||||||||
Disco Corp. | 500 | 122,375 | 10.9 | |||||||||
DMG Mori Co. Ltd. | 1,000 | 12,550 | 1.1 | |||||||||
Ebara Corp. | 2,600 | 119,411 | 10.7 | |||||||||
Electric Power Development Co. Ltd. | 15,800 | 216,504 | 19.4 | |||||||||
FP Corp. | 8,400 | 189,985 | 17.0 | |||||||||
Freee KK | 3,600 | 103,872 | 9.3 | |||||||||
Furukawa Electric Co. Ltd. | 16,100 | 261,449 | 23.4 | |||||||||
H.U. Group Holdings, Inc. | 2,900 | 64,619 | 5.8 | |||||||||
Hamamatsu Photonics KK | 9,900 | 442,957 | 39.6 | |||||||||
Hirose Electric Co. Ltd. | 2,500 | 317,185 | 28.4 | |||||||||
Hitachi Construction Machinery Co. Ltd. | 12,200 | 276,224 | 24.7 | |||||||||
Hoshizaki Corp. | 2,900 | 183,693 | 16.4 | |||||||||
Hoya Corp. | 4,200 | 416,817 | 37.3 | |||||||||
Information Services International-Dentsu Ltd. | 9,000 | 258,464 | 23.1 | |||||||||
Internet Initiative Japan, Inc. | 1,100 | 34,332 | 3.1 | |||||||||
ITOCHU Corp. | 15,100 | 455,733 | 40.8 | |||||||||
Itochu Techno-Solutions Corp. | 20,900 | 489,390 | 43.8 | |||||||||
Izumi Co. Ltd. | 22,700 | 493,354 | 44.1 | |||||||||
J Front Retailing Co. Ltd. | 18,500 | 138,632 | 12.4 | |||||||||
Japan Exchange Group, Inc. | 2,400 | 35,737 | 3.2 | |||||||||
Japan Post Bank Co. Ltd. | 2,600 | 19,615 | 1.8 | |||||||||
Japan Post Holdings Co. Ltd. | 5,800 | 40,669 | 3.6 | |||||||||
Japan Prime Realty Investment Corp. | 28 | 84,945 | 7.6 | |||||||||
Japan Tobacco, Inc. | 38,500 | 654,954 | 58.6 | |||||||||
JFE Holdings, Inc. | 1,300 | 15,897 | 1.4 | |||||||||
JGC Holdings Corp. | 1,100 | 12,448 | 1.1 | |||||||||
Kamigumi Co. Ltd. | 20,700 | 351,463 | 31.4 | |||||||||
Kandenko Co. Ltd. | 43,000 | 272,689 | 24.4 | |||||||||
Kao Corp. | 5,000 | 200,392 | 17.9 | |||||||||
Kawasaki Kisen Kaisha Ltd. | 3,500 | 182,987 | 16.4 | |||||||||
Keisei Electric Railway Co. Ltd. | 11,600 | 284,426 | 25.4 | |||||||||
Kewpie Corp. | 27,000 | 454,727 | 40.7 | |||||||||
Keyence Corp. | 600 | 241,203 | 21.6 | |||||||||
Kikkoman Corp. | 2,900 | 162,983 | 14.6 | |||||||||
Kintetsu Group Holdings Co. Ltd. | 3,800 | 108,951 | 9.7 | |||||||||
Koito Manufacturing Co. Ltd. | 5,800 | 212,828 | 19.0 | |||||||||
Kokuyo Co. Ltd. | 21,900 | 285,229 | 25.5 | |||||||||
Konami Holdings Corp. | 3,700 | 227,526 | 20.4 | |||||||||
Konica Minolta, Inc. | 2,800 | 9,745 | 0.9 | |||||||||
Kusuri no Aoki Holdings Co. Ltd. | 8,400 | 372,155 | 33.3 | |||||||||
Kyocera Corp. | 7,600 | 399,053 | 35.7 | |||||||||
| 108 | 2 0 2 2 BLACK ROCK ANNUAL REPORT TO SHAREHOLDERS |
Schedule of Investments (continued) April 30, 2022 | BlackRock Global Long/Short Equity Fund |
| Security | Shares | Value | % of Basket Value | |||||||||
| Japan (continued) | ||||||||||||
Kyowa Kirin Co. Ltd. | 1,100 | $ | 23,184 | 2.1 | % | |||||||
Kyudenko Corp. | 300 | 6,803 | 0.6 | |||||||||
Lasertec Corp. | 200 | 26,720 | 2.4 | |||||||||
Lion Corp. | 11,900 | 122,611 | 11.0 | |||||||||
Lixil Corp. | 20,900 | 367,596 | 32.9 | |||||||||
Mani Inc. | 11,500 | 131,330 | 11.8 | |||||||||
Marubeni Corp. | 33,400 | 364,582 | 32.6 | |||||||||
Maruwa Unyu Kikan Co. Ltd. | 30,700 | 358,423 | 32.1 | |||||||||
Mitsubishi Corp. | 32,900 | 1,104,635 | 98.8 | |||||||||
Mitsubishi HC Capital, Inc. | 100,700 | 453,097 | 40.5 | |||||||||
Mitsubishi Logistics Corp. | 10,400 | 239,694 | 21.4 | |||||||||
Mitsubishi Materials Corp. | 5,000 | 78,216 | 7.0 | |||||||||
Mitsui & Co. Ltd. | 17,500 | 423,776 | 37.9 | |||||||||
Mitsui Chemicals, Inc. | 26,200 | 598,615 | 53.6 | |||||||||
Mitsui Mining & Smelting Co. Ltd. | 7,900 | 199,757 | 17.9 | |||||||||
Mitsui OSK Lines Ltd. | 1,800 | 42,140 | 3.8 | |||||||||
Mizuho Financial Group, Inc. | 19,000 | 230,711 | 20.6 | |||||||||
MS&AD Insurance Group Holdings, Inc. | 6,700 | 199,441 | 17.8 | |||||||||
Nagoya Railroad Co. Ltd. | 17,800 | 285,888 | 25.6 | |||||||||
Nankai Electric Railway Co. Ltd. | 5,100 | 91,049 | 8.1 | |||||||||
Nichirei Corp. | 25,500 | 468,192 | 41.9 | |||||||||
Nihon Kohden Corp. | 8,100 | 194,449 | 17.4 | |||||||||
Nippon Steel Corp. | 24,100 | 382,674 | 34.2 | |||||||||
Nippon Telegraph & Telephone Corp. | 15,900 | 468,563 | 41.9 | |||||||||
Nippon Yusen KK | 500 | 36,072 | 3.2 | |||||||||
Nipro Corp. | 54,000 | 425,500 | 38.1 | |||||||||
Nissan Chemical Corp. | 9,100 | 480,686 | 43.0 | |||||||||
Nissin Foods Holdings Co. Ltd. | 8,200 | 570,413 | 51.0 | |||||||||
Nitori Holdings Co. Ltd. | 2,600 | 267,486 | 23.9 | |||||||||
NOK Corp. | 27,800 | 236,530 | 21.2 | |||||||||
Nomura Real Estate Holdings, Inc. | 6,900 | 168,124 | 15.0 | |||||||||
Nomura Research Institute Ltd. | 12,200 | 344,972 | 30.9 | |||||||||
NTT Data Corp. | 32,100 | 591,857 | 53.0 | |||||||||
Obayashi Corp. | 57,600 | 396,123 | 35.4 | |||||||||
OBIC Business Consultants Co. Ltd. | 2,900 | 104,231 | 9.3 | |||||||||
Obic Co. Ltd. | 1,000 | 147,739 | 13.2 | |||||||||
Olympus Corp. | 2,600 | 45,763 | 4.1 | |||||||||
Omron Corp. | 1,700 | 100,222 | 9.0 | |||||||||
Otsuka Corp. | 17,200 | 563,680 | 50.4 | |||||||||
PALTAC Corp. | 7,100 | 258,781 | 23.2 | |||||||||
Panasonic Corp. | 54,300 | 483,987 | 43.3 | |||||||||
Park24 Co. Ltd. | 7,600 | 108,228 | 9.7 | |||||||||
Penta-Ocean Construction Co. Ltd. | 43,700 | 213,823 | 19.1 | |||||||||
Pigeon Corp. | 25,700 | 438,314 | 39.2 | |||||||||
Pola Orbis Holdings, Inc. | 2,300 | 26,517 | 2.4 | |||||||||
Rakuten Group, Inc. | 9,100 | 63,972 | 5.7 | |||||||||
Recruit Holdings Co. Ltd. | 3,500 | 126,986 | 11.4 | |||||||||
Relo Group, Inc. | 100 | 1,429 | 0.1 | |||||||||
Resorttrust, Inc. | 32,900 | 553,494 | 49.5 | |||||||||
Rinnai Corp. | 10,600 | 677,546 | 60.6 | |||||||||
Ryohin Keikaku Co. Ltd. | 19,300 | 173,452 | 15.5 | |||||||||
Sankyu Inc. | 8,100 | 246,961 | 22.1 | |||||||||
Santen Pharmaceutical Co. Ltd. | 6,700 | 54,502 | 4.9 | |||||||||
Sawai Group Holdings Co. Ltd. | 7,200 | 241,522 | 21.6 | |||||||||
SBI Holdings, Inc. | 21,800 | 487,603 | 43.6 | |||||||||
SCSK Corp. | 10,500 | 166,932 | 14.9 | |||||||||
Sega Sammy Holdings, Inc. | 1,800 | 31,895 | 2.9 | |||||||||
Seino Holdings Co Ltd. | 35,300 | 288,364 | 25.8 | |||||||||
Sekisui House Ltd. | 25,100 | 435,935 | 39.0 | |||||||||
Sekisui House REIT, Inc. | 600 | 351,091 | 31.4 | |||||||||
| Security | Shares | Value | % of Basket Value | |||||||||
| Japan (continued) | ||||||||||||
SG Holdings Co. Ltd. | 13,200 | $ | 232,619 | 20.8 | % | |||||||
Shimizu Corp. | 99,900 | 523,839 | 46.9 | |||||||||
Shin-Etsu Chemical Co. Ltd. | 2,300 | 316,099 | 28.3 | |||||||||
Skylark Co. Ltd. | 29,700 | 352,411 | 31.5 | |||||||||
SMS Co. Ltd. | 6,200 | 145,506 | 13.0 | |||||||||
SoftBank Group Corp. | 3,500 | 143,956 | 12.9 | |||||||||
Sojitz Corp. | 2,800 | 42,695 | 3.8 | |||||||||
Sompo Holdings, Inc. | 1,200 | 48,852 | 4.4 | |||||||||
Sony Group Corp. | 8,900 | 768,079 | 68.7 | |||||||||
Sotetsu Holdings Inc. | 3,000 | 51,429 | 4.6 | |||||||||
Square Enix Holdings Co. Ltd. | 700 | 27,948 | 2.5 | |||||||||
Subaru Corp. | 5,600 | 84,978 | 7.6 | |||||||||
Sumitomo Chemical Co. Ltd. | 2,800 | 11,906 | 1.1 | |||||||||
Sumitomo Corp. | 13,200 | 208,872 | 18.7 | |||||||||
Sumitomo Dainippon Pharma Co. Ltd. | 6,300 | 56,118 | 5.0 | |||||||||
Sumitomo Forestry Co. Ltd. | 18,900 | 289,148 | 25.9 | |||||||||
Sumitomo Mitsui Trust Holdings, Inc. | 14,100 | 437,629 | 39.2 | |||||||||
Sumitomo Rubber Industries Ltd. | 36,000 | 312,040 | 27.9 | |||||||||
Sundrug Co. Ltd. | 35,900 | 835,827 | 74.8 | |||||||||
T&D Holdings, Inc. | 2,900 | 37,266 | 3.3 | |||||||||
Taiheiyo Cement Corp. | 38,100 | 616,442 | 55.2 | |||||||||
Takara Bio Inc. | 20,500 | 329,720 | 29.5 | |||||||||
Takashimaya Co. Ltd. | 67,300 | 613,860 | 54.9 | |||||||||
Takeda Pharmaceutical Co. Ltd. | 9,600 | 278,559 | 24.9 | |||||||||
TBS Holdings, Inc. | 7,200 | 94,483 | 8.5 | |||||||||
TIS, Inc. | 1,000 | 22,459 | 2.0 | |||||||||
Tokio Marine Holdings, Inc. | 12,300 | 665,045 | 59.5 | |||||||||
Tokyo Electron Ltd. | 600 | 253,168 | 22.7 | |||||||||
Tokyo Ohka Kogyo Co. Ltd. | 200 | 10,867 | 1.0 | |||||||||
Toray Industries, Inc. | 90,900 | 430,801 | 38.5 | |||||||||
Tosoh Corp. | 38,900 | 537,151 | 48.1 | |||||||||
Toyo Seikan Group Holdings Ltd. | 16,600 | 179,552 | 16.1 | |||||||||
Toyo Suisan Kaisha Ltd. | 14,200 | 438,444 | 39.2 | |||||||||
Toyota Tsusho Corp. | 22,200 | 797,584 | 71.4 | |||||||||
Trend Micro, Inc. | 2,200 | 122,665 | 11.0 | |||||||||
Tsumura & Co. | 11,900 | 292,797 | 26.2 | |||||||||
Tsuruha Holdings, Inc. | 2,800 | 143,103 | 12.8 | |||||||||
Unicharm Corp. | 800 | 27,834 | 2.5 | |||||||||
Welcia Holdings Co. Ltd. | 12,700 | 260,338 | 23.3 | |||||||||
Yakult Honsha Co. Ltd. | 3,000 | 155,342 | 13.9 | |||||||||
Yamada Holdings Co. Ltd. | 122,800 | 366,691 | 32.8 | |||||||||
Yamaguchi Financial Group, Inc. | 74,200 | 406,851 | 36.4 | |||||||||
Yaoko Co. Ltd. | 3,800 | 201,030 | 18.0 | |||||||||
Yokohama Rubber Co. Ltd. | 16,300 | 218,234 | 19.5 | |||||||||
Z Holdings Corp. | 15,200 | 59,673 | 5.3 | |||||||||
Zensho Holdings Co. Ltd. | 14,200 | 334,867 | 30.0 | |||||||||
ZOZO, Inc. | 11,400 | 238,687 | 21.4 | |||||||||
|
|
|
| |||||||||
| 45,876,435 | ||||||||||||
| Jordan | ||||||||||||
Hikma Pharmaceuticals PLC | 10,044 | 235,938 | 21.1 | |||||||||
|
|
|
| |||||||||
| Luxembourg | ||||||||||||
ArcelorMittal SA | 6,028 | 178,790 | 16.0 | |||||||||
Aroundtown SA | 119,766 | 602,247 | 53.9 | |||||||||
L’Occitane International SA | 31,750 | 99,522 | 8.9 | |||||||||
RTL Group SA | 6,043 | 314,221 | 28.1 | |||||||||
|
|
|
| |||||||||
| 1,194,780 | ||||||||||||
SCHEDULE OF INVESTMENTS | 109 |
Schedule of Investments (continued) April 30, 2022 | BlackRock Global Long/Short Equity Fund |
| Security | Shares | Value | % of Basket Value | |||||||||
| Macau | ||||||||||||
MGM China Holdings Ltd. | 380,000 | $ | 217,506 | 19.5 | % | |||||||
Wynn Macau Ltd. | 262,400 | 161,173 | 14.4 | |||||||||
|
|
|
| |||||||||
| 378,679 | ||||||||||||
| Netherlands | ||||||||||||
ASR Nederland NV | 566 | 25,724 | 2.3 | |||||||||
CTP NV | 4,327 | 61,265 | 5.5 | |||||||||
Heineken Holding NV | 1,884 | 147,069 | 13.2 | |||||||||
ING Groep NV | 45,530 | 431,361 | 38.6 | |||||||||
Koninklijke Ahold Delhaize NV | 694 | 20,470 | 1.8 | |||||||||
PostNL NV | 23,179 | 75,952 | 6.8 | |||||||||
QIAGEN NV | 2,766 | 127,560 | 11.4 | |||||||||
Signify NV | 918 | 39,319 | 3.5 | |||||||||
Wolters Kluwer NV | 3,777 | 381,412 | 34.1 | |||||||||
|
|
|
| |||||||||
| 1,310,132 | ||||||||||||
| New Zealand | ||||||||||||
a2 Milk Co. Ltd. | 8,515 | 26,449 | 2.4 | |||||||||
Air New Zealand Ltd. | 103,158 | 58,545 | 5.2 | |||||||||
Contact Energy Ltd. | 83,136 | 436,764 | 39.1 | |||||||||
Fisher & Paykel Healthcare Corp. Ltd. | 10,925 | 150,133 | 13.4 | |||||||||
Infratil Ltd. | 75,229 | 407,112 | 36.4 | |||||||||
|
|
|
| |||||||||
| 1,079,003 | ||||||||||||
| Norway | ||||||||||||
Adevinta ASA | 13,099 | 101,195 | 9.1 | |||||||||
Equinor ASA | 1,252 | 42,317 | 3.8 | |||||||||
Golden Ocean Group Ltd. | 5,398 | 67,200 | 6.0 | |||||||||
NEL ASA | 21,406 | 30,420 | 2.7 | |||||||||
Nordic Semiconductor ASA | 2,153 | 42,804 | 3.8 | |||||||||
Norsk Hydro ASA | 29,497 | 247,702 | 22.2 | |||||||||
Schibsted ASA, Class A | 4,136 | 86,190 | 7.7 | |||||||||
Schibsted ASA, Class B | 2,117 | 40,966 | 3.7 | |||||||||
|
|
|
| |||||||||
| 658,794 | ||||||||||||
| Portugal | ||||||||||||
EDP - Energias de Portugal SA | 163,442 | 761,748 | 68.2 | |||||||||
Jeronimo Martins SGPS SA | 746 | 15,529 | 1.4 | |||||||||
|
|
|
| |||||||||
| 777,277 | ||||||||||||
| Singapore | ||||||||||||
Capitaland Investment Ltd. | 114,200 | 346,277 | 31.0 | |||||||||
ComfortDelGro Corp. Ltd. | 39,100 | 41,303 | 3.7 | |||||||||
Mapletree Commercial Trust | 436,800 | 587,462 | 52.6 | |||||||||
NetLink NBN Trust | 417,900 | 302,180 | 27.0 | |||||||||
Oversea-Chinese Banking Corp. Ltd. | 5,400 | 47,944 | 4.3 | |||||||||
SIA Engineering Co. Ltd. | 6,600 | 12,675 | 1.1 | |||||||||
StarHub Ltd. | 129,400 | 117,370 | 10.5 | |||||||||
United Overseas Bank Ltd. | 9,100 | 194,797 | 17.4 | |||||||||
Wing Tai Holdings Ltd. | 3,600 | 4,519 | 0.4 | |||||||||
|
|
|
| |||||||||
| 1,654,527 | ||||||||||||
| Spain | ||||||||||||
Iberdrola SA | 33,475 | 384,655 | 34.4 | |||||||||
Industria de Diseno Textil SA | 2,303 | 48,834 | 4.4 | |||||||||
Inmobiliaria Colonial Socimi SA | 41,078 | 341,579 | 30.6 | |||||||||
Merlin Properties Socimi SA | 41,100 | 446,496 | 39.9 | |||||||||
Naturgy Energy Group SA | 8,484 | 255,218 | 22.8 | |||||||||
Solaria Energia y Medio Ambiente SA | 1,645 | 36,504 | 3.3 | |||||||||
|
|
|
| |||||||||
| 1,513,286 | ||||||||||||
| Sweden | ||||||||||||
Boliden AB | 8,623 | 373,903 | 33.5 | |||||||||
Elekta AB, B Shares | 9,647 | 64,975 | 5.8 | |||||||||
| Security | Shares | Value | % of Basket Value | |||||||||
| Sweden (continued) | ||||||||||||
Epiroc AB, Class B | 10,675 | $ | 186,235 | 16.7 | % | |||||||
Essity AB, Class B | 21,160 | 558,010 | 49.9 | |||||||||
Hexagon AB, B Shares | 73,845 | 952,816 | 85.2 | |||||||||
Holmen AB, B Shares | 3,660 | 211,544 | 18.9 | |||||||||
Lifco AB, B Shares | 16,331 | 342,553 | 30.6 | |||||||||
Nibe Industrier AB, B Shares | 6,941 | 68,052 | 6.1 | |||||||||
Saab AB, Class B | 16,063 | 679,447 | 60.8 | |||||||||
Skanska AB, B Shares | 6,357 | 121,433 | 10.9 | |||||||||
SSAB AB, A Shares | 52,801 | 335,345 | 30.0 | |||||||||
Swedish Match AB | 131,061 | 1,043,872 | 93.4 | |||||||||
Tele2 AB, B Shares | 32,051 | 424,813 | 38.0 | |||||||||
Vitrolife AB | 727 | 18,694 | 1.7 | |||||||||
|
|
|
| |||||||||
| 5,381,692 | ||||||||||||
| Switzerland | ||||||||||||
Adecco Group AG | 2,918 | 112,605 | 10.1 | |||||||||
Chocoladefabriken Lindt & Spruengli AG, Registered Shares | 1 | 118,633 | 10.6 | |||||||||
SIG Combibloc Group AG | 4,874 | 102,040 | 9.1 | |||||||||
|
|
|
| |||||||||
| 333,278 | ||||||||||||
| United Kingdom | ||||||||||||
Abrdn PLC | 4,114 | 9,660 | 0.9 | |||||||||
Ashtead Group PLC | 6,401 | 330,978 | 29.6 | |||||||||
BAE Systems PLC | 23,564 | 217,653 | 19.5 | |||||||||
Barclays PLC | 366,934 | 674,476 | 60.3 | |||||||||
Barratt Developments PLC | 10,888 | 66,613 | 6.0 | |||||||||
Beazley PLC | 45,317 | 245,942 | 22.0 | |||||||||
British American Tobacco PLC | 2,746 | 115,091 | 10.3 | |||||||||
Centrica PLC | 119,907 | 118,803 | 10.6 | |||||||||
Croda International PLC | 2,553 | 247,964 | 22.2 | |||||||||
Dechra Pharmaceuticals PLC | 8,854 | 401,222 | 35.9 | |||||||||
Direct Line Insurance Group PLC | 265,753 | 843,468 | 75.5 | |||||||||
Drax Group PLC | 3,664 | 37,027 | 3.3 | |||||||||
easyJet PLC | 48,498 | 336,066 | 30.1 | |||||||||
Electrocomponents PLC | 14,118 | 184,275 | 16.5 | |||||||||
Halma PLC | 15,279 | 468,997 | 42.0 | |||||||||
Hargreaves Lansdown PLC | 129,759 | 1,485,526 | 132.9 | |||||||||
Imperial Brands PLC | 44,315 | 922,440 | 82.5 | |||||||||
Intertek Group PLC | 851 | 53,030 | 4.7 | |||||||||
Persimmon PLC | 773 | 20,132 | 1.8 | |||||||||
Phoenix Group Holdings PLC | 13,577 | 102,838 | 9.2 | |||||||||
Rolls-Royce Holdings PLC | 209,768 | 215,046 | 19.2 | |||||||||
Smiths Group PLC | 24,393 | 446,375 | 39.9 | |||||||||
SSE PLC | 40,686 | 944,966 | 84.6 | |||||||||
SSP Group PLC | 114,826 | 338,923 | 30.3 | |||||||||
Tate & Lyle PLC | 108,647 | 1,056,006 | 94.5 | |||||||||
THG PLC | 69,746 | 93,641 | 8.4 | |||||||||
Tritax Big Box REIT PLC | 348,150 | 1,062,786 | 95.1 | |||||||||
United Utilities Group PLC | 13,663 | 196,343 | 17.6 | |||||||||
Weir Group PLC | 2,986 | 57,404 | 5.1 | |||||||||
Whitbread PLC | 8,979 | 313,429 | 28.0 | |||||||||
|
|
|
| |||||||||
| 11,607,120 | ||||||||||||
| United States | ||||||||||||
Carnival PLC | 24,797 | 388,773 | 34.8 | |||||||||
Ovintiv Inc. | 18,552 | 949,515 | 84.9 | |||||||||
|
|
|
| |||||||||
| 1,338,288 | ||||||||||||
| 110 | 2 0 2 2 BLACK ROCK ANNUAL REPORT TO SHAREHOLDERS |
Schedule of Investments (continued) April 30, 2022 | BlackRock Global Long/Short Equity Fund |
| Security | Shares | Value | % of Basket Value | |||||||||
| United States (continued) | ||||||||||||
| Preferred Stocks | ||||||||||||
| Germany | ||||||||||||
Fuchs Petrolub SE, Preference Shares | 10,874 | $ | 342,979 | 30.7 | % | |||||||
Porsche Automobil Holding SE, Preference Shares | 1,096 | 90,398 | 8.1 | |||||||||
|
|
|
| |||||||||
| Warrants | ||||||||||||
| Australia | ||||||||||||
Magellan Financial Group Ltd. | 3,393 | 3,752 | 0.3 | |||||||||
|
|
|
| |||||||||
Total Reference Entity — Long | 150,744,874 | |||||||||||
|
| |||||||||||
Reference Entity — Short | ||||||||||||
| Common Stocks | ||||||||||||
| Australia | ||||||||||||
Appen Ltd. | (1,975 | ) | (9,021 | ) | (0.8 | ) | ||||||
BHP Group Ltd. | (10,163 | ) | (340,587 | ) | (30.5 | ) | ||||||
TPG Telecom Ltd. | (4,258 | ) | (17,455 | ) | (1.5 | ) | ||||||
|
|
|
| |||||||||
| (367,063 | ) | |||||||||||
| Austria | ||||||||||||
BAWAG Group AG | (5,200 | ) | (246,916 | ) | (22.1 | ) | ||||||
OMV AG | (8,148 | ) | (416,507 | ) | (37.2 | ) | ||||||
Telekom Austria AG | (7,470 | ) | (53,259 | ) | (4.8 | ) | ||||||
Verbund AG | (326 | ) | (34,846 | ) | (3.1 | ) | ||||||
|
|
|
| |||||||||
| (751,528 | ) | |||||||||||
| Belgium | ||||||||||||
Ageas SA | (3,881 | ) | (185,712 | ) | (16.6 | ) | ||||||
Anheuser-Busch InBev SA/NV | (5,013 | ) | (288,446 | ) | (25.8 | ) | ||||||
Etablissements Franz Colruyt NV | (2,210 | ) | (81,153 | ) | (7.3 | ) | ||||||
Galapagos NV | (1,604 | ) | (94,176 | ) | (8.4 | ) | ||||||
|
|
|
| |||||||||
| (649,487 | ) | |||||||||||
| Chile | ||||||||||||
Antofagasta PLC | (34,722 | ) | (664,715 | ) | (59.5 | ) | ||||||
|
|
|
| |||||||||
| Denmark | ||||||||||||
Ambu A/S, Class B | (2,090 | ) | (27,510 | ) | (2.5 | ) | ||||||
Carlsberg A/S, Class B | (6,465 | ) | (821,269 | ) | (73.5 | ) | ||||||
Chr Hansen Holding A/S | (2,072 | ) | (161,429 | ) | (14.4 | ) | ||||||
Novozymes A/S, B Shares | (2,169 | ) | (151,200 | ) | (13.5 | ) | ||||||
Pandora A/S | (1,160 | ) | (101,855 | ) | (9.1 | ) | ||||||
Rockwool International A/S, B Shares | (273 | ) | (76,353 | ) | (6.8 | ) | ||||||
Royal Unibrew A/S | (4,324 | ) | (372,690 | ) | (33.4 | ) | ||||||
Vestas Wind Systems A/S | (782 | ) | (19,942 | ) | (1.8 | ) | ||||||
|
|
|
| |||||||||
| (1,732,248 | ) | |||||||||||
| Finland | ||||||||||||
Elisa OYJ | (3,485 | ) | (204,296 | ) | (18.3 | ) | ||||||
Fortum OYJ | (44,787 | ) | (744,622 | ) | (66.6 | ) | ||||||
Huhtamaki OYJ | (36,999 | ) | (1,398,572 | ) | (125.1 | ) | ||||||
Kojamo OYJ | (18,598 | ) | (369,973 | ) | (33.1 | ) | ||||||
Kone OYJ, Class B | (4,494 | ) | (216,061 | ) | (19.3 | ) | ||||||
Neste OYJ | (1,064 | ) | (45,655 | ) | (4.1 | ) | ||||||
Orion OYJ, Class B | (7,201 | ) | (282,441 | ) | (25.3 | ) | ||||||
QT Group OYJ | (635 | ) | (55,325 | ) | (5.0 | ) | ||||||
Stora Enso OYJ, B Shares | (15,663 | ) | (308,240 | ) | (27.6 | ) | ||||||
UPM-Kymmene OYJ | (23,335 | ) | (807,211 | ) | (72.2 | ) | ||||||
|
|
|
| |||||||||
| (4,432,396 | ) | |||||||||||
| France | ||||||||||||
Airbus SE | (8,707 | ) | (953,171 | ) | (85.3 | ) | ||||||
| Security | Shares | Value | % of Basket Value | |||||||||
| France (continued) | ||||||||||||
BioMerieux | (2,974 | ) | $ | (283,130 | ) | (25.3 | )% | |||||
Bollore SA | (119,889 | ) | (559,453 | ) | (50.1 | ) | ||||||
Cie de Saint-Gobain | (624 | ) | (36,403 | ) | (3.3 | ) | ||||||
Cie Generale des Etablissements Michelin SCA | (10,756 | ) | (1,332,237 | ) | (119.2 | ) | ||||||
Credit Agricole SA | (13,673 | ) | (147,642 | ) | (13.2 | ) | ||||||
Danone SA | (15,417 | ) | (932,285 | ) | (83.4 | ) | ||||||
Eramet SA | (967 | ) | (128,884 | ) | (11.5 | ) | ||||||
EssilorLuxottica SA | (5,953 | ) | (1,013,485 | ) | (90.7 | ) | ||||||
Gaztransport Et Technigaz SA | (327 | ) | (38,939 | ) | (3.5 | ) | ||||||
Getlink SE | (4,539 | ) | (83,060 | ) | (7.4 | ) | ||||||
JCDecaux SA | (4,829 | ) | (101,231 | ) | (9.1 | ) | ||||||
L’Oreal SA | (2,392 | ) | (870,233 | ) | (77.9 | ) | ||||||
Pernod Ricard SA | (189 | ) | (39,007 | ) | (3.5 | ) | ||||||
Renault SA | (3,321 | ) | (81,144 | ) | (7.3 | ) | ||||||
Rexel SA | (7,980 | ) | (163,468 | ) | (14.6 | ) | ||||||
Sanofi | (2,761 | ) | (294,709 | ) | (26.4 | ) | ||||||
Sartorius Stedim Biotech | (1,351 | ) | (442,086 | ) | (39.5 | ) | ||||||
Schneider Electric SE | (14,011 | ) | (2,010,146 | ) | (179.8 | ) | ||||||
SEB SA | (1,069 | ) | (128,373 | ) | (11.5 | ) | ||||||
Sodexo SA | (6,260 | ) | (470,912 | ) | (42.1 | ) | ||||||
SOITEC | (4,603 | ) | (824,554 | ) | (73.8 | ) | ||||||
Unibail-Rodamco-Westfield | (6,040 | ) | (426,272 | ) | (38.1 | ) | ||||||
Vallourec SA | (4,314 | ) | (50,833 | ) | (4.5 | ) | ||||||
Veolia Environnement SA | (34,043 | ) | (993,258 | ) | (88.9 | ) | ||||||
Worldline SA | (16,595 | ) | (652,916 | ) | (58.4 | ) | ||||||
|
|
|
| |||||||||
| (13,057,831 | ) | |||||||||||
| Germany | ||||||||||||
Adidas AG | (5,671 | ) | (1,143,609 | ) | (102.3 | ) | ||||||
Aurubis AG | (1,573 | ) | (178,755 | ) | (16.0 | ) | ||||||
Auto1 Group SE | (30,025 | ) | (314,366 | ) | (28.1 | ) | ||||||
BASF SE | (17,700 | ) | (932,135 | ) | (83.4 | ) | ||||||
Bechtle AG | (6,627 | ) | (306,232 | ) | (27.4 | ) | ||||||
Carl Zeiss Meditec AG | (2,285 | ) | (287,006 | ) | (25.7 | ) | ||||||
Continental AG | (2,546 | ) | (174,506 | ) | (15.6 | ) | ||||||
Daimler Truck Holding AG | (21,310 | ) | (573,126 | ) | (51.3 | ) | ||||||
Delivery Hero SE | (10,428 | ) | (366,575 | ) | (32.8 | ) | ||||||
Deutsche Post AG | (14,812 | ) | (632,805 | ) | (56.6 | ) | ||||||
Deutsche Telekom AG | (127,718 | ) | (2,352,712 | ) | (210.5 | ) | ||||||
DWS Group GmbH & Co. KGaA | (481 | ) | (15,829 | ) | (1.4 | ) | ||||||
Evotec SE | (8,821 | ) | (214,778 | ) | (19.2 | ) | ||||||
Fielmann AG | (4,384 | ) | (221,620 | ) | (19.8 | ) | ||||||
Puma SE | (374 | ) | (27,518 | ) | (2.5 | ) | ||||||
Siemens Healthineers AG | (1,144 | ) | (61,170 | ) | (5.5 | ) | ||||||
Telefonica Deutschland Holding AG | (156,150 | ) | (469,626 | ) | (42.0 | ) | ||||||
Uniper SE | (17,957 | ) | (461,578 | ) | (41.3 | ) | ||||||
VERBIO Vereinigte BioEnergie AG | (3,057 | ) | (216,632 | ) | (19.4 | ) | ||||||
Volkswagen AG | (1,637 | ) | (355,002 | ) | (31.8 | ) | ||||||
Vonovia SE | (15,257 | ) | (607,854 | ) | (54.4 | ) | ||||||
Zalando SE | (4,557 | ) | (179,301 | ) | (16.0 | ) | ||||||
|
|
|
| |||||||||
| (10,092,735 | ) | |||||||||||
| Hong Kong | ||||||||||||
Champion REIT | (72,000 | ) | (31,563 | ) | (2.8 | ) | ||||||
ESR Cayman Ltd. | (225,400 | ) | (684,226 | ) | (61.2 | ) | ||||||
Hang Seng Bank Ltd. | (37,700 | ) | (667,496 | ) | (59.7 | ) | ||||||
Henderson Land Development Co. Ltd. | (53,000 | ) | (214,333 | ) | (19.2 | ) | ||||||
Hong Kong & China Gas Co. Ltd. | (308,000 | ) | (339,699 | ) | (30.4 | ) | ||||||
MTR Corp. Ltd. | (332,000 | ) | (1,763,951 | ) | (157.8 | ) | ||||||
|
|
|
| |||||||||
| (3,701,268 | ) | |||||||||||
SCHEDULE OF INVESTMENTS | 111 |
Schedule of Investments (continued) April 30, 2022 | BlackRock Global Long/Short Equity Fund |
| Security | Shares | Value | % of Basket Value | |||||||||
| Ireland | ||||||||||||
CRH PLC | (10,340 | ) | $ | (408,687 | ) | (36.6 | )% | |||||
DCC PLC | (7,367 | ) | (558,190 | ) | (49.9 | ) | ||||||
Smurfit Kappa Group PLC | (13,030 | ) | (550,592 | ) | (49.3 | ) | ||||||
|
|
|
| |||||||||
| (1,517,469 | ) | |||||||||||
| Isle of Man | ||||||||||||
GVC Holdings PLC | (3,452 | ) | (64,864 | ) | (5.8 | ) | ||||||
|
|
|
| |||||||||
| Italy | ||||||||||||
Banco BPM SpA | (53,948 | ) | (169,974 | ) | (15.2 | ) | ||||||
Eni SpA | (16,326 | ) | (228,218 | ) | (20.4 | ) | ||||||
FinecoBank Banca Fineco SpA | (19,055 | ) | (264,890 | ) | (23.7 | ) | ||||||
Intesa Sanpaolo SpA | (261,160 | ) | (532,170 | ) | (47.6 | ) | ||||||
Pirelli & C SpA | (10,290 | ) | (50,997 | ) | (4.6 | ) | ||||||
Poste Italiane SpA | (48,759 | ) | (477,796 | ) | (42.8 | ) | ||||||
Snam SpA | (77,518 | ) | (425,155 | ) | (38.0 | ) | ||||||
Terna Rete Elettrica Nazionale SpA | (7,858 | ) | (64,091 | ) | (5.7 | ) | ||||||
Unipol Gruppo SpA | (25,831 | ) | (140,847 | ) | (12.6 | ) | ||||||
|
|
|
| |||||||||
| (2,354,138 | ) | |||||||||||
| Japan | ||||||||||||
Advance Residence Investment Corp. | (192 | ) | (527,436 | ) | (47.2 | ) | ||||||
Aeon Co. Ltd. | (23,900 | ) | (454,226 | ) | (40.6 | ) | ||||||
AEON REIT Investment Corp. | (626 | ) | (718,719 | ) | (64.3 | ) | ||||||
AGC, Inc. | (2,200 | ) | (82,477 | ) | (7.4 | ) | ||||||
Air Water, Inc. | (30,400 | ) | (403,496 | ) | (36.1 | ) | ||||||
Aisin Corp. | (12,700 | ) | (368,942 | ) | (33.0 | ) | ||||||
ANA Holdings, Inc. | (27,000 | ) | (508,968 | ) | (45.5 | ) | ||||||
Ariake Japan Co. Ltd. | (4,800 | ) | (192,582 | ) | (17.2 | ) | ||||||
Asahi Intecc Co. Ltd. | (22,900 | ) | (442,518 | ) | (39.6 | ) | ||||||
Asics Corp. | (19,100 | ) | (301,336 | ) | (27.0 | ) | ||||||
ASKUL Corp. | (24,600 | ) | (301,241 | ) | (27.0 | ) | ||||||
BayCurrent Consulting, Inc. | (200 | ) | (65,573 | ) | (5.9 | ) | ||||||
Benefit One, Inc. | (24,300 | ) | (368,447 | ) | (33.0 | ) | ||||||
Bic Camera, Inc. | (6,500 | ) | (54,863 | ) | (4.9 | ) | ||||||
Bridgestone Corp. | (11,200 | ) | (410,521 | ) | (36.7 | ) | ||||||
Brother Industries Ltd. | (38,400 | ) | (667,376 | ) | (59.7 | ) | ||||||
Canon Marketing Japan, Inc. | (5,300 | ) | (115,327 | ) | (10.3 | ) | ||||||
Canon, Inc. | (4,500 | ) | (103,541 | ) | (9.3 | ) | ||||||
Chiba Bank Ltd. | (23,200 | ) | (133,708 | ) | (12.0 | ) | ||||||
Credit Saison Co. Ltd. | (29,100 | ) | (327,766 | ) | (29.3 | ) | ||||||
CyberAgent, Inc. | (28,200 | ) | (297,929 | ) | (26.7 | ) | ||||||
Dai Nippon Printing Co. Ltd. | (25,700 | ) | (537,079 | ) | (48.1 | ) | ||||||
Daicel Corp. | (121,100 | ) | (740,283 | ) | (66.2 | ) | ||||||
Daido Steel Co. Ltd. | (4,300 | ) | (122,657 | ) | (11.0 | ) | ||||||
Daiichikosho Co. Ltd. | (5,700 | ) | (155,468 | ) | (13.9 | ) | ||||||
Daio Paper Corp. | (15,200 | ) | (181,250 | ) | (16.2 | ) | ||||||
Daiwa House REIT Investment Corp. | (225 | ) | (547,650 | ) | (49.0 | ) | ||||||
Daiwa Office Investment Corp. | (116 | ) | (656,706 | ) | (58.8 | ) | ||||||
Daiwa Securities Group, Inc. | (47,700 | ) | (233,784 | ) | (20.9 | ) | ||||||
DeNA Co. Ltd. | (12,500 | ) | (181,176 | ) | (16.2 | ) | ||||||
Denka Co. Ltd. | (17,900 | ) | (479,863 | ) | (42.9 | ) | ||||||
Descente Ltd. | (1,800 | ) | (34,568 | ) | (3.1 | ) | ||||||
DIC Corp. | (8,100 | ) | (154,457 | ) | (13.8 | ) | ||||||
Dowa Holdings Co. Ltd. | (4,100 | ) | (174,417 | ) | (15.6 | ) | ||||||
Ezaki Glico Co. Ltd. | (10,200 | ) | (292,420 | ) | (26.2 | ) | ||||||
Fancl Corp. | (7,000 | ) | (134,001 | ) | (12.0 | ) | ||||||
FANUC Corp. | (400 | ) | (61,291 | ) | (5.5 | ) | ||||||
Fast Retailing Co. Ltd. | (1,700 | ) | (782,690 | ) | (70.0 | ) | ||||||
Fuji Electric Co. Ltd. | (18,200 | ) | (798,083 | ) | (71.4 | ) | ||||||
Fuji Media Holdings, Inc. | (14,000 | ) | (120,915 | ) | (10.8 | ) | ||||||
Fuji Oil Holdings, Inc. | (24,600 | ) | (349,119 | ) | (31.2 | ) | ||||||
| Security | Shares | Value | % of Basket Value | |||||||||
| Japan (continued) | ||||||||||||
Fukuoka Financial Group, Inc. | (37,700 | ) | $ | (688,827 | ) | (61.6 | )% | |||||
Fukuyama Transporting Co. Ltd. | (8,400 | ) | (235,113 | ) | (21.0 | ) | ||||||
GLP J-REIT | (293 | ) | (395,367 | ) | (35.4 | ) | ||||||
GMO internet, Inc. | (17,500 | ) | (349,741 | ) | (31.3 | ) | ||||||
Goldwin, Inc. | (6,500 | ) | (326,024 | ) | (29.2 | ) | ||||||
GS Yuasa Corp. | (33,900 | ) | (587,838 | ) | (52.6 | ) | ||||||
Hachijuni Bank Ltd. | (48,600 | ) | (160,270 | ) | (14.3 | ) | ||||||
Hakuhodo DY Holdings, Inc. | (14,300 | ) | (168,762 | ) | (15.1 | ) | ||||||
Haseko Corp. | (82,500 | ) | (903,955 | ) | (80.9 | ) | ||||||
Heiwa Corp. | (22,400 | ) | (336,797 | ) | (30.1 | ) | ||||||
Hikari Tsushin, Inc. | (2,500 | ) | (292,733 | ) | (26.2 | ) | ||||||
Hino Motors Ltd. | (83,900 | ) | (433,091 | ) | (38.7 | ) | ||||||
Hitachi Ltd. | (7,100 | ) | (336,728 | ) | (30.1 | ) | ||||||
Hitachi Metals Ltd. | (38,300 | ) | (597,659 | ) | (53.5 | ) | ||||||
Hitachi Transport System Ltd. | (4,300 | ) | (282,250 | ) | (25.3 | ) | ||||||
Horiba Ltd. | (5,600 | ) | (272,459 | ) | (24.4 | ) | ||||||
House Foods Group, Inc. | (60,500 | ) | (1,415,962 | ) | (126.7 | ) | ||||||
Ibiden Co. Ltd. | (10,200 | ) | (381,193 | ) | (34.1 | ) | ||||||
Idemitsu Kosan Co. Ltd. | (20,700 | ) | (545,550 | ) | (48.8 | ) | ||||||
Iida Group Holdings Co. Ltd. | (5,800 | ) | (92,247 | ) | (8.3 | ) | ||||||
Industrial & Infrastructure Fund Investment Corp. | (302 | ) | (433,335 | ) | (38.8 | ) | ||||||
Isetan Mitsukoshi Holdings Ltd. | (85,700 | ) | (636,029 | ) | (56.9 | ) | ||||||
Isuzu Motors Ltd. | (42,800 | ) | (499,295 | ) | (44.7 | ) | ||||||
Ito En Ltd. | (8,800 | ) | (361,641 | ) | (32.4 | ) | ||||||
Itoham Yonekyu Holdings, Inc. | (58,900 | ) | (296,446 | ) | (26.5 | ) | ||||||
Iyo Bank Ltd. | (37,600 | ) | (182,318 | ) | (16.3 | ) | ||||||
Japan Airport Terminal Co. Ltd. | (2,000 | ) | (82,873 | ) | (7.4 | ) | ||||||
Japan Aviation Electronics Industry Ltd. | (20,700 | ) | (289,450 | ) | (25.9 | ) | ||||||
Japan Hotel REIT Investment Corp. | (229 | ) | (116,306 | ) | (10.4 | ) | ||||||
Japan Logistics Fund, Inc. | (241 | ) | (588,162 | ) | (52.6 | ) | ||||||
Japan Metropolitan Fund Invest | (337 | ) | (267,857 | ) | (24.0 | ) | ||||||
Japan Post Insurance Co. Ltd. | (7,400 | ) | (119,656 | ) | (10.7 | ) | ||||||
Japan Real Estate Investment Corp. | (15 | ) | (72,598 | ) | (6.5 | ) | ||||||
Japan Steel Works Ltd. | (700 | ) | (19,701 | ) | (1.8 | ) | ||||||
JCR Pharmaceuticals Co. Ltd. | (35,700 | ) | (663,478 | ) | (59.4 | ) | ||||||
Jeol Ltd. | (4,100 | ) | (184,125 | ) | (16.5 | ) | ||||||
JMDC, Inc. | (14,500 | ) | (699,240 | ) | (62.6 | ) | ||||||
JTEKT Corp. | (19,700 | ) | (137,347 | ) | (12.3 | ) | ||||||
Justsystems Corp. | (300 | ) | (13,039 | ) | (1.2 | ) | ||||||
Kadokawa Dwango | (2,100 | ) | (52,643 | ) | (4.7 | ) | ||||||
Kagome Co. Ltd. | (22,000 | ) | (550,573 | ) | (49.3 | ) | ||||||
Kajima Corp. | (7,300 | ) | (81,355 | ) | (7.3 | ) | ||||||
Kaken Pharmaceutical Co. Ltd. | (12,500 | ) | (378,777 | ) | (33.9 | ) | ||||||
Kaneka Corp. | (7,500 | ) | (200,682 | ) | (18.0 | ) | ||||||
Kansai Electric Power Co Inc/The | (25,800 | ) | (226,163 | ) | (20.2 | ) | ||||||
Kawasaki Heavy Industries Ltd. | (12,900 | ) | (229,398 | ) | (20.5 | ) | ||||||
Keihan Holdings Co. Ltd. | (15,800 | ) | (337,010 | ) | (30.2 | ) | ||||||
Keikyu Corp. | (54,500 | ) | (548,951 | ) | (49.1 | ) | ||||||
Keio Corp. | (7,600 | ) | (291,479 | ) | (26.1 | ) | ||||||
Kenedix Office Investment Corp. | (27 | ) | (141,121 | ) | (12.6 | ) | ||||||
Kinden Corp. | (31,400 | ) | (372,075 | ) | (33.3 | ) | ||||||
Kobe Steel Ltd. | (5,600 | ) | (24,278 | ) | (2.2 | ) | ||||||
Komatsu Ltd. | (4,700 | ) | (105,780 | ) | (9.5 | ) | ||||||
Kose Corp. | (1,800 | ) | (184,790 | ) | (16.5 | ) | ||||||
K’s Holdings Corp. | (27,800 | ) | (275,307 | ) | (24.6 | ) | ||||||
Kubota Corp. | (37,600 | ) | (638,774 | ) | (57.1 | ) | ||||||
Kurita Water Industries Ltd. | (13,500 | ) | (460,570 | ) | (41.2 | ) | ||||||
Kyushu Financial Group, Inc. | (117,500 | ) | (360,590 | ) | (32.3 | ) | ||||||
Kyushu Railway Co. | (17,600 | ) | (344,973 | ) | (30.9 | ) | ||||||
LaSalle Logiport REIT | (288 | ) | (389,636 | ) | (34.9 | ) | ||||||
Lintec Corp. | (13,900 | ) | (258,924 | ) | (23.2 | ) | ||||||
| 112 | 2 0 2 2 BLACK ROCK ANNUAL REPORT TO SHAREHOLDERS |
Schedule of Investments (continued) April 30, 2022 | BlackRock Global Long/Short Equity Fund |
| Security | Shares | Value | % of Basket Value | |||||||||
| Japan (continued) | ||||||||||||
Mabuchi Motor Co. Ltd. | (11,500 | ) | $ | (307,148 | ) | (27.5 | )% | |||||
Makita Corp. | (900 | ) | (26,601 | ) | (2.4 | ) | ||||||
Marui Group Co. Ltd. | (44,200 | ) | (761,013 | ) | (68.1 | ) | ||||||
Matsui Securities Co. Ltd. | (27,900 | ) | (172,556 | ) | (15.4 | ) | ||||||
Matsumotokiyoshi Holdings Co. Ltd. | (15,600 | ) | (515,663 | ) | (46.1 | ) | ||||||
Mazda Motor Corp. | (13,300 | ) | (94,440 | ) | (8.4 | ) | ||||||
Mebuki Financial Group, Inc. | (3,300 | ) | (6,645 | ) | (0.6 | ) | ||||||
Medipal Holdings Corp. | (56,400 | ) | (928,818 | ) | (83.1 | ) | ||||||
MEIJI Holdings Co. Ltd. | (4,200 | ) | (209,357 | ) | (18.7 | ) | ||||||
Menicon Co. Ltd. | (5,800 | ) | (123,885 | ) | (11.1 | ) | ||||||
MINEBEA MITSUMI, Inc. | (3,500 | ) | (67,152 | ) | (6.0 | ) | ||||||
Mitsubishi Estate Co. Ltd. | (8,100 | ) | (117,989 | ) | (10.6 | ) | ||||||
Mitsubishi Gas Chemical Co., Inc. | (32,600 | ) | (476,057 | ) | (42.6 | ) | ||||||
Mitsubishi UFJ Financial Group, Inc. | (38,000 | ) | (220,908 | ) | (19.8 | ) | ||||||
Mitsui High-Tec, Inc. | (700 | ) | (60,470 | ) | (5.4 | ) | ||||||
Miura Co. Ltd. | (19,000 | ) | (396,866 | ) | (35.5 | ) | ||||||
Money Forward, Inc. | (8,000 | ) | (272,013 | ) | (24.3 | ) | ||||||
MonotaRO Co. Ltd. | (1,300 | ) | (22,331 | ) | (2.0 | ) | ||||||
Mori Hills REIT Investment Corp. | (408 | ) | (462,728 | ) | (41.4 | ) | ||||||
Morinaga & Co. Ltd. | (4,200 | ) | (130,236 | ) | (11.7 | ) | ||||||
Morinaga Milk Industry Co. Ltd. | (600 | ) | (24,163 | ) | (2.2 | ) | ||||||
Nabtesco Corp. | (20,800 | ) | (474,398 | ) | (42.4 | ) | ||||||
Nagase & Co. Ltd. | (16,500 | ) | (236,445 | ) | (21.2 | ) | ||||||
NEC Networks & System Integration Corp. | (24,500 | ) | (347,881 | ) | (31.1 | ) | ||||||
Nexon Co. Ltd. | (5,800 | ) | (132,072 | ) | (11.8 | ) | ||||||
NGK Insulators Ltd. | (46,700 | ) | (628,191 | ) | (56.2 | ) | ||||||
NH Foods Ltd. | (7,600 | ) | (240,011 | ) | (21.5 | ) | ||||||
NHK Spring Co. Ltd. | (55,700 | ) | (359,762 | ) | (32.2 | ) | ||||||
Nidec Corp. | (5,600 | ) | (362,035 | ) | (32.4 | ) | ||||||
Nifco, Inc. | (8,800 | ) | (185,802 | ) | (16.6 | ) | ||||||
Nihon Unisys Ltd. | (7,500 | ) | (189,487 | ) | (17.0 | ) | ||||||
Nintendo Co. Ltd. | (300 | ) | (136,917 | ) | (12.2 | ) | ||||||
Nippon Accommodations Fund, Inc. | (41 | ) | (201,880 | ) | (18.1 | ) | ||||||
Nippon Electric Glass Co. Ltd. | (17,400 | ) | (350,270 | ) | (31.3 | ) | ||||||
Nippon Paint Holdings Co. Ltd. | (5,200 | ) | (41,191 | ) | (3.7 | ) | ||||||
Nippon Shinyaku Co. Ltd. | (6,800 | ) | (459,910 | ) | (41.1 | ) | ||||||
Nippon Shokubai Co. Ltd. | (7,100 | ) | (285,642 | ) | (25.6 | ) | ||||||
Nishi-Nippon Railroad Co. Ltd. | (2,700 | ) | (54,013 | ) | (4.8 | ) | ||||||
Nisshin Seifun Group, Inc. | (31,900 | ) | (425,253 | ) | (38.0 | ) | ||||||
Noevir Holdings Co. Ltd. | (5,800 | ) | (227,413 | ) | (20.3 | ) | ||||||
NOF Corp. | (10,900 | ) | (409,126 | ) | (36.6 | ) | ||||||
Nomura Holdings, Inc. | (3,500 | ) | (13,477 | ) | (1.2 | ) | ||||||
Nomura Real Estate Master Fund, Inc. | (209 | ) | (262,408 | ) | (23.5 | ) | ||||||
NS Solutions Corp. | (6,700 | ) | (199,884 | ) | (17.9 | ) | ||||||
Odakyu Electric Railway Co. Ltd. | (32,100 | ) | (486,092 | ) | (43.5 | ) | ||||||
Oji Holdings Corp. | (30,000 | ) | (142,110 | ) | (12.7 | ) | ||||||
OKUMA Corp. | (14,300 | ) | (511,102 | ) | (45.7 | ) | ||||||
Open House Co. Ltd. | (1,400 | ) | (54,173 | ) | (4.8 | ) | ||||||
Oracle Corp. Japan | (1,100 | ) | (70,687 | ) | (6.3 | ) | ||||||
Orient Corp. | (696,200 | ) | (668,275 | ) | (59.8 | ) | ||||||
Orix JREIT, Inc. | (306 | ) | (413,627 | ) | (37.0 | ) | ||||||
Osaka Gas Co. Ltd. | (25,500 | ) | (459,597 | ) | (41.1 | ) | ||||||
OSG Corp. | (24,100 | ) | (302,756 | ) | (27.1 | ) | ||||||
Pan Pacific International Holdings Corp. | (22,800 | ) | (349,144 | ) | (31.2 | ) | ||||||
Persol Holdings Co. Ltd. | (6,800 | ) | (134,909 | ) | (12.1 | ) | ||||||
Rengo Co. Ltd. | (79,000 | ) | (467,724 | ) | (41.8 | ) | ||||||
RENOVA, Inc. | (17,800 | ) | (219,311 | ) | (19.6 | ) | ||||||
Resona Holdings Inc. | (159,200 | ) | (692,269 | ) | (61.9 | ) | ||||||
Rohto Pharmaceutical Co. Ltd. | (14,700 | ) | (392,557 | ) | (35.1 | ) | ||||||
Sankyo Co. Ltd. | (1,500 | ) | (43,162 | ) | (3.9 | ) | ||||||
Sansan, Inc. | (30,100 | ) | (287,174 | ) | (25.7 | ) | ||||||
| Security | Shares | Value | % of Basket Value | |||||||||
| Japan (continued) | ||||||||||||
Sanwa Holdings Corp. | (59,000 | ) | $ | (537,505 | ) | (48.1 | )% | |||||
SCREEN Holdings Co. Ltd. | (800 | ) | (65,383 | ) | (5.8 | ) | ||||||
Seibu Holdings, Inc. | (33,000 | ) | (327,857 | ) | (29.3 | ) | ||||||
Sharp Corp. | (40,100 | ) | (339,298 | ) | (30.4 | ) | ||||||
SHIFT, Inc. | (1,200 | ) | (227,400 | ) | (20.3 | ) | ||||||
Shikoku Electric Power Co., Inc. | (58,100 | ) | (334,047 | ) | (29.9 | ) | ||||||
Shimamura Co. Ltd. | (3,800 | ) | (337,016 | ) | (30.2 | ) | ||||||
Shimano, Inc. | (1,500 | ) | (265,776 | ) | (23.8 | ) | ||||||
Ship Healthcare Holdings, Inc. | (11,400 | ) | (190,425 | ) | (17.0 | ) | ||||||
Shiseido Co. Ltd. | (3,000 | ) | (141,814 | ) | (12.7 | ) | ||||||
Shizuoka Bank Ltd. | (77,900 | ) | (504,019 | ) | (45.1 | ) | ||||||
SHO-BOND Holdings Co. Ltd. | (9,200 | ) | (386,676 | ) | (34.6 | ) | ||||||
Shochiku Co. Ltd. | (200 | ) | (20,412 | ) | (1.8 | ) | ||||||
Showa Denko KK | (17,600 | ) | (342,467 | ) | (30.6 | ) | ||||||
Stanley Electric Co. Ltd. | (24,000 | ) | (413,834 | ) | (37.0 | ) | ||||||
Sugi Holdings Co. Ltd. | (7,400 | ) | (317,167 | ) | (28.4 | ) | ||||||
SUMCO Corp. | (1,500 | ) | (21,602 | ) | (1.9 | ) | ||||||
Sumitomo Bakelite Co. Ltd. | (8,700 | ) | (285,457 | ) | (25.5 | ) | ||||||
Sumitomo Realty & Development Co. Ltd. | (12,400 | ) | (328,953 | ) | (29.4 | ) | ||||||
Sushiro Global Holdings Ltd. | (8,900 | ) | (211,203 | ) | (18.9 | ) | ||||||
Suzuken Co Ltd/Aichi Japan | (15,000 | ) | (442,759 | ) | (39.6 | ) | ||||||
Taisho Pharmaceutical Holdings Co. Ltd. | (1,600 | ) | (63,021 | ) | (5.6 | ) | ||||||
Taiyo Nippon Sanso Corp. | (17,200 | ) | (309,522 | ) | (27.7 | ) | ||||||
Taiyo Yuden Co. Ltd. | (9,000 | ) | (353,587 | ) | (31.6 | ) | ||||||
Takara Holdings, Inc. | (53,700 | ) | (452,309 | ) | (40.5 | ) | ||||||
TechnoPro Holdings Inc. | (17,600 | ) | (448,238 | ) | (40.1 | ) | ||||||
THK Co. Ltd. | (16,600 | ) | (328,953 | ) | (29.4 | ) | ||||||
Tobu Railway Co. Ltd. | (13,000 | ) | (292,216 | ) | (26.1 | ) | ||||||
Toda Corp. | (44,800 | ) | (257,400 | ) | (23.0 | ) | ||||||
Toho Gas Co. Ltd. | (12,500 | ) | (293,238 | ) | (26.2 | ) | ||||||
Tokai Carbon Co. Ltd. | (18,200 | ) | (150,493 | ) | (13.5 | ) | ||||||
Tokyo Century Corp. | (1,300 | ) | (40,043 | ) | (3.6 | ) | ||||||
Tokyo Electric Power Co. Holdings, Inc. | (4,300 | ) | (14,843 | ) | (1.3 | ) | ||||||
Tokyu Fudosan Holdings Corp. | (14,800 | ) | (77,014 | ) | (6.9 | ) | ||||||
Toppan Inc. | (46,700 | ) | (771,935 | ) | (69.1 | ) | ||||||
Toshiba Corp. | (10,900 | ) | (452,659 | ) | (40.5 | ) | ||||||
Toshiba TEC Corp. | (6,700 | ) | (227,112 | ) | (20.3 | ) | ||||||
Toyo Tire Corp. | (18,000 | ) | (206,459 | ) | (18.5 | ) | ||||||
Toyoda Gosei Co. Ltd. | (13,500 | ) | (196,587 | ) | (17.6 | ) | ||||||
Toyota Boshoku Corp. | (38,200 | ) | (608,809 | ) | (54.5 | ) | ||||||
Toyota Industries Corp. | (8,600 | ) | (515,800 | ) | (46.1 | ) | ||||||
TS Tech Co. Ltd. | (15,600 | ) | (162,796 | ) | (14.6 | ) | ||||||
Ube Industries Ltd. | (27,000 | ) | (418,630 | ) | (37.5 | ) | ||||||
Ulvac, Inc. | (1,200 | ) | (47,022 | ) | (4.2 | ) | ||||||
United Urban Investment Corp. | (320 | ) | (350,123 | ) | (31.3 | ) | ||||||
USS Co. Ltd. | (20,200 | ) | (336,291 | ) | (30.1 | ) | ||||||
West Japan Railway Co. | (9,900 | ) | (367,478 | ) | (32.9 | ) | ||||||
Yamato Holdings Co. Ltd. | (8,600 | ) | (160,923 | ) | (14.4 | ) | ||||||
Yamazaki Baking Co. Ltd. | (9,800 | ) | (121,149 | ) | (10.8 | ) | ||||||
Yokogawa Electric Corp. | (39,400 | ) | (628,134 | ) | (56.2 | ) | ||||||
Zenkoku Hosho Co. Ltd. | (3,500 | ) | (122,836 | ) | (11.0 | ) | ||||||
Zeon Corp. | (19,700 | ) | (209,780 | ) | (18.8 | ) | ||||||
|
|
|
| |||||||||
| (66,845,826 | ) | |||||||||||
| Luxembourg | ||||||||||||
Grand City Properties SA | (7,886 | ) | (139,228 | ) | (12.5 | ) | ||||||
Tenaris SA | (58,398 | ) | (892,449 | ) | (79.8 | ) | ||||||
|
|
|
| |||||||||
| (1,031,677 | ) | |||||||||||
| Netherlands | ||||||||||||
Aalberts NV | (552 | ) | (26,823 | ) | (2.4 | ) | ||||||
Adyen NV | (105 | ) | (176,116 | ) | (15.8 | ) | ||||||
SCHEDULE OF INVESTMENTS | 113 |
Schedule of Investments (continued) April 30, 2022 | BlackRock Global Long/Short Equity Fund |
| Security | Shares | Value | % of Basket Value | |||||||||
| Netherlands (continued) | ||||||||||||
Akzo Nobel NV | (5,226 | ) | $ | (453,337 | ) | (40.6 | )% | |||||
Argenx SE | (1,061 | ) | (305,683 | ) | (27.3 | ) | ||||||
ASM International NV | (3,519 | ) | (1,057,432 | ) | (94.6 | ) | ||||||
ASML Holding NV | (991 | ) | (562,431 | ) | (50.3 | ) | ||||||
BE Semiconductor Industries NV | (1,067 | ) | (65,043 | ) | (5.8 | ) | ||||||
Euronext NV | (1,477 | ) | (118,340 | ) | (10.6 | ) | ||||||
EXOR NV | (11,459 | ) | (795,195 | ) | (71.1 | ) | ||||||
Iveco Group NV | (97,806 | ) | (575,430 | ) | (51.5 | ) | ||||||
JDE Peet’s NV | (423 | ) | (12,444 | ) | (1.1 | ) | ||||||
Just Eat Takeaway.com NV | (3,895 | ) | (105,798 | ) | (9.5 | ) | ||||||
Koninklijke KPN NV | (27,230 | ) | (93,960 | ) | (8.4 | ) | ||||||
NN Group NV | (2,106 | ) | (103,155 | ) | (9.2 | ) | ||||||
Prosus NV | (640 | ) | (30,866 | ) | (2.8 | ) | ||||||
SBM Offshore NV | (18,095 | ) | (262,217 | ) | (23.5 | ) | ||||||
Stellantis NV | (16,033 | ) | (215,254 | ) | (19.3 | ) | ||||||
Universal Music Group NV | (3,964 | ) | (91,990 | ) | (8.2 | ) | ||||||
|
|
|
| |||||||||
| (5,051,514 | ) | |||||||||||
| New Zealand | ||||||||||||
Fletcher Building Ltd. | (6,480 | ) | (25,813 | ) | (2.3 | ) | ||||||
Kiwi Property Group Ltd. | (215,752 | ) | (147,154 | ) | (13.2 | ) | ||||||
Mainfreight Ltd. | (526 | ) | (27,533 | ) | (2.4 | ) | ||||||
Mercury NZ Ltd. | (8,921 | ) | (34,587 | ) | (3.1 | ) | ||||||
Meridian Energy Ltd. | (125,895 | ) | (382,099 | ) | (34.2 | ) | ||||||
|
|
|
| |||||||||
| (617,186 | ) | |||||||||||
| Norway | ||||||||||||
Aker ASA, A Shares | (1,013 | ) | (82,571 | ) | (7.4 | ) | ||||||
Leroy Seafood Group ASA | (2,030 | ) | (19,052 | ) | (1.7 | ) | ||||||
Mowi ASA | (8,355 | ) | (236,004 | ) | (21.1 | ) | ||||||
Orkla ASA | (66,476 | ) | (539,429 | ) | (48.3 | ) | ||||||
Scatec ASA | (19,472 | ) | (235,351 | ) | (21.1 | ) | ||||||
Storebrand ASA | (46,437 | ) | (403,361 | ) | (36.1 | ) | ||||||
Tomra Systems ASA | (8,762 | ) | (344,569 | ) | (30.8 | ) | ||||||
Yara International ASA | (20,401 | ) | (1,037,354 | ) | (92.8 | ) | ||||||
|
|
|
| |||||||||
| (2,897,691 | ) | |||||||||||
| Poland | ||||||||||||
InPost SA | (17,682 | ) | (108,406 | ) | (9.7 | ) | ||||||
|
|
|
| |||||||||
| Portugal | ||||||||||||
Banco Comercial Portugues SA | (797,696 | ) | (123,315 | ) | (11.0 | ) | ||||||
Galp Energia SGPS SA | (23,756 | ) | (289,150 | ) | (25.9 | ) | ||||||
|
|
|
| |||||||||
| (412,465 | ) | |||||||||||
| Singapore | ||||||||||||
Ascott Residence Trust | (201,400 | ) | (167,320 | ) | (15.0 | ) | ||||||
Golden Agri-Resources Ltd. | (995,900 | ) | (232,678 | ) | (20.8 | ) | ||||||
Keppel REIT | (668,200 | ) | (585,400 | ) | (52.4 | ) | ||||||
Mapletree North Asia Commercial Trust | (16,100 | ) | (13,905 | ) | (1.3 | ) | ||||||
Sembcorp Industries Ltd. | (37,700 | ) | (79,841 | ) | (7.1 | ) | ||||||
Suntec Real Estate Investment Trust | (310,800 | ) | (410,588 | ) | (36.7 | ) | ||||||
|
|
|
| |||||||||
| (1,489,732 | ) | |||||||||||
| South Africa | ||||||||||||
Investec PLC | (34,146 | ) | (201,116 | ) | (18.0 | ) | ||||||
|
|
|
| |||||||||
| Spain | ||||||||||||
Acerinox SA | (22,467 | ) | (236,560 | ) | (21.2 | ) | ||||||
ACS Actividades de Construccion y Servicios SA | (1,176 | ) | (30,112 | ) | (2.7 | ) | ||||||
Banco de Sabadell SA | (130,331 | ) | (101,146 | ) | (9.1 | ) | ||||||
Corp. ACCIONA Energias Renovables SA | (10,466 | ) | (386,899 | ) | (34.6 | ) | ||||||
EDP Renovaveis SA | (2,759 | ) | (65,298 | ) | (5.8 | ) | ||||||
Fluidra SA | (18,346 | ) | (496,519 | ) | (44.4 | ) | ||||||
| Security | Shares | Value | % of Basket Value | |||||||||
| Spain (continued) | ||||||||||||
Red Electrica Corp. SA | (13,310 | ) | $ | (267,987 | ) | (24.0 | )% | |||||
Siemens Gamesa Renewable Energy SA | (16,510 | ) | (262,981 | ) | (23.5 | ) | ||||||
Telefonica SA | (16,743 | ) | (81,449 | ) | (7.3 | ) | ||||||
|
|
|
| |||||||||
| (1,928,951 | ) | |||||||||||
| Sweden | ||||||||||||
Atlas Copco AB, Class A | (4,158 | ) | (188,511 | ) | (16.9 | ) | ||||||
Avanza Bank Holding AB | (6,288 | ) | (159,223 | ) | (14.2 | ) | ||||||
Beijer Ref AB | (27,814 | ) | (452,923 | ) | (40.5 | ) | ||||||
Embracer Group AB | (43,758 | ) | (292,479 | ) | (26.2 | ) | ||||||
Fastighets AB Balder, Class B | (7,261 | ) | (359,908 | ) | (32.2 | ) | ||||||
Getinge AB, B Shares | (14,789 | ) | (427,813 | ) | (38.3 | ) | ||||||
H & M Hennes & Mauritz AB, B Shares | (8,302 | ) | (104,515 | ) | (9.3 | ) | ||||||
Husqvarna AB, B Shares | (75,651 | ) | (723,156 | ) | (64.7 | ) | ||||||
Investor AB, Class A | (31,676 | ) | (661,601 | ) | (59.2 | ) | ||||||
Investor AB, Class B | (76,414 | ) | (1,470,427 | ) | (131.6 | ) | ||||||
L E Lundbergforetagen AB, B Shares | (10,313 | ) | (482,301 | ) | (43.1 | ) | ||||||
Samhallsbyggnadsbolaget i Norden AB | (23,432 | ) | (74,094 | ) | (6.6 | ) | ||||||
Sandvik AB | (15,270 | ) | (289,035 | ) | (25.9 | ) | ||||||
Securitas AB, B Shares | (53,660 | ) | (633,553 | ) | (56.7 | ) | ||||||
Sinch AB | (9,431 | ) | (41,679 | ) | (3.7 | ) | ||||||
SKF AB, B Shares | (38,524 | ) | (629,200 | ) | (56.3 | ) | ||||||
Svenska Cellulosa AB SCA, Class B | (19,369 | ) | (374,844 | ) | (33.5 | ) | ||||||
Sweco AB, B Shares | (17,813 | ) | (251,397 | ) | (22.5 | ) | ||||||
Swedish Orphan Biovitrum AB | (5,545 | ) | (116,649 | ) | (10.4 | ) | ||||||
Telia Co. AB | (43,597 | ) | (180,954 | ) | (16.2 | ) | ||||||
Thule Group AB | (3,632 | ) | (125,984 | ) | (11.3 | ) | ||||||
Trelleborg AB, B Shares | (2,634 | ) | (57,773 | ) | (5.2 | ) | ||||||
Volvo AB, A Shares | (21,695 | ) | (356,679 | ) | (31.9 | ) | ||||||
Volvo AB, B Shares | (5,953 | ) | (96,054 | ) | (8.6 | ) | ||||||
|
|
|
| |||||||||
| (8,550,752 | ) | |||||||||||
| Switzerland | ||||||||||||
Bachem Holding AG, Class B | (559 | ) | (243,918 | ) | (21.8 | ) | ||||||
BKW AG | (519 | ) | (63,178 | ) | (5.7 | ) | ||||||
Coca-Cola HBC AG | (23,178 | ) | (469,908 | ) | (42.0 | ) | ||||||
EMS-Chemie Holding AG | (207 | ) | (184,670 | ) | (16.5 | ) | ||||||
Roche Holding AG | (736 | ) | (295,685 | ) | (26.5 | ) | ||||||
Schindler Holding AG, Registered Shares | (473 | ) | (90,804 | ) | (8.1 | ) | ||||||
Swatch Group AG | (1,976 | ) | (97,484 | ) | (8.7 | ) | ||||||
|
|
|
| |||||||||
| (1,445,647 | ) | |||||||||||
| United Kingdom | ||||||||||||
3i Group PLC | (18,059 | ) | (295,540 | ) | (26.4 | ) | ||||||
Admiral Group PLC | (13,242 | ) | (416,822 | ) | (37.3 | ) | ||||||
Airtel Africa PLC | (319,777 | ) | (585,107 | ) | (52.4 | ) | ||||||
Anglo American PLC | (4,127 | ) | (182,789 | ) | (16.4 | ) | ||||||
AstraZeneca PLC | (820 | ) | (109,422 | ) | (9.8 | ) | ||||||
Avast PLC | (22,607 | ) | (160,329 | ) | (14.3 | ) | ||||||
Aviva PLC | (3,860 | ) | (20,709 | ) | (1.9 | ) | ||||||
B&M European Value Retail SA | (12,622 | ) | (77,336 | ) | (6.9 | ) | ||||||
Berkeley Group Holdings PLC | (607 | ) | (30,785 | ) | (2.8 | ) | ||||||
BP PLC | (175,227 | ) | (845,960 | ) | (75.7 | ) | ||||||
Bunzl PLC | (4,429 | ) | (170,874 | ) | (15.3 | ) | ||||||
Burberry Group PLC | (11,445 | ) | (225,872 | ) | (20.2 | ) | ||||||
CNH Industrial NV | (62,198 | ) | (881,115 | ) | (78.8 | ) | ||||||
Compass Group PLC | (19,097 | ) | (402,982 | ) | (36.1 | ) | ||||||
ConvaTec Group PLC | (25,654 | ) | (67,862 | ) | (6.1 | ) | ||||||
Diageo PLC | (6,368 | ) | (317,692 | ) | (28.4 | ) | ||||||
Dr. Martens PLC | (155,619 | ) | (406,885 | ) | (36.4 | ) | ||||||
DS Smith PLC | (187,717 | ) | (771,379 | ) | (69.0 | ) | ||||||
Ferguson PLC | (1,147 | ) | (143,890 | ) | (12.9 | ) | ||||||
Future PLC | (7,937 | ) | (217,380 | ) | (19.5 | ) | ||||||
| 114 | 2 0 2 2 BLACK ROCK ANNUAL REPORT TO SHAREHOLDERS |
Schedule of Investments (continued) April 30, 2022 | BlackRock Global Long/Short Equity Fund |
| Security | Shares | Value | % of Basket Value | |||||||||
| United Kingdom (continued) | ||||||||||||
GlaxoSmithKline PLC | (11,891 | ) | $ | (268,054 | ) | (24.0 | )% | |||||
Greggs PLC | (16,814 | ) | (490,564 | ) | (43.9 | ) | ||||||
Harbour Energy PLC | (12,773 | ) | (80,100 | ) | (7.2 | ) | ||||||
Howden Joinery Group PLC | (163,913 | ) | (1,551,848 | ) | (138.8 | ) | ||||||
HSBC Holdings PLC | (15,071 | ) | (94,181 | ) | (8.4 | ) | ||||||
IG Group Holdings PLC | (1,338 | ) | (13,674 | ) | (1.2 | ) | ||||||
Informa PLC | (35,448 | ) | (251,464 | ) | (22.5 | ) | ||||||
Intermediate Capital Group PLC | (11,301 | ) | (216,261 | ) | (19.4 | ) | ||||||
JD Sports Fashion PLC | (757,232 | ) | (1,247,672 | ) | (111.6 | ) | ||||||
JET2 PLC | (17,824 | ) | (273,723 | ) | (24.5 | ) | ||||||
Kingfisher PLC | (141,448 | ) | (446,066 | ) | (39.9 | ) | ||||||
Land Securities Group PLC | (2,425 | ) | (22,949 | ) | (2.1 | ) | ||||||
Lloyds Banking Group PLC | (1,260,119 | ) | (715,701 | ) | (64.0 | ) | ||||||
London Stock Exchange Group PLC | (1,471 | ) | (145,028 | ) | (13.0 | ) | ||||||
Man Group PLC | (42,594 | ) | (124,141 | ) | (11.1 | ) | ||||||
Mondi PLC | (15,020 | ) | (282,165 | ) | (25.2 | ) | ||||||
National Grid PLC | (5,098 | ) | (75,741 | ) | (6.8 | ) | ||||||
Next PLC | (14,883 | ) | (1,114,747 | ) | (99.7 | ) | ||||||
Pearson PLC | (65,586 | ) | (636,827 | ) | (57.0 | ) | ||||||
Pennon Group PLC | (9,956 | ) | (138,351 | ) | (12.4 | ) | ||||||
Prudential PLC | (61,327 | ) | (763,426 | ) | (68.3 | ) | ||||||
RELX PLC | (1,198 | ) | (35,689 | ) | (3.2 | ) | ||||||
Renishaw PLC | (4,193 | ) | (221,588 | ) | (19.8 | ) | ||||||
| Security | Shares | Value | % of Basket Value | |||||||||
| United Kingdom (continued) | ||||||||||||
Rentokil Initial PLC | (49,178 | ) | $ | (337,768 | ) | (30.2 | )% | |||||
Rightmove PLC | (54,138 | ) | (416,164 | ) | (37.2 | ) | ||||||
Rio Tinto PLC | (5,079 | ) | (358,863 | ) | (32.1 | ) | ||||||
Royal Mail PLC | (116,942 | ) | (501,248 | ) | (44.8 | ) | ||||||
Sage Group PLC | (1,760 | ) | (16,151 | ) | (1.4 | ) | ||||||
Severn Trent PLC | (3,029 | ) | (119,044 | ) | (10.7 | ) | ||||||
Shell PLC | (2,014 | ) | (54,068 | ) | (4.8 | ) | ||||||
Smith & Nephew PLC | (1,314 | ) | (21,298 | ) | (1.9 | ) | ||||||
Standard Chartered PLC | (92,987 | ) | (635,689 | ) | (56.9 | ) | ||||||
Tesco PLC | (38,961 | ) | (132,363 | ) | (11.8 | ) | ||||||
Unilever PLC | (119 | ) | (5,523 | ) | (0.5 | ) | ||||||
Unilever PLC | (5,849 | ) | (271,921 | ) | (24.3 | ) | ||||||
Vodafone Group PLC | (368,640 | ) | (558,106 | ) | (49.9 | ) | ||||||
WH Smith PLC | (11,283 | ) | (202,996 | ) | (18.2 | ) | ||||||
Wise PLC, Class A | (83,364 | ) | (408,522 | ) | (36.6 | ) | ||||||
|
|
|
| |||||||||
| (19,580,414 | ) | |||||||||||
Preferred Stocks | ||||||||||||
| Germany | ||||||||||||
Volkswagen AG, Preference Shares | (517 | ) | (80,066 | ) | (7.2 | ) | ||||||
|
|
|
| |||||||||
Total Reference Entity — Short | (149,627,185 | ) | ||||||||||
|
| |||||||||||
Net Value of Reference Entity — UBS AG |
| $ | 1,117,689 | |||||||||
|
| |||||||||||
Balances Reported in the Statements of Assets and Liabilities for OTC Swaps
| Description | Swap Premiums Paid | Swap Premiums Received | Unrealized Appreciation | Unrealized Depreciation | ||||||||||||
OTC Swaps | $ | — | $ | — | $ | 37,617,367 | $ | — | ||||||||
Derivative Financial Instruments Categorized by Risk Exposure
As of period end, the fair values of derivative financial instruments located in the Statements of Assets and Liabilities were as follows:
| Commodity Contracts | Credit Contracts | Equity Contracts | Foreign Currency Exchange Contracts | Interest Rate Contracts | Other Contracts | Total | ||||||||||||||||||||||
Assets — Derivative Financial Instruments |
| |||||||||||||||||||||||||||
Swaps — OTC | ||||||||||||||||||||||||||||
Unrealized appreciation on OTC swaps; Swap premiums paid | $ | — | $ | — | $ | 37,617,367 | $ | — | $ | — | $ | — | $ | 37,617,367 | ||||||||||||||
|
|
|
|
|
|
|
|
|
|
|
|
|
| |||||||||||||||
Liabilities — Derivative Financial Instruments |
| |||||||||||||||||||||||||||
Futures contracts | ||||||||||||||||||||||||||||
Unrealized depreciation on futures contracts(a) | $ | — | $ | — | $ | 611,340 | $ | — | $ | — | $ | — | $ | 611,340 | ||||||||||||||
|
|
|
|
|
|
|
|
|
|
|
|
|
| |||||||||||||||
| (a) | Net cumulative unrealized appreciation (depreciation) on futures contracts and centrally cleared swaps, if any, are reported in the Schedule of Investments. In the Statements of Assets and Liabilities, only current day’s variation margin is reported in receivables or payables and the net cumulative unrealized appreciation (depreciation) is included in accumulated earnings (loss). |
For the period ended April 30, 2022, the effect of derivative financial instruments in the Statements of Operations was as follows:
| Commodity Contracts | Credit Contracts | Equity Contracts | Foreign Currency Exchange Contracts | Interest Rate Contracts | Other Contracts | Total | ||||||||||||||||||||||
Net Realized Gain (Loss) from: | ||||||||||||||||||||||||||||
Futures contracts | $ | — | $ | — | $ | 3,315,892 | $ | — | $ | — | $ | — | $ | 3,315,892 | ||||||||||||||
Options purchased(a) | — | — | (6,827,207 | ) | — | — | — | (6,827,207 | ) | |||||||||||||||||||
SCHEDULE OF INVESTMENTS | 115 |
Schedule of Investments (continued) April 30, 2022 | BlackRock Global Long/Short Equity Fund |
| Commodity Contracts | Credit Contracts | Equity Contracts | Foreign Currency Exchange Contracts | Interest Rate Contracts | Other Contracts | Total | ||||||||||||||||||||||
Options written | $ | — | $ | — | $ | 5,026,244 | $ | — | $ | — | $ | — | $ | 5,026,244 | ||||||||||||||
Swaps | — | — | (39,884,002 | ) | — | — | — | (39,884,002 | ) | |||||||||||||||||||
|
|
|
|
|
|
|
|
|
|
|
|
|
| |||||||||||||||
| $ | — | $ | — | $ | (38,369,073 | ) | $ | — | $ | — | $ | — | $ | (38,369,073 | ) | |||||||||||||
|
|
|
|
|
|
|
|
|
|
|
|
|
| |||||||||||||||
| Net Change in Unrealized Appreciation (Depreciation) on: | ||||||||||||||||||||||||||||
Futures contracts | $ | — | $ | — | $ | (1,443,089 | ) | $ | — | $ | — | $ | — | $ | (1,443,089 | ) | ||||||||||||
Options purchased(b) | — | — | 153,085 | — | — | — | 153,085 | |||||||||||||||||||||
Options written | — | — | (114,676 | ) | — | — | — | (114,676 | ) | |||||||||||||||||||
Swaps | — | — | 33,768,518 | — | — | — | 33,768,518 | |||||||||||||||||||||
|
|
|
|
|
|
|
|
|
|
|
|
|
| |||||||||||||||
| $ | — | $ | — | $ | 32,363,838 | $ | — | $ | — | $ | — | $ | 32,363,838 | |||||||||||||||
|
|
|
|
|
|
|
|
|
|
|
|
|
| |||||||||||||||
| (a) | Options purchased are included in net realized gain (loss) from investments — unaffiliated. |
| (b) | Options purchased are included in net change in unrealized appreciation (depreciation) on investments — unaffiliated. |
Average Quarterly Balances of Outstanding Derivative Financial Instruments
Futures contracts: | ||||
Average notional value of contracts — long | $ | 99,477,435 | ||
Average notional value of contracts — short | $ | 43,033,040 | ||
Options: | ||||
Average value of option contracts purchased | $ | 620,526 | ||
Average value of option contracts written | $ | 400,098 | ||
Total return swaps: | ||||
Average notional value | $ | (13,701,592 | ) |
For more information about the Fund’s investment risks regarding derivative financial instruments, refer to the Notes to Financial Statements.
Derivative Financial Instruments — Offsetting as of Period End
The Fund’s derivative assets and liabilities (by type) were as follows:
| Assets | Liabilities | |||||||
Derivative Financial Instruments | ||||||||
Futures contracts | $ | — | $ | 379,075 | ||||
Swaps — OTC(a) | 37,617,367 | — | ||||||
|
|
|
| |||||
Total derivative assets and liabilities in the Statements of Assets and Liabilities | 37,617,367 | 379,075 | ||||||
|
|
|
| |||||
Derivatives not subject to a Master Netting Agreement or similar agreement (“MNA”) | — | (379,075 | ) | |||||
|
|
|
| |||||
Total derivative assets and liabilities subject to an MNA | $ | 37,617,367 | $ | — | ||||
|
|
|
| |||||
| (a) | Includes unrealized appreciation (depreciation) on OTC swaps and swap premiums (paid/received) in the Statements of Assets and Liabilities. |
The following table presents the Fund’s derivative assets by counterparty net of amounts available for offset under an MNA and net of the related collateral received by the Fund:
| Counterparty | | Derivative Assets Subject to an MNA by Counterparty | | | Derivatives Available for Offset | | | Non-Cash Collateral Received | | | Cash Collateral Received | (a) | | Net Amount of Derivative Assets | (b) | |||||
Bank of America N.A. | $ | 6,279,242 | $ | — | $ | — | $ | — | $ | 6,279,242 | ||||||||||
BNP Paribas SA | 6,902,033 | — | — | (6,902,033 | ) | — | ||||||||||||||
Goldman Sachs & Co. | 19,627,002 | — | — | (19,210,000 | ) | 417,002 | ||||||||||||||
UBS AG | 4,809,090 | — | — | — | 4,809,090 | |||||||||||||||
|
|
|
|
|
|
|
|
|
| |||||||||||
| $ | 37,617,367 | $ | — | $ | — | $ | (26,112,033 | ) | $ | 11,505,334 | ||||||||||
|
|
|
|
|
|
|
|
|
| |||||||||||
| (a) | Excess of collateral received from the individual counterparty is not shown for financial reporting purposes. |
| (b) | Net amount represents the net amount receivable from the counterparty in the event of default. |
| 116 | 2 0 2 2 BLACK ROCK ANNUAL REPORT TO SHAREHOLDERS |
Schedule of Investments (continued) April 30, 2022 | BlackRock Global Long/Short Equity Fund |
Fair Value Hierarchy as of Period End
Various inputs are used in determining the fair value of financial instruments. For a description of the input levels and information about the Fund’s policy regarding valuation of financial instruments, refer to the Notes to Financial Statements.
The following table summarizes the Fund’s financial instruments categorized in the fair value hierarchy. The breakdown of the Fund’s financial instruments into major categories is disclosed in the Schedule of Investments above.
| Level 1 | Level 2 | Level 3 | Total | |||||||||||||
Assets | ||||||||||||||||
Investments | ||||||||||||||||
Long-Term Investments | ||||||||||||||||
Common Stocks | $ | 472,783 | $ | — | $ | — | $ | 472,783 | ||||||||
Preferred Securities | ||||||||||||||||
Preferred Stocks | — | — | 3,323,126 | 3,323,126 | ||||||||||||
U.S. Treasury Obligations | — | 6,535,065 | — | 6,535,065 | ||||||||||||
Warrants | 2,141 | — | — | 2,141 | ||||||||||||
Short-Term Securities | ||||||||||||||||
Money Market Funds | 36,355,831 | — | — | 36,355,831 | ||||||||||||
U.S. Treasury Obligations | — | 513,678,051 | — | 513,678,051 | ||||||||||||
|
|
|
|
|
|
|
| |||||||||
| $ | 36,830,755 | $ | 520,213,116 | $ | 3,323,126 | $ | 560,366,997 | |||||||||
|
|
|
|
|
|
|
| |||||||||
Derivative Financial Instruments(a) | ||||||||||||||||
Assets | ||||||||||||||||
Equity Contracts | $ | — | $ | 37,617,367 | $ | — | $ | 37,617,367 | ||||||||
Liabilities | ||||||||||||||||
Equity Contracts | (123,607 | ) | (487,733 | ) | — | (611,340 | ) | |||||||||
|
|
|
|
|
|
|
| |||||||||
| $ | (123,607 | ) | $ | 37,129,634 | $ | — | $ | 37,006,027 | ||||||||
|
|
|
|
|
|
|
| |||||||||
| (a) | Derivative financial instruments are swaps and futures contracts. Swaps and futures contracts are valued at the unrealized appreciation (depreciation) on the instrument. |
See notes to financial statements.
SCHEDULE OF INVESTMENTS | 117 |
Statements of Assets and Liabilities
April 30, 2022
| BlackRock Advantage Emerging Markets Fund | BlackRock Global Long/Short Equity Fund | |||||||
ASSETS | ||||||||
Investments, at value — unaffiliated(a)(b) | $ | 131,209,736 | $ | 524,011,166 | ||||
Investments, at value — affiliated(c) | 7,388,472 | 36,355,831 | ||||||
Cash | 49,533 | 19,266,990 | ||||||
Cash pledged: | ||||||||
Collateral — OTC derivatives | — | 9,320,000 | ||||||
Futures contracts | 460,000 | 1,335,000 | ||||||
Foreign currency, at value(d) | 173,782 | 15,409,160 | ||||||
Receivables: | ||||||||
Investments sold | 118,936 | — | ||||||
Securities lending income — affiliated | 619 | — | ||||||
Capital shares sold | 1,941,176 | 1,067,128 | ||||||
Dividends — unaffiliated | 303,007 | — | ||||||
Dividends — affiliated | 1,234 | 40,066 | ||||||
Interest — unaffiliated | — | 57,128 | ||||||
Due from broker | 24,532 | 500,000 | ||||||
Variation margin on futures contracts | 30,943 | — | ||||||
Unrealized appreciation on OTC swaps | — | 37,617,367 | ||||||
Prepaid expenses | 31,589 | 77,381 | ||||||
|
|
|
| |||||
Total assets | 141,733,559 | 645,057,217 | ||||||
|
|
|
| |||||
LIABILITIES | ||||||||
Cash received as collateral for OTC derivatives | — | 26,510,000 | ||||||
Collateral on securities loaned | 254,881 | — | ||||||
Payables: | ||||||||
Investments purchased | 65,306 | 14,043,069 | ||||||
Accounting services fees | 21,647 | 78,699 | ||||||
Administration fees | — | 20,766 | ||||||
Capital shares redeemed | 12,861 | 716,172 | ||||||
Custodian fees | 78,521 | 173,647 | ||||||
Investment advisory fees | 49,193 | 504,607 | ||||||
Trustees’ and Officer’s fees | 1,779 | 1,203 | ||||||
Other accrued expenses | 20,119 | 28,582 | ||||||
Professional fees | 90,344 | 110,295 | ||||||
Service and distribution fees | 1,372 | 8,528 | ||||||
Transfer agent fees | 3,248 | 66,665 | ||||||
Variation margin on futures contracts | — | 379,075 | ||||||
Other liabilities | — | 219,092 | ||||||
|
|
|
| |||||
Total liabilities | 599,271 | 42,860,400 | ||||||
|
|
|
| |||||
NET ASSETS | $ | 141,134,288 | $ | 602,196,817 | ||||
|
|
|
| |||||
NET ASSETS CONSIST OF | ||||||||
Paid-in capital | $ | 166,365,696 | $ | 652,584,044 | ||||
Accumulated loss | (25,231,408 | ) | (50,387,227 | ) | ||||
|
|
|
| |||||
NET ASSETS | $ | 141,134,288 | $ | 602,196,817 | ||||
|
|
|
| |||||
(a) Investments, at cost — unaffiliated | $ | 134,427,117 | $ | 524,008,822 | ||||
(b) Securities loaned, at value | $ | 247,707 | $ | — | ||||
(c) Investments, at cost — affiliated | $ | 7,388,472 | $ | 36,355,831 | ||||
(d) Foreign currency, at cost | $ | 176,340 | $ | 15,968,486 | ||||
| 118 | 2 0 2 2 BLACK ROCK ANNUAL REPORT TO SHAREHOLDERS |
Statements of Assets and Liabilities (continued)
April 30, 2022
| BlackRock Advantage Emerging Markets Fund | BlackRock Global Long/Short Equity Fund | |||||||
NET ASSET VALUE | ||||||||
| Institutional | ||||||||
Net assets | $ | 9,583,296 | $ | 565,501,998 | ||||
|
|
|
| |||||
Shares outstanding | 947,904 | 49,235,822 | ||||||
|
|
|
| |||||
Net asset value | $ | 10.11 | $ | 11.49 | ||||
|
|
|
| |||||
Shares authorized | Unlimited | Unlimited | ||||||
|
|
|
| |||||
Par value | $ | 0.001 | $ | 0.001 | ||||
|
|
|
| |||||
| Investor A | ||||||||
Net assets | $ | 5,246,191 | $ | 25,229,069 | ||||
|
|
|
| |||||
Shares outstanding | 528,313 | 2,231,978 | ||||||
|
|
|
| |||||
Net asset value | $ | 9.93 | $ | 11.30 | ||||
|
|
|
| |||||
Shares authorized | Unlimited | Unlimited | ||||||
|
|
|
| |||||
Par value | $ | 0.001 | $ | 0.001 | ||||
|
|
|
| |||||
| Investor C | ||||||||
Net assets | $ | 281,815 | $ | 4,385,594 | ||||
|
|
|
| |||||
Shares outstanding | 29,786 | 412,156 | ||||||
|
|
|
| |||||
Net asset value | $ | 9.46 | $ | 10.64 | ||||
|
|
|
| |||||
Shares authorized | Unlimited | Unlimited | ||||||
|
|
|
| |||||
Par value | $ | 0.001 | $ | 0.001 | ||||
|
|
|
| |||||
| Class K | ||||||||
Net assets | $ | 126,022,986 | $ | 7,080,156 | ||||
|
|
|
| |||||
Shares outstanding | 12,465,309 | 614,706 | ||||||
|
|
|
| |||||
Net asset value | $ | 10.11 | $ | 11.52 | ||||
|
|
|
| |||||
Shares authorized | Unlimited | Unlimited | ||||||
|
|
|
| |||||
Par value | $ | 0.001 | $ | 0.001 | ||||
|
|
|
| |||||
See notes to financial statements.
FINANCIAL STATEMENTS | 119 |
Year Ended April 30, 2022
| BlackRock Advantage Emerging Markets Fund | BlackRock Global Long/Short Equity Fund | |||||||
INVESTMENT INCOME | ||||||||
Dividends — unaffiliated | $ | 4,517,185 | $ | — | ||||
Dividends — affiliated | 2,206 | 11,465 | ||||||
Interest — unaffiliated | — | 377,553 | ||||||
Securities lending income — affiliated — net | 3,475 | — | ||||||
Other income — affiliated | — | 4,851 | ||||||
Foreign taxes withheld | (460,563 | ) | — | |||||
|
|
|
| |||||
Total investment income | 4,062,303 | 393,869 | ||||||
|
|
|
| |||||
EXPENSES | ||||||||
Investment advisory | 1,331,037 | 6,983,224 | ||||||
Professional | 176,670 | 194,951 | ||||||
Custodian | 84,443 | 387,818 | ||||||
Registration | 71,095 | 93,707 | ||||||
Administration | 70,711 | 232,520 | ||||||
Accounting services | 44,311 | 127,263 | ||||||
Administration — class specific | 33,276 | 110,011 | ||||||
Transfer agent — class specific | 22,012 | 445,669 | ||||||
Service and distribution — class specific | 20,504 | 118,029 | ||||||
Trustees and Officer | 8,104 | 8,802 | ||||||
Miscellaneous | 57,186 | 109,212 | ||||||
|
|
|
| |||||
Total expenses | 1,919,349 | 8,811,206 | ||||||
Less: | ||||||||
Administration fees waived | (70,711 | ) | — | |||||
Administration fees waived - class specific | (33,276 | ) | (110,011 | ) | ||||
Fees waived and/or reimbursed by the Manager | (427,131 | ) | (941,342 | ) | ||||
Transfer agent fees waived and/or reimbursed — class specific | (9,736 | ) | (173,682 | ) | ||||
|
|
|
| |||||
Total expenses after fees waived and/or reimbursed | 1,378,495 | 7,586,171 | ||||||
|
|
|
| |||||
Net investment income (loss) | 2,683,808 | (7,192,302 | ) | |||||
|
|
|
| |||||
REALIZED AND UNREALIZED GAIN (LOSS) | ||||||||
Net realized gain (loss) from: | ||||||||
Investments — unaffiliated(a) | (8,466,114 | ) | (8,696,033 | ) | ||||
Investments — affiliated | (8 | ) | — | |||||
Foreign currency transactions | (335,228 | ) | (586,434 | ) | ||||
Futures contracts | (1,502,287 | ) | 3,315,892 | |||||
Options written | — | 5,026,244 | ||||||
Swaps | — | (39,884,002 | ) | |||||
|
|
|
| |||||
| (10,303,637 | ) | (40,824,333 | ) | |||||
|
|
|
| |||||
Net change in unrealized appreciation (depreciation) on: | ||||||||
Investments — unaffiliated(b) | (32,516,214 | ) | 762,238 | |||||
Foreign currency translations | (36,368 | ) | (1,347,397 | ) | ||||
Futures contracts | (444,244 | ) | (1,443,089 | ) | ||||
Options written | — | (114,676 | ) | |||||
Swaps | — | 33,768,518 | ||||||
|
|
|
| |||||
| (32,996,826 | ) | 31,625,594 | ||||||
|
|
|
| |||||
Net realized and unrealized loss | (43,300,463 | ) | (9,198,739 | ) | ||||
|
|
|
| |||||
NET DECREASE IN NET ASSETS RESULTING FROM OPERATIONS | $ | (40,616,655 | ) | $ | (16,391,041 | ) | ||
|
|
|
| |||||
(a) Net of foreign capital gain tax and capital gain tax refund, if applicable of | $ | (351,868 | ) | $ | — | |||
(b) Net of reduction in deferred foreign capital gain tax of | $ | 152,567 | $ | — | ||||
See notes to financial statements.
| 120 | 2 0 2 2 BLACK ROCK ANNUAL REPORT TO SHAREHOLDERS |
Statements of Changes in Net Assets
| BlackRock Advantage Emerging Markets Fund | BlackRock Global Long/Short Equity Fund | |||||||||||||||||||
| Year Ended April 30, | Year Ended April 30, | |||||||||||||||||||
| 2022 | 2021 | 2022 | 2021 | |||||||||||||||||
INCREASE (DECREASE) IN NET ASSETS |
| |||||||||||||||||||
OPERATIONS | ||||||||||||||||||||
Net investment income (loss) | $ | 2,683,808 | $ | 1,736,060 | $ | (7,192,302 | ) | $ | (8,008,841 | ) | ||||||||||
Net realized gain (loss) | (10,303,637 | ) | 20,058,021 | (40,824,333 | ) | 43,649,263 | ||||||||||||||
Net change in unrealized appreciation (depreciation) | (32,996,826 | ) | 28,008,446 | 31,625,594 | (10,917,001 | ) | ||||||||||||||
|
|
|
|
|
|
|
| |||||||||||||
Net increase (decrease) in net assets resulting from operations | (40,616,655 | ) | 49,802,527 | (16,391,041 | ) | 24,723,421 | ||||||||||||||
|
|
|
|
|
|
|
| |||||||||||||
DISTRIBUTIONS TO SHAREHOLDERS(a) | ||||||||||||||||||||
Institutional | (211,822 | ) | (184,178 | ) | (5,694,760 | ) | (1,486,534 | ) | ||||||||||||
Investor A | (69,700 | ) | (88,691 | ) | (289,045 | ) | (9,555 | ) | ||||||||||||
Investor C | (451 | ) | (10,800 | ) | (83,551 | ) | — | |||||||||||||
Class K | (2,045,863 | ) | (1,758,353 | ) | (64,174 | ) | (1,121 | ) | ||||||||||||
|
|
|
|
|
|
|
| |||||||||||||
Decrease in net assets resulting from distributions to shareholders | (2,327,836 | ) | (2,042,022 | ) | (6,131,530 | ) | (1,497,210 | ) | ||||||||||||
|
|
|
|
|
|
|
| |||||||||||||
CAPITAL SHARE TRANSACTIONS | ||||||||||||||||||||
Net increase (decrease) in net assets derived from capital share transactions | 9,079,203 | 25,998,281 | 129,941,298 | (55,842,584 | ) | |||||||||||||||
|
|
|
|
|
|
|
| |||||||||||||
NET ASSETS | ||||||||||||||||||||
Total increase (decrease) in net assets | (33,865,288 | ) | 73,758,786 | 107,418,727 | (32,616,373 | ) | ||||||||||||||
Beginning of year | 174,999,576 | 101,240,790 | 494,778,090 | 527,394,463 | ||||||||||||||||
|
|
|
|
|
|
|
| |||||||||||||
End of year | $ | 141,134,288 | $ | 174,999,576 | $ | 602,196,817 | $ | 494,778,090 | ||||||||||||
|
|
|
|
|
|
|
| |||||||||||||
| (a) | Distributions for annual periods determined in accordance with U.S. federal income tax regulations. |
See notes to financial statements.
FINANCIAL STATEMENTS | 121 |
(For a share outstanding throughout each period)
| BlackRock Advantage Emerging Markets Fund | ||||||||||||||||||||||||||||
| Institutional | ||||||||||||||||||||||||||||
| Year Ended April 30, | Period from to 04/30/20 | Year Ended July 31, | ||||||||||||||||||||||||||
| 2022 | 2021 | 2019 | 2018 | 2017 | ||||||||||||||||||||||||
Net asset value, beginning of period | $ | 13.24 | $ | 8.85 | $ | 10.25 | $ | 10.59 | $ | 10.10 | $ | 9.76 | ||||||||||||||||
|
|
|
|
|
|
|
|
|
|
|
| |||||||||||||||||
Net investment income (loss)(a) | 0.20 | 0.15 | 0.10 | 0.18 | 0.07 | (0.12 | ) | |||||||||||||||||||||
Net realized and unrealized gain (loss) | (3.17 | ) | 4.43 | (1.27 | ) | (0.52 | ) | 0.42 | 0.46 | |||||||||||||||||||
|
|
|
|
|
|
|
|
|
|
|
| |||||||||||||||||
Net increase (decrease) from investment operations | (2.97 | ) | 4.58 | (1.17 | ) | (0.34 | ) | 0.49 | 0.34 | |||||||||||||||||||
|
|
|
|
|
|
|
|
|
|
|
| |||||||||||||||||
Distributions from net investment income(b) | (0.16 | ) | (0.19 | ) | (0.23 | ) | — | — | — | |||||||||||||||||||
|
|
|
|
|
|
|
|
|
|
|
| |||||||||||||||||
Net asset value, end of period | $ | 10.11 | $ | 13.24 | $ | 8.85 | $ | 10.25 | $ | 10.59 | $ | 10.10 | ||||||||||||||||
|
|
|
|
|
|
|
|
|
|
|
| |||||||||||||||||
Total Return(c) | ||||||||||||||||||||||||||||
Based on net asset value | (22.62 | )% | 52.00 | % | (11.78 | )%(d) | (3.21 | )%(e) | 4.85 | % | 3.48 | %(f) | ||||||||||||||||
|
|
|
|
|
|
|
|
|
|
|
| |||||||||||||||||
Ratios to Average Net Assets(g) | ||||||||||||||||||||||||||||
Total expenses | 1.19 | % | 1.40 | % | 1.38 | %(h)(i) | 1.42 | %(j) | 1.28 | % | 1.91 | % | ||||||||||||||||
|
|
|
|
|
|
|
|
|
|
|
| |||||||||||||||||
Total expenses excluding recoupment of past fees waived and/or reimbursed | 1.19 | % | 1.40 | %(k) | 1.38 | %(h)(i) | 1.39 | %(j) | 1.28 | % | 1.90 | % | ||||||||||||||||
|
|
|
|
|
|
|
|
|
|
|
| |||||||||||||||||
Total expenses after fees waived and/or reimbursed | 0.85 | % | 0.85 | % | 0.81 | %(h) | 0.92 | %(j) | 0.94 | % | 1.70 | % | ||||||||||||||||
|
|
|
|
|
|
|
|
|
|
|
| |||||||||||||||||
Net investment income (loss) | 1.62 | % | 1.29 | % | 1.38 | %(h) | 1.83 | % | 0.67 | % | (1.29 | )% | ||||||||||||||||
|
|
|
|
|
|
|
|
|
|
|
| |||||||||||||||||
Supplemental Data | ||||||||||||||||||||||||||||
Net assets, end of period (000) | $ | 9,583 | $ | 17,216 | $ | 9,689 | $ | 15,904 | $ | 32,775 | $ | 106,243 | ||||||||||||||||
|
|
|
|
|
|
|
|
|
|
|
| |||||||||||||||||
Portfolio turnover rate | 183 | % | 180 | %(l) | 141 | %(l) | 128 | %(l) | 111 | %(l) | 7 | %(l) | ||||||||||||||||
|
|
|
|
|
|
|
|
|
|
|
| |||||||||||||||||
| (a) | Based on average shares outstanding. |
| (b) | Distributions for annual periods determined in accordance with U.S. federal income tax regulations. |
| (c) | Where applicable, assumes the reinvestment of distributions. |
| (d) | Aggregate total return. |
| (e) | Includes payment from an affiliate, which had no impact on the Fund’s total return. |
| (f) | The Fund’s total return includes a reimbursement by an affiliate for a realized investment loss. Excluding this payment, the Fund’s total return would have been 3.38%. |
| (g) | Excludes fees and expenses incurred indirectly as a result of investments in underlying funds. |
| (h) | Annualized. |
| (i) | Audit, printing and tax costs were not annualized in the calculation of the expense ratios. If these expenses were annualized, the total expenses and total expenses excluding recoupment of past fees waived and/or reimbursed would have been 1.42%, respectively. |
| (j) | Includes non-recurring expenses of offering costs. Without these costs, total expenses, total expenses excluding recoupment of past fees waived and/or reimbursed, and total expenses after fees waived and/or reimbursed would have been 1.40%, 1.37% and 0.90%, respectively. |
| (k) | Amount was previously reflected as total expenses after fees waived and/or reimbursed in the amount of 0.85%. |
| (l) | Excludes underlying investments in total return swaps. |
See notes to financial statements.
| 122 | 2 0 2 2 BLACK ROCK ANNUAL REPORT TO SHAREHOLDERS |
Financial Highlights (continued)
(For a share outstanding throughout each period)
| BlackRock Advantage Emerging Markets Fund (continued) | ||||||||||||||||||||||||||||
| Investor A | ||||||||||||||||||||||||||||
| Year Ended April 30, | Period from to 04/30/20 | Year Ended July 31, | ||||||||||||||||||||||||||
| 2022 | 2021 | 2019 | 2018 | 2017 | ||||||||||||||||||||||||
Net asset value, beginning of period | $ | 13.00 | $ | 8.69 | $ | 10.07 | $ | 10.43 | $ | 9.97 | $ | 9.67 | ||||||||||||||||
|
|
|
|
|
|
|
|
|
|
|
| |||||||||||||||||
Net investment income (loss)(a) | 0.15 | 0.11 | 0.07 | 0.17 | 0.14 | (0.15 | ) | |||||||||||||||||||||
Net realized and unrealized gain (loss) | (3.09 | ) | 4.36 | (1.25 | ) | (0.53 | ) | 0.32 | 0.45 | |||||||||||||||||||
|
|
|
|
|
|
|
|
|
|
|
| |||||||||||||||||
Net increase (decrease) from investment operations | (2.94 | ) | 4.47 | (1.18 | ) | (0.36 | ) | 0.46 | 0.30 | |||||||||||||||||||
|
|
|
|
|
|
|
|
|
|
|
| |||||||||||||||||
Distributions from net investment income(b) | (0.13 | ) | (0.16 | ) | (0.20 | ) | — | — | — | |||||||||||||||||||
|
|
|
|
|
|
|
|
|
|
|
| |||||||||||||||||
Net asset value, end of period | $ | 9.93 | $ | 13.00 | $ | 8.69 | $ | 10.07 | $ | 10.43 | $ | 9.97 | ||||||||||||||||
|
|
|
|
|
|
|
|
|
|
|
| |||||||||||||||||
Total Return(c) | ||||||||||||||||||||||||||||
Based on net asset value | (22.83 | )% | 51.62 | % | (12.05 | )%(d) | (3.45 | )%(e) | 4.61 | % | 3.10 | %(e) | ||||||||||||||||
|
|
|
|
|
|
|
|
|
|
|
| |||||||||||||||||
Ratios to Average Net Assets(f) | ||||||||||||||||||||||||||||
Total expenses | 1.52 | % | 1.74 | % | 1.70 | %(g)(h) | 1.69 | %(i) | 1.57 | % | 2.22 | % | ||||||||||||||||
|
|
|
|
|
|
|
|
|
|
|
| |||||||||||||||||
Total expenses excluding recoupment of past fees waived and/or reimbursed | 1.52 | % | 1.74 | %(j) | 1.70 | %(g)(h) | 1.67 | %(i) | 1.55 | % | 2.21 | % | ||||||||||||||||
|
|
|
|
|
|
|
|
|
|
|
| |||||||||||||||||
Total expenses after fees waived and/or reimbursed | 1.15 | % | 1.14 | % | 1.12 | %(g) | 1.17 | %(i) | 1.19 | % | 1.99 | % | ||||||||||||||||
|
|
|
|
|
|
|
|
|
|
|
| |||||||||||||||||
Net investment income (loss) | 1.29 | % | 0.98 | % | 1.02 | %(g) | 1.74 | % | 1.32 | % | (1.62 | )% | ||||||||||||||||
|
|
|
|
|
|
|
|
|
|
|
| |||||||||||||||||
Supplemental Data | ||||||||||||||||||||||||||||
Net assets, end of period (000) | $ | 5,246 | $ | 7,125 | $ | 5,224 | $ | 3,817 | $ | 5,454 | $ | 3,272 | ||||||||||||||||
|
|
|
|
|
|
|
|
|
|
|
| |||||||||||||||||
Portfolio turnover rate | 183 | % | 180 | %(k) | 141 | %(k) | 128 | %(k) | 111 | %(k) | 7 | %(k) | ||||||||||||||||
|
|
|
|
|
|
|
|
|
|
|
| |||||||||||||||||
| (a) | Based on average shares outstanding. |
| (b) | Distributions for annual periods determined in accordance with U.S. federal income tax regulations. |
| (c) | Where applicable, excludes the effects of any sales charges and assumes the reinvestment of distributions. |
| (d) | Aggregate total return. |
| (e) | Includes payment from an affiliate, which had no impact on the Fund’s total return. |
| (f) | Excludes fees and expenses incurred indirectly as a result of investments in underlying funds. |
| (g) | Annualized. |
| (h) | Audit, printing and tax costs were not annualized in the calculation of the expense ratios. If these expenses were annualized, the total expenses and total expenses excluding recoupment of past fees waived and/or reimbursed would have been 1.74%, respectively. |
| (i) | Includes non-recurring expenses of offering costs. Without these costs, total expenses, total expenses excluding recoupment of past fees waived and/or reimbursed, and total expenses after fees waived and/or reimbursed would have been 1.67%, 1.65% and 1.15%, respectively. |
| (j) | Amount was previously reflected as total expenses after fees waived and/or reimbursed in the amount of 1.14%. |
| (k) | Excludes underlying investments in total return swaps. |
See notes to financial statements.
FINANCIAL HIGHLIGHTS | 123 |
Financial Highlights (continued)
(For a share outstanding throughout each period)
| BlackRock Advantage Emerging Markets Fund (continued) | ||||||||||||||||||||||||||||
| Investor C | ||||||||||||||||||||||||||||
| Year Ended April 30, | Period from to 04/30/20 | Year Ended July 31, | ||||||||||||||||||||||||||
| 2022 | 2021 | 2019 | 2018 | 2017 | ||||||||||||||||||||||||
Net asset value, beginning of period | $ | 12.36 | $ | 8.29 | $ | 9.53 | $ | 9.95 | $ | 9.58 | $ | 9.36 | ||||||||||||||||
|
|
|
|
|
|
|
|
|
|
|
| |||||||||||||||||
Net investment income (loss)(a) | 0.07 | 0.04 | 0.02 | 0.08 | 0.03 | (0.21 | ) | |||||||||||||||||||||
Net realized and unrealized gain (loss) | (2.96 | ) | 4.14 | (1.21 | ) | (0.50 | ) | 0.34 | 0.43 | |||||||||||||||||||
|
|
|
|
|
|
|
|
|
|
|
| |||||||||||||||||
Net increase (decrease) from investment operations | (2.89 | ) | 4.18 | (1.19 | ) | (0.42 | ) | 0.37 | 0.22 | |||||||||||||||||||
|
|
|
|
|
|
|
|
|
|
|
| |||||||||||||||||
Distributions from net investment income(b) | (0.01 | ) | (0.11 | ) | (0.05 | ) | — | — | — | |||||||||||||||||||
|
|
|
|
|
|
|
|
|
|
|
| |||||||||||||||||
Net asset value, end of period | $ | 9.46 | $ | 12.36 | $ | 8.29 | $ | 9.53 | $ | 9.95 | $ | 9.58 | ||||||||||||||||
|
|
|
|
|
|
|
|
|
|
|
| |||||||||||||||||
Total Return(c) | ||||||||||||||||||||||||||||
Based on net asset value | (23.40 | )% | 50.49 | % | (12.57 | )%(d) | (4.22 | )%(e) | 3.86 | % | 2.35 | %(e) | ||||||||||||||||
|
|
|
|
|
|
|
|
|
|
|
| |||||||||||||||||
Ratios to Average Net Assets(f) | ||||||||||||||||||||||||||||
Total expenses | 2.43 | % | 2.56 | % | 2.53 | %(g)(h) | 2.53 | %(i) | 2.38 | % | 2.91 | % | ||||||||||||||||
|
|
|
|
|
|
|
|
|
|
|
| |||||||||||||||||
Total expenses excluding recoupment of past fees waived and/or reimbursed | 2.43 | % | 2.56 | %(j) | 2.53 | %(g)(h) | 2.53 | %(i) | 2.38 | % | 2.91 | % | ||||||||||||||||
|
|
|
|
|
|
|
|
|
|
|
| |||||||||||||||||
Total expenses after fees waived and/or reimbursed | 1.90 | % | 1.90 | % | 1.90 | %(g) | 1.92 | %(i) | 1.94 | % | 2.71 | % | ||||||||||||||||
|
|
|
|
|
|
|
|
|
|
|
| |||||||||||||||||
Net investment income (loss) | 0.61 | % | 0.43 | % | 0.26 | %(g) | 0.81 | % | 0.25 | % | (2.30 | )% | ||||||||||||||||
|
|
|
|
|
|
|
|
|
|
|
| |||||||||||||||||
Supplemental Data | ||||||||||||||||||||||||||||
Net assets, end of period (000) | $ | 282 | $ | 550 | $ | 1,164 | $ | 2,280 | $ | 3,240 | $ | 3,823 | ||||||||||||||||
|
|
|
|
|
|
|
|
|
|
|
| |||||||||||||||||
Portfolio turnover rate | 183 | % | 180 | %(k) | 141 | %(k) | 128 | %(k) | 111 | %(k) | 7 | %(k) | ||||||||||||||||
|
|
|
|
|
|
|
|
|
|
|
| |||||||||||||||||
| (a) | Based on average shares outstanding. |
| (b) | Distributions for annual periods determined in accordance with U.S. federal income tax regulations. |
| (c) | Where applicable, excludes the effects of any sales charges and assumes the reinvestment of distributions. |
| (d) | Aggregate total return. |
| (e) | Includes payment from an affiliate, which had no impact on the Fund’s total return. |
| (f) | Excludes fees and expenses incurred indirectly as a result of investments in underlying funds. |
| (g) | Annualized. |
| (h) | Audit, printing and tax costs were not annualized in the calculation of the expense ratios. If these expenses were annualized, the total expenses and total expenses excluding recoupment of past fees waived and/or reimbursed would have been 2.57%, respectively. |
| (i) | Includes non-recurring expenses of offering costs. Without these costs, total expenses, total expenses excluding recoupment of past fees waived and/or reimbursed, and total expenses after fees waived and/or reimbursed would have been 2.51%, 2.51% and 1.90%, respectively. |
| (j) | Amount was previously reflected as total expenses after fees waived and/or reimbursed in the amount of 1.90%. |
| (k) | Excludes underlying investments in total return swaps. |
See notes to financial statements.
| 124 | 2 0 2 2 BLACK ROCK ANNUAL REPORT TO SHAREHOLDERS |
Financial Highlights (continued)
(For a share outstanding throughout each period)
| BlackRock Advantage Emerging Markets Fund (continued) | ||||||||||||||||||||||||
| Class K | ||||||||||||||||||||||||
| Year Ended April 30, |
| Period from to 04/30/20 | Year Ended July 31, 2019 | Period from to 07/31/18 | ||||||||||||||||||||
| 2022 | 2021 | |||||||||||||||||||||||
Net asset value, beginning of period | $ | 13.24 | $ 8.84 | $ | 10.26 | $ | 10.59 | $ | 12.14 | |||||||||||||||
|
|
|
|
|
|
|
|
|
| |||||||||||||||
Net investment income(b) | 0.20 | 0.16 | 0.10 | 0.19 | 0.13 | |||||||||||||||||||
Net realized and unrealized gain (loss) | (3.16 | ) | 4.43 | (1.28 | ) | (0.52 | ) | (1.68 | ) | |||||||||||||||
|
|
|
|
|
|
|
|
|
| |||||||||||||||
Net increase (decrease) from investment operations | (2.96 | ) | 4.59 | (1.18 | ) | (0.33 | ) | (1.55 | ) | |||||||||||||||
|
|
|
|
|
|
|
|
|
| |||||||||||||||
Distributions from net investment income(c) | (0.17 | ) | (0.19 | ) | (0.24 | ) | — | — | ||||||||||||||||
|
|
|
|
|
|
|
|
|
| |||||||||||||||
Net asset value, end of period | $ | 10.11 | $ 13.24 | $ | 8.84 | $ | 10.26 | $ | 10.59 | |||||||||||||||
|
|
|
|
|
|
|
|
|
| |||||||||||||||
Total Return(d) | ||||||||||||||||||||||||
Based on net asset value | (22.59 | )% | 52.19 | % | (11.87 | )%(e) | (3.12 | )%(f) | (12.77 | )%(e) | ||||||||||||||
|
|
|
|
|
|
|
|
|
| |||||||||||||||
Ratios to Average Net Assets(g) | ||||||||||||||||||||||||
Total expenses | 1.13 | % | 1.36 | % | 1.41 | %(h)(i) | 1.37 | %(j) | 1.32 | %(h)(k) | ||||||||||||||
|
|
|
|
|
|
|
|
|
| |||||||||||||||
Total expenses after fees waived and/or reimbursed | 0.81 | % | 0.81 | % | 0.81 | %(h) | 0.87 | %(j) | 0.89 | %(h) | ||||||||||||||
|
|
|
|
|
|
|
|
|
| |||||||||||||||
Net investment income | 1.63 | % | 1.36 | % | 1.33 | %(h) | 1.93 | % | 2.33 | %(h) | ||||||||||||||
|
|
|
|
|
|
|
|
|
| |||||||||||||||
Supplemental Data | ||||||||||||||||||||||||
Net assets, end of period (000) | $ | 126,023 | $150,108 | $ | 85,164 | $ | 80,529 | $ | 145,476 | |||||||||||||||
|
|
|
|
|
|
|
|
|
| |||||||||||||||
Portfolio turnover rate | 183 | % | 180 | %(l) | 141 | %(l) | 128 | %(l) | 111 | %(l)(m) | ||||||||||||||
|
|
|
|
|
|
|
|
|
| |||||||||||||||
| (a) | Commencement of operations. |
| (b) | Based on average shares outstanding. |
| (c) | Distributions for annual periods determined in accordance with U.S. federal income tax regulations. |
| (d) | Where applicable, assumes the reinvestment of distributions. |
| (e) | Aggregate total return. |
| (f) | Includes payment from an affiliate, which had no impact on the Fund’s total return. |
| (g) | Excludes fees and expenses incurred indirectly as a result of investments in underlying funds. |
| (h) | Annualized. |
| (i) | Audit, printing and tax costs were not annualized in the calculation of the expense ratios. If these expenses were annualized, the total expenses would have been 1.45%. |
| (j) | Includes non-recurring expenses of offering costs. Without these costs, total expenses and total expenses after fees waived and/or reimbursed would have been 1.34% and 0.84%, respectively. |
| (k) | Offering costs were not annualized in the calculation of the expense ratios. If these expenses were annualized, the total expenses would have been 1.31%. |
| (l) | Excludes underlying investments in total return swaps. |
| (m) | Portfolio turnover rate is representative of the Fund for the entire year. |
See notes to financial statements.
FINANCIAL HIGHLIGHTS | 125 |
Financial Highlights (continued)
(For a share outstanding throughout each period)
| BlackRock Global Long/Short Equity Fund | ||||||||||||||||||||||||||||||||
| Institutional | ||||||||||||||||||||||||||||||||
| Year Ended April 30, |
| Period from to 04/30/20 | Year Ended July 31, | |||||||||||||||||||||||||||||
| 2022 | 2021 | 2019 | 2018 | 2017 | ||||||||||||||||||||||||||||
Net asset value, beginning of period | $ | 11.98 | $ | 11.42 | $ | 12.67 | $ | 12.17 | $ | 11.62 | $ | 10.56 | ||||||||||||||||||||
|
|
|
|
|
|
|
|
|
|
|
| |||||||||||||||||||||
Net investment income (loss)(a) | (0.15 | ) | (0.17 | ) | (0.01 | ) | 0.05 | (0.06 | ) | (0.14 | ) | |||||||||||||||||||||
Net realized and unrealized gain (loss) | (0.20 | ) | 0.76 | (0.46 | ) | 0.57 | 0.61 | 1.20 | ||||||||||||||||||||||||
|
|
|
|
|
|
|
|
|
|
|
| |||||||||||||||||||||
Net increase (decrease) from investment operations | (0.35 | ) | 0.59 | (0.47 | ) | 0.62 | 0.55 | 1.06 | ||||||||||||||||||||||||
|
|
|
|
|
|
|
|
|
|
|
| |||||||||||||||||||||
Distributions(b) | ||||||||||||||||||||||||||||||||
From net investment income | — | — | (0.04 | ) | — | — | — | |||||||||||||||||||||||||
From net realized gain | (0.14 | ) | (0.03 | ) | (0.74 | ) | (0.12 | ) | — | — | ||||||||||||||||||||||
|
|
|
|
|
|
|
|
|
|
|
| |||||||||||||||||||||
Total distributions | (0.14 | ) | (0.03 | ) | (0.78 | ) | (0.12 | ) | — | — | ||||||||||||||||||||||
|
|
|
|
|
|
|
|
|
|
|
| |||||||||||||||||||||
Net asset value, end of period | $ | 11.49 | $ | 11.98 | $ | 11.42 | $ | 12.67 | $ | 12.17 | $ | 11.62 | ||||||||||||||||||||
|
|
|
|
|
|
|
|
|
|
|
| |||||||||||||||||||||
Total Return(c) | ||||||||||||||||||||||||||||||||
Based on net asset value | (2.94 | )%(d) | 5.21 | %(e) | (3.80 | )%(f) | 5.09 | % | 4.73 | % | 10.04 | % | ||||||||||||||||||||
|
|
|
|
|
|
|
|
|
|
|
| |||||||||||||||||||||
Ratios to Average Net Assets(g) | ||||||||||||||||||||||||||||||||
Total expenses | 1.58 | % | 1.82 | % | 1.80 | %(h) | 1.76 | % | 1.73 | % | 1.78 | % | ||||||||||||||||||||
|
|
|
|
|
|
|
|
|
|
|
| |||||||||||||||||||||
Total expenses excluding recoupment of past fees waived and/or reimbursed | 1.58 | % | 1.82 | %(i) | 1.80 | %(h) | 1.76 | % | 1.71 | % | 1.78 | % | ||||||||||||||||||||
|
|
|
|
|
|
|
|
|
|
|
| |||||||||||||||||||||
Total expenses after fees waived and/or reimbursed | 1.36 | % | 1.57 | % | 1.57 | %(h) | 1.63 | % | 1.66 | % | 1.70 | % | ||||||||||||||||||||
|
|
|
|
|
|
|
|
|
|
|
| |||||||||||||||||||||
Net investment income (loss) | (1.29 | )% | (1.49 | )% | (0.09 | )%(h) | 0.36 | % | (0.51 | )% | (1.28 | )% | ||||||||||||||||||||
|
|
|
|
|
|
|
|
|
|
|
| |||||||||||||||||||||
Supplemental Data | ||||||||||||||||||||||||||||||||
Net assets, end of period (000) | $ | 565,502 | $ | 459,420 | $ | 492,021 | $ | 546,561 | $ | 559,028 | $ | 544,301 | ||||||||||||||||||||
|
|
|
|
|
|
|
|
|
|
|
| |||||||||||||||||||||
Portfolio turnover rate | 31 | %(j) | 43 | %(j) | 53 | %(j) | 7 | %(j) | 20 | %(j) | — | % | ||||||||||||||||||||
|
|
|
|
|
|
|
|
|
|
|
| |||||||||||||||||||||
| (a) | Based on average shares outstanding. |
| (b) | Distributions for annual periods determined in accordance with U.S. federal income tax regulations. |
| (c) | Where applicable, assumes the reinvestment of distributions. |
| (d) | Includes payment from an affiliate, which had no impact on the Fund’s total return. |
| (e) | Includes payments from an affiliate, which impacted the Fund’s total return. Excluding the payments, the Fund’s total return would have been 5.12%. |
| (f) | Aggregate total return. |
| (g) | Excludes fees and expenses incurred indirectly as a result of investments in underlying funds. |
| (h) | Annualized. |
| (i) | Amount was previously reflected as total expenses after fees waived and/or reimbursed in the amount of 1.57%. |
| (j) | Excludes underlying investments in total return swaps. |
See notes to financial statements.
| 126 | 2 0 2 2 BLACK ROCK ANNUAL REPORT TO SHAREHOLDERS |
Financial Highlights (continued)
(For a share outstanding throughout each period)
| BlackRock Global Long/Short Equity Fund (continued) | ||||||||||||||||||||||||||||
| Investor A | ||||||||||||||||||||||||||||
|
| |||||||||||||||||||||||||||
| Year Ended April 30, | Period from to 04/30/20 | Year Ended July 31, | ||||||||||||||||||||||||||
| 2022 | 2021 | 2019 | 2018 | 2017 | ||||||||||||||||||||||||
Net asset value, beginning of period | $ | 11.82 | $ | 11.27 | $ | 12.50 | $ | 12.03 | $ | 11.52 | $ | 10.49 | ||||||||||||||||
|
|
|
|
|
|
|
|
|
|
|
| |||||||||||||||||
Net investment income (loss)(a) | (0.18 | ) | (0.20 | ) | (0.02 | ) | 0.01 | (0.10 | ) | (0.17 | ) | |||||||||||||||||
Net realized and unrealized gain (loss) | (0.20 | ) | 0.75 | (0.46 | ) | 0.56 | 0.61 | 1.20 | ||||||||||||||||||||
|
|
|
|
|
|
|
|
|
|
|
| |||||||||||||||||
Net increase (decrease) from investment operations | (0.38 | ) | 0.55 | (0.48 | ) | 0.57 | 0.51 | 1.03 | ||||||||||||||||||||
|
|
|
|
|
|
|
|
|
|
| �� | |||||||||||||||||
Distributions(b) | ||||||||||||||||||||||||||||
From net investment income | — | — | (0.01 | ) | — | — | — | |||||||||||||||||||||
From net realized gain | (0.14 | ) | (0.00 | )(c) | (0.74 | ) | (0.10 | ) | — | — | ||||||||||||||||||
|
|
|
|
|
|
|
|
|
|
|
| |||||||||||||||||
Total distributions | (0.14 | ) | (0.00 | ) | (0.75 | ) | (0.10 | ) | — | — | ||||||||||||||||||
|
|
|
|
|
|
|
|
|
|
|
| |||||||||||||||||
Net asset value, end of period | $ | 11.30 | $ | 11.82 | $ | 11.27 | $ | 12.50 | $ | 12.03 | $ | 11.52 | ||||||||||||||||
|
|
|
|
|
|
|
|
|
|
|
| |||||||||||||||||
Total Return(d) | ||||||||||||||||||||||||||||
Based on net asset value | (3.23 | )%(e) | 4.92 | %(f) | (3.94 | )%(g) | 4.79 | % | 4.43 | % | 9.82 | % | ||||||||||||||||
|
|
|
|
|
|
|
|
|
|
|
| |||||||||||||||||
Ratios to Average Net Assets(h) | ||||||||||||||||||||||||||||
Total expenses | 1.86 | % | 2.07 | % | 2.07 | %(i) | 2.04 | % | 2.03 | % | 2.10 | % | ||||||||||||||||
|
|
|
|
|
|
|
|
|
|
|
| |||||||||||||||||
Total expenses excluding recoupment of past fees waived and/or reimbursed | 1.86 | % | 2.07 | %(j) | 2.07 | %(i) | 2.04 | % | 1.95 | % | 2.10 | % | ||||||||||||||||
|
|
|
|
|
|
|
|
|
|
|
| |||||||||||||||||
Total expenses after fees waived and/or reimbursed | 1.61 | % | 1.82 | % | 1.82 | %(i) | 1.88 | % | 1.96 | % | 1.98 | % | ||||||||||||||||
|
|
|
|
|
|
|
|
|
|
|
| |||||||||||||||||
Net investment income (loss) | (1.54 | )% | (1.75 | )% | (0.28 | )%(i) | 0.12 | % | (0.84 | )% | (1.60 | )% | ||||||||||||||||
|
|
|
|
|
|
|
|
|
|
|
| |||||||||||||||||
Supplemental Data | ||||||||||||||||||||||||||||
Net assets, end of period (000) | $ | 25,229 | $ | 23,390 | $ | 23,509 | $ | 49,514 | $ | 49,180 | $ | 35,658 | ||||||||||||||||
|
|
|
|
|
|
|
|
|
|
|
| |||||||||||||||||
Portfolio turnover rate | 31 | %(k) | 43 | %(k) | 53 | %(k) | 7 | %(k) | 20 | %(k) | — | % | ||||||||||||||||
|
|
|
|
|
|
|
|
|
|
|
| |||||||||||||||||
| (a) | Based on average shares outstanding. |
| (b) | Distributions for annual periods determined in accordance with U.S. federal income tax regulations. |
| (c) | Amount is greater than $(0.005) per share. |
| (d) | Where applicable, excludes the effects of any sales charges and assumes the reinvestment of distributions. |
| (e) | Includes payment from an affiliate, which had no impact on the Fund’s total return. |
| (f) | Includes payments received from an affiliate, which impacted the Fund’s total return. Excluding the payments, the Fund’s total return would have been 4.83%. |
| (g) | Aggregate total return. |
| (h) | Excludes fees and expenses incurred indirectly as a result of investments in underlying funds. |
| (i) | Annualized. |
| (j) | Amount was previously reflected as total expenses after fees waived and/or reimbursed in the amount of 1.82%. |
| (k) | Excludes underlying investments in total return swaps. |
See notes to financial statements.
FINANCIAL HIGHLIGHTS | 127 |
Financial Highlights (continued)
(For a share outstanding throughout each period)
| BlackRock Global Long/Short Equity Fund (continued) | ||||||||||||||||||||||||||||
| Investor C | ||||||||||||||||||||||||||||
| Year Ended April 30, | Period from to 04/30/20 | Year Ended July 31, | ||||||||||||||||||||||||||
| 2022 | 2021 | 2019 | 2018 | 2017 | ||||||||||||||||||||||||
Net asset value, beginning of period | $ | 11.22 | $ | 10.77 | $ | 11.99 | $ | 11.59 | $ | 11.18 | $ | 10.26 | ||||||||||||||||
|
|
|
|
|
|
|
|
|
|
|
| |||||||||||||||||
Net investment loss(a) | (0.25 | ) | (0.27 | ) | (0.09 | ) | (0.08 | ) | (0.18 | ) | (0.24 | ) | ||||||||||||||||
Net realized and unrealized gain (loss) | (0.19 | ) | 0.72 | (0.44 | ) | 0.54 | 0.59 | 1.16 | ||||||||||||||||||||
|
|
|
|
|
|
|
|
|
|
|
| |||||||||||||||||
Net increase (decrease) from investment operations | (0.44 | ) | 0.45 | (0.53 | ) | 0.46 | 0.41 | 0.92 | ||||||||||||||||||||
|
|
|
|
|
|
|
|
|
|
|
| |||||||||||||||||
Distributions from net realized gain(b) | (0.14 | ) | — | (0.69 | ) | (0.06 | ) | — | — | |||||||||||||||||||
|
|
|
|
|
|
|
|
|
|
|
| |||||||||||||||||
Net asset value, end of period | $ | 10.64 | $ | 11.22 | $ | 10.77 | $ | 11.99 | $ | 11.59 | $ | 11.18 | ||||||||||||||||
|
|
|
|
|
|
|
|
|
|
|
| |||||||||||||||||
Total Return(c) | ||||||||||||||||||||||||||||
Based on net asset value | (3.95 | )%(d) | 4.18 | %(e) | (4.51 | )%(f) | 4.02 | % | 3.67 | % | 8.97 | % | ||||||||||||||||
|
|
|
|
|
|
|
|
|
|
|
| |||||||||||||||||
Ratios to Average Net Assets(g) | ||||||||||||||||||||||||||||
Total expenses | 2.64 | % | 2.86 | % | 2.83 | %(h) | 2.79 | % | 2.76 | % | 2.81 | % | ||||||||||||||||
|
|
|
|
|
|
|
|
|
|
|
| |||||||||||||||||
Total expenses excluding recoupment of past fees waived and/or reimbursed | 2.64 | % | 2.86 | %(i) | 2.83 | %(h) | 2.79 | % | 2.72 | % | 2.81 | % | ||||||||||||||||
|
|
|
|
|
|
|
|
|
|
|
| |||||||||||||||||
Total expenses after fees waived and/or reimbursed | 2.36 | % | 2.57 | % | 2.57 | %(h) | 2.63 | % | 2.69 | % | 2.72 | % | ||||||||||||||||
|
|
|
|
|
|
|
|
|
|
|
| |||||||||||||||||
Net investment loss | (2.30 | )% | (2.44 | )% | (1.04 | )%(h) | (0.64 | )% | (1.58 | )% | (2.32 | )% | ||||||||||||||||
|
|
|
|
|
|
|
|
|
|
|
| |||||||||||||||||
Supplemental Data | ||||||||||||||||||||||||||||
Net assets, end of period (000) | $ | 4,386 | $ | 6,817 | $ | 11,539 | $ | 17,282 | $ | 21,168 | $ | 25,857 | ||||||||||||||||
|
|
|
|
|
|
|
|
|
|
|
| |||||||||||||||||
Portfolio turnover rate | 31 | %(j) | 43 | %(j) | 53 | %(j) | 7 | %(j) | 20 | %(j) | — | % | ||||||||||||||||
|
|
|
|
|
|
|
|
|
|
|
| |||||||||||||||||
| (a) | Based on average shares outstanding. |
| (b) | Distributions for annual periods determined in accordance with U.S. federal income tax regulations. |
| (c) | Where applicable, excludes the effects of any sales charges and assumes the reinvestment of distributions. |
| (d) | Includes payment from an affiliate, which had no impact on the Fund’s total return. |
| (e) | Includes payments received from an affiliate, which impacted the Fund’s total return. Excluding the payments, the Fund’s total return would have been 4.09%. |
| (f) | Aggregate total return. |
| (g) | Excludes fees and expenses incurred indirectly as a result of investments in underlying funds. |
| (h) | Annualized. |
| (i) | Amount was previously reflected as total expenses after fees waived and/or reimbursed in the amount of 2.57%. |
| (j) | Excludes underlying investments in total return swaps. |
See notes to financial statements.
| 128 | 2 0 2 2 BLACK ROCK ANNUAL REPORT TO SHAREHOLDERS |
Financial Highlights (continued)
(For a share outstanding throughout each period)
| BlackRock Global Long/Short Equity Fund (continued) | ||||||||||||||||||||||||||||
| Class K | ||||||||||||||||||||||||||||
| Year Ended April 30, | Period from 08/01/19 to 04/30/20 | Year Ended July 31, | ||||||||||||||||||||||||||
| 2022 | 2021 | 2019 | 2018 | 2017 | ||||||||||||||||||||||||
Net asset value, beginning of period | $ | 12.00 | $ | 11.44 | $ | 12.69 | $ | 12.19 | $ | 11.63 | $ | 10.56 | ||||||||||||||||
|
|
|
|
|
|
|
|
|
|
|
| |||||||||||||||||
Net investment income (loss)(a) | (0.14 | ) | (0.25 | ) | (0.01 | ) | 0.06 | (0.01 | ) | (0.14 | ) | |||||||||||||||||
Net realized and unrealized gain (loss) | (0.20 | ) | 0.85 | (0.46 | ) | 0.56 | 0.57 | 1.21 | ||||||||||||||||||||
|
|
|
|
|
|
|
|
|
|
|
| |||||||||||||||||
Net increase (decrease) from investment operations | (0.34 | ) | 0.60 | (0.47 | ) | 0.62 | 0.56 | 1.07 | ||||||||||||||||||||
|
|
|
|
|
|
|
|
|
|
|
| |||||||||||||||||
Distributions(b) | ||||||||||||||||||||||||||||
From net investment income | — | — | (0.04 | ) | — | — | — | |||||||||||||||||||||
From net realized gain | (0.14 | ) | (0.04 | ) | (0.74 | ) | (0.12 | ) | — | — | ||||||||||||||||||
|
|
|
|
|
|
|
|
|
|
|
| |||||||||||||||||
Total distributions | (0.14 | ) | (0.04 | ) | (0.78 | ) | (0.12 | ) | — | — | ||||||||||||||||||
|
|
|
|
|
|
|
|
|
|
|
| |||||||||||||||||
Net asset value, end of period | $ | 11.52 | $ | 12.00 | $ | 11.44 | $ | 12.69 | $ | 12.19 | $ | 11.63 | ||||||||||||||||
|
|
|
|
|
|
|
|
|
|
|
| |||||||||||||||||
Total Return(c) | ||||||||||||||||||||||||||||
Based on net asset value | (2.85 | )%(d) | 5.24 | %(d) | (3.77 | )%(e) | 5.11 | % | 4.82 | % | 10.13 | % | ||||||||||||||||
|
|
|
|
|
|
|
|
|
|
|
| |||||||||||||||||
Ratios to Average Net Assets(f) | ||||||||||||||||||||||||||||
Total expenses | 1.51 | % | 1.77 | % | 1.76 | %(g) | 1.72 | % | 1.65 | % | 1.70 | % | ||||||||||||||||
|
|
|
|
|
|
|
|
|
|
|
| |||||||||||||||||
Total expenses excluding recoupment of past fees waived and/or reimbursed | 1.51 | % | 1.77 | %(h) | 1.76 | %(g) | 1.72 | % | 1.64 | % | 1.70 | % | ||||||||||||||||
|
|
|
|
|
|
|
|
|
|
|
| |||||||||||||||||
Total expenses after fees waived and/or reimbursed | 1.31 | % | 1.52 | % | 1.52 | %(g) | 1.57 | % | 1.58 | % | 1.63 | % | ||||||||||||||||
|
|
|
|
|
|
|
|
|
|
|
| |||||||||||||||||
Net investment income (loss) | (1.24 | )% | (2.07 | )% | (0.07 | )%(g) | 0.45 | % | (0.04 | )% | (1.32 | )% | ||||||||||||||||
|
|
|
|
|
|
|
|
|
|
|
| |||||||||||||||||
Supplemental Data | ||||||||||||||||||||||||||||
Net assets, end of period (000) | $ | 7,080 | $ | 5,151 | $ | 325 | $ | 453 | $ | 217 | $ | 108 | ||||||||||||||||
|
|
|
|
|
|
|
|
|
|
|
| |||||||||||||||||
Portfolio turnover rate | 31 | %(i) | 43 | %(i) | 53 | %(i) | 7 | %(i) | 20 | %(i) | — | % | ||||||||||||||||
|
|
|
|
|
|
|
|
|
|
|
| |||||||||||||||||
| (a) | Based on average shares outstanding. |
| (b) | Distributions for annual periods determined in accordance with U.S. federal income tax regulations. |
| (c) | Where applicable, assumes the reinvestment of distributions. |
| (d) | Includes payment from an affiliate, which had no impact on the Fund’s total return. |
| (e) | Aggregate total return. |
| (f) | Excludes fees and expenses incurred indirectly as a result of investments in underlying funds. |
| (g) | Annualized. |
| (h) | Amount was previously reflected as total expenses after fees waived and/or reimbursed in the amount of 1.52%. |
| (i) | Excludes underlying investments in total return swaps. |
See notes to financial statements.
FINANCIAL HIGHLIGHTS | 129 |
| Notes to Financial Statements |
| 1. | ORGANIZATION |
BlackRock FundsSM (the “Trust”) is registered under the Investment Company Act of 1940, as amended (the “1940 Act”), as an open-end management investment company. The Trust is organized as a Massachusetts business trust. The following, each of which is a series of the Trust, are referred to herein collectively as the “Funds” or individually as a “Fund”:
Fund Name | Herein Referred To As | Diversification Classification | ||||||
BlackRock Advantage Emerging Markets Fund | Advantage Emerging Markets | Diversified | ||||||
BlackRock Global Long/Short Equity Fund | Global Long/Short Equity | Diversified | ||||||
Each Fund offers multiple classes of shares. All classes of shares have identical voting, dividend, liquidation and other rights and are subject to the same terms and conditions, except that certain classes bear expenses related to the shareholder servicing and distribution of such shares. Institutional and Class K Shares are sold only to certain eligible investors. Investor A and Investor C Shares bear certain expenses related to shareholder servicing of such shares, and Investor C Shares also bear certain expenses related to the distribution of such shares. Investor A and Investor C Shares are generally available through financial intermediaries. Each class has exclusive voting rights with respect to matters relating to its shareholder servicing and distribution expenditures (except that Investor C shareholders may vote on material changes to the Investor A Shares distribution and service plan).
| Share Class | Initial Sales Charge | CDSC | Conversion Privilege | |||||||||
Institutional and Class K Shares | No | No | None | |||||||||
Investor A Shares | Yes | No | (a) | None | ||||||||
Investor C Shares | No | Yes | (b) | To Investor A Shares after approximately 8 years | ||||||||
| (a) | Investor A Shares may be subject to a contingent deferred sales charge (“CDSC”) for certain redemptions where no initial sales charge was paid at the time of purchase. |
| (b) | A CDSC of 1.00% is assessed on certain redemptions of Investor C Shares made within one year after purchase. |
The Funds, together with certain other registered investment companies advised by BlackRock Advisors, LLC (the “Manager”) or its affiliates, are included in a complex of open-end equity, multi-asset, index and money market funds referred to as the BlackRock Multi-Asset Complex.
| 2. | SIGNIFICANT ACCOUNTING POLICIES |
The financial statements are prepared in conformity with accounting principles generally accepted in the United States of America (“U.S. GAAP”), which may require management to make estimates and assumptions that affect the reported amounts of assets and liabilities in the financial statements, disclosure of contingent assets and liabilities at the date of the financial statements and the reported amounts of increases and decreases in net assets from operations during the reporting period. Actual results could differ from those estimates. Each Fund is considered an investment company under U.S. GAAP and follows the accounting and reporting guidance applicable to investment companies. Below is a summary of significant accounting policies:
Investment Transactions and Income Recognition: For financial reporting purposes, investment transactions are recorded on the dates the transactions are executed. Realized gains and losses on investment transactions are determined using the specific identification method. Dividend income and capital gain distributions, if any, are recorded on the ex-dividend dates. Non-cash dividends, if any, are recorded on the ex-dividend dates at fair value. Dividends from foreign securities where the ex-dividend dates may have passed are subsequently recorded when the Funds are informed of the ex-dividend dates. Under the applicable foreign tax laws, a withholding tax at various rates may be imposed on capital gains, dividends and interest. Upon notification from issuers, a portion of the dividend income received from a real estate investment trust may be redesignated as a reduction of cost of the related investment and/or realized gain. Interest income, including amortization and accretion of premiums and discounts on debt securities, is recognized daily on an accrual basis. Income, expenses and realized and unrealized gains and losses are allocated daily to each class based on its relative net assets.
Foreign Currency Translation: Each Fund’s books and records are maintained in U.S. dollars. Securities and other assets and liabilities denominated in foreign currencies are translated into U.S. dollars using exchange rates determined as of the close of trading on the New York Stock Exchange (“NYSE”). Purchases and sales of investments are recorded at the rates of exchange prevailing on the respective dates of such transactions. Generally, when the U.S. dollar rises in value against a foreign currency, the investments denominated in that currency will lose value; the opposite effect occurs if the U.S. dollar falls in relative value.
Each Fund does not isolate the effect of fluctuations in foreign exchange rates from the effect of fluctuations in the market prices of investments for financial reporting purposes. Accordingly, the effects of changes in exchange rates on investments are not segregated in the Statements of Operations from the effects of changes in market prices of those investments, but are included as a component of net realized and unrealized gain (loss) from investments. Each Fund reports realized currency gains (losses) on foreign currency related transactions as components of net realized gain (loss) for financial reporting purposes, whereas such components are generally treated as ordinary income for U.S. federal income tax purposes.
Foreign Taxes: The Funds may be subject to foreign taxes (a portion of which may be reclaimable) on income, stock dividends, capital gains on investments, or certain foreign currency transactions. All foreign taxes are recorded in accordance with the applicable foreign tax regulations and rates that exist in the foreign jurisdictions in which each Fund invests. These foreign taxes, if any, are paid by each Fund and are reflected in its Statements of Operations as follows: foreign taxes withheld at source are presented as a reduction of income, foreign taxes on securities lending income are presented as a reduction of securities lending income, foreign taxes on stock dividends are presented as “Foreign taxes withheld”, and foreign taxes on capital gains from sales of investments and foreign taxes on foreign currency transactions are included in their respective net realized gain (loss) categories. Foreign taxes payable or deferred as of April 30, 2022, if any, are disclosed in the Statements of Assets and Liabilities.
| 130 | 2 0 2 2 BLACK ROCK ANNUAL REPORT TO SHAREHOLDERS |
Notes to Financial Statements (continued)
The Funds file withholding tax reclaims in certain jurisdictions to recover a portion of amounts previously withheld. The Funds may record a reclaim receivable based on collectability, which includes factors such as the jurisdiction’s applicable laws, payment history and market convention. The Statements of Operations include tax reclaims recorded as well as professional and other fees, if any, associated with recovery of foreign withholding taxes.
Segregation and Collateralization: In cases where a Fund enters into certain investments (e.g., futures contracts, options written and swaps) that would be treated as “senior securities” for 1940 Act purposes, a Fund may segregate or designate on its books and records cash or liquid assets having a market value at least equal to the amount of its future obligations under such investments. Doing so allows the investments to be excluded from treatment as a “senior security.” Furthermore, if required by an exchange or counterparty agreement, the Funds may be required to deliver/deposit cash and/or securities to/with an exchange, or broker-dealer or custodian as collateral for certain investments or obligations.
Distributions: Distributions paid by the Funds are recorded on the ex-dividend dates. Distributions of capital gains are recorded on the ex-dividend dates and made at least annually. The character and timing of distributions are determined in accordance with U.S. federal income tax regulations, which may differ from U.S. GAAP.
Indemnifications: In the normal course of business, a Fund enters into contracts that contain a variety of representations that provide general indemnification. A Fund’s maximum exposure under these arrangements is unknown because it involves future potential claims against a Fund, which cannot be predicted with any certainty.
Other: Expenses directly related to a Fund or its classes are charged to that Fund or the applicable class. Expenses directly related to the Funds and other shared expenses prorated to the Funds are allocated daily to each class based on their relative net assets or other appropriate methods. Other operating expenses shared by several funds, including other funds managed by the Manager, are prorated among those funds on the basis of relative net assets or other appropriate methods.
| 3. | INVESTMENT VALUATION AND FAIR VALUE MEASUREMENTS |
Investment Valuation Policies: Each Fund’s investments are valued at fair value (also referred to as “market value” within the financial statements) each day that the Fund is open for business and, for financial reporting purposes, as of the report date. U.S. GAAP defines fair value as the price a fund would receive to sell an asset or pay to transfer a liability in an orderly transaction between market participants at the measurement date. Each Fund determines the fair values of its financial instruments using various independent dealers or pricing services under policies approved by the Board. If a security’s market price is not readily available or does not otherwise accurately represent the fair value of the security, the security will be valued in accordance with a policy approved by the Board as reflecting fair value. The BlackRock Global Valuation Methodologies Committee (the “Global Valuation Committee”) is the committee formed by management to develop global pricing policies and procedures and to oversee the pricing function for all financial instruments.
Fair Value Inputs and Methodologies: The following methods and inputs are used to establish the fair value of each Fund’s assets and liabilities:
| • | Equity investments traded on a recognized securities exchange are valued at that day’s official closing price, as applicable, on the exchange where the stock is primarily traded. Equity investments traded on a recognized exchange for which there were no sales on that day may be valued at the last available bid (long positions) or ask (short positions) price. |
| • | Fixed-income investments for which market quotations are readily available are generally valued using the last available bid price or current market quotations provided by independent dealers or third-party pricing services. Pricing services generally value fixed-income securities assuming orderly transactions of an institutional round lot size, but a fund may hold or transact in such securities in smaller, odd lot sizes. Odd lots may trade at lower prices than institutional round lots. The pricing services may use matrix pricing or valuation models that utilize certain inputs and assumptions to derive values, including transaction data (e.g., recent representative bids and offers), market data, credit quality information, perceived market movements, news, and other relevant information. Certain fixed-income securities, including asset-backed and mortgage related securities may be valued based on valuation models that consider the estimated cash flows of each tranche of the entity, establish a benchmark yield and develop an estimated tranche specific spread to the benchmark yield based on the unique attributes of the tranche. The amortized cost method of valuation may be used with respect to debt obligations with sixty days or less remaining to maturity unless the Manager determines such method does not represent fair value. |
| • | Investments in open-end U.S. mutual funds (including money market funds) are valued at that day’s published net asset value (“NAV”). |
| • | The Funds value their investment in SL Liquidity Series, LLC, Money Market Series (the “Money Market Series”) at fair value, which is ordinarily based upon their pro rata ownership in the underlying fund’s net assets. |
| • | Futures contracts are valued based on that day’s last reported settlement or trade price on the exchange where the contract is traded. |
| • | Exchange-traded options are valued at the mean between the last bid and ask prices at the close of the options market in which the options trade. An exchange-traded option for which there is no mean price is valued at the last bid (long positions) or ask (short positions) price. If no bid or ask price is available, the prior day’s price will be used, unless it is determined that the prior day’s price no longer reflects the fair value of the option. OTC options and options on swaps (“swaptions”) are valued by an independent pricing service using a mathematical model, which incorporates a number of market data factors, such as the trades and prices of the underlying instruments. |
| • | Swap agreements are valued utilizing quotes received daily by independent pricing services or through brokers, which are derived using daily swap curves and models that incorporate a number of market data factors, such as discounted cash flows, trades and values of the underlying reference instruments. |
NOTES TO FINANCIAL STATEMENTS | 131 |
| Notes to Financial Statements (continued) |
Generally, trading in foreign instruments is substantially completed each day at various times prior to the close of trading on the NYSE. Each business day, the Funds use current market factors supplied by independent pricing services to value certain foreign instruments (“Systematic Fair Value Price”). The Systematic Fair Value Price is designed to value such foreign securities at fair value as of the close of trading on the NYSE, which follows the close of the local markets.
If events (e.g., market volatility, company announcement or a natural disaster) occur that are expected to materially affect the value of such investment, or in the event that application of these methods of valuation results in a price for an investment that is deemed not to be representative of the market value of such investment, or if a price is not available, the investment will be valued by the Global Valuation Committee, or its delegate, in accordance with a policy approved by the Board as reflecting fair value (“Fair Valued Investments”). The fair valuation approaches that may be used by the Global Valuation Committee include market approach, income approach and cost approach. Valuation techniques such as discounted cash flow, use of market comparables and matrix pricing are types of valuation approaches and are typically used in determining fair value. When determining the price for Fair Valued Investments, the Global Valuation Committee, or its delegate, seeks to determine the price that each Fund might reasonably expect to receive or pay from the current sale or purchase of that asset or liability in an arm’s-length transaction. Fair value determinations shall be based upon all available factors that the Global Valuation Committee, or its delegate, deems relevant and consistent with the principles of fair value measurement. The pricing of all Fair Valued Investments is subsequently reported to the Board or a committee thereof on a quarterly basis.
For investments in equity or debt issued by privately held companies or funds (“Private Company” or collectively, the “Private Companies”) and other Fair Valued Investments, the fair valuation approaches that are used by the Global Valuation Committee and third-party pricing services utilize one or a combination of, but not limited to, the following inputs.
| Standard Inputs Generally Considered By Third Party-Pricing Services | ||
Market approach | (i) recent market transactions, including subsequent rounds of financing, in the underlying investment or comparable issuers; (ii) recapitalizations and other transactions across the capital structure; and (iii) market multiples of comparable issuers. | |
Income approach | (i) future cash flows discounted to present and adjusted as appropriate for liquidity, credit, and/or market risks; (ii) quoted prices for similar investments or assets in active markets; and (iii) other risk factors, such as interest rates, yield curves, volatilities, prepayment speeds, loss severities, credit risks, recovery rates, liquidation amounts and/or default rates. | |
Cost approach | (i) audited or unaudited financial statements, investor communications and financial or operational metrics issued by the Private Company; (ii) changes in the valuation of relevant indices or publicly traded companies comparable to the Private Company; (iii) relevant news and other public sources; and (iv) known secondary market transactions in the Private Company’s interests and merger or acquisition activity in companies comparable to the Private Company. |
Investments in series of preferred stock issued by Private Companies are typically valued utilizing market approach in determining the enterprise value of the company. Such investments often contain rights and preferences that differ from other series of preferred and common stock of the same issuer. Enterprise valuation techniques such as an option pricing model (“OPM”), a probability weighted expected return model (“PWERM”), current value method or a hybrid of those techniques are used as deemed appropriate under the circumstances. The use of these valuation techniques involve a determination of the exit scenarios of the investment in order to appropriately allocate the enterprise value of the company among the various parts of its capital structure.
The Private Companies are not subject to the public company disclosure, timing, and reporting standards applicable to other investments held by a Fund. Typically, the most recently available information by a Private Company is as of a date that is earlier than the date a Fund is calculating its NAV. This factor may result in a difference between the value of the investment and the price a Fund could receive upon the sale of the investment.
Fair Value Hierarchy: Various inputs are used in determining the fair value of financial instruments. These inputs to valuation techniques are categorized into a fair value hierarchy consisting of three broad levels for financial reporting purposes as follows:
| • | Level 1 – Unadjusted price quotations in active markets/exchanges for identical assets or liabilities that each Fund has the ability to access; |
| • | Level 2 – Other observable inputs (including, but not limited to, quoted prices for similar assets or liabilities in markets that are active, quoted prices for identical or similar assets or liabilities in markets that are not active, inputs other than quoted prices that are observable for the assets or liabilities (such as interest rates, yield curves, volatilities, prepayment speeds, loss severities, credit risks and default rates) or other market–corroborated inputs); and |
| • | Level 3 – Unobservable inputs based on the best information available in the circumstances, to the extent observable inputs are not available (including the Global Valuation Committee’s assumptions used in determining the fair value of financial instruments). |
The hierarchy gives the highest priority to unadjusted quoted prices in active markets for identical assets or liabilities (Level 1 measurements) and the lowest priority to unobservable inputs (Level 3 measurements). Accordingly, the degree of judgment exercised in determining fair value is greatest for instruments categorized in Level 3. The inputs used to measure fair value may fall into different levels of the fair value hierarchy. In such cases, for disclosure purposes, the fair value hierarchy classification is determined based on the lowest level input that is significant to the fair value measurement in its entirety. Investments classified within Level 3 have significant unobservable inputs used by the Global Valuation Committee in determining the price for Fair Valued Investments. Level 3 investments include equity or debt issued by Private Companies that may not have a secondary market and/or may have a limited number of investors. The categorization of a value determined for financial instruments is based on the pricing transparency of the financial instruments and is not necessarily an indication of the risks associated with investing in those securities.
As of April 30, 2022, certain investments of Advantage Emerging Markets were fair valued using NAV per share as no quoted market value is available and therefore have been excluded from the fair value hierarchy.
| 132 | 2 0 2 2 BLACK ROCK ANNUAL REPORT TO SHAREHOLDERS |
Notes to Financial Statements (continued)
| 4. | SECURITIES AND OTHER INVESTMENTS |
Preferred Stocks: Preferred stock has a preference over common stock in liquidation (and generally in receiving dividends as well), but is subordinated to the liabilities of the issuer in all respects. As a general rule, the market value of preferred stock with a fixed dividend rate and no conversion element varies inversely with interest rates and perceived credit risk, while the market price of convertible preferred stock generally also reflects some element of conversion value. Because preferred stock is junior to debt securities and other obligations of the issuer, deterioration in the credit quality of the issuer will cause greater changes in the value of a preferred stock than in a more senior debt security with similar stated yield characteristics. Unlike interest payments on debt securities, preferred stock dividends are payable only if declared by the issuer’s board of directors. Preferred stock also may be subject to optional or mandatory redemption provisions.
Warrants: Warrants entitle a fund to purchase a specified number of shares of common stock and are non-income producing. The purchase price and number of shares are subject to adjustment under certain conditions until the expiration date of the warrants, if any. If the price of the underlying stock does not rise above the strike price before the warrant expires, the warrant generally expires without any value and a fund will lose any amount it paid for the warrant. Thus, investments in warrants may involve more risk than investments in common stock. Warrants may trade in the same markets as their underlying stock; however, the price of the warrant does not necessarily move with the price of the underlying stock.
Securities Lending: Certain Funds may lend their securities to approved borrowers, such as brokers, dealers and other financial institutions. The borrower pledges and maintains with the Funds collateral consisting of cash, an irrevocable letter of credit issued by a bank, or securities issued or guaranteed by the U.S. Government. The initial collateral received by each Fund is required to have a value of at least 102% of the current value of the loaned securities for securities traded on U.S. exchanges and a value of at least 105% for all other securities. The collateral is maintained thereafter at a value equal to at least 100% of the current market value of the securities on loan. The market value of the loaned securities is determined at the close of each business day of the Fund and any additional required collateral is delivered to the Fund, or excess collateral returned by the Fund, on the next business day. During the term of the loan, the Funds are entitled to all distributions made on or in respect of the loaned securities, but do not receive interest income on securities received as collateral. Loans of securities are terminable at any time and the borrower, after notice, is required to return borrowed securities within the standard time period for settlement of securities transactions.
As of period end, any securities on loan were collateralized by cash and/or U.S. Government obligations. Cash collateral invested by the securities lending agent, BlackRock Investment Management, LLC (“BIM”), if any, is disclosed in the Schedules of Investments. Any non-cash collateral received cannot be sold, re-invested or pledged by the Fund, except in the event of borrower default. The securities on loan, if any, are disclosed in the Funds’ Schedules of Investments,. The market value of any securities on loan and the value of any related collateral are shown separately in the Statements of Assets and Liabilities as a component of investments at value – unaffiliated, and collateral on securities loaned, respectively.
Securities lending transactions are entered into by the Funds under Master Securities Lending Agreements (each, an “MSLA”), which provide the right, in the event of default (including bankruptcy or insolvency), for the non-defaulting party to liquidate the collateral and calculate a net exposure to the defaulting party or request additional collateral. In the event that a borrower defaults, the Funds, as lender, would offset the market value of the collateral received against the market value of the securities loaned. When the value of the collateral is greater than that of the market value of the securities loaned, the lender is left with a net amount payable to the defaulting party. However, bankruptcy or insolvency laws of a particular jurisdiction may impose restrictions on or prohibitions against such a right of offset in the event of an MSLA counterparty’s bankruptcy or insolvency. Under the MSLA, absent an event of default, the borrower can resell or re-pledge the loaned securities, and the Funds can reinvest cash collateral received in connection with loaned securities. Upon an event of default, the parties’ obligations to return the securities or collateral to the other party are extinguished, and the parties can resell or re-pledge the loaned securities or the collateral received in connection with the loaned securities in order to satisfy the defaulting party’s net payment obligation for all transactions under the MSLA. The defaulting party remains liable for any deficiency.
| Fund Name/Counterparty | | Securities Loaned at Value |
| | Cash Collateral Received | (a) | | Non-Cash Collateral Received at Fair Value |
| | Net Amount |
| ||||
Advantage Emerging Markets | ||||||||||||||||
Citigroup Global Markets, Inc. | $ | 141,950 | $ | (141,950 | ) | $ | — | $ | — | |||||||
SG Americas Securities LLC | 105,757 | (105,757 | ) | — | — | |||||||||||
|
|
|
|
|
|
|
| |||||||||
| $ | 247,707 | $ | (247,707 | ) | $ | — | $ | — | ||||||||
|
|
|
|
|
|
|
| |||||||||
| (a) | Collateral received in excess of the market value of securities on loan is not presented in this table. The total cash collateral received by each Fund is disclosed in the Fund’s Statements of Assets and Liabilities. |
The risks of securities lending include the risk that the borrower may not provide additional collateral when required or may not return the securities when due. To mitigate these risks, the Funds benefit from a borrower default indemnity provided by BIM. BIM’s indemnity allows for full replacement of the securities loaned to the extent the collateral received does not cover the value on the securities loaned in the event of borrower default. Each Fund could incur a loss if the value of an investment purchased with cash collateral falls below the market value of loaned securities or if the value of an investment purchased with cash collateral falls below the value of the original cash collateral received. Such losses are borne entirely by the Funds.
| 5. | DERIVATIVE FINANCIAL INSTRUMENTS |
The Funds engage in various portfolio investment strategies using derivative contracts both to increase the returns of the Funds and/or to manage their exposure to certain risks such as credit risk, equity risk, interest rate risk, foreign currency exchange rate risk, commodity price risk or other risks (e.g., inflation risk). Derivative financial instruments categorized by risk exposure are included in the Schedules of Investments. These contracts may be transacted on an exchange or OTC.
Futures Contracts: Futures contracts are purchased or sold to gain exposure to, or manage exposure to, changes in interest rates (interest rate risk) and changes in the value of equity securities (equity risk) or foreign currencies (foreign currency exchange rate risk).
NOTES TO FINANCIAL STATEMENTS | 133 |
| Notes to Financial Statements (continued) |
Futures contracts are exchange-traded agreements between the Funds and a counterparty to buy or sell a specific quantity of an underlying instrument at a specified price and on a specified date. Depending on the terms of a contract, it is settled either through physical delivery of the underlying instrument on the settlement date or by payment of a cash amount on the settlement date. Upon entering into a futures contract, the Funds are required to deposit initial margin with the broker in the form of cash or securities in an amount that varies depending on a contract’s size and risk profile. The initial margin deposit must then be maintained at an established level over the life of the contract. Amounts pledged, which are considered restricted, are included in cash pledged for futures contracts in the Statements of Assets and Liabilities.
Securities deposited as initial margin are designated in the Schedules of Investments and cash deposited, if any, are shown as cash pledged for futures contracts in the Statements of Assets and Liabilities. Pursuant to the contract, the Funds agree to receive from or pay to the broker an amount of cash equal to the daily fluctuation in market value of the contract (“variation margin”). Variation margin is recorded as unrealized appreciation (depreciation) and, if any, shown as variation margin receivable (or payable) on futures contracts in the Statements of Assets and Liabilities. When the contract is closed, a realized gain or loss is recorded in the Statements of Operations equal to the difference between the notional amount of the contract at the time it was opened and the notional amount at the time it was closed. The use of futures contracts involves the risk of an imperfect correlation in the movements in the price of futures contracts and interest rates, foreign currency exchange rates or underlying assets.
Options: The Funds may purchase and write call and put options to increase or decrease their exposure to the risks of underlying instruments, including equity risk, interest rate risk and/or commodity price risk and/or, in the case of options written, to generate gains from options premiums.
A call option gives the purchaser (holder) of the option the right (but not the obligation) to buy, and obligates the seller (writer) to sell (when the option is exercised) the underlying instrument at the exercise or strike price at any time or at a specified time during the option period. A put option gives the holder the right to sell and obligates the writer to buy the underlying instrument at the exercise or strike price at any time or at a specified time during the option period.
Premiums paid on options purchased and premiums received on options written, as well as the daily fluctuation in market value, are included in investments at value – unaffiliated and options written at value, respectively, in the Statements of Assets and Liabilities. When an instrument is purchased or sold through the exercise of an option, the premium is offset against the cost or proceeds of the underlying instrument. When an option expires, a realized gain or loss is recorded in the Statements of Operations to the extent of the premiums received or paid. When an option is closed or sold, a gain or loss is recorded in the Statements of Operations to the extent the cost of the closing transaction exceeds the premiums received or paid. When the Funds write a call option, such option is typically “covered,” meaning that they hold the underlying instrument subject to being called by the option counterparty. When the Funds write a put option, cash is segregated in an amount sufficient to cover the obligation. These amounts, which are considered restricted, are included in cash pledged as collateral for options written in the Statements of Assets and Liabilities.
In purchasing and writing options, the Funds bear the risk of an unfavorable change in the value of the underlying instrument or the risk that they may not be able to enter into a closing transaction due to an illiquid market. Exercise of a written option could result in the Funds purchasing or selling a security when they otherwise would not, or at a price different from the current market value.
Swaps: Swap contracts are entered into to manage exposure to issuers, markets and securities. Such contracts are agreements between the Funds and a counterparty to make periodic net payments on a specified notional amount or a net payment upon termination. Swap agreements are privately negotiated in the OTC market and may be entered into as a bilateral contract (“OTC swaps”) or centrally cleared (“centrally cleared swaps”).
For OTC swaps, any upfront premiums paid and any upfront fees received are shown as swap premiums paid and swap premiums received, respectively, in the Statements of Assets and Liabilities and amortized over the term of the contract. The daily fluctuation in market value is recorded as unrealized appreciation (depreciation) on OTC Swaps in the Statements of Assets and Liabilities. Payments received or paid are recorded in the Statements of Operations as realized gains or losses, respectively. When an OTC swap is terminated, a realized gain or loss is recorded in the Statements of Operations equal to the difference between the proceeds from (or cost of) the closing transaction and the Funds’ basis in the contract, if any. Generally, the basis of the contract is the premium received or paid.
In a centrally cleared swap, immediately following execution of the swap contract, the swap contract is novated to a central counterparty (the “CCP”) and the CCP becomes the Funds’ counterparty on the swap. Each Fund is required to interface with the CCP through the broker. Upon entering into a centrally cleared swap, each Fund is required to deposit initial margin with the broker in the form of cash or securities in an amount that varies depending on the size and risk profile of the particular swap. Securities deposited as initial margin are designated in the Schedules of Investments and cash deposited is shown as cash pledged for centrally cleared swaps in the Statements of Assets and Liabilities. Amounts pledged, which are considered restricted cash, are included in cash pledged for centrally cleared swaps in the Statements of Assets and Liabilities. Pursuant to the contract, each Fund agrees to receive from or pay to the broker an amount of cash equal to the daily fluctuation in market value of the contract (“variation margin”). Variation margin is recorded as unrealized appreciation (depreciation) and shown as variation margin receivable (or payable) on centrally cleared swaps in the Statements of Assets and Liabilities. Payments received from (paid to) the counterparty are amortized over the term of the contract and recorded as realized gains (losses) in the Statements of Operations, including those at termination.
| • | Total return swaps — Total return swaps are entered into to obtain exposure to a security or market without owning such security or investing directly in such market or to exchange the risk/return of one security or market (e.g., fixed-income) with another security or market (e.g., equity or commodity prices) (equity risk, commodity price risk and/or interest rate risk). |
Total return swaps are agreements in which there is an exchange of cash flows whereby one party commits to make payments based on the total return (distributions plus capital gains/losses) of an underlying instrument, or basket of underlying instruments, in exchange for fixed or floating rate interest payments. If the total return of the instrument(s) or index underlying the transaction exceeds or falls short of the offsetting fixed or floating interest rate obligation, the Funds receive payment from or make a payment to the counterparty.
Certain total return swaps are designed to function as a portfolio of direct investments in long and short equity positions. This means that the Fund has the ability to trade in and out of these long and short positions within the swap and will receive the economic benefits and risks equivalent to direct investment in these positions, subject to certain adjustments due to events related to the counterparty. Benefits and risks include capital appreciation (depreciation), corporate actions and dividends received
| 134 | 2 0 2 2 BLACK ROCK ANNUAL REPORT TO SHAREHOLDERS |
Notes to Financial Statements (continued)
and paid, all of which are reflected in the swap’s market value. The market value also includes interest charges and credits (“financing fees”) related to the notional values of the long and short positions and cash balances within the swap. These interest charges and credits are based on a specified benchmark rate plus or minus a specified spread determined based upon the country and/or currency of the positions in the portfolio.
Positions within the swap and financing fees are reset periodically. During a reset, any unrealized appreciation (depreciation) on positions and accrued financing fees become available for cash settlement between the Funds and the counterparty. The amounts that are available for cash settlement are recorded as realized gains or losses in the Statements of Operations. Cash settlement in and out of the swap may occur at a reset date or any other date, at the discretion of the Funds and the counterparty, over the life of the agreement. Certain swaps have no stated expiration and can be terminated by either party at any time.
Swap transactions involve, to varying degrees, elements of interest rate, credit and market risk in excess of the amounts recognized in the Statements of Assets and Liabilities. Such risks involve the possibility that there will be no liquid market for these agreements, that the counterparty to the agreements may default on its obligation to perform or disagree as to the meaning of the contractual terms in the agreements, and that there may be unfavorable changes in interest rates and/or market values associated with these transactions.
Master Netting Arrangements: In order to define its contractual rights and to secure rights that will help it mitigate its counterparty risk, a Fund may enter into an International Swaps and Derivatives Association, Inc. Master Agreement (“ISDA Master Agreement”) or similar agreement with its counterparties. An ISDA Master Agreement is a bilateral agreement between a Fund and a counterparty that governs certain OTC derivatives and typically contains, among other things, collateral posting terms and netting provisions in the event of a default and/or termination event. Under an ISDA Master Agreement, a Fund may, under certain circumstances, offset with the counterparty certain derivative financial instruments’ payables and/or receivables with collateral held and/or posted and create one single net payment. The provisions of the ISDA Master Agreement typically permit a single net payment in the event of default including the bankruptcy or insolvency of the counterparty. However, bankruptcy or insolvency laws of a particular jurisdiction may impose restrictions on or prohibitions against the right of offset in bankruptcy, insolvency or other events.
Collateral Requirements: For derivatives traded under an ISDA Master Agreement, the collateral requirements are typically calculated by netting the mark-to-market amount for each transaction under such agreement and comparing that amount to the value of any collateral currently pledged by the Funds and the counterparty.
Cash collateral that has been pledged to cover obligations of the Funds and cash collateral received from the counterparty, if any, is reported separately in the Statements of Assets and Liabilities as cash pledged as collateral and cash received as collateral, respectively. Non-cash collateral pledged by the Funds, if any, is noted in the Schedules of Investments. Generally, the amount of collateral due from or to a counterparty is subject to a certain minimum transfer amount threshold before a transfer is required, which is determined at the close of business of the Funds. Any additional required collateral is delivered to/pledged by the Funds on the next business day. Typically, the counterparty is not permitted to sell, re-pledge or use cash and non-cash collateral it receives. A Fund generally agrees not to use non-cash collateral that it receives but may, absent default or certain other circumstances defined in the underlying ISDA Master Agreement, be permitted to use cash collateral received. In such cases, interest may be paid pursuant to the collateral arrangement with the counterparty. To the extent amounts due to the Funds from the counterparties are not fully collateralized, each Fund bears the risk of loss from counterparty non-performance. Likewise, to the extent the Funds have delivered collateral to a counterparty and stand ready to perform under the terms of their agreement with such counterparty, each Fund bears the risk of loss from a counterparty in the amount of the value of the collateral in the event the counterparty fails to return such collateral. Based on the terms of agreements, collateral may not be required for all derivative contracts.
For financial reporting purposes, the Funds do not offset derivative assets and derivative liabilities that are subject to netting arrangements, if any, in the Statements of Assets and Liabilities.
| 6. | INVESTMENT ADVISORY AGREEMENT AND OTHER TRANSACTIONS WITH AFFILIATES |
Investment Advisory: The Trust, on behalf of each Fund, entered into an Investment Advisory Agreement with the Manager, the Funds’ investment adviser and an indirect, wholly-owned subsidiary of BlackRock, Inc. (“BlackRock”), to provide investment advisory services. The Manager is responsible for the management of each Fund’s portfolio and provides the personnel, facilities, equipment and certain other services necessary to the operations of each Fund.
For such services, each Fund pays the Manager a monthly fee at an annual rate equal to the following percentages of the average daily value of each Fund’s net assets:
| Investment Advisory Fees | ||||||||
| Average Daily Net Assets | Advantage Emerging Markets | Global Long/Short Equity | ||||||
First $1 billion. | 0.80 | % | 1.25 | % | ||||
$1 billion — $3 billion | 0.75 | 1.18 | ||||||
$3 billion — $5 billion | 0.72 | 1.13 | ||||||
$5 billion — $10 billion | 0.70 | 1.09 | ||||||
Greater than $10 billion | 0.68 | 1.06 | ||||||
Prior to June 1, 2021, the annual rates as a percentage of average daily net assets, for the Global Long/Short Equity were as follows:
| Average Daily Net Assets | Investment Advisory Fees | |||
First $1 Billion | 1.50 | % | ||
$1 Billion — $3 Billion | 1.41 | |||
$3 Billion — $5 Billion | 1.35 | |||
$5 Billion — $10 Billion | 1.31 | |||
Greater than $10 Billion | 1.28 | |||
NOTES TO FINANCIAL STATEMENTS | 135 |
Notes to Financial Statements (continued)
With respect to Global Long/Short Equity, the Manager entered into a sub-advisory agreement with BlackRock International Limited (“BIL”), an affiliate of the Manager. The Manager pays BIL for services it provides for that portion of the Fund for which BIL acts as sub-adviser, a monthly fee that is equal to a percentage of the investment advisory fees paid by Global Long/Short Equity to the Manager.
Service and Distribution Fees: The Trust, on behalf of the Funds, entered into a Distribution Agreement and a Distribution and Service Plan with BlackRock Investments, LLC (“BRIL”), an affiliate of the Manager. Pursuant to the Distribution and Service Plan and in accordance with Rule 12b-1 under the 1940 Act, each Fund pays BRIL ongoing service and distribution fees. The fees are accrued daily and paid monthly at annual rates based upon the average daily net assets of the relevant share class of each Fund as follows:
| Share Class | Service Fees | Distribution Fees | ||||||
Investor A | 0.25 | % | N/A | |||||
Investor C | 0.25 | 0.75 | % | |||||
BRIL and broker-dealers, pursuant to sub-agreements with BRIL, provide shareholder servicing and distribution services to the Funds. The ongoing service and/or distribution fee compensates/reimburses BRIL and each broker-dealer for providing shareholder servicing and/or distribution related services to shareholders.
For the year ended April 30, 2022, the following table shows the class specific service and distribution fees borne directly by each share class of each Fund:
Fund Name | Investor A | Investor C | Total | |||||||||
Advantage Emerging Markets | $ | 16,421 | $ | 4,083 | $ | 20,504 | ||||||
Global Long/Short Equity. | 59,340 | 58,689 | 118,029 | |||||||||
Administration: The Trust, on behalf of each Fund, entered into an Administration Agreement with the Manager, an indirect, wholly-owned subsidiary of BlackRock, to provide administrative services. For these services, the Manager receives an administration fee computed daily and payable monthly, based on a percentage of the average daily net assets of each Fund. The administration fee, which is shown as administration in the Statements of Operations, is paid at the annual rates below.
| Average Daily Net Assets | Administration Fees | |||
First $500 million | 0.0425 | % | ||
$500 million — $1 billion | 0.0400 | |||
$1 billion — $2 billion | 0.0375 | |||
$2 billion — $4 billion | 0.0350 | |||
$4 billion — $13 billion | 0.0325 | |||
Greater than $13 billion | 0.0300 | |||
In addition, the Manager charges each of the share classes an administration fee, which is shown as administration – class specific in the Statements of Operations, at an annual rate of 0.02% of the average daily net assets of each respective class.
For the year ended April 30, 2022, the following table shows the class specific administration fees borne directly by each share class of each Fund:
| Fund Name | Institutional | Investor A | Investor C | Class K | Total | |||||||||||||||
Advantage Emerging Markets | $ | 2,997 | $ | 1,314 | $ | 82 | $ | 28,883 | $ | 33,276 | ||||||||||
Global Long/Short Equity | 102,874 | 4,747 | 1,174 | 1,216 | 110,011 | |||||||||||||||
Transfer Agent: Pursuant to written agreements, certain financial intermediaries, some of which may be affiliates, provide the Funds with sub-accounting, recordkeeping, sub-transfer agency and other administrative services with respect to servicing of underlying investor accounts. For these services, these entities receive an asset-based fee or an annual fee per shareholder account, which will vary depending on share class and/or net assets. For the year ended April 30, 2022, the Funds did not pay any amounts to affiliates in return for these services.
The Manager maintains a call center that is responsible for providing certain shareholder services to the Funds. Shareholder services include responding to inquiries and processing purchases and sales based upon instructions from shareholders. For the year ended April 30, 2022, each Fund reimbursed the Manager the following amounts for costs incurred in running the call center, which are included in transfer agent — class specific in the Statements of Operations:
| Fund Name | Institutional | Investor A | Investor C | Class K | Total | |||||||||||||||
Advantage Emerging Markets | $ | 244 | $ | 438 | $ | 119 | $ | 115 | $ | 916 | ||||||||||
Global Long/Short Equity | 944 | 500 | 376 | — | 1,820 | |||||||||||||||
For the year ended April 30, 2022, the following table shows the class specific transfer agent fees borne directly by each share class of each Fund:
| Fund Name | Institutional | Investor A | Investor C | Class K | Total | |||||||||||||||
Advantage Emerging Markets | $ | 10,038 | $ | 9,537 | $ | 1,239 | $ | 1,198 | $ | 22,012 | ||||||||||
Global Long/Short Equity | 412,246 | 25,245 | 7,608 | 570 | 445,669 | |||||||||||||||
| 136 | 2 0 2 2 BLACK ROCK ANNUAL REPORT TO SHAREHOLDERS |
Notes to Financial Statements (continued)
Other Fees: For the year ended April 30, 2022, affiliates earned underwriting discounts, direct commissions and dealer concessions on sales of each Fund’s Investor A Shares as follows:
| Fund Name | Investor A | |||
Advantage Emerging Markets | $ | 254 | ||
Global Long/Short Equity | 420 | |||
For the year ended April 30, 2022, affiliates received CDSCs as follows:
| Fund Name | Investor A | Investor C | ||||||
Advantage Emerging Markets | $ | 254 | $ | — | ||||
Global Long/Short Equity. | 192 | 125 | ||||||
Expense Limitations, Waivers and Reimbursements: With respect to each Fund, the Manager contractually agreed to waive its investment advisory fees by the amount of investment advisory fees each Fund pays to the Manager indirectly through its investment in affiliated money market funds (the “affiliated money market fund waiver”) through June 30, 2023. The contractual agreement may be terminated upon 90 days’ notice by a majority of the trustees who are not “interested persons” of the Trust, as defined in the 1940 Act (“Independent Trustees”), or by a vote of a majority of the outstanding voting securities of a Fund. The amount of waivers and/or reimbursements of fees and expenses made pursuant to the expense limitation described below will be reduced by the amount of the affiliated money market fund waiver. This amount is included in fees waived and/or reimbursed by the Manager in the Statements of Operations. For the year ended April 30, 2022, the amounts waived were as follows:
| Fund Name | Fees Waived and/or Reimbursed by the Manager | |||
Advantage Emerging Markets. | $ | 2,055 | ||
Global Long/Short Equity | 5,918 | |||
The Manager has contractually agreed to waive its investment advisory fee with respect to any portion of each Fund’s assets invested in affiliated equity and fixed-income mutual funds and affiliated exchange-traded funds that have a contractual management fee through June 30, 2023. The contractual agreement may be terminated upon 90 days’ notice by a majority of the Independent Trustees, or by a vote of a majority of the outstanding voting securities of a Fund. For the year ended April 30, 2022, there were no fees waived and/or reimbursed by the Manager pursuant to this arrangement.
With respect to Advantage Emerging Markets, the Manager contractually agreed to waive and/or reimburse fees or expenses in order to limit other expenses (“expense limitation”) through June 30, 2023. Other expenses include accounting, administration, transfer agency, custody, professional and registration fees and exclude dividend expense, interest expense, and certain other fund expenses that constitute extraordinary expenses not incurred in the ordinary course of the Fund’s business. The expense limitations as a percentage of average daily net assets are as follows:
| Fund Name/Share Class | Expense Limitation | |||
Advantage Emerging Markets | ||||
Institutional | 0.05 | % | ||
Investor A | 0.10 | |||
Investor C | 0.10 | |||
Class K | 0.01 | |||
With respect to Global Long/Short Equity, the Manager contractually agreed to waive and/or reimburse fees or expenses in order to limit expenses, excluding interest expense, dividend expense, tax expense, acquired fund fees and expenses, and certain other fund expenses, which constitute extraordinary expenses not incurred in the ordinary course of each Fund’s business (“expense limitation”). The expense limitations as a percentage of average daily net assets are as follows:
| Fund Name/Share Class | Expense Limitation | |||
Global Long/Short Equity | ||||
Institutional | 1.34 | % | ||
Investor A | 1.59 | |||
Investor C | 2.34 | |||
Class K | 1.29 | |||
Prior to June 1, 2021, the expense limitations as a percentage of average daily net assets were as follows:
| Fund Name/Share Class | Expense Limitation | |||
Global Long/Short Equity | ||||
Institutional | 1.57 | % | ||
Investor A | 1.82 | |||
Investor C | 2.57 | |||
Class K | 1.52 | |||
NOTES TO FINANCIAL STATEMENTS | 137 |
Notes to Financial Statements (continued)
The Manager has agreed not to reduce or discontinue the contractual expense limitations through June 30, 2023, unless approved by the Board, including a majority of the Independent Trustees, or by a vote of a majority of the outstanding voting securities of a Fund. For the year ended April 30, 2022, amounts included in the Statements of Operations were as follows:
| Fund Name | Fees Waived and/or Reimbursed by the Manager | |||
Advantage Emerging Markets. | $ | 425,076 | ||
Global Long/Short Equity | 935,424 | |||
| Fund Name | Administration Fees Waived | |||
Advantage Emerging Markets | $ | 70,711 | ||
In addition, these amounts waived and/or reimbursed by the Manager are included in Administration fees waived — class specific and transfer agent fees waived and/or reimbursed — class specific, respectively, in the Statements of Operations. For the year ended April 30, 2022, class specific expense waivers and/or reimbursements are as follows:
| Administration Fees Waived - Class Specific | ||||||||||||||||||||
| Fund Name | Institutional | Investor A | Investor C | Class K | Total | |||||||||||||||
Advantage Emerging Markets | $ | 2,997 | $ | 1,314 | $ | 82 | $ | 28,883 | $ | 33,276 | ||||||||||
Global Long/Short Equity | 102,874 | 4,747 | 1,174 | 1,216 | 110,011 | |||||||||||||||
| Transfer Agent Fees Waived and/or Reimbursed - Class Specific | ||||||||||||||||||||
| Fund Name | Institutional | Investor A | Investor C | Class K | Total | |||||||||||||||
Advantage Emerging Markets | $ | 4,043 | $ | 3,626 | $ | 871 | $ | 1,196 | $ | 9,736 | ||||||||||
Global Long/Short Equity | 155,063 | 13,377 | 4,673 | 569 | 173,682 | |||||||||||||||
Securities Lending: The U.S. Securities and Exchange Commission (“SEC”) has issued an exemptive order which permits BIM, an affiliate of the Manager, to serve as securities lending agent for the Funds, subject to applicable conditions. As securities lending agent, BIM bears all operational costs directly related to securities lending. The Funds are responsible for expenses in connection with the investment of cash collateral received for securities on loan (the “collateral investment expenses”). The cash collateral is invested in a private investment company, Money Market Series, managed by the Manager or its affiliates. However, BIM has agreed to cap the collateral investment expenses of the Money Market Series to an annual rate of 0.04%. The investment adviser to the Money Market Series will not charge any advisory fees with respect to shares purchased by the Funds. The Money Market Series may, under certain circumstances, impose a liquidity fee of up to 2% of the value withdrawn or temporarily restrict withdrawals for up to 10 business days during a 90 day period, in the event that the private investment company’s weekly liquid assets fall below certain thresholds. The Money Market Series seeks current income consistent with maintaining liquidity and preserving capital. Although the Money Market Series is not registered under the 1940 Act, its investments may follow the parameters of investments by a money market fund that is subject to Rule 2a-7 under the 1940 Act.
Securities lending income is equal to the total of income earned from the reinvestment of cash collateral, net of fees and other payments to and from borrowers of securities, and less the collateral investment expenses. Each Fund retains a portion of securities lending income and remits a remaining portion to BIM as compensation for its services as securities lending agent.
Pursuant to the current securities lending agreement, Advantage Emerging Markets retains 82% of securities lending income (which excludes collateral investment expenses), and this amount retained can never be less than 70% of the total of securities lending income plus the collateral investment expenses.
In addition, commencing the business day following the date that the aggregate securities lending income earned across the BlackRock Multi-Asset Complex in a calendar year exceeds a specified threshold, Advantage Emerging Markets, pursuant to the securities lending agreement, will retain for the remainder of that calendar year securities lending income in an amount equal to 85% of securities lending income (which excludes collateral investment expenses), and this amount retained can never be less than 70% of the total of securities lending income plus the collateral investment expenses.
The share of securities lending income earned by each Fund is shown as securities lending income — affiliated — net in the Statements of Operations. For the year ended April 30, 2022, each Fund paid BIM the following amounts for securities lending agent services:
| Fund Name | Amounts | |||
Advantage Emerging Markets | $ | 783 | ||
Interfund Lending: In accordance with an exemptive order (the “Order”) from the SEC, each Fund may participate in a joint lending and borrowing facility for temporary purposes (the “Interfund Lending Program”), subject to compliance with the terms and conditions of the Order, and to the extent permitted by each Fund’s investment policies and restrictions. Each Fund is currently permitted to borrow and lend under the Interfund Lending Program.
A lending BlackRock fund may lend in aggregate up to 15% of its net assets, but may not lend more than 5% of its net assets to any one borrowing fund through the Interfund Lending Program. A borrowing BlackRock fund may not borrow through the Interfund Lending Program or from any other source more than 33 1/3% of its total assets (or any lower threshold provided for by the fund’s investment restrictions). If a borrowing BlackRock fund’s total outstanding borrowings exceed 10% of its total assets, each of its outstanding interfund loans will be subject to collateralization of at least 102% of the outstanding principal value of the loan. All interfund loans are for temporary or emergency
| 138 | 2 0 2 2 BLACK ROCK ANNUAL REPORT TO SHAREHOLDERS |
Notes to Financial Statements (continued)
purposes and the interest rate to be charged will be the average of the highest current overnight repurchase agreement rate available to a lending fund and the bank loan rate, as calculated according to a formula established by the Board.
During the year ended April 30, 2022, the Funds did not participate in the Interfund Lending Program.
Trustees and Officers: Certain trustees and/or officers of the Trust are directors and/or officers of BlackRock or its affiliates. The Funds reimburse the Manager for a portion of the compensation paid to the Trust’s Chief Compliance Officer, which is included in Trustees and Officer in the Statements of Operations.
Other Transactions: During the year ended April 30, 2022, Global Long/Short Equity received a reimbursement of $4,851 from an affiliate, which is included in Other income - affiliated in the Statements of Operations, related to an operating event.
| 7. | PURCHASES AND SALES |
For the year ended April 30, 2022, purchases and sales of investments, excluding short-term investments, were as follows:
| U.S. Government Securities | Other Securities | |||||||||||||||
| Fund Name | Purchases | Sales | Purchases | Sales | ||||||||||||
Advantage Emerging Markets | $ | — | $ | — | $ | 292,771,699 | $ | 286,274,826 | ||||||||
Global Long/Short Equity | 10,877,429 | 38,405,766 | 6,957,438 | 5,088,767 | ||||||||||||
| 8. | INCOME TAX INFORMATION |
It is each Fund’s policy to comply with the requirements of the Internal Revenue Code of 1986, as amended, applicable to regulated investment companies, and to distribute substantially all of its taxable income to its shareholders. Therefore, no U.S. federal income tax provision is required.
Each Fund files U.S. federal and various state and local tax returns. No income tax returns are currently under examination. The statute of limitations on each Fund’s U.S. federal tax returns generally remains open for a period of three fiscal years after they are filed. The statutes of limitations on each Fund’s state and local tax returns may remain open for an additional year depending upon the jurisdiction.
Management has analyzed tax laws and regulations and their application to the Funds as of April 30, 2022, inclusive of the open tax return years, and does not believe that there are any uncertain tax positions that require recognition of a tax liability in the Funds’ financial statements.
U.S. GAAP requires that certain components of net assets be adjusted to reflect permanent differences between financial and tax reporting. These reclassifications have no effect on net assets or NAVs per share. As of period end, permanent differences attributable to a net operating loss were reclassified to the following accounts:
| Fund Name | Paid-in Capital | Accumulated Earnings (Loss) | ||||||
Global Long/Short Equity | $ | (7,576,836 | ) | $ | 7,576,836 | |||
The tax character of distributions paid was as follows:
| Fund Name | Year Ended 04/30/22 | Year Ended 04/30/21 | ||||||
Advantage Emerging Markets | ||||||||
Ordinary income | $ | 2,327,836 | $ | 2,042,022 | ||||
|
|
|
| |||||
Global Long/Short Equity | ||||||||
Ordinary income | $ | — | $ | 1,497,210 | ||||
Long-term capital gains | $ | 6,131,530 | $ | — | ||||
|
|
|
| |||||
As of April 30, 2022, the tax components of accumulated earnings (loss) were as follows:
| Fund Name | Undistributed Ordinary Income | Non-Expiring Capital Loss Carryforwards(a) | Net Unrealized Gains (Losses)(b) | Qualified Late-Year Loss(c) | Total | |||||||||||||||
Advantage Emerging Markets | $ | 1,890 | $ | (18,689,323 | ) | $ | (6,543,975 | ) | $ | — | $ | (25,231,408 | ) | |||||||
Global Long/Short Equity | — | (7,778,325 | ) | (39,753,638 | ) | (2,855,264 | ) | (50,387,227 | ) | |||||||||||
| (a) | Amounts available to offset future realized capital gains. |
| (b) | The difference between book-basis and tax-basis net unrealized losses was attributable primarily to the tax deferral of losses on wash sales and straddles, the realization for tax purposes of unrealized gains/losses on certain futures, options and foreign currency contracts, the realization for tax purposes of unrealized gain on investments in passive foreign investment companies, the timing and recognition of partnership income and the realization for tax purposes of unrealized gains on constructive sales. |
| (c) | The Fund has elected to defer certain qualified late-year losses and recognize such losses in the next taxable year. |
NOTES TO FINANCIAL STATEMENTS | 139 |
Notes to Financial Statements (continued)
As of April 30, 2022, gross unrealized appreciation and depreciation based on cost of investments (including short positions and derivatives, if any) for U.S. federal income tax purposes were as follows:
| Fund Name | Tax Cost | Gross Unrealized Appreciation | Gross Unrealized Depreciation | Net Unrealized Appreciation (Depreciation) | ||||||||||||
Advantage Emerging Markets | $ | 145,132,262 | $ | 11,499,820 | $ | (18,033,874 | ) | $ | (6,534,054 | ) | ||||||
Global Long/Short Equity | 560,377,376 | 39,509,994 | (78,608,833 | ) | (39,098,839 | ) | ||||||||||
| 9. | BANK BORROWINGS |
The Trust, on behalf of the Funds, along with certain other funds managed by the Manager and its affiliates (“Participating Funds”), is a party to a 364-day, $2.50 billion credit agreement with a group of lenders. Under this agreement, the Funds may borrow to fund shareholder redemptions. Excluding commitments designated for certain individual funds, the Participating Funds, including the Funds, can borrow up to an aggregate commitment amount of $1.75 billion at any time outstanding, subject to asset coverage and other limitations as specified in the agreement. The credit agreement has the following terms: a fee of 0.10% per annum on unused commitment amounts and interest at a rate equal to the higher of (a) Overnight Bank Funding Rate (“OBFR”) (but, in any event, not less than 0.00%) on the date the loan is made plus 0.80% per annum, (b) the Fed Funds rate (but, in any event, not less than 0.00%) in effect from time to time plus 0.80% per annum on amounts borrowed or (c) the sum of (x) Daily Simple Secured Overnight Financing Rate (“SOFR”) (but, in any event, not less than 0.00%) on the date the loan is made plus 0.10% and (y) 0.80% per annum. The agreement expires in April 2023 unless extended or renewed. These fees were allocated among such funds based upon portions of the aggregate commitment available to them and relative net assets of Participating Funds. During the year ended April 30, 2022, the Funds did not borrow under the credit agreement.
| 10. | PRINCIPAL RISKS |
In the normal course of business, the Funds invest in securities or other instruments and may enter into certain transactions, and such activities subject each Fund to various risks, including among others, fluctuations in the market (market risk) or failure of an issuer to meet all of its obligations. The value of securities or other instruments may also be affected by various factors, including, without limitation: (i) the general economy; (ii) the overall market as well as local, regional or global political and/or social instability; (iii) regulation, taxation or international tax treaties between various countries; or (iv) currency, interest rate and price fluctuations. Local, regional or global events such as war, acts of terrorism, the spread of infectious illness or other public health issues, recessions, or other events could have a significant impact on the Funds and their investments. Each Fund’s prospectus provides details of the risks to which each Fund is subject.
The Funds may be exposed to additional risks when reinvesting cash collateral in money market funds that do not seek to maintain a stable NAV per share of $1.00, which may be subject to redemption gates or liquidity fees under certain circumstances.
Market Risk: Investments in the securities of issuers domiciled in countries with emerging capital markets involve certain additional risks that do not generally apply to investments in securities of issuers in more developed capital markets, such as (i) low or nonexistent trading volume, resulting in a lack of liquidity and increased volatility in prices for such securities; (ii) uncertain national policies and social, political and economic instability, increasing the potential for expropriation of assets, confiscatory taxation, high rates of inflation or unfavorable diplomatic developments; (iii) lack of publicly available or reliable information about issuers as a result of not being subject to the same degree of regulatory requirements and accounting, auditing and financial reporting standards; and (iv) possible fluctuations in exchange rates, differing legal systems and the existence or possible imposition of exchange controls, custodial restrictions or other foreign or U.S. governmental laws or restrictions applicable to such investments.
An outbreak of respiratory disease caused by a novel coronavirus has developed into a global pandemic and has resulted in closing borders, quarantines, disruptions to supply chains and customer activity, as well as general concern and uncertainty. The impact of this pandemic, and other global health crises that may arise in the future, could affect the economies of many nations, individual companies and the market in general in ways that cannot necessarily be foreseen at the present time. This pandemic may result in substantial market volatility and may adversely impact the prices and liquidity of a fund’s investments. Although vaccines have been developed and approved for use by various governments, the duration of this pandemic and its effects cannot be determined with certainty.
Valuation Risk: The market values of equities, such as common stocks and preferred securities or equity related investments, such as futures and options, may decline due to general market conditions which are not specifically related to a particular company. They may also decline due to factors which affect a particular industry or industries. A Fund may invest in illiquid investments. An illiquid investment is any investment that a Fund reasonably expects cannot be sold or disposed of in current market conditions in seven calendar days or less without the sale or disposition significantly changing the market value of the investment. A Fund may experience difficulty in selling illiquid investments in a timely manner at the price that it believes the investments are worth. Prices may fluctuate widely over short or extended periods in response to company, market or economic news. Markets also tend to move in cycles, with periods of rising and falling prices. This volatility may cause each Fund’s NAV to experience significant increases or decreases over short periods of time. If there is a general decline in the securities and other markets, the NAV of a Fund may lose value, regardless of the individual results of the securities and other instruments in which a Fund invests.
The price a Fund could receive upon the sale of any particular portfolio investment may differ from a Fund’s valuation of the investment, particularly for securities that trade in thin or volatile markets or that are valued using a fair valuation technique or a price provided by an independent pricing service. Changes to significant unobservable inputs and assumptions (i.e., publicly traded company multiples, growth rate, time to exit) due to the lack of observable inputs may significantly impact the resulting fair value and therefore a Fund’s results of operations. As a result, the price received upon the sale of an investment may be less than the value ascribed by a Fund, and a Fund could realize a greater than expected loss or lesser than expected gain upon the sale of the investment. A Fund’s ability to value its investments may also be impacted by technological issues and/or errors by pricing services or other third-party service providers.
| 140 | 2 0 2 2 BLACK ROCK ANNUAL REPORT TO SHAREHOLDERS |
Notes to Financial Statements (continued)
Counterparty Credit Risk: The Funds may be exposed to counterparty credit risk, or the risk that an entity may fail to or be unable to perform on its commitments related to unsettled or open transactions, including making timely interest and/or principal payments or otherwise honoring its obligations. The Funds manage counterparty credit risk by entering into transactions only with counterparties that the Manager believes have the financial resources to honor their obligations and by monitoring the financial stability of those counterparties. Financial assets, which potentially expose the Funds to market, issuer and counterparty credit risks, consist principally of financial instruments and receivables due from counterparties. The extent of the Funds’ exposure to market, issuer and counterparty credit risks with respect to these financial assets is approximately their value recorded in the Statements of Assets and Liabilities, less any collateral held by the Funds.
A derivative contract may suffer a mark-to-market loss if the value of the contract decreases due to an unfavorable change in the market rates or values of the underlying instrument. Losses can also occur if the counterparty does not perform under the contract.
For OTC options purchased, each Fund bears the risk of loss in the amount of the premiums paid plus the positive change in market values net of any collateral held by the Funds should the counterparty fail to perform under the contracts. Options written by the Funds do not typically give rise to counterparty credit risk, as options written generally obligate the Funds, and not the counterparty, to perform. The Funds may be exposed to counterparty credit risk with respect to options written to the extent each Fund deposits collateral with its counterparty to a written option.
With exchange-traded options purchased and exchange-traded futures, there is less counterparty credit risk to the Funds since the exchange or clearinghouse, as counterparty to such instruments, guarantees against a possible default. The clearinghouse stands between the buyer and the seller of the contract; therefore, credit risk is limited to failure of the clearinghouse. While offset rights may exist under applicable law, a Fund does not have a contractual right of offset against a clearing broker or clearinghouse in the event of a default (including the bankruptcy or insolvency). Additionally, credit risk exists in exchange-traded futures with respect to initial and variation margin that is held in a clearing broker’s customer accounts. While clearing brokers are required to segregate customer margin from their own assets, in the event that a clearing broker becomes insolvent or goes into bankruptcy and at that time there is a shortfall in the aggregate amount of margin held by the clearing broker for all its clients, typically the shortfall would be allocated on a pro rata basis across all the clearing broker’s customers, potentially resulting in losses to the Funds.
Concentration Risk: A diversified portfolio, where this is appropriate and consistent with a fund’s objectives, minimizes the risk that a price change of a particular investment will have a material impact on the NAV of a fund. The investment concentrations within each Fund’s portfolio are disclosed in its Schedule of Investments.
Certain Funds invest a substantial amount of their assets in issuers located in a single country or a limited number of countries. When a Fund concentrates its investments in this manner, it assumes the risk that economic, regulatory, political and social conditions in those countries may have a significant impact on their investment performance and could affect the income from, or the value or liquidity of, the Fund’s portfolio. Unanticipated or sudden political or social developments may cause uncertainty in the markets and as a result adversely affect the Fund’s investments. Foreign issuers may not be subject to the same uniform accounting, auditing and financial reporting standards and practices as used in the United States. Foreign securities markets may also be more volatile and less liquid than U.S. securities and may be less subject to governmental supervision not typically associated with investing in U.S. securities. Investment percentages in specific countries are presented in the Schedules of Investments.
Certain Funds invest a significant portion of their assets in securities of issuers located in Europe or with significant exposure to European issuers or countries. The European financial markets have recently experienced volatility and adverse trends due to concerns about economic downturns in, or rising government debt levels of, several European countries as well as acts of war in the region. These events may spread to other countries in Europe and may affect the value and liquidity of certain of the Funds’ investments.
Responses to the financial problems by European governments, central banks and others, including austerity measures and reforms, may not work, may result in social unrest and may limit future growth and economic recovery or have other unintended consequences. Further defaults or restructurings by governments and others of their debt could have additional adverse effects on economies, financial markets and asset valuations around the world. The United Kingdom has withdrawn from the European Union, and one or more other countries may withdraw from the European Union and/or abandon the Euro, the common currency of the European Union. The impact of these actions, especially if they occur in a disorderly fashion, is not clear but could be significant and far reaching. In addition, Russia launched a large-scale invasion of Ukraine on February 24, 2022. The extent and duration of the military action, resulting sanctions and resulting future market disruptions in the region are impossible to predict, but could be significant and have a severe adverse effect on the region, including significant negative impacts on the economy and the markets for certain securities and commodities, such as oil and natural gas, as well as other sectors.
Certain Funds invest a significant portion of their assets in securities of issuers located in Asia or with significant exposure to Asian issuers or countries. The Asian financial markets have recently experienced volatility and adverse trends due to concerns in several Asian countries regarding monetary policy, government intervention in the markets, rising government debt levels or economic downturns. These events may spread to other countries in Asia and may affect the value and liquidity of certain of the Funds’ investments.
Certain Funds invest a significant portion of their assets in securities of issuers located in China or with significant exposure to Chinese issuers or countries. Investments in Chinese securities, including certain Hong Kong-listed securities, involves risks specific to China. China may be subject to considerable degrees of economic, political and social instability and demonstrates significantly higher volatility from time to time in comparison to developed markets. Chinese markets generally continue to experience inefficiency, volatility and pricing anomalies resulting from governmental influence, a lack of publicly available information and/or political and social instability. Internal social unrest or confrontations with other neighboring countries may disrupt economic development in China and result in a greater risk of currency fluctuations, currency non-convertibility, interest rate fluctuations and higher rates of inflation. Incidents involving China’s or the region’s security may cause uncertainty in Chinese markets and may adversely affect the Chinese economy and the Fund’s investments. Reduction in spending on Chinese products and services, institution of tariffs or other trade barriers, or a downturn in any of the economies of China’s key trading partners may have an adverse impact on the Chinese economy. In addition, measures may be taken to limit the flow of capital and/or sanctions may be imposed, which could prohibit or restrict the ability to own or transfer fund assets and may also include retaliatory actions, such as seizure of fund assets.
LIBOR Transition Risk: The United Kingdom’s Financial Conduct Authority announced a phase out of the London Interbank Offered Rate (“LIBOR”). Although many LIBOR rates ceased to be published or no longer are representative of the underlying market they seek to measure after December 31, 2021, a selection of widely used USD LIBOR
NOTES TO FINANCIAL STATEMENTS | 141 |
Notes to Financial Statements (continued)
rates will continue to be published through June 2023 in order to assist with the transition. The Funds may be exposed to financial instruments tied to LIBOR to determine payment obligations, financing terms, hedging strategies or investment value. The transition process away from LIBOR might lead to increased volatility and illiquidity in markets for, and reduce the effectiveness of new hedges placed against instruments whose terms currently include LIBOR. The ultimate effect of the LIBOR transition process on the Funds is uncertain.
| 11. | CAPITAL SHARE TRANSACTIONS |
Transactions in capital shares for each class were as follows:
| Year Ended 04/30/22 | Year Ended 04/30/21 | |||||||||||||||
| Fund Name / Share Class | Shares | Amounts | Shares | Amounts | ||||||||||||
Advantage Emerging Markets | ||||||||||||||||
Institutional | ||||||||||||||||
Shares sold | 172,173 | $ | 2,149,062 | 486,880 | $ | 6,360,500 | ||||||||||
Shares issued in reinvestment of distributions | 15,307 | 189,748 | 13,009 | 156,567 | ||||||||||||
Shares redeemed | (540,197 | ) | (6,345,580 | ) | (294,601 | ) | (3,337,976 | ) | ||||||||
|
|
|
|
|
|
|
| |||||||||
| (352,717 | ) | $ | (4,006,770 | ) | 205,288 | $ | 3,179,091 | |||||||||
|
|
|
|
|
|
|
| |||||||||
Investor A | ||||||||||||||||
Shares sold | 60,578 | $ | 730,563 | 204,267 | $ | 2,338,991 | ||||||||||
Shares issued in reinvestment of distributions | 5,633 | 68,598 | 7,349 | 87,639 | ||||||||||||
Shares redeemed | (85,864 | ) | (1,000,083 | ) | (264,631 | ) | (3,105,555 | ) | ||||||||
|
|
|
|
|
|
|
| |||||||||
| (19,653 | ) | $ | (200,922 | ) | (53,015 | ) | $ | (678,925 | ) | |||||||
|
|
|
|
|
|
|
| |||||||||
Investor C | ||||||||||||||||
Shares sold | 494 | $ | 5,613 | 12,988 | $ | 127,341 | ||||||||||
Shares issued in reinvestment of distributions | 36 | 450 | 949 | 10,800 | ||||||||||||
Shares redeemed | (15,259 | ) | (175,008 | ) | (109,763 | ) | (1,201,547 | ) | ||||||||
|
|
|
|
|
|
|
| |||||||||
| (14,729 | ) | $ | (168,945 | ) | (95,826 | ) | $ | (1,063,406 | ) | |||||||
|
|
|
|
|
|
|
| |||||||||
Class K | ||||||||||||||||
Shares sold | 2,518,212 | $ | 29,836,376 | 6,925,990 | $ | 82,456,154 | ||||||||||
Shares issued in reinvestment of distributions | 165,545 | 2,045,863 | 145,913 | 1,758,353 | ||||||||||||
Shares redeemed | (1,558,201 | ) | (18,426,399 | ) | (5,365,264 | ) | (59,652,986 | ) | ||||||||
|
|
|
|
|
|
|
| |||||||||
| 1,125,556 | $ | 13,455,840 | 1,706,639 | $ | 24,561,521 | |||||||||||
|
|
|
|
|
|
|
| |||||||||
| 738,457 | $ | 9,079,203 | 1,763,086 | $ | 25,998,281 | |||||||||||
|
|
|
|
|
|
|
| |||||||||
| Year Ended 04/30/22 | Year Ended 04/30/21 | |||||||||||||||
| Fund Name / Share Class | Shares | Amounts | Shares | Amounts | ||||||||||||
Global Long/Short Equity | ||||||||||||||||
Institutional | ||||||||||||||||
Shares sold | 21,428,123 | $ | 249,500,008 | 16,451,047 | $ | 191,723,004 | ||||||||||
Shares issued in reinvestment of distributions | 338,212 | 4,007,822 | 86,013 | 1,014,954 | ||||||||||||
Shares redeemed | (10,894,979 | ) | (126,513,641 | ) | (21,253,572 | ) | (247,004,557 | ) | ||||||||
|
|
|
|
|
|
|
| |||||||||
| 10,871,356 | $ | 126,994,189 | (4,716,512 | ) | $ | (54,266,599 | ) | |||||||||
|
|
|
|
|
|
|
| |||||||||
Investor A | ||||||||||||||||
Shares sold | 798,505 | $ | 9,148,217 | 881,103 | $ | 10,154,455 | ||||||||||
Shares issued in reinvestment of distributions | 23,726 | 277,350 | 803 | 9,371 | ||||||||||||
Shares redeemed | (569,722 | ) | (6,530,854 | ) | (988,539 | ) | (11,330,527 | ) | ||||||||
|
|
|
|
|
|
|
| |||||||||
| 252,509 | $ | 2,894,713 | (106,633 | ) | $ | (1,166,701 | ) | |||||||||
|
|
|
|
|
|
|
| |||||||||
Investor C | ||||||||||||||||
Shares sold | 70,815 | $ | 760,368 | 21,226 | $ | 233,394 | ||||||||||
Shares issued in reinvestment of distributions | 7,514 | 83,179 | — | — | ||||||||||||
Shares redeemed | (274,027 | ) | (2,959,803 | ) | (484,504 | ) | (5,318,904 | ) | ||||||||
|
|
|
|
|
|
|
| |||||||||
| (195,698 | ) | $ | (2,116,256 | ) | (463,278 | ) | $ | (5,085,510 | ) | |||||||
|
|
|
|
|
|
|
| |||||||||
| 142 | 2 0 2 2 BLACK ROCK ANNUAL REPORT TO SHAREHOLDERS |
Notes to Financial Statements (continued)
| Year Ended 04/30/22 | Year Ended 04/30/21 | |||||||||||||||
| Fund Name / Share Class (continued) | Shares | Amounts | Shares | Amounts | ||||||||||||
Global Long/Short Equity (continued) | ||||||||||||||||
Class K | ||||||||||||||||
Shares sold | 215,060 | $ | 2,517,495 | 433,307 | $ | 5,059,238 | ||||||||||
Shares issued in reinvestment of distributions | 5,402 | 64,174 | 95 | 1,121 | ||||||||||||
Shares redeemed | (34,941 | ) | (413,017 | ) | (32,642 | ) | (384,133 | ) | ||||||||
|
|
|
|
|
|
|
| |||||||||
| 185,521 | $ | 2,168,652 | 400,760 | $ | 4,676,226 | |||||||||||
|
|
|
|
|
|
|
| |||||||||
| 11,113,688 | $ | 129,941,298 | (4,885,663 | ) | $ | (55,842,584 | ) | |||||||||
|
|
|
|
|
|
|
| |||||||||
| 12. | SUBSEQUENT EVENTS |
Management’s evaluation of the impact of all subsequent events on the Funds’ financial statements was completed through the date the financial statements were issued and the following items were noted:
On May 10, 2022, the Board approved a proposal to change the name of the Fund from BlackRock Global Long/Short Equity Fund to BlackRock Global Equity Market Neutral Fund. The name change is expected to become effective on or about September 1, 2022.
NOTES TO FINANCIAL STATEMENTS | 143 |
Report of Independent Registered Public Accounting Firm
To the Shareholders of BlackRock Advantage Emerging Markets Fund and BlackRock Global Long/Short Equity Fund and the Board of Trustees of BlackRock FundsSM:
Opinion on the Financial Statements and Financial Highlights
We have audited the accompanying statements of assets and liabilities of BlackRock Advantage Emerging Markets Fund and BlackRock Global Long/Short Equity Fund of BlackRock FundsSM (the “Funds”), including the schedules of investments, as of April 30, 2022, the related statements of operations for the year then ended, the statements of changes in net assets for each of the two years in the period then ended, and the financial highlights for each of the two years in the period then ended and for the period from August 1, 2019 through April 30, 2020, and the related notes. In our opinion, the financial statements and financial highlights present fairly, in all material respects, the financial position of the Funds as of April 30, 2022, and the results of their operations for the year then ended, the changes in their net assets for each of the two years in the period then ended, and the financial highlights for each of the two years in the period then ended and for the period from August 1, 2019 through April 30, 2020, in conformity with accounting principles generally accepted in the United States of America.
The financial highlights for each of the three years in the period ended July 31, 2019 of the Funds were audited by other auditors whose report dated September 24, 2019, expressed an unqualified opinion on those financial statements and financial highlights.
Basis for Opinion
These financial statements and financial highlights are the responsibility of the Funds’ management. Our responsibility is to express an opinion on the Funds’ financial statements and financial highlights based on our audits. We are a public accounting firm registered with the Public Company Accounting Oversight Board (United States) (PCAOB) and are required to be independent with respect to the Funds in accordance with the U.S. federal securities laws and the applicable rules and regulations of the Securities and Exchange Commission and the PCAOB.
We conducted our audits in accordance with the standards of the PCAOB. Those standards require that we plan and perform the audit to obtain reasonable assurance about whether the financial statements and financial highlights are free of material misstatement, whether due to error or fraud. The Funds are not required to have, nor were we engaged to perform, an audit of their internal control over financial reporting. As part of our audits we are required to obtain an understanding of internal control over financial reporting but not for the purpose of expressing an opinion on the effectiveness of the Funds’ internal control over financial reporting. Accordingly, we express no such opinion.
Our audits included performing procedures to assess the risks of material misstatement of the financial statements and financial highlights, whether due to error or fraud, and performing procedures that respond to those risks. Such procedures included examining, on a test basis, evidence regarding the amounts and disclosures in the financial statements and financial highlights. Our audits also included evaluating the accounting principles used and significant estimates made by management, as well as evaluating the overall presentation of the financial statements and financial highlights. Our procedures included confirmation of securities owned as of April 30, 2022, by correspondence with the custodians or counterparties; when replies were not received, we performed other auditing procedures. We believe that our audits provide a reasonable basis for our opinion.
Deloitte & Touche LLP
Boston, Massachusetts
June 28, 2022
We have served as the auditor of one or more BlackRock investment companies since 1992.
| 144 | 2 0 2 2 BLACK ROCK ANNUAL REPORT TO SHAREHOLDERS |
Important Tax Information (unaudited)
The following amounts, or maximum amounts allowable by law, are hereby designated as qualified dividend income for individuals for the fiscal year ended April 30, 2022:
| ||||
| Fund Name | Qualified Dividend Income | |||
| ||||
Advantage Emerging Markets | $ | 2,153,163 | ||
| ||||
The Funds hereby designate the following amounts, or maximum amounts allowable by law, as capital gain dividends, subject to a long-term capital gains tax rate as noted below, for the fiscal year ended April 30, 2022:
| ||||
| Fund Name | 20% Rate Long-Term Capital Gain Dividends | |||
| ||||
Global Long/Short Equity | $ | 6,131,516 | ||
| ||||
The Funds intend to pass through to their shareholders the following amounts, or maximum amounts allowable by law, of foreign source income earned and foreign taxes paid for the fiscal year ended April 30, 2022:
| ||||||||
| Fund Name | Foreign Source Income Earned | Foreign Taxes Paid | ||||||
| ||||||||
Advantage Emerging Markets | $ | 2,330,790 | $ | 212,135 | ||||
| ||||||||
| 145 |
Statement Regarding Liquidity Risk Management Program
In compliance with Rule 22e-4 under the Investment Company Act of 1940, as amended (the “Liquidity Rule”), BlackRock FundsSM (the “Trust”) has adopted and implemented a liquidity risk management program (the “Program”) for BlackRock Advantage Emerging Markets Fund and BlackRock Global Long/Short Equity Fund (the “Funds”), each a series of the Trust, which is reasonably designed to assess and manage each Fund’s liquidity risk.
The Board of Trustees (the “Board”) of the Trust, on behalf of the Funds, met on November 9-10, 2021 (the “Meeting”) to review the Program. The Board previously appointed BlackRock Advisors, LLC or BlackRock Fund Advisors (“BlackRock”), each an investment adviser to certain BlackRock funds, as the program administrator for each Fund’s Program, as applicable. BlackRock also previously delegated oversight of the Program to the 40 Act Liquidity Risk Management Committee (the “Committee”). At the Meeting, the Committee, on behalf of BlackRock, provided the Board with a report that addressed the operation of the Program and assessed its adequacy and effectiveness of implementation, including the management of each Fund’s Highly Liquid Investment Minimum (“HLIM”) where applicable, and any material changes to the Program (the “Report”). The Report covered the period from October 1, 2020 through September 30, 2021 (the “Program Reporting Period”).
The Report described the Program’s liquidity classification methodology for categorizing each Fund’s investments (including derivative transactions) into one of four liquidity buckets. It also referenced the methodology used by BlackRock to establish each Fund’s HLIM and noted that the Committee reviews and ratifies the HLIM assigned to each Fund no less frequently than annually. The Report also discussed notable events affecting liquidity over the Program Reporting Period, including the imposition of capital controls in certain countries.
The Report noted that the Program complied with the key factors for consideration under the Liquidity Rule for assessing, managing and periodically reviewing each Fund’s liquidity risk, as follows:
| a) | The Fund’s investment strategy and liquidity of portfolio investments during both normal and reasonably foreseeable stressed conditions. During the Program Reporting Period, the Committee reviewed whether each Fund’s strategy is appropriate for an open-end fund structure with a focus on funds with more significant and consistent holdings of less liquid and illiquid assets. The Committee also factored a fund’s concentration in an issuer into the liquidity classification methodology by taking issuer position sizes into account. Where a fund participated in borrowings for investment purposes (such as tender option bonds or reverse repurchase agreements), such borrowings were factored into the Program’s calculation of a fund’s liquidity bucketing. Derivative exposure was also considered in such calculation. |
| b) | Short-term and long-term cash flow projections during both normal and reasonably foreseeable stressed conditions. During the Program Reporting Period, the Committee reviewed historical redemption activity and used this information as a component to establish each Fund’s reasonably anticipated trading size (“RATS”). Each Fund has adopted an in-kind redemption policy which may be utilized to meet larger redemption requests. The Committee may also take into consideration a fund’s shareholder ownership concentration (which, depending on product type and distribution channel, may or may not be available), a fund’s distribution channels, and the degree of certainty associated with a fund’s short-term and long-term cash flow projections. |
| c) | Holdings of cash and cash equivalents, as well as borrowing arrangements. The Committee considered the terms of the credit facility committed to each Fund, the financial health of the institution providing the facility and the fact that the credit facility is shared among multiple funds (including that a portion of the aggregate commitment amount is specifically designated for BlackRock Floating Rate Income Portfolio, a series of BlackRock Funds V). The Committee also considered other types of borrowing available to the Funds, such as the ability to use reverse repurchase agreements and interfund lending, as applicable. |
There were no material changes to the Program during the Program Reporting Period other than the enhancement of certain model components in the Program’s methodology. The Report provided to the Board stated that the Committee concluded that based on the operation of the functions, as described in the Report, the Program is operating as intended and is effective in implementing the requirements of the Liquidity Rule.
| 146 | 2 0 2 2 BLACK ROCK ANNUAL REPORT TO SHAREHOLDERS |
Trustee and Officer Information
| Independent Trustees(a) | ||||||||
Name Year of Birth(b) | Position(s) Held (Length of Service)(c) | Principal Occupation(s) During Past Five Years | Number of BlackRock-Advised Investment Portfolios | Public Company Past Five Years | ||||
Mark Stalnecker 1951 | Chair of the Board (Since 2019) and Trustee (Since 2015) | Chief Investment Officer, University of Delaware from 1999 to 2013; Trustee and Chair of the Finance and Investment Committees, Winterthur Museum and Country Estate from 2005 to 2016; Member of the Investment Committee, Delaware Public Employees’ Retirement System since 2002; Member of the Investment Committee, Christiana Care Health System from 2009 to 2017; Member of the Investment Committee, Delaware Community Foundation from 2013 to 2014; Director and Chair of the Audit Committee, SEI Private Trust Co. from 2001 to 2014. | 29 RICs consisting of 163 Portfolios | None | ||||
Susan J. Carter 1956 | Trustee (Since 2016) | Trustee, Financial Accounting Foundation from 2017 to 2021; Advisory Board Member, Center for Private Equity and Entrepreneurship at Tuck School of Business from 1997 to 2021; Director, Pacific Pension Institute from 2014 to 2018; Senior Advisor, Commonfund Capital, Inc. (“CCI”) (investment adviser) in 2015; Chief Executive Officer, CCI from 2013 to 2014; President & Chief Executive Officer, CCI from 1997 to 2013; Advisory Board Member, Girls Who Invest from 2015 to 2018 and Board Member thereof since 2018; Advisory Board Member, Bridges Fund Management since 2016; Practitioner Advisory Board Member, Private Capital Research Institute (“PCRI”) since 2017; Lecturer in the Practice of Management, Yale School of Management since 2019; Advisor to Finance Committee, Altman Foundation since 2020; Investment Committee Member, Tostan since 2021. | 29 RICs consisting of 163 Portfolios | None | ||||
Collette Chilton 1958 | Trustee (Since 2015) | Chief Investment Officer, Williams College since 2006; Chief Investment Officer, Lucent Asset Management Corporation from 1998 to 2006; Director, Boys and Girls Club of Boston since 2017; Director, B1 Capital since 2018; Director, David and Lucile Packard Foundation since 2020. | 29 RICs consisting of 163 Portfolios | None | ||||
Neil A. Cotty 1954 | Trustee (Since 2016) | Bank of America Corporation from 1996 to 2015, serving in various senior finance leadership roles, including Chief Accounting Officer from 2009 to 2015, Chief Financial Officer of Global Banking, Markets and Wealth Management from 2008 to 2009, Chief Accounting Officer from 2004 to 2008, Chief Financial Officer of Consumer Bank from 2003 to 2004, Chief Financial Officer of Global Corporate Investment Bank from 1999 to 2002. | 29 RICs consisting of 163 Portfolios | None | ||||
Lena G. Goldberg 1949 | Trustee (Since 2019) | Director, Charles Stark Draper Laboratory, Inc. since 2013; Senior Lecturer, Harvard Business School from 2008 to 2021; FMR LLC/Fidelity Investments (financial services) from 1996 to 2008, serving in various senior roles including Executive Vice President—Strategic Corporate Initiatives and Executive Vice President and General Counsel; Partner, Sullivan & Worcester LLP from 1985 to 1996 and Associate thereof from 1979 to 1985. | 29 RICs consisting of 163 Portfolios | None | ||||
TRUSTEE AND OFFICER INFORMATION | 147 |
Trustee and Officer Information (continued)
| Independent Trustees(a) (continued) | ||||||||
Name Year of Birth(b) | Position(s) Held (Length of Service)(c) | Principal Occupation(s) During Past Five Years | Number of BlackRock-Advised Investment Portfolios | Public Company Past Five Years | ||||
Henry R. Keizer 1956 | Trustee (Since 2019) | Director, Park Indemnity Ltd. (captive insurer) since 2010; Director, MUFG Americas Holdings Corporation and MUFG Union Bank, N.A. (financial and bank holding company) from 2014 to 2016; Director, American Institute of Certified Public Accountants from 2009 to 2011; Director, KPMG LLP (audit, tax and advisory services) from 2004 to 2005 and 2010 to 2012; Director, KPMG International in 2012, Deputy Chairman and Chief Operating Officer thereof from 2010 to 2012 and U.S. Vice Chairman of Audit thereof from 2005 to 2010; Global Head of Audit, KPMGI (consortium of KPMG firms) from 2006 to 2010; Director, YMCA of Greater New York from 2006 to 2010. | 29 RICs consisting of 163 Portfolios | Hertz Global Holdings (car rental); GrafTech International Ltd. (materials manufacturing); Montpelier Re Holdings, Ltd. (publicly held property and casualty reinsurance) from 2013 to 2015; WABCO (commercial vehicle safety systems) from 2015 to 2020; Sealed Air Corp. (packaging) from 2015 to 2021. | ||||
Cynthia A. Montgomery 1952 | Trustee (Since 2007) | Professor, Harvard Business School since 1989. | 29 RICs consisting of 163 Portfolios | Newell Rubbermaid, Inc. (manufacturing) from 1995 to 2016. | ||||
Donald C. Opatrny 1952 | Trustee (Since 2019) | Director, Athena Capital Advisors LLC (investment management firm) from 2013 to 2020; Trustee, Vice Chair, Member of the Executive Committee and Chair of the Investment Committee, Cornell University from 2004 to 2019; President and Trustee, the Center for the Arts, Jackson Hole from 2011 to 2018; Member of the Board and Investment Committee, University School from 2007 to 2018; Trustee, Artstor (a Mellon Foundation affiliate) from 2010 to 2015; Member of the Investment Committee, Mellon Foundation from 2009 to 2015; President, Trustee and Member of the Investment Committee, The Aldrich Contemporary Art Museum from 2007 to 2014; Trustee and Chair of the Investment Committee, Community Foundation of Jackson Hole since 2014; Member of Affordable Housing Supply Board of Jackson, Wyoming since 2017; Member, Investment Funds Committee, State of Wyoming since 2017; Trustee, Phoenix Art Museum since 2018; Trustee, Arizona Community Foundation and Member of Investment Committee since 2020. | 29 RICs consisting of 163 Portfolios | None | ||||
Joseph P. Platt 1947 | Trustee (Since 2007) | General Partner, Thorn Partners, LP (private investments) since 1998; Director, WQED Multi-Media (public broadcasting not-for-profit) since 2001; Chair, Basic Health International (non-profit) since 2015. | 29 RICs consisting of 163 Portfolios | Greenlight Capital Re, Ltd. (reinsurance company); Consol Energy Inc. | ||||
| 148 | 2 0 2 2 BLACK ROCK ANNUAL REPORT TO SHAREHOLDERS |
Trustee and Officer Information (continued)
| Independent Trustees(a) (continued) | ||||||||
Name Year of Birth(b) | Position(s) Held (Length of Service)(c) | Principal Occupation(s) During Past Five Years | Number of BlackRock-Advised Investment Portfolios | Public Company Past Five Years | ||||
Kenneth L. Urish 1951 | Trustee (Since 2007) | Managing Partner, Urish Popeck & Co., LLC (certified public accountants and consultants) since 1976; Past- Chairman of the Professional Ethics Committee of the Pennsylvania Institute of Certified Public Accountants and Committee Member thereof since 2007; Member of External Advisory Board, The Pennsylvania State University Accounting Department since founding in 2001; Principal, UP Strategic Wealth Investment Advisors, LLC since 2013; Trustee, The Holy Family Institute from 2001 to 2010; President and Trustee, Pittsburgh Catholic Publishing Associates from 2003 to 2008; Director, Inter-Tel from 2006 to 2007; Member, Advisory Board, ESG Competent Boards since 2020. | 29 RICs consisting of 163 Portfolios | None | ||||
Claire A. Walton 1957 | Trustee (Since 2016) | Chief Operating Officer and Chief Financial Officer of Liberty Square Asset Management, LP from 1998 to 2015; General Partner of Neon Liberty Capital Management, LLC since 2003; Director, Boston Hedge Fund Group from 2009 to 2018; Director, Woodstock Ski Runners since 2013; Director, Massachusetts Council on Economic Education from 2013 to 2015. | 29 RICs consisting of 163 Portfolios | None | ||||
| Interested Trustees(a)(d) | ||||||||
Name Year of Birth(b) | Position(s) Held (Length of Service)(c) | Principal Occupation(s) During Past Five Years | Number of BlackRock-Advised Investment Portfolios (“Portfolios”) Overseen | Public Company and Other Past Five Years | ||||
Robert Fairbairn 1965 | Trustee (Since 2018) | Vice Chairman of BlackRock, Inc. since 2019; Member of BlackRock’s Global Executive and Global Operating Committees; Co-Chair of BlackRock’s Human Capital Committee; Senior Managing Director of BlackRock, Inc. from 2010 to 2019; oversaw BlackRock’s Strategic Partner Program and Strategic Product Management Group from 2012 to 2019; Member of the Board of Managers of BlackRock Investments, LLC from 2011 to 2018; Global Head of BlackRock’s Retail and iShares® businesses from 2012 to 2016. | 98 RICs consisting of 262 Portfolios | None | ||||
John M. Perlowski(e) 1964 | Trustee (Since 2015) President and Chief Executive Officer (Since 2010) | Managing Director of BlackRock, Inc. since 2009; Head of BlackRock Global Accounting and Product Services since 2009; Advisory Director of Family Resource Network (charitable foundation) since 2009. | 100 RICs consisting of 264 Portfolios | None | ||||
| (a) | The address of each Trustee is c/o BlackRock, Inc., 55 East 52nd Street, New York, New York 10055. |
| (b) | Independent Trustees serve until their resignation, retirement, removal or death, or until December 31 of the year in which they turn 75. The Board may determine to extend the terms of Independent Trustees on a case-by-case basis, as appropriate. |
| (c) | Following the combination of Merrill Lynch Investment Managers, L.P. (“MLIM”) and BlackRock, Inc. in September 2006, the various legacy MLIM and legacy BlackRock fund boards were realigned and consolidated into three new fund boards in 2007. Furthermore, effective January 1, 2019, three BlackRock Fund Complexes were realigned and consolidated into two BlackRock Fund Complexes. As a result, although the chart shows the year that each Independent Trustee joined the Board, certain Independent Trustees first became members of the boards of other BlackRock-advised Funds, legacy MLIM funds or legacy BlackRock funds as follows: Cynthia A. Montgomery, 1994; Joseph P. Platt, 1999; Kenneth L. Urish, 1999; Lena G. Goldberg, 2016; Henry R. Keizer, 2016; Donald C. Opatrny, 2015. |
| (d) | Mr. Fairbairn and Mr. Perlowski are both “interested persons,” as defined in the 1940 Act, of the Trust based on their positions with BlackRock, Inc. and its affiliates. Mr. Fairbairn and Mr. Perlowski are also board members of the BlackRock Fixed-Income Complex. |
TRUSTEE AND OFFICER INFORMATION | 149 |
Trustee and Officer Information (continued)
| (e) | Mr. Perlowski is also a trustee of the BlackRock Credit Strategies Fund and BlackRock Private Investments Fund. |
| Officers Who Are Not Trustees(a) | ||||
Name Year of Birth(b) | Position(s) Held (Length of Service) | Principal Occupation(s) During Past Five Years | ||
Jennifer McGovern 1977 | Vice President (Since 2014) | Managing Director of BlackRock, Inc. since 2016; Director of BlackRock, Inc. from 2011 to 2015; Head of Americas Product Development and Governance for BlackRock’s Global Product Group since 2019; Head of Product Structure and Oversight for BlackRock’s U.S. Wealth Advisory Group from 2013 to 2019. | ||
Trent Walker 1974 | Chief Financial Officer (Since 2021) | Managing Director of BlackRock, Inc. since September 2019; Executive Vice President of PIMCO from 2016 to 2019; Senior Vice President of PIMCO from 2008 to 2015; Treasurer from 2013 to 2019 and Assistant Treasurer from 2007 to 2017 of PIMCO Funds, PIMCO Variable Insurance Trust, PIMCO ETF Trust, PIMCO Equity Series, PIMCO Equity Series VIT, PIMCO Managed Accounts Trust, 2 PIMCO-sponsored interval funds and 21 PIMCO-sponsored closed-end funds. | ||
Jay M. Fife 1970 | Treasurer (Since 2007) | Managing Director of BlackRock, Inc. since 2007. | ||
Charles Park 1967 | Chief Compliance Officer (Since 2014) | Anti-Money Laundering Compliance Officer for certain BlackRock-advised Funds from 2014 to 2015; Chief Compliance Officer of BlackRock Advisors, LLC and the BlackRock-advised Funds in the BlackRock Multi-Asset Complex and the BlackRock Fixed-Income Complex since 2014; Principal of and Chief Compliance Officer for iShares® Delaware Trust Sponsor LLC since 2012 and BlackRock Fund Advisors (“BFA”) since 2006; Chief Compliance Officer for the BFA-advised iShares® exchange traded funds since 2006; Chief Compliance Officer for BlackRock Asset Management International Inc. since 2012. | ||
Lisa Belle 1968 | Anti-Money Laundering Compliance Officer (Since 2019) | Managing Director of BlackRock, Inc. since 2019; Global Financial Crime Head for Asset and Wealth Management of JP Morgan from 2013 to 2019; Managing Director of RBS Securities from 2012 to 2013; Head of Financial Crimes for Barclays Wealth Americas from 2010 to 2012. | ||
Janey Ahn 1975 | Secretary (Since 2019) | Managing Director of BlackRock, Inc. since 2018; Director of BlackRock, Inc. from 2009 to 2017. | ||
(a) The address of each Officer is c/o BlackRock, Inc., 55 East 52nd Street, New York, New York 10055. (b) Officers of the Trust serve at the pleasure of the Board. | ||||
Further information about the Trust’s Trustees and Officers is available in the Trust’s Statement of Additional Information, which can be obtained without charge by calling (800) 441-7762.
Effective December 31, 2021, Bruce R. Bond retired as a Trustee of the Funds.
Effective March 31, 2022, Thomas Callahan resigned as a Vice President of the Funds and effective May 10, 2022, Roland Villacorta was appointed as a Vice President of the Funds.
| 150 | 2 0 2 2 BLACK ROCK ANNUAL REPORT TO SHAREHOLDERS |
Regulation Regarding Derivatives
On October 28, 2020, the Securities and Exchange Commission (the “SEC”) adopted regulations governing the use of derivatives by registered investment companies (“Rule 18f-4”). The Funds will be required to implement and comply with Rule 18f-4 by August 19, 2022. Once implemented, Rule 18f-4 will impose limits on the amount of derivatives a fund can enter into, eliminate the asset segregation framework currently used by funds to comply with Section 18 of the 1940 Act, treat derivatives as senior securities and require funds whose use of derivatives is more than a limited specified exposure amount to establish and maintain a comprehensive derivatives risk management program and appoint a derivatives risk manager.
General Information
Quarterly performance, semi-annual and annual reports, current net asset value and other information regarding the Funds may be found on BlackRock’s website, which can be accessed at blackrock.com. Any reference to BlackRock’s website in this report is intended to allow investors public access to information regarding the Funds and does not, and is not intended to, incorporate BlackRock’s website in this report.
Householding
The Funds will mail only one copy of shareholder documents, including prospectuses, annual and semi-annual reports, Rule 30e-3 notices and proxy statements, to shareholders with multiple accounts at the same address. This practice is commonly called “householding” and is intended to reduce expenses and eliminate duplicate mailings of shareholder documents. Mailings of your shareholder documents may be householded indefinitely unless you instruct us otherwise. If you do not want the mailing of these documents to be combined with those for other members of your household, please call the Funds at (800) 441-7762.
Availability of Quarterly Schedule of Investments
The Funds file their complete schedules of portfolio holdings with the SEC for the first and third quarters of each fiscal year as an exhibit to their reports on Form N-PORT. The Funds’ Forms N-PORT are available on the SEC’s website at sec.gov. Additionally, each Fund makes its portfolio holdings for the first and third quarters of each fiscal year available at blackrock.com/fundreports.
Availability of Proxy Voting Policies, Procedures and Voting Records
A description of the policies and procedures that the Funds use to determine how to vote proxies relating to portfolio securities and information about how the Funds voted proxies relating to securities held in the Funds’ portfolios during the most recent 12-month period ended June 30 is available without charge, upon request (1) by calling (800) 441-7762; (2) on the BlackRock website at blackrock.com; and (3) on the SEC’s website at sec.gov.
BlackRock’s Mutual Fund Family
BlackRock offers a diverse lineup of open-end mutual funds crossing all investment styles and managed by experts in equity, fixed-income and tax-exempt investing. Visit blackrock.com for more information.
Shareholder Privileges
Account Information
Call us at (800) 441-7762 from 8:00 AM to 6:00 PM ET on any business day to get information about your account balances, recent transactions and share prices. You can also visit blackrock.com for more information.
Automatic Investment Plans
Investor class shareholders who want to invest regularly can arrange to have $50 or more automatically deducted from their checking or savings account and invested in any of the BlackRock funds.
Systematic Withdrawal Plans
Investor class shareholders can establish a systematic withdrawal plan and receive periodic payments of $50 or more from their BlackRock funds, as long as their account balance is at least $10,000.
Retirement Plans
Shareholders may make investments in conjunction with Traditional, Rollover, Roth, Coverdell, Simple IRAs, SEP IRAs and 403(b) Plans.
ADDITIONAL INFORMATION | 151 |
Additional Information (continued)
BlackRock Privacy Principles
BlackRock is committed to maintaining the privacy of its current and former fund investors and individual clients (collectively, “Clients”) and to safeguarding their non-public personal information. The following information is provided to help you understand what personal information BlackRock collects, how we protect that information and why in certain cases we share such information with select parties.
If you are located in a jurisdiction where specific laws, rules or regulations require BlackRock to provide you with additional or different privacy-related rights beyond what is set forth below, then BlackRock will comply with those specific laws, rules or regulations.
BlackRock obtains or verifies personal non-public information from and about you from different sources, including the following: (i) information we receive from you or, if applicable, your financial intermediary, on applications, forms or other documents; (ii) information about your transactions with us, our affiliates, or others; (iii) information we receive from a consumer reporting agency; and (iv) from visits to our websites.
BlackRock does not sell or disclose to non-affiliated third parties any non-public personal information about its Clients, except as permitted by law or as is necessary to respond to regulatory requests or to service Client accounts. These non-affiliated third parties are required to protect the confidentiality and security of this information and to use it only for its intended purpose.
We may share information with our affiliates to service your account or to provide you with information about other BlackRock products or services that may be of interest to you. In addition, BlackRock restricts access to non-public personal information about its Clients to those BlackRock employees with a legitimate business need for the information. BlackRock maintains physical, electronic and procedural safeguards that are designed to protect the non-public personal information of its Clients, including procedures relating to the proper storage and disposal of such information.
Fund and Service Providers
Investment Adviser and Administrator
BlackRock Advisors, LLC
Wilmington, DE 19809
Sub-Adviser
BlackRock International Limited(a)
Edinburgh, EH3 8BL
United Kingdom
Accounting Agent and Custodian
State Street Bank and Trust Company
Boston, MA 02111
Transfer Agent
BNY Mellon Investment Servicing (US) Inc.
Wilmington, DE 19809
Distributor
BlackRock Investments, LLC
New York, NY 10022
Independent Registered Public Accounting Firm
Deloitte & Touche LLP
Boston, MA 02116
Legal Counsel
Sidley Austin LLP
New York, NY 10019
Address of the Funds
100 Bellevue Parkway
Wilmington, DE 19809
| (a) | For Global Long/Short Equity. |
| 152 | 2 0 2 2 BLACK ROCK ANNUAL REPORT TO SHAREHOLDERS |
Glossary of Terms Used in this Report
| Currency Abbreviation | ||
| USD | United States Dollar | |
| Portfolio Abbreviation | ||
| ADR | American Depositary Receipt | |
| AGC | Assured Guaranty Corp. | |
| AMBAC | AMBAC Assurance Corp. | |
| ARB | Airport Revenue Bonds | |
| BAM | Build America Mutual Assurance Co. | |
| BMO | BMO Capital Markets | |
| CME | Chicago Mercantile Exchange | |
| CVA | Certificaten Van Aandelen (Dutch Certificate) | |
| DIP | Debtor-In-Possession | |
| GAN | Grant Anticipation Notes | |
| GDR | Global Depositary Receipt | |
| JSC | Joint Stock Company | |
| LP | Limited Partnership | |
| MSCI | Morgan Stanley Capital International | |
| NVDR | Non-Voting Depositary Receipt | |
| PCL | Public Company Limited | |
| PILOT | Payment in Lieu of Taxes | |
| PJSC | Public Joint Stock Company | |
| REIT | Real Estate Investment Trust | |
| S&P | Standard & Poor’s | |
| SAW | State Aid Withholding | |
| SCA | Societe en Commandite par Actions | |
| SDR | Swedish Depositary Receipt | |
| SEB | SEB Securities Inc. | |
| SG | Syncora Guarantee | |
| SRF | State Revolving Fund | |
| ST | Special Tax | |
| UT | Unlimited Tax | |
GLOSSARY OF TERMS USED IN THIS REPORT | 153 |
Want to know more?
blackrock.com | 800-441-7762
This report is intended for current holders. It is not authorized for use as an offer of sale or a solicitation of an offer to buy shares of the Funds unless preceded or accompanied by the Funds’ current prospectus. Past performance results shown in this report should not be considered a representation of future performance. Investment returns and principal value of shares will fluctuate so that shares, when redeemed, may be worth more or less than their original cost. Statements and other information herein are as dated and are subject to change.
EMLSGLS-04/22-AR
|  |

| (b) | Not Applicable |
| Item 3 – | Audit Committee Financial Expert – The registrant’s board of directors (the “board of directors”), has determined that (i) the registrant has the following audit committee financial experts serving on its audit committee and (ii) each audit committee financial expert is independent: |
Neil A. Cotty
Henry R. Keizer
Kenneth L. Urish
Under applicable securities laws, a person determined to be an audit committee financial expert will not be deemed an “expert” for any purpose, including without limitation for the purposes of Section 11 of the Securities Act of 1933, as a result of being designated or identified as an audit committee financial expert. The designation or identification of a person as an audit committee financial expert does not impose on such person any duties, obligations, or liabilities greater than the duties, obligations, and liabilities imposed on such person as a member of the audit committee and board of directors in the absence of such designation or identification. The designation or identification of a person as an audit committee financial expert does not affect the duties, obligations, or liability of any other member of the audit committee or board of directors.
| Item 4 – | Principal Accountant Fees and Services |
The following table presents fees billed by PricewaterhouseCoopers LLP (“PwC”) and Deloitte & Touche (“D&T”) in each of the last two fiscal years for the services rendered to the Fund:
| (a) Audit Fees | (b) Audit-Related Fees1 | (c) Tax Fees2 | (d) All Other Fees | |||||||||||||||||||||||||||||||||||||
| Entity Name | Current Fiscal Year End | Previous Fiscal Year End | Current Fiscal Year End | Previous Fiscal Year End | Current Fiscal Year End | Previous Fiscal Year End | Current Fiscal Year End | Previous Fiscal Year End | ||||||||||||||||||||||||||||||||
| BlackRock Advantage Emerging Markets Fund | $46,002 | $45,551 | $0 | $0 | $18,100 | $21,800 | $420 | $0 | ||||||||||||||||||||||||||||||||
| BlackRock Global Long/Short Equity Fund | $62,016 | $61,408 | $0 | $0 | $24,000 | $21,800 | $420 | $0 | ||||||||||||||||||||||||||||||||
The following table presents fees billed by PwC that were required to be approved by the registrant’s audit committee (the “Committee”) for services that relate directly to the operations or financial reporting of the Fund and that are rendered on behalf of BlackRock Advisors, LLC (the “Investment Adviser” or “BlackRock”) and entities controlling, controlled by, or under common control with BlackRock (not including any sub-adviser whose role is primarily portfolio management and is subcontracted with or overseen by another investment adviser) that provide ongoing services to the Fund (“Affiliated Service Providers”):
| Current Fiscal Year End | Previous Fiscal Year End | |||
(b) Audit-Related Fees1 | $0 | $0 | ||
(c) Tax Fees2 | $0 | $0 | ||
(d) All Other Fees3 | $0 | $0 | ||
| 1 | The nature of the services includes assurance and related services reasonably related to the performance of the audit or review of financial statements not included in Audit Fees, including accounting consultations, agreed-upon procedure reports, attestation reports, comfort letters, out-of-pocket expenses and internal control reviews not required by regulators. |
| 2 | The nature of the services includes tax compliance and/or tax preparation, including services relating to the filing or amendment of federal, state or local income tax returns, regulated investment company qualification reviews, taxable income and tax distribution calculations. |
| 3 | Aggregate fees borne by BlackRock in connection with the review of compliance procedures and attestation thereto performed by PwC with respect to all of the registered closed-end funds and some of the registered open-end funds advised by BlackRock. |
(e)(1) Audit Committee Pre-Approval Policies and Procedures:
The Committee has adopted policies and procedures with regard to the pre-approval of services. Audit, audit-related and tax compliance services provided to the registrant on an annual basis require specific pre-approval by the Committee. The Committee also must approve other non-audit services provided to the registrant and those non-audit services provided to the Investment Adviser and Affiliated Service Providers that relate directly to the operations and the financial reporting of the registrant. Certain of these non-audit services that the Committee believes are (a) consistent with the SEC’s auditor independence rules and (b) routine and recurring services that will not impair the independence of the independent accountants may be approved by the Committee without consideration on a specific case-by-case basis (“general pre-approval”). The term of any general pre-approval is 12 months from the date of the pre-approval, unless the Committee provides for a different period. Tax or other non-audit services provided to the registrant which have a direct impact on the operations or financial reporting of the registrant will only be deemed pre-approved provided that any individual project does not exceed $10,000 attributable to the registrant or $50,000 per project. For this purpose, multiple projects will be aggregated to determine if they exceed the previously mentioned cost levels.
Any proposed services exceeding the pre-approved cost levels will require specific pre-approval by the Committee, as will any other services not subject to general pre-approval (e.g., unanticipated but permissible services). The Committee is informed of each service approved subject to general pre-approval at the next regularly scheduled in-person board meeting. At this meeting, an analysis of such services is presented to the Committee for ratification. The Committee may delegate to the Committee Chairman the authority to approve the provision of and fees for any specific engagement of permitted non-audit services, including services exceeding pre-approved cost levels.
(e)(2) None of the services described in each of Items 4(b) through (d) were approved by the Committee pursuant to the de minimis exception in paragraph (c)(7)(i)(C) of Rule 2-01 of Regulation S-X.
(f) Not Applicable
(g) The aggregate non-audit fees, defined as the sum of the fees shown under “Audit-Related Fees,” “Tax Fees” and “All Other Fees,” paid to the accountant for services rendered by the accountant to the registrant, the Investment Adviser and the Affiliated Service Providers were:
| Entity Name | Current Fiscal Year End | Previous Fiscal Year End | ||||||||
BlackRock Advantage Emerging Markets Fund | $18,520 | $21,800 | ||||||||
BlackRock Global Long/Short Equity Fund | $24,420 | $21,800 | ||||||||
(h) The Committee has considered and determined that the provision of non-audit services that were rendered to the Investment Adviser and the Affiliated Service Providers that were not pre-approved pursuant to paragraph (c)(7)(ii) of Rule 2-01 of Regulation S-X is compatible with maintaining the principal accountant’s independence.
(i) – Not Applicable
(j) – Not Applicable
| Item 5 – | Audit Committee of Listed Registrant – Not Applicable |
| Item 6 – | Investments |
(a) The registrant’s Schedule of Investments is included as part of the Report to Stockholders filed under Item 1(a) of this Form.
(b) Not Applicable due to no such divestments during the semi-annual period covered since the previous Form N-CSR filing.
| Item 7 – | Disclosure of Proxy Voting Policies and Procedures for Closed-End Management Investment Companies – Not Applicable |
| Item 8 – | Portfolio Managers of Closed-End Management Investment Companies – Not Applicable |
| Item 9 – | Purchases of Equity Securities by Closed-End Management Investment Company and Affiliated Purchasers – Not Applicable |
| Item 10 – | Submission of Matters to a Vote of Security Holders – There have been no material changes to these procedures. |
| Item 11 – | Controls and Procedures |
(a) The registrant’s principal executive and principal financial officers, or persons performing similar functions, have concluded that the registrant’s disclosure controls and procedures (as defined in Rule 30a-3(c) under the Investment Company Act of 1940, as amended (the “1940 Act”)) are effective as of a date within 90 days of the filing of this report based on the evaluation of these controls and procedures required by Rule 30a-3(b) under the 1940 Act and Rule 15d-15(b) under the Securities Exchange Act of 1934, as amended.
(b) There were no changes in the registrant’s internal control over financial reporting (as defined in Rule 30a-3(d) under the 1940 Act) that occurred during the period covered by this report that have materially affected, or are reasonably likely to materially affect, the registrant’s internal control over financial reporting.
| Item 12 – | Disclosure of Securities Lending Activities for Closed-End Management Investment Companies –Not Applicable |
| Item 13 – | Exhibits attached hereto |
(a)(1) Code of Ethics – See Item 2
(a)(2) Section 302 Certifications are attached
(a)(3) Any written solicitation to purchase securities under Rule 23c-1 – Not Applicable
(a)(4) Change in Registrant’s independent public accountant – Not Applicable
(b) Section 906 Certifications are attached
Pursuant to the requirements of the Securities Exchange Act of 1934 and the Investment Company Act of 1940, the registrant has duly caused this report to be signed on its behalf by the undersigned, thereunto duly authorized.
BlackRock Funds
By: | /s/ John M. Perlowski | |||
John M. Perlowski | ||||
Chief Executive Officer (principal executive officer) of | ||||
BlackRock Funds |
Date: June 28, 2022
Pursuant to the requirements of the Securities Exchange Act of 1934 and the Investment Company Act of 1940, this report has been signed below by the following persons on behalf of the registrant and in the capacities and on the dates indicated.
By: | /s/ John M. Perlowski | |||
John M. Perlowski | ||||
Chief Executive Officer (principal executive officer) of | ||||
BlackRock Funds |
Date: June 28, 2022
By: | /s/ Trent Walker | |||
Trent Walker | ||||
Chief Financial Officer (principal financial officer) of | ||||
BlackRock Funds |
Date: June 28, 2022