UNITED STATES
SECURITIES AND EXCHANGE COMMISSION
Washington, D.C. 20549
FORM N-CSR
CERTIFIED SHAREHOLDER REPORT OF REGISTERED MANAGEMENT
INVESTMENT COMPANIES
Investment Company Act file number: 811-05742
| Name of Fund: | BlackRock FundsSM |
| iShares U.S. Intermediate Credit Bond Index Fund |
| iShares U.S. Intermediate Government Bond Index Fund |
| iShares U.S. Long Credit Bond Index Fund |
| iShares U.S. Long Government Bond Index Fund |
| iShares U.S. Securitized Bond Index Fund |
| Fund Address: | 100 Bellevue Parkway, Wilmington, DE 19809 |
Name and address of agent for service: John M. Perlowski, Chief Executive Officer, BlackRock FundsSM, 50 Hudson Yards, New York, NY 10001
Registrant’s telephone number, including area code: (800) 441-7762
Date of fiscal year end: 10/31/2023
Date of reporting period: 10/31/2023
Item 1 – Report to Stockholders
(a) The Report to Shareholders is attached herewith.
| OCTOBER 31, 2023 |

| 2023 Annual Report
| |
BlackRock FundsSM
· iShares U.S. Intermediate Credit Bond Index Fund
· iShares U.S. Intermediate Government Bond Index Fund
· iShares U.S. Long Credit Bond Index Fund
· iShares U.S. Long Government Bond Index Fund
· iShares U.S. Securitized Bond Index Fund
Not FDIC Insured • May Lose Value • No Bank Guarantee
|
Dear Shareholder,
The combination of continued economic growth and cooling inflation provided a supportive backdrop for investors during the 12-month reporting period ended October 31, 2023. Significantly tighter monetary policy helped to rein in inflation, as the annual increase in the Consumer Price Index declined to its long-term average of approximately 3% in October 2023. Meanwhile, real economic growth proved more resilient than many investors anticipated. A moderating labor market also helped ease inflationary pressure, although wages continued to grow and unemployment rates touched the lowest levels in decades before rising slightly. This robust labor market powered further growth in consumer spending, backstopping the economy. On October 7, 2023, Hamas launched a horrific attack on Israel. The ensuing war will have a significant humanitarian impact and could lead to heightened economic and market volatility. We see geopolitics as a structural market risk going forward. See our geopolitical risk dashboard at blackrock.com for more details.
Equity returns were solid during the period, as the durability of consumer spending mitigated investors’ concerns about the economy’s trajectory. The U.S. economy continued to show strength, and growth further accelerated in the third quarter of 2023. However, equity returns were uneven, as the performance of a few notable technology companies supported gains among large-capitalization U.S. stocks, while small-capitalization U.S. stocks declined overall. Meanwhile, international developed market equities advanced, and emerging market equities posted solid gains.
The 10-year U.S. Treasury yield rose during the reporting period, driving its price down, as investors reacted to elevated inflation and attempted to anticipate future interest rate changes. The corporate bond market benefited from improving economic sentiment, although high-yield corporate bond prices fared significantly better than investment-grade bonds as demand from yield-seeking investors remained strong.
The U.S. Federal Reserve (the “Fed”), attempting to manage persistent inflation, raised interest rates six times during the 12-month period, but slowed and then paused its tightening later in the period. The Fed also wound down its bond-buying programs and incrementally reduced its balance sheet by not replacing securities that reach maturity.
Supply constraints appear to have become an embedded feature of the new macroeconomic environment, making it difficult for developed economies to increase production without sparking higher inflation. Geopolitical fragmentation and an aging population risk further exacerbating these constraints, keeping the labor market tight and wage growth high. Although the Fed has decelerated the pace of interest rate hikes and recently opted for several pauses, we believe that the new economic regime means that the Fed will need to maintain high rates for an extended period to keep inflation under control. Furthermore, ongoing structural changes may mean that the Fed will be hesitant to cut interest rates in the event of faltering economic activity lest inflation accelerate again.
While we favor an overweight position in developed market equities in the long term, we prefer an underweight stance in the near term. Expectations for corporate earnings remain elevated, which seems inconsistent with macroeconomic constraints. Nevertheless, we are overweight on Japanese stocks in the near term as shareholder-friendly policies generate increased investor interest. We also believe that stocks with an AI tilt should benefit from an investment cycle that is set to support revenues and margins. In credit, there are selective opportunities in the near term despite tightening credit and financial conditions. For fixed income investing with a six- to twelve-month horizon, we see the most attractive investments in short-term U.S. Treasuries, U.S. inflation-linked bonds, euro area government bonds and gilts, U.S. mortgage-backed securities, and hard-currency emerging market bonds.
Overall, our view is that investors need to think globally, position themselves to be prepared for a decarbonizing economy, and be nimble as market conditions change. We encourage you to talk with your financial advisor and visit blackrock.com for further insight about investing in today’s markets.
Sincerely,

Rob Kapito
President, BlackRock Advisors, LLC

Rob Kapito
President, BlackRock Advisors, LLC
Total Returns as of October 31, 2023
| ||||
6-Month
|
12-Month
| |||
U.S. large cap equities (S&P 500® Index) | 1.39% | 10.14% | ||
U.S. small cap equities (Russell 2000® Index) | (5.29) | (8.56) | ||
International equities (MSCI Europe, Australasia, Far East Index) | (7.88) | 14.40 | ||
Emerging market equities (MSCI Emerging Markets Index) | (4.78) | 10.80 | ||
3-month Treasury bills (ICE BofA 3-Month U.S. Treasury Bill Index) | 2.63 | 4.77 | ||
U.S. Treasury securities (ICE BofA 10-Year U.S. Treasury Index) | (9.70) | (3.25) | ||
U.S. investment grade bonds (Bloomberg U.S. Aggregate Bond Index) | (6.13) | 0.36 | ||
Tax-exempt municipal bonds (Bloomberg Municipal Bond Index) | (4.65) | 2.64 | ||
U.S. high yield bonds (Bloomberg U.S. Corporate High Yield 2% Issuer Capped Index) | 0.02 | 6.23 | ||
Past performance is not an indication of future results. Index performance is shown for illustrative purposes only. You cannot invest directly in an index. | ||||
| 2 | THIS PAGE IS NOT PART OF YOUR FUND REPORT |
Page
| ||||
| ||||
| 2 | ||||
Annual Report: | ||||
| 4 | ||||
| 14 | ||||
| 14 | ||||
| 14 | ||||
Financial Statements: | ||||
| 15 | ||||
| 102 | ||||
| 104 | ||||
| 106 | ||||
| 109 | ||||
| 114 | ||||
| 125 | ||||
| 126 | ||||
| 127 | ||||
| 130 | ||||
| 134 | ||||
| 136 | ||||

| 3 |
| Fund Summary as of October 31, 2023 | iShares U.S. Intermediate Credit Bond Index Fund |
Investment Objective
iShares U.S. Intermediate Credit Bond Index Fund’s (the “Fund”) investment objective is to seek to provide investment results that correspond to the total return performance of fixed-income securities, in aggregate, as represented by the Bloomberg U.S. Intermediate Credit Bond Index (the “Index”).
Portfolio Management Commentary
How did the Fund perform?
For the 12-month period ended October 31, 2023, the Fund returned 3.53%. The Fund’s benchmark, the Bloomberg U.S. Intermediate Credit Bond Index, returned 3.52% for the same period.
Describe the market environment.
U.S. Treasury yields rose (as prices fell) over the past 12 months, dampening returns across the bond market. In the early part of the reporting period, the market performed well as moderating inflation raised hopes that the Fed could be nearing the end of its long series of interest rate hikes. As 2023 progressed, however, the combination of persistent inflation and communications from Fed officials made it clear that although rate hikes were indeed winding down, interest rates were likely to remain “higher for longer.” The Fed ultimately raised rates six times over the course of the 12-month period, bringing the benchmark fed funds rate from a range of 3.0-3.25% to 5.25%-5.50%. More important was the fact that the markets continued to push out expectations for the central bank’s first rate cut. At the beginning of the reporting period, the futures markets were indicating the initial rate reduction would occur in the second half of 2023. In contrast, the expected timing had shifted to late 2024 by the end of October.
Despite the headwind from rising Treasury yields, intermediate-term corporate issues delivered gains thanks to the contribution from income and a decline in yield spreads relative to government debt. The compression in spreads reflected the backdrop of positive economic growth, better-than-expected corporate earnings, and investors’ generally healthy appetite for risk.
Describe recent portfolio activity.
The Fund maintained its objective of seeking to provide investment results that correspond to the total return performance of the Index by selecting securities in accordance with their relative proportion within the Index. Other factors considered in security selection included transaction costs and maturity.
Describe portfolio positioning at period end.
The Fund remained positioned to attempt to match the risk characteristics of the Index, irrespective of the market’s future direction.
The views expressed reflect the opinions of BlackRock as of the date of this report and are subject to change based on changes in market, economic or other conditions. These views are not intended to be a forecast of future events and are no guarantee of future results.
GROWTH OF $10,000 INVESTMENT
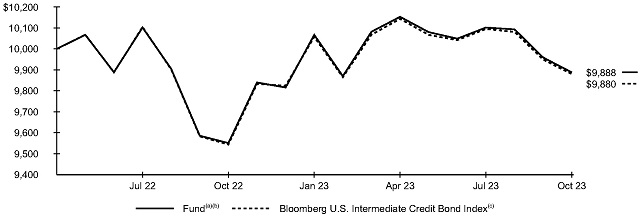
The Fund commenced operations on May 20, 2022.
| (a) | Assuming transaction costs and other operating expenses, including investment advisory fees, if any. |
| (b) | Under normal circumstances, at least 90% of the value of the Fund’s assets, plus the amount of any borrowings for investment purposes, is invested in securities comprising the Bloomberg U.S. Intermediate Credit Bond Index, which, for the Fund, are considered bonds. |
| (c) | An index that measures the investment grade, U.S. dollar-denominated, fixed-rate, taxable corporate and government-related bond markets with a maturity greater than 1 year and less than 10 years. It is composed of the U.S. Corporate Index and a non-corporate component that includes non-U.S. agencies, sovereigns, supranationals and local authorities constrained by maturity. |
| 4 | 2 0 2 3 BLACK ROCK ANNUAL REPORT TO SHAREHOLDERS |
| Fund Summary as of October 31, 2023 (continued) | iShares U.S. Intermediate Credit Bond Index Fund |
Performance
| Average Annual Total Returns | ||||||||
|
| |||||||
| 1 Year | | Since Inception | (a) | |||||
Fund | 3.53 | % | (0.77 | )% | ||||
Bloomberg U.S. Intermediate Credit Bond Index | 3.52 | (0.83 | ) | |||||
| (a) | The Fund commenced operations on May 20, 2022. |
Past performance is not an indication of future results.
Performance results may include adjustments made for financial reporting purposes in accordance with U.S. generally accepted accounting principles.
Expense Example
| Actual | Hypothetical 5% Return | |||||||||||||||||||||||||||
|
|
| ||||||||||||||||||||||||||
Beginning Account Value (05/01/23) | | Ending Account Value (10/31/23) |
| | Expenses Paid During the Period |
(a) | | Beginning Account Value (05/01/23) |
| | Ending Account Value (10/31/23) |
| | Expenses Paid During the Period |
(a) | | Annualized Expense Ratio |
| ||||||||||
| ||||||||||||||||||||||||||||
$ 1,000.00 | $ 973.90 | $ 0.00 | $ 1,000.00 | $ 1,025.21 | $ 0.00 | 0.00% | ||||||||||||||||||||||
| ||||||||||||||||||||||||||||
| (a) | Expenses are equal to the annualized expense ratio for the class, multiplied by the average account value over the period, multiplied by 184/365 (to reflect the one-half year period shown). |
See “Disclosure of Expenses” for further information on how expenses were calculated.
Portfolio Information
PORTFOLIO COMPOSITION
| ||||
| Asset Type(a)(b) | Percent of Total Investments | |||
| ||||
Corporate Bonds | 89.4% | |||
Foreign Agency Obligations | 9.9 | |||
Other* | 0.7 | |||
| ||||
| (a) | Excludes short-term securities. |
| (b) | For Fund compliance purposes, the Fund’s industry classifications refer to one or more of the industry sub-classifications used by one or more widely recognized market indexes or ratings group indexes, and/or as defined by the investment adviser. These definitions may not apply for purposes of this report, which may combine such industry sub-classifications for reporting ease. |
| * | Includes one or more investment categories that individually represents less than 1.0% of the Fund’s total investments. Please refer to the Schedule of Investments for details. |
FUND SUMMARY | 5 |
| Fund Summary as of October 31, 2023 | iShares U.S. Intermediate Government Bond Index Fund |
Investment Objective
iShares U.S. Intermediate Government Bond Index Fund’s (the “Fund”) investment objective is to seek to provide investment results that correspond to the total return performance of fixed-income securities, in aggregate, as represented by the Bloomberg U.S. Intermediate Government Bond Index (the “Index”).
Portfolio Management Commentary
How did the Fund perform?
For the 12-month period ended October 31, 2023, the Fund returned 1.59%. The Fund’s benchmark, the Bloomberg U.S. Intermediate Government Bond Index, returned 1.46% for the same period.
Describe the market environment.
U.S. Treasury yields rose (as prices fell) over the past 12 months, but the benefit of income outweighed the effects of falling prices and helped intermediate-term Treasuries register a positive total return.
In the early part of the reporting period, the market performed well as moderating inflation raised hopes that the Fed could be nearing the end of its long series of interest rate hikes. As 2023 progressed, however, the combination of persistent inflation and communications from Fed officials made it clear that although rate hikes were indeed winding down, interest rates were likely to remain “higher for longer.” The Fed ultimately raised rates six times over the course of the 12-month period, bringing the benchmark fed funds rate from a range of 3.0-3.25% to 5.25%-5.50%. More important, however, was the fact that the markets continued to push out expectations for the central bank’s first rate cut. At the beginning of the period, the futures markets were indicating the initial rate reduction would occur in the second half of 2023. In contrast, the expected timing had shifted to late 2024 by the end of October.
These developments led to negative price performance for intermediate-term Treasuries. The yield on the five-year note climbed from 4.27% to 4.82% over the course of the period, while the 10-year yield rose from 4.10% to 4.88%.
The Fund’s cash position had no material impact on performance.
Describe recent portfolio activity.
The Fund maintained its objective of seeking to provide investment results that correspond to the total return performance of the Index by selecting securities in accordance with their relative proportion within the Index. Other factors considered in security selection included transaction costs and maturity.
Describe portfolio positioning at period end.
The Fund remained positioned to attempt to match the risk characteristics of the Index, irrespective of the market’s future direction.
The views expressed reflect the opinions of BlackRock as of the date of this report and are subject to change based on changes in market, economic or other conditions. These views are not intended to be a forecast of future events and are no guarantee of future results.
GROWTH OF $10,000 INVESTMENT
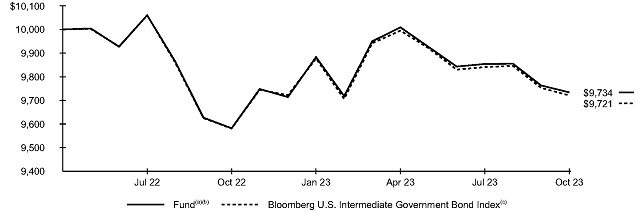
The Fund commenced operations on May 20, 2022.
| (a) | Assuming transaction costs and other operating expenses, including investment advisory fees, if any. |
| (b) | Under normal circumstances, at least 90% of the value of the Fund’s assets, plus the amount of any borrowings for investment purposes, is invested in securities comprising the Bloomberg U.S. Intermediate Government Bond Index, which, for the Fund, are considered bonds issued or guaranteed by the U.S. Government and its agencies or instrumentalities. |
| (c) | An index that includes U.S. dollar-denominated, fixed-rate, nominal U.S. Treasuries and U.S. agency debentures (securities issued by U.S. government owned or government sponsored entities, and debt explicitly guaranteed by the U.S. government) with a maturity greater than 1 year and less than 10 years. |
| 6 | 2 0 2 3 BLACK ROCK ANNUAL REPORT TO SHAREHOLDERS |
| Fund Summary as of October 31, 2023 (continued) | iShares U.S. Intermediate Government Bond Index Fund |
Performance
Average Annual Total Returns | ||||||||
| 1 Year | | Since Inception | (a) | |||||
Fund | 1.59 | % | (1.85 | )% | ||||
Bloomberg U.S. Intermediate Government Bond Index | 1.46 | (1.94 | ) | |||||
| (a) | The Fund commenced operations on May 20, 2022. |
Past performance is not an indication of future results.
Performance results may include adjustments made for financial reporting purposes in accordance with U.S. generally accepted accounting principles.
Expense Example
| Actual | Hypothetical 5% Return | |||||||||||||||||||||||||||
|
|
| ||||||||||||||||||||||||||
Beginning Account Value (05/01/23) | | Ending Account Value (10/31/23) |
| | Expenses Paid During the Period |
(a) | | Beginning Account Value (05/01/23) |
| | Ending Account Value (10/31/23) |
| | Expenses Paid During the Period |
(a) | | Annualized Expense Ratio |
| ||||||||||
| ||||||||||||||||||||||||||||
$ 1,000.00 | $ 972.50 | $ 0.00 | $ 1,000.00 | $ 1,025.21 | $ 0.00 | 0.00% | ||||||||||||||||||||||
| ||||||||||||||||||||||||||||
| (a) | Expenses are equal to the annualized expense ratio for the class, multiplied by the average account value over the period, multiplied by 184/365 (to reflect the one-half year period shown). |
See “Disclosure of Expenses” for further information on how expenses were calculated.
Portfolio Information
| PORTFOLIO COMPOSITION |
| |||
| ||||
| Asset Type(a) | Percent of Total Investments | |||
| ||||
U.S. Treasury Obligations | 97.9% | |||
U.S. Government Sponsored Agency Securities | 2.1 | |||
| ||||
| (a) | Excludes short-term securities. |
FUND SUMMARY | 7 |
| Fund Summary as of October 31, 2023 | iShares U.S. Long Credit Bond Index Fund |
Investment Objective
iShares U.S. Long Credit Bond Index Fund’s (the “Fund”) investment objective is to seek to provide investment results that correspond to the total return performance of fixed-income securities, in aggregate, as represented by the Bloomberg U.S. Long Credit Bond Index (the “Index”).
Portfolio Management Commentary
How did the Fund perform?
For the 12-month period ended October 31, 2023, the Fund returned 0.80%. The Fund’s benchmark, the Bloomberg U.S. Long Credit Bond Index, returned 0.62% for the same period.
Describe the market environment.
U.S. Treasury yields rose (as prices fell) over the past 12 months, pressuring returns across the bond market. In the early part of the reporting period, the market performed well as moderating inflation raised hopes that the Fed could be nearing the end of its long series of interest rate hikes. As 2023 progressed, however, the combination of persistent inflation and communications from Fed officials made it clear that although rate hikes were indeed winding down, interest rates were likely to remain “higher for longer.” The Fed ultimately raised rates six times over the course of the 12-month period, bringing the benchmark fed funds rate from a range of 3.0-3.25% to 5.25%-5.50%. More important, however, was the fact that the markets continued to push out expectations for the central bank’s first rate cut. At the beginning of the period, the futures markets were indicating the initial rate reduction would occur in the second half of 2023. In contrast, the expected timing had shifted to late 2024 by the end of October.
Despite the headwind from rising Treasury yields, long-term corporate issues delivered gains thanks to the contribution from income and a decline in yield spreads relative to government debt. The compression in spreads reflected the backdrop of positive economic growth, better-than-expected corporate earnings, and investors’ generally healthy appetite for risk. However, longer-term corporates underperformed short- and intermediate-term issues due to their higher sensitivity to interest rate movements.
The Fund’s cash position had no material impact on performance.
Describe recent portfolio activity.
The Fund maintained its objective of seeking to provide investment results that correspond to the total return performance of the Index by selecting securities in accordance with their relative proportion within the Index. Other factors considered in security selection included transaction costs and maturity.
Describe portfolio positioning at period end.
The Fund remained positioned to attempt to match the risk characteristics of the Index, irrespective of the market’s future direction.
The views expressed reflect the opinions of BlackRock as of the date of this report and are subject to change based on changes in market, economic or other conditions. These views are not intended to be a forecast of future events and are no guarantee of future results.
GROWTH OF $10,000 INVESTMENT
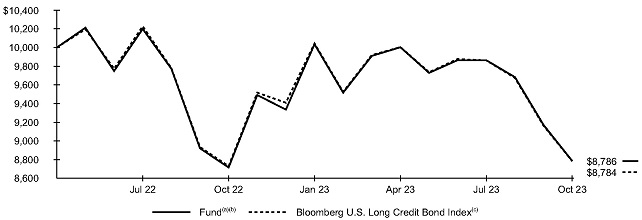
The Fund commenced operations on May 20, 2022.
| (a) | Assuming transaction costs and other operating expenses, including investment advisory fees, if any. |
| (b) | Under normal circumstances, at least 90% of the value of the Fund’s assets, plus the amount of any borrowings for investment purposes, is invested in securities comprising the Bloomberg U.S. Long Credit Bond Index, which, for the Fund, are considered bonds. |
| (c) | An index that measures the investment grade, U.S. dollar-denominated, fixed-rate, taxable corporate and government-related bond markets with a maturity greater than 10 years. It is composed of the U.S. Corporate Index and a non-corporate component that includes non-U.S. agencies, sovereigns, supranationals and local authorities constrained by maturity. |
| 8 | 2 0 2 3 BLACK ROCK ANNUAL REPORT TO SHAREHOLDERS |
| Fund Summary as of October 31, 2023 (continued) | iShares U.S. Long Credit Bond Index Fund |
Performance
| Average Annual Total Returns | ||||||||
|
| |||||||
| 1 Year | | Since Inception | (a) | |||||
Fund | 0.80 | % | (8.55 | )% | ||||
Bloomberg U.S. Long Credit Bond Index | 0.62 | (8.59 | ) | |||||
| (a) | The Fund commenced operations on May 20, 2022. |
Past performance is not an indication of future results.
Performance results may include adjustments made for financial reporting purposes in accordance with U.S. generally accepted accounting principles.
Expense Example
| Actual | Hypothetical 5% Return | |||||||||||||||||||||||||||
|
|
| ||||||||||||||||||||||||||
Beginning Account Value (05/01/23) | | Ending Account Value (10/31/23) |
| | Expenses Paid During the Period |
(a) | | Beginning Account Value (05/01/23) |
| | Ending Account Value (10/31/23) |
| | Expenses Paid During the Period |
(a) | | Annualized Expense Ratio |
| ||||||||||
| ||||||||||||||||||||||||||||
$ 1,000.00 | $ 878.30 | $ 0.00 | $ 1,000.00 | $ 1,025.20 | $ 0.00 | 0.00% | ||||||||||||||||||||||
| ||||||||||||||||||||||||||||
| (a) | Expenses are equal to the annualized expense ratio for the class, multiplied by the average account value over the period, multiplied by 184/365 (to reflect the one-half year period shown). |
See “Disclosure of Expenses” for further information on how expenses were calculated.
Portfolio Information
| PORTFOLIO COMPOSITION | ||||
| ||||
| Asset Type(a)(b) | Percent of Total Investments | |||
| ||||
Corporate Bonds | 89.3% | |||
Foreign Agency Obligations | 5.4 | |||
Municipal Bonds | 5.2 | |||
Capital Trust | 0.1 | |||
| ||||
| (a) | Excludes short-term securities. |
| (b) | For Fund compliance purposes, the Fund’s industry classifications refer to one or more of the industry sub-classifications used by one or more widely recognized market indexes or ratings group indexes, and/or as defined by the investment adviser. These definitions may not apply for purposes of this report, which may combine such industry sub-classifications for reporting ease. |
FUND SUMMARY | 9 |
| Fund Summary as of October 31, 2023 | iShares U.S. Long Government Bond Index Fund |
Investment Objective
iShares U.S. Long Government Bond Index Fund’s (the “Fund”) investment objective is to seek to provide investment results that correspond to the total return performance of fixed-income securities, in aggregate, as represented by the Bloomberg U.S. Long Government Bond Index (the “Index”).
Portfolio Management Commentary
How did the Fund perform?
For the 12-month period ended October 31, 2023, the Fund returned (8.17)%. The Fund’s benchmark, the Bloomberg Long U.S. Government Bond Index, returned (8.45)% for the same period.
Describe the market environment.
U.S. Treasury yields rose (as prices fell) over the past 12 months, pressuring returns across the bond market. In the early part of the reporting period, the market performed well as moderating inflation raised hopes that the Fed could be nearing the end of its long series of interest rate hikes. As 2023 progressed, however, the combination of persistent inflation and communications from Fed officials made it clear that although rate hikes were indeed winding down, interest rates were likely to remain “higher for longer.” The Fed ultimately raised rates six times over the course of the 12-month period, bringing the benchmark fed funds rate from a range of 3.0-3.25% to 5.25%-5.50%. More important, however, was the fact that the markets continued to push out expectations for the central bank’s first rate cut. At the beginning of the period, the futures markets were indicating the initial rate reduction would occur in the second half of 2023. In contrast, the expected timing had shifted to late 2024 by the end of October.
These developments weighed on long-term U.S. Treasuries and caused the category to finish as one of the worst-performing segments in the fixed-income market. The yield on the 10-year note climbed from 4.10% to 4.88% over the course of the period, while the 30-year yield rose from 4.22% to 5.04%.
The Fund’s cash position had no material impact on performance.
Describe recent portfolio activity.
The Fund maintained its objective of seeking to provide investment results that correspond to the total return performance of the Index by selecting securities in accordance with their relative proportion within the Index. Other factors considered in security selection included transaction costs and maturity.
Describe portfolio positioning at period end.
The Fund remained positioned to attempt to match the risk characteristics of the Index, irrespective of the market’s future direction.
The views expressed reflect the opinions of BlackRock as of the date of this report and are subject to change based on changes in market, economic or other conditions. These views are not intended to be a forecast of future events and are no guarantee of future results.
GROWTH OF $10,000 INVESTMENT
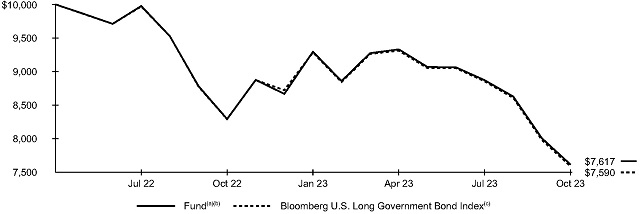
The Fund commenced operations on May 20, 2022.
| (a) | Assuming transaction costs and other operating expenses, including investment advisory fees, if any. |
| (b) | Under normal circumstances, at least 90% of the value of the Fund’s assets, plus the amount of any borrowings for investment purposes, is invested in securities comprising the Bloomberg U.S. Long Government Bond Index, which, for the Fund, are considered bonds issued or guaranteed by the U.S. Government and its agencies or instrumentalities. |
| (c) | An index that includes U.S. dollar-denominated, fixed-rate, nominal U.S. Treasuries and U.S. agency debentures (securities issued by U.S. government owned or government sponsored entities, and debt explicitly guaranteed by the U.S. government) with a maturity greater than 10 years. |
| 10 | 2 0 2 3 BLACK ROCK ANNUAL REPORT TO SHAREHOLDERS |
| Fund Summary as of October 31, 2023 (continued) | iShares U.S. Long Government Bond Index Fund |
Performance
| Average Annual Total Returns | ||||||||
|
| |||||||
| 1 Year | | Since Inception | (a) | |||||
Fund | (8.17 | )% | (17.13 | )% | ||||
Bloomberg U.S. Long Government Bond Index | (8.45 | ) | (17.38 | ) | ||||
| (a) | The Fund commenced operations on May 20, 2022. |
Past performance is not an indication of future results.
Performance results may include adjustments made for financial reporting purposes in accordance with U.S. generally accepted accounting principles.
Expense Example
| Actual | Hypothetical 5% Return | |||||||||||||||||||||||||||
|
|
| ||||||||||||||||||||||||||
Beginning Account Value (05/01/23) | | Ending Account Value (10/31/23) |
| | Expenses Paid During the Period |
(a) | | Beginning Account Value (05/01/23) |
| | Ending Account Value (10/31/23) |
| | Expenses Paid During the Period |
(a) | | Annualized Expense Ratio |
| ||||||||||
| ||||||||||||||||||||||||||||
$ 1,000.00 | $ 816.30 | $ 0.00 | $ 1,000.00 | $ 1,025.21 | $ 0.00 | 0.00% | ||||||||||||||||||||||
| ||||||||||||||||||||||||||||
| (a) | Expenses are equal to the annualized expense ratio for the class, multiplied by the average account value over the period, multiplied by 184/365 (to reflect the one-half year period shown). |
See “Disclosure of Expenses” for further information on how expenses were calculated.
Portfolio Information
| PORTFOLIO COMPOSITION |
| |||
| ||||
| Asset Type(a) | Percent of Total Investments | |||
| ||||
U.S. Treasury Obligations | 98.9% | |||
U.S. Government Sponsored Agency Securities | 1.1 | |||
| ||||
| (a) | Excludes short-term securities. |
FUND SUMMARY | 11 |
| Fund Summary as of October 31, 2023 | iShares U.S. Securitized Bond Index Fund |
Investment Objective
iShares U.S. Securitized Bond Index Fund’s (the “Fund”) investment objective is to seek to provide investment results that correspond to the total return performance of fixed-income securities, in aggregate, as represented by the Bloomberg U.S. Securitized: MBS, ABS, and CMBS Index (the “Index”).
Portfolio Management Commentary
How did the Fund perform?
For the 12-month period ended October 31, 2023, the Fund returned (0.53)%. The Fund’s benchmark, the Bloomberg U.S. Securitized: MBS, ABS, and CMBS Index, returned (0.59)% for the same period.
Describe the market environment.
U.S. Treasury yields rose (as prices fell) over the past 12 months, pressuring returns across the bond market. In the early part of the reporting period, the market performed well as moderating inflation raised hopes that the Fed could be nearing the end of its long series of interest rate hikes. As 2023 progressed, however, the combination of persistent inflation and communications from Fed officials made it clear that although rate hikes were indeed winding down, interest rates were likely to remain “higher for longer.” The Fed ultimately raised rates six times over the course of the 12-month period, bringing the benchmark fed funds rate from a range of 3.0-3.25% to 5.25%-5.50%. More important, however, was the fact that the markets continued to push out expectations for the central bank’s first rate cut. At the beginning of the period, the futures markets were indicating the initial rate reduction would occur in the second half of 2023. In contrast, the expected timing had shifted to late 2024 by the end of October.
Securitized assets produced a return in line with the broader investment-grade market. Asset-backed securities performed well, largely due to the ongoing strength in the U.S. consumer sector. Commercial mortgage-backed securities (“CMBS”) posted a modest gain, with a broad range of returns across property types. Sentiment around CMBS collateralized by office properties continued to suffer from remote or hybrid work policies and higher vacancy rates relative to pre-pandemic levels. By contrast, hotel- and multifamily-backed CMBS benefited from strong consumer spending and high housing rental rates, respectively. Mortgage-backed securities lagged, however. The category was pressured by volatile market conditions and the increased interest-rate sensitivity brought about by lower prepayments.
The Fund’s cash position had no material impact on performance.
Describe recent portfolio activity.
The Fund maintained its objective of seeking to provide investment results that correspond to the total return performance of the Index by selecting securities in accordance with their relative proportion within the Index. Other factors considered in security selection included transaction costs and maturity.
Describe portfolio positioning at period end.
The Fund remained positioned to attempt to match the risk characteristics of the Index, irrespective of the market’s future direction.
The views expressed reflect the opinions of BlackRock as of the date of this report and are subject to change based on changes in market, economic or other conditions. These views are not intended to be a forecast of future events and are no guarantee of future results.
GROWTH OF $10,000 INVESTMENT

| The | Fund commenced operations on May 20, 2022. |
| (a) | Assuming transaction costs and other operating expenses, including investment advisory fees, if any. |
| (b) | Under normal circumstances, at least 90% of the value of the Fund’s assets, plus the amount of any borrowings for investment purposes, is invested in securities comprising the Bloomberg U.S. Securitized: MBS, ABS, and CMBS Index, which, for the Fund, are considered bonds. |
| (c) | An index that measures the performance of residential mortgage backed securities issued by Government Sponsored Enterprises, asset backed securities and commercial mortgage backed securities. |
| 12 | 2 0 2 3 BLACK ROCK ANNUAL REPORT TO SHAREHOLDERS |
| Fund Summary as of October 31, 2023 (continued) | iShares U.S. Securitized Bond Index Fund |
Performance
Average Annual Total Returns | ||||||||
| 1 Year | | Since Inception | (a) | |||||
Fund | (0.53 | )% | (5.73 | )% | ||||
Bloomberg U.S. Securitized: MBS, ABS, and CMBS Index | (0.59 | ) | (5.84 | ) | ||||
| (a) | The Fund commenced operations on May 20, 2022. |
Past performance is not an indication of future results.
Performance results may include adjustments made for financial reporting purposes in accordance with U.S. generally accepted accounting principles.
Expense Example
| Actual | Hypothetical 5% Return | |||||||||||||||||||||||||||
|
|
| ||||||||||||||||||||||||||
Beginning Account Value (05/01/23) | | Ending Account Value (10/31/23) |
| | Expenses Paid During the Period |
(a) | | Beginning Account Value (05/01/23) |
| | Ending Account Value (10/31/23) |
| | Expenses Paid During the Period |
(a) | | Annualized Expense Ratio |
| ||||||||||
| ||||||||||||||||||||||||||||
$ 1,000.00 | $ 933.10 | $ 0.00 | $ 1,000.00 | $ 1,025.21 | $ 0.00 | 0.00% | ||||||||||||||||||||||
| ||||||||||||||||||||||||||||
| (a) | Expenses are equal to the annualized expense ratio for the class, multiplied by the average account value over the period, multiplied by 184/365 (to reflect the one-half year period shown). |
See “Disclosure of Expenses” for further information on how expenses were calculated.
Portfolio Information
| PORTFOLIO COMPOSITION |
| |||
| ||||
| Asset Type(a)(b) | Percent of Total Investments | |||
| ||||
U.S. Government Sponsored Agency Securities | 96.3% | |||
Non-Agency Mortgage-Backed Securities | 2.9 | |||
Asset-Backed Securities | 0.8 | |||
| ||||
| (a) | Excludes short-term securities. |
| (b) | For Fund compliance purposes, the Fund’s industry classifications refer to one or more of the industry sub-classifications used by one or more widely recognized market indexes or ratings group indexes, and/or as defined by the investment adviser. These definitions may not apply for purposes of this report, which may combine such industry sub-classifications for reporting ease. |
FUND SUMMARY | 13 |
Past performance is not an indication of future results. Financial markets have experienced extreme volatility and trading in many instruments has been disrupted. These circumstances may continue for an extended period of time and may continue to affect adversely the value and liquidity of each Fund’s investments. As a result, current performance may be lower or higher than the performance data quoted. Refer to blackrock.com to obtain performance data current to the most recent month-end. Performance results do not reflect the deduction of taxes that a shareholder would pay on Fund distributions or the redemption of Fund shares. Figures shown in the performance table(s) assume reinvestment of all distributions, if any, at net asset value (“NAV”) on the ex-dividend date or payable date, as applicable. Investment return and principal value of shares will fluctuate so that shares, when redeemed, may be worth more or less than their original cost. Distributions paid to each class of shares will vary because of the different levels of service, distribution and transfer agency fees applicable to each class, which are deducted from the income available to be paid to shareholders.
BlackRock Fund Advisors (the “Manager”), each Fund’s investment adviser, and BlackRock Advisors, LLC (the “Administrator”), each Fund’s administrator, have contractually and/or voluntarily agreed to waive and/or reimburse a portion of each Fund’s expenses. Without such waiver(s) and/or reimbursement(s) each Fund’s performance would have been lower. With respect to each Fund’s voluntary waiver(s), if any, the Manager and the Administrator are under no obligation to waive and/or reimburse or to continue waiving and/or reimbursing its fees and such voluntary waiver(s) may be reduced or discontinued at any time. With respect to each Fund’s contractual waiver(s), if any, the Manager and the Administrator are under no obligation to continue waiving and/or reimbursing its fees after the applicable termination date of such agreement. See the Notes to Financial Statements for additional information on waivers and/or reimbursements.
Shareholders of each Fund may incur the following charges: (a) transactional expenses; and (b) operating expenses, including investment advisory fees, administration fees, service and distribution fees, including 12b-1 fees, acquired fund fees and expenses, and other fund expenses. The expense examples shown (which are based on a hypothetical investment of $1,000 invested at the beginning of the period and held through the end of the period) are intended to assist shareholders both in calculating expenses based on an investment in each Fund and in comparing these expenses with similar costs of investing in other mutual funds.
The expense examples provide information about actual account values and actual expenses. Annualized expense ratios reflect contractual and voluntary fee waivers, if any. In order to estimate the expenses a shareholder paid during the period covered by this report, shareholders can divide their account value by $1,000 and then multiply the result by the number corresponding to their Fund under the heading entitled “Expenses Paid During the Period.”
The expense examples also provide information about hypothetical account values and hypothetical expenses based on a Fund’s actual expense ratio and an assumed rate of return of 5% per year before expenses. In order to assist shareholders in comparing the ongoing expenses of investing in these Funds and other funds, compare the 5% hypothetical examples with the 5% hypothetical examples that appear in shareholder reports of other funds.
The expenses shown in the expense examples are intended to highlight shareholders’ ongoing costs only and do not reflect transactional expenses, such as sales charges, if any. Therefore, the hypothetical examples are useful in comparing ongoing expenses only and will not help shareholders determine the relative total expenses of owning different funds. If these transactional expenses were included, shareholder expenses would have been higher.
Derivative Financial Instruments
The Funds may invest in various derivative financial instruments. These instruments are used to obtain exposure to a security, commodity, index, market, and/or other assets without owning or taking physical custody of securities, commodities and/or other referenced assets or to manage market, equity, credit, interest rate, foreign currency exchange rate, commodity and/or other risks. Derivative financial instruments may give rise to a form of economic leverage and involve risks, including the imperfect correlation between the value of a derivative financial instrument and the underlying asset, possible default of the counterparty to the transaction or illiquidity of the instrument. Pursuant to Rule 18f-4 under the 1940 Act, among other things, the Funds must either use derivative financial instruments with embedded leverage in a limited manner or comply with an outer limit on fund leverage risk based on value-at-risk. The Funds’ successful use of a derivative financial instrument depends on the investment adviser’s ability to predict pertinent market movements accurately, which cannot be assured. The use of these instruments may result in losses greater than if they had not been used, may limit the amount of appreciation a Fund can realize on an investment and/or may result in lower distributions paid to shareholders. The Funds’ investments in these instruments, if any, are discussed in detail in the Notes to Financial Statements.
| 14 | 2 0 2 3 BLACK ROCK ANNUAL REPORT TO SHAREHOLDERS |
October 31, 2023 | iShares U.S. Intermediate Credit Bond Index Fund (Percentages shown are based on Net Assets) |
| Security | Par (000) | Value | ||||||
Corporate Bonds | ||||||||
| Advertising Agencies — 0.1% | ||||||||
Omnicom Group, Inc. | $ | 579 | $ | 459,455 | ||||
4.20%, 06/01/30 | 350 | 308,268 | ||||||
2.60%, 08/01/31(a) | 317 | 243,575 | ||||||
Omnicom Group, Inc./Omnicom Capital, Inc. | 450 | 438,953 | ||||||
3.60%, 04/15/26 | 813 | 770,067 | ||||||
|
| |||||||
| 2,220,318 | ||||||||
| Aerospace & Defense — 1.6% | ||||||||
3M Co. | 829 | 787,925 | ||||||
3.00%, 08/07/25 | 163 | 155,306 | ||||||
2.25%, 09/19/26(a) | 400 | 362,421 | ||||||
2.88%, 10/15/27(a) | 620 | 558,698 | ||||||
3.38%, 03/01/29 | 289 | 254,119 | ||||||
2.38%, 08/26/29(a) | 816 | 666,013 | ||||||
3.05%, 04/15/30 | 350 | 295,561 | ||||||
Boeing Co. | 1,659 | 1,629,796 | ||||||
2.75%, 02/01/26 | 829 | 771,514 | ||||||
2.20%, 02/04/26 | 3,073 | 2,823,568 | ||||||
3.10%, 05/01/26 | 829 | 772,949 | ||||||
2.70%, 02/01/27(a) | 550 | 495,215 | ||||||
2.80%, 03/01/27 | 129 | 116,064 | ||||||
5.04%, 05/01/27 | 1,159 | 1,122,255 | ||||||
3.25%, 02/01/28 | 400 | 357,469 | ||||||
3.20%, 03/01/29 | 359 | 310,204 | ||||||
2.95%, 02/01/30 | 470 | 388,134 | ||||||
5.15%, 05/01/30 | 2,489 | 2,332,068 | ||||||
3.63%, 02/01/31 | 509 | 429,019 | ||||||
6.13%, 02/15/33 | 200 | 196,844 | ||||||
Eaton Corp., 3.10%, 09/15/27 | 572 | 524,576 | ||||||
General Dynamics Corp. | 413 | 400,028 | ||||||
3.50%, 05/15/25 | 829 | 804,406 | ||||||
1.15%, 06/01/26 | 362 | 324,675 | ||||||
2.13%, 08/15/26 | 413 | 378,945 | ||||||
3.50%, 04/01/27 | 500 | 468,794 | ||||||
2.63%, 11/15/27 | 350 | 313,162 | ||||||
3.75%, 05/15/28(a) | 413 | 384,770 | ||||||
3.63%, 04/01/30 | 450 | 400,194 | ||||||
2.25%, 06/01/31(a) | 279 | 220,497 | ||||||
HEICO Corp., 5.35%, 08/01/33 | 230 | 211,106 | ||||||
Huntington Ingalls Industries, Inc. | 350 | 317,096 | ||||||
2.04%, 08/16/28 | 329 | 273,966 | ||||||
4.20%, 05/01/30 | 450 | 398,437 | ||||||
Illinois Tool Works, Inc., 2.65%, 11/15/26 | 389 | 359,028 | ||||||
L3Harris Technologies, Inc. | 413 | 399,606 | ||||||
5.40%, 01/15/27 | 500 | 491,043 | ||||||
4.40%, 06/15/28 | 1,163 | 1,086,141 | ||||||
2.90%, 12/15/29 | 579 | 486,978 | ||||||
1.80%, 01/15/31 | 762 | 567,727 | ||||||
5.40%, 07/31/33(a) | 520 | 485,902 | ||||||
Lockheed Martin Corp. | 40 | 39,709 | ||||||
3.55%, 01/15/26 | 931 | 895,066 | ||||||
5.10%, 11/15/27 | 420 | 415,165 | ||||||
4.45%, 05/15/28 | 100 | 95,848 | ||||||
| Security | Par (000) | Value | ||||||
| Aerospace & Defense (continued) | ||||||||
Lockheed Martin Corp. (continued) | $ | 272 | $ | 238,085 | ||||
5.25%, 01/15/33 | 800 | 770,814 | ||||||
Northrop Grumman Corp. | 829 | 800,692 | ||||||
3.20%, 02/01/27 | 400 | 370,500 | ||||||
3.25%, 01/15/28 | 1,259 | 1,147,323 | ||||||
4.40%, 05/01/30 | 829 | 764,238 | ||||||
4.70%, 03/15/33(a) | 500 | 455,390 | ||||||
Parker-Hannifin Corp. | 450 | 426,743 | ||||||
3.25%, 06/14/29 | 859 | 754,693 | ||||||
4.50%, 09/15/29 | 500 | 464,702 | ||||||
RTX Corp. | 829 | 801,870 | ||||||
5.00%, 02/27/26 | 215 | 211,282 | ||||||
2.65%, 11/01/26 | 500 | 457,323 | ||||||
3.50%, 03/15/27 | 829 | 766,525 | ||||||
3.13%, 05/04/27 | 409 | 372,548 | ||||||
4.13%, 11/16/28 | 1,989 | 1,826,443 | ||||||
2.25%, 07/01/30 | 419 | 328,770 | ||||||
1.90%, 09/01/31 | 829 | 607,925 | ||||||
2.38%, 03/15/32 | 405 | 304,132 | ||||||
5.15%, 02/27/33 | 820 | 756,508 | ||||||
Textron, Inc. | 829 | 683,443 | ||||||
2.45%, 03/15/31(a) | 177 | 138,040 | ||||||
|
| |||||||
| 39,015,996 | ||||||||
| Air Freight & Logistics — 0.0% | ||||||||
JB Hunt Transport Services, Inc., | 829 | 795,600 | ||||||
|
| |||||||
| Automobile Components — 0.1% | ||||||||
Aptiv PLC/Aptiv Corp. | 300 | 286,141 | ||||||
3.25%, 03/01/32(a) | 488 | 391,097 | ||||||
BorgWarner, Inc., 2.65%, 07/01/27 | 749 | 665,856 | ||||||
Lear Corp. | 350 | 320,625 | ||||||
4.25%, 05/15/29 | 129 | 115,334 | ||||||
2.60%, 01/15/32 | 329 | 242,555 | ||||||
Magna International, Inc. | 400 | 388,505 | ||||||
5.98%, 03/21/26 | 200 | 200,063 | ||||||
2.45%, 06/15/30 | 455 | 367,221 | ||||||
5.50%, 03/21/33(a) | 400 | 381,551 | ||||||
|
| |||||||
| 3,358,948 | ||||||||
| Automobiles — 1.9% | ||||||||
American Honda Finance Corp. | 413 | 393,064 | ||||||
5.00%, 05/23/25 | 250 | 247,797 | ||||||
1.20%, 07/08/25 | 450 | 417,893 | ||||||
1.00%, 09/10/25 | 450 | 413,405 | ||||||
5.80%, 10/03/25 | 250 | 250,743 | ||||||
4.75%, 01/12/26 | 60 | 58,955 | ||||||
5.25%, 07/07/26(a) | 550 | 545,533 | ||||||
1.30%, 09/09/26 | 329 | 292,145 | ||||||
2.35%, 01/08/27 | 413 | 372,791 | ||||||
4.70%, 01/12/28 | 100 | 96,115 | ||||||
2.00%, 03/24/28 | 447 | 382,976 | ||||||
5.13%, 07/07/28 | 400 | 389,816 | ||||||
2.25%, 01/12/29 | 413 | 350,202 | ||||||
4.60%, 04/17/30 | 320 | 297,592 | ||||||
SCHEDULE OF INVESTMENTS | 15 |
Schedule of Investments (continued) October 31, 2023 | iShares U.S. Intermediate Credit Bond Index Fund (Percentages shown are based on Net Assets) |
| Security | Par (000) | Value | ||||||
| Automobiles (continued) | ||||||||
American Honda Finance Corp. (continued) | $ | 250 | $ | 248,234 | ||||
1.80%, 01/13/31 | 300 | 227,535 | ||||||
Series A, 4.60%, 04/17/25 | 340 | 335,056 | ||||||
AutoNation, Inc. | 136 | 109,325 | ||||||
4.75%, 06/01/30(a) | 179 | 156,782 | ||||||
2.40%, 08/01/31 | 362 | 257,848 | ||||||
3.85%, 03/01/32 | 400 | 313,561 | ||||||
AutoZone, Inc. | 107 | 103,078 | ||||||
3.75%, 06/01/27(a) | 400 | 373,808 | ||||||
4.50%, 02/01/28 | 340 | 321,475 | ||||||
3.75%, 04/18/29 | 179 | 159,900 | ||||||
4.00%, 04/15/30 | 300 | 264,247 | ||||||
1.65%, 01/15/31 | 300 | 219,859 | ||||||
4.75%, 08/01/32 | 300 | 266,390 | ||||||
4.75%, 02/01/33 | 350 | 308,736 | ||||||
5.20%, 08/01/33 | 160 | 145,120 | ||||||
Cummins, Inc. | 413 | 379,479 | ||||||
1.50%, 09/01/30 | 350 | 267,370 | ||||||
General Motors Co. | 209 | 202,608 | ||||||
6.13%, 10/01/25 | 1,106 | 1,104,036 | ||||||
4.20%, 10/01/27 | 829 | 767,733 | ||||||
6.80%, 10/01/27(a) | 496 | 503,739 | ||||||
5.40%, 10/15/29 | 665 | 624,429 | ||||||
5.60%, 10/15/32(a) | 650 | 593,538 | ||||||
General Motors Financial Co., Inc. | 163 | 158,484 | ||||||
2.90%, 02/26/25 | 546 | 521,316 | ||||||
3.80%, 04/07/25 | 700 | 675,594 | ||||||
4.35%, 04/09/25 | 600 | 583,376 | ||||||
2.75%, 06/20/25 | 811 | 765,333 | ||||||
4.30%, 07/13/25 | 829 | 800,608 | ||||||
6.05%, 10/10/25 | 500 | 497,943 | ||||||
1.25%, 01/08/26 | 900 | 806,568 | ||||||
5.25%, 03/01/26 | 476 | 463,913 | ||||||
5.40%, 04/06/26 | 860 | 841,642 | ||||||
1.50%, 06/10/26 | 829 | 731,812 | ||||||
4.35%, 01/17/27 | 413 | 387,953 | ||||||
2.35%, 02/26/27 | 829 | 728,771 | ||||||
5.00%, 04/09/27 | 800 | 764,933 | ||||||
2.70%, 08/20/27 | 829 | 724,261 | ||||||
6.00%, 01/09/28 | 300 | 294,622 | ||||||
2.40%, 04/10/28 | 416 | 350,702 | ||||||
5.80%, 06/23/28 | 765 | 741,140 | ||||||
2.40%, 10/15/28 | 802 | 661,212 | ||||||
5.65%, 01/17/29 | 163 | 156,452 | ||||||
4.30%, 04/06/29 | 650 | 577,560 | ||||||
5.85%, 04/06/30 | 765 | 723,022 | ||||||
3.60%, 06/21/30 | 457 | 377,099 | ||||||
2.35%, 01/08/31 | 550 | 409,528 | ||||||
2.70%, 06/10/31 | 588 | 442,191 | ||||||
3.10%, 01/12/32 | 350 | 266,150 | ||||||
6.40%, 01/09/33(a) | 450 | 431,132 | ||||||
Genuine Parts Co., 1.88%, 11/01/30 | 200 | 147,908 | ||||||
Honda Motor Co. Ltd. | 600 | 573,541 | ||||||
2.53%, 03/10/27 | 450 | 406,811 | ||||||
| Security | Par (000) | Value | ||||||
| Automobiles (continued) | ||||||||
Honda Motor Co. Ltd. (continued) | $ | 637 | $ | 524,351 | ||||
Mercedes-Benz Finance North America LLC, 8.50%, 01/18/31 | 996 | 1,151,644 | ||||||
PACCAR Financial Corp. | 200 | 193,618 | ||||||
4.95%, 10/03/25 | 235 | 233,208 | ||||||
4.45%, 03/30/26 | 395 | 387,040 | ||||||
1.10%, 05/11/26 | 530 | 477,219 | ||||||
2.00%, 02/04/27 | 225 | 201,061 | ||||||
4.60%, 01/10/28 | 200 | 193,556 | ||||||
Toyota Motor Corp. | 413 | 374,896 | ||||||
5.28%, 07/13/26(a) | 160 | 159,476 | ||||||
5.12%, 07/13/28 | 200 | 197,353 | ||||||
2.76%, 07/02/29(a) | 120 | 104,493 | ||||||
2.36%, 03/25/31 | 413 | 330,422 | ||||||
5.12%, 07/13/33(a) | 175 | 168,318 | ||||||
Toyota Motor Credit Corp. | 750 | 743,550 | ||||||
1.45%, 01/13/25 | 829 | 789,130 | ||||||
1.80%, 02/13/25(a) | 600 | 571,780 | ||||||
3.00%, 04/01/25 | 500 | 482,318 | ||||||
3.95%, 06/30/25 | 565 | 550,617 | ||||||
3.65%, 08/18/25 | 450 | 435,386 | ||||||
5.60%, 09/11/25 | 150 | 150,197 | ||||||
0.80%, 10/16/25 | 900 | 821,800 | ||||||
5.40%, 11/10/25 | 400 | 399,402 | ||||||
0.80%, 01/09/26 | 450 | 406,694 | ||||||
4.45%, 05/18/26 | 880 | 859,553 | ||||||
1.13%, 06/18/26 | 390 | 348,779 | ||||||
5.00%, 08/14/26 | 400 | 395,037 | ||||||
3.20%, 01/11/27 | 500 | 465,892 | ||||||
1.90%, 01/13/27 | 829 | 739,287 | ||||||
3.05%, 03/22/27 | 829 | 764,422 | ||||||
1.15%, 08/13/27(a) | 350 | 298,763 | ||||||
4.55%, 09/20/27(a) | 500 | 483,017 | ||||||
5.45%, 11/10/27 | 450 | 448,744 | ||||||
4.63%, 01/12/28(a) | 600 | 580,816 | ||||||
1.90%, 04/06/28 | 311 | 267,998 | ||||||
5.25%, 09/11/28 | 150 | 147,629 | ||||||
3.65%, 01/08/29 | 179 | 163,840 | ||||||
4.45%, 06/29/29(a) | 200 | 189,193 | ||||||
2.15%, 02/13/30 | 413 | 334,885 | ||||||
3.38%, 04/01/30 | 829 | 722,445 | ||||||
4.55%, 05/17/30 | 380 | 355,506 | ||||||
1.90%, 09/12/31 | 579 | 437,240 | ||||||
|
| |||||||
| 46,825,065 | ||||||||
| Banks — 9.2% | ||||||||
African Development Bank, 4.38%, 03/14/28 | 2,000 | 1,949,813 | ||||||
Asian Development Bank | 1,500 | 1,425,271 | ||||||
4.50%, 08/25/28 | 2,000 | 1,958,112 | ||||||
3.88%, 06/14/33 | 1,000 | 909,304 | ||||||
Asian Infrastructure Investment Bank, | 1,500 | 1,450,315 | ||||||
Australia & New Zealand Banking Group Ltd. | 435 | 432,982 | ||||||
5.67%, 10/03/25 | 500 | 500,751 | ||||||
3.70%, 11/16/25 | 450 | 433,362 | ||||||
5.09%, 12/08/25 | 750 | 741,734 | ||||||
| 16 | 2 0 2 3 BLACK ROCK ANNUAL REPORT TO SHAREHOLDERS |
Schedule of Investments (continued) October 31, 2023 | iShares U.S. Intermediate Credit Bond Index Fund (Percentages shown are based on Net Assets) |
| Security | Par (000) | Value | ||||||
| Banks (continued) | ||||||||
Banco Bilbao Vizcaya Argentaria SA | $ | 600 | $ | 545,845 | ||||
(1-year CMT + 2.30%), 5.86%, 09/14/26(b) | 400 | 394,056 | ||||||
(1-year CMT + 2.70%), 6.14%, 09/14/28(b) | 400 | 390,533 | ||||||
Banco Santander SA(c) | 400 | 400,649 | ||||||
6.61%, 11/07/28 | 400 | 400,378 | ||||||
Bank of America N.A. | 750 | 747,786 | ||||||
5.53%, 08/18/26 | 750 | 744,202 | ||||||
Bank of Montreal | 400 | 396,471 | ||||||
1.50%, 01/10/25 | 700 | 663,770 | ||||||
1.85%, 05/01/25(a) | 1,000 | 939,810 | ||||||
3.70%, 06/07/25 | 700 | 674,730 | ||||||
5.92%, 09/25/25 | 250 | 249,362 | ||||||
5.30%, 06/05/26 | 800 | 787,088 | ||||||
1.25%, 09/15/26 | 459 | 402,304 | ||||||
2.65%, 03/08/27 | 637 | 569,836 | ||||||
5.20%, 02/01/28 | 400 | 385,863 | ||||||
5.72%, 09/25/28 | 500 | 489,585 | ||||||
(1-day SOFR + 0.60%), 0.95%, 01/22/27(b) | 500 | 445,863 | ||||||
(5-year CMT + 1.40%), 3.09%, 01/10/37(b) | 659 | 476,008 | ||||||
(5-year USD Swap + 1.43%), | 413 | 357,929 | ||||||
Series H, 4.70%, 09/14/27 | 700 | 666,354 | ||||||
Bank of New York Mellon(b) | ||||||||
(1-day SOFR + 0.80%), 5.22%, 11/21/25 | 250 | 248,009 | ||||||
(1-day SOFR + 1.07%), 5.15%, 05/22/26 | 250 | 246,776 | ||||||
Bank of Nova Scotia | 260 | 257,321 | ||||||
5.25%, 06/12/28 | 1,060 | 1,015,826 | ||||||
BPCE SA, 3.38%, 12/02/26 | 400 | 368,531 | ||||||
Canadian Imperial Bank of Commerce | 500 | 477,510 | ||||||
3.30%, 04/07/25 | 1,000 | 962,204 | ||||||
5.14%, 04/28/25 | 700 | 690,679 | ||||||
3.95%, 08/04/25 | 700 | 675,273 | ||||||
0.95%, 10/23/25 | 596 | 540,913 | ||||||
1.25%, 06/22/26 | 259 | 229,381 | ||||||
5.62%, 07/17/26 | 150 | 148,628 | ||||||
5.93%, 10/02/26 | 250 | 249,509 | ||||||
3.45%, 04/07/27 | 500 | 457,404 | ||||||
5.00%, 04/28/28 | 300 | 285,623 | ||||||
5.99%, 10/03/28 | 250 | 246,900 | ||||||
3.60%, 04/07/32(a) | 400 | 328,816 | ||||||
6.09%, 10/03/33 | 650 | 626,107 | ||||||
Citibank N.A. | 750 | 750,905 | ||||||
5.80%, 09/29/28 | 750 | 740,669 | ||||||
Citizens Bank NA/Providence RI | 550 | 509,364 | ||||||
3.75%, 02/18/26 | 400 | 366,449 | ||||||
(1-day SOFR + 1.45%), 6.06%, 10/24/25(b) | 500 | 478,136 | ||||||
(1-day SOFR + 2.00%), 4.58%, 08/09/28(b) | 350 | 310,412 | ||||||
Citizens Financial Group, Inc. | 193 | 171,486 | ||||||
2.50%, 02/06/30 | 279 | 207,684 | ||||||
3.25%, 04/30/30(a) | 450 | 347,084 | ||||||
2.64%, 09/30/32(a) | 300 | 199,059 | ||||||
(5-year CMT + 2.75%), 5.64%, 05/21/37(b) | 200 | 159,532 | ||||||
Comerica, Inc., 4.00%, 02/01/29 | 829 | 678,236 | ||||||
Commonwealth Bank of Australia | 750 | 746,334 | ||||||
| Security | Par (000) | Value | ||||||
| Banks (continued) | ||||||||
Commonwealth Bank of Australia (continued) 5.50%, 09/12/25 | $ | 250 | $ | 249,739 | ||||
5.32%, 03/13/26 | 650 | 646,435 | ||||||
Cooperatieve Rabobank UA | 261 | 247,663 | ||||||
5.00%, 01/13/25 | 500 | 495,396 | ||||||
3.38%, 05/21/25 | 500 | 481,426 | ||||||
5.50%, 07/18/25 | 250 | 248,375 | ||||||
4.38%, 08/04/25 | 600 | 576,228 | ||||||
3.75%, 07/21/26 | 1,037 | 963,452 | ||||||
5.50%, 10/05/26 | 250 | 248,083 | ||||||
Council Of Europe Development Bank, | 800 | 770,670 | ||||||
Credit Suisse AG | 500 | 507,131 | ||||||
2.95%, 04/09/25 | 261 | 247,825 | ||||||
1.25%, 08/07/26 | 1,050 | 915,986 | ||||||
5.00%, 07/09/27 | 650 | 620,242 | ||||||
Credit Suisse AG/New York | 1,650 | 1,589,062 | ||||||
7.50%, 02/15/28 | 1,550 | 1,609,378 | ||||||
Discover Bank | 400 | 362,036 | ||||||
4.65%, 09/13/28 | 350 | 307,602 | ||||||
2.70%, 02/06/30 | 300 | 226,155 | ||||||
European Bank for Reconstruction & Development, 4.38%, 03/09/28 | 1,100 | 1,073,613 | ||||||
Fifth Third Bancorp | 450 | 427,425 | ||||||
2.55%, 05/05/27 | 259 | 223,697 | ||||||
3.95%, 03/14/28 | 400 | 357,595 | ||||||
(1-day SOFR + 0.69%), 1.71%, 11/01/27(b) | 829 | 706,576 | ||||||
(1-day SOFR + 1.36%), 4.06%, 04/25/28(b) | 279 | 251,818 | ||||||
(1-day SOFR + 1.66%), 4.34%, 04/25/33(b) | 279 | 227,274 | ||||||
(1-day SOFR + 2.34%), 6.34%, 07/27/29(b) | 680 | 658,647 | ||||||
(1-day SOFR Index + 2.13%), | 400 | 354,488 | ||||||
(1-day SOFR Index + 2.19%), | 200 | 194,658 | ||||||
Fifth Third Bank NA | 600 | 575,910 | ||||||
3.85%, 03/15/26 | 300 | 276,392 | ||||||
2.25%, 02/01/27(a) | 350 | 305,015 | ||||||
First Horizon Corp., 4.00%, 05/26/25 | 200 | 186,040 | ||||||
First-Citizens Bank & Trust Co., | 225 | 218,163 | ||||||
HSBC USA, Inc., 5.63%, 03/17/25 | 290 | 288,114 | ||||||
Huntington Bancshares, Inc. | 829 | 794,305 | ||||||
2.55%, 02/04/30 | 660 | 507,937 | ||||||
(1-day SOFR + 1.97%), 4.44%, 08/04/28(b) | 450 | 411,012 | ||||||
(1-day SOFR + 2.02%), 6.21%, 08/21/29(b) | 600 | 576,775 | ||||||
(1-day SOFR + 2.05%), | 200 | 171,453 | ||||||
Huntington National Bank | 400 | 366,466 | ||||||
(1-day SOFR + 1.22%), 5.70%, 11/18/25(b) | 450 | 436,913 | ||||||
(1-day SOFR Index + 1.65%), | 750 | 689,339 | ||||||
ING Groep NV | 1,000 | 925,830 | ||||||
4.55%, 10/02/28 | 478 | 441,214 | ||||||
4.05%, 04/09/29 | 478 | 427,152 | ||||||
(1-day SOFR + 1.01%), 1.73%, 04/01/27(b) | 700 | 625,246 | ||||||
(1-day SOFR + 1.32%), 2.73%, 04/01/32(b) | 450 | 343,181 | ||||||
(1-day SOFR + 1.56%), 6.08%, 09/11/27(b) | 200 | 198,092 | ||||||
(1-day SOFR + 1.64%), 3.87%, 03/28/26(b) | 800 | 771,254 | ||||||
(1-day SOFR + 1.83%), 4.02%, 03/28/28(b) | 1,489 | 1,369,945 | ||||||
SCHEDULE OF INVESTMENTS | 17 |
Schedule of Investments (continued) October 31, 2023 | iShares U.S. Intermediate Credit Bond Index Fund (Percentages shown are based on Net Assets) |
| Security | Par (000) | Value | ||||||
| Banks (continued) | ||||||||
ING Groep NV (continued) | ||||||||
(1-day SOFR + 2.07%), 4.25%, 03/28/33(b) | $ | 400 | $ | 334,660 | ||||
(1-day SOFR + 2.09%), 6.11%, 09/11/34(b) | 600 | 562,226 | ||||||
Inter-American Development Bank | 2,100 | 2,020,009 | ||||||
3.50%, 04/12/33 | 1,100 | 970,649 | ||||||
International Bank for Reconstruction & Development | 700 | 681,176 | ||||||
3.50%, 07/12/28(a) | 2,500 | 2,346,702 | ||||||
4.63%, 08/01/28 | 2,000 | 1,969,322 | ||||||
3.88%, 02/14/30(a) | 4,000 | 3,743,758 | ||||||
4.00%, 07/25/30 | 1,500 | 1,409,280 | ||||||
KeyBank NA | 450 | 417,378 | ||||||
4.15%, 08/08/25 | 800 | 744,007 | ||||||
3.40%, 05/20/26 | 450 | 396,049 | ||||||
6.95%, 02/01/28 | 550 | 510,736 | ||||||
3.90%, 04/13/29 | 261 | 203,635 | ||||||
4.90%, 08/08/32 | 300 | 223,272 | ||||||
KeyBank NA/Cleveland OH | 350 | 325,062 | ||||||
5.85%, 11/15/27 | 500 | 463,052 | ||||||
5.00%, 01/26/33 | 700 | 563,571 | ||||||
KeyCorp. | 163 | 135,282 | ||||||
2.55%, 10/01/29 | 413 | 308,546 | ||||||
(1-day SOFR Index + 2.06%), | 200 | 157,715 | ||||||
Kreditanstalt fuer Wiederaufbau | 3,000 | 2,969,929 | ||||||
4.75%, 10/29/30 | 1,500 | 1,472,394 | ||||||
4.13%, 07/15/33 | 2,200 | �� | 2,037,872 | |||||
M&T Bank Corp.(b) | ||||||||
(1-day SOFR + 1.85%), 5.05%, 01/27/34 | 600 | 502,250 | ||||||
(1-day SOFR Index + 1.78%), | 450 | 409,826 | ||||||
Manufacturers & Traders Trust Co. | 300 | 284,460 | ||||||
5.40%, 11/21/25 | 300 | 290,301 | ||||||
4.65%, 01/27/26 | 700 | 661,134 | ||||||
4.70%, 01/27/28 | 700 | 634,324 | ||||||
Mitsubishi UFJ Financial Group, Inc., (1-year CMT + 1.70%), 5.24%, 04/19/29(b) | 335 | 322,303 | ||||||
Morgan Stanley Bank NA | 490 | 487,852 | ||||||
4.75%, 04/21/26 | 280 | 272,732 | ||||||
5.88%, 10/30/26 | 750 | 749,267 | ||||||
National Australia Bank Ltd. | 400 | 397,805 | ||||||
5.20%, 05/13/25 | 250 | 248,404 | ||||||
3.50%, 06/09/25 | 300 | 290,652 | ||||||
4.97%, 01/12/26 | 750 | 741,139 | ||||||
3.38%, 01/14/26 | 500 | 476,393 | ||||||
2.50%, 07/12/26 | 597 | 551,036 | ||||||
3.91%, 06/09/27 | 500 | 469,650 | ||||||
4.94%, 01/12/28 | 700 | 677,349 | ||||||
4.90%, 06/13/28 | 650 | 625,729 | ||||||
National Bank of Canada, 5.25%, 01/17/25 | 500 | 495,832 | ||||||
PNC Bank NA | 500 | 479,342 | ||||||
3.88%, 04/10/25 | 500 | 482,772 | ||||||
3.25%, 06/01/25 | 500 | 477,762 | ||||||
3.10%, 10/25/27 | 800 | 712,913 | ||||||
| Security | Par (000) | Value | ||||||
| Banks (continued) | ||||||||
PNC Bank NA (continued) | $ | 900 | $ | 801,506 | ||||
PNC Financial Services Group, Inc. | 225 | 216,326 | ||||||
2.60%, 07/23/26 | 500 | 459,585 | ||||||
1.15%, 08/13/26(a) | 829 | 727,990 | ||||||
3.15%, 05/19/27 | 450 | 406,825 | ||||||
3.45%, 04/23/29 | 559 | 482,804 | ||||||
2.55%, 01/22/30(a) | 829 | 658,576 | ||||||
(1-day SOFR + 0.98%), | 829 | 620,099 | ||||||
(1-day SOFR + 1.32%), 5.81%, 06/12/26(b) | 370 | 365,094 | ||||||
(1-day SOFR + 1.62%), 5.35%, 12/02/28(b) | 675 | 644,886 | ||||||
(1-day SOFR + 1.73%), 6.62%, 10/20/27(b) | 500 | 501,243 | ||||||
(1-day SOFR + 1.84%), 5.58%, 06/12/29(b) | 1,370 | 1,311,718 | ||||||
(1-day SOFR + 1.93%), 5.07%, 01/24/34(b) | 875 | 769,950 | ||||||
(1-day SOFR + 1.95%), 5.94%, 08/18/34(b) | 500 | 466,066 | ||||||
(1-day SOFR + 2.28%), 6.88%, 10/20/34(b) | 1,025 | 1,024,381 | ||||||
(1-day SOFR Index + 1.09%), | 370 | 356,095 | ||||||
(1-day SOFR Index + 1.85%), | 450 | 375,439 | ||||||
(1-day SOFR Index + 2.14%), | 700 | 659,200 | ||||||
Regions Financial Corp. | 259 | 237,816 | ||||||
1.80%, 08/12/28 | 209 | 163,315 | ||||||
Royal Bank of Canada | 1,243 | 1,198,822 | ||||||
1.60%, 01/21/25 | 500 | 475,288 | ||||||
3.38%, 04/14/25 | 631 | 608,900 | ||||||
4.95%, 04/25/25 | 900 | 886,561 | ||||||
1.15%, 06/10/25 | 800 | 743,084 | ||||||
4.88%, 01/12/26(a) | 300 | 293,585 | ||||||
0.88%, 01/20/26 | 1,659 | 1,487,000 | ||||||
4.65%, 01/27/26 | 579 | 561,336 | ||||||
1.20%, 04/27/26 | 619 | 552,011 | ||||||
1.15%, 07/14/26 | 829 | 730,616 | ||||||
5.20%, 07/20/26 | 400 | 393,479 | ||||||
1.40%, 11/02/26 | 324 | 284,509 | ||||||
3.63%, 05/04/27 | 231 | 213,967 | ||||||
4.24%, 08/03/27 | 650 | 610,460 | ||||||
6.00%, 11/01/27 | 1,100 | 1,099,758 | ||||||
4.90%, 01/12/28 | 300 | 287,866 | ||||||
5.20%, 08/01/28 | 400 | 385,752 | ||||||
2.30%, 11/03/31 | 800 | 602,348 | ||||||
3.88%, 05/04/32 | 700 | 588,850 | ||||||
5.00%, 02/01/33 | 550 | 497,263 | ||||||
5.00%, 05/02/33 | 300 | 270,132 | ||||||
Series FXD, 2.05%, 01/21/27 | 413 | 365,521 | ||||||
Santander Holdings USA, Inc. | 500 | 473,044 | ||||||
4.50%, 07/17/25(a) | 1,000 | 960,494 | ||||||
3.24%, 10/05/26 | 359 | 322,418 | ||||||
4.40%, 07/13/27 | 500 | 460,016 | ||||||
(1-day SOFR + 1.25%), 2.49%, 01/06/28(b) | 675 | 581,122 | ||||||
(1-day SOFR + 2.33%), 5.81%, 09/09/26(b) | 300 | 293,776 | ||||||
(1-day SOFR + 2.36%), 6.50%, 03/09/29(b) | 300 | 290,152 | ||||||
(1-day SOFR + 2.70%), 6.57%, 06/12/29(b) | 138 | 133,200 | ||||||
Santander U.K. Group Holdings PLC(b) |
| |||||||
(1-day SOFR + 0.99%), 1.67%, 06/14/27 | 1,179 | 1,027,594 | ||||||
(1-day SOFR + 1.22%), 2.47%, 01/11/28 | 650 | 561,497 | ||||||
(1-day SOFR + 1.48%), 2.90%, 03/15/32 | 250 | 188,967 | ||||||
(1-day SOFR + 2.60%), 6.53%, 01/10/29 | 800 | 782,659 | ||||||
(1-day SOFR + 2.75%), 6.83%, 11/21/26 | 600 | 599,033 | ||||||
| 18 | 2 0 2 3 BLACK ROCK ANNUAL REPORT TO SHAREHOLDERS |
Schedule of Investments (continued) October 31, 2023 | iShares U.S. Intermediate Credit Bond Index Fund (Percentages shown are based on Net Assets) |
| Security | Par (000) | Value | ||||||
| Banks (continued) | ||||||||
Santander U.K. Group Holdings PLC(b) (continued) |
| |||||||
(1-year CMT + 1.25%), 1.53%, 08/21/26 | $ | 478 | $ | 432,969 | ||||
(3-mo. LIBOR US + 1.40%), | 400 | 351,966 | ||||||
Sumitomo Mitsui Financial Group, Inc. | 200 | 199,050 | ||||||
5.80%, 07/13/28 | 1,300 | 1,275,865 | ||||||
5.72%, 09/14/28 | 800 | 782,913 | ||||||
5.85%, 07/13/30 | 200 | 193,924 | ||||||
5.78%, 07/13/33 | 200 | 189,926 | ||||||
5.81%, 09/14/33 | 600 | 567,921 | ||||||
Synchrony Bank | 500 | 477,498 | ||||||
5.63%, 08/23/27 | 500 | 456,874 | ||||||
Synovus Bank/Columbus GA, | 250 | 222,034 | ||||||
Toronto-Dominion Bank | 829 | 788,014 | ||||||
3.77%, 06/06/25 | 400 | 386,543 | ||||||
0.75%, 09/11/25 | 550 | 500,967 | ||||||
0.75%, 01/06/26(a) | 1,493 | 1,335,140 | ||||||
1.20%, 06/03/26 | 493 | 437,088 | ||||||
5.53%, 07/17/26 | 1,025 | 1,014,392 | ||||||
1.25%, 09/10/26 | 911 | 801,344 | ||||||
2.80%, 03/10/27 | 637 | 574,603 | ||||||
4.11%, 06/08/27 | 400 | 375,013 | ||||||
4.69%, 09/15/27 | 800 | 761,882 | ||||||
5.16%, 01/10/28 | 750 | 723,061 | ||||||
5.52%, 07/17/28 | 425 | 414,349 | ||||||
2.00%, 09/10/31 | 911 | 672,915 | ||||||
2.45%, 01/12/32 | 413 | 310,785 | ||||||
3.20%, 03/10/32 | 637 | 506,294 | ||||||
4.46%, 06/08/32 | 1,010 | 880,717 | ||||||
(5-year USD Swap + 2.21%), | 413 | 379,571 | ||||||
Series FXD, 1.45%, 01/10/25 | 413 | 392,464 | ||||||
Series FXD, 1.95%, 01/12/27 | 413 | 364,724 | ||||||
Truist Bank | 261 | 249,231 | ||||||
1.50%, 03/10/25 | 600 | 561,393 | ||||||
3.63%, 09/16/25 | 600 | 566,051 | ||||||
2.25%, 03/11/30 | 261 | 192,739 | ||||||
(5-year CMT + 1.15%), 2.64%, 09/17/29(b) | 261 | 240,803 | ||||||
Truist Financial Corp. | 1,000 | 960,847 | ||||||
3.70%, 06/05/25 | 550 | 527,706 | ||||||
1.13%, 08/03/27 | 745 | 614,298 | ||||||
3.88%, 03/19/29(a) | 330 | 282,041 | ||||||
1.95%, 06/05/30(a) | 659 | 491,196 | ||||||
(1-day SOFR + 0.61%), 1.27%, 03/02/27(b) | 600 | 525,985 | ||||||
(1-day SOFR + 0.86%), 1.89%, 06/07/29(b) | 829 | 664,508 | ||||||
(1-day SOFR + 1.37%), 4.12%, 06/06/28(b) | 255 | 231,998 | ||||||
(1-day SOFR + 1.44%), 4.87%, 01/26/29(b) | 750 | 692,273 | ||||||
(1-day SOFR + 1.46%), 4.26%, 07/28/26(b) | 2,000 | 1,915,507 | ||||||
(1-day SOFR + 1.63%), | 400 | 393,226 | ||||||
(1-day SOFR + 1.85%), 5.12%, 01/26/34(b) | 665 | 570,584 | ||||||
(1-day SOFR + 2.05%), 6.05%, 06/08/27(b) | 785 | 768,919 | ||||||
(1-day SOFR + 2.24%), 4.92%, 07/28/33(b) | 400 | 326,636 | ||||||
(1-day SOFR + 2.30%), 6.12%, 10/28/33(b) | 500 | 462,976 | ||||||
(1-day SOFR + 2.36%), 5.87%, 06/08/34(b) | 885 | 805,085 | ||||||
(1-day SOFR + 2.45%), 7.16%, 10/30/29(b) | 1,035 | 1,041,103 | ||||||
U.S. Bancorp | 1,300 | 1,211,833 | ||||||
3.10%, 04/27/26(a) | 800 | 737,432 | ||||||
3.90%, 04/26/28 | 1,659 | 1,508,367 | ||||||
1.38%, 07/22/30 | 509 | 361,652 | ||||||
| Security | Par (000) | Value | ||||||
| Banks (continued) | ||||||||
U.S. Bancorp (continued) | ||||||||
(1-day SOFR + 0.73%), 2.22%, 01/27/28(b) | $ | 413 | $ | 359,554 | ||||
(1-day SOFR + 1.02%), 2.68%, 01/27/33(a)(b) | 413 | 302,759 | ||||||
(1-day SOFR + 1.23%), 4.65%, 02/01/29(b) | 550 | 507,688 | ||||||
(1-day SOFR + 1.43%), 5.73%, 10/21/26(b) | 600 | 591,392 | ||||||
(1-day SOFR + 1.60%), 4.84%, 02/01/34(b) | 1,300 | 1,110,785 | ||||||
(1-day SOFR + 1.66%), 4.55%, 07/22/28(b) | 1,160 | 1,076,769 | ||||||
(1-day SOFR + 1.88%), 6.79%, 10/26/27(b) | 200 | 201,496 | ||||||
(1-day SOFR + 2.02%), 5.78%, 06/12/29(b) | 1,045 | 1,004,832 | ||||||
(1-day SOFR + 2.09%), 5.85%, 10/21/33(b) | 700 | 643,108 | ||||||
(1-day SOFR + 2.11%), 4.97%, 07/22/33(b) | 475 | 397,507 | ||||||
(1-day SOFR + 2.26%), 5.84%, 06/12/34(b) | 1,013 | 933,041 | ||||||
(5-year CMT + 0.95%), 2.49%, 11/03/36(b) | 579 | 395,630 | ||||||
Series V, 2.38%, 07/22/26 | 413 | 373,977 | ||||||
Series X, 3.15%, 04/27/27 | 520 | 469,372 | ||||||
U.S. Bank NA | 650 | 618,718 | ||||||
2.80%, 01/27/25 | 650 | 623,614 | ||||||
UBS AG | 400 | 397,836 | ||||||
5.65%, 09/11/28 | 400 | 391,448 | ||||||
Wells Fargo & Co. | 1,038 | 998,462 | ||||||
3.55%, 09/29/25 | 829 | 791,533 | ||||||
3.00%, 04/22/26 | 3,100 | 2,880,303 | ||||||
4.10%, 06/03/26 | 925 | 873,523 | ||||||
3.00%, 10/23/26 | 1,450 | 1,328,288 | ||||||
4.30%, 07/22/27 | 1,243 | 1,158,564 | ||||||
4.15%, 01/24/29(a) | 829 | 752,960 | ||||||
(1-day SOFR + 1.32%), 3.91%, 04/25/26(b) | 1,331 | 1,283,356 | ||||||
(1-day SOFR + 1.50%), 3.35%, 03/02/33(b) | 2,363 | 1,860,547 | ||||||
(1-day SOFR + 1.51%), 3.53%, 03/24/28(b) | 1,777 | 1,620,224 | ||||||
(1-day SOFR + 1.56%), 4.54%, 08/15/26(b) | 1,000 | 969,102 | ||||||
(1-day SOFR + 1.74%), 5.57%, 07/25/29(b) | 2,325 | 2,241,960 | ||||||
(1-day SOFR + 1.79%), 6.30%, 10/23/29(b) | 610 | 604,956 | ||||||
(1-day SOFR + 1.98%), 4.81%, 07/25/28(b) | 1,545 | 1,461,552 | ||||||
(1-day SOFR + 1.99%), 5.56%, 07/25/34(b) | 1,855 | 1,698,050 | ||||||
(1-day SOFR + 2.00%), 2.19%, 04/30/26(b) | 1,189 | 1,118,491 | ||||||
(1-day SOFR + 2.02%), 5.39%, 04/24/34(b) | 2,235 | 2,023,246 | ||||||
(1-day SOFR + 2.06%), 6.49%, 10/23/34(b) | 1,305 | 1,282,295 | ||||||
(1-day SOFR + 2.10%), 2.39%, 06/02/28(b) | 1,945 | 1,695,393 | ||||||
(1-day SOFR + 2.10%), 4.90%, 07/25/33(b) | 2,530 | 2,223,752 | ||||||
(3-mo. CME Term SOFR + 1.01%), | 1,243 | 1,175,754 | ||||||
(3-mo. CME Term SOFR + 1.26%), | 1,243 | 984,217 | ||||||
(3-mo. CME Term SOFR + 1.43%), | 1,106 | 1,022,396 | ||||||
(3-mo. CME Term SOFR + 1.43%), | 1,659 | 1,356,644 | ||||||
(3-mo. CME Term SOFR + 1.57%), | 2,143 | 1,950,641 | ||||||
(3-mo. CME Term SOFR + 4.03%), | 1,859 | 1,651,747 | ||||||
Wells Fargo Bank NA | 1,500 | 1,494,650 | ||||||
5.45%, 08/07/26 | 1,500 | 1,485,905 | ||||||
Westpac Banking Corp. | 416 | 396,075 | ||||||
2.35%, 02/19/25 | 413 | 396,131 | ||||||
3.74%, 08/26/25 | 500 | 484,292 | ||||||
2.85%, 05/13/26 | 863 | 808,619 | ||||||
1.15%, 06/03/26 | 829 | 740,781 | ||||||
SCHEDULE OF INVESTMENTS | 19 |
Schedule of Investments (continued) October 31, 2023 | iShares U.S. Intermediate Credit Bond Index Fund (Percentages shown are based on Net Assets) |
| Security | Par (000) | Value | ||||||
| Banks (continued) | ||||||||
Westpac Banking Corp. (continued) | $ | 300 | $ | 277,498 | ||||
3.35%, 03/08/27 | 700 | 649,157 | ||||||
4.04%, 08/26/27 | 600 | 569,558 | ||||||
5.46%, 11/18/27 | 800 | 793,967 | ||||||
3.40%, 01/25/28 | 413 | 378,762 | ||||||
1.95%, 11/20/28 | 829 | 693,340 | ||||||
2.65%, 01/16/30 | 657 | 550,717 | ||||||
2.15%, 06/03/31 | 360 | 279,165 | ||||||
(1-year CMT + 2.68%), | 550 | 483,296 | ||||||
(5-year CMT + 1.35%), | 1,036 | 980,496 | ||||||
(5-year CMT + 1.53%), | 374 | 269,017 | ||||||
(5-year CMT + 1.75%), | 913 | 663,541 | ||||||
(5-year CMT + 2.00%), | 700 | 594,191 | ||||||
(5-year USD ICE Swap + 2.24%), | 620 | 572,257 | ||||||
Zions Bancorp NA, 3.25%, 10/29/29 | 261 | 194,374 | ||||||
|
| |||||||
| 223,951,218 | ||||||||
| Beverages — 1.3% | ||||||||
Anheuser-Busch Cos. | ||||||||
Worldwide, Inc., 3.65%, 02/01/26 | 1,866 | 1,793,957 | ||||||
Anheuser-Busch InBev Worldwide, Inc. | 1,679 | 1,578,952 | ||||||
4.75%, 01/23/29 | 2,153 | 2,077,817 | ||||||
3.50%, 06/01/30 | 703 | 617,840 | ||||||
4.90%, 01/23/31(a) | 500 | 478,803 | ||||||
Brown-Forman Corp., 4.75%, 04/15/33(a) | 200 | 185,460 | ||||||
Coca-Cola Co. | 400 | 377,481 | ||||||
2.90%, 05/25/27 | 163 | 150,341 | ||||||
1.45%, 06/01/27(a) | 1,000 | 878,746 | ||||||
1.50%, 03/05/28 | 829 | 712,146 | ||||||
1.00%, 03/15/28(a) | 500 | 419,774 | ||||||
2.13%, 09/06/29 | 829 | 698,246 | ||||||
3.45%, 03/25/30 | 413 | 367,888 | ||||||
1.65%, 06/01/30 | 600 | 473,889 | ||||||
2.00%, 03/05/31 | 312 | 245,277 | ||||||
1.38%, 03/15/31 | 500 | 375,162 | ||||||
2.25%, 01/05/32 | 1,059 | 837,503 | ||||||
Coca-Cola Femsa SAB de CV | 655 | 545,707 | ||||||
1.85%, 09/01/32 | 482 | 346,717 | ||||||
Constellation Brands, Inc. | 129 | 126,124 | ||||||
5.00%, 02/02/26 | 150 | 147,369 | ||||||
3.70%, 12/06/26 | 620 | 582,133 | ||||||
3.50%, 05/09/27 | 179 | 165,523 | ||||||
4.35%, 05/09/27 | 400 | 381,553 | ||||||
3.60%, 02/15/28 | 350 | 320,119 | ||||||
4.65%, 11/15/28 | 250 | 236,581 | ||||||
3.15%, 08/01/29 | 829 | 715,790 | ||||||
2.88%, 05/01/30 | 229 | 188,573 | ||||||
2.25%, 08/01/31 | 334 | 253,810 | ||||||
4.75%, 05/09/32 | 330 | 296,840 | ||||||
4.90%, 05/01/33 | 340 | 306,981 | ||||||
Diageo Capital PLC | 500 | 462,890 | ||||||
5.20%, 10/24/25 | 200 | 199,074 | ||||||
5.30%, 10/24/27 | 500 | 495,678 | ||||||
3.88%, 05/18/28 | 478 | 446,864 | ||||||
2.38%, 10/24/29 | 566 | 472,156 | ||||||
2.00%, 04/29/30 | 478 | 380,038 | ||||||
2.13%, 04/29/32 | 478 | 359,010 | ||||||
| Security | Par (000) | Value | ||||||
| Beverages (continued) | ||||||||
Diageo Capital PLC (continued) | $ | 500 | $ | 487,472 | ||||
Keurig Dr. Pepper, Inc. | 350 | 342,383 | ||||||
3.40%, 11/15/25 | 300 | 286,355 | ||||||
4.60%, 05/25/28 | 450 | 428,188 | ||||||
3.95%, 04/15/29 | 300 | 273,106 | ||||||
3.20%, 05/01/30 | 413 | 348,448 | ||||||
2.25%, 03/15/31 | 413 | 317,610 | ||||||
4.05%, 04/15/32 | 329 | 283,014 | ||||||
Molson Coors Beverage Co., | 1,045 | 970,657 | ||||||
PepsiCo, Inc. | 540 | 517,314 | ||||||
2.75%, 04/30/25 | 829 | 797,198 | ||||||
3.50%, 07/17/25 | 163 | 157,970 | ||||||
4.55%, 02/13/26 | 200 | 197,154 | ||||||
2.85%, 02/24/26 | 413 | 391,439 | ||||||
2.38%, 10/06/26(a) | 829 | 767,784 | ||||||
3.00%, 10/15/27 | 813 | 749,711 | ||||||
3.60%, 02/18/28 | 445 | 416,687 | ||||||
4.45%, 05/15/28(a) | 200 | 194,927 | ||||||
7.00%, 03/01/29 | 250 | 266,739 | ||||||
2.63%, 07/29/29 | 829 | 717,511 | ||||||
2.75%, 03/19/30 | 509 | 433,520 | ||||||
1.63%, 05/01/30 | 496 | 390,098 | ||||||
1.40%, 02/25/31 | 244 | 183,291 | ||||||
1.95%, 10/21/31 | 816 | 626,687 | ||||||
3.90%, 07/18/32 | 585 | 518,480 | ||||||
4.45%, 02/15/33(a) | 550 | 515,139 | ||||||
|
| |||||||
| 31,277,694 | ||||||||
| Biotechnology — 0.9% | ||||||||
Amgen, Inc. | 1,420 | 1,408,543 | ||||||
3.13%, 05/01/25 | 620 | 596,182 | ||||||
5.51%, 03/02/26 | 850 | 845,520 | ||||||
2.60%, 08/19/26 | 591 | 544,479 | ||||||
2.20%, 02/21/27 | 650 | 582,526 | ||||||
3.20%, 11/02/27 | 359 | 327,618 | ||||||
5.15%, 03/02/28 | 2,085 | 2,034,920 | ||||||
1.65%, 08/15/28 | 800 | 664,463 | ||||||
3.00%, 02/22/29 | 300 | 263,445 | ||||||
4.05%, 08/18/29(a) | 600 | 548,805 | ||||||
2.45%, 02/21/30 | 550 | 449,048 | ||||||
5.25%, 03/02/30 | 1,470 | 1,411,194 | ||||||
2.30%, 02/25/31 | 550 | 429,987 | ||||||
2.00%, 01/15/32 | 460 | 340,377 | ||||||
3.35%, 02/22/32 | 342 | 281,655 | ||||||
4.20%, 03/01/33 | 600 | 517,261 | ||||||
5.25%, 03/02/33 | 2,170 | 2,023,748 | ||||||
Baxalta, Inc., 4.00%, 06/23/25 | 308 | 298,804 | ||||||
Biogen, Inc. | 892 | 860,807 | ||||||
2.25%, 05/01/30 | 657 | 515,989 | ||||||
Bio-Rad Laboratories, | 250 | 227,922 | ||||||
3.70%, 03/15/32 | 313 | 251,276 | ||||||
Gilead Sciences, Inc. | 970 | 942,575 | ||||||
3.65%, 03/01/26 | 1,898 | 1,811,987 | ||||||
2.95%, 03/01/27 | 863 | 791,090 | ||||||
1.20%, 10/01/27 | 293 | 247,647 | ||||||
1.65%, 10/01/30(a) | 527 | 402,506 | ||||||
5.25%, 10/15/33 | 275 | 260,500 | ||||||
| 20 | 2 0 2 3 BLACK ROCK ANNUAL REPORT TO SHAREHOLDERS |
Schedule of Investments (continued) October 31, 2023 | iShares U.S. Intermediate Credit Bond Index Fund (Percentages shown are based on Net Assets) |
| Security | Par (000) | Value | ||||||
| Biotechnology (continued) | ||||||||
Illumina, Inc. | ||||||||
5.80%, 12/12/25 | $ | 200 | $ | 197,985 | ||||
5.75%, 12/13/27 | 200 | 195,419 | ||||||
2.55%, 03/23/31 | 195 | 148,475 | ||||||
Regeneron Pharmaceuticals, Inc., | 670 | 504,926 | ||||||
Royalty Pharma PLC | ||||||||
1.20%, 09/02/25 | 829 | 755,927 | ||||||
1.75%, 09/02/27 | 343 | 292,058 | ||||||
2.20%, 09/02/30 | 359 | 274,005 | ||||||
2.15%, 09/02/31 | 286 | 209,999 | ||||||
|
| |||||||
| 22,459,668 | ||||||||
| Broadline Retail — 0.9% | ||||||||
Alibaba Group Holding Ltd. | ||||||||
3.60%, 11/28/24(a) | 1,432 | 1,396,816 | ||||||
3.40%, 12/06/27 | 1,628 | 1,485,721 | ||||||
2.13%, 02/09/31(a) | 600 | 459,948 | ||||||
Amazon.com, Inc. | ||||||||
4.70%, 11/29/24 | 500 | 496,415 | ||||||
3.80%, 12/05/24 | 800 | 786,050 | ||||||
3.00%, 04/13/25 | 1,500 | 1,450,864 | ||||||
0.80%, 06/03/25 | 800 | 744,851 | ||||||
4.60%, 12/01/25 | 500 | 493,603 | ||||||
1.00%, 05/12/26 | 1,409 | 1,267,297 | ||||||
3.30%, 04/13/27 | 1,210 | 1,133,547 | ||||||
1.20%, 06/03/27 | 509 | 441,159 | ||||||
3.15%, 08/22/27 | 2,231 | 2,064,124 | ||||||
4.55%, 12/01/27 | 500 | 486,553 | ||||||
1.65%, 05/12/28 | 1,409 | 1,203,147 | ||||||
3.45%, 04/13/29 | 552 | 503,912 | ||||||
4.65%, 12/01/29 | 500 | 482,053 | ||||||
1.50%, 06/03/30 | 839 | 653,916 | ||||||
2.10%, 05/12/31 | 1,159 | 913,607 | ||||||
3.60%, 04/13/32 | 1,726 | 1,498,638 | ||||||
4.70%, 12/01/32 | 1,450 | 1,359,761 | ||||||
O’Reilly Automotive, Inc. | ||||||||
4.35%, 06/01/28(a) | 179 | 169,035 | ||||||
3.90%, 06/01/29 | 179 | 162,104 | ||||||
4.20%, 04/01/30 | 250 | 223,857 | ||||||
1.75%, 03/15/31 | 362 | 268,248 | ||||||
4.70%, 06/15/32 | 400 | 358,252 | ||||||
TJX Cos., Inc. | ||||||||
2.25%, 09/15/26 | 343 | 314,913 | ||||||
1.15%, 05/15/28 | 350 | 289,540 | ||||||
3.88%, 04/15/30 | 250 | 224,939 | ||||||
1.60%, 05/15/31 | 350 | 263,136 | ||||||
Tractor Supply Co., | 201 | 148,903 | ||||||
|
| |||||||
| 21,744,909 | ||||||||
| Building Materials — 0.4% | ||||||||
Carrier Global Corp. | ||||||||
2.24%, 02/15/25 | 476 | 453,208 | ||||||
2.49%, 02/15/27 | 542 | 485,012 | ||||||
2.72%, 02/15/30 | 1,073 | 874,013 | ||||||
2.70%, 02/15/31 | 350 | 276,426 | ||||||
Eagle Materials, Inc., 2.50%, 07/01/31 | 313 | 238,640 | ||||||
Fortune Brands Innovations, Inc. | ||||||||
4.00%, 06/15/25(a) | 179 | 172,977 | ||||||
3.25%, 09/15/29 | 413 | 351,688 | ||||||
4.00%, 03/25/32 | 413 | 342,297 | ||||||
Johnson Controls International PLC/Tyco Fire & |
| |||||||
1.75%, 09/15/30 | 325 | 246,853 | ||||||
| Security | Par (000) | Value | ||||||
| Building Materials (continued) | ||||||||
Johnson Controls International PLC/Tyco Fire & | ||||||||
Security Finance SCA (continued) | ||||||||
2.00%, 09/16/31 | $ | 579 | $ | 430,555 | ||||
4.90%, 12/01/32(a) | 185 | 170,863 | ||||||
Martin Marietta Materials, Inc. | ||||||||
3.45%, 06/01/27 | 163 | 150,580 | ||||||
3.50%, 12/15/27 | 300 | 273,708 | ||||||
2.40%, 07/15/31 | 457 | 350,460 | ||||||
Series CB, 2.50%, 03/15/30 | 179 | 143,910 | ||||||
Masco Corp. | ||||||||
1.50%, 02/15/28 | 300 | 249,291 | ||||||
2.00%, 10/01/30 | 109 | 81,723 | ||||||
2.00%, 02/15/31(a) | 413 | 309,635 | ||||||
Mohawk Industries, Inc., 3.63%, 05/15/30(a) | 225 | 193,012 | ||||||
Owens Corning | ||||||||
4.20%, 12/01/24 | 163 | 159,603 | ||||||
3.88%, 06/01/30 | 225 | 194,104 | ||||||
Trane Technologies Financing Ltd. | ||||||||
3.50%, 03/21/26(a) | 200 | 189,980 | ||||||
5.25%, 03/03/33 | 400 | 374,444 | ||||||
Trane Technologies Global Holding Co. Ltd., | 400 | 367,714 | ||||||
Trane Technologies Luxembourg Finance SA | ||||||||
3.55%, 11/01/24 | 413 | 403,363 | ||||||
3.80%, 03/21/29 | 300 | 273,790 | ||||||
Vulcan Materials Co. | ||||||||
5.80%, 03/01/26 | 350 | 346,991 | ||||||
3.90%, 04/01/27 | 129 | 120,405 | ||||||
3.50%, 06/01/30 | 400 | 341,319 | ||||||
|
| |||||||
| 8,566,564 | ||||||||
| Building Products — 0.7% | ||||||||
Allegion PLC, 3.50%, 10/01/29 | 413 | 354,401 | ||||||
Carlisle Cos., Inc. | ||||||||
3.75%, 12/01/27 | 400 | 367,032 | ||||||
2.75%, 03/01/30 | 311 | 251,356 | ||||||
2.20%, 03/01/32 | 225 | 164,743 | ||||||
Fortune Brands Innovations, Inc., | 186 | 173,444 | ||||||
Home Depot, Inc. | ||||||||
2.70%, 04/15/25(a) | 159 | 152,946 | ||||||
3.35%, 09/15/25 | 993 | 956,502 | ||||||
4.00%, 09/15/25 | 450 | 438,945 | ||||||
3.00%, 04/01/26 | 550 | 520,108 | ||||||
2.13%, 09/15/26 | 413 | 378,112 | ||||||
2.50%, 04/15/27 | 660 | 599,084 | ||||||
2.88%, 04/15/27 | 231 | 212,234 | ||||||
2.80%, 09/14/27(a) | 413 | 375,525 | ||||||
0.90%, 03/15/28(a) | 558 | 463,800 | ||||||
1.50%, 09/15/28 | 413 | 343,270 | ||||||
3.90%, 12/06/28 | 362 | 337,007 | ||||||
2.95%, 06/15/29 | 938 | 823,007 | ||||||
2.70%, 04/15/30 | 725 | 607,042 | ||||||
1.38%, 03/15/31(a) | 475 | 351,245 | ||||||
1.88%, 09/15/31 | 413 | 311,735 | ||||||
3.25%, 04/15/32 | 734 | 611,108 | ||||||
4.50%, 09/15/32(a) | 600 | 550,408 | ||||||
Lowe’s Cos., Inc. | ||||||||
4.00%, 04/15/25 | 829 | 808,019 | ||||||
4.40%, 09/08/25 | 650 | 635,419 | ||||||
3.38%, 09/15/25 | 413 | 394,927 | ||||||
4.80%, 04/01/26 | 170 | 166,506 | ||||||
2.50%, 04/15/26 | 791 | 734,876 | ||||||
3.35%, 04/01/27(a) | 350 | 324,102 | ||||||
SCHEDULE OF INVESTMENTS | 21 |
Schedule of Investments (continued) October 31, 2023 | iShares U.S. Intermediate Credit Bond Index Fund (Percentages shown are based on Net Assets) |
| Security | Par (000) | Value | ||||||
| Building Products (continued) | ||||||||
Lowe’s Cos., Inc. (continued) | ||||||||
3.10%, 05/03/27 | $ | 1,000 | $ | 916,426 | ||||
1.30%, 04/15/28 | 699 | 577,837 | ||||||
1.70%, 09/15/28 | 458 | 378,889 | ||||||
3.65%, 04/05/29 | 1,013 | 908,716 | ||||||
4.50%, 04/15/30 | 829 | 758,304 | ||||||
1.70%, 10/15/30 | 371 | 278,696 | ||||||
3.75%, 04/01/32 | 617 | 517,595 | ||||||
5.00%, 04/15/33(a) | 850 | 773,286 | ||||||
5.15%, 07/01/33 | 370 | 338,632 | ||||||
|
| |||||||
| 17,855,284 | ||||||||
| Capital Markets — 4.0% | ||||||||
AerCap Ireland Capital DAC/AerCap Global Aviation Trust | ||||||||
6.10%, 01/15/27 | 170 | 167,212 | ||||||
6.15%, 09/30/30 | 150 | 143,461 | ||||||
Ameriprise Financial, Inc. | ||||||||
3.00%, 04/02/25 | 250 | 240,082 | ||||||
2.88%, 09/15/26(a) | 413 | 384,335 | ||||||
4.50%, 05/13/32 | 313 | 281,596 | ||||||
5.15%, 05/15/33 | 210 | 193,831 | ||||||
Ares Capital Corp. | ||||||||
4.25%, 03/01/25 | 250 | 240,649 | ||||||
3.25%, 07/15/25 | 724 | 678,931 | ||||||
3.88%, 01/15/26 | 829 | 775,281 | ||||||
2.15%, 07/15/26(a) | 450 | 395,232 | ||||||
2.88%, 06/15/27 | 179 | 155,242 | ||||||
2.88%, 06/15/28 | 402 | 332,720 | ||||||
3.20%, 11/15/31 | 413 | 307,876 | ||||||
Bain Capital Specialty Finance, Inc., | 130 | 111,706 | ||||||
Bank of New York Mellon Corp. | ||||||||
1.60%, 04/24/25 | 509 | 477,509 | ||||||
2.45%, 08/17/26 | 500 | 459,006 | ||||||
1.05%, 10/15/26 | 829 | 726,359 | ||||||
2.05%, 01/26/27 | 829 | 734,302 | ||||||
3.25%, 05/16/27 | 620 | 567,444 | ||||||
3.85%, 04/28/28 | 343 | 317,927 | ||||||
1.65%, 07/14/28 | 225 | 186,642 | ||||||
3.85%, 04/26/29 | 572 | 521,610 | ||||||
3.30%, 08/23/29 | 829 | 703,337 | ||||||
1.80%, 07/28/31 | 829 | 609,224 | ||||||
2.50%, 01/26/32(a) | 413 | 315,506 | ||||||
(1-day SOFR + 1.03%), 4.95%, 04/26/27(b) | 840 | 816,389 | ||||||
(1-day SOFR + 1.15%), | 100 | 93,177 | ||||||
(1-day SOFR + 1.17%), 4.54%, 02/01/29(b) | 300 | 281,475 | ||||||
(1-day SOFR + 1.35%), 4.41%, 07/24/26(b) | 1,155 | 1,121,498 | ||||||
(1-day SOFR + 1.42%), | 500 | 430,327 | ||||||
(1-day SOFR + 1.51%), 4.71%, 02/01/34(b) | 300 | 263,450 | ||||||
(1-day SOFR + 1.60%), 6.32%, 10/25/29(b) | 375 | 377,901 | ||||||
(1-day SOFR + 1.85%), 6.47%, 10/25/34(b) | 375 | 376,253 | ||||||
(1-day SOFR Index + 1.80%), | 590 | 582,391 | ||||||
(1-day SOFR Index + 2.07%), | 770 | 737,528 | ||||||
(3-mo. CME Term SOFR + 1.33%), | 409 | 377,205 | ||||||
Series G, 3.00%, 02/24/25 | 27 | 25,999 | ||||||
Series J, (1-day SOFR + 1.61%), | 440 | 394,828 | ||||||
Blackstone Private Credit Fund | ||||||||
2.35%, 11/22/24(a) | 200 | 190,287 | ||||||
2.70%, 01/15/25 | 130 | 123,370 | ||||||
4.70%, 03/24/25 | 413 | 400,036 | ||||||
| Security | Par (000) | Value | ||||||
| Capital Markets (continued) | ||||||||
Blackstone Private Credit Fund (continued) | ||||||||
7.05%, 09/29/25 | $ | 450 | $ | 448,281 | ||||
2.63%, 12/15/26 | 675 | 577,876 | ||||||
3.25%, 03/15/27 | 394 | 339,862 | ||||||
4.00%, 01/15/29 | 243 | 203,297 | ||||||
Blackstone Secured Lending Fund | ||||||||
3.63%, 01/15/26 | 450 | 415,688 | ||||||
2.75%, 09/16/26 | 300 | 263,251 | ||||||
2.13%, 02/15/27 | 400 | 337,792 | ||||||
2.85%, 09/30/28 | 240 | 194,510 | ||||||
Blue Owl Capital Corp. | ||||||||
4.00%, 03/30/25(a) | 286 | 272,059 | ||||||
3.75%, 07/22/25 | 198 | 185,022 | ||||||
4.25%, 01/15/26 | 250 | 233,018 | ||||||
3.40%, 07/15/26 | 829 | 739,686 | ||||||
2.63%, 01/15/27 | 225 | 192,321 | ||||||
2.88%, 06/11/28 | 274 | 223,310 | ||||||
Blue Owl Capital Corp. III, 3.13%, 04/13/27 | 130 | 110,742 | ||||||
Blue Owl Credit Income Corp. | ||||||||
5.50%, 03/21/25 | 200 | 193,509 | ||||||
7.75%, 09/16/27 | 300 | 295,392 | ||||||
Brookfield Capital Finance LLC, 6.09%, 06/14/33 | 250 | 235,869 | ||||||
Brookfield Corp., 4.00%, 01/15/25 | 166 | 161,809 | ||||||
Brookfield Finance I U.K. PLC/Brookfield | 399 | 290,486 | ||||||
Brookfield Finance, Inc. | ||||||||
4.25%, 06/02/26 | 179 | 170,783 | ||||||
3.90%, 01/25/28 | 869 | 792,142 | ||||||
4.85%, 03/29/29 | 400 | 372,179 | ||||||
4.35%, 04/15/30 | 413 | 365,036 | ||||||
2.72%, 04/15/31(a) | 193 | 149,307 | ||||||
Charles Schwab Corp. | ||||||||
3.63%, 04/01/25 | 179 | 172,642 | ||||||
3.85%, 05/21/25 | 829 | 799,651 | ||||||
0.90%, 03/11/26 | 501 | 441,888 | ||||||
1.15%, 05/13/26 | 409 | 359,473 | ||||||
5.88%, 08/24/26 | 160 | 158,893 | ||||||
2.45%, 03/03/27 | 1,243 | 1,095,890 | ||||||
3.30%, 04/01/27(a) | 350 | 317,881 | ||||||
3.20%, 01/25/28 | 829 | 732,650 | ||||||
2.00%, 03/20/28 | 660 | 551,105 | ||||||
3.25%, 05/22/29 | 130 | 110,672 | ||||||
2.75%, 10/01/29 | 179 | 147,462 | ||||||
4.63%, 03/22/30 | 179 | 163,339 | ||||||
1.65%, 03/11/31 | 413 | 294,183 | ||||||
2.30%, 05/13/31 | 829 | 619,332 | ||||||
1.95%, 12/01/31 | 500 | 355,842 | ||||||
2.90%, 03/03/32 | 660 | 504,229 | ||||||
6.14%, 08/24/34 | 775 | 725,867 | ||||||
(1-day SOFR + 2.21%), 5.64%, 05/19/29(b) | 500 | 481,324 | ||||||
(1-day SOFR + 2.50%), 5.85%, 05/19/34(b) | 500 | 458,587 | ||||||
CI Financial Corp., 3.20%, 12/17/30 | 496 | 362,936 | ||||||
Credit Suisse USA, Inc., 7.13%, 07/15/32 | 300 | 310,836 | ||||||
European Investment Bank, 3.88%, 03/15/28(a) | 4,000 | 3,831,542 | ||||||
Franklin Resources, Inc., 1.60%, 10/30/30 | 400 | 296,504 | ||||||
FS KKR Capital Corp. | ||||||||
4.13%, 02/01/25 | 26 | 25,053 | ||||||
3.40%, 01/15/26 | 579 | 529,663 | ||||||
2.63%, 01/15/27 | 329 | 280,479 | ||||||
3.25%, 07/15/27 | 413 | 354,981 | ||||||
3.13%, 10/12/28 | 213 | 171,225 | ||||||
Goldman Sachs BDC, Inc., 2.88%, 01/15/26 | 250 | 230,175 | ||||||
| 22 | 2 0 2 3 BLACK ROCK ANNUAL REPORT TO SHAREHOLDERS |
Schedule of Investments (continued) October 31, 2023 | iShares U.S. Intermediate Credit Bond Index Fund (Percentages shown are based on Net Assets) |
| Security | Par (000) | Value | ||||||
| Capital Markets (continued) | ||||||||
Golub Capital BDC, Inc. | ||||||||
2.50%, 08/24/26 | $ | 130 | $ | 113,672 | ||||
2.05%, 02/15/27 | 145 | 122,016 | ||||||
Invesco Finance PLC, 3.75%, 01/15/26 | 250 | 238,917 | ||||||
Jefferies Financial Group, Inc. | ||||||||
4.85%, 01/15/27 | 829 | 787,863 | ||||||
5.88%, 07/21/28 | 335 | 323,378 | ||||||
4.15%, 01/23/30 | 329 | 280,727 | ||||||
2.63%, 10/15/31 | 329 | 242,557 | ||||||
2.75%, 10/15/32 | 459 | 332,391 | ||||||
Kreditanstalt fuer Wiederaufbau | ||||||||
2.50%, 11/20/24 | 1,659 | 1,607,390 | ||||||
1.25%, 01/31/25 | 1,000 | 949,938 | ||||||
2.00%, 05/02/25(a) | 1,659 | 1,579,791 | ||||||
3.13%, 06/10/25 | 3,000 | 2,900,450 | ||||||
0.38%, 07/18/25 | 3,319 | 3,056,460 | ||||||
0.63%, 01/22/26 | 1,659 | 1,503,800 | ||||||
3.63%, 04/01/26 | 1,000 | 967,386 | ||||||
3.00%, 05/20/27 | 3,700 | 3,465,138 | ||||||
3.75%, 02/15/28 | 1,650 | 1,571,451 | ||||||
2.88%, 04/03/28(a) | 1,150 | 1,054,147 | ||||||
3.88%, 06/15/28 | 3,000 | 2,863,873 | ||||||
1.75%, 09/14/29 | 1,243 | 1,043,680 | ||||||
0.75%, 09/30/30 | 789 | 595,078 | ||||||
Landwirtschaftliche Rentenbank | ||||||||
2.00%, 01/13/25 | 829 | 795,007 | ||||||
2.38%, 06/10/25 | 1,659 | 1,582,922 | ||||||
0.88%, 09/03/30(a) | 1,659 | 1,256,832 | ||||||
Series 40, 0.50%, 05/27/25 | 1,659 | 1,538,025 | ||||||
Lazard Group LLC | ||||||||
4.50%, 09/19/28 | 200 | 184,156 | ||||||
4.38%, 03/11/29 | 179 | 162,497 | ||||||
Main Street Capital Corp., 3.00%, 07/14/26 | 130 | 115,059 | ||||||
Morgan Stanley | ||||||||
6.41%, 11/01/29 | 380 | 379,825 | ||||||
6.63%, 11/01/34 | 640 | 639,040 | ||||||
Nasdaq, Inc. | ||||||||
5.65%, 06/28/25 | 70 | 69,746 | ||||||
5.35%, 06/28/28 | 565 | 550,194 | ||||||
Nomura Holdings, Inc. | ||||||||
2.65%, 01/16/25 | 585 | 558,705 | ||||||
5.10%, 07/03/25 | 400 | 392,312 | ||||||
1.85%, 07/16/25 | 600 | 555,805 | ||||||
5.71%, 01/09/26 | 200 | 197,135 | ||||||
1.65%, 07/14/26 | 500 | 441,014 | ||||||
2.33%, 01/22/27 | 478 | 419,061 | ||||||
5.39%, 07/06/27 | 400 | 384,694 | ||||||
5.84%, 01/18/28(a) | 200 | 194,599 | ||||||
6.07%, 07/12/28 | 450 | 440,517 | ||||||
2.17%, 07/14/28 | 400 | 329,131 | ||||||
2.71%, 01/22/29 | 478 | 394,689 | ||||||
5.61%, 07/06/29 | 400 | 381,238 | ||||||
3.10%, 01/16/30 | 635 | 515,658 | ||||||
2.68%, 07/16/30 | 310 | 239,730 | ||||||
2.61%, 07/14/31 | 450 | 334,849 | ||||||
3.00%, 01/22/32 | 450 | 340,276 | ||||||
6.18%, 01/18/33(a) | 600 | 575,227 | ||||||
6.09%, 07/12/33(a) | 300 | 286,198 | ||||||
Northern Trust Corp. | ||||||||
3.95%, 10/30/25 | 300 | 289,575 | ||||||
4.00%, 05/10/27 | 483 | 453,991 | ||||||
3.65%, 08/03/28(a) | 163 | 148,921 | ||||||
| Security | Par (000) | Value | ||||||
| Capital Markets (continued) | ||||||||
Northern Trust Corp. (continued) | ||||||||
3.15%, 05/03/29 | $ | 413 | $ | 361,726 | ||||
1.95%, 05/01/30 | 550 | 426,222 | ||||||
6.13%, 11/02/32 | 610 | 587,995 | ||||||
Oaktree Specialty Lending Corp., | 100 | 95,351 | ||||||
Oesterreichische Kontrollbank AG | ||||||||
1.50%, 02/12/25 | 829 | 787,746 | ||||||
0.38%, 09/17/25 | 700 | 639,644 | ||||||
4.63%, 11/03/25 | 500 | 494,315 | ||||||
4.13%, 01/20/26 | 500 | 488,565 | ||||||
0.50%, 02/02/26 | 600 | 540,527 | ||||||
4.25%, 03/01/28(a) | 1,000 | 969,105 | ||||||
Prospect Capital Corp. | ||||||||
3.36%, 11/15/26 | 393 | 337,633 | ||||||
3.44%, 10/15/28(a) | 225 | 173,428 | ||||||
Sixth Street Specialty Lending, Inc., | 413 | 400,925 | ||||||
State Street Corp. | ||||||||
3.30%, 12/16/24 | 333 | 323,482 | ||||||
3.55%, 08/18/25 | 700 | 672,160 | ||||||
2.65%, 05/19/26(a) | 829 | 770,288 | ||||||
2.40%, 01/24/30 | 225 | 183,249 | ||||||
2.20%, 03/03/31 | 450 | 336,719 | ||||||
(1-day SOFR + 0.56%), 1.68%, 11/18/27(b) | 745 | 662,321 | ||||||
(1-day SOFR + 0.60%), 4.86%, 01/26/26(b) | 210 | 206,418 | ||||||
(1-day SOFR + 0.73%), 2.20%, 02/07/28(b) | 279 | 246,576 | ||||||
(1-day SOFR + 0.94%), 2.35%, 11/01/25(b) | 351 | 336,817 | ||||||
(1-day SOFR + 1.00%), 2.62%, 02/07/33(b) | 123 | 93,369 | ||||||
(1-day SOFR + 1.13%), 5.10%, 05/18/26(b) | 340 | 335,167 | ||||||
(1-day SOFR + 1.35%), 5.75%, 11/04/26(b) | 220 | 218,754 | ||||||
(1-day SOFR + 1.49%), 3.03%, 11/01/34(b) | 130 | 107,314 | ||||||
(1-day SOFR + 1.57%), | 240 | 212,800 | ||||||
(1-day SOFR + 1.61%), 4.42%, 05/13/33(b) | 350 | 305,635 | ||||||
(1-day SOFR + 1.72%), 5.82%, 11/04/28(b) | 115 | 113,671 | ||||||
(1-day SOFR + 1.73%), | 500 | 423,531 | ||||||
(1-day SOFR + 1.89%), 5.16%, 05/18/34(b) | 340 | 307,477 | ||||||
(1-day SOFR + 2.60%), 2.90%, 03/30/26(b) | 829 | 790,056 | ||||||
(1-day SOFR + 2.65%), 3.15%, 03/30/31(b) | 829 | 691,820 | ||||||
(3-mo. CME Term SOFR + 1.29%), | 350 | 323,318 | ||||||
Stifel Financial Corp., 4.00%, 05/15/30 | 300 | 251,139 | ||||||
UBS Group AG, 4.55%, 04/17/26 | 1,474 | 1,409,178 | ||||||
Voya Financial, Inc., 3.65%, 06/15/26 | 288 | 271,313 | ||||||
|
| |||||||
| 95,909,150 | ||||||||
| Chemicals — 1.1% | ||||||||
Air Products and Chemicals, Inc. | ||||||||
1.50%, 10/15/25 | 483 | 447,270 | ||||||
1.85%, 05/15/27 | 342 | 302,199 | ||||||
2.05%, 05/15/30 | 355 | 285,642 | ||||||
4.80%, 03/03/33(a) | 400 | 374,095 | ||||||
Albemarle Corp.(a) | ||||||||
4.65%, 06/01/27 | 400 | 377,740 | ||||||
5.05%, 06/01/32 | 300 | 261,840 | ||||||
Cabot Corp. | ||||||||
4.00%, 07/01/29 | 93 | 83,201 | ||||||
5.00%, 06/30/32 | 100 | 89,063 | ||||||
Celanese U.S. Holdings LLC | ||||||||
6.05%, 03/15/25 | 638 | 636,033 | ||||||
1.40%, 08/05/26 | 130 | 113,216 | ||||||
6.17%, 07/15/27 | 950 | 927,246 | ||||||
6.35%, 11/15/28(a) | 445 | 434,465 | ||||||
6.33%, 07/15/29 | 410 | 395,214 | ||||||
SCHEDULE OF INVESTMENTS | 23 |
Schedule of Investments (continued) October 31, 2023 | iShares U.S. Intermediate Credit Bond Index Fund (Percentages shown are based on Net Assets) |
| Security | Par (000) | Value | ||||||
| Chemicals (continued) | ||||||||
Celanese U.S. Holdings LLC (continued) | ||||||||
6.55%, 11/15/30 | $ | 500 | $ | 480,926 | ||||
6.38%, 07/15/32 | 420 | 394,218 | ||||||
6.70%, 11/15/33(a) | 265 | 251,695 | ||||||
Dow Chemical Co. | ||||||||
4.80%, 11/30/28(a) | 475 | 454,529 | ||||||
7.38%, 11/01/29 | 500 | 528,564 | ||||||
2.10%, 11/15/30(a) | 450 | 348,722 | ||||||
6.30%, 03/15/33(a) | 600 | 602,706 | ||||||
DuPont de Nemours, Inc. | ||||||||
4.49%, 11/15/25 | 750 | 730,869 | ||||||
4.73%, 11/15/28 | 1,243 | 1,187,834 | ||||||
Eastman Chemical Co. | ||||||||
3.80%, 03/15/25 | 869 | 840,206 | ||||||
4.50%, 12/01/28 | 179 | 166,403 | ||||||
5.75%, 03/08/33 | 160 | 148,191 | ||||||
Ecolab, Inc. | ||||||||
2.70%, 11/01/26 | 500 | 463,179 | ||||||
3.25%, 12/01/27 | 179 | 164,650 | ||||||
5.25%, 01/15/28(a) | 150 | 148,652 | ||||||
4.80%, 03/24/30 | 413 | 391,305 | ||||||
1.30%, 01/30/31 | 660 | 485,676 | ||||||
2.13%, 02/01/32 | 329 | 250,615 | ||||||
EIDP, Inc. | ||||||||
1.70%, 07/15/25 | 660 | 614,233 | ||||||
4.50%, 05/15/26 | 350 | 339,834 | ||||||
2.30%, 07/15/30(a) | 660 | 526,525 | ||||||
4.80%, 05/15/33(a) | 350 | 318,213 | ||||||
Emerson Electric Co. | ||||||||
3.15%, 06/01/25 | 250 | 241,214 | ||||||
0.88%, 10/15/26 | 350 | 307,512 | ||||||
1.80%, 10/15/27 | 400 | 349,437 | ||||||
2.00%, 12/21/28 | 413 | 349,944 | ||||||
2.20%, 12/21/31 | 225 | 174,666 | ||||||
FMC Corp. | ||||||||
5.15%, 05/18/26 | 220 | 212,406 | ||||||
3.20%, 10/01/26 | 100 | 91,175 | ||||||
3.45%, 10/01/29 | 305 | 252,501 | ||||||
5.65%, 05/18/33(a) | 220 | 193,947 | ||||||
Huntsman International LLC | ||||||||
4.50%, 05/01/29 | 300 | 268,330 | ||||||
2.95%, 06/15/31 | 120 | 91,097 | ||||||
International Flavors & Fragrances, Inc., | 413 | 377,717 | ||||||
Linde, Inc. | ||||||||
2.65%, 02/05/25 | 107 | 103,178 | ||||||
4.70%, 12/05/25 | 200 | 197,609 | ||||||
3.20%, 01/30/26 | 163 | 155,400 | ||||||
1.10%, 08/10/30 | 745 | 567,271 | ||||||
Linde, Inc./CT, 4.80%, 12/05/24 | 100 | 99,328 | ||||||
LYB International Finance III LLC | ||||||||
1.25%, 10/01/25 | 136 | 124,071 | ||||||
2.25%, 10/01/30 | 558 | 431,303 | ||||||
5.63%, 05/15/33(a) | 220 | 206,146 | ||||||
Mosaic Co., 4.05%, 11/15/27(a) | 829 | 773,651 | ||||||
Nutrien Ltd. | ||||||||
3.00%, 04/01/25 | 163 | 156,087 | ||||||
5.95%, 11/07/25 | 350 | 350,001 | ||||||
4.00%, 12/15/26 | 163 | 154,205 | ||||||
4.90%, 03/27/28 | 460 | 440,658 | ||||||
4.20%, 04/01/29 | 300 | 275,275 | ||||||
| Security | Par (000) | Value | ||||||
| Chemicals (continued) | ||||||||
Nutrien Ltd. (continued) | ||||||||
2.95%, 05/13/30 | $ | 179 | $ | 147,335 | ||||
PPG Industries, Inc. | ||||||||
1.20%, 03/15/26 | 346 | 310,448 | ||||||
3.75%, 03/15/28 | 500 | 461,231 | ||||||
2.80%, 08/15/29 | 129 | 110,198 | ||||||
RPM International, Inc., | 159 | 120,836 | ||||||
Sherwin-Williams Co. | ||||||||
4.25%, 08/08/25 | 150 | 145,799 | ||||||
3.95%, 01/15/26 | 413 | 397,073 | ||||||
3.45%, 06/01/27 | 963 | 891,956 | ||||||
2.95%, 08/15/29 | 512 | 436,332 | ||||||
2.30%, 05/15/30 | 350 | 278,936 | ||||||
2.20%, 03/15/32 | 211 | 156,912 | ||||||
Westlake Corp. | ||||||||
3.60%, 08/15/26 | 413 | 387,806 | ||||||
3.38%, 06/15/30 | 225 | 187,028 | ||||||
|
| |||||||
| 25,540,988 | ||||||||
| Commercial Services & Supplies — 0.2% | ||||||||
GATX Corp. | ||||||||
3.25%, 09/15/26(a) | 620 | 573,870 | ||||||
3.85%, 03/30/27 | 413 | 381,104 | ||||||
4.70%, 04/01/29 | 179 | 164,949 | ||||||
4.00%, 06/30/30 | 250 | 215,076 | ||||||
1.90%, 06/01/31 | 159 | 114,385 | ||||||
3.50%, 06/01/32 | 350 | 276,662 | ||||||
4.90%, 03/15/33 | 215 | 189,154 | ||||||
5.45%, 09/15/33 | 300 | 272,519 | ||||||
Triton Container International Ltd./TAL International Container Corp., | 250 | 180,620 | ||||||
UL Solutions, Inc., 6.50%, 10/20/28 | 150 | 148,724 | ||||||
Veralto Corp. | ||||||||
5.50%, 09/18/26 | 325 | 321,731 | ||||||
5.35%, 09/18/28 | 325 | 314,408 | ||||||
5.45%, 09/18/33 | 325 | 303,686 | ||||||
Waste Management, Inc., 4.88%, 02/15/29 | 375 | 361,404 | ||||||
|
| |||||||
| 3,818,292 | ||||||||
| Communications Equipment — 0.2% | ||||||||
Cisco Systems, Inc. | ||||||||
3.50%, 06/15/25 | 250 | 242,271 | ||||||
2.95%, 02/28/26 | 293 | 278,151 | ||||||
2.50%, 09/20/26 | 829 | 769,781 | ||||||
Juniper Networks, Inc. | ||||||||
3.75%, 08/15/29 | 413 | 362,525 | ||||||
2.00%, 12/10/30 | 250 | 183,669 | ||||||
Motorola Solutions, Inc. | ||||||||
4.60%, 02/23/28 | 413 | 390,689 | ||||||
4.60%, 05/23/29 | 799 | 744,522 | ||||||
2.30%, 11/15/30 | 694 | 530,446 | ||||||
2.75%, 05/24/31 | 550 | 426,368 | ||||||
Nokia OYJ, 4.38%, 06/12/27 | 350 | 323,817 | ||||||
|
| |||||||
| 4,252,239 | ||||||||
| Construction & Engineering — 0.1% | ||||||||
Asian Development Bank, 4.00%, 01/12/33 | 1,700 | 1,565,932 | ||||||
Jacobs Engineering Group, Inc., 5.90%, 03/01/33 | 265 | 245,439 | ||||||
|
| |||||||
| 1,811,371 | ||||||||
| Construction Materials — 0.0% | ||||||||
WW Grainger, Inc., 1.85%, 02/15/25 | 250 | 237,954 | ||||||
|
| |||||||
| 24 | 2 0 2 3 BLACK ROCK ANNUAL REPORT TO SHAREHOLDERS |
Schedule of Investments (continued) October 31, 2023 | iShares U.S. Intermediate Credit Bond Index Fund (Percentages shown are based on Net Assets) |
| Security | Par (000) | Value | ||||||
| Consumer Discretionary — 0.1% | ||||||||
Cintas Corp. No. 2 | ||||||||
3.45%, 05/01/25 | $ | 159 | $ | 153,878 | ||||
3.70%, 04/01/27 | 413 | 389,277 | ||||||
4.00%, 05/01/32 | 350 | 305,630 | ||||||
Quanta Services, Inc. | ||||||||
2.90%, 10/01/30 | 443 | 348,836 | ||||||
2.35%, 01/15/32 | 150 | 107,979 | ||||||
RELX Capital, Inc. | ||||||||
4.00%, 03/18/29 | 400 | 368,294 | ||||||
3.00%, 05/22/30 | 450 | 376,525 | ||||||
4.75%, 05/20/32 | 210 | 192,408 | ||||||
|
| |||||||
| 2,242,827 | ||||||||
| Consumer Finance — 2.2% | ||||||||
American Express Co. | ||||||||
3.63%, 12/05/24 | 225 | 219,340 | ||||||
2.25%, 03/04/25 | 1,009 | 959,631 | ||||||
3.95%, 08/01/25 | 1,700 | 1,642,490 | ||||||
4.20%, 11/06/25 | 450 | 435,475 | ||||||
4.90%, 02/13/26 | 1,000 | 979,817 | ||||||
3.13%, 05/20/26 | 989 | 927,977 | ||||||
6.34%, 10/30/26 | 375 | 376,063 | ||||||
1.65%, 11/04/26 | 829 | 730,118 | ||||||
2.55%, 03/04/27 | 983 | 880,123 | ||||||
3.30%, 05/03/27 | 963 | 881,353 | ||||||
5.85%, 11/05/27(a) | 1,190 | 1,191,222 | ||||||
4.05%, 05/03/29 | 399 | 364,953 | ||||||
(1-day SOFR + 0.97%), 5.39%, 07/28/27(b) | 175 | 171,388 | ||||||
(1-day SOFR + 1.00%), 4.99%, 05/01/26(b) | 500 | 490,407 | ||||||
(1-day SOFR + 1.28%), 5.28%, 07/27/29(b) | 525 | 503,950 | ||||||
(1-day SOFR + 1.76%), 4.42%, 08/03/33(b) | 700 | 611,103 | ||||||
(1-day SOFR + 1.84%), 5.04%, 05/01/34(b) | 800 | 718,169 | ||||||
(1-day SOFR + 1.93%), 5.63%, 07/28/34(b) | 50 | 45,569 | ||||||
(1-day SOFR + 1.94%), 6.49%, 10/30/31(b) | 370 | 370,556 | ||||||
(1-day SOFR + 2.26%), 4.99%, 05/26/33(b) | 300 | 267,359 | ||||||
Andrew W Mellon Foundation, Series 2020, | 29 | 24,636 | ||||||
Automatic Data Processing, Inc. | ||||||||
3.38%, 09/15/25 | 600 | 578,699 | ||||||
1.70%, 05/15/28 | 480 | 412,035 | ||||||
1.25%, 09/01/30 | 409 | 311,002 | ||||||
Block Financial LLC | ||||||||
2.50%, 07/15/28 | 421 | 355,088 | ||||||
3.88%, 08/15/30(a) | 229 | 194,503 | ||||||
Capital One Financial Corp. | ||||||||
3.20%, 02/05/25 | 163 | 155,844 | ||||||
4.25%, 04/30/25(a) | 309 | 298,394 | ||||||
4.20%, 10/29/25 | 929 | 880,927 | ||||||
3.75%, 07/28/26 | 900 | 826,299 | ||||||
3.75%, 03/09/27 | 413 | 372,943 | ||||||
3.65%, 05/11/27 | 409 | 368,924 | ||||||
7.15%, 10/29/27 | 250 | 250,037 | ||||||
3.80%, 01/31/28 | 829 | 730,830 | ||||||
7.62%, 10/30/31 | 90 | 89,956 | ||||||
(1-day SOFR + 0.86%), 1.88%, 11/02/27(b) | 829 | 711,264 | ||||||
(1-day SOFR + 1.27%), 2.62%, 11/02/32(b) | 413 | 291,467 | ||||||
(1-day SOFR + 1.29%), 2.64%, 03/03/26(b) | 362 | 339,516 | ||||||
(1-day SOFR + 1.34%), 2.36%, 07/29/32(b) | 829 | 546,841 | ||||||
(1-day SOFR + 1.79%), 3.27%, 03/01/30(b) | 562 | 460,845 | ||||||
(1-day SOFR + 2.06%), 4.93%, 05/10/28(b) | 620 | 573,564 | ||||||
(1-day SOFR + 2.08%), 5.47%, 02/01/29(b) | 325 | 302,161 | ||||||
(1-day SOFR + 2.16%), 4.99%, 07/24/26(b) | 750 | 723,085 | ||||||
(1-day SOFR + 2.37%), | 650 | 555,951 | ||||||
| Security | Par (000) | Value | ||||||
| Consumer Finance (continued) | ||||||||
Capital One Financial Corp. (continued) | ||||||||
(1-day SOFR + 2.60%), 5.25%, 07/26/30(b) | $ | 300 | $ | 269,556 | ||||
(1-day SOFR + 2.60%), 5.82%, 02/01/34(b) | 285 | 249,253 | ||||||
(1-day SOFR + 2.64%), 6.31%, 06/08/29(b) | 1,065 | 1,019,709 | ||||||
(1-day SOFR + 2.86%), 6.38%, 06/08/34(b) | 1,055 | 962,086 | ||||||
Discover Financial Services | ||||||||
3.95%, 11/06/24 | 288 | 280,133 | ||||||
3.75%, 03/04/25 | 350 | 335,701 | ||||||
4.50%, 01/30/26(a) | 400 | 379,816 | ||||||
4.10%, 02/09/27 | 400 | 359,050 | ||||||
6.70%, 11/29/32 | 300 | 277,923 | ||||||
7.96%, 11/02/34 | 375 | 372,389 | ||||||
Equifax, Inc. | ||||||||
2.60%, 12/01/24(a) | 829 | 798,695 | ||||||
5.10%, 12/15/27 | 400 | 385,273 | ||||||
2.35%, 09/15/31 | 829 | 616,623 | ||||||
Global Payments, Inc. | ||||||||
2.65%, 02/15/25 | 600 | 572,055 | ||||||
1.20%, 03/01/26 | 400 | 356,641 | ||||||
4.80%, 04/01/26(a) | 413 | 398,928 | ||||||
2.15%, 01/15/27 | 404 | 355,025 | ||||||
4.95%, 08/15/27 | 275 | 261,092 | ||||||
4.45%, 06/01/28 | 350 | 322,235 | ||||||
3.20%, 08/15/29 | 563 | 472,534 | ||||||
5.30%, 08/15/29 | 520 | 488,428 | ||||||
2.90%, 05/15/30 | 504 | 403,706 | ||||||
2.90%, 11/15/31 | 321 | 245,452 | ||||||
5.40%, 08/15/32 | 335 | 303,534 | ||||||
International Finance Corp., 4.50%, 07/13/28 | 1,100 | 1,078,887 | ||||||
Mastercard, Inc. | ||||||||
2.00%, 03/03/25(a) | 294 | 280,985 | ||||||
2.95%, 11/21/26 | 400 | 373,040 | ||||||
3.30%, 03/26/27 | 653 | 609,776 | ||||||
3.50%, 02/26/28 | 179 | 166,289 | ||||||
4.88%, 03/09/28 | 410 | 403,340 | ||||||
2.95%, 06/01/29 | 393 | 344,773 | ||||||
3.35%, 03/26/30 | 686 | 602,727 | ||||||
1.90%, 03/15/31(a) | 425 | 329,911 | ||||||
2.00%, 11/18/31 | 274 | 209,071 | ||||||
4.85%, 03/09/33 | 200 | 188,142 | ||||||
Moody’s Corp. | ||||||||
3.75%, 03/24/25 | 300 | 291,239 | ||||||
3.25%, 01/15/28(a) | 620 | 563,284 | ||||||
4.25%, 02/01/29 | 129 | 120,133 | ||||||
2.00%, 08/19/31(a) | 222 | 167,381 | ||||||
4.25%, 08/08/32(a) | 350 | 308,792 | ||||||
PayPal Holdings, Inc. | ||||||||
1.65%, 06/01/25 | 362 | 339,702 | ||||||
2.65%, 10/01/26 | 829 | 763,510 | ||||||
3.90%, 06/01/27 | 350 | 332,541 | ||||||
2.85%, 10/01/29 | 856 | 728,032 | ||||||
2.30%, 06/01/30 | 384 | 307,859 | ||||||
4.40%, 06/01/32(a) | 430 | 385,346 | ||||||
S&P Global, Inc. | ||||||||
2.45%, 03/01/27 | 700 | 633,449 | ||||||
4.75%, 08/01/28 | 329 | 317,652 | ||||||
2.70%, 03/01/29 | 630 | 546,309 | ||||||
4.25%, 05/01/29 | 829 | 771,611 | ||||||
2.50%, 12/01/29 | 239 | 199,964 | ||||||
1.25%, 08/15/30 | 355 | 263,952 | ||||||
2.90%, 03/01/32 | 800 | 641,889 | ||||||
5.25%, 09/15/33(d) | 45 | 42,457 | ||||||
SCHEDULE OF INVESTMENTS | 25 |
Schedule of Investments (continued) October 31, 2023 | iShares U.S. Intermediate Credit Bond Index Fund (Percentages shown are based on Net Assets) |
| Security | Par (000) | Value | ||||||
| Consumer Finance (continued) | ||||||||
Synchrony Financial | ||||||||
4.88%, 06/13/25 | $ | 485 | $ | 459,969 | ||||
4.50%, 07/23/25 | 473 | 444,344 | ||||||
3.70%, 08/04/26 | 200 | 177,403 | ||||||
3.95%, 12/01/27 | 479 | 410,023 | ||||||
5.15%, 03/19/29 | 413 | 356,717 | ||||||
2.88%, 10/28/31 | 236 | 159,926 | ||||||
Visa, Inc. | ||||||||
3.15%, 12/14/25 | 2,144 | 2,045,779 | ||||||
1.90%, 04/15/27 | 559 | 497,771 | ||||||
0.75%, 08/15/27(a) | 350 | 297,025 | ||||||
2.75%, 09/15/27 | 303 | 275,194 | ||||||
2.05%, 04/15/30 | 829 | 670,627 | ||||||
1.10%, 02/15/31(a) | 360 | 266,678 | ||||||
Western Union Co. | ||||||||
1.35%, 03/15/26 | 745 | 662,944 | ||||||
2.75%, 03/15/31 | 95 | 72,187 | ||||||
|
| |||||||
| 52,716,341 | ||||||||
| Consumer Staples Distribution & Retail — 1.4% | ||||||||
Ahold Finance USA LLC, 6.88%, 05/01/29(a) | 179 | 186,625 | ||||||
Campbell Soup Co. | ||||||||
3.95%, 03/15/25 | 450 | 437,451 | ||||||
3.30%, 03/19/25 | 413 | 396,897 | ||||||
4.15%, 03/15/28(a) | 500 | 465,800 | ||||||
2.38%, 04/24/30(a) | 159 | 126,046 | ||||||
Conagra Brands, Inc. | ||||||||
4.60%, 11/01/25 | 829 | 804,943 | ||||||
1.38%, 11/01/27 | 323 | 268,694 | ||||||
7.00%, 10/01/28 | 200 | 207,552 | ||||||
4.85%, 11/01/28 | 500 | 469,801 | ||||||
Costco Wholesale Corp. | ||||||||
3.00%, 05/18/27 | 393 | 364,115 | ||||||
1.38%, 06/20/27 | 700 | 609,244 | ||||||
1.60%, 04/20/30(a) | 1,243 | 982,627 | ||||||
1.75%, 04/20/32 | 413 | 309,101 | ||||||
Dollar General Corp. | ||||||||
3.88%, 04/15/27 | 350 | 326,546 | ||||||
4.63%, 11/01/27 | 270 | 256,331 | ||||||
4.13%, 05/01/28 | 300 | 277,369 | ||||||
5.20%, 07/05/28(a) | 140 | 134,499 | ||||||
3.50%, 04/03/30 | 400 | 337,529 | ||||||
5.00%, 11/01/32(a) | 355 | 316,383 | ||||||
5.45%, 07/05/33(a) | 630 | 575,315 | ||||||
Dollar Tree, Inc. | ||||||||
4.00%, 05/15/25 | 400 | 387,356 | ||||||
4.20%, 05/15/28 | 829 | 763,323 | ||||||
2.65%, 12/01/31 | 413 | 313,182 | ||||||
General Mills, Inc. | ||||||||
4.00%, 04/17/25 | 500 | 486,588 | ||||||
3.20%, 02/10/27 | 163 | 150,360 | ||||||
4.20%, 04/17/28 | 829 | 776,912 | ||||||
2.25%, 10/14/31 | 279 | 210,884 | ||||||
Ingredion, Inc. | ||||||||
3.20%, 10/01/26 | 350 | 327,334 | ||||||
2.90%, 06/01/30 | 250 | 205,270 | ||||||
Kellogg Co. | ||||||||
3.25%, 04/01/26 | 300 | 283,038 | ||||||
3.40%, 11/15/27 | 450 | 408,260 | ||||||
4.30%, 05/15/28 | 179 | 167,214 | ||||||
2.10%, 06/01/30 | 159 | 123,954 | ||||||
5.25%, 03/01/33(a) | 200 | 183,680 | ||||||
Series B, 7.45%, 04/01/31 | 400 | 424,149 | ||||||
| Security | Par (000) | Value | ||||||
| Consumer Staples Distribution & Retail (continued) | ||||||||
Kraft Heinz Foods Co. | ||||||||
3.00%, 06/01/26 | $ | 994 | $ | 928,855 | ||||
3.88%, 05/15/27 | 702 | 658,098 | ||||||
4.63%, 01/30/29(a) | 163 | 153,881 | ||||||
3.75%, 04/01/30 | 371 | 324,849 | ||||||
4.25%, 03/01/31 | 163 | 144,039 | ||||||
6.75%, 03/15/32 | 130 | 134,145 | ||||||
Kroger Co. | ||||||||
3.50%, 02/01/26 | 408 | 387,963 | ||||||
2.65%, 10/15/26 | 829 | 759,582 | ||||||
3.70%, 08/01/27 | 413 | 382,425 | ||||||
4.50%, 01/15/29(a) | 229 | 215,009 | ||||||
2.20%, 05/01/30 | 193 | 151,340 | ||||||
1.70%, 01/15/31(a) | 183 | 135,047 | ||||||
McCormick & Co., Inc. | ||||||||
0.90%, 02/15/26 | 308 | 275,482 | ||||||
3.40%, 08/15/27(a) | 350 | 320,453 | ||||||
2.50%, 04/15/30 | 209 | 167,462 | ||||||
1.85%, 02/15/31(a) | 314 | 232,747 | ||||||
Sysco Corp. | ||||||||
3.75%, 10/01/25 | 476 | 456,084 | ||||||
3.30%, 07/15/26 | 520 | 486,112 | ||||||
3.25%, 07/15/27 | 829 | 755,232 | ||||||
5.95%, 04/01/30 | 529 | 525,161 | ||||||
2.45%, 12/14/31 | 413 | 315,101 | ||||||
Target Corp. | ||||||||
2.25%, 04/15/25 | 527 | 503,155 | ||||||
2.50%, 04/15/26 | 613 | 576,091 | ||||||
1.95%, 01/15/27 | 346 | 311,496 | ||||||
3.38%, 04/15/29 | 829 | 748,153 | ||||||
2.35%, 02/15/30 | 811 | 666,310 | ||||||
2.65%, 09/15/30 | 161 | 132,317 | ||||||
4.50%, 09/15/32(a) | 400 | 362,870 | ||||||
4.40%, 01/15/33(a) | 250 | 225,434 | ||||||
Walgreens Boots Alliance, Inc. | ||||||||
3.80%, 11/18/24 | 450 | 437,185 | ||||||
3.45%, 06/01/26 | 778 | 709,076 | ||||||
3.20%, 04/15/30(a) | 159 | 123,817 | ||||||
Walmart, Inc. | ||||||||
3.55%, 06/26/25 | 350 | 339,885 | ||||||
3.90%, 09/09/25 | 1,300 | 1,269,950 | ||||||
4.00%, 04/15/26 | 270 | 262,748 | ||||||
3.05%, 07/08/26 | 350 | 331,680 | ||||||
1.05%, 09/17/26 | 656 | 584,705 | ||||||
5.88%, 04/05/27 | 800 | 818,848 | ||||||
3.95%, 09/09/27 | 550 | 526,477 | ||||||
3.90%, 04/15/28 | 320 | 303,358 | ||||||
3.70%, 06/26/28 | 550 | 517,421 | ||||||
1.50%, 09/22/28 | 453 | 381,342 | ||||||
3.25%, 07/08/29(a) | 400 | 360,271 | ||||||
4.00%, 04/15/30 | 500 | 461,855 | ||||||
1.80%, 09/22/31 | 734 | 564,460 | ||||||
4.15%, 09/09/32(a) | 500 | 455,728 | ||||||
4.10%, 04/15/33 | 1,000 | 895,155 | ||||||
|
| |||||||
| 33,843,226 | ||||||||
| Containers & Packaging — 0.4% | ||||||||
Amcor Finance USA, Inc. | ||||||||
3.63%, 04/28/26(a) | 350 | 329,729 | ||||||
4.50%, 05/15/28(a) | 250 | 233,992 | ||||||
5.63%, 05/26/33 | 220 | 204,897 | ||||||
Amcor Flexibles North America, Inc. | ||||||||
4.00%, 05/17/25 | 313 | 303,055 | ||||||
| 26 | 2 0 2 3 BLACK ROCK ANNUAL REPORT TO SHAREHOLDERS |
Schedule of Investments (continued) October 31, 2023 | iShares U.S. Intermediate Credit Bond Index Fund (Percentages shown are based on Net Assets) |
| Security | Par (000) | Value | ||||||
| Containers & Packaging (continued) | ||||||||
Amcor Flexibles North America, Inc. (continued) | ||||||||
2.63%, 06/19/30 | $ | 205 | $ | 161,808 | ||||
2.69%, 05/25/31 | 213 | 164,733 | ||||||
Avery Dennison Corp. | ||||||||
4.88%, 12/06/28 | 350 | 333,437 | ||||||
2.65%, 04/30/30 | 350 | 281,108 | ||||||
2.25%, 02/15/32 | 413 | 304,339 | ||||||
5.75%, 03/15/33 | 270 | 257,519 | ||||||
Berry Global, Inc. | ||||||||
1.57%, 01/15/26 | 829 | 748,976 | ||||||
1.65%, 01/15/27 | 413 | 355,887 | ||||||
5.50%, 04/15/28(d) | 350 | 334,939 | ||||||
Georgia-Pacific LLC, 8.88%, 05/15/31 | 433 | 504,280 | ||||||
Packaging Corp. of America | ||||||||
3.40%, 12/15/27 | 350 | 319,960 | ||||||
3.00%, 12/15/29(a) | 130 | 109,701 | ||||||
Sonoco Products Co. | ||||||||
1.80%, 02/01/25 | 159 | 150,486 | ||||||
2.25%, 02/01/27 | 88 | 77,562 | ||||||
3.13%, 05/01/30 | 227 | 187,900 | ||||||
2.85%, 02/01/32 | 179 | 139,047 | ||||||
Suzano Austria GmbH | ||||||||
2.50%, 09/15/28 | 250 | 207,063 | ||||||
6.00%, 01/15/29(a) | 878 | 842,924 | ||||||
5.00%, 01/15/30(a) | 400 | 359,900 | ||||||
3.75%, 01/15/31 | 809 | 652,135 | ||||||
3.13%, 01/15/32(a) | 400 | 300,625 | ||||||
WestRock MWV LLC, 8.20%, 01/15/30 | 26 | 28,177 | ||||||
WRKCo, Inc. | ||||||||
3.75%, 03/15/25 | 350 | 339,022 | ||||||
4.65%, 03/15/26 | 320 | 310,053 | ||||||
3.38%, 09/15/27 | 413 | 373,619 | ||||||
4.00%, 03/15/28 | 829 | 761,634 | ||||||
4.90%, 03/15/29(a) | 829 | 784,128 | ||||||
3.00%, 06/15/33(a) | 450 | 343,795 | ||||||
|
| |||||||
| 10,806,430 | ||||||||
| Distributors — 0.1% | ||||||||
Genuine Parts Co. | ||||||||
1.75%, 02/01/25 | 250 | 236,308 | ||||||
6.50%, 11/01/28(c) | 200 | 199,987 | ||||||
2.75%, 02/01/32(a) | 250 | 188,527 | ||||||
6.88%, 11/01/33(c) | 200 | 199,496 | ||||||
LKQ Corp. | ||||||||
5.75%, 06/15/28 | 400 | 387,639 | ||||||
6.25%, 06/15/33 | 350 | 326,842 | ||||||
|
| |||||||
| 1,538,799 | ||||||||
| Diversified — 0.0% | ||||||||
Parker-Hannifin Corp., 3.25%, 03/01/27 | 300 | 278,146 | ||||||
|
| |||||||
| Diversified Consumer Services — 0.0% | ||||||||
Johns Hopkins University, Series A, | 125 | 118,378 | ||||||
|
| |||||||
| Diversified REITs — 3.4% | ||||||||
Agree LP, 4.80%, 10/01/32 | 200 | 173,628 | ||||||
Alexandria Real Estate Equities, Inc. | ||||||||
3.45%, 04/30/25 | 450 | 432,857 | ||||||
4.30%, 01/15/26(a) | 620 | 597,245 | ||||||
3.95%, 01/15/27 | 413 | 386,043 | ||||||
4.90%, 12/15/30 | 450 | 410,128 | ||||||
3.38%, 08/15/31 | 679 | 550,960 | ||||||
2.00%, 05/18/32 | 600 | 422,212 | ||||||
| Security | Par (000) | Value | ||||||
| Diversified REITs (continued) | ||||||||
Alexandria Real Estate Equities, Inc. (continued) | ||||||||
1.88%, 02/01/33 | $ | 683 | $ | 465,366 | ||||
American Homes 4 Rent LP | ||||||||
4.25%, 02/15/28 | 200 | 184,019 | ||||||
4.90%, 02/15/29 | 129 | 120,038 | ||||||
2.38%, 07/15/31(a) | 200 | 148,669 | ||||||
3.63%, 04/15/32(a) | 300 | 242,276 | ||||||
American Tower Corp. | ||||||||
2.95%, 01/15/25 | 413 | 397,601 | ||||||
2.40%, 03/15/25 | 483 | 458,673 | ||||||
4.00%, 06/01/25 | 500 | 483,391 | ||||||
1.60%, 04/15/26 | 421 | 376,846 | ||||||
1.45%, 09/15/26 | 191 | 167,640 | ||||||
3.38%, 10/15/26 | 413 | 382,313 | ||||||
2.75%, 01/15/27 | 359 | 322,302 | ||||||
3.65%, 03/15/27 | 201 | 185,069 | ||||||
1.50%, 01/31/28 | 243 | 199,983 | ||||||
5.50%, 03/15/28 | 290 | 280,908 | ||||||
5.25%, 07/15/28 | 200 | 190,784 | ||||||
5.80%, 11/15/28 | 420 | 410,319 | ||||||
3.95%, 03/15/29 | 413 | 367,913 | ||||||
3.80%, 08/15/29 | 1,063 | 930,707 | ||||||
2.90%, 01/15/30 | 447 | 364,529 | ||||||
2.10%, 06/15/30 | 309 | 235,356 | ||||||
1.88%, 10/15/30 | 399 | 295,342 | ||||||
2.70%, 04/15/31 | 496 | 383,506 | ||||||
2.30%, 09/15/31 | 591 | 435,846 | ||||||
4.05%, 03/15/32(a) | 366 | 307,067 | ||||||
5.55%, 07/15/33 | 220 | 202,617 | ||||||
AvalonBay Communities, Inc. | ||||||||
3.45%, 06/01/25 | 26 | 25,070 | ||||||
3.20%, 01/15/28 | 159 | 143,871 | ||||||
1.90%, 12/01/28(a) | 496 | 414,561 | ||||||
3.30%, 06/01/29 | 191 | 166,822 | ||||||
2.30%, 03/01/30 | 450 | 361,365 | ||||||
2.45%, 01/15/31 | 691 | 546,124 | ||||||
2.05%, 01/15/32(a) | 625 | 471,717 | ||||||
5.00%, 02/15/33 | 75 | 69,683 | ||||||
Boston Properties LP | ||||||||
3.20%, 01/15/25 | 829 | 793,283 | ||||||
3.65%, 02/01/26 | 123 | 114,501 | ||||||
2.75%, 10/01/26 | 450 | 397,889 | ||||||
4.50%, 12/01/28 | 829 | 729,178 | ||||||
2.90%, 03/15/30 | 397 | 304,465 | ||||||
3.25%, 01/30/31 | 829 | 628,823 | ||||||
2.55%, 04/01/32 | 615 | 426,641 | ||||||
Brixmor Operating Partnership LP | ||||||||
3.85%, 02/01/25 | 300 | 288,950 | ||||||
4.13%, 06/15/26 | 163 | 153,388 | ||||||
4.13%, 05/15/29 | 286 | 250,434 | ||||||
4.05%, 07/01/30(a) | 400 | 341,503 | ||||||
2.50%, 08/16/31 | 495 | 363,980 | ||||||
Broadstone Net Lease LLC, 2.60%, 09/15/31 | 220 | 152,579 | ||||||
Camden Property Trust | ||||||||
3.15%, 07/01/29 | 400 | 347,976 | ||||||
2.80%, 05/15/30 | 293 | 242,314 | ||||||
Corporate Office Properties LP | ||||||||
2.00%, 01/15/29 | 130 | 98,772 | ||||||
2.75%, 04/15/31 | 179 | 131,197 | ||||||
Crown Castle, Inc. | ||||||||
4.45%, 02/15/26 | 350 | 337,174 | ||||||
3.70%, 06/15/26 | 209 | 196,449 | ||||||
SCHEDULE OF INVESTMENTS | 27 |
Schedule of Investments (continued) October 31, 2023 | iShares U.S. Intermediate Credit Bond Index Fund (Percentages shown are based on Net Assets) |
| Security | Par (000) | Value | ||||||
| Diversified REITs (continued) | ||||||||
Crown Castle, Inc. (continued) | ||||||||
1.05%, 07/15/26 | $ | 409 | $ | 357,575 | ||||
4.00%, 03/01/27 | 829 | 772,056 | ||||||
2.90%, 03/15/27 | 430 | 385,934 | ||||||
3.65%, 09/01/27 | 600 | 545,455 | ||||||
5.00%, 01/11/28 | 645 | 612,322 | ||||||
3.80%, 02/15/28 | 409 | 368,864 | ||||||
3.10%, 11/15/29 | 400 | 332,592 | ||||||
3.30%, 07/01/30 | 300 | 246,604 | ||||||
2.25%, 01/15/31 | 829 | 624,756 | ||||||
2.10%, 04/01/31(a) | 393 | 290,894 | ||||||
2.50%, 07/15/31 | 500 | 377,614 | ||||||
CubeSmart LP | ||||||||
2.25%, 12/15/28 | 207 | 171,002 | ||||||
3.00%, 02/15/30 | 93 | 76,084 | ||||||
2.00%, 02/15/31 | 413 | 305,523 | ||||||
2.50%, 02/15/32(a) | 350 | 259,482 | ||||||
Digital Realty Trust LP | ||||||||
3.70%, 08/15/27 | 829 | 757,564 | ||||||
5.55%, 01/15/28 | 685 | 664,067 | ||||||
4.45%, 07/15/28 | 350 | 323,613 | ||||||
3.60%, 07/01/29(a) | 620 | 537,975 | ||||||
EPR Properties | ||||||||
4.50%, 04/01/25(a) | 130 | 125,348 | ||||||
4.75%, 12/15/26 | 225 | 205,233 | ||||||
4.50%, 06/01/27 | 225 | 198,583 | ||||||
4.95%, 04/15/28 | 225 | 196,062 | ||||||
3.75%, 08/15/29 | 225 | 177,517 | ||||||
3.60%, 11/15/31 | 250 | 179,952 | ||||||
Equinix, Inc. | ||||||||
2.63%, 11/18/24 | 691 | 667,197 | ||||||
1.25%, 07/15/25 | 393 | 362,510 | ||||||
1.00%, 09/15/25 | 829 | 754,875 | ||||||
1.45%, 05/15/26 | 325 | 290,273 | ||||||
2.90%, 11/18/26 | 64 | 58,386 | ||||||
1.55%, 03/15/28 | 691 | 573,105 | ||||||
2.00%, 05/15/28 | 308 | 256,903 | ||||||
3.20%, 11/18/29 | 374 | 316,024 | ||||||
2.15%, 07/15/30 | 413 | 317,130 | ||||||
2.50%, 05/15/31 | 533 | 406,916 | ||||||
3.90%, 04/15/32 | 800 | 665,776 | ||||||
ERP Operating LP | ||||||||
3.25%, 08/01/27 | 413 | 375,574 | ||||||
3.50%, 03/01/28 | 179 | 162,392 | ||||||
3.00%, 07/01/29 | 607 | 521,190 | ||||||
2.50%, 02/15/30 | 333 | 270,495 | ||||||
1.85%, 08/01/31 | 229 | 170,249 | ||||||
Essex Portfolio LP | ||||||||
3.50%, 04/01/25 | 350 | 337,183 | ||||||
3.38%, 04/15/26 | 200 | 188,296 | ||||||
3.63%, 05/01/27 | 150 | 137,664 | ||||||
1.70%, 03/01/28(a) | 210 | 174,102 | ||||||
4.00%, 03/01/29 | 179 | 160,429 | ||||||
3.00%, 01/15/30 | 130 | 106,095 | ||||||
2.55%, 06/15/31 | 410 | 312,693 | ||||||
2.65%, 03/15/32(a) | 300 | 226,181 | ||||||
Extra Space Storage LP | ||||||||
5.70%, 04/01/28 | 50 | 48,724 | ||||||
4.00%, 06/15/29 | 129 | 114,839 | ||||||
5.50%, 07/01/30 | 540 | 510,776 | ||||||
2.20%, 10/15/30 | 61 | 46,539 | ||||||
2.55%, 06/01/31 | 413 | 313,340 | ||||||
2.40%, 10/15/31 | 355 | 265,462 | ||||||
| Security | Par (000) | Value | ||||||
| Diversified REITs (continued) | ||||||||
Extra Space Storage LP (continued) | ||||||||
2.35%, 03/15/32 | $ | 205 | $ | 150,248 | ||||
Federal Realty OP LP | ||||||||
3.25%, 07/15/27 | 413 | 372,742 | ||||||
5.38%, 05/01/28 | 160 | 154,224 | ||||||
3.50%, 06/01/30 | 660 | 551,066 | ||||||
GLP Capital LP/GLP Financing II, Inc. | ||||||||
5.30%, 01/15/29 | 829 | 757,220 | ||||||
4.00%, 01/15/30 | 311 | 259,544 | ||||||
4.00%, 01/15/31 | 400 | 325,316 | ||||||
3.25%, 01/15/32 | 450 | 340,360 | ||||||
Healthcare Realty Holdings LP | ||||||||
3.50%, 08/01/26 | 400 | 370,194 | ||||||
3.75%, 07/01/27 | 500 | 456,557 | ||||||
3.10%, 02/15/30 | 229 | 186,329 | ||||||
2.00%, 03/15/31 | 500 | 364,474 | ||||||
Healthpeak OP LLC | ||||||||
4.00%, 06/01/25 | 163 | 157,910 | ||||||
3.25%, 07/15/26 | 400 | 374,076 | ||||||
1.35%, 02/01/27 | 113 | 97,345 | ||||||
2.13%, 12/01/28 | 350 | 288,566 | ||||||
3.50%, 07/15/29 | 243 | 209,800 | ||||||
3.00%, 01/15/30 | 438 | 360,606 | ||||||
2.88%, 01/15/31 | 400 | 315,439 | ||||||
5.25%, 12/15/32 | 430 | 389,423 | ||||||
Highwoods Realty LP | ||||||||
4.13%, 03/15/28 | 163 | 140,531 | ||||||
3.05%, 02/15/30 | 413 | 309,584 | ||||||
Host Hotels & Resorts LP | ||||||||
Series E, 4.00%, 06/15/25 | 123 | 118,051 | ||||||
Series H, 3.38%, 12/15/29 | 629 | 518,307 | ||||||
Series I, 3.50%, 09/15/30 | 450 | 363,757 | ||||||
Series J, 2.90%, 12/15/31(a) | 329 | 245,588 | ||||||
Hudson Pacific Properties LP | ||||||||
3.95%, 11/01/27 | 300 | 230,462 | ||||||
4.65%, 04/01/29(a) | 179 | 127,820 | ||||||
Invitation Homes Operating Partnership LP | ||||||||
2.30%, 11/15/28 | 231 | 191,120 | ||||||
5.45%, 08/15/30 | 300 | 279,723 | ||||||
2.00%, 08/15/31 | 330 | 237,609 | ||||||
4.15%, 04/15/32(a) | 296 | 246,923 | ||||||
5.50%, 08/15/33(a) | 530 | 480,500 | ||||||
Kilroy Realty LP | ||||||||
4.25%, 08/15/29 | 160 | 133,103 | ||||||
3.05%, 02/15/30(a) | 179 | 137,515 | ||||||
2.50%, 11/15/32(a) | 308 | 203,791 | ||||||
Kimco Realty OP LLC | ||||||||
3.30%, 02/01/25 | 288 | 277,522 | ||||||
2.80%, 10/01/26 | 413 | 377,026 | ||||||
3.80%, 04/01/27 | 250 | 230,194 | ||||||
2.70%, 10/01/30 | 350 | 275,485 | ||||||
2.25%, 12/01/31 | 163 | 119,264 | ||||||
3.20%, 04/01/32(a) | 500 | 391,570 | ||||||
4.60%, 02/01/33(a) | 260 | 224,679 | ||||||
6.40%, 03/01/34 | 125 | 122,709 | ||||||
Kite Realty Group Trust, 4.75%, 09/15/30 | 200 | 173,665 | ||||||
Mid-America Apartments LP | ||||||||
4.00%, 11/15/25 | 250 | 240,935 | ||||||
1.10%, 09/15/26 | 198 | 174,126 | ||||||
3.60%, 06/01/27 | 413 | 383,776 | ||||||
3.95%, 03/15/29 | 413 | 375,781 | ||||||
2.75%, 03/15/30 | 163 | 133,932 | ||||||
1.70%, 02/15/31 | 126 | 93,937 | ||||||
| 28 | 2 0 2 3 BLACK ROCK ANNUAL REPORT TO SHAREHOLDERS |
Schedule of Investments (continued) October 31, 2023 | iShares U.S. Intermediate Credit Bond Index Fund (Percentages shown are based on Net Assets) |
| Security | Par (000) | Value | ||||||
| Diversified REITs (continued) | ||||||||
National Health Investors, Inc., 3.00%, 02/01/31 | $ | 200 | $ | 144,204 | ||||
Omega Healthcare Investors, Inc. | ||||||||
4.50%, 01/15/25 | 150 | 145,449 | ||||||
4.50%, 04/01/27 | 163 | 150,117 | ||||||
4.75%, 01/15/28 | 413 | 376,687 | ||||||
3.63%, 10/01/29 | 496 | 404,078 | ||||||
3.38%, 02/01/31 | 300 | 230,637 | ||||||
3.25%, 04/15/33(a) | 400 | 285,095 | ||||||
Phillips Edison Grocery Center Operating Partnership I LP, 2.63%, 11/15/31 | 95 | 68,235 | ||||||
Physicians Realty LP, 2.63%, 11/01/31 | 413 | 303,350 | ||||||
Piedmont Operating Partnership LP, | 413 | 287,708 | ||||||
Prologis LP | ||||||||
3.25%, 06/30/26 | 413 | 388,284 | ||||||
2.13%, 04/15/27 | 350 | 310,490 | ||||||
4.88%, 06/15/28 | 185 | 177,956 | ||||||
3.88%, 09/15/28 | 250 | 229,380 | ||||||
4.00%, 09/15/28 | 200 | 183,808 | ||||||
2.88%, 11/15/29 | 447 | 376,457 | ||||||
2.25%, 04/15/30 | 427 | 341,336 | ||||||
1.75%, 07/01/30 | 243 | 185,254 | ||||||
1.25%, 10/15/30 | 300 | 219,410 | ||||||
1.75%, 02/01/31 | 191 | 142,819 | ||||||
2.25%, 01/15/32 | 210 | 158,077 | ||||||
4.63%, 01/15/33(a) | 465 | 416,615 | ||||||
4.75%, 06/15/33 | 505 | 452,203 | ||||||
Public Storage | ||||||||
1.50%, 11/09/26 | 657 | 585,961 | ||||||
1.85%, 05/01/28 | 198 | 167,672 | ||||||
1.95%, 11/09/28 | 642 | 537,800 | ||||||
2.30%, 05/01/31 | 219 | 169,988 | ||||||
2.25%, 11/09/31 | 408 | 311,164 | ||||||
Rayonier LP, 2.75%, 05/17/31 | 241 | 184,104 | ||||||
Realty Income Corp., 3.25%, 01/15/31 | 554 | 453,957 | ||||||
Regency Centers LP | ||||||||
3.60%, 02/01/27 | 350 | 325,578 | ||||||
2.95%, 09/15/29 | 179 | 149,549 | ||||||
3.70%, 06/15/30 | 413 | 350,700 | ||||||
Rexford Industrial Realty LP | ||||||||
5.00%, 06/15/28 | 120 | 113,407 | ||||||
2.13%, 12/01/30 | 329 | 244,943 | ||||||
2.15%, 09/01/31 | 366 | 265,200 | ||||||
Sabra Health Care LP | ||||||||
5.13%, 08/15/26 | 350 | 331,876 | ||||||
3.90%, 10/15/29(a) | 129 | 106,215 | ||||||
3.20%, 12/01/31 | 413 | 303,104 | ||||||
Safehold GL Holdings LLC, 2.80%, 06/15/31(a) | 129 | 95,072 | ||||||
Simon Property Group LP | ||||||||
3.50%, 09/01/25 | 500 | 478,995 | ||||||
3.30%, 01/15/26 | 293 | 277,087 | ||||||
3.25%, 11/30/26 | 450 | 416,227 | ||||||
1.38%, 01/15/27 | 279 | 241,978 | ||||||
3.38%, 06/15/27 | 620 | 567,218 | ||||||
3.38%, 12/01/27(a) | 450 | 407,581 | ||||||
1.75%, 02/01/28 | 450 | 377,758 | ||||||
2.45%, 09/13/29 | 413 | 337,158 | ||||||
2.65%, 07/15/30 | 829 | 668,332 | ||||||
2.25%, 01/15/32 | 579 | 424,575 | ||||||
2.65%, 02/01/32(a) | 229 | 174,177 | ||||||
5.50%, 03/08/33(a) | 500 | 464,641 | ||||||
| Security | Par (000) | Value | ||||||
| Diversified REITs (continued) | ||||||||
SITE Centers Corp. | ||||||||
3.63%, 02/01/25 | $ | 350 | $ | 335,978 | ||||
4.25%, 02/01/26 | 163 | 152,486 | ||||||
4.70%, 06/01/27 | 350 | 322,296 | ||||||
Spirit Realty LP | ||||||||
3.20%, 01/15/27 | 79 | 71,499 | ||||||
4.00%, 07/15/29 | 350 | 305,120 | ||||||
3.40%, 01/15/30 | 413 | 339,989 | ||||||
3.20%, 02/15/31 | 350 | 275,562 | ||||||
STORE Capital Corp. | ||||||||
4.50%, 03/15/28(a) | 300 | 258,837 | ||||||
2.70%, 12/01/31 | 413 | 276,817 | ||||||
Sun Communities Operating LP | ||||||||
2.30%, 11/01/28 | 231 | 189,609 | ||||||
2.70%, 07/15/31 | 307 | 229,123 | ||||||
4.20%, 04/15/32(a) | 201 | 165,906 | ||||||
5.70%, 01/15/33 | 250 | 228,121 | ||||||
Tanger Properties LP | ||||||||
3.88%, 07/15/27 | 79 | 69,277 | ||||||
2.75%, 09/01/31 | 200 | 141,484 | ||||||
UDR, Inc. | ||||||||
4.40%, 01/26/29 | 129 | 117,595 | ||||||
3.20%, 01/15/30 | 413 | 347,125 | ||||||
3.00%, 08/15/31 | 413 | 327,114 | ||||||
1.90%, 03/15/33 | 350 | 238,346 | ||||||
2.10%, 06/15/33 | 300 | 206,162 | ||||||
Ventas Realty LP | ||||||||
2.65%, 01/15/25(a) | 538 | 514,606 | ||||||
4.13%, 01/15/26 | 186 | 177,747 | ||||||
3.25%, 10/15/26 | 413 | 379,007 | ||||||
4.00%, 03/01/28 | 243 | 221,216 | ||||||
4.40%, 01/15/29 | 500 | 457,224 | ||||||
3.00%, 01/15/30 | 229 | 187,040 | ||||||
4.75%, 11/15/30(a) | 179 | 160,064 | ||||||
2.50%, 09/01/31 | 579 | 435,497 | ||||||
VICI Properties LP | ||||||||
4.38%, 05/15/25 | 64 | 61,924 | ||||||
4.75%, 02/15/28 | 558 | 513,862 | ||||||
4.95%, 02/15/30(a) | 500 | 445,740 | ||||||
Vornado Realty LP | ||||||||
3.50%, 01/15/25 | 163 | 154,097 | ||||||
2.15%, 06/01/26 | 200 | 168,502 | ||||||
Welltower OP LLC | ||||||||
4.00%, 06/01/25 | 1,036 | 1,001,370 | ||||||
4.25%, 04/01/26 | 288 | 275,902 | ||||||
4.25%, 04/15/28 | 400 | 368,825 | ||||||
2.05%, 01/15/29 | 162 | 131,949 | ||||||
4.13%, 03/15/29 | 229 | 206,712 | ||||||
3.10%, 01/15/30 | 829 | 688,328 | ||||||
2.75%, 01/15/31 | 209 | 164,068 | ||||||
2.80%, 06/01/31 | 282 | 220,806 | ||||||
2.75%, 01/15/32 | 413 | 314,930 | ||||||
3.85%, 06/15/32(a) | 231 | 191,695 | ||||||
Weyerhaeuser Co. | ||||||||
4.00%, 11/15/29 | 829 | 734,875 | ||||||
4.00%, 04/15/30 | 500 | 437,219 | ||||||
7.38%, 03/15/32 | 145 | 152,964 | ||||||
3.38%, 03/09/33 | 250 | 198,391 | ||||||
SCHEDULE OF INVESTMENTS | 29 |
Schedule of Investments (continued) October 31, 2023 | iShares U.S. Intermediate Credit Bond Index Fund (Percentages shown are based on Net Assets) |
| Security | Par (000) | Value | ||||||
| Diversified REITs (continued) | ||||||||
WP Carey, Inc. | ||||||||
3.85%, 07/15/29 | $ | 393 | $ | 343,079 | ||||
2.45%, 02/01/32 | 572 | 420,650 | ||||||
|
| |||||||
| 82,091,676 | ||||||||
| Diversified Telecommunication Services — 1.6% | ||||||||
AT&T, Inc. | ||||||||
5.54%, 02/20/26 | 700 | 694,368 | ||||||
1.70%, 03/25/26 | 2,654 | 2,408,931 | ||||||
3.80%, 02/15/27 | 450 | 419,989 | ||||||
4.25%, 03/01/27 | 2,000 | 1,898,020 | ||||||
2.30%, 06/01/27 | 900 | 795,137 | ||||||
1.65%, 02/01/28 | 1,150 | 961,428 | ||||||
4.10%, 02/15/28 | 650 | 601,545 | ||||||
4.35%, 03/01/29 | 1,450 | 1,334,850 | ||||||
4.30%, 02/15/30 | 1,500 | 1,345,221 | ||||||
2.75%, 06/01/31 | 1,159 | 911,746 | ||||||
2.25%, 02/01/32 | 1,400 | 1,034,584 | ||||||
British Telecommunications PLC | ||||||||
5.13%, 12/04/28 | 478 | 453,947 | ||||||
9.63%, 12/15/30 | 1,476 | 1,702,142 | ||||||
Deutsche Telekom International Finance BV, 8.75%, 06/15/30 | 2,149 | 2,407,825 | ||||||
Koninklijke KPN NV, 8.38%, 10/01/30 | 350 | 383,010 | ||||||
KT Corp., 4.00%, 08/08/25(d) | 400 | 388,106 | ||||||
Sprint Capital Corp. | ||||||||
6.88%, 11/15/28 | 1,000 | 1,025,576 | ||||||
8.75%, 03/15/32 | 1,000 | 1,125,646 | ||||||
Telefonica Emisiones SA, 4.10%, 03/08/27(a) | 655 | 613,077 | ||||||
Telefonica Europe BV, 8.25%, 09/15/30 | 525 | 570,834 | ||||||
Verizon Communications, Inc. | ||||||||
3.50%, 11/01/24 | 613 | 599,105 | ||||||
3.38%, 02/15/25 | 539 | 522,645 | ||||||
0.85%, 11/20/25 | 551 | 499,087 | ||||||
1.45%, 03/20/26 | 583 | 527,360 | ||||||
2.63%, 08/15/26 | 745 | 685,918 | ||||||
4.13%, 03/16/27 | 1,331 | 1,260,783 | ||||||
3.00%, 03/22/27 | 700 | 639,392 | ||||||
2.10%, 03/22/28 | 1,170 | 998,008 | ||||||
4.33%, 09/21/28(a) | 2,545 | 2,369,590 | ||||||
3.88%, 02/08/29 | 409 | 371,324 | ||||||
4.02%, 12/03/29 | 2,589 | 2,312,153 | ||||||
3.15%, 03/22/30 | 829 | 695,472 | ||||||
1.50%, 09/18/30 | 450 | 336,466 | ||||||
1.68%, 10/30/30 | 459 | 342,268 | ||||||
1.75%, 01/20/31 | 889 | 657,343 | ||||||
2.55%, 03/21/31(a) | 2,121 | 1,657,059 | ||||||
2.36%, 03/15/32 | 3,006 | 2,247,738 | ||||||
5.05%, 05/09/33(a) | 1,245 | 1,139,520 | ||||||
|
| |||||||
| 38,937,213 | ||||||||
| Education — 0.0% | ||||||||
Emory University, Series 2020, | 250 | 200,847 | ||||||
Yale University, Series 2020, | 98 | 77,057 | ||||||
|
| |||||||
| 277,904 | ||||||||
| Electric Utilities — 4.9% | ||||||||
AEP Texas, Inc. | ||||||||
3.95%, 06/01/28 | 413 | 379,018 | ||||||
4.70%, 05/15/32 | 130 | 115,386 | ||||||
5.40%, 06/01/33 | 445 | 413,049 | ||||||
Series I, 2.10%, 07/01/30 | 600 | 464,210 | ||||||
AEP Transmission Co. LLC, 3.10%, 12/01/26 | 413 | 384,339 | ||||||
| Security | Par (000) | Value | ||||||
| Electric Utilities (continued) | ||||||||
AES Corp. | ||||||||
1.38%, 01/15/26 | $ | 829 | $ | 736,807 | ||||
5.45%, 06/01/28 | 320 | 305,587 | ||||||
2.45%, 01/15/31 | 413 | 310,338 | ||||||
Alabama Power Co. | ||||||||
3.75%, 09/01/27 | 300 | 281,703 | ||||||
3.05%, 03/15/32 | 600 | 487,060 | ||||||
3.94%, 09/01/32(a) | 300 | 258,673 | ||||||
Series 20-A, 1.45%, 09/15/30 | 179 | 133,921 | ||||||
Allegion U.S. Holding Co., Inc., | 500 | 457,008 | ||||||
Ameren Corp. | ||||||||
1.95%, 03/15/27 | 637 | 563,802 | ||||||
3.50%, 01/15/31 | 829 | 694,942 | ||||||
Ameren Illinois Co. | ||||||||
3.85%, 09/01/32 | 200 | 170,358 | ||||||
4.95%, 06/01/33 | 250 | 230,254 | ||||||
American Electric Power Co., Inc. | ||||||||
5.70%, 08/15/25 | 450 | 446,303 | ||||||
5.75%, 11/01/27 | 400 | 397,414 | ||||||
2.30%, 03/01/30 | 225 | 176,804 | ||||||
5.95%, 11/01/32(a) | 200 | 193,254 | ||||||
5.63%, 03/01/33 | 678 | 636,387 | ||||||
Series J, 4.30%, 12/01/28 | 413 | 384,058 | ||||||
Series N, 1.00%, 11/01/25 | 413 | 374,768 | ||||||
Appalachian Power Co. | ||||||||
Series AA, 2.70%, 04/01/31 | 250 | 196,856 | ||||||
Series BB, 4.50%, 08/01/32 | 200 | 174,583 | ||||||
Arizona Public Service Co. | ||||||||
3.15%, 05/15/25 | 163 | 156,353 | ||||||
2.60%, 08/15/29 | 413 | 350,141 | ||||||
2.20%, 12/15/31 | 129 | 95,364 | ||||||
6.35%, 12/15/32 | 300 | 299,109 | ||||||
5.55%, 08/01/33 | 175 | 164,401 | ||||||
Avangrid, Inc. | ||||||||
3.20%, 04/15/25 | 300 | 287,114 | ||||||
3.80%, 06/01/29 | 400 | 351,581 | ||||||
Baltimore Gas and Electric Co. | ||||||||
2.40%, 08/15/26 | 129 | 118,627 | ||||||
2.25%, 06/15/31 | 239 | 185,959 | ||||||
Berkshire Hathaway Energy Co. | ||||||||
3.50%, 02/01/25 | 28 | 27,220 | ||||||
4.05%, 04/15/25 | 1,009 | 985,516 | ||||||
3.25%, 04/15/28 | 413 | 370,339 | ||||||
3.70%, 07/15/30 | 413 | 359,303 | ||||||
1.65%, 05/15/31(a) | 699 | 509,876 | ||||||
Black Hills Corp. | ||||||||
3.95%, 01/15/26 | 130 | 124,004 | ||||||
5.95%, 03/15/28(a) | 200 | 197,608 | ||||||
3.05%, 10/15/29 | 342 | 283,255 | ||||||
4.35%, 05/01/33 | 220 | 182,523 | ||||||
CenterPoint Energy Houston Electric LLC | ||||||||
5.20%, 10/01/28 | 105 | 102,659 | ||||||
4.95%, 04/01/33 | 560 | 517,168 | ||||||
Series AI, 4.45%, 10/01/32 | 100 | 89,432 | ||||||
CenterPoint Energy, Inc. | ||||||||
1.45%, 06/01/26 | 156 | 140,086 | ||||||
2.95%, 03/01/30 | 129 | 105,935 | ||||||
2.65%, 06/01/31 | 670 | 522,431 | ||||||
Cleco Corporate Holdings LLC, | 413 | 386,528 | ||||||
CMS Energy Corp. | ||||||||
3.45%, 08/15/27 | 129 | 118,067 | ||||||
(5-year CMT + 4.12%), 4.75%, 06/01/50(b) | 300 | 248,779 | ||||||
| 30 | 2 0 2 3 BLACK ROCK ANNUAL REPORT TO SHAREHOLDERS |
Schedule of Investments (continued) October 31, 2023 | iShares U.S. Intermediate Credit Bond Index Fund (Percentages shown are based on Net Assets) |
| Security | Par (000) | Value | ||||||
| Electric Utilities (continued) | ||||||||
Commonwealth Edison Co. | ||||||||
2.55%, 06/15/26 | $ | 163 | $ | 151,544 | ||||
3.70%, 08/15/28 | 413 | 379,216 | ||||||
4.90%, 02/01/33(a) | 120 | 111,268 | ||||||
Connecticut Light and Power Co. | ||||||||
4.90%, 07/01/33 | 150 | 138,092 | ||||||
Series A, 3.20%, 03/15/27 | 413 | 381,796 | ||||||
Series A, 2.05%, 07/01/31 | 660 | 503,255 | ||||||
Consolidated Edison Co. of New York, Inc. | ||||||||
3.80%, 05/15/28(a) | 413 | 381,667 | ||||||
2.40%, 06/15/31(a) | 829 | 651,539 | ||||||
5.20%, 03/01/33(a) | 200 | 188,029 | ||||||
Series 20A, 3.35%, 04/01/30 | 193 | 166,082 | ||||||
Series D, 4.00%, 12/01/28 | 413 | 381,323 | ||||||
Constellation Energy Generation LLC | ||||||||
3.25%, 06/01/25 | 350 | 334,921 | ||||||
5.60%, 03/01/28 | 200 | 196,341 | ||||||
5.80%, 03/01/33 | 200 | 189,680 | ||||||
6.13%, 01/15/34 | 175 | 169,158 | ||||||
Consumers Energy Co. | ||||||||
4.65%, 03/01/28(a) | 250 | 241,081 | ||||||
4.90%, 02/15/29 | 290 | 280,210 | ||||||
3.60%, 08/15/32 | 255 | 214,584 | ||||||
4.63%, 05/15/33 | 350 | 316,965 | ||||||
Dominion Energy South Carolina, Inc. | ||||||||
5.30%, 05/15/33 | 200 | 188,822 | ||||||
Series A, 2.30%, 12/01/31 | 130 | 99,192 | ||||||
Dominion Energy, Inc. | ||||||||
3.90%, 10/01/25 | 259 | 249,697 | ||||||
4.25%, 06/01/28 | 250 | 233,236 | ||||||
5.38%, 11/15/32 | 500 | 462,995 | ||||||
Series A, 1.45%, 04/15/26 | 130 | 116,904 | ||||||
Series A, 4.35%, 08/15/32 | 500 | 432,634 | ||||||
Series C, 3.38%, 04/01/30 | 1,093 | 919,170 | ||||||
Series C, 2.25%, 08/15/31 | 388 | 289,333 | ||||||
Series F, 5.25%, 08/01/33 | 300 | 273,468 | ||||||
DTE Electric Co. | ||||||||
5.20%, 04/01/33 | 300 | 282,629 | ||||||
Series A, 1.90%, 04/01/28 | 413 | 354,289 | ||||||
Series A, 3.00%, 03/01/32 | 279 | 224,654 | ||||||
Series C, 2.63%, 03/01/31 | 300 | 241,752 | ||||||
DTE Energy Co. | ||||||||
4.22%, 11/01/24(e) | 200 | 196,098 | ||||||
4.88%, 06/01/28 | 500 | 475,591 | ||||||
2.95%, 03/01/30 | 79 | 64,770 | ||||||
Series C, 3.40%, 06/15/29 | 581 | 504,070 | ||||||
Series F, 1.05%, 06/01/25 | 741 | 684,529 | ||||||
Duke Energy Carolinas LLC | ||||||||
3.95%, 11/15/28 | 450 | 416,212 | ||||||
2.45%, 08/15/29 | 400 | 333,981 | ||||||
2.45%, 02/01/30 | 329 | 269,918 | ||||||
2.55%, 04/15/31 | 225 | 179,915 | ||||||
2.85%, 03/15/32 | 458 | 363,781 | ||||||
4.95%, 01/15/33 | 1,335 | 1,232,945 | ||||||
Series A, 6.00%, 12/01/28(a) | 413 | 419,465 | ||||||
Duke Energy Corp. | ||||||||
0.90%, 09/15/25 | 222 | 202,440 | ||||||
5.00%, 12/08/25 | 65 | 63,954 | ||||||
2.65%, 09/01/26 | 863 | 790,885 | ||||||
3.15%, 08/15/27 | 413 | 373,996 | ||||||
5.00%, 12/08/27 | 210 | 202,919 | ||||||
4.30%, 03/15/28 | 180 | 168,928 | ||||||
2.45%, 06/01/30 | 306 | 243,853 | ||||||
| Security | Par (000) | Value | ||||||
| Electric Utilities (continued) | ||||||||
Duke Energy Corp. (continued) | ||||||||
2.55%, 06/15/31 | $ | 829 | $ | 639,083 | ||||
4.50%, 08/15/32 | 200 | 174,693 | ||||||
5.75%, 09/15/33(a) | 375 | 356,200 | ||||||
(5-year CMT + 2.32%), 3.25%, 01/15/82(b) | 516 | 370,703 | ||||||
Duke Energy Florida LLC | ||||||||
3.20%, 01/15/27 | 400 | 372,571 | ||||||
2.50%, 12/01/29 | 286 | 238,049 | ||||||
1.75%, 06/15/30 | 388 | 298,546 | ||||||
2.40%, 12/15/31 | 679 | 522,213 | ||||||
Duke Energy Ohio, Inc., 5.25%, 04/01/33 | 130 | 122,155 | ||||||
Duke Energy Progress LLC | ||||||||
3.70%, 09/01/28 | 300 | 274,951 | ||||||
3.45%, 03/15/29 | 413 | 369,596 | ||||||
2.00%, 08/15/31 | 426 | 320,293 | ||||||
3.40%, 04/01/32 | 313 | 258,661 | ||||||
5.25%, 03/15/33 | 120 | 113,092 | ||||||
Edison International | ||||||||
3.55%, 11/15/24 | 113 | 109,779 | ||||||
4.70%, 08/15/25 | 300 | 291,477 | ||||||
5.75%, 06/15/27 | 201 | 197,587 | ||||||
4.13%, 03/15/28 | 179 | 162,824 | ||||||
5.25%, 11/15/28 | 130 | 123,348 | ||||||
6.95%, 11/15/29 | 245 | 249,074 | ||||||
Emera U.S. Finance LP | ||||||||
3.55%, 06/15/26 | 240 | 224,926 | ||||||
2.64%, 06/15/31(a) | 145 | 109,615 | ||||||
Enel Chile SA, 4.88%, 06/12/28 | 400 | 371,710 | ||||||
Entergy Arkansas LLC | ||||||||
3.50%, 04/01/26 | 350 | 332,634 | ||||||
5.15%, 01/15/33 | 300 | 279,243 | ||||||
5.30%, 09/15/33 | 200 | 186,851 | ||||||
Entergy Corp. | ||||||||
0.90%, 09/15/25 | 549 | 499,640 | ||||||
2.95%, 09/01/26 | 829 | 764,737 | ||||||
1.90%, 06/15/28 | 329 | 275,014 | ||||||
2.80%, 06/15/30 | 231 | 187,514 | ||||||
2.40%, 06/15/31 | 496 | 376,868 | ||||||
Entergy Louisiana LLC | ||||||||
5.59%, 10/01/24 | 500 | 498,849 | ||||||
5.40%, 11/01/24 | 139 | 138,479 | ||||||
1.60%, 12/15/30 | 243 | 178,876 | ||||||
2.35%, 06/15/32 | 250 | 187,122 | ||||||
4.00%, 03/15/33 | 600 | 504,098 | ||||||
Entergy Mississippi LLC | ||||||||
2.85%, 06/01/28 | 413 | 364,282 | ||||||
5.00%, 09/01/33 | 40 | 36,602 | ||||||
Entergy Texas, Inc., 1.75%, 03/15/31 | 350 | 258,762 | ||||||
Evergy Kansas Central, Inc., 2.55%, 07/01/26 | 288 | 266,208 | ||||||
Evergy Metro, Inc. | ||||||||
3.65%, 08/15/25 | 97 | 93,166 | ||||||
4.95%, 04/15/33 | 115 | 104,976 | ||||||
Evergy, Inc., 2.90%, 09/15/29 | 413 | 346,828 | ||||||
Eversource Energy | ||||||||
4.75%, 05/15/26 | 70 | 68,061 | ||||||
2.90%, 03/01/27 | 313 | 283,617 | ||||||
4.60%, 07/01/27 | 400 | 380,928 | ||||||
5.45%, 03/01/28 | 765 | 746,808 | ||||||
2.55%, 03/15/31 | 413 | 320,023 | ||||||
3.38%, 03/01/32 | 313 | 251,669 | ||||||
5.13%, 05/15/33 | 400 | 361,551 | ||||||
Series H, 3.15%, 01/15/25 | 59 | 57,058 | ||||||
Series M, 3.30%, 01/15/28(a) | 143 | 128,867 | ||||||
SCHEDULE OF INVESTMENTS | 31 |
Schedule of Investments (continued) October 31, 2023 | iShares U.S. Intermediate Credit Bond Index Fund (Percentages shown are based on Net Assets) |
| Security | Par (000) | Value | ||||||
| Electric Utilities (continued) | ||||||||
Eversource Energy (continued) | ||||||||
Series O, 4.25%, 04/01/29 | $ | 193 | $ | 177,144 | ||||
Series Q, 0.80%, 08/15/25 | 660 | 602,752 | ||||||
Series R, 1.65%, 08/15/30(a) | 400 | 299,445 | ||||||
Series U, 1.40%, 08/15/26 | 413 | 365,864 | ||||||
Exelon Corp. | ||||||||
3.95%, 06/15/25 | 620 | 599,751 | ||||||
3.40%, 04/15/26 | 620 | 587,824 | ||||||
5.15%, 03/15/28 | 550 | 533,539 | ||||||
4.05%, 04/15/30 | 829 | 732,289 | ||||||
3.35%, 03/15/32 | 650 | 525,538 | ||||||
5.30%, 03/15/33 | 300 | 278,311 | ||||||
Series WI, 2.75%, 03/15/27 | 347 | 313,927 | ||||||
Florida Power & Light Co. | ||||||||
2.85%, 04/01/25 | 557 | 535,734 | ||||||
3.13%, 12/01/25(a) | 413 | 393,705 | ||||||
4.45%, 05/15/26 | 115 | 112,496 | ||||||
5.05%, 04/01/28 | 1,305 | 1,276,826 | ||||||
4.40%, 05/15/28 | 470 | 447,187 | ||||||
4.63%, 05/15/30 | 180 | 168,231 | ||||||
2.45%, 02/03/32 | 919 | 716,666 | ||||||
5.10%, 04/01/33 | 290 | 271,611 | ||||||
4.80%, 05/15/33(a) | 315 | 288,706 | ||||||
Fortis, Inc., 3.06%, 10/04/26 | 829 | 760,430 | ||||||
Georgia Power Co. | ||||||||
3.25%, 03/30/27 | 250 | 229,798 | ||||||
4.65%, 05/16/28 | 400 | 382,126 | ||||||
4.70%, 05/15/32 | 430 | 389,297 | ||||||
4.95%, 05/17/33 | 400 | 365,104 | ||||||
Series B, 2.65%, 09/15/29 | 229 | 192,299 | ||||||
Interstate Power and Light Co. | ||||||||
3.25%, 12/01/24 | 163 | 158,335 | ||||||
4.10%, 09/26/28 | 225 | 208,410 | ||||||
2.30%, 06/01/30 | 400 | 314,500 | ||||||
5.70%, 10/15/33 | 150 | 143,414 | ||||||
IPALCO Enterprises, Inc., 4.25%, 05/01/30 | 179 | 154,147 | ||||||
ITC Holdings Corp. | ||||||||
3.25%, 06/30/26 | 129 | 120,994 | ||||||
3.35%, 11/15/27(a) | 350 | 317,811 | ||||||
Kentucky Utilities Co., 5.45%, 04/15/33 | 175 | 166,793 | ||||||
Louisville Gas and Electric Co., | 95 | 90,791 | ||||||
MidAmerican Energy Co. | ||||||||
3.65%, 04/15/29 | 763 | 687,923 | ||||||
5.35%, 01/15/34(a) | 175 | 168,238 | ||||||
Mississippi Power Co., 3.95%, 03/30/28 | 300 | 277,013 | ||||||
National Grid PLC | ||||||||
5.60%, 06/12/28 | 500 | 488,149 | ||||||
5.81%, 06/12/33(a) | 550 | 518,476 | ||||||
National Rural Utilities Cooperative Finance Corp. |
| |||||||
2.85%, 01/27/25 | 163 | 157,442 | ||||||
1.88%, 02/07/25 | 413 | 392,988 | ||||||
3.45%, 06/15/25 | 130 | 125,340 | ||||||
5.45%, 10/30/25 | 100 | 99,846 | ||||||
4.45%, 03/13/26 | 100 | 97,464 | ||||||
1.00%, 06/15/26 | 600 | 532,806 | ||||||
3.40%, 02/07/28 | 259 | 235,994 | ||||||
4.80%, 03/15/28 | 215 | 208,037 | ||||||
2.40%, 03/15/30 | 686 | 552,256 | ||||||
1.35%, 03/15/31 | 200 | 143,174 | ||||||
2.75%, 04/15/32 | 413 | 322,167 | ||||||
4.02%, 11/01/32 | 600 | 512,681 | ||||||
4.15%, 12/15/32 | 200 | 172,411 | ||||||
5.80%, 01/15/33 | 175 | 169,260 | ||||||
| Security | Par (000) | Value | ||||||
| Electric Utilities (continued) | ||||||||
Nevada Power Co., Series DD, | $ | 329 | $ | 264,094 | ||||
NextEra Energy Capital Holdings, Inc. | ||||||||
6.05%, 03/01/25 | 1,180 | 1,179,324 | ||||||
4.45%, 06/20/25 | 300 | 292,507 | ||||||
1.88%, 01/15/27 | 736 | 646,428 | ||||||
3.55%, 05/01/27 | 829 | 762,733 | ||||||
4.63%, 07/15/27 | 1,000 | 952,957 | ||||||
4.90%, 02/28/28 | 500 | 477,827 | ||||||
1.90%, 06/15/28 | 566 | 472,364 | ||||||
3.50%, 04/01/29 | 1,000 | 881,081 | ||||||
2.75%, 11/01/29 | 609 | 505,205 | ||||||
5.00%, 02/28/30 | 500 | 467,023 | ||||||
2.25%, 06/01/30 | 1,058 | 824,429 | ||||||
2.44%, 01/15/32 | 849 | 636,502 | ||||||
5.00%, 07/15/32 | 670 | 608,848 | ||||||
5.05%, 02/28/33(a) | 500 | 453,828 | ||||||
Northern States Power Co., | 100 | 78,486 | ||||||
Ohio Power Co. | ||||||||
5.00%, 06/01/33(a) | 70 | 63,716 | ||||||
Series Q, 1.63%, 01/15/31 | 359 | 266,442 | ||||||
Oklahoma Gas and Electric Co. | ||||||||
3.25%, 04/01/30 | 79 | 66,702 | ||||||
5.40%, 01/15/33 | 200 | 188,838 | ||||||
Oncor Electric Delivery Co. LLC | ||||||||
0.55%, 10/01/25 | 480 | 436,139 | ||||||
3.70%, 11/15/28 | 293 | 268,228 | ||||||
2.75%, 05/15/30 | 829 | 684,711 | ||||||
7.00%, 05/01/32 | 800 | 844,543 | ||||||
4.55%, 09/15/32 | 145 | 129,393 | ||||||
Pacific Gas and Electric Co. | ||||||||
4.95%, 06/08/25 | 500 | 488,336 | ||||||
3.45%, 07/01/25(a) | 800 | 758,490 | ||||||
3.15%, 01/01/26 | 1,109 | 1,026,537 | ||||||
5.45%, 06/15/27 | 500 | 477,739 | ||||||
2.10%, 08/01/27(a) | 483 | 408,972 | ||||||
3.30%, 12/01/27 | 655 | 570,425 | ||||||
3.00%, 06/15/28 | 516 | 436,711 | ||||||
3.75%, 07/01/28 | 550 | 482,292 | ||||||
6.10%, 01/15/29 | 165 | 158,753 | ||||||
4.20%, 03/01/29 | 620 | 540,160 | ||||||
4.55%, 07/01/30 | 1,659 | 1,435,873 | ||||||
2.50%, 02/01/31 | 1,243 | 921,455 | ||||||
3.25%, 06/01/31 | 550 | 426,971 | ||||||
4.40%, 03/01/32 | 143 | 117,503 | ||||||
5.90%, 06/15/32 | 350 | 319,226 | ||||||
6.15%, 01/15/33 | 170 | 156,461 | ||||||
6.40%, 06/15/33 | 590 | 553,681 | ||||||
PacifiCorp, 7.70%, 11/15/31(a) | 400 | 439,927 | ||||||
PECO Energy Co., 4.90%, 06/15/33(a) | 264 | 244,268 | ||||||
PPL Capital Funding, Inc., 3.10%, 05/15/26 | 400 | 373,905 | ||||||
PPL Electric Utilities Corp., 5.00%, 05/15/33 | 500 | 463,727 | ||||||
Public Service Co. of Colorado | ||||||||
3.70%, 06/15/28 | 129 | 117,796 | ||||||
1.88%, 06/15/31 | 450 | 337,644 | ||||||
Series 35, 1.90%, 01/15/31 | 160 | 121,408 | ||||||
Series 38, 4.10%, 06/01/32 | 150 | 129,780 | ||||||
Public Service Co. of New Hampshire, 5.35%, 10/01/33 | 200 | 190,761 | ||||||
Public Service Co. of Oklahoma | ||||||||
5.25%, 01/15/33 | 200 | 184,109 | ||||||
Series J, 2.20%, 08/15/31 | 413 | 310,581 | ||||||
Public Service Electric and Gas Co. | ||||||||
3.20%, 05/15/29 | 413 | 363,703 | ||||||
| 32 | 2 0 2 3 BLACK ROCK ANNUAL REPORT TO SHAREHOLDERS |
Schedule of Investments (continued) October 31, 2023 | iShares U.S. Intermediate Credit Bond Index Fund (Percentages shown are based on Net Assets) |
| Security | Par (000) | Value | ||||||
| Electric Utilities (continued) | ||||||||
Public Service Electric and Gas Co. (continued) |
| |||||||
2.45%, 01/15/30 | $ | 329 | $ | 270,335 | ||||
1.90%, 08/15/31 | 679 | 513,144 | ||||||
3.10%, 03/15/32 | 400 | 327,424 | ||||||
4.90%, 12/15/32 | 480 | 445,851 | ||||||
4.65%, 03/15/33 | 135 | 122,993 | ||||||
Public Service Enterprise Group, Inc. | ||||||||
0.80%, 08/15/25 | 209 | 191,168 | ||||||
5.85%, 11/15/27 | 400 | 397,877 | ||||||
2.45%, 11/15/31 | 350 | 264,527 | ||||||
Puget Energy, Inc. | ||||||||
3.65%, 05/15/25 | 163 | 156,453 | ||||||
2.38%, 06/15/28 | 329 | 278,581 | ||||||
4.10%, 06/15/30 | 413 | 352,768 | ||||||
4.22%, 03/15/32 | 279 | 232,190 | ||||||
San Diego Gas & Electric Co. | ||||||||
2.50%, 05/15/26(a) | 350 | 323,781 | ||||||
4.95%, 08/15/28 | 695 | 670,026 | ||||||
Series VVV, 1.70%, 10/01/30 | 413 | 312,229 | ||||||
Series XXX, 3.00%, 03/15/32 | 350 | 282,013 | ||||||
Sempra | ||||||||
3.30%, 04/01/25 | 610 | 586,607 | ||||||
3.25%, 06/15/27 | 500 | 453,004 | ||||||
3.40%, 02/01/28 | 359 | 323,509 | ||||||
3.70%, 04/01/29 | 159 | 140,928 | ||||||
5.50%, 08/01/33 | 225 | 209,246 | ||||||
(5-year CMT + 2.87%), | 413 | 318,123 | ||||||
Sierra Pacific Power Co., 2.60%, 05/01/26 | 136 | 126,361 | ||||||
Southern California Edison Co. | ||||||||
4.90%, 06/01/26 | 140 | 136,612 | ||||||
5.85%, 11/01/27 | 500 | 499,276 | ||||||
5.30%, 03/01/28 | 495 | 483,944 | ||||||
5.65%, 10/01/28 | 45 | 44,558 | ||||||
6.65%, 04/01/29 | 300 | 303,525 | ||||||
2.85%, 08/01/29 | 184 | 156,352 | ||||||
2.25%, 06/01/30 | 179 | 141,104 | ||||||
2.75%, 02/01/32 | 413 | 321,419 | ||||||
5.95%, 11/01/32 | 525 | 512,716 | ||||||
Series A, 4.20%, 03/01/29 | 400 | 367,961 | ||||||
Series C, 4.20%, 06/01/25 | 276 | 268,754 | ||||||
Series D, 4.70%, 06/01/27 | 300 | 288,590 | ||||||
Series E, 3.70%, 08/01/25 | 309 | 296,724 | ||||||
Series G, 2.50%, 06/01/31 | 149 | 115,938 | ||||||
Southern Co. | ||||||||
5.15%, 10/06/25 | 200 | 197,625 | ||||||
3.25%, 07/01/26 | 913 | 853,387 | ||||||
5.11%, 08/01/27 | 500 | 482,264 | ||||||
4.85%, 06/15/28 | 280 | 267,524 | ||||||
5.50%, 03/15/29 | 175 | 171,486 | ||||||
5.70%, 10/15/32 | 350 | 335,319 | ||||||
5.20%, 06/15/33 | 280 | 257,370 | ||||||
Series 21-A, (5-year CMT + 2.92%), 3.75%, 09/15/51(b) | 500 | 427,546 | ||||||
Series A, 3.70%, 04/30/30 | 450 | 390,174 | ||||||
Series B, (5-year CMT + 3.73%), | 829 | 756,367 | ||||||
Southern Power Co., 4.15%, 12/01/25 | 650 | 627,583 | ||||||
Southwestern Electric Power Co. | ||||||||
5.30%, 04/01/33 | 75 | 69,078 | ||||||
Series M, 4.10%, 09/15/28 | 179 | 164,002 | ||||||
Tucson Electric Power Co., 1.50%, 08/01/30 | 116 | 86,457 | ||||||
| Security | Par (000) | Value | ||||||
| Electric Utilities (continued) | ||||||||
Union Electric Co. | ||||||||
2.95%, 06/15/27 | $ | 129 | $ | 117,861 | ||||
2.15%, 03/15/32 | 179 | 134,127 | ||||||
Virginia Electric and Power Co. | ||||||||
2.30%, 11/15/31 | 413 | 315,383 | ||||||
2.40%, 03/30/32 | 530 | 402,226 | ||||||
5.00%, 04/01/33 | 275 | 250,589 | ||||||
5.30%, 08/15/33 | 250 | 231,588 | ||||||
Series A, 3.15%, 01/15/26(a) | 458 | 434,283 | ||||||
Series A, 3.50%, 03/15/27(a) | 620 | 576,119 | ||||||
Series A, 3.80%, 04/01/28 | 413 | 381,581 | ||||||
Series A, 2.88%, 07/15/29 | 55 | 47,259 | ||||||
Series B, 3.75%, 05/15/27 | 400 | 375,013 | ||||||
WEC Energy Group, Inc. | ||||||||
5.00%, 09/27/25 | 260 | 256,169 | ||||||
4.75%, 01/09/26 | 390 | 380,501 | ||||||
5.15%, 10/01/27 | 500 | 487,839 | ||||||
1.38%, 10/15/27(a) | 350 | 295,127 | ||||||
4.75%, 01/15/28 | 250 | 239,030 | ||||||
2.20%, 12/15/28 | 350 | 291,651 | ||||||
Wisconsin Electric Power Co. | ||||||||
1.70%, 06/15/28(a) | 159 | 134,433 | ||||||
4.75%, 09/30/32 | 305 | 280,790 | ||||||
5.63%, 05/15/33(a) | 200 | 195,821 | ||||||
Wisconsin Power and Light Co. | ||||||||
3.00%, 07/01/29(a) | 129 | 111,272 | ||||||
1.95%, 09/16/31 | 194 | 143,916 | ||||||
3.95%, 09/01/32 | 400 | 344,144 | ||||||
4.95%, 04/01/33 | 40 | 36,624 | ||||||
Wisconsin Public Service Corp., | 250 | 249,183 | ||||||
Xcel Energy, Inc. | ||||||||
3.30%, 06/01/25 | 218 | 209,140 | ||||||
3.35%, 12/01/26 | 413 | 383,221 | ||||||
1.75%, 03/15/27 | 413 | 359,977 | ||||||
4.00%, 06/15/28 | 229 | 211,626 | ||||||
2.60%, 12/01/29 | 130 | 107,363 | ||||||
3.40%, 06/01/30 | 350 | 296,423 | ||||||
2.35%, 11/15/31 | 329 | 244,764 | ||||||
4.60%, 06/01/32 | 397 | 350,949 | ||||||
5.45%, 08/15/33(a) | 500 | 465,880 | ||||||
|
| |||||||
| 118,088,180 | ||||||||
| Electrical Equipment — 0.1% | ||||||||
Acuity Brands Lighting, Inc., | 250 | 189,136 | ||||||
Eaton Corp. | ||||||||
4.35%, 05/18/28 | 90 | 85,821 | ||||||
4.00%, 11/02/32 | 324 | 283,099 | ||||||
4.15%, 03/15/33 | 700 | 615,861 | ||||||
Regal Rexnord Corp.(d) | ||||||||
6.05%, 02/15/26 | 450 | 442,622 | ||||||
6.05%, 04/15/28 | 500 | 478,296 | ||||||
6.30%, 02/15/30 | 500 | 470,493 | ||||||
6.40%, 04/15/33 | 700 | 642,177 | ||||||
Tyco Electronics Group SA, | 405 | 317,231 | ||||||
|
| |||||||
| 3,524,736 | ||||||||
| Electronic Equipment, Instruments & Components — 0.4% | ||||||||
Amphenol Corp. | ||||||||
4.75%, 03/30/26 | 25 | 24,424 | ||||||
4.35%, 06/01/29 | 350 | 326,789 | ||||||
2.80%, 02/15/30 | 829 | 689,422 | ||||||
2.20%, 09/15/31 | 243 | 185,520 | ||||||
Arrow Electronics, Inc. | ||||||||
4.00%, 04/01/25 | 413 | 398,913 | ||||||
SCHEDULE OF INVESTMENTS | 33 |
Schedule of Investments (continued) October 31, 2023 | iShares U.S. Intermediate Credit Bond Index Fund (Percentages shown are based on Net Assets) |
| Security | Par (000) | Value | ||||||
| Electronic Equipment, Instruments & Components (continued) | ||||||||
Arrow Electronics, Inc. (continued) | ||||||||
3.88%, 01/12/28 | $ | 350 | $ | 316,442 | ||||
2.95%, 02/15/32 | 329 | 249,405 | ||||||
Avnet, Inc. | ||||||||
6.25%, 03/15/28 | 160 | 157,880 | ||||||
3.00%, 05/15/31 | 413 | 312,610 | ||||||
5.50%, 06/01/32 | 130 | 116,076 | ||||||
CDW LLC/CDW Finance Corp. | ||||||||
5.50%, 12/01/24 | 620 | 613,589 | ||||||
4.13%, 05/01/25 | 350 | 337,698 | ||||||
2.67%, 12/01/26 | 660 | 590,363 | ||||||
4.25%, 04/01/28 | 329 | 299,068 | ||||||
3.28%, 12/01/28 | 660 | 563,864 | ||||||
3.25%, 02/15/29 | 371 | 313,221 | ||||||
3.57%, 12/01/31 | 300 | 240,558 | ||||||
Keysight Technologies, Inc. | ||||||||
4.60%, 04/06/27 | 450 | 429,178 | ||||||
3.00%, 10/30/29 | 260 | 218,265 | ||||||
Rockwell Automation, Inc., 1.75%, 08/15/31 | 159 | 119,906 | ||||||
TD SYNNEX Corp. | ||||||||
1.75%, 08/09/26 | 279 | 244,263 | ||||||
2.38%, 08/09/28 | 179 | 146,925 | ||||||
2.65%, 08/09/31 | 413 | 301,280 | ||||||
Teledyne Technologies, Inc. | ||||||||
2.25%, 04/01/28 | 350 | 298,815 | ||||||
2.75%, 04/01/31 | 829 | 653,895 | ||||||
Trimble, Inc.(a) | ||||||||
4.90%, 06/15/28 | 350 | 331,298 | ||||||
6.10%, 03/15/33 | 400 | 381,811 | ||||||
Tyco Electronics Group SA | ||||||||
4.50%, 02/13/26(a) | 300 | 292,866 | ||||||
3.13%, 08/15/27 | 250 | 229,295 | ||||||
Vontier Corp. | ||||||||
1.80%, 04/01/26 | 496 | 441,810 | ||||||
2.40%, 04/01/28 | 200 | 164,810 | ||||||
2.95%, 04/01/31(a) | 350 | 263,501 | ||||||
|
| |||||||
| 10,253,760 | ||||||||
| Energy Equipment & Services — 0.2% | ||||||||
Baker Hughes Holdings LLC/Baker Hughes Co.- |
| |||||||
2.06%, 12/15/26 | 566 | 507,461 | ||||||
3.34%, 12/15/27 | 721 | 656,827 | ||||||
3.14%, 11/07/29 | 243 | 207,597 | ||||||
4.49%, 05/01/30 | 350 | 321,418 | ||||||
Halliburton Co. | ||||||||
3.80%, 11/15/25 | 151 | 145,903 | ||||||
2.92%, 03/01/30 | 329 | 276,046 | ||||||
NOV, Inc., 3.60%, 12/01/29 | 179 | 154,774 | ||||||
Patterson-UTI Energy, Inc., | 250 | 221,418 | ||||||
Schlumberger Finance Canada Ltd., 1.40%, 09/17/25 | 300 | 278,149 | ||||||
Schlumberger Investment SA | ||||||||
4.50%, 05/15/28 | 300 | 287,266 | ||||||
2.65%, 06/26/30(a) | 550 | 455,250 | ||||||
4.85%, 05/15/33 | 300 | 276,098 | ||||||
|
| |||||||
| 3,788,207 | ||||||||
| Environmental, Maintenance & Security Service — 0.3% | ||||||||
Republic Services, Inc. | ||||||||
3.20%, 03/15/25 | 163 | 157,298 | ||||||
3.38%, 11/15/27 | 400 | 368,148 | ||||||
3.95%, 05/15/28 | 300 | 279,783 | ||||||
| Security | Par (000) | Value | ||||||
| Environmental, Maintenance & Security Service (continued) | ||||||||
Republic Services, Inc. (continued) |
| |||||||
4.88%, 04/01/29 | $ | 55 | $ | 52,752 | ||||
1.45%, 02/15/31 | 727 | 534,502 | ||||||
1.75%, 02/15/32(a) | 829 | 603,446 | ||||||
2.38%, 03/15/33(a) | 450 | 336,185 | ||||||
Waste Connections, Inc. | ||||||||
4.25%, 12/01/28 | 200 | 187,297 | ||||||
2.20%, 01/15/32 | 229 | 172,391 | ||||||
3.20%, 06/01/32 | 342 | 276,843 | ||||||
4.20%, 01/15/33 | 800 | 694,228 | ||||||
Waste Management, Inc. | ||||||||
0.75%, 11/15/25 | 179 | 163,080 | ||||||
3.15%, 11/15/27(a) | 829 | 758,379 | ||||||
2.00%, 06/01/29 | 159 | 131,176 | ||||||
4.63%, 02/15/30 | 400 | 375,916 | ||||||
1.50%, 03/15/31 | 829 | 615,233 | ||||||
4.15%, 04/15/32(a) | 500 | 442,496 | ||||||
4.63%, 02/15/33(a) | 270 | 244,870 | ||||||
|
| |||||||
| 6,394,023 | ||||||||
| Financial Services — 18.0% | ||||||||
AerCap Ireland Capital DAC/AerCap Global Aviation Trust | ||||||||
3.50%, 01/15/25 | 300 | 289,281 | ||||||
6.50%, 07/15/25 | 655 | 653,487 | ||||||
4.45%, 10/01/25 | 400 | 383,747 | ||||||
1.75%, 01/30/26 | 655 | 588,993 | ||||||
2.45%, 10/29/26 | 1,864 | 1,658,257 | ||||||
3.65%, 07/21/27 | 655 | 587,994 | ||||||
5.75%, 06/06/28(a) | 910 | 873,624 | ||||||
3.00%, 10/29/28 | 1,823 | 1,535,412 | ||||||
3.30%, 01/30/32 | 2,300 | 1,780,634 | ||||||
3.40%, 10/29/33 | 900 | 673,021 | ||||||
Air Lease Corp. | ||||||||
2.30%, 02/01/25 | 308 | 292,382 | ||||||
3.25%, 03/01/25 | 259 | 248,027 | ||||||
3.38%, 07/01/25 | 829 | 786,862 | ||||||
2.88%, 01/15/26(a) | 829 | 769,439 | ||||||
3.75%, 06/01/26 | 450 | 423,180 | ||||||
1.88%, 08/15/26 | 550 | 486,618 | ||||||
2.20%, 01/15/27 | 450 | 394,443 | ||||||
3.63%, 04/01/27 | 1,000 | 895,953 | ||||||
3.63%, 12/01/27(a) | 130 | 116,474 | ||||||
5.30%, 02/01/28(a) | 300 | 286,945 | ||||||
2.10%, 09/01/28 | 413 | 338,926 | ||||||
3.25%, 10/01/29 | 413 | 347,649 | ||||||
3.00%, 02/01/30 | 329 | 267,226 | ||||||
3.13%, 12/01/30 | 309 | 246,000 | ||||||
2.88%, 01/15/32(a) | 450 | 342,418 | ||||||
Aircastle Ltd., 4.25%, 06/15/26 | 413 | 387,286 | ||||||
Ally Financial, Inc. | ||||||||
4.63%, 03/30/25 | 193 | 186,216 | ||||||
5.80%, 05/01/25(a) | 293 | 286,784 | ||||||
4.75%, 06/09/27(a) | 500 | 452,715 | ||||||
7.10%, 11/15/27 | 300 | 293,929 | ||||||
2.20%, 11/02/28 | 285 | 218,819 | ||||||
8.00%, 11/01/31 | 929 | 906,744 | ||||||
(1-day SOFR + 3.26%), | 500 | 477,922 | ||||||
Banco Santander SA | ||||||||
3.50%, 03/24/25 | 1,200 | 1,154,104 | ||||||
2.75%, 05/28/25 | 600 | 565,395 | ||||||
5.15%, 08/18/25 | 1,000 | 974,129 | ||||||
1.85%, 03/25/26 | 1,600 | 1,429,429 | ||||||
| 34 | 2 0 2 3 BLACK ROCK ANNUAL REPORT TO SHAREHOLDERS |
Schedule of Investments (continued) October 31, 2023 | iShares U.S. Intermediate Credit Bond Index Fund (Percentages shown are based on Net Assets) |
| Security | Par (000) | Value | ||||||
| Financial Services (continued) | ||||||||
Banco Santander SA (continued) | ||||||||
4.25%, 04/11/27 | $ | 1,000 | $ | 926,710 | ||||
5.29%, 08/18/27 | 1,000 | 954,253 | ||||||
3.80%, 02/23/28 | 400 | 355,696 | ||||||
4.38%, 04/12/28 | 400 | 363,761 | ||||||
5.59%, 08/08/28 | 800 | 770,626 | ||||||
3.31%, 06/27/29 | 200 | 170,749 | ||||||
3.49%, 05/28/30 | 600 | 491,692 | ||||||
2.75%, 12/03/30 | 800 | 583,500 | ||||||
2.96%, 03/25/31 | 400 | 308,371 | ||||||
6.92%, 08/08/33 | 800 | 743,023 | ||||||
6.94%, 11/07/33(c) | 400 | 401,079 | ||||||
(1-year CMT + 0.90%), | 800 | 693,426 | ||||||
(1-year CMT + 1.60%), | 600 | 440,324 | ||||||
(1-year CMT + 2.00%), | 800 | 732,539 | ||||||
Bank of America Corp. | ||||||||
4.00%, 01/22/25 | 620 | 603,412 | ||||||
3.88%, 08/01/25 | 716 | 693,119 | ||||||
4.45%, 03/03/26 | 1,111 | 1,063,871 | ||||||
3.50%, 04/19/26 | 1,484 | 1,400,866 | ||||||
4.25%, 10/22/26(a) | 1,069 | 1,008,812 | ||||||
3.25%, 10/21/27 | 1,139 | 1,029,211 | ||||||
(1-day SOFR + 0.65%), | 829 | 782,882 | ||||||
(1-day SOFR + 0.96%), | 3,468 | 3,060,546 | ||||||
(1-day SOFR + 1.01%), | 911 | 822,952 | ||||||
(1-day SOFR + 1.05%), | 908 | 802,421 | ||||||
(1-day SOFR + 1.06%), | 1,659 | 1,369,746 | ||||||
(1-day SOFR + 1.15%), | 1,409 | 1,294,900 | ||||||
(1-day SOFR + 1.21%), | 1,828 | 1,369,068 | ||||||
(1-day SOFR + 1.22%), | 2,550 | 1,881,299 | ||||||
(1-day SOFR + 1.29%), | 1,600 | 1,557,544 | ||||||
(1-day SOFR + 1.32%), | 1,859 | 1,425,386 | ||||||
(1-day SOFR + 1.33%), | 994 | 952,403 | ||||||
(1-day SOFR + 1.33%), | 2,218 | 1,699,950 | ||||||
(1-day SOFR + 1.37%), | 1,409 | 1,039,043 | ||||||
(1-day SOFR + 1.53%), | 1,009 | 750,670 | ||||||
(1-day SOFR + 1.57%), | 1,400 | 1,363,220 | ||||||
(1-day SOFR + 1.58%), | 1,000 | 933,484 | ||||||
(1-day SOFR + 1.63%), | 2,240 | 2,129,712 | ||||||
(1-day SOFR + 1.75%), | 1,240 | 1,208,333 | ||||||
(1-day SOFR + 1.83%), | 1,807 | 1,558,373 | ||||||
(1-day SOFR + 1.84%), | 1,800 | 1,695,011 | ||||||
(1-day SOFR + 1.91%), | 2,680 | 2,420,551 | ||||||
(1-day SOFR + 1.99%), | 515 | 511,526 | ||||||
(1-day SOFR + 2.04%), | 2,055 | 1,952,950 | ||||||
(1-day SOFR + 2.15%), | 2,000 | 1,576,729 | ||||||
(1-day SOFR + 2.16%), | 2,430 | 2,172,607 | ||||||
(3-mo. CME Term SOFR + 0.90%), | 1,160 | 1,093,922 | ||||||
(3-mo. CME Term SOFR + 1.07%), | 1,659 | 1,594,594 | ||||||
(3-mo. CME Term SOFR + 1.25%), | 1,953 | 1,539,353 | ||||||
(3-mo. CME Term SOFR + 1.30%), | 4,051 | 3,605,917 | ||||||
(3-mo. CME Term SOFR + 1.32%), | 1,879 | 1,755,041 | ||||||
(3-mo. CME Term SOFR + 1.33%), | 829 | 750,110 | ||||||
(3-mo. CME Term SOFR + 1.44%), | 1,214 | 1,018,065 | ||||||
| Security | Par (000) | Value | ||||||
| Financial Services (continued) | ||||||||
Bank of America Corp. (continued) | ||||||||
(3-mo. CME Term SOFR + 1.45%), 2.88%, 10/22/30(b) | $ | 829 | $ | 678,384 | ||||
(3-mo. CME Term SOFR + 1.47%), 3.97%, 02/07/30(b) | 1,249 | 1,104,585 | ||||||
(3-mo. CME Term SOFR + 1.57%), 4.27%, 07/23/29(b) | 1,201 | 1,092,930 | ||||||
(3-mo. CME Term SOFR + 1.63%), 3.59%, 07/21/28(b) | 413 | 373,745 | ||||||
(3-mo. CME Term SOFR + 1.77%), 3.71%, 04/24/28(b) | 829 | 757,283 | ||||||
(3-mo. CME Term SOFR + 1.84%), 3.82%, 01/20/28(b) | 1,659 | 1,531,037 | ||||||
(5-year CMT + 1.20%), | 829 | 590,824 | ||||||
(5-year CMT + 2.00%), | 800 | 631,110 | ||||||
Series L, 3.95%, 04/21/25 | 1,037 | 1,002,275 | ||||||
Series L, 4.18%, 11/25/27 | 829 | 762,537 | ||||||
Series N, (1-day SOFR + 0.91%), | 1,409 | 1,260,680 | ||||||
Series N, (1-day SOFR + 1.22%), | 1,409 | 1,079,817 | ||||||
Bank of Nova Scotia | ||||||||
5.25%, 12/06/24 | 600 | 594,810 | ||||||
1.45%, 01/10/25 | 413 | 391,463 | ||||||
2.20%, 02/03/25 | 459 | 437,847 | ||||||
3.45%, 04/11/25 | 1,172 | 1,129,417 | ||||||
4.50%, 12/16/25 | 163 | 157,195 | ||||||
4.75%, 02/02/26 | 1,900 | 1,851,566 | ||||||
1.35%, 06/24/26 | 259 | 229,673 | ||||||
2.70%, 08/03/26 | 413 | 379,238 | ||||||
1.30%, 09/15/26 | 1,160 | 1,017,415 | ||||||
1.95%, 02/02/27 | 829 | 731,527 | ||||||
4.85%, 02/01/30 | 600 | 551,733 | ||||||
2.15%, 08/01/31 | 829 | 616,448 | ||||||
2.45%, 02/02/32 | 829 | 621,540 | ||||||
Barclays PLC | ||||||||
3.65%, 03/16/25 | 1,150 | 1,105,902 | ||||||
4.38%, 01/12/26 | 1,310 | 1,250,430 | ||||||
5.20%, 05/12/26 | 1,178 | 1,125,059 | ||||||
4.34%, 01/10/28 | 700 | 639,802 | ||||||
4.84%, 05/09/28 | 1,178 | 1,058,654 | ||||||
(1-day SOFR + 1.88%), | 200 | 198,126 | ||||||
(1-day SOFR + 2.21%), | 800 | 781,721 | ||||||
(1-day SOFR + 2.22%), | 650 | 633,697 | ||||||
(1-day SOFR + 2.62%), | 800 | 756,584 | ||||||
(1-day SOFR + 2.71%), | 1,000 | 943,320 | ||||||
(1-day SOFR + 2.98%), | 1,300 | 1,191,652 | ||||||
(1-day SOFR + 3.57%), | 600 | 557,211 | ||||||
(1-year CMT + 1.05%), | 878 | 768,563 | ||||||
(1-year CMT + 1.20%), | 1,310 | 968,862 | ||||||
(1-year CMT + 1.30%), | 500 | 365,086 | ||||||
(1-year CMT + 1.90%), | 300 | 227,674 | ||||||
(1-year CMT + 2.30%), | 800 | 780,599 | ||||||
(1-year CMT + 2.65%), | 700 | 663,835 | ||||||
(1-year CMT + 3.00%), | 200 | 179,493 | ||||||
(1-year CMT + 3.05%), | 1,700 | 1,719,776 | ||||||
(1-year CMT + 3.30%), | 500 | 505,477 | ||||||
(1-year CMT + 3.50%), | 1,200 | 1,197,331 | ||||||
(3-mo. LIBOR US + 1.90%), | 845 | 777,861 | ||||||
(3-mo. LIBOR US + 3.05%), | 478 | 414,215 | ||||||
(5-year CMT + 2.90%), | 478 | 359,965 | ||||||
SCHEDULE OF INVESTMENTS | 35 |
Schedule of Investments (continued) October 31, 2023 | iShares U.S. Intermediate Credit Bond Index Fund (Percentages shown are based on Net Assets) |
| Security | Par (000) | Value | ||||||
| Financial Services (continued) | ||||||||
Cboe Global Markets, Inc. | ||||||||
1.63%, 12/15/30 | $ | 159 | $ | 119,913 | ||||
3.00%, 03/16/32(a) | 579 | 464,839 | ||||||
Citigroup, Inc. | ||||||||
3.88%, 03/26/25 | 413 | 398,360 | ||||||
3.30%, 04/27/25 | 800 | 769,761 | ||||||
4.40%, 06/10/25 | 1,813 | 1,754,636 | ||||||
5.50%, 09/13/25 | 829 | 817,351 | ||||||
3.70%, 01/12/26 | 829 | 788,897 | ||||||
4.60%, 03/09/26 | 620 | 594,233 | ||||||
3.40%, 05/01/26 | 1,113 | 1,047,074 | ||||||
3.20%, 10/21/26 | 1,173 | 1,081,346 | ||||||
4.30%, 11/20/26 | 97 | 91,151 | ||||||
4.45%, 09/29/27 | 1,989 | 1,837,322 | ||||||
4.13%, 07/25/28 | 620 | 556,535 | ||||||
6.63%, 06/15/32 | 526 | 521,011 | ||||||
(1-day SOFR + 0.53%), 1.28%, 11/03/25(b) | 366 | 346,375 | ||||||
(1-day SOFR + 0.69%), 2.01%, 01/25/26(b) | 1,190 | 1,123,599 | ||||||
(1-day SOFR + 0.77%), 1.12%, 01/28/27(b) | 974 | 866,186 | ||||||
(1-day SOFR + 0.77%), 1.46%, 06/09/27(b) | 1,059 | 932,136 | ||||||
(1-day SOFR + 1.15%), 2.67%, 01/29/31(b) | 829 | 660,503 | ||||||
(1-day SOFR + 1.17%), 2.56%, 05/01/32(b) | 1,398 | 1,060,812 | ||||||
(1-day SOFR + 1.18%), 2.52%, 11/03/32(b) | 900 | 669,548 | ||||||
(1-day SOFR + 1.28%), 3.07%, 02/24/28(b) | 1,329 | 1,196,232 | ||||||
(1-day SOFR + 1.35%), 3.06%, 01/25/33(b) | 1,243 | 956,996 | ||||||
(1-day SOFR + 1.42%), | 829 | 680,533 | ||||||
(1-day SOFR + 1.53%), 3.29%, 03/17/26(b) | 572 | 547,768 | ||||||
(1-day SOFR + 1.55%), 5.61%, 09/29/26(b) | 840 | 829,214 | ||||||
(1-day SOFR + 1.89%), 4.66%, 05/24/28(b) | 1,700 | 1,610,071 | ||||||
(1-day SOFR + 1.94%), 3.79%, 03/17/33(b) | 2,977 | 2,416,788 | ||||||
(1-day SOFR + 2.09%), 4.91%, 05/24/33(b) | 1,150 | 1,019,166 | ||||||
(1-day SOFR + 2.11%), 2.57%, 06/03/31(b) | 2,243 | 1,756,390 | ||||||
(1-day SOFR + 2.34%), | 1,500 | 1,456,438 | ||||||
(1-day SOFR + 2.66%), 6.17%, 05/25/34(b) | 1,735 | 1,612,742 | ||||||
(1-day SOFR + 2.84%), 3.11%, 04/08/26(b) | 1,660 | 1,584,270 | ||||||
(1-day SOFR + 3.91%), 4.41%, 03/31/31(b) | 1,990 | 1,760,562 | ||||||
(3-mo. CME Term SOFR + 1.41%), | 859 | 772,142 | ||||||
(3-mo. CME Term SOFR + 1.45%), | 2,000 | 1,819,059 | ||||||
(3-mo. CME Term SOFR + 1.60%), | 1,873 | 1,657,080 | ||||||
(3-mo. CME Term SOFR + 1.65%), | 829 | 751,010 | ||||||
(3-mo. CME Term SOFR + 1.82%), | 829 | 768,549 | ||||||
Clorox Co. | ||||||||
3.10%, 10/01/27 | 413 | 374,642 | ||||||
4.40%, 05/01/29 | 500 | 463,649 | ||||||
1.80%, 05/15/30 | 250 | 192,317 | ||||||
4.60%, 05/01/32(a) | 250 | 225,657 | ||||||
CME Group, Inc. | ||||||||
3.00%, 03/15/25 | 286 | 276,858 | ||||||
3.75%, 06/15/28 | 179 | 167,260 | ||||||
2.65%, 03/15/32 | 321 | 256,239 | ||||||
Corebridge Financial, Inc., 6.05%, 09/15/33 | 250 | 234,674 | ||||||
Deutsche Bank AG | ||||||||
4.50%, 04/01/25(a) | 700 | 669,192 | ||||||
4.10%, 01/13/26 | 288 | 273,713 | ||||||
1.69%, 03/19/26 | 400 | 360,588 | ||||||
(1-day SOFR + 1.22%), 2.31%, 11/16/27(b) | 667 | 576,908 | ||||||
(1-day SOFR + 1.32%), 2.55%, 01/07/28(b) | 1,348 | 1,166,768 | ||||||
(1-day SOFR + 1.72%), 3.04%, 05/28/32(b) | 455 | 338,933 | ||||||
| Security | Par (000) | Value | ||||||
| Financial Services (continued) | ||||||||
Deutsche Bank AG (continued) | ||||||||
(1-day SOFR + 1.87%), 2.13%, 11/24/26(b) | $ | 919 | $ | 829,823 | ||||
(1-day SOFR + 2.26%), | 950 | 664,393 | ||||||
(1-day SOFR + 2.52%), 7.15%, 07/13/27(b) | 400 | 399,724 | ||||||
(1-day SOFR + 2.58%), 3.96%, 11/26/25(b) | 1,181 | 1,138,856 | ||||||
(1-day SOFR + 2.76%), 3.73%, 01/14/32(b) | 650 | 470,624 | ||||||
(1-day SOFR + 3.04%), 3.55%, 09/18/31(b) | 1,159 | 910,274 | ||||||
(1-day SOFR + 3.18%), 6.72%, 01/18/29(b) | 950 | 932,467 | ||||||
(1-day SOFR + 3.19%), 6.12%, 07/14/26(b) | 500 | 492,230 | ||||||
(1-day SOFR + 3.65%), 7.08%, 02/10/34(b) | 650 | 572,595 | ||||||
(5-year USD ICE Swap + 2.55%), | 350 | 294,709 | ||||||
European Investment Bank | ||||||||
4.50%, 10/16/28 | 2,400 | 2,354,238 | ||||||
3.63%, 07/15/30 | 2,100 | 1,933,602 | ||||||
3.75%, 02/14/33 | 4,000 | 3,624,319 | ||||||
Fiserv, Inc., 5.38%, 08/21/28 | 300 | 293,411 | ||||||
GE Capital Funding LLC, 4.55%, 05/15/32 | 250 | 224,572 | ||||||
Goldman Sachs Group, Inc. | ||||||||
5.70%, 11/01/24 | 800 | 796,986 | ||||||
3.50%, 01/23/25 | 1,012 | 979,910 | ||||||
3.50%, 04/01/25 | 1,588 | 1,528,347 | ||||||
3.75%, 05/22/25 | 916 | 882,827 | ||||||
4.25%, 10/21/25 | 869 | 832,873 | ||||||
3.75%, 02/25/26 | 1,613 | 1,530,227 | ||||||
3.50%, 11/16/26 | 1,659 | 1,538,573 | ||||||
5.95%, 01/15/27 | 163 | 160,806 | ||||||
3.85%, 01/26/27 | 1,659 | 1,545,106 | ||||||
2.60%, 02/07/30 | 809 | 649,528 | ||||||
3.80%, 03/15/30 | 1,006 | 869,172 | ||||||
(1-day SOFR + 0.79%), 1.09%, 12/09/26(b) | 889 | 793,661 | ||||||
(1-day SOFR + 0.80%), 1.43%, 03/09/27(b) | 1,223 | 1,086,178 | ||||||
(1-day SOFR + 0.82%), 1.54%, 09/10/27(b) | 1,659 | 1,443,388 | ||||||
(1-day SOFR + 0.91%), | 2,767 | 2,426,702 | ||||||
(1-day SOFR + 1.08%), 5.80%, 08/10/26(b) | 1,300 | 1,286,670 | ||||||
(1-day SOFR + 1.09%), 1.99%, 01/27/32(b) | 1,210 | 887,666 | ||||||
(1-day SOFR + 1.11%), 2.64%, 02/24/28(b) | 1,693 | 1,499,740 | ||||||
(1-day SOFR + 1.25%), 2.38%, 07/21/32(b) | 2,423 | 1,798,469 | ||||||
(1-day SOFR + 1.26%), 2.65%, 10/21/32(b) | 1,981 | 1,489,422 | ||||||
(1-day SOFR + 1.28%), 2.62%, 04/22/32(b) | 2,118 | 1,613,703 | ||||||
(1-day SOFR + 1.41%), 3.10%, 02/24/33(b) | 1,894 | 1,472,383 | ||||||
(1-day SOFR + 1.51%), 4.39%, 06/15/27(b) | 620 | 592,357 | ||||||
(1-day SOFR + 1.73%), 4.48%, 08/23/28(b) | 1,000 | 936,254 | ||||||
(1-day SOFR + 1.77%), 6.48%, 10/24/29(b) | 650 | 649,847 | ||||||
(1-day SOFR + 1.85%), 3.62%, 03/15/28(b) | 1,270 | 1,162,794 | ||||||
(1-day SOFR + 1.95%), 6.79%, 10/24/34(b) | 700 | 695,819 | ||||||
(3-mo. CME Term SOFR + 1.42%), 3.81%, 04/23/29(b) | 1,659 | 1,490,248 | ||||||
(3-mo. CME Term SOFR + 1.56%), | 2,279 | 2,080,239 | ||||||
(3-mo. CME Term SOFR + 1.77%), | 1,023 | 933,643 | ||||||
Hercules Capital, Inc., | 130 | 113,254 | ||||||
HSBC Holdings PLC | ||||||||
4.30%, 03/08/26 | 1,878 | 1,799,732 | ||||||
3.90%, 05/25/26 | 2,489 | 2,348,500 | ||||||
4.38%, 11/23/26(a) | 1,310 | 1,236,038 | ||||||
4.95%, 03/31/30 | 886 | 815,001 | ||||||
(1-day SOFR + 1.10%), 2.25%, 11/22/27(b) | 818 | 717,189 | ||||||
(1-day SOFR + 1.19%), 2.80%, 05/24/32(b) | 2,264 | 1,704,500 | ||||||
(1-day SOFR + 1.29%), 1.59%, 05/24/27(b) | 1,300 | 1,145,059 | ||||||
(1-day SOFR + 1.29%), 2.21%, 08/17/29(b) | 800 | 650,896 | ||||||
(1-day SOFR + 1.41%), 2.87%, 11/22/32(b) | 1,310 | 976,623 | ||||||
| 36 | 2 0 2 3 BLACK ROCK ANNUAL REPORT TO SHAREHOLDERS |
Schedule of Investments (continued) October 31, 2023 | iShares U.S. Intermediate Credit Bond Index Fund (Percentages shown are based on Net Assets) |
| Security | Par (000) | Value | ||||||
| Financial Services (continued) | ||||||||
HSBC Holdings PLC (continued) | ||||||||
(1-day SOFR + 1.43%), 3.00%, 03/10/26(b) | $ | 1,000 | $ | 953,562 | ||||
(1-day SOFR + 1.54%), 1.65%, 04/18/26(b) | 1,140 | 1,059,944 | ||||||
(1-day SOFR + 1.57%), 5.89%, 08/14/27(b) | 1,000 | 982,422 | ||||||
(1-day SOFR + 1.73%), 2.01%, 09/22/28(b) | 478 | 401,191 | ||||||
(1-day SOFR + 1.93%), 2.10%, 06/04/26(b) | 1,350 | 1,257,944 | ||||||
(1-day SOFR + 1.97%), 6.16%, 03/09/29(b) | 550 | �� | 538,767 | |||||
(1-day SOFR + 2.11%), 4.76%, 06/09/28(b) | 500 | 468,138 | ||||||
(1-day SOFR + 2.39%), 2.85%, 06/04/31(b) | 1,310 | 1,028,002 | ||||||
(1-day SOFR + 2.39%), 6.25%, 03/09/34(b) | 1,700 | 1,613,598 | ||||||
(1-day SOFR + 2.53%), 4.76%, 03/29/33(b) | 535 | 442,620 | ||||||
(1-day SOFR + 2.61%), 5.21%, 08/11/28(b) | 900 | 858,431 | ||||||
(1-day SOFR + 2.87%), 5.40%, 08/11/33(b) | 1,000 | 899,175 | ||||||
(1-day SOFR + 2.98%), 6.55%, 06/20/34(b) | 1,000 | 929,347 | ||||||
(1-day SOFR + 4.25%), 8.11%, 11/03/33(b) | 500 | 517,417 | ||||||
(3-mo. CME Term SOFR + 1.40%), | 1,678 | 1,608,949 | ||||||
(3-mo. CME Term SOFR + 1.61%), | 2,489 | 2,388,253 | ||||||
(3-mo. CME Term SOFR + 1.80%), | 1,189 | 1,083,466 | ||||||
(3-mo. CME Term SOFR + 1.81%), | 989 | 908,370 | ||||||
(3-mo. CME Term SOFR + 1.87%), | 2,039 | 1,761,658 | ||||||
(1-day SOFR + 3.03%), 7.34%, 11/03/26(b) | 1,500 | 1,525,888 | ||||||
(1-day SOFR + 3.35%), | 1,805 | 1,851,569 | ||||||
Inter-American Development Bank, | 1,200 | 1,183,799 | ||||||
Inter-American Investment Corp., | 300 | 295,403 | ||||||
Intercontinental Exchange, Inc. | ||||||||
3.65%, 05/23/25 | 693 | 670,020 | ||||||
3.75%, 12/01/25(a) | 923 | 885,822 | ||||||
4.00%, 09/15/27 | 1,145 | 1,070,493 | ||||||
4.35%, 06/15/29 | 953 | 878,663 | ||||||
2.10%, 06/15/30 | 637 | 500,000 | ||||||
1.85%, 09/15/32 | 610 | 431,784 | ||||||
4.60%, 03/15/33(a) | 800 | 714,214 | ||||||
JPMorgan Chase & Co. | ||||||||
3.13%, 01/23/25 | 1,036 | 1,002,255 | ||||||
3.90%, 07/15/25 | 1,866 | 1,807,310 | ||||||
3.30%, 04/01/26 | 413 | 389,183 | ||||||
3.20%, 06/15/26 | 829 | 777,219 | ||||||
2.95%, 10/01/26 | 1,239 | 1,146,292 | ||||||
7.63%, 10/15/26 | 413 | 431,485 | ||||||
4.13%, 12/15/26 | 163 | 154,001 | ||||||
4.25%, 10/01/27 | 413 | 389,446 | ||||||
3.63%, 12/01/27 | 829 | 757,484 | ||||||
(1-day SOFR + 0.61%), 1.56%, 12/10/25(b) | 829 | 784,505 | ||||||
(1-day SOFR + 0.77%), 1.47%, 09/22/27(b) | 829 | 722,171 | ||||||
(1-day SOFR + 0.80%), 1.05%, 11/19/26(b) | 1,850 | 1,663,834 | ||||||
(1-day SOFR + 0.89%), 1.58%, 04/22/27(b) | 2,375 | 2,118,820 | ||||||
(1-day SOFR + 0.92%), 2.60%, 02/24/26(b) | 572 | 545,180 | ||||||
(1-day SOFR + 1.02%), 2.07%, 06/01/29(b) | 1,160 | 964,204 | ||||||
(1-day SOFR + 1.07%), 5.55%, 12/15/25(b) | 2,500 | 2,481,218 | ||||||
(1-day SOFR + 1.07%), 1.95%, 02/04/32(b) | 1,659 | 1,232,466 | ||||||
(1-day SOFR + 1.17%), 2.95%, 02/24/28(b) | 534 | 480,659 | ||||||
(1-day SOFR + 1.18%), 2.55%, 11/08/32(b) | 1,244 | 942,528 | ||||||
(1-day SOFR + 1.26%), 2.96%, 01/25/33(b) | 1,957 | 1,524,688 | ||||||
(1-day SOFR + 1.32%), 4.08%, 04/26/26(b) | 2,194 | 2,126,469 | ||||||
(1-day SOFR + 1.33%), 6.07%, 10/22/27(b) | 970 | 967,950 | ||||||
(1-day SOFR + 1.45%), 5.30%, 07/24/29(b) | 1,245 | 1,198,630 | ||||||
(1-day SOFR + 1.56%), 4.32%, 04/26/28(b) | 2,298 | 2,158,607 | ||||||
| Security | Par (000) | Value | ||||||
| Financial Services (continued) | ||||||||
JPMorgan Chase & Co. (continued) | ||||||||
(1-day SOFR + 1.57%), 6.09%, 10/23/29(b) | $ | 925 | $ | 919,514 | ||||
(1-day SOFR + 1.75%), 4.57%, 06/14/30(b) | 1,300 | 1,193,097 | ||||||
(1-day SOFR + 1.80%), 4.59%, 04/26/33(b) | 898 | 789,270 | ||||||
(1-day SOFR + 1.81%), 6.25%, 10/23/34(a)(b) | 1,570 | 1,548,837 | ||||||
(1-day SOFR + 1.85%), 2.08%, 04/22/26(b) | 1,422 | 1,336,431 | ||||||
(1-day SOFR + 1.85%), 5.35%, 06/01/34(b) | 2,415 | 2,227,400 | ||||||
(1-day SOFR + 1.99%), 4.85%, 07/25/28(b) | 3,000 | 2,866,520 | ||||||
(1-day SOFR + 2.04%), 2.52%, 04/22/31(b) | 1,325 | 1,053,820 | ||||||
(1-day SOFR + 2.08%), 4.91%, 07/25/33(b) | 3,050 | 2,739,601 | ||||||
(1-day SOFR + 2.58%), 5.72%, 09/14/33(a)(b) | 1,650 | 1,545,145 | ||||||
(3-mo. CME Term SOFR + 0.70%), | 1,650 | 1,467,219 | ||||||
(3-mo. CME Term SOFR + 1.11%), | 829 | 613,249 | ||||||
(3-mo. CME Term SOFR + 1.21%), | 829 | 743,806 | ||||||
(3-mo. CME Term SOFR + 1.25%), | 1,900 | 1,467,434 | ||||||
(3-mo. CME Term SOFR + 1.38%), | 919 | 836,962 | ||||||
(3-mo. CME Term SOFR + 1.42%), | 1,229 | 1,078,267 | ||||||
(3-mo. CME Term SOFR + 1.51%), | 1,539 | 1,264,388 | ||||||
(3-mo. CME Term SOFR + 1.52%), | 973 | 892,342 | ||||||
(3-mo. CME Term SOFR + 1.59%), | 1,077 | 1,016,318 | ||||||
(3-mo. CME Term SOFR + 1.59%), | 1,023 | 940,952 | ||||||
(3-mo. CME Term SOFR + 1.60%), | 1,659 | 1,539,224 | ||||||
(3-mo. CME Term SOFR + 1.64%), | 1,450 | 1,327,238 | ||||||
(3-mo. CME Term SOFR + 2.52%), | 859 | 692,682 | ||||||
(3-mo. CME Term SOFR + 3.79%), | 2,759 | 2,488,912 | ||||||
Kimberly-Clark Corp. | ||||||||
2.75%, 02/15/26 | 413 | 389,531 | ||||||
1.05%, 09/15/27 | 350 | 297,412 | ||||||
3.95%, 11/01/28 | 400 | 376,699 | ||||||
3.20%, 04/25/29 | 350 | 313,333 | ||||||
3.10%, 03/26/30 | 400 | 344,968 | ||||||
2.00%, 11/02/31 | 225 | 172,887 | ||||||
4.50%, 02/16/33 | 400 | 367,935 | ||||||
Lloyds Banking Group PLC | ||||||||
4.50%, 11/04/24(a) | 1,310 | 1,279,574 | ||||||
4.45%, 05/08/25 | 600 | 582,773 | ||||||
4.65%, 03/24/26 | 1,200 | 1,136,460 | ||||||
3.75%, 01/11/27 | 800 | 735,538 | ||||||
4.38%, 03/22/28 | 478 | 438,530 | ||||||
4.55%, 08/16/28 | 1,310 | 1,208,255 | ||||||
(1-year CMT + 0.85%), 1.63%, 05/11/27(b) | 800 | 708,569 | ||||||
(1-year CMT + 1.48%), 5.99%, 08/07/27(b) | 1,500 | 1,478,200 | ||||||
(1-year CMT + 1.60%), 3.51%, 03/18/26(b) | 1,235 | 1,183,931 | ||||||
(1-year CMT + 1.70%), 5.87%, 03/06/29(b) | 500 | 484,193 | ||||||
(1-year CMT + 1.75%), 4.72%, 08/11/26(b) | 600 | 581,575 | ||||||
(1-year CMT + 1.80%), 3.75%, 03/18/28(b) | 478 | 435,648 | ||||||
(1-year CMT + 2.30%), 4.98%, 08/11/33(a)(b) | 500 | 434,030 | ||||||
(1-year CMT + 3.75%), 7.95%, 11/15/33(b) | 450 | 456,301 | ||||||
SCHEDULE OF INVESTMENTS | 37 |
Schedule of Investments (continued) October 31, 2023 | iShares U.S. Intermediate Credit Bond Index Fund (Percentages shown are based on Net Assets) |
| Security | Par (000) | Value | ||||||
| Financial Services (continued) | ||||||||
Lloyds Banking Group PLC (continued) | ||||||||
(3-mo. LIBOR US + 1.21%), | $ | 500 | $ | 443,937 | ||||
Mitsubishi UFJ Financial Group, Inc. | ||||||||
2.19%, 02/25/25 | 1,350 | 1,282,809 | ||||||
1.41%, 07/17/25 | 900 | 831,620 | ||||||
3.85%, 03/01/26 | 1,000 | 952,826 | ||||||
3.29%, 07/25/27(a) | 829 | 756,154 | ||||||
3.96%, 03/02/28 | 829 | 767,753 | ||||||
3.74%, 03/07/29 | 1,659 | 1,487,171 | ||||||
3.20%, 07/18/29 | 900 | 766,873 | ||||||
2.56%, 02/25/30 | 1,310 | 1,052,023 | ||||||
2.05%, 07/17/30 | 1,310 | 998,252 | ||||||
(1-year CMT + 0.67%), 1.64%, 10/13/27(b) | 750 | 657,910 | ||||||
(1-year CMT + 0.75%), 1.54%, 07/20/27(b) | 1,500 | 1,325,042 | ||||||
(1-year CMT + 0.83%), 2.34%, 01/19/28(b) | 750 | 662,822 | ||||||
(1-year CMT + 0.95%), 2.31%, 07/20/32(b) | 1,310 | 976,949 | ||||||
(1-year CMT + 1.08%), 5.72%, 02/20/26(b) | 400 | 397,490 | ||||||
(1-year CMT + 1.38%), 5.42%, 02/22/29(b) | 480 | 464,821 | ||||||
(1-year CMT + 1.50%), 5.54%, 04/17/26(b) | 215 | 212,732 | ||||||
(1-year CMT + 1.53%), 5.48%, 02/22/31(b) | 440 | 418,300 | ||||||
(1-year CMT + 1.63%), 5.44%, 02/22/34(b) | 755 | 703,647 | ||||||
(1-year CMT + 1.90%), 5.35%, 09/13/28(b) | 455 | 440,458 | ||||||
(1-year CMT + 1.95%), 5.02%, 07/20/28(b) | 500 | 478,903 | ||||||
(1-year CMT + 1.97%), | 400 | 371,686 | ||||||
(1-year CMT + 2.13%), 5.13%, 07/20/33(b) | 500 | 456,901 | ||||||
(1-year CMT + 2.13%), 5.47%, 09/13/33(b) | 450 | 420,250 | ||||||
Mizuho Financial Group, Inc. | ||||||||
2.84%, 09/13/26(a) | 800 | 731,978 | ||||||
3.17%, 09/11/27(a) | 478 | 430,175 | ||||||
4.02%, 03/05/28 | 600 | 554,317 | ||||||
2.56%, 09/13/31 | 1,310 | 962,599 | ||||||
(1-year CMT + 0.67%), 1.23%, 05/22/27(b) | 1,310 | 1,154,643 | ||||||
(1-year CMT + 0.75%), 1.55%, 07/09/27(b) | 500 | 441,724 | ||||||
(1-year CMT + 0.90%), | 400 | 377,644 | ||||||
(1-year CMT + 1.50%), 5.67%, 05/27/29(b) | 300 | 291,870 | ||||||
(1-year CMT + 1.65%), 5.78%, 07/06/29(b) | 600 | 585,992 | ||||||
(1-year CMT + 1.65%), | 300 | 287,216 | ||||||
(1-year CMT + 1.80%), 5.75%, 05/27/34(b) | 600 | 560,270 | ||||||
(1-year CMT + 1.90%), 5.75%, 07/06/34(b) | 600 | 557,742 | ||||||
(1-year CMT + 2.05%), 5.41%, 09/13/28(b) | 400 | 388,128 | ||||||
(1-year CMT + 2.40%), 5.67%, 09/13/33(b) | 300 | 280,374 | ||||||
(3-mo. CME Term SOFR + 1.09%), | 450 | 422,091 | ||||||
(3-mo. CME Term SOFR + 1.39%), | 478 | 401,462 | ||||||
(3-mo. CME Term SOFR + 1.53%), | 600 | 545,133 | ||||||
(3-mo. CME Term SOFR + 1.53%), | 300 | 222,615 | ||||||
(3-mo. CME Term SOFR + 1.57%), | 420 | 345,622 | ||||||
(3-mo. CME Term SOFR + 1.77%), | 478 | 363,000 | ||||||
Morgan Stanley | ||||||||
4.00%, 07/23/25 | 1,662 | 1,608,493 | ||||||
5.00%, 11/24/25 | 1,036 | 1,012,336 | ||||||
3.88%, 01/27/26 | 1,450 | 1,383,056 | ||||||
3.13%, 07/27/26 | 1,763 | 1,631,037 | ||||||
4.35%, 09/08/26 | 1,243 | 1,176,008 | ||||||
3.63%, 01/20/27(a) | 1,659 | 1,541,881 | ||||||
3.95%, 04/23/27 | 1,063 | 978,871 | ||||||
3.59%, 07/22/28(b) | 1,866 | 1,692,298 | ||||||
7.25%, 04/01/32 | 400 | 426,850 | ||||||
| Security | Par (000) | Value | ||||||
| Financial Services (continued) | ||||||||
Morgan Stanley (continued) | ||||||||
(1-day SOFR + 0.72%), | $ | 1,493 | $ | 1,328,696 | ||||
(1-day SOFR + 0.86%), | 1,584 | 1,390,499 | ||||||
(1-day SOFR + 0.88%), | 1,809 | 1,607,433 | ||||||
(1-day SOFR + 0.94%), | 676 | 643,620 | ||||||
(1-day SOFR + 1.00%), | 1,181 | 1,046,641 | ||||||
(1-day SOFR + 1.02%), | 972 | 704,076 | ||||||
(1-day SOFR + 1.03%), | 1,642 | 1,187,927 | ||||||
(1-day SOFR + 1.14%), | 1,659 | 1,332,967 | ||||||
(1-day SOFR + 1.18%), | 2,063 | 1,521,555 | ||||||
(1-day SOFR + 1.20%), | 1,364 | 1,020,223 | ||||||
(1-day SOFR + 1.29%), | 1,662 | 1,275,416 | ||||||
(1-day SOFR + 1.30%), | 480 | 468,778 | ||||||
(1-day SOFR + 1.36%), | 1,031 | 729,344 | ||||||
(1-day SOFR + 1.59%), | 1,710 | 1,626,942 | ||||||
(1-day SOFR + 1.61%), | 1,554 | 1,449,261 | ||||||
(1-day SOFR + 1.63%), | 1,680 | 1,615,723 | ||||||
(1-day SOFR + 1.67%), | 1,715 | 1,666,395 | ||||||
(1-day SOFR + 1.73%), 5.12%, 02/01/29(b) | 1,195 | 1,137,749 | ||||||
(1-day SOFR + 1.87%), | 2,190 | 1,973,211 | ||||||
(1-day SOFR + 1.88%), | 1,295 | 1,181,923 | ||||||
(1-day SOFR + 1.99%), | 2,196 | 2,065,542 | ||||||
(1-day SOFR + 2.08%), | 1,165 | 1,031,672 | ||||||
(1-day SOFR + 2.24%), | 1,800 | 1,796,764 | ||||||
(1-day SOFR + 2.56%), | 1,400 | 1,372,530 | ||||||
(1-day SOFR + 2.62%), | 546 | 473,525 | ||||||
(1-day SOFR + 3.12%), | 1,186 | 1,004,158 | ||||||
(3-mo. CME Term SOFR + 1.40%), | 1,189 | 1,072,399 | ||||||
(3-mo. CME Term SOFR + 1.89%), | 1,020 | 928,735 | ||||||
(5-year CMT + 2.43%), | 910 | 825,164 | ||||||
Nasdaq, Inc. | ||||||||
3.85%, 06/30/26 | 496 | 473,307 | ||||||
1.65%, 01/15/31 | 243 | 179,473 | ||||||
National Rural Utilities Cooperative Finance Corp. | ||||||||
5.60%, 11/13/26 | 150 | 149,941 | ||||||
5.05%, 09/15/28 | 175 | 169,970 | ||||||
(5-year CMT + 3.53%), | 200 | 198,290 | ||||||
NatWest Group PLC | ||||||||
4.80%, 04/05/26 | 478 | 460,559 | ||||||
(1-year CMT + 0.90%), | 1,100 | 968,905 | ||||||
(1-year CMT + 1.35%), | 650 | 639,118 | ||||||
(1-year CMT + 1.95%), | 400 | 383,409 | ||||||
(1-year CMT + 2.10%), | 500 | 465,559 | ||||||
(1-year CMT + 2.27%), 5.52%, 09/30/28(b) | 525 | 502,335 | ||||||
(1-year CMT + 2.55%), 3.07%, 05/22/28(b) | 650 | 574,957 | ||||||
(1-year CMT + 2.85%), 7.47%, 11/10/26(b) | 800 | 814,068 | ||||||
(3-mo. LIBOR US + 1.75%), | 728 | 673,551 | ||||||
(3-mo. LIBOR US + 1.87%), | 478 | 423,705 | ||||||
(3-mo. LIBOR US + 1.91%), | 1,178 | 1,081,253 | ||||||
(5-year CMT + 2.10%), | 1,725 | 1,646,175 | ||||||
ORIX Corp. | ||||||||
3.70%, 07/18/27(a) | 350 | 323,797 | ||||||
5.00%, 09/13/27(a) | 200 | 194,353 | ||||||
2.25%, 03/09/31 | 413 | 318,628 | ||||||
4.00%, 04/13/32 | 313 | 269,697 | ||||||
5.20%, 09/13/32(a) | 200 | 187,350 | ||||||
Radian Group, Inc., 6.63%, 03/15/25 | 400 | 396,000 | ||||||
Sumitomo Mitsui Financial Group, Inc. | ||||||||
2.35%, 01/15/25 | 1,310 | 1,252,572 | ||||||
1.47%, 07/08/25 | 1,310 | 1,213,373 | ||||||
0.95%, 01/12/26 | 550 | 491,816 | ||||||
| 38 | 2 0 2 3 BLACK ROCK ANNUAL REPORT TO SHAREHOLDERS |
Schedule of Investments (continued) October 31, 2023 | iShares U.S. Intermediate Credit Bond Index Fund (Percentages shown are based on Net Assets) |
| Security | Par (000) | Value | ||||||
| Financial Services (continued) | ||||||||
Sumitomo Mitsui Financial Group, Inc. (continued) |
| |||||||
5.46%, 01/13/26 | $ | 500 | $ | 493,406 | ||||
3.78%, 03/09/26 | 2,489 | 2,363,374 | ||||||
2.63%, 07/14/26 | 829 | 759,824 | ||||||
1.40%, 09/17/26 | 982 | 861,936 | ||||||
3.01%, 10/19/26(a) | 863 | 792,080 | ||||||
3.45%, 01/11/27 | 700 | 646,192 | ||||||
3.36%, 07/12/27(a) | 829 | 753,781 | ||||||
3.35%, 10/18/27 | 413 | 372,379 | ||||||
5.52%, 01/13/28 | 500 | 486,932 | ||||||
3.54%, 01/17/28 | 309 | 278,556 | ||||||
1.90%, 09/17/28 | 982 | 803,061 | ||||||
3.04%, 07/16/29 | 1,440 | 1,214,062 | ||||||
3.20%, 09/17/29(a) | 413 | 349,971 | ||||||
2.72%, 09/27/29 | 478 | 393,446 | ||||||
5.71%, 01/13/30 | 1,000 | 963,333 | ||||||
2.75%, 01/15/30 | 750 | 608,615 | ||||||
2.13%, 07/08/30 | 1,310 | 1,003,175 | ||||||
1.71%, 01/12/31 | 235 | 170,702 | ||||||
2.22%, 09/17/31 | 400 | 296,312 | ||||||
5.77%, 01/13/33 | 650 | 616,336 | ||||||
UBS Group AG, 3.75%, 03/26/25 | 1,637 | 1,576,415 | ||||||
|
| |||||||
| 437,228,103 | ||||||||
| Food Products — 0.7% | ||||||||
Archer-Daniels-Midland Co. | ||||||||
2.50%, 08/11/26 | 350 | 324,647 | ||||||
3.25%, 03/27/30 | 500 | 433,129 | ||||||
2.90%, 03/01/32 | 523 | 424,343 | ||||||
4.50%, 08/15/33 | 310 | 279,411 | ||||||
Bunge Ltd. Finance Corp. | ||||||||
1.63%, 08/17/25 | 350 | 324,051 | ||||||
3.25%, 08/15/26 | 400 | 372,535 | ||||||
3.75%, 09/25/27 | 179 | 165,557 | ||||||
2.75%, 05/14/31 | 579 | 458,351 | ||||||
Conagra Brands, Inc., 5.30%, 10/01/26 | 250 | 245,724 | ||||||
Diageo Capital PLC | ||||||||
5.38%, 10/05/26 | 200 | 200,129 | ||||||
5.63%, 10/05/33 | 200 | 196,331 | ||||||
Flowers Foods, Inc., 2.40%, 03/15/31 | 350 | 267,969 | ||||||
General Mills, Inc. | ||||||||
5.50%, 10/17/28 | 165 | 162,011 | ||||||
2.88%, 04/15/30 | 229 | 189,302 | ||||||
4.95%, 03/29/33(a) | 670 | 608,484 | ||||||
Hershey Co. | ||||||||
2.05%, 11/15/24 | 413 | 397,841 | ||||||
2.30%, 08/15/26 | 350 | 324,385 | ||||||
4.25%, 05/04/28 | 35 | 33,592 | ||||||
2.45%, 11/15/29 | 413 | 350,754 | ||||||
4.50%, 05/04/33(a) | 50 | 45,946 | ||||||
Hormel Foods Corp. | ||||||||
1.70%, 06/03/28 | 277 | 234,931 | ||||||
1.80%, 06/11/30 | 400 | 313,073 | ||||||
J M Smucker Co. | ||||||||
3.50%, 03/15/25 | 336 | 325,220 | ||||||
3.38%, 12/15/27 | 250 | 228,177 | ||||||
5.90%, 11/15/28 | 375 | 372,041 | ||||||
2.13%, 03/15/32 | 179 | 131,026 | ||||||
6.20%, 11/15/33 | 375 | 364,507 | ||||||
JBS USA LUX SA/JBS USA Food Co./JBS USA Finance, Inc. | ||||||||
2.50%, 01/15/27 | 400 | 351,304 | ||||||
5.13%, 02/01/28 | 500 | 469,548 | ||||||
| Security | Par (000) | Value | ||||||
| Food Products (continued) | ||||||||
JBS USA LUX SA/JBS USA Food Co./JBS USA Finance, Inc. (continued) | ||||||||
3.00%, 02/02/29 | $ | 350 | $ | 288,160 | ||||
5.50%, 01/15/30 | 700 | 639,712 | ||||||
3.63%, 01/15/32(a) | 550 | 422,784 | ||||||
3.00%, 05/15/32 | 900 | 654,543 | ||||||
5.75%, 04/01/33(a) | 880 | 777,233 | ||||||
JM Smucker Co., 2.38%, 03/15/30 | 250 | 199,870 | ||||||
McCormick & Co., Inc., 4.95%, 04/15/33(a) | 300 | 270,366 | ||||||
Mondelez International, Inc. | ||||||||
1.50%, 05/04/25 | 288 | 269,708 | ||||||
2.63%, 03/17/27 | 259 | 234,374 | ||||||
2.75%, 04/13/30 | 459 | 377,987 | ||||||
1.50%, 02/04/31 | 480 | 352,279 | ||||||
3.00%, 03/17/32 | 400 | 321,152 | ||||||
1.88%, 10/15/32 | 413 | 296,643 | ||||||
Pilgrim’s Pride Corp. | ||||||||
4.25%, 04/15/31 | 450 | 370,692 | ||||||
3.50%, 03/01/32 | 360 | 274,248 | ||||||
6.25%, 07/01/33(a) | 550 | 505,448 | ||||||
Tyson Foods, Inc. | ||||||||
4.00%, 03/01/26 | 300 | 287,662 | ||||||
3.55%, 06/02/27(a) | 829 | 763,035 | ||||||
4.35%, 03/01/29 | 500 | 459,578 | ||||||
Unilever Capital Corp. | ||||||||
4.88%, 09/08/28(a) | 300 | 293,037 | ||||||
5.00%, 12/08/33 | 300 | 282,483 | ||||||
|
| |||||||
| 16,935,313 | ||||||||
| Gas Utilities — 0.2% | ||||||||
Atmos Energy Corp., 5.90%, 11/15/33(a) | 200 | 197,064 | ||||||
CenterPoint Energy Resources Corp., | 515 | 503,484 | ||||||
Cheniere Corpus Christi Holdings LLC | ||||||||
5.88%, 03/31/25 | 950 | 945,396 | ||||||
5.13%, 06/30/27 | 593 | 572,154 | ||||||
3.70%, 11/15/29 | 763 | 664,813 | ||||||
National Fuel Gas Co., 5.50%, 10/01/26 | 140 | 136,892 | ||||||
NiSource, Inc. | ||||||||
5.25%, 03/30/28 | 555 | 538,841 | ||||||
5.40%, 06/30/33 | 60 | 55,831 | ||||||
Piedmont Natural Gas Co., Inc., | 160 | 148,583 | ||||||
Southern California Gas Co., | 220 | 203,257 | ||||||
Southern Co. Gas Capital Corp. | ||||||||
5.75%, 09/15/33 | 300 | 285,551 | ||||||
Series 20-A, 1.75%, 01/15/31 | 413 | 304,858 | ||||||
Southwest Gas Corp., 4.05%, 03/15/32(a) | 225 | 190,556 | ||||||
|
| |||||||
| 4,747,280 | ||||||||
| Ground Transportation — 0.8% | ||||||||
Burlington Northern Santa Fe LLC | ||||||||
3.00%, 04/01/25 | 350 | 338,808 | ||||||
3.65%, 09/01/25 | 620 | 600,444 | ||||||
7.00%, 12/15/25(a) | 163 | 168,503 | �� | |||||
3.25%, 06/15/27(a) | 1,450 | 1,347,894 | ||||||
Canadian National Railway Co. | ||||||||
2.95%, 11/21/24 | 229 | 222,184 | ||||||
2.75%, 03/01/26 | 463 | 434,802 | ||||||
6.90%, 07/15/28 | 250 | 264,221 | ||||||
3.85%, 08/05/32 | 400 | 346,245 | ||||||
5.85%, 11/01/33 | 80 | 79,715 | ||||||
Canadian Pacific Railway Co. | ||||||||
1.35%, 12/02/24 | 950 | 904,656 | ||||||
2.90%, 02/01/25 | 829 | 799,154 | ||||||
SCHEDULE OF INVESTMENTS | 39 |
Schedule of Investments (continued) October 31, 2023 | iShares U.S. Intermediate Credit Bond Index Fund (Percentages shown are based on Net Assets) |
| Security | Par (000) | Value | ||||||
| Ground Transportation (continued) | ||||||||
Canadian Pacific Railway Co. (continued) | ||||||||
1.75%, 12/02/26 | $ | 613 | $ | 545,090 | ||||
4.00%, 06/01/28 | 400 | 371,791 | ||||||
2.88%, 11/15/29 | 57 | 48,044 | ||||||
2.05%, 03/05/30 | 179 | 142,071 | ||||||
7.13%, 10/15/31 | 163 | 172,274 | ||||||
2.45%, 12/02/31 | 916 | 798,605 | ||||||
CSX Corp. | ||||||||
3.35%, 11/01/25 | 163 | 155,912 | ||||||
2.60%, 11/01/26 | 400 | 366,355 | ||||||
3.25%, 06/01/27 | 309 | 284,477 | ||||||
3.80%, 03/01/28 | 1,023 | 950,124 | ||||||
4.25%, 03/15/29 | 500 | 466,586 | ||||||
2.40%, 02/15/30 | 413 | 337,527 | ||||||
4.10%, 11/15/32 | 300 | 262,224 | ||||||
5.20%, 11/15/33 | 300 | 281,558 | ||||||
Kirby Corp., | 250 | 230,290 | ||||||
Norfolk Southern Corp. | ||||||||
2.90%, 06/15/26 | 400 | 373,678 | ||||||
3.15%, 06/01/27(a) | 727 | 666,791 | ||||||
2.55%, 11/01/29 | 107 | 88,786 | ||||||
5.05%, 08/01/30 | 440 | 415,975 | ||||||
3.00%, 03/15/32(a) | 374 | 300,623 | ||||||
4.45%, 03/01/33(a) | 500 | 443,604 | ||||||
Ryder System, Inc. | ||||||||
6.30%, 12/01/28 | 200 | 199,243 | ||||||
6.60%, 12/01/33 | 170 | 168,737 | ||||||
Union Pacific Corp. | ||||||||
3.75%, 07/15/25 | 400 | 388,293 | ||||||
3.25%, 08/15/25 | 163 | 156,669 | ||||||
4.75%, 02/21/26 | 500 | 492,821 | ||||||
2.75%, 03/01/26 | 829 | 777,253 | ||||||
2.15%, 02/05/27 | 103 | 92,470 | ||||||
3.95%, 09/10/28(a) | 829 | 775,702 | ||||||
3.70%, 03/01/29 | 829 | 760,648 | ||||||
2.40%, 02/05/30 | 312 | 256,328 | ||||||
2.38%, 05/20/31 | 419 | 330,573 | ||||||
2.80%, 02/14/32 | 741 | 593,230 | ||||||
4.50%, 01/20/33(a) | 500 | 452,669 | ||||||
|
| |||||||
| 18,653,647 | ||||||||
| Health Care Equipment & Supplies — 1.0% | ||||||||
Abbott Laboratories | ||||||||
2.95%, 03/15/25(a) | 400 | 386,839 | ||||||
3.75%, 11/30/26 | 1,174 | 1,123,391 | ||||||
1.15%, 01/30/28 | 438 | 370,982 | ||||||
1.40%, 06/30/30(a) | 366 | 284,106 | ||||||
Baxter International, Inc. | ||||||||
1.32%, 11/29/24 | 600 | 570,192 | ||||||
2.60%, 08/15/26 | 603 | 550,037 | ||||||
1.92%, 02/01/27 | 502 | 440,232 | ||||||
2.27%, 12/01/28(a) | 446 | 369,072 | ||||||
3.95%, 04/01/30 | 413 | 358,944 | ||||||
1.73%, 04/01/31 | 400 | 290,555 | ||||||
2.54%, 02/01/32(a) | 600 | 449,959 | ||||||
Becton Dickinson & Co. | ||||||||
3.73%, 12/15/24 | 282 | 275,076 | ||||||
3.70%, 06/06/27 | 1,051 | 977,947 | ||||||
4.69%, 02/13/28 | 410 | 392,459 | ||||||
2.82%, 05/20/30 | 388 | 319,572 | ||||||
1.96%, 02/11/31(a) | 390 | 296,854 | ||||||
4.30%, 08/22/32 | 190 | 166,882 | ||||||
Boston Scientific Corp., | 829 | 681,859 | ||||||
Danaher Corp., | 225 | 216,099 | ||||||
| Security | Par (000) | Value | ||||||
| Health Care Equipment & Supplies (continued) | ||||||||
DENTSPLY SIRONA, Inc., 3.25%, 06/01/30 | $ | 450 | $ | 366,300 | ||||
DH Europe Finance II SARL | ||||||||
2.20%, 11/15/24 | 829 | 798,967 | ||||||
2.60%, 11/15/29 | 366 | 309,769 | ||||||
Edwards Lifesciences Corp., | 400 | 374,786 | ||||||
GE HealthCare Technologies, Inc. | ||||||||
5.55%, 11/15/24 | 260 | 258,753 | ||||||
5.60%, 11/15/25 | 620 | 616,601 | ||||||
5.65%, 11/15/27 | 1,000 | 989,744 | ||||||
5.86%, 03/15/30 | 500 | 488,388 | ||||||
5.91%, 11/22/32 | 1,100 | 1,064,781 | ||||||
Medtronic Global Holdings SCA | ||||||||
4.25%, 03/30/28 | 650 | 619,174 | ||||||
4.50%, 03/30/33(a) | 645 | 586,098 | ||||||
Revvity, Inc. | ||||||||
1.90%, 09/15/28 | 430 | 352,502 | ||||||
3.30%, 09/15/29 | 429 | 365,422 | ||||||
2.25%, 09/15/31 | 156 | 116,073 | ||||||
Smith & Nephew PLC, 2.03%, 10/14/30 | 560 | 421,283 | ||||||
STERIS Irish FinCo UnLtd Co., | 334 | 264,360 | ||||||
Stryker Corp. | ||||||||
1.15%, 06/15/25 | 400 | 371,834 | ||||||
3.38%, 11/01/25 | 480 | 459,601 | ||||||
3.50%, 03/15/26 | 413 | 392,748 | ||||||
3.65%, 03/07/28 | 350 | 323,074 | ||||||
1.95%, 06/15/30 | 400 | 312,828 | ||||||
Thermo Fisher Scientific, Inc. | ||||||||
4.95%, 08/10/26 | 700 | 693,019 | ||||||
4.80%, 11/21/27(a) | 125 | 122,560 | ||||||
1.75%, 10/15/28(a) | 313 | 261,738 | ||||||
2.60%, 10/01/29 | 402 | 340,939 | ||||||
4.98%, 08/10/30 | 520 | 496,020 | ||||||
2.00%, 10/15/31 | 763 | 575,736 | ||||||
4.95%, 11/21/32 | 230 | 214,064 | ||||||
5.09%, 08/10/33 | 605 | 565,891 | ||||||
Zimmer Biomet Holdings, Inc. | ||||||||
1.45%, 11/22/24 | 350 | 333,289 | ||||||
3.55%, 04/01/25 | 700 | 676,252 | ||||||
3.05%, 01/15/26 | 400 | 376,251 | ||||||
2.60%, 11/24/31 | 261 | 200,057 | ||||||
|
| |||||||
| 23,229,959 | ||||||||
| Health Care Providers & Services — 2.0% | ||||||||
Adventist Health System, 5.43%, 03/01/32 | 500 | 473,439 | ||||||
Aetna, Inc., 3.50%, 11/15/24 | 239 | 232,975 | ||||||
Ascension Health, Series B, | 97 | 81,645 | ||||||
Banner Health, 2.34%, 01/01/30 | 500 | 406,086 | ||||||
Baylor Scott & White Holdings, | 57 | 43,652 | ||||||
Bon Secours Mercy Health, Inc., | 130 | 112,432 | ||||||
Cardinal Health, Inc. | ||||||||
3.50%, 11/15/24 | 163 | 158,764 | ||||||
3.75%, 09/15/25 | 413 | 396,262 | ||||||
3.41%, 06/15/27 | 829 | 759,519 | ||||||
Cedars-Sinai Health System, | 130 | 100,203 | ||||||
Cencora, Inc. | ||||||||
3.45%, 12/15/27(a) | 620 | 571,152 | ||||||
2.80%, 05/15/30 | 329 | 270,466 | ||||||
2.70%, 03/15/31 | 413 | 327,266 | ||||||
Centene Corp. | ||||||||
4.25%, 12/15/27 | 1,100 | 1,012,330 | ||||||
2.45%, 07/15/28 | 1,700 | 1,430,023 | ||||||
4.63%, 12/15/29 | 1,750 | 1,563,206 | ||||||
| 40 | 2 0 2 3 BLACK ROCK ANNUAL REPORT TO SHAREHOLDERS |
Schedule of Investments (continued) October 31, 2023 | iShares U.S. Intermediate Credit Bond Index Fund (Percentages shown are based on Net Assets) |
| Security | Par (000) | Value | ||||||
| Health Care Providers & Services (continued) | ||||||||
Centene Corp. (continued) | ||||||||
3.38%, 02/15/30 | $ | 1,050 | $ | 868,192 | ||||
3.00%, 10/15/30(a) | 900 | 712,236 | ||||||
2.50%, 03/01/31 | 1,000 | 756,489 | ||||||
2.63%, 08/01/31 | 550 | 413,050 | ||||||
CHRISTUS Health, Series C, 4.34%, 07/01/28 | 100 | 93,950 | ||||||
CommonSpirit Health | ||||||||
1.55%, 10/01/25 | 120 | 109,914 | ||||||
3.35%, 10/01/29 | 338 | 290,059 | ||||||
2.78%, 10/01/30 | 430 | 344,824 | ||||||
Elevance Health, Inc. | ||||||||
3.35%, 12/01/24 | 350 | 340,686 | ||||||
2.38%, 01/15/25 | 603 | 578,581 | ||||||
5.35%, 10/15/25 | 220 | 218,294 | ||||||
4.90%, 02/08/26 | 250 | 245,340 | ||||||
1.50%, 03/15/26 | 820 | 742,782 | ||||||
3.65%, 12/01/27 | 829 | 763,692 | ||||||
4.10%, 03/01/28 | 600 | 560,489 | ||||||
2.88%, 09/15/29 | 550 | 467,259 | ||||||
2.25%, 05/15/30 | 649 | 517,392 | ||||||
2.55%, 03/15/31 | 579 | 457,945 | ||||||
5.50%, 10/15/32 | 600 | 573,966 | ||||||
4.75%, 02/15/33 | 700 | 634,747 | ||||||
HCA, Inc. | ||||||||
5.38%, 02/01/25 | 1,500 | 1,484,083 | ||||||
5.25%, 04/15/25 | 829 | 817,341 | ||||||
5.88%, 02/15/26 | 550 | 545,161 | ||||||
5.25%, 06/15/26 | 829 | 809,401 | ||||||
5.38%, 09/01/26 | 400 | 391,214 | ||||||
4.50%, 02/15/27 | 400 | 378,321 | ||||||
3.13%, 03/15/27 | 942 | 850,041 | ||||||
5.20%, 06/01/28 | 245 | 233,268 | ||||||
5.63%, 09/01/28 | 550 | 532,101 | ||||||
5.88%, 02/01/29 | 600 | 581,291 | ||||||
4.13%, 06/15/29 | 1,170 | 1,038,459 | ||||||
3.50%, 09/01/30 | 1,650 | 1,365,612 | ||||||
2.38%, 07/15/31 | 829 | 616,395 | ||||||
3.63%, 03/15/32 | 775 | 622,532 | ||||||
5.50%, 06/01/33 | 500 | 456,159 | ||||||
Humana, Inc. | ||||||||
4.50%, 04/01/25 | 350 | 343,816 | ||||||
1.35%, 02/03/27 | 633 | 548,753 | ||||||
3.95%, 03/15/27 | 350 | 330,009 | ||||||
5.75%, 03/01/28 | 115 | 114,556 | ||||||
3.70%, 03/23/29 | 288 | 260,477 | ||||||
3.13%, 08/15/29(a) | 413 | 358,111 | ||||||
2.15%, 02/03/32 | 384 | 283,605 | ||||||
5.88%, 03/01/33 | 500 | 484,773 | ||||||
Kaiser Foundation Hospitals, 3.15%, 05/01/27 | 679 | 629,178 | ||||||
McKesson Corp. | ||||||||
0.90%, 12/03/25 | 250 | 226,638 | ||||||
1.30%, 08/15/26 | 745 | 661,296 | ||||||
3.95%, 02/16/28 | 129 | 121,190 | ||||||
4.90%, 07/15/28 | 110 | 106,810 | ||||||
5.10%, 07/15/33 | 90 | 83,676 | ||||||
PeaceHealth Obligated Group, | 200 | 182,375 | ||||||
Providence St Joseph Health Obligated Group, |
| |||||||
Series 19A, 2.53%, 10/01/29 | 743 | 610,239 | ||||||
Quest Diagnostics, Inc., 6.40%, 11/30/33 | 100 | 99,699 | ||||||
SSM Health Care Corp., 4.89%, 06/01/28 | 250 | 241,539 | ||||||
| Security | Par (000) | Value | ||||||
| Health Care Providers & Services (continued) | ||||||||
Stanford Health Care, | $ | 250 | $ | 214,628 | ||||
Sutter Health | ||||||||
Series 20A, 2.29%, 08/15/30(a) | 267 | 210,836 | ||||||
Series 20-A, 1.32%, 08/15/25 | 63 | 57,816 | ||||||
UnitedHealth Group, Inc. | ||||||||
3.75%, 07/15/25 | 829 | 807,324 | ||||||
5.15%, 10/15/25 | 500 | 498,074 | ||||||
1.25%, 01/15/26 | 136 | 124,124 | ||||||
3.10%, 03/15/26 | 413 | 391,999 | ||||||
1.15%, 05/15/26 | 824 | 743,934 | ||||||
3.45%, 01/15/27 | 413 | 388,562 | ||||||
3.38%, 04/15/27 | 829 | 774,174 | ||||||
3.70%, 05/15/27 | 400 | 376,858 | ||||||
2.95%, 10/15/27 | 350 | 318,504 | ||||||
5.25%, 02/15/28(a) | 625 | 620,868 | ||||||
3.85%, 06/15/28 | 829 | 773,302 | ||||||
3.88%, 12/15/28 | 500 | 465,024 | ||||||
4.25%, 01/15/29(a) | 590 | 554,675 | ||||||
4.00%, 05/15/29 | 350 | 323,845 | ||||||
2.88%, 08/15/29 | 416 | 360,846 | ||||||
5.30%, 02/15/30 | 800 | 785,311 | ||||||
2.00%, 05/15/30 | 736 | 584,839 | ||||||
2.30%, 05/15/31 | 948 | 745,938 | ||||||
4.20%, 05/15/32 | 950 | 842,289 | ||||||
5.35%, 02/15/33(a) | 900 | 865,055 | ||||||
4.50%, 04/15/33 | 590 | 531,238 | ||||||
Universal Health Services, Inc. | ||||||||
1.65%, 09/01/26 | 745 | 657,092 | ||||||
2.65%, 10/15/30 | 350 | 267,563 | ||||||
2.65%, 01/15/32 | 195 | 143,156 | ||||||
UPMC, 5.04%, 05/15/33 | 614 | 569,556 | ||||||
|
| |||||||
| 48,034,856 | ||||||||
| Health Care Technology — 0.2% | ||||||||
IQVIA, Inc., 5.70%, 05/15/28(d) | 350 | 336,000 | ||||||
Laboratory Corp. of America Holdings | ||||||||
2.30%, 12/01/24 | 829 | 796,479 | ||||||
3.60%, 02/01/25 | 450 | 436,975 | ||||||
1.55%, 06/01/26 | 425 | 380,533 | ||||||
3.60%, 09/01/27 | 413 | 384,315 | ||||||
2.95%, 12/01/29 | 400 | 337,573 | ||||||
2.70%, 06/01/31 | 156 | 122,993 | ||||||
Quest Diagnostics, Inc. | ||||||||
3.50%, 03/30/25 | 305 | 294,272 | ||||||
3.45%, 06/01/26 | 250 | 235,721 | ||||||
4.20%, 06/30/29 | 163 | 149,935 | ||||||
2.95%, 06/30/30 | 350 | 287,396 | ||||||
2.80%, 06/30/31 | 329 | 260,425 | ||||||
|
| |||||||
| 4,022,617 | ||||||||
| Hotels, Restaurants & Leisure — 0.8% | ||||||||
Choice Hotels International, Inc. | ||||||||
3.70%, 12/01/29 | 130 | 106,468 | ||||||
3.70%, 01/15/31 | 300 | 235,957 | ||||||
Darden Restaurants, Inc. | ||||||||
3.85%, 05/01/27 | 250 | 231,858 | ||||||
6.30%, 10/10/33 | 250 | 242,831 | ||||||
GLP Capital LP/GLP Financing II, Inc. | ||||||||
5.25%, 06/01/25 | 329 | 320,905 | ||||||
5.38%, 04/15/26 | 450 | 431,281 | ||||||
Hyatt Hotels Corp. | ||||||||
5.38%, 04/23/25 | 500 | 493,568 | ||||||
4.38%, 09/15/28 | 229 | 209,641 | ||||||
SCHEDULE OF INVESTMENTS | 41 |
Schedule of Investments (continued) October 31, 2023 | iShares U.S. Intermediate Credit Bond Index Fund (Percentages shown are based on Net Assets) |
| Security | Par (000) | Value | ||||||
| Hotels, Restaurants & Leisure (continued) | ||||||||
Hyatt Hotels Corp. (continued) | ||||||||
5.75%, 04/23/30(a) | $ | 413 | $ | 391,548 | ||||
Marriott International, Inc. | ||||||||
5.45%, 09/15/26 | 75 | 74,047 | ||||||
5.00%, 10/15/27(a) | 210 | 202,857 | ||||||
5.55%, 10/15/28 | 250 | 243,624 | ||||||
4.90%, 04/15/29 | 490 | 459,579 | ||||||
Series EE, 5.75%, 05/01/25 | 502 | 500,439 | ||||||
Series FF, 4.63%, 06/15/30 | 829 | 747,955 | ||||||
Series GG, 3.50%, 10/15/32 | 400 | 317,560 | ||||||
Series HH, 2.85%, 04/15/31 | 550 | 432,211 | ||||||
Series R, 3.13%, 06/15/26 | 829 | 773,688 | ||||||
Series X, 4.00%, 04/15/28 | 829 | 761,772 | ||||||
McDonald’s Corp. | ||||||||
3.38%, 05/26/25 | 413 | 398,809 | ||||||
3.30%, 07/01/25 | 455 | 438,066 | ||||||
3.70%, 01/30/26 | 829 | 796,888 | ||||||
3.50%, 03/01/27 | 829 | 774,709 | ||||||
3.50%, 07/01/27 | 360 | 334,480 | ||||||
3.80%, 04/01/28 | 829 | 769,127 | ||||||
4.80%, 08/14/28 | 250 | 241,106 | ||||||
2.63%, 09/01/29 | 400 | 340,628 | ||||||
2.13%, 03/01/30 | 450 | 361,704 | ||||||
3.60%, 07/01/30 | 315 | 275,885 | ||||||
4.60%, 09/09/32(a) | 400 | 367,065 | ||||||
4.95%, 08/14/33(a) | 375 | 347,896 | ||||||
Sands China Ltd. | ||||||||
5.38%, 08/08/25 | 800 | 770,792 | ||||||
5.65%, 08/08/28 | 850 | 783,913 | ||||||
3.10%, 03/08/29 | 400 | 320,828 | ||||||
4.88%, 06/18/30 | 400 | 334,300 | ||||||
3.50%, 08/08/31 | 400 | 300,900 | ||||||
Starbucks Corp. | ||||||||
3.80%, 08/15/25 | 829 | 801,984 | ||||||
4.75%, 02/15/26 | 200 | 196,439 | ||||||
2.00%, 03/12/27 | 500 | 444,377 | ||||||
3.50%, 03/01/28 | 350 | 321,446 | ||||||
4.00%, 11/15/28 | 413 | 383,852 | ||||||
3.55%, 08/15/29 | 336 | 300,622 | ||||||
2.25%, 03/12/30 | 179 | 144,423 | ||||||
2.55%, 11/15/30 | 660 | 532,378 | ||||||
3.00%, 02/14/32 | 628 | 507,370 | ||||||
4.80%, 02/15/33(a) | 300 | 274,748 | ||||||
|
| |||||||
| 19,042,524 | ||||||||
| Household Durables — 0.2% | ||||||||
DR Horton, Inc. | ||||||||
2.60%, 10/15/25 | 350 | 328,247 | ||||||
1.30%, 10/15/26 | 241 | 211,350 | ||||||
1.40%, 10/15/27 | 179 | 150,880 | ||||||
Leggett & Platt, Inc. | ||||||||
3.80%, 11/15/24 | 130 | 127,475 | ||||||
3.50%, 11/15/27 | 250 | 224,889 | ||||||
4.40%, 03/15/29 | 179 | 162,272 | ||||||
Lennar Corp. | ||||||||
4.75%, 05/30/25 | 159 | 155,667 | ||||||
4.75%, 11/29/27 | 309 | 293,990 | ||||||
MDC Holdings, Inc., 2.50%, 01/15/31 | 130 | 95,168 | ||||||
Mohawk Industries, Inc., 5.85%, 09/18/28(a) | 250 | 245,630 | ||||||
NVR, Inc., 3.00%, 05/15/30 | 350 | 287,262 | ||||||
PulteGroup, Inc. | ||||||||
5.50%, 03/01/26 | 250 | 246,927 | ||||||
5.00%, 01/15/27(a) | 250 | 242,951 | ||||||
| Security | Par (000) | Value | ||||||
| Household Durables (continued) | ||||||||
PulteGroup, Inc. (continued) | ||||||||
7.88%, 06/15/32 | $ | 200 | $ | 214,581 | ||||
Toll Brothers Finance Corp. | ||||||||
4.88%, 11/15/25 | 26 | 25,262 | ||||||
4.88%, 03/15/27 | 225 | 214,352 | ||||||
4.35%, 02/15/28 | 225 | 206,648 | ||||||
3.80%, 11/01/29 | 225 | 193,817 | ||||||
Whirlpool Corp. | ||||||||
4.75%, 02/26/29(a) | 250 | 233,399 | ||||||
2.40%, 05/15/31 | 159 | 121,479 | ||||||
4.70%, 05/14/32(a) | 130 | 114,759 | ||||||
5.50%, 03/01/33 | 150 | 136,931 | ||||||
|
| |||||||
| 4,233,936 | ||||||||
| Household Products — 0.0% | ||||||||
Church & Dwight Co., Inc. | ||||||||
3.15%, 08/01/27 | 250 | 229,550 | ||||||
2.30%, 12/15/31 | 129 | 99,916 | ||||||
5.60%, 11/15/32 | 50 | 48,923 | ||||||
|
| |||||||
| 378,389 | ||||||||
| Industrial Conglomerates — 0.0% | ||||||||
General Electric Co., Series A, 6.75%, 03/15/32 | 750 | 794,641 | ||||||
Pentair Finance SARL, 5.90%, 07/15/32(a) | 400 | 380,310 | ||||||
|
| |||||||
| 1,174,951 | ||||||||
| Industrial REITs — 0.0% | ||||||||
LXP Industrial Trust, 2.38%, 10/01/31 | 300 | 214,537 | ||||||
|
| |||||||
| Insurance — 1.9% | ||||||||
Aegon NV, (6-mo. LIBOR US + 3.54%), | 300 | 271,124 | ||||||
Aflac, Inc. | ||||||||
1.13%, 03/15/26 | 129 | 115,827 | ||||||
2.88%, 10/15/26 | 620 | 573,239 | ||||||
3.60%, 04/01/30 | 450 | 391,995 | ||||||
Alleghany Corp., 3.63%, 05/15/30 | 579 | 508,426 | ||||||
Allied World Assurance Co. Holdings Ltd., | 350 | 335,766 | ||||||
Allstate Corp. | ||||||||
0.75%, 12/15/25 | 350 | 315,413 | ||||||
3.28%, 12/15/26 | 620 | 576,530 | ||||||
1.45%, 12/15/30 | 193 | 140,267 | ||||||
5.25%, 03/30/33(a) | 600 | 554,080 | ||||||
American Equity Investment Life Holding Co., | ||||||||
5.00%, 06/15/27 | 200 | 185,380 | ||||||
American International Group, Inc. | ||||||||
2.50%, 06/30/25 | 553 | 521,902 | ||||||
3.90%, 04/01/26 | 287 | 273,444 | ||||||
4.20%, 04/01/28 | 500 | 463,734 | ||||||
5.13%, 03/27/33 | 590 | 536,521 | ||||||
Aon Corp. | ||||||||
4.50%, 12/15/28 | 129 | 120,772 | ||||||
3.75%, 05/02/29 | 279 | 249,443 | ||||||
2.80%, 05/15/30 | 393 | 320,691 | ||||||
Aon Corp./Aon Global Holdings PLC | ||||||||
2.85%, 05/28/27 | 450 | 406,955 | ||||||
2.05%, 08/23/31 | 413 | 305,735 | ||||||
2.60%, 12/02/31 | 286 | 219,060 | ||||||
5.00%, 09/12/32 | 200 | 181,389 | ||||||
5.35%, 02/28/33(a) | 400 | 372,797 | ||||||
Aon Global Ltd., 3.88%, 12/15/25 | 496 | 475,104 | ||||||
Arch Capital Finance LLC, 4.01%, 12/15/26 | 179 | 168,779 | ||||||
Arthur J Gallagher & Co. | ||||||||
2.40%, 11/09/31 | 413 | 311,112 | ||||||
| 42 | 2 0 2 3 BLACK ROCK ANNUAL REPORT TO SHAREHOLDERS |
Schedule of Investments (continued) October 31, 2023 | iShares U.S. Intermediate Credit Bond Index Fund (Percentages shown are based on Net Assets) |
| Security | Par (000) | Value | ||||||
| Insurance (continued) | ||||||||
Arthur J Gallagher & Co. (continued) | ||||||||
5.50%, 03/02/33(a) | $ | 35 | $ | 32,602 | ||||
6.50%, 02/15/34 | 75 | 74,439 | ||||||
Assurant, Inc. | ||||||||
3.70%, 02/22/30 | 150 | 124,316 | ||||||
2.65%, 01/15/32 | 143 | 103,033 | ||||||
Assured Guaranty U.S. Holdings, Inc., | 250 | 202,276 | ||||||
Athene Holding Ltd. | ||||||||
4.13%, 01/12/28(a) | 400 | 361,865 | ||||||
6.15%, 04/03/30(a) | 659 | 640,589 | ||||||
6.65%, 02/01/33 | 200 | 192,735 | ||||||
AXA SA, 8.60%, 12/15/30 | 500 | 573,662 | ||||||
AXIS Specialty Finance PLC, 4.00%, 12/06/27(a) | 200 | 183,469 | ||||||
Berkshire Hathaway Finance Corp. | ||||||||
2.30%, 03/15/27(a) | 637 | 580,868 | ||||||
1.85%, 03/12/30 | 413 | 331,249 | ||||||
1.45%, 10/15/30 | 745 | 570,169 | ||||||
2.88%, 03/15/32 | 500 | 407,589 | ||||||
Berkshire Hathaway, Inc., 3.13%, 03/15/26 | 1,160 | �� 1,106,233 | ||||||
Brighthouse Financial, Inc.(a) | ||||||||
3.70%, 06/22/27 | 400 | 360,761 | ||||||
5.63%, 05/15/30 | 229 | 209,848 | ||||||
Brown & Brown, Inc. | ||||||||
2.38%, 03/15/31(a) | 829 | 621,790 | ||||||
4.20%, 03/17/32 | 156 | 130,762 | ||||||
Chubb INA Holdings, Inc. | ||||||||
3.15%, 03/15/25 | 829 | 799,986 | ||||||
3.35%, 05/03/26 | 657 | 622,203 | ||||||
1.38%, 09/15/30(a) | 354 | 265,455 | ||||||
CNA Financial Corp. | ||||||||
4.50%, 03/01/26 | 288 | 278,537 | ||||||
3.90%, 05/01/29 | 413 | 369,469 | ||||||
5.50%, 06/15/33 | 400 | 366,998 | ||||||
CNO Financial Group, Inc. | ||||||||
5.25%, 05/30/25 | 250 | 244,142 | ||||||
5.25%, 05/30/29 | 300 | 276,826 | ||||||
Corebridge Financial, Inc. | ||||||||
3.50%, 04/04/25 | 425 | 408,618 | ||||||
3.65%, 04/05/27 | 475 | 435,011 | ||||||
3.85%, 04/05/29 | 925 | 817,489 | ||||||
3.90%, 04/05/32 | 825 | 674,867 | ||||||
(5-year CMT + 3.85%), 6.88%, 12/15/52(b) | 350 | 323,352 | ||||||
Enstar Group Ltd., 3.10%, 09/01/31 | 591 | 436,903 | ||||||
Equitable Holdings, Inc. | ||||||||
4.35%, 04/20/28 | 829 | 758,825 | ||||||
5.59%, 01/11/33 | 350 | 322,276 | ||||||
F&G Annuities & Life, Inc., 7.40%, 01/13/28 | 100 | 98,790 | ||||||
Fairfax Financial Holdings Ltd. | ||||||||
4.85%, 04/17/28 | 300 | 283,102 | ||||||
4.63%, 04/29/30 | 229 | 203,275 | ||||||
3.38%, 03/03/31(a) | 300 | 241,545 | ||||||
5.63%, 08/16/32 | 300 | 277,180 | ||||||
Fidelity National Financial, Inc. | ||||||||
3.40%, 06/15/30 | 413 | 339,996 | ||||||
2.45%, 03/15/31 | 500 | 375,127 | ||||||
First American Financial Corp. | ||||||||
4.60%, 11/15/24 | 130 | 128,134 | ||||||
4.00%, 05/15/30 | 430 | 358,636 | ||||||
2.40%, 08/15/31 | 142 | 102,568 | ||||||
Globe Life, Inc. | ||||||||
4.55%, 09/15/28 | 350 | 327,936 | ||||||
2.15%, 08/15/30 | 129 | 98,465 | ||||||
| Security | Par (000) | Value | ||||||
| Insurance (continued) | ||||||||
Globe Life, Inc. (continued) | ||||||||
4.80%, 06/15/32 | $ | 160 | $ | 143,489 | ||||
Hanover Insurance Group, Inc. | ||||||||
4.50%, 04/15/26 | 496 | 476,535 | ||||||
2.50%, 09/01/30 | 413 | 310,196 | ||||||
Hartford Financial Services Group, Inc., | 413 | 349,409 | ||||||
Jackson Financial, Inc.(a) | ||||||||
5.17%, 06/08/27 | 200 | 190,750 | ||||||
3.13%, 11/23/31 | 179 | 133,596 | ||||||
5.67%, 06/08/32 | 200 | 183,955 | ||||||
Kemper Corp., 3.80%, 02/23/32 | 226 | 171,755 | ||||||
Lincoln National Corp., 3.80%, 03/01/28(a) | 1,243 | 1,107,865 | ||||||
Loews Corp. | ||||||||
3.75%, 04/01/26 | 413 | 394,996 | ||||||
3.20%, 05/15/30 | 541 | 459,525 | ||||||
Manulife Financial Corp. | ||||||||
4.15%, 03/04/26 | 413 | 397,324 | ||||||
2.48%, 05/19/27 | 179 | 159,646 | ||||||
3.70%, 03/16/32(a) | 373 | 317,928 | ||||||
(5-year USD ICE Swap + 1.65%), | 413 | 372,718 | ||||||
Markel Group, Inc., 3.35%, 09/17/29 | 393 | 341,793 | ||||||
Marsh & McLennan Cos., Inc. | ||||||||
3.50%, 03/10/25 | 413 | 400,331 | ||||||
3.75%, 03/14/26 | 829 | 793,222 | ||||||
4.38%, 03/15/29 | 829 | 775,531 | ||||||
2.25%, 11/15/30 | 286 | 224,963 | ||||||
2.38%, 12/15/31 | 250 | 191,324 | ||||||
5.75%, 11/01/32(a) | 100 | 97,499 | ||||||
5.88%, 08/01/33 | 300 | 295,222 | ||||||
5.40%, 09/15/33 | 300 | 285,147 | ||||||
MetLife, Inc. | ||||||||
3.00%, 03/01/25 | 167 | 160,655 | ||||||
4.55%, 03/23/30(a) | 829 | 770,847 | ||||||
6.50%, 12/15/32(a) | 400 | 409,158 | ||||||
5.38%, 07/15/33 | 300 | 280,534 | ||||||
Old Republic International Corp., | 250 | 235,391 | ||||||
PartnerRe Finance B LLC, 3.70%, 07/02/29 | 600 | 530,496 | ||||||
Primerica, Inc., 2.80%, 11/19/31 | 136 | 104,865 | ||||||
Principal Financial Group, Inc. | ||||||||
3.40%, 05/15/25 | 163 | 156,505 | ||||||
3.10%, 11/15/26 | 129 | 118,941 | ||||||
3.70%, 05/15/29 | 189 | 167,924 | ||||||
2.13%, 06/15/30 | 229 | 177,863 | ||||||
5.38%, 03/15/33(a) | 200 | 186,892 | ||||||
Progressive Corp. | ||||||||
2.45%, 01/15/27 | 413 | 374,331 | ||||||
2.50%, 03/15/27 | 194 | 175,147 | ||||||
4.00%, 03/01/29 | 225 | 209,152 | ||||||
3.20%, 03/26/30 | 350 | 298,228 | ||||||
3.00%, 03/15/32(a) | 190 | 154,438 | ||||||
6.25%, 12/01/32 | 400 | 404,186 | ||||||
4.95%, 06/15/33 | 160 | 147,549 | ||||||
Prudential Financial, Inc. | ||||||||
1.50%, 03/10/26 | 179 | 161,779 | ||||||
3.88%, 03/27/28 | 577 | 535,594 | ||||||
(3-mo. LIBOR US + 2.38%), | 450 | 394,386 | ||||||
(3-mo. LIBOR US + 2.67%), | 829 | 742,773 | ||||||
(5-year CMT + 2.85%), 6.75%, 03/01/53(b) | 300 | 282,537 | ||||||
(5-year CMT + 3.04%), 3.70%, 10/01/50(b) | 329 | 259,207 | ||||||
(5-year CMT + 3.16%), 5.13%, 03/01/52(b) | 393 | 334,145 | ||||||
(5-year CMT + 3.23%), 6.00%, 09/01/52(b) | 500 | 447,282 | ||||||
SCHEDULE OF INVESTMENTS | 43 |
Schedule of Investments (continued) October 31, 2023 | iShares U.S. Intermediate Credit Bond Index Fund (Percentages shown are based on Net Assets) |
| Security | Par (000) | Value | ||||||
| Insurance (continued) | ||||||||
Prudential Funding Asia PLC | ||||||||
3.13%, 04/14/30 | $ | 529 | $ | 441,313 | ||||
3.63%, 03/24/32(a) | 413 | 340,713 | ||||||
Reinsurance Group of America, Inc. | ||||||||
3.90%, 05/15/29 | 393 | 346,731 | ||||||
3.15%, 06/15/30 | 350 | 283,801 | ||||||
RenaissanceRe Holdings Ltd. | ||||||||
3.60%, 04/15/29 | 300 | 261,565 | ||||||
5.75%, 06/05/33 | 340 | 312,788 | ||||||
Stewart Information Services Corp., 3.60%, 11/15/31 | 180 | 128,137 | ||||||
Travelers Property Casualty Corp., 6.38%, 03/15/33 | 250 | 259,928 | ||||||
Trinity Acquisition PLC, 4.40%, 03/15/26 | 413 | 396,154 | ||||||
Unum Group, 4.00%, 06/15/29 | 129 | 114,930 | ||||||
Willis North America, Inc. | ||||||||
4.65%, 06/15/27 | 339 | 322,645 | ||||||
4.50%, 09/15/28(a) | 193 | 179,405 | ||||||
2.95%, 09/15/29 | 450 | 377,293 | ||||||
5.35%, 05/15/33 | 460 | 419,224 | ||||||
|
| |||||||
| 46,919,602 | ||||||||
| Interactive Media & Services — 0.7% | ||||||||
Alphabet, Inc. | ||||||||
0.45%, 08/15/25 | 663 | 610,468 | ||||||
2.00%, 08/15/26 | 1,323 | 1,216,330 | ||||||
0.80%, 08/15/27 | 447 | 382,710 | ||||||
1.10%, 08/15/30 | 1,488 | 1,140,512 | ||||||
Baidu, Inc. | ||||||||
3.08%, 04/07/25(a) | 560 | 537,718 | ||||||
4.13%, 06/30/25 | 478 | 463,646 | ||||||
1.72%, 04/09/26 | 350 | 316,925 | ||||||
3.63%, 07/06/27 | 400 | 369,260 | ||||||
4.38%, 03/29/28(a) | 350 | 327,985 | ||||||
2.38%, 08/23/31 | 350 | 264,541 | ||||||
eBay, Inc. | ||||||||
1.90%, 03/11/25 | 829 | 785,549 | ||||||
1.40%, 05/10/26 | 325 | 291,143 | ||||||
3.60%, 06/05/27 | 829 | 765,914 | ||||||
2.70%, 03/11/30 | 829 | 673,199 | ||||||
2.60%, 05/10/31 | 254 | 198,120 | ||||||
JD.com, Inc., 3.38%, 01/14/30(a) | 478 | 403,819 | ||||||
Meta Platforms, Inc. | ||||||||
3.50%, 08/15/27 | 1,500 | 1,410,254 | ||||||
4.60%, 05/15/28 | 940 | 911,177 | ||||||
4.80%, 05/15/30 | 340 | 327,842 | ||||||
3.85%, 08/15/32 | 1,590 | 1,381,915 | ||||||
4.95%, 05/15/33 | 1,040 | 974,930 | ||||||
Netflix, Inc. | ||||||||
5.88%, 02/15/25 | 550 | 549,913 | ||||||
4.38%, 11/15/26 | 700 | 673,298 | ||||||
4.88%, 04/15/28 | 750 | 722,577 | ||||||
5.88%, 11/15/28 | 1,500 | 1,500,561 | ||||||
6.38%, 05/15/29(a) | 500 | 513,544 | ||||||
Tencent Music Entertainment Group, 2.00%, 09/03/30 | 250 | 186,739 | ||||||
Weibo Corp., 3.38%, 07/08/30(a) | 300 | 231,033 | ||||||
|
| |||||||
| 18,131,622 | ||||||||
| Internet Software & Services — 0.2% | ||||||||
Booking Holdings, Inc. | ||||||||
3.65%, 03/15/25 | 350 | 340,835 | ||||||
3.60%, 06/01/26 | 343 | 326,646 | ||||||
3.55%, 03/15/28 | 350 | 323,656 | ||||||
| Security | Par (000) | Value | ||||||
| Internet Software & Services (continued) | ||||||||
Booking Holdings, Inc. (continued) | ||||||||
4.63%, 04/13/30 | $ | 829 | $ | 772,362 | ||||
Expedia Group, Inc. | ||||||||
5.00%, 02/15/26 | 413 | 403,692 | ||||||
4.63%, 08/01/27 | 500 | 473,234 | ||||||
3.80%, 02/15/28 | 620 | 561,155 | ||||||
3.25%, 02/15/30 | 683 | 565,600 | ||||||
2.95%, 03/15/31 | 252 | 197,955 | ||||||
VeriSign, Inc. | ||||||||
5.25%, 04/01/25 | 179 | 176,875 | ||||||
4.75%, 07/15/27 | 179 | 170,616 | ||||||
2.70%, 06/15/31 | 244 | 188,432 | ||||||
|
| |||||||
| 4,501,058 | ||||||||
| IT Services — 1.0% | ||||||||
Amdocs Ltd., 2.54%, 06/15/30 | 400 | 314,787 | ||||||
Booz Allen Hamilton, Inc., 5.95%, 08/04/33 | 330 | 313,641 | ||||||
Broadridge Financial Solutions, Inc. | ||||||||
3.40%, 06/27/26 | 201 | 188,030 | ||||||
2.90%, 12/01/29 | 413 | 343,479 | ||||||
2.60%, 05/01/31 | 381 | 295,559 | ||||||
CGI, Inc. | ||||||||
1.45%, 09/14/26 | 413 | 364,227 | ||||||
2.30%, 09/14/31(a) | 213 | 156,646 | ||||||
DXC Technology Co. | ||||||||
1.80%, 09/15/26 | 496 | 434,723 | ||||||
2.38%, 09/15/28(a) | 329 | 265,929 | ||||||
Fidelity National Information Services, Inc. | ||||||||
4.50%, 07/15/25 | 300 | 292,968 | ||||||
1.15%, 03/01/26 | 492 | 440,758 | ||||||
4.70%, 07/15/27 | 85 | 81,358 | ||||||
1.65%, 03/01/28(a) | 562 | 470,509 | ||||||
3.75%, 05/21/29(a) | 400 | 359,475 | ||||||
2.25%, 03/01/31(a) | 484 | 368,865 | ||||||
5.10%, 07/15/32(a) | 280 | 258,342 | ||||||
Fiserv, Inc. | ||||||||
3.85%, 06/01/25 | 350 | 339,202 | ||||||
3.20%, 07/01/26 | 1,250 | 1,167,830 | ||||||
2.25%, 06/01/27 | 393 | 347,272 | ||||||
5.45%, 03/02/28 | 400 | 392,101 | ||||||
4.20%, 10/01/28 | 829 | 765,168 | ||||||
3.50%, 07/01/29 | 1,864 | 1,635,117 | ||||||
2.65%, 06/01/30 | 291 | 234,504 | ||||||
5.60%, 03/02/33(a) | 250 | 235,246 | ||||||
5.63%, 08/21/33 | 750 | 703,492 | ||||||
Genpact Luxembourg SARL, 3.38%, 12/01/24 | 129 | 124,356 | ||||||
International Business Machines Corp. | ||||||||
4.00%, 07/27/25 | 450 | 438,024 | ||||||
7.00%, 10/30/25 | 350 | 360,147 | ||||||
4.50%, 02/06/26 | 300 | 292,725 | ||||||
3.45%, 02/19/26 | 700 | 667,022 | ||||||
3.30%, 05/15/26 | 1,593 | 1,506,610 | ||||||
3.30%, 01/27/27 | 655 | 608,920 | ||||||
2.20%, 02/09/27 | 400 | 358,580 | ||||||
1.70%, 05/15/27 | 881 | 769,064 | ||||||
4.15%, 07/27/27 | 1,000 | 947,645 | ||||||
6.22%, 08/01/27 | 250 | 256,438 | ||||||
4.50%, 02/06/28 | 300 | 286,997 | ||||||
3.50%, 05/15/29 | 1,619 | 1,442,819 | ||||||
1.95%, 05/15/30 | 459 | 362,021 | ||||||
2.72%, 02/09/32(a) | 250 | 199,037 | ||||||
4.40%, 07/27/32(a) | 350 | 313,963 | ||||||
| 44 | 2 0 2 3 BLACK ROCK ANNUAL REPORT TO SHAREHOLDERS |
Schedule of Investments (continued) October 31, 2023 | iShares U.S. Intermediate Credit Bond Index Fund (Percentages shown are based on Net Assets) |
| Security | Par (000) | Value | ||||||
| IT Services (continued) | ||||||||
International Business Machines Corp. (continued) |
| |||||||
5.88%, 11/29/32(a) | $ | 163 | $ | 163,922 | ||||
4.75%, 02/06/33 | 300 | 275,331 | ||||||
Kyndryl Holdings, Inc. | ||||||||
2.05%, 10/15/26 | 300 | 261,465 | ||||||
2.70%, 10/15/28(a) | 200 | 161,714 | ||||||
3.15%, 10/15/31(a) | 260 | 189,507 | ||||||
Leidos, Inc. | ||||||||
3.63%, 05/15/25 | 200 | 191,676 | ||||||
4.38%, 05/15/30 | 500 | 439,617 | ||||||
2.30%, 02/15/31 | 620 | 466,298 | ||||||
5.75%, 03/15/33 | 350 | 325,302 | ||||||
Verisk Analytics, Inc. | ||||||||
4.00%, 06/15/25 | 563 | 545,394 | ||||||
5.75%, 04/01/33 | 285 | 273,131 | ||||||
|
| |||||||
| 22,996,953 | ||||||||
| Leisure Products — 0.0% | ||||||||
Hasbro, Inc. | ||||||||
3.00%, 11/19/24 | 413 | 399,772 | ||||||
3.55%, 11/19/26 | 225 | 207,398 | ||||||
3.50%, 09/15/27 | 163 | 148,465 | ||||||
3.90%, 11/19/29 | 225 | 193,319 | ||||||
|
| |||||||
| 948,954 | ||||||||
| Life Sciences Tools & Services — 0.0% | ||||||||
Agilent Technologies, Inc. | ||||||||
2.75%, 09/15/29 | 534 | 450,479 | ||||||
2.30%, 03/12/31 | 572 | 443,148 | ||||||
|
| |||||||
| 893,627 | ||||||||
| Machinery — 1.2% | ||||||||
Brunswick Corp. | ||||||||
2.40%, 08/18/31 | 194 | 136,782 | ||||||
4.40%, 09/15/32 | 329 | 258,796 | ||||||
Caterpillar Financial Services Corp. | ||||||||
2.15%, 11/08/24 | 374 | 361,105 | ||||||
4.90%, 01/17/25 | 500 | 497,014 | ||||||
3.40%, 05/13/25 | 1,300 | 1,259,287 | ||||||
5.15%, 08/11/25 | 400 | 397,680 | ||||||
3.65%, 08/12/25 | 400 | 387,463 | ||||||
0.80%, 11/13/25 | 829 | 754,954 | ||||||
4.80%, 01/06/26 | 200 | 197,289 | ||||||
4.35%, 05/15/26 | 500 | 487,943 | ||||||
1.15%, 09/14/26 | 745 | 661,943 | ||||||
1.70%, 01/08/27(a) | 413 | 368,722 | ||||||
3.60%, 08/12/27(a) | 400 | 375,401 | ||||||
1.10%, 09/14/27 | 400 | 341,043 | ||||||
Caterpillar, Inc. | ||||||||
2.60%, 04/09/30 | 413 | 346,777 | ||||||
1.90%, 03/12/31(a) | 753 | 593,555 | ||||||
CNH Industrial Capital LLC | ||||||||
3.95%, 05/23/25 | 201 | 194,779 | ||||||
5.45%, 10/14/25 | 200 | 198,467 | ||||||
1.88%, 01/15/26(a) | 179 | 164,273 | ||||||
1.45%, 07/15/26 | 142 | 126,640 | ||||||
4.55%, 04/10/28 | 200 | 187,952 | ||||||
5.50%, 01/12/29 | 200 | 193,858 | ||||||
CNH Industrial NV, 3.85%, 11/15/27(a) | 350 | 322,550 | ||||||
Deere & Co. | ||||||||
2.75%, 04/15/25 | 829 | 797,537 | ||||||
3.10%, 04/15/30 | 413 | 356,397 | ||||||
Dover Corp. | ||||||||
3.15%, 11/15/25 | 163 | 154,762 | ||||||
| Security | Par (000) | Value | ||||||
| Machinery (continued) | ||||||||
Dover Corp. (continued) | ||||||||
2.95%, 11/04/29(a) | $ | 110 | $ | 94,097 | ||||
Flowserve Corp. | ||||||||
3.50%, 10/01/30 | 200 | 160,873 | ||||||
2.80%, 01/15/32 | 130 | 95,797 | ||||||
Fortive Corp., 3.15%, 06/15/26 | 413 | 384,900 | ||||||
IDEX Corp. | ||||||||
3.00%, 05/01/30(a) | 400 | 330,732 | ||||||
2.63%, 06/15/31 | 123 | 95,985 | ||||||
Ingersoll Rand, Inc. | ||||||||
5.40%, 08/14/28 | 50 | 48,719 | ||||||
5.70%, 08/14/33 | 590 | 557,474 | ||||||
John Deere Capital Corp. | ||||||||
2.05%, 01/09/25 | 179 | 171,942 | ||||||
1.25%, 01/10/25(a) | 413 | 393,121 | ||||||
3.45%, 03/13/25 | 500 | 486,732 | ||||||
3.40%, 06/06/25 | 635 | 615,006 | ||||||
4.95%, 06/06/25 | 150 | 148,987 | ||||||
4.05%, 09/08/25 | 85 | 83,035 | ||||||
5.30%, 09/08/25 | 175 | 174,710 | ||||||
3.40%, 09/11/25 | 500 | 482,247 | ||||||
4.80%, 01/09/26 | 650 | 641,410 | ||||||
0.70%, 01/15/26 | 745 | 671,815 | ||||||
4.75%, 06/08/26 | 260 | 256,123 | ||||||
1.05%, 06/17/26 | 209 | 186,855 | ||||||
5.15%, 09/08/26(a) | 115 | 114,456 | ||||||
2.25%, 09/14/26 | 413 | 381,060 | ||||||
1.30%, 10/13/26 | 425 | 379,584 | ||||||
1.70%, 01/11/27 | 193 | 171,635 | ||||||
4.15%, 09/15/27(a) | 950 | 908,977 | ||||||
3.05%, 01/06/28 | 225 | 205,446 | ||||||
4.75%, 01/20/28 | 600 | 582,705 | ||||||
4.90%, 03/03/28(a) | 450 | 440,312 | ||||||
1.50%, 03/06/28 | 163 | 137,866 | ||||||
4.95%, 07/14/28 | 845 | 824,235 | �� | |||||
3.35%, 04/18/29 | 279 | 251,278 | ||||||
2.80%, 07/18/29 | 520 | 449,830 | ||||||
2.45%, 01/09/30 | 225 | 187,604 | ||||||
4.70%, 06/10/30 | 260 | 244,760 | ||||||
1.45%, 01/15/31 | 745 | 558,689 | ||||||
2.00%, 06/17/31 | 209 | 160,705 | ||||||
4.35%, 09/15/32(a) | 450 | 406,421 | ||||||
5.15%, 09/08/33 | 70 | 66,569 | ||||||
Series FXD, 5.05%, 03/03/26 | 300 | 298,121 | ||||||
Kennametal, Inc., 2.80%, 03/01/31(a) | 100 | 76,747 | ||||||
Nordson Corp., 5.80%, 09/15/33 | 125 | 118,989 | ||||||
NORDSON Corp. SR UNSECURED 09/28 5.6, | ||||||||
5.60%, 09/15/28 | 85 | 83,432 | ||||||
nVent Finance SARL | ||||||||
2.75%, 11/15/31(a) | 120 | 89,310 | ||||||
5.65%, 05/15/33 | 400 | 363,138 | ||||||
Otis Worldwide Corp. | ||||||||
2.06%, 04/05/25 | 775 | 734,430 | ||||||
5.25%, 08/16/28 | 150 | 145,908 | ||||||
2.57%, 02/15/30 | 829 | 674,503 | ||||||
Stanley Black & Decker, Inc. | ||||||||
6.00%, 03/06/28(a) | 750 | 749,201 | ||||||
4.25%, 11/15/28 | 179 | 165,416 | ||||||
2.30%, 03/15/30 | 329 | 258,498 | ||||||
(5-year CMT + 2.66%), 4.00%, 03/15/60(b) | 496 | 407,144 | ||||||
Westinghouse Air Brake Technologies Corp. | ||||||||
3.20%, 06/15/25 | 413 | 393,071 | ||||||
SCHEDULE OF INVESTMENTS | 45 |
Schedule of Investments (continued) October 31, 2023 | iShares U.S. Intermediate Credit Bond Index Fund (Percentages shown are based on Net Assets) |
| Security | Par (000) | Value | ||||||
| Machinery (continued) | ||||||||
Westinghouse Air Brake Technologies | ||||||||
3.45%, 11/15/26 | $ | 400 | $ | 371,053 | ||||
4.70%, 09/15/28 | 813 | 758,039 | ||||||
Xylem, Inc. | ||||||||
3.25%, 11/01/26 | 300 | 279,132 | ||||||
1.95%, 01/30/28(a) | 350 | 298,851 | ||||||
2.25%, 01/30/31 | 350 | 270,510 | ||||||
|
| |||||||
| 29,211,154 | ||||||||
| Media — 2.0% | ||||||||
Bell Telephone Co. of Canada or Bell Canada(a) | ||||||||
5.10%, 05/11/33 | 300 | 273,148 | ||||||
Series US-5, 2.15%, 02/15/32 | 413 | 307,901 | ||||||
Charter Communications Operating LLC/Charter Communications Operating Capital | ||||||||
4.91%, 07/23/25 | 3,000 | 2,933,336 | ||||||
3.75%, 02/15/28 | 413 | 368,755 | ||||||
4.20%, 03/15/28 | 500 | 455,044 | ||||||
2.25%, 01/15/29 | 849 | 687,482 | ||||||
5.05%, 03/30/29(a) | 829 | 766,840 | ||||||
2.80%, 04/01/31 | 659 | 503,960 | ||||||
2.30%, 02/01/32 | 393 | 280,769 | ||||||
4.40%, 04/01/33(a) | 550 | 455,067 | ||||||
Comcast Corp. | ||||||||
3.38%, 08/15/25 | 623 | 599,664 | ||||||
3.95%, 10/15/25 | 2,036 | 1,974,445 | ||||||
5.25%, 11/07/25 | 835 | 830,569 | ||||||
3.15%, 03/01/26 | 1,450 | 1,375,755 | ||||||
2.35%, 01/15/27 | 702 | 634,583 | ||||||
3.30%, 02/01/27 | 829 | 771,034 | ||||||
3.30%, 04/01/27 | 309 | 286,345 | ||||||
5.35%, 11/15/27 | 175 | 173,746 | ||||||
3.15%, 02/15/28 | 1,036 | 938,644 | ||||||
3.55%, 05/01/28 | 829 | 759,844 | ||||||
4.15%, 10/15/28 | 2,691 | 2,513,824 | ||||||
4.55%, 01/15/29 | 440 | 417,663 | ||||||
2.65%, 02/01/30 | 782 | 648,966 | ||||||
3.40%, 04/01/30 | 648 | 560,984 | ||||||
4.25%, 10/15/30 | 479 | 433,298 | ||||||
1.95%, 01/15/31(a) | 699 | 536,163 | ||||||
1.50%, 02/15/31 | 714 | 528,368 | ||||||
5.50%, 11/15/32 | 650 | 626,114 | ||||||
4.25%, 01/15/33 | 1,150 | 1,005,849 | ||||||
4.65%, 02/15/33(a) | 390 | 352,929 | ||||||
7.05%, 03/15/33 | 500 | 531,616 | ||||||
4.80%, 05/15/33 | 440 | 401,314 | ||||||
Discovery Communications LLC | ||||||||
3.90%, 11/15/24 | 163 | 158,591 | ||||||
3.45%, 03/15/25 | 79 | 75,984 | ||||||
3.95%, 06/15/25 | 500 | 481,742 | ||||||
4.90%, 03/11/26 | 272 | 265,025 | ||||||
3.95%, 03/20/28 | 862 | 778,528 | ||||||
4.13%, 05/15/29 | 300 | 264,082 | ||||||
3.63%, 05/15/30 | 400 | 333,139 | ||||||
FactSet Research Systems, Inc. | ||||||||
2.90%, 03/01/27(a) | 140 | 126,458 | ||||||
3.45%, 03/01/32 | 130 | 105,139 | ||||||
Fox Corp. | ||||||||
3.05%, 04/07/25 | 300 | 287,982 | ||||||
4.71%, 01/25/29 | 829 | 774,724 | ||||||
3.50%, 04/08/30 | 350 | 296,802 | ||||||
6.50%, 10/13/33 | 250 | 244,166 | ||||||
| Security | Par (000) | Value | ||||||
| Media (continued) | ||||||||
Interpublic Group of Cos., Inc. | ||||||||
4.75%, 03/30/30 | $ | 829 | $ | 755,993 | ||||
2.40%, 03/01/31 | 185 | 142,455 | ||||||
5.38%, 06/15/33 | 138 | 126,852 | ||||||
Paramount Global | ||||||||
4.75%, 05/15/25 | 250 | 244,241 | ||||||
4.00%, 01/15/26(a) | 293 | 278,114 | ||||||
2.90%, 01/15/27 | 400 | 351,283 | ||||||
3.38%, 02/15/28 | 413 | 353,423 | ||||||
3.70%, 06/01/28 | 413 | 355,990 | ||||||
4.20%, 06/01/29 | 250 | 211,625 | ||||||
7.88%, 07/30/30 | 350 | 344,626 | ||||||
4.95%, 01/15/31(a) | 829 | 692,311 | ||||||
4.20%, 05/19/32(a) | 400 | 308,836 | ||||||
TCI Communications, Inc., 7.88%, 02/15/26 | 163 | 170,144 | ||||||
TELUS Corp. | ||||||||
2.80%, 02/16/27 | 400 | 362,648 | ||||||
3.70%, 09/15/27 | 400 | 370,894 | ||||||
3.40%, 05/13/32 | 360 | 285,069 | ||||||
Thomson Reuters Corp., 3.35%, 05/15/26 | 66 | 61,980 | ||||||
Time Warner Cable Enterprises LLC, | 500 | 521,651 | ||||||
TWDC Enterprises 18 Corp. | ||||||||
3.15%, 09/17/25 | 107 | 102,437 | ||||||
3.00%, 02/13/26(a) | 580 | 547,719 | ||||||
1.85%, 07/30/26 | 829 | 754,297 | ||||||
2.95%, 06/15/27 | 620 | 572,211 | ||||||
Series B, 7.00%, 03/01/32 | 250 | 266,736 | ||||||
Walt Disney Co. | ||||||||
3.35%, 03/24/25 | 1,077 | 1,043,266 | ||||||
3.70%, 10/15/25 | 686 | 663,099 | ||||||
1.75%, 01/13/26 | 496 | 458,025 | ||||||
3.38%, 11/15/26 | 143 | 134,317 | ||||||
3.70%, 03/23/27 | 250 | 236,808 | ||||||
2.20%, 01/13/28(a) | 829 | 730,168 | ||||||
2.00%, 09/01/29 | 863 | 708,094 | ||||||
3.80%, 03/22/30 | 829 | 739,165 | ||||||
2.65%, 01/13/31 | 1,256 | 1,019,499 | ||||||
Warnermedia Holdings, Inc. | ||||||||
3.64%, 03/15/25 | 613 | 592,464 | ||||||
3.79%, 03/15/25 | 600 | 580,195 | ||||||
6.41%, 03/15/26 | 600 | 598,774 | ||||||
3.76%, 03/15/27 | 1,901 | 1,750,061 | ||||||
4.05%, 03/15/29 | 802 | 709,665 | ||||||
4.28%, 03/15/32(a) | 2,622 | 2,173,940 | ||||||
|
| |||||||
| 48,445,456 | ||||||||
| Metals & Mining — 0.7% | ||||||||
AngloGold Ashanti Holdings PLC | ||||||||
3.38%, 11/01/28 | 450 | 370,181 | ||||||
3.75%, 10/01/30 | 478 | 374,632 | ||||||
ArcelorMittal SA | ||||||||
4.55%, 03/11/26 | 163 | 158,748 | ||||||
6.55%, 11/29/27(a) | 500 | 502,356 | ||||||
4.25%, 07/16/29 | 225 | 202,633 | ||||||
6.80%, 11/29/32 | 400 | 383,128 | ||||||
BHP Billiton Finance USA Ltd. | ||||||||
4.88%, 02/27/26(a) | 550 | 541,420 | ||||||
5.25%, 09/08/26(a) | 600 | 594,845 | ||||||
4.75%, 02/28/28 | 550 | 530,986 | ||||||
5.10%, 09/08/28 | 600 | 584,918 | ||||||
5.25%, 09/08/30 | 600 | 577,133 | ||||||
4.90%, 02/28/33 | 465 | 430,044 | ||||||
| 46 | 2 0 2 3 BLACK ROCK ANNUAL REPORT TO SHAREHOLDERS |
Schedule of Investments (continued) October 31, 2023 | iShares U.S. Intermediate Credit Bond Index Fund (Percentages shown are based on Net Assets) |
| Security | Par (000) | Value | ||||||
| Metals & Mining (continued) | ||||||||
BHP Billiton Finance USA Ltd. (continued) |
| |||||||
5.25%, 09/08/33 | $ | 600 | $ | 563,946 | ||||
Freeport-McMoRan, Inc. | ||||||||
4.55%, 11/14/24 | 413 | 404,176 | ||||||
5.00%, 09/01/27 | 329 | 311,066 | ||||||
4.13%, 03/01/28 | 413 | 375,351 | ||||||
4.38%, 08/01/28 | 329 | 298,123 | ||||||
5.25%, 09/01/29(a) | 329 | 309,479 | ||||||
4.25%, 03/01/30(a) | 329 | 285,143 | ||||||
4.63%, 08/01/30 | 140 | 123,352 | ||||||
Kinross Gold Corp., 6.25%, 07/15/33 | 350 | 333,424 | ||||||
Newmont Corp. | ||||||||
2.80%, 10/01/29(a) | 245 | 205,506 | ||||||
2.25%, 10/01/30 | 413 | 322,744 | ||||||
2.60%, 07/15/32 | 550 | 420,810 | ||||||
Nucor Corp. | ||||||||
3.95%, 05/23/25 | 355 | 343,988 | ||||||
2.00%, 06/01/25 | 250 | 235,277 | ||||||
4.30%, 05/23/27 | 366 | 349,364 | ||||||
3.95%, 05/01/28 | 179 | 166,541 | ||||||
2.70%, 06/01/30(a) | 179 | 147,856 | ||||||
3.13%, 04/01/32(a) | 209 | 168,847 | ||||||
Precision Castparts Corp., 3.25%, 06/15/25 | 350 | 337,872 | ||||||
Reliance Steel & Aluminum Co., | 350 | 267,925 | ||||||
Rio Tinto Finance USA Ltd., 7.13%, 07/15/28 | 829 | 878,447 | ||||||
Rio Tinto Finance USA PLC, | 270 | 253,032 | ||||||
Southern Copper Corp., 3.88%, 04/23/25 | 620 | 595,975 | ||||||
Steel Dynamics, Inc. | ||||||||
2.40%, 06/15/25 | 300 | 282,514 | ||||||
5.00%, 12/15/26 | 161 | 155,449 | ||||||
1.65%, 10/15/27 | 413 | 348,876 | ||||||
3.45%, 04/15/30 | 350 | 296,057 | ||||||
3.25%, 01/15/31 | 213 | 176,110 | ||||||
Teck Resources Ltd., 3.90%, 07/15/30(a) | 350 | 297,667 | ||||||
Timken Co. | ||||||||
4.50%, 12/15/28 | 413 | 381,060 | ||||||
4.13%, 04/01/32 | 225 | 187,849 | ||||||
Vale Overseas Ltd. | ||||||||
3.75%, 07/08/30(a) | 829 | 700,256 | ||||||
6.13%, 06/12/33 | 750 | 705,375 | ||||||
Yamana Gold, Inc., 2.63%, 08/15/31 | 250 | 189,436 | ||||||
|
| |||||||
| 16,669,917 | ||||||||
| Multi-Utilities — 0.3% | ||||||||
Atmos Energy Corp. | ||||||||
3.00%, 06/15/27 | 350 | 320,911 | ||||||
2.63%, 09/15/29 | 136 | 116,094 | ||||||
1.50%, 01/15/31 | 179 | 132,208 | ||||||
CenterPoint Energy Resources Corp. | ||||||||
1.75%, 10/01/30 | 159 | 119,721 | ||||||
4.40%, 07/01/32 | 200 | 175,452 | ||||||
5.40%, 03/01/33(a) | 400 | 373,493 | ||||||
CenterPoint Energy, Inc., 5.25%, 08/10/26 | 150 | 147,717 | ||||||
Eastern Energy Gas Holdings LLC | ||||||||
3.60%, 12/15/24(a) | 108 | 105,028 | ||||||
Series A, 2.50%, 11/15/24 | 408 | 393,353 | ||||||
National Fuel Gas Co. | ||||||||
5.20%, 07/15/25 | 400 | 393,044 | ||||||
5.50%, 01/15/26 | 350 | 343,280 | ||||||
2.95%, 03/01/31(a) | 413 | 313,948 | ||||||
NiSource, Inc. | ||||||||
0.95%, 08/15/25 | 721 | 658,753 | ||||||
3.49%, 05/15/27 | 829 | 762,779 | ||||||
| Security | Par (000) | Value | ||||||
| Multi-Utilities (continued) | ||||||||
NiSource, Inc. (continued) | ||||||||
2.95%, 09/01/29 | $ | 529 | $ | 450,196 | ||||
3.60%, 05/01/30 | 450 | 385,178 | ||||||
1.70%, 02/15/31 | 366 | 268,061 | ||||||
Piedmont Natural Gas Co., Inc., 2.50%, 03/15/31 | 413 | 318,161 | ||||||
Public Service Enterprise Group, Inc. | ||||||||
5.88%, 10/15/28(a) | 250 | 247,406 | ||||||
6.13%, 10/15/33 | 250 | 243,980 | ||||||
Sempra, 5.40%, 08/01/26(a) | 225 | 221,812 | ||||||
Southern California Gas Co. | ||||||||
2.95%, 04/15/27 | 530 | 483,121 | ||||||
Series TT, 2.60%, 06/15/26 | 186 | 172,146 | ||||||
Series XX, 2.55%, 02/01/30 | 229 | 186,353 | ||||||
Southwest Gas Corp. | ||||||||
5.80%, 12/01/27 | 300 | 297,072 | ||||||
5.45%, 03/23/28 | 65 | 63,468 | ||||||
2.20%, 06/15/30 | 129 | 99,924 | ||||||
WEC Energy Group, Inc., 5.60%, 09/12/26 | 175 | 173,945 | ||||||
|
| |||||||
| 7,966,604 | ||||||||
| Offshore Drilling & Other Services — 0.2% | ||||||||
Applied Materials, Inc. | ||||||||
3.90%, 10/01/25 | 503 | 488,675 | ||||||
3.30%, 04/01/27(a) | 829 | 772,920 | ||||||
1.75%, 06/01/30 | 213 | 167,227 | ||||||
KLA Corp. | ||||||||
4.65%, 11/01/24 | 467 | 461,778 | ||||||
4.10%, 03/15/29 | 413 | 384,860 | ||||||
4.65%, 07/15/32 | 640 | 593,246 | ||||||
Lam Research Corp. | ||||||||
3.80%, 03/15/25 | 150 | 146,274 | ||||||
3.75%, 03/15/26 | 450 | 431,915 | ||||||
4.00%, 03/15/29 | 650 | 603,354 | ||||||
1.90%, 06/15/30 | 679 | 534,287 | ||||||
|
| |||||||
| 4,584,536 | ||||||||
| Oil, Gas & Consumable Fuels — 5.0% | ||||||||
Apache Corp., 4.25%, 01/15/30(a) | 350 | 304,748 | ||||||
Boardwalk Pipelines LP | ||||||||
4.95%, 12/15/24 | 350 | 344,507 | ||||||
5.95%, 06/01/26 | 400 | 396,235 | ||||||
4.45%, 07/15/27 | 189 | 177,181 | ||||||
4.80%, 05/03/29 | 413 | 380,151 | ||||||
3.40%, 02/15/31 | 350 | 285,625 | ||||||
3.60%, 09/01/32 | 200 | 158,530 | ||||||
BP Capital Markets America, Inc. | ||||||||
3.80%, 09/21/25 | 829 | 805,144 | ||||||
3.41%, 02/11/26 | 409 | 389,910 | ||||||
3.12%, 05/04/26 | 288 | 271,864 | ||||||
3.02%, 01/16/27 | 373 | 344,523 | ||||||
3.54%, 04/06/27 | 179 | 167,701 | ||||||
3.94%, 09/21/28 | 413 | 383,405 | ||||||
4.23%, 11/06/28 | 829 | 778,409 | ||||||
3.63%, 04/06/30 | 829 | 732,280 | ||||||
1.75%, 08/10/30 | 425 | 329,202 | ||||||
2.72%, 01/12/32 | 1,263 | 1,003,055 | ||||||
4.81%, 02/13/33 | 1,450 | 1,324,852 | ||||||
4.89%, 09/11/33 | 280 | 256,300 | ||||||
BP Capital Markets PLC | ||||||||
3.28%, 09/19/27 | 413 | 380,905 | ||||||
3.72%, 11/28/28 | 829 | 759,288 | ||||||
Burlington Resources LLC | ||||||||
7.20%, 08/15/31 | 250 | 268,150 | ||||||
SCHEDULE OF INVESTMENTS | 47 |
Schedule of Investments (continued) October 31, 2023 | iShares U.S. Intermediate Credit Bond Index Fund (Percentages shown are based on Net Assets) |
| Security | Par (000) | Value | ||||||
| Oil, Gas & Consumable Fuels (continued) | ||||||||
Burlington Resources LLC (continued) |
| |||||||
7.40%, 12/01/31 | $ | 320 | $ | 348,909 | ||||
Canadian Natural Resources Ltd. | ||||||||
3.90%, 02/01/25 | 163 | 158,450 | ||||||
2.05%, 07/15/25 | 400 | 373,547 | ||||||
3.85%, 06/01/27 | 613 | 568,264 | ||||||
2.95%, 07/15/30(a) | 413 | 336,776 | ||||||
7.20%, 01/15/32 | 350 | 360,857 | ||||||
Cenovus Energy, Inc., 2.65%, 01/15/32 | 136 | 102,785 | ||||||
Cheniere Energy Partners LP | ||||||||
4.50%, 10/01/29 | 600 | 537,209 | ||||||
4.00%, 03/01/31 | 1,000 | 837,366 | ||||||
3.25%, 01/31/32 | 500 | 387,719 | ||||||
5.95%, 06/30/33(d) | 930 | 869,717 | ||||||
Cheniere Energy, Inc., 4.63%, 10/15/28 | 600 | 548,217 | ||||||
Chevron Corp. | ||||||||
1.55%, 05/11/25 | 1,204 | 1,135,880 | ||||||
3.33%, 11/17/25 | 413 | 396,620 | ||||||
2.95%, 05/16/26 | 1,036 | 979,540 | ||||||
2.00%, 05/11/27(a) | 430 | 384,040 | ||||||
2.24%, 05/11/30 | 787 | 644,370 | ||||||
Chevron USA, Inc. | ||||||||
3.90%, 11/15/24 | 350 | 343,883 | ||||||
0.69%, 08/12/25 | 628 | 578,842 | ||||||
1.02%, 08/12/27 | 541 | 463,262 | ||||||
3.85%, 01/15/28 | 243 | 230,035 | ||||||
3.25%, 10/15/29 | 350 | 310,961 | ||||||
CNOOC Finance 2015 USA LLC, | 1,310 | 1,248,594 | ||||||
CNOOC Petroleum North America ULC, | 176 | 195,884 | ||||||
Columbia Pipeline Group, Inc., | 563 | 549,299 | ||||||
Conoco Funding Co., 7.25%, 10/15/31 | 350 | 376,566 | ||||||
ConocoPhillips, 5.90%, 10/15/32 | 250 | 251,738 | ||||||
ConocoPhillips Co. | ||||||||
2.40%, 03/07/25 | 61 | 58,372 | ||||||
6.95%, 04/15/29 | 450 | 480,093 | ||||||
5.05%, 09/15/33 | 340 | 316,808 | ||||||
Continental Resources, Inc., 4.38%, 01/15/28 | 579 | 533,453 | ||||||
Coterra Energy, Inc. | ||||||||
3.90%, 05/15/27(a) | 400 | 372,953 | ||||||
4.38%, 03/15/29 | 179 | 163,761 | ||||||
DCP Midstream Operating LP | ||||||||
5.38%, 07/15/25 | 330 | 326,036 | ||||||
5.63%, 07/15/27 | 200 | 196,340 | ||||||
5.13%, 05/15/29 | 250 | 236,051 | ||||||
8.13%, 08/16/30 | 300 | 327,147 | ||||||
3.25%, 02/15/32 | 160 | 125,818 | ||||||
Devon Energy Corp. | ||||||||
5.85%, 12/15/25 | 163 | 161,918 | ||||||
5.25%, 10/15/27 | 200 | 193,750 | ||||||
5.88%, 06/15/28 | 538 | 528,645 | ||||||
4.50%, 01/15/30 | 538 | 478,434 | ||||||
7.88%, 09/30/31 | 450 | 481,252 | ||||||
Diamondback Energy, Inc. | ||||||||
3.25%, 12/01/26 | 500 | 466,040 | ||||||
3.50%, 12/01/29(a) | 829 | 725,215 | ||||||
3.13%, 03/24/31 | 470 | 384,799 | ||||||
6.25%, 03/15/33 | 720 | 710,661 | ||||||
Eastern Gas Transmission & Storage, Inc., 3.00%, 11/15/29 | 179 | 150,211 | ||||||
Enbridge Energy Partners LP, 5.88%, 10/15/25 | 193 | 192,507 | ||||||
| Security | Par (000) | Value | ||||||
| Oil, Gas & Consumable Fuels (continued) | ||||||||
Enbridge, Inc. | ||||||||
2.50%, 01/15/25 | $ | 163 | $ | 156,322 | ||||
2.50%, 02/14/25 | 59 | 56,428 | ||||||
5.97%, 03/08/26 | 450 | 446,865 | ||||||
1.60%, 10/04/26 | 381 | 338,256 | ||||||
4.25%, 12/01/26 | 829 | 787,693 | ||||||
3.70%, 07/15/27 | 829 | 765,323 | ||||||
3.13%, 11/15/29 | 320 | 270,872 | ||||||
5.70%, 03/08/33 | 1,090 | 1,019,187 | ||||||
2.50%, 08/01/33 | 500 | 360,729 | ||||||
Energy Transfer LP | ||||||||
4.05%, 03/15/25 | 829 | 805,838 | ||||||
2.90%, 05/15/25 | 457 | 435,337 | ||||||
4.75%, 01/15/26 | 829 | 804,423 | ||||||
3.90%, 07/15/26 | 350 | 330,700 | ||||||
6.05%, 12/01/26 | 375 | 374,234 | ||||||
4.40%, 03/15/27 | 500 | 470,938 | ||||||
4.20%, 04/15/27 | 829 | 776,363 | ||||||
5.50%, 06/01/27(a) | 650 | 633,963 | ||||||
4.00%, 10/01/27 | 300 | 276,212 | ||||||
5.55%, 02/15/28 | 290 | 281,532 | ||||||
4.95%, 05/15/28 | 829 | 783,887 | ||||||
4.95%, 06/15/28 | 393 | 371,451 | ||||||
6.10%, 12/01/28 | 90 | 88,880 | ||||||
5.25%, 04/15/29 | 593 | 562,799 | ||||||
3.75%, 05/15/30 | 1,029 | 879,464 | ||||||
6.40%, 12/01/30 | 185 | 182,999 | ||||||
5.75%, 02/15/33 | 600 | 562,469 | ||||||
6.55%, 12/01/33 | 130 | 128,285 | ||||||
Enterprise Products Operating LLC | ||||||||
3.75%, 02/15/25 | 684 | 665,894 | ||||||
5.05%, 01/10/26 | 350 | 345,851 | ||||||
3.70%, 02/15/26 | 376 | 359,530 | ||||||
3.95%, 02/15/27 | 209 | 197,760 | ||||||
4.15%, 10/16/28 | 829 | 770,479 | ||||||
3.13%, 07/31/29 | 600 | 520,848 | ||||||
2.80%, 01/31/30 | 711 | 593,911 | ||||||
5.35%, 01/31/33 | 600 | 571,891 | ||||||
Series D, 6.88%, 03/01/33 | 400 | 421,458 | ||||||
Series E, (3-mo. CME Term SOFR + 3.29%), | 620 | 532,098 | ||||||
EOG Resources, Inc. | ||||||||
4.15%, 01/15/26 | 450 | 435,928 | ||||||
4.38%, 04/15/30(a) | 829 | 767,649 | ||||||
EQT Corp. | ||||||||
6.13%, 02/01/25 | 298 | 297,085 | ||||||
3.90%, 10/01/27(a) | 660 | 607,259 | ||||||
5.70%, 04/01/28 | 55 | 53,504 | ||||||
5.00%, 01/15/29 | 130 | 121,223 | ||||||
7.00%, 02/01/30 | 371 | 375,905 | ||||||
Equinor ASA | ||||||||
3.25%, 11/10/24 | 413 | 402,796 | ||||||
2.88%, 04/06/25 | 409 | 394,391 | ||||||
3.63%, 09/10/28 | 600 | 555,918 | ||||||
3.13%, 04/06/30(a) | 829 | 722,648 | ||||||
2.38%, 05/22/30 | 829 | 681,299 | ||||||
Exxon Mobil Corp. | ||||||||
2.71%, 03/06/25 | 1,036 | 999,303 | ||||||
2.99%, 03/19/25 | 1,409 | 1,362,923 | ||||||
3.04%, 03/01/26 | 1,412 | 1,341,763 | ||||||
2.28%, 08/16/26(a) | 413 | 381,567 | ||||||
3.29%, 03/19/27 | 660 | 620,042 | ||||||
| 48 | 2 0 2 3 BLACK ROCK ANNUAL REPORT TO SHAREHOLDERS |
Schedule of Investments (continued) October 31, 2023 | iShares U.S. Intermediate Credit Bond Index Fund (Percentages shown are based on Net Assets) |
| Security | Par (000) | Value | ||||||
| Oil, Gas & Consumable Fuels (continued) | ||||||||
Exxon Mobil Corp. (continued) |
| |||||||
2.44%, 08/16/29 | $ | 663 | $ | 566,199 | ||||
3.48%, 03/19/30 | 911 | 807,463 | ||||||
2.61%, 10/15/30 | 1,010 | 838,275 | ||||||
Helmerich & Payne, Inc., 2.90%, 09/29/31 | 350 | 268,834 | ||||||
Hess Corp. | ||||||||
4.30%, 04/01/27 | 393 | 376,047 | ||||||
7.88%, 10/01/29 | 350 | 384,433 | ||||||
7.30%, 08/15/31 | 250 | 269,841 | ||||||
7.13%, 03/15/33(a) | 450 | 484,322 | ||||||
HF Sinclair Corp., 5.88%, 04/01/26 | 413 | 407,267 | ||||||
Kinder Morgan Energy Partners LP, 7.30%, | 300 | 308,135 | ||||||
Kinder Morgan, Inc. | ||||||||
4.30%, 06/01/25 | 739 | 719,282 | ||||||
1.75%, 11/15/26(a) | 215 | 190,531 | ||||||
4.30%, 03/01/28 | 493 | 459,770 | ||||||
2.00%, 02/15/31 | 745 | 556,706 | ||||||
7.80%, 08/01/31 | 350 | 370,166 | ||||||
7.75%, 01/15/32 | 829 | 879,859 | ||||||
4.80%, 02/01/33 | 200 | 174,892 | ||||||
5.20%, 06/01/33 | 950 | 856,152 | ||||||
Magellan Midstream Partners LP | ||||||||
5.00%, 03/01/26 | 350 | 341,467 | ||||||
3.25%, 06/01/30(a) | 225 | 186,780 | ||||||
Marathon Oil Corp. | ||||||||
4.40%, 07/15/27 | 829 | 776,829 | ||||||
6.80%, 03/15/32 | 229 | 230,421 | ||||||
Marathon Petroleum Corp. | ||||||||
4.70%, 05/01/25 | 829 | 811,725 | ||||||
5.13%, 12/15/26 | 350 | 342,590 | ||||||
3.80%, 04/01/28 | 179 | 163,312 | ||||||
MPLX LP | ||||||||
4.88%, 12/01/24 | 763 | 752,700 | ||||||
4.88%, 06/01/25 | 763 | 747,984 | ||||||
1.75%, 03/01/26 | 600 | 544,382 | ||||||
4.13%, 03/01/27 | �� | 829 | 778,541 | |||||
4.25%, 12/01/27 | 309 | 287,436 | ||||||
4.00%, 03/15/28 | 829 | 759,458 | ||||||
4.80%, 02/15/29 | 500 | 467,691 | ||||||
2.65%, 08/15/30 | 727 | 574,329 | ||||||
4.95%, 09/01/32 | 500 | 443,878 | ||||||
5.00%, 03/01/33 | 705 | 624,300 | ||||||
Occidental Petroleum Corp. | ||||||||
5.55%, 03/15/26 | 1,200 | 1,183,884 | ||||||
6.38%, 09/01/28(a) | 200 | 201,272 | ||||||
8.88%, 07/15/30 | 1,000 | 1,110,460 | ||||||
6.63%, 09/01/30 | 750 | 752,292 | ||||||
6.13%, 01/01/31 | 500 | 488,980 | ||||||
7.50%, 05/01/31 | 500 | 524,295 | ||||||
ONEOK Partners LP, 4.90%, 03/15/25 | 163 | 160,101 | ||||||
ONEOK, Inc. | ||||||||
5.85%, 01/15/26 | 229 | 228,773 | ||||||
5.55%, 11/01/26 | 500 | 493,961 | ||||||
4.00%, 07/13/27 | 250 | 232,399 | ||||||
4.55%, 07/15/28 | 413 | 385,033 | ||||||
5.65%, 11/01/28 | 500 | 487,901 | ||||||
4.35%, 03/15/29 | 829 | 753,283 | ||||||
3.40%, 09/01/29 | 229 | 195,947 | ||||||
3.10%, 03/15/30 | 400 | 329,984 | ||||||
5.80%, 11/01/30 | 425 | 409,078 | ||||||
6.35%, 01/15/31 | 229 | 225,884 | ||||||
6.10%, 11/15/32 | 300 | 289,094 | ||||||
| Security | Par (000) | Value | ||||||
| Oil, Gas & Consumable Fuels (continued) | ||||||||
ONEOK, Inc. (continued) | ||||||||
6.05%, 09/01/33 | $ | 500 | $ | 479,179 | ||||
Ovintiv Exploration, Inc., 5.38%, 01/01/26(a) | 251 | 246,668 | ||||||
Ovintiv, Inc. | ||||||||
5.65%, 05/15/25 | 300 | 298,358 | ||||||
5.65%, 05/15/28 | 300 | 291,268 | ||||||
8.13%, 09/15/30 | 130 | 138,870 | ||||||
7.20%, 11/01/31 | 145 | 146,215 | ||||||
7.38%, 11/01/31 | 413 | 423,534 | ||||||
6.25%, 07/15/33 | 220 | 209,127 | ||||||
Phillips 66 | ||||||||
3.85%, 04/09/25 | 239 | 232,254 | ||||||
1.30%, 02/15/26 | 400 | 361,261 | ||||||
3.90%, 03/15/28 | 300 | 278,029 | ||||||
2.15%, 12/15/30 | 329 | 254,162 | ||||||
Phillips 66 Co. | ||||||||
3.55%, 10/01/26 | 413 | 388,096 | ||||||
4.95%, 12/01/27(a) | 420 | 408,037 | ||||||
3.15%, 12/15/29(a) | 305 | 260,464 | ||||||
5.30%, 06/30/33 | 230 | 214,354 | ||||||
Pioneer Natural Resources Co. | ||||||||
5.10%, 03/29/26 | 455 | 449,982 | ||||||
1.90%, 08/15/30 | 994 | 776,640 | ||||||
2.15%, 01/15/31 | 650 | 510,488 | ||||||
Plains All American Pipeline LP/PAA Finance Corp. |
| |||||||
3.60%, 11/01/24 | 620 | 604,602 | ||||||
4.65%, 10/15/25 | 450 | 435,884 | ||||||
4.50%, 12/15/26 | 413 | 393,595 | ||||||
3.55%, 12/15/29 | 329 | 279,615 | ||||||
3.80%, 09/15/30 | 200 | 168,538 | ||||||
Sabine Pass Liquefaction LLC | ||||||||
5.63%, 03/01/25 | 1,279 | 1,270,635 | ||||||
5.88%, 06/30/26 | 829 | 822,812 | ||||||
5.00%, 03/15/27 | 829 | 798,379 | ||||||
4.20%, 03/15/28 | 829 | 762,782 | ||||||
4.50%, 05/15/30 | 1,259 | 1,129,295 | ||||||
Shell International Finance BV | ||||||||
2.00%, 11/07/24 | 829 | 799,958 | ||||||
3.25%, 05/11/25 | 1,386 | 1,341,617 | ||||||
2.88%, 05/10/26 | 593 | 558,373 | ||||||
2.50%, 09/12/26(a) | 829 | 767,882 | ||||||
3.88%, 11/13/28 | 829 | 772,027 | ||||||
2.38%, 11/07/29 | 829 | 693,703 | ||||||
2.75%, 04/06/30 | 589 | 497,925 | ||||||
Spectra Energy Partners LP | ||||||||
3.50%, 03/15/25 | 163 | 157,440 | ||||||
3.38%, 10/15/26 | 829 | 771,683 | ||||||
Suncor Energy, Inc., 7.15%, 02/01/32 | 250 | 257,954 | ||||||
Targa Resources Corp. | ||||||||
5.20%, 07/01/27 | 450 | 435,412 | ||||||
4.20%, 02/01/33 | 374 | 309,995 | ||||||
6.13%, 03/15/33(a) | 450 | 430,984 | ||||||
Targa Resources Partners LP/Targa Resources |
| |||||||
Partners Finance Corp. | ||||||||
6.50%, 07/15/27 | 329 | 325,151 | ||||||
5.00%, 01/15/28 | 329 | 310,484 | ||||||
6.88%, 01/15/29 | 329 | 327,394 | ||||||
5.50%, 03/01/30 | 496 | 457,074 | ||||||
4.88%, 02/01/31 | 496 | 437,240 | ||||||
4.00%, 01/15/32 | 496 | 408,223 | ||||||
TC PipeLines LP | ||||||||
4.38%, 03/13/25 | 163 | 159,149 | ||||||
3.90%, 05/25/27 | 27 | 25,010 | ||||||
SCHEDULE OF INVESTMENTS | 49 |
Schedule of Investments (continued) October 31, 2023 | iShares U.S. Intermediate Credit Bond Index Fund (Percentages shown are based on Net Assets) |
| Security | Par (000) | Value | ||||||
| Oil, Gas & Consumable Fuels (continued) | ||||||||
TotalEnergies Capital International SA |
| |||||||
2.43%, 01/10/25 | $ | 400 | $ | 385,558 | ||||
3.46%, 02/19/29 | 489 | 442,887 | ||||||
2.83%, 01/10/30 | 500 | 426,365 | ||||||
TotalEnergies Capital SA, 3.88%, 10/11/28 | 400 | 371,367 | ||||||
TransCanada PipeLines Ltd. | ||||||||
4.88%, 01/15/26 | 702 | 685,071 | ||||||
6.20%, 03/09/26(a) | 400 | 399,753 | ||||||
4.25%, 05/15/28 | 620 | 573,078 | ||||||
4.10%, 04/15/30 | 443 | 388,906 | ||||||
2.50%, 10/12/31 | 413 | 311,544 | ||||||
Transcontinental Gas Pipe Line Co. LLC | ||||||||
7.85%, 02/01/26 | 663 | 684,522 | ||||||
4.00%, 03/15/28 | 220 | 202,426 | ||||||
3.25%, 05/15/30 | 450 | 376,859 | ||||||
Valero Energy Corp. | ||||||||
2.15%, 09/15/27 | 209 | 182,687 | ||||||
4.35%, 06/01/28(a) | 212 | 198,460 | ||||||
2.80%, 12/01/31(a) | 179 | 138,544 | ||||||
7.50%, 04/15/32 | 310 | 328,941 | ||||||
Valero Energy Partners LP, 4.50%, 03/15/28 | 413 | 388,780 | ||||||
Western Midstream Operating LP | ||||||||
3.10%, 02/01/25 | 400 | 384,299 | ||||||
4.65%, 07/01/26 | 200 | 191,221 | ||||||
4.75%, 08/15/28 | 200 | 186,047 | ||||||
6.35%, 01/15/29(a) | 560 | 556,989 | ||||||
4.05%, 02/01/30(a) | 500 | 433,473 | ||||||
6.15%, 04/01/33(a) | 400 | 378,311 | ||||||
Williams Cos., Inc. | ||||||||
3.90%, 01/15/25 | 163 | 158,723 | ||||||
4.00%, 09/15/25(a) | 163 | 156,719 | ||||||
5.40%, 03/02/26 | 220 | 217,503 | ||||||
3.75%, 06/15/27 | 620 | 572,781 | ||||||
5.30%, 08/15/28 | 700 | 674,632 | ||||||
3.50%, 11/15/30 | 829 | 698,402 | ||||||
2.60%, 03/15/31 | 539 | 420,252 | ||||||
8.75%, 03/15/32 | 400 | 444,498 | ||||||
4.65%, 08/15/32 | 600 | 528,674 | ||||||
5.65%, 03/15/33 | 600 | 566,073 | ||||||
|
| |||||||
| 121,960,695 | ||||||||
| Paper & Forest Products — 0.0% | ||||||||
Suzano International Finance BV, | 829 | 805,456 | ||||||
|
| |||||||
| Passenger Airlines — 0.2% | ||||||||
American Airlines Pass-Through Trust | ||||||||
Series 2016-2, Class AA, 3.20%, 12/15/29 | 288 | 253,858 | ||||||
Series 2019-1, Class AA, 3.15%, 08/15/33 | 671 | 559,693 | ||||||
JetBlue Pass-Through Trust, Series 1A, | 251 | 221,664 | ||||||
Southwest Airlines Co. | ||||||||
5.25%, 05/04/25 | 543 | 535,474 | ||||||
5.13%, 06/15/27 | 1,027 | 990,958 | ||||||
2.63%, 02/10/30 | 159 | 128,421 | ||||||
United Airlines Pass-Through Trust | ||||||||
Class A, 5.80%, 07/15/37 | 610 | 571,637 | ||||||
Series 2016-1, Class AA, 3.10%, 01/07/30 | 282 | 250,989 | ||||||
Series 2019-1, Class AA, 4.15%, 02/25/33 | 182 | 160,893 | ||||||
| Security | Par (000) | Value | ||||||
| Passenger Airlines (continued) | ||||||||
United Airlines Pass-Through Trust (continued) |
| |||||||
Series 2020-1, Class A, 5.88%, 04/15/29(a) | $ | 963 | $ | 947,828 | ||||
Series A, Class A, 4.30%, 02/15/27 | 72 | 68,887 | ||||||
|
| |||||||
| 4,690,302 | ||||||||
| Personal Care Products — 0.8% | ||||||||
Colgate-Palmolive Co. | ||||||||
4.80%, 03/02/26 | 80 | 79,493 | ||||||
4.60%, 03/01/28 | 480 | 470,177 | ||||||
4.60%, 03/01/33 | 480 | 451,223 | ||||||
Estee Lauder Cos., Inc. | ||||||||
2.00%, 12/01/24 | 243 | 233,381 | ||||||
3.15%, 03/15/27 | 179 | 165,640 | ||||||
4.38%, 05/15/28 | 100 | 95,482 | ||||||
2.38%, 12/01/29 | 411 | 339,829 | ||||||
2.60%, 04/15/30 | 413 | 340,412 | ||||||
1.95%, 03/15/31 | 193 | 147,991 | ||||||
4.65%, 05/15/33(a) | 450 | 409,089 | ||||||
Haleon U.K. Capital PLC, 3.13%, 03/24/25 | 982 | 943,920 | ||||||
Haleon U.S. Capital LLC | ||||||||
3.38%, 03/24/27 | 1,150 | 1,060,497 | ||||||
3.38%, 03/24/29 | 400 | 353,512 | ||||||
3.63%, 03/24/32 | 1,062 | 884,685 | ||||||
Kenvue, Inc. | ||||||||
5.50%, 03/22/25 | 430 | 429,301 | ||||||
5.35%, 03/22/26 | 370 | 368,687 | ||||||
5.05%, 03/22/28(a) | 515 | 505,385 | ||||||
5.00%, 03/22/30 | 390 | 375,290 | ||||||
4.90%, 03/22/33 | 690 | 646,557 | ||||||
Procter & Gamble Co. | ||||||||
0.55%, 10/29/25 | 349 | 318,391 | ||||||
4.10%, 01/26/26(a) | 550 | 537,755 | ||||||
2.70%, 02/02/26 | 350 | 331,344 | ||||||
1.00%, 04/23/26 | 467 | 422,156 | ||||||
2.45%, 11/03/26 | 450 | 416,732 | ||||||
1.90%, 02/01/27 | 500 | 451,151 | ||||||
2.80%, 03/25/27 | 1,000 | 923,007 | ||||||
2.85%, 08/11/27 | 413 | 379,569 | ||||||
3.95%, 01/26/28 | 250 | 239,313 | ||||||
3.00%, 03/25/30 | 829 | 721,464 | ||||||
1.20%, 10/29/30 | 425 | 321,506 | ||||||
1.95%, 04/23/31 | 829 | 656,528 | ||||||
2.30%, 02/01/32 | 480 | 383,047 | ||||||
4.05%, 01/26/33 | 450 | 409,711 | ||||||
Unilever Capital Corp. | ||||||||
3.10%, 07/30/25 | 400 | 384,468 | ||||||
2.00%, 07/28/26 | 490 | 448,307 | ||||||
2.90%, 05/05/27 | 490 | 450,429 | ||||||
3.50%, 03/22/28 | 500 | 461,863 | ||||||
2.13%, 09/06/29 | 655 | 545,474 | ||||||
1.38%, 09/14/30(a) | 527 | 401,075 | ||||||
1.75%, 08/12/31 | 450 | 339,703 | ||||||
5.90%, 11/15/32 | 450 | 455,729 | ||||||
|
| |||||||
| 18,299,273 | ||||||||
| Pharmaceuticals — 3.5% | ||||||||
AbbVie, Inc. | ||||||||
2.60%, 11/21/24 | 1,534 | 1,482,243 | ||||||
3.80%, 03/15/25 | 1,450 | 1,411,488 | ||||||
3.60%, 05/14/25 | 1,793 | 1,734,564 | ||||||
3.20%, 05/14/26 | 1,190 | 1,122,188 | ||||||
| 50 | 2 0 2 3 BLACK ROCK ANNUAL REPORT TO SHAREHOLDERS |
Schedule of Investments (continued) October 31, 2023 | iShares U.S. Intermediate Credit Bond Index Fund (Percentages shown are based on Net Assets) |
| Security | Par (000) | Value | ||||||
| Pharmaceuticals (continued) | ||||||||
AbbVie, Inc. (continued) | ||||||||
2.95%, 11/21/26(a) | $ | 2,709 | $ | 2,508,979 | ||||
4.25%, 11/14/28 | 723 | 680,648 | ||||||
3.20%, 11/21/29 | 2,714 | 2,365,165 | ||||||
Astrazeneca Finance LLC | ||||||||
1.20%, 05/28/26 | 829 | 745,611 | ||||||
4.88%, 03/03/28 | 400 | 390,399 | ||||||
1.75%, 05/28/28 | 721 | 613,624 | ||||||
4.90%, 03/03/30 | 500 | 479,423 | ||||||
2.25%, 05/28/31 | 150 | 118,001 | ||||||
4.88%, 03/03/33 | 250 | 235,075 | ||||||
AstraZeneca PLC | ||||||||
3.38%, 11/16/25 | 1,141 | 1,095,333 | ||||||
0.70%, 04/08/26 | 911 | 815,467 | ||||||
3.13%, 06/12/27 | 413 | 382,020 | ||||||
4.00%, 01/17/29 | 343 | 319,411 | ||||||
1.38%, 08/06/30 | 911 | 694,249 | ||||||
Bristol-Myers Squibb Co. | ||||||||
0.75%, 11/13/25 | 450 | 410,382 | ||||||
3.20%, 06/15/26 | 626 | 593,197 | ||||||
1.13%, 11/13/27 | 450 | 382,348 | ||||||
3.45%, 11/15/27(a) | 800 | 742,087 | ||||||
3.90%, 02/20/28 | 829 | 779,457 | ||||||
3.40%, 07/26/29 | 1,067 | 957,284 | ||||||
1.45%, 11/13/30 | 620 | 467,228 | ||||||
5.75%, 02/01/31(c) | 500 | 496,964 | ||||||
2.95%, 03/15/32(a) | 965 | 784,444 | ||||||
5.90%, 11/15/33(c) | 370 | 367,631 | ||||||
Cigna Group | ||||||||
3.25%, 04/15/25 | 225 | 216,844 | ||||||
4.13%, 11/15/25 | 1,129 | 1,093,900 | ||||||
4.50%, 02/25/26 | 663 | 643,625 | ||||||
1.25%, 03/15/26 | 413 | 371,557 | ||||||
5.69%, 03/15/26 | 400 | 398,515 | ||||||
3.40%, 03/01/27 | 620 | 574,727 | ||||||
3.05%, 10/15/27 | 179 | 161,844 | ||||||
4.38%, 10/15/28 | 2,153 | 2,012,275 | ||||||
2.40%, 03/15/30 | 829 | 668,768 | ||||||
2.38%, 03/15/31 | 590 | 459,503 | ||||||
5.40%, 03/15/33 | 290 | 274,429 | ||||||
CVS Health Corp. | ||||||||
4.10%, 03/25/25 | 568 | 555,978 | ||||||
3.88%, 07/20/25 | 1,330 | 1,286,602 | ||||||
5.00%, 02/20/26 | 910 | 892,729 | ||||||
2.88%, 06/01/26 | 700 | 650,516 | ||||||
3.00%, 08/15/26 | 1,000 | 927,433 | ||||||
3.63%, 04/01/27 | 113 | 104,891 | ||||||
1.30%, 08/21/27 | 1,243 | 1,048,428 | ||||||
4.30%, 03/25/28 | 3,275 | 3,068,304 | ||||||
5.00%, 01/30/29 | 440 | 421,204 | ||||||
3.25%, 08/15/29 | 709 | 612,598 | ||||||
5.13%, 02/21/30 | 500 | 470,695 | ||||||
3.75%, 04/01/30 | 597 | 519,397 | ||||||
1.75%, 08/21/30 | 512 | 386,902 | ||||||
5.25%, 01/30/31(a) | 335 | 315,289 | ||||||
1.88%, 02/28/31 | 1,023 | 760,499 | ||||||
2.13%, 09/15/31 | 371 | 276,454 | ||||||
5.25%, 02/21/33 | 950 | 876,134 | ||||||
5.30%, 06/01/33(a) | 440 | 406,357 | ||||||
Eli Lilly & Co. | ||||||||
2.75%, 06/01/25 | 350 | 336,085 | ||||||
5.00%, 02/27/26(a) | 350 | 349,130 | ||||||
| Security | Par (000) | Value | ||||||
| Pharmaceuticals (continued) | ||||||||
Eli Lilly & Co. (continued) | ||||||||
3.10%, 05/15/27 | $ | 620 | $ | 575,996 | ||||
3.38%, 03/15/29 | 829 | 754,462 | ||||||
4.70%, 02/27/33 | 590 | 554,063 | ||||||
GlaxoSmithKline Capital PLC, 3.38%, 06/01/29 | 829 | 747,072 | ||||||
GlaxoSmithKline Capital, Inc. | ||||||||
3.63%, 05/15/25 | 829 | 806,761 | ||||||
3.88%, 05/15/28(a) | 829 | 777,434 | ||||||
Johnson & Johnson | ||||||||
2.63%, 01/15/25 | 300 | 290,871 | ||||||
0.55%, 09/01/25(a) | 339 | 311,349 | ||||||
2.45%, 03/01/26 | 1,065 | 1,000,583 | ||||||
2.95%, 03/03/27 | 400 | 372,704 | ||||||
0.95%, 09/01/27 | 600 | 513,658 | ||||||
2.90%, 01/15/28(a) | 829 | 759,145 | ||||||
1.30%, 09/01/30(a) | 650 | 502,114 | ||||||
4.95%, 05/15/33(a) | 250 | 243,778 | ||||||
Mead Johnson Nutrition Co., 4.13%, 11/15/25 | 829 | 803,708 | ||||||
Merck & Co., Inc. | ||||||||
2.75%, 02/10/25 | 1,263 | 1,221,488 | ||||||
0.75%, 02/24/26(a) | 400 | 360,689 | ||||||
1.70%, 06/10/27 | 775 | 683,045 | ||||||
4.05%, 05/17/28(a) | 200 | 190,376 | ||||||
1.90%, 12/10/28(a) | 795 | 672,657 | ||||||
3.40%, 03/07/29 | 750 | 678,081 | ||||||
4.30%, 05/17/30 | 400 | 370,867 | ||||||
1.45%, 06/24/30 | 793 | 609,706 | ||||||
2.15%, 12/10/31 | 1,264 | 974,294 | ||||||
4.50%, 05/17/33 | 820 | 745,441 | ||||||
Mylan, Inc., 4.55%, 04/15/28 | 660 | 600,738 | ||||||
Novartis Capital Corp. | ||||||||
1.75%, 02/14/25 | 413 | 394,382 | ||||||
3.00%, 11/20/25 | 911 | 868,482 | ||||||
2.00%, 02/14/27 | 413 | 371,811 | ||||||
3.10%, 05/17/27 | 373 | 345,861 | ||||||
2.20%, 08/14/30 | 829 | 674,094 | ||||||
Pfizer Investment Enterprises Pte Ltd. | ||||||||
4.65%, 05/19/25 | 1,680 | 1,658,717 | ||||||
4.45%, 05/19/26 | 1,680 | 1,640,145 | ||||||
4.45%, 05/19/28 | 1,680 | 1,605,764 | ||||||
4.65%, 05/19/30 | 1,550 | 1,457,542 | ||||||
4.75%, 05/19/33(a) | 2,705 | 2,485,903 | ||||||
Pfizer, Inc. | ||||||||
0.80%, 05/28/25 | 285 | 264,970 | ||||||
2.75%, 06/03/26 | 505 | 473,131 | ||||||
3.00%, 12/15/26 | 620 | 577,384 | ||||||
3.60%, 09/15/28(a) | 359 | 331,734 | ||||||
3.45%, 03/15/29 | 860 | 781,128 | ||||||
2.63%, 04/01/30 | 829 | 692,847 | ||||||
1.70%, 05/28/30 | 683 | 537,949 | ||||||
1.75%, 08/18/31 | 829 | 625,465 | ||||||
Pharmacia LLC, 6.60%, 12/01/28 | 400 | 417,153 | ||||||
Sanofi SA, 3.63%, 06/19/28 | 559 | 522,815 | ||||||
Shire Acquisitions Investments Ireland DAC, 3.20%, 09/23/26 | 1,576 | 1,467,543 | ||||||
Takeda Pharmaceutical Co. Ltd. | ||||||||
5.00%, 11/26/28 | 1,078 | 1,040,715 | ||||||
2.05%, 03/31/30 | 1,254 | 991,002 | ||||||
Utah Acquisition Sub, Inc., 3.95%, 06/15/26 | 913 | 855,196 | ||||||
Viatris, Inc. | ||||||||
1.65%, 06/22/25 | 829 | 769,968 | ||||||
2.30%, 06/22/27 | 829 | 710,709 | ||||||
SCHEDULE OF INVESTMENTS | 51 |
Schedule of Investments (continued) October 31, 2023 | iShares U.S. Intermediate Credit Bond Index Fund (Percentages shown are based on Net Assets) |
| Security | Par (000) | Value | ||||||
| Pharmaceuticals (continued) | ||||||||
Viatris, Inc. (continued) | ||||||||
2.70%, 06/22/30(a) | $ | 493 | $ | 378,635 | ||||
Zoetis, Inc. | ||||||||
4.50%, 11/13/25 | 300 | 292,724 | ||||||
5.40%, 11/14/25 | 400 | 397,115 | ||||||
3.00%, 09/12/27 | 350 | 318,032 | ||||||
3.90%, 08/20/28(a) | 179 | 166,399 | ||||||
2.00%, 05/15/30 | 329 | 259,121 | ||||||
5.60%, 11/16/32 | 300 | 290,821 | ||||||
|
| |||||||
| 85,102,859 | ||||||||
| Professional Services — 0.1% | ||||||||
Concentrix Corp. | ||||||||
6.65%, 08/02/26 | 250 | 248,463 | ||||||
6.60%, 08/02/28 | 500 | 480,025 | ||||||
6.85%, 08/02/33 | 250 | 225,843 | ||||||
Equifax, Inc., 5.10%, 06/01/28 | 220 | 209,979 | ||||||
Jacobs Engineering Group, Inc., | 250 | 248,610 | ||||||
Verisk Analytics, Inc., 4.13%, 03/15/29 | 413 | 378,029 | ||||||
|
| |||||||
| 1,790,949 | ||||||||
| Real Estate Management & Development — 0.1% | ||||||||
CBRE Services, Inc. | ||||||||
4.88%, 03/01/26 | 163 | 157,648 | ||||||
2.50%, 04/01/31 | 193 | 145,292 | ||||||
Essential Properties LP, 2.95%, 07/15/31 | 129 | 92,285 | ||||||
VICI Properties LP, 5.13%, 05/15/32 | 950 | 820,950 | ||||||
|
| |||||||
| 1,216,175 | ||||||||
| Residential REITs — 0.0% | ||||||||
Camden Property Trust, 5.85%, 11/03/26 | 135 | 135,006 | ||||||
|
| |||||||
| Retail REITs — 0.3% | ||||||||
NNN REIT, Inc. | ||||||||
3.60%, 12/15/26 | 500 | 463,304 | ||||||
4.30%, 10/15/28(a) | 129 | 117,736 | ||||||
2.50%, 04/15/30 | 200 | 159,141 | ||||||
5.60%, 10/15/33 | 200 | 184,345 | ||||||
Realty Income Corp. | ||||||||
4.63%, 11/01/25 | 350 | 341,215 | ||||||
0.75%, 03/15/26 | 475 | 420,341 | ||||||
4.88%, 06/01/26 | 400 | 389,543 | ||||||
4.13%, 10/15/26 | 829 | 788,626 | ||||||
3.00%, 01/15/27 | 829 | 756,074 | ||||||
3.95%, 08/15/27 | 413 | 383,486 | ||||||
3.40%, 01/15/28 | 413 | 371,757 | ||||||
4.70%, 12/15/28 | 220 | 206,902 | ||||||
3.25%, 06/15/29 | 207 | 180,753 | ||||||
3.10%, 12/15/29 | 413 | 348,738 | ||||||
4.85%, 03/15/30 | 40 | 36,945 | ||||||
5.63%, 10/13/32(a) | 500 | 471,909 | �� | |||||
2.85%, 12/15/32 | 179 | 135,482 | ||||||
4.90%, 07/15/33 | 340 | 302,211 | ||||||
|
| |||||||
| 6,058,508 | ||||||||
| Semiconductors & Semiconductor Equipment — 2.1% | ||||||||
Advanced Micro Devices, Inc., 3.92%, 06/01/32 | 430 | 376,437 | ||||||
Analog Devices, Inc. | ||||||||
3.50%, 12/05/26 | 620 | 585,917 | ||||||
3.45%, 06/15/27 | 500 | 465,583 | ||||||
1.70%, 10/01/28 | 450 | 376,463 | ||||||
2.10%, 10/01/31 | 650 | 501,179 | ||||||
Broadcom Corp./Broadcom Cayman Finance Ltd. |
| |||||||
3.88%, 01/15/27 | 1,842 | 1,721,649 | ||||||
| Security | Par (000) | Value | ||||||
| Semiconductors & Semiconductor Equipment (continued) | ||||||||
Broadcom Corp./Broadcom Cayman Finance Ltd. (continued) | ||||||||
3.50%, 01/15/28 | $ | 413 | $ | 372,062 | ||||
Broadcom, Inc. | ||||||||
3.15%, 11/15/25 | 294 | 278,497 | ||||||
3.46%, 09/15/26 | 309 | 289,907 | ||||||
1.95%, 02/15/28(d) | 198 | 167,093 | ||||||
4.11%, 09/15/28(a) | 700 | 642,061 | ||||||
4.00%, 04/15/29(d) | 450 | 401,961 | ||||||
4.75%, 04/15/29 | 800 | 743,927 | ||||||
4.15%, 11/15/30 | 1,146 | 997,528 | ||||||
2.45%, 02/15/31(d) | 1,715 | 1,316,120 | ||||||
4.15%, 04/15/32(d) | 512 | 433,209 | ||||||
4.30%, 11/15/32(a) | 1,244 | 1,058,642 | ||||||
2.60%, 02/15/33(d) | 700 | 507,881 | ||||||
3.42%, 04/15/33(a)(d) | 1,000 | 777,524 | ||||||
Flex Ltd. | ||||||||
4.75%, 06/15/25 | 250 | 243,880 | ||||||
3.75%, 02/01/26 | 250 | 236,424 | ||||||
6.00%, 01/15/28 | 300 | 296,271 | ||||||
4.88%, 06/15/29 | 413 | 377,713 | ||||||
4.88%, 05/12/30(a) | 243 | 220,012 | ||||||
Honeywell International, Inc. | ||||||||
4.85%, 11/01/24 | 100 | 99,279 | ||||||
1.35%, 06/01/25 | 472 | 443,361 | ||||||
2.50%, 11/01/26(a) | 600 | 554,902 | ||||||
1.10%, 03/01/27 | 829 | 723,633 | ||||||
4.95%, 02/15/28(a) | 100 | 98,792 | ||||||
4.25%, 01/15/29 | 160 | 150,908 | ||||||
2.70%, 08/15/29 | 293 | 251,856 | ||||||
1.95%, 06/01/30 | 829 | 659,236 | ||||||
1.75%, 09/01/31 | 829 | 620,652 | ||||||
5.00%, 02/15/33 | 600 | 566,843 | ||||||
Hubbell, Inc., 3.50%, 02/15/28 | 250 | 229,699 | ||||||
Intel Corp. | ||||||||
3.40%, 03/25/25 | 890 | 863,376 | ||||||
3.70%, 07/29/25 | 1,379 | 1,334,961 | ||||||
4.88%, 02/10/26 | 600 | 591,815 | ||||||
2.60%, 05/19/26 | 400 | 374,268 | ||||||
3.75%, 03/25/27 | 660 | 622,766 | ||||||
3.15%, 05/11/27 | 400 | 368,690 | ||||||
3.75%, 08/05/27 | 750 | 704,164 | ||||||
4.88%, 02/10/28 | 1,055 | 1,027,008 | ||||||
1.60%, 08/12/28 | 297 | 248,538 | ||||||
4.00%, 08/05/29 | 350 | 322,337 | ||||||
2.45%, 11/15/29 | 829 | 695,848 | ||||||
5.13%, 02/10/30 | 600 | 580,591 | ||||||
3.90%, 03/25/30 | 550 | 494,879 | ||||||
2.00%, 08/12/31 | 413 | 316,234 | ||||||
4.15%, 08/05/32 | 810 | 717,992 | ||||||
4.00%, 12/15/32 | 500 | 436,019 | ||||||
5.20%, 02/10/33 | 1,000 | 944,070 | ||||||
Jabil, Inc. | ||||||||
1.70%, 04/15/26 | 694 | 625,526 | ||||||
4.25%, 05/15/27 | 145 | 136,069 | ||||||
3.95%, 01/12/28 | 250 | 227,961 | ||||||
5.45%, 02/01/29 | 75 | 72,093 | ||||||
3.60%, 01/15/30 | 250 | 212,341 | ||||||
3.00%, 01/15/31 | 219 | 173,493 | ||||||
Marvell Technology, Inc. | ||||||||
1.65%, 04/15/26 | 736 | 665,055 | ||||||
2.45%, 04/15/28 | 429 | 367,046 | ||||||
| 52 | 2 0 2 3 BLACK ROCK ANNUAL REPORT TO SHAREHOLDERS |
Schedule of Investments (continued) October 31, 2023 | iShares U.S. Intermediate Credit Bond Index Fund (Percentages shown are based on Net Assets) |
| Security | Par (000) | Value | ||||||
| Semiconductors & Semiconductor Equipment (continued) | ||||||||
Marvell Technology, Inc. (continued) | ||||||||
5.75%, 02/15/29 | $ | 260 | $ | 252,759 | ||||
2.95%, 04/15/31 | 393 | 310,239 | ||||||
5.95%, 09/15/33(a) | 260 | 246,950 | ||||||
Microchip Technology, Inc., 4.25%, 09/01/25 | 829 | 799,439 | ||||||
Micron Technology, Inc. | ||||||||
4.98%, 02/06/26 | 163 | 158,848 | ||||||
4.19%, 02/15/27 | 400 | 374,448 | ||||||
5.38%, 04/15/28 | 340 | 326,368 | ||||||
5.33%, 02/06/29 | 363 | 344,897 | ||||||
6.75%, 11/01/29 | 500 | 502,431 | ||||||
4.66%, 02/15/30 | 300 | 268,837 | ||||||
2.70%, 04/15/32 | 829 | 615,484 | ||||||
5.88%, 02/09/33 | 200 | 186,055 | ||||||
5.88%, 09/15/33 | 600 | 553,930 | ||||||
NVIDIA Corp. | ||||||||
3.20%, 09/16/26(a) | 829 | 782,477 | ||||||
1.55%, 06/15/28 | 600 | 507,236 | ||||||
2.85%, 04/01/30 | 946 | 808,544 | ||||||
2.00%, 06/15/31 | 579 | 451,008 | ||||||
NXP BV / NXP Funding LLC, 5.55%, 12/01/28 | 400 | 387,940 | ||||||
NXP BV/NXP Funding LLC/NXP USA, Inc. | ||||||||
2.70%, 05/01/25 | 400 | 380,020 | ||||||
3.88%, 06/18/26 | 239 | 226,326 | ||||||
3.15%, 05/01/27 | 300 | 271,233 | ||||||
4.40%, 06/01/27(a) | 400 | 376,640 | ||||||
4.30%, 06/18/29 | 829 | 746,705 | ||||||
3.40%, 05/01/30 | 465 | 388,847 | ||||||
2.50%, 05/11/31 | 311 | 237,268 | ||||||
2.65%, 02/15/32 | 308 | 231,822 | ||||||
5.00%, 01/15/33 | 500 | 444,571 | ||||||
Qorvo, Inc., 4.38%, 10/15/29 | 454 | 394,196 | ||||||
QUALCOMM, Inc. | ||||||||
3.45%, 05/20/25 | 600 | 581,466 | ||||||
3.25%, 05/20/27(a) | 1,163 | 1,081,826 | ||||||
1.30%, 05/20/28 | 366 | 305,407 | ||||||
2.15%, 05/20/30 | 500 | 404,439 | ||||||
1.65%, 05/20/32 | 700 | 510,606 | ||||||
4.25%, 05/20/32 | 93 | 83,888 | ||||||
5.40%, 05/20/33(a) | 500 | 487,880 | ||||||
Skyworks Solutions, Inc. | ||||||||
1.80%, 06/01/26 | 107 | 95,495 | ||||||
3.00%, 06/01/31 | 123 | 94,193 | ||||||
Texas Instruments, Inc. | ||||||||
4.70%, 11/18/24 | 100 | 99,143 | ||||||
1.38%, 03/12/25 | 450 | 426,060 | ||||||
1.13%, 09/15/26 | 350 | 313,210 | ||||||
4.60%, 02/15/28 | 200 | 194,391 | ||||||
2.25%, 09/04/29 | 562 | 472,644 | ||||||
1.75%, 05/04/30 | 450 | 358,727 | ||||||
1.90%, 09/15/31 | 467 | 359,888 | ||||||
3.65%, 08/16/32 | 200 | 171,311 | ||||||
4.90%, 03/14/33 | 620 | 583,341 | ||||||
TSMC Arizona Corp. | ||||||||
1.75%, 10/25/26 | 450 | 402,529 | ||||||
3.88%, 04/22/27 | 1,000 | 945,410 | ||||||
4.13%, 04/22/29 | 250 | 232,853 | ||||||
2.50%, 10/25/31 | 410 | 322,432 | ||||||
| Security | Par (000) | Value | ||||||
| Semiconductors & Semiconductor Equipment (continued) | ||||||||
TSMC Arizona Corp. (continued) | ||||||||
4.25%, 04/22/32(a) | $ | 400 | $ | 359,728 | ||||
Xilinx, Inc., 2.38%, 06/01/30 | 260 | 211,992 | ||||||
|
| |||||||
| 51,584,618 | ||||||||
| Software — 1.7% | ||||||||
Activision Blizzard, Inc. | ||||||||
3.40%, 09/15/26 | 350 | 330,988 | ||||||
3.40%, 06/15/27 | 129 | 120,106 | ||||||
1.35%, 09/15/30(a) | 61 | 46,779 | ||||||
Autodesk, Inc. | ||||||||
3.50%, 06/15/27 | 209 | 193,254 | ||||||
2.85%, 01/15/30 | 376 | 313,725 | ||||||
2.40%, 12/15/31 | 637 | 489,358 | ||||||
Electronic Arts, Inc., 1.85%, 02/15/31 | 213 | 162,099 | ||||||
Intuit, Inc. | ||||||||
0.95%, 07/15/25 | 625 | 578,070 | ||||||
5.25%, 09/15/26 | 330 | 329,017 | ||||||
1.35%, 07/15/27 | 683 | 589,556 | ||||||
5.13%, 09/15/28 | 450 | 442,856 | ||||||
1.65%, 07/15/30 | 166 | 128,327 | ||||||
5.20%, 09/15/33 | 450 | 428,071 | ||||||
Microsoft Corp. | ||||||||
2.70%, 02/12/25 | 1,450 | 1,402,684 | ||||||
3.13%, 11/03/25 | 1,834 | 1,759,862 | ||||||
2.40%, 08/08/26 | 2,553 | 2,374,287 | ||||||
3.30%, 02/06/27 | 2,584 | 2,441,141 | ||||||
Oracle Corp. | ||||||||
2.95%, 11/15/24 | 2,903 | 2,815,356 | ||||||
2.50%, 04/01/25 | 1,479 | 1,410,882 | ||||||
2.95%, 05/15/25 | 1,563 | 1,495,966 | ||||||
5.80%, 11/10/25 | 920 | 919,817 | ||||||
1.65%, 03/25/26(a) | 1,691 | 1,533,717 | ||||||
2.65%, 07/15/26 | 1,315 | 1,210,489 | ||||||
2.80%, 04/01/27 | 1,243 | 1,124,617 | ||||||
3.25%, 11/15/27 | 1,820 | 1,647,753 | ||||||
2.30%, 03/25/28 | 1,148 | 985,732 | ||||||
4.50%, 05/06/28 | 130 | 123,003 | ||||||
6.15%, 11/09/29 | 205 | 205,741 | ||||||
2.95%, 04/01/30 | 1,750 | 1,450,408 | ||||||
4.65%, 05/06/30 | 130 | 119,180 | ||||||
3.25%, 05/15/30 | 787 | 661,978 | ||||||
2.88%, 03/25/31 | 1,643 | 1,316,962 | ||||||
6.25%, 11/09/32(a) | 900 | 891,560 | ||||||
4.90%, 02/06/33 | 730 | 655,538 | ||||||
Roper Technologies, Inc. | ||||||||
1.00%, 09/15/25 | 512 | 468,974 | ||||||
3.80%, 12/15/26 | 413 | 390,149 | ||||||
1.40%, 09/15/27 | 305 | 258,119 | ||||||
4.20%, 09/15/28 | 450 | 418,136 | ||||||
2.95%, 09/15/29 | 359 | 305,830 | ||||||
2.00%, 06/30/30 | 313 | 242,604 | ||||||
1.75%, 02/15/31 | 404 | 298,483 | ||||||
Salesforce, Inc. | ||||||||
3.70%, 04/11/28 | 1,009 | 945,130 | ||||||
1.50%, 07/15/28 | 450 | 378,907 | ||||||
1.95%, 07/15/31 | 689 | 531,945 | ||||||
ServiceNow, Inc., 1.40%, 09/01/30 | 670 | 505,043 | ||||||
Take-Two Interactive Software, Inc. | ||||||||
3.55%, 04/14/25 | 388 | 374,886 | ||||||
5.00%, 03/28/26 | 300 | 294,004 | ||||||
SCHEDULE OF INVESTMENTS | 53 |
Schedule of Investments (continued) October 31, 2023 | iShares U.S. Intermediate Credit Bond Index Fund (Percentages shown are based on Net Assets) |
| Security | Par (000) | Value | ||||||
| Software (continued) | ||||||||
Take-Two Interactive Software, Inc. (continued) | ||||||||
3.70%, 04/14/27 | $ | 305 | $ | 283,891 | ||||
4.95%, 03/28/28 | 300 | 288,267 | ||||||
4.00%, 04/14/32 | 359 | 307,465 | ||||||
VMware, Inc. | ||||||||
4.50%, 05/15/25 | 500 | 488,326 | ||||||
1.40%, 08/15/26 | 909 | 800,711 | ||||||
4.65%, 05/15/27(a) | 400 | 383,148 | ||||||
3.90%, 08/21/27 | 600 | 555,936 | ||||||
1.80%, 08/15/28(a) | 500 | 412,703 | ||||||
4.70%, 05/15/30 | 309 | 279,863 | ||||||
2.20%, 08/15/31 | 750 | 554,449 | ||||||
Workday, Inc. | ||||||||
3.50%, 04/01/27 | 639 | 593,271 | ||||||
3.70%, 04/01/29 | 279 | 249,110 | ||||||
3.80%, 04/01/32 | 821 | 683,715 | ||||||
|
| |||||||
| 41,991,944 | ||||||||
| Specialized REITs — 0.1% | ||||||||
American Tower Corp. | ||||||||
5.65%, 03/15/33(a) | 290 | 269,806 | ||||||
5.90%, 11/15/33 | 500 | 472,214 | ||||||
Crown Castle, Inc. | ||||||||
4.80%, 09/01/28 | 220 | 205,565 | ||||||
5.10%, 05/01/33 | 225 | 199,872 | ||||||
Public Storage Operating Co. | ||||||||
5.13%, 01/15/29 | 145 | 141,322 | ||||||
5.10%, 08/01/33 | 460 | 426,243 | ||||||
Weyerhaeuser Co., 4.75%, 05/15/26 | 300 | 292,140 | ||||||
|
| |||||||
| 2,007,162 | ||||||||
| Specialty Retail — 0.1% | ||||||||
AutoZone, Inc. | ||||||||
5.05%, 07/15/26 | 160 | 157,281 | ||||||
6.25%, 11/01/28 | 200 | 202,015 | ||||||
6.55%, 11/01/33(a) | 200 | 200,559 | ||||||
Best Buy Co., Inc.(a) | ||||||||
4.45%, 10/01/28 | 250 | 233,727 | ||||||
1.95%, 10/01/30 | 236 | 179,893 | ||||||
Dick’s Sporting Goods, Inc., 3.15%, 01/15/32(a) | 329 | 248,280 | ||||||
Lowe’s Cos., Inc., 2.63%, 04/01/31 | 829 | 654,779 | ||||||
O’Reilly Automotive, Inc., 3.60%, 09/01/27 | 300 | 278,272 | ||||||
Ross Stores, Inc. | ||||||||
4.60%, 04/15/25 | 413 | 405,234 | ||||||
0.88%, 04/15/26 | 250 | 221,346 | ||||||
1.88%, 04/15/31 | 179 | 132,857 | ||||||
Tractor Supply Co., 5.25%, 05/15/33(a) | 320 | 292,931 | ||||||
|
| |||||||
| 3,207,174 | ||||||||
| Technology Hardware, Storage & Peripherals — 1.5% | ||||||||
Adobe, Inc. | ||||||||
1.90%, 02/01/25 | 103 | 98,598 | ||||||
3.25%, 02/01/25 | 500 | 486,937 | ||||||
2.15%, 02/01/27 | 306 | 276,661 | ||||||
2.30%, 02/01/30 | 994 | 826,263 | ||||||
Apple, Inc. | ||||||||
2.75%, 01/13/25 | 829 | 803,815 | ||||||
2.50%, 02/09/25 | 966 | 932,523 | ||||||
1.13%, 05/11/25 | 1,488 | 1,396,297 | ||||||
3.20%, 05/13/25(a) | 620 | 600,594 | ||||||
0.55%, 08/20/25 | 523 | 481,370 | ||||||
0.70%, 02/08/26 | 1,613 | 1,456,947 | ||||||
3.25%, 02/23/26 | 1,584 | 1,516,001 | ||||||
| Security | Par (000) | Value | ||||||
| Technology Hardware, Storage & Peripherals (continued) | ||||||||
Apple, Inc. (continued) | ||||||||
4.42%, 05/08/26 | $ | 600 | $ | 588,736 | ||||
2.45%, 08/04/26 | 1,169 | 1,085,627 | ||||||
2.05%, 09/11/26 | 900 | 825,143 | ||||||
3.35%, 02/09/27 | 909 | 856,961 | ||||||
3.20%, 05/11/27(a) | 1,243 | 1,162,278 | ||||||
3.00%, 06/20/27(a) | 700 | 649,415 | ||||||
2.90%, 09/12/27 | 829 | 762,211 | ||||||
3.00%, 11/13/27 | 829 | 762,191 | ||||||
1.20%, 02/08/28 | 989 | 839,694 | ||||||
4.00%, 05/10/28 | 360 | 343,012 | ||||||
1.40%, 08/05/28 | 1,530 | 1,287,862 | ||||||
3.25%, 08/08/29 | 400 | 361,200 | ||||||
2.20%, 09/11/29 | 1,023 | 865,895 | ||||||
4.15%, 05/10/30 | 360 | 338,816 | ||||||
1.65%, 05/11/30 | 1,160 | 925,580 | ||||||
1.25%, 08/20/30 | 523 | 401,627 | ||||||
1.65%, 02/08/31 | 1,773 | 1,379,593 | ||||||
1.70%, 08/05/31 | 130 | 100,053 | ||||||
3.35%, 08/08/32 | 800 | 686,874 | ||||||
4.30%, 05/10/33(a) | 360 | 332,895 | ||||||
Dell International LLC/EMC Corp. | ||||||||
5.85%, 07/15/25 | 496 | 495,071 | ||||||
6.02%, 06/15/26 | 1,684 | 1,686,156 | ||||||
4.90%, 10/01/26 | 829 | 806,872 | ||||||
5.25%, 02/01/28 | 550 | 537,488 | ||||||
5.30%, 10/01/29 | 1,036 | 988,309 | ||||||
6.20%, 07/15/30 | 450 | 446,068 | ||||||
5.75%, 02/01/33 | 400 | 378,226 | ||||||
Dell, Inc., 7.10%, 04/15/28 | 329 | 344,780 | ||||||
Fortinet, Inc. | ||||||||
1.00%, 03/15/26 | 628 | 559,852 | ||||||
2.20%, 03/15/31 | 183 | 139,537 | ||||||
Hewlett Packard Enterprise Co. | ||||||||
4.90%, 10/15/25 | 1,036 | 1,015,368 | ||||||
1.75%, 04/01/26 | 829 | 752,393 | ||||||
5.25%, 07/01/28 | 140 | 135,183 | ||||||
HP, Inc. | ||||||||
2.20%, 06/17/25 | 413 | 389,938 | ||||||
3.00%, 06/17/27 | 450 | 405,307 | ||||||
4.75%, 01/15/28 | 350 | 333,386 | ||||||
4.00%, 04/15/29(a) | 430 | 388,710 | ||||||
2.65%, 06/17/31 | 529 | 403,710 | ||||||
4.20%, 04/15/32 | 215 | 181,275 | ||||||
5.50%, 01/15/33(a) | 650 | 596,735 | ||||||
NetApp, Inc. | ||||||||
1.88%, 06/22/25 | 558 | 522,239 | ||||||
2.38%, 06/22/27(a) | 400 | 355,067 | ||||||
2.70%, 06/22/30 | 400 | 321,071 | ||||||
Western Digital Corp. | ||||||||
4.75%, 02/15/26(a) | 1,109 | 1,039,892 | ||||||
2.85%, 02/01/29 | 226 | 176,049 | ||||||
3.10%, 02/01/32(a) | 145 | 102,490 | ||||||
|
| |||||||
| 36,932,841 | ||||||||
| Textiles, Apparel & Luxury Goods — 0.1% | ||||||||
NIKE, Inc. | ||||||||
2.40%, 03/27/25 | 400 | 383,867 | ||||||
2.38%, 11/01/26 | 400 | 368,016 | ||||||
2.75%, 03/27/27(a) | 359 | 330,659 | ||||||
2.85%, 03/27/30 | 829 | 709,102 | ||||||
Ralph Lauren Corp., 2.95%, 06/15/30 | 350 | 293,154 | ||||||
| 54 | 2 0 2 3 BLACK ROCK ANNUAL REPORT TO SHAREHOLDERS |
Schedule of Investments (continued) October 31, 2023 | iShares U.S. Intermediate Credit Bond Index Fund (Percentages shown are based on Net Assets) |
| Security | Par (000) | Value | ||||||
| Textiles, Apparel & Luxury Goods (continued) | ||||||||
Tapestry, Inc., 3.05%, 03/15/32(a) | $ | 200 | $ | 143,497 | ||||
VF Corp. | ||||||||
2.40%, 04/23/25 | 350 | 329,567 | ||||||
2.95%, 04/23/30(a) | 413 | 323,465 | ||||||
|
| |||||||
| 2,881,327 | ||||||||
| Tobacco — 1.0% | ||||||||
Altria Group, Inc. | ||||||||
2.35%, 05/06/25 | 656 | 621,706 | ||||||
4.40%, 02/14/26 | 500 | 483,583 | ||||||
2.63%, 09/16/26(a) | 209 | 191,859 | ||||||
6.20%, 11/01/28 | 175 | 174,025 | ||||||
4.80%, 02/14/29(a) | 1,107 | 1,036,805 | ||||||
3.40%, 05/06/30 | 359 | 300,241 | ||||||
2.45%, 02/04/32 | 857 | 625,392 | ||||||
6.88%, 11/01/33 | 130 | 128,873 | ||||||
BAT Capital Corp. | ||||||||
3.22%, 09/06/26 | 829 | 767,755 | ||||||
4.70%, 04/02/27 | 413 | 393,311 | ||||||
3.56%, 08/15/27 | 1,199 | 1,086,950 | ||||||
2.26%, 03/25/28(a) | 1,196 | 1,003,693 | ||||||
4.91%, 04/02/30 | 496 | 447,212 | ||||||
6.34%, 08/02/30 | 600 | 582,308 | ||||||
2.73%, 03/25/31 | 493 | 371,532 | ||||||
4.74%, 03/16/32 | 454 | 390,045 | ||||||
7.75%, 10/19/32 | 340 | 348,894 | ||||||
6.42%, 08/02/33 | 530 | 499,434 | ||||||
BAT International Finance PLC | ||||||||
1.67%, 03/25/26 | 663 | 597,077 | ||||||
4.45%, 03/16/28 | 454 | 418,305 | ||||||
5.93%, 02/02/29 | 600 | 583,445 | ||||||
Philip Morris International, Inc. | ||||||||
3.25%, 11/10/24 | 829 | 807,414 | ||||||
5.13%, 11/15/24 | 500 | 496,578 | ||||||
1.50%, 05/01/25(a) | 300 | 281,823 | ||||||
3.38%, 08/11/25 | 620 | 595,049 | ||||||
5.00%, 11/17/25 | 500 | 493,747 | ||||||
4.88%, 02/13/26(a) | 700 | 687,555 | ||||||
2.75%, 02/25/26 | 342 | 320,346 | ||||||
0.88%, 05/01/26 | 300 | 267,017 | ||||||
3.13%, 08/17/27(a) | 179 | 163,727 | ||||||
5.13%, 11/17/27 | 740 | 721,325 | ||||||
4.88%, 02/15/28 | 700 | 672,681 | ||||||
3.13%, 03/02/28 | 250 | 223,871 | ||||||
5.25%, 09/07/28 | 175 | 170,299 | ||||||
3.38%, 08/15/29 | 800 | 696,291 | ||||||
5.63%, 11/17/29 | 385 | 376,761 | ||||||
5.13%, 02/15/30 | 1,500 | 1,413,092 | ||||||
2.10%, 05/01/30 | 259 | 203,278 | ||||||
5.50%, 09/07/30 | 175 | 167,510 | ||||||
1.75%, 11/01/30 | 259 | 194,059 | ||||||
5.75%, 11/17/32 | 615 | 587,570 | ||||||
5.38%, 02/15/33 | 1,300 | 1,201,066 | ||||||
5.63%, 09/07/33 | 575 | 539,811 | ||||||
Reynolds American, Inc., 4.45%, 06/12/25 | 793 | 773,255 | ||||||
|
| |||||||
| 23,106,570 | ||||||||
| Transportation Infrastructure — 0.3% | ||||||||
CH Robinson Worldwide, Inc., 4.20%, 04/15/28 | 350 | 323,207 | ||||||
FedEx Corp. | ||||||||
3.25%, 04/01/26 | 450 | 425,415 | ||||||
3.40%, 02/15/28 | 250 | 227,593 | ||||||
3.10%, 08/05/29 | 829 | 717,130 | ||||||
4.25%, 05/15/30 | 309 | 279,627 | ||||||
| Security | Par (000) | Value | ||||||
| Transportation Infrastructure (continued) | ||||||||
FedEx Corp. (continued) | ||||||||
2.40%, 05/15/31(a) | $ | 516 | $ | 403,368 | ||||
GXO Logistics, Inc. | ||||||||
1.65%, 07/15/26 | 129 | 113,510 | ||||||
2.65%, 07/15/31(a) | 413 | 306,388 | ||||||
Ryder System, Inc. | ||||||||
1.75%, 09/01/26 | 404 | 362,620 | ||||||
2.90%, 12/01/26 | 161 | 146,616 | ||||||
2.85%, 03/01/27 | 103 | 93,053 | ||||||
4.30%, 06/15/27 | 110 | 103,923 | ||||||
5.65%, 03/01/28(a) | 200 | 195,366 | ||||||
5.25%, 06/01/28 | 200 | 192,502 | ||||||
United Parcel Service, Inc. | ||||||||
3.90%, 04/01/25 | 829 | 809,410 | ||||||
2.40%, 11/15/26 | 659 | 606,400 | ||||||
3.05%, 11/15/27 | 413 | 377,057 | ||||||
3.40%, 03/15/29 | 350 | 316,834 | ||||||
4.45%, 04/01/30 | 350 | 328,307 | ||||||
4.88%, 03/03/33 | 400 | 374,104 | ||||||
|
| |||||||
| 6,702,430 | ||||||||
| Water Utilities — 0.1% | ||||||||
American Water Capital Corp. | ||||||||
3.40%, 03/01/25 | 620 | 600,108 | ||||||
2.95%, 09/01/27 | 413 | 373,741 | ||||||
3.75%, 09/01/28 | 193 | 177,090 | ||||||
3.45%, 06/01/29 | 413 | 366,133 | ||||||
2.30%, 06/01/31 | 745 | 579,201 | ||||||
4.45%, 06/01/32(a) | 430 | 386,854 | ||||||
Essential Utilities, Inc. | ||||||||
2.70%, 04/15/30 | 250 | 201,898 | ||||||
2.40%, 05/01/31(a) | 129 | 98,887 | ||||||
|
| |||||||
| 2,783,912 | ||||||||
| Wireless Telecommunication Services — 1.1% | ||||||||
America Movil SAB de C.V. | ||||||||
2.88%, 05/07/30 | 582 | 477,240 | ||||||
4.70%, 07/21/32 | 350 | 313,194 | ||||||
America Movil SAB de CV, 3.63%, 04/22/29 | 916 | 813,866 | ||||||
American Tower Corp. | ||||||||
1.30%, 09/15/25 | 300 | 274,157 | ||||||
3.55%, 07/15/27 | 500 | 454,721 | ||||||
3.60%, 01/15/28 | 500 | 449,476 | ||||||
Crown Castle, Inc., 4.30%, 02/15/29 | 450 | 407,310 | ||||||
Orange SA, 9.00%, 03/01/31 | 1,263 | 1,446,877 | ||||||
Rogers Communications, Inc. | ||||||||
2.95%, 03/15/25 | 329 | 314,689 | ||||||
3.63%, 12/15/25 | 298 | 282,661 | ||||||
2.90%, 11/15/26 | 179 | 163,136 | ||||||
3.20%, 03/15/27 | 767 | 697,253 | ||||||
3.80%, 03/15/32 | 1,222 | 990,983 | ||||||
Sprint LLC | ||||||||
7.63%, 02/15/25 | 750 | 760,673 | ||||||
7.63%, 03/01/26 | 600 | 616,280 | ||||||
T-Mobile U.S., Inc. | ||||||||
3.50%, 04/15/25 | 1,166 | 1,126,499 | ||||||
1.50%, 02/15/26 | 829 | 751,874 | ||||||
2.25%, 02/15/26 | 800 | 735,885 | ||||||
2.63%, 04/15/26 | 450 | 415,902 | ||||||
3.75%, 04/15/27 | 2,153 | 2,002,216 | ||||||
4.75%, 02/01/28 | 700 | 665,955 | ||||||
2.05%, 02/15/28 | 813 | 693,245 | ||||||
4.95%, 03/15/28 | 170 | 163,577 | ||||||
4.80%, 07/15/28 | 200 | 190,292 | ||||||
SCHEDULE OF INVESTMENTS | 55 |
Schedule of Investments (continued) October 31, 2023 | iShares U.S. Intermediate Credit Bond Index Fund (Percentages shown are based on Net Assets) |
| Security | Par (000) | Value | ||||||
| Wireless Telecommunication Services (continued) | ||||||||
T-Mobile U.S., Inc. (continued) | ||||||||
2.63%, 02/15/29 | $ | 700 | $ | 586,849 | ||||
3.38%, 04/15/29 | 1,500 | 1,305,986 | ||||||
3.88%, 04/15/30 | 3,564 | 3,103,186 | ||||||
2.55%, 02/15/31 | 1,041 | 811,092 | ||||||
2.88%, 02/15/31 | 700 | 557,408 | ||||||
3.50%, 04/15/31 | 1,200 | 996,183 | ||||||
2.25%, 11/15/31 | 286 | 212,336 | ||||||
2.70%, 03/15/32 | 625 | 476,388 | ||||||
5.20%, 01/15/33 | 320 | 293,961 | ||||||
5.05%, 07/15/33 | 1,685 | 1,522,708 | ||||||
T-Mobile USA, Inc. | ||||||||
2.40%, 03/15/29 | 250 | 208,042 | ||||||
5.75%, 01/15/34 | 305 | 289,367 | ||||||
Vodafone Group PLC | ||||||||
4.13%, 05/30/25 | 543 | 529,455 | ||||||
4.38%, 05/30/28(a) | 400 | 380,389 | ||||||
7.88%, 02/15/30 | 376 | 404,008 | ||||||
6.25%, 11/30/32(a) | 500 | 494,489 | ||||||
|
| |||||||
| 27,379,808 | ||||||||
|
| |||||||
Total Corporate Bonds — 88.0% | 2,132,343,708 | |||||||
|
| |||||||
Foreign Agency Obligations | ||||||||
Canada — 1.4% | ||||||||
Canada Government International Bond | ||||||||
1.63%, 01/22/25 | 1,645 | 1,571,187 | ||||||
2.88%, 04/28/25 | 1,000 | 964,816 | ||||||
0.75%, 05/19/26 | 1,200 | 1,077,883 | ||||||
3.75%, 04/26/28 | 2,000 | 1,903,857 | ||||||
Export Development Canada | ||||||||
3.38%, 08/26/25 | 1,300 | 1,258,490 | ||||||
4.38%, 06/29/26 | 1,100 | 1,081,191 | ||||||
3.00%, 05/25/27 | 1,100 | 1,029,263 | ||||||
3.88%, 02/14/28 | 1,600 | 1,529,420 | ||||||
Hydro-Quebec, Series HK, 9.38%, 04/15/30 | 300 | 358,233 | ||||||
Province of Alberta Canada | ||||||||
1.88%, 11/13/24(a) | 829 | 797,526 | ||||||
1.00%, 05/20/25 | 1,039 | 970,145 | ||||||
3.30%, 03/15/28 | 409 | 379,157 | ||||||
1.30%, 07/22/30(a) | 659 | 510,764 | ||||||
Province of British Columbia Canada | ||||||||
2.25%, 06/02/26 | 829 | 770,723 | ||||||
0.90%, 07/20/26 | 859 | 767,480 | ||||||
4.20%, 07/06/33 | 1,200 | 1,092,032 | ||||||
Province of Manitoba Canada, Series HB, | 359 | 301,964 | ||||||
Province of New Brunswick Canada, | 179 | 167,158 | ||||||
Province of Ontario Canada | ||||||||
0.63%, 01/21/26 | 1,229 | 1,111,060 | ||||||
1.05%, 04/14/26 | 1,050 | 950,179 | ||||||
2.50%, 04/27/26 | 2,489 | 2,331,469 | ||||||
3.10%, 05/19/27 | 800 | 748,779 | ||||||
1.05%, 05/21/27(a) | 829 | 721,708 | ||||||
2.00%, 10/02/29 | 829 | 699,372 | ||||||
1.13%, 10/07/30 | 459 | 349,333 | ||||||
1.60%, 02/25/31 | 1,659 | 1,295,927 | ||||||
2.13%, 01/21/32 | 1,200 | 950,016 | ||||||
Province of Quebec Canada | ||||||||
0.60%, 07/23/25 | 1,659 | 1,529,679 | ||||||
| Security | Par (000) | Value | ||||||
| Canada (continued) | ||||||||
Province of Quebec Canada (continued) | ||||||||
2.50%, 04/20/26 | $ | 881 | $ | 826,709 | ||||
2.75%, 04/12/27(a) | 1,659 | 1,536,788 | ||||||
1.35%, 05/28/30(a) | 659 | 516,826 | ||||||
4.50%, 09/08/33 | 800 | 744,681 | ||||||
Series QX, 1.50%, 02/11/25 | 859 | 816,058 | ||||||
Province Of Quebec SR, 3.63%, 04/13/28(a) | 1,700 | 1,599,000 | ||||||
|
| |||||||
| 33,258,873 | ||||||||
| Chile — 0.2% | ||||||||
Chile Government International Bond | ||||||||
3.13%, 01/21/26 | 400 | 379,568 | ||||||
2.75%, 01/31/27 | 600 | 547,512 | ||||||
3.24%, 02/06/28(a) | 982 | 893,620 | ||||||
2.45%, 01/31/31 | 783 | 628,749 | ||||||
2.55%, 01/27/32(a) | 478 | 375,469 | ||||||
2.55%, 07/27/33 | 1,300 | 971,750 | ||||||
|
| |||||||
| 3,796,668 | ||||||||
| Germany — 0.0% | ||||||||
Landwirtschaftliche Rentenbank, | 829 | 759,492 | ||||||
|
| |||||||
| Indonesia — 0.3% | ||||||||
Indonesia Government International Bond | ||||||||
4.15%, 09/20/27 | 600 | 568,110 | ||||||
3.50%, 01/11/28 | 1,310 | 1,203,995 | ||||||
4.10%, 04/24/28 | 478 | 448,082 | ||||||
4.75%, 02/11/29 | 478 | 456,982 | ||||||
2.85%, 02/14/30(a) | 1,310 | 1,107,264 | ||||||
3.85%, 10/15/30 | 1,310 | 1,163,726 | ||||||
2.15%, 07/28/31 | 600 | 462,924 | ||||||
3.55%, 03/31/32(a) | 700 | 592,382 | ||||||
4.65%, 09/20/32 | 600 | 548,442 | ||||||
4.85%, 01/11/33(a) | 500 | 466,150 | ||||||
|
| |||||||
| 7,018,057 | ||||||||
| Israel — 0.1% | ||||||||
Israel Government International Bond | ||||||||
2.88%, 03/16/26 | 400 | 370,000 | ||||||
3.25%, 01/17/28(a) | 982 | 879,420 | ||||||
2.75%, 07/03/30(a) | 858 | 704,005 | ||||||
4.50%, 01/17/33 | 600 | 525,258 | ||||||
State of Israel, 2.50%, 01/15/30 | 710 | 577,097 | ||||||
|
| |||||||
| 3,055,780 | ||||||||
| Italy — 0.1% | ||||||||
Republic of Italy Government International Bond | ||||||||
1.25%, 02/17/26 | 2,489 | 2,242,365 | ||||||
2.88%, 10/17/29 | 883 | 748,434 | ||||||
|
| |||||||
| 2,990,799 | ||||||||
| Japan — 0.7% | ||||||||
Japan Bank for International Cooperation | ||||||||
0.63%, 07/15/25 | 1,310 | 1,206,234 | ||||||
4.25%, 01/26/26 | 1,500 | 1,463,622 | ||||||
4.25%, 04/27/26 | 1,000 | 973,336 | ||||||
1.88%, 07/21/26(a) | 800 | 729,199 | ||||||
2.88%, 06/01/27 | 476 | 439,125 | ||||||
2.88%, 07/21/27 | 900 | 828,322 | ||||||
2.75%, 11/16/27 | 1,200 | 1,091,600 | ||||||
3.25%, 07/20/28(a) | 1,310 | 1,198,267 | ||||||
2.13%, 02/16/29(a) | 900 | 767,554 | ||||||
2.00%, 10/17/29 | 476 | 395,670 | ||||||
1.25%, 01/21/31(a) | 1,310 | 985,384 | ||||||
1.88%, 04/15/31 | 986 | 772,002 | ||||||
Series DTC, 2.50%, 05/28/25 | 2,486 | 2,369,858 | ||||||
| 56 | 2 0 2 3 BLACK ROCK ANNUAL REPORT TO SHAREHOLDERS |
Schedule of Investments (continued) October 31, 2023 | iShares U.S. Intermediate Credit Bond Index Fund (Percentages shown are based on Net Assets) |
| Security | Par (000) | Value | ||||||
| Japan (continued) | ||||||||
Japan Bank for International | ||||||||
Series DTC, 2.38%, 04/20/26 | $ | 650 | $ | 604,691 | ||||
Series DTC, 2.25%, 11/04/26 | 1,500 | 1,371,889 | ||||||
Japan International Cooperation Agency | ||||||||
2.13%, 10/20/26 | 300 | 273,510 | ||||||
2.75%, 04/27/27 | 800 | 735,107 | ||||||
3.25%, 05/25/27 | 500 | 467,300 | ||||||
4.00%, 05/23/28 | 1,000 | 947,328 | ||||||
|
| |||||||
| 17,619,998 | ||||||||
| Mexico — 0.5% | ||||||||
Mexico Government International Bond | ||||||||
4.13%, 01/21/26 | 2,489 | 2,420,652 | ||||||
4.15%, 03/28/27(a) | 1,028 | 984,855 | ||||||
3.75%, 01/11/28 | 478 | 440,716 | ||||||
5.40%, 02/09/28 | 750 | 735,750 | ||||||
4.50%, 04/22/29(a) | 1,053 | 972,445 | ||||||
3.25%, 04/16/30 | 1,139 | 959,038 | ||||||
2.66%, 05/24/31 | 2,310 | 1,798,335 | ||||||
4.75%, 04/27/32 | 1,639 | 1,450,515 | ||||||
4.88%, 05/19/33 | 1,600 | 1,404,000 | ||||||
|
| |||||||
| 11,166,306 | ||||||||
| Panama — 0.2% | ||||||||
Panama Government International Bond | ||||||||
3.75%, 03/16/25 | 2,903 | 2,794,138 | ||||||
3.88%, 03/17/28 | 633 | 567,168 | ||||||
9.38%, 04/01/29 | 400 | 441,600 | ||||||
3.16%, 01/23/30(a) | 1,178 | 944,756 | ||||||
2.25%, 09/29/32 | 1,300 | 878,800 | ||||||
3.30%, 01/19/33 | 400 | 293,600 | ||||||
|
| |||||||
| 5,920,062 | ||||||||
| Peru — 0.1% | ||||||||
Peruvian Government International Bond | ||||||||
7.35%, 07/21/25 | 360 | 367,855 | ||||||
2.39%, 01/23/26 | 251 | 233,229 | ||||||
4.13%, 08/25/27(a) | 580 | 550,420 | ||||||
2.84%, 06/20/30 | 170 | 140,335 | ||||||
2.78%, 01/23/31 | 1,759 | 1,408,959 | ||||||
1.86%, 12/01/32(a) | 620 | 436,170 | ||||||
|
| |||||||
| 3,136,968 | ||||||||
| Philippines — 0.3% | ||||||||
Philippines Government International Bond | ||||||||
10.63%, 03/16/25 | 700 | 746,011 | ||||||
3.00%, 02/01/28 | 978 | 881,325 | ||||||
4.63%, 07/17/28 | 800 | 770,224 | ||||||
3.75%, 01/14/29 | 489 | 448,814 | ||||||
9.50%, 02/02/30 | 600 | 711,240 | ||||||
2.46%, 05/05/30 | 710 | 582,051 | ||||||
7.75%, 01/14/31 | 1,243 | 1,383,036 | ||||||
1.65%, 06/10/31 | 478 | 357,391 | ||||||
1.95%, 01/06/32 | 500 | 373,455 | ||||||
6.38%, 01/15/32 | 600 | 620,538 | ||||||
3.56%, 09/29/32 | 400 | 336,256 | ||||||
5.61%, 04/13/33 | 400 | 391,988 | ||||||
5.00%, 07/17/33 | 700 | 658,000 | ||||||
|
| |||||||
| 8,260,329 | ||||||||
| Poland — 0.2% | ||||||||
Republic of Poland Government International Bond | ||||||||
3.25%, 04/06/26(a) | 1,036 | 981,061 | ||||||
| Security | Par (000) | Value | ||||||
| Poland (continued) | ||||||||
Republic of Poland Government International Bond (continued) | ||||||||
5.50%, 11/16/27 | $ | 700 | $ | 702,849 | ||||
5.75%, 11/16/32 | 600 | 593,772 | ||||||
4.88%, 10/04/33 | 1,500 | 1,387,305 | ||||||
|
| |||||||
| 3,664,987 | ||||||||
| South Korea — 0.6% | ||||||||
Export-Import Bank of Korea | ||||||||
1.25%, 01/18/25 | 500 | 474,195 | ||||||
2.88%, 01/21/25 | 478 | 462,159 | ||||||
1.88%, 02/12/25 | 478 | 455,673 | ||||||
4.88%, 01/11/26 | 1,500 | 1,476,885 | ||||||
0.63%, 02/09/26 | 1,000 | 895,790 | ||||||
2.63%, 05/26/26 | 478 | 444,970 | ||||||
1.63%, 01/18/27 | 1,000 | 885,130 | ||||||
4.25%, 09/15/27 | 400 | 381,648 | ||||||
5.00%, 01/11/28(a) | 850 | 832,235 | ||||||
4.50%, 09/15/32 | 600 | 546,720 | ||||||
5.13%, 01/11/33 | 1,000 | 952,770 | ||||||
5.13%, 09/18/33 | 300 | 284,616 | ||||||
Korea Development Bank | ||||||||
4.00%, 09/08/25 | 850 | 824,645 | ||||||
3.38%, 09/16/25 | 1,000 | 961,780 | ||||||
3.00%, 01/13/26(a) | 1,310 | 1,240,635 | ||||||
0.80%, 07/19/26 | 400 | 352,472 | ||||||
5.38%, 10/23/28 | 800 | 794,379 | ||||||
4.25%, 09/08/32 | 400 | 357,436 | ||||||
4.38%, 02/15/33 | 800 | 719,312 | ||||||
5.63%, 10/23/33 | 500 | 491,770 | ||||||
Korea International Bond, 2.50%, 06/19/29 | 500 | 433,940 | ||||||
|
| |||||||
| 14,269,160 | ||||||||
| Supranational — 4.8% | ||||||||
African Development Bank | ||||||||
Series GDIF, 0.88%, 03/23/26 | 1,659 | 1,501,271 | ||||||
Series GDIF, 0.88%, 07/22/26 | 950 | 849,501 | ||||||
Arab Petroleum Investments Corp., | 800 | 709,872 | ||||||
Asian Development Bank | ||||||||
2.00%, 01/22/25 | 1,000 | 959,013 | ||||||
0.63%, 04/29/25 | 1,500 | 1,399,261 | ||||||
0.38%, 09/03/25 | 1,000 | 915,980 | ||||||
4.25%, 01/09/26 | 2,000 | 1,964,179 | ||||||
0.50%, 02/04/26 | 1,659 | 1,496,862 | ||||||
1.00%, 04/14/26 | 1,659 | 1,504,252 | ||||||
2.00%, 04/24/26 | 829 | 769,767 | ||||||
2.63%, 01/12/27 | 829 | 771,793 | ||||||
1.50%, 01/20/27 | 1,400 | 1,256,225 | ||||||
3.13%, 08/20/27 | 2,000 | 1,877,456 | ||||||
2.50%, 11/02/27(a) | 1,659 | 1,511,973 | ||||||
2.75%, 01/19/28 | 620 | 567,271 | ||||||
5.82%, 06/16/28 | 2,519 | 2,591,617 | ||||||
1.88%, 03/15/29 | 1,500 | 1,282,443 | ||||||
1.75%, 09/19/29 | 1,659 | 1,392,119 | ||||||
1.88%, 01/24/30 | 789 | 654,574 | ||||||
1.50%, 03/04/31 | 1,500 | 1,176,411 | ||||||
3.13%, 04/27/32 | 1,000 | 865,706 | ||||||
Asian Infrastructure Investment Bank | ||||||||
0.50%, 01/27/26 | 1,450 | 1,304,836 | ||||||
4.00%, 01/18/28 | 2,000 | 1,912,895 | ||||||
Corp. Andina de Fomento | ||||||||
1.63%, 09/23/25(a) | 700 | 646,947 | ||||||
SCHEDULE OF INVESTMENTS | 57 |
Schedule of Investments (continued) October 31, 2023 | iShares U.S. Intermediate Credit Bond Index Fund (Percentages shown are based on Net Assets) |
| Security | Par (000) | Value | ||||||
| Supranational (continued) | ||||||||
Corp. Andina de Fomento (continued) | ||||||||
2.25%, 02/08/27 | $ | 400 | $ | 354,824 | ||||
Council Of Europe Development Bank, | 1,000 | 947,249 | ||||||
European Bank for Reconstruction & Development | ||||||||
1.50%, 02/13/25 | 829 | 788,493 | ||||||
0.50%, 05/19/25 | 1,659 | 1,539,384 | ||||||
0.50%, 01/28/26 | 900 | 811,866 | ||||||
European Investment Bank | ||||||||
1.88%, 02/10/25 | 1,000 | 956,753 | ||||||
1.63%, 03/14/25(a) | 3,319 | 3,155,915 | ||||||
0.63%, 07/25/25 | 1,659 | 1,533,952 | ||||||
2.75%, 08/15/25 | 1,050 | 1,006,372 | ||||||
0.38%, 12/15/25 | 1,350 | 1,222,638 | ||||||
0.38%, 03/26/26 | 3,000 | 2,686,338 | ||||||
2.13%, 04/13/26(a) | 829 | 773,260 | ||||||
0.75%, 10/26/26 | 1,198 | 1,059,903 | ||||||
2.38%, 05/24/27 | 2,903 | 2,663,306 | ||||||
3.25%, 11/15/27 | 1,000 | 940,064 | ||||||
1.75%, 03/15/29 | 1,100 | 936,550 | ||||||
1.63%, 10/09/29 | 620 | 516,155 | ||||||
0.88%, 05/17/30 | 400 | 308,509 | ||||||
1.25%, 02/14/31 | 3,000 | 2,325,458 | ||||||
Inter-American Development Bank | ||||||||
2.13%, 01/15/25 | 829 | 796,864 | ||||||
1.75%, 03/14/25 | 2,489 | 2,368,972 | ||||||
0.88%, 04/03/25 | 2,489 | 2,335,836 | ||||||
0.63%, 07/15/25 | 1,350 | 1,248,715 | ||||||
0.88%, 04/20/26 | 2,489 | 2,248,584 | ||||||
2.00%, 06/02/26(a) | 413 | 382,174 | ||||||
2.00%, 07/23/26 | 1,700 | 1,568,598 | ||||||
1.50%, 01/13/27 | 1,500 | 1,346,217 | ||||||
2.38%, 07/07/27 | 829 | 758,289 | ||||||
1.13%, 07/20/28 | 2,489 | 2,088,145 | ||||||
2.25%, 06/18/29(a) | 934 | 810,254 | ||||||
3.50%, 09/14/29 | 2,000 | 1,854,397 | ||||||
1.13%, 01/13/31(a) | 2,073 | 1,587,471 | ||||||
Inter-American Investment Corp., | 500 | 479,830 | ||||||
International Bank for Reconstruction & Development | ||||||||
1.63%, 01/15/25 | 2,489 | 2,378,667 | ||||||
0.75%, 03/11/25 | 1,200 | 1,127,392 | ||||||
0.63%, 04/22/25 | 4,150 | 3,875,344 | ||||||
0.38%, 07/28/25 | 2,489 | 2,288,992 | ||||||
0.50%, 10/28/25 | 1,659 | 1,514,394 | ||||||
0.88%, 07/15/26 | 850 | 761,310 | ||||||
3.13%, 06/15/27(a) | 2,000 | 1,880,343 | ||||||
0.75%, 11/24/27 | 1,000 | 848,190 | ||||||
1.13%, 09/13/28(a) | 2,150 | 1,794,939 | ||||||
3.63%, 09/21/29 | 1,000 | 932,992 | ||||||
0.75%, 08/26/30 | 300 | 225,833 | ||||||
1.25%, 02/10/31 | 4,150 | 3,199,955 | ||||||
2.50%, 03/29/32 | 4,000 | 3,311,936 | ||||||
Series GDIF, 2.50%, 11/25/24 | 2,489 | 2,411,148 | ||||||
Series GDIF, 2.50%, 07/29/25(a) | 829 | 791,468 | ||||||
Series GDIF, 1.88%, 10/27/26(a) | 1,720 | 1,572,401 | ||||||
Series GDIF, 2.50%, 11/22/27 | 1,659 | 1,511,828 | ||||||
Series GDIF, 1.38%, 04/20/28 | 2,903 | 2,486,434 | ||||||
Series GDIF, 1.75%, 10/23/29 | 2,489 | 2,079,120 | ||||||
International Finance Corp. | ||||||||
0.38%, 07/16/25 | 1,659 | 1,528,469 | ||||||
| Security | Par (000) | Value | ||||||
| Supranational (continued) | ||||||||
International Finance Corp. (continued) | ||||||||
0.75%, 10/08/26 | $ | 1,659 | $ | 1,469,337 | ||||
0.75%, 08/27/30(a) | 459 | 345,715 | ||||||
Nordic Investment Bank | ||||||||
0.38%, 09/11/25 | 1,100 | 1,006,894 | ||||||
3.38%, 09/08/27 | 500 | 473,259 | ||||||
4.38%, 03/14/28 | 2,000 | 1,951,048 | ||||||
|
| |||||||
| 116,050,967 | ||||||||
| Sweden — 0.2% | ||||||||
Svensk Exportkredit AB | ||||||||
0.63%, 05/14/25 | 1,310 | 1,217,064 | ||||||
0.50%, 08/26/25 | 1,310 | 1,200,078 | ||||||
4.38%, 02/13/26 | 1,500 | 1,469,729 | ||||||
2.25%, 03/22/27 | 500 | 455,881 | ||||||
|
| |||||||
| 4,342,752 | ||||||||
| Uruguay — 0.1% | ||||||||
Uruguay Government International Bond | ||||||||
4.38%, 10/27/27 | 829 | 818,778 | ||||||
4.38%, 01/23/31(a) | 823 | 776,192 | ||||||
|
| |||||||
| 1,594,970 | ||||||||
|
| |||||||
Total Foreign Agency Obligations — 9.8% | 236,906,168 | |||||||
|
| |||||||
Municipal Bonds | ||||||||
California — 0.2% | ||||||||
California Earthquake Authority, RB, | 250 | 247,348 | ||||||
Los Angeles Community College District, | 540 | 415,990 | ||||||
Los Angeles Unified School District, GO, BAB, | 215 | 214,192 | ||||||
Regents of the University of California Medical Center Pooled Revenue, RB, Series Q, 4.13%, 05/15/32 | 200 | 177,955 | ||||||
State of California, GO, 5.75%, 10/01/31 | 150 | 150,178 | ||||||
State of California, Refunding GO | ||||||||
3.38%, 04/01/25 | 25 | 24,302 | ||||||
3.50%, 04/01/28 | 285 | 265,371 | ||||||
2.50%, 10/01/29 | 530 | 449,695 | ||||||
6.00%, 03/01/33 | 325 | 327,482 | ||||||
4.50%, 04/01/33 | 1,000 | 905,623 | ||||||
University of California, RB | ||||||||
Series BD, 3.35%, 07/01/29 | 460 | 406,919 | ||||||
Series BG, 0.88%, 05/15/25 | 150 | 139,484 | ||||||
Series BG, 1.61%, 05/15/30 | 320 | 247,812 | ||||||
University of California, Refunding RB, Series AX, 3.06%, 07/01/25 | 25 | 23,950 | ||||||
|
| |||||||
| 3,996,301 | ||||||||
| Connecticut — 0.0% | ||||||||
State of Connecticut, GO, Series A, | 490 | 490,673 | ||||||
|
| |||||||
| Florida — 0.1% | ||||||||
State Board of Administration Finance Corp., RB | ||||||||
Series A, 1.26%, 07/01/25 | 607 | 565,532 | ||||||
Series A, 1.71%, 07/01/27 | 371 | 321,708 | ||||||
Series A, 2.15%, 07/01/30(a) | 795 | 630,790 | ||||||
|
| |||||||
| 1,518,030 | ||||||||
| 58 | 2 0 2 3 BLACK ROCK ANNUAL REPORT TO SHAREHOLDERS |
Schedule of Investments (continued) October 31, 2023 | iShares U.S. Intermediate Credit Bond Index Fund (Percentages shown are based on Net Assets) |
| Security | Par (000) | Value | ||||||
| ||||||||
| Illinois — 0.2% | ||||||||
State of Illinois, GO, 5.10%, 06/01/33 | $ | 4,025 | $ | 3,736,592 | ||||
|
| |||||||
| Louisiana — 0.0% | ||||||||
Louisiana Local Government Environmental Facilities & Community Development Authority, RB | ||||||||
5.08%, 06/01/31 | 210 | 206,743 | ||||||
Class A-1, 3.62%, 02/01/29 | 449 | 432,185 | ||||||
|
| |||||||
| 638,928 | ||||||||
| Massachusetts — 0.0% | ||||||||
Commonwealth of Massachusetts, RB, | 320 | 296,481 | ||||||
Massachusetts School Building Authority, Refunding RB, Series B, 1.75%, 08/15/30 | 425 | 341,802 | ||||||
|
| |||||||
| 638,283 | ||||||||
| New Jersey — 0.1% | ||||||||
New Jersey Economic Development Authority, | 1,201 | 1,252,520 | ||||||
New Jersey Transportation Trust Fund Authority, | 580 | 578,404 | ||||||
|
| |||||||
| 1,830,924 | ||||||||
| New York — 0.0% | ||||||||
City of New York, GO, BAB, Series A-2, 5.21%, 10/01/31 | 235 | 229,094 | ||||||
Port Authority of New York & New Jersey, | 125 | 127,510 | ||||||
|
| |||||||
| 356,604 | ||||||||
| Ohio — 0.0% | ||||||||
JobsOhio Beverage System, Refunding RB, | 25 | 23,986 | ||||||
|
| |||||||
| Oregon — 0.0% | ||||||||
Oregon School Boards Association, GO, | 300 | 299,030 | ||||||
State of Oregon, GO, 5.89%, 06/01/27 | 610 | 615,363 | ||||||
|
| |||||||
| 914,393 | ||||||||
| Tennessee — 0.0% | ||||||||
Metropolitan Government Nashville & Davidson County Health & Educational Facilities Board, RB, Series B, 4.05%, 07/01/26 | 288 | 274,863 | ||||||
|
| |||||||
| Texas — 0.0% | ||||||||
Texas Transportation Commission State Highway Fund, RB, BAB, Series B, | 490 | 483,123 | ||||||
|
| |||||||
| Wisconsin — 0.0% | ||||||||
State of Wisconsin, Refunding RB, | 230 | 213,658 | ||||||
|
| |||||||
Total Municipal Bonds — 0.6% | 15,116,358 | |||||||
|
| |||||||
| Security | Par (000) | Value | ||||||
| ||||||||
Preferred Securities | ||||||||
| Capital Trusts — 0.0%(b) | ||||||||
| Electric Utilities — 0.0% | ||||||||
American Electric Power Co., Inc., | $ | 329 | $ | 258,372 | ||||
|
| |||||||
| Insurance — 0.0% | ||||||||
Prudential Financial, Inc., 5.38%, 05/15/45 | 413 | 392,575 | ||||||
|
| |||||||
| 650,947 | ||||||||
|
| |||||||
Total Preferred Securities — 0.0% | 650,947 | |||||||
|
| |||||||
Total Long-Term Investments — 98.4% | 2,385,017,181 | |||||||
|
| |||||||
| Shares | ||||||||
Short-Term Securities | ||||||||
| Money Market Funds — 7.5% | ||||||||
BlackRock Cash Funds: Institutional, SL Agency Shares, 5.54%(f)(g)(h) | 182,799,727 | 182,872,847 | ||||||
|
| |||||||
Total Short-Term Securities — 7.5% | 182,872,847 | |||||||
|
| |||||||
Total Investments — 105.9% | 2,567,890,028 | |||||||
Liabilities in Excess of Other Assets — (5.9)% |
| (143,881,938 | ) | |||||
|
| |||||||
Net Assets — 100.0% | $ | 2,424,008,090 | ||||||
|
| |||||||
| (a) | All or a portion of this security is on loan. |
| (b) | Variable rate security. Interest rate resets periodically. The rate shown is the effective interest rate as of period end. Security description also includes the reference rate and spread if published and available. |
| (c) | When-issued security. |
| (d) | Security exempt from registration pursuant to Rule 144A under the Securities Act of 1933, as amended. These securities may be resold in transactions exempt from registration to qualified institutional investors. |
| (e) | Step coupon security. Coupon rate will either increase (step-up bond) or decrease (step-down bond) at regular intervals until maturity. Interest rate shown reflects the rate currently in effect. |
| (f) | Affiliate of the Fund. |
| (g) | Annualized 7-day yield as of period end. |
| (h) | All or a portion of this security was purchased with the cash collateral from loaned securities. |
For Fund compliance purposes, the Fund’s industry classifications refer to one or more of the industry sub-classifications used by one or more widely recognized market indexes or rating group indexes, and/or as defined by the investment adviser. These definitions may not apply for purposes of this report, which may combine such industry sub-classifications for reporting ease.
SCHEDULE OF INVESTMENTS | 59 |
Schedule of Investments (continued) October 31, 2023 | iShares U.S. Intermediate Credit Bond Index Fund |
Affiliates
Investments in issuers considered to be affiliate(s) of the Fund during the year ended October 31, 2023 for purposes of Section 2(a)(3) of the Investment Company Act of 1940, as amended, were as follows:
| Affiliated Issuer | Value at 10/31/22 | Purchases at Cost | Proceeds from Sales | Net Realized Gain (Loss) | Change in Unrealized Appreciation (Depreciation) | Value at 10/31/23 | Shares Held at 10/31/23 | Income | Capital Gain Distributions from Underlying Funds |
| ||||||||||||||||||||||||||||||||
BlackRock Cash Funds: Institutional, SL Agency Shares | $ | 150,880,559 | $ | 31,892,334 | (a) | $ | — | $ | 9,892 | $ | 90,062 | $ | 182,872,847 | 182,799,727 | $ | 1,797,894 | (b) | $ | — | |||||||||||||||||||||||
|
|
|
|
|
|
|
|
|
| |||||||||||||||||||||||||||||||||
| (a) | Represents net amount purchased (sold). |
| (b) | All or a portion represents securities lending income earned from the reinvestment of cash collateral from loaned securities, net of fees and collateral investment expenses, and other payments to and from borrowers of securities. |
Fair Value Hierarchy as of Period End
Various inputs are used in determining the fair value of financial instruments. For a description of the input levels and information about the Fund’s policy regarding valuation of financial instruments, refer to the Notes to Financial Statements.
The following table summarizes the Fund’s financial instruments categorized in the fair value hierarchy. The breakdown of the Fund’s financial instruments into major categories is disclosed in the Schedule of Investments above.
| Level 1 | Level 2 | Level 3 | Total | |||||||||||||
Assets | ||||||||||||||||
Investments | ||||||||||||||||
Long-Term Investments | ||||||||||||||||
Corporate Bonds | $ | — | $ | 2,132,343,708 | $ | — | $ | 2,132,343,708 | ||||||||
Foreign Agency Obligations | — | 236,906,168 | — | 236,906,168 | ||||||||||||
Municipal Bonds | — | 15,116,358 | — | 15,116,358 | ||||||||||||
Preferred Securities | — | 650,947 | — | 650,947 | ||||||||||||
Short-Term Securities | ||||||||||||||||
Money Market Funds | 182,872,847 | — | — | 182,872,847 | ||||||||||||
|
|
|
|
|
|
|
| |||||||||
| $ | 182,872,847 | $ | 2,385,017,181 | $ | — | $ | 2,567,890,028 | |||||||||
|
|
|
|
|
|
|
| |||||||||
See notes to financial statements.
| 60 | 2 0 2 3 BLACK ROCK ANNUAL REPORT TO SHAREHOLDERS |
Schedule of Investments October 31, 2023 | iShares U.S. Intermediate Government Bond Index Fund (Percentages shown are based on Net Assets) |
| Security | Par (000) | Value | ||||||
| ||||||||
U.S. Government Sponsored Agency Securities |
| |||||||
| Agency Obligations — 2.1% | ||||||||
Fannie Mae | ||||||||
2.63%, 09/06/24(a) | $ | 4,979 | $ | 4,862,231 | ||||
0.50%, 06/17/25 | 16,605 | 15,401,009 | ||||||
6.25%, 05/15/29 | 4,441 | 4,705,369 | ||||||
7.13%, 01/15/30 | 8,302 | 9,159,580 | ||||||
7.25%, 05/15/30(a) | 17,063 | 19,039,953 | ||||||
0.88%, 08/05/30 | 5,819 | 4,409,155 | ||||||
6.63%, 11/15/30 | 96 | 104,100 | ||||||
Federal Farm Credit Banks Funding Corp, 4.75%, 09/01/26 | 1,000 | 993,647 | ||||||
Federal Home Loan Banks | ||||||||
2.75%, 12/13/24 | 4,145 | 4,024,515 | ||||||
3.13%, 06/13/25 | 7,930 | 7,671,760 | ||||||
2.13%, 09/14/29 | 5,000 | 4,264,831 | ||||||
Federal Home Loan Mortgage Corp. | ||||||||
0.25%, 12/04/23 | 5,129 | 5,103,353 | ||||||
0.38%, 07/21/25 | 243 | 224,239 | ||||||
6.75%, 03/15/31 | 2,323 | 2,550,363 | ||||||
Tennessee Valley Authority, 1.50%, 09/15/31 | 130 | 98,296 | ||||||
|
| |||||||
| 82,612,401 | ||||||||
|
| |||||||
Total U.S. Government Sponsored Agency |
| 82,612,401 | ||||||
|
| |||||||
U.S. Treasury Obligations | ||||||||
U.S. Treasury Bonds | ||||||||
7.50%, 11/15/24 | 4,150 | 4,239,646 | ||||||
7.63%, 02/15/25(a) | 308 | 317,240 | ||||||
6.88%, 08/15/25(a) | 6,641 | 6,836,598 | ||||||
6.00%, 02/15/26 | 6,359 | 6,492,142 | ||||||
6.75%, 08/15/26 | 6,225 | 6,518,256 | ||||||
6.63%, 02/15/27(a) | 2,903 | 3,051,325 | ||||||
6.38%, 08/15/27 | 4,000 | 4,201,875 | ||||||
5.25%, 11/15/28 - 02/15/29(a) | 11,621 | 11,807,508 | ||||||
6.13%, 08/15/29 | 6,225 | 6,602,391 | ||||||
6.25%, 05/15/30 | 1,700 | 1,826,105 | ||||||
5.38%, 02/15/31 | 4,979 | 5,128,370 | ||||||
U.S. Treasury Notes | ||||||||
0.75%, 11/15/24 - 01/31/28(a) | 243,100 | 220,463,474 | ||||||
2.25%, 11/15/24 - 11/15/27(a) | 158,611 | 148,337,096 | ||||||
2.13%, 11/30/24 - 05/31/26 | 50,962 | 48,542,351 | ||||||
4.50%, 11/30/24 - 07/15/26(a) | 107,900 | 106,738,300 | ||||||
1.00%, 12/15/24 - 07/31/28(a) | 66,428 | 59,451,763 | ||||||
1.75%, 12/31/24 - 11/15/29(a) | 22,605 | 20,966,492 | ||||||
4.25%, 12/31/24 - 10/15/25(a) | 109,700 | 108,190,113 | ||||||
1.38%, 01/31/25 - 11/15/31(a) | 160,450 | 136,519,711 | ||||||
1.50%, 02/15/25 - 02/15/30(a) | 91,952 | 82,760,447 | ||||||
2.00%, 02/15/25 - 11/15/26 | 30,706 | 28,949,094 | ||||||
2.75%, 02/28/25 - 08/15/32(a) | 203,814 | 187,036,663 | ||||||
4.63%, 02/28/25 - 09/30/30 | 68,900 | 68,267,328 | ||||||
2.63%, 04/15/25 - 07/31/29 | 83,389 | 76,479,897 | ||||||
0.38%, 04/30/25 - 09/30/27(a) | 99,098 | 87,807,320 | ||||||
| Security | Par (000) | Value | ||||||
| ||||||||
U.S. Treasury Obligations (continued) |
| |||||||
U.S. Treasury Notes (continued) | ||||||||
2.88%, 04/30/25 - 05/15/32(a) | $ | 157,820 | $ | 145,216,428 | ||||
3.88%, 04/30/25 - 08/15/33(a) | 239,600 | 228,708,779 | ||||||
0.25%, 05/31/25 - 10/31/25(a) | 133,130 | 122,226,308 | ||||||
3.00%, 07/15/25 - 10/31/25(a) | 61,007 | 58,718,311 | ||||||
4.75%, 07/31/25 | 7,000 | 6,954,336 | ||||||
3.13%, 08/15/25 - 08/31/29(a) | 76,804 | 71,713,287 | ||||||
5.00%, 08/31/25 - 09/30/25(a) | 12,900 | 12,874,539 | ||||||
3.50%, 09/15/25 - 02/15/33(a) | 158,500 | 146,763,563 | ||||||
4.00%, 12/15/25 - 02/28/30(a) | 111,900 | 108,120,406 | ||||||
1.63%, 02/15/26 - 05/15/31(a) | 228,635 | 203,074,892 | ||||||
0.50%, 02/28/26 - 08/31/27(a) | 57,521 | 51,482,957 | ||||||
2.50%, 02/28/26 | 7,000 | 6,620,469 | ||||||
3.75%, 04/15/26 - 06/30/30(a) | 82,700 | 78,678,648 | ||||||
2.38%, 04/30/26 - 05/15/29(a) | 93,956 | 84,066,153 | ||||||
3.63%, 05/15/26 - 03/31/30 | 76,100 | 72,605,386 | ||||||
4.13%, 06/15/26 - 11/15/32(a) | 111,700 | 106,646,078 | ||||||
0.88%, 06/30/26 - 11/15/30(a) | 83,103 | 69,406,178 | ||||||
1.88%, 06/30/26 - 02/15/32 | 95,959 | 80,779,665 | ||||||
0.63%, 07/31/26 - 08/15/30(a) | 201,363 | 164,062,911 | ||||||
4.38%, 08/15/26 - 08/31/28(a) | 38,100 | 37,469,031 | ||||||
1.13%, 10/31/26 - 02/15/31(a) | 200,946 | 169,115,724 | ||||||
1.25%, 11/30/26 - 08/15/31(a) | 326,853 | 277,131,677 | ||||||
3.25%, 06/30/29 | 25,500 | 23,411,191 | ||||||
4.88%, 10/31/30 | 6,000 | 5,987,813 | ||||||
3.38%, 05/15/33(a) | 49,000 | 43,326,719 | ||||||
|
| |||||||
Total U.S. Treasury Obligations — 97.2% |
| 3,812,692,954 | ||||||
|
| |||||||
Total Long-Term Investments — 99.3% |
| 3,895,305,355 | ||||||
|
| |||||||
| Shares | ||||||||
Short-Term Securities |
| |||||||
| Money Market Funds — 41.3% | ||||||||
BlackRock Cash Funds: Institutional, SL Agency Shares, 5.54%(b)(c)(d) | 1,621,140,319 | 1,621,788,775 | ||||||
|
| |||||||
Total Short-Term Securities — 41.3% |
| 1,621,788,775 | ||||||
|
| |||||||
Total Investments — 140.6% |
| 5,517,094,130 | ||||||
Liabilities in Excess of Other Assets — (40.6)% |
| (1,594,194,709 | ) | |||||
|
| |||||||
Net Assets — 100.0% |
| $ | 3,922,899,421 | |||||
|
| |||||||
| (a) | All or a portion of this security is on loan. |
| (b) | Affiliate of the Fund. |
| (c) | Annualized 7-day yield as of period end. |
| (d) | All or a portion of this security was purchased with the cash collateral from loaned securities. |
SCHEDULE OF INVESTMENTS | 61 |
Schedule of Investments (continued) October 31, 2023 | iShares U.S. Intermediate Government Bond Index Fund |
Affiliates
Investments in issuers considered to be affiliate(s) of the Fund during the year ended October 31, 2023 for purposes of Section 2(a)(3) of the Investment Company Act of 1940, as amended, were as follows:
| ||||||||||||||||||||||||||||||||||||||||
| Affiliated Issuer | Value at 10/31/22 | Purchases at Cost | Proceeds from Sales | Net Realized Gain (Loss) | Change in Unrealized Appreciation (Depreciation) | Value at 10/31/23 | Shares Held at 10/31/23 | Income | Capital Gain Distributions from Underlying Funds |
| ||||||||||||||||||||||||||||||
| ||||||||||||||||||||||||||||||||||||||||
BlackRock Cash Funds: Institutional, SL Agency Shares | $ | 1,242,799,616 | $ | 378,299,603 | (a) | $ | — | $ | (159,708 | ) | $ | 849,264 | $ | 1,621,788,775 | 1,621,140,319 | $ | 2,517,092 | (b) | $ | — | ||||||||||||||||||||
|
|
|
|
|
|
|
|
|
|
|
| |||||||||||||||||||||||||||||
| (a) | Represents net amount purchased (sold). |
| (b) | All or a portion represents securities lending income earned from the reinvestment of cash collateral from loaned securities, net of fees and collateral investment expenses, and other payments to and from borrowers of securities. |
Fair Value Hierarchy as of Period End
Various inputs are used in determining the fair value of financial instruments. For a description of the input levels and information about the Fund’s policy regarding valuation of financial instruments, refer to the Notes to Financial Statements.
The following table summarizes the Fund’s financial instruments categorized in the fair value hierarchy. The breakdown of the Fund’s financial instruments into major categories is disclosed in the Schedule of Investments above.
| Level 1 | Level 2 | Level 3 | Total | |||||||||||||
Assets | ||||||||||||||||
Investments | ||||||||||||||||
Long-Term Investments | ||||||||||||||||
U.S. Government Sponsored Agency Securities | $ | — | $ | 82,612,401 | $ | — | $ | 82,612,401 | ||||||||
U.S. Treasury Obligations | — | 3,812,692,954 | — | 3,812,692,954 | ||||||||||||
Short-Term Securities | ||||||||||||||||
Money Market Funds | 1,621,788,775 | — | — | 1,621,788,775 | ||||||||||||
|
|
|
|
|
|
|
| |||||||||
| $ | 1,621,788,775 | $ | 3,895,305,355 | $ | — | $ | 5,517,094,130 | |||||||||
|
|
|
|
|
|
|
| |||||||||
See notes to financial statements.
| 62 | 2 0 2 3 BLACK ROCK ANNUAL REPORT TO SHAREHOLDERS |
Schedule of Investments October 31, 2023 | iShares U.S. Long Credit Bond Index Fund (Percentages shown are based on Net Assets) |
| Security | Par (000) | Value | ||||||
Corporate Bonds |
| |||||||
| Aerospace & Defense — 2.7% | ||||||||
3M Co. | ||||||||
5.70%, 03/15/37(a) | $ | 500 | $ | 481,204 | ||||
3.13%, 09/19/46(a) | 363 | 220,879 | ||||||
3.63%, 10/15/47(a) | 1,000 | 643,477 | ||||||
4.00%, 09/14/48(a) | 979 | 687,423 | ||||||
3.25%, 08/26/49(a) | 805 | 472,817 | ||||||
3.70%, 04/15/50 | 713 | 471,741 | ||||||
Boeing Co. | ||||||||
3.60%, 05/01/34 | 800 | 623,656 | ||||||
3.25%, 02/01/35 | 725 | 536,050 | ||||||
3.55%, 03/01/38 | 650 | 456,649 | ||||||
3.50%, 03/01/39 | 350 | 238,078 | ||||||
6.88%, 03/15/39 | 450 | 455,809 | ||||||
5.88%, 02/15/40 | 400 | 357,767 | ||||||
5.71%, 05/01/40 | 2,759 | 2,440,527 | ||||||
3.38%, 06/15/46(a) | 463 | 279,333 | ||||||
3.65%, 03/01/47 | 250 | 155,707 | ||||||
3.63%, 03/01/48 | 320 | 198,314 | ||||||
3.85%, 11/01/48 | 324 | 209,475 | ||||||
3.90%, 05/01/49 | 620 | 403,828 | ||||||
3.75%, 02/01/50 | 1,697 | 1,079,344 | ||||||
5.81%, 05/01/50 | 5,038 | 4,337,218 | ||||||
3.95%, 08/01/59(a) | 900 | 554,329 | ||||||
5.93%, 05/01/60 | 3,273 | 2,753,589 | ||||||
General Dynamics Corp. | ||||||||
4.25%, 04/01/40 | 829 | 671,970 | ||||||
2.85%, 06/01/41 | 397 | 260,440 | ||||||
3.60%, 11/15/42 | 450 | 323,722 | ||||||
4.25%, 04/01/50 | 713 | 555,404 | ||||||
General Electric Co. | ||||||||
5.88%, 01/14/38 | 800 | 781,454 | ||||||
6.88%, 01/10/39 | 700 | 748,882 | ||||||
4.50%, 03/11/44 | 500 | 396,729 | ||||||
4.35%, 05/01/50 | 450 | 337,000 | ||||||
Illinois Tool Works, Inc. | ||||||||
4.88%, 09/15/41 | 569 | 499,263 | ||||||
3.90%, 09/01/42 | 1,000 | 769,935 | ||||||
L3Harris Technologies, Inc. | ||||||||
4.85%, 04/27/35 | 883 | 772,265 | ||||||
6.15%, 12/15/40 | 270 | 256,000 | ||||||
5.60%, 07/31/53 | 515 | 455,093 | ||||||
Lockheed Martin Corp. | ||||||||
4.75%, 02/15/34 | 675 | 620,451 | ||||||
3.60%, 03/01/35(a) | 450 | 367,276 | ||||||
4.50%, 05/15/36 | 1,159 | 1,014,926 | ||||||
5.72%, 06/01/40(a) | 300 | 286,824 | ||||||
4.07%, 12/15/42 | 1,161 | 899,614 | ||||||
3.80%, 03/01/45 | 1,243 | 904,927 | ||||||
4.70%, 05/15/46 | 1,170 | 966,482 | ||||||
2.80%, 06/15/50 | 650 | 379,273 | ||||||
4.09%, 09/15/52 | 1,413 | 1,042,039 | ||||||
4.15%, 06/15/53 | 660 | 490,889 | ||||||
5.70%, 11/15/54(a) | 850 | 795,992 | ||||||
5.20%, 02/15/55 | 635 | 553,646 | ||||||
4.30%, 06/15/62 | 660 | 482,611 | ||||||
5.90%, 11/15/63 | 675 | 645,166 | ||||||
Series B, 6.15%, 09/01/36 | 550 | 559,791 | ||||||
Northrop Grumman Corp. | ||||||||
5.15%, 05/01/40 | 500 | 438,180 | ||||||
5.05%, 11/15/40 | 300 | 257,631 | ||||||
| Security | Par (000) | Value | ||||||
| Aerospace & Defense (continued) | ||||||||
Northrop Grumman Corp. (continued) | ||||||||
4.75%, 06/01/43 | $ | 1,024 | $ | 838,960 | ||||
3.85%, 04/15/45 | 550 | 389,813 | ||||||
4.03%, 10/15/47 | 2,243 | 1,630,422 | ||||||
5.25%, 05/01/50 | 829 | 720,770 | ||||||
4.95%, 03/15/53 | 970 | 803,477 | ||||||
Parker-Hannifin Corp. | ||||||||
4.20%, 11/21/34 | 763 | 643,646 | ||||||
6.25%, 05/15/38 | 295 | 285,963 | ||||||
4.45%, 11/21/44 | 400 | 309,086 | ||||||
4.10%, 03/01/47 | 613 | 447,186 | ||||||
4.00%, 06/14/49 | 763 | 546,070 | ||||||
RTX Corp. | ||||||||
5.40%, 05/01/35(a) | 800 | 740,758 | ||||||
6.13%, 07/15/38 | 550 | 526,107 | ||||||
4.45%, 11/16/38 | 413 | 329,342 | ||||||
5.70%, 04/15/40 | 600 | 538,861 | ||||||
4.88%, 10/15/40 | 163 | 133,735 | ||||||
4.70%, 12/15/41 | 426 | 339,111 | ||||||
4.50%, 06/01/42 | 3,774 | 2,928,556 | ||||||
4.80%, 12/15/43 | 350 | 277,340 | ||||||
4.15%, 05/15/45 | 663 | 475,178 | ||||||
3.75%, 11/01/46 | 1,220 | 807,853 | ||||||
4.35%, 04/15/47 | 829 | 608,188 | ||||||
4.05%, 05/04/47 | 413 | 288,922 | ||||||
4.63%, 11/16/48 | 1,486 | 1,143,487 | ||||||
3.13%, 07/01/50 | 1,103 | 639,775 | ||||||
2.82%, 09/01/51 | 1,063 | 573,092 | ||||||
3.03%, 03/15/52 | 1,100 | 614,715 | ||||||
5.38%, 02/27/53 | 1,290 | 1,093,493 | ||||||
|
| |||||||
| 54,264,995 | ||||||||
| Automobile Components — 0.2% | ||||||||
Aptiv PLC | ||||||||
4.40%, 10/01/46(a) | 413 | 280,012 | ||||||
5.40%, 03/15/49(a) | 350 | 272,976 | ||||||
3.10%, 12/01/51 | 1,479 | 796,668 | ||||||
Aptiv PLC/Aptiv Corp., 4.15%, 05/01/52 | 963 | 634,141 | ||||||
BorgWarner, Inc., 4.38%, 03/15/45 | 400 | 284,783 | ||||||
Lear Corp. | ||||||||
5.25%, 05/15/49 | 563 | 433,084 | ||||||
3.55%, 01/15/52 | 376 | 211,725 | ||||||
|
| |||||||
| 2,913,389 | ||||||||
| Automobiles — 0.4% | ||||||||
Cummins, Inc. | ||||||||
4.88%, 10/01/43 | 400 | 342,373 | ||||||
2.60%, 09/01/50 | 613 | 336,626 | ||||||
General Motors Co. | ||||||||
5.00%, 04/01/35 | 620 | 515,943 | ||||||
6.60%, 04/01/36 | 1,013 | 952,596 | ||||||
5.15%, 04/01/38 | 963 | 774,581 | ||||||
6.25%, 10/02/43 | 1,413 | 1,214,407 | ||||||
5.20%, 04/01/45 | 1,029 | 764,913 | ||||||
6.75%, 04/01/46 | 642 | 575,306 | ||||||
5.40%, 04/01/48 | 883 | 661,969 | ||||||
5.95%, 04/01/49(a) | 888 | 717,966 | ||||||
|
| |||||||
| 6,856,680 | ||||||||
| Banks — 1.6% | ||||||||
Bank of America N.A., 6.00%, 10/15/36 | 900 | 867,422 | ||||||
Cooperatieve Rabobank UA | ||||||||
5.25%, 05/24/41 | 1,299 | 1,187,913 | ||||||
5.75%, 12/01/43(a) | 1,050 | 929,067 | ||||||
SCHEDULE OF INVESTMENTS | 63 |
Schedule of Investments (continued) October 31, 2023 | iShares U.S. Long Credit Bond Index Fund (Percentages shown are based on Net Assets) |
| Security | Par (000) | Value | ||||||
| Banks (continued) | ||||||||
Cooperatieve Rabobank UA (continued) | $ | 997 | $ | 821,377 | ||||
Fifth Third Bancorp, 8.25%, 03/01/38 | 925 | 941,070 | ||||||
HSBC Bank USA NA, 7.00%, 01/15/39(a) | 261 | 261,197 | ||||||
Regions Bank, 6.45%, 06/26/37 | 450 | 395,604 | ||||||
Sumitomo Mitsui Financial Group, Inc., | 950 | 888,789 | ||||||
UBS AG, 4.50%, 06/26/48 | 800 | 634,976 | ||||||
Wachovia Corp., 5.50%, 08/01/35 | 1,200 | 1,068,182 | ||||||
Wells Fargo & Co. | ||||||||
5.38%, 11/02/43 | 1,895 | 1,554,561 | ||||||
5.61%, 01/15/44 | 2,292 | 1,931,697 | ||||||
4.65%, 11/04/44 | 2,075 | 1,529,564 | ||||||
3.90%, 05/01/45 | 2,503 | 1,739,363 | ||||||
4.90%, 11/17/45 | 1,993 | 1,515,810 | ||||||
4.40%, 06/14/46 | 1,706 | 1,193,312 | ||||||
4.75%, 12/07/46 | 1,575 | 1,159,953 | ||||||
(1-day SOFR + 2.13%), 4.61%, 04/25/53(b) | 2,881 | 2,124,145 | ||||||
(1-day SOFR + 2.53%), 3.07%, 04/30/41(b) | 3,359 | 2,146,413 | ||||||
(3-mo. CME Term SOFR + 4.50%), | 4,957 | 3,931,203 | ||||||
Wells Fargo Bank NA | ||||||||
5.85%, 02/01/37 | 1,550 | 1,429,483 | ||||||
6.60%, 01/15/38 | 1,200 | 1,177,351 | ||||||
Westpac Banking Corp. | ||||||||
4.42%, 07/24/39 | 829 | 605,940 | ||||||
2.96%, 11/16/40 | 1,000 | 583,623 | ||||||
3.13%, 11/18/41 | 926 | 540,891 | ||||||
|
| |||||||
| 31,158,906 | ||||||||
| Beverages — 2.6% | ||||||||
Anheuser-Busch Cos. LLC/Anheuser-Busch InBev Worldwide, Inc. | ||||||||
4.70%, 02/01/36 | 5,403 | 4,754,853 | ||||||
4.90%, 02/01/46 | 9,988 | 8,317,771 | ||||||
Anheuser-Busch InBev Finance, Inc. | ||||||||
4.70%, 02/01/36 | 600 | 528,024 | ||||||
4.63%, 02/01/44 | 538 | 435,624 | ||||||
4.90%, 02/01/46 | 1,463 | 1,218,352 | ||||||
Anheuser-Busch InBev Worldwide, Inc. | ||||||||
4.38%, 04/15/38 | 1,479 | 1,223,421 | ||||||
8.20%, 01/15/39 | 1,253 | 1,464,474 | ||||||
5.45%, 01/23/39 | 2,029 | 1,871,863 | ||||||
4.35%, 06/01/40 | 829 | 669,342 | ||||||
4.95%, 01/15/42 | 1,713 | 1,472,072 | ||||||
4.60%, 04/15/48 | 1,785 | 1,446,031 | ||||||
4.44%, 10/06/48(a) | 1,023 | 791,565 | ||||||
5.55%, 01/23/49 | 3,539 | 3,210,646 | ||||||
4.50%, 06/01/50 | 2,000 | 1,588,066 | ||||||
4.75%, 04/15/58 | 1,300 | 1,041,541 | ||||||
5.80%, 01/23/59 | 1,929 | 1,781,519 | ||||||
Brown-Forman Corp. | ||||||||
4.00%, 04/15/38 | 413 | 329,316 | ||||||
4.50%, 07/15/45 | 425 | 339,843 | ||||||
Coca-Cola Co. | ||||||||
2.50%, 06/01/40 | 829 | 535,325 | ||||||
2.88%, 05/05/41 | 613 | 412,162 | ||||||
4.20%, 03/25/50 | 450 | 352,412 | ||||||
2.60%, 06/01/50 | 1,279 | 728,041 | ||||||
3.00%, 03/05/51(a) | 1,770 | 1,104,040 | ||||||
2.50%, 03/15/51 | 1,663 | 917,288 | ||||||
2.75%, 06/01/60(a) | 825 | 462,891 | ||||||
| Security | Par (000) | Value | ||||||
| Beverages (continued) | ||||||||
Coca-Cola Femsa SAB de CV, 5.25%, 11/26/43 | $ | 500 | $ | 428,290 | ||||
Constellation Brands, Inc. | ||||||||
4.50%, 05/09/47 | 400 | 300,525 | ||||||
4.10%, 02/15/48 | 613 | 433,460 | ||||||
5.25%, 11/15/48 | 400 | 334,333 | ||||||
3.75%, 05/01/50 | 663 | 442,111 | ||||||
Diageo Capital PLC | ||||||||
5.88%, 09/30/36 | 500 | 494,205 | ||||||
3.88%, 04/29/43 | 931 | 693,343 | ||||||
Diageo Investment Corp. | ||||||||
7.45%, 04/15/35 | 350 | 387,776 | ||||||
4.25%, 05/11/42 | 163 | 127,434 | ||||||
Keurig Dr. Pepper, Inc. | ||||||||
4.50%, 11/15/45 | 500 | 377,372 | ||||||
4.42%, 12/15/46 | 413 | 300,949 | ||||||
5.09%, 05/25/48 | 250 | 204,641 | ||||||
3.80%, 05/01/50 | 663 | 440,056 | ||||||
3.35%, 03/15/51(a) | 463 | 278,605 | ||||||
4.50%, 04/15/52 | 1,163 | 860,675 | ||||||
Molson Coors Beverage Co. | ||||||||
5.00%, 05/01/42 | 1,150 | 940,999 | ||||||
4.20%, 07/15/46 | 1,668 | 1,182,828 | ||||||
PepsiCo, Inc. | ||||||||
5.50%, 01/15/40(a) | 450 | 425,004 | ||||||
3.50%, 03/19/40 | 250 | 186,278 | ||||||
4.88%, 11/01/40 | 250 | 221,094 | ||||||
2.63%, 10/21/41 | 563 | 360,506 | ||||||
4.00%, 03/05/42 | 500 | 386,561 | ||||||
3.60%, 08/13/42 | 800 | 587,999 | ||||||
4.45%, 04/14/46 | 800 | 652,939 | ||||||
3.45%, 10/06/46 | 1,399 | 968,233 | ||||||
4.00%, 05/02/47 | 450 | 346,610 | ||||||
3.38%, 07/29/49 | 225 | 150,593 | ||||||
2.88%, 10/15/49 | 813 | 494,313 | ||||||
3.63%, 03/19/50 | 579 | 404,349 | ||||||
2.75%, 10/21/51 | 1,043 | 606,016 | ||||||
4.20%, 07/18/52 | 675 | 520,762 | ||||||
4.65%, 02/15/53 | 500 | 419,480 | ||||||
3.88%, 03/19/60 | 450 | 315,568 | ||||||
|
| |||||||
| 52,270,389 | ||||||||
| Biotechnology — 1.9% | ||||||||
Amgen, Inc. | ||||||||
6.38%, 06/01/37 | 400 | 394,511 | ||||||
6.40%, 02/01/39 | 300 | 297,044 | ||||||
3.15%, 02/21/40 | 1,829 | 1,224,919 | ||||||
5.75%, 03/15/40 | 350 | 318,229 | ||||||
2.80%, 08/15/41 | 911 | 563,515 | ||||||
4.95%, 10/01/41 | 650 | 535,372 | ||||||
5.15%, 11/15/41 | 663 | 560,255 | ||||||
5.60%, 03/02/43 | 3,200 | 2,854,130 | ||||||
4.40%, 05/01/45 | 2,045 | 1,535,921 | ||||||
4.56%, 06/15/48 | 1,263 | 955,489 | ||||||
3.38%, 02/21/50 | 2,029 | 1,253,828 | ||||||
4.66%, 06/15/51 | 3,628 | 2,761,003 | ||||||
3.00%, 01/15/52(a) | 1,160 | 659,042 | ||||||
4.20%, 02/22/52 | 810 | 569,847 | ||||||
4.88%, 03/01/53 | 400 | 312,287 | ||||||
5.65%, 03/02/53 | 4,050 | 3,562,027 | ||||||
2.77%, 09/01/53 | 829 | 433,110 | ||||||
4.40%, 02/22/62 | 1,075 | 743,707 | ||||||
5.75%, 03/02/63 | 2,670 | 2,312,539 | ||||||
| 64 | 2 0 2 3 BLACK ROCK ANNUAL REPORT TO SHAREHOLDERS |
Schedule of Investments (continued) October 31, 2023 | iShares U.S. Long Credit Bond Index Fund (Percentages shown are based on Net Assets) |
| Security | Par (000) | Value | ||||||
| Biotechnology (continued) | ||||||||
Baxalta, Inc., 5.25%, 06/23/45 | $ | 427 | $ | 363,070 | ||||
Biogen, Inc. | ||||||||
5.20%, 09/15/45 | 1,000 | 832,161 | ||||||
3.15%, 05/01/50 | 1,387 | 798,758 | ||||||
3.25%, 02/15/51(a) | 736 | 430,440 | ||||||
Gilead Sciences, Inc. | ||||||||
4.60%, 09/01/35 | 1,119 | 981,798 | ||||||
4.00%, 09/01/36 | 750 | 611,025 | ||||||
2.60%, 10/01/40 | 1,030 | 644,204 | ||||||
5.65%, 12/01/41 | 869 | 803,592 | ||||||
4.80%, 04/01/44 | 1,761 | 1,447,290 | ||||||
4.50%, 02/01/45 | 1,753 | 1,371,433 | ||||||
4.75%, 03/01/46 | 2,393 | 1,934,238 | ||||||
4.15%, 03/01/47 | 1,253 | 922,817 | ||||||
2.80%, 10/01/50(a) | 1,294 | 729,817 | ||||||
5.55%, 10/15/53 | 1,100 | 993,645 | ||||||
Regeneron Pharmaceuticals, Inc., | 691 | 372,082 | ||||||
Royalty Pharma PLC | ||||||||
3.30%, 09/02/40(a) | 1,079 | 681,832 | ||||||
3.55%, 09/02/50(a) | 950 | 554,281 | ||||||
3.35%, 09/02/51 | 663 | 365,635 | ||||||
|
| |||||||
| 36,684,893 | ||||||||
| Broadline Retail — 1.1% | ||||||||
Alibaba Group Holding Ltd. | ||||||||
4.50%, 11/28/34 | 500 | 420,680 | ||||||
4.00%, 12/06/37 | 878 | 655,295 | ||||||
2.70%, 02/09/41(a) | 950 | 545,376 | ||||||
4.20%, 12/06/47 | 1,751 | 1,177,066 | ||||||
3.15%, 02/09/51 | 1,366 | 734,375 | ||||||
4.40%, 12/06/57 | 978 | 645,969 | ||||||
3.25%, 02/09/61 | 950 | 482,743 | ||||||
Amazon.com, Inc. | ||||||||
4.80%, 12/05/34 | 1,496 | 1,400,189 | ||||||
3.88%, 08/22/37 | 2,129 | 1,743,720 | ||||||
2.88%, 05/12/41 | 1,660 | 1,114,376 | ||||||
4.95%, 12/05/44 | 1,513 | 1,350,373 | ||||||
4.05%, 08/22/47 | 3,773 | 2,876,308 | ||||||
2.50%, 06/03/50 | 2,279 | 1,260,377 | ||||||
3.10%, 05/12/51 | 3,309 | 2,050,162 | ||||||
3.95%, 04/13/52(a) | 1,826 | 1,334,926 | ||||||
4.25%, 08/22/57 | 1,959 | 1,482,487 | ||||||
2.70%, 06/03/60 | 2,029 | 1,088,148 | ||||||
3.25%, 05/12/61 | 1,779 | 1,065,352 | ||||||
4.10%, 04/13/62 | 1,129 | 811,694 | ||||||
TJX Cos., Inc., 4.50%, 04/15/50 | 413 | 326,241 | ||||||
|
| |||||||
| 22,565,857 | ||||||||
| Building Materials — 0.4% | ||||||||
Carrier Global Corp. | ||||||||
3.38%, 04/05/40 | 1,379 | 927,873 | ||||||
3.58%, 04/05/50 | 1,843 | 1,155,778 | ||||||
Fortune Brands Innovations, Inc., | 413 | 283,984 | ||||||
Johnson Controls International PLC | ||||||||
6.00%, 01/15/36 | 300 | 291,982 | ||||||
4.63%, 07/02/44 | 620 | 478,345 | ||||||
5.13%, 09/14/45 | 238 | 195,930 | ||||||
4.50%, 02/15/47 | 453 | 343,003 | ||||||
4.95%, 07/02/64(c) | 365 | 275,132 | ||||||
Lafarge SA, 7.13%, 07/15/36 | 400 | 411,270 | ||||||
Martin Marietta Materials, Inc. | ||||||||
4.25%, 12/15/47 | 513 | 371,467 | ||||||
3.20%, 07/15/51 | 925 | 549,508 | ||||||
| Security | Par (000) | Value | ||||||
| Building Materials (continued) | ||||||||
Masco Corp. | ||||||||
4.50%, 05/15/47 | $ | 350 | $ | 249,313 | ||||
3.13%, 02/15/51 | 222 | 124,392 | ||||||
Owens Corning | ||||||||
7.00%, 12/01/36 | 300 | 301,491 | ||||||
4.30%, 07/15/47 | 650 | 463,238 | ||||||
4.40%, 01/30/48 | 329 | 236,499 | ||||||
Trane Technologies Global Holding Co. Ltd., 4.30%, 02/21/48(a) | 413 | 301,256 | ||||||
Trane Technologies Luxembourg Finance SA | ||||||||
4.65%, 11/01/44(a) | 500 | 387,803 | ||||||
4.50%, 03/21/49 | 413 | 312,968 | ||||||
Vulcan Materials Co. | ||||||||
4.50%, 06/15/47(a) | 713 | 544,063 | ||||||
4.70%, 03/01/48 | 400 | 311,055 | ||||||
|
| |||||||
| 8,516,350 | ||||||||
| Building Products — 1.2% | ||||||||
Home Depot, Inc. | ||||||||
5.88%, 12/16/36 | 2,776 | 2,749,116 | ||||||
3.30%, 04/15/40 | 1,311 | 926,906 | ||||||
5.40%, 09/15/40 | 413 | 377,560 | ||||||
5.95%, 04/01/41 | 913 | 885,316 | ||||||
4.20%, 04/01/43 | 920 | 714,441 | ||||||
4.88%, 02/15/44 | 900 | 757,333 | ||||||
4.40%, 03/15/45 | 1,036 | 811,355 | ||||||
4.25%, 04/01/46 | 1,479 | 1,124,211 | ||||||
3.90%, 06/15/47 | 1,069 | 764,886 | ||||||
4.50%, 12/06/48 | 1,379 | 1,086,771 | ||||||
3.13%, 12/15/49 | 1,146 | 697,246 | ||||||
3.35%, 04/15/50 | 1,298 | 822,572 | ||||||
2.38%, 03/15/51 | 1,145 | 584,797 | ||||||
2.75%, 09/15/51 | 913 | 508,660 | ||||||
3.63%, 04/15/52 | 1,358 | 904,374 | ||||||
4.95%, 09/15/52(a) | 930 | 782,785 | ||||||
3.50%, 09/15/56 | 900 | 569,104 | ||||||
Lowe’s Cos., Inc. | ||||||||
5.50%, 10/15/35 | 900 | 840,554 | ||||||
5.00%, 04/15/40 | 329 | 274,776 | ||||||
4.38%, 09/15/45 | 829 | 604,393 | ||||||
3.70%, 04/15/46 | 1,250 | 822,075 | ||||||
4.05%, 05/03/47 | 1,579 | 1,089,550 | ||||||
5.13%, 04/15/50 | 750 | 606,165 | ||||||
3.00%, 10/15/50(a) | 1,719 | 944,807 | ||||||
3.50%, 04/01/51 | 829 | 502,071 | ||||||
4.25%, 04/01/52 | 1,108 | 767,904 | ||||||
5.63%, 04/15/53 | 1,145 | 989,429 | ||||||
5.75%, 07/01/53 | 130 | 114,071 | ||||||
4.45%, 04/01/62 | 900 | 614,490 | ||||||
5.85%, 04/01/63 | 1,000 | 853,167 | ||||||
|
| |||||||
| 24,090,885 | ||||||||
| Capital Markets — 0.4% | ||||||||
Brookfield Finance LLC, 3.45%, 04/15/50 | 450 | 259,734 | ||||||
Brookfield Finance, Inc. | ||||||||
4.70%, 09/20/47 | 823 | 607,744 | ||||||
3.50%, 03/30/51 | 581 | 339,567 | ||||||
3.63%, 02/15/52 | 279 | 165,152 | ||||||
CI Financial Corp., 4.10%, 06/15/51(a) | 709 | 377,153 | ||||||
Franklin Resources, Inc., 2.95%, 08/12/51 | 225 | 119,876 | ||||||
Invesco Finance PLC, 5.38%, 11/30/43 | 413 | 348,401 | ||||||
Jefferies Financial Group, Inc., 6.25%, 01/15/36 | 950 | 900,792 | ||||||
Legg Mason, Inc., 5.63%, 01/15/44 | 516 | 455,144 | ||||||
SCHEDULE OF INVESTMENTS | 65 |
Schedule of Investments (continued) October 31, 2023 | iShares U.S. Long Credit Bond Index Fund (Percentages shown are based on Net Assets) |
| Security | Par (000) | Value | ||||||
| Capital Markets (continued) | ||||||||
Nasdaq, Inc. | ||||||||
5.55%, 02/15/34 | $ | 1,170 | $ | 1,085,282 | ||||
5.95%, 08/15/53 | 300 | 267,650 | ||||||
Raymond James Financial, Inc. | ||||||||
4.95%, 07/15/46 | 663 | 524,653 | ||||||
3.75%, 04/01/51 | 650 | 417,296 | ||||||
S&P Global, Inc., 3.70%, 03/01/52 | 849 | 573,648 | ||||||
UBS Group AG, 4.88%, 05/15/45 | 1,932 | 1,539,423 | ||||||
|
| |||||||
| 7,981,515 | ||||||||
| Chemicals — 1.6% | ||||||||
Air Products and Chemicals, Inc. | ||||||||
2.70%, 05/15/40 | 708 | 459,361 | ||||||
2.80%, 05/15/50(a) | 884 | 521,019 | ||||||
Albemarle Corp.(a) | ||||||||
5.45%, 12/01/44 | 350 | 286,045 | ||||||
5.65%, 06/01/52 | 400 | 309,769 | ||||||
CF Industries, Inc. | ||||||||
5.15%, 03/15/34 | 663 | 587,518 | ||||||
4.95%, 06/01/43 | 663 | 511,824 | ||||||
5.38%, 03/15/44 | 663 | 539,158 | ||||||
Dow Chemical Co. | ||||||||
4.25%, 10/01/34 | 378 | 318,718 | ||||||
9.40%, 05/15/39 | 479 | 584,759 | ||||||
5.25%, 11/15/41 | 826 | 693,525 | ||||||
4.38%, 11/15/42 | 1,063 | 789,598 | ||||||
4.63%, 10/01/44 | 400 | 301,561 | ||||||
5.55%, 11/30/48 | 829 | 699,727 | ||||||
4.80%, 05/15/49 | 829 | 629,531 | ||||||
3.60%, 11/15/50 | 963 | 607,642 | ||||||
6.90%, 05/15/53 | 850 | 849,691 | ||||||
DuPont de Nemours, Inc. | ||||||||
5.32%, 11/15/38 | 1,530 | 1,367,482 | ||||||
5.42%, 11/15/48 | 2,043 | 1,771,949 | ||||||
Eastman Chemical Co. | ||||||||
4.80%, 09/01/42 | 463 | 355,024 | ||||||
4.65%, 10/15/44 | 879 | 641,071 | ||||||
Ecolab, Inc. | ||||||||
3.95%, 12/01/47 | 500 | 363,774 | ||||||
2.13%, 08/15/50 | 660 | 320,562 | ||||||
2.70%, 12/15/51(a) | 841 | 461,611 | ||||||
2.75%, 08/18/55(a) | 700 | 372,143 | ||||||
Emerson Electric Co. | ||||||||
5.25%, 11/15/39 | 250 | 225,302 | ||||||
2.75%, 10/15/50(a) | 829 | 465,046 | ||||||
2.80%, 12/21/51 | 807 | 457,019 | ||||||
FMC Corp. | ||||||||
4.50%, 10/01/49 | 507 | 334,807 | ||||||
6.38%, 05/18/53 | 420 | 353,587 | ||||||
International Flavors & Fragrances, Inc. | ||||||||
4.38%, 06/01/47 | 413 | 268,482 | ||||||
5.00%, 09/26/48 | 763 | 548,956 | ||||||
Linde, Inc. | ||||||||
3.55%, 11/07/42 | 500 | 357,209 | ||||||
2.00%, 08/10/50(a) | 233 | 112,128 | ||||||
LYB International Finance BV | ||||||||
5.25%, 07/15/43 | 700 | 563,323 | ||||||
4.88%, 03/15/44 | 938 | 715,139 | ||||||
LYB International Finance III LLC | ||||||||
3.38%, 10/01/40 | 741 | 480,021 | ||||||
4.20%, 10/15/49 | 966 | 640,502 | ||||||
4.20%, 05/01/50 | 963 | 637,090 | ||||||
3.63%, 04/01/51 | 953 | 574,318 | ||||||
| Security | Par (000) | Value | ||||||
| Chemicals (continued) | ||||||||
LYB International Finance III LLC (continued) 3.80%, 10/01/60(a) | $ | 480 | $ | 277,199 | ||||
LyondellBasell Industries NV, 4.63%, 02/26/55 | 795 | 554,665 | ||||||
Mosaic Co. | ||||||||
5.45%, 11/15/33 | 386 | 352,772 | ||||||
4.88%, 11/15/41 | 350 | 267,827 | ||||||
5.63%, 11/15/43 | 520 | 436,212 | ||||||
Nutrien Ltd. | ||||||||
4.13%, 03/15/35 | 350 | 281,269 | ||||||
5.88%, 12/01/36 | 410 | 380,005 | ||||||
5.63%, 12/01/40 | 600 | 527,923 | ||||||
6.13%, 01/15/41 | 350 | 322,685 | ||||||
4.90%, 06/01/43(a) | 413 | 327,839 | ||||||
5.25%, 01/15/45 | 520 | 425,704 | ||||||
5.00%, 04/01/49 | 620 | 482,523 | ||||||
3.95%, 05/13/50 | 413 | 278,107 | ||||||
5.80%, 03/27/53(a) | 660 | 576,691 | ||||||
RPM International, Inc. | ||||||||
5.25%, 06/01/45 | 163 | 128,940 | ||||||
4.25%, 01/15/48(a) | 300 | 205,110 | ||||||
Sherwin-Williams Co. | ||||||||
4.55%, 08/01/45 | 400 | 300,420 | ||||||
4.50%, 06/01/47 | 1,329 | 1,002,439 | ||||||
3.80%, 08/15/49 | 727 | 480,489 | ||||||
3.30%, 05/15/50 | 500 | 300,070 | ||||||
2.90%, 03/15/52 | 500 | 270,817 | ||||||
Westlake Corp. | ||||||||
2.88%, 08/15/41 | 295 | 173,339 | ||||||
5.00%, 08/15/46 | 620 | 471,276 | ||||||
4.38%, 11/15/47 | 465 | 321,578 | ||||||
3.13%, 08/15/51(a) | 520 | 280,052 | ||||||
3.38%, 08/15/61 | 420 | 216,884 | ||||||
|
| |||||||
| 30,718,826 | ||||||||
| Commercial Services & Supplies — 0.1% | ||||||||
GATX Corp. | ||||||||
5.20%, 03/15/44(a) | 300 | 237,367 | ||||||
3.10%, 06/01/51 | 500 | 268,291 | ||||||
Republic Services, Inc., 5.00%, 04/01/34 | 710 | 651,250 | ||||||
|
| |||||||
| 1,156,908 | ||||||||
| Communications Equipment — 0.2% | ||||||||
Cisco Systems, Inc. | ||||||||
5.90%, 02/15/39 | 1,859 | 1,848,770 | ||||||
5.50%, 01/15/40 | 1,902 | 1,804,952 | ||||||
Juniper Networks, Inc., 5.95%, 03/15/41 | 413 | 358,913 | ||||||
Motorola Solutions, Inc., 5.50%, 09/01/44 | 300 | 251,726 | ||||||
Nokia OYJ, 6.63%, 05/15/39(a) | 500 | 434,132 | ||||||
|
| |||||||
| 4,698,493 | ||||||||
| Construction Materials — 0.1% | ||||||||
WW Grainger, Inc. | ||||||||
4.60%, 06/15/45 | 1,036 | 839,109 | ||||||
3.75%, 05/15/46 | 350 | 245,472 | ||||||
4.20%, 05/15/47 | 600 | 465,779 | ||||||
|
| |||||||
| 1,550,360 | ||||||||
| Consumer Discretionary — 0.0% | ||||||||
Harley-Davidson, Inc., 4.63%, 07/28/45(a) | 246 | 168,704 | ||||||
Quanta Services, Inc., 3.05%, 10/01/41 | 451 | 270,343 | ||||||
|
| |||||||
| 439,047 | ||||||||
| Consumer Finance — 0.8% | ||||||||
American Express Co., 4.05%, 12/03/42 | 1,100 | 829,213 | ||||||
| 66 | 2 0 2 3 BLACK ROCK ANNUAL REPORT TO SHAREHOLDERS |
Schedule of Investments (continued) October 31, 2023 | iShares U.S. Long Credit Bond Index Fund (Percentages shown are based on Net Assets) |
| Security | Par (000) | Value | ||||||
| Consumer Finance (continued) | ||||||||
Global Payments, Inc. | ||||||||
4.15%, 08/15/49 | $ | 743 | $ | 481,786 | ||||
5.95%, 08/15/52 | 655 | 552,981 | ||||||
Mastercard, Inc. | ||||||||
3.80%, 11/21/46 | 550 | 403,765 | ||||||
3.95%, 02/26/48 | 450 | 339,776 | ||||||
3.65%, 06/01/49 | 963 | 681,062 | ||||||
3.85%, 03/26/50 | 1,419 | 1,036,808 | ||||||
2.95%, 03/15/51(a) | 704 | 429,587 | ||||||
Moody’s Corp. | ||||||||
2.75%, 08/19/41(a) | 547 | 337,537 | ||||||
5.25%, 07/15/44(a) | 500 | 429,717 | ||||||
4.88%, 12/17/48 | 350 | 281,688 | ||||||
3.25%, 05/20/50 | 64 | 38,569 | ||||||
3.75%, 02/25/52 | 766 | 510,631 | ||||||
3.10%, 11/29/61 | 384 | 208,053 | ||||||
PayPal Holdings, Inc. | ||||||||
3.25%, 06/01/50(a) | 900 | 552,559 | ||||||
5.05%, 06/01/52 | 780 | 659,552 | ||||||
5.25%, 06/01/62(a) | 430 | 356,038 | ||||||
S&P Global, Inc. | ||||||||
3.25%, 12/01/49 | 545 | 339,576 | ||||||
2.30%, 08/15/60 | 663 | 308,151 | ||||||
3.90%, 03/01/62 | 450 | 302,696 | ||||||
Visa, Inc. | ||||||||
4.15%, 12/14/35 | 1,413 | 1,231,204 | ||||||
2.70%, 04/15/40 | 829 | 554,573 | ||||||
4.30%, 12/14/45 | 3,246 | 2,591,503 | ||||||
3.65%, 09/15/47 | 676 | 486,482 | ||||||
2.00%, 08/15/50(a) | 1,611 | 822,660 | ||||||
Western Union Co., 6.20%, 11/17/36(a) | 433 | 407,797 | ||||||
|
| |||||||
| 15,173,964 | ||||||||
| Consumer Staples Distribution & Retail — 1.8% | ||||||||
Campbell Soup Co. | ||||||||
4.80%, 03/15/48 | 620 | 470,527 | ||||||
3.13%, 04/24/50 | 465 | 264,789 | ||||||
Conagra Brands, Inc. | ||||||||
5.30%, 11/01/38 | 829 | 693,957 | ||||||
5.40%, 11/01/48 | 973 | 778,760 | ||||||
Dollar General Corp. | ||||||||
4.13%, 04/03/50 | 429 | 280,392 | ||||||
5.50%, 11/01/52(a) | 250 | 199,828 | ||||||
Dollar Tree, Inc., 3.38%, 12/01/51 | 329 | 186,930 | ||||||
General Mills, Inc. | ||||||||
5.40%, 06/15/40 | 450 | 394,506 | ||||||
4.70%, 04/17/48(a) | 400 | 317,483 | ||||||
3.00%, 02/01/51 | 571 | 327,002 | ||||||
Ingredion, Inc., 3.90%, 06/01/50 | 413 | 260,752 | ||||||
Kellogg Co., 4.50%, 04/01/46 | 553 | 424,660 | ||||||
Koninklijke Ahold Delhaize NV, 5.70%, 10/01/40 | 400 | 361,604 | ||||||
Kraft Heinz Foods Co. | ||||||||
5.00%, 07/15/35 | 671 | 596,517 | ||||||
6.88%, 01/26/39 | 813 | 821,562 | ||||||
4.63%, 10/01/39 | 413 | 332,768 | ||||||
6.50%, 02/09/40 | 421 | 409,667 | ||||||
5.00%, 06/04/42 | 1,487 | 1,225,576 | ||||||
5.20%, 07/15/45 | 1,253 | 1,035,446 | ||||||
4.38%, 06/01/46 | 2,700 | 1,975,471 | ||||||
4.88%, 10/01/49 | 1,187 | 929,297 | ||||||
5.50%, 06/01/50 | 763 | 654,853 | ||||||
Kroger Co. | ||||||||
6.90%, 04/15/38 | 350 | 356,154 | ||||||
| Security | Par (000) | Value | ||||||
| Consumer Staples Distribution & Retail (continued) | ||||||||
Kroger Co. (continued) | ||||||||
5.40%, 07/15/40 | $ | 900 | $ | 771,702 | ||||
5.15%, 08/01/43 | 309 | 250,368 | ||||||
3.88%, 10/15/46 | 413 | 273,056 | ||||||
4.45%, 02/01/47 | 829 | 614,053 | ||||||
4.65%, 01/15/48 | 413 | 312,724 | ||||||
5.40%, 01/15/49 | 613 | 525,345 | ||||||
3.95%, 01/15/50 | 575 | 389,378 | ||||||
Sysco Corp. | ||||||||
5.38%, 09/21/35 | 350 | 319,185 | ||||||
6.60%, 04/01/40 | 350 | 344,884 | ||||||
4.85%, 10/01/45 | 397 | 307,119 | ||||||
4.50%, 04/01/46 | 428 | 317,017 | ||||||
4.45%, 03/15/48(a) | 413 | 305,777 | ||||||
3.30%, 02/15/50 | 400 | 241,569 | ||||||
6.60%, 04/01/50(a) | 1,179 | 1,163,155 | ||||||
3.15%, 12/14/51(a) | 1,000 | 578,222 | ||||||
Target Corp. | ||||||||
6.50%, 10/15/37 | 400 | 410,217 | ||||||
7.00%, 01/15/38 | 655 | 709,979 | ||||||
4.00%, 07/01/42 | 950 | 736,491 | ||||||
3.63%, 04/15/46 | 702 | 486,331 | ||||||
3.90%, 11/15/47 | 413 | 294,927 | ||||||
2.95%, 01/15/52(a) | 850 | 489,549 | ||||||
4.80%, 01/15/53(a) | 1,000 | 813,312 | ||||||
Walgreens Boots Alliance, Inc. | ||||||||
4.50%, 11/18/34 | 300 | 242,088 | ||||||
4.80%, 11/18/44(a) | 750 | 500,265 | ||||||
4.65%, 06/01/46(a) | 450 | 291,548 | ||||||
4.10%, 04/15/50(a) | 829 | 482,537 | ||||||
Walmart, Inc. | ||||||||
5.25%, 09/01/35 | 1,200 | 1,173,651 | ||||||
6.50%, 08/15/37 | 1,000 | 1,075,015 | ||||||
6.20%, 04/15/38 | 650 | 678,852 | ||||||
3.95%, 06/28/38 | 500 | 411,642 | ||||||
5.63%, 04/01/40 | 1,659 | 1,608,014 | ||||||
5.00%, 10/25/40 | 350 | 320,445 | ||||||
5.63%, 04/15/41 | 550 | 536,418 | ||||||
2.50%, 09/22/41 | 854 | 539,218 | ||||||
4.30%, 04/22/44 | 300 | 247,388 | ||||||
4.05%, 06/29/48 | 1,493 | 1,151,662 | ||||||
2.95%, 09/24/49(a) | 550 | 342,478 | ||||||
2.65%, 09/22/51 | 1,342 | 770,284 | ||||||
4.50%, 09/09/52 | 900 | 730,218 | ||||||
4.50%, 04/15/53 | 1,300 | 1,055,550 | ||||||
|
| |||||||
| 36,110,134 | ||||||||
| Containers & Packaging — 0.2% | ||||||||
Celulosa Arauco y Constitucion SA, | 300 | 225,750 | ||||||
International Paper Co. | ||||||||
5.00%, 09/15/35(a) | 400 | 362,996 | ||||||
6.00%, 11/15/41 | 600 | 552,079 | ||||||
4.80%, 06/15/44 | 1,041 | 812,664 | ||||||
5.15%, 05/15/46 | 400 | 323,845 | ||||||
4.40%, 08/15/47 | 613 | 447,328 | ||||||
4.35%, 08/15/48(a) | 675 | 495,304 | ||||||
Packaging Corp. of America | ||||||||
4.05%, 12/15/49 | 538 | 369,039 | ||||||
3.05%, 10/01/51 | 620 | 349,544 | ||||||
Sonoco Products Co., 5.75%, 11/01/40(a) | 450 | 398,747 | ||||||
|
| |||||||
| 4,337,296 | ||||||||
SCHEDULE OF INVESTMENTS | 67 |
Schedule of Investments (continued) October 31, 2023 | iShares U.S. Long Credit Bond Index Fund (Percentages shown are based on Net Assets) |
| Security | Par (000) | Value | ||||||
| Diversified Consumer Services — 0.0% | ||||||||
University of Southern California, 4.98%, 10/01/53 | $ | 315 | $ | 271,273 | ||||
|
| |||||||
| Diversified REITs — 1.0% | ||||||||
Alexandria Real Estate Equities, Inc. | ||||||||
2.95%, 03/15/34 | 843 | 614,559 | ||||||
4.75%, 04/15/35 | 510 | 431,373 | ||||||
4.85%, 04/15/49 | 163 | 120,126 | ||||||
4.00%, 02/01/50 | 629 | 409,560 | ||||||
3.00%, 05/18/51 | 880 | 465,969 | ||||||
3.55%, 03/15/52 | 1,030 | 614,284 | ||||||
5.15%, 04/15/53 | 545 | 429,171 | ||||||
American Homes 4 Rent LP | ||||||||
3.38%, 07/15/51 | 450 | 253,358 | ||||||
4.30%, 04/15/52 | 150 | 101,719 | ||||||
American Tower Corp. | ||||||||
3.70%, 10/15/49 | 600 | 371,946 | ||||||
3.10%, 06/15/50 | 1,128 | 622,025 | ||||||
2.95%, 01/15/51(a) | 1,070 | 569,538 | ||||||
AvalonBay Communities, Inc. | ||||||||
3.90%, 10/15/46 | 663 | 447,305 | ||||||
4.15%, 07/01/47 | 300 | 213,658 | ||||||
Boston Properties LP, 6.50%, 01/15/34(a) | 400 | 365,251 | ||||||
Camden Property Trust, 3.35%, 11/01/49 | 300 | 186,675 | ||||||
Corporate Office Properties LP, 2.90%, 12/01/33(a) | 413 | 280,553 | ||||||
Crown Castle, Inc. | ||||||||
2.90%, 04/01/41(a) | 1,159 | 698,834 | ||||||
4.75%, 05/15/47 | 350 | 258,958 | ||||||
5.20%, 02/15/49 | 400 | 315,092 | ||||||
4.00%, 11/15/49 | 200 | 129,624 | ||||||
3.25%, 01/15/51(a) | 900 | 509,050 | ||||||
Equinix, Inc. | ||||||||
3.00%, 07/15/50(a) | 514 | 279,838 | ||||||
2.95%, 09/15/51 | 200 | 107,206 | ||||||
3.40%, 02/15/52 | 660 | 391,460 | ||||||
ERP Operating LP | ||||||||
4.50%, 07/01/44 | 697 | 524,717 | ||||||
4.50%, 06/01/45(a) | 413 | 300,132 | ||||||
Essex Portfolio LP | ||||||||
4.50%, 03/15/48 | 300 | 216,540 | ||||||
2.65%, 09/01/50 | 329 | 161,168 | ||||||
Federal Realty OP LP, 4.50%, 12/01/44 | 500 | 351,926 | ||||||
Healthpeak OP LLC, 6.75%, 02/01/41(a) | 250 | 238,414 | ||||||
Invitation Homes Operating Partnership LP, | 413 | 292,624 | ||||||
Kilroy Realty LP, 2.65%, 11/15/33(a) | 329 | 214,990 | ||||||
Kimco Realty OP LLC | ||||||||
4.25%, 04/01/45(a) | 500 | 347,474 | ||||||
4.13%, 12/01/46 | 250 | 164,873 | ||||||
4.45%, 09/01/47 | 288 | 202,202 | ||||||
3.70%, 10/01/49(a) | 413 | 255,571 | ||||||
Mid-America Apartments LP, 2.88%, 09/15/51 | 259 | 141,010 | ||||||
Prologis LP | ||||||||
5.13%, 01/15/34 | 425 | 389,190 | ||||||
4.38%, 09/15/48 | 496 | 361,540 | ||||||
3.05%, 03/01/50 | 200 | 114,973 | ||||||
3.00%, 04/15/50(a) | 700 | 403,167 | ||||||
2.13%, 10/15/50 | 400 | 187,348 | ||||||
5.25%, 06/15/53 | 1,010 | 849,341 | ||||||
Regency Centers LP, 4.40%, 02/01/47 | 413 | 288,845 | ||||||
Simon Property Group LP | ||||||||
6.75%, 02/01/40 | 600 | 589,319 | ||||||
4.75%, 03/15/42 | 476 | 366,548 | ||||||
4.25%, 10/01/44 | 163 | 114,247 | ||||||
4.25%, 11/30/46 | 413 | 286,422 | ||||||
| Security | Par (000) | Value | ||||||
| Diversified REITs (continued) | ||||||||
Simon Property Group LP (continued) | ||||||||
3.25%, 09/13/49(a) | $ | 1,341 | $ | 776,670 | ||||
3.80%, 07/15/50(a) | 829 | 526,921 | ||||||
5.85%, 03/08/53 | 600 | 521,977 | ||||||
Ventas Realty LP | ||||||||
5.70%, 09/30/43 | 550 | 452,333 | ||||||
4.88%, 04/15/49 | 300 | 217,981 | ||||||
Welltower OP LLC | ||||||||
6.50%, 03/15/41(a) | 350 | 331,819 | ||||||
4.95%, 09/01/48 | 450 | 349,192 | ||||||
Weyerhaeuser Co., 4.00%, 03/09/52 | 350 | 238,763 | ||||||
|
| |||||||
| 19,965,369 | ||||||||
| Diversified Telecommunication Services — 3.6% | ||||||||
AT&T, Inc. | ||||||||
2.55%, 12/01/33 | 3,580 | 2,569,368 | ||||||
5.40%, 02/15/34(a) | 2,445 | 2,246,537 | ||||||
4.50%, 05/15/35 | 2,320 | 1,934,723 | ||||||
5.25%, 03/01/37 | 850 | 742,980 | ||||||
4.90%, 08/15/37 | 575 | 483,422 | ||||||
6.30%, 01/15/38 | 700 | 673,455 | ||||||
6.55%, 02/15/39 | 300 | 290,907 | ||||||
4.85%, 03/01/39 | 1,100 | 897,380 | ||||||
5.35%, 09/01/40 | 1,000 | 849,874 | ||||||
3.50%, 06/01/41(a) | 2,300 | 1,537,641 | ||||||
5.55%, 08/15/41(a) | 500 | 431,567 | ||||||
4.30%, 12/15/42 | 1,350 | 999,625 | ||||||
3.10%, 02/01/43(a) | 1,300 | 824,603 | ||||||
4.65%, 06/01/44 | 405 | 306,072 | ||||||
4.35%, 06/15/45 | 1,250 | 896,522 | ||||||
4.75%, 05/15/46 | 2,000 | 1,511,616 | ||||||
5.15%, 11/15/46 | 680 | 542,948 | ||||||
5.65%, 02/15/47(a) | 900 | 794,608 | ||||||
5.45%, 03/01/47(a) | 300 | 252,448 | ||||||
4.50%, 03/09/48 | 1,850 | 1,339,553 | ||||||
4.55%, 03/09/49 | 850 | 613,546 | ||||||
5.15%, 02/15/50 | 500 | 393,979 | ||||||
3.65%, 06/01/51 | 3,100 | 1,907,971 | ||||||
3.30%, 02/01/52(a) | 800 | 466,340 | ||||||
3.50%, 09/15/53 | 6,889 | 4,056,583 | ||||||
3.55%, 09/15/55 | 6,833 | 3,972,008 | ||||||
5.70%, 03/01/57(a) | 250 | 210,956 | ||||||
3.80%, 12/01/57 | 5,499 | 3,311,511 | ||||||
3.65%, 09/15/59 | 5,911 | 3,419,884 | ||||||
3.85%, 06/01/60(a) | 1,400 | 843,324 | ||||||
3.50%, 02/01/61 | 750 | 426,059 | ||||||
Telefonica Emisiones SA | ||||||||
7.05%, 06/20/36 | 1,840 | 1,837,024 | ||||||
4.67%, 03/06/38 | 655 | 509,282 | ||||||
5.21%, 03/08/47 | 2,267 | 1,724,638 | ||||||
4.90%, 03/06/48 | 1,182 | 851,639 | ||||||
5.52%, 03/01/49(a) | 1,000 | 788,935 | ||||||
Verizon Communications, Inc. | ||||||||
4.40%, 11/01/34 | 1,993 | 1,687,237 | ||||||
4.27%, 01/15/36(a) | 1,200 | 990,287 | ||||||
5.25%, 03/16/37 | 800 | 720,535 | ||||||
4.81%, 03/15/39 | 1,242 | 1,029,269 | ||||||
2.65%, 11/20/40 | 3,213 | 1,942,184 | ||||||
3.40%, 03/22/41(a) | 3,586 | 2,419,855 | ||||||
2.85%, 09/03/41 | 1,288 | 795,475 | ||||||
3.85%, 11/01/42 | 163 | 115,301 | ||||||
6.55%, 09/15/43 | 900 | 896,014 | ||||||
4.13%, 08/15/46 | 950 | 679,340 | ||||||
4.86%, 08/21/46(a) | 1,959 | 1,559,223 | ||||||
| 68 | 2 0 2 3 BLACK ROCK ANNUAL REPORT TO SHAREHOLDERS |
Schedule of Investments (continued) October 31, 2023 | iShares U.S. Long Credit Bond Index Fund (Percentages shown are based on Net Assets) |
| Security | Par (000) | Value | ||||||
| Diversified Telecommunication Services (continued) | ||||||||
Verizon Communications, Inc. (continued) | ||||||||
4.52%, 09/15/48 | $ | 1,250 | $ | 935,388 | ||||
4.00%, 03/22/50 | 779 | 529,684 | ||||||
2.88%, 11/20/50(a) | 2,823 | 1,542,984 | ||||||
3.55%, 03/22/51(a) | 4,699 | 2,952,515 | ||||||
3.88%, 03/01/52(a) | 1,322 | 881,815 | ||||||
5.01%, 08/21/54 | 800 | 633,391 | ||||||
4.67%, 03/15/55(a) | 750 | 559,662 | ||||||
2.99%, 10/30/56 | 3,939 | 2,072,471 | ||||||
3.00%, 11/20/60(a) | 2,025 | 1,036,625 | ||||||
3.70%, 03/22/61(a) | 3,212 | 1,958,942 | ||||||
|
| |||||||
| 71,397,725 | ||||||||
| Education — 0.9% | ||||||||
American University, Series 2019, | 111 | 77,547 | ||||||
Brown University, Series A, 2.92%, 09/01/50 | 610 | 369,847 | ||||||
California Institute of Technology | ||||||||
4.70%, 11/01/2111 | 250 | 183,995 | ||||||
3.65%, 09/01/2119 | 1,829 | 1,057,766 | ||||||
Case Western Reserve University, Series 22-C, 5.41%, 06/01/2122 | 279 | 228,839 | ||||||
Duke University | ||||||||
Series 2020, 2.68%, 10/01/44 | 225 | 145,773 | ||||||
Series 2020, 2.83%, 10/01/55 | 1,330 | 757,084 | ||||||
Emory University, Series 2020, 2.97%, 09/01/50 | 288 | 172,284 | ||||||
Ford Foundation, Series 2020, | 2,520 | 1,282,691 | ||||||
George Washington University | ||||||||
4.87%, 09/15/45 | 26 | 21,873 | ||||||
Series 2014, 4.30%, 09/15/44 | 163 | 125,067 | ||||||
Series 2018, 4.13%, 09/15/48 | 606 | 457,145 | ||||||
Georgetown University, Series 20A, | 27 | 15,798 | ||||||
Howard University, Series 22A, 5.21%, 10/01/52 | 64 | 49,826 | ||||||
Leland Stanford Junior University | ||||||||
3.65%, 05/01/48 | 620 | 448,024 | ||||||
2.41%, 06/01/50(a) | 225 | 122,762 | ||||||
Massachusetts Institute of Technology | ||||||||
3.96%, 07/01/38 | 1,967 | 1,635,356 | ||||||
5.60%, 07/01/2111 | 413 | 382,418 | ||||||
4.68%, 07/01/2114 | 225 | 173,983 | ||||||
3.89%, 07/01/2116(a) | 1,000 | 643,249 | ||||||
Series F, 2.99%, 07/01/50 | 216 | 134,896 | ||||||
Series G, 2.29%, 07/01/51(a) | 101 | 53,202 | ||||||
Northwestern University | ||||||||
3.87%, 12/01/48 | 26 | 19,260 | ||||||
Series 2017, 3.66%, 12/01/57 | 1,000 | 674,353 | ||||||
President and Fellows of Harvard College | ||||||||
3.15%, 07/15/46 | 2,113 | 1,399,367 | ||||||
2.52%, 10/15/50 | 133 | 74,653 | ||||||
3.30%, 07/15/56 | 579 | 370,107 | ||||||
Rockefeller Foundation, Series 2020, | 329 | 180,078 | ||||||
Thomas Jefferson University, 3.85%, 11/01/57 | 66 | 41,450 | ||||||
Trustees of Boston College, 3.13%, 07/01/52 | 413 | 257,027 | ||||||
Trustees of Princeton University(a) | ||||||||
5.70%, 03/01/39 | 413 | 407,718 | ||||||
4.20%, 03/01/52 | 1,000 | 791,028 | ||||||
Series 2020, 2.52%, 07/01/50 | 346 | 197,998 | ||||||
Trustees of the University of Pennsylvania | ||||||||
3.61%, 02/15/2119 | 103 | 61,002 | ||||||
Series 2020, 2.40%, 10/01/50 | 674 | 360,456 | ||||||
University of Chicago | ||||||||
3.00%, 10/01/52 | 2,000 | 1,237,028 | ||||||
| Security | Par (000) | Value | ||||||
| Education (continued) | ||||||||
University of Chicago (continued) | ||||||||
Series C, 2.55%, 04/01/50 | $ | 64 | $ | 37,065 | ||||
University of Miami, Series 2022, | 500 | 360,551 | ||||||
University of Notre Dame du Lac, Series 2017, 3.39%, 02/15/48 | 28 | 19,117 | ||||||
University of Southern California | ||||||||
3.03%, 10/01/39 | 130 | 93,971 | ||||||
2.81%, 10/01/50 | 63 | 36,438 | ||||||
Series 2017, 3.84%, 10/01/47 | 1,000 | 739,232 | ||||||
Series 21A, 2.95%, 10/01/51 | 883 | 526,891 | ||||||
Series A, 3.23%, 10/01/2120 | 61 | 31,436 | ||||||
Washington University | ||||||||
4.35%, 04/15/2122 | 29 | 20,423 | ||||||
Series 2022, 3.52%, 04/15/54(a) | 1,350 | 915,848 | ||||||
William Marsh Rice University, 3.77%, 05/15/55 | 215 | 153,235 | ||||||
Yale University, Series 2020, 2.40%, 04/15/50 | 113 | 61,482 | ||||||
|
| |||||||
| 17,606,639 | ||||||||
| Electric Utilities — 10.1% | ||||||||
AEP Texas, Inc. | ||||||||
3.45%, 05/15/51 | 829 | 495,915 | ||||||
5.25%, 05/15/52 | 880 | 712,108 | ||||||
Series H, 3.45%, 01/15/50 | 163 | 98,797 | ||||||
AEP Transmission Co. LLC | ||||||||
3.75%, 12/01/47 | 600 | 406,566 | ||||||
3.80%, 06/15/49 | 829 | 562,185 | ||||||
3.15%, 09/15/49 | 64 | 38,208 | ||||||
5.40%, 03/15/53 | 500 | 436,739 | ||||||
Series M, 3.65%, 04/01/50 | 413 | 271,890 | ||||||
Series N, 2.75%, 08/15/51 | 329 | 176,754 | ||||||
Series O, 4.50%, 06/15/52 | 2,000 | 1,518,686 | ||||||
Alabama Power Co. | ||||||||
6.13%, 05/15/38 | 829 | 807,175 | ||||||
6.00%, 03/01/39 | 450 | 427,234 | ||||||
3.85%, 12/01/42 | 500 | 358,808 | ||||||
3.75%, 03/01/45 | 618 | 425,934 | ||||||
4.30%, 01/02/46 | 163 | 119,980 | ||||||
3.45%, 10/01/49 | 120 | 75,477 | ||||||
3.13%, 07/15/51 | 496 | 287,409 | ||||||
3.00%, 03/15/52 | 550 | 310,181 | ||||||
Series B, 3.70%, 12/01/47 | 277 | 184,778 | ||||||
Ameren Illinois Co. | ||||||||
4.15%, 03/15/46 | 413 | 301,787 | ||||||
3.70%, 12/01/47 | 500 | 342,000 | ||||||
4.50%, 03/15/49 | 250 | 195,482 | ||||||
3.25%, 03/15/50 | 197 | 121,597 | ||||||
5.90%, 12/01/52 | 400 | 379,676 | ||||||
American Electric Power Co., Inc., | 829 | 485,725 | ||||||
Appalachian Power Co. | ||||||||
7.00%, 04/01/38 | 400 | 411,161 | ||||||
4.40%, 05/15/44 | 163 | 117,904 | ||||||
4.45%, 06/01/45 | 250 | 183,864 | ||||||
Series Z, 3.70%, 05/01/50 | 650 | 410,034 | ||||||
Arizona Public Service Co. | ||||||||
5.05%, 09/01/41(a) | 163 | 131,916 | ||||||
4.50%, 04/01/42 | 829 | 627,192 | ||||||
3.75%, 05/15/46 | 750 | 483,881 | ||||||
4.20%, 08/15/48 | 163 | 111,511 | ||||||
3.50%, 12/01/49 | 911 | 547,188 | ||||||
3.35%, 05/15/50(a) | 500 | 293,885 | ||||||
2.65%, 09/15/50 | 300 | 153,411 | ||||||
SCHEDULE OF INVESTMENTS | 69 |
Schedule of Investments (continued) October 31, 2023 | iShares U.S. Long Credit Bond Index Fund (Percentages shown are based on Net Assets) |
| Security | Par (000) | Value | ||||||
| Electric Utilities (continued) | ||||||||
Avista Corp. | ||||||||
4.35%, 06/01/48 | $ | 496 | $ | 358,133 | ||||
4.00%, 04/01/52(a) | 300 | 198,681 | ||||||
Baltimore Gas and Electric Co. | ||||||||
6.35%, 10/01/36 | 413 | 412,879 | ||||||
3.50%, 08/15/46 | 579 | 374,005 | ||||||
3.75%, 08/15/47 | 800 | 543,843 | ||||||
3.20%, 09/15/49 | 145 | 88,283 | ||||||
2.90%, 06/15/50 | 371 | 208,388 | ||||||
4.55%, 06/01/52 | 630 | 478,975 | ||||||
5.40%, 06/01/53 | 710 | 615,820 | ||||||
Berkshire Hathaway Energy Co. | ||||||||
6.13%, 04/01/36 | 1,563 | 1,520,760 | ||||||
5.95%, 05/15/37 | 829 | 791,737 | ||||||
5.15%, 11/15/43 | 563 | 474,078 | ||||||
4.50%, 02/01/45 | 679 | 522,096 | ||||||
3.80%, 07/15/48 | 763 | 502,712 | ||||||
4.45%, 01/15/49 | 963 | 705,400 | ||||||
4.25%, 10/15/50 | 829 | 580,298 | ||||||
2.85%, 05/15/51 | 1,429 | 787,126 | ||||||
4.60%, 05/01/53 | 1,029 | 762,383 | ||||||
Black Hills Corp. | ||||||||
4.20%, 09/15/46(a) | 250 | 170,818 | ||||||
3.88%, 10/15/49 | 288 | 182,863 | ||||||
CenterPoint Energy Houston Electric LLC | ||||||||
3.55%, 08/01/42 | 26 | 18,041 | ||||||
4.50%, 04/01/44 | 800 | 624,927 | ||||||
3.95%, 03/01/48 | 163 | 116,234 | ||||||
5.30%, 04/01/53 | 60 | 52,929 | ||||||
Sereis AJ, 4.85%, 10/01/52 | 500 | 408,889 | ||||||
Series AC, 4.25%, 02/01/49 | 950 | 710,893 | ||||||
Series AD, 2.90%, 07/01/50 | 250 | 142,755 | ||||||
Series AF, 3.35%, 04/01/51 | 613 | 383,605 | ||||||
Series AH, 3.60%, 03/01/52 | 800 | 525,315 | ||||||
CenterPoint Energy, Inc., 3.70%, 09/01/49 | 163 | 103,159 | ||||||
Cleco Corporate Holdings LLC, 4.97%, 05/01/46 | 300 | 217,229 | ||||||
Cleveland Electric Illuminating Co., | 280 | 257,662 | ||||||
Commonwealth Edison Co. | ||||||||
5.90%, 03/15/36 | 800 | 776,214 | ||||||
6.45%, 01/15/38 | 350 | 349,425 | ||||||
3.80%, 10/01/42 | 320 | 229,780 | ||||||
4.60%, 08/15/43 | 300 | 239,788 | ||||||
3.70%, 03/01/45 | 163 | 112,099 | ||||||
4.35%, 11/15/45 | 800 | 603,630 | ||||||
3.65%, 06/15/46 | 620 | 415,379 | ||||||
4.00%, 03/01/48 | 829 | 592,369 | ||||||
4.00%, 03/01/49 | 829 | 589,173 | ||||||
3.00%, 03/01/50 | 413 | 238,505 | ||||||
5.30%, 02/01/53 | 440 | 379,687 | ||||||
Series 123, 3.75%, 08/15/47 | 900 | 614,341 | ||||||
Series 127, 3.20%, 11/15/49 | 505 | 301,847 | ||||||
Series 130, 3.13%, 03/15/51 | 329 | 193,429 | ||||||
Series 131, 2.75%, 09/01/51 | 413 | 223,203 | ||||||
Series 133, 3.85%, 03/15/52 | 659 | 447,368 | ||||||
Connecticut Light and Power Co. | ||||||||
4.30%, 04/15/44 | 450 | 340,700 | ||||||
4.00%, 04/01/48 | 1,200 | 856,787 | ||||||
5.25%, 01/15/53(a) | 500 | 430,067 | ||||||
Series A, 4.15%, 06/01/45 | 600 | 447,703 | ||||||
Consolidated Edison Co. of New York, Inc. | ||||||||
5.70%, 06/15/40 | 400 | 358,907 | ||||||
3.95%, 03/01/43 | 547 | 392,319 | ||||||
4.45%, 03/15/44 | 663 | 504,864 | ||||||
| Security | Par (000) | Value | ||||||
| Electric Utilities (continued) | ||||||||
Consolidated Edison Co. of New York, | ||||||||
4.50%, 12/01/45 | $ | 563 | $ | 426,102 | ||||
3.85%, 06/15/46 | 829 | 562,106 | ||||||
3.20%, 12/01/51 | 450 | 263,022 | ||||||
6.15%, 11/15/52 | 700 | 665,720 | ||||||
4.63%, 12/01/54 | 600 | 445,689 | ||||||
4.50%, 05/15/58 | 829 | 593,239 | ||||||
3.70%, 11/15/59 | 480 | 292,282 | ||||||
3.60%, 06/15/61 | 620 | 377,744 | ||||||
Series 06-A, 5.85%, 03/15/36 | 1,000 | 952,081 | ||||||
Series 07-A, 6.30%, 08/15/37 | 393 | 383,971 | ||||||
Series 09-C, 5.50%, 12/01/39 | 867 | 766,771 | ||||||
Series 12-A, 4.20%, 03/15/42 | 329 | 245,335 | ||||||
Series 2017, 3.88%, 06/15/47 | 400 | 272,215 | ||||||
Series 20B, 3.95%, 04/01/50(a) | 829 | 578,488 | ||||||
Series A, 4.13%, 05/15/49 | 913 | 645,766 | ||||||
Series C, 4.30%, 12/01/56 | 413 | 287,036 | ||||||
Series C, 4.00%, 11/15/57 | 620 | 415,603 | ||||||
Series C, 3.00%, 12/01/60 | 660 | 348,015 | ||||||
Series E, 4.65%, 12/01/48 | 413 | 317,737 | ||||||
Constellation Energy Generation LLC | ||||||||
6.25%, 10/01/39 | 847 | 785,119 | ||||||
5.75%, 10/01/41(a) | 413 | 359,476 | ||||||
5.60%, 06/15/42 | 869 | 746,817 | ||||||
6.50%, 10/01/53 | 840 | 788,964 | ||||||
Consumers Energy Co. | ||||||||
3.25%, 08/15/46 | 1,000 | 634,405 | ||||||
4.05%, 05/15/48 | 450 | 327,895 | ||||||
4.35%, 04/15/49 | 829 | 629,468 | ||||||
3.10%, 08/15/50 | 440 | 268,486 | ||||||
3.50%, 08/01/51 | 829 | 543,662 | ||||||
2.65%, 08/15/52(a) | 34 | 18,442 | ||||||
4.20%, 09/01/52 | 510 | 374,386 | ||||||
2.50%, 05/01/60 | 874 | 423,308 | ||||||
Dayton Power & Light Co., | 350 | 232,332 | ||||||
Dominion Energy South Carolina, Inc. | ||||||||
5.45%, 02/01/41 | 829 | 738,495 | ||||||
4.60%, 06/15/43 | 163 | 128,884 | ||||||
5.10%, 06/01/65 | 413 | 333,053 | ||||||
Dominion Energy, Inc. | ||||||||
7.00%, 06/15/38 | 163 | 163,215 | ||||||
4.70%, 12/01/44(a) | 829 | 626,582 | ||||||
Series A, 4.60%, 03/15/49 | 413 | 303,888 | ||||||
Series B, 5.95%, 06/15/35 | 290 | 271,751 | ||||||
Series B, 4.85%, 08/15/52 | 400 | 303,996 | ||||||
Series C, 3.30%, 04/15/41 | 225 | 147,042 | ||||||
Series C, 4.90%, 08/01/41 | 409 | 326,654 | ||||||
DTE Electric Co. | ||||||||
4.30%, 07/01/44 | 300 | 228,477 | ||||||
3.70%, 03/15/45 | 534 | 369,007 | ||||||
3.70%, 06/01/46 | 163 | 111,257 | ||||||
3.75%, 08/15/47 | 630 | 431,479 | ||||||
3.95%, 03/01/49 | 750 | 526,440 | ||||||
2.95%, 03/01/50 | 829 | 478,753 | ||||||
5.40%, 04/01/53 | 400 | 351,219 | ||||||
Series A, 4.00%, 04/01/43 | 97 | 71,022 | ||||||
Series A, 4.05%, 05/15/48 | 463 | 331,966 | ||||||
Series B, 3.25%, 04/01/51 | 579 | 350,120 | ||||||
Series B, 3.65%, 03/01/52 | 117 | 76,421 | ||||||
Duke Energy Carolinas LLC | ||||||||
6.10%, 06/01/37 | 413 | 401,116 | ||||||
6.00%, 01/15/38 | 900 | 874,293 | ||||||
| 70 | 2 0 2 3 BLACK ROCK ANNUAL REPORT TO SHAREHOLDERS |
Schedule of Investments (continued) October 31, 2023 | iShares U.S. Long Credit Bond Index Fund (Percentages shown are based on Net Assets) |
| Security | Par (000) | Value | ||||||
| Electric Utilities (continued) | ||||||||
Duke Energy Carolinas LLC (continued) |
| |||||||
6.05%, 04/15/38 | $ | 511 | $ | 492,513 | ||||
5.30%, 02/15/40 | 963 | 851,938 | ||||||
4.25%, 12/15/41 | 829 | 631,943 | ||||||
4.00%, 09/30/42 | 1,113 | 814,061 | ||||||
3.88%, 03/15/46 | 800 | 549,709 | ||||||
3.70%, 12/01/47 | 413 | 277,555 | ||||||
3.95%, 03/15/48 | 329 | 228,862 | ||||||
3.20%, 08/15/49 | 769 | 460,605 | ||||||
3.45%, 04/15/51 | 225 | 140,262 | ||||||
3.55%, 03/15/52 | 892 | 566,091 | ||||||
5.35%, 01/15/53 | 750 | 642,945 | ||||||
5.40%, 01/15/54 | 382 | 329,621 | ||||||
Duke Energy Corp. | ||||||||
3.30%, 06/15/41 | 279 | 182,440 | ||||||
4.80%, 12/15/45 | 463 | 359,132 | ||||||
3.75%, 09/01/46 | 1,243 | 809,883 | ||||||
3.95%, 08/15/47 | 413 | 275,582 | ||||||
4.20%, 06/15/49 | 413 | 284,013 | ||||||
3.50%, 06/15/51 | 829 | 502,663 | ||||||
5.00%, 08/15/52(a) | 800 | 621,103 | ||||||
6.10%, 09/15/53 | 675 | 614,907 | ||||||
Duke Energy Florida LLC | ||||||||
6.35%, 09/15/37 | 450 | 445,344 | ||||||
6.40%, 06/15/38 | 1,100 | 1,092,007 | ||||||
5.65%, 04/01/40 | 300 | 273,633 | ||||||
3.40%, 10/01/46 | 863 | 544,472 | ||||||
3.00%, 12/15/51 | 300 | 169,832 | ||||||
5.95%, 11/15/52 | 525 | 485,841 | ||||||
Duke Energy Indiana LLC | ||||||||
6.12%, 10/15/35 | 500 | 484,266 | ||||||
6.35%, 08/15/38 | 450 | 444,917 | ||||||
6.45%, 04/01/39 | 200 | 199,601 | ||||||
3.75%, 05/15/46 | 413 | 277,458 | ||||||
2.75%, 04/01/50 | 500 | 268,636 | ||||||
5.40%, 04/01/53 | 450 | 385,878 | ||||||
Series WWW, 4.90%, 07/15/43 | 163 | 133,874 | ||||||
Series YYY, 3.25%, 10/01/49 | 800 | 478,328 | ||||||
Duke Energy Ohio, Inc. | ||||||||
3.70%, 06/15/46 | 163 | 106,587 | ||||||
5.65%, 04/01/53 | 125 | 110,839 | ||||||
Duke Energy Progress LLC | ||||||||
6.30%, 04/01/38 | 300 | 294,263 | ||||||
4.10%, 05/15/42 | 797 | 593,678 | ||||||
4.10%, 03/15/43 | 863 | 630,464 | ||||||
4.38%, 03/30/44 | 326 | 247,168 | ||||||
4.15%, 12/01/44 | 413 | 301,712 | ||||||
4.20%, 08/15/45 | 963 | 700,374 | ||||||
3.70%, 10/15/46 | 413 | 272,961 | ||||||
3.60%, 09/15/47 | 829 | 540,204 | ||||||
2.50%, 08/15/50 | 413 | 211,875 | ||||||
2.90%, 08/15/51 | 1,026 | 570,743 | ||||||
4.00%, 04/01/52 | 100 | 68,504 | ||||||
5.35%, 03/15/53 | 300 | 255,418 | ||||||
El Paso Electric Co., 6.00%, 05/15/35 | 413 | 383,992 | ||||||
Emera U.S. Finance LP, 4.75%, 06/15/46 | 988 | 690,533 | ||||||
Entergy Arkansas LLC | ||||||||
4.20%, 04/01/49 | 450 | 321,159 | ||||||
2.65%, 06/15/51 | 975 | 508,559 | ||||||
3.35%, 06/15/52 | 413 | 248,114 | ||||||
Entergy Corp., 3.75%, 06/15/50(a) | 464 | 292,394 | ||||||
| Security | Par (000) | Value | ||||||
| Electric Utilities (continued) | ||||||||
Entergy Louisiana LLC |
| |||||||
3.10%, 06/15/41 | $ | 400 | $ | 259,538 | ||||
4.95%, 01/15/45 | 350 | 277,816 | ||||||
4.20%, 09/01/48 | 913 | 650,869 | ||||||
4.20%, 04/01/50 | 829 | 589,958 | ||||||
2.90%, 03/15/51 | 493 | 271,819 | ||||||
4.75%, 09/15/52 | 500 | 383,299 | ||||||
Entergy Mississippi LLC | ||||||||
3.85%, 06/01/49 | 413 | 277,235 | ||||||
3.50%, 06/01/51 | 350 | 215,127 | ||||||
Entergy Texas, Inc. | ||||||||
4.50%, 03/30/39 | 400 | 319,897 | ||||||
3.55%, 09/30/49 | 130 | 82,179 | ||||||
5.00%, 09/15/52 | 200 | 158,901 | ||||||
5.80%, 09/01/53(a) | 325 | 290,626 | ||||||
Evergy Kansas Central, Inc. | ||||||||
4.13%, 03/01/42 | 400 | 293,992 | ||||||
4.10%, 04/01/43 | 350 | 253,178 | ||||||
4.25%, 12/01/45 | 829 | 602,370 | ||||||
3.25%, 09/01/49 | 413 | 246,519 | ||||||
3.45%, 04/15/50 | 413 | 256,393 | ||||||
5.70%, 03/15/53 | 345 | 303,366 | ||||||
Evergy Metro, Inc. | ||||||||
5.30%, 10/01/41 | 340 | 297,024 | ||||||
Series 2019, 4.13%, 04/01/49 | 550 | 380,500 | ||||||
Eversource Energy, 3.45%, 01/15/50 | 629 | 382,939 | ||||||
Exelon Corp. | ||||||||
4.95%, 06/15/35 | 700 | 606,538 | ||||||
5.63%, 06/15/35 | 300 | 278,779 | ||||||
5.10%, 06/15/45 | 763 | 619,568 | ||||||
4.45%, 04/15/46 | 600 | 440,357 | ||||||
4.70%, 04/15/50 | 713 | 537,596 | ||||||
5.60%, 03/15/53 | 670 | 574,781 | ||||||
Series WI, 4.10%, 03/15/52(a) | 959 | 652,074 | ||||||
Florida Power & Light Co. | ||||||||
5.63%, 04/01/34 | 450 | 437,844 | ||||||
4.95%, 06/01/35 | 1,055 | 953,779 | ||||||
5.95%, 02/01/38 | 800 | 776,598 | ||||||
5.96%, 04/01/39 | 250 | 242,573 | ||||||
5.69%, 03/01/40 | 413 | 392,561 | ||||||
5.25%, 02/01/41 | 413 | 370,151 | ||||||
4.13%, 02/01/42 | 413 | 320,321 | ||||||
4.05%, 06/01/42 | 700 | 532,006 | ||||||
3.80%, 12/15/42 | 400 | 293,781 | ||||||
4.05%, 10/01/44 | 620 | 461,970 | ||||||
3.70%, 12/01/47 | 829 | 567,362 | ||||||
3.95%, 03/01/48 | 1,013 | 722,942 | ||||||
4.13%, 06/01/48 | 413 | 302,626 | ||||||
3.99%, 03/01/49 | 413 | 295,742 | ||||||
3.15%, 10/01/49 | 733 | 446,413 | ||||||
2.88%, 12/04/51 | 1,200 | 680,456 | ||||||
5.30%, 04/01/53 | 445 | 387,932 | ||||||
Georgia Power Co. | ||||||||
4.30%, 03/15/42 | 829 | 634,301 | ||||||
4.30%, 03/15/43 | 340 | 255,629 | ||||||
5.13%, 05/15/52 | 930 | 770,233 | ||||||
Series A, 3.25%, 03/15/51 | 600 | 357,773 | ||||||
Series B, 3.70%, 01/30/50 | 829 | 544,781 | ||||||
Iberdrola International BV, 6.75%, 07/15/36 | 400 | 411,010 | ||||||
Idaho Power Co. | ||||||||
5.50%, 03/15/53 | 220 | 192,314 | ||||||
5.80%, 04/01/54 | 521 | 471,492 | ||||||
SCHEDULE OF INVESTMENTS | 71 |
Schedule of Investments (continued) October 31, 2023 | iShares U.S. Long Credit Bond Index Fund (Percentages shown are based on Net Assets) |
| Security | Par (000) | Value | ||||||
| Electric Utilities (continued) | ||||||||
Idaho Power Co. (continued) | ||||||||
Series K, 4.20%, 03/01/48 | $ | 400 | $ | 291,298 | ||||
Indiana Michigan Power Co. | ||||||||
6.05%, 03/15/37 | 513 | 493,274 | ||||||
4.25%, 08/15/48 | 163 | 116,579 | ||||||
5.63%, 04/01/53 | 305 | 270,011 | ||||||
Series K, 4.55%, 03/15/46 | 96 | 74,002 | ||||||
Series L, 3.75%, 07/01/47 | 829 | 543,732 | ||||||
Interstate Power and Light Co. | ||||||||
6.25%, 07/15/39 | 260 | 244,792 | ||||||
3.70%, 09/15/46 | 413 | 264,685 | ||||||
3.50%, 09/30/49 | 477 | 296,520 | ||||||
3.10%, 11/30/51 | 355 | 197,226 | ||||||
ITC Holdings Corp., 5.30%, 07/01/43 | 200 | 167,422 | ||||||
John Sevier Combined Cycle Generation LLC, 4.63%, 01/15/42(a) | 650 | 566,802 | ||||||
Kentucky Utilities Co. | ||||||||
5.13%, 11/01/40 | 850 | 718,079 | ||||||
4.38%, 10/01/45 | 829 | 614,522 | ||||||
3.30%, 06/01/50 | 225 | 136,812 | ||||||
Louisville Gas and Electric Co., | 829 | 597,403 | ||||||
MidAmerican Energy Co. | ||||||||
5.80%, 10/15/36 | 300 | 290,671 | ||||||
4.80%, 09/15/43 | 163 | 133,521 | ||||||
4.40%, 10/15/44 | 829 | 640,218 | ||||||
4.25%, 05/01/46 | 300 | 223,601 | ||||||
3.95%, 08/01/47 | 400 | 284,511 | ||||||
3.65%, 08/01/48 | 413 | 279,192 | ||||||
4.25%, 07/15/49 | 1,243 | 917,979 | ||||||
3.15%, 04/15/50 | 513 | 307,185 | ||||||
2.70%, 08/01/52 | 225 | 120,438 | ||||||
5.85%, 09/15/54 | 800 | 749,121 | ||||||
Mississippi Power Co. | ||||||||
Series 12-A, 4.25%, 03/15/42 | 413 | 303,361 | ||||||
Series B, 3.10%, 07/30/51 | 413 | 228,773 | ||||||
National Grid USA, 5.80%, 04/01/35 | 300 | 276,666 | ||||||
National Rural Utilities Cooperative Finance Corp. | ||||||||
4.40%, 11/01/48 | 270 | 200,853 | ||||||
4.30%, 03/15/49 | 413 | 302,121 | ||||||
Nevada Power Co. | ||||||||
6.00%, 03/15/54 | 450 | 413,636 | ||||||
Series EE, 3.13%, 08/01/50 | 329 | 188,096 | ||||||
Series GG, 5.90%, 05/01/53 | 100 | 91,002 | ||||||
Series N, 6.65%, 04/01/36 | 600 | 603,259 | ||||||
NextEra Energy Capital Holdings, Inc. | ||||||||
3.00%, 01/15/52(a) | 454 | 248,904 | ||||||
5.25%, 02/28/53 | 950 | 771,117 | ||||||
Northern States Power Co. | ||||||||
6.20%, 07/01/37 | 400 | 396,017 | ||||||
5.35%, 11/01/39 | 350 | 316,452 | ||||||
3.40%, 08/15/42 | 130 | 88,754 | ||||||
4.13%, 05/15/44 | 250 | 185,315 | ||||||
4.00%, 08/15/45 | 250 | 178,991 | ||||||
3.60%, 05/15/46 | 500 | 333,597 | ||||||
3.60%, 09/15/47 | 953 | 640,058 | ||||||
2.90%, 03/01/50 | 366 | 210,496 | ||||||
2.60%, 06/01/51 | 700 | 371,505 | ||||||
3.20%, 04/01/52 | 145 | 86,463 | ||||||
4.50%, 06/01/52 | 626 | 480,015 | ||||||
5.10%, 05/15/53 | 600 | 507,996 | ||||||
NorthWestern Corp., 4.18%, 11/15/44 | 350 | 251,296 | ||||||
NSTAR Electric Co. | ||||||||
3.10%, 06/01/51 | 250 | 145,999 | ||||||
| Security | Par (000) | Value | ||||||
| Electric Utilities (continued) | ||||||||
NSTAR Electric Co. (continued) | ||||||||
4.55%, 06/01/52 | $ | 381 | $ | 290,938 | ||||
4.95%, 09/15/52 | 300 | 244,045 | ||||||
Oglethorpe Power Corp. | ||||||||
5.95%, 11/01/39 | 350 | 318,414 | ||||||
5.38%, 11/01/40 | 300 | 247,029 | ||||||
4.50%, 04/01/47 | 479 | 343,768 | ||||||
5.05%, 10/01/48 | 829 | 642,590 | ||||||
3.75%, 08/01/50(a) | 163 | 102,864 | ||||||
Ohio Edison Co., 6.88%, 07/15/36 | 300 | 306,540 | ||||||
Ohio Power Co. | ||||||||
4.15%, 04/01/48 | 829 | 587,965 | ||||||
Series R, 2.90%, 10/01/51(a) | 609 | 340,118 | ||||||
Oklahoma Gas and Electric Co. | ||||||||
4.15%, 04/01/47 | 500 | 354,575 | ||||||
3.85%, 08/15/47 | 150 | 100,842 | ||||||
5.60%, 04/01/53 | 320 | 281,477 | ||||||
Oncor Electric Delivery Co. LLC | ||||||||
5.25%, 09/30/40 | 163 | 146,081 | ||||||
4.55%, 12/01/41 | 350 | 282,229 | ||||||
5.30%, 06/01/42 | 295 | 267,308 | ||||||
3.75%, 04/01/45 | 163 | 114,751 | ||||||
3.80%, 09/30/47 | 279 | 191,397 | ||||||
4.10%, 11/15/48 | 413 | 296,994 | ||||||
3.80%, 06/01/49 | 829 | 563,561 | ||||||
3.10%, 09/15/49 | 809 | 480,069 | ||||||
3.70%, 05/15/50 | 370 | 246,205 | ||||||
2.70%, 11/15/51 | 626 | 332,877 | ||||||
4.60%, 06/01/52 | 500 | 386,333 | ||||||
4.95%, 09/15/52 | 500 | 410,585 | ||||||
4.95%, 09/15/52(d) | 300 | 246,351 | ||||||
5.35%, 10/01/52 | 300 | 261,867 | ||||||
Pacific Gas and Electric Co. | ||||||||
4.50%, 07/01/40 | 1,659 | 1,177,509 | ||||||
3.30%, 08/01/40 | 741 | 449,607 | ||||||
4.20%, 06/01/41 | 712 | 474,293 | ||||||
4.45%, 04/15/42 | 450 | 303,991 | ||||||
4.60%, 06/15/43 | 350 | 239,654 | ||||||
4.75%, 02/15/44 | 613 | 427,063 | ||||||
4.30%, 03/15/45 | 476 | 308,011 | ||||||
4.25%, 03/15/46 | 700 | 441,057 | ||||||
4.00%, 12/01/46 | 510 | 308,480 | ||||||
3.95%, 12/01/47 | 655 | 390,808 | ||||||
4.95%, 07/01/50 | 2,946 | 2,056,392 | ||||||
3.50%, 08/01/50 | 1,745 | 971,113 | ||||||
5.25%, 03/01/52 | 543 | 393,123 | ||||||
6.75%, 01/15/53 | 1,205 | 1,066,482 | ||||||
6.70%, 04/01/53 | 665 | 589,018 | ||||||
PacifiCorp. | ||||||||
5.25%, 06/15/35 | 163 | 144,588 | ||||||
5.75%, 04/01/37 | 500 | 458,531 | ||||||
6.25%, 10/15/37 | 700 | 664,433 | ||||||
6.35%, 07/15/38 | 243 | 235,455 | ||||||
6.00%, 01/15/39 | 500 | 458,417 | ||||||
4.10%, 02/01/42 | 163 | 115,237 | ||||||
4.13%, 01/15/49 | 829 | 554,887 | ||||||
4.15%, 02/15/50 | 663 | 444,510 | ||||||
3.30%, 03/15/51 | 1,000 | 570,763 | ||||||
2.90%, 06/15/52 | 926 | 482,678 | ||||||
5.35%, 12/01/53 | 950 | 755,630 | ||||||
5.50%, 05/15/54(a) | 1,135 | 924,419 | ||||||
PECO Energy Co. | ||||||||
5.95%, 10/01/36 | 260 | 252,881 | ||||||
| 72 | 2 0 2 3 BLACK ROCK ANNUAL REPORT TO SHAREHOLDERS |
Schedule of Investments (continued) October 31, 2023 | iShares U.S. Long Credit Bond Index Fund (Percentages shown are based on Net Assets) |
| Security | Par (000) | Value | ||||||
| Electric Utilities (continued) | ||||||||
PECO Energy Co. (continued) | ||||||||
3.90%, 03/01/48 | $ | 829 | $ | 588,867 | ||||
3.00%, 09/15/49 | 126 | 73,323 | ||||||
3.05%, 03/15/51 | 57 | 33,068 | ||||||
2.85%, 09/15/51 | 243 | 133,879 | ||||||
4.60%, 05/15/52 | 300 | 232,668 | ||||||
4.38%, 08/15/52 | 200 | 150,194 | ||||||
Potomac Electric Power Co. | ||||||||
6.50%, 11/15/37 | 450 | 456,728 | ||||||
4.15%, 03/15/43 | 563 | 426,182 | ||||||
PPL Electric Utilities Corp. | ||||||||
6.25%, 05/15/39 | 250 | 245,691 | ||||||
4.75%, 07/15/43 | 163 | 132,610 | ||||||
4.15%, 10/01/45 | 300 | 220,676 | ||||||
3.95%, 06/01/47 | 400 | 284,551 | ||||||
4.15%, 06/15/48 | 400 | 292,502 | ||||||
3.00%, 10/01/49 | 110 | 65,124 | ||||||
5.25%, 05/15/53 | 500 | 430,315 | ||||||
Progress Energy, Inc., 6.00%, 12/01/39 | 800 | 742,744 | ||||||
Public Service Co. of Colorado | ||||||||
3.60%, 09/15/42 | 163 | 110,997 | ||||||
3.80%, 06/15/47 | 829 | 557,530 | ||||||
4.05%, 09/15/49 | 829 | 569,315 | ||||||
5.25%, 04/01/53 | 1,000 | 836,187 | ||||||
Series 34, 3.20%, 03/01/50 | 650 | 383,272 | ||||||
Series 36, 2.70%, 01/15/51 | 660 | 346,626 | ||||||
Series 39, 4.50%, 06/01/52 | 500 | 368,679 | ||||||
Public Service Co. of New Hampshire | ||||||||
3.60%, 07/01/49 | 229 | 152,763 | ||||||
5.15%, 01/15/53 | 350 | 298,380 | ||||||
Public Service Co. of Oklahoma, Series K, 3.15%, 08/15/51(a) | 130 | 73,520 | ||||||
Public Service Electric and Gas Co. | ||||||||
5.80%, 05/01/37 | 288 | 274,078 | ||||||
3.95%, 05/01/42 | 385 | 287,938 | ||||||
3.80%, 01/01/43 | 260 | 188,532 | ||||||
3.80%, 03/01/46 | 1,036 | 730,167 | ||||||
3.60%, 12/01/47 | 250 | 169,179 | ||||||
4.05%, 05/01/48 | 350 | 256,850 | ||||||
3.85%, 05/01/49 | 413 | 288,145 | ||||||
3.20%, 08/01/49 | 300 | 184,994 | ||||||
3.15%, 01/01/50 | 329 | 200,852 | ||||||
2.70%, 05/01/50 | 300 | 167,090 | ||||||
2.05%, 08/01/50 | 300 | 143,452 | ||||||
3.00%, 03/01/51(a) | 829 | 488,487 | ||||||
Puget Sound Energy, Inc. | ||||||||
6.27%, 03/15/37 | 400 | 386,969 | ||||||
5.76%, 10/01/39 | 300 | 272,859 | ||||||
5.80%, 03/15/40 | 413 | 375,413 | ||||||
5.64%, 04/15/41 | 250 | 223,539 | ||||||
4.30%, 05/20/45 | 400 | 291,503 | ||||||
4.22%, 06/15/48 | 413 | 296,456 | ||||||
3.25%, 09/15/49 | 620 | 371,656 | ||||||
2.89%, 09/15/51 | 300 | 163,638 | ||||||
5.45%, 06/01/53 | 320 | 277,036 | ||||||
San Diego Gas & Electric Co. | ||||||||
6.00%, 06/01/39 | 400 | 382,335 | ||||||
4.15%, 05/15/48 | 829 | 598,547 | ||||||
3.70%, 03/15/52 | 400 | 260,325 | ||||||
5.35%, 04/01/53 | 870 | 744,173 | ||||||
Series RRR, 3.75%, 06/01/47 | 300 | 200,942 | ||||||
Series TTT, 4.10%, 06/15/49 | 700 | 484,558 | ||||||
Series UUU, 3.32%, 04/15/50(a) | 300 | 179,751 | ||||||
| Security | Par (000) | Value | ||||||
| Electric Utilities (continued) | ||||||||
San Diego Gas & Electric Co. (continued) | ||||||||
Series WWW, 2.95%, 08/15/51 | $ | 600 | $ | 341,065 | ||||
Sempra | ||||||||
3.80%, 02/01/38 | 1,329 | 991,005 | ||||||
6.00%, 10/15/39 | 700 | 640,254 | ||||||
4.00%, 02/01/48 | 829 | 565,996 | ||||||
Sierra Pacific Power Co., 5.90%, 03/15/54(d) | 550 | 496,071 | ||||||
Southern California Edison Co. | ||||||||
6.00%, 01/15/34 | 1,243 | 1,203,630 | ||||||
5.63%, 02/01/36 | 300 | 274,092 | ||||||
6.05%, 03/15/39 | 700 | 650,815 | ||||||
4.50%, 09/01/40 | 829 | 643,523 | ||||||
4.05%, 03/15/42 | 340 | 243,256 | ||||||
4.65%, 10/01/43 | 1,038 | 801,549 | ||||||
4.00%, 04/01/47 | 1,779 | 1,217,700 | ||||||
3.65%, 02/01/50 | 1,029 | 653,676 | ||||||
3.45%, 02/01/52 | 880 | 526,541 | ||||||
5.70%, 03/01/53(a) | 465 | 404,209 | ||||||
5.88%, 12/01/53 | 420 | 373,624 | ||||||
Series 04-G, 5.75%, 04/01/35 | 300 | 282,517 | ||||||
Series 05-E, 5.35%, 07/15/35 | 300 | 275,121 | ||||||
Series 08-A, 5.95%, 02/01/38 | 413 | 383,113 | ||||||
Series 13-A, 3.90%, 03/15/43 | 307 | 212,524 | ||||||
Series 20A, 2.95%, 02/01/51 | 1,000 | 555,698 | ||||||
Series B, 4.88%, 03/01/49 | 413 | 320,815 | ||||||
Series C, 3.60%, 02/01/45 | 163 | 105,896 | ||||||
Series C, 4.13%, 03/01/48 | 1,279 | 887,107 | ||||||
Series E, 5.45%, 06/01/52 | 243 | 202,888 | ||||||
Series H, 3.65%, 06/01/51 | 229 | 143,568 | ||||||
Southern Co. | ||||||||
5.70%, 03/15/34(a) | 325 | 309,173 | ||||||
4.25%, 07/01/36 | 550 | 445,713 | ||||||
4.40%, 07/01/46 | 1,920 | 1,416,261 | ||||||
Southern Power Co. | ||||||||
5.15%, 09/15/41 | 900 | 739,373 | ||||||
5.25%, 07/15/43 | 413 | 333,058 | ||||||
Series F, 4.95%, 12/15/46 | 829 | 633,543 | ||||||
Southwestern Electric Power Co. | ||||||||
6.20%, 03/15/40 | 300 | 278,506 | ||||||
3.25%, 11/01/51 | 329 | 185,384 | ||||||
Series J, 3.90%, 04/01/45 | 340 | 224,890 | ||||||
Series L, 3.85%, 02/01/48 | 413 | 263,426 | ||||||
Southwestern Public Service Co. | ||||||||
3.40%, 08/15/46 | 250 | 151,475 | ||||||
3.70%, 08/15/47 | 413 | 267,476 | ||||||
3.75%, 06/15/49 | 829 | 535,101 | ||||||
Series 8, 3.15%, 05/01/50 | 329 | 189,961 | ||||||
Tampa Electric Co. | ||||||||
4.10%, 06/15/42 | 163 | 119,287 | ||||||
4.35%, 05/15/44 | 300 | 220,925 | ||||||
4.30%, 06/15/48 | 329 | 236,890 | ||||||
4.45%, 06/15/49 | 1,036 | 759,331 | ||||||
3.63%, 06/15/50 | 300 | 190,787 | ||||||
5.00%, 07/15/52 | 175 | 139,617 | ||||||
Toledo Edison Co., 6.15%, 05/15/37 | 276 | 266,509 | ||||||
Tucson Electric Power Co. | ||||||||
4.85%, 12/01/48 | 163 | 124,666 | ||||||
4.00%, 06/15/50 | 500 | 333,665 | ||||||
3.25%, 05/01/51 | 130 | 74,728 | ||||||
5.50%, 04/15/53 | 250 | 212,960 | ||||||
Union Electric Co. | ||||||||
5.30%, 08/01/37 | 300 | 273,222 | ||||||
8.45%, 03/15/39 | 300 | 351,507 | ||||||
SCHEDULE OF INVESTMENTS | 73 |
Schedule of Investments (continued) October 31, 2023 | iShares U.S. Long Credit Bond Index Fund (Percentages shown are based on Net Assets) |
| Security | Par (000) | Value | ||||||
| Electric Utilities (continued) | ||||||||
Union Electric Co. (continued) | ||||||||
3.90%, 09/15/42 | $ | 1,000 | $ | 718,613 | ||||
3.65%, 04/15/45 | 285 | 189,875 | ||||||
4.00%, 04/01/48 | 829 | 573,152 | ||||||
3.25%, 10/01/49 | 413 | 242,250 | ||||||
3.90%, 04/01/52 | 579 | 398,736 | ||||||
5.45%, 03/15/53(a) | 600 | 522,570 | ||||||
Virginia Electric and Power Co. | ||||||||
6.35%, 11/30/37 | 1,000 | 972,399 | ||||||
8.88%, 11/15/38 | 950 | 1,145,001 | ||||||
4.00%, 01/15/43 | 463 | 336,410 | ||||||
4.45%, 02/15/44 | 538 | 404,784 | ||||||
4.60%, 12/01/48 | 374 | 285,818 | ||||||
3.30%, 12/01/49 | 209 | 126,964 | ||||||
2.45%, 12/15/50 | 891 | 450,713 | ||||||
2.95%, 11/15/51 | 913 | 508,701 | ||||||
5.45%, 04/01/53 | 1,010 | 860,886 | ||||||
5.70%, 08/15/53 | 450 | 398,279 | ||||||
Series A, 6.00%, 05/15/37 | 863 | 825,370 | ||||||
Series B, 6.00%, 01/15/36 | 829 | 798,615 | ||||||
Series B, 4.20%, 05/15/45 | 300 | 215,661 | ||||||
Series B, 3.80%, 09/15/47 | 413 | 275,910 | ||||||
Series C, 4.00%, 11/15/46 | 225 | 155,958 | ||||||
Series C, 4.63%, 05/15/52 | 529 | 400,983 | ||||||
Series D, 4.65%, 08/15/43 | 413 | 321,667 | ||||||
Wisconsin Electric Power Co. | ||||||||
5.70%, 12/01/36 | 500 | 477,974 | ||||||
4.30%, 10/15/48 | 620 | 458,613 | ||||||
Wisconsin Power and Light Co., | 200 | 197,477 | ||||||
Wisconsin Public Service Corp. | ||||||||
4.75%, 11/01/44 | 400 | 319,915 | ||||||
3.30%, 09/01/49 | 516 | 315,106 | ||||||
2.85%, 12/01/51 | 153 | 84,469 | ||||||
Xcel Energy, Inc. | ||||||||
6.50%, 07/01/36 | 650 | 646,391 | ||||||
3.50%, 12/01/49 | 680 | 420,085 | ||||||
|
| |||||||
| 199,629,662 | ||||||||
| Electrical Equipment — 0.1% | ||||||||
Eaton Corp. | ||||||||
4.15%, 11/02/42 | 913 | 709,950 | ||||||
4.70%, 08/23/52 | 800 | 649,335 | ||||||
Fortive Corp., 4.30%, 06/15/46 | 500 | 362,877 | ||||||
Rockwell Automation, Inc., 4.20%, 03/01/49 | 479 | 365,507 | ||||||
|
| |||||||
| 2,087,669 | ||||||||
| Electronic Equipment, Instruments & Components — 0.2% | ||||||||
ABB Finance USA, Inc., 4.38%, 05/08/42 | 550 | 446,645 | ||||||
Corning, Inc. | ||||||||
5.75%, 08/15/40 | 350 | 316,875 | ||||||
4.75%, 03/15/42 | 550 | 447,655 | ||||||
5.35%, 11/15/48 | 620 | 527,863 | ||||||
3.90%, 11/15/49 | 163 | 110,050 | ||||||
4.38%, 11/15/57(a) | 620 | 440,574 | ||||||
5.85%, 11/15/68 | 496 | 420,002 | ||||||
5.45%, 11/15/79 | 963 | 759,520 | ||||||
Rockwell Automation, Inc., 2.80%, 08/15/61 | 410 | 220,158 | ||||||
Tyco Electronics Group SA, | 400 | 426,770 | ||||||
|
| |||||||
| 4,116,112 | ||||||||
| Energy Equipment & Services — 0.4% | ||||||||
Baker Hughes Holdings LLC, | 976 | 849,474 | ||||||
| Security | Par (000) | Value | ||||||
| Energy Equipment & Services (continued) | ||||||||
Baker Hughes Holdings LLC/Baker Hughes Co.- Obligor, Inc., 4.08%, 12/15/47 | $ | 1,243 | $ | 886,352 | ||||
Halliburton Co. | ||||||||
4.85%, 11/15/35(a) | 829 | 729,407 | ||||||
6.70%, 09/15/38 | 800 | 837,252 | ||||||
7.45%, 09/15/39 | 930 | 1,014,201 | ||||||
4.50%, 11/15/41 | 450 | 347,360 | ||||||
4.75%, 08/01/43 | 736 | 583,131 | ||||||
5.00%, 11/15/45(a) | 1,859 | 1,527,174 | ||||||
NOV, Inc., 3.95%, 12/01/42(a) | 1,017 | 680,865 | ||||||
|
| |||||||
| 7,455,216 | ||||||||
| Environmental, Maintenance & Security Service — 0.2% | ||||||||
Nature Conservancy, Series A, | 66 | 48,553 | ||||||
Republic Services, Inc. | ||||||||
6.20%, 03/01/40 | 400 | 389,749 | ||||||
5.70%, 05/15/41 | 600 | 560,438 | ||||||
3.05%, 03/01/50(a) | 350 | 210,606 | ||||||
Waste Connections, Inc.(a) | ||||||||
3.05%, 04/01/50 | 379 | 224,893 | ||||||
2.95%, 01/15/52 | 650 | 371,527 | ||||||
Waste Management, Inc. | ||||||||
4.88%, 02/15/34 | 1,250 | 1,144,677 | ||||||
2.95%, 06/01/41 | 470 | 307,201 | ||||||
4.10%, 03/01/45 | 355 | 266,232 | ||||||
4.15%, 07/15/49 | 663 | 496,858 | ||||||
2.50%, 11/15/50 | 450 | 239,338 | ||||||
|
| |||||||
| 4,260,072 | ||||||||
| Financial Services — 6.1% | ||||||||
AerCap Ireland Capital DAC/AerCap Global Aviation Trust, 3.85%, 10/29/41 | 1,350 | 904,820 | ||||||
Bank of America Corp. | ||||||||
6.11%, 01/29/37 | 1,500 | 1,425,248 | ||||||
7.75%, 05/14/38 | 1,550 | 1,660,969 | ||||||
5.88%, 02/07/42 | 1,661 | 1,556,750 | ||||||
5.00%, 01/21/44 | 2,186 | 1,832,675 | ||||||
4.88%, 04/01/44 | 829 | 676,434 | ||||||
(1-day SOFR + 1.56%), 2.97%, 07/21/52(a)(b) | 1,630 | 934,986 | ||||||
(1-day SOFR + 1.58%), 3.31%, 04/22/42(b) | 3,589 | 2,383,033 | ||||||
(1-day SOFR + 1.88%), 2.83%, 10/24/51(b) | 825 | 455,793 | ||||||
(1-day SOFR + 1.93%), 2.68%, 06/19/41(b) | 4,139 | 2,523,536 | ||||||
(3-mo. CME Term SOFR + 1.45%), | 496 | 345,518 | ||||||
(3-mo. CME Term SOFR + 1.58%), | 1,579 | 1,190,349 | ||||||
(3-mo. CME Term SOFR + 1.78%), | 2,809 | 2,062,257 | ||||||
(3-mo. CME Term SOFR + 2.08%), | 2,243 | 1,770,115 | ||||||
(3-mo. CME Term SOFR + 2.25%), | 2,053 | 1,552,857 | ||||||
(3-mo. CME Term SOFR + 3.41%), | 5,085 | 3,565,080 | ||||||
Series N, (1-day SOFR + 1.65%), | 841 | 530,709 | ||||||
Barclays PLC | ||||||||
5.25%, 08/17/45 | 1,250 | 1,008,566 | ||||||
4.95%, 01/10/47(a) | 1,478 | 1,132,341 | ||||||
(1-year CMT + 1.30%), 3.33%, 11/24/42(b) | 928 | 569,391 | ||||||
(1-year CMT + 1.70%), 3.81%, 03/10/42(b) | 950 | 598,507 | ||||||
Citigroup, Inc. | ||||||||
8.13%, 07/15/39 | 1,975 | 2,226,882 | ||||||
| 74 | 2 0 2 3 BLACK ROCK ANNUAL REPORT TO SHAREHOLDERS |
Schedule of Investments (continued) October 31, 2023 | iShares U.S. Long Credit Bond Index Fund (Percentages shown are based on Net Assets) |
| Security | Par (000) | Value | ||||||
| Financial Services (continued) | ||||||||
Citigroup, Inc. (continued) | ||||||||
5.88%, 01/30/42 | $ | 1,623 | $ | 1,503,987 | ||||
6.68%, 09/13/43 | 163 | 155,838 | ||||||
5.30%, 05/06/44 | 413 | 336,609 | ||||||
4.65%, 07/30/45 | 2,070 | 1,590,918 | ||||||
4.75%, 05/18/46 | 2,243 | 1,674,921 | ||||||
4.65%, 07/23/48 | 2,393 | 1,843,111 | ||||||
(1-day SOFR + 1.38%), | 1,208 | 742,273 | ||||||
(1-day SOFR + 4.55%), | 990 | 854,712 | ||||||
(3-mo. CME Term SOFR + 1.43%), | 900 | 673,527 | ||||||
(3-mo. CME Term SOFR + 2.10%), | 829 | 609,154 | ||||||
CME Group, Inc. | ||||||||
5.30%, 09/15/43 | 829 | 769,183 | ||||||
4.15%, 06/15/48(a) | 650 | 503,327 | ||||||
GE Capital International Funding Co. Unlimited Co., | ||||||||
4.42%, 11/15/35 | 1,000 | 870,673 | ||||||
Goldman Sachs Group, Inc. | ||||||||
6.45%, 05/01/36 | 500 | 481,775 | ||||||
6.75%, 10/01/37 | 4,949 | 4,834,518 | ||||||
6.25%, 02/01/41 | 2,529 | 2,448,379 | ||||||
4.80%, 07/08/44 | 1,636 | 1,296,518 | ||||||
5.15%, 05/22/45 | 2,243 | 1,818,285 | ||||||
4.75%, 10/21/45 | 1,500 | 1,197,738 | ||||||
(1-day SOFR + 1.47%), | 1,659 | 1,022,052 | ||||||
(1-day SOFR + 1.51%), | 2,279 | 1,479,039 | ||||||
(1-day SOFR + 1.63%), | 1,504 | 993,524 | ||||||
(3-mo. CME Term SOFR + 1.63%), | 2,309 | 1,748,136 | ||||||
(3-mo. CME Term SOFR + 1.69%), | 1,579 | 1,252,968 | ||||||
HSBC Holdings PLC | ||||||||
6.50%, 05/02/36 | 1,803 | 1,647,100 | ||||||
6.50%, 09/15/37 | 2,440 | 2,219,233 | ||||||
6.80%, 06/01/38 | 1,350 | 1,258,978 | ||||||
6.10%, 01/14/42(a) | 1,529 | 1,470,303 | ||||||
5.25%, 03/14/44(a) | 1,418 | 1,142,244 | ||||||
(1-day SOFR + 2.65%), | 2,215 | 2,053,545 | ||||||
Intercontinental Exchange, Inc. | ||||||||
2.65%, 09/15/40 | 1,029 | 644,397 | ||||||
4.25%, 09/21/48 | 1,413 | 1,047,545 | ||||||
3.00%, 06/15/50(a) | 1,259 | 737,840 | ||||||
4.95%, 06/15/52 | 1,246 | 1,021,899 | ||||||
3.00%, 09/15/60 | 1,285 | 684,561 | ||||||
5.20%, 06/15/62 | 1,025 | 845,704 | ||||||
JPMorgan Chase & Co. | ||||||||
6.40%, 05/15/38 | 2,561 | 2,586,766 | ||||||
5.50%, 10/15/40 | 1,259 | 1,146,947 | ||||||
5.60%, 07/15/41 | 1,804 | 1,659,657 | ||||||
5.40%, 01/06/42 | 1,329 | 1,196,635 | ||||||
5.63%, 08/16/43(a) | 1,413 | 1,276,961 | ||||||
4.85%, 02/01/44 | 1,026 | 853,850 | ||||||
4.95%, 06/01/45 | 1,536 | 1,257,706 | ||||||
(1-day SOFR + 1.46%), | 908 | 598,149 | ||||||
(1-day SOFR + 1.58%), | 2,791 | 1,711,206 | ||||||
(1-day SOFR + 2.44%), | 2,109 | 1,242,263 | ||||||
(3-mo. CME Term SOFR + 1.48%), | 1,900 | 1,314,031 | ||||||
(3-mo. CME Term SOFR + 1.51%), | 1,493 | 892,162 | ||||||
| Security | Par (000) | Value | ||||||
| Financial Services (continued) | ||||||||
JPMorgan Chase & Co. (continued) | ||||||||
(3-mo. CME Term SOFR + 1.62%), | $ | 1,700 | $ | 1,300,722 | ||||
(3-mo. CME Term SOFR + 1.64%), | 3,873 | 2,707,467 | ||||||
(3-mo. CME Term SOFR + 1.72%), | 1,513 | 1,071,128 | ||||||
(3-mo. CME Term SOFR + 1.84%), | 2,029 | 1,497,725 | ||||||
(3-mo. CME Term SOFR + 2.46%), | 1,661 | 1,100,949 | ||||||
Kimberly-Clark Corp. | ||||||||
6.63%, 08/01/37 | 600 | 641,478 | ||||||
5.30%, 03/01/41 | 413 | 378,097 | ||||||
3.20%, 07/30/46 | 136 | 87,103 | ||||||
3.90%, 05/04/47 | 620 | 449,757 | ||||||
2.88%, 02/07/50(a) | 660 | 395,482 | ||||||
Lloyds Banking Group PLC | ||||||||
5.30%, 12/01/45(a) | 971 | 762,976 | ||||||
4.34%, 01/09/48 | 1,001 | 653,145 | ||||||
(5-year CMT + 1.50%), 3.37%, 12/14/46(b) | 1,150 | 666,380 | ||||||
Mitsubishi UFJ Financial Group, Inc. | ||||||||
4.29%, 07/26/38(a) | 163 | 131,892 | ||||||
4.15%, 03/07/39(a) | 450 | 354,935 | ||||||
3.75%, 07/18/39 | 1,832 | 1,377,972 | ||||||
Morgan Stanley | ||||||||
3.97%, 07/22/38(b) | 1,979 | 1,497,772 | ||||||
6.38%, 07/24/42(a) | 1,719 | 1,703,842 | ||||||
4.30%, 01/27/45 | 2,479 | 1,863,241 | ||||||
4.38%, 01/22/47 | 2,000 | 1,493,567 | ||||||
(1-day SOFR + 1.43%), 2.80%, 01/25/52(b) | 2,064 | 1,138,020 | ||||||
(1-day SOFR + 1.49%), 3.22%, 04/22/42(b) | 1,000 | 660,849 | ||||||
(1-day SOFR + 4.84%), 5.60%, 03/24/51(b) | 1,579 | 1,409,974 | ||||||
(3-mo. CME Term SOFR + 1.69%), | 2,489 | 1,995,791 | ||||||
Nasdaq, Inc. | ||||||||
2.50%, 12/21/40 | 600 | 350,394 | ||||||
3.25%, 04/28/50 | 430 | 252,042 | ||||||
3.95%, 03/07/52 | 2,750 | 1,816,814 | ||||||
Sumitomo Mitsui Financial Group, Inc. | ||||||||
2.30%, 01/12/41 | 500 | 292,395 | ||||||
2.93%, 09/17/41(a) | 780 | 485,871 | ||||||
3.05%, 01/14/42(a) | 450 | 295,381 | ||||||
Voya Financial, Inc. | ||||||||
5.70%, 07/15/43 | 413 | 346,676 | ||||||
4.80%, 06/15/46 | 255 | 183,351 | ||||||
|
| |||||||
| 121,480,851 | ||||||||
| Food Products — 0.7% | ||||||||
Archer-Daniels-Midland Co. | ||||||||
5.38%, 09/15/35 | 700 | 664,610 | ||||||
4.54%, 03/26/42 | 350 | 283,025 | ||||||
4.02%, 04/16/43 | 59 | 43,548 | ||||||
3.75%, 09/15/47 | 429 | 300,000 | ||||||
4.50%, 03/15/49 | 829 | 658,673 | ||||||
2.70%, 09/15/51 | 600 | 337,312 | ||||||
Hershey Co. | ||||||||
3.13%, 11/15/49 | 413 | 255,531 | ||||||
2.65%, 06/01/50 | 300 | 169,211 | ||||||
Hormel Foods Corp., 3.05%, 06/03/51 | 413 | 245,371 | ||||||
J M Smucker Co. | ||||||||
4.25%, 03/15/35 | 513 | 418,208 | ||||||
2.75%, 09/15/41(a) | 300 | 178,542 | ||||||
SCHEDULE OF INVESTMENTS | 75 |
Schedule of Investments (continued) October 31, 2023 | iShares U.S. Long Credit Bond Index Fund (Percentages shown are based on Net Assets) |
| Security | Par (000) | Value | ||||||
| Food Products (continued) | ||||||||
J M Smucker Co. (continued) | ||||||||
6.50%, 11/15/43 | $ | 725 | $ | 688,052 | ||||
4.38%, 03/15/45 | 563 | 410,574 | ||||||
3.55%, 03/15/50 | 330 | 199,845 | ||||||
6.50%, 11/15/53 | 930 | 876,871 | ||||||
JBS USA LUX SA/JBS USA Food Co./JBS | ||||||||
6.75%, 03/15/34 | 1,475 | 1,382,193 | ||||||
7.25%, 11/15/53 | 825 | 736,810 | ||||||
JBS USA LUX SA/JBS USA Food Co./JBS USA Finance, Inc. | ||||||||
4.38%, 02/02/52 | 850 | 519,114 | ||||||
6.50%, 12/01/52 | 1,450 | 1,191,302 | ||||||
McCormick & Co., Inc., 4.20%, 08/15/47(a) | 360 | 257,503 | ||||||
Mondelez International, Inc., | 1,080 | 588,254 | ||||||
Pilgrim’s Pride Corp., 6.88%, 05/15/34 | 465 | 439,982 | ||||||
Tyson Foods, Inc. | ||||||||
4.88%, 08/15/34(a) | 425 | 374,543 | ||||||
5.15%, 08/15/44 | 413 | 327,044 | ||||||
4.55%, 06/02/47 | 813 | 580,331 | ||||||
5.10%, 09/28/48 | 1,393 | 1,076,545 | ||||||
|
| |||||||
| 13,202,994 | ||||||||
| Gas Utilities — 0.1% | ||||||||
Atmos Energy Corp. | ||||||||
4.13%, 10/15/44 | 640 | 477,117 | ||||||
6.20%, 11/15/53 | 550 | 533,793 | ||||||
Cheniere Corpus Christi Holdings LLC, | 763 | 550,076 | ||||||
NiSource, Inc., 5.00%, 06/15/52 | 450 | 352,381 | ||||||
Southern California Gas Co. | ||||||||
6.35%, 11/15/52 | 400 | 386,164 | ||||||
5.75%, 06/01/53 | 420 | 371,536 | ||||||
|
| |||||||
| 2,671,067 | ||||||||
| Ground Transportation — 2.5% | ||||||||
Burlington Northern Santa Fe LLC | ||||||||
6.20%, 08/15/36 | 250 | 252,545 | ||||||
6.15%, 05/01/37 | 650 | 653,802 | ||||||
5.75%, 05/01/40 | 750 | 714,920 | ||||||
5.05%, 03/01/41 | 450 | 391,805 | ||||||
5.40%, 06/01/41 | 500 | 453,686 | ||||||
4.95%, 09/15/41 | 250 | 215,123 | ||||||
4.40%, 03/15/42 | 647 | 512,933 | ||||||
4.38%, 09/01/42 | 563 | 443,573 | ||||||
4.45%, 03/15/43 | 830 | 657,115 | ||||||
5.15%, 09/01/43 | 713 | 620,316 | ||||||
4.90%, 04/01/44 | 1,013 | 850,529 | ||||||
4.55%, 09/01/44 | 813 | 647,081 | ||||||
4.15%, 04/01/45 | 1,013 | 757,061 | ||||||
4.70%, 09/01/45 | 413 | 334,128 | ||||||
3.90%, 08/01/46 | 309 | 218,951 | ||||||
4.13%, 06/15/47 | 763 | 563,261 | ||||||
4.05%, 06/15/48 | 829 | 600,684 | ||||||
4.15%, 12/15/48 | 813 | 596,529 | ||||||
3.55%, 02/15/50 | 931 | 620,831 | ||||||
3.05%, 02/15/51 | 329 | 193,881 | ||||||
3.30%, 09/15/51 | 829 | 516,733 | ||||||
2.88%, 06/15/52 | 650 | 370,941 | ||||||
4.45%, 01/15/53 | 800 | 619,320 | ||||||
5.20%, 04/15/54 | 1,410 | 1,217,498 | ||||||
Canadian National Railway Co. | 400 | 404,026 | ||||||
| Security | Par (000) | Value | ||||||
| Ground Transportation (continued) | ||||||||
Canadian National Railway Co. (continued) | ||||||||
6.20%, 06/01/36 | $ | 450 | $ | 454,639 | ||||
6.38%, 11/15/37 | 250 | 254,442 | ||||||
3.20%, 08/02/46 | 660 | 419,589 | ||||||
3.65%, 02/03/48 | 493 | 340,802 | ||||||
2.45%, 05/01/50 | 1,174 | 618,803 | ||||||
4.40%, 08/05/52(a) | 868 | 670,641 | ||||||
6.13%, 11/01/53 | 60 | 59,908 | ||||||
Canadian Pacific Railway Co. | ||||||||
4.80%, 09/15/35 | 163 | 143,492 | ||||||
5.95%, 05/15/37 | 500 | 480,072 | ||||||
3.00%, 12/02/41(a) | 992 | 796,234 | ||||||
4.30%, 05/15/43 | 400 | 301,751 | ||||||
4.80%, 08/01/45 | 519 | 413,517 | ||||||
4.95%, 08/15/45 | 450 | 368,662 | ||||||
4.70%, 05/01/48 | 413 | 321,974 | ||||||
3.50%, 05/01/50 | 413 | 263,735 | ||||||
3.10%, 12/02/51(a) | 1,792 | 1,051,934 | ||||||
4.20%, 11/15/69 | 377 | 254,882 | ||||||
6.13%, 09/15/2115 | 963 | 866,736 | ||||||
CSX Corp. | ||||||||
6.00%, 10/01/36 | 300 | 295,532 | ||||||
6.15%, 05/01/37 | 650 | 648,195 | ||||||
6.22%, 04/30/40 | 550 | 541,172 | ||||||
5.50%, 04/15/41 | 500 | 451,575 | ||||||
4.75%, 05/30/42 | 911 | 746,406 | ||||||
4.10%, 03/15/44 | 750 | 557,948 | ||||||
3.80%, 11/01/46 | 750 | 517,665 | ||||||
4.30%, 03/01/48 | 820 | 611,876 | ||||||
4.75%, 11/15/48 | 600 | 475,028 | ||||||
4.50%, 03/15/49 | 829 | 632,693 | ||||||
3.35%, 09/15/49 | 590 | 369,982 | ||||||
3.80%, 04/15/50 | 454 | 307,059 | ||||||
3.95%, 05/01/50 | 571 | 398,167 | ||||||
2.50%, 05/15/51(a) | 425 | 220,807 | ||||||
4.50%, 11/15/52 | 800 | 610,304 | ||||||
4.50%, 08/01/54 | 413 | 312,224 | ||||||
4.25%, 11/01/66 | 663 | 459,825 | ||||||
4.65%, 03/01/68 | 413 | 306,119 | ||||||
Norfolk Southern Corp. | ||||||||
4.84%, 10/01/41(a) | 600 | 494,778 | ||||||
3.95%, 10/01/42 | 626 | 456,066 | ||||||
4.45%, 06/15/45 | 563 | 429,407 | ||||||
4.65%, 01/15/46 | 600 | 465,777 | ||||||
3.94%, 11/01/47 | 745 | 522,133 | ||||||
4.15%, 02/28/48 | 713 | 512,276 | ||||||
4.10%, 05/15/49 | 400 | 284,647 | ||||||
3.40%, 11/01/49 | 276 | 171,380 | ||||||
3.05%, 05/15/50 | 750 | 435,090 | ||||||
2.90%, 08/25/51 | 626 | 348,021 | ||||||
4.05%, 08/15/52 | 829 | 574,168 | ||||||
3.70%, 03/15/53 | 272 | 175,182 | ||||||
4.55%, 06/01/53 | 675 | 508,748 | ||||||
5.35%, 08/01/54 | 1,225 | 1,045,427 | ||||||
3.16%, 05/15/55 | 829 | 469,938 | ||||||
4.10%, 05/15/2121 | 579 | 349,223 | ||||||
Union Pacific Corp. | ||||||||
3.38%, 02/01/35 | 413 | 322,983 | ||||||
2.89%, 04/06/36 | 700 | 512,927 | ||||||
3.60%, 09/15/37 | 436 | 335,216 | ||||||
3.55%, 08/15/39 | 500 | 368,115 | ||||||
3.20%, 05/20/41 | 975 | 663,146 | ||||||
| 76 | 2 0 2 3 BLACK ROCK ANNUAL REPORT TO SHAREHOLDERS |
Schedule of Investments (continued) October 31, 2023 | iShares U.S. Long Credit Bond Index Fund (Percentages shown are based on Net Assets) |
| Security | Par (000) | Value | ||||||
| Ground Transportation (continued) | ||||||||
Union Pacific Corp. (continued) | ||||||||
3.38%, 02/14/42 | $ | 493 | $ | 344,644 | ||||
4.05%, 11/15/45 | 163 | 116,341 | ||||||
4.05%, 03/01/46 | 466 | 334,487 | ||||||
4.50%, 09/10/48 | 413 | 320,951 | ||||||
4.30%, 03/01/49 | 650 | 489,728 | ||||||
3.25%, 02/05/50 | 1,711 | 1,075,388 | ||||||
3.80%, 10/01/51 | 1,013 | 699,904 | ||||||
2.95%, 03/10/52 | 1,086 | 627,392 | ||||||
4.95%, 09/09/52(a) | 550 | 463,630 | ||||||
3.50%, 02/14/53 | 1,216 | 786,882 | ||||||
4.95%, 05/15/53(a) | 1,400 | 1,180,334 | ||||||
3.95%, 08/15/59 | 645 | 432,914 | ||||||
3.84%, 03/20/60 | 1,501 | 988,607 | ||||||
3.55%, 05/20/61 | 977 | 593,981 | ||||||
2.97%, 09/16/62 | 1,000 | 527,379 | ||||||
5.15%, 01/20/63 | 200 | 164,673 | ||||||
4.10%, 09/15/67 | 400 | 270,291 | ||||||
3.75%, 02/05/70 | 400 | 248,217 | ||||||
3.80%, 04/06/71 | 1,159 | 724,215 | ||||||
3.85%, 02/14/72 | 451 | 286,506 | ||||||
|
| |||||||
| 50,092,774 | ||||||||
| Health Care Equipment & Supplies — 1.1% | ||||||||
Abbott Laboratories | ||||||||
4.75%, 11/30/36 | 1,466 | 1,336,380 | ||||||
6.15%, 11/30/37 | 500 | 513,428 | ||||||
6.00%, 04/01/39 | 500 | 501,462 | ||||||
5.30%, 05/27/40 | 613 | 574,428 | ||||||
4.75%, 04/15/43 | 563 | 486,157 | ||||||
4.90%, 11/30/46 | 3,309 | 2,854,204 | ||||||
Baxter International, Inc. | ||||||||
3.50%, 08/15/46 | 413 | 247,733 | ||||||
3.13%, 12/01/51(a) | 671 | 368,725 | ||||||
Becton Dickinson & Co. | ||||||||
4.69%, 12/15/44 | 944 | 754,519 | ||||||
4.67%, 06/06/47 | 1,513 | 1,191,601 | ||||||
3.79%, 05/20/50(a) | 497 | 334,633 | ||||||
Boston Scientific Corp. | ||||||||
6.50%, 11/15/35 | 240 | 241,819 | ||||||
4.55%, 03/01/39(a) | 615 | 509,106 | ||||||
7.38%, 01/15/40 | 250 | 266,040 | ||||||
4.70%, 03/01/49(a) | 689 | 549,169 | ||||||
Danaher Corp. | ||||||||
4.38%, 09/15/45 | 475 | 375,753 | ||||||
2.60%, 10/01/50 | 813 | 447,405 | ||||||
2.80%, 12/10/51(a) | 1,060 | 597,137 | ||||||
DH Europe Finance II SARL | ||||||||
3.25%, 11/15/39 | 729 | 520,934 | ||||||
3.40%, 11/15/49 | 708 | 462,710 | ||||||
GE HealthCare Technologies, Inc., | 915 | 886,366 | ||||||
Koninklijke Philips NV | ||||||||
6.88%, 03/11/38 | 674 | 672,695 | ||||||
5.00%, 03/15/42 | 413 | 327,783 | ||||||
Medtronic, Inc. | ||||||||
4.38%, 03/15/35 | 1,938 | 1,695,460 | ||||||
4.63%, 03/15/45 | 1,850 | 1,526,874 | ||||||
Revvity, Inc., 3.63%, 03/15/51 | 300 | 181,005 | ||||||
STERIS Irish FinCo UnLtd Co., | 500 | 330,374 | ||||||
Stryker Corp. | ||||||||
4.10%, 04/01/43 | 300 | 225,152 | ||||||
4.38%, 05/15/44 | 350 | 269,201 | ||||||
4.63%, 03/15/46 | 936 | 755,441 | ||||||
2.90%, 06/15/50(a) | 713 | 416,945 | ||||||
| Security | Par (000) | Value | ||||||
| Health Care Equipment & Supplies (continued) | ||||||||
Thermo Fisher Scientific, Inc. | ||||||||
2.80%, 10/15/41 | $ | 1,177 | $ | 749,924 | ||||
5.30%, 02/01/44 | 400 | 357,008 | ||||||
4.10%, 08/15/47 | 663 | 493,833 | ||||||
Zimmer Biomet Holdings, Inc. | ||||||||
5.75%, 11/30/39 | 250 | 222,067 | ||||||
4.45%, 08/15/45(a) | 413 | 309,144 | ||||||
|
| |||||||
| 22,552,615 | ||||||||
| Health Care Providers & Services — 4.4% | ||||||||
AdventHealth Obligated Group, Series E, | 66 | 37,261 | ||||||
Adventist Health System, 3.63%, 03/01/49 | 127 | 81,128 | ||||||
Advocate Health & Hospitals Corp. | ||||||||
4.27%, 08/15/48 | 27 | 20,744 | ||||||
3.39%, 10/15/49 | 1,585 | 1,023,410 | ||||||
Series 2020, 3.01%, 06/15/50(a) | 198 | 116,208 | ||||||
Aetna, Inc. | ||||||||
6.63%, 06/15/36 | 700 | 700,297 | ||||||
6.75%, 12/15/37 | 475 | 478,305 | ||||||
4.50%, 05/15/42 | 428 | 322,710 | ||||||
4.75%, 03/15/44 | 849 | 656,239 | ||||||
3.88%, 08/15/47 | 869 | 572,177 | ||||||
AHS Hospital Corp., Series 2021, | 961 | 526,822 | ||||||
Allina Health System, Series 2019, | 142 | 100,822 | ||||||
Ascension Health | ||||||||
3.95%, 11/15/46 | 1,243 | 899,706 | ||||||
Series B, 3.11%, 11/15/39 | 1,500 | 1,041,939 | ||||||
Banner Health | ||||||||
2.91%, 01/01/42 | 1,640 | 1,046,627 | ||||||
2.91%, 01/01/51(a) | 231 | 130,458 | ||||||
Series 2020, 3.18%, 01/01/50 | 118 | 72,278 | ||||||
BayCare Health System, Inc., Series 2020, | 213 | 149,342 | ||||||
Baylor Scott & White Holdings, Series 2021, | 2,496 | 1,427,810 | ||||||
Bon Secours Mercy Health, Inc., Series 20-2, | 110 | 65,936 | ||||||
Cardinal Health, Inc. | ||||||||
4.50%, 11/15/44 | 400 | 290,364 | ||||||
4.90%, 09/15/45 | 320 | 244,490 | ||||||
4.37%, 06/15/47 | 413 | 297,206 | ||||||
Cencora, Inc. | ||||||||
4.25%, 03/01/45(a) | 363 | 264,165 | ||||||
4.30%, 12/15/47 | 413 | 302,338 | ||||||
Children’s Hospital Corp., Series 2017, | 130 | 98,039 | ||||||
Children’s Hospital Medical Center, | 1,000 | 785,427 | ||||||
Children’s Hospital of Philadelphia, | 93 | 52,438 | ||||||
City of Hope, Series 2013, 5.62%, 11/15/43 | 610 | 531,766 | ||||||
Cleveland Clinic Foundation, | 250 | 193,707 | ||||||
CommonSpirit Health | ||||||||
3.82%, 10/01/49 | 1,437 | 946,181 | ||||||
4.19%, 10/01/49 | 1,761 | 1,229,187 | ||||||
6.46%, 11/01/52(a) | 343 | 335,817 | ||||||
Community Health Network, Inc., Series 20-A, |
| |||||||
3.10%, 05/01/50 | 225 | 127,593 | ||||||
Corewell Health Obligated Group, |
| |||||||
3.49%, 07/15/49 | 1,000 | 653,058 | ||||||
Cottage Health Obligated Group, | 1,000 | 622,346 | ||||||
Dartmouth-Hitchcock Health, Series B, | 1,164 | 801,869 | ||||||
SCHEDULE OF INVESTMENTS | 77 |
Schedule of Investments (continued) October 31, 2023 | iShares U.S. Long Credit Bond Index Fund (Percentages shown are based on Net Assets) |
| Security | Par (000) | Value | ||||||
| Health Care Providers & Services (continued) | ||||||||
Dignity Health, 5.27%, 11/01/64(a) | $ | 26 | $ | 20,862 | ||||
Duke University Health System, Inc., | 862 | 624,870 | ||||||
Elevance Health, Inc. | ||||||||
5.95%, 12/15/34 | 350 | 340,883 | ||||||
6.38%, 06/15/37 | 350 | 347,203 | ||||||
4.63%, 05/15/42 | 900 | 721,622 | ||||||
4.65%, 01/15/43 | 859 | 683,704 | ||||||
5.10%, 01/15/44 | 745 | 624,236 | ||||||
4.65%, 08/15/44 | 788 | 621,033 | ||||||
4.38%, 12/01/47 | 1,479 | 1,106,720 | ||||||
4.55%, 03/01/48 | 620 | 474,549 | ||||||
3.70%, 09/15/49(a) | 800 | 525,281 | ||||||
3.13%, 05/15/50 | 999 | 591,961 | ||||||
3.60%, 03/15/51 | 1,220 | 783,064 | ||||||
4.55%, 05/15/52 | 1,029 | 779,022 | ||||||
6.10%, 10/15/52 | 610 | 576,790 | ||||||
5.13%, 02/15/53 | 700 | 580,827 | ||||||
Fred Hutchinson Cancer Center, | 326 | 271,313 | ||||||
Hackensack Meridian Health, Inc. | ||||||||
4.50%, 07/01/57 | 1,000 | 764,921 | ||||||
Series 2020, 2.68%, 09/01/41 | 126 | 78,411 | ||||||
Series 2020, 2.88%, 09/01/50 | 657 | 383,611 | ||||||
Hartford HealthCare Corp., 3.45%, 07/01/54 | 113 | 71,682 | ||||||
HCA, Inc. | ||||||||
5.13%, 06/15/39 | 829 | 681,943 | ||||||
4.38%, 03/15/42 | 500 | 360,343 | ||||||
5.50%, 06/15/47 | 1,479 | 1,191,415 | ||||||
5.25%, 06/15/49 | 1,856 | 1,426,621 | ||||||
3.50%, 07/15/51 | 1,545 | 895,037 | ||||||
4.63%, 03/15/52 | 1,906 | 1,326,949 | ||||||
5.90%, 06/01/53 | 935 | 790,425 | ||||||
Hoag Memorial Hospital Presbyterian, | 1,127 | 774,114 | ||||||
Humana, Inc. | ||||||||
4.63%, 12/01/42 | 829 | 649,968 | ||||||
4.95%, 10/01/44 | 563 | 450,107 | ||||||
4.80%, 03/15/47 | 480 | 377,560 | ||||||
3.95%, 08/15/49(a) | 400 | 274,351 | ||||||
5.50%, 03/15/53 | 600 | 516,801 | ||||||
Indiana University Health, Inc. Obligated Group, |
| |||||||
Series 2021, 2.85%, 11/01/51 | 1,413 | 802,327 | ||||||
Inova Health System Foundation, | 25 | 18,563 | ||||||
Integris Baptist Medical Center, Inc., Series A, |
| |||||||
3.88%, 08/15/50 | 122 | 79,691 | ||||||
Johns Hopkins Health System Corp., | 1,113 | 794,217 | ||||||
Kaiser Foundation Hospitals | ||||||||
4.15%, 05/01/47 | 919 | 692,162 | ||||||
Series 2019, 3.27%, 11/01/49 | 243 | 151,759 | ||||||
Series 2021, 2.81%, 06/01/41 | 1,430 | 919,443 | ||||||
Series 2021, 3.00%, 06/01/51(a) | 3,055 | 1,794,019 | ||||||
Mass General Brigham, Inc. | ||||||||
Series 2017, 3.77%, 07/01/48 | 600 | 422,383 | ||||||
Series 2020, 3.19%, 07/01/49(a) | 913 | 563,250 | ||||||
Series 2020, 3.34%, 07/01/60 | 329 | 194,413 | ||||||
Mayo Clinic(a) | ||||||||
Series 2016, 4.13%, 11/15/52 | 225 | 169,025 | ||||||
Series 2021, 3.20%, 11/15/61 | 1,801 | 1,043,651 | ||||||
MedStar Health, Inc., Series 20A, | 25 | 16,042 | ||||||
| Security | Par (000) | Value | ||||||
| Health Care Providers & Services (continued) | ||||||||
Memorial Health Services, 3.45%, 11/01/49 | $ | 323 | $ | 207,073 | ||||
Memorial Sloan-Kettering Cancer Center | ||||||||
5.00%, 07/01/42 | 130 | 112,275 | ||||||
4.13%, 07/01/52 | 130 | 95,161 | ||||||
Series 2020, 2.96%, 01/01/50 | 2,505 | 1,482,367 | ||||||
Methodist Hospital, Series 20A, | 942 | 515,671 | ||||||
Montefiore Obligated Group, 4.29%, 09/01/50 | 300 | 167,078 | ||||||
Mount Nittany Medical Center Obligated Group, Series 2022, 3.80%, 11/15/52 | 103 | 68,884 | ||||||
Mount Sinai Hospitals Group, Inc. | ||||||||
Series 2017, 3.98%, 07/01/48 | 1,500 | 1,067,829 | ||||||
Series 2019, 3.74%, 07/01/49 | 225 | 149,140 | ||||||
Series 2020, 3.39%, 07/01/50 | 120 | 71,142 | ||||||
MultiCare Health System, 2.80%, 08/15/50 | 200 | 105,046 | ||||||
Nationwide Children’s Hospital, Inc., | 25 | 20,135 | ||||||
New York and Presbyterian Hospital | ||||||||
2.26%, 08/01/40 | 413 | 245,828 | ||||||
4.02%, 08/01/45 | 97 | 72,044 | ||||||
2.61%, 08/01/60(a) | 413 | 198,181 | ||||||
Series 2019, 3.95%, 08/01/2119 | 270 | 165,577 | ||||||
Northwell Healthcare, Inc. | ||||||||
3.98%, 11/01/46 | 130 | 90,568 | ||||||
3.81%, 11/01/49 | 1,544 | 995,232 | ||||||
Novant Health, Inc. | ||||||||
2.64%, 11/01/36 | 66 | 45,981 | ||||||
3.17%, 11/01/51 | 1,858 | 1,120,975 | ||||||
3.32%, 11/01/61 | 141 | 81,575 | ||||||
NYU Langone Hospitals | ||||||||
4.37%, 07/01/47(a) | 645 | 497,242 | ||||||
Series 13-A, 5.75%, 07/01/43 | 500 | 462,400 | ||||||
Series 2020, 3.38%, 07/01/55 | 500 | 297,871 | ||||||
OhioHealth Corp., 2.83%, 11/15/41 | 272 | 171,470 | ||||||
Orlando Health Obligated Group, | 125 | 80,173 | ||||||
PeaceHealth Obligated Group, Series 2020, | 66 | 36,898 | ||||||
Piedmont Healthcare, Inc., Series 2042, | 106 | 65,378 | ||||||
Presbyterian Healthcare Services, | 108 | 90,879 | ||||||
Providence St Joseph Health Obligated Group, | ||||||||
Series 21A, 2.70%, 10/01/51 | 2,499 | 1,257,017 | ||||||
Queen’s Health Systems, 4.81%, 07/01/52(a) | 60 | 48,988 | ||||||
Rady Children’s Hospital-San Diego, | 57 | 34,477 | ||||||
RWJ Barnabas Health, Inc., 3.95%, 07/01/46 | 1,150 | 821,025 | ||||||
Seattle Children’s Hospital, Series 2021, | 113 | 62,700 | ||||||
Sentara Healthcare, Series 2021, | 63 | 36,443 | ||||||
Stanford Health Care | ||||||||
3.03%, 08/15/51 | 579 | 346,574 | ||||||
Series 2018, 3.80%, 11/15/48 | 250 | 169,012 | ||||||
Summa Health, 3.51%, 11/15/51(a) | 130 | 78,306 | ||||||
Sutter Health | ||||||||
5.55%, 08/15/53 | 915 | 833,300 | ||||||
Series 2018, 4.09%, 08/15/48 | 27 | 19,688 | ||||||
Series 20A, 3.16%, 08/15/40 | 115 | 77,340 | ||||||
Series 20A, 3.36%, 08/15/50 | 800 | 495,925 | ||||||
Texas Health Resources, 2.33%, 11/15/50 | 107 | 53,100 | ||||||
Trinity Health Corp. | ||||||||
4.13%, 12/01/45 | 1,500 | 1,125,904 | ||||||
Series 2019, 3.43%, 12/01/48 | 64 | 43,011 | ||||||
| 78 | 2 0 2 3 BLACK ROCK ANNUAL REPORT TO SHAREHOLDERS |
Schedule of Investments (continued) October 31, 2023 | iShares U.S. Long Credit Bond Index Fund (Percentages shown are based on Net Assets) |
| Security | Par (000) | Value | ||||||
| Health Care Providers & Services (continued) | ||||||||
Trinity Health Corp. (continued) | ||||||||
Series 2021, 2.63%, 12/01/40 | $ | 29 | $ | 18,092 | ||||
UMass Memorial Health Care Obligated Group, | 212 | 175,390 | ||||||
UnitedHealth Group, Inc. | ||||||||
4.63%, 07/15/35 | 58 | 51,563 | ||||||
5.80%, 03/15/36 | 1,000 | 983,480 | ||||||
6.50%, 06/15/37 | 1,000 | 1,035,950 | ||||||
6.63%, 11/15/37 | 800 | 834,550 | ||||||
6.88%, 02/15/38 | 926 | 992,962 | ||||||
3.50%, 08/15/39 | 1,384 | 1,016,271 | ||||||
2.75%, 05/15/40 | 1,175 | 760,719 | ||||||
5.95%, 02/15/41 | 26 | 24,966 | ||||||
3.05%, 05/15/41 | 1,639 | 1,093,701 | ||||||
4.63%, 11/15/41 | 496 | 407,405 | ||||||
4.38%, 03/15/42 | 650 | 514,850 | ||||||
3.95%, 10/15/42 | 597 | 445,154 | ||||||
4.25%, 03/15/43 | 663 | 517,198 | ||||||
4.75%, 07/15/45 | 1,143 | 938,391 | ||||||
4.20%, 01/15/47 | 620 | 462,093 | ||||||
4.25%, 04/15/47 | 829 | 623,907 | ||||||
3.75%, 10/15/47 | 1,113 | 770,736 | ||||||
4.25%, 06/15/48 | 1,160 | 867,721 | ||||||
4.45%, 12/15/48 | 1,579 | 1,217,643 | ||||||
3.70%, 08/15/49 | 1,243 | 841,246 | ||||||
2.90%, 05/15/50 | 1,069 | 616,701 | ||||||
3.25%, 05/15/51 | 2,558 | 1,571,307 | ||||||
4.75%, 05/15/52 | 1,750 | 1,400,860 | ||||||
5.88%, 02/15/53 | 2,400 | 2,269,682 | ||||||
5.05%, 04/15/53 | 1,350 | 1,135,268 | ||||||
3.88%, 08/15/59 | 379 | 250,584 | ||||||
3.13%, 05/15/60 | 1,150 | 654,410 | ||||||
4.95%, 05/15/62 | 1,250 | 1,014,801 | ||||||
6.05%, 02/15/63 | 1,400 | 1,334,152 | ||||||
5.20%, 04/15/63 | 1,630 | 1,361,829 | ||||||
UPMC, 5.38%, 05/15/43 | 500 | 440,091 | ||||||
WakeMed, Series A, 3.29%, 10/01/52(a) | 59 | 35,003 | ||||||
Willis-Knighton Medical Center, Series 2018, | 528 | 414,091 | ||||||
Yale-New Haven Health Services Corp., | ||||||||
Series 2020, 2.50%, 07/01/50 | 57 | 29,034 | ||||||
|
| |||||||
| 87,000,038 | ||||||||
| Health Care Technology — 0.1% | ||||||||
Catholic Health Services of Long Island Obligated Group, Series 2020, 3.37%, 07/01/50 | 145 | 86,682 | ||||||
Laboratory Corp. of America Holdings, | 721 | 559,450 | ||||||
Quest Diagnostics, Inc., 4.70%, 03/30/45(a) | 363 | 284,687 | ||||||
|
| |||||||
| 930,819 | ||||||||
| Hotels, Restaurants & Leisure — 0.6% | ||||||||
Darden Restaurants, Inc., 4.55%, 02/15/48 | 213 | 155,112 | ||||||
McDonald’s Corp. | ||||||||
4.70%, 12/09/35 | 696 | 610,677 | ||||||
6.30%, 10/15/37 | 600 | 606,376 | ||||||
6.30%, 03/01/38 | 829 | 835,973 | ||||||
5.70%, 02/01/39 | 300 | 282,392 | ||||||
4.88%, 07/15/40 | 50 | 41,954 | ||||||
3.70%, 02/15/42 | 726 | 517,230 | ||||||
4.60%, 05/26/45 | 829 | 654,672 | ||||||
4.88%, 12/09/45 | 1,379 | 1,135,139 | ||||||
4.45%, 03/01/47 | 1,113 | 853,964 | ||||||
| Security | Par (000) | Value | ||||||
| Hotels, Restaurants & Leisure (continued) | ||||||||
McDonald’s Corp. (continued) | ||||||||
4.45%, 09/01/48 | $ | 600 | $ | 458,352 | ||||
3.63%, 09/01/49 | 1,974 | 1,308,329 | ||||||
4.20%, 04/01/50 | 697 | 507,436 | ||||||
5.15%, 09/09/52 | 650 | 547,953 | ||||||
5.45%, 08/14/53 | 740 | 652,317 | ||||||
Regency Centers LP, 4.65%, 03/15/49 | 300 | 216,752 | ||||||
Starbucks Corp. | ||||||||
3.75%, 12/01/47 | 829 | 557,518 | ||||||
4.50%, 11/15/48 | 930 | 705,218 | ||||||
4.45%, 08/15/49 | 800 | 603,525 | ||||||
3.35%, 03/12/50 | 829 | 511,851 | ||||||
3.50%, 11/15/50 | 1,010 | 647,172 | ||||||
|
| |||||||
| 12,409,912 | ||||||||
| Household Durables — 0.1% | ||||||||
Leggett & Platt, Inc., 3.50%, 11/15/51 | 500 | 299,015 | ||||||
MDC Holdings, Inc. | ||||||||
6.00%, 01/15/43 | 329 | 258,447 | ||||||
3.97%, 08/06/61 | 300 | 158,398 | ||||||
PulteGroup, Inc., 6.00%, 02/15/35 | 300 | 279,139 | ||||||
Whirlpool Corp. | ||||||||
5.15%, 03/01/43 | 130 | 100,936 | ||||||
4.50%, 06/01/46(a) | 413 | 294,800 | ||||||
4.60%, 05/15/50(a) | 496 | 356,496 | ||||||
|
| |||||||
| 1,747,231 | ||||||||
| Household Products — 0.0% | ||||||||
Church & Dwight Co., Inc. | ||||||||
3.95%, 08/01/47 | 370 | 264,360 | ||||||
5.00%, 06/15/52 | 400 | 336,135 | ||||||
|
| |||||||
| 600,495 | ||||||||
| Insurance — 3.3% | ||||||||
Aflac, Inc. | ||||||||
4.00%, 10/15/46 | 340 | 235,225 | ||||||
4.75%, 01/15/49 | 543 | 433,136 | ||||||
Alleghany Corp. | ||||||||
4.90%, 09/15/44 | 300 | 248,825 | ||||||
3.25%, 08/15/51 | 429 | 262,698 | ||||||
Allstate Corp. | ||||||||
5.55%, 05/09/35 | 450 | 419,476 | ||||||
5.95%, 04/01/36 | 350 | 335,156 | ||||||
4.50%, 06/15/43 | 397 | 300,169 | ||||||
4.20%, 12/15/46 | 729 | 512,076 | ||||||
3.85%, 08/10/49 | 559 | 368,628 | ||||||
(3-mo. LIBOR US + 2.12%), | 425 | 377,969 | ||||||
American Financial Group, Inc., | 620 | 444,273 | ||||||
American International Group, Inc. | ||||||||
3.88%, 01/15/35 | 500 | 400,968 | ||||||
6.25%, 05/01/36 | 750 | 725,707 | ||||||
4.50%, 07/16/44 | 700 | 532,605 | ||||||
4.80%, 07/10/45 | 620 | 488,193 | ||||||
4.75%, 04/01/48 | 829 | 649,252 | ||||||
4.38%, 06/30/50 | 963 | 704,392 | ||||||
Aon Corp., 6.25%, 09/30/40 | 255 | 245,691 | ||||||
Aon Corp./Aon Global Holdings PLC | ||||||||
2.90%, 08/23/51 | 600 | 331,122 | ||||||
3.90%, 02/28/52 | 889 | 597,719 | ||||||
Aon Global Ltd. | ||||||||
4.60%, 06/14/44 | 563 | 438,909 | ||||||
4.75%, 05/15/45 | 663 | 527,716 | ||||||
Arch Capital Finance LLC, 5.03%, 12/15/46 | 500 | 399,728 | ||||||
SCHEDULE OF INVESTMENTS | 79 |
Schedule of Investments (continued) October 31, 2023 | iShares U.S. Long Credit Bond Index Fund (Percentages shown are based on Net Assets) |
| Security | Par (000) | Value | ||||||
| Insurance (continued) | ||||||||
Arch Capital Group Ltd. | ||||||||
7.35%, 05/01/34 | $ | 250 | $ | 262,908 | ||||
3.64%, 06/30/50 | 1,029 | 653,783 | ||||||
Arch Capital Group U.S., Inc., | 259 | 213,836 | ||||||
Arthur J Gallagher & Co. | ||||||||
3.50%, 05/20/51 | 763 | 460,048 | ||||||
3.05%, 03/09/52 | 300 | 162,740 | ||||||
5.75%, 03/02/53 | 494 | 430,462 | ||||||
6.75%, 02/15/54 | 135 | 132,651 | ||||||
Assured Guaranty U.S. Holdings, Inc., | 300 | 175,439 | ||||||
Athene Holding Ltd. | ||||||||
3.95%, 05/25/51 | 394 | 246,640 | ||||||
3.45%, 05/15/52(a) | 700 | 391,755 | ||||||
Berkshire Hathaway Finance Corp. | ||||||||
5.75%, 01/15/40(a) | 700 | 690,181 | ||||||
4.40%, 05/15/42 | 676 | 558,781 | ||||||
4.30%, 05/15/43(a) | 463 | 373,216 | ||||||
4.20%, 08/15/48 | 2,209 | 1,691,654 | ||||||
4.25%, 01/15/49 | 1,879 | 1,450,575 | ||||||
2.85%, 10/15/50 | 1,629 | 935,815 | ||||||
2.50%, 01/15/51 | 628 | 337,885 | ||||||
3.85%, 03/15/52 | 2,517 | 1,754,719 | ||||||
Berkshire Hathaway, Inc., 4.50%, 02/11/43(a) | 911 | 764,347 | ||||||
Brighthouse Financial, Inc. | ||||||||
4.70%, 06/22/47 | 985 | 646,955 | ||||||
3.85%, 12/22/51 | 350 | 190,389 | ||||||
Brown & Brown, Inc., 4.95%, 03/17/52(a) | 570 | 422,910 | ||||||
Chubb Corp. | ||||||||
6.00%, 05/11/37 | 1,100 | 1,088,496 | ||||||
Series 1, 6.50%, 05/15/38 | 526 | 543,415 | ||||||
Chubb INA Holdings, Inc. | ||||||||
4.15%, 03/13/43 | 97 | 74,837 | ||||||
4.35%, 11/03/45 | 1,359 | 1,060,641 | ||||||
2.85%, 12/15/51(a) | 413 | 240,761 | ||||||
3.05%, 12/15/61(a) | 936 | 526,639 | ||||||
Cincinnati Financial Corp., 6.13%, 11/01/34 | 310 | 293,728 | ||||||
Corebridge Financial, Inc. | ||||||||
4.35%, 04/05/42 | 525 | 380,654 | ||||||
4.40%, 04/05/52 | 1,155 | 793,611 | ||||||
Equitable Holdings, Inc., 5.00%, 04/20/48 | 1,379 | 1,050,479 | ||||||
Everest Reinsurance Holdings, Inc. | ||||||||
3.50%, 10/15/50 | 1,113 | 673,320 | ||||||
3.13%, 10/15/52 | 865 | 486,027 | ||||||
Fidelity National Financial, Inc., | 422 | 219,884 | ||||||
Hartford Financial Services Group, Inc. | ||||||||
5.95%, 10/15/36(a) | 500 | 475,870 | ||||||
6.10%, 10/01/41 | 26 | 24,277 | ||||||
4.30%, 04/15/43 | 500 | 368,215 | ||||||
4.40%, 03/15/48 | 350 | 259,976 | ||||||
3.60%, 08/19/49 | 656 | 424,798 | ||||||
2.90%, 09/15/51 | 629 | 346,399 | ||||||
Jackson Financial, Inc., 4.00%, 11/23/51 | 400 | 236,026 | ||||||
Lincoln National Corp. | ||||||||
6.30%, 10/09/37 | 363 | 336,189 | ||||||
7.00%, 06/15/40 | 375 | 354,173 | ||||||
4.35%, 03/01/48(a) | 280 | 182,490 | ||||||
4.38%, 06/15/50(a) | 413 | 269,303 | ||||||
Loews Corp. | ||||||||
6.00%, 02/01/35 | 300 | 295,414 | ||||||
4.13%, 05/15/43 | 400 | 297,928 | ||||||
Manulife Financial Corp., 5.38%, 03/04/46 | 579 | 508,143 | ||||||
| Security | Par (000) | Value | ||||||
| Insurance (continued) | ||||||||
Markel Group, Inc. | ||||||||
5.00%, 04/05/46 | $ | 400 | $ | 314,282 | ||||
4.30%, 11/01/47 | 220 | 154,187 | ||||||
5.00%, 05/20/49 | 600 | 474,044 | ||||||
4.15%, 09/17/50 | 413 | 279,605 | ||||||
3.45%, 05/07/52(a) | 475 | 286,626 | ||||||
Marsh & McLennan Cos., Inc. | ||||||||
4.75%, 03/15/39 | 450 | 382,855 | ||||||
4.35%, 01/30/47 | 513 | 389,667 | ||||||
4.20%, 03/01/48 | 413 | 304,975 | ||||||
4.90%, 03/15/49 | 1,279 | 1,051,376 | ||||||
2.90%, 12/15/51 | 343 | 191,662 | ||||||
6.25%, 11/01/52 | 450 | 440,278 | ||||||
5.45%, 03/15/53 | 610 | 537,423 | ||||||
5.70%, 09/15/53 | 1,025 | 941,000 | ||||||
MetLife, Inc. | ||||||||
6.38%, 06/15/34 | 613 | 617,661 | ||||||
5.70%, 06/15/35 | 1,050 | 996,534 | ||||||
5.88%, 02/06/41 | 655 | 612,256 | ||||||
4.13%, 08/13/42 | 825 | 614,225 | ||||||
4.88%, 11/13/43 | 1,036 | 845,235 | ||||||
4.72%, 12/15/44 | 450 | 353,446 | ||||||
4.05%, 03/01/45 | 1,013 | 728,109 | ||||||
4.60%, 05/13/46 | 693 | 541,672 | ||||||
5.00%, 07/15/52 | 910 | 735,127 | ||||||
5.25%, 01/15/54 | 1,000 | 836,244 | ||||||
Nationwide Financial Services, Inc., | 340 | 307,422 | ||||||
Old Republic International Corp., | 600 | 371,496 | ||||||
Principal Financial Group, Inc. | ||||||||
6.05%, 10/15/36 | 450 | 431,339 | ||||||
4.63%, 09/15/42 | 250 | 192,916 | ||||||
4.35%, 05/15/43(a) | 300 | 221,335 | ||||||
4.30%, 11/15/46 | 213 | 150,868 | ||||||
5.50%, 03/15/53 | 325 | 271,176 | ||||||
Progressive Corp. | ||||||||
4.35%, 04/25/44 | 376 | 287,782 | ||||||
3.70%, 01/26/45(a) | 130 | 89,622 | ||||||
4.13%, 04/15/47 | 713 | 528,204 | ||||||
4.20%, 03/15/48 | 413 | 307,486 | ||||||
3.95%, 03/26/50 | 413 | 293,716 | ||||||
3.70%, 03/15/52 | 655 | 439,167 | ||||||
Prudential Financial, Inc. | ||||||||
5.70%, 12/14/36 | 1,000 | 960,089 | ||||||
6.63%, 12/01/37 | 300 | 306,758 | ||||||
3.00%, 03/10/40(a) | 379 | 251,508 | ||||||
4.60%, 05/15/44 | 763 | 597,090 | ||||||
3.91%, 12/07/47 | 813 | 554,569 | ||||||
4.42%, 03/27/48 | 450 | 333,248 | ||||||
3.94%, 12/07/49 | 752 | 509,355 | ||||||
4.35%, 02/25/50 | 1,329 | 973,419 | ||||||
3.70%, 03/13/51(a) | 1,386 | 902,667 | ||||||
Transatlantic Holdings, Inc., 8.00%, 11/30/39 | 300 | 338,709 | ||||||
Travelers Cos., Inc. | ||||||||
6.75%, 06/20/36(a) | 163 | 171,912 | ||||||
6.25%, 06/15/37(a) | 1,113 | 1,126,687 | ||||||
5.35%, 11/01/40 | 650 | 591,076 | ||||||
4.60%, 08/01/43 | 702 | 574,488 | ||||||
4.30%, 08/25/45 | 163 | 123,519 | ||||||
3.75%, 05/15/46 | 450 | 310,983 | ||||||
4.00%, 05/30/47 | 563 | 409,130 | ||||||
4.05%, 03/07/48 | 450 | 330,004 | ||||||
| 80 | 2 0 2 3 BLACK ROCK ANNUAL REPORT TO SHAREHOLDERS |
Schedule of Investments (continued) October 31, 2023 | iShares U.S. Long Credit Bond Index Fund (Percentages shown are based on Net Assets) |
| Security | Par (000) | Value | ||||||
| Insurance (continued) | ||||||||
Travelers Cos., Inc. (continued) | ||||||||
4.10%, 03/04/49 | $ | 163 | $ | 119,445 | ||||
2.55%, 04/27/50 | 450 | 244,973 | ||||||
3.05%, 06/08/51 | 829 | 493,269 | ||||||
5.45%, 05/25/53 | 700 | 628,881 | ||||||
Unum Group | ||||||||
5.75%, 08/15/42 | 363 | 300,922 | ||||||
4.50%, 12/15/49 | 163 | 108,222 | ||||||
4.13%, 06/15/51 | 975 | 607,514 | ||||||
W R Berkley Corp. | ||||||||
4.75%, 08/01/44 | 300 | 229,693 | ||||||
4.00%, 05/12/50 | 413 | 276,751 | ||||||
3.55%, 03/30/52 | 413 | 248,369 | ||||||
3.15%, 09/30/61 | 300 | 155,677 | ||||||
Willis North America, Inc. | ||||||||
5.05%, 09/15/48 | 300 | 230,471 | ||||||
3.88%, 09/15/49 | 480 | 307,045 | ||||||
XL Group Ltd., 5.25%, 12/15/43 | 300 | 255,305 | ||||||
|
| |||||||
| 64,831,781 | ||||||||
| Interactive Media & Services — 0.5% | ||||||||
Alphabet, Inc.(a) | ||||||||
1.90%, 08/15/40 | 1,141 | 682,256 | ||||||
2.05%, 08/15/50 | 2,510 | 1,297,506 | ||||||
2.25%, 08/15/60 | 2,043 | 1,033,058 | ||||||
eBay, Inc. | ||||||||
4.00%, 07/15/42 | 600 | 420,824 | ||||||
3.65%, 05/10/51 | 813 | 508,779 | ||||||
Meta Platforms, Inc. | ||||||||
4.45%, 08/15/52 | 2,600 | 1,965,754 | ||||||
5.60%, 05/15/53 | 2,320 | 2,098,248 | ||||||
4.65%, 08/15/62 | 1,250 | 942,582 | ||||||
5.75%, 05/15/63 | 1,740 | 1,561,034 | ||||||
|
| |||||||
| 10,510,041 | ||||||||
| IT Services — 0.5% | ||||||||
Fidelity National Information Services, Inc. |
| |||||||
3.10%, 03/01/41 | 666 | 420,209 | ||||||
4.50%, 08/15/46 | 300 | 213,008 | ||||||
5.63%, 07/15/52 | 440 | 373,029 | ||||||
Fiserv, Inc., 4.40%, 07/01/49 | 1,677 | 1,216,719 | ||||||
International Business Machines Corp. |
| |||||||
4.15%, 05/15/39 | 2,070 | 1,625,031 | ||||||
5.60%, 11/30/39 | 850 | 784,105 | ||||||
2.85%, 05/15/40 | 655 | 419,607 | ||||||
4.00%, 06/20/42(a) | 902 | 670,698 | ||||||
4.70%, 02/19/46 | 491 | 388,242 | ||||||
4.25%, 05/15/49 | 2,795 | 2,042,849 | ||||||
2.95%, 05/15/50 | 564 | 320,087 | ||||||
3.43%, 02/09/52 | 550 | 339,964 | ||||||
4.90%, 07/27/52 | 800 | 642,721 | ||||||
5.10%, 02/06/53(a) | 750 | 623,143 | ||||||
7.13%, 12/01/96 | 150 | 157,622 | ||||||
Kyndryl Holdings, Inc., 4.10%, 10/15/41(a) | 479 | 297,165 | ||||||
|
| |||||||
| 10,534,199 | ||||||||
| Leisure Products — 0.0% | ||||||||
Hasbro, Inc. | ||||||||
6.35%, 03/15/40 | 463 | 422,093 | ||||||
5.10%, 05/15/44(a) | 255 | 195,900 | ||||||
Mattel, Inc., 5.45%, 11/01/41 | 250 | 195,016 | ||||||
|
| |||||||
| 813,009 | ||||||||
| Security | Par (000) | Value | ||||||
| Life Sciences Tools & Services — 0.0% | ||||||||
Thermo Fisher Scientific, Inc., | $ | 785 | $ | 711,843 | ||||
|
| |||||||
| Machinery — 0.6% | ||||||||
Brunswick Corp., 5.10%, 04/01/52 | 329 | 215,130 | ||||||
Caterpillar, Inc. | ||||||||
5.30%, 09/15/35 | 250 | 241,985 | ||||||
6.05%, 08/15/36 | 690 | 699,689 | ||||||
5.20%, 05/27/41 | 994 | 910,457 | ||||||
3.80%, 08/15/42 | 1,951 | 1,473,841 | ||||||
3.25%, 09/19/49 | 829 | 543,626 | ||||||
3.25%, 04/09/50 | 829 | 540,898 | ||||||
4.75%, 05/15/64 | 400 | 320,365 | ||||||
Deere & Co. | ||||||||
3.90%, 06/09/42(a) | 1,104 | 864,468 | ||||||
2.88%, 09/07/49 | 517 | 320,915 | ||||||
3.75%, 04/15/50 | 750 | 555,106 | ||||||
Dover Corp. | ||||||||
5.38%, 10/15/35 | 300 | 280,766 | ||||||
5.38%, 03/01/41 | 400 | 352,880 | ||||||
Otis Worldwide Corp. | ||||||||
3.11%, 02/15/40 | 829 | 563,716 | ||||||
3.36%, 02/15/50 | 676 | 425,457 | ||||||
Snap-on, Inc. | ||||||||
4.10%, 03/01/48 | 350 | 256,155 | ||||||
3.10%, 05/01/50 | 429 | 262,601 | ||||||
Stanley Black & Decker, Inc. | ||||||||
5.20%, 09/01/40 | 350 | 295,109 | ||||||
4.85%, 11/15/48 | 463 | 352,348 | ||||||
2.75%, 11/15/50 | 675 | 344,061 | ||||||
Valmont Industries, Inc., 5.00%, 10/01/44(a) | 829 | 637,803 | ||||||
Xylem, Inc., 4.38%, 11/01/46 | 413 | 296,447 | ||||||
|
| |||||||
| 10,753,823 | ||||||||
| Media — 5.0% | ||||||||
Bell Telephone Co. of Canada or Bell Canada | ||||||||
4.46%, 04/01/48 | 1,085 | 801,335 | ||||||
4.30%, 07/29/49 | 498 | 355,907 | ||||||
3.65%, 08/15/52 | 658 | 416,700 | ||||||
Series US-4, 3.65%, 03/17/51 | 500 | 318,216 | ||||||
Series US-6, 3.20%, 02/15/52 | 559 | 325,734 | ||||||
Charter Communications Operating LLC/Charter Communications Operating Capital |
| |||||||
6.38%, 10/23/35(a) | 2,013 | 1,819,369 | ||||||
5.38%, 04/01/38 | 829 | 654,282 | ||||||
3.50%, 06/01/41 | 979 | 586,616 | ||||||
3.50%, 03/01/42 | 1,363 | 804,932 | ||||||
6.48%, 10/23/45 | 3,493 | 2,936,462 | ||||||
5.38%, 05/01/47 | 2,043 | 1,477,583 | ||||||
5.75%, 04/01/48 | 2,359 | 1,789,835 | ||||||
5.13%, 07/01/49 | 1,229 | 850,329 | ||||||
4.80%, 03/01/50 | 2,726 | 1,796,955 | ||||||
3.70%, 04/01/51 | 2,046 | 1,121,660 | ||||||
3.90%, 06/01/52 | 2,425 | 1,368,789 | ||||||
5.25%, 04/01/53(a) | 1,252 | 887,926 | ||||||
6.83%, 10/23/55 | 163 | 137,532 | ||||||
3.85%, 04/01/61 | 1,617 | 854,209 | ||||||
4.40%, 12/01/61 | 1,429 | 832,026 | ||||||
3.95%, 06/30/62 | 1,243 | 663,510 | ||||||
5.50%, 04/01/63 | 1,000 | 703,084 | ||||||
Comcast Corp. | ||||||||
4.20%, 08/15/34 | 953 | 805,607 | ||||||
5.65%, 06/15/35 | 900 | 857,585 | ||||||
4.40%, 08/15/35 | 163 | 138,681 | ||||||
SCHEDULE OF INVESTMENTS | 81 |
Schedule of Investments (continued) October 31, 2023 | iShares U.S. Long Credit Bond Index Fund (Percentages shown are based on Net Assets) |
| Security | Par (000) | Value | ||||||
| Media (continued) | ||||||||
Comcast Corp. (continued) | ||||||||
3.20%, 07/15/36 | $ | 1,163 | $ | 858,348 | ||||
6.45%, 03/15/37 | 350 | 351,821 | ||||||
3.90%, 03/01/38 | 1,213 | 940,933 | ||||||
4.60%, 10/15/38 | 1,370 | 1,138,136 | ||||||
3.25%, 11/01/39 | 1,579 | 1,088,854 | ||||||
3.75%, 04/01/40 | 1,629 | 1,197,139 | ||||||
4.65%, 07/15/42 | 475 | 381,830 | ||||||
4.75%, 03/01/44 | 308 | 248,052 | ||||||
4.60%, 08/15/45 | 1,036 | 810,642 | ||||||
3.40%, 07/15/46 | 1,413 | 907,588 | ||||||
4.00%, 08/15/47 | 1,163 | 819,277 | ||||||
3.97%, 11/01/47 | 2,093 | 1,469,095 | ||||||
4.00%, 03/01/48 | 1,163 | 820,008 | ||||||
4.70%, 10/15/48 | 2,286 | 1,821,260 | ||||||
4.00%, 11/01/49 | 2,039 | 1,424,228 | ||||||
3.45%, 02/01/50 | 1,500 | 948,286 | ||||||
2.80%, 01/15/51 | 1,000 | 546,461 | ||||||
2.89%, 11/01/51 | 4,709 | 2,600,625 | ||||||
2.45%, 08/15/52(a) | 1,409 | 708,655 | ||||||
4.05%, 11/01/52 | 1,047 | 726,387 | ||||||
5.35%, 05/15/53 | 1,590 | 1,367,936 | ||||||
2.94%, 11/01/56 | 5,401 | 2,861,445 | ||||||
4.95%, 10/15/58(a) | 829 | 667,184 | ||||||
2.65%, 08/15/62 | 1,300 | 631,333 | ||||||
2.99%, 11/01/63 | 4,079 | 2,094,089 | ||||||
5.50%, 05/15/64 | 1,090 | 929,434 | ||||||
Discovery Communications LLC | ||||||||
5.00%, 09/20/37 | 463 | 362,415 | ||||||
6.35%, 06/01/40 | 700 | 607,320 | ||||||
4.88%, 04/01/43 | 500 | 355,285 | ||||||
5.20%, 09/20/47 | 1,099 | 786,651 | ||||||
5.30%, 05/15/49 | 613 | 441,553 | ||||||
4.65%, 05/15/50 | 1,079 | 709,753 | ||||||
4.00%, 09/15/55 | 1,575 | 904,643 | ||||||
Fox Corp. | ||||||||
5.48%, 01/25/39 | 1,129 | 934,204 | ||||||
5.58%, 01/25/49 | 1,429 | 1,125,855 | ||||||
Grupo Televisa SAB | ||||||||
6.63%, 01/15/40 | 463 | 435,220 | ||||||
5.00%, 05/13/45(a) | 850 | 635,375 | ||||||
6.13%, 01/31/46(a) | 702 | 610,740 | ||||||
5.25%, 05/24/49(a) | 600 | 465,426 | ||||||
Interpublic Group of Cos., Inc. | ||||||||
3.38%, 03/01/41 | 464 | 294,066 | ||||||
5.40%, 10/01/48 | 500 | 402,776 | ||||||
NBCUniversal Media LLC | ||||||||
5.95%, 04/01/41 | 516 | 485,126 | ||||||
4.45%, 01/15/43 | 680 | 528,041 | ||||||
Paramount Global | ||||||||
6.88%, 04/30/36 | 1,263 | 1,088,054 | ||||||
5.90%, 10/15/40 | 400 | 294,469 | ||||||
4.85%, 07/01/42 | 443 | 282,723 | ||||||
4.38%, 03/15/43 | 1,186 | 711,510 | ||||||
5.85%, 09/01/43 | 1,061 | 765,994 | ||||||
5.25%, 04/01/44 | 163 | 105,968 | ||||||
4.90%, 08/15/44 | 379 | 238,143 | ||||||
4.60%, 01/15/45 | 600 | 359,416 | ||||||
4.95%, 05/19/50 | 929 | 589,173 | ||||||
TELUS Corp. | ||||||||
4.60%, 11/16/48 | 630 | 463,172 | ||||||
| Security | Par (000) | Value | ||||||
| Media (continued) | ||||||||
TELUS Corp. (continued) | ||||||||
4.30%, 06/15/49 | $ | 413 | $ | 289,298 | ||||
Thomson Reuters Corp. | ||||||||
5.50%, 08/15/35 | 350 | 322,026 | ||||||
5.85%, 04/15/40 | 400 | 359,865 | ||||||
5.65%, 11/23/43(a) | 279 | 236,263 | ||||||
Time Warner Cable LLC | ||||||||
6.55%, 05/01/37 | 1,288 | 1,130,781 | ||||||
7.30%, 07/01/38(a) | 1,400 | 1,304,662 | ||||||
6.75%, 06/15/39 | 1,701 | 1,483,407 | ||||||
5.88%, 11/15/40 | 913 | 720,253 | ||||||
5.50%, 09/01/41 | 900 | 674,500 | ||||||
4.50%, 09/15/42 | 1,163 | 763,851 | ||||||
TWDC Enterprises 18 Corp. | ||||||||
4.38%, 08/16/41 | 500 | 392,347 | ||||||
3.70%, 12/01/42 | 400 | 286,183 | ||||||
4.13%, 06/01/44(a) | 813 | 611,030 | ||||||
3.00%, 07/30/46 | 600 | 360,041 | ||||||
Series E, 4.13%, 12/01/41 | 513 | 391,163 | ||||||
Walt Disney Co. | ||||||||
6.20%, 12/15/34 | 788 | 799,459 | ||||||
6.40%, 12/15/35 | 903 | 919,413 | ||||||
6.65%, 11/15/37 | 1,536 | 1,598,367 | ||||||
4.63%, 03/23/40 | 829 | 696,840 | ||||||
3.50%, 05/13/40(a) | 1,625 | 1,168,120 | ||||||
6.15%, 02/15/41(a) | 550 | 532,996 | ||||||
5.40%, 10/01/43 | 550 | 490,323 | ||||||
4.75%, 09/15/44 | 413 | 336,978 | ||||||
4.95%, 10/15/45 | 450 | 371,513 | ||||||
7.75%, 12/01/45 | 250 | 288,568 | ||||||
4.75%, 11/15/46 | 373 | 301,137 | ||||||
2.75%, 09/01/49 | 1,779 | 994,152 | ||||||
4.70%, 03/23/50(a) | 1,727 | 1,398,849 | ||||||
3.60%, 01/13/51 | 2,524 | 1,668,188 | ||||||
3.80%, 05/13/60(a) | 1,389 | 905,747 | ||||||
Warnermedia Holdings, Inc. | ||||||||
5.05%, 03/15/42 | 4,150 | 3,074,024 | ||||||
5.14%, 03/15/52(a) | 6,464 | 4,574,034 | ||||||
5.39%, 03/15/62 | 2,750 | 1,926,012 | ||||||
|
| |||||||
| 98,017,371 | ||||||||
| Metals & Mining — 1.4% | ||||||||
ArcelorMittal SA | ||||||||
7.00%, 10/15/39 | 771 | 732,877 | ||||||
6.75%, 03/01/41 | 225 | 204,562 | ||||||
Barrick Gold Corp. | ||||||||
6.45%, 10/15/35 | 250 | 246,111 | ||||||
5.25%, 04/01/42 | 300 | 258,826 | ||||||
Barrick North America Finance LLC | ||||||||
5.70%, 05/30/41 | 1,063 | 972,990 | ||||||
5.75%, 05/01/43 | 713 | 656,310 | ||||||
Barrick PD Australia Finance Pty. Ltd., | 713 | 665,908 | ||||||
BHP Billiton Finance USA Ltd. | ||||||||
4.13%, 02/24/42 | 913 | 716,309 | ||||||
5.00%, 09/30/43 | 2,234 | 1,930,120 | ||||||
5.50%, 09/08/53 | 885 | 804,460 | ||||||
Freeport-McMoRan, Inc. | ||||||||
5.40%, 11/14/34(a) | 613 | 542,323 | ||||||
5.45%, 03/15/43 | 1,644 | 1,352,174 | ||||||
Newmont Corp. | ||||||||
5.88%, 04/01/35 | 563 | 543,369 | ||||||
| 82 | 2 0 2 3 BLACK ROCK ANNUAL REPORT TO SHAREHOLDERS |
Schedule of Investments (continued) October 31, 2023 | iShares U.S. Long Credit Bond Index Fund (Percentages shown are based on Net Assets) |
| Security | Par (000) | Value | ||||||
| Metals & Mining (continued) | ||||||||
Newmont Corp. (continued) | ||||||||
6.25%, 10/01/39 | $ | 800 | $ | 772,637 | ||||
4.88%, 03/15/42 | 927 | 760,219 | ||||||
5.45%, 06/09/44 | 380 | 326,906 | ||||||
Nucor Corp. | ||||||||
6.40%, 12/01/37 | 550 | 551,280 | ||||||
5.20%, 08/01/43(a) | 350 | 304,307 | ||||||
4.40%, 05/01/48 | 250 | 187,443 | ||||||
3.85%, 04/01/52 | 550 | 370,230 | ||||||
2.98%, 12/15/55 | 413 | 221,229 | ||||||
Precision Castparts Corp. | ||||||||
3.90%, 01/15/43 | 400 | 297,005 | ||||||
4.38%, 06/15/45 | 413 | 318,504 | ||||||
Rio Tinto Alcan, Inc. | ||||||||
6.13%, 12/15/33 | 700 | 699,596 | ||||||
5.75%, 06/01/35 | 250 | 237,251 | ||||||
Rio Tinto Finance USA Ltd. | ||||||||
5.20%, 11/02/40 | 1,088 | 974,926 | ||||||
2.75%, 11/02/51 | 1,289 | 717,676 | ||||||
Rio Tinto Finance USA PLC | ||||||||
4.75%, 03/22/42 | 288 | 243,937 | ||||||
4.13%, 08/21/42 | 713 | 548,478 | ||||||
5.13%, 03/09/53 | 1,130 | 973,190 | ||||||
Southern Copper Corp. | ||||||||
7.50%, 07/27/35 | 990 | 1,045,737 | ||||||
6.75%, 04/16/40 | 869 | 859,954 | ||||||
5.25%, 11/08/42 | 1,250 | 1,038,725 | ||||||
5.88%, 04/23/45 | 1,338 | 1,193,496 | ||||||
Steel Dynamics, Inc., 3.25%, 10/15/50 | 496 | 281,894 | ||||||
Teck Resources Ltd. | ||||||||
6.13%, 10/01/35 | 240 | 222,069 | ||||||
6.00%, 08/15/40 | 400 | 347,151 | ||||||
6.25%, 07/15/41 | 630 | 558,440 | ||||||
5.20%, 03/01/42 | 300 | 234,155 | ||||||
5.40%, 02/01/43 | 560 | 447,706 | ||||||
Vale Overseas Ltd.(a) | ||||||||
8.25%, 01/17/34 | 410 | 446,707 | ||||||
6.88%, 11/21/36 | 1,258 | 1,232,840 | ||||||
6.88%, 11/10/39 | 1,226 | 1,197,655 | ||||||
Vale SA, 5.63%, 09/11/42(a) | 379 | 333,702 | ||||||
|
| |||||||
| 27,571,384 | ||||||||
| Multi-Utilities — 0.6% | ||||||||
Atmos Energy Corp. | ||||||||
4.15%, 01/15/43(a) | 26 | 19,893 | ||||||
4.30%, 10/01/48 | 488 | 363,301 | ||||||
4.13%, 03/15/49 | 1,243 | 889,540 | ||||||
3.38%, 09/15/49 | 520 | 326,699 | ||||||
2.85%, 02/15/52(a) | 650 | 365,927 | ||||||
5.75%, 10/15/52 | 500 | 458,744 | ||||||
Black Hills Corp., 6.15%, 05/15/34 | 540 | 508,736 | ||||||
CenterPoint Energy Resources Corp. | ||||||||
5.85%, 01/15/41 | 163 | 148,128 | ||||||
4.10%, 09/01/47 | 380 | 264,315 | ||||||
Dominion Energy South Carolina, Inc., | 140 | 136,219 | ||||||
NiSource, Inc. | ||||||||
5.95%, 06/15/41(a) | 319 | 290,712 | ||||||
5.25%, 02/15/43 | 301 | 252,444 | ||||||
4.80%, 02/15/44 | 663 | 521,788 | ||||||
5.65%, 02/01/45 | 428 | 371,141 | ||||||
4.38%, 05/15/47 | 963 | 697,968 | ||||||
| Security | Par (000) | Value | ||||||
| Multi-Utilities (continued) | ||||||||
NiSource, Inc. (continued) | ||||||||
3.95%, 03/30/48 | $ | 750 | $ | 507,203 | ||||
ONE Gas, Inc. | ||||||||
4.66%, 02/01/44(a) | 563 | 433,580 | ||||||
4.50%, 11/01/48 | 350 | 256,743 | ||||||
Piedmont Natural Gas Co., Inc. | ||||||||
4.65%, 08/01/43 | 255 | 196,540 | ||||||
3.64%, 11/01/46 | 255 | 158,956 | ||||||
3.35%, 06/01/50 | 329 | 190,423 | ||||||
5.05%, 05/15/52 | 500 | 390,066 | ||||||
Public Service Electric and Gas Co. | ||||||||
5.13%, 03/15/53(a) | 390 | 335,021 | ||||||
5.45%, 08/01/53 | 300 | 270,718 | ||||||
Southern California Gas Co. | ||||||||
3.75%, 09/15/42 | 600 | 412,752 | ||||||
Series UU, 4.13%, 06/01/48 | 163 | 113,863 | ||||||
Series VV, 4.30%, 01/15/49 | 379 | 271,726 | ||||||
Series WW, 3.95%, 02/15/50 | 350 | 234,216 | ||||||
Southern Co. Gas Capital Corp. | ||||||||
5.88%, 03/15/41 | 550 | 484,462 | ||||||
4.40%, 06/01/43 | 261 | 188,240 | ||||||
3.95%, 10/01/46 | 620 | 405,982 | ||||||
4.40%, 05/30/47 | 350 | 252,108 | ||||||
Series 21A, 3.15%, 09/30/51 | 745 | 419,304 | ||||||
Southwest Gas Corp., 3.18%, 08/15/51 | 745 | 402,867 | ||||||
Washington Gas Light Co. | ||||||||
3.65%, 09/15/49 | 413 | 258,666 | ||||||
Series K, 3.80%, 09/15/46 | 350 | 228,110 | ||||||
|
| |||||||
| 12,027,101 | ||||||||
| Offshore Drilling & Other Services — 0.2% | ||||||||
Applied Materials, Inc. | ||||||||
5.10%, 10/01/35 | 400 | 379,045 | ||||||
5.85%, 06/15/41 | 625 | 602,864 | ||||||
4.35%, 04/01/47 | 970 | 774,816 | ||||||
2.75%, 06/01/50(a) | 763 | 452,214 | ||||||
KLA Corp., 5.00%, 03/15/49 | 400 | 332,222 | ||||||
Lam Research Corp. | ||||||||
4.88%, 03/15/49 | 829 | 683,795 | ||||||
2.88%, 06/15/50(a) | 779 | 451,756 | ||||||
3.13%, 06/15/60 | 500 | 277,789 | ||||||
|
| |||||||
| 3,954,501 | ||||||||
| Oil, Gas & Consumable Fuels — 7.9% | ||||||||
Apache Corp. | ||||||||
6.00%, 01/15/37 | 300 | 265,479 | ||||||
5.10%, 09/01/40(a) | 1,950 | 1,515,248 | ||||||
5.25%, 02/01/42 | 100 | 75,524 | ||||||
4.75%, 04/15/43 | 200 | 140,463 | ||||||
5.35%, 07/01/49 | 350 | 255,448 | ||||||
BP Capital Markets America, Inc. | ||||||||
3.06%, 06/17/41 | 1,430 | 945,835 | ||||||
3.00%, 02/24/50 | 1,829 | 1,079,096 | ||||||
2.77%, 11/10/50 | 1,559 | 865,377 | ||||||
2.94%, 06/04/51(a) | 2,067 | 1,188,427 | ||||||
3.00%, 03/17/52(a) | 1,263 | 733,658 | ||||||
3.38%, 02/08/61(a) | 2,077 | 1,229,077 | ||||||
Burlington Resources LLC, 5.95%, 10/15/36(a) | 250 | 247,123 | ||||||
Canadian Natural Resources Ltd. | ||||||||
5.85%, 02/01/35 | 300 | 274,450 | ||||||
6.50%, 02/15/37 | 400 | 379,932 | ||||||
6.25%, 03/15/38 | 925 | 864,311 | ||||||
SCHEDULE OF INVESTMENTS | 83 |
Schedule of Investments (continued) October 31, 2023 | iShares U.S. Long Credit Bond Index Fund (Percentages shown are based on Net Assets) |
| Security | Par (000) | Value | ||||||
| Oil, Gas & Consumable Fuels (continued) | ||||||||
Canadian Natural Resources Ltd. (continued) |
| |||||||
6.75%, 02/01/39 | $ | 350 | $ | 337,021 | ||||
4.95%, 06/01/47 | 643 | 504,503 | ||||||
Cenovus Energy, Inc. | ||||||||
5.25%, 06/15/37 | 290 | 247,952 | ||||||
6.75%, 11/15/39 | 628 | 606,977 | ||||||
5.40%, 06/15/47(a) | 527 | 432,865 | ||||||
3.75%, 02/15/52(a) | 609 | 380,758 | ||||||
Chevron Corp., 3.08%, 05/11/50(a) | 900 | 564,952 | ||||||
Chevron USA, Inc. | ||||||||
6.00%, 03/01/41 | 350 | 346,958 | ||||||
5.25%, 11/15/43 | 300 | 269,956 | ||||||
2.34%, 08/12/50(a) | 613 | 324,633 | ||||||
CNOOC Petroleum North America ULC | ||||||||
5.88%, 03/10/35 | 1,000 | 962,820 | ||||||
6.40%, 05/15/37 | 1,329 | 1,325,996 | ||||||
7.50%, 07/30/39(a) | 1,000 | 1,088,630 | ||||||
Columbia Pipeline Group, Inc., | 400 | 338,349 | ||||||
ConocoPhillips | ||||||||
6.50%, 02/01/39 | 1,450 | 1,497,547 | ||||||
4.88%, 10/01/47(a) | 500 | 411,492 | ||||||
ConocoPhillips Co. | ||||||||
3.76%, 03/15/42 | 630 | 457,655 | ||||||
4.30%, 11/15/44 | 829 | 636,664 | ||||||
5.95%, 03/15/46 | 300 | 280,859 | ||||||
3.80%, 03/15/52 | 988 | 673,018 | ||||||
5.30%, 05/15/53 | 980 | 846,061 | ||||||
5.55%, 03/15/54 | 1,240 | 1,108,401 | ||||||
4.03%, 03/15/62 | 1,530 | 1,031,604 | ||||||
5.70%, 09/15/63 | 700 | 624,658 | ||||||
Continental Resources, Inc., 4.90%, 06/01/44 | 613 | 432,839 | ||||||
DCP Midstream Operating LP, | 350 | 295,799 | ||||||
Devon Energy Corp. | ||||||||
5.60%, 07/15/41 | 1,263 | 1,072,142 | ||||||
4.75%, 05/15/42 | 719 | 548,166 | ||||||
5.00%, 06/15/45(a) | 763 | 587,911 | ||||||
Diamondback Energy, Inc. | ||||||||
4.40%, 03/24/51 | 613 | 434,970 | ||||||
4.25%, 03/15/52 | 700 | 481,104 | ||||||
6.25%, 03/15/53 | 600 | 553,656 | ||||||
Eastern Gas Transmission & Storage, Inc. | ||||||||
4.80%, 11/01/43 | 300 | 233,300 | ||||||
4.60%, 12/15/44 | 500 | 369,300 | ||||||
Enbridge Energy Partners LP | ||||||||
5.50%, 09/15/40 | 500 | 420,469 | ||||||
7.38%, 10/15/45 | 660 | 674,866 | ||||||
Series B, 7.50%, 04/15/38 | 350 | 359,168 | ||||||
Enbridge, Inc. | ||||||||
4.50%, 06/10/44 | 413 | 301,151 | ||||||
5.50%, 12/01/46 | 250 | 208,578 | ||||||
4.00%, 11/15/49 | 454 | 301,130 | ||||||
3.40%, 08/01/51(a) | 989 | 584,809 | ||||||
Energy Transfer LP | ||||||||
4.90%, 03/15/35 | 463 | 393,136 | ||||||
6.63%, 10/15/36 | 370 | 354,695 | ||||||
7.50%, 07/01/38 | 500 | 511,076 | ||||||
6.05%, 06/01/41 | 700 | 607,476 | ||||||
6.50%, 02/01/42 | 963 | 890,213 | ||||||
6.10%, 02/15/42 | 250 | 218,550 | ||||||
4.95%, 01/15/43 | 163 | 121,673 | ||||||
5.15%, 02/01/43 | 413 | 316,943 | ||||||
5.95%, 10/01/43 | 397 | 335,787 | ||||||
5.30%, 04/01/44 | 626 | 491,941 | ||||||
| Security | Par (000) | Value | ||||||
| Oil, Gas & Consumable Fuels (continued) | ||||||||
Energy Transfer LP (continued) |
| |||||||
5.00%, 05/15/44 | $ | 413 | $ | 309,208 | ||||
5.15%, 03/15/45 | 1,029 | 796,860 | ||||||
5.35%, 05/15/45 | 813 | 638,868 | ||||||
6.13%, 12/15/45 | 1,036 | 895,136 | ||||||
5.30%, 04/15/47 | 920 | 713,093 | ||||||
5.40%, 10/01/47 | 1,479 | 1,161,544 | ||||||
6.00%, 06/15/48 | 1,000 | 850,250 | ||||||
6.25%, 04/15/49 | 1,779 | 1,565,464 | ||||||
5.00%, 05/15/50 | 2,036 | 1,526,564 | ||||||
Series 20Y, 5.80%, 06/15/38 | 500 | 436,673 | ||||||
Enterprise Products Operating LLC | ||||||||
6.13%, 10/15/39 | 600 | 580,904 | ||||||
6.45%, 09/01/40 | 600 | 597,167 | ||||||
5.95%, 02/01/41 | 597 | 566,052 | ||||||
4.85%, 08/15/42 | 1,100 | 919,583 | ||||||
4.45%, 02/15/43 | 1,133 | 894,572 | ||||||
4.85%, 03/15/44 | 1,529 | 1,266,276 | ||||||
5.10%, 02/15/45 | 1,036 | 881,911 | ||||||
4.90%, 05/15/46 | 911 | 749,903 | ||||||
4.25%, 02/15/48 | 1,279 | 957,061 | ||||||
4.80%, 02/01/49 | 1,329 | 1,074,229 | ||||||
4.20%, 01/31/50 | 1,378 | 1,009,314 | ||||||
3.70%, 01/31/51 | 1,025 | 685,544 | ||||||
3.20%, 02/15/52(a) | 1,029 | 620,864 | ||||||
3.30%, 02/15/53(a) | 981 | 600,680 | ||||||
4.95%, 10/15/54 | 300 | 242,168 | ||||||
3.95%, 01/31/60 | 1,000 | 669,648 | ||||||
Series H, 6.65%, 10/15/34 | 300 | 310,992 | ||||||
EOG Resources, Inc. | ||||||||
3.90%, 04/01/35 | 450 | 369,213 | ||||||
4.95%, 04/15/50 | 713 | 598,589 | ||||||
Equinor ASA | ||||||||
3.63%, 04/06/40 | 829 | 614,195 | ||||||
5.10%, 08/17/40 | 911 | 817,005 | ||||||
4.25%, 11/23/41 | 225 | 178,933 | ||||||
3.95%, 05/15/43 | 1,650 | 1,249,340 | ||||||
3.25%, 11/18/49 | 620 | 393,424 | ||||||
3.70%, 04/06/50 | 1,429 | 988,792 | ||||||
Exxon Mobil Corp. | ||||||||
3.00%, 08/16/39 | 713 | 496,242 | ||||||
4.23%, 03/19/40 | 1,844 | 1,496,455 | ||||||
3.57%, 03/06/45 | 900 | 630,223 | ||||||
4.11%, 03/01/46 | 2,329 | 1,775,155 | ||||||
3.10%, 08/16/49 | 1,243 | 772,350 | ||||||
4.33%, 03/19/50 | 2,768 | 2,143,535 | ||||||
3.45%, 04/15/51 | 2,615 | 1,718,318 | ||||||
Hess Corp. | ||||||||
6.00%, 01/15/40 | 750 | 724,594 | ||||||
5.60%, 02/15/41 | 1,254 | 1,164,355 | ||||||
5.80%, 04/01/47(a) | 429 | 404,990 | ||||||
Kinder Morgan Energy Partners LP | ||||||||
5.80%, 03/15/35 | 829 | 759,661 | ||||||
6.50%, 02/01/37 | 576 | 544,406 | ||||||
6.95%, 01/15/38 | 1,086 | 1,076,595 | ||||||
6.50%, 09/01/39 | 600 | 556,497 | ||||||
6.55%, 09/15/40 | 350 | 324,465 | ||||||
7.50%, 11/15/40 | 650 | 655,479 | ||||||
6.38%, 03/01/41 | 413 | 376,300 | ||||||
5.00%, 08/15/42 | 650 | 507,848 | ||||||
4.70%, 11/01/42(a) | 400 | 296,567 | ||||||
5.00%, 03/01/43 | 513 | 396,412 | ||||||
5.50%, 03/01/44 | 620 | 505,057 | ||||||
| 84 | 2 0 2 3 BLACK ROCK ANNUAL REPORT TO SHAREHOLDERS |
Schedule of Investments (continued) October 31, 2023 | iShares U.S. Long Credit Bond Index Fund (Percentages shown are based on Net Assets) |
Security | Par (000) | Value | ||||||
| Oil, Gas & Consumable Fuels (continued) | ||||||||
Kinder Morgan Energy Partners LP (continued) |
| |||||||
5.40%, 09/01/44 | $ | 463 | $ | 372,780 | ||||
Kinder Morgan, Inc. | ||||||||
5.30%, 12/01/34 | 763 | 675,182 | ||||||
5.55%, 06/01/45 | 1,736 | 1,428,942 | ||||||
5.05%, 02/15/46 | 620 | 472,870 | ||||||
5.20%, 03/01/48 | 686 | 533,709 | ||||||
3.25%, 08/01/50 | 500 | 282,921 | ||||||
3.60%, 02/15/51 | 1,029 | 619,504 | ||||||
5.45%, 08/01/52(a) | 700 | 565,782 | ||||||
Magellan Midstream Partners LP | ||||||||
5.15%, 10/15/43 | 400 | 317,473 | ||||||
4.25%, 09/15/46 | 563 | 380,234 | ||||||
4.20%, 10/03/47(a) | 660 | 436,474 | ||||||
4.85%, 02/01/49 | 450 | 332,985 | ||||||
3.95%, 03/01/50(a) | 636 | 401,335 | ||||||
Marathon Oil Corp. | ||||||||
6.60%, 10/01/37 | 763 | 729,331 | ||||||
5.20%, 06/01/45 | 513 | 396,048 | ||||||
Marathon Petroleum Corp. | ||||||||
6.50%, 03/01/41 | 1,150 | 1,091,450 | ||||||
4.75%, 09/15/44 | 763 | 576,632 | ||||||
4.50%, 04/01/48 | 459 | 325,953 | ||||||
5.00%, 09/15/54 | 250 | 184,337 | ||||||
MPLX LP | ||||||||
4.50%, 04/15/38 | 1,700 | 1,324,393 | ||||||
5.20%, 03/01/47 | 829 | 641,120 | ||||||
5.20%, 12/01/47 | 413 | 317,945 | ||||||
4.70%, 04/15/48 | 1,386 | 1,001,932 | ||||||
5.50%, 02/15/49 | 1,479 | 1,193,795 | ||||||
4.95%, 03/14/52 | 1,371 | 1,016,059 | ||||||
5.65%, 03/01/53 | 440 | 361,922 | ||||||
4.90%, 04/15/58 | 500 | 351,960 | ||||||
Occidental Petroleum Corp. | ||||||||
6.45%, 09/15/36 | 1,500 | 1,456,920 | ||||||
6.20%, 03/15/40 | 1,000 | 927,200 | ||||||
6.60%, 03/15/46(a) | 500 | 481,453 | ||||||
4.20%, 03/15/48(a) | 1,650 | 1,112,150 | ||||||
ONEOK Partners LP | ||||||||
6.65%, 10/01/36 | 500 | 481,746 | ||||||
6.85%, 10/15/37 | 400 | 390,581 | ||||||
6.13%, 02/01/41 | 575 | 519,603 | ||||||
6.20%, 09/15/43 | 350 | 313,280 | ||||||
ONEOK, Inc. | ||||||||
6.00%, 06/15/35 | 300 | 278,004 | ||||||
4.95%, 07/13/47 | 679 | 506,805 | ||||||
5.20%, 07/15/48 | 963 | 745,081 | ||||||
4.45%, 09/01/49 | 625 | 428,012 | ||||||
4.50%, 03/15/50 | 413 | 285,151 | ||||||
7.15%, 01/15/51 | 250 | 244,476 | ||||||
6.63%, 09/01/53 | 1,600 | 1,495,280 | ||||||
Ovintiv, Inc. | ||||||||
6.50%, 08/15/34(a) | 413 | 395,090 | ||||||
6.63%, 08/15/37 | 725 | 679,262 | ||||||
6.50%, 02/01/38 | 243 | 225,123 | ||||||
7.10%, 07/15/53 | 350 | 333,101 | ||||||
Phillips 66 | ||||||||
4.65%, 11/15/34 | 872 | 758,261 | ||||||
5.88%, 05/01/42 | 1,426 | 1,330,609 | ||||||
4.88%, 11/15/44 | 1,636 | 1,344,931 | ||||||
3.30%, 03/15/52(a) | 967 | 566,690 | ||||||
Phillips 66 Co. | ||||||||
4.68%, 02/15/45 | 400 | 304,447 | ||||||
Security | Par (000) | Value | ||||||
| Oil, Gas & Consumable Fuels (continued) | ||||||||
Phillips 66 Co. (continued) |
| |||||||
4.90%, 10/01/46 | $ | 613 | $ | 482,013 | ||||
Plains All American Pipeline LP/PAA Finance Corp. |
| |||||||
6.65%, 01/15/37 | 500 | 472,719 | ||||||
5.15%, 06/01/42 | 450 | 341,255 | ||||||
4.30%, 01/31/43 | 300 | 203,184 | ||||||
4.70%, 06/15/44 | 620 | 434,088 | ||||||
4.90%, 02/15/45 | 579 | 417,616 | ||||||
Sabine Pass Liquefaction LLC, | 400 | 383,337 | ||||||
Shell International Finance BV | ||||||||
4.13%, 05/11/35 | 1,390 | 1,185,035 | ||||||
6.38%, 12/15/38 | 2,575 | 2,632,133 | ||||||
5.50%, 03/25/40(a) | 775 | 723,763 | ||||||
2.88%, 11/26/41 | 463 | 299,367 | ||||||
3.63%, 08/21/42(a) | 600 | 434,074 | ||||||
4.55%, 08/12/43 | 1,159 | 939,335 | ||||||
4.38%, 05/11/45 | 2,823 | 2,204,100 | ||||||
4.00%, 05/10/46 | 2,086 | 1,536,087 | ||||||
3.75%, 09/12/46 | 1,095 | 766,159 | ||||||
3.13%, 11/07/49 | 1,128 | 692,555 | ||||||
3.25%, 04/06/50 | 1,939 | 1,222,337 | ||||||
3.00%, 11/26/51 | 1,000 | 589,607 | ||||||
Spectra Energy Partners LP | ||||||||
5.95%, 09/25/43 | 350 | 304,801 | ||||||
4.50%, 03/15/45 | 660 | 476,541 | ||||||
Suncor Energy, Inc. | ||||||||
5.95%, 12/01/34 | 400 | 374,957 | ||||||
6.80%, 05/15/38 | 750 | 737,452 | ||||||
6.50%, 06/15/38 | 1,193 | 1,146,943 | ||||||
6.85%, 06/01/39 | 613 | 596,388 | ||||||
4.00%, 11/15/47 | 829 | 555,402 | ||||||
3.75%, 03/04/51(a) | 621 | 394,559 | ||||||
Targa Resources Corp. | ||||||||
4.95%, 04/15/52 | 752 | 548,711 | ||||||
6.25%, 07/01/52 | 400 | 349,614 | ||||||
6.50%, 02/15/53 | 800 | 729,413 | ||||||
TotalEnergies Capital International SA | ||||||||
2.99%, 06/29/41 | 700 | 461,930 | ||||||
3.46%, 07/12/49 | 963 | 637,170 | ||||||
3.13%, 05/29/50 | 2,329 | 1,423,429 | ||||||
3.39%, 06/29/60 | 829 | 500,063 | ||||||
TransCanada PipeLines Ltd. | ||||||||
4.63%, 03/01/34 | 1,120 | 947,379 | ||||||
5.60%, 03/31/34 | 413 | 376,287 | ||||||
5.85%, 03/15/36 | 500 | 459,816 | ||||||
6.20%, 10/15/37 | 880 | 820,708 | ||||||
4.75%, 05/15/38 | 386 | 307,099 | ||||||
7.25%, 08/15/38 | 513 | 525,844 | ||||||
7.63%, 01/15/39 | 1,363 | 1,443,545 | ||||||
6.10%, 06/01/40 | 500 | 459,364 | ||||||
5.00%, 10/16/43 | 517 | 408,007 | ||||||
4.88%, 05/15/48 | 870 | 658,232 | ||||||
5.10%, 03/15/49(a) | 1,370 | 1,069,561 | ||||||
Transcontinental Gas Pipe Line Co. LLC | ||||||||
5.40%, 08/15/41 | 400 | 339,141 | ||||||
4.45%, 08/01/42 | 163 | 122,949 | ||||||
4.60%, 03/15/48 | 930 | 699,799 | ||||||
3.95%, 05/15/50 | 413 | 279,820 | ||||||
Valero Energy Corp. | ||||||||
6.63%, 06/15/37 | 1,375 | 1,350,200 | ||||||
4.90%, 03/15/45(a) | 413 | 324,290 | ||||||
3.65%, 12/01/51 | 875 | 531,013 | ||||||
4.00%, 06/01/52(a) | 519 | 337,293 | ||||||
SCHEDULE OF INVESTMENTS | 85 |
Schedule of Investments (continued) October 31, 2023 | iShares U.S. Long Credit Bond Index Fund (Percentages shown are based on Net Assets) |
| Security | Par (000) | Value | ||||||
| Oil, Gas & Consumable Fuels (continued) | ||||||||
Western Midstream Operating LP |
| |||||||
5.45%, 04/01/44 | $ | 180 | $ | 138,532 | ||||
5.30%, 03/01/48(a) | 1,000 | 747,054 | ||||||
5.50%, 08/15/48 | 300 | 227,466 | ||||||
5.25%, 02/01/50 | 1,100 | 812,856 | ||||||
Williams Cos., Inc. | ||||||||
6.30%, 04/15/40 | 1,113 | 1,050,840 | ||||||
5.80%, 11/15/43 | 350 | 304,927 | ||||||
5.40%, 03/04/44 | 429 | 356,537 | ||||||
5.75%, 06/24/44 | 529 | 461,179 | ||||||
4.90%, 01/15/45 | 463 | 355,117 | ||||||
5.10%, 09/15/45 | 945 | 759,604 | ||||||
4.85%, 03/01/48 | 713 | 545,917 | ||||||
3.50%, 10/15/51 | 600 | 362,630 | ||||||
5.30%, 08/15/52 | 720 | 585,373 | ||||||
|
| |||||||
| 156,816,988 | ||||||||
| Passenger Airlines — 0.1% | ||||||||
American Airlines Pass-Through Trust, | 548 | 441,241 | ||||||
United Airlines Pass-Through Trust, | 1,200 | 1,124,531 | ||||||
|
| |||||||
| 1,565,772 | ||||||||
| Personal Care Products — 0.4% | ||||||||
Colgate-Palmolive Co. | ||||||||
4.00%, 08/15/45 | 500 | 393,952 | ||||||
3.70%, 08/01/47(a) | 620 | 455,651 | ||||||
Estee Lauder Cos., Inc. | ||||||||
6.00%, 05/15/37 | 300 | 298,201 | ||||||
4.38%, 06/15/45 | 500 | 382,623 | ||||||
4.15%, 03/15/47 | 413 | 306,350 | ||||||
3.13%, 12/01/49 | 566 | 345,300 | ||||||
5.15%, 05/15/53 | 530 | 454,502 | ||||||
Haleon U.S. Capital LLC, | 1,000 | 702,339 | ||||||
Kenvue, Inc. | ||||||||
5.10%, 03/22/43 | 630 | 557,345 | ||||||
5.05%, 03/22/53 | 1,300 | 1,116,953 | ||||||
5.20%, 03/22/63 | 700 | 594,317 | ||||||
Procter & Gamble Co. | ||||||||
5.80%, 08/15/34 | 350 | 361,787 | ||||||
5.55%, 03/05/37 | 950 | 945,603 | ||||||
3.55%, 03/25/40 | 463 | 356,647 | ||||||
3.60%, 03/25/50(a) | 829 | 599,977 | ||||||
Unilever Capital Corp., Series 30Y, | 704 | 398,090 | ||||||
|
| |||||||
| 8,269,637 | ||||||||
| Pharmaceuticals — 6.6% | ||||||||
AbbVie, Inc. | ||||||||
4.55%, 03/15/35 | 1,720 | 1,512,143 | ||||||
4.50%, 05/14/35 | 2,001 | 1,748,076 | ||||||
4.30%, 05/14/36 | 1,030 | 874,684 | ||||||
4.05%, 11/21/39 | 3,937 | 3,076,086 | ||||||
4.40%, 11/06/42 | 2,910 | 2,310,953 | ||||||
4.85%, 06/15/44 | 1,036 | 866,442 | ||||||
4.75%, 03/15/45 | 552 | 452,438 | ||||||
4.70%, 05/14/45 | 2,423 | 1,969,852 | ||||||
4.45%, 05/14/46 | 1,486 | 1,154,823 | ||||||
4.88%, 11/14/48 | 1,879 | 1,555,795 | ||||||
4.25%, 11/21/49 | 5,431 | 4,075,897 | ||||||
AstraZeneca PLC | ||||||||
6.45%, 09/15/37 | 2,525 | 2,625,752 | ||||||
4.00%, 09/18/42 | 850 | 658,996 | ||||||
| Security | Par (000) | Value | ||||||
| Pharmaceuticals (continued) | ||||||||
AstraZeneca PLC (continued) |
| |||||||
4.38%, 11/16/45 | $ | 1,037 | $ | 824,322 | ||||
4.38%, 08/17/48 | 745 | 590,760 | ||||||
2.13%, 08/06/50(a) | 348 | 179,365 | ||||||
3.00%, 05/28/51 | 650 | 398,347 | ||||||
Bristol-Myers Squibb Co. | ||||||||
4.13%, 06/15/39 | 1,863 | 1,479,529 | ||||||
2.35%, 11/13/40 | 650 | 390,156 | ||||||
3.55%, 03/15/42 | 1,040 | 737,135 | ||||||
3.25%, 08/01/42 | 750 | 503,186 | ||||||
4.63%, 05/15/44 | 650 | 528,385 | ||||||
5.00%, 08/15/45 | 650 | 553,360 | ||||||
4.35%, 11/15/47 | 1,460 | 1,110,331 | ||||||
4.55%, 02/20/48 | 1,042 | 820,733 | ||||||
4.25%, 10/26/49 | 3,513 | 2,612,690 | ||||||
2.55%, 11/13/50 | 1,589 | 846,763 | ||||||
3.70%, 03/15/52 | 1,893 | 1,270,792 | ||||||
6.25%, 11/15/53(e) | 580 | 573,980 | ||||||
3.90%, 03/15/62(a) | 864 | 564,858 | ||||||
6.40%, 11/15/63(e) | 580 | 574,623 | ||||||
Cigna Group | ||||||||
4.80%, 08/15/38 | 2,079 | 1,761,073 | ||||||
3.20%, 03/15/40 | 829 | 562,006 | ||||||
6.13%, 11/15/41 | 350 | 334,404 | ||||||
4.80%, 07/15/46 | 1,536 | 1,219,953 | ||||||
3.88%, 10/15/47 | 620 | 422,627 | ||||||
4.90%, 12/15/48 | 2,693 | 2,153,554 | ||||||
3.40%, 03/15/50 | 1,229 | 759,976 | ||||||
3.40%, 03/15/51 | 1,436 | 884,808 | ||||||
CVS Health Corp. | ||||||||
4.88%, 07/20/35 | 829 | 715,789 | ||||||
4.78%, 03/25/38 | 4,573 | 3,782,303 | ||||||
6.13%, 09/15/39(a) | 200 | 186,358 | ||||||
4.13%, 04/01/40 | 1,010 | 748,079 | ||||||
2.70%, 08/21/40 | 1,283 | 776,932 | ||||||
5.30%, 12/05/43 | 750 | 620,167 | ||||||
5.13%, 07/20/45 | 2,981 | 2,379,920 | ||||||
5.05%, 03/25/48(a) | 7,642 | 6,007,259 | ||||||
4.25%, 04/01/50 | 496 | 343,738 | ||||||
5.63%, 02/21/53 | 1,275 | 1,080,469 | ||||||
5.88%, 06/01/53(a) | 1,140 | 996,940 | ||||||
6.00%, 06/01/63 | 640 | 554,451 | ||||||
Eli Lilly & Co. | ||||||||
5.55%, 03/15/37 | 400 | 393,089 | ||||||
3.70%, 03/01/45 | 829 | 606,689 | ||||||
3.95%, 03/15/49 | 800 | 604,391 | ||||||
2.25%, 05/15/50(a) | 1,659 | 880,271 | ||||||
4.88%, 02/27/53 | 1,110 | 962,008 | ||||||
4.15%, 03/15/59 | 500 | 370,014 | ||||||
2.50%, 09/15/60 | 796 | 404,511 | ||||||
4.95%, 02/27/63 | 940 | 800,595 | ||||||
GlaxoSmithKline Capital, Inc. | ||||||||
5.38%, 04/15/34(a) | 463 | 452,740 | ||||||
6.38%, 05/15/38 | 2,551 | 2,655,232 | ||||||
4.20%, 03/18/43 | 496 | 397,175 | ||||||
Johnson & Johnson | ||||||||
4.38%, 12/05/33 | 713 | 664,146 | ||||||
3.55%, 03/01/36 | 970 | 793,699 | ||||||
3.63%, 03/03/37 | 1,263 | 1,024,869 | ||||||
5.95%, 08/15/37 | 850 | 872,676 | ||||||
3.40%, 01/15/38 | 850 | 660,234 | ||||||
5.85%, 07/15/38 | 600 | 613,158 | ||||||
2.10%, 09/01/40 | 1,493 | 906,770 | ||||||
| 86 | 2 0 2 3 BLACK ROCK ANNUAL REPORT TO SHAREHOLDERS |
Schedule of Investments (continued) October 31, 2023 | iShares U.S. Long Credit Bond Index Fund (Percentages shown are based on Net Assets) |
| Security | Par (000) | Value | ||||||
| Pharmaceuticals (continued) | ||||||||
Johnson & Johnson (continued) | ||||||||
4.50%, 09/01/40 | $ | 291 | $ | 250,777 | ||||
4.85%, 05/15/41 | 250 | 223,455 | ||||||
4.50%, 12/05/43 | 620 | 530,034 | ||||||
3.70%, 03/01/46 | 2,063 | 1,521,436 | ||||||
3.75%, 03/03/47 | 850 | 629,388 | ||||||
3.50%, 01/15/48 | 586 | 414,286 | ||||||
2.25%, 09/01/50(a) | 850 | 456,932 | ||||||
2.45%, 09/01/60 | 1,243 | 637,922 | ||||||
Mead Johnson Nutrition Co. | ||||||||
5.90%, 11/01/39 | 360 | 337,858 | ||||||
4.60%, 06/01/44 | 463 | 368,022 | ||||||
Merck & Co., Inc. | ||||||||
6.50%, 12/01/33 | 600 | 629,683 | ||||||
6.55%, 09/15/37 | 350 | 365,493 | ||||||
3.90%, 03/07/39 | 913 | 724,955 | ||||||
2.35%, 06/24/40 | 809 | 501,908 | ||||||
3.60%, 09/15/42(a) | 450 | 329,434 | ||||||
4.15%, 05/18/43 | 1,120 | 878,978 | ||||||
4.90%, 05/17/44 | 800 | 691,743 | ||||||
3.70%, 02/10/45 | 1,876 | 1,344,116 | ||||||
4.00%, 03/07/49 | 1,329 | 982,707 | ||||||
2.45%, 06/24/50 | 1,129 | 606,615 | ||||||
2.75%, 12/10/51(a) | 1,671 | 943,583 | ||||||
5.00%, 05/17/53 | 1,520 | 1,298,018 | ||||||
2.90%, 12/10/61 | 1,329 | 714,641 | ||||||
5.15%, 05/17/63(a) | 1,015 | 864,883 | ||||||
Merck Sharp & Dohme Corp., | 300 | 294,044 | ||||||
Mylan, Inc. | ||||||||
5.40%, 11/29/43 | 413 | 303,851 | ||||||
5.20%, 04/15/48 | 754 | 518,404 | ||||||
Novartis Capital Corp. | ||||||||
3.70%, 09/21/42 | 450 | 335,550 | ||||||
4.40%, 05/06/44 | 1,836 | 1,500,358 | ||||||
4.00%, 11/20/45 | 1,120 | 858,123 | ||||||
2.75%, 08/14/50(a) | 1,110 | 659,678 | ||||||
Pfizer Investment Enterprises Pte Ltd. | ||||||||
5.30%, 05/19/53(a) | 11,630 | 10,174,480 | ||||||
5.34%, 05/19/63 | 200 | 171,332 | ||||||
Pfizer, Inc. | ||||||||
4.00%, 12/15/36 | 763 | 635,168 | ||||||
4.10%, 09/15/38 | 829 | 667,499 | ||||||
3.90%, 03/15/39 | 813 | 636,501 | ||||||
7.20%, 03/15/39 | 3,166 | 3,489,555 | ||||||
2.55%, 05/28/40 | 1,109 | 704,014 | ||||||
5.60%, 09/15/40 | 400 | 375,617 | ||||||
4.30%, 06/15/43 | 2,463 | 1,951,532 | ||||||
4.40%, 05/15/44 | 813 | 658,323 | ||||||
4.13%, 12/15/46 | 1,243 | 945,020 | ||||||
4.20%, 09/15/48 | 813 | 622,960 | ||||||
4.00%, 03/15/49 | 829 | 614,056 | ||||||
2.70%, 05/28/50(a) | 1,160 | 673,015 | ||||||
Takeda Pharmaceutical Co. Ltd. | ||||||||
3.03%, 07/09/40 | 1,391 | 914,997 | ||||||
3.18%, 07/09/50 | 1,833 | 1,087,004 | ||||||
3.38%, 07/09/60(a) | 1,078 | 616,454 | ||||||
Utah Acquisition Sub, Inc., 5.25%, 06/15/46 | 1,013 | 709,607 | ||||||
Viatris, Inc. | ||||||||
3.85%, 06/22/40 | 1,379 | 858,277 | ||||||
4.00%, 06/22/50 | 1,643 | 945,264 | ||||||
Wyeth LLC | ||||||||
6.50%, 02/01/34 | 813 | 839,199 | ||||||
| Security | Par (000) | Value | ||||||
| Pharmaceuticals (continued) | ||||||||
Wyeth LLC (continued) | ||||||||
5.95%, 04/01/37 | $ | 1,563 | $ | 1,541,277 | ||||
Zoetis, Inc. | ||||||||
4.70%, 02/01/43 | 1,129 | 927,039 | ||||||
3.95%, 09/12/47 | 463 | 331,151 | ||||||
4.45%, 08/20/48 | 413 | 317,768 | ||||||
3.00%, 05/15/50 | 329 | 195,023 | ||||||
|
| |||||||
| 130,113,332 | ||||||||
| Professional Services — 0.0% | ||||||||
Verisk Analytics, Inc. | ||||||||
5.50%, 06/15/45 | 300 | 253,825 | ||||||
3.63%, 05/15/50(a) | 472 | 301,588 | ||||||
|
| |||||||
| 555,413 | ||||||||
| Real Estate — 0.0% | ||||||||
VICI Properties LP, 5.63%, 05/15/52 | 629 | 492,356 | ||||||
|
| |||||||
| Real Estate Management & Development — 0.0% | ||||||||
CBRE Services, Inc., 5.95%, 08/15/34 | 750 | 681,887 | ||||||
|
| |||||||
| Retail REITs — 0.1% | ||||||||
NNN REIT, Inc. | ||||||||
3.10%, 04/15/50 | 829 | 453,228 | ||||||
3.50%, 04/15/51 | 350 | 209,355 | ||||||
3.00%, 04/15/52 | 378 | 201,706 | ||||||
Realty Income Corp., 4.65%, 03/15/47 | 500 | 392,541 | ||||||
|
| |||||||
| 1,256,830 | ||||||||
| Semiconductors & Semiconductor Equipment — 2.5% | ||||||||
Advanced Micro Devices, Inc., | 430 | 331,235 | ||||||
Analog Devices, Inc. | ||||||||
2.80%, 10/01/41 | 701 | 444,608 | ||||||
2.95%, 10/01/51(a) | 950 | 556,597 | ||||||
Broadcom, Inc.(d) | ||||||||
3.47%, 04/15/34 | 2,881 | 2,195,148 | ||||||
3.14%, 11/15/35 | 3,443 | 2,428,681 | ||||||
3.19%, 11/15/36 | 2,700 | 1,869,909 | ||||||
4.93%, 05/15/37 | 2,400 | 2,000,215 | ||||||
3.50%, 02/15/41 | 2,466 | 1,640,093 | ||||||
3.75%, 02/15/51 | 1,385 | 883,114 | ||||||
Honeywell International, Inc. | ||||||||
4.50%, 01/15/34 | 900 | 808,802 | ||||||
5.70%, 03/15/36 | 450 | 439,209 | ||||||
5.70%, 03/15/37(a) | 400 | 390,240 | ||||||
5.38%, 03/01/41 | 400 | 369,532 | ||||||
3.81%, 11/21/47 | 413 | 295,991 | ||||||
2.80%, 06/01/50 | 659 | 409,338 | ||||||
Intel Corp. | ||||||||
4.60%, 03/25/40(a) | 600 | 502,330 | ||||||
2.80%, 08/12/41 | 657 | 411,257 | ||||||
4.80%, 10/01/41 | 740 | 613,656 | ||||||
5.63%, 02/10/43 | 1,380 | 1,263,601 | ||||||
4.90%, 07/29/45 | 750 | 646,252 | ||||||
4.10%, 05/19/46 | 1,123 | 819,442 | ||||||
4.10%, 05/11/47 | 1,113 | 802,393 | ||||||
3.73%, 12/08/47 | 1,909 | 1,284,836 | ||||||
3.25%, 11/15/49 | 1,750 | 1,055,561 | ||||||
4.75%, 03/25/50 | 2,156 | 1,693,062 | ||||||
3.05%, 08/12/51 | 1,050 | 601,148 | ||||||
4.90%, 08/05/52 | 1,500 | 1,195,329 | ||||||
5.70%, 02/10/53(a) | 1,860 | 1,664,575 | ||||||
3.10%, 02/15/60 | 813 | 438,978 | ||||||
4.95%, 03/25/60(a) | 829 | 664,758 | ||||||
3.20%, 08/12/61 | 1,257 | 687,168 | ||||||
SCHEDULE OF INVESTMENTS | 87 |
Schedule of Investments (continued) October 31, 2023 | iShares U.S. Long Credit Bond Index Fund (Percentages shown are based on Net Assets) |
| Security | Par (000) | Value | ||||||
| Semiconductors & Semiconductor Equipment (continued) | ||||||||
Intel Corp. (continued) | ||||||||
5.05%, 08/05/62 | $ | 800 | $ | 631,146 | ||||
5.90%, 02/10/63 | 1,050 | 949,321 | ||||||
KLA Corp. | ||||||||
3.30%, 03/01/50 | 736 | 463,839 | ||||||
4.95%, 07/15/52 | 1,245 | 1,043,117 | ||||||
5.25%, 07/15/62 | 720 | 610,152 | ||||||
Massachusetts Institute of Technology, | 230 | 143,092 | ||||||
Micron Technology, Inc. | ||||||||
3.37%, 11/01/41 | 413 | 260,276 | ||||||
3.48%, 11/01/51 | 413 | 242,177 | ||||||
NVIDIA Corp. | ||||||||
3.50%, 04/01/40 | 988 | 739,652 | ||||||
3.50%, 04/01/50(a) | 2,093 | 1,432,288 | ||||||
3.70%, 04/01/60 | 693 | 466,095 | ||||||
NXP BV/NXP Funding LLC/NXP USA, Inc. | ||||||||
3.25%, 05/11/41 | 963 | 614,991 | ||||||
3.13%, 02/15/42 | 413 | 254,718 | ||||||
3.25%, 11/30/51 | 475 | 271,781 | ||||||
QUALCOMM, Inc. | ||||||||
4.65%, 05/20/35(a) | 963 | 876,104 | ||||||
4.80%, 05/20/45(a) | 1,470 | 1,236,155 | ||||||
4.30%, 05/20/47(a) | 1,543 | 1,178,836 | ||||||
3.25%, 05/20/50(a) | 660 | 421,264 | ||||||
4.50%, 05/20/52 | 942 | 724,108 | ||||||
6.00%, 05/20/53 | 1,020 | 981,614 | ||||||
Texas Instruments, Inc. | ||||||||
3.88%, 03/15/39 | 829 | 658,927 | ||||||
4.15%, 05/15/48 | 1,479 | 1,119,529 | ||||||
2.70%, 09/15/51 | 500 | 282,084 | ||||||
4.10%, 08/16/52 | 95 | 69,940 | ||||||
5.00%, 03/14/53 | 570 | 485,377 | ||||||
5.05%, 05/18/63 | 1,175 | 978,410 | ||||||
TSMC Arizona Corp. | ||||||||
3.13%, 10/25/41 | 916 | 629,887 | ||||||
3.25%, 10/25/51 | 750 | 476,760 | ||||||
4.50%, 04/22/52(a) | 1,180 | 957,086 | ||||||
|
| |||||||
| 48,605,784 | ||||||||
| Software — 2.7% | ||||||||
Activision Blizzard, Inc. | ||||||||
4.50%, 06/15/47 | 350 | 292,852 | ||||||
2.50%, 09/15/50 | 1,460 | 816,168 | ||||||
Electronic Arts, Inc., 2.95%, 02/15/51 | 571 | 327,955 | ||||||
Intuit, Inc., 5.50%, 09/15/53 | 1,185 | 1,077,997 | ||||||
Microsoft Corp. | ||||||||
3.50%, 02/12/35(a) | 1,515 | 1,288,901 | ||||||
4.20%, 11/03/35 | 700 | 630,149 | ||||||
3.45%, 08/08/36 | 1,742 | 1,420,509 | ||||||
4.10%, 02/06/37 | 850 | 736,731 | ||||||
5.30%, 02/08/41 | 750 | 734,513 | ||||||
4.45%, 11/03/45 | 1,000 | 854,923 | ||||||
3.70%, 08/08/46 | 1,729 | 1,287,377 | ||||||
4.25%, 02/06/47 | 1,500 | 1,225,122 | ||||||
2.53%, 06/01/50(a) | 6,411 | 3,669,796 | ||||||
2.92%, 03/17/52 | 6,177 | 3,813,116 | ||||||
4.50%, 02/06/57 | 709 | 585,244 | ||||||
2.68%, 06/01/60 | 3,708 | 2,050,356 | ||||||
3.04%, 03/17/62(a) | 2,165 | 1,285,575 | ||||||
Oracle Corp. | ||||||||
4.30%, 07/08/34 | 1,066 | 888,544 | ||||||
3.90%, 05/15/35 | 1,213 | 955,385 | ||||||
| Security | Par (000) | Value | ||||||
| Software (continued) | ||||||||
Oracle Corp. (continued) | ||||||||
3.85%, 07/15/36 | $ | 1,370 | $ | 1,044,895 | ||||
3.80%, 11/15/37 | 1,670 | 1,228,903 | ||||||
6.50%, 04/15/38 | 1,200 | 1,170,904 | ||||||
6.13%, 07/08/39 | 1,413 | 1,320,369 | ||||||
3.60%, 04/01/40 | 2,884 | 1,980,304 | ||||||
5.38%, 07/15/40(a) | 1,679 | 1,428,866 | ||||||
3.65%, 03/25/41 | 2,385 | 1,624,099 | ||||||
4.50%, 07/08/44 | 913 | 674,883 | ||||||
4.13%, 05/15/45 | 1,866 | 1,292,586 | ||||||
4.00%, 07/15/46 | 2,866 | 1,925,600 | ||||||
4.00%, 11/15/47 | 1,743 | 1,158,814 | ||||||
3.60%, 04/01/50(a) | 4,419 | 2,707,831 | ||||||
3.95%, 03/25/51 | 2,534 | 1,644,917 | ||||||
6.90%, 11/09/52 | 2,600 | 2,562,049 | ||||||
5.55%, 02/06/53 | 2,375 | 1,973,132 | ||||||
4.38%, 05/15/55 | 1,036 | 700,942 | ||||||
3.85%, 04/01/60 | 2,791 | 1,675,158 | ||||||
4.10%, 03/25/61 | 1,450 | 909,452 | ||||||
Salesforce, Inc. | ||||||||
2.70%, 07/15/41(a) | 1,179 | 758,164 | ||||||
2.90%, 07/15/51 | 2,048 | 1,204,489 | ||||||
3.05%, 07/15/61 | 1,020 | 568,097 | ||||||
|
| |||||||
| 53,495,667 | ||||||||
| Specialized REITs — 0.0% | ||||||||
Public Storage Operating Co., 5.35%, 08/01/53 | 550 | 473,446 | ||||||
|
| |||||||
| Specialty Retail — 0.1% | ||||||||
Dick’s Sporting Goods, Inc., | 580 | 339,304 | ||||||
Lowe’s Cos., Inc. | ||||||||
2.80%, 09/15/41 | 1,213 | 736,774 | ||||||
5.80%, 09/15/62 | 700 | 593,125 | ||||||
|
| |||||||
| 1,669,203 | ||||||||
| Technology Hardware, Storage & Peripherals — 1.6% | ||||||||
Apple, Inc. | ||||||||
4.50%, 02/23/36(a) | 1,263 | 1,167,938 | ||||||
2.38%, 02/08/41(a) | 1,500 | 957,037 | ||||||
3.85%, 05/04/43 | 3,000 | 2,320,173 | ||||||
4.45%, 05/06/44 | 1,163 | 980,761 | ||||||
3.45%, 02/09/45 | 2,069 | 1,479,660 | ||||||
4.38%, 05/13/45 | 2,013 | 1,650,473 | ||||||
4.65%, 02/23/46 | 4,242 | 3,619,065 | ||||||
3.85%, 08/04/46 | 2,020 | 1,514,782 | ||||||
4.25%, 02/09/47(a) | 1,163 | 939,426 | ||||||
3.75%, 09/12/47 | 500 | 364,740 | ||||||
3.75%, 11/13/47 | 1,036 | 759,352 | ||||||
2.95%, 09/11/49 | 1,386 | 863,189 | ||||||
2.65%, 05/11/50 | 2,494 | 1,443,654 | ||||||
2.40%, 08/20/50 | 523 | 290,936 | ||||||
2.65%, 02/08/51 | 2,536 | 1,456,238 | ||||||
2.70%, 08/05/51 | 1,815 | 1,049,639 | ||||||
3.95%, 08/08/52(a) | 1,950 | 1,445,698 | ||||||
4.85%, 05/10/53 | 680 | 590,675 | ||||||
2.55%, 08/20/60(a) | 829 | 454,064 | ||||||
2.80%, 02/08/61 | 973 | 537,303 | ||||||
2.85%, 08/05/61 | 2,430 | 1,350,828 | ||||||
4.10%, 08/08/62 | 1,000 | 733,302 | ||||||
Dell International LLC/EMC Corp. | ||||||||
8.10%, 07/15/36 | 901 | 977,176 | ||||||
3.38%, 12/15/41 | 779 | 501,828 | ||||||
8.35%, 07/15/46 | 725 | 809,935 | ||||||
3.45%, 12/15/51 | 1,113 | 663,127 | ||||||
| 88 | 2 0 2 3 BLACK ROCK ANNUAL REPORT TO SHAREHOLDERS |
Schedule of Investments (continued) October 31, 2023 | iShares U.S. Long Credit Bond Index Fund (Percentages shown are based on Net Assets) |
| Security | Par (000) | Value | ||||||
| Technology Hardware, Storage & Peripherals (continued) | ||||||||
Dell, Inc., 6.50%, 04/15/38(a) | $ | 329 | $ | 313,854 | ||||
Hewlett Packard Enterprise Co. | ||||||||
6.20%, 10/15/35 | 663 | 650,805 | ||||||
6.35%, 10/15/45 | 1,220 | 1,118,191 | ||||||
HP, Inc., 6.00%, 09/15/41(a) | 988 | 894,724 | ||||||
|
| |||||||
| 31,898,573 | ||||||||
| Textiles, Apparel & Luxury Goods — 0.1% | ||||||||
NIKE, Inc. | ||||||||
3.25%, 03/27/40 | 929 | 669,092 | ||||||
3.63%, 05/01/43 | 450 | 334,266 | ||||||
3.88%, 11/01/45(a) | 763 | 569,880 | ||||||
3.38%, 11/01/46 | 343 | 230,948 | ||||||
3.38%, 03/27/50(a) | 1,450 | 975,681 | ||||||
|
| |||||||
| 2,779,867 | ||||||||
| Tobacco — 1.2% | ||||||||
Altria Group, Inc. | ||||||||
5.80%, 02/14/39(a) | 1,793 | 1,593,746 | ||||||
3.40%, 02/04/41 | 1,579 | 967,613 | ||||||
4.25%, 08/09/42 | 850 | 581,782 | ||||||
4.50%, 05/02/43 | 629 | 444,016 | ||||||
5.38%, 01/31/44(a) | 1,644 | 1,410,591 | ||||||
3.88%, 09/16/46 | 1,036 | 639,914 | ||||||
5.95%, 02/14/49(a) | 2,393 | 2,030,033 | ||||||
4.45%, 05/06/50 | 541 | 359,150 | ||||||
3.70%, 02/04/51(a) | 1,145 | 667,101 | ||||||
4.00%, 02/04/61 | 979 | 590,114 | ||||||
BAT Capital Corp. | ||||||||
4.39%, 08/15/37 | 2,466 | 1,792,299 | ||||||
3.73%, 09/25/40 | 730 | 462,931 | ||||||
7.08%, 08/02/43 | 700 | 638,170 | ||||||
4.54%, 08/15/47 | 2,369 | 1,532,664 | ||||||
4.76%, 09/06/49 | 970 | 644,860 | ||||||
5.28%, 04/02/50 | 463 | 329,280 | ||||||
3.98%, 09/25/50 | 946 | 556,575 | ||||||
5.65%, 03/16/52 | 454 | 341,432 | ||||||
7.08%, 08/02/53 | 900 | 803,260 | ||||||
Philip Morris International, Inc. | ||||||||
6.38%, 05/16/38 | 1,400 | 1,385,787 | ||||||
4.38%, 11/15/41 | 695 | 522,543 | ||||||
4.50%, 03/20/42 | 510 | 390,120 | ||||||
3.88%, 08/21/42 | 788 | 552,936 | ||||||
4.13%, 03/04/43 | 971 | 695,853 | ||||||
4.88%, 11/15/43 | 663 | 528,332 | ||||||
4.25%, 11/10/44 | 1,150 | 829,394 | ||||||
Reynolds American, Inc. | ||||||||
5.70%, 08/15/35 | 593 | 508,069 | ||||||
7.25%, 06/15/37 | 400 | 385,847 | ||||||
6.15%, 09/15/43 | 497 | 415,371 | ||||||
5.85%, 08/15/45 | 2,450 | 1,915,219 | ||||||
|
| |||||||
| 24,515,002 | ||||||||
| Trading Companies & Distributors — 0.0% | ||||||||
GATX Corp. | ||||||||
6.05%, 03/15/34(a) | 400 | 376,880 | ||||||
6.90%, 05/01/34 | 275 | 274,535 | ||||||
|
| |||||||
| 651,415 | ||||||||
| Transportation Infrastructure — 0.7% | ||||||||
FedEx Corp. | ||||||||
4.90%, 01/15/34(a) | 400 | 364,267 | ||||||
3.90%, 02/01/35 | 423 | 340,594 | ||||||
3.25%, 05/15/41 | 708 | 466,718 | ||||||
| Security | Par (000) | Value | ||||||
| Transportation Infrastructure (continued) | ||||||||
FedEx Corp. (continued) | ||||||||
3.88%, 08/01/42 | $ | 500 | $ | 356,195 | ||||
4.10%, 04/15/43 | 500 | 360,077 | ||||||
5.10%, 01/15/44 | 650 | 536,054 | ||||||
4.10%, 02/01/45 | 600 | 425,769 | ||||||
4.75%, 11/15/45 | 946 | 734,266 | ||||||
4.55%, 04/01/46 | 1,220 | 920,319 | ||||||
4.40%, 01/15/47 | 763 | 560,649 | ||||||
4.05%, 02/15/48 | 1,053 | 733,164 | ||||||
4.95%, 10/17/48 | 829 | 659,942 | ||||||
5.25%, 05/15/50 | 1,129 | 937,863 | ||||||
FedEx Corp. Pass-Through Trust, | 756 | 592,828 | ||||||
United Parcel Service, Inc. | ||||||||
6.20%, 01/15/38 | 1,226 | 1,254,930 | ||||||
5.20%, 04/01/40 | 379 | 344,194 | ||||||
4.88%, 11/15/40(a) | 400 | 350,484 | ||||||
3.63%, 10/01/42(a) | 463 | 337,572 | ||||||
3.40%, 11/15/46 | 142 | 94,812 | ||||||
3.75%, 11/15/47 | 1,463 | 1,038,282 | ||||||
4.25%, 03/15/49 | 879 | 668,688 | ||||||
3.40%, 09/01/49(a) | 575 | 385,391 | ||||||
5.30%, 04/01/50(a) | 1,129 | 1,012,483 | ||||||
5.05%, 03/03/53 | 1,000 | 858,517 | ||||||
|
| |||||||
| 14,334,058 | ||||||||
| Water Utilities — 0.2% | ||||||||
American Water Capital Corp. | ||||||||
6.59%, 10/15/37 | 800 | 827,193 | ||||||
4.30%, 12/01/42 | 500 | 387,058 | ||||||
4.30%, 09/01/45 | 163 | 121,439 | ||||||
4.00%, 12/01/46 | 280 | 197,692 | ||||||
3.75%, 09/01/47(a) | 613 | 419,717 | ||||||
4.20%, 09/01/48 | 500 | 367,139 | ||||||
4.15%, 06/01/49(a) | 413 | 299,791 | ||||||
3.45%, 05/01/50(a) | 600 | 383,444 | ||||||
3.25%, 06/01/51(a) | 745 | 459,185 | ||||||
Essential Utilities, Inc. | ||||||||
4.28%, 05/01/49 | 400 | 280,078 | ||||||
3.35%, 04/15/50 | 429 | 252,094 | ||||||
5.30%, 05/01/52 | 579 | 467,502 | ||||||
|
| |||||||
| 4,462,332 | ||||||||
| Wireless Telecommunication Services — 1.7% | ||||||||
America Movil SAB de C.V. | ||||||||
6.38%, 03/01/35 | 900 | 902,250 | ||||||
6.13%, 11/15/37 | 300 | 289,656 | ||||||
6.13%, 03/30/40 | 1,650 | 1,581,525 | ||||||
4.38%, 07/16/42 | 1,371 | 1,045,388 | ||||||
4.38%, 04/22/49(a) | 1,228 | 915,106 | ||||||
Crown Castle, Inc., 4.15%, 07/01/50 | 500 | 333,641 | ||||||
Orange SA | ||||||||
5.38%, 01/13/42 | 812 | 704,398 | ||||||
5.50%, 02/06/44 | 750 | 660,225 | ||||||
Rogers Communications, Inc. | ||||||||
7.50%, 08/15/38 | 200 | 198,368 | ||||||
4.50%, 03/15/42(a) | 976 | 722,050 | ||||||
4.50%, 03/15/43 | 500 | 360,709 | ||||||
5.45%, 10/01/43 | 500 | 409,633 | ||||||
5.00%, 03/15/44 | 1,013 | 778,939 | ||||||
4.30%, 02/15/48 | 636 | 427,035 | ||||||
4.35%, 05/01/49 | 1,036 | 705,361 | ||||||
3.70%, 11/15/49(a) | 979 | 596,756 | ||||||
SCHEDULE OF INVESTMENTS | 89 |
Schedule of Investments (continued) October 31, 2023 | iShares U.S. Long Credit Bond Index Fund (Percentages shown are based on Net Assets) |
| Security | Par (000) | Value | ||||||
| Wireless Telecommunication Services (continued) | ||||||||
Rogers Communications, Inc. (continued) | ||||||||
4.55%, 03/15/52(a) | $ | 2,010 | $ | 1,390,215 | ||||
T-Mobile U.S., Inc. | ||||||||
4.38%, 04/15/40(a) | 2,036 | 1,574,716 | ||||||
3.00%, 02/15/41 | 1,959 | 1,236,520 | ||||||
4.50%, 04/15/50 | 2,200 | 1,604,991 | ||||||
3.30%, 02/15/51 | 2,600 | 1,527,894 | ||||||
3.40%, 10/15/52 | 2,859 | 1,691,974 | ||||||
5.65%, 01/15/53 | 1,650 | 1,426,172 | ||||||
5.75%, 01/15/54 | 2,000 | 1,755,743 | ||||||
3.60%, 11/15/60 | 1,606 | 934,271 | ||||||
5.80%, 09/15/62 | 650 | 560,120 | ||||||
T-Mobile USA, Inc., 6.00%, 06/15/54 | 1,005 | 912,505 | ||||||
Vodafone Group PLC | ||||||||
6.15%, 02/27/37 | 1,263 | 1,199,034 | ||||||
5.00%, 05/30/38(a) | 500 | 433,010 | ||||||
4.38%, 02/19/43 | 1,187 | 877,854 | ||||||
5.25%, 05/30/48 | 1,200 | 967,742 | ||||||
4.88%, 06/19/49(a) | 1,493 | 1,129,345 | ||||||
4.25%, 09/17/50 | 1,135 | 773,997 | ||||||
5.63%, 02/10/53 | 1,700 | 1,429,825 | ||||||
5.13%, 06/19/59 | 496 | 373,132 | ||||||
5.75%, 02/10/63 | 400 | 333,297 | ||||||
|
| |||||||
| 32,763,397 | ||||||||
|
| |||||||
Total Corporate Bonds — 87.5% | 1,736,093,432 | |||||||
|
| |||||||
Foreign Agency Obligations | ||||||||
| Chile — 0.6% | ||||||||
Chile Government International Bond | ||||||||
3.50%, 01/31/34 | 1,300 | 1,041,300 | ||||||
4.95%, 01/05/36 | 1,500 | 1,331,250 | ||||||
3.10%, 05/07/41 | 2,500 | 1,625,000 | ||||||
4.34%, 03/07/42 | 1,900 | 1,467,750 | ||||||
3.63%, 10/30/42(a) | 300 | 206,925 | ||||||
3.86%, 06/21/47(a) | 975 | 677,137 | ||||||
3.50%, 01/25/50(a) | 2,178 | 1,373,229 | ||||||
4.00%, 01/31/52(a) | 960 | 660,000 | ||||||
5.33%, 01/05/54 | 1,470 | 1,242,360 | ||||||
3.10%, 01/22/61(a) | 1,932 | 1,032,654 | ||||||
3.25%, 09/21/71 | 708 | 375,240 | ||||||
|
| |||||||
| 11,032,845 | ||||||||
| Hungary — 0.1% | ||||||||
Hungary Government International Bond, 7.63%, 03/29/41 | 1,516 | 1,553,426 | ||||||
|
| |||||||
| Indonesia — 0.4% | ||||||||
Indonesia Government International Bond | ||||||||
4.35%, 01/11/48 | 1,666 | 1,267,509 | ||||||
5.35%, 02/11/49 | 900 | 793,044 | ||||||
3.70%, 10/30/49(a) | 1,000 | 675,900 | ||||||
3.50%, 02/14/50(a) | 478 | 310,351 | ||||||
4.20%, 10/15/50(a) | 1,528 | 1,118,878 | ||||||
3.05%, 03/12/51 | 1,589 | 969,814 | ||||||
4.30%, 03/31/52 | 750 | 555,473 | ||||||
5.45%, 09/20/52 | 575 | 507,087 | ||||||
5.65%, 01/11/53(a) | 630 | 574,610 | ||||||
3.20%, 09/23/61 | 478 | 271,179 | ||||||
| Security | Par (000) | Value | ||||||
| Indonesia (continued) | ||||||||
Indonesia Government International | ||||||||
4.45%, 04/15/70 | $ | 1,000 | $ | 728,980 | ||||
3.35%, 03/12/71(a) | 750 | 429,660 | ||||||
|
| |||||||
| 8,202,485 | ||||||||
| Israel — 0.3% | ||||||||
Israel Government International Bond | ||||||||
4.50%, 01/30/43 | 1,585 | 1,230,852 | ||||||
4.13%, 01/17/48 | 978 | 680,933 | ||||||
3.88%, 07/03/50 | 1,978 | 1,304,491 | ||||||
4.50%, 12/31/99 | 850 | 556,920 | ||||||
State of Israel, 3.38%, 01/15/50 | 1,778 | 1,073,467 | ||||||
|
| |||||||
| 4,846,663 | ||||||||
| Italy — 0.1% | ||||||||
Republic of Italy Government International Bond | ||||||||
4.00%, 10/17/49 | 1,783 | 1,168,685 | ||||||
3.88%, 05/06/51 | 2,178 | 1,354,329 | ||||||
|
| |||||||
| 2,523,014 | ||||||||
| Mexico — 1.4% | ||||||||
Mexico Government International Bond | ||||||||
3.50%, 02/12/34 | 3,150 | 2,397,150 | ||||||
6.35%, 02/09/35 | 2,605 | 2,482,565 | ||||||
6.05%, 01/11/40 | 2,406 | 2,153,370 | ||||||
4.28%, 08/14/41 | 2,582 | 1,834,511 | ||||||
4.75%, 03/08/44 | 3,272 | 2,412,380 | ||||||
5.55%, 01/21/45(a) | 2,565 | 2,122,537 | ||||||
4.60%, 01/23/46 | 2,082 | 1,468,851 | ||||||
4.35%, 01/15/47(a) | 1,522 | 1,026,589 | ||||||
4.60%, 02/10/48 | 1,422 | 988,290 | ||||||
4.50%, 01/31/50 | 1,729 | 1,183,501 | ||||||
5.00%, 04/27/51(a) | 2,110 | 1,548,782 | ||||||
4.40%, 02/12/52 | 2,150 | 1,415,775 | ||||||
6.34%, 05/04/53 | 2,864 | 2,481,656 | ||||||
3.77%, 05/24/61 | 2,710 | 1,514,890 | ||||||
5.75%, 12/31/99 | 2,472 | 1,870,068 | ||||||
Series A, 6.75%, 09/27/34 | 1,497 | 1,483,527 | ||||||
|
| |||||||
| �� | 28,384,442 | |||||||
| Panama — 0.6% | ||||||||
Panama Government International Bond | ||||||||
6.40%, 02/14/35 | 2,000 | 1,818,000 | ||||||
6.70%, 01/26/36 | 1,938 | 1,803,309 | ||||||
6.88%, 01/31/36 | 1,020 | 959,608 | ||||||
4.50%, 05/15/47 | 1,150 | 738,875 | ||||||
4.50%, 04/16/50(a) | 2,268 | 1,409,562 | ||||||
4.30%, 04/29/53 | 1,578 | 939,699 | ||||||
6.85%, 03/28/54 | 1,350 | 1,151,550 | ||||||
4.50%, 04/01/56(a) | 2,058 | 1,236,858 | ||||||
3.87%, 07/23/60(a) | 2,903 | 1,515,366 | ||||||
4.50%, 01/19/63 | 1,500 | 874,500 | ||||||
|
| |||||||
| 12,447,327 | ||||||||
| Peru — 0.5% | ||||||||
Peruvian Government International Bond | ||||||||
8.75%, 11/21/33 | 1,414 | 1,648,950 | ||||||
3.00%, 01/15/34 | 2,187 | 1,650,091 | ||||||
6.55%, 03/14/37 | 1,113 | 1,119,121 | ||||||
3.30%, 03/11/41(a) | 1,209 | 798,545 | ||||||
5.63%, 11/18/50(a) | 2,410 | 2,123,210 | ||||||
3.55%, 03/10/51(a) | 1,725 | 1,078,988 | ||||||
2.78%, 12/01/60 | 1,886 | 943,943 | ||||||
| 90 | 2 0 2 3 BLACK ROCK ANNUAL REPORT TO SHAREHOLDERS |
Schedule of Investments (continued) October 31, 2023 | iShares U.S. Long Credit Bond Index Fund (Percentages shown are based on Net Assets) |
| Security | Par (000) | Value | ||||||
| Peru (continued) | ||||||||
Peruvian Government International | ||||||||
3.60%, 01/15/72 | $ | 925 | $ | 521,700 | ||||
3.23%, 07/28/2121 | 913 | 457,870 | ||||||
|
| |||||||
| 10,342,418 | ||||||||
| Philippines — 0.6% | ||||||||
Philippines Government International Bond | ||||||||
6.38%, 10/23/34 | 1,750 | 1,796,305 | ||||||
5.00%, 01/13/37 | 1,128 | 1,026,672 | ||||||
3.95%, 01/20/40 | 1,850 | 1,413,086 | ||||||
3.70%, 03/01/41 | 1,926 | 1,392,825 | ||||||
3.70%, 02/02/42(a) | 2,903 | 2,074,252 | ||||||
2.95%, 05/05/45 | 478 | 292,861 | ||||||
2.65%, 12/10/45 | 1,310 | 758,529 | ||||||
3.20%, 07/06/46 | 1,910 | 1,197,436 | ||||||
4.20%, 03/29/47 | 900 | 668,574 | ||||||
5.95%, 10/13/47 | 700 | 665,903 | ||||||
5.50%, 01/17/48 | 1,200 | 1,075,212 | ||||||
|
| |||||||
| 12,361,655 | ||||||||
| Poland — 0.1% | ||||||||
Republic of Poland Government | 2,350 | 2,064,405 | ||||||
|
| |||||||
| South Korea — 0.1% | ||||||||
Export-Import Bank of Korea, | 478 | 302,215 | ||||||
Korea International Bond | ||||||||
4.13%, 06/10/44 | 1,000 | 801,950 | ||||||
3.88%, 09/20/48 | 345 | 258,757 | ||||||
|
| |||||||
| 1,362,922 | ||||||||
| Supranational — 0.1% | ||||||||
European Investment Bank, | 750 | 729,922 | ||||||
Inter-American Development Bank | ||||||||
3.20%, 08/07/42 | 370 | 269,187 | ||||||
4.38%, 01/24/44 | 225 | 191,980 | ||||||
International Bank for Reconstruction & | 413 | 393,948 | ||||||
|
| |||||||
| 1,585,037 | ||||||||
| Uruguay — 0.4% | ||||||||
Uruguay Government International Bond | ||||||||
5.75%, 10/28/34 | 1,300 | 1,298,050 | ||||||
7.63%, 03/21/36(a) | 1,050 | 1,185,975 | ||||||
4.13%, 11/20/45(a) | 800 | 632,000 | ||||||
5.10%, 06/18/50 | 3,606 | 3,108,372 | ||||||
4.98%, 04/20/55 | 2,324 | 1,935,892 | ||||||
|
| |||||||
| 8,160,289 | ||||||||
|
| |||||||
Total Foreign Agency Obligations — 5.3% |
| 104,866,928 | ||||||
|
| |||||||
Municipal Bonds | ||||||||
| Arizona — 0.1% | ||||||||
Salt River Project Agricultural Improvement & Power District, RB, BAB, 4.84%, 01/01/41 | 910 | 792,103 | ||||||
|
| |||||||
| California — 1.7% | ||||||||
Bay Area Toll Authority, RB, BAB | ||||||||
Series F-2, 6.26%, 04/01/49 | 610 | 629,141 | ||||||
Series S-1, 6.92%, 04/01/40 | 500 | 540,597 | ||||||
Series S-1, 7.04%, 04/01/50 | 25 | 28,340 | ||||||
Series S-3, 6.91%, 10/01/50 | 1,540 | 1,703,873 | ||||||
| Security | Par (000) | Value | ||||||
| California (continued) | ||||||||
Bay Area Toll Authority, Refunding RB, | $ | 845 | $ | 505,093 | ||||
California Health Facilities Financing Authority, RB, M/F Housing, | 500 | 406,845 | ||||||
California State University, RB | ||||||||
Series B, 5.18%, 11/01/53 | 1,245 | 1,076,203 | ||||||
Series E, 2.90%, 11/01/51 | 125 | 78,402 | ||||||
California State University, Refunding RB | ||||||||
Series B, 2.98%, 11/01/51 | 835 | 504,598 | ||||||
Series B, 2.72%, 11/01/52 | 270 | 153,906 | ||||||
City of Los Angeles Department of Airports Customer Facility Charge Revenue, Refunding ARB, Class A, (AGM), | 540 | 413,976 | ||||||
City of San Francisco California Public Utilities Commission Water Revenue, RB, BAB, 6.95%, 11/01/50 | 25 | 27,279 | ||||||
East Bay Municipal Utility District Water System Revenue, RB, BAB, | 1,525 | 1,514,069 | ||||||
Foothill-Eastern Transportation Corridor Agency, Refunding RB | ||||||||
Series A, 4.09%, 01/15/49 | 195 | 138,778 | ||||||
Series A, (AGM), 3.92%, 01/15/53 | 110 | 74,553 | ||||||
Golden State Tobacco Securitization Corp., | ||||||||
Refunding RB | ||||||||
Class B, (SAP), 3.29%, 06/01/42 | 1,420 | 946,130 | ||||||
Class B, (SAP), 3.00%, 06/01/46 | 90 | 79,390 | ||||||
Series A-1, 3.71%, 06/01/41 | 210 | 140,829 | ||||||
Series A-1, 4.21%, 06/01/50 | 210 | 136,796 | ||||||
Los Angeles Community College District, GO, BAB, 6.75%, 08/01/49 | 1,315 | 1,434,138 | ||||||
Los Angeles County Metropolitan Transportation Authority Sales Tax Revenue, RB, BAB, 5.74%, 06/01/39 | 625 | 606,940 | ||||||
Los Angeles County Public Works Financing Authority, Refunding RB, BAB, | 25 | 28,158 | ||||||
Los Angeles Department of Water & Power, RB, BAB | ||||||||
5.72%, 07/01/39 | 125 | 121,461 | ||||||
6.57%, 07/01/45 | 1,300 | 1,360,213 | ||||||
Los Angeles Unified School District, GO, BAB | ||||||||
Series KR, 5.75%, 07/01/34 | 690 | 682,210 | ||||||
Series RY, 6.76%, 07/01/34 | 1,775 | 1,872,901 | ||||||
Regents of the University of California Medical Center Pooled Revenue, RB | ||||||||
Series N, 3.26%, 05/15/60 | 290 | 167,526 | ||||||
Series N, 3.71%, 05/15/2120 | 1,400 | 819,447 | ||||||
Series Q, 4.56%, 05/15/53 | 1,135 | 898,039 | ||||||
Regents of the University of California Medical Center Pooled Revenue, RB, BAB, Series H, 6.55%, 05/15/48 | 55 | 57,512 | ||||||
Regents of the University of California Medical Center Pooled Revenue, Refunding RB, BAB, Series F, 6.58%, 05/15/49 | 490 | 514,985 | ||||||
San Diego County Regional Transportation Commission, RB, BAB, 5.91%, 04/01/48 | 190 | 186,045 | ||||||
San Diego County Water Authority, RB, BAB, Series B, 6.14%, 05/01/49 | 1,030 | 1,052,042 | ||||||
San Joaquin Hills Transportation Corridor Agency, Refunding RB, Series B, (AGM), | 225 | 147,354 | ||||||
State of California, GO, BAB | ||||||||
7.50%, 04/01/34 | 520 | 580,174 | ||||||
7.55%, 04/01/39 | 1,965 | 2,219,909 | ||||||
7.30%, 10/01/39 | 3,390 | 3,719,470 | ||||||
SCHEDULE OF INVESTMENTS | 91 |
Schedule of Investments (continued) October 31, 2023 | iShares U.S. Long Credit Bond Index Fund (Percentages shown are based on Net Assets) |
| Security | Par (000) | Value | ||||||
| California (continued) | ||||||||
State of California, GO, BAB (continued) | ||||||||
7.35%, 11/01/39 | $ | 1,270 | $ | 1,394,706 | ||||
7.63%, 03/01/40(a) | 2,480 | 2,812,194 | ||||||
7.60%, 11/01/40(a) | 1,525 | 1,736,994 | ||||||
State of California, Refunding GO | ||||||||
4.50%, 04/01/33 | 125 | 113,203 | ||||||
4.60%, 04/01/38 | 100 | 87,037 | ||||||
5.20%, 03/01/43 | 265 | 232,892 | ||||||
University of California, RB | ||||||||
Series AD, 4.86%, 05/15/2112 | 225 | 173,677 | ||||||
Series AQ, 4.77%, 05/15/2115(a) | 333 | 250,525 | ||||||
University of California, RB, BAB | ||||||||
5.77%, 05/15/43 | 815 | 785,893 | ||||||
5.95%, 05/15/45(a) | 400 | 389,758 | ||||||
|
| |||||||
| 33,544,201 | ||||||||
| Colorado — 0.0% | ||||||||
Regional Transportation District Sales Tax Revenue, RB, BAB, Series B, 5.84%, 11/01/50 | 25 | 24,533 | ||||||
|
| |||||||
| District of Columbia — 0.1% | ||||||||
District of Columbia Water & Sewer Authority, RB, Series A, Senior Lien, 4.81%, 10/01/2114(a) | 530 | 421,476 | ||||||
District of Columbia Water & Sewer Authority, Refunding RB, Series D, Subordinate Lien, 3.21%, 10/01/48 | 95 | 63,407 | ||||||
District of Columbia, RB, BAB, Series E, 5.59%, 12/01/34 | 1,125 | 1,107,513 | ||||||
Metropolitan Washington Airports Authority Dulles Toll Road Revenue, RB, BAB, 7.46%, 10/01/46 | 25 | 27,940 | ||||||
|
| |||||||
| 1,620,336 | ||||||||
| Florida — 0.0% | ||||||||
County of Miami-Dade Florida Aviation Revenue, Refunding RB, Series C, 4.28%, 10/01/41 | 540 | 437,003 | ||||||
County of Miami-Dade Florida Transit System, Refunding RB, Series B, 2.60%, 07/01/42 | 90 | 58,213 | ||||||
|
| |||||||
| 495,216 | ||||||||
| Georgia — 0.1% | ||||||||
City of Atlanta Georgia Water & Wastewater Revenue, Refunding RB, 2.26%, 11/01/35 | 150 | 110,017 | ||||||
Municipal Electric Authority of Georgia, Refunding RB, BAB | ||||||||
6.64%, 04/01/57 | 1,015 | 1,031,911 | ||||||
6.66%, 04/01/57 | 823 | 836,820 | ||||||
|
| |||||||
| 1,978,748 | ||||||||
| Idaho — 0.0% | ||||||||
Idaho Energy Resources Authority, RB, 2.86%, 09/01/46 | 25 | 15,511 | ||||||
|
| |||||||
| Illinois — 0.3% | ||||||||
Chicago O’Hare International Airport, ARB(a) | ||||||||
Series C, Senior Lien, 4.47%, 01/01/49 | 100 | 80,129 | ||||||
Series C, Senior Lien, 4.57%, 01/01/54 | 100 | 79,926 | ||||||
Chicago O’Hare International Airport, Refunding ARB, BAB, Series B, 6.40%, 01/01/40 | 890 | 940,661 | ||||||
Chicago Transit Authority Sales & Transfer Tax Receipts Revenue, RB | ||||||||
Series A, 6.90%, 12/01/40 | 420 | 437,825 | ||||||
Series B, 6.90%, 12/01/40 | 1,140 | 1,188,524 | ||||||
| Security | Par (000) | Value | ||||||
| Illinois (continued) | ||||||||
Chicago Transit Authority Sales Tax Receipts Fund, RB, BAB, Series B, 6.20%, 12/01/40 | $ | 345 | $ | 342,871 | ||||
Illinois State Toll Highway Authority, RB, BAB, | ||||||||
Series A, 6.18%, 01/01/34 | 163 | 164,398 | ||||||
Metropolitan Water Reclamation District of Greater Chicago, GO, BAB, 5.72%, 12/01/38 | 670 | 653,023 | ||||||
Sales Tax Securitization Corp., Refunding RB | ||||||||
3.59%, 01/01/43 | 320 | 242,177 | ||||||
Series B, 2nd Lien, 3.24%, 01/01/42 | 1,030 | 732,083 | ||||||
State of Illinois, GO, BAB, 7.35%, 07/01/35 | 896 | 914,702 | ||||||
|
| |||||||
| 5,776,319 | ||||||||
| Indiana — 0.0% | ||||||||
Indiana Finance Authority, Refunding RB, 3.05%, 01/01/51(a) | 55 | 36,081 | ||||||
|
| |||||||
| Kansas — 0.0% | ||||||||
Kansas Development Finance Authority, RB, | ||||||||
Series K, (BAM), 2.77%, 05/01/51 | 90 | 55,386 | ||||||
|
| |||||||
| Louisiana — 0.1% | ||||||||
Louisiana Local Government Environmental Facilities & Community Development Authority, RB | ||||||||
Class A-4, 4.48%, 08/01/39 | 1,460 | 1,274,139 | ||||||
Series A-3, 5.20%, 12/01/39 | 495 | 463,869 | ||||||
State of Louisiana Gasoline & Fuels Tax Revenue, Refunding RB, | 150 | 101,052 | ||||||
|
| |||||||
| 1,839,060 | ||||||||
| Massachusetts — 0.1% | ||||||||
Commonwealth of Massachusetts, GO, | 25 | 15,427 | ||||||
Commonwealth of Massachusetts, GO, BAB, 5.46%, 12/01/39 | 820 | 786,677 | ||||||
Commonwealth of Massachusetts, Refunding GO | ||||||||
Series D, 2.66%, 09/01/39 | 637 | 463,693 | ||||||
Series D, 2.81%, 09/01/43(a) | 820 | 527,244 | ||||||
Massachusetts School Building Authority, RB, BAB, 5.72%, 08/15/39 | 670 | 650,150 | ||||||
Massachusetts School Building Authority, Refunding RB, Sub-Series B, 3.40%, 10/15/40 | 55 | 41,260 | ||||||
Massachusetts Water Resources Authority, | ||||||||
Refunding RB, Series C, 2.82%, 08/01/41 | 110 | 78,008 | ||||||
|
| |||||||
| 2,562,459 | ||||||||
| Michigan — 0.2% | ||||||||
Michigan Finance Authority, Refunding RB | ||||||||
3.08%, 12/01/34 | 90 | 70,506 | ||||||
3.38%, 12/01/40 | 1,555 | 1,124,154 | ||||||
Michigan State Building Authority, Refunding RB, | ||||||||
2nd Series, 2.71%, 10/15/40 | 155 | 103,895 | ||||||
Michigan State University, RB, | 243 | 161,933 | ||||||
University of Michigan, RB | ||||||||
Series A, 3.50%, 04/01/52(a) | 55 | 37,403 | ||||||
Series A, 4.45%, 04/01/2122 | 1,547 | 1,122,573 | ||||||
Series B, 2.44%, 04/01/40 | 475 | 307,087 | ||||||
Series B, 2.56%, 04/01/50 | 1,163 | 657,304 | ||||||
University of Michigan, Refunding RB, Series C, | ||||||||
3.60%, 04/01/47 | 1,000 | 765,992 | ||||||
|
| |||||||
| 4,350,847 | ||||||||
| 92 | 2 0 2 3 BLACK ROCK ANNUAL REPORT TO SHAREHOLDERS |
Schedule of Investments (continued) October 31, 2023 | iShares U.S. Long Credit Bond Index Fund (Percentages shown are based on Net Assets) |
| Security | Par (000) | Value | ||||||
| Minnesota — 0.0% | ||||||||
University of Minnesota, RB, 4.05%, 04/01/52(a) | $ | 118 | $ | 87,957 | ||||
|
| |||||||
| Missouri — 0.0% | ||||||||
Health & Educational Facilities Authority of the State of Missouri, RB, Series A, 3.65%, 08/15/57 | 750 | 500,512 | ||||||
Health & Educational Facilities Authority of the State of Missouri, Refunding RB, Class A, 3.23%, 05/15/50 | 155 | 100,609 | ||||||
|
| |||||||
| 601,121 | ||||||||
| Nebraska — 0.0% | ||||||||
University of Nebraska Facilities Corp., Refunding RB, Series A, 3.04%, 10/01/49 | 125 | 81,343 | ||||||
|
| |||||||
| Nevada — 0.0% | ||||||||
County of Clark Department of Aviation, ARB, BAB, Series C, 6.82%, 07/01/45 | 355 | 384,012 | ||||||
|
| |||||||
| New Jersey — 0.3% | ||||||||
New Jersey Transportation Trust Fund Authority, RB, BAB, Series B, 6.56%, 12/15/40 | 1,025 | 1,045,280 | ||||||
New Jersey Turnpike Authority, RB, BAB | ||||||||
Series A, 7.10%, 01/01/41(a) | 620 | 676,060 | ||||||
Series F, 7.41%, 01/01/40 | 2,505 | 2,812,907 | ||||||
Rutgers The State University of New Jersey, RB, Series P, 3.92%, 05/01/2119 | 463 | 281,008 | ||||||
Rutgers The State University of New Jersey, | ||||||||
Refunding RB, Series R, 3.27%, 05/01/43 | 345 | 246,747 | ||||||
|
| |||||||
| 5,062,002 | ||||||||
| New York — 0.9% | ||||||||
City of New York, GO, 5.26%, 10/01/52(a) | 780 | 705,575 | ||||||
City of New York, GO, BAB | ||||||||
5.52%, 10/01/37 | 400 | 383,120 | ||||||
Series F-1, 6.27%, 12/01/37 | 415 | 423,148 | ||||||
Metropolitan Transportation Authority, RB, BAB | ||||||||
6.67%, 11/15/39 | 1,855 | 1,858,069 | ||||||
7.34%, 11/15/39 | 400 | 446,576 | ||||||
6.81%, 11/15/40 | 320 | 320,796 | ||||||
Metropolitan Transportation Authority, Refunding RB, | ||||||||
Series C-2, 5.18%, 11/15/49 | 125 | 104,642 | ||||||
New York City Municipal Water Finance Authority, RB, BAB | ||||||||
5.75%, 06/15/41(a) | 2,825 | 2,700,012 | ||||||
5.95%, 06/15/42 | 55 | 53,946 | ||||||
New York City Municipal Water Finance Authority, Refunding RB, 5.88%, 06/15/44(a) | 25 | 24,275 | ||||||
New York City Municipal Water Finance Authority, Refunding RB, BAB | ||||||||
5.72%, 06/15/42 | 215 | 205,487 | ||||||
6.01%, 06/15/42 | 490 | 483,734 | ||||||
5.44%, 06/15/43 | 125 | 115,473 | ||||||
New York City Transitional Finance Authority Future Tax Secured Revenue, RB, BAB | ||||||||
5.77%, 08/01/36 | 25 | 24,790 | ||||||
5.57%, 11/01/38 | 520 | 501,941 | ||||||
New York State Dormitory Authority, RB, BAB | ||||||||
Series D, 5.60%, 03/15/40 | 1,110 | 1,070,325 | ||||||
Series F, 5.63%, 03/15/39 | 350 | 340,093 | ||||||
New York State Thruway Authority, Refunding RB | ||||||||
Series M, 2.90%, 01/01/35 | 400 | 317,234 | ||||||
Series M, 3.50%, 01/01/42 | 95 | 71,475 | ||||||
Security | Par (000) | Value | ||||||
| New York (continued) | ||||||||
New York State Urban Development Corp., RB, BAB, 5.77%, 03/15/39 | $ | 1,125 | $ | 1,109,983 | ||||
Port Authority of New York & New Jersey, ARB | ||||||||
3.14%, 02/15/51 | 1,600 | 1,020,829 | ||||||
3.18%, 07/15/60 | 370 | 210,071 | ||||||
192nd Series, 4.81%, 10/15/65 | 125 | 102,220 | ||||||
215th Series, 3.29%, 08/01/69(a) | 125 | 72,060 | ||||||
Series 20, 4.23%, 10/15/57 | 1,070 | 791,556 | ||||||
Port Authority of New York & New Jersey, RB | ||||||||
165th Series, 5.65%, 11/01/40 | 1,025 | 976,797 | ||||||
168th Series, 4.93%, 10/01/51 | 1,030 | 878,491 | ||||||
181st Series, 4.96%, 08/01/46 | 110 | 93,888 | ||||||
182nd Series, 5.31%, 08/01/46 | 25 | 22,342 | ||||||
Port Authority of New York & New Jersey, Refunding RB, 174th Series, 4.46%, 10/01/62 | 2,315 | 1,764,228 | ||||||
|
| |||||||
| 17,193,176 | ||||||||
| North Carolina — 0.0% | ||||||||
Charlotte-Mecklenburg Hospital Authority, RB, Series S, 3.20%, 01/15/51 | 60 | 37,498 | ||||||
|
| |||||||
| Ohio — 0.2% | ||||||||
American Municipal Power, Inc., RB | ||||||||
Series B, 7.83%, 02/15/41 | 525 | 602,823 | ||||||
Series B, 8.08%, 02/15/50 | 400 | 484,032 | ||||||
American Municipal Power, Inc., RB, BAB, | 1,025 | 986,547 | ||||||
JobsOhio Beverage System, Refunding RB | ||||||||
Series A, 2.83%, 01/01/38(a) | 400 | 290,006 | ||||||
Series B, 4.53%, 01/01/35 | 280 | 256,226 | ||||||
Ohio State University, RB, BAB, Series C, | 1,760 | 1,547,288 | ||||||
Ohio Turnpike & Infrastructure Commission, Refunding RB, Series A, Junior Lien, 3.22%, 02/15/48 | 155 | 99,416 | ||||||
|
| |||||||
| 4,266,338 | ||||||||
| Oklahoma — 0.1% | ||||||||
Oklahoma Development Finance Authority, RB | ||||||||
4.85%, 02/01/45 | 500 | 447,859 | ||||||
4.38%, 11/01/45 | 290 | 247,669 | ||||||
Class A3, 4.71%, 05/01/52 | 115 | 97,630 | ||||||
Series A-2, 4.62%, 06/01/44 | 580 | 502,811 | ||||||
Series A-3, 5.09%, 02/01/52 | 265 | 229,105 | ||||||
|
| |||||||
| 1,525,074 | ||||||||
| Oregon — 0.0% | ||||||||
Oregon State University, RB, (BAM), | 113 | 71,045 | ||||||
State of Oregon Department of Transportation, RB, BAB, Series A, 5.83%, 11/15/34 | 55 | 55,419 | ||||||
|
| |||||||
| 126,464 | ||||||||
| Pennsylvania — 0.1% | ||||||||
City of Philadelphia Pennsylvania Water & Wastewater Revenue, Refunding RB, Series B, 2.93%, 07/01/45 | 115 | 74,679 | ||||||
Commonwealth Financing Authority, RB, Series A, 2.99%, 06/01/42 | 1,540 | 1,023,616 | ||||||
Pennsylvania State University, Refunding RB | ||||||||
Series D, 2.79%, 09/01/43 | 400 | 267,200 | ||||||
Series D, 2.84%, 09/01/50 | 95 | 56,864 | ||||||
SCHEDULE OF INVESTMENTS | 93 |
Schedule of Investments (continued) October 31, 2023 | iShares U.S. Long Credit Bond Index Fund (Percentages shown are based on Net Assets) |
| Security | Par (000) | Value | ||||||
| ||||||||
| Pennsylvania (continued) | ||||||||
Pennsylvania Turnpike Commission, RB, BAB, Series B, 5.51%, 12/01/45 | $ | 610 | $ | 561,348 | ||||
University of Pittsburgh-of the Commonwealth System of Higher Education, RB, 3.56%, 09/15/2119 | 113 | 65,100 | ||||||
|
| |||||||
| 2,048,807 | ||||||||
| South Carolina — 0.0% | ||||||||
South Carolina Public Service Authority, RB, BAB, Series C, 6.45%, 01/01/50 | 26 | 25,313 | ||||||
|
| |||||||
| Texas — 0.8% | ||||||||
Board of Regents of the University of Texas System, RB, BAB, Series C, | 2,505 | 2,244,677 | ||||||
City of San Antonio Texas Electric & Gas Systems Revenue, RB, 4.43%, 02/01/42 | 180 | 152,313 | ||||||
City of San Antonio Texas Electric & Gas Systems Revenue, RB, BAB, Junior Lien, 5.81%, 02/01/41 | 155 | 148,500 | ||||||
Dallas Area Rapid Transit, RB, BAB | ||||||||
5.02%, 12/01/48 | 455 | 403,419 | ||||||
Series B, 6.00%, 12/01/44 | 1,450 | 1,467,506 | ||||||
Dallas Area Rapid Transit, Refunding RB, Series A, Senior Lien, 2.61%, 12/01/48 | 455 | 275,344 | ||||||
Dallas Fort Worth International Airport, ARB | ||||||||
Series A, 4.09%, 11/01/51 | 1,300 | 962,752 | ||||||
Series A, 4.51%, 11/01/51 | 190 | 151,607 | ||||||
Dallas Fort Worth International Airport, Refunding RB | ||||||||
Series A, 2.99%, 11/01/38 | 125 | 94,174 | ||||||
Series A, 3.14%, 11/01/45 | 190 | 127,736 | ||||||
Series C, 3.09%, 11/01/40 | 1,065 | 742,619 | ||||||
Series C, 2.92%, 11/01/50(a) | 720 | 452,872 | ||||||
Grand Parkway Transportation Corp., Refunding RB, Subordinate, | 890 | 544,301 | ||||||
North Texas Tollway Authority, RB, BAB, Series B, 6.72%, 01/01/49 | 1,160 | 1,260,775 | ||||||
Permanent University Fund - University of Texas System, Refunding RB, Series A, 3.38%, 07/01/47 | 850 | 592,470 | ||||||
State of Texas, GO, BAB | ||||||||
5.52%, 04/01/39 | 945 | 906,264 | ||||||
Series A, 4.68%, 04/01/40 | 1,500 | 1,349,439 | ||||||
Texas Natural Gas Securitization Finance Corp., RB | ||||||||
Series 2023-1, 5.10%, 04/01/35 | 1,565 | 1,516,635 | ||||||
Series 2023-1, 5.17%, 04/01/41 | 1,500 | 1,390,225 | ||||||
Texas Private Activity Bond Surface Transportation Corp., RB, Series B, 3.92%, 12/31/49 | 375 | 267,697 | ||||||
Texas Transportation Commission State Highway Fund, Refunding RB, | 400 | 354,673 | ||||||
Texas Transportation Commission, Refunding GO, 2.47%, 10/01/44 | 800 | 482,169 | ||||||
|
| |||||||
| 15,888,167 | ||||||||
| Virginia — 0.0% | ||||||||
University of Virginia, Refunding RB | ||||||||
2.26%, 09/01/50 | 500 | 258,867 | ||||||
Series A, 3.23%, 09/01/2119 | 55 | 29,533 | ||||||
Series U, 2.58%, 11/01/51(a) | 215 | 119,539 | ||||||
|
| |||||||
| 407,939 | ||||||||
| Security | Par (000) | Value | ||||||
| ||||||||
| Washington — 0.0% | ||||||||
State of Washington, GO, BAB, | $ | 325 | $ | 297,089 | ||||
|
| |||||||
| Wisconsin — 0.0% | ||||||||
State of Wisconsin, Refunding RB, | 490 | 412,558 | ||||||
|
| |||||||
Total Municipal Bonds — 5.1% | 101,535,658 | |||||||
|
| |||||||
Preferred Securities | ||||||||
| Capital Trust — 0.1% | ||||||||
| Insurance — 0.1% | ||||||||
MetLife, Inc., 6.40%, 12/15/66 | 1,250 | 1,171,846 | ||||||
|
| |||||||
Total Preferred Securities — 0.1% |
| 1,171,846 | ||||||
|
| |||||||
Total Long-Term Investments — 98.0% |
| 1,943,667,864 | ||||||
|
| |||||||
| Shares | ||||||||
| ||||||||
Short-Term Securities | ||||||||
| Money Market Funds — 8.8% | ||||||||
BlackRock Cash Funds: Institutional, | 175,495,370 | 175,565,567 | ||||||
|
| |||||||
Total Short-Term Securities — 8.8% | 175,565,567 | |||||||
|
| |||||||
Total Investments — 106.8% | 2,119,233,431 | |||||||
Liabilities in Excess of Other Assets — (6.8)% |
| (135,667,957 | ) | |||||
|
| |||||||
Net Assets — 100.0% | $ | 1,983,565,474 | ||||||
|
| |||||||
| (a) | All or a portion of this security is on loan. |
| (b) | Variable rate security. Interest rate resets periodically. The rate shown is the effective interest rate as of period end. Security description also includes the reference rate and spread if published and available. |
| (c) | Step coupon security. Coupon rate will either increase (step-up bond) or decrease (step-down bond) at regular intervals until maturity. Interest rate shown reflects the rate currently in effect. |
| (d) | Security exempt from registration pursuant to Rule 144A under the Securities Act of 1933, as amended. These securities may be resold in transactions exempt from registration to qualified institutional investors. |
| (e) | When-issued security. |
| (f) | Affiliate of the Fund. |
| (g) | Annualized 7-day yield as of period end. |
| (h) | All or a portion of this security was purchased with the cash collateral from loaned securities. |
For Fund compliance purposes, the Fund’s industry classifications refer to one or more of the industry sub-classifications used by one or more widely recognized market indexes or rating group indexes, and/or as defined by the investment adviser. These definitions may not apply for purposes of this report, which may combine such industry sub-classifications for reporting ease.
| 94 | 2 0 2 3 BLACK ROCK ANNUAL REPORT TO SHAREHOLDERS |
Schedule of Investments (continued) October 31, 2023 | iShares U.S. Long Credit Bond Index Fund |
Affiliates
Investments in issuers considered to be affiliate(s) of the Fund during the year ended October 31, 2023 for purposes of Section 2(a)(3) of the Investment Company Act of 1940, as amended, were as follows:
| Affiliated Issuer | Value at 10/31/22 | Purchases at Cost | Proceeds from Sales | Net Realized Gain (Loss) | Change in Unrealized Appreciation (Depreciation) | Value at 10/31/23 | Shares Held at 10/31/23 | Income | Capital Gain Distributions from Underlying Funds | |||||||||||||||||||||||||||
BlackRock Cash Funds: Institutional, SL Agency Shares | $ | 104,925,359 | $ | 70,571,223 | (a) | $ | — | $ | (5,873 | ) | $ | 74,858 | $ | 175,565,567 | 175,495,370 | $ | 1,618,125 | (b) | $ | — | ||||||||||||||||
|
|
|
|
|
|
|
|
|
| |||||||||||||||||||||||||||
| (a) | Represents net amount purchased (sold). |
| (b) | All or a portion represents securities lending income earned from the reinvestment of cash collateral from loaned securities, net of fees and collateral investment expenses, and other payments to and from borrowers of securities. |
Fair Value Hierarchy as of Period End
Various inputs are used in determining the fair value of financial instruments. For a description of the input levels and information about the Fund’s policy regarding valuation of financial instruments, refer to the Notes to Financial Statements.
The following table summarizes the Fund’s financial instruments categorized in the fair value hierarchy. The breakdown of the Fund’s financial instruments into major categories is disclosed in the Schedule of Investments above.
| Level 1 | Level 2 | Level 3 | Total | |||||||||||||
Assets | ||||||||||||||||
Investments | ||||||||||||||||
Long-Term Investments | ||||||||||||||||
Corporate Bonds | $ | — | $ | 1,736,093,432 | $ | — | $ | 1,736,093,432 | ||||||||
Foreign Agency Obligations | — | 104,866,928 | — | 104,866,928 | ||||||||||||
Municipal Bonds | — | 101,535,658 | — | 101,535,658 | ||||||||||||
Preferred Securities | ||||||||||||||||
Capital Trust | — | 1,171,846 | — | 1,171,846 | ||||||||||||
Short-Term Securities | ||||||||||||||||
Money Market Funds | 175,565,567 | — | — | 175,565,567 | ||||||||||||
|
|
|
|
|
|
|
| |||||||||
| $ | 175,565,567 | $ | 1,943,667,864 | $ | — | $ | 2,119,233,431 | |||||||||
|
|
|
|
|
|
|
| |||||||||
See notes to financial statements.
SCHEDULE OF INVESTMENTS | 95 |
Schedule of Investments October 31, 2023 | iShares U.S. Long Government Bond Index Fund (Percentages shown are based on Net Assets) |
| Security | Par (000) | Value | ||||||
| ||||||||
U.S. Government Sponsored Agency Securities |
| |||||||
| Agency Obligations — 1.0% | ||||||||
Fannie Mae, 5.63%, 07/15/37 | $ | 4,000 | $ | 4,119,169 | ||||
Federal Home Loan Banks | ||||||||
5.63%, 03/14/36 | 1,000 | 1,017,478 | ||||||
5.50%, 07/15/36 | 4,730 | 4,830,275 | ||||||
Tennessee Valley Authority | ||||||||
5.88%, 04/01/36 | 11,841 | 12,286,113 | ||||||
3.50%, 12/15/42 | 66 | 48,917 | ||||||
|
| |||||||
| 22,301,952 | ||||||||
|
| |||||||
Total U.S. Government Sponsored Agency |
| 22,301,952 | ||||||
|
| |||||||
U.S. Treasury Obligations |
| |||||||
U.S. Treasury Bonds | ||||||||
4.50%, 02/15/36 - 08/15/39(a) | 29,566 | 27,760,774 | ||||||
4.75%, 02/15/37 - 02/15/41(a) | 28,828 | 28,035,724 | ||||||
5.00%, 05/15/37(a) | 27,415 | 27,452,482 | ||||||
4.38%, 02/15/38 - 08/15/43(a) | 65,670 | 59,230,214 | ||||||
3.50%, 02/15/39 | 12,761 | 10,550,256 | ||||||
4.25%, 05/15/39 - 11/15/40 | 20,025 | 17,994,888 | ||||||
4.63%, 02/15/40 | 16,575 | 15,545,537 | ||||||
1.13%, 05/15/40 - 08/15/40(a) | 119,755 | 64,927,460 | ||||||
3.88%, 08/15/40 - 05/15/43 | 54,603 | 45,427,424 | ||||||
1.38%, 11/15/40 - 08/15/50(a) | 127,489 | 62,839,969 | ||||||
1.88%, 02/15/41 - 11/15/51(a) | 242,985 | 138,573,431 | ||||||
2.25%, 05/15/41 - 02/15/52(a) | 362,778 | 223,546,611 | ||||||
1.75%, 08/15/41 | 44,509 | 26,425,480 | ||||||
3.75%, 08/15/41 - 11/15/43 | 45,466 | 37,027,867 | ||||||
2.00%, 11/15/41 - 08/15/51(a) | 174,541 | 96,657,476 | ||||||
3.13%, 11/15/41 - 05/15/48 | 88,536 | 64,473,831 | ||||||
2.38%, 02/15/42 - 05/15/51(a) | 74,460 | 45,368,923 | ||||||
3.00%, 05/15/42 - 08/15/52(a) | 367,992 | 256,946,036 | ||||||
3.25%, 05/15/42 | 23,247 | 17,703,135 | ||||||
2.75%, 08/15/42 - 11/15/47 | 157,938 | 107,301,406 | ||||||
| Security | Par (000) | Value | ||||||
| ||||||||
U.S. Treasury Obligations (continued) |
| |||||||
U.S. Treasury Bonds (continued) | ||||||||
3.38%, 08/15/42 - 11/15/48 | $ | 84,477 | $ | 63,558,749 | ||||
4.00%, 11/15/42 - 11/15/52(a) | 88,000 | 73,919,657 | ||||||
2.88%, 05/15/43 - 05/15/52(a) | 138,608 | 94,100,597 | ||||||
3.63%, 08/15/43 - 05/15/53(a) | 171,656 | 134,531,404 | ||||||
2.50%, 02/15/45 - 05/15/46(a) | 247,030 | 158,202,205 | ||||||
1.25%, 05/15/50(a) | 28,428 | 12,506,099 | ||||||
1.63%, 11/15/50(a) | 254,369 | 124,591,129 | ||||||
4.13%, 08/15/53(a) | 60,700 | 51,926,953 | ||||||
|
| |||||||
Total U.S. Treasury Obligations — 97.3% | 2,087,125,717 | |||||||
|
| |||||||
Total Long-Term Investments — 98.3% | 2,109,427,669 | |||||||
|
| |||||||
| Shares | ||||||||
Short-Term Securities |
| |||||||
| Money Market Funds — 36.0% | ||||||||
BlackRock Cash Funds: Institutional, SL Agency Shares, 5.54%(b)(c)(d) | 771,246,176 | 771,554,674 | ||||||
|
| |||||||
Total Short-Term Securities — 36.0% |
| 771,554,674 | ||||||
|
| |||||||
Total Investments — 134.3% |
| 2,880,982,343 | ||||||
Liabilities in Excess of Other Assets — (34.3)% |
| (735,569,200 | ) | |||||
|
| |||||||
Net Assets — 100.0% |
| $ | 2,145,413,143 | |||||
|
| |||||||
| (a) | All or a portion of this security is on loan. |
| (b) | Affiliate of the Fund. |
| (c) | Annualized 7-day yield as of period end. |
| (d) | All or a portion of this security was purchased with the cash collateral from loaned securities. |
Affiliates
Investments in issuers considered to be affiliate(s) of the Fund during the year ended October 31, 2023 for purposes of Section 2(a)(3) of the Investment Company Act of 1940, as amended, were as follows:
| Affiliated Issuer | Value at 10/31/22 | Purchases at Cost | Proceeds from Sales | Net Realized Gain (Loss) | Change in Unrealized Appreciation (Depreciation) | Value at 10/31/23 | Shares Held at 10/31/23 | Income | Capital Gain Distributions from Underlying Funds | |||||||||||||||||||||||||||
BlackRock Cash Funds: Institutional, SL Agency Shares | $ | 667,911,530 | $ | 103,220,804 | (a) | $ | — | $ | 34,404 | $ | 387,936 | $ | 771,554,674 | 771,246,176 | $ | 1,667,282 | (b) | $ | — | |||||||||||||||||
|
|
|
|
|
|
|
|
|
| |||||||||||||||||||||||||||
| (a) | Represents net amount purchased (sold). |
| (b) | All or a portion represents securities lending income earned from the reinvestment of cash collateral from loaned securities, net of fees and collateral investment expenses, and other payments to and from borrowers of securities. |
| 96 | 2 0 2 3 BLACK ROCK ANNUAL REPORT TO SHAREHOLDERS |
Schedule of Investments (continued) October 31, 2023 | iShares U.S. Long Government Bond Index Fund |
Derivative Financial Instruments Outstanding as of Period End
Futures Contracts
| Description | Number of Contracts | Expiration Date | Notional Amount (000) | Value/ Unrealized Appreciation (Depreciation) | ||||||||||||
Long Contracts | ||||||||||||||||
Ultra U.S. Treasury Bond | 1 | 12/19/23 | $ | 112 | $ | (16,093 | ) | |||||||||
|
| |||||||||||||||
Derivative Financial Instruments Categorized by Risk Exposure
As of period end, the fair values of derivative financial instruments located in the Statements of Assets and Liabilities were as follows:
Commodity Contracts | Credit Contracts | Equity Contracts | Foreign Currency Exchange Contracts | Interest Rate Contracts | Other Contracts | Total | ||||||||||||||||||||||
Liabilities — Derivative Financial Instruments | ||||||||||||||||||||||||||||
Futures contracts | ||||||||||||||||||||||||||||
Unrealized depreciation on futures contracts(a) | $ — | $ — | $ — | $ — | $ 16,093 | $ — | $ 16,093 | |||||||||||||||||||||
|
|
|
|
|
|
|
|
|
|
|
|
|
| |||||||||||||||
| (a) | Net cumulative unrealized appreciation (depreciation) on futures contracts and centrally cleared swaps, if any, are reported in the Schedule of Investments. In the Statements of Assets and Liabilities, only current day’s variation margin is reported in receivables or payables and the net cumulative unrealized appreciation (depreciation) is included in accumulated earnings (loss). |
For the period ended October 31, 2023, the effect of derivative financial instruments in the Statements of Operations was as follows:
Commodity Contracts | Credit Contracts | Equity Contracts | Foreign Currency Exchange Contracts | Interest Rate Contracts | Other Contracts | Total | ||||||||||||||||||||||
Net Realized Gain (Loss) from: | ||||||||||||||||||||||||||||
Futures contracts | $ — | $ — | $ — | $ — | $ (1,370,516 | ) | $ — | $ (1,370,516 | ) | |||||||||||||||||||
|
|
|
|
|
|
|
|
|
|
|
|
|
| |||||||||||||||
| Net Change in Unrealized Appreciation (Depreciation) on: | ||||||||||||||||||||||||||||
Futures contracts | $ — | $ — | $ — | $ — | $ 815,478 | $ — | $ 815,478 | |||||||||||||||||||||
|
|
|
|
|
|
|
|
|
|
|
|
|
| |||||||||||||||
Average Quarterly Balances of Outstanding Derivative Financial Instruments
Futures contracts: | ||||
Average notional value of contracts — long | $ | 4,303,750 | ||
For more information about the Fund’s investment risks regarding derivative financial instruments, refer to the Notes to Financial Statements.
Fair Value Hierarchy as of Period End
Various inputs are used in determining the fair value of financial instruments. For a description of the input levels and information about the Fund’s policy regarding valuation of financial instruments, refer to the Notes to Financial Statements.
The following table summarizes the Fund’s financial instruments categorized in the fair value hierarchy. The breakdown of the Fund’s financial instruments into major categories is disclosed in the Schedule of Investments above.
| Level 1 | Level 2 | Level 3 | Total | |||||||||||||
Assets | ||||||||||||||||
Investments | ||||||||||||||||
Long-Term Investments | ||||||||||||||||
U.S. Government Sponsored Agency Securities | $ | — | $ | 22,301,952 | $ | — | $ | 22,301,952 | ||||||||
U.S. Treasury Obligations | — | 2,087,125,717 | — | 2,087,125,717 | ||||||||||||
Short-Term Securities | ||||||||||||||||
Money Market Funds | 771,554,674 | — | — | 771,554,674 | ||||||||||||
|
|
|
|
|
|
|
| |||||||||
| $ | 771,554,674 | $ | 2,109,427,669 | $ | — | $ | 2,880,982,343 | |||||||||
|
|
|
|
|
|
|
| |||||||||
SCHEDULE OF INVESTMENTS | 97 |
Schedule of Investments (continued) October 31, 2023 | iShares U.S. Long Government Bond Index Fund |
Fair Value Hierarchy as of Period End (continued)
| Level 1 | Level 2 | Level 3 | Total | |||||||||||||
Derivative Financial Instruments(a) | ||||||||||||||||
Liabilities | ||||||||||||||||
Interest Rate Contracts | $ | (16,093 | ) | $ | — | $ | — | $ | (16,093 | ) | ||||||
|
|
|
|
|
|
|
| |||||||||
| (a) | Derivative financial instruments are futures contracts. Futures contracts are valued at the unrealized appreciation (depreciation) on the instrument. |
See notes to financial statements.
| 98 | 2 0 2 3 BLACK ROCK ANNUAL REPORT TO SHAREHOLDERS |
Schedule of Investments October 31, 2023 | iShares U.S. Securitized Bond Index Fund (Percentages shown are based on Net Assets) |
| Security | Par (000) | Value | ||||||
Asset-Backed Securities |
| |||||||
American Express Credit Account Master Trust |
| |||||||
Series 2022-1, Class A, 2.21%, 03/15/27 | $ | 3,750 | $ | 3,569,968 | ||||
Series 2022-2, Class A, 3.39%, 05/15/27 | 8,302 | 8,014,131 | ||||||
BA Credit Card Trust, Series 2021-A1, Class A1, 0.44%, 09/15/26 | 4,166 | 4,065,648 | ||||||
GM Financial Consumer Automobile Receivables Trust, Series 2020-2, Class A4, 1.74%, 08/18/25 | 1,708 | 1,695,943 | ||||||
Hyundai Auto Receivables Trust | ||||||||
Series 2022-B, Class A3, 3.72%, 11/16/26 | 620 | 605,387 | ||||||
Series 2022-B, Class A4, 3.80%, 08/15/28 | 450 | 431,990 | ||||||
Santander Drive Auto Receivables Trust, | ||||||||
Series 2022-4, Class A3, 4.14%, 02/16/27 | 682 | 675,569 | ||||||
Toyota Auto Receivables Owner Trust | ||||||||
Series 2021-B, Class A3, 0.26%, 11/17/25 | 1,544 | 1,502,555 | ||||||
Series 2021-B, Class A4, 0.53%, 10/15/26 | 2,073 | 1,927,394 | ||||||
Series 2022-B, Class A3, 2.93%, 09/15/26 | 10,000 | 9,724,799 | ||||||
Verizon Master Trust, Series 2021-1, Class A, 0.50%, 05/20/27 | 2,382 | 2,310,432 | ||||||
|
| |||||||
Total Asset-Backed Securities — 0.8% | 34,523,816 | |||||||
|
| |||||||
Non-Agency Mortgage-Backed Securities |
| |||||||
| Commercial Mortgage-Backed Securities — 2.8% | ||||||||
Bank | ||||||||
Series 2019-BN18, Class A4, | 1,659 | 1,411,579 | ||||||
Series 2019-BN21, Class A5, | 4,564 | 3,752,204 | ||||||
Series 2020-BN27, Class A5, | 4,515 | 3,451,775 | ||||||
BBCMS Mortgage Trust | ||||||||
Series 2017-C1, Class A4, | 1,908 | 1,755,261 | ||||||
Series 2020-C7, Class A5, | 5,536 | 4,300,613 | ||||||
BBCMS Trust, Series 2021-C10, Class A5, | 7,713 | 5,980,519 | ||||||
Benchmark Mortgage Trust | ||||||||
Series 2018-B5, Class A4, | 2,489 | 2,269,740 | ||||||
Series 2019-B10, Class A4, | 2,654 | 2,333,232 | ||||||
Series 2019-B11, Class A4, | 3,319 | 2,834,236 | ||||||
Series 2019-B13, Class A4, | 7,093 | 5,923,623 | ||||||
Series 2019-B9, Class A5, | 2,489 | 2,189,356 | ||||||
Series 2020-B19, Class B, | 937 | 575,900 | ||||||
Series 2020-B21, Class A4, | 2,988 | 2,251,203 | ||||||
Series 2020-B21, Class A5, | 1,990 | 1,485,519 | ||||||
Series 2021-B28, Class A5, | 7,100 | 5,294,359 | ||||||
Series 2021-B29, Class A5, | 2,763 | 2,088,146 | ||||||
Citigroup Commercial Mortgage Trust | ||||||||
Series 2014-GC25, Class A4, | 413 | 401,280 | ||||||
Series 2014-GC25, Class AS, | 1,243 | 1,194,444 | ||||||
Series 2016-GC37, Class A4, | 2,903 | 2,701,088 | ||||||
Series 2016-P5, Class A4, | 829 | 748,764 | ||||||
Series 2017-C4, Class A4, | 7,905 | 7,093,949 | ||||||
Series 2017-P7, Class A4, | 1,866 | 1,691,263 | ||||||
Commercial Mortgage Trust | ||||||||
Series 2013-CR12, Class A4, | 265 | 258,841 | ||||||
Series 2014-UBS2, Class A5, | 366 | 364,119 | ||||||
Series 2015-PC1, Class A5, | 1,243 | 1,194,596 | ||||||
Series 2016-CR28, Class A4, | 620 | 583,685 | ||||||
CSAIL Commercial Mortgage Trust | ||||||||
Series 2015-C3, Class A4, | 829 | 787,604 | ||||||
Series 2016-C7, Class A5, | 3,984 | 3,660,476 | ||||||
Series 2018-CX11, Class A5, | 3,319 | 3,002,843 | ||||||
| Security | Par (000) | Value | ||||||
| Commercial Mortgage-Backed Securities (continued) | ||||||||
DBJPM Mortgage Trust, Series 2016-C3, | $ | 6,225 | $ | 5,648,961 | ||||
Federal Home Loan Mortgage Corp. Multifamily Structured Pass-Through Certificates, Series K146, Class A2, | 2,000 | 1,630,931 | ||||||
GS Mortgage Securities Corp. II, Series 2018- GS10, Class A5, 4.16%, 07/10/51(a) | 2,489 | 2,230,579 | ||||||
GS Mortgage Securities Trust | ||||||||
Series 2014-GC24, Class A5, | 5,809 | 5,641,078 | ||||||
Series 2015-GC30, Class A4, | 496 | 471,306 | ||||||
Series 2015-GS1, Class A3, | 1,908 | 1,801,350 | ||||||
JPMBB Commercial Mortgage Securities Trust | ||||||||
Series 2014-C18, Class A5, | 163 | 161,755 | ||||||
Series 2015-C31, Class A3, | 1,611 | 1,520,795 | ||||||
JPMCC Commercial Mortgage Securities Trust, Series 2017-JP7, Class A5, | 2,903 | 2,590,815 | ||||||
JPMDB Commercial Mortgage Securities Trust, Series 2017-C7, Class A5, | 4,979 | 4,430,030 | ||||||
Morgan Stanley Bank of America Merrill Lynch Trust | ||||||||
Series 2013-C10, Class AS, | 249 | 237,553 | ||||||
Series 2015-C24, Class A4, | 620 | 589,836 | ||||||
Series 2016-C28, Class A4, | 5,621 | 5,247,715 | ||||||
Morgan Stanley Capital I Trust | ||||||||
Series 2015-UBS8, Class A4, | 978 | 918,152 | ||||||
Series 2018-H3, Class A4, | 2,489 | 2,269,222 | ||||||
Series 2019-H6, Class A4, | 488 | 419,726 | ||||||
Series 2019-L3, Class AS, | 628 | 512,385 | ||||||
Wells Fargo Commercial Mortgage Trust | ||||||||
Series 2015-C27, Class A5, | 1,243 | 1,188,848 | ||||||
Series 2015-SG1, Class A4, 3.79%, 09/15/48 | 4,028 | 3,839,361 | ||||||
Series 2019-C49, Class A5, | 3,195 | 2,852,969 | ||||||
Series 2020-C56, Class A5, | 2,580 | 2,033,688 | ||||||
Series 2020-C58, Class A4, | 2,349 | 1,769,197 | ||||||
|
| |||||||
Total Non-Agency Mortgage-Backed Securities — 2.8% |
| 119,586,469 | ||||||
|
| |||||||
U.S. Government Sponsored Agency Securities |
| |||||||
| Agency Obligations — 6.6% | ||||||||
Ginnie Mae Mortgage-Backed Securities | ||||||||
3.00%, 03/20/52 | 6,152 | 5,032,400 | ||||||
3.50%, 05/20/53 | 4,984 | 4,299,506 | ||||||
4.50%, 05/20/53 | 7,195 | 6,503,810 | ||||||
5.50%, 07/20/53 - 09/20/53 | 25,531 | 24,433,500 | ||||||
6.00%, 09/20/53 | 5,868 | 5,752,326 | ||||||
Uniform Mortgage-Backed Securities | ||||||||
2.50%, 03/01/37 - 04/01/53 | 38,594 | 29,909,381 | ||||||
2.00%, 10/01/37 - 07/01/51 | 18,480 | 14,013,366 | ||||||
3.50%, 07/01/38 | 6,431 | 5,872,393 | ||||||
4.00%, 01/01/50 | 2,233 | 1,963,675 | ||||||
3.00%, 07/01/50 - 03/01/52 | 49,976 | 40,245,526 | ||||||
6.00%, 01/01/53 - 09/01/53 | 53,118 | 51,927,258 | ||||||
5.00%, 04/01/53 - 07/01/53 | 32,036 | 29,590,642 | ||||||
5.50%, 04/01/53 - 06/01/53 | 32,826 | 31,266,870 | ||||||
6.50%, 07/01/53 - 10/01/53 | 24,301 | 24,296,830 | ||||||
4.50%, 08/01/53 | 3,837 | 3,430,294 | ||||||
|
| |||||||
| 278,537,777 | ||||||||
| Commercial Mortgage-Backed Securities — 2.3% | ||||||||
Fannie Mae | ||||||||
Series 2016-M5, Class A2, | 4,570 | 4,272,189 | ||||||
SCHEDULE OF INVESTMENTS | 99 |
Schedule of Investments (continued) October 31, 2023 | iShares U.S. Securitized Bond Index Fund (Percentages shown are based on Net Assets) |
| Security | Par (000) | Value | ||||||
| ||||||||
| Commercial Mortgage-Backed Securities (continued) | ||||||||
Fannie Mae (continued) |
| |||||||
Series 2016-M6, Class A2, | $ | 4,720 | $ | 4,402,944 | ||||
Series 2017-M15, Class A2, | 2,991 | 2,772,434 | ||||||
Series 2018-M12, Class A2, | 2,489 | 2,231,824 | ||||||
Series 2018-M3, Class A2, | 6,877 | 6,084,035 | ||||||
Series 2019-M22, Class A2, | 3,707 | 3,195,727 | ||||||
Series 2020-M46, Class A2, | 4,549 | 3,572,182 | ||||||
Series 2021-M17, Class A2, | 2,489 | 1,906,810 | ||||||
Series 2022-M21, Class A2, | 3,536 | 2,697,457 | ||||||
Freddie Mac Multifamily Structured Pass Through Certificates |
| |||||||
Series K052, Class A2, 3.15%, 11/25/25 | 620 | 593,633 | ||||||
Series K063, Class A2, 3.43%, 01/25/27(a) | 4,150 | 3,916,446 | ||||||
Series K066, Class A2, 3.12%, 06/25/27 | 2,903 | 2,692,305 | ||||||
Series K067, Class A1, 2.90%, 03/25/27 | 1,969 | 1,875,516 | ||||||
Series K076, Class A2, 3.90%, 04/25/28 | 1,659 | 1,561,942 | ||||||
Series K081, Class A2, 3.90%, 08/25/28(a) | 8,302 | 7,781,020 | ||||||
Series K088, Class A2, 3.69%, 01/25/29 | 413 | 380,903 | ||||||
Series K100, Class A2, 2.67%, 09/25/29 | 8,302 | 7,121,378 | ||||||
Series K101, Class A2, 2.52%, 10/25/29 | 4,690 | 3,982,290 | ||||||
Series K110, Class A2, 1.48%, 04/25/30 | 2,190 | 1,717,368 | ||||||
Series K111, Class A2, 1.35%, 05/25/30 | 829 | 641,020 | ||||||
Series K123, Class A2, 1.62%, 12/25/30 | 8,302 | 6,391,684 | ||||||
Series K126, Class A2, 2.07%, 01/25/31 | 9,074 | 7,193,673 | ||||||
Series K144, Class A2, 2.45%, 04/25/32 | 5,000 | 3,933,689 | ||||||
Series K-1521, Class A2, 2.18%, 08/25/36 | 3,967 | 2,683,661 | ||||||
Series K730, Class A2, 3.59%, 01/25/25(a) | 7,122 | 6,947,911 | ||||||
Series K734, Class A2, 3.21%, 02/25/26 | 4,731 | 4,524,545 | ||||||
|
| |||||||
| 95,074,586 | ||||||||
| Mortgage-Backed Securities — 86.8% | ||||||||
Fannie Mae Mortgage-Backed Securities | ||||||||
3.00%, 02/01/47 | 914 | 783,194 | ||||||
4.00%, 02/01/47 - 02/01/57 | 3,250 | 2,843,974 | ||||||
3.50%, 11/01/51 | 4,981 | 4,209,927 | ||||||
(12-mo. LIBOR US + 1.53%), | 36 | 35,299 | ||||||
(12-mo. LIBOR US + 1.54%), | 48 | 47,864 | ||||||
(12-mo. LIBOR US + 1.70%), | 12 | 11,883 | ||||||
(12-mo. LIBOR US + 1.75%), | 4 | 3,799 | ||||||
(12-mo. LIBOR US + 1.83%), | 2 | 2,318 | ||||||
Freddie Mac, Series K-151, Class A2, | 3,750 | 3,259,824 | ||||||
Freddie Mac Mortgage-Backed Securities | ||||||||
8.00%, 12/01/24 | 3 | 2,671 | ||||||
3.00%, 03/01/27 - 10/01/47 | 34,861 | 29,442,124 | ||||||
2.50%, 07/01/28 - 01/01/33 | 8,068 | 7,407,367 | ||||||
3.50%, 03/01/32 - 06/01/49 | 33,995 | 29,491,792 | ||||||
5.00%, 04/01/33 - 04/01/49 | 1,466 | 1,393,178 | ||||||
4.00%, 05/01/33 - 01/01/49 | 11,621 | 10,314,879 | ||||||
5.50%, 06/01/35 - 01/01/39 | 50 | 48,652 | ||||||
4.50%, 06/01/38 - 01/01/49 | 4,838 | 4,427,082 | ||||||
(12-mo. LIBOR US + 1.50%), | 1 | 985 | ||||||
(12-mo. LIBOR US + 1.70%), | 3 | 2,647 | ||||||
(12-mo. LIBOR US + 1.84%), | 5 | 5,112 | ||||||
| Security | Par (000) | Value | ||||||
| ||||||||
| Mortgage-Backed Securities (continued) | ||||||||
Freddie Mac Multifamily Structured Pass Through Certificates |
| |||||||
Series K109, Class A2, | $ | 8,471 | $ | 6,665,710 | ||||
Series K748, Class A2, | 10,000 | 8,539,307 | ||||||
Ginnie Mae Mortgage-Backed Securities | ||||||||
7.50%, 12/15/23 | — | (b) | 6 | |||||
5.50%, 12/15/32 - 11/20/53(c) | 32,042 | 30,664,329 | ||||||
6.00%, 03/15/35 - 11/20/53(c) | 24,173 | 23,686,189 | ||||||
6.50%, 09/15/36 - 11/20/53(c) | 18,516 | 18,473,604 | ||||||
4.50%, 07/15/39 - 11/20/53(c) | 62,279 | 56,550,621 | ||||||
5.00%, 11/15/39 - 11/20/53(c) | 61,411 | 57,274,486 | ||||||
4.00%, 03/15/41 - 11/20/53(c) | 82,843 | 73,565,815 | ||||||
3.50%, 09/20/42 - 11/20/53(c) | 124,363 | 107,060,977 | ||||||
3.00%, 01/20/43 - 11/20/53(c) | 158,618 | 131,794,764 | ||||||
2.50%, 05/20/45 - 11/20/53(c) | 239,043 | 190,395,364 | ||||||
2.00%, 07/20/50 - 11/20/53(c) | 223,484 | 172,711,111 | ||||||
1.50%, 10/20/51 | 785 | 583,219 | ||||||
Uniform Mortgage-Backed Securities | ||||||||
4.50%, 05/01/24 - 11/13/53(c) | 144,421 | 129,542,318 | ||||||
4.00%, 10/01/25 - 11/13/53(c) | 228,726 | 201,120,056 | ||||||
3.50%, 02/01/26 - 11/13/53(c) | 265,910 | 226,690,454 | ||||||
3.00%, 01/01/27 - 11/13/53(c) | 392,809 | 326,009,786 | ||||||
2.50%, 09/01/28 - 11/13/53(c) | 749,854 | 590,947,591 | ||||||
7.00%, 02/01/32 | 8 | 7,691 | ||||||
6.50%, 07/01/32 - 11/13/53(c) | 14,106 | 14,021,090 | ||||||
5.00%, 11/01/33 - 11/13/53(c) | 108,680 | 100,403,569 | ||||||
6.00%, 03/01/34 - 11/13/53(c) | 23,416 | 22,832,521 | ||||||
2.00%, 12/01/35 - 11/13/53(c) | 1,178,325 | 900,170,842 | ||||||
1.50%, 03/01/36 - 11/01/51 | 128,412 | 96,422,676 | ||||||
5.50%, 04/01/36 - 11/13/53(c) | 92,089 | 87,545,634 | ||||||
|
| |||||||
| 3,667,414,301 | ||||||||
|
| |||||||
Total U.S. Government Sponsored Agency |
| 4,041,026,664 | ||||||
|
| |||||||
Total Long-Term Investments — 99.3% |
| 4,195,136,949 | ||||||
|
| |||||||
| Shares | ||||||||
| ||||||||
Short-Term Securities |
| |||||||
| Money Market Funds — 13.8% | ||||||||
BlackRock Cash Funds: Institutional, SL Agency Shares, Series M, 5.54%(d)(e) | 580,649,445 | 580,881,705 | ||||||
|
| |||||||
Total Short-Term Securities — 13.8% |
| 580,881,705 | ||||||
|
| |||||||
Total Investments Before TBA Sale Commitments — 113.1% |
| 4,776,018,654 | ||||||
|
| |||||||
Par (000) | ||||||||
| ||||||||
TBA Sale Commitments(c) | ||||||||
| Mortgage-Backed Securities — (1.1)% | ||||||||
Ginnie Mae Mortgage-Backed Securities, | $ | (1,725 | ) | (1,470,113 | ) | |||
Uniform Mortgage-Backed Securities | ||||||||
2.00%, 11/13/53 | (24,075 | ) | (17,676,316 | ) | ||||
2.50%, 11/13/53 | (19,450 | ) | (14,918,758 | ) | ||||
3.00%, 11/13/53 | (8,750 | ) | (7,000,087 | ) | ||||
| 100 | 2 0 2 3 BLACK ROCK ANNUAL REPORT TO SHAREHOLDERS |
Schedule of Investments (continued) October 31, 2023 | iShares U.S. Securitized Bond Index Fund (Percentages shown are based on Net Assets) |
| Security | Par (000) | Value | ||||||
| ||||||||
Mortgage-Backed Securities (continued) |
| |||||||
Uniform Mortgage-Backed Securities (continued) |
| |||||||
3.50%, 11/13/53 | $ | (2,050 | ) | $ | (1,706,892 | ) | ||
4.00%, 11/13/53 | (600 | ) | (518,250 | ) | ||||
4.50%, 11/13/53 | (1,125 | ) | (1,004,484 | ) | ||||
5.00%, 11/13/53 | (1,100 | ) | (1,014,063 | ) | ||||
|
| |||||||
Total TBA Sale Commitments — (1.1)% |
| (45,308,963 | ) | |||||
|
| |||||||
Total Investments, Net of TBA Sale |
| 4,730,709,691 | ||||||
Liabilities in Excess of Other Assets — (12.0)% |
| (505,673,687 | ) | |||||
|
| |||||||
Net Assets — 100.0% |
| $ | 4,225,036,004 | |||||
|
| |||||||
| (a) | Variable rate security. Interest rate resets periodically. The rate shown is the effective interest rate as of period end. Security description also includes the reference rate and spread if published and available. |
| (b) | Rounds to less than 1,000. |
| (c) | Represents or includes a TBA transaction. |
| (d) | Affiliate of the Fund. |
| (e) | Annualized 7-day yield as of period end. |
Affiliates
Investments in issuers considered to be affiliate(s) of the Fund during the year ended October 31, 2023 for purposes of Section 2(a)(3) of the Investment Company Act of 1940, as amended, were as follows:
| Affiliated Issuer | Value at 10/31/22 | Purchases at Cost | Proceeds from Sales | Net Realized Gain (Loss) | Change in Unrealized Appreciation (Depreciation) | Value at 10/31/23 | Shares Held at 10/31/23 | Income | Capital Gain Distributions from Underlying Funds | |||||||||||||||||||||||||||
BlackRock Cash Funds: Institutional, SL Agency Shares | $ | 629,253,363 | $ | — | $ | (48,776,350 | )(a) | $ | 44,114 | $ | 360,578 | $ | 580,881,705 | 580,649,445 | $ | 36,145,953 | $ | — | ||||||||||||||||||
|
|
|
|
|
|
|
|
|
| |||||||||||||||||||||||||||
| (a) | Represents net amount purchased (sold). |
Fair Value Hierarchy as of Period End
Various inputs are used in determining the fair value of financial instruments. For a description of the input levels and information about the Fund’s policy regarding valuation of financial instruments, refer to the Notes to Financial Statements.
The following table summarizes the Fund’s financial instruments categorized in the fair value hierarchy. The breakdown of the Fund’s financial instruments into major categories is disclosed in the Schedule of Investments above.
| Level 1 | Level 2 | Level 3 | Total | |||||||||||||
Assets | ||||||||||||||||
Investments | ||||||||||||||||
Long-Term Investments | ||||||||||||||||
Asset-Backed Securities | $ | — | $ | 34,523,816 | $ | — | $ | 34,523,816 | ||||||||
Non-Agency Mortgage-Backed Securities | — | 119,586,469 | — | 119,586,469 | ||||||||||||
U.S. Government Sponsored Agency Securities | — | 4,041,026,664 | — | 4,041,026,664 | ||||||||||||
Short-Term Securities | ||||||||||||||||
Money Market Funds | 580,881,705 | — | — | 580,881,705 | ||||||||||||
Liabilities | ||||||||||||||||
Investments | ||||||||||||||||
TBA Sale Commitments | — | (45,308,963 | ) | — | (45,308,963 | ) | ||||||||||
|
|
|
|
|
|
|
| |||||||||
| $ | 580,881,705 | $ | 4,149,827,986 | $ | — | $ | 4,730,709,691 | |||||||||
|
|
|
|
|
|
|
| |||||||||
See notes to financial statements.
SCHEDULE OF INVESTMENTS | 101 |
Statements of Assets and Liabilities
October 31, 2023
iShares U.S. Intermediate Credit Bond Index Fund | iShares U.S. Intermediate Government Bond Index Fund | iShares U.S. Long Credit Bond Index Fund | iShares U.S. Long Government Bond Index Fund | |||||||||||||||||
| ||||||||||||||||||||
ASSETS | ||||||||||||||||||||
Investments, at value — unaffiliated(a)(b) | $ | 2,385,017,181 | $ | 3,895,305,355 | $ | 1,943,667,864 | $ | 2,109,427,669 | ||||||||||||
Investments, at value — affiliated(c) | 182,872,847 | 1,621,788,775 | 175,565,567 | 771,554,674 | ||||||||||||||||
Cash pledged for futures contracts | — | — | — | 7,000 | ||||||||||||||||
Receivables: | ||||||||||||||||||||
Investments sold | 31,492,262 | 38,208,431 | — | 10,000,286 | ||||||||||||||||
Securities lending income — affiliated | 61,999 | 161,780 | 57,726 | 80,195 | ||||||||||||||||
Capital shares sold | — | — | 728,396 | — | ||||||||||||||||
Dividends — affiliated | 90,670 | 20,658 | 77,477 | 23,564 | ||||||||||||||||
Interest — unaffiliated | 23,188,684 | 29,782,307 | 29,798,519 | 28,489,116 | ||||||||||||||||
Prepaid expenses | 5,554 | 4,544 | 3,710 | 3,666 | ||||||||||||||||
|
|
|
|
|
|
|
| |||||||||||||
Total assets | 2,622,729,197 | 5,585,271,850 | 2,149,899,259 | 2,919,586,170 | ||||||||||||||||
|
|
|
|
|
|
|
| |||||||||||||
LIABILITIES | ||||||||||||||||||||
Bank overdraft | — | 28,097 | — | — | ||||||||||||||||
Collateral on securities loaned | 167,334,237 | 1,611,619,239 | 159,757,787 | 764,713,617 | ||||||||||||||||
Payables: | ||||||||||||||||||||
Investments purchased | 25,923,035 | 26,702,916 | 6,538,412 | 9,420,981 | ||||||||||||||||
Capital shares redeemed | 5,427,255 | 23,984,540 | — | — | ||||||||||||||||
Trustees’ and Officer’s fees | 2,720 | 3,915 | 3,752 | 3,946 | ||||||||||||||||
Professional fees | 33,860 | 33,722 | 33,834 | 33,721 | ||||||||||||||||
Variation margin on futures contracts | — | — | — | 762 | ||||||||||||||||
|
|
|
|
|
|
|
| |||||||||||||
Total liabilities | 198,721,107 | 1,662,372,429 | 166,333,785 | 774,173,027 | ||||||||||||||||
|
|
|
|
|
|
|
| |||||||||||||
Commitments and contingent liabilities | ||||||||||||||||||||
NET ASSETS | $ | 2,424,008,090 | $ | 3,922,899,421 | $ | 1,983,565,474 | $ | 2,145,413,143 | ||||||||||||
|
|
|
|
|
|
|
| |||||||||||||
NET ASSETS CONSIST OF | ||||||||||||||||||||
Paid-in capital(d)(e)(f) | $ | 2,736,846,293 | $ | 4,372,755,964 | $ | 2,627,903,756 | $ | 2,969,339,221 | ||||||||||||
Accumulated loss | (312,838,203 | ) | (449,856,543 | ) | (644,338,282 | ) | (823,926,078 | ) | ||||||||||||
|
|
|
|
|
|
|
| |||||||||||||
NET ASSETS | $ | 2,424,008,090 | $ | 3,922,899,421 | $ | 1,983,565,474 | $ | 2,145,413,143 | ||||||||||||
|
|
|
|
|
|
|
| |||||||||||||
Net asset value | $ | 9.42 | $ | 9.44 | $ | 8.17 | $ | 7.25 | ||||||||||||
|
|
|
|
|
|
|
| |||||||||||||
(a) Investments, at cost — unaffiliated | $ | 2,614,380,028 | $ | 4,256,285,843 | $ | 2,518,457,095 | $ | 2,896,082,117 | ||||||||||||
(b) Securities loaned, at value | $ | 161,173,833 | $ | 1,569,523,120 | $ | 153,306,778 | $ | 735,282,283 | ||||||||||||
(c) Investments, at cost — affiliated | $ | 182,804,902 | $ | 1,621,128,767 | $ | 175,507,525 | $ | 771,288,241 | ||||||||||||
(d) Shares outstanding | 257,297,124 | 415,575,072 | 242,763,970 | 295,991,474 | ||||||||||||||||
(e) Shares authorized | Unlimited | Unlimited | Unlimited | Unlimited | ||||||||||||||||
(f) Par value | $ | 0.001 | $ | 0.001 | $ | 0.001 | $ | 0.001 | ||||||||||||
See notes to financial statements.
| 102 | 2 0 2 3 BLACK ROCK ANNUAL REPORT TO SHAREHOLDERS |
Statements of Assets and Liabilities (continued)
October 31, 2023
iShares U.S. Securitized Bond Index Fund | ||||
| ||||
ASSETS | ||||
Investments, at value — unaffiliated(a) | $ | 4,195,136,949 | ||
Investments, at value — affiliated(b) | 580,881,705 | |||
Cash pledged as collateral for TBA commitments | 269,000 | |||
Receivables: | ||||
Investments sold | 67,622 | |||
TBA sale commitments | 45,456,106 | |||
Dividends — affiliated | 2,878,567 | |||
Interest — unaffiliated | 11,635,933 | |||
Principal paydowns | 127,485 | |||
Prepaid expenses | 3,746 | |||
|
| |||
Total assets | 4,836,457,113 | |||
|
| |||
LIABILITIES | ||||
Bank overdraft | 17,200 | |||
TBA sale commitments, at value(c) | 45,308,963 | |||
Payables: | ||||
Investments purchased | 566,056,527 | |||
Trustees’ and Officer’s fees | 4,699 | |||
Professional fees | 33,720 | |||
|
| |||
Total liabilities | 611,421,109 | |||
|
| |||
Commitments and contingent liabilities | ||||
NET ASSETS | $ | 4,225,036,004 | ||
|
| |||
NET ASSETS CONSIST OF | ||||
Paid-in capital(d)(e)(f) | $ | 5,038,327,686 | ||
Accumulated loss | (813,291,682 | ) | ||
|
| |||
NET ASSETS | $ | 4,225,036,004 | ||
|
| |||
Net asset value | $ | 8.76 | ||
|
| |||
(a) Investments, at cost — unaffiliated | $ | 4,917,479,565 | ||
(b) Investments, at cost — affiliated | $ | 580,633,793 | ||
(c) Proceeds from TBA sale commitments | $ | 45,456,106 | ||
(d) Shares outstanding | 482,106,852 | |||
(e) Shares authorized | Unlimited | |||
(f) Par value | $ | 0.001 | ||
See notes to financial statements.
FINANCIAL STATEMENTS | 103 |
Year Ended October 31, 2023
iShares U.S. Intermediate Credit Bond Index Fund | iShares U.S. Intermediate Government Bond Index Fund | iShares U.S. Long Credit Bond Index Fund | iShares U.S. Long Government Bond Index Fund | |||||||||||||||||||||
INVESTMENT INCOME | ||||||||||||||||||||||||
Dividends — affiliated | $ | 1,205,105 | $ | 585,121 | $ | 1,061,119 | $ | 812,621 | ||||||||||||||||
Interest — unaffiliated | 75,454,034 | 88,199,499 | 105,138,413 | 73,560,105 | ||||||||||||||||||||
Securities lending income — affiliated — net | 592,789 | 1,931,971 | 557,006 | 854,661 | ||||||||||||||||||||
Foreign taxes withheld | (274 | ) | — | — | — | |||||||||||||||||||
|
|
|
|
|
|
|
| |||||||||||||||||
Total investment income | 77,251,654 | 90,716,591 | 106,756,538 | 75,227,387 | ||||||||||||||||||||
|
|
|
|
|
|
|
| |||||||||||||||||
EXPENSES | ||||||||||||||||||||||||
Administration | 1,283,499 | 1,926,345 | 1,252,410 | 1,054,422 | ||||||||||||||||||||
Investment advisory | 1,283,499 | 1,926,345 | 1,252,410 | 1,054,422 | ||||||||||||||||||||
Professional | 33,736 | 33,966 | 33,735 | 33,888 | ||||||||||||||||||||
Trustees and Officer | 20,723 | 33,035 | 20,158 | 19,712 | ||||||||||||||||||||
Miscellaneous | 1,068 | 1,068 | 2,103 | 1,068 | ||||||||||||||||||||
|
|
|
|
|
|
|
| |||||||||||||||||
Total expenses | 2,622,525 | 3,920,759 | 2,560,816 | 2,163,512 | ||||||||||||||||||||
Less: | ||||||||||||||||||||||||
Fees waived and/or reimbursed by the Administrator/Manager | (2,621,457 | ) | (3,919,691 | ) | (2,558,713 | ) | (2,162,444 | ) | ||||||||||||||||
|
|
|
|
|
|
|
| |||||||||||||||||
Total expenses after fees waived and/or reimbursed | 1,068 | 1,068 | 2,103 | 1,068 | ||||||||||||||||||||
|
|
|
|
|
|
|
| |||||||||||||||||
Net investment income | 77,250,586 | 90,715,523 | 106,754,435 | 75,226,319 | ||||||||||||||||||||
|
|
|
|
|
|
|
| |||||||||||||||||
REALIZED AND UNREALIZED GAIN (LOSS) | ||||||||||||||||||||||||
Net realized gain (loss) from: | ||||||||||||||||||||||||
Investments — unaffiliated | (14,682,196 | ) | (35,161,156 | ) | (45,661,123 | ) | (27,123,094 | ) | ||||||||||||||||
Investments — affiliated | 9,892 | (159,708 | ) | (5,873 | ) | 34,404 | ||||||||||||||||||
Futures contracts | — | — | — | (1,370,516 | ) | |||||||||||||||||||
|
|
|
|
|
|
|
| |||||||||||||||||
| (14,672,304 | ) | (35,320,864 | ) | (45,666,996 | ) | (28,459,206 | ) | |||||||||||||||||
|
|
|
|
|
|
|
| |||||||||||||||||
Net change in unrealized appreciation (depreciation) on: | ||||||||||||||||||||||||
Investments — unaffiliated | (10,230,552 | ) | (7,101,329 | ) | (48,436,540 | ) | (261,837,524 | ) | ||||||||||||||||
Investments — affiliated | 90,062 | 849,264 | 74,858 | 387,936 | ||||||||||||||||||||
Futures contracts | — | — | — | 815,478 | ||||||||||||||||||||
|
|
|
|
|
|
|
| |||||||||||||||||
| (10,140,490 | ) | (6,252,065 | ) | (48,361,682 | ) | (260,634,110 | ) | |||||||||||||||||
|
|
|
|
|
|
|
| |||||||||||||||||
Net realized and unrealized loss | (24,812,794 | ) | (41,572,929 | ) | (94,028,678 | ) | (289,093,316 | ) | ||||||||||||||||
|
|
|
|
|
|
|
| |||||||||||||||||
NET INCREASE (DECREASE) IN NET ASSETS RESULTING FROM OPERATIONS | $ | 52,437,792 | $ | 49,142,594 | $ | 12,725,757 | $ | (213,866,997 | ) | |||||||||||||||
|
|
|
|
|
|
|
| |||||||||||||||||
See notes to financial statements.
| 104 | 2 0 2 3 BLACK ROCK ANNUAL REPORT TO SHAREHOLDERS |
Statements of Operations (continued)
Year Ended October 31, 2023
iShares U.S. Securitized Bond Index Fund | ||||
| ||||
INVESTMENT INCOME | ||||
Dividends — affiliated | $ | 36,145,953 | ||
Interest — unaffiliated | 108,667,498 | |||
|
| |||
Total investment income | 144,813,451 | |||
|
| |||
EXPENSES | ||||
Administration | 2,530,344 | |||
Investment advisory | 2,530,344 | |||
Trustees and Officer | 34,238 | |||
Professional | 33,886 | |||
Miscellaneous | 2,068 | |||
|
| |||
Total expenses | 5,130,880 | |||
Less: | ||||
Fees waived and/or reimbursed by the Administrator/Manager | (5,128,812 | ) | ||
|
| |||
Total expenses after fees waived and/or reimbursed | 2,068 | |||
|
| |||
Net investment income | 144,811,383 | |||
|
| |||
REALIZED AND UNREALIZED GAIN (LOSS) | ||||
Net realized gain (loss) from: | ||||
Investments — unaffiliated | (36,983,899 | ) | ||
Investments — affiliated | 44,114 | |||
|
| |||
| (36,939,785 | ) | |||
|
| |||
Net change in unrealized appreciation (depreciation) on: | ||||
Investments — unaffiliated | (151,624,014 | ) | ||
Investments — affiliated | 360,578 | |||
|
| |||
| (151,263,436 | ) | |||
|
| |||
Net realized and unrealized loss | (188,203,221 | ) | ||
|
| |||
NET DECREASE IN NET ASSETS RESULTING FROM OPERATIONS | $ | (43,391,838 | ) | |
|
| |||
See notes to financial statements.
FINANCIAL STATEMENTS | 105 |
Statements of Changes in Net Assets
| iShares U.S. Intermediate Credit Bond Index Fund | iShares U.S. Intermediate Government Bond Index Fund | |||||||||||||||||||
| Period from | Period from | |||||||||||||||||||
| Year Ended | 05/20/22 | (a) | Year Ended | 05/20/22 | (a) | |||||||||||||||
| 10/31/23 | to 10/31/22 | 10/31/23 | to 10/31/22 | |||||||||||||||||
| ||||||||||||||||||||
INCREASE (DECREASE) IN NET ASSETS | ||||||||||||||||||||
OPERATIONS | ||||||||||||||||||||
Net investment income | $ | 77,250,586 | $ | 23,149,963 | $ | 90,715,523 | $ | 27,621,404 | ||||||||||||
Net realized loss | (14,672,304 | ) | (66,202,940 | ) | (35,320,864 | ) | (54,656,754 | ) | ||||||||||||
Net change in unrealized appreciation (depreciation) | (10,140,490 | ) | (35,394,589 | ) | (6,252,065 | ) | (126,789,563 | ) | ||||||||||||
|
|
|
|
|
|
|
| |||||||||||||
Net increase (decrease) in net assets resulting from operations | 52,437,792 | (78,447,566 | ) | 49,142,594 | (153,824,913 | ) | ||||||||||||||
|
|
|
|
|
|
|
| |||||||||||||
DISTRIBUTIONS TO SHAREHOLDERS(b) | ||||||||||||||||||||
Decrease in net assets resulting from distributions to shareholders | (77,358,427 | ) | (23,303,934 | ) | (89,518,603 | ) | (27,048,669 | ) | ||||||||||||
|
|
|
|
|
|
|
| |||||||||||||
CAPITAL SHARE TRANSACTIONS | ||||||||||||||||||||
Net increase in net assets derived from capital share transactions | 678,827,108 | 1,871,853,117 | 500,310,980 | 3,643,838,032 | ||||||||||||||||
|
|
|
|
|
|
|
| |||||||||||||
NET ASSETS | ||||||||||||||||||||
Total increase in net assets | 653,906,473 | 1,770,101,617 | 459,934,971 | 3,462,964,450 | ||||||||||||||||
Beginning of period | 1,770,101,617 | — | 3,462,964,450 | — | ||||||||||||||||
|
|
|
|
|
|
|
| |||||||||||||
End of period | $ | 2,424,008,090 | $ | 1,770,101,617 | $ | 3,922,899,421 | $ | 3,462,964,450 | ||||||||||||
|
|
|
|
|
|
|
| |||||||||||||
| (a) | Commencement of operations. |
| (b) | Distributions for annual periods determined in accordance with U.S. federal income tax regulations. |
See notes to financial statements.
| 106 | 2 0 2 3 BLACK ROCK ANNUAL REPORT TO SHAREHOLDERS |
Statements of Changes in Net Assets (continued)
iShares U.S. Long Credit Bond Index Fund | iShares U.S. Long Government Bond Index Fund | |||||||||||||||||
|
|
|
| |||||||||||||||
| | Year Ended 10/31/23 |
| | Period from 05/20/22 to 10/31/22 | (a)
| | Year Ended 10/31/23 |
| | Period from 05/20/22 to 10/31/22 | (a)
| |||||||
| ||||||||||||||||||
INCREASE (DECREASE) IN NET ASSETS | ||||||||||||||||||
OPERATIONS | ||||||||||||||||||
Net investment income | $ | 106,754,435 | $ | 42,486,679 | $ | 75,226,319 | $ | 25,501,108 | ||||||||||
Net realized loss | (45,666,996 | ) | (21,571,184 | ) | (28,459,206 | ) | (6,608,515 | ) | ||||||||||
Net change in unrealized appreciation (depreciation) | (48,361,682 | ) | (315,076,386 | ) | (260,634,110 | ) | (353,582,214 | ) | ||||||||||
|
|
|
|
|
|
|
| |||||||||||
Net increase (decrease) in net assets resulting from operations | 12,725,757 | (294,160,891 | ) | (213,866,997 | ) | (334,689,621 | ) | |||||||||||
|
|
|
|
|
|
|
| |||||||||||
DISTRIBUTIONS TO SHAREHOLDERS(b) | ||||||||||||||||||
Decrease in net assets resulting from distributions to shareholders | (106,546,280 | ) | (42,348,892 | ) | (74,646,145 | ) | (25,264,214 | ) | ||||||||||
|
|
|
|
|
|
|
| |||||||||||
CAPITAL SHARE TRANSACTIONS | ||||||||||||||||||
Net increase in net assets derived from capital share transactions | 153,018,649 | 2,260,877,131 | 573,402,649 | 2,220,477,471 | ||||||||||||||
|
|
|
|
|
|
|
| |||||||||||
NET ASSETS | ||||||||||||||||||
Total increase in net assets | 59,198,126 | 1,924,367,348 | 284,889,507 | 1,860,523,636 | ||||||||||||||
Beginning of period | 1,924,367,348 | — | 1,860,523,636 | — | ||||||||||||||
|
|
|
|
|
|
|
| |||||||||||
End of period | $ | 1,983,565,474 | $ | 1,924,367,348 | $ | 2,145,413,143 | $ | 1,860,523,636 | ||||||||||
|
|
|
|
|
|
|
| |||||||||||
| (a) | Commencement of operations. |
| (b) | Distributions for annual periods determined in accordance with U.S. federal income tax regulations. |
See notes to financial statements.
FINANCIAL STATEMENTS | 107 |
Statements of Changes in Net Assets (continued)
iShares U.S. Securitized Bond Index Fund | ||||||||
|
| |||||||
| | Year Ended 10/31/23 |
| | Period from 05/20/22 to 10/31/22 | (a)
| |||
| ||||||||
INCREASE (DECREASE) IN NET ASSETS | ||||||||
OPERATIONS | ||||||||
Net investment income | $ | 144,811,383 | $ | 44,751,001 | ||||
Net realized loss | (36,939,785 | ) | (49,850,568 | ) | ||||
Net change in unrealized appreciation (depreciation) | (151,263,436 | ) | (311,838,720 | ) | ||||
|
|
|
| |||||
Net decrease in net assets resulting from operations | (43,391,838 | ) | (316,938,287 | ) | ||||
|
|
|
| |||||
DISTRIBUTIONS TO SHAREHOLDERS(b) | ||||||||
From net investment income | (145,884,807 | ) | (47,023,066 | ) | ||||
Return of capital | (1,646,980 | ) | — | |||||
|
|
|
| |||||
Decrease in net assets resulting from distributions to shareholders | (147,531,787 | ) | (47,023,066 | ) | ||||
|
|
|
| |||||
CAPITAL SHARE TRANSACTIONS | ||||||||
Net increase in net assets derived from capital share transactions | 548,245,723 | 4,231,675,259 | ||||||
|
|
|
| |||||
NET ASSETS | ||||||||
Total increase in net assets | 357,322,098 | 3,867,713,906 | ||||||
Beginning of period | 3,867,713,906 | — | ||||||
|
|
|
| |||||
End of period | $ | 4,225,036,004 | $ | 3,867,713,906 | ||||
|
|
|
| |||||
| (a) | Commencement of operations. |
| (b) | Distributions for annual periods determined in accordance with U.S. federal income tax regulations. |
See notes to financial statements.
| 108 | 2 0 2 3 BLACK ROCK ANNUAL REPORT TO SHAREHOLDERS |
(For a share outstanding throughout each period)
| iShares U.S. Intermediate Credit Bond Index Fund | ||||||||||||||||
| | Year Ended 10/31/23 |
| | Period from 05/20/22 to 10/31/22 | (a)
| |||||||||||
Net asset value, beginning of period | $ | 9.43 | $ | 10.00 | ||||||||||||
|
|
|
| |||||||||||||
Net investment income(b) | 0.35 | 0.12 | ||||||||||||||
Net realized and unrealized loss | (0.01 | ) | (0.57 | ) | ||||||||||||
|
|
|
| |||||||||||||
Net increase (decrease) from investment operations | 0.34 | (0.45 | ) | |||||||||||||
|
|
|
| |||||||||||||
Distributions from net investment income(c) | (0.35 | ) | (0.12 | ) | ||||||||||||
|
|
|
| |||||||||||||
Net asset value, end of period | $ | 9.42 | $ | 9.43 | ||||||||||||
|
|
|
| |||||||||||||
Total Return(d) | ||||||||||||||||
Based on net asset value | 3.53 | % | (4.49 | )%(e) | ||||||||||||
|
|
|
| |||||||||||||
Ratios to Average Net Assets(f) | ||||||||||||||||
Total expenses | 0.12 | % | 0.12 | %(g) | ||||||||||||
|
|
|
| |||||||||||||
Total expenses after fees waived and/or reimbursed | 0.00 | %(h) | — | %(g) | ||||||||||||
|
|
|
| |||||||||||||
Net investment income | 3.61 | % | 2.84 | %(g) | ||||||||||||
|
|
|
| |||||||||||||
Supplemental Data | ||||||||||||||||
Net assets, end of period (000) | $ | 2,424,008 | $ | 1,770,102 | ||||||||||||
|
|
|
| |||||||||||||
Portfolio turnover rate | 14 | % | 19 | %(i) | ||||||||||||
|
|
|
| |||||||||||||
| (a) | Commencement of operations. |
| (b) | Based on average shares outstanding. |
| (c) | Distributions for annual periods determined in accordance with U.S. federal income tax regulations. |
| (d) | Where applicable, assumes the reinvestment of distributions. |
| (e) | Not annualized. |
| (f) | Excludes fees and expenses incurred indirectly as a result of investments in underlying funds. |
| (g) | Annualized. |
| (h) | Amount is less than 0.005%. |
| (i) | Portfolio turnover rate excludes in-kind transactions. |
See notes to financial statements.
FINANCIAL HIGHLIGHTS | 109 |
Financial Highlights (continued)
(For a share outstanding throughout each period)
| iShares U.S. Intermediate Government Bond Index Fund | ||||||||||||||||
| | Year Ended 10/31/23 |
| | Period from 05/20/22 to 10/31/22 | (a)
| |||||||||||
Net asset value, beginning of period | $ | 9.51 | $ | 10.00 | ||||||||||||
|
|
|
| |||||||||||||
Net investment income(b) | 0.23 | 0.08 | ||||||||||||||
Net realized and unrealized loss | (0.08 | ) | (0.50 | ) | ||||||||||||
|
|
|
| |||||||||||||
Net increase (decrease) from investment operations | 0.15 | (0.42 | ) | |||||||||||||
|
|
|
| |||||||||||||
Distributions from net investment income(c) | (0.22 | ) | (0.07 | ) | ||||||||||||
|
|
|
| |||||||||||||
Net asset value, end of period | $ | 9.44 | $ | 9.51 | ||||||||||||
|
|
|
| |||||||||||||
Total Return(d) | ||||||||||||||||
Based on net asset value | 1.59 | % | (4.18 | )%(e) | ||||||||||||
|
|
|
| |||||||||||||
Ratios to Average Net Assets(f) | ||||||||||||||||
Total expenses | 0.10 | % | 0.10 | %(g) | ||||||||||||
|
|
|
| |||||||||||||
Total expenses after fees waived and/or reimbursed | 0.00 | %(h) | — | %(g) | ||||||||||||
|
|
|
| |||||||||||||
Net investment income | 2.35 | % | 1.73 | %(g) | ||||||||||||
|
|
|
| |||||||||||||
Supplemental Data | ||||||||||||||||
Net assets, end of period (000) | $ | 3,922,899 | $ | 3,462,964 | ||||||||||||
|
|
|
| |||||||||||||
Portfolio turnover rate | 24 | % | 16 | %(i) | ||||||||||||
|
|
|
| |||||||||||||
| (a) | Commencement of operations. |
| (b) | Based on average shares outstanding. |
| (c) | Distributions for annual periods determined in accordance with U.S. federal income tax regulations. |
| (d) | Where applicable, assumes the reinvestment of distributions. |
| (e) | Not annualized. |
| (f) | Excludes fees and expenses incurred indirectly as a result of investments in underlying funds. |
| (g) | Annualized. |
| (h) | Amount is less than 0.005%. |
| (i) | Portfolio turnover rate excludes in-kind transactions. |
See notes to financial statements.
| 110 | 2 0 2 3 BLACK ROCK ANNUAL REPORT TO SHAREHOLDERS |
Financial Highlights (continued)
(For a share outstanding throughout each period)
| iShares U.S. Long Credit Bond Index Fund | ||||||||||||||||
| | Year Ended 10/31/23 |
| | Period from 05/20/22 to 10/31/22 | (a)
| |||||||||||
Net asset value, beginning of period | $ | 8.53 | $ | 10.00 | ||||||||||||
|
|
|
| |||||||||||||
Net investment income(b) | 0.47 | 0.20 | ||||||||||||||
Net realized and unrealized loss | (0.36 | ) | (1.47 | ) | ||||||||||||
|
|
|
| |||||||||||||
Net increase (decrease) from investment operations | 0.11 | (1.27 | ) | |||||||||||||
|
|
|
| |||||||||||||
Distributions from net investment income(c) | (0.47 | ) | (0.20 | ) | ||||||||||||
|
|
|
| |||||||||||||
Net asset value, end of period | $ | 8.17 | $ | 8.53 | ||||||||||||
|
|
|
| |||||||||||||
Total Return(d) | ||||||||||||||||
Based on net asset value | 0.80 | % | (12.84 | )%(e) | ||||||||||||
|
|
|
| |||||||||||||
Ratios to Average Net Assets(f) | ||||||||||||||||
Total expenses | 0.12 | % | 0.12 | %(g) | ||||||||||||
|
|
|
| |||||||||||||
Total expenses after fees waived and/or reimbursed | 0.00 | %(h) | — | %(g) | ||||||||||||
|
|
|
| |||||||||||||
Net investment income | 5.11 | % | 4.79 | %(g) | ||||||||||||
|
|
|
| |||||||||||||
Supplemental Data | ||||||||||||||||
Net assets, end of period (000) | $ | 1,983,565 | $ | 1,924,367 | ||||||||||||
|
|
|
| |||||||||||||
Portfolio turnover rate | 13 | % | 7 | %(i) | ||||||||||||
|
|
|
| |||||||||||||
| (a) | Commencement of operations. |
| (b) | Based on average shares outstanding. |
| (c) | Distributions for annual periods determined in accordance with U.S. federal income tax regulations. |
| (d) | Where applicable, assumes the reinvestment of distributions. |
| (e) | Not annualized. |
| (f) | Excludes fees and expenses incurred indirectly as a result of investments in underlying funds. |
| (g) | Annualized. |
| (h) | Amount is less than 0.005%. |
| (i) | Portfolio turnover rate excludes in-kind transactions. |
See notes to financial statements.
FINANCIAL HIGHLIGHTS | 111 |
Financial Highlights (continued)
(For a share outstanding throughout each period)
| iShares U.S. Long Government Bond Index Fund | ||||||||||||
| Period from | ||||||||||||
| Year Ended |
| 05/20/22 | (a) | |||||||||
10/31/23 | to 10/31/22 | |||||||||||
Net asset value, beginning of period | $ | 8.18 | $ | 10.00 | ||||||||
|
|
|
| |||||||||
Net investment income(b) | 0.30 | 0.13 | ||||||||||
Net realized and unrealized loss | (0.93 | ) | (1.82 | ) | ||||||||
|
|
|
| |||||||||
Net decrease from investment operations | (0.63 | ) | (1.69 | ) | ||||||||
|
|
|
| |||||||||
Distributions from net investment income(c) | (0.30 | ) | (0.13 | ) | ||||||||
|
|
|
| |||||||||
Net asset value, end of period | $ | 7.25 | $ | 8.18 | ||||||||
|
|
|
| |||||||||
Total Return(d) | ||||||||||||
Based on net asset value | (8.17 | )% | (17.06 | )%(e) | ||||||||
|
|
|
| |||||||||
Ratios to Average Net Assets(f) | ||||||||||||
Total expenses | 0.10 | % | 0.10 | %(g) | ||||||||
|
|
|
| |||||||||
Total expenses after fees waived and/or reimbursed | 0.00 | %(h) | — | %(g) | ||||||||
|
|
|
| |||||||||
Net investment income | 3.57 | % | 3.09 | %(g) | ||||||||
|
|
|
| |||||||||
Supplemental Data | ||||||||||||
Net assets, end of period (000) | $ | 2,145,413 | $ | 1,860,524 | ||||||||
|
|
|
| |||||||||
Portfolio turnover rate | 4 | % | 5 | %(i) | ||||||||
|
|
|
| |||||||||
| (a) | Commencement of operations. |
| (b) | Based on average shares outstanding. |
| (c) | Distributions for annual periods determined in accordance with U.S. federal income tax regulations. |
| (d) | Where applicable, assumes the reinvestment of distributions. |
| (e) | Not annualized. |
| (f) | Excludes fees and expenses incurred indirectly as a result of investments in underlying funds. |
| (g) | Annualized. |
| (h) | Amount is less than 0.005%. |
| (i) | Portfolio turnover rate excludes in-kind transactions. |
See notes to financial statements.
| 112 | 2 0 2 3 BLACK ROCK ANNUAL REPORT TO SHAREHOLDERS |
Financial Highlights (continued)
(For a share outstanding throughout each period)
| iShares U.S. Securitized Bond Index Fund | ||||||||||||||||
| Period from | ||||||||||||||||
| Year Ended | 05/20/22 | (a) | ||||||||||||||
| 10/31/23 | to 10/31/22 | |||||||||||||||
Net asset value, beginning of period | $ | 9.12 | $ | 10.00 | ||||||||||||
|
|
|
| |||||||||||||
Net investment income(b) | 0.32 | 0.11 | ||||||||||||||
Net realized and unrealized loss | (0.35 | ) | (0.88 | ) | ||||||||||||
|
|
|
| |||||||||||||
Net decrease from investment operations | (0.03 | ) | (0.77 | ) | ||||||||||||
|
|
|
| |||||||||||||
Distributions(c) | ||||||||||||||||
From net investment income | (0.33 | ) | (0.11 | ) | ||||||||||||
Return of capital | (0.00 | )(d) | — | |||||||||||||
|
|
|
| |||||||||||||
Total distributions | (0.33 | ) | (0.11 | ) | ||||||||||||
|
|
|
| |||||||||||||
Net asset value, end of period | $ | 8.76 | $ | 9.12 | ||||||||||||
|
|
|
| |||||||||||||
Total Return(e) | ||||||||||||||||
Based on net asset value | (0.53 | )% | (7.71 | )%(f) | ||||||||||||
|
|
|
| |||||||||||||
Ratios to Average Net Assets(g) | ||||||||||||||||
Total expenses | 0.12 | % | 0.12 | %(h) | ||||||||||||
|
|
|
| |||||||||||||
Total expenses after fees waived and/or reimbursed | 0.00 | %(i) | — | %(h) | ||||||||||||
|
|
|
| |||||||||||||
Net investment income | 3.43 | % | 2.53 | %(h) | ||||||||||||
|
|
|
| |||||||||||||
Supplemental Data | ||||||||||||||||
Net assets, end of period (000) | $ | 4,225,036 | $ | 3,867,714 | ||||||||||||
|
|
|
| |||||||||||||
Portfolio turnover rate(j) | 341 | % | 150 | %(k) | ||||||||||||
| (a) | Commencement of operations. |
| (b) | Based on average shares outstanding. |
| (c) | Distributions for annual periods determined in accordance with U.S. federal income tax regulations. |
| (d) | Amount is greater than $(0.005) per share. |
| (e) | Where applicable, assumes the reinvestment of distributions. |
| (f) | Not annualized. |
| (g) | Excludes fees and expenses incurred indirectly as a result of investments in underlying funds. |
| (h) | Annualized. |
| (i) | Amount is less than 0.005%. |
| (j) | Includes mortgage dollar roll transactions (“MDRs”). Additional information regarding portfolio turnover rate is as follows: |
| Period from | ||||||||||||||||
| Year Ended | 05/20/22 | (a) | ||||||||||||||
| 10/31/23 | to 10/31/22 | |||||||||||||||
Portfolio turnover rate (excluding MDRs) | 163 | % | 150 | % | ||||||||||||
|
|
|
| |||||||||||||
| (k) | Portfolio turnover rate excludes in-kind transactions. |
See notes to financial statements.
FINANCIAL HIGHLIGHTS | 113 |
| 1. | ORGANIZATION |
BlackRock FundsSM (the “Trust”) is registered under the Investment Company Act of 1940, as amended (the “1940 Act”), as an open-end management investment company. The Trust is organized as a Massachusetts business trust. The following, each of which is a series of the Trust, are referred to herein collectively as the “Funds” or individually as a “Fund”:
| Fund Name | Herein Referred To As | Diversification Classification | ||
iShares U.S. Intermediate Credit Bond Index Fund | U.S. Intermediate Credit Bond | Diversified | ||
iShares U.S. Intermediate Government Bond Index Fund | U.S. Intermediate Government Bond | Diversified | ||
iShares U.S. Long Credit Bond Index Fund | U.S. Long Credit Bond | Diversified | ||
iShares U.S. Long Government Bond Index Fund | U.S. Long Government Bond | Diversified | ||
iShares U.S. Securitized Bond Index Fund | U.S. Securitized Bond | Diversified | ||
The Funds, together with certain other registered investment companies advised by BlackRock Fund Advisors (“BFA” or the “Manager”) or its affiliates, are included in a complex of funds referred to as the BlackRock Multi-Asset Complex. Shares of each Fund may be purchased and held only by or on behalf of mutual funds advised by BFA or its affiliates.
| 2. | SIGNIFICANT ACCOUNTING POLICIES |
The financial statements are prepared in conformity with accounting principles generally accepted in the United States of America (“U.S. GAAP”), which may require management to make estimates and assumptions that affect the reported amounts of assets and liabilities in the financial statements, disclosure of contingent assets and liabilities at the date of the financial statements and the reported amounts of increases and decreases in net assets from operations during the reporting period. Actual results could differ from those estimates. Each Fund is considered an investment company under U.S. GAAP and follows the accounting and reporting guidance applicable to investment companies. Below is a summary of significant accounting policies:
Investment Transactions and Income Recognition: For financial reporting purposes, investment transactions are recorded on the dates the transactions are executed (the “trade dates”). Realized gains and losses on investment transactions are determined using the specific identification method. Dividend income and capital gain distributions, if any, are recorded on the ex-dividend dates. Non-cash dividends, if any, are recorded on the ex-dividend dates at fair value. Upon notification from issuers, a portion of the dividend income received from a real estate investment trust may be redesignated as a reduction of cost of the related investment and/or realized gain. Interest income, including amortization and accretion of premiums and discounts on debt securities, is recognized daily on an accrual basis.
Foreign Taxes: The Funds may be subject to foreign taxes (a portion of which may be reclaimable) on income, stock dividends, capital gains on investments, or certain foreign currency transactions. All foreign taxes are recorded in accordance with the applicable foreign tax regulations and rates that exist in the foreign jurisdictions in which each Fund invests. These foreign taxes, if any, are paid by each Fund and are reflected in its Statements of Operations as follows: foreign taxes withheld at source are presented as a reduction of income, foreign taxes on securities lending income are presented as a reduction of securities lending income, foreign taxes on stock dividends are presented as “Foreign taxes withheld”, and foreign taxes on capital gains from sales of investments and foreign taxes on foreign currency transactions are included in their respective net realized gain (loss) categories. Foreign taxes payable or deferred as of October 31, 2023, if any, are disclosed in the Statements of Assets and Liabilities.
The Funds file withholding tax reclaims in certain jurisdictions to recover a portion of amounts previously withheld. The Funds may record a reclaim receivable based on collectability, which includes factors such as the jurisdiction’s applicable laws, payment history and market convention. The Statements of Operations include tax reclaims recorded as well as professional and other fees, if any, associated with recovery of foreign withholding taxes.
Bank Overdraft: Certain Funds had outstanding cash disbursements exceeding deposited cash amounts at the custodian during the reporting period and as of the report date. The Funds are obligated to repay the custodian for any overdraft, including any related costs or expenses, where applicable. For financial reporting purposes, overdraft fees, if any, are included in interest expense in the Statements of Operations.
Collateralization: If required by an exchange or counterparty agreement, the Funds may be required to deliver/deposit cash and/or securities to/with an exchange, or broker-dealer or custodian as collateral for certain investments.
Distributions: Distributions from net investment income are declared daily and paid monthly. Distributions of capital gains are recorded on the ex-dividend dates and made at least annually. The portion of distributions, if any, that exceeds a fund’s current and accumulated earnings and profits, as measured on a tax basis, constitute a non-taxable return of capital. The character and timing of distributions are determined in accordance with U.S. federal income tax regulations, which may differ from U.S. GAAP.
Indemnifications: In the normal course of business, a Fund enters into contracts that contain a variety of representations that provide general indemnification. A Fund’s maximum exposure under these arrangements is unknown because it involves future potential claims against a Fund, which cannot be predicted with any certainty.
Other: Expenses directly related to a Fund are charged to that Fund. Other operating expenses shared by several funds, including other funds managed by the Manager, are prorated among those funds on the basis of relative net assets or other appropriate methods.
| 3. | INVESTMENT VALUATION AND FAIR VALUE MEASUREMENTS |
Investment Valuation Policies: Each Fund’s investments are valued at fair value (also referred to as “market value” within the financial statements) each day that the Fund is open for business and, for financial reporting purposes, as of the report date. U.S. GAAP defines fair value as the price a fund would receive to sell an asset or pay to transfer
| 114 | 2 0 2 3 BLACK ROCK ANNUAL REPORT TO SHAREHOLDERS |
Notes to Financial Statements (continued)
a liability in an orderly transaction between market participants at the measurement date. The Board of Trustees of the Trust (the “Board”) has approved the designation of each Fund’s Manager as the valuation designee for each Fund. Each Fund determines the fair values of its financial instruments using various independent dealers or pricing services under the Manager’s policies. If a security’s market price is not readily available or does not otherwise accurately represent the fair value of the security, the security will be valued in accordance with the Manager’s policies and procedures as reflecting fair value. The Manager has formed a committee (the “Valuation Committee”) to develop pricing policies and procedures and to oversee the pricing function for all financial instruments, with assistance from other BlackRock pricing committees.
Fair Value Inputs and Methodologies: The following methods and inputs are used to establish the fair value of each Fund’s assets and liabilities:
| • | Fixed-income investments for which market quotations are readily available are generally valued using the last available bid price or current market quotations provided by independent dealers or third-party pricing services. Pricing services generally value fixed-income securities assuming orderly transactions of an institutional round lot size, but a fund may hold or transact in such securities in smaller, odd lot sizes. Odd lots may trade at lower prices than institutional round lots. The pricing services may use matrix pricing or valuation models that utilize certain inputs and assumptions to derive values, including transaction data (e.g., recent representative bids and offers), market data, credit quality information, perceived market movements, news, and other relevant information. Certain fixed-income securities, including asset-backed and mortgage related securities may be valued based on valuation models that consider the estimated cash flows of each tranche of the entity, establish a benchmark yield and develop an estimated tranche specific spread to the benchmark yield based on the unique attributes of the tranche. The amortized cost method of valuation may be used with respect to debt obligations with sixty days or less remaining to maturity unless the Manager determines such method does not represent fair value. |
| • | Investments in open-end U.S. mutual funds (including money market funds) are valued at that day’s published net asset value (“NAV”). |
| • | Futures contracts are valued based on that day’s last reported settlement or trade price on the exchange where the contract is traded. |
If events (e.g., market volatility, company announcement or a natural disaster) occur that are expected to materially affect the value of such investment, or in the event that application of these methods of valuation results in a price for an investment that is deemed not to be representative of the market value of such investment, or if a price is not available, the investment will be valued by the Valuation Committee in accordance with the Manager’s policies and procedures as reflecting fair value (“Fair Valued Investments”). The fair valuation approaches that may be used by the Valuation Committee include market approach, income approach and cost approach. Valuation techniques such as discounted cash flow, use of market comparables and matrix pricing are types of valuation approaches and are typically used in determining fair value. When determining the price for Fair Valued Investments, the Valuation Committee seeks to determine the price that each Fund might reasonably expect to receive or pay from the current sale or purchase of that asset or liability in an arm’s-length transaction. Fair value determinations shall be based upon all available factors that the Valuation Committee deems relevant and consistent with the principles of fair value measurement.
Fair Value Hierarchy: Various inputs are used in determining the fair value of financial instruments. These inputs to valuation techniques are categorized into a fair value hierarchy consisting of three broad levels for financial reporting purposes as follows:
| • | Level 1 – Unadjusted price quotations in active markets/exchanges for identical assets or liabilities that each Fund has the ability to access; |
| • | Level 2 – Other observable inputs (including, but not limited to, quoted prices for similar assets or liabilities in markets that are active, quoted prices for identical or similar assets or liabilities in markets that are not active, inputs other than quoted prices that are observable for the assets or liabilities (such as interest rates, yield curves, volatilities, prepayment speeds, loss severities, credit risks and default rates) or other market–corroborated inputs); and |
| • | Level 3 – Unobservable inputs based on the best information available in the circumstances, to the extent observable inputs are not available (including the Valuation Committee’s assumptions used in determining the fair value of financial instruments). |
The hierarchy gives the highest priority to unadjusted quoted prices in active markets for identical assets or liabilities (Level 1 measurements) and the lowest priority to unobservable inputs (Level 3 measurements). Accordingly, the degree of judgment exercised in determining fair value is greatest for instruments categorized in Level 3. The inputs used to measure fair value may fall into different levels of the fair value hierarchy. In such cases, for disclosure purposes, the fair value hierarchy classification is determined based on the lowest level input that is significant to the fair value measurement in its entirety. Investments classified within Level 3 have significant unobservable inputs used by the Valuation Committee in determining the price for Fair Valued Investments. Level 3 investments include equity or debt issued by privately held companies or funds that may not have a secondary market and/or may have a limited number of investors. The categorization of a value determined for financial instruments is based on the pricing transparency of the financial instruments and is not necessarily an indication of the risks associated with investing in those securities.
| 4. | SECURITIES AND OTHER INVESTMENTS |
Asset-Backed and Mortgage-Backed Securities: Asset-backed securities are generally issued as pass-through certificates or as debt instruments. Asset-backed securities issued as pass-through certificates represent undivided fractional ownership interests in an underlying pool of assets. Asset-backed securities issued as debt instruments, which are also known as collateralized obligations, are typically issued as the debt of a special purpose entity organized solely for the purpose of owning such assets and issuing such debt. Asset-backed securities are often backed by a pool of assets representing the obligations of a number of different parties. The yield characteristics of certain asset-backed securities may differ from traditional debt securities. One such major difference is that all or a principal part of the obligations may be prepaid at any time because the underlying assets (i.e., loans) may be prepaid at any time. As a result, a decrease in interest rates in the market may result in increases in the level of prepayments as borrowers, particularly mortgagors, refinance and repay their loans. An increased prepayment rate with respect to an asset-backed security will have the effect of shortening the maturity of the security. In addition, a fund may subsequently have to reinvest the proceeds at lower interest rates. If a fund has purchased such an asset-backed security at a premium, a faster than anticipated prepayment rate could result in a loss of principal to the extent of the premium paid.
NOTES TO FINANCIAL STATEMENTS | 115 |
Notes to Financial Statements (continued)
For mortgage pass-through securities (the “Mortgage Assets”) there are a number of important differences among the agencies and instrumentalities of the U.S. Government that issue mortgage-related securities and among the securities that they issue. For example, mortgage-related securities guaranteed by Ginnie Mae are guaranteed as to the timely payment of principal and interest by Ginnie Mae and such guarantee is backed by the full faith and credit of the United States. However, mortgage-related securities issued by Freddie Mac and Fannie Mae, including Freddie Mac and Fannie Mae guaranteed mortgage pass-through certificates, which are solely the obligations of Freddie Mac and Fannie Mae, are not backed by or entitled to the full faith and credit of the United States, but are supported by the right of the issuer to borrow from the U.S. Treasury.
Non-agency mortgage-backed securities are securities issued by non-governmental issuers and have no direct or indirect government guarantees of payment and are subject to various risks. Non-agency mortgage loans are obligations of the borrowers thereunder only and are not typically insured or guaranteed by any other person or entity. The ability of a borrower to repay a loan is dependent upon the income or assets of the borrower. A number of factors, including a general economic downturn, acts of God, terrorism, social unrest and civil disturbances, may impair a borrower’s ability to repay its loans.
Capital Securities and Trust Preferred Securities: Capital securities, including trust preferred securities, are typically issued by corporations, generally in the form of interest-bearing notes with preferred securities characteristics. In the case of trust preferred securities, an affiliated business trust of a corporation issues these securities, generally in the form of beneficial interests in subordinated debentures or similarly structured securities. The securities can be structured with either a fixed or adjustable coupon that can have either a perpetual or stated maturity date. For trust preferred securities, the issuing bank or corporation pays interest to the trust, which is then distributed to holders of these securities as a dividend. Dividends can be deferred without creating an event of default or acceleration, although maturity cannot take place unless all cumulative payment obligations have been met. The deferral of payments does not affect the purchase or sale of these securities in the open market. These securities generally are rated below that of the issuing company’s senior debt securities and are freely callable at the issuer’s option.
Forward Commitments, When-Issued and Delayed Delivery Securities: The Funds may purchase securities on a when-issued basis and may purchase or sell securities on a forward commitment basis. Settlement of such transactions normally occurs within a month or more after the purchase or sale commitment is made. The Funds may purchase securities under such conditions with the intention of actually acquiring them but may enter into a separate agreement to sell the securities before the settlement date. Since the value of securities purchased may fluctuate prior to settlement, the Funds may be required to pay more at settlement than the security is worth. In addition, a fund is not entitled to any of the interest earned prior to settlement. When purchasing a security on a delayed delivery basis, the Funds assume the rights and risks of ownership of the security, including the risk of price and yield fluctuations. In the event of default by the counterparty, the Funds’ maximum amount of loss is the unrealized appreciation of unsettled when-issued transactions.
TBA Commitments: TBA commitments are forward agreements for the purchase or sale of securities, including mortgage-backed securities for a fixed price, with payment and delivery on an agreed upon future settlement date. The specific securities to be delivered are not identified at the trade date. However, delivered securities must meet specified terms, including issuer, rate and mortgage terms. When entering into TBA commitments, a fund may take possession of or deliver the underlying mortgage-backed securities but can extend the settlement or roll the transaction. TBA commitments involve a risk of loss if the value of the security to be purchased or sold declines or increases, respectively, prior to settlement date, if there are expenses or delays in connection with the TBA transactions, or if the counterparty fails to complete the transaction.
In order to better define contractual rights and to secure rights that will help a fund mitigate its counterparty risk, TBA commitments may be entered into by a fund under Master Securities Forward Transaction Agreements (each, an “MSFTA”). An MSFTA typically contains, among other things, collateral posting terms and netting provisions in the event of default and/or termination event. The collateral requirements are typically calculated by netting the mark-to-market amount for each transaction under such agreement and comparing that amount to the value of the collateral currently pledged by a fund and the counterparty. Cash collateral that has been pledged to cover the obligations of a fund and cash collateral received from the counterparty, if any, is reported separately in the Statements of Assets and Liabilities as cash pledged as collateral for TBA commitments or cash received as collateral for TBA commitments, respectively. Non-cash collateral pledged by a fund, if any, is noted in the Schedules of Investments. Typically, a fund is permitted to sell, re-pledge or use the collateral it receives; however, the counterparty is not permitted to do so. To the extent amounts due to a fund are not fully collateralized, contractually or otherwise, a fund bears the risk of loss from counterparty non-performance.
Securities Lending: Certain Funds may lend their securities to approved borrowers, such as brokers, dealers and other financial institutions. The borrower pledges and maintains with the Funds collateral consisting of cash, an irrevocable letter of credit issued by a bank, or securities issued or guaranteed by the U.S. Government. The initial collateral received by each Fund is required to have a value of at least 102% of the current value of the loaned securities for securities traded on U.S. exchanges and a value of at least 105% for all other securities. The collateral is maintained thereafter at a value equal to at least 100% of the current market value of the securities on loan. The market value of the loaned securities is determined at the close of each business day of the Fund and any additional required collateral is delivered to the Fund, or excess collateral returned by the Fund, on the next business day. During the term of the loan, the Funds are entitled to all distributions made on or in respect of the loaned securities, but do not receive interest income on securities received as collateral. Loans of securities are terminable at any time and the borrower, after notice, is required to return borrowed securities within the standard time period for settlement of securities transactions.
As of period end, any securities on loan were collateralized by cash and/or U.S. Government obligations. Cash collateral invested by the securities lending agent, BlackRock Institutional Trust Company, N.A. (“BTC”), if any, is disclosed in the Schedules of Investments. Any non-cash collateral received cannot be sold, re-invested or pledged by the Fund, except in the event of borrower default. The securities on loan, if any, are disclosed in the Funds’ Schedules of Investments. The market value of any securities on loan and the value of related collateral, if any, are shown separately in the Statements of Assets and Liabilities as a component of investments at value – unaffiliated and collateral on securities loaned, respectively.
Securities lending transactions are entered into by the Funds under Master Securities Lending Agreements (each, an “MSLA”), which provide the right, in the event of default (including bankruptcy or insolvency), for the non-defaulting party to liquidate the collateral and calculate a net exposure to the defaulting party or request additional collateral. In the event that a borrower defaults, the Funds, as lender, would offset the market value of the collateral received against the market value of the securities loaned. When the value of the collateral is greater than that of the market value of the securities loaned, the lender is left with a net amount payable to the defaulting party. However, bankruptcy or insolvency laws of a particular jurisdiction may impose restrictions on or prohibitions against such a right of offset in the event of an MSLA counterparty’s bankruptcy or insolvency. Under the MSLA, absent an event of default, the borrower can resell or re-pledge the loaned securities, and the Funds can reinvest cash collateral received in connection with loaned securities. Upon an event of default, the parties’ obligations to return the securities or collateral to the other party are extinguished, and the parties can
| 116 | 2 0 2 3 BLACK ROCK ANNUAL REPORT TO SHAREHOLDERS |
Notes to Financial Statements (continued)
resell or re-pledge the loaned securities or the collateral received in connection with the loaned securities in order to satisfy the defaulting party’s net payment obligation for all transactions under the MSLA. The defaulting party remains liable for any deficiency.
As of period end, the following table is a summary of the Funds’ securities on loan by counterparty which are subject to offset under an MSLA:
| ||||||||||||||||
| Securities | Cash Collateral | Non-Cash Collateral | Net | |||||||||||||
Fund Name/Counterparty | Loaned at Value | Received | (a) | Received, at Fair Value | (a) | Amount | ||||||||||
| ||||||||||||||||
U.S. Intermediate Credit Bond | ||||||||||||||||
Barclays Capital, Inc. | $ | 12,294,062 | $ | (12,294,062 | ) | $ | — | $ | — | |||||||
BMO Capital Markets Corp. | 4,727,236 | (4,727,236 | ) | — | — | |||||||||||
BNP Paribas SA | 41,059,839 | (41,059,839 | ) | — | — | |||||||||||
BofA Securities, Inc. | 12,391,831 | (12,391,831 | ) | — | — | |||||||||||
Goldman Sachs & Co. LLC | 14,282,175 | (14,282,175 | ) | — | — | |||||||||||
HSBC Securities (USA), Inc. | 1,294,446 | (1,294,446 | ) | — | — | |||||||||||
J.P. Morgan Securities LLC | 24,578,958 | (24,578,958 | ) | — | — | |||||||||||
Jefferies LLC | 2,330,547 | (2,330,547 | ) | — | — | |||||||||||
Nomura Securities International, Inc. | 4,582,579 | (4,582,579 | ) | — | — | |||||||||||
RBC Capital Markets LLC | 15,932,306 | (15,932,306 | ) | — | — | |||||||||||
Scotia Capital (USA), Inc. | 4,470,273 | (4,470,273 | ) | — | — | |||||||||||
State Street Bank & Trust Co. | 3,150,292 | (3,150,292 | ) | — | — | |||||||||||
TD Securities (USA) LLC | 777,233 | (777,233 | ) | — | — | |||||||||||
Toronto-Dominion Bank | 632,325 | (632,325 | ) | — | — | |||||||||||
UBS AG | 195,569 | (195,569 | ) | — | — | |||||||||||
Wells Fargo Securities LLC | 18,474,162 | (18,474,162 | ) | — | — | |||||||||||
|
|
|
|
|
|
|
| |||||||||
| $ | 161,173,833 | $ | (161,173,833 | ) | $ | — | $ | — | ||||||||
|
|
|
|
|
|
|
| |||||||||
U.S. Intermediate Government Bond | ||||||||||||||||
BofA Securities, Inc. | $ | 153,800,547 | $ | (153,800,547 | ) | $ | — | $ | — | |||||||
Citigroup Global Markets, Inc. | 66,868,879 | (66,868,879 | ) | — | — | |||||||||||
Credit Agricole Corporate & Investment Bank SA | 513,917,878 | (513,917,878 | ) | — | — | |||||||||||
Goldman Sachs & Co. LLC | 204,805,392 | (204,805,392 | ) | — | — | |||||||||||
HSBC Securities (USA), Inc. | 126,518,434 | (126,518,434 | ) | — | — | |||||||||||
J.P. Morgan Securities LLC | 168,588,111 | (168,588,111 | ) | — | — | |||||||||||
Morgan Stanley | 265,542,750 | (265,542,750 | ) | — | — | |||||||||||
Wells Fargo Securities LLC | 69,481,129 | (69,481,129 | ) | — | — | |||||||||||
|
|
|
|
|
|
|
| |||||||||
| $ | 1,569,523,120 | $ | (1,569,523,120 | ) | $ | — | $ | — | ||||||||
|
|
|
|
|
|
|
| |||||||||
U.S. Long Credit Bond | ||||||||||||||||
Barclays Capital, Inc. | $ | 19,088,792 | $ | (19,088,792 | ) | $ | — | $ | — | |||||||
BMO Capital Markets Corp. | 1,518,947 | (1,518,947 | ) | — | — | |||||||||||
BNP Paribas SA | 40,794,304 | (40,794,304 | ) | — | — | |||||||||||
BofA Securities, Inc. | 9,088,180 | (9,088,180 | ) | — | — | |||||||||||
HSBC Securities (USA), Inc. | 4,129,460 | (4,129,460 | ) | — | — | |||||||||||
J.P. Morgan Securities LLC | 38,458,992 | (38,458,992 | ) | — | — | |||||||||||
Jefferies LLC | 2,536,655 | (2,536,655 | ) | — | — | |||||||||||
Nomura Securities International, Inc. | 2,781,085 | (2,781,085 | ) | — | — | |||||||||||
RBC Capital Markets LLC | 11,104,925 | (11,104,925 | ) | — | — | |||||||||||
Scotia Capital (USA), Inc. | 6,871,380 | (6,871,380 | ) | — | — | |||||||||||
State Street Bank & Trust Co. | 5,504,582 | (5,504,582 | ) | — | — | |||||||||||
UBS AG | 87,529 | (87,529 | ) | — | — | |||||||||||
Wells Fargo Bank N.A. | 1,483,620 | (1,483,620 | ) | — | — | |||||||||||
Wells Fargo Securities LLC | 9,858,327 | (9,858,327 | ) | — | — | |||||||||||
|
|
|
|
|
|
|
| |||||||||
| $ | 153,306,778 | $ | (153,306,778 | ) | $ | — | $ | — | ||||||||
|
|
|
|
|
|
|
| |||||||||
U.S. Long Government Bond | ||||||||||||||||
BofA Securities, Inc. | $ | 10,470,519 | $ | (10,470,519 | ) | $ | — | $ | — | |||||||
Citigroup Global Markets, Inc. | 339,297,889 | (339,297,889 | ) | — | — | |||||||||||
Credit Agricole Corporate & Investment Bank SA | 212,384,199 | (212,384,199 | ) | — | — | |||||||||||
HSBC Securities (USA), Inc. | 13,848,598 | (13,848,598 | ) | — | — | |||||||||||
J.P. Morgan Securities LLC | 106,183,765 | (106,183,765 | ) | — | — | |||||||||||
Morgan Stanley | 52,967,945 | (52,967,945 | ) | — | — | |||||||||||
Wells Fargo Securities LLC | 129,368 | (129,368 | ) | — | — | |||||||||||
|
|
|
|
|
|
|
| |||||||||
| $ | 735,282,283 | $ | (735,282,283 | ) | $ | — | $ | — | ||||||||
|
|
|
|
|
|
|
| |||||||||
| (a) | Collateral received, if any, in excess of the market value of securities on loan is not presented in this table. The total cash collateral received by each Fund is disclosed in the Fund’s Statements of Assets and Liabilities. |
NOTES TO FINANCIAL STATEMENTS | 117 |
Notes to Financial Statements (continued)
The risks of securities lending include the risk that the borrower may not provide additional collateral when required or may not return the securities when due. To mitigate these risks, the Funds benefit from a borrower default indemnity provided by BlackRock, Inc. (“BlackRock”). BlackRock’s indemnity allows for full replacement of the securities loaned to the extent the collateral received does not cover the value on the securities loaned in the event of borrower default. Each Fund could incur a loss if the value of an investment purchased with cash collateral falls below the market value of loaned securities or if the value of an investment purchased with cash collateral falls below the value of the original cash collateral received. Such losses are borne entirely by the Funds.
| 5. | DERIVATIVE FINANCIAL INSTRUMENTS |
The Funds engage in various portfolio investment strategies using derivative contracts both to increase the returns of the Funds and/or to manage their exposure to certain risks such as credit risk, equity risk, interest rate risk, foreign currency exchange rate risk, commodity price risk or other risks (e.g., inflation risk). Derivative financial instruments categorized by risk exposure are included in the Schedules of Investments. These contracts may be transacted on an exchange or over-the-counter (“OTC”).
Futures Contracts: Futures contracts are purchased or sold to gain exposure to, or manage exposure to, changes in interest rates (interest rate risk) and changes in the value of equity securities (equity risk) or foreign currencies (foreign currency exchange rate risk).
Futures contracts are exchange-traded agreements between the Funds and a counterparty to buy or sell a specific quantity of an underlying instrument at a specified price and on a specified date. Depending on the terms of a contract, it is settled either through physical delivery of the underlying instrument on the settlement date or by payment of a cash amount on the settlement date. Upon entering into a futures contract, the Funds are required to deposit initial margin with the broker in the form of cash or securities in an amount that varies depending on a contract’s size and risk profile. The initial margin deposit must then be maintained at an established level over the life of the contract. Amounts pledged, which are considered restricted, are included in cash pledged for futures contracts in the Statements of Assets and Liabilities.
Securities deposited as initial margin are designated in the Schedules of Investments and cash deposited, if any, are shown as cash pledged for futures contracts in the Statements of Assets and Liabilities. Pursuant to the contract, the Funds agree to receive from or pay to the broker an amount of cash equal to the daily fluctuation in market value of the contract (“variation margin”). Variation margin is recorded as unrealized appreciation (depreciation) and, if any, shown as variation margin receivable (or payable) on futures contracts in the Statements of Assets and Liabilities. When the contract is closed, a realized gain or loss is recorded in the Statements of Operations equal to the difference between the notional amount of the contract at the time it was opened and the notional amount at the time it was closed. The use of futures contracts involves the risk of an imperfect correlation in the movements in the price of futures contracts and interest rates, foreign currency exchange rates or underlying assets.
| 6. | INVESTMENT ADVISORY AGREEMENT AND OTHER TRANSACTIONS WITH AFFILIATES |
Investment Advisory: The Trust, on behalf of each Fund, entered into an Investment Advisory Agreement with the Manager, the Funds’ investment adviser and an indirect, wholly-owned subsidiary of BlackRock, to provide investment advisory services. The Manager is responsible for the management of each Fund’s portfolio and provides the personnel, facilities, equipment and certain other services necessary to the operations of each Fund.
For such services, each Fund pays the Manager a monthly fee at an annual rate equal to the following percentages of the average daily value of each Fund’s net assets:
| Fund Name | Investment Advisory Fees | |||
U.S. Intermediate Credit Bond | 0.06 | % | ||
U.S. Intermediate Government Bond | 0.05 | |||
U.S. Long Credit Bond | 0.06 | |||
U.S. Long Government Bond | 0.05 | |||
U.S. Securitized Bond | 0.06 | |||
The Manager contractually agreed to waive each Fund’s investment advisory fees through June 30, 2033. The contractual agreement may be terminated upon 90 days’ notice by a majority of the trustees who are not “interested persons” of the Trust, as defined in the 1940 Act (“Independent Trustees”), or by a vote of a majority of the outstanding voting securities of each Fund. These amounts waived and/or reimbursed are included in fees waived and/or reimbursed by the Administrator/Manager in the Statements of Operations. For the year ended October 31, 2023, the amounts were as follows:
| ||||
| Fund Name | Fees Waived and/or Reimbursed by the Administrator/Manager | |||
| ||||
U.S. Intermediate Credit Bond | $ | 1,283,499 | ||
U.S. Intermediate Government Bond | 1,926,345 | |||
U.S. Long Credit Bond | 1,252,410 | |||
U.S. Long Government Bond | 1,054,422 | |||
U.S. Securitized Bond | 2,530,344 | |||
| ||||
| 118 | 2 0 2 3 BLACK ROCK ANNUAL REPORT TO SHAREHOLDERS |
Notes to Financial Statements (continued)
Administration: The Trust, on behalf of each Fund, entered into an Administration Agreement with the BlackRock Advisors, LLC (the “Administrator”), an indirect, wholly-owned subsidiary of BlackRock, to provide administrative services. For these services, the Manager receives an administration fee computed daily and payable monthly, based on a percentage of the average daily net assets of each Fund. The administration fee, which is shown as administration in the Statements of Operations, is paid at the annual rates below.
| ||||
| Administration Fees | ||||
| ||||
U.S. Intermediate Credit Bond | 0.06 | % | ||
U.S. Intermediate Government Bond | 0.05 | |||
U.S. Long Credit Bond | 0.06 | |||
U.S. Long Government Bond | 0.05 | |||
U.S. Securitized Bond | 0.06 | |||
| ||||
The Administrator contractually agreed to waive each Fund’s administration fees through June 30, 2033. The contractual agreement may be terminated upon 90 days’ notice by a majority of the Independent Trustees, or by a vote of a majority of the outstanding voting securities of each Fund. These amounts waived and/or reimbursed are included in fees waived and/or reimbursed by the Administrator/Manager in the Statements of Operations. For the year ended October 31, 2023, the amounts were as follows:
| ||||
| Fund Name | Fees Waived and/or Reimbursed by the Administrator/Manager | |||
| ||||
U.S. Intermediate Credit Bond | $ | 1,283,499 | ||
U.S. Intermediate Government Bond | 1,926,345 | |||
U.S. Long Credit Bond | 1,252,410 | |||
U.S. Long Government Bond | 1,054,422 | |||
U.S. Securitized Bond | 2,530,344 | |||
| ||||
Expense Waivers and Reimbursements: The fees and expenses of the Independent Trustees, counsel to the Independent Trustees and the Funds’ independent registered public accounting firm (together, the “independent expenses”) are paid directly by each Fund. The Administrator and the Manager have contractually agreed to reimburse each Fund or provide an offsetting credit to each Fund in an amount equal to these independent expenses as applicable, through June 30, 2033. The contractual agreement may be terminated upon 90 days’ notice by a majority of the Independent Trustees, or by a vote of a majority of the outstanding voting securities of each Fund. The amounts waived are included in fees waived and/or reimbursed by the Administrator/Manager in the Statements of Operations. For the year ended October 31, 2023, the amounts waived were as follows:
| ||||
| Fund Name | Fees Waived and/or Reimbursed by the Administrator/Manager | |||
| ||||
U.S. Intermediate Credit Bond | $ | 54,459 | ||
U.S. Intermediate Government Bond | 67,001 | |||
U.S. Long Credit Bond | 53,893 | |||
U.S. Long Government Bond | 53,600 | |||
U.S. Securitized Bond | 68,124 | |||
| ||||
Securities Lending: The U.S. Securities and Exchange Commission (“SEC”) has issued an exemptive order which permits BTC, an affiliate of the Manager, to serve as securities lending agent for the Funds, subject to applicable conditions. As securities lending agent, BTC bears all operational costs directly related to securities lending, including any custodial costs. The Funds are responsible for fees in connection with the investment of cash collateral received for securities on loan (the “collateral investment fees”). The cash collateral is invested in a money market fund, BlackRock Cash Funds: Institutional or BlackRock Cash Funds: Treasury, managed by the Manager or its affiliates. However, BTC has agreed to reduce the amount of securities lending income it receives in order to effectively limit the collateral investment fees the Funds bear to an annual rate of 0.04%. The SL Agency Shares of such money market fund will not be subject to a sales load, distribution fee or service fee. The money market fund in which the cash collateral has been invested may impose a discretionary liquidity fee of up to 2% of the value redeemed, if such fee is determined to be in the best interests of such money market fund.
Securities lending income is equal to the total of income earned from the reinvestment of cash collateral, net of fees and other payments to and from borrowers of securities, and less the collateral investment fees. Each Fund retains a portion of securities lending income and remits a remaining portion to BTC as compensation for its services as securities lending agent.
Pursuant to the current securities lending agreement, each Fund retains 82% of securities lending income (which excludes collateral investment fees), and this amount retained can never be less than 70% of the total of securities lending income plus the collateral investment fees.
In addition, commencing the business day following the date that the aggregate securities lending income earned across the BlackRock Multi-Asset Complex in a calendar year exceeds a specified threshold, each Fund, pursuant to the securities lending agreement, will retain for the remainder of that calendar year securities lending income in an amount equal to 85% of securities lending income (which excludes collateral investment fees), and this amount retained can never be less than 70% of the total of securities lending income plus the collateral investment fees.
The share of securities lending income earned by each Fund is shown as securities lending income — affiliated — net in the Statements of Operations. For the year ended October 31, 2023, each Fund paid BTC the following amounts for securities lending agent services:
| ||||
| Fund Name | Amounts | |||
| ||||
U.S. Intermediate Credit Bond | $ | 179,314 | ||
U.S. Intermediate Government Bond | 815,934 | |||
| ||||
NOTES TO FINANCIAL STATEMENTS | 119 |
Notes to Financial Statements (continued)
| ||||
| Fund Name | Amounts | |||
| ||||
U.S. Long Credit Bond | $ | 162,636 | ||
U.S. Long Government Bond | 363,143 | |||
| ||||
Interfund Lending: In accordance with an exemptive order (the “Order”) from the SEC, each Fund may participate in a joint lending and borrowing facility for temporary purposes (the “Interfund Lending Program”), subject to compliance with the terms and conditions of the Order, and to the extent permitted by each Fund’s investment policies and restrictions. Each Fund is currently permitted to borrow and lend under the Interfund Lending Program.
A lending BlackRock fund may lend in aggregate up to 15% of its net assets but may not lend more than 5% of its net assets to any one borrowing fund through the Interfund Lending Program. A borrowing BlackRock fund may not borrow through the Interfund Lending Program or from any other source more than 33 1/3% of its total assets (or any lower threshold provided for by the fund’s investment restrictions). If a borrowing BlackRock fund’s total outstanding borrowings exceed 10% of its total assets, each of its outstanding interfund loans will be subject to collateralization of at least 102% of the outstanding principal value of the loan. All interfund loans are for temporary or emergency purposes and the interest rate to be charged will be the average of the highest current overnight repurchase agreement rate available to a lending fund and the bank loan rate, as calculated according to a formula established by the Board.
During the year ended October 31, 2023, the Funds did not participate in the Interfund Lending Program.
Trustees and Officers: Certain trustees and/or officers of the Trust are directors and/or officers of BlackRock or its affiliates. The Funds reimburse the Manager for a portion of the compensation paid to the Trust’s Chief Compliance Officer, which is included in Trustees and Officer in the Statements of Operations.
| 7. | PURCHASES AND SALES |
For the year ended October 31, 2023, purchases and sales of investments, including paydowns/payups and mortgage dollar rolls and excluding short-term securities, were as follows:
| ||||||||||||||||
| U.S. Government Securities | Other Securities | |||||||||||||||
|
| |||||||||||||||
| Fund Name | Purchases | Sales | Purchases | Sales | ||||||||||||
| ||||||||||||||||
U.S. Intermediate Credit Bond | $ | — | $ | — | $ | 973,843,877 | $ | 292,160,693 | ||||||||
U.S. Intermediate Government Bond | 1,433,893,001 | 920,943,281 | 5,408,946 | — | ||||||||||||
U.S. Long Credit Bond | — | — | 417,458,191 | 257,871,502 | ||||||||||||
U.S. Long Government Bond | 650,125,612 | 83,076,521 | 6,910,953 | 5,789,450 | ||||||||||||
U.S. Securitized Bond | — | — | 14,714,382,800 | 14,205,432,642 | ||||||||||||
| ||||||||||||||||
For the year ended October 31, 2023, purchases and sales related to mortgage dollar rolls were as follows:
| ||||||||
| Fund Name | Purchases | Sales | ||||||
| ||||||||
U.S. Securitized Bond | $ | 7,430,734,692 | $ | 7,427,137,495 | ||||
| ||||||||
| 8. | INCOME TAX INFORMATION |
It is each Fund’s policy to comply with the requirements of the Internal Revenue Code of 1986, as amended, applicable to regulated investment companies, and to distribute substantially all of its taxable income to its shareholders. Therefore, no U.S. federal income tax provision is required.
Each Fund files U.S. federal and various state and local tax returns. No income tax returns are currently under examination. The statute of limitations on each Fund’s U.S. federal tax returns generally remains open for a period of three years after they are filed. The statutes of limitations on each Fund’s state and local tax returns may remain open for an additional year depending upon the jurisdiction.
Management has analyzed tax laws and regulations and their application to the Funds as of October 31, 2023, inclusive of the open tax return years, and does not believe that there are any uncertain tax positions that require recognition of a tax liability in the Funds’ financial statements.
The tax character of distributions paid was as follows:
| ||||||||
| Fund Name | Year Ended 10/31/23 | Year Ended 10/31/22 | ||||||
| ||||||||
U.S. Intermediate Credit Bond | ||||||||
Ordinary income | $ | 77,358,427 | $ | 23,303,934 | ||||
|
|
|
| |||||
U.S. Intermediate Government Bond | ||||||||
Ordinary income | $ | 89,518,603 | $ | 27,048,669 | ||||
|
|
|
| |||||
U.S. Long Credit Bond | ||||||||
Ordinary income | $ | 106,546,280 | $ | 42,348,892 | ||||
|
|
|
| |||||
U.S. Long Government Bond | ||||||||
Ordinary income | $ | 74,646,145 | $ | 25,264,214 | ||||
|
|
|
| |||||
| 120 | 2 0 2 3 BLACK ROCK ANNUAL REPORT TO SHAREHOLDERS |
Notes to Financial Statements (continued)
| ||||||||
| Fund Name | Year Ended 10/31/23 | Year Ended 10/31/22 | ||||||
| ||||||||
U.S. Securitized Bond | ||||||||
Ordinary income | $ | 145,884,807 | $ | 47,023,066 | ||||
Return of capital | 1,646,980 | — | ||||||
|
|
|
| |||||
| $ | 147,531,787 | $ | 47,023,066 | |||||
|
|
|
| |||||
As of October 31, 2023, the tax components of accumulated earnings (loss) were as follows:
| ||||||||||||||||
| Fund Name | Undistributed Ordinary Income | Non-Expiring Capital Loss Carryforwards(a) | Net Unrealized Gains (Losses)(b) | Total | ||||||||||||
| ||||||||||||||||
U.S. Intermediate Credit Bond | $ | 3,798 | $ | (81,273,219 | ) | $ | (231,568,782 | ) | $ | (312,838,203 | ) | |||||
U.S. Intermediate Government Bond | 10,060 | (86,114,195 | ) | (363,752,408 | ) | (449,856,543 | ) | |||||||||
U.S. Long Credit Bond | 3,992 | (61,349,243 | ) | (582,993,031 | ) | (644,338,282 | ) | |||||||||
U.S. Long Government Bond | 5,252 | (33,584,335 | ) | (790,346,995 | ) | (823,926,078 | ) | |||||||||
U.S. Securitized Bond | — | (87,116,574 | ) | (726,175,108 | ) | (813,291,682 | ) | |||||||||
| ||||||||||||||||
| (a) | Amounts available to offset future realized capital gains. |
| (b) | The difference between book-basis and tax-basis net unrealized gains (losses) was attributable primarily to the tax deferral of losses on wash sales, the realization for tax purposes of unrealized gains (losses) on certain futures contracts, the timing and recognition of realized gains (losses) for tax purposes and amortization methods for premiums on fixed income securities. |
As of October 31, 2023, gross unrealized appreciation and depreciation based on cost of investments (including short positions and derivatives, if any) for U.S. federal income tax purposes were as follows:
| ||||||||||||||||
| Fund Name | Tax Cost | Gross Unrealized Appreciation | Gross Unrealized Depreciation | Net Unrealized Appreciation (Depreciation) | ||||||||||||
| ||||||||||||||||
U.S. Intermediate Credit Bond | $ | 2,799,458,811 | $ | 895,908 | $ | (232,464,690 | ) | $ | (231,568,782 | ) | ||||||
U.S. Intermediate Government Bond | 5,880,846,540 | 322,295 | (364,074,703 | ) | (363,752,408 | ) | ||||||||||
U.S. Long Credit Bond | 2,702,226,461 | 153,461 | (583,146,492 | ) | (582,993,031 | ) | ||||||||||
U.S. Long Government Bond | 3,671,329,339 | 157,478 | (790,504,473 | ) | (790,346,995 | ) | ||||||||||
U.S. Securitized Bond | 5,502,340,905 | 591,824 | (726,766,932 | ) | (726,175,108 | ) | ||||||||||
| ||||||||||||||||
| 9. | BANK BORROWINGS |
The Trust, on behalf of each Fund, along with certain other funds managed by the Manager and its affiliates (“Participating Funds”), is party to a 364-day, $2.50 billion credit agreement with a group of lenders. Under this agreement, the Funds may borrow to fund shareholder redemptions. Excluding commitments designated for certain individual funds, the Participating Funds, including the Funds, can borrow up to an aggregate commitment amount of $1.75 billion at any time outstanding, subject to asset coverage and other limitations as specified in the agreement. The credit agreement has the following terms: a fee of 0.10% per annum on unused commitment amounts and interest at a rate equal to the higher of (a) Overnight Bank Funding Rate (“OBFR”) (but, in any event, not less than 0.00%) on the date the loan is made plus 0.80% per annum, (b) the Fed Funds rate (but, in any event, not less than 0.00%) in effect from time to time plus 0.80% per annum on amounts borrowed or (c) the sum of (x) Daily Simple Secured Overnight Financing Rate (“SOFR”) (but, in any event, not less than 0.00%) on the date the loan is made plus 0.10% and (y) 0.80% per annum. The agreement expires in April 2024 unless extended or renewed. These fees were allocated among such funds based upon portions of the aggregate commitment available to them and relative net assets of Participating Funds. During the year ended October 31, 2023, the Funds did not borrow under the credit agreement.
| 10. | PRINCIPAL RISKS |
In the normal course of business, the Funds invest in securities or other instruments and may enter into certain transactions, and such activities subject each Fund to various risks, including among others, fluctuations in the market (market risk) or failure of an issuer to meet all of its obligations. The value of securities or other instruments may also be affected by various factors, including, without limitation: (i) the general economy; (ii) the overall market as well as local, regional or global political and/or social instability; (iii) regulation, taxation or international tax treaties between various countries; or (iv) currency, interest rate and price fluctuations. Local, regional or global events such as war, acts of terrorism, the spread of infectious illness or other public health issues, recessions, or other events could have a significant impact on the Funds and their investments. Each Fund’s prospectus provides details of the risks to which each Fund is subject.
The Manager uses a “passive” or index approach to try to achieve each Fund’s investment objective following the securities included in its underlying index during upturns as well as downturns. The Manager does not take steps to reduce market exposure or to lessen the effects of a declining market. Divergence from the underlying index and the composition of the portfolio is monitored by the Manager.
The Funds may be exposed to additional risks when reinvesting cash collateral in money market funds that do not seek to maintain a stable NAV per share of $1.00, which may be subject to discretionary liquidity fees under certain circumstances.
Market Risk: Each Fund may be exposed to prepayment risk, which is the risk that borrowers may exercise their option to prepay principal earlier than scheduled during periods of declining interest rates, which would force each Fund to reinvest in lower yielding securities. Each Fund may also be exposed to reinvestment risk, which is the risk
NOTES TO FINANCIAL STATEMENTS | 121 |
Notes to Financial Statements (continued)
that income from each Fund’s portfolio will decline if each Fund invests the proceeds from matured, traded or called fixed-income securities at market interest rates that are below each Fund portfolio’s current earnings rate.
Municipal securities are subject to the risk that litigation, legislation or other political events, local business or economic conditions, credit rating downgrades, or the bankruptcy of the issuer could have a significant effect on an issuer’s ability to make payments of principal and/or interest or otherwise affect the value of such securities. Municipal securities can be significantly affected by political or economic changes, including changes made in the law after issuance of the securities, as well as uncertainties in the municipal market related to, taxation, legislative changes or the rights of municipal security holders, including in connection with an issuer insolvency. Municipal securities backed by current or anticipated revenues from a specific project or specific assets can be negatively affected by the discontinuance of the tax benefits supporting the project or assets or the inability to collect revenues for the project or from the assets. Municipal securities may be less liquid than taxable bonds, and there may be less publicly available information on the financial condition of municipal security issuers than for issuers of other securities.
Infectious Illness Risk: An outbreak of an infectious illness, such as the COVID-19 pandemic, may adversely impact the economies of many nations and the global economy, and may impact individual issuers and capital markets in ways that cannot be foreseen. An infectious illness outbreak may result in, among other things, closed international borders, prolonged quarantines, supply chain disruptions, market volatility or disruptions and other significant economic, social and political impacts.
Valuation Risk: The market values of equities, such as common stocks and preferred securities or equity related investments, such as futures and options, may decline due to general market conditions which are not specifically related to a particular company. They may also decline due to factors which affect a particular industry or industries. A Fund may invest in illiquid investments. An illiquid investment is any investment that a Fund reasonably expects cannot be sold or disposed of in current market conditions in seven calendar days or less without the sale or disposition significantly changing the market value of the investment. A Fund may experience difficulty in selling illiquid investments in a timely manner at the price that it believes the investments are worth. Prices may fluctuate widely over short or extended periods in response to company, market or economic news. Markets also tend to move in cycles, with periods of rising and falling prices. This volatility may cause each Fund’s NAV to experience significant increases or decreases over short periods of time. If there is a general decline in the securities and other markets, the NAV of a Fund may lose value, regardless of the individual results of the securities and other instruments in which a Fund invests.
Counterparty Credit Risk: The Funds may be exposed to counterparty credit risk, or the risk that an entity may fail to or be unable to perform on its commitments related to unsettled or open transactions, including making timely interest and/or principal payments or otherwise honoring its obligations. The Funds manage counterparty credit risk by entering into transactions only with counterparties that the Manager believes have the financial resources to honor their obligations and by monitoring the financial stability of those counterparties. Financial assets, which potentially expose the Funds to market, issuer and counterparty credit risks, consist principally of financial instruments and receivables due from counterparties. The extent of the Funds’ exposure to market, issuer and counterparty credit risks with respect to these financial assets is approximately their value recorded in the Statements of Assets and Liabilities, less any collateral held by the Funds.
A derivative contract may suffer a mark-to-market loss if the value of the contract decreases due to an unfavorable change in the market rates or values of the underlying instrument. Losses can also occur if the counterparty does not perform under the contract.
With exchange-traded futures, there is less counterparty credit risk to the Funds since the exchange or clearinghouse, as counterparty to such instruments, guarantees against a possible default. The clearinghouse stands between the buyer and the seller of the contract; therefore, credit risk is limited to failure of the clearinghouse. While offset rights may exist under applicable law, a Fund does not have a contractual right of offset against a clearing broker or clearinghouse in the event of a default (including the bankruptcy or insolvency). Additionally, credit risk exists in exchange-traded futures with respect to initial and variation margin that is held in a clearing broker’s customer accounts. While clearing brokers are required to segregate customer margin from their own assets, in the event that a clearing broker becomes insolvent or goes into bankruptcy and at that time there is a shortfall in the aggregate amount of margin held by the clearing broker for all its clients, typically the shortfall would be allocated on a pro rata basis across all the clearing broker’s customers, potentially resulting in losses to the Funds.
Geographic/Asset Class Risk: A diversified portfolio, where this is appropriate and consistent with a fund’s objectives, minimizes the risk that a price change of a particular investment will have a material impact on the NAV of a fund. The investment concentrations within each Fund’s portfolio are disclosed in its Schedule of Investments.
The Funds invest a significant portion of their assets in fixed-income securities and/or use derivatives tied to the fixed-income markets. Changes in market interest rates or economic conditions may affect the value and/or liquidity of such investments. Interest rate risk is the risk that prices of bonds and other fixed-income securities will decrease as interest rates rise and increase as interest rates fall. The Funds may be subject to a greater risk of rising interest rates due to the period of historically low interest rates that ended in March 2022. The Federal Reserve has recently been raising the federal funds rate as part of its efforts to address inflation. There is a risk that interest rates will continue to rise, which will likely drive down the prices of bonds and other fixed-income securities, and could negatively impact the Funds’ performance.
The Funds invest a significant portion of their assets in securities of issuers located in the United States. A decrease in imports or exports, changes in trade regulations, inflation and/or an economic recession in the United States may have a material adverse effect on the U.S. economy and the securities listed on U.S. exchanges. Proposed and adopted policy and legislative changes in the United States may also have a significant effect on U.S. markets generally, as well as on the value of certain securities. Governmental agencies project that the United States will continue to maintain elevated public debt levels for the foreseeable future which may constrain future economic growth. Circumstances could arise that could prevent the timely payment of interest or principal on U.S. government debt, such as reaching the legislative “debt ceiling.” Such non-payment would result in substantial negative consequences for the U.S. economy and the global financial system. If U.S. relations with certain countries deteriorate, it could adversely affect issuers that rely on the United States for trade. The United States has also experienced increased internal unrest and discord. If these trends were to continue, they may have an adverse impact on the U.S. economy and the issuers in which the Funds invest.
Certain Funds invest a significant portion of their assets in securities backed by commercial or residential mortgage loans or in issuers that hold mortgage and other asset-backed securities. When a fund concentrates its investments in this manner, it assumes a greater risk of prepayment or payment extension by securities issuers. Changes in economic conditions, including delinquencies and/or defaults on assets underlying these securities, can affect the value, income and/or liquidity of such positions. Investment percentages in these securities are presented in the Schedules of Investments.
| 122 | 2 0 2 3 BLACK ROCK ANNUAL REPORT TO SHAREHOLDERS |
Notes to Financial Statements (continued)
Significant Shareholder Redemption Risk: Certain shareholders may own or manage a substantial amount of fund shares and/or hold their fund investments for a limited period of time. Large redemptions of fund shares by these shareholders may force a fund to sell portfolio securities, which may negatively impact the fund’s NAV, increase the fund’s brokerage costs, and/or accelerate the realization of taxable income/gains and cause the fund to make additional taxable distributions to shareholders.
LIBOR Transition Risk: The Funds may be exposed to financial instruments that recently transitioned from, or continue to be tied to, the London Interbank Offered Rate (“LIBOR”) to determine payment obligations, financing terms, hedging strategies or investment value. The United Kingdom’s Financial Conduct Authority, which regulates LIBOR, has ceased publishing all LIBOR settings, but some USD LIBOR settings will continue to be published under a synthetic methodology until September 30, 2024 for certain legacy contracts. SOFR has been used increasingly on a voluntary basis in new instruments and transactions. Under U.S. regulations that implement a statutory fallback mechanism to replace LIBOR, benchmark rates based on SOFR have replaced LIBOR in certain financial contracts. The ultimate effect of the LIBOR transition process on the Funds is uncertain.
| 11. | CAPITAL SHARE TRANSACTIONS |
Transactions in capital shares were as follows:
| ||||||||||||||||
Year Ended 10/31/23 | Period from 05/20/22(a) to 10/31/22 | |||||||||||||||
|
|
|
| |||||||||||||
| Fund Name | Shares | Amounts | Shares | Amounts | ||||||||||||
| ||||||||||||||||
U.S. Intermediate Credit Bond | ||||||||||||||||
Shares sold | 72,487,287 | $ | 707,238,370 | 271,911,778 | $ | 2,718,174,088 | ||||||||||
Shares issued in reinvestment of distributions | 7,993,574 | 77,358,950 | 2,392,662 | 23,304,023 | ||||||||||||
Shares redeemed | (10,971,490 | ) | (105,770,212 | ) | (86,516,687 | ) | (869,624,994 | ) | ||||||||
|
|
|
|
|
|
|
| |||||||||
| 69,509,371 | $ | 678,827,108 | 187,787,753 | $ | 1,871,853,117 | |||||||||||
|
|
|
|
|
|
|
| |||||||||
|
| |||||||||||||||
| ||||||||||||||||
Year Ended 10/31/23 | Period from 05/20/22(a) to 10/31/22 | |||||||||||||||
|
|
|
| |||||||||||||
| Fund Name | Shares | Amounts | Shares | Amounts | ||||||||||||
| ||||||||||||||||
U.S. Intermediate Government Bond | ||||||||||||||||
Shares sold | 89,647,418 | $ | 867,928,770 | 474,514,308 | $ | 4,743,912,073 | ||||||||||
Shares issued in reinvestment of distributions | 9,290,586 | 89,518,684 | 2,769,160 | 27,048,669 | ||||||||||||
Shares redeemed | (47,418,357 | ) | (457,136,474 | ) | (113,228,043 | ) | (1,127,122,710 | ) | ||||||||
|
|
|
|
|
|
|
| |||||||||
| 51,519,647 | $ | 500,310,980 | 364,055,425 | $ | 3,643,838,032 | |||||||||||
|
|
|
|
|
|
|
| |||||||||
|
| |||||||||||||||
| ||||||||||||||||
Year Ended 10/31/23 | Period from 05/20/22(a) to 10/31/22 | |||||||||||||||
|
|
|
| |||||||||||||
| Fund Name | Shares | Amounts | Shares | Amounts | ||||||||||||
| ||||||||||||||||
U.S. Long Credit Bond | ||||||||||||||||
Shares sold | 38,136,216 | $ | 350,550,132 | 237,144,897 | $ | 2,377,357,132 | ||||||||||
Shares issued in reinvestment of distributions | 11,669,706 | 106,546,600 | 4,539,345 | 42,348,843 | ||||||||||||
Shares redeemed | (32,636,820 | ) | (304,078,083 | ) | (16,089,374 | ) | (158,828,844 | ) | ||||||||
|
|
|
|
|
|
|
| |||||||||
| 17,169,102 | $ | 153,018,649 | 225,594,868 | $ | 2,260,877,131 | |||||||||||
|
|
|
|
|
|
|
| |||||||||
|
| |||||||||||||||
| ||||||||||||||||
Year Ended 10/31/23 | Period from 05/20/22(a) to 10/31/22 | |||||||||||||||
|
|
|
| |||||||||||||
| Fund Name | Shares | Amounts | Shares | Amounts | ||||||||||||
| ||||||||||||||||
U.S. Long Government Bond | ||||||||||||||||
Shares sold | 70,820,611 | $ | 594,020,955 | 234,116,473 | $ | 2,285,383,527 | ||||||||||
Shares issued in reinvestment of distributions | 8,853,903 | 74,647,020 | 2,761,471 | 25,264,214 | ||||||||||||
Shares redeemed | (11,242,159 | ) | (95,265,326 | ) | (9,318,825 | ) | (90,170,270 | ) | ||||||||
|
|
|
|
|
|
|
| |||||||||
| 68,432,355 | $ | 573,402,649 | 227,559,119 | $ | 2,220,477,471 | |||||||||||
|
|
|
|
|
|
|
| |||||||||
NOTES TO FINANCIAL STATEMENTS | 123 |
Notes to Financial Statements (continued)
| ||||||||||||||||
Year Ended 10/31/23 | Period from 05/20/22(a) to 10/31/22 | |||||||||||||||
|
|
|
| |||||||||||||
| Fund Name | Shares | Amounts | Shares | Amounts | ||||||||||||
| ||||||||||||||||
U.S. Securitized Bond | ||||||||||||||||
Shares sold | 65,646,206 | $ | 617,560,584 | 437,111,769 | $ | 4,362,411,151 | ||||||||||
Shares issued in reinvestment of distributions | 15,816,297 | 147,532,018 | 4,888,972 | 47,023,064 | ||||||||||||
Shares redeemed | (23,299,753 | ) | (216,846,879 | ) | (18,056,639 | ) | (177,758,956 | ) | ||||||||
|
|
|
|
|
|
|
| |||||||||
| 58,162,750 | $ | 548,245,723 | 423,944,102 | $ | 4,231,675,259 | |||||||||||
|
|
|
|
|
|
|
| |||||||||
| (a) | Commencement of operations. |
| 12. | SUBSEQUENT EVENTS |
Management has evaluated the impact of all subsequent events on the Funds through the date the financial statements were issued and has determined that there were no subsequent events requiring adjustment or additional disclosure in the financial statements.
| 124 | 2 0 2 3 BLACK ROCK ANNUAL REPORT TO SHAREHOLDERS |
Report of Independent Registered Public Accounting Firm
To the Board of Trustees of BlackRock FundsSM and Shareholders of each of the five funds listed in the table below
Opinions on the Financial Statements
We have audited the accompanying statements of assets and liabilities, including the schedules of investments, of each of the funds listed in the table below (five of the funds constituting BlackRock FundsSM, hereafter collectively referred to as the “Funds”) as of October 31, 2023, the related statements of operations for the year ended October 31, 2023 and the statements of changes in net assets and the financial highlights for the year ended October 31, 2023 and for the period May 20, 2022 (commencement of operations) to October 31, 2022, including the related notes (collectively referred to as the “financial statements”). In our opinion, the financial statements present fairly, in all material respects, the financial position of each of the Funds as of October 31, 2023, the results of each of their operations for the year then ended, and the changes in each of their net assets and each of the financial highlights for the year ended October 31, 2023 and for the period May 20, 2022 (commencement of operations) to October 31, 2022 in conformity with accounting principles generally accepted in the United States of America.
iShares U.S. Intermediate Credit Bond Index Fund
iShares U.S. Intermediate Government Bond Index Fund
iShares U.S. Long Credit Bond Index Fund
iShares U.S. Long Government Bond Index Fund
iShares U.S. Securitized Bond Index Fund
Basis for Opinions
These financial statements are the responsibility of the Funds’ management. Our responsibility is to express an opinion on the Funds’ financial statements based on our audits. We are a public accounting firm registered with the Public Company Accounting Oversight Board (United States) (PCAOB) and are required to be independent with respect to the Funds in accordance with the U.S. federal securities laws and the applicable rules and regulations of the Securities and Exchange Commission and the PCAOB.
We conducted our audits of these financial statements in accordance with the standards of the PCAOB. Those standards require that we plan and perform the audit to obtain reasonable assurance about whether the financial statements are free of material misstatement, whether due to error or fraud.
Our audits included performing procedures to assess the risks of material misstatement of the financial statements, whether due to error or fraud, and performing procedures that respond to those risks. Such procedures included examining, on a test basis, evidence regarding the amounts and disclosures in the financial statements. Our audits also included evaluating the accounting principles used and significant estimates made by management, as well as evaluating the overall presentation of the financial statements. Our procedures included confirmation of securities owned as of October 31, 2023 by correspondence with the custodian, transfer agents and brokers; when replies were not received from brokers, we performed other auditing procedures. We believe that our audits provide a reasonable basis for our opinions.
/s/PricewaterhouseCoopers LLP
Philadelphia, Pennsylvania
December 21, 2023
We have served as the auditor of one or more BlackRock investment companies since 2000.
REPORT OF INDEPENDENT REGISTERED PUBLIC ACCOUNTING FIRM | 125 |
| Important Tax Information (unaudited) |
The Funds hereby designate the following amounts, or maximum amounts allowable by law, of distributions from direct federal obligation interest for the fiscal year ended October 31, 2023:
| ||||
| Fund Name | Federal Obligation Interest | |||
| ||||
U.S. Intermediate Government Bond | $ | 15,191,806 | ||
U.S. Long Government Bond | 30,955,580 | |||
| ||||
The law varies in each state as to whether and what percent of ordinary income dividends attributable to federal obligations is exempt from state income tax. Shareholders are advised to check with their tax advisers to determine if any portion of the dividends received is exempt from state income tax.
The Funds hereby designate the following amounts, or maximum amounts allowable by law, as interest income eligible to be treated as a Section 163(j) interest dividend for the fiscal year ended October 31, 2023:
| ||||
| Fund Name | Interest Dividends | |||
| ||||
U.S. Intermediate Credit Bond | $ | 76,747,434 | ||
U.S. Intermediate Government Bond | 87,575,510 | |||
U.S. Long Credit Bond | 105,927,167 | |||
U.S. Long Government Bond | 73,758,100 | |||
U.S. Securitized Bond | 143,327,496 | |||
| ||||
The Funds hereby designate the following amounts, or maximum amounts allowable by law, as interest-related dividends eligible for exemption from U.S. withholding tax for nonresident aliens and foreign corporations for the fiscal year ended October 31, 2023:
| ||||
| Fund Name | Interest- Related Dividends | |||
| ||||
U.S. Intermediate Credit Bond | $ | 76,551,006 | ||
U.S. Intermediate Government Bond | 87,480,137 | |||
U.S. Long Credit Bond | 105,767,072 | |||
U.S. Long Government Bond | 73,625,645 | |||
U.S. Securitized Bond | 137,459,820 | |||
| ||||
| 126 | 2 0 2 3 BLACK ROCK ANNUAL REPORT TO SHAREHOLDERS |
Disclosure of Investment Advisory Agreement
The Board of Trustees (the “Board,” the members of which are referred to as “Board Members”) of BlackRock Funds (the “Trust”) met on April 18, 2023 (the “April Meeting”) and May 23-24, 2023 (the “May Meeting”) to consider the approval to continue the investment advisory agreement (the “Agreement”) between the Trust, on behalf of iShares U.S. Intermediate Credit Bond Index Fund (“Intermediate Credit Bond Index Fund”), iShares U.S. Intermediate Government Bond Index Fund (“Intermediate Government Bond Index Fund”), iShares U.S. Long Credit Bond Index Fund (“Long Credit Bond Index Fund”), iShares U.S. Long Government Bond Index Fund (“Long Government Bond Index Fund”) and iShares U.S. Securitized Bond Index Fund (“Securitized Bond Index Fund” and, together with Intermediate Credit Bond Index Fund, Intermediate Government Bond Index Fund, Long Credit Bond Index Fund and Long Government Bond Index Fund, the “Funds”), and BlackRock Fund Advisors (the “Manager”), each Fund’s investment advisor.
The Approval Process
Consistent with the requirements of the Investment Company Act of 1940 (the “1940 Act”), the Board considers the approval of the continuation of the Agreement for each Fund on an annual basis. The Board members who are not “interested persons” of the Trust, as defined in the 1940 Act, are considered independent Board members (the “Independent Board Members”). The Board’s consideration entailed a year-long deliberative process during which the Board and its committees assessed BlackRock’s various services to each Fund, including through the review of written materials and oral presentations, and the review of additional information provided in response to requests from the Independent Board Members. The Board had four quarterly meetings per year, each of which extended over a two-day period, as well as additional ad hoc meetings and executive sessions throughout the year, as needed. The committees of the Board similarly met throughout the year. The Board also had an additional one-day meeting to consider specific information regarding the renewal of the Agreement. In considering the renewal of the Agreement, the Board assessed, among other things, the nature, extent and quality of the services provided to the Fund by BlackRock, BlackRock’s personnel and affiliates, including (as applicable): investment management services; accounting oversight; administrative and shareholder services; oversight of the Fund’s service providers; risk management and oversight; and legal, regulatory and compliance services. Throughout the year, including during the contract renewal process, the Independent Board Members were advised by independent legal counsel, and met with independent legal counsel in various executive sessions outside of the presence of BlackRock’s management.
During the year, the Board, acting directly and through its committees, considered information that was relevant to its annual consideration of the renewal of the Agreement, including the services and support provided by BlackRock to the Fund and its shareholders. BlackRock also furnished additional information to the Board in response to specific questions from the Board. Among the matters the Board considered were: (a) investment performance for one-year, three-year, five-year, and/or since inception periods, as applicable, against peer funds, an applicable benchmark, and other performance metrics, as applicable, as well as BlackRock senior management’s and portfolio managers’ analyses of the reasons for any outperformance or underperformance relative to its peers, benchmarks, and other performance metrics, as applicable; (b) fees, including advisory, administration, if applicable, and other amounts paid to BlackRock and its affiliates by the Fund for services; (c) Fund operating expenses and how BlackRock allocates expenses to the Fund; (d) the resources devoted to risk oversight of, and compliance reports relating to, implementation of the Fund’s investment objective, policies and restrictions, and meeting regulatory requirements; (e) BlackRock’s and the Fund’s adherence to applicable compliance policies and procedures; (f) the nature, character and scope of non-investment management services provided by BlackRock and its affiliates and the estimated cost of such services, as available; (g) BlackRock’s and other service providers’ internal controls and risk and compliance oversight mechanisms; (h) BlackRock’s implementation of the proxy voting policies approved by the Board; (i) execution quality of portfolio transactions; (j) BlackRock’s implementation of the Fund’s valuation and liquidity procedures; (k) an analysis of management fees paid to BlackRock for products with similar investment mandates across the open-end fund, exchange-traded fund (“ETF”), closed-end fund, sub-advised mutual fund, separately managed account, collective investment trust, and institutional separate account product channels, as applicable, and the similarities and differences between these products and the services provided as compared to the Fund; (l) BlackRock’s compensation methodology for its investment professionals and the incentives and accountability it creates, along with investment professionals’ investments in the fund(s) they manage; and (m) periodic updates on BlackRock’s business.
Prior to and in preparation for the April Meeting, the Board received and reviewed materials specifically relating to the renewal of the Agreement. The Independent Board Members are continuously engaged in a process with their independent legal counsel and BlackRock to review the nature and scope of the information provided to the Board to better assist its deliberations. The materials provided in connection with the April Meeting included, among other things: (a) information independently compiled and prepared by Broadridge Financial Solutions, Inc. (“Broadridge”), based on either a Lipper classification or Morningstar category, regarding each Fund’s fees and expenses as compared with a peer group of funds as determined by Broadridge (“Expense Peers”) and the investment performance of each Fund as compared with a peer group of funds (“Performance Peers”); (b) information on the composition of the Expense Peers and Performance Peers and a description of Broadridge’s methodology; (c) information on the estimated profits realized by BlackRock and its affiliates pursuant to the Agreement and a discussion of fall-out benefits to BlackRock and its affiliates; (d) a general analysis provided by BlackRock concerning investment management fees received in connection with other types of investment products, such as institutional accounts, sub-advised mutual funds, ETFs, closed-end funds, open-end funds, and separately managed accounts, under similar investment mandates, as well as the performance of such other products, as applicable; (e) a review of non-management fees; (f) the existence, impact and sharing of potential economies of scale, if any, with the Funds; (g) a summary of aggregate amounts paid by each Fund to BlackRock; (h) sales and redemption data regarding each Fund’s shares; and (i) various additional information requested by the Board as appropriate regarding BlackRock’s and the Funds’ operations.
At the April Meeting, the Board reviewed materials relating to its consideration of the Agreement and the Independent Board Members presented BlackRock with questions and requests for additional information. BlackRock responded to these questions and requests with additional written information in advance of the May Meeting.
At the May Meeting, the Board concluded its assessment of, among other things: (a) the nature, extent and quality of the services provided by BlackRock; (b) the investment performance of each Fund as compared to its Performance Peers and to other metrics, as applicable; (c) the advisory fee and the estimated cost of the services and estimated profits realized by BlackRock and its affiliates from their relationship with the Funds; (d) each Fund’s fees and expenses compared to its Expense Peers; (e) the existence and sharing of potential economies of scale; (f) any fall-out benefits to BlackRock and its affiliates as a result of BlackRock’s relationship with the Funds; and (g) other factors deemed relevant by the Board Members.
The Board also considered other matters it deemed important to the approval process, such as other payments made to BlackRock or its affiliates relating to securities lending and cash management, and BlackRock’s services related to the valuation and pricing of Fund portfolio holdings. The Board noted the willingness of BlackRock’s personnel to engage in open, candid discussions with the Board. The Board Members evaluated the information available to it on a fund-by-fund basis. The following paragraphs provide more information about some of the primary factors that were relevant to the Board’s decision. The Board Members did not identify any particular information, or any single factor as determinative, and each Board Member may have attributed different weights to the various items and factors considered.
DISCLOSURE OF INVESTMENT ADVISORY AGREEMENT | 127 |
Disclosure of Investment Advisory Agreement (continued)
A. Nature, Extent and Quality of the Services Provided by BlackRock
The Board, including the Independent Board Members, reviewed the nature, extent and quality of services provided by BlackRock, including the investment advisory services, and the resulting performance of each Fund. Throughout the year, the Board compared each Fund’s performance to the performance of a comparable group of mutual funds, relevant benchmarks, and performance metrics, as applicable. The Board met with BlackRock’s senior management personnel responsible for investment activities, including the senior investment officers. The Board also reviewed the materials provided by each Fund’s portfolio management team discussing the Fund’s performance, investment strategies and outlook.
The Board considered, among other factors, with respect to BlackRock: the experience of investment personnel generally and each Fund’s portfolio management team; research capabilities; investments by portfolio managers in the funds they manage; portfolio trading capabilities; use of technology; commitment to compliance; credit analysis capabilities; risk analysis and oversight capabilities; and the approach to training and retaining portfolio managers and other research, advisory and management personnel. The Board also considered BlackRock’s overall risk management program, including the continued efforts of BlackRock and its affiliates to address cybersecurity risks and the role of BlackRock’s Risk & Quantitative Analysis Group. The Board engaged in a review of BlackRock’s compensation structure with respect to each Fund’s portfolio management team and BlackRock’s ability to attract and retain high-quality talent and create performance incentives.
In addition to investment advisory services, the Board considered the nature and quality of the administrative and other non-investment advisory services provided to each Fund. BlackRock and its affiliates provide the Funds with certain administrative, shareholder and other services (in addition to any such services provided to the Fund by third parties) and officers and other personnel as are necessary for the operations of the Funds. In particular, BlackRock and its affiliates provide the Funds with administrative services including, among others: (i) responsibility for disclosure documents, such as the prospectus, the summary prospectus (as applicable), the statement of additional information and periodic shareholder reports; (ii) oversight of daily accounting and pricing; (iii) responsibility for periodic filings with regulators; (iv) overseeing and coordinating the activities of third-party service providers, including, among others, each Fund’s custodian, fund accountant, transfer agent, and auditor; (v) organizing Board meetings and preparing the materials for such Board meetings; (vi) providing legal and compliance support; (vii) furnishing analytical and other support to assist the Board in its consideration of strategic issues such as the merger, consolidation or repurposing of certain open-end funds; and (viii) performing or managing administrative functions necessary for the operation of the Funds, such as tax reporting, expense management, fulfilling regulatory filing requirements, overseeing each Fund’s distribution partners, and shareholder call center and other services. The Board reviewed the structure and duties of BlackRock’s fund administration, shareholder services, and legal and compliance departments and considered BlackRock’s policies and procedures for assuring compliance with applicable laws and regulations. The Board considered the operation of BlackRock’s business continuity plans.
B. The Investment Performance of the Funds and BlackRock
The Board, including the Independent Board Members, reviewed and considered the performance history of the Fund throughout the year and at the April Meeting. In preparation for the April Meeting, the Board was provided with reports independently prepared by Broadridge, which included an analysis of the Fund’s performance as of December 31, 2022, as compared to its Performance Peers. Broadridge ranks funds in quartiles, ranging from first to fourth, where first is the most desirable quartile position and fourth is the least desirable. In connection with its review, the Board received and reviewed information regarding the investment performance of each Fund as compared to its Performance Peers and the performance of the Fund as compared with its benchmark. The Board and its Performance Oversight Committee regularly review and meet with Fund management to discuss the performance of each Fund throughout the year.
In evaluating performance, the Board focused particular attention on funds with less favorable performance records. The Board also noted that while it found the data provided by Broadridge generally useful, it recognized the limitations of such data, including in particular, that notable differences may exist between a fund and its Performance Peers (for example, the investment objectives and strategies). Further, the Board recognized that the performance data reflects a snapshot of a period as of a particular date and that selecting a different performance period could produce significantly different results. The Board also acknowledged that long-term performance could be impacted by even one period of significant outperformance or underperformance, and that a single investment theme could have the ability to disproportionately affect long-term performance.
The Board noted that each of Intermediate Credit Bond Index Fund’s, Intermediate Government Bond Index Fund’s, Long Credit Bond Index Fund’s, Long Government Bond Index Fund’s and Securitized Bond Index Fund’s net performance was compared to its benchmark, and that each Fund had less than one full year of performance information as of December 31, 2022. The Board noted that BlackRock believes that net performance relative to the benchmark is an appropriate performance metric for each Fund, and that BlackRock has explained its rationale for this belief to the Board.
C. Consideration of the Advisory/Management Fees and the Estimated Cost of the Services and Estimated Profits Realized by BlackRock and its Affiliates from their Relationship with the Funds
The Board, including the Independent Board Members, reviewed each Fund’s contractual management fee rate compared with those of its Expense Peers. The contractual management fee rate represents a combination of the advisory fee and any administrative fees, before taking into account any reimbursements or fee waivers. The Board also compared each Fund’s total expense ratio, as well as its actual management fee rate, to those of its Expense Peers. The total expense ratio represents a fund’s total net operating expenses, including any 12b-1 or non-12b-1 service fees. The total expense ratio gives effect to any expense reimbursements or fee waivers, and the actual management fee rate gives effect to any management fee reimbursements or waivers. The Board considered that the fee and expense information in the Broadridge report for the Fund reflected information for a specific period and that historical asset levels and expenses may differ from current levels, particularly in a period of market volatility. The Board considered the services provided and the fees charged by BlackRock and its affiliates to other types of clients with similar investment mandates, as applicable, including institutional accounts and sub-advised mutual funds (including mutual funds sponsored by third parties).
The Board received and reviewed statements relating to BlackRock’s financial condition. The Board reviewed BlackRock’s profitability methodology and was also provided with an estimated profitability analysis that detailed the revenues earned and the expenses incurred by BlackRock for services provided to each Fund. The Board reviewed
| 128 | 2 0 2 3 BLACK ROCK ANNUAL REPORT TO SHAREHOLDERS |
Disclosure of Investment Advisory Agreement (continued)
BlackRock’s estimated profitability with respect to each Fund and other funds the Board currently oversees for the year ended December 31, 2022 compared to available aggregate estimated profitability data provided for the prior two years. The Board reviewed BlackRock’s estimated profitability with respect to certain other U.S. fund complexes managed by the Manager and/or its affiliates. The Board reviewed BlackRock’s assumptions and methodology of allocating expenses in the estimated profitability analysis, noting the inherent limitations in allocating costs among various advisory products. The Board recognized that profitability may be affected by numerous factors including, among other things, fee waivers and expense reimbursements by the Manager, the types of funds managed, precision of expense allocations and business mix. The Board thus recognized that calculating and comparing profitability at the individual fund level is difficult.
The Board noted that, in general, individual fund or product line profitability of other advisors is not publicly available. The Board reviewed BlackRock’s overall operating margin, in general, compared to that of certain other publicly traded asset management firms. The Board considered the differences between BlackRock and these other firms, including the contribution of technology at BlackRock, BlackRock’s expense management, and the relative product mix.
The Board considered whether BlackRock has the financial resources necessary to attract and retain high quality investment management personnel to perform its obligations under the Agreement and to continue to provide the high quality of services that is expected by the Board. The Board further considered factors including but not limited to BlackRock’s commitment of time and resources, assumption of risk, and liability profile in servicing the Funds, including in contrast to what is required of BlackRock with respect to other products with similar investment mandates across the open-end fund, ETF, closed-end fund, sub-advised mutual fund, separately managed account, collective investment trust, and institutional separate account product channels, as applicable.
The Board noted that Long Government Bond Index Fund’s contractual management fee rate ranked in the second quartile, and that the actual management fee rate and total expense ratio each ranked in the first quartile relative to the Fund’s Expense Peers.
The Board noted that each of Intermediate Credit Bond Index Fund’s, Long Credit Bond Index Fund’s and Securitized Bond Index Fund’s contractual management fee rate ranked in the third quartile, and that the actual management fee rate and total expense ratio each ranked in the first quartile relative to the pertinent Fund’s Expense Peers.
The Board noted that Intermediate Government Bond Index Fund’s contractual management fee rate ranked third out of four funds, and that the actual management fee rate and total expense ratio each ranked first out of four funds relative to the Fund’s Expense Peers.
The Board also noted that BlackRock has contractually agreed to waive a portion of its administration and advisory fees payable by each Fund. The Board further noted that BlackRock and its affiliates have contractually agreed to reimburse or otherwise compensate each Fund for certain other fees and expenses.
D. Economies of Scale
The Board, including the Independent Board Members, considered the extent to which economies of scale might be realized as the assets of the Funds increase, including the existence of fee waivers and/or expense caps, as applicable, noting that any contractual fee waivers and contractual expense caps had been approved by the Board. In its consideration, the Board further considered the continuation and/or implementation of fee waivers and/or expense caps, as applicable. The Board also considered the extent to which the Funds benefit from such economies of scale in a variety of ways, and whether there should be changes in the advisory fee rate or breakpoint structure in order to enable the Funds to more fully participate in these economies of scale. The Board considered each Fund’s asset levels and whether the current fee schedule was appropriate.
E. Other Factors Deemed Relevant by the Board Members
The Board, including the Independent Board Members, also took into account other ancillary or “fall-out” benefits that BlackRock or its affiliates may derive from BlackRock’s respective relationships with the Funds, both tangible and intangible, such as BlackRock’s ability to leverage its investment professionals who manage other portfolios and its risk management personnel, an increase in BlackRock’s profile in the investment advisory community, and the engagement of BlackRock’s affiliates as service providers to the Funds, including for administrative, distribution, securities lending and cash management services. With respect to securities lending, during the year the Board also considered information provided by independent third-party consultants related to the performance of each BlackRock affiliate as securities lending agent. The Board also considered BlackRock’s overall operations and its efforts to expand the scale of, and improve the quality of, its operations. The Board also noted that, subject to applicable law, BlackRock may use and benefit from third-party research obtained by soft dollars generated by certain registered fund transactions to assist in managing all or a number of its other client accounts.
In connection with its consideration of the Agreement, the Board also received information regarding BlackRock’s brokerage and soft dollar practices. The Board received reports from BlackRock which included information on brokerage commissions and trade execution practices throughout the year.
The Board noted the competitive nature of the open-end fund marketplace, and that shareholders are able to redeem their Fund shares if they believe that the pertinent Fund’s fees and expenses are too high or if they are dissatisfied with the performance of the Fund.
Conclusion
At the May Meeting, in a continuation of the discussions that occurred during the April Meeting, and as a culmination of the Board’s year-long deliberative process, the Board, including the Independent Board Members, unanimously approved the continuation of the Agreement between the Manager and the Trust, on behalf of each Fund, for a one-year term ending June 30, 2024. Based upon its evaluation of all of the aforementioned factors in their totality, as well as other information, the Board, including the Independent Board Members, was satisfied that the terms of the Agreement were fair and reasonable and, in the best interest of each Fund and its shareholders. In arriving at its decision to approve the Agreement, the Board did not identify any single factor or group of factors as all-important or controlling, but considered all factors together, and different Board Members may have attributed different weights to the various factors considered. The Independent Board Members were advised by independent legal counsel throughout the deliberative process.
DISCLOSURE OF INVESTMENT ADVISORY AGREEMENT | 129 |
Trustee and Officer Information
| Independent Trustees(a) | ||||||||
Name Year of Birth(b) | Position(s) Held (Length of Service)(c) | Principal Occupation(s) During Past 5 Years | Number of BlackRock-Advised Registered Investment Companies (“RICs”) Consisting of Investment Portfolios (“Portfolios”) Overseen | Public Company and Other Investment Company Directorships Held During Past 5 Years | ||||
Mark Stalnecker 1951 | Chair of the Board (Since 2019) and Trustee (Since 2015) | Chief Investment Officer, University of Delaware from 1999 to 2013; Trustee and Chair of the Finance and Investment Committees, Winterthur Museum and Country Estate from 2005 to 2016; Member of the Investment Committee, Delaware Public Employees’ Retirement System since 2002; Member of the Investment Committee, Christiana Care Health System from 2009 to 2017; Member of the Investment Committee, Delaware Community Foundation from 2013 to 2014; Director and Chair of the Audit Committee, SEI Private Trust Co. from 2001 to 2014. | 28 RICs consisting of 169 Portfolios | None | ||||
Susan J. Carter 1956 | Trustee (Since 2016) | Trustee, Financial Accounting Foundation from 2017 to 2021; Advisory Board Member, Center for Private Equity and Entrepreneurship at Tuck School of Business from 1997 to 2021; Director, Pacific Pension Institute from 2014 to 2018; Senior Advisor, Commonfund Capital, Inc. (“CCI”) (investment adviser) in 2015; Chief Executive Officer, CCI from 2013 to 2014; President & Chief Executive Officer, CCI from 1997 to 2013; Advisory Board Member, Girls Who Invest from 2015 to 2018 and Board Member thereof from 2018 to 2022; Advisory Board Member, Bridges Fund Management since 2016; Practitioner Advisory Board Member, Private Capital Research Institute (“PCRI”) since 2017; Lecturer in the Practice of Management, Yale School of Management since 2019; Advisor to Finance Committee, Altman Foundation since 2020; Investment Committee Member, Tostan since 2021; Member of the President’s Counsel, Commonfund since 2023. | 28 RICs consisting of 169 Portfolios | None | ||||
Collette Chilton 1958 | Trustee (Since 2015) | Chief Investment Officer, Williams College from 2006 to 2023; Chief Investment Officer, Lucent Asset Management Corporation from 1998 to 2006; Director, Boys and Girls Club of Boston since 2017; Director, B1 Capital since 2018; Director, David and Lucile Packard Foundation since 2020. | 28 RICs consisting of 169 Portfolios | None | ||||
Neil A. Cotty 1954 | Trustee (Since 2016) | Bank of America Corporation from 1996 to 2015, serving in various senior finance leadership roles, including Chief Accounting Officer from 2009 to 2015, Chief Financial Officer of Global Banking, Markets and Wealth Management from 2008 to 2009, Chief Accounting Officer from 2004 to 2008, Chief Financial Officer of Consumer Bank from 2003 to 2004, Chief Financial Officer of Global Corporate Investment Bank from 1999 to 2002. | 28 RICs consisting of 169 Portfolios | None | ||||
Lena G. Goldberg 1949 | Trustee (Since 2019) | Director, Pioneer Legal Institute since 2023; Director, Charles Stark Draper Laboratory, Inc. from 2013 to 2021; Senior Lecturer, Harvard Business School from 2008 to 2021; FMR LLC/Fidelity Investments (financial services) from 1996 to 2008, serving in various senior roles including Executive Vice President - Strategic Corporate Initiatives and Executive Vice President and General Counsel; Partner, Sullivan & Worcester LLP from 1985 to 1996 and Associate thereof from 1979 to 1985. | 28 RICs consisting of 169 Portfolios | None | ||||
| 130 | 2 0 2 3 BLACK ROCK ANNUAL REPORT TO SHAREHOLDERS |
Trustee and Officer Information (continued)
| Independent Trustees(a) (continued) | ||||||||
Name Year of Birth(b) | Position(s) Held (Length of Service)(c) | Principal Occupation(s) During Past 5 Years | Number of BlackRock-Advised Registered Investment Companies (“RICs”) Consisting of Investment Portfolios (“Portfolios”) Overseen | Public Company and Other Investment Company Directorships Held During Past 5 Years | ||||
Henry R. Keizer 1956 | Trustee (Since 2019) | Director, Park Indemnity Ltd. (captive insurer) from 2010 to 2022. | 28 RICs consisting of 169 Portfolios | GrafTech International Ltd. (materials manufacturing); Sealed Air Corp. (packaging); WABCO (commercial vehicle safety systems) from 2015 to 2020; Hertz Global Holdings (car rental) from 2015 to 2021 | ||||
Cynthia A. Montgomery 1952 | Trustee (Since 2007) | Professor, Harvard Business School since 1989. | 28 RICs consisting of 169 Portfolios | None | ||||
Donald C. Opatrny 1952 | Trustee (Since 2019) | Chair of the Board of Phoenix Art Museum since 2022 and Trustee thereof since 2018; Chair of the Investment Committee of The Arizona Community Foundation since 2022 and Trustee thereof since 2020; Director, Athena Capital Advisors LLC (investment management firm) from 2013 to 2020; Trustee, Vice Chair, Member of the Executive Committee and Chair of the Investment Committee, Cornell University from 2004 to 2019; President and Trustee, the Center for the Arts, Jackson Hole from 2011 to 2018; Member of the Board and Investment Committee, University School from 2007 to 2018; Member of Affordable Housing Supply Board of Jackson, Wyoming since 2017; Member, Investment Funds Committee, State of Wyoming since 2017; Trustee, Artstor (a Mellon Foundation affiliate) from 2010 to 2015; Member of the Investment Committee, Mellon Foundation from 2009 to 2015; President, Trustee and Member of the Investment Committee, The Aldrich Contemporary Art Museum from 2007 to 2014; Trustee and Chair of the Investment Committee, Community Foundation of Jackson Hole since 2014. | 28 RICs consisting of 169 Portfolios | None | ||||
Kenneth L. Urish 1951 | Trustee (Since 2007) | Managing Partner, Urish Popeck & Co., LLC (certified public accountants and consultants) since 1976; Past- Chairman of the Professional Ethics Committee of the Pennsylvania Institute of Certified Public Accountants and Committee Member thereof since 2007; Member of External Advisory Board, The Pennsylvania State University Accounting Department since 2001, Emeritus since 2022; Principal, UP Strategic Wealth Investment Advisors, LLC since 2013; Trustee, The Holy Family Institute from 2001 to 2010; President and Trustee, Pittsburgh Catholic Publishing Associates from 2003 to 2008; Director, Inter-Tel from 2006 to 2007; Member, Advisory Board, ESG Competent Boards since 2020. | 28 RICs consisting of 169 Portfolios | None | ||||
TRUSTEE AND OFFICER INFORMATION | 131 |
Trustee and Officer Information (continued)
| Independent Trustees(a) (continued) | ||||||||
Name Year of Birth(b) | Position(s) Held (Length of Service)(c) | Principal Occupation(s) During Past 5 Years | Number of BlackRock-Advised Registered Investment Companies (“RICs”) Consisting of Investment Portfolios (“Portfolios”) Overseen | Public Company and Other Investment Company Directorships Held During Past 5 Years | ||||
Claire A. Walton 1957 | Trustee (Since 2016) | Advisory Board Member, Grossman School of Business at the University of Vermont since 2023; Advisory Board Member, Scientific Financial Systems since 2022; General Partner of Neon Liberty Capital Management, LLC since 2003; Chief Operating Officer and Chief Financial Officer of Liberty Square Asset Management, LP from 1998 to 2015; Director, Boston Hedge Fund Group from 2009 to 2018; Director, Massachusetts Council on Economic Education from 2013 to 2015; Director, Woodstock Ski Runners from 2013 to 2022. | 28 RICs consisting of 169 Portfolios | None | ||||
| Interested Trustees(a)(d) | ||||||||
Name Year of Birth(b) | Position(s) Held (Length of Service)(c) | Principal Occupation(s) During Past 5 Years | Number of BlackRock-Advised (“RICs”) Consisting of Investment Portfolios (“Portfolios”) Overseen | Public Company and Other Investment Company Directorships Held During Past 5 Years | ||||
Robert Fairbairn 1965 | Trustee (Since 2018) | Vice Chairman of BlackRock, Inc. since 2019; Member of BlackRock’s Global Executive and Global Operating Committees; Co-Chair of BlackRock’s Human Capital Committee; Senior Managing Director of BlackRock, Inc. from 2010 to 2019; oversaw BlackRock’s Strategic Partner Program and Strategic Product Management Group from 2012 to 2019; Member of the Board of Managers of BlackRock Investments, LLC from 2011 to 2018; Global Head of BlackRock’s Retail and iShares® businesses from 2012 to 2016. | 98 RICs consisting of 273 Portfolios | None | ||||
John M. Perlowski(e) 1964 | Trustee (Since 2015) President and Chief Executive Officer (Since 2010) | Managing Director of BlackRock, Inc. since 2009; Head of BlackRock Global Accounting and Product Services since 2009; Advisory Director of Family Resource Network (charitable foundation) since 2009. | 100 RICs consisting of 275 Portfolios | None | ||||
| (a) | The address of each Trustee is c/o BlackRock, Inc., 50 Hudson Yards, New York, New York 10001. |
| (b) | Independent Trustees serve until their resignation, retirement, removal or death, or until December 31 of the year in which they turn 75. The Board may determine to extend the terms of Independent Trustees on a case-by-case basis, as appropriate. |
| (c) | Following the combination of Merrill Lynch Investment Managers, L.P. (“MLIM”) and BlackRock, Inc. in September 2006, the various legacy MLIM and legacy BlackRock fund boards were realigned and consolidated into three new fund boards in 2007. Furthermore, effective January 1, 2019, three BlackRock Fund Complexes were realigned and consolidated into two BlackRock Fund Complexes. As a result, although the chart shows the year that each Independent Trustee joined the Board, certain Independent Trustees first became members of the boards of other BlackRock-advised Funds, legacy MLIM funds or legacy BlackRock funds as follows: Cynthia A. Montgomery, 1994; Kenneth L. Urish, 1999; Lena G. Goldberg, 2016; Henry R. Keizer, 2016; Donald C. Opatrny, 2015. |
| (d) | Mr. Fairbairn and Mr. Perlowski are both “interested persons,” as defined in the 1940 Act, of the Trust based on their positions with BlackRock, Inc. and its affiliates. Mr. Fairbairn and Mr. Perlowski are also board members of the BlackRock Fixed-Income Complex. |
| (e) | Mr. Perlowski is also a trustee of the BlackRock Credit Strategies Fund and BlackRock Private Investments Fund. |
| 132 | 2 0 2 3 BLACK ROCK ANNUAL REPORT TO SHAREHOLDERS |
Trustee and Officer Information (continued)
| Officers Who Are Not Trustees(a) | ||||
Name Year of Birth(b) | Position(s) Held (Length of Service) | Principal Occupation(s) During Past 5 Years | ||
Roland Villacorta 1971 | Vice President (Since 2022) | Managing Director of BlackRock, Inc. since 2022; Head of Global Cash Management and Head of Securities Lending within BlackRock’s Portfolio Management Group since 2022; Member of BlackRock’s Global Operating Committee since 2022; Head of Portfolio Management in BlackRock’s Financial Markets Advisory Group within BlackRock Solutions from 2008 to 2015; Co-Head of BlackRock Solutions’ Portfolio Analytics Group; previously Mr. Villacorta was Co-Head of Fixed Income within BlackRock’s Risk & Quantitative Analysis Group. | ||
Jennifer McGovern 1977 | Vice President (Since 2014) | Managing Director of BlackRock, Inc. since 2016; Director of BlackRock, Inc. from 2011 to 2015; Head of Americas Product Development and Governance for BlackRock’s Global Product Group since 2019; Head of Product Structure and Oversight for BlackRock’s U.S. Wealth Advisory Group from 2013 to 2019. | ||
Trent Walker 1974 | Chief Financial Officer (Since 2021) | Managing Director of BlackRock, Inc. since September 2019; Executive Vice President of PIMCO from 2016 to 2019; Senior Vice President of PIMCO from 2008 to 2015; Treasurer from 2013 to 2019 and Assistant Treasurer from 2007 to 2017 of PIMCO Funds, PIMCO Variable Insurance Trust, PIMCO ETF Trust, PIMCO Equity Series, PIMCO Equity Series VIT, PIMCO Managed Accounts Trust, 2 PIMCO-sponsored interval funds and 21 PIMCO-sponsored closed-end funds. | ||
Jay M. Fife 1970 | Treasurer (Since 2007) | Managing Director of BlackRock, Inc. since 2007. | ||
Aaron Wasserman 1974 | Chief Compliance Officer (Since 2023) | Managing Director of BlackRock, Inc. since 2018; Chief Compliance Officer of the BlackRock-advised funds in the BlackRock Multi-Asset Complex, the BlackRock Fixed-Income Complex and the iShares Complex since 2023; Deputy Chief Compliance Officer for the BlackRock-advised funds in the BlackRock Multi-Asset Complex, the BlackRock Fixed- Income Complex and the iShares Complex from 2014 to 2023. | ||
Lisa Belle 1968 | Anti-Money Laundering Compliance Officer (Since 2019) | Managing Director of BlackRock, Inc. since 2019; Global Financial Crime Head for Asset and Wealth Management of JP Morgan from 2013 to 2019; Managing Director of RBS Securities from 2012 to 2013; Head of Financial Crimes for Barclays Wealth Americas from 2010 to 2012. | ||
Janey Ahn 1975 | Secretary (Since 2019) | Managing Director of BlackRock, Inc. since 2018; Director of BlackRock, Inc. from 2009 to 2017. | ||
| (a) | The address of each Officer is c/o BlackRock, Inc., 50 Hudson Yards, New York, New York 10001. |
| (b) | Officers of the Trust serve at the pleasure of the Board. |
Further information about the Trust’s Trustees and Officers is available in the Trust’s Statement of Additional Information, which can be obtained without charge by calling (800) 441-7762.
Effective December 31, 2022, Joseph P. Platt retired as a Trustee of the Trust.
Effective July 1, 2023, Aaron Wasserman replaced Charles Park as Chief Compliance Officer of the Trust.
TRUSTEE AND OFFICER INFORMATION | 133 |
Tailored Shareholder Reports for Open-End Mutual Funds and ETFs
Effective January 24, 2023, the SEC adopted rule and form amendments to require open-end mutual funds and ETFs to transmit concise and visually engaging streamlined annual and semiannual reports to shareholders that highlight key information. Other information, including financial statements, will no longer appear in a streamlined shareholder report but must be available online, delivered free of charge upon request, and filed on a semiannual basis on Form N-CSR. The rule and form amendments have a compliance date of July 24, 2024. At this time, management is evaluating the impact of these amendments on the shareholder reports for the Funds.
General Information
Quarterly performance, semi-annual and annual reports, current net asset value and other information regarding the Funds may be found on BlackRock’s website, which can be accessed at blackrock.com. Any reference to BlackRock’s website in this report is intended to allow investors public access to information regarding the Funds and does not, and is not intended to, incorporate BlackRock’s website in this report.
Householding
The Funds will mail only one copy of shareholder documents, including prospectuses, annual and semi-annual reports, Rule 30e-3 notices and proxy statements, to shareholders with multiple accounts at the same address. This practice is commonly called “householding” and is intended to reduce expenses and eliminate duplicate mailings of shareholder documents. Mailings of your shareholder documents may be householded indefinitely unless you instruct us otherwise. If you do not want the mailing of these documents to be combined with those for other members of your household, please call the Funds at (800) 441-7762.
Availability of Quarterly Schedule of Investments
The Funds file their complete schedules of portfolio holdings with the SEC for the first and third quarters of each fiscal year as an exhibit to their reports on Form N-PORT. The Funds’ Forms N-PORT are available on the SEC’s website at sec.gov. Additionally, each Fund makes its portfolio holdings for the first and third quarters of each fiscal year available at blackrock.com/fundreports.
Availability of Proxy Voting Policies, Procedures and Voting Records
A description of the policies and procedures that the Funds use to determine how to vote proxies relating to portfolio securities and information about how the Funds voted proxies relating to securities held in the Funds’ portfolios during the most recent 12-month period ended June 30 is available without charge, upon request (1) by calling (800) 441-7762; (2) on the BlackRock website at blackrock.com; and (3) on the SEC’s website at sec.gov.
BlackRock’s Mutual Fund Family
BlackRock offers a diverse lineup of open-end mutual funds crossing all investment styles and managed by experts in equity, fixed-income and tax-exempt investing. Visit blackrock.com for more information.
Shareholder Privileges
Account Information
Call us at (800) 441-7762 from 8:00 AM to 6:00 PM ET on any business day to get information about your account balances, recent transactions and share prices. You can also visit blackrock.com for more information.
Automatic Investment Plans
Investor class shareholders who want to invest regularly can arrange to have $50 or more automatically deducted from their checking or savings account and invested in any of the BlackRock funds.
Systematic Withdrawal Plans
Investor class shareholders can establish a systematic withdrawal plan and receive periodic payments of $50 or more from their BlackRock funds, as long as their account balance is at least $10,000.
Retirement Plans
Shareholders may make investments in conjunction with Traditional, Rollover, Roth, Coverdell, Simple IRAs, SEP IRAs and 403(b) Plans.
BlackRock Privacy Principles
BlackRock is committed to maintaining the privacy of its current and former fund investors and individual clients (collectively, “Clients”) and to safeguarding their non-public personal information. The following information is provided to help you understand what personal information BlackRock collects, how we protect that information and why in certain cases we share such information with select parties.
| 134 | 2 0 2 3 BLACK ROCK ANNUAL REPORT TO SHAREHOLDERS |
Additional Information (continued)
BlackRock Privacy Principles (continued)
If you are located in a jurisdiction where specific laws, rules or regulations require BlackRock to provide you with additional or different privacy-related rights beyond what is set forth below, then BlackRock will comply with those specific laws, rules or regulations.
BlackRock obtains or verifies personal non-public information from and about you from different sources, including the following: (i) information we receive from you or, if applicable, your financial intermediary, on applications, forms or other documents; (ii) information about your transactions with us, our affiliates, or others; (iii) information we receive from a consumer reporting agency; and (iv) from visits to our websites.
BlackRock does not sell or disclose to non-affiliated third parties any non-public personal information about its Clients, except as permitted by law or as is necessary to respond to regulatory requests or to service Client accounts. These non-affiliated third parties are required to protect the confidentiality and security of this information and to use it only for its intended purpose.
We may share information with our affiliates to service your account or to provide you with information about other BlackRock products or services that may be of interest to you. In addition, BlackRock restricts access to non-public personal information about its Clients to those BlackRock employees with a legitimate business need for the information. BlackRock maintains physical, electronic and procedural safeguards that are designed to protect the non-public personal information of its Clients, including procedures relating to the proper storage and disposal of such information.
Fund and Service Providers
Investment Adviser
BlackRock Fund Advisors
San Francisco, CA 94105
Administrator
BlackRock Advisors, LLC
Wilmington, DE 19809
Accounting Agent and Custodian
State Street Bank and Trust Company
Boston, MA 02114
Transfer Agent
BNY Mellon Investment Servicing (US) Inc.
Wilmington, DE 19809
Distributor
BlackRock Investments, LLC
New York, NY 10001
Independent Registered Public Accounting Firm
PricewaterhouseCoopers LLP
Philadelphia, PA 19103
Legal Counsel
Sidley Austin LLP
New York, NY 10019
Address of the Funds
100 Bellevue Parkway
Wilmington, DE 19809
ADDITIONAL INFORMATION | 135 |
Glossary of Terms Used in this Report
| Currency Abbreviation | ||
| AGM | Assured Guaranty Municipal Corp. | |
| ARB | Airport Revenue Bonds | |
| BAB | Build America Bond | |
| BAM | Build America Mutual Assurance Co. | |
| CMT | Constant Maturity Treasury | |
| DAC | Designated Activity Company | |
| GO | General Obligation Bonds | |
| LIBOR | London Interbank Offered Rate | |
| M/F | Multi-Family | |
| NPFGC | National Public Finance Guarantee Corp. | |
| RB | Revenue Bond | |
| REIT | Real Estate Investment Trust | |
| S&P | Standard & Poor’s | |
| SAB | Special Assessment Bonds | |
| SAN | State Aid Notes | |
| SAP | Subject to Appropriations | |
| SCA | Societe en Commandite par Actions | |
| SOFR | Secured Overnight Financing Rate | |
| TBA | To-Be-Announced | |
| 136 | 2 0 2 3 BLACK ROCK ANNUAL REPORT TO SHAREHOLDERS |
Want to know more?
blackrock.com | 800-441-7762
This report is intended for current holders. It is not authorized for use as an offer of sale or a solicitation of an offer to buy shares of the Funds unless preceded or accompanied by the Funds’ current prospectus. Past performance results shown in this report should not be considered a representation of future performance. Investment returns and principal value of shares will fluctuate so that shares, when redeemed, may be worth more or less than their original cost. Statements and other information herein are as dated and are subject to change.
ISUSCGSB-10/23-AR
|
|

(b) Not Applicable
| Item 3 – | Audit Committee Financial Expert – The registrant’s board of directors (the “board of directors”), has determined that (i) the registrant has the following audit committee financial experts serving on its audit committee and (ii) each audit committee financial expert is independent: |
Neil A. Cotty
Henry R. Keizer
Kenneth L. Urish
Under applicable securities laws, a person determined to be an audit committee financial expert will not be deemed an “expert” for any purpose, including without limitation for the purposes of Section 11 of the Securities Act of 1933, as a result of being designated or identified as an audit committee financial expert. The designation or identification of a person as an audit committee financial expert does not impose on such person any duties, obligations, or liabilities greater than the duties, obligations, and liabilities imposed on such person as a member of the audit committee and board of directors in the absence of such designation or identification. The designation or identification of a person as an audit committee financial expert does not affect the duties, obligations, or liability of any other member of the audit committee or board of directors.
| Item 4 – | Principal Accountant Fees and Services |
The following table presents fees billed by PricewaterhouseCoopers LLP (“PwC”) in each of the last two fiscal years for the services rendered to the Fund:
| (a) Audit Fees | (b) Audit-Related Fees1 | (c) Tax Fees2 | (d) All Other Fees3 | |||||||||||||||||||||||||||
| Entity Name | Current Fiscal Year End | Previous Fiscal Year End | Current Fiscal Year End | Previous Fiscal Year End | Current Fiscal Year End | Previous Fiscal Year End | Current Fiscal Year End | Previous Fiscal Year End | ||||||||||||||||||||||
| iShares U.S. Intermediate Credit bond Index Fund | $33,633 | $28,800 | $0 | $0 | $12,000 | $12,000 | $0 | $0 | ||||||||||||||||||||||
| iShares U.S. Intermediate Government Bond Index Fund | $33,633 | $28,800 | $0 | $0 | $12,000 | $12,000 | $0 | $0 | ||||||||||||||||||||||
| iShares U.S. Long Credit Bond Index Fund | $33,633 | $28,800 | $0 | $0 | $12,000 | $12,000 | $0 | $0 | ||||||||||||||||||||||
| iShares U.S. Long Government Bond Index Fund | $33,633 | $28,800 | $0 | $0 | $12,000 | $12,000 | $0 | $0 | ||||||||||||||||||||||
| iShares U.S. Securitized Bond Index Fund | $33,633 | $28,800 | $0 | $0 | $12,000 | $12,000 | $0 | $0 | ||||||||||||||||||||||
2
The following table presents fees billed by PwC that were required to be approved by the registrant’s audit committee (the “Committee”) for services that relate directly to the operations or financial reporting of the Fund and that are rendered on behalf of BlackRock Advisors, LLC (the “Investment Adviser” or “BlackRock”) and entities controlling, controlled by, or under common control with BlackRock (not including any sub-adviser whose role is primarily portfolio management and is subcontracted with or overseen by another investment adviser) that provide ongoing services to the Fund (“Affiliated Service Providers”):
| Current Fiscal Year End | Previous Fiscal Year End | |||||
(b) Audit-Related Fees1 | $0 | $0 | ||||
(c) Tax Fees2 | $0 | $0 | ||||
(d) All Other Fees3 | $0 | $0 |
1 The nature of the services includes assurance and related services reasonably related to the performance of the audit or review of financial statements not included in Audit Fees, including accounting consultations, agreed-upon procedure reports, attestation reports, comfort letters, out-of-pocket expenses and internal control reviews not required by regulators.
2 The nature of the services includes tax compliance and/or tax preparation, including services relating to the filing or amendment of federal, state or local income tax returns, regulated investment company qualification reviews, taxable income and tax distribution calculations.
3 Aggregate fees borne by BlackRock in connection with the review of compliance procedures and attestation thereto performed by PwC with respect to all of the registered closed-end funds and some of the registered open-end funds advised by BlackRock.
(e)(1) Audit Committee Pre-Approval Policies and Procedures:
The Committee has adopted policies and procedures with regard to the pre-approval of services. Audit, audit-related and tax compliance services provided to the registrant on an annual basis require specific pre-approval by the Committee. The Committee also must approve other non-audit services provided to the registrant and those non-audit services provided to the Investment Adviser and Affiliated Service Providers that relate directly to the operations and the financial reporting of the registrant. Certain of these non-audit services that the Committee believes are (a) consistent with the SEC’s auditor independence rules and (b) routine and recurring services that will not impair the independence of the independent accountants may be approved by the Committee without consideration on a specific case-by-case basis (“general pre-approval”). The term of any general pre-approval is 12 months from the date of the pre-approval, unless the Committee provides for a different period. Tax or other non-audit services provided to the registrant which have a direct impact on the operations or financial reporting of the registrant will only be deemed pre-approved provided that any individual project does not exceed $10,000 attributable to the registrant or $50,000 per project. For this purpose, multiple projects will be aggregated to determine if they exceed the previously mentioned cost levels.
Any proposed services exceeding the pre-approved cost levels will require specific pre-approval by the Committee, as will any other services not subject to general pre-approval (e.g., unanticipated but permissible services). The Committee is informed of each service approved subject to general pre-approval at the next regularly scheduled in-person board meeting. At this meeting, an analysis of such services is presented to the Committee for ratification. The Committee may delegate to the Committee Chairman the authority to approve the provision of and fees for any specific engagement of permitted non-audit services, including services exceeding pre-approved cost levels.
(e)(2) None of the services described in each of Items 4(b) through (d) were approved by the Committee pursuant to the de minimis exception in paragraph (c)(7)(i)(C) of Rule 2-01 of Regulation S-X.
(f) Not Applicable
3
(g) The aggregate non-audit fees, defined as the sum of the fees shown under “Audit-Related Fees,” “Tax Fees” and “All Other Fees,” paid to the accountant for services rendered by the accountant to the registrant, the Investment Adviser and the Affiliated Service Providers were:
| Entity Name | Current Fiscal Year End | Previous Fiscal Year End | ||||||||
| iShares U.S. Intermediate Credit bond Index Fund | $12,000 | $12,000 | ||||||||
| iShares U.S. Intermediate Government Bond Index Fund | $12,000 | $12,000 | ||||||||
| iShares U.S. Long Credit Bond Index Fund | $12,000 | $12,000 | ||||||||
| iShares U.S. Long Government Bond Index Fund | $12,000 | $12,000 | ||||||||
| iShares U.S. Securitized Bond Index Fund | $12,000 | $12,000 |
(h) The Committee has considered and determined that the provision of non-audit services that were rendered to the Investment Adviser and the Affiliated Service Providers that were not pre-approved pursuant to paragraph (c)(7)(ii) of Rule 2-01 of Regulation S-X is compatible with maintaining the principal accountant’s independence.
(i) – Not Applicable
(j) – Not Applicable
| Item 5 – | Audit Committee of Listed Registrant – Not Applicable |
| Item 6 – | Investments |
(a) The registrant’s Schedule of Investments is included as part of the Report to Stockholders filed under Item 1(a) of this Form.
(b) Not Applicable due to no such divestments during the semi-annual period covered since the previous Form N-CSR filing.
| Item 7 – | Disclosure of Proxy Voting Policies and Procedures for Closed-End Management Investment Companies – Not Applicable |
| Item 8 – | Portfolio Managers of Closed-End Management Investment Companies – Not Applicable |
| Item 9 – | Purchases of Equity Securities by Closed-End Management Investment Company and Affiliated Purchasers – Not Applicable |
| Item 10 – | Submission of Matters to a Vote of Security Holders – There have been no material changes to these procedures. |
| Item 11 – | Controls and Procedures |
4
(a) The registrant’s principal executive and principal financial officers, or persons performing similar functions, have concluded that the registrant’s disclosure controls and procedures (as defined in Rule 30a-3(c) under the Investment Company Act of 1940, as amended (the “1940 Act”)) are effective as of a date within 90 days of the filing of this report based on the evaluation of these controls and procedures required by Rule 30a-3(b) under the 1940 Act and Rule 15d-15(b) under the Securities Exchange Act of 1934, as amended.
(b) There were no changes in the registrant’s internal control over financial reporting (as defined in Rule 30a-3(d) under the 1940 Act) that occurred during the period covered by this report that have materially affected, or are reasonably likely to materially affect, the registrant’s internal control over financial reporting.
| Item 12 – | Disclosure of Securities Lending Activities for Closed-End Management Investment Companies – Not Applicable |
| Item 13 – | Recovery of Erroneously Awarded Compensation – Not Applicable |
| Item 14 – | Exhibits attached hereto |
(a)(1) Code of Ethics – See Item 2
(a)(2) Section 302 Certifications are attached
(a)(3) Any written solicitation to purchase securities under Rule 23c-1 – Not Applicable
(a)(4) Change in Registrant’s independent public accountant – Not Applicable
(b) Section 906 Certifications are attached
5
Pursuant to the requirements of the Securities Exchange Act of 1934 and the Investment Company Act of 1940, the registrant has duly caused this report to be signed on its behalf by the undersigned, thereunto duly authorized.
BlackRock FundsSM
| By: | /s/ John M. Perlowski | |||
| John M. Perlowski | ||||
| Chief Executive Officer (principal executive officer) of | ||||
| BlackRock FundsSM |
Date: December 21, 2023
Pursuant to the requirements of the Securities Exchange Act of 1934 and the Investment Company Act of 1940, this report has been signed below by the following persons on behalf of the registrant and in the capacities and on the dates indicated.
| By: | /s/ John M. Perlowski | |||
| John M. Perlowski | ||||
| Chief Executive Officer (principal executive officer) of | ||||
| BlackRock FundsSM |
Date: December 21, 2023
| By: | /s/ Trent Walker | |||
| Trent Walker | ||||
| Chief Financial Officer (principal financial officer) of | ||||
| BlackRock FundsSM |
Date: December 21, 2023
6