0000844779 bf1:C000004038Member bf1:MonolithicPowerSystemsIncMember 2024-05-31 0000844779 bf1:C000228505Member us-gaap:ShortTermInvestmentsMember 2024-05-31
UNITED STATES
SECURITIES AND EXCHANGE COMMISSION
Washington, D.C. 20549
FORM N-CSR
CERTIFIED SHAREHOLDER REPORT OF REGISTERED MANAGEMENT INVESTMENT COMPANIES
Investment Company Act file number:
Name of Fund:
BlackRock FundsSM
BlackRock Advantage International Fund
BlackRock Advantage Large Cap Growth Fund
BlackRock Advantage Small Cap Core Fund
BlackRock Commodity Strategies Fund
BlackRock Energy Opportunities Fund
BlackRock Health Sciences Opportunities Portfolio
BlackRock High Equity Income Fund
BlackRock Infrastructure Sustainable Opportunities Fund
BlackRock International Dividend Fund
BlackRock Mid-Cap Growth Equity Portfolio
BlackRock SMID-Cap Growth Equity Fund
BlackRock Technology Opportunities Fund
BlackRock U.S. Insights Long/Short Equity Fund
Fund Address: 100 Bellevue Parkway, Wilmington, DE 19809
Name and address of agent for service: John M. Perlowski, Chief Executive Officer, BlackRock FundsSM, 50 Hudson Yards, New York, NY 10001
Registrant's telephone number, including area code:
Date of reporting period:
Item 1 — Reports to Stockholders
(a) The Reports to Shareholders are attached herewith
(b) Not Applicable
BlackRock Advantage International Fund
Institutional Shares | BROIX
Annual Shareholder Report — May 31, 2024
This annual shareholder report contains important information about BlackRock Advantage International Fund (the “Fund”) for the period of June 1, 2023 to May 31, 2024. You can find additional information about the Fund at blackrock.com/fundreports. You can also request this information by contacting us at (800) 441‑7762.
What were the Fund costs for the last year?
(based on a hypothetical $10,000 investment)
| Class name | Costs of a $10,000
investment | Costs paid as a percentage of a
$10,000 investment |
| Institutional Shares | $55 | 0.50% |
How did the Fund perform last year?
Global equities enjoyed strong performance as resilient macro and micro data combined with excitement around the dominant themes of innovation in information technology and healthcare drove gains.
Fears of a U.S. recession waned while major overseas economies returned to positive growth.
Signs of easing inflation led to expectations that the U.S. Federal Reserve and other leading central banks were poised to reduce interest rates.
What contributed to performance?
Positive contributions to performance, relative to the benchmark (MSCI EAFE Index) were led by sentiment measures that were able to identify dominant trends by looking at informed investor positioning and through text-based analysis of broker reports (or conference calls). These insights correctly positioned the portfolio around Japanese stocks within financials and industrials that benefited as the theme of corporate reform continued to materialize in the region. Traditional fundamental measures also were additive, notably by driving positioning in U.K. consumer staples companies. An insight looking at research and development spending correctly positioned the portfolio in European healthcare stocks that benefited from enthusiasm around the use of GLP-1 drugs for weight loss. Finally, traditional quality insights looking at external financing correctly positioned the portfolio within information technology, particularly with respect to Japanese semiconductor companies likely to benefit from the emerging artificial intelligence theme.
What detracted from performance?
The largest detractors from relative performance included certain non-traditional fundamental quality insights, most notably those related to human capital such as those looking at veteran hiring, employee sentiment and hiring for environmental roles. In addition, changing market leadership proved a headwind to trend-following industry insights, with industry measures picking up on price momentum and favoring defensive positioning among the biggest laggards.
The views expressed reflect the opinions of BlackRock as of the date of this report and are subject to change based on changes in market, economic or other conditions. These views are not intended to be a forecast of future events and are no guarantee of future results.
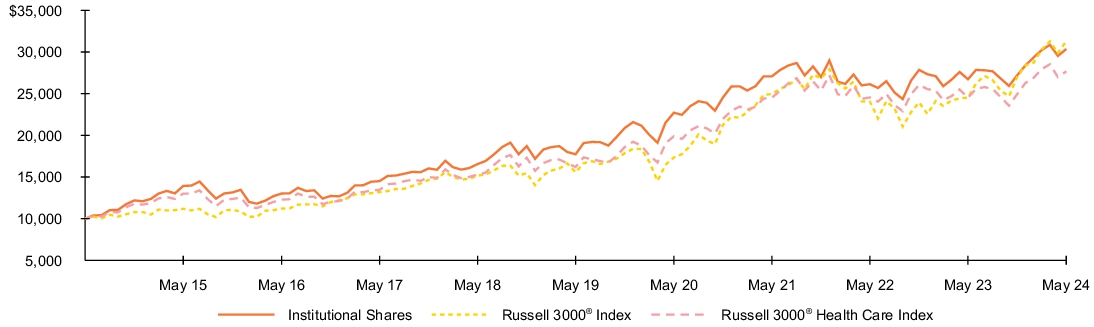
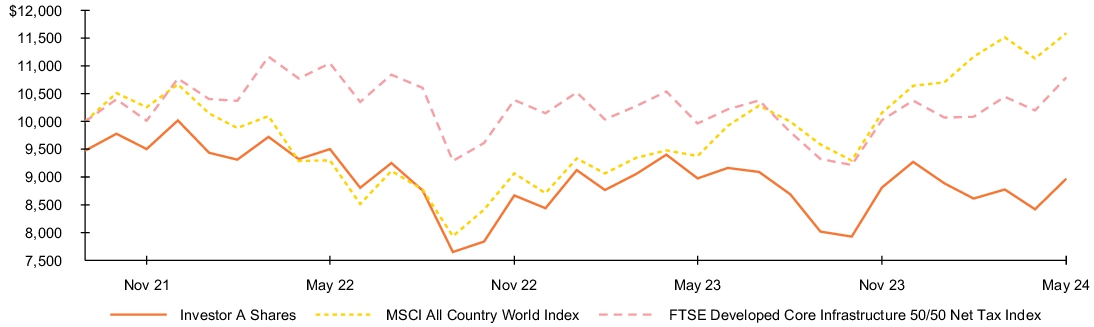
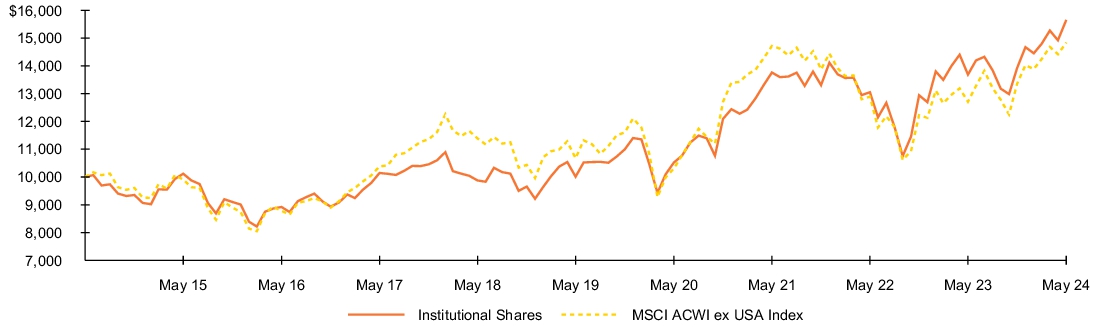
Fund performance
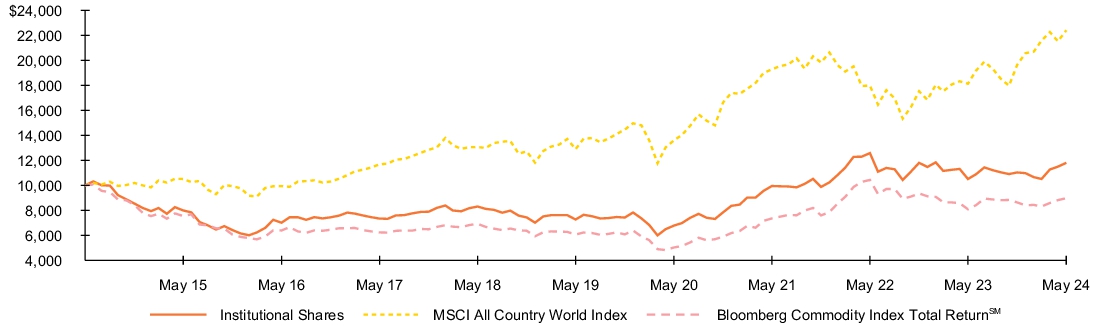
Cumulative performance: June 1, 2014 through May 31, 2024
Initial investment of $10,000
See “Average annual total returns” for additional information on fund performance.
Average annual total returns
| 1 Year | 5 Years | 10 Years |
| Institutional Shares | 20.40% | 8.87% | 5.79% |
| MSCI EAFE Index | 18.53% | 8.05% | 4.60% |
| Net Assets | $1,747,385,984% |
| Number of Portfolio Holdings | $324% |
| Net Investment Advisory Fees | $5,104,033% |
| Portfolio Turnover Rate | $128% |
Performance shown prior to June 12, 2017 are the returns of the Fund when it followed different investment strategies under the name BlackRock Global Opportunities Portfolio.
Past performance is not an indication of future results. Performance results may include adjustments made for financial reporting purposes in accordance with U.S. generally accepted accounting principles. Performance results do not reflect the deduction of taxes that a shareholder would pay on fund distributions or on the redemption or sale of fund shares. Visit blackrock.com for more recent performance information.
What did the Fund invest in?
(as of May 31, 2024)
| Country | Percent of
Net Assets |
| Japan | 22.3)% |
| United Kingdom | 11.3)% |
| Germany | 10.0)% |
| France | 9.1)% |
| Switzerland | 8.2)% |
| Netherlands | 5.1)% |
| Australia | 5.1)% |
| United States | 5.0)% |
| Denmark | 4.2)% |
| Spain | 4.0)% |
| Other | 13.0)% |
| Short-Term Securities | 3.5)% |
| Liabilities in Excess of Other Assets | (0.8)% |
| Security(a) | Percent of
Net Assets |
| Novo Nordisk A/S, Class B | 3.4% |
| ASML Holding NV | 3.1% |
| Novartis AG, Registered Shares | 2.3% |
| SAP SE | 2.1% |
| Shell PLC | 1.9% |
| BHP Group Ltd. | 1.8% |
| Siemens AG, Registered Shares | 1.8% |
| Allianz SE, Registered Shares | 1.7% |
| GSK PLC | 1.6% |
| Tokyo Electron Ltd. | 1.6% |
(a) | Excludes short-term securities. |
Additional information
If you wish to view additional information about the Fund, including but not limited to financial statements, the Fund’s prospectus, and proxy voting policies and procedures, please visit blackrock.com/fundreports. For proxy voting records, visit blackrock.com/proxyrecords.
Householding
The Fund will mail only one copy of shareholder documents, including prospectuses, annual and semi-annual reports and proxy statements, to shareholders with multiple accounts at the same address. This practice is commonly called “householding” and is intended to reduce expenses and eliminate duplicate mailings of shareholder documents. Mailings of your shareholder documents may be householded indefinitely unless you instruct us otherwise. If you do not want the mailing of these documents to be combined with those for other members of your household, please call the Fund at (800) 441-7762.
The Fund is not sponsored, endorsed, issued, sold, or promoted by MSCI Inc. and its affiliates, nor does this company make any representation regarding the advisability of investing in the Fund. BlackRock is not affiliated with the company listed above.
©2024 BlackRock, Inc. or its affiliates. All rights reserved. BLACKROCK is a registered trademark of BlackRock, Inc. or its affiliates. All other trademarks are those of their respective owners.
BlackRock Advantage International Fund
Institutional Shares | BROIX
Annual Shareholder Report — May 31, 2024
BROIX-05/24-AR
BlackRock Advantage International Fund
Investor A Shares | BROAX
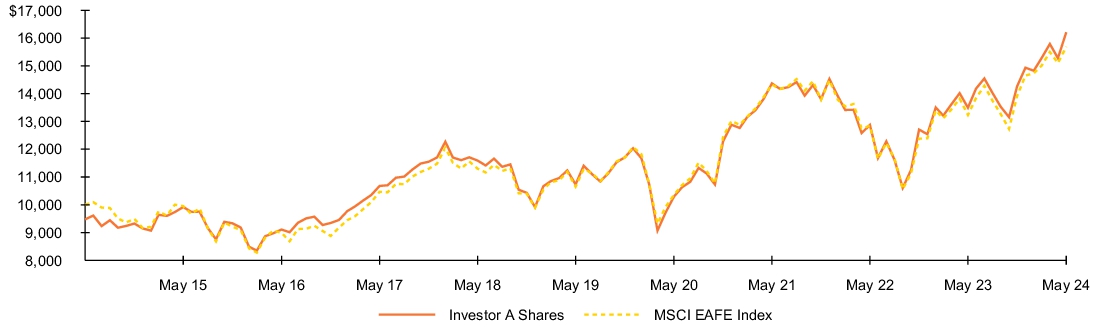
Annual Shareholder Report — May 31, 2024
This annual shareholder report contains important information about BlackRock Advantage International Fund (the “Fund”) for the period of June 1, 2023 to May 31, 2024. You can find additional information about the Fund at blackrock.com/fundreports. You can also request this information by contacting us at (800) 441‑7762.
What were the Fund costs for the last year?
(based on a hypothetical $10,000 investment)
| Class name | Costs of a $10,000
investment | Costs paid as a percentage of a
$10,000 investment |
| Investor A Shares | $83 | 0.75% |
How did the Fund perform last year?
Global equities enjoyed strong performance as resilient macro and micro data combined with excitement around the dominant themes of innovation in information technology and healthcare drove gains.
Fears of a U.S. recession waned while major overseas economies returned to positive growth.
Signs of easing inflation led to expectations that the U.S. Federal Reserve and other leading central banks were poised to reduce interest rates.
What contributed to performance?
Positive contributions to performance, relative to the benchmark (MSCI EAFE Index) were led by sentiment measures that were able to identify dominant trends by looking at informed investor positioning and through text-based analysis of broker reports (or conference calls). These insights correctly positioned the portfolio around Japanese stocks within financials and industrials that benefited as the theme of corporate reform continued to materialize in the region. Traditional fundamental measures also were additive, notably by driving positioning in U.K. consumer staples companies. An insight looking at research and development spending correctly positioned the portfolio in European healthcare stocks that benefited from enthusiasm around the use of GLP-1 drugs for weight loss. Finally, traditional quality insights looking at external financing correctly positioned the portfolio within information technology, particularly with respect to Japanese semiconductor companies likely to benefit from the emerging artificial intelligence theme.
What detracted from performance?
The largest detractors from relative performance included certain non-traditional fundamental quality insights, most notably those related to human capital such as those looking at veteran hiring, employee sentiment and hiring for environmental roles. In addition, changing market leadership proved a headwind to trend-following industry insights, with industry measures picking up on price momentum and favoring defensive positioning among the biggest laggards.
The views expressed reflect the opinions of BlackRock as of the date of this report and are subject to change based on changes in market, economic or other conditions. These views are not intended to be a forecast of future events and are no guarantee of future results.
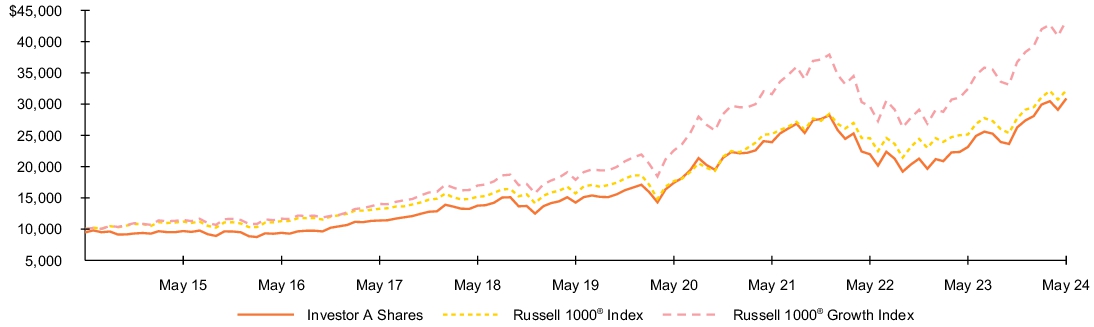
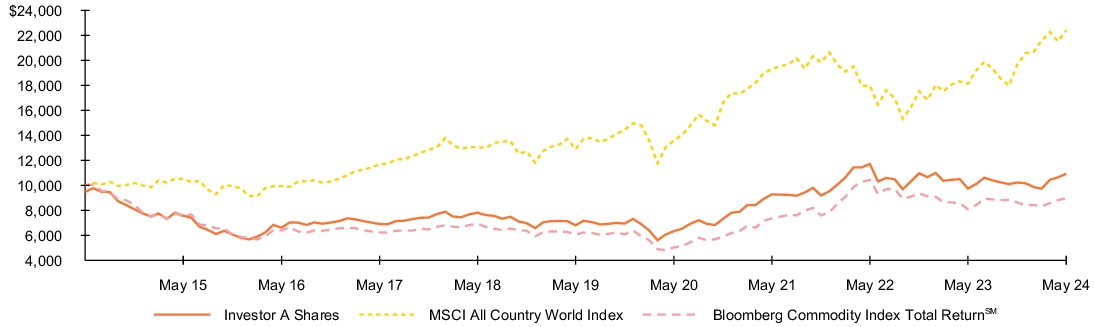
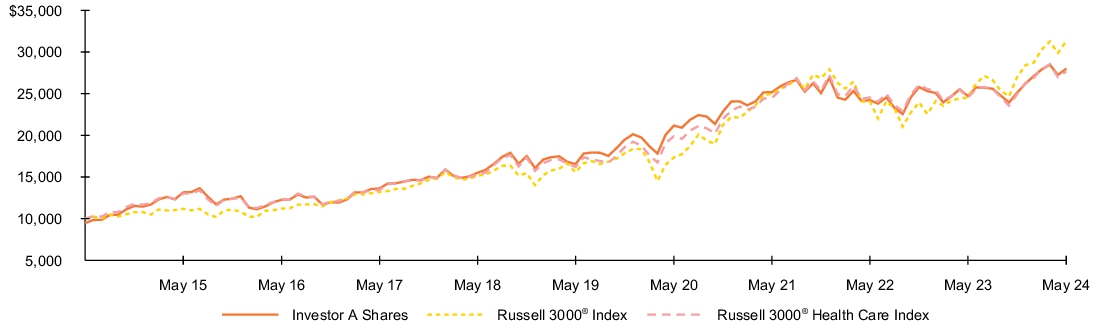
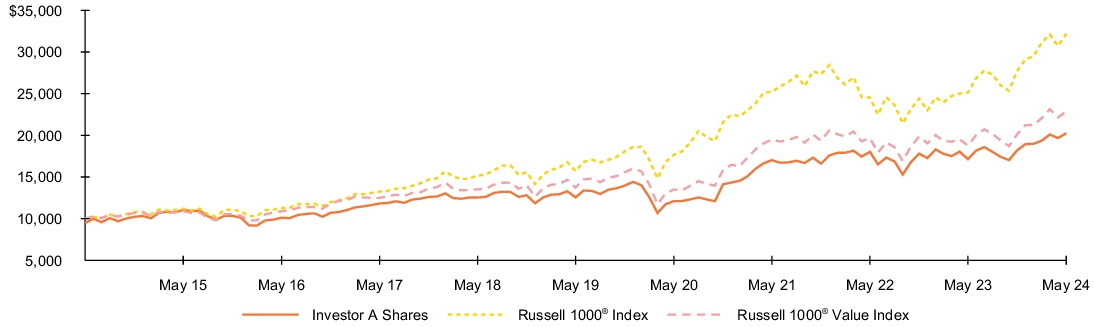
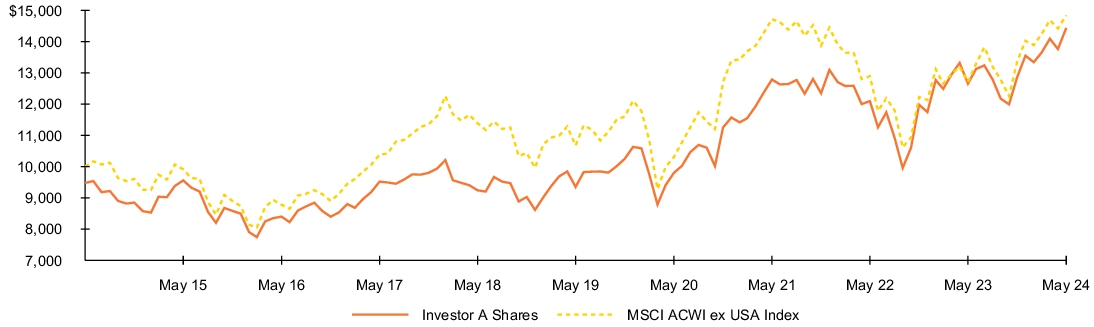
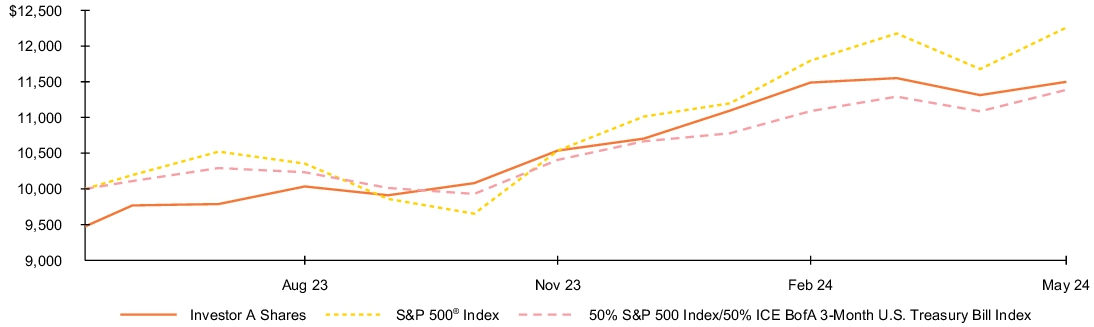
Fund performance
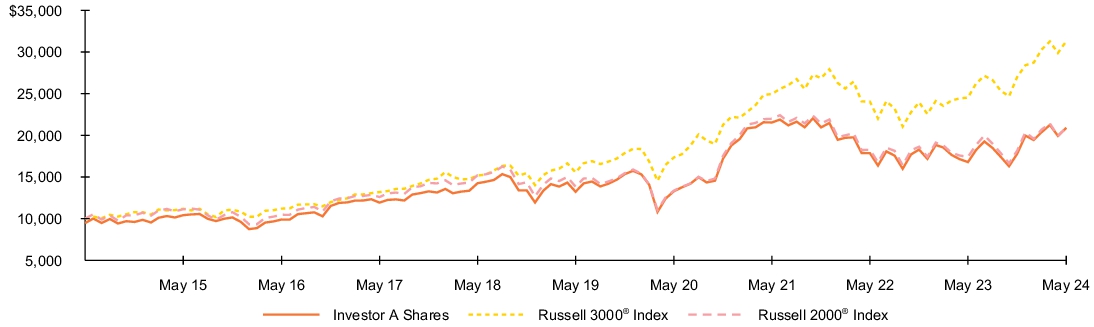
Cumulative performance: June 1, 2014 through May 31, 2024
Initial investment of $10,000
See “Average annual total returns” for additional information on fund performance.
Average annual total returns
| 1 Year | 5 Years | 10 Years |
| Investor A Shares | 20.11% | 8.60% | 5.52% |
| Investor A Shares (with sales charge) | 13.81% | 7.43% | 4.95% |
| MSCI EAFE Index | 18.53% | 8.05% | 4.60% |
| Net Assets | $1,747,385,984% |
| Number of Portfolio Holdings | $324% |
| Net Investment Advisory Fees | $5,104,033% |
| Portfolio Turnover Rate | $128% |
Performance shown prior to June 12, 2017 are the returns of the Fund when it followed different investment strategies under the name BlackRock Global Opportunities Portfolio.
Assuming maximum sales charges. Average annual total returns with and without sales charges reflect reductions for service fees.
Past performance is not an indication of future results. Performance results may include adjustments made for financial reporting purposes in accordance with U.S. generally accepted accounting principles. Performance results do not reflect the deduction of taxes that a shareholder would pay on fund distributions or on the redemption or sale of fund shares. Visit blackrock.com for more recent performance information.
What did the Fund invest in?
(as of May 31, 2024)
| Country | Percent of
Net Assets |
| Japan | 22.3)% |
| United Kingdom | 11.3)% |
| Germany | 10.0)% |
| France | 9.1)% |
| Switzerland | 8.2)% |
| Netherlands | 5.1)% |
| Australia | 5.1)% |
| United States | 5.0)% |
| Denmark | 4.2)% |
| Spain | 4.0)% |
| Other | 13.0)% |
| Short-Term Securities | 3.5)% |
| Liabilities in Excess of Other Assets | (0.8)% |
| Security(a) | Percent of
Net Assets |
| Novo Nordisk A/S, Class B | 3.4% |
| ASML Holding NV | 3.1% |
| Novartis AG, Registered Shares | 2.3% |
| SAP SE | 2.1% |
| Shell PLC | 1.9% |
| BHP Group Ltd. | 1.8% |
| Siemens AG, Registered Shares | 1.8% |
| Allianz SE, Registered Shares | 1.7% |
| GSK PLC | 1.6% |
| Tokyo Electron Ltd. | 1.6% |
(a) | Excludes short-term securities. |
Additional information
If you wish to view additional information about the Fund, including but not limited to financial statements, the Fund’s prospectus, and proxy voting policies and procedures, please visit blackrock.com/fundreports. For proxy voting records, visit blackrock.com/proxyrecords.
Householding
The Fund will mail only one copy of shareholder documents, including prospectuses, annual and semi-annual reports and proxy statements, to shareholders with multiple accounts at the same address. This practice is commonly called “householding” and is intended to reduce expenses and eliminate duplicate mailings of shareholder documents. Mailings of your shareholder documents may be householded indefinitely unless you instruct us otherwise. If you do not want the mailing of these documents to be combined with those for other members of your household, please call the Fund at (800) 441-7762.
The Fund is not sponsored, endorsed, issued, sold, or promoted by MSCI Inc. and its affiliates, nor does this company make any representation regarding the advisability of investing in the Fund. BlackRock is not affiliated with the company listed above.
©2024 BlackRock, Inc. or its affiliates. All rights reserved. BLACKROCK is a registered trademark of BlackRock, Inc. or its affiliates. All other trademarks are those of their respective owners.
BlackRock Advantage International Fund
Investor A Shares | BROAX
Annual Shareholder Report — May 31, 2024
BROAX-05/24-AR
BlackRock Advantage International Fund
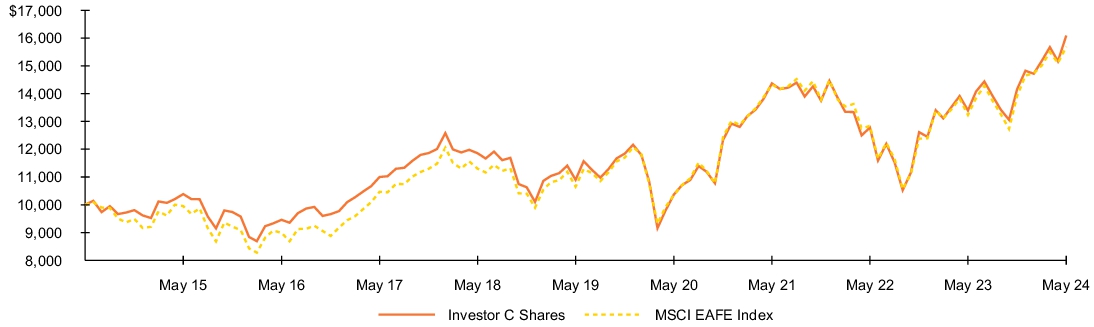
Investor C Shares | BROCX
Annual Shareholder Report — May 31, 2024
This annual shareholder report contains important information about BlackRock Advantage International Fund (the “Fund”) for the period of June 1, 2023 to May 31, 2024. You can find additional information about the Fund at blackrock.com/fundreports. You can also request this information by contacting us at (800) 441‑7762.
What were the Fund costs for the last year?
(based on a hypothetical $10,000 investment)
| Class name | Costs of a $10,000
investment | Costs paid as a percentage of a
$10,000 investment |
| Investor C Shares | $164 | 1.50% |
How did the Fund perform last year?
Global equities enjoyed strong performance as resilient macro and micro data combined with excitement around the dominant themes of innovation in information technology and healthcare drove gains.
Fears of a U.S. recession waned while major overseas economies returned to positive growth.
Signs of easing inflation led to expectations that the U.S. Federal Reserve and other leading central banks were poised to reduce interest rates.
What contributed to performance?
Positive contributions to performance, relative to the benchmark (MSCI EAFE Index) were led by sentiment measures that were able to identify dominant trends by looking at informed investor positioning and through text-based analysis of broker reports (or conference calls). These insights correctly positioned the portfolio around Japanese stocks within financials and industrials that benefited as the theme of corporate reform continued to materialize in the region. Traditional fundamental measures also were additive, notably by driving positioning in U.K. consumer staples companies. An insight looking at research and development spending correctly positioned the portfolio in European healthcare stocks that benefited from enthusiasm around the use of GLP-1 drugs for weight loss. Finally, traditional quality insights looking at external financing correctly positioned the portfolio within information technology, particularly with respect to Japanese semiconductor companies likely to benefit from the emerging artificial intelligence theme.
What detracted from performance?
The largest detractors from relative performance included certain non-traditional fundamental quality insights, most notably those related to human capital such as those looking at veteran hiring, employee sentiment and hiring for environmental roles. In addition, changing market leadership proved a headwind to trend-following industry insights, with industry measures picking up on price momentum and favoring defensive positioning among the biggest laggards.
The views expressed reflect the opinions of BlackRock as of the date of this report and are subject to change based on changes in market, economic or other conditions. These views are not intended to be a forecast of future events and are no guarantee of future results.
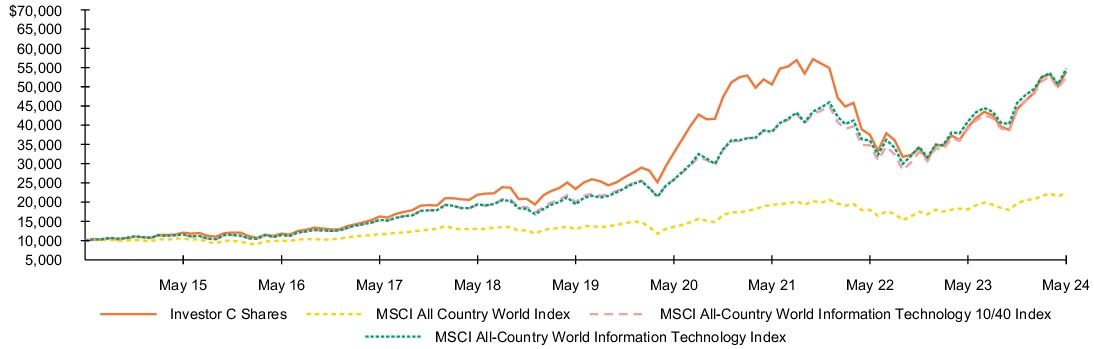
Fund performance
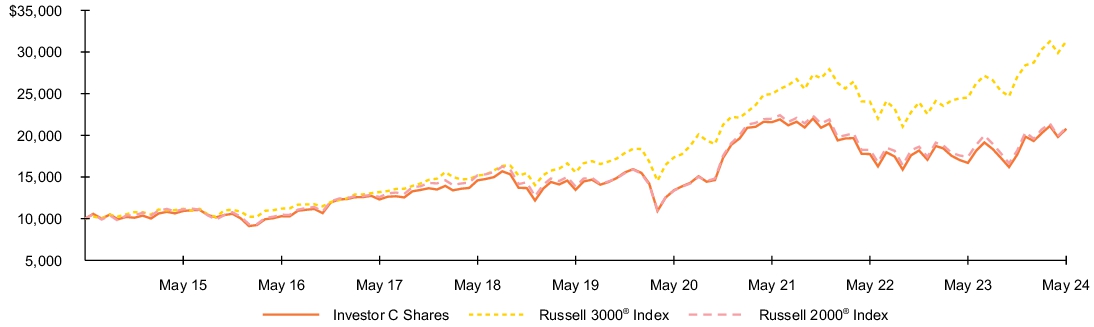
Cumulative performance: June 1, 2014 through May 31, 2024
Initial investment of $10,000
See “Average annual total returns” for additional information on fund performance.
Average annual total returns
| 1 Year | 5 Years | 10 Years |
| Investor C Shares | 19.21% | 7.78% | 4.87% |
| Investor C Shares (with sales charge) | 18.21% | 7.78% | 4.87% |
| MSCI EAFE Index | 18.53% | 8.05% | 4.60% |
| Net Assets | $1,747,385,984% |
| Number of Portfolio Holdings | $324% |
| Net Investment Advisory Fees | $5,104,033% |
| Portfolio Turnover Rate | $128% |
Performance shown prior to June 12, 2017 are the returns of the Fund when it followed different investment strategies under the name BlackRock Global Opportunities Portfolio.
Assuming maximum sales charges. Average annual total returns with and without sales charges reflect reductions for distribution and service fees.
Past performance is not an indication of future results. Performance results may include adjustments made for financial reporting purposes in accordance with U.S. generally accepted accounting principles. Performance results do not reflect the deduction of taxes that a shareholder would pay on fund distributions or on the redemption or sale of fund shares. Visit blackrock.com for more recent performance information.
What did the Fund invest in?
(as of May 31, 2024)
| Country | Percent of
Net Assets |
| Japan | 22.3)% |
| United Kingdom | 11.3)% |
| Germany | 10.0)% |
| France | 9.1)% |
| Switzerland | 8.2)% |
| Netherlands | 5.1)% |
| Australia | 5.1)% |
| United States | 5.0)% |
| Denmark | 4.2)% |
| Spain | 4.0)% |
| Other | 13.0)% |
| Short-Term Securities | 3.5)% |
| Liabilities in Excess of Other Assets | (0.8)% |
| Security(a) | Percent of
Net Assets |
| Novo Nordisk A/S, Class B | 3.4% |
| ASML Holding NV | 3.1% |
| Novartis AG, Registered Shares | 2.3% |
| SAP SE | 2.1% |
| Shell PLC | 1.9% |
| BHP Group Ltd. | 1.8% |
| Siemens AG, Registered Shares | 1.8% |
| Allianz SE, Registered Shares | 1.7% |
| GSK PLC | 1.6% |
| Tokyo Electron Ltd. | 1.6% |
(a) | Excludes short-term securities. |
Additional information
If you wish to view additional information about the Fund, including but not limited to financial statements, the Fund’s prospectus, and proxy voting policies and procedures, please visit blackrock.com/fundreports. For proxy voting records, visit blackrock.com/proxyrecords.
Householding
The Fund will mail only one copy of shareholder documents, including prospectuses, annual and semi-annual reports and proxy statements, to shareholders with multiple accounts at the same address. This practice is commonly called “householding” and is intended to reduce expenses and eliminate duplicate mailings of shareholder documents. Mailings of your shareholder documents may be householded indefinitely unless you instruct us otherwise. If you do not want the mailing of these documents to be combined with those for other members of your household, please call the Fund at (800) 441-7762.
The Fund is not sponsored, endorsed, issued, sold, or promoted by MSCI Inc. and its affiliates, nor does this company make any representation regarding the advisability of investing in the Fund. BlackRock is not affiliated with the company listed above.
©2024 BlackRock, Inc. or its affiliates. All rights reserved. BLACKROCK is a registered trademark of BlackRock, Inc. or its affiliates. All other trademarks are those of their respective owners.
BlackRock Advantage International Fund
Investor C Shares | BROCX
Annual Shareholder Report — May 31, 2024
BROCX-05/24-AR
BlackRock Advantage International Fund
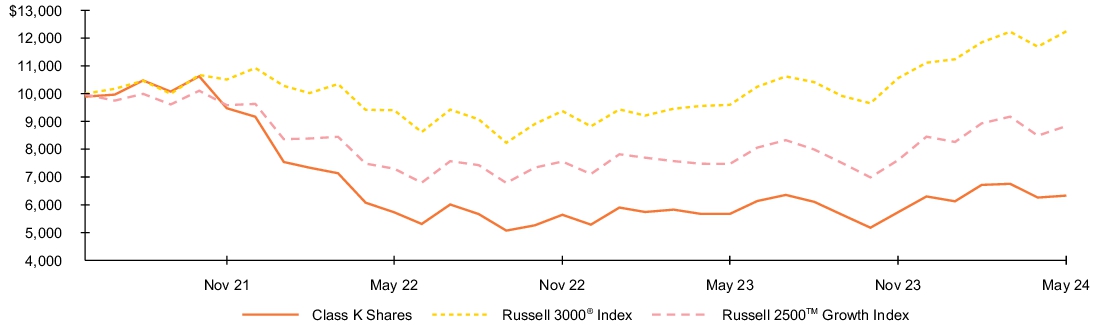
Class K Shares | BROKX
Annual Shareholder Report — May 31, 2024
This annual shareholder report contains important information about BlackRock Advantage International Fund (the “Fund”) for the period of June 1, 2023 to May 31, 2024. You can find additional information about the Fund at blackrock.com/fundreports. You can also request this information by contacting us at (800) 441‑7762.
What were the Fund costs for the last year?
(based on a hypothetical $10,000 investment)
| Class name | Costs of a $10,000
investment | Costs paid as a percentage of a
$10,000 investment |
| Class K Shares | $50 | 0.45% |
How did the Fund perform last year?
Global equities enjoyed strong performance as resilient macro and micro data combined with excitement around the dominant themes of innovation in information technology and healthcare drove gains.
Fears of a U.S. recession waned while major overseas economies returned to positive growth.
Signs of easing inflation led to expectations that the U.S. Federal Reserve and other leading central banks were poised to reduce interest rates.
What contributed to performance?
Positive contributions to performance, relative to the benchmark (MSCI EAFE Index) were led by sentiment measures that were able to identify dominant trends by looking at informed investor positioning and through text-based analysis of broker reports (or conference calls). These insights correctly positioned the portfolio around Japanese stocks within financials and industrials that benefited as the theme of corporate reform continued to materialize in the region. Traditional fundamental measures also were additive, notably by driving positioning in U.K. consumer staples companies. An insight looking at research and development spending correctly positioned the portfolio in European healthcare stocks that benefited from enthusiasm around the use of GLP-1 drugs for weight loss. Finally, traditional quality insights looking at external financing correctly positioned the portfolio within information technology, particularly with respect to Japanese semiconductor companies likely to benefit from the emerging artificial intelligence theme.
What detracted from performance?
The largest detractors from relative performance included certain non-traditional fundamental quality insights, most notably those related to human capital such as those looking at veteran hiring, employee sentiment and hiring for environmental roles. In addition, changing market leadership proved a headwind to trend-following industry insights, with industry measures picking up on price momentum and favoring defensive positioning among the biggest laggards.
The views expressed reflect the opinions of BlackRock as of the date of this report and are subject to change based on changes in market, economic or other conditions. These views are not intended to be a forecast of future events and are no guarantee of future results.
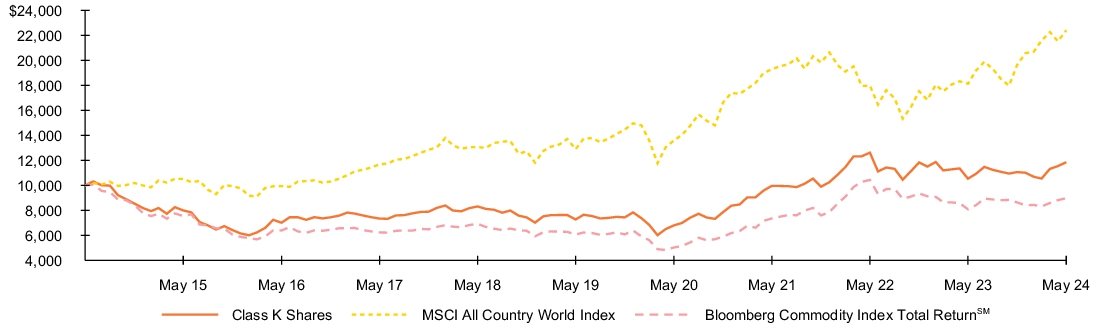
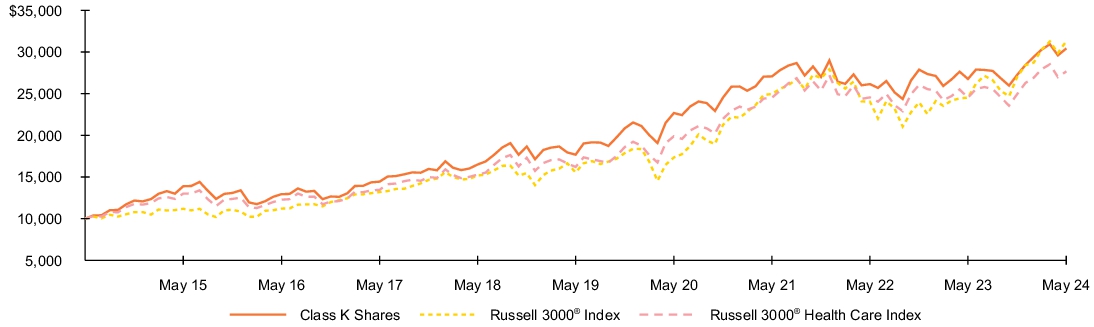
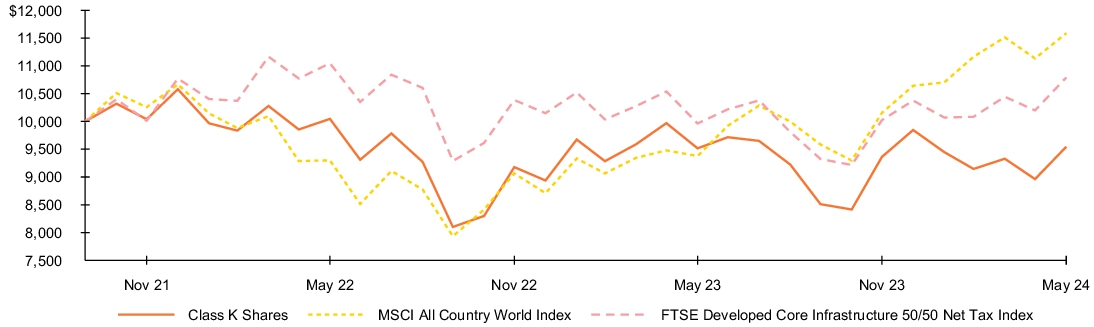
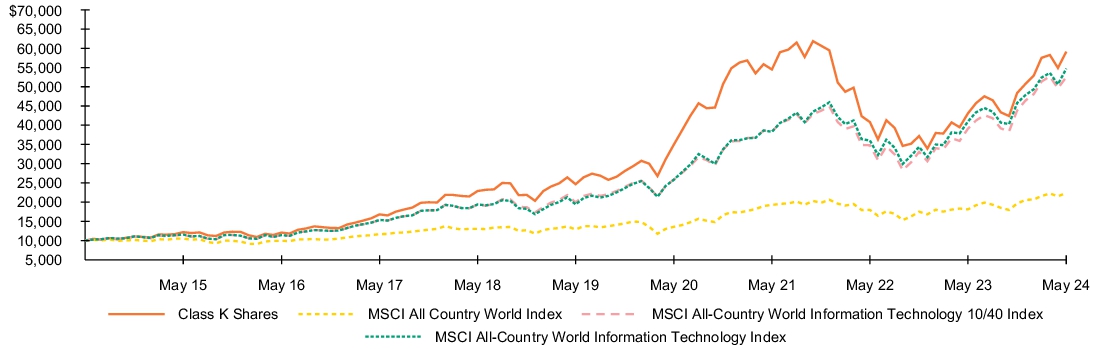
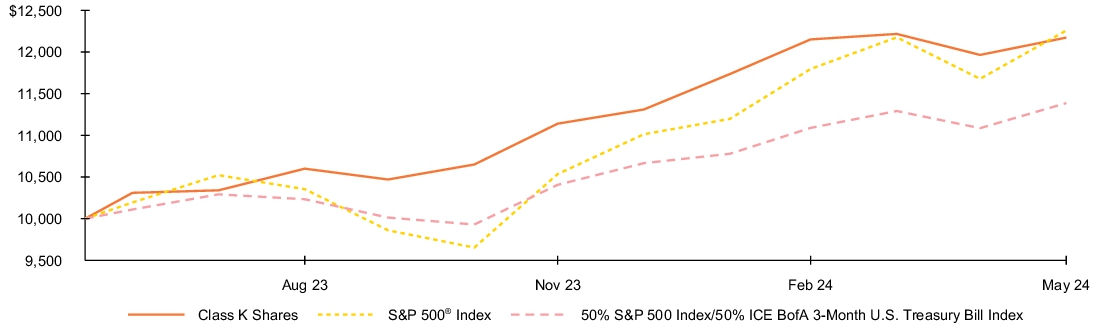
Fund performance
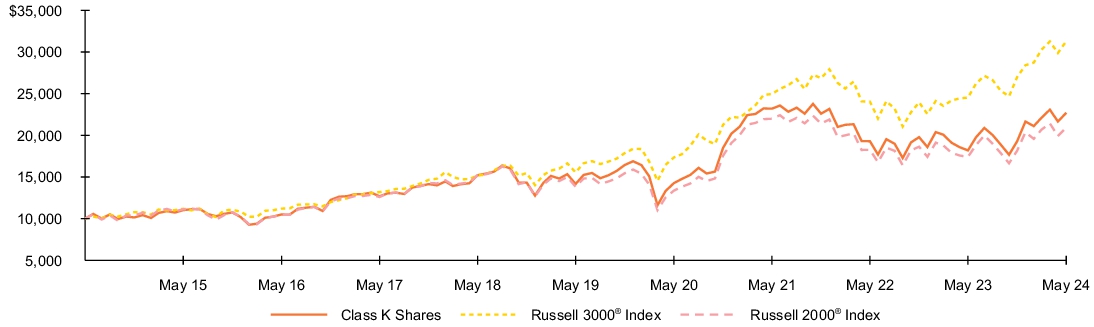
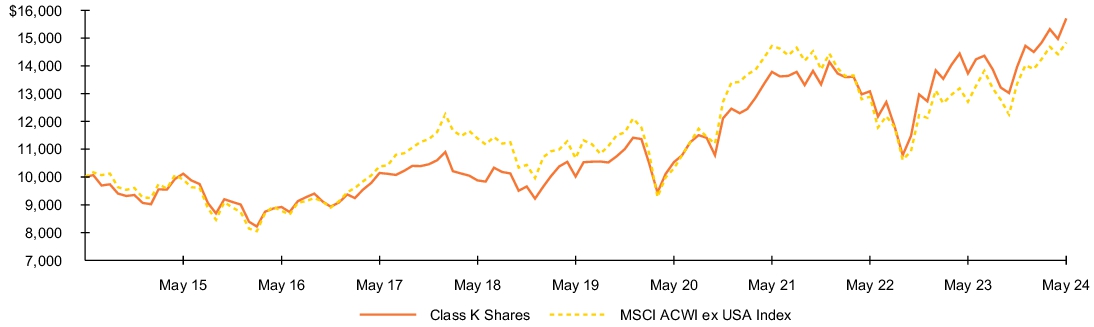
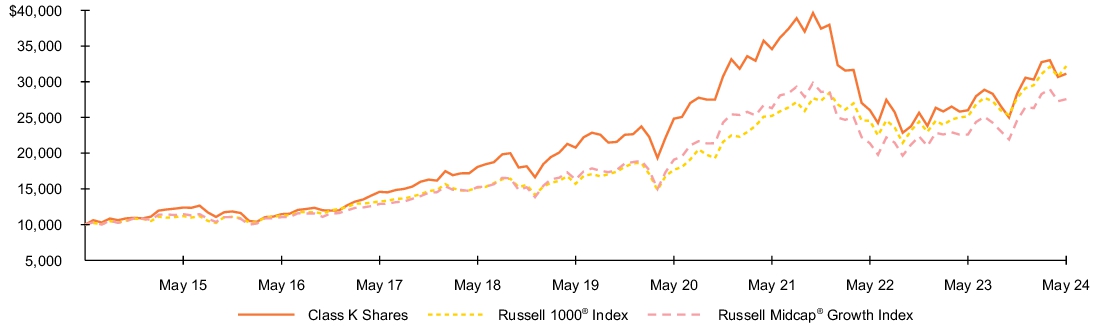
Cumulative performance: June 1, 2014 through May 31, 2024
Initial investment of $10,000
See “Average annual total returns” for additional information on fund performance.
Average annual total returns
| 1 Year | 5 Years | 10 Years |
| Class K Shares | 20.45% | 8.92% | 5.82% |
| MSCI EAFE Index | 18.53% | 8.05% | 4.60% |
| Net Assets | $1,747,385,984% |
| Number of Portfolio Holdings | $324% |
| Net Investment Advisory Fees | $5,104,033% |
| Portfolio Turnover Rate | $128% |
Performance shown prior to June 12, 2017 are the returns of the Fund when it followed different investment strategies under the name BlackRock Global Opportunities Portfolio.
Performance shown prior to the Class K Shares inception date of January 25, 2018 is that of Institutional Shares. The performance of the Class K Shares would be substantially similar to Institutional Shares because Class K Shares and Institutional Shares invest in the same portfolio of securities and performance would only differ to the extent that Class K Shares and Institutional Shares have different expenses. The actual returns of Class K Shares would have been higher than those of the Institutional Shares because Class K Shares have lower expenses than the Institutional Shares.
Past performance is not an indication of future results. Performance results may include adjustments made for financial reporting purposes in accordance with U.S. generally accepted accounting principles. Performance results do not reflect the deduction of taxes that a shareholder would pay on fund distributions or on the redemption or sale of fund shares. Visit blackrock.com for more recent performance information.
What did the Fund invest in?
(as of May 31, 2024)
| Country | Percent of
Net Assets |
| Japan | 22.3)% |
| United Kingdom | 11.3)% |
| Germany | 10.0)% |
| France | 9.1)% |
| Switzerland | 8.2)% |
| Netherlands | 5.1)% |
| Australia | 5.1)% |
| United States | 5.0)% |
| Denmark | 4.2)% |
| Spain | 4.0)% |
| Other | 13.0)% |
| Short-Term Securities | 3.5)% |
| Liabilities in Excess of Other Assets | (0.8)% |
| Security(a) | Percent of
Net Assets |
| Novo Nordisk A/S, Class B | 3.4% |
| ASML Holding NV | 3.1% |
| Novartis AG, Registered Shares | 2.3% |
| SAP SE | 2.1% |
| Shell PLC | 1.9% |
| BHP Group Ltd. | 1.8% |
| Siemens AG, Registered Shares | 1.8% |
| Allianz SE, Registered Shares | 1.7% |
| GSK PLC | 1.6% |
| Tokyo Electron Ltd. | 1.6% |
(a) | Excludes short-term securities. |
Additional information
If you wish to view additional information about the Fund, including but not limited to financial statements, the Fund’s prospectus, and proxy voting policies and procedures, please visit blackrock.com/fundreports. For proxy voting records, visit blackrock.com/proxyrecords.
Householding
The Fund will mail only one copy of shareholder documents, including prospectuses, annual and semi-annual reports and proxy statements, to shareholders with multiple accounts at the same address. This practice is commonly called “householding” and is intended to reduce expenses and eliminate duplicate mailings of shareholder documents. Mailings of your shareholder documents may be householded indefinitely unless you instruct us otherwise. If you do not want the mailing of these documents to be combined with those for other members of your household, please call the Fund at (800) 441-7762.
The Fund is not sponsored, endorsed, issued, sold, or promoted by MSCI Inc. and its affiliates, nor does this company make any representation regarding the advisability of investing in the Fund. BlackRock is not affiliated with the company listed above.
©2024 BlackRock, Inc. or its affiliates. All rights reserved. BLACKROCK is a registered trademark of BlackRock, Inc. or its affiliates. All other trademarks are those of their respective owners.
BlackRock Advantage International Fund
Class K Shares | BROKX
Annual Shareholder Report — May 31, 2024
BROKX-05/24-AR
BlackRock Advantage International Fund
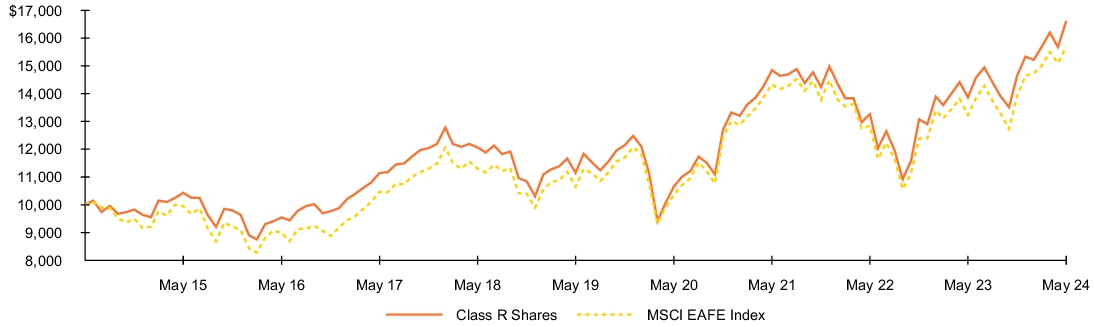
Class R Shares | BGORX
Annual Shareholder Report — May 31, 2024
This annual shareholder report contains important information about BlackRock Advantage International Fund (the “Fund”) for the period of June 1, 2023 to May 31, 2024. You can find additional information about the Fund at blackrock.com/fundreports. You can also request this information by contacting us at (800) 441‑7762.
What were the Fund costs for the last year?
(based on a hypothetical $10,000 investment)
| Class name | Costs of a $10,000
investment | Costs paid as a percentage of a
$10,000 investment |
| Class R Shares | $110 | 1.00% |
How did the Fund perform last year?
Global equities enjoyed strong performance as resilient macro and micro data combined with excitement around the dominant themes of innovation in information technology and healthcare drove gains.
Fears of a U.S. recession waned while major overseas economies returned to positive growth.
Signs of easing inflation led to expectations that the U.S. Federal Reserve and other leading central banks were poised to reduce interest rates.
What contributed to performance?
Positive contributions to performance, relative to the benchmark (MSCI EAFE Index) were led by sentiment measures that were able to identify dominant trends by looking at informed investor positioning and through text-based analysis of broker reports (or conference calls). These insights correctly positioned the portfolio around Japanese stocks within financials and industrials that benefited as the theme of corporate reform continued to materialize in the region. Traditional fundamental measures also were additive, notably by driving positioning in U.K. consumer staples companies. An insight looking at research and development spending correctly positioned the portfolio in European healthcare stocks that benefited from enthusiasm around the use of GLP-1 drugs for weight loss. Finally, traditional quality insights looking at external financing correctly positioned the portfolio within information technology, particularly with respect to Japanese semiconductor companies likely to benefit from the emerging artificial intelligence theme.
What detracted from performance?
The largest detractors from relative performance included certain non-traditional fundamental quality insights, most notably those related to human capital such as those looking at veteran hiring, employee sentiment and hiring for environmental roles. In addition, changing market leadership proved a headwind to trend-following industry insights, with industry measures picking up on price momentum and favoring defensive positioning among the biggest laggards.
The views expressed reflect the opinions of BlackRock as of the date of this report and are subject to change based on changes in market, economic or other conditions. These views are not intended to be a forecast of future events and are no guarantee of future results.
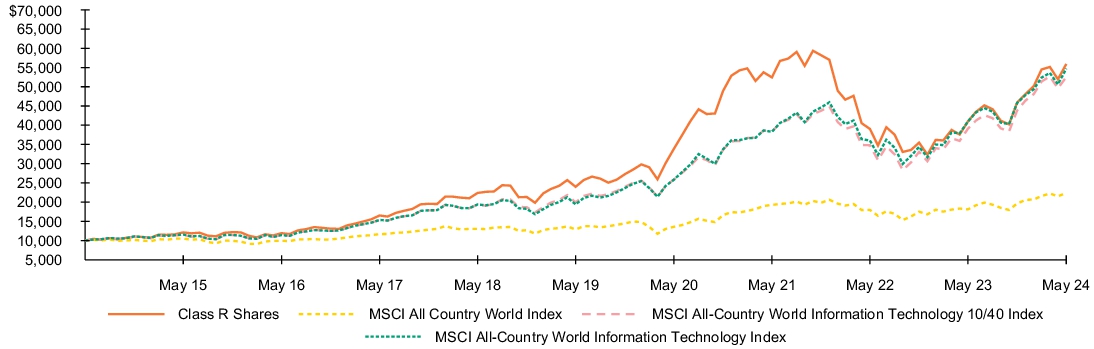
Fund performance
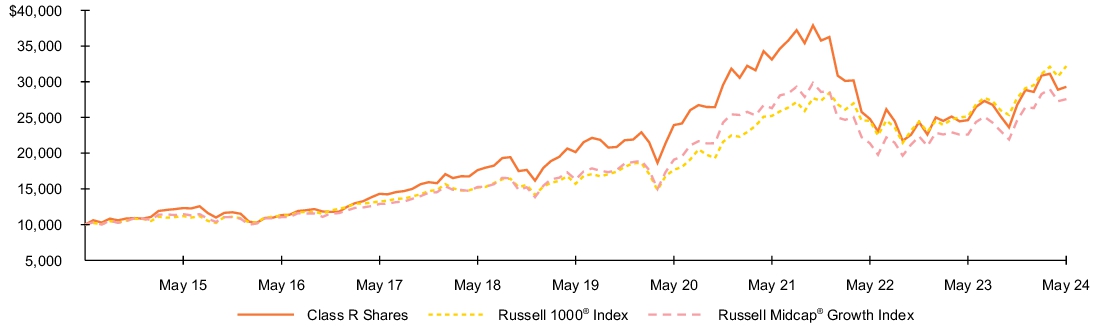
Cumulative performance: June 1, 2014 through May 31, 2024
Initial investment of $10,000
See “Average annual total returns” for additional information on fund performance.
Average annual total returns
| 1 Year | 5 Years | 10 Years |
| Class R Shares | 19.81% | 8.31% | 5.21% |
| MSCI EAFE Index | 18.53% | 8.05% | 4.60% |
| Net Assets | $1,747,385,984% |
| Number of Portfolio Holdings | $324% |
| Net Investment Advisory Fees | $5,104,033% |
| Portfolio Turnover Rate | $128% |
Performance shown prior to June 12, 2017 are the returns of the Fund when it followed different investment strategies under the name BlackRock Global Opportunities Portfolio.
Average annual total returns reflect reductions for distribution and service fees.
Past performance is not an indication of future results. Performance results may include adjustments made for financial reporting purposes in accordance with U.S. generally accepted accounting principles. Performance results do not reflect the deduction of taxes that a shareholder would pay on fund distributions or on the redemption or sale of fund shares. Visit blackrock.com for more recent performance information.
What did the Fund invest in?
(as of May 31, 2024)
| Country | Percent of
Net Assets |
| Japan | 22.3)% |
| United Kingdom | 11.3)% |
| Germany | 10.0)% |
| France | 9.1)% |
| Switzerland | 8.2)% |
| Netherlands | 5.1)% |
| Australia | 5.1)% |
| United States | 5.0)% |
| Denmark | 4.2)% |
| Spain | 4.0)% |
| Other | 13.0)% |
| Short-Term Securities | 3.5)% |
| Liabilities in Excess of Other Assets | (0.8)% |
| Security(a) | Percent of
Net Assets |
| Novo Nordisk A/S, Class B | 3.4% |
| ASML Holding NV | 3.1% |
| Novartis AG, Registered Shares | 2.3% |
| SAP SE | 2.1% |
| Shell PLC | 1.9% |
| BHP Group Ltd. | 1.8% |
| Siemens AG, Registered Shares | 1.8% |
| Allianz SE, Registered Shares | 1.7% |
| GSK PLC | 1.6% |
| Tokyo Electron Ltd. | 1.6% |
(a) | Excludes short-term securities. |
Additional information
If you wish to view additional information about the Fund, including but not limited to financial statements, the Fund’s prospectus, and proxy voting policies and procedures, please visit blackrock.com/fundreports. For proxy voting records, visit blackrock.com/proxyrecords.
Householding
The Fund will mail only one copy of shareholder documents, including prospectuses, annual and semi-annual reports and proxy statements, to shareholders with multiple accounts at the same address. This practice is commonly called “householding” and is intended to reduce expenses and eliminate duplicate mailings of shareholder documents. Mailings of your shareholder documents may be householded indefinitely unless you instruct us otherwise. If you do not want the mailing of these documents to be combined with those for other members of your household, please call the Fund at (800) 441-7762.
The Fund is not sponsored, endorsed, issued, sold, or promoted by MSCI Inc. and its affiliates, nor does this company make any representation regarding the advisability of investing in the Fund. BlackRock is not affiliated with the company listed above.
©2024 BlackRock, Inc. or its affiliates. All rights reserved. BLACKROCK is a registered trademark of BlackRock, Inc. or its affiliates. All other trademarks are those of their respective owners.
BlackRock Advantage International Fund
Class R Shares | BGORX
Annual Shareholder Report — May 31, 2024
BGORX-05/24-AR
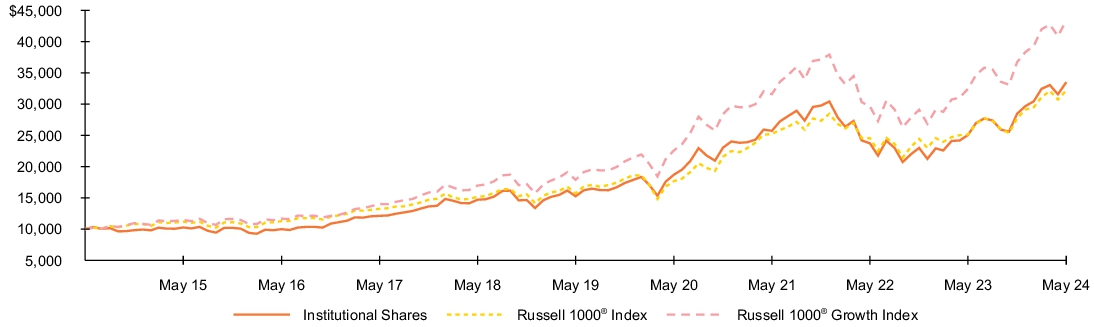
BlackRock Advantage Large Cap Growth Fund
Institutional Shares | CMVIX
Annual Shareholder Report — May 31, 2024
This annual shareholder report contains important information about BlackRock Advantage Large Cap Growth Fund (the “Fund”) for the period of June 1, 2023 to May 31, 2024. You can find additional information about the Fund at blackrock.com/fundreports. You can also request this information by contacting us at (800) 441‑7762.
What were the Fund costs for the last year?
(based on a hypothetical $10,000 investment)
| Class name | Costs of a $10,000
investment | Costs paid as a percentage of a
$10,000 investment |
| Institutional Shares | $72 | 0.62% |
How did the Fund perform last year?
U.S. equities enjoyed strong performance as resilient macro and micro data combined with excitement around the dominant themes of innovation in information technology and healthcare drove gains.
Fears of a U.S. recession waned while major overseas economies returned to positive growth.
Signs of easing inflation led to expectations that the U.S. Federal Reserve and other leading central banks were poised to reduce interest rates, leading growth-oriented stocks to outperform value stocks.
What contributed to performance?
Positive contributions to performance, relative to the benchmark (Russell 1000® Growth Index) were led by sentiment measures that were able to identify dominant trends by looking at informed investor positioning and through text-based analysis of broker reports (or conference calls). These insights motivated a successful overweight to healthcare stocks that benefited from the GLP-1 (weight loss drug) theme. Fundamental measures also were additive, as defensive quality measures with a preference for companies with balance sheet strength and cash flow generation correctly positioned the portfolio within consumer durables. Additionally, non-traditional quality measures focusing on hiring practices and employee satisfaction contributed to performance. Finally, macro related insights successfully captured evolving dynamics at the industry level by analyzing company invoices.
What detracted from performance?
The largest detractors from relative performance were certain fundamental insights including defensive quality measures that prefer balance sheet strength and more stable companies. Certain sentiment measures looking at bond markets struggled to position the portfolio as the market narrative shifted between the “soft landing” and “higher-for-longer” themes.
The views expressed reflect the opinions of BlackRock as of the date of this report and are subject to change based on changes in market, economic or other conditions. These views are not intended to be a forecast of future events and are no guarantee of future results.
Fund performance
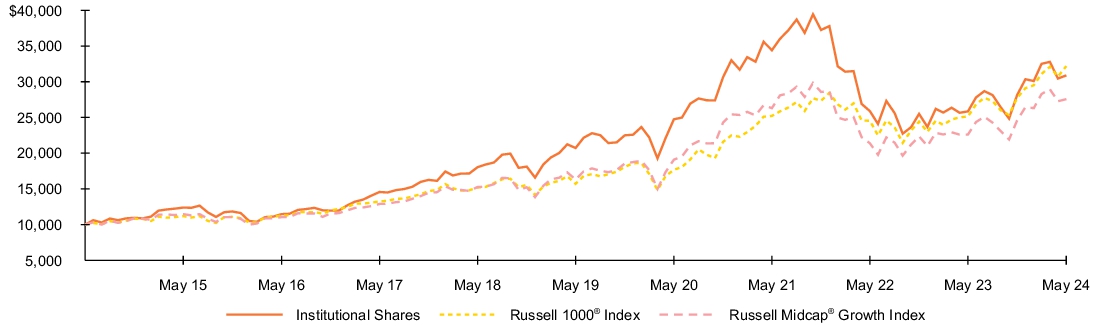
Cumulative performance: June 1, 2014 through May 31, 2024
Initial investment of $10,000
See “Average annual total returns” for additional information on fund performance.
Average annual total returns
| 1 Year | 5 Years | 10 Years |
| Institutional Shares | 33.74% | 17.04% | 12.85% |
| Russell 1000® Index | 28.01% | 15.42% | 12.40% |
| Russell 1000® Growth Index | 33.60% | 19.37% | 15.80% |
| Net Assets | $1,226,660,906% |
| Number of Portfolio Holdings | $128% |
| Net Investment Advisory Fees | $5,323,635% |
| Portfolio Turnover Rate | $128% |
Performance shown prior to June 12, 2017 are the returns of the Fund when it followed different investment strategies under the name BlackRock Flexible Equity Fund.
Past performance is not an indication of future results. Performance results may include adjustments made for financial reporting purposes in accordance with U.S. generally accepted accounting principles. Performance results do not reflect the deduction of taxes that a shareholder would pay on fund distributions or on the redemption or sale of fund shares. Visit blackrock.com for more recent performance information.
What did the Fund invest in?
(as of May 31, 2024)
| Sector(a) | Percent of
Net Assets |
| Information Technology | 46.6% |
| Consumer Discretionary | 13.2% |
| Communication Services | 12.7% |
| Health Care | 11.6% |
| Financials | 6.1% |
| Industrials | 5.9% |
| Consumer Staples | 2.2% |
| Materials | 0.3% |
| Real Estate | 0.2% |
| Short-Term Securities | 1.0% |
| Other Assets Less Liabilities | 0.2% |
| Security(b) | Percent of
Net Assets |
| Microsoft Corp. | 12.8% |
| Apple Inc. | 10.1% |
| NVIDIA Corp. | 5.8% |
| Meta Platforms, Inc., Class A | 4.9% |
| Amazon.com, Inc. | 4.9% |
| Broadcom, Inc. | 3.4% |
| Eli Lilly & Co. | 3.4% |
| Alphabet, Inc., Class C, NVS | 3.2% |
| Mastercard, Inc., Class A | 2.6% |
| Home Depot, Inc. (The) | 2.4% |
(a) | For purposes of this report, sector sub-classifications may differ from those utilized for compliance purposes. |
(b) | Excludes short-term securities. |
Additional information
If you wish to view additional information about the Fund, including but not limited to financial statements, the Fund’s prospectus, and proxy voting policies and procedures, please visit blackrock.com/fundreports. For proxy voting records, visit blackrock.com/proxyrecords.
Householding
The Fund will mail only one copy of shareholder documents, including prospectuses, annual and semi-annual reports and proxy statements, to shareholders with multiple accounts at the same address. This practice is commonly called “householding” and is intended to reduce expenses and eliminate duplicate mailings of shareholder documents. Mailings of your shareholder documents may be householded indefinitely unless you instruct us otherwise. If you do not want the mailing of these documents to be combined with those for other members of your household, please call the Fund at (800) 441-7762.
The Fund is not sponsored, endorsed, issued, sold, or promoted by FTSE International Limited and its affiliates, nor does this company make any representation regarding the advisability of investing in the Fund. BlackRock is not affiliated with the company listed above.
©2024 BlackRock, Inc. or its affiliates. All rights reserved. BLACKROCK is a registered trademark of BlackRock, Inc. or its affiliates. All other trademarks are those of their respective owners.
BlackRock Advantage Large Cap Growth Fund
Institutional Shares | CMVIX
Annual Shareholder Report — May 31, 2024
CMVIX-05/24-AR
BlackRock Advantage Large Cap Growth Fund
Investor A Shares | BMCAX
Annual Shareholder Report — May 31, 2024
This annual shareholder report contains important information about BlackRock Advantage Large Cap Growth Fund (the “Fund”) for the period of June 1, 2023 to May 31, 2024. You can find additional information about the Fund at blackrock.com/fundreports. You can also request this information by contacting us at (800) 441‑7762.
What were the Fund costs for the last year?
(based on a hypothetical $10,000 investment)
| Class name | Costs of a $10,000
investment | Costs paid as a percentage of a
$10,000 investment |
| Investor A Shares | $102 | 0.87% |
How did the Fund perform last year?
U.S. equities enjoyed strong performance as resilient macro and micro data combined with excitement around the dominant themes of innovation in information technology and healthcare drove gains.
Fears of a U.S. recession waned while major overseas economies returned to positive growth.
Signs of easing inflation led to expectations that the U.S. Federal Reserve and other leading central banks were poised to reduce interest rates, leading growth-oriented stocks to outperform value stocks.
What contributed to performance?
Positive contributions to performance, relative to the benchmark (Russell 1000® Growth Index) were led by sentiment measures that were able to identify dominant trends by looking at informed investor positioning and through text-based analysis of broker reports (or conference calls). These insights motivated a successful overweight to healthcare stocks that benefited from the GLP-1 (weight loss drug) theme. Fundamental measures also were additive, as defensive quality measures with a preference for companies with balance sheet strength and cash flow generation correctly positioned the portfolio within consumer durables. Additionally, non-traditional quality measures focusing on hiring practices and employee satisfaction contributed to performance. Finally, macro related insights successfully captured evolving dynamics at the industry level by analyzing company invoices.
What detracted from performance?
The largest detractors from relative performance were certain fundamental insights including defensive quality measures that prefer balance sheet strength and more stable companies. Certain sentiment measures looking at bond markets struggled to position the portfolio as the market narrative shifted between the “soft landing” and “higher-for-longer” themes.
The views expressed reflect the opinions of BlackRock as of the date of this report and are subject to change based on changes in market, economic or other conditions. These views are not intended to be a forecast of future events and are no guarantee of future results.
Fund performance
Cumulative performance: June 1, 2014 through May 31, 2024
Initial investment of $10,000
See “Average annual total returns” for additional information on fund performance.
Average annual total returns
| 1 Year | 5 Years | 10 Years |
| Investor A Shares | 33.45% | 16.74% | 12.54% |
| Investor A Shares (with sales charge) | 26.44% | 15.48% | 11.93% |
| Russell 1000® Index | 28.01% | 15.42% | 12.40% |
| Russell 1000® Growth Index | 33.60% | 19.37% | 15.80% |
| Net Assets | $1,226,660,906% |
| Number of Portfolio Holdings | $128% |
| Net Investment Advisory Fees | $5,323,635% |
| Portfolio Turnover Rate | $128% |
Performance shown prior to June 12, 2017 are the returns of the Fund when it followed different investment strategies under the name BlackRock Flexible Equity Fund.
Assuming maximum sales charges. Average annual total returns with and without sales charges reflect reductions for service fees.
Past performance is not an indication of future results. Performance results may include adjustments made for financial reporting purposes in accordance with U.S. generally accepted accounting principles. Performance results do not reflect the deduction of taxes that a shareholder would pay on fund distributions or on the redemption or sale of fund shares. Visit blackrock.com for more recent performance information.
What did the Fund invest in?
(as of May 31, 2024)
| Sector(a) | Percent of
Net Assets |
| Information Technology | 46.6% |
| Consumer Discretionary | 13.2% |
| Communication Services | 12.7% |
| Health Care | 11.6% |
| Financials | 6.1% |
| Industrials | 5.9% |
| Consumer Staples | 2.2% |
| Materials | 0.3% |
| Real Estate | 0.2% |
| Short-Term Securities | 1.0% |
| Other Assets Less Liabilities | 0.2% |
| Security(b) | Percent of
Net Assets |
| Microsoft Corp. | 12.8% |
| Apple Inc. | 10.1% |
| NVIDIA Corp. | 5.8% |
| Meta Platforms, Inc., Class A | 4.9% |
| Amazon.com, Inc. | 4.9% |
| Broadcom, Inc. | 3.4% |
| Eli Lilly & Co. | 3.4% |
| Alphabet, Inc., Class C, NVS | 3.2% |
| Mastercard, Inc., Class A | 2.6% |
| Home Depot, Inc. (The) | 2.4% |
(a) | For purposes of this report, sector sub-classifications may differ from those utilized for compliance purposes. |
(b) | Excludes short-term securities. |
Additional information
If you wish to view additional information about the Fund, including but not limited to financial statements, the Fund’s prospectus, and proxy voting policies and procedures, please visit blackrock.com/fundreports. For proxy voting records, visit blackrock.com/proxyrecords.
Householding
The Fund will mail only one copy of shareholder documents, including prospectuses, annual and semi-annual reports and proxy statements, to shareholders with multiple accounts at the same address. This practice is commonly called “householding” and is intended to reduce expenses and eliminate duplicate mailings of shareholder documents. Mailings of your shareholder documents may be householded indefinitely unless you instruct us otherwise. If you do not want the mailing of these documents to be combined with those for other members of your household, please call the Fund at (800) 441-7762.
The Fund is not sponsored, endorsed, issued, sold, or promoted by FTSE International Limited and its affiliates, nor does this company make any representation regarding the advisability of investing in the Fund. BlackRock is not affiliated with the company listed above.
©2024 BlackRock, Inc. or its affiliates. All rights reserved. BLACKROCK is a registered trademark of BlackRock, Inc. or its affiliates. All other trademarks are those of their respective owners.
BlackRock Advantage Large Cap Growth Fund
Investor A Shares | BMCAX
Annual Shareholder Report — May 31, 2024
BMCAX-05/24-AR
BlackRock Advantage Large Cap Growth Fund
Investor C Shares | BMCCX
Annual Shareholder Report — May 31, 2024
This annual shareholder report contains important information about BlackRock Advantage Large Cap Growth Fund (the “Fund”) for the period of June 1, 2023 to May 31, 2024. You can find additional information about the Fund at blackrock.com/fundreports. You can also request this information by contacting us at (800) 441‑7762.
What were the Fund costs for the last year?
(based on a hypothetical $10,000 investment)
| Class name | Costs of a $10,000
investment | Costs paid as a percentage of a
$10,000 investment |
| Investor C Shares | $188 | 1.62% |
How did the Fund perform last year?
U.S. equities enjoyed strong performance as resilient macro and micro data combined with excitement around the dominant themes of innovation in information technology and healthcare drove gains.
Fears of a U.S. recession waned while major overseas economies returned to positive growth.
Signs of easing inflation led to expectations that the U.S. Federal Reserve and other leading central banks were poised to reduce interest rates, leading growth-oriented stocks to outperform value stocks.
What contributed to performance?
Positive contributions to performance, relative to the benchmark (Russell 1000® Growth Index) were led by sentiment measures that were able to identify dominant trends by looking at informed investor positioning and through text-based analysis of broker reports (or conference calls). These insights motivated a successful overweight to healthcare stocks that benefited from the GLP-1 (weight loss drug) theme. Fundamental measures also were additive, as defensive quality measures with a preference for companies with balance sheet strength and cash flow generation correctly positioned the portfolio within consumer durables. Additionally, non-traditional quality measures focusing on hiring practices and employee satisfaction contributed to performance. Finally, macro related insights successfully captured evolving dynamics at the industry level by analyzing company invoices.
What detracted from performance?
The largest detractors from relative performance were certain fundamental insights including defensive quality measures that prefer balance sheet strength and more stable companies. Certain sentiment measures looking at bond markets struggled to position the portfolio as the market narrative shifted between the “soft landing” and “higher-for-longer” themes.
The views expressed reflect the opinions of BlackRock as of the date of this report and are subject to change based on changes in market, economic or other conditions. These views are not intended to be a forecast of future events and are no guarantee of future results.
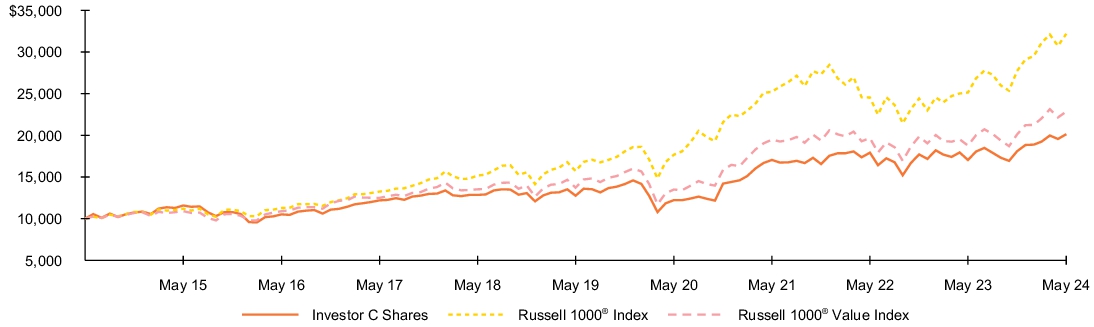
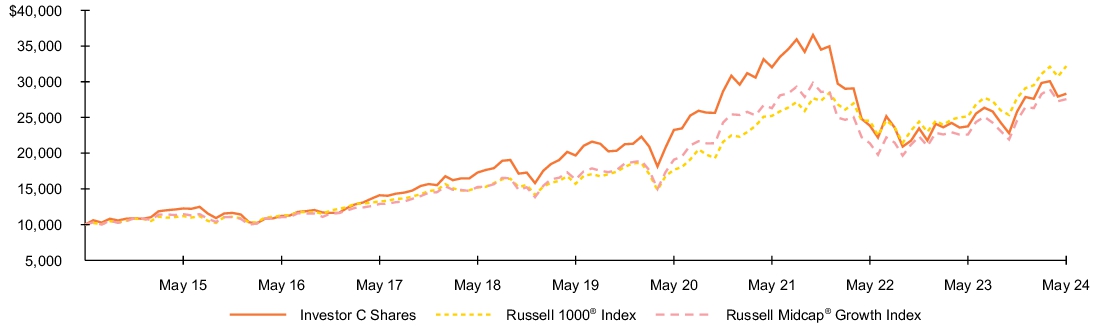
Fund performance
Cumulative performance: June 1, 2014 through May 31, 2024
Initial investment of $10,000
See “Average annual total returns” for additional information on fund performance.
Average annual total returns
| 1 Year | 5 Years | 10 Years |
| Investor C Shares | 32.46% | 15.87% | 11.86% |
| Investor C Shares (with sales charge) | 31.46% | 15.87% | 11.86% |
| Russell 1000® Index | 28.01% | 15.42% | 12.40% |
| Russell 1000® Growth Index | 33.60% | 19.37% | 15.80% |
| Net Assets | $1,226,660,906% |
| Number of Portfolio Holdings | $128% |
| Net Investment Advisory Fees | $5,323,635% |
| Portfolio Turnover Rate | $128% |
Performance shown prior to June 12, 2017 are the returns of the Fund when it followed different investment strategies under the name BlackRock Flexible Equity Fund.
Assuming maximum sales charges. Average annual total returns with and without sales charges reflect reductions for distribution and service fees.
Past performance is not an indication of future results. Performance results may include adjustments made for financial reporting purposes in accordance with U.S. generally accepted accounting principles. Performance results do not reflect the deduction of taxes that a shareholder would pay on fund distributions or on the redemption or sale of fund shares. Visit blackrock.com for more recent performance information.
What did the Fund invest in?
(as of May 31, 2024)
| Sector(a) | Percent of
Net Assets |
| Information Technology | 46.6% |
| Consumer Discretionary | 13.2% |
| Communication Services | 12.7% |
| Health Care | 11.6% |
| Financials | 6.1% |
| Industrials | 5.9% |
| Consumer Staples | 2.2% |
| Materials | 0.3% |
| Real Estate | 0.2% |
| Short-Term Securities | 1.0% |
| Other Assets Less Liabilities | 0.2% |
| Security(b) | Percent of
Net Assets |
| Microsoft Corp. | 12.8% |
| Apple Inc. | 10.1% |
| NVIDIA Corp. | 5.8% |
| Meta Platforms, Inc., Class A | 4.9% |
| Amazon.com, Inc. | 4.9% |
| Broadcom, Inc. | 3.4% |
| Eli Lilly & Co. | 3.4% |
| Alphabet, Inc., Class C, NVS | 3.2% |
| Mastercard, Inc., Class A | 2.6% |
| Home Depot, Inc. (The) | 2.4% |
(a) | For purposes of this report, sector sub-classifications may differ from those utilized for compliance purposes. |
(b) | Excludes short-term securities. |
Additional information
If you wish to view additional information about the Fund, including but not limited to financial statements, the Fund’s prospectus, and proxy voting policies and procedures, please visit blackrock.com/fundreports. For proxy voting records, visit blackrock.com/proxyrecords.
Householding
The Fund will mail only one copy of shareholder documents, including prospectuses, annual and semi-annual reports and proxy statements, to shareholders with multiple accounts at the same address. This practice is commonly called “householding” and is intended to reduce expenses and eliminate duplicate mailings of shareholder documents. Mailings of your shareholder documents may be householded indefinitely unless you instruct us otherwise. If you do not want the mailing of these documents to be combined with those for other members of your household, please call the Fund at (800) 441-7762.
The Fund is not sponsored, endorsed, issued, sold, or promoted by FTSE International Limited and its affiliates, nor does this company make any representation regarding the advisability of investing in the Fund. BlackRock is not affiliated with the company listed above.
©2024 BlackRock, Inc. or its affiliates. All rights reserved. BLACKROCK is a registered trademark of BlackRock, Inc. or its affiliates. All other trademarks are those of their respective owners.
BlackRock Advantage Large Cap Growth Fund
Investor C Shares | BMCCX
Annual Shareholder Report — May 31, 2024
BMCCX-05/24-AR
BlackRock Advantage Large Cap Growth Fund
Class K Shares | BMCKX
Annual Shareholder Report — May 31, 2024
This annual shareholder report contains important information about BlackRock Advantage Large Cap Growth Fund (the “Fund”) for the period of June 1, 2023 to May 31, 2024. You can find additional information about the Fund at blackrock.com/fundreports. You can also request this information by contacting us at (800) 441‑7762.
What were the Fund costs for the last year?
(based on a hypothetical $10,000 investment)
| Class name | Costs of a $10,000
investment | Costs paid as a percentage of a
$10,000 investment |
| Class K Shares | $67 | 0.57% |
How did the Fund perform last year?
U.S. equities enjoyed strong performance as resilient macro and micro data combined with excitement around the dominant themes of innovation in information technology and healthcare drove gains.
Fears of a U.S. recession waned while major overseas economies returned to positive growth.
Signs of easing inflation led to expectations that the U.S. Federal Reserve and other leading central banks were poised to reduce interest rates, leading growth-oriented stocks to outperform value stocks.
What contributed to performance?
Positive contributions to performance, relative to the benchmark (Russell 1000® Growth Index) were led by sentiment measures that were able to identify dominant trends by looking at informed investor positioning and through text-based analysis of broker reports (or conference calls). These insights motivated a successful overweight to healthcare stocks that benefited from the GLP-1 (weight loss drug) theme. Fundamental measures also were additive, as defensive quality measures with a preference for companies with balance sheet strength and cash flow generation correctly positioned the portfolio within consumer durables. Additionally, non-traditional quality measures focusing on hiring practices and employee satisfaction contributed to performance. Finally, macro related insights successfully captured evolving dynamics at the industry level by analyzing company invoices.
What detracted from performance?
The largest detractors from relative performance were certain fundamental insights including defensive quality measures that prefer balance sheet strength and more stable companies. Certain sentiment measures looking at bond markets struggled to position the portfolio as the market narrative shifted between the “soft landing” and “higher-for-longer” themes.
The views expressed reflect the opinions of BlackRock as of the date of this report and are subject to change based on changes in market, economic or other conditions. These views are not intended to be a forecast of future events and are no guarantee of future results.
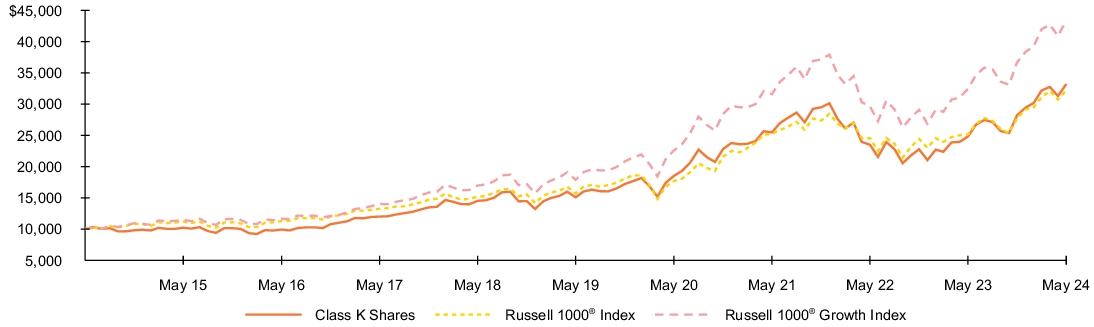
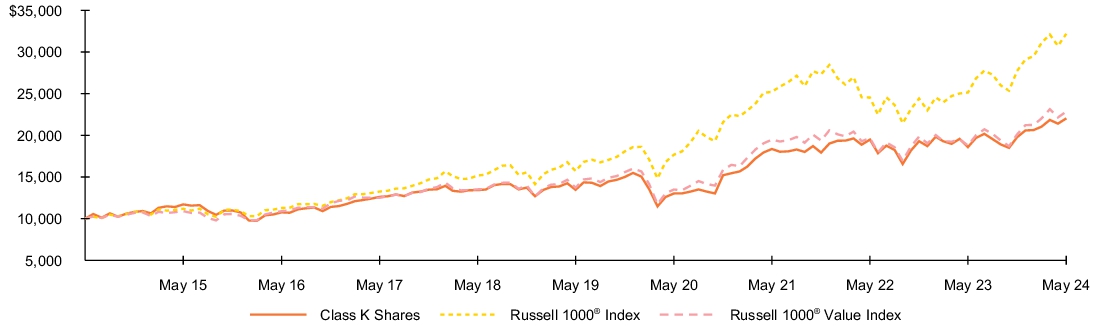
Fund performance
Cumulative performance: June 1, 2014 through May 31, 2024
Initial investment of $10,000
See “Average annual total returns” for additional information on fund performance.
Average annual total returns
| 1 Year | 5 Years | 10 Years |
| Class K Shares | 33.81% | 17.09% | 12.75% |
| Russell 1000® Index | 28.01% | 15.42% | 12.40% |
| Russell 1000® Growth Index | 33.60% | 19.37% | 15.80% |
| Net Assets | $1,226,660,906% |
| Number of Portfolio Holdings | $128% |
| Net Investment Advisory Fees | $5,323,635% |
| Portfolio Turnover Rate | $128% |
Performance shown prior to June 12, 2017 are the returns of the Fund when it followed different investment strategies under the name BlackRock Flexible Equity Fund.
Performance shown prior to the Class K Shares inception date of January 25, 2018 is that of Investor A Shares. The performance of the Class K Shares would be substantially similar to Investor A Shares because Class K Shares and Investor A Shares invest in the same portfolio of securities and performance would only differ to the extent that Class K Shares and Investor A Shares have different expenses. The actual returns of Class K Shares would have been higher than those of the Investor A Shares because Class K Shares have lower expenses than the Investor A Shares.
Past performance is not an indication of future results. Performance results may include adjustments made for financial reporting purposes in accordance with U.S. generally accepted accounting principles. Performance results do not reflect the deduction of taxes that a shareholder would pay on fund distributions or on the redemption or sale of fund shares. Visit blackrock.com for more recent performance information.
What did the Fund invest in?
(as of May 31, 2024)
| Sector(a) | Percent of
Net Assets |
| Information Technology | 46.6% |
| Consumer Discretionary | 13.2% |
| Communication Services | 12.7% |
| Health Care | 11.6% |
| Financials | 6.1% |
| Industrials | 5.9% |
| Consumer Staples | 2.2% |
| Materials | 0.3% |
| Real Estate | 0.2% |
| Short-Term Securities | 1.0% |
| Other Assets Less Liabilities | 0.2% |
| Security(b) | Percent of
Net Assets |
| Microsoft Corp. | 12.8% |
| Apple Inc. | 10.1% |
| NVIDIA Corp. | 5.8% |
| Meta Platforms, Inc., Class A | 4.9% |
| Amazon.com, Inc. | 4.9% |
| Broadcom, Inc. | 3.4% |
| Eli Lilly & Co. | 3.4% |
| Alphabet, Inc., Class C, NVS | 3.2% |
| Mastercard, Inc., Class A | 2.6% |
| Home Depot, Inc. (The) | 2.4% |
(a) | For purposes of this report, sector sub-classifications may differ from those utilized for compliance purposes. |
(b) | Excludes short-term securities. |
Additional information
If you wish to view additional information about the Fund, including but not limited to financial statements, the Fund’s prospectus, and proxy voting policies and procedures, please visit blackrock.com/fundreports. For proxy voting records, visit blackrock.com/proxyrecords.
Householding
The Fund will mail only one copy of shareholder documents, including prospectuses, annual and semi-annual reports and proxy statements, to shareholders with multiple accounts at the same address. This practice is commonly called “householding” and is intended to reduce expenses and eliminate duplicate mailings of shareholder documents. Mailings of your shareholder documents may be householded indefinitely unless you instruct us otherwise. If you do not want the mailing of these documents to be combined with those for other members of your household, please call the Fund at (800) 441-7762.
The Fund is not sponsored, endorsed, issued, sold, or promoted by FTSE International Limited and its affiliates, nor does this company make any representation regarding the advisability of investing in the Fund. BlackRock is not affiliated with the company listed above.
©2024 BlackRock, Inc. or its affiliates. All rights reserved. BLACKROCK is a registered trademark of BlackRock, Inc. or its affiliates. All other trademarks are those of their respective owners.
BlackRock Advantage Large Cap Growth Fund
Class K Shares | BMCKX
Annual Shareholder Report — May 31, 2024
BMCKX-05/24-AR
BlackRock Advantage Large Cap Growth Fund
Class R Shares | BMCRX
Annual Shareholder Report — May 31, 2024
This annual shareholder report contains important information about BlackRock Advantage Large Cap Growth Fund (the “Fund”) for the period of June 1, 2023 to May 31, 2024. You can find additional information about the Fund at blackrock.com/fundreports. You can also request this information by contacting us at (800) 441‑7762.
What were the Fund costs for the last year?
(based on a hypothetical $10,000 investment)
| Class name | Costs of a $10,000
investment | Costs paid as a percentage of a
$10,000 investment |
| Class R Shares | $131 | 1.12% |
How did the Fund perform last year?
U.S. equities enjoyed strong performance as resilient macro and micro data combined with excitement around the dominant themes of innovation in information technology and healthcare drove gains.
Fears of a U.S. recession waned while major overseas economies returned to positive growth.
Signs of easing inflation led to expectations that the U.S. Federal Reserve and other leading central banks were poised to reduce interest rates, leading growth-oriented stocks to outperform value stocks.
What contributed to performance?
Positive contributions to performance, relative to the benchmark (Russell 1000® Growth Index) were led by sentiment measures that were able to identify dominant trends by looking at informed investor positioning and through text-based analysis of broker reports (or conference calls). These insights motivated a successful overweight to healthcare stocks that benefited from the GLP-1 (weight loss drug) theme. Fundamental measures also were additive, as defensive quality measures with a preference for companies with balance sheet strength and cash flow generation correctly positioned the portfolio within consumer durables. Additionally, non-traditional quality measures focusing on hiring practices and employee satisfaction contributed to performance. Finally, macro related insights successfully captured evolving dynamics at the industry level by analyzing company invoices.
What detracted from performance?
The largest detractors from relative performance were certain fundamental insights including defensive quality measures that prefer balance sheet strength and more stable companies. Certain sentiment measures looking at bond markets struggled to position the portfolio as the market narrative shifted between the “soft landing” and “higher-for-longer” themes.
The views expressed reflect the opinions of BlackRock as of the date of this report and are subject to change based on changes in market, economic or other conditions. These views are not intended to be a forecast of future events and are no guarantee of future results.
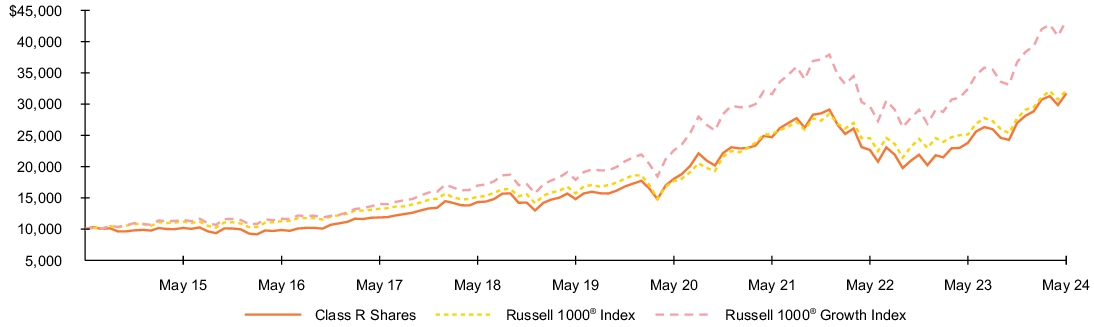
Fund performance
Cumulative performance: June 1, 2014 through May 31, 2024
Initial investment of $10,000
See “Average annual total returns” for additional information on fund performance.
Average annual total returns
| 1 Year | 5 Years | 10 Years |
| Class R Shares | 33.12% | 16.45% | 12.22% |
| Russell 1000® Index | 28.01% | 15.42% | 12.40% |
| Russell 1000® Growth Index | 33.60% | 19.37% | 15.80% |
| Net Assets | $1,226,660,906% |
| Number of Portfolio Holdings | $128% |
| Net Investment Advisory Fees | $5,323,635% |
| Portfolio Turnover Rate | $128% |
Performance shown prior to June 12, 2017 are the returns of the Fund when it followed different investment strategies under the name BlackRock Flexible Equity Fund.
Average annual total returns reflect reductions for distribution and service fees.
Past performance is not an indication of future results. Performance results may include adjustments made for financial reporting purposes in accordance with U.S. generally accepted accounting principles. Performance results do not reflect the deduction of taxes that a shareholder would pay on fund distributions or on the redemption or sale of fund shares. Visit blackrock.com for more recent performance information.
What did the Fund invest in?
(as of May 31, 2024)
| Sector(a) | Percent of
Net Assets |
| Information Technology | 46.6% |
| Consumer Discretionary | 13.2% |
| Communication Services | 12.7% |
| Health Care | 11.6% |
| Financials | 6.1% |
| Industrials | 5.9% |
| Consumer Staples | 2.2% |
| Materials | 0.3% |
| Real Estate | 0.2% |
| Short-Term Securities | 1.0% |
| Other Assets Less Liabilities | 0.2% |
| Security(b) | Percent of
Net Assets |
| Microsoft Corp. | 12.8% |
| Apple Inc. | 10.1% |
| NVIDIA Corp. | 5.8% |
| Meta Platforms, Inc., Class A | 4.9% |
| Amazon.com, Inc. | 4.9% |
| Broadcom, Inc. | 3.4% |
| Eli Lilly & Co. | 3.4% |
| Alphabet, Inc., Class C, NVS | 3.2% |
| Mastercard, Inc., Class A | 2.6% |
| Home Depot, Inc. (The) | 2.4% |
(a) | For purposes of this report, sector sub-classifications may differ from those utilized for compliance purposes. |
(b) | Excludes short-term securities. |
Additional information
If you wish to view additional information about the Fund, including but not limited to financial statements, the Fund’s prospectus, and proxy voting policies and procedures, please visit blackrock.com/fundreports. For proxy voting records, visit blackrock.com/proxyrecords.
Householding
The Fund will mail only one copy of shareholder documents, including prospectuses, annual and semi-annual reports and proxy statements, to shareholders with multiple accounts at the same address. This practice is commonly called “householding” and is intended to reduce expenses and eliminate duplicate mailings of shareholder documents. Mailings of your shareholder documents may be householded indefinitely unless you instruct us otherwise. If you do not want the mailing of these documents to be combined with those for other members of your household, please call the Fund at (800) 441-7762.
The Fund is not sponsored, endorsed, issued, sold, or promoted by FTSE International Limited and its affiliates, nor does this company make any representation regarding the advisability of investing in the Fund. BlackRock is not affiliated with the company listed above.
©2024 BlackRock, Inc. or its affiliates. All rights reserved. BLACKROCK is a registered trademark of BlackRock, Inc. or its affiliates. All other trademarks are those of their respective owners.
BlackRock Advantage Large Cap Growth Fund
Class R Shares | BMCRX
Annual Shareholder Report — May 31, 2024
BMCRX-05/24-AR
BlackRock Advantage Small Cap Core Fund
Institutional Shares | BDSIX
Annual Shareholder Report — May 31, 2024
This annual shareholder report contains important information about BlackRock Advantage Small Cap Core Fund (the “Fund”) for the period of June 1, 2023 to May 31, 2024. You can find additional information about the Fund at blackrock.com/fundreports. You can also request this information by contacting us at (800) 441‑7762.
What were the Fund costs for the last year?
(based on a hypothetical $10,000 investment)
| Class name | Costs of a $10,000
investment | Costs paid as a percentage of a
$10,000 investment |
| Institutional Shares | $56 | 0.50% |
How did the Fund perform last year?
U.S. equities broadly moved higher as the reporting period progressed, resulting in significant positive returns across most market segments.
Fears of a U.S. recession waned while major overseas economies returned to positive growth.
Signs of easing inflation led to expectations that the U.S. Federal Reserve and other leading central banks were poised to reduce interest rates, driving outperformance by mega-cap growth stocks within information technology and communications services.
What contributed to performance?
Positive contributions to performance, relative to the benchmark (Russell 2000® Index) were led by fundamental and sentiment insights. Within fundamental measures, traditional valuation insights evaluating a company’s sales value worked well within the industrials and financials sectors. Within sentiment insights, measures of text-based trends along with retail investor and smart money flows supported stock selection across the industrials and energy sectors. Finally, while performance from macro measures was mixed overall, insights looking at inventory levels drove successful positioning within the consumer discretionary sector.
What detracted from performance?
The largest detractors from relative performance included fundamental quality insights, most notably defensive quality measures focusing on cash flows and debt maturities which drove unsuccessful stock selection within healthcare amid enthusiasm around the use of GLP-1 drugs for weight loss. Nontraditional measures with a preference for founder-led company management also detracted.
The views expressed reflect the opinions of BlackRock as of the date of this report and are subject to change based on changes in market, economic or other conditions. These views are not intended to be a forecast of future events and are no guarantee of future results.
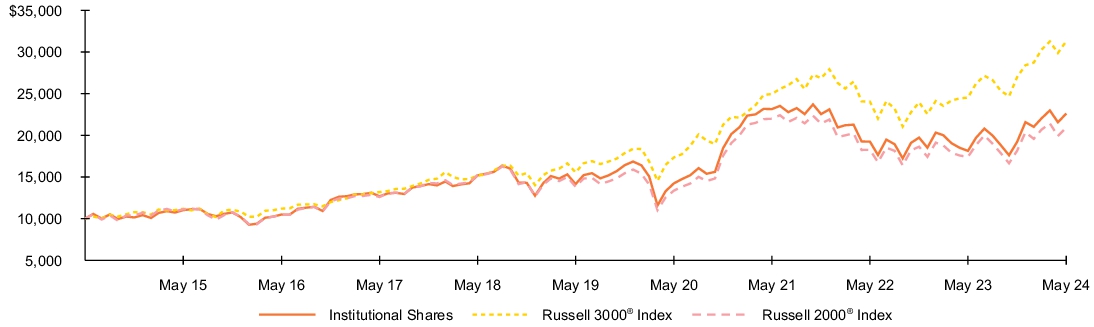
Fund performance
Cumulative performance: June 1, 2014 through May 31, 2024
Initial investment of $10,000
See “Average annual total returns” for additional information on fund performance.
Average annual total returns
| 1 Year | 5 Years | 10 Years |
| Institutional Shares | 24.68% | 9.83% | 8.50% |
| Russell 3000® Index | 27.58% | 15.00% | 12.09% |
| Russell 2000® Index | 20.12% | 8.61% | 7.66% |
| Net Assets | $3,514,797,540% |
| Number of Portfolio Holdings | $781% |
| Net Investment Advisory Fees | $13,668,396% |
| Portfolio Turnover Rate | $75% |
Past performance is not an indication of future results. Performance results may include adjustments made for financial reporting purposes in accordance with U.S. generally accepted accounting principles. Performance results do not reflect the deduction of taxes that a shareholder would pay on fund distributions or on the redemption or sale of fund shares. Visit blackrock.com for more recent performance information.
What did the Fund invest in?
(as of May 31, 2024)
| Sector(a) | Percent of
Net Assets |
| Industrials | 18.5)% |
| Health Care | 16.0)% |
| Information Technology | 15.7)% |
| Financials | 14.2)% |
| Consumer Discretionary | 11.7)% |
| Energy | 6.5)% |
| Real Estate | 4.5)% |
| Materials | 4.0)% |
| Consumer Staples | 3.0)% |
| Communication Services | 2.9)% |
| Utilities | 2.2)% |
| Short-Term Securities | 5.3)% |
| Liabilities in Excess of Other Assets | (4.5)% |
| Security(b) | Percent of
Net Assets |
| Super Micro Computer, Inc. | 1.4% |
| Boise Cascade Co. | 1.1% |
| Flowserve Corp. | 1.0% |
| SM Energy Co. | 0.8% |
| Plains GP Holdings LP, Class A | 0.8% |
| Murphy Oil Corp. | 0.8% |
| Reinsurance Group of America, Inc. | 0.7% |
| EMCOR Group, Inc. | 0.7% |
| Sanmina Corp. | 0.7% |
| Laureate Education, Inc., Class A | 0.7% |
(a) | For purposes of this report, sector sub-classifications may differ from those utilized for compliance purposes. |
(b) | Excludes short-term securities. |
Additional information
If you wish to view additional information about the Fund, including but not limited to financial statements, the Fund’s prospectus, and proxy voting policies and procedures, please visit blackrock.com/fundreports. For proxy voting records, visit blackrock.com/proxyrecords.
Householding
The Fund will mail only one copy of shareholder documents, including prospectuses, annual and semi-annual reports and proxy statements, to shareholders with multiple accounts at the same address. This practice is commonly called “householding” and is intended to reduce expenses and eliminate duplicate mailings of shareholder documents. Mailings of your shareholder documents may be householded indefinitely unless you instruct us otherwise. If you do not want the mailing of these documents to be combined with those for other members of your household, please call the Fund at (800) 441-7762.
The Fund is not sponsored, endorsed, issued, sold, or promoted by FTSE International Limited and its affiliates, nor does this company make any representation regarding the advisability of investing in the Fund. BlackRock is not affiliated with the company listed above.
©2024 BlackRock, Inc. or its affiliates. All rights reserved. BLACKROCK is a registered trademark of BlackRock, Inc. or its affiliates. All other trademarks are those of their respective owners.
BlackRock Advantage Small Cap Core Fund
Institutional Shares | BDSIX
Annual Shareholder Report — May 31, 2024
BDSIX-05/24-AR
BlackRock Advantage Small Cap Core Fund
Investor A Shares | BDSAX
Annual Shareholder Report — May 31, 2024
This annual shareholder report contains important information about BlackRock Advantage Small Cap Core Fund (the “Fund”) for the period of June 1, 2023 to May 31, 2024. You can find additional information about the Fund at blackrock.com/fundreports. You can also request this information by contacting us at (800) 441‑7762.
What were the Fund costs for the last year?
(based on a hypothetical $10,000 investment)
| Class name | Costs of a $10,000
investment | Costs paid as a percentage of a
$10,000 investment |
| Investor A Shares | $84 | 0.75% |
How did the Fund perform last year?
U.S. equities broadly moved higher as the reporting period progressed, resulting in significant positive returns across most market segments.
Fears of a U.S. recession waned while major overseas economies returned to positive growth.
Signs of easing inflation led to expectations that the U.S. Federal Reserve and other leading central banks were poised to reduce interest rates, driving outperformance by mega-cap growth stocks within information technology and communications services.
What contributed to performance?
Positive contributions to performance, relative to the benchmark (Russell 2000® Index) were led by fundamental and sentiment insights. Within fundamental measures, traditional valuation insights evaluating a company’s sales value worked well within the industrials and financials sectors. Within sentiment insights, measures of text-based trends along with retail investor and smart money flows supported stock selection across the industrials and energy sectors. Finally, while performance from macro measures was mixed overall, insights looking at inventory levels drove successful positioning within the consumer discretionary sector.
What detracted from performance?
The largest detractors from relative performance included fundamental quality insights, most notably defensive quality measures focusing on cash flows and debt maturities which drove unsuccessful stock selection within healthcare amid enthusiasm around the use of GLP-1 drugs for weight loss. Nontraditional measures with a preference for founder-led company management also detracted.
The views expressed reflect the opinions of BlackRock as of the date of this report and are subject to change based on changes in market, economic or other conditions. These views are not intended to be a forecast of future events and are no guarantee of future results.
Fund performance
Cumulative performance: June 1, 2014 through May 31, 2024
Initial investment of $10,000
See “Average annual total returns” for additional information on fund performance.
Average annual total returns
| 1 Year | 5 Years | 10 Years |
| Investor A Shares | 24.42% | 9.57% | 8.23% |
| Investor A Shares (with sales charge) | 17.89% | 8.39% | 7.65% |
| Russell 3000® Index | 27.58% | 15.00% | 12.09% |
| Russell 2000® Index | 20.12% | 8.61% | 7.66% |
| Net Assets | $3,514,797,540% |
| Number of Portfolio Holdings | $781% |
| Net Investment Advisory Fees | $13,668,396% |
| Portfolio Turnover Rate | $75% |
Assuming maximum sales charges. Average annual total returns with and without sales charges reflect reductions for service fees.
Past performance is not an indication of future results. Performance results may include adjustments made for financial reporting purposes in accordance with U.S. generally accepted accounting principles. Performance results do not reflect the deduction of taxes that a shareholder would pay on fund distributions or on the redemption or sale of fund shares. Visit blackrock.com for more recent performance information.
What did the Fund invest in?
(as of May 31, 2024)
| Sector(a) | Percent of
Net Assets |
| Industrials | 18.5)% |
| Health Care | 16.0)% |
| Information Technology | 15.7)% |
| Financials | 14.2)% |
| Consumer Discretionary | 11.7)% |
| Energy | 6.5)% |
| Real Estate | 4.5)% |
| Materials | 4.0)% |
| Consumer Staples | 3.0)% |
| Communication Services | 2.9)% |
| Utilities | 2.2)% |
| Short-Term Securities | 5.3)% |
| Liabilities in Excess of Other Assets | (4.5)% |
| Security(b) | Percent of
Net Assets |
| Super Micro Computer, Inc. | 1.4% |
| Boise Cascade Co. | 1.1% |
| Flowserve Corp. | 1.0% |
| SM Energy Co. | 0.8% |
| Plains GP Holdings LP, Class A | 0.8% |
| Murphy Oil Corp. | 0.8% |
| Reinsurance Group of America, Inc. | 0.7% |
| EMCOR Group, Inc. | 0.7% |
| Sanmina Corp. | 0.7% |
| Laureate Education, Inc., Class A | 0.7% |
(a) | For purposes of this report, sector sub-classifications may differ from those utilized for compliance purposes. |
(b) | Excludes short-term securities. |
Additional information
If you wish to view additional information about the Fund, including but not limited to financial statements, the Fund’s prospectus, and proxy voting policies and procedures, please visit blackrock.com/fundreports. For proxy voting records, visit blackrock.com/proxyrecords.
Householding
The Fund will mail only one copy of shareholder documents, including prospectuses, annual and semi-annual reports and proxy statements, to shareholders with multiple accounts at the same address. This practice is commonly called “householding” and is intended to reduce expenses and eliminate duplicate mailings of shareholder documents. Mailings of your shareholder documents may be householded indefinitely unless you instruct us otherwise. If you do not want the mailing of these documents to be combined with those for other members of your household, please call the Fund at (800) 441-7762.
The Fund is not sponsored, endorsed, issued, sold, or promoted by FTSE International Limited and its affiliates, nor does this company make any representation regarding the advisability of investing in the Fund. BlackRock is not affiliated with the company listed above.
©2024 BlackRock, Inc. or its affiliates. All rights reserved. BLACKROCK is a registered trademark of BlackRock, Inc. or its affiliates. All other trademarks are those of their respective owners.
BlackRock Advantage Small Cap Core Fund
Investor A Shares | BDSAX
Annual Shareholder Report — May 31, 2024
BDSAX-05/24-AR
BlackRock Advantage Small Cap Core Fund
Investor C Shares | BDSCX
Annual Shareholder Report — May 31, 2024
This annual shareholder report contains important information about BlackRock Advantage Small Cap Core Fund (the “Fund”) for the period of June 1, 2023 to May 31, 2024. You can find additional information about the Fund at blackrock.com/fundreports. You can also request this information by contacting us at (800) 441‑7762.
What were the Fund costs for the last year?
(based on a hypothetical $10,000 investment)
| Class name | Costs of a $10,000
investment | Costs paid as a percentage of a
$10,000 investment |
| Investor C Shares | $168 | 1.50% |
How did the Fund perform last year?
U.S. equities broadly moved higher as the reporting period progressed, resulting in significant positive returns across most market segments.
Fears of a U.S. recession waned while major overseas economies returned to positive growth.
Signs of easing inflation led to expectations that the U.S. Federal Reserve and other leading central banks were poised to reduce interest rates, driving outperformance by mega-cap growth stocks within information technology and communications services.
What contributed to performance?
Positive contributions to performance, relative to the benchmark (Russell 2000® Index) were led by fundamental and sentiment insights. Within fundamental measures, traditional valuation insights evaluating a company’s sales value worked well within the industrials and financials sectors. Within sentiment insights, measures of text-based trends along with retail investor and smart money flows supported stock selection across the industrials and energy sectors. Finally, while performance from macro measures was mixed overall, insights looking at inventory levels drove successful positioning within the consumer discretionary sector.
What detracted from performance?
The largest detractors from relative performance included fundamental quality insights, most notably defensive quality measures focusing on cash flows and debt maturities which drove unsuccessful stock selection within healthcare amid enthusiasm around the use of GLP-1 drugs for weight loss. Nontraditional measures with a preference for founder-led company management also detracted.
The views expressed reflect the opinions of BlackRock as of the date of this report and are subject to change based on changes in market, economic or other conditions. These views are not intended to be a forecast of future events and are no guarantee of future results.
Fund performance
Cumulative performance: June 1, 2014 through May 31, 2024
Initial investment of $10,000
See “Average annual total returns” for additional information on fund performance.
Average annual total returns
| 1 Year | 5 Years | 10 Years |
| Investor C Shares | 23.55% | 8.74% | 7.58% |
| Investor C Shares (with sales charge) | 22.55% | 8.74% | 7.58% |
| Russell 3000® Index | 27.58% | 15.00% | 12.09% |
| Russell 2000® Index | 20.12% | 8.61% | 7.66% |
| Net Assets | $3,514,797,540% |
| Number of Portfolio Holdings | $781% |
| Net Investment Advisory Fees | $13,668,396% |
| Portfolio Turnover Rate | $75% |
Assuming maximum sales charges. Average annual total returns with and without sales charges reflect reductions for distribution and service fees.
Past performance is not an indication of future results. Performance results may include adjustments made for financial reporting purposes in accordance with U.S. generally accepted accounting principles. Performance results do not reflect the deduction of taxes that a shareholder would pay on fund distributions or on the redemption or sale of fund shares. Visit blackrock.com for more recent performance information.
What did the Fund invest in?
(as of May 31, 2024)
| Sector(a) | Percent of
Net Assets |
| Industrials | 18.5)% |
| Health Care | 16.0)% |
| Information Technology | 15.7)% |
| Financials | 14.2)% |
| Consumer Discretionary | 11.7)% |
| Energy | 6.5)% |
| Real Estate | 4.5)% |
| Materials | 4.0)% |
| Consumer Staples | 3.0)% |
| Communication Services | 2.9)% |
| Utilities | 2.2)% |
| Short-Term Securities | 5.3)% |
| Liabilities in Excess of Other Assets | (4.5)% |
| Security(b) | Percent of
Net Assets |
| Super Micro Computer, Inc. | 1.4% |
| Boise Cascade Co. | 1.1% |
| Flowserve Corp. | 1.0% |
| SM Energy Co. | 0.8% |
| Plains GP Holdings LP, Class A | 0.8% |
| Murphy Oil Corp. | 0.8% |
| Reinsurance Group of America, Inc. | 0.7% |
| EMCOR Group, Inc. | 0.7% |
| Sanmina Corp. | 0.7% |
| Laureate Education, Inc., Class A | 0.7% |
(a) | For purposes of this report, sector sub-classifications may differ from those utilized for compliance purposes. |
(b) | Excludes short-term securities. |
Additional information
If you wish to view additional information about the Fund, including but not limited to financial statements, the Fund’s prospectus, and proxy voting policies and procedures, please visit blackrock.com/fundreports. For proxy voting records, visit blackrock.com/proxyrecords.
Householding
The Fund will mail only one copy of shareholder documents, including prospectuses, annual and semi-annual reports and proxy statements, to shareholders with multiple accounts at the same address. This practice is commonly called “householding” and is intended to reduce expenses and eliminate duplicate mailings of shareholder documents. Mailings of your shareholder documents may be householded indefinitely unless you instruct us otherwise. If you do not want the mailing of these documents to be combined with those for other members of your household, please call the Fund at (800) 441-7762.
The Fund is not sponsored, endorsed, issued, sold, or promoted by FTSE International Limited and its affiliates, nor does this company make any representation regarding the advisability of investing in the Fund. BlackRock is not affiliated with the company listed above.
©2024 BlackRock, Inc. or its affiliates. All rights reserved. BLACKROCK is a registered trademark of BlackRock, Inc. or its affiliates. All other trademarks are those of their respective owners.
BlackRock Advantage Small Cap Core Fund
Investor C Shares | BDSCX
Annual Shareholder Report — May 31, 2024
BDSCX-05/24-AR
BlackRock Advantage Small Cap Core Fund
Class K Shares | BDSKX
Annual Shareholder Report — May 31, 2024
This annual shareholder report contains important information about BlackRock Advantage Small Cap Core Fund (the “Fund”) for the period of June 1, 2023 to May 31, 2024. You can find additional information about the Fund at blackrock.com/fundreports. You can also request this information by contacting us at (800) 441‑7762.
What were the Fund costs for the last year?
(based on a hypothetical $10,000 investment)
| Class name | Costs of a $10,000
investment | Costs paid as a percentage of a
$10,000 investment |
| Class K Shares | $51 | 0.45% |
How did the Fund perform last year?
U.S. equities broadly moved higher as the reporting period progressed, resulting in significant positive returns across most market segments.
Fears of a U.S. recession waned while major overseas economies returned to positive growth.
Signs of easing inflation led to expectations that the U.S. Federal Reserve and other leading central banks were poised to reduce interest rates, driving outperformance by mega-cap growth stocks within information technology and communications services.
What contributed to performance?
Positive contributions to performance, relative to the benchmark (Russell 2000® Index) were led by fundamental and sentiment insights. Within fundamental measures, traditional valuation insights evaluating a company’s sales value worked well within the industrials and financials sectors. Within sentiment insights, measures of text-based trends along with retail investor and smart money flows supported stock selection across the industrials and energy sectors. Finally, while performance from macro measures was mixed overall, insights looking at inventory levels drove successful positioning within the consumer discretionary sector.
What detracted from performance?
The largest detractors from relative performance included fundamental quality insights, most notably defensive quality measures focusing on cash flows and debt maturities which drove unsuccessful stock selection within healthcare amid enthusiasm around the use of GLP-1 drugs for weight loss. Nontraditional measures with a preference for founder-led company management also detracted.
The views expressed reflect the opinions of BlackRock as of the date of this report and are subject to change based on changes in market, economic or other conditions. These views are not intended to be a forecast of future events and are no guarantee of future results.
Fund performance
Cumulative performance: June 1, 2014 through May 31, 2024
Initial investment of $10,000
See “Average annual total returns” for additional information on fund performance.
Average annual total returns
| 1 Year | 5 Years | 10 Years |
| Class K Shares | 24.80% | 9.90% | 8.54% |
| Russell 3000® Index | 27.58% | 15.00% | 12.09% |
| Russell 2000® Index | 20.12% | 8.61% | 7.66% |
| Net Assets | $3,514,797,540% |
| Number of Portfolio Holdings | $781% |
| Net Investment Advisory Fees | $13,668,396% |
| Portfolio Turnover Rate | $75% |
Performance shown prior to the Class K Shares inception date of March 28, 2016 is that of Institutional Shares. The performance of the Class K Shares would be substantially similar to Institutional Shares because Class K Shares and Institutional Shares invest in the same portfolio of securities and performance would only differ to the extent that Class K Shares and Institutional Shares have different expenses. The actual returns of Class K Shares would have been higher than those of the Institutional Shares because Class K Shares have lower expenses than the Institutional Shares.
Past performance is not an indication of future results. Performance results may include adjustments made for financial reporting purposes in accordance with U.S. generally accepted accounting principles. Performance results do not reflect the deduction of taxes that a shareholder would pay on fund distributions or on the redemption or sale of fund shares. Visit blackrock.com for more recent performance information.
What did the Fund invest in?
(as of May 31, 2024)
| Sector(a) | Percent of
Net Assets |
| Industrials | 18.5)% |
| Health Care | 16.0)% |
| Information Technology | 15.7)% |
| Financials | 14.2)% |
| Consumer Discretionary | 11.7)% |
| Energy | 6.5)% |
| Real Estate | 4.5)% |
| Materials | 4.0)% |
| Consumer Staples | 3.0)% |
| Communication Services | 2.9)% |
| Utilities | 2.2)% |
| Short-Term Securities | 5.3)% |
| Liabilities in Excess of Other Assets | (4.5)% |
| Security(b) | Percent of
Net Assets |
| Super Micro Computer, Inc. | 1.4% |
| Boise Cascade Co. | 1.1% |
| Flowserve Corp. | 1.0% |
| SM Energy Co. | 0.8% |
| Plains GP Holdings LP, Class A | 0.8% |
| Murphy Oil Corp. | 0.8% |
| Reinsurance Group of America, Inc. | 0.7% |
| EMCOR Group, Inc. | 0.7% |
| Sanmina Corp. | 0.7% |
| Laureate Education, Inc., Class A | 0.7% |
(a) | For purposes of this report, sector sub-classifications may differ from those utilized for compliance purposes. |
(b) | Excludes short-term securities. |
Additional information
If you wish to view additional information about the Fund, including but not limited to financial statements, the Fund’s prospectus, and proxy voting policies and procedures, please visit blackrock.com/fundreports. For proxy voting records, visit blackrock.com/proxyrecords.
Householding
The Fund will mail only one copy of shareholder documents, including prospectuses, annual and semi-annual reports and proxy statements, to shareholders with multiple accounts at the same address. This practice is commonly called “householding” and is intended to reduce expenses and eliminate duplicate mailings of shareholder documents. Mailings of your shareholder documents may be householded indefinitely unless you instruct us otherwise. If you do not want the mailing of these documents to be combined with those for other members of your household, please call the Fund at (800) 441-7762.
The Fund is not sponsored, endorsed, issued, sold, or promoted by FTSE International Limited and its affiliates, nor does this company make any representation regarding the advisability of investing in the Fund. BlackRock is not affiliated with the company listed above.
©2024 BlackRock, Inc. or its affiliates. All rights reserved. BLACKROCK is a registered trademark of BlackRock, Inc. or its affiliates. All other trademarks are those of their respective owners.
BlackRock Advantage Small Cap Core Fund
Class K Shares | BDSKX
Annual Shareholder Report — May 31, 2024
BDSKX-05/24-AR
BlackRock Commodity Strategies Fund
Institutional Shares | BICSX
Annual Shareholder Report — May 31, 2024
This annual shareholder report contains important information about BlackRock Commodity Strategies Fund (the “Fund”) for the period of June 1, 2023 to May 31, 2024. You can find additional information about the Fund at blackrock.com/fundreports. You can also request this information by contacting us at (800) 441‑7762.
What were the Fund costs for the last year?
(based on a hypothetical $10,000 investment)
| Class name | Costs of a $10,000
investment | Costs paid as a percentage of a
$10,000 investment |
| Institutional Shares | $76 | 0.72% |
How did the Fund perform last year?
Commodities produced a strong, broad-based gain during the reporting period, reflecting positive supply-and-demand trends.
Natural resource stocks delivered robust returns, albeit with elevated volatility, thanks to the gains in both commodity prices and the equity market more broadly.
What contributed to performance?
The Fund invested in both commodity derivatives and natural resources equities, with a weighting of approximately 50% in each. Positions in energy stocks delivered the most meaningful outperformance, as the Fund’s holdings in some of the larger integrated energy companies benefitted from robust oil prices. The Fund’s holdings in precious metals (both commodity-linked derivatives and mining companies) also delivered strong relative returns. The gold price increased approximately 20% over the period, driven by strong investment demand and plateauing interest rates. The Fund’s cash position had no material impact on performance.
What detracted from performance?
The Fund’s holdings in agriculture stocks detracted. While grain prices were relatively rangebound, companies with exposure to the onshore China market came under pressure.
The views expressed reflect the opinions of BlackRock as of the date of this report and are subject to change based on changes in market, economic or other conditions. These views are not intended to be a forecast of future events and are no guarantee of future results.
Fund performance
Cumulative performance: June 1, 2014 through May 31, 2024
Initial investment of $10,000
See “Average annual total returns” for additional information on fund performance.
Average annual total returns
| 1 Year | 5 Years | 10 Years |
| Institutional Shares | 12.30% | 10.19% | 1.67)% |
| MSCI All Country World Index | 23.56% | 11.68% | 8.40)% |
| Bloomberg Commodity Index Total ReturnSM | 10.95% | 8.15% | (1.08)% |
| Net Assets | $680,078,745% |
| Number of Portfolio Holdings | $207% |
| Net Investment Advisory Fees | $4,802,627% |
| Portfolio Turnover Rate | $53% |
Past performance is not an indication of future results. Performance results may include adjustments made for financial reporting purposes in accordance with U.S. generally accepted accounting principles. Performance results do not reflect the deduction of taxes that a shareholder would pay on fund distributions or on the redemption or sale of fund shares. Visit blackrock.com for more recent performance information.
What did the Fund invest in?
(as of May 31, 2024)
| Sector(a) | Percent of
Net Assets |
| Materials | 26.0)% |
| Energy | 18.5)% |
| Consumer Staples | 2.3)% |
| Industrials | 1.3)% |
| Health Care | 0.8)% |
| Consumer Discretionary | 0.6)% |
| Financials | 0.1)% |
| Short-Term Securities | 51.4)% |
| Liabilities in Excess of Other Assets | (1.0)% |
| Security(b) | Percent of
Net Assets |
| Exxon Mobil Corp. | 3.7% |
| Shell PLC | 1.9% |
| Wheaton Precious Metals Corp. | 1.4% |
| Agnico Eagle Mines Ltd. | 1.4% |
| Chevron Corp. | 1.4% |
| Barrick Gold Corp. | 1.2% |
| Glencore PLC | 1.2% |
| Newmont Corp. | 1.1% |
| BP PLC | 1.1% |
| Rio Tinto PLC | 1.0% |
(a) | For purposes of this report, sector sub-classifications may differ from those utilized for compliance purposes. |
(b) | Excludes short-term securities. |
Additional information
If you wish to view additional information about the Fund, including but not limited to financial statements, the Fund’s prospectus, and proxy voting policies and procedures, please visit blackrock.com/fundreports. For proxy voting records, visit blackrock.com/proxyrecords.
Householding
The Fund will mail only one copy of shareholder documents, including prospectuses, annual and semi-annual reports and proxy statements, to shareholders with multiple accounts at the same address. This practice is commonly called “householding” and is intended to reduce expenses and eliminate duplicate mailings of shareholder documents. Mailings of your shareholder documents may be householded indefinitely unless you instruct us otherwise. If you do not want the mailing of these documents to be combined with those for other members of your household, please call the Fund at (800) 441-7762.
The Fund is not sponsored, endorsed, issued, sold, or promoted by Bloomberg Index Services Limited, MSCI, Inc., and their respective affiliates, nor do these companies make any representation regarding the advisability of investing in the Fund. BlackRock is not affiliated with the companies listed above.
©2024 BlackRock, Inc. or its affiliates. All rights reserved. BLACKROCK is a registered trademark of BlackRock, Inc. or its affiliates. All other trademarks are those of their respective owners.
BlackRock Commodity Strategies Fund
Institutional Shares | BICSX
Annual Shareholder Report — May 31, 2024
BICSX-05/24-AR
BlackRock Commodity Strategies Fund
Investor A Shares | BCSAX
Annual Shareholder Report — May 31, 2024
This annual shareholder report contains important information about BlackRock Commodity Strategies Fund (the “Fund”) for the period of June 1, 2023 to May 31, 2024. You can find additional information about the Fund at blackrock.com/fundreports. You can also request this information by contacting us at (800) 441‑7762.
What were the Fund costs for the last year?
(based on a hypothetical $10,000 investment)
| Class name | Costs of a $10,000
investment | Costs paid as a percentage of a
$10,000 investment |
| Investor A Shares | $103 | 0.97% |
How did the Fund perform last year?
Commodities produced a strong, broad-based gain during the reporting period, reflecting positive supply-and-demand trends.
Natural resource stocks delivered robust returns, albeit with elevated volatility, thanks to the gains in both commodity prices and the equity market more broadly.
What contributed to performance?
The Fund invested in both commodity derivatives and natural resources equities, with a weighting of approximately 50% in each. Positions in energy stocks delivered the most meaningful outperformance, as the Fund’s holdings in some of the larger integrated energy companies benefitted from robust oil prices. The Fund’s holdings in precious metals (both commodity-linked derivatives and mining companies) also delivered strong relative returns. The gold price increased approximately 20% over the period, driven by strong investment demand and plateauing interest rates. The Fund’s cash position had no material impact on performance.
What detracted from performance?
The Fund’s holdings in agriculture stocks detracted. While grain prices were relatively rangebound, companies with exposure to the onshore China market came under pressure.
The views expressed reflect the opinions of BlackRock as of the date of this report and are subject to change based on changes in market, economic or other conditions. These views are not intended to be a forecast of future events and are no guarantee of future results.
Fund performance
Cumulative performance: June 1, 2014 through May 31, 2024
Initial investment of $10,000
See “Average annual total returns” for additional information on fund performance.
Average annual total returns
| 1 Year | 5 Years | 10 Years |
| Investor A Shares | 12.12% | 9.92% | 1.43)% |
| Investor A Shares (with sales charge) | 6.24% | 8.74% | 0.89)% |
| MSCI All Country World Index | 23.56% | 11.68% | 8.40)% |
| Bloomberg Commodity Index Total ReturnSM | 10.95% | 8.15% | (1.08)% |
| Net Assets | $680,078,745% |
| Number of Portfolio Holdings | $207% |
| Net Investment Advisory Fees | $4,802,627% |
| Portfolio Turnover Rate | $53% |
Assuming maximum sales charges. Average annual total returns with and without sales charges reflect reductions for service fees.
Past performance is not an indication of future results. Performance results may include adjustments made for financial reporting purposes in accordance with U.S. generally accepted accounting principles. Performance results do not reflect the deduction of taxes that a shareholder would pay on fund distributions or on the redemption or sale of fund shares. Visit blackrock.com for more recent performance information.
What did the Fund invest in?
(as of May 31, 2024)
| Sector(a) | Percent of
Net Assets |
| Materials | 26.0)% |
| Energy | 18.5)% |
| Consumer Staples | 2.3)% |
| Industrials | 1.3)% |
| Health Care | 0.8)% |
| Consumer Discretionary | 0.6)% |
| Financials | 0.1)% |
| Short-Term Securities | 51.4)% |
| Liabilities in Excess of Other Assets | (1.0)% |
| Security(b) | Percent of
Net Assets |
| Exxon Mobil Corp. | 3.7% |
| Shell PLC | 1.9% |
| Wheaton Precious Metals Corp. | 1.4% |
| Agnico Eagle Mines Ltd. | 1.4% |
| Chevron Corp. | 1.4% |
| Barrick Gold Corp. | 1.2% |
| Glencore PLC | 1.2% |
| Newmont Corp. | 1.1% |
| BP PLC | 1.1% |
| Rio Tinto PLC | 1.0% |
(a) | For purposes of this report, sector sub-classifications may differ from those utilized for compliance purposes. |
(b) | Excludes short-term securities. |
Additional information
If you wish to view additional information about the Fund, including but not limited to financial statements, the Fund’s prospectus, and proxy voting policies and procedures, please visit blackrock.com/fundreports. For proxy voting records, visit blackrock.com/proxyrecords.
Householding
The Fund will mail only one copy of shareholder documents, including prospectuses, annual and semi-annual reports and proxy statements, to shareholders with multiple accounts at the same address. This practice is commonly called “householding” and is intended to reduce expenses and eliminate duplicate mailings of shareholder documents. Mailings of your shareholder documents may be householded indefinitely unless you instruct us otherwise. If you do not want the mailing of these documents to be combined with those for other members of your household, please call the Fund at (800) 441-7762.
The Fund is not sponsored, endorsed, issued, sold, or promoted by Bloomberg Index Services Limited, MSCI, Inc., and their respective affiliates, nor do these companies make any representation regarding the advisability of investing in the Fund. BlackRock is not affiliated with the companies listed above.
©2024 BlackRock, Inc. or its affiliates. All rights reserved. BLACKROCK is a registered trademark of BlackRock, Inc. or its affiliates. All other trademarks are those of their respective owners.
BlackRock Commodity Strategies Fund
Investor A Shares | BCSAX
Annual Shareholder Report — May 31, 2024
BCSAX-05/24-AR
BlackRock Commodity Strategies Fund
Investor C Shares | BCSCX
Annual Shareholder Report — May 31, 2024
This annual shareholder report contains important information about BlackRock Commodity Strategies Fund (the “Fund”) for the period of June 1, 2023 to May 31, 2024. You can find additional information about the Fund at blackrock.com/fundreports. You can also request this information by contacting us at (800) 441‑7762.
What were the Fund costs for the last year?
(based on a hypothetical $10,000 investment)
| Class name | Costs of a $10,000
investment | Costs paid as a percentage of a
$10,000 investment |
| Investor C Shares | $182 | 1.72% |
How did the Fund perform last year?
Commodities produced a strong, broad-based gain during the reporting period, reflecting positive supply-and-demand trends.
Natural resource stocks delivered robust returns, albeit with elevated volatility, thanks to the gains in both commodity prices and the equity market more broadly.
What contributed to performance?
The Fund invested in both commodity derivatives and natural resources equities, with a weighting of approximately 50% in each. Positions in energy stocks delivered the most meaningful outperformance, as the Fund’s holdings in some of the larger integrated energy companies benefitted from robust oil prices. The Fund’s holdings in precious metals (both commodity-linked derivatives and mining companies) also delivered strong relative returns. The gold price increased approximately 20% over the period, driven by strong investment demand and plateauing interest rates. The Fund’s cash position had no material impact on performance.
What detracted from performance?
The Fund’s holdings in agriculture stocks detracted. While grain prices were relatively rangebound, companies with exposure to the onshore China market came under pressure.
The views expressed reflect the opinions of BlackRock as of the date of this report and are subject to change based on changes in market, economic or other conditions. These views are not intended to be a forecast of future events and are no guarantee of future results.
Fund performance
Cumulative performance: June 1, 2014 through May 31, 2024
Initial investment of $10,000
See “Average annual total returns” for additional information on fund performance.
Average annual total returns
| 1 Year | 5 Years | 10 Years |
| Investor C Shares | 11.29% | 9.12% | 0.82)% |
| Investor C Shares (with sales charge) | 10.29% | 9.12% | 0.82)% |
| MSCI All Country World Index | 23.56% | 11.68% | 8.40)% |
| Bloomberg Commodity Index Total ReturnSM | 10.95% | 8.15% | (1.08)% |
| Net Assets | $680,078,745% |
| Number of Portfolio Holdings | $207% |
| Net Investment Advisory Fees | $4,802,627% |
| Portfolio Turnover Rate | $53% |
Assuming maximum sales charges. Average annual total returns with and without sales charges reflect reductions for distribution and service fees.
Past performance is not an indication of future results. Performance results may include adjustments made for financial reporting purposes in accordance with U.S. generally accepted accounting principles. Performance results do not reflect the deduction of taxes that a shareholder would pay on fund distributions or on the redemption or sale of fund shares. Visit blackrock.com for more recent performance information.
What did the Fund invest in?
(as of May 31, 2024)
| Sector(a) | Percent of
Net Assets |
| Materials | 26.0)% |
| Energy | 18.5)% |
| Consumer Staples | 2.3)% |
| Industrials | 1.3)% |
| Health Care | 0.8)% |
| Consumer Discretionary | 0.6)% |
| Financials | 0.1)% |
| Short-Term Securities | 51.4)% |
| Liabilities in Excess of Other Assets | (1.0)% |
| Security(b) | Percent of
Net Assets |
| Exxon Mobil Corp. | 3.7% |
| Shell PLC | 1.9% |
| Wheaton Precious Metals Corp. | 1.4% |
| Agnico Eagle Mines Ltd. | 1.4% |
| Chevron Corp. | 1.4% |
| Barrick Gold Corp. | 1.2% |
| Glencore PLC | 1.2% |
| Newmont Corp. | 1.1% |
| BP PLC | 1.1% |
| Rio Tinto PLC | 1.0% |
(a) | For purposes of this report, sector sub-classifications may differ from those utilized for compliance purposes. |
(b) | Excludes short-term securities. |
Additional information
If you wish to view additional information about the Fund, including but not limited to financial statements, the Fund’s prospectus, and proxy voting policies and procedures, please visit blackrock.com/fundreports. For proxy voting records, visit blackrock.com/proxyrecords.
Householding
The Fund will mail only one copy of shareholder documents, including prospectuses, annual and semi-annual reports and proxy statements, to shareholders with multiple accounts at the same address. This practice is commonly called “householding” and is intended to reduce expenses and eliminate duplicate mailings of shareholder documents. Mailings of your shareholder documents may be householded indefinitely unless you instruct us otherwise. If you do not want the mailing of these documents to be combined with those for other members of your household, please call the Fund at (800) 441-7762.
The Fund is not sponsored, endorsed, issued, sold, or promoted by Bloomberg Index Services Limited, MSCI, Inc., and their respective affiliates, nor do these companies make any representation regarding the advisability of investing in the Fund. BlackRock is not affiliated with the companies listed above.
©2024 BlackRock, Inc. or its affiliates. All rights reserved. BLACKROCK is a registered trademark of BlackRock, Inc. or its affiliates. All other trademarks are those of their respective owners.
BlackRock Commodity Strategies Fund
Investor C Shares | BCSCX
Annual Shareholder Report — May 31, 2024
BCSCX-05/24-AR
BlackRock Commodity Strategies Fund
Class K Shares | BCSKX
Annual Shareholder Report — May 31, 2024
This annual shareholder report contains important information about BlackRock Commodity Strategies Fund (the “Fund”) for the period of June 1, 2023 to May 31, 2024. You can find additional information about the Fund at blackrock.com/fundreports. You can also request this information by contacting us at (800) 441‑7762.
What were the Fund costs for the last year?
(based on a hypothetical $10,000 investment)
| Class name | Costs of a $10,000
investment | Costs paid as a percentage of a
$10,000 investment |
| Class K Shares | $71 | 0.67% |
How did the Fund perform last year?
Commodities produced a strong, broad-based gain during the reporting period, reflecting positive supply-and-demand trends.
Natural resource stocks delivered robust returns, albeit with elevated volatility, thanks to the gains in both commodity prices and the equity market more broadly.
What contributed to performance?
The Fund invested in both commodity derivatives and natural resources equities, with a weighting of approximately 50% in each. Positions in energy stocks delivered the most meaningful outperformance, as the Fund’s holdings in some of the larger integrated energy companies benefitted from robust oil prices. The Fund’s holdings in precious metals (both commodity-linked derivatives and mining companies) also delivered strong relative returns. The gold price increased approximately 20% over the period, driven by strong investment demand and plateauing interest rates. The Fund’s cash position had no material impact on performance.
What detracted from performance?
The Fund’s holdings in agriculture stocks detracted. While grain prices were relatively rangebound, companies with exposure to the onshore China market came under pressure.
The views expressed reflect the opinions of BlackRock as of the date of this report and are subject to change based on changes in market, economic or other conditions. These views are not intended to be a forecast of future events and are no guarantee of future results.
Fund performance
Cumulative performance: June 1, 2014 through May 31, 2024
Initial investment of $10,000
See “Average annual total returns” for additional information on fund performance.
Average annual total returns
| 1 Year | 5 Years | 10 Years |
| Class K Shares | 12.49% | 10.27% | 1.71)% |
| MSCI All Country World Index | 23.56% | 11.68% | 8.40)% |
| Bloomberg Commodity Index Total ReturnSM | 10.95% | 8.15% | (1.08)% |
| Net Assets | $680,078,745% |
| Number of Portfolio Holdings | $207% |
| Net Investment Advisory Fees | $4,802,627% |
| Portfolio Turnover Rate | $53% |
Performance shown prior to the Class K Shares inception date of January 25, 2018 is that of Institutional Shares. The performance of the Class K Shares would be substantially similar to Institutional Shares because Class K Shares and Institutional Shares invest in the same portfolio of securities and performance would only differ to the extent that Class K Shares and Institutional Shares have different expenses. The actual returns of Class K Shares would have been higher than those of the Institutional Shares because Class K Shares have lower expenses than the Institutional Shares.
Past performance is not an indication of future results. Performance results may include adjustments made for financial reporting purposes in accordance with U.S. generally accepted accounting principles. Performance results do not reflect the deduction of taxes that a shareholder would pay on fund distributions or on the redemption or sale of fund shares. Visit blackrock.com for more recent performance information.
What did the Fund invest in?
(as of May 31, 2024)
| Sector(a) | Percent of
Net Assets |
| Materials | 26.0)% |
| Energy | 18.5)% |
| Consumer Staples | 2.3)% |
| Industrials | 1.3)% |
| Health Care | 0.8)% |
| Consumer Discretionary | 0.6)% |
| Financials | 0.1)% |
| Short-Term Securities | 51.4)% |
| Liabilities in Excess of Other Assets | (1.0)% |
| Security(b) | Percent of
Net Assets |
| Exxon Mobil Corp. | 3.7% |
| Shell PLC | 1.9% |
| Wheaton Precious Metals Corp. | 1.4% |
| Agnico Eagle Mines Ltd. | 1.4% |
| Chevron Corp. | 1.4% |
| Barrick Gold Corp. | 1.2% |
| Glencore PLC | 1.2% |
| Newmont Corp. | 1.1% |
| BP PLC | 1.1% |
| Rio Tinto PLC | 1.0% |
(a) | For purposes of this report, sector sub-classifications may differ from those utilized for compliance purposes. |
(b) | Excludes short-term securities. |
Additional information
If you wish to view additional information about the Fund, including but not limited to financial statements, the Fund’s prospectus, and proxy voting policies and procedures, please visit blackrock.com/fundreports. For proxy voting records, visit blackrock.com/proxyrecords.
Householding
The Fund will mail only one copy of shareholder documents, including prospectuses, annual and semi-annual reports and proxy statements, to shareholders with multiple accounts at the same address. This practice is commonly called “householding” and is intended to reduce expenses and eliminate duplicate mailings of shareholder documents. Mailings of your shareholder documents may be householded indefinitely unless you instruct us otherwise. If you do not want the mailing of these documents to be combined with those for other members of your household, please call the Fund at (800) 441-7762.
The Fund is not sponsored, endorsed, issued, sold, or promoted by Bloomberg Index Services Limited, MSCI, Inc., and their respective affiliates, nor do these companies make any representation regarding the advisability of investing in the Fund. BlackRock is not affiliated with the companies listed above.
©2024 BlackRock, Inc. or its affiliates. All rights reserved. BLACKROCK is a registered trademark of BlackRock, Inc. or its affiliates. All other trademarks are those of their respective owners.
BlackRock Commodity Strategies Fund
Class K Shares | BCSKX
Annual Shareholder Report — May 31, 2024
BCSKX-05/24-AR
BlackRock Energy Opportunities Fund
Institutional Shares | BACIX
Annual Shareholder Report — May 31, 2024
This annual shareholder report contains important information about BlackRock Energy Opportunities Fund (the “Fund”) for the period of June 1, 2023 to May 31, 2024. You can find additional information about the Fund at blackrock.com/fundreports. You can also request this information by contacting us at (800) 441‑7762.
What were the Fund costs for the last year?
(based on a hypothetical $10,000 investment)
| Class name | Costs of a $10,000
investment | Costs paid as a percentage of a
$10,000 investment |
| Institutional Shares | $103 | 0.91% |
How did the Fund perform last year?
Global equities produced strong performance behind resilient economic data, steady corporate earnings, and expectations that the U.S. Federal Reserve would begin to cut interest rates later in the year.
Energy stocks delivered robust returns, albeit with elevated volatility, thanks to gains in both crude oil prices and the equity market more broadly.
What contributed to performance?
A zero weighting in Woodside Energy Group, Ltd. Contributed to performance, as did an underweight in Chevron Corp. An overweight in the midstream distribution company Williams Cos. also contributed to relative performance given its significant exposure to natural gas pipelines.
What detracted from performance?
The Fund held no positions in the refining company Phillips66, which rallied due to moves from an activist investor, which detracted from performance. A zero weighting in the Canadian integrated oil company Suncor Energy, Inc. detracted, as the stock rose on the strength of higher oil prices. Lack of positions in the Canadian uranium producer Cameco Corp., was an additional detractor, as the United States’ ban on Russia uranium imports was seen as a positive for the company.
The views expressed reflect the opinions of BlackRock as of the date of this report and are subject to change based on changes in market, economic or other conditions. These views are not intended to be a forecast of future events and are no guarantee of future results.
Fund performance
Cumulative performance: June 1, 2014 through May 31, 2024
Initial investment of $10,000
See “Average annual total returns” for additional information on fund performance.
Average annual total returns
| 1 Year | 5 Years | 10 Years |
| Institutional Shares | 26.56% | 12.11% | 1.26% |
| MSCI All Country World Index | 23.56% | 11.68% | 8.40% |
| MSCI World Energy Index | 25.46% | 10.93% | 2.21% |
| Net Assets | $343,286,416% |
| Number of Portfolio Holdings | $32% |
| Net Investment Advisory Fees | $2,611,139% |
| Portfolio Turnover Rate | $35% |
Past performance is not an indication of future results. Performance results may include adjustments made for financial reporting purposes in accordance with U.S. generally accepted accounting principles. Performance results do not reflect the deduction of taxes that a shareholder would pay on fund distributions or on the redemption or sale of fund shares. Visit blackrock.com for more recent performance information.
What did the Fund invest in?
(as of May 31, 2024)
| Industry(a) | Percent of
Net Assets |
| Oil, Gas & Consumable Fuels | 91.1% |
| Energy Equipment & Services | 7.6% |
| Short-Term Securities | 0.8% |
| Other Assets Less Liabilities | 0.5% |
| Security(b) | Percent of
Net Assets |
| Exxon Mobil Corp. | 19.8% |
| Shell PLC | 10.5% |
| Chevron Corp. | 6.7% |
| BP PLC | 6.2% |
| ConocoPhillips | 5.4% |
| TotalEnergies SE | 4.5% |
| Canadian Natural Resources Ltd. | 4.4% |
| Hess Corp. | 4.3% |
| Marathon Petroleum Corp. | 3.6% |
| Valero Energy Corp. | 3.2% |
(a) | For purposes of this report, industry sub-classifications may differ from those utilized for compliance purposes. |
(b) | Excludes short-term securities. |
Additional information
If you wish to view additional information about the Fund, including but not limited to financial statements, the Fund’s prospectus, and proxy voting policies and procedures, please visit blackrock.com/fundreports. For proxy voting records, visit blackrock.com/proxyrecords.
Householding
The Fund will mail only one copy of shareholder documents, including prospectuses, annual and semi-annual reports and proxy statements, to shareholders with multiple accounts at the same address. This practice is commonly called “householding” and is intended to reduce expenses and eliminate duplicate mailings of shareholder documents. Mailings of your shareholder documents may be householded indefinitely unless you instruct us otherwise. If you do not want the mailing of these documents to be combined with those for other members of your household, please call the Fund at (800) 441-7762.
The Fund is not sponsored, endorsed, issued, sold, or promoted by MSCI Inc. and its affiliates, nor does this company make any representation regarding the advisability of investing in the Fund. BlackRock is not affiliated with the company listed above.
©2024 BlackRock, Inc. or its affiliates. All rights reserved. BLACKROCK is a registered trademark of BlackRock, Inc. or its affiliates. All other trademarks are those of their respective owners.
BlackRock Energy Opportunities Fund
Institutional Shares | BACIX
Annual Shareholder Report — May 31, 2024
BACIX-05/24-AR
BlackRock Energy Opportunities Fund
Investor A Shares | BACAX
Annual Shareholder Report — May 31, 2024
This annual shareholder report contains important information about BlackRock Energy Opportunities Fund (the “Fund”) for the period of June 1, 2023 to May 31, 2024. You can find additional information about the Fund at blackrock.com/fundreports. You can also request this information by contacting us at (800) 441‑7762.
What were the Fund costs for the last year?
(based on a hypothetical $10,000 investment)
| Class name | Costs of a $10,000
investment | Costs paid as a percentage of a
$10,000 investment |
| Investor A Shares | $149 | 1.32% |
How did the Fund perform last year?
Global equities produced strong performance behind resilient economic data, steady corporate earnings, and expectations that the U.S. Federal Reserve would begin to cut interest rates later in the year.
Energy stocks delivered robust returns, albeit with elevated volatility, thanks to gains in both crude oil prices and the equity market more broadly.
What contributed to performance?
A zero weighting in Woodside Energy Group, Ltd. Contributed to performance, as did an underweight in Chevron Corp. An overweight in the midstream distribution company Williams Cos. also contributed to relative performance given its significant exposure to natural gas pipelines.
What detracted from performance?
The Fund held no positions in the refining company Phillips66, which rallied due to moves from an activist investor, which detracted from performance. A zero weighting in the Canadian integrated oil company Suncor Energy, Inc. detracted, as the stock rose on the strength of higher oil prices. Lack of positions in the Canadian uranium producer Cameco Corp., was an additional detractor, as the United States’ ban on Russia uranium imports was seen as a positive for the company.
The views expressed reflect the opinions of BlackRock as of the date of this report and are subject to change based on changes in market, economic or other conditions. These views are not intended to be a forecast of future events and are no guarantee of future results.
Fund performance
Cumulative performance: June 1, 2014 through May 31, 2024
Initial investment of $10,000
See “Average annual total returns” for additional information on fund performance.
Average annual total returns
| 1 Year | 5 Years | 10 Years |
| Investor A Shares | 26.06% | 11.66% | 0.85% |
| Investor A Shares (with sales charge) | 19.44% | 10.47% | 0.31% |
| MSCI All Country World Index | 23.56% | 11.68% | 8.40% |
| MSCI World Energy Index | 25.46% | 10.93% | 2.21% |
| Net Assets | $343,286,416% |
| Number of Portfolio Holdings | $32% |
| Net Investment Advisory Fees | $2,611,139% |
| Portfolio Turnover Rate | $35% |
Assuming maximum sales charges. Average annual total returns with and without sales charges reflect reductions for service fees.
Past performance is not an indication of future results. Performance results may include adjustments made for financial reporting purposes in accordance with U.S. generally accepted accounting principles. Performance results do not reflect the deduction of taxes that a shareholder would pay on fund distributions or on the redemption or sale of fund shares. Visit blackrock.com for more recent performance information.
What did the Fund invest in?
(as of May 31, 2024)
| Industry(a) | Percent of
Net Assets |
| Oil, Gas & Consumable Fuels | 91.1% |
| Energy Equipment & Services | 7.6% |
| Short-Term Securities | 0.8% |
| Other Assets Less Liabilities | 0.5% |
| Security(b) | Percent of
Net Assets |
| Exxon Mobil Corp. | 19.8% |
| Shell PLC | 10.5% |
| Chevron Corp. | 6.7% |
| BP PLC | 6.2% |
| ConocoPhillips | 5.4% |
| TotalEnergies SE | 4.5% |
| Canadian Natural Resources Ltd. | 4.4% |
| Hess Corp. | 4.3% |
| Marathon Petroleum Corp. | 3.6% |
| Valero Energy Corp. | 3.2% |
(a) | For purposes of this report, industry sub-classifications may differ from those utilized for compliance purposes. |
(b) | Excludes short-term securities. |
Additional information
If you wish to view additional information about the Fund, including but not limited to financial statements, the Fund’s prospectus, and proxy voting policies and procedures, please visit blackrock.com/fundreports. For proxy voting records, visit blackrock.com/proxyrecords.
Householding
The Fund will mail only one copy of shareholder documents, including prospectuses, annual and semi-annual reports and proxy statements, to shareholders with multiple accounts at the same address. This practice is commonly called “householding” and is intended to reduce expenses and eliminate duplicate mailings of shareholder documents. Mailings of your shareholder documents may be householded indefinitely unless you instruct us otherwise. If you do not want the mailing of these documents to be combined with those for other members of your household, please call the Fund at (800) 441-7762.
The Fund is not sponsored, endorsed, issued, sold, or promoted by MSCI Inc. and its affiliates, nor does this company make any representation regarding the advisability of investing in the Fund. BlackRock is not affiliated with the company listed above.
©2024 BlackRock, Inc. or its affiliates. All rights reserved. BLACKROCK is a registered trademark of BlackRock, Inc. or its affiliates. All other trademarks are those of their respective owners.
BlackRock Energy Opportunities Fund
Investor A Shares | BACAX
Annual Shareholder Report — May 31, 2024
BACAX-05/24-AR
BlackRock Energy Opportunities Fund
Investor C Shares | BACCX
Annual Shareholder Report — May 31, 2024
This annual shareholder report contains important information about BlackRock Energy Opportunities Fund (the “Fund”) for the period of June 1, 2023 to May 31, 2024. You can find additional information about the Fund at blackrock.com/fundreports. You can also request this information by contacting us at (800) 441‑7762.
What were the Fund costs for the last year?
(based on a hypothetical $10,000 investment)
| Class name | Costs of a $10,000
investment | Costs paid as a percentage of a
$10,000 investment |
| Investor C Shares | $230 | 2.04% |
How did the Fund perform last year?
Global equities produced strong performance behind resilient economic data, steady corporate earnings, and expectations that the U.S. Federal Reserve would begin to cut interest rates later in the year.
Energy stocks delivered robust returns, albeit with elevated volatility, thanks to gains in both crude oil prices and the equity market more broadly.
What contributed to performance?
A zero weighting in Woodside Energy Group, Ltd. Contributed to performance, as did an underweight in Chevron Corp. An overweight in the midstream distribution company Williams Cos. also contributed to relative performance given its significant exposure to natural gas pipelines.
What detracted from performance?
The Fund held no positions in the refining company Phillips66, which rallied due to moves from an activist investor, which detracted from performance. A zero weighting in the Canadian integrated oil company Suncor Energy, Inc. detracted, as the stock rose on the strength of higher oil prices. Lack of positions in the Canadian uranium producer Cameco Corp., was an additional detractor, as the United States’ ban on Russia uranium imports was seen as a positive for the company.
The views expressed reflect the opinions of BlackRock as of the date of this report and are subject to change based on changes in market, economic or other conditions. These views are not intended to be a forecast of future events and are no guarantee of future results.
Fund performance
Cumulative performance: June 1, 2014 through May 31, 2024
Initial investment of $10,000
See “Average annual total returns” for additional information on fund performance.
Average annual total returns
| 1 Year | 5 Years | 10 Years |
| Investor C Shares | 25.20% | 10.88% | 0.27% |
| Investor C Shares (with sales charge) | 24.20% | 10.88% | 0.27% |
| MSCI All Country World Index | 23.56% | 11.68% | 8.40% |
| MSCI World Energy Index | 25.46% | 10.93% | 2.21% |
| Net Assets | $343,286,416% |
| Number of Portfolio Holdings | $32% |
| Net Investment Advisory Fees | $2,611,139% |
| Portfolio Turnover Rate | $35% |
Assuming maximum sales charges. Average annual total returns with and without sales charges reflect reductions for distribution and service fees.
Past performance is not an indication of future results. Performance results may include adjustments made for financial reporting purposes in accordance with U.S. generally accepted accounting principles. Performance results do not reflect the deduction of taxes that a shareholder would pay on fund distributions or on the redemption or sale of fund shares. Visit blackrock.com for more recent performance information.
What did the Fund invest in?
(as of May 31, 2024)
| Industry(a) | Percent of
Net Assets |
| Oil, Gas & Consumable Fuels | 91.1% |
| Energy Equipment & Services | 7.6% |
| Short-Term Securities | 0.8% |
| Other Assets Less Liabilities | 0.5% |
| Security(b) | Percent of
Net Assets |
| Exxon Mobil Corp. | 19.8% |
| Shell PLC | 10.5% |
| Chevron Corp. | 6.7% |
| BP PLC | 6.2% |
| ConocoPhillips | 5.4% |
| TotalEnergies SE | 4.5% |
| Canadian Natural Resources Ltd. | 4.4% |
| Hess Corp. | 4.3% |
| Marathon Petroleum Corp. | 3.6% |
| Valero Energy Corp. | 3.2% |
(a) | For purposes of this report, industry sub-classifications may differ from those utilized for compliance purposes. |
(b) | Excludes short-term securities. |
Additional information
If you wish to view additional information about the Fund, including but not limited to financial statements, the Fund’s prospectus, and proxy voting policies and procedures, please visit blackrock.com/fundreports. For proxy voting records, visit blackrock.com/proxyrecords.
Householding
The Fund will mail only one copy of shareholder documents, including prospectuses, annual and semi-annual reports and proxy statements, to shareholders with multiple accounts at the same address. This practice is commonly called “householding” and is intended to reduce expenses and eliminate duplicate mailings of shareholder documents. Mailings of your shareholder documents may be householded indefinitely unless you instruct us otherwise. If you do not want the mailing of these documents to be combined with those for other members of your household, please call the Fund at (800) 441-7762.
The Fund is not sponsored, endorsed, issued, sold, or promoted by MSCI Inc. and its affiliates, nor does this company make any representation regarding the advisability of investing in the Fund. BlackRock is not affiliated with the company listed above.
©2024 BlackRock, Inc. or its affiliates. All rights reserved. BLACKROCK is a registered trademark of BlackRock, Inc. or its affiliates. All other trademarks are those of their respective owners.
BlackRock Energy Opportunities Fund
Investor C Shares | BACCX
Annual Shareholder Report — May 31, 2024
BACCX-05/24-AR
BlackRock Health Sciences Opportunities Portfolio
Institutional Shares | SHSSX
Annual Shareholder Report — May 31, 2024
This annual shareholder report contains important information about BlackRock Health Sciences Opportunities Portfolio (the “Fund”) for the period of June 1, 2023 to May 31, 2024. You can find additional information about the Fund at blackrock.com/fundreports. You can also request this information by contacting us at (800) 441‑7762.
What were the Fund costs for the last year?
(based on a hypothetical $10,000 investment)
| Class name | Costs of a $10,000
investment | Costs paid as a percentage of a
$10,000 investment |
| Institutional Shares | $90 | 0.84% |
How did the Fund perform last year?
Equities produced strong performance behind resilient economic data, steady corporate earnings, and expectations that the U.S. Federal Reserve would begin to cut interest rates later in the year.
Healthcare stocks, while producing a strong absolute return, did not keep pace with the broader market at a time in which technology stocks played the largest role in the performance of the major indexes.
What contributed to performance?
At the sub-sector level, security selection in pharmaceuticals contributed to results. On a stock-specific basis, an underweight position in Bristol Myers Squibb Co. was the top contributor to performance. The biopharmaceutical company missed sales expectations for select treatments and faced elevated competition from generic drugs. An overweight position in Boston Scientific Corp. was another leading contributor. The medical device company reported robust sales growth in its surgery and cardiovascular segments and received approval for a new treatment from the Food and Drug Administration.
What detracted from performance?
Selection in the biotechnology sub-sector detracted. Among individual positions, an overweight in the biotechnology stock Biogen, Inc.—which was hurt by slower-than-expected sales for its Alzheimer’s treatment Leqembi—was the largest detractor. An overweight position in Penumbra, Inc. also hurt results. The medical device company missed first-quarter earnings estimates due to a decline in its international sales.
The views expressed reflect the opinions of BlackRock as of the date of this report and are subject to change based on changes in market, economic or other conditions. These views are not intended to be a forecast of future events and are no guarantee of future results.
Fund performance
Cumulative performance: June 1, 2014 through May 31, 2024
Initial investment of $10,000
See “Average annual total returns” for additional information on fund performance.
Average annual total returns
| 1 Year | 5 Years | 10 Years |
| Institutional Shares | 13.57% | 11.36% | 11.74% |
| Russell 3000® Index | 27.58% | 15.00% | 12.09% |
| Russell 3000® Health Care Index | 12.85% | 11.30% | 10.71% |
| Net Assets | $8,314,133,305% |
| Number of Portfolio Holdings | $141% |
| Net Investment Advisory Fees | $55,667,396% |
| Portfolio Turnover Rate | $27% |
Past performance is not an indication of future results. Performance results may include adjustments made for financial reporting purposes in accordance with U.S. generally accepted accounting principles. Performance results do not reflect the deduction of taxes that a shareholder would pay on fund distributions or on the redemption or sale of fund shares. Visit blackrock.com for more recent performance information.
What did the Fund invest in?
(as of May 31, 2024)
| Industry(a) | Percent of
Net Assets |
| Biotechnology | 24.2)% |
| Health Care Equipment & Supplies | 22.7)% |
| Pharmaceuticals | 21.3)% |
| Health Care Providers & Services | 21.2)% |
| Life Sciences Tools & Services | 9.4)% |
| Financial Services | 0.1)% |
| Software | 0.1)% |
| Short-Term Securities | 2.0)% |
| Liabilities in Excess of Other Assets | (1.0)% |
| Security(b) | Percent of
Net Assets |
| Eli Lilly & Co. | 9.9% |
| UnitedHealth Group, Inc. | 7.8% |
| Boston Scientific Corp. | 5.6% |
| AbbVie, Inc. | 4.8% |
| Merck & Co., Inc. | 4.3% |
| Amgen, Inc. | 3.8% |
| Thermo Fisher Scientific, Inc. | 3.5% |
| Danaher Corp. | 3.4% |
| Elevance Health, Inc. | 3.0% |
| Intuitive Surgical, Inc. | 2.9% |
(a) | For purposes of this report, industry sub-classifications may differ from those utilized for compliance purposes. |
(b) | Excludes short-term securities. |
Additional information
If you wish to view additional information about the Fund, including but not limited to financial statements, the Fund’s prospectus, and proxy voting policies and procedures, please visit blackrock.com/fundreports. For proxy voting records, visit blackrock.com/proxyrecords.
Householding
The Fund will mail only one copy of shareholder documents, including prospectuses, annual and semi-annual reports and proxy statements, to shareholders with multiple accounts at the same address. This practice is commonly called “householding” and is intended to reduce expenses and eliminate duplicate mailings of shareholder documents. Mailings of your shareholder documents may be householded indefinitely unless you instruct us otherwise. If you do not want the mailing of these documents to be combined with those for other members of your household, please call the Fund at (800) 441-7762.
The Fund is not sponsored, endorsed, issued, sold, or promoted by FTSE International Limited and its affiliates, nor does this company make any representation regarding the advisability of investing in the Fund. BlackRock is not affiliated with the company listed above.
©2024 BlackRock, Inc. or its affiliates. All rights reserved. BLACKROCK is a registered trademark of BlackRock, Inc. or its affiliates. All other trademarks are those of their respective owners.
BlackRock Health Sciences Opportunities Portfolio
Institutional Shares | SHSSX
Annual Shareholder Report — May 31, 2024
SHSSX-05/24-AR
BlackRock Health Sciences Opportunities Portfolio
Service Shares | SHISX
Annual Shareholder Report — May 31, 2024
This annual shareholder report contains important information about BlackRock Health Sciences Opportunities Portfolio (the “Fund”) for the period of June 1, 2023 to May 31, 2024. You can find additional information about the Fund at blackrock.com/fundreports. You can also request this information by contacting us at (800) 441‑7762.
What were the Fund costs for the last year?
(based on a hypothetical $10,000 investment)
| Class name | Costs of a $10,000
investment | Costs paid as a percentage of a
$10,000 investment |
| Service Shares | $122 | 1.14% |
How did the Fund perform last year?
Equities produced strong performance behind resilient economic data, steady corporate earnings, and expectations that the U.S. Federal Reserve would begin to cut interest rates later in the year.
Healthcare stocks, while producing a strong absolute return, did not keep pace with the broader market at a time in which technology stocks played the largest role in the performance of the major indexes.
What contributed to performance?
At the sub-sector level, security selection in pharmaceuticals contributed to results. On a stock-specific basis, an underweight position in Bristol Myers Squibb Co. was the top contributor to performance. The biopharmaceutical company missed sales expectations for select treatments and faced elevated competition from generic drugs. An overweight position in Boston Scientific Corp. was another leading contributor. The medical device company reported robust sales growth in its surgery and cardiovascular segments and received approval for a new treatment from the Food and Drug Administration.
What detracted from performance?
Selection in the biotechnology sub-sector detracted. Among individual positions, an overweight in the biotechnology stock Biogen, Inc.—which was hurt by slower-than-expected sales for its Alzheimer’s treatment Leqembi—was the largest detractor. An overweight position in Penumbra, Inc. also hurt results. The medical device company missed first-quarter earnings estimates due to a decline in its international sales.
The views expressed reflect the opinions of BlackRock as of the date of this report and are subject to change based on changes in market, economic or other conditions. These views are not intended to be a forecast of future events and are no guarantee of future results.
Fund performance
Cumulative performance: June 1, 2014 through May 31, 2024
Initial investment of $10,000
See “Average annual total returns” for additional information on fund performance.
Average annual total returns
| 1 Year | 5 Years | 10 Years |
| Service Shares | 13.24% | 11.02% | 11.42% |
| Russell 3000® Index | 27.58% | 15.00% | 12.09% |
| Russell 3000® Health Care Index | 12.85% | 11.30% | 10.71% |
| Net Assets | $8,314,133,305% |
| Number of Portfolio Holdings | $141% |
| Net Investment Advisory Fees | $55,667,396% |
| Portfolio Turnover Rate | $27% |
Average annual total returns reflect reductions for service fees.
Past performance is not an indication of future results. Performance results may include adjustments made for financial reporting purposes in accordance with U.S. generally accepted accounting principles. Performance results do not reflect the deduction of taxes that a shareholder would pay on fund distributions or on the redemption or sale of fund shares. Visit blackrock.com for more recent performance information.
What did the Fund invest in?
(as of May 31, 2024)
| Industry(a) | Percent of
Net Assets |
| Biotechnology | 24.2)% |
| Health Care Equipment & Supplies | 22.7)% |
| Pharmaceuticals | 21.3)% |
| Health Care Providers & Services | 21.2)% |
| Life Sciences Tools & Services | 9.4)% |
| Financial Services | 0.1)% |
| Software | 0.1)% |
| Short-Term Securities | 2.0)% |
| Liabilities in Excess of Other Assets | (1.0)% |
| Security(b) | Percent of
Net Assets |
| Eli Lilly & Co. | 9.9% |
| UnitedHealth Group, Inc. | 7.8% |
| Boston Scientific Corp. | 5.6% |
| AbbVie, Inc. | 4.8% |
| Merck & Co., Inc. | 4.3% |
| Amgen, Inc. | 3.8% |
| Thermo Fisher Scientific, Inc. | 3.5% |
| Danaher Corp. | 3.4% |
| Elevance Health, Inc. | 3.0% |
| Intuitive Surgical, Inc. | 2.9% |
(a) | For purposes of this report, industry sub-classifications may differ from those utilized for compliance purposes. |
(b) | Excludes short-term securities. |
Additional information
If you wish to view additional information about the Fund, including but not limited to financial statements, the Fund’s prospectus, and proxy voting policies and procedures, please visit blackrock.com/fundreports. For proxy voting records, visit blackrock.com/proxyrecords.
Householding
The Fund will mail only one copy of shareholder documents, including prospectuses, annual and semi-annual reports and proxy statements, to shareholders with multiple accounts at the same address. This practice is commonly called “householding” and is intended to reduce expenses and eliminate duplicate mailings of shareholder documents. Mailings of your shareholder documents may be householded indefinitely unless you instruct us otherwise. If you do not want the mailing of these documents to be combined with those for other members of your household, please call the Fund at (800) 441-7762.
The Fund is not sponsored, endorsed, issued, sold, or promoted by FTSE International Limited and its affiliates, nor does this company make any representation regarding the advisability of investing in the Fund. BlackRock is not affiliated with the company listed above.
©2024 BlackRock, Inc. or its affiliates. All rights reserved. BLACKROCK is a registered trademark of BlackRock, Inc. or its affiliates. All other trademarks are those of their respective owners.
BlackRock Health Sciences Opportunities Portfolio
Service Shares | SHISX
Annual Shareholder Report — May 31, 2024
SHISX-05/24-AR
BlackRock Health Sciences Opportunities Portfolio
Investor A Shares | SHSAX
Annual Shareholder Report — May 31, 2024
This annual shareholder report contains important information about BlackRock Health Sciences Opportunities Portfolio (the “Fund”) for the period of June 1, 2023 to May 31, 2024. You can find additional information about the Fund at blackrock.com/fundreports. You can also request this information by contacting us at (800) 441‑7762.
What were the Fund costs for the last year?
(based on a hypothetical $10,000 investment)
| Class name | Costs of a $10,000
investment | Costs paid as a percentage of a
$10,000 investment |
| Investor A Shares | $116 | 1.09% |
How did the Fund perform last year?
Equities produced strong performance behind resilient economic data, steady corporate earnings, and expectations that the U.S. Federal Reserve would begin to cut interest rates later in the year.
Healthcare stocks, while producing a strong absolute return, did not keep pace with the broader market at a time in which technology stocks played the largest role in the performance of the major indexes.
What contributed to performance?
At the sub-sector level, security selection in pharmaceuticals contributed to results. On a stock-specific basis, an underweight position in Bristol Myers Squibb Co. was the top contributor to performance. The biopharmaceutical company missed sales expectations for select treatments and faced elevated competition from generic drugs. An overweight position in Boston Scientific Corp. was another leading contributor. The medical device company reported robust sales growth in its surgery and cardiovascular segments and received approval for a new treatment from the Food and Drug Administration.
What detracted from performance?
Selection in the biotechnology sub-sector detracted. Among individual positions, an overweight in the biotechnology stock Biogen, Inc.—which was hurt by slower-than-expected sales for its Alzheimer’s treatment Leqembi—was the largest detractor. An overweight position in Penumbra, Inc. also hurt results. The medical device company missed first-quarter earnings estimates due to a decline in its international sales.
The views expressed reflect the opinions of BlackRock as of the date of this report and are subject to change based on changes in market, economic or other conditions. These views are not intended to be a forecast of future events and are no guarantee of future results.
Fund performance
Cumulative performance: June 1, 2014 through May 31, 2024
Initial investment of $10,000
See “Average annual total returns” for additional information on fund performance.
Average annual total returns
| 1 Year | 5 Years | 10 Years |
| Investor A Shares | 13.28% | 11.07% | 11.44% |
| Investor A Shares (with sales charge) | 7.34% | 9.88% | 10.84% |
| Russell 3000® Index | 27.58% | 15.00% | 12.09% |
| Russell 3000® Health Care Index | 12.85% | 11.30% | 10.71% |
| Net Assets | $8,314,133,305% |
| Number of Portfolio Holdings | $141% |
| Net Investment Advisory Fees | $55,667,396% |
| Portfolio Turnover Rate | $27% |
Assuming maximum sales charges. Average annual total returns with and without sales charges reflect reductions for service fees.
Past performance is not an indication of future results. Performance results may include adjustments made for financial reporting purposes in accordance with U.S. generally accepted accounting principles. Performance results do not reflect the deduction of taxes that a shareholder would pay on fund distributions or on the redemption or sale of fund shares. Visit blackrock.com for more recent performance information.
What did the Fund invest in?
(as of May 31, 2024)
| Industry(a) | Percent of
Net Assets |
| Biotechnology | 24.2)% |
| Health Care Equipment & Supplies | 22.7)% |
| Pharmaceuticals | 21.3)% |
| Health Care Providers & Services | 21.2)% |
| Life Sciences Tools & Services | 9.4)% |
| Financial Services | 0.1)% |
| Software | 0.1)% |
| Short-Term Securities | 2.0)% |
| Liabilities in Excess of Other Assets | (1.0)% |
| Security(b) | Percent of
Net Assets |
| Eli Lilly & Co. | 9.9% |
| UnitedHealth Group, Inc. | 7.8% |
| Boston Scientific Corp. | 5.6% |
| AbbVie, Inc. | 4.8% |
| Merck & Co., Inc. | 4.3% |
| Amgen, Inc. | 3.8% |
| Thermo Fisher Scientific, Inc. | 3.5% |
| Danaher Corp. | 3.4% |
| Elevance Health, Inc. | 3.0% |
| Intuitive Surgical, Inc. | 2.9% |
(a) | For purposes of this report, industry sub-classifications may differ from those utilized for compliance purposes. |
(b) | Excludes short-term securities. |
Additional information
If you wish to view additional information about the Fund, including but not limited to financial statements, the Fund’s prospectus, and proxy voting policies and procedures, please visit blackrock.com/fundreports. For proxy voting records, visit blackrock.com/proxyrecords.
Householding
The Fund will mail only one copy of shareholder documents, including prospectuses, annual and semi-annual reports and proxy statements, to shareholders with multiple accounts at the same address. This practice is commonly called “householding” and is intended to reduce expenses and eliminate duplicate mailings of shareholder documents. Mailings of your shareholder documents may be householded indefinitely unless you instruct us otherwise. If you do not want the mailing of these documents to be combined with those for other members of your household, please call the Fund at (800) 441-7762.
The Fund is not sponsored, endorsed, issued, sold, or promoted by FTSE International Limited and its affiliates, nor does this company make any representation regarding the advisability of investing in the Fund. BlackRock is not affiliated with the company listed above.
©2024 BlackRock, Inc. or its affiliates. All rights reserved. BLACKROCK is a registered trademark of BlackRock, Inc. or its affiliates. All other trademarks are those of their respective owners.
BlackRock Health Sciences Opportunities Portfolio
Investor A Shares | SHSAX
Annual Shareholder Report — May 31, 2024
SHSAX-05/24-AR
BlackRock Health Sciences Opportunities Portfolio
Investor C Shares | SHSCX
Annual Shareholder Report — May 31, 2024
This annual shareholder report contains important information about BlackRock Health Sciences Opportunities Portfolio (the “Fund”) for the period of June 1, 2023 to May 31, 2024. You can find additional information about the Fund at blackrock.com/fundreports. You can also request this information by contacting us at (800) 441‑7762.
What were the Fund costs for the last year?
(based on a hypothetical $10,000 investment)
| Class name | Costs of a $10,000
investment | Costs paid as a percentage of a
$10,000 investment |
| Investor C Shares | $198 | 1.86% |
How did the Fund perform last year?
Equities produced strong performance behind resilient economic data, steady corporate earnings, and expectations that the U.S. Federal Reserve would begin to cut interest rates later in the year.
Healthcare stocks, while producing a strong absolute return, did not keep pace with the broader market at a time in which technology stocks played the largest role in the performance of the major indexes.
What contributed to performance?
At the sub-sector level, security selection in pharmaceuticals contributed to results. On a stock-specific basis, an underweight position in Bristol Myers Squibb Co. was the top contributor to performance. The biopharmaceutical company missed sales expectations for select treatments and faced elevated competition from generic drugs. An overweight position in Boston Scientific Corp. was another leading contributor. The medical device company reported robust sales growth in its surgery and cardiovascular segments and received approval for a new treatment from the Food and Drug Administration.
What detracted from performance?
Selection in the biotechnology sub-sector detracted. Among individual positions, an overweight in the biotechnology stock Biogen, Inc.—which was hurt by slower-than-expected sales for its Alzheimer’s treatment Leqembi—was the largest detractor. An overweight position in Penumbra, Inc. also hurt results. The medical device company missed first-quarter earnings estimates due to a decline in its international sales.
The views expressed reflect the opinions of BlackRock as of the date of this report and are subject to change based on changes in market, economic or other conditions. These views are not intended to be a forecast of future events and are no guarantee of future results.
Fund performance
Cumulative performance: June 1, 2014 through May 31, 2024
Initial investment of $10,000
See “Average annual total returns” for additional information on fund performance.
Average annual total returns
| 1 Year | 5 Years | 10 Years |
| Investor C Shares | 12.42% | 10.24% | 10.80% |
| Investor C Shares (with sales charge) | 11.42% | 10.24% | 10.80% |
| Russell 3000® Index | 27.58% | 15.00% | 12.09% |
| Russell 3000® Health Care Index | 12.85% | 11.30% | 10.71% |
| Net Assets | $8,314,133,305% |
| Number of Portfolio Holdings | $141% |
| Net Investment Advisory Fees | $55,667,396% |
| Portfolio Turnover Rate | $27% |
Assuming maximum sales charges. Average annual total returns with and without sales charges reflect reductions for distribution and service fees.
Past performance is not an indication of future results. Performance results may include adjustments made for financial reporting purposes in accordance with U.S. generally accepted accounting principles. Performance results do not reflect the deduction of taxes that a shareholder would pay on fund distributions or on the redemption or sale of fund shares. Visit blackrock.com for more recent performance information.
What did the Fund invest in?
(as of May 31, 2024)
| Industry(a) | Percent of
Net Assets |
| Biotechnology | 24.2)% |
| Health Care Equipment & Supplies | 22.7)% |
| Pharmaceuticals | 21.3)% |
| Health Care Providers & Services | 21.2)% |
| Life Sciences Tools & Services | 9.4)% |
| Financial Services | 0.1)% |
| Software | 0.1)% |
| Short-Term Securities | 2.0)% |
| Liabilities in Excess of Other Assets | (1.0)% |
| Security(b) | Percent of
Net Assets |
| Eli Lilly & Co. | 9.9% |
| UnitedHealth Group, Inc. | 7.8% |
| Boston Scientific Corp. | 5.6% |
| AbbVie, Inc. | 4.8% |
| Merck & Co., Inc. | 4.3% |
| Amgen, Inc. | 3.8% |
| Thermo Fisher Scientific, Inc. | 3.5% |
| Danaher Corp. | 3.4% |
| Elevance Health, Inc. | 3.0% |
| Intuitive Surgical, Inc. | 2.9% |
(a) | For purposes of this report, industry sub-classifications may differ from those utilized for compliance purposes. |
(b) | Excludes short-term securities. |
Additional information
If you wish to view additional information about the Fund, including but not limited to financial statements, the Fund’s prospectus, and proxy voting policies and procedures, please visit blackrock.com/fundreports. For proxy voting records, visit blackrock.com/proxyrecords.
Householding
The Fund will mail only one copy of shareholder documents, including prospectuses, annual and semi-annual reports and proxy statements, to shareholders with multiple accounts at the same address. This practice is commonly called “householding” and is intended to reduce expenses and eliminate duplicate mailings of shareholder documents. Mailings of your shareholder documents may be householded indefinitely unless you instruct us otherwise. If you do not want the mailing of these documents to be combined with those for other members of your household, please call the Fund at (800) 441-7762.
The Fund is not sponsored, endorsed, issued, sold, or promoted by FTSE International Limited and its affiliates, nor does this company make any representation regarding the advisability of investing in the Fund. BlackRock is not affiliated with the company listed above.
©2024 BlackRock, Inc. or its affiliates. All rights reserved. BLACKROCK is a registered trademark of BlackRock, Inc. or its affiliates. All other trademarks are those of their respective owners.
BlackRock Health Sciences Opportunities Portfolio
Investor C Shares | SHSCX
Annual Shareholder Report — May 31, 2024
SHSCX-05/24-AR
BlackRock Health Sciences Opportunities Portfolio
Class K Shares | SHSKX
Annual Shareholder Report — May 31, 2024
This annual shareholder report contains important information about BlackRock Health Sciences Opportunities Portfolio (the “Fund”) for the period of June 1, 2023 to May 31, 2024. You can find additional information about the Fund at blackrock.com/fundreports. You can also request this information by contacting us at (800) 441‑7762.
What were the Fund costs for the last year?
(based on a hypothetical $10,000 investment)
| Class name | Costs of a $10,000
investment | Costs paid as a percentage of a
$10,000 investment |
| Class K Shares | $80 | 0.75% |
How did the Fund perform last year?
Equities produced strong performance behind resilient economic data, steady corporate earnings, and expectations that the U.S. Federal Reserve would begin to cut interest rates later in the year.
Healthcare stocks, while producing a strong absolute return, did not keep pace with the broader market at a time in which technology stocks played the largest role in the performance of the major indexes.
What contributed to performance?
At the sub-sector level, security selection in pharmaceuticals contributed to results. On a stock-specific basis, an underweight position in Bristol Myers Squibb Co. was the top contributor to performance. The biopharmaceutical company missed sales expectations for select treatments and faced elevated competition from generic drugs. An overweight position in Boston Scientific Corp. was another leading contributor. The medical device company reported robust sales growth in its surgery and cardiovascular segments and received approval for a new treatment from the Food and Drug Administration.
What detracted from performance?
Selection in the biotechnology sub-sector detracted. Among individual positions, an overweight in the biotechnology stock Biogen, Inc.—which was hurt by slower-than-expected sales for its Alzheimer’s treatment Leqembi—was the largest detractor. An overweight position in Penumbra, Inc. also hurt results. The medical device company missed first-quarter earnings estimates due to a decline in its international sales.
The views expressed reflect the opinions of BlackRock as of the date of this report and are subject to change based on changes in market, economic or other conditions. These views are not intended to be a forecast of future events and are no guarantee of future results.
Fund performance
Cumulative performance: June 1, 2014 through May 31, 2024
Initial investment of $10,000
See “Average annual total returns” for additional information on fund performance.
Average annual total returns
| 1 Year | 5 Years | 10 Years |
| Class K Shares | 13.68% | 11.47% | 11.77% |
| Russell 3000® Index | 27.58% | 15.00% | 12.09% |
| Russell 3000® Health Care Index | 12.85% | 11.30% | 10.71% |
| Net Assets | $8,314,133,305% |
| Number of Portfolio Holdings | $141% |
| Net Investment Advisory Fees | $55,667,396% |
| Portfolio Turnover Rate | $27% |
Performance shown prior to the Class K Shares inception date of June 8, 2016 is that of Investor A Shares. The performance of the Class K Shares would be substantially similar to Investor A Shares because Class K Shares and Investor A Shares invest in the same portfolio of securities and performance would only differ to the extent that Class K Shares and Investor A Shares have different expenses. The actual returns of Class K Shares would have been higher than those of the Investor A Shares because Class K Shares have lower expenses than the Investor A Shares.
Past performance is not an indication of future results. Performance results may include adjustments made for financial reporting purposes in accordance with U.S. generally accepted accounting principles. Performance results do not reflect the deduction of taxes that a shareholder would pay on fund distributions or on the redemption or sale of fund shares. Visit blackrock.com for more recent performance information.
What did the Fund invest in?
(as of May 31, 2024)
| Industry(a) | Percent of
Net Assets |
| Biotechnology | 24.2)% |
| Health Care Equipment & Supplies | 22.7)% |
| Pharmaceuticals | 21.3)% |
| Health Care Providers & Services | 21.2)% |
| Life Sciences Tools & Services | 9.4)% |
| Financial Services | 0.1)% |
| Software | 0.1)% |
| Short-Term Securities | 2.0)% |
| Liabilities in Excess of Other Assets | (1.0)% |
| Security(b) | Percent of
Net Assets |
| Eli Lilly & Co. | 9.9% |
| UnitedHealth Group, Inc. | 7.8% |
| Boston Scientific Corp. | 5.6% |
| AbbVie, Inc. | 4.8% |
| Merck & Co., Inc. | 4.3% |
| Amgen, Inc. | 3.8% |
| Thermo Fisher Scientific, Inc. | 3.5% |
| Danaher Corp. | 3.4% |
| Elevance Health, Inc. | 3.0% |
| Intuitive Surgical, Inc. | 2.9% |
(a) | For purposes of this report, industry sub-classifications may differ from those utilized for compliance purposes. |
(b) | Excludes short-term securities. |
Additional information
If you wish to view additional information about the Fund, including but not limited to financial statements, the Fund’s prospectus, and proxy voting policies and procedures, please visit blackrock.com/fundreports. For proxy voting records, visit blackrock.com/proxyrecords.
Householding
The Fund will mail only one copy of shareholder documents, including prospectuses, annual and semi-annual reports and proxy statements, to shareholders with multiple accounts at the same address. This practice is commonly called “householding” and is intended to reduce expenses and eliminate duplicate mailings of shareholder documents. Mailings of your shareholder documents may be householded indefinitely unless you instruct us otherwise. If you do not want the mailing of these documents to be combined with those for other members of your household, please call the Fund at (800) 441-7762.
The Fund is not sponsored, endorsed, issued, sold, or promoted by FTSE International Limited and its affiliates, nor does this company make any representation regarding the advisability of investing in the Fund. BlackRock is not affiliated with the company listed above.
©2024 BlackRock, Inc. or its affiliates. All rights reserved. BLACKROCK is a registered trademark of BlackRock, Inc. or its affiliates. All other trademarks are those of their respective owners.
BlackRock Health Sciences Opportunities Portfolio
Class K Shares | SHSKX
Annual Shareholder Report — May 31, 2024
SHSKX-05/24-AR
BlackRock Health Sciences Opportunities Portfolio
Class R Shares | BHSRX
Annual Shareholder Report — May 31, 2024
This annual shareholder report contains important information about BlackRock Health Sciences Opportunities Portfolio (the “Fund”) for the period of June 1, 2023 to May 31, 2024. You can find additional information about the Fund at blackrock.com/fundreports. You can also request this information by contacting us at (800) 441‑7762.
What were the Fund costs for the last year?
(based on a hypothetical $10,000 investment)
| Class name | Costs of a $10,000
investment | Costs paid as a percentage of a
$10,000 investment |
| Class R Shares | $155 | 1.46% |
How did the Fund perform last year?
Equities produced strong performance behind resilient economic data, steady corporate earnings, and expectations that the U.S. Federal Reserve would begin to cut interest rates later in the year.
Healthcare stocks, while producing a strong absolute return, did not keep pace with the broader market at a time in which technology stocks played the largest role in the performance of the major indexes.
What contributed to performance?
At the sub-sector level, security selection in pharmaceuticals contributed to results. On a stock-specific basis, an underweight position in Bristol Myers Squibb Co. was the top contributor to performance. The biopharmaceutical company missed sales expectations for select treatments and faced elevated competition from generic drugs. An overweight position in Boston Scientific Corp. was another leading contributor. The medical device company reported robust sales growth in its surgery and cardiovascular segments and received approval for a new treatment from the Food and Drug Administration.
What detracted from performance?
Selection in the biotechnology sub-sector detracted. Among individual positions, an overweight in the biotechnology stock Biogen, Inc.—which was hurt by slower-than-expected sales for its Alzheimer’s treatment Leqembi—was the largest detractor. An overweight position in Penumbra, Inc. also hurt results. The medical device company missed first-quarter earnings estimates due to a decline in its international sales.
The views expressed reflect the opinions of BlackRock as of the date of this report and are subject to change based on changes in market, economic or other conditions. These views are not intended to be a forecast of future events and are no guarantee of future results.
Fund performance
Cumulative performance: June 1, 2014 through May 31, 2024
Initial investment of $10,000
See “Average annual total returns” for additional information on fund performance.
Average annual total returns
| 1 Year | 5 Years | 10 Years |
| Class R Shares | 12.88% | 10.68% | 11.07% |
| Russell 3000® Index | 27.58% | 15.00% | 12.09% |
| Russell 3000® Health Care Index | 12.85% | 11.30% | 10.71% |
| Net Assets | $8,314,133,305% |
| Number of Portfolio Holdings | $141% |
| Net Investment Advisory Fees | $55,667,396% |
| Portfolio Turnover Rate | $27% |
Average annual total returns reflect reductions for distribution and service fees.
Past performance is not an indication of future results. Performance results may include adjustments made for financial reporting purposes in accordance with U.S. generally accepted accounting principles. Performance results do not reflect the deduction of taxes that a shareholder would pay on fund distributions or on the redemption or sale of fund shares. Visit blackrock.com for more recent performance information.
What did the Fund invest in?
(as of May 31, 2024)
| Industry(a) | Percent of
Net Assets |
| Biotechnology | 24.2)% |
| Health Care Equipment & Supplies | 22.7)% |
| Pharmaceuticals | 21.3)% |
| Health Care Providers & Services | 21.2)% |
| Life Sciences Tools & Services | 9.4)% |
| Financial Services | 0.1)% |
| Software | 0.1)% |
| Short-Term Securities | 2.0)% |
| Liabilities in Excess of Other Assets | (1.0)% |
| Security(b) | Percent of
Net Assets |
| Eli Lilly & Co. | 9.9% |
| UnitedHealth Group, Inc. | 7.8% |
| Boston Scientific Corp. | 5.6% |
| AbbVie, Inc. | 4.8% |
| Merck & Co., Inc. | 4.3% |
| Amgen, Inc. | 3.8% |
| Thermo Fisher Scientific, Inc. | 3.5% |
| Danaher Corp. | 3.4% |
| Elevance Health, Inc. | 3.0% |
| Intuitive Surgical, Inc. | 2.9% |
(a) | For purposes of this report, industry sub-classifications may differ from those utilized for compliance purposes. |
(b) | Excludes short-term securities. |
Additional information
If you wish to view additional information about the Fund, including but not limited to financial statements, the Fund’s prospectus, and proxy voting policies and procedures, please visit blackrock.com/fundreports. For proxy voting records, visit blackrock.com/proxyrecords.
Householding
The Fund will mail only one copy of shareholder documents, including prospectuses, annual and semi-annual reports and proxy statements, to shareholders with multiple accounts at the same address. This practice is commonly called “householding” and is intended to reduce expenses and eliminate duplicate mailings of shareholder documents. Mailings of your shareholder documents may be householded indefinitely unless you instruct us otherwise. If you do not want the mailing of these documents to be combined with those for other members of your household, please call the Fund at (800) 441-7762.
The Fund is not sponsored, endorsed, issued, sold, or promoted by FTSE International Limited and its affiliates, nor does this company make any representation regarding the advisability of investing in the Fund. BlackRock is not affiliated with the company listed above.
©2024 BlackRock, Inc. or its affiliates. All rights reserved. BLACKROCK is a registered trademark of BlackRock, Inc. or its affiliates. All other trademarks are those of their respective owners.
BlackRock Health Sciences Opportunities Portfolio
Class R Shares | BHSRX
Annual Shareholder Report — May 31, 2024
BHSRX-05/24-AR
BlackRock High Equity Income Fund
Institutional Shares | BMCIX
Annual Shareholder Report — May 31, 2024
This annual shareholder report contains important information about BlackRock High Equity Income Fund (the “Fund”) for the period of June 1, 2023 to May 31, 2024. You can find additional information about the Fund at blackrock.com/fundreports. You can also request this information by contacting us at (800) 441‑7762.
What were the Fund costs for the last year?
(based on a hypothetical $10,000 investment)
| Class name | Costs of a $10,000
investment | Costs paid as a percentage of a
$10,000 investment |
| Institutional Shares | $93 | 0.85% |
How did the Fund perform last year?
U.S. equities broadly moved higher as the period progressed, resulting in significant positive returns across most market segments.
Fears of a U.S. recession waned while major overseas economies returned to positive growth.
Signs of easing inflation led to expectations that the U.S. Federal Reserve and other leading central banks were poised to reduce interest rates, leading growth-oriented stocks to outperform value stocks.
What contributed to performance?
Positive contributions to the Fund’s performance relative to the benchmark (Russell 1000® Value Index) were led by security selection within the financial sector, driven by holdings within the financial services and bank industries. The Fund’s underweight to real estate also contributed to performance, most notably an underweight to industrial real estate investment trusts (“REITs”).
What detracted from performance?
The Fund’s overweight to and security selection with the healthcare sector detracted the most, with positioning in the healthcare equipment and supplies industry weighing most heavily on performance. Security selection within consumer staples also detracted from performance, particularly within the distribution and retail industry.
Approximately 30% of the Fund is overwritten using a covered call strategy designed to provide a consistent stream of income. The use of covered calls detracted from performance as expected during a rising market environment.
The views expressed reflect the opinions of BlackRock as of the date of this report and are subject to change based on changes in market, economic or other conditions. These views are not intended to be a forecast of future events and are no guarantee of future results.
Fund performance
Cumulative performance: June 1, 2014 through May 31, 2024
Initial investment of $10,000
See “Average annual total returns” for additional information on fund performance.
Average annual total returns
| 1 Year | 5 Years | 10 Years |
| Institutional Shares | 18.41% | 10.31% | 8.20% |
| Russell 1000® Index | 28.01% | 15.42% | 12.40% |
| Russell 1000® Value Index | 21.71% | 10.74% | 8.61% |
| Net Assets | $2,032,731,260% |
| Number of Portfolio Holdings | $177% |
| Net Investment Advisory Fees | $14,704,213% |
| Portfolio Turnover Rate | $85% |
Performance shown prior to June 12, 2017 are the returns of the Fund when it followed different investment strategies under the name BlackRock U.S. Opportunities Portfolio.
Past performance is not an indication of future results. Performance results may include adjustments made for financial reporting purposes in accordance with U.S. generally accepted accounting principles. Performance results do not reflect the deduction of taxes that a shareholder would pay on fund distributions or on the redemption or sale of fund shares. Visit blackrock.com for more recent performance information.
What did the Fund invest in?
(as of May 31, 2024)
| Sector(a) | Percent of
Net Assets |
| Financials | 19.2)% |
| Health Care | 18.0)% |
| Industrials | 14.3)% |
| Information Technology | 9.0)% |
| Energy | 8.1)% |
| Consumer Staples | 7.7)% |
| Communication Services | 6.8)% |
| Consumer Discretionary | 6.3)% |
| Utilities | 4.7)% |
| Materials | 3.6)% |
| Real Estate | 1.4)% |
| Short-Term Securities | 1.0)% |
| Liabilities in Excess of Other Assets | (0.1)% |
| Security(b) | Percent of
Net Assets |
| Wells Fargo & Co. | 2.5% |
| RTX Corp. | 1.6% |
| Citigroup, Inc. | 1.6% |
| Samsung Electronics Co. Ltd., Registered Shares, GDR | 1.6% |
| Shell PLC | 1.6% |
| BP PLC | 1.6% |
| First Citizens BancShares, Inc., Class A | 1.5% |
| Baxter International, Inc. | 1.4% |
| Fidelity National Information Services, Inc. | 1.4% |
| L3Harris Technologies, Inc. | 1.4% |
(a) | For purposes of this report, sector sub-classifications may differ from those utilized for compliance purposes. |
(b) | Excludes short-term securities. |
Additional information
If you wish to view additional information about the Fund, including but not limited to financial statements, the Fund’s prospectus, and proxy voting policies and procedures, please visit blackrock.com/fundreports. For proxy voting records, visit blackrock.com/proxyrecords.
Householding
The Fund will mail only one copy of shareholder documents, including prospectuses, annual and semi-annual reports and proxy statements, to shareholders with multiple accounts at the same address. This practice is commonly called “householding” and is intended to reduce expenses and eliminate duplicate mailings of shareholder documents. Mailings of your shareholder documents may be householded indefinitely unless you instruct us otherwise. If you do not want the mailing of these documents to be combined with those for other members of your household, please call the Fund at (800) 441-7762.
The Fund is not sponsored, endorsed, issued, sold, or promoted by FTSE International Limited and its affiliates, nor does this company make any representation regarding the advisability of investing in the Fund. BlackRock is not affiliated with the company listed above.
©2024 BlackRock, Inc. or its affiliates. All rights reserved. BLACKROCK is a registered trademark of BlackRock, Inc. or its affiliates. All other trademarks are those of their respective owners.
BlackRock High Equity Income Fund
Institutional Shares | BMCIX
Annual Shareholder Report — May 31, 2024
BMCIX-05/24-AR
BlackRock High Equity Income Fund
Investor A Shares | BMEAX
Annual Shareholder Report — May 31, 2024
This annual shareholder report contains important information about BlackRock High Equity Income Fund (the “Fund”) for the period of June 1, 2023 to May 31, 2024. You can find additional information about the Fund at blackrock.com/fundreports. You can also request this information by contacting us at (800) 441‑7762.
What were the Fund costs for the last year?
(based on a hypothetical $10,000 investment)
| Class name | Costs of a $10,000
investment | Costs paid as a percentage of a
$10,000 investment |
| Investor A Shares | $120 | 1.10% |
How did the Fund perform last year?
U.S. equities broadly moved higher as the period progressed, resulting in significant positive returns across most market segments.
Fears of a U.S. recession waned while major overseas economies returned to positive growth.
Signs of easing inflation led to expectations that the U.S. Federal Reserve and other leading central banks were poised to reduce interest rates, leading growth-oriented stocks to outperform value stocks.
What contributed to performance?
Positive contributions to the Fund’s performance relative to the benchmark (Russell 1000® Value Index) were led by security selection within the financial sector, driven by holdings within the financial services and bank industries. The Fund’s underweight to real estate also contributed to performance, most notably an underweight to industrial real estate investment trusts (“REITs”).
What detracted from performance?
The Fund’s overweight to and security selection with the healthcare sector detracted the most, with positioning in the healthcare equipment and supplies industry weighing most heavily on performance. Security selection within consumer staples also detracted from performance, particularly within the distribution and retail industry.
Approximately 30% of the Fund is overwritten using a covered call strategy designed to provide a consistent stream of income. The use of covered calls detracted from performance as expected during a rising market environment.
The views expressed reflect the opinions of BlackRock as of the date of this report and are subject to change based on changes in market, economic or other conditions. These views are not intended to be a forecast of future events and are no guarantee of future results.
Fund performance
Cumulative performance: June 1, 2014 through May 31, 2024
Initial investment of $10,000
See “Average annual total returns” for additional information on fund performance.
Average annual total returns
| 1 Year | 5 Years | 10 Years |
| Investor A Shares | 18.14% | 10.04% | 7.89% |
| Investor A Shares (with sales charge) | 11.94% | 8.86% | 7.31% |
| Russell 1000® Index | 28.01% | 15.42% | 12.40% |
| Russell 1000® Value Index | 21.71% | 10.74% | 8.61% |
| Net Assets | $2,032,731,260% |
| Number of Portfolio Holdings | $177% |
| Net Investment Advisory Fees | $14,704,213% |
| Portfolio Turnover Rate | $85% |
Performance shown prior to June 12, 2017 are the returns of the Fund when it followed different investment strategies under the name BlackRock U.S. Opportunities Portfolio.
Assuming maximum sales charges. Average annual total returns with and without sales charges reflect reductions for service fees.
Past performance is not an indication of future results. Performance results may include adjustments made for financial reporting purposes in accordance with U.S. generally accepted accounting principles. Performance results do not reflect the deduction of taxes that a shareholder would pay on fund distributions or on the redemption or sale of fund shares. Visit blackrock.com for more recent performance information.
What did the Fund invest in?
(as of May 31, 2024)
| Sector(a) | Percent of
Net Assets |
| Financials | 19.2)% |
| Health Care | 18.0)% |
| Industrials | 14.3)% |
| Information Technology | 9.0)% |
| Energy | 8.1)% |
| Consumer Staples | 7.7)% |
| Communication Services | 6.8)% |
| Consumer Discretionary | 6.3)% |
| Utilities | 4.7)% |
| Materials | 3.6)% |
| Real Estate | 1.4)% |
| Short-Term Securities | 1.0)% |
| Liabilities in Excess of Other Assets | (0.1)% |
| Security(b) | Percent of
Net Assets |
| Wells Fargo & Co. | 2.5% |
| RTX Corp. | 1.6% |
| Citigroup, Inc. | 1.6% |
| Samsung Electronics Co. Ltd., Registered Shares, GDR | 1.6% |
| Shell PLC | 1.6% |
| BP PLC | 1.6% |
| First Citizens BancShares, Inc., Class A | 1.5% |
| Baxter International, Inc. | 1.4% |
| Fidelity National Information Services, Inc. | 1.4% |
| L3Harris Technologies, Inc. | 1.4% |
(a) | For purposes of this report, sector sub-classifications may differ from those utilized for compliance purposes. |
(b) | Excludes short-term securities. |
Additional information
If you wish to view additional information about the Fund, including but not limited to financial statements, the Fund’s prospectus, and proxy voting policies and procedures, please visit blackrock.com/fundreports. For proxy voting records, visit blackrock.com/proxyrecords.
Householding
The Fund will mail only one copy of shareholder documents, including prospectuses, annual and semi-annual reports and proxy statements, to shareholders with multiple accounts at the same address. This practice is commonly called “householding” and is intended to reduce expenses and eliminate duplicate mailings of shareholder documents. Mailings of your shareholder documents may be householded indefinitely unless you instruct us otherwise. If you do not want the mailing of these documents to be combined with those for other members of your household, please call the Fund at (800) 441-7762.
The Fund is not sponsored, endorsed, issued, sold, or promoted by FTSE International Limited and its affiliates, nor does this company make any representation regarding the advisability of investing in the Fund. BlackRock is not affiliated with the company listed above.
©2024 BlackRock, Inc. or its affiliates. All rights reserved. BLACKROCK is a registered trademark of BlackRock, Inc. or its affiliates. All other trademarks are those of their respective owners.
BlackRock High Equity Income Fund
Investor A Shares | BMEAX
Annual Shareholder Report — May 31, 2024
BMEAX-05/24-AR
BlackRock High Equity Income Fund
Investor C Shares | BMECX
Annual Shareholder Report — May 31, 2024
This annual shareholder report contains important information about BlackRock High Equity Income Fund (the “Fund”) for the period of June 1, 2023 to May 31, 2024. You can find additional information about the Fund at blackrock.com/fundreports. You can also request this information by contacting us at (800) 441‑7762.
What were the Fund costs for the last year?
(based on a hypothetical $10,000 investment)
| Class name | Costs of a $10,000
investment | Costs paid as a percentage of a
$10,000 investment |
| Investor C Shares | $201 | 1.85% |
How did the Fund perform last year?
U.S. equities broadly moved higher as the period progressed, resulting in significant positive returns across most market segments.
Fears of a U.S. recession waned while major overseas economies returned to positive growth.
Signs of easing inflation led to expectations that the U.S. Federal Reserve and other leading central banks were poised to reduce interest rates, leading growth-oriented stocks to outperform value stocks.
What contributed to performance?
Positive contributions to the Fund’s performance relative to the benchmark (Russell 1000® Value Index) were led by security selection within the financial sector, driven by holdings within the financial services and bank industries. The Fund’s underweight to real estate also contributed to performance, most notably an underweight to industrial real estate investment trusts (“REITs”).
What detracted from performance?
The Fund’s overweight to and security selection with the healthcare sector detracted the most, with positioning in the healthcare equipment and supplies industry weighing most heavily on performance. Security selection within consumer staples also detracted from performance, particularly within the distribution and retail industry.
Approximately 30% of the Fund is overwritten using a covered call strategy designed to provide a consistent stream of income. The use of covered calls detracted from performance as expected during a rising market environment.
The views expressed reflect the opinions of BlackRock as of the date of this report and are subject to change based on changes in market, economic or other conditions. These views are not intended to be a forecast of future events and are no guarantee of future results.
Fund performance
Cumulative performance: June 1, 2014 through May 31, 2024
Initial investment of $10,000
See “Average annual total returns” for additional information on fund performance.
Average annual total returns
| 1 Year | 5 Years | 10 Years |
| Investor C Shares | 17.22% | 9.23% | 7.25% |
| Investor C Shares (with sales charge) | 16.22% | 9.23% | 7.25% |
| Russell 1000® Index | 28.01% | 15.42% | 12.40% |
| Russell 1000® Value Index | 21.71% | 10.74% | 8.61% |
| Net Assets | $2,032,731,260% |
| Number of Portfolio Holdings | $177% |
| Net Investment Advisory Fees | $14,704,213% |
| Portfolio Turnover Rate | $85% |
Performance shown prior to June 12, 2017 are the returns of the Fund when it followed different investment strategies under the name BlackRock U.S. Opportunities Portfolio.
Assuming maximum sales charges, if any. Average annual total returns with and without sales charges reflect reductions for distribution and service fees.
Past performance is not an indication of future results. Performance results may include adjustments made for financial reporting purposes in accordance with U.S. generally accepted accounting principles. Performance results do not reflect the deduction of taxes that a shareholder would pay on fund distributions or on the redemption or sale of fund shares. Visit blackrock.com for more recent performance information.
What did the Fund invest in?
(as of May 31, 2024)
| Sector(a) | Percent of
Net Assets |
| Financials | 19.2)% |
| Health Care | 18.0)% |
| Industrials | 14.3)% |
| Information Technology | 9.0)% |
| Energy | 8.1)% |
| Consumer Staples | 7.7)% |
| Communication Services | 6.8)% |
| Consumer Discretionary | 6.3)% |
| Utilities | 4.7)% |
| Materials | 3.6)% |
| Real Estate | 1.4)% |
| Short-Term Securities | 1.0)% |
| Liabilities in Excess of Other Assets | (0.1)% |
| Security(b) | Percent of
Net Assets |
| Wells Fargo & Co. | 2.5% |
| RTX Corp. | 1.6% |
| Citigroup, Inc. | 1.6% |
| Samsung Electronics Co. Ltd., Registered Shares, GDR | 1.6% |
| Shell PLC | 1.6% |
| BP PLC | 1.6% |
| First Citizens BancShares, Inc., Class A | 1.5% |
| Baxter International, Inc. | 1.4% |
| Fidelity National Information Services, Inc. | 1.4% |
| L3Harris Technologies, Inc. | 1.4% |
(a) | For purposes of this report, sector sub-classifications may differ from those utilized for compliance purposes. |
(b) | Excludes short-term securities. |
Additional information
If you wish to view additional information about the Fund, including but not limited to financial statements, the Fund’s prospectus, and proxy voting policies and procedures, please visit blackrock.com/fundreports. For proxy voting records, visit blackrock.com/proxyrecords.
Householding
The Fund will mail only one copy of shareholder documents, including prospectuses, annual and semi-annual reports and proxy statements, to shareholders with multiple accounts at the same address. This practice is commonly called “householding” and is intended to reduce expenses and eliminate duplicate mailings of shareholder documents. Mailings of your shareholder documents may be householded indefinitely unless you instruct us otherwise. If you do not want the mailing of these documents to be combined with those for other members of your household, please call the Fund at (800) 441-7762.
The Fund is not sponsored, endorsed, issued, sold, or promoted by FTSE International Limited and its affiliates, nor does this company make any representation regarding the advisability of investing in the Fund. BlackRock is not affiliated with the company listed above.
©2024 BlackRock, Inc. or its affiliates. All rights reserved. BLACKROCK is a registered trademark of BlackRock, Inc. or its affiliates. All other trademarks are those of their respective owners.
BlackRock High Equity Income Fund
Investor C Shares | BMECX
Annual Shareholder Report — May 31, 2024
BMECX-05/24-AR
BlackRock High Equity Income Fund
Class K Shares | BHEIX
Annual Shareholder Report — May 31, 2024
This annual shareholder report contains important information about BlackRock High Equity Income Fund (the “Fund”) for the period of June 1, 2023 to May 31, 2024. You can find additional information about the Fund at blackrock.com/fundreports. You can also request this information by contacting us at (800) 441‑7762.
What were the Fund costs for the last year?
(based on a hypothetical $10,000 investment)
| Class name | Costs of a $10,000
investment | Costs paid as a percentage of a
$10,000 investment |
| Class K Shares | $87 | 0.80% |
How did the Fund perform last year?
U.S. equities broadly moved higher as the period progressed, resulting in significant positive returns across most market segments.
Fears of a U.S. recession waned while major overseas economies returned to positive growth.
Signs of easing inflation led to expectations that the U.S. Federal Reserve and other leading central banks were poised to reduce interest rates, leading growth-oriented stocks to outperform value stocks.
What contributed to performance?
Positive contributions to the Fund’s performance relative to the benchmark (Russell 1000® Value Index) were led by security selection within the financial sector, driven by holdings within the financial services and bank industries. The Fund’s underweight to real estate also contributed to performance, most notably an underweight to industrial real estate investment trusts (“REITs”).
What detracted from performance?
The Fund’s overweight to and security selection with the healthcare sector detracted the most, with positioning in the healthcare equipment and supplies industry weighing most heavily on performance. Security selection within consumer staples also detracted from performance, particularly within the distribution and retail industry.
Approximately 30% of the Fund is overwritten using a covered call strategy designed to provide a consistent stream of income. The use of covered calls detracted from performance as expected during a rising market environment.
The views expressed reflect the opinions of BlackRock as of the date of this report and are subject to change based on changes in market, economic or other conditions. These views are not intended to be a forecast of future events and are no guarantee of future results.
Fund performance
Cumulative performance: June 1, 2014 through May 31, 2024
Initial investment of $10,000
See “Average annual total returns” for additional information on fund performance.
Average annual total returns
| 1 Year | 5 Years | 10 Years |
| Class K Shares | 18.48% | 10.34% | 8.22% |
| Russell 1000® Index | 28.01% | 15.42% | 12.40% |
| Russell 1000® Value Index | 21.71% | 10.74% | 8.61% |
| Net Assets | $2,032,731,260% |
| Number of Portfolio Holdings | $177% |
| Net Investment Advisory Fees | $14,704,213% |
| Portfolio Turnover Rate | $85% |
Performance shown prior to June 12, 2017 are the returns of the Fund when it followed different investment strategies under the name BlackRock U.S. Opportunities Portfolio.
Performance shown prior to the Class K Shares inception date of April 21, 2020 is that of Institutional Shares. The performance of the Class K Shares would be substantially similar to Institutional Shares because Class K Shares and Institutional Shares invest in the same portfolio of securities and performance would only differ to the extent that Class K Shares and Institutional Shares have different expenses. The actual returns of Class K Shares would have been higher than those of the Institutional Shares because Class K Shares have lower expenses than the Institutional Shares.
Past performance is not an indication of future results. Performance results may include adjustments made for financial reporting purposes in accordance with U.S. generally accepted accounting principles. Performance results do not reflect the deduction of taxes that a shareholder would pay on fund distributions or on the redemption or sale of fund shares. Visit blackrock.com for more recent performance information.
What did the Fund invest in?
(as of May 31, 2024)
| Sector(a) | Percent of
Net Assets |
| Financials | 19.2)% |
| Health Care | 18.0)% |
| Industrials | 14.3)% |
| Information Technology | 9.0)% |
| Energy | 8.1)% |
| Consumer Staples | 7.7)% |
| Communication Services | 6.8)% |
| Consumer Discretionary | 6.3)% |
| Utilities | 4.7)% |
| Materials | 3.6)% |
| Real Estate | 1.4)% |
| Short-Term Securities | 1.0)% |
| Liabilities in Excess of Other Assets | (0.1)% |
| Security(b) | Percent of
Net Assets |
| Wells Fargo & Co. | 2.5% |
| RTX Corp. | 1.6% |
| Citigroup, Inc. | 1.6% |
| Samsung Electronics Co. Ltd., Registered Shares, GDR | 1.6% |
| Shell PLC | 1.6% |
| BP PLC | 1.6% |
| First Citizens BancShares, Inc., Class A | 1.5% |
| Baxter International, Inc. | 1.4% |
| Fidelity National Information Services, Inc. | 1.4% |
| L3Harris Technologies, Inc. | 1.4% |
(a) | For purposes of this report, sector sub-classifications may differ from those utilized for compliance purposes. |
(b) | Excludes short-term securities. |
Additional information
If you wish to view additional information about the Fund, including but not limited to financial statements, the Fund’s prospectus, and proxy voting policies and procedures, please visit blackrock.com/fundreports. For proxy voting records, visit blackrock.com/proxyrecords.
Householding
The Fund will mail only one copy of shareholder documents, including prospectuses, annual and semi-annual reports and proxy statements, to shareholders with multiple accounts at the same address. This practice is commonly called “householding” and is intended to reduce expenses and eliminate duplicate mailings of shareholder documents. Mailings of your shareholder documents may be householded indefinitely unless you instruct us otherwise. If you do not want the mailing of these documents to be combined with those for other members of your household, please call the Fund at (800) 441-7762.
The Fund is not sponsored, endorsed, issued, sold, or promoted by FTSE International Limited and its affiliates, nor does this company make any representation regarding the advisability of investing in the Fund. BlackRock is not affiliated with the company listed above.
©2024 BlackRock, Inc. or its affiliates. All rights reserved. BLACKROCK is a registered trademark of BlackRock, Inc. or its affiliates. All other trademarks are those of their respective owners.
BlackRock High Equity Income Fund
Class K Shares | BHEIX
Annual Shareholder Report — May 31, 2024
BHEIX-05/24-AR
BlackRock Infrastructure Sustainable Opportunities Fund
Institutional Shares | BINFX
Annual Shareholder Report — May 31, 2024
This annual shareholder report contains important information about BlackRock Infrastructure Sustainable Opportunities Fund (the “Fund”) for the period of June 1, 2023 to May 31, 2024. You can find additional information about the Fund at blackrock.com/fundreports. You can also request this information by contacting us at (800) 441‑7762.
What were the Fund costs for the last year?
(based on a hypothetical $10,000 investment)
| Class name | Costs of a $10,000
investment | Costs paid as a percentage of a
$10,000 investment |
| Institutional Shares | $100 | 1.00% |
How did the Fund perform last year?
Equities produced strong performance behind resilient economic data, steady corporate earnings, and expectations that the U.S. Federal Reserve would begin to cut interest rates later in the year.
Infrastructure stocks, while producing a positive absolute return, did not keep pace with the broader market at a time in which information technology stocks played the largest role in the performance of the major indexes.
What contributed to performance?
At the sector level, Eurozone highways, U.S. data centers, and Australian communications were the largest contributors. Among individual stocks, Ferrovial SE, Enel SpA, and Digital Realty Trust, Inc. were the leading contributors. The Fund’s cash position had no material impact on performance.
What detracted from performance?
Eurozone electric utilities, U.K. diversified utilities and Eurozone communications were the largest detractors. Energias de Portugal SA, EDP Renováveis SA, and Orsted SA were the most notable detractors at the individual stock level. The Fund’s use of derivatives marginally detracted from performance.
The views expressed reflect the opinions of BlackRock as of the date of this report and are subject to change based on changes in market, economic or other conditions. These views are not intended to be a forecast of future events and are no guarantee of future results.
Fund performance
Cumulative performance: September 30, 2021 through May 31, 2024
Initial investment of $10,000
See “Average annual total returns” for additional information on fund performance.
Average annual total returns
| 1 Year | Since
Inception |
| Institutional Shares | 0.13% | (1.82)% |
| MSCI All Country World Index | 23.56% | 5.68)% |
| FTSE Developed Core Infrastructure 50/50 Net Tax Index | 8.29% | 2.89)% |
| Net Assets | $9,028,871% |
| Number of Portfolio Holdings | $40% |
| Net Investment Advisory Fees | $0% |
| Portfolio Turnover Rate | $57% |
The Fund commenced operations on September 30, 2021.
Past performance is not an indication of future results. Performance results may include adjustments made for financial reporting purposes in accordance with U.S. generally accepted accounting principles. Performance results do not reflect the deduction of taxes that a shareholder would pay on fund distributions or on the redemption or sale of fund shares. Visit blackrock.com for more recent performance information.
What did the Fund invest in?
(as of May 31, 2024)
| Sector(a) | Percent of
Net Assets |
| Utilities | 50.6% |
| Industrials | 25.8% |
| Real Estate | 14.6% |
| Communication Services | 4.5% |
| Information Technology | 1.1% |
| Short-Term Securities | 2.0% |
| Other Assets Less Liabilities | 1.4% |
| Security(b) | Percent of
Net Assets |
| Terna - Rete Elettrica Nazionale | 5.4% |
| National Grid PLC | 5.1% |
| SBA Communications Corp. | 4.9% |
| Ferrovial SE | 4.5% |
| Alliant Energy Corp. | 4.2% |
| Enel SpA | 4.1% |
| SSE PLC | 4.0% |
| Clearway Energy, Inc., Class C | 3.6% |
| Fraport AG Frankfurt Airport Services Worldwide | 3.4% |
| Equinix, Inc. | 3.4% |
(a) | For purposes of this report, sector sub-classifications may differ from those utilized for compliance purposes. |
(b) | Excludes short-term securities. |
Additional information
If you wish to view additional information about the Fund, including but not limited to financial statements, the Fund’s prospectus, and proxy voting policies and procedures, please visit blackrock.com/fundreports. For proxy voting records, visit blackrock.com/proxyrecords.
Householding
The Fund will mail only one copy of shareholder documents, including prospectuses, annual and semi-annual reports and proxy statements, to shareholders with multiple accounts at the same address. This practice is commonly called “householding” and is intended to reduce expenses and eliminate duplicate mailings of shareholder documents. Mailings of your shareholder documents may be householded indefinitely unless you instruct us otherwise. If you do not want the mailing of these documents to be combined with those for other members of your household, please call the Fund at (800) 441-7762.
The Fund is not sponsored, endorsed, issued, sold, or promoted by FTSE International Limited, MSCI, Inc., and their respective affiliates, nor do these companies make any representation regarding the advisability of investing in the Fund. BlackRock is not affiliated with the companies listed above.
©2024 BlackRock, Inc. or its affiliates. All rights reserved. BLACKROCK is a registered trademark of BlackRock, Inc. or its affiliates. All other trademarks are those of their respective owners.
BlackRock Infrastructure Sustainable Opportunities Fund
Institutional Shares | BINFX
Annual Shareholder Report — May 31, 2024
BINFX-05/24-AR
BlackRock Infrastructure Sustainable Opportunities Fund
Investor A Shares | BINAX
Annual Shareholder Report — May 31, 2024
This annual shareholder report contains important information about BlackRock Infrastructure Sustainable Opportunities Fund (the “Fund”) for the period of June 1, 2023 to May 31, 2024. You can find additional information about the Fund at blackrock.com/fundreports. You can also request this information by contacting us at (800) 441‑7762.
What were the Fund costs for the last year?
(based on a hypothetical $10,000 investment)
| Class name | Costs of a $10,000
investment | Costs paid as a percentage of a
$10,000 investment |
| Investor A Shares | $125 | 1.25% |
How did the Fund perform last year?
Equities produced strong performance behind resilient economic data, steady corporate earnings, and expectations that the U.S. Federal Reserve would begin to cut interest rates later in the year.
Infrastructure stocks, while producing a positive absolute return, did not keep pace with the broader market at a time in which information technology stocks played the largest role in the performance of the major indexes.
What contributed to performance?
At the sector level, Eurozone highways, U.S. data centers, and Australian communications were the largest contributors. Among individual stocks, Ferrovial SE, Enel SpA, and Digital Realty Trust, Inc. were the leading contributors. The Fund’s cash position had no material impact on performance.
What detracted from performance?
Eurozone electric utilities, U.K. diversified utilities and Eurozone communications were the largest detractors. Energias de Portugal SA, EDP Renováveis SA, and Orsted SA were the most notable detractors at the individual stock level. The Fund’s use of derivatives marginally detracted from performance.
The views expressed reflect the opinions of BlackRock as of the date of this report and are subject to change based on changes in market, economic or other conditions. These views are not intended to be a forecast of future events and are no guarantee of future results.
Fund performance
Cumulative performance: September 30, 2021 through May 31, 2024
Initial investment of $10,000
See “Average annual total returns” for additional information on fund performance.
Average annual total returns
| 1 Year | Since
Inception |
| Investor A Shares | (0.08)% | (2.04)% |
| Investor A Shares (with sales charge) | (5.33)% | (4.01)% |
| MSCI All Country World Index | 23.56)% | 5.68)% |
| FTSE Developed Core Infrastructure 50/50 Net Tax Index | 8.29)% | 2.89)% |
| Net Assets | $9,028,871% |
| Number of Portfolio Holdings | $40% |
| Net Investment Advisory Fees | $0% |
| Portfolio Turnover Rate | $57% |
The Fund commenced operations on September 30, 2021.
Assuming maximum sales charges. Average annual total returns with and without sales charges reflect reductions for service fees.
Past performance is not an indication of future results. Performance results may include adjustments made for financial reporting purposes in accordance with U.S. generally accepted accounting principles. Performance results do not reflect the deduction of taxes that a shareholder would pay on fund distributions or on the redemption or sale of fund shares. Visit blackrock.com for more recent performance information.
What did the Fund invest in?
(as of May 31, 2024)
| Sector(a) | Percent of
Net Assets |
| Utilities | 50.6% |
| Industrials | 25.8% |
| Real Estate | 14.6% |
| Communication Services | 4.5% |
| Information Technology | 1.1% |
| Short-Term Securities | 2.0% |
| Other Assets Less Liabilities | 1.4% |
| Security(b) | Percent of
Net Assets |
| Terna - Rete Elettrica Nazionale | 5.4% |
| National Grid PLC | 5.1% |
| SBA Communications Corp. | 4.9% |
| Ferrovial SE | 4.5% |
| Alliant Energy Corp. | 4.2% |
| Enel SpA | 4.1% |
| SSE PLC | 4.0% |
| Clearway Energy, Inc., Class C | 3.6% |
| Fraport AG Frankfurt Airport Services Worldwide | 3.4% |
| Equinix, Inc. | 3.4% |
(a) | For purposes of this report, sector sub-classifications may differ from those utilized for compliance purposes. |
(b) | Excludes short-term securities. |
Additional information
If you wish to view additional information about the Fund, including but not limited to financial statements, the Fund’s prospectus, and proxy voting policies and procedures, please visit blackrock.com/fundreports. For proxy voting records, visit blackrock.com/proxyrecords.
Householding
The Fund will mail only one copy of shareholder documents, including prospectuses, annual and semi-annual reports and proxy statements, to shareholders with multiple accounts at the same address. This practice is commonly called “householding” and is intended to reduce expenses and eliminate duplicate mailings of shareholder documents. Mailings of your shareholder documents may be householded indefinitely unless you instruct us otherwise. If you do not want the mailing of these documents to be combined with those for other members of your household, please call the Fund at (800) 441-7762.
The Fund is not sponsored, endorsed, issued, sold, or promoted by FTSE International Limited, MSCI, Inc., and their respective affiliates, nor do these companies make any representation regarding the advisability of investing in the Fund. BlackRock is not affiliated with the companies listed above.
©2024 BlackRock, Inc. or its affiliates. All rights reserved. BLACKROCK is a registered trademark of BlackRock, Inc. or its affiliates. All other trademarks are those of their respective owners.
BlackRock Infrastructure Sustainable Opportunities Fund
Investor A Shares | BINAX
Annual Shareholder Report — May 31, 2024
BINAX-05/24-AR
BlackRock Infrastructure Sustainable Opportunities Fund
Class K Shares | BINKX
Annual Shareholder Report — May 31, 2024
This annual shareholder report contains important information about BlackRock Infrastructure Sustainable Opportunities Fund (the “Fund”) for the period of June 1, 2023 to May 31, 2024. You can find additional information about the Fund at blackrock.com/fundreports. You can also request this information by contacting us at (800) 441‑7762.
What were the Fund costs for the last year?
(based on a hypothetical $10,000 investment)
| Class name | Costs of a $10,000
investment | Costs paid as a percentage of a
$10,000 investment |
| Class K Shares | $95 | 0.95% |
How did the Fund perform last year?
Equities produced strong performance behind resilient economic data, steady corporate earnings, and expectations that the U.S. Federal Reserve would begin to cut interest rates later in the year.
Infrastructure stocks, while producing a positive absolute return, did not keep pace with the broader market at a time in which information technology stocks played the largest role in the performance of the major indexes.
What contributed to performance?
At the sector level, Eurozone highways, U.S. data centers, and Australian communications were the largest contributors. Among individual stocks, Ferrovial SE, Enel SpA, and Digital Realty Trust, Inc. were the leading contributors. The Fund’s cash position had no material impact on performance.
What detracted from performance?
Eurozone electric utilities, U.K. diversified utilities and Eurozone communications were the largest detractors. Energias de Portugal SA, EDP Renováveis SA, and Orsted SA were the most notable detractors at the individual stock level. The Fund’s use of derivatives marginally detracted from performance.
The views expressed reflect the opinions of BlackRock as of the date of this report and are subject to change based on changes in market, economic or other conditions. These views are not intended to be a forecast of future events and are no guarantee of future results.
Fund performance
Cumulative performance: September 30, 2021 through May 31, 2024
Initial investment of $10,000
See “Average annual total returns” for additional information on fund performance.
Average annual total returns
| 1 Year | Since
Inception |
| Class K Shares | 0.29% | (1.73)% |
| MSCI All Country World Index | 23.56% | 5.68)% |
| FTSE Developed Core Infrastructure 50/50 Net Tax Index | 8.29% | 2.89)% |
| Net Assets | $9,028,871% |
| Number of Portfolio Holdings | $40% |
| Net Investment Advisory Fees | $0% |
| Portfolio Turnover Rate | $57% |
The Fund commenced operations on September 30, 2021.
Past performance is not an indication of future results. Performance results may include adjustments made for financial reporting purposes in accordance with U.S. generally accepted accounting principles. Performance results do not reflect the deduction of taxes that a shareholder would pay on fund distributions or on the redemption or sale of fund shares. Visit blackrock.com for more recent performance information.
What did the Fund invest in?
(as of May 31, 2024)
| Sector(a) | Percent of
Net Assets |
| Utilities | 50.6% |
| Industrials | 25.8% |
| Real Estate | 14.6% |
| Communication Services | 4.5% |
| Information Technology | 1.1% |
| Short-Term Securities | 2.0% |
| Other Assets Less Liabilities | 1.4% |
| Security(b) | Percent of
Net Assets |
| Terna - Rete Elettrica Nazionale | 5.4% |
| National Grid PLC | 5.1% |
| SBA Communications Corp. | 4.9% |
| Ferrovial SE | 4.5% |
| Alliant Energy Corp. | 4.2% |
| Enel SpA | 4.1% |
| SSE PLC | 4.0% |
| Clearway Energy, Inc., Class C | 3.6% |
| Fraport AG Frankfurt Airport Services Worldwide | 3.4% |
| Equinix, Inc. | 3.4% |
(a) | For purposes of this report, sector sub-classifications may differ from those utilized for compliance purposes. |
(b) | Excludes short-term securities. |
Additional information
If you wish to view additional information about the Fund, including but not limited to financial statements, the Fund’s prospectus, and proxy voting policies and procedures, please visit blackrock.com/fundreports. For proxy voting records, visit blackrock.com/proxyrecords.
Householding
The Fund will mail only one copy of shareholder documents, including prospectuses, annual and semi-annual reports and proxy statements, to shareholders with multiple accounts at the same address. This practice is commonly called “householding” and is intended to reduce expenses and eliminate duplicate mailings of shareholder documents. Mailings of your shareholder documents may be householded indefinitely unless you instruct us otherwise. If you do not want the mailing of these documents to be combined with those for other members of your household, please call the Fund at (800) 441-7762.
The Fund is not sponsored, endorsed, issued, sold, or promoted by FTSE International Limited, MSCI, Inc., and their respective affiliates, nor do these companies make any representation regarding the advisability of investing in the Fund. BlackRock is not affiliated with the companies listed above.
©2024 BlackRock, Inc. or its affiliates. All rights reserved. BLACKROCK is a registered trademark of BlackRock, Inc. or its affiliates. All other trademarks are those of their respective owners.
BlackRock Infrastructure Sustainable Opportunities Fund
Class K Shares | BINKX
Annual Shareholder Report — May 31, 2024
BINKX-05/24-AR
BlackRock International Dividend Fund
Institutional Shares | BISIX
Annual Shareholder Report — May 31, 2024
This annual shareholder report contains important information about BlackRock International Dividend Fund (the “Fund”) for the period of June 1, 2023 to May 31, 2024. You can find additional information about the Fund at blackrock.com/fundreports. You can also request this information by contacting us at (800) 441‑7762.
This report describes changes to the Fund that occurred during the reporting period.
What were the Fund costs for the last year?
(based on a hypothetical $10,000 investment)
| Class name | Costs of a $10,000
investment | Costs paid as a percentage of a
$10,000 investment |
| Institutional Shares | $72 | 0.67% |
How did the Fund perform last year?
International equities broadly moved higher as the period progressed, resulting in significant positive returns across most market segments.
Major overseas economies returned to positive growth, supporting the corporate earnings outlook.
Signs of easing inflation led to expectations that leading central banks were poised to begin reducing interest rates, leading growth-oriented stocks to outperform dividend payers.
What contributed to performance?
Positive contributions to performance, relative to the benchmark (MSCI ACWI ex USA Index) were led by stock selection in information technology, industrials and materials. In terms of individual holdings, Danish pharmaceutical company Novo Nordisk benefited from increased demand for its diabetes and obesity products, including Wegovy which is increasingly available outside the United States. ASML, the Dutch manufacturer of silicon photolithography systems used in semiconductor manufacturing, reported revenues and earnings that exceeded expectations, driven by record order growth. Results for British arms, security and aerospace company BAE Systems have been boosted by conflicts in Ukraine and the Middle East as governments bolster their military capabilities.
What detracted from performance?
The largest detractors from performance included stock selection within and underweights to financials and consumer staples. With respect to specific holdings, Swiss pharmaceutical and biotech company Lonza Biologics experienced the unexpected departure of its CEO and downgraded 2024 guidance at its Capital Markets Day. The downgrade was centered on the biologics division which management had previously indicated was fully booked for the foreseeable future, and the Fund exited the position. U.K.-based multinational insurance company Prudential Financial came under pressure due to weaker sentiment around China. Bank Rakyat, the Indonesian bank that specializes in small scale and microfinance lending, indicated that inconsistent underwriting practices (since rectified) in its rural loan program would likely lead to increased credit losses in coming months.
The views expressed reflect the opinions of BlackRock as of the date of this report and are subject to change based on changes in market, economic or other conditions. These views are not intended to be a forecast of future events and are no guarantee of future results.
Fund performance
Cumulative performance: June 1, 2014 through May 31, 2024
Initial investment of $10,000
See “Average annual total returns” for additional information on fund performance.
Average annual total returns
| 1 Year | 5 Years | 10 Years |
| Institutional Shares | 14.35% | 9.35% | 4.58% |
| MSCI ACWI ex USA Index | 16.74% | 6.81% | 4.03% |
| Net Assets | $735,887,706% |
| Number of Portfolio Holdings | $40% |
| Net Investment Advisory Fees | $3,469,534% |
| Portfolio Turnover Rate | $71% |
Performance shown prior to June 12, 2017 are the returns of the Fund when it followed different investment strategies under the name BlackRock International Opportunities Portfolio.
Past performance is not an indication of future results. Performance results may include adjustments made for financial reporting purposes in accordance with U.S. generally accepted accounting principles. Performance results do not reflect the deduction of taxes that a shareholder would pay on fund distributions or on the redemption or sale of fund shares. Visit blackrock.com for more recent performance information.
What did the Fund invest in?
(as of May 31, 2024)
| Country | Percent of
Net Assets |
| United Kingdom | 14.9% |
| United States | 12.1% |
| France | 11.8% |
| Netherlands | 9.1% |
| Sweden | 6.4% |
| Japan | 6.0% |
| Canada | 5.5% |
| Taiwan | 5.3% |
| Germany | 5.2% |
| Denmark | 4.7% |
| Other | 18.4% |
| Short-Term Securities | 0.1% |
| Other Assets Less Liabilities | 0.5% |
| Security(a) | Percent of
Net Assets |
| Taiwan Semiconductor Manufacturing Co. Ltd. | 5.3% |
| Novo Nordisk A/S, Class B | 4.7% |
| AstraZeneca PLC | 3.9% |
| Baker Hughes Co., Class A | 3.7% |
| LVMH Moet Hennessy Louis Vuitton SE | 3.7% |
| RELX PLC | 3.6% |
| ASML Holding NV | 3.6% |
| Assa Abloy AB, Class B | 3.6% |
| Air Liquide SA | 3.5% |
| Texas Instruments, Inc. | 3.3% |
(a) | Excludes short-term securities. |
Material Fund changes
This is a summary of certain changes and planned changes to the Fund since May 31, 2023. For more complete information, you may review the Fund’s next prospectus, which we expect to be available approximately 120 days after May 31, 2024 at blackrock.com/fundreports or upon request by contacting us at (800) 441-7762.
The net expense ratio decreased from the prior fiscal year end primarily due to a change in the Fund’s investment advisory agreement during the prior fiscal year and an increase in average net assets.
On April 16, 2024, the Board of Trustees of the Fund approved the reorganization of the Fund into a newly created ETF to be named BlackRock International Dividend ETF. The reorganization is expected to close on or about November 18, 2024.
Additional information
If you wish to view additional information about the Fund, including but not limited to financial statements, the Fund’s prospectus, and proxy voting policies and procedures, please visit blackrock.com/fundreports. For proxy voting records, visit blackrock.com/proxyrecords.
Householding
The Fund will mail only one copy of shareholder documents, including prospectuses, annual and semi-annual reports and proxy statements, to shareholders with multiple accounts at the same address. This practice is commonly called “householding” and is intended to reduce expenses and eliminate duplicate mailings of shareholder documents. Mailings of your shareholder documents may be householded indefinitely unless you instruct us otherwise. If you do not want the mailing of these documents to be combined with those for other members of your household, please call the Fund at (800) 441-7762.
The Fund is not sponsored, endorsed, issued, sold, or promoted by MSCI Inc. and its affiliates, nor does this company make any representation regarding the advisability of investing in the Fund. BlackRock is not affiliated with the company listed above.
©2024 BlackRock, Inc. or its affiliates. All rights reserved. BLACKROCK is a registered trademark of BlackRock, Inc. or its affiliates. All other trademarks are those of their respective owners.
BlackRock International Dividend Fund
Institutional Shares | BISIX
Annual Shareholder Report — May 31, 2024
BISIX-05/24-AR
BlackRock International Dividend Fund
Investor A Shares | BREAX
Annual Shareholder Report — May 31, 2024
This annual shareholder report contains important information about BlackRock International Dividend Fund (the “Fund”) for the period of June 1, 2023 to May 31, 2024. You can find additional information about the Fund at blackrock.com/fundreports. You can also request this information by contacting us at (800) 441‑7762.
This report describes changes to the Fund that occurred during the reporting period.
What were the Fund costs for the last year?
(based on a hypothetical $10,000 investment)
| Class name | Costs of a $10,000
investment | Costs paid as a percentage of a
$10,000 investment |
| Investor A Shares | $98 | 0.92% |
How did the Fund perform last year?
International equities broadly moved higher as the period progressed, resulting in significant positive returns across most market segments.
Major overseas economies returned to positive growth, supporting the corporate earnings outlook.
Signs of easing inflation led to expectations that leading central banks were poised to begin reducing interest rates, leading growth-oriented stocks to outperform dividend payers.
What contributed to performance?
Positive contributions to performance, relative to the benchmark (MSCI ACWI ex USA Index) were led by stock selection in information technology, industrials and materials. In terms of individual holdings, Danish pharmaceutical company Novo Nordisk benefited from increased demand for its diabetes and obesity products, including Wegovy which is increasingly available outside the United States. ASML, the Dutch manufacturer of silicon photolithography systems used in semiconductor manufacturing, reported revenues and earnings that exceeded expectations, driven by record order growth. Results for British arms, security and aerospace company BAE Systems have been boosted by conflicts in Ukraine and the Middle East as governments bolster their military capabilities.
What detracted from performance?
The largest detractors from performance included stock selection within and underweights to financials and consumer staples. With respect to specific holdings, Swiss pharmaceutical and biotech company Lonza Biologics experienced the unexpected departure of its CEO and downgraded 2024 guidance at its Capital Markets Day. The downgrade was centered on the biologics division which management had previously indicated was fully booked for the foreseeable future, and the Fund exited the position. U.K.-based multinational insurance company Prudential Financial came under pressure due to weaker sentiment around China. Bank Rakyat, the Indonesian bank that specializes in small scale and microfinance lending, indicated that inconsistent underwriting practices (since rectified) in its rural loan program would likely lead to increased credit losses in coming months.
The views expressed reflect the opinions of BlackRock as of the date of this report and are subject to change based on changes in market, economic or other conditions. These views are not intended to be a forecast of future events and are no guarantee of future results.
Fund performance
Cumulative performance: June 1, 2014 through May 31, 2024
Initial investment of $10,000
See “Average annual total returns” for additional information on fund performance.
Average annual total returns
| 1 Year | 5 Years | 10 Years |
| Investor A Shares | 14.07% | 9.08% | 4.30% |
| Investor A Shares (with sales charge) | 8.08% | 7.91% | 3.74% |
| MSCI ACWI ex USA Index | 16.74% | 6.81% | 4.03% |
| Net Assets | $735,887,706% |
| Number of Portfolio Holdings | $40% |
| Net Investment Advisory Fees | $3,469,534% |
| Portfolio Turnover Rate | $71% |
Performance shown prior to June 12, 2017 are the returns of the Fund when it followed different investment strategies under the name BlackRock International Opportunities Portfolio.
Assuming maximum sales charges. Average annual total returns with and without sales charges reflect reductions for service fees.
Past performance is not an indication of future results. Performance results may include adjustments made for financial reporting purposes in accordance with U.S. generally accepted accounting principles. Performance results do not reflect the deduction of taxes that a shareholder would pay on fund distributions or on the redemption or sale of fund shares. Visit blackrock.com for more recent performance information.
What did the Fund invest in?
(as of May 31, 2024)
| Country | Percent of
Net Assets |
| United Kingdom | 14.9% |
| United States | 12.1% |
| France | 11.8% |
| Netherlands | 9.1% |
| Sweden | 6.4% |
| Japan | 6.0% |
| Canada | 5.5% |
| Taiwan | 5.3% |
| Germany | 5.2% |
| Denmark | 4.7% |
| Other | 18.4% |
| Short-Term Securities | 0.1% |
| Other Assets Less Liabilities | 0.5% |
| Security(a) | Percent of
Net Assets |
| Taiwan Semiconductor Manufacturing Co. Ltd. | 5.3% |
| Novo Nordisk A/S, Class B | 4.7% |
| AstraZeneca PLC | 3.9% |
| Baker Hughes Co., Class A | 3.7% |
| LVMH Moet Hennessy Louis Vuitton SE | 3.7% |
| RELX PLC | 3.6% |
| ASML Holding NV | 3.6% |
| Assa Abloy AB, Class B | 3.6% |
| Air Liquide SA | 3.5% |
| Texas Instruments, Inc. | 3.3% |
(a) | Excludes short-term securities. |
Material Fund changes
This is a summary of certain changes and planned changes to the Fund since May 31, 2023. For more complete information, you may review the Fund’s next prospectus, which we expect to be available approximately 120 days after May 31, 2024 at blackrock.com/fundreports or upon request by contacting us at (800) 441-7762.
The net expense ratio decreased from the prior fiscal year end primarily due to a change in the Fund’s investment advisory agreement during the prior fiscal year and an increase in average net assets.
On April 16, 2024, the Board of Trustees of the Fund approved the reorganization of the Fund into a newly created ETF to be named BlackRock International Dividend ETF. The reorganization is expected to close on or about November 18, 2024.
Additional information
If you wish to view additional information about the Fund, including but not limited to financial statements, the Fund’s prospectus, and proxy voting policies and procedures, please visit blackrock.com/fundreports. For proxy voting records, visit blackrock.com/proxyrecords.
Householding
The Fund will mail only one copy of shareholder documents, including prospectuses, annual and semi-annual reports and proxy statements, to shareholders with multiple accounts at the same address. This practice is commonly called “householding” and is intended to reduce expenses and eliminate duplicate mailings of shareholder documents. Mailings of your shareholder documents may be householded indefinitely unless you instruct us otherwise. If you do not want the mailing of these documents to be combined with those for other members of your household, please call the Fund at (800) 441-7762.
The Fund is not sponsored, endorsed, issued, sold, or promoted by MSCI Inc. and its affiliates, nor does this company make any representation regarding the advisability of investing in the Fund. BlackRock is not affiliated with the company listed above.
©2024 BlackRock, Inc. or its affiliates. All rights reserved. BLACKROCK is a registered trademark of BlackRock, Inc. or its affiliates. All other trademarks are those of their respective owners.
BlackRock International Dividend Fund
Investor A Shares | BREAX
Annual Shareholder Report — May 31, 2024
BREAX-05/24-AR
BlackRock International Dividend Fund
Investor C Shares | BRECX
Annual Shareholder Report — May 31, 2024
This annual shareholder report contains important information about BlackRock International Dividend Fund (the “Fund”) for the period of June 1, 2023 to May 31, 2024. You can find additional information about the Fund at blackrock.com/fundreports. You can also request this information by contacting us at (800) 441‑7762.
This report describes changes to the Fund that occurred during the reporting period.
What were the Fund costs for the last year?
(based on a hypothetical $10,000 investment)
| Class name | Costs of a $10,000
investment | Costs paid as a percentage of a
$10,000 investment |
| Investor C Shares | $178 | 1.67% |
How did the Fund perform last year?
International equities broadly moved higher as the period progressed, resulting in significant positive returns across most market segments.
Major overseas economies returned to positive growth, supporting the corporate earnings outlook.
Signs of easing inflation led to expectations that leading central banks were poised to begin reducing interest rates, leading growth-oriented stocks to outperform dividend payers.
What contributed to performance?
Positive contributions to performance, relative to the benchmark (MSCI ACWI ex USA Index) were led by stock selection in information technology, industrials and materials. In terms of individual holdings, Danish pharmaceutical company Novo Nordisk benefited from increased demand for its diabetes and obesity products, including Wegovy which is increasingly available outside the United States. ASML, the Dutch manufacturer of silicon photolithography systems used in semiconductor manufacturing, reported revenues and earnings that exceeded expectations, driven by record order growth. Results for British arms, security and aerospace company BAE Systems have been boosted by conflicts in Ukraine and the Middle East as governments bolster their military capabilities.
What detracted from performance?
The largest detractors from performance included stock selection within and underweights to financials and consumer staples. With respect to specific holdings, Swiss pharmaceutical and biotech company Lonza Biologics experienced the unexpected departure of its CEO and downgraded 2024 guidance at its Capital Markets Day. The downgrade was centered on the biologics division which management had previously indicated was fully booked for the foreseeable future, and the Fund exited the position. U.K.-based multinational insurance company Prudential Financial came under pressure due to weaker sentiment around China. Bank Rakyat, the Indonesian bank that specializes in small scale and microfinance lending, indicated that inconsistent underwriting practices (since rectified) in its rural loan program would likely lead to increased credit losses in coming months.
The views expressed reflect the opinions of BlackRock as of the date of this report and are subject to change based on changes in market, economic or other conditions. These views are not intended to be a forecast of future events and are no guarantee of future results.
Fund performance
Cumulative performance: June 1, 2014 through May 31, 2024
Initial investment of $10,000
See “Average annual total returns” for additional information on fund performance.
Average annual total returns
| 1 Year | 5 Years | 10 Years |
| Investor C Shares | 13.21% | 8.27% | 3.68% |
| Investor C Shares (with sales charge) | 12.21% | 8.27% | 3.68% |
| MSCI ACWI ex USA Index | 16.74% | 6.81% | 4.03% |
| Net Assets | $735,887,706% |
| Number of Portfolio Holdings | $40% |
| Net Investment Advisory Fees | $3,469,534% |
| Portfolio Turnover Rate | $71% |
Performance shown prior to June 12, 2017 are the returns of the Fund when it followed different investment strategies under the name BlackRock International Opportunities Portfolio.
Assuming maximum sales charges. Average annual total returns with and without sales charges reflect reductions for distribution and service fees.
Past performance is not an indication of future results. Performance results may include adjustments made for financial reporting purposes in accordance with U.S. generally accepted accounting principles. Performance results do not reflect the deduction of taxes that a shareholder would pay on fund distributions or on the redemption or sale of fund shares. Visit blackrock.com for more recent performance information.
What did the Fund invest in?
(as of May 31, 2024)
| Country | Percent of
Net Assets |
| United Kingdom | 14.9% |
| United States | 12.1% |
| France | 11.8% |
| Netherlands | 9.1% |
| Sweden | 6.4% |
| Japan | 6.0% |
| Canada | 5.5% |
| Taiwan | 5.3% |
| Germany | 5.2% |
| Denmark | 4.7% |
| Other | 18.4% |
| Short-Term Securities | 0.1% |
| Other Assets Less Liabilities | 0.5% |
| Security(a) | Percent of
Net Assets |
| Taiwan Semiconductor Manufacturing Co. Ltd. | 5.3% |
| Novo Nordisk A/S, Class B | 4.7% |
| AstraZeneca PLC | 3.9% |
| Baker Hughes Co., Class A | 3.7% |
| LVMH Moet Hennessy Louis Vuitton SE | 3.7% |
| RELX PLC | 3.6% |
| ASML Holding NV | 3.6% |
| Assa Abloy AB, Class B | 3.6% |
| Air Liquide SA | 3.5% |
| Texas Instruments, Inc. | 3.3% |
(a) | Excludes short-term securities. |
Material Fund changes
This is a summary of certain changes and planned changes to the Fund since May 31, 2023. For more complete information, you may review the Fund’s next prospectus, which we expect to be available approximately 120 days after May 31, 2024 at blackrock.com/fundreports or upon request by contacting us at (800) 441-7762.
On April 16, 2024, the Board of Trustees of the Fund approved the reorganization of the Fund into a newly created ETF to be named BlackRock International Dividend ETF. The reorganization is expected to close on or about November 18, 2024.
Additional information
If you wish to view additional information about the Fund, including but not limited to financial statements, the Fund’s prospectus, and proxy voting policies and procedures, please visit blackrock.com/fundreports. For proxy voting records, visit blackrock.com/proxyrecords.
Householding
The Fund will mail only one copy of shareholder documents, including prospectuses, annual and semi-annual reports and proxy statements, to shareholders with multiple accounts at the same address. This practice is commonly called “householding” and is intended to reduce expenses and eliminate duplicate mailings of shareholder documents. Mailings of your shareholder documents may be householded indefinitely unless you instruct us otherwise. If you do not want the mailing of these documents to be combined with those for other members of your household, please call the Fund at (800) 441-7762.
The Fund is not sponsored, endorsed, issued, sold, or promoted by MSCI Inc. and its affiliates, nor does this company make any representation regarding the advisability of investing in the Fund. BlackRock is not affiliated with the company listed above.
©2024 BlackRock, Inc. or its affiliates. All rights reserved. BLACKROCK is a registered trademark of BlackRock, Inc. or its affiliates. All other trademarks are those of their respective owners.
BlackRock International Dividend Fund
Investor C Shares | BRECX
Annual Shareholder Report — May 31, 2024
BRECX-05/24-AR
BlackRock International Dividend Fund
Class K Shares | BREKX
Annual Shareholder Report — May 31, 2024
This annual shareholder report contains important information about BlackRock International Dividend Fund (the “Fund”) for the period of June 1, 2023 to May 31, 2024. You can find additional information about the Fund at blackrock.com/fundreports. You can also request this information by contacting us at (800) 441‑7762.
This report describes changes to the Fund that occurred during the reporting period.
What were the Fund costs for the last year?
(based on a hypothetical $10,000 investment)
| Class name | Costs of a $10,000
investment | Costs paid as a percentage of a
$10,000 investment |
| Class K Shares | $66 | 0.62% |
How did the Fund perform last year?
International equities broadly moved higher as the period progressed, resulting in significant positive returns across most market segments.
Major overseas economies returned to positive growth, supporting the corporate earnings outlook.
Signs of easing inflation led to expectations that leading central banks were poised to begin reducing interest rates, leading growth-oriented stocks to outperform dividend payers.
What contributed to performance?
Positive contributions to performance, relative to the benchmark (MSCI ACWI ex USA Index) were led by stock selection in information technology, industrials and materials. In terms of individual holdings, Danish pharmaceutical company Novo Nordisk benefited from increased demand for its diabetes and obesity products, including Wegovy which is increasingly available outside the United States. ASML, the Dutch manufacturer of silicon photolithography systems used in semiconductor manufacturing, reported revenues and earnings that exceeded expectations, driven by record order growth. Results for British arms, security and aerospace company BAE Systems have been boosted by conflicts in Ukraine and the Middle East as governments bolster their military capabilities.
What detracted from performance?
The largest detractors from performance included stock selection within and underweights to financials and consumer staples. With respect to specific holdings, Swiss pharmaceutical and biotech company Lonza Biologics experienced the unexpected departure of its CEO and downgraded 2024 guidance at its Capital Markets Day. The downgrade was centered on the biologics division which management had previously indicated was fully booked for the foreseeable future, and the Fund exited the position. U.K.-based multinational insurance company Prudential Financial came under pressure due to weaker sentiment around China. Bank Rakyat, the Indonesian bank that specializes in small scale and microfinance lending, indicated that inconsistent underwriting practices (since rectified) in its rural loan program would likely lead to increased credit losses in coming months.
The views expressed reflect the opinions of BlackRock as of the date of this report and are subject to change based on changes in market, economic or other conditions. These views are not intended to be a forecast of future events and are no guarantee of future results.
Fund performance
Cumulative performance: June 1, 2014 through May 31, 2024
Initial investment of $10,000
See “Average annual total returns” for additional information on fund performance.
Average annual total returns
| 1 Year | 5 Years | 10 Years |
| Class K Shares | 14.41% | 9.41% | 4.62% |
| MSCI ACWI ex USA Index | 16.74% | 6.81% | 4.03% |
| Net Assets | $735,887,706% |
| Number of Portfolio Holdings | $40% |
| Net Investment Advisory Fees | $3,469,534% |
| Portfolio Turnover Rate | $71% |
Performance shown prior to June 12, 2017 are the returns of the Fund when it followed different investment strategies under the name BlackRock International Opportunities Portfolio.
Performance shown prior to the Class K Shares inception date of January 25, 2018 is that of Institutional Shares. The performance of the Class K Shares would be substantially similar to Institutional Shares because Class K Shares and Institutional Shares invest in the same portfolio of securities and performance would only differ to the extent that Class K Shares and Institutional Shares have different expenses. The actual returns of Class K Shares would have been higher than those of the Institutional Shares because Class K Shares have lower expenses than the Institutional Shares.
Past performance is not an indication of future results. Performance results may include adjustments made for financial reporting purposes in accordance with U.S. generally accepted accounting principles. Performance results do not reflect the deduction of taxes that a shareholder would pay on fund distributions or on the redemption or sale of fund shares. Visit blackrock.com for more recent performance information.
What did the Fund invest in?
(as of May 31, 2024)
| Country | Percent of
Net Assets |
| United Kingdom | 14.9% |
| United States | 12.1% |
| France | 11.8% |
| Netherlands | 9.1% |
| Sweden | 6.4% |
| Japan | 6.0% |
| Canada | 5.5% |
| Taiwan | 5.3% |
| Germany | 5.2% |
| Denmark | 4.7% |
| Other | 18.4% |
| Short-Term Securities | 0.1% |
| Other Assets Less Liabilities | 0.5% |
| Security(a) | Percent of
Net Assets |
| Taiwan Semiconductor Manufacturing Co. Ltd. | 5.3% |
| Novo Nordisk A/S, Class B | 4.7% |
| AstraZeneca PLC | 3.9% |
| Baker Hughes Co., Class A | 3.7% |
| LVMH Moet Hennessy Louis Vuitton SE | 3.7% |
| RELX PLC | 3.6% |
| ASML Holding NV | 3.6% |
| Assa Abloy AB, Class B | 3.6% |
| Air Liquide SA | 3.5% |
| Texas Instruments, Inc. | 3.3% |
(a) | Excludes short-term securities. |
Material Fund changes
This is a summary of certain changes and planned changes to the Fund since May 31, 2023. For more complete information, you may review the Fund’s next prospectus, which we expect to be available approximately 120 days after May 31, 2024 at blackrock.com/fundreports or upon request by contacting us at (800) 441-7762.
The net expense ratio decreased from the prior fiscal year end primarily due to a change in the Fund’s investment advisory agreement during the prior fiscal year and an increase in average net assets.
On April 16, 2024, the Board of Trustees of the Fund approved the reorganization of the Fund into a newly created ETF to be named BlackRock International Dividend ETF. The reorganization is expected to close on or about November 18, 2024.
Additional information
If you wish to view additional information about the Fund, including but not limited to financial statements, the Fund’s prospectus, and proxy voting policies and procedures, please visit blackrock.com/fundreports. For proxy voting records, visit blackrock.com/proxyrecords.
Householding
The Fund will mail only one copy of shareholder documents, including prospectuses, annual and semi-annual reports and proxy statements, to shareholders with multiple accounts at the same address. This practice is commonly called “householding” and is intended to reduce expenses and eliminate duplicate mailings of shareholder documents. Mailings of your shareholder documents may be householded indefinitely unless you instruct us otherwise. If you do not want the mailing of these documents to be combined with those for other members of your household, please call the Fund at (800) 441-7762.
The Fund is not sponsored, endorsed, issued, sold, or promoted by MSCI Inc. and its affiliates, nor does this company make any representation regarding the advisability of investing in the Fund. BlackRock is not affiliated with the company listed above.
©2024 BlackRock, Inc. or its affiliates. All rights reserved. BLACKROCK is a registered trademark of BlackRock, Inc. or its affiliates. All other trademarks are those of their respective owners.
BlackRock International Dividend Fund
Class K Shares | BREKX
Annual Shareholder Report — May 31, 2024
BREKX-05/24-AR
BlackRock Mid-Cap Growth Equity Portfolio
Institutional Shares | CMGIX
Annual Shareholder Report — May 31, 2024
This annual shareholder report contains important information about BlackRock Mid-Cap Growth Equity Portfolio (the “Fund”) for the period of June 1, 2023 to May 31, 2024. You can find additional information about the Fund at blackrock.com/fundreports. You can also request this information by contacting us at (800) 441‑7762.
What were the Fund costs for the last year?
(based on a hypothetical $10,000 investment)
| Class name | Costs of a $10,000
investment | Costs paid as a percentage of a
$10,000 investment |
| Institutional Shares | $88 | 0.80% |
How did the Fund perform last year?
Equity market sentiment was supported as fears of a U.S. recession waned while major overseas economies returned to positive growth.
Signs of easing inflation led to expectations that the U.S. Federal Reserve and other leading central banks were poised to reduce interest rates.
Within the growth stock universe, performance was led by a handful of mega-cap technology companies viewed as the likely principal beneficiaries of efforts to commercialize the use of artificial intelligence.
What contributed to performance?
Positive contributions to the Fund’s performance relative to the benchmark (Russell Midcap® Growth Index) were led by security selection in the financials sector along with positioning in information technology and investment decisions in industrials. In financials, an overweight to the capital markets industry, specifically an overweight to alternatives asset manager KKR, contributed to performance. In information technology, overweight positioning in the semiconductors and semiconductor equipment sub-sector contributed to performance, most notably an off-benchmark position in wafer processing equipment provider ASM International. Finally, an overweight to aerospace manufacturer TransDigm Group within industrials contributed to performance.
What detracted from performance?
The largest detractors from relative performance included stock selection in consumer discretionary and real estate, as well as positioning in energy. Within consumer discretionary, an out-of-benchmark benchmark position in Swedish online gaming solutions provider Evolution within the hotels, restaurants and leisure sub-sector weighed most heavily on returns. An overweight position to CoStar Group within real estate management and development was the biggest detractor. Lastly, an underweight to the energy sector, most notably to the oil, gas and consumable fuels sub-sector, detracted from relative performance.
The views expressed reflect the opinions of BlackRock as of the date of this report and are subject to change based on changes in market, economic or other conditions. These views are not intended to be a forecast of future events and are no guarantee of future results.
Fund performance
Cumulative performance: June 1, 2014 through May 31, 2024
Initial investment of $10,000
See “Average annual total returns” for additional information on fund performance.
Average annual total returns
| 1 Year | 5 Years | 10 Years |
| Institutional Shares | 19.49% | 8.30% | 11.94% |
| Russell 1000® Index | 28.01% | 15.42% | 12.40% |
| Russell Midcap® Growth Index | 21.91% | 11.06% | 10.67% |
| Net Assets | $11,667,139,522% |
| Number of Portfolio Holdings | $69% |
| Net Investment Advisory Fees | $74,546,434% |
| Portfolio Turnover Rate | $48% |
Past performance is not an indication of future results. Performance results may include adjustments made for financial reporting purposes in accordance with U.S. generally accepted accounting principles. Performance results do not reflect the deduction of taxes that a shareholder would pay on fund distributions or on the redemption or sale of fund shares. Visit blackrock.com for more recent performance information.
What did the Fund invest in?
(as of May 31, 2024)
| Sector(a) | Percent of
Net Assets |
| Industrials | 27.3)% |
| Information Technology | 24.3)% |
| Health Care | 16.3)% |
| Financials | 10.2)% |
| Consumer Discretionary | 9.4)% |
| Communication Services | 7.1)% |
| Real Estate | 2.9)% |
| Materials | 1.9)% |
| Consumer Staples | 0.5)% |
| Energy | 0.2)% |
| Short-Term Securities | 4.0)% |
| Liabilities in Excess of Other Assets | (4.1)% |
| Security(b) | Percent of
Net Assets |
| Copart, Inc. | 3.8% |
| Monolithic Power Systems, Inc. | 3.5% |
| Pinterest, Inc., Class A | 3.1% |
| IDEXX Laboratories, Inc. | 3.0% |
| Ares Management Corp., Class A | 3.0% |
| CoStar Group, Inc. | 2.9% |
| HEICO Corp. | 2.7% |
| Axon Enterprise, Inc. | 2.7% |
| Tradeweb Markets, Inc., Class A | 2.6% |
| Entegris, Inc. | 2.5% |
(a) | For purposes of this report, sector sub-classifications may differ from those utilized for compliance purposes. |
(b) | Excludes short-term securities. |
Additional information
If you wish to view additional information about the Fund, including but not limited to financial statements, the Fund’s prospectus, and proxy voting policies and procedures, please visit blackrock.com/fundreports. For proxy voting records, visit blackrock.com/proxyrecords.
Householding
The Fund will mail only one copy of shareholder documents, including prospectuses, annual and semi-annual reports and proxy statements, to shareholders with multiple accounts at the same address. This practice is commonly called “householding” and is intended to reduce expenses and eliminate duplicate mailings of shareholder documents. Mailings of your shareholder documents may be householded indefinitely unless you instruct us otherwise. If you do not want the mailing of these documents to be combined with those for other members of your household, please call the Fund at (800) 441-7762.
The Fund is not sponsored, endorsed, issued, sold, or promoted by FTSE International Limited and its affiliates, nor does this company make any representation regarding the advisability of investing in the Fund. BlackRock is not affiliated with the company listed above.
©2024 BlackRock, Inc. or its affiliates. All rights reserved. BLACKROCK is a registered trademark of BlackRock, Inc. or its affiliates. All other trademarks are those of their respective owners.
BlackRock Mid-Cap Growth Equity Portfolio
Institutional Shares | CMGIX
Annual Shareholder Report — May 31, 2024
CMGIX-05/24-AR
BlackRock Mid-Cap Growth Equity Portfolio
Service Shares | CMGSX
Annual Shareholder Report — May 31, 2024
This annual shareholder report contains important information about BlackRock Mid-Cap Growth Equity Portfolio (the “Fund”) for the period of June 1, 2023 to May 31, 2024. You can find additional information about the Fund at blackrock.com/fundreports. You can also request this information by contacting us at (800) 441‑7762.
What were the Fund costs for the last year?
(based on a hypothetical $10,000 investment)
| Class name | Costs of a $10,000
investment | Costs paid as a percentage of a
$10,000 investment |
| Service Shares | $115 | 1.05% |
How did the Fund perform last year?
Equity market sentiment was supported as fears of a U.S. recession waned while major overseas economies returned to positive growth.
Signs of easing inflation led to expectations that the U.S. Federal Reserve and other leading central banks were poised to reduce interest rates.
Within the growth stock universe, performance was led by a handful of mega-cap technology companies viewed as the likely principal beneficiaries of efforts to commercialize the use of artificial intelligence.
What contributed to performance?
Positive contributions to the Fund’s performance relative to the benchmark (Russell Midcap® Growth Index) were led by security selection in the financials sector along with positioning in information technology and investment decisions in industrials. In financials, an overweight to the capital markets industry, specifically an overweight to alternatives asset manager KKR, contributed to performance. In information technology, overweight positioning in the semiconductors and semiconductor equipment sub-sector contributed to performance, most notably an off-benchmark position in wafer processing equipment provider ASM International. Finally, an overweight to aerospace manufacturer TransDigm Group within industrials contributed to performance.
What detracted from performance?
The largest detractors from relative performance included stock selection in consumer discretionary and real estate, as well as positioning in energy. Within consumer discretionary, an out-of-benchmark benchmark position in Swedish online gaming solutions provider Evolution within the hotels, restaurants and leisure sub-sector weighed most heavily on returns. An overweight position to CoStar Group within real estate management and development was the biggest detractor. Lastly, an underweight to the energy sector, most notably to the oil, gas and consumable fuels sub-sector, detracted from relative performance.
The views expressed reflect the opinions of BlackRock as of the date of this report and are subject to change based on changes in market, economic or other conditions. These views are not intended to be a forecast of future events and are no guarantee of future results.
Fund performance
Cumulative performance: June 1, 2014 through May 31, 2024
Initial investment of $10,000
See “Average annual total returns” for additional information on fund performance.
Average annual total returns
| 1 Year | 5 Years | 10 Years |
| Service Shares | 19.23% | 8.04% | 11.64% |
| Russell 1000® Index | 28.01% | 15.42% | 12.40% |
| Russell Midcap® Growth Index | 21.91% | 11.06% | 10.67% |
| Net Assets | $11,667,139,522% |
| Number of Portfolio Holdings | $69% |
| Net Investment Advisory Fees | $74,546,434% |
| Portfolio Turnover Rate | $48% |
Average annual total returns reflect reductions for service fees.
Past performance is not an indication of future results. Performance results may include adjustments made for financial reporting purposes in accordance with U.S. generally accepted accounting principles. Performance results do not reflect the deduction of taxes that a shareholder would pay on fund distributions or on the redemption or sale of fund shares. Visit blackrock.com for more recent performance information.
What did the Fund invest in?
(as of May 31, 2024)
| Sector(a) | Percent of
Net Assets |
| Industrials | 27.3)% |
| Information Technology | 24.3)% |
| Health Care | 16.3)% |
| Financials | 10.2)% |
| Consumer Discretionary | 9.4)% |
| Communication Services | 7.1)% |
| Real Estate | 2.9)% |
| Materials | 1.9)% |
| Consumer Staples | 0.5)% |
| Energy | 0.2)% |
| Short-Term Securities | 4.0)% |
| Liabilities in Excess of Other Assets | (4.1)% |
| Security(b) | Percent of
Net Assets |
| Copart, Inc. | 3.8% |
| Monolithic Power Systems, Inc. | 3.5% |
| Pinterest, Inc., Class A | 3.1% |
| IDEXX Laboratories, Inc. | 3.0% |
| Ares Management Corp., Class A | 3.0% |
| CoStar Group, Inc. | 2.9% |
| HEICO Corp. | 2.7% |
| Axon Enterprise, Inc. | 2.7% |
| Tradeweb Markets, Inc., Class A | 2.6% |
| Entegris, Inc. | 2.5% |
(a) | For purposes of this report, sector sub-classifications may differ from those utilized for compliance purposes. |
(b) | Excludes short-term securities. |
Additional information
If you wish to view additional information about the Fund, including but not limited to financial statements, the Fund’s prospectus, and proxy voting policies and procedures, please visit blackrock.com/fundreports. For proxy voting records, visit blackrock.com/proxyrecords.
Householding
The Fund will mail only one copy of shareholder documents, including prospectuses, annual and semi-annual reports and proxy statements, to shareholders with multiple accounts at the same address. This practice is commonly called “householding” and is intended to reduce expenses and eliminate duplicate mailings of shareholder documents. Mailings of your shareholder documents may be householded indefinitely unless you instruct us otherwise. If you do not want the mailing of these documents to be combined with those for other members of your household, please call the Fund at (800) 441-7762.
The Fund is not sponsored, endorsed, issued, sold, or promoted by FTSE International Limited and its affiliates, nor does this company make any representation regarding the advisability of investing in the Fund. BlackRock is not affiliated with the company listed above.
©2024 BlackRock, Inc. or its affiliates. All rights reserved. BLACKROCK is a registered trademark of BlackRock, Inc. or its affiliates. All other trademarks are those of their respective owners.
BlackRock Mid-Cap Growth Equity Portfolio
Service Shares | CMGSX
Annual Shareholder Report — May 31, 2024
CMGSX-05/24-AR
BlackRock Mid-Cap Growth Equity Portfolio
Investor A Shares | BMGAX
Annual Shareholder Report — May 31, 2024
This annual shareholder report contains important information about BlackRock Mid-Cap Growth Equity Portfolio (the “Fund”) for the period of June 1, 2023 to May 31, 2024. You can find additional information about the Fund at blackrock.com/fundreports. You can also request this information by contacting us at (800) 441‑7762.
What were the Fund costs for the last year?
(based on a hypothetical $10,000 investment)
| Class name | Costs of a $10,000
investment | Costs paid as a percentage of a
$10,000 investment |
| Investor A Shares | $115 | 1.05% |
How did the Fund perform last year?
Equity market sentiment was supported as fears of a U.S. recession waned while major overseas economies returned to positive growth.
Signs of easing inflation led to expectations that the U.S. Federal Reserve and other leading central banks were poised to reduce interest rates.
Within the growth stock universe, performance was led by a handful of mega-cap technology companies viewed as the likely principal beneficiaries of efforts to commercialize the use of artificial intelligence.
What contributed to performance?
Positive contributions to the Fund’s performance relative to the benchmark (Russell Midcap® Growth Index) were led by security selection in the financials sector along with positioning in information technology and investment decisions in industrials. In financials, an overweight to the capital markets industry, specifically an overweight to alternatives asset manager KKR, contributed to performance. In information technology, overweight positioning in the semiconductors and semiconductor equipment sub-sector contributed to performance, most notably an off-benchmark position in wafer processing equipment provider ASM International. Finally, an overweight to aerospace manufacturer TransDigm Group within industrials contributed to performance.
What detracted from performance?
The largest detractors from relative performance included stock selection in consumer discretionary and real estate, as well as positioning in energy. Within consumer discretionary, an out-of-benchmark benchmark position in Swedish online gaming solutions provider Evolution within the hotels, restaurants and leisure sub-sector weighed most heavily on returns. An overweight position to CoStar Group within real estate management and development was the biggest detractor. Lastly, an underweight to the energy sector, most notably to the oil, gas and consumable fuels sub-sector, detracted from relative performance.
The views expressed reflect the opinions of BlackRock as of the date of this report and are subject to change based on changes in market, economic or other conditions. These views are not intended to be a forecast of future events and are no guarantee of future results.
Fund performance
Cumulative performance: June 1, 2014 through May 31, 2024
Initial investment of $10,000
See “Average annual total returns” for additional information on fund performance.
Average annual total returns
| 1 Year | 5 Years | 10 Years |
| Investor A Shares | 19.21% | 8.03% | 11.62% |
| Investor A Shares (with sales charge) | 12.95% | 6.87% | 11.02% |
| Russell 1000® Index | 28.01% | 15.42% | 12.40% |
| Russell Midcap® Growth Index | 21.91% | 11.06% | 10.67% |
| Net Assets | $11,667,139,522% |
| Number of Portfolio Holdings | $69% |
| Net Investment Advisory Fees | $74,546,434% |
| Portfolio Turnover Rate | $48% |
Assuming maximum sales charges. Average annual total returns with and without sales charges reflect reductions for service fees.
Past performance is not an indication of future results. Performance results may include adjustments made for financial reporting purposes in accordance with U.S. generally accepted accounting principles. Performance results do not reflect the deduction of taxes that a shareholder would pay on fund distributions or on the redemption or sale of fund shares. Visit blackrock.com for more recent performance information.
What did the Fund invest in?
(as of May 31, 2024)
| Sector(a) | Percent of
Net Assets |
| Industrials | 27.3)% |
| Information Technology | 24.3)% |
| Health Care | 16.3)% |
| Financials | 10.2)% |
| Consumer Discretionary | 9.4)% |
| Communication Services | 7.1)% |
| Real Estate | 2.9)% |
| Materials | 1.9)% |
| Consumer Staples | 0.5)% |
| Energy | 0.2)% |
| Short-Term Securities | 4.0)% |
| Liabilities in Excess of Other Assets | (4.1)% |
| Security(b) | Percent of
Net Assets |
| Copart, Inc. | 3.8% |
| Monolithic Power Systems, Inc. | 3.5% |
| Pinterest, Inc., Class A | 3.1% |
| IDEXX Laboratories, Inc. | 3.0% |
| Ares Management Corp., Class A | 3.0% |
| CoStar Group, Inc. | 2.9% |
| HEICO Corp. | 2.7% |
| Axon Enterprise, Inc. | 2.7% |
| Tradeweb Markets, Inc., Class A | 2.6% |
| Entegris, Inc. | 2.5% |
(a) | For purposes of this report, sector sub-classifications may differ from those utilized for compliance purposes. |
(b) | Excludes short-term securities. |
Additional information
If you wish to view additional information about the Fund, including but not limited to financial statements, the Fund’s prospectus, and proxy voting policies and procedures, please visit blackrock.com/fundreports. For proxy voting records, visit blackrock.com/proxyrecords.
Householding
The Fund will mail only one copy of shareholder documents, including prospectuses, annual and semi-annual reports and proxy statements, to shareholders with multiple accounts at the same address. This practice is commonly called “householding” and is intended to reduce expenses and eliminate duplicate mailings of shareholder documents. Mailings of your shareholder documents may be householded indefinitely unless you instruct us otherwise. If you do not want the mailing of these documents to be combined with those for other members of your household, please call the Fund at (800) 441-7762.
The Fund is not sponsored, endorsed, issued, sold, or promoted by FTSE International Limited and its affiliates, nor does this company make any representation regarding the advisability of investing in the Fund. BlackRock is not affiliated with the company listed above.
©2024 BlackRock, Inc. or its affiliates. All rights reserved. BLACKROCK is a registered trademark of BlackRock, Inc. or its affiliates. All other trademarks are those of their respective owners.
BlackRock Mid-Cap Growth Equity Portfolio
Investor A Shares | BMGAX
Annual Shareholder Report — May 31, 2024
BMGAX-05/24-AR
BlackRock Mid-Cap Growth Equity Portfolio
Investor C Shares | BMGCX
Annual Shareholder Report — May 31, 2024
This annual shareholder report contains important information about BlackRock Mid-Cap Growth Equity Portfolio (the “Fund”) for the period of June 1, 2023 to May 31, 2024. You can find additional information about the Fund at blackrock.com/fundreports. You can also request this information by contacting us at (800) 441‑7762.
What were the Fund costs for the last year?
(based on a hypothetical $10,000 investment)
| Class name | Costs of a $10,000
investment | Costs paid as a percentage of a
$10,000 investment |
| Investor C Shares | $196 | 1.80% |
How did the Fund perform last year?
Equity market sentiment was supported as fears of a U.S. recession waned while major overseas economies returned to positive growth.
Signs of easing inflation led to expectations that the U.S. Federal Reserve and other leading central banks were poised to reduce interest rates.
Within the growth stock universe, performance was led by a handful of mega-cap technology companies viewed as the likely principal beneficiaries of efforts to commercialize the use of artificial intelligence.
What contributed to performance?
Positive contributions to the Fund’s performance relative to the benchmark (Russell Midcap® Growth Index) were led by security selection in the financials sector along with positioning in information technology and investment decisions in industrials. In financials, an overweight to the capital markets industry, specifically an overweight to alternatives asset manager KKR, contributed to performance. In information technology, overweight positioning in the semiconductors and semiconductor equipment sub-sector contributed to performance, most notably an off-benchmark position in wafer processing equipment provider ASM International. Finally, an overweight to aerospace manufacturer TransDigm Group within industrials contributed to performance.
What detracted from performance?
The largest detractors from relative performance included stock selection in consumer discretionary and real estate, as well as positioning in energy. Within consumer discretionary, an out-of-benchmark benchmark position in Swedish online gaming solutions provider Evolution within the hotels, restaurants and leisure sub-sector weighed most heavily on returns. An overweight position to CoStar Group within real estate management and development was the biggest detractor. Lastly, an underweight to the energy sector, most notably to the oil, gas and consumable fuels sub-sector, detracted from relative performance.
The views expressed reflect the opinions of BlackRock as of the date of this report and are subject to change based on changes in market, economic or other conditions. These views are not intended to be a forecast of future events and are no guarantee of future results.
Fund performance
Cumulative performance: June 1, 2014 through May 31, 2024
Initial investment of $10,000
See “Average annual total returns” for additional information on fund performance.
Average annual total returns
| 1 Year | 5 Years | 10 Years |
| Investor C Shares | 18.32% | 7.23% | 10.97% |
| Investor C Shares (with sales charge) | 17.32% | 7.23% | 10.97% |
| Russell 1000® Index | 28.01% | 15.42% | 12.40% |
| Russell Midcap® Growth Index | 21.91% | 11.06% | 10.67% |
| Net Assets | $11,667,139,522% |
| Number of Portfolio Holdings | $69% |
| Net Investment Advisory Fees | $74,546,434% |
| Portfolio Turnover Rate | $48% |
Assuming maximum sales charges. Average annual total returns with and without sales charges reflect reductions for distribution and service fees.
Past performance is not an indication of future results. Performance results may include adjustments made for financial reporting purposes in accordance with U.S. generally accepted accounting principles. Performance results do not reflect the deduction of taxes that a shareholder would pay on fund distributions or on the redemption or sale of fund shares. Visit blackrock.com for more recent performance information.
What did the Fund invest in?
(as of May 31, 2024)
| Sector(a) | Percent of
Net Assets |
| Industrials | 27.3)% |
| Information Technology | 24.3)% |
| Health Care | 16.3)% |
| Financials | 10.2)% |
| Consumer Discretionary | 9.4)% |
| Communication Services | 7.1)% |
| Real Estate | 2.9)% |
| Materials | 1.9)% |
| Consumer Staples | 0.5)% |
| Energy | 0.2)% |
| Short-Term Securities | 4.0)% |
| Liabilities in Excess of Other Assets | (4.1)% |
| Security(b) | Percent of
Net Assets |
| Copart, Inc. | 3.8% |
| Monolithic Power Systems, Inc. | 3.5% |
| Pinterest, Inc., Class A | 3.1% |
| IDEXX Laboratories, Inc. | 3.0% |
| Ares Management Corp., Class A | 3.0% |
| CoStar Group, Inc. | 2.9% |
| HEICO Corp. | 2.7% |
| Axon Enterprise, Inc. | 2.7% |
| Tradeweb Markets, Inc., Class A | 2.6% |
| Entegris, Inc. | 2.5% |
(a) | For purposes of this report, sector sub-classifications may differ from those utilized for compliance purposes. |
(b) | Excludes short-term securities. |
Additional information
If you wish to view additional information about the Fund, including but not limited to financial statements, the Fund’s prospectus, and proxy voting policies and procedures, please visit blackrock.com/fundreports. For proxy voting records, visit blackrock.com/proxyrecords.
Householding
The Fund will mail only one copy of shareholder documents, including prospectuses, annual and semi-annual reports and proxy statements, to shareholders with multiple accounts at the same address. This practice is commonly called “householding” and is intended to reduce expenses and eliminate duplicate mailings of shareholder documents. Mailings of your shareholder documents may be householded indefinitely unless you instruct us otherwise. If you do not want the mailing of these documents to be combined with those for other members of your household, please call the Fund at (800) 441-7762.
The Fund is not sponsored, endorsed, issued, sold, or promoted by FTSE International Limited and its affiliates, nor does this company make any representation regarding the advisability of investing in the Fund. BlackRock is not affiliated with the company listed above.
©2024 BlackRock, Inc. or its affiliates. All rights reserved. BLACKROCK is a registered trademark of BlackRock, Inc. or its affiliates. All other trademarks are those of their respective owners.
BlackRock Mid-Cap Growth Equity Portfolio
Investor C Shares | BMGCX
Annual Shareholder Report — May 31, 2024
BMGCX-05/24-AR
BlackRock Mid-Cap Growth Equity Portfolio
Class K Shares | BMGKX
Annual Shareholder Report — May 31, 2024
This annual shareholder report contains important information about BlackRock Mid-Cap Growth Equity Portfolio (the “Fund”) for the period of June 1, 2023 to May 31, 2024. You can find additional information about the Fund at blackrock.com/fundreports. You can also request this information by contacting us at (800) 441‑7762.
What were the Fund costs for the last year?
(based on a hypothetical $10,000 investment)
| Class name | Costs of a $10,000
investment | Costs paid as a percentage of a
$10,000 investment |
| Class K Shares | $78 | 0.71% |
How did the Fund perform last year?
Equity market sentiment was supported as fears of a U.S. recession waned while major overseas economies returned to positive growth.
Signs of easing inflation led to expectations that the U.S. Federal Reserve and other leading central banks were poised to reduce interest rates.
Within the growth stock universe, performance was led by a handful of mega-cap technology companies viewed as the likely principal beneficiaries of efforts to commercialize the use of artificial intelligence.
What contributed to performance?
Positive contributions to the Fund’s performance relative to the benchmark (Russell Midcap® Growth Index) were led by security selection in the financials sector along with positioning in information technology and investment decisions in industrials. In financials, an overweight to the capital markets industry, specifically an overweight to alternatives asset manager KKR, contributed to performance. In information technology, overweight positioning in the semiconductors and semiconductor equipment sub-sector contributed to performance, most notably an off-benchmark position in wafer processing equipment provider ASM International. Finally, an overweight to aerospace manufacturer TransDigm Group within industrials contributed to performance.
What detracted from performance?
The largest detractors from relative performance included stock selection in consumer discretionary and real estate, as well as positioning in energy. Within consumer discretionary, an out-of-benchmark benchmark position in Swedish online gaming solutions provider Evolution within the hotels, restaurants and leisure sub-sector weighed most heavily on returns. An overweight position to CoStar Group within real estate management and development was the biggest detractor. Lastly, an underweight to the energy sector, most notably to the oil, gas and consumable fuels sub-sector, detracted from relative performance.
The views expressed reflect the opinions of BlackRock as of the date of this report and are subject to change based on changes in market, economic or other conditions. These views are not intended to be a forecast of future events and are no guarantee of future results.
Fund performance
Cumulative performance: June 1, 2014 through May 31, 2024
Initial investment of $10,000
See “Average annual total returns” for additional information on fund performance.
Average annual total returns
| 1 Year | 5 Years | 10 Years |
| Class K Shares | 19.64% | 8.40% | 12.02% |
| Russell 1000® Index | 28.01% | 15.42% | 12.40% |
| Russell Midcap® Growth Index | 21.91% | 11.06% | 10.67% |
| Net Assets | $11,667,139,522% |
| Number of Portfolio Holdings | $69% |
| Net Investment Advisory Fees | $74,546,434% |
| Portfolio Turnover Rate | $48% |
Performance shown prior to the Class K Shares inception date of March 28, 2016 is that of Institutional Shares. The performance of the Class K Shares would be substantially similar to Institutional Shares because Class K Shares and Institutional Shares invest in the same portfolio of securities and performance would only differ to the extent that Class K Shares and Institutional Shares have different expenses. The actual returns of Class K Shares would have been higher than those of the Institutional Shares because Class K Shares have lower expenses than the Institutional Shares.
Past performance is not an indication of future results. Performance results may include adjustments made for financial reporting purposes in accordance with U.S. generally accepted accounting principles. Performance results do not reflect the deduction of taxes that a shareholder would pay on fund distributions or on the redemption or sale of fund shares. Visit blackrock.com for more recent performance information.
What did the Fund invest in?
(as of May 31, 2024)
| Sector(a) | Percent of
Net Assets |
| Industrials | 27.3)% |
| Information Technology | 24.3)% |
| Health Care | 16.3)% |
| Financials | 10.2)% |
| Consumer Discretionary | 9.4)% |
| Communication Services | 7.1)% |
| Real Estate | 2.9)% |
| Materials | 1.9)% |
| Consumer Staples | 0.5)% |
| Energy | 0.2)% |
| Short-Term Securities | 4.0)% |
| Liabilities in Excess of Other Assets | (4.1)% |
| Security(b) | Percent of
Net Assets |
| Copart, Inc. | 3.8% |
| Monolithic Power Systems, Inc. | 3.5% |
| Pinterest, Inc., Class A | 3.1% |
| IDEXX Laboratories, Inc. | 3.0% |
| Ares Management Corp., Class A | 3.0% |
| CoStar Group, Inc. | 2.9% |
| HEICO Corp. | 2.7% |
| Axon Enterprise, Inc. | 2.7% |
| Tradeweb Markets, Inc., Class A | 2.6% |
| Entegris, Inc. | 2.5% |
(a) | For purposes of this report, sector sub-classifications may differ from those utilized for compliance purposes. |
(b) | Excludes short-term securities. |
Additional information
If you wish to view additional information about the Fund, including but not limited to financial statements, the Fund’s prospectus, and proxy voting policies and procedures, please visit blackrock.com/fundreports. For proxy voting records, visit blackrock.com/proxyrecords.
Householding
The Fund will mail only one copy of shareholder documents, including prospectuses, annual and semi-annual reports and proxy statements, to shareholders with multiple accounts at the same address. This practice is commonly called “householding” and is intended to reduce expenses and eliminate duplicate mailings of shareholder documents. Mailings of your shareholder documents may be householded indefinitely unless you instruct us otherwise. If you do not want the mailing of these documents to be combined with those for other members of your household, please call the Fund at (800) 441-7762.
The Fund is not sponsored, endorsed, issued, sold, or promoted by FTSE International Limited and its affiliates, nor does this company make any representation regarding the advisability of investing in the Fund. BlackRock is not affiliated with the company listed above.
©2024 BlackRock, Inc. or its affiliates. All rights reserved. BLACKROCK is a registered trademark of BlackRock, Inc. or its affiliates. All other trademarks are those of their respective owners.
BlackRock Mid-Cap Growth Equity Portfolio
Class K Shares | BMGKX
Annual Shareholder Report — May 31, 2024
BMGKX-05/24-AR
BlackRock Mid-Cap Growth Equity Portfolio
Class R Shares | BMRRX
Annual Shareholder Report — May 31, 2024
This annual shareholder report contains important information about BlackRock Mid-Cap Growth Equity Portfolio (the “Fund”) for the period of June 1, 2023 to May 31, 2024. You can find additional information about the Fund at blackrock.com/fundreports. You can also request this information by contacting us at (800) 441‑7762.
What were the Fund costs for the last year?
(based on a hypothetical $10,000 investment)
| Class name | Costs of a $10,000
investment | Costs paid as a percentage of a
$10,000 investment |
| Class R Shares | $142 | 1.30% |
How did the Fund perform last year?
Equity market sentiment was supported as fears of a U.S. recession waned while major overseas economies returned to positive growth.
Signs of easing inflation led to expectations that the U.S. Federal Reserve and other leading central banks were poised to reduce interest rates.
Within the growth stock universe, performance was led by a handful of mega-cap technology companies viewed as the likely principal beneficiaries of efforts to commercialize the use of artificial intelligence.
What contributed to performance?
Positive contributions to the Fund’s performance relative to the benchmark (Russell Midcap® Growth Index) were led by security selection in the financials sector along with positioning in information technology and investment decisions in industrials. In financials, an overweight to the capital markets industry, specifically an overweight to alternatives asset manager KKR, contributed to performance. In information technology, overweight positioning in the semiconductors and semiconductor equipment sub-sector contributed to performance, most notably an off-benchmark position in wafer processing equipment provider ASM International. Finally, an overweight to aerospace manufacturer TransDigm Group within industrials contributed to performance.
What detracted from performance?
The largest detractors from relative performance included stock selection in consumer discretionary and real estate, as well as positioning in energy. Within consumer discretionary, an out-of-benchmark benchmark position in Swedish online gaming solutions provider Evolution within the hotels, restaurants and leisure sub-sector weighed most heavily on returns. An overweight position to CoStar Group within real estate management and development was the biggest detractor. Lastly, an underweight to the energy sector, most notably to the oil, gas and consumable fuels sub-sector, detracted from relative performance.
The views expressed reflect the opinions of BlackRock as of the date of this report and are subject to change based on changes in market, economic or other conditions. These views are not intended to be a forecast of future events and are no guarantee of future results.
Fund performance
Cumulative performance: June 1, 2014 through May 31, 2024
Initial investment of $10,000
See “Average annual total returns” for additional information on fund performance.
Average annual total returns
| 1 Year | 5 Years | 10 Years |
| Class R Shares | 18.89% | 7.76% | 11.34% |
| Russell 1000® Index | 28.01% | 15.42% | 12.40% |
| Russell Midcap® Growth Index | 21.91% | 11.06% | 10.67% |
| Net Assets | $11,667,139,522% |
| Number of Portfolio Holdings | $69% |
| Net Investment Advisory Fees | $74,546,434% |
| Portfolio Turnover Rate | $48% |
Average annual total returns reflect reductions for distribution and service fees.
Past performance is not an indication of future results. Performance results may include adjustments made for financial reporting purposes in accordance with U.S. generally accepted accounting principles. Performance results do not reflect the deduction of taxes that a shareholder would pay on fund distributions or on the redemption or sale of fund shares. Visit blackrock.com for more recent performance information.
What did the Fund invest in?
(as of May 31, 2024)
| Sector(a) | Percent of
Net Assets |
| Industrials | 27.3)% |
| Information Technology | 24.3)% |
| Health Care | 16.3)% |
| Financials | 10.2)% |
| Consumer Discretionary | 9.4)% |
| Communication Services | 7.1)% |
| Real Estate | 2.9)% |
| Materials | 1.9)% |
| Consumer Staples | 0.5)% |
| Energy | 0.2)% |
| Short-Term Securities | 4.0)% |
| Liabilities in Excess of Other Assets | (4.1)% |
(a) | For purposes of this report, sector sub-classifications may differ from those utilized for compliance purposes. |
(b) | Excludes short-term securities. |
| Security(b) | Percent of
Net Assets |
| Copart, Inc. | 3.8% |
| Monolithic Power Systems, Inc. | 3.5% |
| Pinterest, Inc., Class A | 3.1% |
| IDEXX Laboratories, Inc. | 3.0% |
| Ares Management Corp., Class A | 3.0% |
| CoStar Group, Inc. | 2.9% |
| HEICO Corp. | 2.7% |
| Axon Enterprise, Inc. | 2.7% |
| Tradeweb Markets, Inc., Class A | 2.6% |
| Entegris, Inc. | 2.5% |
Additional information
If you wish to view additional information about the Fund, including but not limited to financial statements, the Fund’s prospectus, and proxy voting policies and procedures, please visit blackrock.com/fundreports. For proxy voting records, visit blackrock.com/proxyrecords.
Householding
The Fund will mail only one copy of shareholder documents, including prospectuses, annual and semi-annual reports and proxy statements, to shareholders with multiple accounts at the same address. This practice is commonly called “householding” and is intended to reduce expenses and eliminate duplicate mailings of shareholder documents. Mailings of your shareholder documents may be householded indefinitely unless you instruct us otherwise. If you do not want the mailing of these documents to be combined with those for other members of your household, please call the Fund at (800) 441-7762.
The Fund is not sponsored, endorsed, issued, sold, or promoted by FTSE International Limited and its affiliates, nor does this company make any representation regarding the advisability of investing in the Fund. BlackRock is not affiliated with the company listed above.
©2024 BlackRock, Inc. or its affiliates. All rights reserved. BLACKROCK is a registered trademark of BlackRock, Inc. or its affiliates. All other trademarks are those of their respective owners.
BlackRock Mid-Cap Growth Equity Portfolio
Class R Shares | BMRRX
Annual Shareholder Report — May 31, 2024
BMRRX-05/24-AR
BlackRock SMID-Cap Growth Equity Fund
Institutional Shares | BSMDX
Annual Shareholder Report — May 31, 2024
This annual shareholder report contains important information about BlackRock SMID-Cap Growth Equity Fund (the “Fund”) for the period of June 1, 2023 to May 31, 2024. You can find additional information about the Fund at blackrock.com/fundreports. You can also request this information by contacting us at (800) 441‑7762.
What were the Fund costs for the last year?
(based on a hypothetical $10,000 investment)
| Class name | Costs of a $10,000
investment | Costs paid as a percentage of a
$10,000 investment |
| Institutional Shares | $90 | 0.85% |
How did the Fund perform last year?
Equity market sentiment was supported as fears of a U.S. recession waned while major overseas economies returned to positive growth.
Signs of easing inflation led to expectations that the U.S. Federal Reserve and other leading central banks were poised to reduce interest rates.
Within the growth stock universe, performance was led by a handful of mega-cap technology companies viewed as the likely principal beneficiaries of efforts to commercialize the use of artificial intelligence.
What contributed to performance?
Positive contributions to performance, relative to the benchmark (Russell 2500TM Growth Index), were led by security selection in the industrials, financials and communication services sectors. In industrials, overweight positioning in the aerospace and defense sub-sector contributed to performance, most notably an overweight position in Axon Enterprise. In financials, an out-of-benchmark position in Tradeweb Markets within capital markets contributed to performance. Finally, an out-of-benchmark position in social media and ecommerce company Pinterest within the communication services sector added to return.
What detracted from performance?
The largest detractors from relative performance included stock selection in consumer discretionary, information technology and consumer staples. Within consumer discretionary, an overweight to the hotels, restaurants and leisure industry, specifically an overweight position in Vail Resorts, detracted from relative returns. Next, within information technology, lack of exposure to the technology hardware, storage and peripherals sub-sector weighed most heavily on performance. Lastly, selection in consumer staples, most notably an out-of-benchmark position in Davide Campari Milano within the beverages sub-sector, detracted from relative performance.
The views expressed reflect the opinions of BlackRock as of the date of this report and are subject to change based on changes in market, economic or other conditions. These views are not intended to be a forecast of future events and are no guarantee of future results.
Fund performance
Cumulative performance: June 29, 2021 through May 31, 2024
Initial investment of $10,000
See “Average annual total returns” for additional information on fund performance.
Average annual total returns
| 1 Year | Since
Inception |
| Institutional Shares | 11.48% | (14.59)% |
| Russell 3000® Index | 27.58% | 7.18)% |
| Russell 2500TM Growth Index | 18.26% | (4.16)% |
| Net Assets | $9,652,087% |
| Number of Portfolio Holdings | $85% |
| Net Investment Advisory Fees | $64,713% |
| Portfolio Turnover Rate | $36% |
The Fund commenced operations on June 29, 2021.
Past performance is not an indication of future results. Performance results may include adjustments made for financial reporting purposes in accordance with U.S. generally accepted accounting principles. Performance results do not reflect the deduction of taxes that a shareholder would pay on fund distributions or on the redemption or sale of fund shares. Visit blackrock.com for more recent performance information.
What did the Fund invest in?
(as of May 31, 2024)
| Sector(a) | Percent of
Net Assets |
| Industrials | 28.2)% |
| Information Technology | 25.6)% |
| Consumer Discretionary | 16.9)% |
| Health Care | 12.4)% |
| Financials | 6.8)% |
| Communication Services | 6.3)% |
| Energy | 2.0)% |
| Consumer Staples | 1.5)% |
| Real Estate | 0.2)% |
| Short-Term Securities | 5.8)% |
| Liabilities in Excess of Other Assets | (5.7)% |
| Security(b) | Percent of
Net Assets |
| Axon Enterprise, Inc. | 3.3% |
| Entegris, Inc. | 2.5% |
| Booz Allen Hamilton Holding Corp., Class A | 2.5% |
| Bentley Systems, Inc., Class B | 2.4% |
| Comfort Systems U.S.A., Inc. | 2.4% |
| ASM International NV | 2.4% |
| Tradeweb Markets, Inc., Class A | 2.4% |
| Vertiv Holdings Co., Class A | 2.3% |
| Monolithic Power Systems, Inc. | 2.3% |
| Pinterest, Inc., Class A | 2.3% |
(a) | For purposes of this report, sector sub-classifications may differ from those utilized for compliance purposes. |
(b) | Excludes short-term securities. |
Additional information
If you wish to view additional information about the Fund, including but not limited to financial statements, the Fund’s prospectus, and proxy voting policies and procedures, please visit blackrock.com/fundreports. For proxy voting records, visit blackrock.com/proxyrecords.
Householding
The Fund will mail only one copy of shareholder documents, including prospectuses, annual and semi-annual reports and proxy statements, to shareholders with multiple accounts at the same address. This practice is commonly called “householding” and is intended to reduce expenses and eliminate duplicate mailings of shareholder documents. Mailings of your shareholder documents may be householded indefinitely unless you instruct us otherwise. If you do not want the mailing of these documents to be combined with those for other members of your household, please call the Fund at (800) 441-7762.
The Fund is not sponsored, endorsed, issued, sold, or promoted by FTSE International Limited and its affiliates, nor does this company make any representation regarding the advisability of investing in the Fund. BlackRock is not affiliated with the company listed above.
©2024 BlackRock, Inc. or its affiliates. All rights reserved. BLACKROCK is a registered trademark of BlackRock, Inc. or its affiliates. All other trademarks are those of their respective owners.
BlackRock SMID-Cap Growth Equity Fund
Institutional Shares | BSMDX
Annual Shareholder Report — May 31, 2024
BSMDX-05/24-AR
BlackRock SMID-Cap Growth Equity Fund
Investor A Shares | BSDAX
Annual Shareholder Report — May 31, 2024
This annual shareholder report contains important information about BlackRock SMID-Cap Growth Equity Fund (the “Fund”) for the period of June 1, 2023 to May 31, 2024. You can find additional information about the Fund at blackrock.com/fundreports. You can also request this information by contacting us at (800) 441‑7762.
What were the Fund costs for the last year?
(based on a hypothetical $10,000 investment)
| Class name | Costs of a $10,000
investment | Costs paid as a percentage of a
$10,000 investment |
| Investor A Shares | $116 | 1.10% |
How did the Fund perform last year?
Equity market sentiment was supported as fears of a U.S. recession waned while major overseas economies returned to positive growth.
Signs of easing inflation led to expectations that the U.S. Federal Reserve and other leading central banks were poised to reduce interest rates.
Within the growth stock universe, performance was led by a handful of mega-cap technology companies viewed as the likely principal beneficiaries of efforts to commercialize the use of artificial intelligence.
What contributed to performance?
Positive contributions to performance, relative to the benchmark (Russell 2500TM Growth Index), were led by security selection in the industrials, financials and communication services sectors. In industrials, overweight positioning in the aerospace and defense sub-sector contributed to performance, most notably an overweight position in Axon Enterprise. In financials, an out-of-benchmark position in Tradeweb Markets within capital markets contributed to performance. Finally, an out-of-benchmark position in social media and ecommerce company Pinterest within the communication services sector added to return.
What detracted from performance?
The largest detractors from relative performance included stock selection in consumer discretionary, information technology and consumer staples. Within consumer discretionary, an overweight to the hotels, restaurants and leisure industry, specifically an overweight position in Vail Resorts, detracted from relative returns. Next, within information technology, lack of exposure to the technology hardware, storage and peripherals sub-sector weighed most heavily on performance. Lastly, selection in consumer staples, most notably an out-of-benchmark position in Davide Campari Milano within the beverages sub-sector, detracted from relative performance.
The views expressed reflect the opinions of BlackRock as of the date of this report and are subject to change based on changes in market, economic or other conditions. These views are not intended to be a forecast of future events and are no guarantee of future results.
Fund performance
Cumulative performance: June 29, 2021 through May 31, 2024
Initial investment of $10,000
See “Average annual total returns” for additional information on fund performance.
Average annual total returns
| 1 Year | Since
Inception |
| Investor A Shares | 11.28% | (14.79)% |
| Investor A Shares (with sales charge) | 5.44% | (16.35)% |
| Russell 3000® Index | 27.58% | 7.18)% |
| Russell 2500TM Growth Index | 18.26% | (4.16)% |
| Net Assets | $9,652,087% |
| Number of Portfolio Holdings | $85% |
| Net Investment Advisory Fees | $64,713% |
| Portfolio Turnover Rate | $36% |
The Fund commenced operations on June 29, 2021.
Assuming maximum sales charges. Average annual total returns with and without sales charges reflect reductions for service fees.
Past performance is not an indication of future results. Performance results may include adjustments made for financial reporting purposes in accordance with U.S. generally accepted accounting principles. Performance results do not reflect the deduction of taxes that a shareholder would pay on fund distributions or on the redemption or sale of fund shares. Visit blackrock.com for more recent performance information.
What did the Fund invest in?
(as of May 31, 2024)
| Sector(a) | Percent of
Net Assets |
| Industrials | 28.2)% |
| Information Technology | 25.6)% |
| Consumer Discretionary | 16.9)% |
| Health Care | 12.4)% |
| Financials | 6.8)% |
| Communication Services | 6.3)% |
| Energy | 2.0)% |
| Consumer Staples | 1.5)% |
| Real Estate | 0.2)% |
| Short-Term Securities | 5.8)% |
| Liabilities in Excess of Other Assets | (5.7)% |
| Security(b) | Percent of
Net Assets |
| Axon Enterprise, Inc. | 3.3% |
| Entegris, Inc. | 2.5% |
| Booz Allen Hamilton Holding Corp., Class A | 2.5% |
| Bentley Systems, Inc., Class B | 2.4% |
| Comfort Systems U.S.A., Inc. | 2.4% |
| ASM International NV | 2.4% |
| Tradeweb Markets, Inc., Class A | 2.4% |
| Vertiv Holdings Co., Class A | 2.3% |
| Monolithic Power Systems, Inc. | 2.3% |
| Pinterest, Inc., Class A | 2.3% |
(a) | For purposes of this report, sector sub-classifications may differ from those utilized for compliance purposes. |
(b) | Excludes short-term securities. |
Additional information
If you wish to view additional information about the Fund, including but not limited to financial statements, the Fund’s prospectus, and proxy voting policies and procedures, please visit blackrock.com/fundreports. For proxy voting records, visit blackrock.com/proxyrecords.
Householding
The Fund will mail only one copy of shareholder documents, including prospectuses, annual and semi-annual reports and proxy statements, to shareholders with multiple accounts at the same address. This practice is commonly called “householding” and is intended to reduce expenses and eliminate duplicate mailings of shareholder documents. Mailings of your shareholder documents may be householded indefinitely unless you instruct us otherwise. If you do not want the mailing of these documents to be combined with those for other members of your household, please call the Fund at (800) 441-7762.
The Fund is not sponsored, endorsed, issued, sold, or promoted by FTSE International Limited and its affiliates, nor does this company make any representation regarding the advisability of investing in the Fund. BlackRock is not affiliated with the company listed above.
©2024 BlackRock, Inc. or its affiliates. All rights reserved. BLACKROCK is a registered trademark of BlackRock, Inc. or its affiliates. All other trademarks are those of their respective owners.
BlackRock SMID-Cap Growth Equity Fund
Investor A Shares | BSDAX
Annual Shareholder Report — May 31, 2024
BSDAX-05/24-AR
BlackRock SMID-Cap Growth Equity Fund
Class K Shares | BSDKX
Annual Shareholder Report — May 31, 2024
This annual shareholder report contains important information about BlackRock SMID-Cap Growth Equity Fund (the “Fund”) for the period of June 1, 2023 to May 31, 2024. You can find additional information about the Fund at blackrock.com/fundreports. You can also request this information by contacting us at (800) 441‑7762.
What were the Fund costs for the last year?
(based on a hypothetical $10,000 investment)
| Class name | Costs of a $10,000
investment | Costs paid as a percentage of a
$10,000 investment |
| Class K Shares | $79 | 0.75% |
How did the Fund perform last year?
Equity market sentiment was supported as fears of a U.S. recession waned while major overseas economies returned to positive growth.
Signs of easing inflation led to expectations that the U.S. Federal Reserve and other leading central banks were poised to reduce interest rates.
Within the growth stock universe, performance was led by a handful of mega-cap technology companies viewed as the likely principal beneficiaries of efforts to commercialize the use of artificial intelligence.
What contributed to performance?
Positive contributions to performance, relative to the benchmark (Russell 2500TM Growth Index), were led by security selection in the industrials, financials and communication services sectors. In industrials, overweight positioning in the aerospace and defense sub-sector contributed to performance, most notably an overweight position in Axon Enterprise. In financials, an out-of-benchmark position in Tradeweb Markets within capital markets contributed to performance. Finally, an out-of-benchmark position in social media and ecommerce company Pinterest within the communication services sector added to return.
What detracted from performance?
The largest detractors from relative performance included stock selection in consumer discretionary, information technology and consumer staples. Within consumer discretionary, an overweight to the hotels, restaurants and leisure industry, specifically an overweight position in Vail Resorts, detracted from relative returns. Next, within information technology, lack of exposure to the technology hardware, storage and peripherals sub-sector weighed most heavily on performance. Lastly, selection in consumer staples, most notably an out-of-benchmark position in Davide Campari Milano within the beverages sub-sector, detracted from relative performance.
The views expressed reflect the opinions of BlackRock as of the date of this report and are subject to change based on changes in market, economic or other conditions. These views are not intended to be a forecast of future events and are no guarantee of future results.
Fund performance
Cumulative performance: June 29, 2021 through May 31, 2024
Initial investment of $10,000
See “Average annual total returns” for additional information on fund performance.
Average annual total returns
| 1 Year | Since
Inception |
| Class K Shares | 11.64% | (14.49)% |
| Russell 3000® Index | 27.58% | 7.18)% |
| Russell 2500TM Growth Index | 18.26% | (4.16)% |
| Net Assets | $9,652,087% |
| Number of Portfolio Holdings | $85% |
| Net Investment Advisory Fees | $64,713% |
| Portfolio Turnover Rate | $36% |
The Fund commenced operations on June 29, 2021.
Past performance is not an indication of future results. Performance results may include adjustments made for financial reporting purposes in accordance with U.S. generally accepted accounting principles. Performance results do not reflect the deduction of taxes that a shareholder would pay on fund distributions or on the redemption or sale of fund shares. Visit blackrock.com for more recent performance information.
What did the Fund invest in?
(as of May 31, 2024)
| Sector(a) | Percent of
Net Assets |
| Industrials | 28.2)% |
| Information Technology | 25.6)% |
| Consumer Discretionary | 16.9)% |
| Health Care | 12.4)% |
| Financials | 6.8)% |
| Communication Services | 6.3)% |
| Energy | 2.0)% |
| Consumer Staples | 1.5)% |
| Real Estate | 0.2)% |
| Short-Term Securities | 5.8)% |
| Liabilities in Excess of Other Assets | (5.7)% |
| Security(b) | Percent of
Net Assets |
| Axon Enterprise, Inc. | 3.3% |
| Entegris, Inc. | 2.5% |
| Booz Allen Hamilton Holding Corp., Class A | 2.5% |
| Bentley Systems, Inc., Class B | 2.4% |
| Comfort Systems U.S.A., Inc. | 2.4% |
| ASM International NV | 2.4% |
| Tradeweb Markets, Inc., Class A | 2.4% |
| Vertiv Holdings Co., Class A | 2.3% |
| Monolithic Power Systems, Inc. | 2.3% |
| Pinterest, Inc., Class A | 2.3% |
(a) | For purposes of this report, sector sub-classifications may differ from those utilized for compliance purposes. |
(b) | Excludes short-term securities. |
Additional information
If you wish to view additional information about the Fund, including but not limited to financial statements, the Fund’s prospectus, and proxy voting policies and procedures, please visit blackrock.com/fundreports. For proxy voting records, visit blackrock.com/proxyrecords.
Householding
The Fund will mail only one copy of shareholder documents, including prospectuses, annual and semi-annual reports and proxy statements, to shareholders with multiple accounts at the same address. This practice is commonly called “householding” and is intended to reduce expenses and eliminate duplicate mailings of shareholder documents. Mailings of your shareholder documents may be householded indefinitely unless you instruct us otherwise. If you do not want the mailing of these documents to be combined with those for other members of your household, please call the Fund at (800) 441-7762.
The Fund is not sponsored, endorsed, issued, sold, or promoted by FTSE International Limited and its affiliates, nor does this company make any representation regarding the advisability of investing in the Fund. BlackRock is not affiliated with the company listed above.
©2024 BlackRock, Inc. or its affiliates. All rights reserved. BLACKROCK is a registered trademark of BlackRock, Inc. or its affiliates. All other trademarks are those of their respective owners.
BlackRock SMID-Cap Growth Equity Fund
Class K Shares | BSDKX
Annual Shareholder Report — May 31, 2024
BSDKX-05/24-AR
BlackRock Technology Opportunities Fund
Institutional Shares | BGSIX
Annual Shareholder Report — May 31, 2024
This annual shareholder report contains important information about BlackRock Technology Opportunities Fund (the “Fund”) for the period of June 1, 2023 to May 31, 2024. You can find additional information about the Fund at blackrock.com/fundreports. You can also request this information by contacting us at (800) 441‑7762.
What were the Fund costs for the last year?
(based on a hypothetical $10,000 investment)
| Class name | Costs of a $10,000
investment | Costs paid as a percentage of a
$10,000 investment |
| Institutional Shares | $109 | 0.92% |
How did the Fund perform last year?
Equities produced strong performance behind resilient economic data, steady corporate earnings, and expectations that the U.S. Federal Reserve would begin to cut interest rates later in the year.
Technology stocks, particularly those expected to benefit from the growing use of artificial intelligence, strongly outpaced the broader equity market.
What contributed to performance?
At the sub-sector level, an underweight allocation to hardware stocks contributed to results. On a stock-specific basis, an underweight position in Apple, Inc., which lagged due in part to increased competition in China, was the top contributor to performance. An off-benchmark position in Meta Platforms, Inc. was another leading contributor. The internet company reported artificial intelligence-driven improvements in monetization across its social media platforms, announced significant cost reductions, and paid its first dividend.
What detracted from performance?
An overweight allocation to the new industries subsector detracted. Among individual positions, an overweight in the semiconductor stock Wolfspeed, Inc.—which was hurt by weakness in the electric vehicle market—was the largest detractor. An overweight position in Adyen NV also hurt results. The Dutch financial-technology company faced subdued demand as price-sensitive customers migrated to lower-cost competitors.
The views expressed reflect the opinions of BlackRock as of the date of this report and are subject to change based on changes in market, economic or other conditions. These views are not intended to be a forecast of future events and are no guarantee of future results.
Fund performance
Cumulative performance: June 1, 2014 through May 31, 2024
Initial investment of $10,000
See “Average annual total returns” for additional information on fund performance.
Average annual total returns
| 1 Year | 5 Years | 10 Years |
| Institutional Shares | 37.08% | 19.03% | 19.41% |
| MSCI All Country World Index | 23.56% | 11.68% | 8.40% |
| MSCI All-Country World Information Technology 10/40 Index | 34.26% | 21.37% | 18.04% |
| MSCI All-Country World Information Technology Index | 33.48% | 23.02% | 18.52% |
| Net Assets | $5,335,557,974% |
| Number of Portfolio Holdings | $80% |
| Net Investment Advisory Fees | $36,849,953% |
| Portfolio Turnover Rate | $21% |
Performance shown prior to December 30, 2017 are the returns of the Fund when it followed different investment strategies under the name BlackRock Science & Technology Opportunities Portfolio.
Past performance is not an indication of future results. Performance results may include adjustments made for financial reporting purposes in accordance with U.S. generally accepted accounting principles. Performance results do not reflect the deduction of taxes that a shareholder would pay on fund distributions or on the redemption or sale of fund shares. Visit blackrock.com for more recent performance information.
What did the Fund invest in?
(as of May 31, 2024)
| Industry(a) | Percent of
Net Assets |
| Semiconductors & Semiconductor Equipment | 35.8)% |
| Software | 28.5)% |
| Technology Hardware, Storage & Peripherals | 8.9)% |
| Interactive Media & Services | 4.9)% |
| Broadline Retail | 4.1)% |
| Financial Services | 3.6)% |
| Entertainment | 3.5)% |
| Professional Services | 2.4)% |
| IT Services | 1.7)% |
| Communications Equipment | 1.5)% |
| Other | 4.7)% |
| Short-Term Securities | 1.3)% |
| Liabilities in Excess of Other Assets | (0.9)% |
| Security(b) | Percent of
Net Assets |
| NVIDIA Corp. | 14.8% |
| Microsoft Corp. | 9.7% |
| Apple Inc. | 7.5% |
| Broadcom, Inc. | 3.6% |
| Cadence Design Systems, Inc. | 3.2% |
| Meta Platforms, Inc., Class A | 2.9% |
| ASML Holding NV | 2.9% |
| Advanced Micro Devices, Inc. | 2.6% |
| Amazon.com, Inc. | 2.5% |
| Micron Technology, Inc. | 2.2% |
(a) | For purposes of this report, industry sub-classifications may differ from those utilized for compliance purposes. |
(b) | Excludes short-term securities. |
Additional information
If you wish to view additional information about the Fund, including but not limited to financial statements, the Fund’s prospectus, and proxy voting policies and procedures, please visit blackrock.com/fundreports. For proxy voting records, visit blackrock.com/proxyrecords.
Householding
The Fund will mail only one copy of shareholder documents, including prospectuses, annual and semi-annual reports and proxy statements, to shareholders with multiple accounts at the same address. This practice is commonly called “householding” and is intended to reduce expenses and eliminate duplicate mailings of shareholder documents. Mailings of your shareholder documents may be householded indefinitely unless you instruct us otherwise. If you do not want the mailing of these documents to be combined with those for other members of your household, please call the Fund at (800) 441-7762.
The Fund is not sponsored, endorsed, issued, sold, or promoted by MSCI Inc. and its affiliates, nor does this company make any representation regarding the advisability of investing in the Fund. BlackRock is not affiliated with the company listed above.
©2024 BlackRock, Inc. or its affiliates. All rights reserved. BLACKROCK is a registered trademark of BlackRock, Inc. or its affiliates. All other trademarks are those of their respective owners.
BlackRock Technology Opportunities Fund
Institutional Shares | BGSIX
Annual Shareholder Report — May 31, 2024
BGSIX-05/24-AR
BlackRock Technology Opportunities Fund
Service Shares | BSTSX
Annual Shareholder Report — May 31, 2024
This annual shareholder report contains important information about BlackRock Technology Opportunities Fund (the “Fund”) for the period of June 1, 2023 to May 31, 2024. You can find additional information about the Fund at blackrock.com/fundreports. You can also request this information by contacting us at (800) 441‑7762.
What were the Fund costs for the last year?
(based on a hypothetical $10,000 investment)
| Class name | Costs of a $10,000
investment | Costs paid as a percentage of a
$10,000 investment |
| Service Shares | $138 | 1.17% |
How did the Fund perform last year?
Equities produced strong performance behind resilient economic data, steady corporate earnings, and expectations that the U.S. Federal Reserve would begin to cut interest rates later in the year.
Technology stocks, particularly those expected to benefit from the growing use of artificial intelligence, strongly outpaced the broader equity market.
What contributed to performance?
At the sub-sector level, an underweight allocation to hardware stocks contributed to results. On a stock-specific basis, an underweight position in Apple, Inc., which lagged due in part to increased competition in China, was the top contributor to performance. An off-benchmark position in Meta Platforms, Inc. was another leading contributor. The internet company reported artificial intelligence-driven improvements in monetization across its social media platforms, announced significant cost reductions, and paid its first dividend.
What detracted from performance?
An overweight allocation to the new industries subsector detracted. Among individual positions, an overweight in the semiconductor stock Wolfspeed, Inc.—which was hurt by weakness in the electric vehicle market—was the largest detractor. An overweight position in Adyen NV also hurt results. The Dutch financial-technology company faced subdued demand as price-sensitive customers migrated to lower-cost competitors.
The views expressed reflect the opinions of BlackRock as of the date of this report and are subject to change based on changes in market, economic or other conditions. These views are not intended to be a forecast of future events and are no guarantee of future results.
Fund performance
Cumulative performance: June 1, 2014 through May 31, 2024
Initial investment of $10,000
See “Average annual total returns” for additional information on fund performance.
Average annual total returns
| 1 Year | 5 Years | 10 Years |
| Service Shares | 36.74% | 18.73% | 19.12% |
| MSCI All Country World Index | 23.56% | 11.68% | 8.40% |
| MSCI All-Country World Information Technology 10/40 Index | 34.26% | 21.37% | 18.04% |
| MSCI All-Country World Information Technology Index | 33.48% | 23.02% | 18.52% |
| Net Assets | $5,335,557,974% |
| Number of Portfolio Holdings | $80% |
| Net Investment Advisory Fees | $36,849,953% |
| Portfolio Turnover Rate | $21% |
Performance shown prior to December 30, 2017 are the returns of the Fund when it followed different investment strategies under the name BlackRock Science & Technology Opportunities Portfolio.
Average annual total returns reflect reductions for service fees.
Past performance is not an indication of future results. Performance results may include adjustments made for financial reporting purposes in accordance with U.S. generally accepted accounting principles. Performance results do not reflect the deduction of taxes that a shareholder would pay on fund distributions or on the redemption or sale of fund shares. Visit blackrock.com for more recent performance information.
What did the Fund invest in?
(as of May 31, 2024)
| Industry(a) | Percent of
Net Assets |
| Semiconductors & Semiconductor Equipment | 35.8)% |
| Software | 28.5)% |
| Technology Hardware, Storage & Peripherals | 8.9)% |
| Interactive Media & Services | 4.9)% |
| Broadline Retail | 4.1)% |
| Financial Services | 3.6)% |
| Entertainment | 3.5)% |
| Professional Services | 2.4)% |
| IT Services | 1.7)% |
| Communications Equipment | 1.5)% |
| Other | 4.7)% |
| Short-Term Securities | 1.3)% |
| Liabilities in Excess of Other Assets | (0.9)% |
| Security(b) | Percent of
Net Assets |
| NVIDIA Corp. | 14.8% |
| Microsoft Corp. | 9.7% |
| Apple Inc. | 7.5% |
| Broadcom, Inc. | 3.6% |
| Cadence Design Systems, Inc. | 3.2% |
| Meta Platforms, Inc., Class A | 2.9% |
| ASML Holding NV | 2.9% |
| Advanced Micro Devices, Inc. | 2.6% |
| Amazon.com, Inc. | 2.5% |
| Micron Technology, Inc. | 2.2% |
(a) | For purposes of this report, industry sub-classifications may differ from those utilized for compliance purposes. |
(b) | Excludes short-term securities. |
Additional information
If you wish to view additional information about the Fund, including but not limited to financial statements, the Fund’s prospectus, and proxy voting policies and procedures, please visit blackrock.com/fundreports. For proxy voting records, visit blackrock.com/proxyrecords.
Householding
The Fund will mail only one copy of shareholder documents, including prospectuses, annual and semi-annual reports and proxy statements, to shareholders with multiple accounts at the same address. This practice is commonly called “householding” and is intended to reduce expenses and eliminate duplicate mailings of shareholder documents. Mailings of your shareholder documents may be householded indefinitely unless you instruct us otherwise. If you do not want the mailing of these documents to be combined with those for other members of your household, please call the Fund at (800) 441-7762.
The Fund is not sponsored, endorsed, issued, sold, or promoted by MSCI Inc. and its affiliates, nor does this company make any representation regarding the advisability of investing in the Fund. BlackRock is not affiliated with the company listed above.
©2024 BlackRock, Inc. or its affiliates. All rights reserved. BLACKROCK is a registered trademark of BlackRock, Inc. or its affiliates. All other trademarks are those of their respective owners.
BlackRock Technology Opportunities Fund
Service Shares | BSTSX
Annual Shareholder Report — May 31, 2024
BSTSX-05/24-AR
BlackRock Technology Opportunities Fund
Investor A Shares | BGSAX
Annual Shareholder Report — May 31, 2024
This annual shareholder report contains important information about BlackRock Technology Opportunities Fund (the “Fund”) for the period of June 1, 2023 to May 31, 2024. You can find additional information about the Fund at blackrock.com/fundreports. You can also request this information by contacting us at (800) 441‑7762.
What were the Fund costs for the last year?
(based on a hypothetical $10,000 investment)
| Class name | Costs of a $10,000
investment | Costs paid as a percentage of a
$10,000 investment |
| Investor A Shares | $138 | 1.17% |
How did the Fund perform last year?
Equities produced strong performance behind resilient economic data, steady corporate earnings, and expectations that the U.S. Federal Reserve would begin to cut interest rates later in the year.
Technology stocks, particularly those expected to benefit from the growing use of artificial intelligence, strongly outpaced the broader equity market.
What contributed to performance?
At the sub-sector level, an underweight allocation to hardware stocks contributed to results. On a stock-specific basis, an underweight position in Apple, Inc., which lagged due in part to increased competition in China, was the top contributor to performance. An off-benchmark position in Meta Platforms, Inc. was another leading contributor. The internet company reported artificial intelligence-driven improvements in monetization across its social media platforms, announced significant cost reductions, and paid its first dividend.
What detracted from performance?
An overweight allocation to the new industries subsector detracted. Among individual positions, an overweight in the semiconductor stock Wolfspeed, Inc.—which was hurt by weakness in the electric vehicle market—was the largest detractor. An overweight position in Adyen NV also hurt results. The Dutch financial-technology company faced subdued demand as price-sensitive customers migrated to lower-cost competitors.
The views expressed reflect the opinions of BlackRock as of the date of this report and are subject to change based on changes in market, economic or other conditions. These views are not intended to be a forecast of future events and are no guarantee of future results.
Fund performance
Cumulative performance: June 1, 2014 through May 31, 2024
Initial investment of $10,000
See “Average annual total returns” for additional information on fund performance.
Average annual total returns
| 1 Year | 5 Years | 10 Years |
| Investor A Shares | 36.71% | 18.72% | 19.09% |
| Investor A Shares (with sales charge) | 29.53% | 17.45% | 18.45% |
| MSCI All Country World Index | 23.56% | 11.68% | 8.40% |
| MSCI All-Country World Information Technology 10/40 Index | 34.26% | 21.37% | 18.04% |
| MSCI All-Country World Information Technology Index | 33.48% | 23.02% | 18.52% |
| Net Assets | $5,335,557,974% |
| Number of Portfolio Holdings | $80% |
| Net Investment Advisory Fees | $36,849,953% |
| Portfolio Turnover Rate | $21% |
Performance shown prior to December 30, 2017 are the returns of the Fund when it followed different investment strategies under the name BlackRock Science & Technology Opportunities Portfolio.
Assuming maximum sales charges. Average annual total returns with and without sales charges reflect reductions for service fees.
Past performance is not an indication of future results. Performance results may include adjustments made for financial reporting purposes in accordance with U.S. generally accepted accounting principles. Performance results do not reflect the deduction of taxes that a shareholder would pay on fund distributions or on the redemption or sale of fund shares. Visit blackrock.com for more recent performance information.
What did the Fund invest in?
(as of May 31, 2024)
| Industry(a) | Percent of
Net Assets |
| Semiconductors & Semiconductor Equipment | 35.8)% |
| Software | 28.5)% |
| Technology Hardware, Storage & Peripherals | 8.9)% |
| Interactive Media & Services | 4.9)% |
| Broadline Retail | 4.1)% |
| Financial Services | 3.6)% |
| Entertainment | 3.5)% |
| Professional Services | 2.4)% |
| IT Services | 1.7)% |
| Communications Equipment | 1.5)% |
| Other | 4.7)% |
| Short-Term Securities | 1.3)% |
| Liabilities in Excess of Other Assets | (0.9)% |
| Security(b) | Percent of
Net Assets |
| NVIDIA Corp. | 14.8% |
| Microsoft Corp. | 9.7% |
| Apple Inc. | 7.5% |
| Broadcom, Inc. | 3.6% |
| Cadence Design Systems, Inc. | 3.2% |
| Meta Platforms, Inc., Class A | 2.9% |
| ASML Holding NV | 2.9% |
| Advanced Micro Devices, Inc. | 2.6% |
| Amazon.com, Inc. | 2.5% |
| Micron Technology, Inc. | 2.2% |
(a) | For purposes of this report, industry sub-classifications may differ from those utilized for compliance purposes. |
(b) | Excludes short-term securities. |
Additional information
If you wish to view additional information about the Fund, including but not limited to financial statements, the Fund’s prospectus, and proxy voting policies and procedures, please visit blackrock.com/fundreports. For proxy voting records, visit blackrock.com/proxyrecords.
Householding
The Fund will mail only one copy of shareholder documents, including prospectuses, annual and semi-annual reports and proxy statements, to shareholders with multiple accounts at the same address. This practice is commonly called “householding” and is intended to reduce expenses and eliminate duplicate mailings of shareholder documents. Mailings of your shareholder documents may be householded indefinitely unless you instruct us otherwise. If you do not want the mailing of these documents to be combined with those for other members of your household, please call the Fund at (800) 441-7762.
The Fund is not sponsored, endorsed, issued, sold, or promoted by MSCI Inc. and its affiliates, nor does this company make any representation regarding the advisability of investing in the Fund. BlackRock is not affiliated with the company listed above.
©2024 BlackRock, Inc. or its affiliates. All rights reserved. BLACKROCK is a registered trademark of BlackRock, Inc. or its affiliates. All other trademarks are those of their respective owners.
BlackRock Technology Opportunities Fund
Investor A Shares | BGSAX
Annual Shareholder Report — May 31, 2024
BGSAX-05/24-AR
BlackRock Technology Opportunities Fund
Investor C Shares | BGSCX
Annual Shareholder Report — May 31, 2024
This annual shareholder report contains important information about BlackRock Technology Opportunities Fund (the “Fund”) for the period of June 1, 2023 to May 31, 2024. You can find additional information about the Fund at blackrock.com/fundreports. You can also request this information by contacting us at (800) 441‑7762.
What were the Fund costs for the last year?
(based on a hypothetical $10,000 investment)
| Class name | Costs of a $10,000
investment | Costs paid as a percentage of a
$10,000 investment |
| Investor C Shares | $226 | 1.92% |
How did the Fund perform last year?
Equities produced strong performance behind resilient economic data, steady corporate earnings, and expectations that the U.S. Federal Reserve would begin to cut interest rates later in the year.
Technology stocks, particularly those expected to benefit from the growing use of artificial intelligence, strongly outpaced the broader equity market.
What contributed to performance?
At the sub-sector level, an underweight allocation to hardware stocks contributed to results. On a stock-specific basis, an underweight position in Apple, Inc., which lagged due in part to increased competition in China, was the top contributor to performance. An off-benchmark position in Meta Platforms, Inc. was another leading contributor. The internet company reported artificial intelligence-driven improvements in monetization across its social media platforms, announced significant cost reductions, and paid its first dividend.
What detracted from performance?
An overweight allocation to the new industries subsector detracted. Among individual positions, an overweight in the semiconductor stock Wolfspeed, Inc.—which was hurt by weakness in the electric vehicle market—was the largest detractor. An overweight position in Adyen NV also hurt results. The Dutch financial-technology company faced subdued demand as price-sensitive customers migrated to lower-cost competitors.
The views expressed reflect the opinions of BlackRock as of the date of this report and are subject to change based on changes in market, economic or other conditions. These views are not intended to be a forecast of future events and are no guarantee of future results.
Fund performance
Cumulative performance: June 1, 2014 through May 31, 2024
Initial investment of $10,000
See “Average annual total returns” for additional information on fund performance.
Average annual total returns
| 1 Year | 5 Years | 10 Years |
| Investor C Shares | 35.68% | 17.83% | 18.36% |
| Investor C Shares (with sales charge) | 34.68% | 17.83% | 18.36% |
| MSCI All Country World Index | 23.56% | 11.68% | 8.40% |
| MSCI All-Country World Information Technology 10/40 Index | 34.26% | 21.37% | 18.04% |
| MSCI All-Country World Information Technology Index | 33.48% | 23.02% | 18.52% |
| Net Assets | $5,335,557,974% |
| Number of Portfolio Holdings | $80% |
| Net Investment Advisory Fees | $36,849,953% |
| Portfolio Turnover Rate | $21% |
Performance shown prior to December 30, 2017 are the returns of the Fund when it followed different investment strategies under the name BlackRock Science & Technology Opportunities Portfolio.
Assuming maximum sales charges. Average annual total returns with and without sales charges reflect reductions for distribution and service fees.
Past performance is not an indication of future results. Performance results may include adjustments made for financial reporting purposes in accordance with U.S. generally accepted accounting principles. Performance results do not reflect the deduction of taxes that a shareholder would pay on fund distributions or on the redemption or sale of fund shares. Visit blackrock.com for more recent performance information.
What did the Fund invest in?
(as of May 31, 2024)
| Industry(a) | Percent of
Net Assets |
| Semiconductors & Semiconductor Equipment | 35.8)% |
| Software | 28.5)% |
| Technology Hardware, Storage & Peripherals | 8.9)% |
| Interactive Media & Services | 4.9)% |
| Broadline Retail | 4.1)% |
| Financial Services | 3.6)% |
| Entertainment | 3.5)% |
| Professional Services | 2.4)% |
| IT Services | 1.7)% |
| Communications Equipment | 1.5)% |
| Other | 4.7)% |
| Short-Term Securities | 1.3)% |
| Liabilities in Excess of Other Assets | (0.9)% |
| Security(b) | Percent of
Net Assets |
| NVIDIA Corp. | 14.8% |
| Microsoft Corp. | 9.7% |
| Apple Inc. | 7.5% |
| Broadcom, Inc. | 3.6% |
| Cadence Design Systems, Inc. | 3.2% |
| Meta Platforms, Inc., Class A | 2.9% |
| ASML Holding NV | 2.9% |
| Advanced Micro Devices, Inc. | 2.6% |
| Amazon.com, Inc. | 2.5% |
| Micron Technology, Inc. | 2.2% |
(a) | For purposes of this report, industry sub-classifications may differ from those utilized for compliance purposes. |
(b) | Excludes short-term securities. |
Additional information
If you wish to view additional information about the Fund, including but not limited to financial statements, the Fund’s prospectus, and proxy voting policies and procedures, please visit blackrock.com/fundreports. For proxy voting records, visit blackrock.com/proxyrecords.
Householding
The Fund will mail only one copy of shareholder documents, including prospectuses, annual and semi-annual reports and proxy statements, to shareholders with multiple accounts at the same address. This practice is commonly called “householding” and is intended to reduce expenses and eliminate duplicate mailings of shareholder documents. Mailings of your shareholder documents may be householded indefinitely unless you instruct us otherwise. If you do not want the mailing of these documents to be combined with those for other members of your household, please call the Fund at (800) 441-7762.
The Fund is not sponsored, endorsed, issued, sold, or promoted by MSCI Inc. and its affiliates, nor does this company make any representation regarding the advisability of investing in the Fund. BlackRock is not affiliated with the company listed above.
©2024 BlackRock, Inc. or its affiliates. All rights reserved. BLACKROCK is a registered trademark of BlackRock, Inc. or its affiliates. All other trademarks are those of their respective owners.
BlackRock Technology Opportunities Fund
Investor C Shares | BGSCX
Annual Shareholder Report — May 31, 2024
BGSCX-05/24-AR
BlackRock Technology Opportunities Fund
Class K Shares | BTEKX
Annual Shareholder Report — May 31, 2024
This annual shareholder report contains important information about BlackRock Technology Opportunities Fund (the “Fund”) for the period of June 1, 2023 to May 31, 2024. You can find additional information about the Fund at blackrock.com/fundreports. You can also request this information by contacting us at (800) 441‑7762.
What were the Fund costs for the last year?
(based on a hypothetical $10,000 investment)
| Class name | Costs of a $10,000
investment | Costs paid as a percentage of a
$10,000 investment |
| Class K Shares | $101 | 0.85% |
How did the Fund perform last year?
Equities produced strong performance behind resilient economic data, steady corporate earnings, and expectations that the U.S. Federal Reserve would begin to cut interest rates later in the year.
Technology stocks, particularly those expected to benefit from the growing use of artificial intelligence, strongly outpaced the broader equity market.
What contributed to performance?
At the sub-sector level, an underweight allocation to hardware stocks contributed to results. On a stock-specific basis, an underweight position in Apple, Inc., which lagged due in part to increased competition in China, was the top contributor to performance. An off-benchmark position in Meta Platforms, Inc. was another leading contributor. The internet company reported artificial intelligence-driven improvements in monetization across its social media platforms, announced significant cost reductions, and paid its first dividend.
What detracted from performance?
An overweight allocation to the new industries subsector detracted. Among individual positions, an overweight in the semiconductor stock Wolfspeed, Inc.—which was hurt by weakness in the electric vehicle market—was the largest detractor. An overweight position in Adyen NV also hurt results. The Dutch financial-technology company faced subdued demand as price-sensitive customers migrated to lower-cost competitors.
The views expressed reflect the opinions of BlackRock as of the date of this report and are subject to change based on changes in market, economic or other conditions. These views are not intended to be a forecast of future events and are no guarantee of future results.
Fund performance
Cumulative performance: June 1, 2014 through May 31, 2024
Initial investment of $10,000
See “Average annual total returns” for additional information on fund performance.
Average annual total returns
| 1 Year | 5 Years | 10 Years |
| Class K Shares | 37.17% | 19.10% | 19.44% |
| MSCI All Country World Index | 23.56% | 11.68% | 8.40% |
| MSCI All-Country World Information Technology 10/40 Index | 34.26% | 21.37% | 18.04% |
| MSCI All-Country World Information Technology Index | 33.48% | 23.02% | 18.52% |
| Net Assets | $5,335,557,974% |
| Number of Portfolio Holdings | $80% |
| Net Investment Advisory Fees | $36,849,953% |
| Portfolio Turnover Rate | $21% |
Performance shown prior to December 30, 2017 are the returns of the Fund when it followed different investment strategies under the name BlackRock Science & Technology Opportunities Portfolio.
Performance shown prior to the Class K Shares inception date of December 10, 2019 is that of Institutional Shares. The performance of the Class K Shares would be substantially similar to Institutional Shares because Class K Shares and Institutional Shares invest in the same portfolio of securities and performance would only differ to the extent that Class K Shares and Institutional Shares have different expenses. The actual returns of Class K Shares would have been higher than those of the Institutional Shares because Class K Shares have lower expenses than the Institutional Shares.
Past performance is not an indication of future results. Performance results may include adjustments made for financial reporting purposes in accordance with U.S. generally accepted accounting principles. Performance results do not reflect the deduction of taxes that a shareholder would pay on fund distributions or on the redemption or sale of fund shares. Visit blackrock.com for more recent performance information.
What did the Fund invest in?
(as of May 31, 2024)
| Industry(a) | Percent of
Net Assets |
| Semiconductors & Semiconductor Equipment | 35.8)% |
| Software | 28.5)% |
| Technology Hardware, Storage & Peripherals | 8.9)% |
| Interactive Media & Services | 4.9)% |
| Broadline Retail | 4.1)% |
| Financial Services | 3.6)% |
| Entertainment | 3.5)% |
| Professional Services | 2.4)% |
| IT Services | 1.7)% |
| Communications Equipment | 1.5)% |
| Other | 4.7)% |
| Short-Term Securities | 1.3)% |
| Liabilities in Excess of Other Assets | (0.9)% |
| Security(b) | Percent of
Net Assets |
| NVIDIA Corp. | 14.8% |
| Microsoft Corp. | 9.7% |
| Apple Inc. | 7.5% |
| Broadcom, Inc. | 3.6% |
| Cadence Design Systems, Inc. | 3.2% |
| Meta Platforms, Inc., Class A | 2.9% |
| ASML Holding NV | 2.9% |
| Advanced Micro Devices, Inc. | 2.6% |
| Amazon.com, Inc. | 2.5% |
| Micron Technology, Inc. | 2.2% |
(a) | For purposes of this report, industry sub-classifications may differ from those utilized for compliance purposes. |
(b) | Excludes short-term securities. |
Additional information
If you wish to view additional information about the Fund, including but not limited to financial statements, the Fund’s prospectus, and proxy voting policies and procedures, please visit blackrock.com/fundreports. For proxy voting records, visit blackrock.com/proxyrecords.
Householding
The Fund will mail only one copy of shareholder documents, including prospectuses, annual and semi-annual reports and proxy statements, to shareholders with multiple accounts at the same address. This practice is commonly called “householding” and is intended to reduce expenses and eliminate duplicate mailings of shareholder documents. Mailings of your shareholder documents may be householded indefinitely unless you instruct us otherwise. If you do not want the mailing of these documents to be combined with those for other members of your household, please call the Fund at (800) 441-7762.
The Fund is not sponsored, endorsed, issued, sold, or promoted by MSCI Inc. and its affiliates, nor does this company make any representation regarding the advisability of investing in the Fund. BlackRock is not affiliated with the company listed above.
©2024 BlackRock, Inc. or its affiliates. All rights reserved. BLACKROCK is a registered trademark of BlackRock, Inc. or its affiliates. All other trademarks are those of their respective owners.
BlackRock Technology Opportunities Fund
Class K Shares | BTEKX
Annual Shareholder Report — May 31, 2024
BTEKX-05/24-AR
BlackRock Technology Opportunities Fund
Class R Shares | BGSRX
Annual Shareholder Report — May 31, 2024
This annual shareholder report contains important information about BlackRock Technology Opportunities Fund (the “Fund”) for the period of June 1, 2023 to May 31, 2024. You can find additional information about the Fund at blackrock.com/fundreports. You can also request this information by contacting us at (800) 441‑7762.
What were the Fund costs for the last year?
(based on a hypothetical $10,000 investment)
| Class name | Costs of a $10,000
investment | Costs paid as a percentage of a
$10,000 investment |
| Class R Shares | $168 | 1.42% |
How did the Fund perform last year?
Equities produced strong performance behind resilient economic data, steady corporate earnings, and expectations that the U.S. Federal Reserve would begin to cut interest rates later in the year.
Technology stocks, particularly those expected to benefit from the growing use of artificial intelligence, strongly outpaced the broader equity market.
What contributed to performance?
At the sub-sector level, an underweight allocation to hardware stocks contributed to results. On a stock-specific basis, an underweight position in Apple, Inc., which lagged due in part to increased competition in China, was the top contributor to performance. An off-benchmark position in Meta Platforms, Inc. was another leading contributor. The internet company reported artificial intelligence-driven improvements in monetization across its social media platforms, announced significant cost reductions, and paid its first dividend.
What detracted from performance?
An overweight allocation to the new industries subsector detracted. Among individual positions, an overweight in the semiconductor stock Wolfspeed, Inc.—which was hurt by weakness in the electric vehicle market—was the largest detractor. An overweight position in Adyen NV also hurt results. The Dutch financial-technology company faced subdued demand as price-sensitive customers migrated to lower-cost competitors.
The views expressed reflect the opinions of BlackRock as of the date of this report and are subject to change based on changes in market, economic or other conditions. These views are not intended to be a forecast of future events and are no guarantee of future results.
Fund performance
Cumulative performance: June 1, 2014 through May 31, 2024
Initial investment of $10,000
See “Average annual total returns” for additional information on fund performance.
Average annual total returns
| 1 Year | 5 Years | 10 Years |
| Class R Shares | 36.39% | 18.43% | 18.78% |
| MSCI All Country World Index | 23.56% | 11.68% | 8.40% |
| MSCI All-Country World Information Technology 10/40 Index | 34.26% | 21.37% | 18.04% |
| MSCI All-Country World Information Technology Index | 33.48% | 23.02% | 18.52% |
| Net Assets | $5,335,557,974% |
| Number of Portfolio Holdings | $80% |
| Net Investment Advisory Fees | $36,849,953% |
| Portfolio Turnover Rate | $21% |
Performance shown prior to December 30, 2017 are the returns of the Fund when it followed different investment strategies under the name BlackRock Science & Technology Opportunities Portfolio.
Average annual total returns reflect reductions for distribution and service fees.
Past performance is not an indication of future results. Performance results may include adjustments made for financial reporting purposes in accordance with U.S. generally accepted accounting principles. Performance results do not reflect the deduction of taxes that a shareholder would pay on fund distributions or on the redemption or sale of fund shares. Visit blackrock.com for more recent performance information.
What did the Fund invest in?
(as of May 31, 2024)
| Industry(a) | Percent of
Net Assets |
| Semiconductors & Semiconductor Equipment | 35.8)% |
| Software | 28.5)% |
| Technology Hardware, Storage & Peripherals | 8.9)% |
| Interactive Media & Services | 4.9)% |
| Broadline Retail | 4.1)% |
| Financial Services | 3.6)% |
| Entertainment | 3.5)% |
| Professional Services | 2.4)% |
| IT Services | 1.7)% |
| Communications Equipment | 1.5)% |
| Other | 4.7)% |
| Short-Term Securities | 1.3)% |
| Liabilities in Excess of Other Assets | (0.9)% |
| Security(b) | Percent of
Net Assets |
| NVIDIA Corp. | 14.8% |
| Microsoft Corp. | 9.7% |
| Apple Inc. | 7.5% |
| Broadcom, Inc. | 3.6% |
| Cadence Design Systems, Inc. | 3.2% |
| Meta Platforms, Inc., Class A | 2.9% |
| ASML Holding NV | 2.9% |
| Advanced Micro Devices, Inc. | 2.6% |
| Amazon.com, Inc. | 2.5% |
| Micron Technology, Inc. | 2.2% |
(a) | For purposes of this report, industry sub-classifications may differ from those utilized for compliance purposes. |
(b) | Excludes short-term securities. |
Additional information
If you wish to view additional information about the Fund, including but not limited to financial statements, the Fund’s prospectus, and proxy voting policies and procedures, please visit blackrock.com/fundreports. For proxy voting records, visit blackrock.com/proxyrecords.
Householding
The Fund will mail only one copy of shareholder documents, including prospectuses, annual and semi-annual reports and proxy statements, to shareholders with multiple accounts at the same address. This practice is commonly called “householding” and is intended to reduce expenses and eliminate duplicate mailings of shareholder documents. Mailings of your shareholder documents may be householded indefinitely unless you instruct us otherwise. If you do not want the mailing of these documents to be combined with those for other members of your household, please call the Fund at (800) 441-7762.
The Fund is not sponsored, endorsed, issued, sold, or promoted by MSCI Inc. and its affiliates, nor does this company make any representation regarding the advisability of investing in the Fund. BlackRock is not affiliated with the company listed above.
©2024 BlackRock, Inc. or its affiliates. All rights reserved. BLACKROCK is a registered trademark of BlackRock, Inc. or its affiliates. All other trademarks are those of their respective owners.
BlackRock Technology Opportunities Fund
Class R Shares | BGSRX
Annual Shareholder Report — May 31, 2024
BGSRX-05/24-AR
BlackRock U.S. Insights Long/Short Equity Fund
Institutional Shares | BILSX
Annual Shareholder Report — May 31, 2024
This annual shareholder report contains important information about BlackRock U.S. Insights Long/Short Equity Fund (the “Fund”) for the period of June 13, 2023 to May 31, 2024. You can find additional information about the Fund at blackrock.com/fundreports. You can also request this information by contacting us at (800) 441‑7762.
What were the Fund costs for the last year?
(based on a hypothetical $10,000 investment)
| Class name | Costs of a $10,000
investment | Costs paid as a percentage of a
$10,000 investment |
| Institutional Shares | $166(a) | 1.55% |
| (a) | Institutional shares commenced operations during the reporting period. Expenses for a full reporting period would be higher than the amount shown. |
How did the Fund perform last year?
Global equities enjoyed strong performance as resilient macro and micro data combined with excitement around the dominant themes of innovation in information technology and healthcare drove gains.
Fears of a U.S. recession waned while major overseas economies returned to positive growth.
Signs of easing inflation led to expectations that the U.S. Federal Reserve and other leading central banks were poised to reduce interest rates.
What contributed to performance?
The Fund’s performance was driven by fundamental stock selection. Long positions in Nvidia Corp. and Amazon.com, Inc. proved beneficial amid the broader excitement around artificial intelligence. Elsewhere, long positions in energy companies Conocophillips Company and Suncor Energy Inc. also contributed positively. Gains from fundamental stock selection were compounded by systematic insights. Sentiment-based measures evaluating trends across analyst and executive comments as well as macro thematic insights measuring hiring trends and business-to-business invoicing collectively were key performance drivers. These insights broadly helped the Fund identify the dominant trends of what became an increasingly trending market. Finally, the Fund used derivatives to implement market timing models expressed in futures. These instruments contributed slightly to performance. The Fund’s cash position had no material impact on performance.
What detracted from performance?
While fundamental stock selection contributed in aggregate, select positions detracted from performance, including a net long to media company Comcast and a short to oil stock CNX Resources Corp. Elsewhere, systematic measures evaluating traditional financial statement data such as cash flows, valuations and dividend consistency ran against the prevailing market themes.
The views expressed reflect the opinions of BlackRock as of the date of this report and are subject to change based on changes in market, economic or other conditions. These views are not intended to be a forecast of future events and are no guarantee of future results.
Fund performance
Cumulative performance: June 13, 2023 through May 31, 2024
Initial investment of $10,000
See “Average annual total returns” for additional information on fund performance.
Average annual total returns
| Since
Inception |
| Institutional Shares | 21.71% |
| S&P 500® Index | 22.58% |
| 50% S&P 500 Index/50% ICE BofA 3-Month U.S. Treasury Bill Index | 13.87% |
| Net Assets | $12,443,302% |
| Number of Portfolio Holdings | $244% |
| Net Investment Advisory Fees | $0% |
| Portfolio Turnover Rate | $0% |
The Fund commenced operations on June 13, 2023.
On December 1, 2023, the Fund began to compare its performance to the standard pricing time of the ICE BofA 3-Month U.S. Treasury Bill Index.
Past performance is not an indication of future results. Performance results may include adjustments made for financial reporting purposes in accordance with U.S. generally accepted accounting principles. Performance results do not reflect the deduction of taxes that a shareholder would pay on fund distributions or on the redemption or sale of fund shares. Visit blackrock.com for more recent performance information.
What did the Fund invest in?
(as of May 31, 2024)
| Percent of Total Investments(a) |
| Sector(b) | Long | Short | Total |
| Energy | 14.5% | 11.9% | 26.4% |
| Financials | 7.5% | 7.7% | 15.2% |
| Information Technology | 5.6% | 5.8% | 11.4% |
| Health Care | 6.4% | 4.1% | 10.5% |
| Utilities | 4.3% | 6.2% | 10.5% |
| Industrials | 4.7% | 3.2% | 7.9% |
| Communication Services | 4.8% | 1.6% | 6.4% |
| Consumer Discretionary | 3.5% | 1.3% | 4.8% |
| Materials | —% | 3.0% | 3.0% |
| Real Estate | 1.2% | 1.1% | 2.3% |
| Consumer Staples | 0.6% | 1.0% | 1.6% |
| 53.1% | 46.9% | 100.0% |
(a) | Includes the gross market value of long and short securities of the underlying derivative contracts and excludes short-term securities and options, if any. |
(b) | For purposes of this report, sector sub-classifications may differ from those utilized for compliance purposes. |
Additional information
If you wish to view additional information about the Fund, including but not limited to financial statements, the Fund’s prospectus, and proxy voting policies and procedures, please visit blackrock.com/fundreports. For proxy voting records, visit blackrock.com/proxyrecords.
Householding
The Fund will mail only one copy of shareholder documents, including prospectuses, annual and semi-annual reports and proxy statements, to shareholders with multiple accounts at the same address. This practice is commonly called “householding” and is intended to reduce expenses and eliminate duplicate mailings of shareholder documents. Mailings of your shareholder documents may be householded indefinitely unless you instruct us otherwise. If you do not want the mailing of these documents to be combined with those for other members of your household, please call the Fund at (800) 441-7762.
The Fund is not sponsored, endorsed, issued, sold, or promoted by ICE Data Indices, LLC, S&P Dow Jones Indices, and their respective affiliates, nor do these companies make any representation regarding the advisability of investing in the Fund. BlackRock is not affiliated with the companies listed above.
©2024 BlackRock, Inc. or its affiliates. All rights reserved. BLACKROCK is a registered trademark of BlackRock, Inc. or its affiliates. All other trademarks are those of their respective owners.
BlackRock U.S. Insights Long/Short Equity Fund
Institutional Shares | BILSX
Annual Shareholder Report — May 31, 2024
BILSX-05/24-AR
BlackRock U.S. Insights Long/Short Equity Fund
Investor A Shares | BALSX
Annual Shareholder Report — May 31, 2024
This annual shareholder report contains important information about BlackRock U.S. Insights Long/Short Equity Fund (the “Fund”) for the period of June 13, 2023 to May 31, 2024. You can find additional information about the Fund at blackrock.com/fundreports. You can also request this information by contacting us at (800) 441‑7762.
What were the Fund costs for the last year?
(based on a hypothetical $10,000 investment)
| Class name | Costs of a $10,000
investment | Costs paid as a percentage of a
$10,000 investment |
| Investor A Shares | $193(a) | 1.80% |
| (a) | Investor A shares commenced operations during the reporting period. Expenses for a full reporting period would be higher than the amount shown. |
How did the Fund perform last year?
Global equities enjoyed strong performance as resilient macro and micro data combined with excitement around the dominant themes of innovation in information technology and healthcare drove gains.
Fears of a U.S. recession waned while major overseas economies returned to positive growth.
Signs of easing inflation led to expectations that the U.S. Federal Reserve and other leading central banks were poised to reduce interest rates.
What contributed to performance?
The Fund’s performance was driven by fundamental stock selection. Long positions in Nvidia Corp. and Amazon.com, Inc. proved beneficial amid the broader excitement around artificial intelligence. Elsewhere, long positions in energy companies Conocophillips Company and Suncor Energy Inc. also contributed positively. Gains from fundamental stock selection were compounded by systematic insights. Sentiment-based measures evaluating trends across analyst and executive comments as well as macro thematic insights measuring hiring trends and business-to-business invoicing collectively were key performance drivers. These insights broadly helped the Fund identify the dominant trends of what became an increasingly trending market. Finally, the Fund used derivatives to implement market timing models expressed in futures. These instruments contributed slightly to performance. The Fund’s cash position had no material impact on performance.
What detracted from performance?
While fundamental stock selection contributed in aggregate, select positions detracted from performance, including a net long to media company Comcast and a short to oil stock CNX Resources Corp. Elsewhere, systematic measures evaluating traditional financial statement data such as cash flows, valuations and dividend consistency ran against the prevailing market themes.
The views expressed reflect the opinions of BlackRock as of the date of this report and are subject to change based on changes in market, economic or other conditions. These views are not intended to be a forecast of future events and are no guarantee of future results.
Fund performance
Cumulative performance: June 13, 2023 through May 31, 2024
Initial investment of $10,000
See “Average annual total returns” for additional information on fund performance.
Average annual total returns
| Since
Inception |
| Investor A Shares | 21.37% |
| Investor A Shares (with sales charge) | 14.99% |
| S&P 500® Index | 22.58% |
| 50% S&P 500 Index/50% ICE BofA 3-Month U.S. Treasury Bill Index | 13.87% |
| Net Assets | $12,443,302% |
| Number of Portfolio Holdings | $244% |
| Net Investment Advisory Fees | $0% |
| Portfolio Turnover Rate | $0% |
The Fund commenced operations on June 13, 2023.
Assuming maximum sales charges. Average annual total returns with and without sales charges reflect reductions for service fees.
On December 1, 2023, the Fund began to compare its performance to the standard pricing time of the ICE BofA 3-Month U.S. Treasury Bill Index.
Past performance is not an indication of future results. Performance results may include adjustments made for financial reporting purposes in accordance with U.S. generally accepted accounting principles. Performance results do not reflect the deduction of taxes that a shareholder would pay on fund distributions or on the redemption or sale of fund shares. Visit blackrock.com for more recent performance information.
What did the Fund invest in?
(as of May 31, 2024)
| Percent of Total Investments(a) |
| Sector(b) | Long | Short | Total |
| Energy | 14.5% | 11.9% | 26.4% |
| Financials | 7.5% | 7.7% | 15.2% |
| Information Technology | 5.6% | 5.8% | 11.4% |
| Health Care | 6.4% | 4.1% | 10.5% |
| Utilities | 4.3% | 6.2% | 10.5% |
| Industrials | 4.7% | 3.2% | 7.9% |
| Communication Services | 4.8% | 1.6% | 6.4% |
| Consumer Discretionary | 3.5% | 1.3% | 4.8% |
| Materials | —% | 3.0% | 3.0% |
| Real Estate | 1.2% | 1.1% | 2.3% |
| Consumer Staples | 0.6% | 1.0% | 1.6% |
| 53.1% | 46.9% | 100.0% |
(a) | Includes the gross market value of long and short securities of the underlying derivative contracts and excludes short-term securities and options, if any. |
(b) | For purposes of this report, sector sub-classifications may differ from those utilized for compliance purposes. |
Additional information
If you wish to view additional information about the Fund, including but not limited to financial statements, the Fund’s prospectus, and proxy voting policies and procedures, please visit blackrock.com/fundreports. For proxy voting records, visit blackrock.com/proxyrecords.
Householding
The Fund will mail only one copy of shareholder documents, including prospectuses, annual and semi-annual reports and proxy statements, to shareholders with multiple accounts at the same address. This practice is commonly called “householding” and is intended to reduce expenses and eliminate duplicate mailings of shareholder documents. Mailings of your shareholder documents may be householded indefinitely unless you instruct us otherwise. If you do not want the mailing of these documents to be combined with those for other members of your household, please call the Fund at (800) 441-7762.
The Fund is not sponsored, endorsed, issued, sold, or promoted by ICE Data Indices, LLC, S&P Dow Jones Indices, and their respective affiliates, nor do these companies make any representation regarding the advisability of investing in the Fund. BlackRock is not affiliated with the companies listed above.
©2024 BlackRock, Inc. or its affiliates. All rights reserved. BLACKROCK is a registered trademark of BlackRock, Inc. or its affiliates. All other trademarks are those of their respective owners.
BlackRock U.S. Insights Long/Short Equity Fund
Investor A Shares | BALSX
Annual Shareholder Report — May 31, 2024
BALSX-05/24-AR
BlackRock U.S. Insights Long/Short Equity Fund
Class K Shares | BKLSX
Annual Shareholder Report — May 31, 2024
This annual shareholder report contains important information about BlackRock U.S. Insights Long/Short Equity Fund (the “Fund”) for the period of June 13, 2023 to May 31, 2024. You can find additional information about the Fund at blackrock.com/fundreports. You can also request this information by contacting us at (800) 441‑7762.
What were the Fund costs for the last year?
(based on a hypothetical $10,000 investment)
| Class name | Costs of a $10,000
investment | Costs paid as a percentage of a
$10,000 investment |
| Class K Shares | $163(a) | 1.52% |
| (a) | Class K shares commenced operations during the reporting period. Expenses for a full reporting period would be higher than the amount shown. |
How did the Fund perform last year?
Global equities enjoyed strong performance as resilient macro and micro data combined with excitement around the dominant themes of innovation in information technology and healthcare drove gains.
Fears of a U.S. recession waned while major overseas economies returned to positive growth.
Signs of easing inflation led to expectations that the U.S. Federal Reserve and other leading central banks were poised to reduce interest rates.
What contributed to performance?
The Fund’s performance was driven by fundamental stock selection. Long positions in Nvidia Corp. and Amazon.com, Inc. proved beneficial amid the broader excitement around artificial intelligence. Elsewhere, long positions in energy companies Conocophillips Company and Suncor Energy Inc. also contributed positively. Gains from fundamental stock selection were compounded by systematic insights. Sentiment-based measures evaluating trends across analyst and executive comments as well as macro thematic insights measuring hiring trends and business-to-business invoicing collectively were key performance drivers. These insights broadly helped the Fund identify the dominant trends of what became an increasingly trending market. Finally, the Fund used derivatives to implement market timing models expressed in futures. These instruments contributed slightly to performance. The Fund’s cash position had no material impact on performance.
What detracted from performance?
While fundamental stock selection contributed in aggregate, select positions detracted from performance, including a net long to media company Comcast and a short to oil stock CNX Resources Corp. Elsewhere, systematic measures evaluating traditional financial statement data such as cash flows, valuations and dividend consistency ran against the prevailing market themes.
The views expressed reflect the opinions of BlackRock as of the date of this report and are subject to change based on changes in market, economic or other conditions. These views are not intended to be a forecast of future events and are no guarantee of future results.
Fund performance
Cumulative performance: June 13, 2023 through May 31, 2024
Initial investment of $10,000
See “Average annual total returns” for additional information on fund performance.
Average annual total returns
| Since
Inception |
| Class K Shares | 21.73% |
| S&P 500® Index | 22.58% |
| 50% S&P 500 Index/50% ICE BofA 3-Month U.S. Treasury Bill Index | 13.87% |
| Net Assets | $12,443,302% |
| Number of Portfolio Holdings | $244% |
| Net Investment Advisory Fees | $0% |
| Portfolio Turnover Rate | $0% |
The Fund commenced operations on June 13, 2023.
On December 1, 2023, the Fund began to compare its performance to the standard pricing time of the ICE BofA 3-Month U.S. Treasury Bill Index.
Past performance is not an indication of future results. Performance results may include adjustments made for financial reporting purposes in accordance with U.S. generally accepted accounting principles. Performance results do not reflect the deduction of taxes that a shareholder would pay on fund distributions or on the redemption or sale of fund shares. Visit blackrock.com for more recent performance information.
What did the Fund invest in?
(as of May 31, 2024)
| Percent of Total Investments(a) |
| Sector(b) | Long | Short | Total |
| Energy | 14.5% | 11.9% | 26.4% |
| Financials | 7.5% | 7.7% | 15.2% |
| Information Technology | 5.6% | 5.8% | 11.4% |
| Health Care | 6.4% | 4.1% | 10.5% |
| Utilities | 4.3% | 6.2% | 10.5% |
| Industrials | 4.7% | 3.2% | 7.9% |
| Communication Services | 4.8% | 1.6% | 6.4% |
| Consumer Discretionary | 3.5% | 1.3% | 4.8% |
| Materials | —% | 3.0% | 3.0% |
| Real Estate | 1.2% | 1.1% | 2.3% |
| Consumer Staples | 0.6% | 1.0% | 1.6% |
| 53.1% | 46.9% | 100.0% |
(a) | Includes the gross market value of long and short securities of the underlying derivative contracts and excludes short-term securities and options, if any. |
(b) | For purposes of this report, sector sub-classifications may differ from those utilized for compliance purposes. |
Additional information
If you wish to view additional information about the Fund, including but not limited to financial statements, the Fund’s prospectus, and proxy voting policies and procedures, please visit blackrock.com/fundreports. For proxy voting records, visit blackrock.com/proxyrecords.
Householding
The Fund will mail only one copy of shareholder documents, including prospectuses, annual and semi-annual reports and proxy statements, to shareholders with multiple accounts at the same address. This practice is commonly called “householding” and is intended to reduce expenses and eliminate duplicate mailings of shareholder documents. Mailings of your shareholder documents may be householded indefinitely unless you instruct us otherwise. If you do not want the mailing of these documents to be combined with those for other members of your household, please call the Fund at (800) 441-7762.
The Fund is not sponsored, endorsed, issued, sold, or promoted by ICE Data Indices, LLC, S&P Dow Jones Indices, and their respective affiliates, nor do these companies make any representation regarding the advisability of investing in the Fund. BlackRock is not affiliated with the companies listed above.
©2024 BlackRock, Inc. or its affiliates. All rights reserved. BLACKROCK is a registered trademark of BlackRock, Inc. or its affiliates. All other trademarks are those of their respective owners.
BlackRock U.S. Insights Long/Short Equity Fund
Class K Shares | BKLSX
Annual Shareholder Report — May 31, 2024
BKLSX-05/24-AR
(b) Not Applicable
| Item 2 – | Code of Ethics – The registrant (or the “Fund”) has adopted a code of ethics, as of the end of the period covered by this report, applicable to the registrant’s principal executive officer, principal financial officer, principal accounting officer or controller, or persons performing similar functions. During the period covered by this report, the code of ethics was amended to update certain information and to make other non-material changes. During the period covered by this report, there have been no waivers granted under the code of ethics. The registrant undertakes to provide a copy of the code of ethics to any person upon request, without charge, who calls 1-800-441-7762. |
| Item 3 – | Audit Committee Financial Expert – The registrant’s board of directors (the “board of directors”), has determined that (i) the registrant has the following audit committee financial experts serving on its audit committee and (ii) each audit committee financial expert is independent: |
Neil A. Cotty
Henry R. Keizer
Kenneth L. Urish
Under applicable securities laws, a person determined to be an audit committee financial expert will not be deemed an “expert” for any purpose, including without limitation for the purposes of Section 11 of the Securities Act of 1933, as a result of being designated or identified as an audit committee financial expert. The designation or identification of a person as an audit committee financial expert does not impose on such person any duties, obligations, or liabilities greater than the duties, obligations, and liabilities imposed on such person as a member of the audit committee and board of directors in the absence of such designation or identification. The designation or identification of a person as an audit committee financial expert does not affect the duties, obligations, or liability of any other member of the audit committee or board of directors.
| Item 4 – | Principal Accountant Fees and Services |
The following table presents fees billed by Deloitte & Touche LLP (“D&T”) in each of the last two fiscal years for the services rendered to the Fund:
| | | | | | | | | | | | | | | | |
| | | (a) Audit Fees | | (b) Audit-Related Fees1 | | (c) Tax Fees2 | | (d) All Other Fees |
| Entity Name | | Current
Fiscal Year End | | Previous Fiscal Year End | | Current Fiscal Year End | | Previous Fiscal Year End | | Current Fiscal Year End | | Previous Fiscal Year End | | Current Fiscal Year End | | Previous Fiscal Year End |
| BlackRock Advantage International Fund | | $33,762 | | $33,762 | | $0 | | $44 | | $16,300 | | $16,300 | | $407 | | $218 |
| BlackRock Advantage Large Cap Growth Fund | | $19,278 | | $19,278 | | $0 | | $0 | | $15,300 | | $15,300 | | $407 | | $218 |
| BlackRock Advantage Small Cap Core Fund | | $31,212 | | $31,212 | | $0 | | $44 | | $15,300 | | $15,300 | | $407 | | $218 |
| BlackRock Commodity Strategies Fund | | $47,838 | | $47,838 | | $0 | | $44 | | $22,900 | | $22,900 | | $407 | | $218 |
| BlackRock Energy Opportunities Fund | | $18,768 | | $18,768 | | $0 | | $0 | | $15,300 | | $15,300 | | $407 | | $218 |
| BlackRock Health Sciences Opportunities Portfolio | | $31,212 | | $31,212 | | $0 | | $0 | | $15,300 | | $17,300 | | $407 | | $218 |
2
| | | | | | | | | | | | | | | | |
| BlackRock High Equity Income Fund | | $22,644 | | $22,644 | | $0 | | $0 | | $15,300 | | $15,300 | | $407 | | $218 |
| BlackRock Infrastructure Sustainable Opportunities Fund | | $23,358 | | $23,358 | | $0 | | $44 | | $16,300 | | $23,150 | | $407 | | $0 |
| BlackRock International Dividend Fund | | $25,806 | | $25,806 | | $0 | | $0 | | $16,300 | | $16,300 | | $407 | | $218 |
| BlackRock Mid-Cap Growth Equity Portfolio | | $19,074 | | $19,074 | | $0 | | $0 | | $15,300 | | $17,300 | | $407 | | $218 |
| BlackRock SMID-Cap Growth Equity Fund | | $19,074 | | $19,074 | | $0 | | $44 | | $15,300 | | $21,650 | | $0 | | $218 |
| BlackRock Technology Opportunities Fund | | $37,434 | | $37,434 | | $0 | | $0 | | $15,300 | | $17,300 | | $407 | | $218 |
| BlackRock U.S. Insights Long/Short Equity Fund | | $37,343 | | $0 | | $0 | | $0 | | $16,328 | | $0 | | $0 | | $0 |
The following table presents fees billed by D&T that were required to be approved by the registrant’s audit committee (the “Committee”) for services that relate directly to the operations or financial reporting of the Fund and that are rendered on behalf of BlackRock Advisors, LLC (the “Investment Adviser” or “BlackRock”) and entities controlling, controlled by, or under common control with BlackRock (not including any sub-adviser whose role is primarily portfolio management and is subcontracted with or overseen by another investment adviser) that provide ongoing services to the Fund (“Affiliated Service Providers”):
| | | | |
| | | Current Fiscal Year End | | Previous Fiscal Year End |
(b) Audit-Related Fees1 | | $0 | | $0 |
(c) Tax Fees2 | | $0 | | $0 |
(d) All Other Fees3 | | $2,149,000 | | $2,154,000 |
1 The nature of the services includes assurance and related services reasonably related to the performance of the audit or review of financial statements not included in Audit Fees, including accounting consultations, agreed-upon procedure reports, attestation reports, comfort letters, out-of-pocket expenses and internal control reviews not required by regulators.
2 The nature of the services includes tax compliance and/or tax preparation, including services relating to the filing or amendment of federal, state or local income tax returns, regulated investment company qualification reviews, taxable income and tax distribution calculations.
3 Non-audit fees of $2,149,000 and $2,154,000 for the current fiscal year and previous fiscal year, respectively, were paid to the Fund’s principal accountant in their entirety by BlackRock, in connection with services provided to the Affiliated Service Providers of the Fund and of certain other funds sponsored and advised by BlackRock or its affiliates for a service organization review and an accounting research tool subscription. These amounts represent aggregate fees paid by BlackRock and were not allocated on a per fund basis.
(e)(1) Audit Committee Pre-Approval Policies and Procedures:
The Committee has adopted policies and procedures with regard to the pre-approval of services. Audit, audit-related and tax compliance services provided to the registrant on an annual basis require specific pre-approval by the Committee. The Committee also must approve other non-audit services provided to the registrant and those non-audit services provided to the Investment Adviser and Affiliated Service Providers that relate directly to the operations and the financial reporting of the registrant. Certain
3
of these non-audit services that the Committee believes are (a) consistent with the SEC’s auditor independence rules and (b) routine and recurring services that will not impair the independence of the independent accountants may be approved by the Committee without consideration on a specific case-by-case basis (“general pre-approval”). The term of any general pre-approval is 12 months from the date of the pre-approval, unless the Committee provides for a different period. Tax or other non-audit services provided to the registrant which have a direct impact on the operations or financial reporting of the registrant will only be deemed pre-approved provided that any individual project does not exceed $10,000 attributable to the registrant or $50,000 per project. For this purpose, multiple projects will be aggregated to determine if they exceed the previously mentioned cost levels.
Any proposed services exceeding the pre-approved cost levels will require specific pre-approval by the Committee, as will any other services not subject to general pre-approval (e.g., unanticipated but permissible services). The Committee is informed of each service approved subject to general pre-approval at the next regularly scheduled in-person board meeting. At this meeting, an analysis of such services is presented to the Committee for ratification. The Committee may delegate to the Committee Chairman the authority to approve the provision of and fees for any specific engagement of permitted non-audit services, including services exceeding pre-approved cost levels.
(e)(2) None of the services described in each of Items 4(b) through (d) were approved by the Committee pursuant to the de minimis exception in paragraph (c)(7)(i)(C) of Rule 2-01 of Regulation S-X.
(f) Not Applicable
(g) The aggregate non-audit fees, defined as the sum of the fees shown under “Audit-Related Fees,” “Tax Fees” and “All Other Fees,” paid to the accountant for services rendered by the accountant to the registrant, the Investment Adviser and the Affiliated Service Providers were:
| | | | |
| Entity Name | | Current Fiscal Year End | | Previous Fiscal Year End |
| BlackRock Advantage International Fund | | $16,707 | | $16,562 |
| BlackRock Advantage Large Cap Growth Fund | | $15,707 | | $15,518 |
| BlackRock Advantage Small Cap Core Fund | | $15,707 | | $15,562 |
| BlackRock Commodity Strategies Fund | | $23,307 | | $23,162 |
| BlackRock Energy Opportunities Fund | | $15,707 | | $15,518 |
| BlackRock Health Sciences Opportunities Portfolio | | $15,707 | | $17,518 |
| BlackRock High Equity Income Fund | | $15,707 | | $15,518 |
| BlackRock Infrastructure Sustainable Opportunities Fund | | $16,707 | | $23,194 |
| BlackRock International Dividend Fund | | $16,707 | | $16,518 |
| BlackRock Mid-Cap Growth Equity Portfolio | | $15,707 | | $17,518 |
| BlackRock SMID-Cap Growth Equity Fund | | $15,300 | | $21,912 |
| BlackRock Technology Opportunities Fund | | $15,707 | | $17,518 |
| BlackRock U.S. Insights Long/Short Equity Fund | | $16,328 | | $0 |
4
Additionally, the amounts billed by D&T in connection with services provided to the Affiliated Service Providers of the Fund and of other funds sponsored and advised by BlackRock or its affiliates during the current and previous fiscal years for a service organization review and an accounting research tool subscription were:
| | |
Current Fiscal Year End | | Previous Fiscal Year End |
$2,149,000 | | $2,154,000 |
These amounts represent aggregate fees paid by BlackRock and were not allocated on a per fund basis.
(h) The Committee has considered and determined that the provision of non-audit services that were rendered to the Investment Adviser and the Affiliated Service Providers that were not pre-approved pursuant to paragraph (c)(7)(ii) of Rule 2-01 of Regulation S-X is compatible with maintaining the principal accountant’s independence.
(i) – Not Applicable
(j) – Not Applicable
| Item 5 – | Audit Committee of Listed Registrant – Not Applicable. |
(a) The registrant’s Schedule of Investments is included as part of the Financial Statement and Financial Highlights for Open-End Management Investment Copmanies filed under Item 7 of this Form.
(b) Not Applicable due to no such divestments during the semi-annual period covered since the previous Form N-CSR filing.
| Item 7 – | Financial Statements and Financial Highlights for Open-End Management Investment Companies |
(a) The registrant’s Financial Statements are attached herewith.
(b) The registrant’s Financial Highlights are attached herewith.
5
| | |

| | MAY 31, 2024 |
| | |
| |
| | 2024 Annual Financial Statements |
BlackRock FundsSM
| · | | BlackRock Energy Opportunities Fund |
| · | | BlackRock High Equity Income Fund |
| · | | BlackRock International Dividend Fund |
|
| |
| Not FDIC Insured • May Lose Value • No Bank Guarantee |
Table of Contents
| | |
Schedule of Investments May 31, 2024 | | BlackRock Energy Opportunities Fund (Percentages shown are based on Net Assets) |
| | | | | | | | |
| Security | | Shares | | | Value | |
|
Common Stocks | |
|
| Energy Equipment & Services — 7.6% | |
ARC Resources Ltd. | | | 253,253 | | | $ | 4,792,102 | |
Patterson-UTI Energy, Inc. | | | 86,108 | | | | 948,910 | |
Poseidon Concepts Corp.(a)(b) | | | 35,081 | | | | — | |
Saipem SpA(b) | | | 1,381,750 | | | | 3,450,773 | |
Schlumberger NV | | | 133,110 | | | | 6,108,418 | |
TechnipFMC PLC | | | 186,473 | | | | 4,883,728 | |
Tenaris SA | | | 157,766 | | | | 2,606,667 | |
Weatherford International PLC(b) | | | 26,393 | | | | 3,176,134 | |
| | | | | | | | |
| | |
| | | | | | | 25,966,732 | |
| | |
| Oil, Gas & Consumable Fuels — 91.1% | | | | | | |
BP PLC | | | 3,396,872 | | | | 21,249,084 | |
Canadian Natural Resources Ltd. | | | 196,774 | | | | 15,115,916 | |
Cenovus Energy, Inc. | | | 381,591 | | | | 7,954,070 | |
Cheniere Energy, Inc. | | | 62,403 | | | | 9,846,569 | |
Chevron Corp. | | | 141,210 | | | | 22,918,383 | |
ConocoPhillips | | | 160,463 | | | | 18,690,730 | |
Diamondback Energy, Inc. | | | 47,593 | | | | 9,483,381 | |
EOG Resources, Inc. | | | 15,674 | | | | 1,952,197 | |
Exxon Mobil Corp. | | | 580,550 | | | | 68,075,293 | |
Gazprom PJSC(a)(b) | | | 639,500 | | | | 71 | |
Hess Corp. | | | 94,763 | | | | 14,602,978 | |
Kosmos Energy Ltd.(b) | | | 280,584 | | | | 1,711,562 | |
Marathon Petroleum Corp. | | | 70,580 | | | | 12,465,134 | |
PBF Energy, Inc., Class A | | | 34,550 | | | | 1,600,702 | |
Pembina Pipeline Corp. | | | 207,880 | | | | 7,722,194 | |
Permian Resources Corp., Class A | | | 371,050 | | | | 6,081,510 | |
Shell PLC | | | 1,001,453 | | | | 36,147,209 | |
| | | | | | | | |
| Security | | Shares | | | Value | |
| | |
| Oil, Gas & Consumable Fuels (continued) | | | | | | |
Targa Resources Corp. | | | 72,735 | | | $ | 8,599,459 | |
TC Energy Corp. | | | 195,187 | | | | 7,527,076 | |
TotalEnergies SE | | | 212,925 | | | | 15,599,843 | |
Tourmaline Oil Corp. | | | 99,685 | | | | 4,944,938 | |
Valero Energy Corp. | | | 69,370 | | | | 10,900,802 | |
Williams Cos., Inc. (The) | | | 234,231 | | | | 9,722,929 | |
| | | | | | | | |
| | | | | | | 312,912,030 | |
| | | | | | | | |
| |
Total Long-Term Investments — 98.7%
(Cost: $215,252,695) | | | | 338,878,762 | |
| | | | | | | | |
| | |
Short-Term Securities | | | | | | | | |
| | |
| Money Market Funds — 0.8% | | | | | | |
BlackRock Liquidity Funds, T-Fund, Institutional Shares, 5.19%(c)(d) | | | 2,548,266 | | | | 2,548,266 | |
| | | | | | | | |
| |
Total Short-Term Securities — 0.8%
(Cost: $2,548,266) | | | | 2,548,266 | |
| | | | | | | | |
| |
Total Investments — 99.5%
(Cost: $217,800,961) | | | | 341,427,028 | |
| | |
Other Assets Less Liabilities — 0.5% | | | | | | | 1,859,388 | |
| | | | | | | | |
| | |
Net Assets — 100.0% | | | | | | $ | 343,286,416 | |
| | | | | | | | |
| (a) | Security is valued using significant unobservable inputs and is classified as Level 3 in the fair value hierarchy. |
| (b) | Non-income producing security. |
| (c) | Affiliate of the Fund. |
| (d) | Annualized 7-day yield as of period end. |
Affiliates
Investments in issuers considered to be affiliate(s) of the Fund during the year ended May 31, 2024 for purposes of Section 2(a)(3) of the Investment Company Act of 1940, as amended, were as follows:
| | | | | | | | | | | | | | | | | | | | | | | | | | | | | | | | | | | | |
| Affiliated Issuer | | Value at
05/31/23 | | | Purchases
at Cost | | | Proceeds
from Sales | | | Net
Realized
Gain (Loss) | | | Change in
Unrealized
Appreciation
(Depreciation) | | | Value at
05/31/24 | | | Shares
Held at
05/31/24 | | | Income | | | Capital
Gain
Distributions
from Underlying
Funds | |
BlackRock Cash Funds: Institutional, SL Agency Shares(a) | | $ | — | | | $ | 69 | (b) | | $ | — | | | $ | (69 | ) | | $ | — | | | $ | — | | | | — | | | $ | 33 | (c) | | $ | — | |
BlackRock Liquidity Funds, T-Fund, Institutional Shares | | | 2,370,913 | | | | 177,353 | (b) | | | — | | | | — | | | | — | | | | 2,548,266 | | | | 2,548,266 | | | | 159,255 | | | | — | |
SL Liquidity Series, LLC, Money Market Series(a) | | | — | | | | 358 | (b) | | | — | | | | (358 | ) | | | — | | | | — | | | | — | | | | 117 | (c) | | | — | |
| | | | | | | | | | | | | | | | | | | | | | | | | | | | | | | | | | | | |
| | | | | | | | | | | | | | $ | (427 | ) | | $ | — | | | $ | 2,548,266 | | | | | | | $ | 159,405 | | | $ | — | |
| | | | | | | | | | | | | | | | | | | | | | | | | | | | | | | | | | | | |
| | (a) | As of period end, the entity is no longer held. | |
| | (b) | Represents net amount purchased (sold). | |
| | (c) | All or a portion represents securities lending income earned from the reinvestment of cash collateral from loaned securities, net of fees and collateral investment expenses, and other payments to and from borrowers of securities. | |
For purposes of this report, industry and sector sub-classifications may differ from those utilized by the Fund for compliance purposes.
| | |
S C H E D U L E S O F I N V E S T M E N T S | | 3 |
| | |
Schedule of Investments (continued) May 31, 2024 | | BlackRock Energy Opportunities Fund |
Fair Value Hierarchy as of Period End
Various inputs are used in determining the fair value of financial instruments. For a description of the input levels and information about the Fund’s policy regarding valuation of financial instruments, refer to the Notes to Financial Statements.
The following table summarizes the Fund’s financial instruments categorized in the fair value hierarchy. The breakdown of the Fund’s financial instruments into major categories is disclosed in the Schedule of Investments above.
| | | | | | | | | | | | | | | | |
| | | Level 1 | | | Level 2 | | | Level 3 | | | Total | |
Assets | | | | | | | | | | | | | | | | |
Investments | | | | | | | | | | | | | | | | |
Long-Term Investments | | | | | | | | | | | | | | | | |
Common Stocks | | | | | | | | | | | | | | | | |
Energy Equipment & Services | | $ | 19,909,292 | | | $ | 6,057,440 | | | $ | — | | | $ | 25,966,732 | |
Oil, Gas & Consumable Fuels | | | 239,915,823 | | | | 72,996,136 | | | | 71 | | | | 312,912,030 | |
Short-Term Securities | | | | | | | | | | | | | | | | |
Money Market Funds | | | 2,548,266 | | | | — | | | | — | | | | 2,548,266 | |
| | | | | | | | | | | | | | | | |
| | $ | 262,373,381 | | | $ | 79,053,576 | | | $ | 71 | | | $ | 341,427,028 | |
| | | | | | | | | | | | | | | | |
See notes to financial statements.
| | |
| 4 | | 2 0 2 4 B L A C K R O C K A N N U A L F I N A N C I A L S T A T E M E N T S |
| | |
Schedule of Investments May 31, 2024 | | BlackRock High Equity Income Fund (Percentages shown are based on Net Assets) |
| | | | | | | | |
Security | | Shares | | | Value | |
| | |
Common Stocks | | | | | | | | |
| | |
| Aerospace & Defense — 3.1% | | | | | | |
L3Harris Technologies, Inc. | | | 129,656 | | | $ | 29,150,558 | |
RTX Corp. | | | 308,544 | | | | 33,264,129 | |
| | | | | | | | |
| | | | | | | 62,414,687 | |
| | |
| Automobile Components — 0.5% | | | | | | |
Aptiv PLC(a) | | | 91,792 | | | | 7,642,602 | |
Lear Corp. | | | 24,004 | | | | 3,008,901 | |
| | | | | | | | |
| | | | | | | 10,651,503 | |
| | |
| Automobiles — 0.9% | | | | | | |
General Motors Co. | | | 403,761 | | | | 18,165,207 | |
| | | | | | | | |
| | |
| Banks — 5.9% | | | | | | |
Citigroup, Inc. | | | 533,372 | | | | 33,234,409 | |
Citizens Financial Group, Inc. | | | 188,725 | | | | 6,660,105 | |
First Citizens BancShares, Inc., Class A | | | 17,928 | | | | 30,449,453 | |
Wells Fargo & Co. | | | 838,745 | | | | 50,257,601 | |
| | | | | | | | |
| | | | | | | 120,601,568 | |
| | |
| Beverages — 0.8% | | | | | | |
Diageo PLC | | | 129,690 | | | | 4,366,323 | |
Keurig Dr. Pepper, Inc. | | | 190,280 | | | | 6,517,090 | |
Pernod Ricard SA | | | 41,570 | | | | 6,225,233 | |
| | | | | | | | |
| | | | | | | 17,108,646 | |
| | |
| Broadline Retail — 0.6% | | | | | | |
Alibaba Group Holding Ltd., ADR | | | 157,765 | | | | 12,359,310 | |
| | | | | | | | |
| | |
| Building Products — 1.0% | | | | | | |
Allegion PLC | | | 61,839 | | | | 7,533,227 | |
Johnson Controls International PLC | | | 174,840 | | | | 12,572,744 | |
| | | | | | | | |
| | | | | | | 20,105,971 | |
| | |
| Capital Markets — 0.3% | | | | | | |
Raymond James Financial, Inc. | | | 51,679 | | | | 6,343,597 | |
| | | | | | | | |
| | |
| Chemicals — 1.1% | | | | | | |
Air Products & Chemicals, Inc. | | | 38,375 | | | | 10,234,613 | |
International Flavors & Fragrances, Inc. | | | 121,941 | | | | 11,728,285 | |
| | | | | | | | |
| | | | | | | 21,962,898 | |
| | |
| Communications Equipment — 0.8% | | | | | | |
Cisco Systems, Inc. | | | 354,296 | | | | 16,474,764 | |
| | | | | | | | |
|
| Consumer Staples Distribution & Retail — 1.0% | |
Dollar General Corp. | | | 141,473 | | | | 19,369,068 | |
| | | | | | | | |
| | |
| Containers & Packaging — 1.2% | | | | | | |
Sealed Air Corp. | | | 648,940 | | | | 25,224,298 | |
| | | | | | | | |
|
| Diversified Telecommunication Services — 1.2% | |
AT&T Inc. | | | 565,453 | | | | 10,302,553 | |
Verizon Communications, Inc. | | | 366,425 | | | | 15,078,389 | |
| | | | | | | | |
| | | | | | | 25,380,942 | |
| | |
| Electric Utilities — 2.0% | | | | | | |
American Electric Power Co., Inc. | | | 126,659 | | | | 11,430,975 | |
Edison International | | | 88,726 | | | | 6,818,593 | |
Exelon Corp. | | | 310,422 | | | | 11,656,346 | |
PG&E Corp. | | | 590,026 | | | | 10,939,082 | |
| | | | | | | | |
| | | | | | | 40,844,996 | |
| | |
| Electrical Equipment — 0.7% | | | | | | |
Sensata Technologies Holding PLC | | | 334,790 | | | | 13,833,523 | |
| | | | | | | | |
|
| Electronic Equipment, Instruments & Components — 0.3% | |
Zebra Technologies Corp., Class A(a) | | | 18,278 | | | | 5,708,951 | |
| | | | | | | | |
| | |
| Entertainment — 0.1% | | | | | | |
Electronic Arts, Inc. | | | 19,314 | | | | 2,566,444 | |
| | | | | | | | |
| | | | | | | | |
Security | | Shares | | | Value | |
| | |
| Financial Services — 2.4% | | | | | | |
Equitable Holdings, Inc. | | | 80,316 | | | $ | 3,332,311 | |
Fidelity National Information Services, Inc. | | | 385,017 | | | | 29,215,090 | |
Visa, Inc., Class A | | | 48,148 | | | | 13,118,404 | |
Voya Financial, Inc. | | | 37,201 | | | | 2,820,580 | |
| | | | | | | | |
| | | | | | | 48,486,385 | |
| | |
| Food Products — 1.4% | | | | | | |
Kraft Heinz Co. (The) | | | 800,030 | | | | 28,297,061 | |
| | | | | | | | |
| | |
| Health Care Equipment & Supplies — 2.9% | | | | | | |
Baxter International, Inc. | | | 857,115 | | | | 29,219,050 | |
Koninklijke Philips NV(a) | | | 489,873 | | | | 13,380,819 | |
Medtronic PLC | | | 189,537 | | | | 15,422,626 | |
| | | | | | | | |
| | | | | | | 58,022,495 | |
| | |
| Health Care Providers & Services — 5.2% | | | | | | |
Cardinal Health, Inc. | | | 274,491 | | | | 27,248,722 | |
Cigna Group (The) | | | 45,014 | | | | 15,512,725 | |
CVS Health Corp. | | | 451,978 | | | | 26,937,889 | |
Elevance Health, Inc. | | | 14,426 | | | | 7,768,112 | |
Humana, Inc. | | | 33,804 | | | | 12,105,888 | |
Labcorp Holdings, Inc. | | | 86,561 | | | | 16,871,605 | |
| | | | | | | | |
| | | | | | | 106,444,941 | |
| | |
| Household Durables — 0.9% | | | | | | |
Newell Brands, Inc. | | | 752,312 | | | | 5,807,849 | |
Sony Group Corp., ADR | | | 150,540 | | | | 12,395,463 | |
| | | | | | | | |
| | | | | | | 18,203,312 | |
| | |
| Household Products — 0.5% | | | | | | |
Henkel AG & Co. KGaA, Preference Shares, NVS | | | 60,105 | | | | 5,441,334 | |
Reckitt Benckiser Group PLC | | | 85,918 | | | | 4,917,376 | |
| | | | | | | | |
| | | | | | | 10,358,710 | |
| | |
| Industrial Conglomerates — 0.2% | | | | | | |
Siemens AG, Registered Shares | | | 23,252 | | | | 4,481,620 | |
| | | | | | | | |
| | |
| Insurance — 3.4% | | | | | | |
American International Group, Inc. | | | 341,408 | | | | 26,909,779 | |
Fidelity National Financial, Inc., Class A | | | 290,540 | | | | 14,631,594 | |
Prudential PLC | | | 1,383,742 | | | | 13,254,406 | |
Willis Towers Watson PLC | | | 53,001 | | | | 13,530,625 | |
| | | | | | | | |
| | | | | | | 68,326,404 | |
| | |
| IT Services — 0.9% | | | | | | |
Cognizant Technology Solutions Corp., Class A | | | 275,748 | | | | 18,240,730 | |
| | | | | | | | |
| | |
| Leisure Products — 0.5% | | | | | | |
Hasbro, Inc. | | | 178,216 | | | | 10,653,753 | |
| | | | | | | | |
| | |
| Life Sciences Tools & Services — 0.2% | | | | | | |
Fortrea Holdings, Inc.(a)(b) | | | 195,324 | | | | 4,959,276 | |
| | | | | | | | |
| | |
| Machinery — 1.2% | | | | | | |
CNH Industrial NV | | | 803,960 | | | | 8,489,818 | |
Komatsu Ltd. | | | 348,000 | | | | 10,228,079 | |
Westinghouse Air Brake Technologies Corp. | | | 27,871 | | | | 4,716,609 | |
| | | | | | | | |
| | | | | | | 23,434,506 | |
| | |
| Media — 2.4% | | | | | | |
Comcast Corp., Class A | | | 666,162 | | | | 26,666,465 | |
Fox Corp., Class A, NVS | | | 303,622 | | | | 10,453,705 | |
WPP PLC | | | 1,057,510 | | | | 11,069,039 | |
| | | | | | | | |
| | | | | | | 48,189,209 | |
| | |
| Metals & Mining — 0.3% | | | | | | |
Teck Resources Ltd., Class B | | | 120,530 | | | | 6,269,028 | |
| | | | | | | | |
| | |
| Multi-Utilities — 0.8% | | | | | | |
Sempra | | | 201,794 | | | | 15,544,192 | |
| | | | | | | | |
| | |
S C H E D U L E S O F I N V E S T M E N T S | | 5 |
| | |
Schedule of Investments (continued) May 31, 2024 | | BlackRock High Equity Income Fund (Percentages shown are based on Net Assets) |
| | | | | | | | | | | | |
| Security | | | | |
Shares | | | Value | |
| |
| Oil, Gas & Consumable Fuels — 5.2% | | | | |
BP PLC | | | | | | | 5,054,415 | | | $ | 31,617,821 | |
Chevron Corp. | | | | | | | 44,306 | | | | 7,190,864 | |
Hess Corp. | | | | | | | 33,175 | | | | 5,112,267 | |
Kosmos Energy Ltd.(a) | | | | | | | 1,930,367 | | | | 11,775,239 | |
Shell PLC | | | | | | | 888,055 | | | | 32,054,135 | |
Suncor Energy, Inc. | | | | | | | 437,486 | | | | 17,858,178 | |
| | | | | | | | | | | | |
| | | | | | | | | | | 105,608,504 | |
|
| Personal Care Products — 0.1% | |
Unilever PLC, ADR | | | | | | | 38,068 | | | | 2,084,223 | |
| | | | | | | | | | | | |
| | | |
| Pharmaceuticals — 3.6% | | | | | | | | | |
AstraZeneca PLC | | | | | | | 68,954 | | | | 10,718,833 | |
Bayer AG, Registered Shares | | | | | | | 395,728 | | | | 12,174,651 | |
Bristol-Myers Squibb Co. | | | | | | | 122,670 | | | | 5,040,510 | |
Eli Lilly & Co. | | | | | | | 16,069 | | | | 13,182,043 | |
GSK PLC, ADR | | | | | | | 115,410 | | | | 5,166,906 | |
Sanofi SA | | | | | | | 268,771 | | | | 26,313,218 | |
| | | | | | | | | | | | |
| | | | | | | | | | | 72,596,161 | |
|
| Professional Services — 3.3% | |
Dun & Bradstreet Holdings, Inc. | | | | | | | 1,538,233 | | | | 14,751,654 | |
Leidos Holdings, Inc. | | | | | | | 169,939 | | | | 24,989,530 | |
SS&C Technologies Holdings, Inc. | | | | | | | 442,970 | | | | 27,486,289 | |
| | | | | | | | | | | | |
| | | | | | | | | | | 67,227,473 | |
|
| Semiconductors & Semiconductor Equipment — 1.0% | |
Taiwan Semiconductor Manufacturing Co. Ltd. | | | | | | | 521,000 | | | | 13,341,739 | |
Texas Instruments, Inc. | | | | | | | 31,120 | | | | 6,068,711 | |
| | | | | | | | | | | | |
| | | | | | | | | | | 19,410,450 | |
|
| Software — 0.6% | |
Microsoft Corp. | | | | | | | 31,511 | | | | 13,081,161 | |
| | | | | | | | | | | | |
| | | |
| Specialized REITs — 0.9% | | | | | | | | | |
Crown Castle, Inc. | | | | | | | 180,683 | | | | 18,520,008 | |
| | | | | | | | | | | | |
|
| Technology Hardware, Storage & Peripherals — 2.5% | |
HP, Inc. | | | | | | | 508,309 | | | | 18,553,278 | |
Samsung Electronics Co. Ltd., Registered Shares, GDR | | | | | | | 24,206 | | | | 32,797,976 | |
| | | | | | | | | | | | |
| | | | | | | | | | | 51,351,254 | |
|
| Textiles, Apparel & Luxury Goods — 0.8% | |
Swatch Group AG (The) | | | | | | | 29,510 | | | | 6,321,291 | |
Tapestry, Inc. | | | | | | | 206,023 | | | | 8,959,940 | |
| | | | | | | | | | | | |
| | | | | | | | | | | 15,281,231 | |
|
| Tobacco — 1.4% | |
British American Tobacco PLC | | | | | | | 927,576 | | | | 28,685,133 | |
| | | | | | | | | | | | |
|
| Wireless Telecommunication Services — 0.7% | |
Vodafone Group PLC | | | | | | | 13,876,037 | | | | 13,415,356 | |
| | | | | | | | | | | | |
| | | |
Total Common Stocks — 64.8%
(Cost: $1,114,690,963) | | | | | | | | | | | 1,316,288,949 | |
| | | | | | | | | | | | |
| | | | | | | | | | | | |
| | | | | | Par
(000) | | | | |
| | | |
Equity-Linked Notes | | | | | | | | | | | | |
| | | |
| Aerospace & Defense — 1.7% | | | | | | | | | |
RBC Capital Markets LLC (RTX Corp.) 19.18% 06/06/24 | | | USD | | | | 173,500 | | | | 18,252,727 | |
SG Americas Securities LLC (L3Harris Technologies, Inc.) 13.25% 06/27/24 | | | | | | | 72,300 | | | | 15,953,914 | |
| | | | | | | | | | | | |
| | | | | | | | | | | 34,206,641 | |
| | | | | | | | | | | | |
| Security | | | | | Par
(000) | | | Value | |
| |
| Automobile Components — 0.5% | | | | |
BMO Capital Markets Corp. (Lear Corp.) 18.96% 07/22/24(c) | | | USD | | | | 13,200 | | | $ | 1,634,688 | |
Mizuho Securities USA LLC (Aptiv PLC) 17.67% 07/15/24 | | | | | | | 50,400 | | | | 4,139,981 | |
Mizuho Securities USA LLC (Lear Corp.) 22.65% 06/03/24 | | | | | | | 28,500 | | | | 3,527,873 | |
| | | | | | | | | | | | |
| | | | | | | | | | | 9,302,542 | |
| |
| Automobiles — 0.4% | | | | |
BMO Capital Markets Corp. (General Motors Co.) 18.24% 07/05/24 | | | | | | | 175,300 | | | | 7,875,769 | |
| | | | | | | | | | | | |
| |
| Banks — 3.0% | | | | |
Goldman Sachs & Co. LLC (Citizens Financial Group, Inc.) 20.17% 06/24/24 | | | | | | | 105,100 | | | | 3,722,997 | |
JP Morgan Securities LLC (Wells Fargo & Co.) Series N10N 18.97% 06/13/24 | | | | | | | 364,100 | | | | 21,865,002 | |
Nomura Securities International, Inc. (Citigroup, Inc.) 18.29% 07/18/24 | | | | | | | 299,100 | | | | 18,712,570 | |
Nomura Securities International, Inc. (First Citizens BancShares, Inc.) 16.98% 07/18/24 | | | | | | | 9,800 | | | | 16,744,078 | |
| | | | | | | | | | | | |
| | | | | | | | | | | 61,044,647 | |
| |
| Beverages — 0.2% | | | | |
Nomura Securities International, Inc. (Keurig Dr. Pepper, Inc.) 10.69% 06/10/24 | | | | | | | 106,100 | | | | 3,498,482 | |
| | | | | | | | | | | | |
| |
| Broadline Retail — 0.3% | | | | |
SG Americas Securities LLC (Alibaba Group Holding Ltd.) 20.81% 06/27/24 | | | | | | | 68,400 | | | | 5,341,829 | |
| | | | | | | | | | | | |
| |
| Building Products — 0.5% | | | | |
BMO Capital Markets Corp. (Allegion PLC) 15.60% 07/05/24 | | | | | | | 34,400 | | | | 4,203,008 | |
BMO Capital Markets Corp. (Johnson Controls International PLC) 15.62% 06/21/24 | | | | | | | 97,500 | | | | 6,122,641 | |
| | | | | | | | | | | | |
| | | | | | | | | | | 10,325,649 | |
| |
| Capital Markets — 0.3% | | | | |
Barclays Capital, Inc. (Raymond James Financial, Inc.) 15.08% 06/13/24 | | | | | | | 51,700 | | | | 6,330,926 | |
| | | | | | | | | | | | |
| |
| Chemicals — 0.4% | | | | |
SG Americas Securities LLC (International Flavors & Fragrances, Inc.) 29.80% 06/21/24 | | | | | | | 92,000 | | | | 8,374,365 | |
| | | | | | | | | | | | |
| |
| Communications Equipment — 0.9% | | | | |
BMO Capital Markets Corp. (Cisco Systems, Inc.) 17.17% 07/22/24(c) | | | | | | | 194,900 | | | | 8,988,788 | |
Mizuho Securities USA LLC (Cisco Systems, Inc.) 19.80% 06/03/24 | | | | | | | 195,700 | | | | 9,021,677 | |
| | | | | | | | | | | | |
| | | | | | | | | | | 18,010,465 | |
| |
| Consumer Staples Distribution & Retail — 0.5% | | | | |
RBC Capital Markets LLC (Dollar General Corp.) 25.99% 06/06/24 | | | | | | | 79,600 | | | | 10,940,854 | |
| | | | | | | | | | | | |
| |
| Containers & Packaging — 0.5% | | | | |
JP Morgan Securities LLC (Sealed Air Corp.) Series MCHD 29.13% 06/10/24 | | | | | | | 85,980 | | | | 2,857,454 | |
JP Morgan Securities LLC (Sealed Air Corp.) Series N10O 35.26% 06/13/24 | | | | | | | 240,020 | | | | 8,015,985 | |
| | | | | | | | | | | | |
| | | | | | | | | | | 10,873,439 | |
| | |
| 6 | | 2 0 2 4 B L A C K R O C K A N N U A L F I N A N C I A L S T A T E M E N T S |
| | |
Schedule of Investments (continued) May 31, 2024 | | BlackRock High Equity Income Fund (Percentages shown are based on Net Assets) |
| | | | | | | | | | | | |
| Security | | | | | Par
(000) | | | Value | |
|
| Diversified Telecommunication Services — 0.8% | |
Barclays Capital, Inc. (Verizon Communications, Inc.) 11.27% 06/13/24 | | | USD | | | | 274,500 | | | $ | 11,166,333 | |
Mizuho Securities USA LLC (AT&T Inc.) 10.92% 06/24/24 | | | | | | | 315,200 | | | | 5,499,603 | |
| | | | | | | | | | | | |
| | | | | | | | | | | 16,665,936 | |
| | | |
| Electric Utilities — 1.5% | | | | | | | | | |
Mizuho Securities USA LLC (American Electric Power Co., Inc.) 18.70% 06/03/24 | | | | | | | 70,000 | | | | 6,115,689 | |
Mizuho Securities USA LLC (Exelon Corp.) 16.32% 06/24/24 | | | | | | | 173,100 | | | | 6,505,094 | |
Nomura Securities International, Inc. (American Electric Power Co., Inc.) 13.00% 07/22/24 | | | | | | | 69,700 | | | | 6,130,596 | |
RBC Capital Markets LLC (Edison International) 17.75% 07/18/24 | | | | | | | 48,800 | | | | 3,693,881 | |
SG Americas Securities LLC (NextEra Energy, Inc.) 13.50% 06/27/24 | | | | | | | 29,600 | | | | 2,260,470 | |
SG Americas Securities LLC (PG&E Corp.) 12.13% 06/27/24 | | | | | | | 329,000 | | | | 5,988,495 | |
| | | | | | | | | | | | |
| | | | | | | | | | | 30,694,225 | |
| | | |
| Electrical Equipment — 0.5% | | | | | | | | | |
Barclays Capital, Inc. (Sensata Technologies Holding PLC) 29.29% 06/03/24 | | | | | | | 99,600 | | | | 3,711,004 | |
Nomura Securities International, Inc. (Sensata Technologies Holding PLC) 14.71% 07/22/24 | | | | | | | 143,400 | | | | 5,813,307 | |
| | | | | | | | | | | | |
| | | | | | | | | | | 9,524,311 | |
|
| Electronic Equipment, Instruments & Components — 0.3% | |
SG Americas Securities LLC (Zebra Technologies Corp.) 19.73% 06/21/24 | | | | | | | 19,200 | | | | 6,021,382 | |
| | | | | | | | | | | | |
| | | |
| Financial Services — 1.4% | | | | | | | | | |
Barclays Capital, Inc. (Fidelity National Information Services, Inc.) 20.44% 06/10/24 | | | | | | | 196,900 | | | | 14,737,876 | |
BMO Capital Markets Corp. (Visa, Inc.) 12.43% 06/27/24 | | | | | | | 26,800 | | | | 7,323,419 | |
RBC Capital Markets LLC (Equitable Holdings, Inc.) 15.01% 07/15/24 | | | | | | | 168,933 | | | | 6,925,038 | |
| | | | | | | | | | | | |
| | | | | | | | | | | 28,986,333 | |
| | | |
| Food Products — 0.8% | | | | | | | | | |
SG Americas Securities LLC (Kraft Heinz Co. (The)) 13.34% 06/27/24 | | | | | | | 446,100 | | | | 15,748,598 | |
| | | | | | | | | | | | |
|
| Health Care Equipment & Supplies — 1.6% | |
HSBC Securities (USA), Inc. (Koninklijke Philips NV) 14.87% 07/18/24 | | | EUR | | | | 269,500 | | | | 7,399,026 | |
JP Morgan Securities LLC (Medtronic PLC) Series N10E 17.61% 07/05/24 | | | USD | | | | 174,700 | | | | 14,319,010 | |
RBC Capital Markets LLC (Baxter International, Inc.) 17.53% 07/15/24 | | | | | | | 329,700 | | | | 11,303,698 | |
| | | | | | | | | | | | |
| | | | | | | | | | | 33,021,734 | |
|
| Health Care Providers & Services — 2.4% | |
BMO Capital Markets Corp. (Elevance Health, Inc.) 12.24% 07/05/24 | | | | | | | 12,300 | | | | 6,582,388 | |
BMO Capital Markets Corp. (Laboratory Corp. of America Holdings) 12.58% 06/24/24 | | | | | | | 45,700 | | | | 8,937,224 | |
Mizuho Securities USA LLC (Cigna Group (The)) 14.47% 06/24/24 | | | | | | | 25,000 | | | | 8,572,199 | |
Mizuho Securities USA LLC (Humana, Inc.) 18.22% 06/24/24 | | | | | | | 18,800 | | | | 6,246,503 | |
| | | | | | | | | | | | |
| Security | | | | | Par
(000) | | | Value | |
|
| Health Care Providers & Services (continued) | |
Nomura Securities International, Inc. (Labcorp Holdings, Inc.) 10.79% 07/22/24 | | | USD | | | | 29,100 | | | $ | 5,614,996 | |
RBC Capital Markets LLC (Cardinal Health, Inc.) 14.43% 07/15/24 | | | | | | | 127,900 | | | | 12,513,864 | |
| | | | | | | | | | | | |
| | | | | | | | | | | 48,467,174 | |
| | | |
| Household Durables — 0.5% | | | | | | | | | |
JP Morgan Securities LLC (Sony Group Corp.) Series N10M 22.21% 06/13/24 | | | | | | | 83,900 | | | | 6,951,631 | |
Nomura Securities International, Inc. (Newell Brands, Inc.) 30.02% 07/15/24 | | | | | | | 322,400 | | | | 2,553,951 | |
| | | | | | | | | | | | |
| | | | | | | | | | | 9,505,582 | |
| | | |
| Household Products — 0.3% | | | | | | | | | |
Barclays Capital, Inc. (Reckitt Benckiser Group PLC) 18.12% 06/17/24 | | | GBP | | | | 47,800 | | | | 2,679,657 | |
BNP Paribas Arbitrage SNC (Henkel AG & Co. KGaA) 10.68% 07/18/24 | | | EUR | | | | 33,000 | | | | 2,942,838 | |
| | | | | | | | | | | | |
| | | | | | | | | | | 5,622,495 | |
| | | |
| Industrial Conglomerates — 0.1% | | | | | | | | | |
BNP Paribas Arbitrage SNC (Siemens AG) 15.73% 06/17/24 | | | | | | | 12,900 | | | | 2,470,775 | |
| | | | | | | | | | | | |
| | | |
| Insurance — 2.5% | | | | | | | | | |
BMO Capital Markets Corp. (Willis Towers Watson PLC) 11.27% 06/27/24 | | | USD | | | | 34,700 | | | | 8,813,484 | |
BNP Paribas Arbitrage SNC (Prudential PLC) 23.29% 07/11/24 | | | GBP | | | | 761,500 | | | | 7,362,058 | |
BNP Paribas Securities Corporation (Fidelity National Financial, Inc.) 20.12% 06/06/24 | | | USD | | | | 313,300 | | | | 15,330,564 | |
Goldman Sachs & Co. LLC (American International Group, Inc.) 20.01% 06/06/24 | | | | | | | 246,066 | | | | 18,960,952 | |
| | | | | | | | | | | | |
| | | | | | | | | | | 50,467,058 | |
| | | |
| IT Services — 0.9% | | | | | | | | | |
Mizuho Securities USA LLC (Cognizant Technology Solutions Corp.) 24.00% 06/03/24 | | | | | | | 147,300 | | | | 9,537,858 | |
Nomura Securities International, Inc. (Cognizant Technology Solutions Corp.) 14.46% 07/22/24 | | | | | | | 146,700 | | | | 9,503,226 | |
| | | | | | | | | | | | |
| | | | | | | | | | | 19,041,084 | |
| | | |
| Leisure Products — 0.3% | | | | | | | | | |
Nomura Securities International, Inc. (Hasbro, Inc.) 39.69% 06/10/24 | | | | | | | 99,300 | | | | 5,889,043 | |
| | | | | | | | | | | | |
|
| Life Sciences Tools & Services — 0.1% | |
SG Americas Securities LLC (Fortrea Holdings, Inc.) 40.01% 06/21/24 | | | | | | | 105,300 | | | | 2,758,516 | |
| | | | | | | | | | | | |
| | | |
| Machinery — 0.2% | | | | | | | | | |
Citigroup Global Markets, Inc. (Westinghouse Air Brake Technologies Corp.) 17.14% 07/18/24 | | | | | | | 25,000 | | | | 4,227,246 | |
| | | | | | | | | | | | |
| | | |
| Media — 1.2% | | | | | | | | | |
Barclays Capital, Inc. (Fox Corp.) 18.00% 06/10/24 | | | | | | | 169,300 | | | | 5,571,433 | |
Barclays Capital, Inc. (WPP PLC) 29.18% 07/11/24 | | | GBP | | | | 582,000 | | | | 6,014,025 | |
Citigroup Global Markets, Inc. (Comcast Corp.) 18.87% 07/18/24 | | | USD | | | | 318,900 | | | | 12,571,505 | |
| | | | | | | | | | | | |
| | | | | | | | | | | 24,156,963 | |
| | | |
| Multi-Utilities — 0.4% | | | | | | | | | |
RBC Capital Markets LLC (Sempra) 11.68% 06/06/24 | | | | | | | 113,400 | | | | 7,837,362 | |
| | | | | | | | | | | | |
| | | |
| Oil, Gas & Consumable Fuels — 2.9% | | | | | | | | | |
BNP Paribas Arbitrage SNC (BP PLC) 17.79% 07/11/24 | | | GBP | | | | 2,829,000 | | | | 17,435,823 | |
| | |
S C H E D U L E S O F I N V E S T M E N T S | | 7 |
| | |
Schedule of Investments (continued) May 31, 2024 | | BlackRock High Equity Income Fund (Percentages shown are based on Net Assets) |
| | | | | | | | | | | | |
| Security | | | | | Par
(000) | | | Value | |
|
| Oil, Gas & Consumable Fuels (continued) | |
BNP Paribas Arbitrage SNC (Shell PLC) 16.95% 06/17/24 | | | GBP | | | | 495,200 | | | $ | 17,873,167 | |
BNP Paribas Securities Corporation (Kosmos Energy Ltd.) 23.04% 06/06/24 | | | USD | | | | 1,086,200 | | | | 6,634,396 | |
RBC Capital Markets LLC (Chevron Corp.) 19.73% 06/06/24 | | | | | | | 43,000 | | | | 6,943,323 | |
RBC Capital Markets LLC (Suncor Energy, Inc.) 20.26% 07/18/24(c) | | | | | | | 240,700 | | | | 9,761,156 | |
| | | | | | | | | | | | |
| | | | | | | | | | | 58,647,865 | |
| | |
| Personal Care Products — 0.1% | | | | | | | |
RBC Capital Markets LLC (Unilever PLC) 18.65% 06/06/24 | | | | | | | 52,900 | | | | 2,511,551 | |
| | | | | | | | | | | | |
| | |
| Pharmaceuticals — 2.0% | | | | | | | |
Barclays Capital, Inc. (Bayer AG) 15.61% 07/18/24 | | | EUR | | | | 217,800 | | | | 6,363,021 | |
Barclays Capital, Inc. (Sanofi SA) 11.25% 07/11/24 | | | | | | | 147,800 | | | | 14,386,891 | |
BMO Capital Markets Corp. (Bristol-Myers Squibb Co.) 15.43% 06/21/24 | | | USD | | | | 68,300 | | | | 2,824,181 | |
BNP Paribas Arbitrage SNC (AstraZeneca PLC) Series 0001 15.43% 06/17/24 | | | GBP | | | | 38,300 | | | | 5,938,090 | |
Citigroup Global Markets, Inc. (Eli Lilly & Co.) 21.49% 07/18/24 | | | USD | | | | 8,700 | | | | 7,114,603 | |
JP Morgan Securities LLC (Pfizer, Inc.) Series MCH9 28.00% 06/10/24 | | | | | | | 125,800 | | | | 3,458,849 | |
| | | | | | | | | | | | |
| | | | | | | | | | | 40,085,635 | |
| | |
| Professional Services — 1.9% | | | | | | | |
Barclays Capital, Inc. (SS&C Technologies Holdings, Inc.) 15.65% 06/10/24 | | | | | | | 246,900 | | | | 15,243,498 | |
BMO Capital Markets Corp. (Dun & Bradstreet Holdings, Inc.) 20.91% 06/27/24 | | | | | | | 857,800 | | | | 8,191,230 | |
SG Americas Securities LLC (Leidos Holdings, Inc.) 18.64% 06/10/24 | | | | | | | 114,800 | | | | 15,242,480 | |
| | | | | | | | | | | | |
| | | | | | | | | | | 38,677,208 | |
| |
| Semiconductors & Semiconductor Equipment — 0.1% | | | | |
SG Americas Securities LLC (Texas Instruments, Inc.) 22.47% 06/21/24 | | | | | | | 17,300 | | | | 3,155,102 | |
| | | | | | | | | | | | |
| | |
| Software — 0.3% | | | | | | | |
Citigroup Global Markets, Inc. (Microsoft Corp.) 17.83% 07/18/24 | | | | | | | 17,200 | | | | 7,220,180 | |
| | | | | | | | | | | | |
| | |
| Specialized REITs — 0.5% | | | | | | | |
BMO Capital Markets Corp. (Crown Castle, Inc.) 22.32% 07/05/24 | | | | | | | 91,800 | | | | 9,280,416 | |
| | | | | | | | | | | | |
| | | | | | | | | | | | |
| Security | | | | | Par
(000) | | | Value | |
|
| Technology Hardware, Storage & Peripherals — 0.3% | |
BMO Capital Markets Corp. (HP, Inc.) 28.45% 06/24/24 | | | USD | | | | 219,000 | | | $ | 6,525,645 | |
| | | | | | | | | | | | |
|
| Textiles, Apparel & Luxury Goods — 0.2% | |
JP Morgan Securities LLC (Tapestry, Inc.) Series MCHA 33.78% 06/10/24 | | | | | | | 114,800 | | | | 4,735,847 | |
| | | | | | | | | | | | |
| | |
| Tobacco — 0.6% | | | | | | | |
JP Morgan Securities LLC (British American Tobacco PLC) 26.92% 07/18/24 | | | GBP | | | | 397,500 | | | | 11,933,479 | |
| | | | | | | | | | | | |
|
| Wireless Telecommunication Services — 0.4% | |
BNP Paribas Arbitrage SNC (Vodafone Group PLC) 49.41% 07/11/24 | | | | | | | 7,637,100 | | | | 7,231,996 | |
| | | | | | | | | | | | |
| | | |
Total Equity-Linked Notes — 34.3%
(Cost: $696,443,144) | | | | | | | | | | | 697,236,349 | |
| | | | | | | | | | | | |
| | |
Total Long-Term Investments — 99.1%
(Cost: $1,811,134,107) | | | | | | | | 2,013,525,298 | |
| | | | | | | | | | | | |
| | | | | | | | | | | | |
| | | |
| | | | | | Shares | | | | |
| | | |
Short-Term Securities | | | | | | | | | | | | |
| | | |
| Money Market Funds — 1.0% | | | | | | | | | |
BlackRock Cash Funds: Institutional, SL Agency Shares, 5.49%(d)(e)(f) | | | | | | | 1,739,623 | | | | 1,740,145 | |
BlackRock Liquidity Funds, T-Fund, Institutional Shares, 5.19%(d)(e) | | | | | | | 19,702,202 | | | | 19,702,202 | |
| | | | | | | | | | | | |
| | | |
Total Short-Term Securities — 1.0%
(Cost: $21,442,347) | | | | | | | | | | | 21,442,347 | |
| | | | | | | | | | | | |
| | | |
Total Investments — 100.1%
(Cost: $1,832,576,454) | | | | | | | | | | | 2,034,967,645 | |
| |
Liabilities in Excess of Other Assets — (0.1)% | | | | (2,236,385 | ) |
| | | | | | | | | | | | |
| | | |
Net Assets — 100.0% | | | | | | | | | | $ | 2,032,731,260 | |
| | | | | | | | | | | | |
| (a) | Non-income producing security. |
| (b) | All or a portion of this security is on loan. |
| (c) | Security is valued using significant unobservable inputs and is classified as Level 3 in the fair value hierarchy. |
| (d) | Affiliate of the Fund. |
| (e) | Annualized 7-day yield as of period end. |
| (f) | All or a portion of this security was purchased with the cash collateral from loaned securities. |
| | |
| 8 | | 2 0 2 4 B L A C K R O C K A N N U A L F I N A N C I A L S T A T E M E N T S |
| | |
Schedule of Investments (continued) May 31, 2024 | | BlackRock High Equity Income Fund |
Affiliates
Investments in issuers considered to be affiliate(s) of the Fund during the year ended May 31, 2024 for purposes of Section 2(a)(3) of the Investment Company Act of 1940, as amended, were as follows:
| | | | | | | | | | | | | | | | | | | | | | | | | | | | | | | | | | | | |
| | | | | | | | | | |
| Affiliated Issuer | | Value at
05/31/23 | | | Purchases
at Cost | | | Proceeds
from Sales | | | Net
Realized
Gain (Loss) | | | Change in
Unrealized
Appreciation
(Depreciation) | | | Value at
05/31/24 | | | Shares
Held at
05/31/24 | | | Income | | | Capital
Gain
Distributions
from Underlying
Funds | |
| | | | | | | | | |
BlackRock Cash Funds: Institutional, SL Agency Shares | | $ | — | | | $ | 1,739,988 | (a) | | | $ — | | | $ | 157 | | | $ | — | | | $ | 1,740,145 | | | | 1,739,623 | | | $ | 1,351 | (b) | | $ | — | |
| | | | | | | | | |
BlackRock Liquidity Funds, T-Fund, Institutional Shares | | | — | | | | 19,702,202 | (a) | | | — | | | | — | | | | — | | | | 19,702,202 | | | | 19,702,202 | | | | 2,758,631 | | | | — | |
| | | | | | | | | |
SL Liquidity Series, LLC, Money Market Series(c) | | | — | | | | — | | | | (85 | )(a) | | | 85 | | | | — | | | | — | | | | — | | | | 3,414 | (b) | | | — | |
| | | | | | | | | | | | | | | | | | | | | | | | | | | | | | | | | | | | |
| | | | | | | | | |
| | | | | | | | | | | | | | $ | 242 | | | $ | — | | | $ | 21,442,347 | | | | | | | $ | 2,763,396 | | | $ | — | |
| | | | | | | | | | | | | | | | | | | | | | | | | | | | | | | | | | | | |
| | (a) | Represents net amount purchased (sold). | |
| | (b) | All or a portion represents securities lending income earned from the reinvestment of cash collateral from loaned securities, net of fees and collateral investment expenses, and other payments to and from borrowers of securities. | |
| | (c) | As of period end, the entity is no longer held. | |
For purposes of this report, industry and sector sub-classifications may differ from those utilized by the Fund for compliance purposes.
Fair Value Hierarchy as of Period End
Various inputs are used in determining the fair value of financial instruments. For a description of the input levels and information about the Fund’s policy regarding valuation of financial instruments, refer to the Notes to Financial Statements.
The following table summarizes the Fund’s financial instruments categorized in the fair value hierarchy. The breakdown of the Fund’s financial instruments into major categories is disclosed in the Schedule of Investments above.
| | | | | | | | | | | | | | | | |
| |
| | | | |
| | | Level 1 | | | Level 2 | | | Level 3 | | | Total | |
| |
| | | | |
Assets | | | | | | | | | | | | | | | | |
Investments | | | | | | | | | | | | | | | | |
Long-Term Investments | | | | | | | | | | | | | | | | |
Common Stocks | | | | | | | | | | | | | | | | |
Aerospace & Defense | | $ | 62,414,687 | | | $ | — | | | $ | — | | | $ | 62,414,687 | |
Automobile Components | | | 10,651,503 | | | | — | | | | — | | | | 10,651,503 | |
Automobiles | | | 18,165,207 | | | | — | | | | — | | | | 18,165,207 | |
Banks | | | 120,601,568 | | | | — | | | | — | | | | 120,601,568 | |
Beverages | | | 6,517,090 | | | | 10,591,556 | | | | — | | | | 17,108,646 | |
Broadline Retail | | | 12,359,310 | | | | — | | | | — | | | | 12,359,310 | |
Building Products | | | 20,105,971 | | | | — | | | | — | | | | 20,105,971 | |
Capital Markets | | | 6,343,597 | | | | — | | | | — | | | | 6,343,597 | |
Chemicals | | | 21,962,898 | | | | — | | | | — | | | | 21,962,898 | |
Communications Equipment | | | 16,474,764 | | | | — | | | | — | | | | 16,474,764 | |
Consumer Staples Distribution & Retail | | | 19,369,068 | | | | — | | | | — | | | | 19,369,068 | |
Containers & Packaging | | | 25,224,298 | | | | — | | | | — | | | | 25,224,298 | |
Diversified Telecommunication Services | | | 25,380,942 | | | | — | | | | — | | | | 25,380,942 | |
Electric Utilities | | | 40,844,996 | | | | — | | | | — | | | | 40,844,996 | |
Electrical Equipment | | | 13,833,523 | | | | — | | | | — | | | | 13,833,523 | |
Electronic Equipment, Instruments & Components | | | 5,708,951 | | | | — | | | | — | | | | 5,708,951 | |
Entertainment | | | 2,566,444 | | | | — | | | | — | | | | 2,566,444 | |
Financial Services | | | 48,486,385 | | | | — | | | | — | | | | 48,486,385 | |
Food Products | | | 28,297,061 | | | | — | | | | — | | | | 28,297,061 | |
Health Care Equipment & Supplies | | | 44,641,676 | | | | 13,380,819 | | | | — | | | | 58,022,495 | |
Health Care Providers & Services | | | 106,444,941 | | | | — | | | | — | | | | 106,444,941 | |
Household Durables | | | 18,203,312 | | | | — | | | | — | | | | 18,203,312 | |
Household Products | | | — | | | | 10,358,710 | | | | — | | | | 10,358,710 | |
Industrial Conglomerates | | | — | | | | 4,481,620 | | | | — | | | | 4,481,620 | |
Insurance | | | 55,071,998 | | | | 13,254,406 | | | | — | | | | 68,326,404 | |
IT Services | | | 18,240,730 | | | | — | | | | — | | | | 18,240,730 | |
Leisure Products | | | 10,653,753 | | | | — | | | | — | | | | 10,653,753 | |
| | |
S C H E D U L E S O F I N V E S T M E N T S | | 9 |
| | |
Schedule of Investments (continued) May 31, 2024 | | BlackRock High Equity Income Fund |
Fair Value Hierarchy as of Period End (continued)
| | | | | | | | | | | | | | | | |
| |
| | | | |
| | | Level 1 | | | Level 2 | | | Level 3 | | | Total | |
| |
Common Stocks (continued) | | | | | | | | | | | | | | | | |
Life Sciences Tools & Services | | $ | 4,959,276 | | | $ | — | | | $ | — | | | $ | 4,959,276 | |
Machinery | | | 13,206,427 | | | | 10,228,079 | | | | — | | | | 23,434,506 | |
Media | | | 37,120,170 | | | | 11,069,039 | | | | — | | | | 48,189,209 | |
Metals & Mining | | | 6,269,028 | | | | — | | | | — | | | | 6,269,028 | |
Multi-Utilities | | | 15,544,192 | | | | — | | | | — | | | | 15,544,192 | |
Oil, Gas & Consumable Fuels | | | 41,936,548 | | | | 63,671,956 | | | | — | | | | 105,608,504 | |
Personal Care Products | | | 2,084,223 | | | | — | | | | — | | | | 2,084,223 | |
Pharmaceuticals | | | 23,389,459 | | | | 49,206,702 | | | | — | | | | 72,596,161 | |
Professional Services | | | 67,227,473 | | | | — | | | | — | | | | 67,227,473 | |
Semiconductors & Semiconductor Equipment | | | 6,068,711 | | | | 13,341,739 | | | | — | | | | 19,410,450 | |
Software | | | 13,081,161 | | | | — | | | | — | | | | 13,081,161 | |
Specialized REITs | | | 18,520,008 | | | | — | | | | — | | | | 18,520,008 | |
Technology Hardware, Storage & Peripherals | | | 18,553,278 | | | | 32,797,976 | | | | — | | | | 51,351,254 | |
Textiles, Apparel & Luxury Goods | | | 8,959,940 | | | | 6,321,291 | | | | — | | | | 15,281,231 | |
Tobacco | | | — | | | | 28,685,133 | | | | — | | | | 28,685,133 | |
Wireless Telecommunication Services | | | — | | | | 13,415,356 | | | | — | | | | 13,415,356 | |
Equity-Linked Notes | | | — | | | | 676,851,717 | | | | 20,384,632 | | | | 697,236,349 | |
Short-Term Securities | | | | | | | | | | | | | | | | |
Money Market Funds | | | 21,442,347 | | | | — | | | | — | | | | 21,442,347 | |
| | | | | | | | | | | | | | | | |
| | | | |
| | $ | 1,056,926,914 | | | $ | 957,656,099 | | | $ | 20,384,632 | | | $ | 2,034,967,645 | |
| | | | | | | | | | | | | | | | |
A reconciliation of Level 3 investments is presented when the Fund had a significant amount of Level 3 investments at the beginning and/or end of the period in relation to net assets. The following table is a reconciliation of Level 3 investments for which significant unobservable inputs were used in determining fair value:
| | | | |
| |
| |
| Equity-Linked
Notes |
|
| |
Assets | | | | |
Opening Balance, as of May 31, 2023 | | $ | 17,914,666 | |
Transfers into Level 3 | | | — | |
Transfers out of Level 3 | | | — | |
Accrued discounts/premiums | | | — | |
Net realized gain (loss) | | | 61,896 | |
Net change in unrealized appreciation (depreciation)(a)(b) | | | 744,646 | |
Purchases | | | 20,283,417 | |
Sales | | | (18,619,993 | ) |
| | | | |
Closing Balance, as of May 31, 2024 | | $ | 20,384,632 | |
| | | | |
Net change in unrealized appreciation (depreciation) on investments still held at May 31, 2024(b) | | $ | 101,215 | |
| | | | |
| | (a) | Included in the related net change in unrealized appreciation (depreciation) in the Statements of Operations. | |
| | (b) | Any difference between net change in unrealized appreciation (depreciation) and net change in unrealized appreciation (depreciation) on investments still held at May 31, 2024, is generally due to investments no longer held or categorized as Level 3 at period end. | |
See notes to financial statements.
| | |
| 10 | | 2 0 2 4 B L A C K R O C K A N N U A L F I N A N C I A L S T A T E M E N T S |
| | |
Schedule of Investments May 31, 2024 | | BlackRock International Dividend Fund (Percentages shown are based on Net Assets) |
| | | | | | | | |
| Security | | Shares | | | Value | |
| | |
Common Stocks | | | | | | | | |
| | |
| Brazil — 1.3% | | | | | | |
B3 SA - Brasil Bolsa Balcao | | | 4,787,592 | | | $ | 9,847,073 | |
| | | | | | | | |
| | |
| Canada — 5.5% | | | | | | |
Canadian National Railway Co. | | | 141,372 | | | | 17,996,289 | |
Teck Resources Ltd., Class B | | | 147,263 | | | | 7,659,469 | |
TELUS Corp. | | | 893,268 | | | | 14,687,359 | |
| | | | | | | | |
| | | | | | | 40,343,117 | |
| | |
| Denmark — 4.7% | | | | | | |
Novo Nordisk A/S, Class B | | | 257,449 | | | | 34,881,280 | |
| | | | | | | | |
| | |
| France — 11.8% | | | | | | |
Air Liquide SA | | | 130,972 | | | | 25,784,982 | |
Cie de Saint-Gobain SA | | | 179,176 | | | | 15,819,698 | |
LVMH Moet Hennessy Louis Vuitton SE | | | 33,930 | | | | 27,135,318 | |
Sanofi SA | | | 185,441 | | | | 18,155,044 | |
| | | | | | | | |
| | | | | | | 86,895,042 | |
| | |
| Germany — 5.2% | | | | | | |
Beiersdorf AG | | | 149,904 | | | | 23,501,518 | |
MTU Aero Engines AG, Class N | | | 59,698 | | | | 14,912,450 | |
| | | | | | | | |
| | | | | | | 38,413,968 | |
| | |
| India — 2.6% | | | | | | |
AceVector Ltd. (Acquired 05/07/14 - 10/29/14, cost $7,423,816)(a)(b)(c) | | | 1,595,200 | | | | 770,546 | |
HDFC Bank Ltd. | | | 987,046 | | | | 18,130,896 | |
| | | | | | | | |
| | | | | | | 18,901,442 | |
| | |
| Indonesia — 1.1% | | | | | | |
Bank Rakyat Indonesia Persero Tbk PT | | | 30,816,600 | | | | 8,260,064 | |
| | | | | | | | |
| | |
| Italy — 3.2% | | | | | | |
FinecoBank Banca Fineco SpA | | | 1,435,172 | | | | 23,276,422 | |
| | | | | | | | |
| | |
| Japan — 6.0% | | | | | | |
Asics Corp. | | | 132,000 | | | | 7,332,799 | |
Keyence Corp. | | | 48,700 | | | | 21,952,087 | |
Sony Group Corp. | | | 176,700 | | | | 14,507,203 | |
| | | | | | | | |
| | | | | | | 43,792,089 | |
| | |
| Mexico — 1.9% | | | | | | |
Wal-Mart de Mexico SAB de CV | | | 3,765,116 | | | | 14,147,063 | |
| | | | | | | | |
| | |
| Netherlands — 9.1% | | | | | | |
ASML Holding NV | | | 27,743 | | | | 26,543,704 | |
Koninklijke KPN NV | | | 4,930,001 | | | | 18,484,102 | |
Shell PLC | | | 597,162 | | | | 21,707,560 | |
| | | | | | | | |
| | | | | | | 66,735,366 | |
| | |
| Singapore — 4.2% | | | | | | |
DBS Group Holdings Ltd. | | | 610,988 | | | | 16,292,493 | |
United Overseas Bank Ltd. | | | 653,354 | | | | 14,897,820 | |
| | | | | | | | |
| | | | | | | 31,190,313 | |
| | | | | | | | |
| Security | | Shares | | | Value | |
| | |
| Sweden — 6.4% | | | | | | |
Assa Abloy AB, Class B | | | 898,897 | | | $ | 26,415,937 | |
Atlas Copco AB, A Shares | | | 1,055,307 | | | | 20,329,725 | |
| | | | | | | | |
| | | | | | | 46,745,662 | |
| | |
| Switzerland — 4.1% | | | | | | |
Nestlé SA, Registered Shares | | | 176,044 | | | | 18,686,394 | |
Zurich Insurance Group AG, Class N | | | 22,395 | | | | 11,786,639 | |
| | | | | | | | |
| | | | | | | 30,473,033 | |
| | |
| Taiwan — 5.3% | | | | | | |
Taiwan Semiconductor Manufacturing Co. Ltd. | | | 1,530,000 | | | | 39,180,154 | |
| | | | | | | | |
| | |
| United Kingdom — 14.9% | | | | | | |
AstraZeneca PLC | | | 186,695 | | | | 29,021,557 | |
BAE Systems PLC | | | 874,340 | | | | 15,568,509 | |
Diageo PLC | | | 605,751 | | | | 20,394,052 | |
RELX PLC | | | 605,089 | | | | 26,545,220 | |
Smith & Nephew PLC | | | 497,484 | | | | 6,294,929 | |
Taylor Wimpey PLC | | | 6,385,180 | | | | 12,088,482 | |
| | | | | | | | |
| | | | | | | 109,912,749 | |
| | |
| United States — 12.1% | | | | | | |
Baker Hughes Co., Class A | | | 824,045 | | | | 27,589,027 | |
Otis Worldwide Corp. | | | 160,873 | | | | 15,958,602 | |
Texas Instruments, Inc. | | | 124,701 | | | | 24,317,942 | |
Visa, Inc., Class A | | | 77,364 | | | | 21,078,595 | |
| | | | | | | | |
| | | | | | | 88,944,166 | |
| | | | | | | | |
| | |
Total Long-Term Investments — 99.4%
(Cost: $613,236,507) | | | | | | | 731,939,003 | |
| | | | | | | | |
| | |
Short-Term Securities | | | | | | | | |
| | |
| Money Market Funds — 0.1% | | | | | | |
BlackRock Liquidity Funds, T-Fund, Institutional Shares, 5.19%(d)(e) | | | 536,652 | | | | 536,652 | |
| | | | | | | | |
| | |
Total Short-Term Securities — 0.1%
(Cost: $536,652) | | | | | | | 536,652 | |
| | | | | | | | |
| | |
Total Investments — 99.5%
(Cost: $613,773,159) | | | | | | | 732,475,655 | |
Other Assets Less Liabilities — 0.5% | | | | | | | 3,412,051 | |
| | | | | | | | |
| | |
Net Assets — 100.0% | | | | | | $ | 735,887,706 | |
| | | | | | | | |
| (a) | Security is valued using significant unobservable inputs and is classified as Level 3 in the fair value hierarchy. |
| (b) | Non-income producing security. |
| (c) | Restricted security as to resale, excluding 144A securities. The Fund held restricted securities with a current value of $770,546, representing 0.1% of its net assets as of period end, and an original cost of $7,423,816. |
| (d) | Affiliate of the Fund. |
| (e) | Annualized 7-day yield as of period end. |
| | |
S C H E D U L E S O F I N V E S T M E N T S | | 11 |
| | |
Schedule of Investments (continued) May 31, 2024 | | BlackRock International Dividend Fund |
Affiliates
Investments in issuers considered to be affiliate(s) of the Fund during the year ended May 31, 2024 for purposes of Section 2(a)(3) of the Investment Company Act of 1940, as amended, were as follows:
| | | | | | | | | | | | | | | | | | | | | | | | | | | | | | | | | | | | |
| | | | | | | | | | |
| Affiliated Issuer | | Value at
05/31/23 | | | Purchases
at Cost | | | Proceeds
from Sales | | | Net
Realized
Gain (Loss) | | | Change in
Unrealized
Appreciation
(Depreciation) | | | Value at
05/31/24 | | | Shares
Held at
05/31/24 | | | Income | | | Capital
Gain
Distributions
from Underlying
Funds | |
| | | | | | | | | |
BlackRock Liquidity Funds, T-Fund, Institutional Shares | | $ | 25,743,453 | | | $ | — | | | | $ (25,206,801 | )(a) | | $ | — | | | $ | — | | | $ | 536,652 | | | | 536,652 | | | $ | 563,658 | | | $ | — | |
| | | | | | | | | | | | | | | | | | | | | | | | | | | | | | | | | | | | |
| | (a) | Represents net amount purchased (sold). | |
Fair Value Hierarchy as of Period End
Various inputs are used in determining the fair value of financial instruments. For a description of the input levels and information about the Fund’s policy regarding valuation of financial instruments, refer to the Notes to Financial Statements.
The following table summarizes the Fund’s financial instruments categorized in the fair value hierarchy. The breakdown of the Fund’s financial instruments into major categories is disclosed in the Schedule of Investments above.
| | | | | | | | | | | | | | | | |
| |
| | | | |
| | | Level 1 | | | Level 2 | | | Level 3 | | | Total | |
| |
| | | | |
Assets | | | | | | | | | | | | | | | | |
Investments | | | | | | | | | | | | | | | | |
Long-Term Investments | | | | | | | | | | | | | | | | |
Common Stocks | | | | | | | | | | | | | | | | |
Brazil | | $ | 9,847,073 | | | $ | — | | | $ | — | | | $ | 9,847,073 | |
Canada | | | 40,343,117 | | | | — | | | | — | | | | 40,343,117 | |
Denmark | | | — | | | | 34,881,280 | | | | — | | | | 34,881,280 | |
France | | | — | | | | 86,895,042 | | | | — | | | | 86,895,042 | |
Germany | | | — | | | | 38,413,968 | | | | — | | | | 38,413,968 | |
India | | | — | | | | 18,130,896 | | | | 770,546 | | | | 18,901,442 | |
Indonesia | | | — | | | | 8,260,064 | | | | — | | | | 8,260,064 | |
Italy | | | — | | | | 23,276,422 | | | | — | | | | 23,276,422 | |
Japan | | | — | | | | 43,792,089 | | | | — | | | | 43,792,089 | |
Mexico | | | 14,147,063 | | | | — | | | | — | | | | 14,147,063 | |
Netherlands | | | — | | | | 66,735,366 | | | | — | | | | 66,735,366 | |
Singapore | | | — | | | | 31,190,313 | | | | — | | | | 31,190,313 | |
Sweden | | | — | | | | 46,745,662 | | | | — | | | | 46,745,662 | |
Switzerland | | | — | | | | 30,473,033 | | | | — | | | | 30,473,033 | |
Taiwan | | | — | | | | 39,180,154 | | | | — | | | | 39,180,154 | |
United Kingdom | | | — | | | | 109,912,749 | | | | — | | | | 109,912,749 | |
United States | | | 88,944,166 | | | | — | | | | — | | | | 88,944,166 | |
Short-Term Securities | | | | | | | | | | | | | | | | |
Money Market Funds | | | 536,652 | | | | — | | | | — | | | | 536,652 | |
| | | | | | | | | | | | | | | | |
| | | | |
| | $ | 153,818,071 | | | $ | 577,887,038 | | | $ | 770,546 | | | $ | 732,475,655 | |
| | | | | | | | | | | | | | | | |
See notes to financial statements.
| | |
| 12 | | 2 0 2 4 B L A C K R O C K A N N U A L F I N A N C I A L S T A T E M E N T S |
Statements of Assets and Liabilities
May 31, 2024
| | | | | | | | | | | | |
| | | BlackRock
Energy
Opportunities
Fund | | | BlackRock
High Equity Income
Fund | | | BlackRock
International
Dividend
Fund | |
| | | |
ASSETS | | | | | | | | | | | | |
Investments, at value — unaffiliated(a)(b) | | $ | 338,878,762 | | | $ | 2,013,525,298 | | | $ | 731,939,003 | |
Investments, at value — affiliated(c) | | | 2,548,266 | | | | 21,442,347 | | | | 536,652 | |
Cash | | | 32,786 | | | | 148,913 | | | | — | |
Foreign currency, at value(d) | | | 422,596 | | | | 32,734,044 | | | | 2,104,256 | |
Receivables: | | | | | | | | | | | | |
Investments sold | | | — | | | | 85,653,032 | | | | 1,457,685 | |
Securities lending income — affiliated | | | — | | | | 545 | | | | — | |
Capital shares sold | | | 659,665 | | | | 1,856,095 | | | | 950,427 | |
Dividends — unaffiliated | | | 1,742,685 | | | | 2,551,681 | | | | 1,804,703 | |
Dividends — affiliated | | | 12,833 | | | | 267,802 | | | | 17,702 | |
Interest — unaffiliated | | | — | | | | 4,137,680 | | | | — | |
From the Manager | | | 14,886 | | | | 80,462 | | | | 52,161 | |
Prepaid expenses | | | 35,395 | | | | 85,240 | | | | 51,701 | |
| | | | | | | | | | | | |
Total assets | | | 344,347,874 | | | | 2,162,483,139 | | | | 738,914,290 | |
| | | | | | | | | | | | |
| | | |
LIABILITIES | | | | | | | | | | | | |
Collateral on securities loaned | | | — | | | | 1,740,000 | | | | — | |
Payables: | | | | | | | | | | | | |
Investments purchased | | | 1,112 | | | | 118,097,423 | | | | — | |
Administration fees | | | 12,318 | | | | 67,622 | | | | 26,142 | |
Capital shares redeemed | | | 390,929 | | | | 6,497,413 | | | | 1,390,933 | |
Income dividend distributions | | | — | | | | 1,374,529 | | | | — | |
Interest expense | | | 1,885 | | | | — | | | | 56,141 | |
Investment advisory fees | | | 216,257 | | | | 1,273,364 | | | | 300,712 | |
IRS compliance fee for foreign withholding tax claims | | | 43,084 | | | | — | | | | 874,455 | |
Trustees’ and Officer’s fees | | | 1,966 | | | | 5,442 | | | | 2,682 | |
Other accrued expenses | | | 34,547 | | | | 84,052 | | | | 71,895 | |
Other affiliate fees | | | 4,842 | | | | — | | | | — | |
Professional fees | | | 84,837 | | | | 92,944 | | | | 76,084 | |
Reorganization costs | | | — | | | | — | | | | 41,268 | |
Service and distribution fees | | | 59,553 | | | | 117,393 | | | | 32,672 | |
Transfer agent fees | | | 210,128 | | | | 401,697 | | | | 153,600 | |
| | | | | | | | | | | | |
| Total liabilities | | | 1,061,458 | | | | 129,751,879 | | | | 3,026,584 | |
| | | | | | | | | | | | |
Commitments and contingent liabilities | | | | | | | | | | | | |
| | | |
NET ASSETS | | $ | 343,286,416 | | | $ | 2,032,731,260 | | | $ | 735,887,706 | |
| | | | | | | | | | | | |
| | | |
NET ASSETS CONSIST OF: | | | | | | | | | | | | |
Paid-in capital | | $ | 520,284,561 | | | $ | 1,973,239,597 | | | $ | 626,882,601 | |
Accumulated earnings (loss) | | | (176,998,145 | ) | | | 59,491,663 | | | | 109,005,105 | |
| | | | | | | | | | | | |
NET ASSETS | | $ | 343,286,416 | | | $ | 2,032,731,260 | | | $ | 735,887,706 | |
| | | | | | | | | | | | |
(a) Investments, at cost — unaffiliated | | $ | 215,252,695 | | | $ | 1,811,134,107 | | | $ | 613,236,507 | |
(b) Securities loaned, at value | | $ | — | | | $ | 1,767,144 | | | $ | — | |
(c) Investments, at cost — affiliated | | $ | 2,548,266 | | | $ | 21,442,347 | | | $ | 536,652 | |
(d) Foreign currency, at cost | | $ | 420,812 | | | $ | 32,720,894 | | | $ | 2,102,507 | |
| | |
F I N A N C I A L S T A T E M E N T S | | 13 |
Statements of Assets and Liabilities (continued)
May 31, 2024
| | | | | | | | | | | | |
| | | BlackRock
Energy
Opportunities
Fund | | | BlackRock
High Equity Income
Fund | | | BlackRock
International
Dividend
Fund | |
NET ASSET VALUE | | | | | | | | | | | | |
| | | |
| Institutional | | | | | | | | | |
Net assets | | $ | 116,190,491 | | | $ | 1,446,439,844 | | | $ | 519,288,703 | |
| | | | | | | | | | | | |
| | | |
Shares outstanding | | | 7,955,735 | | | | 49,866,682 | | | | 14,098,398 | |
| | | | | | | | | | | | |
| | | |
Net asset value | | $ | 14.60 | | | $ | 29.01 | | | $ | 36.83 | |
| | | | | | | | | | | | |
| | | |
Shares authorized | | | Unlimited | | | | Unlimited | | | | Unlimited | |
| | | | | | | | | | | | |
| | | |
Par value | | $ | 0.001 | | | $ | 0.001 | | | $ | 0.001 | |
| | | | | | | | | | | | |
| | | |
| Investor A | | | | | | | | | |
Net assets | | $ | 209,291,440 | | | $ | 303,691,753 | | | $ | 133,138,720 | |
| | | | | | | | | | | | |
| | | |
Shares outstanding | | | 14,788,663 | | | | 12,514,937 | | | | 3,927,377 | |
| | | | | | | | | | | | |
| | | |
Net asset value | | $ | 14.15 | | | $ | 24.27 | | | $ | 33.90 | |
| | | | | | | | | | | | |
| | | |
Shares authorized | | | Unlimited | | | | Unlimited | | | | Unlimited | |
| | | | | | | | | | | | |
| | | |
Par value | | $ | 0.001 | | | $ | 0.001 | | | $ | 0.001 | |
| | | | | | | | | | | | |
| | | |
| Investor C | | | | | | | | | |
Net assets | | $ | 17,804,485 | | | $ | 62,684,999 | | | $ | 4,182,906 | |
| | | | | | | | | | | | |
| | | |
Shares outstanding | | | 1,308,599 | | | | 4,161,907 | | | | 144,954 | |
| | | | | | | | | | | | |
| | | |
Net asset value | | $ | 13.61 | | | $ | 15.06 | | | $ | 28.86 | |
| | | | | | | | | | | | |
| | | |
Shares authorized | | | Unlimited | | | | Unlimited | | | | Unlimited | |
| | | | | | | | | | | | |
| | | |
Par value | | $ | 0.001 | | | $ | 0.001 | | | $ | 0.001 | |
| | | | | | | | | | | | |
| | | |
| Class K | | | | | | | | | |
Net assets | | | N/A | | | $ | 219,914,664 | | | $ | 79,277,377 | |
| | | | | | | | | | | | |
| | | |
Shares outstanding | | | N/A | | | | 7,586,291 | | | | 2,151,823 | |
| | | | | | | | | | | | |
| | | |
Net asset value | | | N/A | | | $ | 28.99 | | | $ | 36.84 | |
| | | | | | | | | | | | |
| | | |
Shares authorized | | | N/A | | | | Unlimited | | | | Unlimited | |
| | | | | | | | | | | | |
| | | |
Par value | | | N/A | | | $ | 0.001 | | | $ | 0.001 | |
| | | | | | | | | | | | |
See notes to financial statements.
| | |
| 14 | | 2 0 2 4 B L A C K R O C K A N N U A L F I N A N C I A L S T A T E M E N T S |
Statements of Operations
Year Ended May 31, 2024
| | | | | | | | | | | | |
| | | BlackRock
Energy
Opportunities
Fund | | | BlackRock
High Equity Income
Fund | | | BlackRock
International
Dividend
Fund | |
| | | |
INVESTMENT INCOME | | | | | | | | | | | | |
Dividends — unaffiliated | | $ | 12,602,349 | | | $ | 39,987,701 | | | $ | 18,985,892 | |
Dividends — affiliated | | | 159,255 | | | | 2,758,631 | | | | 563,658 | |
Interest — unaffiliated | | | — | | | | 114,635,504 | | | | — | |
Securities lending income — affiliated — net | | | 150 | | | | 4,765 | | | | — | |
Other income | | | 4,103 | | | | — | | | | 94,994 | |
Foreign taxes withheld | | | (522,051 | ) | | | (891,748 | ) | | | (1,799,112 | ) |
Foreign withholding tax claims | | | 40,711 | | | | — | | | | 572,945 | |
IRS compliance fee for foreign withholding tax claims | | | (44,969 | ) | | | — | | | | (56,141 | ) |
| | | | | | | | | | | | |
| | | |
Total investment income | | | 12,239,548 | | | | 156,494,853 | | | | 18,362,236 | |
| | | | | | | | | | | | |
| | | |
EXPENSES | | | | | | | | | | | | |
Investment advisory | | | 2,614,369 | | | | 15,855,452 | | | | 4,303,616 | |
Service and distribution — class specific | | | 709,601 | | | | 1,362,489 | | | | 360,458 | |
Transfer agent — class specific | | | 652,350 | | | | 1,979,838 | | | | 829,043 | |
Administration | | | 148,148 | | | | 794,475 | | | | 299,408 | |
Professional | | | 90,131 | | | | 59,553 | | | | 173,889 | |
Registration | | | 81,959 | | | | 237,481 | | | | 129,807 | |
Administration — class specific | | | 69,788 | | | | 404,297 | | | | 143,411 | |
Accounting services | | | 55,452 | | | | 146,718 | | | | 75,611 | |
Custodian | | | 46,461 | | | | 129,054 | | | | 144,001 | |
Printing and postage | | | 31,741 | | | | 46,888 | | | | 38,362 | |
Trustees and Officer | | | 8,738 | | | | 22,315 | | | | 12,308 | |
Miscellaneous | | | 12,385 | | | | 22,970 | | | | 69,143 | |
| | | | | | | | | | | | |
| | | |
Total expenses excluding interest expense | | | 4,521,123 | | | | 21,061,530 | | | | 6,579,057 | |
Interest expense | | | 180 | | | | 42,896 | | | | 27,306 | |
| | | | | | | | | | | | |
| | | |
Total expenses | | | 4,521,303 | | | | 21,104,426 | | | | 6,606,363 | |
Less: | | | | | | | | | | | | |
Administration fees waived — class specific | | | (68,398 | ) | | | (404,218 | ) | | | (143,411 | ) |
Fees waived and/or reimbursed by the Manager | | | (3,230 | ) | | | (1,151,239 | ) | | | (834,082 | ) |
Transfer agent fees waived and/or reimbursed — class specific | | | (206,006 | ) | | | (1,065,758 | ) | | | (507,790 | ) |
| | | | | | | | | | | | |
| | | |
Total expenses after fees waived and/or reimbursed | | | 4,243,669 | | | | 18,483,211 | | | | 5,121,080 | |
| | | | | | | | | | | | |
| | | |
Net investment income | | | 7,995,879 | | | | 138,011,642 | | | | 13,241,156 | |
| | | | | | | | | | | | |
| | | |
REALIZED AND UNREALIZED GAIN (LOSS) | | | | | | | | | | | | |
Net realized gain (loss) from: | | | | | | | | | | | | |
Investments — unaffiliated | | | 20,465,486 | | | | (16,707,360 | ) | | | (11,094,611 | ) |
Investments — affiliated | | | (427 | ) | | | 242 | | | | — | |
Foreign currency transactions | | | (12,435 | ) | | | 1,796,205 | | | | 185,377 | |
| | | | | | | | | | | | |
| | | |
| | | 20,452,624 | | | | (14,910,913 | ) | | | (10,909,234 | ) |
| | | | | | | | | | | | |
Net change in unrealized appreciation (depreciation) on: | | | | | | | | | | | | |
Investments — unaffiliated(a) | | | 54,588,862 | | | | 218,512,206 | | | | 90,937,343 | |
Foreign currency translations | | | 3,204 | | | | (74,383 | ) | | | (2,932 | ) |
| | | | | | | | | | | | |
| | | |
| | | 54,592,066 | | | | 218,437,823 | | | | 90,934,411 | |
| | | | | | | | | | | | |
| | | |
Net realized and unrealized gain | | | 75,044,690 | | | | 203,526,910 | | | | 80,025,177 | |
| | | | | | | | | | | | |
| | | |
NET INCREASE IN NET ASSETS RESULTING FROM OPERATIONS | | $ | 83,040,569 | | | $ | 341,538,552 | | | $ | 93,266,333 | |
| | | | | | | | | | | | |
| | | |
(a) Net of reduction in deferred foreign capital gain tax of | | | — | | | | — | | | | 26,396 | |
See notes to financial statements.
| | |
F I N A N C I A L S T A T E M E N T S | | 15 |
Statements of Changes in Net Assets
| | | | | | | | |
| | | BlackRock Energy Opportunities Fund | |
| | |
| | | Year Ended
05/31/24 | | | Year Ended
05/31/23 | |
| | |
INCREASE (DECREASE) IN NET ASSETS | | | | | | | | |
| | |
OPERATIONS | | | | | | | | |
Net investment income | | $ | 7,995,879 | | | $ | 12,034,678 | |
Net realized gain | | | 20,452,624 | | | | 3,433,394 | |
Net change in unrealized appreciation (depreciation) | | | 54,592,066 | | | | (68,192,358 | ) |
| | | | | | | | |
Net increase (decrease) in net assets resulting from operations | | | 83,040,569 | | | | (52,724,286 | ) |
| | | | | | | | |
| | |
DISTRIBUTIONS TO SHAREHOLDERS(a) | | | | | | | | |
Institutional | | | (4,041,903 | ) | | | (4,153,602 | ) |
Investor A | | | (6,302,765 | ) | | | (4,979,465 | ) |
Investor C | | | (458,800 | ) | | | (385,896 | ) |
| | | | | | | | |
Decrease in net assets resulting from distributions to shareholders | | | (10,803,468 | ) | | | (9,518,963 | ) |
| | | | | | | | |
| | |
CAPITAL SHARE TRANSACTIONS | | | | | | | | |
| | |
Net increase (decrease) in net assets derived from capital share transactions | | | (105,569,884 | ) | | | 50,744,840 | |
| | | | | | | | |
| | |
NET ASSETS | | | | | | | | |
Total decrease in net assets | | | (33,332,783 | ) | | | (11,498,409 | ) |
Beginning of year | | | 376,619,199 | | | | 388,117,608 | |
| | | | | | | | |
End of year | | $ | 343,286,416 | | | $ | 376,619,199 | |
| | | | | | | | |
| (a) | Distributions for annual periods determined in accordance with U.S. federal income tax regulations. |
See notes to financial statements.
| | |
| 16 | | 2 0 2 4 B L A C K R O C K A N N U A L F I N A N C I A L S T A T E M E N T S |
Statements of Changes in Net Assets (continued)
| | | | | | | | |
| | | BlackRock High Equity Income Fund | |
| | |
| | | Year Ended
05/31/24 | | | Year Ended
05/31/23 | |
| | |
INCREASE (DECREASE) IN NET ASSETS | | | | | | | | |
| | |
OPERATIONS | | | | | | | | |
Net investment income | | $ | 138,011,642 | | | $ | 118,917,910 | |
Net realized loss | | | (14,910,913 | ) | | | (92,991,127 | ) |
Net change in unrealized appreciation (depreciation) | | | 218,437,823 | | | | (89,960,124 | ) |
| | | | | | | | |
Net increase (decrease) in net assets resulting from operations | | | 341,538,552 | | | | (64,033,341 | ) |
| | | | | | | | |
| | |
DISTRIBUTIONS TO SHAREHOLDERS(a) | | | | | | | | |
Institutional | | | (101,737,937 | ) | | | (94,841,361 | ) |
Investor A | | | (19,982,439 | ) | | | (20,115,999 | ) |
Investor C | | | (3,614,308 | ) | | | (3,255,218 | ) |
Class K | | | (13,231,823 | ) | | | (5,726,980 | ) |
| | | | | | | | |
Decrease in net assets resulting from distributions to shareholders | | | (138,566,507 | ) | | | (123,939,558 | ) |
| | | | | | | | |
| | |
CAPITAL SHARE TRANSACTIONS | | | | | | | | |
| | |
Net increase (decrease) in net assets derived from capital share transactions | | | (139,152,881 | ) | | | 867,175,165 | |
| | | | | | | | |
| | |
NET ASSETS | | | | | | | | |
Total increase in net assets | | | 63,819,164 | | | | 679,202,266 | |
Beginning of year | | | 1,968,912,096 | | | | 1,289,709,830 | |
| | | | | | | | |
End of year | | $ | 2,032,731,260 | | | $ | 1,968,912,096 | |
| | | | | | | | |
| (a) | Distributions for annual periods determined in accordance with U.S. federal income tax regulations. |
See notes to financial statements.
| | |
F I N A N C I A L S T A T E M E N T S | | 17 |
Statements of Changes in Net Assets (continued)
| | | | | | | | |
| | | BlackRock International Dividend Fund | |
| | |
| | | Year Ended
05/31/24 | | | Year Ended
05/31/23 | |
|
|
| | |
INCREASE (DECREASE) IN NET ASSETS | | | | | | | | |
| | |
OPERATIONS | | | | | | | | |
Net investment income | | $ | 13,241,156 | | | $ | 8,395,328 | |
Net realized loss | | | (10,909,234 | ) | | | (290,320 | ) |
Net change in unrealized appreciation (depreciation) | | | 90,934,411 | | | | 8,859,050 | |
| | | | | | | | |
Net increase in net assets resulting from operations | | | 93,266,333 | | | | 16,964,058 | |
| | | | | | | | |
| | |
DISTRIBUTIONS TO SHAREHOLDERS(a) | | | | | | | | |
Institutional | | | (9,705,515 | ) | | | (4,254,124 | ) |
Investor A | | | (2,302,905 | ) | | | (3,455,327 | ) |
Investor C | | | (63,643 | ) | | | (111,861 | ) |
Class K | | | (1,364,928 | ) | | | (679,380 | ) |
| | | | | | | | |
Decrease in net assets resulting from distributions to shareholders | | | (13,436,991 | ) | | | (8,500,692 | ) |
| | | | | | | | |
| | |
CAPITAL SHARE TRANSACTIONS | | | | | | | | |
| | |
Net increase in net assets derived from capital share transactions | | | 36,925,249 | | | | 357,362,077 | |
| | | | | | | | |
| | |
NET ASSETS | | | | | | | | |
Total increase in net assets | | | 116,754,591 | | | | 365,825,443 | |
Beginning of year | | | 619,133,115 | | | | 253,307,672 | |
| | | | | | | | |
End of year | | $ | 735,887,706 | | | $ | 619,133,115 | |
| | | | | | | | |
| (a) | Distributions for annual periods determined in accordance with U.S. federal income tax regulations. |
See notes to financial statements.
| | |
| 18 | | 2 0 2 4 B L A C K R O C K A N N U A L F I N A N C I A L S T A T E M E N T S |
Financial Highlights
(For a share outstanding throughout each period)
| | | | | | | | | | | | | | | | | | | | | | | | |
| | | BlackRock Energy Opportunities Fund | |
| |
| | | Institutional | |
| | | Year Ended
05/31/24 | | | Year Ended
05/31/23 | | | Year Ended
05/31/22 | | | Year Ended
05/31/21 | | | Period from
10/01/19
to 05/31/20 | | | Year Ended
09/30/19 | |
| | | | | | | |
Net asset value, beginning of period | | $ | 11.94 | | | $ | 13.73 | | | $ | 8.55 | | | $ | 6.64 | | | $ | 9.66 | | | $ | 12.34 | |
| | | | | | | | | | | | | | | | | | | | | | | | |
| | | | | | |
Net investment income(a) | | | 0.35 | | | | 0.42 | | | | 0.32 | | | | 0.26 | | | | 0.21 | | | | 0.29 | |
Net realized and unrealized gain (loss) | | | 2.75 | | | | (1.88 | ) | | | 5.11 | | | | 1.90 | | | | (2.93 | ) | | | (2.66 | ) |
| | | | | | | | | | | | | | | | | | | | | | | | |
| | | | | | |
Net increase (decrease) from investment operations | | | 3.10 | | | | (1.46 | ) | | | 5.43 | | | | 2.16 | | | | (2.72 | ) | | | (2.37 | ) |
| | | | | | | | | | | | | | | | | | | | | | | | |
| | | | | | |
Distributions from net investment income(b) | | | (0.44 | ) | | | (0.33 | ) | | | (0.25 | ) | | | (0.25 | ) | | | (0.30 | ) | | | (0.31 | ) |
| | | | | | | | | | | | | | | | | | | | | | | | |
| | | | | | |
Net asset value, end of period | | $ | 14.60 | | | $ | 11.94 | | | $ | 13.73 | | | $ | 8.55 | | | $ | 6.64 | | | $ | 9.66 | |
| | | | | | | | | | | | | | | | | | | | | | | | |
| | | | | | |
Total Return(c) | | | | | | | | | | | | | | | | | | | | | | | | |
Based on net asset value | | | 26.56 | % | | | (10.59 | )% | | | 65.17 | % | | | 33.50 | % | | | (29.02 | )%(d) | | | (19.24 | )% |
| | | | | | | | | | | | | | | | | | | | | | | | |
| | | | | | |
Ratios to Average Net Assets(e) | | | | | | | | | | | | | | | | | | | | | | | | |
| | | | | | |
Total expenses | | | 1.07 | % | | | 1.03 | % | | | 1.11 | % | | | 1.33 | % | | | 1.40 | %(f)(g) | | | 1.30 | % |
| | | | | | | | | | | | | | | | | | | | | | | | |
| | | | | | |
Total expenses after fees waived and/or reimbursed | | | 0.91 | % | | | 0.91 | % | | | 0.91 | % | | | 0.91 | % | | | 0.91 | %(f)(g) | | | 0.91 | % |
| | | | | | | | | | | | | | | | | | | | | | | | |
| | | | | | |
Net investment income | | | 2.59 | % | | | 3.28 | % | | | 3.05 | % | | | 3.75 | % | | | 3.89 | %(f) | | | 2.91 | % |
| | | | | | | | | | | | | | | | | | | | | | | | |
| | | | | | |
Supplemental Data | | | | | | | | | | | | | | | | | | | | | | | | |
Net assets, end of period (000) | | $ | 116,190 | | | $ | 153,530 | | | $ | 128,580 | | | $ | 52,377 | | | $ | 38,779 | | | $ | 23,579 | |
| | | | | | | | | | | | | | | | | | | | | | | | |
| | | | | | |
Portfolio turnover rate | | | 35 | % | | | 77 | % | | | 75 | % | | | 79 | % | | | 39 | % | | | 37 | % |
| | | | | | | | | | | | | | | | | | | | | | | | |
| (a) | Based on average shares outstanding. |
| (b) | Distributions for annual periods determined in accordance with U.S. federal income tax regulations. |
| (c) | Where applicable, assumes the reinvestment of distributions. |
| (e) | Excludes fees and expenses incurred indirectly as a result of investments in underlying funds. |
| (g) | Reorganization, Audit and Printing costs were not annualized in the calculation of the expense ratios. If these expenses were annualized, the total expenses and total expenses after fees waived and/or reimbursed would have been 1.47% and 0.91%, respectively. |
See notes to financial statements.
| | |
F I N A N C I A L H I G H L I G H T S | | 19 |
Financial Highlights (continued)
(For a share outstanding throughout each period)
| | | | | | | | | | | | | | | | | | | | | | | | |
| | | BlackRock Energy Opportunities Fund (continued) | |
| |
| | | Investor A | |
| | | Year Ended
05/31/24 | | | Year Ended
05/31/23 | | | Year Ended
05/31/22 | | | Year Ended
05/31/21 | | | Period from
10/01/19
to 05/31/20 | | | Year Ended
09/30/19 | |
| | | | | | | |
Net asset value, beginning of period | | $ | 11.58 | | | $ | 13.33 | | | $ | 8.31 | | | $ | 6.46 | | | $ | 9.39 | | | $ | 11.99 | |
| | | | | | | | | | | | | | | | | | | | | | | | |
| | | | | | |
Net investment income(a) | | | 0.29 | | | | 0.37 | | | | 0.27 | | | | 0.23 | | | | 0.18 | | | | 0.24 | |
Net realized and unrealized gain (loss) | | | 2.67 | | | | (1.84 | ) | | | 4.97 | | | | 1.84 | | | | (2.85 | ) | | | (2.59 | ) |
| | | | | | | | | | | | | | | | | | | | | | | | |
| | | | | | |
Net increase (decrease) from investment operations | | | 2.96 | | | | (1.47 | ) | | | 5.24 | | | | 2.07 | | | | (2.67 | ) | | | (2.35 | ) |
| | | | | | | | | | | | | | | | | | | | | | | | |
| | | | | | |
Distributions from net investment income(b) | | | (0.39 | ) | | | (0.28 | ) | | | (0.22 | ) | | | (0.22 | ) | | | (0.26 | ) | | | (0.25 | ) |
| | | | | | | | | | | | | | | | | | | | | | | | |
| | | | | | |
Net asset value, end of period | | $ | 14.15 | | | $ | 11.58 | | | $ | 13.33 | | | $ | 8.31 | | | $ | 6.46 | | | $ | 9.39 | |
| | | | | | | | | | | | | | | | | | | | | | | | |
| | | | | | |
Total Return(c) | | | | | | | | | | | | | | | | | | | | | | | | |
Based on net asset value | | | 26.06 | % | | | (10.97 | )% | | | 64.51 | % | | | 33.00 | % | | | (29.23 | )%(d) | | | (19.61 | )% |
| | | | | | | | | | | | | | | | | | | | | | | | |
| | | | | | |
Ratios to Average Net Assets(e) | | | | | | | | | | | | | | | | | | | | | | | | |
| | | | | | |
Total expenses | | | 1.36 | % | | | 1.33 | % | | | 1.43 | % | | | 1.73 | % | | | 1.94 | %(f)(g) | | | 1.66 | % |
| | | | | | | | | | | | | | | | | | | | | | | | |
| | | | | | |
Total expenses after fees waived and/or reimbursed | | | 1.32 | % | | | 1.32 | % | | | 1.32 | % | | | 1.32 | % | | | 1.32 | %(f)(g) | | | 1.33 | % |
| | | | | | | | | | | | | | | | | | | | | | | | |
| | | | | | |
Net investment income | | | 2.22 | % | | | 2.94 | % | | | 2.66 | % | | | 3.30 | % | | | 3.65 | %(f) | | | 2.44 | % |
| | | | | | | | | | | | | | | | | | | | | | | | |
| | | | | | |
Supplemental Data | | | | | | | | | | | | | | | | | | | | | | | | |
Net assets, end of period (000) | | $ | 209,291 | | | $ | 204,035 | | | $ | 232,979 | | | $ | 103,858 | | | $ | 72,733 | | | $ | 34,574 | |
| | | | | | | | | | | | | | | | | | | | | | | | |
| | | | | | |
Portfolio turnover rate | | | 35 | % | | | 77 | % | | | 75 | % | | | 79 | % | | | 39 | % | | | 37 | % |
| | | | | | | | | | | | | | | | | | | | | | | | |
| (a) | Based on average shares outstanding. |
| (b) | Distributions for annual periods determined in accordance with U.S. federal income tax regulations. |
| (c) | Where applicable, excludes the effects of any sales charges and assumes the reinvestment of distributions. |
| (e) | Excludes fees and expenses incurred indirectly as a result of investments in underlying funds. |
| (g) | Reorganization, Audit and Printing costs were not annualized in the calculation of the expense ratios. If these expenses were annualized, the total expenses and total expenses after fees waived and/or reimbursed would have been 2.00% and 1.32%, respectively. |
See notes to financial statements.
| | |
| 20 | | 2 0 2 4 B L A C K R O C K A N N U A L F I N A N C I A L S T A T E M E N T S |
Financial Highlights (continued)
(For a share outstanding throughout each period)
| | | | | | | | | | | | | | | | | | | | | | | | |
| | | BlackRock Energy Opportunities Fund (continued) | |
| |
| | | Investor C | |
| | | Year Ended
05/31/24 | | | Year Ended
05/31/23 | | | Year Ended
05/31/22 | | | Year Ended
05/31/21 | | | Period from
10/01/19
to 05/31/20 | | | Year Ended
09/30/19 | |
| | | | | | | |
Net asset value, beginning of period | | $ | 11.14 | | | $ | 12.83 | | | $ | 8.01 | | | $ | 6.24 | | | $ | 9.03 | | | $ | 11.39 | |
| | | | | | | | | | | | | | | | | | | | | | | | |
| | | | | | |
Net investment income(a) | | | 0.19 | | | | 0.27 | | | | 0.19 | | | | 0.17 | | | | 0.14 | | | | 0.14 | |
Net realized and unrealized gain (loss) | | | 2.57 | | | | (1.76 | ) | | | 4.79 | | | | 1.77 | | | | (2.75 | ) | | | (2.44 | ) |
| | | | | | | | | | | | | | | | | | | | | | | | |
| | | | | | |
Net increase (decrease) from investment operations | | | 2.76 | | | | (1.49 | ) | | | 4.98 | | | | 1.94 | | | | (2.61 | ) | | | (2.30 | ) |
| | | | | | | | | | | | | | | | | | | | | | | | |
| | | | | | |
Distributions from net investment income(b) | | | (0.29 | ) | | | (0.20 | ) | | | (0.16 | ) | | | (0.17 | ) | | | (0.18 | ) | | | (0.06 | ) |
| | | | | | | | | | | | | | | | | | | | | | | | |
| | | | | | |
Net asset value, end of period | | $ | 13.61 | | | $ | 11.14 | | | $ | 12.83 | | | $ | 8.01 | | | $ | 6.24 | | | $ | 9.03 | |
| | | | | | | | | | | | | | | | | | | | | | | | |
| | | | | | |
Total Return(c) | | | | | | | | | | | | | | | | | | | | | | | | |
Based on net asset value | | | 25.20 | % | | | (11.57 | )% | | | 63.37 | % | | | 31.89 | % | | | (29.51 | )%(d) | | | (20.21 | )% |
| | | | | | | | | | | | | | | | | | | | | | | | |
| | | | | | |
Ratios to Average Net Assets(e) | | | | | | | | | | | | | | | | | | | | | | | | |
| | | | | | |
Total expenses(f) | | | 2.10 | % | | | 2.05 | % | | | 2.16 | % | | | 2.53 | % | | | 2.61 | %(g)(h) | | | 2.35 | % |
| | | | | | | | | | | | | | | | | | | | | | | | |
| | | | | | |
Total expenses after fees waived and/or reimbursed | | | 2.04 | % | | | 2.03 | % | | | 2.04 | % | | | 2.04 | % | | | 2.04 | %(g)(h) | | | 2.05 | % |
| | | | | | | | | | | | | | | | | | | | | | | | |
| | | | | | |
Net investment income | | | 1.49 | % | | | 2.22 | % | | | 1.92 | % | | | 2.60 | % | | | 2.77 | %(g) | | | 1.48 | % |
| | | | | | | | | | | | | | | | | | | | | | | | |
| | | | | | |
Supplemental Data | | | | | | | | | | | | | | | | | | | | | | | | |
Net assets, end of period (000) | | $ | 17,804 | | | $ | 19,054 | | | $ | 26,559 | | | $ | 10,699 | | | $ | 11,152 | | | $ | 7,554 | |
| | | | | | | | | | | | | | | | | | | | | | | | |
| | | | | | |
Portfolio turnover rate | | | 35 | % | | | 77 | % | | | 75 | % | | | 79 | % | | | 39 | % | | | 37 | % |
| | | | | | | | | | | | | | | | | | | | | | | | |
| (a) | Based on average shares outstanding. |
| (b) | Distributions for annual periods determined in accordance with U.S. federal income tax regulations. |
| (c) | Where applicable, excludes the effects of any sales charges and assumes the reinvestment of distributions. |
| (e) | Excludes fees and expenses incurred indirectly as a result of investments in underlying funds. |
| (f) | Includes recoupment of past waived and/or reimbursed fees. Excluding the recoupment of past waived and/or reimbursed fees, the ratios were as follows: |
| | | | | | | | | | | | | | | | | | | | | | | | | | | | | | | | | | | | | | | | | | | | |
| | | Year Ended
05/31/24 | | | | | | Year Ended
05/31/23 | | | | | | Year Ended
05/31/22 | | | | | | Year Ended
05/31/21 | | | | | | Period from
10/01/19
to 5/31/20 | | | | | | Year Ended
09/30/19 | |
Expense ratios | | | N/A | | | | | | | | N/A | | | | | | | | N/A | | | | | | | | N/A | | | | | | | | 2.61 | % | | | | | | | 2.35 | % |
| | | | | | | | | | | | | | | | | | | | | | | | | | | | | | | | | | | | | | | | | | | | |
| (h) | Reorganization, Audit and Printing costs were not annualized in the calculation of the expense ratios. If these expenses were annualized, the total expenses and total expenses after fees waived and/or reimbursed would have been 2.67% and 2.04%, respectively. |
See notes to financial statements.
| | |
F I N A N C I A L H I G H L I G H T S | | 21 |
Financial Highlights
(For a share outstanding throughout each period)
| | | | | | | | | | | | | | | | | | | | | | | | |
| | | BlackRock High Equity Income Fund | |
| |
| | | Institutional | |
| | | Year Ended
05/31/24 | | | Year Ended
05/31/23 | | | Year Ended
05/31/22 | | | Year Ended
05/31/21 | | | Period from
10/01/19
to 05/31/20 | | | Year Ended
09/30/19 | |
| | | | | | | |
Net asset value, beginning of period | | $ | 26.23 | | | $ | 29.54 | | | $ | 29.99 | | | $ | 22.81 | | | $ | 26.57 | | | $ | 28.16 | |
| | | | | | | | | | | | | | | | | | | | | | | | |
| | | | | | |
Net investment income(a) | | | 1.89 | | | | 1.86 | | | | 1.99 | | | | 1.81 | | | | 0.94 | | | | 1.24 | |
Net realized and unrealized gain (loss) | | | 2.78 | | | | (3.25 | ) | | | (0.20 | ) | | | 7.13 | | | | (3.54 | ) | | | (0.73 | ) |
| | | | | | | | | | | | | | | | | | | | | | | | |
| | | | | | |
Net increase (decrease) from investment operations | | | 4.67 | | | | (1.39 | ) | | | 1.79 | | | | 8.94 | | | | (2.60 | ) | | | 0.51 | |
| | | | | | | | | | | | | | | | | | | | | | | | |
| | | | | | |
Distributions(b) | | | | | | | | | | | | | | | | | | | | | | | | |
From net investment income | | | (1.89 | ) | | | (1.86 | ) | | | (1.95 | ) | | | (1.76 | ) | | | (1.16 | ) | | | (1.05 | ) |
From net realized gain | | | — | | | | (0.06 | ) | | | (0.29 | ) | | | — | | | | — | | | | (1.05 | ) |
| | | | | | | | | | | | | | | | | | | | | | | | |
| | | | | | |
Total distributions | | | (1.89 | ) | | | (1.92 | ) | | | (2.24 | ) | | | (1.76 | ) | | | (1.16 | ) | | | (2.10 | ) |
| | | | | | | | | | | | | | | | | | | | | | | | |
| | | | | | |
Net asset value, end of period | | $ | 29.01 | | | $ | 26.23 | | | $ | 29.54 | | | $ | 29.99 | | | $ | 22.81 | | | $ | 26.57 | |
| | | | | | | | | | | | | | | | | | | | | | | | |
| | | | | | |
Total Return(c) | | | | | | | | | | | | | | | | | | | | | | | | |
Based on net asset value | | | 18.41 | % | | | (4.70 | )% | | | 6.28 | %(d) | | | 40.81 | % | | | (9.94 | )%(e) | | | 2.27 | % |
| | | | | | | | | | | | | | | | | | | | | | | | |
| | | | | | |
Ratios to Average Net Assets(f) | | | | | | | | | | | | | | | | | | | | | | | | |
Total expenses | | | 0.99 | % | | | 1.00 | % | | | 1.02 | % | | | 1.12 | % | | | 1.12 | %(g) | | | 1.12 | % |
| | | | | | | | | | | | | | | | | | | | | | | | |
| | | | | | |
Total expenses after fees waived and/or reimbursed | | | 0.85 | % | | | 0.85 | % | | | 0.85 | % | | | 0.85 | % | | | 0.85 | %(g) | | | 0.85 | % |
| | | | | | | | | | | | | | | | | | | | | | | | |
| | | | | | |
Net investment income | | | 6.89 | % | | | 6.81 | % | | | 6.76 | % | | | 6.93 | % | | | 5.63 | %(g) | | | 4.80 | % |
| | | | | | | | | | | | | | | | | | | | | | | | |
| | | | | | |
Supplemental Data | | | | | | | | | | | | | | | | | | | | | | | | |
Net assets, end of period (000) | | $ | 1,446,440 | | | $ | 1,475,683 | | | $ | 953,582 | | | $ | 277,653 | | | $ | 128,474 | | | $ | 151,747 | |
| | | | | | | | | | | | | | | | | | | | | | | | |
| | | | | | |
Portfolio turnover rate | | | 85 | % | | | 126 | % | | | 140 | % | | | 146 | % | | | 76 | % | | | 79 | % |
| | | | | | | | | | | | | | | | | | | | | | | | |
| (a) | Based on average shares outstanding. |
| (b) | Distributions for annual periods determined in accordance with U.S. federal income tax regulations. |
| (c) | Where applicable, assumes the reinvestment of distributions. |
| (d) | Includes a capital contribution from affiliate, which had no impact on the Fund’s total return. |
| (f) | Excludes fees and expenses incurred indirectly as a result of investments in underlying funds. |
See notes to financial statements.
| | |
| 22 | | 2 0 2 4 B L A C K R O C K A N N U A L F I N A N C I A L S T A T E M E N T S |
Financial Highlights (continued)
(For a share outstanding throughout each period)
| | | | | | | | | | | | | | | | | | | | | | | | |
| | | BlackRock High Equity Income Fund (continued) | |
| |
| | | Investor A | |
| | | Year Ended
05/31/24 | | | Year Ended
05/31/23 | | | Year Ended
05/31/22 | | | Year Ended
05/31/21 | | | Period from
10/01/19
to 05/31/20 | | | Year Ended
09/30/19 | |
| | | | | | | |
Net asset value, beginning of period | | $ | 21.94 | | | $ | 24.73 | | | $ | 25.16 | | | $ | 19.14 | | | $ | 22.43 | | | $ | 24.12 | |
| | | | | | | | | | | | | | | | | | | | | | | | |
| | | | | | |
Net investment income(a) | | | 1.53 | | | | 1.49 | | | | 1.58 | | | | 1.42 | | | | 0.75 | | | | 1.00 | |
Net realized and unrealized gain (loss) | | | 2.32 | | | | (2.72 | ) | | | (0.14 | ) | | | 6.03 | | | | (2.98 | ) | | | (0.64 | ) |
| | | | | | | | | | | | | | | | | | | | | | | | |
| | | | | | |
Net increase (decrease) from investment operations | | | 3.85 | | | | (1.23 | ) | | | 1.44 | | | | 7.45 | | | | (2.23 | ) | | | 0.36 | |
| | | | | | | | | | | | | | | | | | | | | | | | |
| | | | | | |
Distributions(b) | | | | | | | | | | | | | | | | | | | | | | | | |
From net investment income | | | (1.52 | ) | | | (1.50 | ) | | | (1.58 | ) | | | (1.43 | ) | | | (1.06 | ) | | | (1.00 | ) |
From net realized gain | | | — | | | | (0.06 | ) | | | (0.29 | ) | | | — | | | | — | | | | (1.05 | ) |
| | | | | | | | | | | | | | | | | | | | | | | | |
| | | | | | |
Total distributions | | | (1.52 | ) | | | (1.56 | ) | | | (1.87 | ) | | | (1.43 | ) | | | (1.06 | ) | | | (2.05 | ) |
| | | | | | | | | | | | | | | | | | | | | | | | |
| | | | | | |
Net asset value, end of period | | $ | 24.27 | | | $ | 21.94 | | | $ | 24.73 | | | $ | 25.16 | | | $ | 19.14 | | | $ | 22.43 | |
| | | | | | | | | | | | | | | | | | | | | | | | |
| | | | | | |
Total Return(c) | | | | | | | | | | | | | | | | | | | | | | | | |
Based on net asset value | | | 18.14 | % | | | (4.96 | )% | | | 5.99 | %(d) | | | 40.44 | % | | | (10.09 | )%(e) | | | 2.02 | % |
| | | | | | | | | | | | | | | | | | | | | | | | |
| | | | | | |
Ratios to Average Net Assets(f) | | | | | | | | | | | | | | | | | | | | | | | | |
Total expenses | | | 1.23 | % | | | 1.24 | % | | | 1.31 | % | | | 1.40 | % | | | 1.40 | %(g) | | | 1.37 | % |
| | | | | | | | | | | | | | | | | | | | | | | | |
| | | | | | |
Total expenses after fees waived and/or reimbursed | | | 1.10 | % | | | 1.10 | % | | | 1.10 | % | | | 1.10 | % | | | 1.10 | %(g) | | | 1.10 | % |
| | | | | | | | | | | | | | | | | | | | | | | | |
| | | | | | |
Net investment income | | | 6.65 | % | | | 6.54 | % | | | 6.41 | % | | | 6.64 | % | | | 5.35 | %(g) | | | 4.55 | % |
| | | | | | | | | | | | | | | | | | | | | | | | |
| | | | | | |
Supplemental Data | | | | | | | | | | | | | | | | | | | | | | | | |
Net assets, end of period (000) | | $ | 303,692 | | | $ | 296,254 | | | $ | 293,050 | | | $ | 208,207 | | | $ | 172,696 | | | $ | 215,121 | |
| | | | | | | | | | | | | | | | | | | | | | | | |
| | | | | | |
Portfolio turnover rate | | | 85 | % | | | 126 | % | | | 140 | % | | | 146 | % | | | 76 | % | | | 79 | % |
| | | | | | | | | | | | | | | | | | | | | | | | |
| (a) | Based on average shares outstanding. |
| (b) | Distributions for annual periods determined in accordance with U.S. federal income tax regulations. |
| (c) | Where applicable, excludes the effects of any sales charges and assumes the reinvestment of distributions. |
| (d) | Includes a capital contribution from affiliate, which had no impact on the Fund’s total return. |
| (f) | Excludes fees and expenses incurred indirectly as a result of investments in underlying funds. |
See notes to financial statements.
| | |
F I N A N C I A L H I G H L I G H T S | | 23 |
Financial Highlights (continued)
(For a share outstanding throughout each period)
| | | | | | | | | | | | | | | | | | | | | | | | |
| | | BlackRock High Equity Income Fund (continued) | |
| |
| | | Investor C | |
| | | Year Ended
05/31/24 | | | Year Ended
05/31/23 | | | Year Ended
05/31/22 | | | Year Ended
05/31/21 | | | Period from
10/01/19
to 05/31/20 | | | Year Ended
09/30/19 | |
| | | | | | | |
Net asset value, beginning of period | | $ | 13.62 | | | $ | 15.37 | | | $ | 15.75 | | | $ | 11.98 | | | $ | 14.35 | | | $ | 16.19 | |
| | | | | | | | | | | | | | | | | | | | | | | | |
| | | | | | |
Net investment income(a) | | | 0.84 | | | | 0.82 | | | | 0.87 | | | | 0.78 | | | | 0.41 | | | | 0.55 | |
Net realized and unrealized gain (loss) | | | 1.44 | | | | (1.68 | ) | | | (0.09 | ) | | | 3.78 | | | | (1.88 | ) | | | (0.45 | ) |
| | | | | | | | | | | | | | | | | | | | | | | | |
| | | | | | |
Net increase (decrease) from investment operations | | | 2.28 | | | | (0.86 | ) | | | 0.78 | | | | 4.56 | | | | (1.47 | ) | | | 0.10 | |
| | | | | | | | | | | | | | | | | | | | | | | | |
| | | | | | |
Distributions(b) | | | | | | | | | | | | | | | | | | | | | | | | |
From net investment income | | | (0.84 | ) | | | (0.83 | ) | | | (0.87 | ) | | | (0.79 | ) | | | (0.90 | ) | | | (0.89 | ) |
From net realized gain | | | — | | | | (0.06 | ) | | | (0.29 | ) | | | — | | | | — | | | | (1.05 | ) |
| | | | | | | | | | | | | | | | | | | | | | | | |
| | | | | | |
Total distributions | | | (0.84 | ) | | | (0.89 | ) | | | (1.16 | ) | | | (0.79 | ) | | | (0.90 | ) | | | (1.94 | ) |
| | | | | | | | | | | | | | | | | | | | | | | | |
| | | | | | |
Net asset value, end of period | | $ | 15.06 | | | $ | 13.62 | | | $ | 15.37 | | | $ | 15.75 | | | $ | 11.98 | | | $ | 14.35 | |
| | | | | | | | | | | | | | | | | | | | | | | | |
| | | | | | |
Total Return(c) | | | | | | | | | | | | | | | | | | | | | | | | |
Based on net asset value | | | 17.22 | % | | | (5.63 | )% | | | 5.17 | %(d) | | | 39.41 | % | | | (10.52 | )%(e) | | | 1.30 | % |
| | | | | | | | | | | | | | | | | | | | | | | | |
| | | | | | |
Ratios to Average Net Assets(f) | | | | | | | | | | | | | | | | | | | | | | | | |
Total expenses | | | 1.98 | % | | | 1.98 | % | | | 2.04 | % | | | 2.18 | % | | | 2.16 | %(g) | | | 2.12 | % |
| | | | | | | | | | | | | | | | | | | | | | | | |
| | | | | | |
Total expenses after fees waived and/or reimbursed | | | 1.85 | % | | | 1.85 | % | | | 1.85 | % | | | 1.85 | % | | | 1.85 | %(g) | | | 1.85 | % |
| | | | | | | | | | | | | | | | | | | | | | | | |
| | | | | | |
Net investment income | | | 5.90 | % | | | 5.80 | % | | | 5.67 | % | | | 5.85 | % | | | 4.57 | %(g) | | | 3.84 | % |
| | | | | | | | | | | | | | | | | | | | | | | | |
| | | | | | |
Supplemental Data | | | | | | | | | | | | | | | | | | | | | | | | |
Net assets, end of period (000) | | $ | 62,685 | | | $ | 59,276 | | | $ | 42,543 | | | $ | 22,379 | | | $ | 24,163 | | | $ | 36,132 | |
| | | | | | | | | | | | | | | | | | | | | | | | |
| | | | | | |
Portfolio turnover rate | | | 85 | % | | | 126 | % | | | 140 | % | | | 146 | % | | | 76 | % | | | 79 | % |
| | | | | | | | | | | | | | | | | | | | | | | | |
| (a) | Based on average shares outstanding. |
| (b) | Distributions for annual periods determined in accordance with U.S. federal income tax regulations. |
| (c) | Where applicable, excludes the effects of any sales charges and assumes the reinvestment of distributions. |
| (d) | Includes a capital contribution from affiliate, which had no impact on the Fund’s total return. |
| (f) | Excludes fees and expenses incurred indirectly as a result of investments in underlying funds. |
See notes to financial statements.
| | |
| 24 | | 2 0 2 4 B L A C K R O C K A N N U A L F I N A N C I A L S T A T E M E N T S |
Financial Highlights (continued)
(For a share outstanding throughout each period)
| | | | | | | | | | | | | | | | | | | | |
| | | BlackRock High Equity Income Fund (continued) | |
| |
| | | Class K | |
| |
| Year Ended
05/31/24 |
| |
| Year Ended
05/31/23 |
| |
| Year Ended
05/31/22 |
| |
| Year Ended
05/31/21 |
| |
| Period from
04/21/20to 05/31/20 |
(a) |
| | | | | | |
Net asset value, beginning of period | | $ | 26.21 | | | $ | 29.53 | | | $ | 30.00 | | | $ | 22.81 | | | $ | 21.04 | |
| | | | | | | | | | | | | | | | | | | | |
| | | | | |
Net investment income(b) | | | 1.91 | | | | 1.87 | | | | 2.00 | | | | 1.78 | | | | 0.20 | |
Net realized and unrealized gain (loss) | | | 2.77 | | | | (3.25 | ) | | | (0.21 | ) | | | 7.19 | | | | 1.77 | |
| | | | | | | | | | | | | | | | | | | | |
| | | | | |
Net increase (decrease) from investment operations | | | 4.68 | | | | (1.38 | ) | | | 1.79 | | | | 8.97 | | | | 1.97 | |
| | | | | | | | | | | | | | | | | | | | |
| | | | | |
Distributions(c) | | | | | | | | | | | | | | | | | | | | |
From net investment income | | | (1.90 | ) | | | (1.88 | ) | | | (1.97 | ) | | | (1.78 | ) | | | (0.20 | ) |
From net realized gain | | | — | | | | (0.06 | ) | | | (0.29 | ) | | | — | | | | — | |
| | | | | | | | | | | | | | | | | | | | |
| | | | | |
Total distributions | | | (1.90 | ) | | | (1.94 | ) | | | (2.26 | ) | | | (1.78 | ) | | | (0.20 | ) |
| | | | | | | | | | | | | | | | | | | | |
| | | | | |
Net asset value, end of period | | $ | 28.99 | | | $ | 26.21 | | | $ | 29.53 | | | $ | 30.00 | | | $ | 22.81 | |
| | | | | | | | | | | | | | | | | | | | |
| | | | | |
Total Return(d) | | | | | | | | | | | | | | | | | | | | |
Based on net asset value | | | 18.48 | % | | | (4.68 | )% | | | 6.27 | %(e) | | | 40.93 | % | | | 9.35 | %(f) |
| | | | | | | | | | | | | | | | | | | | |
| | | | | |
Ratios to Average Net Assets(g) | | | | | | | | | | | | | | | | | | | | |
Total expenses | | | 0.88 | % | | | 0.89 | % | | | 0.98 | % | | | 1.01 | % | | | 0.99 | %(h) |
| | | | | | | | | | | | | | | | | | | | |
| | | | | |
Total expenses after fees waived and/or reimbursed | | | 0.80 | % | | | 0.80 | % | | | 0.80 | % | | | 0.80 | % | | | 0.80 | %(h) |
| | | | | | | | | | | | | | | | | | | | |
| | | | | |
Net investment income | | | 6.94 | % | | | 6.88 | % | | | 6.76 | % | | | 6.94 | % | | | 8.28 | %(h) |
| | | | | | | | | | | | | | | | | | | | |
| | | | | |
Supplemental Data | | | | | | | | | | | | | | | | | | | | |
Net assets, end of period (000) | | $ | 219,915 | | | $ | 137,700 | | | $ | 535 | | | $ | 359 | | | $ | 288 | |
| | | | | | | | | | | | | | | | | | | | |
| | | | | |
Portfolio turnover rate | | | 85 | % | | | 126 | % | | | 140 | % | | | 146 | % | | | 76 | %(i) |
| | | | | | | | | | | | | | | | | | | | |
| (a) | Commencement of operations. |
| (b) | Based on average shares outstanding. |
| (c) | Distributions for annual periods determined in accordance with U.S. federal income tax regulations. |
| (d) | Where applicable, assumes the reinvestment of distributions. |
| (e) | Includes a capital contribution from affiliate, which had no impact on the Fund’s total return. |
| (g) | Excludes fees and expenses incurred indirectly as a result of investments in underlying funds. |
| (i) | Portfolio turnover is representative of the Fund for the entire year. |
See notes to financial statements.
| | |
F I N A N C I A L H I G H L I G H T S | | 25 |
Financial Highlights
(For a share outstanding throughout each period)
| | | | | | | | | | | | | | | | | | | | | | | | |
| | | BlackRock International Dividend Fund | |
| |
| | | Institutional | |
| | | Year Ended
05/31/24 | | | Year Ended
05/31/23 | | | Year Ended
05/31/22 | | | Year Ended
05/31/21 | | | Period from
10/01/19
to 05/31/20 | | | Year Ended
09/30/19 | |
| | | | | | | |
Net asset value, beginning of period | | $ | 32.82 | | | $ | 32.36 | | | $ | 36.36 | | | $ | 28.23 | | | $ | 28.67 | | | $ | 29.16 | |
| | | | | | | | | | | | | | | | | | | | | | | | |
| | | | | | |
Net investment income(a) | | | 0.64 | | | | 0.86 | | | | 0.64 | | | | 0.85 | | | | 0.42 | | | | 0.70 | |
Net realized and unrealized gain (loss) | | | 4.01 | | | | 0.56 | | | | (2.45 | ) | | | 7.81 | | | | (0.40 | ) | | | 0.32 | |
| | | | | | | | | | | | | | | | | | | | | | | | |
| | | | | | |
Net increase (decrease) from investment operations | | | 4.65 | | | | 1.42 | | | | (1.81 | ) | | | 8.66 | | | | 0.02 | | | | 1.02 | |
| | | | | | | | | | | | | | | | | | | | | | | | |
| | | | | | |
Distributions(b) | | | | | | | | | | | | | | | | | | | | | | | | |
From net investment income | | | (0.64 | ) | | | (0.43 | ) | | | (0.79 | ) | | | (0.53 | ) | | | (0.39 | ) | | | (0.66 | ) |
From net realized gain | | | — | | | | (0.53 | ) | | | (1.40 | ) | | | — | | | | (0.07 | ) | | | (0.85 | ) |
| | | | | | | | | | | | | | | | | | | | | | | | |
| | | | | | |
Total distributions | | | (0.64 | ) | | | (0.96 | ) | | | (2.19 | ) | | | (0.53 | ) | | | (0.46 | ) | | | (1.51 | ) |
| | | | | | | | | | | | | | | | | | | | | | | | |
| | | | | | |
Net asset value, end of period | | $ | 36.83 | | | $ | 32.82 | | | $ | 32.36 | | | $ | 36.36 | | | $ | 28.23 | | | $ | 28.67 | |
| | | | | | | | | | | | | | | | | | | | | | | | |
| | | | | | |
Total Return(c) | | | | | | | | | | | | | | | | | | | | | | | | |
Based on net asset value | | | 14.35 | % | | | 4.81 | % | | | (5.23 | )% | | | 30.98 | % | | | 0.08 | %(d) | | | 3.86 | % |
| | | | | | | | | | | | | | | | | | | | | | | | |
| | | | | | |
Ratios to Average Net Assets(e) | | | | | | | | | | | | | | | | | | | | | | | | |
Total expenses | | | 0.87 | % | | | 1.07 | % | | | 1.18 | % | | | 1.13 | % | | | 1.17 | %(f)(g) | | | 1.15 | % |
| | | | | | | | | | | | | | | | | | | | | | | | |
| | | | | | |
Total expenses after fees waived and/or reimbursed | | | 0.67 | % | | | 0.84 | % | | | 0.87 | % | | | 0.84 | % | | | 0.84 | %(f)(g) | | | 0.84 | % |
| | | | | | | | | | | | | | | | | | | | | | | | |
| | | | | | |
Net investment income | | | 1.88 | % | | | 2.71 | % | | | 1.85 | % | | | 2.63 | % | | | 2.23 | %(f) | | | 2.52 | % |
| | | | | | | | | | | | | | | | | | | | | | | | |
| | | | | | |
Supplemental Data | | | | | | | | | | | | | | | | | | | | | | | | |
Net assets, end of period (000) | | $ | 519,289 | | | $ | 432,855 | | | $ | 118,637 | | | $ | 101,899 | | | $ | 74,681 | | | $ | 83,814 | |
| | | | | | | | | | | | | | | | | | | | | | | | |
| | | | | | |
Portfolio turnover rate | | | 71 | % | | | 34 | % | | | 50 | % | | | 83 | % | | | 29 | % | | | 22 | % |
| | | | | | | | | | | | | | | | | | | | | | | | |
| (a) | Based on average shares outstanding. |
| (b) | Distributions for annual periods determined in accordance with U.S. federal income tax regulations. |
| (c) | Where applicable, assumes the reinvestment of distributions. |
| (e) | Excludes fees and expenses incurred indirectly as a result of investments in underlying funds. |
| (g) | Audit and Printing costs were not annualized in the calculation of the expense ratios. If these expenses were annualized, the total expenses and total expenses after fees waived and/or reimbursed would have been 1.19% and 0.84%, respectively. |
See notes to financial statements.
| | |
| 26 | | 2 0 2 4 B L A C K R O C K A N N U A L F I N A N C I A L S T A T E M E N T S |
Financial Highlights (continued)
(For a share outstanding throughout each period)
| | | | | | | | | | | | | | | | | | | | | | | | |
| | | BlackRock International Dividend Fund (continued) | |
| |
| | | Investor A | |
| | | Year Ended
05/31/24 | | | Year Ended
05/31/23 | | | Year Ended
05/31/22 | | | Year Ended
05/31/21 | | | Period from
10/01/19
to 05/31/20 | | | Year Ended
09/30/19 | |
| | | | | | | |
Net asset value, beginning of period | | $ | 30.26 | | | $ | 29.91 | | | $ | 33.78 | | | $ | 26.26 | | | $ | 26.69 | | | $ | 27.26 | |
| | | | | | | | | | | | | | | | | | | | | | | | |
| | | | | | |
Net investment income(a) | | | 0.52 | | | | 0.50 | | | | 0.45 | | | | 0.70 | | | | 0.34 | | | | 0.60 | |
Net realized and unrealized gain (loss) | | | 3.68 | | | | 0.74 | | | | (2.21 | ) | | | 7.28 | | | | (0.37 | ) | | | 0.27 | |
| | | | | | | | | | | | | | | | | | | | | | | | |
| | | | | | |
Net increase (decrease) from investment operations | | | 4.20 | | | | 1.24 | | | | (1.76 | ) | | | 7.98 | | | | (0.03 | ) | | | 0.87 | |
| | | | | | | | | | | | | | | | | | | | | | | | |
| | | | | | |
Distributions(b) | | | | | | | | | | | | | | | | | | | | | | | | |
From net investment income | | | (0.56 | ) | | | (0.36 | ) | | | (0.71 | ) | | | (0.46 | ) | | | (0.33 | ) | | | (0.59 | ) |
From net realized gain | | | — | | | | (0.53 | ) | | | (1.40 | ) | | | — | | | | (0.07 | ) | | | (0.85 | ) |
| | | | | | | | | | | | | | | | | | | | | | | | |
| | | | | | |
Total distributions | | | (0.56 | ) | | | (0.89 | ) | | | (2.11 | ) | | | (0.46 | ) | | | (0.40 | ) | | | (1.44 | ) |
| | | | | | | | | | | | | | | | | | | | | | | | |
| | | | | | |
Net asset value, end of period | | $ | 33.90 | | | $ | 30.26 | | | $ | 29.91 | | | $ | 33.78 | | | $ | 26.26 | | | $ | 26.69 | |
| | | | | | | | | | | | | | | | | | | | | | | | |
| | | | | | |
Total Return(c) | | | | | | | | | | | | | | | | | | | | | | | | |
Based on net asset value | | | 14.07 | % | | | 4.56 | % | | | (5.48 | )% | | | 30.67 | % | | | (0.08 | )%(d) | | | 3.57 | % |
| | | | | | | | | | | | | | | | | | | | | | | | |
| | | | | | |
Ratios to Average Net Assets(e) | | | | | | | | | | | | | | | | | | | | | | | | |
Total expenses | | | 1.17 | % | | | 1.39 | % | | | 1.46 | % | | | 1.45 | % | | | 1.48 | %(f)(g) | | | 1.43 | % |
| | | | | | | | | | | | | | | | | | | | | | | | |
| | | | | | |
Total expenses after fees waived and/or reimbursed | | | 0.92 | % | | | 1.11 | % | | | 1.12 | % | | | 1.09 | % | | | 1.09 | %(f)(g) | | | 1.09 | % |
| | | | | | | | | | | | | | | | | | | | | | | | |
| | | | | | |
Net investment income | | | 1.66 | % | | | 1.76 | % | | | 1.42 | % | | | 2.34 | % | | | 1.92 | %(f) | | | 2.30 | % |
| | | | | | | | | | | | | | | | | | | | | | | | |
| | | | | | |
Supplemental Data | | | | | | | | | | | | | | | | | | | | | | | | |
Net assets, end of period (000) | | $ | 133,139 | | | $ | 121,411 | | | $ | 113,512 | | | $ | 128,077 | | | $ | 100,753 | | | $ | 125,196 | |
| | | | | | | | | | | | | | | | | | | | | | | | |
| | | | | | |
Portfolio turnover rate | | | 71 | % | | | 34 | % | | | 50 | % | | | 83 | % | | | 29 | % | | | 22 | % |
| | | | | | | | | | | | | | | | | | | | | | | | |
| (a) | Based on average shares outstanding. |
| (b) | Distributions for annual periods determined in accordance with U.S. federal income tax regulations. |
| (c) | Where applicable, excludes the effects of any sales charges and assumes the reinvestment of distributions. |
| (e) | Excludes fees and expenses incurred indirectly as a result of investments in underlying funds. |
| (g) | Audit and Printing costs were not annualized in the calculation of the expense ratios. If these expenses were annualized, the total expenses and total expenses after fees waived and/or reimbursed would have been 1.51% and 1.09%, respectively. |
See notes to financial statements.
| | |
F I N A N C I A L H I G H L I G H T S | | 27 |
Financial Highlights (continued)
(For a share outstanding throughout each period)
| | | | | | | | | | | | | | | | | | | | | | | | |
| | | BlackRock International Dividend Fund (continued) | |
| |
| | | Investor C | |
| | | Year Ended
05/31/24 | | | Year Ended
05/31/23 | | | Year Ended
05/31/22 | | | Year Ended
05/31/21 | | | Period from
10/01/19
to 05/31/20 | | | Year Ended
09/30/19 | |
| | | | | | | |
Net asset value, beginning of period | | $ | 25.85 | | | $ | 25.71 | | | $ | 29.33 | | | $ | 22.85 | | | $ | 23.25 | | | $ | 23.94 | |
| | | | | | | | | | | | | | | | | | | | | | | | |
| | | | | | |
Net investment income(a) | | | 0.24 | | | | 0.26 | | | | 0.16 | | | | 0.33 | | | | 0.18 | | | | 0.32 | |
Net realized and unrealized gain (loss) | | | 3.14 | | | | 0.61 | | | | (1.87 | ) | | | 6.41 | | | | (0.32 | ) | | | 0.26 | |
| | | | | | | | | | | | | | | | | | | | | | | | |
| | | | | | |
Net increase (decrease) from investment operations | | | 3.38 | | | | 0.87 | | | | (1.71 | ) | | | 6.74 | | | | (0.14 | ) | | | 0.58 | |
| | | | | | | | | | | | | | | | | | | | | | | | |
| | | | | | |
Distributions(b) | | | | | | | | | | | | | | | | | | | | | | | | |
From net investment income | | | (0.37 | ) | | | (0.20 | ) | | | (0.51 | ) | | | (0.26 | ) | | | (0.19 | ) | | | (0.42 | ) |
From net realized gain | | | — | | | | (0.53 | ) | | | (1.40 | ) | | | — | | | | (0.07 | ) | | | (0.85 | ) |
| | | | | | | | | | | | | | | | | | | | | | | | |
| | | | | | |
Total distributions | | | (0.37 | ) | | | (0.73 | ) | | | (1.91 | ) | | | (0.26 | ) | | | (0.26 | ) | | | (1.27 | ) |
| | | | | | | | | | | | | | | | | | | | | | | | |
| | | | | | |
Net asset value, end of period | | $ | 28.86 | | | $ | 25.85 | | | $ | 25.71 | | | $ | 29.33 | | | $ | 22.85 | | | $ | 23.25 | |
| | | | | | | | | | | | | | | | | | | | | | | | |
| | | | | | |
Total Return(c) | | | | | | | | | | | | | | | | | | | | | | | | |
Based on net asset value | | | 13.21 | % | | | 3.77 | % | | | (6.17 | )% | | | 29.70 | % | | | (0.58 | )%(d) | | | 2.80 | % |
| | | | | | | | | | | | | | | | | | | | | | | | |
| | | | | | |
Ratios to Average Net Assets(e) | | | | | | | | | | | | | | | | | | | | | | | | |
Total expenses | | | 1.99 | % | | | 2.19 | % | | | 2.30 | % | | | 2.28 | % | | | 2.27 | %(f)(g) | | | 2.20 | % |
| | | | | | | | | | | | | | | | | | | | | | | | |
| | | | | | |
Total expenses after fees waived and/or reimbursed | | | 1.67 | % | | | 1.86 | % | | | 1.86 | % | | | 1.84 | % | | | 1.84 | %(f)(g) | | | 1.84 | % |
| | | | | | | | | | | | | | | | | | | | | | | | |
| | | | | | |
Net investment income | | | 0.89 | % | | | 1.06 | % | | | 0.60 | % | | | 1.31 | % | | | 1.15 | %(f) | | | 1.39 | % |
| | | | | | | | | | | | | | | | | | | | | | | | |
| | | | | | |
Supplemental Data | | | | | | | | | | | | | | | | | | | | | | | | |
Net assets, end of period (000) | | $ | 4,183 | | | $ | 4,517 | | | $ | 4,067 | | | $ | 5,607 | | | $ | 9,906 | | | $ | 14,805 | |
| | | | | | | | | | | | | | | | | | | | | | | | |
| | | | | | |
Portfolio turnover rate | | | 71 | % | | | 34 | % | | | 50 | % | | | 83 | % | | | 29 | % | | | 22 | % |
| | | | | | | | | | | | | | | | | | | | | | | | |
| (a) | Based on average shares outstanding. |
| (b) | Distributions for annual periods determined in accordance with U.S. federal income tax regulations. |
| (c) | Where applicable, excludes the effects of any sales charges and assumes the reinvestment of distributions. |
| (e) | Excludes fees and expenses incurred indirectly as a result of investments in underlying funds. |
| (g) | Audit and Printing costs were not annualized in the calculation of the expense ratios. If these expenses were annualized, the total expenses and total expenses after fees waived and/or reimbursed would have been 2.29% and 1.84%, respectively. |
See notes to financial statements.
| | |
| 28 | | 2 0 2 4 B L A C K R O C K A N N U A L F I N A N C I A L S T A T E M E N T S |
Financial Highlights (continued)
(For a share outstanding throughout each period)
| | | | | | | | | | | | | | | | | | | | | | | | |
| | | BlackRock International Dividend Fund (continued) | |
| |
| | | Class K | |
| | | Year Ended
05/31/24 | | | Year Ended
05/31/23 | | | Year Ended
05/31/22 | | | Year Ended
05/31/21 | | | Period from
10/01/19
to 05/31/20 | | | Year Ended
09/30/19 | |
| | | | | | | |
Net asset value, beginning of period | | $ | 32.83 | | | $ | 32.36 | | | $ | 36.36 | | | $ | 28.23 | | | $ | 28.68 | | | $ | 29.17 | |
| | | | | | | | | | | | | | | | | | | | | | | | |
| | | | | | |
Net investment income(a) | | | 0.69 | | | | 0.76 | | | | 0.76 | | | | 0.87 | | | | 0.44 | | | | 0.73 | |
Net realized and unrealized gain (loss) | | | 3.98 | | | | 0.69 | | | | (2.55 | ) | | | 7.80 | | | | (0.42 | ) | | | 0.30 | |
| | | | | | | | | | | | | | | | | | | | | | | | |
| | | | | | |
Net increase (decrease) from investment operations | | | 4.67 | | | | 1.45 | | | | (1.79 | ) | | | 8.67 | | | | 0.02 | | | | 1.03 | |
| | | | | | | | | | | | | | | | | | | | | | | | |
| | | | | | |
Distributions(b) | | | | | | | | | | | | | | | | | | | | | | | | |
From net investment income | | | (0.66 | ) | | | (0.45 | ) | | | (0.81 | ) | | | (0.54 | ) | | | (0.40 | ) | | | (0.67 | ) |
From net realized gain | | | — | | | | (0.53 | ) | | | (1.40 | ) | | | — | | | | (0.07 | ) | | | (0.85 | ) |
| | | | | | | | | | | | | | | | | | | | | | | | |
| | | | | | |
Total distributions | | | (0.66 | ) | | | (0.98 | ) | | | (2.21 | ) | | | (0.54 | ) | | | (0.47 | ) | | | (1.52 | ) |
| | | | | | | | | | | | | | | | | | | | | | | | |
| | | | | | |
Net asset value, end of period | | $ | 36.84 | | | $ | 32.83 | | | $ | 32.36 | | | $ | 36.36 | | | $ | 28.23 | | | $ | 28.68 | |
| | | | | | | | | | | | | | | | | | | | | | | | |
| | | | | | |
Total Return(c) | | | | | | | | | | | | | | | | | | | | | | | | |
Based on net asset value | | | 14.41 | % | | | 4.89 | % | | | (5.18 | )% | | | 31.04 | % | | | 0.09 | %(d) | | | 3.92 | % |
| | | | | | | | | | | | | | | | | | | | | | | | |
| | | | | | |
Ratios to Average Net Assets(e) | | | | | | | | | | | | | | | | | | | | | | | | |
Total expenses | | | 0.76 | % | | | 0.97 | % | | | 1.09 | % | | | 1.03 | % | | | 1.08 | %(f)(g) | | | 1.04 | % |
| | | | | | | | | | | | | | | | | | | | | | | | |
| | | | | | |
Total expenses after fees waived and/or reimbursed | | | 0.62 | % | | | 0.80 | % | | | 0.82 | % | | | 0.79 | % | | | 0.79 | %(f)(g) | | | 0.79 | % |
| | | | | | | | | | | | | | | | | | | | | | | | |
| | | | | | |
Net investment income | | | 2.03 | % | | | 2.42 | % | | | 2.23 | % | | | 2.68 | % | | | 2.28 | %(f) | | | 2.63 | % |
| | | | | | | | | | | | | | | | | | | | | | | | |
| | | | | | |
Supplemental Data | | | | | | | | | | | | | | | | | | | | | | | | |
Net assets, end of period (000) | | $ | 79,277 | | | $ | 60,350 | | | $ | 17,092 | | | $ | 5,936 | | | $ | 3,266 | | | $ | 3,847 | |
| | | | | | | | | | | | | | | | | | | | | | | | |
| | | | | | |
Portfolio turnover rate | | | 71 | % | | | 34 | % | | | 50 | % | | | 83 | % | | | 29 | % | | | 22 | % |
| | | | | | | | | | | | | | | | | | | | | | | | |
| (a) | Based on average shares outstanding. |
| (b) | Distributions for annual periods determined in accordance with U.S. federal income tax regulations. |
| (c) | Where applicable, assumes the reinvestment of distributions. |
| (e) | Excludes fees and expenses incurred indirectly as a result of investments in underlying funds. |
| (g) | Audit and Printing costs were not annualized in the calculation of the expense ratios. If these expenses were annualized, the total expenses and total expenses after fees waived and/or reimbursed would have been 1.10% and 0.79%, respectively. |
See notes to financial statements.
| | |
F I N A N C I A L H I G H L I G H T S | | 29 |
Notes to Financial Statements
BlackRock FundsSM (the “Trust”) is registered under the Investment Company Act of 1940, as amended (the “1940 Act”), as an open-end management investment company. The Trust is organized as a Massachusetts business trust. The following, each of which is a series of the Trust, are referred to herein collectively as the “Funds” or individually as a “Fund”:
| | | | | | | | |
| |
| | |
| Fund Name | | Herein Referred To As | | | Diversification Classification | |
| |
| | |
BlackRock Energy Opportunities Fund | | | Energy Opportunities | | | | Non-Diversified | |
BlackRock High Equity Income Fund | | | High Equity Income | | | | Diversified | |
BlackRock International Dividend Fund | | | International Dividend | | | | Diversified | |
| |
Each Fund offers multiple classes of shares. All classes of shares have identical voting, dividend, liquidation and other rights and are subject to the same terms and conditions, except that certain classes bear expenses related to the shareholder servicing and distribution of such shares. Institutional and Class K Shares are sold only to certain eligible investors. Investor A and Investor C Shares bear certain expenses related to shareholder servicing of such shares, and Investor C Shares also bear certain expenses related to the distribution of such shares. Investor A and Investor C Shares are generally available through financial intermediaries. Each class has exclusive voting rights with respect to matters relating to its shareholder servicing and distribution expenditures (except that Investor C shareholders may vote on material changes to the Investor A Shares distribution and service plan).
| | | | | | | | | | | | |
| |
| | | |
| Share Class | | Initial Sales Charge | | | CDSC | | | Conversion Privilege | |
| |
| | | |
Institutional and Class K Shares | | | No | | | | No | | | | None | |
Investor A Shares | | | Yes | | | | No | (a) | | | None | |
Investor C Shares | | | No | | | | Yes | (b) | | | To Investor A Shares after approximately 8 years | |
| |
| | (a) | Investor A Shares may be subject to a contingent deferred sales charge (“CDSC”) for certain redemptions where no initial sales charge was paid at the time of purchase. | |
| | (b) | A CDSC of 1.00% is assessed on certain redemptions of Investor C Shares made within one year after purchase. | |
The Funds, together with certain other registered investment companies advised by BlackRock Advisors, LLC (the “Manager”) or its affiliates, are included in a complex of funds referred to as the BlackRock Multi-Asset Complex.
On April 16, 2024, the Board of Trustees (“the Board”) approved the reorganization of International Dividend into a newly created ETF, BlackRock International Dividend ETF. The newly created ETF will have identical investment objectives, investment policies and investment strategies as International Dividend. The reorganization is anticipated to close on or about November 18, 2024.
| 2. | SIGNIFICANT ACCOUNTING POLICIES |
The financial statements are prepared in conformity with accounting principles generally accepted in the United States of America (“U.S. GAAP”), which may require management to make estimates and assumptions that affect the reported amounts of assets and liabilities in the financial statements, disclosure of contingent assets and liabilities at the date of the financial statements and the reported amounts of increases and decreases in net assets from operations during the reporting period. Actual results could differ from those estimates. Each Fund is considered an investment company under U.S. GAAP and follows the accounting and reporting guidance applicable to investment companies. Below is a summary of significant accounting policies:
Investment Transactions and Income Recognition: For financial reporting purposes, investment transactions are recorded on the dates the transactions are executed. Realized gains and losses on investment transactions are determined using the specific identification method. Dividend income and capital gain distributions, if any, are recorded on the ex-dividend dates. Non-cash dividends, if any, are recorded on the ex-dividend dates at fair value. Dividends from foreign securities where the ex-dividend dates may have passed are subsequently recorded when the Funds are informed of the ex-dividend dates. Under the applicable foreign tax laws, a withholding tax at various rates may be imposed on capital gains, dividends and interest. Upon notification from issuers, a portion of the dividend income received from a real estate investment trust may be redesignated as a reduction of cost of the related investment and/or realized gain. Interest income, including amortization and accretion of premiums and discounts on debt securities, is recognized daily on an accrual basis. Income, expenses and realized and unrealized gains and losses are allocated daily to each class based on its relative net assets.
Foreign Currency Translation: Each Fund’s books and records are maintained in U.S. dollars. Securities and other assets and liabilities denominated in foreign currencies are translated into U.S. dollars using exchange rates determined as of the close of trading on the New York Stock Exchange (“NYSE”). Purchases and sales of investments are recorded at the rates of exchange prevailing on the respective dates of such transactions. Generally, when the U.S. dollar rises in value against a foreign currency, the investments denominated in that currency will lose value; the opposite effect occurs if the U.S. dollar falls in relative value.
Each Fund does not isolate the effect of fluctuations in foreign exchange rates from the effect of fluctuations in the market prices of investments for financial reporting purposes. Accordingly, the effects of changes in exchange rates on investments are not segregated in the Statements of Operations from the effects of changes in market prices of those investments, but are included as a component of net realized and unrealized gain (loss) from investments. Each Fund reports realized currency gains (losses) on foreign currency related transactions as components of net realized gain (loss) for financial reporting purposes, whereas such components are generally treated as ordinary income for U.S. federal income tax purposes.
Foreign Taxes: The Funds may be subject to foreign taxes (a portion of which may be reclaimable) on income, stock dividends, capital gains on investments, or certain foreign currency transactions. All foreign taxes are recorded in accordance with the applicable foreign tax regulations and rates that exist in the foreign jurisdictions in which each Fund invests. These foreign taxes, if any, are paid by each Fund and are reflected in its Statements of Operations as follows: foreign taxes withheld at source are presented as a reduction of income, foreign taxes on securities lending income are presented as a reduction of securities lending income, foreign taxes on stock dividends are presented as
| | |
| 30 | | 2 0 2 4 B L A C K R O C K A N N U A L F I N A N C I A L S T A T E M E N T S |
Notes to Financial Statements (continued)
“Foreign taxes withheld”, and foreign taxes on capital gains from sales of investments and foreign taxes on foreign currency transactions are included in their respective net realized gain (loss) categories. Foreign taxes payable or deferred as of May 31, 2024, if any, are disclosed in the Statements of Assets and Liabilities.
The Funds file withholding tax reclaims in certain jurisdictions to recover a portion of amounts previously withheld. The Funds may record a reclaim receivable based on collectability, which includes factors such as the jurisdiction’s applicable laws, payment history and market convention. The Statements of Operations include tax reclaims recorded as well as professional and other fees, if any, associated with recovery of foreign withholding taxes.
Bank Overdraft: The Funds had outstanding cash disbursements exceeding deposited cash amounts at the custodian during the reporting period. The Funds are obligated to repay the custodian for any overdraft, including any related costs or expenses, where applicable. For financial reporting purposes, overdraft fees, if any, are included in interest expense in the Statements of Operations.
Collateralization: If required by an exchange or counterparty agreement, the Funds may be required to deliver/deposit cash and/or securities to/with an exchange, or broker-dealer or custodian as collateral for certain investments.
Distributions: Distributions paid by each Fund are recorded on the ex-dividend dates. The character and timing of distributions are determined in accordance with U.S. federal income tax regulations, which may differ from U.S. GAAP.
Indemnifications: In the normal course of business, a Fund enters into contracts that contain a variety of representations that provide general indemnification. A Fund’s maximum exposure under these arrangements is unknown because it involves future potential claims against a Fund, which cannot be predicted with any certainty.
Other: Expenses directly related to a Fund or its classes are charged to that Fund or the applicable class. Expenses directly related to the Funds and other shared expenses prorated to the Funds are allocated daily to each class based on their relative net assets or other appropriate methods. Other operating expenses shared by several funds, including other funds managed by the Manager, are prorated among those funds on the basis of relative net assets or other appropriate methods.
The Funds have an arrangement with their custodian whereby credits are earned on uninvested cash balances. For financial reporting purposes, custodian credits, if any, are included in interest income in the Statements of Operations.
| 3. | INVESTMENT VALUATION AND FAIR VALUE MEASUREMENTS |
Investment Valuation Policies: Each Fund’s investments are valued at fair value (also referred to as “market value” within the financial statements) each day that the Fund is open for business and, for financial reporting purposes, as of the report date. U.S. GAAP defines fair value as the price a fund would receive to sell an asset or pay to transfer a liability in an orderly transaction between market participants at the measurement date. The Board has approved the designation of each Fund’s Manager as the valuation designee for each Fund. Each Fund determines the fair values of its financial instruments using various independent dealers or pricing services under the Manager’s policies. If a security’s market price is not readily available or does not otherwise accurately represent the fair value of the security, the security will be valued in accordance with the Manager’s policies and procedures as reflecting fair value. The Manager has formed a committee (the “Valuation Committee”) to develop pricing policies and procedures and to oversee the pricing function for all financial instruments, with assistance from other BlackRock pricing committees.
Fair Value Inputs and Methodologies: The following methods and inputs are used to establish the fair value of each Fund’s assets and liabilities:
| | • | | Equity investments traded on a recognized securities exchange are valued at that day’s official closing price, as applicable, on the exchange where the stock is primarily traded. Equity investments traded on a recognized exchange for which there were no sales on that day may be valued at the last available bid (long positions) or ask (short positions) price. |
| | • | | Fixed-income investments for which market quotations are readily available are generally valued using the last available bid price or current market quotations provided by independent dealers or third-party pricing services. Pricing services generally value fixed-income securities assuming orderly transactions of an institutional round lot size, but a fund may hold or transact in such securities in smaller, odd lot sizes. Odd lots may trade at lower prices than institutional round lots. The pricing services may use matrix pricing or valuation models that utilize certain inputs and assumptions to derive values, including transaction data (e.g., recent representative bids and offers), market data, credit quality information, perceived market movements, news, and other relevant information. Certain fixed-income securities, including asset-backed and mortgage related securities may be valued based on valuation models that consider the estimated cash flows of each tranche of the entity, establish a benchmark yield and develop an estimated tranche specific spread to the benchmark yield based on the unique attributes of the tranche. The amortized cost method of valuation may be used with respect to debt obligations with sixty days or less remaining to maturity unless the Manager determines such method does not represent fair value. |
| | • | | Investments in open-end U.S. mutual funds (including money market funds) are valued at that day’s published net asset value (“NAV”). |
Generally, trading in foreign instruments is substantially completed each day at various times prior to the close of trading on the NYSE. Each business day, the Funds use current market factors supplied by independent pricing services to value certain foreign instruments (“Systematic Fair Value Price”). The Systematic Fair Value Price is designed to value such foreign securities at fair value as of the close of trading on the NYSE, which follows the close of the local markets.
If events (e.g., market volatility, company announcement or a natural disaster) occur that are expected to materially affect the value of such investment, or in the event that application of these methods of valuation results in a price for an investment that is deemed not to be representative of the market value of such investment, or if a price is not available, the investment will be valued by the Valuation Committee, in accordance with the Manager’s policies and procedures as reflecting fair value (“Fair Valued Investments”). The fair valuation approaches that may be used by the Valuation Committee include market approach, income approach and cost approach. Valuation techniques such as discounted cash flow, use of market comparables and matrix pricing are types of valuation approaches and are typically used in determining fair value. When determining the price for Fair Valued Investments, the Valuation Committee seeks to determine the price that each Fund might reasonably expect to receive or pay from the current sale or purchase of that asset or liability in an arm’s-length transaction. Fair value determinations shall be based upon all available factors that the Valuation Committee deems relevant and consistent with the principles of fair value measurement.
| | |
N O T E S T O F I N A N C I A L S T A T E M E N T S | | 31 |
Notes to Financial Statements (continued)
For investments in equity or debt issued by privately held companies or funds (“Private Company” or collectively, the “Private Companies”) and other Fair Valued Investments, the fair valuation approaches that are used by the Valuation Committee and third-party pricing services utilized by the Valuation Committee include one or a combination of, but not limited to, the following inputs.
| | | | |
| Standard Inputs Generally Considered By The Valuation Committee And Third-Party Pricing Services |
| | |
Market approach | | (i) | | recent market transactions, including subsequent rounds of financing, in the underlying investment or comparable issuers; |
| | (ii) | | recapitalizations and other transactions across the capital structure; and |
| | | (iii) | | market multiples of comparable issuers. |
| | |
Income approach | | (i) | | future cash flows discounted to present and adjusted as appropriate for liquidity, credit, and/or market risks; |
| | (ii) | | quoted prices for similar investments or assets in active markets; and |
| | | (iii) | | other risk factors, such as interest rates, yield curves, volatilities, prepayment speeds, loss severities, credit risks, recovery rates, liquidation amounts and/or default rates. |
| | |
Cost approach | | (i) | | audited or unaudited financial statements, investor communications and financial or operational metrics issued by the Private Company; |
| | (ii) | | changes in the valuation of relevant indices or publicly traded companies comparable to the Private Company; |
| | (iii) | | relevant news and other public sources; and |
| | | (iv) | | known secondary market transactions in the Private Company’s interests and merger or acquisition activity in companies comparable to the Private Company. |
Investments in series of preferred stock issued by Private Companies are typically valued utilizing market approach in determining the enterprise value of the company. Such investments often contain rights and preferences that differ from other series of preferred and common stock of the same issuer. Enterprise valuation techniques such as an option pricing model (“OPM”), a probability weighted expected return model (“PWERM”), current value method or a hybrid of those techniques are used as deemed appropriate under the circumstances. The use of these valuation techniques involves a determination of the exit scenarios of the investment in order to appropriately allocate the enterprise value of the company among the various parts of its capital structure.
The Private Companies are not subject to the public company disclosure, timing, and reporting standards applicable to other investments held by a Fund. Typically, the most recently available information by a Private Company is as of a date that is earlier than the date a Fund is calculating its NAV. This factor may result in a difference between the value of the investment and the price a Fund could receive upon the sale of the investment.
Fair Value Hierarchy: Various inputs are used in determining the fair value of financial instruments. These inputs to valuation techniques are categorized into a fair value hierarchy consisting of three broad levels for financial reporting purposes as follows:
| | • | | Level 1 – Unadjusted price quotations in active markets/exchanges for identical assets or liabilities that each Fund has the ability to access; |
| | • | | Level 2 – Other observable inputs (including, but not limited to, quoted prices for similar assets or liabilities in markets that are active, quoted prices for identical or similar assets or liabilities in markets that are not active, inputs other than quoted prices that are observable for the assets or liabilities (such as interest rates, yield curves, volatilities, prepayment speeds, loss severities, credit risks and default rates) or other market–corroborated inputs); and |
| | • | | Level 3 – Unobservable inputs based on the best information available in the circumstances, to the extent observable inputs are not available (including the Valuation Committee’s assumptions used in determining the fair value of financial instruments). |
The hierarchy gives the highest priority to unadjusted quoted prices in active markets for identical assets or liabilities (Level 1 measurements) and the lowest priority to unobservable inputs (Level 3 measurements). Accordingly, the degree of judgment exercised in determining fair value is greatest for instruments categorized in Level 3. The inputs used to measure fair value may fall into different levels of the fair value hierarchy. In such cases, for disclosure purposes, the fair value hierarchy classification is determined based on the lowest level input that is significant to the fair value measurement in its entirety. Investments classified within Level 3 have significant unobservable inputs used by the Valuation Committee in determining the price for Fair Valued Investments. Level 3 investments include equity or debt issued by Private Companies that may not have a secondary market and/or may have a limited number of investors. The categorization of a value determined for financial instruments is based on the pricing transparency of the financial instruments and is not necessarily an indication of the risks associated with investing in those securities.
| 4. | SECURITIES AND OTHER INVESTMENTS |
Equity-Linked Notes: Equity-linked notes seek to generate income and provide exposure to the performance of an underlying security, group of securities or exchange-traded funds (the “underlying reference instrument”). In an equity-linked note, a fund purchases a note from a bank or broker-dealer and in return, the issuer provides for interest payments during the term of the note. At maturity or when the security is sold, a fund will either settle by taking physical delivery of the underlying reference instrument or by receipt of a cash settlement amount equal to the value of the note at termination or maturity. The use of equity-linked notes involves the risk that the value of the note changes unfavorably due to movements in the value of the underlying reference instrument. Equity-linked notes are considered general unsecured contractual obligations of the bank or broker-dealer. A fund must rely on the creditworthiness of the issuer for its investment returns.
Securities Lending: Certain Funds may lend their securities to approved borrowers, such as brokers, dealers and other financial institutions. The borrower pledges and maintains with the Funds collateral consisting of cash, an irrevocable letter of credit issued by a bank, or securities issued or guaranteed by the U.S. Government. The initial collateral received by each Fund is required to have a value of at least 102% of the current value of the loaned securities for securities traded on U.S. exchanges and a value of at least 105% for all other securities. The collateral is maintained thereafter at a value equal to at least 100% of the current market value of the securities on loan. The market value of the loaned securities is determined at the close of each business day of the Fund and any additional required collateral is delivered to the Fund, or excess collateral returned by the Fund, on the next business day. During the term of the loan, the Funds are entitled to all distributions made on or in respect of the loaned securities, but do not
| | |
| 32 | | 2 0 2 4 B L A C K R O C K A N N U A L F I N A N C I A L S T A T E M E N T S |
Notes to Financial Statements (continued)
receive interest income on securities received as collateral. Loans of securities are terminable at any time and the borrower, after notice, is required to return borrowed securities within the standard time period for settlement of securities transactions.
As of period end, any securities on loan were collateralized by cash and/or U.S. Government obligations. Cash collateral invested by the securities lending agent, BlackRock Investment Management, LLC (“BIM”), if any, is disclosed in the Schedules of Investments. Any non-cash collateral received cannot be sold, re-invested or pledged by the Fund, except in the event of borrower default. The securities on loan, if any, are disclosed in the Funds’ Schedules of Investments. The market value of any securities on loan and the value of related collateral, if any, are shown separately in the Statements of Assets and Liabilities as a component of investments at value – unaffiliated and collateral on securities loaned, respectively.
Securities lending transactions are entered into by the Funds under Master Securities Lending Agreements (each, an “MSLA”), which provide the right, in the event of default (including bankruptcy or insolvency), for the non-defaulting party to liquidate the collateral and calculate a net exposure to the defaulting party or request additional collateral. In the event that a borrower defaults, the Funds, as lender, would offset the market value of the collateral received against the market value of the securities loaned. When the value of the collateral is greater than that of the market value of the securities loaned, the lender is left with a net amount payable to the defaulting party. However, bankruptcy or insolvency laws of a particular jurisdiction may impose restrictions on or prohibitions against such a right of offset in the event of an MSLA counterparty’s bankruptcy or insolvency. Under the MSLA, absent an event of default, the borrower can resell or re-pledge the loaned securities, and the Funds can reinvest cash collateral received in connection with loaned securities. Upon an event of default, the parties’ obligations to return the securities or collateral to the other party are extinguished, and the parties can resell or re-pledge the loaned securities or the collateral received in connection with the loaned securities in order to satisfy the defaulting party’s net payment obligation for all transactions under the MSLA. The defaulting party remains liable for any deficiency.
As of period end, the following table is a summary of the Fund’s securities on loan by counterparty which are subject to offset under an MSLA:
| | | | | | | | | | | | | | | | | | | | | | | | |
| |
| | | | |
| Fund Name/Counterparty | | Securities
Loaned at Value | | | Cash Collateral Received(a) | | Non-Cash
Collateral Received,
at Fair Value(a) | | | Net
Amount(b) | |
| |
| | | | | | | |
High Equity Income | | | | | | | | | | | | | | | | | | | | | | | | |
| | | | | | | |
J.P. Morgan Securities LLC | | | $ 1,767,144 | | | | | $ (1,740,000) | | | | | | | $ — | | | | | | | | $ 27,144 | |
| | | | | | | | | | | | | | | | | | | | | | | | |
| | (a) | Collateral received, if any, in excess of the market value of securities on loan is not presented in this table. The total cash collateral received by the Fund is disclosed in the Fund’s Statements of Assets and Liabilities. |
| | (b) | The market value of the loaned securities is determined as of May 31, 2024. Additional collateral is delivered to the Fund on the next business day in accordance with the MSLA. The net amount would be subject to the borrower default indemnity in the event of default by the counterparty. |
The risks of securities lending include the risk that the borrower may not provide additional collateral when required or may not return the securities when due. To mitigate these risks, the Funds benefit from a borrower default indemnity provided by BIM. BIM’s indemnity allows for full replacement of the securities loaned to the extent the collateral received does not cover the value on the securities loaned in the event of borrower default. Each Fund could incur a loss if the value of an investment purchased with cash collateral falls below the market value of loaned securities or if the value of an investment purchased with cash collateral falls below the value of the original cash collateral received. Such losses are borne entirely by the Funds.
| 5. | INVESTMENT ADVISORY AGREEMENT AND OTHER TRANSACTIONS WITH AFFILIATES |
Investment Advisory: The Trust, on behalf of each Fund, entered into an Investment Advisory Agreement with the Manager, the Funds’ investment adviser and an indirect, wholly-owned subsidiary of BlackRock, Inc. (“BlackRock”), to provide investment advisory services. The Manager is responsible for the management of each Fund’s portfolio and provides the personnel, facilities, equipment and certain other services necessary to the operations of each Fund.
For such services, each Fund pays the Manager a monthly fee at an annual rate equal to the following percentages of the average daily value of each Fund’s net assets:
| | | | | | |
| | | |
| | | | | Investment Advisory Fees | |
| | |
| Average Daily Net Assets | | | | Energy Opportunities | |
| | |
First $1 billion | | | | | 0.750 | % |
$1 billion - $2 billion | | | | | 0.700 | |
$2 billion - $3 billion | | | | | 0.675 | |
Greater than $3 billion | | | | | 0.650 | |
| | | | | | | | | | |
| | | |
| | | | | Investment Advisory Fees | |
| | | |
| Average Daily Net Assets | | | | High Equity
Income | | | International
Dividend | |
| | | |
First $1 billion | | | | | 0.810% | | | | 0.600 | % |
$1 billion - $3 billion | | | | | 0.760 | | | | 0.560 | |
$3 billion - $5 billion | | | | | 0.730 | | | | 0.540 | |
$5 billion - $10 billion | | | | | 0.700 | | | | 0.520 | |
Greater than $10 billion | | | | | 0.680 | | | | 0.510 | |
| | |
N O T E S T O F I N A N C I A L S T A T E M E N T S | | 33 |
Notes to Financial Statements (continued)
With respect to Energy Opportunities and International Dividend, the Manager entered into separate sub-advisory agreements with BlackRock International Limited (“BIL”), an affiliate of the Manager. The Manager pays BIL, for services it provides for that portion of each applicable Fund for which BIL acts as sub-adviser, a monthly fee that is equal to a percentage of the investment advisory fees paid by each Fund to the Manager.
Service and Distribution Fees: The Trust, on behalf of each Fund, entered into a Distribution Agreement and a Distribution and Service Plan with BlackRock Investments, LLC (“BRIL”), an affiliate of the Manager. Pursuant to the Distribution and Service Plan and in accordance with Rule 12b-1 under the 1940 Act, each Fund pays BRIL ongoing service and distribution fees. The fees are accrued daily and paid monthly at annual rates based upon the average daily net assets of the relevant share class of each Fund as follows:
| | | | | | | | |
| | | |
| Share Class | | Service Fees | | | Distribution Fees | |
| | |
Investor A | | | 0.25 | % | | | N/A | |
Investor C | | | 0.25 | | | | 0.75 | % |
BRIL and broker-dealers, pursuant to sub-agreements with BRIL, provide shareholder servicing and distribution services to the Funds. The ongoing service and/or distribution fee compensates BRIL and each broker-dealer for providing shareholder servicing and/or distribution related services to shareholders.
For the year ended May 31, 2024, the following table shows the class specific service and distribution fees borne directly by each share class of each Fund:
| | | | | | | | | | | | |
| | | | |
| Fund Name | | Investor A | | | Investor C | | | Total | |
| | | |
BlackRock Energy Opportunities Fund | | $ | 522,577 | | | $ | 187,024 | | | $ | 709,601 | |
BlackRock High Equity Income Fund | | | 750,461 | | | | 612,028 | | | | 1,362,489 | |
BlackRock International Dividend Fund | | | 316,943 | | | | 43,515 | | | | 360,458 | |
Administration: The Trust, on behalf of each Fund, entered into an Administration Agreement with the Manager, an indirect, wholly-owned subsidiary of BlackRock, to provide administrative services. For these services, the Manager receives an administration fee computed daily and payable monthly, based on a percentage of the average daily net assets of each Fund. The administration fee, which is shown as administration in the Statements of Operations, is paid at the annual rates below.
| | | | | | | | |
| | |
| Average Daily Net Assets | | Administration Fees | |
| | |
First $500 million | | | | | | | 0.0425 | % |
$500 million - $1 billion | | | | | | | 0.0400 | |
$1 billion - $2 billion | | | | | | | 0.0375 | |
$2 billion - $4 billion | | | | | | | 0.0350 | |
$4 billion - $13 billion | | | | | | | 0.0325 | |
Greater than $13 billion | | | | | | | 0.0300 | |
In addition, the Manager charges each of the share classes an administration fee, which is shown as administration — class specific in the Statements of Operations, at an annual rate of 0.02% of the average daily net assets of each respective class.
For the year ended May 31, 2024, the following table shows the class specific administration fees borne directly by each share class of each Fund:
| | | | | | | | | | | | | | | | | | | | |
| Fund Name | | Institutional | | | Investor A | | | Investor C | | | Class K | | | Total | |
| | | | | |
Energy Opportunities | | $ | 24,293 | | | $ | 41,750 | | | $ | 3,745 | | | $ | — | | | $ | 69,788 | |
High Equity Income | | | 294,191 | | | | 59,920 | | | | 12,217 | | | | 37,969 | | | | 404,297 | |
International Dividend | | | 102,486 | | | | 25,315 | | | | 872 | | | | 14,738 | | | | 143,411 | |
Transfer Agent: Pursuant to written agreements, certain financial intermediaries, some of which may be affiliates, provide the Funds with sub-accounting, recordkeeping, sub-transfer agency and other administrative services with respect to servicing of underlying investor accounts. For these services, these entities receive an asset-based fee or an annual fee per shareholder account, which will vary depending on share class and/or net assets. For the year ended May 31, 2024, the Funds did not pay any amounts to affiliates in return for these services.
The Manager maintains a call center that is responsible for providing certain shareholder services to the Funds. Shareholder services include responding to inquiries and processing purchases and sales based upon instructions from shareholders. For the year ended May 31, 2024, each Fund reimbursed the Manager the following amounts for costs incurred in running the call center, which are included in transfer agent — class specific in the Statements of Operations:
| | | | | | | | | | | | | | | | | | | | |
| | | | | | |
| Fund Name | | Institutional | | | Investor A | | | Investor C | | | Class K | | | Total | |
| | | | | |
Energy Opportunities | | $ | 3,830 | | | $ | 49,173 | | | $ | 6,063 | | | $ | — | | | $ | 59,066 | |
High Equity Income | | | 6,926 | | | | 30,702 | | | | 5,205 | | | | 742 | | | | 43,575 | |
International Dividend | | | 2,942 | | | | 17,724 | | | | 1,526 | | | | 236 | | | | 22,428 | |
| | |
| 34 | | 2 0 2 4 B L A C K R O C K A N N U A L F I N A N C I A L S T A T E M E N T S |
Notes to Financial Statements (continued)
For the year ended May 31, 2024, the following table shows the class specific transfer agent fees borne directly by each share class of each Fund:
| | | | | | | | | | | | | | | | | | | | |
| | | | | | |
| Fund Name | | Institutional | | | Investor A | | | Investor C | | | Class K | | | Total | |
| | | | | |
Energy Opportunities | | $ | 199,284 | | | $ | 417,459 | | | $ | 35,607 | | | $ | — | | | $ | 652,350 | |
High Equity Income | | | 1,608,082 | | | | 306,657 | | | | 58,985 | | | | 6,114 | | | | 1,979,838 | |
International Dividend | | | 601,569 | | | | 211,592 | | | | 10,289 | | | | 5,593 | | | | 829,043 | |
Other Fees: For the year ended May 31, 2024, affiliates earned underwriting discounts, direct commissions and dealer concessions on sales of each Fund’s Investor A Shares as follows:
| | | | |
| Fund Name | | Amounts | |
| |
Energy Opportunities | | $ | 12,085 | |
High Equity Income | | | 43,206 | |
International Dividend | | | 2,792 | |
For the year ended May 31, 2024, affiliates received CDSCs as follows:
| | | | | | | | | | | | |
| Share Class | | Energy
Opportunities | | | High
Equity
Income | | | International
Dividend | |
| | | |
Investor A | | $ | 309 | | | $ | 2,118 | | | $ | 579 | |
Investor C | | | 2,363 | | | | 4,105 | | | | 1,274 | |
Expense Limitations, Waivers and Reimbursements: With respect to each Fund, the Manager contractually agreed to waive its investment advisory fees by the amount of investment advisory fees each Fund pays to the Manager indirectly through its investment in affiliated money market funds (the “affiliated money market fund waiver”) through June 30, 2025. The contractual agreement may be terminated upon 90 days’ notice by a majority of the trustees who are not “interested persons” of the Trust, as defined in the 1940 Act (“Independent Trustees”), or by a vote of a majority of the outstanding voting securities of a Fund. The amount of waivers and/or reimbursements of fees and expenses made pursuant to the expense limitation described below will be reduced by the amount of the affiliated money market fund waiver. This amount is included in fees waived and/or reimbursed by the Manager in the Statements of Operations. For the year ended May 31, 2024, the amounts waived were as follows:
| | | | |
| | |
| Fund Name | | Amounts Waived | |
| |
Energy Opportunities | | $ | 2,302 | |
High Equity Income | | | 37,767 | |
International Dividend | | | 8,243 | |
The Manager has contractually agreed to waive its investment advisory fee with respect to any portion of each Fund’s assets invested in affiliated equity and fixed-income mutual funds and affiliated exchange-traded funds that have a contractual management fee through June 30, 2025. The contractual agreement may be terminated upon 90 days’ notice by a majority of the Independent Trustees, or by a vote of a majority of the outstanding voting securities of a Fund. For the year ended May 31, 2024, there were no fees waived by the Manager pursuant to this arrangement.
With respect to each Fund, the Manager contractually agreed to waive and/or reimburse fees or expenses in order to limit expenses, excluding interest expense, dividend expense, tax expense, acquired fund fees and expenses, and certain other fund expenses, which constitute extraordinary expenses not incurred in the ordinary course of each Fund’s business (“expense limitation”). The expense limitations as a percentage of average daily net assets are as follows:
| | | | | | | | | | | | | | | | |
| Fund Name | | Institutional | | | Investor A | | | Investor C | | | Class K | |
| | | | |
Energy Opportunities | | | 0.91 | % | | | 1.32 | % | | | 2.04 | % | | | 0.91 | %(a) |
High Equity Income | | | 0.85 | | | | 1.10 | | | | 1.85 | | | | 0.80 | % |
International Dividend | | | 0.65 | | | | 0.90 | | | | 1.65 | | | | 0.60 | |
| | (a) | There were no shares outstanding as of May 31, 2024. |
The Manager has agreed not to reduce or discontinue the contractual expense limitations through June 30, 2025, unless approved by the Board, including a majority of the Independent Trustees or by a vote of a majority of the outstanding voting securities of a Fund. For the year ended May 31, 2024, the amounts included in the Statements of Operations were as follows:
| | | | |
| | |
| Fund Name | | Amounts Waived | |
| |
Energy Opportunities | | $ | 928 | |
High Equity Income | | | 1,113,472 | |
International Dividend | | | 825,839 | |
| | |
N O T E S T O F I N A N C I A L S T A T E M E N T S | | 35 |
Notes to Financial Statements (continued)
In addition, these amounts waived and/or reimbursed by the Manager are included in administration fees waived by the Manager — class specific and transfer agent fees waived and/or reimbursed by the Manager — class specific, respectively, in the Statements of Operations. For the year ended May 31, 2024, class specific expense waivers and/or reimbursements were as follows:
| | | | | | | | | | | | | | | | | | | | |
| |
| |
| | | Administration Fees Waived by the Manager - Class Specific | |
| | | | |
| | | | | |
| Fund Name | | Institutional | | | Investor A | | | Investor C | | | Class K | | | Total | |
| |
| | | | | |
Energy Opportunities | | $ | 24,293 | | | $ | 40,499 | | | $ | 3,606 | | | $ | — | | | $ | 68,398 | |
High Equity Income | | | 294,190 | | | | 59,920 | | | | 12,217 | | | | 37,891 | | | | 404,218 | |
International Dividend | | | 102,486 | | | | 25,315 | | | | 872 | | | | 14,738 | | | | 143,411 | |
| |
| | | | | | | | | | | | | | | | | | | | |
| |
| |
| | | Transfer Agent Fees Waived and/or Reimbursed by the Manager -
Class Specific | |
| | | | |
| | | | | |
| Fund Name | | Institutional | | | Investor A | | | Investor C | | | Class K | | | Total | |
| |
| | | | | |
Energy Opportunities | | $ | 167,309 | | | $ | 32,145 | | | $ | 6,552 | | | $ | — | | | $ | 206,006 | |
High Equity Income | | | 872,537 | | | | 158,288 | | | | 29,593 | | | | 5,340 | | | | 1,065,758 | |
International Dividend | | | 345,246 | | | | 148,915 | | | | 8,036 | | | | 5,593 | | | | 507,790 | |
| |
Securities Lending: The U.S. Securities and Exchange Commission (“SEC”) has issued an exemptive order which permits BIM, an affiliate of the Manager, to serve as securities lending agent for the Funds, subject to applicable conditions. As securities lending agent, BIM bears all operational costs directly related to securities lending. The Funds are responsible for fees in connection with the investment of cash collateral received for securities on loan (the “collateral investment fees”). The cash collateral is invested in a money market fund, BlackRock Cash Funds: Institutional, managed by the Manager or its affiliates. However, BIM has agreed to reduce the amount of securities lending income it receives in order to effectively limit the collateral investment fees the Funds bear to an annual rate of 0.04%. The SL Agency Shares of such money market fund will not be subject to a sales load, redemption fee, distribution fee or service fee. The money market fund in which the cash collateral has been reinvested may impose a discretionary liquidity fee of up to 2% of the value redeemed, if such fee, is determined to be in the best interests of such money market fund.
Securities lending income is generally equal to the total of income earned from the reinvestment of cash collateral, (and excludes collateral investment fees), and any fees or other payments to and from borrowers of securities. Each Fund retains a portion of the securities lending income and remits the remaining portion to BIM as compensation for its services as securities lending agent.
Pursuant to the current securities lending agreement, Energy Opportunities and International Dividend retain 82% of securities lending income (which excludes collateral investment expenses), and this amount retained can never be less than 70% of the total of securities lending income plus the collateral investment expenses. Pursuant to the current securities lending agreement, High Equity Income retains 81% of securities lending income (which excludes collateral investment expenses), and this amount retained can never be less than 70% of the total of securities lending income plus the collateral investment expenses.
In addition, commencing the business day following the date that the aggregate securities lending income earned across the BlackRock Multi-Asset Complex in a calendar year exceeds a specified threshold, Energy Opportunities and International Dividend, pursuant to the securities lending agreement, will retain for the remainder of that calendar year securities lending income in an amount equal to 85% of securities lending income (which excludes collateral investment expenses), and this amount retained can never be less than 70% of the total of securities lending income plus the collateral investment expenses. High Equity Income, pursuant to the securities lending agreement, will retain for the remainder of that calendar year securities lending income in an amount equal to 81% of securities lending income (which excludes collateral investment expenses), and this amount retained can never be less than 70% of the total of securities lending income plus the collateral investment expenses.
The share of securities lending income earned by each Fund is shown as securities lending income — affiliated — net in the Statements of Operations. For the year ended May 31, 2024, each Fund paid BIM the following amounts for securities lending agent services:
| | | | |
| |
| |
| Fund Name | | Amounts | |
| |
| |
Energy Opportunities | | $ | 31 | |
High Equity Income | | | 919 | |
| |
Trustees and Officers: Certain trustees and/or officers of the Trust are directors and/or officers of BlackRock or its affiliates. The Funds reimburse the Manager for a portion of the compensation paid to the Trust’s Chief Compliance Officer, which is included in Trustees and Officer in the Statements of Operations.
Other Transactions: The Funds may purchase securities from, or sell securities to, an affiliated fund provided the affiliation is due solely to having a common investment adviser, common officers, or common trustees. For the year ended May 31, 2024, the purchase and sale transactions and any net realized gains (losses) with an affiliated fund in compliance with Rule 17a-7 under the 1940 Act were as follows:
| | | | | | | | | | | | |
| Fund Name | | Purchases | | | Sales | | | Net Realized
Gain (Loss) | |
| | | |
International Dividend | | $ | 3,430,853 | | | | $ — | | | $ | — | |
| | |
| 36 | | 2 0 2 4 B L A C K R O C K A N N U A L F I N A N C I A L S T A T E M E N T S |
Notes to Financial Statements (continued)
For the year ended May 31, 2024, purchases and sales of investments, excluding short-term securities and equity-linked notes, were as follows:
| | | | | | | | |
| |
| | |
| Fund Name | | Purchases | | | Sales | |
| |
| | |
Energy Opportunities | | $ | 121,241,672 | | | $ | 229,232,176 | |
High Equity Income | | | 1,137,335,952 | | | | 1,302,802,312 | |
International Dividend | | | 545,467,374 | | | | 497,861,039 | |
| |
It is each Fund’s policy to comply with the requirements of the Internal Revenue Code of 1986, as amended, applicable to regulated investment companies, and to distribute substantially all of its taxable income to its shareholders. Therefore, no U.S. federal income tax provision is required.
Each Fund files U.S. federal and various state and local tax returns. No income tax returns are currently under examination. The statute of limitations on each Fund’s U.S. federal tax returns generally remains open for a period of three years after they are filed. The statutes of limitations on each Fund’s state and local tax returns may remain open for an additional year depending upon the jurisdiction.
Management has analyzed tax laws and regulations and their application to the Funds as of May 31, 2024, inclusive of the open tax return years, and does not believe that there are any uncertain tax positions that require recognition of a tax liability in the Funds’ financial statements.
The tax character of distributions paid was as follows:
| | | | | | | | |
| | | |
| Fund Name | | Year Ended
05/31/24 | | | Year Ended
05/31/23 | |
| | |
Energy Opportunities | | | | | | | | |
Ordinary income | | $ | 10,803,469 | | | $ | 9,518,963 | |
| | | | | | | | |
| | |
High Equity Income | | | | | | | | |
Ordinary income | | $ | 138,566,507 | | | $ | 123,218,102 | |
Long term capital gains | | | — | | | | 721,456 | |
| | | | | | | | |
| | $ | 138,566,507 | | | $ | 123,939,558 | |
| | |
International Dividend | | | | | | | | |
Ordinary income | | $ | 13,436,991 | | | $ | 4,123,182 | |
Long term capital gains | | | — | | | | 4,377,510 | |
| | | | | | | | |
| | | $ | 13,436,991 | | | $ | 8,500,692 | |
As of May 31, 2024, the tax components of accumulated earnings (loss) were as follows:
| | | | | | | | | | | | | | | | |
| Fund Name | | Undistributed
Ordinary Income | | | Non-expiring
Capital Loss
Carryforwards(a) | | | Net Unrealized
Gains (Losses)(b) | | | Total | |
| | | | |
Energy Opportunities | | $ | 3,205,466 | | | $ | (292,466,462 | ) | | $ | 112,262,851 | | | $ | (176,998,145 | ) |
High Equity Income | | | — | | | | (54,064,620 | ) | | | 113,556,283 | | | | 59,491,663 | |
International Dividend | | | 6,031,904 | | | | (14,312,825 | ) | | | 117,286,026 | | | | 109,005,105 | |
| (a) | Amounts available to offset future realized capital gains. |
| (b) | The difference between book-basis and tax-basis net unrealized gains (losses) was attributable primarily to the tax deferral of losses on wash sales, the realization for tax purposes of unrealized gains(losses) on certain foreign currency contracts and the characterization of corporate actions. |
During the year ended May 31, 2024, the Fund listed below utilized the following amounts of their respective capital loss carryforward:
| | | | |
| Fund Name | | Utilized | |
| |
Energy Opportunities | | $ | 15,577,154 | |
As of May 31, 2024, gross unrealized appreciation and depreciation based on cost of investments (including short positions and derivatives, if any) for U.S. federal income tax purposes were as follows:
| | | | | | | | | | | | | | | | |
| Fund Name | | Tax Cost | | | Gross Unrealized
Appreciation | | | Gross Unrealized
Depreciation | | | Net Unrealized
Appreciation
(Depreciation) | |
| | | | |
Energy Opportunities | | $ | 229,165,089 | | | $ | 116,806,402 | | | $ | (4,543,351 | ) | | $ | 112,263,051 | |
High Equity Income | | | 1,920,616,451 | | | | 153,332,997 | | | | (39,090,532 | ) | | | 114,242,465 | |
International Dividend | | | 615,206,480 | | | | 134,594,744 | | | | (17,308,718 | ) | | | 117,286,026 | |
| | |
N O T E S T O F I N A N C I A L S T A T E M E N T S | | 37 |
Notes to Financial Statements (continued)
The Trust, on behalf of each Fund, along with certain other funds managed by the Manager and its affiliates (“Participating Funds”), is party to a 364-day, $2.40 billion credit agreement with a group of lenders. Under this agreement, the Funds may borrow to fund shareholder redemptions. Excluding commitments designated for certain individual funds, the Participating Funds, including the Funds, can borrow up to an aggregate commitment amount of $1.75 billion at any time outstanding, subject to asset coverage and other limitations as specified in the agreement. The credit agreement has the following terms: a fee of 0.10% per annum on unused commitment amounts and interest at a rate equal to the higher of (a) Overnight Bank Funding Rate (“OBFR”) (but, in any event, not less than 0.00%) on the date the loan is made plus 0.80% per annum, (b) the Fed Funds rate (but, in any event, not less than 0.00%) in effect from time to time plus 0.80% per annum on amounts borrowed or (c) the sum of (x) Daily Simple Secured Overnight Financing Rate (“SOFR”) (but, in any event, not less than 0.00%) on the date the loan is made plus 0.10% and (y) 0.80% per annum. The agreement expires in April 2025 unless extended or renewed. These fees were allocated among such funds based upon portions of the aggregate commitment available to them and relative net assets of Participating Funds. During the year ended May 31, 2024, the Funds did not borrow under the credit agreement.
In the normal course of business, the Funds invest in securities or other instruments and may enter into certain transactions, and such activities subject each Fund to various risks, including among others, fluctuations in the market (market risk) or failure of an issuer to meet all of its obligations. The value of securities or other instruments may also be affected by various factors, including, without limitation: (i) the general economy; (ii) the overall market as well as local, regional or global political and/or social instability; (iii) regulation, taxation or international tax treaties between various countries; or (iv) currency, interest rate and price fluctuations. Local, regional or global events such as war, acts of terrorism, the spread of infectious illness or other public health issues, recessions, or other events could have a significant impact on the Funds and their investments. Each Fund’s prospectus provides details of the risks to which each Fund is subject.
The Funds may be exposed to additional risks when reinvesting cash collateral in money market funds that do not seek to maintain a stable NAV per share of $1.00, which may be subject to discretionary liquidity fees under certain circumstances.
Valuation Risk: The market values of equities, such as common stocks and preferred securities or equity related investments, such as futures and options, may decline due to general market conditions which are not specifically related to a particular company. They may also decline due to factors which affect a particular industry or industries. A Fund may invest in illiquid investments. An illiquid investment is any investment that a Fund reasonably expects cannot be sold or disposed of in current market conditions in seven calendar days or less without the sale or disposition significantly changing the market value of the investment. A Fund may experience difficulty in selling illiquid investments in a timely manner at the price that it believes the investments are worth. Prices may fluctuate widely over short or extended periods in response to company, market or economic news. Markets also tend to move in cycles, with periods of rising and falling prices. This volatility may cause each Fund’s NAV to experience significant increases or decreases over short periods of time. If there is a general decline in the securities and other markets, the NAV of a Fund may lose value, regardless of the individual results of the securities and other instruments in which a Fund invests.
The price a Fund could receive upon the sale of any particular portfolio investment may differ from a Fund’s valuation of the investment, particularly for securities that trade in thin or volatile markets or that are valued using a fair valuation technique or a price provided by an independent pricing service. Changes to significant unobservable inputs and assumptions (i.e., publicly traded company multiples, growth rate, time to exit) due to the lack of observable inputs may significantly impact the resulting fair value and therefore a Fund’s results of operations. As a result, the price received upon the sale of an investment may be less than the value ascribed by a Fund, and a Fund could realize a greater than expected loss or lesser than expected gain upon the sale of the investment. A Fund’s ability to value its investments may also be impacted by technological issues and/or errors by pricing services or other third-party service providers.
Counterparty Credit Risk: The Funds may be exposed to counterparty credit risk, or the risk that an entity may fail to or be unable to perform on its commitments related to unsettled or open transactions, including making timely interest and/or principal payments or otherwise honoring its obligations. The Funds manage counterparty credit risk by entering into transactions only with counterparties that the Manager believes have the financial resources to honor their obligations and by monitoring the financial stability of those counterparties. Financial assets, which potentially expose the Funds to market, issuer and counterparty credit risks, consist principally of financial instruments and receivables due from counterparties. The extent of the Funds’ exposure to market, issuer and counterparty credit risks with respect to these financial assets is approximately their value recorded in the Statements of Assets and Liabilities, less any collateral held by the Funds.
Geographic/Asset Class Risk: A diversified portfolio, where this is appropriate and consistent with a fund’s objectives, minimizes the risk that a price change of a particular investment will have a material impact on the NAV of a fund. The investment concentrations within each Fund’s portfolio are disclosed in its Schedule of Investments.
Certain Funds invest a significant portion of their assets in securities within a single or limited number of market sectors. When a Fund concentrates its investments in this manner, it assumes the risk that economic, regulatory, political and social conditions affecting such sectors may have a significant impact on the Fund and could affect the income from, or the value or liquidity of, the Fund’s portfolio. Investment percentages in specific sectors are presented in the Schedules of Investments.
International Dividend invests a substantial amount of its assets in issuers located in a single country or a limited number of countries. When a Fund concentrates its investments in this manner, it assumes the risk that economic, regulatory, political and social conditions in those countries may have a significant impact on its investment performance and could affect the income from, or the value or liquidity of, the Fund’s portfolio. Unanticipated or sudden political or social developments may cause uncertainty in the markets and as a result adversely affect the Fund’s investments. Foreign issuers may not be subject to the same uniform accounting, auditing and financial reporting standards and practices as used in the United States. Foreign securities markets may also be more volatile and less liquid than U.S. securities and may be less subject to governmental supervision not typically associated with investing in U.S. securities. Investment percentages in specific countries are presented in the Schedule of Investments.
Certain Funds invest a significant portion of their assets in securities of issuers located in the United States. A decrease in imports or exports, changes in trade regulations, inflation and/or an economic recession in the United States may have a material adverse effect on the U.S. economy and the securities listed on U.S. exchanges. Proposed
| | |
| 38 | | 2 0 2 4 B L A C K R O C K A N N U A L F I N A N C I A L S T A T E M E N T S |
Notes to Financial Statements (continued)
and adopted policy and legislative changes in the United States may also have a significant effect on U.S. markets generally, as well as on the value of certain securities. Governmental agencies project that the United States will continue to maintain elevated public debt levels for the foreseeable future which may constrain future economic growth. Circumstances could arise that could prevent the timely payment of interest or principal on U.S. government debt, such as reaching the legislative “debt ceiling.” Such non-payment would result in substantial negative consequences for the U.S. economy and the global financial system. If U.S. relations with certain countries deteriorate, it could adversely affect issuers that rely on the United States for trade. The United States has also experienced increased internal unrest and discord. If these trends were to continue, they may have an adverse impact on the U.S. economy and the issuers in which the certain Funds invest.
International Dividend invests a significant portion of its assets in securities of issuers located in Europe or with significant exposure to European issuers or countries. The European financial markets have recently experienced volatility and adverse trends due to concerns about economic downturns in, or rising government debt levels of, several European countries as well as acts of war in the region. These events may spread to other countries in Europe and may affect the value and liquidity of certain of International Dividend’s investments.
Responses to the financial problems by European governments, central banks and others, including austerity measures and reforms, may not work, may result in social unrest and may limit future growth and economic recovery or have other unintended consequences. Further defaults or restructurings by governments and others of their debt could have additional adverse effects on economies, financial markets and asset valuations around the world. The United Kingdom has withdrawn from the European Union, and one or more other countries may withdraw from the European Union and/or abandon the Euro, the common currency of the European Union. These events and actions have adversely affected, and may in the future adversely affect, the value and exchange rate of the Euro and may continue to significantly affect the economies of every country in Europe, including countries that do not use the Euro and non-European Union member states. The impact of these actions, especially if they occur in a disorderly fashion, is not clear but could be significant and far reaching. In addition, Russia launched a large-scale invasion of Ukraine on February 24, 2022. The extent and duration of the military action, resulting sanctions and resulting future market disruptions in the region are impossible to predict, but have been, and may continue to be, significant and have a severe adverse effect on the region, including significant negative impacts on the economy and the markets for certain securities and commodities, such as oil and natural gas, as well as other sectors.
Significant Shareholder Redemption Risk: Certain shareholders may own or manage a substantial amount of fund shares and/or hold their fund investments for a limited period of time. Large redemptions of fund shares by these shareholders may force a fund to sell portfolio securities, which may negatively impact the fund’s NAV, increase the fund’s brokerage costs, and/or accelerate the realization of taxable income/gains and cause the fund to make additional taxable distributions to shareholders.
| 10. | CAPITAL SHARE TRANSACTIONS |
Transactions in capital shares for each class were as follows:
| | | | | | | | | | | | | | | | |
| | | |
| | | Year Ended 05/31/24 | | | Year Ended 05/31/23 | |
| | | | |
| Fund Name/Share Class | | Shares | | | Amount | | | Shares | | | Amount | |
| | | | |
Energy Opportunities | | | | | | | | | | | | | | | | |
Institutional | | | | | | | | | | | | | | | | |
Shares sold | | | 7,173,629 | | | $ | 97,116,078 | | | | 12,067,659 | | | $ | 156,474,280 | |
Shares issued in reinvestment of distributions | | | 314,646 | | | | 4,030,855 | | | | 344,414 | | | | 4,146,262 | |
Shares redeemed | | | (12,393,223 | ) | | | (165,638,410 | ) | | | (8,916,366 | ) | | | (111,402,349 | ) |
| | | | | | | | | | | | | | | | |
| | | (4,904,948 | ) | | $ | (64,491,477 | ) | | | 3,495,707 | | | $ | 49,218,193 | |
| | | | | | | | | | | | | | | | |
Investor A | | | | | | | | | | | | | | | | |
Shares sold and automatic conversion of shares | | | 3,464,629 | | | $ | 45,743,773 | | | | 10,055,914 | | | $ | 125,839,735 | |
Shares issued in reinvestment of distributions | | | 500,381 | | | | 6,209,339 | | | | 428,848 | | | | 4,913,297 | |
Shares redeemed | | | (6,800,384 | ) | | | (88,026,155 | ) | | | (10,342,732 | ) | | | (125,289,679 | ) |
| | | | | | | | | | | | | | | | |
| | | (2,835,374 | ) | | $ | (36,073,043 | ) | | | 142,030 | | | $ | 5,463,353 | |
| | | | | | | | | | | | | | | | |
Investor C | | | | | | | | | | | | | | | | |
Shares sold | | | 176,928 | | | $ | 2,249,456 | | | | 524,342 | | | $ | 6,358,068 | |
Shares issued in reinvestment of distributions | | | 38,007 | | | | 455,047 | | | | 34,611 | | | | 378,968 | |
Shares redeemed and automatic conversion of shares | | | (617,417 | ) | | | (7,709,867 | ) | | | (917,902 | ) | | | (10,673,742 | ) |
| | | | | | | | | | | | | | | | |
| | | (402,482 | ) | | $ | (5,005,364 | ) | | | (358,949 | ) | | $ | (3,936,706 | ) |
| | | | | | | | | | | | | | | | |
| | | (8,142,804 | ) | | $ | (105,569,884 | ) | | | 3,278,788 | | | $ | 50,744,840 | |
| | | | | | | | | | | | | | | | |
| | |
N O T E S T O F I N A N C I A L S T A T E M E N T S | | 39 |
Notes to Financial Statements (continued)
| | | | | | | | | | | | | | | | |
| | | |
| | | Year Ended 05/31/24 | | | Year Ended 05/31/23 | |
| | | | |
| Fund Name/Share Class | | Shares | | | Amount | | | Shares | | | Amount | |
| | | | |
High Equity Income | | | | | | | | | | | | | | | | |
Institutional | | | | | | | | | | | | | | | | |
Shares sold | | | 21,509,286 | | | $ | 588,083,365 | | | | 43,564,325 | | | $ | 1,195,222,978 | |
Shares issued in reinvestment of distributions | | | 3,537,819 | | | | 97,630,330 | | | | 3,437,184 | | | | 93,276,417 | |
Shares redeemed | | | (31,448,082 | ) | | | (861,048,299 | ) | | | (23,014,916 | ) | | | (624,903,631 | ) |
| | | | | | | | | | | | | | | | |
| | | (6,400,977 | ) | | $ | (175,334,604 | ) | | | 23,986,593 | | | $ | 663,595,764 | |
| | | | | | | | | | | | | | | | |
Investor A | | | | | | | | | | | | | | | | |
Shares sold and automatic conversion of shares | | | 1,989,055 | | | $ | 45,453,814 | | | | 3,945,697 | | | $ | 90,206,380 | |
Shares issued in reinvestment of distributions | | | 840,974 | | | | 19,429,061 | | | | 867,585 | | | | 19,692,071 | |
Shares redeemed | | | (3,817,910 | ) | | | (87,203,434 | ) | | | (3,160,034 | ) | | | (71,467,053 | ) |
| | | | | | | | | | | | | | | | |
| | | (987,881 | ) | | $ | (22,320,559 | ) | | | 1,653,248 | | | $ | 38,431,398 | |
| | | | | | | | | | | | | | | | |
Investor C | | | | | | | | | | | | | | | | |
Shares sold | | | 608,558 | | | $ | 8,640,528 | | | | 2,116,697 | | | $ | 30,073,990 | |
Shares issued in reinvestment of distributions | | | 250,046 | | | | 3,586,042 | | | | 230,643 | | | | 3,252,346 | |
Shares redeemed and automatic conversions of shares | | | (1,050,128 | ) | | | (14,933,876 | ) | | | (761,451 | ) | | | (10,735,623 | ) |
| | | | | | | | | | | | | | | | |
| | | (191,524 | ) | | $ | (2,707,306 | ) | | | 1,585,889 | | | $ | 22,590,713 | |
| | | | | | | | | | | | | | | | |
Class K | | | | | | | | | | | | | | | | |
Shares sold | | | 3,626,200 | | | $ | 96,784,712 | | | | 5,616,247 | | | $ | 152,879,817 | |
Shares issued in reinvestment of distributions | | | 473,682 | | | | 13,113,564 | | | | 209,416 | | | | 5,701,757 | |
Shares redeemed | | | (1,767,169 | ) | | | (48,688,688 | ) | | | (590,210 | ) | | | (16,024,284 | ) |
| | | | | | | | | | | | | | | | |
| | | 2,332,713 | | | $ | 61,209,588 | | | | 5,235,453 | | | $ | 142,557,290 | |
| | | | | | | | | | | | | | | | |
| | | (5,247,669 | ) | | $ | (139,152,881 | ) | | | 32,461,183 | | | $ | 867,175,165 | |
| | | | | | | | | | | | | | | | |
| | | | |
International Dividend | | | | | | | | | | | | | | | | |
Institutional | | | | | | | | | | | | | | | | |
Shares sold | | | 9,816,189 | | | $ | 328,663,471 | | | | 11,844,319 | | | $ | 384,760,335 | |
Shares issued in reinvestment of distributions | | | 272,838 | | | | 9,209,734 | | | | 125,517 | | | | 3,705,818 | |
Shares redeemed | | | (9,178,188 | ) | | | (307,341,218 | ) | | | (2,448,728 | ) | | | (77,994,091 | ) |
| | | | | | | | | | | | | | | | |
| | | 910,839 | | | $ | 30,531,987 | | | | 9,521,108 | | | $ | 310,472,062 | |
| | | | | | | | | | | | | | | | |
Investor A | | | | | | | | | | | | | | | | |
Shares sold and automatic conversion of shares | | | 701,634 | | | $ | 21,794,880 | | | | 880,305 | | | $ | 25,436,596 | |
Shares issued in reinvestment of distributions | | | 72,025 | | | | 2,243,948 | | | | 124,210 | | | | 3,304,279 | |
Shares redeemed | | | (858,667 | ) | | | (26,686,177 | ) | | | (787,096 | ) | | | (22,191,435 | ) |
| | | | | | | | | | | | | | | | |
| | | (85,008 | ) | | $ | (2,647,349 | ) | | | 217,419 | | | $ | 6,549,440 | |
| | | | | | | | | | | | | | | | |
Investor C | | | | | | | | | | | | | | | | |
Shares sold | | | 31,067 | | | $ | 825,606 | | | | 63,048 | | | $ | 1,552,610 | |
Shares issued in reinvestment of distributions | | | 2,372 | | | | 63,357 | | | | 4,936 | | | | 111,585 | |
Shares redeemed and automatic conversion of shares | | | (63,264 | ) | | | (1,695,558 | ) | | | (51,428 | ) | | | (1,239,376 | ) |
| | | | | | | | | | | | | | | | |
| | | (29,825 | ) | | $ | (806,595 | ) | | | 16,556 | | | $ | 424,819 | |
| | | | | | | | | | | | | | | | |
Class K | | | | | | | | | | | | | | | | |
Shares sold | | | 1,250,900 | | | $ | 42,132,615 | | | | 1,571,774 | | | $ | 48,180,217 | |
Shares issued in reinvestment of distributions | | | 40,417 | | | | 1,364,927 | | | | 23,059 | | | | 679,380 | |
Shares redeemed | | | (977,770 | ) | | | (33,650,336 | ) | | | (284,694 | ) | | | (8,943,841 | ) |
| | | | | | | | | | | | | | | | |
| | | 313,547 | | | $ | 9,847,206 | | | | 1,310,139 | | | $ | 39,915,756 | |
| | | | | | | | | | | | | | | | |
| | | 1,109,553 | | | $ | 36,925,249 | | | | 11,065,222 | | | $ | 357,362,077 | |
| | | | | | | | | | | | | | | | |
As of May 31, 2024, BlackRock Financial Management, Inc., an affiliate of the Fund, owned 11,882 Class K Shares of High Equity Income.
| | |
| 40 | | 2 0 2 4 B L A C K R O C K A N N U A L F I N A N C I A L S T A T E M E N T S |
Notes to Financial Statements (continued)
| 11. | FOREIGN WITHHOLDINGS TAX CLAIMS |
The Internal Revenue Service (“IRS”) has issued guidance to address U.S. income tax liabilities attributable to fund shareholders resulting from the recovery of foreign taxes withheld in prior calendar years. These withheld foreign taxes were passed through to shareholders in the form of foreign tax credits in the year the taxes were withheld. Assuming there are sufficient foreign taxes paid which International Dividend is able to pass through to shareholders as a foreign tax credit in the current year, the Fund will be able to offset the prior years’ withholding taxes recovered against the foreign taxes paid in the current year. Accordingly, no federal income tax liability is recorded by the Fund.
International Dividend and Energy Opportunities are seeking, a closing agreement with the IRS to address any prior years’ U.S. income tax liabilities attributable to Fund shareholders resulting from the recovery of foreign taxes. The closing agreement would result in the Funds paying a compliance fee to the IRS, on behalf of its shareholders, representing the estimated tax savings generated from foreign tax credits claimed by Fund shareholders on their tax returns in prior years. The Funds have accrued a liability for the estimated IRS compliance fee related to foreign withholding tax claims, which is disclosed in the Statements of Assets and Liabilities. The actual IRS compliance fee may differ from the estimate and that difference may be material.
Management has evaluated the impact of all subsequent events on the Funds through the date the financial statements were issued and has determined that there were no subsequent events requiring adjustment or additional disclosure in the financial statements.
| | |
N O T E S T O F I N A N C I A L S T A T E M E N T S | | 41 |
Report of Independent Registered Public Accounting Firm
To the Shareholders of BlackRock Energy Opportunities Fund, BlackRock High Equity Income Fund, and BlackRock International Dividend Fund and the Board of Trustees of BlackRock FundsSM:
Opinion on the Financial Statements and Financial Highlights
We have audited the accompanying statements of assets and liabilities of BlackRock Energy Opportunities Fund, BlackRock High Equity Income Fund, and BlackRock International Dividend Fund of BlackRock FundsSM (the “Funds”), including the schedules of investments, as of May 31, 2024, the related statements of operations for the year then ended, the statements of changes in net assets for each of the two years in the period then ended, the financial highlights for each of the four years in the period then ended, for the period from October 1, 2019 through May 31, 2020, and for the year ended September 30, 2019, and the related notes. In our opinion, the financial statements and financial highlights present fairly, in all material respects, the financial position of the Funds as of May 31, 2024, and the results of their operations for the year then ended, the changes in their net assets for each of the two years in the period then ended, and the financial highlights for each of the four years in the period then ended, for the period from October 1, 2019 through May 31, 2020, and for the year ended September 30, 2019, in conformity with accounting principles generally accepted in the United States of America.
Basis for Opinion
These financial statements and financial highlights are the responsibility of the Funds’ management. Our responsibility is to express an opinion on the Funds’ financial statements and financial highlights based on our audits. We are a public accounting firm registered with the Public Company Accounting Oversight Board (United States) (PCAOB) and are required to be independent with respect to the Funds in accordance with the U.S. federal securities laws and the applicable rules and regulations of the Securities and Exchange Commission and the PCAOB.
We conducted our audits in accordance with the standards of the PCAOB. Those standards require that we plan and perform the audit to obtain reasonable assurance about whether the financial statements and financial highlights are free of material misstatement, whether due to error or fraud. The Funds are not required to have, nor were we engaged to perform, an audit of their internal control over financial reporting. As part of our audits we are required to obtain an understanding of internal control over financial reporting but not for the purpose of expressing an opinion on the effectiveness of the Funds’ internal control over financial reporting. Accordingly, we express no such opinion.
Our audits included performing procedures to assess the risks of material misstatement of the financial statements and financial highlights, whether due to error or fraud, and performing procedures that respond to those risks. Such procedures included examining, on a test basis, evidence regarding the amounts and disclosures in the financial statements and financial highlights. Our audits also included evaluating the accounting principles used and significant estimates made by management, as well as evaluating the overall presentation of the financial statements and financial highlights. Our procedures included confirmation of securities owned as of May 31, 2024, by correspondence with custodians or counterparties; when replies were not received, we performed other auditing procedures. We believe that our audits provide a reasonable basis for our opinion.
Deloitte & Touche LLP
Boston, Massachusetts
July 24, 2024
We have served as the auditor of one or more BlackRock investment companies since 1992.
| | |
| 42 | | 2 0 2 4 B L A C K R O C K A N N U A L F I N A N C I A L S T A T E M E N T S |
| | |
| Important Tax Information (unaudited) | | |
The following amounts, or maximum amounts allowable by law, are hereby designated as qualified dividend income for individuals for the fiscal year ended May 31, 2024:
| | | | |
| |
| |
| Fund Name | | Qualified Dividend
Income | |
| |
| |
Energy Opportunities | | $ | 12,555,053 | |
High Equity Income | | | 38,615,218 | |
International Dividend | | | 14,085,645 | |
| |
The following amount, or maximum amount allowable by law, is hereby designated as qualified business income for individuals for the fiscal year ended May 31, 2024:
| | | | |
| |
| |
| Fund Name | | Qualified Business
Income | |
| |
| |
High Equity Income | | $ | 29,436 | |
| |
The Funds intend to pass through to its shareholders the following amounts, or maximum amounts allowable by law, of foreign source income earned and foreign taxes paid for the fiscal year ended May 31, 2024:
| | | | | | | | |
| |
| | |
| Fund Name | | Foreign Source
Income Earned | | | Foreign Taxes
Paid | |
| |
| | |
International Dividend | | $ | 12,881,924 | | | $ | 946,369 | |
| |
The Funds hereby designate the following amounts, or maximum amounts allowable by law, of distributions from direct federal obligation interest for the fiscal year ended May 31, 2024:
| | | | |
| |
| |
| Fund Name | | Federal Obligation
Interest | |
| |
| |
Energy Opportunities | | $ | 16,297 | |
High Equity Income | | | 381,331 | |
International Dividend | | | 64,921 | |
| |
The law varies in each state as to whether and what percent of ordinary income dividends attributable to federal obligations is exempt from state income tax. Shareholders are advised to check with their tax advisers to determine if any portion of the dividends received is exempt from state income tax.
The following percentages, or maximum percentages allowable by law, of ordinary income distributions paid during the fiscal year ended May 31, 2024 qualified for the dividends-received deduction for corporate shareholders:
| | | | |
| |
| |
| Fund Name | | Dividends-Received Deduction | |
| |
| |
Energy Opportunities | | | 79.10% | |
High Equity Income | | | 17.83 | |
International Dividend | | | 10.85 | |
| |
The Funds hereby designate the following amounts, or maximum amounts allowable by law, as interest income eligible to be treated as a Section 163(j) interest dividend for the fiscal year ended May 31, 2024:
| | | | |
| |
| |
| Fund Name | | Interest Dividends | |
| |
| |
Energy Opportunities | | $ | 101,921 | |
High Equity Income | | | 2,390,403 | |
International Dividend | | | 333,103 | |
| |
The Funds hereby designate the following amounts, or maximum amounts allowable by law, as interest-related dividends eligible for exemption from U.S. withholding tax for nonresident aliens and foreign corporations for the fiscal year ended May 31, 2024:
| | | | |
| |
| |
| Fund Name | | Interest-Related
Dividends | |
| |
| |
Energy Opportunities | | $ | 103,957 | |
High Equity Income | | | 2,432,542 | |
International Dividend | | | 414,140 | |
| |
| | |
I M P O R T A N T T A X I N F O R M A T I O N | | 43 |
Disclosure of Investment Advisory Agreement and Sub-Advisory Agreements
The Board of Trustees (the “Board,” the members of which are referred to as “Board Members”) of BlackRock Funds (the “Trust”) met on April 16, 2024 (the “April Meeting”) and May 16-17, 2024 (the “May Meeting”) to consider the approval to continue the investment advisory agreement (the “Advisory Agreement”) between the Trust, on behalf of BlackRock Energy Opportunities Fund (“Energy Opportunities Fund”), BlackRock High Equity Income Fund (“High Equity Income Fund”) and BlackRock International Dividend Fund (“International Dividend Fund” and, together with Energy Opportunities Fund and High Equity Income Fund, the “Funds” and, each individually a “Fund”), and BlackRock Advisors, LLC (the “Manager”), each Fund’s investment advisor. The Board also considered the approval to continue the sub-advisory agreement between the Manager and BlackRock International Limited (the “Sub-Advisor”) with respect to Energy Opportunities Fund (the “Energy Opportunities Fund Sub-Advisory Agreement”) and the sub-advisory agreement between the Manager and the Sub-Advisor with respect to International Dividend Fund (the “International Dividend Fund Sub-Advisory Agreement” and, together with the Energy Opportunities Fund Sub-Advisory Agreement, the “Sub-Advisory Agreements”). The Manager and the Sub-Advisor are referred to herein as “BlackRock.” The Advisory Agreement and the Sub-Advisory Agreements are referred to herein as the “Agreements.”
The Approval Process
Consistent with the requirements of the Investment Company Act of 1940 (the “1940 Act”), the Board considers the approval of the continuation of the Agreements for each Fund on an annual basis. The Board members who are not “interested persons” of the Trust, as defined in the 1940 Act, are considered independent Board members (the “Independent Board Members”). The Board’s consideration entailed a year-long deliberative process during which the Board and its committees assessed BlackRock’s various services to each Fund, including through the review of written materials and oral presentations, and the review of additional information provided in response to requests from the Independent Board Members. The Board had four quarterly meetings per year, each of which extended over a two-day period, as well as additional ad hoc meetings and executive sessions throughout the year, as needed. The committees of the Board similarly met throughout the year. The Board also had an additional one-day meeting to consider specific information regarding the renewal of the Agreements. In considering the renewal of the Agreements, the Board assessed, among other things, the nature, extent and quality of the services provided to the Fund by BlackRock, BlackRock’s personnel and affiliates, including (as applicable): investment management services; accounting oversight; administrative and shareholder services; oversight of the Fund’s service providers; risk management and oversight; and legal, regulatory and compliance services. Throughout the year, including during the contract renewal process, the Independent Board Members were advised by independent legal counsel, and met with independent legal counsel in various executive sessions outside of the presence of BlackRock’s management.
During the year, the Board, acting directly and through its committees, considered information that was relevant to its annual consideration of the renewal of the Agreements, including the services and support provided by BlackRock to the Fund and its shareholders. BlackRock also furnished additional information to the Board in response to specific questions from the Board. Among the matters the Board considered were: (a) investment performance for one-year, three-year, five-year, and/or since inception periods, as applicable, against peer funds, an applicable benchmark, and other performance metrics, as applicable, as well as BlackRock senior management’s and portfolio managers’ investment performance analyses, and the reasons for any outperformance or underperformance relative to its peers, benchmarks, and other performance metrics, as applicable; (b) fees, including advisory, administration, if applicable, and other amounts paid to BlackRock and its affiliates by the Fund for services; (c) Fund operating expenses and how BlackRock allocates expenses to the Fund; (d) the resources devoted to, risk oversight of, and compliance reports relating to, implementation of the Fund’s investment objective, policies and restrictions, and meeting regulatory requirements; (e) BlackRock’s and the Fund’s adherence to applicable compliance policies and procedures; (f) the nature, character and scope of non-investment management services provided by BlackRock and its affiliates and the estimated cost of such services, as available; (g) BlackRock’s and other service providers’ internal controls and risk and compliance oversight mechanisms; (h) BlackRock’s implementation of the proxy voting policies approved by the Board; (i) the use of brokerage commissions and execution quality of portfolio transactions; (j) BlackRock’s implementation of the Fund’s valuation and liquidity procedures; (k) an analysis of management fees paid to BlackRock for products with similar investment mandates across the open-end fund, exchange-traded fund (“ETF”), closed-end fund, sub-advised mutual fund, separately managed account, collective investment trust, and institutional separate account product channels, as applicable, and the similarities and differences between these products and the services provided as compared to the Fund; (l) BlackRock’s compensation methodology for its investment professionals and the incentives and accountability it creates, along with investment professionals’ investments in the fund(s) they manage; and (m) periodic updates on BlackRock’s business.
Prior to and in preparation for the April Meeting, the Board received and reviewed materials specifically relating to the renewal of the Agreements. The Independent Board Members continuously engaged in a process with their independent legal counsel and BlackRock to review the nature and scope of the information provided to the Board to better assist its deliberations. The materials provided in connection with the April Meeting included, among other things: (a) information independently compiled and prepared by Broadridge Financial Solutions, Inc. (“Broadridge”), based on either a Lipper classification or Morningstar category, regarding each Fund’s fees and expenses as compared with a peer group of funds as determined by Broadridge (“Expense Peers”) and the investment performance of each Fund as compared with a peer group of funds (“Performance Peers”); (b) information on the composition of the Expense Peers and Performance Peers and a description of Broadridge’s methodology; (c) information on the estimated profits realized by BlackRock and its affiliates pursuant to the Agreements and a discussion of fall-out benefits to BlackRock and its affiliates; (d) a general analysis provided by BlackRock concerning investment management fees received in connection with other types of investment products, such as institutional accounts, sub-advised mutual funds, ETFs, closed-end funds, open-end funds, and separately managed accounts, under similar investment mandates, as well as the performance of such other products, as applicable; (e) a review of non-management fees; (f) the existence, impact and sharing of potential economies of scale, if any, with the Funds; (g) a summary of aggregate amounts paid by each Fund to BlackRock; (h) sales and redemption data regarding each Fund’s shares; and (i) various additional information requested by the Board as appropriate regarding BlackRock’s and the Funds’ operations.
At the April Meeting, the Board reviewed materials relating to its consideration of the Agreements and the Independent Board Members presented BlackRock with questions and requests for additional information. BlackRock responded to these questions and requests with additional written information in advance of the May Meeting, and such responses were reviewed by the Board Members.
At the May Meeting, the Board concluded its assessment of, among other things: (a) the nature, extent and quality of the services provided by BlackRock; (b) the investment performance of each Fund as compared to its Performance Peers and to other metrics, as applicable; (c) the advisory fee and the estimated cost of the services and estimated profits realized by BlackRock and its affiliates from their relationship with the Funds; (d) each Fund’s fees and expenses compared to its Expense Peers; (e) the existence and sharing of potential economies of scale; (f) any fall-out benefits to BlackRock and its affiliates as a result of BlackRock’s relationship with the Funds; and (g) other factors deemed relevant by the Board Members.
| | |
| 44 | | 2 0 2 4 B L A C K R O C K A N N U A L F I N A N C I A L S T A T E M E N T S |
Disclosure of Investment Advisory Agreement and Sub-Advisory Agreements (continued)
The Board also considered other matters it deemed important to the approval process, such as other payments made to BlackRock or its affiliates relating to securities lending and cash management, and BlackRock’s services related to the valuation and pricing of Fund portfolio holdings. The Board noted the willingness of BlackRock’s personnel to engage in open, candid discussions with the Board. The Board evaluated the information available to it on a fund-by-fund basis. The following paragraphs provide more information about some of the primary factors that were relevant to the Board’s decision. The Board Members did not identify any particular information, or any single factor as determinative, and each Board Member may have attributed different weights to the various items and factors considered.
A. Nature, Extent and Quality of the Services Provided by BlackRock
The Board, including the Independent Board Members, reviewed the nature, extent and quality of services provided by BlackRock, including the investment advisory services, and the resulting performance of each Fund. Throughout the year, the Board compared each Fund’s performance to the performance of a comparable group of mutual funds, relevant benchmark, and performance metrics, as applicable. The Board met with BlackRock’s senior management personnel responsible for investment activities, including the senior investment officers. The Board also reviewed the materials provided by each Fund’s portfolio management team discussing the Fund’s performance, investment strategies and outlook.
The Board considered, among other factors, with respect to BlackRock: the experience of each Fund’s portfolio management team; research capabilities; investments by portfolio managers in the funds they manage; portfolio trading capabilities; use of technology; commitment to compliance; credit analysis capabilities; risk analysis and oversight capabilities; and the approach to training and retaining portfolio managers and other research, advisory and management personnel. The Board also considered BlackRock’s overall risk management program, including the continued efforts of BlackRock and its affiliates to address cybersecurity risks and the role of BlackRock’s Risk & Quantitative Analysis Group. The Board engaged in a review of BlackRock’s compensation structure with respect to each Fund’s portfolio management team and BlackRock’s ability to attract and retain high-quality talent and create performance incentives.
In addition to investment advisory services, the Board considered the nature and quality of the administrative and other non-investment advisory services provided to each Fund. BlackRock and its affiliates provide the Funds with certain administrative, shareholder and other services (in addition to any such services provided to the Funds by third-parties) and officers and other personnel as are necessary for the operations of the Funds. In particular, BlackRock and its affiliates provide the Funds with administrative services including, among others: (i) responsibility for disclosure documents, such as the prospectus, the summary prospectus (as applicable), the statement of additional information and periodic shareholder reports; (ii) oversight of daily accounting and pricing; (iii) responsibility for periodic filings with regulators; (iv) overseeing and coordinating the activities of third-party service providers including, among others, each Fund’s custodian, fund accountant, transfer agent, and auditor; (v) organizing Board meetings and preparing the materials for such Board meetings; (vi) providing legal and compliance support; (vii) furnishing analytical and other support to assist the Board in its consideration of strategic issues such as the merger, consolidation or repurposing of certain open-end funds; and (viii) performing or managing administrative functions necessary for the operation of the Funds, such as tax reporting, expense management, fulfilling regulatory filing requirements, overseeing each Fund’s distribution partners, and shareholder call center and other services. The Board reviewed the structure and duties of BlackRock’s fund administration, shareholder services, and legal and compliance departments and considered BlackRock’s policies and procedures for assuring compliance with applicable laws and regulations. The Board considered the operation of BlackRock’s business continuity plans.
The Board noted that the engagement of the Sub-Advisor with respect to Energy Opportunities Fund and International Dividend Fund facilitates the provision of investment advice and trading by investment personnel out of non-U.S. jurisdictions. The Board considered that this arrangement provides additional flexibility to the portfolio management team, which may benefit Energy Opportunities Fund and International Dividend Fund and their shareholders.
B. The Investment Performance of the Funds
The Board, including the Independent Board Members, reviewed and considered the performance history of each Fund throughout the year and at the April Meeting. In preparation for the April Meeting, the Board was provided with reports independently prepared by Broadridge, which included an analysis of each Fund’s performance as of December 31, 2023, as compared to its Performance Peers. Broadridge ranks funds in quartiles, ranging from first to fourth, where first is the most desirable quartile position and fourth is the least desirable. In connection with its review, with respect to each Fund, the Board received and reviewed information regarding the investment performance of the Fund as compared to its Performance Peers and, with respect to Energy Opportunities Fund and High Equity Income Fund, the respective Morningstar Category (“Morningstar Category”) and, with respect to International Dividend Fund, the respective Lipper Classification (“Lipper Classification”). The Board and its Performance Oversight Committee regularly review and meet with Fund management to discuss the performance of each Fund throughout the year.
In evaluating performance, the Board focused particular attention on funds with less favorable performance records. The Board also noted that while it found the data provided by Broadridge generally useful, it recognized the limitations of such data, including in particular, that notable differences may exist between a fund and its Performance Peers (for example, the investment objectives and strategies). Further, the Board recognized that the performance data reflects a snapshot of a period as of a particular date and that selecting a different performance period could produce significantly different results. The Board also acknowledged that long-term performance could be impacted by even one period of significant outperformance or underperformance, and that a single investment theme could have the ability to disproportionately affect long-term performance.
The Board noted that for the one-, three- and five-year periods reported, Energy Opportunities Fund ranked in the second, third and second quartiles, respectively, against its Morningstar Category. The Board noted that BlackRock believes that the Morningstar Category is an appropriate performance metric for the Fund, and that BlackRock has explained its rationale for this belief to the Board. The Board and BlackRock reviewed the Fund’s underperformance relative to its Morningstar Category during the applicable period.
The Board noted that for the one-, three- and five-year periods reported, High Equity Income Fund ranked in the third, first and second quartiles, respectively, against its Morningstar Category. The Board noted that BlackRock believes that the Morningstar Category is an appropriate performance metric for the Fund, and that BlackRock has explained its rationale for this belief to the Board. The Board and BlackRock reviewed the Fund’s underperformance relative to its Morningstar Category during the applicable period.
| | |
D I S C L O S U R E O F I N V E S T M E N T A D V I S O R Y A G R E E M E N T A N D S U B - A D V I S O R Y A G R E E M E N T S | | 45 |
Disclosure of Investment Advisory Agreement and Sub-Advisory Agreements (continued)
The Board noted that for the one-, three- and five-year periods reported, International Dividend Fund ranked in the third, second and first quartiles, respectively, against its Lipper Classification. The Board noted that BlackRock believes that the Lipper Classification is an appropriate performance metric for the Fund, and that BlackRock has explained its rationale for this belief to the Board. The Board and BlackRock reviewed the Fund’s underperformance relative to its Lipper Classification during the applicable period.
C. Consideration of the Advisory/Management Fees and the Estimated Cost of the Services and Estimated Profits Realized by BlackRock and its Affiliates from their Relationship with the Funds
The Board, including the Independent Board Members, reviewed each Fund’s contractual management fee rate compared with those of its Expense Peers. The contractual management fee rate represents a combination of the advisory fee and any administrative fees, before taking into account any reimbursements or fee waivers. The Board also compared each Fund’s total expense ratio, as well as its actual management fee rate, to those of its Expense Peers. The total expense ratio represents a fund’s total net operating expenses, including any 12b-1 or non-12b-1 service fees. The total expense ratio gives effect to any expense reimbursements or fee waivers, and the actual management fee rate gives effect to any management fee reimbursements or waivers. The Board considered that the fee and expense information in the Broadridge report for the Fund reflected information for a specific period and that historical asset levels and expenses may differ from current levels, particularly in a period of market volatility. The Board considered the services provided and the fees charged by BlackRock and its affiliates to other types of clients with similar investment mandates, as applicable, including institutional accounts and sub-advised mutual funds (including mutual funds sponsored by third parties).
The Board received and reviewed statements relating to BlackRock’s financial condition. The Board reviewed BlackRock’s profitability methodology and was also provided with an estimated profitability analysis that detailed the revenues earned and the expenses incurred by BlackRock for services provided to each Fund. The Board reviewed BlackRock’s estimated profitability with respect to each Fund and other funds the Board currently oversees for the year ended December 31, 2023 compared to available aggregate estimated profitability data provided for the prior two years. The Board reviewed BlackRock’s estimated profitability with respect to certain other U.S. fund complexes managed by the Manager and/or its affiliates. The Board reviewed BlackRock’s assumptions and methodology of allocating expenses in the estimated profitability analysis, noting the inherent limitations in allocating costs among various advisory products. The Board recognized that profitability may be affected by numerous factors including, among other things, fee waivers and expense reimbursements by the Manager, the types of funds managed, precision of expense allocations and business mix. The Board thus recognized that calculating and comparing profitability at the individual fund level is difficult.
The Board noted that, in general, individual fund or product line profitability of other advisors is not publicly available. The Board reviewed BlackRock’s overall operating margin, in general, compared to that of certain other publicly traded asset management firms. The Board considered the differences between BlackRock and these other firms, including the contribution of technology at BlackRock, BlackRock’s expense management, and the relative product mix.
The Board considered whether BlackRock has the financial resources necessary to attract and retain high quality investment management personnel to perform its obligations under the Agreements and to continue to provide the high quality of services that is expected by the Board. The Board further considered factors including but not limited to BlackRock’s commitment of time and resources, assumption of risk, and liability profile in servicing the Funds, including in contrast to what is required of BlackRock with respect to other products with similar investment mandates across the open-end fund, ETF, closed-end fund, sub-advised mutual fund, separately managed account, collective investment trust, and institutional separate account product channels, as applicable.
The Board noted that International Dividend Fund’s contractual management fee rate ranked in the first quartile, and that the actual management fee rate and total expense ratio each ranked in the first quartile relative to the Fund’s Expense Peers. The Board further noted that BlackRock and the Board have contractually agreed to a cap on the Fund’s total operating expenses as a percentage of the Fund’s average daily net assets on a class-by-class basis.
The Board noted that High Equity Income Fund’s contractual management fee rate ranked in the second quartile, and that the actual management fee rate and total expense ratio ranked in the second and first quartiles, respectively, relative to the Fund’s Expense Peers. The Board further noted that BlackRock and the Board have contractually agreed to a cap on the Fund’s total expenses as a percentage of the Fund’s average daily net assets on a class-by-class basis.
The Board noted that Energy Opportunities Fund’s contractual management fee rate ranked in the third quartile, and that the actual management fee rate and total expense ratio ranked in the third and second quartiles, respectively, relative to the Fund’s Expense Peers. The Board further noted that BlackRock and the Board have contractually agreed to a cap on the Fund’s total expenses as a percentage of the Fund’s average daily net assets on a class-by-class basis.
The Board also noted that each Fund has an advisory fee arrangement that includes breakpoints that adjust the fee rate downward as the size of the Fund increases above certain contractually specified levels. The Board additionally noted that the breakpoints can, conversely, adjust the advisory fee rate upward as the size of a Fund decreases below certain contractually specified levels.
D. Economies of Scale
The Board, including the Independent Board Members, considered the extent to which any economies of scale might benefit the Funds in a variety of ways as the assets of the Funds increase. The Board considered multiple factors, including the advisory fee rate and breakpoints, unitary fee structure, fee waivers, and/or expense caps, as applicable. The Board considered each Fund’s asset levels and whether the current fee schedule was appropriate.
E. Other Factors Deemed Relevant by the Board Members
The Board, including the Independent Board Members, also took into account other ancillary or “fall-out” benefits that BlackRock or its affiliates may derive from BlackRock’s respective relationships with the Funds, both tangible and intangible, such as BlackRock’s ability to leverage its investment professionals who manage other portfolios and its risk management personnel, an increase in BlackRock’s profile in the investment advisory community, and the engagement of BlackRock’s affiliates as service providers to the Funds, including for administrative, distribution, securities lending and cash management services. With respect to securities lending, during the year the Board also considered information provided by independent third-party consultants related to the performance of each BlackRock affiliate as securities lending agent. The Board also
| | |
| 46 | | 2 0 2 4 B L A C K R O C K A N N U A L F I N A N C I A L S T A T E M E N T S |
Disclosure of Investment Advisory Agreement and Sub-Advisory Agreements (continued)
considered BlackRock’s overall operations and its efforts to expand the scale of, and improve the quality of, its operations. The Board also noted that, subject to applicable law, BlackRock may use and benefit from third-party research obtained by soft dollars generated by certain registered fund transactions to assist in managing all or a number of its other client accounts.
In connection with its consideration of the Agreements, the Board also received information regarding BlackRock’s brokerage and soft dollar practices. The Board received reports from BlackRock which included information on brokerage commissions and trade execution practices throughout the year.
The Board noted the competitive nature of the open-end fund marketplace, and that shareholders are able to redeem their Fund shares if they believe that the pertinent Fund’s fees and expenses are too high or if they are dissatisfied with the performance of the Fund.
Conclusion
At the May Meeting, in a continuation of the discussions that occurred during the April Meeting, and as a culmination of the Board’s year-long deliberative process, the Board, including the Independent Board Members, unanimously approved the continuation of (i) the Advisory Agreement between the Manager and the Trust, on behalf of each Fund; (ii) the International Dividend Fund Sub-Advisory Agreement between the Manager and the Sub-Advisor with respect to International Dividend Fund; and (iii) the Energy Opportunities Fund Sub-Advisory Agreement between the Manager and the Sub-Advisor with respect to Energy Opportunities Fund, each for a one-year term ending June 30, 2025. Based upon its evaluation of all of the aforementioned factors in their totality, as well as other information, the Board, including the Independent Board Members, was satisfied that the terms of the Agreements were fair and reasonable and in the best interest of each Fund and its shareholders. In arriving at its decision to approve the Agreements, the Board did not identify any single factor or group of factors as all-important or controlling, but considered all factors together, and different Board Members may have attributed different weights to the various factors considered. The Independent Board Members were advised by independent legal counsel throughout the deliberative process.
| | |
D I S C L O S U R E O F I N V E S T M E N T A D V I S O R Y A G R E E M E N T A N D S U B - A D V I S O R Y A G R E E M E N T S | | 47 |
Additional Information
Changes in and Disagreements with Accountants
Not applicable.
Proxy Results
Not applicable.
Remuneration Paid to Trustees, Officers, and Others
Compensation to the independent directors/trustees of the Trust is paid by the Trust, on behalf of the Funds.
General Information
Quarterly performance, semi-annual and annual reports, current net asset value and other information regarding the Funds may be found on BlackRock’s website, which can be accessed at blackrock.com. Any reference to BlackRock’s website in this report is intended to allow investors public access to information regarding the Funds and does not, and is not intended to, incorporate BlackRock’s website in this report.
Electronic Delivery
Shareholders can sign up for e-mail notifications of quarterly statements, annual and semi-annual shareholder reports and prospectuses by enrolling in the electronic delivery program.
To enroll in electronic delivery:
Shareholders Who Hold Accounts with Investment Advisors, Banks or Brokerages:
Please contact your financial advisor. Please note that not all investment advisors, banks or brokerages may offer this service.
Shareholders Who Hold Accounts Directly with BlackRock:
1. Access the BlackRock website at blackrock.com
2. Select “Access Your Account”
3. Next, select “eDelivery” in the “Related Resources” box and follow the sign-up instructions.
BlackRock’s Mutual Fund Family
BlackRock offers a diverse lineup of open-end mutual funds crossing all investment styles and managed by experts in equity, fixed-income and tax-exempt investing. Visit blackrock.com for more information.
Shareholder Privileges
Account Information
Call us at (800) 441-7762 from 8:00 AM to 6:00 PM ET on any business day to get information about your account balances, recent transactions and share prices. You can also visit blackrock.com for more information.
Automatic Investment Plans
Investor class shareholders who want to invest regularly can arrange to have $50 or more automatically deducted from their checking or savings account and invested in any of the BlackRock funds.
Systematic Withdrawal Plans
Investor class shareholders can establish a systematic withdrawal plan and receive periodic payments of $50 or more from their BlackRock funds, as long as their account balance is at least $10,000.
Retirement Plans
Shareholders may make investments in conjunction with Traditional, Rollover, Roth, Coverdell, Simple IRAs, SEP IRAs and 403(b) Plans.
| | |
| 48 | | 2 0 2 4 B L A C K R O C K A N N U A L F I N A N C I A L S T A T E M E N T S |
Additional Information (continued)
Fund and Service Providers
| | |
| Investment Adviser and Administrator | | Independent Registered Public Accounting Firm |
| BlackRock Advisors, LLC | | Deloitte & Touche LLP |
| Wilmington, DE 19809 | | Boston, MA 02116 |
| |
| Sub-Adviser(a) | | Distributor |
| BlackRock International Limited | | BlackRock Investments, LLC |
| Edinburgh, EH3 8BL | | New York, NY 10022 |
| United Kingdom | | |
| |
| | Legal Counsel |
| Accounting Agent and Transfer Agent | | Sidley Austin LLP |
| BNY Mellon Investment Servicing (US) Inc. | | New York, NY 10019 |
| Wilmington, DE 19809 | | |
| |
| | Address of the Trust |
| Custodian | | 100 Bellevue Parkway |
| The Bank of New York Mellon | | Wilmington, DE 19809 |
| New York, NY 10286 | | |
(a) BlackRock Energy Opportunities Fund and BlackRock International Dividend Fund.
| | |
A D D I T I O N A L I N F O R M A T I O N | | 49 |
Glossary of Terms Used in this Report
Currency Abbreviation
| | |
| |
| EUR | | Euro |
| |
| GBP | | British Pound |
| |
| USD | | United States Dollar |
|
| Portfolio Abbreviation |
| |
| ADR | | American Depositary Receipt |
| |
| GDR | | Global Depositary Receipt |
| |
| NVS | | Non-Voting Shares |
| | |
| 50 | | 2 0 2 4 B L A C K R O C K A N N U A L F I N A N C I A L S T A T E M E N T S |
THIS PAGE INTENTIONALLY LEFT BLANK.
Want to know more?
blackrock.com | 800-441-7762
This report is intended for current holders. It is not authorized for use as an offer of sale or a solicitation of an offer to buy shares of the Funds unless preceded or accompanied by the Funds’ current prospectus. Past performance results shown in this report should not be considered a representation of future performance. Investment returns and principal value of shares will fluctuate so that shares, when redeemed, may be worth more or less than their original cost. Statements and other information herein are as dated and are subject to change.
| | |

| | MAY 31, 2024 |
| | |
| |
| | 2024 Annual Financial Statements |
BlackRock FundsSM
| · | | BlackRock Advantage International Fund |
| · | | BlackRock Advantage Large Cap Growth Fund |
| · | | BlackRock Advantage Small Cap Core Fund |
BlackRock Large Cap Series Funds, Inc.
| · | | BlackRock Advantage Large Cap Core Fund |
| · | | BlackRock Advantage Large Cap Value Fund |
|
Not FDIC Insured • May Lose Value • No Bank Guarantee |
Table of Contents
Derivative Financial Instruments
The Funds may invest in various derivative financial instruments. These instruments are used to obtain exposure to a security, commodity, index, market, and/or other assets without owning or taking physical custody of securities, commodities and/or other referenced assets or to manage market, equity, credit, interest rate, foreign currency exchange rate, commodity and/or other risks. Derivative financial instruments may give rise to a form of economic leverage and involve risks, including the imperfect correlation between the value of a derivative financial instrument and the underlying asset, possible default of the counterparty to the transaction or illiquidity of the instrument. Pursuant to Rule 18f-4 under the 1940 Act, among other things, the Funds must either use derivative financial instruments with embedded leverage in a limited manner or comply with an outer limit on fund leverage risk based on value-at-risk. The Funds’ successful use of a derivative financial instrument depends on the investment adviser’s ability to predict pertinent market movements accurately, which cannot be assured. The use of these instruments may result in losses greater than if they had not been used, may limit the amount of appreciation a Fund can realize on an investment and/or may result in lower distributions paid to shareholders. The Funds’ investments in these instruments, if any, are discussed in detail in the Notes to Financial Statements.
| | |
D E R I V A T I V E F I N A N C I A L I N S T R U M E N T S | | 3 |
| | |
Schedule of Investments May 31, 2024 | | BlackRock Advantage International Fund (Percentages shown are based on Net Assets) |
| | | | | | |
Security | | Shares | | | Value |
| | |
Common Stocks | | | | | | |
| | |
| Australia — 5.1% | | | | | |
AGL Energy Ltd. | | | 480,274 | | | $ 3,285,685 |
Aristocrat Leisure Ltd. | | | 273,418 | | | 8,219,335 |
BHP Group Ltd. | | | 1,080,012 | | | 32,143,675 |
Brambles Ltd. | | | 151,000 | | | 1,435,337 |
Charter Hall Group | | | 5,658 | | | 46,022 |
Cochlear Ltd. | | | 13,236 | | | 2,852,253 |
Coles Group Ltd. | | | 19,188 | | | 210,358 |
CSL Ltd. | | | 43,688 | | | 8,177,888 |
Macquarie Group Ltd. | | | 69,547 | | | 8,879,190 |
REA Group Ltd. | | | 24,680 | | | 3,086,428 |
Rio Tinto Ltd. | | | 44,663 | | | 3,841,664 |
Rio Tinto PLC | | | 57,729 | | | 4,063,971 |
Rocketboots Ltd.(a)(b) | | | 1,389 | | | 97 |
South32 Ltd. | | | 1,055,770 | | | 2,797,316 |
Transurban Group | | | 251,962 | | | 2,105,666 |
Wesfarmers Ltd. | | | 169,343 | | | 7,346,305 |
Woodside Energy Group Ltd. | | | 35,524 | | | 657,319 |
Worley Ltd. | | | 24,709 | | | 241,159 |
| | | | | | |
| | |
| | | | | | 89,389,668 |
|
| Austria — 0.5% |
BAWAG Group AG(c) | | | 26,157 | | | 1,730,340 |
Erste Group Bank AG | | | 93,772 | | | 4,607,978 |
OMV AG | | | 60,477 | | | 3,056,418 |
| | | | | | |
| | |
| | | | | | 9,394,736 |
|
| Belgium — 0.1% |
KBC Group NV | | | 17,289 | | | 1,262,628 |
Sofina SA | | | 2,990 | | | 727,579 |
| | | | | | |
| | |
| | | | | | 1,990,207 |
|
| China — 0.3% |
BOC Hong Kong Holdings Ltd. | | | 274,000 | | | 861,291 |
Budweiser Brewing Co. APAC Ltd.(c) | | | 916,800 | | | 1,163,934 |
Prosus NV | | | 2,356 | | | 85,538 |
Wilmar International Ltd. | | | 108,000 | | | 247,684 |
Yangzijiang Shipbuilding Holdings Ltd. | | | 1,708,900 | | | 2,891,460 |
| | | | | | |
| | |
| | | | | | 5,249,907 |
|
| Denmark — 4.2% |
DSV A/S | | | 18,414 | | | 2,835,191 |
Genmab A/S(a) | | | 9,595 | | | 2,708,275 |
Novo Nordisk A/S, Class B | | | 441,744 | | | 59,851,063 |
Pandora A/S | | | 34,242 | | | 5,624,603 |
Vestas Wind Systems A/S(a) | | | 47,519 | | | 1,333,306 |
| | | | | | |
| | |
| | | | | | 72,352,438 |
|
| Finland — 0.4% |
Nordea Bank Abp | | | 448,656 | | | 5,515,444 |
Sampo Oyj, A Shares | | | 4,424 | | | 189,368 |
Stora Enso Oyj, R Shares | | | 7,235 | | | 105,988 |
Wartsila Oyj Abp | | | 66,529 | | | 1,394,934 |
| | | | | | |
| | |
| | | | | | 7,205,734 |
|
| France — 9.1% |
Air Liquide SA | | | 28,719 | | | 5,654,024 |
Amundi SA(c) | | | 16,978 | | | 1,310,088 |
Bouygues SA | | | 21,214 | | | 831,349 |
Capgemini SE | | | 12,077 | | | 2,446,826 |
Carrefour SA | | | 710,830 | | | 11,591,880 |
Credit Agricole SA | | | 726,119 | | | 11,814,605 |
Danone SA | | | 249,079 | | | 16,063,083 |
Dassault Aviation SA | | | 1,412 | | | 306,452 |
Dassault Systemes SE | | | 213,419 | | | 8,673,765 |
| | | | | | |
Security | | Shares | | | Value |
| | |
| France (continued) | | | | | |
Eiffage SA | | | 74,935 | | | $ 8,290,817 |
Engie SA | | | 31,669 | | | 536,524 |
EssilorLuxottica SA | | | 17,441 | | | 3,911,214 |
Eurazeo SE | | | 6,282 | | | 530,267 |
Forvia SE(a) | | | 64,832 | | | 1,064,328 |
Gecina SA | | | 11,977 | | | 1,292,766 |
Hermes International SCA | | | 8,172 | | | 19,397,231 |
Legrand SA | | | 16,067 | | | 1,744,602 |
L’Oreal SA | | | 1,360 | | | 671,297 |
LVMH Moet Hennessy Louis Vuitton SE | | | 10,884 | | | 8,704,415 |
Publicis Groupe SA | | | 19,617 | | | 2,203,477 |
Rexel SA | | | 24,403 | | | 741,604 |
Sanofi SA | | | 88,700 | | | 8,683,907 |
Schneider Electric SE | | | 39,307 | | | 9,806,326 |
TotalEnergies SE | | | 26,387 | | | 1,933,230 |
Ubisoft Entertainment SA(a) | | | 103,282 | | | 2,525,832 |
Valeo SE | | | 242,740 | | | 3,002,291 |
Veolia Environnement SA | | | 311,965 | | | 10,443,614 |
Vinci SA | | | 121,769 | | | 15,195,820 |
Worldline SA(a)(c) | | | 21,700 | | | 290,062 |
| | | | | | |
| | |
| | | | | | 159,661,696 |
|
| Germany — 10.0% |
adidas AG, Class N | | | 701 | | | 177,543 |
Allianz SE, Registered Shares | | | 100,526 | | | 29,427,777 |
BASF SE | | | 1,382 | | | 73,145 |
Bayer AG, Registered Shares | | | 436,544 | | | 13,430,364 |
Beiersdorf AG | | | 13,027 | | | 2,042,336 |
Brenntag SE, Registered Shares | | | 1,999 | | | 144,000 |
Deutsche Bank AG, Registered Shares | | | 174,976 | | | 2,911,685 |
Deutsche Lufthansa AG, Registered Shares | | | 146,437 | | | 1,025,645 |
Deutsche Telekom AG, Registered Shares | | | 957,121 | | | 23,271,741 |
Evonik Industries AG | | | 17,158 | | | 377,965 |
Fresenius Medical Care AG | | | 21,801 | | | 929,908 |
Fresenius SE & Co. KGaA(a) | | | 52,620 | | | 1,678,910 |
Heidelberg Materials AG | | | 30,076 | | | 3,154,174 |
Henkel AG & Co. KGaA | | | 15,364 | | | 1,231,118 |
Henkel AG & Co. KGaA, Preference Shares, NVS | | | 14,274 | | | 1,292,232 |
HUGO BOSS AG | | | 5,321 | | | 281,657 |
K+S AG, Registered Shares | | | 39,402 | | | 580,239 |
Muenchener Rueckversicherungs-Gesellschaft AG, Registered Shares | | | 18,209 | | | 9,080,796 |
Nemetschek SE | | | 28,301 | | | 2,600,718 |
Nordex SE(a) | | | 56,415 | | | 891,068 |
Porsche Automobil Holding SE, Preference Shares, NVS | | | 94,051 | | | 5,189,602 |
Rheinmetall AG | | | 257 | | | 148,140 |
SAP SE | | | 196,644 | | | 35,859,712 |
Scout24 SE(c) | | | 13,414 | | | 1,009,048 |
Siemens AG, Registered Shares | | | 158,883 | | | 30,623,309 |
Siemens Energy AG(a) | | | 200,996 | | | 5,473,375 |
Talanx AG | | | 10,167 | | | 810,987 |
Volkswagen AG | | | 2,169 | | | 311,007 |
Zalando SE(a)(c) | | | 47,847 | | | 1,270,781 |
| | | | | | |
| | | | | | 175,298,982 |
|
| Hong Kong — 1.5% |
AIA Group Ltd. | | | 2,256,400 | | | 17,525,914 |
ASMPT Ltd. | | | 11,100 | | | 132,746 |
CK Asset Holdings Ltd. | | | 872,000 | | | 3,453,850 |
Hang Lung Properties Ltd.(b) | | | 169,000 | | | 153,927 |
Jardine Matheson Holdings Ltd. | | | 48,800 | | | 1,798,497 |
Sino Land Co. Ltd. | | | 530,000 | | | 564,048 |
Sun Hung Kai Properties Ltd. | | | 27,000 | | | 260,888 |
| | |
| 4 | | 2 0 2 4 B L A C K R O C K A N N U A L F I N A N C I A L S T A T E M E N T S |
| | |
Schedule of Investments (continued) May 31, 2024 | | BlackRock Advantage International Fund (Percentages shown are based on Net Assets) |
| | | | | | |
Security | | Shares | | | Value |
|
| Hong Kong (continued) |
Swire Properties Ltd. | | | 294,200 | | | $ 541,117 |
Wharf Real Estate Investment Co. Ltd. | | | 461,000 | | | 1,341,332 |
| | | | | | |
| | |
| | | | | | 25,772,319 |
| | |
| India — 0.0% | | | | | |
AceVector Ltd. (Acquired 05/07/14,
cost $804,375)(a)(d)(e) | | | 172,800 | | | 83,469 |
| | | | | | |
| | |
| Ireland — 0.4% | | | | | |
James Hardie Industries PLC(a) | | | 113,751 | | | 3,545,930 |
Kerry Group PLC, Class A | | | 37,982 | | | 3,217,923 |
| | | | | | |
| | |
| | | | | | 6,763,853 |
| | |
| Israel — 0.3% | | | | | |
Bank Hapoalim BM | | | 36,442 | | | 335,236 |
Bank Leumi Le-Israel BM | | | 107,752 | | | 896,494 |
Elbit Systems Ltd. | | | 3,035 | | | 578,559 |
Nice Ltd.(a) | | | 18,534 | | | 3,422,387 |
| | | | | | |
| | |
| | | | | | 5,232,676 |
| | |
| Italy — 2.8% | | | | | |
A2A SpA | | | 1,752,766 | | | 3,692,173 |
Amplifon SpA | | | 18,108 | | | 669,328 |
Assicurazioni Generali SpA | | | 97,959 | | | 2,521,327 |
Banca Monte dei Paschi di Siena SpA | | | 1,309,144 | | | 7,072,140 |
Banco BPM SpA | | | 33,373 | | | 240,786 |
Enel SpA | | | 687,266 | | | 4,990,043 |
Ferrari NV | | | 30,216 | | | 12,451,487 |
Intesa Sanpaolo SpA | | | 1,047,529 | | | 4,126,465 |
Mediobanca Banca di Credito Finanziario SpA | | | 49,555 | | | 784,338 |
MFE-MediaForEurope NV, Class A | | | 23 | | | 79 |
MFE-MediaForEurope NV, Class B | | | 2 | | | 9 |
Moncler SpA | | | 5,518 | | | 368,213 |
Poste Italiane SpA(c) | | | 180,507 | | | 2,479,629 |
Recordati Industria Chimica e Farmaceutica SpA | | | 32,763 | | | 1,729,326 |
Saipem SpA(a) | | | 655,364 | | | 1,636,702 |
UniCredit SpA | | | 153,883 | | | 6,126,489 |
| | | | | | |
| | |
| | | | | | 48,888,534 |
| | |
| Japan — 22.3% | | | | | |
Asahi Group Holdings Ltd. | | | 30,300 | | | 1,111,599 |
Canon, Inc. | | | 141,100 | | | 4,106,311 |
Central Japan Railway Co. | | | 295,000 | | | 6,579,758 |
Concordia Financial Group Ltd. | | | 25,600 | | | 154,578 |
Dai-ichi Life Holdings, Inc. | | | 93,600 | | | 2,518,399 |
Daiichi Sankyo Co. Ltd. | | | 364,700 | | | 12,873,577 |
Daikin Industries Ltd. | | | 1,600 | | | 233,809 |
Daito Trust Construction Co. Ltd. | | | 12,400 | | | 1,309,631 |
Daiwa House Industry Co. Ltd. | | | 198,700 | | | 5,286,740 |
Denso Corp. | | | 43,700 | | | 710,149 |
Disco Corp. | | | 6,200 | | | 2,438,826 |
ENEOS Holdings, Inc. | | | 428,400 | | | 2,214,931 |
Fujitsu Ltd. | | | 95,000 | | | 1,375,692 |
Hikari Tsushin, Inc. | | | 400 | | | 65,656 |
Hitachi Ltd. | | | 223,700 | | | 23,038,346 |
Honda Motor Co. Ltd. | | | 192,400 | | | 2,178,683 |
Hoya Corp. | | | 15,200 | | | 1,850,343 |
Hulic Co. Ltd. | | | 188,900 | | | 1,749,842 |
ITOCHU Corp. | | | 219,900 | | | 10,380,731 |
J Front Retailing Co. Ltd. | | | 72,500 | | | 704,499 |
Japan Exchange Group, Inc. | | | 50,100 | | | 1,177,599 |
Japan Post Bank Co. Ltd. | | | 143,900 | | | 1,425,449 |
Japan Post Holdings Co. Ltd. | | | 533,200 | | | 5,148,838 |
Japan Tobacco, Inc. | | | 189,000 | | | 5,362,445 |
Kakaku.com, Inc. | | | 102,000 | | | 1,234,809 |
| | | | | | |
Security | | Shares | | | Value |
|
| Japan (continued) |
Kansai Electric Power Co., Inc. (The) | | | 115,800 | | | $ 2,095,657 |
KDDI Corp. | | | 4,100 | | | 112,975 |
Keyence Corp. | | | 20,400 | | | 9,195,535 |
Komatsu Ltd. | | | 177,500 | | | 5,216,908 |
Kyowa Kirin Co. Ltd. | | | 59,500 | | | 1,006,049 |
Makita Corp. | | | 11,100 | | | 327,301 |
Marubeni Corp. | | | 291,100 | | | 5,701,354 |
Mazda Motor Corp. | | | 35,000 | | | 368,997 |
Mitsubishi Chemical Group Corp. | | | 589,300 | | | 3,121,035 |
Mitsubishi HC Capital, Inc. | | | 79,100 | | | 525,029 |
Mitsubishi UFJ Financial Group, Inc. | | | 2,611,500 | | | 27,738,513 |
Mitsui Fudosan Co. Ltd. | | | 213,600 | | | 1,962,356 |
Mizuho Financial Group, Inc. | | | 724,500 | | | 14,840,905 |
MS&AD Insurance Group Holdings, Inc. | | | 145,700 | | | 3,030,548 |
Murata Manufacturing Co. Ltd. | | | 521,200 | | | 9,858,714 |
Nidec Corp. | | | 36,900 | | | 1,839,407 |
Nintendo Co. Ltd. | | | 141,200 | | | 7,678,526 |
Nippon Steel Corp. | | | 84,200 | | | 1,843,326 |
Nippon Telegraph & Telephone Corp. | | | 16,974,800 | | | 16,669,396 |
Nippon Yusen KK | | | 3,500 | | | 110,943 |
Nissan Motor Co. Ltd. | | | 350,700 | | | 1,254,319 |
Nomura Holdings, Inc. | | | 338,100 | | | 2,053,358 |
Nomura Research Institute Ltd. | | | 175,800 | | | 4,706,602 |
Obayashi Corp. | | | 10,400 | | | 121,071 |
Ono Pharmaceutical Co. Ltd. | | | 162,100 | | | 2,347,351 |
Oracle Corp. Japan(a) | | | 7,900 | | | 561,775 |
Oriental Land Co. Ltd. | | | 144,900 | | | 4,050,920 |
ORIX Corp. | | | 117,200 | | | 2,555,903 |
Otsuka Corp. | | | 30,400 | | | 577,214 |
Otsuka Holdings Co. Ltd. | | | 22,500 | | | 928,923 |
Pan Pacific International Holdings Corp. | | | 149,000 | | | 3,854,192 |
Panasonic Holdings Corp. | | | 1,137,400 | | | 10,046,472 |
Park24 Co. Ltd.(a) | | | 7,100 | | | 73,799 |
Recruit Holdings Co. Ltd. | | | 439,400 | | | 22,181,745 |
Renesas Electronics Corp. | | | 191,000 | | | 3,519,484 |
Resona Holdings, Inc. | | | 210,900 | | | 1,463,941 |
Sankyo Co. Ltd. | | | 209,300 | | | 2,040,739 |
SBI Holdings, Inc. | | | 2,000 | | | 51,799 |
Sekisui House Ltd. | | | 53,800 | | | 1,211,446 |
Shin-Etsu Chemical Co. Ltd. | | | 24,600 | | | 918,283 |
SoftBank Corp. | | | 286,600 | | | 3,436,395 |
SoftBank Group Corp. | | | 102,600 | | | 5,937,206 |
Sojitz Corp. | | | 16,900 | | | 442,135 |
Sompo Holdings, Inc. | | | 227,800 | | | 4,821,330 |
Sony Group Corp. | | | 42,200 | | | 3,464,652 |
Subaru Corp. | | | 7,000 | | | 156,483 |
Sumitomo Chemical Co. Ltd. | | | 45,500 | | | 93,547 |
Sumitomo Corp. | | | 314,000 | | | 8,171,068 |
Sumitomo Electric Industries Ltd. | | | 15,100 | | | 245,064 |
Sumitomo Mitsui Financial Group, Inc. | | | 323,300 | | | 21,159,700 |
Sumitomo Mitsui Trust Holdings, Inc. | | | 73,800 | | | 1,715,818 |
Suzuki Motor Corp. | | | 16,000 | | | 190,751 |
T&D Holdings, Inc. | | | 48,800 | | | 882,224 |
TDK Corp. | | | 2,400 | | | 120,541 |
Tokio Marine Holdings, Inc. | | | 531,300 | | | 18,407,052 |
Tokyo Electron Ltd. | | | 131,100 | | | 27,840,217 |
Toyota Industries Corp. | | | 13,400 | | | 1,263,764 |
Toyota Motor Corp. | | | 411,000 | | | 8,952,687 |
Toyota Tsusho Corp. | | | 70,000 | | | 4,274,830 |
Trend Micro, Inc. | | | 1,600 | | | 72,413 |
Unicharm Corp. | | | 136,800 | | | 4,414,740 |
| | | | | | |
| | |
| | | | | | 389,056,667 |
| | |
S C H E D U L E S O F I N V E S T M E N T S | | 5 |
| | |
Schedule of Investments (continued) May 31, 2024 | | BlackRock Advantage International Fund (Percentages shown are based on Net Assets) |
| | | | | | |
Security | | Shares | | | Value |
|
| Luxembourg — 0.8% |
ArcelorMittal SA | | | 491,855 | | | $ 12,976,411 |
SES SA | | | 9 | | | 51 |
| | | | | | |
| | |
| | | | | | 12,976,462 |
|
| Netherlands — 5.1% |
Adyen NV(a)(c) | | | 1,519 | | | 1,969,816 |
Aegon Ltd. | | | 320,784 | | | 2,080,691 |
Argenx SE(a) | | | 3,434 | | | 1,270,057 |
ASML Holding NV | | | 55,857 | | | 53,442,371 |
Euronext NV(c) | | | 25,851 | | | 2,545,452 |
EXOR NV | | | 6,996 | | | 785,656 |
Koninklijke Philips NV(a) | | | 125,977 | | | 3,441,046 |
NN Group NV | | | 115,060 | | | 5,368,601 |
Signify NV(c) | | | 49,591 | | | 1,355,071 |
Stellantis NV | | | 249,289 | | | 5,523,258 |
Wolters Kluwer NV, Class C | | | 73,944 | | | 11,793,293 |
| | | | | | |
| | |
| | | | | | 89,575,312 |
|
| New Zealand — 0.4% |
Xero Ltd.(a) | | | 69,371 | | | 6,298,490 |
| | | | | | |
|
| Norway — 0.6% |
Equinor ASA | | | 339,780 | | | 9,863,044 |
Norsk Hydro ASA | | | 51,447 | | | 348,380 |
Yara International ASA | | | 28,801 | | | 895,580 |
| | | | | | |
| | |
| | | | | | 11,107,004 |
|
| Portugal — 0.1% |
Banco Comercial Portugues SA, Class R(a) | | | 5,776,499 | | | 2,347,244 |
| | | | | | |
|
| Singapore — 1.2% |
CapitaLand Integrated Commercial Trust | | | 62,100 | | | 90,453 |
City Developments Ltd. | | | 22,700 | | | 94,495 |
DBS Group Holdings Ltd. | | | 34,560 | | | 921,571 |
Jardine Cycle & Carriage Ltd.(b) | | | 108,000 | | | 2,065,155 |
Mapletree Pan Asia Commercial Trust | | | 292,700 | | | 265,522 |
Seatrium Ltd.(a) | | | 415,000 | | | 541,702 |
Singapore Telecommunications Ltd. | | | 7,331,100 | | | 13,485,925 |
United Overseas Bank Ltd. | | | 124,100 | | | 2,829,736 |
| | | | | | |
| | |
| | | | | | 20,294,559 |
|
| Spain — 4.0% |
Acciona SA | | | 1,327 | | | 170,369 |
ACS Actividades de Construccion y Servicios SA | | | 135,385 | | | 6,061,557 |
Banco Bilbao Vizcaya Argentaria SA | | | 226,761 | | | 2,460,666 |
Banco Santander SA | | | 4,882,175 | | | 25,747,380 |
Iberdrola SA | | | 261,515 | | | 3,451,677 |
Industria de Diseno Textil SA | | | 441,818 | | | 21,009,150 |
Repsol SA | | | 634,534 | | | 10,358,583 |
| | | | | | |
| | |
| | | | | | 69,259,382 |
|
| Sweden — 3.6% |
Assa Abloy AB, Class B | | | 307,918 | | | 9,048,804 |
Atlas Copco AB, A Shares | | | 402,565 | | | 7,755,123 |
Atlas Copco AB, B Shares | | | 241,569 | | | 4,010,675 |
Electrolux AB, Class B(a) | | | 28,704 | | | 275,062 |
Essity AB, Class B | | | 43,121 | | | 1,107,881 |
Fastighets AB Balder, B Shares(a) | | | 22,147 | | | 149,951 |
H & M Hennes & Mauritz AB, B Shares | | | 97,122 | | | 1,717,333 |
Hexagon AB, B Shares | | | 960,657 | | | 10,581,538 |
Industrivarden AB, A Shares | | | 28,093 | | | 1,000,094 |
Industrivarden AB, C Shares | | | 62,833 | | | 2,207,125 |
Investor AB, B Shares | | | 535,406 | | | 14,528,434 |
Trelleborg AB, B Shares | | | 163,052 | | | 6,380,162 |
Volvo AB, B Shares | | | 164,088 | | | 4,416,413 |
| | | | | | |
| | |
| | | | | | 63,178,595 |
| | | | | | |
Security | | Shares | | | Value |
|
| Switzerland — 8.2% |
ABB Ltd., Registered Shares | | | 499,310 | | | $ 27,529,677 |
Chocoladefabriken Lindt & Spruengli AG, NVS | | | 410 | | | 4,771,818 |
Chocoladefabriken Lindt & Spruengli AG, Registered Shares | | | 4 | | | 474,995 |
Givaudan SA, Registered Shares | | | 1,107 | | | 5,218,728 |
Holcim AG | | | 222,599 | | | 19,555,310 |
Kuehne + Nagel International AG, Registered Shares | | | 10,787 | | | 3,059,226 |
Logitech International SA, Registered Shares | | | 45,496 | | | 4,553,668 |
Medmix AG(c) | | | 2 | | | 37 |
Nestlé SA, Registered Shares | | | 203,862 | | | 21,639,167 |
Novartis AG, Registered Shares | | | 388,019 | | | 40,159,174 |
Roche Holding AG | | | 5,113 | | | 1,430,961 |
Roche Holding AG, NVS | | | 16,868 | | | 4,306,686 |
Schindler Holding AG, NVS | | | 2,674 | | | 695,614 |
Sonova Holding AG, Registered Shares | | | 14,641 | | | 4,651,733 |
Swatch Group AG (The), Registered Shares | | | 903 | | | 37,598 |
UBS Group AG, Registered Shares | | | 36,218 | | | 1,152,227 |
Zurich Insurance Group AG, Class N | | | 8,268 | | | 4,351,504 |
| | | | | | |
| | |
| | | | | | 143,588,123 |
|
| United Kingdom — 11.3% |
3i Group PLC | | | 36,797 | | | 1,355,857 |
AstraZeneca PLC | | | 120,517 | | | 18,734,251 |
Auto Trader Group PLC(c) | | | 443,885 | | | 4,669,436 |
Aviva PLC | | | 32,197 | | | 197,757 |
BAE Systems PLC | | | 1,158,205 | | | 20,623,013 |
British American Tobacco PLC | | | 317,536 | | | 9,819,748 |
British Land Co. PLC (The) | | | 378,848 | | | 2,130,794 |
BT Group PLC | | | 2,109,815 | | | 3,532,328 |
Bunzl PLC | | | 139,420 | | | 5,241,527 |
CK Hutchison Holdings Ltd. | | | 1,431,500 | | | 6,990,137 |
Close Brothers Group PLC | | | 15 | | | 91 |
Compass Group PLC | | | 475,208 | | | 13,342,032 |
Direct Line Insurance Group PLC | | | 219,470 | | | 602,772 |
Drax Group PLC | | | 83,720 | | | 553,137 |
Dunelm Group PLC | | | 24 | | | 340 |
easyJet PLC | | | 186,149 | | | 1,101,032 |
Experian PLC | | | 324,054 | | | 15,016,063 |
Halma PLC | | | 51,424 | | | 1,472,043 |
HSBC Holdings PLC | | | 365,240 | | | 3,255,340 |
IG Group Holdings PLC | | | 12,051 | | | 124,666 |
IMI PLC | | | 20,584 | | | 491,987 |
Imperial Brands PLC | | | 264,643 | | | 6,576,146 |
Informa PLC | | | 916,680 | | | 9,977,167 |
International Consolidated Airlines Group SA(a) | | | 273,235 | | | 601,254 |
Intertek Group PLC | | | 15,127 | | | 928,409 |
J Sainsbury PLC | | | 32,042 | | | 113,603 |
Johnson Matthey PLC | | | 159,087 | | | 3,563,758 |
London Stock Exchange Group PLC | | | 66,026 | | | 7,739,341 |
Marks & Spencer Group PLC | | | 669,821 | | | 2,591,355 |
Melrose Industries PLC | | | 26,133 | | | 206,794 |
Pearson PLC | | | 7,992 | | | 97,169 |
Reckitt Benckiser Group PLC | | | 33,471 | | | 1,915,658 |
RELX PLC | | | 296,544 | | | 13,008,461 |
Rolls-Royce Holdings PLC(a) | | | 370,871 | | | 2,166,209 |
Schroders PLC | | | 9,523 | | | 48,039 |
Smiths Group PLC | | | 286,892 | | | 6,348,266 |
Spectris PLC | | | 55,636 | | | 2,337,072 |
Standard Chartered PLC | | | 129,544 | | | 1,290,335 |
Tesco PLC | | | 4,519,164 | | | 17,976,777 |
| | |
| 6 | | 2 0 2 4 B L A C K R O C K A N N U A L F I N A N C I A L S T A T E M E N T S |
| | |
Schedule of Investments (continued) May 31, 2024 | | BlackRock Advantage International Fund (Percentages shown are based on Net Assets) |
| | | | | | | | |
Security | | Shares | | | Value | |
| |
|
| United Kingdom (continued) | |
Unilever PLC | | | 143,826 | | | $ | 7,876,354 | |
Vodafone Group PLC | | | 3,429,455 | | | | 3,315,598 | |
| | | | | | | | |
| | |
| | | | | | | 197,932,116 | |
United States — 5.0% | | | | | | | | |
BP PLC | | | 2,532,830 | | | | 15,844,082 | |
CRH PLC | | | 137,869 | | | | 10,880,131 | |
GSK PLC | | | 1,250,744 | | | | 28,064,217 | |
Shell PLC | | | 906,840 | | | | 32,732,175 | |
| | | | | | | | |
| | |
| | | | | | | 87,520,605 | |
| | | | | | | | |
| |
Total Long-Term Investments — 97.3%
(Cost: $1,406,137,802) | | | | 1,700,418,778 | |
| | | | | | | | |
|
Short-Term Securities | |
|
| Money Market Funds — 3.5% | |
BlackRock Cash Funds: Institutional, SL Agency Shares, 5.49%(f)(g)(h) | | | 760,176 | | | | 760,404 | |
BlackRock Liquidity Funds, T-Fund, Institutional Shares, 5.19%(f)(g) | | | 60,864,854 | | | | 60,864,854 | |
| | | | | | | | |
| |
Total Short-Term Securities — 3.5%
(Cost: $61,625,258) | | | | 61,625,258 | |
| | | | | | | | |
Total Investments — 100.8%
(Cost: $1,467,763,060) | | | | 1,762,044,036 | |
Liabilities in Excess of Other Assets — (0.8)% | | | | (14,658,052 | ) |
| | | | | | | | |
| |
Net Assets — 100.0% | | | $ | 1,747,385,984 | |
| | | | | | | | |
| (a) | Non-income producing security. |
| (b) | All or a portion of this security is on loan. |
| (c) | Security exempt from registration pursuant to Rule 144A under the Securities Act of 1933, as amended. These securities may be resold in transactions exempt from registration to qualified institutional investors. |
| (d) | Security is valued using significant unobservable inputs and is classified as Level 3 in the fair value hierarchy. |
| (e) | Restricted security as to resale, excluding 144A securities. The Fund held restricted securities with a current value of $83,469, representing 0.0% of its net assets as of period end, and an original cost of $804,375. |
| (f) | Affiliate of the Fund. |
| (g) | Annualized 7-day yield as of period end. |
| (h) | All or a portion of this security was purchased with the cash collateral from loaned securities. |
Affiliates
Investments in issuers considered to be affiliate(s) of the Fund during the year ended May 31, 2024 for purposes of Section 2(a)(3) of the Investment Company Act of 1940, as amended, were as follows:
| | | | | | | | | | | | | | | | | | | | | | | | | | | | | | | | | | | | |
| |
| Affiliated Issuer | | Value at
05/31/23 | | | Purchases at Cost | | | Proceeds
from Sales | | | Net Realized
Gain (Loss) | | | Change in
Unrealized
Appreciation
(Depreciation) | | | Value at
05/31/24 | | | Shares Held at
05/31/24 | | | Income | | | Capital Gain
Distributions
from Underlying
Funds | |
| |
| | | | | | | | | |
BlackRock Cash Funds: Institutional, SL Agency Shares | | $ | — | | | $ | 760,485 | (a) | | $ | — | | | $ | (81 | ) | | $ | — | | | $ | 760,404 | | | | 760,176 | | | $ | 1,066 | (b) | | $ | — | |
BlackRock Liquidity Funds, T-Fund, Institutional Shares | | | 39,104,394 | | | | 21,760,460 | (a) | | | — | | | | — | | | | — | | | | 60,864,854 | | | | 60,864,854 | | | | 1,680,755 | | | | — | |
SL Liquidity Series, LLC, Money Market Series(c) | | | 2,613,380 | | | | — | | | | (2,613,970 | )(a) | | | 783 | | | | (193 | ) | | | — | | | | — | | | | 17,141 | (b) | | | — | |
| | | | | | | | | | | | | | | | | | | | | | | | | | | | | | | | | | | | |
| | | | | | | | | | | | | | $ | 702 | | | $ | (193 | ) | | $ | 61,625,258 | | | | | | | $ | 1,698,962 | | | $ | — | |
| | | | | | | | | | | | | | | | | | | | | | | | | | | | | | | | | | | | |
| | (a) | Represents net amount purchased (sold). |
| | (b) | All or a portion represents securities lending income earned from the reinvestment of cash collateral from loaned securities, net of fees and collateral investment expenses, and other payments to and from borrowers of securities. |
| | (c) | As of period end, the entity is no longer held. |
| | |
S C H E D U L E S O F I N V E S T M E N T S | | 7 |
| | |
Schedule of Investments (continued) May 31, 2024 | | BlackRock Advantage International Fund |
Derivative Financial Instruments Outstanding as of Period End
Futures Contracts
| | | | | | | | | | | | | | | | |
| |
| Description | | Number of
Contracts | | | Expiration
Date | | | Notional
Amount
(000) | | | Value/
Unrealized
Appreciation
(Depreciation) | |
| |
Long Contracts | | | | | | | | | | | | | | | | |
MSCI EAFE Index | | | 333 | | | | 06/21/24 | | | $ | 39,464 | | | $ | 202,528 | |
| | | | | | | | | | | | | | | | |
Derivative Financial Instruments Categorized by Risk Exposure
As of period end, the fair values of derivative financial instruments located in the Statements of Assets and Liabilities were as follows:
| | | | | | | | | | | | | | | | | | | | | | | | | | | | |
| |
| | | | | | | |
| | | Commodity Contracts | | | Credit Contracts | | | Equity Contracts | | | Foreign
Currency
Exchange
Contracts | | | Interest
Rate
Contracts | | | Other Contracts | | | Total | |
| |
| | | | | | | |
Assets — Derivative Financial Instruments | | | | | | | | | | | | | | | | | | | | | | | | | | | | |
| | | | | | | |
Futures contracts | | | | | | | | | | | | | | | | | | | | | | | | | | | | |
Unrealized appreciation on futures contracts(a) | | $ | — | | | $ | — | | | $ | 202,528 | | | $ | — | | | $ | — | | | $ | — | | | $ | 202,528 | |
| | | | | | | | | | | | | | | | | | | | | | | | | | | | |
| | (a) | Net cumulative unrealized appreciation (depreciation) on futures contracts and centrally cleared swaps, if any, are reported in the Schedule of Investments. In the Statements of Assets and Liabilities, only current day’s variation margin is reported in receivables or payables and the net cumulative unrealized appreciation (depreciation) is included in accumulated earnings (loss). | |
For the period ended May 31, 2024, the effect of derivative financial instruments in the Statements of Operations was as follows:
| | | | | | | | | | | | | | | | | | | | | | | | | | |
| | | Commodity
Contracts | | | Credit
Contracts | | | Equity
Contracts | | | Foreign
Currency
Exchange
Contracts | | | Interest
Rate
Contracts | | | Other
Contracts | | | Total |
| | | | | | | |
Net Realized Gain (Loss) from: | | | | | | | | | | | | | | | | | | | | | | | | | | |
Futures contracts | | $ | — | | | $ | — | | | $ | 2,714,451 | | | $ | — | | | $ | — | | | $ | — | | | $ 2,714,451 |
| | | | | | | | | | | | | | | | | | | | | | | | | | |
| | | | | | | |
Net Change in Unrealized Appreciation
(Depreciation) on: | | | | | | | | | | | | | | | | | | | | |
Futures contracts | | $ | — | | | $ | — | | | $ | 1,478,871 | | | $ | — | | | $ | — | | | $ | — | | | $ 1,478,871 |
| | | | | | | | | | | | | | | | | | | | | | | | | | |
Average Quarterly Balances of Outstanding Derivative Financial Instruments
| | | | |
| | |
Futures contracts | | | | |
Average notional value of contracts — long | | $ | 32,494,748 | |
For more information about the Fund’s investment risks regarding derivative financial instruments, refer to the Notes to Financial Statements.
Fair Value Hierarchy as of Period End
Various inputs are used in determining the fair value of financial instruments. For a description of the input levels and information about the Fund’s policy regarding valuation of financial instruments, refer to the Notes to Financial Statements.
The following table summarizes the Fund’s financial instruments categorized in the fair value hierarchy. The breakdown of the Fund’s financial instruments into major categories is disclosed in the Schedule of Investments above.
| | | | | | | | | | | | | | | | |
| |
| | | Level 1 | | | Level 2 | | | Level 3 | | | Total | |
| |
Assets | | | | | | | | | | | | | | | | |
Investments | | | | | | | | | | | | | | | | |
Long-Term Investments | | | | | | | | | | | | | | | | |
Common Stocks | | | | | | | | | | | | | | | | |
Australia | | $ | — | | | $ | 89,389,668 | | | $ | — | | | $ | 89,389,668 | |
Austria | | | — | | | | 9,394,736 | | | | — | | | | 9,394,736 | |
Belgium | | | — | | | | 1,990,207 | | | | — | | | | 1,990,207 | |
China | | | — | | | | 5,249,907 | | | | — | | | | 5,249,907 | |
Denmark | | | — | | | | 72,352,438 | | | | — | | | | 72,352,438 | |
Finland | | | — | | | | 7,205,734 | | | | — | | | | 7,205,734 | |
| | |
| 8 | | 2 0 2 4 B L A C K R O C K A N N U A L F I N A N C I A L S T A T E M E N T S |
| | |
Schedule of Investments (continued) May 31, 2024 | | BlackRock Advantage International Fund |
Fair Value Hierarchy as of Period End (continued)
| | | | | | | | | | | | | | | | |
| | | Level 1 | | | Level 2 | | | Level 3 | | | Total | |
| | | | |
Common Stocks (continued) | | | | | | | | | | | | | | | | |
France | | $ | — | | | $ | 159,661,696 | | | $ | — | | | $ | 159,661,696 | |
Germany | | | — | | | | 175,298,982 | | | | — | | | | 175,298,982 | |
Hong Kong | | | — | | | | 25,772,319 | | | | — | | | | 25,772,319 | |
India | | | — | | | | — | | | | 83,469 | | | | 83,469 | |
Ireland | | | — | | | | 6,763,853 | | | | — | | | | 6,763,853 | |
Israel | | | — | | | | 5,232,676 | | | | — | | | | 5,232,676 | |
Italy | | | 9 | | | | 48,888,525 | | | | — | | | | 48,888,534 | |
Japan | | | 110,943 | | | | 388,945,724 | | | | — | | | | 389,056,667 | |
Luxembourg | | | — | | | | 12,976,462 | | | | — | | | | 12,976,462 | |
Netherlands | | | — | | | | 89,575,312 | | | | — | | | | 89,575,312 | |
New Zealand | | | — | | | | 6,298,490 | | | | — | | | | 6,298,490 | |
Norway | | | — | | | | 11,107,004 | | | | — | | | | 11,107,004 | |
Portugal | | | — | | | | 2,347,244 | | | | — | | | | 2,347,244 | |
Singapore | | | — | | | | 20,294,559 | | | | — | | | | 20,294,559 | |
Spain | | | — | | | | 69,259,382 | | | | — | | | | 69,259,382 | |
Sweden | | | — | | | | 63,178,595 | | | | — | | | | 63,178,595 | |
Switzerland | | | 37 | | | | 143,588,086 | | | | — | | | | 143,588,123 | |
United Kingdom | | | 4,116,986 | | | | 193,815,130 | | | | — | | | | 197,932,116 | |
United States | | | — | | | | 87,520,605 | | | | — | | | | 87,520,605 | |
Short-Term Securities | | | | | | | | | | | | | | | | |
Money Market Funds | | | 61,625,258 | | | | — | | | | — | | | | 61,625,258 | |
| | | | | | | | | | | | | | | | |
| | | | |
| | $ | 65,853,233 | | | $ | 1,696,107,334 | | | $ | 83,469 | | | $ | 1,762,044,036 | |
| | | | | | | | | | | | | | | | |
Derivative Financial Instruments(a) | | | | | | | | | | | | | | | | |
Assets | | | | | | | | | | | | | | | | |
Equity Contracts | | $ | 202,528 | | | $ | — | | | $ | — | | | $ | 202,528 | |
| | | | | | | | | | | | | | | | |
| | (a) | Derivative financial instruments are futures contracts. Futures contracts are valued at the unrealized appreciation (depreciation) on the instrument. | |
See notes to financial statements.
| | |
S C H E D U L E S O F I N V E S T M E N T S | | 9 |
| | |
Schedule of Investments May 31, 2024 | | BlackRock Advantage Large Cap Growth Fund (Percentages shown are based on Net Assets) |
| | | | | | |
Security | | Shares | | | Value |
| | |
Common Stocks | | | | | | |
| | |
| Aerospace & Defense — 0.7% | | | | | |
Lockheed Martin Corp | | | 17,348 | | | $ 8,159,458 |
| | | | | | |
|
| Air Freight & Logistics — 0.0% |
Expeditors International of Washington, Inc. | | | 1,640 | | | 198,276 |
| | | | | | |
|
| Automobiles — 1.1% |
General Motors Co. | | | 10,250 | | | 461,148 |
Tesla, Inc.(a) | | | 74,468 | | | 13,261,261 |
| | | | | | |
| | |
| | | | | | 13,722,409 |
|
| Beverages — 0.2% |
Monster Beverage Corp.(a) | | | 41,792 | | | 2,169,841 |
PepsiCo, Inc. | | | 4,241 | | | 733,269 |
| | | | | | |
| | |
| | | | | | 2,903,110 |
|
| Biotechnology — 4.1% |
AbbVie, Inc. | | | 71,513 | | | 11,530,756 |
Alnylam Pharmaceuticals, Inc.(a) | | | 5,462 | | | 810,725 |
Amgen, Inc. | | | 10,070 | | | 3,079,909 |
Biogen, Inc.(a) | | | 10,095 | | | 2,270,769 |
Exelixis, Inc.(a) | | | 50,564 | | | 1,096,733 |
Gilead Sciences, Inc. | | | 241,207 | | | 15,502,374 |
Incyte Corp.(a) | | | 117,710 | | | 6,802,461 |
Neurocrine Biosciences, Inc.(a) | | | 40,238 | | | 5,448,628 |
Sarepta Therapeutics, Inc.(a) | | | 860 | | | 111,680 |
United Therapeutics Corp.(a) | | | 6,989 | | | 1,922,884 |
Vertex Pharmaceuticals, Inc.(a) | | | 3,960 | | | 1,803,146 |
| | | | | | |
| | |
| | | | | | 50,380,065 |
|
| Broadline Retail — 5.2% |
Amazon.com, Inc.(a) | | | 337,258 | | | 59,505,801 |
MercadoLibre, Inc.(a) | | | 2,174 | | | 3,751,411 |
| | | | | | |
| | |
| | | | | | 63,257,212 |
|
| Building Products — 0.1% |
Advanced Drainage Systems, Inc. | | | 4,058 | | | 704,023 |
Builders FirstSource, Inc.(a) | | | 5,422 | | | 871,803 |
| | | | | | |
| | |
| | | | | | 1,575,826 |
|
| Capital Markets — 0.8% |
MSCI, Inc., Class A | | | 236 | | | 116,863 |
Nasdaq, Inc. | | | 62,074 | | | 3,664,228 |
S&P Global, Inc. | | | 13,890 | | | 5,938,114 |
| | | | | | |
| | |
| | | | | | 9,719,205 |
|
| Chemicals — 0.0% |
Cabot Corp. | | | 1 | | | 102 |
| | | | | | |
|
| Commercial Services & Supplies — 1.6% |
Cintas Corp. | | | 18,487 | | | 12,533,632 |
Waste Connections, Inc. | | | 2,954 | | | 485,401 |
Waste Management, Inc. | | | 28,736 | | | 6,055,537 |
| | | | | | |
| | |
| | | | | | 19,074,570 |
|
| Communications Equipment — 0.1% |
Arista Networks, Inc.(a) | | | 3,105 | | | 924,203 |
| | | | | | |
|
| Construction & Engineering — 0.2% |
EMCOR Group, Inc. | | | 3,748 | | | 1,456,698 |
Quanta Services, Inc. | | | 2,398 | | | 661,704 |
| | | | | | |
| | |
| | | | | | 2,118,402 |
|
| Consumer Staples Distribution & Retail — 1.4% |
Costco Wholesale Corp. | | | 21,262 | | | 17,219,881 |
| | | | | | |
|
| Distributors — 0.2% |
Pool Corp. | | | 6,446 | | | 2,343,443 |
| | | | | | |
| | | | | | |
Security | | Shares | | | Value |
|
| Electrical Equipment — 0.0% |
AMETEK, Inc. | | | 3,232 | | | $ 548,083 |
| | | | | | |
|
| Electronic Equipment, Instruments & Components — 0.9% |
TE Connectivity Ltd. | | | 77,081 | | | 11,539,026 |
| | | | | | |
|
| Entertainment — 1.4% |
Electronic Arts, Inc. | | | 1,727 | | | 229,484 |
Netflix, Inc.(a) | | | 18,485 | | | 11,860,345 |
Spotify Technology SA(a) | | | 17,568 | | | 5,213,831 |
| | | | | | |
| | |
| | | | | | 17,303,660 |
|
| Financial Services — 4.6% |
Mastercard, Inc., Class A | | | 71,537 | | | 31,982,047 |
Visa, Inc., Class A | | | 89,433 | | | 24,366,915 |
| | | | | | |
| | |
| | | | | | 56,348,962 |
|
| Ground Transportation — 1.2% |
Old Dominion Freight Line, Inc. | | | 40,900 | | | 7,167,725 |
Uber Technologies, Inc.(a) | | | 115,266 | | | 7,441,573 |
| | | | | | |
| | |
| | | | | | 14,609,298 |
|
| Health Care Equipment & Supplies — 1.1% |
Dexcom, Inc.(a) | | | 42,644 | | | 5,064,828 |
IDEXX Laboratories, Inc.(a) | | | 3,021 | | | 1,501,286 |
Intuitive Surgical, Inc.(a) | | | 2,819 | | | 1,133,576 |
Stryker Corp. | | | 18,244 | | | 6,222,846 |
| | | | | | |
| | |
| | | | | | 13,922,536 |
|
| Health Care Providers & Services — 2.2% |
Cardinal Health, Inc. | | | 87,391 | | | 8,675,305 |
Elevance Health, Inc. | | | 13,982 | | | 7,529,027 |
UnitedHealth Group, Inc. | | | 21,070 | | | 10,437,446 |
| | | | | | |
| | |
| | | | | | 26,641,778 |
|
| Hotels, Restaurants & Leisure — 1.9% |
Booking Holdings, Inc. | | | 2,850 | | | 10,762,598 |
Boyd Gaming Corp. | | | 55,976 | | | 2,984,640 |
Carnival Corp.(a) | | | 61,013 | | | 920,076 |
Domino’s Pizza, Inc. | | | 5,806 | | | 2,952,815 |
McDonald’s Corp. | | | 12,037 | | | 3,116,259 |
MGM Resorts International(a) | | | 55,088 | | | 2,212,885 |
| | | | | | |
| | |
| | | | | | 22,949,273 |
|
| Household Durables — 0.9% |
DR Horton, Inc. | | | 38,313 | | | 5,662,661 |
Toll Brothers, Inc. | | | 43,129 | | | 5,246,212 |
| | | | | | |
| | |
| | | | | | 10,908,873 |
|
| Household Products — 0.5% |
Kimberly-Clark Corp. | | | 50,756 | | | 6,765,775 |
| | | | | | |
|
| Insurance — 0.7% |
Marsh & McLennan Cos., Inc. | | | 4,009 | | | 832,188 |
Progressive Corp. (The) | | | 39,729 | | | 8,389,970 |
| | | | | | |
| | |
| | | | | | 9,222,158 |
|
| Interactive Media & Services — 10.6% |
Alphabet, Inc., Class A(a) | | | 119,420 | | | 20,599,950 |
Alphabet, Inc., Class C, NVS(a) | | | 228,917 | | | 39,822,401 |
Meta Platforms, Inc., Class A | | | 129,484 | | | 60,447,016 |
Pinterest, Inc., Class A(a) | | | 145,931 | | | 6,054,677 |
Snap, Inc., Class A, NVS(a) | | | 195,735 | | | 2,939,940 |
| | | | | | |
| | |
| | | | | | 129,863,984 |
|
| IT Services — 0.8% |
Accenture PLC, Class A | | | 562 | | | 158,647 |
Akamai Technologies, Inc.(a) | | | 24,358 | | | 2,246,782 |
Amdocs Ltd. | | | 12,747 | | | 1,007,013 |
Cognizant Technology Solutions Corp., Class A | | | 16,391 | | | 1,084,265 |
| | |
| 10 | | 2 0 2 4 B L A C K R O C K A N N U A L F I N A N C I A L S T A T E M E N T S |
| | |
Schedule of Investments (continued) May 31, 2024 | | BlackRock Advantage Large Cap Growth Fund (Percentages shown are based on Net Assets) |
| | | | | | |
Security | | Shares | | | Value |
|
| IT Services (continued) |
EPAM Systems, Inc.(a) | | | 3,036 | | | $ 540,195 |
GoDaddy, Inc., Class A(a) | | | 2,015 | | | 281,354 |
Snowflake, Inc., Class A(a) | | | 11,375 | | | 1,549,048 |
VeriSign, Inc.(a) | | | 20,021 | | | 3,490,061 |
| | | | | | |
| | |
| | | | | | 10,357,365 |
|
| Leisure Products — 0.0% |
Mattel, Inc.(a) | | | 8,381 | | | 149,098 |
| | | | | | |
|
| Life Sciences Tools & Services — 0.3% |
Agilent Technologies, Inc. | | | 1,740 | | | 226,914 |
Thermo Fisher Scientific, Inc. | | | 6,238 | | | 3,543,059 |
| | | | | | |
| | |
| | | | | | 3,769,973 |
|
| Machinery — 1.4% |
Oshkosh Corp. | | | 21,381 | | | 2,431,661 |
Otis Worldwide Corp. | | | 21,818 | | | 2,164,345 |
Parker-Hannifin Corp. | | | 24,863 | | | 13,215,182 |
| | | | | | |
| | |
| | | | | | 17,811,188 |
|
| Media — 0.7% |
Comcast Corp., Class A | | | 212,816 | | | 8,519,024 |
| | | | | | |
|
| Metals & Mining — 0.1% |
Nucor Corp. | | | 6,672 | | | 1,126,567 |
| | | | | | |
|
| Paper & Forest Products — 0.2% |
Louisiana-Pacific Corp. | | | 25,442 | | | 2,332,523 |
| | | | | | |
|
| Passenger Airlines — 0.1% |
American Airlines Group, Inc.(a) | | | 55,892 | | | 642,758 |
| | | | | | |
|
| Pharmaceuticals — 3.9% |
Bristol-Myers Squibb Co. | | | 12,193 | | | 501,010 |
Eli Lilly & Co. | | | 50,479 | | | 41,409,943 |
Merck & Co., Inc. | | | 45,499 | | | 5,711,945 |
Zoetis, Inc., Class A | | | 1,518 | | | 257,392 |
| | | | | | |
| | |
| | | | | | 47,880,290 |
|
| Semiconductors & Semiconductor Equipment — 15.8% |
Advanced Micro Devices, Inc.(a) | | | 134,260 | | | 22,407,994 |
Applied Materials, Inc. | | | 38,477 | | | 8,275,633 |
Broadcom, Inc. | | | 31,260 | | | 41,530,473 |
Cirrus Logic, Inc.(a) | | | 39,406 | | | 4,519,868 |
Lam Research Corp. | | | 17,770 | | | 16,569,459 |
Micron Technology, Inc. | | | 17,812 | | | 2,226,500 |
Monolithic Power Systems, Inc. | | | 11,749 | | | 8,642,917 |
NVIDIA Corp. | | | 65,437 | | | 71,740,546 |
QUALCOMM, Inc. | | | 90,493 | | | 18,465,097 |
| | | | | | |
| | |
| | | | | | 194,378,487 |
|
| Software — 17.9% |
Adobe, Inc.(a) | | | 33,448 | | | 14,876,332 |
Atlassian Corp., Class A(a) | | | 12,816 | | | 2,010,318 |
Cadence Design Systems, Inc.(a) | | | 1,297 | | | 371,344 |
Crowdstrike Holdings, Inc., Class A(a) | | | 29,485 | | | 9,248,560 |
Fortinet, Inc.(a) | | | 68,047 | | | 4,036,548 |
FreedomPay, Inc.(a)(b) | | | 43,051 | | | 622,087 |
HubSpot, Inc.(a) | | | 835 | | | 510,227 |
Manhattan Associates, Inc.(a) | | | 37,416 | | | 8,214,309 |
| | | | | | |
Security | | Shares | | | Value |
|
| Software (continued) |
Microsoft Corp. | | | 377,310 | | | $ 156,632,700 |
Salesforce, Inc. | | | 11,411 | | | 2,675,195 |
ServiceNow, Inc.(a) | | | 15,387 | | | 10,108,182 |
Smartsheet, Inc., Class A(a) | | | 80,533 | | | 2,979,721 |
Synopsys, Inc.(a) | | | 8,257 | | | 4,630,526 |
Teradata Corp.(a) | | | 48,489 | | | 1,581,226 |
Workday, Inc., Class A(a) | | | 1,225 | | | 259,026 |
Zscaler, Inc.(a) | | | 5,753 | | | 977,780 |
| | | | | | |
| | |
| | | | | | 219,734,081 |
|
| Specialized REITs — 0.2% |
Equinix, Inc. | | | 2,822 | | | 2,153,130 |
| | | | | | |
|
| Specialty Retail — 3.3% |
AutoNation, Inc.(a) | | | 12,088 | | | 2,057,982 |
Home Depot, Inc. (The) | | | 89,130 | | | 29,846,963 |
O’Reilly Automotive, Inc.(a) | | | 1,918 | | | 1,847,533 |
Penske Automotive Group, Inc. | | | 10,506 | | | 1,597,963 |
Ross Stores, Inc. | | | 14,969 | | | 2,092,067 |
TJX Cos., Inc. (The) | | | 10,954 | | | 1,129,357 |
Ulta Beauty, Inc.(a) | | | 4,530 | | | 1,789,758 |
| | | | | | |
| | |
| | | | | | 40,361,623 |
|
| Technology Hardware, Storage & Peripherals — 11.0% |
Apple Inc. | | | 644,591 | | | 123,922,620 |
Super Micro Computer, Inc.(a) | | | 13,540 | | | 10,622,265 |
| | | | | | |
| | |
| | | | | | 134,544,885 |
|
| Textiles, Apparel & Luxury Goods — 0.7% |
NIKE, Inc., Class B | | | 87,689 | | | 8,334,839 |
| | | | | | |
|
| Trading Companies & Distributors — 0.7% |
Watsco, Inc. | | | 7,464 | | | 3,544,653 |
WESCO International, Inc. | | | 7,755 | | | 1,391,945 |
WW Grainger, Inc. | | | 3,421 | | | 3,152,315 |
| | | | | | |
| | |
| | | | | | 8,088,913 |
| | | | | | |
| |
Total Long-Term Investments — 98.8%
(Cost: $719,103,129) | | | 1,212,404,312 |
| | | | | | |
|
Short-Term Securities |
|
| Money Market Funds — 1.0% |
BlackRock Liquidity Funds, T-Fund, Institutional Shares, 5.19%(c)(d) | | | 11,949,669 | | | 11,949,669 |
| | | | | | |
| |
Total Short-Term Securities — 1.0%
(Cost: $11,949,669) | | | 11,949,669 |
| | | | | | |
| |
Total Investments — 99.8%
(Cost: $731,052,798) | | | 1,224,353,981 |
| Other Assets Less Liabilities — 0.2% | | | | | 2,306,925 |
| | | | | | |
| | |
| Net Assets — 100.0% | | | | | $ 1,226,660,906 |
| | | | | | |
| (a) | Non-income producing security. |
| (b) | Security is valued using significant unobservable inputs and is classified as Level 3 in the fair value hierarchy. |
| (c) | Affiliate of the Fund. |
| (d) | Annualized 7-day yield as of period end. |
| | |
S C H E D U L E S O F I N V E S T M E N T S | | 11 |
| | |
Schedule of Investments (continued) May 31, 2024 | | BlackRock Advantage Large Cap Growth Fund |
Affiliates
Investments in issuers considered to be affiliate(s) of the Fund during the year ended May 31, 2024 for purposes of Section 2(a)(3) of the Investment Company Act of 1940, as amended, were as follows:
| | | | | | | | | | | | | | | | | | | | | | | | | | | | | | | | | | |
| Affiliated Issuer | | Value at
05/31/23 | | | Purchases
at Cost | | | Proceeds
from Sales | | | Net
Realized
Gain (Loss) | | | Change in
Unrealized
Appreciation
(Depreciation) | | | Value at
05/31/24 | | | Shares
Held at
05/31/24 | | | Income | | | Capital
Gain Distributions from Underlying
Funds |
| | | | | | | | | |
BlackRock Cash Funds: Institutional, SL Agency Shares(a) | | $ | — | | | $ | — | | | $ | (603 | )(b) | | $ | 603 | | | $ | — | | | $ | — | | | | — | | | $ | 2,732 | (c) | | $ — |
BlackRock Liquidity Funds,
T-Fund, Institutional Shares | | | 6,109,397 | | | | 5,840,272 | (b) | | | — | | | | — | | | | — | | | | 11,949,669 | | | | 11,949,669 | | | | 533,342 | | | — |
SL Liquidity Series, LLC, Money Market Series(a) | | | 12,171,918 | | | | — | | | | (12,170,884 | )(b) | | | (2,216 | ) | | | 1,182 | | | | — | | | | — | | | | 114,435 | (c) | | — |
| | | | | | | | | | | | | | | | | | | | | | | | | | | | | | | | | | |
| | | | | | | | | |
| | | | | | | | | | | | | | $ | (1,613 | ) | | $ | 1,182 | | | $ | 11,949,669 | | | | | | | $ | 650,509 | | | $ — |
| | | | | | | | | | | | | | | | | | | | | | | | | | | | | | | | | | |
| | (a) | As of period end, the entity is no longer held. | |
| | (b) | Represents net amount purchased (sold). | |
| | (c) | All or a portion represents securities lending income earned from the reinvestment of cash collateral from loaned securities, net of fees and collateral investment expenses, and other payments to and from borrowers of securities. | |
For purposes of this report, industry and sector sub-classifications may differ from those utilized by the Fund for compliance purposes.
Derivative Financial Instruments Outstanding as of Period End
Futures Contracts
| | | | | | | | | | | | | | |
| Description | | Number of
Contracts | | | Expiration
Date | | | Notional
Amount
(000) | | | Value/
Unrealized
Appreciation
(Depreciation) |
| | | | |
Long Contracts | | | | | | | | | | | | | | |
NASDAQ 100 E-Mini Index | | | 41 | | | | 06/21/24 | | | $ | 15,245 | | | $ 288,745 |
| | | | | | | | | | | | | | |
Derivative Financial Instruments Categorized by Risk Exposure
As of period end, the fair values of derivative financial instruments located in the Statements of Assets and Liabilities were as follows:
| | | | | | | | | | | | | | | | | | | | | | | | | | |
| | | Commodity
Contracts | | | Credit
Contracts | | | Equity
Contracts | | | Foreign
Currency
Exchange
Contracts | | | Interest
Rate
Contracts | | | Other
Contracts | | | Total |
| | | | | | | |
Assets — Derivative Financial Instruments | | | | | | | | | | | | | | | | | | | | | | | | | | |
Futures contracts | | | | | | | | | | | | | | | | | | | | | | | | | | |
Unrealized appreciation on futures contracts(a) | | $ | — | | | $ | — | | | $ | 288,745 | | | $ | — | | | $ | — | | | $ | — | | | $ 288,745 |
| | | | | | | | | | | | | | | | | | | | | | | | | | |
| | (a) | Net cumulative unrealized appreciation (depreciation) on futures contracts and centrally cleared swaps, if any, are reported in the Schedule of Investments. In the Statements of Assets and Liabilities, only current day’s variation margin is reported in receivables or payables and the net cumulative unrealized appreciation (depreciation) is included in accumulated earnings (loss). | |
For the period ended May 31, 2024, the effect of derivative financial instruments in the Statements of Operations was as follows:
| | | | | | | | | | | | | | | | | | | | | | | | | | | | |
| |
| | | Commodity
Contracts | | | Credit
Contracts | | | Equity
Contracts | | | Foreign
Currency
Exchange
Contracts | | | Interest
Rate
Contracts | | | Other
Contracts | | | Total | |
| |
| | | | | | | |
Net Realized Gain (Loss) from: | | | | | | | | | | | | | | | | | | | | | | | | | | | | |
Futures contracts | | $ | — | | | $ | — | | | $ | 2,866,512 | | | $ | — | | | $ | — | | | $ | — | | | $ | 2,866,512 | |
| | | | | | | | | | | | | | | | | | | | | | | | | | | | |
| | | | | | | |
Net Change in Unrealized Appreciation
(Depreciation) on: | | | | | | | | | | | | | | | | | | | | | |
Futures contracts | | $ | — | | | $ | — | | | $ | (118,383 | ) | | $ | — | | | $ | — | | | $ | — | | | $ | (118,383 | ) |
| | | | | | | | | | | | | | | | | | | | | | | | | | | | |
| | |
| 12 | | 2 0 2 4 B L A C K R O C K A N N U A L F I N A N C I A L S T A T E M E N T S |
| | |
Schedule of Investments (continued) May 31, 2024 | | BlackRock Advantage Large Cap Growth Fund |
Average Quarterly Balances of Outstanding Derivative Financial Instruments
| | |
| | |
Futures contracts | | |
Average notional value of contracts — long | | $12,753,091 |
For more information about the Fund’s investment risks regarding derivative financial instruments, refer to the Notes to Financial Statements.
Fair Value Hierarchy as of Period End
Various inputs are used in determining the fair value of financial instruments. For a description of the input levels and information about the Fund’s policy regarding valuation of financial instruments, refer to the Notes to Financial Statements.
The following table summarizes the Fund’s financial instruments categorized in the fair value hierarchy. The breakdown of the Fund’s financial instruments into major categories is disclosed in the Schedule of Investments above.
| | | | | | | | | | | | | | |
| | | Level 1 | | | Level 2 | | | Level 3 | | | Total |
| | | | |
Assets | | | | | | | | | | | | | | |
Investments | | | | | | | | | | | | | | |
Long-Term Investments | | | | | | | | | | | | | | |
Common Stocks | | $ | 1,211,782,225 | | | $ | — | | | $ | 622,087 | | | $ 1,212,404,312 |
Short-Term Securities | | | | | | | | | | | | | | |
Money Market Funds | | | 11,949,669 | | | | — | | | | — | | | 11,949,669 |
| | | | | | | | | | | | | | |
| | | | |
| | $ | 1,223,731,894 | | | $ | — | | | $ | 622,087 | | | $ 1,224,353,981 |
| | | | | | | | | | | | | | |
Derivative Financial Instruments(a) | | | | | | | | | | | | | | |
Assets | | | | | | | | | | | | | | |
Equity Contracts | | $ | 288,745 | | | $ | — | | | $ | — | | | $ 288,745 |
| | | | | | | | | | | | | | |
| | (a) | Derivative financial instruments are futures contracts. Futures contracts are valued at the unrealized appreciation (depreciation) on the instrument. | |
See notes to financial statements.
| | |
S C H E D U L E S O F I N V E S T M E N T S | | 13 |
| | |
Schedule of Investments May 31, 2024 | | BlackRock Advantage Small Cap Core Fund (Percentages shown are based on Net Assets) |
| | | | | | |
Security | | Shares | | | Value |
|
Common Stocks |
|
| Aerospace & Defense — 0.7% |
BWX Technologies, Inc. | | | 8,329 | | | $ 767,351 |
Cadre Holdings, Inc. | | | 21,581 | | | 708,720 |
Ducommun, Inc.(a) | | | 72,150 | | | 4,197,687 |
Huntington Ingalls Industries, Inc. | | | 34,809 | | | 8,810,158 |
Loar Holdings, Inc.(a) | | | 3,721 | | | 211,985 |
Moog, Inc., Class A | | | 39,784 | | | 6,740,603 |
V2X, Inc.(a) | | | 37,636 | | | 1,810,668 |
| | | | | | |
| | |
| | | | | | 23,247,172 |
|
| Air Freight & Logistics — 0.1% |
GXO Logistics, Inc.(a) | | | 64,838 | | | 3,256,813 |
Hub Group, Inc., Class A | | | 13,118 | | | 566,041 |
| | | | | | |
| | |
| | | | | | 3,822,854 |
|
| Automobile Components — 2.2% |
Adient PLC(a) | | | 586,077 | | | 16,550,814 |
Cooper-Standard Holdings, Inc.(a) | | | 79,987 | | | 1,055,828 |
Dana, Inc | | | 1,044,833 | | | 14,690,352 |
Gentherm, Inc.(a) | | | 37,050 | | | 1,998,477 |
Goodyear Tire & Rubber Co. (The)(a) | | | 330,014 | | | 4,062,472 |
Lear Corp. | | | 47,332 | | | 5,933,066 |
Modine Manufacturing Co.(a) | | | 70,840 | | | 7,149,173 |
Motorcar Parts of America, Inc.(a) | | | 16,899 | | | 86,016 |
Patrick Industries, Inc. | | | 55,686 | | | 6,381,616 |
Standard Motor Products, Inc. | | | 73,287 | | | 2,250,644 |
Visteon Corp.(a) | | | 165,135 | | | 18,391,085 |
| | | | | | |
| | |
| | | | | | 78,549,543 |
|
| Banks — 7.0% |
Amalgamated Financial Corp. | | | 246,639 | | | 6,235,034 |
Ameris Bancorp | | | 78,935 | | | 3,942,803 |
Axos Financial, Inc.(a)(b) | | | 72,885 | | | 3,926,315 |
Bank of Marin Bancorp | | | 61,052 | | | 938,980 |
BankFinancial Corp. | | | 40,446 | | | 408,909 |
Business First Bancshares, Inc. | | | 70,423 | | | 1,510,573 |
Byline Bancorp, Inc. | | | 96,773 | | | 2,235,456 |
Capital City Bank Group, Inc. | | | 181,245 | | | 4,922,614 |
Capitol Federal Financial, Inc. | | | 166,579 | | | 861,213 |
Civista Bancshares, Inc. | | | 11,062 | | | 158,518 |
Coastal Financial Corp.(a) | | | 43,990 | | | 1,950,517 |
Community Trust Bancorp, Inc. | | | 52,385 | | | 2,205,932 |
ConnectOne Bancorp, Inc. | | | 162,257 | | | 3,024,470 |
Cullen/Frost Bankers, Inc. | | | 15,350 | | | 1,559,253 |
Customers Bancorp, Inc.(a) | | | 38,505 | | | 1,744,277 |
Dime Community Bancshares, Inc. | | | 46,661 | | | 861,829 |
Eagle Bancorp, Inc. | | | 27,856 | | | 502,244 |
Eastern Bankshares, Inc. | | | 55,763 | | | 763,953 |
Enterprise Bancorp, Inc. | | | 19,941 | | | 501,516 |
Enterprise Financial Services Corp. | | | 242,590 | | | 9,385,807 |
FB Financial Corp. | | | 258,589 | | | 9,567,793 |
Financial Institutions, Inc. | | | 63,249 | | | 1,113,815 |
First Bancshares, Inc. (The) | | | 140,957 | | | 3,573,260 |
First Busey Corp. | | | 114,412 | | | 2,586,855 |
First Business Financial Services, Inc. | | | 45,644 | | | 1,552,352 |
First Community Bankshares, Inc. | | | 62,503 | | | 2,171,354 |
First Financial Bankshares, Inc. | | | 116,600 | | | 3,495,668 |
First Financial Corp. | | | 56,705 | | | 2,100,353 |
First Financial Northwest, Inc. | | | 53,811 | | | 1,143,484 |
First Foundation, Inc. | | | 72,620 | | | 429,910 |
First Internet Bancorp | | | 62,273 | | | 1,834,563 |
First Interstate BancSystem, Inc., Class A | | | 304,826 | | | 8,090,082 |
First United Corp. | | | 27,487 | | | 550,839 |
Flushing Financial Corp. | | | 29,696 | | | 377,733 |
| | | | | | |
Security | | Shares | | | Value |
|
| Banks (continued) |
Hancock Whitney Corp. | | | 468,394 | | | $ 21,888,052 |
HBT Financial, Inc. | | | 158,747 | | | 3,095,566 |
Heartland Financial U.S.A., Inc. | | | 116,298 | | | 5,112,460 |
Heritage Commerce Corp. | | | 667,385 | | | 5,439,188 |
Heritage Financial Corp. | | | 34,073 | | | 617,743 |
HomeTrust Bancshares, Inc. | | | 120,731 | | | 3,333,383 |
Hope Bancorp, Inc. | | | 22,509 | | | 237,020 |
Horizon Bancorp, Inc. | | | 560,534 | | | 6,849,725 |
Independent Bank Corp. | | | 114,459 | | | 2,868,343 |
Independent Bank Group, Inc. | | | 48,794 | | | 2,246,476 |
Live Oak Bancshares, Inc. | | | 18,605 | | | 641,500 |
MainStreet Bancshares, Inc. | | | 9,353 | | | 158,066 |
Mercantile Bank Corp. | | | 56,845 | | | 2,177,732 |
Mid Penn Bancorp, Inc. | | | 63,296 | | | 1,354,534 |
Midland States Bancorp, Inc. | | | 331,835 | | | 7,539,291 |
MidWestOne Financial Group, Inc. | | | 16,062 | | | 343,887 |
MVB Financial Corp. | | | 7,875 | | | 147,499 |
National Bank Holdings Corp., Class A | | | 39,476 | | | 1,439,690 |
Northrim BanCorp, Inc. | | | 107,875 | | | 6,300,979 |
OceanFirst Financial Corp. | | | 839,519 | | | 12,634,761 |
Origin Bancorp, Inc. | | | 65,318 | | | 2,042,494 |
Peapack-Gladstone Financial Corp. | | | 77,677 | | | 1,685,591 |
Premier Financial Corp. | | | 324,483 | | | 6,395,560 |
Primis Financial Corp. | | | 4,735 | | | 49,670 |
Prosperity Bancshares, Inc. | | | 33,365 | | | 2,078,640 |
Provident Financial Services, Inc. | | | 481,474 | | | 6,933,226 |
Republic Bancorp, Inc., Class A | | | 30,740 | | | 1,592,025 |
Riverview Bancorp, Inc. | | | 207,936 | | | 887,887 |
Sandy Spring Bancorp, Inc. | | | 248,300 | | | 5,820,152 |
ServisFirst Bancshares, Inc. | | | 28,475 | | | 1,759,755 |
Shore Bancshares, Inc. | | | 129,815 | | | 1,468,208 |
Sierra Bancorp | | | 79,426 | | | 1,669,535 |
SmartFinancial, Inc. | | | 40,044 | | | 926,618 |
South Plains Financial, Inc. | | | 78,203 | | | 2,123,211 |
Southern First Bancshares, Inc.(a) | | | 48,173 | | | 1,323,312 |
Stellar Bancorp, Inc. | | | 18,383 | | | 415,272 |
Third Coast Bancshares, Inc.(a) | | | 5,742 | | | 121,099 |
Timberland Bancorp, Inc. | | | 6,143 | | | 152,039 |
UMB Financial Corp. | | | 78,390 | | | 6,462,472 |
United Bankshares, Inc. | | | 42,795 | | | 1,388,270 |
Univest Financial Corp. | | | 174,877 | | | 3,812,319 |
Valley National Bancorp | | | 1,127,884 | | | 8,041,813 |
Veritex Holdings, Inc. | | | 61,981 | | | 1,264,412 |
WaFd, Inc. | | | 85,257 | | | 2,388,049 |
Washington Trust Bancorp, Inc. | | | 202,648 | | | 5,319,510 |
WesBanco, Inc. | | | 295,835 | | | 8,165,046 |
Western New England Bancorp, Inc. | | | 6,620 | | | 44,420 |
| | | | | | |
| | |
| | | | | | 244,984,774 |
|
| Beverages — 1.0% |
Boston Beer Co., Inc. (The), Class A(a) | | | 11,690 | | | 3,666,803 |
Coca-Cola Consolidated, Inc. | | | 1,380 | | | 1,353,835 |
MGP Ingredients, Inc. | | | 55,974 | | | 4,344,702 |
National Beverage Corp.(a) | | | 75,866 | | | 3,505,009 |
Primo Water Corp. | | | 939,834 | | | 21,202,655 |
| | | | | | |
| | |
| | | | | | 34,073,004 |
|
| Biotechnology — 8.0% |
4D Molecular Therapeutics, Inc.(a)(b) | | | 60,885 | | | 1,459,413 |
ACADIA Pharmaceuticals, Inc.(a) | | | 298,556 | | | 4,508,196 |
ADMA Biologics, Inc.(a) | | | 87,101 | | | 831,815 |
Agios Pharmaceuticals, Inc.(a)(b) | | | 37,126 | | | 1,349,159 |
Alector, Inc.(a) | | | 638,750 | | | 3,142,650 |
Alkermes PLC(a)(b) | | | 75,151 | | | 1,758,533 |
| | |
| 14 | | 2 0 2 4 B L A C K R O C K A N N U A L F I N A N C I A L S T A T E M E N T S |
| | |
Schedule of Investments (continued) May 31, 2024 | | BlackRock Advantage Small Cap Core Fund (Percentages shown are based on Net Assets) |
| | | | | | |
Security | | Shares | | | Value |
| | |
| Biotechnology (continued) | | | | | |
Allogene Therapeutics, Inc.(a)(b) | | | 317,760 | | | $ 794,400 |
ALX Oncology Holdings, Inc.(a) | | | 42,495 | | | 451,722 |
Amicus Therapeutics, Inc.(a) | | | 432,765 | | | 4,241,097 |
Anika Therapeutics, Inc.(a) | | | 36,521 | | | 936,764 |
Apellis Pharmaceuticals, Inc.(a) | | | 13,207 | | | 518,375 |
Arcellx, Inc.(a) | | | 21,925 | | | 1,140,100 |
Arcturus Therapeutics Holdings, Inc.(a) | | | 101,913 | | | 3,955,244 |
Arcus Biosciences, Inc.(a) | | | 195,279 | | | 2,942,855 |
Ardelyx, Inc.(a) | | | 72,568 | | | 497,816 |
Arrowhead Pharmaceuticals, Inc.(a) | | | 71,108 | | | 1,631,929 |
ARS Pharmaceuticals, Inc.(a) | | | 65 | | | 577 |
Atossa Therapeutics, Inc.(a) | | | 246,842 | | | 320,895 |
Avidity Biosciences, Inc.(a) | | | 18,128 | | | 486,918 |
Beam Therapeutics, Inc.(a)(b) | | | 182,930 | | | 4,357,393 |
BioCryst Pharmaceuticals, Inc.(a) | | | 472,611 | | | 3,053,067 |
Blueprint Medicines Corp.(a) | | | 113,750 | | | 12,007,450 |
Bridgebio Pharma, Inc.(a) | | | 80,523 | | | 2,255,449 |
Cabaletta Bio, Inc.(a) | | | 9,400 | | | 95,786 |
CareDx, Inc.(a) | | | 306,684 | | | 3,989,959 |
Catalyst Pharmaceuticals, Inc.(a) | | | 280,784 | | | 4,540,277 |
Cerevel Therapeutics Holdings, Inc.(a) | | | 14,020 | | | 571,175 |
Chinook Therapeutics, Inc., CVR(a)(c) | | | 35,990 | | | 15,836 |
Coherus Biosciences, Inc.(a)(b) | | | 945,290 | | | 1,720,428 |
Crinetics Pharmaceuticals, Inc.(a) | | | 15,553 | | | 690,709 |
Cyclo Therapeutics, Inc.(a) | | | 623 | | | 797 |
Cytokinetics, Inc.(a)(b) | | | 94,903 | | | 4,603,745 |
Deciphera Pharmaceuticals, Inc.(a) | | | 72,300 | | | 1,846,542 |
Denali Therapeutics, Inc.(a) | | | 491,629 | | | 9,124,634 |
Dynavax Technologies Corp.(a) | | | 353,393 | | | 4,237,182 |
Dyne Therapeutics, Inc.(a) | | | 109,741 | | | 3,498,543 |
Editas Medicine, Inc.(a) | | | 269,193 | | | 1,399,804 |
Emergent BioSolutions, Inc.(a) | | | 929,759 | | | 5,299,626 |
Enanta Pharmaceuticals, Inc.(a) | | | 104,837 | | | 1,307,317 |
Exelixis, Inc.(a) | | | 77,246 | | | 1,675,466 |
Fate Therapeutics, Inc.(a) | | | 831,258 | | | 3,059,029 |
Halozyme Therapeutics, Inc.(a)(b) | | | 96,336 | | | 4,266,721 |
Ideaya Biosciences, Inc.(a) | | | 82,242 | | | 3,005,945 |
Immunovant, Inc.(a) | | | 6,509 | | | 165,264 |
Incyte Corp.(a) | | | 108,345 | | | 6,261,258 |
Insmed, Inc.(a)(b) | | | 121,700 | | | 6,699,585 |
Intellia Therapeutics, Inc.(a) | | | 338,236 | | | 7,231,486 |
Ionis Pharmaceuticals, Inc.(a) | | | 143,974 | | | 5,409,103 |
Iovance Biotherapeutics, Inc.(a) | | | 87,360 | | | 775,757 |
Ironwood Pharmaceuticals, Inc., Class A(a) | | | 89,502 | | | 563,863 |
iTeos Therapeutics, Inc.(a) | | | 405,245 | | | 6,783,801 |
Jounce Therapeutics, Inc., CVR(a) | | | 10,334 | | | 91 |
Karyopharm Therapeutics, Inc.(a) | | | 702,009 | | | 680,317 |
Kezar Life Sciences, Inc.(a) | | | 61,112 | | | 42,412 |
Kiniksa Pharmaceuticals Ltd., Class A(a) | | | 363,124 | | | 6,902,987 |
Kodiak Sciences, Inc.(a) | | | 516,263 | | | 1,641,716 |
Kronos Bio, Inc.(a) | | | 43,065 | | | 34,021 |
Krystal Biotech, Inc.(a) | | | 7,110 | | | 1,137,955 |
Kura Oncology, Inc.(a) | | | 348,713 | | | 7,186,975 |
Kymera Therapeutics, Inc.(a) | | | 90,841 | | | 2,916,904 |
Madrigal Pharmaceuticals, Inc.(a) | | | 4,529 | | | 1,069,569 |
MiMedx Group, Inc.(a) | | | 130,791 | | | 935,156 |
Myriad Genetics, Inc.(a) | | | 182,509 | | | 4,153,905 |
Natera, Inc.(a) | | | 56,228 | | | 5,989,969 |
NextCure, Inc.(a) | | | 169,789 | | | 261,475 |
Nkarta, Inc.(a) | | | 37,346 | | | 253,579 |
Nurix Therapeutics, Inc.(a) | | | 123,123 | | | 1,939,187 |
Olema Pharmaceuticals, Inc.(a) | | | 144,694 | | | 1,400,638 |
| | | | | | |
Security | | Shares | | | Value |
| | |
| Biotechnology (continued) | | | | | |
Organogenesis Holdings, Inc., Class A(a) | | | 42,912 | | | $ 118,008 |
Passage Bio, Inc.(a)(b) | | | 143,703 | | | 163,821 |
PMV Pharmaceuticals, Inc.(a) | | | 280,445 | | | 510,410 |
Poseida Therapeutics, Inc.(a) | | | 146,029 | | | 436,627 |
Protagonist Therapeutics, Inc.(a) | | | 15,084 | | | 424,615 |
Prothena Corp. PLC(a)(b) | | | 64,496 | | | 1,342,162 |
PTC Therapeutics, Inc.(a) | | | 231,565 | | | 8,419,703 |
Puma Biotechnology, Inc.(a) | | | 215,312 | | | 828,951 |
Recursion Pharmaceuticals, Inc., Class A(a) | | | 87,223 | | | 722,206 |
REGENXBIO, Inc.(a) | | | 253,990 | | | 3,644,756 |
Relay Therapeutics, Inc.(a) | | | 386,778 | | | 2,479,247 |
Replimune Group, Inc.(a) | | | 95,931 | | | 505,556 |
REVOLUTION Medicines, Inc.(a) | | | 103,266 | | | 3,958,186 |
Rhythm Pharmaceuticals, Inc.(a) | | | 12,171 | | | 434,261 |
Rigel Pharmaceuticals, Inc.(a) | | | 722,952 | | | 706,902 |
Sana Biotechnology, Inc.(a) | | | 121,544 | | | 911,580 |
Sangamo Therapeutics, Inc.(a) | | | 1,579,197 | | | 891,299 |
Sarepta Therapeutics, Inc.(a) | | | 22,666 | | | 2,943,407 |
Scholar Rock Holding Corp.(a) | | | 65,635 | | | 616,313 |
SpringWorks Therapeutics, Inc.(a) | | | 26,038 | | | 1,079,535 |
Sutro Biopharma, Inc.(a) | | | 337,853 | | | 1,427,429 |
Syndax Pharmaceuticals, Inc.(a) | | | 343,349 | | | 6,616,335 |
TG Therapeutics, Inc.(a) | | | 279,884 | | | 4,562,109 |
Travere Therapeutics, Inc.(a)(b) | | | 558,193 | | | 4,141,792 |
Twist Bioscience Corp.(a)(b) | | | 188,819 | | | 7,911,516 |
Ultragenyx Pharmaceutical, Inc.(a) | | | 75,931 | | | 3,047,870 |
United Therapeutics Corp.(a) | | | 14,757 | | | 4,060,093 |
Vanda Pharmaceuticals, Inc.(a) | | | 652,206 | | | 3,332,773 |
Vaxcyte, Inc.(a) | | | 92,866 | | | 6,525,694 |
Veracyte, Inc.(a)(b) | | | 320,247 | | | 6,645,125 |
Vericel Corp.(a)(b) | | | 91,546 | | | 4,366,744 |
Viking Therapeutics, Inc.(a) | | | 133,529 | | | 8,313,516 |
Vir Biotechnology, Inc.(a) | | | 354,493 | | | 3,640,643 |
Voyager Therapeutics, Inc.(a) | | | 81,729 | | | 686,524 |
Xencor, Inc.(a) | | | 316,775 | | | 7,526,574 |
| | | | | | |
| | |
| | | | | | 281,970,593 |
| | |
| Broadline Retail — 0.6% | | | | | |
Dillard’s, Inc., Class A | | | 6,037 | | | 2,700,652 |
Kohl’s Corp. | | | 374,731 | | | 8,390,227 |
Macy’s, Inc. | | | 145,522 | | | 2,834,768 |
Ollie’s Bargain Outlet Holdings, Inc.(a)(b) | | | 91,469 | | | 7,539,790 |
| | | | | | |
| | |
| | | | | | 21,465,437 |
| | |
| Building Products — 1.9% | | | | | |
American Woodmark Corp.(a)(b) | | | 83,622 | | | 7,200,690 |
Apogee Enterprises, Inc. | | | 56,753 | | | 3,687,242 |
AZEK Co., Inc. (The), Class A(a) | | | 81,419 | | | 3,904,855 |
Builders FirstSource, Inc.(a) | | | 5,814 | | | 934,833 |
Caesarstone Ltd.(a) | | | 73,216 | | | 437,832 |
Gibraltar Industries, Inc.(a) | | | 153,204 | | | 11,560,774 |
Janus International Group, Inc.(a) | | | 511,754 | | | 7,103,145 |
JELD-WEN Holding, Inc.(a)(b) | | | 481,062 | | | 7,461,272 |
UFP Industries, Inc. | | | 205,668 | | | 24,573,213 |
Zurn Elkay Water Solutions Corp. | | | 19,102 | | | 598,084 |
| | | | | | |
| | |
| | | | | | 67,461,940 |
| | |
| Capital Markets — 2.1% | | | | | |
Artisan Partners Asset Management, Inc., Class A | | | 85,209 | | | 3,751,752 |
AssetMark Financial Holdings, Inc.(a) | | | 82,242 | | | 2,828,302 |
Brightsphere Investment Group, Inc. | | | 52,587 | | | 1,165,854 |
Cohen & Steers, Inc. | | | 17,640 | | | 1,239,916 |
Donnelley Financial Solutions, Inc.(a) | | | 26,496 | | | 1,615,196 |
Evercore, Inc., Class A | | | 83,070 | | | 16,858,226 |
| | |
S C H E D U L E S O F I N V E S T M E N T S | | 15 |
| | |
Schedule of Investments (continued) May 31, 2024 | | BlackRock Advantage Small Cap Core Fund (Percentages shown are based on Net Assets) |
| | | | | | |
Security | | Shares | | | Value |
| | |
| Capital Markets (continued) | | | | | |
Federated Hermes, Inc., Class B | | | 223,782 | | | $ 7,422,849 |
GCM Grosvenor, Inc., Class A | | | 28,392 | | | 285,340 |
Hamilton Lane, Inc., Class A | | | 88,121 | | | 11,058,304 |
Houlihan Lokey, Inc., Class A | | | 90,601 | | | 12,262,845 |
Invesco Ltd. | | | 217,769 | | | 3,421,151 |
Oppenheimer Holdings, Inc., Class A, NVS | | | 10,738 | | | 490,512 |
Patria Investments Ltd., Class A | | | 98,549 | | | 1,281,137 |
PJT Partners, Inc., Class A | | | 24,618 | | | 2,626,002 |
SEI Investments Co. | | | 32,253 | | | 2,183,851 |
Victory Capital Holdings, Inc., Class A | | | 135,031 | | | 7,025,663 |
| | | | | | |
| | |
| | | | | | 75,516,900 |
| | |
| Chemicals — 1.8% | | | | | |
Alto Ingredients, Inc.(a) | | | 77,029 | | | 117,084 |
Cabot Corp. | | | 150,944 | | | 15,441,571 |
Huntsman Corp. | | | 140,683 | | | 3,488,938 |
Ingevity Corp.(a) | | | 21,636 | | | 1,056,919 |
Innospec, Inc. | | | 36,874 | | | 4,823,119 |
Koppers Holdings, Inc. | | | 7,767 | | | 344,311 |
Minerals Technologies, Inc. | | | 120,141 | | | 10,422,232 |
Mosaic Co. (The) | | | 484,847 | | | 14,996,318 |
Quaker Chemical Corp. | | | 57,046 | | | 10,345,292 |
Rayonier Advanced Materials, Inc.(a) | | | 215,502 | | | 1,217,586 |
| | | | | | |
| | |
| | | | | | 62,253,370 |
| | |
| Commercial Services & Supplies — 0.7% | | | | | |
ABM Industries, Inc. | | | 62,626 | | | 2,960,331 |
BrightView Holdings, Inc.(a)(b) | | | 307,279 | | | 4,243,523 |
CECO Environmental Corp.(a) | | | 58,294 | | | 1,459,099 |
CoreCivic, Inc.(a) | | | 309,538 | | | 4,968,085 |
Healthcare Services Group, Inc.(a) | | | 360,667 | | | 3,887,990 |
Li-Cycle Holdings Corp.(a) | | | 199,351 | | | 102,606 |
Steelcase, Inc., Class A | | | 383,952 | | | 5,244,784 |
| | | | | | |
| | |
| | | | | | 22,866,418 |
| | |
| Communications Equipment — 0.4% | | | | | |
Calix, Inc.(a) | | | 242,608 | | | 8,661,106 |
NETGEAR, Inc.(a) | | | 364,514 | | | 5,033,938 |
Viasat, Inc.(a) | | | 26,934 | | | 454,915 |
| | | | | | |
| | |
| | | | | | 14,149,959 |
| | |
| Construction & Engineering — 3.3% | | | | | |
Comfort Systems U.S.A., Inc.(b) | | | 58,650 | | | 19,198,491 |
Construction Partners, Inc., Class A(a)(b) | | | 69,670 | | | 4,055,491 |
EMCOR Group, Inc. | | | 64,677 | | | 25,137,363 |
Fluor Corp.(a) | | | 358,938 | | | 15,577,909 |
MasTec, Inc.(a) | | | 75,317 | | | 8,454,333 |
Matrix Service Co.(a) | | | 65,662 | | | 793,197 |
MYR Group, Inc.(a)(b) | | | 89,890 | | | 13,938,344 |
Primoris Services Corp. | | | 297,732 | | | 16,303,804 |
Sterling Infrastructure, Inc.(a) | | | 62,247 | | | 7,648,289 |
Tutor Perini Corp.(a) | | | 207,253 | | | 4,572,001 |
| | | | | | |
| | |
| | | | | | 115,679,222 |
| | |
| Construction Materials — 0.1% | | | | | |
Summit Materials, Inc., Class A(a) | | | 133,632 | | | 5,163,541 |
| | | | | | |
| | |
| Consumer Finance — 1.7% | | | | | |
Enova International, Inc.(a) | | | 272,559 | | | 16,803,262 |
EZCORP, Inc., Class A, NVS(a)(b) | | | 959,262 | | | 10,062,658 |
FirstCash Holdings, Inc. | | | 122,892 | | | 14,491,425 |
LendingTree, Inc.(a) | | | 69,319 | | | 2,980,024 |
OneMain Holdings, Inc. | | | 143,155 | | | 7,031,774 |
Oportun Financial Corp.(a) | | | 49,135 | | | 166,076 |
| | | | | | |
Security | | Shares | | | Value |
| | |
| Consumer Finance (continued) | | | | | |
PROG Holdings, Inc. | | | 154,172 | | | $ 5,826,160 |
Regional Management Corp. | | | 98,756 | | | 2,715,790 |
| | | | | | |
| | |
| | | | | | 60,077,169 |
|
| Consumer Staples Distribution & Retail — 0.6% |
Andersons, Inc. (The) | | | 50,837 | | | 2,660,808 |
Performance Food Group Co.(a) | | | 146,645 | | | 10,206,492 |
PriceSmart, Inc. | | | 52,452 | | | 4,413,836 |
SpartanNash Co. | | | 63,074 | | | 1,239,404 |
Sprouts Farmers Market, Inc.(a) | | | 37,513 | | | 2,962,777 |
| | | | | | |
| | |
| | | | | | 21,483,317 |
| | |
| Diversified Consumer Services — 1.4% | | | | | |
American Public Education, Inc.(a) | | | 72,676 | | | 1,264,562 |
Chegg, Inc.(a) | | | 304,518 | | | 1,166,304 |
Duolingo, Inc., Class A(a) | | | 8,121 | | | 1,554,359 |
Frontdoor, Inc.(a) | | | 491,859 | | | 17,397,053 |
Laureate Education, Inc., Class A | | | 1,589,048 | | | 24,884,492 |
OneSpaWorld Holdings Ltd.(a) | | | 134,696 | | | 2,094,523 |
Strategic Education, Inc. | | | 22,530 | | | 2,555,353 |
| | | | | | |
| | |
| | | | | | 50,916,646 |
| | |
| Diversified REITs — 0.4% | | | | | |
American Assets Trust, Inc. | | | 569,713 | | | 12,391,258 |
Armada Hoffler Properties, Inc. | | | 128,029 | | | 1,451,849 |
Empire State Realty Trust, Inc., Class A | | | 115,407 | | | 1,099,828 |
| | | | | | |
| | |
| | | | | | 14,942,935 |
|
| Diversified Telecommunication Services — 0.3% |
Bandwidth, Inc., Class A(a) | | | 215,238 | | | 4,332,741 |
IDT Corp., Class B | | | 27,001 | | | 1,094,350 |
Iridium Communications, Inc. | | | 16,682 | | | 502,295 |
Liberty Latin America Ltd., Class A(a) | | | 36,895 | | | 334,638 |
Lumen Technologies, Inc.(a) | | | 258,248 | | | 333,140 |
Ooma, Inc.(a) | | | 418,637 | | | 3,617,024 |
| | | | | | |
| | |
| | | | | | 10,214,188 |
| | |
| Electric Utilities — 0.4% | | | | | |
ALLETE, Inc. | | | 85,440 | | | 5,395,536 |
PNM Resources, Inc. | | | 187,564 | | | 7,191,204 |
| | | | | | |
| | |
| | | | | | 12,586,740 |
| | |
| Electrical Equipment — 1.6% | | | | | |
Acuity Brands, Inc. | | | 23,647 | | | 6,138,998 |
Allient, Inc. | | | 25,090 | | | 679,939 |
Atkore, Inc. | | | 122,613 | | | 18,655,568 |
Encore Wire Corp. | | | 34,973 | | | 10,097,754 |
EnerSys | | | 164,835 | | | 17,775,807 |
NEXTracker, Inc., Class A(a) | | | 33,101 | | | 1,826,182 |
| | | | | | |
| | |
| | | | | | 55,174,248 |
|
| Electronic Equipment, Instruments & Components — 4.3% |
Avnet, Inc. | | | 381,177 | | | 20,812,264 |
Badger Meter, Inc. | | | 17,822 | | | 3,438,933 |
Benchmark Electronics, Inc. | | | 204,200 | | | 8,794,894 |
ePlus, Inc.(a) | | | 35,254 | | | 2,638,409 |
Fabrinet(a) | | | 51,360 | | | 12,302,261 |
FARO Technologies, Inc.(a) | | | 20,570 | | | 385,276 |
Flex Ltd.(a) | | | 300,457 | | | 9,954,140 |
Insight Enterprises, Inc.(a)(b) | | | 41,544 | | | 8,121,852 |
Itron, Inc.(a) | | | 163,914 | | | 17,628,951 |
Kimball Electronics, Inc.(a) | | | 53,814 | | | 1,233,417 |
OSI Systems, Inc.(a) | | | 24,458 | | | 3,515,593 |
PC Connection, Inc. | | | 183,574 | | | 12,416,945 |
Plexus Corp.(a) | | | 31,133 | | | 3,428,989 |
Sanmina Corp.(a) | | | 363,193 | | | 24,893,248 |
| | |
| 16 | | 2 0 2 4 B L A C K R O C K A N N U A L F I N A N C I A L S T A T E M E N T S |
| | |
Schedule of Investments (continued) May 31, 2024 | | BlackRock Advantage Small Cap Core Fund (Percentages shown are based on Net Assets) |
| | | | | | |
Security | | Shares | | | Value |
|
| Electronic Equipment, Instruments & Components (continued) |
ScanSource, Inc.(a) | | | 80,001 | | | $ 3,794,448 |
TD SYNNEX Corp. | | | 69,748 | | | 9,125,828 |
TTM Technologies, Inc.(a) | | | 486,965 | | | 9,057,549 |
| | | | | | |
| | |
| | | | | | 151,542,997 |
| | |
| Energy Equipment & Services — 1.6% | | | | | |
Archrock, Inc. | | | 359,604 | | | 7,278,385 |
Borr Drilling Ltd. | | | 248,467 | | | 1,711,938 |
Helix Energy Solutions Group, Inc.(a) | | | 293,786 | | | 3,381,477 |
Helmerich & Payne, Inc. | | | 156,489 | | | 5,955,971 |
Liberty Energy, Inc., Class A | | | 346,809 | | | 8,562,714 |
NOV, Inc. | | | 316,151 | | | 5,949,962 |
Oil States International, Inc.(a) | | | 490,918 | | | 2,194,404 |
Patterson-UTI Energy, Inc. | | | 628,178 | | | 6,922,522 |
ProPetro Holding Corp.(a) | | | 1,186,270 | | | 11,364,467 |
RPC, Inc. | | | 115,768 | | | 790,695 |
Solaris Oilfield Infrastructure, Inc., Class A | | | 131,446 | | | 1,204,045 |
U.S. Silica Holdings, Inc.(a) | | | 101,621 | | | 1,574,109 |
| | | | | | |
| | |
| | | | | | 56,890,689 |
| | |
| Entertainment — 0.3% | | | | | |
Eros Media World PLC, Class A(a) | | | 23,977 | | | 2 |
Eventbrite, Inc., Class A(a) | | | 311,358 | | | 1,550,563 |
Lions Gate Entertainment Corp., Class A(a)(b) | | | 89,712 | | | 745,507 |
Lions Gate Entertainment Corp., Class B, NVS(a) | | | 64,629 | | | 498,936 |
Marcus Corp. (The) | | | 28,724 | | | 305,910 |
Roku, Inc., Class A(a) | | | 132,687 | | | 7,616,234 |
| | | | | | |
| | |
| | | | | | 10,717,152 |
| | |
| Financial Services — 1.9% | | | | | |
Enact Holdings, Inc. | | | 20,094 | | | 617,087 |
Euronet Worldwide, Inc.(a)(b) | | | 107,786 | | | 12,565,692 |
NMI Holdings, Inc., Class A(a) | | | 308,093 | | | 10,222,525 |
Pagseguro Digital Ltd., Class A(a) | | | 1,641,375 | | | 20,106,844 |
Repay Holdings Corp., Class A(a) | | | 281,779 | | | 2,744,527 |
StoneCo Ltd., Class A(a) | | | 1,368,164 | | | 18,935,390 |
| | | | | | |
| | |
| | | | | | 65,192,065 |
| | |
| Food Products — 1.0% | | | | | |
Cal-Maine Foods, Inc. | | | 102,710 | | | 6,334,126 |
Fresh Del Monte Produce, Inc. | | | 57,477 | | | 1,342,663 |
John B. Sanfilippo & Son, Inc. | | | 2,309 | | | 232,816 |
Lancaster Colony Corp. | | | 43,778 | | | 8,120,819 |
Pilgrim’s Pride Corp.(a) | | | 60,059 | | | 2,157,920 |
Simply Good Foods Co. (The)(a) | | | 47,020 | | | 1,809,800 |
SunOpta, Inc.(a) | | | 469,914 | | | 2,824,183 |
Vital Farms, Inc.(a) | | | 340,254 | | | 14,079,710 |
| | | | | | |
| | |
| | | | | | 36,902,037 |
| | |
| Gas Utilities — 1.1% | | | | | |
Brookfield Infrastructure Corp., Class A | | | 219,091 | | | 7,547,685 |
New Jersey Resources Corp. | | | 374,786 | | | 16,288,200 |
ONE Gas, Inc. | | | 140,005 | | | 8,628,508 |
UGI Corp. | | | 312,292 | | | 7,950,954 |
| | | | | | |
| | |
| | | | | | 40,415,347 |
| | |
| Ground Transportation — 0.2% | | | | | |
Covenant Logistics Group, Inc., Class A | | | 128,376 | | | 6,101,711 |
| | | | | | |
|
| Health Care Equipment & Supplies — 1.7% |
Accuray, Inc.(a) | | | 326,532 | | | 577,962 |
AngioDynamics, Inc.(a) | | | 233,676 | | | 1,474,496 |
Artivion, Inc.(a) | | | 110,374 | | | 2,604,826 |
AtriCure, Inc.(a) | | | 70,601 | | | 1,591,347 |
Atrion Corp. | | | 1,819 | | | 837,195 |
Axonics, Inc.(a) | | | 64,355 | | | 4,317,577 |
| | | | | | |
Security | | Shares | | | Value |
|
| Health Care Equipment & Supplies (continued) |
Cerus Corp.(a) | | | 236,096 | | | $ 422,612 |
CONMED Corp. | | | 6,902 | | | 527,589 |
Enovis Corp.(a) | | | 17,177 | | | 863,488 |
Envista Holdings Corp.(a) | | | 417,027 | | | 8,073,643 |
ICU Medical, Inc.(a) | | | 2,214 | | | 235,437 |
Inari Medical, Inc.(a) | | | 20,362 | | | 1,018,100 |
Inmode Ltd.(a) | | | 98,455 | | | 1,883,444 |
Inspire Medical Systems, Inc.(a)(b) | | | 11,202 | | | 1,778,766 |
Insulet Corp.(a) | | | 11,344 | | | 2,010,043 |
iRadimed Corp. | | | 25,490 | | | 1,082,560 |
Lantheus Holdings, Inc.(a) | | | 95,356 | | | 7,802,981 |
LeMaitre Vascular, Inc. | | | 48,486 | | | 3,824,576 |
Merit Medical Systems, Inc.(a) | | | 16,461 | | | 1,335,810 |
Nevro Corp.(a) | | | 62,187 | | | 581,448 |
Omnicell, Inc.(a) | | | 78,409 | | | 2,555,349 |
OraSure Technologies, Inc.(a) | | | 462,792 | | | 2,189,006 |
Penumbra, Inc.(a) | | | 30,070 | | | 5,697,363 |
SI-BONE, Inc.(a) | | | 83,812 | | | 1,177,559 |
Tactile Systems Technology, Inc.(a) | | | 224,110 | | | 2,852,920 |
Varex Imaging Corp.(a)(b) | | | 191,790 | | | 2,963,155 |
| | | | | | |
| | |
| | | | | | 60,279,252 |
| | |
| Health Care Providers & Services — 2.6% | | | | | |
Accolade, Inc.(a) | | | 92,580 | | | 655,466 |
AdaptHealth Corp.(a) | | | 20,586 | | | 195,155 |
Addus HomeCare Corp.(a) | | | 51,190 | | | 5,877,124 |
Alignment Healthcare, Inc.(a) | | | 76,719 | | | 604,546 |
AMN Healthcare Services, Inc.(a) | | | 24,266 | | | 1,357,440 |
Aveanna Healthcare Holdings, Inc.(a) | | | 135,239 | | | 352,974 |
Brookdale Senior Living, Inc.(a) | | | 251,702 | | | 1,688,921 |
Castle Biosciences, Inc.(a) | | | 77,507 | | | 1,802,813 |
CorVel Corp.(a) | | | 10,145 | | | 2,433,278 |
Cross Country Healthcare, Inc.(a)(b) | | | 84,895 | | | 1,283,613 |
Ensign Group, Inc. (The) | | | 103,416 | | | 12,538,156 |
Fulgent Genetics, Inc.(a) | | | 20,939 | | | 432,390 |
Guardant Health, Inc.(a) | | | 235,115 | | | 6,371,617 |
HealthEquity, Inc.(a) | | | 57,618 | | | 4,706,238 |
Hims & Hers Health, Inc., Class A(a) | | | 380,626 | | | 7,391,757 |
NeoGenomics, Inc.(a)(b) | | | 68,793 | | | 943,152 |
Option Care Health, Inc.(a) | | | 88,821 | | | 2,648,642 |
PetIQ, Inc., Class A(a) | | | 184,878 | | | 3,838,067 |
Privia Health Group, Inc.(a) | | | 383,874 | | | 6,667,891 |
Progyny, Inc.(a) | | | 483,059 | | | 13,018,440 |
Quipt Home Medical Corp.(a) | | | 62,518 | | | 210,061 |
RadNet, Inc.(a) | | | 128,288 | | | 7,522,808 |
Select Medical Holdings Corp. | | | 24,279 | | | 838,840 |
Surface Oncology, Inc., CVR(a) | | | 58,721 | | | 5,515 |
Surgery Partners, Inc.(a) | | | 159,425 | | | 4,400,130 |
Universal Health Services, Inc., Class B | | | 8,419 | | | 1,597,926 |
Viemed Healthcare, Inc.(a) | | | 178,715 | | | 1,324,278 |
| | | | | | |
| | |
| | | | | | 90,707,238 |
| | |
| Health Care REITs — 0.0% | | | | | |
Diversified Healthcare Trust | | | 298,237 | | | 724,716 |
| | | | | | |
| | |
| Health Care Technology — 0.6% | | | | | |
American Well Corp., Class A(a) | | | 1,088,977 | | | 464,884 |
Evolent Health, Inc., Class A(a) | | | 13,914 | | | 294,838 |
Health Catalyst, Inc.(a) | | | 217,392 | | | 1,441,309 |
HealthStream, Inc. | | | 27,652 | | | 754,623 |
Phreesia, Inc.(a) | | | 326,199 | | | 6,171,685 |
Teladoc Health, Inc.(a)(b) | | | 1,022,462 | | | 11,492,473 |
| | | | | | |
| | |
| | | | | | 20,619,812 |
| | |
S C H E D U L E S O F I N V E S T M E N T S | | 17 |
| | |
Schedule of Investments (continued) May 31, 2024 | | BlackRock Advantage Small Cap Core Fund (Percentages shown are based on Net Assets) |
| | | | | | |
Security | | Shares | | | Value |
| | |
| Hotel & Resort REITs — 0.9% | | | | | |
Braemar Hotels & Resorts, Inc. | | | 1,869,407 | | | $ 5,215,646 |
Chatham Lodging Trust | | | 130,175 | | | 1,101,280 |
Park Hotels & Resorts, Inc. | | | 231,905 | | | 3,678,013 |
Pebblebrook Hotel Trust | | | 262,490 | | | 3,714,233 |
RLJ Lodging Trust | | | 1,734,669 | | | 17,311,997 |
Summit Hotel Properties, Inc. | | | 297,373 | | | 1,819,923 |
| | | | | | |
| | |
| | | | | | 32,841,092 |
| | |
| Hotels, Restaurants & Leisure — 0.7% | | | | | |
Accel Entertainment, Inc., Class A(a) | | | 201,986 | | | 2,001,681 |
BJ’s Restaurants, Inc.(a) | | | 20,421 | | | 715,552 |
Boyd Gaming Corp. | | | 7,467 | | | 398,140 |
Chuy’s Holdings, Inc.(a) | | | 11,277 | | | 301,209 |
El Pollo Loco Holdings, Inc.(a) | | | 159,604 | | | 1,704,571 |
Everi Holdings, Inc.(a) | | | 237,055 | | | 1,713,908 |
Monarch Casino & Resort, Inc. | | | 64,384 | | | 4,311,796 |
PlayAGS, Inc.(a) | | | 170,435 | | | 1,968,524 |
Shake Shack, Inc., Class A(a) | | | 29,267 | | | 2,777,146 |
Super Group SGHC Ltd.(a) | | | 132,987 | | | 482,743 |
Wingstop, Inc. | | | 22,847 | | | 8,422,546 |
| | | | | | |
| | |
| | | | | | 24,797,816 |
| | |
| Household Durables — 2.5% | | | | | |
Century Communities, Inc. | | | 137,399 | | | 11,597,850 |
Ethan Allen Interiors, Inc. | | | 93,122 | | | 2,710,781 |
GoPro, Inc., Class A(a) | | | 208,909 | | | 317,542 |
Hooker Furnishings Corp. | | | 24,843 | | | 431,771 |
Installed Building Products, Inc. | | | 78,299 | | | 16,586,860 |
KB Home | | | 193,827 | | | 13,684,186 |
M/I Homes, Inc.(a) | | | 22,576 | | | 2,820,194 |
Meritage Homes Corp. | | | 20,420 | | | 3,601,067 |
Taylor Morrison Home Corp., Class A(a) | | | 61,890 | | | 3,579,099 |
Toll Brothers, Inc. | | | 159,202 | | | 19,365,331 |
Tri Pointe Homes, Inc.(a) | | | 341,344 | | | 13,220,253 |
Universal Electronics, Inc.(a) | | | 18,302 | | | 209,009 |
Vizio Holding Corp., Class A(a) | | | 78,609 | | | 844,261 |
| | | | | | |
| | |
| | | | | | 88,968,204 |
| | |
| Household Products — 0.3% | | | | | |
Central Garden & Pet Co.(a) | | | 12,996 | | | 564,676 |
Central Garden & Pet Co., Class A, NVS(a) | | | 241,859 | | | 9,033,434 |
| | | | | | |
| | |
| | | | | | 9,598,110 |
|
| Independent Power and Renewable Electricity Producers — 0.5% |
Brookfield Renewable Corp., Class A | | | 475,126 | | | 14,985,474 |
Clearway Energy, Inc., Class A | | | 55,743 | | | 1,431,480 |
Spruce Power Holding Corp.(a) | | | 110 | | | 375 |
| | | | | | |
| | |
| | | | | | 16,417,329 |
| | |
| Industrial REITs — 0.2% | | | | | |
Industrial Logistics Properties Trust | | | 162,460 | | | 612,474 |
Terreno Realty Corp. | | | 82,967 | | | 4,694,273 |
| | | | | | |
| | |
| | | | | | 5,306,747 |
| | |
| Insurance — 1.5% | | | | | |
Ambac Financial Group, Inc.(a) | | | 193,019 | | | 3,420,297 |
CNO Financial Group, Inc. | | | 173,508 | | | 4,977,944 |
Crawford & Co., Class A, NVS | | | 52,097 | | | 473,041 |
Donegal Group, Inc., Class A | | | 103,234 | | | 1,366,818 |
eHealth, Inc.(a) | | | 201,715 | | | 1,194,153 |
Genworth Financial, Inc., Class A(a) | | | 399,488 | | | 2,512,779 |
Mercury General Corp. | | | 58,184 | | | 3,248,413 |
Palomar Holdings, Inc.(a) | | | 19,461 | | | 1,651,071 |
Reinsurance Group of America, Inc. | | | 119,822 | | | 25,138,656 |
Selective Insurance Group, Inc. | | | 75,521 | | | 7,371,605 |
Selectquote, Inc.(a) | | | 282,414 | | | 881,132 |
| | | | | | |
Security | | Shares | | | Value |
| | |
| Insurance (continued) | | | | | |
Tiptree, Inc. | | | 14,403 | | | $ 251,764 |
United Fire Group, Inc. | | | 28,041 | | | 623,912 |
| | | | | | |
| | |
| | | | | | 53,111,585 |
| | |
| Interactive Media & Services — 1.2% | | | | | |
Bumble, Inc., Class A(a) | | | 582,334 | | | 6,813,308 |
Cargurus, Inc., Class A(a) | | | 150,751 | | | 3,649,682 |
EverQuote, Inc., Class A(a) | | | 96,125 | | | 2,296,426 |
MediaAlpha, Inc., Class A(a) | | | 56,517 | | | 1,004,872 |
QuinStreet, Inc.(a) | | | 63,664 | | | 1,121,123 |
Shutterstock, Inc. | | | 120,502 | | | 4,895,996 |
TrueCar, Inc.(a) | | | 259,888 | | | 766,670 |
Vimeo, Inc.(a) | | | 960,302 | | | 3,725,972 |
Yelp, Inc.(a) | | | 325,933 | | | 12,049,743 |
ZipRecruiter, Inc., Class A(a) | | | 631,987 | | | 6,389,388 |
| | | | | | |
| | |
| | | | | | 42,713,180 |
| | |
| IT Services — 0.5% | | | | | |
Backblaze, Inc., Class A(a) | | | 46,578 | | | 284,592 |
Brightcove, Inc.(a) | | | 55,261 | | | 115,495 |
Fastly, Inc., Class A(a) | | | 217,326 | | | 1,703,836 |
Grid Dynamics Holdings, Inc., Class A(a) | | | 52,724 | | | 500,878 |
Hackett Group, Inc. (The) | | | 189,394 | | | 4,225,380 |
Kyndryl Holdings, Inc.(a) | | | 223,098 | | | 5,936,638 |
Squarespace, Inc., Class A(a) | | | 81,277 | | | 3,576,188 |
Unisys Corp.(a) | | | 179,930 | | | 771,900 |
| | | | | | |
| | |
| | | | | | 17,114,907 |
| | |
| Leisure Products — 0.1% | | | | | |
Malibu Boats, Inc., Class A(a) | | | 25,011 | | | 961,923 |
MasterCraft Boat Holdings, Inc.(a) | | | 42,675 | | | 900,443 |
| | | | | | |
| | |
| | | | | | 1,862,366 |
| | |
| Life Sciences Tools & Services — 0.5% | | | | | |
10X Genomics, Inc., Class A(a) | | | 76,275 | | | 1,710,086 |
AbCellera Biologics, Inc.(a)(b) | | | 368,420 | | | 1,444,206 |
Adaptive Biotechnologies Corp.(a) | | | 816,757 | | | 2,817,812 |
Codexis, Inc.(a) | | | 503,665 | | | 1,702,388 |
Harvard Bioscience, Inc.(a) | | | 307 | | | 973 |
Medpace Holdings, Inc.(a) | | | 15,044 | | | 5,812,099 |
Personalis, Inc.(a) | | | 677,851 | | | 881,206 |
Quanterix Corp.(a) | | | 30,399 | | | 485,472 |
Quantum-Si, Inc., Class A(a)(b) | | | 297,405 | | | 452,056 |
Seer, Inc., Class A(a) | | | 322,240 | | | 580,032 |
Singular Genomics Systems, Inc.(a)(b) | | | 130,459 | | | 47,578 |
| | | | | | |
| | |
| | | | | | 15,933,908 |
| | |
| Machinery — 4.0% | | | | | |
Alamo Group, Inc. | | | 4,620 | | | 877,754 |
Albany International Corp., Class A | | | 5,698 | | | 499,829 |
Astec Industries, Inc. | | | 69,064 | | | 2,243,889 |
Blue Bird Corp.(a) | | | 27,410 | | | 1,562,644 |
Chart Industries, Inc.(a) | | | 1,840 | | | 288,935 |
Columbus McKinnon Corp. | | | 13,831 | | | 540,792 |
Commercial Vehicle Group, Inc.(a) | | | 28,435 | | | 153,833 |
Federal Signal Corp. | | | 26,576 | | | 2,445,524 |
Flowserve Corp. | | | 695,165 | | | 34,549,700 |
Franklin Electric Co., Inc. | | | 113,293 | | | 11,270,388 |
Kadant, Inc. | | | 2,173 | | | 621,500 |
Kennametal, Inc. | | | 539,847 | | | 13,901,060 |
Manitowoc Co., Inc. (The)(a) | | | 426,175 | | | 5,297,355 |
Mueller Industries, Inc. | | | 228,024 | | | 13,432,894 |
Oshkosh Corp. | | | 208,036 | | | 23,659,934 |
Tennant Co. | | | 46,524 | | | 4,776,154 |
Terex Corp. | | | 64,334 | | | 3,838,810 |
| | |
| 18 | | 2 0 2 4 B L A C K R O C K A N N U A L F I N A N C I A L S T A T E M E N T S |
| | |
Schedule of Investments (continued) May 31, 2024 | | BlackRock Advantage Small Cap Core Fund (Percentages shown are based on Net Assets) |
| | | | | | |
Security | | Shares | | | Value |
| | |
| Machinery (continued) | | | | | |
Trinity Industries, Inc. | | | 208,852 | | | $ 6,568,395 |
Wabash National Corp. | | | 38,390 | | | 867,998 |
Watts Water Technologies, Inc., Class A | | | 62,508 | | | 12,447,218 |
| | | | | | |
| | |
| | | | | | 139,844,606 |
| | |
| Marine Transportation — 0.2% | | | | | |
Matson, Inc. | | | 64,962 | | | 8,328,128 |
| | | | | | |
| | |
| Media — 0.9% | | | | | |
Cable One, Inc. | | | 1,216 | | | 469,267 |
Cardlytics, Inc.(a) | | | 67,274 | | | 589,320 |
EchoStar Corp., Class A(a)(b) | | | 163,907 | | | 3,147,015 |
Entravision Communications Corp., Class A | | | 297,476 | | | 642,548 |
EW Scripps Co. (The), Class A, NVS(a) | | | 179,198 | | | 487,419 |
Gambling.com Group Ltd.(a) | | | 69,200 | | | 534,916 |
Gray Television, Inc. | | | 66,008 | | | 411,890 |
Ibotta, Inc., Class A(a)(b) | | | 6,739 | | | 654,559 |
Integral Ad Science Holding Corp.(a) | | | 212,754 | | | 1,970,102 |
Paramount Global, Class B, NVS | | | 847,708 | | | 10,096,202 |
PubMatic, Inc., Class A(a) | | | 78,858 | | | 1,726,990 |
TEGNA, Inc. | | | 265,219 | | | 3,954,415 |
Thryv Holdings, Inc.(a) | | | 273,229 | | | 5,756,935 |
Townsquare Media, Inc., Class A | | | 77 | | | 848 |
| | | | | | |
| | |
| | | | | | 30,442,426 |
| | |
| Metals & Mining — 2.1% | | | | | |
Alcoa Corp. | | | 125,772 | | | 5,567,926 |
Atlas Lithium Corp.(a) | | | 15,821 | | | 225,291 |
Caledonia Mining Corp. PLC | | | 12,852 | | | 134,303 |
Century Aluminum Co.(a) | | | 137,996 | | | 2,529,467 |
Cleveland-Cliffs, Inc.(a)(b) | | | 918,039 | | | 15,863,714 |
Coeur Mining, Inc.(a) | | | 1,523,026 | | | 8,757,400 |
Commercial Metals Co. | | | 22,664 | | | 1,276,436 |
Hecla Mining Co. | | | 718,947 | | | 4,234,598 |
i-80 Gold Corp.(a)(b) | | | 514,346 | | | 560,637 |
Kaiser Aluminum Corp. | | | 88,784 | | | 8,683,075 |
Materion Corp. | | | 39,055 | | | 4,467,111 |
NioCorp Developments Ltd.(a) | | | 41,996 | | | 99,111 |
Novagold Resources, Inc.(a) | | | 633,038 | | | 2,487,839 |
Olympic Steel, Inc. | | | 33,932 | | | 1,769,215 |
Perpetua Resources Corp.(a) | | | 17,005 | | | 116,314 |
Radius Recycling, Inc., Class A | | | 234,023 | | | 4,004,134 |
Ryerson Holding Corp. | | | 129,072 | | | 3,065,460 |
SunCoke Energy, Inc. | | | 70,615 | | | 744,988 |
Tredegar Corp. | | | 65,928 | | | 359,308 |
Warrior Met Coal, Inc. | | | 104,259 | | | 7,134,443 |
| | | | | | |
| | |
| | | | | | 72,080,770 |
| | |
| Multi-Utilities — 0.2% | | | | | |
Avista Corp. | | | 37,665 | | | 1,392,852 |
Black Hills Corp. | | | 102,956 | | | 5,811,866 |
Unitil Corp. | | | 17,884 | | | 956,615 |
| | | | | | |
| | |
| | | | | | 8,161,333 |
| | |
| Office REITs — 1.0% | | | | | |
Brandywine Realty Trust | | | 330,971 | | | 1,525,776 |
City Office REIT, Inc. | | | 22,109 | | | 108,997 |
COPT Defense Properties | | | 168,014 | | | 4,144,905 |
Equity Commonwealth(a) | | | 636,998 | | | 12,300,431 |
Hudson Pacific Properties, Inc. | | | 139,617 | | | 685,520 |
Kilroy Realty Corp. | | | 112,956 | | | 3,787,415 |
Office Properties Income Trust | | | 251,549 | | | 576,047 |
Paramount Group, Inc. | | | 2,285,547 | | | 10,399,239 |
Piedmont Office Realty Trust, Inc., Class A | | | 344,919 | | | 2,514,460 |
| | | | | | |
| | |
| | | | | | 36,042,790 |
| | | | | | |
Security | | Shares | | | Value |
| | |
| Oil, Gas & Consumable Fuels — 4.9% | | | | | |
Delek U.S. Holdings, Inc. | | | 456,257 | | | $ 11,616,303 |
Encore Energy Corp.(a) | | | 192,424 | | | 933,256 |
Energy Fuels, Inc.(a)(b) | | | 145,463 | | | 1,018,241 |
Evolution Petroleum Corp. | | | 204,676 | | | 1,176,887 |
HF Sinclair Corp. | | | 70,862 | | | 3,913,708 |
Magnolia Oil & Gas Corp., Class A | | | 556,765 | | | 14,448,052 |
Matador Resources Co. | | | 201,021 | | | 12,754,783 |
Murphy Oil Corp. | | | 642,367 | | | 27,486,884 |
Ovintiv, Inc. | | | 76,299 | | | 3,942,369 |
Par Pacific Holdings, Inc.(a) | | | 190,710 | | | 5,175,870 |
PBF Energy, Inc., Class A | | | 343,608 | | | 15,919,359 |
Plains GP Holdings LP, Class A | | | 1,545,872 | | | 27,841,155 |
REX American Resources Corp.(a) | | | 64,165 | | | 3,207,608 |
Scorpio Tankers, Inc. | | | 53,245 | | | 4,369,817 |
SM Energy Co. | | | 555,588 | | | 28,018,303 |
World Kinect Corp. | | | 405,595 | | | 10,683,372 |
| | | | | | |
| | |
| | | | | | 172,505,967 |
| | |
| Paper & Forest Products — 0.0% | | | | | |
Louisiana-Pacific Corp. | | | 2,721 | | | 249,461 |
| | | | | | |
| | |
| Passenger Airlines — 0.5% | | | | | |
Alaska Air Group, Inc.(a) | | | 43,853 | | | 1,842,703 |
Allegiant Travel Co. | | | 48,988 | | | 2,606,161 |
Hawaiian Holdings, Inc.(a) | | | 68,559 | | | 936,516 |
JetBlue Airways Corp.(a) | | | 1,229,091 | | | 6,870,619 |
SkyWest, Inc.(a) | | | 51,186 | | | 3,822,059 |
Sun Country Airlines Holdings, Inc.(a)(b) | | | 234,154 | | | 2,479,691 |
| | | | | | |
| | |
| | | | | | 18,557,749 |
| | |
| Personal Care Products — 0.1% | | | | | |
BellRing Brands, Inc.(a)(b) | | | 31,343 | | | 1,823,222 |
| | | | | | |
| | |
| Pharmaceuticals — 2.6% | | | | | |
Alto Neuroscience, Inc.(a) | | | 730 | | | 8,731 |
Amphastar Pharmaceuticals, Inc.(a)(b) | | | 17,020 | | | 720,457 |
ANI Pharmaceuticals, Inc.(a) | | | 24,257 | | | 1,574,279 |
Arvinas, Inc.(a) | | | 142,742 | | | 4,730,470 |
Atea Pharmaceuticals, Inc.(a) | | | 635,543 | | | 2,332,443 |
Axsome Therapeutics, Inc.(a) | | | 1,665 | | | 122,261 |
Collegium Pharmaceutical, Inc.(a) | | | 194,896 | | | 6,458,853 |
Corcept Therapeutics, Inc.(a) | | | 657,849 | | | 19,847,304 |
Elanco Animal Health, Inc.(a)(b) | | | 180,792 | | | 3,196,403 |
Evolus, Inc.(a) | | | 62,023 | | | 801,957 |
Harmony Biosciences Holdings, Inc.(a) | | | 206,408 | | | 6,068,395 |
Innoviva, Inc.(a) | | | 30,813 | | | 486,537 |
Intra-Cellular Therapies, Inc.(a) | | | 95,523 | | | 6,422,966 |
Jazz Pharmaceuticals PLC(a) | | | 12,848 | | | 1,352,252 |
Mind Medicine MindMed, Inc.(a) | | | 16,675 | | | 146,740 |
Nektar Therapeutics(a) | | | 967,197 | | | 1,228,340 |
Nuvation Bio, Inc., Class A(a) | | | 571,973 | | | 1,773,116 |
Pacira BioSciences, Inc.(a)(b) | | | 173,526 | | | 5,263,044 |
Prestige Consumer Healthcare, Inc.(a)(b) | | | 204,425 | | | 13,146,572 |
Scilex Holding Co. (Acquired 03/05/21 - 01/09/23, cost $9,826,744)(a)(b)(d) | | | 430,177 | | | 448,847 |
SIGA Technologies, Inc. | | | 22,168 | | | 165,817 |
Supernus Pharmaceuticals, Inc.(a) | | | 520,733 | | | 14,122,279 |
Trevi Therapeutics, Inc.(a) | | | 45 | | | 116 |
Xeris Biopharma Holdings, Inc.(a) | | | 184,792 | | | 416,706 |
| | | | | | |
| | |
| | | | | | 90,834,885 |
| | |
| Professional Services — 2.1% | | | | | |
CSG Systems International, Inc. | | | 81,945 | | | 3,535,927 |
ExlService Holdings, Inc.(a) | | | 807,382 | | | 24,108,426 |
Franklin Covey Co.(a) | | | 76,898 | | | 2,845,226 |
| | |
S C H E D U L E S O F I N V E S T M E N T S | | 19 |
| | |
Schedule of Investments (continued) May 31, 2024 | | BlackRock Advantage Small Cap Core Fund (Percentages shown are based on Net Assets) |
| | | | | | |
Security | | Shares | | | Value |
| | |
| Professional Services (continued) | | | | | |
Genpact Ltd. | | | 126,401 | | | $ 4,178,817 |
Insperity, Inc. | | | 214,389 | | | 20,306,926 |
Kelly Services, Inc., Class A, NVS | | | 144,142 | | | 3,133,647 |
Kforce, Inc. | | | 30,857 | | | 1,907,271 |
Korn Ferry | | | 17,804 | | | 1,173,996 |
ManpowerGroup, Inc. | | | 169,556 | | | 12,652,269 |
Parsons Corp.(a) | | | 9,260 | | | 705,149 |
ShiftPixy, Inc.(a) | | | 3 | | | 5 |
| | | | | | |
| | |
| | | | | | 74,547,659 |
|
| Real Estate Management & Development — 0.6% |
Anywhere Real Estate, Inc.(a) | | | 210,012 | | | 854,749 |
Compass, Inc., Class A(a) | | | 214,779 | | | 805,421 |
eXp World Holdings, Inc. | | | 50,372 | | | 564,670 |
Forestar Group, Inc.(a) | | | 49,374 | | | 1,679,210 |
FRP Holdings, Inc.(a) | | | 55,184 | | | 1,688,630 |
Jones Lang LaSalle, Inc.(a) | | | 6,552 | | | 1,323,963 |
Opendoor Technologies, Inc.(a) | | | 569,970 | | | 1,242,535 |
RMR Group, Inc. (The), Class A | | | 173,943 | | | 4,092,879 |
St. Joe Co. (The) | | | 181,932 | | | 10,297,351 |
| | | | | | |
| | |
| | | | | | 22,549,408 |
| | |
| Residential REITs — 0.2% | | | | | |
Bluerock Homes Trust, Inc., Class A | | | 77 | | | 1,290 |
Elme Communities | | | 90,635 | | | 1,396,685 |
NexPoint Residential Trust, Inc. | | | 116,725 | | | 4,280,306 |
| | | | | | |
| | |
| | | | | | 5,678,281 |
| | |
| Retail REITs — 0.5% | | | | | |
Kite Realty Group Trust | | | 872,112 | | | 19,116,695 |
| | | | | | |
|
| Semiconductors & Semiconductor Equipment — 2.8% |
ACM Research, Inc., Class A(a)(b) | | | 69,953 | | | 1,510,985 |
Ambarella, Inc.(a) | | | 82,741 | | | 4,820,491 |
Amkor Technology, Inc. | | | 461,342 | | | 15,035,136 |
Astera Labs, Inc.(a)(b) | | | 38,804 | | | 2,504,410 |
Axcelis Technologies, Inc.(a) | | | 169,041 | | | 19,015,422 |
Cirrus Logic, Inc.(a) | | | 51,527 | | | 5,910,147 |
Credo Technology Group Holding Ltd.(a) | | | 257,780 | | | 6,720,325 |
Diodes, Inc.(a)(b) | | | 94,793 | | | 7,027,005 |
Ichor Holdings Ltd.(a) | | | 59,095 | | | 2,245,019 |
Impinj, Inc.(a)(b) | | | 25,732 | | | 4,211,556 |
inTEST Corp.(a) | | | 35,226 | | | 350,851 |
Maxeon Solar Technologies Ltd.(a)(b) | | | 674,346 | | | 1,267,771 |
MaxLinear, Inc.(a) | | | 214,009 | | | 3,802,940 |
Onto Innovation, Inc.(a) | | | 25,402 | | | 5,504,613 |
Photronics, Inc.(a)(b) | | | 143,943 | | | 3,936,841 |
Power Integrations, Inc. | | | 72,538 | | | 5,513,613 |
Rambus, Inc.(a) | | | 39,195 | | | 2,165,916 |
Silicon Laboratories, Inc.(a) | | | 44,608 | | | 5,628,191 |
SiTime Corp.(a) | | | 3,682 | | | 448,541 |
Synaptics, Inc.(a) | | | 7,201 | | | 674,806 |
Ultra Clean Holdings, Inc.(a) | | | 4,644 | | | 215,389 |
| | | | | | |
| | |
| | | | | | 98,509,968 |
| | |
| Software — 6.3% | | | | | |
8x8, Inc.(a) | | | 625,981 | | | 1,708,928 |
ACI Worldwide, Inc.(a) | | | 466,563 | | | 16,800,934 |
Alarm.com Holdings, Inc.(a) | | | 111,611 | | | 7,300,476 |
Appfolio, Inc., Class A(a)(b) | | | 18,439 | | | 4,209,992 |
BILL Holdings, Inc.(a) | | | 24,136 | | | 1,256,279 |
Bit Digital, Inc.(a)(b) | | | 1,174,575 | | | 2,912,946 |
BlackLine, Inc.(a) | | | 10,451 | | | 498,722 |
Box, Inc., Class A(a)(b) | | | 179,284 | | | 4,885,489 |
Braze, Inc., Class A(a) | | | 31,643 | | | 1,191,359 |
| | | | | | |
Security | | Shares | | | Value |
| | |
| Software (continued) | | | | | |
C3.ai, Inc., Class A(a)(b) | | | 59,023 | | | $ 1,745,310 |
Cleanspark, Inc.(a) | | | 42,031 | | | 675,438 |
Clear Secure, Inc., Class A | | | 448,819 | | | 7,580,553 |
CommVault Systems, Inc.(a) | | | 117,769 | | | 12,670,178 |
Confluent, Inc., Class A(a) | | | 45,216 | | | 1,174,260 |
DocuSign, Inc.(a) | | | 71,670 | | | 3,923,216 |
Domo, Inc., Class B(a) | | | 244,455 | | | 1,628,070 |
Everbridge, Inc.(a) | | | 55,043 | | | 1,913,295 |
Expensify, Inc., Class A(a) | | | 130,806 | | | 197,517 |
Five9, Inc.(a) | | | 57,041 | | | 2,667,237 |
Freshworks, Inc., Class A(a) | | | 126,534 | | | 1,629,758 |
Gitlab, Inc., Class A(a) | | | 201,368 | | | 9,502,556 |
HashiCorp, Inc., Class A(a) | | | 78,985 | | | 2,652,316 |
Informatica, Inc., Class A(a) | | | 82,141 | | | 2,369,768 |
Intapp, Inc.(a)(b) | | | 49,396 | | | 1,773,316 |
LiveRamp Holdings, Inc.(a) | | | 154,371 | | | 4,830,269 |
Marathon Digital Holdings, Inc.(a) | | | 73,140 | | | 1,427,693 |
MicroStrategy, Inc., Class A(a)(b) | | | 14,989 | | | 22,850,581 |
Model N, Inc.(a)(b) | | | 52,209 | | | 1,560,527 |
Nutanix, Inc., Class A(a) | | | 63,976 | | | 3,538,832 |
Olo, Inc., Class A(a) | | | 259,456 | | | 1,188,308 |
PagerDuty, Inc.(a)(b) | | | 11,232 | | | 213,071 |
Pegasystems, Inc. | | | 6,545 | | | 376,076 |
PROS Holdings, Inc.(a) | | | 105,343 | | | 3,105,512 |
Q2 Holdings, Inc.(a)(b) | | | 218,526 | | | 13,290,751 |
Qualys, Inc.(a) | | | 28,426 | | | 3,997,264 |
Rapid7, Inc.(a)(b) | | | 75,285 | | | 2,720,800 |
RingCentral, Inc., Class A(a) | | | 187,495 | | | 6,412,329 |
Rubrik, Inc., Class A(a) | | | 51,512 | | | 1,570,086 |
SEMrush Holdings, Inc., Class A(a) | | | 199,080 | | | 3,037,961 |
SentinelOne, Inc., Class A(a) | | | 373,465 | | | 6,285,416 |
Smartsheet, Inc., Class A(a) | | | 197,403 | | | 7,303,911 |
Sprinklr, Inc., Class A(a) | | | 87,329 | | | 978,958 |
Sprout Social, Inc., Class A(a) | | | 65,133 | | | 2,126,592 |
Tenable Holdings, Inc.(a) | | | 41,511 | | | 1,751,349 |
Teradata Corp.(a) | | | 90,704 | | | 2,957,857 |
UiPath, Inc., Class A(a) | | | 18,481 | | | 226,577 |
Unity Software, Inc.(a) | | | 16,176 | | | 295,536 |
Upland Software, Inc.(a) | | | 147,254 | | | 404,948 |
Varonis Systems, Inc.(a)(b) | | | 309,170 | | | 13,281,943 |
Verint Systems, Inc.(a) | | | 195,553 | | | 5,800,102 |
Weave Communications, Inc.(a) | | | 15,288 | | | 132,241 |
Workiva, Inc., Class A(a)(b) | | | 26,677 | | | 2,053,329 |
Yext, Inc.(a) | | | 145,738 | | | 735,977 |
Zeta Global Holdings Corp., Class A(a) | | | 449,122 | | | 7,334,162 |
Zuora, Inc., Class A(a) | | | 571,510 | | | 5,800,826 |
| | | | | | |
| | |
| | | | | | 220,457,697 |
| | |
| Specialized REITs — 0.6% | | | | | |
Lamar Advertising Co., Class A | | | 111,047 | | | 13,115,761 |
Outfront Media, Inc. | | | 650,171 | | | 9,394,971 |
| | | | | | |
| | |
| | | | | | 22,510,732 |
| | |
| Specialty Retail — 3.7% | | | | | |
1-800-Flowers.com, Inc., Class A(a)(b) | | | 532,713 | | | 5,156,662 |
Aaron’s Co., Inc. (The) | | | 258,485 | | | 2,191,953 |
Abercrombie & Fitch Co., Class A(a) | | | 88,136 | | | 15,236,070 |
Academy Sports & Outdoors, Inc. | | | 46,322 | | | 2,672,316 |
American Eagle Outfitters, Inc. | | | 137,419 | | | 3,019,095 |
Beyond, Inc.(a) | | | 162,749 | | | 2,462,392 |
CarParts.com, Inc.(a) | | | 224,513 | | | 264,925 |
Carvana Co., Class A(a) | | | 145,753 | | | 14,572,385 |
Chewy, Inc., Class A(a)(b) | | | 237,722 | | | 5,042,084 |
Conn’s, Inc.(a) | | | 308,282 | | | 1,103,650 |
| | |
| 20 | | 2 0 2 4 B L A C K R O C K A N N U A L F I N A N C I A L S T A T E M E N T S |
| | |
Schedule of Investments (continued) May 31, 2024 | | BlackRock Advantage Small Cap Core Fund (Percentages shown are based on Net Assets) |
| | | | | | |
Security | | Shares | | | Value |
| | |
| Specialty Retail (continued) | | | | | |
Container Store Group, Inc. (The)(a)(b) | | | 88,112 | | | $ 59,053 |
Duluth Holdings, Inc., Class B(a)(b) | | | 23,595 | | | 93,200 |
Five Below, Inc.(a) | | | 31,014 | | | 4,283,964 |
Foot Locker, Inc. | | | 194,434 | | | 5,391,655 |
Gap, Inc. (The) | | | 59,735 | | | 1,729,926 |
Genesco, Inc.(a) | | | 21,325 | | | 607,762 |
Group 1 Automotive, Inc.(b) | | | 70,347 | | | 21,876,510 |
Haverty Furniture Cos., Inc. | | | 31,914 | | | 906,677 |
Lands’ End, Inc.(a) | | | 73,295 | | | 1,047,386 |
Lulu’s Fashion Lounge Holdings, Inc.(a) | | | 163 | | | 290 |
Murphy U.S.A., Inc. | | | 6,973 | | | 3,059,404 |
National Vision Holdings, Inc.(a) | | | 147,538 | | | 2,226,348 |
Penske Automotive Group, Inc. | | | 19,727 | | | 3,000,477 |
Revolve Group, Inc., Class A(a)(b) | | | 100,996 | | | 1,927,004 |
RH(a) | | | 7,428 | | | 2,019,896 |
Sonic Automotive, Inc., Class A | | | 20,035 | | | 1,135,383 |
Stitch Fix, Inc., Class A(a) | | | 916,977 | | | 2,264,933 |
Upbound Group, Inc. | | | 93,150 | | | 3,057,183 |
Urban Outfitters, Inc.(a) | | | 112,240 | | | 4,681,530 |
Warby Parker, Inc., Class A(a) | | | 317,776 | | | 5,627,813 |
Wayfair, Inc., Class A(a) | | | 106,144 | | | 6,314,507 |
Winmark Corp. | | | 9,165 | | | 3,261,823 |
Zumiez, Inc.(a) | | | 162,482 | | | 3,051,412 |
| | | | | | |
| | |
| | | | | | 129,345,668 |
|
| Technology Hardware, Storage & Peripherals — 1.4% |
Super Micro Computer, Inc.(a) | | | 62,079 | | | 48,701,596 |
| | | | | | |
| | |
| Textiles, Apparel & Luxury Goods — 0.4% | | | | | |
Figs, Inc., Class A(a) | | | 233,644 | | | 1,238,313 |
G-III Apparel Group Ltd.(a) | | | 296,065 | | | 8,899,714 |
Oxford Industries, Inc. | | | 11,344 | | | 1,255,668 |
Ralph Lauren Corp., Class A | | | 9,199 | | | 1,719,109 |
Under Armour, Inc., Class A(a) | | | 28,517 | | | 205,037 |
Unifi, Inc.(a) | | | 38,167 | | | 249,994 |
| | | | | | |
| | |
| | | | | | 13,567,835 |
| | |
| Tobacco — 0.1% | | | | | |
Turning Point Brands, Inc. | | | 85,746 | | | 2,813,326 |
| | | | | | |
| | |
| Trading Companies & Distributors — 3.3% | | | | | |
Applied Industrial Technologies, Inc. | | | 73,606 | | | 14,205,958 |
BlueLinx Holdings, Inc.(a) | | | 58,775 | | | 6,047,360 |
Boise Cascade Co. | | | 272,715 | | | 37,441,042 |
DNOW, Inc.(a) | | | 668,921 | | | 9,759,557 |
GATX Corp. | | | 69,378 | | | 9,571,389 |
Global Industrial Co. | | | 14,805 | | | 512,401 |
GMS, Inc.(a)(b) | | | 233,240 | | | 21,915,231 |
H&E Equipment Services, Inc. | | | 77,951 | | | 3,692,539 |
Herc Holdings, Inc. | | | 53,003 | | | 7,689,145 |
McGrath RentCorp | | | 33,198 | | | 3,617,918 |
MRC Global, Inc.(a) | | | 74,322 | | | 987,739 |
Titan Machinery, Inc.(a) | | | 29,605 | | | 557,166 |
| | | | | | |
| | |
| | | | | | 115,997,445 |
| | | | | | | | |
Security | | Shares | | | Value | |
| |
|
| Wireless Telecommunication Services — 0.2% | |
Telephone & Data Systems, Inc. | | | 240,099 | | | $ | 4,775,569 | |
United States Cellular Corp.(a) | | | 41,660 | | | | 2,310,464 | |
| | | | | | | | |
| | |
| | | | | | | 7,086,033 | |
| | | | | | | | |
| |
Total Common Stocks — 99.2%
(Cost: $3,113,803,238) | | | | 3,485,111,910 | |
| | | | | | | | |
|
| Rights | |
|
Biotechnology — 0.0% | |
Albireo Pharma Inc., CVR(a)(b)(c) | | | 28,456 | | | | 92,767 | |
Flexion Therapeutics, Inc., CVR(a)(c) | | | 73,745 | | | | 40,560 | |
Radius Health, Inc., CVR(a) | | | 72,193 | | | | 5,775 | |
| | | | | | | | |
| | |
| | | | | | | 139,102 | |
| | |
| Paper & Forest Products — 0.0% | | | | | | |
Resolute Forest Products, Inc., CVR(a)(c) | | | 72,036 | | | | 112,376 | |
| | | | | | | | |
| | |
Total Rights — 0.0%
(Cost: $ —) | | | | | | | 251,478 | |
| | | | | | | | |
| | |
Total Long-Term Investments — 99.2%
(Cost: $3,113,803,238) | | | | | | | 3,485,363,388 | |
| | | | | | | | |
|
Short-Term Securities | |
| |
| Money Market Funds — 5.3% | | | | |
BlackRock Cash Funds: Institutional, SL Agency Shares, 5.49%(e)(f)(g) | | | 153,810,154 | | | | 153,856,296 | |
BlackRock Liquidity Funds, T-Fund, Institutional Shares, 5.19%(e)(f) | | | 34,625,874 | | | | 34,625,874 | |
| | | | | | | | |
| | |
Total Short-Term Securities — 5.3%
(Cost: $188,482,170) | | | | | | | 188,482,170 | |
| | | | | | | | |
| | |
Total Investments — 104.5%
(Cost: $3,302,285,408) | | | | | | | 3,673,845,558 | |
Liabilities in Excess of Other Assets — (4.5)% | | | | (159,048,018 | ) |
| | | | | | | | |
| | |
| Net Assets — 100.0% | | | | | $ 3,514,797,540 | |
| | | | | | | | |
| (a) | Non-income producing security. |
| (b) | All or a portion of this security is on loan. |
| (c) | Security is valued using significant unobservable inputs and is classified as Level 3 in the fair value hierarchy. |
| (d) | Restricted security as to resale, excluding 144A securities. The Fund held restricted securities with a current value of $448,847, representing 0.0% of its net assets as of period end, and an original cost of $9,826,744. |
| (e) | Affiliate of the Fund. |
| (f) | Annualized 7-day yield as of period end. |
| (g) | All or a portion of this security was purchased with the cash collateral from loaned securities. |
| | |
S C H E D U L E S O F I N V E S T M E N T S | | 21 |
| | |
Schedule of Investments (continued) May 31, 2024 | | BlackRock Advantage Small Cap Core Fund |
Affiliates
Investments in issuers considered to be affiliate(s) of the Fund during the year ended May 31, 2024 for purposes of Section 2(a)(3) of the Investment Company Act of 1940, as amended, were as follows:
| | | | | | | | | | | | | | | | | | | | | | | | | | | | | | | | | | | | |
| Affiliated Issuer | | Value at
05/31/23 | | | Purchases
at Cost | | | Proceeds
from Sales | | | Net
Realized
Gain (Loss) | | | Change in
Unrealized
Appreciation
(Depreciation) | | | Value at
05/31/24 | | | Shares Held at 05/31/24 | | | Income | | | Capital
Gain
Distributions
from Underlying
Funds | |
| | | | | | | | | |
BlackRock Cash Funds: Institutional, SL Agency Shares | | $ | — | | | $ | 153,859,901 | (a) | | $ | — | | | $ | (3,605 | ) | | $ | — | | | $ | 153,856,296 | | | | 153,810,154 | | | $ | 84,284 | (b) | | $ | — | |
BlackRock Liquidity Funds,
T-Fund, Institutional Shares | | | 32,705,335 | | | | 1,920,539 | (a) | | | — | | | | — | | | | — | | | | 34,625,874 | | | | 34,625,874 | | | | 1,642,653 | | | | — | |
SL Liquidity Series, LLC, Money Market Series(c) | | | 99,134,034 | | | | — | | | | (99,159,952 | )(a) | | | 77,569 | | | | (51,651 | ) | | | — | | | | — | | | | 544,679 | (b) | | | — | |
| | | | | | | | | | | | | | | | | | | | | | | | | | | | | | | | | | | | |
| | | | | | | | | |
| | | | | | | | | | | | | | $ | 73,964 | | | $ | (51,651 | ) | | $ | 188,482,170 | | | | | | | $ | 2,271,616 | | | $ | — | |
| | | | | | | | | | | | | | | | | | | | | | | | | | | | | | | | | | | | |
| | (a) | Represents net amount purchased (sold). | |
| | (b) | All or a portion represents securities lending income earned from the reinvestment of cash collateral from loaned securities, net of fees and collateral investment expenses, and other payments to and from borrowers of securities. | |
| | (c) | As of period end, the entity is no longer held. | |
For purposes of this report, industry and sector sub-classifications may differ from those utilized by the Fund for compliance purposes.
Derivative Financial Instruments Outstanding as of Period End
Futures Contracts
| | | | | | | | | | | | | | | | |
| |
| Description | | Number of
Contracts | | | Expiration
Date | | | Notional
Amount
(000) | | | Value/
Unrealized
Appreciation
(Depreciation) | |
| |
| | | | |
Long Contracts | | | | | | | | | | | | | | | | |
Russell 2000 E-Mini Index | | | 379 | | | | 06/21/24 | | | $ | 39,336 | | | $ | (28,076 | ) |
| | | | | | | | | | | | | | | | |
Derivative Financial Instruments Categorized by Risk Exposure
As of period end, the fair values of derivative financial instruments located in the Statements of Assets and Liabilities were as follows:
| | | | | | | | | | | | | | | | | | | | | | | | | | | | |
| |
| | | Commodity
Contracts | | | Credit
Contracts | | | Equity
Contracts | | | Foreign
Currency
Exchange
Contracts | | | Interest
Rate
Contracts | | | Other
Contracts | | | Total | |
| |
Liabilities — Derivative Financial Instruments | | | | | | | | | | | | | | | | | | | | | | | | | | | | |
Futures contracts | | | | | | | | | | | | | | | | | | | | | | | | | | | | |
Unrealized depreciation on futures contracts(a) | | $ | — | | | $ | — | | | $ | 28,076 | | | $ | — | | | $ | — | | | $ | — | | | $ | 28,076 | |
| | | | | | | | | | | | | | | | | | | | | | | | | | | | |
| | (a) | Net cumulative unrealized appreciation (depreciation) on futures contracts and centrally cleared swaps, if any, are reported in the Schedule of Investments. In the Statements of Assets and Liabilities, only current day’s variation margin is reported in receivables or payables and the net cumulative unrealized appreciation (depreciation) is included in accumulated earnings (loss). | |
| | |
| 22 | | 2 0 2 4 B L A C K R O C K A N N U A L F I N A N C I A L S T A T E M E N T S |
| | |
Schedule of Investments (continued) May 31, 2024 | | BlackRock Advantage Small Cap Core Fund |
For the period ended May 31, 2024, the effect of derivative financial instruments in the Statements of Operations was as follows:
| | | | | | | | | | | | | | | | | | | | | | | | | | | | |
| |
| | | Commodity
Contracts | | | Credit
Contracts | | | Equity
Contracts | | | Foreign
Currency
Exchange
Contracts | | | Interest
Rate
Contracts | | | Other
Contracts | | | Total | |
| |
| | | | | | | |
Net Realized Gain (Loss) from: | | | | | | | | | | | | | | | | | | | | | | | | | | | | |
Futures contracts | | $ | — | | | $ | — | | | $ | 6,393,027 | | | $ | — | | | $ | — | | | $ | — | | | $ | 6,393,027 | |
| | | | | | | | | | | | | | | | | | | | | | | | | | | | |
| | | | | | | |
Net Change in Unrealized Appreciation
(Depreciation) on: | | | | | | | | | | | | | | | | | | | | | |
Futures contracts | | $ | — | | | $ | — | | | $ | 243,424 | | | $ | — | | | $ | — | | | $ | — | | | $ | 243,424 | |
| | | | | | | | | | | | | | | | | | | | | | | | | | | | |
Average Quarterly Balances of Outstanding Derivative Financial Instruments
| | | | |
| | |
Futures contracts | | | | |
Average notional value of contracts — long | | $ | 38,771,851 | |
For more information about the Fund’s investment risks regarding derivative financial instruments, refer to the Notes to Financial Statements.
Fair Value Hierarchy as of Period End
Various inputs are used in determining the fair value of financial instruments. For a description of the input levels and information about the Fund’s policy regarding valuation of financial instruments, refer to the Notes to Financial Statements.
The following table summarizes the Fund’s financial instruments categorized in the fair value hierarchy. The breakdown of the Fund’s financial instruments into major categories is disclosed in the Schedule of Investments above.
| | | | | | | | | | | | | | | | |
| |
| | | Level 1 | | | Level 2 | | | Level 3 | | | Total | |
| |
| | | | |
Assets | | | | | | | | | | | | | | | | |
Investments | | | | | | | | | | | | | | | | |
Long-Term Investments | | | | | | | | | | | | | | | | |
Common Stocks | | | | | | | | | | | | | | | | |
Aerospace & Defense | | $ | 23,247,172 | | | $ | — | | | $ | — | | | $ | 23,247,172 | |
Air Freight & Logistics | | | 3,822,854 | | | | — | | | | — | | | | 3,822,854 | |
Automobile Components | | | 78,549,543 | | | | — | | | | — | | | | 78,549,543 | |
Banks | | | 244,984,774 | | | | — | | | | — | | | | 244,984,774 | |
Beverages | | | 34,073,004 | | | | — | | | | — | | | | 34,073,004 | |
Biotechnology | | | 281,954,666 | | | | 91 | | | | 15,836 | | | | 281,970,593 | |
Broadline Retail | | | 21,465,437 | | | | — | | | | — | | | | 21,465,437 | |
Building Products | | | 67,461,940 | | | | — | | | | — | | | | 67,461,940 | |
Capital Markets | | | 75,516,900 | | | | — | | | | — | | | | 75,516,900 | |
Chemicals | | | 62,253,370 | | | | — | | | | — | | | | 62,253,370 | |
Commercial Services & Supplies | | | 22,866,418 | | | | — | | | | — | | | | 22,866,418 | |
Communications Equipment | | | 14,149,959 | | | | — | | | | — | | | | 14,149,959 | |
Construction & Engineering | | | 115,679,222 | | | | — | | | | — | | | | 115,679,222 | |
Construction Materials | | | 5,163,541 | | | | — | | | | — | | | | 5,163,541 | |
Consumer Finance | | | 60,077,169 | | | | — | | | | — | | | | 60,077,169 | |
Consumer Staples Distribution & Retail | | | 21,483,317 | | | | — | | | | — | | | | 21,483,317 | |
Diversified Consumer Services | | | 50,916,646 | | | | — | | | | — | | | | 50,916,646 | |
Diversified REITs | | | 14,942,935 | | | | — | | | | — | | | | 14,942,935 | |
Diversified Telecommunication Services | | | 10,214,188 | | | | — | | | | — | | | | 10,214,188 | |
Electric Utilities | | | 12,586,740 | | | | — | | | | — | | | | 12,586,740 | |
Electrical Equipment | | | 55,174,248 | | | | — | | | | — | | | | 55,174,248 | |
Electronic Equipment, Instruments & Components | | | 151,542,997 | | | | — | | | | — | | | | 151,542,997 | |
Energy Equipment & Services | | | 56,890,689 | | | | — | | | | — | | | | 56,890,689 | |
Entertainment | | | 10,717,152 | | | | — | | | | — | | | | 10,717,152 | |
Financial Services | | | 65,192,065 | | | | — | | | | — | | | | 65,192,065 | |
Food Products | | | 36,902,037 | | | | — | | | | — | | | | 36,902,037 | |
Gas Utilities | | | 40,415,347 | | | | — | | | | — | | | | 40,415,347 | |
Ground Transportation | | | 6,101,711 | | | | — | | | | — | | | | 6,101,711 | |
Health Care Equipment & Supplies | | | 60,279,252 | | | | — | | | | — | | | | 60,279,252 | |
Health Care Providers & Services | | | 90,701,723 | | | | 5,515 | | | | — | | | | 90,707,238 | |
Health Care REITs | | | 724,716 | | | | — | | | | — | | | | 724,716 | |
Health Care Technology | | | 20,619,812 | | | | — | | | | — | | | | 20,619,812 | |
Hotel & Resort REITs | | | 32,841,092 | | | | — | | | | — | | | | 32,841,092 | |
Hotels, Restaurants & Leisure | | | 24,797,816 | | | | — | | | | — | | | | 24,797,816 | |
Household Durables | | | 88,968,204 | | | | — | | | | — | | | | 88,968,204 | |
| | |
S C H E D U L E S O F I N V E S T M E N T S | | 23 |
| | |
Schedule of Investments (continued) May 31, 2024 | | BlackRock Advantage Small Cap Core Fund |
Fair Value Hierarchy as of Period End (continued)
| | | | | | | | | | | | | | | | |
| |
| | | Level 1 | | | Level 2 | | | Level 3 | | | Total | |
| |
| | | | |
Common Stocks (continued) | | | | | | | | | | | | | | | | |
Household Products | | $ | 9,598,110 | | | $ | — | | | $ | — | | | $ | 9,598,110 | |
Independent Power and Renewable Electricity Producers | | | 16,417,329 | | | | — | | | | — | | | | 16,417,329 | |
Industrial REITs | | | 5,306,747 | | | | — | | | | — | | | | 5,306,747 | |
Insurance | | | 53,111,585 | | | | — | | | | — | | | | 53,111,585 | |
Interactive Media & Services | | | 42,713,180 | | | | — | | | | — | | | | 42,713,180 | |
IT Services | | | 17,114,907 | | | | — | | | | — | | | | 17,114,907 | |
Leisure Products | | | 1,862,366 | | | | — | | | | — | | | | 1,862,366 | |
Life Sciences Tools & Services | | | 15,933,908 | | | | — | | | | — | | | | 15,933,908 | |
Machinery | | | 139,844,606 | | | | — | | | | — | | | | 139,844,606 | |
Marine Transportation | | | 8,328,128 | | | | — | | | | — | | | | 8,328,128 | |
Media | | | 30,442,426 | | | | — | | | | — | | | | 30,442,426 | |
Metals & Mining | | | 72,080,770 | | | | — | | | | — | | | | 72,080,770 | |
Multi-Utilities | | | 8,161,333 | | | | — | | | | — | | | | 8,161,333 | |
Office REITs | | | 36,042,790 | | | | — | | | | — | | | | 36,042,790 | |
Oil, Gas & Consumable Fuels | | | 172,505,967 | | | | — | | | | — | | | | 172,505,967 | |
Paper & Forest Products | | | 249,461 | | | | — | | | | — | | | | 249,461 | |
Passenger Airlines | | | 18,557,749 | | | | — | | | | — | | | | 18,557,749 | |
Personal Care Products | | | 1,823,222 | | | | — | | | | — | | | | 1,823,222 | |
Pharmaceuticals | | | 90,386,038 | | | | 448,847 | | | | — | | | | 90,834,885 | |
Professional Services | | | 74,547,659 | | | | — | | | | — | | | | 74,547,659 | |
Real Estate Management & Development | | | 22,549,408 | | | | — | | | | — | | | | 22,549,408 | |
Residential REITs | | | 5,678,281 | | | | — | | | | — | | | | 5,678,281 | |
Retail REITs | | | 19,116,695 | | | | — | | | | — | | | | 19,116,695 | |
Semiconductors & Semiconductor Equipment | | | 98,509,968 | | | | — | | | | — | | | | 98,509,968 | |
Software | | | 220,457,697 | | | | — | | | | — | | | | 220,457,697 | |
Specialized REITs | | | 22,510,732 | | | | — | | | | — | | | | 22,510,732 | |
Specialty Retail | | | 129,345,668 | | | | — | | | | — | | | | 129,345,668 | |
Technology Hardware, Storage & Peripherals | | | 48,701,596 | | | | — | | | | — | | | | 48,701,596 | |
Textiles, Apparel & Luxury Goods | | | 13,567,835 | | | | — | | | | — | | | | 13,567,835 | |
Tobacco | | | 2,813,326 | | | | — | | | | — | | | | 2,813,326 | |
Trading Companies & Distributors | | | 115,997,445 | | | | — | | | | — | | | | 115,997,445 | |
Wireless Telecommunication Services | | | 7,086,033 | | | | — | | | | — | | | | 7,086,033 | |
Rights | | | — | | | | 5,775 | | | | 245,703 | | | | 251,478 | |
Short-Term Securities | | | | | | | | | | | | | | | | |
Money Market Funds | | | 188,482,170 | | | | — | | | | — | | | | 188,482,170 | |
| | | | | | | | | | | | | | | | |
| | $ | 3,673,123,791 | | | $ | 460,228 | | | $ | 261,539 | | | $ | 3,673,845,558 | |
| | | | | | | | | | | | | | | | |
Derivative Financial Instruments(a) | | | | | | | | | | | | | | | | |
Liabilities | | | | | | | | | | | | | | | | |
Equity Contracts | | $ | (28,076 | ) | | $ | — | | | $ | — | | | $ | (28,076 | ) |
| | | | | | | | | | | | | | | | |
| | (a) | Derivative financial instruments are futures contracts. Futures contracts are valued at the unrealized appreciation (depreciation) on the instrument. | |
See notes to financial statements.
| | |
| 24 | | 2 0 2 4 B L A C K R O C K A N N U A L F I N A N C I A L S T A T E M E N T S |
| | |
Schedule of Investments May 31, 2024 | | BlackRock Advantage Large Cap Core Fund (Percentages shown are based on Net Assets) |
| | | | | | |
Security | | Shares | | | Value |
|
Common Stocks |
|
| Aerospace & Defense — 1.4% |
Lockheed Martin Corp. | | | 86,410 | | | $ 40,642,080 |
| | | | | | |
|
| Air Freight & Logistics — 0.7% |
Expeditors International of Washington, Inc. | | | 175,765 | | | 21,249,989 |
| | | | | | |
|
| Automobiles — 0.9% |
General Motors Co. | | | 414,497 | | | 18,648,220 |
Tesla, Inc.(a) | | | 46,298 | | | 8,244,748 |
| | | | | | |
| | |
| | | | | | 26,892,968 |
|
| Banks — 1.9% |
JPMorgan Chase & Co. | | | 162,123 | | | 32,850,984 |
KeyCorp | | | 1,387,492 | | | 19,938,260 |
| | | | | | |
| | |
| | | | | | 52,789,244 |
|
| Beverages — 0.8% |
PepsiCo, Inc. | | | 129,060 | | | 22,314,474 |
| | | | | | |
|
| Biotechnology — 3.9% |
AbbVie, Inc. | | | 79,035 | | | 12,743,603 |
Amgen, Inc. | | | 27,545 | | | 8,424,638 |
Biogen, Inc.(a) | | | 87,583 | | | 19,700,920 |
Gilead Sciences, Inc. | | | 605,591 | | | 38,921,334 |
Incyte Corp.(a) | | | 269,878 | | | 15,596,250 |
United Therapeutics Corp.(a) | | | 56,987 | | | 15,678,833 |
| | | | | | |
| | |
| | | | | | 111,065,578 |
|
| Broadline Retail — 4.4% |
Amazon.com, Inc.(a) | | | 716,939 | | | 126,496,717 |
| | | | | | |
|
| Building Products — 0.4% |
Builders FirstSource, Inc.(a) | | | 65,429 | | | 10,520,329 |
| | | | | | |
|
| Capital Markets — 2.4% |
Invesco Ltd. | | | 1,645,764 | | | 25,854,953 |
Nasdaq, Inc. | | | 485,903 | | | 28,682,854 |
S&P Global, Inc. | | | 31,836 | | | 13,610,208 |
| | | | | | |
| | |
| | | | | | 68,148,015 |
|
| Commercial Services & Supplies — 1.9% |
Cintas Corp. | | | 49,584 | | | 33,616,465 |
Waste Management, Inc. | | | 101,495 | | | 21,388,041 |
| | | | | | |
| | |
| | | | | | 55,004,506 |
|
| Construction & Engineering — 0.7% |
AECOM | | | 154,262 | | | 13,473,243 |
Quanta Services, Inc. | | | 18,830 | | | 5,195,950 |
| | | | | | |
| | |
| | | | | | 18,669,193 |
|
| Consumer Staples Distribution & Retail — 1.3% |
Costco Wholesale Corp. | | | 45,180 | | | 36,590,830 |
| | | | | | |
|
| Electric Utilities — 0.3% |
OGE Energy Corp. | | | 203,082 | | | 7,371,877 |
| | | | | | |
|
| Electrical Equipment — 0.3% |
AMETEK, Inc. | | | 57,791 | | | 9,800,198 |
| | | | | | |
|
| Electronic Equipment, Instruments & Components — 1.2% |
TE Connectivity Ltd. | | | 236,643 | | | 35,425,457 |
| | | | | | |
|
| Energy Equipment & Services — 1.0% |
Schlumberger NV | | | 612,058 | | | 28,087,342 |
| | | | | | |
|
| Entertainment — 0.7% |
Electronic Arts, Inc. | | | 47,832 | | | 6,355,916 |
Netflix, Inc.(a) | | | 22,972 | | | 14,739,295 |
| | | | | | |
| | |
| | | | | | 21,095,211 |
| | | | | | |
Security | | Shares | | | Value |
| | |
| Financial Services — 4.4% | | | | | |
Berkshire Hathaway, Inc., Class B(a) | | | 54,107 | | | $ 22,421,941 |
Mastercard, Inc., Class A | | | 123,791 | | | 55,343,242 |
Visa, Inc., Class A | | | 177,162 | | | 48,269,559 |
| | | | | | |
| | |
| | | | | | 126,034,742 |
| | |
| Food Products — 0.4% | | | | | |
Hershey Co. (The) | | | 51,864 | | | 10,260,255 |
| | | | | | |
| | |
| Ground Transportation — 0.6% | | | | | |
Old Dominion Freight Line, Inc. | | | 99,553 | | | 17,446,663 |
| | | | | | |
| | |
| Health Care Equipment & Supplies — 2.6% | | | | | |
Dexcom, Inc.(a) | | | 65,314 | | | 7,757,344 |
Medtronic PLC | | | 487,617 | | | 39,677,395 |
Stryker Corp. | | | 79,791 | | | 27,215,912 |
| | | | | | |
| | |
| | | | | | 74,650,651 |
| | |
| Health Care Providers & Services — 2.8% | | | | | |
Cardinal Health, Inc. | | | 172,940 | | | 17,167,754 |
Elevance Health, Inc. | | | 49,684 | | | 26,753,840 |
Labcorp Holdings, Inc. | | | 107,458 | | | 20,944,639 |
UnitedHealth Group, Inc. | | | 31,003 | | | 15,357,956 |
| | | | | | |
| | |
| | | | | | 80,224,189 |
| | |
| Hotel & Resort REITs — 0.0% | | | | | |
RLJ Lodging Trust | | | 51 | | | 509 |
| | | | | | |
| | |
| Hotels, Restaurants & Leisure — 1.0% | | | | | |
Boyd Gaming Corp. | | | 257,578 | | | 13,734,059 |
MGM Resorts International(a) | | | 362,972 | | | 14,580,585 |
| | | | | | |
| | |
| | | | | | 28,314,644 |
| | |
| Household Durables — 1.5% | | | | | |
DR Horton, Inc. | | | 191,099 | | | 28,244,432 |
Toll Brothers, Inc. | | | 124,188 | | | 15,106,229 |
| | | | | | |
| | |
| | | | | | 43,350,661 |
| | |
| Household Products — 1.3% | | | | | |
Kimberly-Clark Corp. | | | 272,811 | | | 36,365,706 |
| | | | | | |
| | |
| Insurance — 2.8% | | | | | |
Marsh & McLennan Cos., Inc. | | | 193,943 | | | 40,258,688 |
Progressive Corp. (The) | | | 182,822 | | | 38,608,350 |
| | | | | | |
| | |
| | | | | | 78,867,038 |
| | |
| Interactive Media & Services — 7.0% | | | | | |
Alphabet, Inc., Class A(a) | | | 537,129 | | | 92,654,752 |
Alphabet, Inc., Class C, NVS(a) | | | 294,435 | | | 51,219,913 |
Meta Platforms, Inc., Class A | | | 115,869 | | | 54,091,125 |
| | | | | | |
| | |
| | | | | | 197,965,790 |
| | |
| Life Sciences Tools & Services — 0.1% | | | | | |
Agilent Technologies, Inc. | | | 23,976 | | | 3,126,710 |
| | | | | | |
| | |
| Machinery — 3.4% | | | | | |
Cummins, Inc. | | | 29,953 | | | 8,438,659 |
Flowserve Corp. | | | 243,576 | | | 12,105,727 |
Oshkosh Corp. | | | 263,002 | | | 29,911,217 |
Parker-Hannifin Corp. | | | 69,633 | | | 37,011,332 |
Xylem, Inc. | | | 65,233 | | | 9,199,158 |
| | | | | | |
| | |
| | | | | | 96,666,093 |
| | |
| Media — 2.3% | | | | | |
Comcast Corp., Class A | | | 1,107,462 | | | 44,331,704 |
Fox Corp., Class A, NVS | | | 578,132 | | | 19,905,085 |
Fox Corp., Class B | | | 9,069 | | | 289,664 |
| | | | | | |
| | |
| | | | | | 64,526,453 |
| | |
| Metals & Mining — 0.6% | | | | | |
Nucor Corp. | | | 94,904 | | | 16,024,540 |
| | | | | | |
| | |
S C H E D U L E S O F I N V E S T M E N T S | | 25 |
| | |
Schedule of Investments (continued) May 31, 2024 | | BlackRock Advantage Large Cap Core Fund (Percentages shown are based on Net Assets) |
| | | | | | |
Security | | Shares | | | Value |
| | |
| Multi-Utilities — 0.8% | | | | | |
CMS Energy Corp. | | | 381,727 | | | $ 24,022,080 |
| | | | | | |
|
| Oil, Gas & Consumable Fuels — 2.6% |
ConocoPhillips | | | 70,256 | | | 8,183,419 |
Devon Energy Corp. | | | 445,065 | | | 21,843,790 |
EOG Resources, Inc. | | | 76,822 | | | 9,568,180 |
Exxon Mobil Corp. | | | 185,529 | | | 21,755,131 |
Marathon Petroleum Corp. | | | 64,566 | | | 11,403,001 |
| | | | | | |
| | |
| | | | | | 72,753,521 |
|
| Passenger Airlines — 0.5% |
American Airlines Group, Inc.(a)(b) | | | 1,299,060 | | | 14,939,190 |
| | | | | | |
|
| Pharmaceuticals — 4.3% |
Bristol-Myers Squibb Co. | | | 463,648 | | | 19,051,296 |
Eli Lilly & Co. | | | 72,489 | | | 59,465,626 |
Merck & Co., Inc. | | | 257,655 | | | 32,346,009 |
Pfizer, Inc. | | | 429,957 | | | 12,322,568 |
| | | | | | |
| | |
| | | | | | 123,185,499 |
|
| Residential REITs — 0.6% |
Camden Property Trust | | | 156,074 | | | 16,020,996 |
| | | | | | |
|
| Semiconductors & Semiconductor Equipment — 10.9% |
Applied Materials, Inc. | | | 75,302 | | | 16,195,954 |
Broadcom, Inc. | | | 14,096 | | | 18,727,241 |
Intel Corp. | | | 247,769 | | | 7,643,674 |
Lam Research Corp. | | | 35,756 | | | 33,340,325 |
Micron Technology, Inc. | | | 173,228 | | | 21,653,500 |
Monolithic Power Systems, Inc. | | | 18,788 | | | 13,821,016 |
NVIDIA Corp. | | | 141,125 | | | 154,719,571 |
QUALCOMM, Inc. | | | 213,224 | | | 43,508,357 |
| | | | | | |
| | |
| | | | | | 309,609,638 |
|
| Software — 11.7% |
Adobe, Inc.(a)(b) | | | 56,041 | | | 24,924,795 |
Atlassian Corp., Class A(a) | | | 37,856 | | | 5,938,092 |
Crowdstrike Holdings, Inc., Class A(a) | | | 34,089 | | | 10,692,697 |
Fortinet, Inc.(a) | | | 261,377 | | | 15,504,884 |
InterDigital, Inc. | | | 6 | | | 683 |
Manhattan Associates, Inc.(a) | | | 126,741 | | | 27,824,719 |
Microsoft Corp. | | | 518,474 | | | 215,234,111 |
ServiceNow, Inc.(a) | | | 35,230 | | | 23,143,644 |
Synopsys, Inc.(a) | | | 18,516 | | | 10,383,773 |
| | | | | | |
| | |
| | | | | | 333,647,398 |
| | | | | | | | |
Security | | Shares | | | Value | |
| | |
| Specialized REITs — 0.7% | | | | | | |
Equinix, Inc. | | | 25,132 | | | $ | 19,175,213 | |
| | | | | | | | |
|
| Specialty Retail — 2.5% | |
AutoNation, Inc.(a) | | | 55,724 | | | | 9,487,011 | |
Home Depot, Inc. (The) | | | 163,464 | | | | 54,739,190 | |
Penske Automotive Group, Inc. | | | 48,505 | | | | 7,377,610 | |
| | | | | | | | |
| | |
| | | | | | | 71,603,811 | |
|
| Technology Hardware, Storage & Peripherals — 7.0% | |
Apple Inc. | | | 964,148 | | | | 185,357,453 | |
HP, Inc. | | | 361,356 | | | | 13,189,494 | |
| | | | | | | | |
| | |
| | | | | | | 198,546,947 | |
|
| Textiles, Apparel & Luxury Goods — 1.1% | |
NIKE, Inc., Class B | | | 324,758 | | | | 30,868,248 | |
| | | | | | | | |
|
| Trading Companies & Distributors — 1.3% | |
Watsco, Inc. | | | 59,194 | | | | 28,111,230 | |
WESCO International, Inc. | | | 54,624 | | | | 9,804,462 | |
| | | | | | | | |
| | |
| | | | | | | 37,915,692 | |
| | | | | | | | |
| |
Total Long-Term Investments — 99.0%
(Cost: $1,895,491,802) | | | | 2,818,276,885 | |
| | | | | | | | |
|
Short-Term Securities | |
| |
| Money Market Funds — 1.2% | | | | |
BlackRock Cash Funds: Institutional, SL Agency Shares, 5.49%(c)(d)(e) | | | 7,652,537 | | | | 7,654,832 | |
BlackRock Liquidity Funds, T-Fund, Institutional Shares, 5.19%(c)(d) | | | 25,852,986 | | | | 25,852,986 | |
| | | | | | | | |
| |
Total Short-Term Securities — 1.2%
(Cost: $33,507,998) | | | | 33,507,818 | |
| | | | | | | | |
| |
Total Investments — 100.2%
(Cost: $1,928,999,800) | | | | 2,851,784,703 | |
| |
Liabilities in Excess of Other Assets — (0.2)% | | | | (4,561,708 | ) |
| | | | | | | | |
| |
Net Assets — 100.0% | | | $ | 2,847,222,995 | |
| | | | | | | | |
| (a) | Non-income producing security. |
| (b) | All or a portion of this security is on loan. |
| (c) | Affiliate of the Fund. |
| (d) | Annualized 7-day yield as of period end. |
| (e) | All or a portion of this security was purchased with the cash collateral from loaned securities. |
| | |
| 26 | | 2 0 2 4 B L A C K R O C K A N N U A L F I N A N C I A L S T A T E M E N T S |
| | |
Schedule of Investments (continued) May 31, 2024 | | BlackRock Advantage Large Cap Core Fund |
Affiliates
Investments in issuers considered to be affiliate(s) of the Fund during the year ended May 31, 2024 for purposes of Section 2(a)(3) of the Investment Company Act of 1940, as amended, were as follows:
| | | | | | | | | | | | | | | | | | | | | | | | | | | | | | | | | | | | |
| Affiliated Issuer | | Value at 05/31/23 | | | Purchases at Cost | | | Proceeds from Sales | | | Net
Realized
Gain (Loss) | | | Change in
Unrealized
Appreciation
(Depreciation) | | | Value at
05/31/24 | | | Shares Held at 05/31/24 | | | Income | | | Capital
Gain
Distributions
from Underlying
Funds | |
BlackRock Cash Funds: Institutional, SL Agency Shares | | $ | — | | | $ | 7,657,391 | (a) | | $ | — | | | $ | (2,379 | ) | | $ | (180 | ) | | $ | 7,654,832 | | | | 7,652,537 | | | $ | 1,552 | (b) | | $ | — | |
BlackRock Liquidity Funds, T-Fund, Institutional Shares | | | 25,513,614 | | | | 339,372 | (a) | | | — | | | | — | | | | — | | | | 25,852,986 | | | | 25,852,986 | | | | 1,397,345 | | | | — | |
SL Liquidity Series, LLC, Money Market Series(c) | | | 1,007,234 | | | | — | | | | (1,007,663 | )(a) | | | 1,153 | | | | (724 | ) | | | — | | | | — | | | | 342,188 | (b) | | | — | |
| | | | | | | | | | | | | | | | | | | | | | | | | | | | | | | | | | | | |
| | | | | | | | | | | | | | $ | (1,226 | ) | | $ | (904 | ) | | $ | 33,507,818 | | | | | | | $ | 1,741,085 | | | $ | — | |
| | | | | | | | | | | | | | | | | | | | | | | | | | | | | | | | | | | | |
| | (a) | Represents net amount purchased (sold). | |
| | (b) | All or a portion represents securities lending income earned from the reinvestment of cash collateral from loaned securities, net of fees and collateral investment expenses, and other payments to and from borrowers of securities. | |
| | (c) | As of period end, the entity is no longer held. | |
For purposes of this report, industry and sector sub-classifications may differ from those utilized by the Fund for compliance purposes.
Derivative Financial Instruments Outstanding as of Period End
Futures Contracts
| | | | | | | | | | | | | | | | |
| Description | | Number of
Contracts | | | Expiration
Date | | | Notional
Amount
(000) | | | Value/
Unrealized
Appreciation
(Depreciation) | |
Long Contracts | | | | | | | | | | | | | | | | |
S&P 500 E-Mini Index | | | 119 | | | | 06/21/24 | | | $ | 31,508 | | | $ | 801,158 | |
| | | | | | | | | | | | | | | | |
Derivative Financial Instruments Categorized by Risk Exposure
As of period end, the fair values of derivative financial instruments located in the Statements of Assets and Liabilities were as follows:
| | | | | | | | | | | | | | | | | | | | | | | | | | | | |
| | | Commodity
Contracts | | | Credit
Contracts | | | Equity
Contracts | | | Foreign
Currency
Exchange
Contracts | | | Interest
Rate
Contracts | | | Other
Contracts | | | Total | |
Assets — Derivative Financial Instruments | | | | | | | | | | | | | | | | | | | | | | | | | | | | |
Futures contracts | | | | | | | | | | | | | | | | | | | | | | | | | | | | |
Unrealized appreciation on futures contracts(a) | | $ | — | | | $ | — | | | $ | 801,158 | | | $ | — | | | $ | — | | | $ | — | | | $ | 801,158 | |
| | | | | | | | | | | | | | | | | | | | | | | | | | | | |
| | (a) | Net cumulative unrealized appreciation (depreciation) on futures contracts and centrally cleared swaps, if any, are reported in the Schedule of Investments. In the Statements of Assets and Liabilities, only current day’s variation margin is reported in receivables or payables and the net cumulative unrealized appreciation (depreciation) is included in accumulated earnings (loss). | |
| | |
S C H E D U L E S O F I N V E S T M E N T S | | 27 |
| | |
Schedule of Investments (continued) May 31, 2024 | | BlackRock Advantage Large Cap Core Fund |
For the period ended May 31, 2024, the effect of derivative financial instruments in the Statements of Operations was as follows:
| | | | | | | | | | | | | | | | | | | | | | | | | | | | |
| | | Commodity
Contracts | | | Credit
Contracts | | | Equity
Contracts | | | Foreign
Currency
Exchange
Contracts | | | Interest
Rate
Contracts | | | Other
Contracts | | | Total | |
Net Realized Gain (Loss) from: | | | | | | | | | | | | | | | | | | | | | | | | | | | | |
Futures contracts | | $ | — | | | $ | — | | | $ | 7,485,098 | | | $ | — | | | $ | — | | | $ | — | | | $ | 7,485,098 | |
| | | | | | | | | | | | | | | | | | | | | | | | | | | | |
| | | | | | |
| Net Change in Unrealized Appreciation (Depreciation) on: | | | | | | | | | | | | | | | | | | | |
Futures contracts | | $ | — | | | $ | — | | | $ | (1,327,305 | ) | | $ | — | | | $ | — | | | $ | — | | | $ | (1,327,305 | ) |
| | | | | | | | | | | | | | | | | | | | | | | | | | | | |
Average Quarterly Balances of Outstanding Derivative Financial Instruments
| | | | |
Futures contracts | | | | |
Average notional value of contracts — long | | $ | 34,317,944 | |
For more information about the Fund’s investment risks regarding derivative financial instruments, refer to the Notes to Financial Statements.
Fair Value Hierarchy as of Period End
Various inputs are used in determining the fair value of financial instruments. For a description of the input levels and information about the Fund’s policy regarding valuation of financial instruments, refer to the Notes to Financial Statements.
The following table summarizes the Fund’s financial instruments categorized in the fair value hierarchy. The breakdown of the Fund’s financial instruments into major categories is disclosed in the Schedule of Investments above.
| | | | | | | | | | | | | | | | |
| | | Level 1 | | | Level 2 | | | Level 3 | | | Total | |
Assets | | | | | | | | | | | | | | | | |
Investments | | | | | | | | | | | | | | | | |
Long-Term Investments | | | | | | | | | | | | | | | | |
Common Stocks | | $ | 2,818,276,885 | | | $ | — | | | $ | — | | | $ | 2,818,276,885 | |
Short-Term Securities | | | | | | | | | | | | | | | | |
Money Market Funds | | | 33,507,818 | | | | — | | | | — | | | | 33,507,818 | |
| | | | | | | | | | | | | | | | |
| | $ | 2,851,784,703 | | | $ | — | | | $ | — | | | $ | 2,851,784,703 | |
| | | | | | | | | | | | | | | | |
Derivative Financial Instruments(a) | | | | | | | | | | | | | | | | |
Assets | | | | | | | | | | | | | | | | |
Equity Contracts | | $ | 801,158 | | | $ | — | | | $ | — | | | $ | 801,158 | |
| | | | | | | | | | | | | | | | |
| | (a) | Derivative financial instruments are futures contracts. Futures contracts are valued at the unrealized appreciation (depreciation) on the instrument. | |
See notes to financial statements.
| | |
| 28 | | 2 0 2 4 B L A C K R O C K A N N U A L F I N A N C I A L S T A T E M E N T S |
| | |
Schedule of Investments May 31, 2024 | | BlackRock Advantage Large Cap Value Fund (Percentages shown are based on Net Assets) |
| | | | | | |
Security | | Shares | | | Value |
| | |
Common Stocks | | | | | | |
| | |
| Aerospace & Defense — 2.4% | | | | | |
HEICO Corp., Class A | | | 10,535 | | | $ 1,850,578 |
Hexcel Corp. | | | 1,012 | | | 69,696 |
Loar Holdings, Inc.(a) | | | 481 | | | 27,403 |
Lockheed Martin Corp. | | | 16,106 | | | 7,575,296 |
Northrop Grumman Corp. | | | 4,802 | | | 2,164,598 |
Textron, Inc. | | | 35,533 | | | 3,113,046 |
| | | | | | |
| | |
| | | | | | 14,800,617 |
|
| Air Freight & Logistics — 1.1% |
Expeditors International of Washington, Inc. | | | 56,003 | | | 6,770,763 |
| | | | | | |
|
| Automobiles — 1.1% |
Ford Motor Co. | | | 213,503 | | | 2,589,791 |
General Motors Co. | | | 89,635 | | | 4,032,679 |
| | | | | | |
| | |
| | | | | | 6,622,470 |
|
| Banks — 5.5% |
Bank of America Corp. | | | 8,747 | | | 349,792 |
Citigroup, Inc. | | | 65,773 | | | 4,098,316 |
Citizens Financial Group, Inc. | | | 127,431 | | | 4,497,040 |
JPMorgan Chase & Co. | | | 81,158 | | | 16,445,046 |
KeyCorp | | | 546,981 | | | 7,860,117 |
Valley National Bancorp | | | 168,042 | | | 1,198,139 |
| | | | | | |
| | |
| | | | | | 34,448,450 |
|
| Beverages — 1.4% |
Coca-Cola Co. (The) | | | 54,327 | | | 3,418,798 |
Monster Beverage Corp.(a) | | | 59,983 | | | 3,114,317 |
PepsiCo, Inc. | | | 13,381 | | | 2,313,575 |
| | | | | | |
| | |
| | | | | | 8,846,690 |
|
| Biotechnology — 3.4% |
Amgen, Inc. | | | 904 | | | 276,488 |
Biogen, Inc.(a) | | | 5,933 | | | 1,334,569 |
Exelixis, Inc.(a) | | | 52,462 | | | 1,137,901 |
Gilead Sciences, Inc. | | | 150,655 | | | 9,682,597 |
Incyte Corp.(a) | | | 56,157 | | | 3,245,313 |
Neurocrine Biosciences, Inc.(a) | | | 9,909 | | | 1,341,778 |
Regeneron Pharmaceuticals, Inc.(a) | | | 1,083 | | | 1,061,513 |
United Therapeutics Corp.(a) | | | 10,019 | | | 2,756,527 |
| | | | | | |
| | |
| | | | | | 20,836,686 |
|
| Broadline Retail — 1.2% |
Amazon.com, Inc.(a) | | | 41,761 | | | 7,368,311 |
| | | | | | |
|
| Building Products — 0.6% |
A. O. Smith Corp. | | | 8,744 | | | 731,348 |
Advanced Drainage Systems, Inc. | | | 4,766 | | | 826,853 |
Builders FirstSource, Inc.(a) | | | 11,935 | | | 1,919,029 |
UFP Industries, Inc. | | | 2,042 | | | 243,978 |
| | | | | | |
| | |
| | | | | | 3,721,208 |
|
| Capital Markets — 4.5% |
Cboe Global Markets, Inc. | | | 1,220 | | | 211,048 |
Coinbase Global, Inc., Class A(a) | | | 341 | | | 77,039 |
Franklin Resources, Inc. | | | 33,441 | | | 789,208 |
Invesco Ltd. | | | 485,239 | | | 7,623,105 |
Jefferies Financial Group, Inc. | | | 12,461 | | | 579,686 |
LPL Financial Holdings, Inc. | | | 950 | | | 271,899 |
Morgan Stanley | | | 3,003 | | | 293,814 |
MSCI, Inc., Class A | | | 3,364 | | | 1,665,785 |
Nasdaq, Inc. | | | 131,842 | | | 7,782,633 |
S&P Global, Inc. | | | 17,406 | | | 7,441,239 |
| | | | | | |
Security | | Shares | | | Value |
| | |
| Capital Markets (continued) | | | | | |
State Street Corp. | | | 4,987 | | | $ 376,967 |
T Rowe Price Group, Inc. | | | 9,787 | | | 1,153,202 |
| | | | | | |
| | |
| | | | | | 28,265,625 |
|
| Chemicals — 2.3% |
Corteva, Inc. | | | 4,281 | | | 239,479 |
Huntsman Corp. | | | 9,038 | | | 224,142 |
LyondellBasell Industries NV, Class A | | | 73,216 | | | 7,279,135 |
Mosaic Co. (The) | | | 83,933 | | | 2,596,048 |
PPG Industries, Inc. | | | 26,463 | | | 3,477,503 |
Sherwin-Williams Co. (The) | | | 2,120 | | | 644,056 |
| | | | | | |
| | |
| | | | | | 14,460,363 |
|
| Commercial Services & Supplies — 1.7% |
Cintas Corp. | | | 6,460 | | | 4,379,686 |
Waste Connections, Inc. | | | 8,449 | | | 1,388,340 |
Waste Management, Inc. | | | 23,600 | | | 4,973,228 |
| | | | | | |
| | |
| | | | | | 10,741,254 |
|
| Communications Equipment — 0.2% |
Ciena Corp.(a) | | | 2,395 | | | 115,367 |
Juniper Networks, Inc. | | | 15,364 | | | 548,034 |
Motorola Solutions, Inc. | | | 937 | | | 341,921 |
| | | | | | |
| | |
| | | | | | 1,005,322 |
|
| Construction & Engineering — 1.1% |
AECOM | | | 48,243 | | | 4,213,544 |
EMCOR Group, Inc. | | | 2,202 | | | 855,829 |
Quanta Services, Inc. | | | 5,480 | | | 1,512,151 |
| | | | | | |
| | |
| | | | | | 6,581,524 |
|
| Consumer Finance — 0.4% |
OneMain Holdings, Inc. | | | 46,354 | | | 2,276,908 |
| | | | | | |
|
| Consumer Staples Distribution & Retail — 2.1% |
Costco Wholesale Corp. | | | 4,654 | | | 3,769,228 |
Kroger Co. (The) | | | 62,238 | | | 3,259,404 |
Walmart, Inc. | | | 87,440 | | | 5,750,055 |
| | | | | | |
| | |
| | | | | | 12,778,687 |
|
| Containers & Packaging — 0.0% |
Packaging Corp. of America | | | 729 | | | 133,764 |
| | | | | | |
|
| Diversified Telecommunication Services — 0.8% |
AT&T Inc. | | | 258,819 | | | 4,715,682 |
Liberty Global Ltd., Class A(a) | | | 14,328 | | | 238,848 |
| | | | | | |
| | |
| | | | | | 4,954,530 |
|
| Electric Utilities — 3.0% |
Exelon Corp. | | | 162,290 | | | 6,093,989 |
IDACORP, Inc. | | | 6,966 | | | 665,044 |
OGE Energy Corp. | | | 188,846 | | | 6,855,110 |
Portland General Electric Co. | | | 23,828 | | | 1,061,776 |
PPL Corp. | | | 126,296 | | | 3,704,262 |
| | | | | | |
| | |
| | | | | | 18,380,181 |
|
| Electrical Equipment — 1.1% |
AMETEK, Inc. | | | 25,664 | | | 4,352,101 |
Eaton Corp. PLC | | | 7,382 | | | 2,457,099 |
| | | | | | |
| | |
| | | | | | 6,809,200 |
|
| Electronic Equipment, Instruments & Components — 1.4% |
Avnet, Inc. | | | 23,058 | | | 1,258,967 |
TE Connectivity Ltd. | | | 49,096 | | | 7,349,671 |
| | | | | | |
| | |
| | | | | | 8,608,638 |
| | |
S C H E D U L E S O F I N V E S T M E N T S | | 29 |
| | |
Schedule of Investments (continued) May 31, 2024 | | BlackRock Advantage Large Cap Value Fund (Percentages shown are based on Net Assets) |
| | | | | | |
Security | | Shares | | | Value |
|
| Energy Equipment & Services — 0.9% |
Baker Hughes Co., Class A | | | 73,654 | | | $ 2,465,936 |
Schlumberger NV | | | 73,665 | | | 3,380,487 |
| | | | | | |
| | |
| | | | | | 5,846,423 |
|
| Entertainment — 0.3% |
Electronic Arts, Inc. | | | 13,552 | | | 1,800,790 |
Spotify Technology SA(a) | | | 1,242 | | | 368,601 |
| | | | | | |
| | |
| | | | | | 2,169,391 |
|
| Financial Services — 5.6% |
Berkshire Hathaway, Inc., Class B(a) | | | 45,775 | | | 18,969,160 |
Euronet Worldwide, Inc.(a)(b) | | | 9,083 | | | 1,058,896 |
Mastercard, Inc., Class A | | | 16,386 | | | 7,325,689 |
Visa, Inc., Class A | | | 27,097 | | | 7,382,849 |
| | | | | | |
| | |
| | | | | | 34,736,594 |
|
| Food Products — 0.6% |
Archer-Daniels-Midland Co. | | | 3,380 | | | 211,047 |
Bunge Global SA | | | 4,793 | | | 515,679 |
Hershey Co. (The) | | | 8,098 | | | 1,602,027 |
Mondelez International, Inc., Class A | | | 10,683 | | | 732,106 |
Tyson Foods, Inc., Class A | | | 10,439 | | | 597,633 |
| | | | | | |
| | |
| | | | | | 3,658,492 |
|
| Gas Utilities — 0.0% |
Atmos Energy Corp. | | | 535 | | | 62,017 |
| | | | | | |
|
| Ground Transportation — 0.5% |
Old Dominion Freight Line, Inc. | | | 18,156 | | | 3,181,839 |
| | | | | | |
|
| Health Care Equipment & Supplies — 3.0% |
Dexcom, Inc.(a) | | | 5,096 | | | 605,252 |
Medtronic PLC | | | 128,914 | | | 10,489,732 |
Stryker Corp. | | | 21,730 | | | 7,411,886 |
| | | | | | |
| | |
| | | | | | 18,506,870 |
|
| Health Care Providers & Services — 3.9% |
Cardinal Health, Inc. | | | 36,251 | | | 3,598,637 |
Centene Corp.(a) | | | 29,234 | | | 2,092,862 |
Cigna Group (The) | | | 3,142 | | | 1,082,796 |
CVS Health Corp. | | | 38,099 | | | 2,270,701 |
Elevance Health, Inc. | | | 13,117 | | | 7,063,242 |
HCA Healthcare, Inc. | | | 2,259 | | | 767,495 |
Labcorp Holdings, Inc. | | | 28,908 | | | 5,634,458 |
Quest Diagnostics, Inc. | | | 10,413 | | | 1,478,334 |
| | | | | | |
| | |
| | | | | | 23,988,525 |
|
| Health Care Technology — 0.2% |
Teladoc Health, Inc.(a) | | | 101,691 | | | 1,143,007 |
| | | | | | |
|
| Hotels, Restaurants & Leisure — 1.0% |
Boyd Gaming Corp. | | | 11,776 | | | 627,896 |
Carnival Corp.(a) | | | 230,369 | | | 3,473,965 |
McDonald’s Corp. | | | 3,551 | | | 919,318 |
MGM Resorts International(a) | | | 30,504 | | | 1,225,346 |
| | | | | | |
| | |
| | | | | | 6,246,525 |
|
| Household Durables — 1.8% |
DR Horton, Inc. | | | 36,495 | | | 5,393,961 |
Leggett & Platt, Inc. | | | 52,526 | | | 609,302 |
Toll Brothers, Inc. | | | 41,277 | | | 5,020,934 |
| | | | | | |
| | |
| | | | | | 11,024,197 |
|
| Household Products — 2.3% |
Colgate-Palmolive Co. | | | 30,705 | | | 2,854,337 |
Kimberly-Clark Corp. | | | 56,457 | | | 7,525,718 |
Procter & Gamble Co. (The) | | | 23,559 | | | 3,876,398 |
| | | | | | |
| | |
| | | | | | 14,256,453 |
| | | | | | |
Security | | Shares | | | Value |
|
| Independent Power and Renewable Electricity Producers — 0.5% |
AES Corp. (The) | | | 157,421 | | | $ 3,398,719 |
| | | | | | |
|
| Industrial Conglomerates — 0.2% |
Honeywell International, Inc. | | | 7,291 | | | 1,474,167 |
| | | | | | |
|
| Industrial REITs — 0.5% |
First Industrial Realty Trust, Inc. | | | 17,477 | | | 823,516 |
Prologis, Inc. | | | 19,331 | | | 2,135,882 |
| | | | | | |
| | |
| | | | | | 2,959,398 |
|
| Insurance — 5.1% |
Globe Life, Inc. | | | 2,509 | | | 207,645 |
Marsh & McLennan Cos., Inc. | | | 35,408 | | | 7,349,993 |
MetLife, Inc. | | | 27,722 | | | 2,006,241 |
Progressive Corp. (The) | | | 40,378 | | | 8,527,026 |
Reinsurance Group of America, Inc. | | | 33,708 | | | 7,071,938 |
Travelers Cos., Inc. (The) | | | 20,510 | | | 4,424,007 |
Unum Group | | | 40,384 | | | 2,175,082 |
| | | | | | |
| | |
| | | | | | 31,761,932 |
|
| Interactive Media & Services — 1.4% |
Alphabet, Inc., Class A(a) | | | 42,221 | | | 7,283,123 |
Pinterest, Inc., Class A(a) | | | 18,743 | | | 777,647 |
Snap, Inc., Class A, NVS(a) | | | 23,716 | | | 356,214 |
| | | | | | |
| | |
| | | | | | 8,416,984 |
|
| IT Services — 0.1% |
Amdocs Ltd. | | | 7,701 | | | 608,379 |
| | | | | | |
|
| Life Sciences Tools & Services — 0.1% |
Thermo Fisher Scientific, Inc. | | | 703 | | | 399,290 |
| | | | | | |
|
| Machinery — 4.8% |
AGCO Corp. | | | 1,399 | | | 150,155 |
CNH Industrial NV | | | 314,125 | | | 3,317,160 |
Cummins, Inc. | | | 6,678 | | | 1,881,393 |
Flowserve Corp. | | | 39,362 | | | 1,956,291 |
Illinois Tool Works, Inc. | | | 17,055 | | | 4,140,101 |
Oshkosh Corp. | | | 60,819 | | | 6,916,945 |
Otis Worldwide Corp. | | | 6,986 | | | 693,011 |
Parker-Hannifin Corp. | | | 9,934 | | | 5,280,120 |
Snap-on, Inc. | | | 9,698 | | | 2,646,196 |
Xylem, Inc. | | | 21,710 | | | 3,061,544 |
| | | | | | |
| | |
| | | | | | 30,042,916 |
|
| Media — 2.9% |
Comcast Corp., Class A | | | 304,365 | | | 12,183,731 |
Fox Corp., Class A, NVS | | | 163,794 | | | 5,639,427 |
Fox Corp., Class B | | | 4,397 | | | 140,440 |
Ibotta, Inc., Class A(a)(b) | | | 856 | | | 83,143 |
Liberty Media Corp. - Liberty SiriusXM, Class A(a) | | | 2,157 | | | 49,029 |
| | | | | | |
| | |
| | | | | | 18,095,770 |
|
| Metals & Mining — 0.9% |
Nucor Corp. | | | 31,219 | | | 5,271,328 |
SSR Mining, Inc. | | | 34,772 | | | 185,683 |
| | | | | | |
| | |
| | | | | | 5,457,011 |
|
| Multi-Utilities — 1.2% |
CMS Energy Corp. | | | 105,590 | | | 6,644,778 |
DTE Energy Co. | | | 5,807 | | | 676,690 |
Sempra | | | 5,430 | | | 418,273 |
| | | | | | |
| | |
| | | | | | 7,739,741 |
|
| Oil, Gas & Consumable Fuels — 6.2% |
Chevron Corp. | | | 49,350 | | | 8,009,505 |
ConocoPhillips | | | 50,985 | | | 5,938,733 |
Devon Energy Corp. | | | 92,636 | | | 4,546,575 |
EOG Resources, Inc. | | | 25,605 | | | 3,189,102 |
| | |
| 30 | | 2 0 2 4 B L A C K R O C K A N N U A L F I N A N C I A L S T A T E M E N T S |
| | |
Schedule of Investments (continued) May 31, 2024 | | BlackRock Advantage Large Cap Value Fund (Percentages shown are based on Net Assets) |
| | | | | | |
Security | | Shares | | | Value |
|
| Oil, Gas & Consumable Fuels (continued) |
Exxon Mobil Corp. | | | 88,353 | | | $ 10,360,273 |
Marathon Petroleum Corp. | | | 31,300 | | | 5,527,893 |
Valero Energy Corp. | | | 6,779 | | | 1,065,252 |
| | | | | | |
| | |
| | | | | | 38,637,333 |
|
| Paper & Forest Products — 0.2% |
Louisiana-Pacific Corp. | | | 14,928 | | | 1,368,599 |
| | | | | | |
|
| Passenger Airlines — 0.2% |
United Airlines Holdings, Inc.(a) | | | 26,405 | | | 1,399,201 |
| | | | | | |
|
| Pharmaceuticals — 4.8% |
Alto Neuroscience, Inc.(a) | | | 85 | | | 1,017 |
Bristol-Myers Squibb Co. | | | 133,599 | | | 5,489,583 |
Eli Lilly & Co. | | | 3,729 | | | 3,059,048 |
Johnson & Johnson | | | 36,768 | | | 5,392,763 |
Merck & Co., Inc. | | | 59,864 | | | 7,515,326 |
Pfizer, Inc. | | | 287,305 | | | 8,234,161 |
| | | | | | |
| | |
| | | | | | 29,691,898 |
|
| Real Estate Management & Development — 0.0% |
Zillow Group, Inc., Class A(a) | | | 1,554 | | | 62,393 |
| | | | | | |
|
| Residential REITs — 1.7% |
Apartment Income REIT Corp. | | | 4,206 | | | 162,983 |
Camden Property Trust | | | 69,187 | | | 7,102,046 |
Equity LifeStyle Properties, Inc. | | | 11,242 | | | 705,660 |
Equity Residential | | | 39,640 | | | 2,577,789 |
| | | | | | |
| | |
| | | | | | 10,548,478 |
|
| Retail REITs — 0.5% |
Kimco Realty Corp. | | | 149,708 | | | 2,898,347 |
| | | | | | |
|
| Semiconductors & Semiconductor Equipment — 4.8% |
Applied Materials, Inc. | | | 8,204 | | | 1,764,516 |
Astera Labs, Inc.(a)(b) | | | 4,856 | | | 313,406 |
Cirrus Logic, Inc.(a) | | | 6,322 | | | 725,134 |
Intel Corp. | | | 140,579 | | | 4,336,862 |
Lam Research Corp. | | | 5,941 | | | 5,539,626 |
Micron Technology, Inc. | | | 57,634 | | | 7,204,250 |
Monolithic Power Systems, Inc. | | | 1,493 | | | 1,098,296 |
NVIDIA Corp. | | | 309 | | | 338,766 |
QUALCOMM, Inc. | | | 40,801 | | | 8,325,444 |
| | | | | | |
| | |
| | | | | | 29,646,300 |
|
| Software — 2.7% |
Adobe, Inc.(a)(b) | | | 4,841 | | | 2,153,083 |
Atlassian Corp., Class A(a) | | | 3,329 | | | 522,187 |
Crowdstrike Holdings, Inc., Class A(a) | | | 3,423 | | | 1,073,693 |
Fortinet, Inc.(a) | | | 11,469 | | | 680,341 |
Manhattan Associates, Inc.(a) | | | 21,617 | | | 4,745,796 |
Microsoft Corp. | | | 17,017 | | | 7,064,267 |
Nutanix, Inc., Class A(a) | | | 2,149 | | | 118,872 |
Rubrik, Inc., Class A(a) | | | 6,664 | | | 203,119 |
Salesforce, Inc. | | | 362 | | | 84,867 |
ServiceNow, Inc.(a) | | | 329 | | | 216,130 |
| | | | | | |
| | |
| | | | | | 16,862,355 |
| | | | | | | | |
Security | | Shares | | | Value | |
|
| Specialized REITs — 0.7% | |
Equinix, Inc. | | | 4,946 | | | $ | 3,773,699 | |
Lamar Advertising Co., Class A | | | 3,831 | | | | 452,479 | |
Weyerhaeuser Co. | | | 5,192 | | | | 155,916 | |
| | | | | | | | |
| | |
| | | | | | | 4,382,094 | |
|
| Specialty Retail — 0.8% | |
Home Depot, Inc. (The) | | | 9,831 | | | | 3,292,107 | |
Penske Automotive Group, Inc. | | | 10,181 | | | | 1,548,530 | |
Ulta Beauty, Inc.(a) | | | 354 | | | | 139,862 | |
| | | | | | | | |
| | |
| | | | | | | 4,980,499 | |
|
| Technology Hardware, Storage & Peripherals — 1.4% | |
Apple Inc. | | | 28,301 | | | | 5,440,867 | |
Hewlett Packard Enterprise Co. | | | 117,276 | | | | 2,069,921 | |
HP, Inc. | | | 33,381 | | | | 1,218,407 | |
| | | | | | | | |
| | |
| | | | | | | 8,729,195 | |
|
| Textiles, Apparel & Luxury Goods — 0.3% | |
NIKE, Inc., Class B | | | 21,846 | | | | 2,076,462 | |
Under Armour, Inc., Class C, NVS(a) | | | 5,427 | | | | 37,772 | |
| | | | | | | | |
| | |
| | | | | | | 2,114,234 | |
|
| Trading Companies & Distributors — 1.6% | |
Watsco, Inc. | | | 9,937 | | | | 4,719,081 | |
WESCO International, Inc. | | | 22,585 | | | | 4,053,782 | |
WW Grainger, Inc. | | | 1,463 | | | | 1,348,096 | |
| | | | | | | | |
| | |
| | | | | | | 10,120,959 | |
| | | | | | | | |
| |
Total Long-Term Investments — 99.0%
(Cost: $530,753,515) | | | | 615,027,716 | |
| | | | | | | | |
|
Short-Term Securities | |
|
| Money Market Funds — 1.4% | |
BlackRock Cash Funds: Institutional, SL Agency Shares, 5.49%(c)(d)(e) | | | 3,323,256 | | | | 3,324,253 | |
BlackRock Liquidity Funds, T-Fund, Institutional Shares, 5.19%(c)(d) | | | 5,735,335 | | | | 5,735,335 | |
| | | | | | | | |
| |
Total Short-Term Securities — 1.4%
(Cost: $9,059,588) | | | | 9,059,588 | |
| | | | | | | | |
| |
Total Investments — 100.4%
(Cost: $539,813,103) | | | | 624,087,304 | |
| |
Liabilities in Excess of Other Assets — (0.4)% | | | | (2,586,009 | ) |
| | | | | | | | |
| |
Net Assets — 100.0% | | | $ | 621,501,295 | |
| | | | | | | | |
| (a) | Non-income producing security. |
| (b) | All or a portion of this security is on loan. |
| (c) | Affiliate of the Fund. |
| (d) | Annualized 7-day yield as of period end. |
| (e) | All or a portion of this security was purchased with the cash collateral from loaned securities. |
| | |
S C H E D U L E S O F I N V E S T M E N T S | | 31 |
| | |
Schedule of Investments (continued) May 31, 2024 | | BlackRock Advantage Large Cap Value Fund |
Affiliates
Investments in issuers considered to be affiliate(s) of the Fund during the year ended May 31, 2024 for purposes of Section 2(a)(3) of the Investment Company Act of 1940, as amended, were as follows:
| | | | | | | | | | | | | | | | | | | | | | | | | | | | | | | | | | | | |
| Affiliated Issuer | | Value at
05/31/23 | | | Purchases
at Cost | | | Proceeds
from Sales | | | Net
Realized
Gain (Loss) | | | Change in
Unrealized
Appreciation
(Depreciation) | | | Value at
05/31/24 | | | Shares
Held at
05/31/24 | | | Income | | | Capital Gain
Distributions
from Underlying
Funds | |
BlackRock Cash Funds: Institutional, SL Agency Shares | | $ | — | | | $ | 3,324,488 | (a) | | $ | — | | | $ | (235 | ) | | $ | — | | | $ | 3,324,253 | | | | 3,323,256 | | | $ | 1,498 | (b) | | $ | — | |
BlackRock Liquidity Funds, T-Fund, Institutional Shares | | | 4,925,122 | | | | 810,213 | (a) | | | — | | | | — | | | | — | | | | 5,735,335 | | | | 5,735,335 | | | | 274,897 | | | | — | |
SL Liquidity Series, LLC, Money Market Series(c) | | | 973,342 | | | | — | | | | (973,512 | )(a) | | | 864 | | | | (694 | ) | | | — | | | | — | | | | 5,817 | (b) | | | — | |
| | | | | | | | | | | | | | | | | | | | | | | | | | | | | | | | | | | | |
| | | | | | | | | | | | | | $ | 629 | | | $ | (694 | ) | | $ | 9,059,588 | | | | | | | $ | 282,212 | | | $ | — | |
| | | | | | | | | | | | | | | | | | | | | | | | | | | | | | | | | | | | |
| | (a) | Represents net amount purchased (sold). | |
| | (b) | All or a portion represents securities lending income earned from the reinvestment of cash collateral from loaned securities, net of fees and collateral investment expenses, and other payments to and from borrowers of securities. | |
| | (c) | As of period end, the entity is no longer held. | |
For purposes of this report, industry and sector sub-classifications may differ from those utilized by the Fund for compliance purposes.
Derivative Financial Instruments Outstanding as of Period End
Futures Contracts
| | | | | | | | | | | | | | | | |
| Description | | Number of
Contracts | | | Expiration
Date | | | Notional
Amount
(000) | | | Value/
Unrealized
Appreciation
(Depreciation) | |
Long Contracts | | | | | | | | | | | | | | | | |
S&P 500 E-Mini Index | | | 27 | | | | 06/21/24 | | | $ | 7,149 | | | $ | 183,245 | |
| | | | | | | | | | | | | | | | |
Derivative Financial Instruments Categorized by Risk Exposure
As of period end, the fair values of derivative financial instruments located in the Statements of Assets and Liabilities were as follows:
| | | | | | | | | | | | | | | | | | | | | | | | | | | | |
| | | Commodity
Contracts | | | Credit
Contracts | | | Equity
Contracts | | | Foreign
Currency
Exchange
Contracts | | | Interest
Rate
Contracts | | | Other
Contracts | | | Total | |
Assets — Derivative Financial Instruments | | | | | | | | | | | | | | | | | |
Futures contracts | | | | | | | | | | | | | | | | | | | | | | | | | | | | |
Unrealized appreciation on futures contracts(a) | | $ | — | | | $ | — | | | $ | 183,245 | | | $ | — | | | $ | — | | | $ | — | | | $ | 183,245 | |
| | | | | | | | | | | | | | | | | | | | | | | | | | | | |
| | (a) | Net cumulative unrealized appreciation (depreciation) on futures contracts and centrally cleared swaps, if any, are reported in the Schedule of Investments. In the Statements of Assets and Liabilities, only current day’s variation margin is reported in receivables or payables and the net cumulative unrealized appreciation (depreciation) is included in accumulated earnings (loss). | |
For the period ended May 31, 2024, the effect of derivative financial instruments in the Statements of Operations was as follows:
| | | | | | | | | | | | | | | | | | | | | | | | | | | | |
| | | Commodity
Contracts | | | Credit
Contracts | | | Equity
Contracts | | | Foreign
Currency
Exchange
Contracts | | | Interest
Rate
Contracts | | | Other
Contracts | | | Total | |
Net Realized Gain (Loss) from: | | | | | | | | | | | | | | | | | | | | | | | | | | | | |
Futures contracts | | $ | — | | | $ | — | | | $ | 1,428,623 | | | $ | — | | | $ | — | | | $ | — | | | $ | 1,428,623 | |
| | | | | | | | | | | | | | | | | | | | | | | | | | | | |
| | | | | |
Net Change in Unrealized Appreciation (Depreciation) on: | | | | | | | | | | | | | | | | | | | | | |
Futures contracts | | $ | — | | | $ | — | | | $ | (170,139 | ) | | $ | — | | | $ | — | | | $ | — | | | $ | (170,139 | ) |
| | | | | | | | | | | | | | | | | | | | | | | | | | | | |
| | |
| 32 | | 2 0 2 4 B L A C K R O C K A N N U A L F I N A N C I A L S T A T E M E N T S |
| | |
Schedule of Investments (continued) May 31, 2024 | | BlackRock Advantage Large Cap Value Fund |
Average Quarterly Balances of Outstanding Derivative Financial Instruments
| | | | | | | | | | | | | | | | | | | | | | | | | | | | |
Futures contracts | | | | | | | | | | | | | | | | | | | | | | | | | | | | |
Average notional value of contracts — long | | | | | | | | | | | | | | | | | | | | | | | | | | $ | 6,862,319 | |
For more information about the Fund’s investment risks regarding derivative financial instruments, refer to the Notes to Financial Statements.
Fair Value Hierarchy as of Period End
Various inputs are used in determining the fair value of financial instruments. For a description of the input levels and information about the Fund’s policy regarding valuation of financial instruments, refer to the Notes to Financial Statements.
The following table summarizes the Fund’s financial instruments categorized in the fair value hierarchy. The breakdown of the Fund’s financial instruments into major categories is disclosed in the Schedule of Investments above.
| | | | | | | | | | | | | | | | |
| | | Level 1 | | | Level 2 | | | Level 3 | | | Total | |
Assets | | | | | | | | | | | | | | | | |
Investments | | | | | | | | | | | | | | | | |
Long-Term Investments | | | | | | | | | | | | | | | | |
Common Stocks | | $ | 615,027,716 | | | $ | — | | | $ | — | | | $ | 615,027,716 | |
Short-Term Securities | | | | | | | | | | | | | | | | |
Money Market Funds | | | 9,059,588 | | | | — | | | | — | | | | 9,059,588 | |
| | | | | | | | | | | | | | | | |
| | $ | 624,087,304 | | | $ | — | | | $ | — | | | $ | 624,087,304 | |
| | | | | | | | | | | | | | | | |
Derivative Financial Instruments(a) | | | | | | | | | | | | | | | | |
Assets | | | | | | | | | | | | | | | | |
Equity Contracts | | $ | 183,245 | | | $ | — | | | $ | — | | | $ | 183,245 | |
| | | | | | | | | | | | | | | | |
| | (a) | Derivative financial instruments are futures contracts. Futures contracts are valued at the unrealized appreciation (depreciation) on the instrument. | |
See notes to financial statements.
| | |
S C H E D U L E S O F I N V E S T M E N T S | | 33 |
Statements of Assets and Liabilities
May 31, 2024
| | | | | | | | | | | | | | | | | | | | |
| | | BlackRock
Advantage
International
Fund | | | BlackRock
Advantage
Large Cap
Growth Fund | | | BlackRock
Advantage
Small Cap Core Fund | | | BlackRock
Advantage
Large Cap Core Fund | | | BlackRock
Advantage
Large Cap
Value Fund | |
| | | | | |
ASSETS | | | | | | | | | | | | | | | | | | | | |
Investments, at value — unaffiliated(a)(b) | | $ | 1,700,418,778 | | | $ | 1,212,404,312 | | | $ | 3,485,363,388 | | | $ | 2,818,276,885 | | | $ | 615,027,716 | |
Investments, at value — affiliated(c) | | | 61,625,258 | | | | 11,949,669 | | | | 188,482,170 | | | | 33,507,818 | | | | 9,059,588 | |
Cash | | | — | | | | — | | | | — | | | | 237,018 | | | | 42,292 | |
Cash pledged: | | | | | | | | | | | | | | | | | | | | |
Futures contracts | | | 2,170,000 | | | | 662,000 | | | | 2,423,000 | | | | 1,478,000 | | | | 322,006 | |
Foreign currency, at value(d) | | | 1,772,244 | | | | 79,354 | | | | — | | | | — | | | | — | |
Receivables: | | | | | | | | | | | | | | | | | | | | |
Investments sold | | | 11,182,875 | | | | 5,583,708 | | | | 10,869,143 | | | | 13,361,089 | | | | 2,925,000 | |
Securities lending income — affiliated | | | 610 | | | | 153 | | | | 45,546 | | | | 1,013 | | | | 1,008 | |
Capital shares sold | | | 2,304,344 | | | | 98,552 | | | | 1,759,356 | | | | 752,967 | | | | 87,992 | |
Dividends — unaffiliated | | | 9,591,628 | | | | 959,436 | | | | 1,695,640 | | | | 3,558,907 | | | | 1,076,702 | |
Dividends — affiliated | | | 183,395 | | | | 55,269 | | | | 160,515 | | | | 130,508 | | | | 25,479 | |
From the Manager | | | 112,784 | | | | 57,694 | | | | 76,409 | | | | 139,565 | | | | 20,995 | |
Variation margin on futures contracts | | | 478,209 | | | | — | | | | 271,892 | | | | 258,213 | | | | 57,375 | |
Prepaid expenses | | | 63,839 | | | | 46,518 | | | | 40,525 | | | | 44,862 | | | | 43,030 | |
| | | | | | | | | | | | | | | | | | | | |
| | | | | |
Total assets | | | 1,789,903,964 | | | | 1,231,896,665 | | | | 3,691,187,584 | | | | 2,871,746,845 | | | | 628,689,183 | |
| | | | | | | | | | | | | | | | | | | | |
| | | | | |
LIABILITIES | | | | | | | | | | | | | | | | | | | | |
Collateral on securities loaned | | | 760,488 | | | | — | | | | 153,859,901 | | | | 7,657,390 | | | | 3,324,488 | |
Payables: | | | | | | | | | | | | | | | | | | | | |
Investments purchased | | | 37,781,682 | | | | 3,657,752 | | | | 10,496,234 | | | | 13,150,958 | | | | 2,866,713 | |
Administration fees | | | 56,626 | | | | 41,899 | | | | 111,738 | | | | 99,002 | | | | 22,119 | |
Capital shares redeemed | | | 2,470,076 | | | | 520,122 | | | | 9,583,897 | | | | 1,032,551 | | | | 371,678 | |
Investment advisory fees | | | 518,865 | | | | 513,060 | | | | 1,186,586 | | | | 979,514 | | | | 204,002 | |
Directors’ and Officer’s fees | | | 4,342 | | | | 3,609 | | | | 8,710 | | | | 7,244 | | | | 2,426 | |
Other accrued expenses | | | 587,984 | | | | 218,531 | | | | 714,523 | | | | 760,286 | | | | 196,396 | |
Other affiliate fees | | | 111,620 | | | | 39,979 | | | | 50,392 | | | | 377,655 | | | | 12,798 | |
Professional fees | | | 144,535 | | | | 88,766 | | | | 86,459 | | | | 92,342 | | | | 87,942 | |
Registration fees | | | — | | | | — | | | | 200,033 | | | | — | | | | — | |
Service and distribution fees | | | 81,762 | | | | 142,247 | | | | 91,571 | | | | 366,908 | | | | 99,326 | |
Variation margin on futures contracts | | | — | | | | 9,794 | | | | — | | | | — | | | | — | |
| | | | | | | | | | | | | | | | | | | | |
| | | | | |
Total liabilities | | | 42,517,980 | | | | 5,235,759 | | | | 176,390,044 | | | | 24,523,850 | | | | 7,187,888 | |
| | | | | | | | | | | | | | | | | | | | |
| | | | | |
Commitments and contingent liabilities | | | | | | | | | | | | | | | | | | | | |
| | | | | |
NET ASSETS | | $ | 1,747,385,984 | | | $ | 1,226,660,906 | | | $ | 3,514,797,540 | | | $ | 2,847,222,995 | | | $ | 621,501,295 | |
| | | | | | | | | | | | | | | | | | | | |
| | | | | |
NET ASSETS CONSIST OF: | | | | | | | | | | | | | | | | | | | | |
Paid-in capital | | $ | 1,480,981,979 | | | $ | 640,308,450 | | | $ | 3,402,461,781 | | | $ | 1,731,046,817 | | | $ | 495,001,416 | |
Accumulated earnings | | | 266,404,005 | | | | 586,352,456 | | | | 112,335,759 | | | | 1,116,176,178 | | | | 126,499,879 | |
| | | | | | | | | | | | | | | | | | | | |
| | | | | |
NET ASSETS | | $ | 1,747,385,984 | | | $ | 1,226,660,906 | | | $ | 3,514,797,540 | | | $ | 2,847,222,995 | | | $ | 621,501,295 | |
| | | | | | | | | | | | | | | | | | | | |
| | | | | |
(a) Investments, at cost — unaffiliated | | $ | 1,406,137,802 | | | $ | 719,103,129 | | | $ | 3,113,803,238 | | | $ | 1,895,491,802 | | | $ | 530,753,515 | |
(b) Securities loaned, at value | | $ | 718,202 | | | $ | — | | | $ | 148,991,314 | | | $ | 7,501,360 | | | $ | 3,258,257 | |
(c) Investments, at cost — affiliated | | $ | 61,625,258 | | | $ | 11,949,669 | | | $ | 188,482,170 | | | $ | 33,507,998 | | | $ | 9,059,588 | |
(d) Foreign currency, at cost | | $ | 1,767,411 | | | $ | 84,861 | | | $ | — | | | $ | — | | | $ | — | |
| | |
| 34 | | 2 0 2 4 B L A C K R O C K A N N U A L F I N A N C I A L S T A T E M E N T S |
Statements of Assets and Liabilities (continued)
May 31, 2024
| | | | | | | | | | | | | | | | | | | | |
| | | BlackRock
Advantage
International
Fund | | | BlackRock
Advantage
Large Cap
Growth Fund | | | BlackRock
Advantage
Small Cap Core Fund | | | BlackRock
Advantage
Large Cap Core Fund | | | BlackRock
Advantage
Large Cap
Value Fund | |
| | | | | |
NET ASSET VALUE | | | | | | | | | | | | | | | | | | | | |
Institutional | | | | | | | | | | | | | | | | | | | | |
Net assets | | $ | 1,183,510,740 | | | $ | 639,877,842 | | | $ | 2,020,581,246 | | | $ | 1,193,776,756 | | | $ | 193,379,398 | |
| | | | | | | | | | | | | | | | | | | | |
| | | | | |
Shares outstanding | | | 60,414,859 | | | | 24,454,254 | | | | 116,440,084 | | | | 53,257,092 | | | | 5,959,465 | |
| | | | | | | | | | | | | | | | | | | | |
| | | | | |
Net asset value | | $ | 19.59 | | | $ | 26.17 | | | $ | 17.35 | | | $ | 22.42 | | | $ | 32.45 | |
| | | | | | | | | | | | | | | | | | | | |
| | | | | |
Shares authorized | | | Unlimited | | | | Unlimited | | | | Unlimited | | | | 400 million | | | | 400 million | |
| | | | | | | | | | | | | | | | | | | | |
| | | | | |
Par value | | $ | 0.001 | | | $ | 0.001 | | | $ | 0.001 | | | $ | 0.10 | | | $ | 0.10 | |
| | | | | | | | | | | | | | | | | | | | |
| | | | | |
Investor A | | | | | | | | | | | | | | | | | | | | |
Net assets | | $ | 264,865,795 | | | $ | 548,826,810 | | | $ | 382,878,446 | | | $ | 1,547,820,973 | | | $ | 393,787,783 | |
| | | | | | | | | | | | | | | | | | | | |
| | | | | |
Shares outstanding | | | 13,696,986 | | | | 22,329,840 | | | | 22,227,080 | | | | 73,130,844 | | | | 12,507,261 | |
| | | | | | | | | | | | | | | | | | | | |
| | | | | |
Net asset value | | $ | 19.34 | | | $ | 24.58 | | | $ | 17.23 | | | $ | 21.17 | | | $ | 31.48 | |
| | | | | | | | | | | | | | | | | | | | |
| | | | | |
Shares authorized | | | Unlimited | | | | Unlimited | | | | Unlimited | | | | 300 million | | | | 400 million | |
| | | | | | | | | | | | | | | | | | | | |
| | | | | |
Par value | | $ | 0.001 | | | $ | 0.001 | | | $ | 0.001 | | | $ | 0.10 | | | $ | 0.10 | |
| | | | | | | | | | | | | | | | | | | | |
| | | | | |
Investor C | | | | | | | | | | | | | | | | | | | | |
Net assets | | $ | 14,764,682 | | | $ | 30,540,266 | | | $ | 11,679,123 | | | $ | 44,928,316 | | | $ | 14,552,923 | |
| | | | | | | | | | | | | | | | | | | | |
| | | | | |
Shares outstanding | | | 789,535 | | | | 1,564,683 | | | | 702,069 | | | | 2,686,267 | | | | 511,718 | |
| | | | | | | | | | | | | | | | | | | | |
| | | | | |
Net asset value | | $ | 18.70 | | | $ | 19.52 | | | $ | 16.64 | | | $ | 16.73 | | | $ | 28.44 | |
| | | | | | | | | | | | | | | | | | | | |
| | | | | |
Shares authorized | | | Unlimited | | | | Unlimited | | | | Unlimited | | | | 400 million | | | | 400 million | |
| | | | | | | | | | | | | | | | | | | | |
| | | | | |
Par value | | $ | 0.001 | | | $ | 0.001 | | | $ | 0.001 | | | $ | 0.10 | | | $ | 0.10 | |
| | | | | | | | | | | | | | | | | | | | |
| | | | | |
Class K | | | | | | | | | | | | | | | | | | | | |
Net assets | | $ | 249,178,300 | | | $ | 5,854,727 | | | $ | 1,099,658,725 | | | $ | 41,459,926 | | | $ | 12,052,509 | |
| | | | | | | | | | | | | | | | | | | | |
| | | | | |
Shares outstanding | | | 12,717,466 | | | | 223,701 | | | | 63,312,363 | | | | 1,848,846 | | | | 371,370 | |
| | | | | | | | | | | | | | | | | | | | |
| | | | | |
Net asset value | | $ | 19.59 | | | $ | 26.17 | | | $ | 17.37 | | | $ | 22.42 | | | $ | 32.45 | |
| | | | | | | | | | | | | | | | | | | | |
| | | | | |
Shares authorized | | | Unlimited | | | | Unlimited | | | | Unlimited | | | | 2 billion | | | | 2 billion | |
| | | | | | | | | | | | | | | | | | | | |
| | | | | |
Par value | | $ | 0.001 | | | $ | 0.001 | | | $ | 0.001 | | | $ | 0.10 | | | $ | 0.10 | |
| | | | | | | | | | | | | | | | | | | | |
| | | | | |
Class R | | | | | | | | | | | | | | | | | | | | |
Net assets | | $ | 35,066,467 | | | $ | 1,561,261 | | | $ | N/A | | | $ | 19,237,024 | | | $ | 7,728,682 | |
| | | | | | | | | | | | | | | | | | | | |
| | | | | |
Shares outstanding | | | 1,816,498 | | | | 60,384 | | | | N/A | | | | 1,008,919 | | | | 259,381 | |
| | | | | | | | | | | | | | | | | | | | |
| | | | | |
Net asset value | | $ | 19.30 | | | $ | 25.86 | | | $ | N/A | | | $ | 19.07 | | | $ | 29.80 | |
| | | | | | | | | | | | | | | | | | | | |
| | | | | |
Shares authorized | | | Unlimited | | | | Unlimited | | | | N/A | | | | 200 million | | | | 200 million | |
| | | | | | | | | | | | | | | | | | | | |
| | | | | |
Par value | | $ | 0.001 | | | $ | 0.001 | | | $ | N/A | | | $ | 0.10 | | | $ | 0.10 | |
| | | | | | | | | | | | | | | | | | | | |
See notes to financial statements.
| | |
F I N A N C I A L S T A T E M E N T S | | 35 |
Statements of Operations
Year Ended May 31, 2024
| | | | | | | | | | | | |
| | | BlackRock
Advantage
International
Fund | | | BlackRock
Advantage
Large Cap
Growth Fund | | | BlackRock
Advantage
Small Cap
Core Fund | |
| | | |
INVESTMENT INCOME | | | | | | | | | | | | |
Dividends — unaffiliated | | $ | 47,560,914 | | | $ | 8,459,101 | | | $ | 45,336,681 | |
Dividends — affiliated | | | 1,680,755 | | | | 533,342 | | | | 1,642,653 | |
Securities lending income — affiliated — net | | | 18,207 | | | | 117,167 | | | | 628,963 | |
Other income | | | 54,338 | | | | — | | | | — | |
Foreign taxes withheld | | | (3,866,154 | ) | | | (5,131 | ) | | | (142,905 | ) |
Foreign withholding tax claims | | | 624,363 | | | | — | | | | — | |
| | | | | | | | | | | | |
| | | |
Total investment income | | | 46,072,423 | | | | 9,104,479 | | | | 47,465,392 | |
| | | | | | | | | | | | |
| | | |
EXPENSES | | | | | | | | | | | | |
Investment advisory | | | 6,321,773 | | | | 6,126,806 | | | | 14,999,433 | |
Transfer agent — class specific | | | 1,714,803 | | | | 1,300,047 | | | | 2,025,130 | |
Service and distribution — class specific | | | 832,837 | | | | 1,468,427 | | | | 983,632 | |
Administration | | | 575,158 | | | | 442,111 | | | | 1,316,720 | |
Custodian | | | 345,224 | | | | 45,115 | | | | 219,128 | |
Administration — class specific | | | 286,567 | | | | 215,900 | | | | 702,911 | |
Professional | | | 197,092 | | | | 84,125 | | | | 90,828 | |
Registration | | | 120,396 | | | | 87,577 | | | | 127,484 | |
Accounting services | | | 114,378 | | | | 95,071 | | | | 227,162 | |
Printing and postage | | | 44,703 | | | | 36,558 | | | | 47,496 | |
Directors and Officer | | | 17,699 | | | | 14,684 | | | | 32,790 | |
Miscellaneous | | | 3,553 | | | | 23,837 | | | | 74,245 | |
| | | | | | | | | | | | |
| | | |
Total expenses excluding interest expense | | | 10,574,183 | | | | 9,940,258 | | | | 20,846,959 | |
Interest expense | | | 2,784 | | | | 3 | | | | — | |
| | | | | | | | | | | | |
| | | |
Total expenses | | | 10,576,967 | | | | 9,940,261 | | | | 20,846,959 | |
Less: | | | | | | | | | | | | |
Administration fees waived by the Manager — class specific | | | (286,567 | ) | | | (213,043 | ) | | | (702,911 | ) |
Fees waived and/or reimbursed by the Manager | | | (1,217,740 | ) | | | (803,171 | ) | | | (1,331,037 | ) |
Transfer agent fees waived and/or reimbursed by the Manager — class specific | | | (1,108,884 | ) | | | (768,715 | ) | | | (785,066 | ) |
| | | | | | | | | | | | |
| | | |
Total expenses after fees waived and/or reimbursed | | | 7,963,776 | | | | 8,155,332 | | | | 18,027,945 | |
| | | | | | | | | | | | |
| | | |
Net investment income | | | 38,108,647 | | | | 949,147 | | | | 29,437,447 | |
| | | | | | | | | | | | |
| | | |
REALIZED AND UNREALIZED GAIN (LOSS) | | | | | | | | | | | | |
Net realized gain (loss) from: | | | | | | | | | | | | |
Investments — unaffiliated | | | 63,027,827 | | | | 129,807,260 | | | | 114,799,158 | |
Investments — affiliated | | | 702 | | | | (1,613 | ) | | | 73,964 | |
Futures contracts | | | 2,714,451 | | | | 2,866,512 | | | | 6,393,027 | |
Foreign currency transactions | | | (371,236 | ) | | | — | | | | (827 | ) |
Payment by affiliate | | | — | | | | 2,554 | | | | — | |
| | | | | | | | | | | | |
| | | |
| | | 65,371,744 | | | | 132,674,713 | | | | 121,265,322 | |
| | | | | | | | | | | | |
Net change in unrealized appreciation (depreciation) on: | | | | | | | | | | | | |
Investments — unaffiliated | | | 173,056,034 | | | | 180,544,294 | | | | 623,914,813 | |
Investments — affiliated | | | (193 | ) | | | 1,182 | | | | (51,651 | ) |
Futures contracts | | | 1,478,871 | | | | (118,383 | ) | | | 243,424 | |
Foreign currency translations | | | 95,684 | | | | 1,175 | | | | — | |
| | | | | | | | | | | | |
| | | |
| | | 174,630,396 | | | | 180,428,268 | | | | 624,106,586 | |
| | | | | | | | | | | | |
| | | |
Net realized and unrealized gain | | | 240,002,140 | | | | 313,102,981 | | | | 745,371,908 | |
| | | | | | | | | | | | |
| | | |
NET INCREASE IN NET ASSETS RESULTING FROM OPERATIONS | | $ | 278,110,787 | | | $ | 314,052,128 | | | $ | 774,809,355 | |
| | | | | | | | | | | | |
See notes to financial statements.
| | |
| 36 | | 2 0 2 4 B L A C K R O C K A N N U A L F I N A N C I A L S T A T E M E N T S |
Statements of Operations (continued)
Year Ended May 31, 2024
| | | | | | | | |
| | | BlackRock
Advantage Large Cap Core Fund | | | BlackRock
Advantage Large Cap Value Fund | |
| | |
INVESTMENT INCOME | | | | | | | | |
Dividends — unaffiliated | | $ | 40,242,735 | | | $ | 12,992,578 | |
Dividends — affiliated | | | 1,397,345 | | | | 274,897 | |
Securities lending income — affiliated — net | | | 343,740 | | | | 7,315 | |
Foreign taxes withheld | | | (7,359 | ) | | | (4,650 | ) |
| | | | | | | | |
| | |
Total investment income | | | 41,976,461 | | | | 13,270,140 | |
| | | | | | | | |
| | |
EXPENSES | | | | | | | | |
Investment advisory | | | 12,632,389 | | | | 2,862,991 | |
Service and distribution — class specific | | | 3,996,731 | | | | 1,116,850 | |
Transfer agent — class specific | | | 3,619,833 | | | | 591,523 | |
Administration | | | 1,115,386 | | | | 246,214 | |
Administration — class specific | | | 587,520 | | | | 116,905 | |
Accounting services | | | 197,593 | | | | 68,104 | |
Professional | | | 139,253 | | | | 76,485 | |
Registration | | | 132,472 | | | | 94,307 | |
Printing and postage | | | 33,504 | | | | 35,619 | |
Directors and Officer | | | 28,858 | | | | 10,654 | |
Custodian | | | 11,489 | | | | 52,088 | |
Miscellaneous | | | 21,380 | | | | 20,207 | |
| | | | | | | | |
| | |
Total expenses excluding interest expense | | | 22,516,408 | | | | 5,291,947 | |
Interest expense | | | 1,236 | | | | — | |
| | | | | | | | |
| | |
Total expenses | | | 22,517,644 | | | | 5,291,947 | |
Less: | | | | | | | | |
Administration fees waived by the Manager — class specific | | | (587,519 | ) | | | (116,905 | ) |
Fees waived and/or reimbursed by the Manager | | | (1,682,854 | ) | | | (603,011 | ) |
Transfer agent fees waived and/or reimbursed — class specific | | | (2,179,569 | ) | | | (308,802 | ) |
| | | | | | | | |
| | |
Total expenses after fees waived and/or reimbursed | | | 18,067,702 | | | | 4,263,229 | |
| | | | | | | | |
| | |
Net investment income | | | 23,908,759 | | | | 9,006,911 | |
| | | | | | | | |
| | |
REALIZED AND UNREALIZED GAIN (LOSS) | | | | | | | | |
Net realized gain (loss) from: | | | | | | | | |
Investments — unaffiliated | | | 321,267,690 | | | | 61,194,998 | |
Investments — affiliated | | | (1,226 | ) | | | 629 | |
Futures contracts | | | 7,485,098 | | | | 1,428,623 | |
| | | | | | | | |
| | |
| | | 328,751,562 | | | | 62,624,250 | |
| | | | | | | | |
Net change in unrealized appreciation (depreciation) on: | | | | | | | | |
Investments — unaffiliated | | | 411,416,014 | | | | 58,919,151 | |
Investments — affiliated | | | (904 | ) | | | (694 | ) |
Futures contracts | | | (1,327,305 | ) | | | (170,139 | ) |
| | | | | | | | |
| | |
| | | 410,087,805 | | | | 58,748,318 | |
| | | | | | | | |
| | |
Net realized and unrealized gain | | | 738,839,367 | | | | 121,372,568 | |
| | | | | | | | |
| | |
NET INCREASE IN NET ASSETS RESULTING FROM OPERATIONS | | $ | 762,748,126 | | | $ | 130,379,479 | |
| | | | | | | | |
See notes to financial statements.
| | |
F I N A N C I A L S T A T E M E N T S | | 37 |
Statements of Changes in Net Assets
| | | | | | | | | | | | | | | | |
| | | BlackRock Advantage International Fund | | | BlackRock Advantage Large Cap Growth
Fund | |
| | | Year Ended
05/31/24 | | | Year Ended
05/31/23 | | | Year Ended
05/31/24 | | | Year Ended
05/31/23 | |
| | | | |
INCREASE (DECREASE) IN NET ASSETS | | | | | | | | | | | | | | | | |
| | | | |
OPERATIONS | | | | | | | | | | | | | | | | |
Net investment income | | $ | 38,108,647 | | | $ | 32,597,808 | | | $ | 949,147 | | | $ | 3,192,201 | |
Net realized gain (loss) | | | 65,371,744 | | | | (65,982,615 | ) | | | 132,674,713 | | | | (14,259,907 | ) |
Net change in unrealized appreciation (depreciation) | | | 174,630,396 | | | | 90,742,580 | | | | 180,428,268 | | | | 67,271,524 | |
| | | | | | | | | | | | | | | | |
| | | | |
Net increase in net assets resulting from operations | | | 278,110,787 | | | | 57,357,773 | | | | 314,052,128 | | | | 56,203,818 | |
| | | | | | | | | | | | | | | | |
| | | | |
DISTRIBUTIONS TO SHAREHOLDERS(a) | | | | | | | | | | | | | | | | |
Institutional | | | (24,298,025 | ) | | | (23,002,049 | ) | | | (5,262,541 | ) | | | (1,487,169 | ) |
Investor A | | | (6,057,012 | ) | | | (6,936,172 | ) | | | (3,948,921 | ) | | | (734,722 | ) |
Investor C | | | (149,273 | ) | | | (57,995 | ) | | | (262,948 | ) | | | — | |
Class K | | | (6,005,547 | ) | | | (3,878,150 | ) | | | (47,549 | ) | | | (6,578 | ) |
Class R | | | (612,167 | ) | | | (73,700 | ) | | | (4,973 | ) | | | (147 | ) |
| | | | | | | | | | | | | | | | |
| | | | |
Decrease in net assets resulting from distributions to shareholders | | | (37,122,024 | ) | | | (33,948,066 | ) | | | (9,526,932 | ) | | | (2,228,616 | ) |
| | | | | | | | | | | | | | | | |
| | | | |
CAPITAL SHARE TRANSACTIONS | | | | | | | | | | | | | | | | |
| | | | |
Net increase (decrease) in net assets derived from capital share transactions | | | 288,550,165 | | | | 135,628,015 | | | | (30,979,579 | ) | | | 1,585,172 | |
| | | | | | | | | | | | | | | | |
| | | | |
NET ASSETS | | | | | | | | | | | | | | | | |
Total increase in net assets | | | 529,538,928 | | | | 159,037,722 | | | | 273,545,617 | | | | 55,560,374 | |
Beginning of year | | | 1,217,847,056 | | | | 1,058,809,334 | | | | 953,115,289 | | | | 897,554,915 | |
| | | | | | | | | | | | | | | | |
| | | | |
End of year | | $ | 1,747,385,984 | | | $ | 1,217,847,056 | | | $ | 1,226,660,906 | | | $ | 953,115,289 | |
| | | | | | | | | | | | | | | | |
| (a) | Distributions for annual periods determined in accordance with U.S. federal income tax regulations. |
See notes to financial statements.
| | |
| 38 | | 2 0 2 4 B L A C K R O C K A N N U A L F I N A N C I A L S T A T E M E N T S |
Statements of Changes in Net Assets (continued)
| | | | | | | | | | | | | | | | |
| | | BlackRock Advantage Small Cap Core Fund | | | BlackRock Advantage Large Cap Core
Fund | |
| | | Year Ended
05/31/24 | | | Year Ended
05/31/23 | | | Year Ended
05/31/24 | | | Year Ended
05/31/23 | |
| | | | |
INCREASE (DECREASE) IN NET ASSETS | | | | | | | | | | | | | | | | |
| | | | |
OPERATIONS | | | | | | | | | | | | | | | | |
Net investment income | | $ | 29,437,447 | | | $ | 34,024,253 | | | $ | 23,908,759 | | | $ | 29,099,395 | |
Net realized gain (loss) | | | 121,265,322 | | | | (243,633,261 | ) | | | 328,751,562 | | | | (57,935,346 | ) |
Net change in unrealized appreciation (depreciation) | | | 624,106,586 | | | | (2,236,033 | ) | | | 410,087,805 | | | | 30,100,345 | |
| | | | | | | | | | | | | | | | |
| | | | |
Net increase (decrease) in net assets resulting from operations | | | 774,809,355 | | | | (211,845,041 | ) | | | 762,748,126 | | | | 1,264,394 | |
| | | | | | | | | | | | | | | | |
| | | | |
DISTRIBUTIONS TO SHAREHOLDERS(a) | | | | | | | | | | | | | | | | |
Institutional | | | (22,210,384 | ) | | | (65,785,212 | ) | | | (14,370,753 | ) | | | (87,947,101 | ) |
Investor A | | | (2,752,160 | ) | | | (8,392,738 | ) | | | (11,658,748 | ) | | | (78,931,541 | ) |
Investor C | | | (22,398 | ) | | | (218,628 | ) | | | (186,649 | ) | | | (2,397,702 | ) |
Class K | | | (10,886,458 | ) | | | (26,282,902 | ) | | | (323,379 | ) | | | (1,924,102 | ) |
Class R | | | — | | | | — | | | | (100,028 | ) | | | (849,067 | ) |
| | | | | | | | | | | | | | | | |
| | | | |
Decrease in net assets resulting from distributions to shareholders | | | (35,871,400 | ) | | | (100,679,480 | ) | | | (26,639,557 | ) | | | (172,049,513 | ) |
| | | | | | | | | | | | | | | | |
| | | | |
CAPITAL SHARE TRANSACTIONS | | | | | | | | | | | | | | | | |
| | | | |
Net increase (decrease) in net assets derived from capital share transactions | | | (666,316,198 | ) | | | (84,503,292 | ) | | | (714,144,215 | ) | | | (48,914,390 | ) |
| | | | | | | | | | | | | | | | |
| | | | |
NET ASSETS | | | | | | | | | | | | | | | | |
Total increase (decrease) in net assets | | | 72,621,757 | | | | (397,027,813 | ) | | | 21,964,354 | | | | (219,699,509 | ) |
Beginning of period | | | 3,442,175,783 | | | | 3,839,203,596 | | | | 2,825,258,641 | | | | 3,044,958,150 | |
| | | | | | | | | | | | | | | | |
| | | | |
End of period | | $ | 3,514,797,540 | | | $ | 3,442,175,783 | | | $ | 2,847,222,995 | | | $ | 2,825,258,641 | |
| | | | | | | | | | | | | | | | |
| (a) | Distributions for annual periods determined in accordance with U.S. federal income tax regulations. |
See notes to financial statements.
| | |
F I N A N C I A L S T A T E M E N T S | | 39 |
Statements of Changes in Net Assets (continued)
| | | | | | | | |
| | | BlackRock Advantage Large Cap Value
Fund | |
| | | Year Ended
05/31/24 | | | Year Ended
05/31/23 | |
| | |
INCREASE (DECREASE) IN NET ASSETS | | | | | | | | |
| | |
OPERATIONS | | | | | | | | |
Net investment income | | $ | 9,006,911 | | | $ | 8,666,756 | |
Net realized gain (loss) | | | 62,624,250 | | | | (1,730,009 | ) |
Net change in unrealized appreciation (depreciation) | | | 58,748,318 | | | | (38,708,040 | ) |
| | | | | | | | |
| | |
Net increase (decrease) in net assets resulting from operations | | | 130,379,479 | | | | (31,771,293 | ) |
| | | | | | | | |
| | |
DISTRIBUTIONS TO SHAREHOLDERS(a) | | | | | | | | |
Institutional | | | (5,038,560 | ) | | | (9,937,889 | ) |
Investor A | | | (10,006,852 | ) | | | (20,893,090 | ) |
Investor C | | | (338,418 | ) | | | (893,218 | ) |
Class K | | | (421,604 | ) | | | (574,235 | ) |
Class R | | | (185,940 | ) | | | (460,361 | ) |
| | | | | | | | |
| | |
Decrease in net assets resulting from distributions to shareholders | | | (15,991,374 | ) | | | (32,758,793 | ) |
| | | | | | | | |
| | |
CAPITAL SHARE TRANSACTIONS | | | | | | | | |
| | |
Net decrease in net assets derived from capital share transactions | | | (35,263,026 | ) | | | (11,079,734 | ) |
| | | | | | | | |
| | |
NET ASSETS | | | | | | | | |
Total increase (decrease) in net assets | | | 79,125,079 | | | | (75,609,820 | ) |
Beginning of year | | | 542,376,216 | | | | 617,986,036 | |
| | | | | | | | |
| | |
End of year | | $ | 621,501,295 | | | $ | 542,376,216 | |
| | | | | | | | |
| (a) | Distributions for annual periods determined in accordance with U.S. federal income tax regulations. |
See notes to financial statements.
| | |
| 40 | | 2 0 2 4 B L A C K R O C K A N N U A L F I N A N C I A L S T A T E M E N T S |
Financial Highlights
(For a share outstanding throughout each period)
| | | | | | | | | | | | | | | | | | | | | | | | |
| | | BlackRock Advantage International Fund | |
| | | Institutional | |
| | | Year Ended
05/31/24 | | | Year Ended
05/31/23 | | | Year Ended
05/31/22 | | | Year Ended
05/31/21 | | | Period from
10/01/19
to 05/31/20 | | | Year Ended
09/30/19 | |
| | | | | | |
Net asset value, beginning of period | | $ | 16.73 | | | $ | 16.48 | | | $ | 19.89 | | | $ | 14.52 | | | $ | 16.12 | | | $ | 16.97 | |
| | | | | | | | | | | | | | | | | | | | | | | | |
| | | | | | |
Net investment income(a) | | | 0.49 | | | | 0.48 | | | | 0.46 | | | | 0.38 | | | | 0.22 | | | | 0.44 | |
Net realized and unrealized gain (loss) | | | 2.86 | | | | 0.29 | | | | (2.28 | ) | | | 5.30 | | | | (1.37 | ) | | | (0.90 | ) |
| | | | | | | | | | | | | | | | | | | | | | | | |
| | | | | | |
Net increase (decrease) from investment operations | | | 3.35 | | | | 0.77 | | | | (1.82 | ) | | | 5.68 | | | | (1.15 | ) | | | (0.46 | ) |
| | | | | | | | | | | | | | | | | | | | | | | | |
| | | | | | |
Distributions(b) | | | | | | | | | | | | | | | | | | | | | | | | |
From net investment income | | | (0.49 | ) | | | (0.52 | ) | | | (0.62 | ) | | | (0.31 | ) | | | (0.45 | ) | | | (0.39 | ) |
From net realized gain | | | — | | | | — | | | | (0.97 | ) | | | — | | | | — | | | | — | |
| | | | | | | | | | | | | | | | | | | | | | | | |
| | | | | | |
Total distributions | | | (0.49 | ) | | | (0.52 | ) | | | (1.59 | ) | | | (0.31 | ) | | | (0.45 | ) | | | (0.39 | ) |
| | | | | | | | | | | | | | | | | | | | | | | | |
| | | | | | |
Net asset value, end of period | | $ | 19.59 | | | $ | 16.73 | | | $ | 16.48 | | | $ | 19.89 | | | $ | 14.52 | | | $ | 16.12 | |
| | | | | | | | | | | | | | | | | | | | | | | | |
| | | | | | |
Total Return(c) | | | | | | | | | | | | | | | | | | | | | | | | |
Based on net asset value | | | 20.40 | % | | | 5.10 | % | | | (9.93 | )% | | | 39.57 | % | | | (7.45 | )%(d) | | | (2.52 | )% |
| | | | | | | | | | | | | | | | | | | | | | | | |
| | | | | | |
Ratios to Average Net Assets(e) | | | | | | | | | | | | | | | | | | | | | | | | |
Total expenses | | | 0.70 | % | | | 0.68 | % | | | 0.73 | % | | | 0.78 | % | | | 0.82 | %(f) | | | 0.88 | % |
| | | | | | | | | | | | | | | | | | | | | | | | |
| | | | | | |
Total expenses after fees waived and/or reimbursed | | | 0.50 | % | | | 0.50 | % | | | 0.50 | % | | | 0.50 | % | | | 0.50 | %(f) | | | 0.59 | % |
| | | | | | | | | | | | | | | | | | | | | | | | |
| | | | | | |
Net investment income | | | 2.73 | % | | | 3.08 | % | | | 2.51 | % | | | 2.21 | % | | | 2.17 | %(f) | | | 2.78 | % |
| | | | | | | | | | | | | | | | | | | | | | | | |
| | | | | | |
Supplemental Data | | | | | | | | | | | | | | | | | | | | | | | | |
Net assets, end of period (000) | | $ | 1,183,511 | | | $ | 771,698 | | | $ | 710,116 | | | $ | 616,649 | | | $ | 477,944 | | | $ | 446,831 | |
| | | | | | | | | | | | | | | | | | | | | | | | |
| | | | | | |
Portfolio turnover rate | | | 128 | % | | | 128 | % | | | 132 | % | | | 247 | % | | | 131 | % | | | 140 | % |
| | | | | | | | | | | | | | | | | | | | | | | | |
| (a) | Based on average shares outstanding. |
| (b) | Distributions for annual periods determined in accordance with U.S. federal income tax regulations. |
| (c) | Where applicable, assumes the reinvestment of distributions. |
| (e) | Excludes fees and expenses incurred indirectly as a result of investments in underlying funds. |
See notes to financial statements.
| | |
F I N A N C I A L H I G H L I G H T S | | 41 |
Financial Highlights (continued)
(For a share outstanding throughout each period)
| | | | | | | | | | | | | | | | | | | | | | | | |
| | | BlackRock Advantage International Fund (continued) | |
| | | Investor A | |
| | | Year Ended
05/31/24 | | | Year Ended
05/31/23 | | | Year Ended
05/31/22 | | | Year Ended
05/31/21 | | | Period from
10/01/19
to 05/31/20 | | | Year Ended
09/30/19 | |
| | | | | | |
Net asset value, beginning of period | | $ | 16.52 | | | $ | 16.28 | | | $ | 19.65 | | | $ | 14.35 | | | $ | 15.93 | | | $ | 16.78 | |
| | | | | | | | | | | | | | | | | | | | | | | | |
| | | | | | |
Net investment income(a) | | | 0.42 | | | | 0.44 | | | | 0.35 | | | | 0.33 | | | | 0.19 | | | | 0.40 | |
Net realized and unrealized gain (loss) | | | 2.85 | | | | 0.28 | | | | (2.19 | ) | | | 5.24 | | | | (1.35 | ) | | | (0.90 | ) |
| | | | | | | | | | | | | | | | | | | | | | | | |
| | | | | | |
Net increase (decrease) from investment operations | | | 3.27 | | | | 0.72 | | | | (1.84 | ) | | | 5.57 | | | | (1.16 | ) | | | (0.50 | ) |
| | | | | | | | | | | | | | | | | | | | | | | | |
| | | | | | |
Distributions(b) | | | | | | | | | | | | | | | | | | | | | | | | |
From net investment income | | | (0.45 | ) | | | (0.48 | ) | | | (0.56 | ) | | | (0.27 | ) | | | (0.42 | ) | | | (0.35 | ) |
From net realized gain | | | — | | | | — | | | | (0.97 | ) | | | — | | | | — | | | | — | |
| | | | | | | | | | | | | | | | | | | | | | | | |
| | | | | | |
Total distributions | | | (0.45 | ) | | | (0.48 | ) | | | (1.53 | ) | | | (0.27 | ) | | | (0.42 | ) | | | (0.35 | ) |
| | | | | | | | | | | | | | | | | | | | | | | | |
| | | | | | |
Net asset value, end of period | | $ | 19.34 | | | $ | 16.52 | | | $ | 16.28 | | | $ | 19.65 | | | $ | 14.35 | | | $ | 15.93 | |
| | | | | | | | | | | | | | | | | | | | | | | | |
| | | | | | |
Total Return(c) | | | | | | | | | | | | | | | | | | | | | | | | |
Based on net asset value | | | 20.11 | % | | | 4.82 | % | | | (10.13 | )% | | | 39.21 | % | | | (7.61 | )%(d) | | | (2.77 | )% |
| | | | | | | | | | | | | | | | | | | | | | | | |
| | | | | | |
Ratios to Average Net Assets(e) | | | | | | | | | | | | | | | | | | | | | | | | |
Total expenses | | | 0.92 | % | | | 1.00 | % | | | 1.02 | % | | | 1.05 | % | | | 1.08 | %(f) | | | 1.16 | % |
| | | | | | | | | | | | | | | | | | | | | | | | |
| | | | | | |
Total expenses after fees waived and/or reimbursed | | | 0.75 | % | | | 0.75 | % | | | 0.75 | % | | | 0.75 | % | | | 0.75 | %(f) | | | 0.84 | % |
| | | | | | | | | | | | | | | | | | | | | | | | |
| | | | | | |
Net investment income | | | 2.38 | % | | | 2.82 | % | | | 1.93 | % | | | 1.95 | % | | | 1.85 | %(f) | | | 2.56 | % |
| | | | | | | | | | | | | | | | | | | | | | | | |
| | | | | | |
Supplemental Data | | | | | | | | | | | | | | | | | | | | | | | | |
Net assets, end of period (000) | | $ | 264,866 | | | $ | 230,879 | | | $ | 240,255 | | | $ | 456,083 | | | $ | 366,411 | | | $ | 404,739 | |
| | | | | | | | | | | | | | | | | | | | | | | | |
| | | | | | |
Portfolio turnover rate | | | 128 | % | | | 128 | % | | | 132 | % | | | 247 | % | | | 131 | % | | | 140 | % |
| | | | | | | | | | | | | | | | | | | | | | | | |
| (a) | Based on average shares outstanding. |
| (b) | Distributions for annual periods determined in accordance with U.S. federal income tax regulations. |
| (c) | Where applicable, excludes the effects of any sales charges and assumes the reinvestment of distributions. |
| (e) | Excludes fees and expenses incurred indirectly as a result of investments in underlying funds. |
See notes to financial statements.
| | |
| 42 | | 2 0 2 4 B L A C K R O C K A N N U A L F I N A N C I A L S T A T E M E N T S |
Financial Highlights (continued)
(For a share outstanding throughout each period)
| | | | | | | | | | | | | | | | | | | | | | | | |
| | | BlackRock Advantage International Fund (continued) | |
| | | Investor C | |
| | | Year Ended
05/31/24 | | | Year Ended
05/31/23 | | | Year Ended
05/31/22 | | | Year Ended
05/31/21 | | | Period from
10/01/19
to 05/31/20 | | | Year Ended
09/30/19 | |
| | | | | | |
Net asset value, beginning of period | | $ | 16.03 | | | $ | 15.81 | | | $ | 19.12 | | | $ | 13.95 | | | $ | 15.43 | | | $ | 16.11 | |
| | | | | | | | | | | | | | | | | | | | | | | | |
| | | | | | |
Net investment income(a) | | | 0.36 | | | | 0.32 | | | | 0.22 | | | | 0.16 | | | | 0.10 | | | | 0.23 | |
Net realized and unrealized gain (loss) | | | 2.67 | | | | 0.27 | | | | (2.15 | ) | | | 5.14 | | | | (1.31 | ) | | | (0.80 | ) |
| | | | | | | | | | | | | | | | | | | | | | | | |
| | | | | | |
Net increase (decrease) from investment operations | | | 3.03 | | | | 0.59 | | | | (1.93 | ) | | | 5.30 | | | | (1.21 | ) | | | (0.57 | ) |
| | | | | | | | | | | | | | | | | | | | | | | | |
| | | | | | |
Distributions(b) | | | | | | | | | | | | | | | | | | | | | | | | |
From net investment income | | | (0.36 | ) | | | (0.37 | ) | | | (0.41 | ) | | | (0.13 | ) | | | (0.27 | ) | | | (0.11 | ) |
From net realized gain | | | — | | | | — | | | | (0.97 | ) | | | — | | | | — | | | | — | |
| | | | | | | | | | | | | | | | | | | | | | | | |
| | | | | | |
Total distributions | | | (0.36 | ) | | | (0.37 | ) | | | (1.38 | ) | | | (0.13 | ) | | | (0.27 | ) | | | (0.11 | ) |
| | | | | | | | | | | | | | | | | | | | | | | | |
| | | | | | |
Net asset value, end of period | | $ | 18.70 | | | $ | 16.03 | | | $ | 15.81 | | | $ | 19.12 | | | $ | 13.95 | | | $ | 15.43 | |
| | | | | | | | | | | | | | | | | | | | | | | | |
| | | | | | |
Total Return(c) | | | | | | | | | | | | | | | | | | | | | | | | |
Based on net asset value | | | 19.21 | % | | | 4.04 | % | | | (10.83 | )% | | | 38.21 | % | | | (8.05 | )%(d) | | | (3.51 | )% |
| | | | | | | | | | | | | | | | | | | | | | | | |
| | | | | | |
Ratios to Average Net Assets(e) | | | | | | | | | | | | | | | | | | | | | | | | |
Total expenses | | | 1.73 | % | | | 1.78 | % | | | 1.83 | % | | | 1.88 | % | | | 1.84 | %(f) | | | 1.88 | % |
| | | | | | | | | | | | | | | | | | | | | | | | |
| | | | | | |
Total expenses after fees waived and/or reimbursed | | | 1.50 | % | | | 1.50 | % | | | 1.50 | % | | | 1.50 | % | | | 1.50 | %(f) | | | 1.59 | % |
| | | | | | | | | | | | | | | | | | | | | | | | |
| | | | | | |
Net investment income | | | 2.09 | % | | | 2.10 | % | | | 1.27 | % | | | 0.98 | % | | | 1.04 | %(f) | | | 1.52 | % |
| | | | | | | | | | | | | | | | | | | | | | | | |
| | | | | | |
Supplemental Data | | | | | | | | | | | | | | | | | | | | | | | | |
Net assets, end of period (000) | | $ | 14,765 | | | $ | 2,598 | | | $ | 2,356 | | | $ | 3,664 | | | $ | 6,193 | | | $ | 9,448 | |
| | | | | | | | | | | | | | | | | | | | | | | | |
| | | | | | |
Portfolio turnover rate | | | 128 | % | | �� | 128 | % | | | 132 | % | | | 247 | % | | | 131 | % | | | 140 | % |
| | | | | | | | | | | | | | | | | | | | | | | | |
| (a) | Based on average shares outstanding. |
| (b) | Distributions for annual periods determined in accordance with U.S. federal income tax regulations. |
| (c) | Where applicable, excludes the effects of any sales charges and assumes the reinvestment of distributions. |
| (e) | Excludes fees and expenses incurred indirectly as a result of investments in underlying funds. |
See notes to financial statements.
| | |
F I N A N C I A L H I G H L I G H T S | | 43 |
Financial Highlights (continued)
(For a share outstanding throughout each period)
| | | | | | | | | | | | | | | | | | | | | | | | |
| | | BlackRock Advantage International Fund (continued) | |
| | | Class K | |
| | | Year Ended
05/31/24 | | | Year Ended
05/31/23 | | | Year Ended
05/31/22 | | | Year Ended
05/31/21 | | | Period from
10/01/19
to 05/31/20 | | | Year Ended
09/30/19 | |
| | | | | | |
Net asset value, beginning of period | | $ | 16.73 | | | $ | 16.48 | | | $ | 19.89 | | | $ | 14.52 | | | $ | 16.12 | | | $ | 16.98 | |
| | | | | | | | | | | | | | | | | | | | | | | | |
| | | | | | |
Net investment income(a) | | | 0.48 | | | | 0.52 | | | | 0.46 | | | | 0.46 | | | | 0.23 | | | | 0.56 | |
Net realized and unrealized gain (loss) | | | 2.88 | | | | 0.26 | | | | (2.28 | ) | | | 5.23 | | | | (1.37 | ) | | | (1.03 | ) |
| | | | | | | | | | | | | | | | | | | | | | | | |
| | | | | | |
Net increase (decrease) from investment operations | | | 3.36 | | | | 0.78 | | | | (1.82 | ) | | | 5.69 | | | | (1.14 | ) | | | (0.47 | ) |
| | | | | | | | | | | | | | | | | | | | | | | | |
| | | | | | |
Distributions(b) | | | | | | | | | | | | | | | | | | | | | | | | |
From net investment income | | | (0.50 | ) | | | (0.53 | ) | | | (0.62 | ) | | | (0.32 | ) | | | (0.46 | ) | | | (0.39 | ) |
From net realized gain | | | — | | | | — | | | | (0.97 | ) | | | — | | | | — | | | | — | |
| | | | | | | | | | | | | | | | | | | | | | | | |
| | | | | | |
Total distributions | | | (0.50 | ) | | | (0.53 | ) | | | (1.59 | ) | | | (0.32 | ) | | | (0.46 | ) | | | (0.39 | ) |
| | | | | | | | | | | | | | | | | | | | | | | | |
| | | | | | |
Net asset value, end of period | | $ | 19.59 | | | $ | 16.73 | | | $ | 16.48 | | | $ | 19.89 | | | $ | 14.52 | | | $ | 16.12 | |
| | | | | | | | | | | | | | | | | | | | | | | | |
| | | | | | |
Total Return(c) | | | | | | | | | | | | | | | | | | | | | | | | |
Based on net asset value | | | 20.45 | % | | | 5.16 | % | | | (9.89 | )% | | | 39.64 | % | | | (7.40 | )%(d) | | | (2.53 | )% |
| | | | | | | | | | | | | | | | | | | | | | | | |
| | | | | | |
Ratios to Average Net Assets(e) | | | | | | | | | | | | | | | | | | | | | | | | |
Total expenses | | | 0.56 | % | | | 0.57 | % | | | 0.61 | % | | | 0.63 | % | | | 0.65 | %(f) | | | 0.75 | % |
| | | | | | | | | | | | | | | | | | | | | | | | |
| | | | | | |
Total expenses after fees waived and/or reimbursed | | | 0.45 | % | | | 0.45 | % | | | 0.45 | % | | | 0.45 | % | | | 0.45 | %(f) | | | 0.54 | % |
| | | | | | | | | | | | | | | | | | | | | | | | |
| | | | | | |
Net investment income | | | 2.71 | % | | | 3.28 | % | | | 2.55 | % | | | 2.65 | % | | | 2.20 | %(f) | | | 3.59 | % |
| | | | | | | | | | | | | | | | | | | | | | | | |
| | | | | | |
Supplemental Data | | | | | | | | | | | | | | | | | | | | | | | | |
Net assets, end of period (000) | | $ | 249,178 | | | $ | 193,748 | | | $ | 103,329 | | | $ | 103,454 | | | $ | 43,073 | | | $ | 43,721 | |
| | | | | | | | | | | | | | | | | | | | | | | | |
| | | | | | |
Portfolio turnover rate | | | 128 | % | | | 128 | % | | | 132 | % | | | 247 | % | | | 131 | % | | | 140 | % |
| | | | | | | | | | | | | | | | | | | | | | | | |
| (a) | Based on average shares outstanding. |
| (b) | Distributions for annual periods determined in accordance with U.S. federal income tax regulations. |
| (c) | Where applicable, assumes the reinvestment of distributions. |
| (e) | Excludes fees and expenses incurred indirectly as a result of investments in underlying funds. |
See notes to financial statements.
| | |
| 44 | | 2 0 2 4 B L A C K R O C K A N N U A L F I N A N C I A L S T A T E M E N T S |
Financial Highlights (continued)
(For a share outstanding throughout each period)
| | | | | | | | | | | | | | | | | | | | | | | | |
| | | BlackRock Advantage International Fund (continued) | |
| | | Class R | |
| | | Year Ended
05/31/24 | | | Year Ended
05/31/23 | | | Year Ended
05/31/22 | | | Year Ended
05/31/21 | | | Period from
10/01/19
to 05/31/20 | | | Year Ended
09/30/19 | |
| | | | | | |
Net asset value, beginning of period | | $ | 16.53 | | | $ | 16.29 | | | $ | 19.68 | | | $ | 14.36 | | | $ | 15.91 | | | $ | 16.74 | |
| | | | | | | | | | | | | | | | | | | | | | | | |
| | | | | | |
Net investment income(a) | | | 0.40 | | | | 0.45 | | | | 0.33 | | | | 0.28 | | | | 0.15 | | | | 0.34 | |
Net realized and unrealized gain (loss) | | | 2.82 | | | | 0.23 | | | | (2.23 | ) | | | 5.26 | | | | (1.34 | ) | | | (0.88 | ) |
| | | | | | | | | | | | | | | | | | | | | | | | |
| | | | | | |
Net increase (decrease) from investment operations | | | 3.22 | | | | 0.68 | | | | (1.90 | ) | | | 5.54 | | | | (1.19 | ) | | | (0.54 | ) |
| | | | | | | | | | | | | | | | | | | | | | | | |
| | | | | | |
Distributions(b) | | | | | | | | | | | | | | | | | | | | | | | | |
From net investment income | | | (0.45 | ) | | | (0.44 | ) | | | (0.52 | ) | | | (0.22 | ) | | | (0.36 | ) | | | (0.29 | ) |
From net realized gain | | | — | | | | — | | | | (0.97 | ) | | | — | | | | — | | | | — | |
| | | | | | | | | | | | | | | | | | | | | | | | |
| | | | | | |
Total distributions | | | (0.45 | ) | | | (0.44 | ) | | | (1.49 | ) | | | (0.22 | ) | | | (0.36 | ) | | | (0.29 | ) |
| | | | | | | | | | | | | | | | | | | | | | | | |
| | | | | | |
Net asset value, end of period | | $ | 19.30 | | | $ | 16.53 | | | $ | 16.29 | | | $ | 19.68 | | | $ | 14.36 | | | $ | 15.91 | |
| | | | | | | | | | | | | | | | | | | | | | | | |
| | | | | | |
Total Return(c) | | | | | | | | | | | | | | | | | | | | | | | | |
Based on net asset value | | | 19.81 | % | | | 4.54 | % | | | (10.42 | )% | | | 38.91 | % | | | (7.75 | )%(d) | | | (3.04 | )% |
| | | | | | | | | | | | | | | | | | | | | | | | |
| | | | | | |
Ratios to Average Net Assets(e) | | | | | | | | | | | | | | | | | | | | | | | | |
Total expenses | | | 1.32 | % | | | 1.33 | % | | | 1.35 | % | | | 1.36 | % | | | 1.37 | %(f) | | | 1.44 | % |
| | | | | | | | | | | | | | | | | | | | | | | | |
| | | | | | |
Total expenses after fees waived and/or reimbursed | | | 1.00 | % | | | 1.00 | % | | | 1.00 | % | | | 1.00 | % | | | 1.00 | %(f) | | | 1.09 | % |
| | | | | | | | | | | | | | | | | | | | | | | | |
| | | | | | |
Net investment income | | | 2.26 | % | | | 2.75 | % | | | 1.81 | % | | | 1.67 | % | | | 1.47 | %(f) | | | 2.20 | % |
| | | | | | | | | | | | | | | | | | | | | | | | |
| | | | | | |
Supplemental Data | | | | | | | | | | | | | | | | | | | | | | | | |
Net assets, end of period (000) | | $ | 35,066 | | | $ | 18,925 | | | $ | 2,753 | | | $ | 3,416 | | | $ | 3,310 | | | $ | 5,244 | |
| | | | | | | | | | | | | | | | | | | | | | | | |
| | | | | | |
Portfolio turnover rate | | | 128 | % | | | 128 | % | | | 132 | % | | | 247 | % | | | 131 | % | | | 140 | % |
| | | | | | | | | | | | | | | | | | | | | | | | |
| (a) | Based on average shares outstanding. |
| (b) | Distributions for annual periods determined in accordance with U.S. federal income tax regulations. |
| (c) | Where applicable, assumes the reinvestment of distributions. |
| (e) | Excludes fees and expenses incurred indirectly as a result of investments in underlying funds. |
See notes to financial statements.
| | |
F I N A N C I A L H I G H L I G H T S | | 45 |
Financial Highlights
(For a share outstanding throughout each period)
| | | | | | | | | | | | | | | | | | | | | | | | |
| | | BlackRock Advantage Large Cap Growth Fund | |
| | | Institutional | |
| | | Year Ended
05/31/24 | | | Year Ended
05/31/23 | | | Year Ended
05/31/22 | | | Year Ended
05/31/21 | | | Period from
10/01/19
to 05/31/20 | | | Year Ended
09/30/19 | |
| | | | | | |
Net asset value, beginning of period | | $ | 19.76 | | | $ | 18.77 | | | $ | 23.33 | | | $ | 18.23 | | | $ | 16.49 | | | $ | 17.89 | |
| | | | | | | | | | | | | | | | | | | | | | | | |
| | | | | | |
Net investment income(a) | | | 0.05 | | | | 0.09 | | | | 0.03 | | | | 0.04 | | | | 0.07 | | | | 0.13 | |
Net realized and unrealized gain (loss) | | | 6.58 | | | | 0.96 | | | | (1.25 | ) | | | 6.59 | | | | 2.40 | | | | (0.22 | ) |
| | | | | | | | | | | | | | | | | | | | | | | | |
| | | | | | |
Net increase (decrease) from investment operations | | | 6.63 | | | | 1.05 | | | | (1.22 | ) | | | 6.63 | | | | 2.47 | | | | (0.09 | ) |
| | | | | | | | | | | | | | | | | | | | | | | | |
| | | | | | |
Distributions(b) | | | | | | | | | | | | | | | | | | | | | | | | |
From net investment income | | | (0.06 | ) | | | (0.06 | ) | | | — | | | | (0.07 | ) | | | (0.14 | ) | | | (0.13 | ) |
From net realized gain | | | (0.16 | ) | | | — | | | | (3.34 | ) | | | (1.46 | ) | | | (0.59 | ) | | | (1.18 | ) |
| | | | | | | | | | | | | | | | | | | | | | | | |
| | | | | | |
Total distributions | | | (0.22 | ) | | | (0.06 | ) | | | (3.34 | ) | | | (1.53 | ) | | | (0.73 | ) | | | (1.31 | ) |
| | | | | | | | | | | | | | | | | | | | | | | | |
| | | | | | |
Net asset value, end of period | | $ | 26.17 | | | $ | 19.76 | | | $ | 18.77 | | | $ | 23.33 | | | $ | 18.23 | | | $ | 16.49 | |
| | | | | | | | | | | | | | | | | | | | | | | | |
| | | | | | |
Total Return(c) | | | | | | | | | | | | | | | | | | | | | | | | |
Based on net asset value | | | 33.74 | %(d) | | | 5.62 | % | | | (7.80 | )% | | | 37.54 | % | | | 15.34 | %(e) | | | 0.41 | % |
| | | | | | | | | | | | | | | | | | | | | | | | |
| | | | | | |
Ratios to Average Net Assets(f) | | | | | | | | | | | | | | | | | | | | | | | | |
Total expenses | | | 0.80 | % | | | 0.75 | % | | | 0.75 | % | | | 0.83 | % | | | 0.86 | %(g) | | | 0.87 | % |
| | | | | | | | | | | | | | | | | | | | | | | | |
| | | | | | |
Total expenses after fees waived and/or reimbursed | | | 0.62 | % | | | 0.61 | % | | | 0.61 | % | | | 0.62 | % | | | 0.62 | %(g) | | | 0.62 | % |
| | | | | | | | | | | | | | | | | | | | | | | | |
| | | | | | |
Net investment income | | | 0.22 | % | | | 0.50 | % | | | 0.15 | % | | | 0.21 | % | | | 0.65 | %(g) | | | 0.82 | % |
| | | | | | | | | | | | | | | | | | | | | | | | |
| | | | | | |
Supplemental Data | | | | | | | | | | | | | | | | | | | | | | | | |
Net assets, end of period (000) | | $ | 639,878 | | | $ | 499,742 | | | $ | 432,076 | | | $ | 125,061 | | | $ | 89,737 | | | $ | 79,564 | |
| | | | | | | | | | | | | | | | | | | | | | | | |
| | | | | | |
Portfolio turnover rate | | | 128 | % | | | 130 | % | | | 130 | % | | | 134 | % | | | 70 | % | | | 154 | % |
| | | | | | | | | | | | | | | | | | | | | | | | |
| (a) | Based on average shares outstanding. |
| (b) | Distributions for annual periods determined in accordance with U.S. federal income tax regulations. |
| (c) | Where applicable, assumes the reinvestment of distributions. |
| (d) | Includes a payment received from an affiliate, which had no impact on the Fund’s total return. |
| (f) | Excludes fees and expenses incurred indirectly as a result of investments in underlying funds. |
See notes to financial statements.
| | |
| 46 | | 2 0 2 4 B L A C K R O C K A N N U A L F I N A N C I A L S T A T E M E N T S |
Financial Highlights (continued)
(For a share outstanding throughout each period)
| | | | | | | | | | | | | | | | | | | | | | | | |
| | | BlackRock Advantage Large Cap Growth Fund (continued) | |
| | | Investor A | |
| | | Year Ended
05/31/24 | | | Year Ended
05/31/23 | | | Year Ended
05/31/22 | | | Year Ended
05/31/21 | | | Period from
10/01/19
to 05/31/20 | | | Year Ended
09/30/19 | |
| | | | | | |
Net asset value, beginning of period | | $ | 18.57 | | | $ | 17.67 | | | $ | 22.13 | | | $ | 17.35 | | | $ | 15.71 | | | $ | 17.11 | |
| | | | | | | | | | | | | | | | | | | | | | | | |
| | | | | | |
Net investment income (loss)(a) | | | (0.01 | ) | | | 0.04 | | | | (0.03 | ) | | | (0.01 | ) | | | 0.04 | | | | 0.09 | |
Net realized and unrealized gain (loss) | | | 6.19 | | | | 0.89 | | | | (1.16 | ) | | | 6.27 | | | | 2.28 | | | | (0.22 | ) |
| | | | | | | | | | | | | | | | | | | | | | | | |
| | | | | | |
Net increase (decrease) from investment operations | | | 6.18 | | | | 0.93 | | | | (1.19 | ) | | | 6.26 | | | | 2.32 | | | | (0.13 | ) |
| | | | | | | | | | | | | | | | | | | | | | | | |
| | | | | | |
Distributions(b) | | | | | | | | | | | | | | | | | | | | | | | | |
From net investment income | | | (0.01 | ) | | | (0.03 | ) | | | — | | | | (0.02 | ) | | | (0.09 | ) | | | (0.09 | ) |
From net realized gain | | | (0.16 | ) | | | — | | | | (3.27 | ) | | | (1.46 | ) | | | (0.59 | ) | | | (1.18 | ) |
| | | | | | | | | | | | | | | | | | | | | | | | |
| | | | | | |
Total distributions | | | (0.17 | ) | | | (0.03 | ) | | | (3.27 | ) | | | (1.48 | ) | | | (0.68 | ) | | | (1.27 | ) |
| | | | | | | | | | | | | | | | | | | | | | | | |
| | | | | | |
Net asset value, end of period | | $ | 24.58 | | | $ | 18.57 | | | $ | 17.67 | | | $ | 22.13 | | | $ | 17.35 | | | $ | 15.71 | |
| | | | | | | | | | | | | | | | | | | | | | | | |
| | | | | | |
Total Return(c) | | | | | | | | | | | | | | | | | | | | | | | | |
Based on net asset value | | | 33.45 | %(d) | | | 5.28 | % | | | (8.05 | )% | | | 37.28 | % | | | 15.16 | %(e) | | | 0.15 | % |
| | | | | | | | | | | | | | | | | | | | | | | | |
| | | | | | |
Ratios to Average Net Assets(f) | | | | | | | | | | | | | | | | | | | | | | | | |
Total expenses | | | 1.01 | % | | | 1.06 | % | | | 1.07 | % | | | 1.08 | % | | | 1.12 | %(g) | | | 1.12 | % |
| | | | | | | | | | | | | | | | | | | | | | | | |
| | | | | | |
Total expenses after fees waived and/or reimbursed | | | 0.87 | % | | | 0.87 | % | | | 0.87 | % | | | 0.87 | % | | | 0.87 | %(g) | | | 0.87 | % |
| | | | | | | | | | | | | | | | | | | | | | | | |
| | | | | | |
Net investment income (loss) | | | (0.03 | )% | | | 0.24 | % | | | (0.16 | )% | | | (0.04 | )% | | | 0.40 | %(g) | | | 0.57 | % |
| | | | | | | | | | | | | | | | | | | | | | | | |
| | | | | | |
Supplemental Data | | | | | | | | | | | | | | | | | | | | | | | | |
Net assets, end of period (000) | | $ | 548,827 | | | $ | 441,983 | | | $ | 452,791 | | | $ | 909,344 | | | $ | 713,162 | | | $ | 699,247 | |
| | | | | | | | | | | | | | | | | | | | | | | | |
| | | | | | |
Portfolio turnover rate | | | 128 | % | | | 130 | % | | | 130 | % | | | 134 | % | | | 70 | % | | | 154 | % |
| | | | | | | | | | | | | | | | | | | | | | | | |
| (a) | Based on average shares outstanding. |
| (b) | Distributions for annual periods determined in accordance with U.S. federal income tax regulations. |
| (c) | Where applicable, excludes the effects of any sales charges and assumes the reinvestment of distributions. |
| (d) | Includes a payment received from an affiliate, which had no impact on the Fund’s total return. |
| (f) | Excludes fees and expenses incurred indirectly as a result of investments in underlying funds. |
See notes to financial statements.
| | |
F I N A N C I A L H I G H L I G H T S | | 47 |
Financial Highlights (continued)
(For a share outstanding throughout each period)
| | | | | | | | | | | | | | | | | | | | | | | | |
| | | BlackRock Advantage Large Cap Growth Fund (continued) | |
| | | Investor C | |
| | | Year Ended
05/31/24 | | | Year Ended
05/31/23 | | | Year Ended
05/31/22 | | | Year Ended
05/31/21 | | | Period from
10/01/19
to 05/31/20 | | | Year Ended
09/30/19 | |
| | | | | | |
Net asset value, beginning of period | | $ | 14.88 | | | $ | 14.24 | | | $ | 18.42 | | | $ | 14.67 | | | $ | 13.35 | | | $ | 14.55 | |
| | | | | | | | | | | | | | | | | | | | | | | | |
| | | | | | |
Net investment loss(a) | | | (0.14 | ) | | | (0.07 | ) | | | (0.16 | ) | | | (0.13 | ) | | | (0.03 | ) | | | (0.03 | ) |
Net realized and unrealized gain (loss) | | | 4.94 | | | | 0.71 | | | | (0.87 | ) | | | 5.27 | | | | 1.93 | | | | (0.17 | ) |
| | | | | | | | | | | | | | | | | | | | | | | | |
| | | | | | |
Net increase (decrease) from investment operations | | | 4.80 | | | | 0.64 | | | | (1.03 | ) | | | 5.14 | | | | 1.90 | | | | (0.20 | ) |
| | | | | | | | | | | | | | | | | | | | | | | | |
| | | | | | |
Distributions from net realized gain(b) | | | (0.16 | ) | | | — | | | | (3.15 | ) | | | (1.39 | ) | | | (0.58 | ) | | | (1.00 | ) |
| | | | | | | | | | | | | | | | | | | | | | | | |
| | | | | | |
Net asset value, end of period | | $ | 19.52 | | | $ | 14.88 | | | $ | 14.24 | | | $ | 18.42 | | | $ | 14.67 | | | $ | 13.35 | |
| | | | | | | | | | | | | | | | | | | | | | | | |
| | | | | | |
Total Return(c) | | | | | | | | | | | | | | | | | | | | | | | | |
Based on net asset value | | | 32.46 | %(d) | | | 4.50 | % | | | (8.74 | )% | | | 36.25 | % | | | 14.56 | %(e) | | | (0.59 | )% |
| | | | | | | | | | | | | | | | | | | | | | | | |
| | | | | | |
Ratios to Average Net Assets(f) | | | | | | | | | | | | | | | | | | | | | | | | |
Total expenses | | | 1.83 | % | | | 1.87 | % | | | 1.83 | % | | | 1.84 | % | | | 1.83 | %(g) | | | 1.85 | % |
| | | | | | | | | | | | | | | | | | | | | | | | |
| | | | | | |
Total expenses after fees waived and/or reimbursed | | | 1.62 | % | | | 1.62 | % | | | 1.62 | % | | | 1.62 | % | | | 1.62 | %(g) | | | 1.62 | % |
| | | | | | | | | | | | | | | | | | | | | | | | |
| | | | | | |
Net investment loss | | | (0.79 | )% | | | (0.51 | )% | | | (0.89 | )% | | | (0.78 | )% | | | (0.35 | )%(g) | | | (0.22 | )% |
| | | | | | | | | | | | | | | | | | | | | | | | |
| | | | | | |
Supplemental Data | | | | | | | | | | | | | | | | | | | | | | | | |
Net assets, end of period (000) | | $ | 30,540 | | | $ | 8,372 | | | $ | 10,162 | | | $ | 12,989 | | | $ | 14,728 | | | $ | 15,277 | |
| | | | | | | | | | | | | | | | | | | | | | | | |
| | | | | | |
Portfolio turnover rate | | | 128 | % | | | 130 | % | | | 130 | % | | | 134 | % | | | 70 | % | | | 154 | % |
| | | | | | | | | | | | | | | | | | | | | | | | |
| (a) | Based on average shares outstanding. |
| (b) | Distributions for annual periods determined in accordance with U.S. federal income tax regulations. |
| (c) | Where applicable, excludes the effects of any sales charges and assumes the reinvestment of distributions. |
| (d) | Includes a payment received from an affiliate, which had no impact on the Fund’s total return. |
| (f) | Excludes fees and expenses incurred indirectly as a result of investments in underlying funds. |
See notes to financial statements.
| | |
| 48 | | 2 0 2 4 B L A C K R O C K A N N U A L F I N A N C I A L S T A T E M E N T S |
Financial Highlights (continued)
(For a share outstanding throughout each period)
| | | | | | | | | | | | | | | | | | | | | | | | |
| | | BlackRock Advantage Large Cap Growth Fund (continued) | |
| | | Class K | |
| | | Year Ended
05/31/24 | | | Year Ended
05/31/23 | | | Year Ended
05/31/22 | | | Year Ended
05/31/21 | | | Period from
10/01/19
to 05/31/20 | | | Year Ended
09/30/19 | |
| | | | | | |
Net asset value, beginning of period | | $ | 19.76 | | | $ | 18.77 | | | $ | 23.33 | | | $ | 18.23 | | | $ | 16.49 | | | $ | 17.89 | |
| | | | | | | | | | | | | | | | | | | | | | | | |
| | | | | | |
Net investment income(a) | | | 0.06 | | | | 0.10 | | | | 0.04 | | | | 0.05 | | | | 0.08 | | | | 0.14 | |
Net realized and unrealized gain (loss) | | | 6.58 | | | | 0.95 | | | | (1.25 | ) | | | 6.59 | | | | 2.40 | | | | (0.23 | ) |
| | | | | | | | | | | | | | | | | | | | | | | | |
| | | | | | |
Net increase (decrease) from investment operations | | | 6.64 | | | | 1.05 | | | | (1.21 | ) | | | 6.64 | | | | 2.48 | | | | (0.09 | ) |
| | | | | | | | | | | | | | | | | | | | | | | | |
| | | | | | |
Distributions(b) | | | | | | | | | | | | | | | | | | | | | | | | |
From net investment income | | | (0.07 | ) | | | (0.06 | ) | | | — | | | | (0.08 | ) | | | (0.15 | ) | | | (0.13 | ) |
From net realized gain | | | (0.16 | ) | | | — | | | | (3.35 | ) | | | (1.46 | ) | | | (0.59 | ) | | | (1.18 | ) |
| | | | | | | | | | | | | | | | | | | | | | | | |
| | | | | | |
Total distributions | | | (0.23 | ) | | | (0.06 | ) | | | (3.35 | ) | | | (1.54 | ) | | | (0.74 | ) | | | (1.31 | ) |
| | | | | | | | | | | | | | | | | | | | | | | | |
| | | | | | |
Net asset value, end of period | | $ | 26.17 | | | $ | 19.76 | | | $ | 18.77 | | | $ | 23.33 | | | $ | 18.23 | | | $ | 16.49 | |
| | | | | | | | | | | | | | | | | | | | | | | | |
| | | | | | |
Total Return(c) | | | | | | | | | | | | | | | | | | | | | | | | |
Based on net asset value | | | 33.81 | %(d) | | | 5.63 | % | | | (7.76 | )% | | | 37.60 | % | | | 15.40 | %(e) | | | 0.47 | % |
| | | | | | | | | | | | | | | | | | | | | | | | |
| | | | | | |
Ratios to Average Net Assets(f) | | | | | | | | | | | | | | | | | | | | | | | | |
Total expenses | | | 0.67 | % | | | 0.69 | % | | | 0.69 | % | | | 0.69 | % | | | 0.70 | %(g) | | | 0.71 | % |
| | | | | | | | | | | | | | | | | | | | | | | | |
| | | | | | |
Total expenses after fees waived and/or reimbursed | | | 0.57 | % | | | 0.57 | % | | | 0.57 | % | | | 0.57 | % | | | 0.57 | %(g) | | | 0.57 | % |
| | | | | | | | | | | | | | | | | | | | | | | | |
| | | | | | |
Net investment income | | | 0.27 | % | | | 0.53 | % | | | 0.18 | % | | | 0.25 | % | | | 0.72 | %(g) | | | 0.85 | % |
| | | | | | | | | | | | | | | | | | | | | | | | |
| | | | | | |
Supplemental Data | | | | | | | | | | | | | | | | | | | | | | | | |
Net assets, end of period (000) | | $ | 5,855 | | | $ | 2,489 | | | $ | 2,177 | | | $ | 1,152 | | | $ | 715 | | | $ | 973 | |
| | | | | | | | | | | | | | | | | | | | | | | | |
| | | | | | |
Portfolio turnover rate | | | 128 | % | | | 130 | % | | | 130 | % | | | 134 | % | | | 70 | % | | | 154 | % |
| | | | | | | | | | | | | | | | | | | | | | | | |
| (a) | Based on average shares outstanding. |
| (b) | Distributions for annual periods determined in accordance with U.S. federal income tax regulations. |
| (c) | Where applicable, assumes the reinvestment of distributions. |
| (d) | Includes a payment received from an affiliate, which had no impact on the Fund’s total return. |
| (f) | Excludes fees and expenses incurred indirectly as a result of investments in underlying funds. |
See notes to financial statements.
| | |
F I N A N C I A L H I G H L I G H T S | | 49 |
Financial Highlights (continued)
(For a share outstanding throughout each period)
| | | | | | | | | | | | | | | | | | | | | | | | |
| | | BlackRock Advantage Large Cap Growth Fund (continued) | |
| | | Class R | |
| | | Year Ended
05/31/24 | | | Year Ended
05/31/23 | | | Year Ended
05/31/22 | | | Year Ended
05/31/21 | | | Period from
10/01/19
to 05/31/20 | | | Year Ended
09/30/19 | |
| | | | | | |
Net asset value, beginning of period | | $ | 19.57 | | | $ | 18.64 | | | $ | 23.17 | | | $ | 18.10 | | | $ | 16.32 | | | $ | 17.69 | |
| | | | | | | | | | | | | | | | | | | | | | | | |
| | | | | | |
Net investment income (loss)(a) | | | (0.06 | ) | | | (0.00 | )(b) | | | (0.09 | ) | | | (0.06 | ) | | | 0.02 | | | | 0.05 | |
Net realized and unrealized gain (loss) | | | 6.51 | | | | 0.94 | | | | (1.25 | ) | | | 6.55 | | | | 2.38 | | | | (0.23 | ) |
| | | | | | | | | | | | | | | | | | | | | | | | |
| | | | | | |
Net increase (decrease) from investment operations | | | 6.45 | | | | 0.94 | | | | (1.34 | ) | | | 6.49 | | | | 2.40 | | | | (0.18 | ) |
| | | | | | | | | | | | | | | | | | | | | | | | |
| | | | | | |
Distributions(c) | | | | | | | | | | | | | | | | | | | | | | | | |
From net investment income | | | — | | | | (0.01 | ) | | | — | | | | — | | | | (0.03 | ) | | | (0.01 | ) |
From net realized gain | | | (0.16 | ) | | | — | | | | (3.19 | ) | | | (1.42 | ) | | | (0.59 | ) | | | (1.18 | ) |
| | | | | | | | | | | | | | | | | | | | | | | | |
| | | | | | |
Total distributions | | | (0.16 | ) | | | (0.01 | ) | | | (3.19 | ) | | | (1.42 | ) | | | (0.62 | ) | | | (1.19 | ) |
| | | | | | | | | | | | | | | | | | | | | | | | |
| | | | | | |
Net asset value, end of period | | $ | 25.86 | | | $ | 19.57 | | | $ | 18.64 | | | $ | 23.17 | | | $ | 18.10 | | | $ | 16.32 | |
| | | | | | | | | | | | | | | | | | | | | | | | |
| | | | | | |
Total Return(d) | | | | | | | | | | | | | | | | | | | | | | | | |
Based on net asset value | | | 33.12 | %(e) | | | 5.03 | % | | | (8.28 | )% | | | 36.93 | % | | | 14.99 | %(f) | | | (0.15 | )% |
| | | | | | | | | | | | | | | | | | | | | | | | |
| | | | | | |
Ratios to Average Net Assets(g) | | | | | | | | | | | | | | | | | | | | | | | | |
Total expenses | | | 1.40 | % | | | 1.42 | % | | | 1.50 | % | | | 1.36 | % | | | 1.46 | %(h) | | | 1.42 | % |
| | | | | | | | | | | | | | | | | | | | | | | | |
| | | | | | |
Total expenses after fees waived and/or reimbursed | | | 1.12 | % | | | 1.12 | % | | | 1.12 | % | | | 1.12 | % | | | 1.12 | %(h) | | | 1.12 | % |
| | | | | | | | | | | | | | | | | | | | | | | | |
| | | | | | |
Net investment income (loss) | | | (0.28 | )% | | | (0.03 | )% | | | (0.39 | )% | | | (0.30 | )% | | | 0.16 | %(h) | | | 0.33 | % |
| | | | | | | | | | | | | | | | | | | | | | | | |
| | | | | | |
Supplemental Data | | | | | | | | | | | | | | | | | | | | | | | | |
Net assets, end of period (000) | | $ | 1,561 | | | $ | 530 | | | $ | 349 | | | $ | 577 | | | $ | 536 | | | $ | 867 | |
| | | | | | | | | | | | | | | | | | | | | | | | |
| | | | | | |
Portfolio turnover rate | | | 128 | % | | | 130 | % | | | 130 | % | | | 134 | % | | | 70 | % | | | 154 | % |
| | | | | | | | | | | | | | | | | | | | | | | | |
| (a) | Based on average shares outstanding. |
| (b) | Amount is less than $0.005 per share. |
| (c) | Distributions for annual periods determined in accordance with U.S. federal income tax regulations. |
| (d) | Where applicable, assumes the reinvestment of distributions. |
| (e) | Includes a payment received from an affiliate, which had no impact on the Fund’s total return. |
| (g) | Excludes fees and expenses incurred indirectly as a result of investments in underlying funds. |
See notes to financial statements.
| | |
| 50 | | 2 0 2 4 B L A C K R O C K A N N U A L F I N A N C I A L S T A T E M E N T S |
Financial Highlights
(For a share outstanding throughout each period)
| | | | | | | | | | | | | | | | | | | | |
| | | BlackRock Advantage Small Cap Core Fund | |
| | | Institutional | |
| | | Year Ended
05/31/24 | | | Year Ended
05/31/23 | | | Year Ended
05/31/22 | | | Year Ended
05/31/21 | | | Year Ended
05/31/20 | |
| | | | | |
Net asset value, beginning of year | | $ | 14.06 | | | $ | 15.35 | | | $ | 20.72 | | | $ | 13.09 | | | $ | 13.13 | |
| | | | | | | | | | | | | | | | | | | | |
| | | | | |
Net investment income(a) | | | 0.14 | | | | 0.14 | | | | 0.13 | | | | 0.12 | | | | 0.14 | |
Net realized and unrealized gain (loss) | | | 3.31 | | | | (1.02 | ) | | | (3.28 | ) | | | 7.97 | | | | (0.05 | ) |
| | | | | | | | | | | | | | | | | | | | |
| | | | | |
Net increase (decrease) from investment operations | | | 3.45 | | | | (0.88 | ) | | | (3.15 | ) | | | 8.09 | | | | 0.09 | |
| | | | | | | | | | | | | | | | | | | | |
| | | | | |
Distributions(b) | | | | | | | | | | | | | | | | | | | | |
From net investment income | | | (0.16 | ) | | | (0.12 | ) | | | (0.14 | ) | | | (0.10 | ) | | | (0.13 | ) |
From net realized gain | | | — | | | | (0.29 | ) | | | (2.08 | ) | | | (0.36 | ) | | | (0.00 | )(c) |
| | | | | | | | | | | | | | | | | | | | |
| | | | | |
Total distributions | | | (0.16 | ) | | | (0.41 | ) | | | (2.22 | ) | | | (0.46 | ) | | | (0.13 | ) |
| | | | | | | | | | | | | | | | | | | | |
| | | | | |
Net asset value, end of year | | $ | 17.35 | | | $ | 14.06 | | | $ | 15.35 | | | $ | 20.72 | | | $ | 13.09 | |
| | | | | | | | | | | | | | | | | | | | |
| | | | | |
Total Return(d) | | | | | | | | | | | | | | | | | | | | |
Based on net asset value | | | 24.68 | % | | | (5.75 | )% | | | (16.89 | )% | | | 62.61 | % | | | 0.61 | % |
| | | | | | | | | | | | | | | | | | | | |
| | | | | |
Ratios to Average Net Assets(e) | | | | | | | | | | | | | | | | | | | | |
Total expenses | | | 0.57 | % | | | 0.59 | % | | | 0.59 | % | | | 0.60 | % | | | 0.64 | % |
| | | | | | | | | | | | | | | | | | | | |
| | | | | |
Total expenses after fees waived and/or reimbursed | | | 0.50 | % | | | 0.50 | % | | | 0.50 | % | | | 0.50 | % | | | 0.50 | % |
| | | | | | | | | | | | | | | | | | | | |
| | | | | |
Net investment income | | | 0.86 | % | | | 0.93 | % | | | 0.69 | % | | | 0.65 | % | | | 0.99 | % |
| | | | | | | | | | | | | | | | | | | | |
| | | | | |
Supplemental Data | | | | | | | | | | | | | | | | | | | | |
Net assets, end of year (000) | | $ | 2,020,581 | | | $ | 2,152,757 | | | $ | 2,501,959 | | | $ | 2,802,145 | | | $ | 847,753 | |
| | | | | | | | | | | | | | | | | | | | |
| | | | | |
Portfolio turnover rate | | | 75 | % | | | 93 | % | | | 81 | % | | | 63 | % | | | 101 | % |
| | | | | | | | | | | | | | | | | | | | |
| (a) | Based on average shares outstanding. |
| (b) | Distributions for annual periods determined in accordance with U.S. federal income tax regulations. |
| (c) | Amount is greater than $(0.005) per share. |
| (d) | Where applicable, assumes the reinvestment of distributions. |
| (e) | Excludes fees and expenses incurred indirectly as a result of investments in underlying funds. |
See notes to financial statements.
| | |
F I N A N C I A L H I G H L I G H T S | | 51 |
Financial Highlights (continued)
(For a share outstanding throughout each period)
| | | | | | | | | | | | | | | | | | | | |
| | | BlackRock Advantage Small Cap Core Fund (continued) | |
| | | Investor A | |
| | | Year Ended
05/31/24 | | | Year Ended
05/31/23 | | | Year Ended
05/31/22 | | | Year Ended
05/31/21 | | | Year Ended
05/31/20 | |
| | | | | |
Net asset value, beginning of year | | $ | 13.96 | | | $ | 15.24 | | | $ | 20.58 | | | $ | 13.02 | | | $ | 13.05 | |
| | | | | | | | | | | | | | | | | | | | |
| | | | | |
Net investment income(a) | | | 0.09 | | | | 0.10 | | | | 0.08 | | | | 0.08 | | | | 0.10 | |
Net realized and unrealized gain (loss) | | | 3.30 | | | | (1.01 | ) | | | (3.25 | ) | | | 7.91 | | | | (0.03 | ) |
| | | | | | | | | | | | | | | | | | | | |
| | | | | |
Net increase (decrease) from investment operations | | | 3.39 | | | | (0.91 | ) | | | (3.17 | ) | | | 7.99 | | | | 0.07 | |
| | | | | | | | | | | | | | | | | | | | |
| | | | | |
Distributions(b) | | | | | | | | | | | | | | | | | | | | |
From net investment income | | | (0.12 | ) | | | (0.08 | ) | | | (0.09 | ) | | | (0.07 | ) | | | (0.10 | ) |
From net realized gain | | | — | | | | (0.29 | ) | | | (2.08 | ) | | | (0.36 | ) | | | (0.00 | )(c) |
| | | | | | | | | | | | | | | | | | | | |
| | | | | |
Total distributions | | | (0.12 | ) | | | (0.37 | ) | | | (2.17 | ) | | | (0.43 | ) | | | (0.10 | ) |
| | | | | | | | | | | | | | | | | | | | |
| | | | | |
Net asset value, end of year | | $ | 17.23 | | | $ | 13.96 | | | $ | 15.24 | | | $ | 20.58 | | | $ | 13.02 | |
| | | | | | | | | | | | | | | | | | | | |
| | | | | |
Total Return(d) | | | | | | | | | | | | | | | | | | | | |
Based on net asset value | | | 24.42 | % | | | (5.98 | )% | | | (17.08 | )% | | | 62.05 | % | | | 0.45 | % |
| | | | | | | | | | | | | | | | | | | | |
| | | | | |
Ratios to Average Net Assets(e) | | | | | | | | | | | | | | | | | | | | |
Total expenses | | | 0.93 | % | | | 0.93 | % | | | 0.92 | % | | | 0.95 | % | | | 1.01 | % |
| | | | | | | | | | | | | | | | | | | | |
| | | | | |
Total expenses after fees waived and/or reimbursed | | | 0.75 | % | | | 0.75 | % | | | 0.75 | % | | | 0.75 | % | | | 0.75 | % |
| | | | | | | | | | | | | | | | | | | | |
| | | | | |
Net investment income | | | 0.59 | % | | | 0.67 | % | | | 0.44 | % | | | 0.45 | % | | | 0.75 | % |
| | | | | | | | | | | | | | | | | | | | |
| | | | | |
Supplemental Data | | | | | | | | | | | | | | | | | | | | |
Net assets, end of year (000) | | $ | 382,878 | | | $ | 315,694 | | | $ | 358,594 | | | $ | 530,664 | | | $ | 277,926 | |
| | | | | | | | | | | | | | | | | | | | |
| | | | | |
Portfolio turnover rate | | | 75 | % | | | 93 | % | | | 81 | % | | | 63 | % | | | 101 | % |
| | | | | | | | | | | | | | | | | | | | |
| (a) | Based on average shares outstanding. |
| (b) | Distributions for annual periods determined in accordance with U.S. federal income tax regulations. |
| (c) | Amount is greater than $(0.005) per share. |
| (d) | Where applicable, excludes the effects of any sales charges and assumes the reinvestment of distributions. |
| (e) | Excludes fees and expenses incurred indirectly as a result of investments in underlying funds. |
See notes to financial statements.
| | |
| 52 | | 2 0 2 4 B L A C K R O C K A N N U A L F I N A N C I A L S T A T E M E N T S |
Financial Highlights (continued)
(For a share outstanding throughout each period)
| | | | | | | | | | | | | | | | | | | | |
| | | BlackRock Advantage Small Cap Core Fund (continued) | |
| | | Investor C | |
| | | Year Ended
05/31/24 | | | Year Ended
05/31/23 | | | Year Ended
05/31/22 | | | Year Ended
05/31/21 | | | Year Ended
05/31/20 | |
| | | | | |
Net asset value, beginning of year | | $ | 13.50 | | | $ | 14.80 | | | $ | 20.08 | | | $ | 12.74 | | | $ | 12.80 | |
| | | | | | | | | | | | | | | | | | | | |
| | | | | |
Net investment income (loss)(a) | | | (0.03 | ) | | | (0.01 | ) | | | (0.05 | ) | | | (0.05 | ) | | | 0.00 | (b) |
Net realized and unrealized gain (loss) | | | 3.20 | | | | (0.98 | ) | | | (3.18 | ) | | | 7.74 | | | | (0.04 | ) |
| | | | | | | | | | | | | | | | | | | | |
| | | | | |
Net increase (decrease) from investment operations | | | 3.17 | | | | (0.99 | ) | | | (3.23 | ) | | | 7.69 | | | | (0.04 | ) |
| | | | | | | | | | | | | | | | | | | | |
| | | | | |
Distributions(c) | | | | | | | | | | | | | | | | | | | | |
From net investment income | | | (0.03 | ) | | | (0.02 | ) | | | — | | | | — | | | | (0.02 | ) |
From net realized gain | | | — | | | | (0.29 | ) | | | (2.05 | ) | | | (0.35 | ) | | | (0.00 | )(d) |
| | | | | | | | | | | | | | | | | | | | |
| | | | | |
Total distributions | | | (0.03 | ) | | | (0.31 | ) | | | (2.05 | ) | | | (0.35 | ) | | | (0.02 | ) |
| | | | | | | | | | | | | | | | | | | | |
| | | | | |
Net asset value, end of year | | $ | 16.64 | | | $ | 13.50 | | | $ | 14.80 | | | $ | 20.08 | | | $ | 12.74 | |
| | | | | | | | | | | | | | | | | | | | |
| | | | | |
Total Return(e) | | | | | | | | | | | | | | | | | | | | |
Based on net asset value | | | 23.55 | % | | | (6.70 | )% | | | (17.74 | )% | | | 60.90 | % | | | (0.33 | )% |
| | | | | | | | | | | | | | | | | | | | |
| | | | | |
Ratios to Average Net Assets(f) | | | | | | | | | | | | | | | | | | | | |
Total expenses | | | 1.71 | % | | | 1.69 | % | | | 1.64 | % | | | 1.70 | % | | | 1.71 | % |
| | | | | | | | | | | | | | | | | | | | |
| | | | | |
Total expenses after fees waived and/or reimbursed | | | 1.50 | % | | | 1.50 | % | | | 1.50 | % | | | 1.50 | % | | | 1.50 | % |
| | | | | | | | | | | | | | | | | | | | |
| | | | | |
Net investment income (loss) | | | (0.18 | )% | | | (0.07 | )% | | | (0.30 | )% | | | (0.32 | )% | | | 0.01 | % |
| | | | | | | | | | | | | | | | | | | | |
| | | | | |
Supplemental Data | | | | | | | | | | | | | | | | | | | | |
Net assets, end of year (000) | | $ | 11,679 | | | $ | 9,276 | | | $ | 10,969 | | | $ | 12,880 | | | $ | 4,955 | |
| | | | | | | | | | | | | | | | | | | | |
| | | | | |
Portfolio turnover rate | | | 75 | % | | | 93 | % | | | 81 | % | | | 63 | % | | | 101 | % |
| | | | | | | | | | | | | | | | | | | | |
| (a) | Based on average shares outstanding. |
| (b) | Amount is less than $0.005 per share. |
| (c) | Distributions for annual periods determined in accordance with U.S. federal income tax regulations. |
| (d) | Amount is greater than $(0.005) per share. |
| (e) | Where applicable, excludes the effects of any sales charges and assumes the reinvestment of distributions. |
| (f) | Excludes fees and expenses incurred indirectly as a result of investments in underlying funds. |
See notes to financial statements.
| | |
F I N A N C I A L H I G H L I G H T S | | 53 |
Financial Highlights (continued)
(For a share outstanding throughout each period)
| | | | | | | | | | | | | | | | | | | | |
| | | BlackRock Advantage Small Cap Core Fund (continued) | |
| | | Class K | |
| | | Year Ended
05/31/24 | | | Year Ended
05/31/23 | | | Year Ended
05/31/22 | | | Year Ended
05/31/21 | | | Year Ended
05/31/20 | |
| | | | | |
Net asset value, beginning of year | | $ | 14.07 | | | $ | 15.36 | | | $ | 20.73 | | | $ | 13.10 | | | $ | 13.13 | |
| | | | | | | | | | | | | | | | | | | | |
| | | | | |
Net investment income(a) | | | 0.14 | | | | 0.14 | | | | 0.13 | | | | 0.13 | | | | 0.14 | |
Net realized and unrealized gain (loss) | | | 3.33 | | | | (1.02 | ) | | | (3.27 | ) | | | 7.97 | | | | (0.03 | ) |
| | | | | | | | | | | | | | | | | | | | |
| | | | | |
Net increase (decrease) from investment operations | | | 3.47 | | | | (0.88 | ) | | | (3.14 | ) | | | 8.10 | | | | 0.11 | |
| | | | | | | | | | | | | | | | | | | | |
| | | | | |
Distributions(b) | | | | | | | | | | | | | | | | | | | | |
From net investment income | | | (0.17 | ) | | | (0.12 | ) | | | (0.15 | ) | | | (0.11 | ) | | | (0.14 | ) |
From net realized gain | | | — | | | | (0.29 | ) | | | (2.08 | ) | | | (0.36 | ) | | | (0.00 | )(c) |
| | | | | | | | | | | | | | | | | | | | |
| | | | | |
Total distributions | | | (0.17 | ) | | | (0.41 | ) | | | (2.23 | ) | | | (0.47 | ) | | | (0.14 | ) |
| | | | | | | | | | | | | | | | | | | | |
| | | | | |
Net asset value, end of year | | $ | 17.37 | | | $ | 14.07 | | | $ | 15.36 | | | $ | 20.73 | | | $ | 13.10 | |
| | | | | | | | | | | | | | | | | | | | |
| | | | | |
Total Return(d) | | | | | | | | | | | | | | | | | | | | |
Based on net asset value | | | 24.80 | % | | | (5.70 | )% | | | (16.84 | )% | | | 62.63 | % | | | 0.73 | % |
| | | | | | | | | | | | | | | | | | | | |
| | | | | |
Ratios to Average Net Assets(e) | | | | | | | | | | | | | | | | | | | | |
Total expenses | | | 0.51 | % | | | 0.51 | % | | | 0.51 | % | | | 0.52 | % | | | 0.56 | % |
| | | | | | | | | | | | | | | | | | | | |
| | | | | |
Total expenses after fees waived and/or reimbursed | | | 0.45 | % | | | 0.45 | % | | | 0.45 | % | | | 0.45 | % | | | 0.45 | % |
| | | | | | | | | | | | | | | | | | | | |
| | | | | |
Net investment income | | | 0.89 | % | | | 0.97 | % | | | 0.73 | % | | | 0.71 | % | | | 0.99 | % |
| | | | | | | | | | | | | | | | | | | | |
| | | | | |
Supplemental Data | | | | | | | | | | | | | | | | | | | | |
Net assets, end of year (000) | | $ | 1,099,659 | | | $ | 964,449 | | | $ | 967,682 | | | $ | 920,752 | | | $ | 188,885 | |
| | | | | | | | | | | | | | | | | | | | |
| | | | | |
Portfolio turnover rate | | | 75 | % | | | 93 | % | | | 81 | % | | | 63 | % | | | 101 | % |
| | | | | | | | | | | | | | | | | | | | |
| (a) | Based on average shares outstanding. |
| (b) | Distributions for annual periods determined in accordance with U.S. federal income tax regulations. |
| (c) | Amount is greater than $(0.005) per share. |
| (d) | Where applicable, assumes the reinvestment of distributions. |
| (e) | Excludes fees and expenses incurred indirectly as a result of investments in underlying funds. |
See notes to financial statements.
| | |
| 54 | | 2 0 2 4 B L A C K R O C K A N N U A L F I N A N C I A L S T A T E M E N T S |
Financial Highlights
(For a share outstanding throughout each period)
| | | | | | | | | | | | | | | | | | | | | | | | |
| | | BlackRock Advantage Large Cap Core Fund | |
| | | Institutional | |
| | | Year Ended
05/31/24 | | | Year Ended
05/31/23 | | | Period from
10/01/21
to 05/31/22 | | | Year Ended
09/30/21 | | | Year Ended
09/30/20 | | | Year Ended
09/30/19 | |
| | | | | | |
Net asset value, beginning of period | | $ | 17.36 | | | $ | 18.39 | | | $ | 23.32 | | | $ | 18.78 | | | $ | 16.87 | | | $ | 18.18 | |
| | | | | | | | | | | | | | | | | | | | | | | | |
| | | | | | |
Net investment income(a) | | | 0.19 | | | | 0.20 | | | | 0.13 | | | | 0.19 | | | | 0.22 | | | | 0.25 | |
Net realized and unrealized gain (loss) | | | 5.06 | | | | (0.18 | ) | | | (0.87 | ) | | | 5.31 | | | | 2.41 | | | | (0.13 | ) |
| | | | | | | | | | | | | | | | | | | | | | | | |
| | | | | | |
Net increase (decrease) from investment operations | | | 5.25 | | | | 0.02 | | | | (0.74 | ) | | | 5.50 | | | | 2.63 | | | | 0.12 | |
| | | | | | | | | | | | | | | | | | | | | | | | |
| | | | | | |
Distributions(b) | | | | | | | | | | | | | | | | | | | | | | | | |
From net investment income | | | (0.19 | ) | | | (0.20 | ) | | | (0.19 | ) | | | (0.22 | ) | | | (0.29 | ) | | | (0.20 | ) |
From net realized gain | | | — | | | | (0.85 | ) | | | (4.00 | ) | | | (0.74 | ) | | | (0.43 | ) | | | (1.23 | ) |
| | | | | | | | | | | | | | | | | | | | | | | | |
| | | | | | |
Total distributions | | | (0.19 | ) | | | (1.05 | ) | | | (4.19 | ) | | | (0.96 | ) | | | (0.72 | ) | | | (1.43 | ) |
| | | | | | | | | | | | | | | | | | | | | | | | |
| | | | | | |
Net asset value, end of period | | $ | 22.42 | | | $ | 17.36 | | | $ | 18.39 | | | $ | 23.32 | | | $ | 18.78 | | | $ | 16.87 | |
| | | | | | | | | | | | | | | | | | | | | | | | |
| | | | | | |
Total Return(c) | | | | | | | | | | | | | | | | | | | | | | | | |
Based on net asset value | | | 30.47 | % | | | 0.63 | % | | | (5.20 | )%(d) | | | 30.31 | % | | | 15.96 | % | | | 1.41 | % |
| | | | | | | | | | | | | | | | | | | | | | | | |
| | | | | | |
Ratios to Average Net Assets(e) | | | | | | | | | | | | | | | | | | | | | | | | |
Total expenses | | | 0.63 | % | | | 0.63 | % | | | 0.61 | %(f)(g) | | | 0.68 | %(h) | | | 0.84 | %(i) | | | 0.82 | %(i) |
| | | | | | | | | | | | | | | | | | | | | | | | |
| | | | | | |
Total expenses after fees waived and/or reimbursed | | | 0.48 | % | | | 0.48 | % | | | 0.48 | %(f)(g) | | | 0.48 | %(h) | | | 0.48 | %(i) | | | 0.47 | %(i) |
| | | | | | | | | | | | | | | | | | | | | | | | |
| | | | | | |
Net investment income | | | 0.95 | % | | | 1.17 | % | | | 0.92 | %(f)(g) | | | 0.87 | %(h) | | | 1.29 | %(i) | | | 1.54 | %(i) |
| | | | | | | | | | | | | | | | | | | | | | | | |
| | | | | | |
Supplemental Data | | | | | | | | | | | | | | | | | | | | | | | | |
Net assets, end of period (000) | | $ | 1,193,777 | | | $ | 1,479,014 | | | $ | 1,547,621 | | | $ | 1,721,850 | | | $ | 1,399,612 | | | $ | 1,325,232 | |
| | | | | | | | | | | | | | | | | | | | | | | | |
| | | | | | |
Portfolio turnover rate(j) | | | 116 | % | | | 105 | % | | | 73 | % | | | 111 | % | | | 99 | % | | | 151 | % |
| | | | | | | | | | | | | | | | | | | | | | | | |
| (a) | Based on average shares outstanding. |
| (b) | Distributions for annual periods determined in accordance with U.S. federal income tax regulations. |
| (c) | Where applicable, assumes the reinvestment of distributions. |
| (e) | Excludes fees and expenses incurred indirectly as a result of investments in underlying funds. |
| (g) | From October 1, 2021 through April 25, 2022, the Fund invested in the Master Portfolio as part of a master-feeder structure and received its corresponding allocated fees waived and expenses and/or net investment income from the Master Portfolio. Includes the Fund’s share of the Master Portfolio’s allocated fees waived of 0.01%. |
| (h) | Includes the Fund’s share of the Master Portfolio’s allocated expenses and/or net investment income. Includes the Fund’s share of the Master Portfolio’s allocated fees waived of less than 0.01%. |
| (i) | Includes the Fund’s share of the Master Portfolio’s allocated expenses and/or net investment income. Includes the Fund’s share of the Master Portfolio’s allocated fees waived of 0.01%. |
| (j) | Portfolio turnover rate includes transactions from the Master Portfolio prior to April 25, 2022. |
See notes to financial statements.
| | |
F I N A N C I A L H I G H L I G H T S | | 55 |
Financial Highlights (continued)
(For a share outstanding throughout each period)
| | | | | | | | | | | | | | | | | | | | | | | | |
| | | BlackRock Advantage Large Cap Core Fund (continued) | |
| | | Investor A | |
| | | Year Ended
05/31/24 | | | Year Ended
05/31/23 | | | Period from
10/01/21
to 05/31/22 | | | Year Ended
09/30/21 | | | Year Ended
09/30/20 | | | Year Ended
09/30/19 | |
| | | | | | |
Net asset value, beginning of period | | $ | 16.40 | | | $ | 17.44 | | | $ | 22.30 | | | $ | 18.00 | | | $ | 16.20 | | | $ | 17.52 | |
| | | | | | | | | | | | | | | | | | | | | | | | |
| | | | | | |
Net investment income(a) | | | 0.13 | | | | 0.15 | | | | 0.09 | | | | 0.13 | | | | 0.17 | | | | 0.20 | |
Net realized and unrealized gain (loss) | | | 4.79 | | | | (0.19 | ) | | | (0.82 | ) | | | 5.08 | | | | 2.31 | | | | (0.12 | ) |
| | | | | | | | | | | | | | | | | | | | | | | | |
| | | | | | |
Net increase (decrease) from investment operations | | | 4.92 | | | | (0.04 | ) | | | (0.73 | ) | | | 5.21 | | | | 2.48 | | | | 0.08 | |
| | | | | | | | | | | | | | | | | | | | | | | | |
| | | | | | |
Distributions(b) | | | | | | | | | | | | | | | | | | | | | | | | |
From net investment income | | | (0.15 | ) | | | (0.15 | ) | | | (0.13 | ) | | | (0.17 | ) | | | (0.25 | ) | | | (0.17 | ) |
From net realized gain | | | — | | | | (0.85 | ) | | | (4.00 | ) | | | (0.74 | ) | | | (0.43 | ) | | | (1.23 | ) |
| | | | | | | | | | | | | | | | | | | | | | | | |
| | | | | | |
Total distributions | | | (0.15 | ) | | | (1.00 | ) | | | (4.13 | ) | | | (0.91 | ) | | | (0.68 | ) | | | (1.40 | ) |
| | | | | | | | | | | | | | | | | | | | | | | | |
| | | | | | |
Net asset value, end of period | | $ | 21.17 | | | $ | 16.40 | | | $ | 17.44 | | | $ | 22.30 | | | $ | 18.00 | | | $ | 16.20 | |
| | | | | | | | | | | | | | | | | | | | | | | | |
| | | | | | |
Total Return(c) | | | | | | | | | | | | | | | | | | | | | | | | |
Based on net asset value | | | 30.18 | % | | | 0.34 | % | | | (5.37 | )%(d) | | | 30.01 | % | | | 15.66 | % | | | 1.18 | % |
| | | | | | | | | | | | | | | | | | | | | | | | |
| | | | | | |
Ratios to Average Net Assets(e) | | | | | | | | | | | | | | | | | | | | | | | | |
Total expenses | | | 0.88 | % | | | 0.90 | % | | | 0.86 | %(f)(g) | | | 0.93 | %(h) | | | 1.09 | %(i) | | | 1.10 | %(i) |
| | | | | | | | | | | | | | | | | | | | | | | | |
| | | | | | |
Total expenses after fees waived and/or reimbursed | | | 0.73 | % | | | 0.73 | % | | | 0.73 | %(f)(g) | | | 0.73 | %(h) | | | 0.73 | %(i) | | | 0.73 | %(i) |
| | | | | | | | | | | | | | | | | | | | | | | | |
| | | | | | |
Net investment income | | | 0.70 | % | | | 0.92 | % | | | 0.67 | %(f)(g) | | | 0.62 | %(h) | | | 1.04 | %(i) | | | 1.30 | %(i) |
| | | | | | | | | | | | | | | | | | | | | | | | |
| | | | | | |
Supplemental Data | | | | | | | | | | | | | | | | | | | | | | | | |
Net assets, end of period (000) | | $ | 1,547,821 | | | $ | 1,271,384 | | | $ | 1,382,899 | | | $ | 1,519,185 | | | $ | 1,325,195 | | | $ | 1,202,715 | |
| | | | | | | | | | | | | | | | | | | | | | | | |
| | | | | | |
Portfolio turnover rate(j) | | | 116 | % | | | 105 | % | | | 73 | % | | | 111 | % | | | 99 | % | | | 151 | % |
| | | | | | | | | | | | | | | | | | | | | | | | |
| (a) | Based on average shares outstanding. |
| (b) | Distributions for annual periods determined in accordance with U.S. federal income tax regulations. |
| (c) | Where applicable, assumes the reinvestment of distributions. |
| (e) | Excludes fees and expenses incurred indirectly as a result of investments in underlying funds. |
| (g) | From October 1, 2021 through April 25, 2022, the Fund invested in the Master Portfolio as part of a master-feeder structure and received its corresponding allocated fees waived and expenses and/or net investment income from the Master Portfolio. Includes the Fund’s share of the Master Portfolio’s allocated fees waived of 0.01%. |
| (h) | Includes the Fund’s share of the Master Portfolio’s allocated expenses and/or net investment income. Includes the Fund’s share of the Master Portfolio’s allocated fees waived of less than 0.01%. |
| (i) | Includes the Fund’s share of the Master Portfolio’s allocated expenses and/or net investment income. Includes the Fund’s share of the Master Portfolio’s allocated fees waived of 0.01%. |
| (j) | Portfolio turnover rate includes transactions from the Master Portfolio prior to April 25, 2022. |
See notes to financial statements.
| | |
| 56 | | 2 0 2 4 B L A C K R O C K A N N U A L F I N A N C I A L S T A T E M E N T S |
Financial Highlights (continued)
(For a share outstanding throughout each period)
| | | | | | | | | | | | | | | | | | | | | | | | |
| | | BlackRock Advantage Large Cap Core Fund (continued) | |
| | | Investor C | |
| | | Year Ended
05/31/24 | | | Year Ended
05/31/23 | | | Period from
10/01/21
to 05/31/22 | | | Year Ended
09/30/21 | | | Year Ended
09/30/20 | | | Year Ended
09/30/19 | |
| | | | | | |
Net asset value, beginning of period | | $ | 13.01 | | | $ | 14.06 | | | $ | 18.68 | | | $ | 15.14 | | | $ | 13.72 | | | $ | 15.03 | |
| | | | | | | | | | | | | | | | | | | | | | | | |
| | | | | | |
Net investment income (loss)(a) | | | (0.01 | ) | | | 0.02 | | | | (0.01 | ) | | | (0.02 | ) | | | 0.04 | | | | 0.07 | |
Net realized and unrealized gain (loss) | | | 3.80 | | | | (0.16 | ) | | | (0.61 | ) | | | 4.28 | | | | 1.95 | | | | (0.12 | ) |
| | | | | | | | | | | | | | | | | | | | | | | | |
| | | | | | |
Net increase (decrease) from investment operations | | | 3.79 | | | | (0.14 | ) | | | (0.62 | ) | | | 4.26 | | | | 1.99 | | | | (0.05 | ) |
| | | | | | | | | | | | | | | | | | | | | | | | |
| | | | | | |
Distributions(b) | | | | | | | | | | | | | | | | | | | | | | | | |
From net investment income | | | (0.07 | ) | | | (0.06 | ) | | | (0.00 | )(c) | | | — | | | | (0.14 | ) | | | (0.03 | ) |
From net realized gain | | | — | | | | (0.85 | ) | | | (4.00 | ) | | | (0.72 | ) | | | (0.43 | ) | | | (1.23 | ) |
| | | | | | | | | | | | | | | | | | | | | | | | |
| | | | | | |
Total distributions | | | (0.07 | ) | | | (0.91 | ) | | | (4.00 | ) | | | (0.72 | ) | | | (0.57 | ) | | | (1.26 | ) |
| | | | | | | | | | | | | | | | | | | | | | | | |
| | | | | | |
Net asset value, end of period | | $ | 16.73 | | | $ | 13.01 | | | $ | 14.06 | | | $ | 18.68 | | | $ | 15.14 | | | $ | 13.72 | |
| | | | | | | | | | | | | | | | | | | | | | | | |
| | | | | | |
Total Return(d) | | | | | | | | | | | | | | | | | | | | | | | | |
Based on net asset value | | | 29.21 | % | | | (0.42 | )% | | | (5.81 | )%(e) | | | 29.03 | % | | | 14.80 | % | | | 0.37 | % |
| | | | | | | | | | | | | | | | | | | | | | | | |
| | | | | | |
Ratios to Average Net Assets(f) | | | | | | | | | | | | | | | | | | | | | | | | |
Total expenses | | | 1.69 | % | | | 1.72 | % | | | 1.69 | %(g)(h) | | | 1.69 | %(i) | | | 1.87 | %(j) | | | 1.89 | %(j) |
| | | | | | | | | | | | | | | | | | | | | | | | |
| | | | | | |
Total expenses after fees waived and/or reimbursed | | | 1.48 | % | | | 1.48 | % | | | 1.48 | %(g)(h) | | | 1.48 | %(i) | | | 1.48 | %(j) | | | 1.48 | %(j) |
| | | | | | | | | | | | | | | | | | | | | | | | |
| | | | | | |
Net investment income (loss) | | | (0.05 | )% | | | 0.17 | % | | | (0.08 | )%(g)(h) | | | (0.13 | )%(i) | | | 0.32 | %(j) | | | 0.52 | %(j) |
| | | | | | | | | | | | | | | | | | | | | | | | |
| | | | | | |
Supplemental Data | | | | | | | | | | | | | | | | | | | | | | | | |
Net assets, end of period (000) | | $ | 44,928 | | | $ | 31,813 | | | $ | 38,506 | | | $ | 42,561 | | | $ | 31,921 | | | $ | 95,571 | |
| | | | | | | | | | | | | | | | | | | | | | | | |
| | | | | | |
Portfolio turnover rate(k) | | | 116 | % | | | 105 | % | | | 73 | % | | | 111 | % | | | 99 | % | | | 151 | % |
| | | | | | | | | | | | | | | | | | | | | | | | |
| (a) | Based on average shares outstanding. |
| (b) | Distributions for annual periods determined in accordance with U.S. federal income tax regulations. |
| (c) | Amount is greater than $(0.005) per share. |
| (d) | Where applicable, assumes the reinvestment of distributions. |
| (f) | Excludes fees and expenses incurred indirectly as a result of investments in underlying funds. |
| (h) | From October 1, 2021 through April 25, 2022, the Fund invested in the Master Portfolio as part of a master-feeder structure and received its corresponding allocated fees waived and expenses and/or net investment income from the Master Portfolio. Includes the Fund’s share of the Master Portfolio’s allocated fees waived of 0.01%. |
| (i) | Includes the Fund’s share of the Master Portfolio’s allocated expenses and/or net investment income. Includes the Fund’s share of the Master Portfolio’s allocated fees waived of less than 0.01%. |
| (j) | Includes the Fund’s share of the Master Portfolio’s allocated expenses and/or net investment income. Includes the Fund’s share of the Master Portfolio’s allocated fees waived of 0.01%. |
| (k) | Portfolio turnover rate includes transactions from the Master Portfolio prior to April 25, 2022. |
See notes to financial statements.
| | |
F I N A N C I A L H I G H L I G H T S | | 57 |
Financial Highlights (continued)
(For a share outstanding throughout each period)
| | | | | | | | | | | | | | | | | | | | | | | | |
| | | BlackRock Advantage Large Cap Core Fund (continued) | |
| | | Class K | |
| | | Year Ended
05/31/24 | | | Year Ended
05/31/23 | | | Period from
10/01/21
to 05/31/22 | | | Year Ended
09/30/21 | | | Year Ended
09/30/20 | | | Year Ended
09/30/19 | |
| | | | | | |
Net asset value, beginning of period | | $ | 17.36 | | | $ | 18.40 | | | $ | 23.34 | | | $ | 18.79 | | | $ | 16.88 | | | $ | 18.19 | |
| | | | | | | | | | | | | | | | | | | | | | | | |
| | | | | | |
Net investment income(a) | | | 0.20 | | | | 0.21 | | | | 0.13 | | | | 0.20 | | | | 0.22 | | | | 0.31 | |
Net realized and unrealized gain (loss) | | | 5.06 | | | | (0.19 | ) | | | (0.87 | ) | | | 5.32 | | | | 2.42 | | | | (0.18 | ) |
| | | | | | | | | | | | | | | | | | | | | | | | |
| | | | | | |
Net increase (decrease) from investment operations | | | 5.26 | | | | 0.02 | | | | (0.74 | ) | | | 5.52 | | | | 2.64 | | | | 0.13 | |
| | | | | | | | | | | | | | | | | | | | | | | | |
| | | | | | |
Distributions(b) | | | | | | | | | | | | | | | | | | | | | | | | |
From net investment income | | | (0.20 | ) | | | (0.21 | ) | | | (0.20 | ) | | | (0.23 | ) | | | (0.30 | ) | | | (0.21 | ) |
From net realized gain | | | — | | | | (0.85 | ) | | | (4.00 | ) | | | (0.74 | ) | | | (0.43 | ) | | | (1.23 | ) |
| | | | | | | | | | | | | | | | | | | | | | | | |
| | | | | | |
Total distributions | | | (0.20 | ) | | | (1.06 | ) | | | (4.20 | ) | | | (0.97 | ) | | | (0.73 | ) | | | (1.44 | ) |
| | | | | | | | | | | | | | | | | | | | | | | | |
| | | | | | |
Net asset value, end of period | | $ | 22.42 | | | $ | 17.36 | | | $ | 18.40 | | | $ | 23.34 | | | $ | 18.79 | | | $ | 16.88 | |
| | | | | | | | | | | | | | | | | | | | | | | | |
| | | | | | |
Total Return(c) | | | | | | | | | | | | | | | | | | | | | | | | |
Based on net asset value | | | 30.53 | % | | | 0.63 | % | | | (5.18 | )%(d) | | | 30.42 | % | | | 16.01 | % | | | 1.45 | % |
| | | | | | | | | | | | | | | | | | | | | | | | |
| | | | | | |
Ratios to Average Net Assets(e) | | | | | | | | | | | | | | | | | | | | | | | | |
Total expenses | | | 0.52 | % | | | 0.54 | % | | | 0.51 | %(f)(g) | | | 0.55 | %(h) | | | 0.70 | %(i) | | | 0.72 | %(i) |
| | | | | | | | | | | | | | | | | | | | | | | | |
| | | | | | |
Total expenses after fees waived and/or reimbursed | | | 0.43 | % | | | 0.43 | % | | | 0.43 | %(f)(g) | | | 0.43 | %(h) | | | 0.43 | %(i) | | | 0.43 | %(i) |
| | | | | | | | | | | | | | | | | | | | | | | | |
| | | | | | |
Net investment income | | | 1.01 | % | | | 1.22 | % | | | 0.98 | %(f)(g) | | | 0.91 | %(h) | | | 1.30 | %(i) | | | 1.87 | %(i) |
| | | | | | | | | | | | | | | | | | | | | | | | |
| | | | | | |
Supplemental Data | | | | | | | | | | | | | | | | | | | | | | | | |
Net assets, end of period (000) | | $ | 41,460 | | | $ | 31,568 | | | $ | 61,965 | | | $ | 56,736 | | | $ | 34,078 | | | $ | 3,079 | |
| | | | | | | | | | | | | | | | | | | | | | | | |
| | | | | | |
Portfolio turnover rate(j) | | | 116 | % | | | 105 | % | | | 73 | % | | | 111 | % | | | 99 | % | | | 151 | % |
| | | | | | | | | | | | | | | | | | | | | | | | |
| (a) | Based on average shares outstanding. |
| (b) | Distributions for annual periods determined in accordance with U.S. federal income tax regulations. |
| (c) | Where applicable, assumes the reinvestment of distributions. |
| (e) | Excludes fees and expenses incurred indirectly as a result of investments in underlying funds. |
| (g) | From October 1, 2021 through April 25, 2022, the Fund invested in the Master Portfolio as part of a master-feeder structure and received its corresponding allocated fees waived and expenses and/or net investment income from the Master Portfolio. Includes the Fund’s share of the Master Portfolio’s allocated fees waived of 0.01%. |
| (h) | Includes the Fund’s share of the Master Portfolio’s allocated expenses and/or net investment income. Includes the Fund’s share of the Master Portfolio’s allocated fees waived of less than 0.01%. |
| (i) | Includes the Fund’s share of the Master Portfolio’s allocated expenses and/or net investment income. Includes the Fund’s share of the Master Portfolio’s allocated fees waived of 0.01%. |
| (j) | Portfolio turnover rate includes transactions from the Master Portfolio prior to April 25, 2022. |
See notes to financial statements.
| | |
| 58 | | 2 0 2 4 B L A C K R O C K A N N U A L F I N A N C I A L S T A T E M E N T S |
Financial Highlights (continued)
(For a share outstanding throughout each period)
| | | | | | | | | | | | | | | | | | | | | | | | |
| | | BlackRock Advantage Large Cap Core Fund (continued) | |
| | | Class R | |
| | | Year Ended
05/31/24 | | | Year Ended
05/31/23 | | | Period from
10/01/21
to 05/31/22 | | | Year Ended
09/30/21 | | | Year Ended
09/30/20 | | | Year Ended
09/30/19 | |
| | | | | | |
Net asset value, beginning of period | | $ | 14.80 | | | $ | 15.84 | | | $ | 20.60 | | | $ | 16.66 | | | $ | 15.03 | | | $ | 16.38 | |
| | | | | | | | | | | | | | | | | | | | | | | | |
| | | | | | |
Net investment income(a) | | | 0.07 | | | | 0.10 | | | | 0.05 | | | | 0.07 | | | | 0.13 | | | | 0.15 | |
Net realized and unrealized gain (loss) | | | 4.32 | | | | (0.17 | ) | | | (0.72 | ) | | | 4.70 | | | | 2.13 | | | | (0.13 | ) |
| | | | | | | | | | | | | | | | | | | | | | | | |
| | | | | | |
Net increase (decrease) from investment operations | | | 4.39 | | | | (0.07 | ) | | | (0.67 | ) | | | 4.77 | | | | 2.26 | | | | 0.02 | |
| | | | | | | | | | | | | | | | | | | | | | | | |
| | | | | | |
Distributions(b) | | | | | | | | | | | | | | | | | | | | | | | | |
From net investment income | | | (0.12 | ) | | | (0.12 | ) | | | (0.09 | ) | | | (0.09 | ) | | | (0.20 | ) | | | (0.14 | ) |
From net realized gain | | | — | | | | (0.85 | ) | | | (4.00 | ) | | | (0.74 | ) | | | (0.43 | ) | | | (1.23 | ) |
| | | | | | | | | | | | | | | | | | | | | | | | |
| | | | | | |
Total distributions | | | (0.12 | ) | | | (0.97 | ) | | | (4.09 | ) | | | (0.83 | ) | | | (0.63 | ) | | | (1.37 | ) |
| | | | | | | | | | | | | | | | | | | | | | | | |
| | | | | | |
Net asset value, end of period | | $ | 19.07 | | | $ | 14.80 | | | $ | 15.84 | | | $ | 20.60 | | | $ | 16.66 | | | $ | 15.03 | |
| | | | | | | | | | | | | | | | | | | | | | | | |
| | | | | | |
Total Return(c) | | | | | | | | | | | | | | | | | | | | | | | | |
Based on net asset value | | | 29.82 | % | | | 0.14 | % | | | (5.55 | )%(d) | | | 29.67 | % | | | 15.38 | % | | | 0.88 | % |
| | | | | | | | | | | | | | | | | | | | | | | | |
| | | | | | |
Ratios to Average Net Assets(e) | | | | | | | | | | | | | | | | | | | | | | | | |
Total expenses | | | 1.22 | % | | | 1.24 | % | | | 1.23 | %(f)(g) | | | 1.26 | %(h) | | | 1.37 | %(i) | | | 1.32 | %(i) |
| | | | | | | | | | | | | | | | | | | | | | | | |
| | | | | | |
Total expenses after fees waived and/or reimbursed | | | 0.98 | % | | | 0.98 | % | | | 0.98 | %(f)(g) | | | 0.98 | %(h) | | | 0.98 | %(i) | | | 0.98 | %(i) |
| | | | | | | | | | | | | | | | | | | | | | | | |
| | | | | | |
Net investment income | | | 0.44 | % | | | 0.68 | % | | | 0.42 | %(f)(g) | | | 0.37 | %(h) | | | 0.83 | %(i) | | | 1.04 | %(i) |
| | | | | | | | | | | | | | | | | | | | | | | | |
| | | | | | |
Supplemental Data | | | | | | | | | | | | | | | | | | | | | | | | |
Net assets, end of period (000) | | $ | 19,237 | | | $ | 11,479 | | | $ | 13,967 | | | $ | 14,399 | | | $ | 12,416 | | | $ | 27,003 | |
| | | | | | | | | | | | | | | | | | | | | | | | |
| | | | | | |
Portfolio turnover rate(j) | | | 116 | % | | | 105 | % | | | 73 | % | | | 111 | % | | | 99 | % | | | 151 | % |
| | | | | | | | | | | | | | | | | | | | | | | | |
| (a) | Based on average shares outstanding. |
| (b) | Distributions for annual periods determined in accordance with U.S. federal income tax regulations. |
| (c) | Where applicable, assumes the reinvestment of distributions. |
| (e) | Excludes fees and expenses incurred indirectly as a result of investments in underlying funds. |
| (g) | From October 1, 2021 through April 25, 2022, the Fund invested in the Master Portfolio as part of a master-feeder structure and received its corresponding allocated fees waived and expenses and/or net investment income from the Master Portfolio. Includes the Fund’s share of the Master Portfolio’s allocated fees waived of 0.01%. |
| (h) | Includes the Fund’s share of the Master Portfolio’s allocated expenses and/or net investment income. Includes the Fund’s share of the Master Portfolio’s allocated fees waived of less than 0.01%. |
| (i) | Includes the Fund’s share of the Master Portfolio’s allocated expenses and/or net investment income. Includes the Fund’s share of the Master Portfolio’s allocated fees waived of 0.01%. |
| (j) | Portfolio turnover rate includes transactions from the Master Portfolio prior to April 25, 2022. |
See notes to financial statements.
| | |
F I N A N C I A L H I G H L I G H T S | | 59 |
Financial Highlights
(For a share outstanding throughout each period)
| | | | | | | | | | | | | | | | | | | | | | | | |
| | | BlackRock Advantage Large Cap Value Fund | |
| | | Institutional | |
| | | Year Ended
05/31/24 | | | Year Ended
05/31/23 | | | Year Ended
05/31/22 | | | Year Ended
05/31/21 | | | Period from
10/01/19
to 05/31/20 | | | Year Ended
09/30/19 | |
| | | | | | |
Net asset value, beginning of period | | $ | 26.63 | | | $ | 29.79 | | | $ | 35.07 | | | $ | 24.74 | | | $ | 28.08 | | | $ | 30.89 | |
| | | | | | | | | | | | | | | | | | | | | | | | |
| | | | | | |
Net investment income(a) | | | 0.51 | | | | 0.47 | | | | 0.45 | | | | 0.46 | | | | 0.39 | | | | 0.57 | |
Net realized and unrealized gain (loss) | | | 6.16 | | | | (2.02 | ) | | | (0.21 | ) | | | 10.36 | | | | (2.60 | ) | | | (0.26 | ) |
| | | | | | | | | | | | | | | | | | | | | | | | |
| | | | | | |
Net increase (decrease) from investment operations | | | 6.67 | | | | (1.55 | ) | | | 0.24 | | | | 10.82 | | | | (2.21 | ) | | | 0.31 | |
| | | | | | | | | | | | | | | | | | | | | | | | |
| | | | | | |
Distributions(b) | | | | | | | | | | | | | | | | | | | | | | | | |
From net investment income | | | (0.50 | ) | | | (0.47 | ) | | | (0.47 | ) | | | (0.49 | ) | | | (0.58 | ) | | | (0.59 | ) |
From net realized gain | | | (0.35 | ) | | | (1.14 | ) | | | (5.05 | ) | | | — | | | | (0.55 | ) | | | (2.53 | ) |
| | | | | | | | | | | | | | | | | | | | | | | | |
| | | | | | |
Total distributions | | | (0.85 | ) | | | (1.61 | ) | | | (5.52 | ) | | | (0.49 | ) | | | (1.13 | ) | | | (3.12 | ) |
| | | | | | | | | | | | | | | | | | | | | | | | |
| | | | | | |
Net asset value, end of period | | $ | 32.45 | | | $ | 26.63 | | | $ | 29.79 | | | $ | 35.07 | | | $ | 24.74 | | | $ | 28.08 | |
| | | | | | | | | | | | | | | | | | | | | | | | |
| | | | | | |
Total Return(c) | | | | | | | | | | | | | | | | | | | | | | | | |
Based on net asset value | | | 25.48 | % | | | (4.97 | )% | | | 0.63 | % | | | 44.37 | % | | | (8.36 | )%(d) | | | 1.80 | % |
| | | | | | | | | | | | | | | | | | | | | | | | |
| | | | | | |
Ratios to Average Net Assets(e) | | | | | | | | | | | | | | | | | | | | | | | | |
Total expenses | | | 0.71 | % | | | 0.70 | % | | | 0.70 | % | | | 0.84 | %(f) | | | 0.89 | %(g)(h) | | | 0.87 | %(h) |
| | | | | | | | | | | | | | | | | | | | | | | | |
| | | | | | |
Total expenses after fees waived and/or reimbursed | | | 0.54 | % | | | 0.54 | % | | | 0.54 | % | | | 0.54 | %(f) | | | 0.54 | %(g)(h) | | | 0.54 | %(h) |
| | | | | | | | | | | | | | | | | | | | | | | | |
| | | | | | |
Net investment income | | | 1.73 | % | | | 1.72 | % | | | 1.41 | % | | | 1.58 | %(f) | | | 2.20 | %(g)(h) | | | 2.09 | %(h) |
| | | | | | | | | | | | | | | | | | | | | | | | |
| | | | | | |
Supplemental Data | | | | | | | | | | | | | | | | | | | | | | | | |
Net assets, end of period (000) | | $ | 193,379 | | | $ | 164,434 | | | $ | 186,903 | | | $ | 194,452 | | | $ | 146,365 | | | $ | 192,744 | |
| | | | | | | | | | | | | | | | | | | | | | | | |
| | | | | | |
Portfolio turnover rate | | | 118 | % | | | 116 | % | | | 136 | % | | | 126 | %(i) | | | 70 | % | | | 161 | % |
| | | | | | | | | | | | | | | | | | | | | | | | |
| (a) | Based on average shares outstanding. |
| (b) | Distributions for annual periods determined in accordance with U.S. federal income tax regulations. |
| (c) | Where applicable, assumes the reinvestment of distributions. |
| (e) | Excludes fees and expenses incurred indirectly as a result of investments in underlying funds. |
| (f) | From June 1, 2020 through February 28, 2021, the Fund invested in the Master Portfolio as part of a master-feeder structure and received its corresponding allocated fees waived and expenses and/or net investment income from the Master Portfolio. Includes the Fund’s share of the Master Portfolio’s allocated fees waived of 0.03%. |
| (h) | Includes the Fund’s share of the Master Portfolio’s allocated expenses and/or net investment income. Includes the Fund’s share of the Master Portfolio’s allocated fees waived of 0.05% and 0.03% for the period October 1, 2019 to May 31, 2020 and September 30, 2019, respectively. |
| (i) | Portfolio turnover rate includes transactions from the Master LLC prior to March 1, 2021. |
See notes to financial statements.
| | |
| 60 | | 2 0 2 4 B L A C K R O C K A N N U A L F I N A N C I A L S T A T E M E N T S |
Financial Highlights (continued)
(For a share outstanding throughout each period)
| | | | | | | | | | | | | | | | | | | | | | | | |
| | | BlackRock Advantage Large Cap Value Fund (continued) | |
| | | Investor A | |
| | | Year Ended
05/31/24 | | | Year Ended
05/31/23 | | | Year Ended
05/31/22 | | | Year Ended
05/31/21 | | | Period from
10/01/19
to 05/31/20 | | | Year Ended
09/30/19 | |
| | | | | | |
Net asset value, beginning of period | | $ | 25.86 | | | $ | 28.98 | | | $ | 34.26 | | | $ | 24.18 | | | $ | 27.45 | | | $ | 30.26 | |
| | | | | | | | | | | | | | | | | | | | | | | | |
| | | | | | |
Net investment income(a) | | | 0.43 | | | | 0.39 | | | | 0.36 | | | | 0.38 | | | | 0.34 | | | | 0.49 | |
Net realized and unrealized gain (loss) | | | 5.97 | | | | (1.97 | ) | | | (0.20 | ) | | | 10.13 | | | | (2.55 | ) | | | (0.25 | ) |
| | | | | | | | | | | | | | | | | | | | | | | | |
| | | | | | |
Net increase (decrease) from investment operations | | | 6.40 | | | | (1.58 | ) | | | 0.16 | | | | 10.51 | | | | (2.21 | ) | | | 0.24 | |
| | | | | | | | | | | | | | | | | | | | | | | | |
| | | | | | |
Distributions(b) | | | | | | | | | | | | | | | | | | | | | | | | |
From net investment income | | | (0.43 | ) | | | (0.40 | ) | | | (0.39 | ) | | | (0.43 | ) | | | (0.51 | ) | | | (0.52 | ) |
From net realized gain | | | (0.35 | ) | | | (1.14 | ) | | | (5.05 | ) | | | — | | | | (0.55 | ) | | | (2.53 | ) |
| | | | | | | | | | | | | | | | | | | | | | | | |
| | | | | | |
Total distributions | | | (0.78 | ) | | | (1.54 | ) | | | (5.44 | ) | | | (0.43 | ) | | | (1.06 | ) | | | (3.05 | ) |
| | | | | | | | | | | | | | | | | | | | | | | | |
| | | | | | |
Net asset value, end of period | | $ | 31.48 | | | $ | 25.86 | | | $ | 28.98 | | | $ | 34.26 | | | $ | 24.18 | | | $ | 27.45 | |
| | | | | | | | | | | | | | | | | | | | | | | | |
| | | | | | |
Total Return(c) | | | | | | | | | | | | | | | | | | | | | | | | |
Based on net asset value | | | 25.15 | % | | | (5.22 | )% | | | 0.40 | % | | | 44.01 | % | | | (8.53 | )%(d) | | | 1.56 | % |
| | | | | | | | | | | | | | | | | | | | | | | | |
| | | | | | |
Ratios to Average Net Assets(e) | | | | | | | | | | | | | | | | | | | | | | | | |
Total expenses | | | 0.96 | % | | | 0.97 | % | | | 0.97 | % | | | 1.10 | %(f) | | | 1.15 | %(g)(h) | | | 1.14 | %(h) |
| | | | | | | | | | | | | | | | | | | | | | | | |
| | | | | | |
Total expenses after fees waived and/or reimbursed | | | 0.79 | % | | | 0.79 | % | | | 0.79 | % | | | 0.79 | %(f) | | | 0.79 | %(g)(h) | | | 0.79 | %(h) |
| | | | | | | | | | | | | | | | | | | | | | | | |
| | | | | | |
Net investment income | | | 1.48 | % | | | 1.47 | % | | | 1.16 | % | | | 1.33 | %(f) | | | 1.95 | %(g)(h) | | | 1.84 | %(h) |
| | | | | | | | | | | | | | | | | | | | | | | | |
| | | | | | |
Supplemental Data | | | | | | | | | | | | | | | | | | | | | | | | |
Net assets, end of period (000) | | $ | 393,788 | | | $ | 345,671 | | | $ | 394,334 | | | $ | 405,607 | | | $ | 280,449 | | | $ | 336,565 | |
| | | | | | | | | | | | | | | | | | | | | | | | |
| | | | | | |
Portfolio turnover rate | | | 118 | % | | | 116 | % | | | 136 | % | | | 126 | %(i) | | | 70 | % | | | 161 | % |
| | | | | | | | | | | | | | | | | | | | | | | | |
| (a) | Based on average shares outstanding. |
| (b) | Distributions for annual periods determined in accordance with U.S. federal income tax regulations. |
| (c) | Where applicable, excludes the effects of any sales charges and assumes the reinvestment of distributions. |
| (e) | Excludes fees and expenses incurred indirectly as a result of investments in underlying funds. |
| (f) | From June 1, 2020 through February 28, 2021, the Fund invested in the Master Portfolio as part of a master-feeder structure and received its corresponding allocated fees waived and expenses and/or net investment income from the Master Portfolio. Includes the Fund’s share of the Master Portfolio’s allocated fees waived of 0.03%. |
| (h) | Includes the Fund’s share of the Master Portfolio’s allocated expenses and/or net investment income. Includes the Fund’s share of the Master Portfolio’s allocated fees waived of 0.05% and 0.03% for the period October 1, 2019 to May 31, 2020 and September 30, 2019, respectively. |
| (i) | Portfolio turnover rate includes transactions from the Master LLC prior to March 1, 2021. |
See notes to financial statements.
| | |
F I N A N C I A L H I G H L I G H T S | | 61 |
Financial Highlights (continued)
(For a share outstanding throughout each period)
| | | | | | | | | | | | | | | | | | | | | | | | |
| | | BlackRock Advantage Large Cap Value Fund (continued) | |
| | | Investor C | |
| | | Year Ended
05/31/24 | | | Year Ended
05/31/23 | | | Year Ended
05/31/22 | | | Year Ended
05/31/21 | | | Period from
10/01/19
to 05/31/20 | | | Year Ended
09/30/19 | |
| | | | | | |
Net asset value, beginning of period | | $ | 23.43 | | | $ | 26.40 | | | $ | 31.69 | | | $ | 22.31 | | | $ | 25.32 | | | $ | 28.06 | |
| | | | | | | | | | | | | | | | | | | | | | | | |
| | | | | | |
Net investment income(a) | | | 0.19 | | | | 0.17 | | | | 0.12 | | | | 0.16 | | | | 0.19 | | | | 0.27 | |
Net realized and unrealized gain (loss) | | | 5.40 | | | | (1.78 | ) | | | (0.19 | ) | | | 9.37 | | | | (2.36 | ) | | | (0.24 | ) |
| | | | | | | | | | | | | | | | | | | | | | | | |
| | | | | | |
Net increase (decrease) from investment operations | | | 5.59 | | | | (1.61 | ) | | | (0.07 | ) | | | 9.53 | | | | (2.17 | ) | | | 0.03 | |
| | | | | | | | | | | | | | | | | | | | | | | | |
| | | | | | |
Distributions(b) | | | | | | | | | | | | | | | | | | | | | | | | |
From net investment income | | | (0.23 | ) | | | (0.22 | ) | | | (0.17 | ) | | | (0.15 | ) | | | (0.29 | ) | | | (0.24 | ) |
From net realized gain | | | (0.35 | ) | | | (1.14 | ) | | | (5.05 | ) | | | — | | | | (0.55 | ) | | | (2.53 | ) |
| | | | | | | | | | | | | | | | | | | | | | | | |
| | | | | | |
Total distributions | | | (0.58 | ) | | | (1.36 | ) | | | (5.22 | ) | | | (0.15 | ) | | | (0.84 | ) | | | (2.77 | ) |
| | | | | | | | | | | | | | | | | | | | | | | | |
| | | | | | |
Net asset value, end of period | | $ | 28.44 | | | $ | 23.43 | | | $ | 26.40 | | | $ | 31.69 | | | $ | 22.31 | | | $ | 25.32 | |
| | | | | | | | | | | | | | | | | | | | | | | | |
| | | | | | |
Total Return(c) | | | | | | | | | | | | | | | | | | | | | | | | |
Based on net asset value | | | 24.21 | % | | | (5.89 | )% | | | (0.38 | )% | | | 42.99 | % | | | (9.00 | )%(d) | | | 0.79 | % |
| | | | | | | | | | | | | | | | | | | | | | | | |
| | | | | | |
Ratios to Average Net Assets(e) | | | | | | | | | | | | | | | | | | | | | | | | |
Total expenses | | | 1.76 | % | | | 1.74 | % | | | 1.73 | % | | | 1.85 | %(f) | | | 1.91 | %(g)(h) | | | 1.94 | %(h) |
| | | | | | | | | | | | | | | | | | | | | | | | |
| | | | | | |
Total expenses after fees waived and/or reimbursed | | | 1.54 | % | | | 1.54 | % | | | 1.54 | % | | | 1.54 | %(f) | | | 1.54 | %(g)(h) | | | 1.54 | %(h) |
| | | | | | | | | | | | | | | | | | | | | | | | |
| | | | | | |
Net investment income | | | 0.73 | % | | | 0.72 | % | | | 0.41 | % | | | 0.63 | %(f) | | | 1.20 | %(g)(h) | | | 1.08 | %(h) |
| | | | | | | | | | | | | | | | | | | | | | | | |
| | | | | | |
Supplemental Data | | | | | | | | | | | | | | | | | | | | | | | | |
Net assets, end of period (000) | | $ | 14,553 | | | $ | 14,894 | | | $ | 18,099 | | | $ | 20,880 | | | $ | 43,395 | | | $ | 63,659 | |
| | | | | | | | | | | | | | | | | | | | | | | | |
| | | | | | |
Portfolio turnover rate | | | 118 | % | | | 116 | % | | | 136 | % | | | 126 | %(i) | | | 70 | % | | | 161 | % |
| | | | | | | | | | | | | | | | | | | | | | | | |
| (a) | Based on average shares outstanding. |
| (b) | Distributions for annual periods determined in accordance with U.S. federal income tax regulations. |
| (c) | Where applicable, excludes the effects of any sales charges and assumes the reinvestment of distributions. |
| (e) | Excludes fees and expenses incurred indirectly as a result of investments in underlying funds. |
| (f) | From June 1, 2020 through February 28, 2021, the Fund invested in the Master Portfolio as part of a master-feeder structure and received its corresponding allocated fees waived and expenses and/or net investment income from the Master Portfolio. Includes the Fund’s share of the Master Portfolio’s allocated fees waived of 0.03%. |
| (h) | Includes the Fund’s share of the Master Portfolio’s allocated expenses and/or net investment income. Includes the Fund’s share of the Master Portfolio’s allocated fees waived of 0.05% and 0.03% for the period October 1, 2019 to May 31, 2020 and September 30, 2019, respectively. |
| (i) | Portfolio turnover rate includes transactions from the Master LLC prior to March 1, 2021. |
See notes to financial statements.
| | |
| 62 | | 2 0 2 4 B L A C K R O C K A N N U A L F I N A N C I A L S T A T E M E N T S |
Financial Highlights (continued)
(For a share outstanding throughout each period)
| | | | | | | | | | | | | | | | | | | | | | | | |
| | | BlackRock Advantage Large Cap Value Fund (continued) | |
| | | Class K | |
| | | Year Ended
05/31/24 | | | Year Ended
05/31/23 | | | Year Ended
05/31/22 | | | Year Ended
05/31/21 | | | Period from
10/01/19
to 05/31/20 | | | Year Ended
09/30/19 | |
| | | | | | |
Net asset value, beginning of period | | $ | 26.64 | | | $ | 29.80 | | | $ | 35.08 | | | $ | 24.74 | | | $ | 28.09 | | | $ | 30.90 | |
| | | | | | | | | | | | | | | | | | | | | | | | |
| | | | | | |
Net investment income(a) | | | 0.53 | | | | 0.48 | | | | 0.47 | | | | 0.47 | | | | 0.40 | | | | 0.58 | |
Net realized and unrealized gain (loss) | | | 6.14 | | | | (2.01 | ) | | | (0.22 | ) | | | 10.38 | | | | (2.60 | ) | | | (0.26 | ) |
| | | | | | | | | | | | | | | | | | | | | | | | |
| | | | | | |
Net increase (decrease) from investment operations | | | 6.67 | | | | (1.53 | ) | | | 0.25 | | | | 10.85 | | | | (2.20 | ) | | | 0.32 | |
| | | | | | | | | | | | | | | | | | | | | | | | |
| | | | | | |
Distributions(b) | | | | | | | | | | | | | | | | | | | | | | | | |
From net investment income | | | (0.51 | ) | | | (0.49 | ) | | | (0.48 | ) | | | (0.51 | ) | | | (0.60 | ) | | | (0.60 | ) |
From net realized gain | | | (0.35 | ) | | | (1.14 | ) | | | (5.05 | ) | | | — | | | | (0.55 | ) | | | (2.53 | ) |
| | | | | | | | | | | | | | | | | | | | | | | | |
| | | | | | |
Total distributions | | | (0.86 | ) | | | (1.63 | ) | | | (5.53 | ) | | | (0.51 | ) | | | (1.15 | ) | | | (3.13 | ) |
| | | | | | | | | | | | | | | | | | | | | | | | |
| | | | | | |
Net asset value, end of period | | $ | 32.45 | | | $ | 26.64 | | | $ | 29.80 | | | $ | 35.08 | | | $ | 24.74 | | | $ | 28.09 | |
| | | | | | | | | | | | | | | | | | | | | | | | |
| | | | | | |
Total Return(c) | | | | | | | | | | | | | | | | | | | | | | | | |
Based on net asset value | | | 25.49 | % | | | (4.91 | )% | | | 0.69 | % | | | 44.48 | % | | | (8.35 | )%(d) | | | 1.85 | % |
| | | | | | | | | | | | | | | | | | | | | | | | |
| | | | | | |
Ratios to Average Net Assets(e) | | | | | | | | | | | | | | | | | | | | | | | | |
Total expenses | | | 0.62 | % | | | 0.63 | % | | | 0.63 | % | | | 0.74 | %(f) | | | 0.80 | %(g)(h) | | | 0.79 | %(h) |
| | | | | | | | | | | | | | | | | | | | | | | | |
| | | | | | |
Total expenses after fees waived and/or reimbursed | | | 0.49 | % | | | 0.49 | % | | | 0.49 | % | | | 0.49 | %(f) | | | 0.49 | %(g)(h) | | | 0.49 | %(h) |
| | | | | | | | | | | | | | | | | | | | | | | | |
| | | | | | |
Net investment income | | | 1.80 | % | | | 1.77 | % | | | 1.47 | % | | | 1.62 | %(f) | | | 2.24 | %(g)(h) | | | 2.14 | %(h) |
| | | | | | | | | | | | | | | | | | | | | | | | |
| | | | | | |
Supplemental Data | | | | | | | | | | | | | | | | | | | | | | | | |
Net assets, end of period (000) | | $ | 12,053 | | | $ | 10,451 | | | $ | 10,210 | | | $ | 8,258 | | | $ | 4,971 | | | $ | 5,699 | |
| | | | | | | | | | | | | | | | | | | | | | | | |
| | | | | | |
Portfolio turnover rate | | | 118 | % | | | 116 | % | | | 136 | % | | | 126 | %(i) | | | 70 | % | | | 161 | % |
| | | | | | | | | | | | | | | | | | | | | | | | |
| (a) | Based on average shares outstanding. |
| (b) | Distributions for annual periods determined in accordance with U.S. federal income tax regulations. |
| (c) | Where applicable, assumes the reinvestment of distributions. |
| (e) | Excludes fees and expenses incurred indirectly as a result of investments in underlying funds. |
| (f) | From June 1, 2020 through February 28, 2021, the Fund invested in the Master Portfolio as part of a master-feeder structure and received its corresponding allocated fees waived and expenses and/or net investment income from the Master Portfolio. Includes the Fund’s share of the Master Portfolio’s allocated fees waived of 0.03%. |
| (h) | Includes the Fund’s share of the Master Portfolio’s allocated expenses and/or net investment income. Includes the Fund’s share of the Master Portfolio’s allocated fees waived of 0.05% and 0.03% for the period October 1, 2019 to May 31, 2020 and September 30, 2019, respectively. |
| (i) | Portfolio turnover rate includes transactions from the Master LLC prior to March 1, 2021. |
See notes to financial statements.
| | |
F I N A N C I A L H I G H L I G H T S | | 63 |
Financial Highlights (continued)
(For a share outstanding throughout each period)
| | | | | | | | | | | | | | | | | | | | | | | | |
| | | BlackRock Advantage Large Cap Value Fund (continued) | |
| | | Class R | |
| | | Year Ended
05/31/24 | | | Year Ended
05/31/23 | | | Year Ended
05/31/22 | | | Year Ended
05/31/21 | | | Period from
10/01/19
to 05/31/20 | | | Year Ended
09/30/19 | |
| | | | | | |
Net asset value, beginning of period | | $ | 24.52 | | | $ | 27.56 | | | $ | 32.84 | | | $ | 23.18 | | | $ | 26.29 | | | $ | 29.10 | |
| | | | | | | | | | | | | | | | | | | | | | | | |
| | | | | | |
Net investment income(a) | | | 0.34 | | | | 0.31 | | | | 0.27 | | | | 0.29 | | | | 0.28 | | | | 0.41 | |
Net realized and unrealized gain (loss) | | | 5.65 | | | | (1.87 | ) | | | (0.19 | ) | | | 9.71 | | | | (2.43 | ) | | | (0.26 | ) |
| | | | | | | | | | | | | | | | | | | | | | | | |
| | | | | | |
Net increase (decrease) from investment operations | | | 5.99 | | | | (1.56 | ) | | | 0.08 | | | | 10.00 | | | | (2.15 | ) | | | 0.15 | |
| | | | | | | | | | | | | | | | | | | | | | | | |
| | | | | | |
Distributions(b) | | | | | | | | | | | | | | | | | | | | | | | | |
From net investment income | | | (0.36 | ) | | | (0.34 | ) | | | (0.31 | ) | | | (0.34 | ) | | | (0.41 | ) | | | (0.43 | ) |
From net realized gain | | | (0.35 | ) | | | (1.14 | ) | | | (5.05 | ) | | | — | | | | (0.55 | ) | | | (2.53 | ) |
| | | | | | | | | | | | | | | | | | | | | | | | |
| | | | | | |
Total distributions | | | (0.71 | ) | | | (1.48 | ) | | | (5.36 | ) | | | (0.34 | ) | | | (0.96 | ) | | | (2.96 | ) |
| | | | | | | | | | | | | | | | | | | | | | | | |
| | | | | | |
Net asset value, end of period | | $ | 29.80 | | | $ | 24.52 | | | $ | 27.56 | | | $ | 32.84 | | | $ | 23.18 | | | $ | 26.29 | |
| | | | | | | | | | | | | | | | | | | | | | | | |
| | | | | | |
Total Return(c) | | | | | | | | | | | | | | | | | | | | | | | | |
Based on net asset value | | | 24.84 | % | | | (5.43 | )% | | | 0.14 | % | | | 43.63 | % | | | (8.65 | )%(d) | | | 1.29 | % |
| | | | | | | | | | | | | | | | | | | | | | | | |
| | | | | | |
Ratios to Average Net Assets(e) | | | | | | | | | | | | | | | | | | | | | | | | |
Total expenses | | | 1.35 | % | | | 1.36 | % | | | 1.35 | % | | | 1.41 | %(f) | | | 1.43 | %(g)(h) | | | 1.44 | %(h) |
| | | | | | | | | | | | | | | | | | | | | | | | |
| | | | | | |
Total expenses after fees waived and/or reimbursed | | | 1.04 | % | | | 1.04 | % | | | 1.04 | % | | | 1.04 | %(f) | | | 1.04 | %(g)(h) | | | 1.04 | %(h) |
| | | | | | | | | | | | | | | | | | | | | | | | |
| | | | | | |
Net investment income | | | 1.23 | % | | | 1.22 | % | | | 0.91 | % | | | 1.11 | %(f) | | | 1.69 | %(g)(h) | | | 1.59 | %(h) |
| | | | | | | | | | | | | | | | | | | | | | | | |
| | | | | | |
Supplemental Data | | | | | | | | | | | | | | | | | | | | | | | | |
Net assets, end of period (000) | | $ | 7,729 | | | $ | 6,925 | | | $ | 8,440 | | | $ | 9,015 | | | $ | 10,820 | | | $ | 18,321 | |
| | | | | | | | | | | | | | | | | | | | | | | | |
| | | | | | |
Portfolio turnover rate | | | 118 | % | | | 116 | % | | | 136 | % | | | 126 | %(i) | | | 70 | % | | | 161 | % |
| | | | | | | | | | | | | | | | | | | | | | | | |
| (a) | Based on average shares outstanding. |
| (b) | Distributions for annual periods determined in accordance with U.S. federal income tax regulations. |
| (c) | Where applicable, assumes the reinvestment of distributions. |
| (e) | Excludes fees and expenses incurred indirectly as a result of investments in underlying funds. |
| (f) | From June 1, 2020 through February 28, 2021, the Fund invested in the Master Portfolio as part of a master-feeder structure and received its corresponding allocated fees waived and expenses and/or net investment income from the Master Portfolio. Includes the Fund’s share of the Master Portfolio’s allocated fees waived of 0.03%. |
| (h) | Includes the Fund’s share of the Master Portfolio’s allocated expenses and/or net investment income. Includes the Fund’s share of the Master Portfolio’s allocated fees waived of 0.05% and 0.03% for the period October 1, 2019 to May 31, 2020 and September 30, 2019, respectively. |
| (i) | Portfolio turnover rate includes transactions from the Master LLC prior to March 1, 2021. |
See notes to financial statements.
| | |
| 64 | | 2 0 2 4 B L A C K R O C K A N N U A L F I N A N C I A L S T A T E M E N T S |
Notes to Financial Statements
BlackRock FundsSM (the “Trust”) and BlackRock Large Cap Series Funds, Inc. (the “Corporation”) are each registered under the Investment Company Act of 1940, as amended (the “1940 Act”), as open-end management investment companies. The Trust is organized as a Massachusetts business trust. The Corporation is organized as a Maryland corporation. BlackRock Advantage International Fund, BlackRock Advantage Large Cap Growth Fund and BlackRock Small Cap Core Fund are series of the Trust. BlackRock Advantage Large Cap Core Fund and BlackRock Advantage Large Cap Value Fund are series of the Corporation. The following are referred to herein collectively as the “Funds” or individually as a “Fund”:
| | | | | | | | |
| |
| | |
| Fund Name | | Herein Referred To As | | | Diversification Classification | |
| |
| | |
BlackRock Advantage International Fund | | | Advantage International | | | | Diversified | |
BlackRock Advantage Large Cap Growth Fund | | | Advantage Large Cap Growth | | | | Diversified | |
BlackRock Advantage Small Cap Core Fund | | | Advantage Small Cap Core | | | | Diversified | |
BlackRock Advantage Large Cap Core Fund | | | Advantage Large Cap Core | | | | Diversified | |
BlackRock Advantage Large Cap Value Fund | | | Advantage Large Cap Value | | | | Diversified | |
| |
Each Fund offers multiple classes of shares. All classes of shares have identical voting, dividend, liquidation and other rights and are subject to the same terms and conditions, except that certain classes bear expenses related to the shareholder servicing and distribution of such shares. Institutional and Class K Shares are sold only to certain eligible investors. Investor A, Investor C and Class R Shares bear certain expenses related to shareholder servicing of such shares, and Investor C and Class R Shares also bear certain expenses related to the distribution of such shares. Investor A and Investor C Shares are generally available through financial intermediaries. Class R Shares are sold only to certain employer-sponsored retirement plans. Each class has exclusive voting rights with respect to matters relating to its shareholder servicing and distribution expenditures (except that Investor C shareholders may vote on material changes to the Investor A Shares distribution and service plan).
| | | | | | | | | | | | |
| |
| | | |
| Share Class | | Initial Sales Charge | | | CDSC | | | Conversion Privilege | |
| |
| | | |
Institutional, Class K and Class R Shares | | | No | | | | No | | | | None | |
Investor A Shares | | | Yes | | | | No | (a) | | | None | |
Investor C Shares | | | No | | | | Yes | (b) | | | To Investor A Shares after approximately 8 years | |
| |
| | (a) | Investor A Shares may be subject to a contingent deferred sales charge (“CDSC”) for certain redemptions where no initial sales charge was paid at the time of purchase. | |
| | (b) | A CDSC of 1.00% is assessed on certain redemptions of Investor C Shares made within one year after purchase. | |
The Board of Directors of the Corporation and the Board of Trustees of the Trust are collectively referred to throughout this report as the “Board”, and the directors/trustees thereof are collectively referred to throughout this report as “Directors”.
The Funds, together with certain other registered investment companies advised by BlackRock Advisors, LLC (the “Manager”) or its affiliates, are included in a complex of funds referred to as the BlackRock Multi-Asset Complex.
| 2. | SIGNIFICANT ACCOUNTING POLICIES |
The financial statements are prepared in conformity with accounting principles generally accepted in the United States of America (“U.S. GAAP”), which may require management to make estimates and assumptions that affect the reported amounts of assets and liabilities in the financial statements, disclosure of contingent assets and liabilities at the date of the financial statements and the reported amounts of increases and decreases in net assets from operations during the reporting period. Actual results could differ from those estimates. Each Fund is considered an investment company under U.S. GAAP and follows the accounting and reporting guidance applicable to investment companies. Below is a summary of significant accounting policies:
Investment Transactions and Income Recognition: For financial reporting purposes, investment transactions are recorded on the dates the transactions are executed. Realized gains and losses on investment transactions are determined using the specific identification method. Dividend income and capital gain distributions, if any, are recorded on the ex-dividend dates. Non-cash dividends, if any, are recorded on the ex-dividend dates at fair value. Dividends from foreign securities where the ex-dividend dates may have passed are subsequently recorded when the Funds are informed of the ex-dividend dates. Under the applicable foreign tax laws, a withholding tax at various rates may be imposed on capital gains, dividends and interest. Upon notification from issuers, a portion of the dividend income received from a real estate investment trust may be redesignated as a reduction of cost of the related investment and/or realized gain. Interest income, including amortization and accretion of premiums and discounts on debt securities, is recognized daily on an accrual basis. Income, expenses and realized and unrealized gains and losses are allocated daily to each class based on its relative net assets.
Foreign Currency Translation: Each Fund’s books and records are maintained in U.S. dollars. Securities and other assets and liabilities denominated in foreign currencies are translated into U.S. dollars using exchange rates determined as of the close of trading on the New York Stock Exchange (“NYSE”). Purchases and sales of investments are recorded at the rates of exchange prevailing on the respective dates of such transactions. Generally, when the U.S. dollar rises in value against a foreign currency, the investments denominated in that currency will lose value; the opposite effect occurs if the U.S. dollar falls in relative value.
Each Fund does not isolate the effect of fluctuations in foreign exchange rates from the effect of fluctuations in the market prices of investments for financial reporting purposes. Accordingly, the effects of changes in exchange rates on investments are not segregated in the Statements of Operations from the effects of changes in market prices of those investments, but are included as a component of net realized and unrealized gain (loss) from investments. Each Fund reports realized currency gains (losses) on foreign currency related transactions as components of net realized gain (loss) for financial reporting purposes, whereas such components are generally treated as ordinary income for U.S. federal income tax purposes.
| | |
N O T E S T O F I N A N C I A L S T A T E M E N T S | | 65 |
Notes to Financial Statements (continued)
Foreign Taxes: The Funds may be subject to foreign taxes (a portion of which may be reclaimable) on income, stock dividends, capital gains on investments, or certain foreign currency transactions. All foreign taxes are recorded in accordance with the applicable foreign tax regulations and rates that exist in the foreign jurisdictions in which each Fund invests. These foreign taxes, if any, are paid by each Fund and are reflected in its Statements of Operations as follows: foreign taxes withheld at source are presented as a reduction of income, foreign taxes on securities lending income are presented as a reduction of securities lending income, foreign taxes on stock dividends are presented as “Foreign taxes withheld”, and foreign taxes on capital gains from sales of investments and foreign taxes on foreign currency transactions are included in their respective net realized gain (loss) categories. Foreign taxes payable or deferred as of May 31, 2024, if any, are disclosed in the Statements of Assets and Liabilities.
The Funds file withholding tax reclaims in certain jurisdictions to recover a portion of amounts previously withheld. Certain Funds may record a reclaim receivable based on collectability, which includes factors such as the jurisdiction’s applicable laws, payment history and market convention. The Statements of Operations include tax reclaims recorded as well as professional and other fees, if any, associated with recovery of foreign withholding taxes.
Bank Overdraft: Certain Funds had outstanding cash disbursements exceeding deposited cash amounts at the custodian during the reporting period. The Funds are obligated to repay the custodian for any overdraft, including any related costs or expenses, where applicable. For financial reporting purposes, overdraft fees, if any, are included in interest expense in the Statements of Operations.
Collateralization: If required by an exchange or counterparty agreement, the Funds may be required to deliver/deposit cash and/or securities to/with an exchange, or broker-dealer or custodian as collateral for certain investments.
Distributions: Distributions paid by the Funds are recorded on the ex-dividend dates. The character and timing of distributions are determined in accordance with U.S. federal income tax regulations, which may differ from U.S. GAAP.
Indemnifications: In the normal course of business, a Fund enters into contracts that contain a variety of representations that provide general indemnification. A Fund’s maximum exposure under these arrangements is unknown because it involves future potential claims against a Fund, which cannot be predicted with any certainty.
Other: Expenses directly related to a Fund or its classes are charged to that Fund or the applicable class. Expenses directly related to the Funds and other shared expenses prorated to the Funds are allocated daily to each class based on their relative net assets or other appropriate methods. Other operating expenses shared by several funds, including other funds managed by the Manager, are prorated among those funds on the basis of relative net assets or other appropriate methods.
The Funds have an arrangement with their custodian whereby credits are earned on uninvested cash balances. For financial reporting purposes, custodian credits, if any, are included in interest income in the Statements of Operations.
| 3. | INVESTMENT VALUATION AND FAIR VALUE MEASUREMENTS |
Investment Valuation Policies: The Funds’ investments are valued at fair value (also referred to as “market value” within the financial statements) each day that the Funds are open for business and, for financial reporting purposes, as of the report date. U.S. GAAP defines fair value as the price a fund would receive to sell an asset or pay to transfer a liability in an orderly transaction between market participants at the measurement date. The Board of each Fund has approved the designation of each Fund’s Manager as the valuation designee for each Fund. Each Fund determines the fair values of its financial instruments using various independent dealers or pricing services under the Manager’s policies. If a security’s market price is not readily available or does not otherwise accurately represent the fair value of the security, the security will be valued in accordance with the Manager’s policies and procedures as reflecting fair value. The Manager has formed a committee (the “Valuation Committee”) to develop pricing policies and procedures and to oversee the pricing function for all financial instruments, with assistance from other BlackRock pricing committees.
Fair Value Inputs and Methodologies: The following methods and inputs are used to establish the fair value of each Fund’s assets and liabilities:
| | • | | Equity investments traded on a recognized securities exchange are valued at that day’s official closing price, as applicable, on the exchange where the stock is primarily traded. Equity investments traded on a recognized exchange for which there were no sales on that day may be valued at the last available bid (long positions) or ask (short positions) price. |
| | • | | Investments in open-end U.S. mutual funds (including money market funds) are valued at that day’s published net asset value (“NAV”). |
| | • | | Futures contracts are valued based on that day’s last reported settlement or trade price on the exchange where the contract is traded. |
Generally, trading in foreign instruments is substantially completed each day at various times prior to the close of trading on the New York Stock Exchange (“NYSE”). Each business day, the Funds use current market factors supplied by independent pricing services to value certain foreign instruments (“Systematic Fair Value Price”). The Systematic Fair Value Price is designed to value such foreign securities at fair value as of the close of trading on the NYSE, which follows the close of the local markets.
If events (e.g., market volatility, company announcement or a natural disaster) occur that are expected to materially affect the value of such investment, or in the event that application of these methods of valuation results in a price for an investment that is deemed not to be representative of the market value of such investment, or if a price is not available, the investment will be valued by the Valuation Committee in accordance with the Manager’s policies and procedures as reflecting fair value (“Fair Valued Investments”). The fair valuation approaches that may be used by the Valuation Committee include market approach, income approach and cost approach. Valuation techniques such as discounted cash flow, use of market comparables and matrix pricing are types of valuation approaches and are typically used in determining fair value. When determining the price for Fair Valued Investments, the Valuation Committee seeks to determine the price that each Fund might reasonably expect to receive or pay from the current sale or purchase of that asset or liability in an arm’s-length transaction. Fair value determinations shall be based upon all available factors that the Valuation Committee deems relevant and consistent with the principles of fair value measurement.
| | |
| 66 | | 2 0 2 4 B L A C K R O C K A N N U A L F I N A N C I A L S T A T E M E N T S |
Notes to Financial Statements (continued)
For investments in equity or debt issued by privately held companies or funds (“Private Company” or collectively, the “Private Companies”) and other Fair Valued Investments, the fair valuation approaches that are used by the Valuation Committee and third-party pricing services utilized by the Valuation Committee include one or a combination of, but not limited to, the following inputs.
| | |
| |
| Standard Inputs Generally Considered By The Valuation Committee And Third-Party Pricing Services |
| |
Market approach | | (i) recent market transactions, including subsequent rounds of financing, in the underlying investment or comparable issuers; |
| | (ii) recapitalizations and other transactions across the capital structure; and |
| | | (iii) market multiples of comparable issuers. |
| |
Income approach | | (i) future cash flows discounted to present and adjusted as appropriate for liquidity, credit, and/or market risks; |
| | (ii) quoted prices for similar investments or assets in active markets; and |
| | | (iii) other risk factors, such as interest rates, yield curves, volatilities, prepayment speeds, loss severities, credit risks, recovery rates, liquidation amounts and/or default rates. |
| |
Cost approach | | (i) audited or unaudited financial statements, investor communications and financial or operational metrics issued by the Private Company; |
| | (ii) changes in the valuation of relevant indices or publicly traded companies comparable to the Private Company; |
| | (iii) relevant news and other public sources; and |
| | | (iv) known secondary market transactions in the Private Company’s interests and merger or acquisition activity in companies comparable to the Private Company. |
Investments in series of preferred stock issued by Private Companies are typically valued utilizing market approach in determining the enterprise value of the company. Such investments often contain rights and preferences that differ from other series of preferred and common stock of the same issuer. Enterprise valuation techniques such as an option pricing model (“OPM”), a probability weighted expected return model (“PWERM”), current value method or a hybrid of those techniques are used as deemed appropriate under the circumstances. The use of these valuation techniques involves a determination of the exit scenarios of the investment in order to appropriately allocate the enterprise value of the company among the various parts of its capital structure.
The Private Companies are not subject to the public company disclosure, timing, and reporting standards applicable to other investments held by a Fund. Typically, the most recently available information by a Private Company is as of a date that is earlier than the date a Fund is calculating its NAV. This factor may result in a difference between the value of the investment and the price a Fund could receive upon the sale of the investment.
Fair Value Hierarchy: Various inputs are used in determining the fair value of financial instruments. These inputs to valuation techniques are categorized into a fair value hierarchy consisting of three broad levels for financial reporting purposes as follows:
| | • | | Level 1 – Unadjusted price quotations in active markets/exchanges for identical assets or liabilities that each Fund has the ability to access; |
| | • | | Level 2 – Other observable inputs (including, but not limited to, quoted prices for similar assets or liabilities in markets that are active, quoted prices for identical or similar assets or liabilities in markets that are not active, inputs other than quoted prices that are observable for the assets or liabilities (such as interest rates, yield curves, volatilities, prepayment speeds, loss severities, credit risks and default rates) or other market–corroborated inputs); and |
| | • | | Level 3 – Unobservable inputs based on the best information available in the circumstances, to the extent observable inputs are not available (including the Valuation Committee’s assumptions used in determining the fair value of financial instruments). |
The hierarchy gives the highest priority to unadjusted quoted prices in active markets for identical assets or liabilities (Level 1 measurements) and the lowest priority to unobservable inputs (Level 3 measurements). Accordingly, the degree of judgment exercised in determining fair value is greatest for instruments categorized in Level 3. The inputs used to measure fair value may fall into different levels of the fair value hierarchy. In such cases, for disclosure purposes, the fair value hierarchy classification is determined based on the lowest level input that is significant to the fair value measurement in its entirety. Investments classified within Level 3 have significant unobservable inputs used by the Valuation Committee in determining the price for Fair Valued Investments. Level 3 investments include equity or debt issued by Private Companies that may not have a secondary market and/or may have a limited number of investors. The categorization of a value determined for financial instruments is based on the pricing transparency of the financial instruments and is not necessarily an indication of the risks associated with investing in those securities.
| 4. | SECURITIES AND OTHER INVESTMENTS |
Securities Lending: Certain Funds may lend their securities to approved borrowers, such as brokers, dealers and other financial institutions. The borrower pledges and maintains with the Fund collateral consisting of cash, an irrevocable letter of credit issued by a bank, or securities issued or guaranteed by the U.S. Government. The initial collateral received by each Fund is required to have a value of at least 102% of the current value of the loaned securities for securities traded on U.S. exchanges and a value of at least 105% for all other securities. The collateral is maintained thereafter at a value equal to at least 100% of the current market value of the securities on loan. The market value of the loaned securities is determined at the close of each business day of the Fund and any additional required collateral is delivered to the Fund, or excess collateral returned by the Fund, on the next business day. During the term of the loan, the Funds are entitled to all distributions made on or in respect of the loaned securities, but do not receive interest income on securities received as collateral. Loans of securities are terminable at any time and the borrower, after notice, is required to return borrowed securities within the standard time period for settlement of securities transactions.
As of period end, any securities on loan were collateralized by cash and/or U.S. Government obligations. Cash collateral invested by the securities lending agent, BlackRock Investment Management, LLC (“BIM”), if any, is disclosed in the Schedules of Investments. Any non-cash collateral received cannot be sold, re-invested or pledged by the Fund, except in the event of borrower default. The securities on loan, if any, are disclosed in the Funds’ Schedules of Investments. The market value of any securities on loan and the value of related collateral, if any, are shown separately in the Statements of Assets and Liabilities as a component of investments at value – unaffiliated and collateral on securities loaned, respectively.
| | |
N O T E S T O F I N A N C I A L S T A T E M E N T S | | 67 |
Notes to Financial Statements (continued)
Securities lending transactions are entered into by the Funds under Master Securities Lending Agreements (each, an “MSLA”), which provide the right, in the event of default (including bankruptcy or insolvency), for the non-defaulting party to liquidate the collateral and calculate a net exposure to the defaulting party or request additional collateral. In the event that a borrower defaults, the Funds, as lender, would offset the market value of the collateral received against the market value of the securities loaned. When the value of the collateral is greater than that of the market value of the securities loaned, the lender is left with a net amount payable to the defaulting party. However, bankruptcy or insolvency laws of a particular jurisdiction may impose restrictions on or prohibitions against such a right of offset in the event of an MSLA counterparty’s bankruptcy or insolvency. Under the MSLA, absent an event of default, the borrower can resell or re-pledge the loaned securities, and the Funds can reinvest cash collateral received in connection with loaned securities. Upon an event of default, the parties’ obligations to return the securities or collateral to the other party are extinguished, and the parties can resell or re-pledge the loaned securities or the collateral received in connection with the loaned securities in order to satisfy the defaulting party’s net payment obligation for all transactions under the MSLA. The defaulting party remains liable for any deficiency.
As of period end, the following table is a summary of the Funds’ securities on loan by counterparty which are subject to offset under an MSLA:
| | | | | | | | | | | | | | | | | | | | | | | | | | | | |
Fund Name/Counterparty | | Securities Loaned at Value | | | Cash Collateral Received(a) | | | Non-Cash Collateral Received, at Fair Value(a) | | | Net Amount(b) | |
| | | | | | | |
Advantage International | | | | | | | | | | | | | | | | | | | | | | | | | | | | |
BofA Securities, Inc. | | $ | 96 | | | | | | | $ | (96 | ) | | | | | | $ | — | | | | | | | $ | — | |
Morgan Stanley | | | 718,106 | | | | | | | | (718,106 | ) | | | | | | | — | | | | | | | | — | |
| | | | | | | | | | | | | | | | | | | | | | | | | | | | |
| | | | | | | |
| | $ | 718,202 | | | | | | | $ | (718,202 | ) | | | | | | $ | — | | | | | | | $ | — | |
| | | | | | | | | | | | | | | | | | | | | | | | | | | | |
| | | | | | | |
Advantage Small Cap Core | | | | | | | | | | | | | | | | | | | | | | | | | | | | |
Barclays Capital, Inc. | | $ | 239,324 | | | | | | | $ | (239,324 | ) | | | | | | $ | — | | | | | | | $ | — | |
BNP Paribas SA | | | 9,050,290 | | | | | | | | (9,050,290 | ) | | | | | | | — | | | | | | | | — | |
BofA Securities, Inc. | | | 5,260,795 | | | | | | | | (5,260,795 | ) | | | | | | | — | | | | | | | | — | |
Citigroup Global Markets, Inc. | | | 6,548,843 | | | | | | | | (6,548,843 | ) | | | | | | | — | | | | | | | | — | |
J.P. Morgan Securities LLC | | | 59,195,734 | | | | | | | | (59,195,734 | ) | | | | | | | — | | | | | | | | — | |
Jefferies LLC | | | 3,388,647 | | | | | | | | (3,388,647 | ) | | | | | | | — | | | | | | | | — | |
Morgan Stanley | | | 60,090,982 | | | | | | | | (60,090,982 | ) | | | | | | | — | | | | | | | | — | |
National Financial Services LLC | | | 1,606,210 | | | | | | | | (1,606,210 | ) | | | | | | | — | | | | | | | | — | |
SG Americas Securities LLC | | | 949,717 | | | | | | | | (949,717 | ) | | | | | | | — | | | | | | | | — | |
State Street Bank & Trust Co. | | | 236,670 | | | | | | | | (236,670 | ) | | | | | | | — | | | | | | | | — | |
Toronto-Dominion Bank | | | 2,424,102 | | | | | | | | (2,424,102 | ) | | | | | | | — | | | | | | | | — | |
| | | | | | | | | | | | | | | | | | | | | | | | | | | | |
| | | | | | | |
| | $ | 148,991,314 | | | | | | | $ | (148,991,314 | ) | | | | | | $ | — | | | | | | | $ | — | |
| | | | | | | | | | | | | | | | | | | | | | | | | | | | |
| | | | | | | |
Advantage Large Cap Core | | | | | | | | | | | | | | | | | | | | | | | | | | | | |
Goldman Sachs & Co. LLC | | $ | 2,961,250 | | | | | | | $ | (2,961,250 | ) | | | | | | $ | — | | | | | | | $ | — | |
J.P. Morgan Securities LLC | | | 4,540,110 | | | | | | | | (4,540,110 | ) | | | | | | | — | | | | | | | | — | |
| | | | | | | | | | | | | | | | | | | | | | | | | | | | |
| | | | | | | |
| | $ | 7,501,360 | | | | | | | $ | (7,501,360 | ) | | | | | | $ | — | | | | | | | $ | — | |
| | | | | | | | | | | | | | | | | | | | | | | | | | | | |
| | | | | | | |
Advantage Large Cap Value | | | | | | | | | | | | | | | | | | | | | | | | | | | | |
Citigroup Global Markets, Inc. | | $ | 734,454 | | | | | | | $ | (731,430 | ) | | | | | | $ | — | | | | | | | $ | 3,024 | |
J.P. Morgan Securities LLC | | | 2,441,534 | | | | | | | | (2,441,534 | ) | | | | | | | — | | | | | | | | — | |
National Financial Services LLC | | | 82,269 | | | | | | | | (82,269 | ) | | | | | | | — | | | | | | | | — | |
| | | | | | | | | | | | | | | | | | | | | | | | | | | | |
| | | | | | | |
| | $ | 3,258,257 | | | | | | | $ | (3,255,233 | ) | | | | | | $ | — | | | | | | | $ | 3,024 | |
| | | | | | | | | | | | | | | | | | | | | | | | | | | | |
| | (a) | Collateral received, if any, in excess of the market value of securities on loan is not presented in this table. The total cash collateral received by each Fund is disclosed in the Funds’ Statements of Assets and Liabilities. | |
| | (b) | The market value of the loaned securities is determined as of May 31, 2024. Additional collateral is delivered to the Fund on the next business day in accordance with the MSLA. The net amount would be subject to the borrower default indemnity in the event of default by the counterparty. | |
The risks of securities lending include the risk that the borrower may not provide additional collateral when required or may not return the securities when due. To mitigate these risks, the Funds benefit from a borrower default indemnity provided by BIM. BIM’s indemnity allows for full replacement of the securities loaned to the extent the collateral received does not cover the value on the securities loaned in the event of borrower default. Each Fund could incur a loss if the value of an investment purchased with cash collateral falls below the market value of loaned securities or if the value of an investment purchased with cash collateral falls below the value of the original cash collateral received. Such losses are borne entirely by the Funds.
| | |
| 68 | | 2 0 2 4 B L A C K R O C K A N N U A L F I N A N C I A L S T A T E M E N T S |
Notes to Financial Statements (continued)
| 5. | DERIVATIVE FINANCIAL INSTRUMENTS |
The Funds engage in various portfolio investment strategies using derivative contracts both to increase the returns of the Funds and/or to manage their exposure to certain risks such as credit risk, equity risk, interest rate risk, foreign currency exchange rate risk, commodity price risk or other risks (e.g., inflation risk). Derivative financial instruments categorized by risk exposure are included in the Schedules of Investments. These contracts may be transacted on an exchange or over-the-counter (“OTC”).
Futures Contracts: Futures contracts are purchased or sold to gain exposure to, or manage exposure to, changes in interest rates (interest rate risk) and changes in the value of equity securities (equity risk) or foreign currencies (foreign currency exchange rate risk).
Futures contracts are exchange-traded agreements between the Funds and a counterparty to buy or sell a specific quantity of an underlying instrument at a specified price and on a specified date. Depending on the terms of a contract, it is settled either through physical delivery of the underlying instrument on the settlement date or by payment of a cash amount on the settlement date. Upon entering into a futures contract, the Funds are required to deposit initial margin with the broker in the form of cash or securities in an amount that varies depending on a contract’s size and risk profile. The initial margin deposit must then be maintained at an established level over the life of the contract. Amounts pledged, which are considered restricted, are included in cash pledged for futures contracts in the Statements of Assets and Liabilities.
Securities deposited as initial margin are designated in the Schedules of Investments and cash deposited, if any, are shown as cash pledged for futures contracts in the Statements of Assets and Liabilities. Pursuant to the contract, the Funds agree to receive from or pay to the broker an amount of cash equal to the daily fluctuation in market value of the contract (“variation margin”). Variation margin is recorded as unrealized appreciation (depreciation) and, if any, shown as variation margin receivable (or payable) on futures contracts in the Statements of Assets and Liabilities. When the contract is closed, a realized gain or loss is recorded in the Statements of Operations equal to the difference between the notional amount of the contract at the time it was opened and the notional amount at the time it was closed. The use of futures contracts involves the risk of an imperfect correlation in the movements in the price of futures contracts and interest rates, foreign currency exchange rates or underlying assets.
| 6. | INVESTMENT ADVISORY AGREEMENT AND OTHER TRANSACTIONS WITH AFFILIATES |
Investment Advisory: The Trust, on behalf of Advantage International, Advantage Large Cap Growth and Advantage Small Cap Core, and the Corporation, on behalf of Advantage Large Cap Core and Advantage Large Cap Value, entered into an Investment Advisory Agreement with the Manager, the Funds’ investment adviser and an indirect, wholly-owned subsidiary of BlackRock, Inc. (“BlackRock”), to provide investment advisory services. The Manager is responsible for the management of each Fund’s portfolio and provides the personnel, facilities, equipment and certain other services necessary to the operations of each Fund.
For such services, each Fund pays the Manager a monthly fee at an annual rate equal to the following percentages of the average daily value of each Fund’s net assets:
| | | | | | | | | | | | | | | | | | | | |
| | |
| | | Investment Advisory Fees | |
| | | | | |
| Average Daily Net Assets | | Advantage
International | | | Advantage Large
Cap Growth
| | | Advantage Small
Cap Core | | | Advantage Large
Cap Core | | | Advantage Large
Cap Value | |
| | | | | |
First $1 billion | | | 0.45% | | | | 0.57% | | | | 0.45% | | | | 0.45% | | | | 0.49% | |
| | | | | |
$1 billion - $3 billion | | | 0.42 | | | | 0.54 | | | | 0.42 | | | | 0.42 | | | | 0.46 | |
| | | | | |
$3 billion - $5 billion | | | 0.41 | | | | 0.51 | | | | 0.41 | | | | 0.41 | | | | 0.44 | |
| | | | | |
$5 billion - $10 billion | | | 0.39 | | | | 0.50 | | | | 0.39 | | | | 0.39 | | | | 0.43 | |
| | | | | |
Greater than $10 billion | | | 0.38 | | | | 0.48 | | | | 0.38 | | | | 0.38 | | | | 0.42 | |
Service and Distribution Fees: The Trust, on behalf of Advantage International, Advantage Large Cap Growth and Advantage Small Cap Core, and the Corporation, on behalf of Advantage Large Cap Core and Advantage Large Cap Value, entered into a Distribution Agreement and a Distribution and Service Plan with BlackRock Investments, LLC (“BRIL”), an affiliate of the Manager. Pursuant to the Distribution and Service Plan and in accordance with Rule 12b-1 under the 1940 Act, each Fund pays BRIL ongoing service and distribution fees. The fees are accrued daily and paid monthly at annual rates based upon the average daily net assets of the relevant share class of each Fund as follows:
| | | | | | | | | | | | | | | | | | | | | | | | |
| | | | |
| | | Advantage International | | | Advantage Large Cap Growth | | | Advantage Small Cap Core | |
| Share Class | | Service Fees | | | Distribution Fees | | | Service Fees | | | Distribution Fees | | | Service Fees | | | Distribution Fees | |
| | | | | | |
Investor A | | | 0.25% | | | | N/A | | | | 0.25% | | | | N/A | | | | 0.25% | | | | N/A | |
| | | | | | |
Investor C | | | 0.25 | | | | 0.75% | | | | 0.25 | | | | 0.75% | | | | 0.25% | | | | 0.75% | |
| | | | | | |
Class R | | | 0.25 | | | | 0.25 | | | | 0.25 | | | | 0.25 | | | | N/A | | | | N/A | |
| | | | | | | | | | | | | | | | | | | | | | | | |
| | | | | |
| | | | | | | | | Advantage Large Cap Core | | | Advantage Large Cap Value | |
| Share Class | | | | | | | | Service Fees | | | Distribution Fees | | | Service Fees | | | Distribution Fees | |
| | | | | | |
Investor A | | | | | | | | | | | 0.25% | | | | N/A | | | | 0.25% | | | | N/A | |
| | | | | | |
Investor C | | | | | | | | | | | 0.25 | | | | 0.75% | | | | 0.25 | | | | 0.75% | |
| | | | | | |
Class R | | | | | | | | | | | 0.25 | | | | 0.25 | | | | 0.25 | | | | 0.25 | |
BRIL and broker-dealers, pursuant to sub-agreements with BRIL, provide shareholder servicing and distribution services to the Funds. The ongoing service and/or distribution fee compensates BRIL and each broker-dealer for providing shareholder servicing and/or distribution related services to shareholders.
| | |
N O T E S T O F I N A N C I A L S T A T E M E N T S | | 69 |
Notes to Financial Statements (continued)
For the year ended May 31, 2024, the following table shows the class specific service and distribution fees borne directly by each share class of each Fund:
| | | | | | | | | | | | | | |
| | | | | |
| Fund Name | | Investor A | | | Investor C | | | Class R | | | Total |
| | | | |
Advantage International | | $ | 601,021 | | | $ | 97,063 | | | $ | 134,753 | | | $ 832,837 |
Advantage Large Cap Growth | | | 1,239,905 | | | | 224,520 | | | | 4,002 | | | 1,468,427 |
Advantage Small Cap Core | | | 879,596 | | | | 104,036 | | | | — | | | 983,632 |
Advantage Large Cap Core | | | 3,532,022 | | | | 389,638 | | | | 75,071 | | | 3,996,731 |
Advantage Large Cap Value | | | 928,721 | | | | 152,189 | | | | 35,940 | | | 1,116,850 |
Administration: The Trust, on behalf of Advantage International, Advantage Large Cap Growth and Advantage Small Cap Core, and the Corporation, on behalf of Advantage Large Cap Core and Advantage Large Cap Value, entered into an Administration Agreement with the Manager, an indirect, wholly-owned subsidiary of BlackRock, to provide administrative services. For these services, the Manager receives an administration fee computed daily and payable monthly, based on a percentage of the average daily net assets of each Fund. The administration fee, which is shown as administration in the Statements of Operations, is paid at the annual rates below.
| | |
| | |
| Average Daily Net Assets | | Administration Fees |
| |
First $500 million | | 0.0425% |
$500 million - $1 billion | | 0.0400 |
$1 billion - $2 billion | | 0.0375 |
$2 billion - $4 billion | | 0.0350 |
$4 billion - $13 billion | | 0.0325 |
Greater than $13 billion | | 0.0300 |
In addition, the Manager charges each of the share classes an administration fee, which is shown as administration — class specific in the Statements of Operations, at an annual rate of 0.02% of the average daily net assets of each respective class.
For the year ended May 31, 2024, the following table shows the class specific administration fees borne directly by each share class of each Fund:
| | | | | | | | | | | | | | | | | | | | | | |
| | | | | | | |
| Fund Name | | Institutional | | | Investor A | | | Investor C | | | Class K | | | Class R | | | Total |
| | | | | | |
Advantage International | | $ | 187,645 | | | $ | 48,006 | | | $ | 1,938 | | | $ | 43,611 | | | $ | 5,367 | | | $ 286,567 |
Advantage Large Cap Growth | | | 111,362 | | | | 98,996 | | | | 4,476 | | | | 907 | | | | 159 | | | 215,900 |
Advantage Small Cap Core | | | 425,004 | | | | 70,244 | | | | 2,077 | | | | 205,586 | | | | — | | | 702,911 |
Advantage Large Cap Core | | | 288,501 | | | | 281,899 | | | | 7,772 | | | | 6,364 | | | | 2,984 | | | 587,520 |
Advantage Large Cap Value | | | 35,611 | | | | 74,172 | | | | 3,039 | | | | 2,648 | | | | 1,435 | | | 116,905 |
Transfer Agent: Pursuant to written agreements, certain financial intermediaries, some of which may be affiliates, provide the Funds with sub-accounting, recordkeeping, sub-transfer agency and other administrative services with respect to servicing of underlying investor accounts. For these services, these entities receive an asset-based fee or an annual fee per shareholder account, which will vary depending on share class and/or net assets. For the year ended May 31, 2024, the Funds paid the following amounts to affiliates of BlackRock in return for these services, which are included in transfer agent — class specific in the Statements of Operations:
| | | | | | |
| | | |
| Fund Name | | Institutional | | | Total |
| | |
Advantage International | | $ | 737,417 | | | $ 737,417 |
Advantage Large Cap Growth | | | 484,703 | | | 484,703 |
Advantage Small Cap Core | | | 266,843 | | | 266,843 |
Advantage Large Cap Core | | | 1,114,836 | | | 1,114,836 |
The Manager maintains a call center that is responsible for providing certain shareholder services to the Funds. Shareholder services include responding to inquiries and processing purchases and sales based upon instructions from shareholders. For the year ended May 31, 2024, each Fund reimbursed the Manager the following amounts for costs incurred in running the call center, which are included in transfer agent — class specific in the Statements of Operations:
| | | | | | | | | | | | | | | | | | | | | | |
| | | | | | | |
| Fund Name | | Institutional | | | Investor A | | | Investor C | | | Class K | | | Class R | | | Total |
| | | | | | |
Advantage International | | $ | 8,745 | | | $ | 16,839 | | | $ | 862 | | | $ | 628 | | | $ | 1,949 | | | $ 29,023 |
Advantage Large Cap Growth | | | 4,297 | | | | 116,330 | | | | 5,263 | | | | 66 | | | | 51 | | | 126,007 |
Advantage Small Cap Core | | | 10,639 | | | | 23,539 | | | | 1,483 | | | | 3,506 | | | | — | | | 39,167 |
Advantage Large Cap Core | | | 31,681 | | | | 184,304 | | | | 3,813 | | | | 101 | | | | 203 | | | 220,102 |
Advantage Large Cap Value | | | 821 | | | | 33,611 | | | | 2,173 | | | | 59 | | | | 141 | | | 36,805 |
For the year ended May 31, 2024, the following table shows the class specific transfer agent fees borne directly by each share class of each Fund:
| | | | | | | | | | | | | | | | | | | | | | |
| | | | | | | |
| Fund Name | | Institutional | | | Investor A | | | Investor C | | | Class K | | | Class R | | | Total |
| | | | | | |
Advantage International | | $ | 1,361,049 | | | $ | 262,113 | | | $ | 16,365 | | | $ | 5,850 | | | $ | 69,426 | | | $ 1,714,803 |
Advantage Large Cap Growth | | | 781,518 | | | | 479,685 | | | | 36,588 | | | | 391 | | | | 1,865 | | | 1,300,047 |
Advantage Small Cap Core | | | 1,358,677 | | | | 595,109 | | | | 21,175 | | | | 50,169 | | | | — | | | 2,025,130 |
Advantage Large Cap Core | | | 1,786,837 | | | | 1,727,639 | | | | 71,009 | | | | 3,724 | | | | 30,624 | | | 3,619,833 |
Advantage Large Cap Value | | | 180,380 | | | | 371,561 | | | | 21,926 | | | | 877 | | | | 16,779 | | | 591,523 |
| | |
| 70 | | 2 0 2 4 B L A C K R O C K A N N U A L F I N A N C I A L S T A T E M E N T S |
Notes to Financial Statements (continued)
Other Fees: For the year ended May 31, 2024, affiliates earned underwriting discounts, direct commissions and dealer concessions on sales of each Fund’s Investor A Shares as follows:
| | |
| | |
| Fund Name | | Amounts |
| |
Advantage International | | $ 6,993 |
Advantage Large Cap Growth | | 11,356 |
Advantage Small Cap Core | | 12,413 |
Advantage Large Cap Core | | 27,448 |
Advantage Large Cap Value | | 5,151 |
For the year ended May 31, 2024, affiliates received CDSCs as follows:
| | | | | | | | | | | | | | | | | | | | | | | | | | | | | | | | | | |
| | | | | | | | | | |
| Share Class | | Advantage
International | | | | | | Advantage
Large Cap
Growth | | | | | | Advantage
Small Cap
Core | | | | | | Advantage
Large Cap
Core | | | | | | Advantage
Large Cap
Value |
| | | | | | | | | |
Investor A | | $ | 1,460 | | | | | | | $ | 82 | | | | | | | $ | 7,899 | | | | | | | $ | 7,200 | | | | | | | $ 461 |
Investor C | | | 76 | | | | | | | | 802 | | | | | | | | 1,106 | | | | | | | | 1,093 | | | | | | | 891 |
Expense Limitations, Waivers and Reimbursements: With respect to each Fund, the Manager contractually agreed to waive its investment advisory fees by the amount of investment advisory fees each Fund pays to the Manager indirectly through its investment in affiliated money market funds (the “affiliated money market fund waiver”) through June 30, 2025. The contractual agreement may be terminated upon 90 days’ notice by a majority of the directors who are not “interested persons” of the Trust or the Corporation, as defined in the 1940 Act (“Independent Directors”), or by a vote of a majority of the outstanding voting securities of a Fund. The amount of waivers and/or reimbursements of fees and expenses made pursuant to the expense limitation described below will be reduced by the amount of the affiliated money market fund waiver. These amounts are included in fees waived and/or reimbursed by the Manager in the Statements of Operations. For the year ended May 31, 2024, the amounts waived were as follows:
| | | | |
| | |
| Fund Name | | | Amounts Waived | |
| |
Advantage International | | | $ 24,249 | |
Advantage Large Cap Growth | | | 7,683 | |
Advantage Small Cap Core | | | 23,708 | |
Advantage Large Cap Core | | | 20,319 | |
Advantage Large Cap Value | | | 3,965 | |
The Manager has contractually agreed to waive its investment advisory fee with respect to any portion of each Fund’s assets invested in affiliated equity and fixed-income mutual funds and affiliated exchange-traded funds that have a contractual management fee through June 30, 2025. The contractual agreement may be terminated upon 90 days’ notice by a majority of the Independent Directors, or by a vote of a majority of the outstanding voting securities of a Fund. For the year ended May 31, 2024, there were no fees waived by the Manager pursuant to this arrangement.
With respect to each Fund, the Manager contractually agreed to waive and/or reimburse fees or expenses in order to limit expenses, excluding interest expense, dividend expense, tax expense, acquired fund fees and expenses, and certain other fund expenses, which constitute extraordinary expenses not incurred in the ordinary course of each Fund’s business (“expense limitation”). The expense limitations as a percentage of average daily net assets are as follows:
| | | | | | | | | | | | | | | | | | | | |
| | | | | | |
| Fund Name | | | Institutional | | | | Investor A | | | | Investor C | | | | Class K | | | | Class R | |
| | | | | |
Advantage International | | | 0.50% | | | | 0.75% | | | | 1.50% | | | | 0.45% | | | | 1.00% | |
Advantage Large Cap Growth | | | 0.62 | | | | 0.87 | | | | 1.62 | | | | 0.57 | | | | 1.12 | |
Advantage Small Cap Core | | | 0.50 | | | | 0.75 | | | | 1.50 | | | | 0.45 | | | | N/A | |
Advantage Large Cap Core | | | 0.48 | | | | 0.73 | | | | 1.48 | | | | 0.43 | | | | 0.98 | |
Advantage Large Cap Value | | | 0.54 | | | | 0.79 | | | | 1.54 | | | | 0.49 | | | | 1.04 | |
The Manager has agreed not to reduce or discontinue the contractual expense limitations through June 30, 2025 (June 30, 2034 with respect to Advantage Large Cap Growth Class R Shares), unless approved by the Board, including a majority of the Independent Directors, or by a vote of a majority of the outstanding voting securities of a Fund.
For the year ended May 31, 2024, the Manager waived and/or reimbursed investment advisory fees, which is included in fees waived and/or reimbursed by the Manager in the Statements of Operations, as follows:
| | | | |
| | |
| Fund Name | | | Amounts Waived | |
| |
Advantage International | | | $ 1,193,491 | |
Advantage Large Cap Growth | | | 795,488 | |
Advantage Small Cap Core | | | 1,307,329 | |
Advantage Large Cap Core | | | 1,662,535 | |
Advantage Large Cap Value | | | 599,046 | |
| | |
N O T E S T O F I N A N C I A L S T A T E M E N T S | | 71 |
Notes to Financial Statements (continued)
In addition, these amounts waived and/or reimbursed by the Manager are included in administration fees waived by the Manager — class specific, transfer agent fees waived and/or reimbursed by the Manager — class specific, service and distribution fees waived and service distribution fees reimbursed respectively, in the Statements of Operations. For the year ended May 31, 2024, class specific expense waivers and/or reimbursements were as follows:
| | | | | | | | | | | | | | | | | | | | | | | | |
| | | Administration Fees Waived by the Manager - Class Specific | |
| | | | | | |
| Fund Name | | Institutional | | | Investor A | | | Investor C | | | Class K | | | Class R | | | Total | |
| | | | | | |
Advantage International | | $ | 187,645 | | | $ | 48,006 | | | $ | 1,938 | | | $ | 43,611 | | | $ | 5,367 | | | $ | 286,567 | |
Advantage Large Cap Growth | | | 111,362 | | | | 96,185 | | | | 4,429 | | | | 907 | | | | 160 | | | | 213,043 | |
Advantage Small Cap Core | | | 425,004 | | | | 70,244 | | | | 2,077 | | | | 205,586 | | | | — | | | | 702,911 | |
Advantage Large Cap Core | | | 288,501 | | | | 281,899 | | | | 7,772 | | | | 6,363 | | | | 2,984 | | | | 587,519 | |
Advantage Large Cap Value | | | 35,611 | | | | 74,172 | | | | 3,039 | | | | 2,648 | | | | 1,435 | | | | 116,905 | |
| | | | | | | | | | | | | | | | | | | | | | | | |
| | | Transfer Agent Fees Waived and/or Reimbursed by the Manager - Class Specific | |
| | | | | | |
| Fund Name | | Institutional | | | Investor A | | | Investor C | | | Class K | | | Class R | | | Total | |
| | | | | | |
Advantage International | | $ | 891,472 | | | $ | 143,318 | | | $ | 11,663 | | | $ | 5,850 | | | $ | 56,581 | | | $ | 1,108,884 | |
Advantage Large Cap Growth | | | 503,122 | | | | 237,914 | | | | 25,807 | | | | 391 | | | | 1,481 | | | | 768,715 | |
Advantage Small Cap Core | | | 297,219 | | | | 421,554 | | | | 16,124 | | | | 50,169 | | | | — | | | | 785,066 | |
Advantage Large Cap Core | | | 1,066,093 | | | | 1,033,446 | | | | 52,670 | | | | 3,724 | | | | 23,636 | | | | 2,179,569 | |
Advantage Large Cap Value | | | 91,514 | | | | 188,522 | | | | 14,634 | | | | 877 | | | | 13,255 | | | | 308,802 | |
Securities Lending: The U.S. Securities and Exchange Commission (“SEC”) has issued an exemptive order which permits BIM, an affiliate of the Manager, to serve as securities lending agent for the Funds, subject to applicable conditions. As securities lending agent, BIM bears all operational costs directly related to securities lending. The Funds are responsible for fees in connection with the investment of cash collateral received for securities on loan (the “collateral investment fees”). The cash collateral is invested in a money market fund, BlackRock Cash Funds: Institutional, managed by the Manager or its affiliates. However, BIM has agreed to reduce the amount of securities lending income it receives in order to effectively limit the collateral investment fees the Funds bear to an annual rate of 0.04%. The SL Agency Shares of such money market fund will not be subject to a sales load, redemption fee, distribution fee or service fee. The money market fund in which the cash collateral has been reinvested may impose a discretionary liquidity fee of up to 2% of the value redeemed, if such fee, is determined to be in the best interests of such money market fund.
Securities lending income is generally equal to the total of income earned from the reinvestment of cash collateral, (and excludes collateral investment fees), and any fees or other payments to and from borrowers of securities. Each Fund retains a portion of the securities lending income and remits the remaining portion to BIM as compensation for its services as securities lending agent.
Pursuant to the current securities lending agreement, each Fund (except Advantage International) retains 81% of securities lending income (which excludes collateral investment expenses), and this amount retained can never be less than 70% of the total of securities lending income plus the collateral investment expenses. Pursuant to the current securities lending agreement, Advantage International retains 82% of securities lending income (which excludes collateral investment expenses), and this amount retained can never be less than 70% of the total of securities lending income plus the collateral investment expenses.
In addition, commencing the business day following the date that the aggregate securities lending income earned across the BlackRock Multi-Asset Complex in a calendar year exceeds a specified threshold, each Fund (except Advantage International), pursuant to the securities lending agreement, will retain for the remainder of that calendar year securities lending income in an amount equal to 81% of securities lending income (which excludes collateral investment expenses), and this amount retained can never be less than 70% of the total of securities lending income plus the collateral investment expenses. Advantage International, pursuant to the securities lending agreement, will retain for the remainder of that calendar year securities lending income in an amount equal to 85% of securities lending income (which excludes collateral investment expenses), and this amount retained can never be less than 70% of the total of securities lending income plus the collateral investment expenses.
The share of securities lending income earned by each Fund is shown as securities lending income — affiliated — net in the Statements of Operations. For the year ended May 31, 2024, each Fund paid BIM the following amounts for securities lending agent services:
| | | | |
| | |
| Fund Name | | Amounts | |
| |
Advantage International | | $ | 3,714 | |
Advantage Large Cap Growth | | | 27,406 | |
Advantage Small Cap Core | | | 152,028 | |
Advantage Large Cap Core | | | 81,545 | |
Advantage Large Cap Value | | | 2,768 | |
Interfund Lending: In accordance with an exemptive order (the “Order”) from the SEC, each Fund other than Advantage Large Cap Growth may participate in a joint lending and borrowing facility for temporary purposes (the “Interfund Lending Program”), subject to compliance with the terms and conditions of the Order, and to the extent permitted by each Fund’s investment policies and restrictions. Advantage Large Cap Core, Advantage Large Cap Value and Advantage International are currently permitted to borrow under the Interfund Lending Program. Advantage Small Cap Core is currently permitted to borrow and lend under the Interfund Lending Program.
A lending BlackRock fund may lend in aggregate up to 15% of its net assets but may not lend more than 5% of its net assets to any one borrowing fund through the Interfund Lending Program. A borrowing BlackRock fund may not borrow through the Interfund Lending Program or from any other source more than 33 1/3% of its total assets (or any lower threshold provided for by the fund’s investment restrictions). If a borrowing BlackRock fund’s total outstanding borrowings exceed 10% of its total assets, each of its outstanding interfund loans will be subject to collateralization of at least 102% of the outstanding principal value of the loan. All interfund loans are for temporary or emergency purposes and the interest rate to be charged will be the average of the highest current overnight repurchase agreement rate available to a lending fund and the bank loan rate, as calculated according to a formula established by the Board.
| | |
| 72 | | 2 0 2 4 B L A C K R O C K A N N U A L F I N A N C I A L S T A T E M E N T S |
Notes to Financial Statements (continued)
During the year ended May 31, 2024, the Funds did not participate in the Interfund Lending Program.
Directors and Officers: Certain directors and/or officers of the Corporation and the Trust are directors and/or officers of BlackRock or its affiliates. The Funds reimburse the Manager for a portion of the compensation paid to the Corporation’s/Trust’s Chief Compliance Officer, which is included in Directors and Officer in the Statements of Operations.
Other Transactions: During the year ended May 31, 2024, Advantage Large Cap Growth received a reimbursement of $2,554 from an affiliate, which is included in payment by affiliate in the Statements of Operations, related to an operating event.
The Funds may purchase securities from, or sell securities to, an affiliated fund provided the affiliation is due solely to having a common investment adviser, common officers, or common directors or trustees. For the year ended May 31, 2024, the purchase and sale transactions and any net realized gains (losses) with an affiliated fund in compliance with Rule 17a-7 under the 1940 Act were as follows:
| | | | | | | | | | | | |
| |
| | | |
| Fund Name | | Purchases | | | Sales | | | Net Realized
Gain | |
| |
Advantage International | | $ | 234,870,446 | | | | $ 269,753,423 | | | $ | 15,207,120 | |
Advantage Large Cap Growth | | | 212,535,797 | | | | 261,180,770 | | | | 21,471,949 | |
Advantage Small Cap Core | | | 52,852,815 | | | | 89,899,610 | | | | 10,810,518 | |
Advantage Large Cap Core | | | 286,665,308 | | | | 379,369,799 | | | | 43,181,330 | |
Advantage Large Cap Value | | | 68,152,477 | | | | 87,705,030 | | | | 9,670,172 | |
| |
For the year ended May 31, 2024, purchases and sales of investments, excluding short-term securities, were as follows:
| | | | | | | | |
| |
| | |
| Fund Name | | Purchases | | | Sales | |
| |
Advantage International | | $ | 2,073,122,203 | | | $ | 1,783,177,335 | |
Advantage Large Cap Growth | | | 1,359,412,482 | | | | 1,402,085,259 | |
Advantage Small Cap Core | | | 2,598,221,182 | | | | 3,256,674,483 | |
Advantage Large Cap Core | | | 3,363,180,139 | | | | 4,072,561,632 | |
Advantage Large Cap Value | | | 682,908,305 | | | | 724,238,591 | |
| |
It is each Fund’s policy to comply with the requirements of the Internal Revenue Code of 1986, as amended, applicable to regulated investment companies, and to distribute substantially all of its taxable income to its shareholders. Therefore, no U.S. federal income tax provision is required.
Each Fund files U.S. federal and various state and local tax returns. No income tax returns are currently under examination. The statute of limitations on each Fund’s U.S. federal tax returns generally remains open for a period of three years after they are filed. The statutes of limitations on each Fund’s state and local tax returns may remain open for an additional year depending upon the jurisdiction.
Management has analyzed tax laws and regulations and their application to the Funds as of May 31, 2024, inclusive of the open tax return years, and does not believe that there are any uncertain tax positions that require recognition of a tax liability in the Funds’ financial statements.
U.S. GAAP requires that certain components of net assets be adjusted to reflect permanent differences between financial and tax reporting. These reclassifications have no effect on net assets or NAVs per share. As of period end, permanent differences attributable to certain deemed distributions were reclassified to the following accounts:
| | | | | | | | |
| |
| | |
| Fund Name | | Paid-in capital | | | Accumulated earnings (loss) | |
| |
Advantage Large Cap Core | | $ | 17,940,398 | | | $ | (17,940,398 | ) |
| |
| | |
N O T E S T O F I N A N C I A L S T A T E M E N T S | | 73 |
Notes to Financial Statements (continued)
The tax character of distributions paid was as follows:
| | | | | | | | |
| | | |
| Fund Name | | Year Ended
May 31, 2024 | | | Year Ended
May 31, 2023 | |
Advantage International | | | | | | | | |
Ordinary income | | $ | 37,122,024 | | | $ | 33,948,066 | |
| | | | | | | | |
Advantage Large Cap Growth | | | | | | | | |
Ordinary income | | $ | 1,571,523 | | | $ | 2,228,616 | |
Long term capital gains | | | 7,955,409 | | | | — | |
| | | | | | | | |
| | | 9,526,932 | | | | 2,228,616 | |
Advantage Small Cap Core | | | | | | | | |
Ordinary income | | $ | 35,871,400 | | | $ | 29,229,941 | |
Long term capital gains | | | — | | | | 71,449,539 | |
| | | | | | | | |
| | $ | 35,871,400 | | | $ | 100,679,480 | |
Advantage Large Cap Core | | | | | | | | |
Ordinary income | | $ | 26,639,557 | | | $ | 29,688,180 | |
Long term capital gains | | | — | | | | 142,361,333 | |
| | | | | | | | |
| | $ | 26,639,557 | | | $ | 172,049,513 | |
Advantage Large Cap Value | | | | | | | | |
Ordinary income | | $ | 8,914,549 | | | $ | 8,879,547 | |
Long term capital gains | | | 7,076,825 | | | | 23,879,246 | |
| | | | | | | | |
| | $ | 15,991,374 | | | $ | 32,758,793 | |
| | | | | | | | | |
As of May 31, 2024, the tax components of accumulated earnings (loss) were as follows:
| | | | | | | | | | | | | | | | | | | | |
| |
| | | | | |
| Fund Name | | Undistributed
Ordinary Income | | | Undistributed Long-Term
Capital Gains | | | Non-expiring
Capital Loss
Carryforwards(a) | | | Net Unrealized
Gains (Losses)(b) | | | Total | |
| |
Advantage International | | $ | 31,187,532 | | | $ | — | | | $ | (36,663,284) | | | $ | 271,879,757 | | | $ | 266,404,005 | |
Advantage Large Cap Growth | | | 43,864,946 | | | | 56,500,814 | | | | — | | | | 485,986,696 | | | | 586,352,456 | |
Advantage Small Cap Core | | | 6,752,127 | | | | — | | | | (203,707,240) | | | | 309,290,872 | | | | 112,335,759 | |
Advantage Large Cap Core | | | 84,706,692 | | | | 143,664,584 | | | | — | | | | 887,804,902 | | | | 1,116,176,178 | |
Advantage Large Cap Value | | | 36,255,127 | | | | 10,202,635 | | | | — | | | | 80,042,117 | | | | 126,499,879 | |
| |
| (a) | Amounts available to offset future realized capital gains. | |
| (b) | The difference between book-basis and tax-basis net unrealized gains (losses) was attributable primarily to the tax deferral of losses on wash sales, the realization for tax purposes of unrealized gains (losses) on certain foreign currency contracts and futures contracts, the realization for tax purposes of unrealized gains on investments in passive foreign investment companies, REITs basis adjustments, characterization of corporate actions and the timing and recognition of partnership income. | |
During the year ended May 31, 2024, the Funds listed below utilized the following amounts of their respective capital loss carryforwards:
| | | | | | | | | | | | | | | | | | | | |
| |
| | | | | |
| | | Advantage
International | | | Advantage
Large Cap
Growth | | | Advantage
Small Cap
Core | | | Advantage
Large Cap
Core | | | Advantage
Large Cap
Value | |
| | | | | |
Amount utilized | | $ | 53,351,890 | | | $ | 25,713,241 | | | $ | 116,703,487 | | | $ | 84,219,781 | | | $ | 10,898,011 | |
| |
As of May 31, 2024, gross unrealized appreciation and depreciation based on cost of investments (including short positions and derivatives, if any) for U.S. federal income tax purposes were as follows:
| | | | | | | | | | | | | | | | |
| |
| | | | |
| Fund Name | | Tax Cost | | | Gross Unrealized
Appreciation | | | Gross Unrealized
Depreciation | | | Net Unrealized
Appreciation
(Depreciation) | |
| |
Advantage International | | $ | 1,490,051,898 | | | $ | 291,918,550 | | | $ | (19,942,245 | ) | | $ | 271,976,305 | |
Advantage Large Cap Growth | | | 738,361,778 | | | | 496,081,188 | | | | (10,088,985 | ) | | | 485,992,203 | |
Advantage Small Cap Core | | | 3,364,554,686 | | | | 626,972,542 | | | | (317,681,670 | ) | | | 309,290,872 | |
Advantage Large Cap Core | | | 1,963,979,800 | | | | 926,003,617 | | | | (38,198,714 | ) | | | 887,804,903 | |
Advantage Large Cap Value | | | 544,032,961 | | | | 90,727,771 | | | | (10,673,428 | ) | | | 80,054,343 | |
| |
The Trust, on behalf of Advantage International, Advantage Large Cap Growth and Advantage Small Cap Core, and the Corporation, on behalf of Advantage Large Cap Core and Advantage Large Cap Value, along with certain other funds managed by the Manager and its affiliates (“Participating Funds”), is party to a 364-day, $2.40 billion credit
| | |
| 74 | | 2 0 2 4 B L A C K R O C K A N N U A L F I N A N C I A L S T A T E M E N T S |
Notes to Financial Statements (continued)
agreement with a group of lenders. Under this agreement, the Funds may borrow to fund shareholder redemptions. Excluding commitments designated for certain individual funds, the Participating Funds, including the Funds, can borrow up to an aggregate commitment amount of $1.75 billion at any time outstanding, subject to asset coverage and other limitations as specified in the agreement. The credit agreement has the following terms: a fee of 0.10% per annum on unused commitment amounts and interest at a rate equal to the higher of (a) Overnight Bank Funding Rate (“OBFR”) (but, in any event, not less than 0.00%) on the date the loan is made plus 0.80% per annum, (b) the Fed Funds rate (but, in any event, not less than 0.00%) in effect from time to time plus 0.80% per annum on amounts borrowed or (c) the sum of (x) Daily Simple Secured Overnight Financing Rate (“SOFR”) (but, in any event, not less than 0.00%) on the date the loan is made plus 0.10% and (y) 0.80% per annum. The agreement expires in April 2025 unless extended or renewed. These fees were allocated among such funds based upon portions of the aggregate commitment available to them and relative net assets of Participating Funds. During the year ended May 31, 2024, the Funds did not borrow under the credit agreement.
In the normal course of business, the Funds invest in securities or other instruments and may enter into certain transactions, and such activities subject each Fund to various risks, including among others, fluctuations in the market (market risk) or failure of an issuer to meet all of its obligations. The value of securities or other instruments may also be affected by various factors, including, without limitation: (i) the general economy; (ii) the overall market as well as local, regional or global political and/or social instability; (iii) regulation, taxation or international tax treaties between various countries; or (iv) currency, interest rate and price fluctuations. Local, regional or global events such as war, acts of terrorism, the spread of infectious illness or other public health issues, recessions, or other events could have a significant impact on the Funds and their investments. Each Fund’s prospectus provides details of the risks to which each Fund is subject.
The Funds may be exposed to additional risks when reinvesting cash collateral in money market funds that do not seek to maintain a stable NAV per share of $1.00, which may be subject to discretionary liquidity fees under certain circumstances.
Valuation Risk: The market values of equities, such as common stocks and preferred securities or equity related investments, such as futures and options, may decline due to general market conditions which are not specifically related to a particular company. They may also decline due to factors which affect a particular industry or industries. A Fund may invest in illiquid investments. An illiquid investment is any investment that a Fund reasonably expects cannot be sold or disposed of in current market conditions in seven calendar days or less without the sale or disposition significantly changing the market value of the investment. A Fund may experience difficulty in selling illiquid investments in a timely manner at the price that it believes the investments are worth. Prices may fluctuate widely over short or extended periods in response to company, market or economic news. Markets also tend to move in cycles, with periods of rising and falling prices. This volatility may cause each Fund’s NAV to experience significant increases or decreases over short periods of time. If there is a general decline in the securities and other markets, the NAV of a Fund may lose value, regardless of the individual results of the securities and other instruments in which a Fund invests.
The price a Fund could receive upon the sale of any particular portfolio investment may differ from a Fund’s valuation of the investment, particularly for securities that trade in thin or volatile markets or that are valued using a fair valuation technique or a price provided by an independent pricing service. Changes to significant unobservable inputs and assumptions (i.e., publicly traded company multiples, growth rate, time to exit) due to the lack of observable inputs may significantly impact the resulting fair value and therefore a Fund’s results of operations. As a result, the price received upon the sale of an investment may be less than the value ascribed by a Fund, and a Fund could realize a greater than expected loss or lesser than expected gain upon the sale of the investment. A Fund’s ability to value its investments may also be impacted by technological issues and/or errors by pricing services or other third-party service providers.
Counterparty Credit Risk: The Funds may be exposed to counterparty credit risk, or the risk that an entity may fail to or be unable to perform on its commitments related to unsettled or open transactions, including making timely interest and/or principal payments or otherwise honoring its obligations. The Funds manage counterparty credit risk by entering into transactions only with counterparties that the Manager believes have the financial resources to honor their obligations and by monitoring the financial stability of those counterparties. Financial assets, which potentially expose the Funds to market, issuer and counterparty credit risks, consist principally of financial instruments and receivables due from counterparties. The extent of the Funds’ exposure to market, issuer and counterparty credit risks with respect to these financial assets is approximately their value recorded in the Statements of Assets and Liabilities, less any collateral held by the Funds.
A derivative contract may suffer a mark-to-market loss if the value of the contract decreases due to an unfavorable change in the market rates or values of the underlying instrument. Losses can also occur if the counterparty does not perform under the contract.
With exchange-traded futures, there is less counterparty credit risk to the Funds since the exchange or clearinghouse, as counterparty to such instruments, guarantees against a possible default. The clearinghouse stands between the buyer and the seller of the contract; therefore, credit risk is limited to failure of the clearinghouse. While offset rights may exist under applicable law, a Fund does not have a contractual right of offset against a clearing broker or clearinghouse in the event of a default (including the bankruptcy or insolvency). Additionally, credit risk exists in exchange-traded futures with respect to initial and variation margin that is held in a clearing broker’s customer accounts. While clearing brokers are required to segregate customer margin from their own assets, in the event that a clearing broker becomes insolvent or goes into bankruptcy and at that time there is a shortfall in the aggregate amount of margin held by the clearing broker for all its clients, typically the shortfall would be allocated on a pro rata basis across all the clearing broker’s customers, potentially resulting in losses to the Funds.
Geographic/Asset Class Risk: A diversified portfolio, where this is appropriate and consistent with a fund’s objectives, minimizes the risk that a price change of a particular investment will have a material impact on the NAV of a fund. The investment concentrations within each Fund’s portfolio are disclosed in its Schedule of Investments.
Certain Funds invest a significant portion of their assets in securities within a single or limited number of market sectors. When a fund concentrates its investments in this manner, it assumes the risk that economic, regulatory, political and social conditions affecting such sectors may have a significant impact on the Fund and could affect the income from, or the value or liquidity of, the Fund’s portfolio. Investment percentages in specific sectors are presented in the Schedules of Investments.
Certain Funds invest a significant portion of their assets in securities of issuers located in the United States. A decrease in imports or exports, changes in trade regulations, inflation and/or an economic recession in the United States may have a material adverse effect on the U.S. economy and the securities listed on U.S. exchanges. Proposed
| | |
N O T E S T O F I N A N C I A L S T A T E M E N T S | | 75 |
Notes to Financial Statements (continued)
and adopted policy and legislative changes in the United States may also have a significant effect on U.S. markets generally, as well as on the value of certain securities. Governmental agencies project that the United States will continue to maintain elevated public debt levels for the foreseeable future which may constrain future economic growth. Circumstances could arise that could prevent the timely payment of interest or principal on U.S. government debt, such as reaching the legislative “debt ceiling.” Such non-payment would result in substantial negative consequences for the U.S. economy and the global financial system. If U.S. relations with certain countries deteriorate, it could adversely affect issuers that rely on the United States for trade. The United States has also experienced increased internal unrest and discord. If these trends were to continue, they may have an adverse impact on the U.S. economy and the issuers in which the Funds invest.
Advantage International invests a significant portion of its assets in securities of issuers located in Europe or with significant exposure to European issuers or countries. The European financial markets have recently experienced volatility and adverse trends due to concerns about economic downturns in, or rising government debt levels of, several European countries as well as acts of war in the region. These events may spread to other countries in Europe and may affect the value and liquidity of certain of the Fund’s investments.
Responses to the financial problems by European governments, central banks and others, including austerity measures and reforms, may not work, may result in social unrest and may limit future growth and economic recovery or have other unintended consequences. Further defaults or restructurings by governments and others of their debt could have additional adverse effects on economies, financial markets and asset valuations around the world. The United Kingdom has withdrawn from the European Union, and one or more other countries may withdraw from the European Union and/or abandon the Euro, the common currency of the European Union. These events and actions have adversely affected, and may in the future adversely affect, the value and exchange rate of the Euro and may continue to significantly affect the economies of every country in Europe, including countries that do not use the Euro and non-European Union member states. The impact of these actions, especially if they occur in a disorderly fashion, is not clear but could be significant and far reaching. In addition, Russia launched a large-scale invasion of Ukraine on February 24, 2022. The extent and duration of the military action, resulting sanctions and resulting future market disruptions in the region are impossible to predict, but have been, and may continue to be, significant and have a severe adverse effect on the region, including significant negative impacts on the economy and the markets for certain securities and commodities, such as oil and natural gas, as well as other sectors.
Advantage International invests a significant portion of its assets in securities of issuers located in Asia or with significant exposure to Asian issuers or countries. The Asian financial markets have recently experienced volatility and adverse trends due to concerns in several Asian countries regarding monetary policy, government intervention in the markets, rising government debt levels or economic downturns. These events may spread to other countries in Asia and may affect the value and liquidity of certain of the Fund’s investments.
Significant Shareholder Redemption Risk: Certain shareholders may own or manage a substantial amount of fund shares and/or hold their fund investments for a limited period of time. Large redemptions of fund shares by these shareholders may force a fund to sell portfolio securities, which may negatively impact the fund’s NAV, increase the fund’s brokerage costs, and/or accelerate the realization of taxable income/gains and cause the fund to make additional taxable distributions to shareholders.
| 11. | CAPITAL SHARE TRANSACTIONS |
Transactions in capital shares for each class were as follows:
| | | | | | | | | | | | | | | | | | | | | | | | | | | | |
| | | Year Ended 05/31/24 | | | | | | Year Ended 05/31/23 | |
| | | | | | | |
| Fund Name/Share Class | | Shares | | | | | | Amount | | | | | | Shares | | | | | | Amount | |
| | | | | | | |
Advantage International | | | | | | | | | | | | | | | | | | | | | | | | | | | | |
| | | | | | | |
Institutional | | | | | | | | | | | | | | | | | | | | | | | | | | | | |
| | | | | | | |
Shares sold | | | 23,297,357 | | | | | | | $ | 414,287,683 | | | | | | | | 11,508,058 | | | | | | | $ | 175,708,419 | |
| | | | | | | |
Shares issued in reinvestment of distributions | | | 1,383,179 | | | | | | | | 24,124,489 | | | | | | | | 1,525,765 | | | | | | | | 22,800,749 | |
| | | | | | | |
Shares redeemed | | | (10,399,113 | ) | | | | | | | (186,487,678 | ) | | | | | | | (9,987,110 | ) | | | | | | | (150,703,357 | ) |
| | | | | | | | | | | | | | | | | | | | | | | | | | | | |
| | | | | | | |
| | | 14,281,423 | | | | | | | $ | 251,924,494 | | | | | | | | 3,046,713 | | | | | | | $ | 47,805,811 | |
| | | | | | | | | | | | | | | | | | | | | | | | | | | | |
| | | | | | | |
Investor A | | | | | | | | | | | | | | | | | | | | | | | | | | | | |
| | | | | | | |
Shares sold and automatic conversion of shares | | | 1,964,803 | | | | | | | $ | 34,539,277 | | | | | | | | 1,491,738 | | | | | | | $ | 22,573,584 | |
| | | | | | | |
Shares issued in reinvestment of distributions | | | 319,591 | | | | | | | | 5,512,362 | | | | | | | | 426,965 | | | | | | | | 6,301,933 | |
| | | | | | | |
Shares redeemed | | | (2,564,768 | ) | | | | | | | (44,937,995 | ) | | | | | | | (2,700,529 | ) | | | | | | | (41,155,670 | ) |
| | | | | | | | | | | | | | | | | | | | | | | | | | | | |
| | | | | | | |
| | | (280,374 | ) | | | | | | $ | (4,886,356 | ) | | | | | | | (781,826 | ) | | | | | | $ | (12,280,153 | ) |
| | | | | | | | | | | | | | | | | | | | | | | | | | | | |
| | | | | | | |
Investor C | | | | | | | | | | | | | | | | | | | | | | | | | | | | |
| | | | | | | |
Shares sold | | | 759,644 | | | | | | | $ | 12,470,746 | | | | | | | | 51,816 | | | | | | | $ | 776,986 | |
| | | | | | | |
Shares issued in reinvestment of distributions | | | 8,965 | | | | | | | | 149,273 | | | | | | | | 4,022 | | | | | | | | 57,985 | |
| | | | | | | |
Shares redeemed and automatic conversion of shares | | | (141,151 | ) | | | | | | | (2,420,929 | ) | | | | | | | (42,803 | ) | | | | | | | (646,954 | ) |
| | | | | | | | | | | | | | | | | | | | | | | | | | | | |
| | | | | | | |
| | | 627,458 | | | | | | | $ | 10,199,090 | | | | | | | | 13,035 | | | | | | | $ | 188,017 | |
| | | | | | | | | | | | | | | | | | | | | | | | | | | | |
| | |
| 76 | | 2 0 2 4 B L A C K R O C K A N N U A L F I N A N C I A L S T A T E M E N T S |
Notes to Financial Statements (continued)
| | | | | | | | | | | | | | | | | | | | | | | | | | | | |
| | | Year Ended 05/31/24 | | | | | | Year Ended 05/31/23 | |
| | | | | | | |
| Fund Name/Share Class | | Shares | | | | | | Amount | | | | | | Shares | | | | | | Amount | |
| | | | | | | |
Advantage International (continued) | | | | | | | | | | | | | | | | | | | | | | | | | | | | |
| | | | | | | |
Class K | | | | | | | | | | | | | | | | | | | | | | | | | | | | |
| | | | | | | |
Shares sold | | | 2,590,705 | | | | | | | $ | 46,132,287 | | | | | | | | 6,766,930 | | | | | | | $ | 106,688,626 | |
| | | | | | | |
Shares issued in reinvestment of distributions | | | 344,221 | | | | | | | | 6,005,317 | | | | | | | | 259,872 | | | | | | | | 3,878,150 | |
| | | | | | | |
Shares redeemed | | | (1,798,410 | ) | | | | | | | (32,102,894 | ) | | | | | | | (1,714,155 | ) | | | | | | | (27,125,496 | ) |
| | | | | | | | | | | | | | | | | | | | | | | | | | | | |
| | | | | | | |
| | | 1,136,516 | | | | | | | $ | 20,034,710 | | | | | | | | 5,312,647 | | | | | | | $ | 83,441,280 | |
| | | | | | | | | | | | | | | | | | | | | | | | | | | | |
| | | | | | | |
Class R | | | | | | | | | | | | | | | | | | | | | | | | | | | | |
| | | | | | | |
Shares sold | | | 1,017,841 | | | | | | | $ | 17,350,290 | | | | | | | | 1,023,690 | | | | | | | $ | 17,224,244 | |
| | | | | | | |
Shares issued in reinvestment of distributions | | | 35,544 | | | | | | | | 612,167 | | | | | | | | 4,989 | | | | | | | | 73,701 | |
| | | | | | | |
Shares redeemed | | | (381,525 | ) | | | | | | | (6,684,230 | ) | | | | | | | (53,022 | ) | | | | | | | (824,885 | ) |
| | | | | | | | | | | | | | | | | | | | | | | | | | | | |
| | | | | | | |
| | | 671,860 | | | | | | | $ | 11,278,227 | | | | | | | | 975,657 | | | | | | | $ | 16,473,060 | |
| | | | | | | | | | | | | | | | | | | | | | | | | | | | |
| | | | | | | |
| | | 16,436,883 | | | | | | | $ | 288,550,165 | | | | | | | | 8,566,226 | | | | | | | $ | 135,628,015 | |
| | | | | | | | | | | | | | | | | | | | | | | | | | | | |
| | | | | | | |
Advantage Large Cap Growth | | | | | | | | | | | | | | | | | | | | | | | | | | | | |
| | | | | | | |
Institutional | | | | | | | | | | | | | | | | | | | | | | | | | | | | |
| | | | | | | |
Shares sold | | | 3,274,605 | | | | | | | $ | 74,950,123 | | | | | | | | 6,868,840 | | | | | | | $ | 118,137,284 | |
| | | | | | | |
Shares issued in reinvestment of distributions | | | 235,499 | | | | | | | | 5,243,158 | | | | | | | | 84,195 | | | | | | | | 1,481,839 | |
| | | | | | | |
Shares redeemed | | | (4,350,268 | ) | | | | | | | (97,770,614 | ) | | | | | | | (4,676,497 | ) | | | | | | | (85,552,119 | ) |
| | | | | | | | | | | | | | | | | | | | | | | | | | | | |
| | | | | | | |
| | | (840,164 | ) | | | | | | $ | (17,577,333 | ) | | | | | | | 2,276,538 | | | | | | | $ | 34,067,004 | |
| | | | | | | | | | | | | | | | | | | | | | | | | | | | |
| | | | | | | |
Investor A | | | | | | | | | | | | | | | | | | | | | | | | | | | | |
| | | | | | | |
Shares sold | | | 985,440 | | | | | | | $ | 21,327,952 | | | | | | | | 783,596 | | | | | | | $ | 13,193,623 | |
| | | | | | | |
Shares issued in reinvestment of distributions | | | 183,148 | | | | | | | | 3,842,876 | | | | | | | | 43,075 | | | | | | | | 713,736 | |
| | | | | | | |
Shares redeemed | | | (2,634,857 | ) | | | | | | | (56,679,531 | ) | | | | | | | (2,657,309 | ) | | | | | | | (44,721,957 | ) |
| | | | | | | | | | | | | | | | | | | | | | | | | | | | |
| | | | | | | |
| | | (1,466,269 | ) | | | | | | $ | (31,508,703 | ) | | | | | | | (1,830,638 | ) | | | | | | $ | (30,814,598 | ) |
| | | | | | | | | | | | | | | | | | | | | | | | | | | | |
| | | | | | | |
Investor C | | | | | | | | | | | | | | | | | | | | | | | | | | | | |
| | | | | | | |
Shares sold | | | 1,314,696 | | | | | | | $ | 20,739,576 | | | | | | | | 63,364 | | | | | | | $ | 871,927 | |
| | | | | | | |
Shares issued in reinvestment of distributions | | | 15,709 | | | | | | | | 263,290 | | | | | | | | — | | | | | | | | — | |
| | | | | | | |
Shares redeemed and automatic conversion of shares | | | (328,177 | ) | | | | | | | (5,811,599 | ) | | | | | | | (214,528 | ) | | | | | | | (2,877,817 | ) |
| | | | | | | | | | | | | | | | | | | | | | | | | | | | |
| | | | | | | |
| | | 1,002,228 | | | | | | | $ | 15,191,267 | | | | | | | | (151,164 | ) | | | | | | $ | (2,005,890 | ) |
| | | | | | | | | | | | | | | | | | | | | | | | | | | | |
| | | | | | | |
Class K | | | | | | | | | | | | | | | | | | | | | | | | | | | | |
| | | | | | | |
Shares sold | | | 138,788 | | | | | | | $ | 3,023,950 | | | | | | | | 33,825 | | | | | | | $ | 619,234 | |
| | | | | | | |
Shares issued in reinvestment of distributions | | | 2,010 | | | | | | | | 44,757 | | | | | | | | 331 | | | | | | | | 5,828 | |
| | | | | | | |
Shares redeemed | | | (43,058 | ) | | | | | | | (985,582 | ) | | | | | | | (24,166 | ) | | | | | | | (435,384 | ) |
| | | | | | | | | | | | | | | | | | | | | | | | | | | | |
| | | | | | | |
| | | 97,740 | | | | | | | $ | 2,083,125 | | | | | | | | 9,990 | | | | | | | $ | 189,678 | |
| | | | | | | | | | | | | | | | | | | | | | | | | | | | |
| | | | | | | |
Class R | | | | | | | | | | | | | | | | | | | | | | | | | | | | |
| | | | | | | |
Shares sold | | | 36,480 | | | | | | | $ | 901,709 | | | | | | | | 10,387 | | | | | | | $ | 185,989 | |
| | | | | | | |
Shares issued in reinvestment of distributions | | | 225 | | | | | | | | 4,973 | | | | | | | | 8 | | | | | | | | 147 | |
| | | | | | | |
Shares redeemed | | | (3,405 | ) | | | | | | | (74,617 | ) | | | | | | | (2,056 | ) | | | | | | | (37,158 | ) |
| | | | | | | | | | | | | | | | | | | | | | | | | | | | |
| | | | | | | |
| | | 33,300 | | | | | | | $ | 832,065 | | | | | | | | 8,339 | | | | | | | $ | 148,978 | |
| | | | | | | | | | | | | | | | | | | | | | | | | | | | |
| | | | | | | |
| | | (1,173,165 | ) | | | | | | $ | (30,979,579 | ) | | | | | | | 313,065 | | | | | | | $ | 1,585,172 | |
| | | | | | | | | | | | | | | | | | | | | | | | | | | | |
| | | | | | | |
Advantage Small Cap Core | | | | | | | | | | | | | | | | | | | | | | | | | | | | |
| | | | | | | |
Institutional | | | | | | | | | | | | | | | | | | | | | | | | | | | | |
| | | | | | | |
Shares sold | | | 21,347,099 | | | | | | | $ | 333,503,755 | | | | | | | | 47,919,449 | | | | | | | $ | 701,900,107 | |
| | | | | | | |
Shares issued in reinvestment of distributions | | | 1,441,914 | | | | | | | | 22,168,806 | | | | | | | | 4,704,458 | | | | | | | | 65,751,152 | |
| | | | | | | |
Shares redeemed | | | (59,497,255 | ) | | | | | | | (936,471,823 | ) | | | | | | | (62,510,640 | ) | | | | | | | (917,764,827 | ) |
| | | | | | | | | | | | | | | | | | | | | | | | | | | | |
| | | | | | | |
| | | (36,708,242 | ) | | | | | | $ | (580,799,262 | ) | | | | | | | (9,886,733 | ) | | | | | | $ | (150,113,568 | ) |
| | | | | | | | | | | | | | | | | | | | | | | | | | | | |
| | |
N O T E S T O F I N A N C I A L S T A T E M E N T S | | 77 |
Notes to Financial Statements (continued)
| | | | | | | | | | | | | | | | | | | | | | | | | | | | |
| | | Year Ended 05/31/24 | | | | | | Year Ended 05/31/23 | |
| | | | | | | |
| Fund Name/Share Class | | Shares | | | | | | Amount | | | | | | Shares | | | | | | Amount | |
| | | | | | | |
Advantage Small Cap Core (continued) | | | | | | | | | | | | | | | | | | | | | | | | | | | | |
| | | | | | | |
Investor A | | | | | | | | | | | | | | | | | | | | | | | | | | | | |
| | | | | | | |
Shares sold and automatic conversion of shares | | | 4,034,735 | | | | | | | $ | 63,459,431 | | | | | | | | 3,601,657 | | | | | | | $ | 52,810,767 | |
| | | | | | | |
Shares issued in reinvestment of distributions | | | 180,437 | | | | | | | | 2,751,052 | | | | | | | | 605,080 | | | | | | | | 8,387,411 | |
| | | | | | | |
Shares redeemed | | | (4,608,184 | ) | | | | | | | (72,025,154 | ) | | | | | | | (5,120,440 | ) | | | | | | | (74,615,130 | ) |
| | | | | | | | | | | | | | | | | | | | | | | | | | | | |
| | | | | | | |
| | | (393,012 | ) | | | | | | $ | (5,814,671 | ) | | | | | | | (913,703 | ) | | | | | | $ | (13,416,952 | ) |
| | | | | | | | | | | | | | | | | | | | | | | | | | | | |
| | | | | | | |
Investor C | | | | | | | | | | | | | | | | | | | | | | | | | | | | |
| | | | | | | |
Shares sold | | | 207,623 | | | | | | | $ | 3,184,439 | | | | | | | | 125,566 | | | | | | | $ | 1,786,554 | |
| | | | | | | |
Shares issued in reinvestment of distributions | | | 1,527 | | | | | | | | 22,365 | | | | | | | | 16,415 | | | | | | | | 218,327 | |
| | | | | | | |
Shares redeemed and automatic conversion of shares | | | (194,068 | ) | | | | | | | (2,922,880 | ) | | | | | | | (196,132 | ) | | | | | | | (2,747,776 | ) |
| | | | | | | | | | | | | | | | | | | | | | | | | | | | |
| | | | | | | |
| | | 15,082 | | | | | | | $ | 283,924 | | | | | | | | (54,151 | ) | | | | | | $ | (742,895 | ) |
| | | | | | | | | | | | | | | | | | | | | | | | | | | | |
| | | | | | | |
Class K | | | | | | | | | | | | | | | | | | | | | | | | | | | | |
| | | | | | | |
Shares sold | | | 10,206,738 | | | | | | | $ | 162,561,113 | | | | | | | | 19,864,648 | | | | | | | $ | 291,931,230 | |
| | | | | | | |
Shares issued in reinvestment of distributions | | | 706,613 | | | | | | | | 10,874,632 | | | | | | | | 1,873,351 | | | | | | | | 26,253,904 | |
| | | | | | | |
Shares redeemed | | | (16,148,319 | ) | | | | | | | (253,421,934 | ) | | | | | | | (16,189,057 | ) | | | | | | | (238,415,011 | ) |
| | | | | | | | | | | | | | | | | | | | | | | | | | | | |
| | | | | | | |
| | | (5,234,968 | ) | | | | | | $ | (79,986,189 | ) | | | | | | | 5,548,942 | | | | | | | $ | 79,770,123 | |
| | | | | | | | | | | | | | | | | | | | | | | | | | | | |
| | | | | | | |
| | | (42,321,140 | ) | | | | | | $ | (666,316,198 | ) | | | | | | | (5,305,645 | ) | | | | | | $ | (84,503,292 | ) |
| | | | | | | | | | | | | | | | | | | | | | | | | | | | |
| | | | | | | |
Advantage Large Cap Core | | | | | | | | | | | | | | | | | | | | | | | | | | | | |
| | | | | | | |
Institutional | | | | | | | | | | | | | | | | | | | | | | | | | | | | |
| | | | | | | |
Shares sold | | | 4,253,897 | | | | | | | $ | 85,531,661 | | | | | | | | 7,232,763 | | | | | | | $ | 117,472,203 | |
| | | | | | | |
Shares issued in reinvestment of distributions | | | 692,648 | | | | | | | | 13,247,256 | | | | | | | | 5,176,989 | | | | | | | | 82,730,713 | |
| | | | | | | |
Shares redeemed | | | (36,907,101 | ) | | | | | | | (738,281,082 | ) | | | | | | | (11,342,719 | ) | | | | | | | (183,436,037 | ) |
| | | | | | | | | | | | | | | | | | | | | | | | | | | | |
| | | | | | | |
| | | (31,960,556 | ) | | | | | | $ | (639,502,165 | ) | | | | | | | 1,067,033 | | | | | | | $ | 16,766,879 | |
| | | | | | | | | | | | | | | | | | | | | | | | | | | | |
| | | | | | | |
Investor A | | | | | | | | | | | | | | | | | | | | | | | | | | | | |
| | | | | | | |
Shares sold | | | 4,162,870 | | | | | | | $ | 77,141,036 | | | | | | | | — | | | | | | | $ | — | |
| | | | | | | |
Shares sold and automatic conversion of shares | | | — | | | | | | | | — | | | | | | | | 4,614,359 | | | | | | | | 72,748,020 | |
| | | | | | | |
Shares issued in reinvestment of distributions | | | 603,551 | | | | | | | | 10,921,227 | | | | | | | | 4,932,185 | | | | | | | | 74,491,359 | |
| | | | | | | |
Shares redeemed | | | (9,152,406 | ) | | | | | | | (171,310,982 | ) | | | | | | | (11,328,154 | ) | | | | | | | (178,943,679 | ) |
| | | | | | | | | | | | | | | | | | | | | | | | | | | | |
| | | | | | | |
| | | (4,385,985 | ) | | | | | | $ | (83,248,719 | ) | | | | | | | (1,781,610 | ) | | | | | | $ | (31,704,300 | ) |
| | | | | | | | | | | | | | | | | | | | | | | | | | | | |
| | | | | | | |
Investor C | | | | | | | | | | | | | | | | | | | | | | | | | | | | |
| | | | | | | |
Shares sold | | | 1,011,189 | | | | | | | $ | 14,414,272 | | | | | | | | 492,228 | | | | | | | $ | 6,204,724 | |
| | | | | | | |
Shares issued in reinvestment of distributions | | | 12,705 | | | | | | | | 182,763 | | | | | | | | 196,124 | | | | | | | | 2,351,728 | |
| | | | | | | |
Shares redeemed and automatic conversion of shares | | | (782,761 | ) | | | | | | | (11,561,228 | ) | | | | | | | (982,251 | ) | | | | | | | (12,432,749 | ) |
| | | | | | | | | | | | | | | | | | | | | | | | | | | | |
| | | | | | | |
| | | 241,133 | | | | | | | $ | 3,035,807 | | | | | | | | (293,899 | ) | | | | | | $ | (3,876,297 | ) |
| | | | | | | | | | | | | | | | | | | | | | | | | | | | |
| | | | | | | |
Class K | | | | | | | | | | | | | | | | | | | | | | | | | | | | |
| | | | | | | |
Shares sold | | | 766,994 | | | | | | | $ | 15,907,891 | | | | | | | | 645,071 | | | | | | | $ | 10,729,466 | |
| | | | | | | |
Shares issued in reinvestment of distributions | | | 16,885 | | | | | | | | 323,379 | | | | | | | | 120,270 | | | | | | | | 1,924,102 | |
| | | | | | | |
Shares redeemed | | | (753,056 | ) | | | | | | | (14,656,265 | ) | | | | | | | (2,315,017 | ) | | | | | | | (41,205,381 | ) |
| | | | | | | | | | | | | | | | | | | | | | | | | | | | |
| | | | | | | |
| | | 30,823 | | | | | | | $ | 1,575,005 | | | | | | | | (1,549,676 | ) | | | | | | $ | (28,551,813 | ) |
| | | | | | | | | | | | | | | | | | | | | | | | | | | | |
| | | | | | | |
Class R | | | | | | | | | | | | | | | | | | | | | | | | | | | | |
| | | | | | | |
Shares sold | | | 346,800 | | | | | | | $ | 5,958,058 | | | | | | | | 81,548 | | | | | | | $ | 1,163,716 | |
| | | | | | | |
Shares issued in reinvestment of distributions | | | 6,126 | | | | | | | | 100,028 | | | | | | | | 62,298 | | | | | | | | 849,067 | |
| | | | | | | |
Shares redeemed | | | (119,768 | ) | | | | | | | (2,062,229 | ) | | | | | | | (249,611 | ) | | | | | | | (3,561,642 | ) |
| | | | | | | | | | | | | | | | | | | | | | | | | | | | |
| | | | | | | |
| | | 233,158 | | | | | | | $ | 3,995,857 | | | | | | | | (105,765 | ) | | | | | | $ | (1,548,859 | ) |
| | | | | | | | | | | | | | | | | | | | | | | | | | | | |
| | | | | | | |
| | | (35,841,427 | ) | | | | | | $ | (714,144,215 | ) | | | | | | | (2,663,917 | ) | | | | | | $ | (48,914,390 | ) |
| | | | | | | | | | | | | | | | | | | | | | | | | | | | |
| | |
| 78 | | 2 0 2 4 B L A C K R O C K A N N U A L F I N A N C I A L S T A T E M E N T S |
Notes to Financial Statements (continued)
| | | | | | | | | | | | | | | | | | | | | | | | | | | | |
| | | Year Ended 05/31/24 | | | | | | Year Ended 05/31/23 | |
| | | | | | | |
| Fund Name/Share Class | | Shares | | | | | | Amount | | | | | | Shares | | | | | | Amount | |
| | | | | | | |
Advantage Large Cap Value | | | | | | | | | | | | | | | | | | | | | | | | | | | | |
| | | | | | | |
Institutional | | | | | | | | | | | | | | | | | | | | | | | | | | | | |
| | | | | | | |
Shares sold | | | 927,476 | | | | | | | $ | 27,481,322 | | | | | | | | 881,237 | | | | | | | $ | 24,019,416 | |
| | | | | | | |
Shares issued in reinvestment of distributions | | | 156,585 | | | | | | | | 4,498,448 | | | | | | | | 344,992 | | | | | | | | 8,902,293 | |
| | | | | | | |
Shares redeemed | | | (1,298,843 | ) | | | | | | | (37,668,127 | ) | | | | | | | (1,325,202 | ) | | | | | | | (36,046,939 | ) |
| | | | | | | | | | | | | | | | | | | | | | | | | | | | |
| | | | | | | |
| | | (214,782 | ) | | | | | | $ | (5,688,357 | ) | | | | | | | (98,973 | ) | | | | | | $ | (3,125,230 | ) |
| | | | | | | | | | | | | | | | | | | | | | | | | | | | |
| | | | | | | |
Investor A | | | | | | | | | | | | | | | | | | | | | | | | | | | | |
| | | | | | | |
Shares sold | | | 633,902 | | | | | | | $ | 18,495,637 | | | | | | | | — | | | | | | | $ | — | |
| | | | | | | |
Shares sold and automatic conversion of shares | | | — | | | | | | | | — | | | | | | | | 1,375,001 | | | | | | | | 36,028,089 | |
| | | | | | | |
Shares issued in reinvestment of distributions | | | 323,626 | | | | | | | | 9,028,137 | | | | | | | | 759,779 | | | | | | | | 19,035,751 | |
| | | | | | | |
Shares redeemed | | | (1,815,261 | ) | | | | | | | (52,151,342 | ) | | | | | | | (2,376,037 | ) | | | | | | | (62,562,160 | ) |
| | | | | | | | | | | | | | | | | | | | | | | | | | | | |
| | | | | | | |
| | | (857,733 | ) | | | | | | $ | (24,627,568 | ) | | | | | | | (241,257 | ) | | | | | | $ | (7,498,320 | ) |
| | | | | | | | | | | | | | | | | | | | | | | | | | | | |
| | | | | | | |
Investor C | | | | | | | | | | | | | | | | | | | | | | | | | | | | |
| | | | | | | |
Shares sold | | | 59,407 | | | | | | | $ | 1,538,116 | | | | | | | | 135,087 | | | | | | | $ | 3,243,871 | |
| | | | | | | |
Shares issued in reinvestment of distributions | | | 13,191 | | | | | | | | 333,274 | | | | | | | | 38,671 | | | | | | | | 875,749 | |
| | | | | | | |
Shares redeemed and automatic conversion of shares | | | (196,611 | ) | | | | | | | (5,153,312 | ) | | | | | | | (223,496 | ) | | | | | | | (5,340,361 | ) |
| | | | | | | | | | | | | | | | | | | | | | | | | | | | |
| | | | | | | |
| | | (124,013 | ) | | | | | | $ | (3,281,922 | ) | | | | | | | (49,738 | ) | | | | | | $ | (1,220,741 | ) |
| | | | | | | | | | | | | | | | | | | | | | | | | | | | |
| | | | | | | |
Class K | | | | | | | | | | | | | | | | | | | | | | | | | | | | |
| | | | | | | |
Shares sold | | | 193,424 | | | | | | | $ | 5,568,726 | | | | | | | | 128,817 | | | | | | | $ | 3,493,709 | |
| | | | | | | |
Shares issued in reinvestment of distributions | | | 14,682 | | | | | | | | 421,603 | | | | | | | | 22,234 | | | | | | | | 574,235 | |
| | | | | | | |
Shares redeemed | | | (229,117 | ) | | | | | | | (7,039,729 | ) | | | | | | | (101,295 | ) | | | | | | | (2,693,778 | ) |
| | | | | | | | | | | | | | | | | | | | | | | | | | | | |
| | | | | | | |
| | | (21,011 | ) | | | | | | $ | (1,049,400 | ) | | | | | | | 49,756 | | | | | | | $ | 1,374,166 | |
| | | | | | | | | | | | | | | | | | | | | | | | | | | | |
| | | | | | | |
Class R | | | | | | | | | | | | | | | | | | | | | | | | | | | | |
| | | | | | | |
Shares sold | | | 24,923 | | | | | | | $ | 685,611 | | | | | | | | 46,745 | | | | | | | $ | 1,166,823 | |
| | | | | | | |
Shares issued in reinvestment of distributions | | | 7,025 | | | | | | | | 185,628 | | | | | | | | 19,382 | | | | | | | | 459,713 | |
| | | | | | | |
Shares redeemed | | | (55,037 | ) | | | | | | | (1,487,018 | ) | | | | | | | (89,884 | ) | | | | | | | (2,236,145 | ) |
| | | | | | | | | | | | | | | | | | | | | | | | | | | | |
| | | | | | | |
| | | (23,089 | ) | | | | | | $ | (615,779 | ) | | | | | | | (23,757 | ) | | | | | | $ | (609,609 | ) |
| | | | | | | | | | | | | | | | | | | | | | | | | | | | |
| | | | | | | |
| | | (1,240,628 | ) | | | | | | $ | (35,263,026 | ) | | | | | | | (363,969 | ) | | | | | | $ | (11,079,734 | ) |
| | | | | | | | | | | | | | | | | | | | | | | | | | | | |
As of May 31, 2024, shares owned by BlackRock Financial Management, Inc., an affiliate of the Funds, were as follows:
| | | | |
| Share Class | | Advantage
Large Cap
Growth | |
| |
Class K | | | 12,217 | |
| 12. | FOREIGN WITHHOLDINGS TAX CLAIMS |
The Internal Revenue Service (“IRS”) has issued guidance to address U.S. income tax liabilities attributable to fund shareholders resulting from the recovery of foreign taxes withheld in prior calendar years. These withheld foreign taxes were passed through to shareholders in the form of foreign tax credits in the year the taxes were withheld. Assuming there are sufficient foreign taxes paid which Advantage International is able to pass through to shareholders as a foreign tax credit in the current year, the Fund will be able to offset the prior years’ withholding taxes recovered against the foreign taxes paid in the current year. Accordingly, no federal income tax liability is recorded by the Fund.
Management has evaluated the impact of all subsequent events on the Funds through the date the financial statements were issued and has determined that there were no subsequent events requiring adjustment or additional disclosure in the financial statements.
| | |
N O T E S T O F I N A N C I A L S T A T E M E N T S | | 79 |
Report of Independent Registered Public Accounting Firm
To the Shareholders of BlackRock Advantage International Fund, BlackRock Advantage Large Cap Growth Fund and BlackRock Advantage Small Cap Core Fund and the Board of Trustees of BlackRock FundsSM, and to the Shareholders of BlackRock Advantage Large Cap Core Fund and BlackRock Advantage Large Cap Value Fund and the Board of Directors of BlackRock Large Cap Series Funds, Inc.:
Opinion on the Financial Statements and Financial Highlights
We have audited the accompanying statements of assets and liabilities of BlackRock Advantage International Fund, BlackRock Advantage Large Cap Growth Fund, and BlackRock Advantage Small Cap Core Fund of BlackRock FundsSM, and BlackRock Advantage Large Cap Core Fund and BlackRock Advantage Large Cap Value Fund of BlackRock Large Cap Series Funds, Inc. (the “Funds”), including the schedules of investments, as of May 31, 2024, the related statements of operations for the year then ended, the statements of changes in net assets for each of the two years in the period then ended, the financial highlights for the periods indicated in the table below, and the related notes. In our opinion, the financial statements and financial highlights present fairly, in all material respects, the financial position of the Funds as of May 31, 2024, and the results of their operations for the year then ended, the changes in their net assets for each of the two years in the period then ended, and the financial highlights for the periods indicated in the table below, in conformity with accounting principles generally accepted in the United States of America.
| | |
Fund | | Financial Highlights |
| BlackRock Advantage International Fund, BlackRock Advantage Large Cap Growth Fund, BlackRock Advantage Large Cap Value Fund | | For each of the four years in the period ended May 31, 2024, for the period from October 1, 2019 through May 31, 2020, and for the year ended September 30, 2019 |
| BlackRock Advantage Small Cap Core Fund | | For each of the five years in the period ended May 31, 2024 |
| BlackRock Advantage Large Cap Core Fund | | For each of the two years in the period ended May 31, 2024, for the period from October 1, 2021 through May 31, 2022, and for each of the three years in the period ended September 30, 2021 |
Basis for Opinion
These financial statements and financial highlights are the responsibility of the Funds’ management. Our responsibility is to express an opinion on the Funds’ financial statements and financial highlights based on our audits. We are a public accounting firm registered with the Public Company Accounting Oversight Board (United States) (PCAOB) and are required to be independent with respect to the Funds in accordance with the U.S. federal securities laws and the applicable rules and regulations of the Securities and Exchange Commission and the PCAOB.
We conducted our audits in accordance with the standards of the PCAOB. Those standards require that we plan and perform the audit to obtain reasonable assurance about whether the financial statements and financial highlights are free of material misstatement, whether due to error or fraud. The Funds are not required to have, nor were we engaged to perform, an audit of their internal control over financial reporting. As part of our audits we are required to obtain an understanding of internal control over financial reporting but not for the purpose of expressing an opinion on the effectiveness of the Funds’ internal control over financial reporting. Accordingly, we express no such opinion.
Our audits included performing procedures to assess the risks of material misstatement of the financial statements and financial highlights, whether due to error or fraud, and performing procedures that respond to those risks. Such procedures included examining, on a test basis, evidence regarding the amounts and disclosures in the financial statements and financial highlights. Our audits also included evaluating the accounting principles used and significant estimates made by management, as well as evaluating the overall presentation of the financial statements and financial highlights. Our procedures included confirmation of securities owned as of May 31, 2024, by correspondence with custodians or counterparties; when replies were not received, we performed other auditing procedures. We believe that our audits provide a reasonable basis for our opinion.
Deloitte & Touche LLP
Boston, Massachusetts
July 24, 2024
We have served as the auditor of one or more BlackRock investment companies since 1992.
| | |
| 80 | | 2 0 2 4 B L A C K R O C K A N N U A L F I N A N C I A L S T A T E M E N T S |
Important Tax Information (unaudited)
The following amounts, or maximum amounts allowable by law, are hereby designated as qualified dividend income for individuals for the fiscal year ended May 31, 2024:
| | |
| Fund Name | | Qualified Dividend
Income |
Advantage International | | $ 43,474,885 |
Advantage Large Cap Growth | | 8,180,802 |
Advantage Small Cap Core | | 40,762,735 |
Advantage Large Cap Core | | 37,479,139 |
Advantage Large Cap Value | | 11,923,960 |
The Funds hereby designates the following amounts, or maximum amounts allowable by law, as capital gain dividends, subject to a long-term capital gains tax rate as noted below, for the fiscal year ended May 31, 2024:
| | |
| Fund Name | | 20% Rate
Long-Term
Capital Gain
Dividends |
Advantage Large Cap Growth | | $ 7,955,409 |
Advantage Large Cap Core | | 11,709,019 |
Advantage Large Cap Value | | 7,076,825 |
The Fund intends to pass through to its shareholders the following amount, or maximum amount allowable by law, of foreign source income earned and foreign taxes paid for the fiscal year ended May 31, 2024:
| | | | |
| Fund Name | | Foreign Source
Income Earned | | Foreign Taxes
Paid |
Advantage International | | $ 41,178,840 | | $ 2,903,898 |
The Funds hereby designate the following amounts, or maximum amounts allowable by law, of distributions from direct federal obligation interest for the fiscal year ended May 31, 2024:
| | |
| Fund Name | | Federal Obligation
Interest |
Advantage International | | $ 228,123 |
Advantage Large Cap Growth | | 9,385 |
Advantage Small Cap Core | | 166,860 |
Advantage Large Cap Core | | 125,693 |
Advantage Large Cap Value | | 29,370 |
The law varies in each state as to whether and what percent of ordinary income dividends attributable to federal obligations is exempt from state income tax. Shareholders are advised to check with their tax advisers to determine if any portion of the dividends received is exempt from state income tax.
The following percentages, or maximum percentages allowable by law, of ordinary income distributions paid during the fiscal year ended May 31, 2024 qualified for the dividends-received deduction for corporate shareholders:
| | |
| Fund Name | | Dividends-Received Deduction |
Advantage Large Cap Growth | | 100.00% |
Advantage Small Cap Core | | 93.15 |
Advantage Large Cap Core | | 100.00 |
Advantage Large Cap Value | | 100.00 |
The Funds hereby designate the following amounts, or maximum amounts allowable by law, as interest income eligible to be treated as a Section 163(j) interest dividend for the fiscal year ended May 31, 2024:
| | |
| Fund Name | | Interest Dividends |
Advantage International | | $ 1,452,514 |
Advantage Large Cap Growth | | 59,851 |
Advantage Small Cap Core | | 1,064,417 |
Advantage Large Cap Core | | 800,419 |
Advantage Large Cap Value | | 187,309 |
| | |
I M P O R T A N T T A X I N F O R M A T I O N | | 81 |
Important Tax Information (unaudited) (continued)
The Funds hereby designate the following amounts, or maximum amounts allowable by law, as interest-related dividends eligible for exemption from U.S. withholding tax for nonresident aliens and foreign corporations for the fiscal year ended May 31, 2024:
| | | | | | | | | | |
| Fund Name | | Interest-Related
Dividends | | | | | Qualified
Short-Term
Capital Gains | |
Advantage International | | $ | 1,455,219 | | | | | $ | — | |
Advantage Large Cap Growth | | | 59,854 | | | | | | — | |
Advantage Small Cap Core | | | 1,064,417 | | | | | | — | |
Advantage Large Cap Core | | | 801,614 | | | | | | 6,231,379 | |
Advantage Large Cap Value | | | 187,309 | | | | | | — | |
| | |
| 82 | | 2 0 2 4 B L A C K R O C K A N N U A L F I N A N C I A L S T A T E M E N T S |
Disclosure of Investment Advisory Agreements
The Board of Trustees of BlackRock Funds (the “Trust”) met on April 16, 2024 and May 16-17, 2024 to consider the approval to continue the investment advisory agreement (the “Trust Advisory Agreement”) between the Trust, on behalf of BlackRock Advantage International Fund (“Advantage International Fund”), BlackRock Advantage Large Cap Growth Fund (“Advantage Large Cap Growth Fund”) and BlackRock Advantage Small Cap Core Fund (“Advantage Small Cap Core Fund”), and BlackRock Advisors, LLC (the “Manager” or “BlackRock”), each Fund’s investment advisor.
The Board of Directors of BlackRock Large Cap Series Funds, Inc. (the “Corporation”) met on April 16, 2024 and May 16-17, 2024 to consider the approval to continue the investment advisory agreement (the “Corporation Advisory Agreement”) between the Corporation, on behalf of BlackRock Advantage Large Cap Value Fund (“Advantage Large Cap Value Fund”) and BlackRock Advantage Large Cap Core Fund (“Advantage Large Cap Core Fund”), and the Manager, each Fund’s investment advisor.
Advantage International Fund, Advantage Large Cap Growth Fund, Advantage Small Cap Core Fund, Advantage Large Cap Value Fund and Advantage Large Cap Core Fund are referred to herein individually as a “Fund” or collectively as the “Funds.” The Trust Advisory Agreement and the Corporation Advisory Agreement are referred to herein individually as an “Agreement” or collectively as the “Agreements.” For simplicity: (a) the Board of Trustees of the Trust and the Board of Directors of the Corporation are referred to herein individually as the “Board” and collectively as the “Boards” and the members are referred to as “Board Members”; and (b) the meetings held on April 16, 2024 are referred to as the “April Meeting” and the meetings held on May 16-17, 2024 are referred to as the “May Meeting.”
The Approval Process
Consistent with the requirements of the Investment Company Act of 1940 (the “1940 Act”), the Boards consider the approval of the continuation of the pertinent Agreement for each Fund on an annual basis. The Board members who are not “interested persons” of the Trust or the Corporation, as defined in the 1940 Act, are considered independent Board members (the “Independent Board Members”). Each Board’s consideration entailed a year-long deliberative process during which the Board and its committees assessed BlackRock’s various services to pertinent Fund, including through the review of written materials and oral presentations, and the review of additional information provided in response to requests from the Independent Board Members. The Boards had four quarterly meetings per year, each of which extended over a two-day period, as well as additional ad hoc meetings and executive sessions throughout the year, as needed. The committees of each Board similarly met throughout the year. The Boards also had an additional one-day meeting to consider specific information regarding the renewal of the Agreements. In considering the renewal of the Agreements, the Boards assessed, among other things, the nature, extent and quality of the services provided to the Fund by BlackRock, BlackRock’s personnel and affiliates, including (as applicable): investment management services; accounting oversight; administrative and shareholder services; oversight of the Fund’s service providers; risk management and oversight; and legal, regulatory and compliance services. Throughout the year, including during the contract renewal process, the Independent Board Members were advised by independent legal counsel, and met with independent legal counsel in various executive sessions outside of the presence of BlackRock’s management.
During the year, the Boards, acting directly and through their committees, considered information that was relevant to their annual consideration of the renewal of the pertinent Agreement, including the services and support provided by BlackRock to the Funds and their shareholders. BlackRock also furnished additional information to the Boards in response to specific questions from the Boards. Among the matters the Boards considered were: (a) investment performance for one-year, three-year, five-year, and/or since inception periods, as applicable, against peer funds, an applicable benchmark, and other performance metrics, as applicable, as well as BlackRock senior management’s and portfolio managers’ investment performance analyses, and the reasons for any outperformance or underperformance relative to its peers, benchmarks, and other performance metrics, as applicable; (b) fees, including advisory, administration, if applicable, and other amounts paid to BlackRock and its affiliates by the Fund for services; (c) Fund operating expenses and how BlackRock allocates expenses to the Fund; (d) the resources devoted to, risk oversight of, and compliance reports relating to, implementation of the Fund’s investment objective, policies and restrictions, and meeting regulatory requirements; (e) BlackRock’s and each Fund’s adherence to applicable compliance policies and procedures; (f) the nature, character and scope of non-investment management services provided by BlackRock and its affiliates and the estimated cost of such services, as available; (g) BlackRock’s and other service providers’ internal controls and risk and compliance oversight mechanisms; (h) BlackRock’s implementation of the proxy voting policies approved by the Board; (i) the use of brokerage commissions and execution quality of portfolio transactions; (j) BlackRock’s implementation of each Fund’s valuation and liquidity procedures; (k) an analysis of management fees paid to BlackRock for products with similar investment mandates across the open-end fund, exchange-traded fund (“ETF”), closed-end fund, sub-advised mutual fund, separately managed account, collective investment trust, and institutional separate account product channels, as applicable, and the similarities and differences between these products and the services provided as compared to the Fund; (l) BlackRock’s compensation methodology for its investment professionals and the incentives and accountability it creates, along with investment professionals’ investments in the fund(s) they manage; and (m) periodic updates on BlackRock’s business.
Prior to and in preparation for the April Meeting, the Boards received and reviewed materials specifically relating to the renewal of the pertinent Agreement. The Independent Board Members continuously engaged in a process with their independent legal counsel and BlackRock to review the nature and scope of the information provided to the Board to better assist their deliberations. The materials provided in connection with the April Meeting included, among other things: (a) information independently compiled and prepared by Broadridge Financial Solutions, Inc. (“Broadridge”), based on either a Lipper classification or Morningstar category, regarding each Fund’s fees and expenses as compared with a peer group of funds as determined by Broadridge (“Expense Peers”) and the investment performance of each Fund as compared with a peer group of funds (“Performance Peers”); (b) information on the composition of the Expense Peers and Performance Peers and a description of Broadridge’s methodology; (c) information on the estimated profits realized by BlackRock and its affiliates pursuant to the Agreements and a discussion of fall-out benefits to BlackRock and its affiliates; (d) a general analysis provided by BlackRock concerning investment management fees received in connection with other types of investment products, such as institutional accounts, sub-advised mutual funds, ETFs, closed-end funds, open-end funds, and separately managed accounts, under similar investment mandates, as well as the performance of such other products, as applicable; (e) a review of non-management fees; (f) the existence, impact and sharing of potential economies of scale, if any, with the Funds; (g) a summary of aggregate amounts paid by each Fund to BlackRock; (h) sales and redemption data regarding each Fund’s shares; and (i) various additional information requested by the Boards as appropriate regarding BlackRock’s and the Funds’ operations.
At the April Meeting, each Board reviewed materials relating to its consideration of the pertinent Agreement and the Independent Board Members presented BlackRock with questions and requests for additional information. BlackRock responded to these questions and requests with additional written information in advance of the May Meeting, and such responses were reviewed by the Board Members.
At the May Meeting, each Board concluded its assessment of, among other things: (a) the nature, extent and quality of the services provided by BlackRock; (b) the investment performance of each Fund as compared to its Performance Peers and to other metrics, as applicable; (c) the advisory fee and the estimated cost of the services and estimated
| | |
D I S C L O S U R E O F I N V E S T M E N T A D V I S O R Y A G R E E M E N T S | | 83 |
Disclosure of Investment Advisory Agreements (continued)
profits realized by BlackRock and its affiliates from their relationship with the Funds; (d) each Fund’s fees and expenses compared to its Expense Peers; (e) the existence and sharing of potential economies of scale; (f) any fall-out benefits to BlackRock and its affiliates as a result of BlackRock’s relationship with the Funds; and (g) other factors deemed relevant by the Board Members.
Each Board also considered other matters it deemed important to the approval process, such as other payments made to BlackRock or its affiliates relating to securities lending and cash management, and BlackRock’s services related to the valuation and pricing of Fund portfolio holdings. Each Board noted the willingness of BlackRock’s personnel to engage in open, candid discussions with the Board. Each Board evaluated the information available to it on a fund-by-fund basis. The following paragraphs provide more information about some of the primary factors that were relevant to each Board’s decision. The Board Members did not identify any particular information, or any single factor as determinative, and each Board Member may have attributed different weights to the various items and factors considered.
A. Nature, Extent and Quality of the Services Provided by BlackRock
Each Board, including the Independent Board Members, reviewed the nature, extent and quality of services provided by BlackRock, including the investment advisory services, and the resulting performance of the applicable Fund. Throughout the year, each Board compared each Fund’s performance to the performance of a comparable group of mutual funds, relevant benchmarks, and performance metrics, as applicable. The Boards met with BlackRock’s senior management personnel responsible for investment activities, including the senior investment officers. Each Board also reviewed the materials provided by each Fund’s portfolio management team discussing the Fund’s performance, investment strategies and outlook.
Each Board considered, among other factors, with respect to BlackRock: the experience of each Fund’s portfolio management team; research capabilities; investments by portfolio managers in the funds they manage; portfolio trading capabilities; use of technology; commitment to compliance; credit analysis capabilities; risk analysis and oversight capabilities; and the approach to training and retaining portfolio managers and other research, advisory and management personnel. The Boards also considered BlackRock’s overall risk management program, including the continued efforts of BlackRock and its affiliates to address cybersecurity risks and the role of BlackRock’s Risk & Quantitative Analysis Group. Each Board engaged in a review of BlackRock’s compensation structure with respect to each Fund’s portfolio management team and BlackRock’s ability to attract and retain high-quality talent and create performance incentives.
In addition to investment advisory services, the Boards considered the nature and quality of the administrative and other non-investment advisory services provided to each Fund. BlackRock and its affiliates provide the Funds with certain administrative, shareholder and other services (in addition to any such services provided to the Funds by third-parties) and officers and other personnel as are necessary for the operations of the Funds. In particular, BlackRock and its affiliates provide the Funds with administrative services including, among others: (i) responsibility for disclosure documents, such as the prospectus, the summary prospectus (as applicable), the statement of additional information and periodic shareholder reports; (ii) oversight of daily accounting and pricing; (iii) responsibility for periodic filings with regulators; (iv) overseeing and coordinating the activities of third-party service providers including, among others, each Fund’s custodian, fund accountant, transfer agent, and auditor; (v) organizing Board meetings and preparing the materials for such Board meetings; (vi) providing legal and compliance support; (vii) furnishing analytical and other support to assist the Board in its consideration of strategic issues such as the merger, consolidation or repurposing of certain open-end funds; and (viii) performing or managing administrative functions necessary for the operation of the Funds, such as tax reporting, expense management, fulfilling regulatory filing requirements, overseeing each Fund’s distribution partners, and shareholder call center and other services. The Boards reviewed the structure and duties of BlackRock’s fund administration, shareholder services, and legal and compliance departments and considered BlackRock’s policies and procedures for assuring compliance with applicable laws and regulations. Each Board considered the operation of BlackRock’s business continuity plans.
B. The Investment Performance of the Funds
Each Board, including the Independent Board Members, reviewed and considered the performance history of each Fund throughout the year and at the April Meeting. In preparation for the April Meeting, the Boards were provided with reports independently prepared by Broadridge, which included an analysis of each Fund’s performance as of December 31, 2023, as compared to its Performance Peers. Broadridge ranks funds in quartiles, ranging from first to fourth, where first is the most desirable quartile position and fourth is the least desirable. In connection with its review, with respect to each Fund, the applicable Board received and reviewed information regarding the investment performance of the Fund as compared to its Performance Peers and the respective Morningstar Category (“Morningstar Category”). Each Board and its Performance Oversight Committee regularly review and meet with Fund management to discuss the performance of each Fund throughout the year.
In evaluating performance, the Boards focused particular attention on funds with less favorable performance records. The Board also noted that while it found the data provided by Broadridge generally useful, it recognized the limitations of such data, including in particular, that notable differences may exist between a fund and its Performance Peers (for example, the investment objectives and strategies). Further, the Boards recognized that the performance data reflects a snapshot of a period as of a particular date and that selecting a different performance period could produce significantly different results. The Board also acknowledged that long-term performance could be impacted by even one period of significant outperformance or underperformance, and that a single investment theme could have the ability to disproportionately affect long-term performance.
The Board noted that for each of the one-, three- and five-year periods reported, Advantage International Fund ranked in the first quartile against its Morningstar Category. The Board noted that BlackRock believes that the Morningstar Category is an appropriate performance metric for the Fund, and that BlackRock has explained its rationale for this belief to the Board.
The Board noted that for each of the one-, three- and five-year periods reported, Advantage Large Cap Growth Fund ranked in the second quartile against its Morningstar Category. The Board noted that BlackRock believes that the Morningstar Category is an appropriate performance metric for the Fund, and that BlackRock has explained its rationale for this belief to the Board.
| | |
| 84 | | 2 0 2 4 B L A C K R O C K A N N U A L F I N A N C I A L S T A T E M E N T S |
Disclosure of Investment Advisory Agreements (continued)
The Board noted that for the one-, three- and five-year periods reported, Advantage Large Cap Core Fund ranked in the second, third and second quartiles, respectively, against its Morningstar Category. The Board noted that BlackRock believes that the Morningstar Category is an appropriate performance metric for the Fund, and that BlackRock has explained its rationale for this belief to the Board. The Board and BlackRock reviewed the Fund’s underperformance relative to its Morningstar Category during the applicable period.
The Board noted that for the one-, three- and five-year periods reported, Advantage Large Cap Value Fund ranked in second, third and third quartiles, respectively, against its Morningstar Category. The Board noted that BlackRock believes that the Morningstar Category is an appropriate performance metric for the Fund, and that BlackRock has explained its rationale for this belief to the Board. The Board and BlackRock reviewed the Fund’s underperformance relative to its Morningstar Category during the applicable periods.
The Board noted that for the one-, three- and five-year periods reported, Advantage Small Cap Core Fund ranked in the third, fourth and third quartiles, respectively, against its Morningstar Category. The Board noted that BlackRock believes that the Morningstar Category is an appropriate performance metric for the Fund, and that BlackRock has explained its rationale for this belief to the Board. The Board and BlackRock reviewed the Fund’s underperformance relative to its Morningstar Category during the applicable periods.
C. Consideration of the Advisory/Management Fees and the Estimated Cost of the Services and Estimated Profits Realized by BlackRock and its Affiliates from their Relationship with the Funds
Each Board, including the Independent Board Members, reviewed each Fund’s contractual management fee rate compared with those of its Expense Peers. The contractual management fee rate represents a combination of the advisory fee and any administrative fees, before taking into account any reimbursements or fee waivers. Each Board also compared each Fund’s total expense ratio, as well as its actual management fee rate, to those of its Expense Peers. The total expense ratio represents a fund’s total net operating expenses, including any 12b-1 or non-12b-1 service fees. The total expense ratio gives effect to any expense reimbursements or fee waivers, and the actual management fee rate gives effect to any management fee reimbursements or waivers. The Boards considered that the fee and expense information in the Broadridge report for the Fund reflected information for a specific period and that historical asset levels and expenses may differ from current levels, particularly in a period of market volatility. The Board considered the services provided and the fees charged by BlackRock and its affiliates to other types of clients with similar investment mandates, as applicable, including institutional accounts and sub-advised mutual funds (including mutual funds sponsored by third parties).
The Boards received and reviewed statements relating to BlackRock’s financial condition. The Boards reviewed BlackRock’s profitability methodology and were also provided with an estimated profitability analysis that detailed the revenues earned and the expenses incurred by BlackRock for services provided to each Fund. The Boards reviewed BlackRock’s estimated profitability with respect to each Fund and other funds the Boards currently oversee for the year ended December 31, 2023 compared to available aggregate estimated profitability data provided for the prior two years. The Boards reviewed BlackRock’s estimated profitability with respect to certain other U.S. fund complexes managed by the Manager and/or its affiliates. The Boards reviewed BlackRock’s assumptions and methodology of allocating expenses in the estimated profitability analysis, noting the inherent limitations in allocating costs among various advisory products. The Boards recognized that profitability may be affected by numerous factors including, among other things, fee waivers and expense reimbursements by the Manager, the types of funds managed, precision of expense allocations and business mix. The Boards thus recognized that calculating and comparing profitability at the individual fund level is difficult.
The Boards noted that, in general, individual fund or product line profitability of other advisors is not publicly available. The Boards reviewed BlackRock’s overall operating margin, in general, compared to that of certain other publicly traded asset management firms. The Boards considered the differences between BlackRock and these other firms, including the contribution of technology at BlackRock, BlackRock’s expense management, and the relative product mix.
Each Board considered whether BlackRock has the financial resources necessary to attract and retain high quality investment management personnel to perform its obligations under the Agreements and to continue to provide the high quality of services that is expected by the Board. The Boards further considered factors including but not limited to BlackRock’s commitment of time and resources, assumption of risk, and liability profile in servicing the Funds, including in contrast to what is required of BlackRock with respect to other products with similar investment mandates across the open-end fund, ETF, closed-end fund, sub-advised mutual fund, separately managed account, collective investment trust, and institutional separate account product channels, as applicable.
The applicable Board noted that each of Advantage Large Cap Core Fund’s, Advantage Small Cap Core Fund’s, Advantage International Fund’s and Advantage Large Cap Value Fund’s contractual management fee rate ranked in the first quartile, and that the actual management fee rate and total expense ratio each ranked in the first quartile relative to the pertinent Fund’s Expense Peers.
The Board noted that Advantage Large Cap Growth Fund’s contractual management fee rate ranked in the second quartile, and that the actual management fee rate and total expense ratio each ranked in the first quartile relative to the Fund’s Expense Peers.
The Boards also noted that each Fund has an advisory fee arrangement that includes breakpoints that adjust the fee rate downward as the size of the pertinent Fund increases above certain contractually specified levels. The Boards additionally noted that the breakpoints can, conversely, adjust the advisory fee rate upward as the size of the pertinent Fund decreases below certain contractually specified levels. The Boards further noted that BlackRock and the applicable Board have contractually agreed to a cap on each Fund’s total expenses as a percentage of the Fund’s average daily net assets on a class-by-class basis.
D. Economies of Scale
Each Board, including the Independent Board Members, considered the extent to which any economies of scale might benefit the Funds in a variety of ways as the assets of the Funds increase. Each Board considered multiple factors, including the advisory fee rate and breakpoints, unitary fee structure, fee waivers, and/or expense caps, as applicable. Each Board considered each Fund’s asset levels and whether the current fee schedule was appropriate.
| | |
D I S C L O S U R E O F I N V E S T M E N T A D V I S O R Y A G R E E M E N T S | | 85 |
Disclosure of Investment Advisory Agreements (continued)
E. Other Factors Deemed Relevant by the Board Members
Each Board, including the Independent Board Members, also took into account other ancillary or “fall-out” benefits that BlackRock or its affiliates may derive from BlackRock’s respective relationships with the applicable Fund, both tangible and intangible, such as BlackRock’s ability to leverage its investment professionals who manage other portfolios and its risk management personnel, an increase in BlackRock’s profile in the investment advisory community, and the engagement of BlackRock’s affiliates as service providers to the Funds, including for administrative, distribution, securities lending and cash management services. With respect to securities lending, during the year the Board also considered information provided by independent third-party consultants related to the performance of each BlackRock affiliate as securities lending agent. The Board also considered BlackRock’s overall operations and its efforts to expand the scale of, and improve the quality of, its operations. The Board also noted that, subject to applicable law, BlackRock may use and benefit from third-party research obtained by soft dollars generated by certain registered fund transactions to assist in managing all or a number of its other client accounts.
In connection with its consideration of the pertinent Agreements, the Boards also received information regarding BlackRock’s brokerage and soft dollar practices. The Boards received reports from BlackRock which included information on brokerage commissions and trade execution practices throughout the year.
The Boards noted the competitive nature of the open-end fund marketplace, and that shareholders are able to redeem their Fund shares if they believe that the pertinent Fund’s fees and expenses are too high or if they are dissatisfied with the performance of the Fund.
Conclusion
At the May Meeting, in a continuation of the discussions that occurred during the April Meeting, and as a culmination of the Board of the Trust’s year-long deliberative process, the Board of the Trust, including the Independent Board Members, unanimously approved the continuation of the Trust Advisory Agreement between the Manager and the Trust, on behalf of each of Advantage International Fund, Advantage Large Cap Growth Fund and Advantage Small Cap Core Fund, for a one-year term ending June 30, 2025.
At the May Meeting, as a result of the discussions that occurred during the April Meeting, and as a culmination of the Board of the Corporation’s year-long deliberative process, the Board of the Corporation, including the Independent Board Members, unanimously approved the continuation of the Corporation Advisory Agreement between the Manager and the Corporation, on behalf of each of Advantage Large Cap Value Fund and Advantage Large Cap Core Fund, for a one-year term ending June 30, 2025.
Based upon its evaluation of all of the aforementioned factors in their totality, as well as other information, the Boards, including the Independent Board Members, was satisfied that the terms of the Agreements were fair and reasonable and in the best interest of each Fund and its shareholders. In arriving at its decision to approve the Agreements, the Boards did not identify any single factor or group of factors as all-important or controlling, but considered all factors together, and different Board Members may have attributed different weights to the various factors considered. The Independent Board Members were advised by independent legal counsel throughout the deliberative process.
| | |
| 86 | | 2 0 2 4 B L A C K R O C K A N N U A L F I N A N C I A L S T A T E M E N T S |
Additional Information
Changes in and Disagreements with Accountants
Not applicable.
Proxy Results
Not applicable.
Remuneration Paid to Directors, Officers, and Others
Compensation to the independent directors/trustees of the Corporation/Trust is paid by the Corporation/Trust, on behalf of the Funds.
General Information
Quarterly performance, semi-annual and annual reports, current net asset value and other information regarding the Funds may be found on BlackRock’s website, which can be accessed at blackrock.com. Any reference to BlackRock’s website in this report is intended to allow investors public access to information regarding the Funds and does not, and is not intended to, incorporate BlackRock’s website in this report.
Electronic Delivery
Shareholders can sign up for e-mail notifications of quarterly statements, annual and semi-annual shareholder reports and prospectuses by enrolling in the electronic delivery program.
To enroll in electronic delivery:
Shareholders Who Hold Accounts with Investment Advisors, Banks or Brokerages:
Please contact your financial advisor. Please note that not all investment advisors, banks or brokerages may offer this service.
Shareholders Who Hold Accounts Directly with BlackRock:
1. Access the BlackRock website at blackrock.com
2. Select “Access Your Account”
3. Next, select “eDelivery” in the “Related Resources” box and follow the sign-up instructions.
BlackRock’s Mutual Fund Family
BlackRock offers a diverse lineup of open-end mutual funds crossing all investment styles and managed by experts in equity, fixed-income and tax-exempt investing. Visit blackrock.com for more information.
Shareholder Privileges
Account Information
Call us at (800) 441-7762 from 8:00 AM to 6:00 PM ET on any business day to get information about your account balances, recent transactions and share prices. You can also visit blackrock.com for more information.
Automatic Investment Plans
Investor class shareholders who want to invest regularly can arrange to have $50 or more automatically deducted from their checking or savings account and invested in any of the BlackRock funds.
Systematic Withdrawal Plans
Investor class shareholders can establish a systematic withdrawal plan and receive periodic payments of $50 or more from their BlackRock funds, as long as their account balance is at least $10,000.
Retirement Plans
Shareholders may make investments in conjunction with Traditional, Rollover, Roth, Coverdell, Simple IRAs, SEP IRAs and 403(b) Plans.
| | |
A D D I T I O N A L I N F O R M A T I O N | | 87 |
Additional Information (continued)
| | |
Fund and Service Providers | | |
Investment Adviser and Administrator | | Independent Registered Public Accounting Firm |
BlackRock Advisors, LLC | | Deloitte & Touche LLP |
Wilmington, DE 19809 | | Boston, MA 02116 |
| |
Accounting Agent and Transfer Agent | | Distributor |
BNY Mellon Investment Servicing (US) Inc. | | BlackRock Investments, LLC |
Wilmington, DE 19809 | | New York, NY 10001 |
| |
Custodian | | Legal Counsel |
The Bank of New York Mellon | | Sidley Austin LLP |
New York, NY 10286 | | New York, NY 10019 |
| |
| | Address of the Trust and the Corporation |
| | 100 Bellevue Parkway |
| | Wilmington, DE 19809 |
| | |
| 88 | | 2 0 2 4 B L A C K R O C K A N N U A L F I N A N C I A L S T A T E M E N T S |
Glossary of Terms Used in this Report
Portfolio Abbreviation
| | |
| NVS | | Non-Voting Shares |
| |
| REIT | | Real Estate Investment Trust |
| | |
G L O S S A R Y O F T E R M S U S E D I N T H I S R E P O R T | | 89 |
THIS PAGE INTENTIONALLY LEFT BLANK.
THIS PAGE INTENTIONALLY LEFT BLANK.
Want to know more?
blackrock.com | 800-441-7762
This report is intended for current holders. It is not authorized for use as an offer of sale or a solicitation of an offer to buy shares of the Funds unless preceded or accompanied by the Funds’ current prospectus. Past performance results shown in this report should not be considered a representation of future performance. Investment returns and principal value of shares will fluctuate so that shares, when redeemed, may be worth more or less than their original cost. Statements and other information herein are as dated and are subject to change.
| | |

| | MAY 31, 2024 |
| | |
| |
| | 2024 Annual Financial Statements |
BlackRock FundsSM
| · | | BlackRock Commodity Strategies Fund |
|
| |
| Not FDIC Insured • May Lose Value • No Bank Guarantee |
Table of Contents
Derivative Financial Instruments
The Fund may invest in various derivative financial instruments. These instruments are used to obtain exposure to a security, commodity, index, market, and/or other assets without owning or taking physical custody of securities, commodities and/or other referenced assets or to manage market, equity, credit, interest rate, foreign currency exchange rate, commodity and/or other risks. Derivative financial instruments may give rise to a form of economic leverage and involve risks, including the imperfect correlation between the value of a derivative financial instrument and the underlying asset, possible default of the counterparty to the transaction or illiquidity of the instrument. Pursuant to Rule 18f-4 under the 1940 Act, among other things, the Fund must either use derivative financial instruments with embedded leverage in a limited manner or comply with an outer limit on fund leverage risk based on value-at-risk. The Fund’s successful use of a derivative financial instrument depends on the investment adviser’s ability to predict pertinent market movements accurately, which cannot be assured. The use of these instruments may result in losses greater than if they had not been used, may limit the amount of appreciation the Fund can realize on an investment and/or may result in lower distributions paid to shareholders. The Fund’s investments in these instruments, if any, are discussed in detail in the Notes to Consolidated Financial Statements.
| | |
D E R I V A T I V E F I N A N C I A L I N S T R U M E N T S | | 3 |
| | |
Consolidated Schedule of Investments May 31, 2024 | | BlackRock Commodity Strategies Fund (Percentages shown are based on Net Assets) |
| | | | | | | | |
| Security | | Shares | | | Value | |
| | |
Common Stocks | | | | | | | | |
| | |
Broadline Retail — 0.2% | | | | | | | | |
Dollarama, Inc. | | | 16,692 | | | $ | 1,579,858 | |
| | | | | | | | |
| | |
Capital Markets — 0.1% | | | | | | | | |
Agronomics Ltd.(a) | | | 8,721,549 | | | | 812,025 | |
| | | | | | | | |
| | |
Chemicals — 1.1% | | | | | | | | |
DSM-Firmenich AG | | | 10,613 | | | | 1,228,489 | |
Givaudan SA, Registered Shares | | | 327 | | | | 1,541,576 | |
Nutrien Ltd. | | | 31,966 | | | | 1,873,527 | |
Robertet SA(b) | | | 1,583 | | | | 1,505,880 | |
Symrise AG | | | 10,022 | | | | 1,197,135 | |
| | | | | | | | |
| | |
| | | | | | | 7,346,607 | |
| |
Consumer Staples Distribution & Retail — 0.8% | | | | | |
Costco Wholesale Corp. | | | 3,453 | | | | 2,796,550 | |
Jeronimo Martins SGPS SA | | | 67,165 | | | | 1,506,830 | |
Koninklijke Ahold Delhaize NV | | | 38,665 | | | | 1,199,120 | |
| | | | | | | | |
| | |
| | | | | | | 5,502,500 | |
| | |
Containers & Packaging — 1.7% | | | | | | | | |
Avery Dennison Corp. | | | 10,903 | | | | 2,481,414 | |
Crown Holdings, Inc. | | | 14,619 | | | | 1,230,774 | |
Graphic Packaging Holding Co. | | | 95,332 | | | | 2,699,802 | |
Packaging Corp. of America | | | 9,060 | | | | 1,662,419 | |
SIG Group AG | | | 52,321 | | | | 1,089,720 | |
Smurfit Kappa Group PLC | | | 45,600 | | | | 2,224,051 | |
| | | | | | | | |
| | |
| | | | | | | 11,388,180 | |
| | |
Energy Equipment & Services — 1.4% | | | | | | | | |
ARC Resources Ltd. | | | 89,906 | | | | 1,701,218 | |
Patterson-UTI Energy, Inc. | | | 36,585 | | | | 403,167 | |
Saipem SpA(a) | | | 508,400 | | | | 1,269,675 | |
Schlumberger NV | | | 48,909 | | | | 2,244,434 | |
TechnipFMC PLC | | | 68,467 | | | | 1,793,151 | |
Tenaris SA | | | 57,811 | | | | 955,174 | |
Weatherford International PLC(a) | | | 9,671 | | | | 1,163,808 | |
| | | | | | | | |
| | |
| | | | | | | 9,530,627 | |
| | |
Food Products — 1.3% | | | | | | | | |
Barry Callebaut AG, Registered Shares | | | 635 | | | | 1,103,752 | |
Bunge Global SA | | | 19,992 | | | | 2,150,939 | |
Darling Ingredients, Inc.(a) | | | 12,623 | | | | 509,969 | |
Kerry Group PLC, Class A | | | 9,633 | | | | 816,130 | |
Nestlé SA, Registered Shares | | | 11,969 | | | | 1,270,464 | |
Salmar ASA | | | 20,048 | | | | 1,224,208 | |
SunOpta, Inc.(a)(b) | | | 148,296 | | | | 891,259 | |
Tate & Lyle PLC | | | 130,253 | | | | 1,158,698 | |
| | | | | | | | |
| | |
| | | | | | | 9,125,419 | |
| | |
Ground Transportation — 0.3% | | | | | | | | |
Canadian Pacific Kansas City Ltd. | | | 9,941 | | | | 788,917 | |
Union Pacific Corp. | | | 5,424 | | | | 1,262,815 | |
| | | | | | | | |
| | |
| | | | | | | 2,051,732 | |
| | |
Hotels, Restaurants & Leisure — 0.4% | | | | | | | | |
Compass Group PLC | | | 97,023 | | | | 2,724,037 | |
| | | | | | | | |
| | |
Machinery — 0.6% | | | | | | | | |
Ag Growth International, Inc. | | | 31,647 | | | | 1,207,413 | |
Deere & Co. | | | 2,798 | | | | 1,048,578 | |
John Bean Technologies Corp.(b) | | | 11,771 | | | | 1,124,484 | |
Marel HF | | | 135,108 | | | | 479,379 | |
| | | | | | | | |
| | |
| | | | | | | 3,859,854 | |
| | |
Metals & Mining — 23.2% | | | | | | | | |
Agnico Eagle Mines Ltd. | | | 139,296 | | | | 9,499,661 | |
| | | | | | | | |
| Security | | Shares | | | Value | |
| | |
Metals & Mining (continued) | | | | | | | | |
Alamos Gold, Inc., Class A | | | 196,150 | | | $ | 3,279,840 | |
Allied Gold Corp.(a) | | | 189,844 | | | | 429,010 | |
Anglo American PLC | | | 161,846 | | | | 5,239,797 | |
Anglogold Ashanti PLC | | | 113,971 | | | | 2,756,959 | |
Antofagasta PLC | | | 21,345 | | | | 605,466 | |
ArcelorMittal SA | | | 53,823 | | | | 1,419,990 | |
Artemis Gold, Inc.(a) | | | 96,083 | | | | 749,376 | |
Aurubis AG | | | 3,189 | | | | 271,323 | |
B2Gold Corp. | | | 249,037 | | | | 701,641 | |
Barrick Gold Corp. | | | 489,271 | | | | 8,361,641 | |
Bellevue Gold Ltd.(a) | | | 1,276,892 | | | | 1,668,947 | |
BHP Group Ltd. | | | 177,170 | | | | 5,272,992 | |
Blackstone Minerals Ltd.(a)(b) | | | 1,192,061 | | | | 44,244 | |
BlueScope Steel Ltd. | | | 31,214 | | | | 440,489 | |
Capstone Copper Corp.(a) | | | 158,085 | | | | 1,113,479 | |
Centerra Gold, Inc. | | | 332,050 | | | | 2,282,775 | |
Chalice Mining Ltd.(a) | | | 188,226 | | | | 209,411 | |
Challenger Gold Ltd.(a)(b) | | | 1,928,385 | | | | 85,964 | |
Champion Iron Ltd. | | | 248,250 | | | | 1,162,980 | |
De Grey Mining Ltd.(a) | | | 1,492,547 | | | | 1,130,159 | |
Develop Global Ltd.(a)(b) | | | 630,468 | | | | 962,115 | |
Dundee Precious Metals, Inc. | | | 196,077 | | | | 1,618,450 | |
Eldorado Gold Corp.(a) | | | 53,251 | | | | 861,069 | |
Emerald Resources NL(a) | | | 277,046 | | | | 687,794 | |
Endeavour Mining PLC | | | 184,480 | | | | 4,005,109 | |
ERO Copper Corp.(a) | | | 12,130 | | | | 258,273 | |
FireFly Metals Ltd.(a)(b) | | | 437,806 | | | | 214,227 | |
First Quantum Minerals Ltd. | | | 62,290 | | | | 800,248 | |
Foran Mining Corp.(a)(b) | | | 280,245 | | | | 873,870 | |
Founders Metals, Inc.(a) | | | 230,890 | | | | 299,846 | |
Franco-Nevada Corp. | | | 29,108 | | | | 3,581,291 | |
Freeport-McMoRan, Inc. | | | 107,309 | | | | 5,658,404 | |
Fresnillo PLC | | | 24,780 | | | | 198,085 | |
Glencore PLC | | | 1,309,394 | | | | 8,070,704 | |
Gold Fields Ltd., ADR | | | 147,841 | | | | 2,328,496 | |
Grupo Mexico SAB de CV, Series B | | | 168,970 | | | | 1,042,512 | |
Hudbay Minerals, Inc. | | | 32,635 | | | | 318,460 | |
Iluka Resources Ltd. | | | 90,253 | | | | 431,725 | |
Ivanhoe Electric, Inc.(a)(b) | | | 27,132 | | | | 308,491 | |
Ivanhoe Mines Ltd., Class A(a)(b) | | | 200,535 | | | | 2,895,579 | |
Kinross Gold Corp. | | | 529,244 | | | | 4,298,566 | |
Lithium Royalty Corp.(a) | | | 57,556 | | | | 295,603 | |
Lundin Gold, Inc. | | | 147,812 | | | | 2,183,100 | |
Lundin Mining Corp. | | | 155,273 | | | | 1,785,192 | |
Lynas Rare Earths Ltd.(a) | | | 258,216 | | | | 1,151,978 | |
MAG Silver Corp.(a) | | | 134,616 | | | | 1,801,530 | |
Metals Acquisition Ltd.(a) | | | 9,000 | | | | 133,650 | |
Metals Acquisition Ltd. (Acquired 06/13/23, cost $744,770)(a)(c) | | | 74,477 | | | | 1,105,983 | |
Mineral Resources Ltd. | | | 31,772 | | | | 1,526,605 | |
Newmont Corp. | | | 185,203 | | | | 7,767,414 | |
Nickel Industries Ltd. | | | 1,406,494 | | | | 904,753 | |
Norsk Hydro ASA | | | 393,659 | | | | 2,665,718 | |
Northern Star Resources Ltd. | | | 557,529 | | | | 5,330,113 | |
Nucor Corp. | | | 19,341 | | | | 3,265,728 | |
Osisko Gold Royalties Ltd. | | | 118,790 | | | | 1,994,142 | |
Osisko Mining, Inc.(a) | | | 556,684 | | | | 1,262,081 | |
Pan American Silver Corp. | | | 157,870 | | | | 3,473,140 | |
Pilbara Minerals Ltd. | | | 231,354 | | | | 588,974 | |
Polyus PJSC(a)(d) | | | 46,252 | | | | 5 | |
Predictive Discovery Ltd.(a) | | | 4,532,681 | | | | 590,588 | |
Rio Tinto PLC | | | 97,269 | | | | 6,847,483 | |
| | |
| 4 | | 2 0 2 4 B L A C K R O C K A N N U A L F I N A N C I A L S T A T E M E N T S |
| | |
Consolidated Schedule of Investments (continued) May 31, 2024 | | BlackRock Commodity Strategies Fund (Percentages shown are based on Net Assets) |
| | | | | | | | |
| Security | | Shares | | | Value | |
| | |
Metals & Mining (continued) | | | | | | | | |
Rupert Resources Ltd.(a)(b) | | | 85,874 | | | $ | 274,076 | |
Rupert Resources Ltd. (Acquired 02/24/23, cost $315,608)(a)(c) | | | 91,372 | | | | 291,624 | |
Sigma Lithium Corp.(a)(b) | | | 77,979 | | | | 1,195,188 | |
Skeena Resources Ltd.(a)(b) | | | 161,551 | | | | 714,738 | |
Sociedad Minera Cerro Verde SAA | | | 20,183 | | | | 817,412 | |
Solaris Resources, Inc.(a) | | | 81,878 | | | | 272,136 | |
Solaris Resources, Inc.(a) | | | 39,000 | | | | 129,623 | |
Southern Copper Corp. | | | 10,105 | | | | 1,198,756 | |
SSAB AB, B Shares | | | 70,134 | | | | 407,489 | |
Steel Dynamics, Inc. | | | 13,063 | | | | 1,748,744 | |
Stelco Holdings, Inc. | | | 32,310 | | | | 966,254 | |
Teck Resources Ltd., Class B | | | 72,158 | | | | 3,753,095 | |
Titan Mining Corp.(a) | | | 98,486 | | | | 23,484 | |
Titan Mining Corp.(a) | | | 20,773 | | | | 4,953 | |
Torex Gold Resources, Inc.(a) | | | 135,913 | | | | 2,138,988 | |
Trident Royalties PLC(a) | | | 835,581 | | | | 451,449 | |
Vale SA, ADR | | | 213,197 | | | | 2,569,024 | |
Wheaton Precious Metals Corp. | | | 177,648 | | | | 9,729,941 | |
| | | | | | | | |
| | |
| | | | | | | 157,800,212 | |
| | |
Oil, Gas & Consumable Fuels — 17.1% | | | | | | | | |
BP PLC | | | 1,236,075 | | | | 7,732,249 | |
Cameco Corp. | | | 30,079 | | | | 1,669,685 | |
Canadian Natural Resources Ltd. | | | 71,476 | | | | 5,490,691 | |
Cenovus Energy, Inc. | | | 134,630 | | | | 2,806,294 | |
Cheniere Energy, Inc. | | | 22,897 | | | | 3,612,918 | |
Chevron Corp. | | | 57,803 | | | | 9,381,427 | |
ConocoPhillips | | | 57,994 | | | | 6,755,141 | |
Diamondback Energy, Inc. | | | 17,114 | | | | 3,410,136 | |
EOG Resources, Inc. | | | 5,635 | | | | 701,839 | |
Exxon Mobil Corp. | | | 211,858 | | | | 24,842,469 | |
Gazprom PJSC(a)(d) | | | 712,200 | | | | 79 | |
Hess Corp. | | | 33,971 | | | | 5,234,931 | |
Kosmos Energy Ltd.(a) | | | 101,099 | | | | 616,704 | |
Marathon Petroleum Corp. | | | 25,862 | | | | 4,567,488 | |
PBF Energy, Inc., Class A | | | 12,600 | | | | 583,758 | |
Pembina Pipeline Corp. | | | 76,252 | | | | 2,832,561 | |
Permian Resources Corp., Class A | | | 132,650 | | | | 2,174,134 | |
Shell PLC | | | 363,982 | | | | 13,137,844 | |
Targa Resources Corp. | | | 26,700 | | | | 3,156,741 | |
TC Energy Corp. | | | 71,646 | | | | 2,762,914 | |
TotalEnergies SE | | | 76,338 | | | | 5,592,865 | |
Tourmaline Oil Corp. | | | 35,317 | | | | 1,751,922 | |
Valero Energy Corp. | | | 25,491 | | | | 4,005,656 | |
Williams Cos., Inc. (The) | | | 86,038 | | | | 3,571,437 | |
Woodside Energy Group Ltd. | | | 11,387 | | | | 210,700 | |
| | | | | | | | |
| | |
| | | | | | | 116,602,583 | |
| | |
Personal Care Products — 0.1% | | | | | | | | |
Jamieson Wellness, Inc.(e) | | | 42,482 | | | | 833,775 | |
| | | | | | | | |
| | |
Pharmaceuticals — 0.8% | | | | | | | | |
Eli Lilly & Co. | | | 2,098 | | | | 1,721,073 | |
Novo Nordisk A/S, Class B | | | 15,457 | | | | 2,094,240 | |
Zoetis, Inc., Class A | | | 10,113 | | | | 1,714,760 | |
| | | | | | | | |
| | |
| | | | | | | 5,530,073 | |
| | |
Professional Services — 0.3% | | | | | | | | |
SGS SA, Registered Shares | | | 18,237 | | | | 1,698,328 | |
| | | | | | | | |
| | |
Trading Companies & Distributors — 0.2% | | | | | | | | |
Beijer Ref AB, Class B | | | 61,267 | | | | 1,002,928 | |
| | | | | | | | |
| | |
Total Common Stocks — 49.6%
(Cost: $244,096,287) | | | | | | | 337,388,738 | |
| | | | | | | | |
| | | | | | | | |
| Security | | Shares | | | Value | |
| | |
Rights | | | | | | | | |
| | |
Metals & Mining — 0.0% | | | | | | | | |
Kincross Gold Corp., CVR(a)(d) | | | 11,812 | | | $ | — | |
| | | | | | | | |
| | |
Total Rights — 0.0%
(Cost: $ —) | | | | | | | — | |
| | | | | | | | |
| | |
Warrants(a) | | | | | | | | |
| | |
Capital Markets — 0.0% | | | | | | | | |
Agronomics Ltd. (Issued/Exercisable, 1 Share for 1 Warrant, Expires 06/01/24, Strike Price GBP 0.28) . | | | 3,014,355 | | | | 38 | |
Agronomics Ltd. (Issued/Exercisable, 1 Share for 1 Warrant, Expires 12/08/24, Strike Price GBP 0.30) | | | 3,909,350 | | | | 50 | |
| | | | | | | | |
| | |
Total Warrants — 0.0%
(Cost: $0) | | | | | | | 88 | |
| | | | | | | | |
| |
Total Long-Term Investments — 49.6%
(Cost: $244,096,287) | | | | 337,388,826 | |
| | | | | | | | |
| | |
Short-Term Securities | | | | | | | | |
| | |
Money Market Funds — 1.5% | | | | | | | | |
BlackRock Cash Funds: Institutional, SL Agency Shares, 5.49%(f)(g)(h) | | | 6,346,561 | | | | 6,348,465 | |
BlackRock Liquidity Funds, T-Fund, Institutional Shares, 5.19%(f)(g) | | | 3,589,797 | | | | 3,589,797 | |
| | | | | | | | |
| | |
| | | | | | | 9,938,262 | |
| | | | | | | | |
| | |
| | | Par (000) | | | | |
| | |
| U.S. Treasury Obligations(i) — 49.9% | | | | | | |
U.S. Treasury Bills | | | | | | | | |
5.28%, 06/06/24 | | USD | 48,000 | | | | 47,979,012 | |
5.24%, 07/05/24 | | | 60,000 | | | | 59,718,700 | |
5.27%, 08/29/24 | | | 235,000 | | | | 232,024,118 | |
| | | | | | | | |
| |
Total U.S. Treasury Obligations — 49.9%
(Cost: $339,671,995) | | | | 339,721,830 | |
| | | | | | | | |
| |
Total Short-Term Securities — 51.4%
(Cost: $349,610,366) | | | | 349,660,092 | |
| | | | | | | | |
| |
Total Investments — 101.0%
(Cost: $593,706,653) | | | | 687,048,918 | |
| |
Liabilities in Excess of Other Assets — (1.0)% | | | | (6,970,173 | ) |
| | | | | | | | |
| | |
| Net Assets — 100.0% | | | | | $ 680,078,745 | |
| | | | | | | | |
| (a) | Non-income producing security. |
| (b) | All or a portion of this security is on loan. |
| (c) | Restricted security as to resale, excluding 144A securities. The Fund held restricted securities with a current value of $1,397,607, representing 0.2% of its net assets as of period end, and an original cost of $1,060,378. |
| (d) | Security is valued using significant unobservable inputs and is classified as Level 3 in the fair value hierarchy. |
| (e) | Security exempt from registration pursuant to Rule 144A under the Securities Act of 1933, as amended. These securities may be resold in transactions exempt from registration to qualified institutional investors. |
| (f) | Affiliate of the Fund. |
| (g) | Annualized 7-day yield as of period end. |
| (h) | All or a portion of this security was purchased with the cash collateral from loaned securities. |
| (i) | Rates are discount rates or a range of discount rates as of period end. |
| | |
C O N S O L I D A T E D S C H E D U L E O F I N V E S T M E N T S | | 5 |
| | |
Consolidated Schedule of Investments (continued) May 31, 2024 | | BlackRock Commodity Strategies Fund |
Affiliates
Investments in issuers considered to be affiliate(s) of the Fund during the year ended May 31, 2024 for purposes of Section 2(a)(3) of the Investment Company Act of 1940, as amended, were as follows:
| | | | | | | | | | | | | | | | | | | | | | | | | | | | | | | | | | | | |
| Affiliated Issuer | | Value at
05/31/23 | | | Purchases
at Cost | | | Proceeds
from Sales | | | Net
Realized
Gain (Loss) | | | Change in
Unrealized
Appreciation
(Depreciation) | | | Value at
05/31/24 | | | Shares
Held at
05/31/24 | | | Income | | | Capital Gain
Distributions
from Underlying
Funds | |
| | | | | | | | | |
BlackRock Cash Funds: Institutional, SL Agency Shares | | $ | — | | | $ | 6,350,191 | (a) | | $ | — | | | $ | (1,617 | ) | | $ | (109 | ) | | $ | 6,348,465 | | | | 6,346,561 | | | $ | 36,054 | (b) | | $ | — | |
BlackRock Liquidity Funds, T-Fund, Institutional Shares | | | 7,558,334 | | | | — | | | | (3,968,537 | )(a) | | | — | | | | — | | | | 3,589,797 | | | | 3,589,797 | | | | 290,304 | | | | — | |
SL Liquidity Series, LLC, Money Market Series(c) | | | 13,698,222 | | | | — | | | | (13,702,331 | )(a) | | | 12,211 | | | | (8,102 | ) | | | — | | | | — | | | | 292,954 | (b) | | | — | |
| | | | | | | | | | | | | | | | | | | | | | | | | | | | | | | | | | | | |
| | | | | | | | | |
| | | | | | | | | | | | | | $ | 10,594 | | | $ | (8,211 | ) | | $ | 9,938,262 | | | | | | | $ | 619,312 | | | $ | — | |
| | | | | | | | | | | | | | | | | | | | | | | | | | | | | | | | | | | | |
| | (a) | Represents net amount purchased (sold). | |
| | (b) | All or a portion represents securities lending income earned from the reinvestment of cash collateral from loaned securities, net of fees and collateral investment expenses, and other payments to and from borrowers of securities. | |
| | (c) | As of period end, the entity is no longer held. | |
For purposes of this report, industry and sector sub-classifications may differ from those utilized by the Fund for compliance purposes.
Derivative Financial Instruments Outstanding as of Period End
OTC Total Return Swaps
| | | | | | | | | | | | | | | | | | | | | | | | | | | | | | | | | | |
Paid by the Fund | | | | Received by the Fund | | Counterparty | | Termination Date | | | Notional Amount (000) | | | Value | | | Upfront Premium Paid (Received) | | | Unrealized Appreciation (Depreciation) | |
| Rate | | Frequency | | | | Reference | | Frequency |
3-month U.S. Treasury Bill, 5.39%(a) | | At Termination | | | | BCOMRAGT | | At Termination | | Merrill Lynch International | | | 06/10/24 | | | | USD | | | | 1,102 | | | $ | (85,618 | ) | | $ | — | | | $ | (85,618 | ) |
3-month U.S. Treasury Bill, 5.39%(a) | | At Termination | | | | BCOMRLIT | | At Termination | | Merrill Lynch International | | | 06/10/24 | | | | USD | | | | 1,053 | | | | 30,259 | | | | — | | | | 30,259 | |
3-month U.S. Treasury Bill, 5.39%(a) | | At Termination | | | | BCOMRINT | | At Termination | | Goldman Sachs International | | | 07/01/24 | | | | USD | | | | 5,408 | | | | 757,551 | | | | — | | | | 757,551 | |
3-month U.S. Treasury Bill, 5.39%(a) | | At Termination | | | | BCOMRAGT | | At Termination | | Societe Generale SA | | | 07/01/24 | | | | USD | | | | 16,737 | | | | (1,383,256 | ) | | | — | | | | (1,383,256 | ) |
3-month U.S. Treasury Bill, 5.39%(a) | | At Termination | | | | BCOMRPRT | | At Termination | | Societe Generale SA | | | 07/01/24 | | | | USD | | | | 7,316 | | | | 1,357,983 | | | | — | | | | 1,357,983 | |
3-month U.S. Treasury Bill, 5.39%(a) | | At Termination | | | | BCOMRENT | | At Termination | | JPMorgan Chase Bank N.A. | | | 07/19/24 | | | | USD | | | | 71,649 | | | | (5,389,269 | ) | | | — | | | | (5,389,269 | ) |
3-month U.S. Treasury Bill, 5.39%(a) | | At Termination | | | | BCOMRLIT | | At Termination | | Societe Generale SA | | | 07/19/24 | | | | USD | | | | 10,288 | | | | (543,762 | ) | | | — | | | | (543,762 | ) |
3-month U.S. Treasury Bill, 5.39%(a) | | At Termination | | | | BCOMRPRT | | At Termination | | Societe Generale SA | | | 07/19/24 | | | | USD | | | | 51,587 | | | | 6,839,477 | | | | — | | | | 6,839,477 | |
3-month U.S. Treasury Bill, 5.39%(a) | | At Termination | | | | BCOMRLIT | | At Termination | | Merrill Lynch International | | | 09/03/24 | | | | USD | | | | 2,724 | | | | (121,712 | ) | | | — | | | | (121,712 | ) |
3-month U.S. Treasury Bill, 5.39%(a) | | At Termination | | | | BCOMRAGT | | At Termination | | Citibank N.A. | | | 09/25/24 | | | | USD | | | | 602 | | | | (39,478 | ) | | | — | | | | (39,478 | ) |
| | |
| 6 | | 2 0 2 4 B L A C K R O C K A N N U A L F I N A N C I A L S T A T E M E N T S |
| | |
Consolidated Schedule of Investments (continued) May 31, 2024 | | BlackRock Commodity Strategies Fund |
OTC Total Return Swaps (continued)
| | | | | | | | | | | | | | | | | | | | | | | | | | | | | | | | | | |
Paid by the Fund | | | | Received by the Fund | | Counterparty | | Termination Date | | | Notional Amount (000) | | | Value | | | Upfront Premium Paid (Received) | | | Unrealized Appreciation (Depreciation) | |
| Rate | | Frequency | | | | Reference | | Frequency |
3-month U.S. Treasury Bill, 5.39%(a) | | At Termination | | | | BCOMRINT | | At Termination | | Citibank N.A. | | | 09/25/24 | | | | USD | | | | 207 | | | $ | 28,461 | | | $ | — | | | $ | 28,461 | |
3-month U.S. Treasury Bill, 5.39%(a) | | At Termination | | | | BCOMRPRT | | At Termination | | Goldman Sachs International | | | 09/25/24 | | | | USD | | | | 480 | | | | 94,498 | | | | — | | | | 94,498 | |
3-month U.S. Treasury Bill, 5.39%(a) | | At Termination | | | | BCOMRLIT | | At Termination | | Societe Generale SA | | | 09/25/24 | | | | USD | | | | 129 | | | | (7,409 | ) | | | — | | | | (7,409 | ) |
3-month U.S. Treasury Bill, 5.39%(a) | | At Termination | | | | BCOMRENT | | At Termination | | JPMorgan Chase Bank N.A. | | | 10/02/24 | | | | USD | | | | 378 | | | | (58,998 | ) | | | — | | | | (58,998 | ) |
3-month U.S. Treasury Bill, 5.39%(a) | | At Termination | | | | BCOMRINT | | At Termination | | JPMorgan Chase Bank N.A. | | | 10/02/24 | | | | USD | | | | 76 | | | | 9,880 | | | | — | | | | 9,880 | |
3-month U.S. Treasury Bill, 5.39%(a) | | At Termination | | | | BCOMRPRT | | At Termination | | Goldman Sachs International | | | 10/11/24 | | | | USD | | | | 7,831 | | | | 1,850,512 | | | | — | | | | 1,850,512 | |
3-month U.S. Treasury Bill, 5.39%(a) | | At Termination | | | | BCOMRENT | | At Termination | | JPMorgan Chase Bank N.A. | | | 10/11/24 | | | | USD | | | | 19,960 | | | | (2,808,892 | ) | | | — | | | | (2,808,892 | ) |
3-month U.S. Treasury Bill, 5.39%(a) | | At Termination | | | | BCOMRPRT | | At Termination | | JPMorgan Chase Bank N.A. | | | 12/02/24 | | | | USD | | | | 2,235 | | | | 288,711 | | | | — | | | | 288,711 | |
3-month U.S. Treasury Bill, 5.39%(a) | | At Termination | | | | BCOMRINT | | At Termination | | JPMorgan Chase Bank N.A. | | | 12/02/24 | | | | USD | | | | 1,300 | | | | 210,889 | | | | — | | | | 210,889 | |
3-month U.S. Treasury Bill, 5.39%(a) | | At Termination | | | | BCOMRENT | | At Termination | | JPMorgan Chase Bank N.A. | | | 12/02/24 | | | | USD | | | | 589 | | | | (25,270 | ) | | | — | | | | (25,270 | ) |
3-month U.S. Treasury Bill, 5.39%(a) | | At Termination | | | | BCOMRAGT | | At Termination | | Macquarie Bank Ltd. | | | 12/02/24 | | | | USD | | | | 8,545 | | | | (633,191 | ) | | | — | | | | (633,191 | ) |
3-month U.S. Treasury Bill, 5.39%(a) | | At Termination | | | | BCOMRLIT | | At Termination | | Societe Generale SA | | | 12/02/24 | | | | USD | | | | 294 | | | | 11,818 | | | | — | | | | 11,818 | |
3-month U.S. Treasury Bill, 5.39%(a) | | At Termination | | | | BCOMRPRT | | At Termination | | Goldman Sachs International | | | 01/03/25 | | | | USD | | | | 2,235 | | | | 359,992 | | | | — | | | | 359,992 | |
3-month U.S. Treasury Bill, 5.39%(a) | | At Termination | | | | BCOMRINT | | At Termination | | Goldman Sachs International | | | 01/03/25 | | | | USD | | | | 3,019 | | | | 433,906 | | | | — | | | | 433,906 | |
3-month U.S. Treasury Bill, 5.39%(a) | | At Termination | | | | BCOMRENT | | At Termination | | JPMorgan Chase Bank N.A. | | | 01/03/25 | | | | USD | | | | 1,019 | | | | (2,006 | ) | | | — | | | | (2,006 | ) |
3-month U.S. Treasury Bill, 5.39%(a) | | At Termination | | | | BCOMRLIT | | At Termination | | Merrill Lynch International | | | 01/03/25 | | | | USD | | | | 291 | | | | 14,827 | | | | — | | | | 14,827 | |
3-month U.S. Treasury Bill, 5.39%(a) | | At Termination | | | | BCOMRAGT | | At Termination | | Merrill Lynch International | | | 01/03/25 | | | | USD | | | | 2,290 | | | | (42,211 | ) | | | — | | | | (42,211 | ) |
3-month U.S. Treasury Bill, 5.39%(a) | | At Termination | | | | BCOMRAGT | | At Termination | | Merrill Lynch International | | | 01/17/25 | | | | USD | | | | 8,407 | | | | 112,489 | | | | — | | | | 112,489 | |
3-month U.S. Treasury Bill, 5.39%(a) | | At Termination | | | | BCOMRINT | | At Termination | | Goldman Sachs International | | | 01/24/25 | | | | USD | | | | 536 | | | | 81,546 | | | | — | | | | 81,546 | |
3-month U.S. Treasury Bill, 5.39%(a) | | At Termination | | | | BCOMRPRT | | At Termination | | JPMorgan Chase Bank N.A. | | | 01/24/25 | | | | USD | | | | 1,155 | | | | 203,234 | | | | — | | | | 203,234 | |
| | |
C O N S O L I D A T E D S C H E D U L E O F I N V E S T M E N T S | | 7 |
| | |
Consolidated Schedule of Investments (continued) May 31, 2024 | | BlackRock Commodity Strategies Fund |
OTC Total Return Swaps (continued)
| | | | | | | | | | | | | | | | | | | | | | | | | | | | | | | | | | |
Paid by the Fund | | | | Received by the Fund | | Counterparty | | Termination Date | | | Notional Amount (000) | | | Value | | | Upfront Premium Paid (Received) | | | Unrealized Appreciation (Depreciation) | |
| Rate | | Frequency | | | | Reference | | Frequency |
3-month U.S. Treasury Bill, 5.39%(a) | | At Termination | | | | BCOMRENT | | At Termination | | JPMorgan Chase Bank N.A. | | | 01/24/25 | | | | USD | | | | 1,385 | | | $ | 6,580 | | | $ | — | | | $ | 6,580 | |
3-month U.S. Treasury Bill, 5.39%(a) | | At Termination | | | | BCOMRLIT | | At Termination | | Merrill Lynch International | | | 01/24/25 | | | | USD | | | | 250 | | | | 5,431 | | | | — | | | | 5,431 | |
3-month U.S. Treasury Bill, 5.39%(a) | | At Termination | | | | BCOMRAGT | | At Termination | | Merrill Lynch International | | | 01/24/25 | | | | USD | | | | 1,363 | | | | (22,756 | ) | | | — | | | | (22,756 | ) |
3-month U.S. Treasury Bill, 5.39%(a) | | At Termination | | | | BCOMRENT | | At Termination | | JPMorgan Chase Bank N.A. | | | 01/31/25 | | | | USD | | | | 312 | | | | 2,772 | | | | — | | | | 2,772 | |
3-month U.S. Treasury Bill, 5.39%(a) | | At Termination | | | | BCOMRINT | | At Termination | | Macquarie Bank Ltd. | | | 01/31/25 | | | | USD | | | | 5,671 | | | | 861,488 | | | | — | | | | 861,488 | |
3-month U.S. Treasury Bill, 5.39%(a) | | At Termination | | | | BCOMRLIT | | At Termination | | Societe Generale SA | | | 01/31/25 | | | | USD | | | | 301 | | | | 296 | | | | — | | | | 296 | |
3-month U.S. Treasury Bill, 5.39%(a) | | At Termination | | | | BCOMRAGT | | At Termination | | Macquarie Bank Ltd. | | | 02/26/25 | | | | USD | | | | 14,713 | | | | (602,462 | ) | | | — | | | | (602,462 | ) |
3-month U.S. Treasury Bill, 5.39%(a) | | At Termination | | | | BCOMRINT | | At Termination | | Goldman Sachs International | | | 02/28/25 | | | | USD | | | | 21,404 | | | | (858,367 | ) | | | — | | | | (858,367 | ) |
3-month U.S. Treasury Bill, 5.39%(a) | | At Termination | | | | BCOMRAGT | | At Termination | | Merrill Lynch International | | | 03/14/25 | | | | USD | | | | 9,839 | | | | 279,031 | | | | — | | | | 279,031 | |
3-month U.S. Treasury Bill, 5.39%(a) | | At Termination | | | | BCOMRLIT | | At Termination | | Goldman Sachs International | | | 03/21/25 | | | | USD | | | | 28 | | | | (793 | ) | | | — | | | | (793 | ) |
3-month U.S. Treasury Bill, 5.39%(a) | | At Termination | | | | BCOMRENT | | At Termination | | JPMorgan Chase Bank N.A. | | | 03/21/25 | | | | USD | | | | 151 | | | | (798 | ) | | | — | | | | (798 | ) |
3-month U.S. Treasury Bill, 5.39%(a) | | At Termination | | | | BCOMRPRT | | At Termination | | JPMorgan Chase Bank N.A. | | | 03/21/25 | | | | USD | | | | 132 | | | | 11,964 | | | | — | | | | 11,964 | |
3-month U.S. Treasury Bill, 5.39%(a) | | At Termination | | | | BCOMRAGT | | At Termination | | Macquarie Bank Ltd. | | | 03/21/25 | | | | USD | | | | 141 | | | | 2,017 | | | | — | | | | 2,017 | |
3-month U.S. Treasury Bill, 5.39%(a) | | At Termination | | | | BCOMRINT | | At Termination | | Macquarie Bank Ltd. | | | 03/21/25 | | | | USD | | | | 59 | | | | 7,626 | | | | — | | | | 7,626 | |
3-month U.S. Treasury Bill, 5.39%(a) | | At Termination | | | | BCOMRAGT | | At Termination | | Merrill Lynch International | | | 04/01/25 | | | | USD | | | | 15,219 | | | | 247,413 | | | | — | | | | 247,413 | |
3-month U.S. Treasury Bill, 5.39%(a) | | At Termination | | | | BCOMRINT | | At Termination | | Goldman Sachs International | | | 04/03/25 | | | | USD | | | | 15,237 | | | | 1,532,013 | | | | — | | | | 1,532,013 | |
3-month U.S. Treasury Bill, 5.39%(a) | | At Termination | | | | BCOMRENT | | At Termination | | Goldman Sachs International | | | 04/03/25 | | | | USD | | | | 2,714 | | | | (109,164 | ) | | | — | | | | (109,164 | ) |
3-month U.S. Treasury Bill, 5.39%(a) | | At Termination | | | | BCOMRPRT | | At Termination | | JPMorgan Chase Bank N.A. | | | 04/03/25 | | | | USD | | | | 2,465 | | | | 76,386 | | | | — | | | | 76,386 | |
| | |
| 8 | | 2 0 2 4 B L A C K R O C K A N N U A L F I N A N C I A L S T A T E M E N T S |
| | |
Consolidated Schedule of Investments (continued) May 31, 2024 | | BlackRock Commodity Strategies Fund |
OTC Total Return Swaps (continued)
| | | | | | | | | | | | | | | | | | | | | | | | | | | | | | | | | | |
Paid by the Fund | | | | Received by the Fund | | Counterparty | | Termination Date | | | Notional Amount (000) | | | Value | | | Upfront Premium Paid (Received) | | | Unrealized Appreciation (Depreciation) | |
| Rate | | Frequency | | | | Reference | | Frequency |
| | | | | | | | | | | |
3-month U.S. Treasury Bill, 5.39%(a) | | At Termination | | | | BCOMRENT | | At Termination | | Goldman Sachs International | | | 04/30/25 | | | | USD | | | | 2,135 | | | $ | (30,030 | ) | | $ | — | | | $ | (30,030 | ) |
3-month U.S. Treasury Bill, 5.39%(a) | | At Termination | | | | BCOMRLIT | | At Termination | | Merrill Lynch International | | | 05/02/25 | | | | USD | | | | 305 | | | | 1,572 | | | | — | | | | 1,572 | |
| | | | | | | | | | | | | | | | | | | | | | | | | | | | | | | | | | |
| | | | | | | | | | | |
| | | | | | | | | | | | | | | | | | | | | | | | $ | 2,955,180 | | | $ | — | | | $ | 2,955,180 | |
| | | | | | | | | | | | | | | | | | | | | | | | | | | | | | | | | | |
| | (a) | All or a portion of the security is held by a wholly-owned subsidiary. See Note 1 of the Notes to Consolidated Financial Statements for details on the wholly-owned subsidiary. | |
Balances Reported in the Consolidated Statement of Assets and Liabilities for OTC Swaps
| | | | | | | | | | | | | | | | |
| | | Swap
Premiums
Paid | | | Swap
Premiums
Received | | | Unrealized
Appreciation | | | Unrealized
Depreciation | |
| | | | |
OTC Swaps | | $ | — | | | $ | — | | | $ | 15,720,622 | | | $ | (12,765,442 | ) |
Derivative Financial Instruments Categorized by Risk Exposure
As of period end, the fair values of derivative financial instruments located in the Consolidated Statement of Assets and Liabilities were as follows:
| | | | | | | | | | | | | | | | | | | | | | | | | | | | |
| | | Commodity
Contracts | | | Credit
Contracts | | | Equity
Contracts | | | Foreign
Currency
Exchange
Contracts | | | Interest
Rate
Contracts | | | Other
Contracts | | | Total | |
| | | | | | | |
Assets — Derivative Financial Instruments | | | | | | | | | | | | | | | | | | | | | | | | | | | | |
Swaps — OTC | | | | | | | | | | | | | | | | | | | | | | | | | | | | |
Unrealized appreciation on OTC swaps; | | | | | | | | | | | | | | | | | | | | | | | | | | | | |
Swap premiums paid | | $ | 15,720,622 | | | $ | — | | | $ | — | | | $ | — | | | $ | — | | | $ | — | | | $ | 15,720,622 | |
| | | | | | | | | | | | | | | | | | | | | | | | | | | | |
| | | | | | | |
Liabilities — Derivative Financial Instruments | | | | | | | | | | | | | | | | | | | | | | | | | | | | |
Swaps — OTC | | | | | | | | | | | | | | | | | | | | | | | | | | | | |
Unrealized depreciation on OTC swaps; | | | | | | | | | | | | | | | | | | | | | | | | | | | | |
Swap premiums received | | $ | 12,765,442 | | | $ | — | | | $ | — | | | $ | — | | | $ | — | | | $ | — | | | $ | 12,765,442 | |
| | | | | | | | | | | | | | | | | | | | | | | | | | | | |
For the period ended May 31, 2024, the effect of derivative financial instruments in the Consolidated Statement of Operations was as follows:
| | | | | | | | | | | | | | | | | | | | | | | | | | | | |
| | | Commodity
Contracts | | | Credit
Contracts | | | Equity
Contracts | | | Foreign
Currency
Exchange
Contracts | | | Interest
Rate
Contracts | | | Other
Contracts | | | Total | |
| | | | | | | |
Net Realized Gain (Loss) from: | | | | | | | | | | | | | | | | | | | | | | | | | | | | |
Swaps | | $ | (74,287,823 | ) | | $ | — | | | $ | — | | | $ | — | | | $ | — | | | $ | — | | | $ | (74,287,823 | ) |
| | | | | | | | | | | | | | | | | | | | | | | | | | | | |
| | | | | | | |
Net Change in Unrealized Appreciation (Depreciation) on: | | | | | | | | | | | | | | | | | | | | | | | | | | | | |
Swaps | | $ | 93,438,294 | | | $ | — | | | $ | — | | | $ | — | | | $ | — | | | $ | — | | | $ | 93,438,294 | |
| | | | | | | | | | | | | | | | | | | | | | | | | | | | |
Average Quarterly Balances of Outstanding Derivative Financial Instruments
| | | | | | | | | | | | | | |
| | | | | | | | |
| Total return swaps Average notional amount | | | | | | | | | | | | | | $396,183,668 |
For more information about the Fund’s investment risks regarding derivative financial instruments, refer to the Notes to Consolidated Financial Statements.
| | |
C O N S O L I D A T E D S C H E D U L E O F I N V E S T M E N T S | | 9 |
| | |
Consolidated Schedule of Investments (continued) May 31, 2024 | | BlackRock Commodity Strategies Fund |
Derivative Financial Instruments – Offsetting as of Period End
The Fund’s derivative assets and liabilities (by type) were as follows:
| | | | | | | | |
| | | Assets | | | Liabilities | |
| | |
Derivative Financial Instruments | | | | | | | | |
Swaps — OTC(a) | | $ | 15,720,622 | | | $ | 12,765,442 | |
| | | | | | | | |
| | |
Total derivative assets and liabilities in the Consolidated Statement of Assets and Liabilities | | $ | 15,720,622 | | | $ | 12,765,442 | |
| | | | | | | | |
| | |
Derivatives not subject to a Master Netting Agreement or similar agreement (“MNA”) | | | — | | | | — | |
| | | | | | | | |
| | |
Total derivative assets and liabilities subject to an MNA | | $ | 15,720,622 | | | $ | 12,765,442 | |
| | | | | | | | |
| | (a) | Includes unrealized appreciation (depreciation) on OTC swaps and swap premiums paid/(received) in the Consolidated Statement of Assets and Liabilities. | |
The following tables present the Fund’s derivative assets and liabilities by counterparty net of amounts available for offset under an MNA and net of the related collateral received and pledged by the Fund:
| | | | | | | | | | | | | | | | | | | | |
| Counterparty | | Derivative
Assets
Subject to an MNA by
Counterparty | | | Derivatives
Available for Offset(a) | | | Non- Cash
Collateral
Received(b) | | | Cash
Collateral
Received(b) | | | Net
Amount of
Derivative
Assets(c) | |
| | | | | |
Citibank N.A.(d) | | $ | 28,461 | | | $ | (28,461 | ) | | $ | — | | | $ | — | | | $ | — | |
Goldman Sachs International(d) | | | 5,110,018 | | | | (998,354 | ) | | | — | | | | (4,111,664 | ) | | | — | |
JPMorgan Chase Bank N.A.(d) | | | 810,416 | | | | (810,416 | ) | | | — | | | | — | | | | — | |
Macquarie Bank Ltd.(d) | | | 871,131 | | | | (871,131 | ) | | | — | | | | — | | | | — | |
Merrill Lynch International(d) | | | 691,022 | | | | (272,297 | ) | | | — | | | | (418,725 | ) | | | — | |
Societe Generale SA(d) | | | 8,209,574 | | | | (1,934,427 | ) | | | — | | | | (6,275,147 | ) | | | — | |
| | | | | | | | | | | | | | | | | | | | |
| | $ | 15,720,622 | | | $ | (4,915,086 | ) | | $ | — | | | $ | (10,805,536 | ) | | $ | — | |
| | | | | | | | | | | | | | | | | | | | |
| | | | | | | | | | | | | | | | | | | | |
| Counterparty | | Derivative
Liabilities
Subject to an MNA by
Counterparty | | | Derivatives
Available for Offset(a) | | | Non- Cash
Collateral
Pledged(b) | | | Cash
Collateral
Pledged(b) | | | Net
Amount of
Derivative
Liabilities(e) | |
| | | | | |
Citibank N.A.(d) | | $ | 39,478 | | | $ | (28,461 | ) | | $ | — | | | $ | — | | | $ | 11,017 | |
Goldman Sachs International(d) | | | 998,354 | | | | (998,354 | ) | | | — | | | | — | | | | — | |
JPMorgan Chase Bank N.A.(d) | | | 8,285,233 | | | | (810,416 | ) | | | — | | | | (7,390,000 | ) | | | 84,817 | |
Macquarie Bank Ltd.(d) | | | 1,235,653 | | | | (871,131 | ) | | | — | | | | — | | | | 364,522 | |
Merrill Lynch International(d) | | | 272,297 | | | | (272,297 | ) | | | — | | | | — | | | | — | |
Societe Generale SA(d) | | | 1,934,427 | | | | (1,934,427 | ) | | | — | | | | — | | | | — | |
| | | | | | | | | | | | | | | | | | | | |
| | $ | 12,765,442 | | | $ | (4,915,086 | ) | | $ | — | | | $ | (7,390,000 | ) | | $ | 460,356 | |
| | | | | | | | | | | | | | | | | | | | |
| | (a) | The amount of derivatives available for offset is limited to the amount of derivative assets and/or liabilities that are subject to an MNA. | |
| | (b) | Excess of collateral received/pledged, if any, from the individual counterparty is not shown for financial reporting purposes. | |
| | (c) | Net amount represents the net amount receivable from the counterparty in the event of default. | |
| | (d) | Represents derivatives owned by the BlackRock Cayman Commodity Strategies Fund, Ltd., a wholly-owed subsidiary of the Fund. See Note 1 of the Notes to Consolidated Financial Statements. | |
| | (e) | Net amount represents the net amount payable due to the counterparty in the event of default. | |
Fair Value Hierarchy as of Period End
Various inputs are used in determining the fair value of financial instruments. For a description of the input levels and information about the Fund’s policy regarding valuation of financial instruments, refer to the Notes to Consolidated Financial Statements.
The following table summarizes the Fund’s financial instruments categorized in the fair value hierarchy. The breakdown of the Fund’s financial instruments into major categories is disclosed in the Consolidated Schedule of Investments above.
| | | | | | | | | | | | | | | | |
| | | Level 1 | | | Level 2 | | | Level 3 | | | Total | |
| | | | |
Assets | | | | | | | | | | | | | | | | |
Investments | | | | | | | | | | | | | | | | |
Long-Term Investments | | | | | | | | | | | | | | | | |
Common Stocks | | | | | | | | | | | | | | | | |
Broadline Retail | | $ | 1,579,858 | | | $ | — | | | $ | — | | | $ | 1,579,858 | |
| | |
| 10 | | 2 0 2 4 B L A C K R O C K A N N U A L F I N A N C I A L S T A T E M E N T S |
| | |
Consolidated Schedule of Investments (continued) May 31, 2024 | | BlackRock Commodity Strategies Fund |
Fair Value Hierarchy as of Period End (continued)
| | | | | | | | | | | | | | | | |
| | | Level 1 | | | Level 2 | | | Level 3 | | | Total | |
Common Stocks (continued) | | | | | | | | | | | | | | | | |
Capital Markets | | $ | — | | | $ | 812,025 | | | $ | — | | | $ | 812,025 | |
Chemicals | | | 1,873,527 | | | | 5,473,080 | | | | — | | | | 7,346,607 | |
Consumer Staples Distribution & Retail | | | 2,796,550 | | | | 2,705,950 | | | | — | | | | 5,502,500 | |
Containers & Packaging | | | 8,074,409 | | | | 3,313,771 | | | | — | | | | 11,388,180 | |
Energy Equipment & Services | | | 7,305,778 | | | | 2,224,849 | | | | — | | | | 9,530,627 | |
Food Products | | | 3,552,167 | | | | 5,573,252 | | | | — | | | | 9,125,419 | |
Ground Transportation | | | 2,051,732 | | | | — | | | | — | | | | 2,051,732 | |
Hotels, Restaurants & Leisure | | | — | | | | 2,724,037 | | | | — | | | | 2,724,037 | |
Machinery | | | 3,859,854 | | | | — | | | | — | | | | 3,859,854 | |
Metals & Mining | | | 107,790,379 | | | | 50,009,828 | | | | 5 | | | | 157,800,212 | |
Oil, Gas & Consumable Fuels | | | 89,928,846 | | | | 26,673,658 | | | | 79 | | | | 116,602,583 | |
Personal Care Products | | | 833,775 | | | | — | | | | — | | | | 833,775 | |
Pharmaceuticals | | | 3,435,833 | | | | 2,094,240 | | | | — | | | | 5,530,073 | |
Professional Services | | | — | | | | 1,698,328 | | | | — | | | | 1,698,328 | |
Trading Companies & Distributors | | | — | | | | 1,002,928 | | | | — | | | | 1,002,928 | |
Rights | | | — | | | | — | | | | — | | | | — | |
Warrants | | | — | | | | 88 | | | | — | | | | 88 | |
Short-Term Securities | | | | | | | | | | | | | | | | |
Money Market Funds | | | 9,938,262 | | | | — | | | | — | | | | 9,938,262 | |
U.S. Treasury Obligations | | | — | | | | 339,721,830 | | | | — | | | | 339,721,830 | |
| | | | | | | | | | | | | | | | |
| | | | |
| | $ | 243,020,970 | | | $ | 444,027,864 | | | $ | 84 | | | $ | 687,048,918 | |
| | | | | | | | | | | | | | | | |
Derivative Financial Instruments(a) | | | | | | | | | | | | | | | | |
Assets | | | | | | | | | | | | | | | | |
Commodity Contracts | | $ | — | | | $ | 15,720,622 | | | $ | — | | | $ | 15,720,622 | |
Liabilities | | | | | | | | | | | | | | | | |
Commodity Contracts | | | — | | | | (12,765,442 | ) | | | — | | | | (12,765,442 | ) |
| | | | | | | | | | | | | | | | |
| | | | |
| | $ | — | | | $ | 2,955,180 | | | $ | — | | | $ | 2,955,180 | |
| | | | | | | | | | | | | | | | |
| | (a) | Derivative financial instruments are swaps. Swaps are valued at the unrealized appreciation (depreciation) on the instrument. | |
See notes to consolidated financial statements.
| | |
C O N S O L I D A T E D S C H E D U L E O F I N V E S T M E N T S | | 11 |
Consolidated Statement of Assets and Liabilities
May 31, 2024
| | | | |
| | | BlackRock
Commodity
Strategies Fund | |
| |
ASSETS | | | | |
Investments, at value — unaffiliated(a)(b) | | $ | 677,110,656 | |
Investments, at value — affiliated(c) | | | 9,938,262 | |
Cash | | | 3,620,974 | |
Cash pledged: | | | | |
Collateral — OTC derivatives | | | 7,390,000 | |
Foreign currency, at value(d) | | | 90,747 | |
Receivables: | | | | |
Investments sold | | | 184,073 | |
Securities lending income — affiliated | | | 18,951 | |
Swaps | | | 1,334,385 | |
Capital shares sold | | | 872,832 | |
Dividends — unaffiliated | | | 919,185 | |
Dividends — affiliated | | | 23,660 | |
From the Manager | | | 34,351 | |
Unrealized appreciation on OTC swaps | | | 15,720,622 | |
Prepaid expenses | | | 39,698 | |
| | | | |
| |
Total assets | | | 717,298,396 | |
| | | | |
| |
LIABILITIES | | | | |
Cash received: | | | | |
Collateral — OTC derivatives | | | 14,130,000 | |
Collateral on securities loaned | | | 6,350,192 | |
Payables: | | | | |
Investments purchased | | | 2,066,028 | |
Administration fees | | | 24,248 | |
Capital shares redeemed | | | 1,016,442 | |
Deferred foreign capital gain tax | | | 22,188 | |
Investment advisory fees | | | 331,121 | |
Trustees’ and Officer’s fees | | | 3,141 | |
Other accrued expenses | | | 398,042 | |
Other affiliate fees | | | 94 | |
Professional fees | | | 78,952 | |
Service and distribution fees | | | 33,761 | |
Unrealized depreciation on OTC swaps | | | 12,765,442 | |
| | | | |
| |
Total liabilities | | | 37,219,651 | |
| | | | |
| |
Commitments and contingent liabilities | | | | |
| |
NET ASSETS | | $ | 680,078,745 | |
| | | | |
| |
NET ASSETS CONSIST OF: | | | | |
Paid-in capital | | $ | 813,410,679 | |
Accumulated loss | | | (133,331,934 | ) |
| | | | |
| |
NET ASSETS | | $ | 680,078,745 | |
| | | | |
| |
(a) Investments, at cost — unaffiliated | | $ | 583,768,282 | |
(b) Securities loaned, at value | | $ | 5,819,194 | |
(c) Investments, at cost — affiliated | | $ | 9,938,371 | |
(d) Foreign currency, at cost | | $ | 91,027 | |
| | |
| 12 | | 2 0 2 4 B L A C K R O C K A N N U A L F I N A N C I A L S T A T E M E N T S |
Consolidated Statement of Assets and Liabilities (continued)
May 31, 2024
| | | | |
| | | BlackRock
Commodity
Strategies Fund | |
| |
NET ASSET VALUE | | | | |
| |
| Institutional | | | |
Net assets | | $ | 463,550,541 | |
| | | | |
| |
Shares outstanding | | | 52,311,577 | |
| | | | |
| |
Net asset value | | $ | 8.86 | |
| | | | |
| |
Shares authorized | | | Unlimited | |
| | | | |
| |
Par value | | $ | 0.001 | |
| | | | |
| |
| Investor A | | | |
Net assets | | $ | 92,117,947 | |
| | | | |
| |
Shares outstanding | | | 10,505,110 | |
| | | | |
| |
Net asset value | | $ | 8.77 | |
| | | | |
| |
Shares authorized | | | Unlimited | |
| | | | |
| |
Par value | | $ | 0.001 | |
| | | | |
| |
| Investor C | | | |
Net assets | | $ | 16,585,536 | |
| | | | |
| |
Shares outstanding | | | 1,989,010 | |
| | | | |
| |
Net asset value | | $ | 8.34 | |
| | | | |
| |
Shares authorized | | | Unlimited | |
| | | | |
Par value | | $ | 0.001 | |
| | | | |
| |
| Class K | | | |
Net assets | | $ | 107,824,721 | |
| | | | |
| |
Shares outstanding | | | 12,159,599 | |
| | | | |
| |
Net asset value | | $ | 8.87 | |
| | | | |
| |
Shares authorized | | | Unlimited | |
| | | | |
| |
Par value | | $ | 0.001 | |
| | | | |
See notes to consolidated financial statements.
| | |
C O N S O L I D A T E D F I N A N C I A L S T A T E M E N T S | | 13 |
Consolidated Statement of Operations
Year Ended May 31, 2024
| | | | |
| | | BlackRock
Commodity
Strategies Fund | |
| |
INVESTMENT INCOME | | | | |
Dividends — unaffiliated | | $ | 13,243,996 | |
Dividends — affiliated | | | 290,304 | |
Interest — unaffiliated | | | 21,625,511 | |
Securities lending income — affiliated — net | | | 329,008 | |
Foreign taxes withheld | | | (770,199 | ) |
| | | | |
| |
Total investment income | | | 34,718,620 | |
| | | | |
| |
EXPENSES | | | | |
Investment advisory | | | 5,284,654 | |
Transfer agent — class specific | | | 959,792 | |
Service and distribution — class specific | | | 478,133 | |
Administration | | | 353,462 | |
Registration | | | 197,145 | |
Administration — class specific | | | 171,200 | |
Professional | | | 122,070 | |
Accounting services | | | 82,760 | |
Printing and postage | | | 54,634 | |
Custodian | | | 43,248 | |
Trustees and Officer | | | 11,105 | |
Miscellaneous | | | 52,529 | |
| | | | |
| |
Total expenses excluding interest expense | | | 7,810,732 | |
Interest expense | | | 7,029 | |
| | | | |
| |
Total expenses | | | 7,817,761 | |
Less: | | | | |
Administration fees waived by the Manager — class specific | | | (171,200 | ) |
Fees waived and/or reimbursed by the Manager | | | (482,027 | ) |
Transfer agent fees waived and/or reimbursed by the Manager — class specific | | | (594,804 | ) |
| | | | |
| |
Total expenses after fees waived and/or reimbursed | | | 6,569,730 | |
| | | | |
| |
Net investment income | | | 28,148,890 | |
| | | | |
| |
REALIZED AND UNREALIZED GAIN (LOSS) | | | | |
Net realized gain (loss) from: | | | | |
Investments — unaffiliated(a) | | | 31,714,009 | |
Investments — affiliated | | | 10,594 | |
Foreign currency transactions | | | (23,482 | ) |
Swaps | | | (74,287,823 | ) |
| | | | |
| |
| | | (42,586,702 | ) |
| | | | |
Net change in unrealized appreciation (depreciation) on: | | | | |
Investments — unaffiliated(b) | | | 18,973,265 | |
Investments — affiliated | | | (8,211 | ) |
Foreign currency translations | | | 300 | |
Swaps | | | 93,438,294 | |
| | | | |
| |
| | | 112,403,648 | |
| | | | |
Net realized and unrealized gain | | | 69,816,946 | |
| |
| | | | |
| |
NET INCREASE IN NET ASSETS RESULTING FROM OPERATIONS | | $ | 97,965,836 | |
| | | | |
| |
(a) Net of foreign capital gain tax of | | | $(4,377 | ) |
(b) Net of increase in deferred foreign capital gain tax of | | | (8,098 | ) |
See notes to consolidated financial statements.
| | |
| 14 | | 2 0 2 4 B L A C K R O C K A N N U A L F I N A N C I A L S T A T E M E N T S |
Consolidated Statements of Changes in Net Assets
| | | | | | | | |
| | | BlackRock Commodity Strategies
Fund | |
| | |
| | | Year Ended
05/31/24 | | | Year Ended
05/31/23 | |
| | |
INCREASE (DECREASE) IN NET ASSETS | | | | | | | | |
| | |
OPERATIONS | | | | | | | | |
Net investment income | | $ | 28,148,890 | | | $ | 40,845,467 | |
Net realized loss | | | (42,586,702 | ) | | | (3,499,342 | ) |
Net change in unrealized appreciation (depreciation) | | | 112,403,648 | | | | (421,860,232 | ) |
| | | | | | | | |
| | |
Net increase (decrease) in net assets resulting from operations | | | 97,965,836 | | | | (384,514,107 | ) |
| | | | | | | | |
| | |
DISTRIBUTIONS TO SHAREHOLDERS(a) | | | | | | | | |
Institutional | | | (63,779,042 | ) | | | (140,578,102 | ) |
Investor A | | | (9,950,222 | ) | | | (16,226,823 | ) |
Investor C | | | (2,042,128 | ) | | | (3,106,978 | ) |
Class K | | | (11,873,753 | ) | | | (24,906,279 | ) |
| | | | | | | | |
| | |
Decrease in net assets resulting from distributions to shareholders | | | (87,645,145 | ) | | | (184,818,182 | ) |
| | | | | | | | |
| | |
CAPITAL SHARE TRANSACTIONS | | | | | | | | |
| | |
Net decrease in net assets derived from capital share transactions | | | (456,087,656 | ) | | | (957,833,933 | ) |
| | | | | | | | |
| | |
NET ASSETS | | | | | | | | |
Total decrease in net assets | | | (445,766,965 | ) | | | (1,527,166,222 | ) |
Beginning of year | | | 1,125,845,710 | | | | 2,653,011,932 | |
| | | | | | | | |
| | |
End of year | | $ | 680,078,745 | | | $ | 1,125,845,710 | |
| | | | | | | | |
| (a) | Distributions for annual periods determined in accordance with U.S. federal income tax regulations. |
See notes to consolidated financial statements.
| | |
C O N S O L I D A T E D F I N A N C I A L S T A T E M E N T S | | 15 |
Consolidated Financial Highlights
(For a share outstanding throughout each period)
| | | | | | | | | | | | | | | | | | | | | | | | | | | | |
| | | BlackRock Commodity Strategies Fund | |
| |
| | | Institutional | |
| | | | | | | |
| | | Year Ended
05/31/24 | | | | | | Year Ended
05/31/23 | | | Year Ended
05/31/22 | | | Year Ended
05/31/21 | | | Period from
08/01/19 to 05/31/20 | | | Year Ended
07/31/19 | |
| | | | | | | | |
Net asset value, beginning of period | | $ | 8.62 | | | | | | | $ | 11.33 | | | $ | 9.22 | | | $ | 6.33 | | | $ | 7.18 | | | $ | 7.82 | |
| | | | | | | | | | | | | | | | | | | | | | | | | | | | |
| | | | | | | |
Net investment income(a) | | | 0.28 | | | | | | | | 0.22 | | | | 0.09 | | | | 0.07 | | | | 0.09 | | | | 0.14 | (b) |
Net realized and unrealized gain (loss) | | | 0.73 | | | | | | | | (2.08 | ) | | | 2.27 | | | | 2.88 | | | | (0.79 | ) | | | (0.64 | ) |
| | | | | | | | | | | | | | | | | | | | | | | | | | | | |
| | | | | | | |
Net increase (decrease) from investment operations | | | 1.01 | | | | | | | | (1.86 | ) | | | 2.36 | | | | 2.95 | | | | (0.70 | ) | | | (0.50 | ) |
| | | | | | | | | | | | | | | | | | | | | | | | | | | | |
| | | | | | | |
Distributions from net investment income(c) | | | (0.77 | ) | | | | | | | (0.85 | ) | | | (0.25 | ) | | | (0.06 | ) | | | (0.15 | ) | | | (0.14 | ) |
| | | | | | | | | | | | | | | | | | | | | | | | | | | | |
| | | | | | | |
Net asset value, end of period | | $ | 8.86 | | | | | | | $ | 8.62 | | | $ | 11.33 | | | $ | 9.22 | | | $ | 6.33 | | | $ | 7.18 | |
| | | | | | | | | | | | | | | | | | | | | | | | | | | | |
| | | | | | | |
Total Return(d) | | | | | | | | | | | | | | | | | | | | | | | | | | | | |
Based on net asset value | | | 12.30 | % | | | | | | | (16.46 | )% | | | 26.31 | % | | | 46.93 | % | | | (9.96 | )%(e) | | | (6.34 | )% |
| | | | | | | | | | | | | | | | | | | | | | | | | | | | |
| | | | | | | |
Ratios to Average Net Assets(f) | | | | | | | | | | | | | | | | | | | | | | | | | | | | |
Total expenses | | | 0.87 | % | | | | | | | 0.83 | % | | | 0.82 | % | | | 0.90 | % | | | 1.04 | %(g) | | | 1.01 | % |
| | | | | | | | | | | | | | | | | | | | | | | | | | | | |
| | | | | | | |
Total expenses after fees waived and/or reimbursed | | | 0.72 | % | | | | | | | 0.72 | % | | | 0.72 | % | | | 0.72 | % | | | 0.72 | %(g) | | | 0.72 | % |
| | | | | | | | | | | | | | | | | | | | | | | | | | | | |
| | | | | | | |
Net investment income | | | 3.35 | % | | | | | | | 2.37 | % | | | 0.95 | % | | | 0.90 | % | | | 1.61 | %(g) | | | 1.90 | %(b) |
| | | | | | | | | | | | | | | | | | | | | | | | | | | | |
| | | | | | | |
Supplemental Data | | | | | | | | | | | | | | | | | | | | | | | | | | | | |
Net assets, end of period (000) | | $ | 463,551 | | | | | | | $ | 837,334 | | | $ | 2,061,348 | | | $ | 862,528 | | | $ | 104,275 | | | $ | 145,239 | |
| | | | | | | | | | | | | | | | | | | | | | | | | | | | |
| | | | | | | |
Portfolio turnover rate | | | 53 | % | | | | | | | 78 | % | | | 91 | %(h) | | | 58 | % | | | 72 | % | | | 76 | % |
| | | | | | | | | | | | | | | | | | | | | | | | | | | | |
| (a) | Based on average shares outstanding. |
| (b) | Net investment income per share and the ratio of net investment income to average net assets includes $0.01 per share and 0.13%, respectively, resulting from a special dividend. |
| (c) | Distributions for annual periods determined in accordance with U.S. federal income tax regulations. |
| (d) | Where applicable, assumes the reinvestment of distributions. |
| (f) | Excludes fees and expenses incurred indirectly as a result of investments in underlying funds. |
| (h) | Portfolio turnover rate excludes in-kind transactions. |
See notes to consolidated financial statements.
| | |
| 16 | | 2 0 2 4 B L A C K R O C K A N N U A L F I N A N C I A L S T A T E M E N T S |
Consolidated Financial Highlights (continued)
(For a share outstanding throughout each period)
| | | | | | | | | | | | | | | | | | | | | | | | | | | | |
| | | BlackRock Commodity Strategies Fund (continued) | |
| |
| | | Investor A | |
| | | | | | | |
| | | Year Ended
05/31/24 | | | | | | Year Ended
05/31/23 | | | Year Ended
05/31/22 | | | Year Ended
05/31/21 | | | Period from
08/01/19 to 05/31/20 | | | Year Ended
07/31/19 | |
| | | | | | | | |
Net asset value, beginning of period | | $ | 8.53 | | | | | | | $ | 11.23 | | | $ | 9.14 | | | $ | 6.28 | | | $ | 7.12 | | | $ | 7.74 | |
| | | | | | | | | | | | | | | | | | | | | | | | | | | | |
| | | | | | | |
Net investment income(a) | | | 0.26 | | | | | | | | 0.20 | | | | 0.07 | | | | 0.05 | | | | 0.08 | | | | 0.12 | (b) |
Net realized and unrealized gain (loss) | | | 0.73 | | | | | | | | (2.07 | ) | | | 2.25 | | | | 2.86 | | | | (0.79 | ) | | | (0.63 | ) |
| | | | | | | | | | | | | | | | | | | | | | | | | | | | |
| | | | | | | |
Net increase (decrease) from investment operations | | | 0.99 | | | | | | | | (1.87 | ) | | | 2.32 | | | | 2.91 | | | | (0.71 | ) | | | (0.51 | ) |
| | | | | | | | | | | | | | | | | | | | | | | | | | | | |
| | | | | | | |
Distributions from net investment income(c) | | | (0.75 | ) | | | | | | | (0.83 | ) | | | (0.23 | ) | | | (0.05 | ) | | | (0.13 | ) | | | (0.11 | ) |
| | | | | | | | | | | | | | | | | | | | | | | | | | | | |
| | | | | | | |
Net asset value, end of period | | $ | 8.77 | | | | | | | $ | 8.53 | | | $ | 11.23 | | | $ | 9.14 | | | $ | 6.28 | | | $ | 7.12 | |
| | | | | | | | | | | | | | | | | | | | | | | | | | | | |
| | | | | | | |
Total Return(d) | | | | | | | | | | | | | | | | | | | | | | | | | | | | |
Based on net asset value | | | 12.12 | % | | | | | | | (16.76 | )% | | | 26.06 | % | | | 46.53 | % | | | (10.18 | )%(e) | | | (6.50 | )% |
| | | | | | | | | | | | | | | | | | | | | | | | | | | | |
| | | | | | | |
Ratios to Average Net Assets(f) | | | | | | | | | | | | | | | | | | | | | | | | | | | | |
Total expenses | | | 1.12 | % | | | | | | | 1.07 | % | | | 1.13 | % | | | 1.18 | % | | | 1.40 | %(g) | | | 1.38 | % |
| | | | | | | | | | | | | | | | | | | | | | | | | | | | |
| | | | | | | |
Total expenses after fees waived and/or reimbursed | | | 0.97 | % | | | | | | | 0.97 | % | | | 0.97 | % | | | 0.97 | % | | | 0.97 | %(g) | | | 0.97 | % |
| | | | | | | | | | | | | | | | | | | | | | | | | | | | |
| | | | | | | |
Net investment income | | | 3.10 | % | | | | | | | 2.15 | % | | | 0.68 | % | | | 0.62 | % | | | 1.38 | %(g) | | | 1.68 | %(b) |
| | | | | | | | | | | | | | | | | | | | | | | | | | | | |
| | | | | | | |
Supplemental Data | | | | | | | | | | | | | | | | | | | | | | | | | | | | |
Net assets, end of period (000) | | $ | 92,118 | | | | | | | $ | 120,674 | | | $ | 236,887 | | | $ | 127,923 | | | $ | 23,628 | | | $ | 33,853 | |
| | | | | | | | | | | | | | | | | | | | | | | | | | | | |
| | | | | | | |
Portfolio turnover rate | | | 53 | % | | | | | | | 78 | % | | | 91 | %(h) | | | 58 | % | | | 72 | % | | | 76 | % |
| | | | | | | | | | | | | | | | | | | | | | | | | | | | |
| (a) | Based on average shares outstanding. |
| (b) | Net investment income per share and the ratio of net investment income to average net assets includes $0.01 per share and 0.13%, respectively, resulting from a special dividend. |
| (c) | Distributions for annual periods determined in accordance with U.S. federal income tax regulations. |
| (d) | Where applicable, excludes the effects of any sales charges and assumes the reinvestment of distributions. |
| (f) | Excludes fees and expenses incurred indirectly as a result of investments in underlying funds. |
| (h) | Portfolio turnover rate excludes in-kind transactions. |
See notes to consolidated financial statements.
| | |
C O N S O L I D A T E D F I N A N C I A L H I G H L I G H T S | | 17 |
Consolidated Financial Highlights (continued)
(For a share outstanding throughout each period)
| | | | | | | | | | | | | | | | | | | | | | | | | | | | |
| | | BlackRock Commodity Strategies Fund (continued) | |
| |
| | | Investor C | |
| | | | | | | |
| | | Year Ended
05/31/24 | | | | | | Year Ended
05/31/23 | | | Year Ended
05/31/22 | | | Year Ended
05/31/21 | | | Period from
08/01/19 to 05/31/20 | | | Year Ended
07/31/19 | |
| | | | | | | | |
Net asset value, beginning of period | | $ | 8.13 | | | | | | | $ | 10.75 | | | $ | 8.78 | | | $ | 6.04 | | | $ | 6.84 | | | $ | 7.45 | |
| | | | | | | | | | | | | | | | | | | | | | | | | | | | |
| | | | | | | |
Net investment income (loss)(a) | | | 0.19 | | | | | | | | 0.13 | | | | (0.00 | )(b) | | | (0.01 | ) | | | 0.03 | | | | 0.06 | (c) |
Net realized and unrealized gain (loss) | | | 0.69 | | | | | | | | (1.98 | ) | | | 2.15 | | | | 2.75 | | | | (0.76 | ) | | | (0.60 | ) |
| | | | | | | | | | | | | | | | | | | | | | | | | | | | |
| | | | | | | |
Net increase (decrease) from investment operations | | | 0.88 | | | | | | | | (1.85 | ) | | | 2.15 | | | | 2.74 | | | | (0.73 | ) | | | (0.54 | ) |
| | | | | | | | | | | | | | | | | | | | | | | | | | | | |
| | | | | | | |
Distributions from net investment income(d) | | | (0.67 | ) | | | | | | | (0.77 | ) | | | (0.18 | ) | | | (0.00 | )(b) | | | (0.07 | ) | | | (0.07 | ) |
| | | | | | | | | | | | | | | | | | | | | | | | | | | | |
| | | | | | | |
Net asset value, end of period | | $ | 8.34 | | | | | | | $ | 8.13 | | | $ | 10.75 | | | $ | 8.78 | | | $ | 6.04 | | | $ | 6.84 | |
| | | | | | | | | | | | | | | | | | | | | | | | | | | | |
| | | | | | | |
Total Return(e) | | | | | | | | | | | | | | | | | | | | | | | | | | | | |
Based on net asset value | | | 11.29 | % | | | | | | | (17.34 | )% | | | 25.06 | % | | | 45.48 | % | | | (10.80 | )%(f) | | | (7.19 | )% |
| | | | | | | | | | | | | | | | | | | | | | | | | | | | |
| | | | | | | |
Ratios to Average Net Assets(g) | | | | | | | | | | | | | | | | | | | | | | | | | | | | |
Total expenses | | | 1.86 | % | | | | | | | 1.80 | % | | | 1.81 | % | | | 1.96 | % | | | 2.07 | %(h) | | | 2.11 | % |
| | | | | | | | | | | | | | | | | | | | | | | | | | | | |
| | | | | | | |
Total expenses after fees waived and/or reimbursed | | | 1.72 | % | | | | | | | 1.72 | % | | | 1.72 | % | | | 1.72 | % | | | 1.72 | %(h) | | | 1.72 | % |
| | | | | | | | | | | | | | | | | | | | | | | | | | | | |
| | | | | | | |
Net investment income (loss) | | | 2.34 | % | | | | | | | 1.49 | % | | | (0.04 | )% | | | (0.15 | )% | | | 0.63 | %(h) | | | 0.92 | %(c) |
| | | | | | | | | | | | | | | | | | | | | | | | | | | | |
| | | | | | | |
Supplemental Data | | | | | | | | | | | | | | | | | | | | | | | | | | | | |
Net assets, end of period (000) | | $ | 16,586 | | | | | | | $ | 29,758 | | | $ | 42,138 | | | $ | 16,246 | | | $ | 4,255 | | | $ | 5,832 | |
| | | | | | | | | | | | | | | | | | | | | | | | | | | | |
| | | | | | | |
Portfolio turnover rate | | | 53 | % | | | | | | | 78 | % | | | 91 | %(i) | | | 58 | % | | | 72 | % | | | 76 | % |
| | | | | | | | | | | | | | | | | | | | | | | | | | | | |
| (a) | Based on average shares outstanding. |
| (b) | Amount is greater than $(0.005) per share. |
| (c) | Net investment income per share and the ratio of net investment income to average net assets includes $0.01 per share and 0.13%, respectively, resulting from a special dividend. |
| (d) | Distributions for annual periods determined in accordance with U.S. federal income tax regulations. |
| (e) | Where applicable, excludes the effects of any sales charges and assumes the reinvestment of distributions. |
| (g) | Excludes fees and expenses incurred indirectly as a result of investments in underlying funds. |
| (i) | Portfolio turnover rate excludes in-kind transactions. |
See notes to consolidated financial statements.
| | |
| 18 | | 2 0 2 4 B L A C K R O C K A N N U A L F I N A N C I A L S T A T E M E N T S |
Consolidated Financial Highlights (continued)
(For a share outstanding throughout each period)
| | | | | | | | | | | | | | | | | | | | | | | | | | | | |
| | | BlackRock Commodity Strategies Fund (continued) | |
| |
| | | Class K | |
| | | | | | | |
| | | Year Ended
05/31/24 | | | | | | Year Ended
05/31/23 | | | Year Ended
05/31/22 | | | Year Ended
05/31/21 | | | Period from
08/01/19 to 05/31/20 | | | Year Ended
07/31/19 | |
| | | | | | | | |
Net asset value, beginning of period | | $ | 8.62 | | | | | | | $ | 11.34 | | | $ | 9.22 | | | $ | 6.34 | | | $ | 7.19 | | | $ | 7.83 | |
| | | | | | | | | | | | | | | | | | | | | | | | | | | | |
| | | | | | | |
Net investment income(a) | | | 0.29 | | | | | | | | 0.23 | | | | 0.10 | | | | 0.06 | | | | 0.09 | | | | 0.14 | (b) |
Net realized and unrealized gain (loss) | | | 0.74 | | | | | | | | (2.09 | ) | | | 2.27 | | | | 2.89 | | | | (0.79 | ) | | | (0.63 | ) |
| | | | | | | | | | | | | | | | | | | | | | | | | | | | |
| | | | | | | |
Net increase (decrease) from investment operations | | | 1.03 | | | | | | | | (1.86 | ) | | | 2.37 | | | | 2.95 | | | | (0.70 | ) | | | (0.49 | ) |
| | | | | | | | | | | | | | | | | | | | | | | | | | | | |
| | | | | | | |
Distributions from net investment income(c) | | | (0.78 | ) | | | | | | | (0.86 | ) | | | (0.25 | ) | | | (0.07 | ) | | | (0.15 | ) | | | (0.15 | ) |
| | | | | | | | | | | | | | | | | | | | | | | | | | | | |
| | | | | | | |
Net asset value, end of period | | $ | 8.87 | | | | | | | $ | 8.62 | | | $ | 11.34 | | | $ | 9.22 | | | $ | 6.34 | | | $ | 7.19 | |
| | | | | | | | | | | | | | | | | | | | | | | | | | | | |
| | | | | | | |
Total Return(d) | | | | | | | | | | | | | | | | | | | | | | | | | | | | |
Based on net asset value | | | 12.49 | % | | | | | | | (16.48 | )% | | | 26.47 | % | | | 46.76 | % | | | (9.90 | )%(e) | | | (6.28 | )% |
| | | | | | | | | | | | | | | | | | | | | | | | | | | | |
| | | | | | | |
Ratios to Average Net Assets(f) | | | | | | | | | | | | | | | | | | | | | | | | | | | | |
Total expenses | | | 0.77 | % | | | | | | | 0.72 | % | | | 0.72 | % | | | 0.80 | % | | | 0.95 | %(g) | | | 0.96 | % |
| | | | | | | | | | | | | | | | | | | | | | | | | | | | |
| | | | | | | |
Total expenses after fees waived and/or reimbursed | | | 0.67 | % | | | | | | | 0.67 | % | | | 0.67 | % | | | 0.67 | % | | | 0.67 | %(g) | | | 0.67 | % |
| | | | | | | | | | | | | | | | | | | | | | | | | | | | |
| | | | | | | |
Net investment income | | | 3.40 | % | | | | | | | 2.42 | % | | | 1.02 | % | | | 0.76 | % | | | 1.60 | %(g) | | | 1.97 | %(b) |
| | | | | | | | | | | | | | | | | | | | | | | | | | | | |
| | | | | | | |
Supplemental Data | | | | | | | | | | | | | | | | | | | | | | | | | | | | |
Net assets, end of period (000) | | $ | 107,825 | | | | | | | $ | 138,079 | | | $ | 312,639 | | | $ | 197,360 | | | $ | 25,283 | | | $ | 22,520 | |
| | | | | | | | | | | | | | | | | | | | | | | | | | | | |
| | | | | | | |
Portfolio turnover rate | | | 53 | % | | | | | | | 78 | % | | | 91 | %(h) | | | 58 | % | | | 72 | % | | | 76 | % |
| | | | | | | | | | | | | | | | | | | | | | | | | | | | |
| (a) | Based on average shares outstanding. |
| (b) | Net investment income per share and the ratio of net investment income to average net assets includes $0.01 per share and 0.13%, respectively, resulting from a special dividend. |
| (c) | Distributions for annual periods determined in accordance with U.S. federal income tax regulations. |
| (d) | Where applicable, assumes the reinvestment of distributions. |
| (f) | Excludes fees and expenses incurred indirectly as a result of investments in underlying funds. |
| (h) | Portfolio turnover rate excludes in-kind transactions. |
See notes to consolidated financial statements.
| | |
C O N S O L I D A T E D F I N A N C I A L H I G H L I G H T S | | 19 |
Notes to Consolidated Financial Statements
BlackRock FundsSM (the “Trust”) is registered under the Investment Company Act of 1940, as amended (the “1940 Act”), as an open-end management investment company. The Trust is organized as a Massachusetts business trust. BlackRock Commodity Strategies Fund (the “Fund”) is a series of the Trust. The Fund is classified as diversified.
The Fund offers multiple classes of shares. All classes of shares have identical voting, dividend, liquidation and other rights and are subject to the same terms and conditions, except that certain classes bear expenses related to the shareholder servicing and distribution of such shares. Institutional and Class K Shares are sold only to certain eligible investors. Investor A and Investor C Shares bear certain expenses related to shareholder servicing of such shares, and Investor C Shares also bear certain expenses related to the distribution of such shares. Investor A and Investor C Shares are generally available through financial intermediaries. Each class has exclusive voting rights with respect to matters relating to its shareholder servicing and distribution expenditures (except that Investor C shareholders may vote on material changes to the Investor A Shares distribution and service plan).
| | | | | | | | |
| Share Class | | Initial Sales Charge | | CDSC | | | Conversion Privilege |
| | | |
Institutional and Class K Shares | | No | | | No | | | None |
Investor A Shares | | Yes | | | No | (a) | | None |
Investor C Shares | | No | | | Yes | (b) | | To Investor A Shares after approximately 8 years |
| | (a) | Investor A Shares may be subject to a contingent deferred sales charge (“CDSC”) for certain redemptions where no initial sales charge was paid at the time of purchase. |
| | (b) | A CDSC of 1.00% is assessed on certain redemptions of Investor C Shares made within one year after purchase. |
The Fund, together with certain other registered investment companies advised by BlackRock Advisors, LLC (the “Manager”) or its affiliates, is included in a complex of funds referred to as the BlackRock Multi-Asset Complex.
Basis of Consolidation: The accompanying consolidated financial statements of the Fund include the accounts of BlackRock Cayman Commodity Strategies Fund, Ltd. (the “Cayman Subsidiary”), which is a wholly-owned subsidiary of the Fund and primarily invests in commodity-related instruments and other derivatives. The Cayman Subsidiary enables the Fund to hold these commodity-related instruments and satisfy regulated investment company tax requirements. The Fund may invest up to 25% of its total assets in the Cayman Subsidiary. The net liabilities of the Cayman Subsidiary as of period end were $(2,610,583), which is (0.38)% of the Fund’s consolidated net assets. Intercompany accounts and transactions, if any, have been eliminated. The Cayman Subsidiary is subject to the same investment policies and restrictions that apply to the Fund, except that the Cayman Subsidiary may invest without limitation in commodity-related instruments.
| 2. | SIGNIFICANT ACCOUNTING POLICIES |
The consolidated financial statements are prepared in conformity with accounting principles generally accepted in the United States of America (“U.S. GAAP”), which may require management to make estimates and assumptions that affect the reported amounts of assets and liabilities in the consolidated financial statements, disclosure of contingent assets and liabilities at the date of the consolidated financial statements and the reported amounts of increases and decreases in net assets from operations during the reporting period. Actual results could differ from those estimates. The Fund is considered an investment company under U.S. GAAP and follows the accounting and reporting guidance applicable to investment companies. Below is a summary of significant accounting policies:
Investment Transactions and Income Recognition: For financial reporting purposes, investment transactions are recorded on the dates the transactions are executed. Realized gains and losses on investment transactions are determined using the specific identification method. Dividend income and capital gain distributions, if any, are recorded on the ex-dividend dates. Non-cash dividends, if any, are recorded on the ex-dividend dates at fair value. Dividends from foreign securities where the ex-dividend dates may have passed are subsequently recorded when the Fund is informed of the ex-dividend dates. Under the applicable foreign tax laws, a withholding tax at various rates may be imposed on capital gains, dividends and interest. Interest income, including amortization and accretion of premiums and discounts on debt securities, is recognized daily on an accrual basis. Income, expenses and realized and unrealized gains and losses are allocated daily to each class based on its relative net assets.
Foreign Currency Translation: The Fund’s books and records are maintained in U.S. dollars. Securities and other assets and liabilities denominated in foreign currencies are translated into U.S. dollars using exchange rates determined as of the close of trading on the New York Stock Exchange (“NYSE”). Purchases and sales of investments are recorded at the rates of exchange prevailing on the respective dates of such transactions. Generally, when the U.S. dollar rises in value against a foreign currency, the investments denominated in that currency will lose value; the opposite effect occurs if the U.S. dollar falls in relative value.
The Fund does not isolate the effect of fluctuations in foreign exchange rates from the effect of fluctuations in the market prices of investments for financial reporting purposes. Accordingly, the effects of changes in exchange rates on investments are not segregated in the Consolidated Statement of Operations from the effects of changes in market prices of those investments, but are included as a component of net realized and unrealized gain (loss) from investments. The Fund reports realized currency gains (losses) on foreign currency related transactions as components of net realized gain (loss) for financial reporting purposes, whereas such components are generally treated as ordinary income for U.S. federal income tax purposes.
Foreign Taxes: The Fund may be subject to foreign taxes (a portion of which may be reclaimable) on income, stock dividends, capital gains on investments, or certain foreign currency transactions. All foreign taxes are recorded in accordance with the applicable foreign tax regulations and rates that exist in the foreign jurisdictions in which the Fund invests. These foreign taxes, if any, are paid by the Fund and are reflected in its Consolidated Statement of Operations as follows: foreign taxes withheld at source are presented as a reduction of income, foreign taxes on securities lending income are presented as a reduction of securities lending income, foreign taxes on stock dividends are presented as “Foreign taxes withheld”, and foreign taxes on capital gains from sales of investments and foreign taxes on foreign currency transactions are included in their respective net realized gain (loss) categories. Foreign taxes payable or deferred as of May 31, 2024, if any, are disclosed in the Consolidated Statement of Assets and Liabilities.
| | |
| 20 | | 2 0 2 4 B L A C K R O C K A N N U A L F I N A N C I A L S T A T E M E N T S |
Notes to Consolidated Financial Statements (continued)
The Fund files withholding tax reclaims in certain jurisdictions to recover a portion of amounts previously withheld. The Fund may record a reclaim receivable based on collectability, which includes factors such as the jurisdiction’s applicable laws, payment history and market convention. The Consolidated Statement of Operations includes tax reclaims recorded as well as professional and other fees, if any, associated with recovery of foreign withholding taxes.
Bank Overdraft: The Fund had outstanding cash disbursements exceeding deposited cash amounts at the custodian during the reporting period. The Fund is obligated to repay the custodian for any overdraft, including any related costs or expenses, where applicable. For financial reporting purposes, overdraft fees, if any, are included in interest expense in the Consolidated Statement of Operations.
Collateralization: If required by an exchange or counterparty agreement, the Fund may be required to deliver/deposit cash and/or securities to/with an exchange, or broker-dealer or custodian as collateral for certain investments.
Distributions: Distributions paid by the Fund are recorded on the ex-dividend dates. The character and timing of distributions are determined in accordance with U.S. federal income tax regulations, which may differ from U.S. GAAP.
Net income and realized gains from investments held by the Cayman Subsidiary are treated as ordinary income for tax purposes. If a net loss is realized by the Cayman Subsidiary in any taxable year, the loss will generally not be available to offset the Fund’s ordinary income and/or capital gains for that year.
Indemnifications: In the normal course of business, the Fund enters into contracts that contain a variety of representations that provide general indemnification. The Fund’s maximum exposure under these arrangements is unknown because it involves future potential claims against the Fund, which cannot be predicted with any certainty.
Other: Expenses directly related to the Fund or its classes are charged to the Fund or the applicable class. Expenses directly related to the Fund and other shared expenses prorated to the Fund are allocated daily to each class based on its relative net assets or other appropriate methods. Other operating expenses shared by several funds, including other funds managed by the Manager, are prorated among those funds on the basis of relative net assets or other appropriate methods.
The Fund has an arrangement with its custodian whereby credits are earned on uninvested cash balances. For financial reporting purposes, custodian credits, if any, are included in interest income in the Consolidated Statement of Operations.
| 3. | INVESTMENT VALUATION AND FAIR VALUE MEASUREMENTS |
Investment Valuation Policies: The Fund’s investments are valued at fair value (also referred to as “market value” within the consolidated financial statements) each day that the Fund is open for business and, for financial reporting purposes, as of the report date. U.S. GAAP defines fair value as the price a fund would receive to sell an asset or pay to transfer a liability in an orderly transaction between market participants at the measurement date. The Board of Trustees of the Trust (the “Board”) has approved the designation of the Fund’s Manager as the valuation designee for the Fund. The Fund determines the fair values of its financial instruments using various independent dealers or pricing services under the Manager’s policies. If a security’s market price is not readily available or does not otherwise accurately represent the fair value of the security, the security will be valued in accordance with the Manager’s policies and procedures as reflecting fair value. The Manager has formed a committee (the “Valuation Committee”) to develop pricing policies and procedures and to oversee the pricing function for all financial instruments, with assistance from other BlackRock pricing committees.
Fair Value Inputs and Methodologies: The following methods and inputs are used to establish the fair value of the Fund’s assets and liabilities:
| | • | | Equity investments traded on a recognized securities exchange are valued at that day’s official closing price, as applicable, on the exchange where the stock is primarily traded. Equity investments traded on a recognized exchange for which there were no sales on that day may be valued at the last available bid (long positions) or ask (short positions) price. |
| | • | | Fixed-income investments for which market quotations are readily available are generally valued using the last available bid price or current market quotations provided by independent dealers or third-party pricing services. Pricing services generally value fixed-income securities assuming orderly transactions of an institutional round lot size, but a fund may hold or transact in such securities in smaller, odd lot sizes. Odd lots may trade at lower prices than institutional round lots. The pricing services may use matrix pricing or valuation models that utilize certain inputs and assumptions to derive values, including transaction data (e.g., recent representative bids and offers), market data, credit quality information, perceived market movements, news, and other relevant information. Certain fixed-income securities, including asset-backed and mortgage related securities may be valued based on valuation models that consider the estimated cash flows of each tranche of the entity, establish a benchmark yield and develop an estimated tranche specific spread to the benchmark yield based on the unique attributes of the tranche. The amortized cost method of valuation may be used with respect to debt obligations with sixty days or less remaining to maturity unless the Manager determines such method does not represent fair value. |
| | • | | Investments in open-end U.S. mutual funds (including money market funds) are valued at that day’s published net asset value (“NAV”). |
| | • | | Swap agreements are valued utilizing quotes received daily by independent pricing services or through brokers, which are derived using daily swap curves and models that incorporate a number of market data factors, such as discounted cash flows, trades and values of the underlying reference instruments. |
Generally, trading in foreign instruments is substantially completed each day at various times prior to the close of trading on the NYSE. Each business day, the Fund uses current market factors supplied by independent pricing services to value certain foreign instruments (“Systematic Fair Value Price”). The Systematic Fair Value Price is designed to value such foreign securities at fair value as of the close of trading on the NYSE, which follows the close of the local markets.
If events (e.g., market volatility, company announcement or a natural disaster) occur that are expected to materially affect the value of such investment, or in the event that application of these methods of valuation results in a price for an investment that is deemed not to be representative of the market value of such investment, or if a price is not available, the investment will be valued by the Valuation Committee in accordance with the Manager’s policies and procedures as reflecting fair value (“Fair Valued Investments”). The fair valuation approaches that may be used by the Valuation Committee include market approach, income approach and cost approach. Valuation techniques such as discounted cash flow, use of market comparables and matrix pricing are types of valuation approaches and are typically used in determining fair value.
| | |
N O T E S T O C O N S O L I D A T E D F I N A N C I A L S T A T E M E N T S | | 21 |
Notes to Consolidated Financial Statements (continued)
When determining the price for Fair Valued Investments, the Valuation Committee seeks to determine the price that the Fund might reasonably expect to receive or pay from the current sale or purchase of that asset or liability in an arm’s-length transaction. Fair value determinations shall be based upon all available factors that the Valuation Committee deems relevant and consistent with the principles of fair value measurement.
For investments in equity or debt issued by privately held companies or funds (“Private Company” or collectively, the “Private Companies”) and other Fair Valued Investments, the fair valuation approaches that are used by the Valuation Committee and third-party pricing services utilized by the Valuation Committee include one or a combination of, but not limited to, the following inputs.
| | |
| Standard Inputs Generally Considered By The Valuation Committee And Third-Party Pricing Services |
| |
Market approach | | (i) recent market transactions, including subsequent rounds of financing, in the underlying investment or comparable issuers; (ii) recapitalizations and other transactions across the capital structure; and (iii) market multiples of comparable issuers. |
| |
Income approach | | (i) future cash flows discounted to present and adjusted as appropriate for liquidity, credit, and/or market risks; (ii) quoted prices for similar investments or assets in active markets; and (iii) other risk factors, such as interest rates, yield curves, volatilities, prepayment speeds, loss severities, credit risks, recovery rates, liquidation amounts and/or default rates. |
| |
Cost approach | | (i) audited or unaudited financial statements, investor communications and financial or operational metrics issued by the Private Company; (ii) changes in the valuation of relevant indices or publicly traded companies comparable to the Private Company; (iii) relevant news and other public sources; and (iv) known secondary market transactions in the Private Company’s interests and merger or acquisition activity in companies comparable to the Private Company. |
Investments in series of preferred stock issued by Private Companies are typically valued utilizing market approach in determining the enterprise value of the company. Such investments often contain rights and preferences that differ from other series of preferred and common stock of the same issuer. Enterprise valuation techniques such as an option pricing model (“OPM”), a probability weighted expected return model (“PWERM”), current value method or a hybrid of those techniques are used as deemed appropriate under the circumstances. The use of these valuation techniques involves a determination of the exit scenarios of the investment in order to appropriately allocate the enterprise value of the company among the various parts of its capital structure.
The Private Companies are not subject to the public company disclosure, timing, and reporting standards applicable to other investments held by the Fund. Typically, the most recently available information by a Private Company is as of a date that is earlier than the date the Fund is calculating its NAV. This factor may result in a difference between the value of the investment and the price the Fund could receive upon the sale of the investment.
Fair Value Hierarchy: Various inputs are used in determining the fair value of financial instruments. These inputs to valuation techniques are categorized into a fair value hierarchy consisting of three broad levels for financial reporting purposes as follows:
| | • | | Level 1 – Unadjusted price quotations in active markets/exchanges for identical assets or liabilities that the Fund has the ability to access; |
| | • | | Level 2 – Other observable inputs (including, but not limited to, quoted prices for similar assets or liabilities in markets that are active, quoted prices for identical or similar assets or liabilities in markets that are not active, inputs other than quoted prices that are observable for the assets or liabilities (such as interest rates, yield curves, volatilities, prepayment speeds, loss severities, credit risks and default rates) or other market–corroborated inputs); and |
| | • | | Level 3 – Unobservable inputs based on the best information available in the circumstances, to the extent observable inputs are not available (including the Valuation Committee’s assumptions used in determining the fair value of financial instruments). |
The hierarchy gives the highest priority to unadjusted quoted prices in active markets for identical assets or liabilities (Level 1 measurements) and the lowest priority to unobservable inputs (Level 3 measurements). Accordingly, the degree of judgment exercised in determining fair value is greatest for instruments categorized in Level 3. The inputs used to measure fair value may fall into different levels of the fair value hierarchy. In such cases, for disclosure purposes, the fair value hierarchy classification is determined based on the lowest level input that is significant to the fair value measurement in its entirety. Investments classified within Level 3 have significant unobservable inputs used by the Valuation Committee in determining the price for Fair Valued Investments. Level 3 investments include equity or debt issued by Private Companies that may not have a secondary market and/or may have a limited number of investors. The categorization of a value determined for financial instruments is based on the pricing transparency of the financial instruments and is not necessarily an indication of the risks associated with investing in those securities.
| 4. | SECURITIES AND OTHER INVESTMENTS |
Warrants: Warrants entitle a fund to purchase a specified number of shares of common stock and are non-income producing. The purchase price and number of shares are subject to adjustment under certain conditions until the expiration date of the warrants, if any. If the price of the underlying stock does not rise above the strike price before the warrant expires, the warrant generally expires without any value and a fund will lose any amount it paid for the warrant. Thus, investments in warrants may involve more risk than investments in common stock. Warrants may trade in the same markets as their underlying stock; however, the price of the warrant does not necessarily move with the price of the underlying stock.
Securities Lending: The Fund may lend its securities to approved borrowers, such as brokers, dealers and other financial institutions. The borrower pledges and maintains with the Fund collateral consisting of cash, an irrevocable letter of credit issued by a bank, or securities issued or guaranteed by the U.S. Government. The initial collateral received by the Fund is required to have a value of at least 102% of the current value of the loaned securities for securities traded on U.S. exchanges and a value of at least 105% for all other securities. The collateral is maintained thereafter at a value equal to at least 100% of the current market value of the securities on loan. The market value of
| | |
| 22 | | 2 0 2 4 B L A C K R O C K A N N U A L F I N A N C I A L S T A T E M E N T S |
Notes to Consolidated Financial Statements (continued)
the loaned securities is determined at the close of each business day of the Fund and any additional required collateral is delivered to the Fund, or excess collateral returned by the Fund, on the next business day. During the term of the loan, the Fund is entitled to all distributions made on or in respect of the loaned securities, but does not receive interest income on securities received as collateral. Loans of securities are terminable at any time and the borrower, after notice, is required to return borrowed securities within the standard time period for settlement of securities transactions.
As of period end, any securities on loan were collateralized by cash and/or U.S. Government obligations. Cash collateral invested by the securities lending agent, BlackRock Investment Management, LLC (“BIM”), if any, is disclosed in the Consolidated Schedule of Investments. Any non-cash collateral received cannot be sold, re-invested or pledged by the Fund, except in the event of borrower default. The securities on loan, if any, are disclosed in the Fund’s Consolidated Schedule of Investments. The market value of any securities on loan and the value of related collateral, if any, are shown separately in the Consolidated Statement of Assets and Liabilities as a component of investments at value – unaffiliated and collateral on securities loaned, respectively.
Securities lending transactions are entered into by the Fund under Master Securities Lending Agreements (each, an “MSLA”), which provide the right, in the event of default (including bankruptcy or insolvency), for the non-defaulting party to liquidate the collateral and calculate a net exposure to the defaulting party or request additional collateral. In the event that a borrower defaults, the Fund, as lender, would offset the market value of the collateral received against the market value of the securities loaned. When the value of the collateral is greater than that of the market value of the securities loaned, the lender is left with a net amount payable to the defaulting party. However, bankruptcy or insolvency laws of a particular jurisdiction may impose restrictions on or prohibitions against such a right of offset in the event of an MSLA counterparty’s bankruptcy or insolvency. Under the MSLA, absent an event of default, the borrower can resell or re-pledge the loaned securities, and the Fund can reinvest cash collateral received in connection with loaned securities. Upon an event of default, the parties’ obligations to return the securities or collateral to the other party are extinguished, and the parties can resell or re-pledge the loaned securities or the collateral received in connection with the loaned securities in order to satisfy the defaulting party’s net payment obligation for all transactions under the MSLA. The defaulting party remains liable for any deficiency.
As of period end, the following table is a summary of the Fund’s securities on loan by counterparty which are subject to offset under an MSLA:
| | | | | | | | | | | | | | | | |
| Counterparty | |
| Securities
Loaned at Value |
| |
| Cash
Collateral Received |
(a) | |
| Non-Cash
Collateral Received,
at Fair Value |
(a) | |
| Net
Amount |
|
| | | | |
Barclays Capital, Inc. | | $ | 763,016 | | | $ | (763,016 | ) | | $ | — | | | $ | — | |
BofA Securities, Inc. | | | 8,916 | | | | (8,916 | ) | | | — | | | | — | |
Citigroup Global Markets, Inc. | | | 3,364,882 | | | | (3,364,882 | ) | | | — | | | | — | |
J.P. Morgan Securities LLC | | | 238,222 | | | | (238,222 | ) | | | — | | | | — | |
Jefferies LLC | | | 53,494 | | | | (53,494 | ) | | | — | | | | — | |
Morgan Stanley | | | 1,126,821 | | | | (1,126,821 | ) | | | — | | | | — | |
SG Americas Securities LLC | | | 263,843 | | | | (263,843 | ) | | | — | | | | — | |
| | | | | | | | | | | | | | | | |
| | | | |
| | $ | 5,819,194 | | | $ | (5,819,194 | ) | | $ | — | | | $ | — | |
| | | | | | | | | | | | | | | | |
| | (a) | Collateral received, if any, in excess of the market value of securities on loan is not presented in this table. The total cash collateral received by the Fund is disclosed in the Fund’s Consolidated Statement of Assets and Liabilities. |
The risks of securities lending include the risk that the borrower may not provide additional collateral when required or may not return the securities when due. To mitigate these risks, the Fund benefits from a borrower default indemnity provided by BIM. BIM’s indemnity allows for full replacement of the securities loaned to the extent the collateral received does not cover the value on the securities loaned in the event of borrower default. The Fund could incur a loss if the value of an investment purchased with cash collateral falls below the market value of loaned securities or if the value of an investment purchased with cash collateral falls below the value of the original cash collateral received. Such losses are borne entirely by the Fund.
| 5. | DERIVATIVE FINANCIAL INSTRUMENTS |
The Fund engages in various portfolio investment strategies using derivative contracts both to increase the returns of the Fund and/or to manage its exposure to certain risks such as credit risk, equity risk, interest rate risk, foreign currency exchange rate risk, commodity price risk or other risks (e.g., inflation risk). Derivative financial instruments categorized by risk exposure are included in the Consolidated Schedule of Investments. These contracts may be transacted on an exchange or over-the-counter (“OTC”).
Swaps: Swap contracts are entered into to manage exposure to issuers, markets and securities. Such contracts are agreements between the Fund and a counterparty to make periodic net payments on a specified notional amount or a net payment upon termination. Swap agreements are privately negotiated in the OTC market and may be entered into as a bilateral contract (“OTC swaps”) or centrally cleared (“centrally cleared swaps”).
For OTC swaps, any upfront premiums paid and any upfront fees received are shown as swap premiums paid and swap premiums received, respectively, in the Consolidated Statement of Assets and Liabilities and amortized over the term of the contract. The daily fluctuation in market value is recorded as unrealized appreciation (depreciation) on OTC swaps in the Consolidated Statement of Assets and Liabilities. Payments received or paid are recorded in the Consolidated Statement of Operations as realized gains or losses, respectively. When an OTC swap is terminated, a realized gain or loss is recorded in the Consolidated Statement of Operations equal to the difference between the proceeds from (or cost of) the closing transaction and the Fund’s basis in the contract, if any. Generally, the basis of the contract is the premium received or paid.
In a centrally cleared swap, immediately following execution of the swap contract, the swap contract is novated to a central counterparty (the “CCP”) and the CCP becomes the Fund’s counterparty on the swap. The Fund is required to interface with the CCP through the broker. Upon entering into a centrally cleared swap, the Fund is required to deposit initial margin with the broker in the form of cash or securities in an amount that varies depending on the size and risk profile of the particular swap. Securities deposited as initial
| | |
N O T E S T O C O N S O L I D A T E D F I N A N C I A L S T A T E M E N T S | | 23 |
Notes to Consolidated Financial Statements (continued)
margin are designated in the Consolidated Schedule of Investments and cash deposited is shown as cash pledged for centrally cleared swaps in the Consolidated Statement of Assets and Liabilities. Amounts pledged, which are considered restricted cash, are included in cash pledged for centrally cleared swaps in the Consolidated Statement of Assets and Liabilities. Pursuant to the contract, the Fund agrees to receive from or pay to the broker an amount of cash equal to the daily fluctuation in market value of the contract (“variation margin”). Variation margin is recorded as unrealized appreciation (depreciation) and shown as variation margin receivable (or payable) on centrally cleared swaps in the Consolidated Statement of Assets and Liabilities. Payments received from (paid to) the counterparty are amortized over the term of the contract and recorded as realized gains (losses) in the Consolidated Statement of Operations, including those at termination.
| | • | | Total return swaps — Total return swaps are entered into to obtain exposure to a security or market without owning such security or investing directly in such market or to exchange the risk/return of one security or market (e.g., fixed-income) with another security or market (e.g., equity or commodity prices) (equity risk, commodity price risk and/or interest rate risk). |
Total return swaps are agreements in which there is an exchange of cash flows whereby one party commits to make payments based on the total return (distributions plus capital gains/losses) of an underlying instrument, or basket of underlying instruments, in exchange for fixed or floating rate interest payments. If the total return of the instrument(s) or index underlying the transaction exceeds or falls short of the offsetting fixed or floating interest rate obligation, the Fund receives payment from or makes a payment to the counterparty.
Swap transactions involve, to varying degrees, elements of interest rate, credit and market risks in excess of the amounts recognized in the Consolidated Statement of Assets and Liabilities. Such risks involve the possibility that there will be no liquid market for these agreements, that the counterparty to the agreements may default on its obligation to perform or disagree as to the meaning of the contractual terms in the agreements, and that there may be unfavorable changes in interest rates and/or market values associated with these transactions.
Master Netting Arrangements: In order to define its contractual rights and to secure rights that will help it mitigate its counterparty risk, the Fund may enter into an International Swaps and Derivatives Association, Inc. Master Agreement (“ISDA Master Agreement”) or similar agreement with its derivative contract counterparties. An ISDA Master Agreement is a bilateral agreement between the Fund and a counterparty that governs certain OTC derivatives and typically contains, among other things, collateral posting terms and netting provisions in the event of a default and/or termination event. Under an ISDA Master Agreement, the Fund may, under certain circumstances, offset with the counterparty certain derivative financial instruments’ payables and/or receivables with collateral held and/or posted and create one single net payment. The provisions of the ISDA Master Agreement typically permit a single net payment in the event of default including the bankruptcy or insolvency of the counterparty. However, bankruptcy or insolvency laws of a particular jurisdiction may impose restrictions on or prohibitions against the right of offset in bankruptcy, insolvency or other events.
Collateral Requirements: For derivatives traded under an ISDA Master Agreement, the collateral requirements are typically calculated by netting the mark-to-market amount for each transaction under such agreement and comparing that amount to the value of any collateral currently pledged by the Fund and the counterparty.
Cash collateral that has been pledged to cover obligations of the Fund and cash collateral received from the counterparty, if any, is reported separately in the Consolidated Statement of Assets and Liabilities as cash pledged as collateral and cash received as collateral, respectively. Non-cash collateral pledged by the Fund, if any, is noted in the Consolidated Schedule of Investments. Generally, the amount of collateral due from or to a counterparty is subject to a certain minimum transfer amount threshold before a transfer is required, which is determined at the close of business of the Fund. Any additional required collateral is delivered to/pledged by the Fund on the next business day. Typically, the counterparty is not permitted to sell, re-pledge or use cash and non-cash collateral it receives. The Fund generally agrees not to use non-cash collateral that it receives but may, absent default or certain other circumstances defined in the underlying ISDA Master Agreement, be permitted to use cash collateral received. In such cases, interest may be paid pursuant to the collateral arrangement with the counterparty. To the extent amounts due to the Fund from the counterparties are not fully collateralized, the Fund bears the risk of loss from counterparty non-performance. Likewise, to the extent the Fund has delivered collateral to a counterparty and stands ready to perform under the terms of its agreement with such counterparty, the Fund bears the risk of loss from a counterparty in the amount of the value of the collateral in the event the counterparty fails to return such collateral. Based on the terms of agreements, collateral may not be required for all derivative contracts.
For financial reporting purposes, the Fund does not offset derivative assets and derivative liabilities that are subject to netting arrangements, if any, in the Consolidated Statement of Assets and Liabilities.
| 6. | INVESTMENT ADVISORY AGREEMENT AND OTHER TRANSACTIONS WITH AFFILIATES |
Investment Advisory: The Trust, on behalf of the Fund, entered into an Investment Advisory Agreement with the Manager, the Fund’s investment adviser and an indirect, wholly-owned subsidiary of BlackRock, Inc. (“BlackRock”), to provide investment advisory services. The Manager is responsible for the management of the Fund’s portfolio and provides the personnel, facilities, equipment and certain other services necessary to the operations of the Fund.
For such services, the Fund pays the Manager a monthly fee at an annual rate equal to the following percentages of the average daily value of the Fund’s net assets:
| | | | |
| Average Daily Net Assets | | Investment Advisory Fees | |
| |
First $1 billion | | | 0.62 | % |
$1 billion - $3 billion | | | 0.58 | |
$3 billion - $5 billion | | | 0.56 | |
$5 billion - $10 billion | | | 0.54 | |
Greater than $10 billion | | | 0.53 | |
The Manager provides investment management and other services to the Cayman Subsidiary. The Manager does not receive separate compensation from the Cayman Subsidiary for providing investment management or administrative services. However, the Fund pays the Manager based on the Fund’s net assets, which includes the assets of the Cayman Subsidiary.
| | |
| 24 | | 2 0 2 4 B L A C K R O C K A N N U A L F I N A N C I A L S T A T E M E N T S |
Notes to Consolidated Financial Statements (continued)
With respect to the Fund, the Manager entered into a sub-advisory agreement with BlackRock International Limited (“BIL”), an affiliate of the Manager. The Manager pays BIL for services it provides for that portion of the Fund for which BIL acts as sub-adviser, a monthly fee that is equal to a percentage of the investment advisory fees paid by the Fund to the Manager.
Service and Distribution Fees: The Trust, on behalf of the Fund, entered into a Distribution Agreement and a Distribution and Service Plan with BlackRock Investments, LLC (“BRIL”), an affiliate of the Manager. Pursuant to the Distribution and Service Plan and in accordance with Rule 12b-1 under the 1940 Act, the Fund pays BRIL ongoing service and distribution fees. The fees are accrued daily and paid monthly at annual rates based upon the average daily net assets of the relevant share class of the Fund as follows:
| | | | | | | | |
| Share Class | | Service Fees | | | Distribution Fees | |
| | |
Investor A | | | 0.25 | % | | | N/A | |
Investor C | | | 0.25 | | | | 0.75 | % |
BRIL and broker-dealers, pursuant to sub-agreements with BRIL, provide shareholder servicing and distribution services to the Fund. The ongoing service and/or distribution fee compensates BRIL and each broker-dealer for providing shareholder servicing and/or distribution related services to shareholders.
For the year ended May 31, 2024, the following table shows the class specific service and distribution fees borne directly by each share class of the Fund:
| | | | | | | | | | | | |
| | | Investor A | | | Investor C | | | Total | |
| | | |
Service and distribution — class specific | | $ | 262,304 | | | $ | 215,829 | | | $ | 478,133 | |
Administration: The Trust, on behalf of the Fund, entered into an Administration Agreement with the Manager, an indirect, wholly-owned subsidiary of BlackRock, to provide administrative services. For these services, the Manager receives an administration fee computed daily and payable monthly, based on a percentage of the average daily net assets of the Fund. The administration fee, which is shown as administration in the Consolidated Statement of Operations, is paid at the annual rates below.
| | | | |
| Average Daily Net Assets | | Administration Fees | |
| |
First $500 million | | | 0.0425 | % |
$500 million - $1 billion | | | 0.0400 | |
$1 billion - $2 billion | | | 0.0375 | |
$2 billion - $4 billion | | | 0.0350 | |
$4 billion - $13 billion | | | 0.0325 | |
Greater than $13 billion | | | 0.0300 | |
In addition, the Manager charges each of the share classes an administration fee, which is shown as administration — class specific in the Consolidated Statement of Operations, at an annual rate of 0.02% of the average daily net assets of each respective class.
For the year ended May 31, 2024, the Fund paid the following to the Manager in return for these services, which are included in administration — class specific in the Consolidated Statement of Operations:
| | | | | | | | | | | | | | | | | | | | |
| | | Institutional | | | Investor A | | | Investor C | | | Class K | | | Total | |
| | | | | |
Administration — class specific | | $ | 121,591 | | | $ | 20,963 | | | $ | 4,318 | | | $ | 24,328 | | | $ | 171,200 | |
Transfer Agent: Pursuant to written agreements, certain financial intermediaries, some of which may be affiliates, provide the Fund with sub-accounting, recordkeeping, sub-transfer agency and other administrative services with respect to servicing of underlying investor accounts. For these services, these entities receive an asset-based fee or an annual fee per shareholder account, which will vary depending on share class and/or net assets. For the year ended May 31, 2024, the Fund did not pay any amounts to affiliates in return for these services.
The Manager maintains a call center that is responsible for providing certain shareholder services to the Fund. Shareholder services include responding to inquiries and processing purchases and sales based upon instructions from shareholders. For the year ended May 31, 2024, the Fund reimbursed the Manager the following amounts for costs incurred in running the call center, which are included in transfer agent — class specific in the Consolidated Statement of Operations:
| | | | | | | | | | | | | | | | | | | | |
| | | Institutional | | | Investor A | | | Investor C | | | Class K | | | Total | |
| | | | | |
Reimbursed amounts | | $ | 5,580 | | | $ | 7,297 | | | $ | 1,519 | | | $ | 877 | | | $ | 15,273 | |
For the year ended May 31, 2024, the following table shows the class specific transfer agent fees borne directly by each share class of the Fund:
| | | | | | | | | | | | | | | | | | | | |
| | | Institutional | | | Investor A | | | Investor C | | | Class K | | | Total | |
| | | | | |
Transfer agent — class specific | | $ | 773,456 | | | $ | 129,943 | | | $ | 24,524 | | | $ | 31,869 | | | $ | 959,792 | |
Other Fees: For the year ended May 31, 2024, affiliates earned underwriting discounts, direct commissions and dealer concessions on sales of the Fund’s Investor A Shares for a total of $2,722.
| | |
N O T E S T O C O N S O L I D A T E D F I N A N C I A L S T A T E M E N T S | | 25 |
Notes to Consolidated Financial Statements (continued)
For the year ended May 31, 2024, affiliates received CDSCs as follows:
| | | | |
| Share Class | | Amounts | |
| |
Investor A | | $ | 544 | |
Investor C | | | 3,980 | |
Expense Limitations, Waivers and Reimbursements: The Manager contractually agreed to waive its investment advisory fees by the amount of investment advisory fees the Fund pays to the Manager indirectly through its investment in affiliated money market funds (the “affiliated money market fund waiver”) through June 30, 2025. The contractual agreement may be terminated upon 90 days’ notice by a majority of the trustees who are not “interested persons” of the Trust, as defined in the 1940 Act (“Independent Trustees”), or by a vote of a majority of the outstanding voting securities of the Fund. The amount of waivers and/or reimbursements of fees and expenses made pursuant to the expense limitation described below will be reduced by the amount of the affiliated money market fund waiver. This amount is included in fees waived and/or reimbursed by the Manager in the Consolidated Statement of Operations. For the year ended May 31, 2024, the amount waived was $4,275.
The Manager has contractually agreed to waive its investment advisory fee with respect to any portion of the Fund’s assets invested in affiliated equity and fixed-income mutual funds and affiliated exchange-traded funds that have a contractual management fee through June 30, 2025. The contractual agreement may be terminated upon 90 days’ notice by a majority of the Independent Trustees, or by a vote of a majority of the outstanding voting securities of the Fund. For the year ended May 31, 2024, there were no fees waived by the Manager pursuant to this arrangement.
The Manager contractually agreed to waive and/or reimburse fees or expenses in order to limit expenses, excluding interest expense, dividend expense, tax expense, acquired fund fees and expenses, and certain other fund expenses, which constitute extraordinary expenses not incurred in the ordinary course of the Fund’s business (“expense limitation”). The expense limitations as a percentage of average daily net assets are as follows:
| | | | | | | | | | | | |
| Institutional | | Investor A | | | Investor C | | | Class K | |
| | | |
0.72% | | | 0.97 | % | | | 1.72 | % | | | 0.67 | % |
The Manager has agreed not to reduce or discontinue the contractual expense limitations through June 30, 2025 unless approved by the Board, including a majority of the Independent Trustees, or by a vote of a majority of the outstanding voting securities of the Fund. For the year ended May 31, 2024, the Manager waived and/or reimbursed investment advisory fees of $477,752, which is included in fees waived and/or reimbursed by the Manager in the Consolidated Statement of Operations.
In addition, these amounts waived and/or reimbursed by the Manager are included in administration fees waived by the Manager — class specific and transfer agent fees waived and/or reimbursed by the Manager — class specific, respectively, in the Consolidated Statement of Operations. For the year ended May 31, 2024, class specific expense waivers and/or reimbursements are as follows:
| | | | | | | | | | | | | | | | | | | | |
| | | Institutional | | | Investor A | | | Investor C | | | Class K | | | Total | |
| | | | | |
Administration fees waived by the Manager — class specific | | $ | 121,591 | | | $ | 20,963 | | | $ | 4,318 | | | $ | 24,328 | | | $ | 171,200 | |
Transfer agent fees waived and/or reimbursed — class specific | | | 470,372 | | | | 78,370 | | | | 14,193 | | | | 31,869 | | | | 594,804 | |
Securities Lending: The U.S. Securities and Exchange Commission (“SEC”) has issued an exemptive order which permits BIM, an affiliate of the Manager, to serve as securities lending agent for the Fund, subject to applicable conditions. As securities lending agent, BIM bears all operational costs directly related to securities lending. The Fund is responsible for fees in connection with the investment of cash collateral received for securities on loan (the “collateral investment fees”). The cash collateral is invested in a money market fund, BlackRock Cash Funds: Institutional, managed by the Manager or its affiliates. However, BIM has agreed to reduce the amount of securities lending income it receives in order to effectively limit the collateral investment fees the Fund bears to an annual rate of 0.04%. The SL Agency Shares of such money market fund will not be subject to a sales load, redemption fee, distribution fee or service fee. The money market fund in which the cash collateral has been reinvested may impose a discretionary liquidity fee of up to 2% of the value redeemed, if such fee, is determined to be in the best interests of such money market fund.
Securities lending income is generally equal to the total of income earned from the reinvestment of cash collateral, (and excludes collateral investment fees), and any fees or other payments to and from borrowers of securities. The Fund retains a portion of the securities lending income and remits the remaining portion to BIM as compensation for its services as securities lending agent.
Pursuant to the current securities lending agreement, the Fund retains 82% of securities lending income (which excludes collateral investment expenses), and this amount retained can never be less than 70% of the total of securities lending income plus the collateral investment expenses.
In addition, commencing the business day following the date that the aggregate securities lending income earned across the BlackRock Multi-Asset Complex in a calendar year exceeds a specified threshold, the Fund, pursuant to the securities lending agreement, will retain for the remainder of that calendar year securities lending income in an amount equal to 85% of securities lending income (which excludes collateral investment expenses), and this amount retained can never be less than 70% of the total of securities lending income plus the collateral investment expenses.
The share of securities lending income earned by the Fund is shown as securities lending income — affiliated — net in the Consolidated Statement of Operations. For the year ended May 31, 2024, the Fund paid BIM $66,419 for securities lending agent services.
Interfund Lending: In accordance with an exemptive order (the “Order”) from the SEC, the Fund may participate in a joint lending and borrowing facility for temporary purposes (the “Interfund Lending Program”), subject to compliance with the terms and conditions of the Order, and to the extent permitted by the Fund’s investment policies and restrictions. The Fund is currently permitted to borrow and lend under the Interfund Lending Program.
| | |
| 26 | | 2 0 2 4 B L A C K R O C K A N N U A L F I N A N C I A L S T A T E M E N T S |
Notes to Consolidated Financial Statements (continued)
A lending BlackRock fund may lend in aggregate up to 15% of its net assets but may not lend more than 5% of its net assets to any one borrowing fund through the Interfund Lending Program. A borrowing BlackRock fund may not borrow through the Interfund Lending Program or from any other source more than 33 1/3% of its total assets (or any lower threshold provided for by the fund’s investment restrictions). If a borrowing BlackRock fund’s total outstanding borrowings exceed 10% of its total assets, each of its outstanding interfund loans will be subject to collateralization of at least 102% of the outstanding principal value of the loan. All interfund loans are for temporary or emergency purposes and the interest rate to be charged will be the average of the highest current overnight repurchase agreement rate available to a lending fund and the bank loan rate, as calculated according to a formula established by the Board.
During the year ended May 31, 2024, the Fund did not participate in the Interfund Lending Program.
Trustees and Officers: Certain trustees and/or officers of the Trust are directors and/or officers of BlackRock or its affiliates. The Fund reimburses the Manager for a portion of the compensation paid to the Trust’s Chief Compliance Officer, which is included in Trustees and Officer in the Consolidated Statement of Operations.
For the year ended May 31, 2024, purchases and sales of investments, excluding short-term securities, were $221,740,260 and $483,908,744, respectively.
It is the Fund’s policy to comply with the requirements of the Internal Revenue Code of 1986, as amended, applicable to regulated investment companies, and to distribute substantially all of its taxable income to its shareholders. Therefore, no U.S. federal income tax provision is required.
The Fund files U.S. federal and various state and local tax returns. No income tax returns are currently under examination. The statute of limitations on the Fund’s U.S. federal tax returns generally remains open for a period of three years after they are filed. The statutes of limitations on the Fund’s state and local tax returns may remain open for an additional year depending upon the jurisdiction.
Management has analyzed tax laws and regulations and their application to the Fund as of May 31, 2024, inclusive of the open tax return years, and does not believe that there are any uncertain tax positions that require recognition of a tax liability in the Fund’s consolidated financial statements.
U.S. GAAP requires that certain components of net assets be adjusted to reflect permanent differences between financial and tax reporting. These reclassifications have no effect on net assets or per share. As of period end, permanent differences attributable to net losses derived from the Fund’s wholly owned subsidiary were reclassified to the following accounts:
| | | | |
| |
| | | Amounts | |
| |
| |
Paid-in capital | | $ | (74,581,297 | ) |
Accumulated earnings (loss) | | | 74,581,297 | |
| |
The tax character of distributions paid was as follows:
| | | | | | | | |
| |
| | | Year Ended
05/31/24 | | | Year Ended
05/31/23 | |
| |
| | |
Ordinary income | | $ | 87,645,145 | | | $ | 184,818,182 | |
| | | | | | | | |
|
| |
As of May 31, 2024, the tax components of accumulated earnings (loss) were as follows:
| | | | | | | | | | | | | | | | |
| |
| Fund Name | | Undistributed
Ordinary Income | | | Non-Expiring
Capital Loss
Carryforwards(a) | | | Net Unrealized
Gains (Losses)(b) | | | Total | |
| |
| | | | |
BlackRock Commodity Strategies Fund | | $ | 9,467,914 | | | $ | (220,568,302 | ) | | $ | 77,768,454 | | | $ | (133,331,934 | ) |
| |
| (a) | Amounts available to offset future realized capital gains. |
| (b) | The difference between book-basis and tax-basis net unrealized gains (losses) was attributable primarily to the tax deferral of losses on wash sales, the realization for tax purposes of unrealized gains (losses) on certain foreign currency contracts, the realization for tax purposes of unrealized gains on investments in passive foreign investment companies and the characterization of corporate actions. |
During the year ended May 31, 2024, the Fund utilized the following amount of its capital loss carryforwards:
| | | | |
| |
| Fund Name | | Utilized | |
| |
| |
BlackRock Commodity Strategies Fund | | $ | 10,837,958 | |
| |
| | |
N O T E S T O C O N S O L I D A T E D F I N A N C I A L S T A T E M E N T S | | 27 |
Notes to Consolidated Financial Statements (continued)
As of May 31, 2024, gross unrealized appreciation and depreciation based on cost of investments (including short positions and derivatives, if any) for U.S. federal income tax purposes were as follows:
| | | | | | | | | | | | | | | | |
| Fund Name | | Tax Cost | | | Gross Unrealized
Appreciation | | | Gross Unrealized
Depreciation | | | Net Unrealized
Appreciation
(Depreciation) | |
| | | | |
BlackRock Commodity Strategies Fund | | $ | 612,213,045 | | | $ | 104,881,751 | | | $ | (27,090,494 | ) | | $ | 77,791,257 | |
The Trust, on behalf of the Fund, along with certain other funds managed by the Manager and its affiliates (“Participating Funds”), is party to a 364-day, $2.40 billion credit agreement with a group of lenders. Under this agreement, the Fund may borrow to fund shareholder redemptions. Excluding commitments designated for certain individual funds, the Participating Funds, including the Fund, can borrow up to an aggregate commitment amount of $1.75 billion at any time outstanding, subject to asset coverage and other limitations as specified in the agreement. The credit agreement has the following terms: a fee of 0.10% per annum on unused commitment amounts and interest at a rate equal to the higher of (a) Overnight Bank Funding Rate (“OBFR”) (but, in any event, not less than 0.00%) on the date the loan is made plus 0.80% per annum, (b) the Fed Funds rate (but, in any event, not less than 0.00%) in effect from time to time plus 0.80% per annum on amounts borrowed or (c) the sum of (x) Daily Simple Secured Overnight Financing Rate (“SOFR”) (but, in any event, not less than 0.00%) on the date the loan is made plus 0.10% and (y) 0.80% per annum. The agreement expires in April 2025 unless extended or renewed. These fees were allocated among such funds based upon portions of the aggregate commitment available to them and relative net assets of Participating Funds. During the year ended May 31, 2024, the Fund did not borrow under the credit agreement.
In the normal course of business, the Fund invests in securities or other instruments and may enter into certain transactions, and such activities subject the Fund to various risks, including among others, fluctuations in the market (market risk) or failure of an issuer to meet all of its obligations. The value of securities or other instruments may also be affected by various factors, including, without limitation: (i) the general economy; (ii) the overall market as well as local, regional or global political and/or social instability; (iii) regulation, taxation or international tax treaties between various countries; or (iv) currency, interest rate and price fluctuations. Local, regional or global events such as war, acts of terrorism, the spread of infectious illness or other public health issues, recessions, or other events could have a significant impact on the Fund and its investments. The Fund’s prospectus provides details of the risks to which the Fund is subject.
The Fund may be exposed to additional risks when reinvesting cash collateral in money market funds that do not seek to maintain a stable NAV per share of $1.00, which may be subject to discretionary liquidity fees under certain circumstances.
Valuation Risk: The market values of equities, such as common stocks and preferred securities or equity related investments, such as futures and options, may decline due to general market conditions which are not specifically related to a particular company. They may also decline due to factors which affect a particular industry or industries. The Fund may invest in illiquid investments. An illiquid investment is any investment that the Fund reasonably expects cannot be sold or disposed of in current market conditions in seven calendar days or less without the sale or disposition significantly changing the market value of the investment. The Fund may experience difficulty in selling illiquid investments in a timely manner at the price that it believes the investments are worth. Prices may fluctuate widely over short or extended periods in response to company, market or economic news. Markets also tend to move in cycles, with periods of rising and falling prices. This volatility may cause the Fund’s NAV to experience significant increases or decreases over short periods of time. If there is a general decline in the securities and other markets, the NAV of the Fund may lose value, regardless of the individual results of the securities and other instruments in which the Fund invests.
The price the Fund could receive upon the sale of any particular portfolio investment may differ from the Fund’s valuation of the investment, particularly for securities that trade in thin or volatile markets or that are valued using a fair valuation technique or a price provided by an independent pricing service. Changes to significant unobservable inputs and assumptions (i.e., publicly traded company multiples, growth rate, time to exit) due to the lack of observable inputs may significantly impact the resulting fair value and therefore the Fund’s results of operations. As a result, the price received upon the sale of an investment may be less than the value ascribed by the Fund, and the Fund could realize a greater than expected loss or lesser than expected gain upon the sale of the investment. The Fund’s ability to value its investments may also be impacted by technological issues and/or errors by pricing services or other third-party service providers.
Counterparty Credit Risk: The Fund may be exposed to counterparty credit risk, or the risk that an entity may fail to or be unable to perform on its commitments related to unsettled or open transactions, including making timely interest and/or principal payments or otherwise honoring its obligations. The Fund manages counterparty credit risk by entering into transactions only with counterparties that the Manager believes have the financial resources to honor their obligations and by monitoring the financial stability of those counterparties. Financial assets, which potentially expose the Fund to market, issuer and counterparty credit risks, consist principally of financial instruments and receivables due from counterparties. The extent of the Fund’s exposure to market, issuer and counterparty credit risks with respect to these financial assets is approximately their value recorded in the Consolidated Statement of Assets and Liabilities, less any collateral held by the Fund.
A derivative contract may suffer a mark-to-market loss if the value of the contract decreases due to an unfavorable change in the market rates or values of the underlying instrument. Losses can also occur if the counterparty does not perform under the contract.
Geographic/Asset Class Risk: A diversified portfolio, where this is appropriate and consistent with a fund’s objectives, minimizes the risk that a price change of a particular investment will have a material impact on the NAV of a fund. The investment concentrations within the Fund’s portfolio are disclosed in its Consolidated Schedule of Investments.
| | |
| 28 | | 2 0 2 4 B L A C K R O C K A N N U A L F I N A N C I A L S T A T E M E N T S |
Notes to Consolidated Financial Statements (continued)
The Fund invests a significant portion of its assets in securities within a single or limited number of market sectors. When a fund concentrates its investments in this manner, it assumes the risk that economic, regulatory, political and social conditions affecting such sectors may have a significant impact on the Fund and could affect the income from, or the value or liquidity of, the Fund’s portfolio. Investment percentages in specific sectors are presented in the Consolidated Schedule of Investments.
The Fund invests a significant portion of its assets in fixed-income securities and/or uses derivatives tied to the fixed-income markets. Changes in market interest rates or economic conditions may affect the value and/or liquidity of such investments. Interest rate risk is the risk that prices of bonds and other fixed-income securities will decrease as interest rates rise and increase as interest rates fall. The Fund may be subject to a greater risk of rising interest rates due to the period of historically low interest rates that ended in March 2022. The Federal Reserve has raised the federal funds rate as part of its efforts to address inflation. There is a risk that interest rates will continue to rise, which will likely drive down the prices of bonds and other fixed-income securities, and could negatively impact the Fund’s performance
The Fund invests a significant portion of its assets in securities of issuers located in the United States. A decrease in imports or exports, changes in trade regulations, inflation and/or an economic recession in the United States may have a material adverse effect on the U.S. economy and the securities listed on U.S. exchanges. Proposed and adopted policy and legislative changes in the United States may also have a significant effect on U.S. markets generally, as well as on the value of certain securities. Governmental agencies project that the United States will continue to maintain elevated public debt levels for the foreseeable future which may constrain future economic growth. Circumstances could arise that could prevent the timely payment of interest or principal on U.S. government debt, such as reaching the legislative “debt ceiling.” Such non-payment would result in substantial negative consequences for the U.S. economy and the global financial system. If U.S. relations with certain countries deteriorate, it could adversely affect issuers that rely on the United States for trade. The United States has also experienced increased internal unrest and discord. If these trends were to continue, they may have an adverse impact on the U.S. economy and the issuers in which the Fund invests.
Significant Shareholder Redemption Risk: Certain shareholders may own or manage a substantial amount of fund shares and/or hold their fund investments for a limited period of time. Large redemptions of fund shares by these shareholders may force a fund to sell portfolio securities, which may negatively impact the fund’s NAV, increase the fund’s brokerage costs, and/or accelerate the realization of taxable income/gains and cause the fund to make additional taxable distributions to shareholders.
| 11. | CAPITAL SHARE TRANSACTIONS |
Transactions in capital shares for each class were as follows:
| | | | | | | | | | | | | | | | |
| | | Year Ended 05/31/24 | | | Year Ended 05/31/23 | |
| | | | |
| Share Class | | Shares | | | Amount | | | Shares | | | Amount | |
| | | | |
Institutional | | | | | | | | | | | | | | | | |
| | | | |
Shares sold | | | 16,238,591 | | | $ | 137,317,730 | | | | 48,377,579 | | | $ | 467,663,752 | |
| | | | |
Shares issued in reinvestment of distributions | | | 7,095,202 | | | | 60,484,375 | | | | 15,381,433 | | | | 135,103,945 | |
| | | | |
Shares redeemed | | | (68,198,567 | ) | | | (578,220,648 | ) | | | (148,478,047 | ) | | | (1,392,777,097 | ) |
| | | | | | | | | | | | | | | | |
| | | | |
| | | (44,864,774 | ) | | $ | (380,418,543 | ) | | | (84,719,035 | ) | | $ | (790,009,400 | ) |
| | | | | | | | | | | | | | | | |
Investor A | | | | | | | | | | | | | | | | |
| | | | |
Shares sold and automatic conversion of shares | | | 1,577,748 | | | $ | 13,256,153 | | | | 3,826,409 | | | $ | 36,751,196 | |
| | | | |
Shares issued in reinvestment of distributions | | | 1,156,635 | | | | 9,757,319 | | | | 1,826,612 | | | | 15,892,675 | |
| | | | |
Shares redeemed | | | (6,373,307 | ) | | | (53,134,580 | ) | | | (12,608,372 | ) | | | (117,252,987 | ) |
| | | | | | | | | | | | | | | | |
| | | | |
| | | (3,638,924 | ) | | $ | (30,121,108 | ) | | | (6,955,351 | ) | | $ | (64,609,116 | ) |
| | | | | | | | | | | | | | | | |
Investor C | | | | | | | | | | | | | | | | |
| | | | |
Shares sold | | | 162,325 | | | $ | 1,312,561 | | | | 998,622 | | | $ | 9,407,731 | |
| | | | |
Shares issued in reinvestment of distributions | | | 252,922 | | | | 2,040,080 | | | | 373,610 | | | | 3,106,485 | |
| | | | |
Shares redeemed and automatic conversion of shares | | | (2,085,435 | ) | | | (16,739,947 | ) | | | (1,631,866 | ) | | | (14,422,937 | ) |
| | | | | | | | | | | | | | | | |
| | | | |
| | | (1,670,188 | ) | | $ | (13,387,306 | ) | | | (259,634 | ) | | $ | (1,908,721 | ) |
| | | | | | | | | | | | | | | | |
Class K | | | | | | | | | | | | | | | | |
| | | | |
Shares sold | | | 4,418,921 | | | $ | 37,807,441 | | | | 8,292,838 | | | $ | 85,776,294 | |
| | | | |
Shares issued in reinvestment of distributions | | | 1,393,260 | | | | 11,870,505 | | | | 2,834,330 | | | | 24,904,192 | |
| | | | |
Shares redeemed | | | (9,665,648 | ) | | | (81,838,645 | ) | | | (22,680,846 | ) | | | (211,987,182 | ) |
| | | | | | | | | | | | | | | | |
| | | | |
| | | (3,853,467 | ) | | $ | (32,160,699 | ) | | | (11,553,678 | ) | | $ | (101,306,696 | ) |
| | | | | | | | | | | | | | | | |
| | | | |
| | | (54,027,353 | ) | | $ | (456,087,656 | ) | | | (103,487,698 | ) | | $ | (957,833,933 | ) |
| | | | | | | | | | | | | | | | |
Management has evaluated the impact of all subsequent events on the Fund through the date the financial statements were issued and has determined that there were no subsequent events requiring adjustment or additional disclosure in the financial statements.
| | |
N O T E S T O C O N S O L I D A T E D F I N A N C I A L S T A T E M E N T S | | 29 |
Report of Independent Registered Public Accounting Firm
To the Shareholders of BlackRock Commodity Strategies Fund and the Board of Trustees of BlackRock FundsSM:
Opinion on the Financial Statements and Financial Highlights
We have audited the accompanying consolidated statement of assets and liabilities of BlackRock Commodity Strategies Fund of BlackRock FundsSM (the “Fund”), including the consolidated schedule of investments, as of May 31, 2024, the related consolidated statement of operations for the year then ended, the consolidated statements of changes in net assets for each of the two years in the period then ended, the consolidated financial highlights for each of the four years in the period then ended and for the period from August 1, 2019 through May 31, 2020, and the related notes. In our opinion, the financial statements and financial highlights present fairly, in all material respects, the financial position of the Fund as of May 31, 2024, and the results of its operations for the year then ended, the changes in its net assets for each of the two years in the period then ended, and the financial highlights for each of the four years in the period then ended and for the period from August 1, 2019 through May 31, 2020, in conformity with accounting principles generally accepted in the United States of America.
The financial highlights for the year ended July 31, 2019 of the Fund were audited by other auditors whose report dated September 24, 2019, expressed an unqualified opinion on those financial highlights.
Basis for Opinion
These financial statements and financial highlights are the responsibility of the Fund’s management. Our responsibility is to express an opinion on the Fund’s financial statements and financial highlights based on our audits. We are a public accounting firm registered with the Public Company Accounting Oversight Board (United States) (PCAOB) and are required to be independent with respect to the Fund in accordance with the U.S. federal securities laws and the applicable rules and regulations of the Securities and Exchange Commission and the PCAOB.
We conducted our audits in accordance with the standards of the PCAOB. Those standards require that we plan and perform the audit to obtain reasonable assurance about whether the financial statements and financial highlights are free of material misstatement, whether due to error or fraud. The Fund is not required to have, nor were we engaged to perform, an audit of its internal control over financial reporting. As part of our audits we are required to obtain an understanding of internal control over financial reporting but not for the purpose of expressing an opinion on the effectiveness of the Fund’s internal control over financial reporting. Accordingly, we express no such opinion.
Our audits included performing procedures to assess the risks of material misstatement of the financial statements and financial highlights, whether due to error or fraud, and performing procedures that respond to those risks. Such procedures included examining, on a test basis, evidence regarding the amounts and disclosures in the financial statements and financial highlights. Our audits also included evaluating the accounting principles used and significant estimates made by management, as well as evaluating the overall presentation of the financial statements and financial highlights. Our procedures included confirmation of securities owned as of May 31, 2024, by correspondence with custodians or counterparties; when replies were not received, we performed other auditing procedures. We believe that our audits provide a reasonable basis for our opinion.
Deloitte & Touche LLP
Boston, Massachusetts
July 24, 2024
We have served as the auditor of one or more BlackRock investment companies since 1992.
| | |
| 30 | | 2 0 2 4 B L A C K R O C K A N N U A L F I N A N C I A L S T A T E M E N T S |
Important Tax Information (unaudited)
The following amount, or maximum amount allowable by law, is hereby designated as qualified dividend income for individuals for the fiscal year ended May 31, 2024:
| | | | |
| |
| Fund Name | | Qualified Dividend
Income | |
| |
| |
BlackRock Commodity Strategies Fund | | $ | 11,339,946 | |
| |
The Fund hereby designates the following amount, or maximum amount allowable by law, of distributions from direct federal obligation interest for the fiscal year ended May 31, 2024:
| | | | |
| |
| Fund Name | | Federal Obligation
Interest | |
| |
| |
BlackRock Commodity Strategies Fund | | $ | 17,559,927 | |
| |
The law varies in each state as to whether and what percent of ordinary income dividends attributable to federal obligations is exempt from state income tax. Shareholders are advised to check with their tax advisers to determine if any portion of the dividends received is exempt from state income tax.
The following percentage, or maximum percentage allowable by law, of ordinary income distributions paid during the fiscal year ended May 31, 2024 qualified for the dividends-received deduction for corporate shareholders:
| | | | |
| |
| Fund Name | | Dividends-Received
Deduction | |
| |
| |
BlackRock Commodity Strategies Fund | | | 5.77 | % |
| |
The Fund hereby designates the following amount, or maximum amount allowable by law, as interest income eligible to be treated as a Section 163(j) interest dividend for the fiscal year ended May 31, 2024:
| | | | |
| |
| Fund Name | | Interest Dividends | |
| |
| |
BlackRock Commodity Strategies Fund | | $ | 17,755,703 | |
| |
The Fund hereby designates the following amount, or maximum amount allowable by law, as interest-related dividends eligible for exemption from U.S. withholding tax for nonresident aliens and foreign corporations for the fiscal year ended May 31, 2024:
| | | | |
| |
| Fund Name | | Interest- Related
Dividends | |
| |
| |
BlackRock Commodity Strategies Fund | | $ | 17,758,284 | |
| |
| | |
I M P O R T A N T T A X I N F O R M A T I O N | | 31 |
Disclosure of Investment Advisory Agreement and Sub-Advisory Agreement
The Board of Trustees (the “Board,” the members of which are referred to as “Board Members”) of BlackRock Funds (the “Trust”) met on April 16, 2024 (the “April Meeting”) and May 16-17, 2024 (the “May Meeting”) to consider the approval to continue the investment advisory agreement (the “Advisory Agreement”) between the Trust, on behalf of BlackRock Commodity Strategies Fund (the “Fund”), and BlackRock Advisors, LLC (the “Manager”), the Fund’s investment advisor. The Board also considered the approval to continue the sub-advisory agreement (the “Sub-Advisory Agreement”) between the Manager and BlackRock International Limited (the “Sub-Advisor”) with respect to the Fund. The Manager and the Sub-Advisor are referred to herein as “BlackRock.” The Advisory Agreement and the Sub-Advisory Agreement are referred to herein as the “Agreements.”
The Approval Process
Consistent with the requirements of the Investment Company Act of 1940 (the “1940 Act”), the Board considers the approval of the continuation of the Agreements for the Fund on an annual basis. The Board members who are not “interested persons” of the Trust, as defined in the 1940 Act, are considered independent Board members (the “Independent Board Members”). The Board’s consideration entailed a year-long deliberative process during which the Board and its committees assessed BlackRock’s various services to the Fund, including through the review of written materials and oral presentations, and the review of additional information provided in response to requests from the Independent Board Members. The Board had four quarterly meetings per year, each of which extended over a two-day period, as well as additional ad hoc meetings and executive sessions throughout the year, as needed. The committees of the Board similarly met throughout the year. The Board also had an additional one-day meeting to consider specific information regarding the renewal of the Agreements. In considering the renewal of the Agreements, the Board assessed, among other things, the nature, extent and quality of the services provided to the Fund by BlackRock, BlackRock’s personnel and affiliates, including (as applicable): investment management services; accounting oversight; administrative and shareholder services; oversight of the Fund’s service providers; risk management and oversight; and legal, regulatory and compliance services. Throughout the year, including during the contract renewal process, the Independent Board Members were advised by independent legal counsel, and met with independent legal counsel in various executive sessions outside of the presence of BlackRock’s management.
During the year, the Board, acting directly and through its committees, considered information that was relevant to its annual consideration of the renewal of the Agreements, including the services and support provided by BlackRock to the Fund and its shareholders. BlackRock also furnished additional information to the Board in response to specific questions from the Board. Among the matters the Board considered were: (a) investment performance for one-year, three-year, five-year, and/or since inception periods, as applicable, against peer funds, relevant benchmarks, and other performance metrics, as applicable, as well as BlackRock senior management’s and portfolio managers’ investment performance analyses, and the reasons for any outperformance or underperformance relative to its peers, benchmarks, and other performance metrics, as applicable; (b) fees, including advisory, administration, if applicable, and other amounts paid to BlackRock and its affiliates by the Fund for services; (c) Fund operating expenses and how BlackRock allocates expenses to the Fund; (d) the resources devoted to, risk oversight of, and compliance reports relating to, implementation of the Fund’s investment objective, policies and restrictions, and meeting regulatory requirements; (e) BlackRock’s and the Fund’s adherence to applicable compliance policies and procedures; (f) the nature, character and scope of non-investment management services provided by BlackRock and its affiliates and the estimated cost of such services, as available; (g) BlackRock’s and other service providers’ internal controls and risk and compliance oversight mechanisms; (h) BlackRock’s implementation of the proxy voting policies approved by the Board; (i) the use of brokerage commissions and execution quality of portfolio transactions; (j) BlackRock’s implementation of the Fund’s valuation and liquidity procedures; (k) an analysis of management fees paid to BlackRock for products with similar investment mandates across the open-end fund, exchange-traded fund (“ETF”), closed-end fund, sub-advised mutual fund, separately managed account, collective investment trust, and institutional separate account product channels, as applicable, and the similarities and differences between these products and the services provided as compared to the Fund; (l) BlackRock’s compensation methodology for its investment professionals and the incentives and accountability it creates, along with investment professionals’ investments in the fund(s) they manage; and (m) periodic updates on BlackRock’s business.
Prior to and in preparation for the April Meeting, the Board received and reviewed materials specifically relating to the renewal of the Agreements. The Independent Board Members continuously engaged in a process with their independent legal counsel and BlackRock to review the nature and scope of the information provided to the Board to better assist its deliberations. The materials provided in connection with the April Meeting included, among other things: (a) information independently compiled and prepared by Broadridge Financial Solutions, Inc. (“Broadridge”), based on either a Lipper classification or Morningstar category, regarding the Fund’s fees and expenses as compared with a peer group of funds as determined by Broadridge (“Expense Peers”) and the investment performance of the Fund as compared with a peer group of funds (“Performance Peers”); (b) information on the composition of the Expense Peers and Performance Peers and a description of Broadridge’s methodology; (c) information on the estimated profits realized by BlackRock and its affiliates pursuant to the Agreements and a discussion of fall-out benefits to BlackRock and its affiliates; (d) a general analysis provided by BlackRock concerning investment management fees received in connection with other types of investment products, such as institutional accounts, sub-advised mutual funds, ETFs, closed-end funds, open-end funds, and separately managed accounts, under similar investment mandates, as well as the performance of such other products, as applicable; (e) a review of non-management fees; (f) the existence, impact and sharing of potential economies of scale, if any, with the Fund; (g) a summary of aggregate amounts paid by the Fund to BlackRock; (h) sales and redemption data regarding the Fund’s shares; and (i) various additional information requested by the Board as appropriate regarding BlackRock’s and the Fund’s operations.
At the April Meeting, the Board reviewed materials relating to its consideration of the Agreements and the Independent Board Members presented BlackRock with questions and requests for additional information. BlackRock responded to these questions and requests with additional written information in advance of the May Meeting, and such responses were reviewed by the Board Members.
At the May Meeting, the Board concluded its assessment of, among other things: (a) the nature, extent and quality of the services provided by BlackRock; (b) the investment performance of the Fund as compared to its Performance Peers and to other metrics, as applicable; (c) the advisory fee and the estimated cost of the services and estimated profits realized by BlackRock and its affiliates from their relationship with the Fund; (d) the Fund’s fees and expenses compared to its Expense Peers; (e) the existence and sharing of potential economies of scale; (f) any fall-out benefits to BlackRock and its affiliates as a result of BlackRock’s relationship with the Fund; and (g) other factors deemed relevant by the Board Members.
The Board also considered other matters it deemed important to the approval process, such as other payments made to BlackRock or its affiliates relating to securities lending and cash management, and BlackRock’s services related to the valuation and pricing of Fund portfolio holdings. The Board noted the willingness of BlackRock’s personnel to engage in open, candid discussions with the Board. The Board evaluated the information available to it on a fund-by-fund basis. The following paragraphs provide more information about some of the primary factors that were relevant to the Board’s decision. The Board Members did not identify any particular information, or any single factor as determinative, and each Board Member may have attributed different weights to the various items and factors considered.
| | |
| 32 | | 2 0 2 4 B L A C K R O C K A N N U A L F I N A N C I A L S T A T E M E N T S |
Disclosure of Investment Advisory Agreement and Sub-Advisory Agreement (continued)
A. Nature, Extent and Quality of the Services Provided by BlackRock
The Board, including the Independent Board Members, reviewed the nature, extent and quality of services provided by BlackRock, including the investment advisory services, and the resulting performance of the Fund. Throughout the year, the Board compared Fund performance to the performance of a comparable group of mutual funds, relevant benchmarks, and performance metrics, as applicable. The Board met with BlackRock’s senior management personnel responsible for investment activities, including the senior investment officers. The Board also reviewed the materials provided by the Fund’s portfolio management team discussing the Fund’s performance, investment strategies and outlook.
The Board considered, among other factors, with respect to BlackRock: the experience of the Fund’s portfolio management team; research capabilities; investments by portfolio managers in the funds they manage; portfolio trading capabilities; use of technology; commitment to compliance; credit analysis capabilities; risk analysis and oversight capabilities; and the approach to training and retaining portfolio managers and other research, advisory and management personnel. The Board also considered BlackRock’s overall risk management program, including the continued efforts of BlackRock and its affiliates to address cybersecurity risks and the role of BlackRock’s Risk & Quantitative Analysis Group. The Board engaged in a review of BlackRock’s compensation structure with respect to the Fund’s portfolio management team and BlackRock’s ability to attract and retain high-quality talent and create performance incentives.
In addition to investment advisory services, the Board considered the nature and quality of the administrative and other non-investment advisory services provided to the Fund. BlackRock and its affiliates provide the Fund with certain administrative, shareholder and other services (in addition to any such services provided to the Fund by third parties) and officers and other personnel as are necessary for the operations of the Fund. In particular, BlackRock and its affiliates provide the Fund with administrative services including, among others: (i) responsibility for disclosure documents, such as the prospectus, the summary prospectus (as applicable), the statement of additional information and periodic shareholder reports; (ii) oversight of daily accounting and pricing; (iii) responsibility for periodic filings with regulators; (iv) overseeing and coordinating the activities of third-party service providers including, among others, the Fund’s custodian, fund accountant, transfer agent, and auditor; (v) organizing Board meetings and preparing the materials for such Board meetings; (vi) providing legal and compliance support; (vii) furnishing analytical and other support to assist the Board in its consideration of strategic issues such as the merger, consolidation or repurposing of certain open-end funds; and (viii) performing or managing administrative functions necessary for the operation of the Fund, such as tax reporting, expense management, fulfilling regulatory filing requirements, overseeing the Fund’s distribution partners, and shareholder call center and other services. The Board reviewed the structure and duties of BlackRock’s fund administration, shareholder services, and legal and compliance departments and considered BlackRock’s policies and procedures for assuring compliance with applicable laws and regulations. The Board considered the operation of BlackRock’s business continuity plans.
The Board noted that the engagement of the Sub-Advisor with respect to the Fund facilitates the provision of investment advice and trading by investment personnel out of non-U.S. jurisdictions. The Board considered that this arrangement provides additional flexibility to the portfolio management team, which may benefit the Fund and its shareholders.
B. The Investment Performance of the Fund
The Board, including the Independent Board Members, reviewed and considered the performance history of the Fund throughout the year and at the April Meeting. In preparation for the April Meeting, the Board was provided with reports independently prepared by Broadridge, which included an analysis of the Fund’s performance as of December 31, 2023, as compared to its Performance Peers. Broadridge ranks funds in quartiles, ranging from first to fourth, where first is the most desirable quartile position and fourth is the least desirable. In connection with its review, the Board received and reviewed information regarding the investment performance of the Fund as compared to its Performance Peers and the respective Morningstar Category (“Morningstar Category”). The Board and its Performance Oversight Committee regularly review and meet with Fund management to discuss the performance of the Fund throughout the year.
In evaluating performance, the Board focused particular attention on funds with less favorable performance records. The Board also noted that while it found the data provided by Broadridge generally useful, it recognized the limitations of such data, including in particular, that notable differences may exist between a fund and its Performance Peers (for example, the investment objectives and strategies). Further, the Board recognized that the performance data reflects a snapshot of a period as of a particular date and that selecting a different performance period could produce significantly different results. The Board also acknowledged that long-term performance could be impacted by even one period of significant outperformance or underperformance, and that a single investment theme could have the ability to disproportionately affect long-term performance.
The Board noted that for the one-, three- and five-year periods reported, the Fund ranked in the second, fourth and second quartiles, respectively, against its Morningstar Category. The Board noted that BlackRock believes that the Morningstar Category is an appropriate performance metric for the Fund, and that BlackRock has explained its rationale for this belief to the Board. The Board and BlackRock reviewed the Fund’s underperformance relative to its Morningstar Category during the applicable period.
C. Consideration of the Advisory/Management Fees and the Estimated Cost of the Services and Estimated Profits Realized by BlackRock and its Affiliates from their Relationship with the Fund
The Board, including the Independent Board Members, reviewed the Fund’s contractual management fee rate compared with those of its Expense Peers. The contractual management fee rate represents a combination of the advisory fee and any administrative fees, before taking into account any reimbursements or fee waivers. The Board also compared the Fund’s total expense ratio, as well as its actual management fee rate, to those of its Expense Peers. The total expense ratio represents a fund’s total net operating expenses, including any 12b-1 or non-12b-1 service fees. The total expense ratio gives effect to any expense reimbursements or fee waivers, and the actual management fee rate gives effect to any management fee reimbursements or waivers. The Board considered that the fee and expense information in the Broadridge report for the Fund reflected information for a specific period and that historical asset levels and expenses may differ from current levels, particularly in a period of market volatility. The Board considered the services provided and the fees charged by BlackRock and its affiliates to other types of clients with similar investment mandates, as applicable, including institutional accounts and sub-advised mutual funds (including mutual funds sponsored by third parties).
| | |
D I S C L O S U R E O F I N V E S T M E N T A D V I S O R Y A G R E E M E N T A N D S U B - A D V I S O R Y A G R E E M E N T | | 33 |
Disclosure of Investment Advisory Agreement and Sub-Advisory Agreement (continued)
The Board received and reviewed statements relating to BlackRock’s financial condition. The Board reviewed BlackRock’s profitability methodology and was also provided with an estimated profitability analysis that detailed the revenues earned and the expenses incurred by BlackRock for services provided to the Fund. The Board reviewed BlackRock’s estimated profitability with respect to the Fund and other funds the Board currently oversees for the year ended December 31, 2023 compared to available aggregate estimated profitability data provided for the prior two years. The Board reviewed BlackRock’s estimated profitability with respect to certain other U.S. fund complexes managed by the Manager and/or its affiliates. The Board reviewed BlackRock’s assumptions and methodology of allocating expenses in the estimated profitability analysis, noting the inherent limitations in allocating costs among various advisory products. The Board recognized that profitability may be affected by numerous factors including, among other things, fee waivers and expense reimbursements by the Manager, the types of funds managed, precision of expense allocations and business mix. The Board thus recognized that calculating and comparing profitability at the individual fund level is difficult.
The Board noted that, in general, individual fund or product line profitability of other advisors is not publicly available. The Board reviewed BlackRock’s overall operating margin, in general, compared to that of other certain publicly traded asset management firms. The Board considered the differences between BlackRock and these other firms, including the contribution of technology at BlackRock, BlackRock’s expense management, and the relative product mix.
The Board considered whether BlackRock has the financial resources necessary to attract and retain high quality investment management personnel to perform its obligations under the Agreements and to continue to provide the high quality of services that is expected by the Board. The Board further considered factors including but not limited to BlackRock’s commitment of time and resources, assumption of risk, and liability profile in servicing the Fund, including in contrast to what is required of BlackRock with respect to other products with similar investment mandates across the open-end fund, ETF, closed-end fund, sub-advised mutual fund, separately managed account, collective investment trust, and institutional separate account product channels, as applicable.
The Board noted that the Fund’s contractual management fee rate ranked in the second quartile, and that the actual management fee rate and total expense ratio each ranked in the second quartile relative to the Fund’s Expense Peers. The Board further noted that the Fund has an advisory fee arrangement that includes breakpoints that adjust the fee rate downward as the size of the Fund increases above certain contractually specified levels. The Board additionally noted that the breakpoints can, conversely, adjust the advisory fee rate upward as the size of the Fund decreases below certain contractually specified levels. The Board also noted that BlackRock and the Board have contractually agreed to a cap on the Fund’s total expenses as a percentage of the Fund’s average daily net assets on a class-by-class basis.
D. Economies of Scale
The Board, including the Independent Board Members, considered the extent to which any economies of scale might benefit the Fund in a variety of ways as the assets of the Fund increase. The Board considered multiple factors, including the advisory fee rate and breakpoints, unitary fee structure, fee waivers, and/or expense caps, as applicable. The Board considered the Fund’s asset levels and whether the current fee schedule was appropriate.
E. Other Factors Deemed Relevant by the Board Members
The Board, including the Independent Board Members, also took into account other ancillary or “fall-out” benefits that BlackRock or its affiliates may derive from BlackRock’s respective relationships with the Fund, both tangible and intangible, such as BlackRock’s ability to leverage its investment professionals who manage other portfolios and its risk management personnel, an increase in BlackRock’s profile in the investment advisory community, and the engagement of BlackRock’s affiliates as service providers to the Fund, including for administrative, distribution, securities lending and cash management services. With respect to securities lending, during the year the Board also considered information provided by independent third-party consultants related to the performance of each BlackRock affiliate as securities lending agent. The Board also considered BlackRock’s overall operations and its efforts to expand the scale of, and improve the quality of, its operations. The Board also noted that, subject to applicable law, BlackRock may use and benefit from third-party research obtained by soft dollars generated by certain registered fund transactions to assist in managing all or a number of its other client accounts.
In connection with its consideration of the Agreements, the Board also received information regarding BlackRock’s brokerage and soft dollar practices. The Board received reports from BlackRock which included information on brokerage commissions and trade execution practices throughout the year.
The Board noted the competitive nature of the open-end fund marketplace, and that shareholders are able to redeem their Fund shares if they believe that the Fund’s fees and expenses are too high or if they are dissatisfied with the performance of the Fund.
Conclusion
At the May Meeting, in a continuation of the discussions that occurred during the April Meeting, and as a culmination of the Board’s year-long deliberative process, the Board, including the Independent Board Members, unanimously approved the continuation of the Advisory Agreement between the Manager and the Trust, on behalf of the Fund, for a one-year term ending June 30, 2025, and the Sub-Advisory Agreement between the Manager and the Sub-Advisor, with respect to the Fund, for a one-year term ending June 30, 2025. Based upon its evaluation of all of the aforementioned factors in their totality, as well as other information, the Board, including the Independent Board Members, was satisfied that the terms of the Agreements were fair and reasonable and in the best interest of the Fund and its shareholders. In arriving at its decision to approve the Agreements, the Board did not identify any single factor or group of factors as all-important or controlling, but considered all factors together, and different Board Members may have attributed different weights to the various factors considered. The Independent Board Members were advised by independent legal counsel throughout the deliberative process.
| | |
| 34 | | 2 0 2 4 B L A C K R O C K A N N U A L F I N A N C I A L S T A T E M E N T S |
Additional Information
Changes in and Disagreements with Accountants
Not applicable.
Proxy Results
Not applicable.
Remuneration Paid to Trustees, Officers, and Others
Compensation to the independent directors/trustees of the Trust is paid by the Trust, on behalf of the Fund.
General Information
Quarterly performance, semi-annual and annual reports, current net asset value and other information regarding the Fund may be found on BlackRock’s website, which can be accessed at blackrock.com. Any reference to BlackRock’s website in this report is intended to allow investors public access to information regarding the Fund and does not, and is not intended to, incorporate BlackRock’s website in this report.
Electronic Delivery
Shareholders can sign up for e-mail notifications of quarterly statements, annual and semi-annual shareholder reports and prospectuses by enrolling in the electronic delivery program.
To enroll in electronic delivery:
Shareholders Who Hold Accounts with Investment Advisors, Banks or Brokerages:
Please contact your financial advisor. Please note that not all investment advisors, banks or brokerages may offer this service.
Shareholders Who Hold Accounts Directly with BlackRock:
1. Access the BlackRock website at blackrock.com
2. Select “Access Your Account”
3. Next, select “eDelivery” in the “Related Resources” box and follow the sign-up instructions.
BlackRock’s Mutual Fund Family
BlackRock offers a diverse lineup of open-end mutual funds crossing all investment styles and managed by experts in equity, fixed-income and tax-exempt investing. Visit blackrock.com for more information.
Shareholder Privileges
Account Information
Call us at (800) 441-7762 from 8:00 AM to 6:00 PM ET on any business day to get information about your account balances, recent transactions and share prices. You can also visit blackrock.com for more information.
Automatic Investment Plans
Investor class shareholders who want to invest regularly can arrange to have $50 or more automatically deducted from their checking or savings account and invested in any of the BlackRock funds.
Systematic Withdrawal Plans
Investor class shareholders can establish a systematic withdrawal plan and receive periodic payments of $50 or more from their BlackRock funds, as long as their account balance is at least $10,000.
Retirement Plans
Shareholders may make investments in conjunction with Traditional, Rollover, Roth, Coverdell, Simple IRAs, SEP IRAs and 403(b) Plans.
| | |
A D D I T I O N A L I N F O R M A T I O N | | 35 |
Additional Information (continued)
Fund and Service Providers
| | |
| Investment Adviser and Administrator | | Distributor |
| BlackRock Advisors, LLC | | BlackRock Investments, LLC |
| Wilmington, DE 19809 | | New York, NY 10001 |
Sub-Adviser | | Independent Registered Public Accounting Firm |
| BlackRock International Limited | | Deloitte & Touche LLP |
| Edinburgh, EH3 8BL | | Boston, MA 02116 |
| United Kingdom | | |
| | Legal Counsel |
| Accounting Agent and Transfer Agent | | Sidley Austin LLP |
| BNY Mellon Investment Servicing (US) Inc. | | New York, NY 10019 |
| Wilmington, DE 19809 | | |
| | Address of the Trust |
| Custodian | | 100 Bellevue Parkway |
| The Bank of New York Mellon | | Wilmington, DE 19809 |
| New York, NY 10286 | | |
| | |
| 36 | | 2 0 2 4 B L A C K R O C K A N N U A L F I N A N C I A L S T A T E M E N T S |
Glossary of Terms Used in this Report
Currency Abbreviation
| | |
| GBP | | British Pound |
| |
| USD | | United States Dollar |
|
Portfolio Abbreviation |
| ADR | | American Depositary Receipt |
| |
| BCOMRAGT | | Bloomberg Roll Select Agriculture Subindex Total ReturnSM |
| |
| BCOMRENT | | Bloomberg Roll Select Energy Subindex Total ReturnSM |
| |
| BCOMRINT | | Bloomberg Roll Select Industrial Metals Subindex Total ReturnSM |
| |
| BCOMRLIT | | Bloomberg Roll Select Livestock Subindex Total ReturnSM |
| |
| BCOMRPRT | | Bloomberg Roll Select Precious Metals Subindex Total ReturnSM |
| |
| CVR | | Contingent Value Rights |
| |
| OTC | | Over-the-Counter |
| | |
G L O S S A R Y O F T E R M S U S E D I N T H I S R E P O R T | | 37 |
THIS PAGE INTENTIONALLY LEFT BLANK.
THIS PAGE INTENTIONALLY LEFT BLANK.
Want to know more?
blackrock.com | 800-441-7762
This report is intended for current holders. It is not authorized for use as an offer of sale or a solicitation of an offer to buy shares of the Fund unless preceded or accompanied by the Fund’s current prospectus. Past performance results shown in this report should not be considered a representation of future performance. Investment returns and principal value of shares will fluctuate so that shares, when redeemed, may be worth more or less than their original cost. Statements and other information herein are as dated and are subject to change.
| | |

| | MAY 31, 2024 |
| | |
| |
| | 2024 Annual Financial Statements |
BlackRock FundsSM
| · | | BlackRock SMID-Cap Growth Equity Fund |
|
| |
| Not FDIC Insured • May Lose Value • No Bank Guarantee |
Table of Contents
| | |
Schedule of Investments May 31, 2024 | | BlackRock SMID-Cap Growth Equity Fund (Percentages shown are based on Net Assets) |
| | | | | | | | |
| Security | | Shares | | | Value | |
|
Common Stocks | |
| | |
| Aerospace & Defense — 5.6% | | | | | | |
Axon Enterprise, Inc.(a) | | | 1,141 | | | $ | 321,385 | |
HEICO Corp. | | | 975 | | | | 216,226 | |
| | | | | | | | |
| | | | | | | 537,611 | |
| | |
| Air Freight & Logistics — 0.9% | | | | | | |
GXO Logistics, Inc.(a) | | | 1,825 | | | | 91,670 | |
| | | | | | | | |
| | |
| Automobile Components — 0.9% | | | | | | |
Fox Factory Holding Corp.(a) | | | 1,868 | | | | 87,086 | |
| | | | | | | | |
| | |
| Beverages — 0.8% | | | | | | |
Davide Campari-Milano NV | | | 7,600 | | | | 76,135 | |
| | | | | | | | |
| | |
| Biotechnology — 1.2% | | | | | | |
Halozyme Therapeutics, Inc.(a)(b) | | | 2,519 | | | | 111,567 | |
| | | | | | | | |
| | |
| Broadline Retail — 0.1% | | | | | | |
Etsy, Inc.(a) | | | 138 | | | | 8,759 | |
| | | | | | | | |
| | |
| Building Products — 1.6% | | | | | | |
AZEK Co., Inc. (The), Class A(a) | | | 3,263 | | | | 156,494 | |
| | | | | | | | |
| | |
| Capital Markets — 6.6% | | | | | | |
Carlyle Group, Inc. (The) | | | 663 | | | | 28,482 | |
MarketAxess Holdings, Inc. | | | 71 | | | | 14,124 | |
Morningstar, Inc. | | | 612 | | | | 176,409 | |
TPG, Inc., Class A | | | 4,479 | | | | 187,760 | |
Tradeweb Markets, Inc., Class A | | | 2,115 | | | | 230,556 | |
| | | | | | | | |
| | | | | | | 637,331 | |
| | |
| Commercial Services & Supplies — 2.1% | | | | | | |
Casella Waste Systems, Inc., Class A(a) | | | 1,671 | | | | 168,086 | |
GFL Environmental, Inc.(b) | | | 1,150 | | | | 36,190 | |
| | | | | | | | |
| | | | | | | 204,276 | |
| | |
| Construction & Engineering — 4.1% | | | | | | |
Comfort Systems U.S.A., Inc. | | | 716 | | | | 234,375 | |
WillScot Mobile Mini Holdings Corp.(a) | | | 4,060 | | | | 160,086 | |
| | | | | | | | |
| | | | | | | 394,461 | |
| | |
| Distributors — 0.8% | | | | | | |
Pool Corp. | | | 215 | | | | 78,163 | |
| | | | | | | | |
| | |
| Diversified Consumer Services — 3.2% | | | | | | |
Bright Horizons Family Solutions, Inc.(a) | | | 1,238 | | | | 130,138 | |
Duolingo, Inc., Class A(a) | | | 580 | | | | 111,012 | |
European Wax Center, Inc., Class A(a) | | | 1,746 | | | | 19,765 | |
Mister Car Wash, Inc.(a) | | | 6,530 | | | | 45,906 | |
| | | | | | | | |
| | | | | | | 306,821 | |
| | |
| Electrical Equipment — 2.3% | | | | | | |
Vertiv Holdings Co., Class A | | | 2,292 | | | | 224,776 | |
| | | | | | | | |
| | |
| Entertainment — 3.9% | | | | | | |
Liberty Media Corp. - Liberty Formula One, Class C, NVS(a) | | | 2,686 | | | | 199,140 | |
Live Nation Entertainment, Inc.(a) | | | 1,874 | | | | 175,669 | |
| | | | | | | | |
| | | | | | | 374,809 | |
| | |
| Financial Services — 0.2% | | | | | | |
Jack Henry & Associates, Inc. | | | 92 | | | | 15,151 | |
| | | | | | | | |
| | |
| Food Products — 0.7% | | | | | | |
Freshpet, Inc.(a) | | | 495 | | | | 64,929 | |
| | | | | | | | |
| | |
| Ground Transportation — 2.1% | | | | | | |
Saia, Inc.(a)(b) | | | 493 | | | | 201,874 | |
| | | | | | | | |
| | |
| Health Care Equipment & Supplies — 2.3% | | | | | | |
Align Technology, Inc.(a) | | | 653 | | | | 167,958 | |
| | | | | | | | |
| Security | | Shares | | | Value | |
| | |
| Health Care Equipment & Supplies (continued) | | | | | | |
Inmode Ltd.(a) | | | 785 | | | $ | 15,017 | |
Inspire Medical Systems, Inc.(a) | | | 216 | | | | 34,299 | |
Teleflex, Inc. | | | 29 | | | | 6,063 | |
| | | | | | | | |
| | | | | | | 223,337 | |
| | |
| Health Care Providers & Services — 0.9% | | | | | | |
Surgery Partners, Inc.(a) | | | 3,199 | | | | 88,292 | |
| | | | | | | | |
| | |
| Health Care Technology — 0.6% | | | | | | |
Certara, Inc.(a) | | | 1,103 | | | | 18,696 | |
Phreesia, Inc.(a) | | | 1,901 | | | | 35,967 | |
| | | | | | | | |
| | | | | | | 54,663 | |
| | |
| Hotels, Restaurants & Leisure — 6.1% | | | | | | |
Churchill Downs, Inc. | | | 1,278 | | | | 165,501 | |
Domino’s Pizza, Inc. | | | 41 | | | | 20,852 | |
DraftKings, Inc., Class A(a) | | | 3,782 | | | | 132,862 | |
Penn Entertainment, Inc.(a) | | | 922 | | | | 16,135 | |
Planet Fitness, Inc., Class A(a) | | | 2,063 | | | | 131,289 | |
Vail Resorts, Inc. | | | 662 | | | | 124,932 | |
| | | | | | | | |
| | | | | | | 591,571 | |
| | |
| Industrial REITs — 0.3% | | | | | | |
Rexford Industrial Realty, Inc. | | | 543 | | | | 24,630 | |
| | | | | | | | |
| | |
| Interactive Media & Services — 2.4% | | | | | | |
Match Group, Inc.(a) | | | 418 | | | | 12,803 | |
Pinterest, Inc., Class A(a) | | | 5,364 | | | | 222,553 | |
| | | | | | | | |
| | | | | | | 235,356 | |
| | |
| IT Services — 3.5% | | | | | | |
DigitalOcean Holdings, Inc.(a) | | | 2,011 | | | | 74,508 | |
Globant SA(a) | | | 1,062 | | | | 171,109 | |
MongoDB, Inc., Class A(a) | | | 405 | | | | 95,604 | |
| | | | | | | | |
| | | | | | | 341,221 | |
| | |
| Life Sciences Tools & Services — 7.5% | | | | | | |
Azenta, Inc.(a) | | | 393 | | | | 19,850 | |
Bio-Techne Corp. | | | 2,529 | | | | 195,214 | |
Charles River Laboratories International, Inc.(a) | | | 680 | | | | 141,739 | |
Medpace Holdings, Inc.(a) | | | 150 | | | | 57,951 | |
Repligen Corp.(a) | | | 993 | | | | 148,046 | |
West Pharmaceutical Services, Inc. | | | 482 | | | | 159,740 | |
| | | | | | | | |
| | | | | | | 722,540 | |
| | |
| Machinery — 3.6% | | | | | | |
AutoStore Holdings Ltd.(a)(c) | | | 56,895 | | | | 80,770 | |
Graco, Inc. | | | 1,924 | | | | 155,363 | |
IDEX Corp. | | | 535 | | | | 111,622 | |
| | | | | | | | |
| | | | | | | 347,755 | |
| | |
| Oil, Gas & Consumable Fuels — 2.0% | | | | | | |
EQT Corp. | | | 61 | | | | 2,507 | |
Permian Resources Corp., Class A | | | 5,303 | | | | 86,916 | |
Texas Pacific Land Corp. | | | 162 | | | | 99,518 | |
| | | | | | | | |
| | | | | | | 188,941 | |
| | |
| Professional Services — 2.7% | | | | | | |
Booz Allen Hamilton Holding Corp., Class A | | | 1,561 | | | | 237,600 | |
Paylocity Holding Corp.(a) | | | 144 | | | | 20,472 | |
| | | | | | | | |
| | | | | | | 258,072 | |
|
| Semiconductors & Semiconductor Equipment — 9.7% | |
ASM International NV | | | 331 | | | | 232,928 | |
Astera Labs, Inc.(a)(b) | | | 254 | | | | 16,393 | |
Entegris, Inc. | | | 1,939 | | | | 244,993 | |
| | |
S C H E D U L E O F I N V E S T M E N T S | | 3 |
| | |
Schedule of Investments (continued) May 31, 2024 | | BlackRock SMID-Cap Growth Equity Fund (Percentages shown are based on Net Assets) |
| | | | | | | | |
| Security | | Shares | | | Value | |
|
| Semiconductors & Semiconductor Equipment (continued) | |
Lattice Semiconductor Corp.(a) | | | 2,906 | | | $ | 215,742 | |
Monolithic Power Systems, Inc. | | | 305 | | | | 224,367 | |
| | | | | | | | |
| | | | | | | 934,423 | |
| | |
| Software — 12.3% | | | | | | |
ANSYS, Inc.(a) | | | 451 | | | | 143,170 | |
Aspen Technology, Inc.(a) | | | 535 | | | | 112,698 | |
Bentley Systems, Inc., Class B | | | 4,695 | | | | 235,877 | |
Confluent, Inc., Class A(a) | | | 7,120 | | | | 184,906 | |
Five9, Inc.(a) | | | 199 | | | | 9,305 | |
HubSpot, Inc.(a)(b) | | | 260 | | | | 158,873 | |
JFrog Ltd.(a) | | | 2,972 | | | | 95,609 | |
Monday.com Ltd.(a) | | | 243 | | | | 54,896 | |
PagerDuty, Inc.(a) | | | 233 | | | | 4,420 | |
PTC, Inc.(a) | | | 973 | | | | 171,482 | |
Zscaler, Inc.(a) | | | 120 | | | | 20,395 | |
| | | | | | | | |
| | | | | | | 1,191,631 | |
| | |
| Specialty Retail — 2.2% | | | | | | |
Floor & Decor Holdings, Inc., Class A(a) | | | 1,815 | | | | 212,101 | |
| | | | | | | | |
| | |
| Textiles, Apparel & Luxury Goods — 3.6% | | | | | | |
Brunello Cucinelli SpA | | | 1,275 | | | | 128,782 | |
Figs, Inc., Class A(a) | | | 2,878 | | | | 15,254 | |
On Holding AG, Class A(a) | | | 4,807 | | | | 204,490 | |
| | | | | | | | |
| | | | | | | 348,526 | |
| | |
| Trading Companies & Distributors — 3.1% | | | | | | |
Core & Main, Inc., Class A(a) | | | 2,699 | | | | 155,354 | |
SiteOne Landscape Supply, Inc.(a) | | | 947 | | | | 146,615 | |
| | | | | | | | |
| | | | | | | 301,969 | |
| | | | | | | | |
| | |
Total Long-Term Investments — 99.9%
(Cost: $8,952,732) | | | | | | | 9,636,941 | |
| | | | | | | | |
| | | | | | | | |
| Security | | Shares | | | Value | |
| | |
Short-Term Securities | | | | | | | | |
| | |
| Money Market Funds — 5.8% | | | | | | |
BlackRock Cash Funds: Institutional, SL Agency Shares, 5.49%(d)(e)(f) | | | 450,984 | | | $ | 451,119 | |
BlackRock Liquidity Funds, T-Fund, Institutional Shares, 5.19%(d)(e) | | | 111,395 | | | | 111,395 | |
| | | | | | | | |
| | |
Total Short-Term Securities — 5.8%
(Cost: $562,524) | | | | | | | 562,514 | |
| | | | | | | | |
| | |
Total Investments — 105.7%
(Cost: $9,515,256) | | | | | | | 10,199,455 | |
| | |
Liabilities in Excess of Other Assets — (5.7)% | | | | | | | (547,368 | ) |
| | | | | | | | |
| | |
Net Assets — 100.0% | | | | | | $ | 9,652,087 | |
| | | | | | | | |
| (a) | Non-income producing security. |
| (b) | All or a portion of this security is on loan. |
| (c) | Security exempt from registration pursuant to Rule 144A under the Securities Act of 1933, as amended. These securities may be resold in transactions exempt from registration to qualified institutional investors. |
| (d) | Affiliate of the Fund. |
| (e) | Annualized 7-day yield as of period end. |
| (f) | All or a portion of this security was purchased with the cash collateral from loaned securities. |
Affiliates
Investments in issuers considered to be affiliate(s) of the Fund during the year ended May 31, 2024 for purposes of Section 2(a)(3) of the Investment Company Act of 1940, as amended, were as follows:
| | | | | | | | | | | | | | | | | | | | | | | | | | | | | | | | | | | | |
| Affiliated Issuer | | Value at
05/31/23 | | | Purchases
at Cost | | | Proceeds
from Sales | | | Net
Realized
Gain (Loss) | | | Change in
Unrealized
Appreciation
(Depreciation) | | | Value at
05/31/24 | | | Shares
Held at
05/31/24 | | | Income | | | Capital
Gain
Distributions
from Underlying
Funds | |
BlackRock Cash Funds: Institutional, SL Agency Shares | | $ | — | | | $ | 451,180 | (a) | | $ | — | | | $ | (51 | ) | | $ | (10 | ) | | $ | 451,119 | | | | 450,984 | | | $ | 74 | (b) | | $ | — | |
BlackRock Liquidity Funds, T-Fund, Institutional Shares | | | 7,120 | | | | 104,275 | (a) | | | — | | | | — | | | | — | | | | 111,395 | | | | 111,395 | | | | 1,500 | | | | — | |
SL Liquidity Series, LLC, Money Market Series(c) | | | 660,597 | | | | — | | | | (660,715 | )(a) | | | 118 | | | | — | | | | — | | | | — | | | | 2,848 | (b) | | | — | |
| | | | | | | | | | | | | | | | | | | | | | | | | | | | | | | | | | | | |
| | | | | | | | | | | | | | $ | 67 | | | $ | (10 | ) | | $ | 562,514 | | | | | | | $ | 4,422 | | | $ | — | |
| | | | | | | | | | | | | | | | | | | | | | | | | | | | | | | | |
| | (a) | Represents net amount purchased (sold). | |
| | (b) | All or a portion represents securities lending income earned from the reinvestment of cash collateral from loaned securities, net of fees and collateral investment expenses, and other payments to and from borrowers of securities. | |
| | (c) | As of period end, the entity is no longer held. | |
For purposes of this report, industry and sector sub-classifications may differ from those utilized by the Fund for compliance purposes.
| | |
| 4 | | 2 0 2 4 B L A C K R O C K A N N U A L F I N A N C I A L S T A T E M E N T S |
| | |
Schedule of Investments (continued) May 31, 2024 | | BlackRock SMID-Cap Growth Equity Fund |
Fair Value Hierarchy as of Period End
Various inputs are used in determining the fair value of financial instruments. For a description of the input levels and information about the Fund’s policy regarding valuation of financial instruments, refer to the Notes to Financial Statements.
The following table summarizes the Fund’s financial instruments categorized in the fair value hierarchy. The breakdown of the Fund’s financial instruments into major categories is disclosed in the Schedule of Investments above.
| | | | | | | | | | | | | | | | |
| | | | | |
| | | Level 1 | | | Level 2 | | | Level 3 | | | Total | |
Assets | | | | | | | | | | | | | | | | |
Investments | | | | | | | | | | | | | | | | |
Long-Term Investments | | | | | | | | | | | | | | | | |
Common Stocks | | | | | | | | | | | | | | | | |
Aerospace & Defense | | $ | 537,611 | | | $ | — | | | $ | — | | | $ | 537,611 | |
Air Freight & Logistics | | | 91,670 | | | | — | | | | — | | | | 91,670 | |
Automobile Components | | | 87,086 | | | | — | | | | — | | | | 87,086 | |
Beverages | | | — | | | | 76,135 | | | | — | | | | 76,135 | |
Biotechnology | | | 111,567 | | | | — | | | | — | | | | 111,567 | |
Broadline Retail | | | 8,759 | | | | — | | | | — | | | | 8,759 | |
Building Products | | | 156,494 | | | | — | | | | — | | | | 156,494 | |
Capital Markets | | | 637,331 | | | | — | | | | — | | | | 637,331 | |
Commercial Services & Supplies | | | 204,276 | | | | — | | | | — | | | | 204,276 | |
Construction & Engineering | | | 394,461 | | | | — | | | | — | | | | 394,461 | |
Distributors | | | 78,163 | | | | — | | | | — | | | | 78,163 | |
Diversified Consumer Services | | | 306,821 | | | | — | | | | — | | | | 306,821 | |
Electrical Equipment | | | 224,776 | | | | — | | | | — | | | | 224,776 | |
Entertainment | | | 374,809 | | | | — | | | | — | | | | 374,809 | |
Financial Services | | | 15,151 | | | | — | | | | — | | | | 15,151 | |
Food Products | | | 64,929 | | | | — | | | | — | | | | 64,929 | |
Ground Transportation | | | 201,874 | | | | — | | | | — | | | | 201,874 | |
Health Care Equipment & Supplies | | | 223,337 | | | | — | | | | — | | | | 223,337 | |
Health Care Providers & Services | | | 88,292 | | | | — | | | | — | | | | 88,292 | |
Health Care Technology | | | 54,663 | | | | — | | | | — | | | | 54,663 | |
Hotels, Restaurants & Leisure | | | 591,571 | | | | — | | | | — | | | | 591,571 | |
Industrial REITs | | | 24,630 | | | | — | | | | — | | | | 24,630 | |
Interactive Media & Services | | | 235,356 | | | | — | | | | — | | | | 235,356 | |
IT Services | | | 341,221 | | | | — | | | | — | | | | 341,221 | |
Life Sciences Tools & Services | | | 722,540 | | | | — | | | | — | | | | 722,540 | |
Machinery | | | 266,985 | | | | 80,770 | | | | — | | | | 347,755 | |
Oil, Gas & Consumable Fuels | | | 188,941 | | | | — | | | | — | | | | 188,941 | |
Professional Services | | | 258,072 | | | | — | | | | — | | | | 258,072 | |
Semiconductors & Semiconductor Equipment | | | 701,495 | | | | 232,928 | | | | — | | | | 934,423 | |
Software | | | 1,191,631 | | | | — | | | | — | | | | 1,191,631 | |
Specialty Retail | | | 212,101 | | | | — | | | | — | | | | 212,101 | |
Textiles, Apparel & Luxury Goods | | | 219,744 | | | | 128,782 | | | | — | | | | 348,526 | |
Trading Companies & Distributors | | | 301,969 | | | | — | | | | — | | | | 301,969 | |
Short-Term Securities | | | | | | | | | | | | | | | | |
Money Market Funds | | | 562,514 | | | | — | | | | — | | | | 562,514 | |
| | | | | | | | | | | | | | | | |
| | $ | 9,680,840 | | | $ | 518,615 | | | $ | — | | | $ | 10,199,455 | |
| | | | | | | | | | | | | | | | |
See notes to financial statements.
| | |
S C H E D U L E O F I N V E S T M E N T S | | 5 |
Statement of Assets and Liabilities
May 31, 2024
| | | | |
| | | BlackRock
SMID-Cap
Growth Equity Fund | |
| |
ASSETS | | | | |
Investments, at value — unaffiliated(a)(b) | | $ | 9,636,941 | |
Investments, at value — affiliated(c) | | | 562,514 | |
Foreign currency, at value(d) | | | 1,941 | |
Receivables: | | | | |
Securities lending income — affiliated | | | 39 | |
Dividends — unaffiliated | | | 1,936 | |
Dividends — affiliated | | | 117 | |
From the Manager | | | 2,061 | |
| | | | |
| |
Total assets | | | 10,205,549 | |
| | | | |
| |
LIABILITIES | | | | |
Collateral on securities loaned | | | 451,180 | |
Payables: | | | | |
Administration fees | | | 440 | |
Capital shares redeemed | | | 75,474 | |
Investment advisory fees | | | 5,836 | |
Trustees’ and Officer’s fees | | | 1,235 | |
Professional fees | | | 19,253 | |
Service fees | | | 44 | |
| | | | |
| |
Total liabilities | | | 553,462 | |
| | | | |
Commitments and contingent liabilities | | | | |
| |
NET ASSETS | | $ | 9,652,087 | |
| | | | |
| |
NET ASSETS CONSIST OF: | | | | |
Paid-in capital | | $ | 15,092,134 | |
Accumulated loss | | | (5,440,047 | ) |
| | | | |
| |
NET ASSETS | | $ | 9,652,087 | |
| | | | |
(a) Investments, at cost — unaffiliated | | $ | 8,952,732 | |
(b) Securities loaned, at value | | $ | 447,234 | |
(c) Investments, at cost — affiliated | | $ | 562,524 | |
(d) Foreign currency, at cost | | $ | 1,941 | |
| | |
| 6 | | 2 0 2 4 B L A C K R O C K A N N U A L F I N A N C I A L S T A T E M E N T S |
Statement of Assets and Liabilities (continued)
May 31, 2024
| | | | |
| | | BlackRock
SMID-Cap
Growth Equity Fund | |
| |
| NET ASSET VALUE | | | |
| |
| Institutional | | | |
| |
Net assets | | $ | 65,699 | |
| | | | |
| |
Shares outstanding | | | 5,207 | |
| | | | |
| |
Net asset value | | $ | 12.62 | |
| | | | |
| |
Shares authorized | | | Unlimited | |
| | | | |
| |
Par value | | $ | 0.001 | |
| | | | |
| |
| Investor A | | | |
| |
Net assets | | $ | 220,042 | |
| | | | |
| |
Shares outstanding | | | 17,567 | |
| | | | |
| |
Net asset value | | $ | 12.53 | |
| | | | |
| |
Shares authorized | | | Unlimited | |
| | | | |
| |
Par value | | $ | 0.001 | |
| | | | |
| |
| Class K | | | |
| |
Net assets | | $ | 9,366,346 | |
| | | | |
| |
Shares outstanding | | | 740,067 | |
| | | | |
| |
Net asset value | | $ | 12.66 | |
| | | | |
| |
Shares authorized | | | Unlimited | |
| | | | |
| |
Par value | | $ | 0.001 | |
| | | | |
See notes to financial statements.
| | |
F I N A N C I A L S T A T E M E N T S | | 7 |
Statement of Operations
Year Ended May 31, 2024
| | | | |
| | | BlackRock
SMID-Cap
Growth Equity Fund | |
| |
INVESTMENT INCOME | | | | |
| |
Dividends — unaffiliated | | $ | 38,140 | |
| |
Dividends — affiliated | | | 1,500 | |
| |
Securities lending income — affiliated — net | | | 2,922 | |
| |
Foreign taxes withheld | | | (500 | ) |
| | | | |
| |
Total investment income | | | 42,062 | |
| | | | |
| |
EXPENSES | | | | |
| |
Investment advisory | | | 64,734 | |
| |
Professional | | | 19,074 | |
| |
Trustees and Officer | | | 6,136 | |
| |
Administration — class specific | | | 4,825 | |
| |
Service — class specific | | | 346 | |
| |
Miscellaneous | | | 58 | |
| | | | |
| |
Total expenses | | | 95,173 | |
| |
Less: | | | | |
| |
Fees waived and/or reimbursed by the Manager | | | (25,231 | ) |
| | | | |
| |
Total expenses after fees waived and/or reimbursed | | | 69,942 | |
| | | | |
| |
Net investment loss | | | (27,880 | ) |
| | | | |
| |
REALIZED AND UNREALIZED GAIN (LOSS) | | | | |
| |
Net realized gain (loss) from: | | | | |
| |
Investments — unaffiliated | | | (582,036 | ) |
| |
Investments — affiliated | | | 67 | |
| |
Foreign currency transactions | | | 44 | |
| | | | |
| |
| | | (581,925 | ) |
| | | | |
| |
Net change in unrealized appreciation (depreciation) on: | | | | |
| |
Investments — unaffiliated | | | 1,596,321 | |
| |
Investments — affiliated | | | (10 | ) |
| |
Foreign currency translations | | | 79 | |
| | | | |
| |
| | | 1,596,390 | |
| | | | |
| |
Net realized and unrealized gain | | | 1,014,465 | |
| | | | |
| |
NET INCREASE IN NET ASSETS RESULTING FROM OPERATIONS | | $ | 986,585 | |
| | | | |
See notes to financial statements.
| | |
| 8 | | 2 0 2 4 B L A C K R O C K A N N U A L F I N A N C I A L S T A T E M E N T S |
Statements of Changes in Net Assets
| | | | | | | | |
| | | BlackRock SMID-Cap Growth Equity Fund | |
| | | Year Ended
05/31/24 | | | Year Ended
05/31/23 | |
| | |
INCREASE (DECREASE) IN NET ASSETS | | | | | | | | |
| | |
OPERATIONS | | | | | | | | |
Net investment loss | | $ | (27,880 | ) | | $ | (22,154 | ) |
Net realized loss | | | (581,925 | ) | | | (2,544,666 | ) |
Net change in unrealized appreciation (depreciation) | | | 1,596,390 | | | | 2,465,040 | |
| | | | | | | | |
| | |
Net increase (decrease) in net assets resulting from operations | | | 986,585 | | | | (101,780 | ) |
| | | | | | | | |
| | |
CAPITAL SHARE TRANSACTIONS | | | | | | | | |
| | |
Net increase (decrease) in net assets derived from capital share transactions | | | 132,415 | | | | (17,247 | ) |
| | | | | | | | |
| | |
NET ASSETS | | | | | | | | |
Total increase (decrease) in net assets | | | 1,119,000 | | | | (119,027 | ) |
Beginning of year | | | 8,533,087 | | | | 8,652,114 | |
| | | | | | | | |
| | |
End of year | | $ | 9,652,087 | | | $ | 8,533,087 | |
| | | | | | | | |
See notes to financial statements.
| | |
F I N A N C I A L S T A T E M E N T S | | 9 |
Financial Highlights
(For a share outstanding throughout each period)
| | | | | | | | | | | | |
| | | BlackRock SMID-Cap Growth Equity Fund | |
| |
| | | Institutional | |
| | |
| Year Ended
05/31/24 |
| |
| Year Ended
05/31/23 |
| |
| Period from
06/29/21 to 05/31/22 |
(a) |
| | | |
Net asset value, beginning of period | | $ | 11.32 | | | $ | 11.45 | | | $ | 20.00 | |
| | | | | | | | | | | | |
| | | |
Net investment loss(b) | | | (0.05 | ) | | | (0.04 | ) | | | (0.09 | ) |
Net realized and unrealized gain (loss) | | | 1.35 | | | | (0.09 | ) | | | (8.46 | ) |
| | | | | | | | | | | | |
Net increase (decrease) from investment operations | | | 1.30 | | | | (0.13 | ) | | | (8.55 | ) |
| | | | | | | | | | | | |
| | | |
Net asset value, end of period | | $ | 12.62 | | | $ | 11.32 | | | $ | 11.45 | |
| | | | | | | | | | | | |
| | | |
Total Return(c) | | | | | | | | | | | | |
Based on net asset value | | | 11.48 | % | | | (1.14 | )% | | | (42.75 | )%(d) |
| | | | | | | | | | | | |
| | | |
Ratios to Average Net Assets(e) | | | | | | | | | | | | |
Total expenses | | | 1.12 | % | | | 1.23 | % | | | 1.06 | %(f)(g) |
| | | | | | | | | | | | |
Total expenses after fees waived and/or reimbursed | | | 0.85 | % | | | 0.85 | % | | | 0.85 | %(f) |
| | | | | | | | | | | | |
Net investment loss | | | (0.40 | )% | | | (0.36 | )% | | | (0.56 | )%(f) |
| | | | | | | | | | | | |
| | | |
Supplemental Data | | | | | | | | | | | | |
Net assets, end of period (000) | | $ | 66 | | | $ | 59 | | | $ | 59 | |
| | | | | | | | | | | | |
Portfolio turnover rate | | | 36 | % | | | 53 | % | | | 54 | % |
| | | | | | | | | | | | |
| (a) | Commencement of operations. |
| (b) | Based on average shares outstanding. |
| (c) | Where applicable, assumes the reinvestment of distributions. |
| (e) | Excludes fees and expenses incurred indirectly as a result of investments in underlying funds. |
| (g) | Audit costs were not annualized in the calculation of the expense ratios. If these expenses were annualized, the total expenses would have been 1.07%. |
See notes to financial statements.
| | |
| 10 | | 2 0 2 4 B L A C K R O C K A N N U A L F I N A N C I A L S T A T E M E N T S |
Financial Highlights (continued)
(For a share outstanding throughout each period)
| | | | | | | | | | | | |
| | | BlackRock SMID-Cap Growth Equity Fund (continued) | |
| |
| | | Investor A | |
| | |
| Year Ended
05/31/24 |
| |
| Year Ended
05/31/23 |
| |
| Period from
06/29/21 to 05/31/22 |
(a) |
| | | |
Net asset value, beginning of period | | $ | 11.26 | | | $ | 11.43 | | | $ | 20.00 | |
| | | | | | | | | | | | |
| | | |
Net investment loss(b) | | | (0.08 | ) | | | (0.07 | ) | | | (0.13 | ) |
Net realized and unrealized gain (loss) | | | 1.35 | | | | (0.10 | ) | | | (8.44 | ) |
| | | | | | | | | | | | |
Net increase (decrease) from investment operations | | | 1.27 | | | | (0.17 | ) | | | (8.57 | ) |
| | | | | | | | | | | | |
| | | |
Net asset value, end of period | | $ | 12.53 | | | $ | 11.26 | | | $ | 11.43 | |
| | | | | | | | | | | | |
| | | |
Total Return(c) | | | | | | | | | | | | |
Based on net asset value | | | 11.28 | % | | | (1.49 | )% | | | (42.85 | )%(d) |
| | | | | | | | | | | | |
| | | |
Ratios to Average Net Assets(e) | | | | | | | | | | | | |
Total expenses | | | 1.37 | % | | | 1.48 | % | | | 1.31 | %(f)(g) |
| | | | | | | | | | | | |
Total expenses after fees waived and/or reimbursed | | | 1.10 | % | | | 1.10 | % | | | 1.10 | %(f) |
| | | | | | | | | | | | |
Net investment loss | | | (0.64 | )% | | | (0.61 | )% | | | (0.80 | )%(f) |
| | | | | | | | | | | | |
| | | |
Supplemental Data | | | | | | | | | | | | |
Net assets, end of period (000) | | $ | 220 | | | $ | 82 | | | $ | 66 | |
| | | | | | | | | | | | |
Portfolio turnover rate | | | 36 | % | | | 53 | % | | | 54 | % |
| | | | | | | | | | | | |
| (a) | Commencement of operations. |
| (b) | Based on average shares outstanding. |
| (c) | Where applicable, excludes the effects of any sales charges and assumes the reinvestment of distributions. |
| (e) | Excludes fees and expenses incurred indirectly as a result of investments in underlying funds. |
| (g) | Audit costs were not annualized in the calculation of the expense ratios. If these expenses were annualized, the total expenses would have been 1.32%. |
See notes to financial statements.
| | |
F I N A N C I A L H I G H L I G H T S | | 11 |
Financial Highlights (continued)
(For a share outstanding throughout each period)
| | | | | | | | | | | | |
| | | BlackRock SMID-Cap Growth Equity Fund (continued) | |
| |
| | | Class K | |
| | |
| Year Ended
05/31/24 |
| |
| Year Ended
05/31/23 |
| |
| Period from
06/29/21 to 05/31/22 |
(a) |
| | | |
Net asset value, beginning of period | | $ | 11.34 | | | $ | 11.46 | | | $ | 20.00 | |
| | | | | | | | | | | | |
| | | |
Net investment loss(b) | | | (0.04 | ) | | | (0.03 | ) | | | (0.07 | ) |
Net realized and unrealized gain (loss) | | | 1.36 | | | | (0.09 | ) | | | (8.47 | ) |
| | | | | | | | | | | | |
Net increase (decrease) from investment operations | | | 1.32 | | | | (0.12 | ) | | | (8.54 | ) |
| | | | | | | | | | | | |
| | | |
Net asset value, end of period | | $ | 12.66 | | | $ | 11.34 | | | $ | 11.46 | |
| | | | | | | | | | | | |
| | | |
Total Return(c) | | | | | | | | | | | | |
Based on net asset value | | | 11.64 | % | | | (1.05 | )% | | | (42.70 | )%(d) |
| | | | | | | | | | | | |
| | | |
Ratios to Average Net Assets(e) | | | | | | | | | | | | |
Total expenses | | | 1.02 | % | | | 1.13 | % | | | 0.96 | %(f)(g) |
| | | | | | | | | | | | |
Total expenses after fees waived and/or reimbursed | | | 0.75 | % | | | 0.75 | % | | | 0.75 | %(f) |
| | | | | | | | | | | | |
Net investment loss | | | (0.30 | )% | | | (0.26 | )% | | | (0.46 | )%(f) |
| | | | | | | | | | | | |
| | | |
Supplemental Data | | | | | | | | | | | | |
Net assets, end of period (000) | | $ | 9,366 | | | $ | 8,392 | | | $ | 8,528 | |
| | | | | | | | | | | | |
Portfolio turnover rate | | | 36 | % | | | 53 | % | | | 54 | % |
| | | | | | | | | | | | |
| (a) | Commencement of operations. |
| (b) | Based on average shares outstanding. |
| (c) | Where applicable, assumes the reinvestment of distributions. |
| (e) | Excludes fees and expenses incurred indirectly as a result of investments in underlying funds. |
| (g) | Audit costs were not annualized in the calculation of the expense ratios. If these expenses were annualized, the total expenses would have been 0.97%. |
See notes to financial statements.
| | |
| 12 | | 2 0 2 4 B L A C K R O C K A N N U A L F I N A N C I A L S T A T E M E N T S |
Notes to Financial Statements
BlackRock FundsSM (the “Trust”) is registered under the Investment Company Act of 1940, as amended (the “1940 Act”), as an open-end management investment company. The Trust is organized as a Massachusetts business trust. BlackRock SMID-Cap Growth Equity Fund (the “Fund”) is a series of the Trust. The Fund is classified as diversified.
The Fund offers multiple classes of shares. All classes of shares have identical voting, dividend, liquidation and other rights and are subject to the same terms and conditions, except that certain classes bear expenses related to the shareholder servicing and distribution of such shares. Institutional and Class K Shares are sold only to certain eligible investors. Investor A Shares bear certain expenses related to shareholder servicing of such shares. Investor A Shares are generally available through financial intermediaries. Each class has exclusive voting rights with respect to matters relating to its shareholder servicing and distribution expenditures.
| | | | | | |
| Share Class | | Initial Sales Charge | | CDSC | | Conversion Privilege |
Institutional and Class K Shares | | No | | No | | None |
| Investor A Shares | | Yes | | No(a) | | None |
| | (a) | | Investor A Shares may be subject to a contingent deferred sales charge (“CDSC”) for certain redemptions where no initial sales charge was paid at the time of purchase. |
The Fund, together with certain other registered investment companies advised by BlackRock Advisors, LLC (the “Manager” or “BAL”) or its affiliates, is included in a complex of funds referred to as the BlackRock Multi-Asset Complex.
| 2. | SIGNIFICANT ACCOUNTING POLICIES |
The financial statements are prepared in conformity with accounting principles generally accepted in the United States of America (“U.S. GAAP”), which may require management to make estimates and assumptions that affect the reported amounts of assets and liabilities in the financial statements, disclosure of contingent assets and liabilities at the date of the financial statements and the reported amounts of increases and decreases in net assets from operations during the reporting period. Actual results could differ from those estimates. The Fund is considered an investment company under U.S. GAAP and follows the accounting and reporting guidance applicable to investment companies. Below is a summary of significant accounting policies:
Investment Transactions and Income Recognition: For financial reporting purposes, investment transactions are recorded on the dates the transactions are executed. Realized gains and losses on investment transactions are determined using the specific identification method. Dividend income and capital gain distributions, if any, are recorded on the ex-dividend dates. Non-cash dividends, if any, are recorded on the ex-dividend dates at fair value. Dividends from foreign securities where the ex-dividend dates may have passed are subsequently recorded when the Fund is informed of the ex-dividend dates. Under the applicable foreign tax laws, a withholding tax at various rates may be imposed on capital gains, dividends and interest. Upon notification from issuers, a portion of the dividend income received from a real estate investment trust may be redesignated as a reduction of cost of the related investment and/or realized gain. Income, expenses and realized and unrealized gains and losses are allocated daily to each class based on its relative net assets.
Foreign Currency Translation: The Fund’s books and records are maintained in U.S. dollars. Securities and other assets and liabilities denominated in foreign currencies are translated into U.S. dollars using exchange rates determined as of the close of trading on the New York Stock Exchange (“NYSE”). Purchases and sales of investments are recorded at the rates of exchange prevailing on the respective dates of such transactions. Generally, when the U.S. dollar rises in value against a foreign currency, the investments denominated in that currency will lose value; the opposite effect occurs if the U.S. dollar falls in relative value.
The Fund does not isolate the effect of fluctuations in foreign exchange rates from the effect of fluctuations in the market prices of investments for financial reporting purposes. Accordingly, the effects of changes in exchange rates on investments are not segregated in the Statement of Operations from the effects of changes in market prices of those investments, but are included as a component of net realized and unrealized gain (loss) from investments. The Fund reports realized currency gains (losses) on foreign currency related transactions as components of net realized gain (loss) for financial reporting purposes, whereas such components are generally treated as ordinary income for U.S. federal income tax purposes.
Foreign Taxes: The Fund may be subject to foreign taxes (a portion of which may be reclaimable) on income, stock dividends, capital gains on investments, or certain foreign currency transactions. All foreign taxes are recorded in accordance with the applicable foreign tax regulations and rates that exist in the foreign jurisdictions in which the Fund invests. These foreign taxes, if any, are paid by the Fund and are reflected in its Statement of Operations as follows: foreign taxes withheld at source are presented as a reduction of income, foreign taxes on securities lending income are presented as a reduction of securities lending income, foreign taxes on stock dividends are presented as “Foreign taxes withheld”, and foreign taxes on capital gains from sales of investments and foreign taxes on foreign currency transactions are included in their respective net realized gain (loss) categories. Foreign taxes payable or deferred as of May 31, 2024, if any, are disclosed in the Statement of Assets and Liabilities.
The Fund files withholding tax reclaims in certain jurisdictions to recover a portion of amounts previously withheld. The Fund may record a reclaim receivable based on collectability, which includes factors such as the jurisdiction’s applicable laws, payment history and market convention. The Statement of Operations includes tax reclaims recorded as well as professional and other fees, if any, associated with recovery of foreign withholding taxes.
Collateralization: If required by an exchange or counterparty agreement, the Fund may be required to deliver/deposit cash and/or securities to/with an exchange, or broker-dealer or custodian as collateral for certain investments.
Distributions: Distributions paid by the Fund are recorded on the ex-dividend dates. The character and timing of distributions are determined in accordance with U.S. federal income tax regulations, which may differ from U.S. GAAP.
Indemnifications: In the normal course of business, the Fund enters into contracts that contain a variety of representations that provide general indemnification. The Fund’s maximum exposure under these arrangements is unknown because it involves future potential claims against the Fund, which cannot be predicted with any certainty.
| | |
N O T E S T O F I N A N C I A L S T A T E M E N T S | | 13 |
Notes to Financial Statements (continued)
Other: Expenses directly related to the Fund or its classes are charged to the Fund or the applicable class. Expenses directly related to the Fund and other shared expenses prorated to the Fund are allocated daily to each class based on its relative net assets or other appropriate methods. Other operating expenses shared by several funds, including other funds managed by the Manager, are prorated among those funds on the basis of relative net assets or other appropriate methods.
The Fund has an arrangement with its custodian whereby credits are earned on uninvested cash balances. For financial reporting purposes, custodian credits, if any, are included in interest income in the Statement of Operations.
| 3. | INVESTMENT VALUATION AND FAIR VALUE MEASUREMENTS |
Investment Valuation Policies: The Fund’s investments are valued at fair value (also referred to as “market value” within the financial statements) each day that the Fund is open for business and, for financial reporting purposes, as of the report date. U.S. GAAP defines fair value as the price a fund would receive to sell an asset or pay to transfer a liability in an orderly transaction between market participants at the measurement date. The Board of Trustees of the Trust (the “Board”) has approved the designation of the Fund’s Manager as the valuation designee for the Fund. The Fund determines the fair values of its financial instruments using various independent dealers or pricing services under the Manager’s policies. If a security’s market price is not readily available or does not otherwise accurately represent the fair value of the security, the security will be valued in accordance with the Manager’s policies and procedures as reflecting fair value. The Manager has formed a committee (the “Valuation Committee”) to develop pricing policies and procedures and to oversee the pricing function for all financial instruments, with assistance from other BlackRock pricing committees.
Fair Value Inputs and Methodologies: The following methods and inputs are used to establish the fair value of the Fund’s assets and liabilities:
| | · | | Equity investments traded on a recognized securities exchange are valued at that day’s official closing price, as applicable, on the exchange where the stock is primarily traded. Equity investments traded on a recognized exchange for which there were no sales on that day may be valued at the last available bid (long positions) or ask (short positions) price. |
| | · | | Investments in open-end U.S. mutual funds (including money market funds) are valued at that day’s published net asset value (“NAV”). |
Generally, trading in foreign instruments is substantially completed each day at various times prior to the close of trading on the NYSE. Each business day, the Fund uses current market factors supplied by independent pricing services to value certain foreign instruments (“Systematic Fair Value Price”). The Systematic Fair Value Price is designed to value such foreign securities at fair value as of the close of trading on the NYSE, which follows the close of the local markets.
If events (e.g., market volatility, company announcement or a natural disaster) occur that are expected to materially affect the value of such investment, or in the event that application of these methods of valuation results in a price for an investment that is deemed not to be representative of the market value of such investment, or if a price is not available, the investment will be valued by the Valuation Committee in accordance with the Manager’s policies and procedures as reflecting fair value (“Fair Valued Investments”). The fair valuation approaches that may be used by the Valuation Committee include market approach, income approach and cost approach. Valuation techniques such as discounted cash flow, use of market comparables and matrix pricing are types of valuation approaches and are typically used in determining fair value. When determining the price for Fair Valued Investments, the Valuation Committee seeks to determine the price that the Fund might reasonably expect to receive or pay from the current sale or purchase of that asset or liability in an arm’s-length transaction. Fair value determinations shall be based upon all available factors that the Valuation Committee deems relevant and consistent with the principles of fair value measurement.
Fair Value Hierarchy: Various inputs are used in determining the fair value of financial instruments. These inputs to valuation techniques are categorized into a fair value hierarchy consisting of three broad levels for financial reporting purposes as follows:
| | · | | Level 1 – Unadjusted price quotations in active markets/exchanges for identical assets or liabilities that the Fund has the ability to access; |
| | · | | Level 2 – Other observable inputs (including, but not limited to, quoted prices for similar assets or liabilities in markets that are active, quoted prices for identical or similar assets or liabilities in markets that are not active, inputs other than quoted prices that are observable for the assets or liabilities (such as interest rates, yield curves, volatilities, prepayment speeds, loss severities, credit risks and default rates) or other market–corroborated inputs); and |
| | · | | Level 3 – Unobservable inputs based on the best information available in the circumstances, to the extent observable inputs are not available (including the Valuation Committee’s assumptions used in determining the fair value of financial instruments). |
The hierarchy gives the highest priority to unadjusted quoted prices in active markets for identical assets or liabilities (Level 1 measurements) and the lowest priority to unobservable inputs (Level 3 measurements). Accordingly, the degree of judgment exercised in determining fair value is greatest for instruments categorized in Level 3. The inputs used to measure fair value may fall into different levels of the fair value hierarchy. In such cases, for disclosure purposes, the fair value hierarchy classification is determined based on the lowest level input that is significant to the fair value measurement in its entirety. Investments classified within Level 3 have significant unobservable inputs used by the Valuation Committee in determining the price for Fair Valued Investments. Level 3 investments include equity or debt issued by privately held companies or funds that may not have a secondary market and/or may have a limited number of investors. The categorization of a value determined for financial instruments is based on the pricing transparency of the financial instruments and is not necessarily an indication of the risks associated with investing in those securities.
| 4. | SECURITIES AND OTHER INVESTMENTS |
Securities Lending: The Fund may lend its securities to approved borrowers, such as brokers, dealers and other financial institutions. The borrower pledges and maintains with the Fund collateral consisting of cash, an irrevocable letter of credit issued by a bank, or securities issued or guaranteed by the U.S. Government. The initial collateral received by the Fund is required to have a value of at least 102% of the current value of the loaned securities for securities traded on U.S. exchanges and a value of at least 105% for all other securities. The collateral is maintained thereafter at a value equal to at least 100% of the current market value of the securities on loan. The market value of the loaned securities is determined at the close of each business day of the Fund and any additional required collateral is delivered to the Fund, or excess collateral returned by the Fund, on the next business day. During the term of the loan, the Fund is entitled to all distributions made on or in respect of the loaned securities, but does not receive
| | |
| 14 | | 2 0 2 4 B L A C K R O C K A N N U A L F I N A N C I A L S T A T E M E N T S |
Notes to Financial Statements (continued)
interest income on securities received as collateral. Loans of securities are terminable at any time and the borrower, after notice, is required to return borrowed securities within the standard time period for settlement of securities transactions.
As of period end, any securities on loan were collateralized by cash and/or U.S. Government obligations. Cash collateral invested by the securities lending agent, BlackRock Investment Management, LLC (“BIM”), if any, is disclosed in the Schedule of Investments. Any non-cash collateral received cannot be sold, re-invested or pledged by the Fund, except in the event of borrower default. The securities on loan, if any, are disclosed in the Fund’s Schedule of Investments. The market value of any securities on loan and the value of related collateral, if any, are shown separately in the Statement of Assets and Liabilities as a component of investments at value – unaffiliated and collateral on securities loaned, respectively.
Securities lending transactions are entered into by the Fund under Master Securities Lending Agreements (each, an “MSLA”), which provide the right, in the event of default (including bankruptcy or insolvency), for the non-defaulting party to liquidate the collateral and calculate a net exposure to the defaulting party or request additional collateral. In the event that a borrower defaults, the Fund, as lender, would offset the market value of the collateral received against the market value of the securities loaned. When the value of the collateral is greater than that of the market value of the securities loaned, the lender is left with a net amount payable to the defaulting party. However, bankruptcy or insolvency laws of a particular jurisdiction may impose restrictions on or prohibitions against such a right of offset in the event of an MSLA counterparty’s bankruptcy or insolvency. Under the MSLA, absent an event of default, the borrower can resell or re-pledge the loaned securities, and the Fund can reinvest cash collateral received in connection with loaned securities. Upon an event of default, the parties’ obligations to return the securities or collateral to the other party are extinguished, and the parties can resell or re-pledge the loaned securities or the collateral received in connection with the loaned securities in order to satisfy the defaulting party’s net payment obligation for all transactions under the MSLA. The defaulting party remains liable for any deficiency.
As of period end, the following table is a summary of the Fund’s securities on loan by counterparty which are subject to offset under an MSLA:
| | | | | | | | | | | | | | |
| | | | | |
| Counterparty | |
| Securities
Loaned at Value |
| |
| Cash
Collateral Received |
(a) | |
| Non-Cash
Collateral Received, at Fair Value |
(a) | | Net Amount |
J.P. Morgan Securities LLC | | $ | 248,825 | | | $ | (248,825 | ) | | $ | — | | | $ — |
Morgan Stanley | | | 198,409 | | | | (198,409 | ) | | | — | | | — |
| | | | | | | | | | | | | | |
| | $ | 447,234 | | | $ | (447,234 | ) | | $ | — | | | $ — |
| | | | | | | | | | | | | | |
| | (a) | Collateral received, if any, in excess of the market value of securities on loan is not presented in this table. The total cash collateral received by the Fund is disclosed in the Fund’s Statement of Assets and Liabilities. |
The risks of securities lending include the risk that the borrower may not provide additional collateral when required or may not return the securities when due. To mitigate these risks, the Fund benefits from a borrower default indemnity provided by BIM. BIM’s indemnity allows for full replacement of the securities loaned to the extent the collateral received does not cover the value on the securities loaned in the event of borrower default. The Fund could incur a loss if the value of an investment purchased with cash collateral falls below the market value of loaned securities or if the value of an investment purchased with cash collateral falls below the value of the original cash collateral received. Such losses are borne entirely by the Fund.
| 5. | INVESTMENT ADVISORY AGREEMENT AND OTHER TRANSACTIONS WITH AFFILIATES |
Investment Advisory: The Trust, on behalf of the Fund, entered into an Investment Advisory Agreement with the Manager, the Fund’s investment adviser and an indirect, wholly-owned subsidiary of BlackRock, Inc. (“BlackRock”), to provide investment advisory services. The Manager is responsible for the management of the Fund’s portfolio and provides the personnel, facilities, equipment and certain other services necessary to the operations of the Fund.
For such services, the Fund pays the Manager a monthly fee at an annual rate equal to the following percentages of the average daily value of the Fund’s net assets:
| | | | |
| | |
| Average Daily Net Assets | | Investment Advisory Fees | |
First $1 billion | | | 0.70 | % |
$1 billion - $3 billion | | | 0.66 | |
$3 billion - $5 billion | | | 0.63 | |
$5 billion - $10 billion | | | 0.61 | |
Greater than $10 billion | | | 0.60 | |
Service and Distribution Fees: The Trust, on behalf of the Fund, entered into a Distribution Agreement and a Distribution and Service Plan with BlackRock Investments, LLC (“BRIL”), an affiliate of the Manager. Pursuant to the Distribution and Service Plan and in accordance with Rule 12b-1 under the 1940 Act, the Fund pays BRIL ongoing service and distribution fees. The fees are accrued daily and paid monthly at annual rates based upon the average daily net assets of the relevant share class of the Fund as follows:
| | | | | | | | |
| Share Class | | Service Fees | | | Distribution Fees | |
Investor A | | | 0.25 | % | | | N/A | |
BRIL and broker-dealers, pursuant to sub-agreements with BRIL, provide shareholder servicing and distribution services to the Fund. The ongoing service and/or distribution fee compensates BRIL and each broker-dealer for providing shareholder servicing and/or distribution related services to shareholders.
| | |
N O T E S T O F I N A N C I A L S T A T E M E N T S | | 15 |
Notes to Financial Statements (continued)
For the year ended May 31, 2024, the following table shows the class specific service and distribution fees borne directly by each share class of the Fund:
| | | | |
| | | Investor A | |
Service — class specific | | | $ 346 | |
Administration: The Trust, on behalf of the Fund, entered into an Administration Agreement with BAL, which has agreed to provide general administrative services (other than investment advice and related portfolio activities). BAL has agreed to bear all of the Fund’s ordinary operating expenses, excluding, generally, investment advisory fees, distribution fees, brokerage and other expenses related to the execution of portfolio transactions, extraordinary expenses and certain other expenses which are borne by the Fund. BAL is entitled to receive for these administrative services an annual fee based on the average daily net assets of the Fund as follows:
| | | | |
Institutional | | | 0.15 | % |
Investor A | | | 0.15 | |
Class K | | | 0.05 | |
From time to time, BAL may waive such fees in whole or in part. Any such waiver will reduce the expenses of the Fund and, accordingly, have a favorable impact on its performance. BAL may delegate certain of its administration duties to sub-administrators. For the year ended May 31, 2024, there were no fees waived/reimbursed by BAL pursuant to this arrangement.
For the year ended May 31, 2024, the following table shows the class specific administration fees borne directly by each share class of the Fund:
| | | | | | | | | | | | | | | | |
| | | Institutional | | | Investor A | | | Class K | | | Total | |
Administration — class specific | | $ | 95 | | | $ | 207 | | | | $ 4,523 | | | | $ 4,825 | |
Other Fees: For the year ended May 31, 2024, affiliates earned underwriting discounts, direct commissions and dealer concessions on sales of the Fund’s Investor A Shares for a total of $176.
Expense Limitations, Waivers and Reimbursements: The Manager contractually agreed to waive its investment advisory fees by the amount of investment advisory fees the Fund pays to the Manager indirectly through its investment in affiliated money market funds (the “affiliated money market fund waiver”) through June 30, 2025. The contractual agreement may be terminated upon 90 days’ notice by a majority of the trustees who are not “interested persons” of the Trust, as defined in the 1940 Act (“Independent Trustees”), or by a vote of a majority of the outstanding voting securities of the Fund. The amount of waivers and/or reimbursements of fees and expenses made pursuant to the expense limitation described below will be reduced by the amount of the affiliated money market fund waiver. This amount is included in fees waived and/or reimbursed by the Manager in the Statement of Operations. For the year ended May 31, 2024, the amount waived was $21.
The Manager has contractually agreed to waive its investment advisory fee with respect to any portion of the Fund’s assets invested in affiliated equity and fixed-income mutual funds and affiliated exchange-traded funds that have a contractual management fee through June 30, 2025. The contractual agreement may be terminated upon 90 days’ notice by a majority of the Independent Trustees, or by a vote of a majority of the outstanding voting securities of the Fund. For the year ended May 31, 2024, there were no fees waived by the Manager pursuant to this arrangement.
The fees and expenses of the Fund’s Independent Trustees, counsel to the Independent Trustees and the Fund’s independent registered public accounting firm (together, the “independent expenses”) are paid directly by the Fund. BAL has contractually agreed to reimburse the Fund or provide an offsetting credit for such independent expenses through June 30, 2025. The amount waived is included in fees waived and/or reimbursed by the Manager in the Statement of Operations. For the year ended May 31, 2024, the amount waived was $25,210.
Securities Lending: The U.S. Securities and Exchange Commission (“SEC”) has issued an exemptive order which permits BIM, an affiliate of the Manager, to serve as securities lending agent for the Fund, subject to applicable conditions. As securities lending agent, BIM bears all operational costs directly related to securities lending. The Fund is responsible for fees in connection with the investment of cash collateral received for securities on loan (the “collateral investment fees”). The cash collateral is invested in a money market fund, BlackRock Cash Funds: Institutional, managed by the Manager or its affiliates. However, BIM has agreed to reduce the amount of securities lending income it receives in order to effectively limit the collateral investment fees the Fund bears to an annual rate of 0.04%. The SL Agency Shares of such money market fund will not be subject to a sales load, redemption fee, distribution fee or service fee. The money market fund in which the cash collateral has been reinvested may impose a discretionary liquidity fee of up to 2% of the value redeemed, if such fee, is determined to be in the best interests of such money market fund.
Securities lending income is generally equal to the total of income earned from the reinvestment of cash collateral, (and excludes collateral investment fees), and any fees or other payments to and from borrowers of securities. The Fund retains a portion of the securities lending income and remits the remaining portion to BIM as compensation for its services as securities lending agent.
Pursuant to the current securities lending agreement, the Fund retains 81% of securities lending income (which excludes collateral investment expenses), and this amount retained can never be less than 70% of the total of securities lending income plus the collateral investment expenses.
In addition, commencing the business day following the date that the aggregate securities lending income earned across the BlackRock Multi-Asset Complex in a calendar year exceeds a specified threshold, the Fund, pursuant to the securities lending agreement, will retain for the remainder of that calendar year securities lending income in an amount equal to 81% of securities lending income (which excludes collateral investment expenses), and this amount retained can never be less than 70% of the total of securities lending income plus the collateral investment expenses.
The share of securities lending income earned by the Fund is shown as securities lending income — affiliated — net in the Statement of Operations. For the year ended May 31, 2024, the Fund paid BIM $878 for securities lending agent services.
| | |
| 16 | | 2 0 2 4 B L A C K R O C K A N N U A L F I N A N C I A L S T A T E M E N T S |
Notes to Financial Statements (continued)
Interfund Lending: In accordance with an exemptive order (the “Order”) from the SEC, the Fund may participate in a joint lending and borrowing facility for temporary purposes (the “Interfund Lending Program”), subject to compliance with the terms and conditions of the Order, and to the extent permitted by the Fund’s investment policies and restrictions. The Fund is currently permitted to borrow and lend under the Interfund Lending Program.
A lending BlackRock fund may lend in aggregate up to 15% of its net assets but may not lend more than 5% of its net assets to any one borrowing fund through the Interfund Lending Program. A borrowing BlackRock fund may not borrow through the Interfund Lending Program or from any other source more than 33 1/3% of its total assets (or any lower threshold provided for by the fund’s investment restrictions). If a borrowing BlackRock fund’s total outstanding borrowings exceed 10% of its total assets, each of its outstanding interfund loans will be subject to collateralization of at least 102% of the outstanding principal value of the loan. All interfund loans are for temporary or emergency purposes and the interest rate to be charged will be the average of the highest current overnight repurchase agreement rate available to a lending fund and the bank loan rate, as calculated according to a formula established by the Board.
During the year ended May 31, 2024, the Fund did not participate in the Interfund Lending Program.
Trustees and Officers: Certain trustees and/or officers of the Trust are directors and/or officers of BlackRock or its affiliates. The Fund reimburses the Manager for a portion of the compensation paid to the Trust’s Chief Compliance Officer, which is included in Trustees and Officer in the Statement of Operations.
For the year ended May 31, 2024, purchases and sales of investments, excluding short-term securities, were $3,488,639 and $3,337,446, respectively.
It is the Fund’s policy to comply with the requirements of the Internal Revenue Code of 1986, as amended, applicable to regulated investment companies, and to distribute substantially all of its taxable income to its shareholders. Therefore, no U.S. federal income tax provision is required.
The Fund files U.S. federal and various state and local tax returns. No income tax returns are currently under examination. The statute of limitations on the Fund’s U.S. federal tax returns generally remains open for a period of three years after they are filed. The statutes of limitations on the Fund’s state and local tax returns may remain open for an additional year depending upon the jurisdiction.
Management has analyzed tax laws and regulations and their application to the Fund as of May 31, 2024, inclusive of the open tax return years, and does not believe that there are any uncertain tax positions that require recognition of a tax liability in the Fund’s financial statements.
U.S. GAAP requires that certain components of net assets be adjusted to reflect permanent differences between financial and tax reporting. These reclassifications have no effect on net assets or NAVs per share. As of period end, permanent differences attributable to net operating loss were reclassified to the following accounts:
| | | | | | | | |
| Fund Name | | Paid-in capital | | | Accumulated earnings (loss) | |
BlackRock SMID-Cap Growth Equity Fund | | $ | (24,651) | | | $ | 24,651 | |
As of May 31, 2024, the tax components of accumulated earnings (loss) were as follows:
| | | | | | | | | | | | | | | | |
| | | | | |
| Fund Name | | Non-expiring
Capital Loss
Carryforwards(a) | | | Net Unrealized
Gains (Losses)(b) | | | Qualified Late-Year
Ordinary Losses(c) | | | Total | |
BlackRock SMID-Cap Growth Equity Fund | | $ | (6,086,903) | | | $ | 656,149 | | | $ | (9,293 | ) | | $ | (5,440,047 | ) |
| (a) | Amounts available to offset future realized capital gains. |
| (b) | The difference between book-basis and tax-basis net unrealized gains (losses) was attributable primarily to the tax deferral of losses on wash sales. |
| (c) | The Fund has elected to defer certain qualified late-year losses and recognize such losses in the next taxable year. |
As of May 31, 2024, gross unrealized appreciation and depreciation based on cost of investments (including short positions and derivatives, if any) for U.S. federal income tax purposes were as follows:
| | | | | | | | | | | | | | | | |
| | | | | |
| Fund Name | | Tax Cost | | | Gross Unrealized
Appreciation | | | Gross Unrealized
Depreciation | | | Net Unrealized
Appreciation
(Depreciation) | |
BlackRock SMID-Cap Growth Equity Fund | | $ | 9,543,306 | | | $ | 1,699,911 | | | $ | (1,043,762) | | | $ | 656,149 | |
The Trust, on behalf of the Fund, along with certain other funds managed by the Manager and its affiliates (“Participating Funds”), is party to a 364-day, $2.40 billion credit agreement with a group of lenders. Under this agreement, the Fund may borrow to fund shareholder redemptions. Excluding commitments designated for certain individual funds, the Participating Funds, including the Fund, can borrow up to an aggregate commitment amount of $1.75 billion at any time outstanding, subject to asset coverage and other limitations as specified in the agreement. The credit agreement has the following terms: a fee of 0.10% per annum on unused commitment amounts and interest at a rate equal to the higher of (a) Overnight Bank Funding Rate (“OBFR”) (but, in any event, not less than 0.00%) on the date the loan is made plus 0.80% per annum, (b) the Fed Funds
| | |
N O T E S T O F I N A N C I A L S T A T E M E N T S | | 17 |
Notes to Financial Statements (continued)
rate (but, in any event, not less than 0.00%) in effect from time to time plus 0.80% per annum on amounts borrowed or (c) the sum of (x) Daily Simple Secured Overnight Financing Rate (“SOFR”) (but, in any event, not less than 0.00%) on the date the loan is made plus 0.10% and (y) 0.80% per annum. The agreement expires in April 2025 unless extended or renewed. These fees were allocated among such funds based upon portions of the aggregate commitment available to them and relative net assets of Participating Funds. During the year ended May 31, 2024, the Fund did not borrow under the credit agreement.
In the normal course of business, the Fund invests in securities or other instruments and may enter into certain transactions, and such activities subject the Fund to various risks, including among others, fluctuations in the market (market risk) or failure of an issuer to meet all of its obligations. The value of securities or other instruments may also be affected by various factors, including, without limitation: (i) the general economy; (ii) the overall market as well as local, regional or global political and/or social instability; (iii) regulation, taxation or international tax treaties between various countries; or (iv) currency, interest rate and price fluctuations. Local, regional or global events such as war, acts of terrorism, the spread of infectious illness or other public health issues, recessions, or other events could have a significant impact on the Fund and its investments. The Fund’s prospectus provides details of the risks to which the Fund is subject.
The Fund may be exposed to additional risks when reinvesting cash collateral in money market funds that do not seek to maintain a stable NAV per share of $1.00, which may be subject to discretionary liquidity fees under certain circumstances.
Valuation Risk: The market values of equities, such as common stocks and preferred securities or equity related investments, such as futures and options, may decline due to general market conditions which are not specifically related to a particular company. They may also decline due to factors which affect a particular industry or industries. The Fund may invest in illiquid investments. An illiquid investment is any investment that the Fund reasonably expects cannot be sold or disposed of in current market conditions in seven calendar days or less without the sale or disposition significantly changing the market value of the investment. The Fund may experience difficulty in selling illiquid investments in a timely manner at the price that it believes the investments are worth. Prices may fluctuate widely over short or extended periods in response to company, market or economic news. Markets also tend to move in cycles, with periods of rising and falling prices. This volatility may cause the Fund’s NAV to experience significant increases or decreases over short periods of time. If there is a general decline in the securities and other markets, the NAV of the Fund may lose value, regardless of the individual results of the securities and other instruments in which the Fund invests.
Counterparty Credit Risk: The Fund may be exposed to counterparty credit risk, or the risk that an entity may fail to or be unable to perform on its commitments related to unsettled or open transactions, including making timely interest and/or principal payments or otherwise honoring its obligations. The Fund manages counterparty credit risk by entering into transactions only with counterparties that the Manager believes have the financial resources to honor their obligations and by monitoring the financial stability of those counterparties. Financial assets, which potentially expose the Fund to market, issuer and counterparty credit risks, consist principally of financial instruments and receivables due from counterparties. The extent of the Fund’s exposure to market, issuer and counterparty credit risks with respect to these financial assets is approximately their value recorded in the Statement of Assets and Liabilities, less any collateral held by the Fund.
Geographic/Asset Class Risk: A diversified portfolio, where this is appropriate and consistent with a fund’s objectives, minimizes the risk that a price change of a particular investment will have a material impact on the NAV of a fund. The investment concentrations within the Fund’s portfolio are disclosed in its Schedule of Investments.
The Fund invests a significant portion of its assets in securities within a single or limited number of market sectors. When a fund concentrates its investments in this manner, it assumes the risk that economic, regulatory, political and social conditions affecting such sectors may have a significant impact on the Fund and could affect the income from, or the value or liquidity of, the Fund’s portfolio. Investment percentages in specific sectors are presented in the Schedule of Investments.
The Fund invests a significant portion of its assets in securities of issuers located in the United States. A decrease in imports or exports, changes in trade regulations, inflation and/or an economic recession in the United States may have a material adverse effect on the U.S. economy and the securities listed on U.S. exchanges. Proposed and adopted policy and legislative changes in the United States may also have a significant effect on U.S. markets generally, as well as on the value of certain securities. Governmental agencies project that the United States will continue to maintain elevated public debt levels for the foreseeable future which may constrain future economic growth. Circumstances could arise that could prevent the timely payment of interest or principal on U.S. government debt, such as reaching the legislative “debt ceiling.” Such non-payment would result in substantial negative consequences for the U.S. economy and the global financial system. If U.S. relations with certain countries deteriorate, it could adversely affect issuers that rely on the United States for trade. The United States has also experienced increased internal unrest and discord. If these trends were to continue, they may have an adverse impact on the U.S. economy and the issuers in which the Fund invests.
Significant Shareholder Redemption Risk: Certain shareholders may own or manage a substantial amount of fund shares and/or hold their fund investments for a limited period of time. Large redemptions of fund shares by these shareholders may force a fund to sell portfolio securities, which may negatively impact the fund’s NAV, increase the fund’s brokerage costs, and/or accelerate the realization of taxable income/gains and cause the fund to make additional taxable distributions to shareholders.
| 10. | CAPITAL SHARE TRANSACTIONS |
Transactions in capital shares for each class were as follows:
| | | | | | | | | | | | | | | | |
| | | Year Ended 05/31/24 | | | Year Ended 05/31/23 | |
| Share Class | | Shares | | | Amount | | | Shares | | | Amount | |
| | | | |
Institutional | | | | | | | | | | | | | | | | |
Shares sold | | | — | | | $ | — | | | | 87 | | | $ | 973 | |
| | | | | | | | | | | | | | | | |
| | |
| 18 | | 2 0 2 4 B L A C K R O C K A N N U A L F I N A N C I A L S T A T E M E N T S |
Notes to Financial Statements (continued)
| | | | | | | | | | | | | | | | |
| | | |
| | | Year Ended 05/31/24 | | | Year Ended 05/31/23 | |
| | | | |
| Share Class | | Shares | | | Amount | | | Shares | | | Amount | |
| | | | |
Investor A | | | | | | | | | | | | | | | | |
Shares sold | | | 17,493 | | | $ | 221,015 | | | | 8,702 | | | $ | 97,672 | |
Shares redeemed | | | (7,238 | ) | | | (89,255 | ) | | | (7,124 | ) | | | (73,826 | ) |
| | | | | | | | | | | | | | | | |
| | | 10,255 | | | $ | 131,760 | | | | 1,578 | | | $ | 23,846 | |
| | | | | | | | | | | | | | | | |
| | | | |
Class K | | | | | | | | | | | | | | | | |
Shares sold | | | 87 | | | $ | 1,055 | | | | 82 | | | $ | 912 | |
Shares redeemed | | | (31 | ) | | | (400 | ) | | | (3,998 | ) | | | (42,978 | ) |
| | | | | | | | | | | | | | | | |
| | | 56 | | | $ | 655 | | | | (3,916) | | | $ | (42,066 | ) |
| | | | | | | | | | | | | | | | |
| | | 10,311 | | | $ | 132,415 | | | | (2,251) | | | $ | (17,247 | ) |
| | | | | | | | | | | | | | | | |
As of May 31, 2024, shares owned by BlackRock Financial Management, Inc., an affiliate of the Fund, were as follows:
| | |
| | |
| Share Class | | |
Institutional | | 5,000 |
Investor A | | 5,000 |
Class K | | 740,000 |
Management has evaluated the impact of all subsequent events on the Fund through the date the financial statements were issued and has determined that there were no subsequent events requiring adjustment or additional disclosure in the financial statements.
| | |
N O T E S T O F I N A N C I A L S T A T E M E N T S | | 19 |
Report of Independent Registered Public Accounting Firm
To the Shareholders of BlackRock SMID-Cap Growth Equity Fund and the Board of Trustees of BlackRock FundsSM:
Opinion on the Financial Statements and Financial Highlights
We have audited the accompanying statement of assets and liabilities of BlackRock SMID-Cap Growth Equity Fund of BlackRock FundsSM (the “Fund”), including the schedule of investments, as of May 31, 2024, the related statement of operations for the year then ended, the statements of changes in net assets for each of the two years in the period then ended, the financial highlights for each of the two years in the period then ended and for the period from June 29, 2021 (commencement of operations) through May 31, 2022, and the related notes. In our opinion, the financial statements and financial highlights present fairly, in all material respects, the financial position of the Fund as of May 31, 2024, and the results of its operations for the year then ended, the changes in its net assets for each of the two years in the period then ended, and the financial highlights for each of the two years in the period then ended and for the period from June 29, 2021 (commencement of operations) through May 31, 2022, in conformity with accounting principles generally accepted in the United States of America.
Basis for Opinion
These financial statements and financial highlights are the responsibility of the Fund’s management. Our responsibility is to express an opinion on the Fund’s financial statements and financial highlights based on our audit. We are a public accounting firm registered with the Public Company Accounting Oversight Board (United States) (PCAOB) and are required to be independent with respect to the Fund in accordance with the U.S. federal securities laws and the applicable rules and regulations of the Securities and Exchange Commission and the PCAOB.
We conducted our audit in accordance with the standards of the PCAOB. Those standards require that we plan and perform the audit to obtain reasonable assurance about whether the financial statements and financial highlights are free of material misstatement, whether due to error or fraud. The Fund is not required to have, nor were we engaged to perform, an audit of its internal control over financial reporting. As part of our audit we are required to obtain an understanding of internal control over financial reporting but not for the purpose of expressing an opinion on the effectiveness of the Fund’s internal control over financial reporting. Accordingly, we express no such opinion.
Our audit included performing procedures to assess the risks of material misstatement of the financial statements and financial highlights, whether due to error or fraud, and performing procedures that respond to those risks. Such procedures included examining, on a test basis, evidence regarding the amounts and disclosures in the financial statements and financial highlights. Our audit also included evaluating the accounting principles used and significant estimates made by management, as well as evaluating the overall presentation of the financial statements and financial highlights. Our procedures included confirmation of securities owned as of May 31, 2024, by correspondence with custodians or counterparties; when replies were not received, we performed other auditing procedures. We believe that our audit provides a reasonable basis for our opinion.
Deloitte & Touche LLP
Boston, Massachusetts
July 24, 2024
We have served as the auditor of one or more BlackRock investment companies since 1992.
| | |
| 20 | | 2 0 2 4 B L A C K R O C K A N N U A L F I N A N C I A L S T A T E M E N T S |
Important Tax Information (unaudited)
The following amount, or maximum amount allowable by law, is hereby designated as qualified dividend income for individuals for the fiscal year ended May 31, 2024:
| | |
| | |
| Fund Name | | Qualified Dividend
Income |
BlackRock SMID-Cap Growth Equity Fund | | $ 37,400 |
| | |
I M P O R T A N T T A X I N F O R M A T I O N | | 21 |
Disclosure of Investment Advisory Agreement
The Board of Trustees (the “Board,” the members of which are referred to as “Board Members”) of BlackRock Funds (the “Trust”) met on April 16, 2024 (the “April Meeting”) and May 16-17, 2024 (the “May Meeting”) to consider the approval to continue the investment advisory agreement (the “Agreement”) between the Trust, on behalf of BlackRock SMID-Cap Growth Equity Fund (the “Fund”), and BlackRock Advisors, LLC (the “Manager” or “BlackRock”), the Fund’s investment advisor.
The Approval Process
Consistent with the requirements of the Investment Company Act of 1940 (the “1940 Act”), the Board considers the approval of the continuation of the Agreement for the Fund on an annual basis. The Board members who are not “interested persons” of the Trust, as defined in the 1940 Act, are considered independent Board members (the “Independent Board Members”). The Board’s consideration entailed a year-long deliberative process during which the Board and its committees assessed BlackRock’s various services to the Fund, including through the review of written materials and oral presentations, and the review of additional information provided in response to requests from the Independent Board Members. The Board had four quarterly meetings per year, each of which extended over a two-day period, as well as additional ad hoc meetings and executive sessions throughout the year, as needed. The committees of the Board similarly met throughout the year. The Board also had an additional one-day meeting to consider specific information regarding the renewal of the Agreement. In considering the renewal of the Agreement, the Board assessed, among other things, the nature, extent and quality of the services provided to the Fund by BlackRock, BlackRock’s personnel and affiliates, including (as applicable): investment management services; accounting oversight; administrative and shareholder services; oversight of the Fund’s service providers; risk management and oversight; and legal, regulatory and compliance services. Throughout the year, including during the contract renewal process, the Independent Board Members were advised by independent legal counsel, and met with independent legal counsel in various executive sessions outside of the presence of BlackRock’s management.
During the year, the Board, acting directly and through its committees, considered information that was relevant to its annual consideration of the renewal of the Agreement, including the services and support provided by BlackRock to the Fund and its shareholders. BlackRock also furnished additional information to the Board in response to specific questions from the Board. Among the matters the Board considered were: (a) investment performance for one-year, three-year, five-year, and/or since inception periods, as applicable, against peer funds, relevant benchmarks, and other performance metrics, as applicable, as well as BlackRock senior management’s and portfolio managers’ investment performance analyses, and the reasons for any outperformance or underperformance relative to its peers, benchmarks, and other performance metrics, as applicable; (b) fees, including advisory, administration, if applicable, and other amounts paid to BlackRock and its affiliates by the Fund for services; (c) Fund operating expenses and how BlackRock allocates expenses to the Fund; (d) the resources devoted to, risk oversight of, and compliance reports relating to, implementation of the Fund’s investment objective, policies and restrictions, and meeting regulatory requirements; (e) BlackRock’s and the Fund’s adherence to applicable compliance policies and procedures; (f) the nature, character and scope of non-investment management services provided by BlackRock and its affiliates and the estimated cost of such services, as available; (g) BlackRock’s and other service providers’ internal controls and risk and compliance oversight mechanisms; (h) BlackRock’s implementation of the proxy voting policies approved by the Board; (i) the use of brokerage commissions and execution quality of portfolio transactions; (j) BlackRock’s implementation of the Fund’s valuation and liquidity procedures; (k) an analysis of management fees paid to BlackRock for products with similar investment mandates across the open-end fund, exchange-traded fund (“ETF”), closed-end fund, sub-advised mutual fund, separately managed account, collective investment trust, and institutional separate account product channels, as applicable, and the similarities and differences between these products and the services provided as compared to the Fund; (l) BlackRock’s compensation methodology for its investment professionals and the incentives and accountability it creates, along with investment professionals’ investments in the fund(s) they manage; and (m) periodic updates on BlackRock’s business.
Prior to and in preparation for the April Meeting, the Board received and reviewed materials specifically relating to the renewal of the Agreement. The Independent Board Members continuously engaged in a process with their independent legal counsel and BlackRock to review the nature and scope of the information provided to the Board to better assist its deliberations. The materials provided in connection with the April Meeting included, among other things: (a) information independently compiled and prepared by Broadridge Financial Solutions, Inc. (“Broadridge”), based on either a Lipper classification or Morningstar category, regarding the Fund’s fees and expenses as compared with a peer group of funds as determined by Broadridge (“Expense Peers”) and the investment performance of the Fund as compared with a peer group of funds (“Performance Peers”); (b) information on the composition of the Expense Peers and Performance Peers and a description of Broadridge’s methodology; (c) information on the estimated profits realized by BlackRock and its affiliates pursuant to the Agreement and a discussion of fall-out benefits to BlackRock and its affiliates; (d) a general analysis provided by BlackRock concerning investment management fees received in connection with other types of investment products, such as institutional accounts, sub-advised mutual funds, ETFs, closed-end funds, open-end funds, and separately managed accounts, under similar investment mandates, as well as the performance of such other products, as applicable; (e) a review of non-management fees; (f) the existence, impact and sharing of potential economies of scale, if any, with the Fund; (g) a summary of aggregate amounts paid by the Fund to BlackRock; (h) sales and redemption data regarding the Fund’s shares; and (i) various additional information requested by the Board as appropriate regarding BlackRock’s and the Fund’s operations.
At the April Meeting, the Board reviewed materials relating to its consideration of the Agreement and the Independent Board Members presented BlackRock with questions and requests for additional information. BlackRock responded to these questions and requests with additional written information in advance of the May Meeting, and such responses were reviewed by the Board Members.
At the May Meeting, the Board concluded its assessment of, among other things: (a) the nature, extent and quality of the services provided by BlackRock; (b) the investment performance of the Fund as compared to its Performance Peers and to other metrics, as applicable; (c) the advisory fee and the estimated cost of the services and estimated profits realized by BlackRock and its affiliates from their relationship with the Fund; (d) the Fund’s fees and expenses compared to its Expense Peers; (e) the existence and sharing of potential economies of scale; (f) any fall-out benefits to BlackRock and its affiliates as a result of BlackRock’s relationship with the Fund; and (g) other factors deemed relevant by the Board Members.
The Board also considered other matters it deemed important to the approval process, such as other payments made to BlackRock or its affiliates relating to securities lending and cash management, and BlackRock’s services related to the valuation and pricing of Fund portfolio holdings. The Board noted the willingness of BlackRock’s personnel to engage in open, candid discussions with the Board. The Board evaluated the information available to it on a fund-by-fund basis. The following paragraphs provide more information about some of the primary factors that were relevant to the Board’s decision. The Board Members did not identify any particular information, or any single factor as determinative, and each Board Member may have attributed different weights to the various items and factors considered.
| | |
| 22 | | 2 0 2 4 B L A C K R O C K A N N U A L F I N A N C I A L S T A T E M E N T S |
Disclosure of Investment Advisory Agreement (continued)
A. Nature, Extent and Quality of the Services Provided by BlackRock
The Board, including the Independent Board Members, reviewed the nature, extent and quality of services provided by BlackRock, including the investment advisory services, and the resulting performance of the Fund. Throughout the year, the Board compared Fund performance to the performance of a comparable group of mutual funds, relevant benchmarks, and performance metrics, as applicable. The Board met with BlackRock’s senior management personnel responsible for investment activities, including the senior investment officers. The Board also reviewed the materials provided by the Fund’s portfolio management team discussing the Fund’s performance, investment strategies and outlook.
The Board considered, among other factors, with respect to BlackRock: the experience of the Fund’s portfolio management team; research capabilities; investments by portfolio managers in the funds they manage; portfolio trading capabilities; use of technology; commitment to compliance; credit analysis capabilities; risk analysis and oversight capabilities; and the approach to training and retaining portfolio managers and other research, advisory and management personnel. The Board also considered BlackRock’s overall risk management program, including the continued efforts of BlackRock and its affiliates to address cybersecurity risks and the role of BlackRock’s Risk & Quantitative Analysis Group. The Board engaged in a review of BlackRock’s compensation structure with respect to the Fund’s portfolio management team and BlackRock’s ability to attract and retain high-quality talent and create performance incentives.
In addition to investment advisory services, the Board considered the nature and quality of the administrative and other non-investment advisory services provided to the Fund. BlackRock and its affiliates provide the Fund with certain administrative, shareholder and other services (in addition to any such services provided to the Fund by third parties) and officers and other personnel as are necessary for the operations of the Fund. In particular, BlackRock and its affiliates provide the Fund with administrative services including, among others: (i) responsibility for disclosure documents, such as the prospectus, the summary prospectus (as applicable), the statement of additional information and periodic shareholder reports; (ii) oversight of daily accounting and pricing; (iii) responsibility for periodic filings with regulators; (iv) overseeing and coordinating the activities of third-party service providers including, among others, the Fund’s custodian, fund accountant, transfer agent, and auditor; (v) organizing Board meetings and preparing the materials for such Board meetings; (vi) providing legal and compliance support; (vii) furnishing analytical and other support to assist the Board in its consideration of strategic issues such as the merger, consolidation or repurposing of certain open-end funds; and (viii) performing or managing administrative functions necessary for the operation of the Fund, such as tax reporting, expense management, fulfilling regulatory filing requirements, overseeing the Fund’s distribution partners, and shareholder call center and other services. The Board reviewed the structure and duties of BlackRock’s fund administration, shareholder services, and legal and compliance departments and considered BlackRock’s policies and procedures for assuring compliance with applicable laws and regulations. The Board considered the operation of BlackRock’s business continuity plans.
B. The Investment Performance of the Fund
The Board, including the Independent Board Members, reviewed and considered the performance history of the Fund throughout the year and at the April Meeting. In preparation for the April Meeting, the Board was provided with reports independently prepared by Broadridge, which included an analysis of the Fund’s performance as of December 31, 2023, as compared to its Performance Peers. Broadridge ranks funds in quartiles, ranging from first to fourth, where first is the most desirable quartile position and fourth is the least desirable. In connection with its review, the Board received and reviewed information regarding the investment performance of the Fund as compared to its Performance Peers and the respective Morningstar Category (“Morningstar Category”). The Board and its Performance Oversight Committee regularly review and meet with Fund management to discuss the performance of the Fund throughout the year.
In evaluating performance, the Board focused particular attention on funds with less favorable performance records. The Board also noted that while it found the data provided by Broadridge generally useful, it recognized the limitations of such data, including in particular, that notable differences may exist between a fund and its Performance Peers (for example, the investment objectives and strategies). Further, the Board recognized that the performance data reflects a snapshot of a period as of a particular date and that selecting a different performance period could produce significantly different results. The Board also acknowledged that long-term performance could be impacted by even one period of significant outperformance or underperformance, and that a single investment theme could have the ability to disproportionately affect long-term performance.
The Board noted that for the one-year and since-inception periods reported, the Fund ranked in the third and fourth quartiles, respectively, against its Morningstar Category. The Board noted that BlackRock believes that the Morningstar Category is an appropriate performance metric for the Fund, and that BlackRock has explained its rationale for this belief to the Board. The Board and BlackRock reviewed the Fund’s underperformance relative to its Morningstar Category during the applicable periods. The Board was informed that, among other things, underperformance was driven by differences in portfolio positioning across sectors, market caps and the types of growth equities. There were also stock-specific issues in the consumer discretionary, healthcare, and information technology spaces. The Board and BlackRock discussed BlackRock’s strategy for improving the Fund’s investment performance. Discussions covered topics such as performance attribution, the Fund’s investment personnel, and the resources appropriate to support the Fund’s investment processes.
C. Consideration of the Advisory/Management Fees and the Estimated Cost of the Services and Estimated Profits Realized by BlackRock and its Affiliates from their Relationship with the Fund
The Board, including the Independent Board Members, reviewed the Fund’s contractual management fee rate compared with those of its Expense Peers. The contractual management fee rate represents a combination of the advisory fee and any administrative fees, before taking into account any reimbursements or fee waivers. The Board also compared the Fund’s total expense ratio, as well as its actual management fee rate, to those of its Expense Peers. The total expense ratio represents a fund’s total net operating expenses, including any 12b-1 or non-12b-1 service fees. The total expense ratio gives effect to any expense reimbursements or fee waivers, and the actual management fee rate gives effect to any management fee reimbursements or waivers. The Board considered that the fee and expense information in the Broadridge report for the Fund reflected information for a specific period and that historical asset levels and expenses may differ from current levels, particularly in a period of market volatility. The Board considered the services provided and the fees charged by BlackRock and its affiliates to other types of clients with similar investment mandates, as applicable, including institutional accounts and sub-advised mutual funds (including mutual funds sponsored by third parties).
| | |
D I S C L O S U R E O F I N V E S T M E N T A D V I S O R Y A G R E E M E N T | | 23 |
Disclosure of Investment Advisory Agreement (continued)
The Board received and reviewed statements relating to BlackRock’s financial condition. The Board reviewed BlackRock’s profitability methodology and was also provided with an estimated profitability analysis that detailed the revenues earned and the expenses incurred by BlackRock for services provided to the Fund. The Board reviewed BlackRock’s estimated profitability with respect to the Fund and other funds the Board currently oversees for the year ended December 31, 2023 compared to available aggregate estimated profitability data provided for the prior two years. The Board reviewed BlackRock’s estimated profitability with respect to certain other U.S. fund complexes managed by the Manager and/or its affiliates. The Board reviewed BlackRock’s assumptions and methodology of allocating expenses in the estimated profitability analysis, noting the inherent limitations in allocating costs among various advisory products. The Board recognized that profitability may be affected by numerous factors including, among other things, fee waivers and expense reimbursements by the Manager, the types of funds managed, precision of expense allocations and business mix. The Board thus recognized that calculating and comparing profitability at the individual fund level is difficult.
The Board noted that, in general, individual fund or product line profitability of other advisors is not publicly available. The Board reviewed BlackRock’s overall operating margin, in general, compared to that of certain other publicly traded asset management firms. The Board considered the differences between BlackRock and these other firms, including the contribution of technology at BlackRock, BlackRock’s expense management, and the relative product mix.
The Board considered whether BlackRock has the financial resources necessary to attract and retain high quality investment management personnel to perform its obligations under the Agreement and to continue to provide the high quality of services that is expected by the Board. The Board further considered factors including but not limited to BlackRock’s commitment of time and resources, assumption of risk, and liability profile in servicing the Fund, including in contrast to what is required of BlackRock with respect to other products with similar investment mandates across the open-end fund, ETF, closed-end fund, sub-advised mutual fund, separately managed account, collective investment trust, and institutional separate account product channels, as applicable.
The Board noted that the Fund’s contractual management fee rate ranked in the third quartile, and that the actual management fee rate and total expense ratio ranked in the second and first quartiles, respectively, relative to the Fund’s Expense Peers. The Board also noted that the Fund has an advisory fee arrangement that includes breakpoints that adjust the fee rate downward as the size of the Fund increases above certain contractually specified levels. The Board additionally noted that the breakpoints can, conversely, adjust the advisory fee rate upward as the size of the Fund decreases below certain contractually specified levels. The Board further noted that BlackRock and its affiliates have contractually agreed to reimburse or otherwise compensate the Fund for certain other fees and expenses.
D. Economies of Scale
The Board, including the Independent Board Members, considered the extent to which any economies of scale might benefit the Fund in a variety of ways as the assets of the Fund increase. The Board considered multiple factors, including the advisory fee rate and breakpoints, unitary fee structure, fee waivers, and/or expense caps, as applicable. The Board considered the Fund’s asset levels and whether the current fee schedule was appropriate.
E. Other Factors Deemed Relevant by the Board Members
The Board, including the Independent Board Members, also took into account other ancillary or “fall-out” benefits that BlackRock or its affiliates may derive from BlackRock’s respective relationships with the Fund, both tangible and intangible, such as BlackRock’s ability to leverage its investment professionals who manage other portfolios and its risk management personnel, an increase in BlackRock’s profile in the investment advisory community, and the engagement of BlackRock’s affiliates as service providers to the Fund, including for administrative, distribution, securities lending and cash management services. With respect to securities lending, during the year the Board also considered information provided by independent third-party consultants related to the performance of each BlackRock affiliate as securities lending agent. The Board also considered BlackRock’s overall operations and its efforts to expand the scale of, and improve the quality of, its operations. The Board also noted that, subject to applicable law, BlackRock may use and benefit from third-party research obtained by soft dollars generated by certain registered fund transactions to assist in managing all or a number of its other client accounts.
In connection with its consideration of the Agreement, the Board also received information regarding BlackRock’s brokerage and soft dollar practices. The Board received reports from BlackRock which included information on brokerage commissions and trade execution practices throughout the year.
The Board noted the competitive nature of the open-end fund marketplace, and that shareholders are able to redeem their Fund shares if they believe that the Fund’s fees and expenses are too high or if they are dissatisfied with the performance of the Fund.
Conclusion
At the May Meeting, in a continuation of the discussions that occurred during the April Meeting, and as a culmination of the Board’s year-long deliberative process, the Board, including the Independent Board Members, unanimously approved the continuation of the Agreement between the Manager and the Trust, on behalf of the Fund, for a one-year term ending June 30, 2025. Based upon its evaluation of all of the aforementioned factors in their totality, as well as other information, the Board, including the Independent Board Members, was satisfied that the terms of the Agreement were fair and reasonable and in the best interest of the Fund and its shareholders. In arriving at its decision to approve the Agreement, the Board did not identify any single factor or group of factors as all-important or controlling, but considered all factors together, and different Board Members may have attributed different weights to the various factors considered. The Independent Board Members were advised by independent legal counsel throughout the deliberative process.
| | |
| 24 | | 2 0 2 4 B L A C K R O C K A N N U A L F I N A N C I A L S T A T E M E N T S |
Additional Information
Changes in and Disagreements with Accountants
Not applicable.
Proxy Results
Not applicable.
Remuneration Paid to Trustees, Officers, and Others
Compensation to the independent directors/trustees of the Fund is paid by the Fund.
General Information
Quarterly performance, semi-annual and annual reports, current net asset value and other information regarding the Fund may be found on BlackRock’s website, which can be accessed at blackrock.com. Any reference to BlackRock’s website in this report is intended to allow investors public access to information regarding the Fund and does not, and is not intended to, incorporate BlackRock’s website in this report.
Electronic Delivery
Shareholders can sign up for e-mail notifications of quarterly statements, annual and semi-annual shareholder reports and prospectuses by enrolling in the electronic delivery program.
To enroll in electronic delivery:
Shareholders Who Hold Accounts with Investment Advisors, Banks or Brokerages:
Please contact your financial advisor. Please note that not all investment advisors, banks or brokerages may offer this service.
Shareholders Who Hold Accounts Directly with BlackRock:
1. Access the BlackRock website at blackrock.com
2. Select “Access Your Account”
3. Next, select “eDelivery” in the “Related Resources” box and follow the sign-up instructions.
BlackRock’s Mutual Fund Family
BlackRock offers a diverse lineup of open-end mutual funds crossing all investment styles and managed by experts in equity, fixed-income and tax-exempt investing. Visit blackrock.com for more information.
Shareholder Privileges
Account Information
Call us at (800) 441-7762 from 8:00 AM to 6:00 PM ET on any business day to get information about your account balances, recent transactions and share prices. You can also visit blackrock.com for more information.
Automatic Investment Plans
Investor class shareholders who want to invest regularly can arrange to have $50 or more automatically deducted from their checking or savings account and invested in any of the BlackRock funds.
Systematic Withdrawal Plans
Investor class shareholders can establish a systematic withdrawal plan and receive periodic payments of $50 or more from their BlackRock funds, as long as their account balance is at least $10,000.
Retirement Plans
Shareholders may make investments in conjunction with Traditional, Rollover, Roth, Coverdell, Simple IRAs, SEP IRAs and 403(b) Plans.
| | |
A D D I T I O N A L I N F O R M A T I O N | | 25 |
Additional Information (continued)
Fund and Service Providers
| | |
| Investment Adviser and Administrator | | Distributor |
| BlackRock Advisors, LLC | | BlackRock Investments, LLC |
| Wilmington, DE 19809 | | New York, NY 10001 |
| |
| Accounting Agent and Transfer Agent | | Independent Registered Public Accounting Firm |
| BNY Mellon Investment Servicing (US) Inc. | | Deloitte & Touche LLP |
| Wilmington, DE 19809 | | Boston, MA 02116 |
| |
| Custodian | | Legal Counsel |
| The Bank of New York Mellon | | Sidley Austin LLP |
| New York, NY 10286 | | New York, NY 10019 |
| |
| | Address of the Trust |
| | 100 Bellevue Parkway |
| | Wilmington, DE 19809 |
| | |
| 26 | | 2 0 2 4 B L A C K R O C K A N N U A L F I N A N C I A L S T A T E M E N T S |
Glossary of Terms Used in this Report
| | |
| Portfolio Abbreviation |
| |
| NVS | | Non-Voting Shares |
| | |
G L O S S A R Y O F T E R M S U S E D I N T H I S R E P O R T | | 27 |
��
Want to know more?
blackrock.com | 800-441-7762
This report is intended for current holders. It is not authorized for use as an offer of sale or a solicitation of an offer to buy shares of the Fund unless preceded or accompanied by the Fund’s current prospectus. Past performance results shown in this report should not be considered a representation of future performance. Investment returns and principal value of shares will fluctuate so that shares, when redeemed, may be worth more or less than their original cost. Statements and other information herein are as dated and are subject to change.
| | |

| | MAY 31, 2024 |
| | |
| |
| | 2024 Annual Financial Statements |
BlackRock Capital Appreciation Fund, Inc.
BlackRock FundsSM
| · | | BlackRock Health Sciences Opportunities Portfolio |
| · | | BlackRock Infrastructure Sustainable Opportunities Fund |
| · | | BlackRock Mid-Cap Growth Equity Portfolio |
| · | | BlackRock Technology Opportunities Fund |
|
| Not FDIC Insured • May Lose Value • No Bank Guarantee |
Table of Contents
Derivative Financial Instruments
The Funds may invest in various derivative financial instruments. These instruments are used to obtain exposure to a security, commodity, index, market, and/or other assets without owning or taking physical custody of securities, commodities and/or other referenced assets or to manage market, equity, credit, interest rate, foreign currency exchange rate, commodity and/or other risks. Derivative financial instruments may give rise to a form of economic leverage and involve risks, including the imperfect correlation between the value of a derivative financial instrument and the underlying asset, possible default of the counterparty to the transaction or illiquidity of the instrument. Pursuant to Rule 18f-4 under the 1940 Act, among other things, the Funds must either use derivative financial instruments with embedded leverage in a limited manner or comply with an outer limit on fund leverage risk based on value-at-risk. The Funds’ successful use of a derivative financial instrument depends on the investment adviser’s ability to predict pertinent market movements accurately, which cannot be assured. The use of these instruments may result in losses greater than if they had not been used, may limit the amount of appreciation a Fund can realize on an investment and/or may result in lower distributions paid to shareholders. The Funds’ investments in these instruments, if any, are discussed in detail in the Notes to Financial Statements.
| | |
D E R I V A T I V E F I N A N C I A L I N S T R U M E N T S | | 3 |
| | |
Schedule of Investments May 31, 2024 | | BlackRock Capital Appreciation Fund, Inc. (Percentages shown are based on Net Assets) |
| | | | | | | | |
| Security | | Shares | | | Value | |
| |
| | |
Common Stocks | | | | | | | | |
| | |
Aerospace & Defense — 2.1% | | | | | | | | |
TransDigm Group, Inc. | | | 54,745 | | | $ | 73,535,126 | |
| | | | | | | | |
| | |
| Automobiles — 0.9% | | | | | | |
Ferrari NV | | | 80,436 | | | | 33,059,196 | |
| | | | | | | | |
| | |
| Broadline Retail — 9.6% | | | | | | |
Amazon.com, Inc.(a) | | | 1,891,163 | | | | 333,676,800 | |
| | | | | | | | |
| | |
| Capital Markets — 3.9% | | | | | | |
Blackstone, Inc., Class A, NVS | | | 291,849 | | | | 35,167,805 | |
MSCI, Inc., Class A | | | 95,451 | | | | 47,265,426 | |
S&P Global, Inc. | | | 122,944 | | | | 52,559,789 | |
| | | | | | | | |
| | | | | | | 134,993,020 | |
| | |
| Chemicals — 1.0% | | | | | | |
Sherwin-Williams Co. (The) | | | 116,787 | | | | 35,479,891 | |
| | | | | | | | |
|
| Commercial Services & Supplies — 2.1% | |
Copart, Inc.(a) | | | 821,631 | | | | 43,595,741 | |
Waste Connections, Inc. | | | 183,053 | | | | 30,079,269 | |
| | | | | | | | |
| | | | | | | 73,675,010 | |
| | |
| Entertainment — 2.6% | | | | | | |
Netflix, Inc.(a) | | | 144,116 | | | | 92,467,708 | |
| | | | | | | | |
| | |
| Financial Services — 5.1% | | | | | | |
Mastercard, Inc., Class A | | | 116,055 | | | | 51,884,709 | |
Visa, Inc., Class A | | | 461,456 | | | | 125,728,302 | |
| | | | | | | | |
| | | | | | | 177,613,011 | |
|
| Health Care Equipment & Supplies — 5.2% | |
Align Technology, Inc.(a) | | | 163,239 | | | | 41,986,703 | |
Boston Scientific Corp.(a) | | | 435,822 | | | | 32,935,068 | |
IDEXX Laboratories, Inc.(a) | | | 72,748 | | | | 36,152,119 | |
Intuitive Surgical, Inc.(a) | | | 171,876 | | | | 69,114,777 | |
| | | | | | | | |
| | | | | | | 180,188,667 | |
|
| Health Care Providers & Services — 0.6% | |
UnitedHealth Group, Inc. | | | 39,254 | | | | 19,445,254 | |
| | | | | | | | |
|
| Hotels, Restaurants & Leisure — 0.9% | |
Chipotle Mexican Grill, Inc.(a) | | | 10,011 | | | | 31,329,625 | |
| | | | | | | | |
|
| Interactive Media & Services — 9.1% | |
Alphabet, Inc., Class A(a) | | | 805,652 | | | | 138,974,970 | |
Meta Platforms, Inc., Class A | | | 381,716 | | | | 178,196,480 | |
| | | | | | | | |
| | | | | | | 317,171,450 | |
| | |
| IT Services — 1.3% | | | | | | |
MongoDB, Inc., Class A(a) | | | 72,101 | | | | 17,020,162 | |
Shopify, Inc., Class A(a) | | | 484,819 | | | | 28,677,044 | |
| | | | | | | | |
| | | | | | | 45,697,206 | |
|
| Life Sciences Tools & Services — 2.6% | |
Danaher Corp. | | | 176,688 | | | | 45,373,479 | |
Thermo Fisher Scientific, Inc. | | | 79,334 | | | | 45,060,125 | |
| | | | | | | | |
| | | | | | | 90,433,604 | |
| | |
| Pharmaceuticals — 3.2% | | | | | | |
Eli Lilly & Co. | | | 136,855 | | | | 112,267,631 | |
| | | | | | | | |
| | | | | | | | |
| Security | | Shares | | | Value | |
| |
|
| Real Estate Management & Development — 1.0% | |
CoStar Group, Inc.(a) | | | 453,059 | | | $ | 35,415,622 | |
| | | | | | | | |
|
| Semiconductors & Semiconductor Equipment — 21.3% | |
ASML Holding NV, Registered Shares | | | 119,759 | | | | 115,010,556 | |
Broadcom, Inc. | | | 95,620 | | | | 127,035,951 | |
KLA Corp. | | | 67,772 | | | | 51,474,867 | |
NVIDIA Corp. | | | 408,032 | | | | 447,337,722 | |
| | | | | | | | |
| | | | | | | 740,859,096 | |
| | |
| Software — 18.2% | | | | | | |
Cadence Design Systems, Inc.(a) | | | 216,675 | | | | 62,036,219 | |
Intuit, Inc. | | | 209,784 | | | | 120,927,889 | |
Microsoft Corp. | | | 873,418 | | | | 362,582,014 | |
Roper Technologies, Inc. | | | 99,862 | | | | 53,202,479 | |
Synopsys, Inc.(a) | | | 62,371 | | | | 34,977,657 | |
| | | | | | | | |
| | | | | | | 633,726,258 | |
|
| Technology Hardware, Storage & Peripherals — 7.3% | |
Apple Inc. | | | 1,317,046 | | | | 253,202,093 | |
| | | | | | | | |
|
| Textiles, Apparel & Luxury Goods — 1.0% | |
LVMH Moet Hennessy Louis Vuitton SE | | | 43,759 | | | | 34,996,002 | |
| | | | | | | | |
| | |
Total Common Stocks — 99.0%
(Cost: $1,398,490,585) | | | | | 3,449,232,270 | |
| | | | | | | | |
| | |
Preferred Securities | | | | | | | | |
| | |
Preferred Stocks — 0.9% | | | | | | | | |
|
| Interactive Media & Services — 0.9% | |
Bytedance Ltd., Series E-1 (Acquired 11/11/20, cost $19,426,516)(a)(b)(c) | | | 177,291 | | | | 30,813,176 | |
| | | | | | | | |
| | |
Total Long-Term Investments — 99.9%
(Cost: $1,417,917,101) | | | | | | | 3,480,045,446 | |
| | | | | | | | |
| | |
Short-Term Securities | | | | | | | | |
| | |
Money Market Funds — 0.1% | | | | | | | | |
BlackRock Liquidity Funds, T-Fund, Institutional Shares, 5.19%(d)(e) | | | 4,697,315 | | | | 4,697,315 | |
| | | | | | | | |
| | |
Total Short-Term Securities — 0.1%
(Cost: $4,697,315) | | | | | | | 4,697,315 | |
| | | | | | | | |
| | |
Total Investments — 100.0%
(Cost: $1,422,614,416) | | | | | | | 3,484,742,761 | |
Other Assets Less Liabilities — 0.0% | | | | | | | 207,501 | |
| | | | | | | | |
| | |
| Net Assets — 100.0% | | | | | $ 3,484,950,262 | |
| | | | | | | | |
| (a) | Non-income producing security. |
| (b) | Security is valued using significant unobservable inputs and is classified as Level 3 in the fair value hierarchy. |
| (c) | Restricted security as to resale, excluding 144A securities. The Fund held restricted securities with a current value of $30,813,176, representing 0.9% of its net assets as of period end, and an original cost of $19,426,516. |
| (d) | Affiliate of the Fund. |
| (e) | Annualized 7-day yield as of period end. |
| | |
| 4 | | 2 0 2 4 B L A C K R O C K A N N U A L F I N A N C I A L S T A T E M E N T S |
| | |
Schedule of Investments (continued) May 31, 2024 | | BlackRock Capital Appreciation Fund, Inc. |
Affiliates
Investments in issuers considered to be affiliate(s) of the Fund during the year ended May 31, 2024 for purposes of Section 2(a)(3) of the Investment Company Act of 1940, as amended, were as follows:
| | | | | | | | | | | | | | | | | | | | | | | | | | | | | | | | | | | | |
| Affiliated Issuer | | Value at
05/31/23 | | | Purchases
at Cost | | | Proceeds
from Sales | | | Net
Realized
Gain (Loss) | | | Change in
Unrealized
Appreciation
(Depreciation) | | | Value at
05/31/24 | | | Shares
Held at
05/31/24 | | | Income | | | Capital Gain
Distributions
from Underlying
Funds | |
BlackRock Liquidity Funds, T-Fund, Institutional Shares | | $ | 1,248,701 | | | $ | 3,448,614 | (a) | | $ | — | | | $ | — | | | $ | — | | | $ | 4,697,315 | | | | 4,697,315 | | | $ | 148,044 | | | $ | — | |
SL Liquidity Series, LLC, Money Market Series(b) | | | — | | | | — | | | | (3,536 | )(a) | | | 3,536 | | | | — | | | | — | | | | — | | | | 5,978 | (c) | | | — | |
| | | | | | | | | | | | | | | | | | | | | | | | | | | | | | | | | | | | |
| | | | | | | | | | | | | | $ | 3,536 | | | $ | — | | | $ | 4,697,315 | | | | | | | $ | 154,022 | | | $ | — | |
| | | | | | | | | | | | | | | | | | | | | | | | | | | | | | | | | | | | |
| | (a) | Represents net amount purchased (sold). | |
| | (b) | As of period end, the entity is no longer held. | |
| | (c) | All or a portion represents securities lending income earned from the reinvestment of cash collateral from loaned securities, net of fees and collateral investment expenses, and other payments to and from borrowers of securities. | |
For purposes of this report, industry and sector sub-classifications may differ from those utilized by the Fund for compliance purposes.
Fair Value Hierarchy as of Period End
Various inputs are used in determining the fair value of financial instruments. For a description of the input levels and information about the Fund’s policy regarding valuation of financial instruments, refer to the Notes to Financial Statements.
The following table summarizes the Fund’s financial instruments categorized in the fair value hierarchy. The breakdown of the Fund’s financial instruments into major categories is disclosed in the Schedule of Investments above.
| | | | | | | | | | | | | | | | |
| | | Level 1 | | | Level 2 | | | Level 3 | | | Total | |
Assets | | | | | | | | | | | | | | | | |
Investments | | | | | | | | | | | | | | | | |
Long-Term Investments | | | | | | | | | | | | | | | | |
Common Stocks | | | | | | | | | | | | | | | | |
Aerospace & Defense | | $ | 73,535,126 | | | $ | — | | | $ | — | | | $ | 73,535,126 | |
Automobiles | | | 33,059,196 | | | | — | | | | — | | | | 33,059,196 | |
Broadline Retail | | | 333,676,800 | | | | — | | | | — | | | | 333,676,800 | |
Capital Markets | | | 134,993,020 | | | | — | | | | — | | | | 134,993,020 | |
Chemicals | | | 35,479,891 | | | | — | | | | — | | | | 35,479,891 | |
Commercial Services & Supplies | | | 73,675,010 | | | | — | | | | — | | | | 73,675,010 | |
Entertainment | | | 92,467,708 | | | | — | | | | — | | | | 92,467,708 | |
Financial Services | | | 177,613,011 | | | | — | | | | — | | | | 177,613,011 | |
Health Care Equipment & Supplies | | | 180,188,667 | | | | — | | | | — | | | | 180,188,667 | |
Health Care Providers & Services | | | 19,445,254 | | | | — | | | | — | | | | 19,445,254 | |
Hotels, Restaurants & Leisure | | | 31,329,625 | | | | — | | | | — | | | | 31,329,625 | |
Interactive Media & Services | | | 317,171,450 | | | | — | | | | — | | | | 317,171,450 | |
IT Services | | | 45,697,206 | | | | — | | | | — | | | | 45,697,206 | |
Life Sciences Tools & Services | | | 90,433,604 | | | | — | | | | — | | | | 90,433,604 | |
Pharmaceuticals | | | 112,267,631 | | | | — | | | | — | | | | 112,267,631 | |
Real Estate Management & Development | | | 35,415,622 | | | | — | | | | — | | | | 35,415,622 | |
Semiconductors & Semiconductor Equipment | | | 740,859,096 | | | | — | | | | — | | | | 740,859,096 | |
Software | | | 633,726,258 | | | | — | | | | — | | | | 633,726,258 | |
Technology Hardware, Storage & Peripherals | | | 253,202,093 | | | | — | | | | — | | | | 253,202,093 | |
Textiles, Apparel & Luxury Goods | | | — | | | | 34,996,002 | | | | — | | | | 34,996,002 | |
Preferred Securities | | | — | | | | — | | | | 30,813,176 | | | | 30,813,176 | |
Short-Term Securities | | | | | | | | | | | | | | | | |
Money Market Funds | | | 4,697,315 | | | | — | | | | — | | | | 4,697,315 | |
| | | | | | | | | | | | | | | | |
| | $ | 3,418,933,583 | | | $ | 34,996,002 | | | $ | 30,813,176 | | | $ | 3,484,742,761 | |
| | | | | | | | | | | | | | | | |
See notes to financial statements.
| | |
S C H E D U L E S O F I N V E S T M E N T S | | 5 |
| | |
Schedule of Investments May 31, 2024 | | BlackRock Health Sciences Opportunities Portfolio (Percentages shown are based on Net Assets) |
| | | | | | | | |
| Security | | Shares | | | Value | |
| | |
Common Stocks | | | | | | | | |
| | |
Biotechnology — 23.8% | | | | | | | | |
4D Molecular Therapeutics, Inc.(a)(b) | | | 237,618 | | | $ | 5,695,703 | |
AbbVie, Inc. | | | 2,493,505 | | | | 402,052,746 | |
AC Immune SA(a) | | | 1,083,340 | | | | 5,037,531 | |
Allogene Therapeutics, Inc.(a) | | | 1,479,779 | | | | 3,699,448 | |
Alnylam Pharmaceuticals, Inc.(a) | | | 336,692 | | | | 49,975,194 | |
Amgen, Inc. | | | 1,031,070 | | | | 315,352,759 | |
Argenx SE, ADR(a) | | | 210,109 | | | | 77,954,641 | |
Autolus Therapeutics PLC, ADR(a) | | | 889,962 | | | | 3,728,941 | |
Avidity Biosciences, Inc.(a) | | | 162,160 | | | | 4,355,618 | |
Beam Therapeutics, Inc.(a)(b) | | | 285,429 | | | | 6,798,919 | |
BeiGene Ltd., ADR(a) | | | 96,865 | | | | 14,418,355 | |
Biogen, Inc.(a) | | | 596,508 | | | | 134,178,510 | |
BioMarin Pharmaceutical, Inc.(a) | | | 642,970 | | | | 48,267,758 | |
Blueprint Medicines Corp.(a) | | | 366,990 | | | | 38,739,464 | |
Bridgebio Pharma, Inc.(a) | | | 231,965 | | | | 6,497,340 | |
Cabaletta Bio, Inc.(a) | | | 419,920 | | | | 4,278,985 | |
CG oncology, Inc.(a) | | | 226,387 | | | | 7,375,688 | |
CureVac NV(a)(b) | | | 412,061 | | | | 1,602,917 | |
Denali Therapeutics, Inc.(a) | | | 485,670 | | | | 9,014,035 | |
Dyne Therapeutics, Inc.(a) | | | 337,551 | | | | 10,761,126 | |
Exact Sciences Corp.(a) | | | 266,253 | | | | 12,101,199 | |
Frequency Therapeutics, Inc., CVR(a) | | | 428,010 | | | | 5,821 | |
Genmab A/S(a) | | | 42,470 | | | | 11,987,539 | |
Genmab A/S, ADR(a)(b) | | | 289,405 | | | | 8,161,221 | |
Gilead Sciences, Inc. | | | 766,272 | | | | 49,248,301 | |
Immatics NV(a)(b) | | | 298,703 | | | | 3,294,694 | |
Immunocore Holdings PLC, ADR(a)(b) | | | 181,355 | | | | 8,882,768 | |
Incyte Corp.(a) | | | 212,725 | | | | 12,293,378 | |
Insmed, Inc.(a) | | | 231,810 | | | | 12,761,141 | |
Ionis Pharmaceuticals, Inc.(a)(b) | | | 259,920 | | | | 9,765,194 | |
Kyverna Therapeutics, Inc.(a) | | | 133,243 | | | | 1,669,535 | |
Legend Biotech Corp., ADR(a)(b) | | | 465,786 | | | | 18,636,098 | |
Merus NV(a) | | | 314,737 | | | | 16,756,598 | |
Mirati Therapeutics, Inc., CVR(a)(b)(c) | | | 228,510 | | | | 159,957 | |
Moderna, Inc.(a) | | | 461,694 | | | | 65,814,480 | |
MoonLake Immunotherapeutics(a) | | | 144,884 | | | | 5,890,983 | |
Morphic Holding, Inc.(a) | | | 111,625 | | | | 3,390,051 | |
Neurocrine Biosciences, Inc.(a) | | | 141,165 | | | | 19,115,153 | |
Neurogene, Inc.(a)(b) | | | 328,151 | | | | 12,338,478 | |
Nurix Therapeutics, Inc.(a) | | | 619,557 | | | | 9,758,023 | |
Nuvalent, Inc., Class A(a) | | | 171,862 | | | | 11,277,584 | |
Prime Medicine, Inc.(a)(b) | | | 360,982 | | | | 2,339,163 | |
Protagonist Therapeutics, Inc.(a) | | | 403,935 | | | | 11,370,770 | |
PTC Therapeutics, Inc.(a) | | | 287,575 | | | | 10,456,227 | |
Regeneron Pharmaceuticals, Inc.(a) | | | 132,462 | | | | 129,833,954 | |
REGENXBIO, Inc.(a) | | | 259,095 | | | | 3,718,013 | |
REVOLUTION Medicines, Inc.(a) | | | 273,618 | | | | 10,487,778 | |
Rhythm Pharmaceuticals, Inc.(a) | | | 690,347 | | | | 24,631,581 | |
Rocket Pharmaceuticals, Inc.(a) | | | 266,176 | | | | 5,674,872 | |
Roivant Sciences Ltd.(a)(b) | | | 793,275 | | | | 8,218,329 | |
Sage Therapeutics, Inc.(a) | | | 188,970 | | | | 2,099,457 | |
Sagimet Biosciences, Inc., Series A(a) | | | 302,930 | | | | 1,614,617 | |
Sarepta Therapeutics, Inc.(a) | | | 277,172 | | | | 35,993,556 | |
Soleno Therapeutics, Inc.(a) | | | 168,265 | | | | 7,080,591 | |
Stoke Therapeutics, Inc.(a) | | | 969,335 | | | | 14,171,678 | |
Tenaya Therapeutics, Inc.(a) | | | 843,991 | | | | 3,553,202 | |
TScan Therapeutics, Inc.(a) | | | 681,015 | | | | 5,822,678 | |
Ultragenyx Pharmaceutical, Inc.(a) | | | 203,611 | | | | 8,172,946 | |
Vaxcyte, Inc.(a) | | | 405,425 | | | | 28,489,215 | |
Vertex Pharmaceuticals, Inc.(a) | | | 369,034 | | | | 168,035,942 | |
Viking Therapeutics, Inc.(a)(b) | | | 355,715 | | | | 22,146,816 | |
| | | | | | | | |
| Security | | Shares | | | Value | |
| | |
| Biotechnology (continued) | | | | | | |
Voyager Therapeutics, Inc.(a) | | | 445,885 | | | $ | 3,745,434 | |
Xenon Pharmaceuticals, Inc.(a) | | | 491,964 | | | | 18,729,069 | |
Zealand Pharma A/S(a) | | | 61,090 | | | | 5,731,054 | |
| | | | | | | | |
| | | | | | | 1,975,210,816 | |
| | |
| Financial Services — 0.1% | | | | | | |
Helix Acquisition Corp. II, Class A(a) | | | 850,715 | | | | 8,796,393 | |
| | | | | | | | |
| | |
| Health Care Equipment & Supplies — 22.7% | | | | | | |
Abbott Laboratories | | | 2,270,813 | | | | 232,054,380 | |
ABIOMED INC, CVR(a)(c) | | | 243,643 | | | | 475,104 | |
Align Technology, Inc.(a) | | | 112,515 | | | | 28,939,983 | |
Baxter International, Inc. | | | 857,481 | | | | 29,231,527 | |
Becton Dickinson & Co. | | | 460,640 | | | | 106,854,661 | |
Boston Scientific Corp.(a) | | | 6,120,098 | | | | 462,495,806 | |
Cooper Cos., Inc. (The) | | | 841,493 | | | | 79,361,205 | |
Dexcom, Inc.(a) | | | 583,560 | | | | 69,309,421 | |
Edwards Lifesciences Corp.(a) | | | 1,050,925 | | | | 91,314,873 | |
GE HealthCare Technologies, Inc.(b) | | | 610,150 | | | | 47,591,700 | |
Glaukos Corp.(a) | | | 72,255 | | | | 8,144,584 | |
IDEXX Laboratories, Inc.(a) | | | 109,065 | | | | 54,199,852 | |
Inspire Medical Systems, Inc.(a)(b) | | | 83,905 | | | | 13,323,275 | |
Intuitive Surgical, Inc.(a) | | | 607,294 | | | | 244,205,063 | |
Masimo Corp.(a) | | | 300,683 | | | | 37,435,033 | |
Medtronic PLC | | | 740,167 | | | | 60,227,389 | |
Novocure Ltd.(a) | | | 326,090 | | | | 7,177,241 | |
Nyxoah SA(a) | | | 411,250 | | | | 3,869,863 | |
Orchestra BioMed Holdings, Inc.(a) | | | 262,308 | | | | 1,817,794 | |
Penumbra, Inc.(a) | | | 169,035 | | | | 32,027,061 | |
Shockwave Medical, Inc.(a) | | | 43,700 | | | | 14,628,575 | |
STERIS PLC | | | 133,060 | | | | 29,656,413 | |
Stryker Corp. | | | 672,262 | | | | 229,301,846 | |
| | | | | | | | |
| | | | | | | 1,883,642,649 | |
| | |
| Health Care Providers & Services — 21.1% | | | | | | |
Cencora, Inc. | | | 884,445 | | | | 200,388,704 | |
Centene Corp.(a) | | | 1,064,645 | | | | 76,217,936 | |
Cigna Group (The) | | | 440,846 | | | | 151,924,348 | |
Elevance Health, Inc. | | | 469,102 | | | | 252,602,045 | |
Guardant Health, Inc.(a) | | | 338,156 | | | | 9,164,028 | |
HCA Healthcare, Inc. | | | 315,226 | | | | 107,098,033 | |
Humana, Inc. | | | 202,155 | | | | 72,395,749 | |
Labcorp Holdings, Inc. | | | 93,970 | | | | 18,315,693 | |
McKesson Corp. | | | 346,650 | | | | 197,448,373 | |
Quest Diagnostics, Inc. | | | 162,538 | | | | 23,075,520 | |
UnitedHealth Group, Inc. | | | 1,307,619 | | | | 647,755,224 | |
| | | | | | | | |
| | | | | | | 1,756,385,653 | |
| | |
| Life Sciences Tools & Services — 9.4% | | | | | | |
Agilent Technologies, Inc. | | | 340,743 | | | | 44,436,295 | |
Avantor, Inc.(a) | | | 772,826 | | | | 18,609,650 | |
Bio-Techne Corp. | | | 229,860 | | | | 17,742,893 | |
Danaher Corp. | | | 1,086,677 | | | | 279,058,654 | |
IQVIA Holdings, Inc.(a) | | | 92,792 | | | | 20,329,799 | |
Mettler-Toledo International, Inc.(a) | | | 16,205 | | | | 22,753,278 | |
Nautilus Biotechnology, Inc.(a) | | | 308,716 | | | | 845,882 | |
QIAGEN NV | | | 491,713 | | | | 21,271,504 | |
Rapid Micro Biosystems, Inc., Class A(a) | | | 227,396 | | | | 181,917 | |
Repligen Corp.(a) | | | 117,900 | | | | 17,577,711 | |
Thermo Fisher Scientific, Inc. | | | 517,267 | | | | 293,797,311 | |
West Pharmaceutical Services, Inc. | | | 141,185 | | | | 46,790,121 | |
| | | | | | | | |
| | | | | | | 783,395,015 | |
| | |
| Pharmaceuticals — 21.2% | | | | | | |
AstraZeneca PLC | | | 387,389 | | | | 60,219,246 | |
| | |
| 6 | | 2 0 2 4 B L A C K R O C K A N N U A L F I N A N C I A L S T A T E M E N T S |
| | |
Schedule of Investments (continued) May 31, 2024 | | BlackRock Health Sciences Opportunities Portfolio (Percentages shown are based on Net Assets) |
| | | | | | | | |
| Security | | Shares | | | Value | |
| | |
| Pharmaceuticals (continued) | | | | | | |
Daiichi Sankyo Co. Ltd. | | | 504,500 | | | $ | 17,808,390 | |
Elanco Animal Health, Inc.(a) | | | 1,398,355 | | | | 24,722,916 | |
Eli Lilly & Co. | | | 1,000,066 | | | | 820,394,142 | |
Johnson & Johnson | | | 1,144,423 | | | | 167,852,521 | |
Longboard Pharmaceuticals, Inc.(a) | | | 40,431 | | | | 762,933 | |
Merck & Co., Inc. | | | 2,846,699 | | | | 357,374,593 | |
Novo Nordisk A/S, Class B | | | 661,170 | | | | 89,580,678 | |
Pfizer, Inc. | | | 4,403,419 | | | | 126,201,989 | |
Sanofi SA | | | 388,736 | | | | 38,058,031 | |
Structure Therapeutics, Inc., ADR(a)(b) | | | 373,826 | | | | 12,784,849 | |
Zoetis, Inc., Class A | | | 294,631 | | | | 49,957,632 | |
| | | | | | | | |
| | | | | | | 1,765,717,920 | |
| | | | | | | | |
| | |
Total Common Stocks — 98.3%
(Cost: $4,663,506,885) | | | | | 8,173,148,446 | |
| | | | | | | | |
| | |
| | | Par (000) | | | | |
| | |
Other Interests(a)(c)(d)(e) | | | | | | | | |
Afferent Pharmaceuticals, Inc., Series C (Acquired 06/30/15, cost $0) | | USD | 3,421 | | | | 478,889 | |
Affinivax Inc. (Acquired 08/19/22, cost $0) | | | 123 | | | | 1,636,016 | |
| | | | | | | | |
| | |
Total Other Interests — 0.0%
(Cost: $0) | | | | | 2,114,905 | |
| | | | | | | | |
| | |
| | | Shares | | | | |
| | |
Preferred Securities | | | | | | | | |
| | |
Preferred Stocks — 0.7% | | | | | | | | |
| | |
| Biotechnology — 0.4% | | | | | | |
Adarx Pharmaceuticals, Inc., Series C (Acquired 08/02/23,
cost $6,399,994)(a)(c)(e) | | | 769,230 | | | | 6,399,994 | |
Cellarity, Inc., Series B (Acquired 01/15/21, cost $5,149,998)(a)(c)(e) | | | 858,333 | | | | 2,583,582 | |
Genesis Therapeutics, Inc., Series B (Acquired 08/10/23,
cost $4,207,998)(a)(c)(e) | | | 823,870 | | | | 4,144,066 | |
Goldfinch Bio, Inc., Series B (Acquired 06/26/20 - 03/21/22,
cost $4,152,184)(a)(c)(e) | | | 3,518,800 | | | | 1,301,956 | |
| | | | | | | | |
| Security | | Shares | | | Value | |
| | |
| Biotechnology (continued) | | | | | | |
Kartos Therapeutics, Inc., Series C (Acquired 08/22/23,
cost $6,974,988)(a)(c)(e) | | | 1,233,856 | | | $ | 7,489,506 | |
Laronde, Inc., Series B (Acquired 07/28/21, cost $10,822,560)(a)(c)(e) | | | 386,520 | | | | 10,822,560 | |
| | | | | | | | |
| | | | | | | 32,741,664 | |
|
| Health Care Equipment & Supplies — 0.0% | |
Exo Imaging, Inc., Series C (Acquired 06/24/21, cost $11,178,997)(a)(c)(e) | | | 1,908,330 | | | | 5,495,990 | |
Swift Health Systems, Inc., Series D (Acquired 08/27/21,
cost $5,271,070)(a)(c)(e) | | | 1,700,345 | | | | 374 | |
| | | | | | | | |
| | | | | | | 5,496,364 | |
| | |
| Health Care Providers & Services — 0.1% | | | | | | |
Quanta Dialysis Technologies Ltd., Series D (Acquired 06/18/21,
cost $9,727,321)(a)(c)(e) | | | 80,024,425 | | | | 5,812,354 | |
| | | | | | | | |
| | |
| Pharmaceuticals — 0.1% | | | | | | |
Insitro, Series C (Acquired 03/10/21,
cost $10,839,964)(a)(c)(e) | | | 592,636 | | | | 6,145,635 | |
| | | | | | | | |
| | |
| Software — 0.1% | | | | | | |
Carbon Health Technologies, Inc. | | | | | | | | |
Series D2 (Acquired 07/09/21,
cost $16,855,000)(a)(c)(e) | | | 1,670,499 | | | | 4,543,758 | |
Series D2 (Acquired 02/27/24,
cost $1,209,000)(a)(c)(e) | | | 1,209 | | | | 1,269,208 | |
| | | | | | | | |
| | | | | | | 5,812,966 | |
| | | | | | | | |
| | |
Total Preferred Securities — 0.7%
(Cost: $92,789,074) | | | | | 56,008,983 | |
| | | | | | | | |
| | |
Warrants(a)(b) | | | | | | | | |
| | |
Health Care Providers & Services — 0.0% | | | | | | | | |
CareMax, Inc. (Issued/Exercisable 07/21/21, 1 Share for 1 Warrant, Expires 08/06/26, Strike Price USD 0.00) | | | 88,432 | | | | 831 | |
| | | | | | | | |
| | |
| Pharmaceuticals — 0.0% | | | | | | |
Nuvation Bio, Inc. (Issued/Exercisable 08/17/20, 1 Share for 1 Warrant, Expires 07/07/27, Strike Price USD 0.00) | | | 77,354 | | | | 19,246 | |
| | | | | | | | |
| | |
Total Warrants — 0.0%
(Cost: $306,235) | | | | | 20,077 | |
| | | | | | | | |
| | |
Total Long-Term Investments — 99.0%
(Cost: $4,756,602,194) | | | | | 8,231,292,411 | |
| | | | | | | | |
| | |
Short-Term Securities | | | | | | | | |
| | |
Money Market Funds — 2.0% | | | | | | | | |
BlackRock Cash Funds: Institutional, SL Agency Shares, 5.49%(f)(g)(h) | | | 77,895,720 | | | | 77,919,089 | |
BlackRock Liquidity Funds, T-Fund, Institutional Shares, 5.19%(f)(g) | | | 90,612,409 | | | | 90,612,409 | |
| | | | | | | | |
| | |
Total Short-Term Securities — 2.0%
(Cost: $168,531,498) | | | | | 168,531,498 | |
| | | | | | | | |
| | |
Total Investments — 101.0%
(Cost: $4,925,133,692) | | | | | 8,399,823,909 | |
| |
Liabilities in Excess of Other Assets — (1.0)% | | | | (85,690,604 | ) |
| | | | | | | | |
| | |
| Net Assets — 100.0% | | | | | $ 8,314,133,305 | |
| | | | | | | | |
| (a) | Non-income producing security. |
| (b) | All or a portion of this security is on loan. |
| | |
S C H E D U L E S O F I N V E S T M E N T S | | 7 |
| | |
Schedule of Investments (continued) May 31, 2024 | | BlackRock Health Sciences Opportunities Portfolio |
| (c) | Security is valued using significant unobservable inputs and is classified as Level 3 in the fair value hierarchy. |
| (d) | Other interests represent beneficial interests in liquidation trusts and other reorganization or private entities. |
| (e) | Restricted security as to resale, excluding 144A securities. The Fund held restricted securities with a current value of $58,123,888, representing 0.7% of its net assets as of period end, and an original cost of $92,789,074. |
| (f) | Affiliate of the Fund. |
| (g) | Annualized 7-day yield as of period end. |
| (h) | All or a portion of this security was purchased with the cash collateral from loaned securities. |
Affiliates
Investments in issuers considered to be affiliate(s) of the Fund during the year ended May 31, 2024 for purposes of Section 2(a)(3) of the Investment Company Act of 1940, as amended, were as follows:
| | | | | | | | | | | | | | | | | | | | | | | | | | | | | | | | | | | | | | | | | | |
| | | Affiliated Issuer | | Value at
05/31/23 | | | Purchases
at Cost | | | Proceeds
from Sales | | | Net
Realized
Gain (Loss) | | | Change in
Unrealized
Appreciation
(Depreciation) | | | Value at
05/31/24 | | | Shares
Held at
05/31/24 | | | Income | | | Capital Gain
Distributions
from Underlying
Funds | | |
| |
| | BlackRock Cash Funds: Institutional, SL Agency Shares | | $ | — | | | $ | 77,928,705 | (a) | | $ | — | | | $ | (9,616 | ) | | $ | — | | | $ | 77,919,089 | | | | 77,895,720 | | | $ | 33,294 | (b) | | $ | — | | | | | |
| | BlackRock Liquidity Funds, T-Fund, Institutional Shares | | | 211,473,753 | | | | — | | | | (120,861,344 | )(a) | | | — | | | | — | | | | 90,612,409 | | | | 90,612,409 | | | | 7,030,104 | | | | — | | | | | |
| | SL Liquidity Series, LLC, Money Market Series(c) | | | 47,521,743 | | | | — | | | | (47,529,135 | )(a) | | | 40,657 | | | | (33,265 | ) | | | — | | | | — | | | | 562,101 | (b) | | | — | | | | | |
| | | | | | | | | | | | | | | | | | | | | | | | | | | | | | | | | | | | | | | | | | |
| | | | | | | | | | | | | | | | $ | 31,041 | | | $ | (33,265 | ) | | $ | 168,531,498 | | | | | | | $ | 7,625,499 | | | $ | — | | | | | |
| | | | | | | | | | | | | | | | | | | | | | | | | | | | | | | | | | | | | | | | | | |
| | (a) | Represents net amount purchased (sold). | |
| | (b) | All or a portion represents securities lending income earned from the reinvestment of cash collateral from loaned securities, net of fees and collateral investment expenses, and other payments to and from borrowers of securities. | |
| | (c) | As of period end, the entity is no longer held. | |
For purposes of this report, industry and sector sub-classifications may differ from those utilized by the Fund for compliance purposes.
Derivative Financial Instruments Categorized by Risk Exposure
For the period ended May 31, 2024, the effect of derivative financial instruments in the Statements of Operations was as follows:
| | | | | | | | | | | | | | | | | | | | | | | | | | | | |
| | | Commodity
Contracts | | | Credit
Contracts | | | Equity
Contracts | | | Foreign
Currency
Exchange
Contracts | | | Interest
Rate
Contracts | | | Other
Contracts | | | Total | |
Net Realized Gain (Loss) from: | | | | | | | | | | | | | | | | | | | | | | | | | | | | |
Forward foreign currency exchange contracts | | $ | — | | | $ | — | | | $ | — | | | $ | (4,758,895 | ) | | $ | — | | | $ | — | | | $ | (4,758,895 | ) |
| | | | | | | | | | | | | | | | | | | | | | | | | | | | |
| | | | | | | |
Net Change in Unrealized Appreciation (Depreciation) on: | | | | | | | | | | | | | | | | | | | | | | | | | | | | |
Forward foreign currency exchange contracts | | $ | — | | | $ | — | | | $ | — | | | $ | 2,418,141 | | | $ | — | | | $ | — | | | $ | 2,418,141 | |
| | | | | | | | | | | | | | | | | | | | | | | | | | | | |
Average Quarterly Balances of Outstanding Derivative Financial Instruments
| | | | |
| | |
Forward foreign currency exchange contracts
Average amounts purchased — in USD | | $ | 123,399,768 | |
For more information about the Fund’s investment risks regarding derivative financial instruments, refer to the Notes to Financial Statements.
| | |
| 8 | | 2 0 2 4 B L A C K R O C K A N N U A L F I N A N C I A L S T A T E M E N T S |
| | |
Schedule of Investments (continued) May 31, 2024 | | BlackRock Health Sciences Opportunities Portfolio |
Fair Value Hierarchy as of Period End
Various inputs are used in determining the fair value of financial instruments. For a description of the input levels and information about the Fund’s policy regarding valuation of financial instruments, refer to the Notes to Financial Statements.
The following table summarizes the Fund’s financial instruments categorized in the fair value hierarchy. The breakdown of the Fund’s financial instruments into major categories is disclosed in the Schedule of Investments above.
| | | | | | | | | | | | | | | | |
| | | Level 1 | | | Level 2 | | | Level 3 | | | Total | |
Assets | | | | | | | | | | | | | | | | |
Investments | | | | | | | | | | | | | | | | |
Long-Term Investments | | | | | | | | | | | | | | | | |
Common Stocks | | | | | | | | | | | | | | | | |
Biotechnology | | $ | 1,957,326,445 | | | $ | 17,724,414 | | | $ | 159,957 | | | $ | 1,975,210,816 | |
Financial Services | | | — | | | | 8,796,393 | | | | — | | | | 8,796,393 | |
Health Care Equipment & Supplies | | | 1,868,538,970 | | | | 14,628,575 | | | | 475,104 | | | | 1,883,642,649 | |
Health Care Providers & Services | | | 1,756,385,653 | | | | — | | | | — | | | | 1,756,385,653 | |
Life Sciences Tools & Services | | | 783,395,015 | | | | — | | | | — | | | | 783,395,015 | |
Pharmaceuticals | | | 1,560,051,575 | | | | 205,666,345 | | | | — | | | | 1,765,717,920 | |
Other Interests | | | — | | | | — | | | | 2,114,905 | | | | 2,114,905 | |
Preferred Securities | | | — | | | | — | | | | 56,008,983 | | | | 56,008,983 | |
Warrants | | | 20,077 | | | | — | | | | — | | | | 20,077 | |
Short-Term Securities | | | | | | | | | | | | | | | | |
Money Market Funds | | | 168,531,498 | | | | — | | | | — | | | | 168,531,498 | |
| | | | | | | | | | | | | | | | |
| | $ | 8,094,249,233 | | | $ | 246,815,727 | | | $ | 58,758,949 | | | $ | 8,399,823,909 | |
| | | | | | | | | | | | | | | | |
See notes to financial statements.
| | |
S C H E D U L E S O F I N V E S T M E N T S | | 9 |
| | |
Schedule of Investments May 31, 2024 | | BlackRock Infrastructure Sustainable Opportunities Fund (Percentages shown are based on Net Assets) |
| | | | | | | | |
| Security | | Shares | | | Value | |
| |
| | |
Common Stocks | | | | | | | | |
| | |
Construction & Engineering — 4.5% | | | | | | | | |
Ferrovial SE | | | 10,212 | | | $ | 403,586 | |
| | | | | | | | |
| | |
| Diversified Telecommunication Services — 4.5% | | | | | | |
Cellnex Telecom SA(a) | | | 7,537 | | | | 275,327 | |
Infrastrutture Wireless Italiane SpA(a) | | | 11,776 | | | | 129,111 | |
| | | | | | | | |
| | | | | | | 404,438 | |
| | |
| Electric Utilities — 29.3% | | | | | | |
Alliant Energy Corp. | | | 7,385 | | | | 380,254 | |
EDP - Energias de Portugal SA | | | 72,234 | | | | 293,923 | |
Enel SpA | | | 50,894 | | | | 369,527 | |
Eversource Energy | | | 3,858 | | | | 228,509 | |
Exelon Corp. | | | 6,053 | | | | 227,290 | |
Hydro One Ltd.(a) | | | 3,092 | | | | 89,065 | |
Orsted AS(a)(b) | | | 3,492 | | | | 214,188 | |
SSE PLC | | | 15,854 | | | | 356,654 | |
Terna - Rete Elettrica Nazionale | | | 57,676 | | | | 485,430 | |
| | | | | | | | |
| | | | | | | 2,644,840 | |
| | |
| Ground Transportation — 6.9% | | | | | | |
Canadian Pacific Kansas City Ltd. | | | 3,339 | | | | 265,782 | |
CSX Corp. | | | 7,960 | | | | 268,650 | |
West Japan Railway Co. | | | 4,400 | | | | 87,783 | |
| | | | | | | | |
| | | | | | | 622,215 | |
| | |
| Health Care REITs — 3.1% | | | | | | |
Aedifica SA | | | 1,320 | | | | 85,851 | |
Healthpeak Properties, Inc. | | | 9,834 | | | | 195,696 | |
| | | | | | | | |
| | | | | | | 281,547 | |
|
| Independent Power and Renewable Electricity Producers — 7.2% | |
Boralex, Inc., Class A | | | 3,907 | | | | 99,155 | |
Clearway Energy, Inc., Class C | | | 11,699 | | | | 327,572 | |
Northland Power, Inc. | | | 13,061 | | | | 223,281 | |
| | | | | | | | |
| | | | | | | 650,008 | |
| | |
| IT Services — 1.1% | | | | | | |
NEXTDC Ltd.(b) | | | 8,047 | | | | 96,055 | |
| | | | | | | | |
| | |
| Multi-Utilities — 8.6% | | | | | | |
CMS Energy Corp. | | | 2,199 | | | | 138,383 | |
National Grid PLC | | | 40,715 | | | | 461,301 | |
Public Service Enterprise Group, Inc. | | | 1,237 | | | | 93,715 | |
REN - Redes Energeticas Nacionais SGPS SA | | | 35,316 | | | | 88,279 | |
| | | | | | | | |
| | | | | | | 781,678 | |
| | |
| Specialized REITs — 11.5% | | | | | | |
American Tower Corp. | | | 1,472 | | | | 288,130 | |
Equinix, Inc. | | | 399 | | | | 304,429 | |
SBA Communications Corp. | | | 2,253 | | | | 443,120 | |
| | | | | | | | |
| | | | | | | 1,035,679 | |
| | | | | | | | |
| Security | | Shares | | | Value | |
| |
| | |
| Transportation Infrastructure — 14.5% | | | | | | |
Aena SME SA(a) | | | 1,420 | | | $ | 277,699 | |
Enav SpA(a) | | | 44,878 | | | | 184,514 | |
Flughafen Zurich AG, Registered Shares | | | 431 | | | | 91,895 | |
Fraport AG Frankfurt Airport Services Worldwide(b) | | | 5,276 | | | | 306,077 | |
Getlink SE | | | 15,025 | | | | 264,779 | |
Transurban Group | | | 21,992 | | | | 183,789 | |
| | | | | | | | |
| | | | | | | 1,308,753 | |
| | |
| Water Utilities — 5.1% | | | | | | |
Severn Trent PLC | | | 6,795 | | | | 207,633 | |
United Utilities Group PLC | | | 19,799 | | | | 257,898 | |
| | | | | | | | |
| | | | | | | 465,531 | |
| | | | | | | | |
| | |
Total Common Stocks — 96.3%
(Cost: $8,759,336) | | | | | | | 8,694,330 | |
| | | | | | | | |
| | |
Rights | | | | | | | | |
|
| Multi-Utilities — 0.3% | |
National Grid PLC(b) | | | 11,875 | | | | 29,666 | |
| | | | | | | | |
| | |
Total Rights — 0.3%
(Cost: $ —) | | | | | | | 29,666 | |
| | | | | | | | |
| | |
Total Long-Term Investments — 96.6%
(Cost: $8,759,336) | | | | | | | 8,723,996 | |
| | | | | | | | |
| | |
Short-Term Securities | | | | | | | | |
| | |
| Money Market Funds — 2.0% | | | | | | |
BlackRock Liquidity Funds, T-Fund, Institutional Shares, 5.19%(c)(d) | | | 179,426 | | | | 179,426 | |
| | | | | | | | |
| | |
Total Short-Term Securities — 2.0%
(Cost: $179,426) | | | | | | | 179,426 | |
| | | | | | | | |
| | |
Total Investments — 98.6%
(Cost: $8,938,762) | | | | | | | 8,903,422 | |
| | |
Other Assets Less Liabilities — 1.4% | | | | | | | 125,449 | |
| | | | | | | | |
| | |
Net Assets — 100.0% | | | | | | $ | 9,028,871 | |
| | | | | | | | |
| (a) | Security exempt from registration pursuant to Rule 144A under the Securities Act of 1933, as amended. These securities may be resold in transactions exempt from registration to qualified institutional investors. |
| (b) | Non-income producing security. |
| (c) | Affiliate of the Fund. |
| (d) | Annualized 7-day yield as of period end. |
| | |
| 10 | | 2 0 2 4 B L A C K R O C K A N N U A L F I N A N C I A L S T A T E M E N T S |
| | |
Schedule of Investments (continued) May 31, 2024 | | BlackRock Infrastructure Sustainable Opportunities Fund |
Affiliates
Investments in issuers considered to be affiliate(s) of the Fund during the year ended May 31, 2024 for purposes of Section 2(a)(3) of the Investment Company Act of 1940, as amended, were as follows:
| | | | | | | | | | | | | | | | | | | | | | | | | | | | | | | | | | | | |
| Affiliated Issuer | | Value at
05/31/23 | | | Purchases
at Cost | | | Proceeds
from Sales | | | Net
Realized
Gain (Loss) | | | Change in
Unrealized
Appreciation
(Depreciation) | | | Value at
05/31/24 | | | Shares
Held at
05/31/24 | | | Income | | | Capital Gain Distributions from Underlying Funds | |
BlackRock Cash Funds: Institutional, SL Agency Shares(a) | | $ | — | | | $ | — | | | $ | (2 | )(b) | | $ | 2 | | | $ | — | | | $ | — | | | | — | | | $ | 32 | (c) | | $ | — | |
BlackRock Liquidity Funds, T-Fund, Institutional Shares | | | 733,814 | | | | — | | | | (554,388 | )(b) | | | — | | | | — | | | | 179,426 | | | | 179,426 | | | | 22,361 | | | | — | |
SL Liquidity Series, LLC, Money Market Series(a) | | | — | | | | — | | | | (1 | )(b) | | | 1 | | | | — | | | | — | | | | — | | | | 12 | (c) | | | — | |
| | | | | | | | | | | | | | | | | | | | | | | | | | | | | | | | | | | | |
| | | | | | | | | | | | | | $ | 3 | | | $ | — | | | $ | 179,426 | | | | | | | $ | 22,405 | | | $ | — | |
| | | | | | | | | | | | | | | | | | | | | | | | | | | | | | | | | | | | |
| | (a) | As of period end, the entity is no longer held. | |
| | (b) | Represents net amount purchased (sold). | |
| | (c) | All or a portion represents securities lending income earned from the reinvestment of cash collateral from loaned securities, net of fees and collateral investment expenses, and other payments to and from borrowers of securities. | |
For purposes of this report, industry and sector sub-classifications may differ from those utilized by the Fund for compliance purposes.
Derivative Financial Instruments Outstanding as of Period End
OTC Total Return Swaps
| | | | | | | | | | | | | | | | | | | | | | | | | | | | | | |
| |
| Reference Entity | | Payment
Frequency | | Counterparty(a) | | | Termination
Date | | | Net
Notional | | | Accrued
Unrealized
Appreciation
(Depreciation) | | | Net Value of
Reference
Entity | | | Gross Notional Amount Net Asset Percentage | |
| |
Equity Securities Long/Short | | Monthly | | | Goldman Sachs Bank USA | (c) | | | 08/19/26 | | | $ | 87,188 | | | | | | | $ | (3,171 | )(b) | | $ | 84,160 | | | | 1.0% | |
| | | | | | | | | | | | | | | | | | | | | | | | | | | | | | |
| | (a) | The Fund receives the total return on a portfolio of long positions underlying the total return swap. The Fund pays the total return on a portfolio of short positions underlying the total return swap. In addition, the Fund pays or receives a variable rate of interest, based on a specified benchmark. The benchmark and spread are determined based upon the country and/or currency of the individual underlying positions. | |
| | (b) | Amount includes $(143) of net dividends and financing fees. | |
The following are the specified benchmarks (plus or minus a range) used in determining the variable rate of interest:
| | |
| | (c) |
Range: | | 26 basis points |
Benchmarks: | | Euro Short-Term Rate: |
| | EUR 1 Day |
The following table represents the individual long positions and related values of equity securities underlying the total return swap with Goldman Sachs Bank USA, as of period end, termination date August 19, 2026:
| | | | | | | | | | | | |
| |
| | | Shares | | | Value | | | % of
Basket
Value | |
| |
| | | |
Reference Entity — Long | | | | | | | | | | | | |
| | | |
| Common Stocks | | | | | | | | | |
| | | |
| Electric Utilities | | | | | | | | | |
EDP - Energias de Portugal SA | | | 20,683 | | | $ | 84,160 | | | | 100.0 | % |
| | | | | | | | | | | | |
| | | |
Total Reference Entity — Long | | | | | | | 84,160 | | | | | |
| | | | | | | | | | | | |
| | | |
Net Value of Reference Entity —
Goldman Sachs Bank USA | | | | | | $ | 84,160 | | | | | |
| | | | | | | | | | | | |
| | |
S C H E D U L E S O F I N V E S T M E N T S | | 11 |
| | |
Schedule of Investments (continued) May 31, 2024 | | BlackRock Infrastructure Sustainable Opportunities Fund |
Balances Reported in the Statements of Assets and Liabilities for OTC Swaps
| | | | | | | | | | | | | | |
|
| | | Swap
Premiums
Paid | | | Swap
Premiums
Received | | | Unrealized
Appreciation | | | Unrealized
Depreciation |
|
OTC Swaps | | $ | — | | | $ | — | | | $ | — | | | $ (3,171) |
|
Derivative Financial Instruments Categorized by Risk Exposure
As of period end, the fair values of derivative financial instruments located in the Statements of Assets and Liabilities were as follows:
| | | | | | | | | | | | | | | | | | | | | | | | | | | | |
| | | Commodity
Contracts | | | Credit
Contracts | | | Equity
Contracts | | | Foreign
Currency
Exchange
Contracts | | | Interest
Rate
Contracts | | | Other
Contracts | | | Total | |
| | | | | | | |
Liabilities — Derivative Financial Instruments | | | | | | | | | | | | | | | | | | | | | | | | | | | | |
Swaps — OTC | | | | | | | | | | | | | | | | | | | | | | | | | | | | |
Unrealized depreciation on OTC swaps; | | | | | | | | | | | | | | | | | | | | | | | | | | | | |
Swap premiums received | | $ | — | | | $ | — | | | $ | 3,171 | | | $ | — | | | $ | — | | | $ | — | | | $ | 3,171 | |
| | | | | | | | | | | | | | | | | | | | | | | | | | | | |
For the period ended May 31, 2024, the effect of derivative financial instruments in the Statements of Operations was as follows:
| | | | | | | | | | | | | | | | | | | | | | | | | | | | |
| | | Commodity
Contracts | | | Credit
Contracts | | | Equity
Contracts | | | Foreign
Currency
Exchange
Contracts | | | Interest
Rate
Contracts | | | Other
Contracts | | | Total | |
| | | | | | | |
Net Realized Gain (Loss) from: | | | | | | | | | | | | | | | | | | | | | | | | | | | | |
Swaps | | $ | — | | | $ | — | | | $ | (21,325 | ) | | $ | — | | | $ | — | | | $ | — | | | $ | (21,325 | ) |
| | | | | | | | | | | | | | | | | | | | | | | | | | | | |
| | | | | | | |
Net Change in Unrealized Appreciation (Depreciation) on: | | | | | | | | | | | | | | | | | | | | | | | | | | | | |
Swaps | | $ | — | | | $ | — | | | $ | 3,592 | | | $ | — | | | $ | — | | | $ | — | | | $ | 3,592 | |
| | | | | | | | | | | | | | | | | | | | | | | | | | | | |
Average Quarterly Balances of Outstanding Derivative Financial Instruments
| | | | |
| | |
Total return swaps | | | | |
Average notional amount | | $ | 97,547 | |
For more information about the Fund’s investment risks regarding derivative financial instruments, refer to the Notes to Financial Statements.
Derivative Financial Instruments – Offsetting as of Period End
The Fund’s derivative assets and liabilities (by type) were as follows:
| | | | | | | | |
| | | Assets | | | Liabilities | |
| | |
Derivative Financial Instruments | | | | | | | | |
Swaps — OTC(a) | | $ | — | | | $ | 3,171 | |
| | | | | | | | |
| | |
Total derivative assets and liabilities in the Statements of Assets and Liabilities | | $ | — | | | $ | 3,171 | |
| | | | | | | | |
| | |
Derivatives not subject to a Master Netting Agreement or similar agreement (“MNA”) | | | — | | | | — | |
| | | | | | | | |
| | |
Total derivative assets and liabilities subject to an MNA | | $ | — | | | $ | 3,171 | |
| | | | | | | | |
| | (a) | Includes unrealized appreciation (depreciation) on OTC swaps and swap premiums paid/(received) in the Statements of Assets and Liabilities. | |
| | |
| 12 | | 2 0 2 4 B L A C K R O C K A N N U A L F I N A N C I A L S T A T E M E N T S |
| | |
Schedule of Investments (continued) May 31, 2024 | | BlackRock Infrastructure Sustainable Opportunities Fund |
The following table presents the Fund’s derivative liabilities by counterparty net of amounts available for offset under an MNA and net of the related collateral pledged by the Fund:
| | | | | | | | | | | | | | | | | | | | |
| Counterparty | | Derivative
Liabilities
Subject to
an MNA by
Counterparty | | | Derivatives
Available
for Offset(a) | | | Non-
Cash
Collateral
Pledged(b) | | | Cash
Collateral
Pledged(b) | | | Net
Amount of
Derivative
Liabilities(c) | |
| | | | | |
Goldman Sachs Bank USA | | $ | 3,171 | | | $ | — | | | $ | — | | | $ | — | | | $ | 3,171 | |
| | | | | | | | | | | | | | | | | | | | |
| | (a) | The amount of derivatives available for offset is limited to the amount of derivative assets and/or liabilities that are subject to an MNA. | |
| | (b) | Excess of collateral received/pledged, if any, from the individual counterparty is not shown for financial reporting purposes. | |
| | (c) | Net amount represents the net amount payable due to the counterparty in the event of default. | |
Fair Value Hierarchy as of Period End
Various inputs are used in determining the fair value of financial instruments. For a description of the input levels and information about the Fund’s policy regarding valuation of financial instruments, refer to the Notes to Financial Statements.
The following table summarizes the Fund’s financial instruments categorized in the fair value hierarchy. The breakdown of the Fund’s financial instruments into major categories is disclosed in the Schedule of Investments above.
| | | | | | | | | | | | | | | | |
| |
| | | Level 1 | | | Level 2 | | | Level 3 | | | Total | |
| |
Assets | | | | | | | | | | | | | | | | |
Investments | | | | | | | | | | | | | | | | |
Long-Term Investments | | | | | | | | | | | | | | | | |
Common Stocks | | | | | | | | | | | | | | | | |
Construction & Engineering | | $ | — | | | $ | 403,586 | | | $ | — | | | $ | 403,586 | |
Diversified Telecommunication Services | | | — | | | | 404,438 | | | | — | | | | 404,438 | |
Electric Utilities | | | 925,118 | | | | 1,719,722 | | | | — | | | | 2,644,840 | |
Ground Transportation | | | 534,432 | | | | 87,783 | | | | — | | | | 622,215 | |
Health Care REITs | | | 195,696 | | | | 85,851 | | | | — | | | | 281,547 | |
Independent Power and Renewable Electricity Producers | | | 650,008 | | | | — | | | | — | | | | 650,008 | |
IT Services | | | — | | | | 96,055 | | | | — | | | | 96,055 | |
Multi-Utilities | | | 232,098 | | | | 549,580 | | | | — | | | | 781,678 | |
Specialized REITs | | | 1,035,679 | | | | — | | | | — | | | | 1,035,679 | |
Transportation Infrastructure | | | — | | | | 1,308,753 | | | | — | | | | 1,308,753 | |
Water Utilities | | | — | | | | 465,531 | | | | — | | | | 465,531 | |
Rights | | | 29,666 | | | | — | | | | — | | | | 29,666 | |
Short-Term Securities | | | | | | | | | | | | | | | | |
Money Market Funds | | | 179,426 | | | | — | | | | — | | | | 179,426 | |
| | | | | | | | | | | | | | | | |
| | $ | 3,782,123 | | | $ | 5,121,299 | | | $ | — | | | $ | 8,903,422 | |
| | | | | | | | | | | | | | | | |
Derivative Financial Instruments(a) | | | | | | | | | | | | | | | | |
Liabilities | | | | | | | | | | | | | | | | |
Equity Contracts | | $ | — | | | $ | (3,171 | ) | | $ | — | | | $ | (3,171 | ) |
| | | | | | | | | | | | | | | | |
| | (a) | Derivative financial instruments are swaps. Swaps are valued at the unrealized appreciation (depreciation) on the instrument. | |
See notes to financial statements.
| | |
S C H E D U L E S O F I N V E S T M E N T S | | 13 |
| | |
Schedule of Investments May 31, 2024 | | BlackRock Mid-Cap Growth Equity Portfolio (Percentages shown are based on Net Assets) |
| | | | | | | | |
| Security | | Shares | | | Value | |
| | |
Common Stocks | | | | | | | | |
|
| Aerospace & Defense — 7.5% | |
Axon Enterprise, Inc.(a) | | | 1,116,967 | | | $ | 314,616,095 | |
HEICO Corp.(b) | | | 1,425,932 | | | | 316,228,939 | |
Howmet Aerospace, Inc.(b) | | | 2,861,426 | | | | 242,219,711 | |
| | | | | | | | |
| | | | | | | 873,064,745 | |
| | |
| Automobiles — 2.2% | | | | | | |
Ferrari NV(b) | | | 636,612 | | | | 261,647,532 | |
| | | | | | | | |
| | |
| Beverages — 0.5% | | | | | | |
Davide Campari-Milano NV | | | 5,765,134 | | | | 57,753,597 | |
| | | | | | | | |
| | |
| Capital Markets — 10.2% | | | | | | |
Ares Management Corp., Class A | | | 2,460,556 | | | | 344,896,134 | |
KKR & Co., Inc., Class A | | | 2,382,114 | | | | 244,976,604 | |
MSCI, Inc., Class A | | | 479,221 | | | | 237,300,655 | |
TPG, Inc., Class A | | | 1,373,336 | | | | 57,570,245 | |
Tradeweb Markets, Inc., Class A | | | 2,794,116 | | | | 304,586,585 | |
| | | | | | | | |
| | | | | | | 1,189,330,223 | |
| | |
| Commercial Services & Supplies — 7.0% | | | | | | |
Copart, Inc.(a) | | | 8,316,120 | | | | 441,253,327 | |
Rollins, Inc. | | | 4,435,857 | | | | 202,674,307 | |
Waste Connections, Inc. | | | 1,020,200 | | | | 167,639,264 | |
| | | | | | | | |
| | | | | | | 811,566,898 | |
| | |
| Construction & Engineering — 2.4% | | | | | | |
Comfort Systems U.S.A., Inc.(b) | | | 532,637 | | | | 174,353,395 | |
WillScot Mobile Mini Holdings Corp.(a) | | | 2,596,488 | | | | 102,379,522 | |
| | | | | | | | |
| | | | | | | 276,732,917 | |
| | |
| Construction Materials — 1.8% | | | | | | |
Vulcan Materials Co. | | | 842,794 | | | | 215,561,421 | |
| | | | | | | | |
| | |
| Electrical Equipment — 2.5% | | | | | | |
Vertiv Holdings Co., Class A | | | 2,962,423 | | | | 290,524,824 | |
| | | | | | | | |
|
| Electronic Equipment, Instruments & Components — 0.0% | |
Teledyne Technologies, Inc.(a) | | | 9,037 | | | | 3,587,237 | |
| | | | | | | | |
|
| Entertainment — 4.0% | |
Liberty Media Corp. - Liberty Formula One, Class C, NVS(a)(b) | | | 3,224,865 | | | | 239,091,491 | |
Live Nation Entertainment, Inc.(a)(b) | | | 2,441,653 | | | | 228,880,552 | |
| | | | | | | | |
| | | | | | | 467,972,043 | |
|
| Ground Transportation — 2.2% | |
Old Dominion Freight Line, Inc. | | | 356,836 | | | | 62,535,509 | |
Saia, Inc.(a)(b) | | | 461,399 | | | | 188,933,663 | |
| | | | | | | | |
| | | | | | | 251,469,172 | |
|
| Health Care Equipment & Supplies — 8.1% | |
Alcon, Inc.(b) | | | 2,345,621 | | | | 209,065,200 | |
Align Technology, Inc.(a) | | | 1,136,243 | | | | 292,253,062 | |
IDEXX Laboratories, Inc.(a) | | | 696,915 | | | | 346,331,909 | |
STERIS PLC | | | 412,832 | | | | 92,011,996 | |
| | | | | | | | |
| | | | | | | 939,662,167 | |
|
| Hotels, Restaurants & Leisure — 3.4% | |
Churchill Downs, Inc.(b) | | | 504,335 | | | | 65,311,383 | |
DraftKings, Inc., Class A(a)(b) | | | 5,127,274 | | | | 180,121,136 | |
Planet Fitness, Inc., Class A(a)(b) | | | 1,266,005 | | | | 80,568,558 | |
Vail Resorts, Inc. | | | 401,395 | | | | 75,751,264 | |
| | | | | | | | |
| | | | | | | 401,752,341 | |
|
| Interactive Media & Services — 3.1% | |
Pinterest, Inc., Class A(a) | | | 8,683,399 | | | | 360,274,225 | |
| | | | | | | | |
|
| IT Services — 3.0% | |
Globant SA(a)(b) | | | 1,099,118 | | | | 177,089,892 | |
| | | | | | | | |
| Security | | Shares | | | Value | |
|
| IT Services (continued) | |
MongoDB, Inc., Class A(a) | | | 632,060 | | | $ | 149,204,083 | |
VeriSign, Inc.(a) | | | 103,505 | | | | 18,042,992 | |
| | | | | | | | |
| | | | | | | 344,336,967 | |
|
| Life Sciences Tools & Services — 8.3% | |
Agilent Technologies, Inc. | | | 110,063 | | | | 14,353,316 | |
Bio-Techne Corp.(b) | | | 2,695,742 | | | | 208,084,325 | |
Charles River Laboratories International,
Inc.(a)(b) | | | 662,074 | | | | 138,002,704 | |
ICON PLC(a) | | | 464,844 | | | | 150,990,628 | |
Mettler-Toledo International, Inc.(a)(b) | | | 9,510 | | | | 13,352,896 | |
Repligen Corp.(a)(b) | | | 1,070,574 | | | | 159,611,878 | |
West Pharmaceutical Services, Inc. | | | 846,232 | | | | 280,449,747 | |
| | | | | | | | |
| | | | | | | 964,845,494 | |
|
| Machinery — 0.8% | |
IDEX Corp. | | | 433,118 | | | | 90,365,740 | |
| | | | | | | | |
|
| Oil, Gas & Consumable Fuels — 0.2% | |
Cheniere Energy, Inc. | | | 162,538 | | | | 25,646,871 | |
| | | | | | | | |
|
| Professional Services — 2.3% | |
Equifax, Inc.(b) | | | 1,148,142 | | | | 265,668,577 | |
| | | | | | | | |
|
| Real Estate Management & Development — 2.9% | |
CoStar Group, Inc.(a) | | | 4,389,825 | | | | 343,152,620 | |
| | | | | | | | |
|
| Semiconductors & Semiconductor Equipment — 9.4% | |
ASM International NV | | | 410,130 | | | | 288,612,787 | |
Entegris, Inc. | | | 2,316,006 | | | | 292,627,358 | |
Lattice Semiconductor Corp.(a)(b) | | | 1,563,701 | | | | 116,089,162 | |
Monolithic Power Systems, Inc. | | | 550,780 | | | | 405,170,291 | |
| | | | | | | | |
| | | | | | | 1,102,499,598 | |
|
| Software — 11.8% | |
ANSYS, Inc.(a) | | | 98,672 | | | | 31,323,426 | |
Aspen Technology, Inc.(a)(b) | | | 387,434 | | | | 81,612,972 | |
Bentley Systems, Inc., Class B | | | 1,380,359 | | | | 69,349,236 | |
Cadence Design Systems, Inc.(a) | | | 843,801 | | | | 241,588,664 | |
Confluent, Inc., Class A(a)(b) | | | 4,831,026 | | | | 125,461,745 | |
CyberArk Software Ltd.(a) | | | 196,814 | | | | 45,119,610 | |
Fair Isaac Corp.(a)(b) | | | 48,703 | | | | 62,823,461 | |
HubSpot, Inc.(a)(b) | | | 330,793 | | | | 202,131,063 | |
Manhattan Associates, Inc.(a) | | | 318,586 | | | | 69,942,371 | |
PTC, Inc.(a)(b) | | | 1,397,499 | | | | 246,295,224 | |
Roper Technologies, Inc. | | | 328,716 | | | | 175,126,736 | |
Tyler Technologies, Inc.(a)(b) | | | 62,010 | | | | 29,787,124 | |
| | | | | | | | |
| | | | | | | 1,380,561,632 | |
|
| Specialty Retail — 2.1% | |
Floor & Decor Holdings, Inc., Class A(a)(b) | | | 2,082,123 | | | | 243,316,894 | |
Tractor Supply Co. | | | 10,783 | | | | 3,076,282 | |
| | | | | | | | |
| | | | | | | 246,393,176 | |
|
| Textiles, Apparel & Luxury Goods — 1.6% | |
On Holding AG, Class A(a)(b) | | | 4,421,026 | | | | 188,070,446 | |
| | | | | | | | |
|
| Trading Companies & Distributors — 2.8% | |
Core & Main, Inc., Class A(a) | | | 3,390,179 | | | | 195,138,703 | |
SiteOne Landscape Supply, Inc.(a)(b) | | | 842,931 | | | | 130,502,578 | |
| | | | | | | | |
| | | | | | | 325,641,281 | |
| | | | | | | | |
| | |
Total Common Stocks — 100.1%
(Cost: $8,371,236,397) | | | | | | | 11,678,081,744 | |
| | | | | | | | |
| | |
| 14 | | 2 0 2 4 B L A C K R O C K A N N U A L F I N A N C I A L S T A T E M E N T S |
| | |
Schedule of Investments (continued) May 31, 2024 | | BlackRock Mid-Cap Growth Equity Portfolio (Percentages shown are based on Net Assets) |
| | | | | | | | |
| Security | | Par (000) | | | Value | |
| | |
| Other Interests(a)(c)(d) | | | | | | |
GCI Liberty, Inc., Class A | | USD | 1,529 | | | $ | 16 | |
| | | | | | | | |
| |
Total Other Interests — 0.0%
(Cost: $0) | | | | 16 | |
| | | | | | | | |
| |
Total Long-Term Investments — 100.1%
(Cost: $8,371,236,397) | | | | 11,678,081,760 | |
| | | | | | | | |
| | |
| | | Shares | | | | |
| | |
Short-Term Securities | | | | | | | | |
| | |
| Money Market Funds — 4.0% | | | | | | |
BlackRock Cash Funds: Institutional, SL Agency Shares, 5.49%(e)(f)(g) | | | 462,799,284 | | | | 462,938,124 | |
BlackRock Liquidity Funds, T-Fund, Institutional Shares, 5.19%(e)(f) | | | 750,097 | | | | 750,097 | |
| | | | | | | | |
| |
Total Short-Term Securities — 4.0%
(Cost: $463,689,974) | | | | 463,688,221 | |
| | | | | | | | |
| |
Total Investments — 104.1%
(Cost: $8,834,926,371) | | | | 12,141,769,981 | |
Liabilities in Excess of Other Assets — (4.1)% | | | | (474,630,459 | ) |
| | | | | | | | |
| | |
Net Assets — 100.0% | | | | | | $ | 11,667,139,522 | |
| | | | | | | | |
| (a) | Non-income producing security. | |
| (b) | All or a portion of this security is on loan. | |
| (c) | Security is valued using significant unobservable inputs and is classified as Level 3 in the fair value hierarchy. | |
| (d) | Other interests represent beneficial interests in liquidation trusts and other reorganization or private entities. | |
| (e) | Affiliate of the Fund. | |
| (f) | Annualized 7-day yield as of period end. | |
| (g) | All or a portion of this security was purchased with the cash collateral from loaned securities. | |
Affiliates
Investments in issuers considered to be affiliate(s) of the Fund during the year ended May 31, 2024 for purposes of Section 2(a)(3) of the Investment Company Act of 1940, as amended, were as follows:
| | | | | | | | | | | | | | | | | | | | | | | | | | | | | | | | | | | | | | | | | | | | | | |
| | | | | | | | | | | | |
| | | Affiliated Issuer | | Value at 05/31/23 | | | Purchases at Cost | | | Proceeds from Sales | | | Net Realized Gain (Loss) | | | | | | Change in Unrealized Appreciation (Depreciation) | | | Value at 05/31/24 | | | Shares Held at 05/31/24 | | | Income | | | Capital Gain Distributions from Underlying Funds | | | | |
| | BlackRock Cash Funds: Institutional, SL Agency Shares | | $ | — | | | $ | 462,954,231 | (a) | | $ | — | | | $ | (14,354 | ) | | | | | | $ | (1,753 | ) | | $ | 462,938,124 | | | | 462,799,284 | | | $ | 95,891 | (b) | | $ | — | | | | | |
| | | | | | | | | | | | |
| | BlackRock Liquidity Funds, T-Fund, Institutional Shares | | | 34,969,706 | | | | — | | | | (34,219,609 | )(a) | | | — | | | | | | | | — | | | | 750,097 | | | | 750,097 | | | | 699,116 | | | | — | | | | | |
| | | | | | | | | | | | |
| | SL Liquidity Series, LLC, Money Market Series(c) | | | 248,967,968 | | | | — | | | | (249,069,444 | )(a) | | | 219,948 | | | | | | | | (118,472 | ) | | | — | | | | — | | | | 526,054 | (b) | | | — | | | | | |
| | | | | | | | | | | | | | | | | | | | | | | | | | | | | | | | | | | | | | | | | | | | | | |
| | | | | | | | | | | | | | | | $ | 205,594 | | | | | | | $ | (120,225 | ) | | $ | 463,688,221 | | | | | | | $ | 1,321,061 | | | $ | — | | | | | |
| | | | | | | | | | | | | | | | | | | | | | | | | | | | | | | | | | | | | | | | | | | | | | |
| (a) | Represents net amount purchased (sold). | |
| (b) | All or a portion represents securities lending income earned from the reinvestment of cash collateral from loaned securities, net of fees and collateral investment expenses, and other payments to and from borrowers of securities. | |
| (c) | As of period end, the entity is no longer held. | |
For purposes of this report, industry and sector sub-classifications may differ from those utilized by the Fund for compliance purposes.
| | |
S C H E D U L E S O F I N V E S T M E N T S | | 15 |
| | |
Schedule of Investments (continued) May 31, 2024 | | BlackRock Mid-Cap Growth Equity Portfolio |
Fair Value Hierarchy as of Period End
Various inputs are used in determining the fair value of financial instruments. For a description of the input levels and information about the Fund’s policy regarding valuation of financial instruments, refer to the Notes to Financial Statements.
The following table summarizes the Fund’s financial instruments categorized in the fair value hierarchy. The breakdown of the Fund’s financial instruments into major categories is disclosed in the Schedule of Investments above.
| | | | | | | | | | | | | | | | |
| | | Level 1 | | | Level 2 | | | Level 3 | | | Total | |
Assets | | | | | | | | | | | | | | | | |
Investments | | | | | | | | | | | | | | | | |
Long-Term Investments | | | | | | | | | | | | | | | | |
Common Stocks | | | | | | | | | | | | | | | | |
Aerospace & Defense | | $ | 873,064,745 | | | $ | — | | | $ | — | | | $ | 873,064,745 | |
Automobiles | | | 261,647,532 | | | | — | | | | — | | | | 261,647,532 | |
Beverages | | | — | | | | 57,753,597 | | | | — | | | | 57,753,597 | |
Capital Markets | | | 1,189,330,223 | | | | — | | | | — | | | | 1,189,330,223 | |
Commercial Services & Supplies | | | 811,566,898 | | | | — | | | | — | | | | 811,566,898 | |
Construction & Engineering | | | 276,732,917 | | | | — | | | | — | | | | 276,732,917 | |
Construction Materials | | | 215,561,421 | | | | — | | | | — | | | | 215,561,421 | |
Electrical Equipment | | | 290,524,824 | | | | — | | | | — | | | | 290,524,824 | |
Electronic Equipment, Instruments & Components | | | 3,587,237 | | | | — | | | | — | | | | 3,587,237 | |
Entertainment | | | 467,972,043 | | | | — | | | | — | | | | 467,972,043 | |
Ground Transportation | | | 251,469,172 | | | | — | | | | — | | | | 251,469,172 | |
Health Care Equipment & Supplies | | | 939,662,167 | | | | — | | | | — | | | | 939,662,167 | |
Hotels, Restaurants & Leisure | | | 401,752,341 | | | | — | | | | — | | | | 401,752,341 | |
Interactive Media & Services | | | 360,274,225 | | | | — | | | | — | | | | 360,274,225 | |
IT Services | | | 344,336,967 | | | | — | | | | — | | | | 344,336,967 | |
Life Sciences Tools & Services | | | 964,845,494 | | | | — | | | | — | | | | 964,845,494 | |
Machinery | | | 90,365,740 | | | | — | | | | — | | | | 90,365,740 | |
Oil, Gas & Consumable Fuels | | | 25,646,871 | | | | — | | | | — | | | | 25,646,871 | |
Professional Services | | | 265,668,577 | | | | — | | | | — | | | | 265,668,577 | |
Real Estate Management & Development | | | 343,152,620 | | | | — | | | | — | | | | 343,152,620 | |
Semiconductors & Semiconductor Equipment | | | 813,886,811 | | | | 288,612,787 | | | | — | | | | 1,102,499,598 | |
Software | | | 1,380,561,632 | | | | — | | | | — | | | | 1,380,561,632 | |
Specialty Retail | | | 246,393,176 | | | | — | | | | — | | | | 246,393,176 | |
Textiles, Apparel & Luxury Goods | | | 188,070,446 | | | | — | | | | — | | | | 188,070,446 | |
Trading Companies & Distributors | | | 325,641,281 | | | | — | | | | — | | | | 325,641,281 | |
Other Interests | | | — | | | | — | | | | 16 | | | | 16 | |
Short-Term Securities | | | | | | | | | | | | | | | | |
Money Market Funds | | | 463,688,221 | | | | — | | | | — | | | | 463,688,221 | |
| | | | | | | | | | | | | | | | |
| | $ | 11,795,403,581 | | | $ | 346,366,384 | | | $ | 16 | | | $ | 12,141,769,981 | |
| | | | | | | | | | | | | | | | |
See notes to financial statements.
| | |
| 16 | | 2 0 2 4 B L A C K R O C K A N N U A L F I N A N C I A L S T A T E M E N T S |
| | |
Schedule of Investments May 31, 2024 | | BlackRock Technology Opportunities Fund (Percentages shown are based on Net Assets) |
| | | | | | | | |
| Security | | Shares | | | Value | |
| |
| | |
Common Stocks | | | | | | | | |
| | |
Automobiles — 1.0% | | | | | | | | |
Tesla, Inc.(a) | | | 289,129 | | | $ | 51,488,092 | |
| | | | | | | | |
| | |
| Broadline Retail — 4.1% | | | | | | |
Amazon.com, Inc.(a) | | | 744,021 | | | | 131,275,065 | |
MercadoLibre, Inc.(a) | | | 51,356 | | | | 88,618,887 | |
| | | | | | | | |
| | | | | | | 219,893,952 | |
| | |
| Capital Markets — 0.5% | | | | | | |
S&P Global, Inc. | | | 68,658 | | | | 29,351,982 | |
| | | | | | | | |
| | |
| Communications Equipment — 1.5% | | | | | | |
Arista Networks, Inc.(a) | | | 177,651 | | | | 52,877,820 | |
Motorola Solutions, Inc. | | | 69,230 | | | | 25,262,719 | |
| | | | | | | | |
| | | | | | | 78,140,539 | |
| | |
| Consumer Finance — 0.6% | | | | | | |
Kaspi.KZ JSC, ADR | | | 274,919 | | | | 34,749,762 | |
| | | | | | | | |
| | |
| Diversified Consumer Services — 0.0% | | | | | | |
Think & Learn Private Ltd. (Acquired 09/30/20, cost $3,427,642)(a)(b)(c) | | | 2,241 | | | | — | |
| | | | | | | | |
| | |
| Electrical Equipment — 1.0% | | | | | | |
NEXTracker, Inc., Class A(a) | | | 332,206 | | | | 18,327,805 | |
Vertiv Holdings Co., Class A | | | 376,210 | | | | 36,894,915 | |
| | | | | | | | |
| | | | | | | 55,222,720 | |
| | |
| Entertainment — 3.5% | | | | | | |
Netflix, Inc.(a) | | | 59,859 | | | | 38,406,732 | |
Nintendo Co. Ltd. | | | 662,300 | | | | 36,016,202 | |
Spotify Technology SA(a) | | | 210,362 | | | | 62,431,234 | |
Take-Two Interactive Software, Inc.(a) | | | 197,412 | | | | 31,656,988 | |
Warner Music Group Corp., Class A | | | 655,878 | | | | 19,532,047 | |
| | | | | | | | |
| | | | | | | 188,043,203 | |
| | |
| Financial Services — 3.6% | | | | | | |
Mastercard, Inc., Class A | | | 238,658 | | | | 106,696,832 | |
Visa, Inc., Class A | | | 318,913 | | | | 86,891,036 | |
| | | | | | | | |
| | | | | | | 193,587,868 | |
| | |
| Ground Transportation — 0.7% | | | | | | |
Uber Technologies, Inc.(a) | | | 596,694 | | | | 38,522,565 | |
| | | | | | | | |
| | |
| Industrial Conglomerates — 0.8% | | | | | | |
Hitachi Ltd. | | | 421,800 | | | | 43,440,207 | |
| | | | | | | | |
| | |
| Interactive Media & Services — 4.6% | | | | | | |
Alphabet, Inc., Class A(a) | | | 525,384 | | | | 90,628,740 | |
Meta Platforms, Inc., Class A | | | 328,656 | | | | 153,426,480 | |
| | | | | | | | |
| | | | | | | 244,055,220 | |
| | |
| IT Services — 1.7% | | | | | | |
Accenture PLC, Class A | | | 70,022 | | | | 19,766,510 | |
Farmer’s Business Network, Inc.(a)(b) | | | 194,200 | | | | 506,862 | |
Klarna Holdings AB (Acquired 09/15/20,
cost $11,017,172)(a)(b)(c) | | | 25,600 | | | | 10,577,224 | |
MongoDB, Inc., Class A(a) | | | 168,545 | | | | 39,786,733 | |
Snowflake, Inc., Class A(a) | | | 142,653 | | | | 19,426,486 | |
| | | | | | | | |
| | | | | | | 90,063,815 | |
| | |
| Professional Services — 2.4% | | | | | | |
Equifax, Inc. | | | 90,223 | | | | 20,876,700 | |
RELX PLC | | | 1,189,859 | | | | 52,195,406 | |
Thomson Reuters Corp. | | | 306,179 | | | | 52,688,083 | |
| | | | | | | | |
| | | | | | | 125,760,189 | |
|
| Semiconductors & Semiconductor Equipment — 35.5% | |
Advanced Micro Devices, Inc.(a) | | | 815,767 | | | | 136,151,512 | |
Applied Materials, Inc. | | | 173,298 | | | | 37,272,934 | |
| | | | | | | | |
| Security | | Shares | | | Value | |
| |
|
| Semiconductors & Semiconductor Equipment (continued) | |
ARM Holdings PLC, ADR(a)(d) | | | 428,395 | | | $ | 51,630,166 | |
ASM International NV | | | 78,386 | | | | 55,161,051 | |
ASML Holding NV | | | 159,696 | | | | 152,792,540 | |
Broadcom, Inc. | | | 145,236 | | | | 192,953,288 | |
Lam Research Corp. | | | 104,111 | | | | 97,077,261 | |
Marvell Technology, Inc. | | | 833,098 | | | | 57,325,473 | |
Micron Technology, Inc. | | | 948,085 | | | | 118,510,625 | |
Monolithic Power Systems, Inc. | | | 81,729 | | | | 60,122,304 | |
NVIDIA Corp. | | | 722,695 | | | | 792,312,209 | |
QUALCOMM, Inc. | | | 215,420 | | | | 43,956,451 | |
STMicroelectronics NV | | | 483,232 | | | | 20,406,226 | |
Taiwan Semiconductor Manufacturing Co. Ltd., ADR | | | 521,399 | | | | 78,752,105 | |
| | | | | | | | |
| | | | | | | 1,894,424,145 | |
| | |
| Software — 27.6% | | | | | | |
Autodesk, Inc.(a) | | | 149,596 | | | | 30,158,554 | |
Cadence Design Systems, Inc.(a) | | | 598,617 | | | | 171,390,033 | |
Constellation Software, Inc. | | | 22,302 | | | | 62,033,415 | |
Crowdstrike Holdings, Inc., Class A(a) | | | 233,797 | | | | 73,335,105 | |
Databricks, Inc. (Acquired 07/24/20 - 09/02/20, cost $5,122,891)(a)(b)(c) | | | 319,983 | | | | 23,518,750 | |
Datadog, Inc., Class A(a) | | | 243,529 | | | | 26,832,025 | |
Fair Isaac Corp.(a) | | | 66,532 | | | | 85,821,623 | |
Intuit, Inc. | | | 139,559 | | | | 80,447,390 | |
Microsoft Corp. | | | 1,241,541 | | | | 515,400,915 | |
Nutanix, Inc., Class A(a) | | | 544,310 | | | | 30,108,508 | |
Oracle Corp. | | | 893,815 | | | | 104,746,180 | |
Palo Alto Networks, Inc.(a) | | | 119,314 | | | | 35,186,892 | |
Salesforce, Inc. | | | 236,325 | | | | 55,404,033 | |
SAP SE | | | 304,913 | | | | 55,603,488 | |
ServiceNow, Inc.(a) | | | 108,016 | | | | 70,958,951 | |
Unqork, Inc. (Acquired 03/05/21,
cost $4,093,769)(a)(b)(c) | | | 149,520 | | | | 720,686 | |
Xero Ltd.(a) | | | 363,695 | | | | 33,021,426 | |
Zscaler, Inc.(a) | | | 100,076 | | | | 17,008,917 | |
| | | | | | | | |
| | | | | | | 1,471,696,891 | |
| | |
| Specialty Retail — 0.0% | | | | | | |
AceVector Ltd. (Acquired 05/07/14 - 10/29/14, cost $1,414,399)(a)(b)(c) | | | 304,000 | | | | 146,844 | |
| | | | | | | | |
|
| Technology Hardware, Storage & Peripherals — 8.9% | |
Apple Inc. | | | 2,074,760 | | | | 398,872,610 | |
Quanta Computer, Inc. | | | 3,248,000 | | | | 27,596,259 | |
Western Digital Corp.(a) | | | 609,555 | | | | 45,893,396 | |
| | | | | | | | |
| | | | | | | 472,362,265 | |
| | | | | | | | |
| |
Total Common Stocks — 98.0%
(Cost: $2,271,254,959) | | | | 5,230,950,259 | |
| | | | | | | | |
| | |
Preferred Securities | | | | | | | | |
| | |
| Preferred Stocks — 1.6% | | | | | | |
| | |
| Diversified Consumer Services — 0.1% | | | | | | |
FlixMobility GmbH, Series F (Acquired 07/26/19, cost $2,492,260)(a)(b)(c) | | | 125 | | | | 3,883,229 | |
Think & Learn Private Ltd., Series F (Acquired 09/30/20, cost $6,867,746)(a)(b)(c) | | | 2,371 | | | | — | |
| | | | | | | | |
| | | | | | | 3,883,229 | |
| | |
| Interactive Media & Services — 0.3% | | | | | | |
Bytedance Ltd., Series E-1 (Acquired 11/11/20, cost $10,748,384)(a)(b)(c) | | | 94,889 | | | | 16,491,708 | |
| | | | | | | | |
| | |
S C H E D U L E S O F I N V E S T M E N T S | | 17 |
| | |
Schedule of Investments (continued) May 31, 2024 | | BlackRock Technology Opportunities Fund (Percentages shown are based on Net Assets) |
| | | | | | | | |
| Security | | Shares | | | Value | |
| |
|
| Semiconductors & Semiconductor Equipment — 0.3% | |
PsiQuantum Corp., Series C (Acquired 09/09/19, cost $2,698,453)(a)(b)(c) | | | 581,814 | | | $ | 16,098,793 | |
| | | | | | | | |
| | |
| Software — 0.9% | | | | | | |
Databricks, Inc. | | | | | | | | |
Series F (Acquired 10/22/19,
cost $3,700,005)(a)(b)(c) | | | 258,450 | | | | 18,996,075 | |
Series G (Acquired 02/01/21,
cost $12,500,003)(a)(b)(c) | | | 211,425 | | | | 15,539,738 | |
SambaNova Systems, Inc., Series C (Acquired 02/20/20, cost $9,804,574)(a)(b)(c) | | | 184,153 | | | | 10,343,874 | |
Unqork, Inc. | | | | | | | | |
Series A (Acquired 03/05/21,
cost $194,941)(a)(b)(c) | | | 7,120 | | | | 36,454 | |
Series B (Acquired 03/05/21,
cost $314,316)(a)(b)(c) | | | 11,480 | | | | 65,436 | |
Series C (Acquired 09/18/20,
cost $8,323,340)(a)(b)(c) | | | 304,000 | | | | 2,194,880 | |
Series Seed (Acquired 03/05/21,
cost $489,544)(a)(b)(c) | | | 17,880 | | | | 87,433 | |
Series Seed A (Acquired 03/05/21,
cost $180,704)(a)(b)(c) | | | 6,600 | | | | 32,142 | |
| | | | | | | | |
| | | | | | | 47,296,032 | |
| | | | | | | | |
| | |
Total Preferred Securities — 1.6%
(Cost: $58,314,270) | | | | | | | 83,769,762 | |
| | | | | | | | |
| | |
Warrants(a)(b) | | | | | | | | |
| | |
| Software — 0.0% | | | | | | |
Constellation Software, Inc. (Issued/Exercisable, 1 Share for 1 Warrant, Expires 03/31/40, Strike Price CAD 0.00) | | | 22,107 | | | | — | |
| | | | | | | | |
| | |
Total Warrants — 0.0%
(Cost: $0) | | | | | | | — | |
| | | | | | | | |
| | |
Total Long-Term Investments — 99.6%
(Cost: $2,329,569,229) | | | | | | | 5,314,720,021 | |
| | | | | | | | |
| | | | | | | | |
| Security | | Shares | | | Value | |
| |
| | |
Short-Term Securities | | | | | | | | |
| | |
| Money Market Funds — 1.3% | | | | | | |
BlackRock Cash Funds: Institutional, SL Agency Shares, 5.49%(e)(f)(g) | | | 42,705,666 | | | $ | 42,718,478 | |
BlackRock Liquidity Funds, T-Fund, Institutional Shares, 5.19%(e)(f) | | | 25,083,311 | | | | 25,083,311 | |
| | | | | | | | |
| | |
Total Short-Term Securities — 1.3%
(Cost: $67,801,789) | | | | | | | 67,801,789 | |
| | | | | | | | |
| | |
Total Investments — 100.9%
(Cost: $2,397,371,018) | | | | | | | 5,382,521,810 | |
| |
Liabilities in Excess of Other Assets — (0.9)% | | | | (46,963,836 | ) |
| | | | | | | | |
| | |
Net Assets — 100.0% | | | | | | $ | 5,335,557,974 | |
| | | | | | | | |
| (a) | Non-income producing security. |
| (b) | Security is valued using significant unobservable inputs and is classified as Level 3 in the fair value hierarchy. |
| (c) | Restricted security as to resale, excluding 144A securities. The Fund held restricted securities with a current value of $118,733,266, representing 2.2% of its net assets as of period end, and an original cost of $83,390,143. |
| (d) | All or a portion of this security is on loan. |
| (e) | Affiliate of the Fund. |
| (f) | Annualized 7-day yield as of period end. |
| (g) | All or a portion of this security was purchased with the cash collateral from loaned securities. |
| | |
| 18 | | 2 0 2 4 B L A C K R O C K A N N U A L F I N A N C I A L S T A T E M E N T S |
| | |
Schedule of Investments (continued) May 31, 2024 | | BlackRock Technology Opportunities Fund |
Affiliates
Investments in issuers considered to be affiliate(s) of the Fund during the year ended May 31, 2024 for purposes of Section 2(a)(3) of the Investment Company Act of 1940, as amended, were as follows:
| | | | | | | | | | | | | | | | | | | | | | | | | | | | | | | | | | | | | | | | | | |
| | | Affiliated Issuer | | Value at 05/31/23 | | | Purchases at Cost | | | Proceeds from Sales | | | Net Realized Gain (Loss) | | | Change in Unrealized Appreciation (Depreciation) | | | Value at 05/31/24 | | | Shares Held at 05/31/24 | | | Income | | | Capital Gain Distributions from Underlying Funds | | |
| |
| | BlackRock Cash Funds: Institutional, SL Agency Shares | | $ | — | | | $ | 42,712,409 | (a) | | $ | — | | | $ | 6,069 | | | $ | — | | | $ | 42,718,478 | | | | 42,705,666 | | | $ | 10,689 | (b) | | $ | — | | | | | |
| | BlackRock Liquidity Funds, T-Fund, Institutional Shares | | | 37,081,328 | | | | — | | | | (11,998,017 | )(a) | | | — | | | | — | | | | 25,083,311 | | | | 25,083,311 | | | | 617,473 | | | | — | | | | | |
| | SL Liquidity Series, LLC, Money Market Series(c) | | | 148,567,014 | | | | — | | | | (148,577,921 | )(a) | | | 38,654 | | | | (27,747 | ) | | | — | | | | — | | | | 216,443 | (b) | | | — | | | | | |
| | | | | | | | | | | | | | | | | | | | | | | | | | | | | | | | | | | | | | | | | | |
| | | | | | | | | | | | | | | | $ | 44,723 | | | $ | (27,747 | ) | | $ | 67,801,789 | | | | | | | $ | 844,605 | | | $ | — | | | | | |
| | | | | | | | | | | | | | | | | | | | | | | | | | | | | | | | | | | | | | | | | | |
| | (a) | Represents net amount purchased (sold). | |
| | (b) | All or a portion represents securities lending income earned from the reinvestment of cash collateral from loaned securities, net of fees and collateral investment expenses, and other payments to and from borrowers of securities. | |
| | (c) | As of period end, the entity is no longer held. | |
For purposes of this report, industry and sector sub-classifications may differ from those utilized by the Fund for compliance purposes.
Fair Value Hierarchy as of Period End
Various inputs are used in determining the fair value of financial instruments. For a description of the input levels and information about the Fund’s policy regarding valuation of financial instruments, refer to the Notes to Financial Statements.
The following table summarizes the Fund’s financial instruments categorized in the fair value hierarchy. The breakdown of the Fund’s financial instruments into major categories is disclosed in the Schedule of Investments above.
| | | | | | | | | | | | | | | | |
| | | Level 1 | | | Level 2 | | | Level 3 | | | Total | |
Assets | | | | | | | | | | | | | | | | |
Investments | | | | | | | | | | | | | | | | |
Long-Term Investments | | | | | | | | | | | | | | | | |
Common Stocks | | | | | | | | | | | | | | | | |
Automobiles | | $ | 51,488,092 | | | $ | — | | | $ | — | | | $ | 51,488,092 | |
Broadline Retail | | | 219,893,952 | | | | — | | | | — | | | | 219,893,952 | |
Capital Markets | | | 29,351,982 | | | | — | | | | — | | | | 29,351,982 | |
Communications Equipment | | | 78,140,539 | | | | — | | | | — | | | | 78,140,539 | |
Consumer Finance | | | 34,749,762 | | | | — | | | | — | | | | 34,749,762 | |
Diversified Consumer Services | | | — | | | | — | | | | — | | | | — | |
Electrical Equipment | | | 55,222,720 | | | | — | | | | — | | | | 55,222,720 | |
Entertainment | | | 152,027,001 | | | | 36,016,202 | | | | — | | | | 188,043,203 | |
Financial Services | | | 193,587,868 | | | | — | | | | — | | | | 193,587,868 | |
Ground Transportation | | | 38,522,565 | | | | — | | | | — | | | | 38,522,565 | |
Industrial Conglomerates | | | — | | | | 43,440,207 | | | | — | | | | 43,440,207 | |
Interactive Media & Services | | | 244,055,220 | | | | — | | | | — | | | | 244,055,220 | |
IT Services | | | 78,979,729 | | | | — | | | | 11,084,086 | | | | 90,063,815 | |
Professional Services | | | 73,564,783 | | | | 52,195,406 | | | | — | | | | 125,760,189 | |
Semiconductors & Semiconductor Equipment | | | 1,666,064,328 | | | | 228,359,817 | | | | — | | | | 1,894,424,145 | |
Software | | | 1,358,832,541 | | | | 88,624,914 | | | | 24,239,436 | | | | 1,471,696,891 | |
Specialty Retail | | | — | | | | — | | | | 146,844 | | | | 146,844 | |
Technology Hardware, Storage & Peripherals | | | 444,766,006 | | | | 27,596,259 | | | | — | | | | 472,362,265 | |
Preferred Securities | | | — | | | | — | | | | 83,769,762 | | | | 83,769,762 | |
Warrants | | | — | | | | — | | | | — | | | | — | |
Short-Term Securities | | | | | | | | | | | | | | | | |
Money Market Funds | | | 67,801,789 | | | | — | | | | — | | | | 67,801,789 | |
| | | | | | | | | | | | | | | | |
| | $ | 4,787,048,877 | | | $ | 476,232,805 | | | $ | 119,240,128 | | | $ | 5,382,521,810 | |
| | | | | | | | | | | | | | | | |
| | |
S C H E D U L E S O F I N V E S T M E N T S | | 19 |
| | |
Schedule of Investments (continued) May 31, 2024 | | BlackRock Technology Opportunities Fund |
A reconciliation of Level 3 financial instruments is presented when the Fund had a significant amount of Level 3 investments at the beginning and/or end of the year in relation to net assets. The following table is a reconciliation of Level 3 investments for which significant unobservable inputs were used in determining fair value:
| | | | | | | | | | | | | | | | |
| | | Common Stocks | | | Preferred Stocks | | | Warrants | | | Total | |
Assets | | | | | | | | | | | | | | | | |
Opening Balance, as of May 31, 2023 | | $ | 27,801,094 | | | $ | 103,069,338 | | | $ | — | | | $ | 130,870,432 | |
Transfers into Level 3 | | | — | | | | — | | | | — | | | | — | |
Transfers out of Level 3 | | | — | | | | — | | | | — | | | | — | |
Other(a) | | | 6,419,592 | | | | (6,419,592 | ) | | | — | | | | — | |
Accrued discounts/premiums | | | — | | | | — | | | | — | | | | — | |
Net realized gain (loss) | | | — | | | | 2,583,493 | | | | — | | | | 2,583,493 | |
Net change in unrealized appreciation (depreciation)(b)(c) | | | 1,249,680 | | | | (1,431,926 | ) | | | —(d | ) | | | (182,246 | ) |
Purchases | | | — | | | | 350,999 | | | | — | | | | 350,999 | |
Sales | | | — | | | | (14,382,550 | ) | | | — | | | | (14,382,550 | ) |
| | | | | | | | | | | | | | | | |
Closing Balance, as of May 31, 2024 | | $ | 35,470,366 | | | $ | 83,769,762 | | | $ | —(d | ) | | $ | 119,240,128 | |
| | | | | | | | | | | | | | | | |
Net change in unrealized appreciation (depreciation) on investments still held at May 31, 2024(c) | | $ | 1,249,680 | | | $ | (1,431,926 | ) | | $ | — | | | $ | (182,246 | ) |
| | | | | | | | | | | | | | | | |
| | (a) | Certain Level 3 investments were re-classified between Preferred Stocks and Common Stocks. | |
| | (b) | Included in the related net change in unrealized appreciation (depreciation) in the Statements of Operations. | |
| | (c) | Any difference between net change in unrealized appreciation (depreciation) and net change in unrealized appreciation (depreciation) on investments still held at May 31, 2023, is generally due to investments no longer held or categorized as Level 3 at period end. | |
| | (d) | Rounds to less than $1. | |
The following table summarizes the valuation approaches used and unobservable inputs utilized by the BlackRock Valuation Committee (the “Valuation Committee”) to determine the value of certain of the Fund’s Level 3 investments as of period end.
| | | | | | | | | | | | | | | | | | | | |
| | | Value | | | Valuation Approach | | | Unobservable Inputs | | | Range of Unobservable Inputs Utilized(a) | | | Weighted Average of Unobservable Inputs Based on Fair Value | |
Assets | | | | | | | | | | | | | | | | | | | | |
Common Stocks | | $ | 35,470,366 | | | | Market | | | | Revenue Multiple | | | | 1.75x - 18.08x | | | | 13.94x | |
| | | | | | | | | | | Volatility | | | | 70% | | | | — | |
| | | | | | | | | | | Time to Exit | | | | 3.0 years | | | | — | |
Preferred Stocks | | | 83,769,762 | | | | Market | | | | Revenue Multiple | | | | 1.55x - 18.08x | | | | 12.42x | |
| | | | | | | | | | | Volatility | | | | 50%- 70% | | | | 53% | |
| | | | | | | | | | | Time to Exit | | | | 3.0 - 4.0 years | | | | 3.9 years | |
| | | | | | | | | | | Market Adjustment Multiple | | | | 1.30x | | | | — | |
| | | | | | | | | | | | | | | | | | | | |
| | $ | 119,240,128 | | | | | | | | | | | | | | | | | |
| | | | | | | | | | | | | | | | | | | | |
| | (a) | A significant change in unobservable input would have resulted in a correlated (inverse) significant change to value. | |
See notes to financial statements.
| | |
| 20 | | 2 0 2 4 B L A C K R O C K A N N U A L F I N A N C I A L S T A T E M E N T S |
Statements of Assets and Liabilities
May 31, 2024
| | | | | | | | | | | | |
| | | BlackRock Capital Appreciation Fund, Inc. | | | BlackRock Health Sciences Opportunities Portfolio | | | BlackRock Infrastructure Sustainable Opportunities Fund | |
| | | |
ASSETS | | | | | | | | | | | | |
Investments, at value — unaffiliated(a)(b) | | $ | 3,480,045,446 | | | $ | 8,231,292,411 | | | $ | 8,723,996 | |
Investments, at value — affiliated(c) | | | 4,697,315 | | | | 168,531,498 | | | | 179,426 | |
Cash | | | 3,221 | | | | — | | | | — | |
Foreign currency, at value(d) | | | — | | | | — | | | | 91,324 | |
Receivables: | | | | | | | | | | | | |
Investments sold | | | 2,823,284 | | | | — | | | | — | |
Securities lending income — affiliated | | | — | | | | 17,813 | | | | 19 | |
Capital shares sold | | | 1,081,996 | | | | 3,225,977 | | | | — | |
Dividends — unaffiliated | | | 1,351,345 | | | | 8,282,823 | | | | 44,460 | |
Dividends — affiliated | | | 9,197 | | | | 91,209 | | | | 1,609 | |
From the Manager | | | — | | | | — | | | | 36,853 | |
Prepaid expenses | | | 19,022 | | | | 68,443 | | | | 20,179 | |
| | | | | | | | | | | | |
Total assets | | | 3,490,030,826 | | | | 8,411,510,174 | | | | 9,097,866 | |
| | | | | | | | | | | | |
| | | |
LIABILITIES | | | | | | | | | | | | |
Collateral on securities loaned | | | — | | | | 77,928,705 | | | | — | |
Payables: | | | | | | | | | | | | |
Accounting services fees | | | 77,072 | | | | 164,831 | | | | 12,428 | |
Administration fees | | | — | | | | 386,412 | | | | — | |
Capital shares redeemed | | | 1,897,327 | | | | 10,966,585 | | | | — | |
Investment advisory fees | | | 1,879,068 | | | | 4,733,957 | | | | — | |
Directors’ and Officer’s fees | | | 9,819 | | | | 19,107 | | | | 1,282 | |
Other accrued expenses | | | 82,927 | | | | 108,054 | | | | 3,663 | |
Other affiliate fees | | | 37,793 | | | | 82,350 | | | | 35 | |
Professional fees | | | 41,336 | | | | 190,443 | | | | 47,984 | |
Service and distribution fees | | | 492,100 | | | | 985,744 | | | | 49 | |
Transfer agent fees | | | 563,122 | | | | 1,810,681 | | | | 383 | |
Unrealized depreciation on OTC swaps | | | — | | | | — | | | | 3,171 | |
| | | | | | | | | | | | |
Total liabilities | | | 5,080,564 | | | | 97,376,869 | | | | 68,995 | |
| | | | | | | | | | | | |
Commitments and contingent liabilities | | | | | | | | | | | | |
| | | |
NET ASSETS | | $ | 3,484,950,262 | | | $ | 8,314,133,305 | | | $ | 9,028,871 | |
| | | | | | | | | | | | |
| | | |
NET ASSETS CONSIST OF: | | | | | | | | | | | | |
Paid-in capital | | $ | 1,168,421,791 | | | $ | 4,588,772,551 | | | $ | 10,129,777 | |
Accumulated earnings (loss) | | | 2,316,528,471 | | | | 3,725,360,754 | | | | (1,100,906 | ) |
| | | | | | | | | | | | |
NET ASSETS | | $ | 3,484,950,262 | | | $ | 8,314,133,305 | | | $ | 9,028,871 | |
| | | | | | | | | | | | |
(a) Investments, at cost — unaffiliated | | $ | 1,417,917,101 | | | $ | 4,756,602,194 | | | $ | 8,759,336 | |
(b) Securities loaned, at value | | $ | — | | | $ | 75,485,003 | | | $ | — | |
(c) Investments, at cost — affiliated | | $ | 4,697,315 | | | $ | 168,531,498 | | | $ | 179,426 | |
(d) Foreign currency, at cost | | $ | — | | | $ | — | | | $ | 91,108 | |
| | |
F I N A N C I A L S T A T E M E N T S | | 21 |
Statements of Assets and Liabilities (continued)
May 31, 2024
| | | | | | | | | | | | |
| | | BlackRock | | | BlackRock | | | BlackRock | |
| | | Capital | | | Health | | | Infrastructure | |
| | | Appreciation | | | Sciences | | | Sustainable | |
| | | Fund, | | | Opportunities | | | Opportunities | |
| | | Inc. | | | Portfolio | | | Fund | |
| | | |
NET ASSET VALUE | | | | | | | | | | | | |
Institutional | | | | | | | | | | | | |
Net assets | | $ | 784,361,079 | | | $ | 4,374,720,923 | | | $ | 102,159 | |
| | | | | | | | | | | | |
Shares outstanding | | | 18,706,105 | | | | 58,461,929 | | | | 11,551 | |
| | | | | | | | | | | | |
Net asset value | | $ | 41.93 | | | $ | 74.83 | | | $ | 8.84 | |
| | | | | | | | | | | | |
Shares authorized | | | 300 million | | | | Unlimited | | | | Unlimited | |
| | | | | | | | | | | | |
Par value | | $ | 0.10 | | | $ | 0.001 | | | $ | 0.001 | |
| | | | | | | | | | | | |
| | | |
| Service | | | | | | | | | |
Net assets | | $ | N/A | | | $ | 31,141,277 | | | $ | N/A | |
| | | | | | | | | | | | |
Shares outstanding | | | N/A | | | | 443,193 | | | | N/A | |
| | | | | | | | | | | | |
Net asset value | | $ | N/A | | | $ | 70.27 | | | $ | N/A | |
| | | | | | | | | | | | |
Shares authorized | | | N/A | | | | Unlimited | | | | N/A | |
| | | | | | | | | | | | |
Par value | | $ | N/A | | | $ | 0.001 | | | $ | N/A | |
| | | | | | | | | | | | |
| | | |
| Investor A | | | | | | | | | |
Net assets | | $ | 2,117,887,666 | | | $ | 2,851,925,440 | | | $ | 252,974 | |
| | | | | | | | | | | | |
Shares outstanding | | | 57,961,201 | | | | 40,809,412 | | | | 28,643 | |
| | | | | | | | | | | | |
Net asset value | | $ | 36.54 | | | $ | 69.88 | | | $ | 8.83 | |
| | | | | | | | | | | | |
Shares authorized | | | 300 million | | | | Unlimited | | | | Unlimited | |
| | | | | | | | | | | | |
Par value | | $ | 0.10 | | | $ | 0.001 | | | $ | 0.001 | |
| | | | | | | | | | | | |
| | | |
| Investor C | | | | | | | | | |
Net assets | | $ | 40,227,924 | | | $ | 311,993,780 | | | $ | N/A | |
| | | | | | | | | | | | |
Shares outstanding | | | 2,038,402 | | | | 5,458,049 | | | | N/A | |
| | | | | | | | | | | | |
Net asset value | | $ | 19.74 | | | $ | 57.16 | | | $ | N/A | |
| | | | | | | | | | | | |
Shares authorized | | | 300 million | | | | Unlimited | | | | N/A | |
| | | | | | | | | | | | |
Par value | | $ | 0.10 | | | $ | 0.001 | | | $ | N/A | |
| | | | | | | | | | | | |
| | | |
| Class K | | | | | | | | | |
Net assets | | $ | 517,123,374 | | | $ | 496,504,353 | | | $ | 8,673,738 | |
| | | | | | | | | | | | |
Shares outstanding | | | 12,179,596 | | | | 6,624,380 | | | | 980,504 | |
| | | | | | | | | | | | |
Net asset value | | $ | 42.46 | | | $ | 74.95 | | | $ | 8.85 | |
| | | | | | | | | | | | |
Shares authorized | | | 300 million | | | | Unlimited | | | | Unlimited | |
| | | | | | | | | | | | |
Par value | | $ | 0.10 | | | $ | 0.001 | | | $ | 0.001 | |
| | | | | | | | | | | | |
| | | |
| Class R | | | | | | | | | |
Net assets | | $ | 25,350,219 | | | $ | 247,847,532 | | | $ | N/A | |
| | | | | | | | | | | | |
Shares outstanding | | | 986,303 | | | | 3,667,130 | | | | N/A | |
| | | | | | | | | | | | |
Net asset value | | $ | 25.70 | | | $ | 67.59 | | | $ | N/A | |
| | | | | | | | | | | | |
Shares authorized | | | 500 million | | | | Unlimited | | | | N/A | |
| | | | | | | | | | | | |
Par value | | $ | 0.10 | | | $ | 0.001 | | | $ | N/A | |
| | | | | | | | | | | | |
See notes to financial statements.
| | |
| 22 | | 2 0 2 4 B L A C K R O C K A N N U A L F I N A N C I A L S T A T E M E N T S |
Statement of Assets and Liabilities (continued)
May 31, 2024
| | | | | | | | |
| | | BlackRock Mid-Cap Growth Equity Portfolio | | | BlackRock Technology Opportunities Fund | |
| | |
ASSETS | | | | | | | | |
Investments, at value — unaffiliated(a)(b) | | $ | 11,678,081,760 | | | $ | 5,314,720,021 | |
Investments, at value — affiliated(c) | | | 463,688,221 | | | | 67,801,789 | |
Cash | | | — | | | | 5,243 | |
Foreign currency, at value(d) | | | — | | | | 5,822 | |
Receivables: | | | | | | | | |
Investments sold | | | 66,018,613 | | | | 1,002,505 | |
Securities lending income — affiliated | | | 60,509 | | | | 7,695 | |
Capital shares sold | | | 10,611,697 | | | | 3,856,343 | |
Dividends — unaffiliated | | | 2,337,149 | | | | 2,848,517 | |
Dividends — affiliated | | | 119,732 | | | | 59,138 | |
From the Manager | | | 156,499 | | | | 44,467 | |
Prepaid expenses | | | 109,280 | | | | 89,804 | |
| | | | | | | | |
Total assets | | | 12,221,183,460 | | | | 5,390,441,344 | |
| | | | | | | | |
| | |
LIABILITIES | | | | | | | | |
Collateral on securities loaned | | | 462,954,231 | | | | 42,712,409 | |
Payables: | | | | | | | | |
Investments purchased | | | 63,436,812 | | | | — | |
Accounting services fees | | | 234,228 | | | | 106,811 | |
Administration fees | | | 426,346 | | | | 166,620 | |
Capital shares redeemed | | | 16,853,616 | | | | 6,018,831 | |
Investment advisory fees | | | 6,387,706 | | | | 3,425,297 | |
Directors’ and Officer’s fees | | | 27,320 | | | | 11,791 | |
Other accrued expenses | | | 115,536 | | | | 243,195 | |
Other affiliate fees | | | 1,005 | | | | 31,424 | |
Professional fees | | | 87,382 | | | | 118,153 | |
Service and distribution fees | | | 567,388 | | | | 686,043 | |
Transfer agent fees | | | 2,952,368 | | | | 1,362,796 | |
| | | | | | | | |
Total liabilities | | | 554,043,938 | | | | 54,883,370 | |
| | | | | | | | |
Commitments and contingent liabilities | | | | | | | | |
| | |
NET ASSETS | | $ | 11,667,139,522 | | | $ | 5,335,557,974 | |
| | | | | | | | |
| | |
NET ASSETS CONSIST OF: | | | | | | | | |
Paid-in capital | | $ | 9,687,762,850 | | | $ | 2,805,517,403 | |
Accumulated earnings | | | 1,979,376,672 | | | | 2,530,040,571 | |
| | | | | | | | |
NET ASSETS | | $ | 11,667,139,522 | | | $ | 5,335,557,974 | |
| | | | | | | | |
(a) Investments, at cost — unaffiliated | | $ | 8,371,236,397 | | | $ | 2,329,569,229 | |
(b) Securities loaned, at value | | $ | 454,513,825 | | | $ | 41,685,337 | |
(c) Investments, at cost — affiliated | | $ | 463,689,974 | | | $ | 67,801,789 | |
(d) Foreign currency, at cost | | $ | — | | | $ | 6,475 | |
| | |
F I N A N C I A L S T A T E M E N T S | | 23 |
Statement of Assets and Liabilities (continued)
May 31, 2024
| | | | | | | | |
| | | BlackRock | | | | |
| | | Mid-Cap | | | BlackRock | |
| | | Growth | | | Technology | |
| | | Equity | | | Opportunities | |
| | | Portfolio | | | Fund | |
| | |
NET ASSET VALUE | | | | | | | | |
Institutional | | | | | | | | |
Net assets | | $ | 5,194,320,250 | | | $ | 2,751,349,842 | |
| | | | | | | | |
Shares outstanding | | | 132,560,792 | | | | 42,045,190 | |
| | | | | | | | |
Net asset value | | $ | 39.18 | | | $ | 65.44 | |
| | | | | | | | |
Shares authorized | | | Unlimited | | | | Unlimited | |
| | | | | | | | |
Par value | | $ | 0.001 | | | $ | 0.001 | |
| | | | | | | | |
| | |
| Service | | | | | | |
Net assets | | $ | 59,730,502 | | | $ | 46,993,440 | |
| | | | | | | | |
Shares outstanding | | | 1,714,113 | | | | 773,163 | |
| | | | | | | | |
Net asset value | | $ | 34.85 | | | $ | 60.78 | |
| | | | | | | | |
Shares authorized | | | Unlimited | | | | Unlimited | |
| | | | | | | | |
Par value | | $ | 0.001 | | | $ | 0.001 | |
| | | | | | | | |
| | |
| Investor A | | | | | | |
Net assets | | $ | 1,622,437,651 | | | $ | 1,959,751,515 | |
| | | | | | | | |
Shares outstanding | | | 48,865,509 | | | | 33,052,395 | |
| | | | | | | | |
Net asset value | | $ | 33.20 | | | $ | 59.29 | |
| | | | | | | | |
Shares authorized | | | Unlimited | | | | Unlimited | |
| | | | | | | | |
Par value | | $ | 0.001 | | | $ | 0.001 | |
| | | | | | | | |
| | |
| Investor C | | | | | | |
Net assets | | $ | 184,965,701 | | | $ | 292,034,387 | |
| | | | | | | | |
Shares outstanding | | | 7,554,425 | | | | 6,224,732 | |
| | | | | | | | |
Net asset value | | $ | 24.48 | | | $ | 46.92 | |
| | | | | | | | |
Shares authorized | | | Unlimited | | | | Unlimited | |
| | | | | | | | |
Par value | | $ | 0.001 | | | $ | 0.001 | |
| | | | | | | | |
| | |
| Class K | | | | | | |
Net assets | | $ | 4,520,357,277 | | | $ | 241,109,256 | |
| | | | | | | | |
Shares outstanding | | | 114,685,480 | | | | 3,674,713 | |
| | | | | | | | |
Net asset value | | $ | 39.42 | | | $ | 65.61 | |
| | | | | | | | |
Shares authorized | | | Unlimited | | | | Unlimited | |
| | | | | | | | |
Par value | | $ | 0.001 | | | $ | 0.001 | |
| | | | | | | | |
| | |
| Class R | | | | | | |
Net assets | | $ | 85,328,141 | | | $ | 44,319,534 | |
| | | | | | | | |
Shares outstanding | | | 2,647,315 | | | | 748,053 | |
| | | | | | | | |
Net asset value | | $ | 32.23 | | | $ | 59.25 | |
| | | | | | | | |
Shares authorized | | | Unlimited | | | | Unlimited | |
| | | | | | | | |
Par value | | $ | 0.001 | | | $ | 0.001 | |
| | | | | | | | |
See notes to financial statements.
| | |
| 24 | | 2 0 2 4 B L A C K R O C K A N N U A L F I N A N C I A L S T A T E M E N T S |
Statement of Operations
Year Ended May 31, 2024
| | | | | | | | | | | | |
| | | BlackRock | | | BlackRock | | | BlackRock | |
| | | Capital | | | Health | | | Infrastructure | |
| | | Appreciation | | | Sciences | | | Sustainable | |
| | | Fund, | | | Opportunities | | | Opportunities | |
| | | Inc. | | | Portfolio | | | Fund | |
| | | |
INVESTMENT INCOME | | | | | | | | | | | | |
Dividends — unaffiliated | | $ | 19,173,936 | | | $ | 98,907,030 | | | $ | 284,093 | |
Dividends — affiliated | | | 148,044 | | | | 7,030,104 | | | | 22,361 | |
Securities lending income — affiliated — net | | | 5,978 | | | | 595,395 | | | | 44 | |
Other income — unaffiliated | | | — | | | | 61,463 | | | | — | |
Foreign taxes withheld | | | (315,429 | ) | | | (510,746 | ) | | | (23,634 | ) |
Foreign withholding tax claims | | | — | | | | 942,463 | | | | — | |
| | | | | | | | | | | | |
Total investment income | | | 19,012,529 | | | | 107,025,709 | | | | 282,864 | |
| | | | | | | | | | | | |
| | | |
EXPENSES | | | | | | | | | | | | |
Investment advisory | | | 20,769,444 | | | | 55,768,956 | | | | 70,212 | |
Service and distribution — class specific | | | 5,335,605 | | | | 11,964,455 | | | | 469 | |
Transfer agent — class specific | | | 2,882,637 | | | | 8,167,102 | | | | 1,364 | |
Accounting services | | | 218,895 | | | | 487,764 | | | | 36,928 | |
Reorganization | | | 202,500 | | | | — | | | | — | |
Registration | | | 140,013 | | | | 168,652 | | | | 57,086 | |
Custodian | | | 79,964 | | | | 133,096 | | | | 7,866 | |
Professional | | | 47,059 | | | | 214,339 | | | | 146,068 | |
Printing and postage | | | 46,915 | | | | 57,691 | | | | 48,358 | |
Directors and Officer | | | 33,371 | | | | 66,138 | | | | 6,320 | |
Administration | | | — | | | | 2,888,448 | | | | 3,730 | |
Administration — class specific | | | — | | | | 1,663,035 | | | | 1,755 | |
Miscellaneous | | | 66,326 | | | | 229,545 | | | | 8,460 | |
| | | | | | | | | | | | |
Total expenses excluding interest expense | | | 29,822,729 | | | | 81,809,221 | | | | 388,616 | |
Interest expense | | | 6,183 | | | | 1,518 | | | | 8 | |
| | | | | | | | | | | | |
Total expenses | | | 29,828,912 | | | | 81,810,739 | | | | 388,624 | |
Less: | | | | | | | | | | | | |
Administration fees waived | | | — | | | | — | | | | (3,730 | ) |
Administration fees waived by the Manager — class specific | | | — | | | | — | | | | (1,755 | ) |
Fees waived and/or reimbursed by the Manager | | | (204,670 | ) | | | (101,560 | ) | | | (297,863 | ) |
Transfer agent fees waived and/or reimbursed by the Manager — class specific | | | — | | | | — | | | | (1,221 | ) |
| | | | | | | | | | | | |
Total expenses after fees waived and/or reimbursed | | | 29,624,242 | | | | 81,709,179 | | | | 84,055 | |
| | | | | | | | | | | | |
Net investment income (loss) | | | (10,611,713 | ) | | | 25,316,530 | | | | 198,809 | |
| | | | | | | | | | | | |
| | | |
REALIZED AND UNREALIZED GAIN (LOSS) | | | | | | | | | | | | |
Net realized gain (loss) from: | | | | | | | | | | | | |
Investments — unaffiliated | | | 341,134,539 | | | | 399,955,398 | | | | (354,253 | ) |
Investments — affiliated | | | 3,536 | | | | 31,041 | | | | 3 | |
Forward foreign currency exchange contracts | | | — | | | | (4,758,895 | ) | | | — | |
Foreign currency transactions | | | (25,841 | ) | | | 78,448 | | | | 87 | |
Swaps | | | — | | | | — | | | | (21,325 | ) |
| | | | | | | | | | | | |
| | | 341,112,234 | | | | 395,305,992 | | | | (375,488 | ) |
| | | | | | | | | | | | |
| | |
F I N A N C I A L S T A T E M E N T S | | 25 |
Statement of Operations (continued)
Year Ended May 31, 2024
| | | | | | | | | | | | |
| | | BlackRock | | | BlackRock | | | BlackRock | |
| | | Capital | | | Health | | | Infrastructure | |
| | | Appreciation | | | Sciences | | | Sustainable | |
| | | Fund, | | | Opportunities | | | Opportunities | |
| | | Inc. | | | Portfolio | | | Fund | |
Net change in unrealized appreciation (depreciation) on: | | | | | | | | | | | | |
Investments — unaffiliated | | $ | 713,787,559 | | | $ | 612,611,612 | | | $ | 195,793 | |
Investments — affiliated | | | — | | | | (33,265 | ) | | | — | |
Forward foreign currency exchange contracts | | | — | | | | 2,418,141 | | | | — | |
Foreign currency translations | | | 2,555 | | | | 69,500 | | | | 912 | |
Swaps | | | — | | | | — | | | | 3,592 | |
| | | | | | | | | | | | |
| | | 713,790,114 | | | | 615,065,988 | | | | 200,297 | |
| | | | | | | | | | | | |
Net realized and unrealized gain (loss) | | | 1,054,902,348 | | | | 1,010,371,980 | | | | (175,191 | ) |
| | | | | | | | | | | | |
NET INCREASE IN NET ASSETS RESULTING FROM OPERATIONS | | $ | 1,044,290,635 | | | $ | 1,035,688,510 | | | $ | 23,618 | |
| | | | | | | | | | | | |
See notes to financial statements.
| | |
| 26 | | 2 0 2 4 B L A C K R O C K A N N U A L F I N A N C I A L S T A T E M E N T S |
Statement of Operations (continued)
Year Ended May 31, 2024
| | | | | | | | |
| | | BlackRock | | | | |
| | | Mid-Cap | | | BlackRock | |
| | | Growth | | | Technology | |
| | | Equity | | | Opportunities | |
| | | Portfolio | | | Fund | |
| | |
INVESTMENT INCOME | | | | | | | | |
Dividends — unaffiliated | | $ | 49,575,875 | | | $ | 24,536,866 | |
Dividends — affiliated | | | 699,116 | | | | 617,473 | |
Securities lending income — affiliated — net | | | 621,945 | | | | 227,132 | |
Foreign taxes withheld | | | (995,609 | ) | | | (1,031,324 | ) |
| | | | | | | | |
Total investment income | | | 49,901,327 | | | | 24,350,147 | |
| | | | | | | | |
| | |
EXPENSES | | | | | | | | |
Investment advisory | | | 74,556,562 | | | | 36,858,993 | |
Transfer agent — class specific | | | 12,247,894 | | | | 5,482,697 | |
Service and distribution — class specific | | | 6,759,533 | | | | 7,427,176 | |
Administration | | | 4,047,230 | | | | 1,745,990 | |
Administration — class specific | | | 2,376,511 | | | | 959,650 | |
Accounting services | | | 681,539 | | | | 297,036 | |
Registration | | | 390,562 | | | | 221,142 | |
Custodian | | | 364,699 | | | | 164,608 | |
Directors and Officer | | | 97,048 | | | | 43,446 | |
Professional | | | 91,524 | | | | 91,827 | |
Printing and postage | | | 87,338 | | | | 59,314 | |
Miscellaneous | | | 83,757 | | | | 62,312 | |
| | | | | | | | |
Total expenses excluding interest expense | | | 101,784,197 | | | | 53,414,191 | |
Interest expense | | | 70,774 | | | | 56,574 | |
| | | | | | | | |
Total expenses | | | 101,854,971 | | | | 53,470,765 | |
Less: | | | | | | | | |
Administration fees waived by the Manager — class specific | | | (1,479,768 | ) | | | (918,064 | ) |
Fees waived and/or reimbursed by the Manager | | | (10,128 | ) | | | (9,040 | ) |
Transfer agent fees waived and/or reimbursed by the Manager — class specific | | | (2,684,917 | ) | | | (1,094,486 | ) |
| | | | | | | | |
Total expenses after fees waived and/or reimbursed | | | 97,680,158 | | | | 51,449,175 | |
| | | | | | | | |
Net investment loss | | | (47,778,831 | ) | | | (27,099,028 | ) |
| | | | | | | | |
| | |
REALIZED AND UNREALIZED GAIN (LOSS) | | | | | | | | |
Net realized gain (loss) from: | | | | | | | | |
Investments — unaffiliated | | | 1,006,864,442 | | | | 280,181,709 | |
Investments — affiliated | | | 205,594 | | | | 44,723 | |
Foreign currency transactions | | | (212,194 | ) | | | 203,167 | |
| | | | | | | | |
| | | 1,006,857,842 | | | | 280,429,599 | |
| | | | | | | | |
Net change in unrealized appreciation (depreciation) on: | | | | | | | | |
Investments — unaffiliated | | | 1,133,740,090 | | | | 1,259,785,596 | |
Investments — affiliated | | | (120,225 | ) | | | (27,747 | ) |
Foreign currency translations | | | 89,314 | | | | (854 | ) |
| | | | | | | | |
| | | 1,133,709,179 | | | | 1,259,756,995 | |
| | | | | | | | |
Net realized and unrealized gain | | | 2,140,567,021 | | | | 1,540,186,594 | |
| | | | | | | | |
NET INCREASE IN NET ASSETS RESULTING FROM OPERATIONS | | $ | 2,092,788,190 | | | $ | 1,513,087,566 | |
| | | | | | | | |
See notes to financial statements.
| | |
F I N A N C I A L S T A T E M E N T S | | 27 |
Statements of Changes in Net Assets
| | | | | | | | | | | | | | | | | | |
| | | BlackRock Capital Appreciation Fund, Inc. | | | | | BlackRock Health Sciences Opportunities Portfolio | |
| | | | | |
| | | Year Ended
05/31/24 | | | Year Ended
05/31/23 | | | | | Year Ended
05/31/24 | | | Year Ended
05/31/23 | |
| | | | |
INCREASE (DECREASE) IN NET ASSETS | | | | | | | | | | | | | | | |
| | | | | |
OPERATIONS | | | | | | | | | | | | | | | | | | |
Net investment income (loss) | | $ | (10,611,713 | ) | | $ | (4,530,704 | ) | | | | $ | 25,316,530 | | | $ | 30,828,045 | |
Net realized gain | | | 341,112,234 | | | | 110,626,983 | | | | | | 395,305,992 | | | | 353,953,705 | |
Net change in unrealized appreciation (depreciation) | | | 713,790,114 | | | | 44,745,953 | | | | | | 615,065,988 | | | | (204,225,469 | ) |
| | | | | | | | | | | | | | | | | | |
Net increase in net assets resulting from operations | | | 1,044,290,635 | | | | 150,842,232 | | | | | | 1,035,688,510 | | | | 180,556,281 | |
| | | | | | | | | | | | | | | | | | |
| | | | | |
DISTRIBUTIONS TO SHAREHOLDERS(a) | | | | | | | | | | | | | | | | | | |
Institutional | | | (24,574,161 | ) | | | (60,013,923 | ) | | | | | (165,666,116 | ) | | | (349,006,342 | ) |
Service | | | — | | | | — | | | | | | (1,218,171 | ) | | | (2,578,561 | ) |
Investor A | | | (69,431,098 | ) | | | (137,177,573 | ) | | | | | (108,961,191 | ) | | | (224,765,771 | ) |
Investor C | | | (2,509,299 | ) | | | (5,779,913 | ) | | | | | (16,034,475 | ) | | | (43,035,902 | ) |
Class K | | | (22,193,494 | ) | | | (42,620,608 | ) | | | | | (17,980,192 | ) | | | (31,126,901 | ) |
Class R | | | (1,215,316 | ) | | | (2,479,998 | ) | | | | | (8,884,277 | ) | | | (18,314,016 | ) |
| | | | | | | | | | | | | | | | | | |
Decrease in net assets resulting from distributions to shareholders | | | (119,923,368 | ) | | | (248,072,015 | ) | | | | | (318,744,422 | ) | | | (668,827,493 | ) |
| | | | | | | | | | | | | | | | | | |
| | | | | |
CAPITAL SHARE TRANSACTIONS | | | | | | | | | | | | | | | | | | |
Net decrease in net assets derived from capital share transactions | | | (551,525,947 | ) | | | (324,095,316 | ) | | | | | (872,061,789 | ) | | | (536,587,817 | ) |
| | | | | | | | | | | | | | | | | | |
| | | | |
NET ASSETS | | | | | | | | | | | | | | | |
Total increase (decrease) in net assets | | | 372,841,320 | | | | (421,325,099 | ) | | | | | (155,117,701 | ) | | | (1,024,859,029 | ) |
Beginning of year | | | 3,112,108,942 | | | | 3,533,434,041 | | | | | | 8,469,251,006 | | | | 9,494,110,035 | |
| | | | | | | | | | | | | | | | | | |
End of year | | $ | 3,484,950,262 | | | $ | 3,112,108,942 | | | | | $ | 8,314,133,305 | | | $ | 8,469,251,006 | |
| | | | | | | | | | | | | | | | | | |
| (a) | Distributions for annual periods determined in accordance with U.S. federal income tax regulations. |
See notes to financial statements.
| | |
| 28 | | 2 0 2 4 B L A C K R O C K A N N U A L F I N A N C I A L S T A T E M E N T S |
Statements of Changes in Net Assets (continued)
| | | | | | | | | | | | | | | | | | |
| | | BlackRock Infrastructure Sustainable Opportunities Fund | | | | | BlackRock Mid-Cap Growth Equity Portfolio | |
| | | | | |
| | | Year Ended 05/31/24 | | | Year Ended 05/31/23 | | | | | Year Ended 05/31/24 | | | Year Ended 05/31/23 | |
| | | | |
INCREASE (DECREASE) IN NET ASSETS | | | | | | | | | | | | | | | |
| | | | | |
OPERATIONS | | | | | | | | | | | | | | | | | | |
Net investment income (loss) | | $ | 198,809 | | | $ | 146,746 | | | | | $ | (47,778,831 | ) | | $ | (34,115,341 | ) |
Net realized gain (loss) | | | (375,488 | ) | | | (697,724 | ) | | | | | 1,006,857,842 | | | | (1,145,834,520 | ) |
Net change in unrealized appreciation (depreciation) | | | 200,297 | | | | 5,508 | | | | | | 1,133,709,179 | | | | 1,071,226,878 | |
| | | | | | | | | | | | | | | | | | |
Net increase (decrease) in net assets resulting from operations | | | 23,618 | | | | (545,470 | ) | | | | | 2,092,788,190 | | | | (108,722,983 | ) |
| | | | | | | | | | | | | | | | | | |
| | | | | |
DISTRIBUTIONS TO SHAREHOLDERS(a) | | | | | | | | | | | | | | | | | | |
Institutional | | | (2,409 | ) | | | (4,103 | ) | | | | | — | | | | — | |
Investor A | | | (3,809 | ) | | | (3,968 | ) | | | | | — | | | | — | |
Class K | | | (214,945 | ) | | | (378,721 | ) | | | | | — | | | | — | |
| | | | | | | | | | | | | | | | | | |
Decrease in net assets resulting from distributions to shareholders | | | (221,163 | ) | | | (386,792 | ) | | | | | — | | | | — | |
| | | | | | | | | | | | | | | | | | |
| | | | | |
CAPITAL SHARE TRANSACTIONS | | | | | | | | | | | | | | | | | | |
Net increase (decrease) in net assets derived from capital share transactions | | | 102,034 | | | | 64,099 | | | | | | (1,914,227,253 | ) | | | (2,206,262,520 | ) |
| | | | | | | | | | | | | | | | | | |
| | | | |
NET ASSETS | | | | | | | | | | | | | | | |
Total increase (decrease) in net assets | | | (95,511 | ) | | | (868,163 | ) | | | | | 178,560,937 | | | | (2,314,985,503 | ) |
Beginning of year | | | 9,124,382 | | | | 9,992,545 | | | | | | 11,488,578,585 | | | | 13,803,564,088 | |
| | | | | | | | | | | | | | | | | | |
End of year | | $ | 9,028,871 | | | $ | 9,124,382 | | | | | $ | 11,667,139,522 | | | $ | 11,488,578,585 | |
| | | | | | | | | | | | | | | | | | |
| (a) | Distributions for annual periods determined in accordance with U.S. federal income tax regulations. |
See notes to financial statements.
| | |
F I N A N C I A L S T A T E M E N T S | | 29 |
Statements of Changes in Net Assets (continued)
| | | | | | | | |
| | | BlackRock Technology Opportunities Fund | |
| | |
| | | Year Ended 05/31/24 | | | Year Ended 05/31/23 | |
| | |
INCREASE (DECREASE) IN NET ASSETS | | | | | | | | |
| | |
OPERATIONS | | | | | | | | |
Net investment loss | | $ | (27,099,028 | ) | | $ | (19,097,180 | ) |
Net realized gain (loss) | | | 280,429,599 | | | | (264,055,854 | ) |
Net change in unrealized appreciation (depreciation) | | | 1,259,756,995 | | | | 408,231,300 | |
| | | | | | | | |
Net increase in net assets resulting from operations | | | 1,513,087,566 | | | | 125,078,266 | |
| | | | | | | | |
| | |
CAPITAL SHARE TRANSACTIONS | | | | | | | | |
Net decrease in net assets derived from capital share transactions | | | (566,590,067 | ) | | | (893,403,112 | ) |
| | | | | | | | |
| | |
NET ASSETS | | | | | | | | |
Total increase (decrease) in net assets | | | 946,497,499 | | | | (768,324,846 | ) |
Beginning of year | | | 4,389,060,475 | | | | 5,157,385,321 | |
| | | | | | | | |
End of year | | $ | 5,335,557,974 | | | $ | 4,389,060,475 | |
| | | | | | | | |
See notes to financial statements.
| | |
| 30 | | 2 0 2 4 B L A C K R O C K A N N U A L F I N A N C I A L S T A T E M E N T S |
Financial Highlights
(For a share outstanding throughout each period)
| | | | | | | | | | | | | | | | | | | | | | | | |
| | | BlackRock Capital Appreciation Fund, Inc. | |
| |
| | | Institutional | |
| | | | | | |
| | | Year Ended
05/31/24 | | | Year Ended
05/31/23 | | | Year Ended
05/31/22 | | | Period from
10/01/20
to 05/31/21 | | | Year Ended
09/30/20 | | | Year Ended
09/30/19 | |
| | | | | | | |
Net asset value, beginning of period | | $ | 31.69 | | | $ | 31.98 | | | $ | 43.32 | | | $ | 38.32 | | | $ | 30.52 | | | $ | 33.72 | |
| | | | | | | | | | | | | | | | | | | | | | | | |
| | | | | | |
Net investment income (loss)(a) | | | (0.06 | ) | | | 0.00 | (b) | | | (0.09 | ) | | | (0.06 | ) | | | (0.07 | ) | | | (0.05 | ) |
| | | | | | |
Net realized and unrealized gain (loss) | | | 11.51 | | | | 1.82 | | | | (6.14 | ) | | | 7.06 | | | | 10.81 | | | | 0.23 | |
| | | | | | | | | | | | | | | | | | | | | | | | |
| | | | | | |
Net increase (decrease) from investment operations | | | 11.45 | | | | 1.82 | | | | (6.23 | ) | | | 7.00 | | | | 10.74 | | | | 0.18 | |
| | | | | | | | | | | | | | | | | | | | | | | | |
| | | | | | |
Distributions from net realized gain(c) | | | (1.21 | ) | | | (2.11 | ) | | | (5.11 | ) | | | (2.00 | ) | | | (2.94 | ) | | | (3.38 | ) |
| | | | | | | | | | | | | | | | | | | | | | | | |
| | | | | | |
Net asset value, end of period | | $ | 41.93 | | | $ | 31.69 | | | $ | 31.98 | | | $ | 43.32 | | | $ | 38.32 | | | $ | 30.52 | |
| | | | | | | | | | | | | | | | | | | | | | | | |
| | | | | | |
Total Return(d) | | | | | | | | | | | | | | | | | | | | | | | | |
Based on net asset value | | | 37.03 | % | | | 6.81 | % | | | (17.30 | )% | | | 18.72 | %(e) | | | 38.17 | % | | | 1.77 | % |
| | | | | | | | | | | | | | | | | | | | | | | | |
| | | | | | |
Ratios to Average Net Assets(f) | | | | | | | | | | | | | | | | | | | | | | | | |
| | | | | | |
Total expenses | | | 0.75 | % | | | 0.73 | % | | | 0.70 | % | | | 0.72 | %(g) | | | 0.75 | % | | | 0.75 | % |
| | | | | | | | | | | | | | | | | | | | | | | | |
| | | | | | |
Total expenses after fees waived and/or reimbursed | | | 0.74 | % | | | 0.73 | % | | | 0.70 | % | | | 0.72 | %(g) | | | 0.75 | % | | | 0.75 | % |
| | | | | | | | | | | | | | | | | | | | | | | | |
| | | | | | |
Net investment income (loss) | | | (0.17 | )% | | | 0.01 | % | | | (0.21 | )% | | | (0.21 | )%(g) | | | (0.22 | )% | | | (0.17 | )% |
| | | | | | | | | | | | | | | | | | | | | | | | |
| | | | | | |
Supplemental Data | | | | | | | | | | | | | | | | | | | | | | | | |
Net assets, end of period (000) | | $ | 784,361 | | | $ | 678,965 | | | $ | 943,275 | | | $ | 1,072,833 | | | $ | 911,484 | | | $ | 644,983 | |
| | | | | | | | | | | | | | | | | | | | | | | | |
Portfolio turnover rate | | | 21 | % | | | 43 | % | | | 55 | % | | | 25 | % | | | 42 | % | | | 48 | % |
| | | | | | | | | | | | | | | | | | | | | | | | |
| (a) | Based on average shares outstanding. |
| (b) | Amount is less than $0.005 per share. |
| (c) | Distributions for annual periods determined in accordance with U.S. federal income tax regulations. |
| (d) | Where applicable, assumes the reinvestment of distributions. |
| (f) | Excludes fees and expenses incurred indirectly as a result of investments in underlying funds. |
See notes to financial statements.
| | |
F I N A N C I A L H I G H L I G H T S | | 31 |
Financial Highlights (continued)
(For a share outstanding throughout each period)
| | | | | | | | | | | | | | | | | | | | | | | | |
| | | BlackRock Capital Appreciation Fund, Inc. (continued) | |
| |
| | | Investor A | |
| | | | | | |
| | | Year Ended
05/31/24 | | | Year Ended
05/31/23 | | | Year Ended
05/31/22 | | | Period from
10/01/20 to 05/31/21 | | | Year Ended
09/30/20 | | | Year Ended
09/30/19 | |
| | | | | | | |
Net asset value, beginning of period | | $ | 27.77 | | | $ | 28.38 | | | $ | 39.00 | | | $ | 34.74 | | | $ | 27.99 | | | $ | 31.25 | |
| | | | | | | | | | | | | | | | | | | | | | | | |
| | | | | | |
Net investment loss(a) | | | (0.13 | ) | | | (0.07 | ) | | | (0.18 | ) | | | (0.11 | ) | | | (0.14 | ) | | | (0.12 | ) |
| | | | | | |
Net realized and unrealized gain (loss) | | | 10.04 | | | | 1.57 | | | | (5.39 | ) | | | 6.37 | | | | 9.83 | | | | 0.18 | |
| | | | | | | | | | | | | | | | | | | | | | | | |
| | | | | | |
Net increase (decrease) from investment operations | | | 9.91 | | | | 1.50 | | | | (5.57 | ) | | | 6.26 | | | | 9.69 | | | | 0.06 | |
| | | | | | | | | | | | | | | | | | | | | | | | |
| | | | | | |
Distributions from net realized gain(b) | | | (1.14 | ) | | | (2.11 | ) | | | (5.05 | ) | | | (2.00 | ) | | | (2.94 | ) | | | (3.32 | ) |
| | | | | | | | | | | | | | | | | | | | | | | | |
| | | | | | |
Net asset value, end of period | | $ | 36.54 | | | $ | 27.77 | | | $ | 28.38 | | | $ | 39.00 | | | $ | 34.74 | | | $ | 27.99 | |
| | | | | | | | | | | | | | | | | | | | | | | | |
| | | | | | |
Total Return(c) | | | | | | | | | | | | | | | | | | | | | | | | |
Based on net asset value | | | 36.66 | % | | | 6.53 | % | | | (17.51 | )% | | | 18.51 | %(d) | | | 37.84 | % | | | 1.48 | % |
| | | | | | | | | | | | | | | | | | | | | | | | |
| | | | | | |
Ratios to Average Net Assets(e) | | | | | | | | | | | | | | | | | | | | | | | | |
| | | | | | |
Total expenses | | | 1.00 | % | | | 1.00 | % | | | 0.97 | % | | | 0.97 | %(f) | | | 1.01 | % | | | 1.01 | % |
| | | | | | | | | | | | | | | | | | | | | | | | |
| | | | | | |
Total expenses after fees waived and/or reimbursed | | | 0.99 | % | | | 1.00 | % | | | 0.97 | % | | | 0.97 | %(f) | | | 1.01 | % | | | 1.01 | % |
| | | | | | | | | | | | | | | | | | | | | | | | |
| | | | | | |
Net investment loss | | | (0.42 | )% | | | (0.27 | )% | | | (0.48 | )% | | | (0.46 | )%(f) | | | (0.48 | )% | | | (0.43 | )% |
| | | | | | | | | | | | | | | | | | | | | | | | |
| | | | | | |
Supplemental Data | | | | | | | | | | | | | | | | | | | | | | | | |
Net assets, end of period (000) | | $ | 2,117,888 | | | $ | 1,723,973 | | | $ | 1,871,340 | | | $ | 2,551,211 | | | $ | 2,195,906 | | | $ | 1,692,630 | |
| | | | | | | | | | | | | | | | | | | | | | | | |
Portfolio turnover rate | | | 21 | % | | | 43 | % | | | 55 | % | | | 25 | % | | | 42 | % | | | 48 | % |
| | | | | | | | | | | | | | | | | | | | | | | | |
| (a) | Based on average shares outstanding. |
| (b) | Distributions for annual periods determined in accordance with U.S. federal income tax regulations. |
| (c) | Where applicable, excludes the effects of any sales charges and assumes the reinvestment of distributions. |
| (e) | Excludes fees and expenses incurred indirectly as a result of investments in underlying funds. |
See notes to financial statements.
| | |
| 32 | | 2 0 2 4 B L A C K R O C K A N N U A L F I N A N C I A L S T A T E M E N T S |
Financial Highlights (continued)
(For a share outstanding throughout each period)
| | | | | | | | | | | | | | | | | | | | | | | | |
| | | BlackRock Capital Appreciation Fund, Inc. (continued) | |
| |
| | | Investor C | |
| | | | | | |
| | | Year Ended
05/31/24 | | | Year Ended
05/31/23 | | | Year Ended
05/31/22 | | | Period from
10/01/20
to 05/31/21 | | | Year Ended
09/30/20 | | | Year Ended
09/30/19 | |
| | | | | | | |
Net asset value, beginning of period | | $ | 15.52 | | | $ | 17.01 | | | $ | 25.27 | | | $ | 23.27 | | | $ | 19.81 | | | $ | 23.29 | |
| | | | | | | | | | | | | | | | | | | | | | | | |
| | | | | | |
Net investment loss(a) | | | (0.22 | ) | | | (0.16 | ) | | | (0.29 | ) | | | (0.20 | ) | | | (0.25 | ) | | | (0.24 | ) |
| | | | | | |
Net realized and unrealized gain (loss) | | | 5.50 | | | | 0.78 | | | | (3.05 | ) | | | 4.20 | | | | 6.65 | | | | 0.04 | |
| | | | | | | | | | | | | | | | | | | | | | | | |
| | | | | | |
Net increase (decrease) from investment operations | | | 5.28 | | | | 0.62 | | | | (3.34 | ) | | | 4.00 | | | | 6.40 | | | | (0.20 | ) |
| | | | | | | | | | | | | | | | | | | | | | | | |
| | | | | | |
Distributions from net realized gain(b) | | | (1.06 | ) | | | (2.11 | ) | | | (4.92 | ) | | | (2.00 | ) | | | (2.94 | ) | | | (3.28 | ) |
| | | | | | | | | | | | | | | | | | | | | | | | |
| | | | | | |
Net asset value, end of period | | $ | 19.74 | | | $ | 15.52 | | | $ | 17.01 | | | $ | 25.27 | | | $ | 23.27 | | | $ | 19.81 | |
| | | | | | | | | | | | | | | | | | | | | | | | |
| | | | | | |
Total Return(c) | | | | | | | | | | | | | | | | | | | | | | | | |
Based on net asset value | | | 35.61 | % | | | 5.62 | % | | | (18.18 | )% | | | 17.89 | %(d) | | | 36.73 | % | | | 0.72 | % |
| | | | | | | | | | | | | | | | | | | | | | | | |
| | | | | | |
Ratios to Average Net Assets(e) | | | | | | | | | | | | | | | | | | | | | | | | |
| | | | | | |
Total expenses | | | 1.84 | % | | | 1.84 | % | | | 1.76 | % | | | 1.77 | %(f) | | | 1.79 | % | | | 1.81 | % |
| | | | | | | | | | | | | | | | | | | | | | | | |
| | | | | | |
Total expenses after fees waived and/or reimbursed | | | 1.83 | % | | | 1.84 | % | | | 1.76 | % | | | 1.77 | %(f) | | | 1.79 | % | | | 1.81 | % |
| | | | | | | | | | | | | | | | | | | | | | | | |
| | | | | | |
Net investment loss | | | (1.26 | )% | | | (1.11 | )% | | | (1.28 | )% | | | (1.27 | )%(f) | | | (1.26 | )% | | | (1.23 | )% |
| | | | | | | | | | | | | | | | | | | | | | | | |
| | | | | | |
Supplemental Data | | | | | | | | | | | | | | | | | | | | | | | | |
Net assets, end of period (000) | | $ | 40,228 | | | $ | 39,581 | | | $ | 48,332 | | | $ | 72,075 | | | $ | 89,336 | | | $ | 195,908 | |
| | | | | | | | | | | | | | | | | | | | | | | | |
Portfolio turnover rate | | | 21 | % | | | 43 | % | | | 55 | % | | | 25 | % | | | 42 | % | | | 48 | % |
| | | | | | | | | | | | | | | | | | | | | | | | |
| (a) | Based on average shares outstanding. |
| (b) | Distributions for annual periods determined in accordance with U.S. federal income tax regulations. |
| (c) | Where applicable, excludes the effects of any sales charges and assumes the reinvestment of distributions. |
| (e) | Excludes fees and expenses incurred indirectly as a result of investments in underlying funds. |
See notes to financial statements.
| | |
F I N A N C I A L H I G H L I G H T S | | 33 |
Financial Highlights (continued)
(For a share outstanding throughout each period)
| | | | | | | | | | | | | | | | | | | | | | | | |
| | | BlackRock Capital Appreciation Fund, Inc. (continued) | |
| |
| | | Class K | |
| | | | | | |
| | | Year Ended
05/31/24 | | | Year Ended
05/31/23 | | | Year Ended
05/31/22 | | | Period from
10/01/20
to 05/31/21 | | | Year Ended
09/30/20 | | | Year Ended
09/30/19 | |
| | | | | | | |
Net asset value, beginning of period | | $ | 32.08 | | | $ | 32.32 | | | $ | 43.71 | | | $ | 38.63 | | | $ | 30.71 | | | $ | 33.91 | |
| | | | | | | | | | | | | | | | | | | | | | | | |
| | | | | | |
Net investment income (loss)(a) | | | (0.03 | ) | | | 0.02 | | | | (0.06 | ) | | | (0.03 | ) | | | (0.04 | ) | | | (0.02 | ) |
| | | | | | |
Net realized and unrealized gain (loss) | | | 11.65 | | | | 1.85 | | | | (6.20 | ) | | | 7.11 | | | | 10.90 | | | | 0.23 | |
| | | | | | | | | | | | | | | | | | | | | | | | |
| | | | | | |
Net increase (decrease) from investment operations | | | 11.62 | | | | 1.87 | | | | (6.26 | ) | | | 7.08 | | | | 10.86 | | | | 0.21 | |
| | | | | | | | | | | | | | | | | | | | | | | | |
| | | | | | |
Distributions from net realized gain(b) | | | (1.24 | ) | | | (2.11 | ) | | | (5.13 | ) | | | (2.00 | ) | | | (2.94 | ) | | | (3.41 | ) |
| | | | | | | | | | | | | | | | | | | | | | | | |
| | | | | | |
Net asset value, end of period | | $ | 42.46 | | | $ | 32.08 | | | $ | 32.32 | | | $ | 43.71 | | | $ | 38.63 | | | $ | 30.71 | |
| | | | | | | | | | | | | | | | | | | | | | | | |
| | | | | | |
Total Return(c) | | | | | | | | | | | | | | | | | | | | | | | | |
Based on net asset value | | | 37.14 | % | | | 6.90 | % | | | (17.22 | )% | | | 18.78 | %(d) | | | 38.33 | % | | | 1.86 | % |
| | | | | | | | | | | | | | | | | | | | | | | | |
| | | | | | |
Ratios to Average Net Assets(e) | | | | | | | | | | | | | | | | | | | | | | | | |
| | | | | | |
Total expenses | | | 0.65 | % | | | 0.65 | % | | | 0.64 | % | | | 0.63 | %(f) | | | 0.64 | % | | | 0.65 | % |
| | | | | | | | | | | | | | | | | | | | | | | | |
| | | | | | |
Total expenses after fees waived and/or reimbursed | | | 0.65 | % | | | 0.65 | % | | | 0.63 | % | | | 0.63 | %(f) | | | 0.64 | % | | | 0.64 | % |
| | | | | | | | | | | | | | | | | | | | | | | | |
| | | | | | |
Net investment income (loss) | | | (0.08 | )% | | | 0.08 | % | | | (0.15 | )% | | | (0.13 | )%(f) | | | (0.11 | )% | | | (0.06 | )% |
| | | | | | | | | | | | | | | | | | | | | | | | |
| | | | | | |
Supplemental Data | | | | | | | | | | | | | | | | | | | | | | | | |
Net assets, end of period (000) | | $ | 517,123 | | | $ | 645,860 | | | $ | 646,115 | | | $ | 845,106 | | | $ | 682,107 | | | $ | 552,523 | |
| | | | | | | | | | | | | | | | | | | | | | | | |
Portfolio turnover rate | | | 21 | % | | | 43 | % | | | 55 | % | | | 25 | % | | | 42 | % | | | 48 | % |
| | | | | | | | | | | | | | | | | | | | | | | | |
| (a) | Based on average shares outstanding. |
| (b) | Distributions for annual periods determined in accordance with U.S. federal income tax regulations. |
| (c) | Where applicable, assumes the reinvestment of distributions. |
| (e) | Excludes fees and expenses incurred indirectly as a result of investments in underlying funds. |
See notes to financial statements.
| | |
| 34 | | 2 0 2 4 B L A C K R O C K A N N U A L F I N A N C I A L S T A T E M E N T S |
Financial Highlights (continued)
(For a share outstanding throughout each period)
| | | | | | | | | | | | | | | | | | | | | | | | |
| | | BlackRock Capital Appreciation Fund, Inc. (continued) | |
| |
| | | Class R | |
| | | | | | |
| | | Year Ended
05/31/24 | | | Year Ended
05/31/23 | | | Year Ended
05/31/22 | | | Period from
10/01/20
to 05/31/21 | | | Year Ended
09/30/20 | | | Year Ended
09/30/19 | |
| | | | | | | |
Net asset value, beginning of period | | $ | 19.86 | | | $ | 21.02 | | | $ | 30.12 | | | $ | 27.30 | | | $ | 22.65 | | | $ | 26.00 | |
| | | | | | | | | | | | | | | | | | | | | | | | |
| | | | | | |
Net investment loss(a) | | | (0.17 | ) | | | (0.11 | ) | | | (0.23 | ) | | | (0.15 | ) | | | (0.17 | ) | | | (0.16 | ) |
| | | | | | |
Net realized and unrealized gain (loss) | | | 7.10 | | | | 1.06 | | | | (3.88 | ) | | | 4.97 | | | | 7.76 | | | | 0.09 | |
| | | | | | | | | | | | | | | | | | | | | | | | |
| | | | | | |
Net increase (decrease) from investment operations | | | 6.93 | | | | 0.95 | | | | (4.11 | ) | | | 4.82 | | | | 7.59 | | | | (0.07 | ) |
| | | | | | | | | | | | | | | | | | | | | | | | |
| | | | | | |
Distributions from net realized gain(b) | | | (1.09 | ) | | | (2.11 | ) | | | (4.99 | ) | | | (2.00 | ) | | | (2.94 | ) | | | (3.28 | ) |
| | | | | | | | | | | | | | | | | | | | | | | | |
| | | | | | |
Net asset value, end of period | | $ | 25.70 | | | $ | 19.86 | | | $ | 21.02 | | | $ | 30.12 | | | $ | 27.30 | | | $ | 22.65 | |
| | | | | | | | | | | | | | | | | | | | | | | | |
| | | | | | |
Total Return(c) | | | | | | | | | | | | | | | | | | | | | | | | |
Based on net asset value | | | 36.14 | % | | | 6.17 | % | | | (17.82 | )% | | | 18.26 | %(d) | | | 37.45 | % | | | 1.19 | % |
| | | | | | | | | | | | | | | | | | | | | | | | |
| | | | | | |
Ratios to Average Net Assets(e) | | | | | | | | | | | | | | | | | | | | | | | | |
| | | | | | |
Total expenses | | | 1.36 | % | | | 1.37 | % | | | 1.33 | % | | | 1.30 | %(f) | | | 1.28 | % | | | 1.29 | % |
| | | | | | | | | | | | | | | | | | | | | | | | |
| | | | | | |
Total expenses after fees waived and/or reimbursed | | | 1.35 | % | | | 1.36 | % | | | 1.33 | % | | | 1.30 | %(f) | | | 1.28 | % | | | 1.29 | % |
| | | | | | | | | | | | | | | | | | | | | | | | |
| | | | | | |
Net investment loss | | | (0.78 | )% | | | (0.63 | )% | | | (0.85 | )% | | | (0.80 | )%(f) | | | (0.75 | )% | | | (0.71 | )% |
| | | | | | | | | | | | | | | | | | | | | | | | |
| | | | | | |
Supplemental Data | | | | | | | | | | | | | | | | | | | | | | | | |
Net assets, end of period (000) | | $ | 25,350 | | | $ | 23,731 | | | $ | 24,371 | | | $ | 36,933 | | | $ | 37,741 | | | $ | 54,828 | |
| | | | | | | | | | | | | | | | | | | | | | | | |
Portfolio turnover rate | | | 21 | % | | | 43 | % | | | 55 | % | | | 25 | % | | | 42 | % | | | 48 | % |
| | | | | | | | | | | | | | | | | | | | | | | | |
| (a) | Based on average shares outstanding. |
| (b) | Distributions for annual periods determined in accordance with U.S. federal income tax regulations. |
| (c) | Where applicable, assumes the reinvestment of distributions. |
| (e) | Excludes fees and expenses incurred indirectly as a result of investments in underlying funds. |
See notes to financial statements.
| | |
F I N A N C I A L H I G H L I G H T S | | 35 |
Financial Highlights
(For a share outstanding throughout each period)
| | | | | | | | | | | | | | | | | | | | | | | | |
| | | BlackRock Health Sciences Opportunities Portfolio | |
| |
| | | Institutional | |
| | | | | | |
| | | Year Ended
05/31/24 | | | Year Ended
05/31/23 | | | Year Ended
05/31/22 | | | Period from
10/01/20
to 05/31/21 | | | Year Ended
09/30/20 | | | Year Ended
09/30/19 | |
| | | | | | | |
Net asset value, beginning of period | | $ | 68.47 | | | $ | 72.10 | | | $ | 81.77 | | | $ | 75.37 | | | $ | 61.55 | | | $ | 67.67 | |
| | | | | | | | | | | | | | | | | | | | | | | | |
| | | | | | |
Net investment income(a) | | | 0.32 | | | | 0.34 | | | | 0.24 | | | | 0.13 | | | | 0.19 | | | | 0.28 | |
| | | | | | |
Net realized and unrealized gain (loss) | | | 8.71 | | | | 1.07 | | | | (2.75 | ) | | | 9.66 | | | | 16.26 | | | | (1.64 | ) |
| | | | | | | | | | | | | | | | | | | | | | | | |
| | | | | | |
Net increase (decrease) from investment operations | | | 9.03 | | | | 1.41 | | | | (2.51 | ) | | | 9.79 | | | | 16.45 | | | | (1.36 | ) |
| | | | | | | | | | | | | | | | | | | | | | | | |
| | | | | | |
Distributions(b) | | | | | | | | | | | | | | | | | | | | | | | | |
| | | | | | |
From net investment income | | | (0.33 | ) | | | (0.38 | ) | | | (0.16 | ) | | | (0.13 | ) | | | (0.32 | ) | | | (0.23 | ) |
From net realized gain | | | (2.34 | ) | | | (4.66 | ) | | | (7.00 | ) | | | (3.26 | ) | | | (2.31 | ) | | | (4.53 | ) |
| | | | | | | | | | | | | | | | | | | | | | | | |
| | | | | | |
Total distributions | | | (2.67 | ) | | | (5.04 | ) | | | (7.16 | ) | | | (3.39 | ) | | | (2.63 | ) | | | (4.76 | ) |
| | | | | | | | | | | | | | | | | | | | | | | | |
| | | | | | |
Net asset value, end of period | | $ | 74.83 | | | $ | 68.47 | | | $ | 72.10 | | | $ | 81.77 | | | $ | 75.37 | | | $ | 61.55 | |
| | | | | | | | | | | | | | | | | | | | | | | | |
| | | | | | |
Total Return(c) | | | | | | | | | | | | | | | | | | | | | | | | |
Based on net asset value | | | 13.57 | % | | | 2.25 | % | | | (3.55 | )%(d) | | | 13.37 | %(e) | | | 27.34 | %(f) | | | (1.84 | )% |
| | | | | | | | | | | | | | | | | | | | | | | | |
| | | | | | |
Ratios to Average Net Assets(g) | | | | | | | | | | | | | | | | | | | | | | | | |
| | | | | | |
Total expenses | | | 0.84 | % | | | 0.84 | % | | | 0.85 | % | | | 0.84 | %(h) | | | 0.85 | % | | | 0.85 | % |
| | | | | | | | | | | | | | | | | | | | | | | | |
| | | | | | |
Total expenses after fees waived and/or reimbursed | | | 0.84 | % | | | 0.84 | % | | | 0.85 | % | | | 0.84 | %(h) | | | 0.85 | % | | | 0.84 | % |
| | | | | | | | | | | | | | | | | | | | | | | | |
| | | | | | |
Net investment income | | | 0.45 | % | | | 0.49 | % | | | 0.31 | % | | | 0.24 | %(h) | | | 0.28 | % | | | 0.45 | % |
| | | | | | | | | | | | | | | | | | | | | | | | |
| | | | | | |
Supplemental Data | | | | | | | | | | | | | | | | | | | | | | | | |
Net assets, end of period (000) | | $ | 4,374,721 | | | $ | 4,436,816 | | | $ | 5,062,514 | | | $ | 5,990,131 | | | $ | 5,133,191 | | | $ | 3,095,352 | |
| | | | | | | | | | | | | | | | | | | | | | | | |
| | | | | | |
Portfolio turnover rate | | | 27 | % | | | 29 | % | | | 51 | % | | | 19 | % | | | 28 | % | | | 41 | % |
| | | | | | | | | | | | | | | | | | | | | | | | |
| (a) | Based on average shares outstanding. |
| (b) | Distributions for annual periods determined in accordance with U.S. federal income tax regulations. |
| (c) | Where applicable, assumes the reinvestment of distributions. |
| (d) | Includes a capital contribution from affiliate, which had no impact on the Fund’s total return. |
| (f) | Includes a payment received from an affiliate, which had no impact on the Fund’s total return. |
| (g) | Excludes fees and expenses incurred indirectly as a result of investments in underlying funds. |
See notes to financial statements.
| | |
| 36 | | 2 0 2 4 B L A C K R O C K A N N U A L F I N A N C I A L S T A T E M E N T S |
Financial Highlights (continued)
(For a share outstanding throughout each period)
| | | | | | | | | | | | | | | | | | | | | | | | |
| | | BlackRock Health Sciences Opportunities Portfolio (continued) | |
| |
| | | Service | |
| | | | | | |
| | | Year Ended
05/31/24 | | | Year Ended
05/31/23 | | | Year Ended
05/31/22 | | | Period from
10/01/20
to 05/31/21 | | | Year Ended
09/30/20 | | | Year Ended
09/30/19 | |
| | | | | | | |
Net asset value, beginning of period | | $ | 64.44 | | | $ | 68.16 | | | $ | 77.63 | | | $ | 71.63 | | | $ | 58.66 | | | $ | 64.73 | |
| | | | | | | | | | | | | | | | | | | | | | | | |
| | | | | | |
Net investment income (loss)(a) | | | 0.10 | | | | 0.13 | | | | 0.01 | | | | (0.03 | ) | | | (0.01 | ) | | | 0.08 | |
| | | | | | |
Net realized and unrealized gain (loss) | | | 8.20 | | | | 1.00 | | | | (2.61 | ) | | | 9.18 | | | | 15.48 | | | | (1.57 | ) |
| | | | | | | | | | | | | | | | | | | | | | | | |
| | | | | | |
Net increase (decrease) from investment operations | | | 8.30 | | | | 1.13 | | | | (2.60 | ) | | | 9.15 | | | | 15.47 | | | | (1.49 | ) |
| | | | | | | | | | | | | | | | | | | | | | | | |
| | | | | | |
Distributions(b) | | | | | | | | | | | | | | | | | | | | | | | | |
| | | | | | |
From net investment income | | | (0.13 | ) | | | (0.19 | ) | | | — | | | | — | | | | (0.19 | ) | | | (0.05 | ) |
From net realized gain | | | (2.34 | ) | | | (4.66 | ) | | | (6.87 | ) | | | (3.15 | ) | | | (2.31 | ) | | | (4.53 | ) |
| | | | | | | | | | | | | | | | | | | | | | | | |
| | | | | | |
Total distributions | | | (2.47 | ) | | | (4.85 | ) | | | (6.87 | ) | | | (3.15 | ) | | | (2.50 | ) | | | (4.58 | ) |
| | | | | | | | | | | | | | | | | | | | | | | | |
| | | | | | |
Net asset value, end of period | | $ | 70.27 | | | $ | 64.44 | | | $ | 68.16 | | | $ | 77.63 | | | $ | 71.63 | | | $ | 58.66 | |
| | | | | | | | | | | | | | | | | | | | | | | | |
| | | | | | |
Total Return(c) | | | | | | | | | | | | | | | | | | | | | | | | |
Based on net asset value | | | 13.24 | % | | | 1.94 | % | | | (3.83 | )%(d) | | | 13.15 | %(e) | | | 26.96 | %(f) | | | (2.16 | )% |
| | | | | | | | | | | | | | | | | | | | | | | | |
| | | | | | |
Ratios to Average Net Assets(g) | | | | | | | | | | | | | | | | | | | | | | | | |
| | | | | | |
Total expenses | | | 1.14 | % | | | 1.14 | % | | | 1.14 | % | | | 1.14 | %(h) | | | 1.15 | % | | | 1.15 | % |
| | | | | | | | | | | | | | | | | | | | | | | | |
| | | | | | |
Total expenses after fees waived and/or reimbursed | | | 1.14 | % | | | 1.14 | % | | | 1.14 | % | | | 1.14 | %(h) | | | 1.15 | % | | | 1.15 | % |
| | | | | | | | | | | | | | | | | | | | | | | | |
| | | | | | |
Net investment income (loss) | | | 0.15 | % | | | 0.19 | % | | | 0.02 | % | | | (0.07 | )%(h) | | | (0.02 | )% | | | 0.14 | % |
| | | | | | | | | | | | | | | | | | | | | | | | |
| | | | | | |
Supplemental Data | | | | | | | | | | | | | | | | | | | | | | | | |
Net assets, end of period (000) | | $ | 31,141 | | | $ | 33,055 | | | $ | 36,625 | | | $ | 43,825 | | | $ | 40,252 | | | $ | 34,708 | |
| | | | | | | | | | | | | | | | | | | | | | | | |
| | | | | | |
Portfolio turnover rate | | | 27 | % | | | 29 | % | | | 51 | % | | | 19 | % | | | 28 | % | | | 41 | % |
| | | | | | | | | | | | | | | | | | | | | | | | |
| (a) | Based on average shares outstanding. |
| (b) | Distributions for annual periods determined in accordance with U.S. federal income tax regulations. |
| (c) | Where applicable, assumes the reinvestment of distributions. |
| (d) | Includes a capital contribution from affiliate, which had no impact on the Fund’s total return. |
| (f) | Includes a payment received from an affiliate, which had no impact on the Fund’s total return. |
| (g) | Excludes fees and expenses incurred indirectly as a result of investments in underlying funds. |
See notes to financial statements.
| | |
F I N A N C I A L H I G H L I G H T S | | 37 |
Financial Highlights (continued)
(For a share outstanding throughout each period)
| | | | | | | | | | | | | | | | | | | | | | | | |
| | | BlackRock Health Sciences Opportunities Portfolio (continued) | |
| |
| | | Investor A | |
| | | | | | |
| | | Year Ended
05/31/24 | | | Year Ended
05/31/23 | | | Year Ended
05/31/22 | | | Period from
10/01/20
to 05/31/21 | | | Year Ended
09/30/20 | | | Year Ended
09/30/19 | |
| | | | | | | |
Net asset value, beginning of period | | $ | 64.11 | | | $ | 67.84 | | | $ | 77.31 | | | $ | 71.37 | | | $ | 58.45 | | | $ | 64.50 | |
| | | | | | | | | | | | | | | | | | | | | | | | |
| | | | | | |
Net investment income (loss)(a) | | | 0.13 | | | | 0.16 | | | | 0.05 | | | | (0.01 | ) | | | 0.01 | | | | 0.10 | |
| | | | | | |
Net realized and unrealized gain (loss) | | | 8.15 | | | | 0.99 | | | | (2.59 | ) | | | 9.15 | | | | 15.42 | | | | (1.56 | ) |
| | | | | | | | | | | | | | | | | | | | | | | | |
| | | | | | |
Net increase (decrease) from investment operations | | | 8.28 | | | | 1.15 | | | | (2.54 | ) | | | 9.14 | | | | 15.43 | | | | (1.46 | ) |
| | | | | | | | | | | | | | | | | | | | | | | | |
| | | | | | |
Distributions(b) | | | | | | | | | | | | | | | | | | | | | | | | |
| | | | | | |
From net investment income | | | (0.17 | ) | | | (0.22 | ) | | | — | | | | — | | | | (0.20 | ) | | | (0.06 | ) |
From net realized gain | | | (2.34 | ) | | | (4.66 | ) | | | (6.93 | ) | | | (3.20 | ) | | | (2.31 | ) | | | (4.53 | ) |
| | | | | | | | | | | | | | | | | | | | | | | | |
| | | | | | |
Total distributions | | | (2.51 | ) | | | (4.88 | ) | | | (6.93 | ) | | | (3.20 | ) | | | (2.51 | ) | | | (4.59 | ) |
| | | | | | | | | | | | | | | | | | | | | | | | |
| | | | | | |
Net asset value, end of period | | $ | 69.88 | | | $ | 64.11 | | | $ | 67.84 | | | $ | 77.31 | | | $ | 71.37 | | | $ | 58.45 | |
| | | | | | | | | | | | | | | | | | | | | | | | |
| | | | | | |
Total Return(c) | | | | | | | | | | | | | | | | | | | | | | | | |
Based on net asset value | | | 13.28 | % | | | 1.99 | % | | | (3.78 | )%(d) | | | 13.18 | %(e) | | | 26.99 | %(f) | | | (2.11 | )% |
| | | | | | | | | | | | | | | | | | | | | | | | |
| | | | | | |
Ratios to Average Net Assets(g) | | | | | | | | | | | | | | | | | | | | | | | | |
| | | | | | |
Total expenses | | | 1.09 | % | | | 1.09 | % | | | 1.09 | % | | | 1.10 | %(h) | | | 1.11 | % | | | 1.12 | % |
| | | | | | | | | | | | | | | | | | | | | | | | |
| | | | | | |
Total expenses after fees waived and/or reimbursed | | | 1.09 | % | | | 1.09 | % | | | 1.09 | % | | | 1.10 | %(h) | | | 1.11 | % | | | 1.12 | % |
| | | | | | | | | | | | | | | | | | | | | | | | |
| | | | | | |
Net investment income (loss) | | | 0.20 | % | | | 0.24 | % | | | 0.07 | % | | | (0.02 | )%(h) | | | 0.01 | % | | | 0.17 | % |
| | | | | | | | | | | | | | | | | | | | | | | | |
| | | | | | |
Supplemental Data | | | | | | | | | | | | | | | | | | | | | | | | |
Net assets, end of period (000) | | $ | 2,851,925 | | | $ | 2,865,706 | | | $ | 3,151,912 | | | $ | 3,496,818 | | | $ | 3,135,882 | | | $ | 2,598,888 | |
| | | | | | | | | | | | | | | | | | | | | | | | |
| | | | | | |
Portfolio turnover rate | | | 27 | % | | | 29 | % | | | 51 | % | | | 19 | % | | | 28 | % | | | 41 | % |
| | | | | | | | | | | | | | | | | | | | | | | | |
| (a) | Based on average shares outstanding. |
| (b) | Distributions for annual periods determined in accordance with U.S. federal income tax regulations. |
| (c) | Where applicable, excludes the effects of any sales charges and assumes the reinvestment of distributions. |
| (d) | Includes a capital contribution from affiliate, which had no impact on the Fund’s total return. |
| (f) | Includes a payment received from an affiliate, which had no impact on the Fund’s total return. |
| (g) | Excludes fees and expenses incurred indirectly as a result of investments in underlying funds. |
See notes to financial statements.
| | |
| 38 | | 2 0 2 4 B L A C K R O C K A N N U A L F I N A N C I A L S T A T E M E N T S |
Financial Highlights (continued)
(For a share outstanding throughout each period)
| | | | | | | | | | | | | | | | | | | | | | | | |
| | | BlackRock Health Sciences Opportunities Portfolio (continued) | |
| |
| | | Investor C | |
| | | | | | |
| | | Year Ended
05/31/24 | | | Year Ended
05/31/23 | | | Year Ended
05/31/22 | | | Period from
10/01/20
to 05/31/21 | | | Year Ended
09/30/20 | | | Year Ended
09/30/19 | |
| | | | | | | |
Net asset value, beginning of period | | $ | 53.11 | | | $ | 57.24 | | | $ | 66.15 | | | $ | 61.38 | | | $ | 50.74 | | | $ | 56.55 | |
| | | | | | | | | | | | | | | | | | | | | | | | |
| | | | | | |
Net investment loss(a) | | | (0.31 | ) | | | (0.27 | ) | | | (0.43 | ) | | | (0.33 | ) | | | (0.40 | ) | | | (0.28 | ) |
| | | | | | |
Net realized and unrealized gain (loss) | | | 6.70 | | | | 0.80 | | | | (2.17 | ) | | | 7.85 | | | | 13.34 | | | | (1.38 | ) |
| | | | | | | | | | | | | | | | | | | | | | | | |
| | | | | | |
Net increase (decrease) from investment operations | | | 6.39 | | | | 0.53 | | | | (2.60 | ) | | | 7.52 | | | | 12.94 | | | | (1.66 | ) |
| | | | | | | | | | | | | | | | | | | | | | | | |
| | | | | | |
Distributions from net realized gain(b) | | | (2.34 | ) | | | (4.66 | ) | | | (6.31 | ) | | | (2.75 | ) | | | (2.30 | ) | | | (4.15 | ) |
| | | | | | | | | | | | | | | | | | | | | | | | |
| | | | | | |
Net asset value, end of period | | $ | 57.16 | | | $ | 53.11 | | | $ | 57.24 | | | $ | 66.15 | | | $ | 61.38 | | | $ | 50.74 | |
| | | | | | | | | | | | | | | | | | | | | | | | |
| | | | | | |
Total Return(c) | | | | | | | | | | | | | | | | | | | | | | | | |
Based on net asset value | | | 12.42 | % | | | 1.22 | % | | | (4.50 | )%(d) | | | 12.61 | %(e) | | | 26.09 | %(f) | | | (2.82 | )% |
| | | | | | | | | | | | | | | | | | | | | | | | |
| | | | | | |
Ratios to Average Net Assets(g) | | | | | | | | | | | | | | | | | | | | | | | | |
| | | | | | |
Total expenses | | | 1.86 | % | | | 1.85 | % | | | 1.84 | % | | | 1.84 | %(h) | | | 1.85 | % | | | 1.85 | % |
| | | | | | | | | | | | | | | | | | | | | | | | |
| | | | | | |
Total expenses after fees waived and/or reimbursed | | | 1.86 | % | | | 1.85 | % | | | 1.84 | % | | | 1.84 | %(h) | | | 1.85 | % | | | 1.85 | % |
| | | | | | | | | | | | | | | | | | | | | | | | |
| | | | | | |
Net investment loss | | | (0.57 | )% | | | (0.51 | )% | | | (0.68 | )% | | | (0.77 | )%(h) | | | (0.72 | )% | | | (0.56 | )% |
| | | | | | | | | | | | | | | | | | | | | | | | |
| | | | | | |
Supplemental Data | | | | | | | | | | | | | | | | | | | | | | | | |
Net assets, end of period (000) | | $ | 311,994 | | | $ | 404,306 | | | $ | 542,880 | | | $ | 719,525 | | | $ | 773,522 | | | $ | 745,636 | |
| | | | | | | | | | | | | | | | | | | | | | | | |
Portfolio turnover rate | | | 27 | % | | | 29 | % | | | 51 | % | | | 19 | % | | | 28 | % | | | 41 | % |
| | | | | | | | | | | | | | | | | | | | | | | | |
| (a) | Based on average shares outstanding. |
| (b) | Distributions for annual periods determined in accordance with U.S. federal income tax regulations. |
| (c) | Where applicable, excludes the effects of any sales charges and assumes the reinvestment of distributions. |
| (d) | Includes a capital contribution from affiliate, which had no impact on the Fund’s total return. |
| (f) | Includes a payment received from an affiliate, which had no impact on the Fund’s total return. |
| (g) | Excludes fees and expenses incurred indirectly as a result of investments in underlying funds. |
See notes to financial statements.
| | |
F I N A N C I A L H I G H L I G H T S | | 39 |
Financial Highlights (continued)
(For a share outstanding throughout each period)
| | | | | | | | | | | | | | | | | | | | | | | | |
| | | BlackRock Health Sciences Opportunities Portfolio (continued) | |
| |
| | | Class K | |
| | | | | | |
| | | Year Ended
05/31/24 | | | Year Ended
05/31/23 | | | Year Ended
05/31/22 | | | Period from
10/01/20
to 05/31/21 | | | Year Ended
09/30/20 | | | Year Ended
09/30/19 | |
| | | | | | | |
Net asset value, beginning of period | | $ | 68.58 | | | $ | 72.21 | | | $ | 81.91 | | | $ | 75.50 | | | $ | 61.63 | | | $ | 67.75 | |
| | | | | | | | | | | | | | | | | | | | | | | | |
| | | | | | |
Net investment income(a) | | | 0.39 | | | | 0.40 | | | | 0.33 | | | | 0.18 | | | | 0.27 | | | | 0.34 | |
| | | | | | |
Net realized and unrealized gain (loss) | | | 8.72 | | | | 1.08 | | | | (2.77 | ) | | | 9.68 | | | | 16.28 | | | | (1.65 | ) |
| | | | | | | | | | | | | | | | | | | | | | | | |
| | | | | | |
Net increase (decrease) from investment operations | | | 9.11 | | | | 1.48 | | | | (2.44 | ) | | | 9.86 | | | | 16.55 | | | | (1.31 | ) |
| | | | | | | | | | | | | | | | | | | | | | | | |
| | | | | | |
Distributions(b) | | | | | | | | | | | | | | | | | | | | | | | | |
| | | | | | |
From net investment income | | | (0.40 | ) | | | (0.45 | ) | | | (0.26 | ) | | | (0.19 | ) | | | (0.37 | ) | | | (0.28 | ) |
From net realized gain | | | (2.34 | ) | | | (4.66 | ) | | | (7.00 | ) | | | (3.26 | ) | | | (2.31 | ) | | | (4.53 | ) |
| | | | | | | | | | | | | | | | | | | | | | | | |
| | | | | | |
Total distributions | | | (2.74 | ) | | | (5.11 | ) | | | (7.26 | ) | | | (3.45 | ) | | | (2.68 | ) | | | (4.81 | ) |
| | | | | | | | | | | | | | | | | | | | | | | | |
| | | | | | |
Net asset value, end of period | | $ | 74.95 | | | $ | 68.58 | | | $ | 72.21 | | | $ | 81.91 | | | $ | 75.50 | | | $ | 61.63 | |
| | | | | | | | | | | | | | | | | | | | | | | | |
| | | | | | |
Total Return(c) | | | | | | | | | | | | | | | | | | | | | | | | |
Based on net asset value | | | 13.68 | % | | | 2.34 | % | | | (3.44 | )%(d) | | | 13.45 | %(e) | | | 27.47 | %(f) | | | (1.75 | )% |
| | | | | | | | | | | | | | | | | | | | | | | | |
| | | | | | |
Ratios to Average Net Assets(g) | | | | | | | | | | | | | | | | | | | | | | | | |
| | | | | | |
Total expenses | | | 0.75 | % | | | 0.75 | % | | | 0.74 | % | | | 0.74 | %(h) | | | 0.75 | % | | | 0.75 | % |
| | | | | | | | | | | | | | | | | | | | | | | | |
| | | | | | |
Total expenses after fees waived and/or reimbursed | | | 0.75 | % | | | 0.75 | % | | | 0.74 | % | | | 0.74 | %(h) | | | 0.75 | % | | | 0.75 | % |
| | | | | | | | | | | | | | | | | | | | | | | | |
| | | | | | |
Net investment income | | | 0.54 | % | | | 0.59 | % | | | 0.42 | % | | | 0.34 | %(h) | | | 0.39 | % | | | 0.55 | % |
| | | | | | | | | | | | | | | | | | | | | | | | |
| | | | | | |
Supplemental Data | | | | | | | | | | | | | | | | | | | | | | | | |
Net assets, end of period (000) | | $ | 496,504 | | | $ | 487,287 | | | $ | 436,984 | | | $ | 464,179 | | | $ | 344,822 | | | $ | 171,517 | |
| | | | | | | | | | | | | | | | | | | | | | | | |
| | | | | | |
Portfolio turnover rate | | | 27 | % | | | 29 | % | | | 51 | % | | | 19 | % | | | 28 | % | | | 41 | % |
| | | | | | | | | | | | | | | | | | | | | | | | |
| (a) | Based on average shares outstanding. |
| (b) | Distributions for annual periods determined in accordance with U.S. federal income tax regulations. |
| (c) | Where applicable, assumes the reinvestment of distributions. |
| (d) | Includes a capital contribution from affiliate, which had no impact on the Fund’s total return. |
| (f) | Includes a payment received from an affiliate, which had no impact on the Fund’s total return. |
| (g) | Excludes fees and expenses incurred indirectly as a result of investments in underlying funds. |
See notes to financial statements.
| | |
| 40 | | 2 0 2 4 B L A C K R O C K A N N U A L F I N A N C I A L S T A T E M E N T S |
Financial Highlights (continued)
(For a share outstanding throughout each period)
| | | | | | | | | | | | | | | | | | | | | | | | |
| | | BlackRock Health Sciences Opportunities Portfolio (continued) | |
| |
| | | Class R | |
| | | | | | |
| | | Year Ended
05/31/24 | | | Year Ended
05/31/23 | | | Year Ended
05/31/22 | | | Period from
10/01/20
to 05/31/21 | | | Year Ended
09/30/20 | | | Year Ended
09/30/19 | |
| | | | | | | |
Net asset value, beginning of period | | $ | 62.14 | | | $ | 65.94 | | | $ | 75.28 | | | $ | 69.54 | | | $ | 57.05 | | | $ | 63.09 | |
| | | | | | | | | | | | | | | | | | | | | | | | |
| | | | | | |
Net investment loss(a) | | | (0.11 | ) | | | (0.08 | ) | | | (0.21 | ) | | | (0.18 | ) | | | (0.20 | ) | | | (0.09 | ) |
| | | | | | |
Net realized and unrealized gain (loss) | | | 7.90 | | | | 0.96 | | | | (2.52 | ) | | | 8.91 | | | | 15.05 | | | | (1.53 | ) |
| | | | | | | | | | | | | | | | | | | | | | | | |
| | | | | | |
Net increase (decrease) from investment operations | | | 7.79 | | | | 0.88 | | | | (2.73 | ) | | | 8.73 | | | | 14.85 | | | | (1.62 | ) |
| | | | | | | | | | | | | | | | | | | | | | | | |
| | | | | | |
Distributions(b) | | | | | | | | | | | | | | | | | | | | | | | | |
| | | | | | |
From net investment income | | | — | | | | (0.02 | ) | | | — | | | | — | | | | (0.05 | ) | | | — | |
From net realized gain | | | (2.34 | ) | | | (4.66 | ) | | | (6.61 | ) | | | (2.99 | ) | | | (2.31 | ) | | | (4.42 | ) |
| | | | | | | | | | | | | | | | | | | | | | | | |
| | | | | | |
Total distributions | | | (2.34 | ) | | | (4.68 | ) | | | (6.61 | ) | | | (2.99 | ) | | | (2.36 | ) | | | (4.42 | ) |
| | | | | | | | | | | | | | | | | | | | | | | | |
| | | | | | |
Net asset value, end of period | | $ | 67.59 | | | $ | 62.14 | | | $ | 65.94 | | | $ | 75.28 | | | $ | 69.54 | | | $ | 57.05 | |
| | | | | | | | | | | | | | | | | | | | | | | | |
| | | | | | |
Total Return(c) | | | | | | | | | | | | | | | | | | | | | | | | |
Based on net asset value | | | 12.88 | % | | | 1.62 | % | | | (4.12 | )%(d) | | | 12.91 | %(e) | | | 26.60 | %(f) | | | (2.44 | )% |
| | | | | | | | | | | | | | | | | | | | | | | | |
| | | | | | |
Ratios to Average Net Assets(g) | | | | | | | | | | | | | | | | | | | | | | | | |
| | | | | | |
Total expenses | | | 1.46 | % | | | 1.46 | % | | | 1.45 | % | | | 1.44 | %(h) | | | 1.45 | % | | | 1.45 | % |
| | | | | | | | | | | | | | | | | | | | | | | | |
| | | | | | |
Total expenses after fees waived and/or reimbursed | | | 1.46 | % | | | 1.46 | % | | | 1.45 | % | | | 1.44 | %(h) | | | 1.45 | % | | | 1.45 | % |
| | | | | | | | | | | | | | | | | | | | | | | | |
| | | | | | |
Net investment loss | | | (0.17 | )% | | | (0.13 | )% | | | (0.29 | )% | | | (0.37 | )%(h) | | | (0.32 | )% | | | (0.15 | )% |
| | | | | | | | | | | | | | | | | | | | | | | | |
| | | | | | |
Supplemental Data | | | | | | | | | | | | | | | | | | | | | | | | |
Net assets, end of period (000) | | $ | 247,848 | | | $ | 242,080 | | | $ | 263,195 | | | $ | 289,676 | | | $ | 260,488 | | | $ | 224,862 | |
| | | | | | | | | | | | | | | | | | | | | | | | |
| | | | | | |
Portfolio turnover rate | | | 27 | % | | | 29 | % | | | 51 | % | | | 19 | % | | | 28 | % | | | 41 | % |
| | | | | | | | | | | | | | | | | | | | | | | | |
| (a) | Based on average shares outstanding. |
| (b) | Distributions for annual periods determined in accordance with U.S. federal income tax regulations. |
| (c) | Where applicable, assumes the reinvestment of distributions. |
| (d) | Includes a capital contribution from affiliate, which had no impact on the Fund’s total return. |
| (f) | Includes a payment received from an affiliate, which had no impact on the Fund’s total return. |
| (g) | Excludes fees and expenses incurred indirectly as a result of investments in underlying funds. |
See notes to financial statements.
| | |
F I N A N C I A L H I G H L I G H T S | | 41 |
Financial Highlights
(For a share outstanding throughout each period)
| | | | | | | | | | | | | | | |
| | | BlackRock Infrastructure Sustainable Opportunities Fund |
| |
| | | Institutional |
| | | |
| Year Ended
05/31/24 |
| | |
| Year Ended
05/31/23 |
| | |
| Period from
09/30/21to 05/31/22 |
(a) |
| | | | |
Net asset value, beginning of period | | | $ | 9.04 | | | | $ | 9.97 | | | | $ | 10.00 | |
| | | | | | | | | | | | | | | |
| | | |
Net investment income(b) | | | | 0.19 | | | | | 0.14 | | | | | 0.07 | |
| | | |
Net realized and unrealized loss | | | | (0.18 | ) | | | | (0.68 | ) | | | | (0.02 | ) |
| | | | | | | | | | | | | | | |
| | | |
Net increase (decrease) from investment operations | | | | 0.01 | | | | | (0.54 | ) | | | | 0.05 | |
| | | | | | | | | | | | | | | |
| | | |
Distributions(c) | | | | | | | | | | | | | | | |
| | | |
From net investment income | | | | (0.21 | ) | | | | (0.13 | ) | | | | (0.04 | ) |
From net realized gain | | | | — | | | | | (0.26 | ) | | | | (0.04 | ) |
| | | | | | | | | | | | | | | |
| | | |
Total distributions | | | | (0.21 | ) | | | | (0.39 | ) | | | | (0.08 | ) |
| | | | | | | | | | | | | | | |
| | | |
Net asset value, end of period | | | $ | 8.84 | | | | $ | 9.04 | | | | $ | 9.97 | |
| | | | | | | | | | | | | | | |
| | | |
Total Return(d) | | | | | | | | | | | | | | | |
Based on net asset value | | | | 0.13 | % | | | | (5.32 | )% | | | | 0.45 | %(e) |
| | | | | | | | | | | | | | | |
| | | |
Ratios to Average Net Assets(f) | | | | | | | | | | | | | | | |
| | | |
Total expenses | | | | 4.73 | % | | | | 4.54 | % | | | | 3.62 | %(g)(h) |
| | | | | | | | | | | | | | | |
| | | |
Total expenses after fees waived and/or reimbursed | | | | 1.00 | % | | | | 1.00 | % | | | | 1.00 | %(g) |
| | | | | | | | | | | | | | | |
| | | |
Net investment income | | | | 2.22 | % | | | | 1.60 | % | | | | 1.09 | %(g) |
| | | | | | | | | | | | | | | |
| | | |
Supplemental Data | | | | | | | | | | | | | | | |
Net assets, end of period (000) | | | $ | 102 | | | | $ | 102 | | | | $ | 107 | |
| | | | | | | | | | | | | | | |
| | | |
Portfolio turnover rate(i) | | | | 57 | % | | | | 104 | % | | | | 70 | % |
| | | | | | | | | | | | | | | |
| (a) | Commencement of operations. |
| (b) | Based on average shares outstanding. |
| (c) | Distributions for annual periods determined in accordance with U.S. federal income tax regulations. |
| (d) | Where applicable, assumes the reinvestment of distributions. |
| (f) | Excludes fees and expenses incurred indirectly as a result of investments in underlying funds. |
| (h) | Audit, offering, organization and printing costs were not annualized in the calculation of the expense ratios. If these expenses were annualized, the total expenses would have been 4.45%. |
| (i) | Excludes underlying investments in total return swaps. |
See notes to financial statements.
| | |
| 42 | | 2 0 2 4 B L A C K R O C K A N N U A L F I N A N C I A L S T A T E M E N T S |
Financial Highlights (continued)
(For a share outstanding throughout each period)
| | | | | | | | | | | | | | | |
| | | BlackRock Infrastructure Sustainable Opportunities Fund (continued) |
| |
| | | Investor A |
| | | | | | | | | | | | | | Period from | |
| | | | Year Ended | | | | | Year Ended | | | | | 09/30/21 | (a) |
| | | | | 05/31/24 | | | | | 05/31/23 | | | | | to 05/31/22 | |
| | | |
Net asset value, beginning of period | | | $ | 9.03 | | | | $ | 9.96 | | | | $ | 10.00 | |
| | | | | | | | | | | | | | | |
| | | |
Net investment income(b) | | | | 0.17 | | | | | 0.13 | | | | | 0.06 | |
| | | |
Net realized and unrealized loss | | | | (0.17 | ) | | | | (0.69 | ) | | | | (0.03 | ) |
| | | | | | | | | | | | | | | |
| | | |
Net increase (decrease) from investment operations | | | | 0.00(c | ) | | | | (0.56 | ) | | | | 0.03 | |
| | | | | | | | | | | | | | | |
| | | |
Distributions(d) | | | | | | | | | | | | | | | |
| | | |
From net investment income | | | | (0.20 | ) | | | | (0.11 | ) | | | | (0.03 | ) |
From net realized gain | | | | — | | | | | (0.26 | ) | | | | (0.04 | ) |
| | | | | | | | | | | | | | | |
| | | |
Total distributions | | | | (0.20 | ) | | | | (0.37 | ) | | | | (0.07 | ) |
| | | | | | | | | | | | | | | |
| | | |
Net asset value, end of period | | | $ | 8.83 | | | | $ | 9.03 | | | | $ | 9.96 | |
| | | | | | | | | | | | | | | |
| | | |
Total Return(e) | | | | | | | | | | | | | | | |
Based on net asset value | | | | (0.08 | )% | | | | (5.55 | )% | | | | 0.29 | %(f) |
| | | | | | | | | | | | | | | |
| | | |
Ratios to Average Net Assets(g) | | | | | | | | | | | | | | | |
| | | |
Total expenses | | | | 5.05 | % | | | | 4.75 | % | | | | 3.88 | %(h)(i) |
| | | | | | | | | | | | | | | |
| | | |
Total expenses after fees waived and/or reimbursed | | | | 1.25 | % | | | | 1.25 | % | | | | 1.25 | %(h) |
| | | | | | | | | | | | | | | |
| | | |
Net investment income | | | | 1.97 | % | | | | 1.41 | % | | | | 0.84 | %(h) |
| | | | | | | | | | | | | | | |
| | | |
Supplemental Data | | | | | | | | | | | | | | | |
Net assets, end of period (000) | | | $ | 253 | | | | $ | 156 | | | | $ | 109 | |
| | | | | | | | | | | | | | | |
| | | |
Portfolio turnover rate(j) | | | | 57 | % | | | | 104 | % | | | | 70 | % |
| | | | | | | | | | | | | | | |
| (a) | Commencement of operations. |
| (b) | Based on average shares outstanding. |
| (c) | Amount is less than $0.005 per share. |
| (d) | Distributions for annual periods determined in accordance with U.S. federal income tax regulations. |
| (e) | Where applicable, excludes the effects of any sales charges and assumes the reinvestment of distributions. |
| (g) | Excludes fees and expenses incurred indirectly as a result of investments in underlying funds. |
| (i) | Audit, offering, organization and printing costs were not annualized in the calculation of the expense ratios. If these expenses were annualized, the total expenses would have been 4.71%. |
| (j) | Excludes underlying investments in total return swaps. |
See notes to financial statements.
| | |
F I N A N C I A L H I G H L I G H T S | | 43 |
Financial Highlights (continued)
(For a share outstanding throughout each period)
| | | | | | | | | | | | | | | |
| | | BlackRock Infrastructure Sustainable Opportunities Fund (continued) |
| |
| | | Class K |
| | | | | | | | | | | | | | Period from | |
| | | | Year Ended | | | | | Year Ended | | | | | 09/30/21 | (a) |
| | | | | 05/31/24 | | | | | 05/31/23 | | | | | to 05/31/22 | |
| | | |
Net asset value, beginning of period | | | $ | 9.04 | | | | $ | 9.97 | | | | $ | 10.00 | |
| | | | | | | | | | | | | | | |
| | | |
Net investment income(b) | | | | 0.20 | | | | | 0.15 | | | | | 0.08 | |
| | | |
Net realized and unrealized loss | | | | (0.17 | ) | | | | (0.69 | ) | | | | (0.03 | ) |
| | | | | | | | | | | | | | | |
| | | |
Net increase (decrease) from investment operations | | | | 0.03 | | | | | (0.54 | ) | | | | 0.05 | |
| | | | | | | | | | | | | | | |
| | | |
Distributions(c) | | | | | | | | | | | | | | | |
| | | |
From net investment income | | | | (0.22 | ) | | | | (0.13 | ) | | | | (0.04 | ) |
From net realized gain | | | | — | | | | | (0.26 | ) | | | | (0.04 | ) |
| | | | | | | | | | | | | | | |
| | | |
Total distributions | | | | (0.22 | ) | | | | (0.39 | ) | | | | (0.08 | ) |
| | | | | | | | | | | | | | | |
| | | |
Net asset value, end of period | | | $ | 8.85 | | | | $ | 9.04 | | | | $ | 9.97 | |
| | | | | | | | | | | | | | | |
| | | |
Total Return(d) | | | | | | | | | | | | | | | |
Based on net asset value | | | | 0.29 | % | | | | (5.27 | )% | | | | 0.46 | %(e) |
| | | | | | | | | | | | | | | |
| | | |
Ratios to Average Net Assets(f) | | | | | | | | | | | | | | | |
| | | |
Total expenses | | | | 4.41 | % | | | | 4.33 | % | | | | 3.36 | %(g)(h) |
| | | | | | | | | | | | | | | |
| | | |
Total expenses after fees waived and/or reimbursed | | | | 0.95 | % | | | | 0.95 | % | | | | 0.95 | %(g) |
| | | | | | | | | | | | | | | |
| | | |
Net investment income | | | | 2.27 | % | | | | 1.65 | % | | | | 1.13 | %(g) |
| | | | | | | | | | | | | | | |
| | | |
Supplemental Data | | | | | | | | | | | | | | | |
Net assets, end of period (000) | | | $ | 8,674 | | | | $ | 8,866 | | | | $ | 9,777 | |
| | | | | | | | | | | | | | | |
| | | |
Portfolio turnover rate(i) | | | | 57 | % | | | | 104 | % | | | | 70 | % |
| | | | | | | | | | | | | | | |
| (a) | Commencement of operations. |
| (b) | Based on average shares outstanding. |
| (c) | Distributions for annual periods determined in accordance with U.S. federal income tax regulations. |
| (d) | Where applicable, assumes the reinvestment of distributions. |
| (f) | Excludes fees and expenses incurred indirectly as a result of investments in underlying funds. |
| (h) | Audit, offering, organization and printing costs were not annualized in the calculation of the expense ratios. If these expenses were annualized, the total expenses would have been 4.21%. |
| (i) | Excludes underlying investments in total return swaps. |
See notes to financial statements.
| | |
| 44 | | 2 0 2 4 B L A C K R O C K A N N U A L F I N A N C I A L S T A T E M E N T S |
Financial Highlights
(For a share outstanding throughout each period)
| | | | | | | | | | | | | | | | | | | | | | | | |
| | | BlackRock Mid-Cap Growth Equity Portfolio | |
| |
| | | Institutional | |
| | | | | | |
| | | Year Ended
05/31/24 | | | Year Ended
05/31/23 | | | Year Ended
05/31/22 | | | Period from
10/01/20
to 05/31/21 | | | Year Ended
09/30/20 | | | Year Ended
09/30/19 | |
| | | | | | | |
Net asset value, beginning of period | | $ | 32.79 | | | $ | 32.83 | | | $ | 45.95 | | | $ | 36.56 | | | $ | 28.68 | | | $ | 27.87 | |
| | | | | | | | | | | | | | | | | | | | | | | | |
| | | | | | |
Net investment loss(a) | | | (0.14 | ) | | | (0.08 | ) | | | (0.23 | ) | | | (0.15 | ) | | | (0.14 | ) | | | (0.09 | ) |
| | | | | | |
Net realized and unrealized gain (loss) | | | 6.53 | | | | 0.04 | | | | (10.52 | ) | | | 9.54 | | | | 8.14 | | | | 1.95 | |
| | | | | | | | | | | | | | | | | | | | | | | | |
| | | | | | |
Net increase (decrease) from investment operations | | | 6.39 | | | | (0.04 | ) | | | (10.75 | ) | | | 9.39 | | | | 8.00 | | | | 1.86 | |
| | | | | | | | | | | | | | | | | | | | | | | | |
| | | | | | |
Distributions from net realized gain(b) | | | — | | | | — | | | | (2.37 | ) | | | — | | | | (0.12 | ) | | | (1.05 | ) |
| | | | | | | | | | | | | | | | | | | | | | | | |
| | | | | | |
Net asset value, end of period | | $ | 39.18 | | | $ | 32.79 | | | $ | 32.83 | | | $ | 45.95 | | | $ | 36.56 | | | $ | 28.68 | |
| | | | | | | | | | | | | | | | | | | | | | | | |
| | | | | | |
Total Return(c) | | | | | | | | | | | | | | | | | | | | | | | | |
Based on net asset value | | | 19.49 | % | | | (0.12 | )% | | | (24.87 | )% | | | 25.68 | %(d) | | | 27.98 | % | | | 7.43 | % |
| | | | | | | | | | | | | | | | | | | | | | | | |
| | | | | | |
Ratios to Average Net Assets(e) | | | | | | | | | | | | | | | | | | | | | | | | |
| | | | | | |
Total expenses | | | 0.85 | % | | | 0.84 | % | | | 0.81 | % | | | 0.80 | %(f) | | | 0.85 | % | | | 0.87 | % |
| | | | | | | | | | | | | | | | | | | | | | | | |
| | | | | | |
Total expenses after fees waived and/or reimbursed | | | 0.80 | % | | | 0.80 | % | | | 0.80 | % | | | 0.80 | %(f) | | | 0.80 | % | | | 0.80 | % |
| | | | | | | | | | | | | | | | | | | | | | | | |
| | | | | | |
Net investment loss | | | (0.38 | )% | | | (0.25 | )% | | | (0.52 | )% | | | (0.52 | )%(f) | | | (0.43 | )% | | | (0.34 | )% |
| | | | | | | | | | | | | | | | | | | | | | | | |
| | | | | | |
Supplemental Data | | | | | | | | | | | | | | | | | | | | | | | | |
Net assets, end of period (000) | | $ | 5,194,320 | | | $ | 5,266,832 | | | $ | 7,095,644 | | | $ | 9,260,191 | | | $ | 6,003,280 | | | $ | 2,700,531 | |
| | | | | | | | | | | | | | | | | | | | | | | | |
| | | | | | |
Portfolio turnover rate | | | 48 | % | | | 46 | % | | | 28 | % | | | 22 | % | | | 35 | % | | | 38 | % |
| | | | | | | | | | | | | | | | | | | | | | | | |
| (a) | Based on average shares outstanding. |
| (b) | Distributions for annual periods determined in accordance with U.S. federal income tax regulations. |
| (c) | Where applicable, assumes the reinvestment of distributions. |
| (e) | Excludes fees and expenses incurred indirectly as a result of investments in underlying funds. |
See notes to financial statements.
| | |
F I N A N C I A L H I G H L I G H T S | | 45 |
Financial Highlights (continued)
(For a share outstanding throughout each period)
| | | | | | | | | | | | | | | | | | | | | | | | |
| | | BlackRock Mid-Cap Growth Equity Portfolio (continued) | |
| |
| | | Service | |
| | | | | | |
| | | Year Ended
05/31/24 | | | Year Ended
05/31/23 | | | Year Ended
05/31/22 | | | Period from
10/01/20
to 05/31/21 | | | Year Ended
09/30/20 | | | Year Ended
09/30/19 | |
| | | | | | | |
Net asset value, beginning of period | | $ | 29.23 | | | $ | 29.34 | | | $ | 41.34 | | | $ | 32.95 | | | $ | 25.92 | | | $ | 25.30 | |
| | | | | | | | | | | | | | | | | | | | | | | | |
| | | | | | |
Net investment loss(a) | | | (0.21 | ) | | | (0.14 | ) | | | (0.31 | ) | | | (0.20 | ) | | | (0.19 | ) | | | (0.15 | ) |
| | | | | | |
Net realized and unrealized gain (loss) | | | 5.83 | | | | 0.03 | | | | (9.39 | ) | | | 8.59 | | | | 7.34 | | | | 1.76 | |
| | | | | | | | | | | | | | | | | | | | | | | | |
| | | | | | |
Net increase (decrease) from investment operations | | | 5.62 | | | | (0.11 | ) | | | (9.70 | ) | | | 8.39 | | | | 7.15 | | | | 1.61 | |
| | | | | | | | | | | | | | | | | | | | | | | | |
| | | | | | |
Distributions from net realized gain(b) | | | — | | | | — | | | | (2.30 | ) | | | — | | | | (0.12 | ) | | | (0.99 | ) |
| | | | | | | | | | | | | | | | | | | | | | | | |
| | | | | | |
Net asset value, end of period | | $ | 34.85 | | | $ | 29.23 | | | $ | 29.34 | | | $ | 41.34 | | | $ | 32.95 | | | $ | 25.92 | |
| | | | | | | | | | | | | | | | | | | | | | | | |
| | | | | | |
Total Return(c) | | | | | | | | | | | | | | | | | | | | | | | | |
Based on net asset value | | | 19.23 | % | | | (0.38 | )% | | | (25.06 | )% | | | 25.46 | %(d) | | | 27.68 | % | | | 7.15 | % |
| | | | | | | | | | | | | | | | | | | | | | | | |
| | | | | | |
Ratios to Average Net Assets(e) | | | | | | | | | | | | | | | | | | | | | | | | |
| | | | | | |
Total expenses | | | 1.12 | % | | | 1.10 | % | | | 1.09 | % | | | 1.10 | %(f) | | | 1.11 | % | | | 1.16 | % |
| | | | | | | | | | | | | | | | | | | | | | | | |
| | | | | | |
Total expenses after fees waived and/or reimbursed | | | 1.05 | % | | | 1.05 | % | | | 1.05 | % | | | 1.05 | %(f) | | | 1.05 | % | | | 1.05 | % |
| | | | | | | | | | | | | | | | | | | | | | | | |
| | | | | | |
Net investment loss | | | (0.63 | )% | | | (0.50 | )% | | | (0.77 | )% | | | (0.78 | )%(f) | | | (0.67 | )% | | | (0.59 | )% |
| | | | | | | | | | | | | | | | | | | | | | | | |
| | | | | | |
Supplemental Data | | | | | | | | | | | | | | | | | | | | | | | | |
Net assets, end of period (000) | | $ | 59,731 | | | $ | 62,693 | | | $ | 81,276 | | | $ | 104,997 | | | $ | 83,680 | | | $ | 61,293 | |
| | | | | | | | | | | | | | | | | | | | | | | | |
| | | | | | |
Portfolio turnover rate | | | 48 | % | | | 46 | % | | | 28 | % | | | 22 | % | | | 35 | % | | | 38 | % |
| | | | | | | | | | | | | | | | | | | | | | | | |
| (a) | Based on average shares outstanding. |
| (b) | Distributions for annual periods determined in accordance with U.S. federal income tax regulations. |
| (c) | Where applicable, assumes the reinvestment of distributions. |
| (e) | Excludes fees and expenses incurred indirectly as a result of investments in underlying funds. |
See notes to financial statements.
| | |
| 46 | | 2 0 2 4 B L A C K R O C K A N N U A L F I N A N C I A L S T A T E M E N T S |
Financial Highlights (continued)
(For a share outstanding throughout each period)
| | | | | | | | | | | | | | | | | | | | | | | | |
| | | BlackRock Mid-Cap Growth Equity Portfolio (continued) | |
| |
| | | Investor A | |
| | | | | | |
| | | Year Ended
05/31/24 | | | Year Ended
05/31/23 | | | Year Ended
05/31/22 | | | Period from
10/01/20
to 05/31/21 | | | Year Ended
09/30/20 | | | Year Ended
09/30/19 | |
| | | | | | | |
Net asset value, beginning of period | | $ | 27.85 | | | $ | 27.96 | | | $ | 39.50 | | | $ | 31.48 | | | $ | 24.78 | | | $ | 24.22 | |
| | | | | | | | | | | | | | | | | | | | | | | | |
| | | | | | |
Net investment loss(a) | | | (0.20 | ) | | | (0.14 | ) | | | (0.29 | ) | | | (0.19 | ) | | | (0.18 | ) | | | (0.14 | ) |
| | | | | | |
Net realized and unrealized gain (loss) | | | 5.55 | | | | 0.03 | | | | (8.94 | ) | | | 8.21 | | | | 7.00 | | | | 1.68 | |
| | | | | | | | | | | | | | | | | | | | | | | | |
| | | | | | |
Net increase (decrease) from investment operations | | | 5.35 | | | | (0.11 | ) | | | (9.23 | ) | | | 8.02 | | | | 6.82 | | | | 1.54 | |
| | | | | | | | | | | | | | | | | | | | | | | | |
| | | | | | |
Distributions from net realized gain(b) | | | — | | | | — | | | | (2.31 | ) | | | — | | | | (0.12 | ) | | | (0.98 | ) |
| | | | | | | | | | | | | | | | | | | | | | | | |
| | | | | | |
Net asset value, end of period | | $ | 33.20 | | | $ | 27.85 | | | $ | 27.96 | | | $ | 39.50 | | | $ | 31.48 | | | $ | 24.78 | |
| | | | | | | | | | | | | | | | | | | | | | | | |
| | | | | | |
Total Return(c) | | | | | | | | | | | | | | | | | | | | | | | | |
Based on net asset value | | | 19.21 | % | | | (0.39 | )% | | | (25.05 | )% | | | 25.48 | %(d) | | | 27.61 | % | | | 7.17 | % |
| | | | | | | | | | | | | | | | | | | | | | | | |
| | | | | | |
Ratios to Average Net Assets(e) | | | | | | | | | | | | | | | | | | | | | | | | |
| | | | | | |
Total expenses | | | 1.13 | % | | | 1.13 | % | | | 1.09 | % | | | 1.09 | %(f) | | | 1.14 | % | | | 1.16 | % |
| | | | | | | | | | | | | | | | | | | | | | | | |
| | | | | | |
Total expenses after fees waived and/or reimbursed | | | 1.05 | % | | | 1.05 | % | | | 1.05 | % | | | 1.05 | %(f) | | | 1.05 | % | | | 1.05 | % |
| | | | | | | | | | | | | | | | | | | | | | | | |
| | | | | | |
Net investment loss | | | (0.63 | )% | | | (0.50 | )% | | | (0.78 | )% | | | (0.78 | )%(f) | | | (0.67 | )% | | | (0.58 | )% |
| | | | | | | | | | | | | | | | | | | | | | | | |
| | | | | | |
Supplemental Data | | | | | | | | | | | | | | | | | | | | | | | | |
Net assets, end of period (000) | | $ | 1,622,438 | | | $ | 1,637,289 | | | $ | 1,913,190 | | | $ | 2,577,151 | | | $ | 1,917,773 | | | $ | 1,335,467 | |
| | | | | | | | | | | | | | | | | | | | | | | | |
| | | | | | |
Portfolio turnover rate | | | 48 | % | | | 46 | % | | | 28 | % | | | 22 | % | | | 35 | % | | | 38 | % |
| | | | | | | | | | | | | | | | | | | | | | | | |
| (a) | Based on average shares outstanding. |
| (b) | Distributions for annual periods determined in accordance with U.S. federal income tax regulations. |
| (c) | Where applicable, excludes the effects of any sales charges and assumes the reinvestment of distributions. |
| (e) | Excludes fees and expenses incurred indirectly as a result of investments in underlying funds. |
See notes to financial statements.
| | |
F I N A N C I A L H I G H L I G H T S | | 47 |
Financial Highlights (continued)
(For a share outstanding throughout each period)
| | | | | | | | | | | | | | | | | | | | | | | | |
| | | BlackRock Mid-Cap Growth Equity Portfolio (continued) | |
| |
| | | Investor C | |
| | | | | | |
| | | Year Ended
05/31/24 | | | Year Ended
05/31/23 | | | Year Ended
05/31/22 | | | Period from
10/01/20
to 05/31/21 | | | Year Ended
09/30/20 | | | Year Ended
09/30/19 | |
| | | | | | | |
Net asset value, beginning of period | | $ | 20.69 | | | $ | 20.93 | | | $ | 30.22 | | | $ | 24.20 | | | $ | 19.21 | | | $ | 19.04 | |
| | | | | | | | | | | | | | | | | | | | | | | | |
| | | | | | |
Net investment loss(a) | | | (0.32 | ) | | | (0.25 | ) | | | (0.43 | ) | | | (0.29 | ) | | | (0.30 | ) | | | (0.24 | ) |
| | | | | | |
Net realized and unrealized gain (loss) | | | 4.11 | | | | 0.01 | | | | (6.67 | ) | | | 6.31 | | | | 5.41 | | | | 1.28 | |
| | | | | | | | | | | | | | | | | | | | | | | | |
| | | | | | |
Net increase (decrease) from investment operations | | | 3.79 | | | | (0.24 | ) | | | (7.10 | ) | | | 6.02 | | | | 5.11 | | | | 1.04 | |
| | | | | | | | | | | | | | | | | | | | | | | | |
| | | | | | |
Distributions from net realized gain(b) | | | — | | | | — | | | | (2.19 | ) | | | — | | | | (0.12 | ) | | | (0.87 | ) |
| | | | | | | | | | | | | | | | | | | | | | | | |
| | | | | | |
Net asset value, end of period | | $ | 24.48 | | | $ | 20.69 | | | $ | 20.93 | | | $ | 30.22 | | | $ | 24.20 | | | $ | 19.21 | |
| | | | | | | | | | | | | | | | | | | | | | | | |
| | | | | | |
Total Return(c) | | | | | | | | | | | | | | | | | | | | | | | | |
Based on net asset value | | | 18.32 | % | | | (1.15 | )% | | | (25.61 | )% | | | 24.88 | %(d) | | | 26.72 | % | | | 6.33 | % |
| | | | | | | | | | | | | | | | | | | | | | | | |
| | | | | | |
Ratios to Average Net Assets(e) | | | | | | | | | | | | | | | | | | | | | | | | |
| | | | | | |
Total expenses | | | 1.84 | % | | | 1.83 | % | | | 1.78 | % | | | 1.80 | %(f) | | | 1.84 | % | | | 1.86 | % |
| | | | | | | | | | | | | | | | | | | | | | | | |
| | | | | | |
Total expenses after fees waived and/or reimbursed | | | 1.80 | % | | | 1.80 | % | | | 1.78 | % | | | 1.79 | %(f) | | | 1.80 | % | | | 1.80 | % |
| | | | | | | | | | | | | | | | | | | | | | | | |
| | | | | | |
Net investment loss | | | (1.38 | )% | | | (1.25 | )% | | | (1.51 | )% | | | (1.52 | )%(f) | | | (1.42 | )% | | | (1.33 | )% |
| | | | | | | | | | | | | | | | | | | | | | | | |
| | | | | | |
Supplemental Data | | | | | | | | | | | | | | | | | | | | | | | | |
Net assets, end of period (000) | | $ | 184,966 | | | $ | 194,849 | | | $ | 243,284 | | | $ | 357,360 | | | $ | 280,143 | | | $ | 209,923 | |
| | | | | | | | | | | | | | | | | | | | | | | | |
| | | | | | |
Portfolio turnover rate | | | 48 | % | | | 46 | % | | | 28 | % | | | 22 | % | | | 35 | % | | | 38 | % |
| | | | | | | | | | | | | | | | | | | | | | | | |
| (a) | Based on average shares outstanding. |
| (b) | Distributions for annual periods determined in accordance with U.S. federal income tax regulations. |
| (c) | Where applicable, excludes the effects of any sales charges and assumes the reinvestment of distributions. |
| (e) | Excludes fees and expenses incurred indirectly as a result of investments in underlying funds. |
See notes to financial statements.
| | |
| 48 | | 2 0 2 4 B L A C K R O C K A N N U A L F I N A N C I A L S T A T E M E N T S |
Financial Highlights (continued)
(For a share outstanding throughout each period)
| | | | | | | | | | | | | | | | | | | | | | | | |
| | | BlackRock Mid-Cap Growth Equity Portfolio (continued) | |
| |
| | | Class K | |
| | | | | | |
| | | Year Ended
05/31/24 | | | Year Ended
05/31/23 | | | Year Ended
05/31/22 | | | Period from
10/01/20
to 05/31/21 | | | Year Ended
09/30/20 | | | Year Ended
09/30/19 | |
| | | | | | | |
Net asset value, beginning of period | | $ | 32.95 | | | $ | 32.96 | | | $ | 46.10 | | | $ | 36.66 | | | $ | 28.74 | | | $ | 27.93 | |
| | | | | | | | | | | | | | | | | | | | | | | | |
| | | | | | |
Net investment loss(a) | | | (0.11 | ) | | | (0.05 | ) | | | (0.17 | ) | | | (0.12 | ) | | | (0.12 | ) | | | (0.09 | ) |
| | | | | | |
Net realized and unrealized gain (loss) | | | 6.58 | | | | 0.04 | | | | (10.58 | ) | | | 9.56 | | | | 8.16 | | | | 1.96 | |
| | | | | | | | | | | | | | | | | | | | | | | | |
| | | | | | |
Net increase (decrease) from investment operations | | | 6.47 | | | | (0.01 | ) | | | (10.75 | ) | | | 9.44 | | | | 8.04 | | | | 1.87 | |
| | | | | | | | | | | | | | | | | | | | | | | | |
| | | | | | |
Distributions from net realized gain(b) | | | — | | | | — | | | | (2.39 | ) | | | — | | | | (0.12 | ) | | | (1.06 | ) |
| | | | | | | | | | | | | | | | | | | | | | | | |
| | | | | | |
Net asset value, end of period | | $ | 39.42 | | | $ | 32.95 | | | $ | 32.96 | | | $ | 46.10 | | | $ | 36.66 | | | $ | 28.74 | |
| | | | | | | | | | | | | | | | | | | | | | | | |
| | | | | | |
Total Return(c) | | | | | | | | | | | | | | | | | | | | | | | | |
Based on net asset value | | | 19.64 | % | | | (0.03 | )% | | | (24.79 | )% | | | 25.75 | %(d) | | | 28.06 | % | | | 7.47 | % |
| | | | | | | | | | | | | | | | | | | | | | | | |
| | | | | | |
Ratios to Average Net Assets(e) | | | | | | | | | | | | | | | | | | | | | | | | |
| | | | | | |
Total expenses | | | 0.71 | % | | | 0.71 | % | | | 0.70 | % | | | 0.70 | %(f) | | | 0.73 | %(g) | | | 0.76 | %(h) |
| | | | | | | | | | | | | | | | | | | | | | | | |
| | | | | | |
Total expenses after fees waived and/or reimbursed | | | 0.71 | % | | | 0.71 | % | | | 0.70 | % | | | 0.70 | %(f) | | | 0.73 | % | | | 0.75 | % |
| | | | | | | | | | | | | | | | | | | | | | | | |
| | | | | | |
Net investment loss | | | (0.29 | )% | | | (0.15 | )% | | | (0.40 | )% | | | (0.42 | )%(f) | | | (0.36 | )% | | | (0.31 | )% |
| | | | | | | | | | | | | | | | | | | | | | | | |
| | | | | | |
Supplemental Data | | | | | | | | | | | | | | | | | | | | | | | | |
Net assets, end of period (000) | | $ | 4,520,357 | | | $ | 4,233,488 | | | $ | 4,376,642 | | | $ | 3,674,402 | | | $ | 2,011,727 | | | $ | 652,138 | |
| | | | | | | | | | | | | | | | | | | | | | | | |
| | | | | | |
Portfolio turnover rate | | | 48 | % | | | 46 | % | | | 28 | % | | | 22 | % | | | 35 | % | | | 38 | % |
| | | | | | | | | | | | | | | | | | | | | | | | |
| (a) | Based on average shares outstanding. |
| (b) | Distributions for annual periods determined in accordance with U.S. federal income tax regulations. |
| (c) | Where applicable, assumes the reinvestment of distributions. |
| (e) | Excludes fees and expenses incurred indirectly as a result of investments in underlying funds. |
| (g) | Includes recoupment of past waived and/or reimbursed fees with no financial impact to the expense ratios. |
| (h) | Includes recoupment of past waived and/or reimbursed fees. Excluding the recoupment of past waived and/or reimbursed fees for the year ended September 30, 2019, the expense ratio would have been 0.75%. |
See notes to financial statements.
| | |
F I N A N C I A L H I G H L I G H T S | | 49 |
Financial Highlights (continued)
(For a share outstanding throughout each period)
| | | | | | | | | | | | | | | | | | | | | | | | |
| | | BlackRock Mid-Cap Growth Equity Portfolio (continued) | |
| |
| | | Class R | |
| | | | | | |
| | | Year Ended
05/31/24 | | | Year Ended
05/31/23 | | | Year Ended
05/31/22 | | | Period from
10/01/20
to 05/31/21 | | | Year Ended
09/30/20 | | | Year Ended
09/30/19 | |
| | | | | | | |
Net asset value, beginning of period | | $ | 27.11 | | | $ | 27.28 | | | $ | 38.65 | | | $ | 30.85 | | | $ | 24.34 | | | $ | 23.83 | |
| | | | | | | | | | | | | | | | | | | | | | | | |
| | | | | | |
Net investment loss(a) | | | (0.26 | ) | | | (0.20 | ) | | | (0.37 | ) | | | (0.25 | ) | | | (0.24 | ) | | | (0.19 | ) |
| | | | | | |
Net realized and unrealized gain (loss) | | | 5.38 | | | | 0.03 | | | | (8.73 | ) | | | 8.05 | | | | 6.87 | | | | 1.65 | |
| | | | | | | | | | | | | | | | | | | | | | | | |
| | | | | | |
Net increase (decrease) from investment operations | | | 5.12 | | | | (0.17 | ) | | | (9.10 | ) | | | 7.80 | | | | 6.63 | | | | 1.46 | |
| | | | | | | | | | | | | | | | | | | | | | | | |
| | | | | | |
Distributions from net realized gain(b) | | | — | | | | — | | | | (2.27 | ) | | | — | | | | (0.12 | ) | | | (0.95 | ) |
| | | | | | | | | | | | | | | | | | | | | | | | |
| | | | | | |
Net asset value, end of period | | $ | 32.23 | | | $ | 27.11 | | | $ | 27.28 | | | $ | 38.65 | | | $ | 30.85 | | | $ | 24.34 | |
| | | | | | | | | | | | | | | | | | | | | | | | |
| | | | | | |
Total Return(c) | | | | | | | | | | | | | | | | | | | | | | | | |
Based on net asset value | | | 18.89 | % | | | (0.62 | )% | | | (25.24 | )% | | | 25.28 | %(d) | | | 27.33 | % | | | 6.89 | % |
| | | | | | | | | | | | | | | | | | | | | | | | |
| | | | | | |
Ratios to Average Net Assets(e) | | | | | | | | | | | | | | | | | | | | | | | | |
| | | | | | |
Total expenses | | | 1.41 | % | | | 1.42 | % | | | 1.40 | % | | | 1.39 | %(f) | | | 1.45 | % | | | 1.47 | % |
| | | | | | | | | | | | | | | | | | | | | | | | |
| | | | | | |
Total expenses after fees waived and/or reimbursed | | | 1.30 | % | | | 1.30 | % | | | 1.30 | % | | | 1.30 | %(f) | | | 1.30 | % | | | 1.30 | % |
| | | | | | | | | | | | | | | | | | | | | | | | |
| | | | | | |
Net investment loss | | | (0.88 | )% | | | (0.75 | )% | | | (1.02 | )% | | | (1.03 | )%(f) | | | (0.92 | )% | | | (0.83 | )% |
| | | | | | | | | | | | | | | | | | | | | | | | |
| | | | | | |
Supplemental Data | | | | | | | | | | | | | | | | | | | | | | | | |
Net assets, end of period (000) | | $ | 85,328 | | | $ | 93,427 | | | $ | 93,527 | | | $ | 98,300 | | | $ | 59,411 | | | $ | 40,999 | |
| | | | | | | | | | | | | | | | | | | | | | | | |
| | | | | | |
Portfolio turnover rate | | | 48 | % | | | 46 | % | | | 28 | % | | | 22 | % | | | 35 | % | | | 38 | % |
| | | | | | | | | | | | | | | | | | | | | | | | |
| (a) | Based on average shares outstanding. |
| (b) | Distributions for annual periods determined in accordance with U.S. federal income tax regulations. |
| (c) | Where applicable, assumes the reinvestment of distributions. |
| (e) | Excludes fees and expenses incurred indirectly as a result of investments in underlying funds. |
See notes to financial statements.
| | |
| 50 | | 2 0 2 4 B L A C K R O C K A N N U A L F I N A N C I A L S T A T E M E N T S |
Financial Highlights
(For a share outstanding throughout each period)
| | | | | | | | | | | | | | | | | | | | | | | | |
| | | BlackRock Technology Opportunities Fund | |
| |
| | | Institutional | |
| | | | | | |
| | | Year Ended
05/31/24 | | | Year Ended
05/31/23 | | | Year Ended
05/31/22 | | | Period from
10/01/20
to 05/31/21 | | | Year Ended
09/30/20 | | | Year Ended
09/30/19 | |
| | | | | | | |
Net asset value, beginning of period | | $ | 47.74 | | | $ | 45.31 | | | $ | 64.81 | | | $ | 55.33 | | | $ | 32.63 | | | $ | 31.83 | |
| | | | | | | | | | | | | | | | | | | | | | | | |
| | | | | | |
Net investment loss(a) | | | (0.23 | ) | | | (0.13 | ) | | | (0.30 | ) | | | (0.28 | ) | | | (0.22 | ) | | | (0.10 | ) |
| | | | | | |
Net realized and unrealized gain (loss) | | | 17.93 | | | | 2.56 | | | | (14.51 | ) | | | 12.67 | | | | 23.43 | | | | 1.20 | |
| | | | | | | | | | | | | | | | | | | | | | | | |
| | | | | | |
Net increase (decrease) from investment operations | | | 17.70 | | | | 2.43 | | | | (14.81 | ) | | | 12.39 | | | | 23.21 | | | | 1.10 | |
| | | | | | | | | | | | | | | | | | | | | | | | |
| | | | | | |
Distributions from net realized gain(b) | | | — | | | | — | | | | (4.69 | ) | | | (2.91 | ) | | | (0.51 | ) | | | (0.30 | ) |
| | | | | | | | | | | | | | | | | | | | | | | | |
| | | | | | |
Net asset value, end of period | | $ | 65.44 | | | $ | 47.74 | | | $ | 45.31 | | | $ | 64.81 | | | $ | 55.33 | | | $ | 32.63 | |
| | | | | | | | | | | | | | | | | | | | | | | | |
| | | | | | |
Total Return(c) | | | | | | | | | | | | | | | | | | | | | | | | |
Based on net asset value | | | 37.08 | % | | | 5.36 | % | | | (25.09 | )% | | | 22.68 | %(d) | | | 72.07 | % | | | 3.63 | % |
| | | | | | | | | | | | | | | | | | | | | | | | |
| | | | | | |
Ratios to Average Net Assets(e) | | | | | | | | | | | | | | | | | | | | | | | | |
| | | | | | |
Total expenses | | | 0.97 | % | | | 0.98 | % | | | 0.94 | % | | | 0.92 | %(f) | | | 0.98 | % | | | 1.02 | % |
| | | | | | | | | | | | | | | | | | | | | | | | |
| | | | | | |
Total expenses after fees waived and/or reimbursed | | | 0.92 | % | | | 0.92 | % | | | 0.92 | % | | | 0.92 | %(f) | | | 0.92 | % | | | 0.92 | % |
| | | | | | | | | | | | | | | | | | | | | | | | |
| | | | | | |
Net investment loss | | | (0.41 | )% | | | (0.30 | )% | | | (0.48 | )% | | | (0.66 | )%(f) | | | (0.50 | )% | | | (0.32 | )% |
| | | | | | | | | | | | | | | | | | | | | | | | |
| | | | | | |
Supplemental Data | | | | | | | | | | | | | | | | | | | | | | | | |
Net assets, end of period (000) | | $ | 2,751,350 | | | $ | 2,316,550 | | | $ | 2,943,616 | | | $ | 4,958,187 | | | $ | 3,641,519 | | | $ | 1,033,286 | |
| | | | | | | | | | | | | | | | | | | | | | | | |
| | | | | | |
Portfolio turnover rate | | | 21 | % | | | 39 | % | | | 29 | % | | | 25 | % | | | 27 | % | | | 33 | % |
| | | | | | | | | | | | | | | | | | | | | | | | |
| (a) | Based on average shares outstanding. |
| (b) | Distributions for annual periods determined in accordance with U.S. federal income tax regulations. |
| (c) | Where applicable, assumes the reinvestment of distributions. |
| (e) | Excludes fees and expenses incurred indirectly as a result of investments in underlying funds. |
See notes to financial statements.
| | |
F I N A N C I A L H I G H L I G H T S | | 51 |
Financial Highlights (continued)
(For a share outstanding throughout each period)
| | | | | | | | | | | | | | | | | | | | | | | | |
| | | BlackRock Technology Opportunities Fund (continued) | |
| |
| | | Service | |
| | | | | | |
| | | Year Ended
05/31/24 | | | Year Ended
05/31/23 | | | Year Ended
05/31/22 | | | Period from
10/01/20
to 05/31/21 | | | Year Ended
09/30/20 | | | Year Ended
09/30/19 | |
| | | | | | | |
Net asset value, beginning of period | | $ | 44.45 | | | $ | 42.30 | | | $ | 60.86 | | | $ | 52.20 | | | $ | 30.88 | | | $ | 30.22 | |
| | | | | | | | | | | | | | | | | | | | | | | | |
| | | | | | |
Net investment loss(a) | | | (0.34 | ) | | | (0.21 | ) | | | (0.42 | ) | | | (0.37 | ) | | | (0.30 | ) | | | (0.17 | ) |
| | | | | | |
Net realized and unrealized gain (loss) | | | 16.67 | | | | 2.36 | | | | (13.52 | ) | | | 11.94 | | | | 22.13 | | | | 1.13 | |
| | | | | | | | | | | | | | | | | | | | | | | | |
| | | | | | |
Net increase (decrease) from investment operations | | | 16.33 | | | | 2.15 | | | | (13.94 | ) | | | 11.57 | | | | 21.83 | | | | 0.96 | |
| | | | | | | | | | | | | | | | | | | | | | | | |
| | | | | | |
Distributions from net realized gain(b) | | | — | | | | — | | | | (4.62 | ) | | | (2.91 | ) | | | (0.51 | ) | | | (0.30 | ) |
| | | | | | | | | | | | | | | | | | | | | | | | |
| | | | | | |
Net asset value, end of period | | $ | 60.78 | | | $ | 44.45 | | | $ | 42.30 | | | $ | 60.86 | | | $ | 52.20 | | | $ | 30.88 | |
| | | | | | | | | | | | | | | | | | | | | | | | |
| | | | | | |
Total Return(c) | | | | | | | | | | | | | | | | | | | | | | | | |
Based on net asset value | | | 36.74 | % | | | 5.08 | % | | | (25.28 | )% | | | 22.46 | %(d) | | | 71.68 | % | | | 3.36 | % |
| | | | | | | | | | | | | | | | | | | | | | | | |
| | | | | | |
Ratios to Average Net Assets(e) | | | | | | | | | | | | | | | | | | | | | | | | |
| | | | | | |
Total expenses | | | 1.21 | % | | | 1.20 | % | | | 1.19 | % | | | 1.17 | %(f) | | | 1.19 | % | | | 1.25 | %(g) |
| | | | | | | | | | | | | | | | | | | | | | | | |
| | | | | | |
Total expenses after fees waived and/or reimbursed | | | 1.17 | % | | | 1.17 | % | | | 1.17 | % | | | 1.16 | %(f) | | | 1.17 | % | | | 1.17 | % |
| | | | | | | | | | | | | | | | | | | | | | | | |
| | | | | | |
Net investment loss | | | (0.67 | )% | | | (0.55 | )% | | | (0.73 | )% | | | (0.90 | )%(f) | | | (0.74 | )% | | | (0.57 | )% |
| | | | | | | | | | | | | | | | | | | | | | | | |
| | | | | | |
Supplemental Data | | | | | | | | | | | | | | | | | | | | | | | | |
Net assets, end of period (000) | | $ | 46,993 | | | $ | 47,332 | | | $ | 55,439 | | | $ | 83,886 | | | $ | 50,710 | | | $ | 20,429 | |
| | | | | | | | | | | | | | | | | | | | | | | | |
| | | | | | |
Portfolio turnover rate | | | 21 | % | | | 39 | % | | | 29 | % | | | 25 | % | | | 27 | % | | | 33 | % |
| | | | | | | | | | | | | | | | | | | | | | | | |
| (a) | Based on average shares outstanding. |
| (b) | Distributions for annual periods determined in accordance with U.S. federal income tax regulations. |
| (c) | Where applicable, assumes the reinvestment of distributions. |
| (e) | Excludes fees and expenses incurred indirectly as a result of investments in underlying funds. |
| (g) | Includes recoupment of past waived and/or reimbursed fees with no financial impact to the expense ratios. |
See notes to financial statements.
| | |
| 52 | | 2 0 2 4 B L A C K R O C K A N N U A L F I N A N C I A L S T A T E M E N T S |
Financial Highlights (continued)
(For a share outstanding throughout each period)
| | | | | | | | | | | | | | | | | | | | | | | | |
| | | BlackRock Technology Opportunities Fund (continued) | |
| |
| | | Investor A | |
| | | | | | |
| | | Year Ended
05/31/24 | | | Year Ended
05/31/23 | | | Year Ended
05/31/22 | | | Period from
10/01/20 to 05/31/21 | | | Year Ended
09/30/20 | | | Year Ended
09/30/19 | |
| | | | | | | |
Net asset value, beginning of period | | $ | 43.37 | | | $ | 41.27 | | | $ | 59.47 | | | $ | 51.06 | | | $ | 30.22 | | | $ | 29.58 | |
| | | | | | | | | | | | | | | | | | | | | | | | |
| | | | | | |
Net investment loss(a) | | | (0.33 | ) | | | (0.21 | ) | | | (0.41 | ) | | | (0.36 | ) | | | (0.29 | ) | | | (0.17 | ) |
| | | | | | |
Net realized and unrealized gain (loss) | | | 16.25 | | | | 2.31 | | | | (13.19 | ) | | | 11.68 | | | | 21.64 | | | | 1.11 | |
| | | | | | | | | | | | | | | | | | | | | | | | |
| | | | | | |
Net increase (decrease) from investment operations | | | 15.92 | | | | 2.10 | | | | (13.60 | ) | | | 11.32 | | | | 21.35 | | | | 0.94 | |
| | | | | | | | | | | | | | | | | | | | | | | | |
| | | | | | |
Distributions from net realized gain(b) | | | — | | | | — | | | | (4.60 | ) | | | (2.91 | ) | | | (0.51 | ) | | | (0.30 | ) |
| | | | | | | | | | | | | | | | | | | | | | | | |
| | | | | | |
Net asset value, end of period | | $ | 59.29 | | | $ | 43.37 | | | $ | 41.27 | | | $ | 59.47 | | | $ | 51.06 | | | $ | 30.22 | |
| | | | | | | | | | | | | | | | | | | | | | | | |
| | | | | | |
Total Return(c) | | | | | | | | | | | | | | | | | | | | | | | | |
Based on net asset value | | | 36.71 | % | | | 5.09 | % | | | (25.28 | )% | | | 22.48 | %(d) | | | 71.65 | % | | | 3.36 | % |
| | | | | | | | | | | | | | | | | | | | | | | | |
| | | | | | |
Ratios to Average Net Assets(e) | | | | | | | | | | | | | | | | | | | | | | | | |
| | | | | | |
Total expenses | | | 1.21 | % | | | 1.23 | % | | | 1.21 | % | | | 1.19 | %(f) | | | 1.25 | % | | | 1.29 | % |
| | | | | | | | | | | | | | | | | | | | | | | | |
| | | | | | |
Total expenses after fees waived and/or reimbursed | | | 1.17 | % | | | 1.17 | % | | | 1.17 | % | | | 1.17 | %(f) | | | 1.17 | % | | | 1.17 | % |
| | | | | | | | | | | | | | | | | | | | | | | | |
| | | | | | |
Net investment loss | | | (0.66 | )% | | | (0.54 | )% | | | (0.73 | )% | | | (0.91 | )%(f) | | | (0.74 | )% | | | (0.58 | )% |
| | | | | | | | | | | | | | | | | | | | | | | | |
| | | | | | |
Supplemental Data | | | | | | | | | | | | | | | | | | | | | | | | |
Net assets, end of period (000) | | $ | 1,959,752 | | | $ | 1,572,976 | | | $ | 1,695,648 | | | $ | 2,524,052 | | | $ | 1,773,399 | | | $ | 672,110 | |
| | | | | | | | | | | | | | | | | | | | | | | | |
| | | | | | |
Portfolio turnover rate | | | 21 | % | | | 39 | % | | | 29 | % | | | 25 | % | | | 27 | % | | | 33 | % |
| | | | | | | | | | | | | | | | | | | | | | | | |
| (a) | Based on average shares outstanding. |
| (b) | Distributions for annual periods determined in accordance with U.S. federal income tax regulations. |
| (c) | Where applicable, excludes the effects of any sales charges and assumes the reinvestment of distributions. |
| (e) | Excludes fees and expenses incurred indirectly as a result of investments in underlying funds. |
See notes to financial statements.
| | |
F I N A N C I A L H I G H L I G H T S | | 53 |
Financial Highlights (continued)
(For a share outstanding throughout each period)
| | | | | | | | | | | | | | | | | | | | | | | | |
| | | BlackRock Technology Opportunities Fund (continued) | |
| |
| | | Investor C | |
| | | | | | |
| | | Year Ended
05/31/24 | | | Year Ended
05/31/23 | | | Year Ended
05/31/22 | | | Period from
10/01/20
to 05/31/21 | | | Year Ended
09/30/20 | | | Year Ended
09/30/19 | |
| | | | | | | |
Net asset value, beginning of period | | $ | 34.58 | | | $ | 33.17 | | | $ | 48.77 | | | $ | 42.52 | | | $ | 25.43 | | | $ | 25.13 | |
| | | | | | | | | | | | | | | | | | | | | | | | |
| | | | | | |
Net investment loss(a) | | | (0.56 | ) | | | (0.40 | ) | | | (0.68 | ) | | | (0.54 | ) | | | (0.48 | ) | | | (0.32 | ) |
| | | | | | |
Net realized and unrealized gain (loss) | | | 12.90 | | | | 1.81 | | | | (10.52 | ) | | | 9.70 | | | | 18.08 | | | | 0.92 | |
| | | | | | | | | | | | | | | | | | | | | | | | |
| | | | | | |
Net increase (decrease) from investment operations | | | 12.34 | | | | 1.41 | | | | (11.20 | ) | | | 9.16 | | | | 17.60 | | | | 0.60 | |
| | | | | | | | | | | | | | | | | | | | | | | | |
| | | | | | |
Distributions from net realized gain(b) | | | — | | | | — | | | | (4.40 | ) | | | (2.91 | ) | | | (0.51 | ) | | | (0.30 | ) |
| | | | | | | | | | | | | | | | | | | | | | | | |
| | | | | | |
Net asset value, end of period | | $ | 46.92 | | | $ | 34.58 | | | $ | 33.17 | | | $ | 48.77 | | | $ | 42.52 | | | $ | 25.43 | |
| | | | | | | | | | | | | | | | | | | | | | | | |
| | | | | | |
Total Return(c) | | | | | | | | | | | | | | | | | | | | | | | | |
Based on net asset value | | | 35.68 | % | | | 4.25 | % | | | (25.81 | )% | | | 21.89 | %(d) | | | 70.39 | % | | | 2.60 | % |
| | | | | | | | | | | | | | | | | | | | | | | | |
| | | | | | |
Ratios to Average Net Assets(e) | | | | | | | | | | | | | | | | | | | | | | | | |
| | | | | | |
Total expenses | | | 1.97 | % | | | 1.98 | % | | | 1.92 | % | | | 1.91 | %(f) | | | 1.98 | % | | | 2.02 | % |
| | | | | | | | | | | | | | | | | | | | | | | | |
| | | | | | |
Total expenses after fees waived and/or reimbursed | | | 1.92 | % | | | 1.92 | % | | | 1.91 | % | | | 1.90 | %(f) | | | 1.92 | % | | | 1.92 | % |
| | | | | | | | | | | | | | | | | | | | | | | | |
| | | | | | |
Net investment loss | | | (1.42 | )% | | | (1.30 | )% | | | (1.47 | )% | | | (1.65 | )%(f) | | | (1.49 | )% | | | (1.33 | )% |
| | | | | | | | | | | | | | | | | | | | | | | | |
| | | | | | |
Supplemental Data | | | | | | | | | | | | | | | | | | | | | | | | |
Net assets, end of period (000) | | $ | 292,034 | | | $ | 259,247 | | | $ | 291,802 | | | $ | 427,435 | | | $ | 317,792 | | | $ | 152,505 | |
| | | | | | | | | | | | | | | | | | | | | | | | |
| | | | | | |
Portfolio turnover rate | | | 21 | % | | | 39 | % | | | 29 | % | | | 25 | % | | | 27 | % | | | 33 | % |
| | | | | | | | | | | | | | | | | | | | | | | | |
| (a) | Based on average shares outstanding. |
| (b) | Distributions for annual periods determined in accordance with U.S. federal income tax regulations. |
| (c) | Where applicable, excludes the effects of any sales charges and assumes the reinvestment of distributions. |
| (e) | Excludes fees and expenses incurred indirectly as a result of investments in underlying funds. |
See notes to financial statements.
| | |
| 54 | | 2 0 2 4 B L A C K R O C K A N N U A L F I N A N C I A L S T A T E M E N T S |
Financial Highlights (continued)
(For a share outstanding throughout each period)
| | | | | | | | | | | | | | | | | | | | |
| | | BlackRock Technology Opportunities Fund (continued) | |
| |
| | | Class K | |
| | | | | |
| | |
| Year Ended
05/31/24 |
| |
| Year Ended
05/31/23 |
| |
| Year Ended
05/31/22 |
| |
| Period from
10/01/20
to 05/31/21 |
| |
| Period from
12/10/19 to 09/30/20 |
(a) |
| | | | | | |
Net asset value, beginning of period | | $ | 47.83 | | | $ | 45.37 | | | $ | 64.89 | | | $ | 55.36 | | | $ | 34.59 | |
| | | | | | | | | | | | | | | | | | | | |
| | | | | |
Net investment loss(b) | | | (0.19 | ) | | | (0.10 | ) | | | (0.24 | ) | | | (0.24 | ) | | | (0.16 | ) |
| | | | | |
Net realized and unrealized gain (loss) | | | 17.97 | | | | 2.56 | | | | (14.55 | ) | | | 12.68 | | | | 20.93 | |
| | | | | | | | | | | | | | | | | | | | |
| | | | | |
Net increase (decrease) from investment operations | | | 17.78 | | | | 2.46 | | | | (14.79 | ) | | | 12.44 | | | | 20.77 | |
| | | | | | | | | | | | | | | | | | | | |
| | | | | |
Distributions from net realized gain(c) | | | — | | | | — | | | | (4.73 | ) | | | (2.91 | ) | | | — | |
| | | | | | | | | | | | | | | | | | | | |
| | | | | |
Net asset value, end of period | | $ | 65.61 | | | $ | 47.83 | | | $ | 45.37 | | | $ | 64.89 | | | $ | 55.36 | |
| | | | | | | | | | | | | | | | | | | | |
| | | | | |
Total Return(d) | | | | | | | | | | | | | | | | | | | | |
Based on net asset value | | | 37.17 | % | | | 5.42 | % | | | (25.05 | )% | | | 22.77 | %(e) | | | 60.05 | %(e) |
| | | | | | | | | | | | | | | | | | | | |
| | | | | |
Ratios to Average Net Assets(f) | | | | | | | | | | | | | | | | | | | | |
| | | | | |
Total expenses | | | 0.85 | % | | | 0.87 | % | | | 0.84 | % | | | 0.83 | %(g) | | | 0.87 | %(g) |
| | | | | | | | | | | | | | | | | | | | |
| | | | | |
Total expenses after fees waived and/or reimbursed | | | 0.85 | % | | | 0.87 | % | | | 0.83 | % | | | 0.82 | %(g) | | | 0.86 | %(g) |
| | | | | | | | | | | | | | | | | | | | |
| | | | | |
Net investment loss | | | (0.34 | )% | | | (0.24 | )% | | | (0.38 | )% | | | (0.56 | )%(g) | | | (0.46 | )%(g) |
| | | | | | | | | | | | | | | | | | | | |
| | | | | |
Supplemental Data | | | | | | | | | | | | | | | | | | | | |
Net assets, end of period (000) | | $ | 241,109 | | | $ | 157,185 | | | $ | 135,879 | | | $ | 122,568 | | | $ | 75,426 | |
| | | | | | | | | | | | | | | | | | | | |
| | | | | |
Portfolio turnover rate | | | 21 | % | | | 39 | % | | | 29 | % | | | 25 | % | | | 27 | %(h) |
| | | | | | | | | | | | | | | | | | | | |
| (a) | Commencement of operations. |
| (b) | Based on average shares outstanding. |
| (c) | Distributions for annual periods determined in accordance with U.S. federal income tax regulations. |
| (d) | Where applicable, assumes the reinvestment of distributions. |
| (f) | Excludes fees and expenses incurred indirectly as a result of investments in underlying funds. |
| (h) | Portfolio turnover is representative of the Fund for the entire year. |
See notes to financial statements.
| | |
F I N A N C I A L H I G H L I G H T S | | 55 |
Financial Highlights (continued)
(For a share outstanding throughout each period)
| | | | | | | | | | | | | | | | | | | | | | | | |
| | | BlackRock Technology Opportunities Fund (continued) | |
| |
| | | Class R | |
| | | | | | |
| | | Year Ended
05/31/24 | | | Year Ended
05/31/23 | | | Year Ended
05/31/22 | | | Period from
10/01/20
to 05/31/21 | | | Year Ended
09/30/20 | | | Year Ended
09/30/19 | |
| | | | | | | |
Net asset value, beginning of period | | $ | 43.44 | | | $ | 41.44 | | | $ | 59.75 | | | $ | 51.37 | | | $ | 30.48 | | | $ | 29.90 | |
| | | | | | | | | | | | | | | | | | | | | | | | |
| | | | | | |
Net investment loss(a) | | | (0.46 | ) | | | (0.30 | ) | | | (0.56 | ) | | | (0.46 | ) | | | (0.38 | ) | | | (0.24 | ) |
| | | | | | |
Net realized and unrealized gain (loss) | | | 16.27 | | | | 2.30 | | | | (13.25 | ) | | | 11.75 | | | | 21.78 | | | | 1.12 | |
| | | | | | | | | | | | | | | | | | | | | | | | |
| | | | | | |
Net increase (decrease) from investment operations | | | 15.81 | | | | 2.00 | | | | (13.81 | ) | | | 11.29 | | | | 21.40 | | | | 0.88 | |
| | | | | | | | | | | | | | | | | | | | | | | | |
| | | | | | |
Distributions from net realized gain(b) | | | — | | | | — | | | | (4.50 | ) | | | (2.91 | ) | | | (0.51 | ) | | | (0.30 | ) |
| | | | | | | | | | | | | | | | | | | | | | | | |
| | | | | | |
Net asset value, end of period | | $ | 59.25 | | | $ | 43.44 | | | $ | 41.44 | | | $ | 59.75 | | | $ | 51.37 | | | $ | 30.48 | |
| | | | | | | | | | | | | | | | | | | | | | | | |
| | | | | | |
Total Return(c) | | | | | | | | | | | | | | | | | | | | | | | | |
Based on net asset value | | | 36.39 | % | | | 4.83 | % | | | (25.47 | )% | | | 22.28 | %(d) | | | 71.20 | % | | | 3.12 | % |
| | | | | | | | | | | | | | | | | | | | | | | | |
| | | | | | |
Ratios to Average Net Assets(e) | | | | | | | | | | | | | | | | | | | | | | | | |
| | | | | | |
Total expenses | | | 1.55 | % | | | 1.58 | % | | | 1.54 | % | | | 1.50 | %(f) | | | 1.57 | % | | | 1.60 | % |
| | | | | | | | | | | | | | | | | | | | | | | | |
| | | | | | |
Total expenses after fees waived and/or reimbursed | | | 1.42 | % | | | 1.42 | % | | | 1.42 | % | | | 1.42 | %(f) | | | 1.42 | % | | | 1.42 | % |
| | | | | | | | | | | | | | | | | | | | | | | | |
| | | | | | |
Net investment loss | | | (0.91 | )% | | | (0.79 | )% | | | (0.98 | )% | | | (1.17 | )%(f) | | | (0.99 | )% | | | (0.83 | )% |
| | | | | | | | | | | | | | | | | | | | | | | | |
| | | | | | |
Supplemental Data | | | | | | | | | | | | | | | | | | | | | | | | |
Net assets, end of period (000) | | $ | 44,320 | | | $ | 35,771 | | | $ | 35,001 | | | $ | 50,186 | | | $ | 38,907 | | | $ | 18,799 | |
| | | | | | | | | | | | | | | | | | | | | | | | |
| | | | | | |
Portfolio turnover rate | | | 21 | % | | | 39 | % | | | 29 | % | | | 25 | % | | | 27 | % | | | 33 | % |
| | | | | | | | | | | | | | | | | | | | | | | | |
| (a) | Based on average shares outstanding. |
| (b) | Distributions for annual periods determined in accordance with U.S. federal income tax regulations. |
| (c) | Where applicable, assumes the reinvestment of distributions. |
| (e) | Excludes fees and expenses incurred indirectly as a result of investments in underlying funds. |
See notes to financial statements.
| | |
| 56 | | 2 0 2 4 B L A C K R O C K A N N U A L F I N A N C I A L S T A T E M E N T S |
Notes to Financial Statements
BlackRock Capital Appreciation Fund, Inc. (the “Corporation”) and BlackRock FundsSM (the “Trust”) are each registered under the Investment Company Act of 1940, as amended (the “1940 Act”), as open-end management investment companies. The Corporation is organized as a Maryland corporation. The Trust is organized as a Massachusetts business trust. BlackRock Capital Appreciation Fund, Inc. is the only series of the Corporation. BlackRock Health Sciences Opportunities Portfolio, BlackRock Infrastructure Sustainable Opportunities Fund, BlackRock Mid-Cap Growth Equity Portfolio and BlackRock Technology Opportunities Fund are series of the Trust. The following are referred to herein collectively as the “Funds” or individually as a “Fund”:
| | | | |
| | | |
| Fund Name | | Herein Referred To As | | Diversification Classification |
| | |
BlackRock Capital Appreciation Fund, Inc. | | Capital Appreciation | | Diversified |
BlackRock Health Sciences Opportunities Portfolio | | Health Sciences Opportunities | | Diversified |
BlackRock Infrastructure Sustainable Opportunities Fund | | Infrastructure Sustainable Opportunities | | Non-Diversified |
BlackRock Mid-Cap Growth Equity Portfolio | | Mid-Cap Growth Equity | | Diversified |
BlackRock Technology Opportunities Fund | | Technology Opportunities | | Diversified |
Each Fund offers multiple classes of shares. All classes of shares have identical voting, dividend, liquidation and other rights and are subject to the same terms and conditions, except that certain classes bear expenses related to the shareholder servicing and distribution of such shares. Institutional, Service and Class K Shares are sold only to certain eligible investors. Service, Investor A, Investor C and Class R Shares bear certain expenses related to shareholder servicing of such shares, and Investor C and Class R Shares also bear certain expenses related to the distribution of such shares. Investor A and Investor C Shares are generally available through financial intermediaries. Class R Shares are sold only to certain employer-sponsored retirement plans. Each class has exclusive voting rights with respect to matters relating to its shareholder servicing and distribution expenditures (except that Investor C shareholders may vote on material changes to the Investor A Shares distribution and service plan).
| | | | | | |
| | | | |
| Share Class | | Initial Sales Charge | | CDSC | | Conversion Privilege |
| | | |
Institutional, Service and Class K Shares | | No | | No | | None |
| | | |
Investor A Shares | | Yes | | No(a) | | None |
| | | |
Investor C Shares | | No | | Yes(b) | | To Investor A Shares after approximately 8 years |
| | (a) | Investor A Shares may be subject to a contingent deferred sales charge (“CDSC”) for certain redemptions where no initial sales charge was paid at the time of purchase. | |
| | (b) | A CDSC of 1.00% is assessed on certain redemptions of Investor C Shares made within one year after purchase. | |
The Board of Directors of the Corporation and BlackRock Large Cap Focus Growth Fund, Inc. (the “Acquiring Fund”) approved an Agreement and Plan of Reorganization between the Corporation and the Acquiring Fund in July 2023, pursuant to which the Corporation would be reorganized into the Acquiring Fund (the “Reorganization”). The Corporation and the Acquiring Fund have determined not to proceed with the Reorganization at this time.
The Board of Directors of the Corporation and the Board of Trustees of the Trust are collectively referred to throughout this report as the “Board”, and the directors/trustees thereof are collectively referred to throughout this report as “Directors”.
The Funds, together with certain other registered investment companies advised by BlackRock Advisors, LLC (the “Manager”) or its affiliates, are included in a complex of funds referred to as the BlackRock Multi-Asset Complex.
| 2. | SIGNIFICANT ACCOUNTING POLICIES |
The financial statements are prepared in conformity with accounting principles generally accepted in the United States of America (“U.S. GAAP”), which may require management to make estimates and assumptions that affect the reported amounts of assets and liabilities in the financial statements, disclosure of contingent assets and liabilities at the date of the financial statements and the reported amounts of increases and decreases in net assets from operations during the reporting period. Actual results could differ from those estimates. Each Fund is considered an investment company under U.S. GAAP and follows the accounting and reporting guidance applicable to investment companies. Below is a summary of significant accounting policies:
Investment Transactions and Income Recognition: For financial reporting purposes, investment transactions are recorded on the dates the transactions are executed. Realized gains and losses on investment transactions are determined using the specific identification method. Dividend income and capital gain distributions, if any, are recorded on the ex-dividend dates. Non-cash dividends, if any, are recorded on the ex-dividend dates at fair value. Dividends from foreign securities where the ex-dividend dates may have passed are subsequently recorded when the Funds are informed of the ex-dividend dates. Under the applicable foreign tax laws, a withholding tax at various rates may be imposed on capital gains, dividends and interest. Upon notification from issuers, a portion of the dividend income received from a real estate investment trust may be redesignated as a reduction of cost of the related investment and/or realized gain. Income, expenses and realized and unrealized gains and losses are allocated daily to each class based on its relative net assets.
Foreign Currency Translation: Each Fund’s books and records are maintained in U.S. dollars. Securities and other assets and liabilities denominated in foreign currencies are translated into U.S. dollars using exchange rates determined as of the close of trading on the New York Stock Exchange (“NYSE”). Purchases and sales of investments are recorded at the rates of exchange prevailing on the respective dates of such transactions. Generally, when the U.S. dollar rises in value against a foreign currency, the investments denominated in that currency will lose value; the opposite effect occurs if the U.S. dollar falls in relative value.
| | |
N O T E S T O F I N A N C I A L S T A T E M E N T S | | 57 |
Notes to Financial Statements (continued)
Each Fund does not isolate the effect of fluctuations in foreign exchange rates from the effect of fluctuations in the market prices of investments for financial reporting purposes. Accordingly, the effects of changes in exchange rates on investments are not segregated in the Statements of Operations from the effects of changes in market prices of those investments, but are included as a component of net realized and unrealized gain (loss) from investments. Each Fund reports realized currency gains (losses) on foreign currency related transactions as components of net realized gain (loss) for financial reporting purposes, whereas such components are generally treated as ordinary income for U.S. federal income tax purposes.
Foreign Taxes: The Funds may be subject to foreign taxes (a portion of which may be reclaimable) on income, stock dividends, capital gains on investments, or certain foreign currency transactions. All foreign taxes are recorded in accordance with the applicable foreign tax regulations and rates that exist in the foreign jurisdictions in which each Fund invests. These foreign taxes, if any, are paid by each Fund and are reflected in its Statements of Operations as follows: foreign taxes withheld at source are presented as a reduction of income, foreign taxes on securities lending income are presented as a reduction of securities lending income, foreign taxes on stock dividends are presented as “Foreign taxes withheld”, and foreign taxes on capital gains from sales of investments and foreign taxes on foreign currency transactions are included in their respective net realized gain (loss) categories. Foreign taxes payable or deferred as of May 31, 2024, if any, are disclosed in the Statements of Assets and Liabilities.
The Funds file withholding tax reclaims in certain jurisdictions to recover a portion of amounts previously withheld. The Funds may record a reclaim receivable based on collectability, which includes factors such as the jurisdiction’s applicable laws, payment history and market convention. The Statements of Operations include tax reclaims recorded as well as professional and other fees, if any, associated with recovery of foreign withholding taxes.
Bank Overdraft: Certain Funds had outstanding cash disbursements exceeding deposited cash amounts at the custodian during the reporting period. The Funds are obligated to repay the custodian for any overdraft, including any related costs or expenses, where applicable. For financial reporting purposes, overdraft fees, if any, are included in interest expense in the Statements of Operations.
Collateralization: If required by an exchange or counterparty agreement, the Funds may be required to deliver/deposit cash and/or securities to/with an exchange, or broker-dealer or custodian as collateral for certain investments.
Distributions: Distributions paid by the Funds are recorded on the ex-dividend dates. The character and timing of distributions are determined in accordance with U.S. federal income tax regulations, which may differ from U.S. GAAP.
Offering Costs: Offering costs are amortized over a 12-month period beginning with the commencement of operations of a class of shares.
Indemnifications: In the normal course of business, a Fund enters into contracts that contain a variety of representations that provide general indemnification. A Fund’s maximum exposure under these arrangements is unknown because it involves future potential claims against a Fund, which cannot be predicted with any certainty.
Other: Expenses directly related to a Fund or its classes are charged to that Fund or the applicable class. Expenses directly related to the Funds and other shared expenses prorated to the Funds are allocated daily to each class based on their relative net assets or other appropriate methods. Other operating expenses shared by several funds, including other funds managed by the Manager, are prorated among those funds on the basis of relative net assets or other appropriate methods.
The Funds have an arrangement with their custodian whereby credits are earned on uninvested cash balances. For financial reporting purposes, custodian credits, if any, are included in interest income in the Statements of Operations.
| 3. | INVESTMENT VALUATION AND FAIR VALUE MEASUREMENTS |
Investment Valuation Policies: Each Fund’s investments are valued at fair value (also referred to as “market value” within the financial statements) each day that the Fund is open for business and, for financial reporting purposes, as of the report date. U.S. GAAP defines fair value as the price a fund would receive to sell an asset or pay to transfer a liability in an orderly transaction between market participants at the measurement date. The Board of each Fund has approved the designation of each Fund’s Manager as the valuation designee for each Fund. Each Fund determines the fair values of its financial instruments using various independent dealers or pricing services under the Manager’s policies. If a security’s market price is not readily available or does not otherwise accurately represent the fair value of the security, the security will be valued in accordance with the Manager’s policies and procedures as reflecting fair value. The Manager has formed a committee (the “Valuation Committee”) to develop pricing policies and procedures and to oversee the pricing function for all financial instruments, with assistance from other BlackRock pricing committees.
Fair Value Inputs and Methodologies: The following methods and inputs are used to establish the fair value of each Fund’s assets and liabilities:
| | • | | Equity investments traded on a recognized securities exchange are valued at that day’s official closing price, as applicable, on the exchange where the stock is primarily traded. Equity investments traded on a recognized exchange for which there were no sales on that day may be valued at the last available bid (long positions) or ask (short positions) price. |
| | • | | Investments in open-end U.S. mutual funds (including money market funds) are valued at that day’s published net asset value (“NAV”). |
| | • | | Forward foreign currency exchange contracts are valued at the mean between the bid and ask prices and are determined as of the close of trading on the NYSE based on that day’s prevailing forward exchange rate for the underlying currencies. |
| | • | | Swap agreements are valued utilizing quotes received daily by independent pricing services or through brokers, which are derived using daily swap curves and models that incorporate a number of market data factors, such as discounted cash flows, trades and values of the underlying reference instruments. |
Generally, trading in foreign instruments is substantially completed each day at various times prior to the close of trading on the NYSE. Each business day, the Funds use current market factors supplied by independent pricing services to value certain foreign instruments (“Systematic Fair Value Price”). The Systematic Fair Value Price is designed to value such foreign securities at fair value as of the close of trading on the NYSE, which follows the close of the local markets.
| | |
| 58 | | 2 0 2 4 B L A C K R O C K A N N U A L F I N A N C I A L S T A T E M E N T S |
Notes to Financial Statements (continued)
If events (e.g., market volatility, company announcement or a natural disaster) occur that are expected to materially affect the value of such investment, or in the event that application of these methods of valuation results in a price for an investment that is deemed not to be representative of the market value of such investment, or if a price is not available, the investment will be valued by the Valuation Committee in accordance with the Manager’s policies and procedures as reflecting fair value (“Fair Valued Investments”). The fair valuation approaches that may be used by the Valuation Committee include market approach, income approach and cost approach. Valuation techniques such as discounted cash flow, use of market comparables and matrix pricing are types of valuation approaches and are typically used in determining fair value. When determining the price for Fair Valued Investments, the Valuation Committee seeks to determine the price that each Fund might reasonably expect to receive or pay from the current sale or purchase of that asset or liability in an arm’s-length transaction. Fair value determinations shall be based upon all available factors that the Valuation Committee deems relevant and consistent with the principles of fair value measurement.
For investments in equity or debt issued by privately held companies or funds (“Private Company” or collectively, the “Private Companies”) and other Fair Valued Investments, the fair valuation approaches that are used by the Valuation Committee and third-party pricing services utilized by the Valuation Committee include one or a combination of, but not limited to, the following inputs.
| | |
| |
| Standard Inputs Generally Considered By The Valuation Committee And Third-Party Pricing Services |
| |
Market approach | | (i) recent market transactions, including subsequent rounds of financing, in the underlying investment or comparable issuers; (ii) recapitalizations and other transactions across the capital structure; and (iii) market multiples of comparable issuers. |
| |
Income approach | | (i) future cash flows discounted to present and adjusted as appropriate for liquidity, credit, and/or market risks; (ii) quoted prices for similar investments or assets in active markets; and (iii) other risk factors, such as interest rates, yield curves, volatilities, prepayment speeds, loss severities, credit risks, recovery rates, liquidation amounts and/or default rates. |
| |
Cost approach | | (i) audited or unaudited financial statements, investor communications and financial or operational metrics issued by the Private Company; (ii) changes in the valuation of relevant indices or publicly traded companies comparable to the Private Company; (iii) relevant news and other public sources; and (iv) known secondary market transactions in the Private Company’s interests and merger or acquisition activity in companies comparable to the Private Company. |
Investments in series of preferred stock issued by Private Companies are typically valued utilizing market approach in determining the enterprise value of the company. Such investments often contain rights and preferences that differ from other series of preferred and common stock of the same issuer. Enterprise valuation techniques such as an option pricing model (“OPM”), a probability weighted expected return model (“PWERM”), current value method or a hybrid of those techniques are used as deemed appropriate under the circumstances. The use of these valuation techniques involves a determination of the exit scenarios of the investment in order to appropriately allocate the enterprise value of the company among the various parts of its capital structure.
The Private Companies are not subject to the public company disclosure, timing, and reporting standards applicable to other investments held by a Fund. Typically, the most recently available information by a Private Company is as of a date that is earlier than the date a Fund is calculating its NAV. This factor may result in a difference between the value of the investment and the price a Fund could receive upon the sale of the investment.
Fair Value Hierarchy: Various inputs are used in determining the fair value of financial instruments. These inputs to valuation techniques are categorized into a fair value hierarchy consisting of three broad levels for financial reporting purposes as follows:
| | • | | Level 1 – Unadjusted price quotations in active markets/exchanges for identical assets or liabilities that each Fund has the ability to access; |
| | • | | Level 2 – Other observable inputs (including, but not limited to, quoted prices for similar assets or liabilities in markets that are active, quoted prices for identical or similar assets or liabilities in markets that are not active, inputs other than quoted prices that are observable for the assets or liabilities (such as interest rates, yield curves, volatilities, prepayment speeds, loss severities, credit risks and default rates) or other market–corroborated inputs); and |
| | • | | Level 3 – Unobservable inputs based on the best information available in the circumstances, to the extent observable inputs are not available (including the Valuation Committee’s assumptions used in determining the fair value of financial instruments). |
The hierarchy gives the highest priority to unadjusted quoted prices in active markets for identical assets or liabilities (Level 1 measurements) and the lowest priority to unobservable inputs (Level 3 measurements). Accordingly, the degree of judgment exercised in determining fair value is greatest for instruments categorized in Level 3. The inputs used to measure fair value may fall into different levels of the fair value hierarchy. In such cases, for disclosure purposes, the fair value hierarchy classification is determined based on the lowest level input that is significant to the fair value measurement in its entirety. Investments classified within Level 3 have significant unobservable inputs used by the Valuation Committee in determining the price for Fair Valued Investments. Level 3 investments include equity or debt issued by Private Companies that may not have a secondary market and/or may have a limited number of investors. The categorization of a value determined for financial instruments is based on the pricing transparency of the financial instruments and is not necessarily an indication of the risks associated with investing in those securities.
| 4. | SECURITIES AND OTHER INVESTMENTS |
Preferred Stocks: Preferred stock has a preference over common stock in liquidation (and generally in receiving dividends as well), but is subordinated to the liabilities of the issuer in all respects. As a general rule, the market value of preferred stock with a fixed dividend rate and no conversion element varies inversely with interest rates and perceived credit risk, while the market price of convertible preferred stock generally also reflects some element of conversion value. Because preferred stock is junior to debt securities and other obligations of the issuer, deterioration in the credit quality of the issuer will cause greater changes in the value of a preferred stock than in a more senior debt security with similar stated yield characteristics. Unlike interest payments on debt securities, preferred stock dividends are payable only if declared by the issuer’s board of directors. Preferred stock also may be subject to optional or mandatory redemption provisions.
| | |
N O T E S T O F I N A N C I A L S T A T E M E N T S | | 59 |
Notes to Financial Statements (continued)
Warrants: Warrants entitle a fund to purchase a specified number of shares of common stock and are non-income producing. The purchase price and number of shares are subject to adjustment under certain conditions until the expiration date of the warrants, if any. If the price of the underlying stock does not rise above the strike price before the warrant expires, the warrant generally expires without any value and a fund will lose any amount it paid for the warrant. Thus, investments in warrants may involve more risk than investments in common stock. Warrants may trade in the same markets as their underlying stock; however, the price of the warrant does not necessarily move with the price of the underlying stock.
Securities Lending: The Funds may lend their securities to approved borrowers, such as brokers, dealers and other financial institutions. The borrower pledges and maintains with the Funds collateral consisting of cash, an irrevocable letter of credit issued by a bank, or securities issued or guaranteed by the U.S. Government. The initial collateral received by each Fund is required to have a value of at least 102% of the current value of the loaned securities for securities traded on U.S. exchanges and a value of at least 105% for all other securities. The collateral is maintained thereafter at a value equal to at least 100% of the current market value of the securities on loan. The market value of the loaned securities is determined at the close of each business day of the Fund and any additional required collateral is delivered to the Fund, or excess collateral returned by the Fund, on the next business day. During the term of the loan, the Fund is entitled to all distributions made on or in respect of the loaned securities, but does not receive interest income on securities received as collateral. Loans of securities are terminable at any time and the borrower, after notice, is required to return borrowed securities within the standard time period for settlement of securities transactions.
As of period end, any securities on loan were collateralized by cash and/or U.S. Government obligations. Cash collateral invested by the securities lending agent, BlackRock Investment Management, LLC (“BIM”), if any, is disclosed in the Schedules of Investments. Any non-cash collateral received cannot be sold, re-invested or pledged by the Fund, except in the event of borrower default. The securities on loan, if any, are disclosed in the Funds’ Schedules of Investments. The market value of any securities on loan and the value of related collateral, if any, are shown separately in the Statements of Assets and Liabilities as a component of investments at value – unaffiliated and collateral on securities loaned, respectively.
Securities lending transactions are entered into by the Funds under Master Securities Lending Agreements (each, an “MSLA”), which provide the right, in the event of default (including bankruptcy or insolvency), for the non-defaulting party to liquidate the collateral and calculate a net exposure to the defaulting party or request additional collateral. In the event that a borrower defaults, the Fund, as lender, would offset the market value of the collateral received against the market value of the securities loaned. When the value of the collateral is greater than that of the market value of the securities loaned, the lender is left with a net amount payable to the defaulting party. However, bankruptcy or insolvency laws of a particular jurisdiction may impose restrictions on or prohibitions against such a right of offset in the event of an MSLA counterparty’s bankruptcy or insolvency. Under the MSLA, absent an event of default, the borrower can resell or re-pledge the loaned securities, and the Funds can reinvest cash collateral received in connection with loaned securities. Upon an event of default, the parties’ obligations to return the securities or collateral to the other party are extinguished, and the parties can resell or re-pledge the loaned securities or the collateral received in connection with the loaned securities in order to satisfy the defaulting party’s net payment obligation for all transactions under the MSLA. The defaulting party remains liable for any deficiency.
As of period end, the following table is a summary of the Funds’ securities on loan by counterparty which are subject to offset under an MSLA:
| | | | | | | | | | | | | | | | | | | | | | | | | | | | |
| | | | | | |
| Fund Name/Counterparty | |
| Securities
Loaned at Value |
| |
| Cash
Collateral Received(a) |
| |
| Non-Cash
Collateral Received,
at Fair Value(a) | | | |
| Net
Amount(b) |
|
| | | | | | | | |
Health Sciences Opportunities | | | | | | | | | | | | | | | | | | | | | | | | | | | | |
BNP Paribas SA | | | | | | $ | 1,316,373 | | | | | | | $ | (1,316,373 | ) | | | | | | $ — | | | | $ | — | |
BofA Securities, Inc. | | | | | | | 2,268,000 | | | | | | | | (2,268,000 | ) | | | | | | — | | | | | — | |
Citigroup Global Markets, Inc. | | | | | | | 345,432 | | | | | | | | (341,880 | ) | | | | | | — | | | | | 3,552 | |
Goldman Sachs & Co. LLC | | | | | | | 1,493 | | | | | | | | (1,493 | ) | | | | | | — | | | | | — | |
J.P. Morgan Securities LLC | | | | | | | 9,576,613 | | | | | | | | (9,576,613 | ) | | | | | | — | | | | | — | |
Jefferies LLC | | | | | | | 6,156,327 | | | | | | | | (5,958,600 | ) | | | | | | — | | | | | 197,727 | |
Morgan Stanley | | | | | | | 55,023,832 | | | | | | | | (55,023,832 | ) | | | | | | — | | | | | — | |
State Street Bank & Trust Co. | | | | | | | 349,417 | | | | | | | | (322,932 | ) | | | | | | — | | | | | 26,485 | |
Toronto-Dominion Bank | | | | | | | 447,516 | | | | | | | | (447,516 | ) | | | | | | — | | | | | — | |
| | | | | | | | | | | | | | | | | | | | | | | | | | | | |
| | | | | | | | |
| | | | | | $ | 75,485,003 | | | | | | | $ | (75,257,239 | ) | | | | | | $ — | | | | $ | 227,764 | |
| | | | | | | | | | | | | | | | | | | | | | | | | | | | |
| | | | | | | | |
Mid-Cap Growth Equity | | | | | | | | | | | | | | | | | | | | | | | | | | | | |
BofA Securities, Inc. | | | | | | $ | 89,229,224 | | | | | | | $ | (89,229,224 | ) | | | | | | $ — | | | | $ | — | |
Citigroup Global Markets, Inc. | | | | | | | 31,811,320 | | | | | | | | (31,811,320 | ) | | | | | | — | | | | | — | |
Goldman Sachs & Co. LLC | | | | | | | 112,744,018 | | | | | | | | (112,744,018 | ) | | | | | | — | | | | | — | |
J.P. Morgan Securities LLC | | | | | | | 132,609,776 | | | | | | | | (132,609,776 | ) | | | | | | — | | | | | — | |
Jefferies LLC | | | | | | | 3,716,449 | | | | | | | | (3,716,449 | ) | | | | | | — | | | | | — | |
Morgan Stanley | | | | | | | 74,046,928 | | | | | | | | (74,046,928 | ) | | | | | | — | | | | | — | |
State Street Bank & Trust Co. | | | | | | | 8,075,244 | | | | | | | | (8,075,244 | ) | | | | | | — | | | | | — | |
Toronto-Dominion Bank | | | | | | | 2,280,866 | | | | | | | | (2,280,866 | ) | | | | | | — | | | | | — | |
| | | | | | | | | | | | | | | | | | | | | | | | | | | | |
| | | | | | | | |
| | | | | | $ | 454,513,825 | | | | | | | $ | (454,513,825 | ) | | | | | | $ — | | | | $ | — | |
| | | | | | | | | | | | | | | | | | | | | | | | | | | | |
| | |
| 60 | | 2 0 2 4 B L A C K R O C K A N N U A L F I N A N C I A L S T A T E M E N T S |
Notes to Financial Statements (continued)
| | | | | | | | | | | | | | | | | | | | | | | | | | | | |
| | | | | | |
| Fund Name/Counterparty | |
| Securities
Loaned at Value |
| |
| Cash
Collateral Received(a) |
| |
| Non-Cash
Collateral Received,
at Fair Value(a) | | | |
| Net
Amount(b) |
|
| | | | | | | | |
Technology Opportunities | | | | | | | | | | | | | | | | | | | | | | | | | | | | |
J.P. Morgan Securities LLC | | | | | | $ | 39,926,830 | | | | | | | $ | (39,926,830 | ) | | | | | | $ — | | | | $ | — | |
State Street Bank & Trust Co. | | | | | | | 1,758,507 | | | | | | | | (1,758,507 | ) | | | | | | — | | | | | — | |
| | | | | | | | | | | | | | | | | | | | | | | | | | | | |
| | | | | | | | |
| | | | | | $ | 41,685,337 | | | | | | | $ | (41,685,337 | ) | | | | | | $ — | | | | $ | — | |
| | | | | | | | | | | | | | | | | | | | | | | | | | | | |
| | (a) | Collateral received, if any, in excess of the market value of securities on loan is not presented in this table. The total cash collateral received by each Fund is disclosed in the Funds’ Statements of Assets and Liabilities. | |
| | (b) | The market value of the loaned securities is determined as of May 31, 2024. Additional collateral is delivered to the Fund on the next business day in accordance with the MSLA. The net amount would be subject to the borrower default indemnity in the event of default by the counterparty. | |
The risks of securities lending include the risk that the borrower may not provide additional collateral when required or may not return the securities when due. To mitigate these risks, the Funds benefit from a borrower default indemnity provided by BIM. BIM’s indemnity allows for full replacement of the securities loaned to the extent the collateral received does not cover the value on the securities loaned in the event of borrower default. Each Fund could incur a loss if the value of an investment purchased with cash collateral falls below the market value of loaned securities or if the value of an investment purchased with cash collateral falls below the value of the original cash collateral received. Such losses are borne entirely by the Funds.
| 5. | DERIVATIVE FINANCIAL INSTRUMENTS |
The Funds engage in various portfolio investment strategies using derivative contracts both to increase the returns of the Funds and/or to manage their exposure to certain risks such as credit risk, equity risk, interest rate risk, foreign currency exchange rate risk, commodity price risk or other risks (e.g., inflation risk). Derivative financial instruments categorized by risk exposure are included in the Schedules of Investments. These contracts may be transacted on an exchange or over-the-counter (“OTC”).
Forward Foreign Currency Exchange Contracts: Forward foreign currency exchange contracts are entered into to gain or reduce exposure to foreign currencies (foreign currency exchange rate risk).
A forward foreign currency exchange contract is an agreement between two parties to buy and sell a currency at a set exchange rate on a specified date. These contracts help to manage the overall exposure to the currencies in which some of the investments held by the Funds are denominated and in some cases, may be used to obtain exposure to a particular market. The contracts are traded OTC and not on an organized exchange.
The contract is marked-to-market daily and the change in market value is recorded as unrealized appreciation (depreciation) in the Statements of Assets and Liabilities. When a contract is closed, a realized gain or loss is recorded in the Statements of Operations equal to the difference between the value at the time it was opened and the value at the time it was closed. Non-deliverable forward foreign currency exchange contracts are settled with the counterparty in cash without the delivery of foreign currency. The use of forward foreign currency exchange contracts involves the risk that the value of a forward foreign currency exchange contract changes unfavorably due to movements in the value of the referenced foreign currencies, and such value may exceed the amounts reflected in the Statements of Assets and Liabilities. Cash amounts pledged for forward foreign currency exchange contracts are considered restricted and are included in cash pledged as collateral for OTC derivatives in the Statements of Assets and Liabilities. The Fund’s risk of loss from counterparty credit risk on OTC derivatives is generally limited to the aggregate unrealized gain netted against any collateral held by the Fund.
Swaps: Swap contracts are entered into to manage exposure to issuers, markets and securities. Such contracts are agreements between the Funds and a counterparty to make periodic net payments on a specified notional amount or a net payment upon termination. Swap agreements are privately negotiated in the OTC market and may be entered into as a bilateral contract (“OTC swaps”) or centrally cleared (“centrally cleared swaps”).
For OTC swaps, any upfront premiums paid and any upfront fees received are shown as swap premiums paid and swap premiums received, respectively, in the Statements of Assets and Liabilities and amortized over the term of the contract. The daily fluctuation in market value is recorded as unrealized appreciation (depreciation) on OTC swaps in the Statements of Assets and Liabilities. Payments received or paid are recorded in the Statements of Operations as realized gains or losses, respectively. When an OTC swap is terminated, a realized gain or loss is recorded in the Statements of Operations equal to the difference between the proceeds from (or cost of) the closing transaction and the Funds’ basis in the contract, if any. Generally, the basis of the contract is the premium received or paid.
| | • | | Total return swaps — Total return swaps are entered into to obtain exposure to a security or market without owning such security or investing directly in such market or to exchange the risk/return of one security or market (e.g., fixed-income) with another security or market (e.g., equity or commodity prices) (equity risk, commodity price risk and/or interest rate risk). |
| | | Total return swaps are agreements in which there is an exchange of cash flows whereby one party commits to make payments based on the total return (distributions plus capital gains/losses) of an underlying instrument, or basket of underlying instruments, in exchange for fixed or floating rate interest payments. If the total return of the instrument(s) or index underlying the transaction exceeds or falls short of the offsetting fixed or floating interest rate obligation, the Funds receive payment from or make a payment to the counterparty. |
| | | Certain total return swaps are designed to function as a portfolio of direct investments in long and short equity positions. This means that the Fund has the ability to trade in and out of these long and short positions within the swap and will receive the economic benefits and risks equivalent to direct investment in these positions, subject to certain adjustments due to events related to the counterparty. Benefits and risks include capital appreciation (depreciation), corporate actions and dividends received and paid, all of which are reflected in the swap’s market value. The market value also includes interest charges and credits (“financing fees”) related to the notional values of the long and short positions and cash balances within the swap. These interest charges and credits are based on a specified benchmark rate plus or minus a specified spread determined based upon the country and/or currency of the positions in the portfolio. |
| | |
N O T E S T O F I N A N C I A L S T A T E M E N T S | | 61 |
Notes to Financial Statements (continued)
| | | Positions within the swap and financing fees are reset periodically. During a reset, any unrealized appreciation (depreciation) on positions and accrued financing fees become available for cash settlement between the Funds and the counterparty. The amounts that are available for cash settlement are recorded as realized gains or losses in the Statements of Operations. Cash settlement in and out of the swap may occur at a reset date or any other date, at the discretion of the Funds and the counterparty, over the life of the agreement. Certain swaps have no stated expiration and can be terminated by either party at any time. |
Swap transactions involve, to varying degrees, elements of interest rate, credit and market risks in excess of the amounts recognized in the Statements of Assets and Liabilities. Such risks involve the possibility that there will be no liquid market for these agreements, that the counterparty to the agreements may default on its obligation to perform or disagree as to the meaning of the contractual terms in the agreements, and that there may be unfavorable changes in interest rates and/or market values associated with these transactions.
Master Netting Arrangements: In order to define its contractual rights and to secure rights that will help it mitigate its counterparty risk, a Fund may enter into an International Swaps and Derivatives Association, Inc. Master Agreement (“ISDA Master Agreement”) or similar agreement with its derivative contract counterparties. An ISDA Master Agreement is a bilateral agreement between a Fund and a counterparty that governs certain OTC derivatives and typically contains, among other things, collateral posting terms and netting provisions in the event of a default and/or termination event. Under an ISDA Master Agreement, a Fund may, under certain circumstances, offset with the counterparty certain derivative financial instruments’ payables and/or receivables with collateral held and/or posted and create one single net payment. The provisions of the ISDA Master Agreement typically permit a single net payment in the event of default including the bankruptcy or insolvency of the counterparty. However, bankruptcy or insolvency laws of a particular jurisdiction may impose restrictions on or prohibitions against the right of offset in bankruptcy, insolvency or other events.
Collateral Requirements: For derivatives traded under an ISDA Master Agreement, the collateral requirements are typically calculated by netting the mark-to-market amount for each transaction under such agreement and comparing that amount to the value of any collateral currently pledged by the Fund and the counterparty.
Cash collateral that has been pledged to cover obligations of the Funds and cash collateral received from the counterparty, if any, is reported separately in the Statements of Assets and Liabilities as cash pledged as collateral and cash received as collateral, respectively. Non-cash collateral pledged by the Funds, if any, is noted in the Schedules of Investments. Generally, the amount of collateral due from or to a counterparty is subject to a certain minimum transfer amount threshold before a transfer is required, which is determined at the close of business of the Funds. Any additional required collateral is delivered to/pledged by the Funds on the next business day. Typically, the counterparty is not permitted to sell, re-pledge or use cash and non-cash collateral it receives. A Fund generally agrees not to use non-cash collateral that it receives but may, absent default or certain other circumstances defined in the underlying ISDA Master Agreement, be permitted to use cash collateral received. In such cases, interest may be paid pursuant to the collateral arrangement with the counterparty. To the extent amounts due to the Funds from the counterparties are not fully collateralized, each Fund bears the risk of loss from counterparty non-performance. Likewise, to the extent the Funds have delivered collateral to a counterparty and stand ready to perform under the terms of their agreement with such counterparty, each Fund bears the risk of loss from a counterparty in the amount of the value of the collateral in the event the counterparty fails to return such collateral. Based on the terms of agreements, collateral may not be required for all derivative contracts.
For financial reporting purposes, the Funds do not offset derivative assets and derivative liabilities that are subject to netting arrangements, if any, in the Statements of Assets and Liabilities.
| 6. | INVESTMENT ADVISORY AGREEMENT AND OTHER TRANSACTIONS WITH AFFILIATES |
Investment Advisory: The Corporation, on behalf of Capital Appreciation, and the Trust, on behalf of Health Sciences Opportunities, Infrastructure Sustainable Opportunities, Mid-Cap Growth Equity and Technology Opportunities, entered into an Investment Advisory Agreement with the Manager, the Funds’ investment adviser and an indirect, wholly-owned subsidiary of BlackRock, Inc. (“BlackRock”), to provide investment advisory services and with respect to Capital Appreciation, administrative services. The Manager is responsible for the management of each Fund’s portfolio and provides the personnel, facilities, equipment and certain other services necessary to the operations of each Fund.
For such services, each Fund pays the Manager a monthly fee at an annual rate equal to the following percentages of the average daily value of each Fund’s net assets:
| | |
| | |
| | | Investment Advisory Fees |
| |
| Average Daily Net Assets | | Capital Appreciation |
First $1 billion | | 0.650% |
$1 billion - $1.5 billion | | 0.625 |
$1.5 billion - $5 billion | | 0.600 |
$5 billion - $7.5 billion | | 0.575 |
Greater than $7.5 billion | | 0.550 |
| | |
| 62 | | 2 0 2 4 B L A C K R O C K A N N U A L F I N A N C I A L S T A T E M E N T S |
Notes to Financial Statements (continued)
| | | | |
| | |
| | | Investment Advisory Fees | |
| |
| Average Daily Net Assets | | Health Sciences Opportunities | |
| |
First $1 billion | | | 0.750 | % |
$1 billion - $2 billion | | | 0.700 | |
$2 billion - $3 billion | | | 0.675 | |
$3 billion - $10 billion | | | 0.650 | |
Greater than $10 billion | | | 0.640 | |
| | | | | | | | |
| | |
| | | Investment Advisory Fees | |
| | |
| Average Daily Net Assets | | Infrastructure Sustainable Opportunities | | | Technology Opportunities | |
| | |
First $1 billion | | | 0.800 | % | | | 0.820 | % |
$1 billion - $3 billion | | | 0.750 | | | | 0.770 | |
$3 billion - $5 billion | | | 0.720 | | | | 0.740 | |
$5 billion - $10 billion | | | 0.700 | | | | 0.710 | |
Greater than $10 billion | | | 0.680 | | | | 0.700 | |
| | | | |
| | |
| | | Investment Advisory Fees | |
| |
| Average Daily Net Assets | | Mid-Cap Growth Equity | |
| |
First $1 billion | | | 0.700 | % |
$1 billion - $3 billion | | | 0.660 | |
$3 billion - $5 billion | | | 0.630 | |
$5 billion - $10 billion | | | 0.610 | |
$10 billion - $18 billion | | | 0.600 | |
Greater than $18 billion | | | 0.590 | |
With respect to Infrastructure Sustainable Opportunities, the Manager entered into separate sub-advisory agreements with each of BlackRock International Limited (“BIL”) and BlackRock (Singapore) Limited (“BSL”), each an affiliate of the Manager. The Manager pays BIL and BSL for services they provide, for that portion of the Fund for which BIL and BSL, as applicable, act as sub-adviser, a monthly fee that is equal to a percentage of the investment advisory fees paid by the Fund to the Manager.
Service and Distribution Fees: The Corporation, on behalf of Capital Appreciation, and the Trust, on behalf of Health Sciences Opportunities, Infrastructure Sustainable Opportunities, Mid-Cap Growth Equity and Technology Opportunities, entered into a Distribution Agreement and a Distribution and Service Plan with BlackRock Investments, LLC (“BRIL”), an affiliate of the Manager. Pursuant to the Distribution and Service Plan and in accordance with Rule 12b-1 under the 1940 Act, each Fund pays BRIL ongoing service and distribution fees. The fees are accrued daily and paid monthly at annual rates based upon the average daily net assets of the relevant share class of each Fund as follows:
| | | | | | | | | | | | | | | | | | | | | | | | | | | | | | | | |
| | | | | | |
| | | Capitlal Appreciation | | | | | | Health Sciences Opportunities | | | | | | Infrastructure Sustainable Opportunities | |
| | | | | | | | |
| Share Class | | Service Fees | | | Distribution Fees | | | | | | Service Fees | | | Distribution Fees | | | | | | Service Fees | | | Distribution Fees | |
Service | | | N/A | | | | N/A | | | | | | | | 0.25 | % | | | N/A | | | | | | | | N/A | | | | N/A | |
Investor A | | | 0.25 | % | | | N/A | | | | | | | | 0.25 | | | | N/A | | | | | | | | 0.25 | % | | | 0.25 | % |
Investor C | | | 0.25 | | | | 0.75 | % | | | | | | | 0.25 | | | | 0.75 | % | | | | | | | N/A | | | | N/A | |
Class R | | | 0.25 | | | | 0.25 | | | | | | | | 0.25 | | | | 0.25 | | | | | | | | N/A | | | | N/A | |
| | | | | | | | | | | | | | | | | | | | |
| | | | |
| | | Mid-Cap Growth Equity | | | | | | Technology Opportunities | |
| | | | | |
| Share Class | | Service Fees | | | Distribution Fees | | | | | | Service Fees | | | Distribution Fees | |
Service | | | 0.25 | % | | | N/A | | | | | | | | 0.25 | % | | | N/A | |
Investor A | | | 0.25 | | | | N/A | | | | | | | | 0.25 | | | | N/A | |
Investor C | | | 0.25 | | | | 0.75 | % | | | | | | | 0.25 | | | | 0.75 | % |
Class R | | | 0.25 | | | | 0.25 | | | | | | | | 0.25 | | | | 0.25 | |
BRIL and broker-dealers, pursuant to sub-agreements with BRIL, provide shareholder servicing and distribution services to the Funds. The ongoing service and/or distribution fee compensates BRIL and each broker-dealer for providing shareholder servicing and/or distribution related services to shareholders.
For the year ended May 31, 2024, the following table shows the class specific service and distribution fees borne directly by each share class of each Fund:
| | | | | | | | | | | | | | | | | | | | | | | | | | | | | | | | | | |
| Fund Name | | Service | | | | | | Investor A | | | | | | Investor C | | | | | | Class R | | | | | | Total |
Capital Appreciation | | $ | — | | | | | | | $ | 4,816,236 | | | | | | | $ | 396,125 | | | | | | | $ | 123,244 | | | | | | | $ 5,335,605 |
Health Sciences Opportunities | | | 79,404 | | | | | | | | 7,141,923 | | | | | | | | 3,526,080 | | | | | | | | 1,217,048 | | | | | | | 11,964,455 |
Infrastructure Sustainable Opportunities | | | — | | | | | | | | 469 | | | | | | | | — | | | | | | | | — | | | | | | | 469 |
Mid-Cap Growth Equity | | | 159,231 | | | | | | | | 4,165,927 | | | | | | | | 1,973,115 | | | | | | | | 461,260 | | | | | | | 6,759,533 |
Technology Opportunities | | | 118,500 | | | | | | | | 4,381,560 | | | | | | | | 2,733,176 | | | | | | | | 193,940 | | | | | | | 7,427,176 |
| | |
N O T E S T O F I N A N C I A L S T A T E M E N T S | | 63 |
Notes to Financial Statements (continued)
Administration: The Trust, on behalf of Health Sciences Opportunities, Infrastructure Sustainable Opportunities, Mid-Cap Growth Equity and Technology Opportunities, entered into an Administration Agreement with the Manager, an indirect, wholly-owned subsidiary of BlackRock, to provide administrative services. For these services, the Manager receives an administration fee computed daily and payable monthly, based on a percentage of the average daily net assets of each Fund. The administration fee, which is shown as administration in the Statements of Operations, is paid at the annual rates below.
| | | | |
| Average Daily Net Assets | | Administration Fees | |
First $500 million | | | 0.0425 | % |
$500 million - $1 billion | | | 0.0400 | |
$1 billion - $2 billion | | | 0.0375 | |
$2 billion - $4 billion | | | 0.0350 | |
$4 billion - $13 billion | | | 0.0325 | |
Greater than $13 billion | | | 0.0300 | |
In addition, the Manager charges each of the share classes an administration fee, which is shown as administration — class specific in the Statements of Operations, at an annual rate of 0.02% of the average daily net assets of each respective class.
For the year ended May 31, 2024, the following table shows the class specific administration fees borne directly by each share class of each Fund:
| | | | | | | | | | | | | | | | | | | | | | | | | | | | | | | | | | | | | | | | | | | | | | | | | | |
| Fund Name | | Institutional | | | | | | Service | | | | | | Investor A | | | | | | Investor C | | | | | | Class K | | | | | | Class R | | | | | | Total |
Health Sciences Opportunities | | $ | 871,510 | | | | | | | $ | 6,344 | | | | | | | $ | 570,583 | | | | | | | $ | 70,471 | | | | | | | $ | 95,515 | | | | | | | $ | 48,612 | | | | | | | $ 1,663,035 |
Infrastructure Sustainable Opportunities | | | 19 | | | | | | | | — | | | | | | | | 38 | | | | | | | | — | | | | | | | | 1,698 | | | | | | | | — | | | | | | | 1,755 |
Mid-Cap Growth Equity | | | 1,077,314 | | | | | | | | 12,718 | | | | | | | | 332,782 | | | | | | | | 39,407 | | | | | | | | 895,865 | | | | | | | | 18,425 | | | | | | | 2,376,511 |
Technology Opportunities | | | 498,284 | | | | | | | | 9,466 | | | | | | | | 349,817 | | | | | | | | 54,566 | | | | | | | | 39,775 | | | | | | | | 7,742 | | | | | | | 959,650 |
Transfer Agent: Pursuant to written agreements, certain financial intermediaries, some of which may be affiliates, provide the Funds with sub-accounting, recordkeeping, sub-transfer agency and other administrative services with respect to servicing of underlying investor accounts. For these services, these entities receive an asset-based fee or an annual fee per shareholder account, which will vary depending on share class and/or net assets. For the year ended May 31, 2024, the Funds paid the following amounts to affiliates of BlackRock in return for these services, which are included in transfer agent— class specific in the Statements of Operations:
| | | | | | | | | | |
| Fund Name | | Institutional | | | | | | Total |
Capital Appreciation | | $ | 143,918 | | | | | | | $ 143,918 |
The Manager maintains a call center that is responsible for providing certain shareholder services to the Funds. Shareholder services include responding to inquiries and processing purchases and sales based upon instructions from shareholders. For the year ended May 31, 2024, each Fund reimbursed the Manager the following amounts for costs incurred in running the call center, which are included in transfer agent — class specific in the Statements of Operations:
| | | | | | | | | | | | | | | | | | | | | | | | | | | | | | | | | | | | | | | | | | | | | | | | | | |
| Fund Name | | Institutional | | | | | | Service | | | | | | Investor A | | | | | | Investor C | | | | | | Class K | | | | | | Class R | | | | | | Total |
Capital Appreciation | | $ | 1,537 | | | | | | | $ | — | | | | | | | $ | 54,777 | | | | | | | $ | 4,458 | | | | | | | $ | 1,741 | | | | | | | $ | 114 | | | | | | | $ 62,627 |
Health Sciences Opportunities | | | 20,964 | | | | | | | | 708 | | | | | | | | 114,093 | | | | | | | | 20,123 | | | | | | | | 2,631 | | | | | | | | 1,566 | | | | | | | 160,085 |
Infrastructure Sustainable Opportunities | | | 140 | | | | | | | | — | | | | | | | | 201 | | | | | | | | — | | | | | | | | 137 | | | | | | | | — | | | | | | | 478 |
Mid-Cap Growth Equity | | | 14,539 | | | | | | | | 457 | | | | | | | | 233,092 | | | | | | | | 9,181 | | | | | | | | 13,628 | | | | | | | | 2,254 | | | | | | | 273,151 |
Technology Opportunities | | | 11,146 | | | | | | | | 35 | | | | | | | | 62,352 | | | | | | | | 12,271 | | | | | | | | 907 | | | | | | | | 832 | | | | | | | 87,543 |
For the year ended May 31, 2024, the following table shows the class specific transfer agent fees borne directly by each share class of each Fund:
| | | | | | | | | | | | | | | | | | | | | | | | | | | | | | | | | | | | | | | | | | | | | | | | | | |
| Fund Name | | Institutional | | | | | | Service | | | | | | Investor A | | | | | | Investor C | | | | | | Class K | | | | | | Class R | | | | | | Total |
Capital Appreciation | | $ | 749,707 | | | | | | | $ | — | | | | | | | $ | 1,952,405 | | | | | | | $ | 74,997 | | | | | | | $ | 52,783 | | | | | | | $ | 52,745 | | | | | | | $ 2,882,637 |
Health Sciences Opportunities | | | 4,336,634 | | | | | | | | 47,864 | | | | | | | | 2,802,837 | | | | | | | | 420,872 | | | | | | | | 29,492 | | | | | | | | 529,403 | | | | | | | 8,167,102 |
Infrastructure Sustainable Opportunities | | | 311 | | | | | | | | — | | | | | | | | 696 | | | | | | | | — | | | | | | | | 357 | | | | | | | | — | | | | | | | 1,364 |
Mid-Cap Growth Equity | | | 8,144,337 | | | | | | | | 106,737 | | | | | | | | 3,057,434 | | | | | | | | 270,155 | | | | | | | | 472,013 | | | | | | | | 197,218 | | | | | | | 12,247,894 |
Technology Opportunities | | | 2,968,814 | | | | | | | | 55,212 | | | | | | | | 2,036,103 | | | | | | | | 325,585 | | | | | | | | 17,270 | | | | | | | | 79,713 | | | | | | | 5,482,697 |
Other Fees: For the year ended May 31, 2024, affiliates earned underwriting discounts, direct commissions and dealer concessions on sales of each Fund’s Investor A Shares as follows:
| | |
| Fund Name | | Amounts |
Capital Appreciation | | $ 38,155 |
Health Sciences Opportunities | | 52,637 |
Infrastructure Sustainable Opportunities | | 142 |
Mid-Cap Growth Equity | | 38,641 |
Technology Opportunities | | 81,501 |
| | |
| 64 | | 2 0 2 4 B L A C K R O C K A N N U A L F I N A N C I A L S T A T E M E N T S |
Notes to Financial Statements (continued)
For the year ended May 31, 2024, affiliates received CDSCs as follows:
| | | | | | | | | | | | | | |
| | | | | |
| Share Class | | Capital
Appreciation | | | Health
Sciences
Opportunities | | | Mid-Cap
Growth
Equity | | | Technology
Opportunities |
| | | | |
Investor A | | $ | 4,574 | | | $ | 7,841 | | | $ | 3,931 | | | $ 3,914 |
Investor C | | | 1,513 | | | | 14,412 | | | | 6,573 | | | 14,023 |
Expense Limitations, Waivers, Reimbursements, and Recoupments: With respect to each Fund, the Manager contractually agreed to waive its investment advisory fees by the amount of investment advisory fees each Fund pays to the Manager indirectly through its investment in affiliated money market funds (the “affiliated money market fund waiver”) through June 30, 2025. The contractual agreement may be terminated upon 90 days’ notice by a majority of the directors who are not “interested persons” of the Corporation or the Trust, as defined in the 1940 Act (“Independent Directors”), or by a vote of a majority of the outstanding voting securities of a Fund. The amount of waivers and/or reimbursements of fees and expenses made pursuant to the expense limitation described below will be reduced by the amount of the affiliated money market fund waiver. These amounts are included in fees waived and/or reimbursed by the Manager in the Statements of Operations. For the year ended May 31, 2024, the amounts waived were as follows:
| | |
| | |
| Fund Name | | Amounts Waived |
| |
Capital Appreciation | | $ 204,670 |
Health Sciences Opportunities | | 101,560 |
Infrastructure Sustainable Opportunities | | 325 |
Mid-Cap Growth Equity | | 10,128 |
Technology Opportunities | | 9,040 |
The Manager has contractually agreed to waive its investment advisory fee with respect to any portion of each Fund’s assets invested in affiliated equity and fixed-income mutual funds and affiliated exchange-traded funds that have a contractual management fee through June 30, 2025. The contractual agreement may be terminated upon 90 days’ notice by a majority of the Independent Directors, or by a vote of a majority of the outstanding voting securities of a Fund. For the year ended May 31, 2024, there were no fees waived and/or reimbursed by the Manager pursuant to this arrangement.
With respect to each Fund (except Health Sciences Opportunities), the Manager contractually agreed to waive and/or reimburse fees or expenses in order to limit expenses, excluding interest expense, dividend expense, tax expense, acquired fund fees and expenses, and certain other fund expenses, which constitute extraordinary expenses not incurred in the ordinary course of each Fund’s business (“expense limitation”). The expense limitations as a percentage of average daily net assets are as follows:
| | | | | | | | | | | | | | |
| | | | | |
| Share Class | | Capital Appreciation | | | Infrastructure Sustainable Opportunities | | | Mid-Cap Growth Equity | | | Technology Opportunities |
| | | | |
Institutional | | | N/A | | | | 1.00 | % | | | 0.80 | % | | 0.92% |
Service | | | N/A | | | | N/A | | | | 1.05 | | | 1.17 |
Investor A | | | N/A | | | | 1.25 | | | | 1.05 | | | 1.17 |
Investor C | | | 1.94 | % | | | N/A | | | | 1.80 | | | 1.92 |
Class K | | | 0.72 | | | | 0.95 | | | | 0.75 | | | 0.87 |
Class R | | | N/A | | | | N/A | | | | 1.30 | | | 1.42 |
The Manager has agreed not to reduce or discontinue the contractual expense limitations through June 30, 2025 (or June 30, 2034 with respect to Capital Appreciation), unless approved by the Board, including a majority of the Independent Directors, or by a vote of a majority of the outstanding voting securities of a Fund.
For the year ended May 31, 2024, Infrastructure Sustainable Opportunities waived and/or reimbursed the Manager investment advisory fees and other expenses of $297,538, which is included in fees waived and/or reimbursed by the Manager in the Statements of Operations.
In addition, these amounts waived and/or reimbursed by the Manager are included in administration fees waived by the Manager — class specific and transfer agent fees waived and/or reimbursed by the Manager — class specific, respectively, in the Statements of Operations. For the year ended May 31, 2024, class specific expense waivers and/or reimbursements are as follows:
| | | | | | | | | | | | | | | | | | | | | | | | | | | | | | | | | | | | | | | | | | | | | | | | | | |
| | |
| | | Administration Fees Waived by the Manager - Class Specific |
| | | | | | | | | | | | | |
| Fund Name | | Institutional | | | | | | Service | | | | | | Investor A | | | | | | Investor C | | | | | | Class K | | | | | | Class R | | | | | | Total |
| | | | | | | | | | | | | |
Infrastructure Sustainable Opportunities | | | $ 19 | | | | | | | | $ — | | | | | | | | $ 38 | | | | | | | | $ — | | | | | | | | $ 1,698 | | | | | | | | $ — | | | | | | | $ 1,755 |
Mid-Cap Growth Equity | | | 1,077,314 | | | | | | | | 12,718 | | | | | | | | 332,782 | | | | | | | | 38,529 | | | | | | | | — | | | | | | | | 18,425 | | | | | | | 1,479,768 |
Technology Opportunities | | | 498,284 | | | | | | | | 8,755 | | | | | | | | 349,817 | | | | | | | | 53,466 | | | | | | | | — | | | | | | | | 7,742 | | | | | | | 918,064 |
| | | | | | | | | | | | | | | | | | | | | | | | | | | | | | | | | | | | | | | | | | | | | | | | | | |
| | |
| | | Transfer Agent Fees Waived and/or Reimbursed by the Manager - Class Specific |
| | | | | | | | | | | | | |
| Fund Name | | Institutional | | | | | | Service | | | | | | Investor A | | | | | | Investor C | | | | | | Class K | | | | | | Class R | | | | | | Total |
| | | | | | | | | | | | | |
Infrastructure Sustainable Opportunities | | | $ 262 | | | | | | | | $ — | | | | | | | | $ 602 | | | | | | | | $ — | | | | | | | | $ 357 | | | | | | | | $ — | | | | | | | $ 1,221 |
Mid-Cap Growth Equity | | | 1,518,529 | | | | | | | | 28,844 | | | | | | | | 1,020,074 | | | | | | | | 32,907 | | | | | | | | — | | | | | | | | 84,563 | | | | | | | 2,684,917 |
Technology Opportunities | | | 590,554 | | | | | | | | 11,090 | | | | | | | | 377,393 | | | | | | | | 72,339 | | | | | | | | — | | | | | | | | 43,110 | | | | | | | 1,094,486 |
Infrastructure Sustainable Opportunities also had a waiver of administration fees, which are included in Administration fees waived in the Statements of Operations. For the year ended May 31, 2024, the amount was $3,730.
| | |
N O T E S T O F I N A N C I A L S T A T E M E N T S | | 65 |
Notes to Financial Statements (continued)
With respect to the contractual expense limitation of Infrastructure Sustainable Opportunities, if during the Fund’s fiscal year the operating expenses of a share class, that at any time during the prior two fiscal years received a waiver and/or reimbursement from the Manager, are less than the current expense limitation for that share class, the Manager is entitled to be reimbursed by such share class up to the lesser of: (a) the amount of fees waived and/or expenses reimbursed during those prior two fiscal years under the agreement and (b) an amount not to exceed either the current expense limitation of that share class or the expense limitation of the share class in effect at the time that the share class received the applicable waiver and/or reimbursement, provided that:
| | (1) | the Fund, of which the share class is a part, has more than $50 million in assets for the fiscal year, and |
| | (2) | the Manager or an affiliate continues to serve as the Fund’s investment adviser or administrator. |
This repayment applies only to the contractual expense limitation on net expenses and does not apply to the contractual investment advisory fee waiver described above or any voluntary waivers that may be in effect from time to time. Effective September 30, 2028 the repayment arrangement between the Fund and the Manager pursuant to which the Fund may be required to repay amounts waived and/or reimbursed under the Fund’s contractual caps on net expenses will be terminated.
As of May 31, 2024, the fund level and class specific waivers and/or reimbursements subject to possible future recoupment under the expense limitation agreement were as follows:
| | | | | | | | |
| | | Expiring May 31, | |
| Fund Name/Fund Level/Share Class | | 2025 | | | 2026 | |
Infrastructure Sustainable Opportunities | | | | | | | | |
Fund Level | | $ | 299,135 | | | $ | 301,268 | |
Institutional | | | 174 | | | | 281 | |
Investor A | | | 40 | | | | 640 | |
Class K | | | 1,854 | | | | 2,055 | |
The following fund level and class specific waivers and/or reimbursements previously recorded by the Fund, which were subject to recoupment by the Manager, expired on May 31, 2024:
| | | | |
| Fund Name/Fund Level/Share Class | | Amounts | |
Infrastructure Sustainable Opportunities | | | | |
Fund Level | | $ | 198,233 | |
Institutional | | | 153 | |
Investor A | | | 151 | |
Class K | | | 1,479 | |
Securities Lending: The U.S. Securities and Exchange Commission (“SEC”) has issued an exemptive order which permits BIM, an affiliate of the Manager, to serve as securities lending agent for the Funds, subject to applicable conditions. As securities lending agent, BIM bears all operational costs directly related to securities lending. The Funds are responsible for fees in connection with the investment of cash collateral received for securities on loan (the “collateral investment fees”). The cash collateral is invested in a money market fund, BlackRock Cash Funds: Institutional, managed by the Manager or its affiliates. However, BIM has agreed to reduce the amount of securities lending income it receives in order to effectively limit the collateral investment fees the Funds bear to an annual rate of 0.04%. The SLAgency Shares of such money market fund will not be subject to a sales load, redemption fee, distribution fee or service fee. The money market fund in which the cash collateral has been reinvested may impose a discretionary liquidity fee of up to 2% of the value redeemed, if such fee, is determined to be in the best interests of such money market fund.
Securities lending income is generally equal to the total of income earned from the reinvestment of cash collateral, (and excludes collateral investment fees), and any fees or other payments to and from borrowers of securities. Each Fund retains a portion of the securities lending income and remits the remaining portion to BIM as compensation for its services as securities lending agent.
Pursuant to the current securities lending agreement, Capital Appreciation, Health Sciences Opportunities, Mid-Cap Growth Equity and Technology Opportunities retain 81% of securities lending income (which excludes collateral investment expenses), and this amount retained can never be less than 70% of the total of securities lending income plus the collateral investment expenses. Pursuant to the current securities lending agreement, Infrastructure Sustainable Opportunities retains 82% of securities lending income (which excludes collateral investment expenses), and this amount retained can never be less than 70% of the total of securities lending income plus the collateral investment expenses.
In addition, commencing the business day following the date that the aggregate securities lending income earned across the BlackRock Multi-Asset Complex in a calendar year exceeds a specified threshold, Capital Appreciation, Health Sciences Opportunities, Mid-Cap Growth Equity and Technology Opportunities, pursuant to the securities lending agreement, will retain for the remainder of that calendar year securities lending income in an amount equal to 81% of securities lending income (which excludes collateral investment expenses), and this amount retained can never be less than 70% of the total of securities lending income plus the collateral investment expenses. Infrastructure Sustainable Opportunities, pursuant to the securities lending agreement, will retain for the remainder of that calendar year securities lending income in an amount equal to 85% of securities lending income (which excludes collateral investment expenses), and this amount retained can never be less than 70% of the total of securities lending income plus the collateral investment expenses.
| | |
| 66 | | 2 0 2 4 B L A C K R O C K A N N U A L F I N A N C I A L S T A T E M E N T S |
Notes to Financial Statements (continued)
The share of securities lending income earned by each Fund is shown as securities lending income — affiliated — net in the Statements of Operations. For the year ended May 31, 2024, each Fund paid BIM the following amounts for securities lending agent services:
| | | | |
| Fund Name | | Amounts | |
Capital Appreciation | | $ | 1,247 | |
Health Sciences Opportunities | | | 139,371 | |
Infrastructure Sustainable Opportunities | | | 10 | |
Mid-Cap Growth Equity | | | 151,221 | |
Technology Opportunities | | | 51,917 | |
Interfund Lending: In accordance with an exemptive order (the “Order”) from the SEC, Capital Appreciation and Infrastructure Sustainable Opportunities may participate in a joint lending and borrowing facility for temporary purposes (the “Interfund Lending Program”), subject to compliance with the terms and conditions of the Order, and to the extent permitted by Capital Appreciation’s and Infrastructure Sustainable Opportunities’s investment policies and restrictions. Capital Appreciation is currently permitted to borrow under the Interfund Lending Program. In addition, Infrastructure Sustainable Opportunities is currently permitted to borrow and lend under the Interfund Lending Program.
A lending BlackRock fund may lend in aggregate up to 15% of its net assets but may not lend more than 5% of its net assets to any one borrowing fund through the Interfund Lending Program. A borrowing BlackRock fund may not borrow through the Interfund Lending Program or from any other source more than 33 1/3% of its total assets (or any lower threshold provided for by the fund’s investment restrictions). If a borrowing BlackRock fund’s total outstanding borrowings exceed 10% of its total assets, each of its outstanding interfund loans will be subject to collateralization of at least 102% of the outstanding principal value of the loan. All interfund loans are for temporary or emergency purposes and the interest rate to be charged will be the average of the highest current overnight repurchase agreement rate available to a lending fund and the bank loan rate, as calculated according to a formula established by the Board.
During the year ended May 31, 2024, Capital Appreciation and Infrastructure Sustainable Opportunities did not participate in the Interfund Lending Program.
Directors and Officers: Certain directors and/or officers of the Corporation and the Trust are directors and/or officers of BlackRock or its affiliates. The Funds reimburse the Manager for a portion of the compensation paid to the Corporation’s/Trust’s Chief Compliance Officer, which is included in Directors and Officer in the Statements of Operations.
Other Transactions: During the year ended May 31, 2024, Capital Appreciation received a reimbursement of $202,500 from an affiliate, which is included in fees waived and/or reimbursed by the Manager in the Statements of Operations, related to the Reorganization. Please refer to the Organization note within the Notes to Financial Statements for details pertaining to the cancelled Reorganization.
The Funds may purchase securities from, or sell securities to, an affiliated fund provided the affiliation is due solely to having a common investment adviser, common officers, or common directors. For the year ended May 31, 2024, the purchase and sale transactions and any net realized gains (losses) with an affiliated fund in compliance with Rule 17a-7 under the 1940 Act were as follows:
| | | | | | | | | | | | | | | | | | | | |
| Fund Name | | Purchases | | | | | | Sales | | | | | | Net Realized Gain (Loss) | |
Capital Appreciation | | $ | 16,402,183 | | | | | | | $ | — | | | | | | | $ | — | |
For the year ended May 31, 2024 purchases and sales of investments, excluding short-term securities, were as follows:
| | | | | | | | | | | | |
| Fund Name | | Purchases | | | | | | Sales | |
Capital Appreciation | | $ | 711,851,037 | | | | | | | $ | 1,400,062,180 | |
Health Sciences Opportunities | | | 2,189,652,961 | | | | | | | | 3,207,202,666 | |
Infrastructure Sustainable Opportunities | | | 5,466,983 | | | | | | | | 4,705,375 | |
Mid-Cap Growth Equity | | | 5,682,244,459 | | | | | | | | 7,646,777,223 | |
Technology Opportunities | | | 1,000,793,934 | | | | | | | | 1,579,605,712 | |
It is each Fund’s policy to comply with the requirements of the Internal Revenue Code of 1986, as amended, applicable to regulated investment companies, and to distribute substantially all of its taxable income to its shareholders. Therefore, no U.S. federal income tax provision is required.
Each Fund files U.S. federal and various state and local tax returns. No income tax returns are currently under examination. The statute of limitations on each Fund’s U.S. federal tax returns generally remains open for a period of three years after they are filed. The statutes of limitations on each Fund’s state and local tax returns may remain open for an additional year depending upon the jurisdiction.
Management has analyzed tax laws and regulations and their application to the Funds as of May 31, 2024, inclusive of the open tax return years, and does not believe that there are any uncertain tax positions that require recognition of a tax liability in the Funds’ financial statements.
| | |
N O T E S T O F I N A N C I A L S T A T E M E N T S | | 67 |
Notes to Financial Statements (continued)
U.S. GAAP requires that certain components of net assets be adjusted to reflect permanent differences between financial and tax reporting. These reclassifications have no effect on net assets or NAVs per share. As of period end, the following permanent differences attributable to net operating losses were reclassified to the following accounts:
| | | | | | | | |
| Fund Name | | Paid-In Capital | | | Accumulated Earnings (Loss) | |
Mid-Cap Growth Equity | | $ | (33,931,840 | ) | | $ | 33,931,840 | |
Technology Opportunities | | | (21,236,306 | ) | | | 21,236,306 | |
The tax character of distributions paid was as follows:
| | | | | | | | | | | | |
| Fund Name | | Year Ended
05/31/24 | | | | | | Year Ended
05/31/23 | |
Capital Appreciation | | | | | | | | | | | | |
Ordinary income | | $ | 10,641,994 | | | | | | | $ | — | |
Long term capital gains | | | 109,281,374 | | | | | | | | 248,072,015 | |
| | | | | | | | | | | | |
| | $ | 119,923,368 | | | | | | | $ | 248,072,015 | |
Health Sciences Opportunities | | | | | | | | | | | | |
Ordinary income | | $ | 29,900,676 | | | | | | | $ | 40,237,395 | |
Long term capital gains | | | 288,843,746 | | | | | | | | 628,590,098 | |
| | | | | | | | | | | | |
| | $ | 318,744,422 | | | | | | | $ | 668,827,493 | |
Infrastructure Sustainable Opportunities | | | | | | | | | | | | |
Ordinary income | | $ | 221,163 | | | | | | | $ | 386,128 | |
Long term capital gains | | | — | | | | | | | | 664 | |
| | | | | | | | | | | | |
| | | $ | 221,163 | | | | | | | $ | 386,792 | |
As of May 31, 2024, the tax components of accumulated earnings (loss) were as follows:
| | | | | | | | | | | | | | | | | | | | | | | | | | | | | | | | | | | | | | | | | | | | | | | | |
| | | | | |
| | | Fund Name | | Undistributed
Ordinary Income | | | | | | Undistributed Long-Term
Capital Gains | | | | | | Non-Expiring
Capital Loss
Carryforwards(a) | | | | | | Net Unrealized
Gains (Losses)(b) | | | | | | Qualified Late-Year
Ordinary Losses(c) | | | | | | Total | | | |
| | | | | |
| | Capital Appreciation | | $ | 27,766,660 | | | | | | | $ | 238,358,458 | | | | | | | $ | — | | | | | | | $ | 2,056,711,734 | | | | | | | $ | (6,308,381 | ) | | | | | | $ | 2,316,528,471 | | | |
| | Health Sciences Opportunities | | | — | | | | | | | | 282,863,079 | | | | | | | | — | | | | | | | | 3,444,154,918 | | | | | | | | (1,657,243 | ) | | | | | | | 3,725,360,754 | | | |
| | Infrastructure Sustainable Opportunities | | | 58,816 | | | | | | | | — | | | | | | | | (968,437 | ) | | | | | | | (191,285 | ) | | | | | | | — | | | | | | | | (1,100,906 | ) | | |
| | Mid-Cap Growth Equity | | | — | | | | | | | | — | | | | | | | | (1,282,051,982 | ) | | | | | | | 3,285,035,440 | | | | | | | | (23,606,786 | ) | | | | | | | 1,979,376,672 | | | |
| | Technology Opportunities | | | — | | | | | | | | — | | | | | | | | (441,794,511 | ) | | | | | | | 2,981,865,861 | | | | | | | | (10,030,779 | ) | | | | | | | 2,530,040,571 | | | |
| | | | | |
| (a) | Amounts available to offset future realized capital gains. | |
| (b) | The difference between book-basis and tax-basis net unrealized gains (losses) was attributable primarily to the tax deferral of losses on wash sales and straddles, the realization for tax purposes of unrealized gains (losses) on certain foreign currency contracts, the accounting for swap agreements, characterization of corporate actions and the realization for tax purposes of unrealized gains on investments in passive foreign investment companies. | |
| (c) | The Funds have elected to defer certain qualified late-year losses and recognize such losses in the next taxable year. | |
During the year ended May 31, 2024, the Funds listed below utilized the following amounts of their respective capital loss carryforwards:
| | | | |
| Fund Name | | Utilized | |
Mid-Cap Growth Equity | | $ | 1,006,154,861 | |
Technology Opportunities | | | 268,242,522 | |
As of May 31, 2024, gross unrealized appreciation and depreciation based on cost of investments (including short positions and derivatives, if any) for U.S. federal income tax purposes were as follows:
| | | | | | | | | | | | | | | | | | | | | | | | | | | | |
| |
| Fund Name | | Tax Cost | | | | | | Gross Unrealized
Appreciation | | | | | | Gross Unrealized
Depreciation | | | | | | Net Unrealized
Appreciation
(Depreciation) | |
| |
Capital Appreciation | | $ | 1,428,037,823 | | | | | | | $ | 2,070,770,504 | | | | | | | $ | (14,065,566 | ) | | | | | | $ | 2,056,704,938 | |
Health Sciences Opportunities | | | 4,955,671,978 | | | | | | | | 3,669,508,258 | | | | | | | | (225,356,327 | ) | | | | | | | 3,444,151,931 | |
Infrastructure Sustainable Opportunities | | | 9,095,029 | | | | | | | | 485,421 | | | | | | | | (677,028 | ) | | | | | | | (191,607 | ) |
Mid-Cap Growth Equity | | | 8,856,671,196 | | | | | | | | 3,479,195,992 | | | | | | | | (194,097,207 | ) | | | | | | | 3,285,098,785 | |
Technology Opportunities | | | 2,400,440,438 | | | | | | | | 3,048,480,626 | | | | | | | | (66,399,254 | ) | | | | | | | 2,982,081,372 | |
| |
The Corporation and the Trust, on behalf of the Funds, along with certain other funds managed by the Manager and its affiliates (“Participating Funds”), is party to a 364-day, $2.40 billion credit agreement with a group of lenders. Under this agreement, the Funds may borrow to fund shareholder redemptions. Excluding commitments designated for certain individual funds, the Participating Funds, including the Funds, can borrow up to an aggregate commitment amount of $1.75 billion at any time outstanding, subject to
| | |
| 68 | | 2 0 2 4 B L A C K R O C K A N N U A L F I N A N C I A L S T A T E M E N T S |
Notes to Financial Statements (continued)
asset coverage and other limitations as specified in the agreement. The credit agreement has the following terms: a fee of 0.10% per annum on unused commitment amounts and interest at a rate equal to the higher of (a) Overnight Bank Funding Rate (“OBFR”) (but, in any event, not less than 0.00%) on the date the loan is made plus 0.80% per annum, (b) the Fed Funds rate (but, in any event, not less than 0.00%) in effect from time to time plus 0.80% per annum on amounts borrowed or (c) the sum of (x) Daily Simple Secured Overnight Financing Rate (“SOFR”) (but, in any event, not less than 0.00%) on the date the loan is made plus 0.10% and (y) 0.80% per annum. The agreement expires in April 2025 unless extended or renewed. These fees were allocated among such funds based upon portions of the aggregate commitment available to them and relative net assets of Participating Funds. During the year ended May 31, 2024, the Funds did not borrow under the credit agreement.
In the normal course of business, the Funds invest in securities or other instruments and may enter into certain transactions, and such activities subject each Fund to various risks, including among others, fluctuations in the market (market risk) or failure of an issuer to meet all of its obligations. The value of securities or other instruments may also be affected by various factors, including, without limitation: (i) the general economy; (ii) the overall market as well as local, regional or global political and/or social instability; (iii) regulation, taxation or international tax treaties between various countries; or (iv) currency, interest rate and price fluctuations. Local, regional or global events such as war, acts of terrorism, the spread of infectious illness or other public health issues, recessions, or other events could have a significant impact on the Funds and their investments. Each Fund’s prospectus provides details of the risks to which each Fund is subject.
The Funds may be exposed to additional risks when reinvesting cash collateral in money market funds that do not seek to maintain a stable NAV per share of $1.00, which may be subject to discretionary liquidity fees under certain circumstances.
Valuation Risk: The market values of equities, such as common stocks and preferred securities or equity related investments, such as futures and options, may decline due to general market conditions which are not specifically related to a particular company. They may also decline due to factors which affect a particular industry or industries. A Fund may invest in illiquid investments. An illiquid investment is any investment that a Fund reasonably expects cannot be sold or disposed of in current market conditions in seven calendar days or less without the sale or disposition significantly changing the market value of the investment. A Fund may experience difficulty in selling illiquid investments in a timely manner at the price that it believes the investments are worth. Prices may fluctuate widely over short or extended periods in response to company, market or economic news. Markets also tend to move in cycles, with periods of rising and falling prices. This volatility may cause each Fund’s NAV to experience significant increases or decreases over short periods of time. If there is a general decline in the securities and other markets, the NAV of a Fund may lose value, regardless of the individual results of the securities and other instruments in which a Fund invests.
The price a Fund could receive upon the sale of any particular portfolio investment may differ from a Fund’s valuation of the investment, particularly for securities that trade in thin or volatile markets or that are valued using a fair valuation technique or a price provided by an independent pricing service. Changes to significant unobservable inputs and assumptions (i.e., publicly traded company multiples, growth rate, time to exit) due to the lack of observable inputs may significantly impact the resulting fair value and therefore a Fund’s results of operations. As a result, the price received upon the sale of an investment may be less than the value ascribed by a Fund, and a Fund could realize a greater than expected loss or lesser than expected gain upon the sale of the investment. A Fund’s ability to value its investments may also be impacted by technological issues and/or errors by pricing services or other third-party service providers.
Counterparty Credit Risk: The Funds may be exposed to counterparty credit risk, or the risk that an entity may fail to or be unable to perform on its commitments related to unsettled or open transactions, including making timely interest and/or principal payments or otherwise honoring its obligations. The Funds manage counterparty credit risk by entering into transactions only with counterparties that the Manager believes have the financial resources to honor their obligations and by monitoring the financial stability of those counterparties. Financial assets, which potentially expose the Funds to market, issuer and counterparty credit risks, consist principally of financial instruments and receivables due from counterparties. The extent of the Funds’ exposure to market, issuer and counterparty credit risks with respect to these financial assets is approximately their value recorded in the Statements of Assets and Liabilities, less any collateral held by the Funds.
A derivative contract may suffer a mark-to-market loss if the value of the contract decreases due to an unfavorable change in the market rates or values of the underlying instrument. Losses can also occur if the counterparty does not perform under the contract.
With exchange-traded options purchased and exchange-traded futures, there is less counterparty credit risk to the Funds since the exchange or clearinghouse, as counterparty to such instruments, guarantees against a possible default. The clearinghouse stands between the buyer and the seller of the contract; therefore, credit risk is limited to failure of the clearinghouse. While offset rights may exist under applicable law, a Fund does not have a contractual right of offset against a clearing broker or clearinghouse in the event of a default (including the bankruptcy or insolvency). Additionally, credit risk exists in exchange-traded futures with respect to initial and variation margin that is held in a clearing broker’s customer accounts. While clearing brokers are required to segregate customer margin from their own assets, in the event that a clearing broker becomes insolvent or goes into bankruptcy and at that time there is a shortfall in the aggregate amount of margin held by the clearing broker for all its clients, typically the shortfall would be allocated on a pro rata basis across all the clearing broker’s customers, potentially resulting in losses to the Funds.
Geographic/Asset Class Risk: A diversified portfolio, where this is appropriate and consistent with a fund’s objectives, minimizes the risk that a price change of a particular investment will have a material impact on the NAV of a fund. The investment concentrations within the Fund’s portfolio are disclosed in its Schedule of Investments.
Certain Funds invest a significant portion of their assets in securities within a single or limited number of market sectors. When a fund concentrates its investments in this manner, it assumes the risk that economic, regulatory, political and social conditions affecting such sectors may have a significant impact on the Fund and could affect the income from, or the value or liquidity of, the Fund’s portfolio. Investment percentages in specific sectors are presented in the Schedules of Investments.
The Funds invest a significant portion of their assets in securities of issuers located in the United States. A decrease in imports or exports, changes in trade regulations, inflation and/or an economic recession in the United States may have a material adverse effect on the U.S. economy and the securities listed on U.S. exchanges. Proposed and adopted policy and legislative changes in the United States may also have a significant effect on U.S. markets generally, as well as on the value of certain securities. Governmental agencies project that the United States will continue to maintain elevated public debt levels for the foreseeable future which may constrain future economic
| | |
N O T E S T O F I N A N C I A L S T A T E M E N T S | | 69 |
Notes to Financial Statements (continued)
growth. Circumstances could arise that could prevent the timely payment of interest or principal on U.S. government debt, such as reaching the legislative “debt ceiling.” Such non-payment would result in substantial negative consequences for the U.S. economy and the global financial system. If U.S. relations with certain countries deteriorate, it could adversely affect issuers that rely on the United States for trade. The United States has also experienced increased internal unrest and discord. If these trends were to continue, they may have an adverse impact on the U.S. economy and the issuers in which the Funds invest.
Significant Shareholder Redemption Risk: Certain shareholders may own or manage a substantial amount of fund shares and/or hold their fund investments for a limited period of time. Large redemptions of fund shares by these shareholders may force a fund to sell portfolio securities, which may negatively impact the fund’s NAV, increase the fund’s brokerage costs, and/or accelerate the realization of taxable income/gains and cause the fund to make additional taxable distributions to shareholders.
| 11. | CAPITAL SHARE TRANSACTIONS |
Transactions in capital shares for each class were as follows:
| | | | | | | | | | | | | | | | | | | | | | | | | | | | |
| | | Year Ended 05/31/24 | | | | | | Year Ended 05/31/23 | |
| | | | | | | |
| Fund Name/Share Class | | Shares | | | | | | Amount | | | | | | Shares | | | | | | Amount | |
| | | | | | | |
Capital Appreciation | | | | | | | | | | | | | | | | | | | | | | | | | | | | |
| | | | | | | |
Institutional | | | | | | | | | | | | | | | | | | | | | | | | | | | | |
| | | | | | | |
Shares sold | | | 2,375,172 | | | | | | | $ | 85,564,796 | | | | | | | | 5,716,023 | | | | | | | $ | 157,957,646 | |
| | | | | | | |
Shares issued in reinvestment of distributions | | | 607,843 | | | | | | | | 20,849,409 | | | | | | | | 1,893,570 | | | | | | | | 51,954,274 | |
| | | | | | | |
Shares redeemed | | | (5,700,478 | ) | | | | | | | (206,766,629 | ) | | | | | | | (15,681,629 | ) | | | | | | | (435,307,849 | ) |
| | | | | | | | | | | | | | | | | | | | | | | | | | | | |
| | | | | | | |
| | | (2,717,463 | ) | | | | | | $ | (100,352,424 | ) | | | | | | | (8,072,036 | ) | | | | | | $ | (225,395,929 | ) |
| | | | | | | | | | | | | | | | | | | | | | | | | | | | |
| | | | | | | |
Investor A | | | | | | | | | | | | | | | | | | | | | | | | | | | | |
| | | | | | | |
Shares sold and automatic conversion of shares | | | 3,059,279 | | | | | | | $ | 95,896,183 | | | | | | | | 3,941,330 | | | | | | | $ | 97,836,995 | |
| | | | | | | |
Shares issued in reinvestment of distributions | | | 2,141,572 | | | | | | | | 64,101,470 | | | | | | | | 5,278,960 | | | | | | | | 127,222,770 | |
| | | | | | | |
Shares redeemed | | | (9,329,188 | ) | | | | | | | (296,845,503 | ) | | | | | | | (13,077,008 | ) | | | | | | | (322,318,537 | ) |
| | | | | | | | | | | | | | | | | | | | | | | | | | | | |
| | | | | | | |
| | | (4,128,337 | ) | | | | | | $ | (136,847,850 | ) | | | | | | | (3,856,718 | ) | | | | | | $ | (97,258,772 | ) |
| | | | | | | | | | | | | | | | | | | | | | | | | | | | |
| | | | | | | |
Investor C | | | | | | | | | | | | | | | | | | | | | | | | | | | | |
| | | | | | | |
Shares sold | | | 259,279 | | | | | | | $ | 4,516,743 | | | | | | | | 295,401 | | | | | | | $ | 4,190,433 | |
| | | | | | | |
Shares issued in reinvestment of distributions | | | 150,664 | | | | | | | | 2,462,125 | | | | | | | | 415,970 | | | | | | | | 5,707,720 | |
| | | | | | | |
Shares redeemed and automatic conversion of shares | | | (921,149 | ) | | | | | | | (15,736,877 | ) | | | | | | | (1,003,070 | ) | | | | | | | (14,231,042 | ) |
| | | | | | | | | | | | | | | | | | | | | | | | | | | | |
| | | | | | | |
| | | (511,206 | ) | | | | | | $ | (8,758,009 | ) | | | | | | | (291,699 | ) | | | | | | $ | (4,332,889 | ) |
| | | | | | | | | | | | | | | | | | | | | | | | | | | | |
| | | | | | | |
Class K | | | | | | | | | | | | | | | | | | | | | | | | | | | | |
| | | | | | | |
Shares sold | | | 1,392,489 | | | | | | | $ | 50,192,656 | | | | | | | | 2,780,441 | | | | | | | $ | 79,543,996 | |
| | | | | | | |
Shares issued in reinvestment of distributions | | | 625,650 | | | | | | | | 21,705,654 | | | | | | | | 1,501,046 | | | | | | | | 41,578,344 | |
| | | | | | | |
Shares redeemed | | | (9,972,800 | ) | | | | | | | (372,605,778 | ) | | | | | | | (4,141,499 | ) | | | | | | | (118,871,975 | ) |
| | | | | | | | | | | | | | | | | | | | | | | | | | | | |
| | | | | | | |
| | | (7,954,661 | ) | | | | | | $ | (300,707,468 | ) | | | | | | | 139,988 | | | | | | | $ | 2,250,365 | |
| | | | | | | | | | | | | | | | | | | | | | | | | | | | |
| | | | | | | |
Class R | | | | | | | | | | | | | | | | | | | | | | | | | | | | |
| | | | | | | |
Shares sold | | | 149,207 | | | | | | | $ | 3,233,921 | | | | | | | | 204,059 | | | | | | | $ | 3,695,774 | |
| | | | | | | |
Shares issued in reinvestment of distributions | | | 57,317 | | | | | | | | 1,211,907 | | | | | | | | 142,318 | | | | | | | | 2,473,411 | |
| | | | | | | |
Shares redeemed | | | (415,361 | ) | | | | | | | (9,306,024 | ) | | | | | | | (310,598 | ) | | | | | | | (5,527,276 | ) |
| | | | | | | | | | | | | | | | | | | | | | | | | | | | |
| | | | | | | |
| | | (208,837 | ) | | | | | | $ | (4,860,196 | ) | | | | | | | 35,779 | | | | | | | $ | 641,909 | |
| | | | | | | | | | | | | | | | | | | | | | | | | | | | |
| | | | | | | |
| | | (15,520,504 | ) | | | | | | $ | (551,525,947 | ) | | | | | | | (12,044,686 | ) | | | | | | $ | (324,095,316 | ) |
| | | | | | | | | | | | | | | | | | | | | | | | | | | | |
| | | | | | | |
Health Sciences Opportunities | | | | | | | | | | | | | | | | | | | | | | | | | | | | |
| | | | | | | |
Institutional | | | | | | | | | | | | | | | | | | | | | | | | | | | | |
| | | | | | | |
Shares sold | | | 8,193,691 | | | | | | | $ | 583,683,482 | | | | | | | | 11,197,111 | | | | | | | $ | 765,047,695 | |
| | | | | | | |
Shares issued in reinvestment of distributions | | | 2,283,482 | | | | | | | | 157,422,926 | | | | | | | | 5,046,141 | | | | | | | | 332,953,033 | |
| | | | | | | |
Shares redeemed | | | (16,815,339 | ) | | | | | | | (1,183,104,439 | ) | | | | | | | (21,662,089 | ) | | | | | | | (1,475,511,418 | ) |
| | | | | | | | | | | | | | | | | | | | | | | | | | | | |
| | | | | | | |
| | | (6,338,166 | ) | | | | | | $ | (441,998,031 | ) | | | | | | | (5,418,837 | ) | | | | | | $ | (377,510,690 | ) |
| | | | | | | | | | | | | | | | | | | | | | | | | | | | |
| | |
| 70 | | 2 0 2 4 B L A C K R O C K A N N U A L F I N A N C I A L S T A T E M E N T S |
Notes to Financial Statements (continued)
| | | | | | | | | | | | | | | | | | | | | | | | | | | | |
| | | Year Ended 05/31/24 | | | | | | Year Ended 05/31/23 | |
| | | | | | | |
| Fund Name/Share Class | | Shares | | | | | | Amount | | | | | | Shares | | | | | | Amount | |
| | | | | | | |
Health Sciences Opportunities (continued) | | | | | | | | | | | | | | | | | | | | | | | | | | | | |
| | | | | | | |
Service | | | | | | | | | | | | | | | | | | | | | | | | | | | | |
| | | | | | | |
Shares sold | | | 41,297 | | | | | | | $ | 2,740,817 | | | | | | | | 57,200 | | | | | | | $ | 3,684,661 | |
| | | | | | | |
Shares issued in reinvestment of distributions | | | 18,476 | | | | | | | | 1,199,629 | | | | | | | | 40,955 | | | | | | | | 2,542,243 | |
| | | | | | | |
Shares redeemed | | | (129,496 | ) | | | | | | | (8,549,804 | ) | | | | | | | (122,578 | ) | | | | | | | (7,895,488 | ) |
| | | | | | | | | | | | | | | | | | | | | | | | | | | | |
| | | | | | | |
| | | (69,723 | ) | | | | | | $ | (4,609,358 | ) | | | | | | | (24,423 | ) | | | | | | $ | (1,668,584 | ) |
| | | | | | | | | | | | | | | | | | | | | | | | | | | | |
| | | | | | | |
Investor A | | | | | | | | | | | | | | | | | | | | | | | | | | | | |
| | | | | | | |
Shares sold and automatic conversion of shares | | | 3,148,635 | | | | | | | $ | 208,743,219 | | | | | | | | 4,334,203 | | | | | | | $ | 278,606,468 | |
| | | | | | | |
Shares issued in reinvestment of distributions | | | 1,628,677 | | | | | | | | 105,093,179 | | | | | | | | 3,522,117 | | | | | | | | 217,567,391 | |
| | | | | | | |
Shares redeemed | | | (8,665,399 | ) | | | | | | | (573,000,127 | ) | | | | | | | (9,621,175 | ) | | | | | | | (618,119,887 | ) |
| | | | | | | | | | | | | | | | | | | | | | | | | | | | |
| | | | | | | |
| | | (3,888,087 | ) | | | | | | $ | (259,163,729 | ) | | | | | | | (1,764,855 | ) | | | | | | $ | (121,946,028 | ) |
| | | | | | | | | | | | | | | | | | | | | | | | | | | | |
| | | | | | | |
Investor C | | | | | | | | | | | | | | | | | | | | | | | | | | | | |
| | | | | | | |
Shares sold | | | 340,682 | | | | | | | $ | 18,635,857 | | | | | | | | 537,584 | | | | | | | $ | 28,698,873 | |
| | | | | | | |
Shares issued in reinvestment of distributions | | | 298,034 | | | | | | | | 15,871,867 | | | | | | | | 832,560 | | | | | | | | 42,677,038 | |
| | | | | | | |
Shares redeemed and automatic conversion of shares | | | (2,792,967 | ) | | | | | | | (151,349,046 | ) | | | | | | | (3,241,641 | ) | | | | | | | (172,577,850 | ) |
| | | | | | | | | | | | | | | | | | | | | | | | | | | | |
| | | | | | | |
| | | (2,154,251 | ) | | | | | | $ | (116,841,322 | ) | | | | | | | (1,871,497 | ) | | | | | | $ | (101,201,939 | ) |
| | | | | | | | | | | | | | | | | | | | | | | | | | | | |
| | | | | | | |
Class K | | | | | | | | | | | | | | | | | | | | | | | | | | | | |
| | | | | | | |
Shares sold | | | 1,849,326 | | | | | | | $ | 131,524,955 | | | | | | | | 2,134,729 | | | | | | | $ | 147,417,118 | |
| | | | | | | |
Shares issued in reinvestment of distributions | | | 255,328 | | | | | | | | 17,603,287 | | | | | | | | 470,645 | | | | | | | | 31,121,552 | |
| | | | | | | |
Shares redeemed | | | (2,585,491 | ) | | | | | | | (183,510,131 | ) | | | | | | | (1,551,519 | ) | | | | | | | (105,963,545 | ) |
| | | | | | | | | | | | | | | | | | | | | | | | | | | | |
| | | | | | | |
| | | (480,837 | ) | | | | | | $ | (34,381,889 | ) | | | | | | | 1,053,855 | | | | | | | $ | 72,575,125 | |
| | | | | | | | | | | | | | | | | | | | | | | | | | | | |
| | | | | | | |
Class R | | | | | | | | | | | | | | | | | | | | | | | | | | | | |
| | | | | | | |
Shares sold | | | 293,019 | | | | | | | $ | 18,639,450 | | | | | | | | 260,827 | | | | | | | $ | 16,205,620 | |
| | | | | | | |
Shares issued in reinvestment of distributions | | | 141,806 | | | | | | | | 8,875,180 | | | | | | | | 305,568 | | | | | | | | 18,277,362 | |
| | | | | | | |
Shares redeemed | | | (663,365 | ) | | | | | | | (42,582,090 | ) | | | | | | | (662,105 | ) | | | | | | | (41,318,683) | |
| | | | | | | | | | | | | | | | | | | | | | | | | | | | |
| | | | | | | |
| | | (228,540 | ) | | | | | | $ | (15,067,460 | ) | | | | | | | (95,710 | ) | | | | | | $ | (6,835,701 | ) |
| | | | | | | | | | | | | | | | | | | | | | | | | | | | |
| | | | | | | |
| | | (13,159,604 | ) | | | | | | $ | (872,061,789 | ) | | | | | | | (8,121,467 | ) | | | | | | $ | (536,587,817 | ) |
| | | | | | | | | | | | | | | | | | | | | | | | | | | | |
| | | | | | | |
Infrastructure Sustainable Opportunities | | | | | | | | | | | | | | | | | | | | | | | | | | | | |
| | | | | | | |
Institutional | | | | | | | | | | | | | | | | | | | | | | | | | | | | |
| | | | | | | |
Shares sold | | | 538 | | | | | | | $ | 4,705 | | | | | | | | 664 | | | | | | | $ | 5,769 | |
| | | | | | | |
Shares issued in reinvestment of distributions | | | 29 | | | | | | | | 261 | | | | | | | | 32 | | | | | | | | 282 | |
| | | | | | | |
Shares redeemed | | | (262 | ) | | | | | | | (2,192 | ) | | | | | | | (133 | ) | | | | | | | (1,200 | ) |
| | | | | | | | | | | | | | | | | | | | | | | | | | | | |
| | | | | | | |
| | | 305 | | | | | | | $ | 2,774 | | | | | | | | 563 | | | | | | | $ | 4,851 | |
| | | | | | | | | | | | | | | | | | | | | | | | | | | | |
| | | | | | | |
Investor A | | | | | | | | | | | | | | | | | | | | | | | | | | | | |
| | | | | | | |
Shares sold | | | 14,312 | | | | | | | $ | 123,978 | | | | | | | | 6,368 | | | | | | | $ | 57,649 | |
| | | | | | | |
Shares issued in reinvestment of distributions | | | 194 | | | | | | | | 1,740 | | | | | | | | 38 | | | | | | | | 332 | |
| | | | | | | |
Shares redeemed | | | (3,167 | ) | | | | | | | (26,060 | ) | | | | | | | (54 | ) | | | | | | | (495 | ) |
| | | | | | | | | | | | | | | | | | | | | | | | | | | | |
| | | | | | | |
| | | 11,339 | | | | | | | $ | 99,658 | | | | | | | | 6,352 | | | | | | | $ | 57,486 | |
| | | | | | | | | | | | | | | | | | | | | | | | | | | | |
| | | | | | | |
Class K | | | | | | | | | | | | | | | | | | | | | | | | | | | | |
| | | | | | | |
Shares sold | | | 82 | | | | | | | $ | 710 | | | | | | | | 189 | | | | | | | $ | 1,620 | |
| | | | | | | |
Shares issued in reinvestment of distributions | | | 14 | | | | | | | | 132 | | | | | | | | 16 | | | | | | | | 142 | |
| | | | | | | |
Shares redeemed | | | (145 | ) | | | | | | | (1,240 | ) | | | | | | | — | | | | | | | | — | |
| | | | | | | | | | | | | | | | | | | | | | | | | | | | |
| | | | | | | |
| | | (49 | ) | | | | | | $ | (398 | ) | | | | | | | 205 | | | | | | | $ | 1,762 | |
| | | | | | | | | | | | | | | | | | | | | | | | | | | | |
| | | | | | | |
| | | 11,595 | | | | | | | $ | 102,034 | | | | | | | | 7,120 | | | | | | | $ | 64,099 | |
| | | | | | | | | | | | | | | | | | | | | | | | | | | | |
| | |
N O T E S T O F I N A N C I A L S T A T E M E N T S | | 71 |
Notes to Financial Statements (continued)
| | | | | | | | | | | | | | | | | | | | | | | | | | | | |
| | | Year Ended 05/31/24 | | | | | | Year Ended 05/31/23 | |
| | | | | | | |
| Fund Name/Share Class | | Shares | | | | | | Amount | | | | | | Shares | | | | | | Amount | |
| | | | | | | |
Mid-Cap Growth Equity | | | | | | | | | | | | | | | | | | | | | | | | | | | | |
| | | | | | | |
Institutional | | | | | | | | | | | | | | | | | | | | | | | | | | | | |
| | | | | | | |
Shares sold | | | 25,774,794 | | | | | | | $ | 943,438,772 | | | | | | | | 47,917,656 | | | | | | | $ | 1,524,488,005 | |
| | | | | | | |
Shares redeemed | | | (53,836,267 | ) | | | | | | | (1,966,094,068 | ) | | | | | | | (103,429,603 | ) | | | | | | | (3,263,321,983 | ) |
| | | | | | | | | | | | | | | | | | | | | | | | | | | | |
| | | | | | | |
| | | (28,061,473 | ) | | | | | | $ | (1,022,655,296 | ) | | | | | | | (55,511,947 | ) | | | | | | $ | (1,738,833,978 | ) |
| | | | | | | | | | | | | | | | | | | | | | | | | | | | |
| | | | | | | |
Service | | | | | | | | | | | | | | | | | | | | | | | | | | | | |
| | | | | | | |
Shares sold | | | 218,068 | | | | | | | $ | 7,181,094 | | | | | | | | 350,535 | | | | | | | $ | 9,881,277 | |
| | | | | | | |
Shares redeemed | | | (648,553 | ) | | | | | | | (21,108,643 | ) | | | | | | | (975,944 | ) | | | | | | | (27,755,309 | ) |
| | | | | | | | | | | | | | | | | | | | | | | | | | | | |
| | | | | | | |
| | | (430,485 | ) | | | | | | $ | (13,927,549 | ) | | | | | | | (625,409 | ) | | | | | | $ | (17,874,032 | ) |
| | | | | | | | | | | | | | | | | | | | | | | | | | | | |
| | | | | | | |
Investor A | | | | | | | | | | | | | | | | | | | | | | | | | | | | |
| | | | | | | |
Shares sold and automatic conversion of shares | | | 5,192,371 | | | | | | | $ | 162,981,384 | | | | | | | | 7,397,275 | | | | | | | $ | 201,630,334 | |
| | | | | | | |
Shares redeemed | | | (15,109,163 | ) | | | | | | | (469,268,479 | ) | | | | | | | (17,049,170 | ) | | | | | | | (459,100,473 | ) |
| | | | | | | | | | | | | | | | | | | | | | | | | | | | |
| | | | | | | |
| | | (9,916,792 | ) | | | | | | $ | (306,287,095 | ) | | | | | | | (9,651,895 | ) | | | | | | $ | (257,470,139 | ) |
| | | | | | | | | | | | | | | | | | | | | | | | | | | | |
| | | | | | | |
Investor C | | | | | | | | | | | | | | | | | | | | | | | | | | | | |
| | | | | | | |
Shares sold | | | 459,280 | | | | | | | $ | 10,686,451 | | | | | | | | 596,600 | | | | | | | $ | 12,112,431 | |
| | | | | | | |
Shares redeemed and automatic conversion of shares | | | (2,320,240 | ) | | | | | | | (53,855,034 | ) | | | | | | | (2,806,057 | ) | | | | | | | (56,412,228 | ) |
| | | | | | | | | | | | | | | | | | | | | | | | | | | | |
| | | | | | | |
| | | (1,860,960 | ) | | | | | | $ | (43,168,583 | ) | | | | | | | (2,209,457 | ) | | | | | | $ | (44,299,797 | ) |
| | | | | | | | | | | | | | | | | | | | | | | | | | | | |
| | | | | | | |
Class K | | | | | | | | | | | | | | | | | | | | | | | | | | | | |
| | | | | | | |
Shares sold | | | 23,280,033 | | | | | | | $ | 866,092,270 | | | | | | | | 43,394,126 | | | | | | | $ | 1,373,927,107 | |
| | | | | | | |
Shares redeemed | | | (37,065,253 | ) | | | | | | | (1,369,957,463 | ) | | | | | | | (47,704,012 | ) | | | | | | | (1,522,478,195 | ) |
| | | | | | | | | | | | | | | | | | | | | | | | | | | | |
| | | | | | | |
| | | (13,785,220 | ) | | | | | | $ | (503,865,193 | ) | | | | | | | (4,309,886 | ) | | | | | | $ | (148,551,088 | ) |
| | | | | | | | | | | | | | | | | | | | | | | | | | | | |
| | | | | | | |
Class R | | | | | | | | | | | | | | | | | | | | | | | | | | | | |
| | | | | | | |
Shares sold | | | 550,929 | | | | | | | $ | 16,719,131 | | | | | | | | 880,078 | | | | | | | $ | 23,445,508 | |
| | | | | | | |
Shares redeemed | | | (1,350,214 | ) | | | | | | | (41,042,668 | ) | | | | | | | (862,426 | ) | | | | | | | (22,678,994 | ) |
| | | | | | | | | | | | | | | | | | | | | | | | | | | | |
| | | | | | | |
| | | (799,285 | ) | | | | | | $ | (24,323,537 | ) | | | | | | | 17,652 | | | | | | | $ | 766,514 | |
| | | | | | | | | | | | | | | | | | | | | | | | | | | | |
| | | | | | | |
| | | (54,854,215 | ) | | | | | | $ | (1,914,227,253 | ) | | | | | | | (72,290,942 | ) | | | | | | $ | (2,206,262,520 | ) |
| | | | | | | | | | | | | | | | | | | | | | | | | | | | |
| | | | | | | |
Technology Opportunities | | | | | | | | | | | | | | | | | | | | | | | | | | | | |
| | | | | | | |
Institutional | | | | | | | | | | | | | | | | | | | | | | | | | | | | |
| | | | | | | |
Shares sold | | | 9,723,910 | | | | | | | $ | 537,366,881 | | | | | | | | 16,615,851 | | | | | | | $ | 696,225,151 | |
| | | | | | | |
Shares redeemed | | | (16,207,338 | ) | | | | | | | (891,747,608 | ) | | | | | | | (33,058,906 | ) | | | | | | | (1,373,686,694 | ) |
| | | | | | | | | | | | | | | | | | | | | | | | | | | | |
| | | | | | | |
| | | (6,483,428 | ) | | | | | | $ | (354,380,727 | ) | | | | | | | (16,443,055 | ) | | | | | | $ | (677,461,543 | ) |
| | | | | | | | | | | | | | | | | | | | | | | | | | | | |
| | | | | | | |
Service | | | | | | | | | | | | | | | | | | | | | | | | | | | | |
| | | | | | | |
Shares sold | | | 206,830 | | | | | | | $ | 10,760,963 | | | | | | | | 171,238 | | | | | | | $ | 6,686,958 | |
| | | | | | | |
Shares redeemed | | | (498,430 | ) | | | | | | | (25,937,289 | ) | | | | | | | (417,065 | ) | | | | | | | (16,352,892 | ) |
| | | | | | | | | | | | | | | | | | | | | | | | | | | | |
| | | | | | | |
| | | (291,600 | ) | | | | | | $ | (15,176,326 | ) | | | | | | | (245,827 | ) | | | | | | $ | (9,665,934 | ) |
| | | | | | | | | | | | | | | | | | | | | | | | | | | | |
| | | | | | | |
Investor A | | | | | | | | | | | | | | | | | | | | | | | | | | | | |
| | | | | | | |
Shares sold and automatic conversion of shares | | | 5,008,601 | | | | | | | $ | 252,087,332 | | | | | | | | 4,850,581 | | | | | | | $ | 188,138,502 | |
| | | | | | | |
Shares redeemed | | | (8,228,564 | ) | | | | | | | (416,589,841 | ) | | | | | | | (9,667,118 | ) | | | | | | | (366,443,166 | ) |
| | | | | | | | | | | | | | | | | | | | | | | | | | | | |
| | | | | | | |
| | | (3,219,963 | ) | | | | | | $ | (164,502,509 | ) | | | | | | | (4,816,537 | ) | | | | | | $ | (178,304,664 | ) |
| | | | | | | | | | | | | | | | | | | | | | | | | | | | |
| | | | | | | |
Investor C | | | | | | | | | | | | | | | | | | | | | | | | | | | | |
| | | | | | | |
Shares sold | | | 731,500 | | | | | | | $ | 29,296,687 | | | | | | | | 705,328 | | | | | | | $ | 21,723,660 | |
| | | | | | | |
Shares redeemed and automatic conversion of shares | | | (2,003,356 | ) | | | | | | | (79,620,760 | ) | | | | | | | (2,005,673 | ) | | | | | | | (60,699,308 | ) |
| | | | | | | | | | | | | | | | | | | | | | | | | | | | |
| | | | | | | |
| | | (1,271,856 | ) | | | | | | $ | (50,324,073 | ) | | | | | | | (1,300,345 | ) | | | | | | $ | (38,975,648 | ) |
| | | | | | | | | | | | | | | | | | | | | | | | | | | | |
| | | | | | | |
Class K | | | | | | | | | | | | | | | | | | | | | | | | | | | | |
| | | | | | | |
Shares sold | | | 1,737,800 | | | | | | | $ | 95,856,044 | | | | | | | | 1,866,384 | | | | | | | $ | 77,400,205 | |
| | | | | | | |
Shares redeemed | | | (1,349,293 | ) | | | | | | | (74,821,457 | ) | | | | | | | (1,574,873 | ) | | | | | | | (65,635,026 | ) |
| | | | | | | | | | | | | | | | | | | | | | | | | | | | |
| | | | | | | |
| | | 388,507 | | | | | | | $ | 21,034,587 | | | | | | | | 291,511 | | | | | | | $ | 11,765,179 | |
| | | | | | | | | | | | | | | | | | | | | | | | | | | | |
| | |
| 72 | | 2 0 2 4 B L A C K R O C K A N N U A L F I N A N C I A L S T A T E M E N T S |
Notes to Financial Statements (continued)
| | | | | | | | | | | | | | | | | | | | | | | | | | | | |
| | | Year Ended 05/31/24 | | | | | | Year Ended 05/31/23 | |
| | | | | | | |
| Fund Name/Share Class | | Shares | | | | | | Amount | | | | | | Shares | | | | | | Amount | |
| | | | | | | |
Technology Opportunities (continued) | | | | | | | | | | | | | | | | | | | | | | | | | | | | |
| | | | | | | |
Class R | | | | | | | | | | | | | | | | | | | | | | | | | | | | |
| | | | | | | |
Shares sold | | | 281,736 | | | | | | | $ | 14,160,044 | | | | | | | | 250,388 | | | | | | | $ | 9,664,993 | |
| | | | | | | |
Shares redeemed | | | (357,121 | ) | | | | | | | (17,401,063 | ) | | | | | | | (271,520 | ) | | | | | | | (10,425,495 | ) |
| | | | | | | | | | | | | | | | | | | | | | | | | | | | |
| | | | | | | |
| | | (75,385 | ) | | | | | | $ | (3,241,019 | ) | | | | | | | (21,132 | ) | | | | | | $ | (760,502 | ) |
| | | | | | | | | | | | | | | | | | | | | | | | | | | | |
| | | | | | | |
| | | (10,953,725 | ) | | | | | | $ | (566,590,067 | ) | | | | | | | (22,535,385 | ) | | | | | | $ | (893,403,112 | ) |
| | | | | | | | | | | | | | | | | | | | | | | | | | | | |
As of May 31, 2024, shares owned by BlackRock Financial Management, Inc., an affiliate of the Funds, were as follows:
| | | | | | | | | | | | |
| Share Class | | Infrastructure
Sustainable
Opportunities | | | | | | Technology
Opportunities | |
Institutional | | | 10,000 | | | | | | | | — | |
Investor A | | | 10,000 | | | | | | | | — | |
Class K | | | 980,000 | | | | | | | | 8,673 | |
Management has evaluated the impact of all subsequent events on the Funds through the date the financial statements were issued and has determined that there were no subsequent events requiring adjustment or additional disclosure in the financial statements.
| | |
N O T E S T O F I N A N C I A L S T A T E M E N T S | | 73 |
Report of Independent Registered Public Accounting Firm
To the Shareholders and the Board of Directors of BlackRock Capital Appreciation Fund, Inc., and the Shareholders of BlackRock Health Sciences Opportunities Portfolio, BlackRock Infrastructure Sustainable Opportunities Fund, BlackRock Mid-Cap Growth Equity Portfolio, and BlackRock Technology Opportunities Fund, and the Board of Trustees of BlackRock FundsSM:
Opinion on the Financial Statements and Financial Highlights
We have audited the accompanying statements of assets and liabilities of BlackRock Capital Appreciation Fund, Inc., and BlackRock Health Sciences Opportunities Portfolio, BlackRock Infrastructure Sustainable Opportunities Fund, BlackRock Mid-Cap Growth Equity Portfolio, and BlackRock Technology Opportunities Fund of BlackRock FundsSM (the “Funds”), including the schedules of investments, as of May 31, 2024, the related statements of operations for the year then ended, the statements of changes in net assets for each of the two years in the period then ended, the financial highlights for the periods indicated in the table below, and the related notes. In our opinion, the financial statements and financial highlights present fairly, in all material respects, the financial position of the Funds as of May 31, 2024, and the results of their operations for the year then ended, the statements of changes in their net assets for each of the two years in the period then ended, and the financial highlights for the periods indicated in the table below, in conformity with accounting principles generally accepted in the United States of America.
| | |
| | |
| | |
Fund | | Financial Highlights |
| | |
| BlackRock Capital Appreciation Fund, Inc., BlackRock Health Sciences Opportunities Portfolio, BlackRock Mid-Cap Growth Equity Portfolio, BlackRock Technology Opportunities Fund | | For each of the three years in the period ended May 31, 2024, for the period from October 1, 2020 through May 31, 2021, and for each of the two years in the period ended September 30, 2020 |
| | |
| BlackRock Infrastructure Sustainable Opportunities Fund | | For each of the two years in the period ended May 31, 2024 and for the period from September 30, 2021 (commencement of operations) through May 31, 2022 |
Basis for Opinion
These financial statements and financial highlights are the responsibility of the Funds’ management. Our responsibility is to express an opinion on the Funds’ financial statements and financial highlights based on our audits. We are a public accounting firm registered with the Public Company Accounting Oversight Board (United States) (PCAOB) and are required to be independent with respect to the Funds in accordance with the U.S. federal securities laws and the applicable rules and regulations of the Securities and Exchange Commission and the PCAOB.
We conducted our audits in accordance with the standards of the PCAOB. Those standards require that we plan and perform the audit to obtain reasonable assurance about whether the financial statements and financial highlights are free of material misstatement, whether due to error or fraud. The Funds are not required to have, nor were we engaged to perform, an audit of their internal control over financial reporting. As part of our audits we are required to obtain an understanding of internal control over financial reporting but not for the purpose of expressing an opinion on the effectiveness of the Funds’ internal control over financial reporting. Accordingly, we express no such opinion.
Our audits included performing procedures to assess the risks of material misstatement of the financial statements and financial highlights, whether due to error or fraud, and performing procedures that respond to those risks. Such procedures included examining, on a test basis, evidence regarding the amounts and disclosures in the financial statements and financial highlights. Our audits also included evaluating the accounting principles used and significant estimates made by management, as well as evaluating the overall presentation of the financial statements and financial highlights. Our procedures included confirmation of securities owned as of May 31, 2024, by correspondence with custodians or counterparties; when replies were not received, we performed other auditing procedures. We believe that our audits provide a reasonable basis for our opinion.
Deloitte & Touche LLP
Boston, Massachusetts
July 24, 2024
We have served as the auditor of one or more BlackRock investment companies since 1992.
| | |
| 74 | | 2 0 2 4 B L A C K R O C K A N N U A L F I N A N C I A L S T A T E M E N T S |
| | |
| Important Tax Information (unaudited) | | |
The following amounts, or maximum amounts allowable by law, are hereby designated as qualified dividend income for individuals for the fiscal year ended May 31, 2024:
| | | | | | | | |
| |
| Fund Name | | | | | Qualified Dividend Income | |
| |
Capital Appreciation | | | | | | $ | 19,768,184 | |
Health Sciences Opportunities | | | | | | | 98,496,686 | |
Infrastructure Sustainable Opportunities | | | | | | | 261,048 | |
| |
The Funds hereby designate the following amounts, or maximum amounts allowable by law, as capital gain dividends, subject to a long-term capital gains tax rate as noted below, for the fiscal year ended May 31, 2024:
| | | | | | | | |
| |
| Fund Name | | | | | 20% Rate Long-Term Capital Gain Dividends | |
| |
Capital Appreciation | | | | | | $ | 109,281,374 | |
Health Sciences Opportunities | | | | | | | 288,843,746 | |
| |
The Fund intends to pass through to its shareholders the following amount, or maximum amount allowable by law, of foreign source income earned and foreign taxes paid for the fiscal year ended May 31, 2024:
| | | | | | | | | | | | |
| |
| Fund Name | | Foreign Source Income Earned | | | | | | Foreign Taxes
Paid | |
| |
Infrastructure Sustainable Opportunities | | $ | 153,512 | | | | | | | $ | 21,412 | |
| |
The Funds hereby designate the following amounts, or maximum amounts allowable by law, of distributions from direct federal obligation interest for the fiscal year ended May 31, 2024:
| | | | | | | | |
| |
| Fund Name | | | | | Federal Obligation Interest | |
| |
Health Sciences Opportunities | | | | | | | $ 295,244 | |
Infrastructure Sustainable Opportunities | | | | | | | 2,479 | |
| |
The law varies in each state as to whether and what percent of ordinary income dividends attributable to federal obligations is exempt from state income tax. Shareholders are advised to check with their tax advisers to determine if any portion of the dividends received is exempt from state income tax.
The following percentages, or maximum percentages allowable by law, of ordinary income distributions paid during the fiscal year ended May 31, 2024 qualified for the dividends-received deduction for corporate shareholders:
| | | | | | | | |
| |
| Fund Name | | | | | Dividends-Received Deduction | |
| |
Capital Appreciation | | | | | | | 46.41% | |
Health Sciences Opportunities | | | | | | | 100.00 | |
Infrastructure Sustainable Opportunities | | | | | | | 29.22 | |
| |
The Funds hereby designate the following amounts, or maximum amounts allowable by law, as interest income eligible to be treated as a Section 163(j) interest dividend for the fiscal year ended May 31, 2024:
| | | | | | | | |
| |
| Fund Name | | | | | Interest Dividends | |
| |
Health Sciences Opportunities | | | | | | $ | 1,881,967 | |
Infrastructure Sustainable Opportunities | | | | | | | 15,806 | |
| |
The Funds hereby designate the following amounts, or maximum amounts allowable by law, as interest-related dividends and qualified short-term capital gains eligible for exemption from U.S. withholding tax for nonresident aliens and foreign corporations for the fiscal year ended May 31, 2024:
| | | | | | | | |
| |
| Fund Name | | Interest-Related Dividends | | | Qualified Short-Term Capital Gains | |
| |
Capital Appreciation | | | $ — | | | $ | 10,641,994 | |
Health Sciences Opportunities | | | 1,881,967 | | | | — | |
Infrastructure Sustainable Opportunities | | | 15,806 | | | | — | |
| |
| | |
I M P O R T A N T T A X I N F O R M A T I O N | | 75 |
Disclosure of Investment Advisory Agreements and Sub-Advisory Agreements
The Board of Trustees of BlackRock Funds (the “Trust”) met on April 16, 2024 and May 16-17, 2024 to consider the approval to continue the investment advisory agreement (the “Trust Advisory Agreement”) between the Trust, on behalf of BlackRock Mid-Cap Growth Equity Portfolio (“Mid-Cap Growth Equity Portfolio”), BlackRock Health Sciences Opportunities Portfolio (“Health Sciences Opportunities Portfolio”), BlackRock Technology Opportunities Fund (“Technology Opportunities Fund”) and BlackRock Infrastructure Sustainable Opportunities Fund (“Infrastructure Sustainable Opportunities Fund”), and BlackRock Advisors, LLC (the “Manager” or “BlackRock”), each Fund’s investment advisor. The Board of Trustees of the Trust also considered the approval to continue the sub-advisory agreement (the “Infrastructure Sustainable Opportunities Fund BSL Sub-Advisory Agreement”) between the Manager and BlackRock (Singapore) Limited (“BSL”) and the sub-advisory agreement (the “Infrastructure Sustainable Opportunities Fund BIL Sub-Advisory Agreement” and, together with the Infrastructure Sustainable Opportunities Fund BSL Sub-Advisory Agreement, the “Sub-Advisory Agreements”) between the Manager and BlackRock International Limited (“BIL” and, together with BSL, the “Sub-Advisors”), each with respect to Infrastructure Sustainable Opportunities Fund.
The Board of Directors of BlackRock Capital Appreciation Fund, Inc. (the “Corporation” or “Capital Appreciation Fund”) met on April 16, 2024 and May 16-17, 2024 to consider the approval to continue the investment advisory agreement (the “Corporation Advisory Agreement”) between the Corporation and the Manager, its investment advisor.
Mid-Cap Growth Equity Portfolio, Health Sciences Opportunities Portfolio, Technology Opportunities Fund, Infrastructure Sustainable Opportunities Fund and Capital Appreciation Fund are referred to herein individually as a “Fund” or collectively as the “Funds.” The Trust Advisory Agreement, the Sub-Advisory Agreements and the Corporation Advisory Agreement are referred to herein individually as an “Agreement” or collectively as the “Agreements.” For simplicity: (a) the Board of Trustees of the Trust and the Board of Directors of the Corporation are referred to herein individually as the “Board” and collectively as the “Boards” and the members are referred to as “Board Members”; and (b) the meetings held on April 16, 2024 are referred to as the “April Meeting” and the meetings held on May 16-17, 2024 are referred to as the “May Meeting.”
The Approval Process
Consistent with the requirements of the Investment Company Act of 1940 (the “1940 Act”), the Boards consider the approval of the continuation of the pertinent Agreements for each Fund on an annual basis. The Board members who are not “interested persons” of the Trust or the Corporation, as defined in the 1940 Act, are considered independent Board members (the “Independent Board Members”). Each Board’s consideration entailed a year-long deliberative process during which the Board and its committees assessed BlackRock’s various services to the pertinent Fund, including through the review of written materials and oral presentations, and the review of additional information provided in response to requests from the Independent Board Members. The Boards had four quarterly meetings per year, each of which extended over a two-day period, as well as additional ad hoc meetings and executive sessions throughout the year, as needed. The committees of each Board similarly met throughout the year. The Boards also had an additional one-day meeting to consider specific information regarding the renewal of the Agreements. In considering the renewal of the Agreements, the Boards assessed, among other things, the nature, extent and quality of the services provided to the pertinent Fund by BlackRock, BlackRock’s personnel and affiliates, including (as applicable): investment management services; accounting oversight; administrative and shareholder services; oversight of the pertinent Fund’s service providers; risk management and oversight; and legal, regulatory and compliance services. Throughout the year, including during the contract renewal process, the Independent Board Members were advised by independent legal counsel, and met with independent legal counsel in various executive sessions outside of the presence of BlackRock’s management.
During the year, the Boards, acting directly and through their committees, considered information that was relevant to their annual consideration of the renewal of the pertinent Agreement(s), including the services and support provided by BlackRock to the Funds and their shareholders. BlackRock also furnished additional information to the Boards in response to specific questions from the Boards. Among the matters the Boards considered, with respect to each Fund, as pertinent, were: (a) investment performance for one-year, three-year, five-year, and/or since inception periods, as applicable, against peer funds, an applicable benchmark, and other performance metrics, as applicable, as well as BlackRock senior management’s and portfolio managers’ investment performance analyses, and the reasons for any outperformance or underperformance relative to its peers, benchmarks, and other performance metrics, as applicable; (b) fees, including advisory, administration, if applicable, and other amounts paid to BlackRock and its affiliates by the Fund for services; (c) Fund operating expenses and how BlackRock allocates expenses to the Fund; (d) the resources devoted to, risk oversight of, and compliance reports relating to, implementation of the Fund’s investment objective, policies and restrictions, and meeting regulatory requirements; (e) BlackRock’s and each Fund’s adherence to applicable compliance policies and procedures, as applicable; (f) the nature, character and scope of non-investment management services provided by BlackRock and its affiliates and the estimated cost of such services, as available; (g) BlackRock’s and other service providers’ internal controls and risk and compliance oversight mechanisms; (h) BlackRock’s implementation of the proxy voting policies approved by the Board; (i) the use of brokerage commissions and execution quality of portfolio transactions; (j) BlackRock’s implementation of each Fund’s valuation and liquidity procedures; (k) an analysis of management fees paid to BlackRock for products with similar investment mandates across the open-end fund, exchange-traded fund (“ETF”), closed-end fund, sub-advised mutual fund, separately managed account, collective investment trust, and institutional separate account product channels, as applicable, and the similarities and differences between these products and the services provided as compared to the Fund; (l) BlackRock’s compensation methodology for its investment professionals and the incentives and accountability it creates, along with investment professionals’ investments in the fund(s) they manage; and (m) periodic updates on BlackRock’s business.
Prior to and in preparation for the April Meeting, the Boards received and reviewed materials specifically relating to the renewal of the pertinent Agreements. The Independent Board Members continuously engaged in a process with their independent legal counsel and BlackRock to review the nature and scope of the information provided to the Board to better assist their deliberations. The materials provided in connection with the April Meeting included, among other things: (a) information independently compiled and prepared by Broadridge Financial Solutions, Inc. (“Broadridge”), based on either a Lipper classification or Morningstar category, regarding the fees and expenses of each Fund as compared with a peer group of funds as determined by Broadridge (“Expense Peers”) and the investment performance of each Fund as compared with a peer group of funds (“Performance Peers”); (b) information on the composition of the Expense Peers and Performance Peers and a description of Broadridge’s methodology; (c) information on the estimated profits realized by BlackRock and its affiliates pursuant to the pertinent Agreements and a discussion of fall-out benefits to BlackRock and its affiliates; (d) a general analysis provided by BlackRock concerning investment management fees received in connection with other types of investment products, such as institutional accounts, sub-advised mutual funds, ETFs, closed-end funds, open-end funds, and separately managed accounts, under similar investment mandates, as well as the performance of such other products, as applicable; (e) a review of non-management fees; (f) the existence, impact and sharing of potential economies of scale, if any, with the Funds; (g) a summary of aggregate amounts paid by each Fund to BlackRock; (h) sales and redemption data regarding each Fund’s shares; and (i) various additional information requested by the Boards as appropriate regarding BlackRock’s and the Funds’ operations.
| | |
| 76 | | 2 0 2 4 B L A C K R O C K A N N U A L F I N A N C I A L S T A T E M E N T S |
Disclosure of Investment Advisory Agreements and Sub-Advisory Agreements (continued)
At the April Meeting, each Board reviewed materials relating to its consideration of the pertinent Agreements and the Independent Board Members presented BlackRock with questions and requests for additional information. BlackRock responded to these questions and requests with additional written information in advance of the May Meeting, and such responses were reviewed by the Board Members.
At the May Meeting, each Board concluded, with respect to the pertinent Fund, its assessment of, among other things: (a) the nature, extent and quality of the services provided by BlackRock; (b) the investment performance of the Fund as compared to its Performance Peers and to other metrics, as applicable; (c) the advisory fee and the estimated cost of the services and estimated profits realized by BlackRock and its affiliates from their relationship with the Fund; (d) the Fund’s fees and expenses compared to its Expense Peers; (e) the existence and sharing of potential economies of scale; (f) any fall-out benefits to BlackRock and its affiliates as a result of BlackRock’s relationship with the Fund; and (g) other factors deemed relevant by the Board Members.
Each Board also considered other matters it deemed important to the approval process, such as other payments made to BlackRock or its affiliates relating to securities lending and cash management, and BlackRock’s services related to the valuation and pricing of the portfolio holdings of the pertinent Fund. Each Board noted the willingness of BlackRock’s personnel to engage in open, candid discussions with the Board. Each Board evaluated the information available to it on a fund-by-fund basis. The following paragraphs provide more information about some of the primary factors that were relevant to each Board’s decision. The Board Members did not identify any particular information, or any single factor as determinative, and each Board Member may have attributed different weights to the various items and factors considered.
A. Nature, Extent and Quality of the Services Provided by BlackRock
Each Board, including the Independent Board Members, reviewed the nature, extent and quality of services provided by BlackRock, including the investment advisory services, and the resulting performance of the applicable Fund. Throughout the year, each Board compared Fund performance to the performance of a comparable group of mutual funds, relevant benchmarks, and performance metrics, as applicable. The Boards met with BlackRock’s senior management personnel responsible for investment activities, including the senior investment officers. Each Board also reviewed the materials provided by the applicable Fund’s portfolio management team discussing the Fund’s performance, investment strategies and outlook.
Each Board considered, among other factors, with respect to BlackRock: the experience of the applicable Fund’s portfolio management team; research capabilities; investments by portfolio managers in the funds they manage; portfolio trading capabilities; use of technology; commitment to compliance; credit analysis capabilities; risk analysis and oversight capabilities; and the approach to training and retaining portfolio managers and other research, advisory and management personnel. The Boards also considered BlackRock’s overall risk management program, including the continued efforts of BlackRock and its affiliates to address cybersecurity risks and the role of BlackRock’s Risk & Quantitative Analysis Group. Each Board engaged in a review of BlackRock’s compensation structure with respect to the applicable Fund’s portfolio management team and BlackRock’s ability to attract and retain high-quality talent and create performance incentives.
In addition to investment advisory services, the Boards considered the nature and quality of the administrative and other non-investment advisory services provided to the Funds. BlackRock and its affiliates provide the Funds with certain administrative, shareholder and other services (in addition to any such services provided to the Funds by third-parties) and officers and other personnel as are necessary for the operations of the Funds. In particular, BlackRock and its affiliates provide each Fund with administrative services including, among others: (i) responsibility for disclosure documents, such as the prospectus, the summary prospectus (as applicable), the statement of additional information and periodic shareholder reports; (ii) oversight of daily accounting and pricing; (iii) responsibility for periodic filings with regulators; (iv) overseeing and coordinating the activities of third-party service providers, including, among others, the Fund’s custodian, fund accountant, transfer agent, and auditor; (v) organizing Board meetings and preparing the materials for such Board meetings; (vi) providing legal and compliance support; (vii) furnishing analytical and other support to assist the Board in its consideration of strategic issues such as the merger, consolidation or repurposing of certain open-end funds; and (viii) performing or managing administrative functions necessary for the operation of the Fund, such as tax reporting, expense management, fulfilling regulatory filing requirements, overseeing the Fund’s distribution partners, and shareholder call center and other services. The Boards reviewed the structure and duties of BlackRock’s fund administration, shareholder services, and legal and compliance departments and considered BlackRock’s policies and procedures for assuring compliance with applicable laws and regulations. Each Board considered the operation of BlackRock’s business continuity plans.
The Board noted that the engagement of the Sub-Advisors with respect to Infrastructure Sustainable Opportunities Fund facilitates the provision of investment advice and trading by investment personnel out of non-U.S. jurisdictions. The Board considered that this arrangement provides additional flexibility to the portfolio management team, which may benefit Infrastructure Sustainable Opportunities Fund and its shareholders.
B. The Investment Performance of the Funds
Each Board, including the Independent Board Members, reviewed and considered the performance history of the applicable Fund throughout the year and at the April Meeting. In preparation for the April Meeting, the Boards were provided with reports independently prepared by Broadridge, which included an analysis of each Fund’s performance as of December 31, 2023, as compared to its Performance Peers. Broadridge ranks funds in quartiles, ranging from first to fourth, where first is the most desirable quartile position and fourth is the least desirable. In connection with its review, with respect to each Fund, the applicable Board received and reviewed information regarding the investment performance of the Fund as compared to its Performance Peers and the respective Morningstar Category (“Morningstar Category”). Each Board and its Performance Oversight Committee regularly review and meet with Fund management to discuss the performance of each Fund throughout the year.
In evaluating performance, the Boards focused particular attention on funds with less favorable performance records. The Board also noted that while it found the data provided by Broadridge generally useful, it recognized the limitations of such data, including in particular, that notable differences may exist between a fund and its Performance Peers (for example, the investment objectives and strategies). Further, the Boards recognized that the performance data reflects a snapshot of a period as of a particular date and that selecting a different performance period could produce significantly different results. The Board also acknowledged that long-term performance could be impacted by even one period of significant outperformance or underperformance, and that a single investment theme could have the ability to disproportionately affect long-term performance.
| | |
D I S C L O S U R E O F I N V E S T M E N T A D V I S O R Y A G R E E M E N T S A N D S U B - A D V I S O R Y A G R E E M E N T S | | 77 |
Disclosure of Investment Advisory Agreements and Sub-Advisory Agreements (continued)
The Board of the Trust noted that for the one-, three- and five-year periods reported, Mid-Cap Growth Equity Portfolio ranked in the first, third and second quartiles, respectively, against its Morningstar Category. The Board noted that BlackRock believes that the Morningstar Category is an appropriate performance metric for the Fund, and that BlackRock has explained its rationale for this belief to the Board. The Board and BlackRock reviewed the Fund’s underperformance relative to its Morningstar Category during the applicable period.
The Board of the Corporation noted that for the one-, three- and five-year periods reported, Capital Appreciation Fund ranked in the first, third and third quartiles, respectively, against its Morningstar Category. The Board noted that BlackRock believes that the Morningstar Category is an appropriate performance metric for the Fund, and that BlackRock has explained its rationale for this belief to the Board. The Board and BlackRock reviewed the Fund’s underperformance relative to its Morningstar Category during the applicable periods.
The Board of the Trust noted that for the one-year and since-inception periods reported, the Infrastructure Sustainable Opportunities Fund ranked in the first and fourth quartiles, respectively, against its Morningstar Category. The Board noted that BlackRock believes that the Morningstar Category is an appropriate performance metric for the Fund, and that BlackRock has explained its rationale for this belief to the Board. The Board and BlackRock reviewed the Fund’s underperformance relative to its Morningstar Category during the applicable period.
The Board of the Trust noted that for each of the one-, three- and five-year periods reported, Health Sciences Opportunities Portfolio ranked in the second quartile against its Morningstar Category. The Board noted that BlackRock believes that the Morningstar Category is an appropriate performance metric for the Fund, and that BlackRock has explained its rationale for this belief to the Board.
The Board of the Trust noted that for the one-, three- and five-year periods reported, Technology Opportunities Fund ranked in the second, third and second quartiles, respectively, against its Morningstar Category. The Board noted that BlackRock believes that the Morningstar Category is an appropriate performance metric for the Fund, and that BlackRock has explained its rationale for this belief to the Board. The Board and BlackRock reviewed the Fund’s underperformance relative to its Morningstar Category during the applicable period.
C. Consideration of the Advisory/Management Fees and the Estimated Cost of the Services and Estimated Profits Realized by BlackRock and its Affiliates from their Relationship with the Funds
Each Board, including the Independent Board Members, reviewed the applicable Fund’s contractual management fee rate compared with those of its Expense Peers. The contractual management fee rate represents a combination of the advisory fee and any administrative fees, before taking into account any reimbursements or fee waivers. Each Board also compared the applicable Fund’s total expense ratio, as well as its actual management fee rate, to those of its Expense Peers. The total expense ratio represents a fund’s total net operating expenses, including any 12b-1 or non-12b-1 service fees. The total expense ratio gives effect to any expense reimbursements or fee waivers, and the actual management fee rate gives effect to any management fee reimbursements or waivers. The Boards considered that the fee and expense information in the Broadridge report for the Fund reflected information for a specific period and that historical asset levels and expenses may differ from current levels, particularly in a period of market volatility. The Board considered the services provided and the fees charged by BlackRock and its affiliates to other types of clients with similar investment mandates, as applicable, including institutional accounts and sub-advised mutual funds (including mutual funds sponsored by third parties).
The Boards received and reviewed statements relating to BlackRock’s financial condition. The Boards reviewed BlackRock’s profitability methodology and were also provided with an estimated profitability analysis that detailed the revenues earned and the expenses incurred by BlackRock for services provided to the Funds. The Boards reviewed BlackRock’s estimated profitability with respect to the Funds and other funds the Boards currently oversee for the year ended December 31, 2023 compared to available aggregate estimated profitability data provided for the prior two years. The Boards reviewed BlackRock’s estimated profitability with respect to certain other U.S. fund complexes managed by BlackRock and/or its affiliates. The Boards reviewed BlackRock’s assumptions and methodology of allocating expenses in the estimated profitability analysis, noting the inherent limitations in allocating costs among various advisory products. The Boards recognized that profitability may be affected by numerous factors including, among other things, fee waivers and expense reimbursements by BlackRock, the types of funds managed, precision of expense allocations and business mix. The Boards thus recognized that calculating and comparing profitability at the individual fund levels is difficult.
The Boards noted that, in general, individual fund or product line profitability of other advisors is not publicly available. The Boards reviewed BlackRock’s overall operating margin, in general, compared to that of certain other publicly traded asset management firms. The Boards considered the differences between BlackRock and these other firms, including the contribution of technology at BlackRock, BlackRock’s expense management, and the relative product mix.
Each Board considered whether BlackRock has the financial resources necessary to attract and retain high quality investment management personnel to perform its obligations under the pertinent Agreement(s) and to continue to provide the high quality of services that is expected by the Board. The Boards further considered factors including but not limited to BlackRock’s commitment of time and resources, assumption of risk, and liability profile in servicing the Funds, including in contrast to what is required of BlackRock with respect to other products with similar investment mandates across the open-end fund, ETF, closed-end fund, sub-advised mutual fund, separately managed account, collective investment trust, and institutional separate account product channels, as applicable.
The Board of the Corporation noted that Capital Appreciation Fund’s contractual management fee rate ranked in the second quartile, and that the actual management fee rate and total expense ratio each ranked in the second quartile relative to the Fund’s Expense Peers. The Board further noted that BlackRock and the Board have contractually agreed to a cap on the Fund’s total expenses as a percentage of the Fund’s average daily net assets on a class-by-class basis, as applicable.
The Board of the Trust noted that Infrastructure Sustainable Opportunities Fund’s contractual management fee rate ranked in the third quartile, and that the actual management fee rate and total expense ratio ranked in the first and second quartiles, respectively, relative to the Fund’s Expense Peers. The Board further noted that BlackRock and the Board have contractually agreed to a cap on the Fund’s total expenses as a percentage of the Fund’s average daily net assets on a class-by-class basis.
The Board of the Trust noted that Health Sciences Opportunities Portfolio’s contractual management fee rate ranked in the fourth quartile, and that the actual management fee rate and total expense ratio each ranked in the third quartile relative to the Fund’s Expense Peers.
| | |
| 78 | | 2 0 2 4 B L A C K R O C K A N N U A L F I N A N C I A L S T A T E M E N T S |
Disclosure of Investment Advisory Agreements and Sub-Advisory Agreements (continued)
The Board of the Trust noted that Technology Opportunities Fund’s contractual management fee rate ranked in the fourth quartile, and that the actual management fee rate and total expense ratio ranked in the fourth and third quartiles, respectively, relative to the Fund’s Expense Peers. The Board further noted that BlackRock and the Board have contractually agreed to a cap on the Fund’s total expenses as a percentage of the Fund’s average daily net assets on a class-by-class basis.
The Board of the Trust noted that Mid-Cap Growth Equity Portfolio’s contractual management fee rate ranked in the fourth quartile, and that the actual management fee rate and total expense ratio each ranked in the fourth quartile relative to the Fund’s Expense Peers. The Board further noted that BlackRock and the Board have contractually agreed to a cap on the Fund’s total expenses as a percentage of the Fund’s average daily net assets on a class-by-class basis.
The Boards also noted that each Fund has an advisory fee arrangement that includes breakpoints that adjust the fee rate downward as the size of the pertinent Fund increases above certain contractually specified levels. The Board additionally noted that the breakpoints can, conversely, adjust the advisory fee rate upward as the size of the pertinent Fund decreases below certain contractually specified levels.
D. Economies of Scale
Each Board, including the Independent Board Members, considered the extent to which any economies of scale might benefit the Funds in a variety of ways as the assets of the Funds increase. Each Board considered multiple factors, including the advisory fee rate and breakpoints, unitary fee structure, fee waivers, and/or expense caps, as applicable. Each Board considered each Fund’s asset levels and whether the current fee schedule was appropriate.
E. Other Factors Deemed Relevant by the Board Members
Each Board, including the Independent Board Members, also took into account other ancillary or “fall-out” benefits that BlackRock or its affiliates may derive from BlackRock’s respective relationships with the applicable Fund, both tangible and intangible, such as BlackRock’s ability to leverage its investment professionals who manage other portfolios and its risk management personnel, an increase in BlackRock’s profile in the investment advisory community, and the engagement of BlackRock’s affiliates as service providers to the Fund, including for administrative, distribution, securities lending and cash management services. With respect to securities lending, during the year the Board also considered information provided by independent third-party consultants related to the performance of each BlackRock affiliate as securities lending agent. The Board also considered BlackRock’s overall operations and its efforts to expand the scale of, and improve the quality of, its operations. The Board also noted that, subject to applicable law, BlackRock may use and benefit from third-party research obtained by soft dollars generated by certain registered fund transactions to assist in managing all or a number of its other client accounts.
In connection with their consideration of the pertinent Agreements, the Boards also received information regarding BlackRock’s brokerage and soft dollar practices. The Boards received reports from BlackRock which included information on brokerage commissions and trade execution practices throughout the year.
The Boards noted the competitive nature of the open-end fund marketplace, and that shareholders are able to redeem their Fund shares if they believe that the pertinent Fund’s fees and expenses are too high or if they are dissatisfied with the performance of the Fund.
Conclusion
At the May Meeting, in a continuation of the discussions that occurred during the April Meeting, and as a culmination of the Board of the Trust’s year-long deliberative process, the Board of the Trust, including the Independent Board Members, unanimously approved the continuation of (i) the Trust Advisory Agreement between the Manager and the Trust, on behalf of Mid-Cap Growth Equity Portfolio, Health Sciences Opportunities Portfolio, Technology Opportunities Fund and Infrastructure Sustainable Opportunities Fund; and (ii) the Sub-Advisory Agreements between the Manager and the Sub-Advisors, with respect to Infrastructure Sustainable Opportunities Fund, each for a one-year term ending June 30, 2025.
At the May Meeting, in a continuation of the discussions that occurred during the April Meeting, and as a culmination of the Board of the Corporation’s year-long deliberative process, the Board of the Corporation, including the Independent Board Members, unanimously approved the continuation of the Corporation Advisory Agreement between the Manager and the Corporation, on behalf of Capital Appreciation Fund, for a one-year term ending June 30, 2025.
Based upon their evaluation of all of the aforementioned factors in their totality, as well as other information, the Boards, including the Independent Board Members, were satisfied that the terms of the Agreements were fair and reasonable and in the best interest of each Fund, as pertinent, and its shareholders. In arriving at its decision to approve the Agreements, the Boards did not identify any single factor or group of factors as all-important or controlling, but considered all factors together, and different Board Members may have attributed different weights to the various factors considered. The Independent Board Members were advised by independent legal counsel throughout the deliberative process.
| | |
D I S C L O S U R E O F I N V E S T M E N T A D V I S O R Y A G R E E M E N T S A N D S U B - A D V I S O R Y A G R E E M E N T S | | 79 |
Additional Information
Changes in and Disagreements with Accountants
Not applicable.
Proxy Results
Not applicable.
Remuneration Paid to Directors, Officers, and Others
Compensation to the independent directors/trustees of the Corporation/Trust is paid by the Corporation/Trust, on behalf of the Funds.
General Information
Quarterly performance, semi-annual and annual reports, current net asset value and other information regarding the Funds may be found on BlackRock’s website, which can be accessed at blackrock.com. Any reference to BlackRock’s website in this report is intended to allow investors public access to information regarding the Funds and does not, and is not intended to, incorporate BlackRock’s website in this report.
Electronic Delivery
Shareholders can sign up for e-mail notifications of quarterly statements, annual and semi-annual shareholder reports and prospectuses by enrolling in the electronic delivery program.
To enroll in electronic delivery:
Shareholders Who Hold Accounts with Investment Advisors, Banks or Brokerages:
Please contact your financial advisor. Please note that not all investment advisors, banks or brokerages may offer this service.
Shareholders Who Hold Accounts Directly with BlackRock:
1. Access the BlackRock website at blackrock.com
2. Select “Access Your Account”
3. Next, select “eDelivery” in the “Related Resources” box and follow the sign-up instructions.
BlackRock’s Mutual Fund Family
BlackRock offers a diverse lineup of open-end mutual funds crossing all investment styles and managed by experts in equity, fixed-income and tax-exempt investing. Visit blackrock.com for more information.
Shareholder Privileges
Account Information
Call us at (800) 441-7762 from 8:00 AM to 6:00 PM ET on any business day to get information about your account balances, recent transactions and share prices. You can also visit blackrock.com for more information.
Automatic Investment Plans
Investor class shareholders who want to invest regularly can arrange to have $50 or more automatically deducted from their checking or savings account and invested in any of the BlackRock funds.
Systematic Withdrawal Plans
Investor class shareholders can establish a systematic withdrawal plan and receive periodic payments of $50 or more from their BlackRock funds, as long as their account balance is at least $10,000.
Retirement Plans
Shareholders may make investments in conjunction with Traditional, Rollover, Roth, Coverdell, Simple IRAs, SEP IRAs and 403(b) Plans.
| | |
| 80 | | 2 0 2 4 B L A C K R O C K A N N U A L F I N A N C I A L S T A T E M E N T S |
Additional Information (continued)
| | |
Fund and Service Providers | | |
Investment Adviser and Administrator | | Independent Registered Public Accounting Firm |
BlackRock Advisors, LLC | | Deloitte & Touche LLP |
Wilmington, DE 19809 | | Boston, MA 02116 |
| |
Sub-Advisers(a) | | Distributor |
BlackRock International Limited | | BlackRock Investments, LLC |
Edinburgh, EH3 8BL | | New York, NY 10001 |
United Kingdom | | |
| |
| | Legal Counsel |
BlackRock (Singapore) Limited | | Sidley Austin LLP |
079912 Singapore | | New York, NY 10019 |
| |
Accounting Agent and Transfer Agent | | Address of the Corporation/Trust |
BNY Mellon Investment Servicing (US) Inc. | | 100 Bellevue Parkway |
Wilmington, DE 19809 | | Wilmington, DE 19809 |
| |
Custodian | | |
The Bank of New York Mellon | | |
New York, NY 10286 | | |
(a) For BlackRock Infrastructure Sustainable Opportunities Fund.
| | |
A D D I T I O N A L I N F O R M A T I O N | | 81 |
Glossary of Terms Used in this Report
| | |
| Currency Abbreviation |
| |
| CAD | | Canadian Dollar |
| |
| EUR | | Euro |
| |
| USD | | United States Dollar |
|
| Portfolio Abbreviation |
| |
| ADR | | American Depositary Receipt |
| |
| CVR | | Contingent Value Rights |
| |
| NVS | | Non-Voting Shares |
| | |
| 82 | | 2 0 2 4 B L A C K R O C K A N N U A L F I N A N C I A L S T A T E M E N T S |
THIS PAGE INTENTIONALLY LEFT BLANK.
Want to know more?
blackrock.com | 800-441-7762
This report is intended for current holders. It is not authorized for use as an offer of sale or a solicitation of an offer to buy shares of the Funds unless preceded or accompanied by the Funds’ current prospectus. Past performance results shown in this report should not be considered a representation of future performance. Investment returns and principal value of shares will fluctuate so that shares, when redeemed, may be worth more or less than their original cost. Statements and other information herein are as dated and are subject to change.
| | |

| | MAY 31, 2024 |
| | |
| |
| | 2024 Annual Financial Statements |
BlackRock FundsSM
| · | | BlackRock U.S. Insights Long/Short Equity Fund |
|
| Not FDIC Insured • May Lose Value • No Bank Guarantee |
Table of Contents
Derivative Financial Instruments
The Fund may invest in various derivative financial instruments. These instruments are used to obtain exposure to a security, commodity, index, market, and/or other assets without owning or taking physical custody of securities, commodities and/or other referenced assets or to manage market, equity, credit, interest rate, foreign currency exchange rate, commodity and/or other risks. Derivative financial instruments may give rise to a form of economic leverage and involve risks, including the imperfect correlation between the value of a derivative financial instrument and the underlying asset, possible default of the counterparty to the transaction or illiquidity of the instrument. Pursuant to Rule 18f-4 under the 1940 Act, among other things, the Fund must either use derivative financial instruments with embedded leverage in a limited manner or comply with an outer limit on fund leverage risk based on value-at-risk. The Fund’s successful use of a derivative financial instrument depends on the investment adviser’s ability to predict pertinent market movements accurately, which cannot be assured. The use of these instruments may result in losses greater than if they had not been used, may limit the amount of appreciation the Fund can realize on an investment and/or may result in lower distributions paid to shareholders. The Fund’s investments in these instruments, if any, are discussed in detail in the Notes to Financial Statements.
| | |
D E R I V A T I V E F I N A N C I A L I N S T R U M E N T S | | 3 |
| | |
Schedule of Investments May 31, 2024 | | BlackRock U.S. Insights Long/Short Equity Fund (Percentages shown are based on Net Assets) |
| | | | | | | | |
| Security | | Shares | | | Value | |
| | |
Common Stocks | | | | | | | | |
| | |
Aerospace & Defense — 0.0% | | | | | | | | |
Loar Holdings, Inc.(a) | | | 39 | | | $ | 2,222 | |
| | | | | | | | |
| | |
Interactive Media & Services — 0.1% | | | | | | | | |
Reddit, Inc., Class A(a) | | | 299 | | | | 16,218 | |
| | | | | | | | |
| | |
Media — 0.0% | | | | | | | | |
Ibotta, Inc., Class A(a) | | | 22 | | | | 2,137 | |
| | | | | | | | |
| |
Semiconductors & Semiconductor Equipment — 0.0% | | | | | |
Astera Labs, Inc.(a)(b) | | | 60 | | | | 3,872 | |
| | | | | | | | |
| | |
Software — 0.2% | | | | | | | | |
Rubrik, Inc., Class A(a) | | | 542 | | | | 16,520 | |
| | | | | | | | |
| | |
Total Long-Term Investments — 0.3%
(Cost: $32,698) | | | | | | | 40,969 | |
| | | | | | | | |
| | |
Short-Term Securities | | | | | | | | |
| | |
Money Market Funds — 0.0% | | | | | | | | |
BlackRock Cash Funds: Institutional, SL Agency Shares, 5.49%(c)(d)(e) | | | 3,937 | | | | 3,806 | |
| | | | | | | | |
| | | | | | | | |
Security | | Par (000) | | | Value | |
| | |
U.S. Treasury Obligations(f) — 96.6% | | | | | | | | |
U.S. Treasury Bills, 5.28%, 06/11/24 | | USD | 12,032 | | | $ | 12,017,511 | |
| | | | | | | | |
| | |
Total Short-Term Securities — 96.6%
(Cost: $12,017,818) | | | | | | | 12,021,317 | |
| | | | | | | | |
| | |
Total Investments — 96.9%
(Cost: $12,050,516) | | | | | | | 12,062,286 | |
| | |
| Other Assets Less Liabilities — 3.1% | | | | | 381,016 | |
| | | | | | | | |
| | |
| Net Assets — 100.0% | | | | | $ 12,443,302 | |
| | | | | | | | |
| (a) | Non-income producing security. |
| (b) | All or a portion of this security is on loan. |
| (c) | Affiliate of the Fund. |
| (d) | Annualized 7-day yield as of period end. |
| (e) | All or a portion of this security was purchased with the cash collateral from loaned securities. |
| (f) | Rates are discount rates or a range of discount rates as of period end. |
Affiliates
Investments in issuers considered to be affiliate(s) of the Fund during the period ended May 31, 2024 for purposes of Section 2(a)(3) of the Investment Company Act of 1940, as amended, were as follows:
| | | | | | | | | | | | | | | | | | | | | | | | | | | | | | | | | | | | |
| Affiliated Issuer | | Value at
06/13/23 | | | Purchases
at Cost | | | Proceeds
from Sales | | | Net
Realized
Gain (Loss) | | | Change in
Unrealized
Appreciation
(Depreciation) | | | Value at
05/31/24 | | | Shares
Held at
05/31/24 | | | Income | | | Capital Gain
Distributions
from Underlying
Funds | |
BlackRock Cash Funds: Institutional, SL Agency Shares | | $ | — | | | $ | 3,806 | (a) | | $ | — | | | $ | — | | | $ | — | | | $ | 3,806 | | | | 3,937 | | | $ | — | | | $ | — | |
| | | | | | | | | | | | | | | | | | | | | | | | | | | | | | | | | | | | |
| | (a) | Represents net amount purchased (sold). | |
For purposes of this report, industry and sector sub-classifications may differ from those utilized by the Fund for compliance purposes.
Derivative Financial Instruments Outstanding as of Period End
Futures Contracts
| | | | | | | | | | | | | | | | |
| Description | | Number of Contracts | | | Expiration Date | | | Notional Amount (000) | | | Value/ Unrealized Appreciation (Depreciation) | |
| | | | |
Long Contracts | | | | | | | | | | | | | | | | |
S&P 500 E-Mini Index | | | 9 | | | | 06/21/24 | | | $ | 2,383 | | | $ | 22,847 | |
S&P 500 Annual Dividend Index | | | 4 | | | | 12/19/25 | | | | 76 | | | | 5,139 | |
S&P 500 Annual Dividend Index | | | 4 | | | | 12/18/26 | | | | 78 | | | | 3,438 | |
| | | | | | | | | | | | | | | | |
| | | | |
| | | | | | | | | | | | | | | 31,424 | |
| | | | | | | | | | | | | | | | |
| | |
| 4 | | 2 0 2 4 B L A C K R O C K A N N U A L F I N A N C I A L S T A T E M E N T S |
| | |
Schedule of Investments (continued) May 31, 2024 | | BlackRock U.S. Insights Long/Short Equity Fund |
OTC Total Return Swaps
| | | | | | | | | | | | | | | | | | | | | | | | | | |
| | | | | | | | |
| Reference Entity | | Payment Frequency | | Counterparty(i) | | | Termination Date | | | Net Notional | | | Accrued Unrealized Appreciation (Depreciation) | | | Net Value of Reference Entity | | | Gross Notional Amount Net Asset Percentage | |
| | | | | | | |
Equity Securities Long/Short | | Monthly | | | Barclays Bank PLC(a) | | | | 07/11/24 | | | $ | 671,052 | | | $ | 36,571 | (b) | | $ | 721,973 | | | | 94.8 | % |
| | Monthly | | | Goldman Sachs Bank USA(c) | | | | 08/19/26 | | | | 664,718 | | | | (92,671 | )(d) | | | 570,899 | | | | 61.9 | |
| | Monthly | | | HSBC Bank PLC(e) | | | | 02/09/28 | | | | 450,131 | | | | (4,171 | )(f) | | | 452,495 | | | | 74.4 | |
| | Monthly | | | Merrill Lynch International(g) | | | | 06/15/28 | | | | 649,896 | | | | (42,297 | )(h) | | | 623,073 | | | | 78.5 | |
| | | | | | | | | | | | | | | | | | | | | | | | | | |
| | | | | | | |
| | | | | | | | | | | | | | | | $ | (102,568 | ) | | $ | 2,368,440 | | | | | |
| | | | | | | | | | | | | | | | | | | | | | | | | | |
| | (b) | Amount includes $(14,350) of net dividends and financing fees. | |
| | (d) | Amount includes $1,148 of net dividends and financing fees. | |
| | (f) | Amount includes $(6,535) of net dividends and financing fees. | |
| | (h) | Amount includes $(15,474) of net dividends and financing fees. | |
| | (i) | The Fund receives the total return on a portfolio of long positions underlying the total return swap. The Fund pays the total return on a portfolio of short positions underlying the total return swap. In addition, the Fund pays or receives a variable rate of interest, based on a specified benchmark. The benchmark and spread are determined based upon the country and/or currency of the individual underlying positions. | |
The following are the specified benchmarks (plus or minus a range) used in determining the variable rate of interest:
| | | | | | |
| | (a) | | (c) | | (e) |
| Range: | | 15-20 basis points | | 0-42 basis points | | 0-20 basis points |
| Benchmarks: | | USD Overnight Bank Funding Rate | | U.S. Overnight Federal Funds Effective Rate | | USD Overnight Bank Funding Rate |
| | | |
| | (g) | | | | |
| Range: | | 0-30 basis points | | | | |
| Benchmarks: | | USD Overnight Bank Funding Rate | | | | |
The following table represents the individual long and short positions and related values of equity securities underlying the total return swap with Barclays Bank PLC as of period end, termination date July 11, 2024:
| | | | | | | | | | | | |
| |
| | | Shares | | | Value | | | % of
Basket
Value | |
| |
| | | |
Reference Entity — Long | | | | | | | | | | | | |
| | | |
| Common Stocks | | | | | | | | | |
| | | |
| Automobile Components | | | | | | | | | |
Aptiv PLC | | | 1,099 | | | $ | 91,503 | | | | 12.7 | % |
| | | | | | | | | | | | |
| | | |
Banks | | | | | | | | | | | | |
Citizens Financial Group, Inc. | | | 288 | | | | 10,164 | | | | 1.4 | |
| | | | | | | | | | | | |
| | | |
Broadline Retail | | | | | | | | | | | | |
Amazon.com, Inc. | | | 202 | | | | 35,641 | | | | 4.9 | |
| | | | | | | | | | | | |
| | | |
Capital Markets | | | | | | | | | | | | |
Intercontinental Exchange, Inc. | | | 1,386 | | | | 185,585 | | | | 25.7 | |
| | | | | | | | | | | | |
| | | |
Electrical Equipment | | | | | | | | | | | | |
AMETEK, Inc. | | | 535 | | | | 90,725 | | | | 12.6 | |
| | | | | | | | | | | | |
| | | |
Financial Services | | | | | | | | | | | | |
Mastercard, Inc., Class A | | | 1,014 | | | | 453,329 | | | | 62.8 | |
Visa, Inc., Class A | | | 1,625 | | | | 442,748 | | | | 61.3 | |
| | | | | | | | | | | | |
| | | | | | | 896,077 | | | | | |
| | | | | | | | | | | | |
| |
| | | Shares | | | Value | | | % of
Basket
Value | |
| |
| | | |
Health Care Providers & Services | | | | | | | | | | | | |
Cardinal Health, Inc. | | | 3,207 | | | $ | 318,359 | | | | 44.1 | % |
| | | | | | | | | | | | |
| | | |
Machinery | | | | | | | | | | | | |
CNH Industrial NV | | | 8,214 | | | | 86,740 | | | | 12.0 | |
| | | | | | | | | | | | |
| | | |
Media | | | | | | | | | | | | |
Comcast Corp., Class A | | | 6,528 | | | | 261,316 | | | | 36.2 | |
Fox Corp., Class A, NVS | | | 8,700 | | | | 299,541 | | | | 41.5 | |
| | | | | | | | | | | | |
| | | | | | | 560,857 | | | | | |
| | | |
Multi-Utilities | | | | | | | | | | | | |
CMS Energy Corp. | | | 1,377 | | | | 86,654 | | | | 12.0 | |
Sempra | | | 992 | | | | 76,414 | | | | 10.6 | |
| | | | | | | | | | | | |
| | | | | | | 163,068 | | | | | |
| | | |
Oil, Gas & Consumable Fuels | | | | | | | | | | | | |
BP PLC | | | 11,145 | | | | 418,718 | | | | 58.0 | |
Devon Energy Corp. | | | 9,676 | | | | 474,898 | | | | 65.8 | |
Hess Corp. | | | 6,044 | | | | 931,380 | | | | 129.0 | |
Shell PLC | | | 133 | | | | 9,680 | | | | 1.3 | |
Suncor Energy, Inc. | | | 18,086 | | | | 738,270 | | | | 102.3 | |
TC Energy Corp. | | | 1,657 | | | | 63,894 | | | | 8.8 | |
| | | | | | | | | | | | |
| | | | | | | 2,636,840 | | | | | |
| | | |
Pharmaceuticals | | | | | | | | | | | | |
Sanofi SA | | | 1,833 | | | | 89,872 | | | | 12.5 | |
| | | | | | | | | | | | |
| | | |
Professional Services | | | | | | | | | | | | |
Dun & Bradstreet Holdings, Inc. | | | 7,556 | | | | 72,462 | | | | 10.0 | |
| | | | | | | | | | | | |
| | |
S C H E D U L E O F I N V E S T M E N T S | | 5 |
| | |
Schedule of Investments (continued) May 31, 2024 | | BlackRock U.S. Insights Long/Short Equity Fund |
| | | | | | | | | | | | |
| |
| | | Shares | | | Value | | | % of
Basket
Value | |
| |
| | | |
| Software | | | | | | | | | |
Gitlab, Inc., Class A | | | 1,655 | | | $ | 78,099 | | | | 10.8 | % |
Microsoft Corp. | | | 1,760 | | | | 730,629 | | | | 101.2 | |
| | | | | | | | | | | | |
| | | | | | | 808,728 | | | | | |
| | | |
| Specialty Retail | | | | | | | | | |
Ulta Beauty, Inc. | | | 456 | | | | 180,161 | | | | 25.0 | |
| | | | | | | | | | | | |
| | |
| Total Reference Entity — Long | | | 6,226,782 | | | | |
| | | | | | | | | | | | |
| | | |
Reference Entity — Short | | | | | | | | | | | | |
| | | |
| Common Stocks | | | | | | | | | |
| | | |
| Banks | | | | | | | | | |
Fifth Third Bancorp | | | 583 | | | | (21,816 | ) | | | (3.0 | ) |
| | | | | | | | | | | | |
| | | |
| Biotechnology | | | | | | | | | |
Moderna, Inc. | | | 1,378 | | | | (196,434 | ) | | | (27.2 | ) |
| | | | | | | | | | | | |
| | | |
| Capital Markets | | | | | | | | | |
Blackstone, Inc., Class A | | | 400 | | | | (48,200 | ) | | | (6.7 | ) |
CME Group, Inc., Class A | | | 68 | | | | (13,803 | ) | | | (1.9 | ) |
MSCI, Inc., Class A | | | 640 | | | | (316,915 | ) | | | (43.9 | ) |
| | | | | | | | | | | | |
| | | |
| | | | | | | (378,918 | ) | | | | |
| | | |
| Chemicals | | | | | | | | | |
Linde PLC | | | 1,082 | | | | (471,233 | ) | | | (65.3 | ) |
| | | | | | | | | | | | |
| | | |
| Commercial Services & Supplies | | | | | | | | | |
GFL Environmental, Inc. | | | 2,488 | | | | (78,297 | ) | | | (10.8 | ) |
| | | | | | | | | | | | |
| | | |
| Communications Equipment | | | | | | | | | |
F5, Inc. | | | 480 | | | | (81,106 | ) | | | (11.2 | ) |
| | | | | | | | | | | | |
| | | |
| Electric Utilities | | | | | | | | | |
Avangrid, Inc. | | | 84 | | | | (3,025 | ) | | | (0.4 | ) |
FirstEnergy Corp. | | | 13,734 | | | | (552,930 | ) | | | (76.6 | ) |
Southern Co. (The) | | | 2,649 | | | | (212,291 | ) | | | (29.4 | ) |
| | | | | | | | | | | | |
| | | |
| | | | | | | (768,246 | ) | | | | |
| | | |
| Electrical Equipment | | | | | | | | | |
Vertiv Holdings Co., Class A | | | 414 | | | | (40,601 | ) | | | (5.6 | ) |
| | | | | | | | | | | | |
| | | |
| Entertainment | | | | | | | | | |
Take-Two Interactive Software, Inc. | | | 325 | | | | (52,117 | ) | | | (7.2 | ) |
| | | | | | | | | | | | |
| | | |
| Financial Services | | | | | | | | | |
Apollo Global Management, Inc. | | | 548 | | | | (63,656 | ) | | | (8.8 | ) |
| | | | | | | | | | | | |
| | | |
| Ground Transportation | | | | | | | | | |
Norfolk Southern Corp. | | | 827 | | | | (185,910 | ) | | | (25.8 | ) |
| | | | | | | | | | | | |
| | | |
| Health Care Providers & Services | | | | | | | | | |
DaVita, Inc. | | | 39 | | | | (5,738 | ) | | | (0.8 | ) |
| | | | | | | | | | | | |
| | | |
| Health Care Technology | | | | | | | | | |
Doximity, Inc., Class A | | | 951 | | | | (26,371 | ) | | | (3.7 | ) |
| | | | | | | | | | | | |
| | | |
| Hotels, Restaurants & Leisure | | | | | | | | | |
Airbnb, Inc., Class A | | | 547 | | | | (79,277 | ) | | | (11.0 | ) |
| | | | | | | | | | | | |
| | | |
| Insurance | | | | | | | | | |
Aflac, Inc. | | | 76 | | | | (6,830 | ) | | | (1.0 | ) |
Marsh & McLennan Cos., Inc. | | | 1,629 | | | | (338,148 | ) | | | (46.8 | ) |
| | | | | | | | | | | | |
| | | |
| | | | | | | (344,978 | ) | | | | |
| | | |
| IT Services | | | | | | | | | |
International Business Machines Corp. | | | 848 | | | | (141,489 | ) | | | (19.6 | ) |
| | | | | | | | | | | | |
| | | | | | | | | | | | |
| |
| | | Shares | | | Value | | | % of
Basket
Value | |
| |
| | |
| Life Sciences Tools & Services | | | | | | | |
Repligen Corp. | | | 24 | | | $ | (3,578 | ) | | | (0.5 | )% |
| | | | | | | | | | | | |
| | | |
| Multi-Utilities | | | | | | | | | |
Public Service Enterprise Group, Inc. | | | 1,166 | | | | (88,336 | ) | | | (12.2 | ) |
| | | | | | | | | | | | |
| | | |
| Oil, Gas & Consumable Fuels | | | | | | | | | |
Coterra Energy, Inc. | | | 5,294 | | | | (150,985 | ) | | | (20.9 | ) |
Enbridge, Inc. | | | 19,907 | | | | (728,198 | ) | | | (100.9 | ) |
Exxon Mobil Corp. | | | 251 | | | | (29,432 | ) | | | (4.1 | ) |
Occidental Petroleum Corp. | | | 4,657 | | | | (291,063 | ) | | | (40.3 | ) |
Range Resources Corp. | | | 3,610 | | | | (133,245 | ) | | | (18.5 | ) |
Southwestern Energy Co. | | | 31,582 | | | | (237,812 | ) | | | (32.9 | ) |
| | | | | | | | | | | | |
| | | |
| | | | | | | (1,570,735 | ) | | | | |
| | | |
| Pharmaceuticals | | | | | | | | | |
Organon & Co. | | | 6,958 | | | | (148,414 | ) | | | (20.6 | ) |
Viatris, Inc. | | | 3,894 | | | | (41,276 | ) | | | (5.7 | ) |
| | | | | | | | | | | | |
| | | |
| | | | | | | (189,690 | ) | | | | |
| | |
| Real Estate Management & Development | | | | | | | |
CBRE Group, Inc., Class A | | | 999 | | | | (87,982 | ) | | | (12.2 | ) |
| | | | | | | | | | | | |
| | | |
| Retail REITs | | | | | | | | | |
Regency Centers Corp. | | | 1,512 | | | | (92,837 | ) | | | (12.8 | ) |
Simon Property Group, Inc. | | | 195 | | | | (29,505 | ) | | | (4.1 | ) |
| | | | | | | | | | | | |
| | | |
| | | | | | | (122,342 | ) | | | | |
| | | |
| Software | | | | | | | | | |
Aspen Technology, Inc. | | | 2,168 | | | | (456,689 | ) | | | (63.3 | ) |
| | | | | | | | | | | | |
| | | |
| Specialized REITs | | | | | | | | | |
Digital Realty Trust, Inc. | | | 339 | | | | (49,270 | ) | | | (6.8 | ) |
| | | | | | | | | | | | |
| | | |
Total Reference Entity — Short | | | | | | | (5,504,809 | ) | | | | |
| | | | | | | | | | | | |
| | |
Net Value of Reference Entity —
Barclays Bank PLC | | | $ 721,973 | | | | |
| | | | | | | | | | | | |
The following table represents the individual long and short positions and related values of equity securities underlying the total return swap with Goldman Sachs Bank USA as of period end, termination date August 19, 2026:
| | | | | | | | | | | | |
| |
| | | Shares | | | Value | | | % of
Basket
Value | |
| |
| | | |
Reference Entity — Long | | | | | | | | | | | | |
| | | |
| Common Stocks | | | | | | | | | |
Broadline Retail | | | | | | | | | | | | |
Amazon.com, Inc. | | | 2,626 | | | $ | 463,332 | | | | 81.2 | % |
| | | | | | | | | | | | |
| | | |
| Capital Markets | | | | | | | | | |
Intercontinental Exchange, Inc. | | | 937 | | | | 125,464 | | | | 22.0 | |
| | | | | | | | | | | | |
| | | |
| Consumer Finance | | | | | | | | | |
Discover Financial Services | | | 2,875 | | | | 352,648 | | | | 61.8 | |
| | | | | | | | | | | | |
| | | |
| Consumer Staples Distribution & Retail | | | | | | | | | |
Dollar Tree, Inc. | | | 916 | | | | 108,042 | | | | 18.9 | |
| | | | | | | | | | | | |
| | | |
| Financial Services | | | | | | | | | |
Visa, Inc., Class A | | | 42 | | | | 11,443 | | | | 2.0 | |
| | | | | | | | | | | | |
| | |
| 6 | | 2 0 2 4 B L A C K R O C K A N N U A L F I N A N C I A L S T A T E M E N T S |
| | |
Schedule of Investments (continued) May 31, 2024 | | BlackRock U.S. Insights Long/Short Equity Fund |
| | | | | | | | | | | | |
| |
| | | Shares | | | Value | | | % of
Basket
Value | |
| |
| | | |
| Health Care Providers & Services | | | | | | | | | |
Cardinal Health, Inc. | | | 97 | | | $ | 9,629 | | | | 1.7 | % |
| | | | | | | | | | | | |
| | | |
| Hotels, Restaurants & Leisure | | | | | | | | | |
DoorDash, Inc., Class A | | | 694 | | | | 76,416 | | | | 13.4 | |
| | | | | | | | | | | | |
| | | |
| Insurance | | | | | | | | | |
Fidelity National Financial, Inc., Class A | | | 3,049 | | | | 153,548 | | | | 26.9 | |
| | | | | | | | | | | | |
| | | |
| Interactive Media & Services | | | | | | | | | |
Meta Platforms, Inc., Class A | | | 189 | | | | 88,231 | | | | 15.4 | |
| | | | | | | | | | | | |
| | | |
| Life Sciences Tools & Services | | | | | | | | | |
Thermo Fisher Scientific, Inc. | | | 645 | | | | 366,347 | | | | 64.2 | |
| | | | | | | | | | | | |
| | | |
| Machinery | | | | | | | | | |
CNH Industrial NV | | | 8,645 | | | | 91,291 | | | | 16.0 | |
| | | | | | | | | | | | |
| | | |
| Media | | | | | | | | | |
Comcast Corp., Class A | | | 10,658 | | | | 426,640 | | | | 74.7 | |
| | | | | | | | | | | | |
| | | |
| Multi-Utilities | | | | | | | | | |
CMS Energy Corp. | | | 8,313 | | | | 523,137 | | | | 91.6 | |
| | | | | | | | | | | | |
| | | |
| Oil, Gas & Consumable Fuels | | | | | | | | | |
Devon Energy Corp. | | | 5,517 | | | | 270,775 | | | | 47.5 | |
Shell PLC | | | 3,531 | | | | 256,986 | | | | 45.0 | |
TC Energy Corp. | | | 17,252 | | | | 665,237 | | | | 116.5 | |
| | | | | | | | | | | | |
| | | |
| | | | | | | 1,192,998 | | | | | |
| | | |
| Professional Services | | | | | | | | | |
Dun & Bradstreet Holdings, Inc. | | | 10,953 | | | | 105,039 | | | | 18.4 | |
| | | | | | | | | | | | |
| | | |
| Total Reference Entity — Long | | | | | 4,094,205 | | | | |
| | | | | | | | | | | | |
| | | |
Reference Entity — Short | | | | | | | | | | | | |
| | | |
| Common Stocks | | | | | | | | | |
| | | |
| Automobiles | | | | | | | | | |
Tesla, Inc. | | | 802 | | | | (142,820 | ) | | | (25.0 | ) |
| | | | | | | | | | | | |
| | | |
| Banks | | | | | | | | | |
Bank of America Corp. | | | 4,790 | | | | (191,552 | ) | | | (33.6 | ) |
Fifth Third Bancorp | | | 1,062 | | | | (39,740 | ) | | | (7.0 | ) |
JPMorgan Chase & Co. | | | 2,012 | | | | (407,692 | ) | | | (71.4 | ) |
Truist Financial Corp. | | | 1,443 | | | | (54,473 | ) | | | (9.5 | ) |
| | | | | | | | | | | | |
| | | |
| | | | | | | (693,457 | ) | | | | |
| | | |
| Biotechnology | | | | | | | | | |
Moderna, Inc. | | | 396 | | | | (56,450 | ) | | | (9.9 | ) |
| | | | | | | | | | | | |
| | | |
| Building Products | | | | | | | | | |
Carrier Global Corp. | | | 1,649 | | | | (104,200 | ) | | | (18.2 | ) |
| | | | | | | | | | | | |
| | | |
| Capital Markets | | | | | | | | | |
MSCI, Inc., Class A | | | 237 | | | | (117,358 | ) | | | (20.6 | ) |
| | | | | | | | | | | | |
| | | |
| Chemicals | | | | | | | | | |
Linde PLC | | | 111 | | | | (48,343 | ) | | | (8.5 | ) |
| | | | | | | | | | | | |
| | | |
| Commercial Services & Supplies | | | | | | | | | |
GFL Environmental, Inc. | | | 2,529 | | | | (79,588 | ) | | | (13.9 | ) |
| | | | | | | | | | | | |
| | | |
| Communications Equipment | | | | | | | | | |
F5, Inc. | | | 35 | | | | (5,914 | ) | | | (1.0 | ) |
| | | | | | | | | | | | |
| | | |
| Containers & Packaging | | | | | | | | | |
Ball Corp. | | | 3,195 | | | | (221,829 | ) | | | (38.9 | ) |
| | | | | | | | | | | | |
| | | | | | | | | | | | |
| |
| | | Shares | | | Value | | | % of
Basket
Value | |
| |
| | | |
| Electric Utilities | | | | | | | | | |
Avangrid, Inc. | | | 2,354 | | | $ | (84,768 | ) | | | (14.8 | )% |
FirstEnergy Corp. | | | 7,231 | | | | (291,120 | ) | | | (51.0 | ) |
| | | | | | | | | | | | |
| | | |
| | | | | | | (375,888 | ) | | | | |
| | | |
| Electrical Equipment | | | | | | | | | |
Rockwell Automation, Inc. | | | 294 | | | | (75,714 | ) | | | (13.3 | ) |
| | | | | | | | | | | | |
| | | |
| Entertainment | | | | | | | | | |
Take-Two Interactive Software, Inc. | | | 267 | | | | (42,816 | ) | | | (7.5 | ) |
| | | | | | | | | | | | |
| | | |
| Financial Services | | | | | | | | | |
PayPal Holdings, Inc. | | | 1,364 | | | | (85,918 | ) | | | (15.0 | ) |
| | | | | | | | | | | | |
| | | |
| Health Care Providers & Services | | | | | | | | | |
DaVita, Inc. | | | 653 | | | | (96,069 | ) | | | (16.8 | ) |
Universal Health Services, Inc., Class B | | | 498 | | | | (94,521 | ) | | | (16.6 | ) |
| | | | | | | | | | | | |
| | | | | | | (190,590 | ) | | | | |
| | | |
| Hotels, Restaurants & Leisure | | | | | | | | | |
Airbnb, Inc., Class A | | | 343 | | | | (49,711 | ) | | | (8.7 | ) |
| | | | | | | | | | | | |
| | | |
| Insurance | | | | | | | | | |
Aflac, Inc. | | | 1,061 | | | | (95,352 | ) | | | (16.7 | ) |
Marsh & McLennan Cos., Inc. | | | 395 | | | | (81,994 | ) | | | (14.4 | ) |
| | | | | | | | | | | | |
| | | | | | | (177,346 | ) | | | | |
| | | |
| IT Services | | | | | | | | | |
International Business Machines Corp. | | | 643 | | | | (107,284 | ) | | | (18.8 | ) |
| | | | | | | | | | | | |
| | | |
| Life Sciences Tools & Services | | | | | | | | | |
Repligen Corp. | | | 57 | | | | (8,498 | ) | | | (1.5 | ) |
| | | | | | | | | | | | |
| | | |
| Media | | | | | | | | | |
Trade Desk, Inc. (The), Class A | | | 83 | | | | (7,701 | ) | | | (1.3 | ) |
| | | | | | | | | | | | |
| | | |
| Oil, Gas & Consumable Fuels | | | | | | | | | |
CNX Resources Corp. | | | 1,564 | | | | (41,133 | ) | | | (7.2 | ) |
Exxon Mobil Corp. | | | 84 | | | | (9,850 | ) | | | (1.7 | ) |
Range Resources Corp. | | | 12,923 | | | | (476,988 | ) | | | (83.6 | ) |
Southwestern Energy Co. | | | 18,270 | | | | (137,573 | ) | | | (24.1 | ) |
| | | | | | | | | | | | |
| | | | | | | (665,544 | ) | | | | |
| | | |
| Pharmaceuticals | | | | | | | | | |
Johnson & Johnson | | | 1,018 | | | | (149,310 | ) | | | (26.2 | ) |
Viatris, Inc. | | | 6,975 | | | | (73,935 | ) | | | (12.9 | ) |
| | | | | | | | | | | | |
| | | |
| | | | | | | (223,245 | ) | | | | |
| |
| Semiconductors & Semiconductor Equipment | | | | |
Allegro MicroSystems, Inc. | | | 1,097 | | | | (33,064 | ) | | | (5.8 | ) |
| | | | | | | | | | | | |
| | | |
| Specialized REITs | | | | | | | | | |
Digital Realty Trust, Inc. | | | 69 | | | | (10,028 | ) | | | (1.8 | ) |
| | | | | | | | | | | | |
| | | |
Total Reference Entity — Short | | | | | | | (3,523,306 | ) | | | | |
| | | | | | | | | | | | |
| | |
Net Value of Reference Entity —
Goldman Sachs Bank USA | | | $ 570,899 | | | | |
| | | | | | | | | | | | |
| | |
S C H E D U L E O F I N V E S T M E N T S | | 7 |
| | |
Schedule of Investments (continued) May 31, 2024 | | BlackRock U.S. Insights Long/Short Equity Fund |
The following table represents the individual long and short positions and related values of equity securities underlying the total return swap with HSBC Bank PLC as of period end, termination date February 9, 2028:
| | | | | | | | | | | | |
| |
| | | Shares | | | Value | | | % of
Basket
Value | |
| |
| | | |
Reference Entity — Long | | | | | | | | | | | | |
| | | |
| Common Stocks | | | | | | | | | |
| | | |
| Banks | | | | | | | | | |
Citizens Financial Group, Inc. | | | 1,004 | | | $ | 35,431 | | | | 7.8 | % |
| | | | | | | | | | | | |
| | | |
| Broadline Retail | | | | | | | | | |
Amazon.com, Inc. | | | 173 | | | | 30,524 | | | | 6.7 | |
| | | | | | | | | | | | |
| | | |
| Commercial Services & Supplies | | | | | | | | | |
Waste Connections, Inc. | | | 780 | | | | 128,170 | | | | 28.3 | |
| | | | | | | | | | | | |
| | |
| Consumer Staples Distribution & Retail | | | | | | | |
Dollar Tree, Inc. | | | 1,127 | | | | 132,930 | | | | 29.4 | |
| | | | | | | | | | | | |
| | | |
| Electrical Equipment | | | | | | | | | |
GE Vernova, Inc. | | | 3,149 | | | | 553,909 | | | | 122.4 | |
| | | | | | | | | | | | |
| | | |
| Ground Transportation | | | | | | | | | |
Saia, Inc. | | | 8 | | | | 3,276 | | | | 0.7 | |
| | | | | | | | | | | | |
| | | |
| Health Care Providers & Services | | | | | | | | | |
Cardinal Health, Inc. | | | 1,293 | | | | 128,356 | | | | 28.4 | |
Humana, Inc. | | | 507 | | | | 181,567 | | | | 40.1 | |
| | | | | | | | | | | | |
| | | |
| | | | | | | 309,923 | | | | | |
| | | |
| Hotels, Restaurants & Leisure | | | | | | | | | |
DoorDash, Inc., Class A | | | 420 | | | | 46,246 | | | | 10.2 | |
| | | | | | | | | | | | |
| | | |
| Insurance | | | | | | | | | |
Allstate Corp. (The) | | | 556 | | | | 93,141 | | | | 20.6 | |
Fidelity National Financial, Inc., Class A | | | 6,292 | | | | 316,865 | | | | 70.0 | |
| | | | | | | | | | | | |
| | | |
| | | | | | | 410,006 | | | | | |
| | | |
| Life Sciences Tools & Services | | | | | | | | | |
Fortrea Holdings, Inc. | | | 3,582 | | | | 90,947 | | | | 20.1 | |
Thermo Fisher Scientific, Inc. | | | 855 | | | | 485,623 | | | | 107.3 | |
| | | | | | | | | | | | |
| | | |
| | | | | | | 576,570 | | | | | |
| | | |
| Media | | | | | | | | | |
Comcast Corp., Class A | | | 6,076 | | | | 243,222 | | | | 53.8 | |
| | | | | | | | | | | | |
| | | |
| Multi-Utilities | | | | | | | | | |
CMS Energy Corp. | | | 4,811 | | | | 302,756 | | | | 66.9 | |
Sempra | | | 1,302 | | | | 100,293 | | | | 22.2 | |
| | | | | | | | | | | | |
| | | |
| | | | | | | 403,049 | | | | | |
| | | |
| Oil, Gas & Consumable Fuels | | | | | | | | | |
BP PLC | | | 572 | | | | 21,490 | | | | 4.8 | |
Cenovus Energy, Inc. | | | 10,647 | | | | 221,670 | | | | 49.0 | |
Devon Energy Corp. | | | 1,585 | | | | 77,792 | | | | 17.2 | |
Shell PLC | | | 279 | | | | 20,306 | | | | 4.5 | |
Suncor Energy, Inc. | | | 4,991 | | | | 203,732 | | | | 45.0 | |
TC Energy Corp. | | | 1,223 | | | | 47,159 | | | | 10.4 | |
| | | | | | | | | | | | |
| | | |
| | | | | | | 592,149 | | | | | |
| | | |
| Pharmaceuticals | | | | | | | | | |
Zoetis, Inc., Class A | | | 542 | | | | 91,902 | | | | 20.3 | |
| | | | | | | | | | | | |
| | | | | | | | | | | | |
| |
| | | Shares | | | Value | | | % of
Basket
Value | |
| |
| | | |
| Professional Services | | | | | | | | | |
Dun & Bradstreet Holdings, Inc. | | | 13,680 | | | $ | 131,191 | | | | 29.0 | % |
| | | | | | | | | | | | |
| |
| Semiconductors & Semiconductor Equipment | | | | |
Applied Materials, Inc. | | | 3,403 | | | | 731,917 | | | | 161.8 | |
Micron Technology, Inc. | | | 718 | | | | 89,750 | | | | 19.8 | |
| | | | | | | | | | | | |
| | | |
| | | | | | | 821,667 | | | | | |
| | | |
| Software | | | | | | | | | |
Microsoft Corp. | | | 111 | | | | 46,080 | | | | 10.2 | |
Oracle Corp. | | | 1,081 | | | | 126,682 | | | | 28.0 | |
Synopsys, Inc. | | | 425 | | | | 238,340 | | | | 52.7 | |
| | | | | | | | | | | | |
| | | |
| | | | | | | 411,102 | | | | | |
| | | |
| Specialized REITs | | | | | | | | | |
Crown Castle, Inc. | | | 77 | | | | 7,893 | | | | 1.7 | |
| | | | | | | | | | | | |
| | | |
| Total Reference Entity — Long | | | | | 4,929,160 | | | | |
| | | | | | | | | | | | |
| | | |
Reference Entity — Short | | | | | | | | | | | | |
| | | |
| Common Stocks | | | | | | | | | |
| | | |
| Banks | | | | | | | | | |
Fifth Third Bancorp | | | 6,287 | | | | (235,260 | ) | | | (52.0 | ) |
Truist Financial Corp. | | | 1,082 | | | | (40,845 | ) | | | (9.0 | ) |
| | | | | | | | | | | | |
| | | |
| | | | | | | (276,105 | ) | | | | |
| | | |
| Capital Markets | | | | | | | | | |
Blackstone, Inc., Class A | | | 326 | | | | (39,283 | ) | | | (8.7 | ) |
Northern Trust Corp. | | | 36 | | | | (3,033 | ) | | | (0.7 | ) |
| | | | | | | | | | | | |
| | | |
| | | | | | | (42,316 | ) | | | | |
| | | |
| Chemicals | | | | | | | | | |
Linde PLC | | | 932 | | | | (405,905 | ) | | | (89.7 | ) |
| | | | | | | | | | | | |
| | |
| Consumer Staples Distribution & Retail | | | | | | | |
Walmart, Inc. | | | 2,678 | | | | (176,105 | ) | | | (38.9 | ) |
| | | | | | | | | | | | |
| | | |
| Electric Utilities | | | | | | | | | |
Avangrid, Inc. | | | 113 | | | | (4,069 | ) | | | (0.9 | ) |
FirstEnergy Corp. | | | 1,500 | | | | (60,390 | ) | | | (13.3 | ) |
| | | | | | | | | | | | |
| | | |
| | | | | | | (64,459 | ) | | | | |
| | | |
| Electrical Equipment | | | | | | | | | |
Rockwell Automation, Inc. | | | 15 | | | | (3,863 | ) | | | (0.8 | ) |
Vertiv Holdings Co., Class A | | | 1,005 | | | | (98,560 | ) | | | (21.8 | ) |
| | | | | | | | | | | | |
| | | |
| | | | | | | (102,423 | ) | | | | |
| | | |
| Financial Services | | | | | | | | | |
Apollo Global Management, Inc. | | | 122 | | | | (14,172 | ) | | | (3.1 | ) |
PayPal Holdings, Inc. | | | 54 | | | | (3,401 | ) | | | (0.8 | ) |
| | | | | | | | | | | | |
| | | |
| | | | | | | (17,573 | ) | | | | |
| | | |
| Ground Transportation | | | | | | | | | |
Norfolk Southern Corp. | | | 310 | | | | (69,688 | ) | | | (15.4 | ) |
| | | | | | | | | | | | |
| | | |
| Health Care Providers & Services | | | | | | | | | |
Centene Corp. | | | 3,420 | | | | (244,838 | ) | | | (54.1 | ) |
Universal Health Services, Inc., Class B | | | 7 | | | | (1,329 | ) | | | (0.3 | ) |
| | | | | | | | | | | | |
| | | |
| | | | | | | (246,167 | ) | | | | |
| | | |
| Hotels, Restaurants & Leisure | | | | | | | | | |
Airbnb, Inc., Class A | | | 553 | | | | (80,146 | ) | | | (17.7 | ) |
| | | | | | | | | | | | |
| | | |
| IT Services | | | | | | | | | |
International Business Machines Corp. | | | 1,059 | | | | (176,694 | ) | | | (39.1 | ) |
| | | | | | | | | | | | |
| | |
| 8 | | 2 0 2 4 B L A C K R O C K A N N U A L F I N A N C I A L S T A T E M E N T S |
| | |
Schedule of Investments (continued) May 31, 2024 | | BlackRock U.S. Insights Long/Short Equity Fund |
| | | | | | | | | | | | |
| |
| | | Shares | | | Value | | | % of
Basket
Value | |
| |
| | | |
| Life Sciences Tools & Services | | | | | | | | | |
Repligen Corp. | | | 444 | | | $ | (66,196 | ) | | | (14.6 | )% |
| | | | | | | | | | | | |
| | | |
| Media | | | | | | | | | |
Trade Desk, Inc. (The), Class A | | | 586 | | | | (54,369 | ) | | | (12.0 | ) |
| | | | | | | | | | | | |
| | | |
| Multi-Utilities | | | | | | | | | |
Public Service Enterprise Group, Inc. | | | 5,008 | | | | (379,406 | ) | | | (83.9 | ) |
| | | | | | | | | | | | |
| | | |
| Oil, Gas & Consumable Fuels | | | | | | | | | |
CNX Resources Corp. | | | 14,418 | | | | (379,193 | ) | | | (83.8 | ) |
Exxon Mobil Corp. | | | 5,847 | | | | (685,619 | ) | | | (151.5 | ) |
Range Resources Corp. | | | 900 | | | | (33,219 | ) | | | (7.3 | ) |
Southwestern Energy Co. | | | 3,584 | | | | (26,988 | ) | | | (6.0 | ) |
| | | | | | | | | | | | |
| | | |
| | | | | | | (1,125,019 | ) | | | | |
| | | |
| Pharmaceuticals | | | | | | | | | |
Viatris, Inc. | | | 6,833 | | | | (72,430 | ) | | | (16.0 | ) |
| | | | | | | | | | | | |
| | | |
| Professional Services | | | | | | | | | |
Paycom Software, Inc. | | | 604 | | | | (87,773 | ) | | | (19.4 | ) |
| | | | | | | | | | | | |
| | |
| Real Estate Management & Development | | | | | | | |
CBRE Group, Inc., Class A | | | 48 | | | | (4,227 | ) | | | (0.9 | ) |
| | | | | | | | | | | | |
| |
| Semiconductors & Semiconductor Equipment | | | | |
Allegro MicroSystems, Inc. | | | 4,680 | | | | (141,055 | ) | | | (31.2 | ) |
KLA Corp. | | | 688 | | | | (522,557 | ) | | | (115.5 | ) |
| | | | | | | | | | | | |
| | | |
| | | | | | | (663,612 | ) | | | | |
| | | |
| Software | | | | | | | | | |
Aspen Technology, Inc. | | | 431 | | | | (90,790 | ) | | | (20.1 | ) |
| | | | | | | | | | | | |
| | | |
| Specialized REITs | | | | | | | | | |
Digital Realty Trust, Inc. | | | 500 | | | | (72,670 | ) | | | (16.1 | ) |
| | | | | | | | | | | | |
| | | |
| Textiles, Apparel & Luxury Goods | | | | | | | | | |
Lululemon Athletica, Inc. | | | 28 | | | | (8,736 | ) | | | (1.9 | ) |
| | | | | | | | | | | | |
| | |
| Wireless Telecommunication Services | | | | | | | |
T-Mobile U.S., Inc. | | | 1,108 | | | | (193,856 | ) | | | (42.8 | ) |
| | | | | | | | | | | | |
| | | |
Total Reference Entity — Short | | | | | | | (4,476,665 | ) | | | | |
| | | | | | | | | | | | |
| | |
Net Value of Reference Entity —
HSBC Bank PLC | | | $ 452,495 | | | | |
| | | | | | | | | | | | |
The following table represents the individual long and short positions and related values of equity securities underlying the total return swap with Merrill Lynch International as of period end, termination date June 15, 2028:
| | | | | | | | | | | | |
| |
| | | Shares | | | Value | | | % of
Basket
Value | |
| |
| | | |
Reference Entity — Long | | | | | | | | | | | | |
| | | |
| Common Stocks | | | | | | | | | |
| | | |
| Automobile Components | | | | | | | | | |
Lear Corp. | | | 807 | | | $ | 101,157 | | | | 16.2 | % |
| | | | | | | | | | | | |
| | | |
| Banks | | | | | | | | | |
Citizens Financial Group, Inc. | | | 3,916 | | | | 138,196 | | | | 22.2 | |
| | | | | | | | | | | | |
| | | |
| Biotechnology | | | | | | | | | |
Biogen, Inc. | | | 743 | | | | 167,130 | | | | 26.8 | |
| | | | | | | | | | | | |
| | | | | | | | | | | | |
| |
| | | Shares | | | Value | | | % of
Basket
Value | |
| |
| | | |
| Broadline Retail | | | | | | | | | |
Amazon.com, Inc. | | | 1,838 | | | $ | 324,297 | | | | 52.0 | % |
| | | | | | | | | | | | |
| | | |
| Capital Markets | | | | | | | | | |
Charles Schwab Corp. (The) | | | 3,315 | | | | 242,923 | | | | 39.0 | |
Intercontinental Exchange, Inc. | | | 2,402 | | | | 321,628 | | | | 51.6 | |
| | | | | | | | | | | | |
| | | |
| | | | | | | 564,551 | | | | | |
| | | |
| Commercial Services & Supplies | | | | | | | | | |
Waste Connections, Inc. | | | 2,793 | | | | 458,946 | | | | 73.7 | |
| | | | | | | | | | | | |
| | | |
| Electric Utilities | | | | | | | | | |
NextEra Energy, Inc. | | | 5,931 | | | | 474,599 | | | | 76.2 | |
| | | | | | | | | | | | |
| | | |
| Ground Transportation | | | | | | | | | |
Saia, Inc. | | | 219 | | | | 89,676 | | | | 14.4 | |
| | | | | | | | | | | | |
| | | |
| Health Care Providers & Services | | | | | | | | | |
Cardinal Health, Inc. | | | 3,695 | | | | 366,802 | | | | 58.9 | |
HCA Healthcare, Inc. | | | 325 | | | | 110,419 | | | | 17.7 | |
| | | | | | | | | | | | |
| | | |
| | | | | | | 477,221 | | | | | |
| | | |
| Hotels, Restaurants & Leisure | | | | | | | | | |
DoorDash, Inc., Class A | | | 120 | | | | 13,213 | | | | 2.1 | |
| | | | | | | | | | | | |
| | | |
| Life Sciences Tools & Services | | | | | | | | | |
Thermo Fisher Scientific, Inc. | | | 72 | | | | 40,895 | | | | 6.6 | |
| | | | | | | | | | | | |
| | | |
| Media | | | | | | | | | |
Fox Corp., Class A, NVS | | | 15,141 | | | | 521,305 | | | | 83.7 | |
| | | | | | | | | | | | |
| | | |
| Multi-Utilities | | | | | | | | | |
CMS Energy Corp. | | | 119 | | | | 7,489 | | | | 1.2 | |
Sempra | | | 895 | | | | 68,942 | | | | 11.1 | |
| | | | | | | | | | | | |
| | | |
| | | | | | | 76,431 | | | | | |
| | | |
| Oil, Gas & Consumable Fuels | | | | | | | | | |
BP PLC | | | 13,202 | | | | 495,999 | | | | 79.6 | |
Cenovus Energy, Inc. | | | 4,956 | | | | 103,184 | | | | 16.5 | |
Devon Energy Corp. | | | 1,179 | | | | 57,865 | | | | 9.3 | |
Shell PLC | | | 5,573 | | | | 405,603 | | | | 65.1 | |
TC Energy Corp. | | | 2,909 | | | | 112,171 | | | | 18.0 | |
| | | | | | | | | | | | |
| | | |
| | | | | | | 1,174,822 | | | | | |
| | | |
| Pharmaceuticals | | | | | | | | | |
Sanofi SA | | | 149 | | | | 7,305 | | | | 1.2 | |
| | | | | | | | | | | | |
| | | |
| Residential REITs | | | | | | | | | |
Mid-America Apartment Communities, Inc. | | | 2,286 | | | | 305,661 | | | | 49.1 | |
| | | | | | | | | | | | |
| | | |
| Software | | | | | | | | | |
Microsoft Corp. | | | 268 | | | | 111,255 | | | | 17.8 | |
| | | | | | | | | | | | |
| | | |
| Specialized REITs | | | | | | | | | |
Crown Castle, Inc. | | | 1,265 | | | | 129,662 | | | | 20.8 | |
| | | | | | | | | | | | |
| | | |
| Total Reference Entity — Long | | | | | 5,176,322 | | | | |
| | | | | | | | | | | | |
| | | |
Reference Entity — Short | | | | | | | | | | | | |
| | | |
| Common Stocks | | | | | | | | | |
| | | |
| Banks | | | | | | | | | |
Fifth Third Bancorp | | | 3,917 | | | | (146,574 | ) | | | (23.5 | ) |
Truist Financial Corp. | | | 2,358 | | | | (89,015 | ) | | | (14.3 | ) |
| | | | | | | | | | | | |
| | | | | | | (235,589 | ) | | | | |
| | |
S C H E D U L E O F I N V E S T M E N T S | | 9 |
| | |
Schedule of Investments (continued) May 31, 2024 | | BlackRock U.S. Insights Long/Short Equity Fund |
| | | | | | | | | | | | |
| |
| | | Shares | | | Value | | | % of
Basket
Value | |
| |
| | | |
| Capital Markets | | | | | | | | | |
CME Group, Inc., Class A | | | 360 | | | $ | (73,073 | ) | | | (11.7 | )% |
Northern Trust Corp. | | | 1,063 | | | | (89,547 | ) | | | (14.4 | ) |
| | | | | | | | | | | | |
| | | |
| | | | | | | (162,620 | ) | | | | |
| | | |
| Commercial Services & Supplies | | | | | | | | | |
GFL Environmental, Inc. | | | 5,070 | | | | (159,553 | ) | | | (25.6 | ) |
| | | | | | | | | | | | |
| | | |
| Communications Equipment | | | | | | | | | |
F5, Inc. | | | 28 | | | | (4,731 | ) | | | (0.8 | ) |
| | | | | | | | | | | | |
| | |
| Consumer Staples Distribution & Retail | | | | | | | |
Walmart, Inc. | | | 3,013 | | | | (198,135 | ) | | | (31.8 | ) |
| | | | | | | | | | | | |
| | | |
| Electric Utilities | | | | | | | | | |
Avangrid, Inc. | | | 346 | | | | (12,460 | ) | | | (2.0 | ) |
Southern Co. (The) | | | 8,758 | | | | (701,866 | ) | | | (112.6 | ) |
| | | | | | | | | | | | |
| | | |
| | | | | | | (714,326 | ) | | | | |
| | | |
| Electrical Equipment | | | | | | | | | |
Rockwell Automation, Inc. | | | 38 | | | | (9,786 | ) | | | (1.6 | ) |
| | | | | | | | | | | | |
| | | |
| Financial Services | | | | | | | | | |
Apollo Global Management, Inc. | | | 3,079 | | | | (357,657 | ) | | | (57.4 | ) |
PayPal Holdings, Inc. | | | 67 | | | | (4,220 | ) | | | (0.7 | ) |
| | | | | | | | | | | | |
| | | |
| | | | | | | (361,877 | ) | | | | |
| | | |
| Ground Transportation | | | | | | | | | |
Norfolk Southern Corp. | | | 995 | | | | (223,676 | ) | | | (35.9 | ) |
| | | | | | | | | | | | |
| | | |
| Health Care Providers & Services | | | | | | | | | |
Centene Corp. | | | 2,099 | | | | (150,267 | ) | | | (24.1 | ) |
DaVita, Inc. | | | 24 | | | | (3,531 | ) | | | (0.6 | ) |
| | | | | | | | | | | | |
| | | |
| | | | | | | (153,798 | ) | | | | |
| | | |
| Health Care Technology | | | | | | | | | |
Doximity, Inc., Class A | | | 3,763 | | | | (104,348 | ) | | | (16.7 | ) |
| | | | | | | | | | | | |
| | | |
| Hotels, Restaurants & Leisure | | | | | | | | | |
Airbnb, Inc., Class A | | | 308 | | | | (44,639 | ) | | | (7.2 | ) |
| | | | | | | | | | | | |
| | | | | | | | | | | | |
| |
| | | Shares | | | Value | | | % of
Basket
Value | |
| |
| | | |
| IT Services | | | | | | | | | |
International Business Machines Corp. | | | 2,881 | | | $ | (480,695 | ) | | | (77.1 | )% |
| | | | | | | | | | | | |
| | | |
| Life Sciences Tools & Services | | | | | | | | | |
Repligen Corp. | | | 55 | | | | (8,200 | ) | | | (1.3 | ) |
| | | | | | | | | | | | |
| | | |
| Media | | | | | | | | | |
Trade Desk, Inc. (The), Class A | | | 1,517 | | | | (140,747 | ) | | | (22.6 | ) |
| | | | | | | | | | | | |
| | | |
| Oil, Gas & Consumable Fuels | | | | | | | | | |
CNX Resources Corp. | | | 1,479 | | | | (38,898 | ) | | | (6.2 | ) |
Coterra Energy, Inc. | | | 5,554 | | | | (158,400 | ) | | | (25.4 | ) |
Enbridge, Inc. | | | 5,342 | | | | (195,410 | ) | | | (31.4 | ) |
Exxon Mobil Corp. | | | 1,577 | | | | (184,919 | ) | | | (29.7 | ) |
Occidental Petroleum Corp. | | | 8,494 | | | | (530,875 | ) | | | (85.2 | ) |
Range Resources Corp. | | | 2,911 | | | | (107,445 | ) | | | (17.3 | ) |
| | | | | | | | | | | | |
| | | |
| | | | | | | (1,215,947 | ) | | | | |
| | | |
| Pharmaceuticals | | | | | | | | | |
Viatris, Inc. | | | 4,485 | | | | (47,541 | ) | | | (7.6 | ) |
| | | | | | | | | | | | |
| | | |
| Professional Services | | | | | | | | | |
Paycom Software, Inc. | | | 82 | | | | (11,916 | ) | | | (1.9 | ) |
| | | | | | | | | | | | |
| | | |
| Retail REITs | | | | | | | | | |
Simon Property Group, Inc. | | | 423 | | | | (64,004 | ) | | | (10.3 | ) |
| | | | | | | | | | | | |
| | |
| Semiconductors & Semiconductor Equipment | | | | | | | |
Allegro MicroSystems, Inc. | | | 292 | | | | (8,801 | ) | | | (1.4 | ) |
| | | | | | | | | | | | |
| | | |
| Textiles, Apparel & Luxury Goods | | | | | | | | | |
Lululemon Athletica, Inc. | | | 275 | | | | (85,797 | ) | | | (13.8 | ) |
| | | | | | | | | | | | |
| | | |
| Wireless Telecommunication Services | | | | | | | | | |
T-Mobile U.S., Inc. | | | 666 | | | | (116,523 | ) | | | (18.7 | ) |
| | | | | | | | | | | | |
| | | |
Total Reference Entity — Short | | | | | | | (4,553,249 | ) | | | | |
| | | | | | | | | | | | |
| | |
Net Value of Reference Entity —
Merrill Lynch International | | | $ 623,073 | | | | |
| | | | | | | | | | | | |
Balances Reported in the Statement of Assets and Liabilities for OTC Swaps
| | | | | | | | | | | | | | | | |
| | | Swap
Premiums
Paid | | | Swap
Premiums
Received | | | Unrealized
Appreciation | | | Unrealized
Depreciation | |
OTC Swaps | | $ | — | | | $ | — | | | $ | 36,571 | | | $ | (139,139 | ) |
| | |
| 10 | | 2 0 2 4 B L A C K R O C K A N N U A L F I N A N C I A L S T A T E M E N T S |
| | |
Schedule of Investments (continued) May 31, 2024 | | BlackRock U.S. Insights Long/Short Equity Fund |
Derivative Financial Instruments Categorized by Risk Exposure
As of period end, the fair values of derivative financial instruments located in the Statement of Assets and Liabilities were as follows:
| | | | | | | | | | | | | | | | | | | | | | | | | | | | |
| | | Commodity Contracts | | | Credit Contracts | | | Equity Contracts | | | Foreign Currency Exchange Contracts | | | Interest Rate Contracts | | | Other Contracts | | | Total | |
Assets — Derivative Financial Instruments | | | | | | | | | | | | | | | | | | | | | |
Futures contracts | | | | | | | | | | | | | | | | | | | | | | | | | | | | |
Unrealized appreciation on futures contracts(a) | | $ | — | | | $ | — | | | $ | 31,424 | | | $ | — | | | $ | — | | | $ | — | | | $ | 31,424 | |
Swaps — OTC | | | | | | | | | | | | | | | | | | | | | | | | | | | | |
Unrealized appreciation on OTC swaps;
Swap premiums paid | | | — | | | | — | | | | 36,571 | | | | — | | | | — | | | | — | | | | 36,571 | |
| | | | | | | | | | | | | | | | | | | | | | | | | | | | |
| | $ | — | | | $ | — | | | $ | 67,995 | | | $ | — | | | $ | — | | | $ | — | | | $ | 67,995 | |
| | | | | | | | | | | | | | | | | | | | | | | | | | | | |
Liabilities — Derivative Financial Instruments | | | | | | | | | | | | | | | | | | | | | |
Swaps — OTC | | | | | | | | | | | | | | | | | | | | | | | | | | | | |
Unrealized depreciation on OTC swaps;
Swap premiums received | | $ | — | | | $ | — | | | $ | 139,139 | | | $ | — | | | $ | — | | | $ | — | | | $ | 139,139 | |
| | | | | | | | | | | | | | | | | | | | | | | | | | | | |
| | (a) | Net cumulative unrealized appreciation (depreciation) on futures contracts and centrally cleared swaps, if any, are reported in the Schedule of Investments. In the Statement of Assets and Liabilities, only current day’s variation margin is reported in receivables or payables and the net cumulative unrealized appreciation (depreciation) is included in accumulated earnings (loss). | |
For the period ended May 31, 2024, the effect of derivative financial instruments in the Statement of Operations was as follows:
| | | | | | | | | | | | | | | | | | | | | | | | | | | | |
| | | | | | | | |
| | | Commodity Contracts | | | Credit Contracts | | | Equity Contracts | | | Foreign Currency Exchange Contracts | | | Interest Rate Contracts | | | Other Contracts | | | Total | |
Net Realized Gain (Loss) from: | | | | | | | | | | | | | | | | | | | | | | | | | | | | |
Futures contracts | | $ | — | | | $ | — | | | $ | 250,344 | | | $ | — | | | $ | — | | | $ | — | | | $ | 250,344 | |
Swaps | | | — | | | | — | | | | 1,614,066 | | | | — | | | | — | | | | — | | | | 1,614,066 | |
| | | | | | | | | | | | | | | | | | | | | | | | | | | | |
| | $ | — | | | $ | — | | | $ | 1,864,410 | | | $ | — | | | $ | — | | | $ | — | | | $ | 1,864,410 | |
| | | | | | | | | | | | | | | | | | | | | | | | | | | | |
| | | | | | | |
| Net Change in Unrealized Appreciation (Depreciation) on: | | | | | | | | | | | | | | | | | | | | | |
Futures contracts | | $ | — | | | $ | — | | | $ | 31,424 | | | $ | — | | | $ | — | | | $ | — | | | $ | 31,424 | |
Swaps | | | — | | | | — | | | | (102,568 | ) | | | — | | | | — | | | | — | | | | (102,568 | ) |
| | | | | | | | | | | | | | | | | | | | | | | | | | | | |
| | $ | — | | | $ | — | | | $ | (71,144 | ) | | $ | — | | | $ | — | | | $ | — | | | $ | (71,144 | ) |
| | | | | | | | | | | | | | | | | | | | | | | | | | | | |
Average Quarterly Balances of Outstanding Derivative Financial Instruments
| | | | |
| |
Futures contracts | | | | |
Average notional value of contracts — long | | | $2,145,275 | |
Average notional value of contracts — short | | | $3,502 | |
Total return swaps | | | | |
Average notional amount | | | $2,093,533 | |
| |
For more information about the Fund’s investment risks regarding derivative financial instruments, refer to the Notes to Financial Statements.
Derivative Financial Instruments – Offsetting as of Period End
The Fund’s derivative assets and liabilities (by type) were as follows:
| | | | | | | | |
| | | Assets | | | Liabilities | |
Derivative Financial Instruments | | | | | | | | |
Futures contracts | | $ | 19,425 | | | $ | — | |
Swaps — OTC(a) | | | 36,571 | | | | 139,139 | |
| | | | | | | | |
Total derivative assets and liabilities in the Statement of Assets and Liabilities | | $ | 55,996 | | | $ | 139,139 | |
| | | | | | | | |
Derivatives not subject to a Master Netting Agreement or similar agreement (“MNA”) | | | (19,425 | ) | | | — | |
| | | | | | | | |
Total derivative assets and liabilities subject to an MNA | | $ | 36,571 | | | $ | 139,139 | |
| | | | | | | | |
| | (a) | Includes unrealized appreciation (depreciation) on OTC swaps and swap premiums paid/(received) in the Statement of Assets and Liabilities. | |
| | |
S C H E D U L E O F I N V E S T M E N T S | | 11 |
| | |
Schedule of Investments (continued) May 31, 2024 | | BlackRock U.S. Insights Long/Short Equity Fund |
The following tables present the Fund’s derivative assets and liabilities by counterparty net of amounts available for offset under an MNA and net of the related collateral received by the Fund:
| | | | | | | | | | | | | | | | | | | | |
| Counterparty | | Derivative Assets Subject to an MNA by Counterparty | | | Derivatives Available for Offset(a) | | | Non- Cash Collateral Received(b) | | | Cash Collateral Received(b) | | | Net Amount of Derivative Assets(c) | |
Barclays Bank PLC | | $ | 36,571 | | | $ | — | | | $ | — | | | $ | — | | | $ | 36,571 | |
| | | | | | | | | | | | | | | | | | | | |
| | | | | | | | | | | | | | | | | | | | |
| Counterparty | | Derivative Liabilities Subject to an MNA by Counterparty | | | Derivatives Available for Offset(a) | | | Non- Cash Collateral Pledged(b) | | | Cash Collateral Pledged(b)
| | | Net Amount of Derivative Liabilities(d) | |
Goldman Sachs Bank USA | | $ | 92,671 | | | $ | — | | | $ | — | | | $ | — | | | $ | 92,671 | |
HSBC Bank PLC | | | 4,171 | | | | — | | | | — | | | | — | | | | 4,171 | |
Merrill Lynch International | | | 42,297 | | | | — | | | | — | | | | (42,297 | ) | | | — | |
| | | | | | | | | | | | | | | | | | | | |
| | $ | 139,139 | | | $ | — | | | $ | — | | | $ | (42,297 | ) | | $ | 96,842 | |
| | | | | | | | | | | | | | | | | | | | |
| | (a) | The amount of derivatives available for offset is limited to the amount of derivative assets and/or liabilities that are subject to an MNA. | |
| | (b) | Excess of collateral received/pledged, if any, from the individual counterparty is not shown for financial reporting purposes. | |
| | (c) | Net amount represents the net amount receivable from the counterparty in the event of default. | |
| | (d) | Net amount represents the net amount payable due to the counterparty in the event of default. | |
Fair Value Hierarchy as of Period End
Various inputs are used in determining the fair value of financial instruments. For a description of the input levels and information about the Fund’s policy regarding valuation of financial instruments, refer to the Notes to Financial Statements.
The following table summarizes the Fund’s financial instruments categorized in the fair value hierarchy. The breakdown of the Fund’s financial instruments into major categories is disclosed in the Schedule of Investments above.
| | | | | | | | | | | | | | | | |
| |
| | | | |
| | | Level 1 | | | Level 2 | | | Level 3 | | | Total | |
| |
Assets | | | | | | | | | | | | | | | | |
Investments | | | | | | | | | | | | | | | | |
Long-Term Investments | | | | | | | | | | | | | | | | |
Common Stocks | | $ | 40,969 | | | $ | — | | | $ | — | | | $ | 40,969 | |
| | | | |
Short-Term Securities | | | | | | | | | | | | | | | | |
Money Market Funds | | | 3,806 | | | | — | | | | — | | | | 3,806 | |
U.S. Treasury Obligations | | | — | | | | 12,017,511 | | | | — | | | | 12,017,511 | |
| | | | | | | | | | | | | | | | |
| | $ | 44,775 | | | $ | 12,017,511 | | | $ | — | | | $ | 12,062,286 | |
| | | | | | | | | | | | | | | | |
Derivative Financial Instruments(a) | | | | | | | | | | | | | | | | |
Assets | | | | | | | | | | | | | | | | |
Equity Contracts | | $ | 31,424 | | | $ | 36,571 | | | $ | — | | | $ | 67,995 | |
Liabilities | | | | | | | | | | | | | | | | |
Equity Contracts | | | — | | | | (139,139 | ) | | | — | | | | (139,139 | ) |
| | | | | | | | | | | | | | | | |
| | $ | 31,424 | | | $ | (102,568 | ) | | $ | — | | | $ | (71,144 | ) |
| | | | | | | | | | | | | | | | |
| | (a) | Derivative financial instruments are swaps and futures contracts. Swaps and futures contracts are valued at the unrealized appreciation (depreciation) on the instrument. | |
See notes to financial statements.
| | |
| 12 | | 2 0 2 4 B L A C K R O C K A N N U A L F I N A N C I A L S T A T E M E N T S |
Statement of Assets and Liabilities
May 31, 2024
| | | | |
| | | BlackRock U.S. Insights Long/Short Equity Fund | |
| |
ASSETS | | | | |
Investments, at value — unaffiliated(a)(b) | | $ | 12,058,480 | |
Investments, at value — affiliated(c) | | | 3,806 | |
Cash pledged: | | | | |
Collateral — OTC derivatives | | | 445,707 | |
Futures contracts | | | 122,000 | |
Receivables: | | | | |
Swaps | | | 59,053 | |
From the Administrator | | | 20,269 | |
Variation margin on futures contracts | | | 19,425 | |
Unrealized appreciation on OTC swaps | | | 36,571 | |
Prepaid expenses | | | 36,276 | |
| | | | |
Total assets | | | 12,801,587 | |
| | | | |
| |
LIABILITIES | | | | |
Bank overdraft | | | 60,709 | |
Due to broker | | | 363 | |
Collateral on securities loaned | | | 3,938 | |
Payables: | | | | |
Swaps | | | 49,149 | |
Administration fees | | | 9 | |
Trustees’ and Officer’s fees | | | 1,238 | |
Other accrued expenses | | | 14,774 | |
Printing and postage fees | | | 19,904 | |
Professional fees | | | 68,979 | |
Service and distribution fees | | | 83 | |
Unrealized depreciation on OTC swaps | | | 139,139 | |
| | | | |
| |
Total liabilities | | | 358,285 | |
| | | | |
| |
Commitments and contingent liabilities | | | | |
| |
NET ASSETS | | $ | 12,443,302 | |
| | | | |
| |
NET ASSETS CONSIST OF: | | | | |
Paid-in capital | | $ | 11,099,524 | |
Accumulated earnings | | | 1,343,778 | |
| | | | |
| |
NET ASSETS | | $ | 12,443,302 | |
| | | | |
| |
(a) Investments, at cost — unaffiliated | | $ | 12,046,710 | |
(b) Securities loaned, at value | | $ | 3,808 | |
(c) Investments, at cost — affiliated | | $ | 3,806 | |
| | |
F I N A N C I A L S T A T E M E N T S | | 13 |
Statement of Assets and Liabilities (continued)
May 31, 2024
| | | | |
| | | BlackRock U.S. Insights
Long/Short Equity Fund | |
| |
NET ASSET VALUE | | | | |
| |
| Institutional | | | |
Net assets | | $ | 121,656 | |
| | | | |
Shares outstanding | | | 10,915 | |
| | | | |
Net asset value | | $ | 11.15 | |
| | | | |
Shares authorized | | | Unlimited | |
| | | | |
Par value | | $ | 0.001 | |
| | | | |
| |
| Investor A | | | |
Net assets | | $ | 396,241 | |
| | | | |
Shares outstanding | | | 35,596 | |
| | | | |
Net asset value | | $ | 11.13 | |
| | | | |
Shares authorized | | | Unlimited | |
| | | | |
Par value | | $ | 0.001 | |
| | | | |
| |
| Class K | | | |
Net assets | | $ | 11,925,405 | |
| | | | |
Shares outstanding | | | 1,069,903 | |
| | | | |
Net asset value | | $ | 11.15 | |
| | | | |
Shares authorized | | | Unlimited | |
| | | | |
Par value | | $ | 0.001 | |
| | | | |
See notes to financial statements.
| | |
| 14 | | 2 0 2 4 B L A C K R O C K A N N U A L R E P O R T T O S H A R E H O L D E R S |
Statement of Operations
Period Ended May 31, 2024
| | | | |
| | | BlackRock U.S. Insights
Long/Short Equity
Fund(a) | |
| |
INVESTMENT INCOME | | | | |
Interest — unaffiliated | | $ | 553,466 | |
| | | | |
| |
Total investment income | | | 553,466 | |
| | | | |
| |
EXPENSES | | | | |
Organization and offering | | | 218,660 | |
Investment advisory | | | 148,641 | |
Professional | | | 70,657 | |
Accounting services | | | 35,814 | |
Printing and postage | | | 25,795 | |
Trustees and Officer | | | 7,635 | |
Administration | | | 4,645 | |
Registration | | | 4,203 | |
Administration — class specific | | | 2,187 | |
Service and distribution — class specific | | | 548 | |
Custodian | | | 500 | |
Transfer agent — class specific | | | 307 | |
Miscellaneous | | | 10,283 | |
| | | | |
| |
Total expenses excluding interest expense | | | 529,875 | |
Interest expense | | | 38 | |
| | | | |
| |
Total expenses | | | 529,913 | |
| |
Less: | | | | |
Administration fees waived | | | (4,645 | ) |
Administration fees waived — class specific | | | (2,130 | ) |
Fees waived and/or reimbursed by the Manager | | | (351,689 | ) |
Transfer agent fees waived and/or reimbursed — class specific | | | (284 | ) |
| | | | |
| |
Total expenses after fees waived and/or reimbursed | | | 171,165 | |
| | | | |
| |
Net investment income | | | 382,301 | |
| | | | |
| |
REALIZED AND UNREALIZED GAIN (LOSS) | | | | |
Net realized gain from: | | | | |
Investments — unaffiliated | | | 8 | |
Futures contracts | | | 250,344 | |
Swaps | | | 1,614,066 | |
| | | | |
| | | 1,864,418 | |
| | | | |
Net change in unrealized appreciation (depreciation) on: | | | | |
Investments — unaffiliated | | | 11,770 | |
Futures contracts | | | 31,424 | |
Foreign currency translations | | | (43 | ) |
Swaps | | | (102,568 | ) |
| | | | |
| | | (59,417 | ) |
| | | | |
Net realized and unrealized gain | | | 1,805,001 | |
| | | | |
| |
NET INCREASE IN NET ASSETS RESULTING FROM OPERATIONS | | $ | 2,187,302 | |
| | | | |
(a) The Fund commenced operations on June 13, 2023.
See notes to financial statements.
| | |
F I N A N C I A L S T A T E M E N T S | | 15 |
Statement of Changes in Net Assets
| | | | |
| | | BlackRock U.S. Insights Long/Short Equity Fund | |
| | | Period from 06/13/23(a) to 05/31/24 | |
| |
INCREASE (DECREASE) IN NET ASSETS | | | | |
| |
OPERATIONS | | | | |
Net investment income | | $ | 382,301 | |
Net realized gain | | | 1,864,418 | |
Net change in unrealized appreciation (depreciation) | | | (59,417 | ) |
| | | | |
Net increase in net assets resulting from operations | | | 2,187,302 | |
| | | | |
| |
DISTRIBUTIONS TO SHAREHOLDERS(b) | | | | |
Institutional | | | (9,320 | ) |
Investor A | | | (13,901 | ) |
Class K | | | (915,213 | ) |
| | | | |
Decrease in net assets resulting from distributions to shareholders | | | (938,434 | ) |
| | | | |
| |
CAPITAL SHARE TRANSACTIONS | | | | |
Net increase in net assets derived from capital share transactions | | | 11,194,434 | |
| | | | |
| |
NET ASSETS | | | | |
Total increase in net assets | | | 12,443,302 | |
Beginning of period | | | — | |
| | | | |
End of period | | $ | 12,443,302 | |
| | | | |
| (a) | Commencement of operations. |
| (b) | Distributions for annual periods determined in accordance with U.S. federal income tax regulations. |
See notes to financial statements.
| | |
| 16 | | 2 0 2 4 B L A C K R O C K A N N U A L R E P O R T T O S H A R E H O L D E R S |
Financial Highlights
(For a share outstanding throughout each period)
| | | | |
| | | BlackRock U.S. Insights Long/Short Equity Fund | |
| |
| | | Institutional | |
| |
| Period from
06/13/23 to 05/31/24 |
(a) |
| | |
Net asset value, beginning of period | | $ | 10.00 | |
| | | | |
Net investment income(b) | | | 0.36 | |
Net realized and unrealized gain | | | 1.72 | |
| | | | |
Net increase from investment operations | | | 2.08 | |
| | | | |
Distributions from net investment income(c) | | | (0.93 | ) |
| | | | |
| |
Net asset value, end of period | | $ | 11.15 | |
| | | | |
| |
Total Return(d) | | | | |
Based on net asset value | | | 21.71 | %(e) |
| | | | |
| |
Ratios to Average Net Assets(f) | | | | |
Total expenses | | | 4.85 | %(g)(h)(i) |
| | | | |
Total expenses after fees waived and/or reimbursed | | | 1.55 | %(g)(h)(i) |
| | | | |
Net investment income | | | 3.47 | %(g) |
| | | | |
| |
Supplemental Data | | | | |
Net assets, end of period (000) | | $ | 122 | |
| | | | |
Portfolio turnover rate(j) | | | — | % |
| | | | |
| (a) | Commencement of operations. |
| (b) | Based on average shares outstanding. |
| (c) | Distributions for annual periods determined in accordance with U.S. federal income tax regulations. |
| (d) | Where applicable, assumes the reinvestment of distributions. |
| (f) | Excludes fees and expenses incurred indirectly as a result of investments in underlying funds. |
| (h) | Includes non-recurring expenses of offering and organization costs. Without these costs, total expenses and total expenses after fees waived and/or reimbursed would have been 2.93% and 1.14%, respectively. |
| (i) | Audit, printing, offering, and organization costs were not annualized in the calculation of the expense ratios. If these expenses were annualized, the total expenses and total expenses after fees waived and/or reimbursed would have been 4.94% and 1.59%, respectively. |
| (j) | Excludes underlying investments in total return swaps. |
See notes to financial statements.
| | |
F I N A N C I A L H I G H L I G H T S | | 17 |
Financial Highlights (continued)
(For a share outstanding throughout each period)
| | | | |
| | | BlackRock U.S. Insights Long/Short Equity Fund (continued) | |
| |
| | | Investor A | |
| |
| Period from
06/13/23 to 05/31/24 |
(a) |
| | |
Net asset value, beginning of period | | $ | 10.00 | |
| | | | |
Net investment income(b) | | | 0.34 | |
Net realized and unrealized gain | | | 1.71 | |
| | | | |
Net increase from investment operations | | | 2.05 | |
| | | | |
Distributions from net investment income(c) | | | (0.92 | ) |
| | | | |
| |
Net asset value, end of period | | $ | 11.13 | |
| | | | |
| |
Total Return(d) | | | | |
Based on net asset value | | | 21.37 | %(e) |
| | | | |
| |
Ratios to Average Net Assets(f) | | | | |
Total expenses | | | 4.90 | %(g)(h)(i) |
| | | | |
Total expenses after fees waived and/or reimbursed | | | 1.80 | %(g)(h)(i) |
| | | | |
Net investment income | | | 3.24 | %(g) |
| | | | |
| |
Supplemental Data | | | | |
Net assets, end of period (000) | | $ | 396 | |
| | | | |
Portfolio turnover rate(j) | | | — | % |
| | | | |
| (a) | Commencement of operations. |
| (b) | Based on average shares outstanding. |
| (c) | Distributions for annual periods determined in accordance with U.S. federal income tax regulations. |
| (d) | Where applicable, excludes the effects of any sales charges and assumes the reinvestment of distributions. |
| (f) | Excludes fees and expenses incurred indirectly as a result of investments in underlying funds. |
| (h) | Includes non-recurring expenses of offering and organization costs. Without these costs, total expenses and total expenses after fees waived and/or reimbursed would have been 3.14% and 1.54%, respectively. |
| (i) | Audit, printing, offering, and organization costs were not annualized in the calculation of the expense ratios. If these expenses were annualized, the total expenses and total expenses after fees waived and/or reimbursed would have been 4.99% and 1.83%, respectively. |
| (j) | Excludes underlying investments in total return swaps. |
See notes to financial statements.
| | |
| 18 | | 2 0 2 4 B L A C K R O C K A N N U A L F I N A N C I A L S T A T E M E N T S |
Financial Highlights (continued)
(For a share outstanding throughout each period)
| | | | |
| | | BlackRock U.S. Insights Long/Short Equity Fund (continued) | |
| |
| | | Class K | |
| |
| Period from
06/13/23 to 05/31/24 |
(a) |
| | |
Net asset value, beginning of period | | $ | 10.00 | |
| | | | |
Net investment income(b) | | | 0.36 | |
Net realized and unrealized gain | | | 1.72 | |
| | | | |
Net increase from investment operations | | | 2.08 | |
| | | | |
Distributions from net investment income(c) | | | (0.93 | ) |
| | | | |
| |
Net asset value, end of period | | $ | 11.15 | |
| | | | |
| |
Total Return(d) | | | | |
Based on net asset value | | | 21.73 | %(e) |
| | | | |
| |
Ratios to Average Net Assets(f) | | | | |
Total expenses | | | 4.75 | %(g)(h)(i) |
| | | | |
Total expenses after fees waived and/or reimbursed | | | 1.52 | %(g)(h)(i) |
| | | | |
Net investment income | | | 3.50 | %(g) |
| | | | |
| |
Supplemental Data | | | | |
Net assets, end of period (000) | | $ | 11,925 | |
| | | | |
Portfolio turnover rate(j) | | | — | % |
| | | | |
| (a) | Commencement of operations. |
| (b) | Based on average shares outstanding. |
| (c) | Distributions for annual periods determined in accordance with U.S. federal income tax regulations. |
| (d) | Where applicable, assumes the reinvestment of distributions. |
| (f) | Excludes fees and expenses incurred indirectly as a result of investments in underlying funds. |
| (h) | Includes non-recurring expenses of offering and organization costs. Without these costs, total expenses and total expenses after fees waived and/or reimbursed would have been 2.84% and 1.12%, respectively. |
| (i) | Audit, printing, offering, and organization costs were not annualized in the calculation of the expense ratios. If these expenses were annualized, the total expenses and total expenses after fees waived and/or reimbursed would have been 4.84% and 1.56%, respectively. |
| (j) | Excludes underlying investments in total return swaps. |
See notes to financial statements.
| | |
F I N A N C I A L H I G H L I G H T S | | 19 |
Notes to Financial Statements
BlackRock FundsSM (the “Trust”) is registered under the Investment Company Act of 1940, as amended (the “1940 Act”), as an open-end management investment company. The Trust is organized as a Massachusetts business trust. BlackRock U.S. Insights Long/Short Equity Fund (the “Fund”) is a series of the Trust. The Fund is classified as non-diversified.
The Fund commenced operations on June 13, 2023.
The Fund offers multiple classes of shares. All classes of shares have identical voting, dividend, liquidation and other rights and are subject to the same terms and conditions, except that certain classes bear expenses related to the shareholder servicing and distribution of such shares. Institutional and Class K Shares are sold only to certain eligible investors. Investor A Shares bear certain expenses related to shareholder servicing of such shares. Investor A Shares are generally available through financial intermediaries. Each class has exclusive voting rights with respect to matters relating to its shareholder servicing and distribution expenditures.
| | | | | | | | |
| Share Class | | Initial Sales Charge | | CDSC | | | Conversion Privilege |
Institutional and Class K Shares | | No | | | No | | | None |
Investor A Shares | | Yes | | | No | (a) | | None |
| | (a) | Investor A Shares may be subject to a contingent deferred sales charge (“CDSC”) for certain redemptions where no initial sales charge was paid at the time of purchase. |
The Fund, together with certain other registered investment companies advised by BlackRock Advisors, LLC (the “Manager”) or its affiliates, is included in a complex of funds referred to as the BlackRock Multi-Asset Complex.
| 2. | SIGNIFICANT ACCOUNTING POLICIES |
The financial statements are prepared in conformity with accounting principles generally accepted in the United States of America (“U.S. GAAP”), which may require management to make estimates and assumptions that affect the reported amounts of assets and liabilities in the financial statements, disclosure of contingent assets and liabilities at the date of the financial statements and the reported amounts of increases and decreases in net assets from operations during the reporting period. Actual results could differ from those estimates. The Fund is considered an investment company under U.S. GAAP and follows the accounting and reporting guidance applicable to investment companies. Below is a summary of significant accounting policies:
Investment Transactions and Income Recognition: For financial reporting purposes, investment transactions are recorded on the dates the transactions are executed. Realized gains and losses on investment transactions are determined using the specific identification method. Interest income, including amortization and accretion of premiums and discounts on debt securities is recognized daily on an accrual basis. Income, expenses and realized and unrealized gains and losses are allocated daily to each class based on its relative net assets.
Foreign Currency Translation: The Fund’s books and records are maintained in U.S. dollars. Securities and other assets and liabilities denominated in foreign currencies are translated into U.S. dollars using exchange rates determined as of the close of trading on the New York Stock Exchange (“NYSE”). Purchases and sales of investments are recorded at the rates of exchange prevailing on the respective dates of such transactions. Generally, when the U.S. dollar rises in value against a foreign currency, the investments denominated in that currency will lose value; the opposite effect occurs if the U.S. dollar falls in relative value.
The Fund does not isolate the effect of fluctuations in foreign exchange rates from the effect of fluctuations in the market prices of investments for financial reporting purposes. Accordingly, the effects of changes in exchange rates on investments are not segregated in the Statement of Operations from the effects of changes in market prices of those investments, but are included as a component of net realized and unrealized gain (loss) from investments. The Fund reports realized currency gains (losses) on foreign currency related transactions as components of net realized gain (loss) for financial reporting purposes, whereas such components are generally treated as ordinary income for U.S. federal income tax purposes.
Bank Overdraft: The Fund had outstanding cash disbursements exceeding deposited cash amounts at the custodian during the reporting period. The Fund is obligated to repay the custodian for any overdraft, including any related costs or expenses, where applicable. For financial reporting purposes, overdraft fees, if any, are included in interest expense in the Statement of Operations.
Collateralization: If required by an exchange or counterparty agreement, the Fund may be required to deliver/deposit cash and/or securities to/with an exchange, or broker-dealer or custodian as collateral for certain investments.
Distributions: Distributions paid by the Fund are recorded on the ex-dividend dates. The character and timing of distributions are determined in accordance with U.S. federal income tax regulations, which may differ from U.S. GAAP.
Organization and Offering Costs: Upon commencement of operations, organization costs associated with the establishment of the Fund were expensed by the Fund and reimbursed by the Manager. The Manager reimbursed the Fund $25,000, which is included in fees waived and/or reimbursed by the Manager in the Statement of Operations. Offering costs are amortized over a 12-month period beginning with the commencement of operations of a class of shares.
Indemnifications: In the normal course of business, the Fund enters into contracts that contain a variety of representations that provide general indemnification. The Fund’s maximum exposure under these arrangements is unknown because it involves future potential claims against the Fund, which cannot be predicted with any certainty.
Other: Expenses directly related to the Fund or its classes are charged to the Fund or the applicable class. Expenses directly related to the Fund and other shared expenses prorated to the Fund are allocated daily to each class based on its relative net assets or other appropriate methods. Other operating expenses shared by several funds, including other funds managed by the Manager, are prorated among those funds on the basis of relative net assets or other appropriate methods.
| | |
| 20 | | 2 0 2 4 B L A C K R O C K A N N U A L F I N A N C I A L S T A T E M E N T S |
Notes to Financial Statements (continued)
The Fund has an arrangement with its custodian whereby credits are earned on uninvested cash balances. For financial reporting purposes, custodian credits, if any, are included in interest income in the Statement of Operations.
| 3. | INVESTMENT VALUATION AND FAIR VALUE MEASUREMENTS |
Investment Valuation Policies: The Fund’s investments are valued at fair value (also referred to as “market value” within the financial statements) each day that the Fund is open for business and, for financial reporting purposes, as of the report date. U.S. GAAP defines fair value as the price a fund would receive to sell an asset or pay to transfer a liability in an orderly transaction between market participants at the measurement date. The Board of Trustees of the Fund (the “Board”) has approved the designation of the Fund’s Manager as the valuation designee for the Fund. The Fund determines the fair values of its financial instruments using various independent dealers or pricing services under the Manager’s policies. If a security’s market price is not readily available or does not otherwise accurately represent the fair value of the security, the security will be valued in accordance with the Manager’s policies and procedures as reflecting fair value. The Manager has formed a committee (the “Valuation Committee”) to develop pricing policies and procedures and to oversee the pricing function for all financial instruments, with assistance from other BlackRock pricing committees.
Fair Value Inputs and Methodologies: The following methods and inputs are used to establish the fair value of the Fund’s assets and liabilities:
| | • | | Equity investments traded on a recognized securities exchange are valued at that day’s official closing price, as applicable, on the exchange where the stock is primarily traded. Equity investments traded on a recognized exchange for which there were no sales on that day may be valued at the last available bid (long positions) or ask (short positions) price. |
| | • | | Fixed-income investments for which market quotations are readily available are generally valued using the last available bid price or current market quotations provided by independent dealers or third-party pricing services. Floating rate loan interests are valued at the mean of the bid prices from one or more independent brokers or dealers as obtained from a third-party pricing service. Pricing services generally value fixed-income securities assuming orderly transactions of an institutional round lot size, but a fund may hold or transact in such securities in smaller, odd lot sizes. Odd lots may trade at lower prices than institutional round lots. The pricing services may use matrix pricing or valuation models that utilize certain inputs and assumptions to derive values, including transaction data (e.g., recent representative bids and offers), market data, credit quality information, perceived market movements, news, and other relevant information. Certain fixed-income securities, including asset-backed and mortgage related securities may be valued based on valuation models that consider the estimated cash flows of each tranche of the entity, establish a benchmark yield and develop an estimated tranche specific spread to the benchmark yield based on the unique attributes of the tranche. The amortized cost method of valuation may be used with respect to debt obligations with sixty days or less remaining to maturity unless the Manager determines such method does not represent fair value. |
| | • | | Investments in open-end U.S. mutual funds (including money market funds) are valued at that day’s published net asset value (“NAV”). |
| | • | | Futures contracts are valued based on that day’s last reported settlement or trade price on the exchange where the contract is traded. |
| | • | | Swap agreements are valued utilizing quotes received daily by independent pricing services or through brokers, which are derived using daily swap curves and models that incorporate a number of market data factors, such as discounted cash flows, trades and values of the underlying reference instruments. |
Generally, trading in foreign instruments is substantially completed each day at various times prior to the close of trading on the NYSE. Each business day, the Fund uses current market factors supplied by independent pricing services to value certain foreign instruments (“Systematic Fair Value Price”). The Systematic Fair Value Price is designed to value such foreign securities at fair value as of the close of trading on the NYSE, which follows the close of the local markets.
If events (e.g., market volatility, company announcement or a natural disaster) occur that are expected to materially affect the value of such investment, or in the event that application of these methods of valuation results in a price for an investment that is deemed not to be representative of the market value of such investment, or if a price is not available, the investment will be valued by the Valuation Committee in accordance with the Manager’s policies and procedures as reflecting fair value (“Fair Valued Investments”). The fair valuation approaches that may be used by the Valuation Committee include market approach, income approach and cost approach. Valuation techniques such as discounted cash flow, use of market comparables and matrix pricing are types of valuation approaches and are typically used in determining fair value. When determining the price for Fair Valued Investments, the Valuation Committee seeks to determine the price that the Fund might reasonably expect to receive or pay from the current sale or purchase of that asset or liability in an arm’s-length transaction. Fair value determinations shall be based upon all available factors that the Valuation Committee deems relevant and consistent with the principles of fair value measurement.
Fair Value Hierarchy: Various inputs are used in determining the fair value of financial instruments. These inputs to valuation techniques are categorized into a fair value hierarchy consisting of three broad levels for financial reporting purposes as follows:
| | • | | Level 1 – Unadjusted price quotations in active markets/exchanges for identical assets or liabilities that the Fund has the ability to access; |
| | • | | Level 2 – Other observable inputs (including, but not limited to, quoted prices for similar assets or liabilities in markets that are active, quoted prices for identical or similar assets or liabilities in markets that are not active, inputs other than quoted prices that are observable for the assets or liabilities (such as interest rates, yield curves, volatilities, prepayment speeds, loss severities, credit risks and default rates) or other market–corroborated inputs); and |
| | • | | Level 3 – Unobservable inputs based on the best information available in the circumstances, to the extent observable inputs are not available (including the Valuation Committee’s assumptions used in determining the fair value of financial instruments). |
The hierarchy gives the highest priority to unadjusted quoted prices in active markets for identical assets or liabilities (Level 1 measurements) and the lowest priority to unobservable inputs (Level 3 measurements). Accordingly, the degree of judgment exercised in determining fair value is greatest for instruments categorized in Level 3. The inputs used to measure fair value may fall into different levels of the fair value hierarchy. In such cases, for disclosure purposes, the fair value hierarchy classification is determined based on the lowest level input that is significant to the fair value measurement in its entirety. Investments classified within Level 3 have significant unobservable inputs used by the Valuation Committee in determining the price for Fair Valued Investments. Level 3 investments include equity or debt issued by privately held companies or funds that may not have a secondary market and/or may have a limited number of investors. The categorization of a value determined for financial instruments is based on the pricing transparency of the financial instruments and is not necessarily an indication of the risks associated with investing in those securities.
| | |
N O T E S T O F I N A N C I A L S T A T E M E N T S | | 21 |
Notes to Financial Statements (continued)
| 4. | SECURITIES AND OTHER INVESTMENTS |
Securities Lending: The Fund may lend its securities to approved borrowers, such as brokers, dealers and other financial institutions. The borrower pledges and maintains with the Fund collateral consisting of cash, an irrevocable letter of credit issued by a bank, or securities issued or guaranteed by the U.S. Government. The initial collateral received by the Fund is required to have a value of at least 102% of the current value of the loaned securities for securities traded on U.S. exchanges and a value of at least 105% for all other securities. The collateral is maintained thereafter at a value equal to at least 100% of the current market value of the securities on loan. The market value of the loaned securities is determined at the close of each business day of the Fund and any additional required collateral is delivered to the Fund, or excess collateral returned by the Fund, on the next business day. During the term of the loan, the Fund is entitled to all distributions made on or in respect of the loaned securities, but does not receive interest income on securities received as collateral. Loans of securities are terminable at any time and the borrower, after notice, is required to return borrowed securities within the standard time period for settlement of securities transactions.
As of period end, any securities on loan were collateralized by cash and/or U.S. Government obligations. Cash collateral invested by the securities lending agent, BlackRock Investment Management, LLC (“BIM”), if any, is disclosed in the Schedule of Investments. Any non-cash collateral received cannot be sold, re-invested or pledged by the Fund, except in the event of borrower default. The securities on loan, if any, are disclosed in the Fund’s Schedule of Investments. The market value of any securities on loan and the value of related collateral, if any, are shown separately in the Statement of Assets and Liabilities as a component of investments at value – unaffiliated and collateral on securities loaned, respectively.
Securities lending transactions are entered into by the Fund under Master Securities Lending Agreements (each, an “MSLA”), which provide the right, in the event of default (including bankruptcy or insolvency), for the non-defaulting party to liquidate the collateral and calculate a net exposure to the defaulting party or request additional collateral. In the event that a borrower defaults, the Fund, as lender, would offset the market value of the collateral received against the market value of the securities loaned. When the value of the collateral is greater than that of the market value of the securities loaned, the lender is left with a net amount payable to the defaulting party. However, bankruptcy or insolvency laws of a particular jurisdiction may impose restrictions on or prohibitions against such a right of offset in the event of an MSLA counterparty’s bankruptcy or insolvency. Under the MSLA, absent an event of default, the borrower can resell or re-pledge the loaned securities, and the Fund can reinvest cash collateral received in connection with loaned securities. Upon an event of default, the parties’ obligations to return the securities or collateral to the other party are extinguished, and the parties can resell or re-pledge the loaned securities or the collateral received in connection with the loaned securities in order to satisfy the defaulting party’s net payment obligation for all transactions under the MSLA. The defaulting party remains liable for any deficiency.
As of period end, the following table is a summary of the Fund’s securities on loan by counterparty which are subject to offset under an MSLA:
| | | | | | | | | | | | | | | | |
| Counterparty | |
| Securities
Loaned at Value |
| |
| Cash
Collateral Received |
(a) | |
| Non-Cash
Collateral Received,
at Fair Value |
(a) | |
| Net
Amount |
|
BofA Securities, Inc. | | $ | 3,808 | | | $ | (3,808 | ) | | $ | — | | | $ | — | |
| | | | | | | | | | | | | | | | |
| | (a) | Collateral received, if any, in excess of the market value of securities on loan is not presented in this table. The total cash collateral received by the Fund is disclosed in the Fund’s Statement of Assets and Liabilities. |
The risks of securities lending include the risk that the borrower may not provide additional collateral when required or may not return the securities when due. To mitigate these risks, the Fund benefits from a borrower default indemnity provided by BIM. BIM’s indemnity allows for full replacement of the securities loaned to the extent the collateral received does not cover the value on the securities loaned in the event of borrower default. The Fund could incur a loss if the value of an investment purchased with cash collateral falls below the market value of loaned securities or if the value of an investment purchased with cash collateral falls below the value of the original cash collateral received. Such losses are borne entirely by the Fund.
| 5. | DERIVATIVE FINANCIAL INSTRUMENTS |
The Fund engages in various portfolio investment strategies using derivative contracts both to increase the returns of the Fund and/or to manage its exposure to certain risks such as credit risk, equity risk, interest rate risk, foreign currency exchange rate risk, commodity price risk or other risks (e.g., inflation risk). Derivative financial instruments categorized by risk exposure are included in the Schedule of Investments. These contracts may be transacted on an exchange or over-the-counter (“OTC”).
Futures Contracts: Futures contracts are purchased or sold to gain exposure to, or manage exposure to, changes in interest rates (interest rate risk) and changes in the value of equity securities (equity risk) or foreign currencies (foreign currency exchange rate risk).
Futures contracts are exchange-traded agreements between the Fund and a counterparty to buy or sell a specific quantity of an underlying instrument at a specified price and on a specified date. Depending on the terms of a contract, it is settled either through physical delivery of the underlying instrument on the settlement date or by payment of a cash amount on the settlement date. Upon entering into a futures contract, the Fund is required to deposit initial margin with the broker in the form of cash or securities in an amount that varies depending on a contract’s size and risk profile. The initial margin deposit must then be maintained at an established level over the life of the contract. Amounts pledged, which are considered restricted, are included in cash pledged for futures contracts in the Statement of Assets and Liabilities.
Securities deposited as initial margin are designated in the Schedule of Investments and cash deposited, if any, are shown as cash pledged for futures contracts in the Statement of Assets and Liabilities. Pursuant to the contract, the Fund agrees to receive from or pay to the broker an amount of cash equal to the daily fluctuation in market value of the contract (“variation margin”). Variation margin is recorded as unrealized appreciation (depreciation) and, if any, shown as variation margin receivable (or payable) on futures contracts in the Statement of Assets and Liabilities. When the contract is closed, a realized gain or loss is recorded in the Statement of Operations equal to the difference between the notional amount of the contract at the time it was opened and the notional amount at the time it was closed. The use of futures contracts involves the risk of an imperfect correlation in the movements in the price of futures contracts and interest rates, foreign currency exchange rates or underlying assets.
| | |
| 22 | | 2 0 2 4 B L A C K R O C K A N N U A L F I N A N C I A L S T A T E M E N T S |
Notes to Financial Statements (continued)
Swaps: Swap contracts are entered into to manage exposure to issuers, markets and securities. Such contracts are agreements between the Fund and a counterparty to make periodic net payments on a specified notional amount or a net payment upon termination. Swap agreements are privately negotiated in the OTC market and may be entered into as a bilateral contract (“OTC swaps”) or centrally cleared (“centrally cleared swaps”).
For OTC swaps, any upfront premiums paid and any upfront fees received are shown as swap premiums paid and swap premiums received, respectively, in the Statement of Assets and Liabilities and amortized over the term of the contract. The daily fluctuation in market value is recorded as unrealized appreciation (depreciation) on OTC swaps in the Statement of Assets and Liabilities. Payments received or paid are recorded in the Statement of Operations as realized gains or losses, respectively. When an OTC swap is terminated, a realized gain or loss is recorded in the Statement of Operations equal to the difference between the proceeds from (or cost of) the closing transaction and the Fund’s basis in the contract, if any. Generally, the basis of the contract is the premium received or paid.
In a centrally cleared swap, immediately following execution of the swap contract, the swap contract is novated to a central counterparty (the “CCP”) and the CCP becomes the Fund’s counterparty on the swap. The Fund is required to interface with the CCP through the broker. Upon entering into a centrally cleared swap, the Fund is required to deposit initial margin with the broker in the form of cash or securities in an amount that varies depending on the size and risk profile of the particular swap. Securities deposited as initial margin are designated in the Schedule of Investments and cash deposited is shown as cash pledged for centrally cleared swaps in the Statement of Assets and Liabilities. Amounts pledged, which are considered restricted cash, are included in cash pledged for centrally cleared swaps in the Statement of Assets and Liabilities. Pursuant to the contract, the Fund agrees to receive from or pay to the broker variation margin. Variation margin is recorded as unrealized appreciation (depreciation) and shown as variation margin receivable (or payable) on centrally cleared swaps in the Statement of Assets and Liabilities. Payments received from (paid to) the counterparty are amortized over the term of the contract and recorded as realized gains (losses) in the Statement of Operations, including those at termination.
| | • | | Total return swaps — Total return swaps are entered into to obtain exposure to a security or market without owning such security or investing directly in such market or to exchange the risk/return of one security or market (e.g., fixed-income) with another security or market (e.g., equity or commodity prices) (equity risk, commodity price risk and/or interest rate risk). |
Total return swaps are agreements in which there is an exchange of cash flows whereby one party commits to make payments based on the total return (distributions plus capital gains/losses) of an underlying instrument, or basket of underlying instruments, in exchange for fixed or floating rate interest payments. If the total return of the instrument(s) or index underlying the transaction exceeds or falls short of the offsetting fixed or floating interest rate obligation, the Fund receives payment from or makes a payment to the counterparty.
Certain total return swaps are designed to function as a portfolio of direct investments in long and short equity positions. This means that the Fund has the ability to trade in and out of these long and short positions within the swap and will receive the economic benefits and risks equivalent to direct investment in these positions, subject to certain adjustments due to events related to the counterparty. Benefits and risks include capital appreciation (depreciation), corporate actions and dividends received and paid, all of which are reflected in the swap’s market value. The market value also includes interest charges and credits (“financing fees”) related to the notional values of the long and short positions and cash balances within the swap. These interest charges and credits are based on a specified benchmark rate plus or minus a specified spread determined based upon the country and/or currency of the positions in the portfolio.
Positions within the swap and financing fees are reset periodically. During a reset, any unrealized appreciation (depreciation) on positions and accrued financing fees become available for cash settlement between the Fund and the counterparty. The amounts that are available for cash settlement are recorded as realized gains or losses in the Statement of Operations. Cash settlement in and out of the swap may occur at a reset date or any other date, at the discretion of the Fund and the counterparty, over the life of the agreement. Certain swaps have no stated expiration and can be terminated by either party at any time.
Swap transactions involve, to varying degrees, elements of interest rate, credit and market risks in excess of the amounts recognized in the Statement of Assets and Liabilities. Such risks involve the possibility that there will be no liquid market for these agreements, that the counterparty to the agreements may default on its obligation to perform or disagree as to the meaning of the contractual terms in the agreements, and that there may be unfavorable changes in interest rates and/or market values associated with these transactions.
Master Netting Arrangements: In order to define its contractual rights and to secure rights that will help it mitigate its counterparty risk, the Fund may enter into an International Swaps and Derivatives Association, Inc. Master Agreement (“ISDA Master Agreement”) or similar agreement with its derivative contract counterparties. An ISDA Master Agreement is a bilateral agreement between a Fund and a counterparty that governs certain OTC derivatives and typically contains, among other things, collateral posting terms and netting provisions in the event of a default and/or termination event. Under an ISDA Master Agreement, a Fund may, under certain circumstances, offset with the counterparty certain derivative financial instruments’ payables and/or receivables with collateral held and/or posted and create one single net payment. The provisions of the ISDA Master Agreement typically permit a single net payment in the event of default including the bankruptcy or insolvency of the counterparty. However, bankruptcy or insolvency laws of a particular jurisdiction may impose restrictions on or prohibitions against the right of offset in bankruptcy, insolvency or other events.
Collateral Requirements: For derivatives traded under an ISDA Master Agreement, the collateral requirements are typically calculated by netting the mark-to-market amount for each transaction under such agreement and comparing that amount to the value of any collateral currently pledged by the Fund and the counterparty.
Cash collateral that has been pledged to cover obligations of the Fund and cash collateral received from the counterparty, if any, is reported separately in the Statement of Assets and Liabilities as cash pledged as collateral and cash received as collateral, respectively. Non-cash collateral pledged by the Fund, if any, is noted in the Schedule of Investments. Generally, the amount of collateral due from or to a counterparty is subject to a certain minimum transfer amount threshold before a transfer is required, which is determined at the close of business of the Fund. Any additional required collateral is delivered to/pledged by the Fund on the next business day. Typically, the counterparty is not permitted to sell, re-pledge or use cash and non-cash collateral it receives. The Fund generally agrees not to use non-cash collateral that it receives but may, absent default
| | |
N O T E S T O F I N A N C I A L S T A T E M E N T S | | 23 |
Notes to Financial Statements (continued)
or certain other circumstances defined in the underlying ISDA Master Agreement, be permitted to use cash collateral received. In such cases, interest may be paid pursuant to the collateral arrangement with the counterparty. To the extent amounts due to the Fund from the counterparties are not fully collateralized, the Fund bears the risk of loss from counterparty non-performance. Likewise, to the extent the Fund has delivered collateral to a counterparty and stands ready to perform under the terms of its agreement with such counterparty, the Fund bears the risk of loss from a counterparty in the amount of the value of the collateral in the event the counterparty fails to return such collateral. Based on the terms of agreements, collateral may not be required for all derivative contracts.
For financial reporting purposes, the Fund does not offset derivative assets and derivative liabilities that are subject to netting arrangements, if any, in the Statement of Assets and Liabilities.
| 6. | INVESTMENT ADVISORY AGREEMENT AND OTHER TRANSACTIONS WITH AFFILIATES |
Investment Advisory: The Trust, on behalf of the Fund, entered into an Investment Advisory Agreement with the Manager, the Fund’s investment adviser and an indirect, wholly-owned subsidiary of BlackRock, Inc. (“BlackRock”), to provide investment advisory and administrative services. The Manager is responsible for the management of the Fund’s portfolio and provides the personnel, facilities, equipment and certain other services necessary to the operations of the Fund.
For such services, the Fund pays the Manager a monthly fee at an annual rate equal to the following percentages of the average daily value of the Fund’s net assets:
| | | | |
| Average Daily Net Assets | | Investment Advisory Fees | |
First $1 billion | | | 1.36 | % |
$1 billion - $3 billion | | | 1.28 | |
$3 billion - $5 billion | | | 1.22 | |
$5 billion - $10 billion | | | 1.18 | |
Greater than $10 billion | | | 1.15 | |
The Manager entered into a sub-advisory agreement with BlackRock International Limited (“BIL”), an affiliate of the Manager. The Manager pays BIL for services it provides for that portion of the Fund for which BIL acts as sub-adviser, a monthly fee that is equal to a percentage of the investment advisory fees paid by the Fund to the Manager.
Service and Distribution Fees: The Trust, on behalf of the Fund, entered into a Distribution Agreement and Distribution and Service Plan with BlackRock Investments, LLC (“BRIL”), an affiliate of the Manager. Pursuant to the Distribution and Service Plan and in accordance with Rule 12b-1 under the 1940 Act, the Fund pays BRIL ongoing service and distribution fees. The fees are accrued daily and paid monthly at annual rates based upon the average daily net assets of the relevant share class of the Fund as follows:
| | | | | | | | |
| Share Class | | Service Fees | | | Distribution Fees | |
Investor A | | | 0.25 | % | | | N/A | |
BRIL and broker-dealers, pursuant to sub-agreements with BRIL, provide shareholder servicing and distribution services to the Fund. The ongoing service and/or distribution fee compensates BRIL and each broker-dealer for providing shareholder servicing and/or distribution related services to shareholders.
For the year ended May 31, 2024, the following table shows the class specific service and distribution fees borne directly by each share class of the Fund:
| | | | | | | | |
| | | Investor A | | | Total | |
Service and distribution — class specific | | $ | 548 | | | $ | 548 | |
Administration: The Trust, on behalf of the Fund, entered into an Administration Agreement with the Manager, an indirect, wholly-owned subsidiary of BlackRock, to provide administrative services. For these services, the Manager receives an administration fee computed daily and payable monthly, based on a percentage of the average daily net assets of the Fund. The administration fee, which is shown as administration in the Statement of Operations, is paid at the annual rates below:
| | | | |
| Average Daily Net Assets | | Administration Fees | |
First $500 million | | | 0.0425 | % |
$500 million - $1 billion | | | 0.0400 | |
$1 billion - $2 billion | | | 0.0375 | |
$2 billion - $4 billion | | | 0.0350 | |
$4 billion - $13 billion | | | 0.0325 | |
Greater than $13 billion | | | 0.0300 | |
In addition, the Manager charges each of the share classes an administration fee, which is shown as administration — class specific in the Statement of Operations, at an annual rate of 0.02% of the average daily net assets of each respective class.
For the year ended May 31, 2024, the Fund paid the following to the Manager in return for these services, which are included in administration — class specific in the Statement of Operations:
| | | | | | | | | | | | | | | | |
| | | Institutional | | | Investor A | | | Class K | | | Total | |
Administration — class specific | | $ | 22 | | | $ | 44 | | | $ | 2,121 | | | $ | 2,187 | |
| | |
| 24 | | 2 0 2 4 B L A C K R O C K A N N U A L F I N A N C I A L S T A T E M E N T S |
Notes to Financial Statements (continued)
Transfer Agent: Pursuant to written agreements, certain financial intermediaries, some of which may be affiliates, provide the Fund with sub-accounting, recordkeeping, sub-transfer agency and other administrative services with respect to servicing of underlying investor accounts. For these services, these entities receive an asset-based fee or an annual fee per shareholder account, which will vary depending on share class and/or net assets. For the year ended May 31, 2024, the Fund did not pay any amounts to affiliates in return for these services.
For the year ended May 31, 2024, the following table shows the class specific transfer agent fees borne directly by each share class of the Fund:
| | | | | | | | | | | | | | | | |
| | | Institutional | | | Investor A | | | Class K | | | Total | |
Transfer agent — class specific | | $ | 102 | | | $ | 103 | | | $ | 102 | | | $ | 307 | |
Other Fees: For the year ended May 31, 2024, affiliates earned underwriting discounts, direct commissions and dealer concessions on sales of the Fund’s Investor A Shares for a total of $325.
Expense Limitations, Waivers, Reimbursements, and Recoupments: The Manager contractually agreed to waive its investment advisory fees by the amount of investment advisory fees the Fund pays to the Manager indirectly through its investment in affiliated money market funds (the “affiliated money market fund waiver”) through June 30, 2025. The contractual agreement may be terminated upon 90 days’ notice by a majority of the trustees who are not “interested persons” of the Trust, as defined in the 1940 Act (“Independent Trustees”), or by a vote of a majority of the outstanding voting securities of the Fund. The amount of waivers and/or reimbursements of fees and expenses made pursuant to the expense limitation described below will be reduced by the amount of the affiliated money market fund waiver. This amount is included in fees waived and/or reimbursed by the Manager in the Statement of Operations. For the year ended May 31, 2024, the amount waived and/or reimbursed was $148,641.
The Manager has contractually agreed to waive its investment advisory fee with respect to any portion of the Fund’s assets invested in affiliated equity and fixed-income mutual funds, and affiliated exchange-traded funds that have a contractual management fee through June 30, 2025. The contractual agreement may be terminated upon 90 days’ notice by a majority of the Independent Trustees, or by a vote of a majority of the outstanding voting securities of the Fund. This amount is included in fees waived and/or reimbursed by the Manager in the Statement of Operations. For the year ended May 31, 2024, there were no fees waived and/or reimbursed by the Manager pursuant to this agreement.
The Manager contractually agreed to waive and/or reimburse fees or expenses in order to limit expenses, excluding interest expense, dividend expense, tax expense, acquired fund fees and expenses, and certain other fund expenses, which constitute extraordinary expenses not incurred in the ordinary course of the Fund’s business (“expense limitation”). The expense limitations as a percentage of average daily net assets are as follows:
| | | | | | |
| Institutional | | Investor A | | Class K | |
1.61% | | 1.86% | | | 1.56 | % |
The Manager has agreed not to reduce or discontinue these contractual expense limitations through June 30, 2025, unless approved by the Board, including a majority of the Independent Trustees, or by a vote of a majority of the outstanding voting securities of the Fund. For the year ended May 31, 2024, the Manager waived and/or reimbursed investment advisory fees of $178,048, which is included in fees waived and/or reimbursed by the Manager in the Statement of Operations.
The Fund also had a waiver of administration fees, which are included in Administration fees waived in the Statement of Operations. For the year ended May 31, 2024, the amount was $4,645.
In addition, these amounts waived and/or reimbursed by the Manager are included in administration fees waived by the Manager — class specific and transfer agent fees waived and/or reimbursed by the Manager — class specific, respectively, in the Statement of Operations. For the year ended May 31, 2024, class specific expense waivers and/or reimbursements were as follows:
| | | | | | | | | | | | | | | | |
| | | Institutional | | | Investor A | | | Class K | | | Total | |
Administration fees waived — class specific | | $ | 6 | | | $ | 7 | | | $ | 2,117 | | | $ | 2,130 | |
Transfer agent fees waived and/or reimbursed — class specific | | | 89 | | | | 89 | | | | 106 | | | | 284 | |
With respect to the contractual expense limitation, if during the Fund’s fiscal year the operating expenses of a share class, that at any time during the prior two fiscal years received a waiver and/or reimbursement from the Manager, are less than the current expense limitation for that share class, the Manager is entitled to be reimbursed by such share class up to the lesser of: (a) the amount of fees waived and/or expenses reimbursed during those prior two fiscal years under the agreement and (b) an amount not to exceed either the current expense limitation of that share class or the expense limitation of the share class in effect at the time that the share class received the applicable waiver and/or reimbursement, provided that:
| | (1) | the Fund, of which the share class is a part, has more than $50 million in assets for the fiscal year, and |
| | (2) | the Manager or an affiliate continues to serve as the Fund’s investment adviser or administrator. |
This repayment applies only to the contractual expense limitation on net expenses and does not apply to the contractual investment advisory fee waiver described above or any voluntary waivers that may be in effect from time to time. Effective June 14, 2030, the repayment arrangement between the Fund and the Manager pursuant to which the Fund may be required to repay amounts waived and/or reimbursed under the Fund’s contractual caps on net expenses will be terminated.
| | |
N O T E S T O F I N A N C I A L S T A T E M E N T S | | 25 |
Notes to Financial Statements (continued)
As of May 31, 2024, the fund level and class specific waivers and/or reimbursements subject to possible future recoupment under the expense limitation agreement were as follows:
| | | | |
| Fund Level/Share Class | | Expiring May 31, 2026 | |
Fund Level | | $ | 207,693 | |
Institutional | | | 95 | |
Investor A | | | 96 | |
Class K | | | 2,223 | |
Securities Lending: The U.S. Securities and Exchange Commission (“SEC”) has issued an exemptive order which permits BIM, an affiliate of the Manager, to serve assecurities lending agent for the Fund, subject to applicable conditions. As securities lending agent, BIM bears all operational costs directly related to securities lending. The Fund is responsible for fees in connection with the investment of cash collateral received for securities on loan (the “collateral investment fees”). The cash collateral is invested in a money market fund, BlackRock Cash Funds: Institutional, managed by the Manager or its affiliates. However, BIM has agreed to reduce the amount of securities lending income it receives in order to effectively limit the collateral investment fees the Fund bears to an annual rate of 0.04%. The SL Agency Shares of such money market fund will not be subject to a sales load, redemption fee, distribution fee or service fee. The money market fund in which the cash collateral has been reinvested may impose a discretionary liquidity fee of up to 2% of the value redeemed, if such fee, is determined to be in the best interests of such money market fund.
Securities lending income is generally equal to the total of income earned from the reinvestment of cash collateral, (and excludes collateral investment fees), and any fees or other payments to and from borrowers of securities. The Fund retains a portion of the securities lending income and remits the remaining portion to BIM as compensation for its services as securities lending agent.
Pursuant to the current securities lending agreement, the Fund retains 81% of securities lending income (which excludes collateral investment expenses), and this amount retained can never be less than 70% of the total of securities lending income plus the collateral investment expenses.
In addition, commencing the business day following the date that the aggregate securities lending income earned across the BlackRock Multi-Asset Complex in a calendar year exceeds a specified threshold, the Fund, pursuant to the securities lending agreement, will retain for the remainder of that calendar year securities lending income in an amount equal to 81% of securities lending income (which excludes collateral investment expenses), and this amount retained can never be less than 70% of the total of securities lending income plus the collateral investment expenses.
The share of securities lending income earned by the Fund is shown as securities lending income — affiliated — net in the Statement of Operations. For the period ended May 31, 2024, the Fund paid BIM less than $1 for securities lending agent services.
Interfund Lending: In accordance with an exemptive order (the “Order”) from the U.S. Securities and Exchange Commission (“SEC”), the Fund may participate in a joint lending and borrowing facility for temporary purposes (the “Interfund Lending Program”), subject to compliance with the terms and conditions of the Order, and to the extent permitted by the Fund’s investment policies and restrictions. The Fund is currently permitted to borrow and lend under the Interfund Lending Program.
A lending BlackRock fund may lend in aggregate up to 15% of its net assets but may not lend more than 5% of its net assets to any one borrowing fund through the Interfund Lending Program. A borrowing BlackRock fund may not borrow through the Interfund Lending Program or from any other source more than 33 1/3% of its total assets (or any lower threshold provided for by the fund’s investment restrictions). If a borrowing BlackRock fund’s total outstanding borrowings exceed 10% of its total assets, each of its outstanding interfund loans will be subject to collateralization of at least 102% of the outstanding principal value of the loan. All interfund loans are for temporary or emergency purposes and the interest rate to be charged will be the average of the highest current overnight repurchase agreement rate available to a lending fund and the bank loan rate, as calculated according to a formula established by the Board.
During the year ended May 31, 2024, the Fund did not participate in the Interfund Lending Program.
Trustees and Officers: Certain trustees and/or officers of the Trust are trustees and/or officers of BlackRock or its affiliates. The Fund reimburses the Manager for a portion of the compensation paid to the Trust’s Chief Compliance Officer, which is included in Trustees and Officer in the Statement of Operations.
For the year ended May 31, 2024, purchases and sales of investments, excluding short-term securities, were $32,698 and $0, respectively.
It is the Fund’s policy to comply with the requirements of the Internal Revenue Code of 1986, as amended, applicable to regulated investment companies, and to distribute substantially all of its taxable income to its shareholders. Therefore, no U.S. federal income tax provision is required.
The Fund files U.S. federal and various state and local tax returns. No income tax returns are currently under examination. The statute of limitations on the Fund’s U.S. federal tax returns generally remains open for a period of three years after they are filed. The statutes of limitations on the Fund’s state and local tax returns may remain open for an additional year depending upon the jurisdiction.
Management has analyzed tax laws and regulations and their application to the Fund as of May 31, 2024, inclusive of the open tax return years, and does not believe that there are any uncertain tax positions that require recognition of a tax liability in the Fund’s financial statements.
| | |
| 26 | | 2 0 2 4 B L A C K R O C K A N N U A L F I N A N C I A L S T A T E M E N T S |
Notes to Financial Statements (continued)
U.S. GAAP requires that certain components of net assets be adjusted to reflect permanent differences between financial and tax reporting. These reclassifications have no effect on net assets or NAVs per share. As of period end, permanent differences attributable to nondeductible expenses were reclassified to the following accounts:
| | | | |
| |
| | | Amounts | |
| |
Paid-in capital | | $ | (94,910 | ) |
Accumulated earnings (loss) | | | 94,910 | |
| |
The tax character of distributions paid was as follows:
| | | | |
| |
| | | Year Ended 05/31/24 | |
| |
Ordinary income | | $ | 938,434 | |
| |
As of May 31, 2024, the tax components of accumulated net earnings were as follows:
| | | | | | | | | | | | | | | | |
| |
| Fund Name | | Undistributed Ordinary Income | | | Undistributed Long-Term Capital Gains | | | Net Unrealized Gains (Losses)(a) | | | Total | |
| |
U.S. Insights Long/Short Equity | | $ | 1,162,991 | | | $ | 169,060 | | | $ | 11,727 | | | $ | 1,343,778 | |
| |
| (a) | The difference between book-basis and tax-basis net unrealized gains (losses) was attributable primarily to the realization for tax purposes of unrealized gains (losses) on certain futures contracts and the accounting for swap agreements. |
As of May 31, 2024, gross unrealized appreciation and depreciation based on cost of investments (including short positions and derivatives, if any) for U.S. federal income tax purposes were as follows:
| | | | | | | | | | | | | | | | |
| |
| Fund Name | | Tax Cost | | | Gross Unrealized Appreciation | | | Gross Unrealized Depreciation | | | Net Unrealized Appreciation (Depreciation) | |
| |
U.S. Insights Long/Short Equity | | $ | 12,050,516 | | | $ | 151,733 | | | $ | (139,963 | ) | | $ | 11,770 | |
| |
The Trust, on behalf of the Fund, along with certain other funds managed by the Manager and its affiliates (“Participating Funds”), is party to a 364-day, $2.40 billion credit agreement with a group of lenders. Under this agreement, the Fund may borrow to fund shareholder redemptions. Excluding commitments designated for certain individual funds, the Participating Funds, including the Fund, can borrow up to an aggregate commitment amount of $1.75 billion at any time outstanding, subject to asset coverage and other limitations as specified in the agreement. The credit agreement has the following terms: a fee of 0.10% per annum on unused commitment amounts and interest at a rate equal to the higher of (a) Overnight Bank Funding Rate (“OBFR”) (but, in any event, not less than 0.00%) on the date the loan is made plus 0.80% per annum, (b) the Fed Funds rate (but, in any event, not less than 0.00%) in effect from time to time plus 0.80% per annum on amounts borrowed or (c) the sum of (x) Daily Simple Secured Overnight Financing Rate (“SOFR”) (but, in any event, not less than 0.00%) on the date the loan is made plus 0.10% and (y) 0.80% per annum. The agreement expires in April 2025 unless extended or renewed. These fees were allocated among such funds based upon portions of the aggregate commitment available to them and relative net assets of Participating Funds. During the year ended May 31, 2024, the Fund did not borrow under the credit agreement.
In the normal course of business, the Fund invests in securities or other instruments and may enter into certain transactions, and such activities subject the Fund to various risks, including among others, fluctuations in the market (market risk) or failure of an issuer to meet all of its obligations. The value of securities or other instruments may also be affected by various factors, including, without limitation: (i) the general economy; (ii) the overall market as well as local, regional or global political and/or social instability; (iii) regulation, taxation or international tax treaties between various countries; or (iv) currency, interest rate and price fluctuations. Local, regional or global events such as war, acts of terrorism, the spread of infectious illness or other public health issues, recessions, or other events could have a significant impact on the Fund and its investments. The Fund’s prospectus provides details of the risks to which the Fund is subject.
The Fund may be exposed to additional risks when reinvesting cash collateral in money market funds that do not seek to maintain a stable NAV per share of $1.00, which may be subject to discretionary liquidity fees under certain circumstances.
Market Risk: The Fund may be exposed to prepayment risk, which is the risk that borrowers may exercise their option to prepay principal earlier than scheduled during periods of declining interest rates, which would force the Fund to reinvest in lower yielding securities. The Fund may also be exposed to reinvestment risk, which is the risk that income from the Fund’s portfolio will decline if the Fund invests the proceeds from matured, traded or called fixed-income securities at market interest rates that are below the Fund portfolio’s current earnings rate.
Valuation Risk: The market values of equities, such as common stocks and preferred securities or equity related investments, such as futures and options, may decline due to general market conditions which are not specifically related to a particular company. They may also decline due to factors which affect a particular industry or industries. The Fund may invest in illiquid investments. An illiquid investment is any investment that the Fund reasonably expects cannot be sold or disposed of in current market conditions in seven calendar days or less without the sale or disposition significantly changing the market value of the investment. The Fund may experience difficulty in selling illiquid investments in a timely manner at the price that it believes the investments are worth. Prices may fluctuate widely over short or extended periods in response to company,
| | |
N O T E S T O F I N A N C I A L S T A T E M E N T S | | 27 |
Notes to Financial Statements (continued)
market or economic news. Markets also tend to move in cycles, with periods of rising and falling prices. This volatility may cause the Fund’s NAV to experience significant increases or decreases over short periods of time. If there is a general decline in the securities and other markets, the NAV of the Fund may lose value, regardless of the individual results of the securities and other instruments in which the Fund invests.
The price the Fund could receive upon the sale of any particular portfolio investment may differ from the Fund’s valuation of the investment, particularly for securities that trade in thin or volatile markets or that are valued using a fair valuation technique or a price provided by an independent pricing service. Changes to significant unobservable inputs and assumptions (i.e., publicly traded company multiples, growth rate, time to exit) due to the lack of observable inputs may significantly impact the resulting fair value and therefore a Fund’s results of operations. As a result, the price received upon the sale of an investment may be less than the value ascribed by the Fund, and the Fund could realize a greater than expected loss or lesser than expected gain upon the sale of the investment. The Fund’s ability to value its investments may also be impacted by technological issues and/or errors by pricing services or other third-party service providers.
Counterparty Credit Risk: The Fund may be exposed to counterparty credit risk, or the risk that an entity may fail to or be unable to perform on its commitments related to unsettled or open transactions, including making timely interest and/or principal payments or otherwise honoring its obligations. The Fund manages counterparty credit risk by entering into transactions only with counterparties that the Manager believes have the financial resources to honor their obligations and by monitoring the financial stability of those counterparties. Financial assets, which potentially expose the Fund to market, issuer and counterparty credit risks, consist principally of financial instruments and receivables due from counterparties. The extent of the Fund’s exposure to market, issuer and counterparty credit risks with respect to these financial assets is approximately their value recorded in the Statement of Assets and Liabilities, less any collateral held by the Fund.
A derivative contract may suffer a mark-to-market loss if the value of the contract decreases due to an unfavorable change in the market rates or values of the underlying instrument. Losses can also occur if the counterparty does not perform under the contract.
With exchange-traded futures, there is less counterparty credit risk to the Fund since the exchange or clearinghouse, as counterparty to such instruments, guarantees against a possible default. The clearinghouse stands between the buyer and the seller of the contract; therefore, credit risk is limited to failure of the clearinghouse. While offset rights may exist under applicable law, the Fund does not have a contractual right of offset against a clearing broker or clearinghouse in the event of a default (including the bankruptcy or insolvency). Additionally, credit risk exists in exchange-traded futures with respect to initial and variation margin that is held in a clearing broker’s customer accounts. While clearing brokers are required to segregate customer margin from their own assets, in the event that a clearing broker becomes insolvent or goes into bankruptcy and at that time there is a shortfall in the aggregate amount of margin held by the clearing broker for all its clients, typically the shortfall would be allocated on a pro rata basis across all the clearing broker’s customers, potentially resulting in losses to the Fund.
Geographic/Asset Class Risk: A diversified portfolio, where this is appropriate and consistent with the fund’s objectives, minimizes the risk that a price change of a particular investment will have a material impact on the NAV of a fund. The investment concentrations within the Fund’s portfolio are disclosed in its Schedule of Investments.
The Fund invests a significant portion of its assets in securities of issuers located in the United States. A decrease in imports or exports, changes in trade regulations, inflation and/or an economic recession in the United States may have a material adverse effect on the U.S. economy and the securities listed on U.S. exchanges. Proposed and adopted policy and legislative changes in the United States may also have a significant effect on U.S. markets generally, as well as on the value of certain securities. Governmental agencies project that the United States will continue to maintain elevated public debt levels for the foreseeable future which may constrain future economic growth. Circumstances could arise that could prevent the timely payment of interest or principal on U.S. government debt, such as reaching the legislative “debt ceiling.” Such non-payment would result in substantial negative consequences for the U.S. economy and the global financial system. If U.S. relations with certain countries deteriorate, it could adversely affect issuers that rely on the United States for trade. The United States has also experienced increased internal unrest and discord. If these trends were to continue, they may have an adverse impact on the U.S. economy and the issuers in which the Fund invests.
Significant Shareholder Redemption Risk: Certain shareholders may own or manage a substantial amount of fund shares and/or hold their fund investments for a limited period of time. Large redemptions of fund shares by these shareholders may force a fund to sell portfolio securities, which may negatively impact the fund’s NAV, increase the fund’s brokerage costs, and/or accelerate the realization of taxable income/gains and cause the fund to make additional taxable distributions to shareholders.
| 11. | CAPITAL SHARE TRANSACTIONS |
Transactions in capital shares for each class were as follows:
| | | | | | | | | | | | | | | | |
| | | Period from 06/13/23(a) to
05/31/24 | | | | | | | |
| | | | |
| Share Class | | Shares | | | Amount | | | | | | | |
| | | | |
Institutional | | | | | | | | | | | | | | | | |
Shares sold | | | 10,000 | | | $ | 100,000 | | | | | | | | | |
Shares issued in reinvestment of distributions | | | 915 | | | | 9,320 | | | | | | | | | |
| | | | | | | | | | | | | | | | |
| | | 10,915 | | | $ | 109,320 | | | | | | | | | |
| | | | | | | | | | | | | | | | |
Investor A | | | | | | | | | | | | | | | | |
Shares sold and automatic conversion of shares | | | 34,230 | | | $ | 356,000 | | | | | | | | | |
Shares issued in reinvestment of distributions | | | 1,366 | | | | 13,901 | | | | | | | | | |
| | | | | | | | | | | | | | | | |
| | | 35,596 | | | $ | 369,901 | | | | | | | | | |
| | | | | | | | | | | | | | | | |
| | |
| 28 | | 2 0 2 4 B L A C K R O C K A N N U A L F I N A N C I A L S T A T E M E N T S |
Notes to Financial Statements (continued)
| | | | | | | | | | | | | | | | |
| | | Period from 06/13/23(a) to
05/31/24 | | | | | | | |
| | | | |
| Share Class | | Shares | | | Amount | | | | | | | |
Class K | | | | | | | | | | | | | | | | |
Shares sold | | | 980,000 | | | $ | 9,800,000 | | | | | | | | | |
Shares issued in reinvestment of distributions | | | 89,903 | | | | 915,213 | | | | | | | | | |
| | | | | | | | | | | | | | | | |
| | | 1,069,903 | | | $ | 10,715,213 | | | | | | | | | |
| | | | | | | | | | | | | | | | |
| | | 1,116,414 | | | $ | 11,194,434 | | | | | | | | | |
| | | | | | | | | | | | | | | | |
| | (a) | Commencement of operations. |
As of May 31, 2024, shares owned by BlackRock Financial Management, Inc., an affiliate of the Fund, were as follows:
| | | | |
| Share Class | | | |
Institutional | | | 10,915 | |
Investor A | | | 10,904 | |
Class K | | | 1,069,903 | |
Management has evaluated the impact of all subsequent events on the Fund through the date the financial statements were issued and has determined that there were no subsequent events requiring adjustment or additional disclosure in the financial statements.
| | |
N O T E S T O F I N A N C I A L S T A T E M E N T S | | 29 |
Report of Independent Registered Public Accounting Firm
To the Shareholders of BlackRock U.S. Insights Long/Short Equity Fund and the Board of Trustees of BlackRock FundsSM:
Opinion on the Financial Statements and Financial Highlights
We have audited the accompanying statement of assets and liabilities of BlackRock U.S. Insights Long/Short Equity Fund of BlackRock FundsSM (the “Fund”), including the schedule of investments, as of May 31, 2024, the related statement of operations, the statement of changes in net assets, and the financial highlights for the period from June 13, 2023 (commencement of operations) through May 31, 2024, and the related notes. In our opinion, the financial statements and financial highlights present fairly, in all material respects, the financial position of the Fund as of May 31, 2024, and the results of its operations, the changes in its net assets, and the financial highlights for the period from June 13, 2023 (commencement of operations) through May 31, 2024, in conformity with accounting principles generally accepted in the United States of America.
Basis for Opinion
These financial statements and financial highlights are the responsibility of the Fund’s management. Our responsibility is to express an opinion on the Fund’s financial statements and financial highlights based on our audits. We are a public accounting firm registered with the Public Company Accounting Oversight Board (United States) (PCAOB) and are required to be independent with respect to the Fund in accordance with the U.S. federal securities laws and the applicable rules and regulations of the Securities and Exchange Commission and the PCAOB.
We conducted our audits in accordance with the standards of the PCAOB. Those standards require that we plan and perform the audit to obtain reasonable assurance about whether the financial statements and financial highlights are free of material misstatement, whether due to error or fraud. The Fund is not required to have, nor were we engaged to perform, an audit of its internal control over financial reporting. As part of our audits we are required to obtain an understanding of internal control over financial reporting but not for the purpose of expressing an opinion on the effectiveness of the Fund’s internal control over financial reporting. Accordingly, we express no such opinion.
Our audits included performing procedures to assess the risks of material misstatement of the financial statements and financial highlights, whether due to error or fraud, and performing procedures that respond to those risks. Such procedures included examining, on a test basis, evidence regarding the amounts and disclosures in the financial statements and financial highlights. Our audits also included evaluating the accounting principles used and significant estimates made by management, as well as evaluating the overall presentation of the financial statements and financial highlights. Our procedures included confirmation of securities owned as of May 31, 2024, by correspondence with custodians or counterparties; when replies were not received, we performed other auditing procedures. We believe that our audits provide a reasonable basis for our opinion.
Deloitte & Touche LLP
Boston, Massachusetts
July 24, 2024
We have served as the auditor of one or more BlackRock investment companies since 1992.
| | |
| 30 | | 2 0 2 4 B L A C K R O C K A N N U A L F I N A N C I A L S T A T E M E N T S |
Important Tax Information (unaudited)
The Fund hereby designates the following amount, or maximum amounts allowable by law, of distributions from direct federal obligation interest for the fiscal year ended May 31, 2024:
| | | | |
| |
| |
| Fund Name | | Federal Obligation Interest | |
| |
BlackRock U.S. Insights Long/Short Equity Fund | | $ | 526,461 | |
| |
The law varies in each state as to whether and what percent of ordinary income dividends attributable to federal obligations is exempt from state income tax. Shareholders are advised to check with their tax advisers to determine if any portion of the dividends received is exempt from state income tax.
The Fund hereby designates the following amount, or maximum amount allowable by law, as interest income eligible to be treated as a Section 163(j) interest dividend for the fiscal year ended May 31, 2024:
| | | | |
| |
| |
| Fund Name | | Interest-Related Dividends | |
| |
BlackRock U.S. Insights Long/Short Equity Fund | | $ | 526,461 | |
| |
The Fund hereby designates the following amount, or maximum amount allowable by law, as interest-related dividends eligible for exemption from U.S. withholding tax for nonresident aliens and foreign corporations for the fiscal year ended May 31, 2024:
| | | | |
| |
| |
| Fund Name | | Interest-
Related
Dividends | |
| |
BlackRock U.S. Insights Long/Short Equity Fund | | $ | 526,461 | |
| |
| | |
I M P O R T A N T T A X I N F O R M A T I O N | | 31 |
Disclosure of Investment Advisory Agreement and Sub-Advisory Agreement
The Board of Trustees (the “Board,” the members of which are referred to as “Board Members”) of BlackRock Funds (the “Trust”) met on April 16, 2024 (the “April Meeting”) and May 16-17, 2024 (the “May Meeting”) to consider the approval to continue the investment advisory agreement (the “Advisory Agreement”) between the Trust, on behalf of BlackRock U.S. Insights Long/Short Equity Fund (the “Fund”), and BlackRock Advisors, LLC (the “Manager”), the Fund’s investment advisor. The Board also considered the approval to continue the sub-advisory agreement (the “Sub-Advisory Agreement”) between the Manager and BlackRock International Limited (the “Sub-Advisor”) with respect to the Fund. The Manager and the Sub-Advisor are referred to herein as “BlackRock.” The Advisory Agreement and the Sub-Advisory Agreement are referred to herein as the “Agreements.”
The Approval Process
Consistent with the requirements of the Investment Company Act of 1940 (the “1940 Act”), the Board considers the approval of the continuation of the Agreements for the Fund on an annual basis. The Board members who are not “interested persons” of the Trust, as defined in the 1940 Act, are considered independent Board members (the “Independent Board Members”). The Board’s consideration entailed a year-long deliberative process during which the Board and its committees assessed BlackRock’s various services to the Fund, including through the review of written materials and oral presentations, and the review of additional information provided in response to requests from the Independent Board Members. The Board had four quarterly meetings per year, each of which extended over a two-day period, as well as additional ad hoc meetings and executive sessions throughout the year, as needed. The committees of the Board similarly met throughout the year. The Board also had an additional one-day meeting to consider specific information regarding the renewal of the Agreements. In considering the renewal of the Agreements, the Board assessed, among other things, the nature, extent and quality of the services provided to the Fund by BlackRock, BlackRock’s personnel and affiliates, including (as applicable): investment management services; accounting oversight; administrative and shareholder services; oversight of the Fund’s service providers; risk management and oversight; and legal, regulatory and compliance services. Throughout the year, including during the contract renewal process, the Independent Board Members were advised by independent legal counsel, and met with independent legal counsel in various executive sessions outside of the presence of BlackRock’s management.
During the year, the Board, acting directly and through its committees, considered information that was relevant to its annual consideration of the renewal of the Agreements, including the services and support provided by BlackRock to the Fund and its shareholders. BlackRock also furnished additional information to the Board in response to specific questions from the Board. Among the matters the Board considered were: (a) investment performance for one-year, three-year, five-year, and/or since inception periods, as applicable, against peer funds, relevant benchmarks, and other performance metrics, as applicable, as well as BlackRock senior management’s and portfolio managers’ investment performance analyses, and the reasons for any outperformance or underperformance relative to its peers, benchmarks, and other performance metrics, as applicable; (b) fees, including advisory, administration, if applicable, and other amounts paid to BlackRock and its affiliates by the Fund for services; (c) Fund operating expenses and how BlackRock allocates expenses to the Fund; (d) the resources devoted to, risk oversight of, and compliance reports relating to, implementation of the Fund’s investment objective, policies and restrictions, and meeting regulatory requirements; (e) BlackRock’s and the Fund’s adherence to applicable compliance policies and procedures; (f) the nature, character and scope of non-investment management services provided by BlackRock and its affiliates and the estimated cost of such services, as available; (g) BlackRock’s and other service providers’ internal controls and risk and compliance oversight mechanisms; (h) BlackRock’s implementation of the proxy voting policies approved by the Board; (i) the use of brokerage commissions and execution quality of portfolio transactions; (j) BlackRock’s implementation of the Fund’s valuation and liquidity procedures; (k) an analysis of management fees paid to BlackRock for products with similar investment mandates across the open-end fund, exchange-traded fund (“ETF”), closed-end fund, sub-advised mutual fund, separately managed account, collective investment trust, and institutional separate account product channels, as applicable, and the similarities and differences between these products and the services provided as compared to the Fund; (l) BlackRock’s compensation methodology for its investment professionals and the incentives and accountability it creates, along with investment professionals’ investments in the fund(s) they manage; and (m) periodic updates on BlackRock’s business.
Prior to and in preparation for the April Meeting, the Board received and reviewed materials specifically relating to the renewal of the Agreements. The Independent Board Members continuously engaged in a process with their independent legal counsel and BlackRock to review the nature and scope of the information provided to the Board to better assist its deliberations. The materials provided in connection with the April Meeting included, among other things: (a) information independently compiled and prepared by Broadridge Financial Solutions, Inc. (“Broadridge”), based on either a Lipper classification or Morningstar category, regarding the Fund’s fees and expenses as compared with a peer group of funds as determined by Broadridge (“Expense Peers”) and the investment performance of the Fund as compared with a peer group of funds (“Performance Peers”); (b) information on the composition of the Expense Peers and Performance Peers and a description of Broadridge’s methodology; (c) information on the estimated profits realized by BlackRock and its affiliates pursuant to the Agreements and a discussion of fall-out benefits to BlackRock and its affiliates; (d) a general analysis provided by BlackRock concerning investment management fees received in connection with other types of investment products, such as institutional accounts, sub-advised mutual funds, ETFs, closed-end funds, open-end funds, and separately managed accounts, under similar investment mandates, as well as the performance of such other products, as applicable; (e) a review of non-management fees; (f) the existence, impact and sharing of potential economies of scale, if any, with the Fund; (g) a summary of aggregate amounts paid by the Fund to BlackRock; (h) sales and redemption data regarding the Fund’s shares; and (i) various additional information requested by the Board as appropriate regarding BlackRock’s and the Fund’s operations.
At the April Meeting, the Board reviewed materials relating to its consideration of the Agreements and the Independent Board Members presented BlackRock with questions and requests for additional information. BlackRock responded to these questions and requests with additional written information in advance of the May Meeting, and such responses were reviewed by the Board Members.
At the May Meeting, the Board concluded its assessment of, among other things: (a) the nature, extent and quality of the services provided by BlackRock; (b) the investment performance of the Fund as compared to its Performance Peers and to other metrics, as applicable; (c) the advisory fee and the estimated cost of the services and estimated profits realized by BlackRock and its affiliates from their relationship with the Fund; (d) the Fund’s fees and expenses compared to its Expense Peers; (e) the existence and sharing of potential economies of scale; (f) any fall-out benefits to BlackRock and its affiliates as a result of BlackRock’s relationship with the Fund; and (g) other factors deemed relevant by the Board Members.
The Board also considered other matters it deemed important to the approval process, such as other payments made to BlackRock or its affiliates relating to securities lending and cash management, and BlackRock’s services related to the valuation and pricing of Fund portfolio holdings. The Board noted the willingness of BlackRock’s personnel to engage in open, candid discussions with the Board. The Board evaluated the information available to it on a fund-by-fund basis. The following paragraphs provide more information about some of the primary factors that were relevant to the Board’s decision. The Board Members did not identify any particular information, or any single factor as determinative, and each Board Member may have attributed different weights to the various items and factors considered.
| | |
| 32 | | 2 0 2 4 B L A C K R O C K A N N U A L F I N A N C I A L S T A T E M E N T S |
Disclosure of Investment Advisory Agreement and Sub-Advisory Agreement (continued)
A. Nature, Extent and Quality of the Services Provided by BlackRock
The Board, including the Independent Board Members, reviewed the nature, extent and quality of services provided by BlackRock, including the investment advisory services, and the resulting performance of the Fund. Throughout the year, the Board compared Fund performance to the performance of a comparable group of mutual funds, relevant benchmarks, and performance metrics, as applicable. The Board met with BlackRock’s senior management personnel responsible for investment activities, including the senior investment officers. The Board also reviewed the materials provided by the Fund’s portfolio management team discussing the Fund’s performance, investment strategies and outlook.
The Board considered, among other factors, with respect to BlackRock: the experience of the Fund’s portfolio management team; research capabilities; investments by portfolio managers in the funds they manage; portfolio trading capabilities; use of technology; commitment to compliance; credit analysis capabilities; risk analysis and oversight capabilities; and the approach to training and retaining portfolio managers and other research, advisory and management personnel. The Board also considered BlackRock’s overall risk management program, including the continued efforts of BlackRock and its affiliates to address cybersecurity risks and the role of BlackRock’s Risk & Quantitative Analysis Group. The Board engaged in a review of BlackRock’s compensation structure with respect to the Fund’s portfolio management team and BlackRock’s ability to attract and retain high-quality talent and create performance incentives.
In addition to investment advisory services, the Board considered the nature and quality of the administrative and other non-investment advisory services provided to the Fund. BlackRock and its affiliates provide the Fund with certain administrative, shareholder and other services (in addition to any such services provided to the Fund by third parties) and officers and other personnel as are necessary for the operations of the Fund. In particular, BlackRock and its affiliates provide the Fund with administrative services including, among others: (i) responsibility for disclosure documents, such as the prospectus, the summary prospectus (as applicable), the statement of additional information and periodic shareholder reports; (ii) oversight of daily accounting and pricing; (iii) responsibility for periodic filings with regulators; (iv) overseeing and coordinating the activities of third-party service providers including, among others, the Fund’s custodian, fund accountant, transfer agent, and auditor; (v) organizing Board meetings and preparing the materials for such Board meetings; (vi) providing legal and compliance support; (vii) furnishing analytical and other support to assist the Board in its consideration of strategic issues such as the merger, consolidation or repurposing of certain open-end funds; and (viii) performing or managing administrative functions necessary for the operation of the Fund, such as tax reporting, expense management, fulfilling regulatory filing requirements, overseeing the Fund’s distribution partners, and shareholder call center and other services. The Board reviewed the structure and duties of BlackRock’s fund administration, shareholder services, and legal and compliance departments and considered BlackRock’s policies and procedures for assuring compliance with applicable laws and regulations. The Board considered the operation of BlackRock’s business continuity plans.
The Board noted that the engagement of the Sub-Advisor with respect to the Fund facilitates the provision of investment advice and trading by investment personnel out of non-U.S. jurisdictions. The Board considered that this arrangement provides additional flexibility to the portfolio management team, which may benefit the Fund and its shareholders.
B. The Investment Performance of the Fund
The Board, including the Independent Board Members, reviewed and considered the performance history of the Fund throughout the year and at the April Meeting. In preparation for the April Meeting, the Board was provided with reports independently prepared by Broadridge, which included an analysis of the Fund’s performance as of December 31, 2023, as compared to its Performance Peers. Broadridge ranks funds in quartiles, ranging from first to fourth, where first is the most desirable quartile position and fourth is the least desirable. In connection with its review, the Board received and reviewed information regarding the investment performance of the Fund as compared to its Performance Peers and the respective Morningstar Category (“Morningstar Category”). The Board and its Performance Oversight Committee regularly review and meet with Fund management to discuss the performance of the Fund throughout the year.
In evaluating performance, the Board focused particular attention on funds with less favorable performance records. The Board also noted that while it found the data provided by Broadridge generally useful, it recognized the limitations of such data, including in particular, that notable differences may exist between a fund and its Performance Peers (for example, the investment objectives and strategies). Further, the Board recognized that the performance data reflects a snapshot of a period as of a particular date and that selecting a different performance period could produce significantly different results. The Board also acknowledged that long-term performance could be impacted by even one period of significant outperformance or underperformance, and that a single investment theme could have the ability to disproportionately affect long-term performance.
The Board noted that for the since-inception period reported, the Fund ranked in the first quartile against its Morningstar Category. The Board noted that BlackRock believes that the Morningstar Category is an appropriate performance metric for the Fund, and that BlackRock has explained its rationale for this belief to the Board.
C. Consideration of the Advisory/Management Fees and the Estimated Cost of the Services and Estimated Profits Realized by BlackRock and its Affiliates from their Relationship with the Fund
The Board, including the Independent Board Members, reviewed the Fund’s contractual management fee rate compared with those of its Expense Peers. The contractual management fee rate represents a combination of the advisory fee and any administrative fees, before taking into account any reimbursements or fee waivers. The Board also compared the Fund’s total expense ratio, as well as its actual management fee rate, to those of its Expense Peers. The total expense ratio represents a fund’s total net operating expenses, including any 12b-1 or non-12b-1 service fees. The total expense ratio gives effect to any expense reimbursements or fee waivers, and the actual management fee rate gives effect to any management fee reimbursements or waivers. The Board considered that the fee and expense information in the Broadridge report for the Fund reflected information for a specific period and that historical asset levels and expenses may differ from current levels, particularly in a period of market volatility. The Board considered the services provided and the fees charged by BlackRock and its affiliates to other types of clients with similar investment mandates, as applicable, including institutional accounts and sub-advised mutual funds (including mutual funds sponsored by third parties).
| | |
D I S C L O S U R E O F I N V E S T M E N T A D V I S O R Y A G R E E M E N T A N D S U B - A D V I S O R Y A G R E E M E N T | | 33 |
Disclosure of Investment Advisory Agreement and Sub-Advisory Agreement (continued)
The Board received and reviewed statements relating to BlackRock’s financial condition. The Board reviewed BlackRock’s profitability methodology and was also provided with an estimated profitability analysis that detailed the revenues earned and the expenses incurred by BlackRock for services provided to the Fund. The Board reviewed BlackRock’s estimated profitability with respect to the Fund and other funds the Board currently oversees for the year ended December 31, 2023 compared to available aggregate estimated profitability data provided for the prior two years. The Board reviewed BlackRock’s estimated profitability with respect to certain other U.S. fund complexes managed by the Manager and/or its affiliates. The Board reviewed BlackRock’s assumptions and methodology of allocating expenses in the estimated profitability analysis, noting the inherent limitations in allocating costs among various advisory products. The Board recognized that profitability may be affected by numerous factors including, among other things, fee waivers and expense reimbursements by the Manager, the types of funds managed, precision of expense allocations and business mix. The Board thus recognized that calculating and comparing profitability at the individual fund level is difficult.
The Board noted that, in general, individual fund or product line profitability of other advisors is not publicly available. The Board reviewed BlackRock’s overall operating margin, in general, compared to that of certain other publicly traded asset management firms. The Board considered the differences between BlackRock and these other firms, including the contribution of technology at BlackRock, BlackRock’s expense management, and the relative product mix.
The Board considered whether BlackRock has the financial resources necessary to attract and retain high quality investment management personnel to perform its obligations under the Agreements and to continue to provide the high quality of services that is expected by the Board. The Board further considered factors including but not limited to BlackRock’s commitment of time and resources, assumption of risk, and liability profile in servicing the Fund, including in contrast to what is required of BlackRock with respect to other products with similar investment mandates across the open-end fund, ETF, closed-end fund, sub-advised mutual fund, separately managed account, collective investment trust, and institutional separate account product channels, as applicable.
The Board noted that the Fund’s contractual management fee rate ranked in the fourth quartile, and that the actual management fee rate and total expense ratio ranked in the first and third quartiles, respectively, relative to the Fund’s Expense Peers. The Board also noted that the Fund has an advisory fee arrangement that includes breakpoints that adjust the fee rate downward as the size of the Fund increases above certain contractually specified levels. The Board additionally noted that the breakpoints can, conversely, adjust the advisory fee rate upward as the size of the Fund decreases below certain contractually specified levels. The Board further noted that BlackRock and the Board have contractually agreed to a cap on the Fund’s total expenses as a percentage of the Fund’s average daily net assets on a class-by-class basis.
D. Economies of Scale
The Board, including the Independent Board Members, considered the extent to which any economies of scale might benefit the Fund in a variety of ways as the assets of the Fund increase. The Board considered multiple factors, including the advisory fee rate and breakpoints, unitary fee structure, fee waivers, and/or expense caps, as applicable. The Board considered the Fund’s asset levels and whether the current fee schedule was appropriate.
E. Other Factors Deemed Relevant by the Board Members
The Board, including the Independent Board Members, also took into account other ancillary or “fall-out” benefits that BlackRock or its affiliates may derive from BlackRock’s respective relationships with the Fund, both tangible and intangible, such as BlackRock’s ability to leverage its investment professionals who manage other portfolios and its risk management personnel, an increase in BlackRock’s profile in the investment advisory community, and the engagement of BlackRock’s affiliates as service providers to the Fund, including for administrative, distribution, securities lending and cash management services. With respect to securities lending, during the year the Board also considered information provided by independent third-party consultants related to the performance of each BlackRock affiliate as securities lending agent. The Board also considered BlackRock’s overall operations and its efforts to expand the scale of, and improve the quality of, its operations. The Board also noted that, subject to applicable law, BlackRock may use and benefit from third-party research obtained by soft dollars generated by certain registered fund transactions to assist in managing all or a number of its other client accounts.
In connection with its consideration of the Agreements, the Board also received information regarding BlackRock’s brokerage and soft dollar practices. The Board received reports from BlackRock which included information on brokerage commissions and trade execution practices throughout the year.
The Board noted the competitive nature of the open-end fund marketplace, and that shareholders are able to redeem their Fund shares if they believe that the Fund’s fees and expenses are too high or if they are dissatisfied with the performance of the Fund.
Conclusion
At the May Meeting, in a continuation of the discussions that occurred during the April Meeting, and as a culmination of the Board’s year-long deliberative process, the Board, including the Independent Board Members, unanimously approved the continuation of the Advisory Agreement between the Manager and the Trust, on behalf of the Fund, for a one-year term ending June 30, 2025, and the Sub-Advisory Agreement between the Manager and the Sub-Advisor, with respect to the Fund, for a one-year term ending June 30, 2025. Based upon its evaluation of all of the aforementioned factors in their totality, as well as other information, the Board, including the Independent Board Members, was satisfied that the terms of the Agreements were fair and reasonable and in the best interest of the Fund and its shareholders. In arriving at its decision to approve the Agreements, the Board did not identify any single factor or group of factors as all-important or controlling, but considered all factors together, and different Board Members may have attributed different weights to the various factors considered. The Independent Board Members were advised by independent legal counsel throughout the deliberative process.
| | |
| 34 | | 2 0 2 4 B L A C K R O C K A N N U A L F I N A N C I A L S T A T E M E N T S |
Additional Information
Changes in and Disagreements with Accountants
Not applicable.
Proxy Results
Not applicable.
Remuneration Paid to Directors, Officers, and Others
Compensation to the independent directors/trustees of the Fund is paid by the Fund.
General Information
Quarterly performance, semi-annual and annual reports, current net asset value and other information regarding the Fund may be found on BlackRock’s website, which can be accessed at blackrock.com. Any reference to BlackRock’s website in this report is intended to allow investors public access to information regarding the Fund and does not, and is not intended to, incorporate BlackRock’s website in this report.
Electronic Delivery
Shareholders can sign up for e-mail notifications of quarterly statements, annual and semi-annual shareholder reports and prospectuses by enrolling in the electronic delivery program.
To enroll in electronic delivery:
Shareholders Who Hold Accounts with Investment Advisors, Banks or Brokerages:
Please contact your financial advisor. Please note that not all investment advisors, banks or brokerages may offer this service.
Shareholders Who Hold Accounts Directly with BlackRock:
1. Access the BlackRock website at blackrock.com
2. Select “Access Your Account”
3. Next, select “eDelivery” in the “Related Resources” box and follow the sign-up instructions.
BlackRock’s Mutual Fund Family
BlackRock offers a diverse lineup of open-end mutual funds crossing all investment styles and managed by experts in equity, fixed-income and tax-exempt investing. Visit blackrock.com for more information.
Shareholder Privileges
Account Information
Call us at (800) 441-7762 from 8:00 AM to 6:00 PM ET on any business day to get information about your account balances, recent transactions and share prices. You can also visit blackrock.com for more information.
Automatic Investment Plans
Investor class shareholders who want to invest regularly can arrange to have $50 or more automatically deducted from their checking or savings account and invested in any of the BlackRock funds.
Systematic Withdrawal Plans
Investor class shareholders can establish a systematic withdrawal plan and receive periodic payments of $50 or more from their BlackRock funds, as long as their account balance is at least $10,000.
Retirement Plans
Shareholders may make investments in conjunction with Traditional, Rollover, Roth, Coverdell, Simple IRAs, SEP IRAs and 403(b) Plans.
| | |
A D D I T I O N A L I N F O R M A T I O N | | 35 |
Additional Information (continued)
Fund and Service Providers
| | |
| Investment Adviser and Administrator | | Distributor |
| BlackRock Advisors, LLC | | BlackRock Investments, LLC |
| Wilmington, DE 19809 | | New York, NY 10001 |
Sub-Adviser | | Independent Registered Public Accounting Firm |
| BlackRock International Limited | | Deloitte & Touche LLP |
| Edinburgh, EH3 8BL | | Boston, MA 02116 |
| United Kingdom | | |
| | Legal Counsel |
| Accounting Agent and Transfer Agent | | Sidley Austin LLP |
| BNY Mellon Investment Servicing (US) Inc. | | New York, NY 10019 |
| Wilmington, DE 19809 | | |
| | Address of the Trust |
| Custodian | | 100 Bellevue Parkway |
| The Bank of New York Mellon | | Wilmington, DE 19809 |
| New York, NY 10286 | | |
| | |
| 36 | | 2 0 2 4 B L A C K R O C K A N N U A L F I N A N C I A L S T A T E M E N T S |
Glossary of Terms Used in this Report
Currency Abbreviation
| | |
| USD | | United States Dollar |
|
| Portfolio Abbreviation |
| |
| NVS | | Non-Voting Shares |
| |
| OTC | | Over-the-Counter |
| | |
G L O S S A R Y O F T E R M S U S E D I N T H I S R E P O R T | | 37 |
THIS PAGE INTENTIONALLY LEFT BLANK.
THIS PAGE INTENTIONALLY LEFT BLANK.
Want to know more?
blackrock.com | 800-441-7762
This report is intended for current holders. It is not authorized for use as an offer of sale or a solicitation of an offer to buy shares of the Fund unless preceded or accompanied by the Fund’s current prospectus. Past performance results shown in this report should not be considered a representation of future performance. Investment returns and principal value of shares will fluctuate so that shares, when redeemed, may be worth more or less than their original cost. Statements and other information herein are as dated and are subject to change.
| Item 8 – | Changes in and Disagreements with Accountants for Open-End Management Investment Companies – See Item 7 |
| Item 9 – | Proxy Disclosures for Open-End Management Investment Companies – See Item 7 |
| Item 10 – | Remuneration Paid to Directors, Officers, and Others of Open-End Management Investment Companies – See Item 7 |
| Item 11 – | Statement Regarding Basis for Approval of Investment Advisory Contract – See Item 7 |
| Item 12 – | Disclosure of Proxy Voting Policies and Procedures for Closed-End Management Investment Companies – Not Applicable |
| Item 13 – | Portfolio Managers of Closed-End Management Investment Companies – Not Applicable |
| Item 14 – | Purchases of Equity Securities by Closed-End Management Investment Company and Affiliated Purchasers – Not Applicable |
| Item 15 – | Submission of Matters to a Vote of Security Holders – There have been no material changes to these procedures. |
| Item 16 – | Controls and Procedures |
(a) The registrant’s principal executive and principal financial officers, or persons performing similar functions, have concluded that the registrant’s disclosure controls and procedures (as defined in Rule 30a-3(c) under the Investment Company Act of 1940, as amended (the “1940 Act”)) are effective as of a date within 90 days of the filing of this report based on the evaluation of these controls and procedures required by Rule 30a-3(b) under the 1940 Act and Rule 13a-15(b) or 15d-15(b) under the Securities Exchange Act of 1934, as amended.
(b) There were no changes in the registrant’s internal control over financial reporting (as defined in Rule 30a-3(d) under the 1940 Act) that occurred during the period covered by this report that have materially affected, or are reasonably likely to materially affect, the registrant’s internal control over financial reporting.
| Item 17 – | Disclosure of Securities Lending Activities for Closed-End Management Investment Companies – Not Applicable |
| Item 18 – | Recovery of Erroneously Awarded Compensation – Not Applicable |
6
| Item 19 – | Exhibits attached hereto |
(a)(1) Code of Ethics – See Item 2
(a)(2) Any policy required by the listing standards adopted pursuant to Rule 10D-1 under the Exchange Act (17 CFR 240.10D-1) by the registered national securities exchange or registered national securities association upon which the registrant’s securities are listed – Not Applicable
(a)(3) Section 302 Certifications are attached.
(a)(4) Any written solicitation to purchase securities under Rule 23c-1 – Not Applicable
(a)(5) Change in Registrant’s independent public accountant – Not Applicable
(b) Section 906 Certifications are attached.
7
Pursuant to the requirements of the Securities Exchange Act of 1934 and the Investment Company Act of 1940, the registrant has duly caused this report to be signed on its behalf by the undersigned, thereunto duly authorized.
BlackRock FundsSM
| | | | |
| | By: | | /s/ John M. Perlowski |
| | | | John M. Perlowski |
| | | | Chief Executive Officer (principal executive officer) of |
| | | | BlackRock FundsSM |
Date: July 24, 2024
Pursuant to the requirements of the Securities Exchange Act of 1934 and the Investment Company Act of 1940, this report has been signed below by the following persons on behalf of the registrant and in the capacities and on the dates indicated.
| | | | |
| | By: | | /s/ John M. Perlowski |
| | | | John M. Perlowski |
| | | | Chief Executive Officer (principal executive officer) of |
| | | | BlackRock FundsSM |
Date: July 24, 2024
| | | | |
| | By: | | /s/ Trent Walker |
| | | | Trent Walker |
| | | | Chief Financial Officer (principal financial officer) of |
| | | | BlackRock FundsSM |
Date: July 24, 2024
8