December 2016 TETRA Technologies, Inc. CSI Compressco LP

Forward Looking Statements Forward-Looking Statements: This presentation includes certain statements that are or may be deemed to be forward-looking statements. Generally, the use of words such as “may,” “will,” “expect,” “intend,” “estimate,” “projects,” “anticipate,” “believe,” “assume,” “could,” “should,” “plans,” “targets” or similar expressions that convey the uncertainty of future events, activities, expectations or outcomes identify forward-looking statements that the company intends to be included within the safe harbor protections provided by the federal securities laws. These forward-looking statements include statements concerning expected results of operational business segments for 2016, anticipated benefits from CSI Compressco following the acquisition of CSI Compressco in 2014, including increases in cash distributions per unit, projections concerning the Company's business activities, financial guidance, estimated earnings, earnings per share, and statements regarding the Company's beliefs, expectations, plans, goals, future events and performance, and other statements that are not purely historical. These forward-looking statements are based on certain assumptions and analyses made in light of our experience and our perception of historical trends, current conditions, expected future developments and other factors we believe are appropriate in the circumstances. Such statements are subject to a number of risks and uncertainties, many of which are beyond our control. Investors are cautioned that any such statements are not guarantees of future performances or results and that actual results or developments may differ materially from those projected in the forward-looking statements. Some of the factors that could affect actual results are described in the section titled “Certain Business Risks” contained in our Annual Report on Form 10-K for the year ended December 31, 2015, as well as other risks identified from time to time in our reports on Form 10-Q and Form 8-K filed with the Securities and Exchange Commission. Further Disclosure Regarding the Use of Non-GAAP Measures: TETRA and CSI Compressco LP define net debt as the sum of long-term and short-term debt on its consolidated balance sheet, less cash, excluding restricted cash on the consolidated balance sheet and excluding the debt and cash of CSI Compressco LP. Management views net debt as a measure of our ability to reduce debt, add to cash balances, pay dividends, repurchase stock, and fund investing and financing activities. Management views adjusted revenue, cash from operating activities excluding Maritech, and Adjusted EBITDA as useful measures to assess our performance in prior periods following the sale of substantially all of our Maritech segment operations. Adjusted EBITDA, a performance measure used by management, is defined as net income (loss) plus: (1) interest expense (net of interest income), (2) income tax provision, and (3) depreciation, depletion, amortization, accretion and impairments, all of which are calculated excluding our Maritech operations. Adjusted EBITDA is not defined under GAAP and does not purport to be an alternative to EBITDA, net income or any other GAAP financial measures as a measure of operating performance. Because not all companies use identical calculations, our presentation of Adjusted EBITDA may not be comparable to other similarly titled measures of other companies. Management views Adjusted EBITDA as useful to investors and other external users of our consolidated financial statements as an additional tool to evaluate and compare our operating performance, because Adjusted EBITDA is a measurement of a company’s operating performance without regard to items such as interest expense, taxes, depreciation, depletion, and amortization, which can vary substantially from company to company. The reconciliation included in the Financial Data Appendix to this presentation is not a substitute for financial information prepared in accordance with GAAP, and should be considered within the context of our complete financial results for the periods indicated, which are available on our website at tetratec.com.
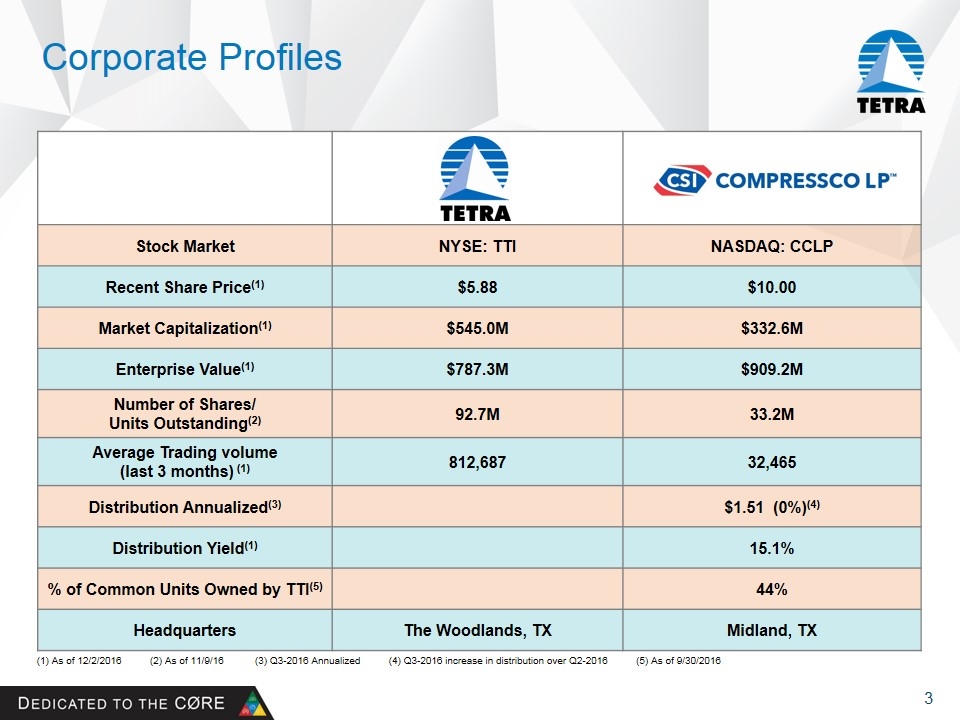
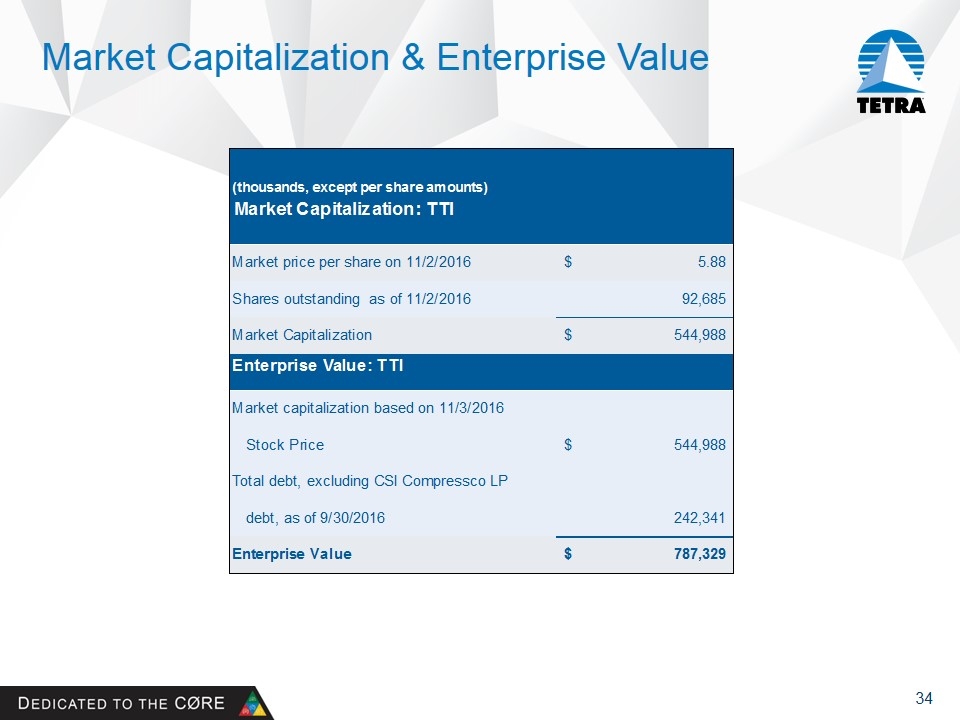
Stock Market NYSE: TTI NASDAQ: CCLP Recent Share Price(1) $5.88 $10.00 Market Capitalization(1) $545.0M $332.6M Enterprise Value(1) $787.3M $909.2M Number of Shares/ Units Outstanding(2) 92.7M 33.2M Average Trading volume (last 3 months) (1) 812,687 32,465 Distribution Annualized(3) $1.51 (0%)(4) Distribution Yield(1) 15.1% % of Common Units Owned by TTI(5) 44% Headquarters The Woodlands, TX Midland, TX Corporate Profiles (1) As of 12/2/2016 (2) As of 11/9/16 (3) Q3-2016 Annualized (4) Q3-2016 increase in distribution over Q2-2016 (5) As of 9/30/2016
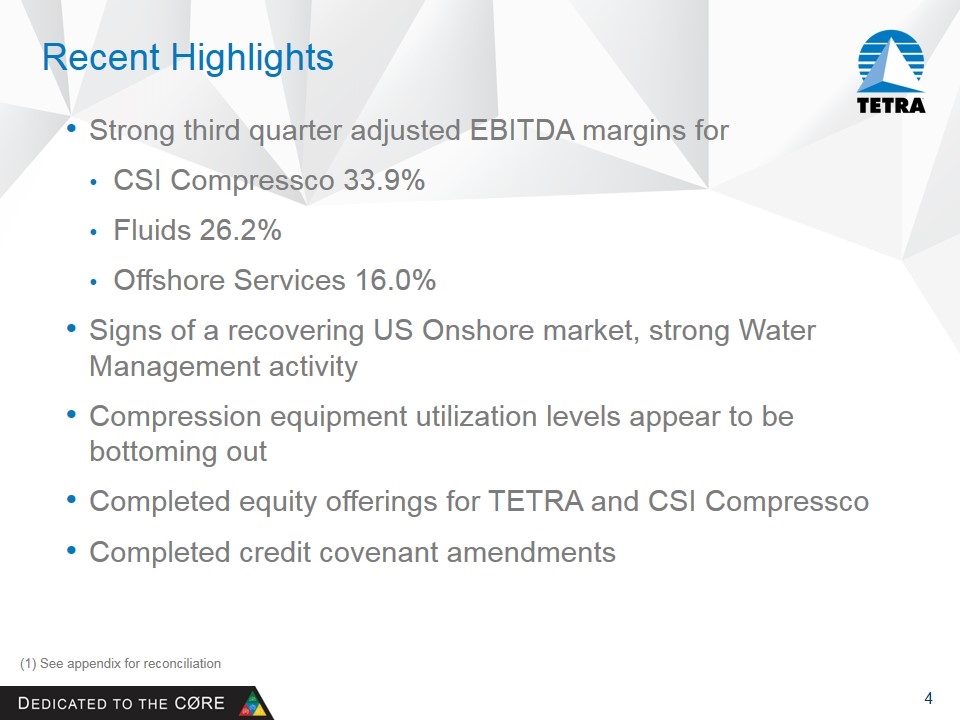
Recent Highlights Strong third quarter adjusted EBITDA margins for CSI Compressco 33.9% Fluids 26.2% Offshore Services 16.0% Signs of a recovering US Onshore market, strong Water Management activity Compression equipment utilization levels appear to be bottoming out Completed equity offerings for TETRA and CSI Compressco Completed credit covenant amendments (1) See appendix for reconciliation
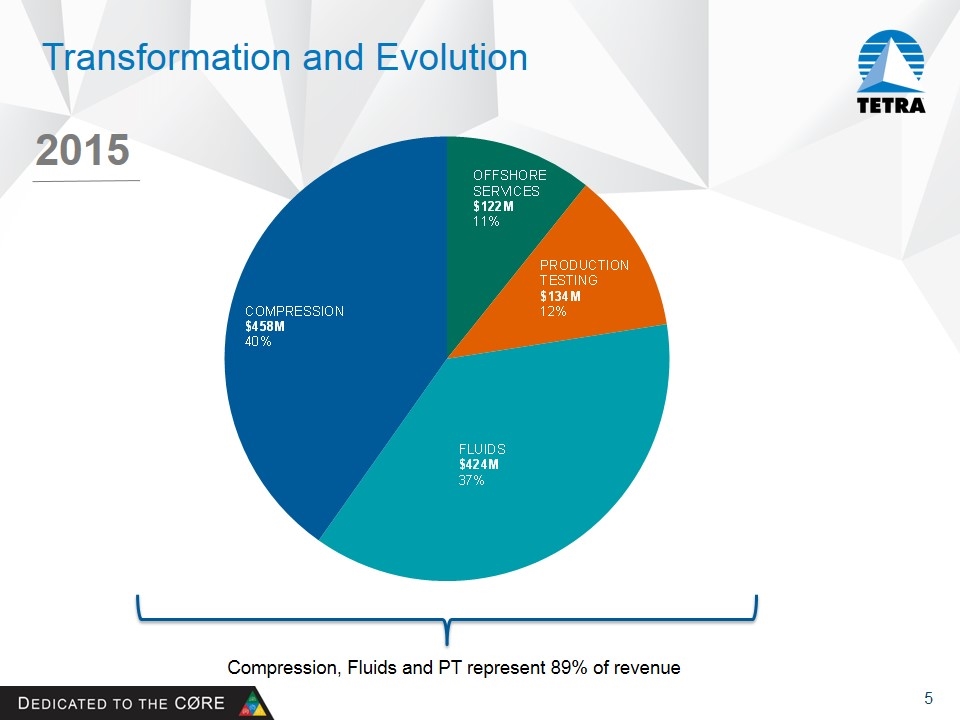
Transformation and Evolution 2015 Compression, Fluids and PT represent 89% of revenue

Fluids
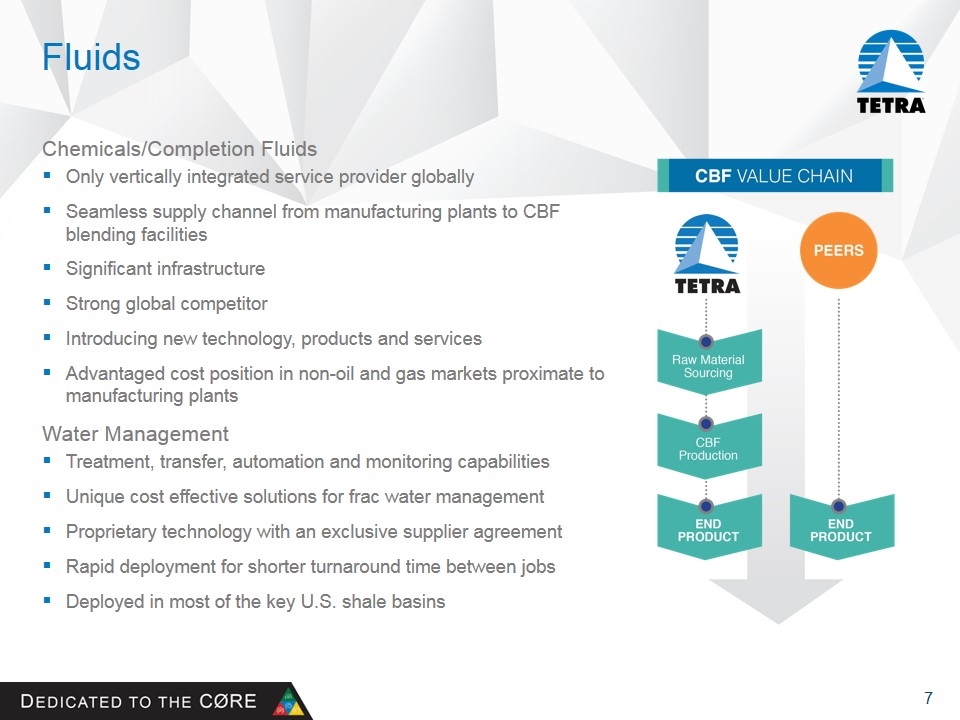
Fluids Chemicals/Completion Fluids Only vertically integrated service provider globally Seamless supply channel from manufacturing plants to CBF blending facilities Significant infrastructure Strong global competitor Introducing new technology, products and services Advantaged cost position in non-oil and gas markets proximate to manufacturing plants Water Management Treatment, transfer, automation and monitoring capabilities Unique cost effective solutions for frac water management Proprietary technology with an exclusive supplier agreement Rapid deployment for shorter turnaround time between jobs Deployed in most of the key U.S. shale basins
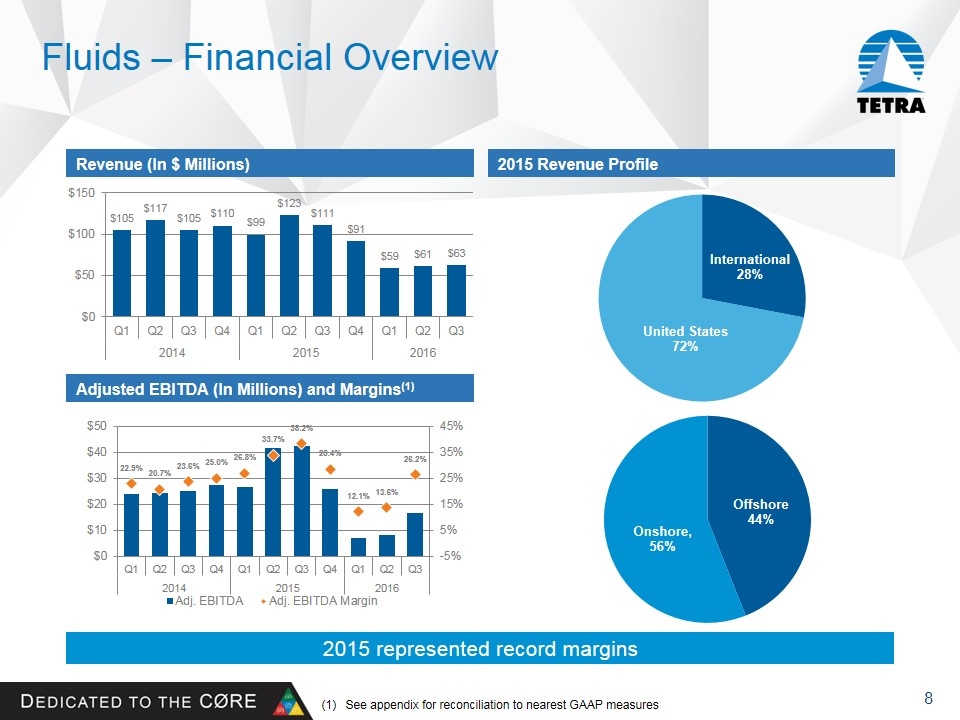
Fluids – Financial Overview Revenue (In $ Millions) Adjusted EBITDA (In Millions) and Margins(1) 2015 Revenue Profile 2015 represented record margins See appendix for reconciliation to nearest GAAP measures
CSI Compressco LP
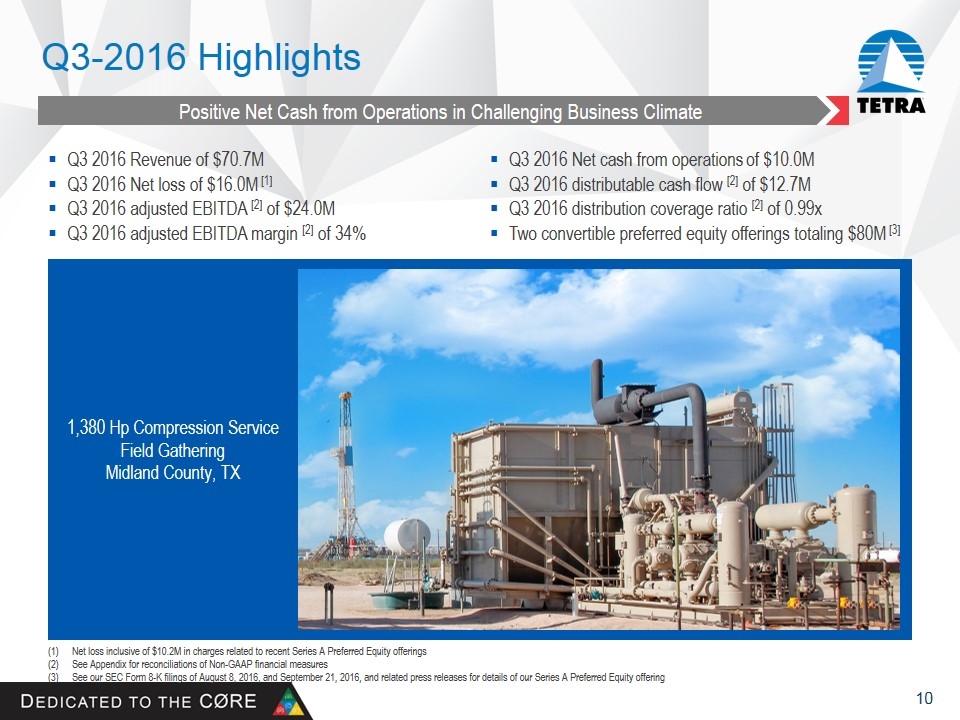
Q3-2016 Highlights Positive Net Cash from Operations in Challenging Business Climate Q3 2016 Revenue of $70.7M Q3 2016 Net loss of $16.0M [1] Q3 2016 adjusted EBITDA [2] of $24.0M Q3 2016 adjusted EBITDA margin [2] of 34% 1,380 Hp Compression Service Field Gathering Midland County, TX Net loss inclusive of $10.2M in charges related to recent Series A Preferred Equity offerings See Appendix for reconciliations of Non-GAAP financial measures See our SEC Form 8-K filings of August 8, 2016, and September 21, 2016, and related press releases for details of our Series A Preferred Equity offering Q3 2016 Net cash from operations of $10.0M Q3 2016 distributable cash flow [2] of $12.7M Q3 2016 distribution coverage ratio [2] of 0.99x Two convertible preferred equity offerings totaling $80M [3]
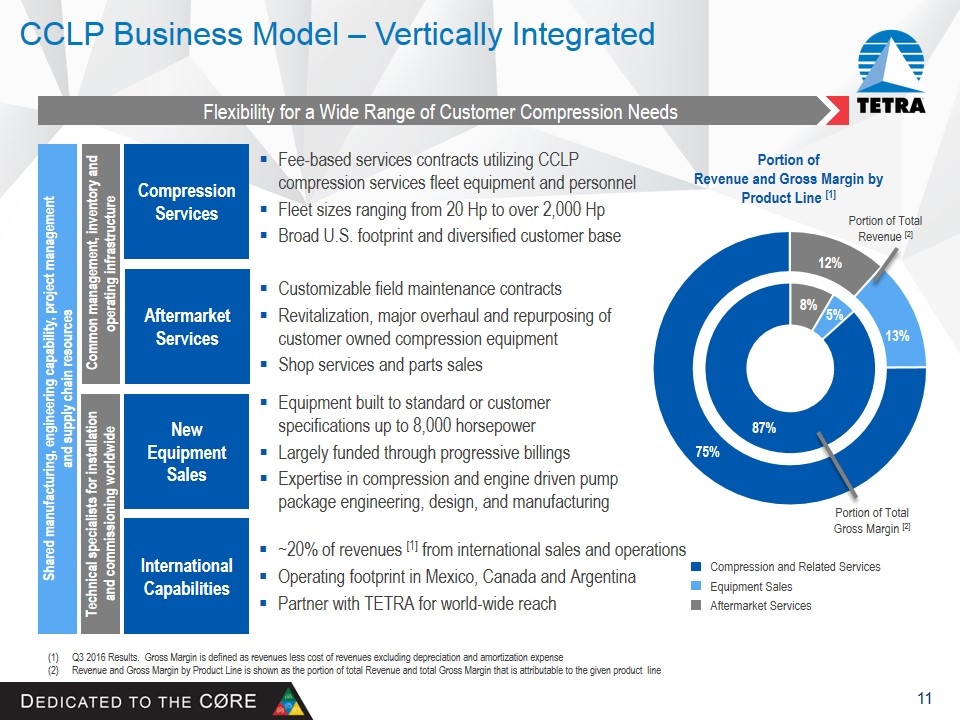
CCLP Business Model – Vertically Integrated Q3 2016 Results. Gross Margin is defined as revenues less cost of revenues excluding depreciation and amortization expense Revenue and Gross Margin by Product Line is shown as the portion of total Revenue and total Gross Margin that is attributable to the given product line Compression Services Aftermarket Services New Equipment Sales International Capabilities Fee-based services contracts utilizing CCLP compression services fleet equipment and personnel Fleet sizes ranging from 20 Hp to over 2,000 Hp Broad U.S. footprint and diversified customer base ~20% of revenues [1] from international sales and operations Operating footprint in Mexico, Canada and Argentina Partner with TETRA for world-wide reach Common management, inventory and operating infrastructure Customizable field maintenance contracts Revitalization, major overhaul and repurposing of customer owned compression equipment Shop services and parts sales Equipment built to standard or customer specifications up to 8,000 horsepower Largely funded through progressive billings Expertise in compression and engine driven pump package engineering, design, and manufacturing Shared manufacturing, engineering capability, project management and supply chain resources Portion of Revenue and Gross Margin by Product Line [1] Flexibility for a Wide Range of Customer Compression Needs Portion of Total Revenue [2] Portion of Total Gross Margin [2] Compression and Related Services Technical specialists for installation and commissioning worldwide Equipment Sales Aftermarket Services
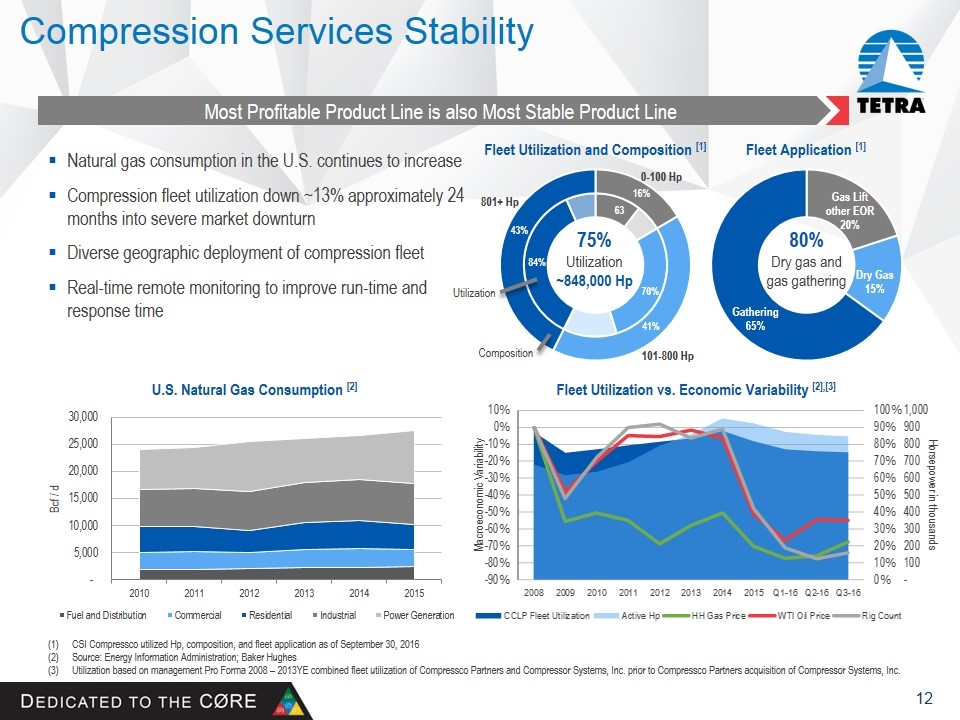
Compression Services Stability Most Profitable Product Line is also Most Stable Product Line Natural gas consumption in the U.S. continues to increase Compression fleet utilization down ~13% approximately 24 months into severe market downturn Diverse geographic deployment of compression fleet Real-time remote monitoring to improve run-time and response time U.S. Natural Gas Consumption [2] Fleet Utilization vs. Economic Variability [2],[3] CSI Compressco utilized Hp, composition, and fleet application as of September 30, 2016 Source: Energy Information Administration; Baker Hughes Utilization based on management Pro Forma 2008 – 2013YE combined fleet utilization of Compressco Partners and Compressor Systems, Inc. prior to Compressco Partners acquisition of Compressor Systems, Inc. 75% Utilization ~848,000 Hp Fleet Utilization and Composition [1] Fleet Application [1] 80% Dry gas and gas gathering 63 70% 84% 0-100 Hp 101-800 Hp 801+ Hp 16% 41% 43% Utilization Composition
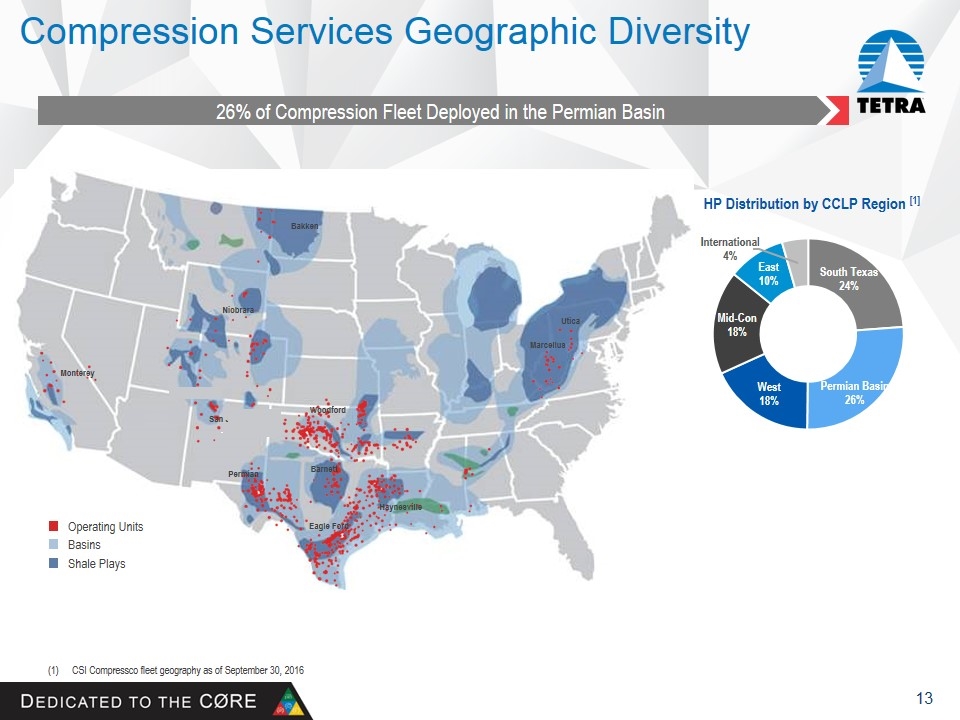
Compression Services Geographic Diversity 26% of Compression Fleet Deployed in the Permian Basin Eagle Ford Marcellus Utica Permian Barnett Haynesville Bakken Niobrara Monterey San Juan Woodford CSI Compressco fleet geography as of September 30, 2016 HP Distribution by CCLP Region [1] Operating Units Basins Shale Plays Gas Jack® unit on Well Head Service
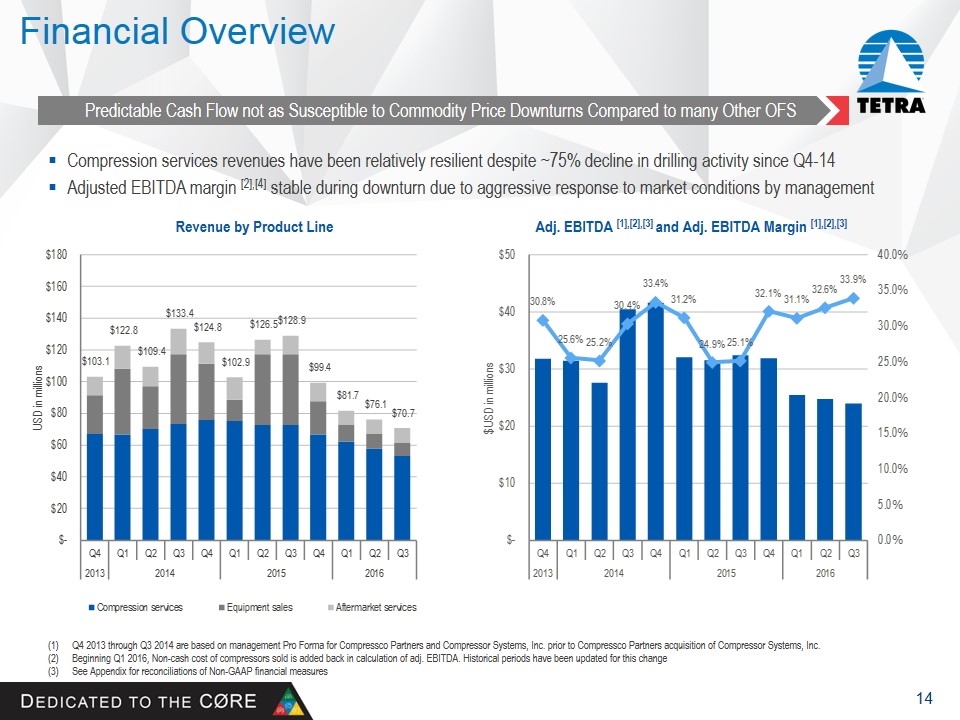
Financial Overview Predictable Cash Flow not as Susceptible to Commodity Price Downturns Compared to many Other OFS Revenue by Product Line Adj. EBITDA [1],[2],[3] and Adj. EBITDA Margin [1],[2],[3] Compression services revenues have been relatively resilient despite ~75% decline in drilling activity since Q4-14 Adjusted EBITDA margin [2],[4] stable during downturn due to aggressive response to market conditions by management Q4 2013 through Q3 2014 are based on management Pro Forma for Compressco Partners and Compressor Systems, Inc. prior to Compressco Partners acquisition of Compressor Systems, Inc. Beginning Q1 2016, Non-cash cost of compressors sold is added back in calculation of adj. EBITDA. Historical periods have been updated for this change See Appendix for reconciliations of Non-GAAP financial measures
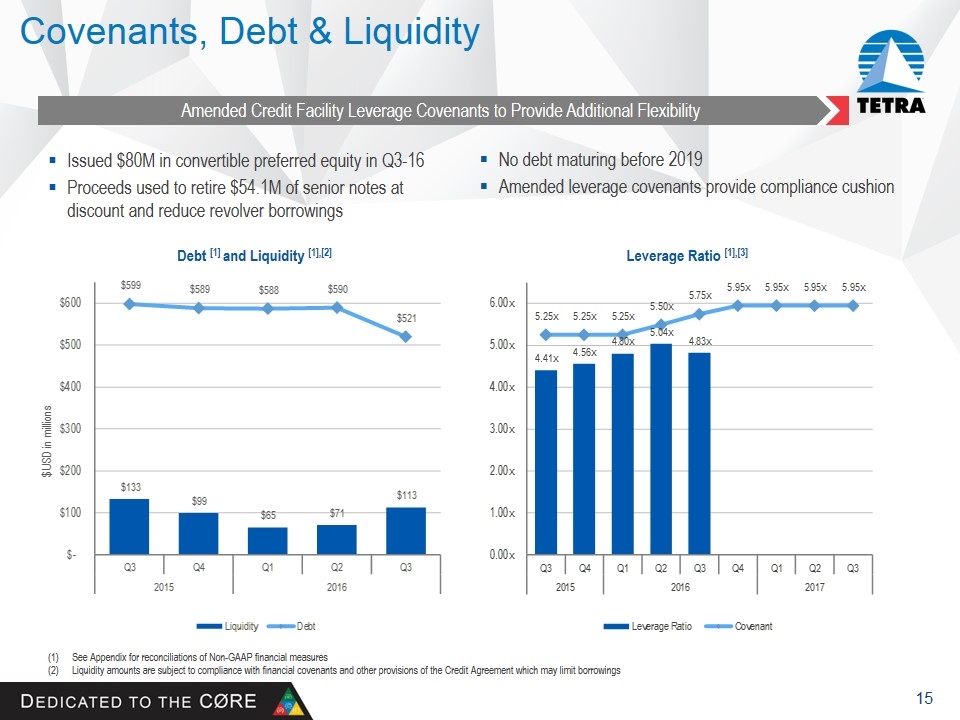
Amended Credit Facility Leverage Covenants to Provide Additional Flexibility Covenants, Debt & Liquidity Issued $80M in convertible preferred equity in Q3-16 Proceeds used to retire $54.1M of senior notes at discount and reduce revolver borrowings Debt [1] and Liquidity [1],[2] Leverage Ratio [1],[3] See Appendix for reconciliations of Non-GAAP financial measures Liquidity amounts are subject to compliance with financial covenants and other provisions of the Credit Agreement which may limit borrowings No debt maturing before 2019 Amended leverage covenants provide compliance cushion

Production Testing
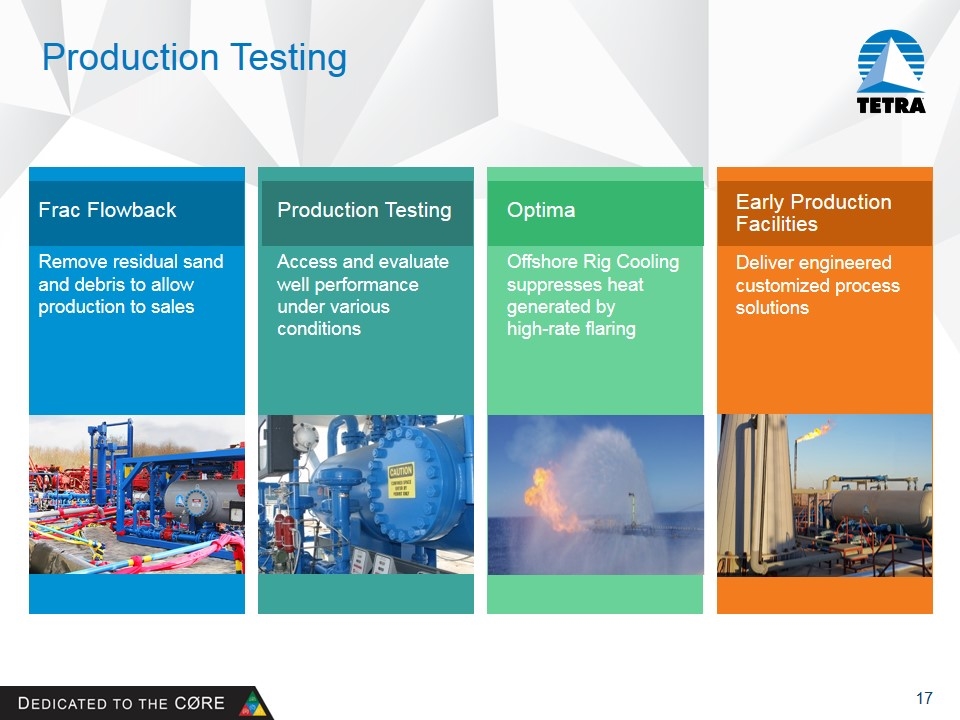
Production Testing Frac Flowback Remove residual sand and debris to allow production to sales Optima Offshore Rig Cooling suppresses heat generated by high-rate flaring Early Production Facilities Deliver engineered customized process solutions Production Testing Access and evaluate well performance under various conditions
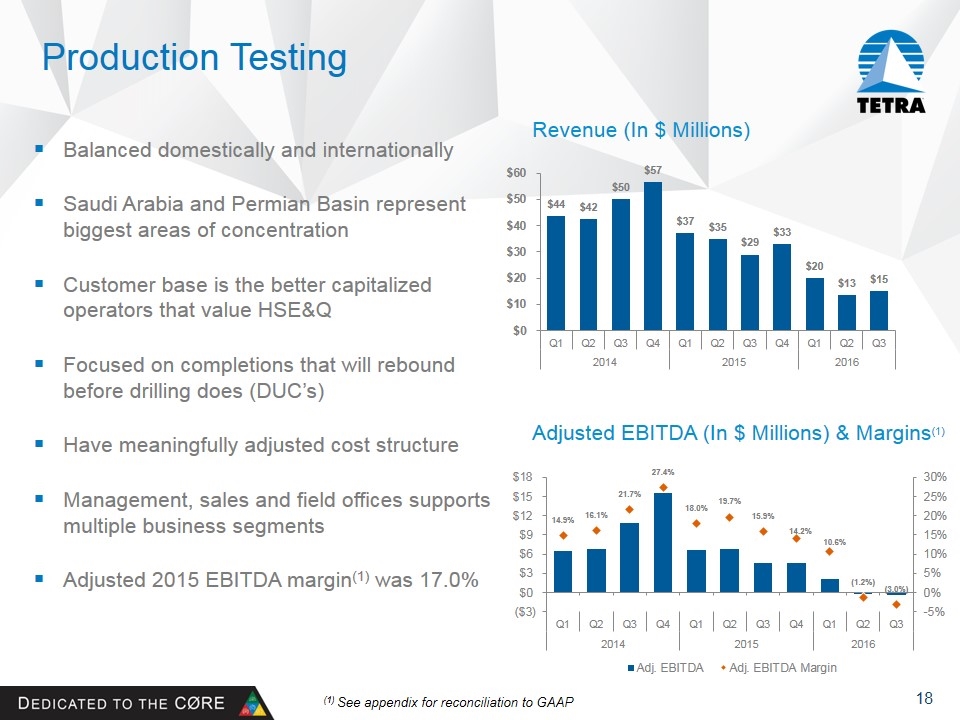
Production Testing Revenue (In $ Millions) Adjusted EBITDA (In $ Millions) & Margins(1) Balanced domestically and internationally Saudi Arabia and Permian Basin represent biggest areas of concentration Customer base is the better capitalized operators that value HSE&Q Focused on completions that will rebound before drilling does (DUC’s) Have meaningfully adjusted cost structure Management, sales and field offices supports multiple business segments Adjusted 2015 EBITDA margin(1) was 17.0% (1) See appendix for reconciliation to GAAP

Offshore Services
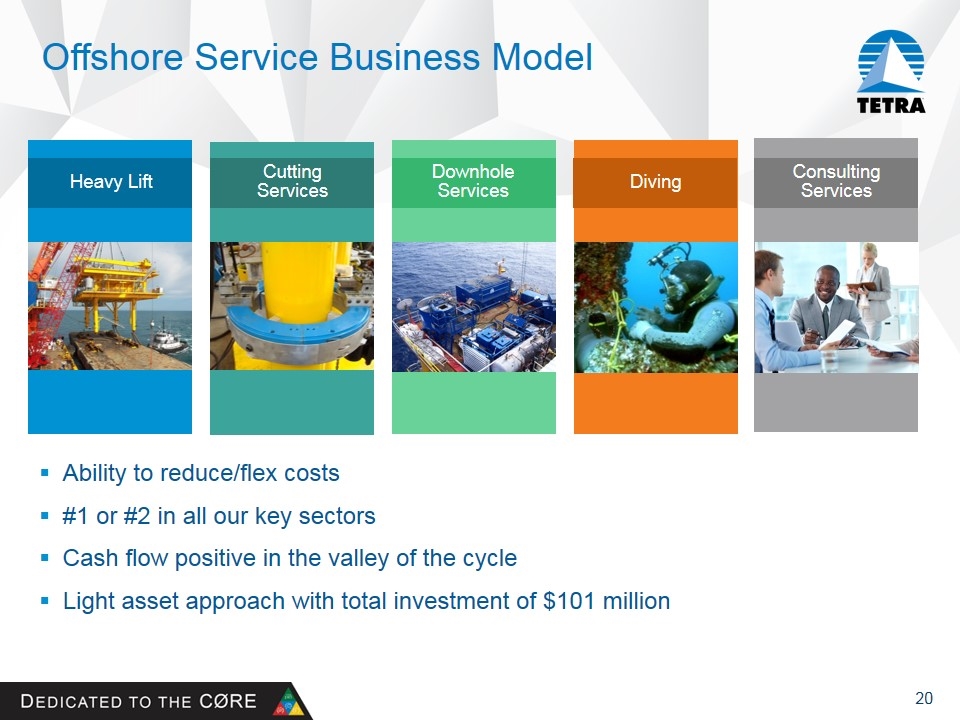
Offshore Service Business Model Heavy Lift Downhole Services Diving Cutting Services Consulting Services Ability to reduce/flex costs #1 or #2 in all our key sectors Cash flow positive in the valley of the cycle Light asset approach with total investment of $101 million
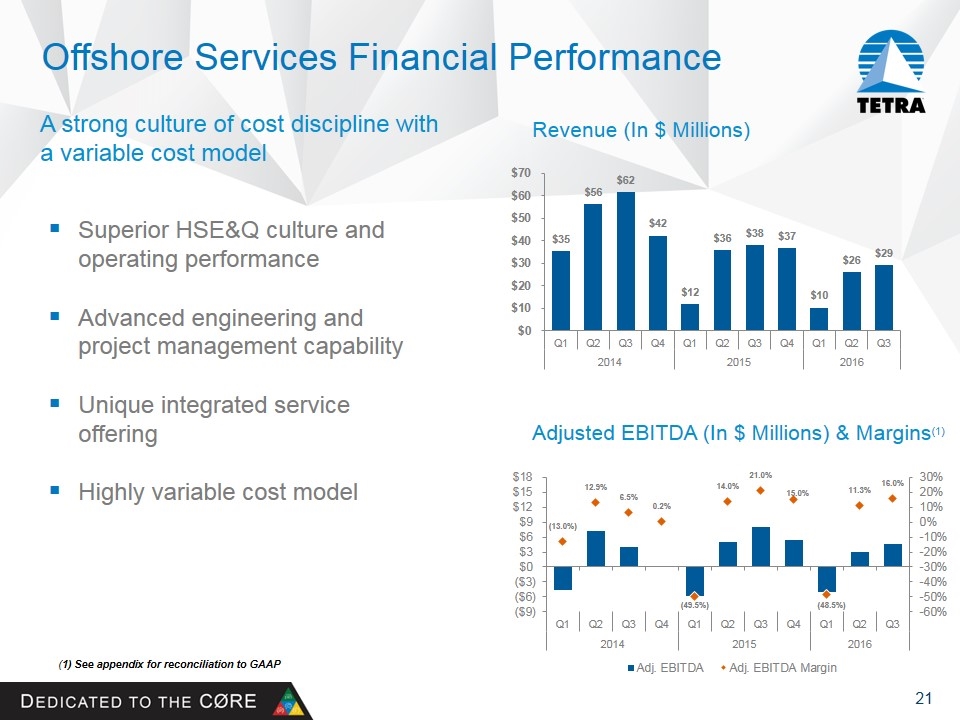
Offshore Services Financial Performance A strong culture of cost discipline with a variable cost model (1) See appendix for reconciliation to GAAP Revenue (In $ Millions) Adjusted EBITDA (In $ Millions) & Margins(1) Superior HSE&Q culture and operating performance Advanced engineering and project management capability Unique integrated service offering Highly variable cost model

Financial Overview
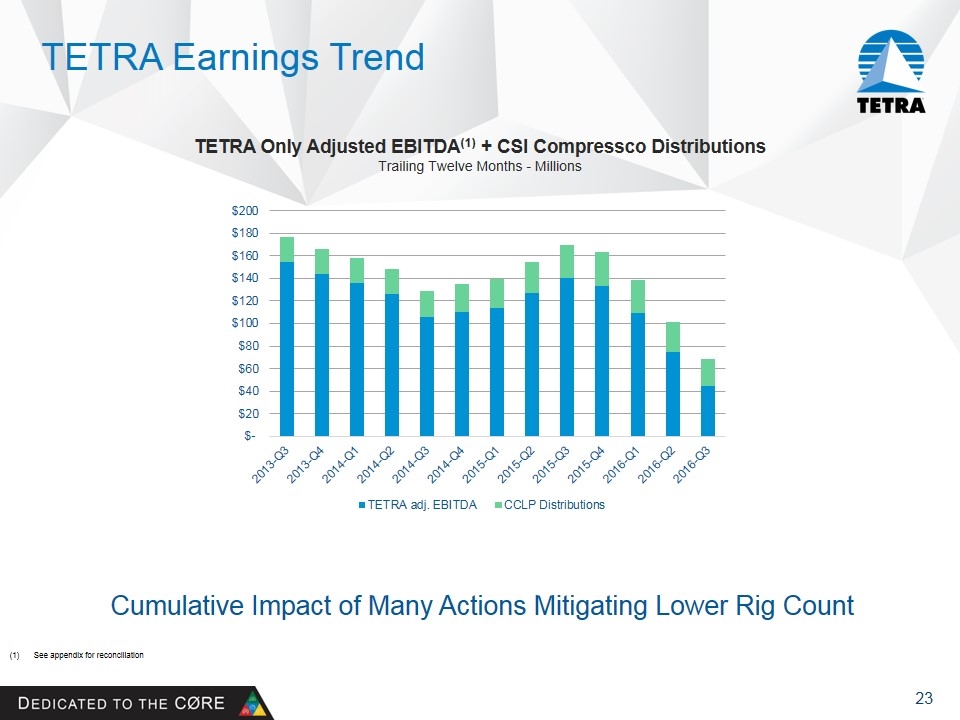
TETRA Earnings Trend TETRA Only Adjusted EBITDA(1) + CSI Compressco Distributions Trailing Twelve Months - Millions See appendix for reconciliation Cumulative Impact of Many Actions Mitigating Lower Rig Count
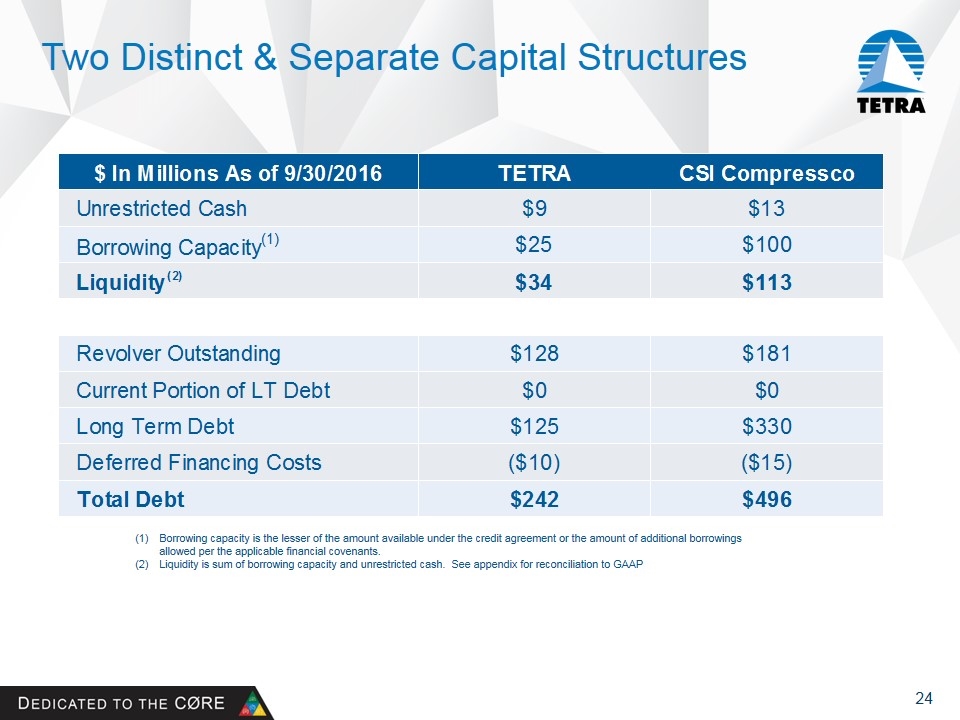
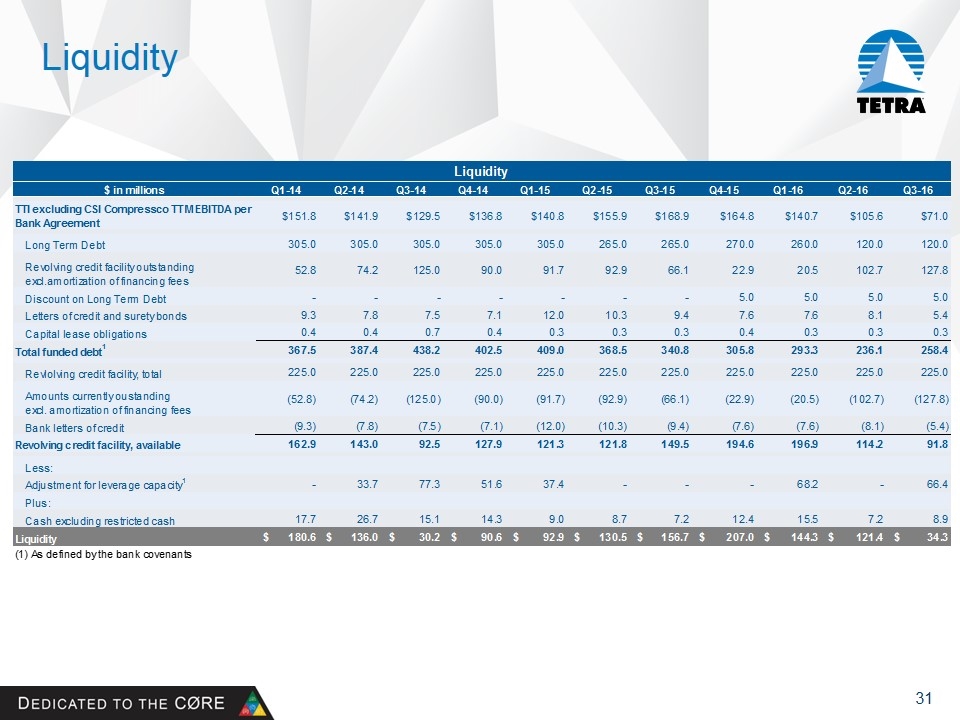
Two Distinct & Separate Capital Structures Borrowing capacity is the lesser of the amount available under the credit agreement or the amount of additional borrowings allowed per the applicable financial covenants. Liquidity is sum of borrowing capacity and unrestricted cash. See appendix for reconciliation to GAAP
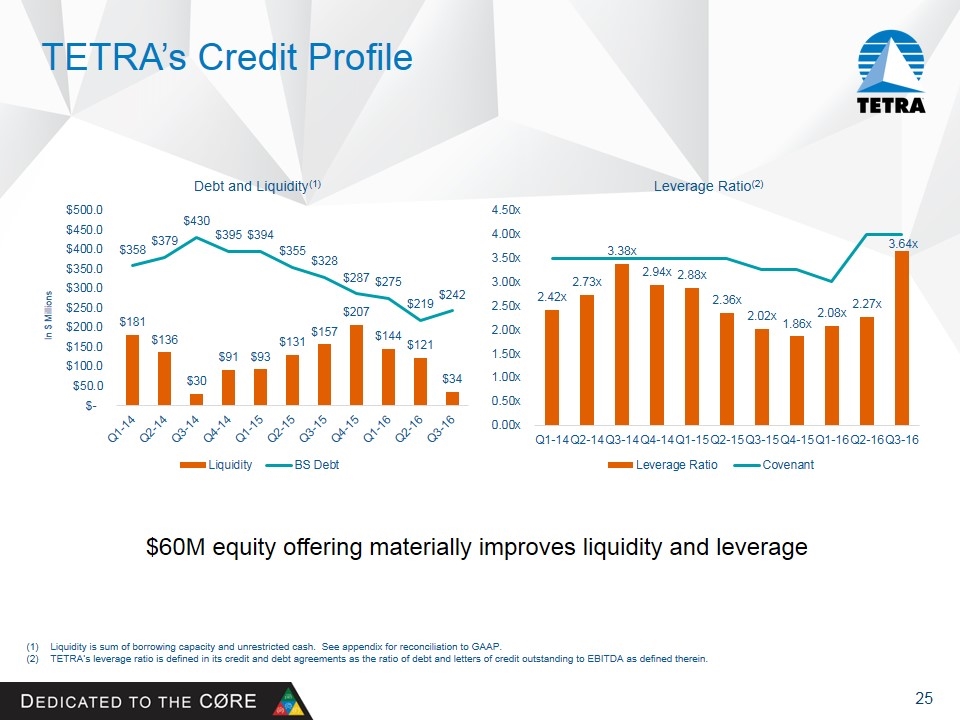
TETRA’s Credit Profile Liquidity is sum of borrowing capacity and unrestricted cash. See appendix for reconciliation to GAAP. TETRA’s leverage ratio is defined in its credit and debt agreements as the ratio of debt and letters of credit outstanding to EBITDA as defined therein. $60M equity offering materially improves liquidity and leverage
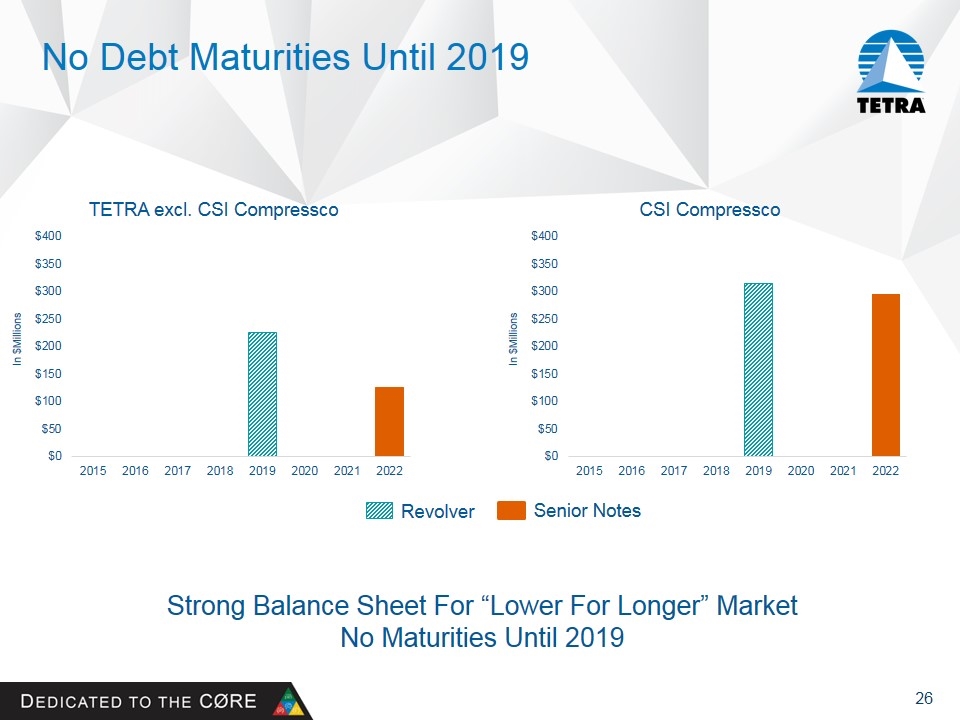
No Debt Maturities Until 2019 Revolver Senior Notes Strong Balance Sheet For “Lower For Longer” Market No Maturities Until 2019
December 2016 TETRA Technologies, Inc. CSI Compressco LP
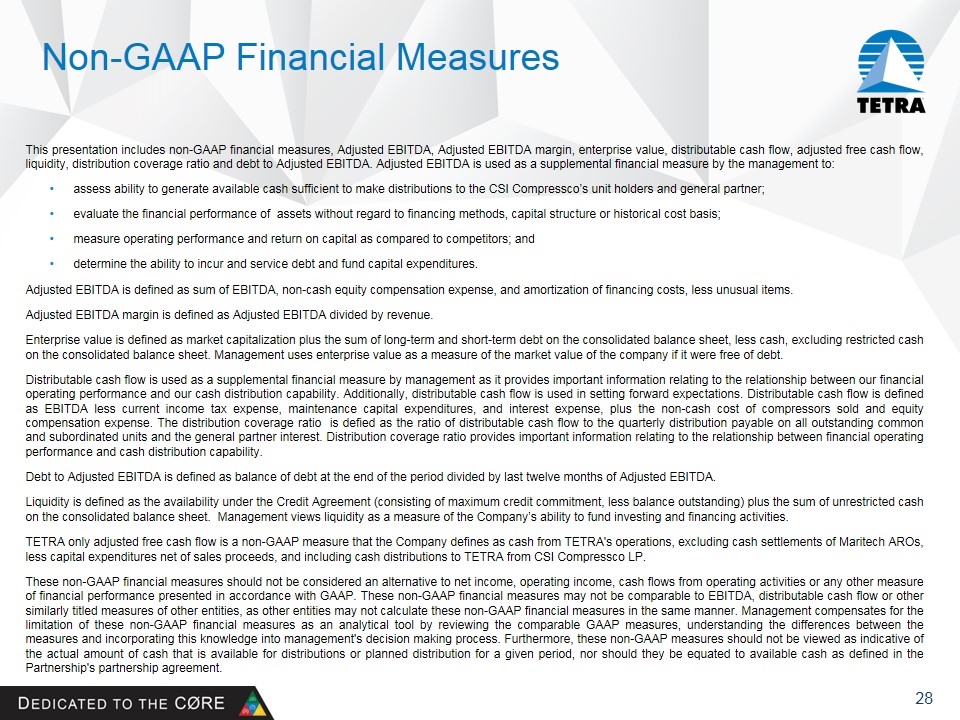
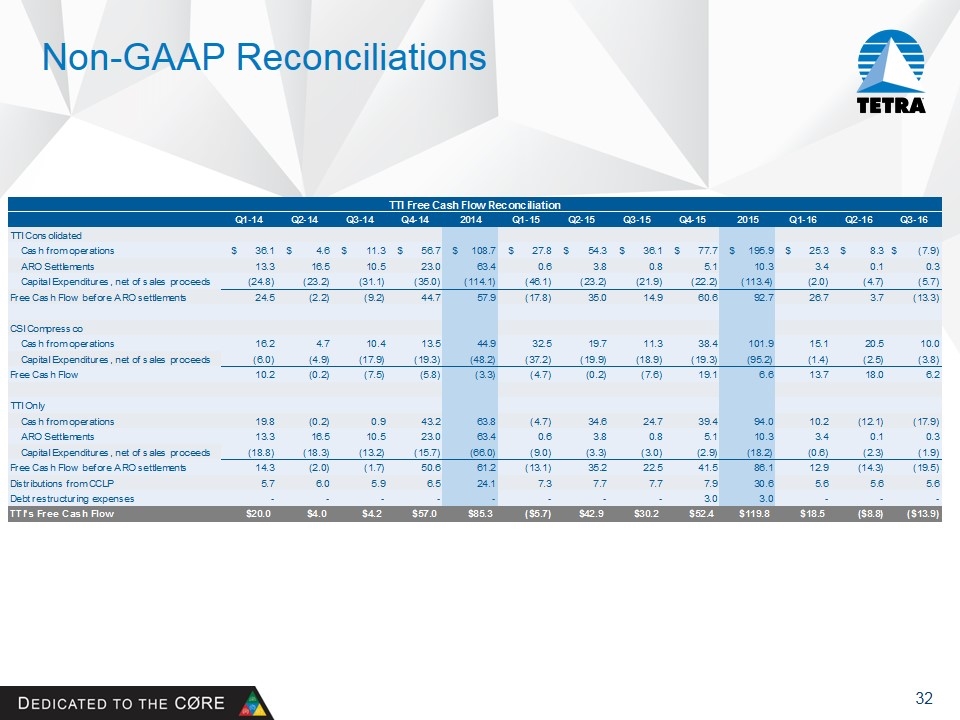
Non-GAAP Financial Measures This presentation includes non-GAAP financial measures, Adjusted EBITDA, Adjusted EBITDA margin, enterprise value, distributable cash flow, adjusted free cash flow, liquidity, distribution coverage ratio and debt to Adjusted EBITDA. Adjusted EBITDA is used as a supplemental financial measure by the management to: assess ability to generate available cash sufficient to make distributions to the CSI Compressco’s unit holders and general partner; evaluate the financial performance of assets without regard to financing methods, capital structure or historical cost basis; measure operating performance and return on capital as compared to competitors; and determine the ability to incur and service debt and fund capital expenditures. Adjusted EBITDA is defined as sum of EBITDA, non-cash equity compensation expense, and amortization of financing costs, less unusual items. Adjusted EBITDA margin is defined as Adjusted EBITDA divided by revenue. Enterprise value is defined as market capitalization plus the sum of long-term and short-term debt on the consolidated balance sheet, less cash, excluding restricted cash on the consolidated balance sheet. Management uses enterprise value as a measure of the market value of the company if it were free of debt. Distributable cash flow is used as a supplemental financial measure by management as it provides important information relating to the relationship between our financial operating performance and our cash distribution capability. Additionally, distributable cash flow is used in setting forward expectations. Distributable cash flow is defined as EBITDA less current income tax expense, maintenance capital expenditures, and interest expense, plus the non-cash cost of compressors sold and equity compensation expense. The distribution coverage ratio is defied as the ratio of distributable cash flow to the quarterly distribution payable on all outstanding common and subordinated units and the general partner interest. Distribution coverage ratio provides important information relating to the relationship between financial operating performance and cash distribution capability. Debt to Adjusted EBITDA is defined as balance of debt at the end of the period divided by last twelve months of Adjusted EBITDA. Liquidity is defined as the availability under the Credit Agreement (consisting of maximum credit commitment, less balance outstanding) plus the sum of unrestricted cash on the consolidated balance sheet. Management views liquidity as a measure of the Company’s ability to fund investing and financing activities. TETRA only adjusted free cash flow is a non-GAAP measure that the Company defines as cash from TETRA's operations, excluding cash settlements of Maritech AROs, less capital expenditures net of sales proceeds, and including cash distributions to TETRA from CSI Compressco LP. These non-GAAP financial measures should not be considered an alternative to net income, operating income, cash flows from operating activities or any other measure of financial performance presented in accordance with GAAP. These non-GAAP financial measures may not be comparable to EBITDA, distributable cash flow or other similarly titled measures of other entities, as other entities may not calculate these non-GAAP financial measures in the same manner. Management compensates for the limitation of these non-GAAP financial measures as an analytical tool by reviewing the comparable GAAP measures, understanding the differences between the measures and incorporating this knowledge into management's decision making process. Furthermore, these non-GAAP measures should not be viewed as indicative of the actual amount of cash that is available for distributions or planned distribution for a given period, nor should they be equated to available cash as defined in the Partnership's partnership agreement.
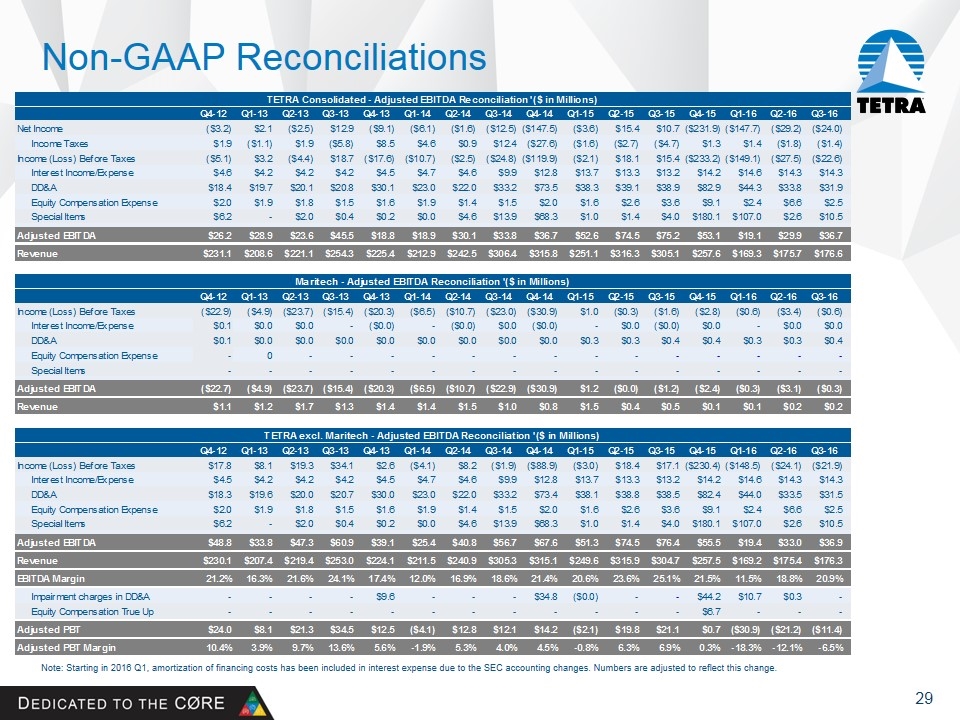
Non-GAAP Reconciliations Note: Starting in 2016 Q1, amortization of financing costs has been included in interest expense due to the SEC accounting changes. Numbers are adjusted to reflect this change.

Non-GAAP Reconciliations Note: Starting in 2016 Q1, amortization of financing costs has been included in interest expense due to the SEC accounting changes. Numbers are adjusted to reflect this change.
Liquidity
Non-GAAP Reconciliations

Non-GAAP Reconciliations
Market Capitalization & Enterprise Value
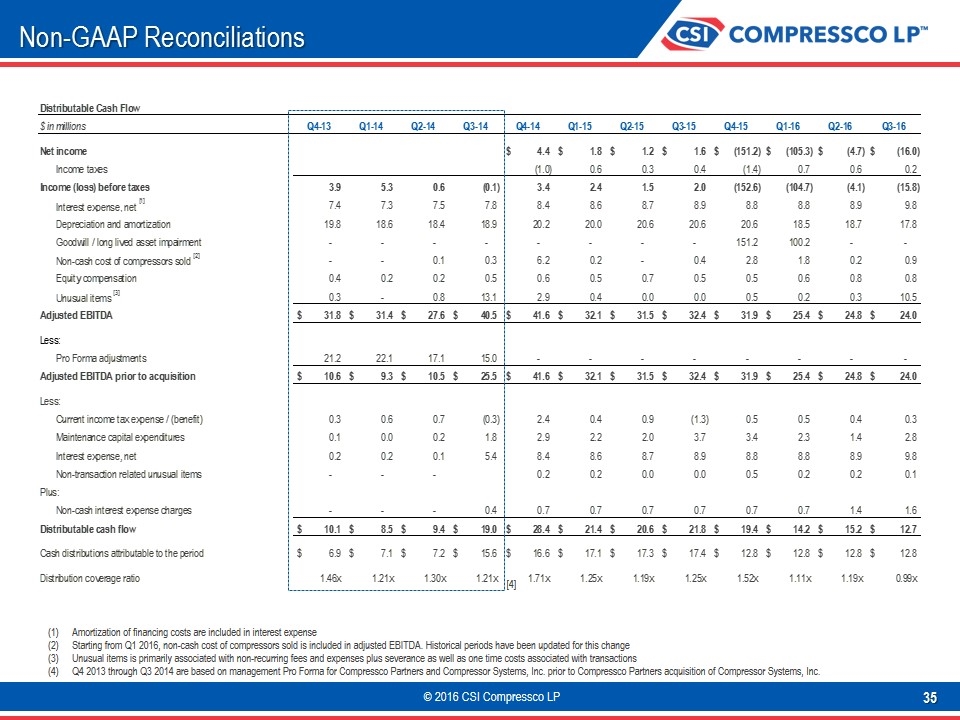
Non-GAAP Reconciliations Amortization of financing costs are included in interest expense Starting from Q1 2016, non-cash cost of compressors sold is included in adjusted EBITDA. Historical periods have been updated for this change Unusual items is primarily associated with non-recurring fees and expenses plus severance as well as one time costs associated with transactions Q4 2013 through Q3 2014 are based on management Pro Forma for Compressco Partners and Compressor Systems, Inc. prior to Compressco Partners acquisition of Compressor Systems, Inc. [4]
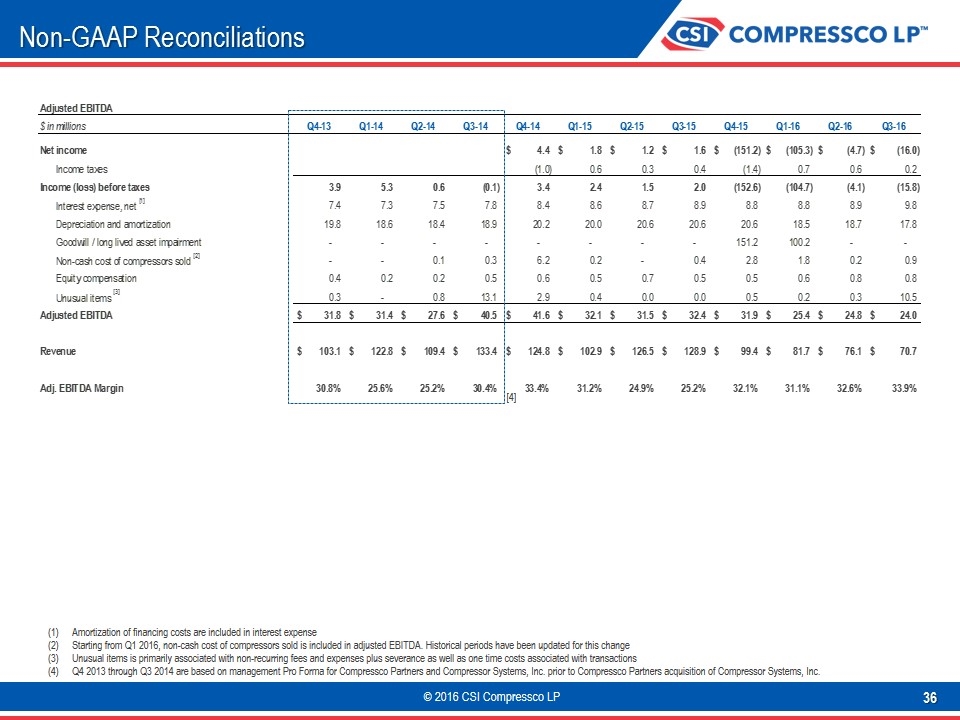
Non-GAAP Reconciliations Amortization of financing costs are included in interest expense Starting from Q1 2016, non-cash cost of compressors sold is included in adjusted EBITDA. Historical periods have been updated for this change Unusual items is primarily associated with non-recurring fees and expenses plus severance as well as one time costs associated with transactions Q4 2013 through Q3 2014 are based on management Pro Forma for Compressco Partners and Compressor Systems, Inc. prior to Compressco Partners acquisition of Compressor Systems, Inc. [4]
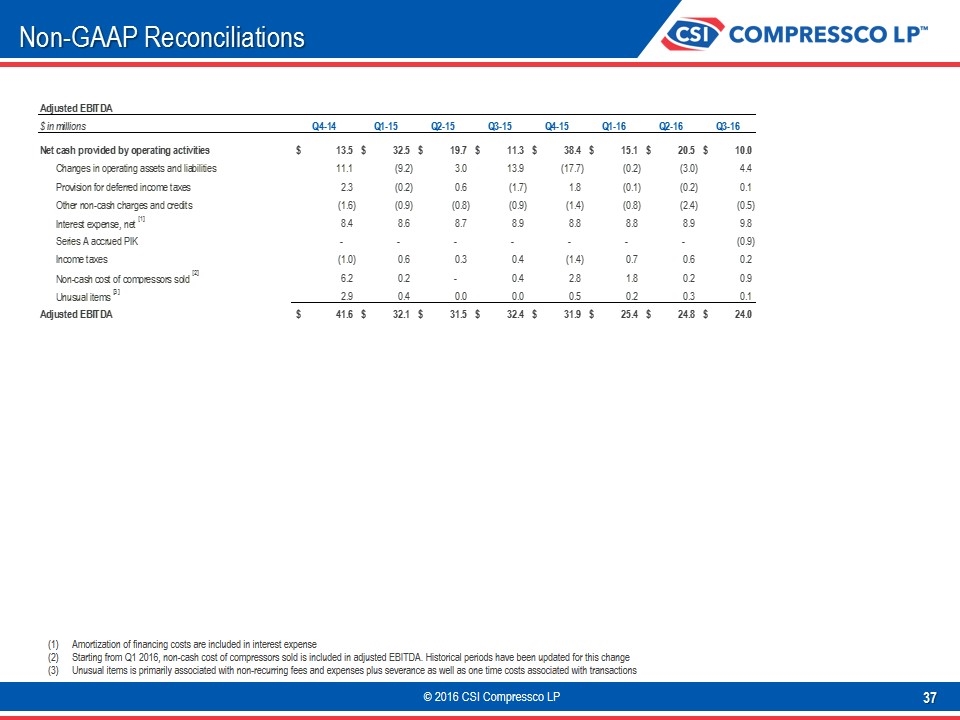
Non-GAAP Reconciliations Amortization of financing costs are included in interest expense Starting from Q1 2016, non-cash cost of compressors sold is included in adjusted EBITDA. Historical periods have been updated for this change Unusual items is primarily associated with non-recurring fees and expenses plus severance as well as one time costs associated with transactions
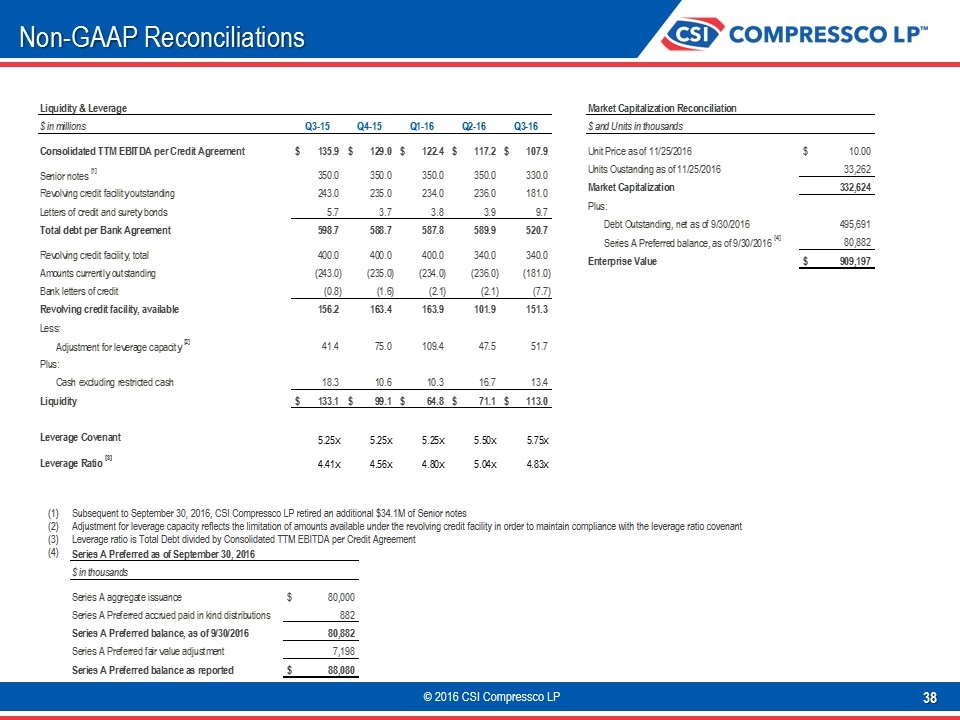
Non-GAAP Reconciliations Subsequent to September 30, 2016, CSI Compressco LP retired an additional $34.1M of Senior notes Adjustment for leverage capacity reflects the limitation of amounts available under the revolving credit facility in order to maintain compliance with the leverage ratio covenant Leverage ratio is Total Debt divided by Consolidated TTM EBITDA per Credit Agreement
December 2016 TETRA Technologies, Inc. CSI Compressco LP


