CEO Overview Stu Brightman CEO of TETRA Technologies, Inc. and Chairman of the Board of Directors of CSI Compressco LP NYC, May 31, 2018
Forward Looking Statement & Non-GAAP Measures Forward-Looking Statements: This presentation includes certain statements that are or may be deemed to be forward-looking statements. Generally, the use of words such as “may,” “will,” “expect,” “intend,” “estimate,” “projects,” “anticipate,” “believe,” “assume,” “could,” “should,” “plans,” “targets” or similar expressions that convey the uncertainty of future events, activities, expectations or outcomes identify forward-looking statements that the company intends to be included within the safe harbor protections provided by the federal securities laws. These forward-looking statements include statements concerning expected results of operational business segments for 2018-2020, anticipated benefits from our acquisitions of assets and businesses, estimated earnings, earnings per share, and statements regarding our beliefs, expectations, plans, goals, future events and performance, and other statements that are not purely historical. These forward-looking statements are based on certain assumptions and analyses made in light of our experience and our perception of historical trends, current conditions, expected future developments and other factors we believe are appropriate in the circumstances. Such statements are subject to a number of risks and uncertainties, many of which are beyond our control. Investors are cautioned that any such statements are not guarantees of future performance or results and that actual results or developments may differ materially from those projected in the forward-looking statements. Some of the factors that could affect actual results are described in the section titled “Risk Factors” contained in the Annual Reports on Form 10-K for the year ended December 31, 2017, for each of TETRA Technologies, Inc. (“TETRA”) and CSI Compressco LP (“CCLP”) as well as other risks identified from time to time in the reports on Form 10-Q and Form 8-K filed by TETRA and CCLP with the Securities and Exchange Commission. Further Disclosure Regarding the Use of Non-GAAP Measures: Management views adjusted revenue, cash from operating activities, and Adjusted EBITDA as useful measures to assess our performance in prior periods following the sale of substantially all of our Maritech and Offshore segment operations. Adjusted EBITDA, a performance measure used by management, is defined as net income (loss) plus: (1) interest expense (net of interest income), (2) income tax provision, and (3) depreciation, depletion, amortization, accretion and impairments, all of which are calculated excluding our sold Maritech and Offshore segment operations. Adjusted EBITDA is not defined under GAAP and does not purport to be an alternative to EBITDA, net income or any other GAAP financial measures as a measure of operating performance. Because not all companies use identical calculations, our presentation of Adjusted EBITDA may not be comparable to other similarly titled measures of other companies. Management views Adjusted EBITDA as useful to investors and other external users of our consolidated financial statements as an additional tool to evaluate and compare our operating performance, because Adjusted EBITDA is a measurement of a company’s operating performance without regard to items such as interest expense, taxes, depreciation, depletion, and amortization, which can vary substantially from company to company. The reconciliation included in the Financial Data Appendix to this presentation is not a substitute for financial information prepared in accordance with GAAP, and should be considered within the context of our complete financial results for the periods indicated, which are available on our website at tetratec.com.
Agenda CEO Key Message. . . . . . . . . . . . . . . . . . . . . . Stu Brightman Divisions Overview and Strategy. . . . . . . . . . . .Brady Murphy Growth Through Innovation Water & Flowback Services. . . . . . . . . . . . .Matt Sanderson Completion Fluids & Products . . . . . . . . . . Matt Sanderson Chemical Advantage. . . . . . . . . . . . . . . . . . . . .Jim Funke Permian Basin Operations . . . . . . . . . . . . . . . .Hunter Morris CSI Compressco. . . . . . . . . . . . . . . . . . . . . . . .Owen Serjeant & Levent Caglar Financial Position and Direction. . . . . . . . . . . . Elijio Serrano Closing Comments. . . . . . . . . . . . . . . . . . . . . . Stu Brightman Reception following the conference at The Lamb Club, 2nd floor, 132 W. 44th St
CEO Highlights – Key Message Committed to Efficient Capital Allocation Divested operations not generating consistent and predictable free cash flow Directing capital towards quick payback shale services and predictable and consistent contract compression markets Positioned for Growth Focused on the shale plays with water management, flowback services, fluids and compression services (gathering systems and enhanced production) Competitive advantage with our fully invested and vertical fluids network leveraging the oil & gas and industrial markets Strengthened Management Team with Strong Board Oversight Enhanced the management team to deliver during upcycle Strong seasoned board of directors
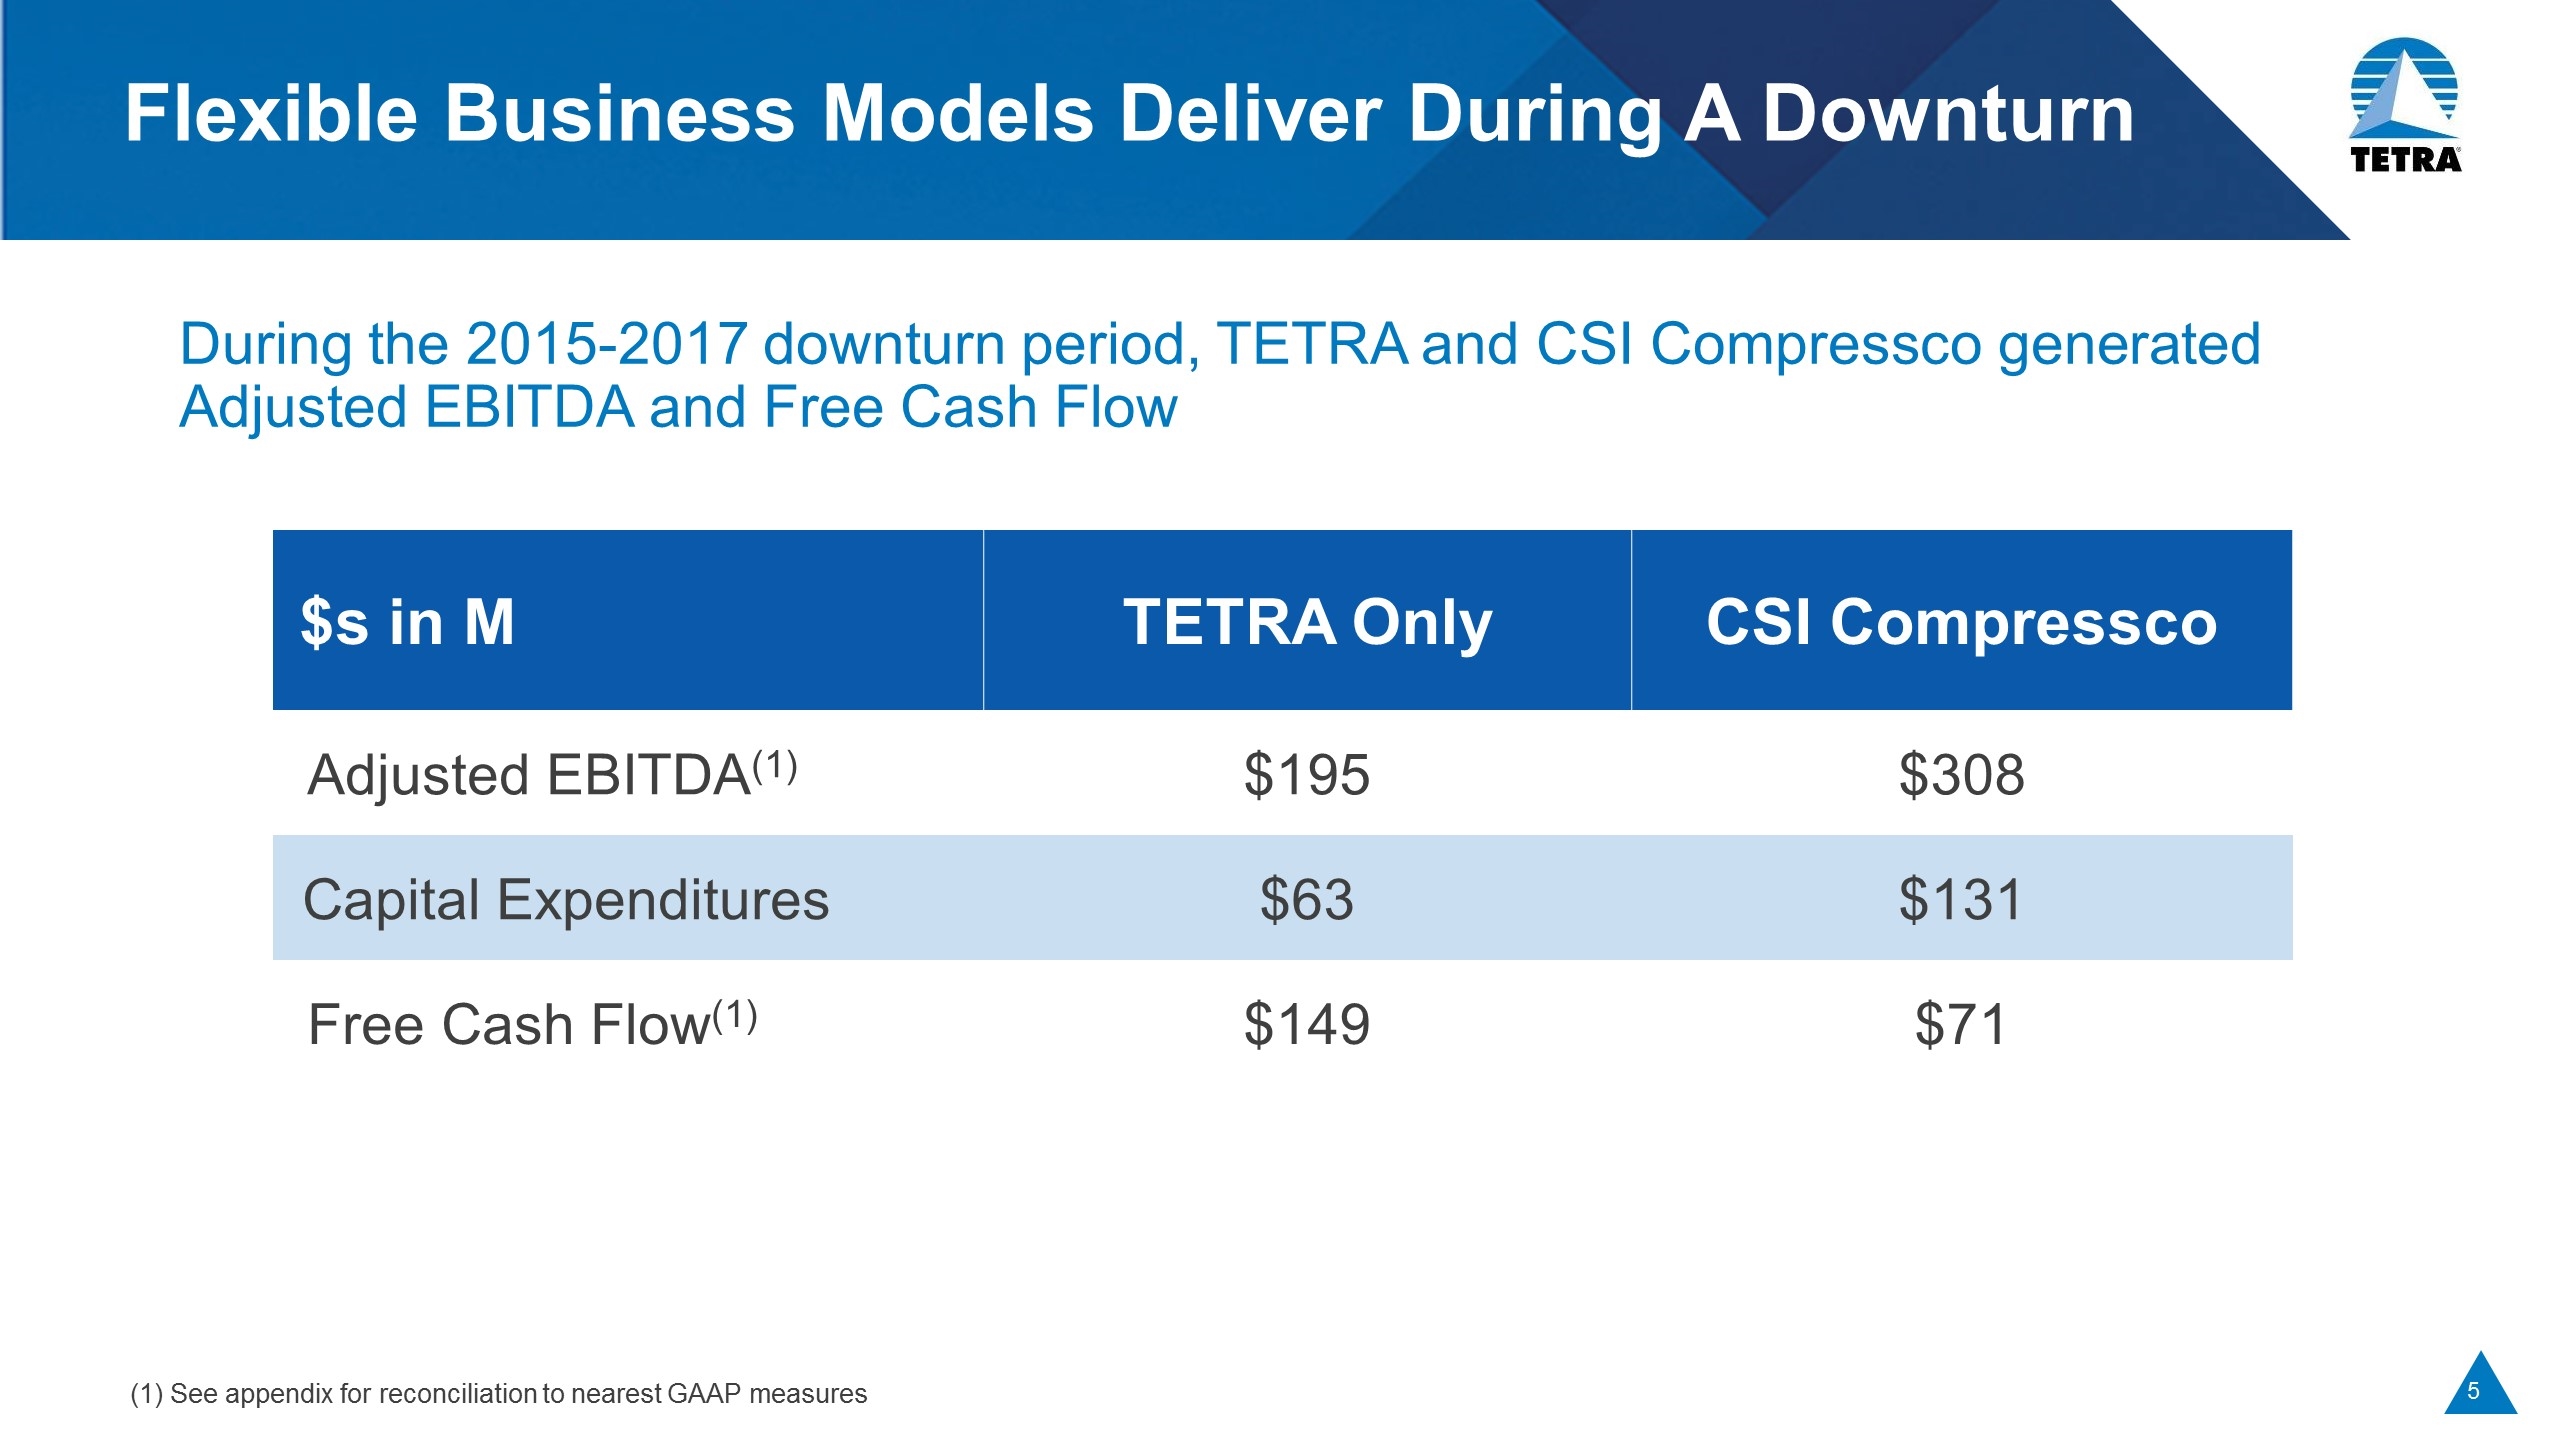
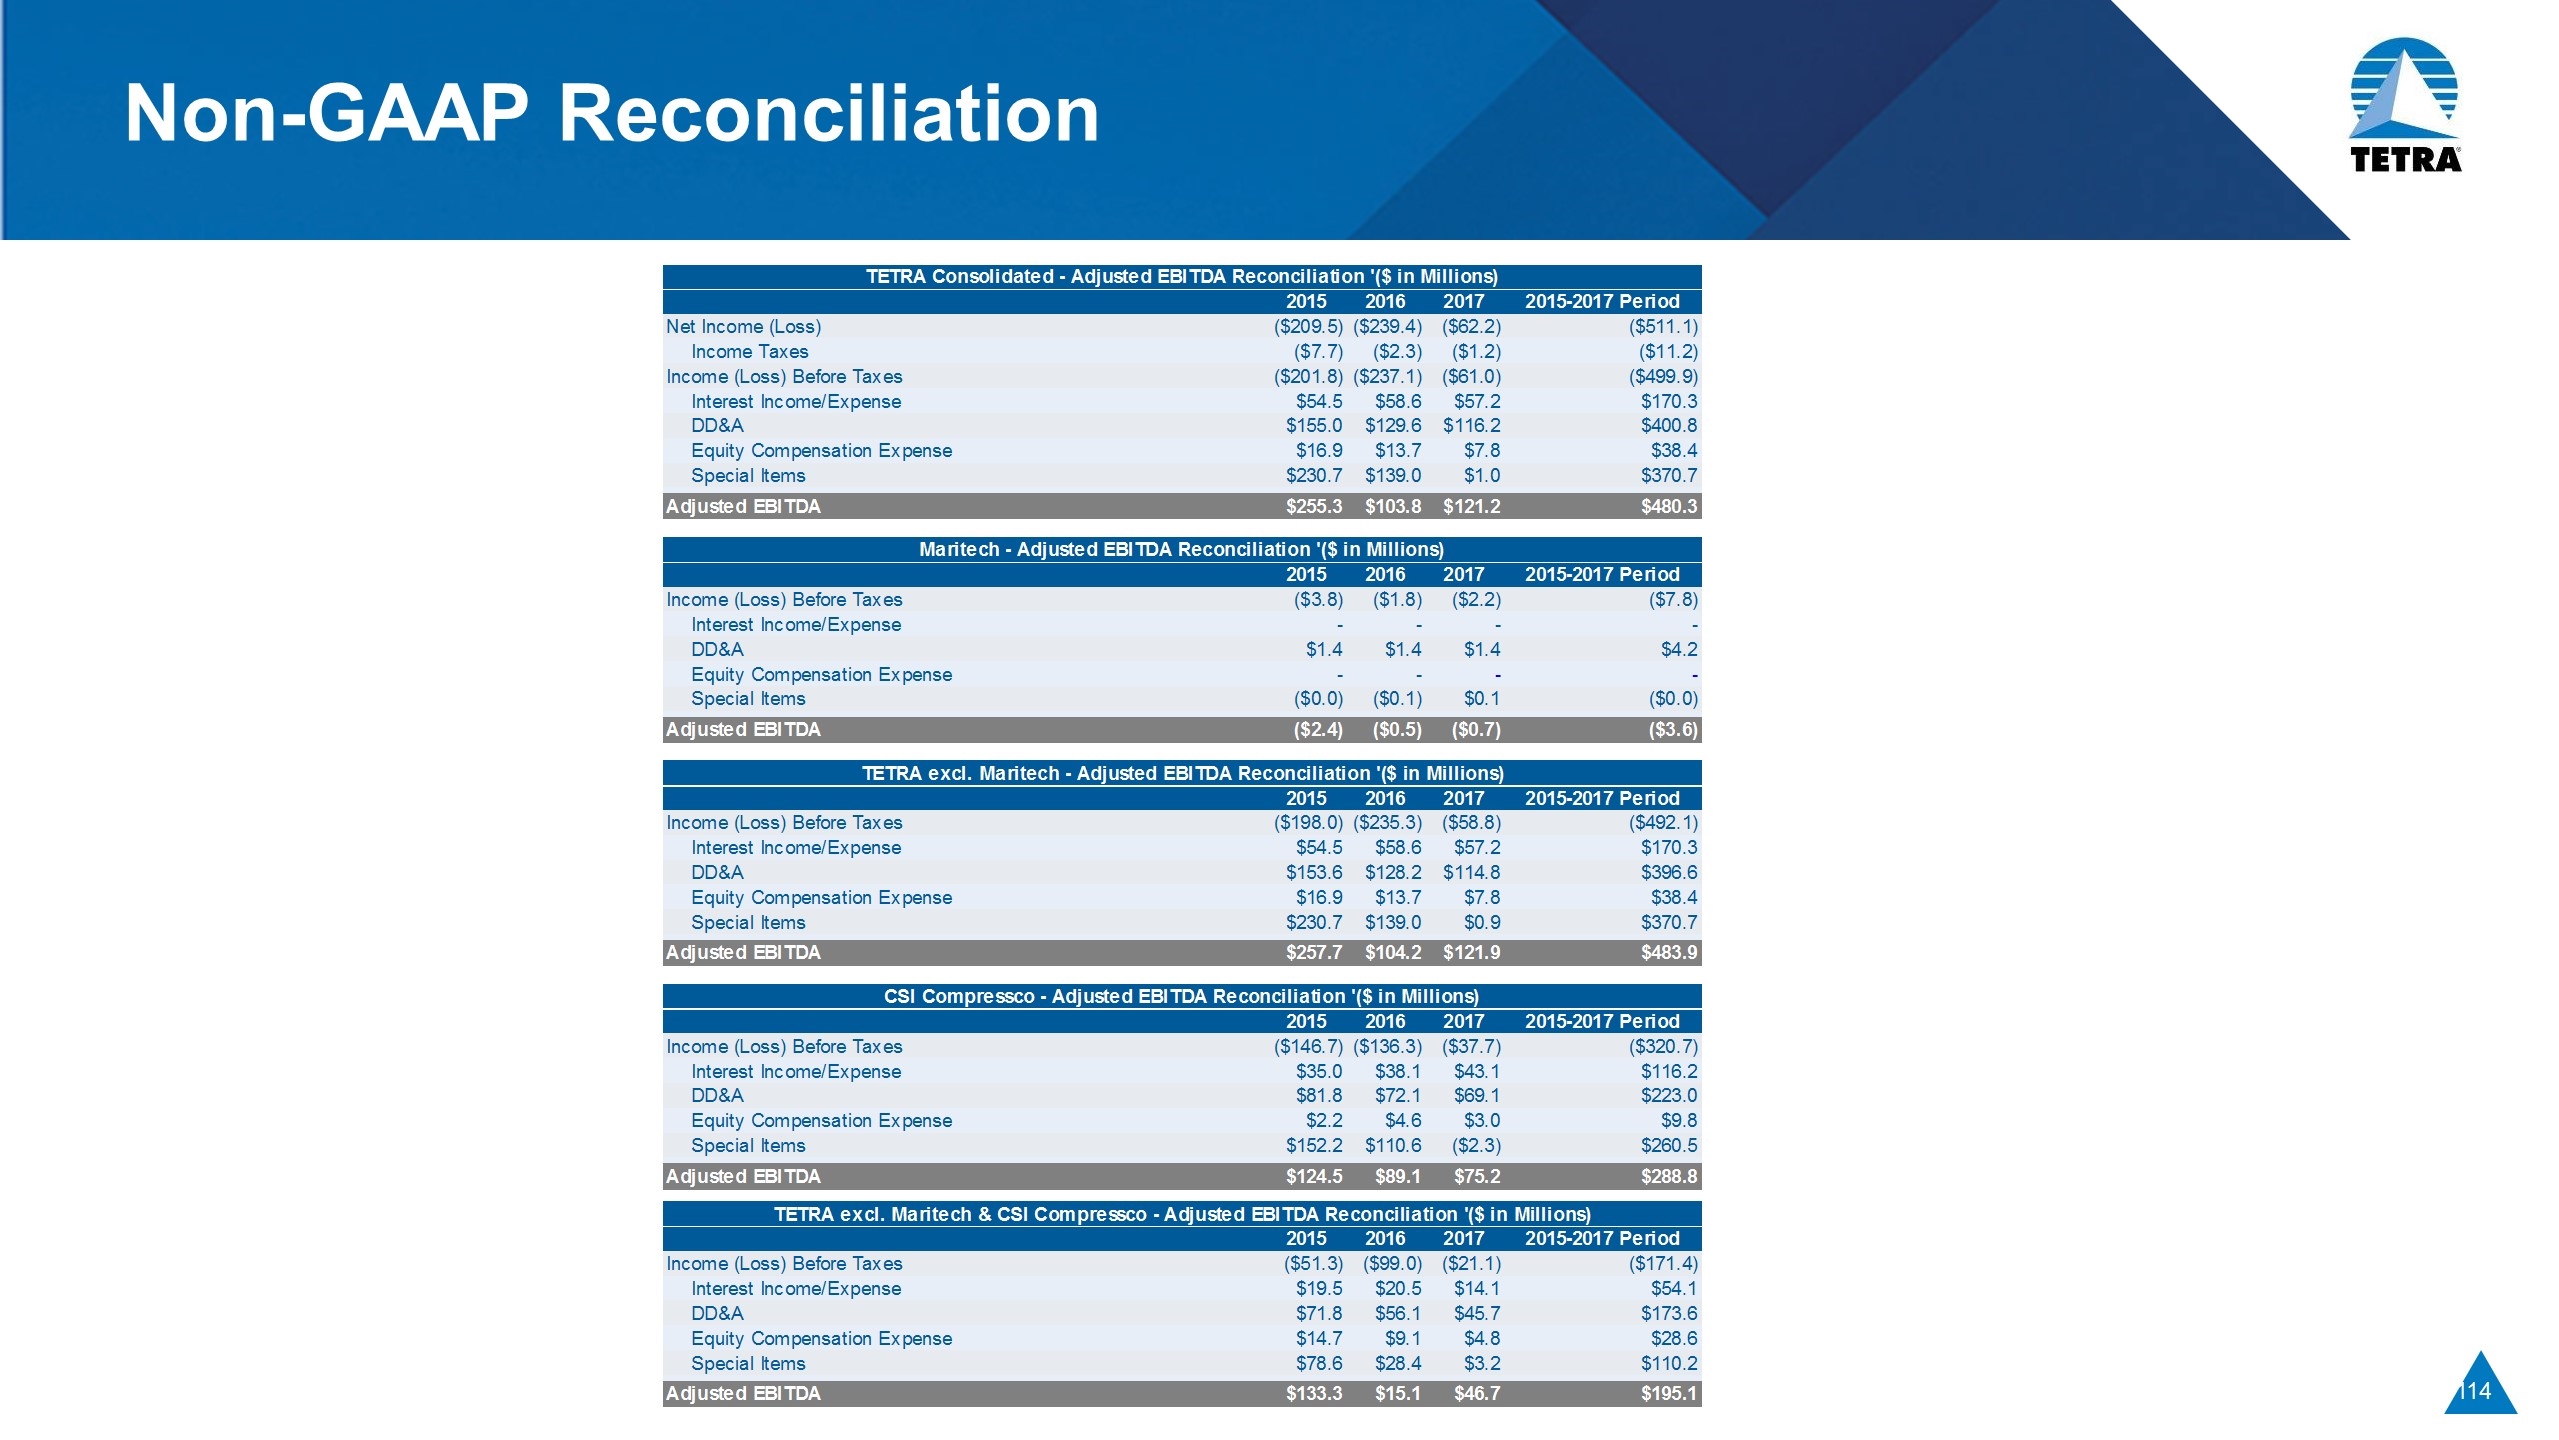
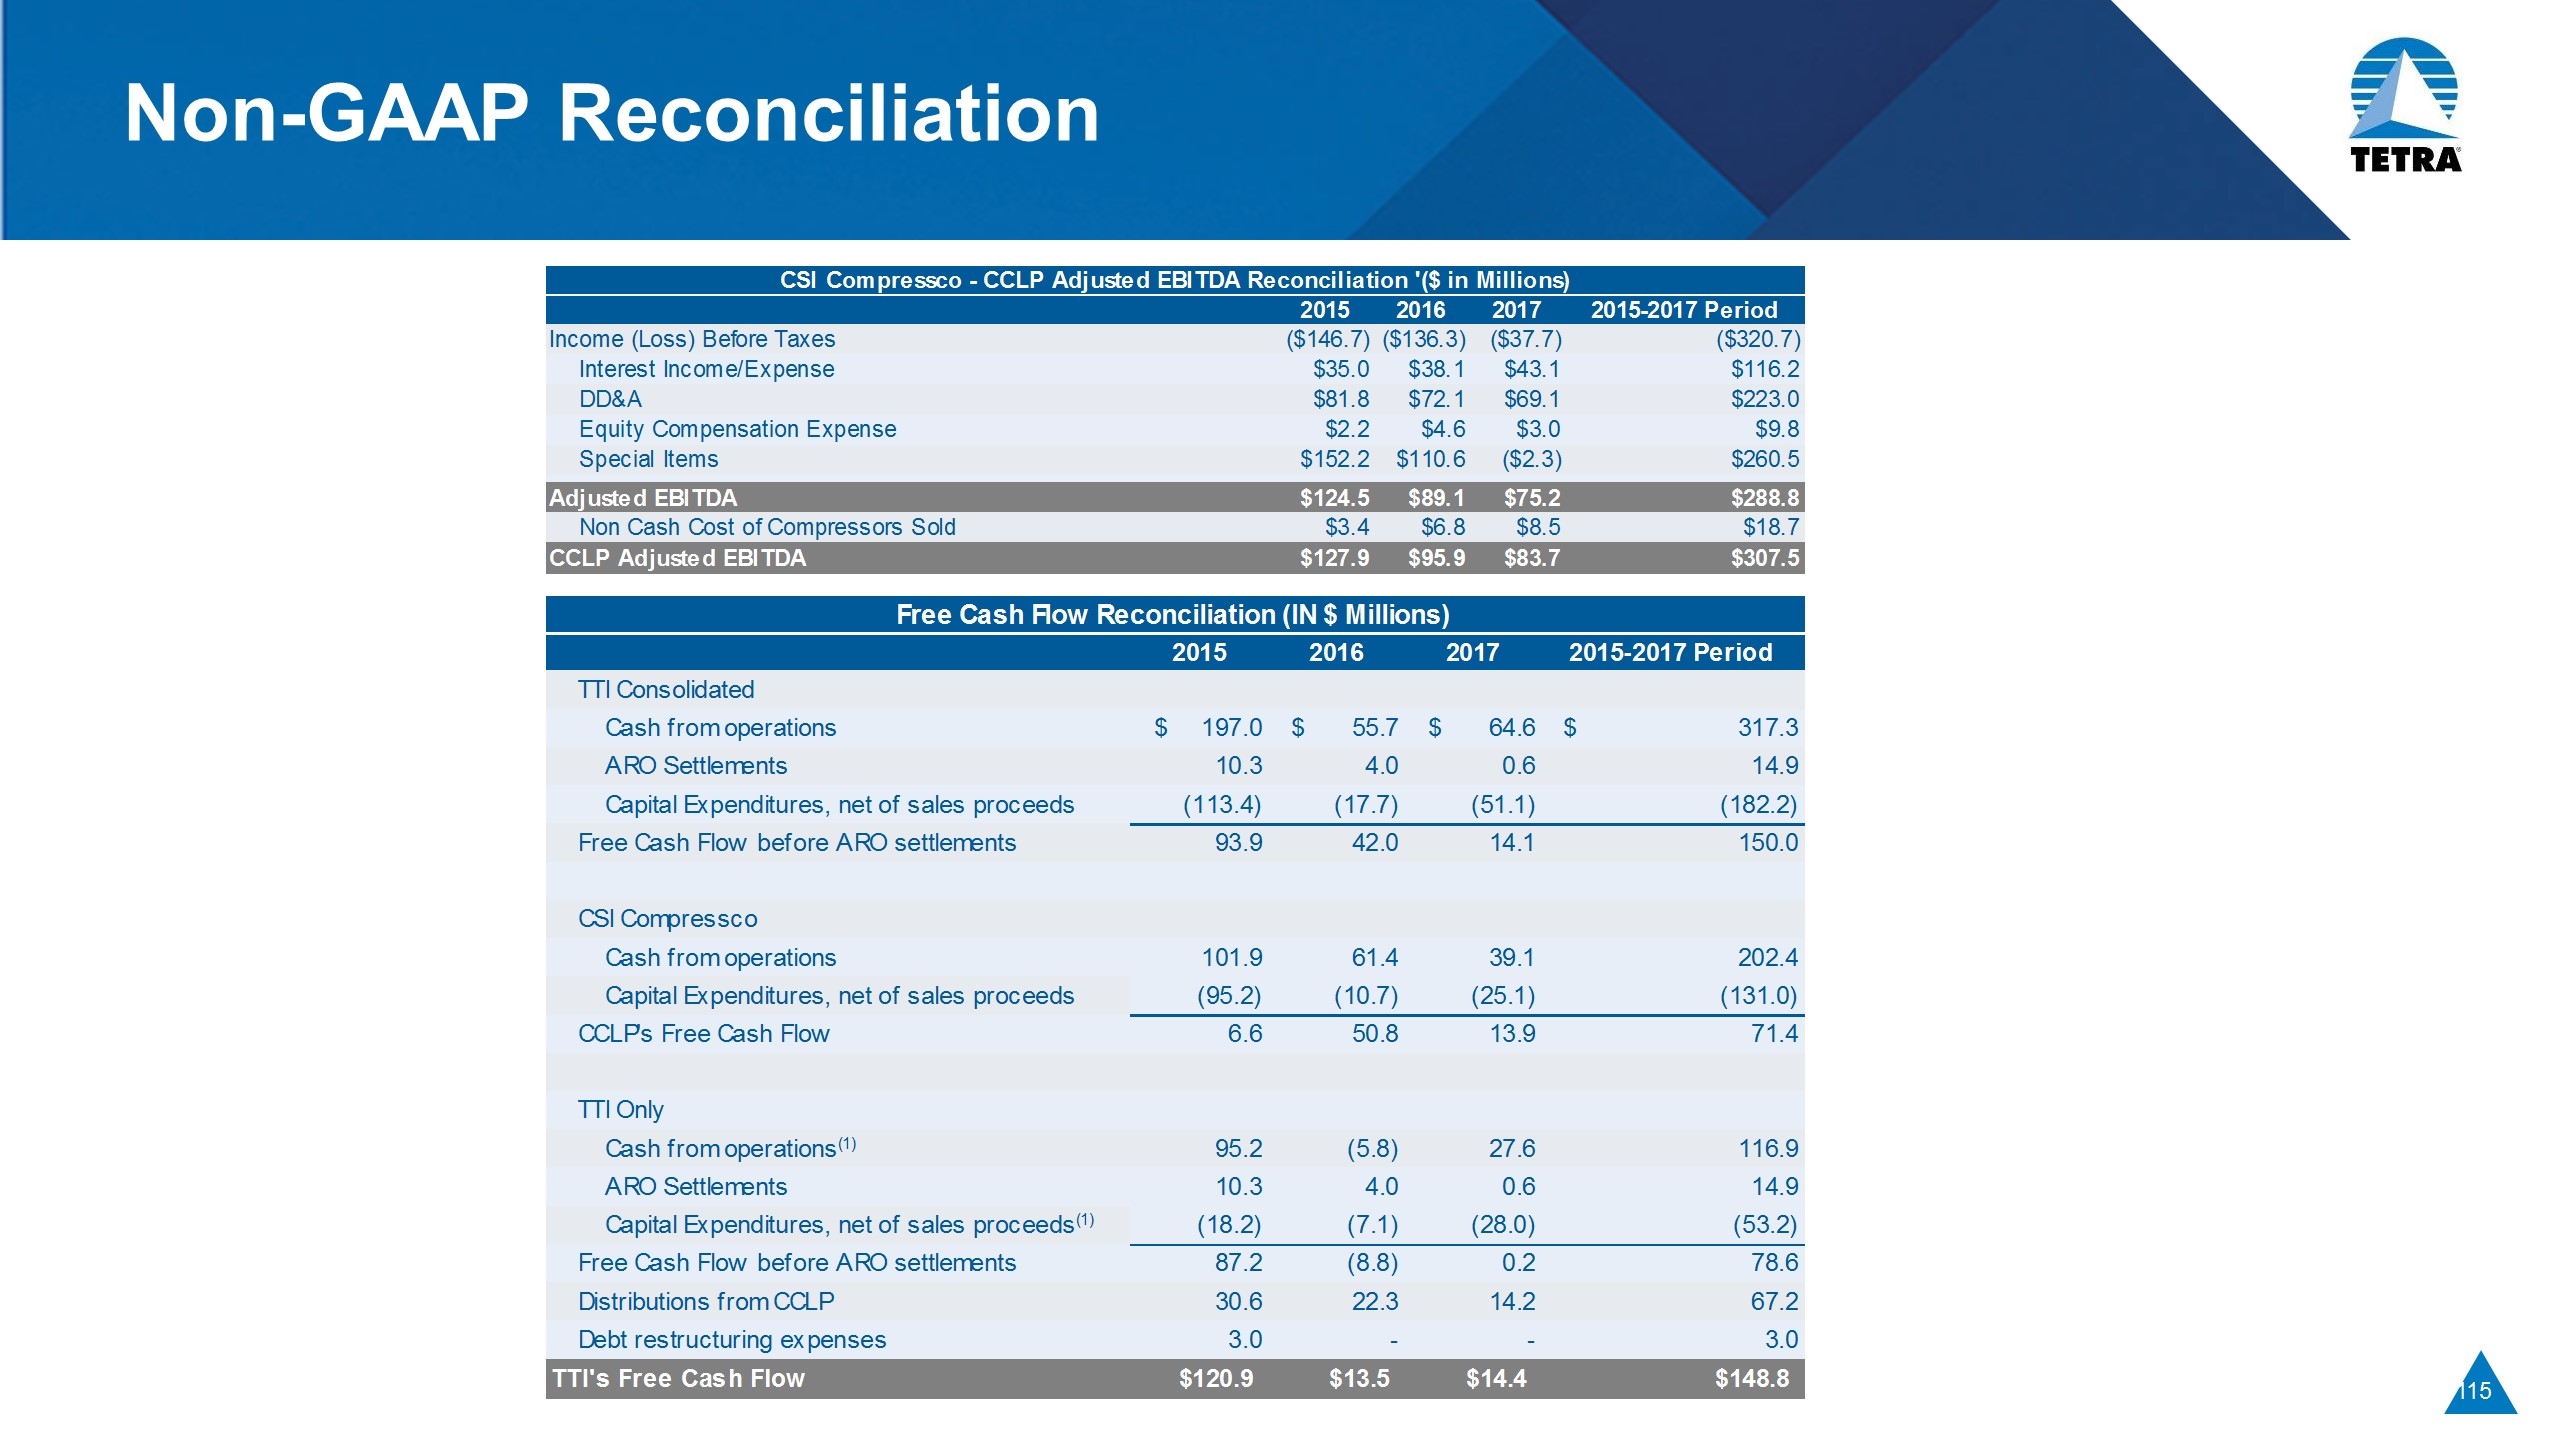
Flexible Business Models Deliver During A Downturn During the 2015-2017 downturn period, TETRA and CSI Compressco generated Adjusted EBITDA and Free Cash Flow $s in M TETRA Only CSI Compressco Adjusted EBITDA(1) $195 $308 Capital Expenditures $63 $131 Free Cash Flow(1) $149 $71 (1) See appendix for reconciliation to nearest GAAP measures
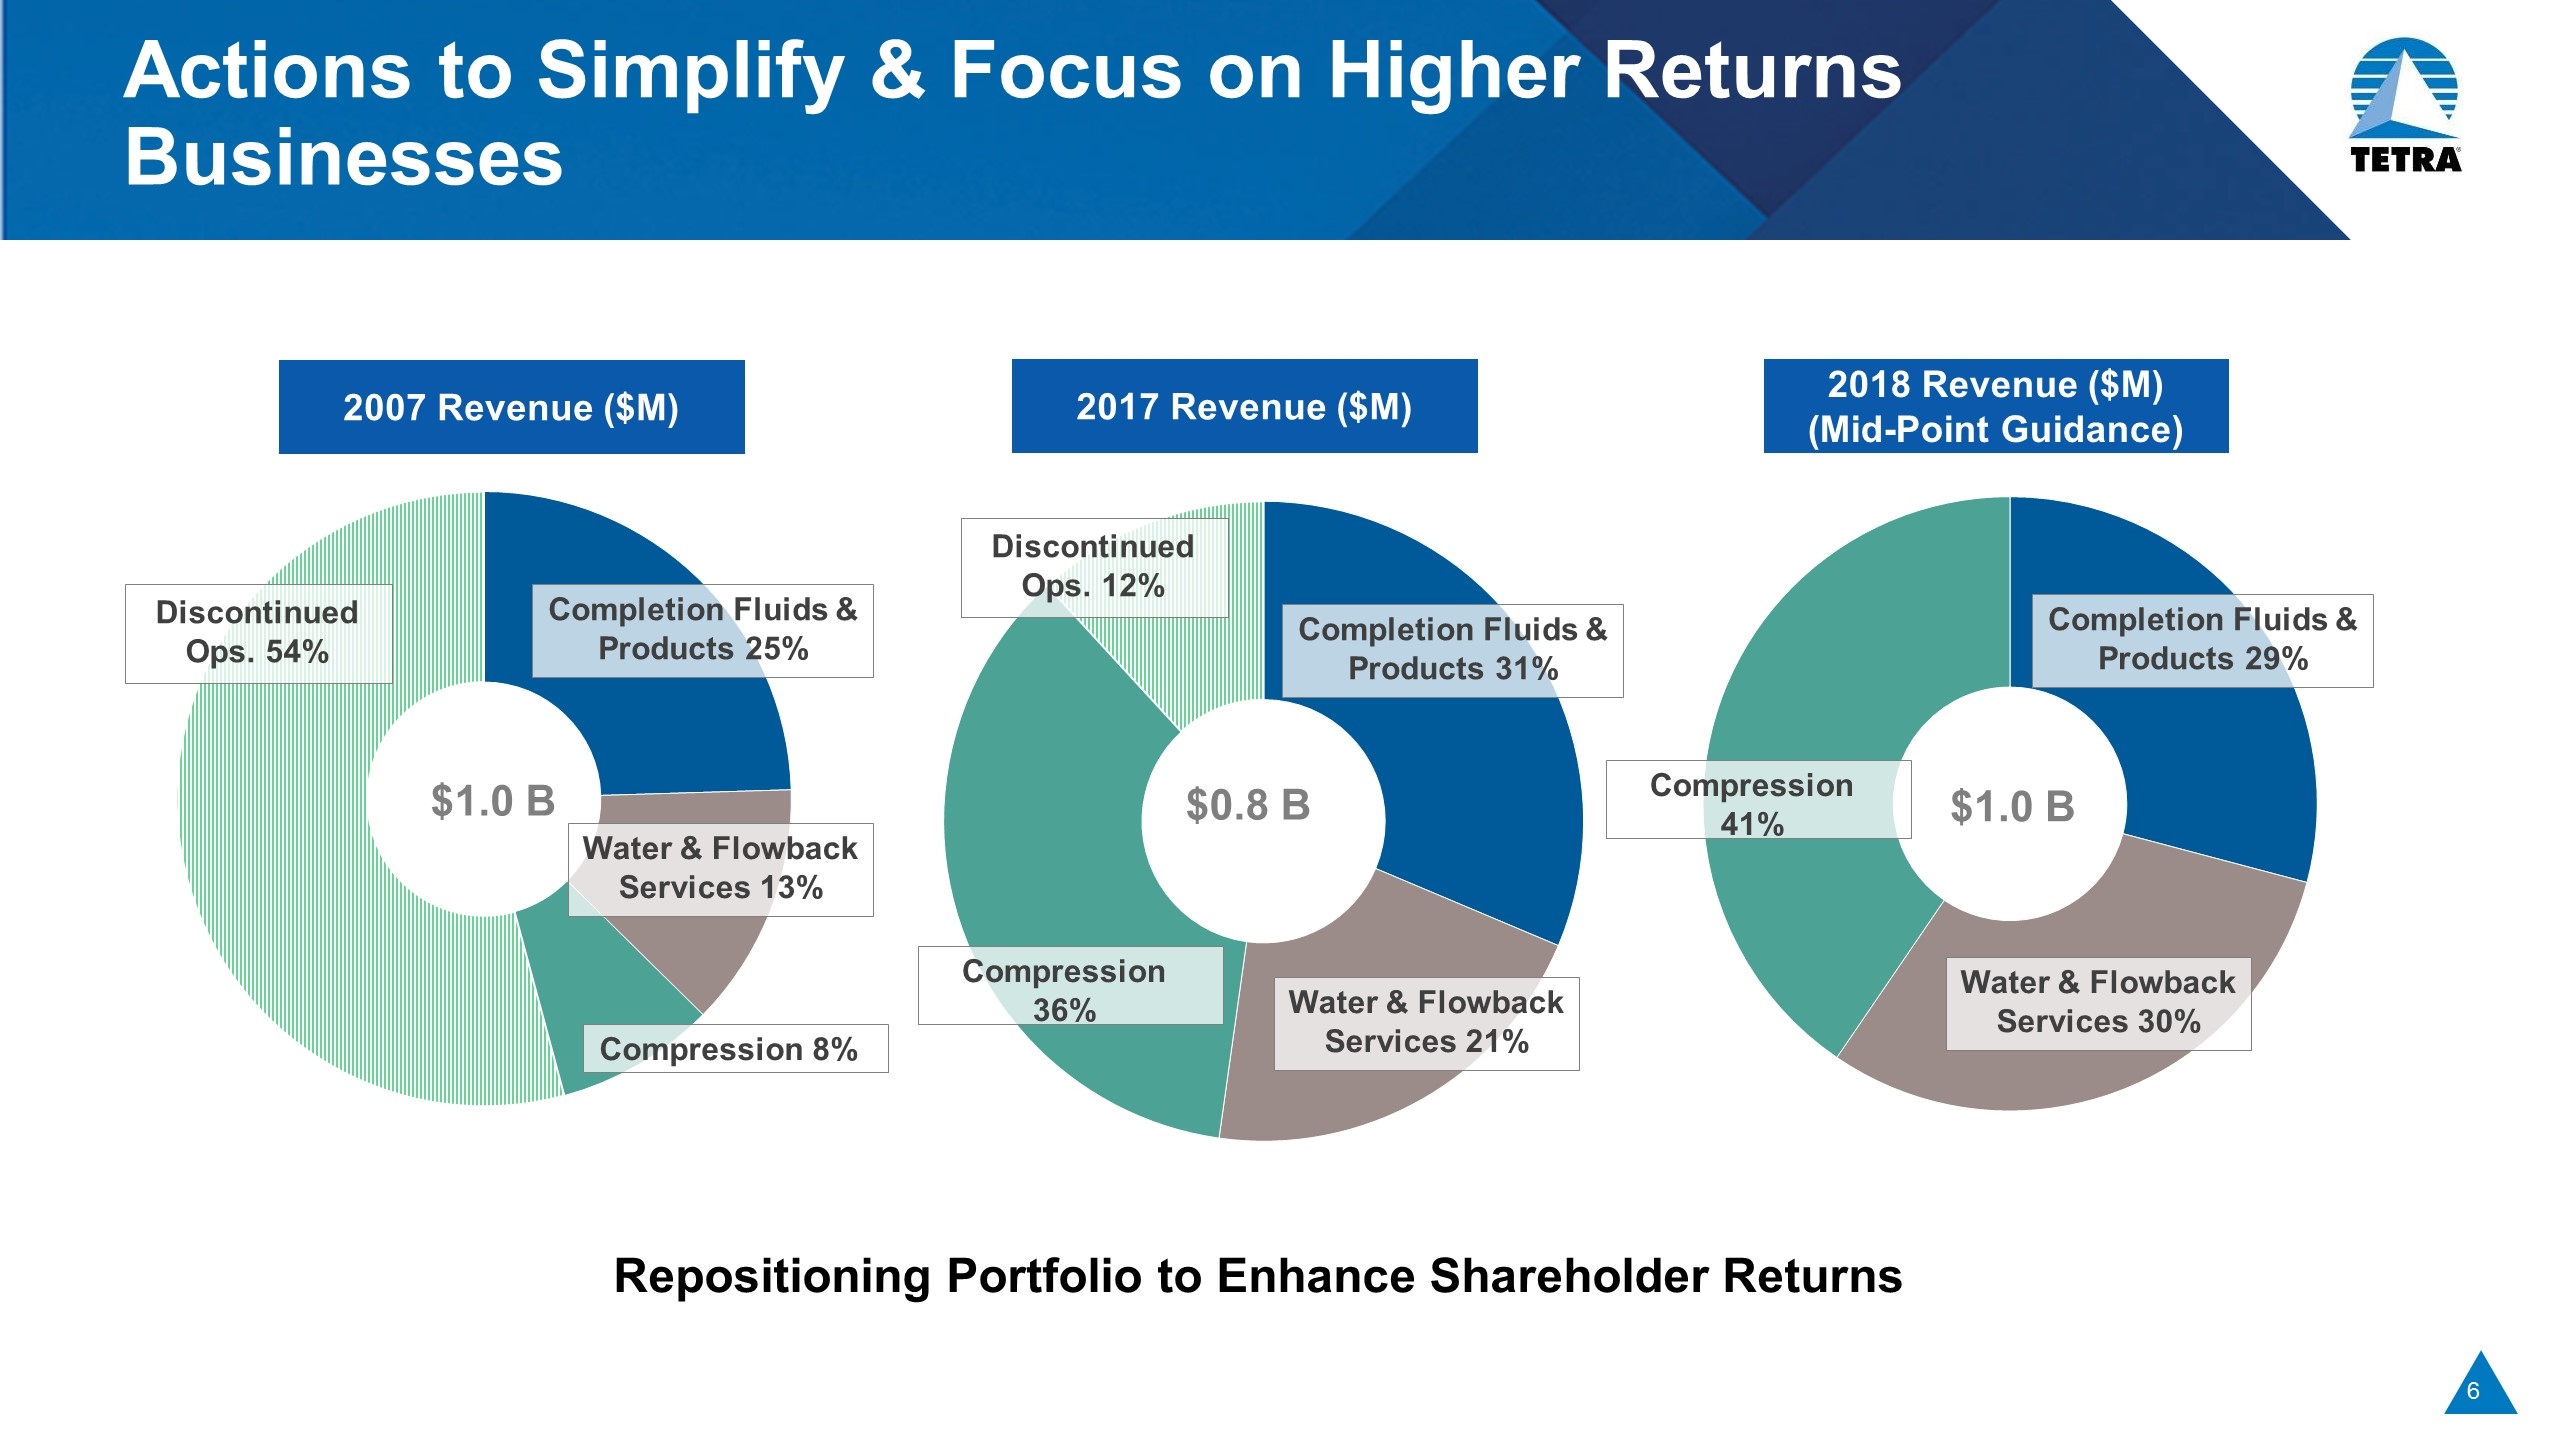
Actions to Simplify & Focus on Higher Returns Businesses Repositioning Portfolio to Enhance Shareholder Returns $1.0 B 2017 Revenue ($M) $0.8 B 2018 Revenue ($M) (Mid-Point Guidance) $1.0 B 2007 Revenue ($M) Discontinued Ops. 54% Completion Fluids & Products 25% Water & Flowback Services 13% Compression 8% Compression 36% Water & Flowback Services 21% Completion Fluids & Products 31% Discontinued Ops. 12% Compression 41% Water & Flowback Services 30% Completion Fluids & Products 29%
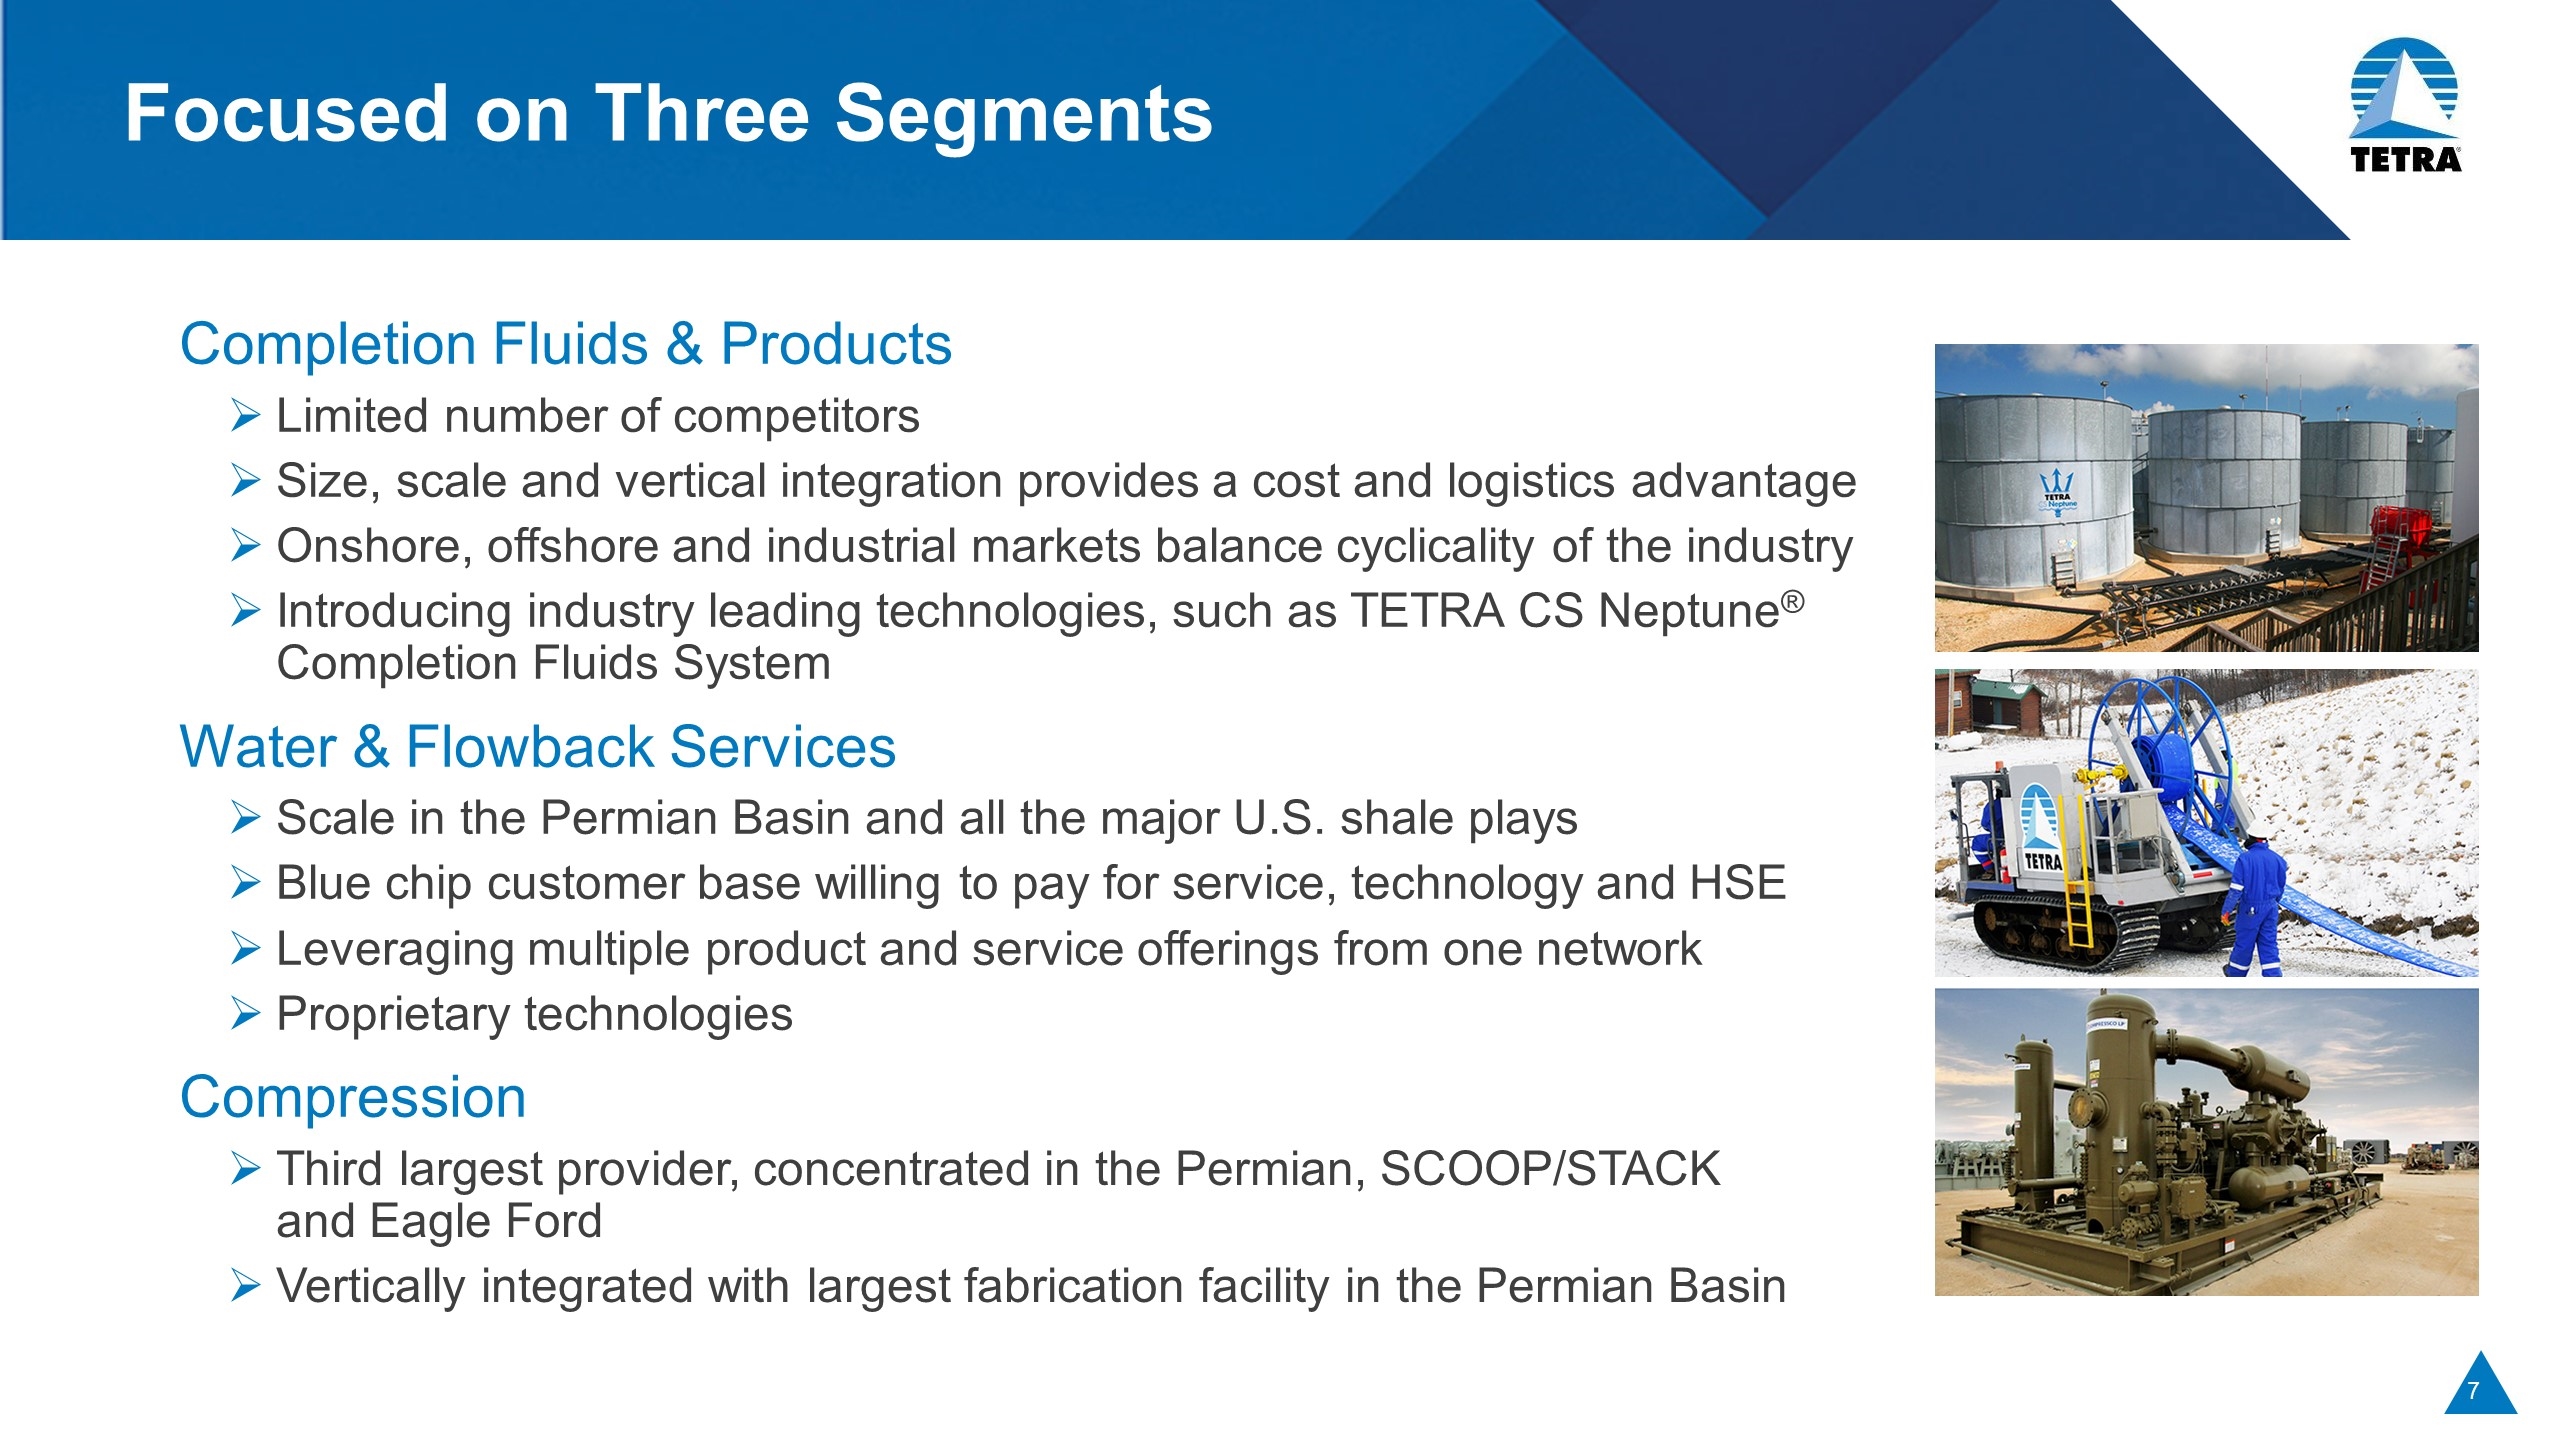
Focused on Three Segments Completion Fluids & Products Limited number of competitors Size, scale and vertical integration provides a cost and logistics advantage Onshore, offshore and industrial markets balance cyclicality of the industry Introducing industry leading technologies, such as TETRA CS Neptune® Completion Fluids System Water & Flowback Services Scale in the Permian Basin and all the major U.S. shale plays Blue chip customer base willing to pay for service, technology and HSE Leveraging multiple product and service offerings from one network Proprietary technologies Compression Third largest provider, concentrated in the Permian, SCOOP/STACK and Eagle Ford Vertically integrated with largest fabrication facility in the Permian Basin
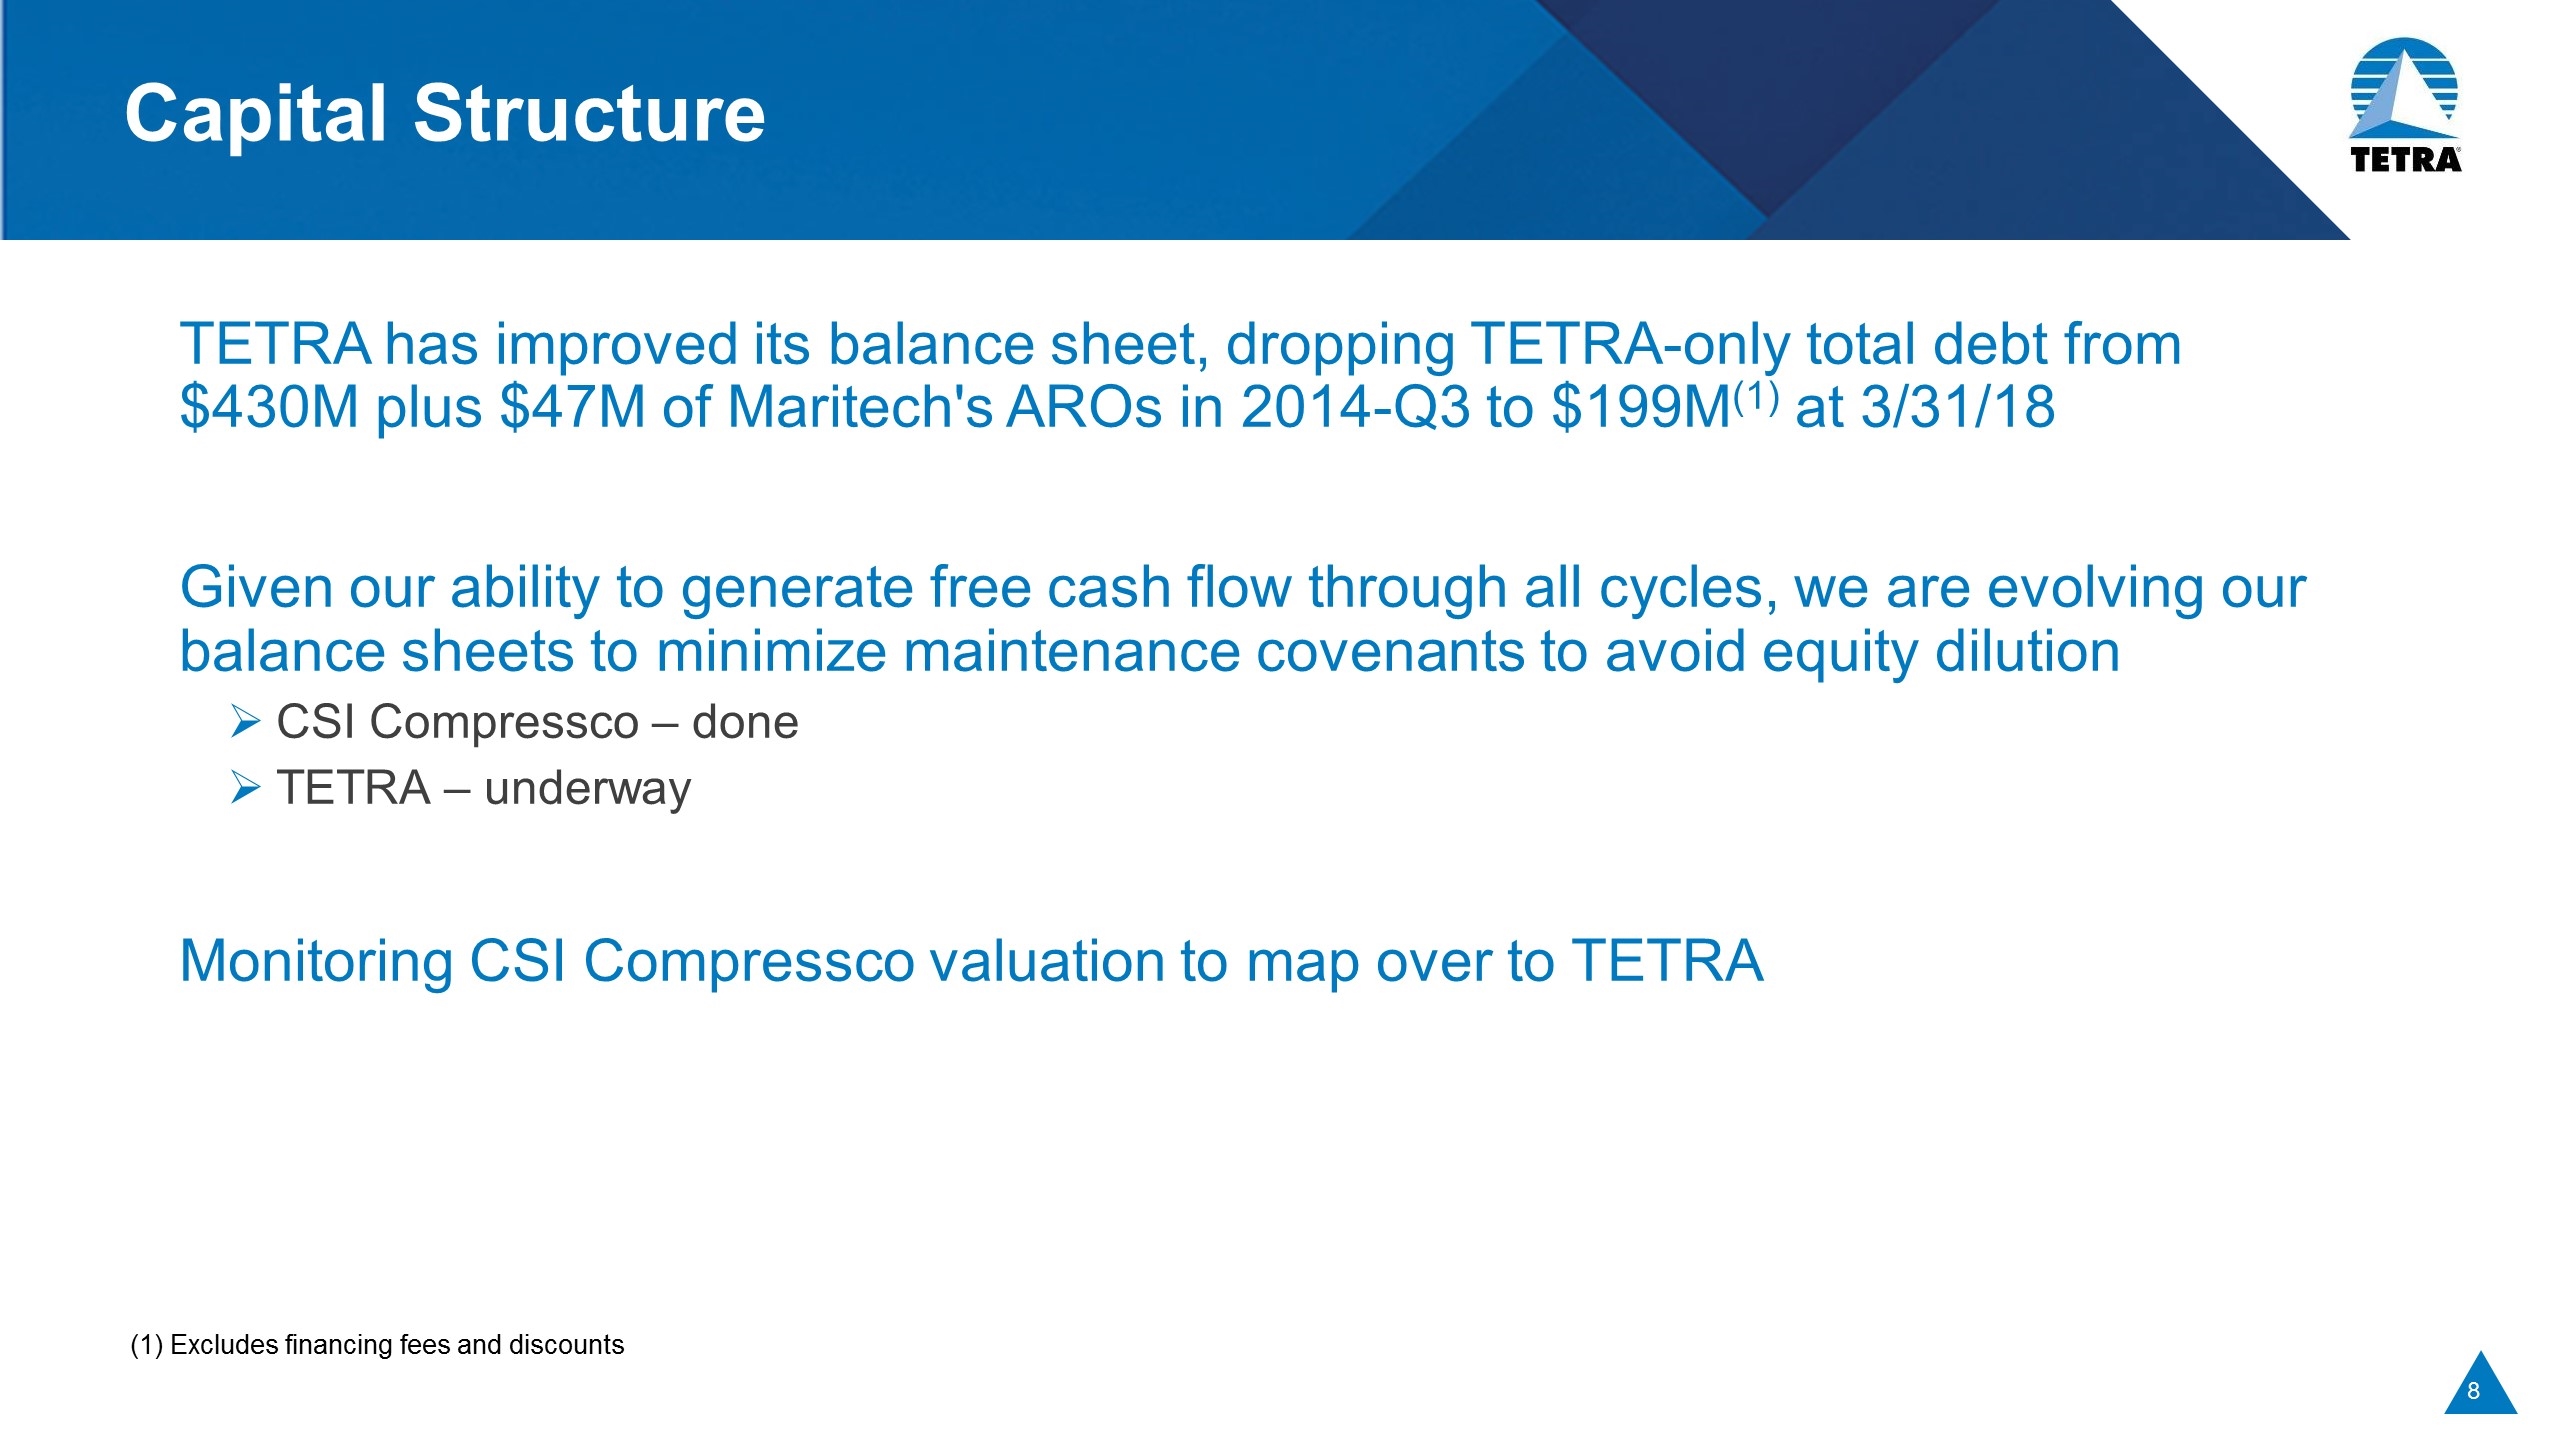
Capital Structure TETRA has improved its balance sheet, dropping TETRA-only total debt from $430M plus $47M of Maritech's AROs in 2014-Q3 to $199M(1) at 3/31/18 Given our ability to generate free cash flow through all cycles, we are evolving our balance sheets to minimize maintenance covenants to avoid equity dilution CSI Compressco – done TETRA – underway Monitoring CSI Compressco valuation to map over to TETRA (1) Excludes financing fees and discounts
Management Depth, Focus and Oversight Recent significant additions to the management team to deliver during this upcycle Management incentive programs focused on shareholder returns with the key metric of generating free cash flow Strong board comprised of industry leaders with relevant and recent experience
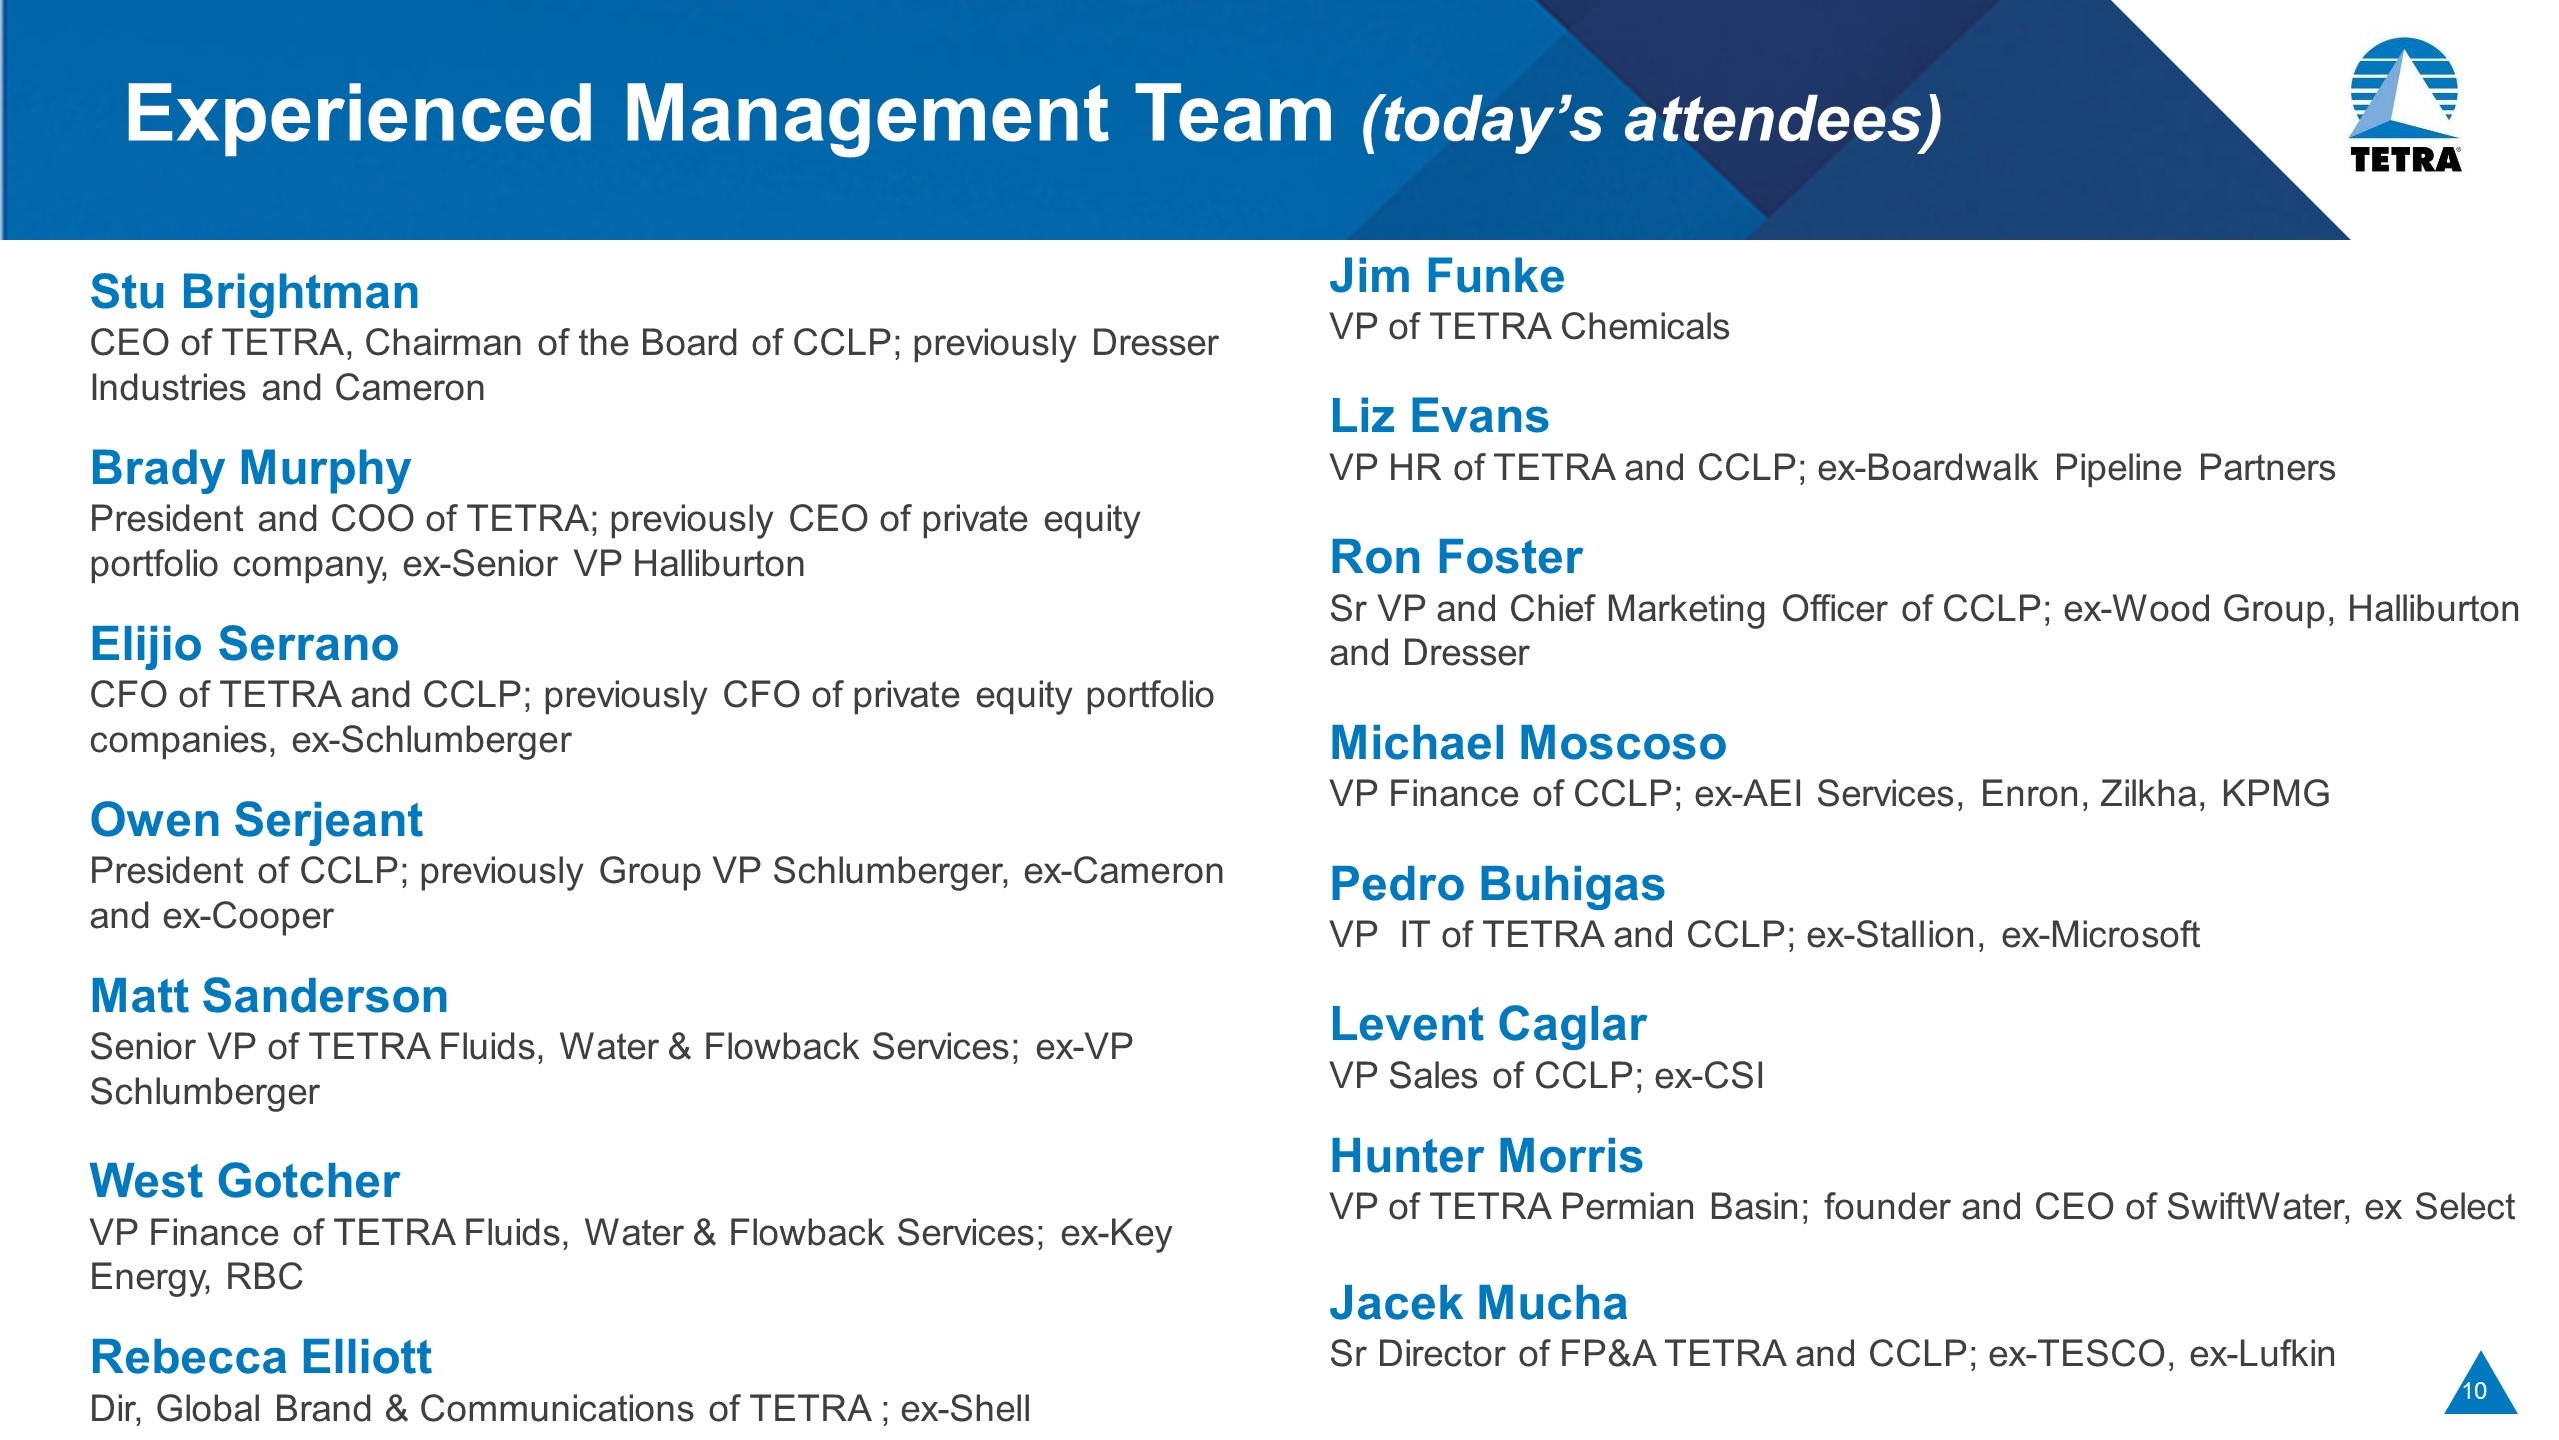
Experienced Management Team (today’s attendees) Stu Brightman CEO of TETRA, Chairman of the Board of CCLP; previously Dresser Industries and Cameron Brady Murphy President and COO of TETRA; previously CEO of private equity portfolio company, ex-Senior VP Halliburton Elijio Serrano CFO of TETRA and CCLP; previously CFO of private equity portfolio companies, ex-Schlumberger Owen Serjeant President of CCLP; previously Group VP Schlumberger, ex-Cameron and ex-Cooper Matt Sanderson Senior VP of TETRA Fluids, Water & Flowback Services; ex-VP Schlumberger West Gotcher VP Finance of TETRA Fluids, Water & Flowback Services; ex-Key Energy, RBC Rebecca Elliott Dir, Global Brand & Communications of TETRA ; ex-Shell Jim Funke VP of TETRA Chemicals Liz Evans VP HR of TETRA and CCLP; ex-Boardwalk Pipeline Partners Ron Foster Sr VP and Chief Marketing Officer of CCLP; ex-Wood Group, Halliburton and Dresser Michael Moscoso VP Finance of CCLP; ex-AEI Services, Enron, Zilkha, KPMG Pedro Buhigas VP IT of TETRA and CCLP; ex-Stallion, ex-Microsoft Levent Caglar VP Sales of CCLP; ex-CSI Hunter Morris VP of TETRA Permian Basin; founder and CEO of SwiftWater, ex Select Jacek Mucha Sr Director of FP&A TETRA and CCLP; ex-TESCO, ex-Lufkin
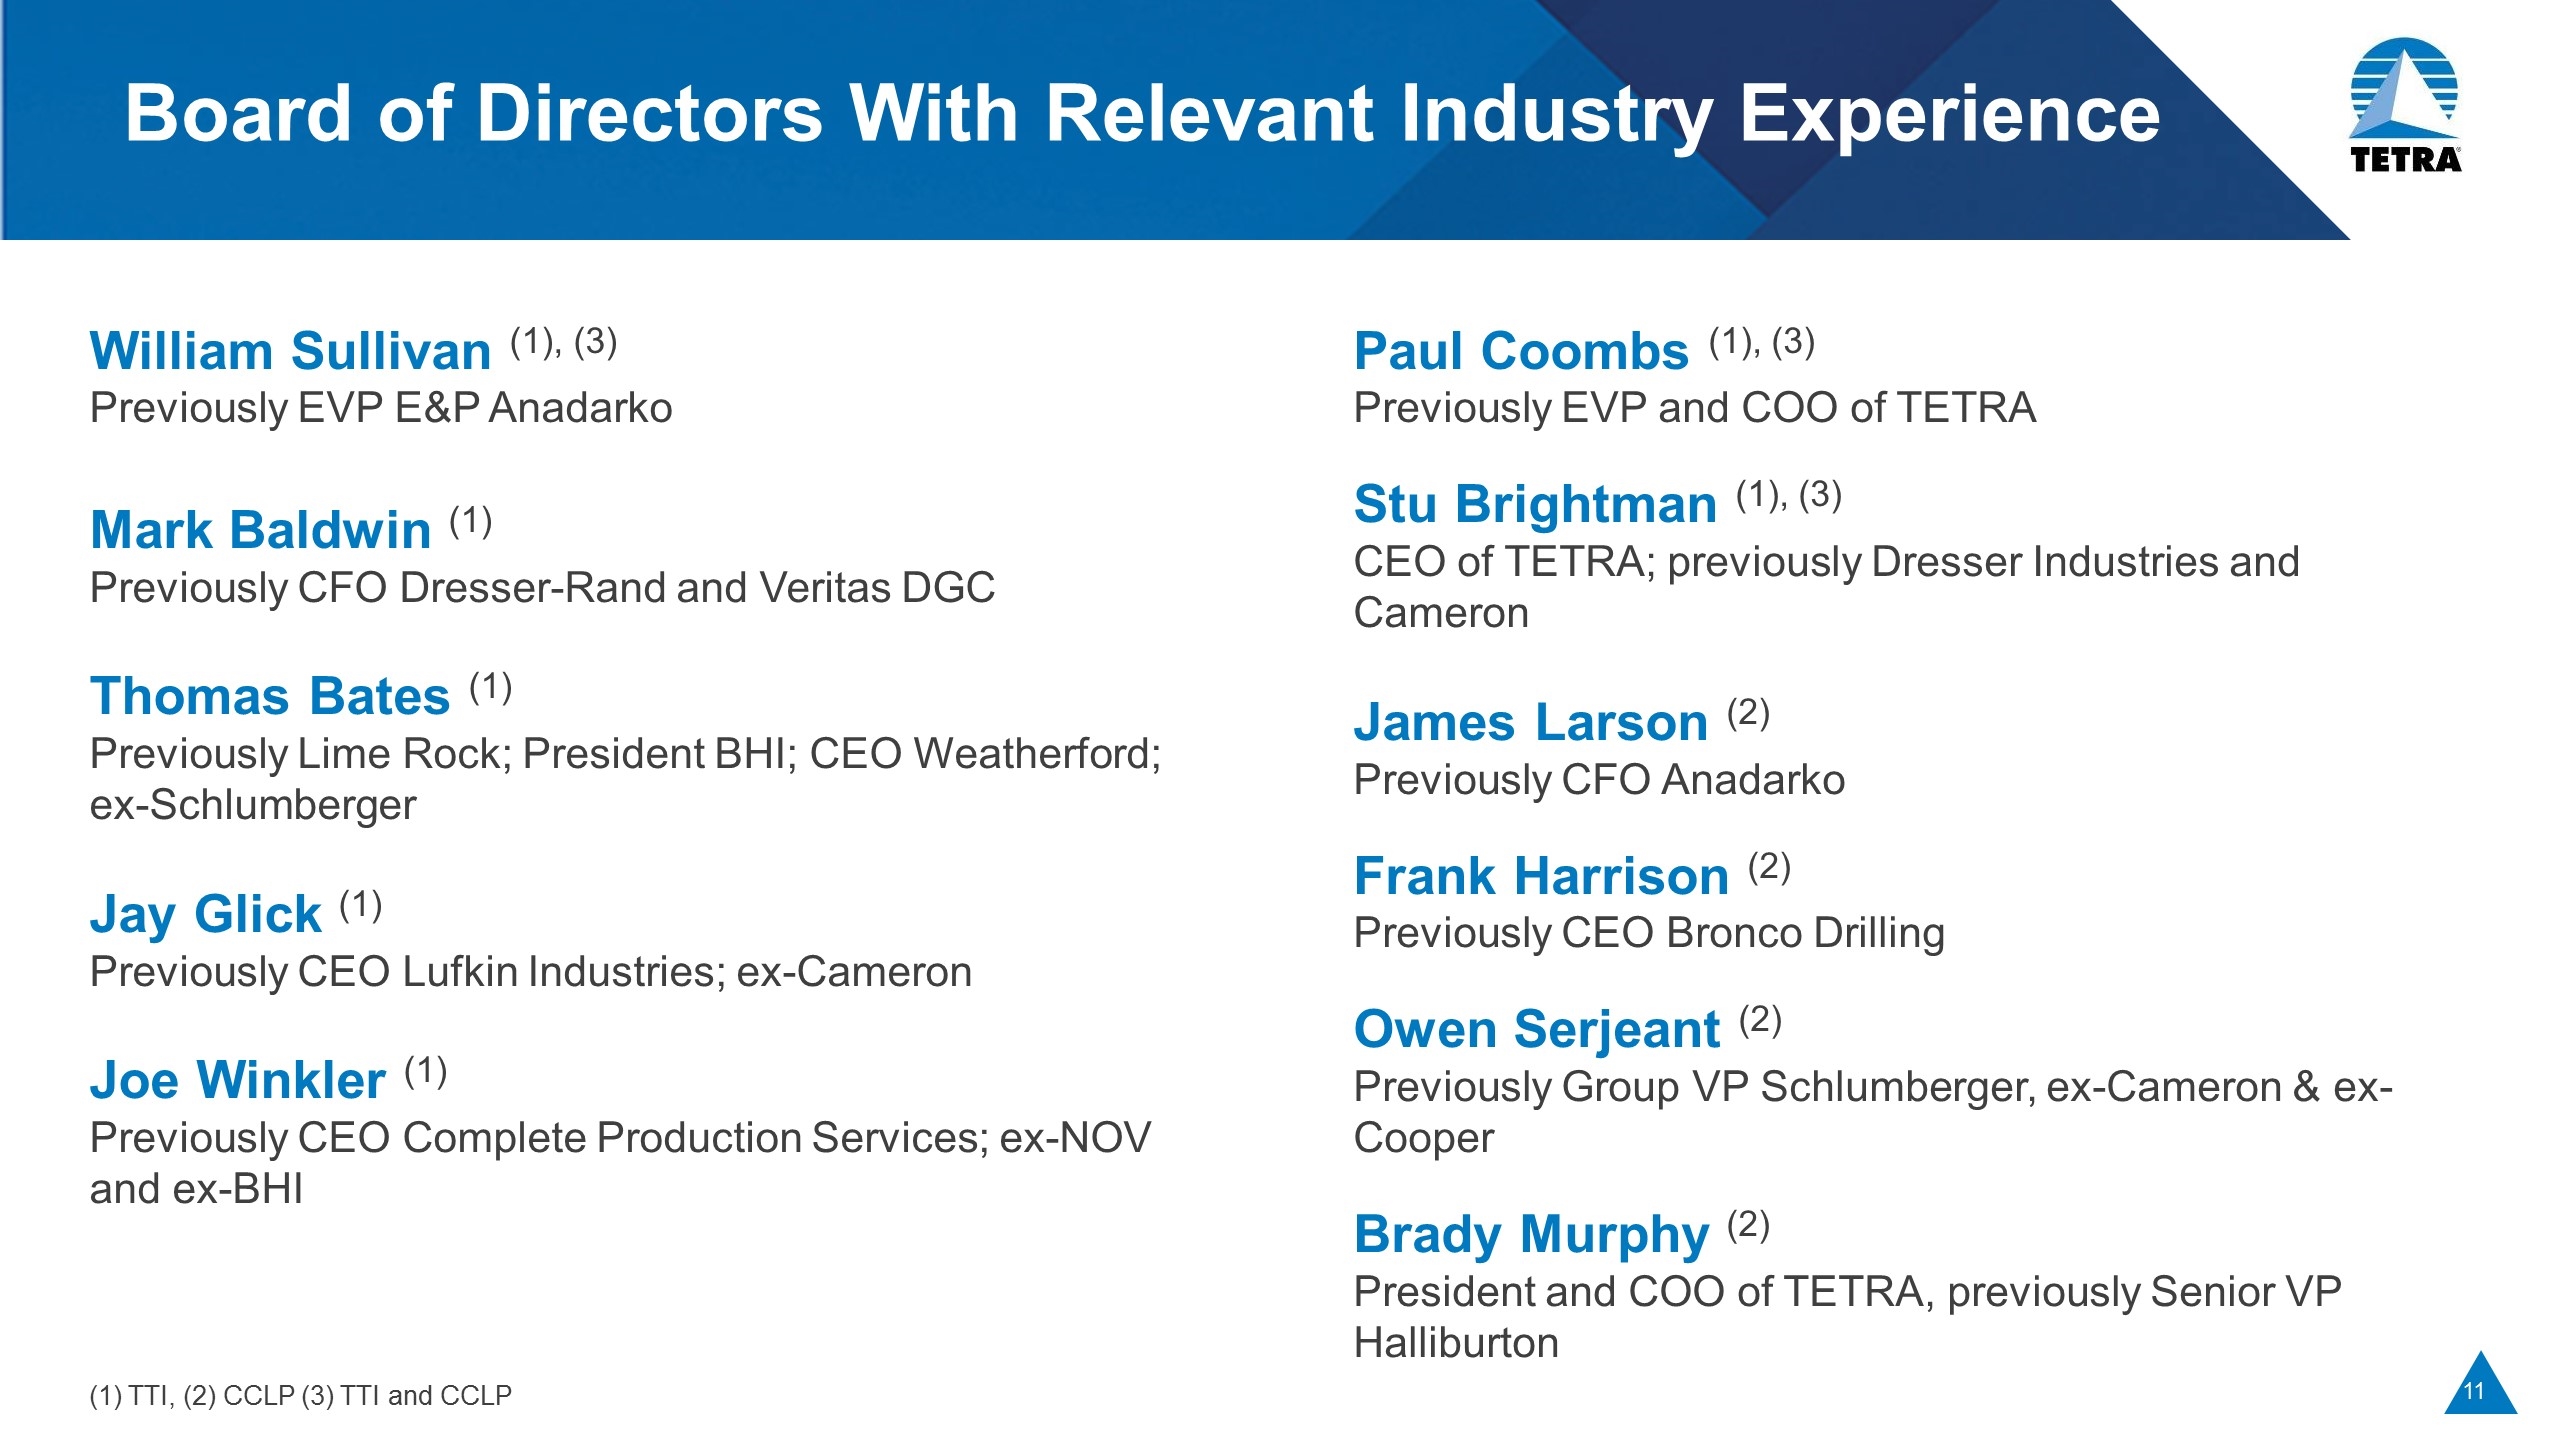
Board of Directors With Relevant Industry Experience William Sullivan (1), (3) Previously EVP E&P Anadarko Mark Baldwin (1) Previously CFO Dresser-Rand and Veritas DGC Thomas Bates (1) Previously Lime Rock; President BHI; CEO Weatherford; ex-Schlumberger Jay Glick (1) Previously CEO Lufkin Industries; ex-Cameron Joe Winkler (1) Previously CEO Complete Production Services; ex-NOV and ex-BHI Paul Coombs (1), (3) Previously EVP and COO of TETRA Stu Brightman (1), (3) CEO of TETRA; previously Dresser Industries and Cameron James Larson (2) Previously CFO Anadarko Frank Harrison (2) Previously CEO Bronco Drilling Owen Serjeant (2) Previously Group VP Schlumberger, ex-Cameron & ex-Cooper Brady Murphy (2) President and COO of TETRA, previously Senior VP Halliburton (1) TTI, (2) CCLP (3) TTI and CCLP
Division Overviews and Strategy Brady Murphy President and COO
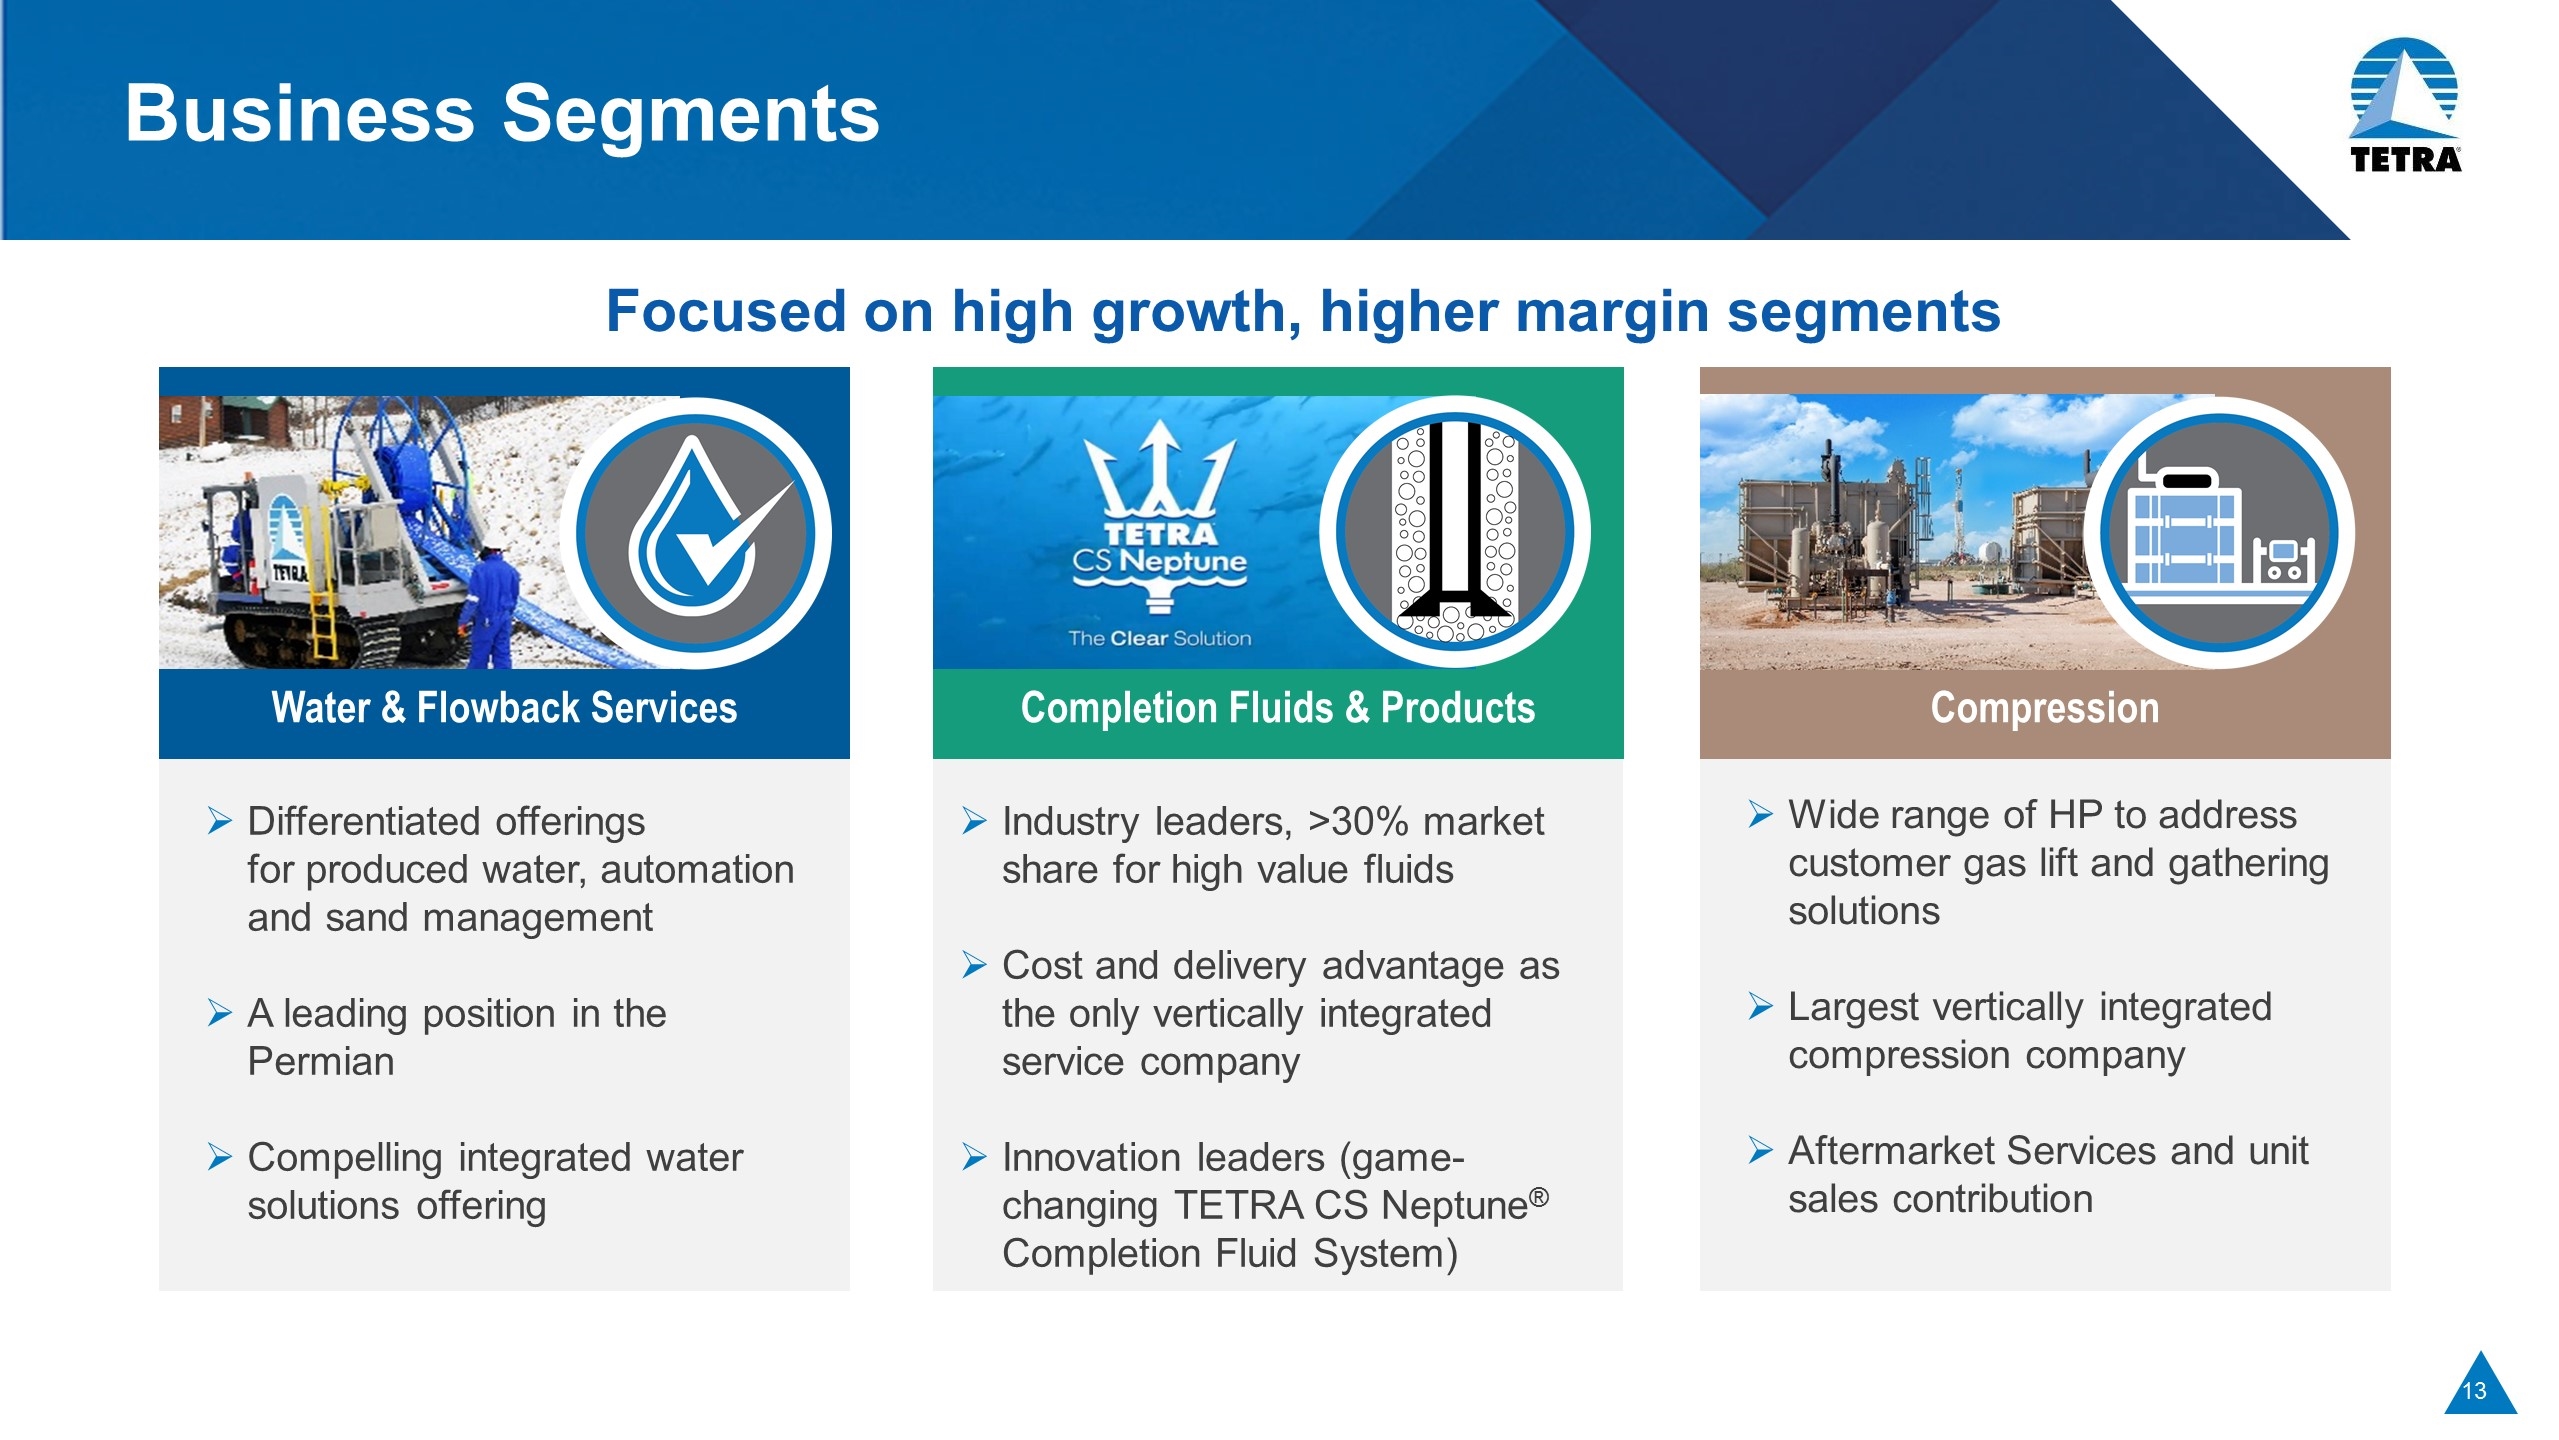
Business Segments Focused on high growth, higher margin segments Differentiated offerings for produced water, automation and sand management A leading position in the Permian Compelling integrated water solutions offering Water & Flowback Services Industry leaders, >30% market share for high value fluids Cost and delivery advantage as the only vertically integrated service company Innovation leaders (game-changing TETRA CS Neptune® Completion Fluid System) Completion Fluids & Products Wide range of HP to address customer gas lift and gathering solutions Largest vertically integrated compression company Aftermarket Services and unit sales contribution Compression
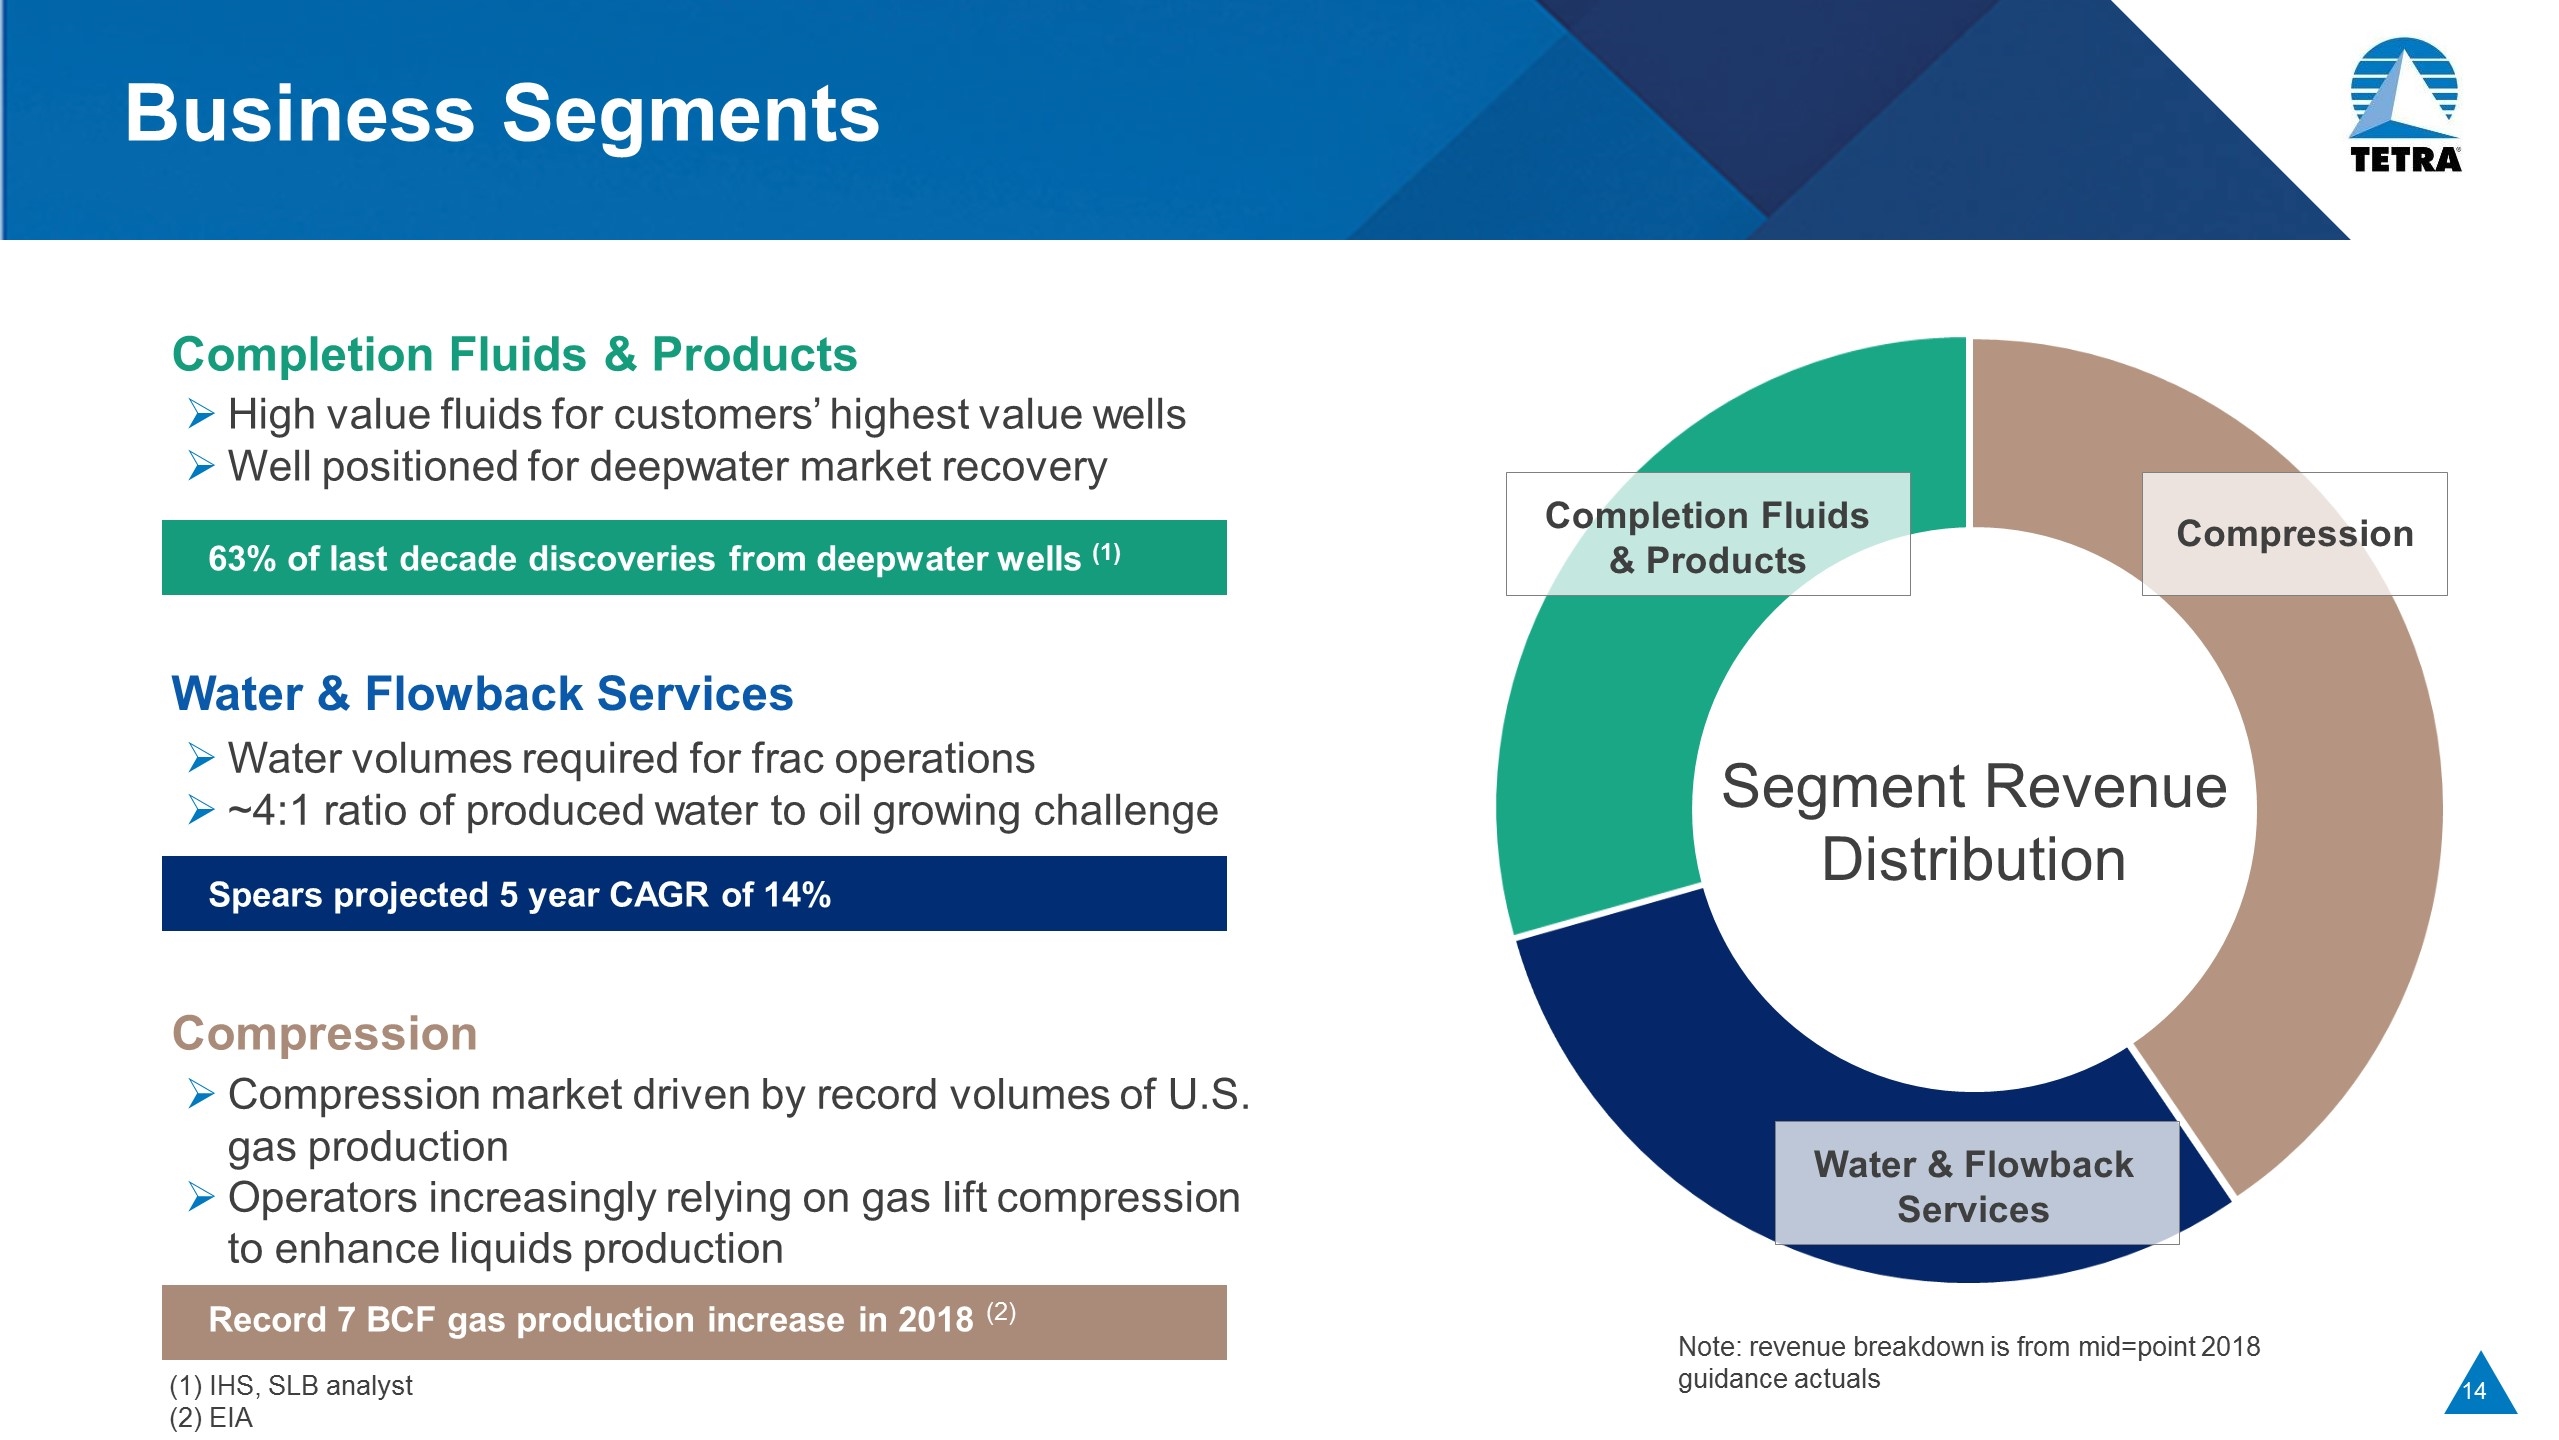
Business Segments 63% of last decade discoveries from deepwater wells (1) High value fluids for customers’ highest value wells Well positioned for deepwater market recovery Completion Fluids & Products Water volumes required for frac operations ~4:1 ratio of produced water to oil growing challenge Water & Flowback Services Spears projected 5 year CAGR of 14% Compression market driven by record volumes of U.S. gas production Operators increasingly relying on gas lift compression to enhance liquids production Compression Record 7 BCF gas production increase in 2018 (2) Note: revenue breakdown is from mid=point 2018 guidance actuals Segment Revenue Distribution Completion Fluids & Products Compression Water & Flowback Services (1) IHS, SLB analyst (2) EIA
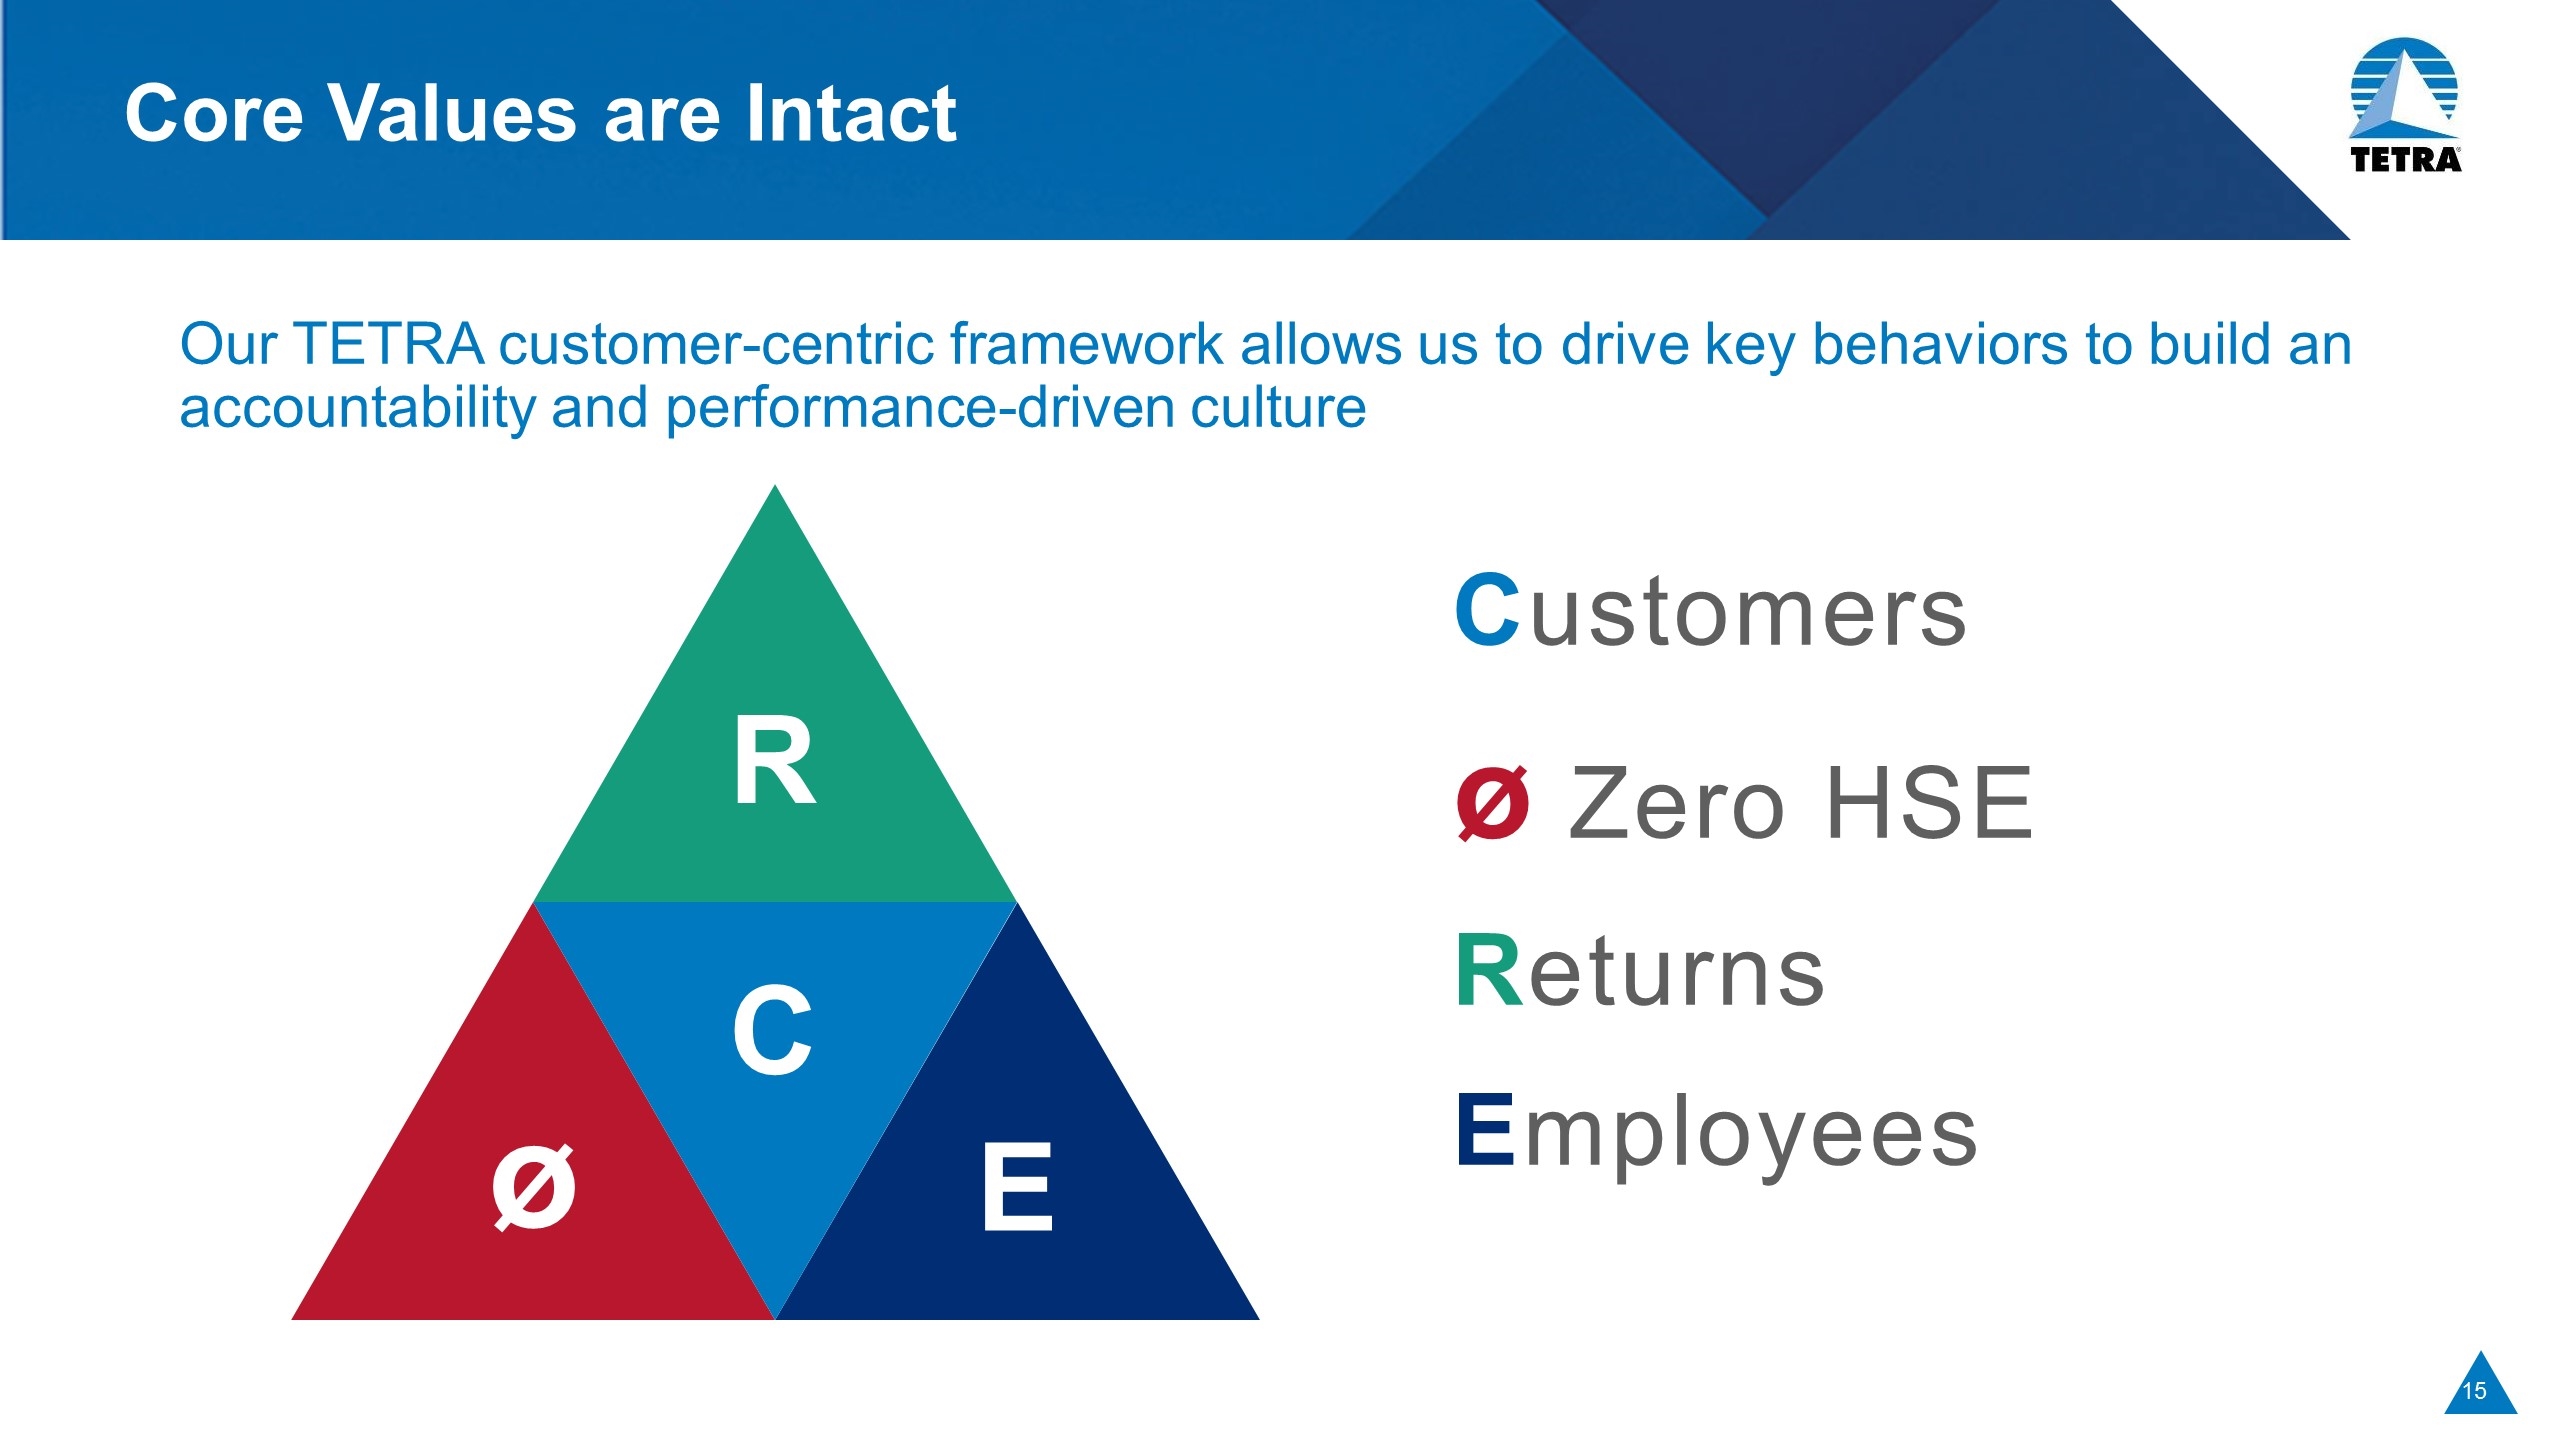
Core Values are Intact Our TETRA customer-centric framework allows us to drive key behaviors to build an accountability and performance-driven culture Customers ø Zero HSE Returns Employees R C ø E
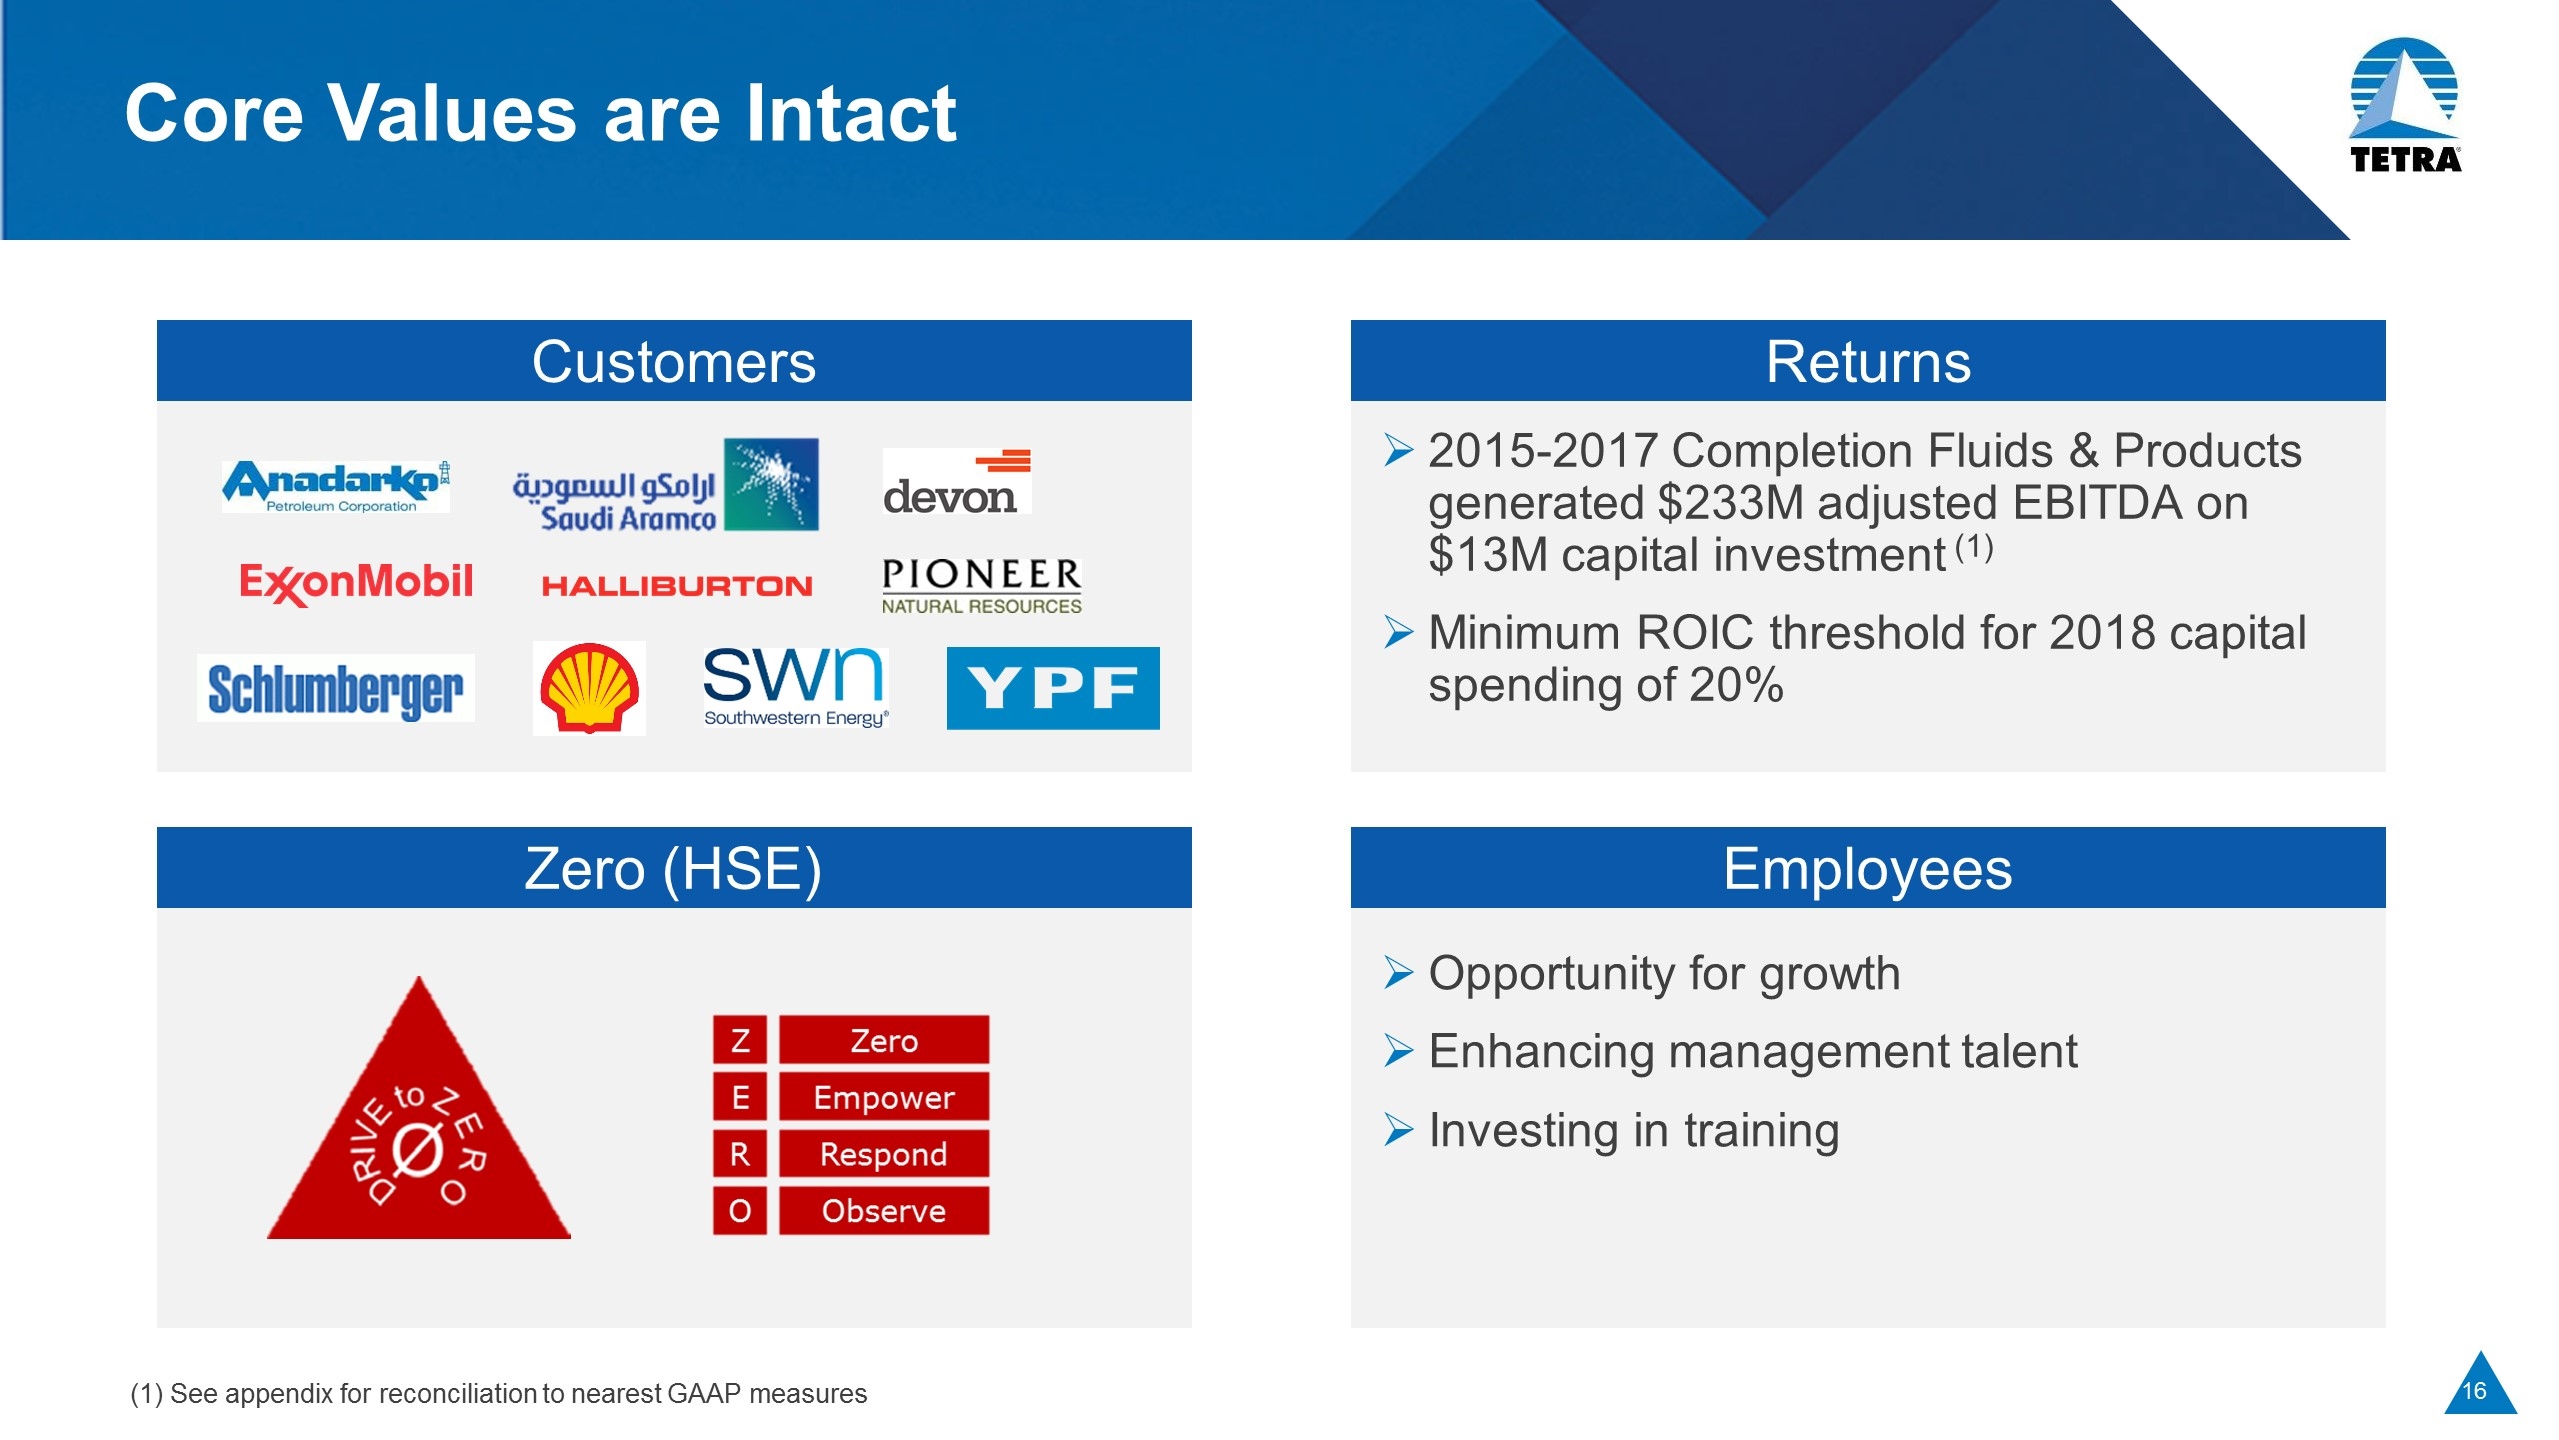
Core Values are Intact Customers Returns Zero (HSE) Employees 2015-2017 Completion Fluids & Products generated $233M adjusted EBITDA on $13M capital investment (1) Minimum ROIC threshold for 2018 capital spending of 20% Opportunity for growth Enhancing management talent Investing in training (1) See appendix for reconciliation to nearest GAAP measures
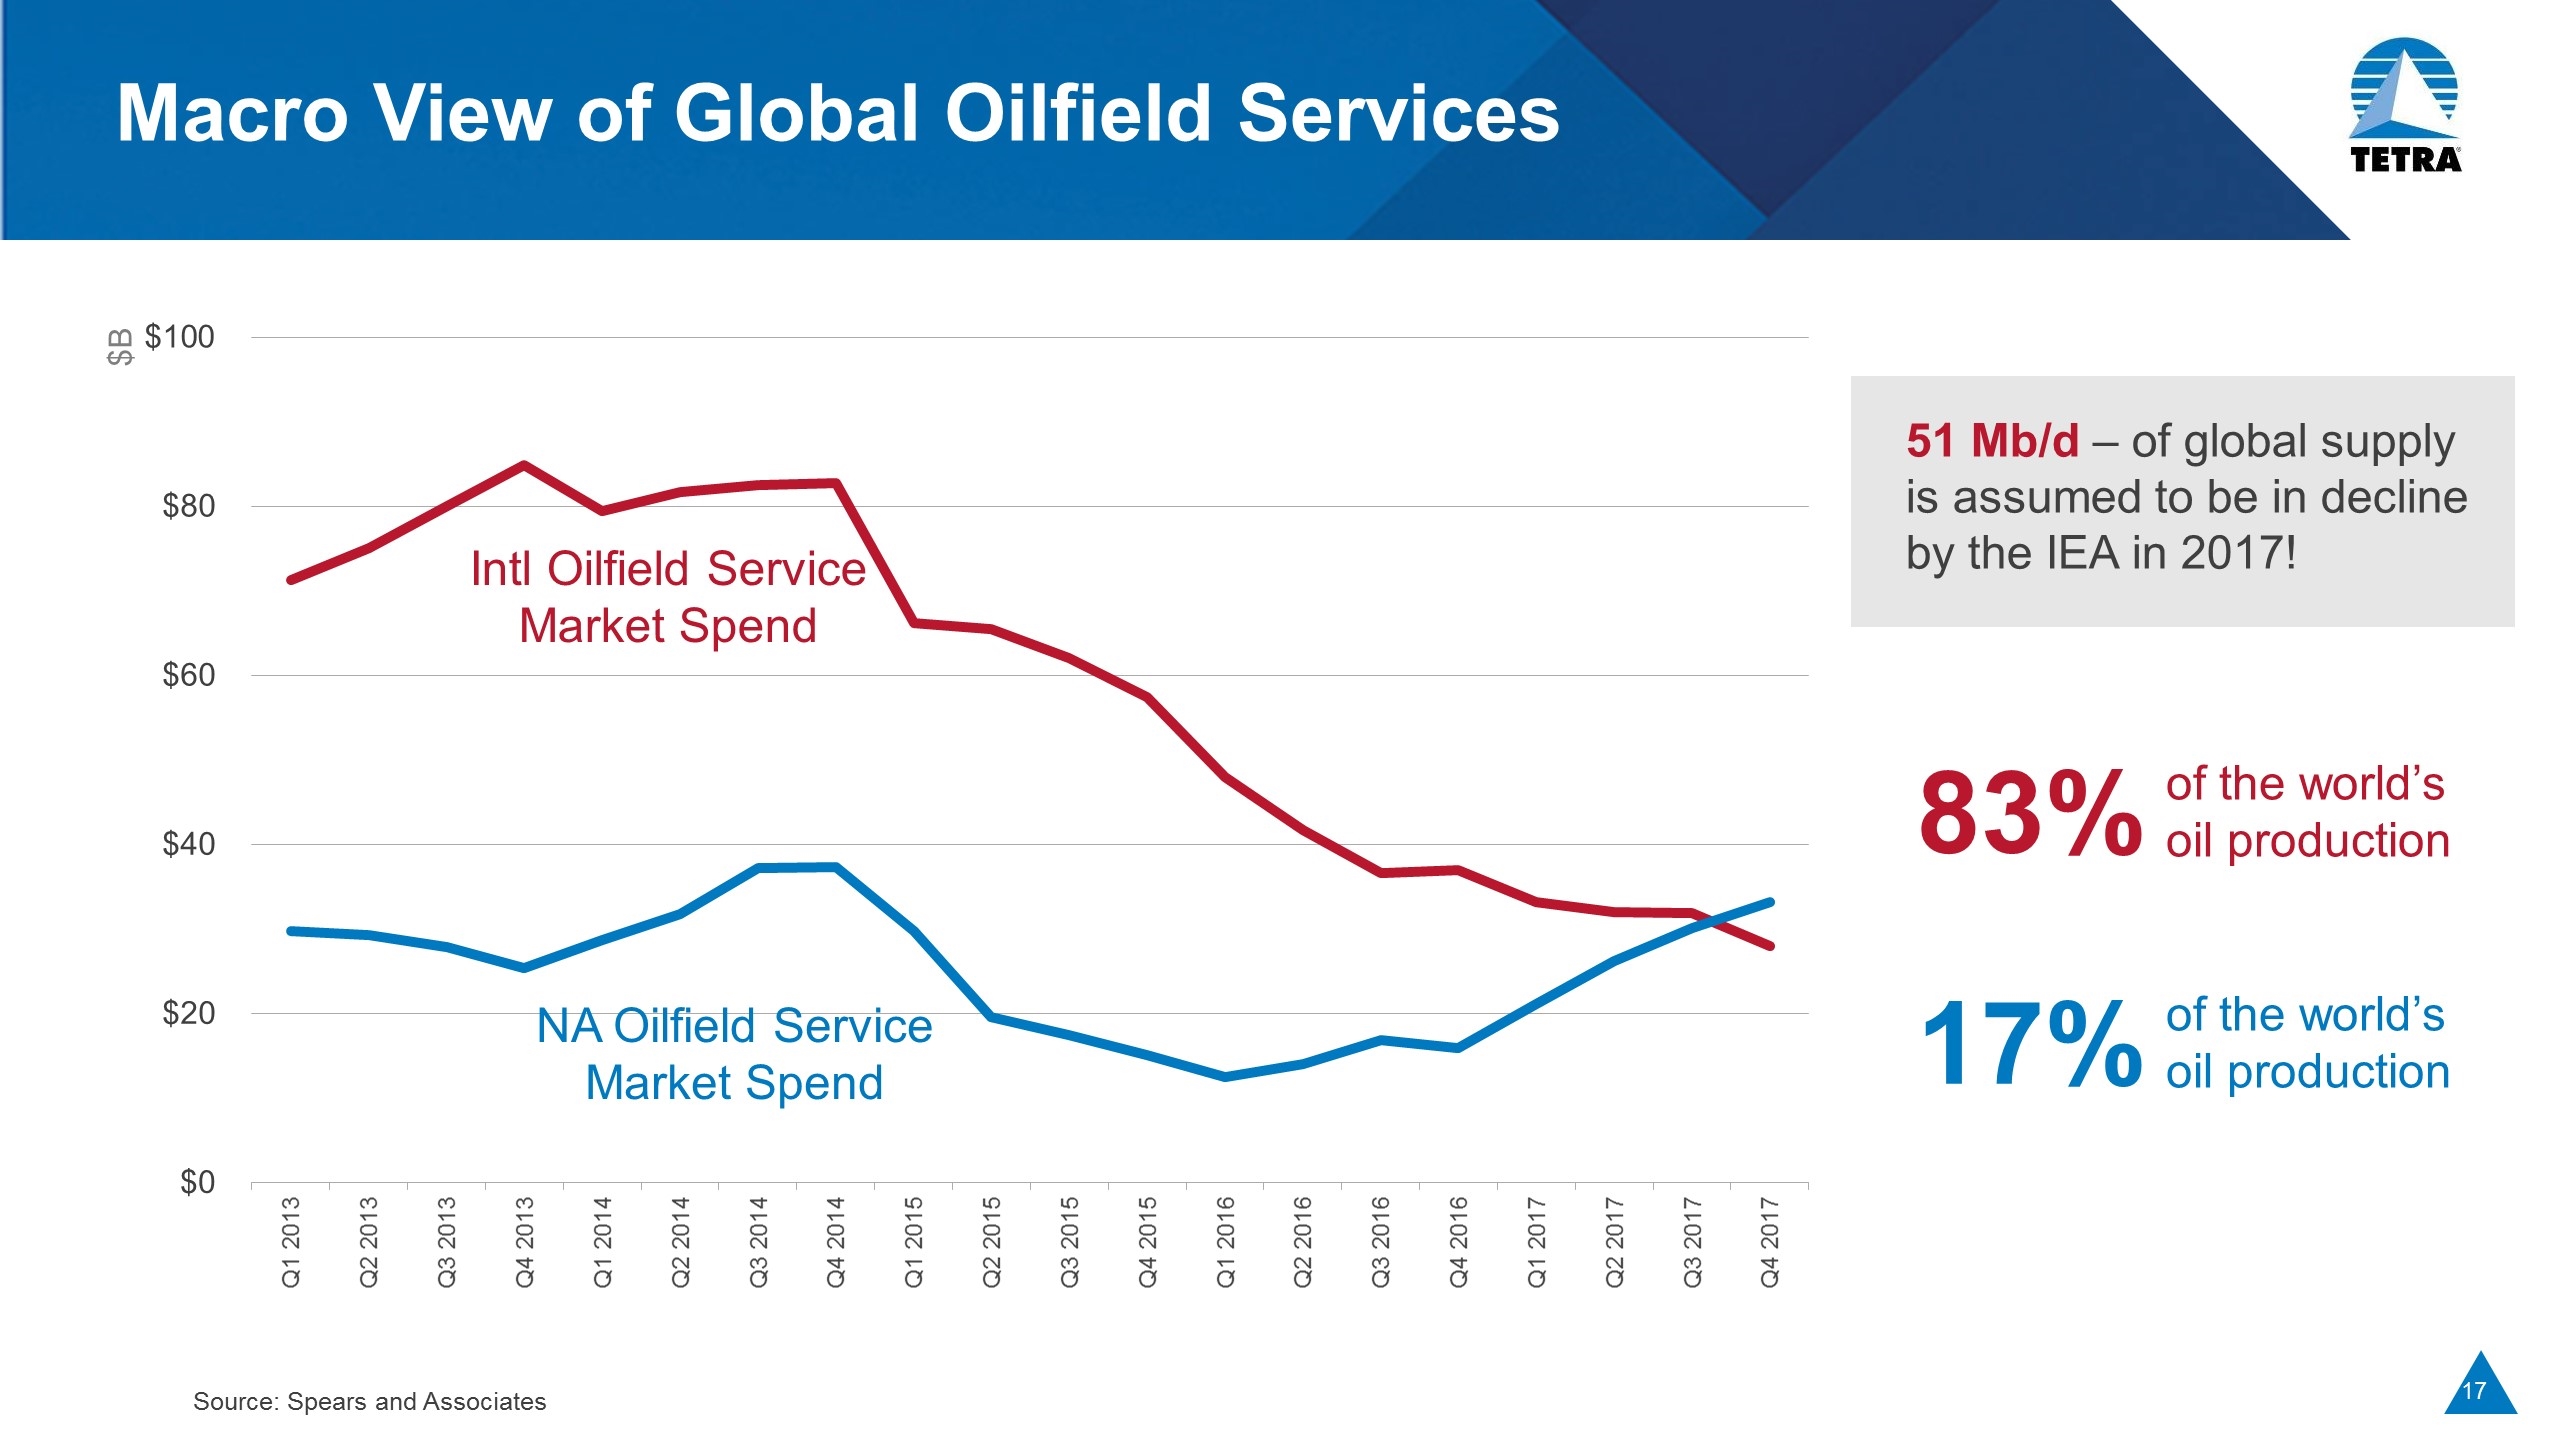
Macro View of Global Oilfield Services NA Oilfield Service Market Spend Intl Oilfield Service Market Spend 51 Mb/d – of global supply is assumed to be in decline by the IEA in 2017! 83% of the world’s oil production 17% of the world’s oil production Source: Spears and Associates $B
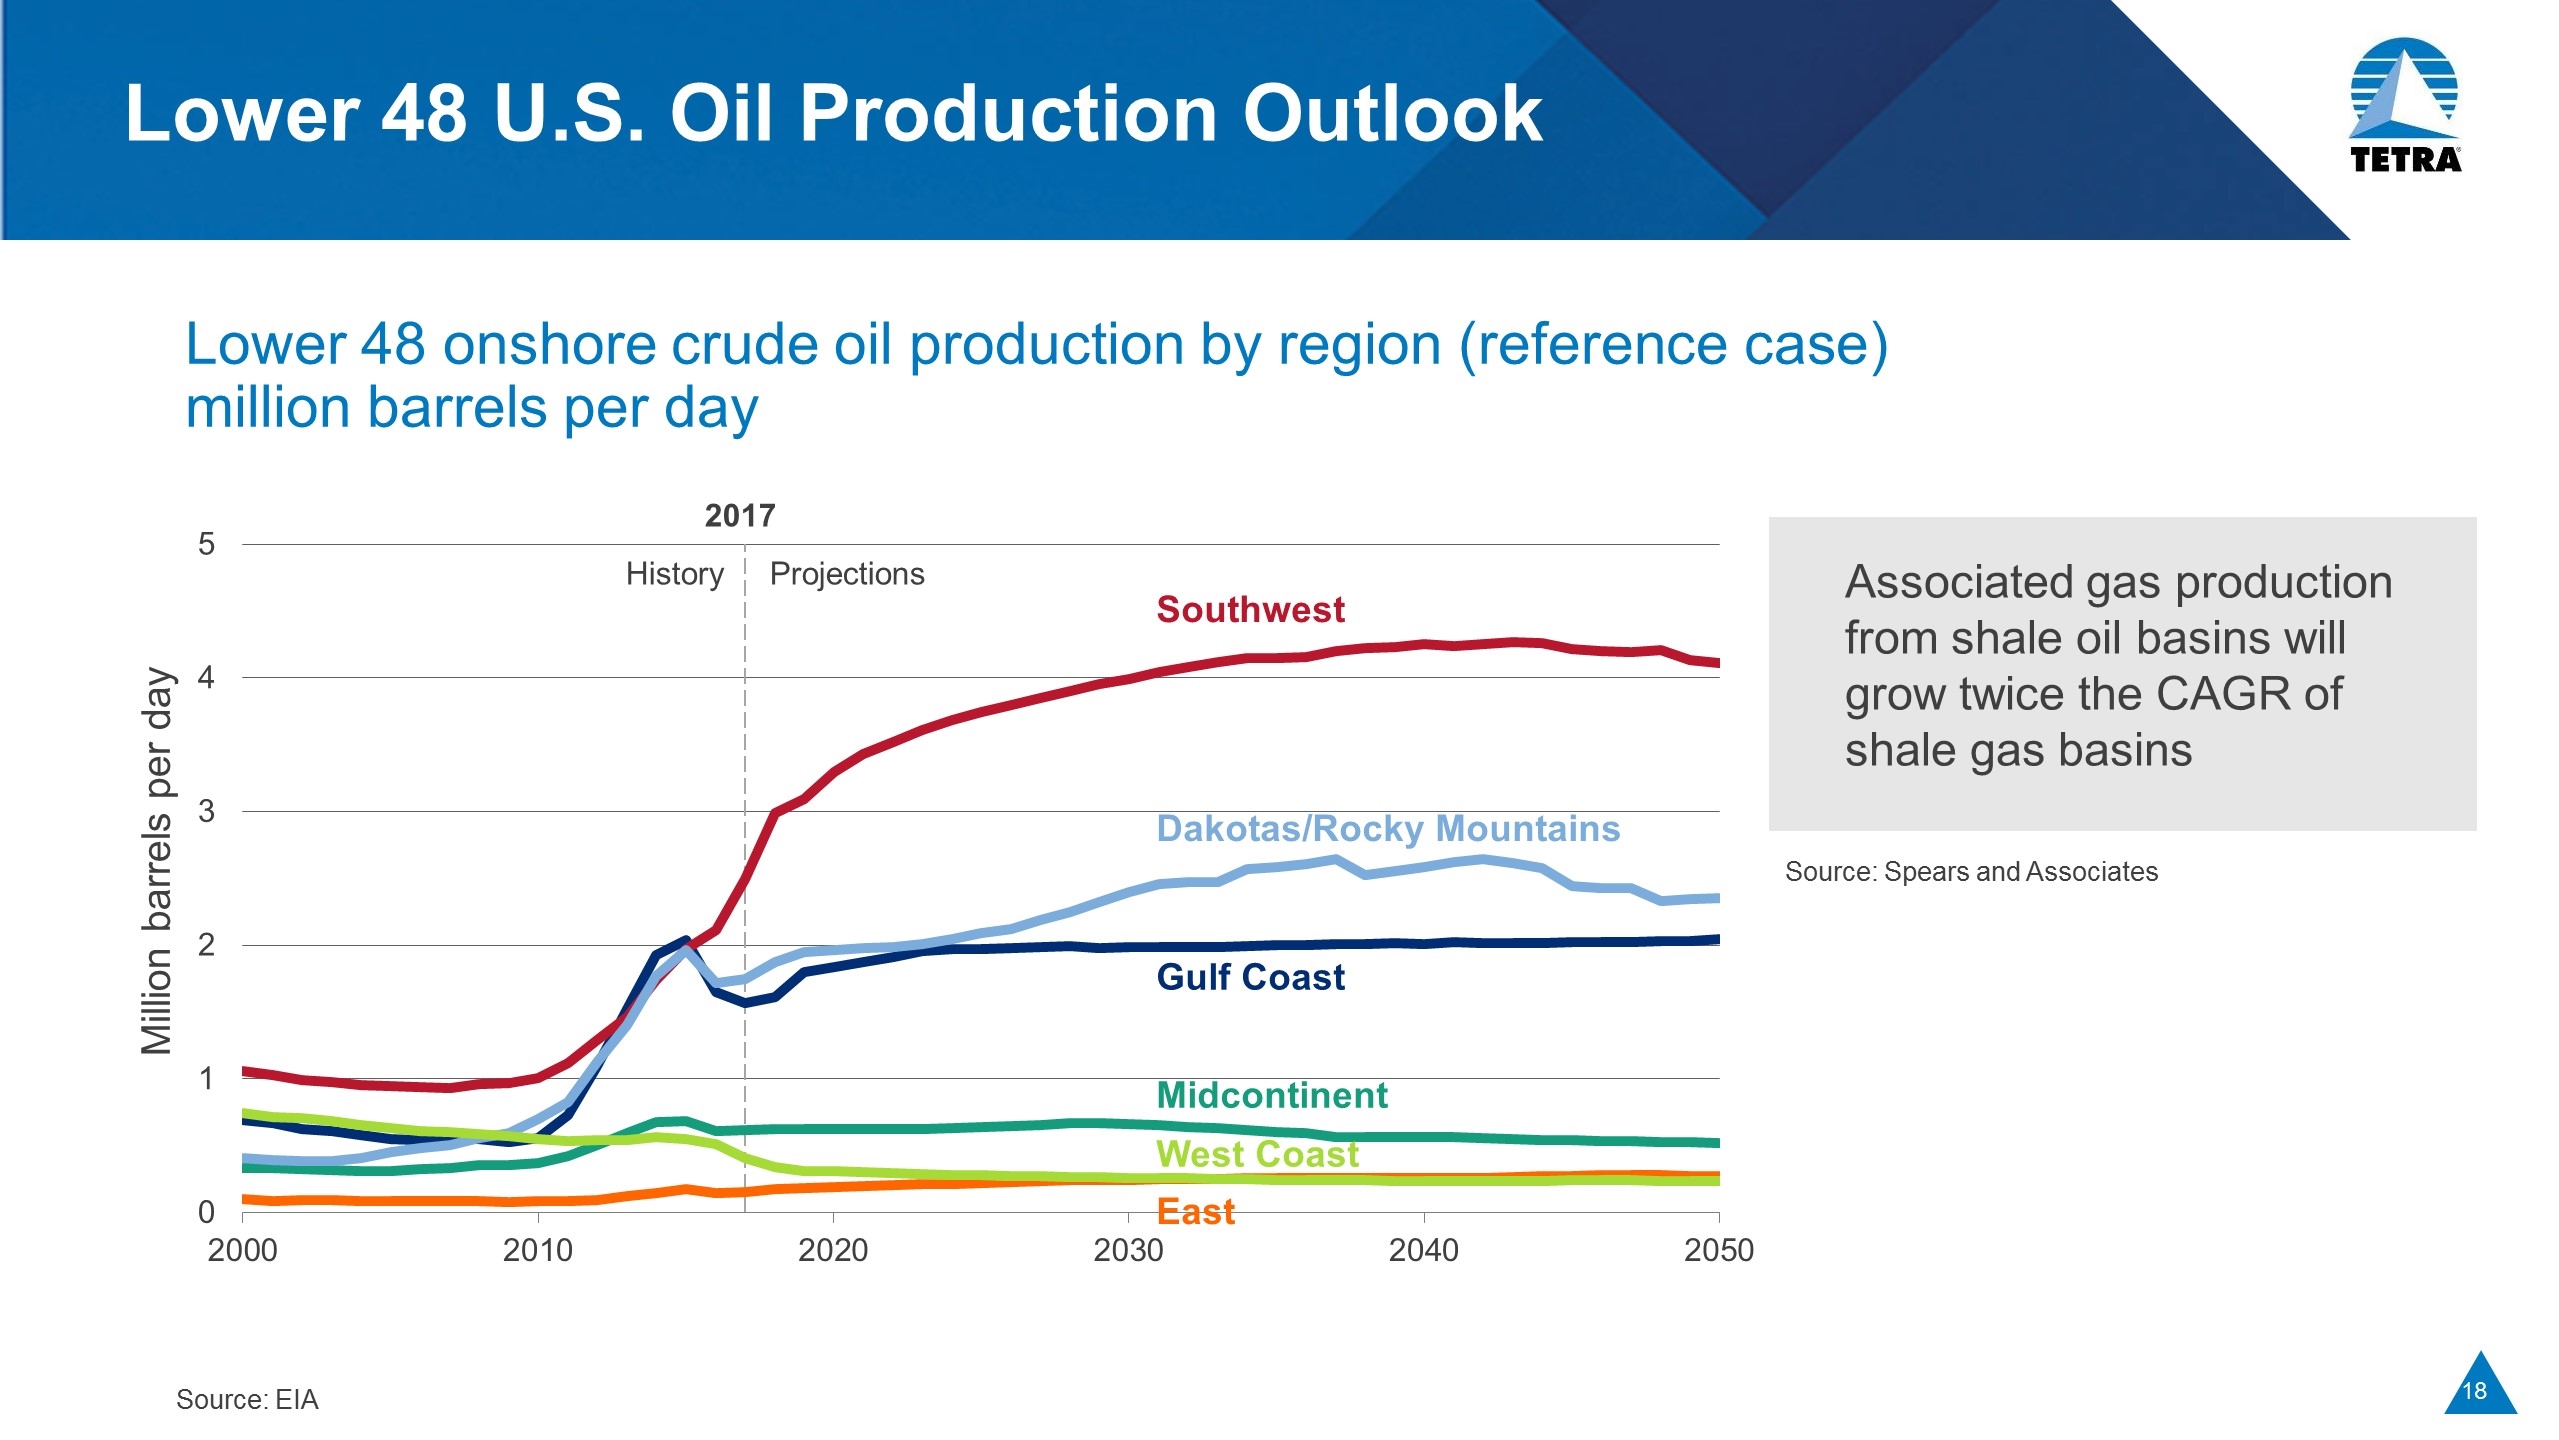
Lower 48 U.S. Oil Production Outlook Lower 48 onshore crude oil production by region (reference case) million barrels per day Southwest Dakotas/Rocky Mountains Gulf Coast Midcontinent West Coast East Source: EIA Associated gas production from shale oil basins will grow twice the CAGR of shale gas basins Source: Spears and Associates Million barrels per day
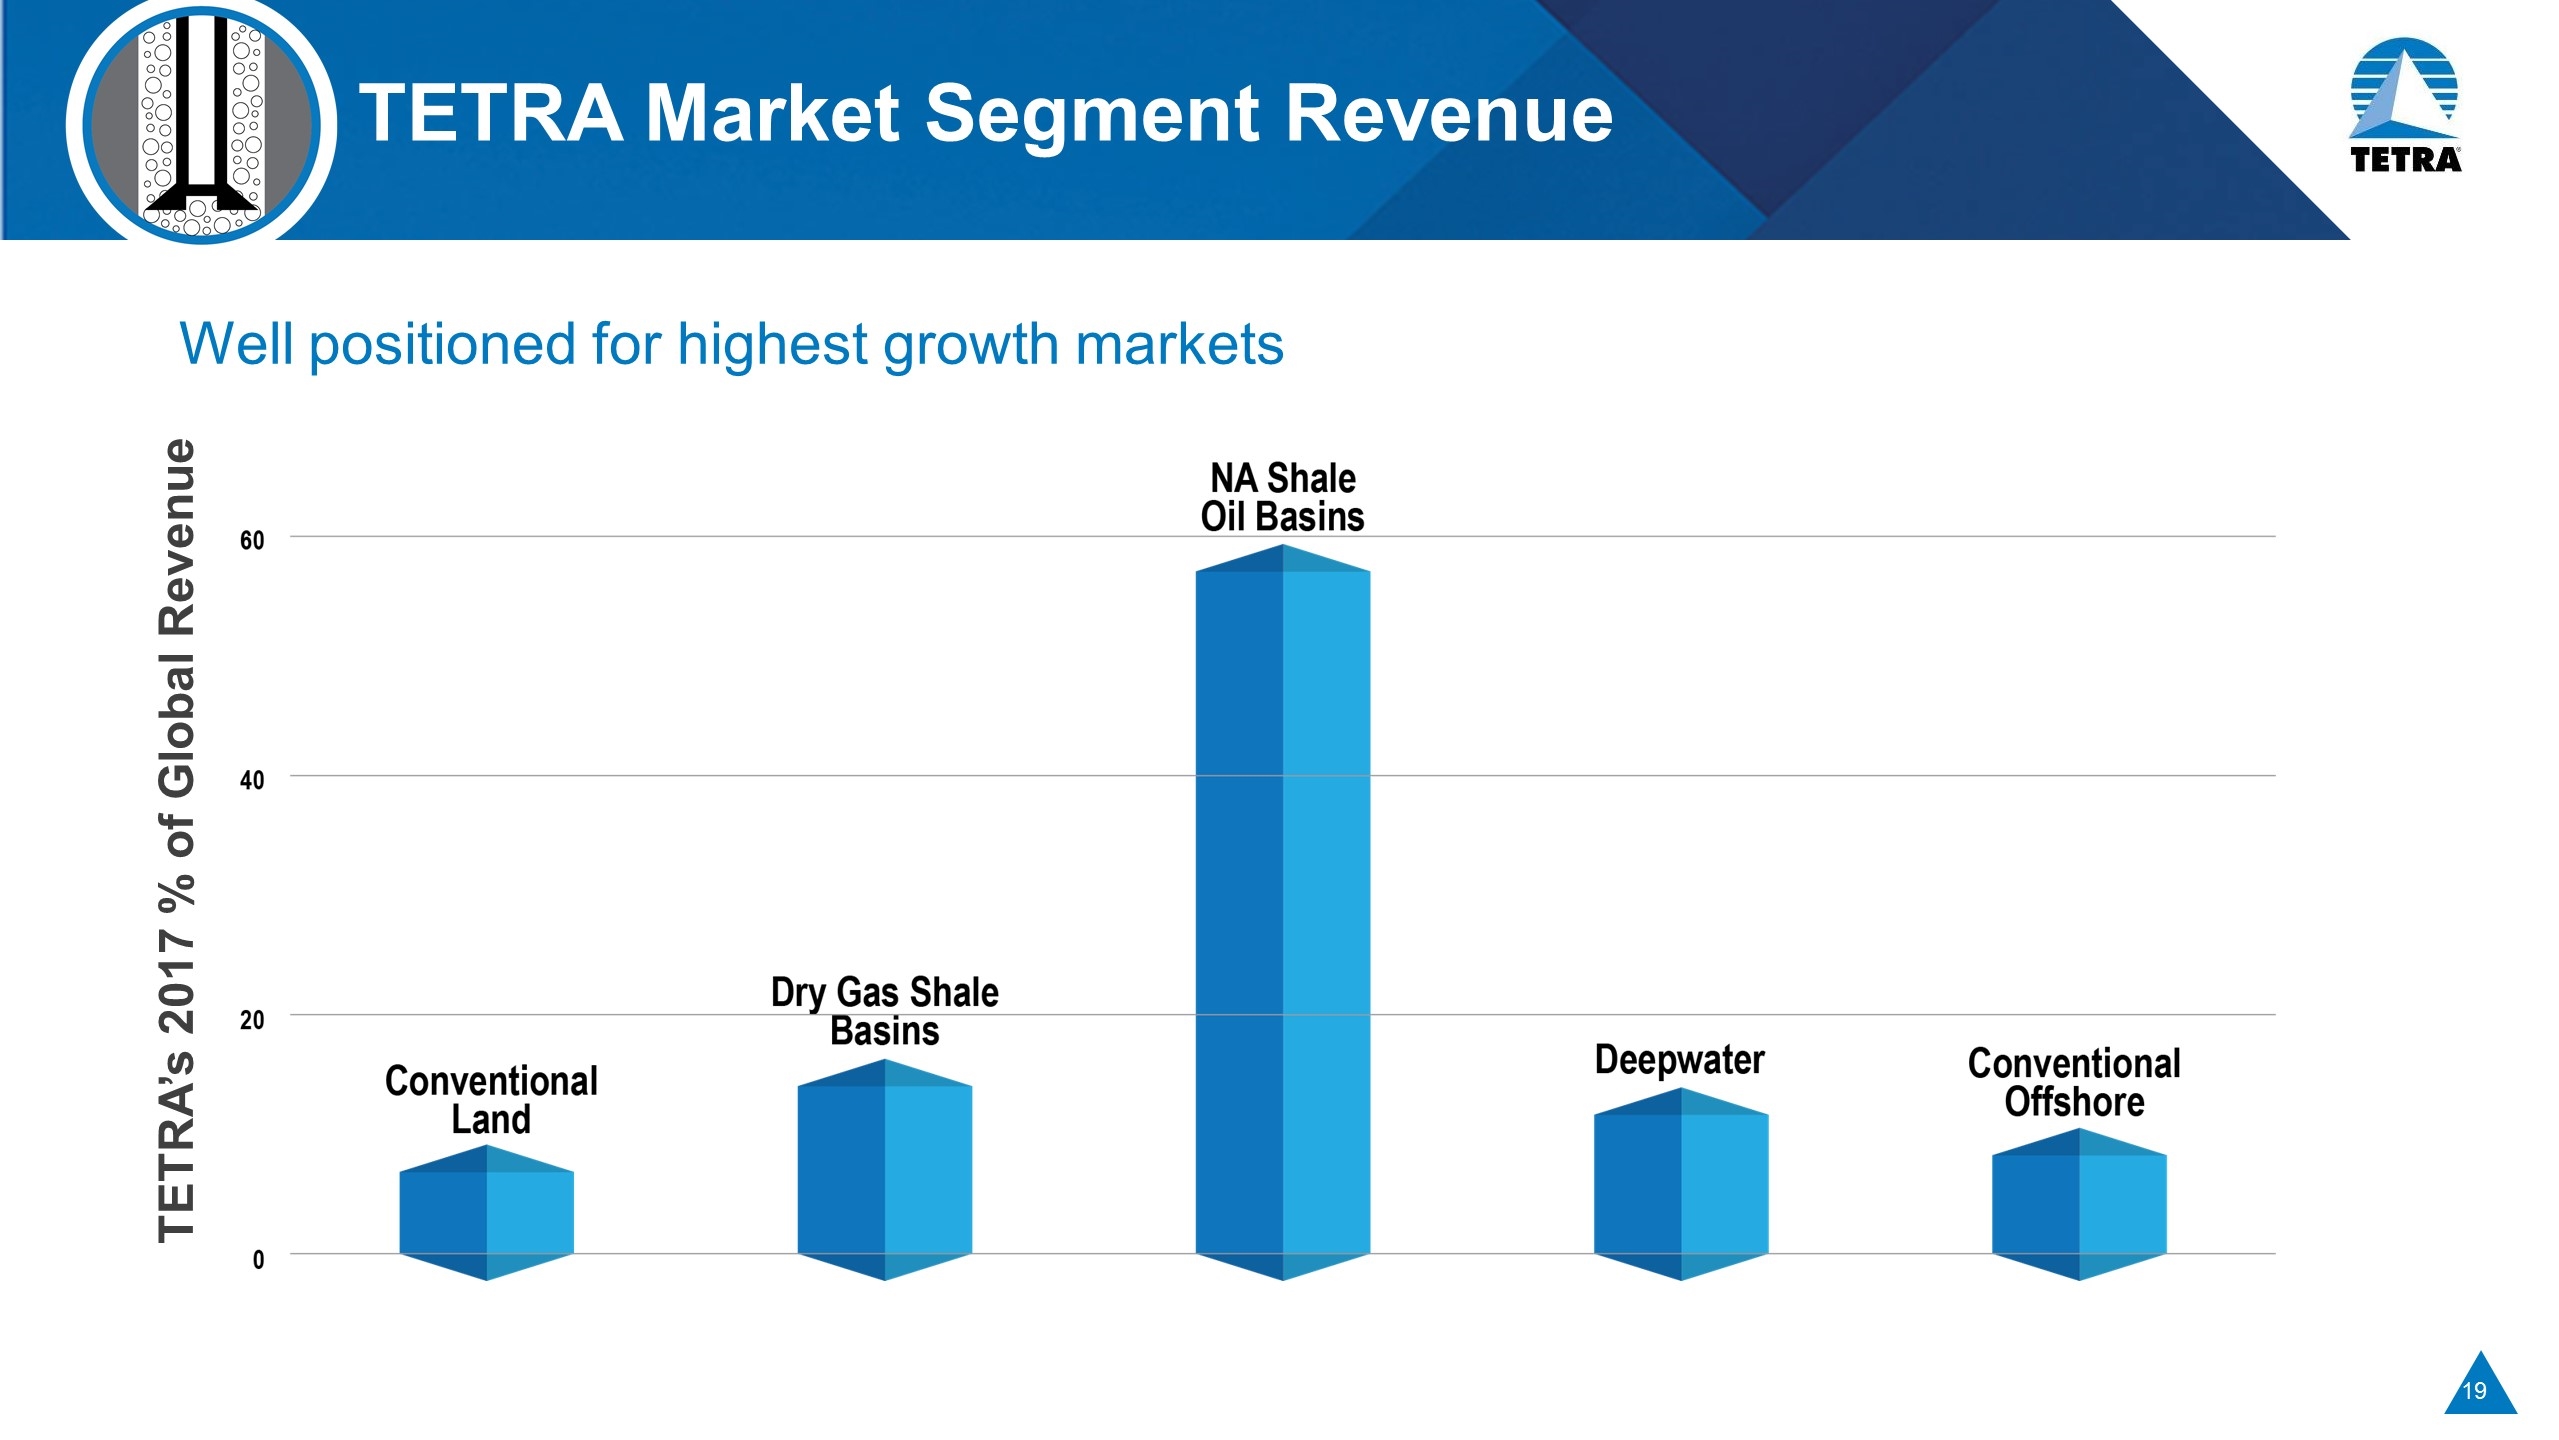
TETRA Market Segment Revenue Well positioned for highest growth markets TETRA’s 2017 % of Global Revenue
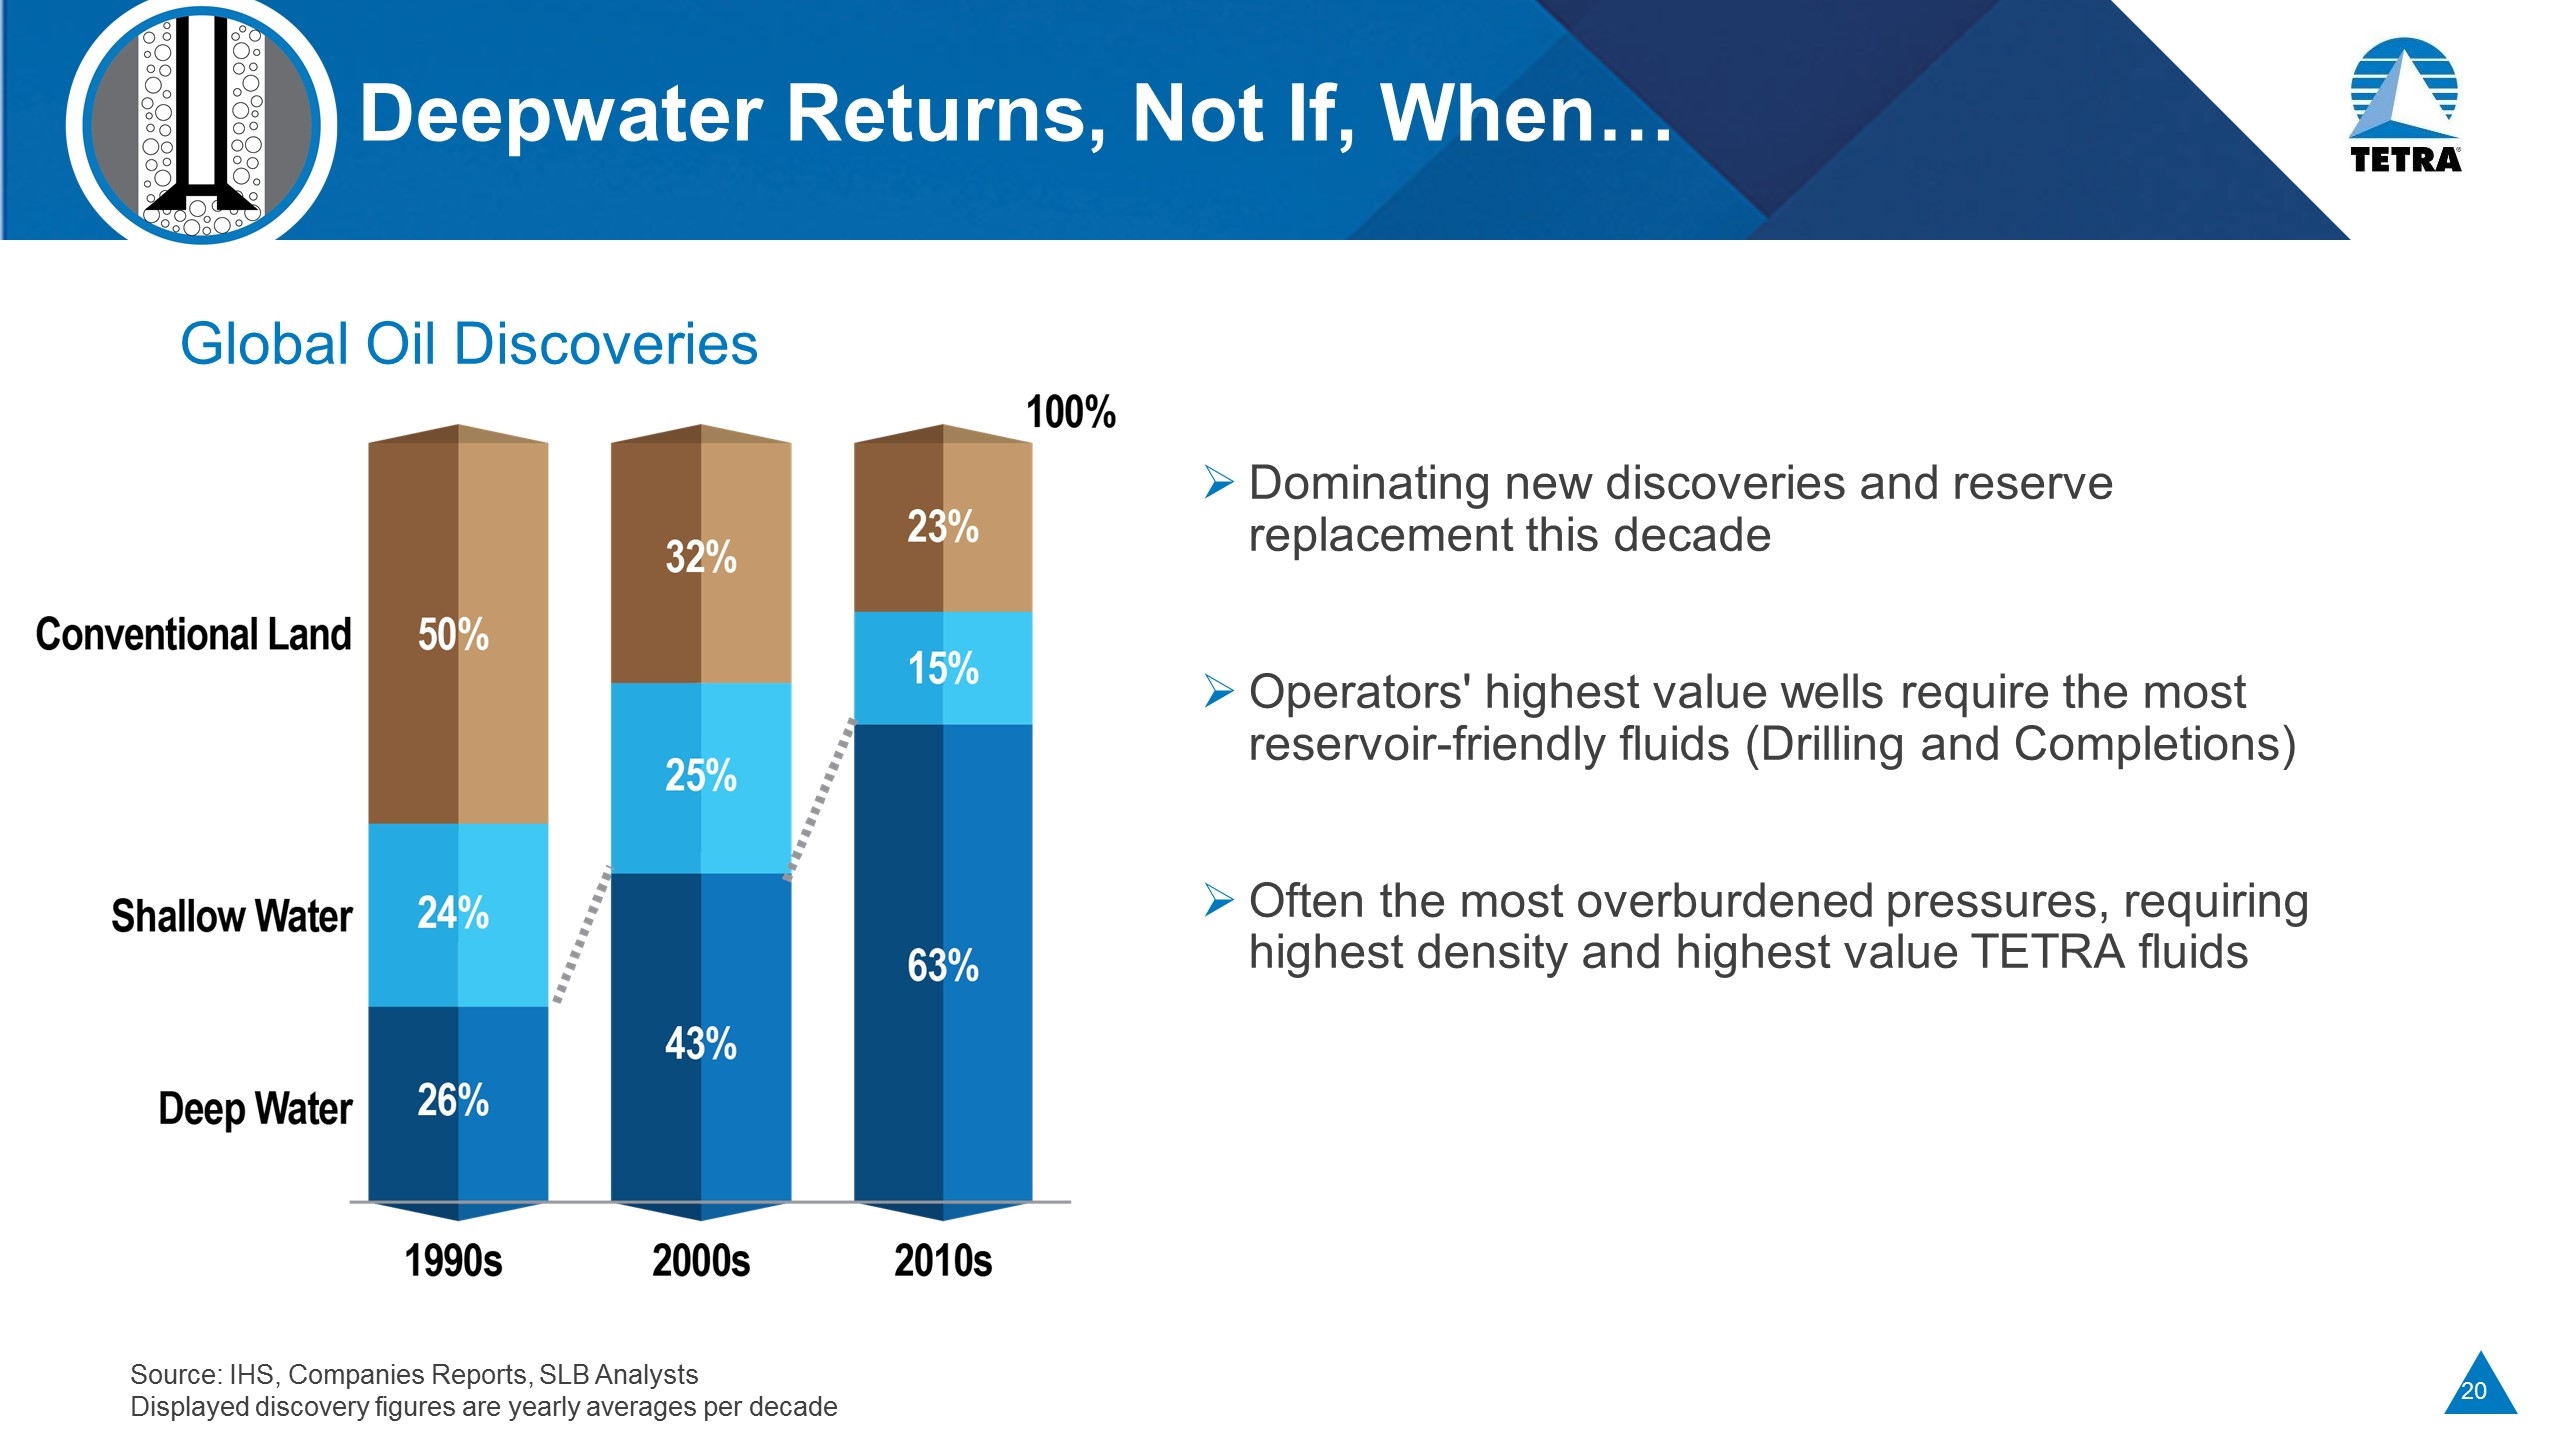
Deepwater Returns, Not If, When… Global Oil Discoveries Dominating new discoveries and reserve replacement this decade Operators' highest value wells require the most reservoir-friendly fluids (Drilling and Completions) Often the most overburdened pressures, requiring highest density and highest value TETRA fluids Source: IHS, Companies Reports, SLB Analysts Displayed discovery figures are yearly averages per decade

Strategy on a Page Market Size Est $1B $9B $3B(2) 2018 Revenue(1) $283M $290M $393M Strategy Leverage innovation, vertical integration and plant capacity to grow with minimal investment Leverage differentiated offerings in water transfer, flowback and treatment/recycle Leverage vertical integration, new unit sales and after market services to achieve the highest peer return on capital Execution Partner with global drilling and fluids market leader for TETRA CS Neptune® Completion Fluids System distribution Implement NA integrated offering for high service intensity segment of Water Management Execute solutions strategy for wide range of HP for production enhancement needs through gas lift and further into the gas gathering and gas processing value chain 2020 Commitments TETRA CS Neptune® Completion Fluid System operations in 4 geo-markets Exceed segment market growth by 2X Margin expansion of 600 basis points (3) * Data estimated for sub-segments in which TETRA competes Water & Flowback Services* Compression Completion Fluids & Products Mid-point of guidance Compression Services only (does not include new unit sales or after-market services) EBITDA margins from 2018 to 2020
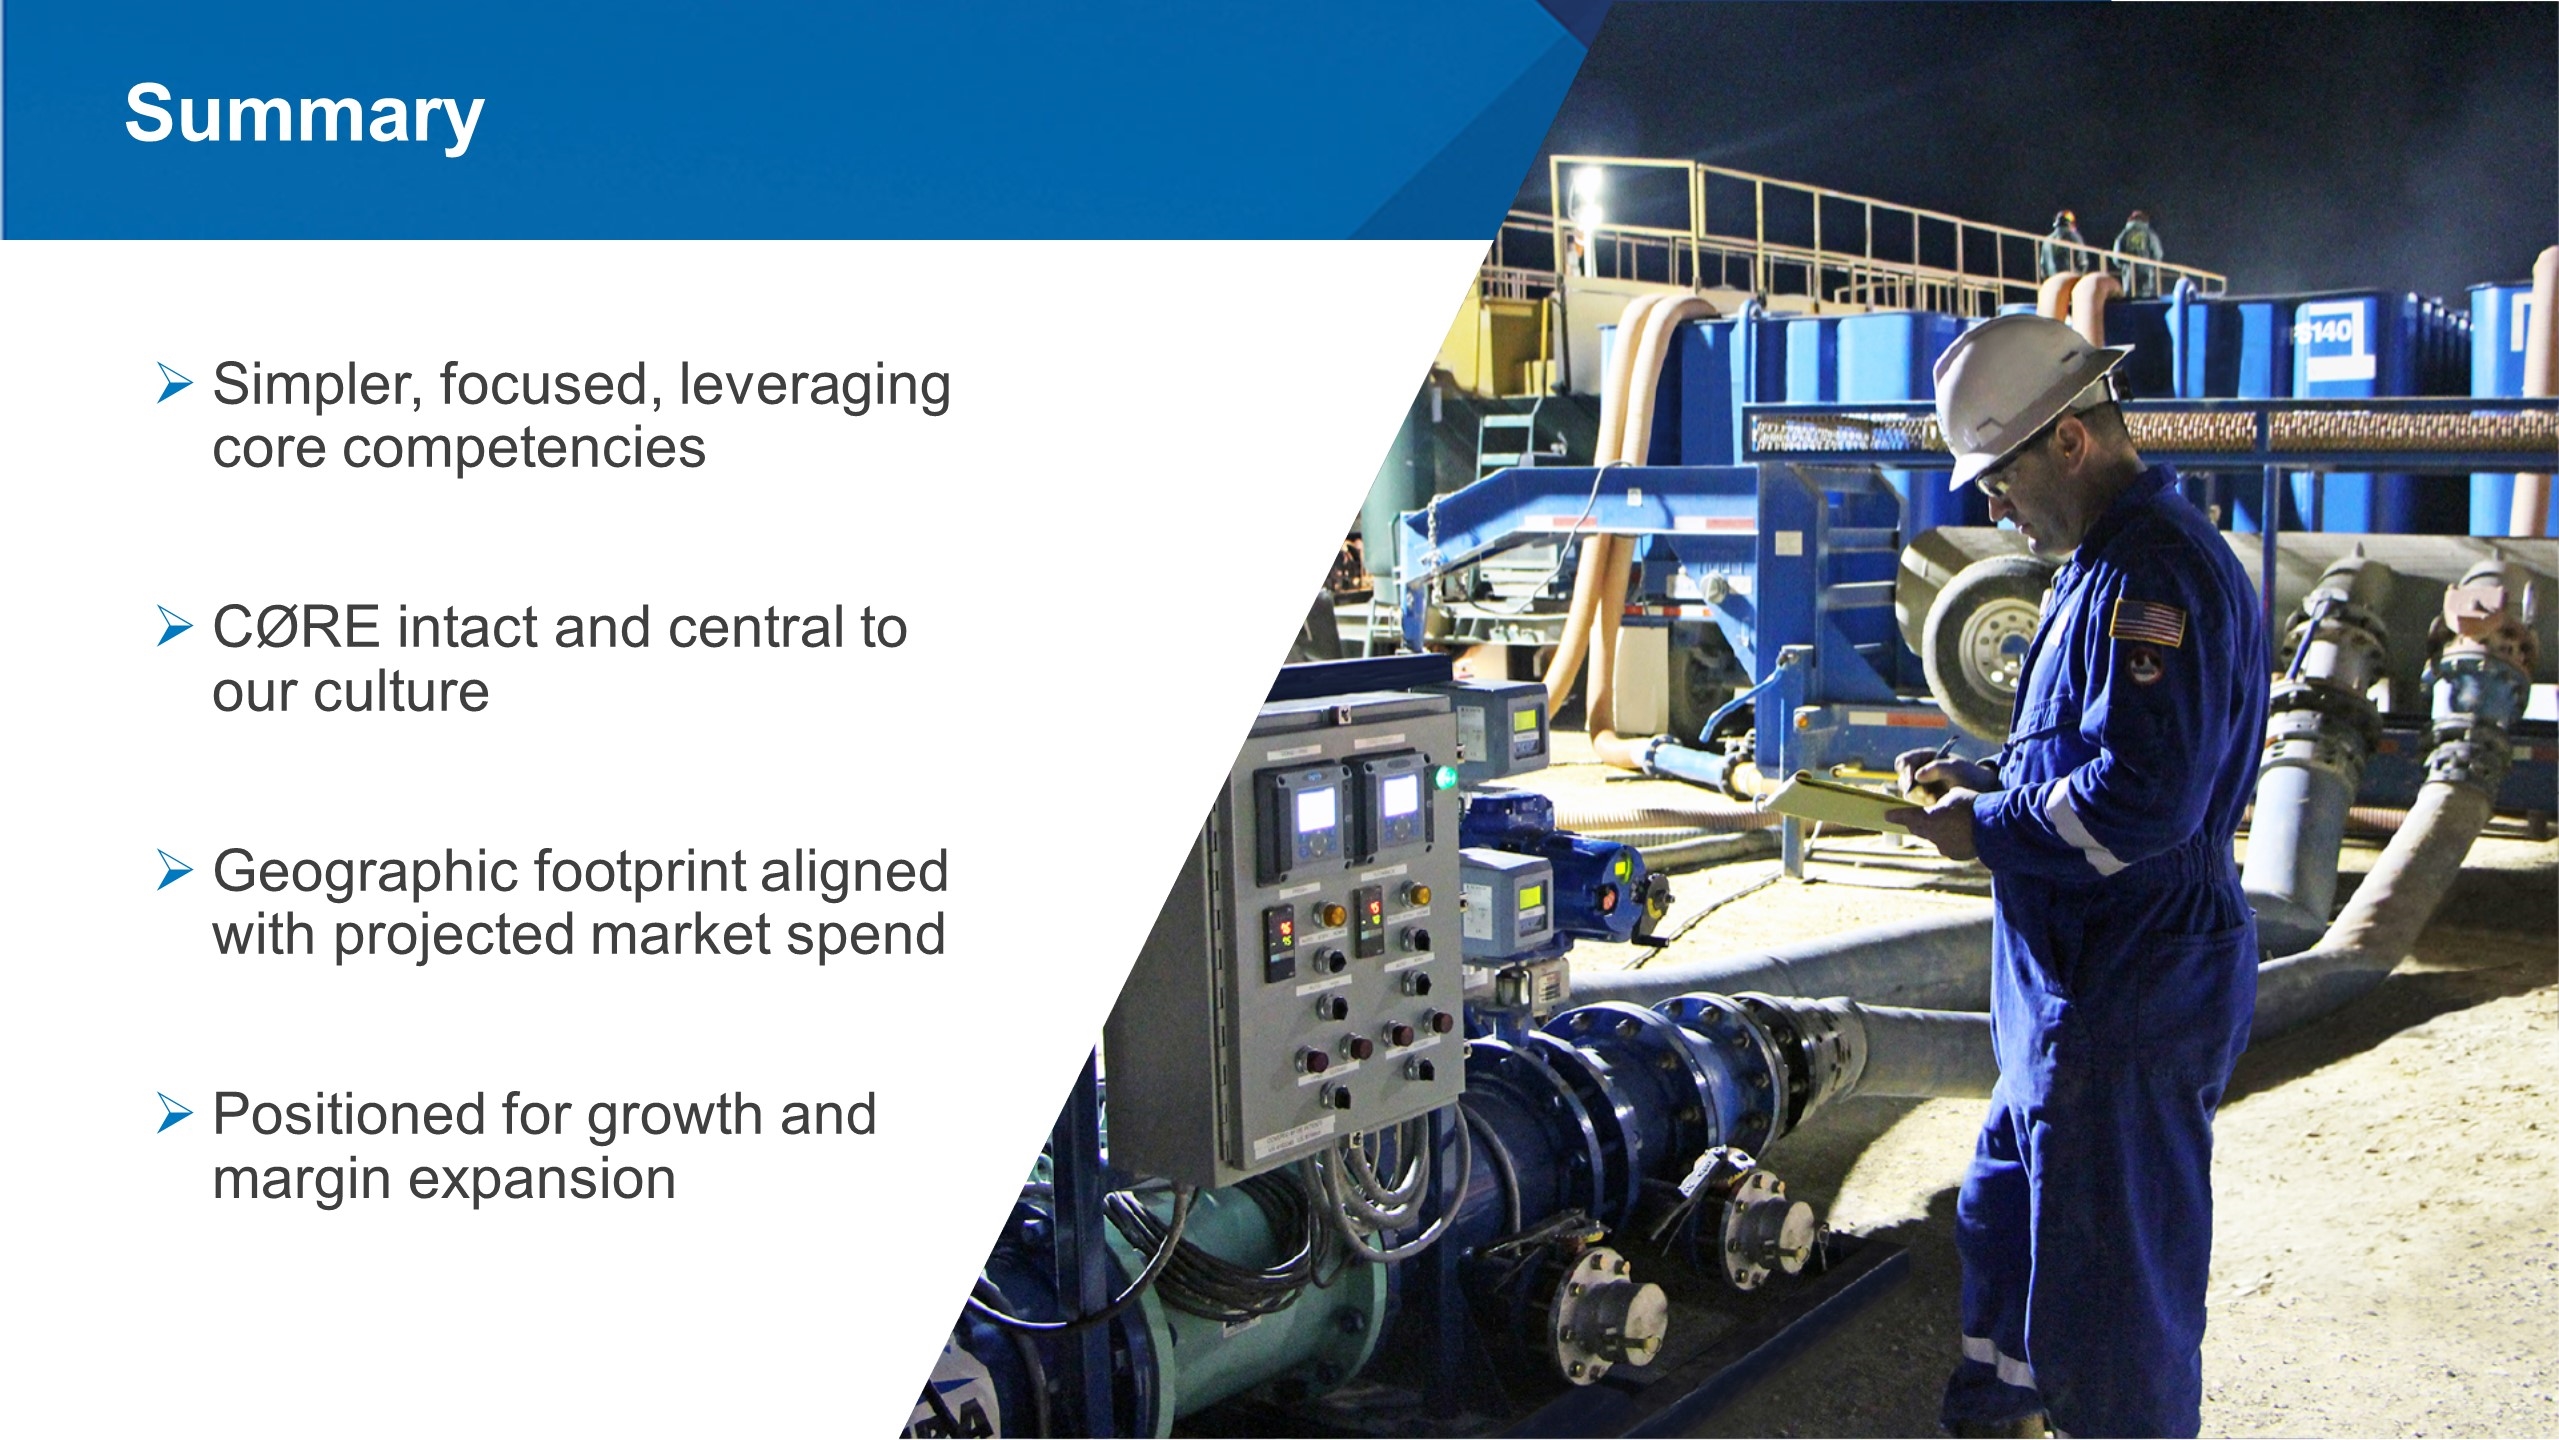
Simpler, focused, leveraging core competencies CøRE intact and central to our culture Geographic footprint aligned with projected market spend Positioned for growth and margin expansion Summary
Growth Through Innovation Water & Flowback Services Matt Sanderson Senior Vice President
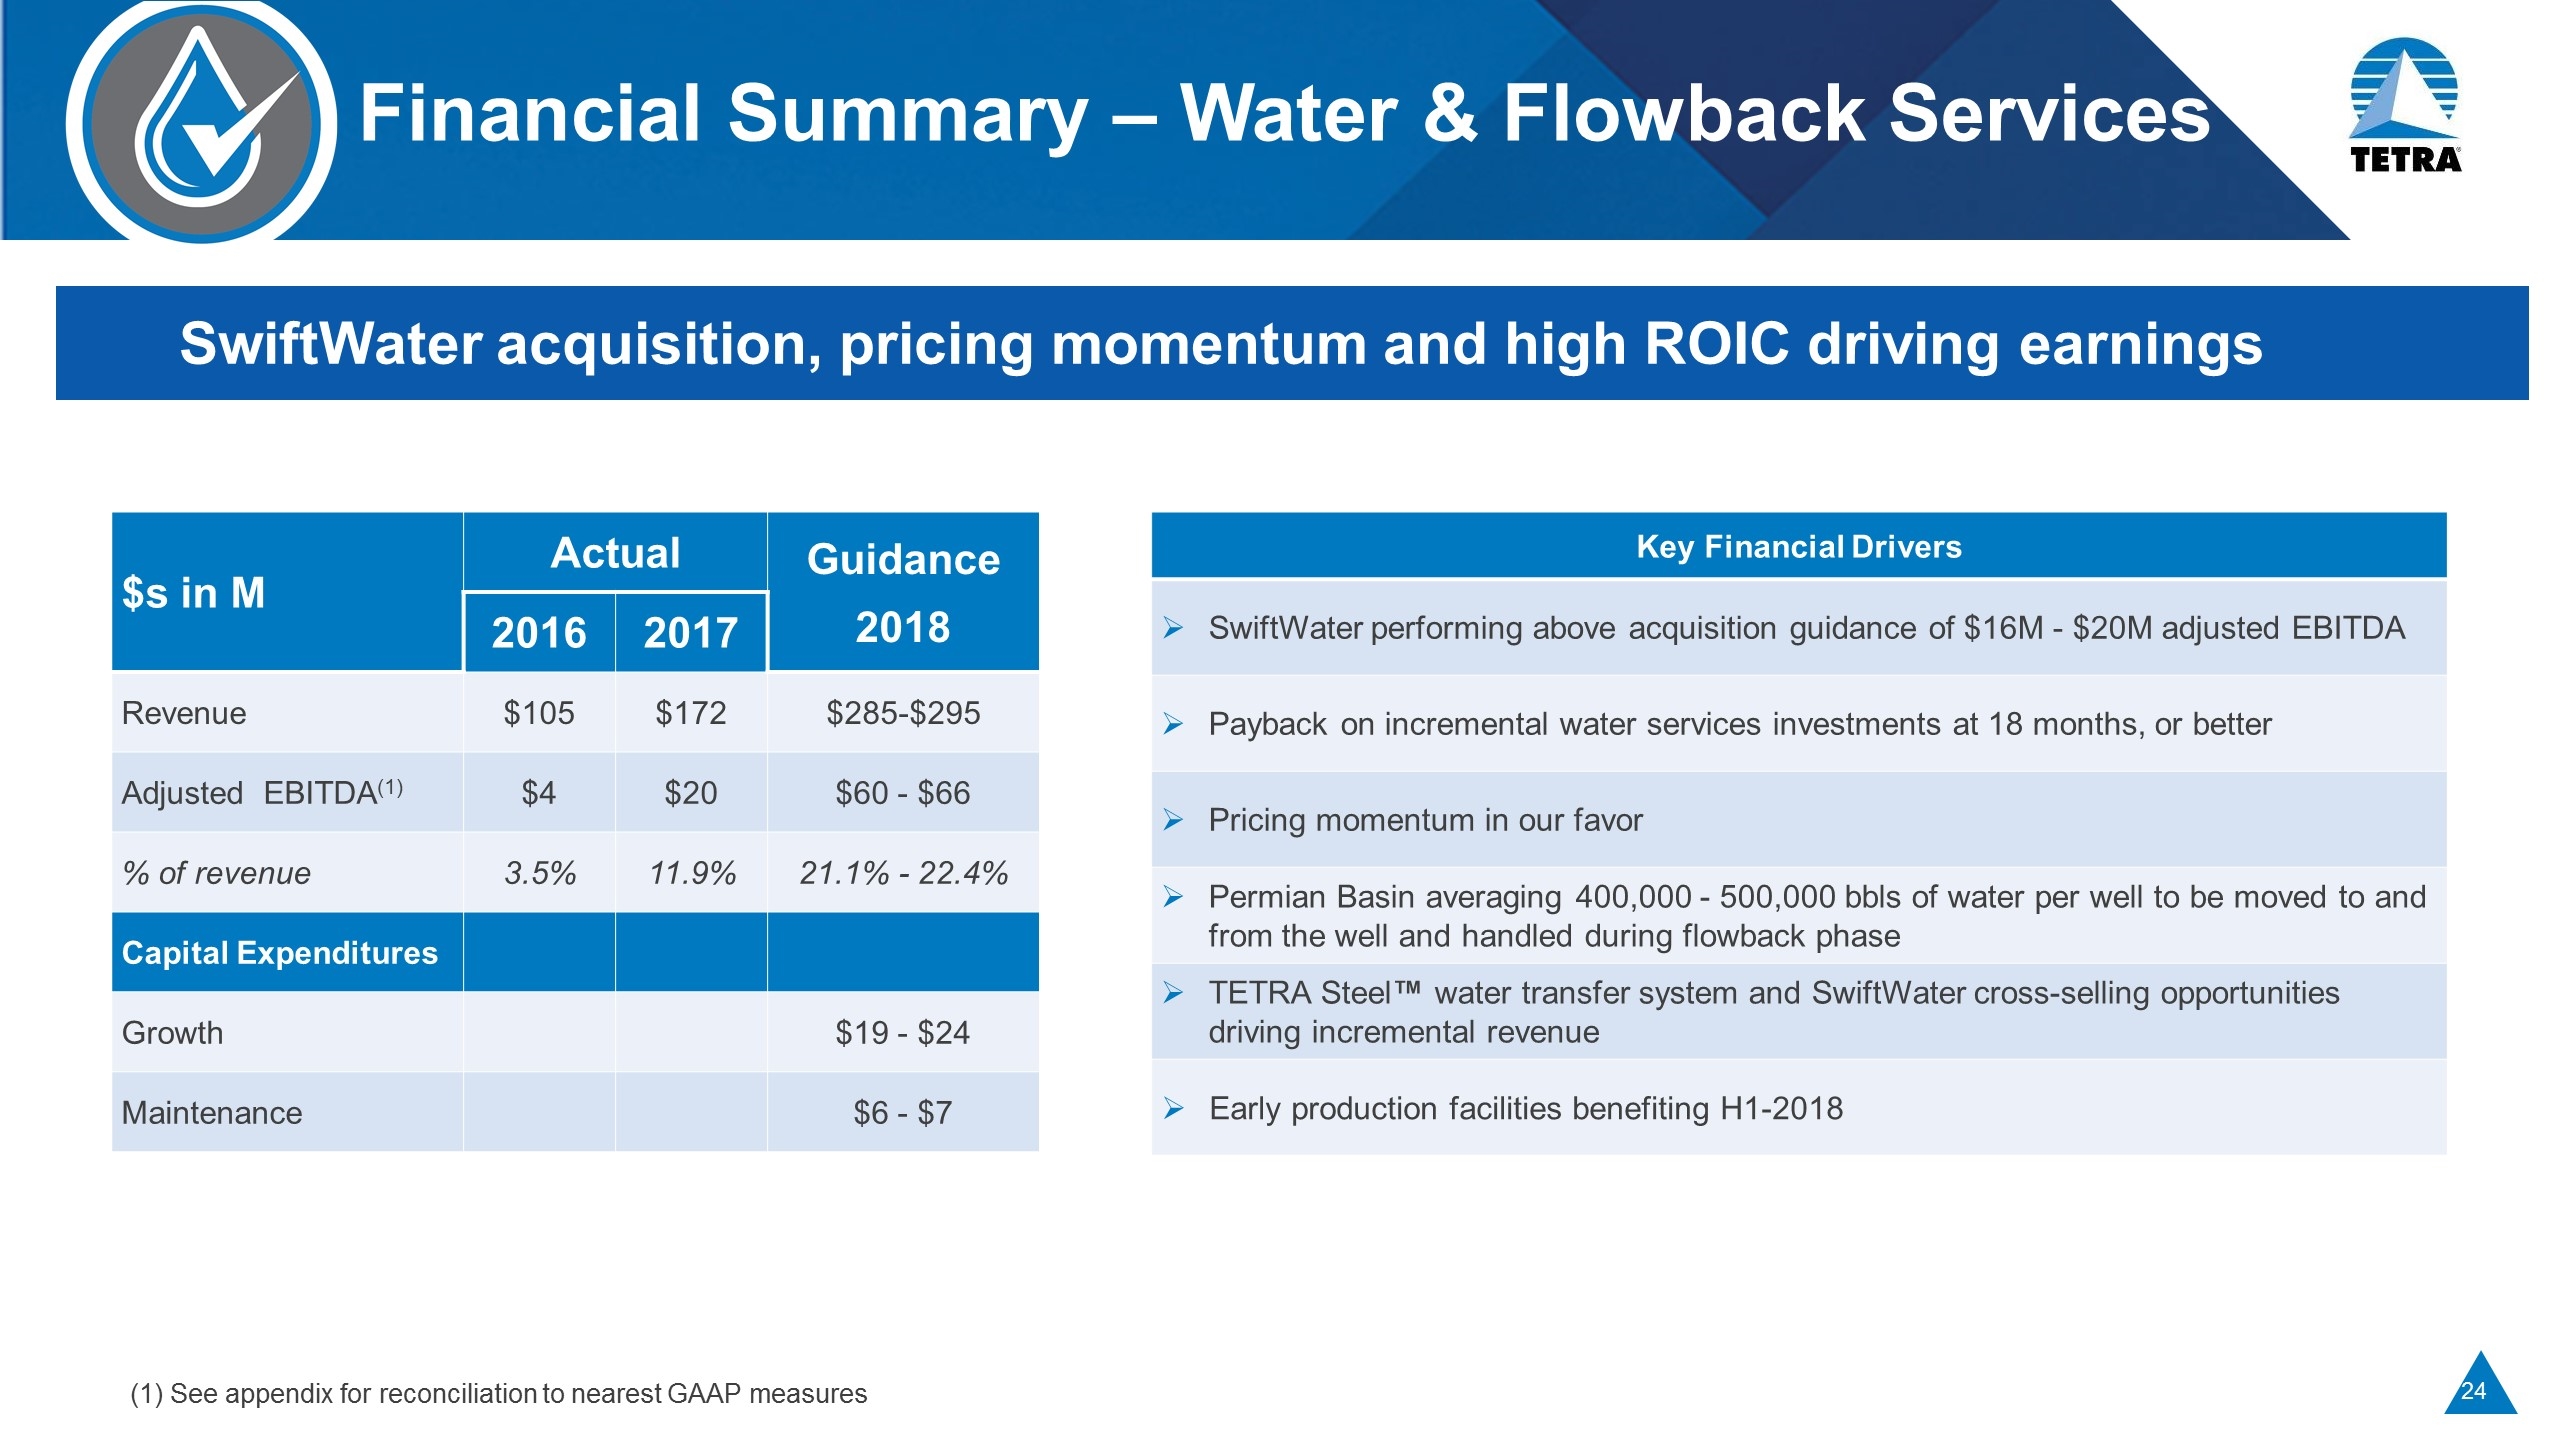
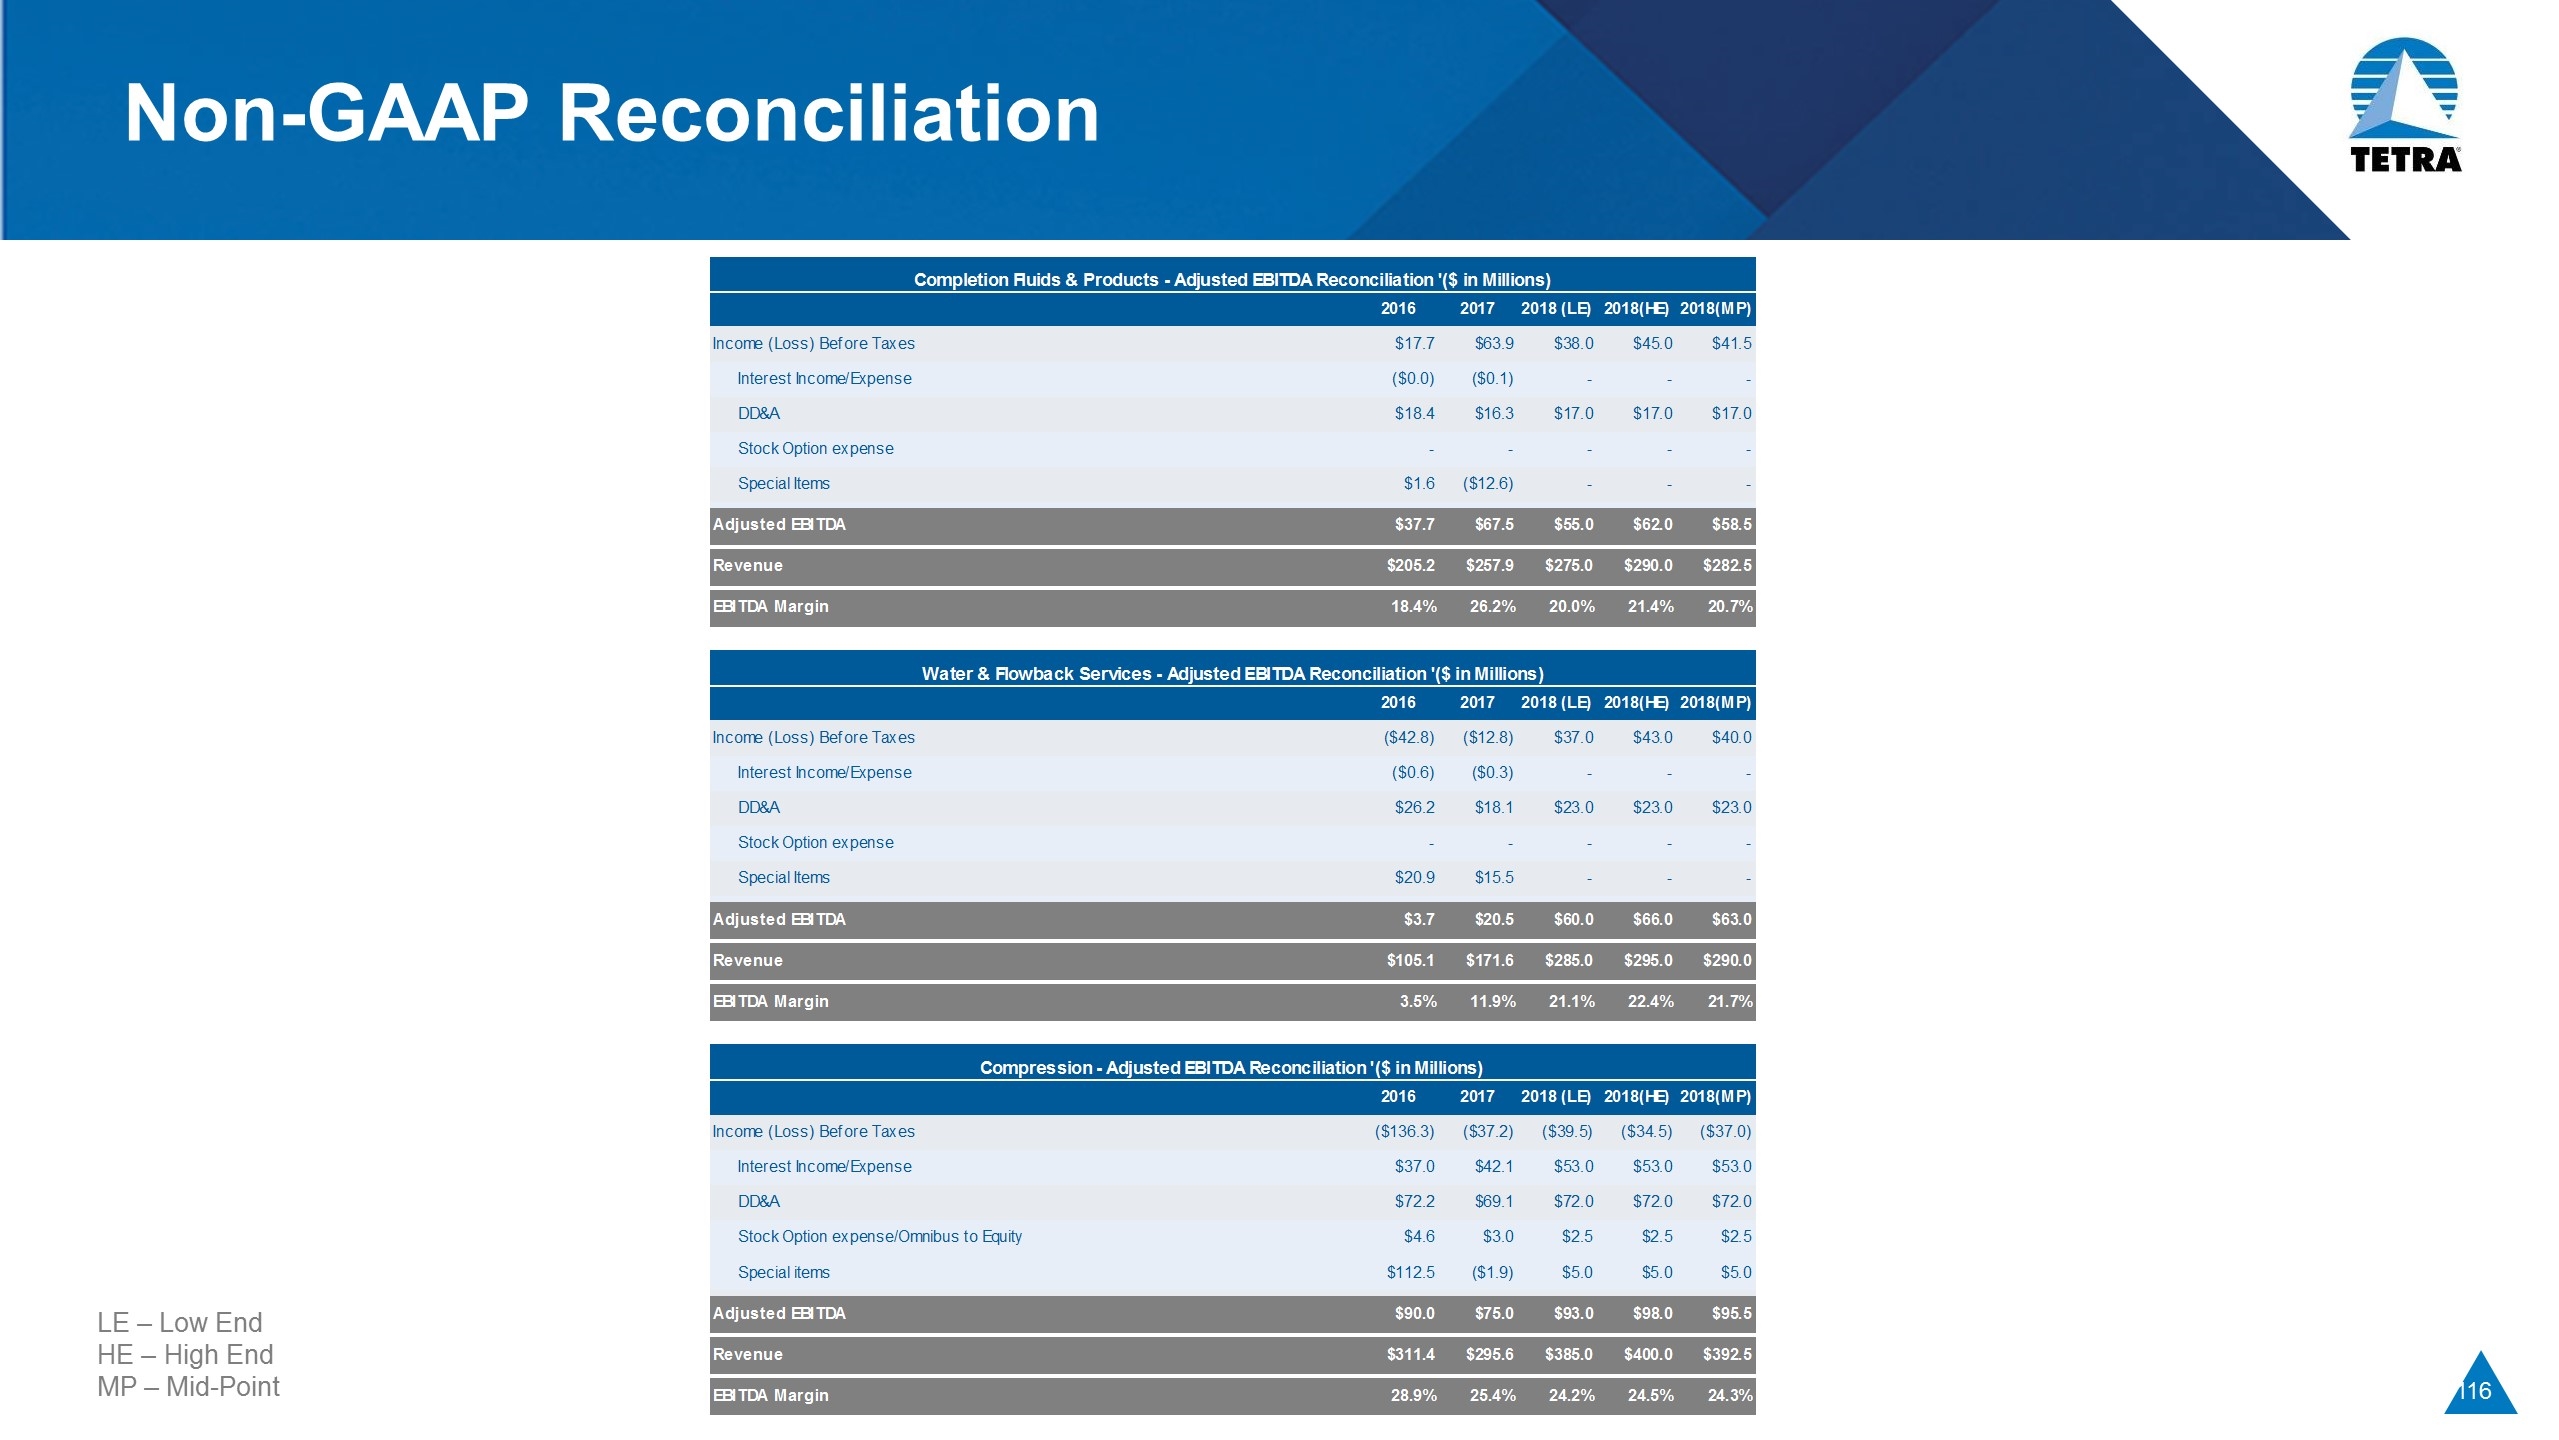
Financial Summary – Water & Flowback Services SwiftWater acquisition, pricing momentum and high ROIC driving earnings $s in M Actual Guidance 2018 2016 2017 Revenue $105 $172 $285-$295 Adjusted EBITDA(1) $4 $20 $60 - $66 % of revenue 3.5% 11.9% 21.1% - 22.4% Capital Expenditures Growth $19 - $24 Maintenance $6 - $7 Key Financial Drivers SwiftWater performing above acquisition guidance of $16M - $20M adjusted EBITDA Payback on incremental water services investments at 18 months, or better Pricing momentum in our favor Permian Basin averaging 400,000 - 500,000 bbls of water per well to be moved to and from the well and handled during flowback phase TETRA Steel™ water transfer system and SwiftWater cross-selling opportunities driving incremental revenue Early production facilities benefiting H1-2018 (1) See appendix for reconciliation to nearest GAAP measures
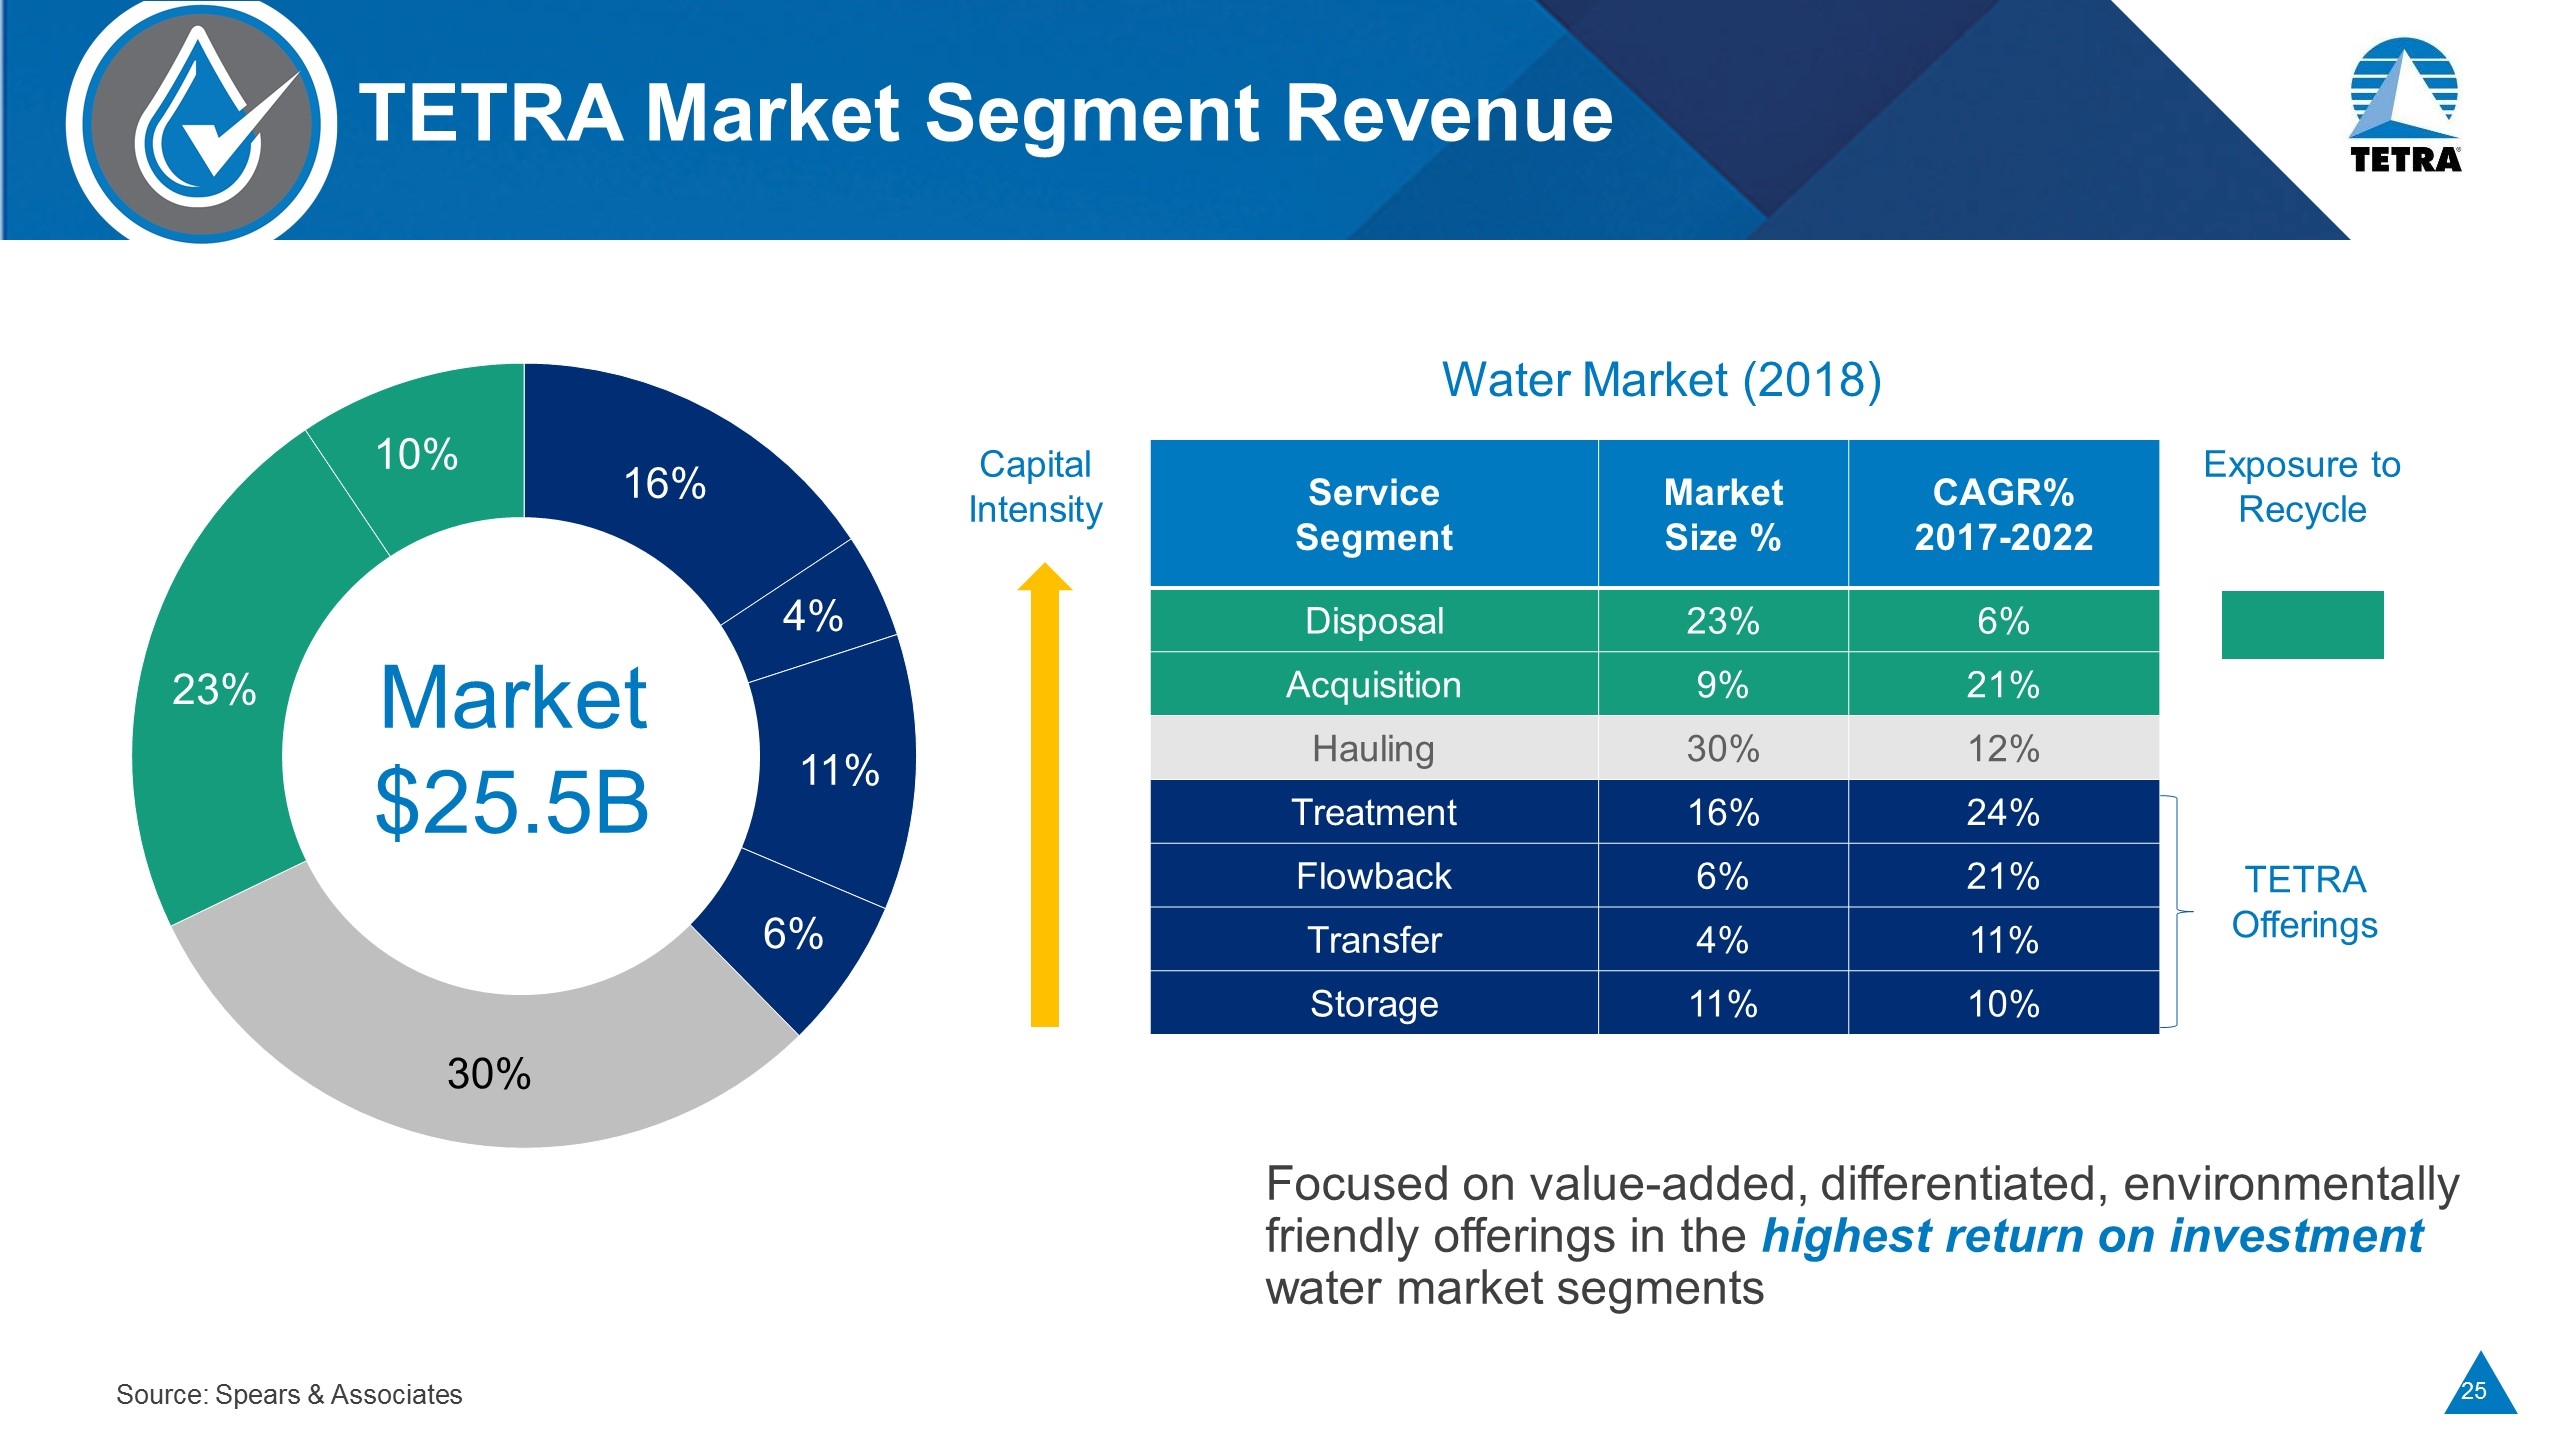
TETRA Market Segment Revenue Focused on value-added, differentiated, environmentally friendly offerings in the highest return on investment water market segments Water Market (2018) Source: Spears & Associates Service Segment Market Size % CAGR% 2017-2022 Disposal 23% 6% Acquisition 9% 21% Hauling 30% 12% Treatment 16% 24% Flowback 6% 21% Transfer 4% 11% Storage 11% 10% Market $25.5B Capital Intensity Exposure to Recycle TETRA Offerings
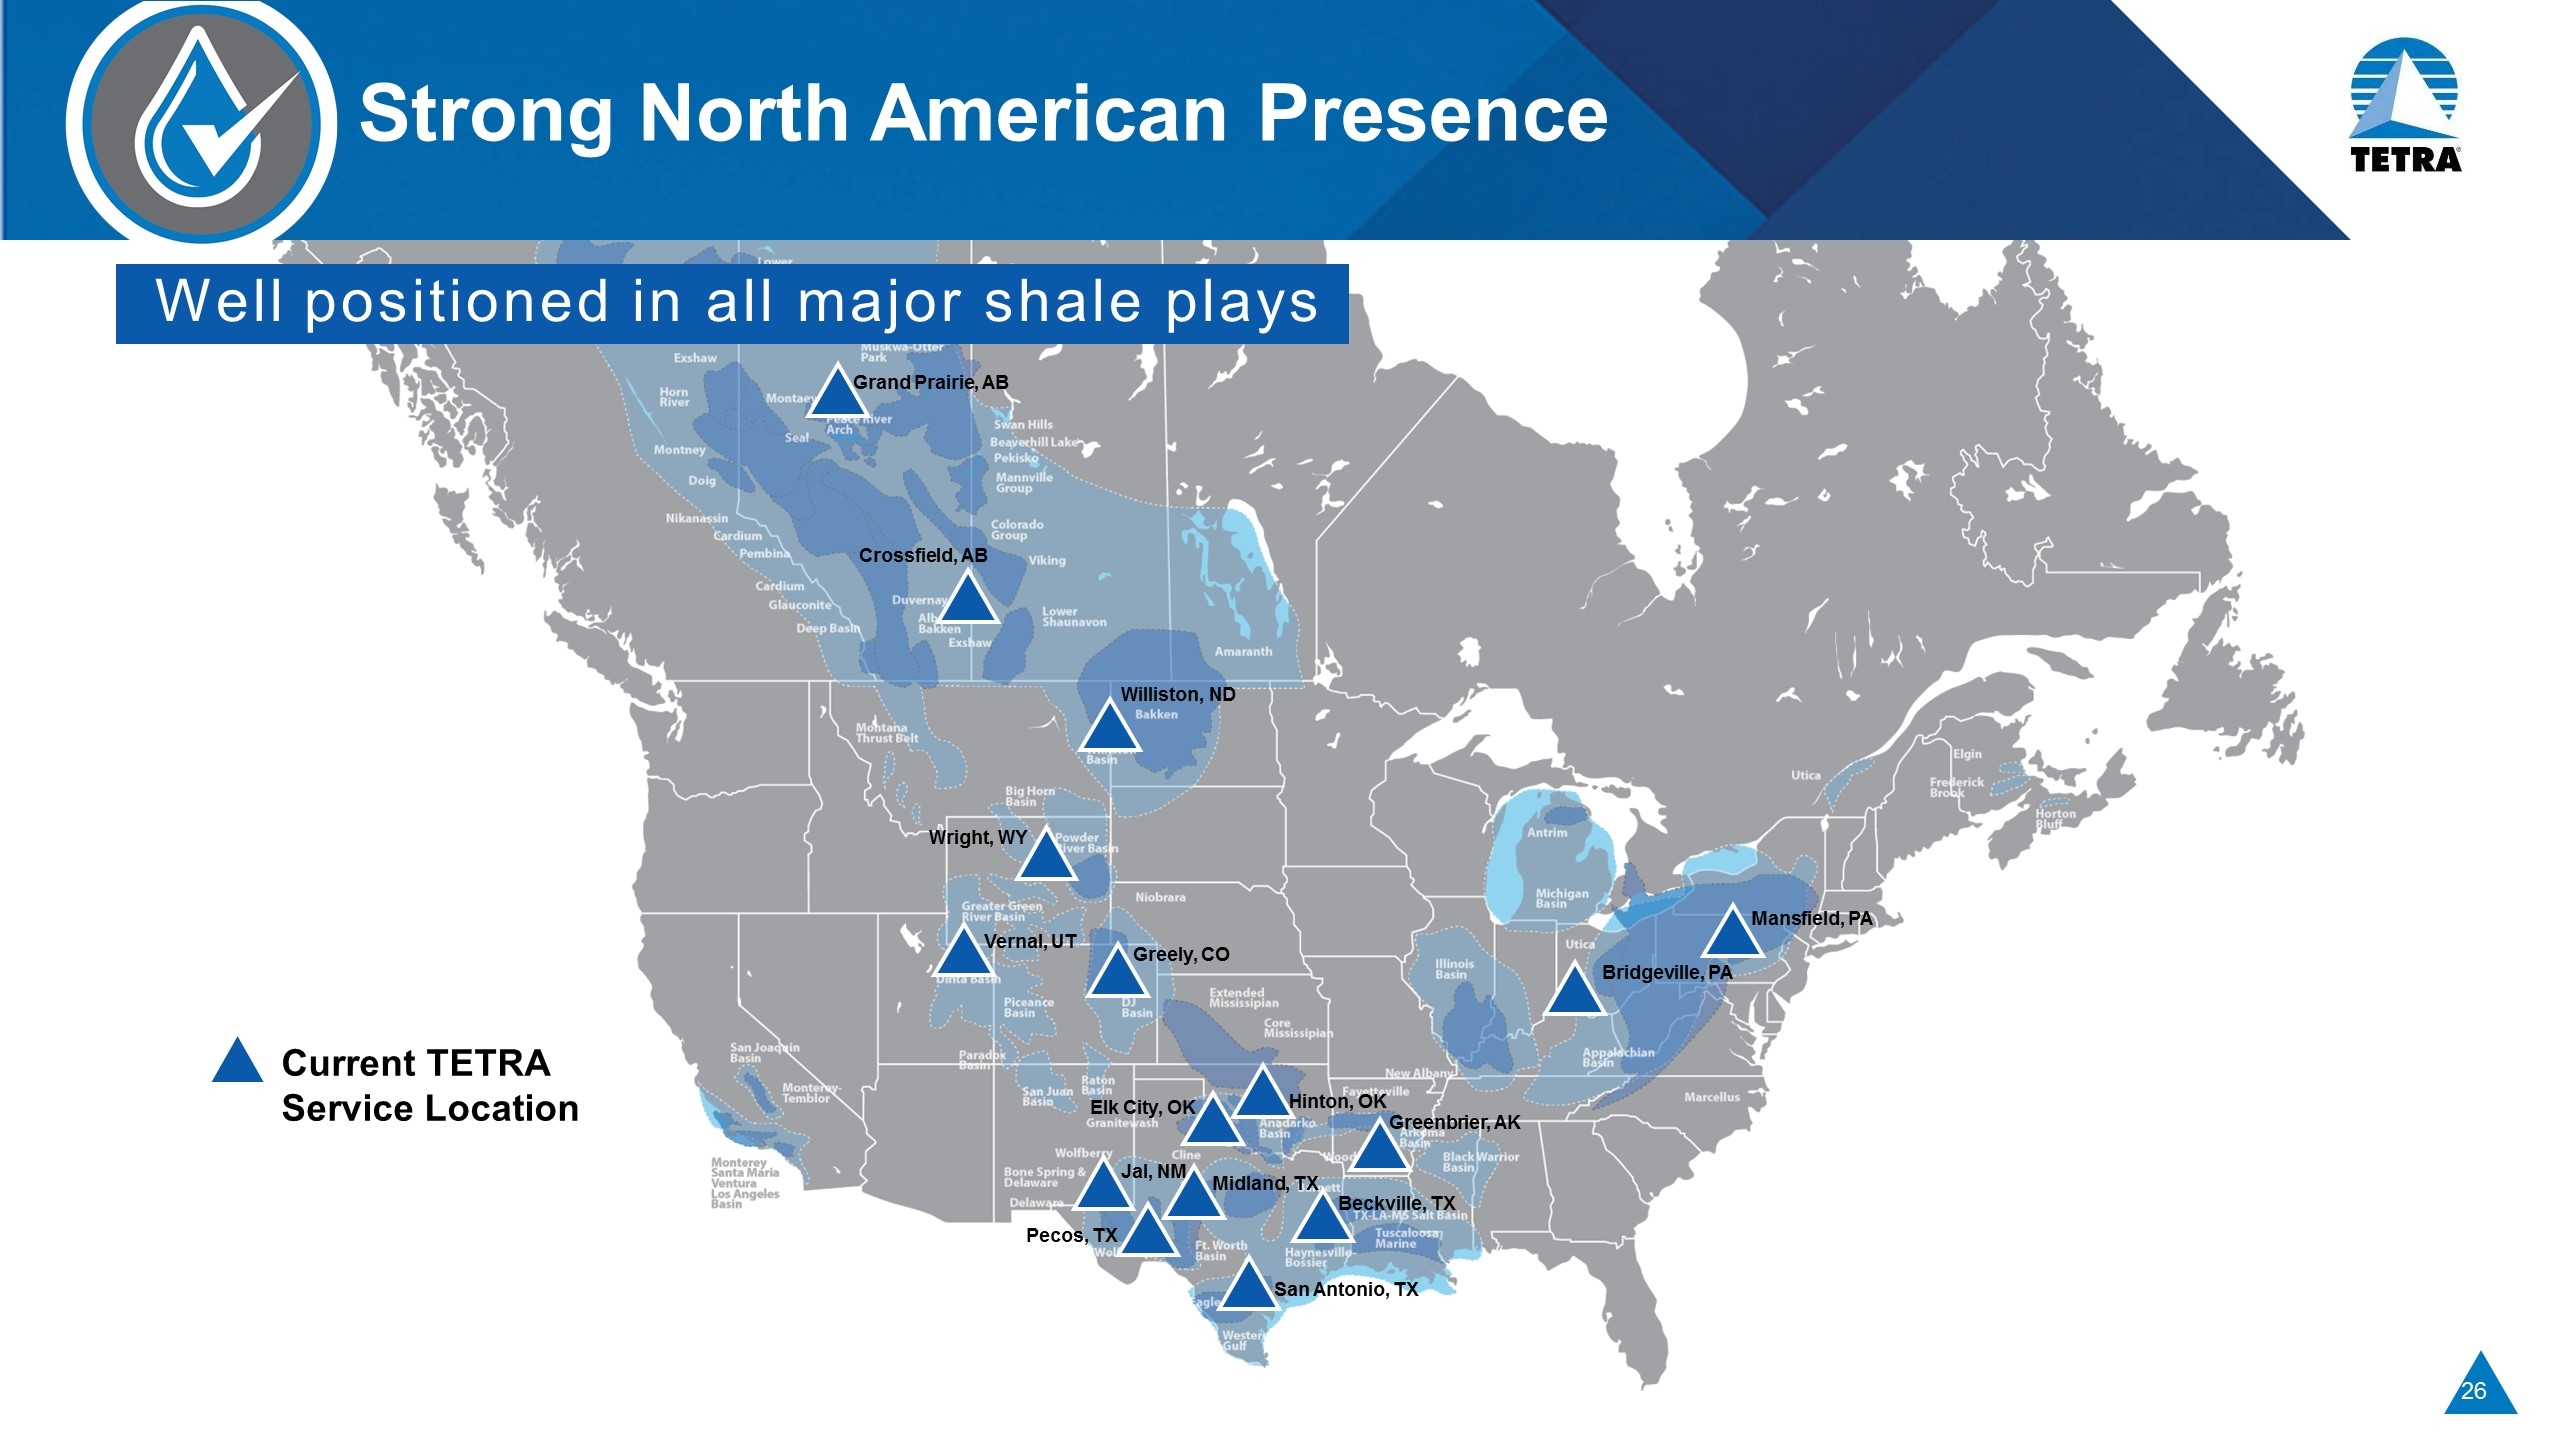
Strong North American Presence Current TETRA Service Location Vernal, UT Greely, CO Wright, WY Williston, ND Crossfield, AB Jal, NM Elk City, OK Hinton, OK Greenbrier, AK Beckville, TX Midland, TX Pecos, TX San Antonio, TX Bridgeville, PA Mansfield, PA Grand Prairie, AB Well positioned in all major shale plays
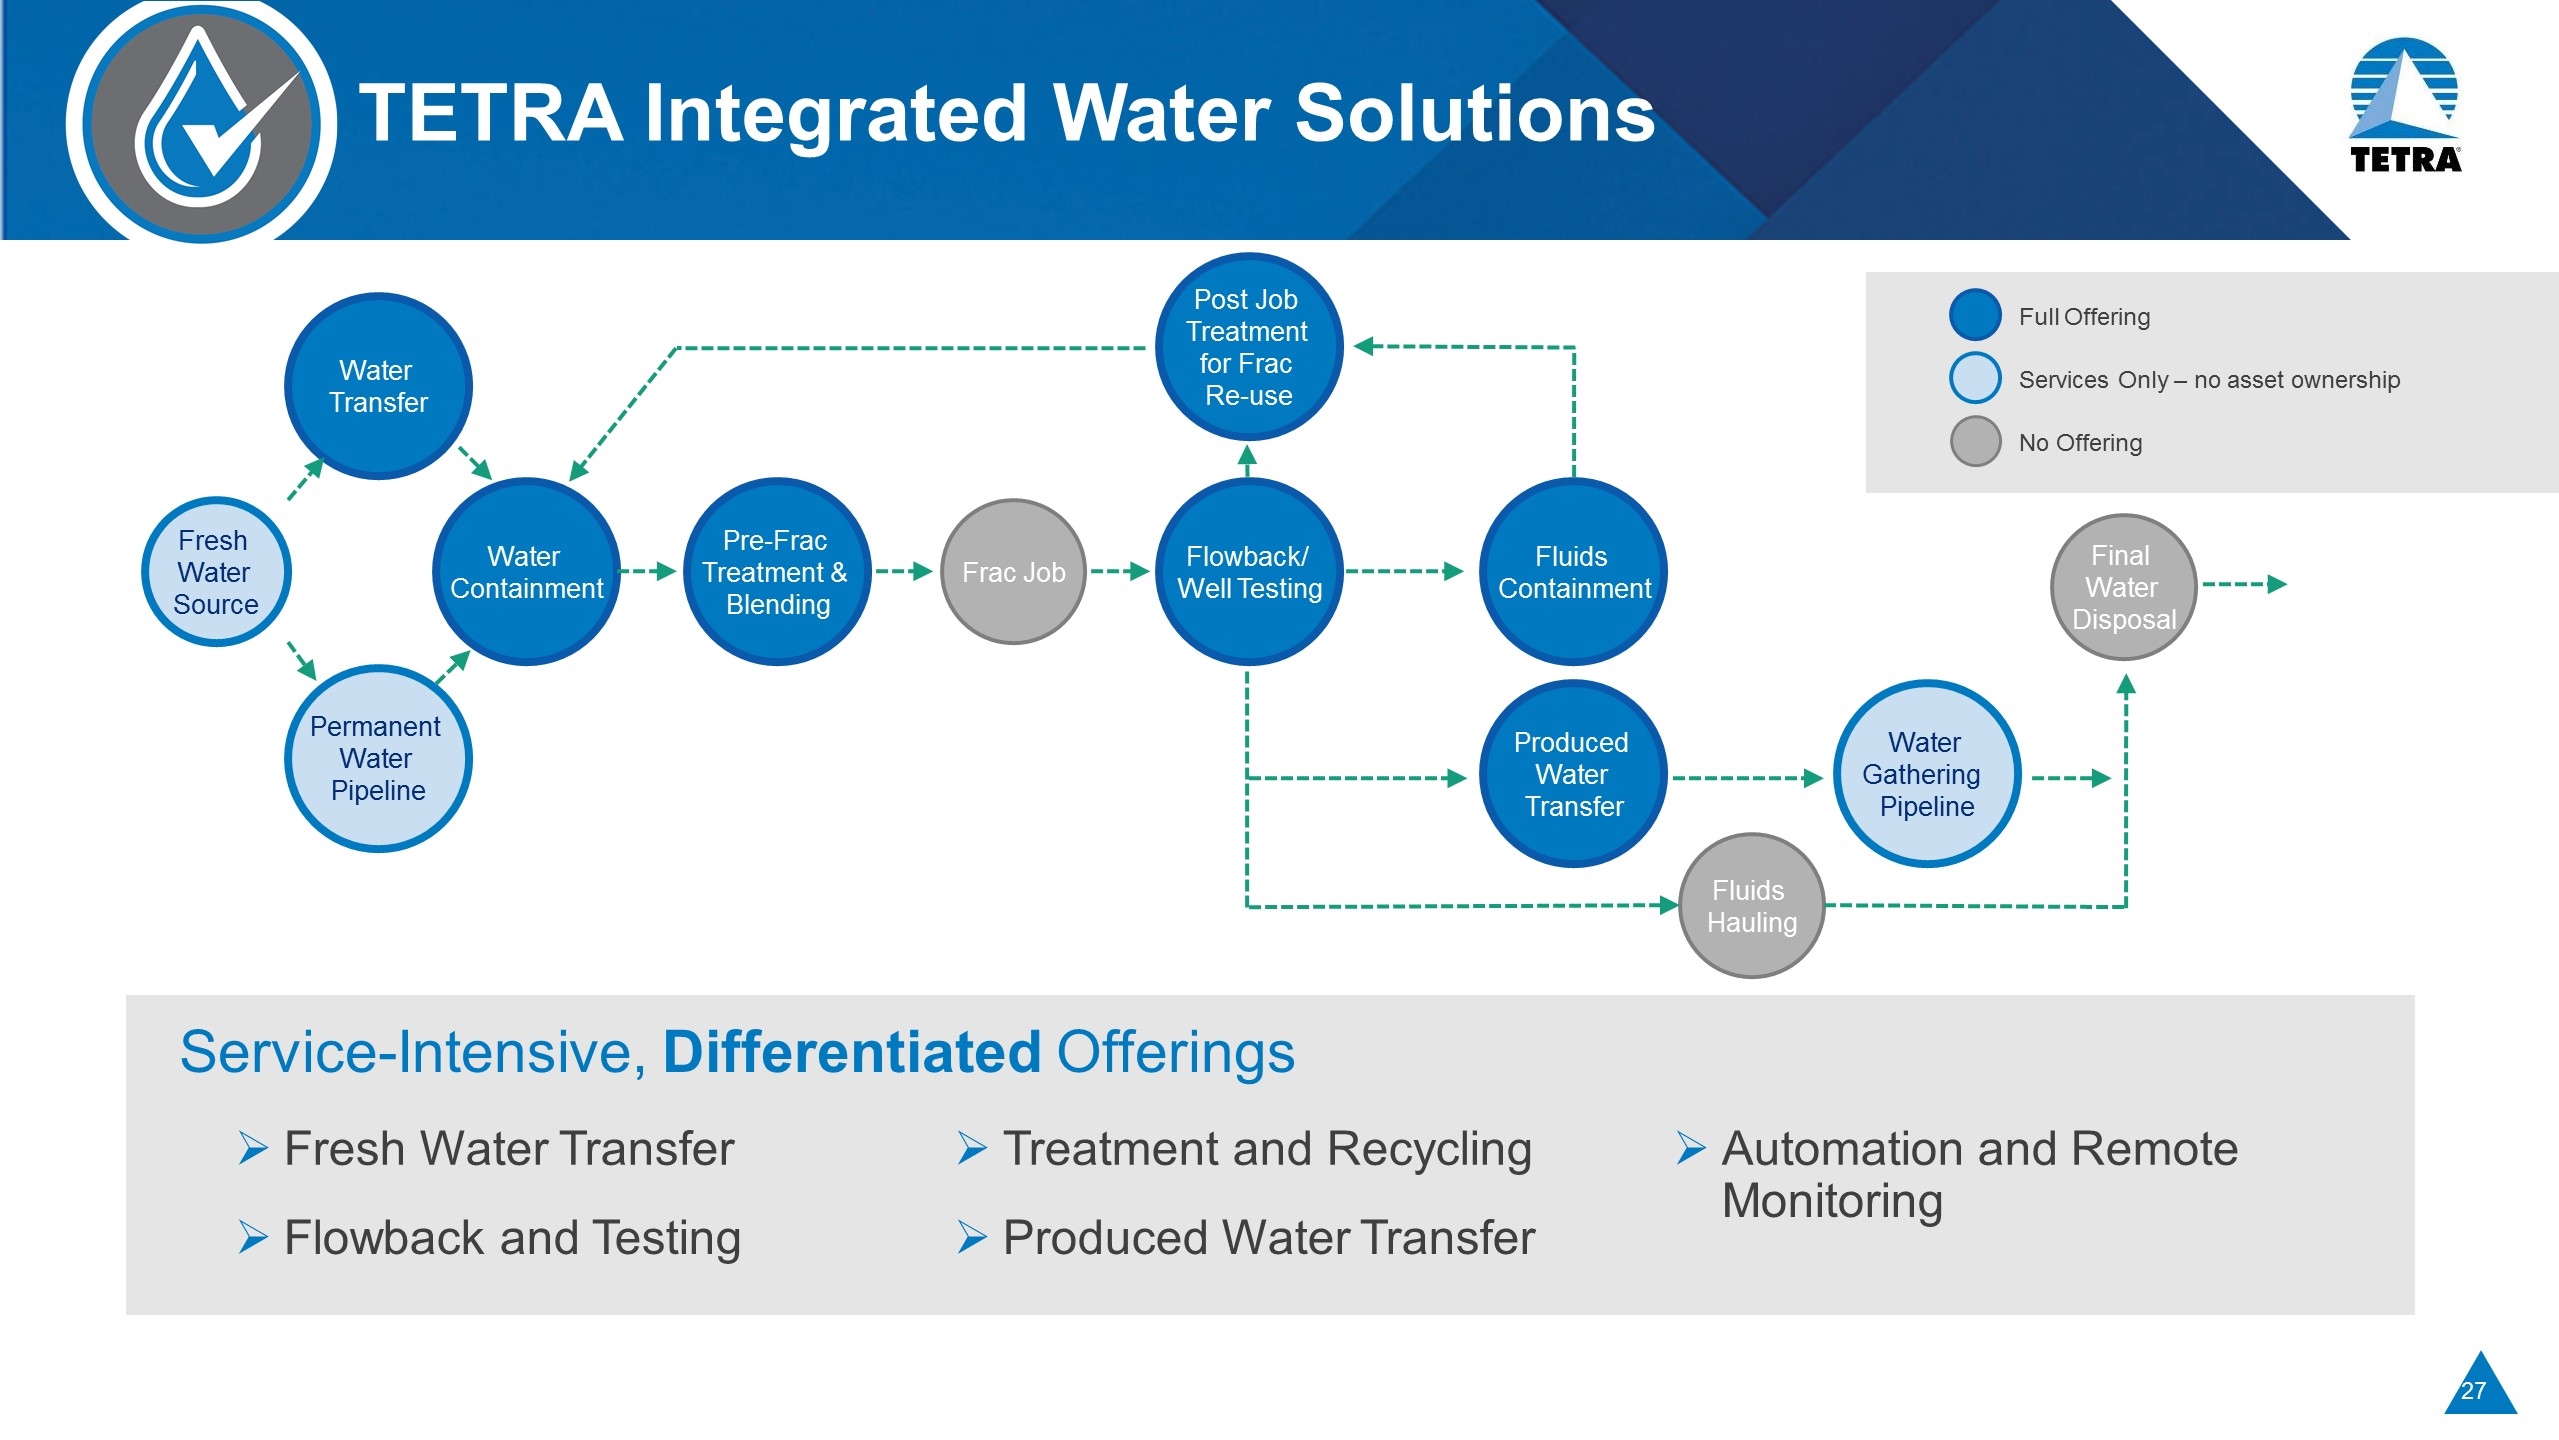
TETRA Integrated Water Solutions Service-Intensive, Differentiated Offerings Full Offering Services Only – no asset ownership No Offering Fresh Water Transfer Flowback and Testing Treatment and Recycling Produced Water Transfer Automation and Remote Monitoring Water Transfer Water Containment Pre-Frac Treatment & Blending Post Job Treatment for Frac Re-use Flowback/ Well Testing Fluids Containment Produced Water Transfer Permanent Water Pipeline Water Gathering Pipeline Fresh Water Source Frac Job Final Water Disposal Fluids Hauling
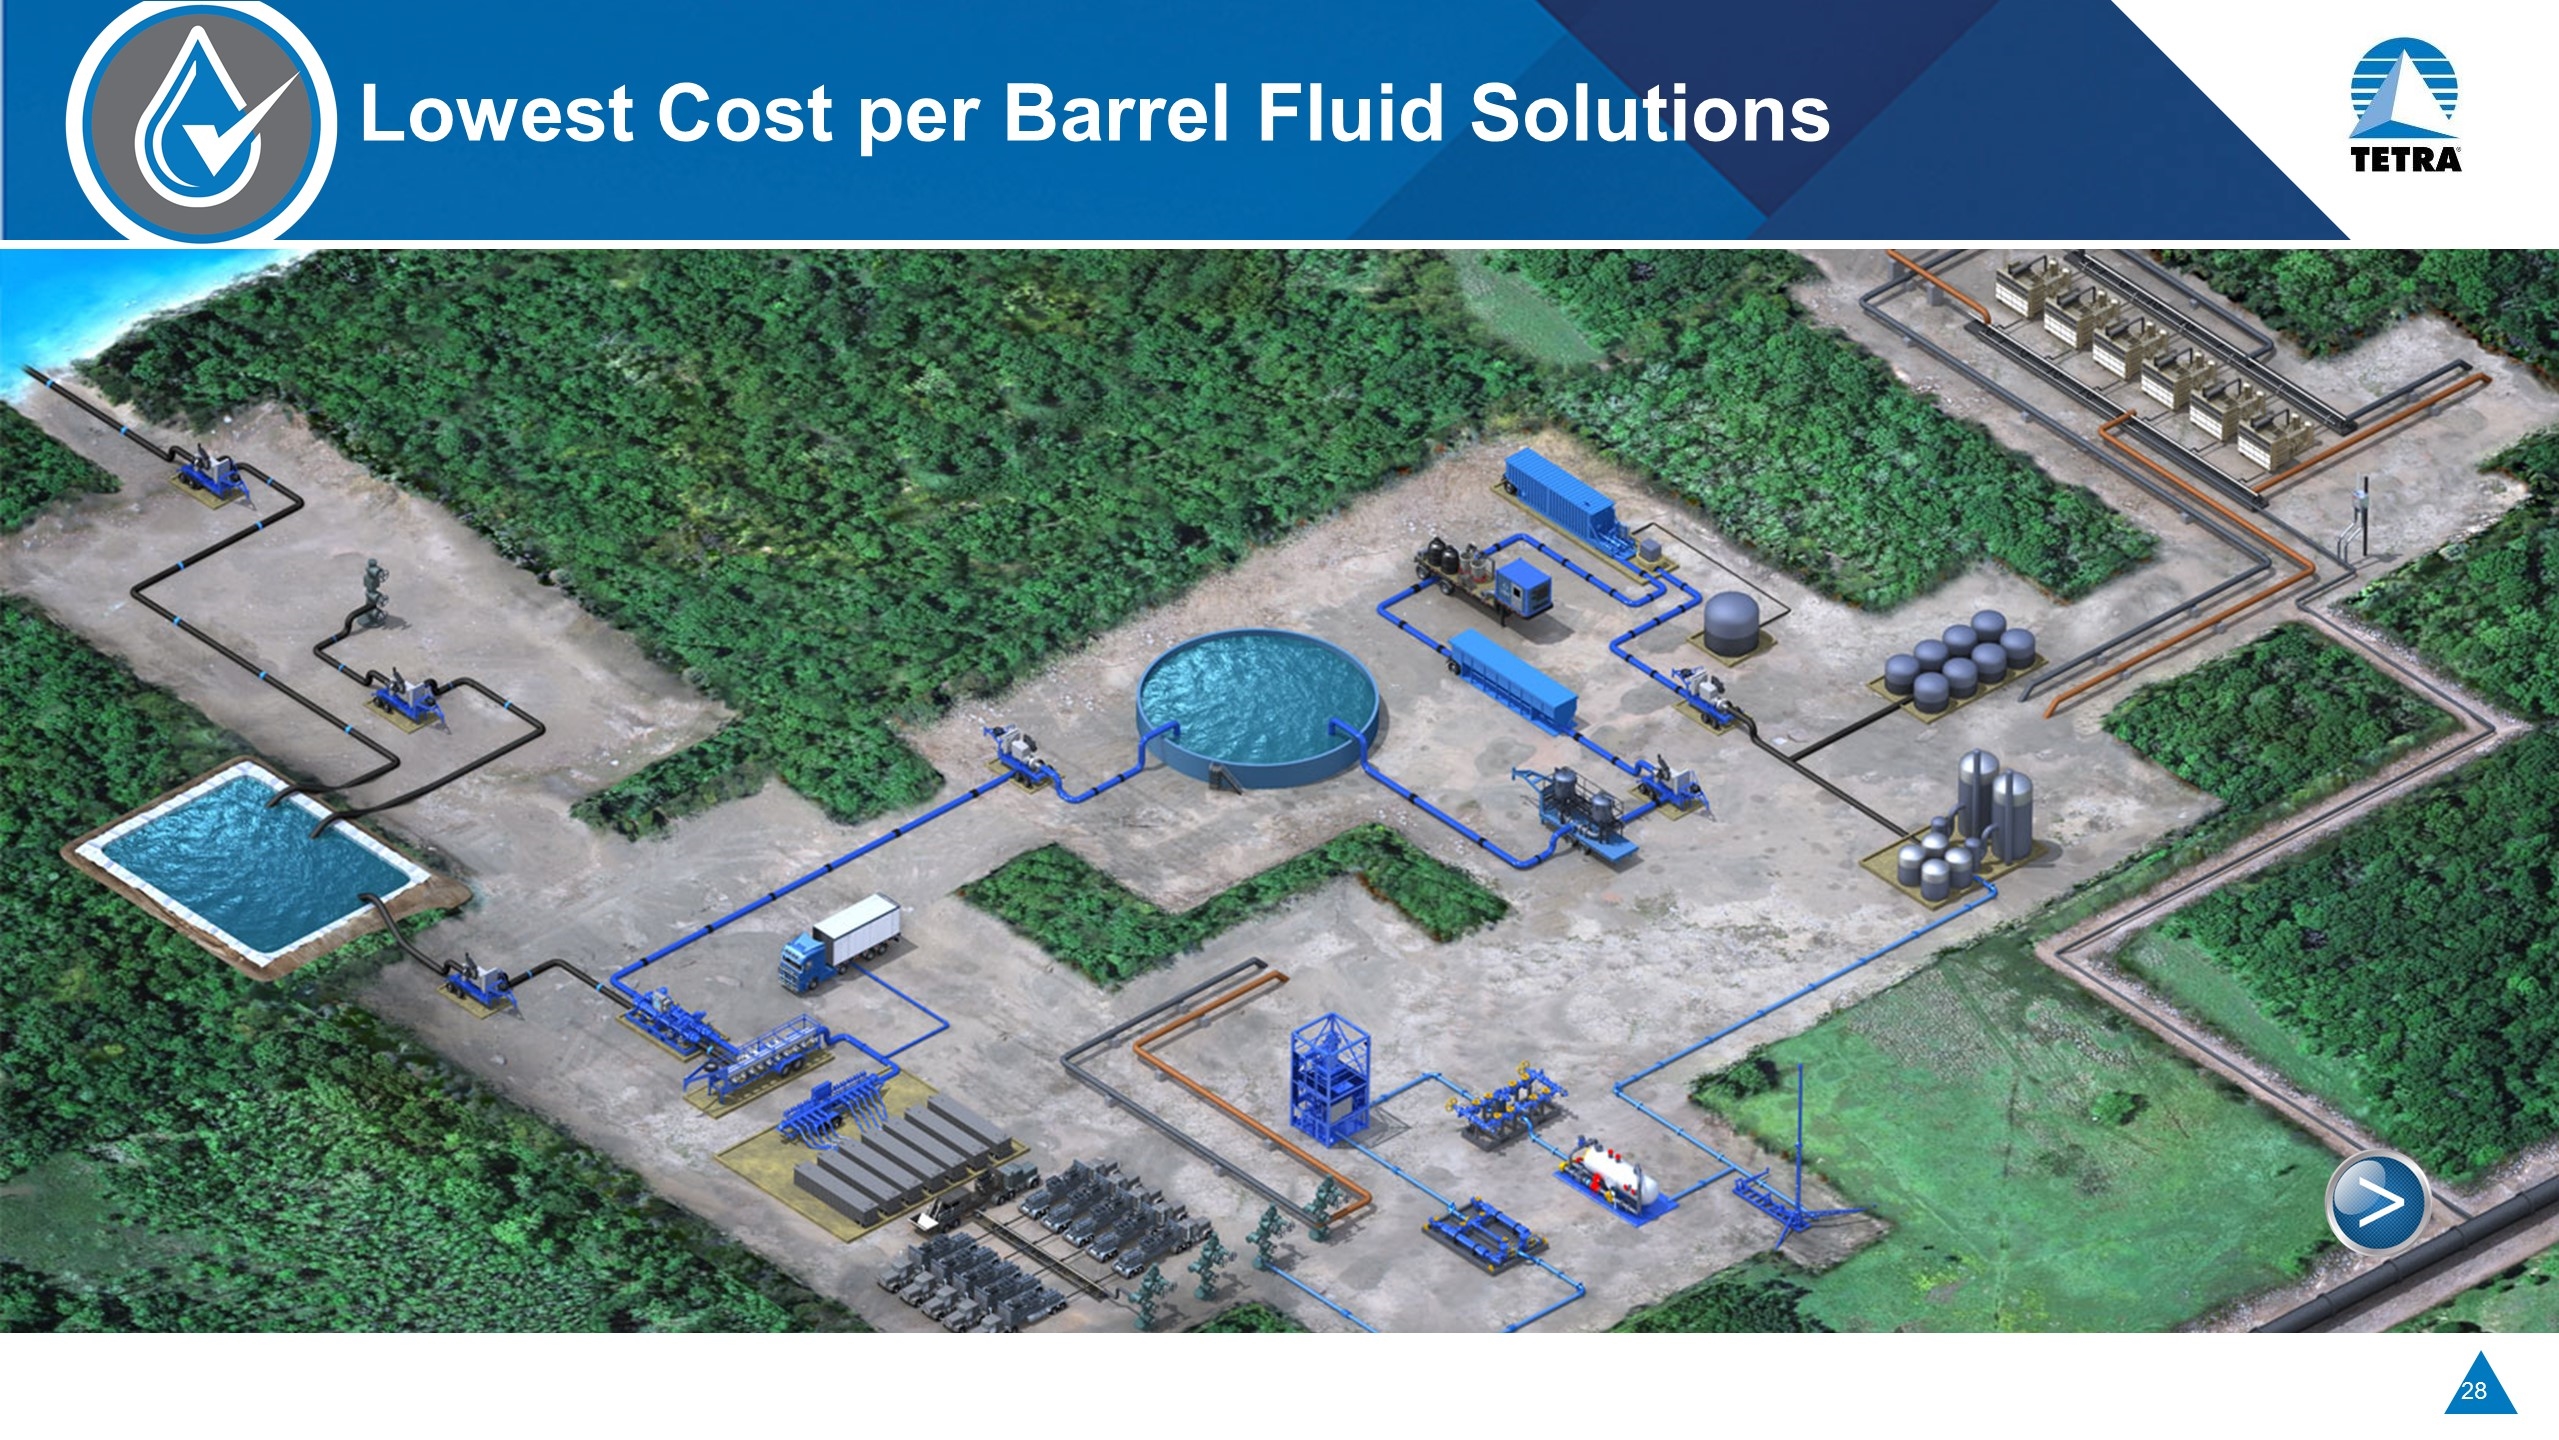
Lowest Cost per Barrel Fluid Solutions
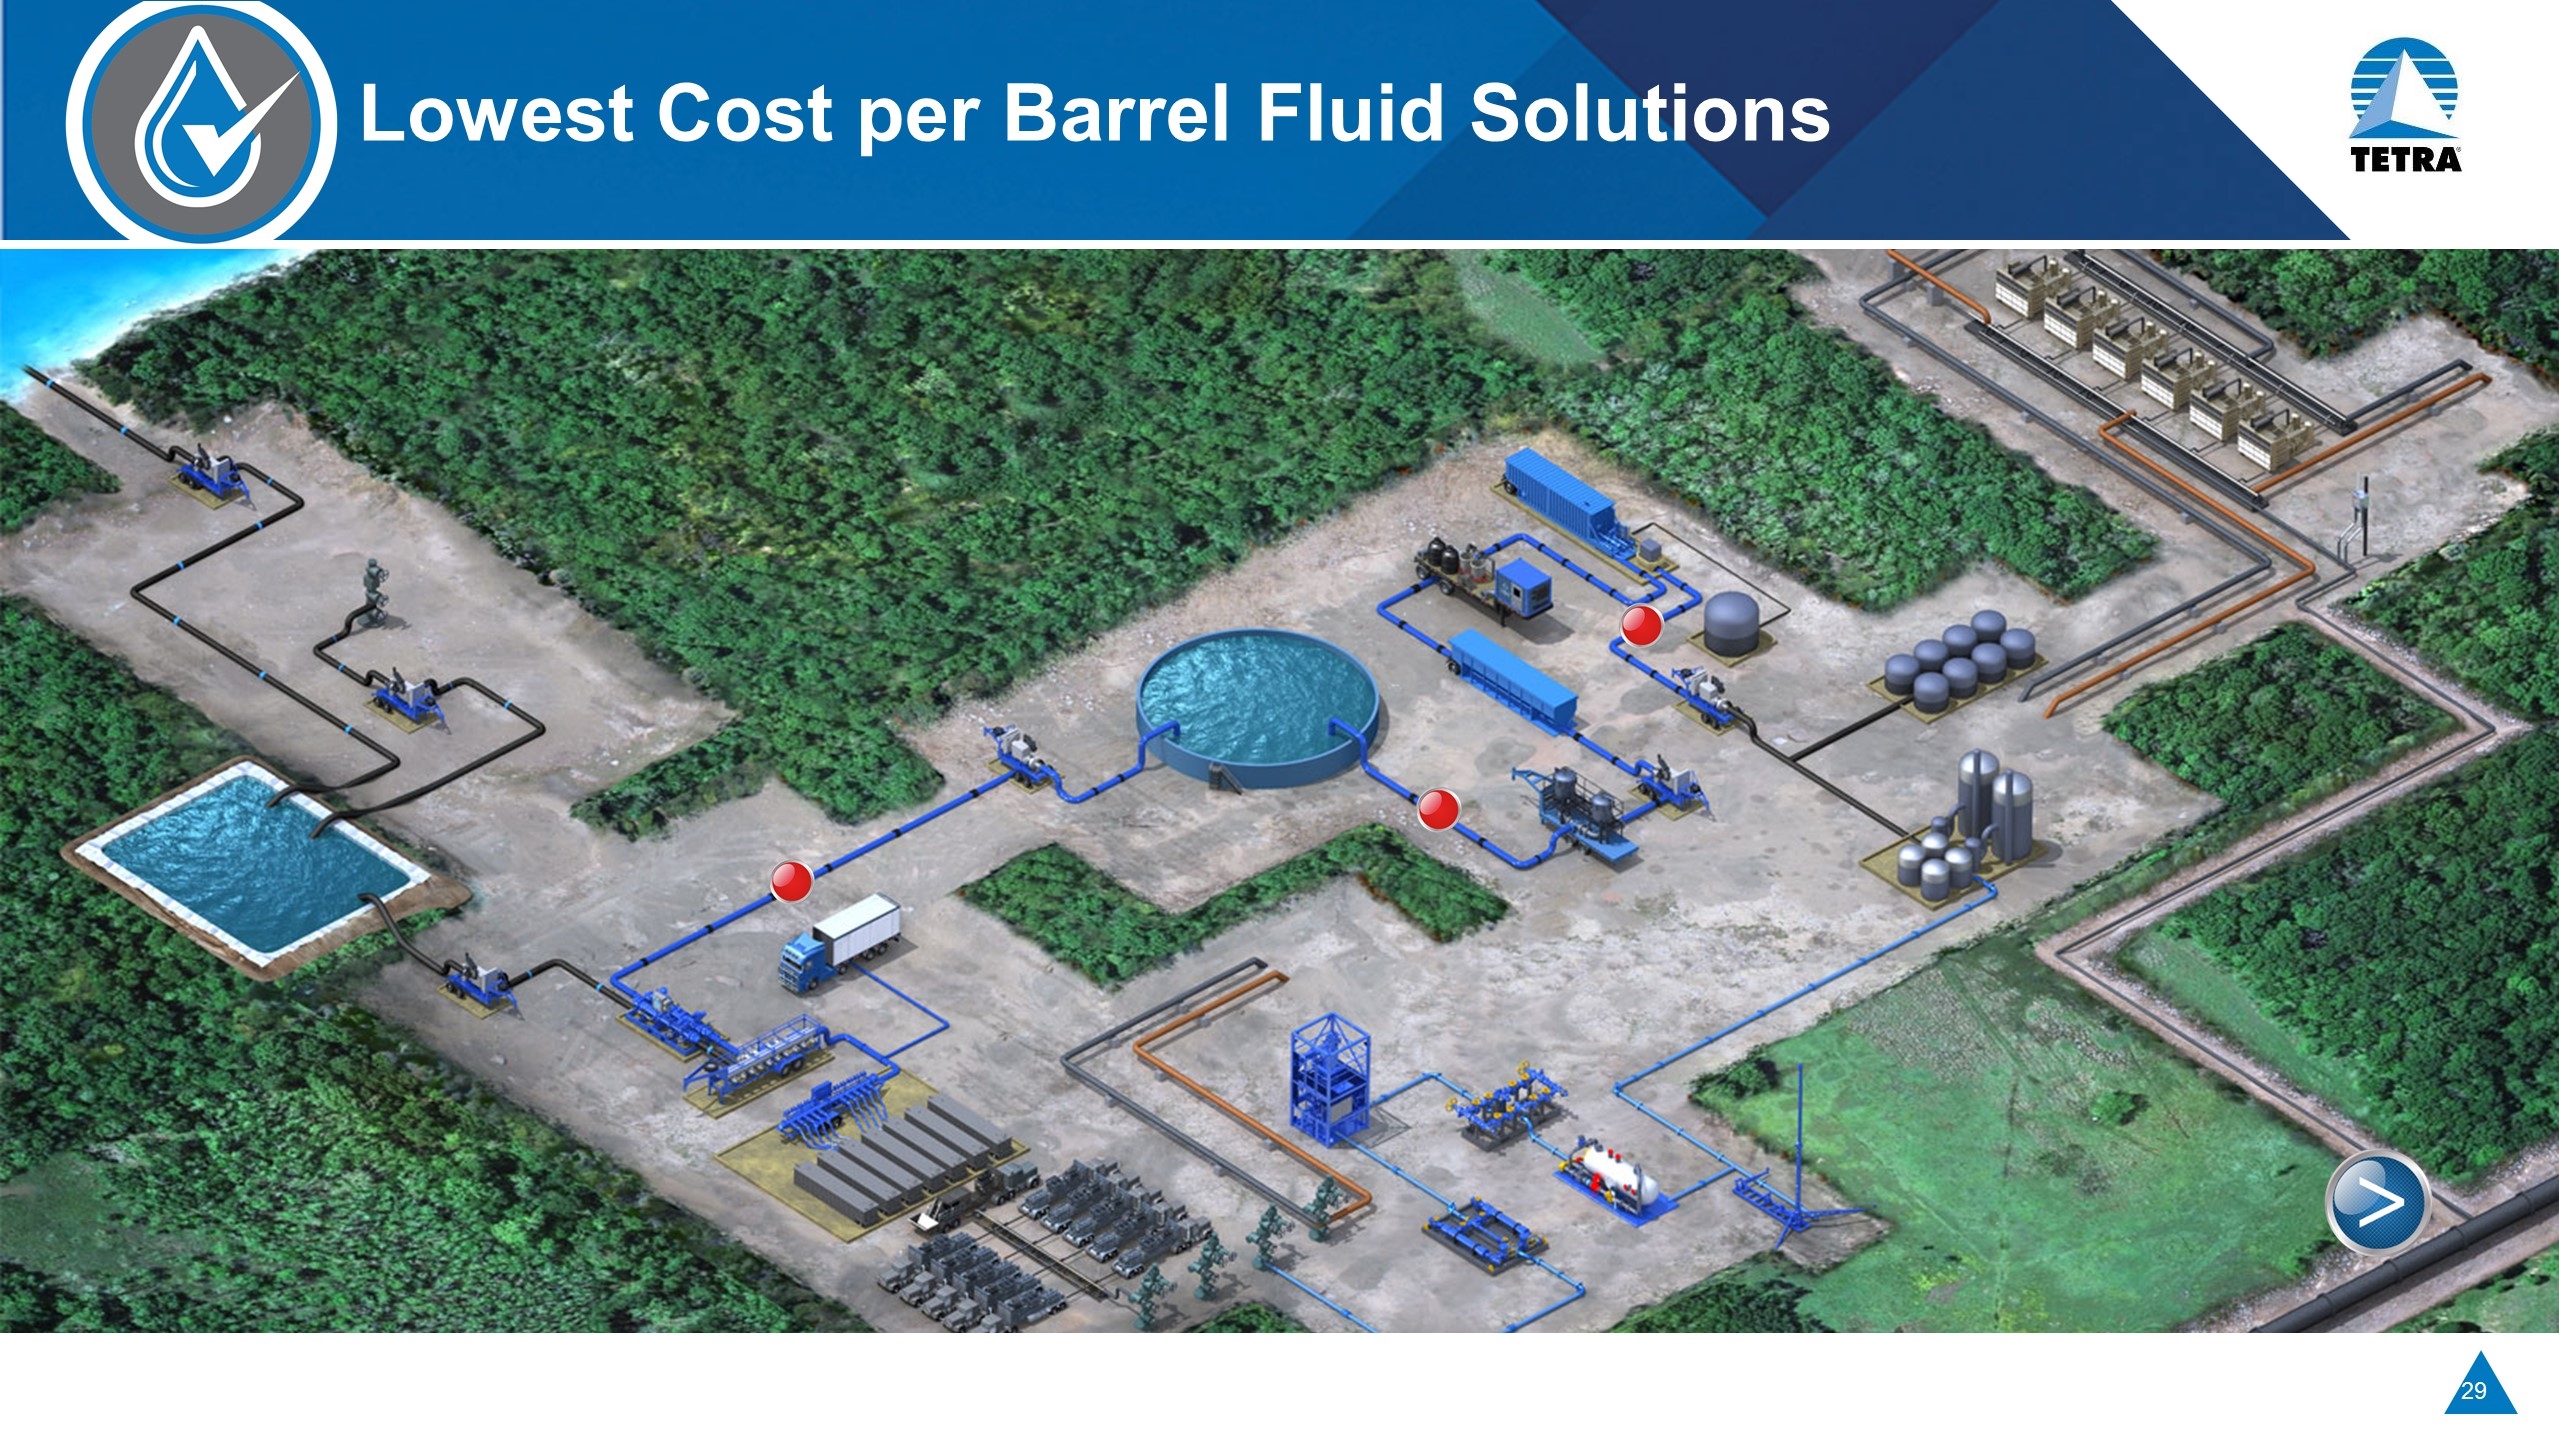
Lowest Cost per Barrel Fluid Solutions
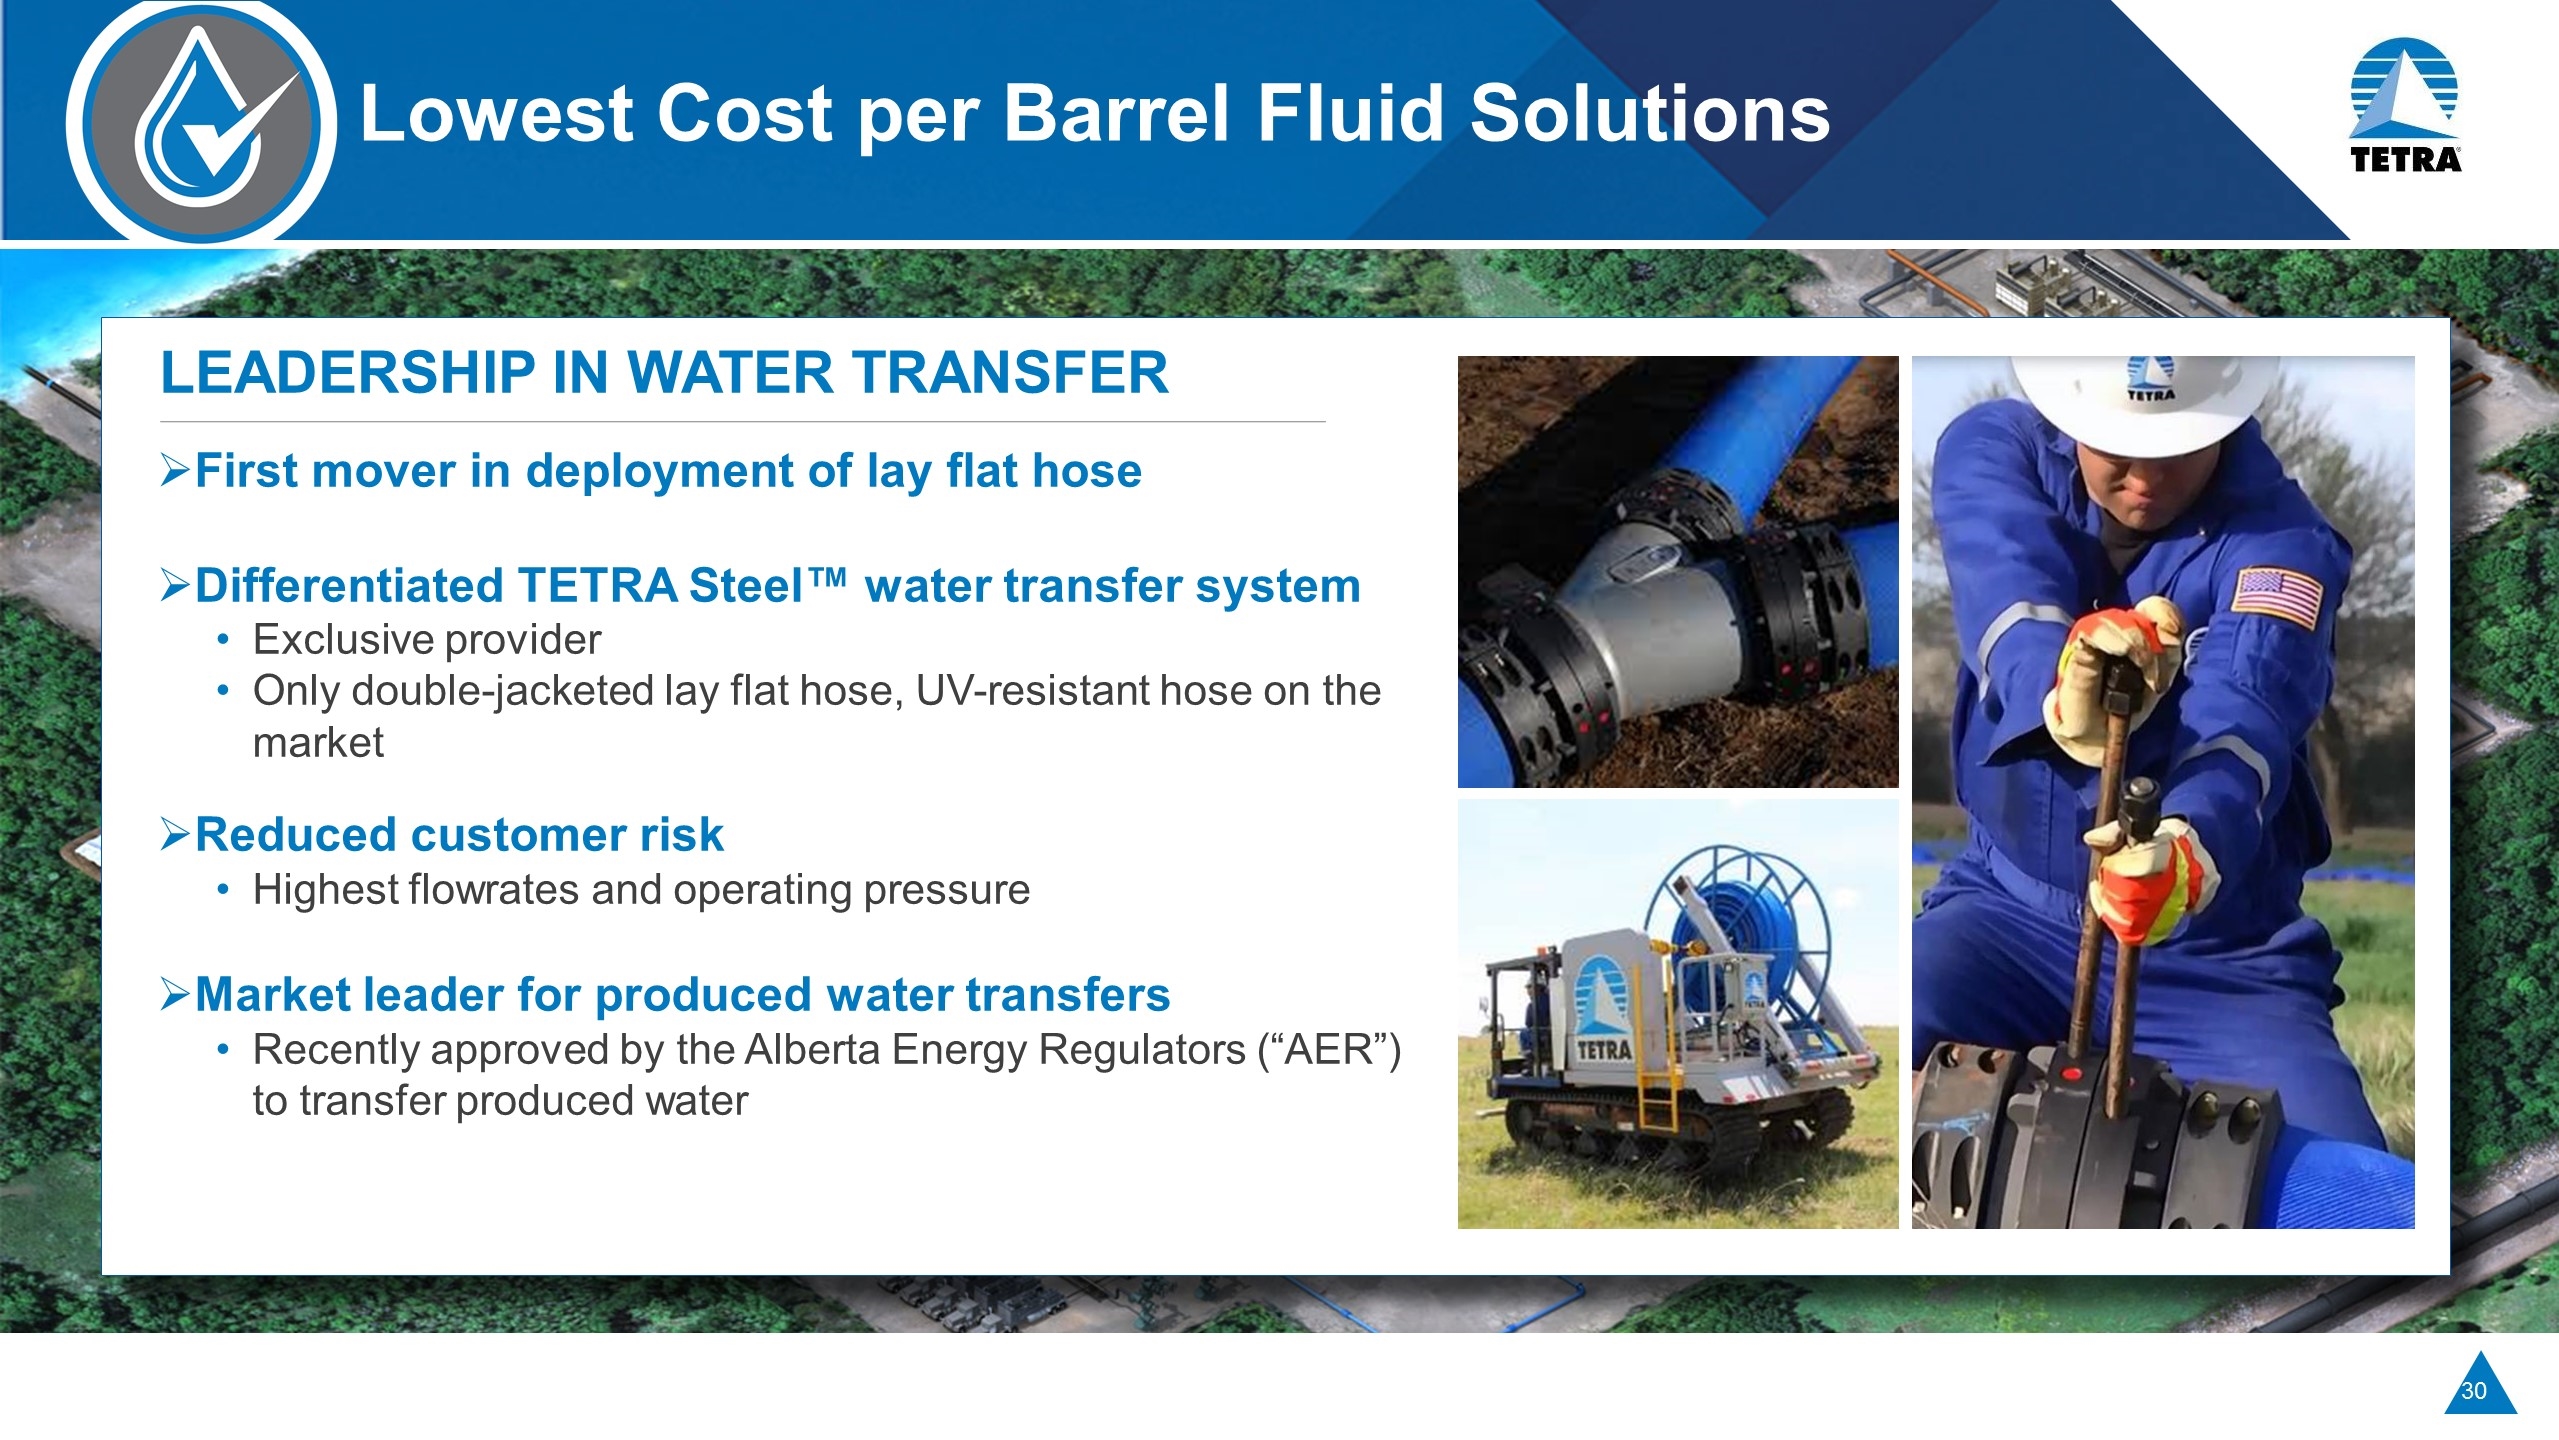
Lowest Cost per Barrel Fluid Solutions First mover in deployment of lay flat hose Differentiated TETRA Steel™ water transfer system Exclusive provider Only double-jacketed lay flat hose, UV-resistant hose on the market Reduced customer risk Highest flowrates and operating pressure Market leader for produced water transfers Recently approved by the Alberta Energy Regulators (“AER”) to transfer produced water LeaderSHIP in Water Transfer
Lowest Cost per Barrel Fluid Solutions
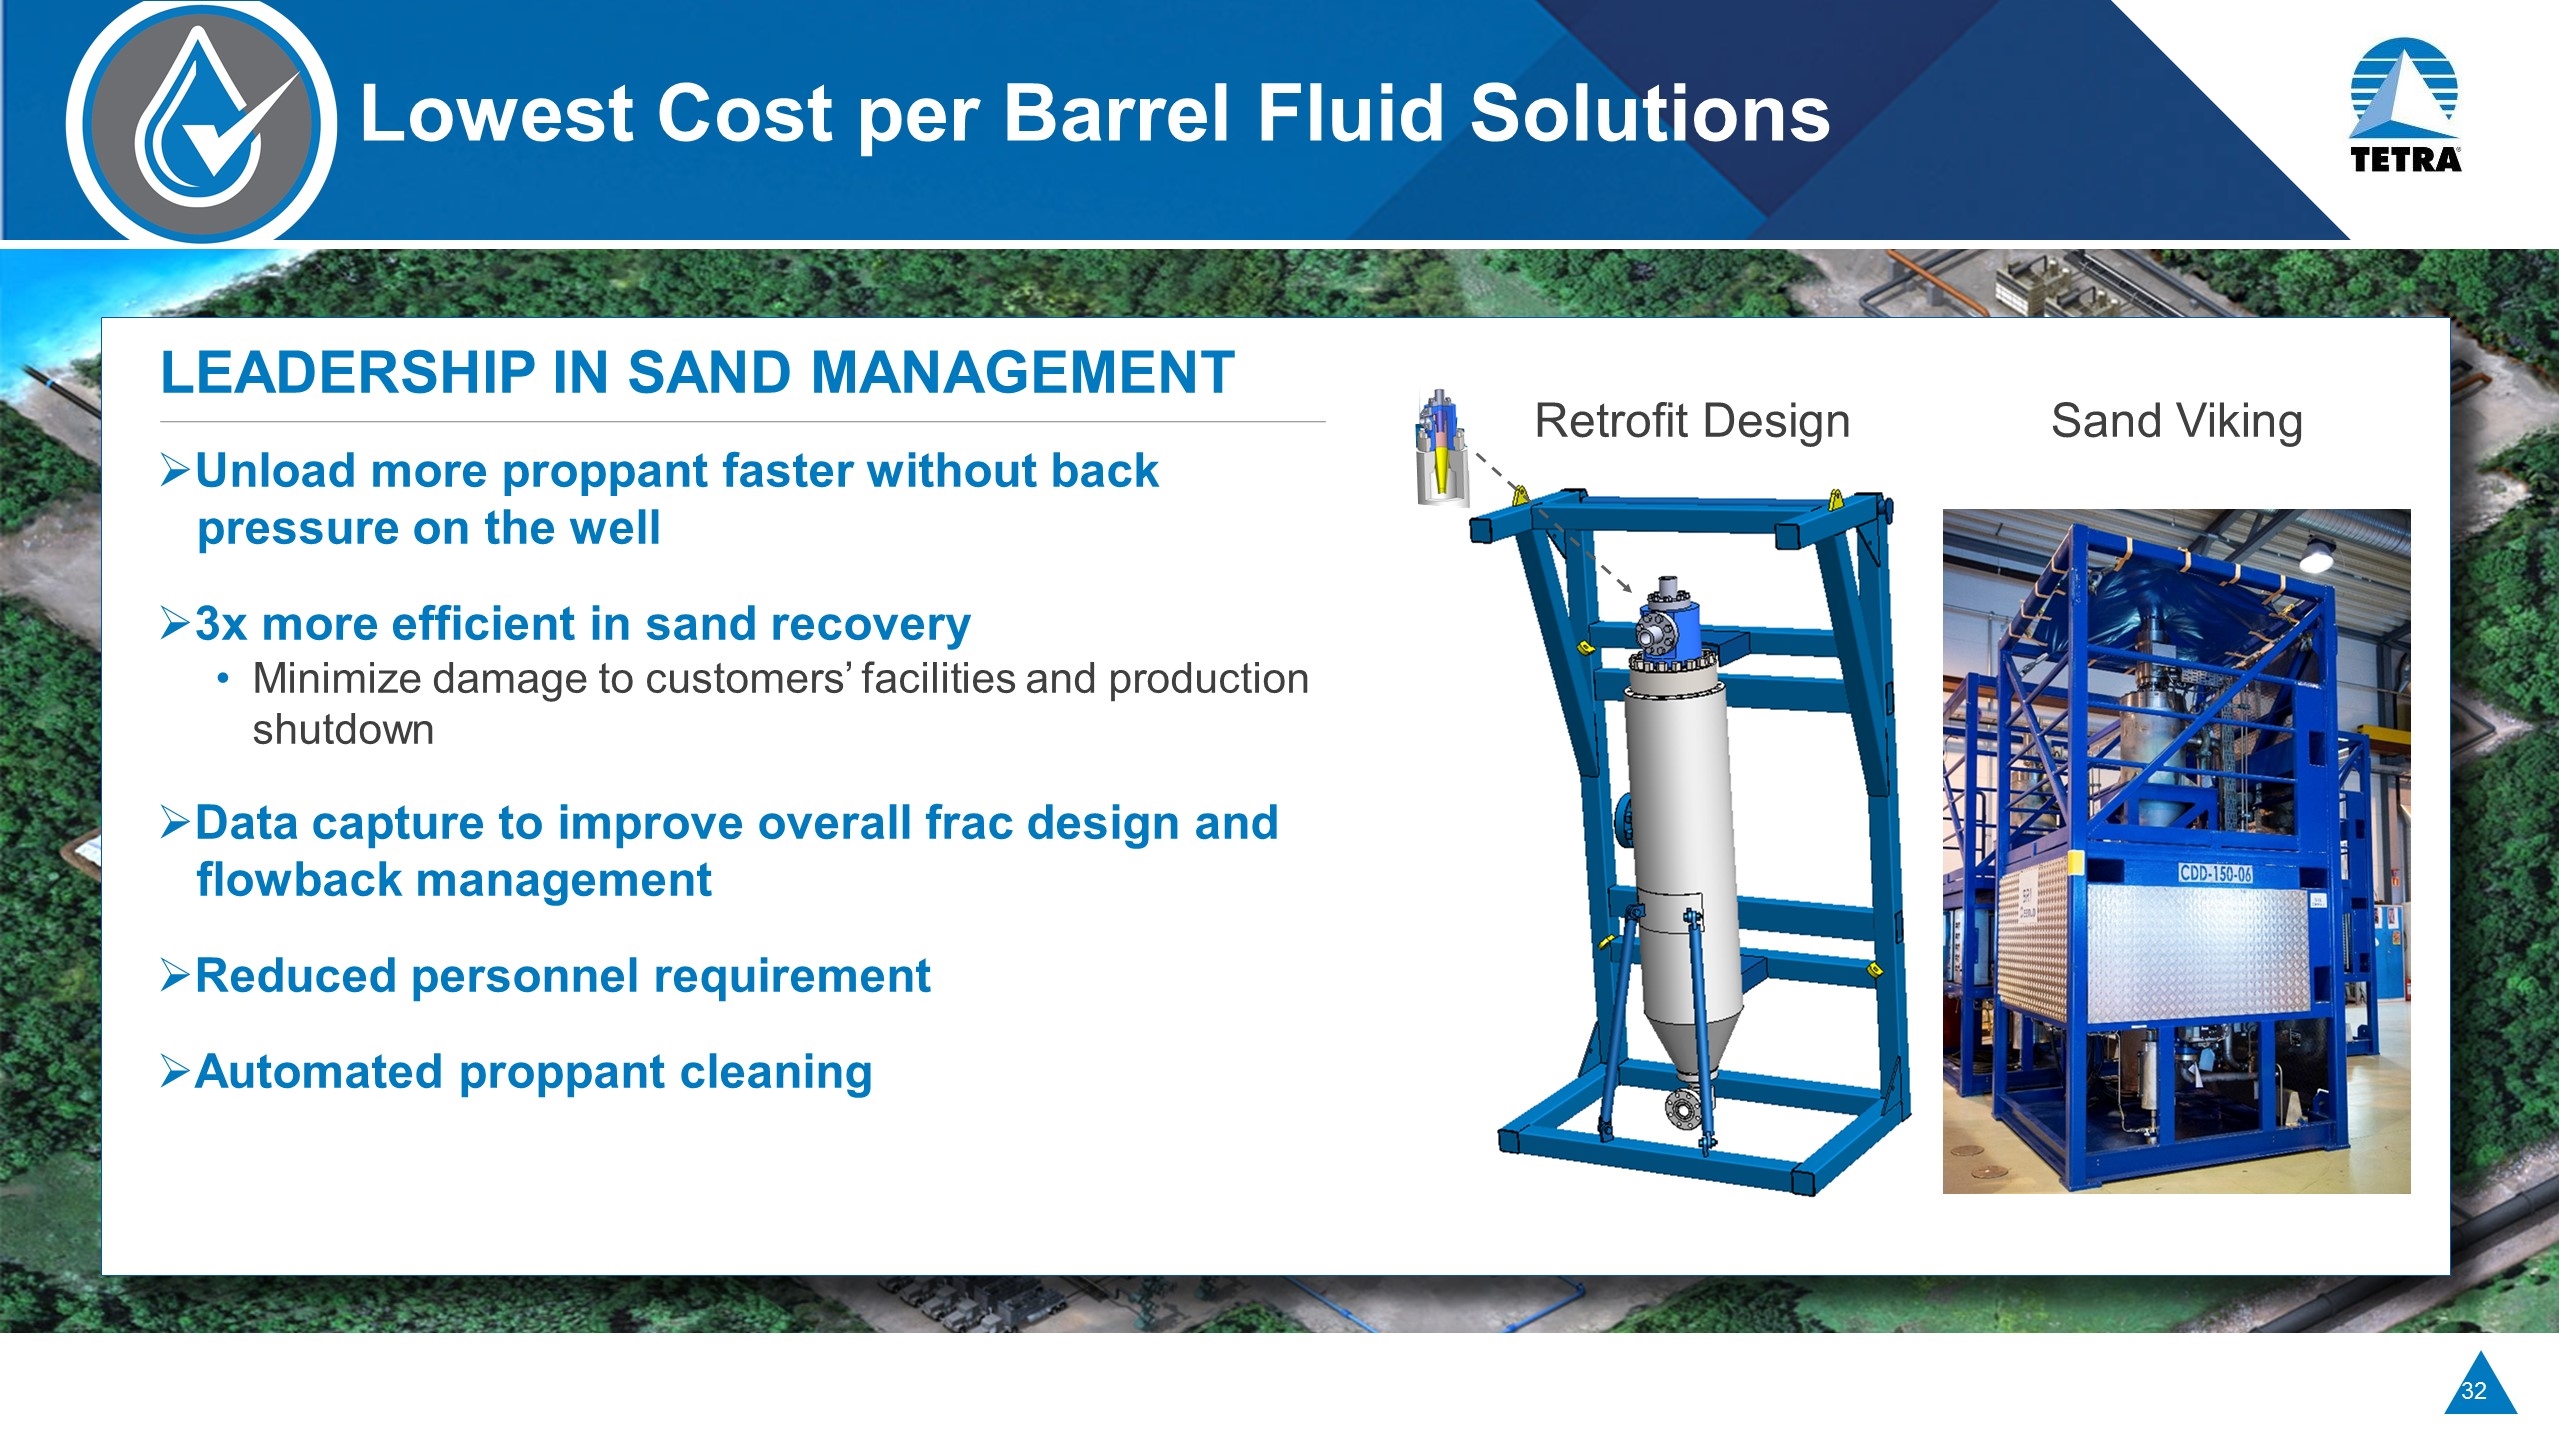
Lowest Cost per Barrel Fluid Solutions Unload more proppant faster without back pressure on the well 3x more efficient in sand recovery Minimize damage to customers’ facilities and production shutdown Data capture to improve overall frac design and flowback management Reduced personnel requirement Automated proppant cleaning LeaderSHIP in SAND MANAGEMENT Retrofit Design Sand Viking
Lowest Cost per Barrel Fluid Solutions
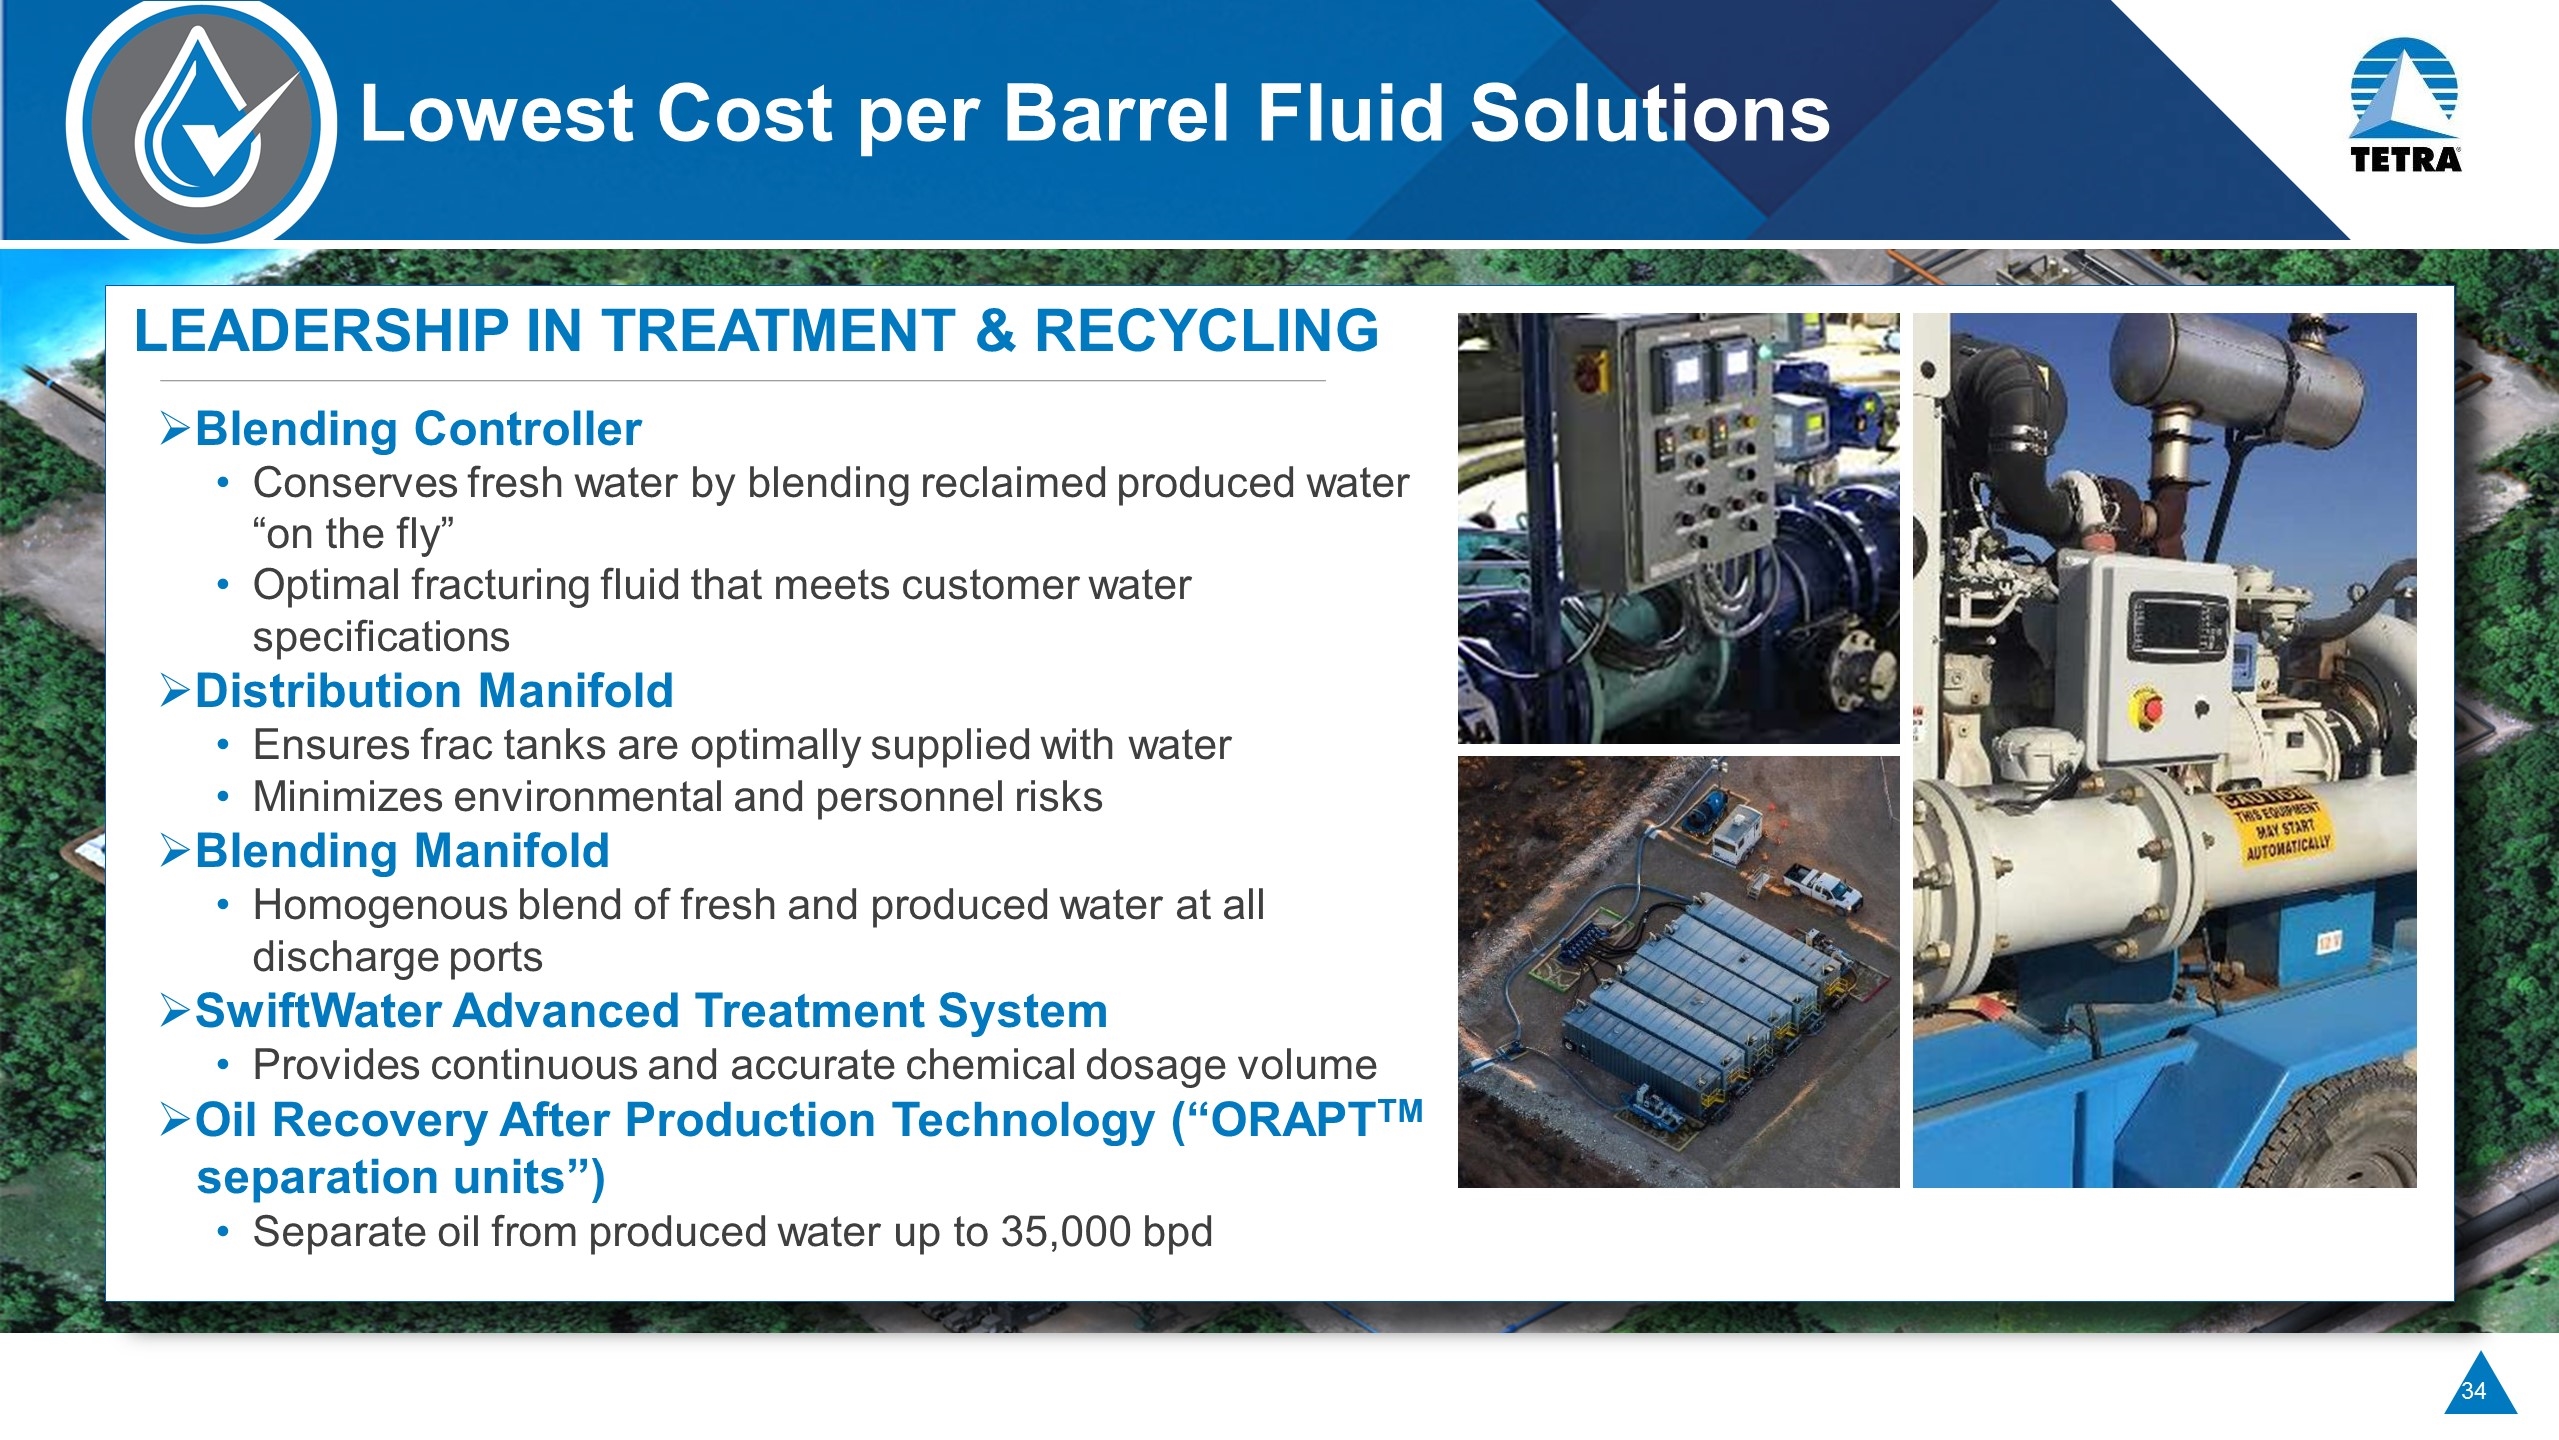
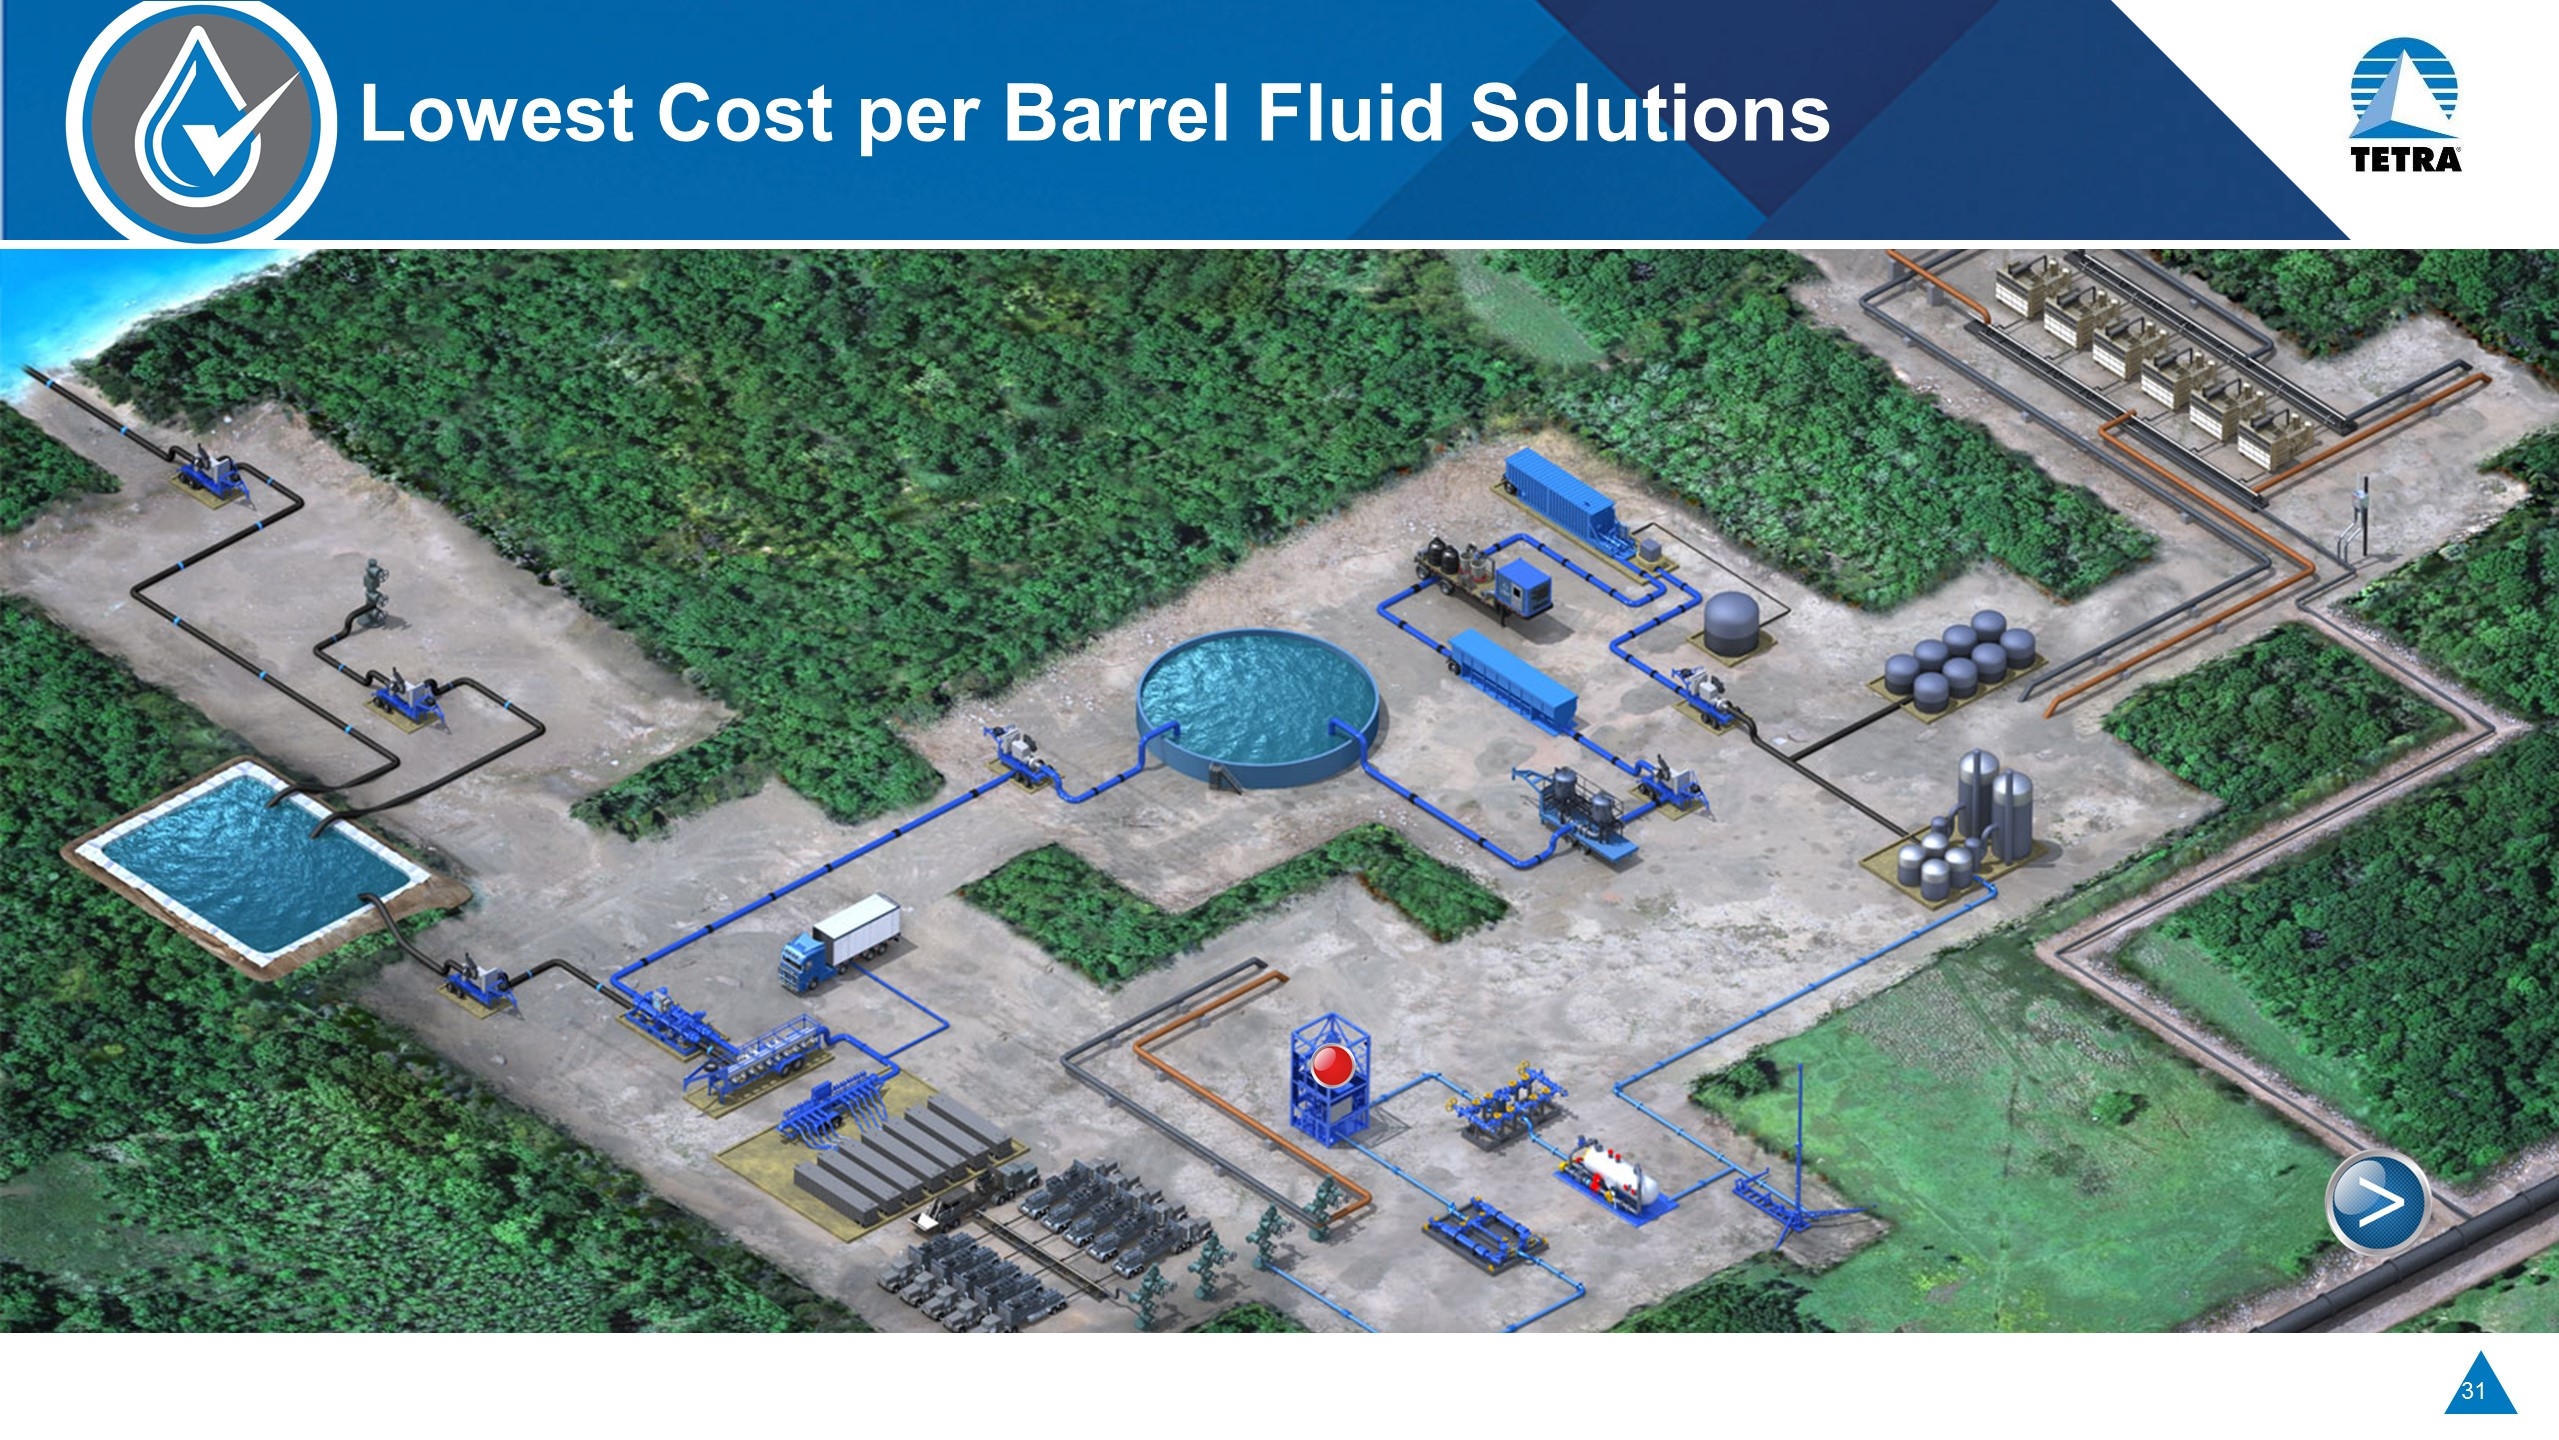
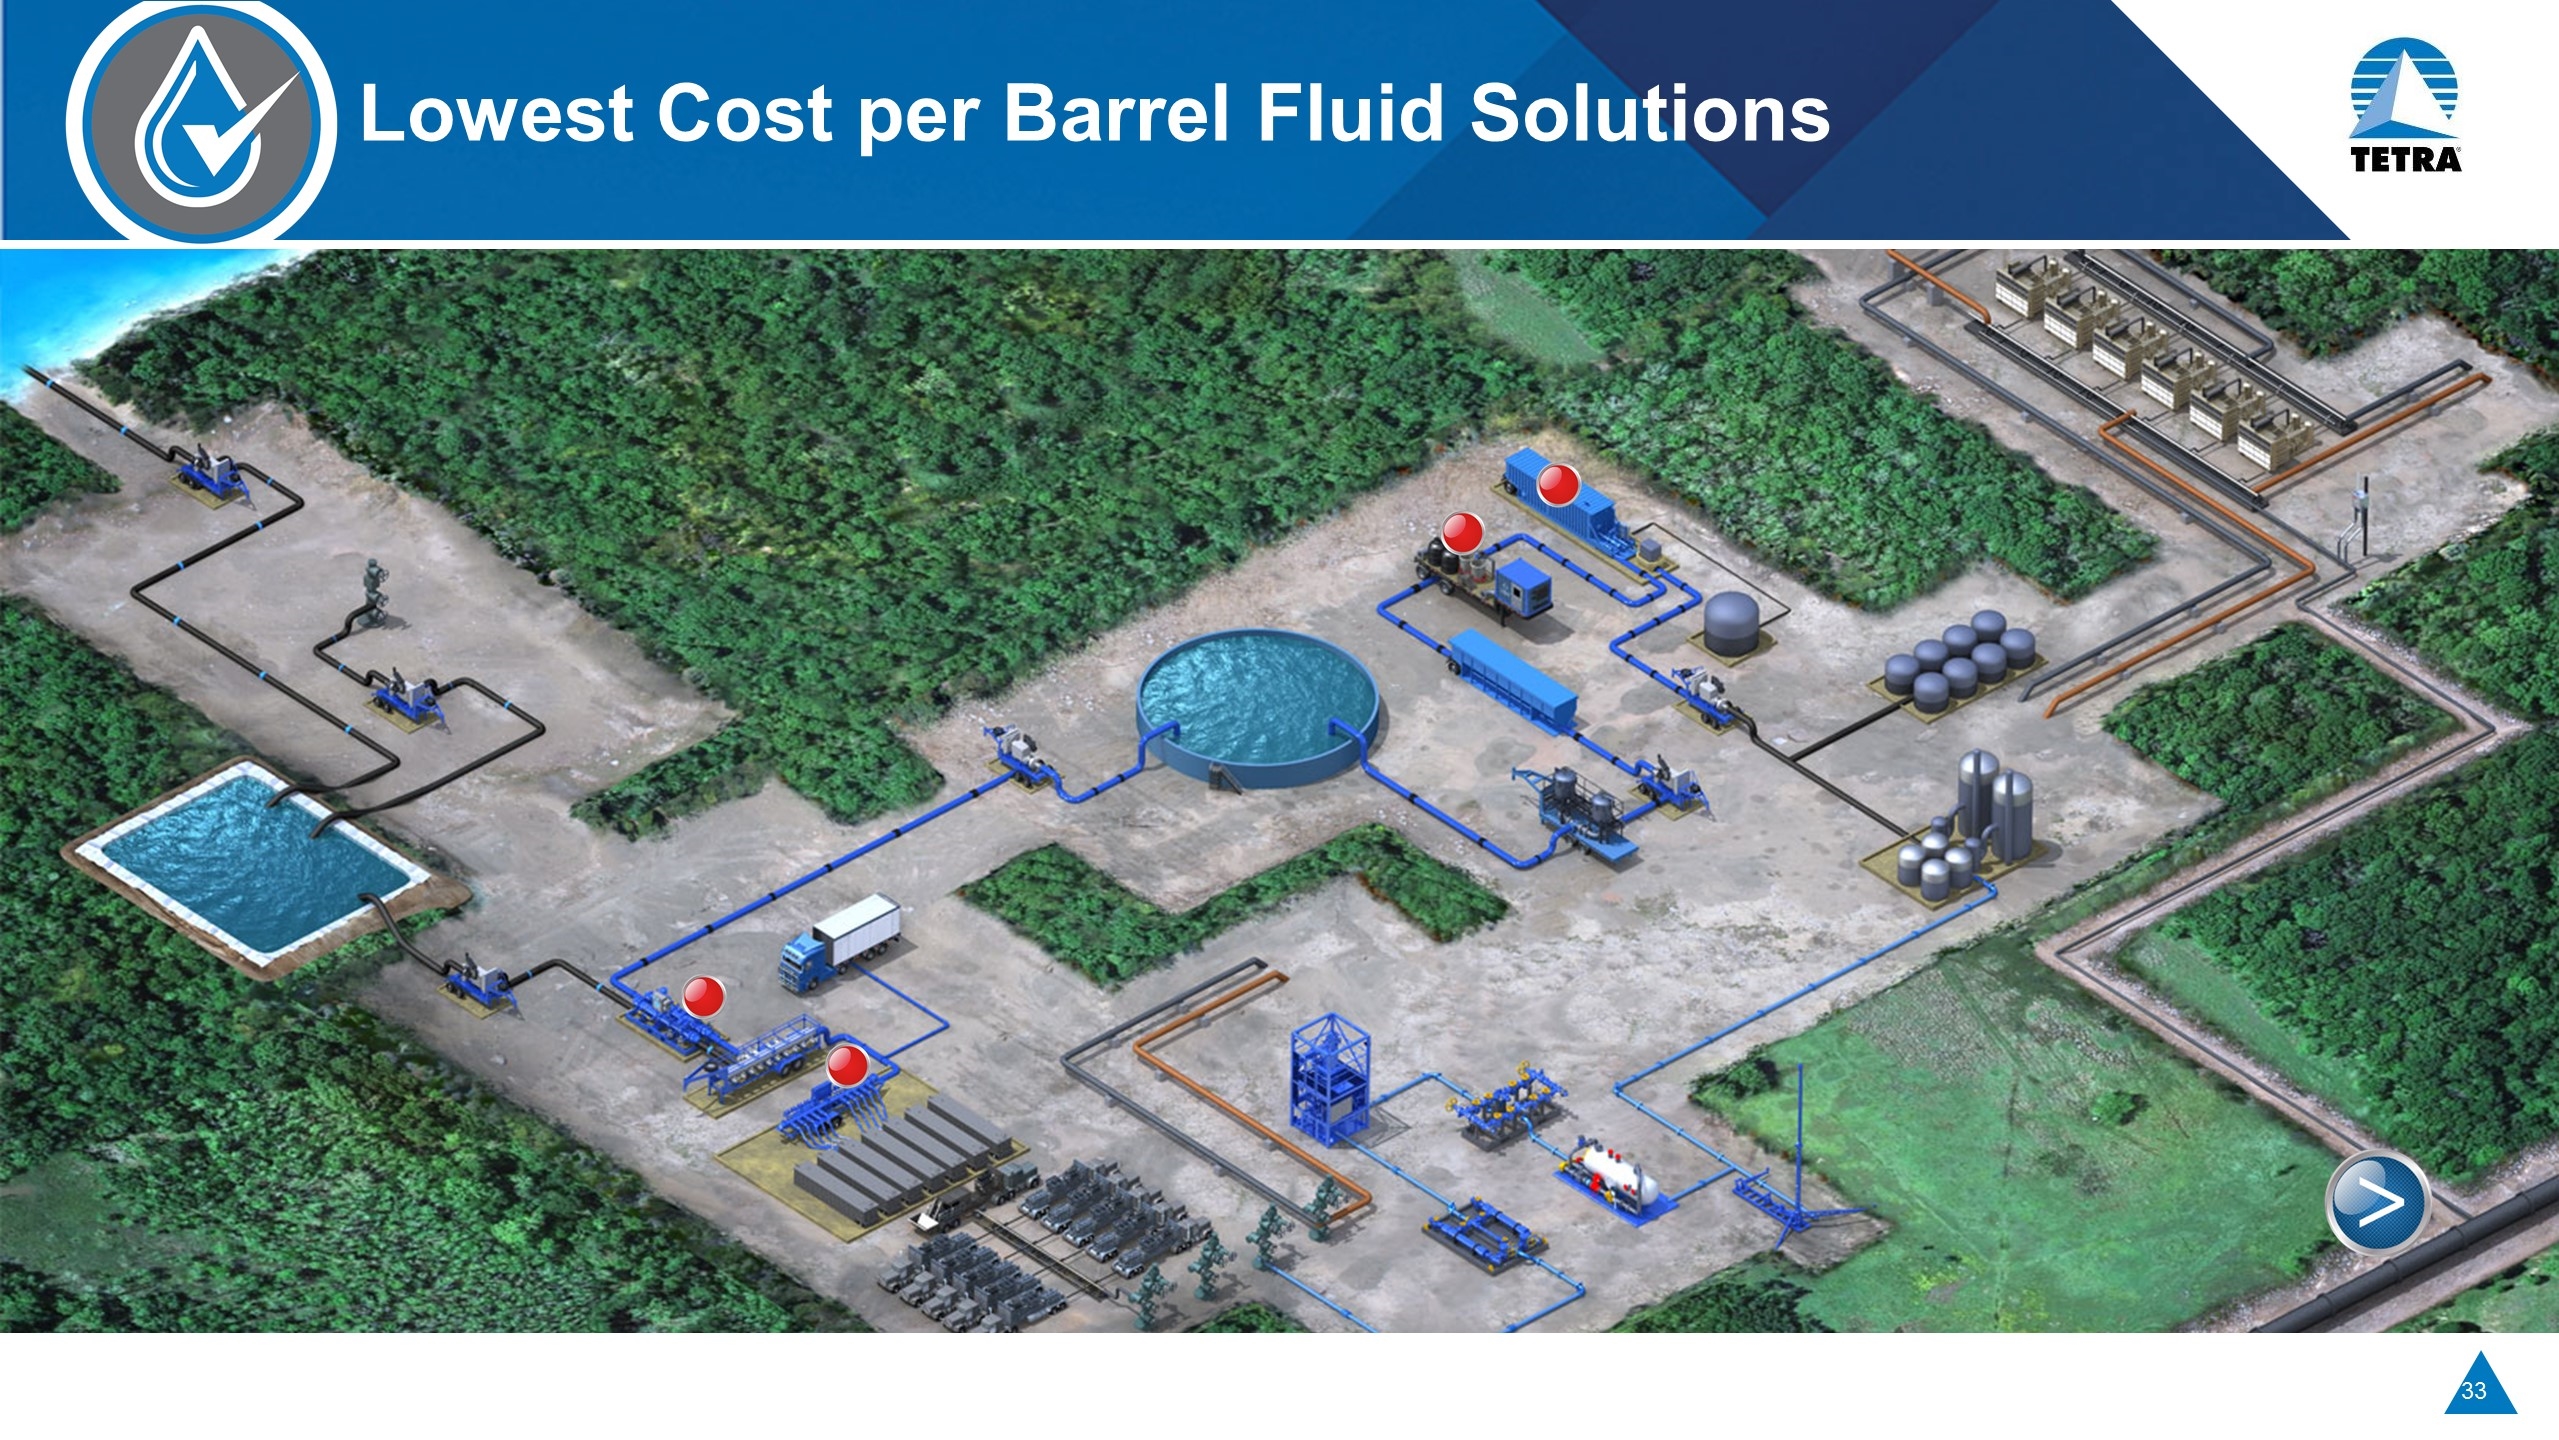
Lowest Cost per Barrel Fluid Solutions Blending Controller Conserves fresh water by blending reclaimed produced water “on the fly” Optimal fracturing fluid that meets customer water specifications Distribution Manifold Ensures frac tanks are optimally supplied with water Minimizes environmental and personnel risks Blending Manifold Homogenous blend of fresh and produced water at all discharge ports SwiftWater Advanced Treatment System Provides continuous and accurate chemical dosage volume Oil Recovery After Production Technology (“ORAPTTM separation units”) Separate oil from produced water up to 35,000 bpd LeaderSHIP in treatment & recycling
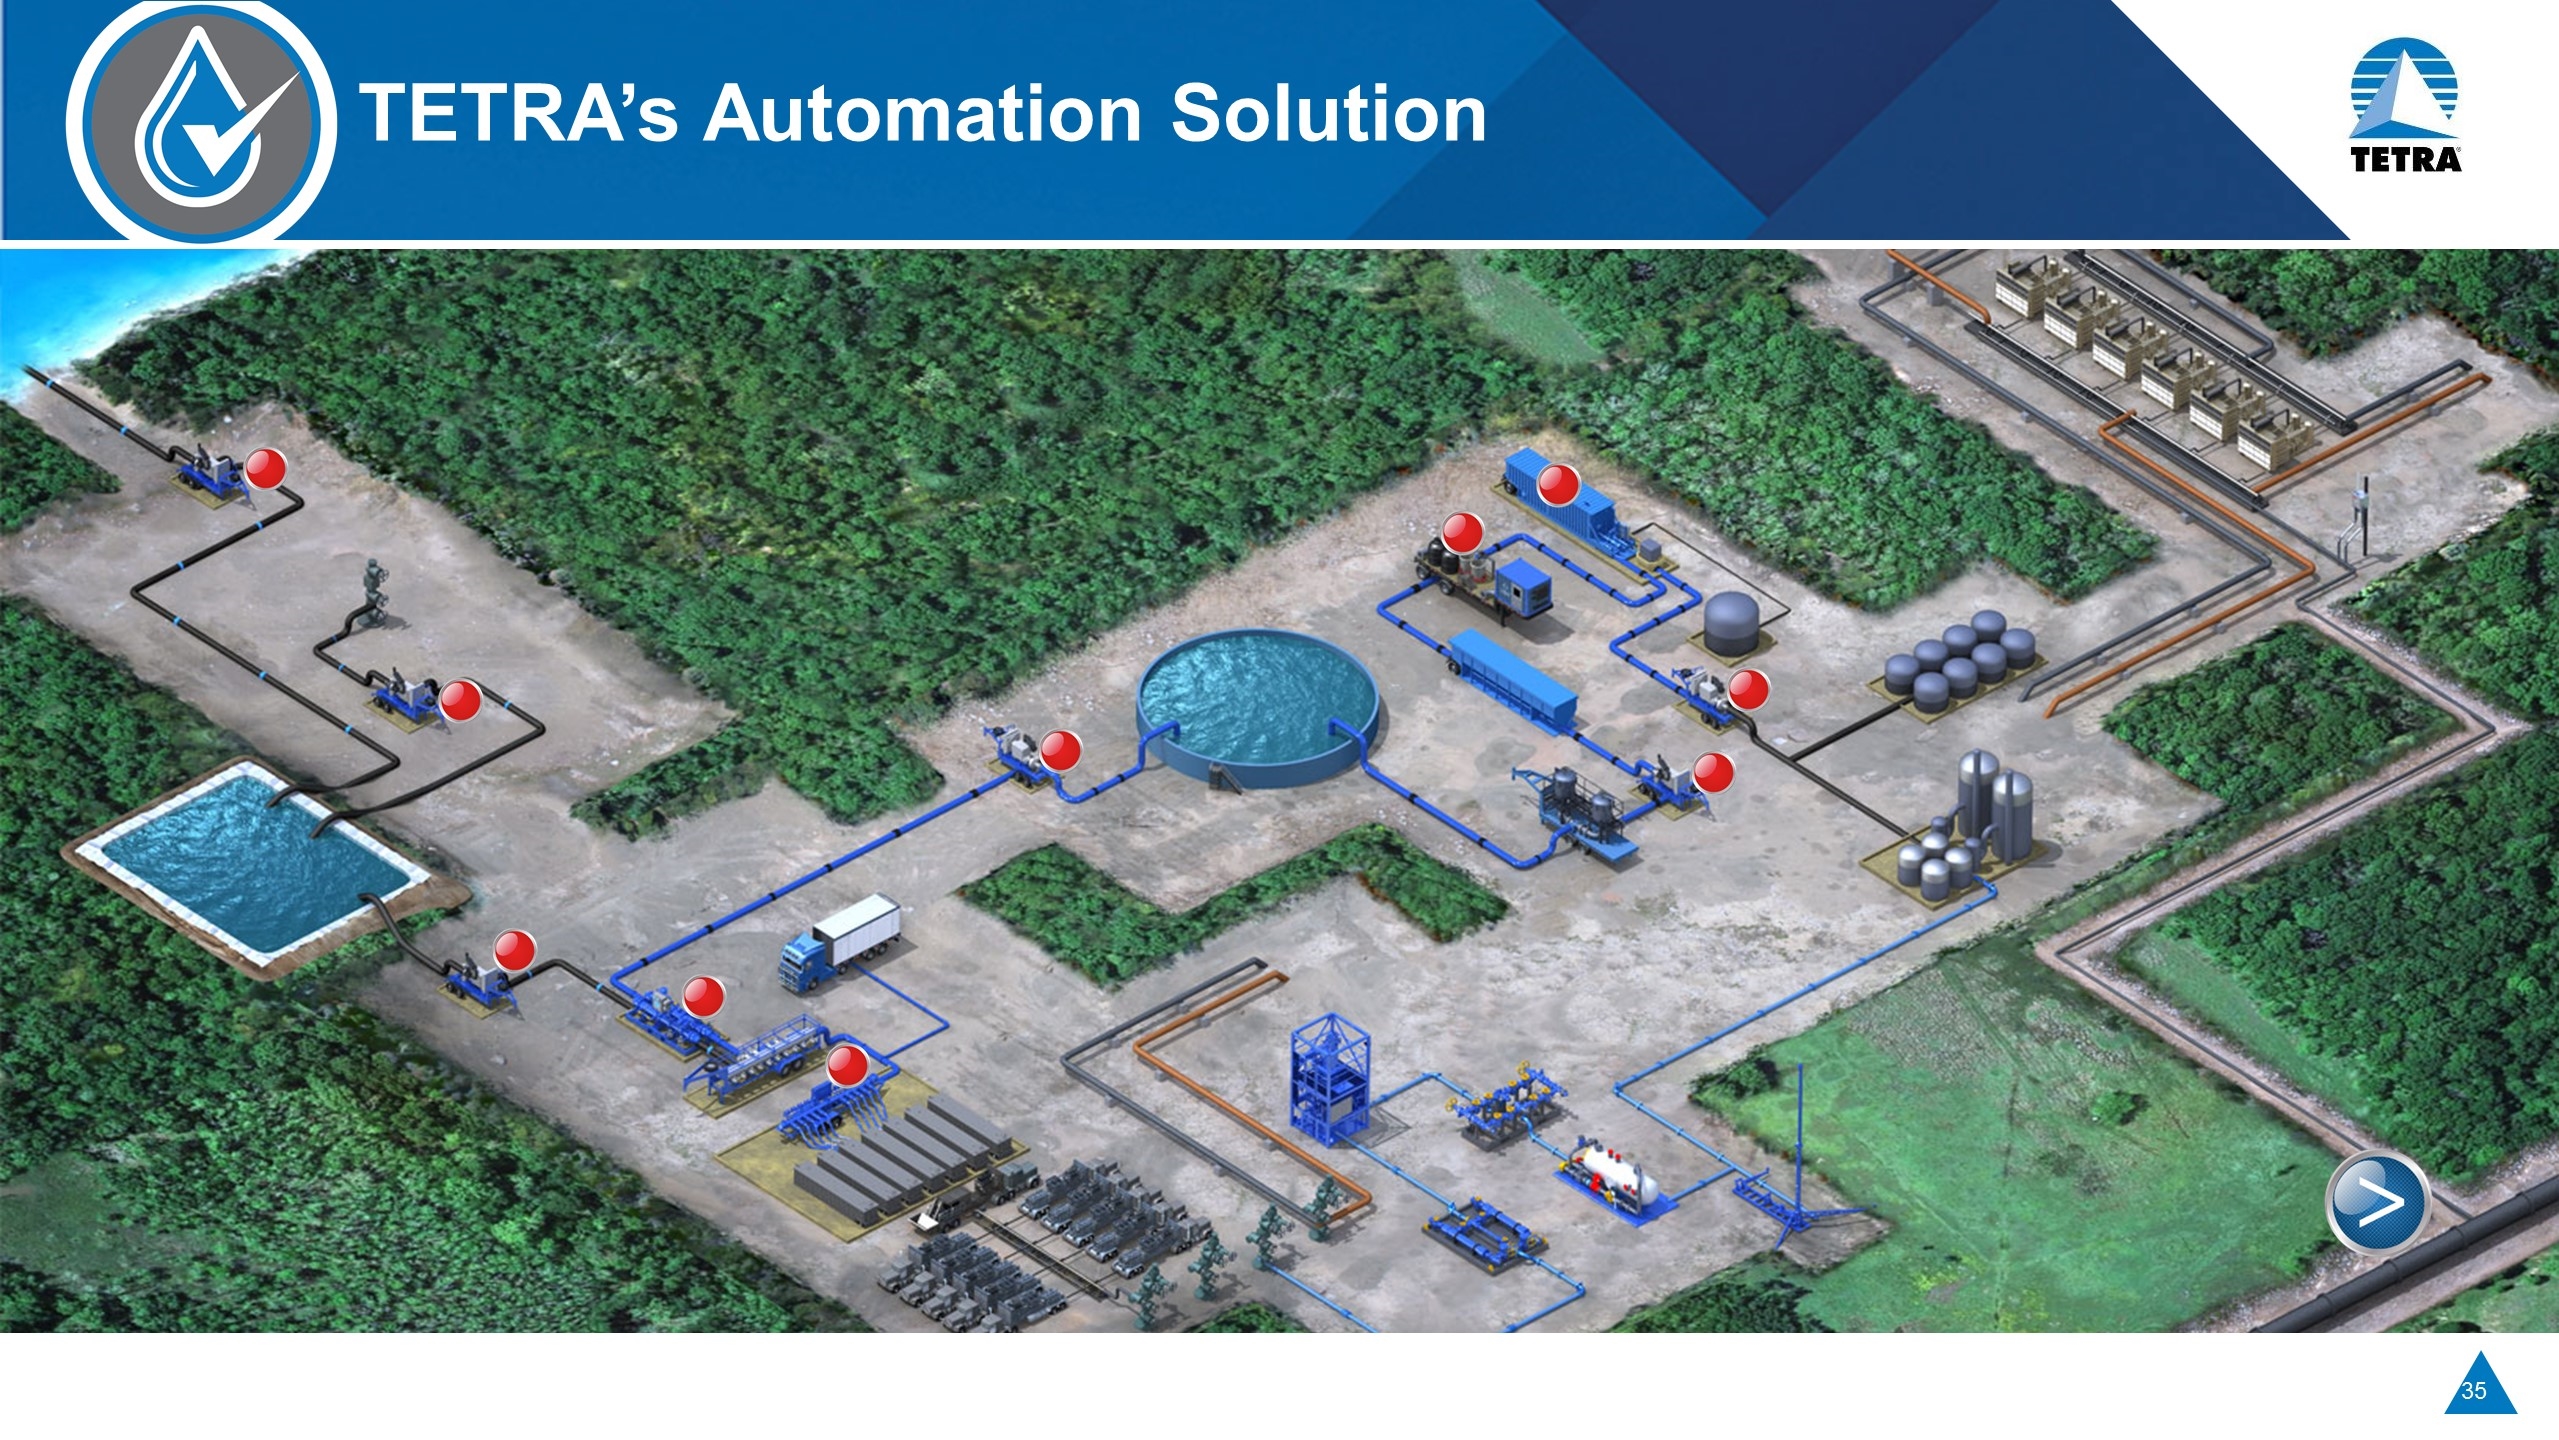
TETRA’s Automation Solution
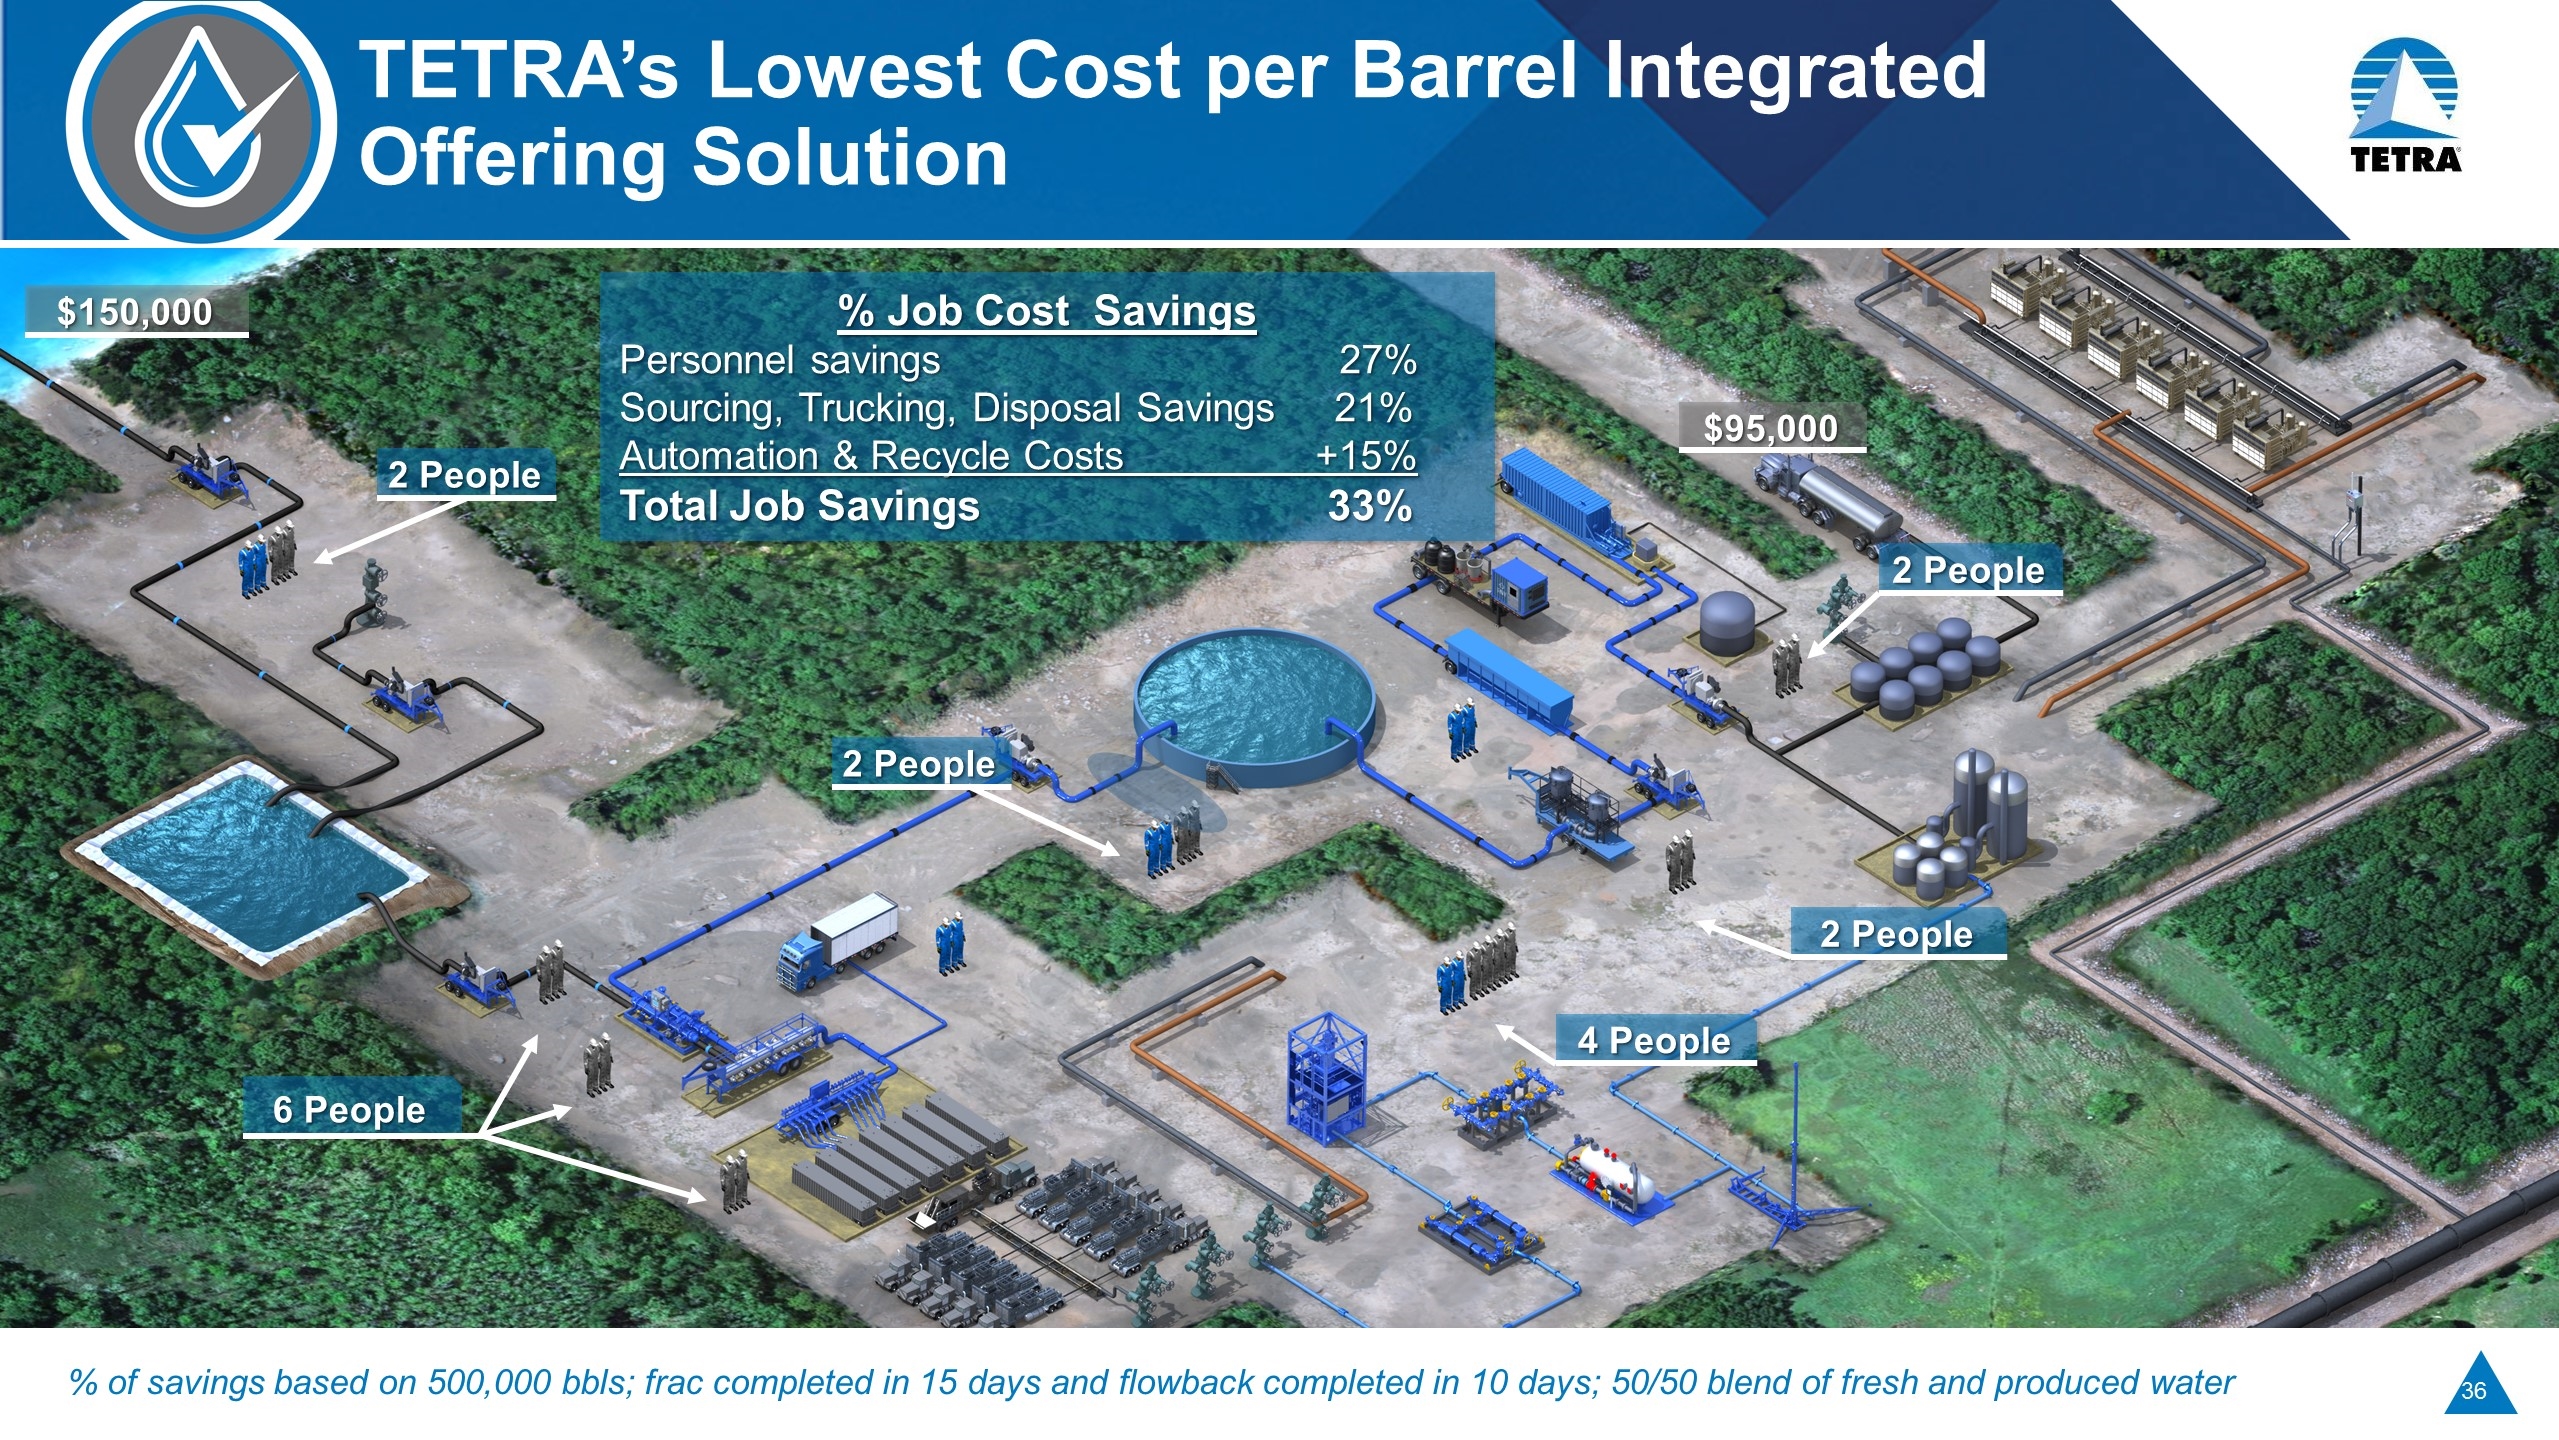
2 People 4 People 2 People 2 People 6 People 2 People % of savings based on 500,000 bbls; frac completed in 15 days and flowback completed in 10 days; 50/50 blend of fresh and produced water % Job Cost Savings Personnel savings 27% Sourcing, Trucking, Disposal Savings 21% Automation & Recycle Costs +15% Total Job Savings 33% $150,000 $95,000 TETRA’s Lowest Cost per Barrel Integrated Offering Solution
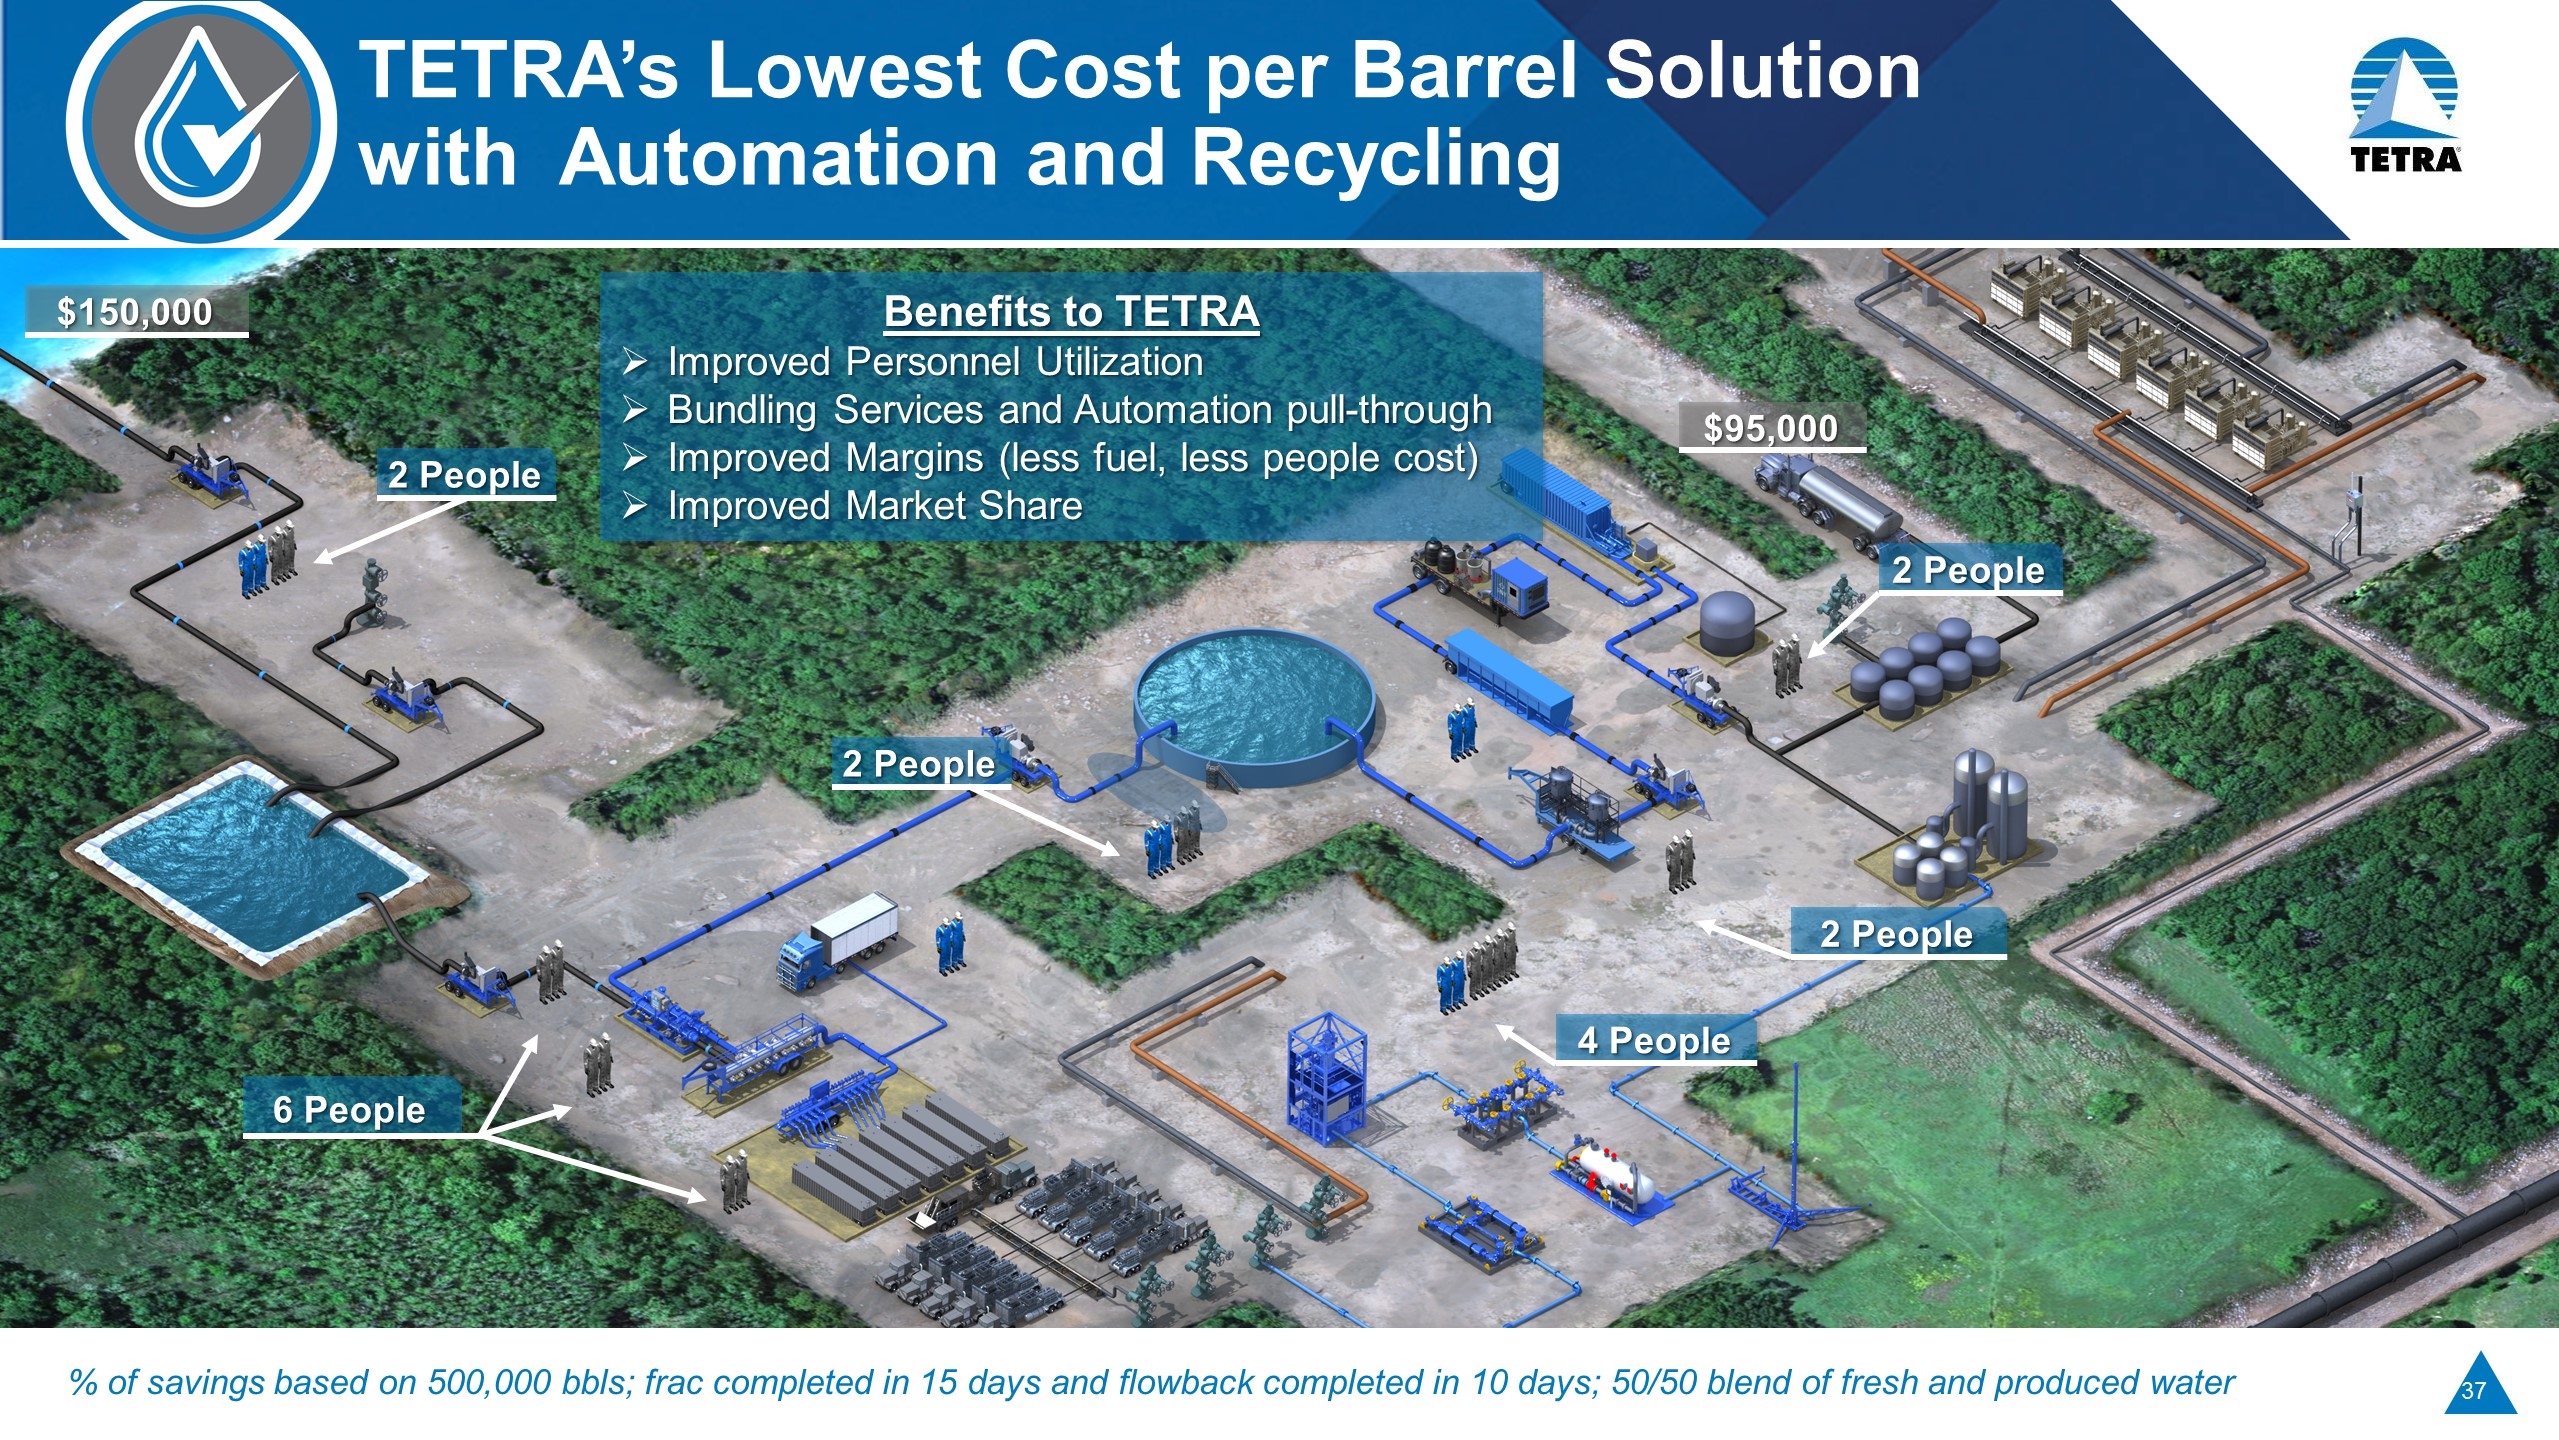
2 People 4 People 2 People 2 People 6 People 2 People % of savings based on 500,000 bbls; frac completed in 15 days and flowback completed in 10 days; 50/50 blend of fresh and produced water TETRA’s Lowest Cost per Barrel Solution with Automation and Recycling Benefits to TETRA Improved Personnel Utilization Bundling Services and Automation pull-through Improved Margins (less fuel, less people cost) Improved Market Share $95,000 $150,000
Water & Flowback Services Perspectives Beyond 2018 One of the best positioned segments for rapid growth and high returns Water volumes expected to remain high TETRA SteelTM water transfer system has proven to be a differentiator Introducing multiple technologies for further differentiation or to become more efficient at the wellsite Ability to cross sell water management services, flowback testing, production chemicals and surface gas lift will be a differentiator TETRA has focused on the better capitalized super majors and large independent customers
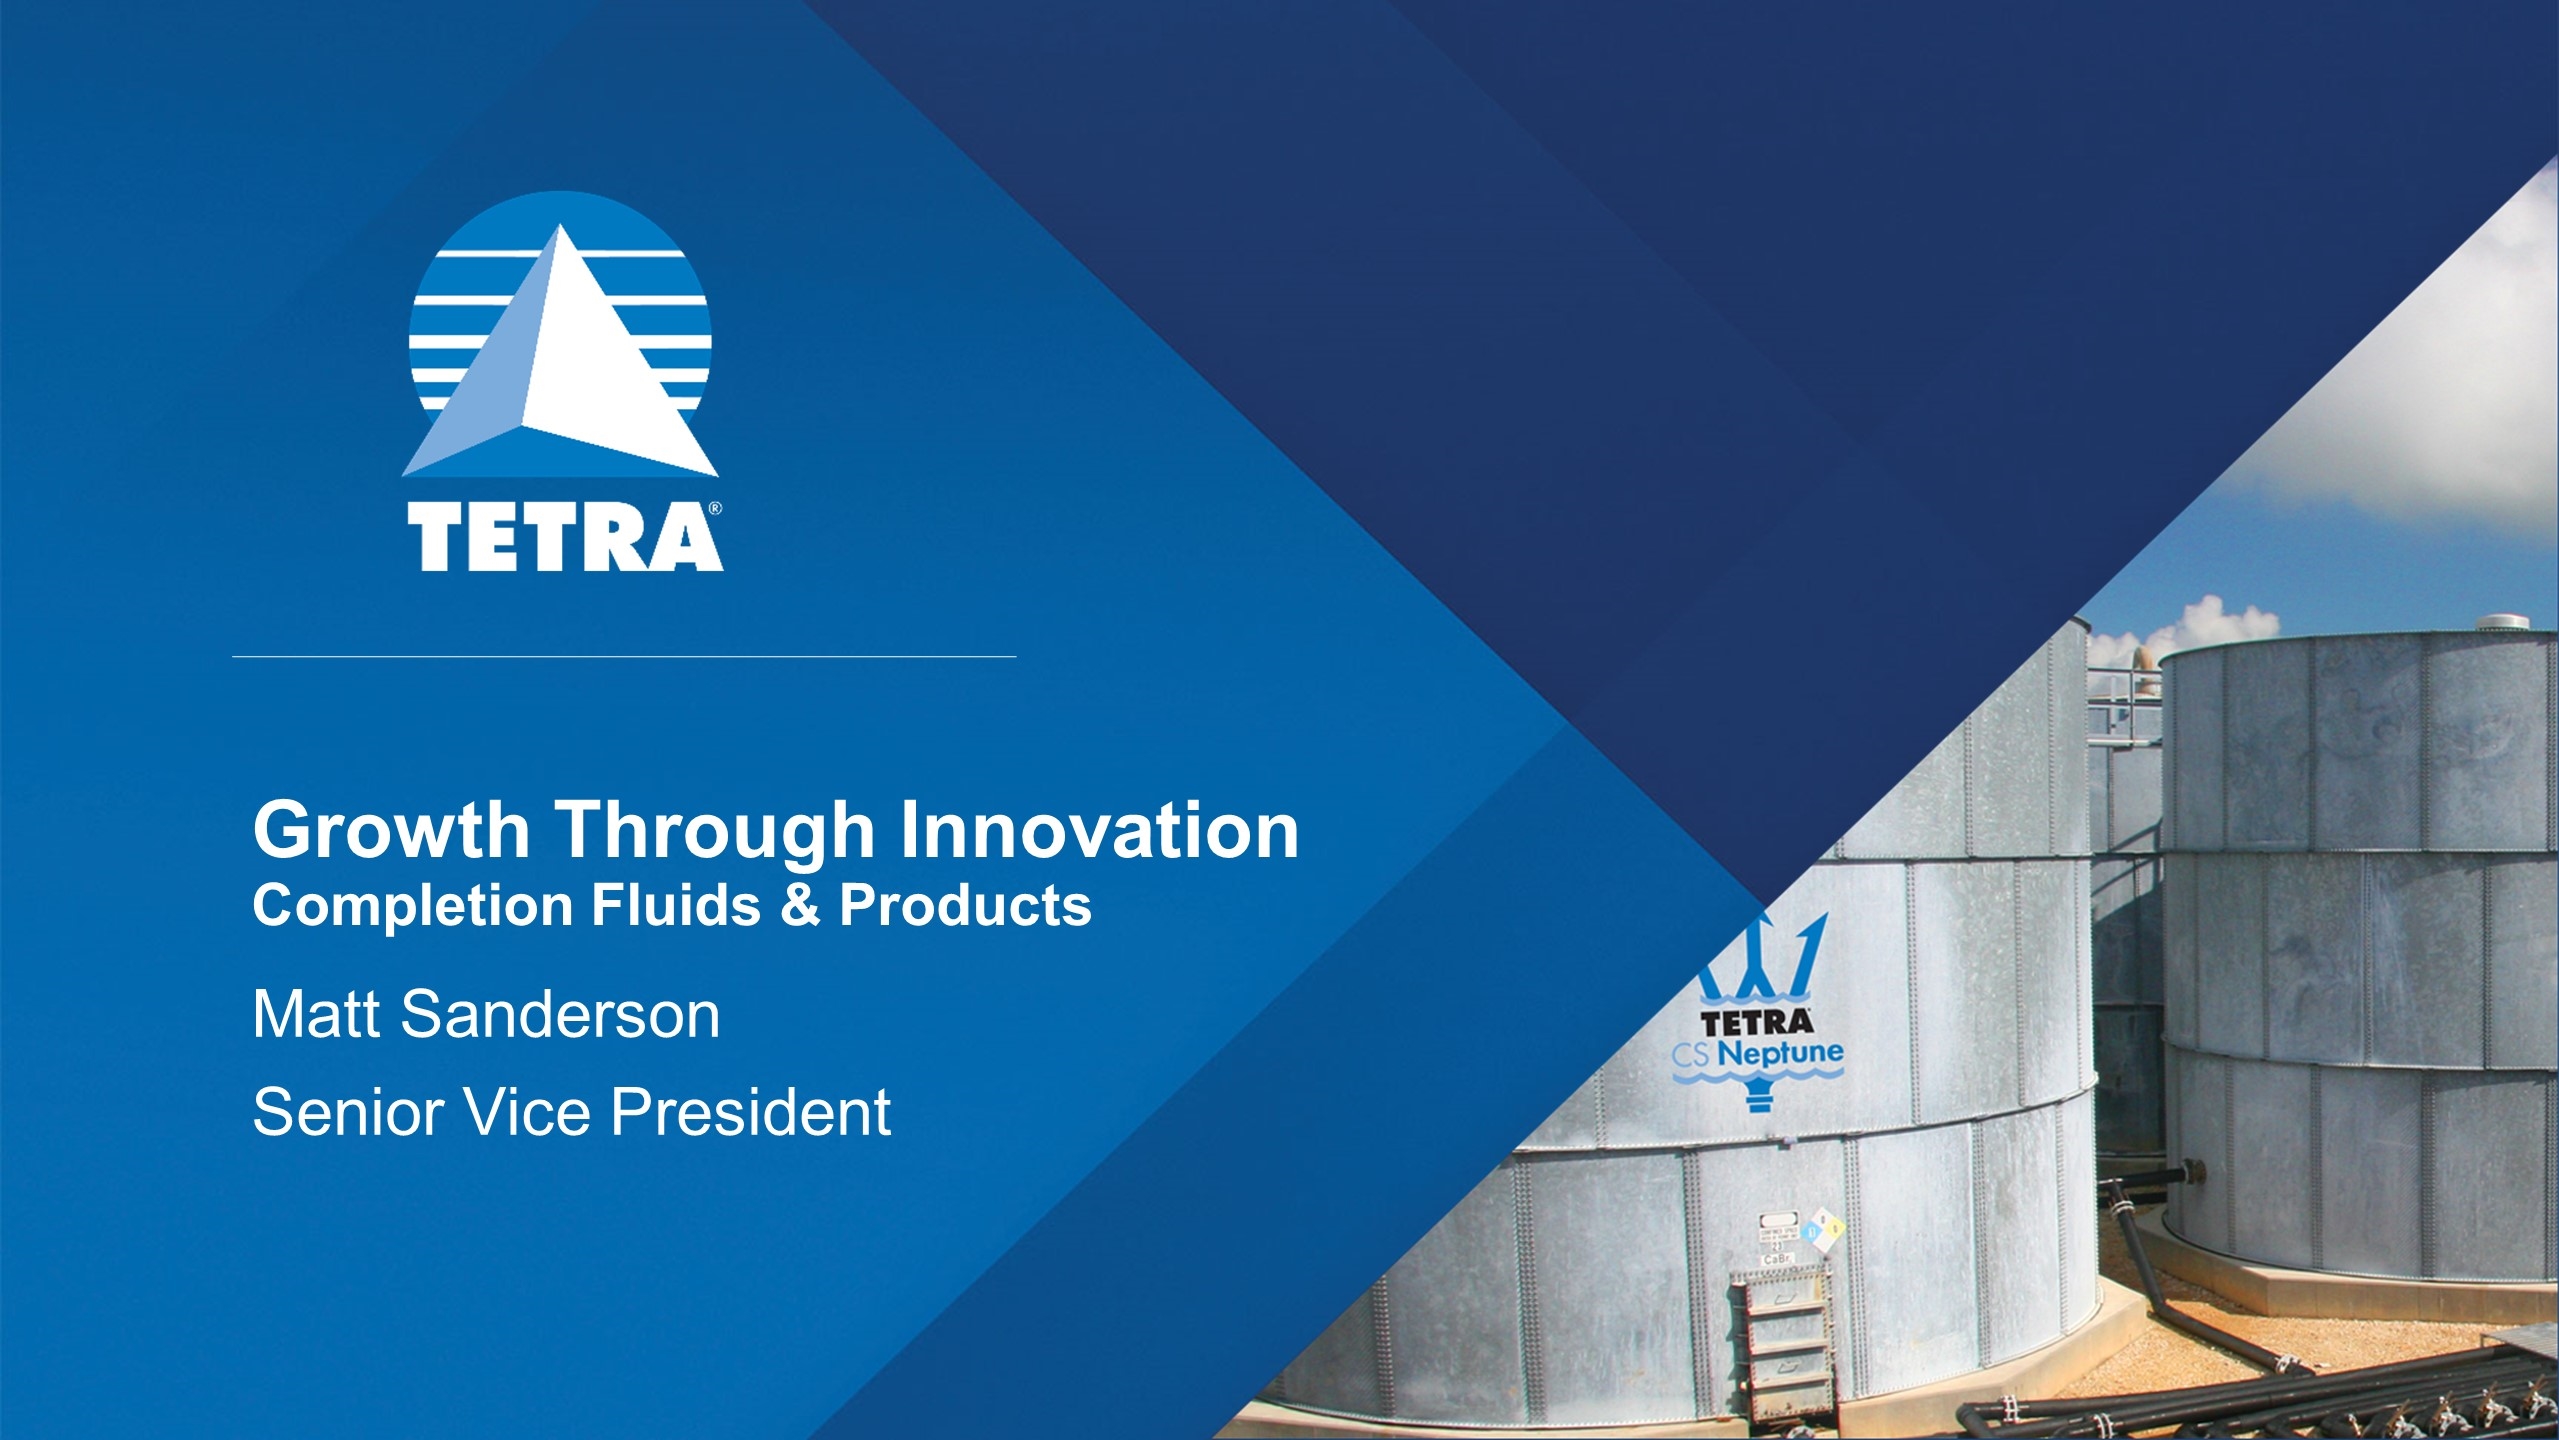
Growth Through Innovation Completion Fluids & Products Matt Sanderson Senior Vice President

Financial Summary – Completion Fluids & Products Multiple opportunities to capture growing demand w/out incremental capital investment $s in M Actual Guidance 2018 2016 2017 Revenue $205 $258 $275 - $290 Adjusted EBITDA(1) $38 $67 $55 - $62 % of revenue 18.4% 26.2% 20.0% - 21.4% Capital Expenditures Growth $6 - $7 Maintenance $6 - $7 Key Financial Drivers Advancing on several TETRA CS Neptune® Completion Fluids System opportunities currently targeted for H2 2018 Q2 historically stronger in Europe Offshore markets waking up, no investment needed to capture incremental demand Have additional capacity in our chemical plants to capture growing O&G and non-O&G demand New revenue and profit streams being identified and implemented in the industrial markets with minimal incremental capital required. (1) See appendix for reconciliation to nearest GAAP measures
Leading Global Completion Fluids Provider Innovation leadership Cost and delivery advantage through vertical integration Control of quality Assurance of supply Unique market insight from both supplier and service perspective
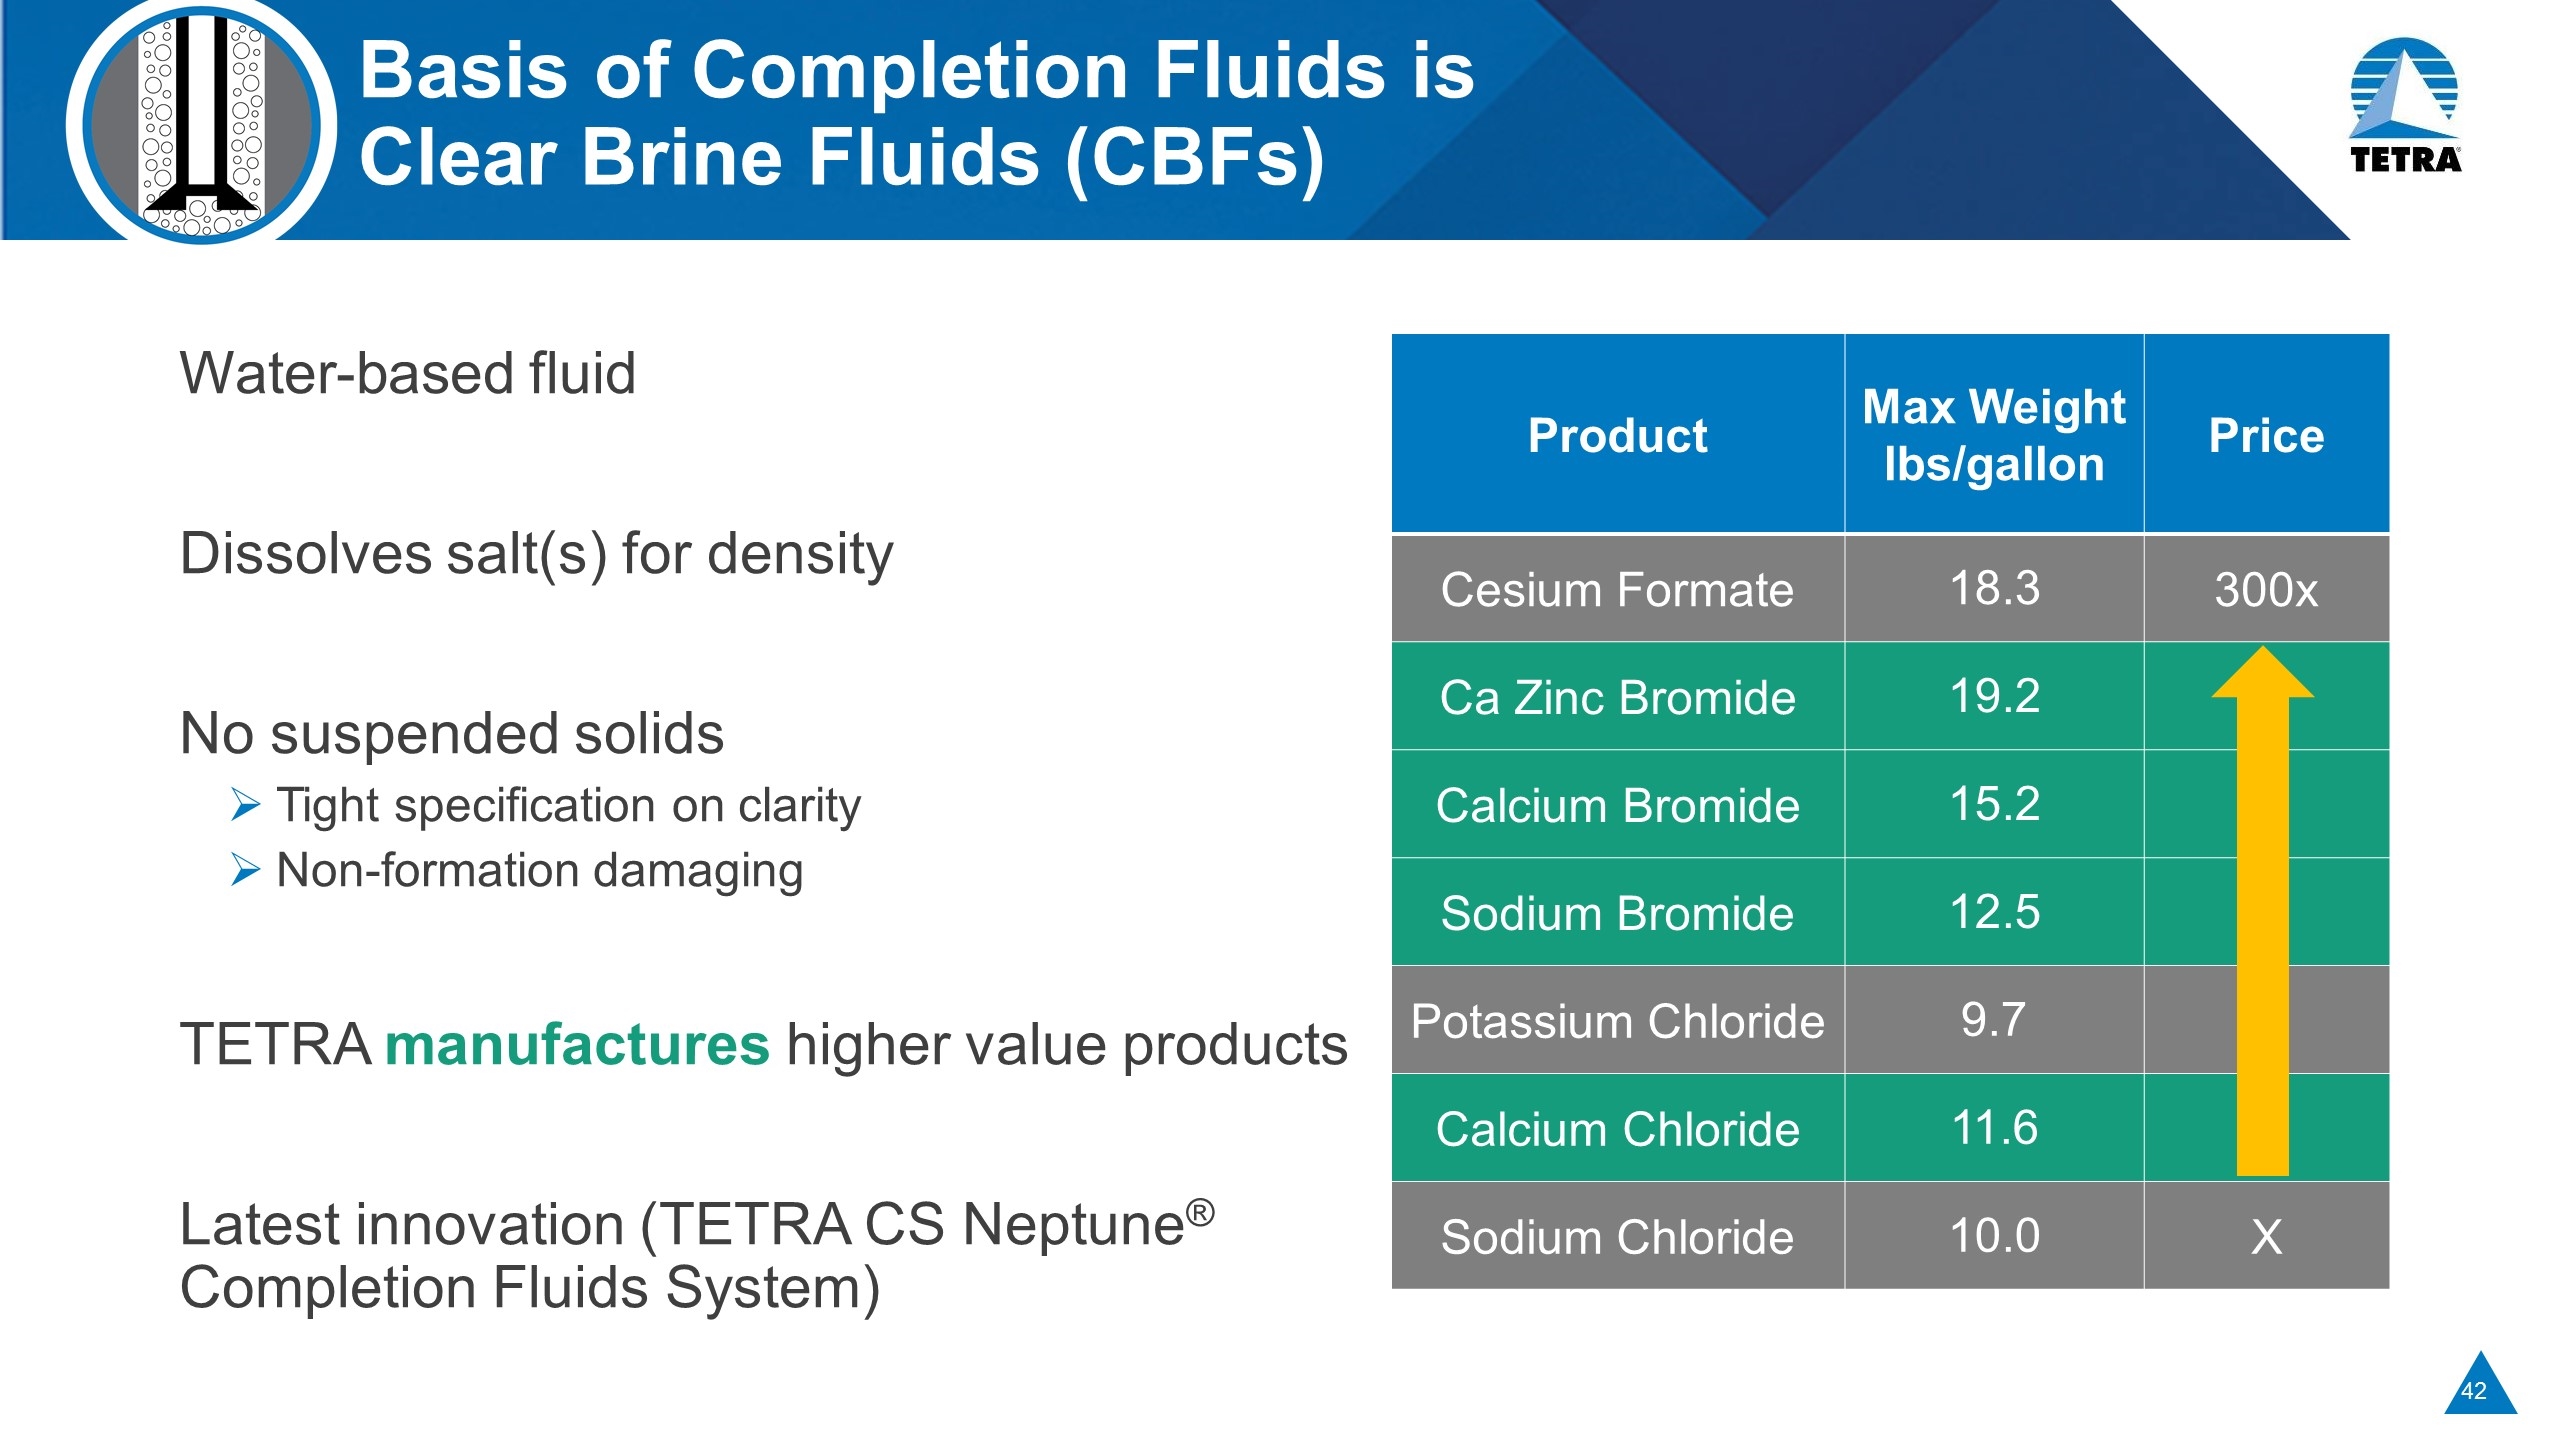
Basis of Completion Fluids is Clear Brine Fluids (CBFs) Water-based fluid Dissolves salt(s) for density No suspended solids Tight specification on clarity Non-formation damaging TETRA manufactures higher value products Latest innovation (TETRA CS Neptune® Completion Fluids System) Product Max Weight lbs/gallon Price Cesium Formate 18.3 300x Ca Zinc Bromide 19.2 Calcium Bromide 15.2 Sodium Bromide 12.5 Potassium Chloride 9.7 Calcium Chloride 11.6 Sodium Chloride 10.0 X
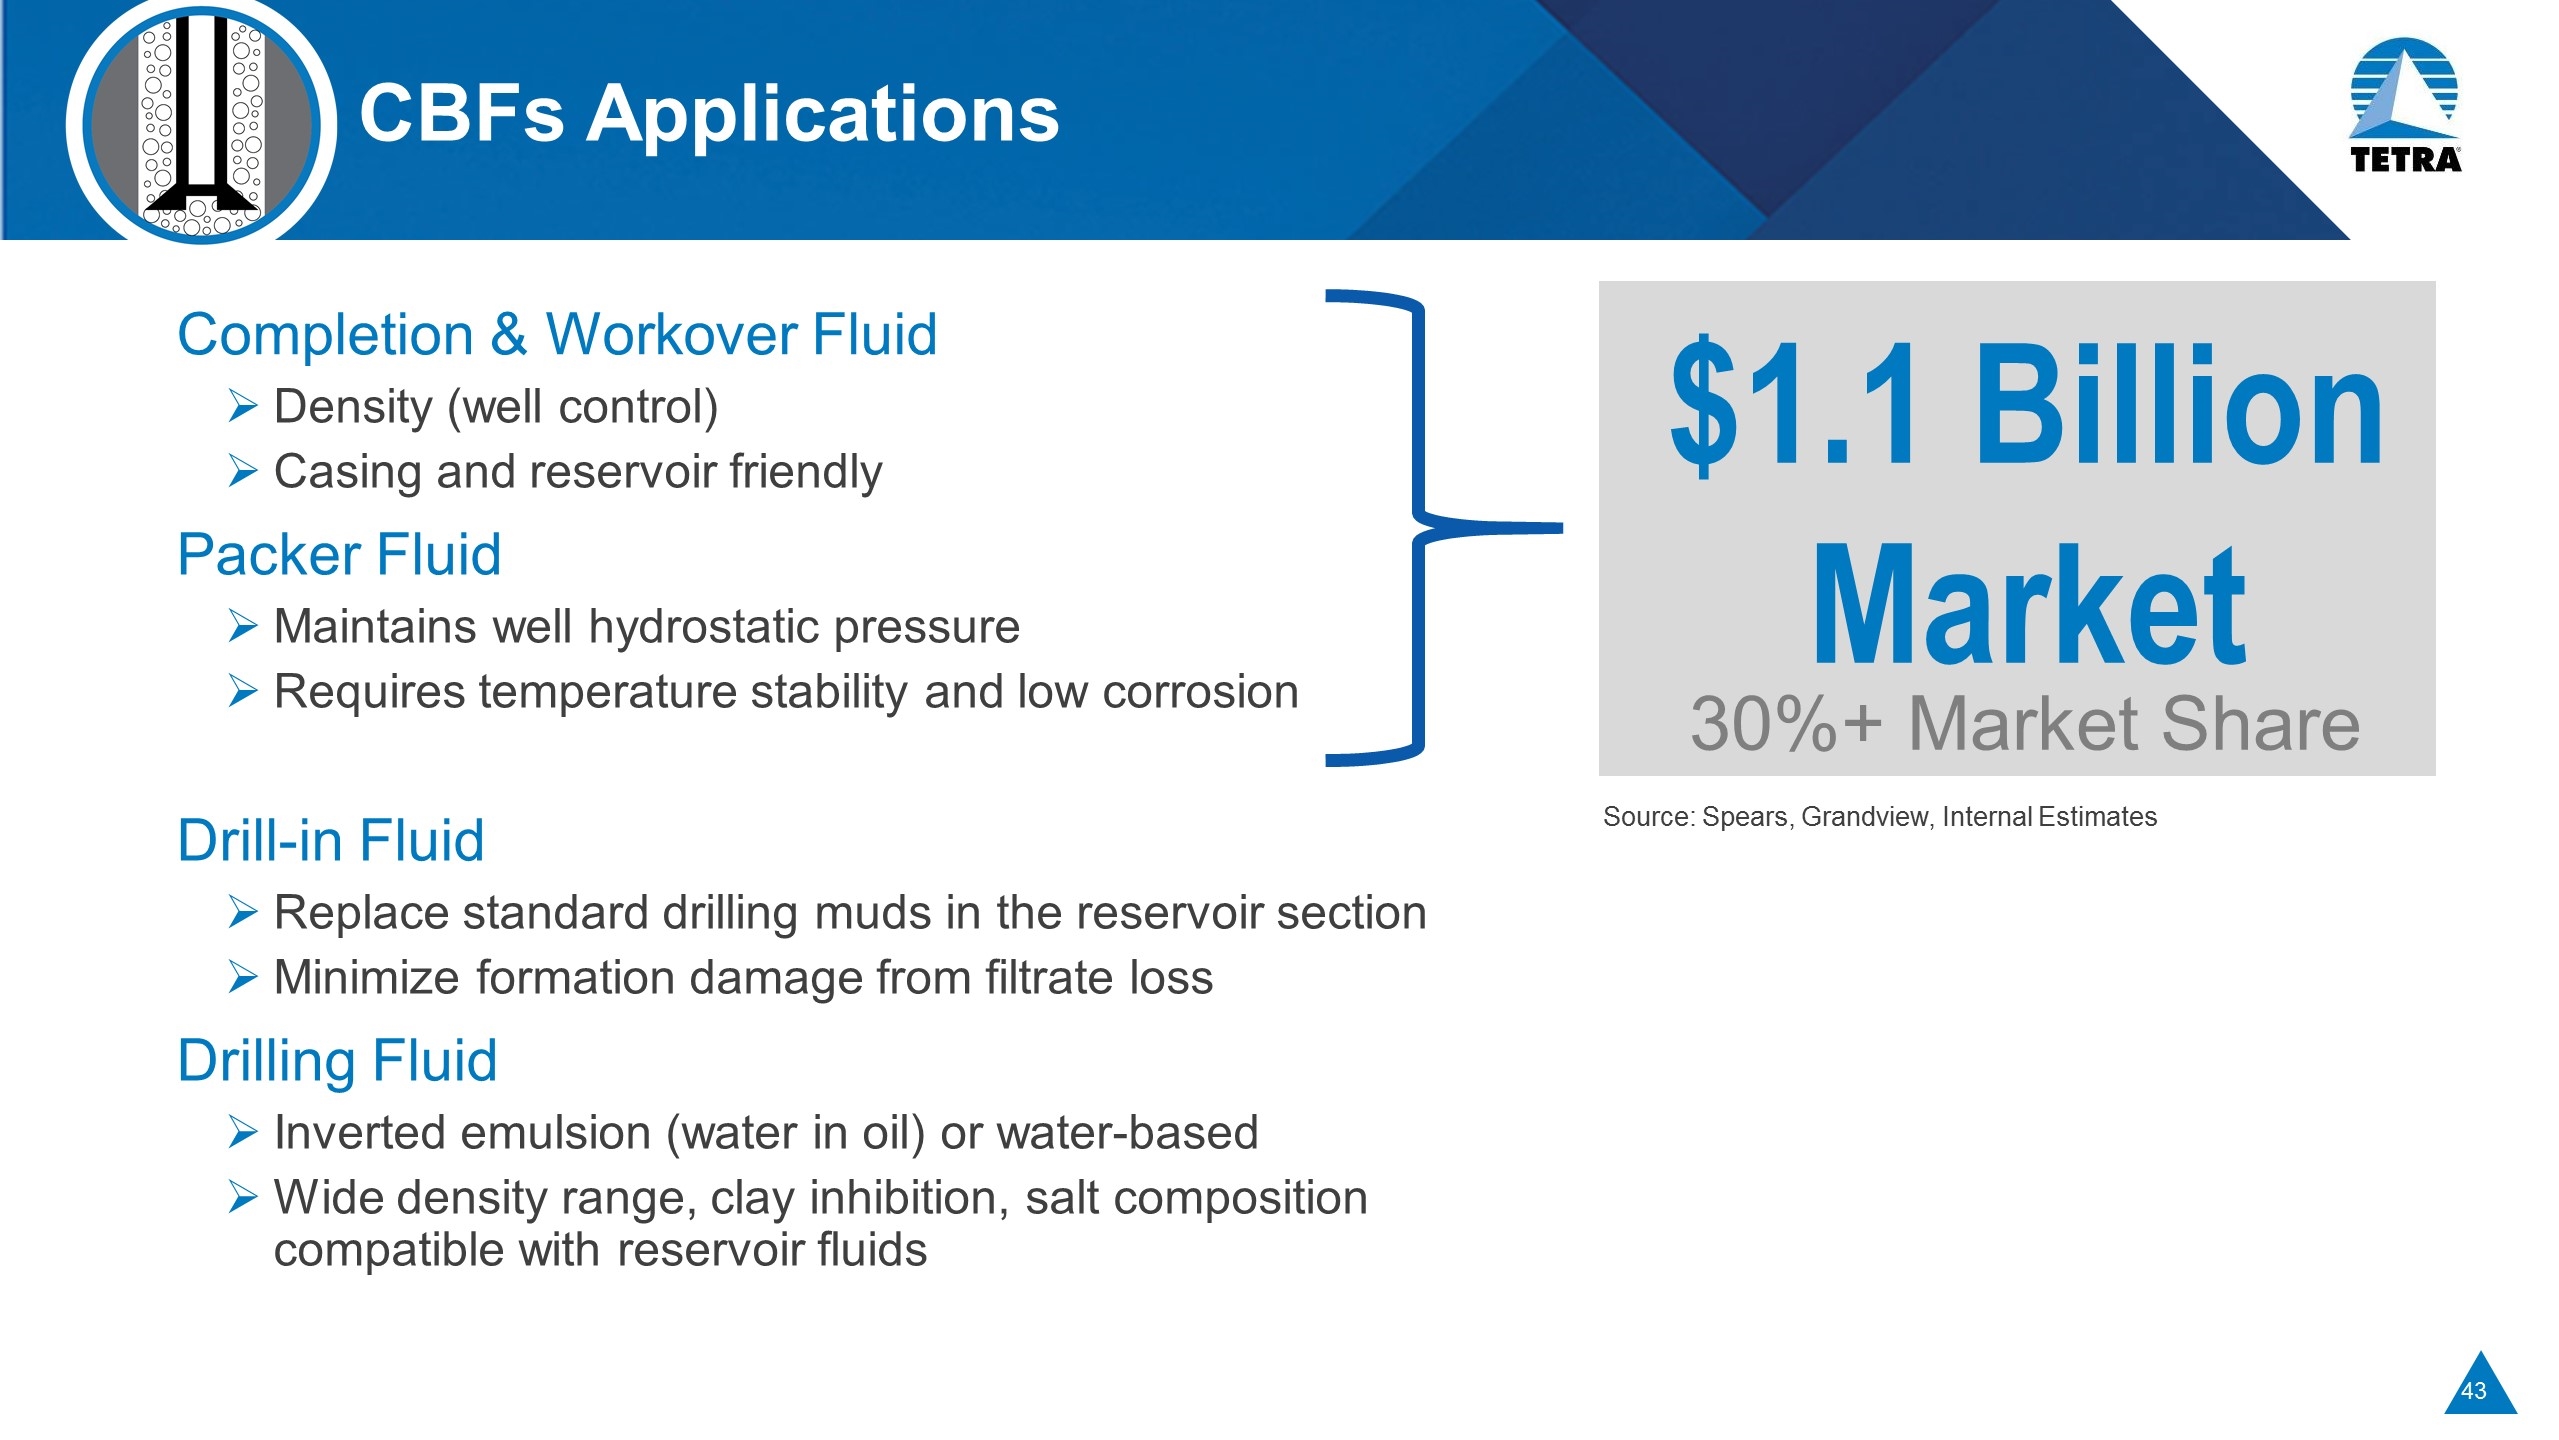
CBFs Applications Completion & Workover Fluid Density (well control) Casing and reservoir friendly Packer Fluid Maintains well hydrostatic pressure Requires temperature stability and low corrosion Drill-in Fluid Replace standard drilling muds in the reservoir section Minimize formation damage from filtrate loss Drilling Fluid Inverted emulsion (water in oil) or water-based Wide density range, clay inhibition, salt composition compatible with reservoir fluids $1.1 Billion Market 30%+ Market Share Source: Spears, Grandview, Internal Estimates
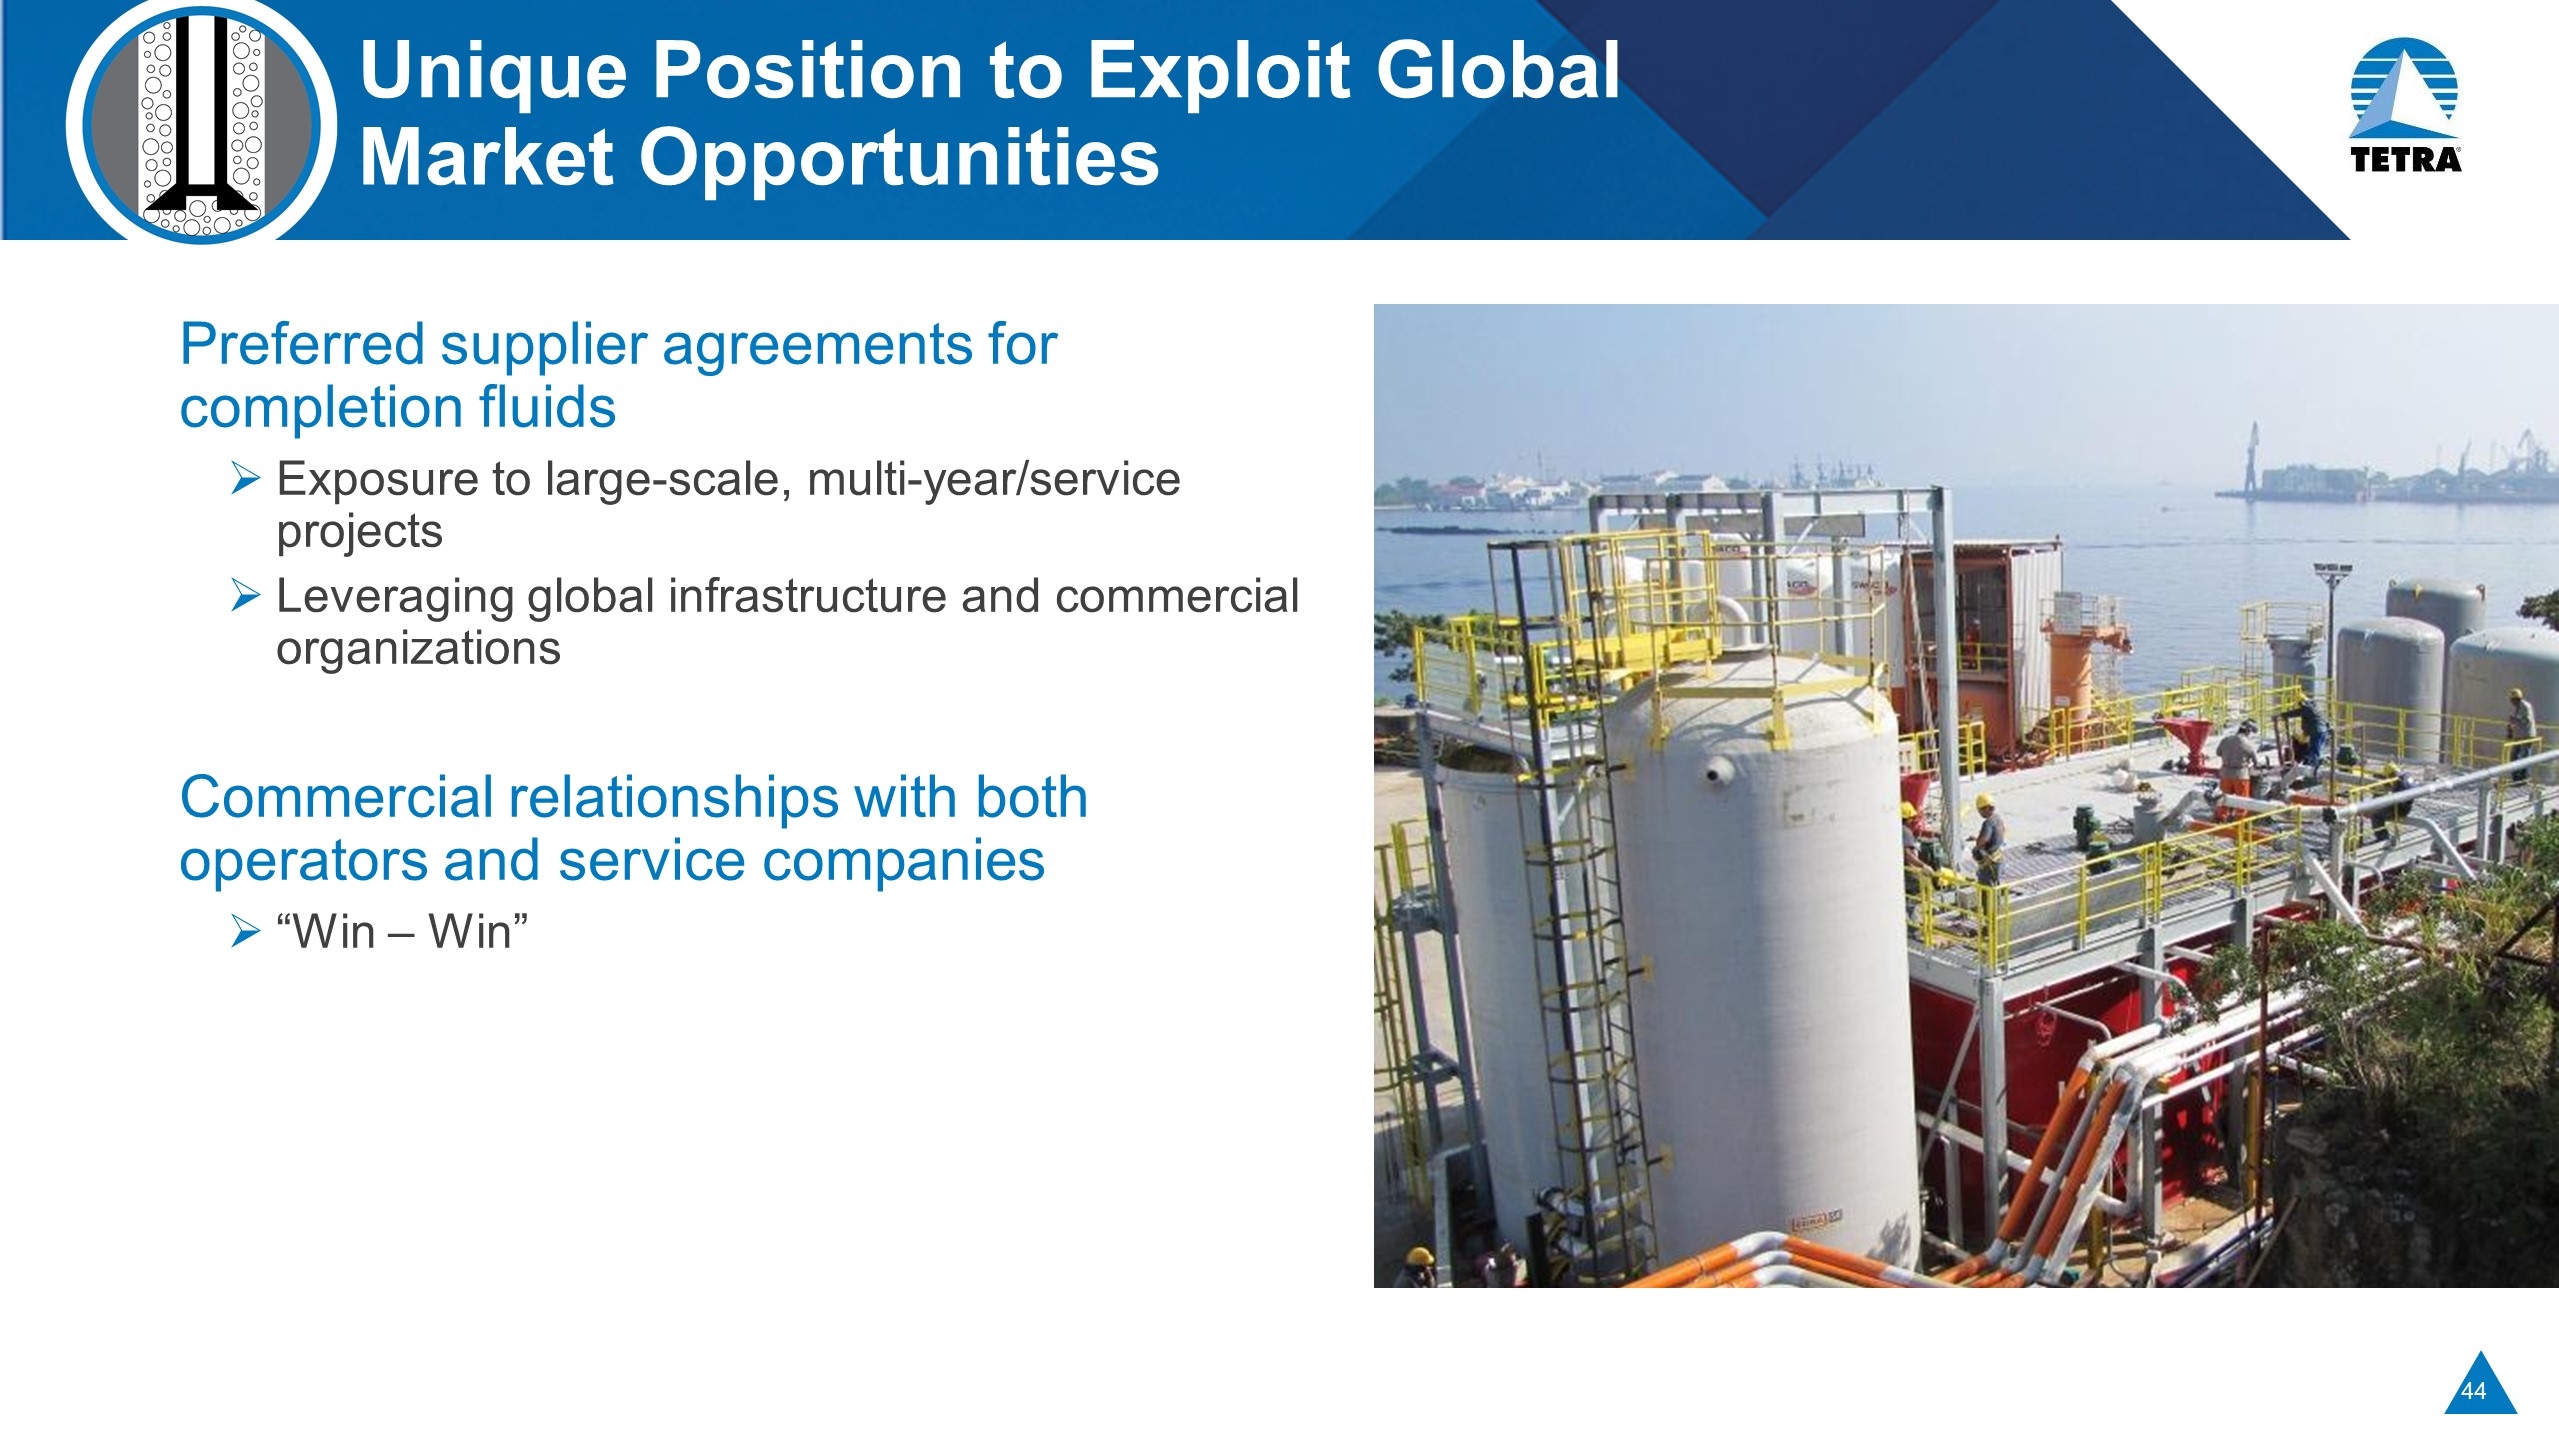
Unique Position to Exploit Global Market Opportunities Preferred supplier agreements for completion fluids Exposure to large-scale, multi-year/service projects Leveraging global infrastructure and commercial organizations Commercial relationships with both operators and service companies “Win – Win”
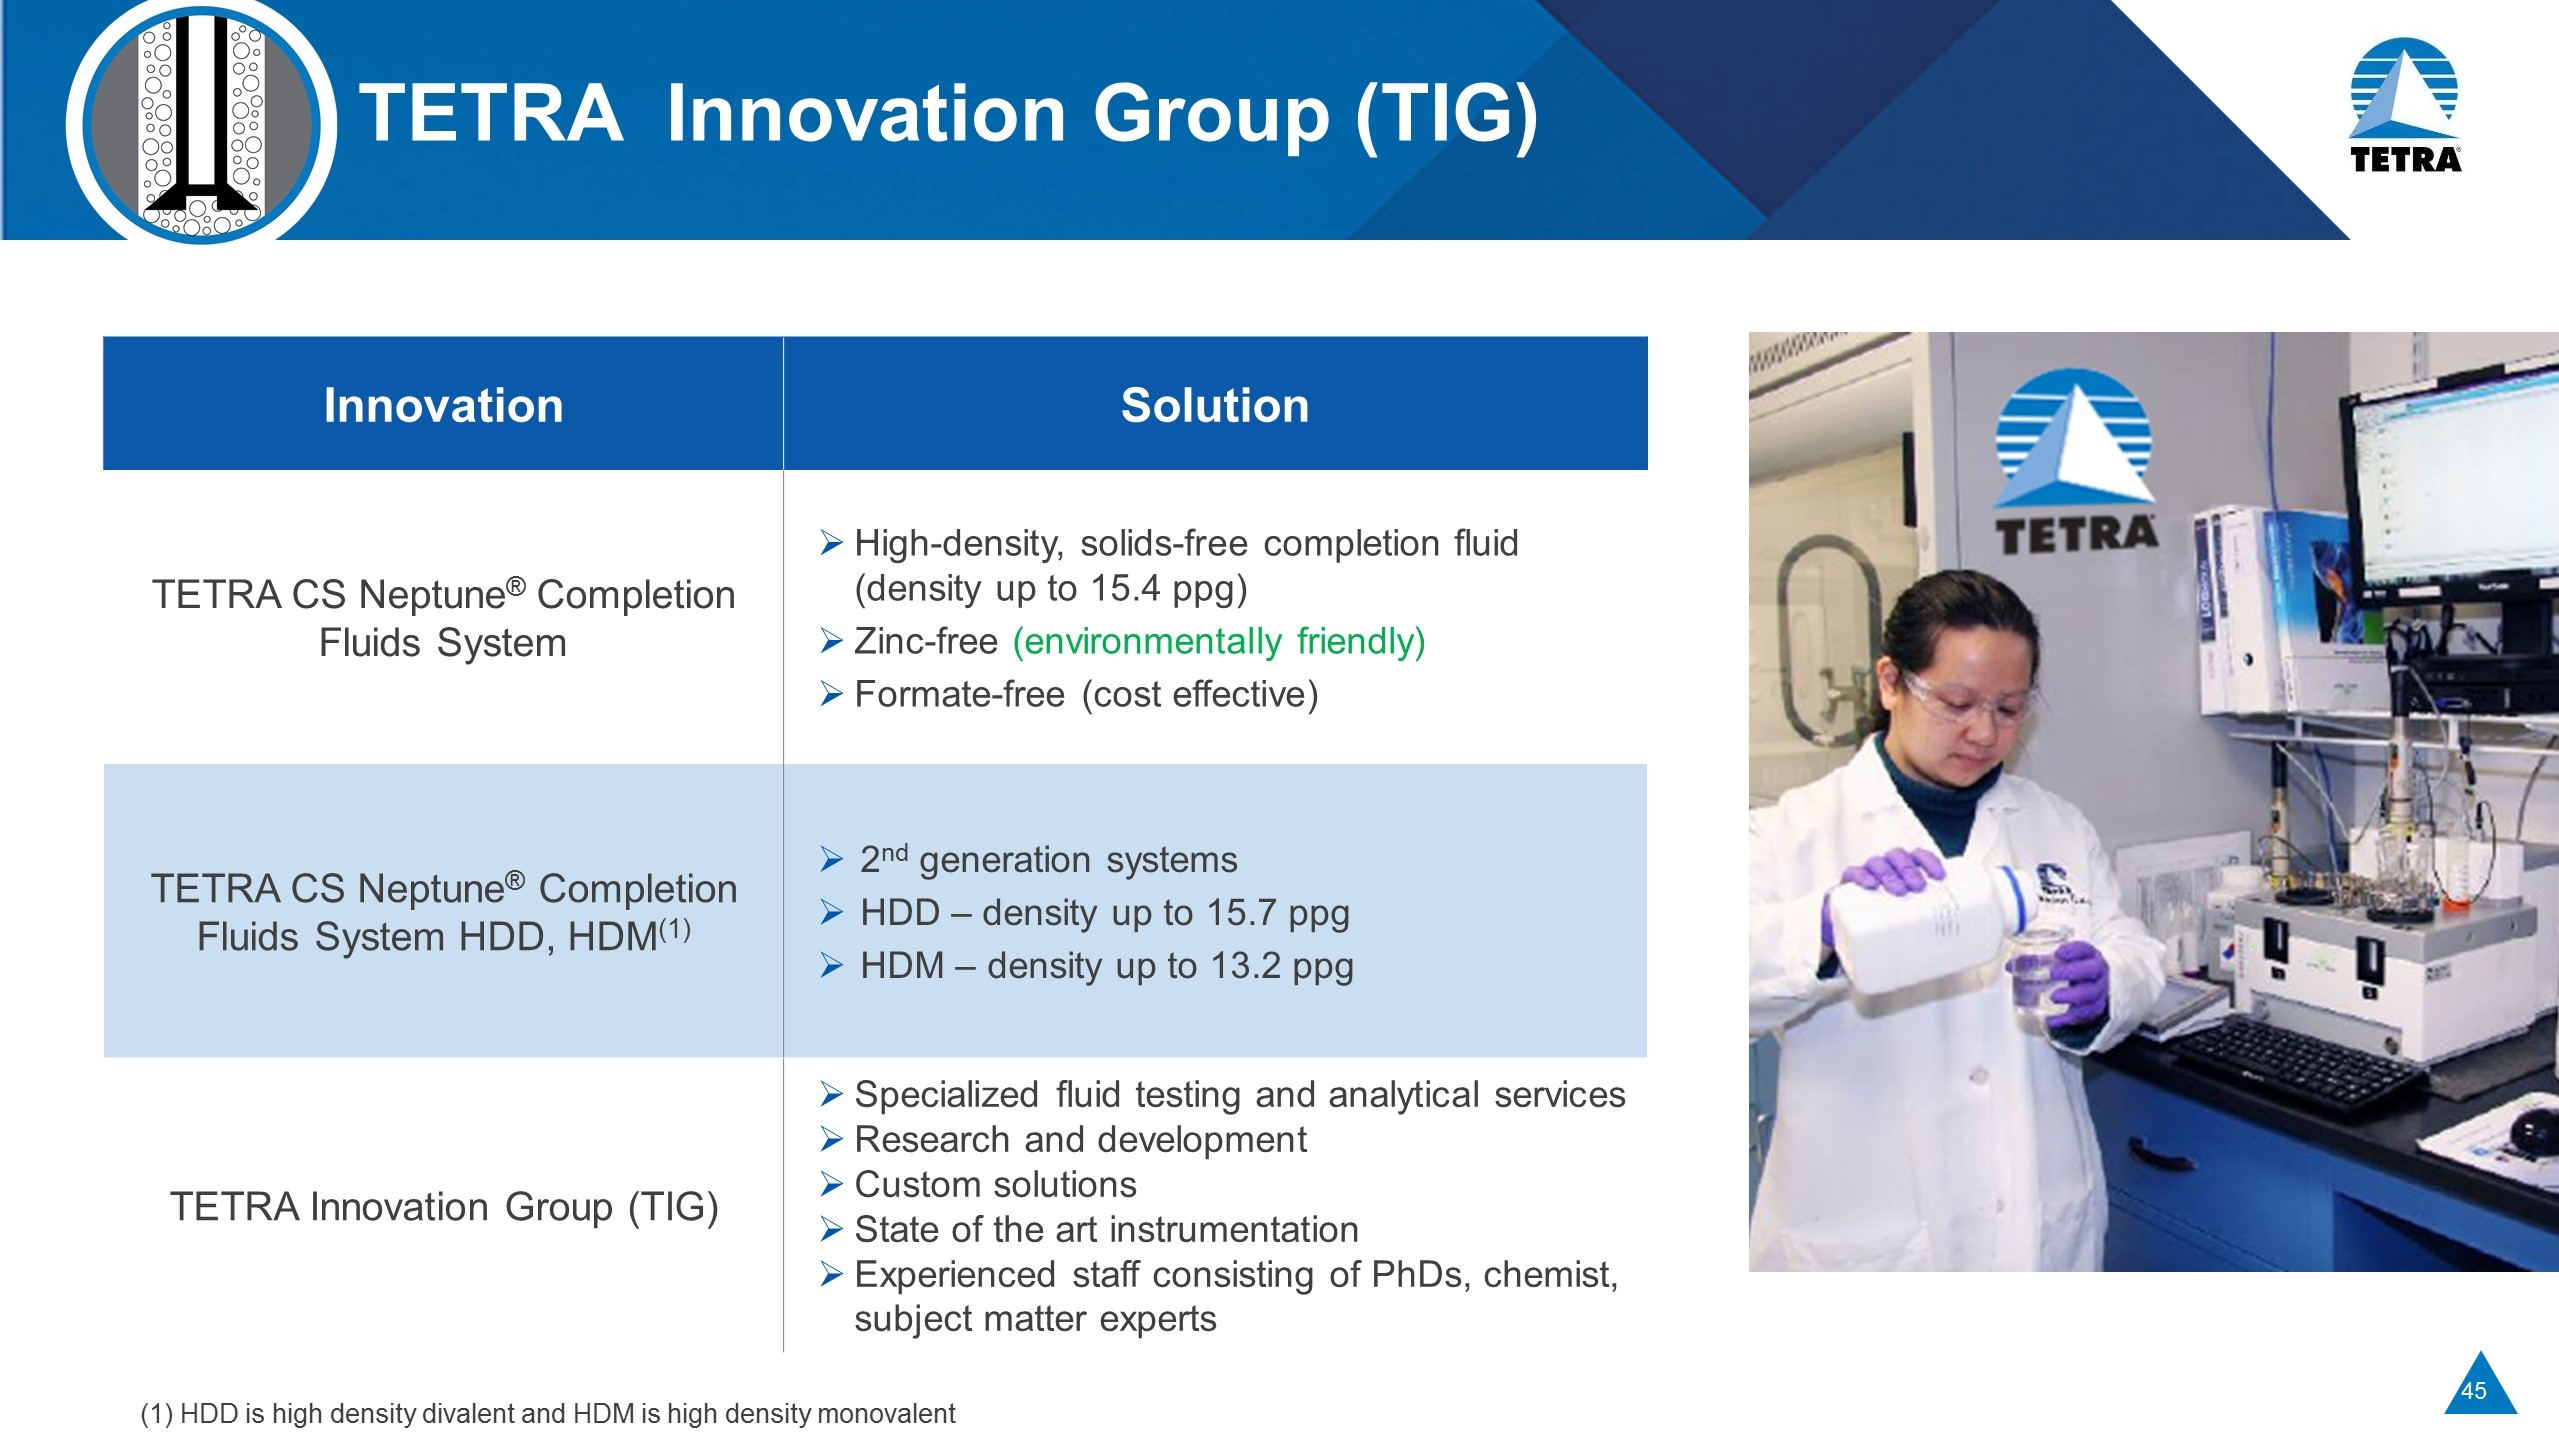
TETRA Innovation Group (TIG) Innovation Solution TETRA CS Neptune® Completion Fluids System High-density, solids-free completion fluid (density up to 15.4 ppg) Zinc-free (environmentally friendly) Formate-free (cost effective) TETRA CS Neptune® Completion Fluids System HDD, HDM(1) 2nd generation systems HDD – density up to 15.7 ppg HDM – density up to 13.2 ppg TETRA Innovation Group (TIG) Specialized fluid testing and analytical services Research and development Custom solutions State of the art instrumentation Experienced staff consisting of PhDs, chemist, subject matter experts (1) HDD is high density divalent and HDM is high density monovalent
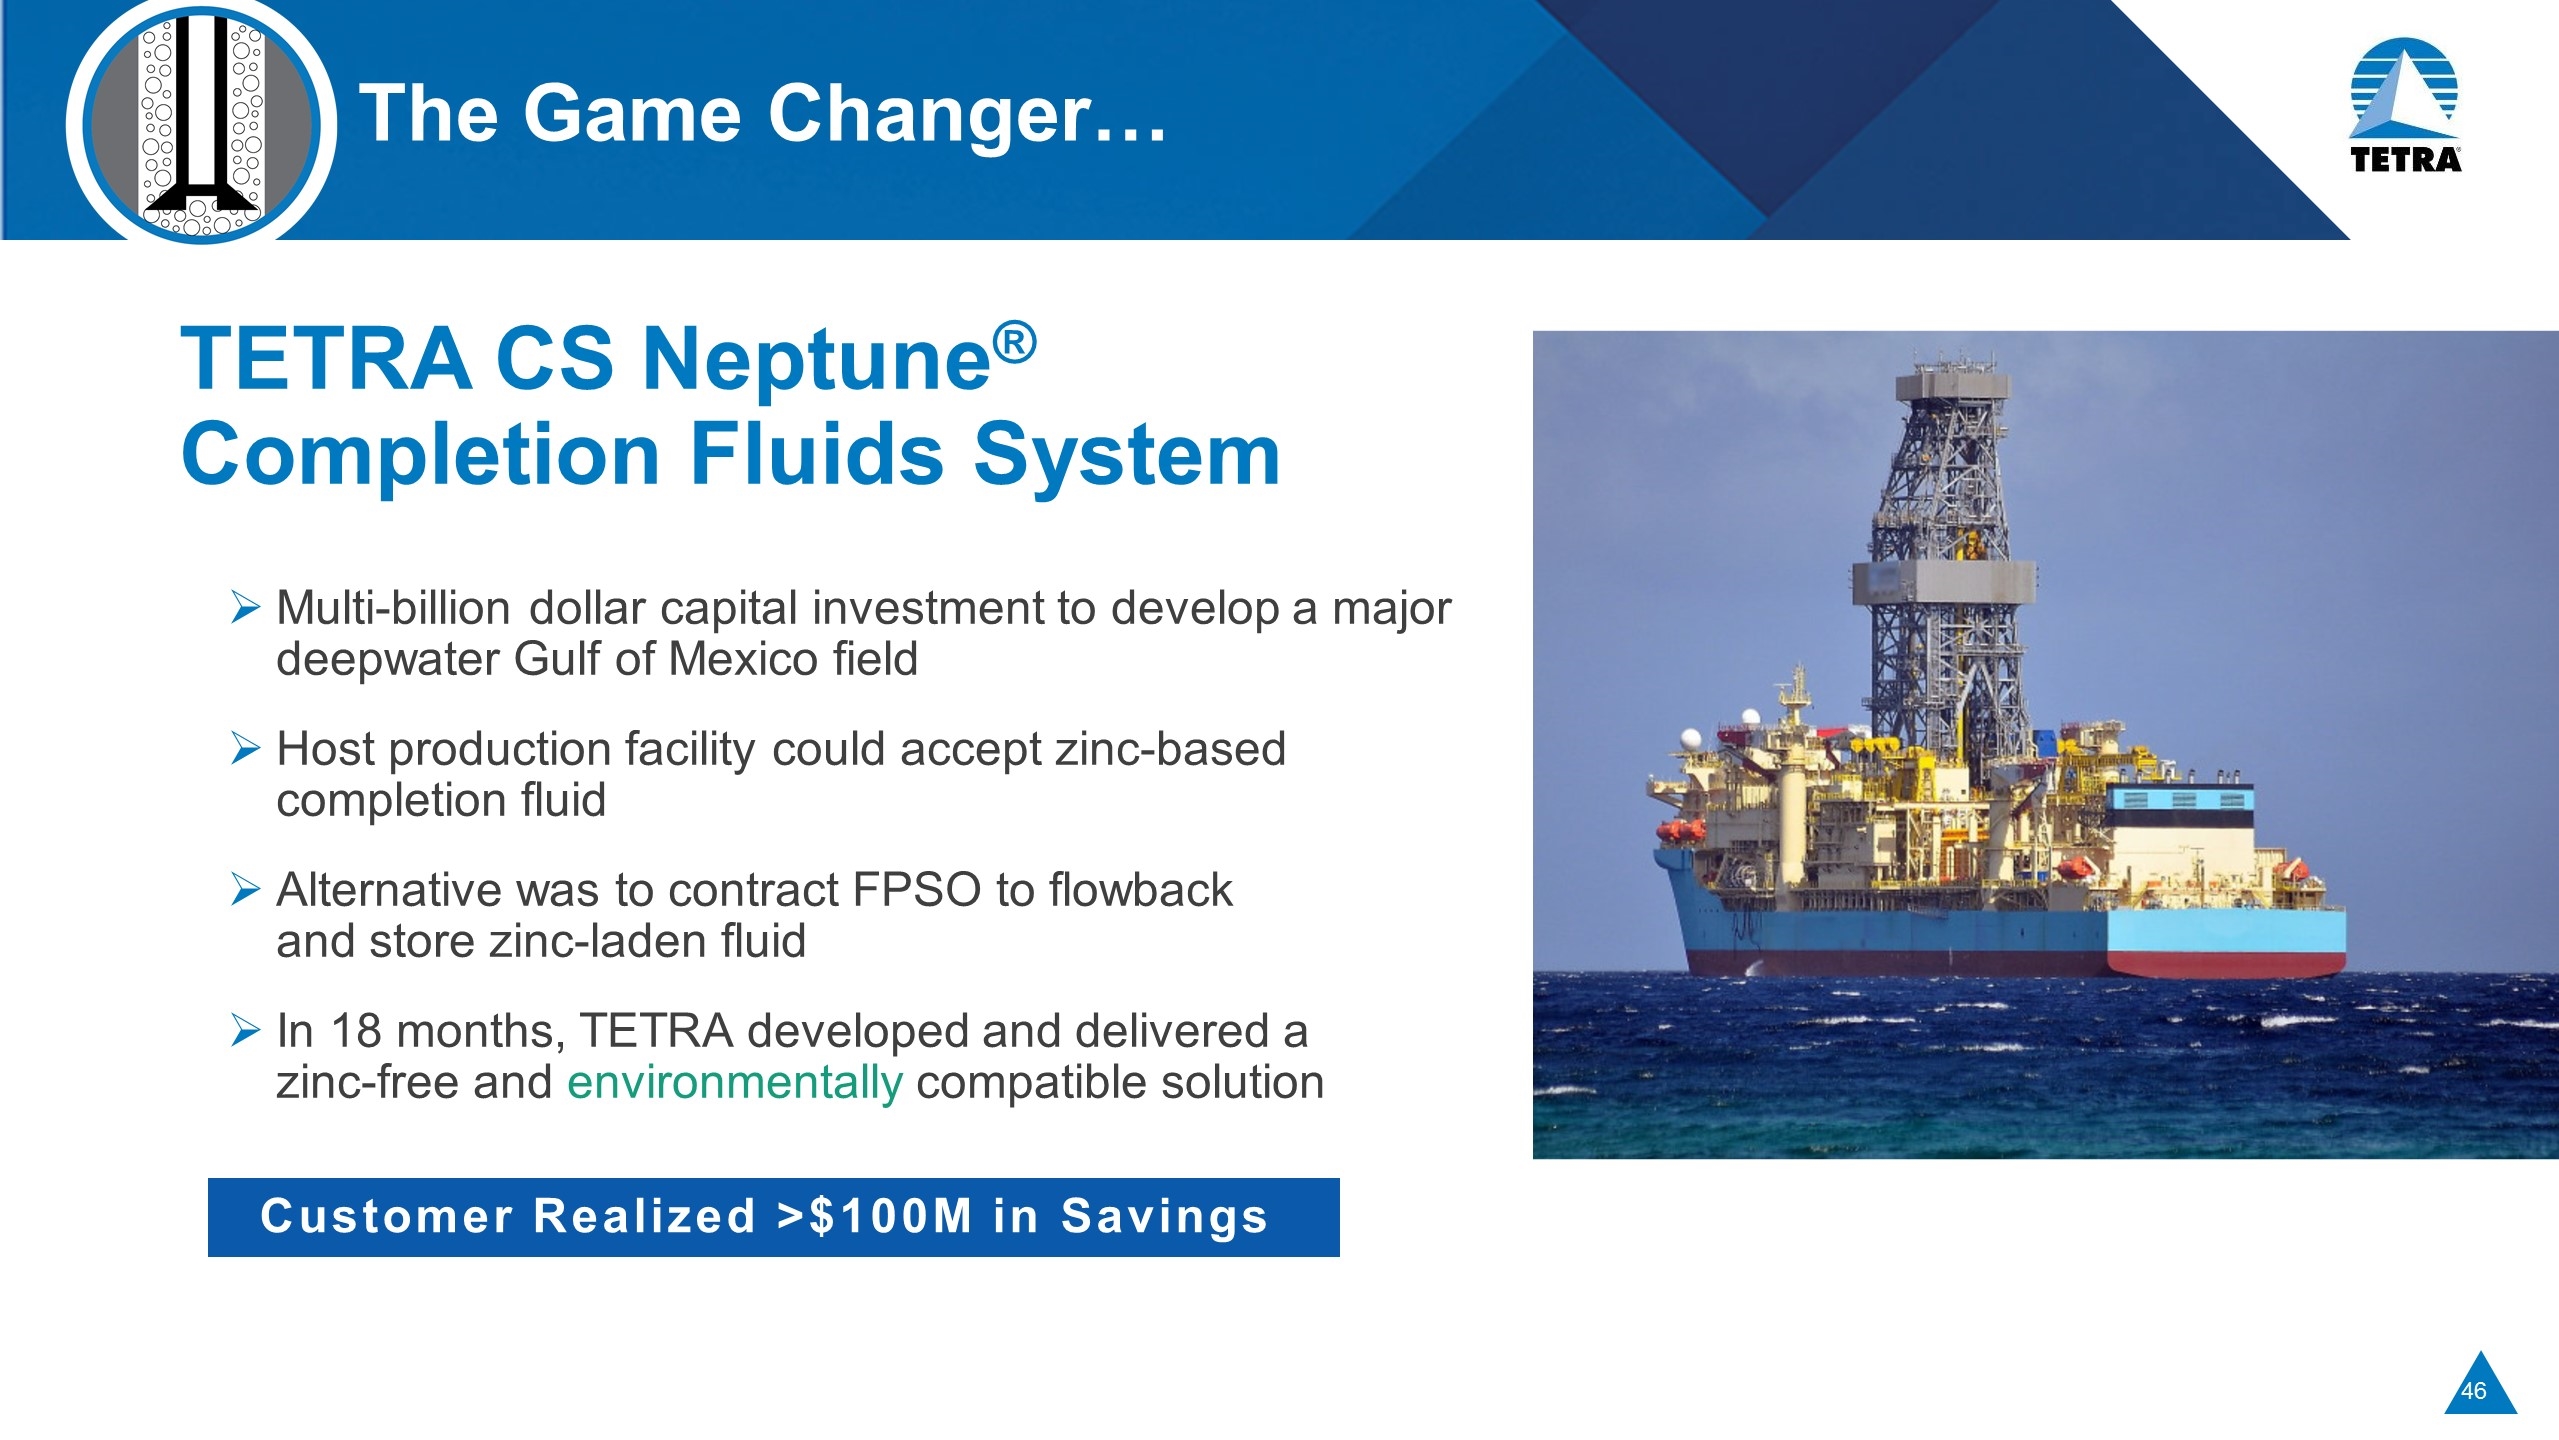
The Game Changer… TETRA CS Neptune® Completion Fluids System Multi-billion dollar capital investment to develop a major deepwater Gulf of Mexico field Host production facility could accept zinc-based completion fluid Alternative was to contract FPSO to flowback and store zinc-laden fluid In 18 months, TETRA developed and delivered a zinc-free and environmentally compatible solution Customer Realized >$100M in Savings
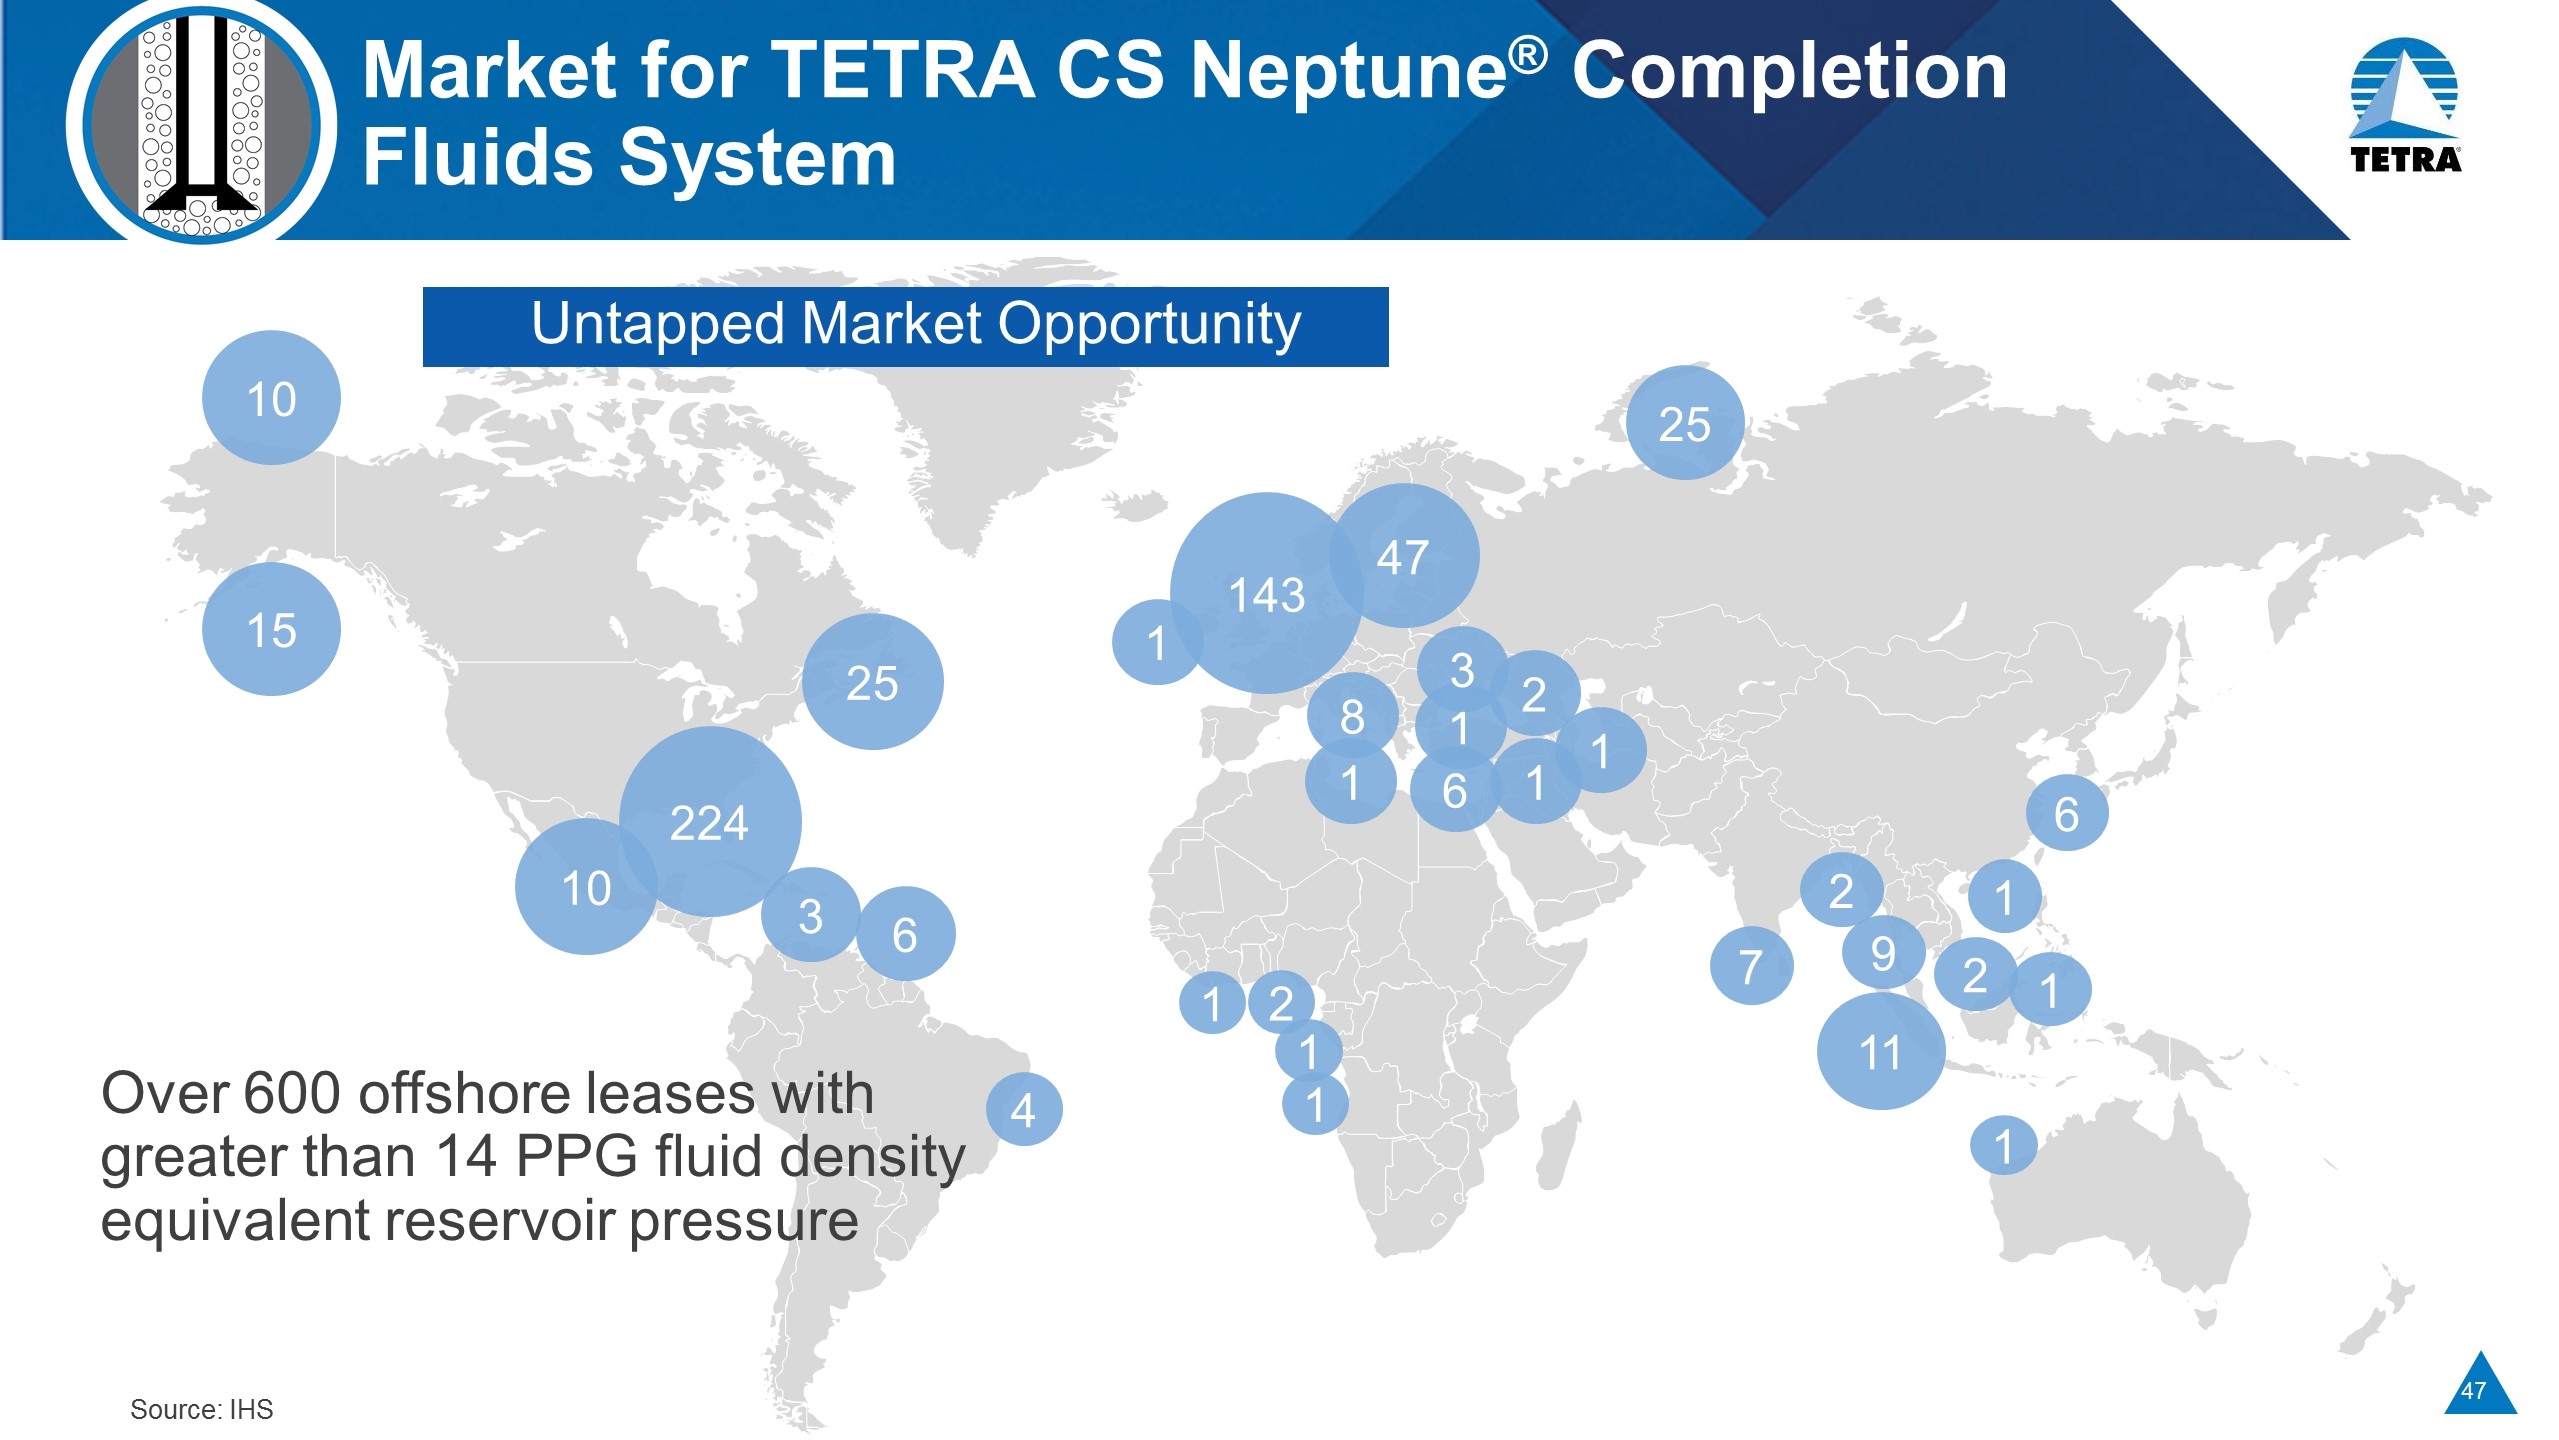
Market for TETRA CS Neptune® Completion Fluids System Over 600 offshore leases with greater than 14 PPG fluid density equivalent reservoir pressure 1 4 1 6 1 1 2 25 1 1 7 2 11 2 9 1 6 1 1 1 8 2 47 1 143 3 10 224 25 6 3 10 15 Untapped Market Opportunity Source: IHS
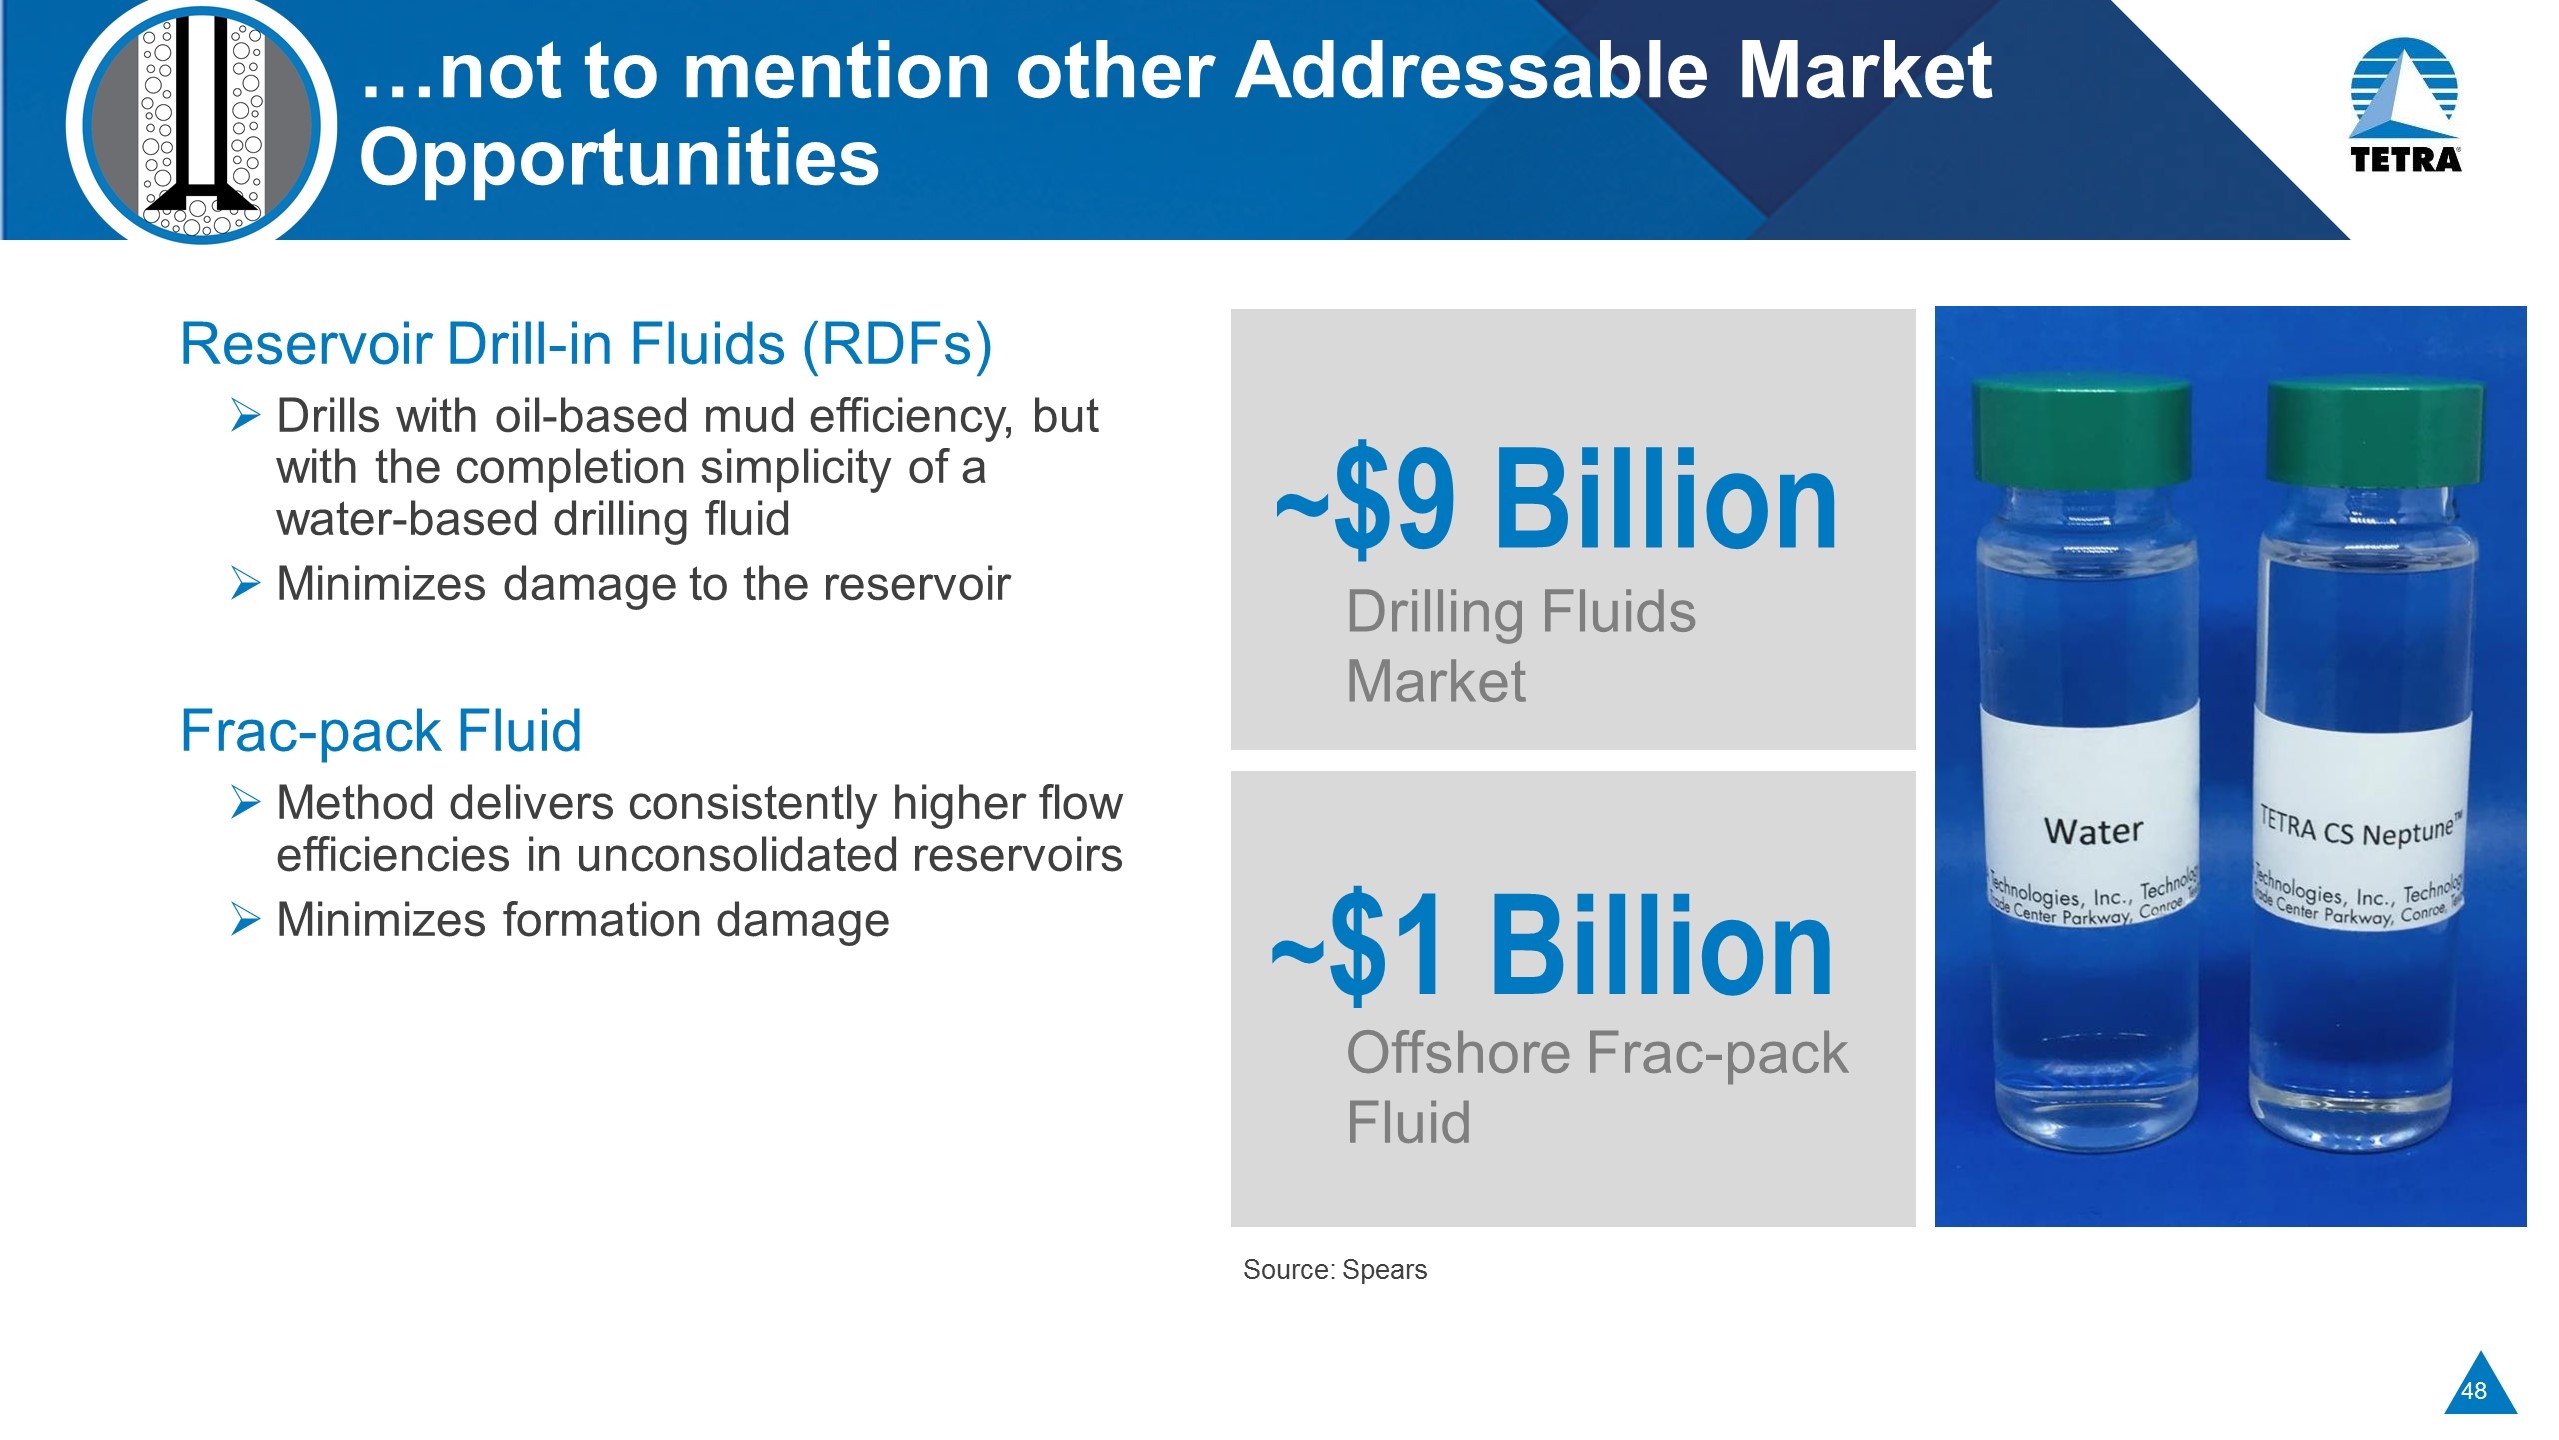
…not to mention other Addressable Market Opportunities Reservoir Drill-in Fluids (RDFs) Drills with oil-based mud efficiency, but with the completion simplicity of a water-based drilling fluid Minimizes damage to the reservoir Frac-pack Fluid Method delivers consistently higher flow efficiencies in unconsolidated reservoirs Minimizes formation damage ~$9 Billion Drilling Fluids Market ~$1 Billion Offshore Frac-pack Fluid Source: Spears
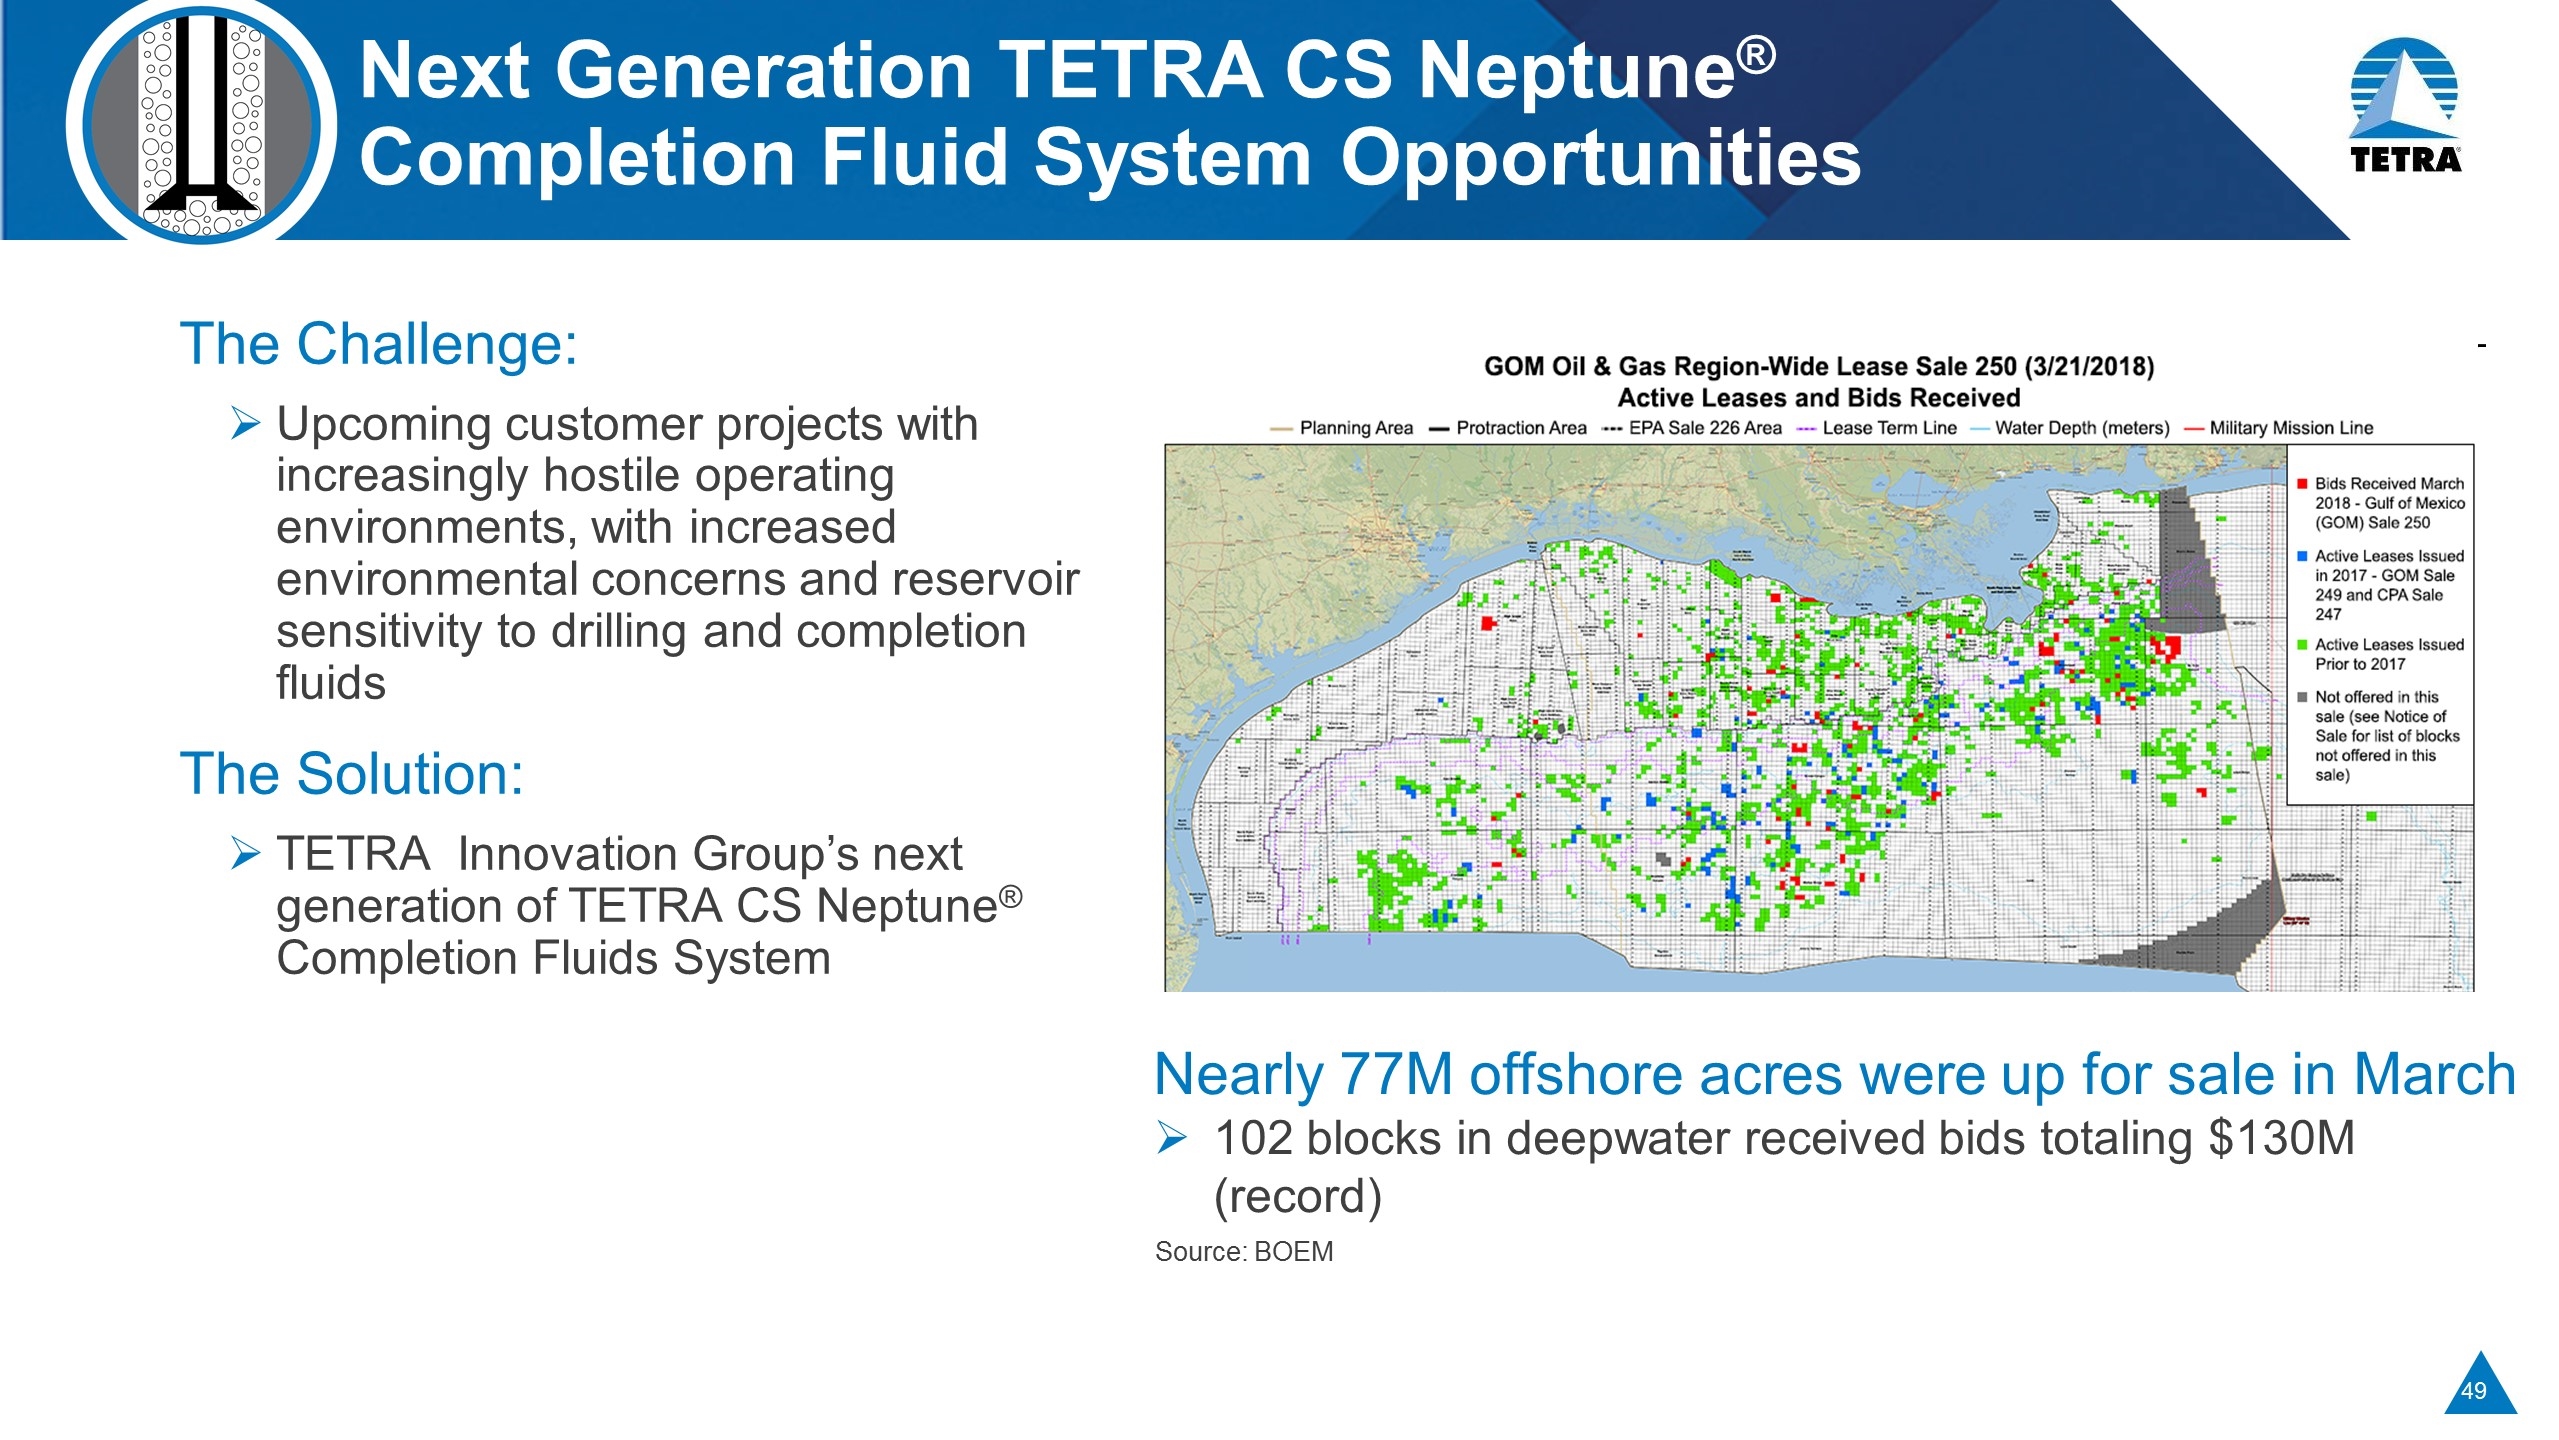
Next Generation TETRA CS Neptune® Completion Fluid System Opportunities The Challenge: Upcoming customer projects with increasingly hostile operating environments, with increased environmental concerns and reservoir sensitivity to drilling and completion fluids The Solution: TETRA Innovation Group’s next generation of TETRA CS Neptune® Completion Fluids System Nearly 77M offshore acres were up for sale in March 102 blocks in deepwater received bids totaling $130M (record) Source: BOEM
Completion Fluids & Products Perspectives Beyond 2018 TETRA CS Neptune® Completion Fluids System projects, diversification and spare capacity positioned to capture growing market Strong returns on capital as volumes increase leveraging current infrastructure Expect to have 2 TETRA CS Neptune® Completion Fluids System projects in 2018 Targeting to be in 4 offshore markets by 2020 Customer acceptance is growing As deepwater market returns, significant opportunities to leverage our technology and infrastructure Offshore completion fluid sales do not require additional capital Industrial chemicals business performs well through the valleys of the cyclical O&G business
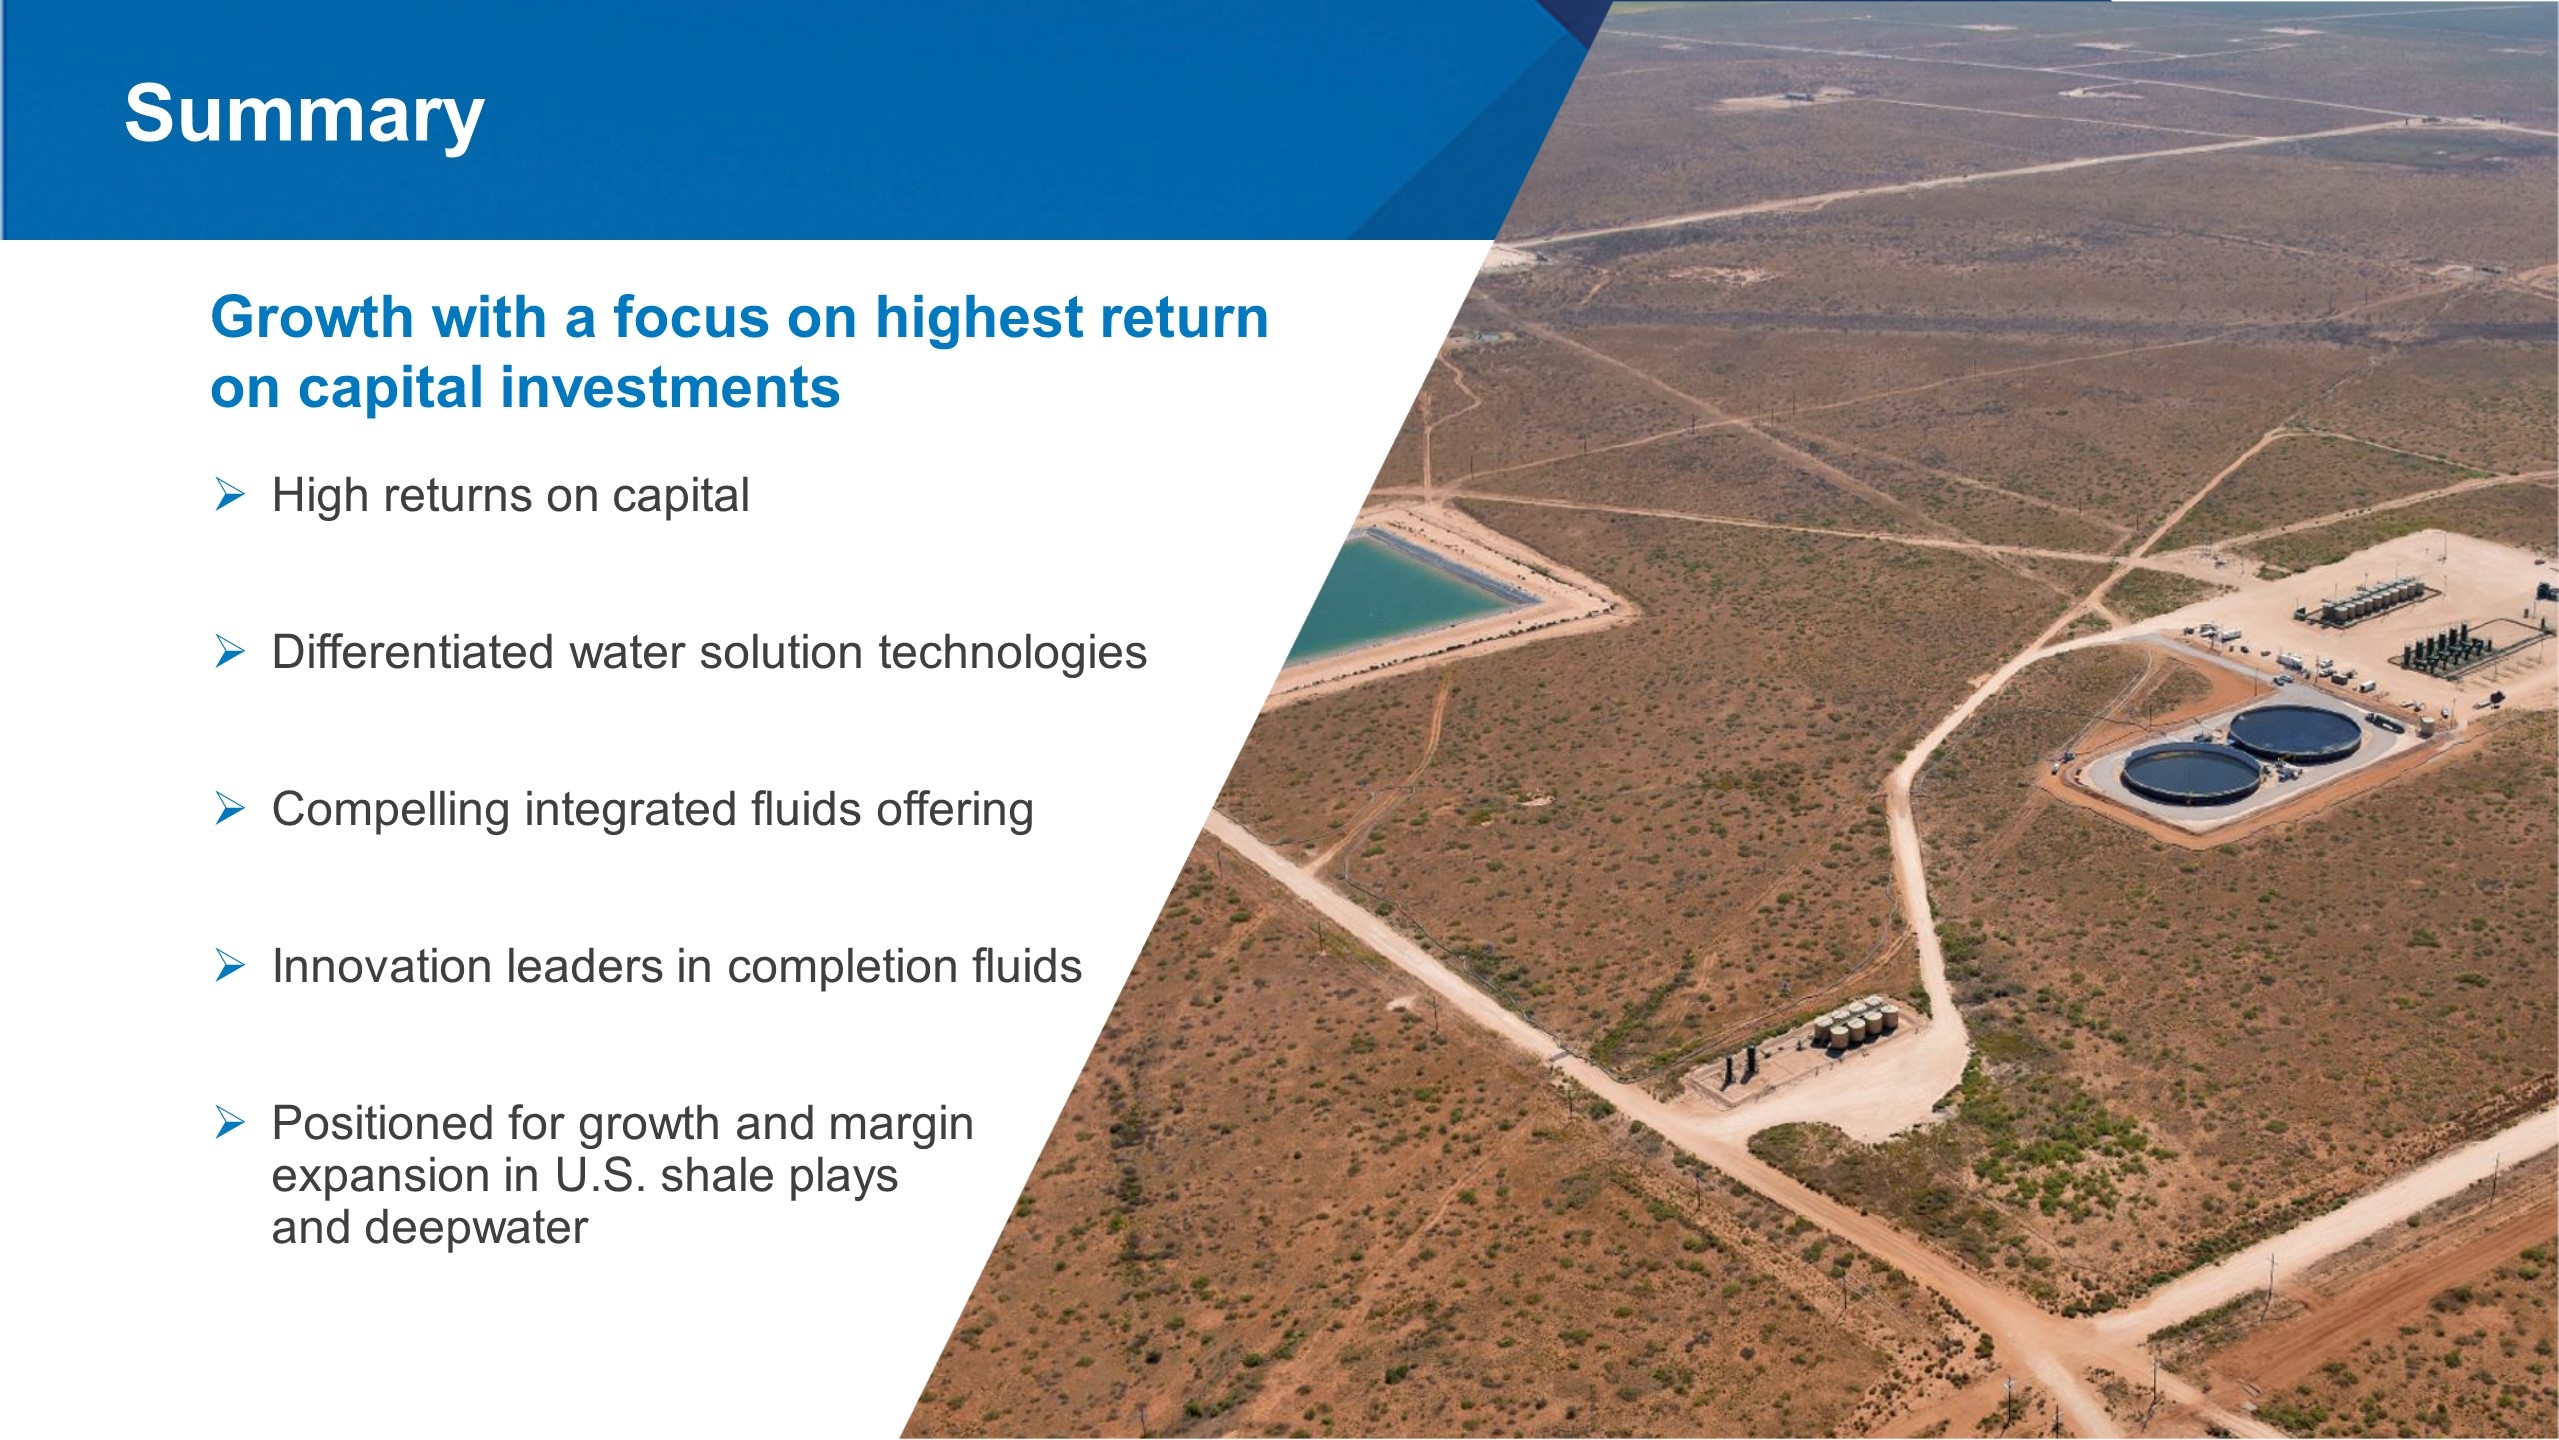
High returns on capital Differentiated water solution technologies Compelling integrated fluids offering Innovation leaders in completion fluids Positioned for growth and margin expansion in U.S. shale plays and deepwater Summary Growth with a focus on highest return on capital investments
Chemical Advantage Jim Funke Vice President
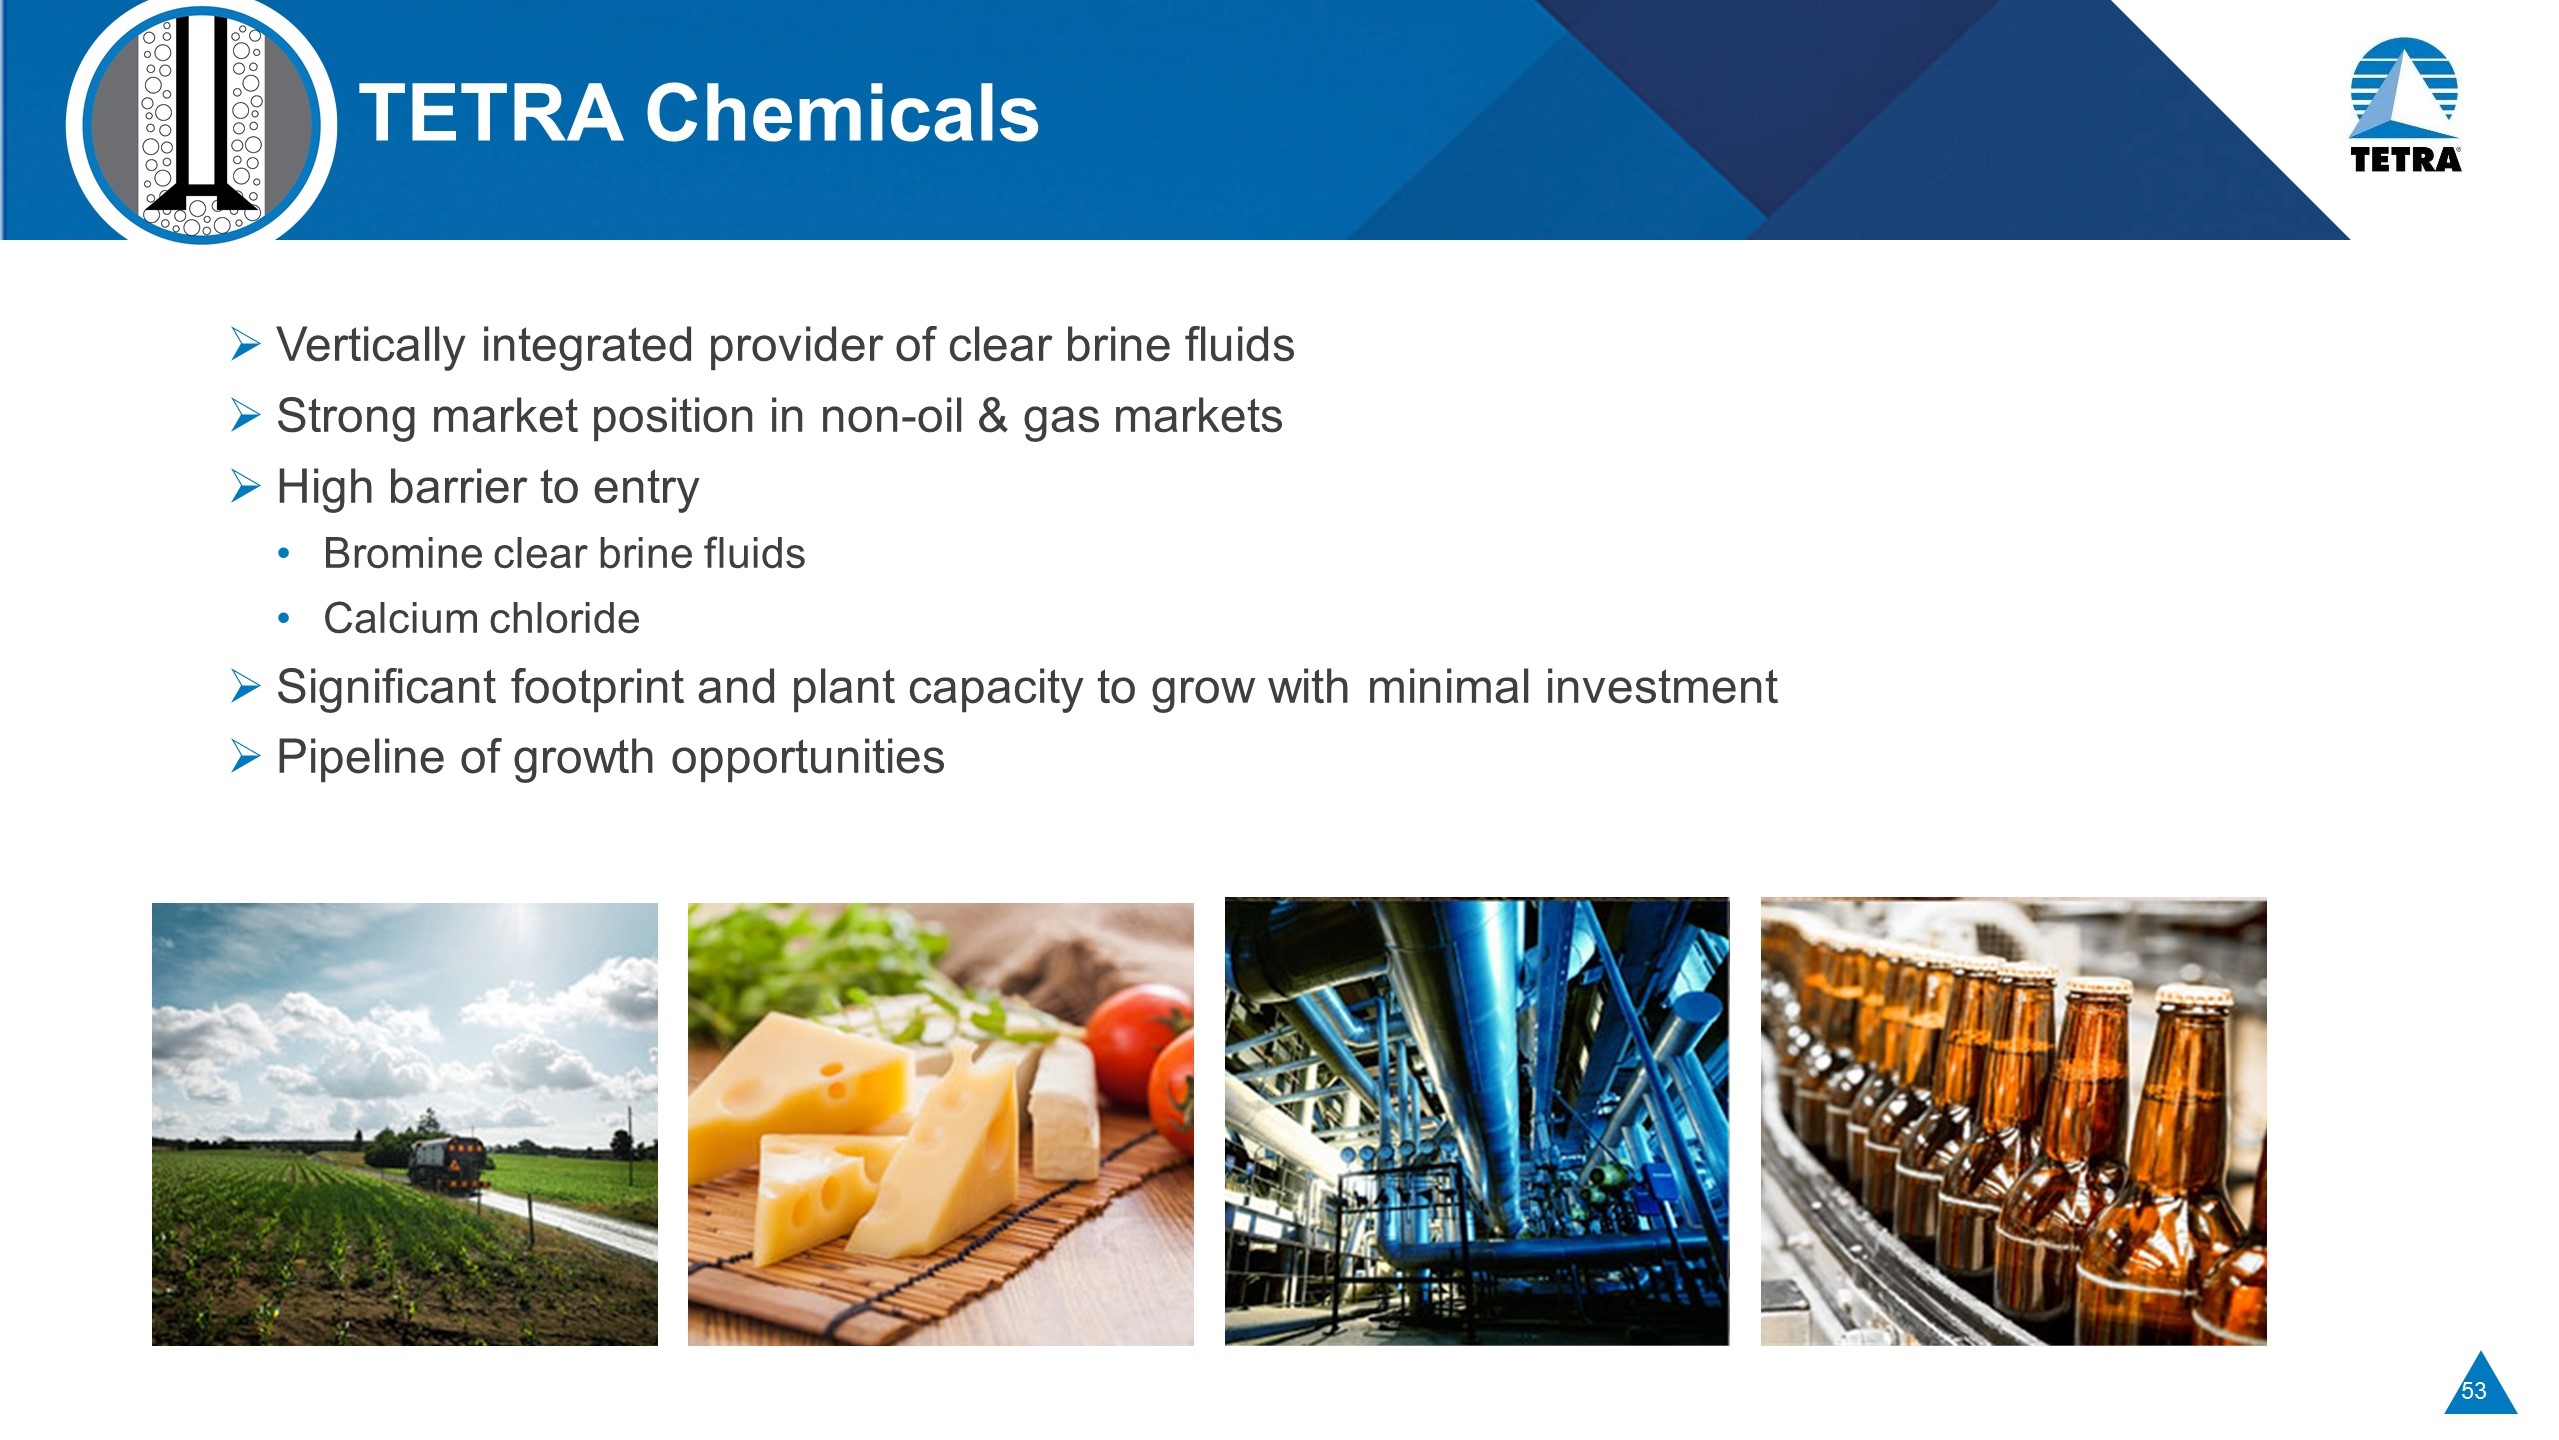
TETRA Chemicals Vertically integrated provider of clear brine fluids Strong market position in non-oil & gas markets High barrier to entry Bromine clear brine fluids Calcium chloride Significant footprint and plant capacity to grow with minimal investment Pipeline of growth opportunities
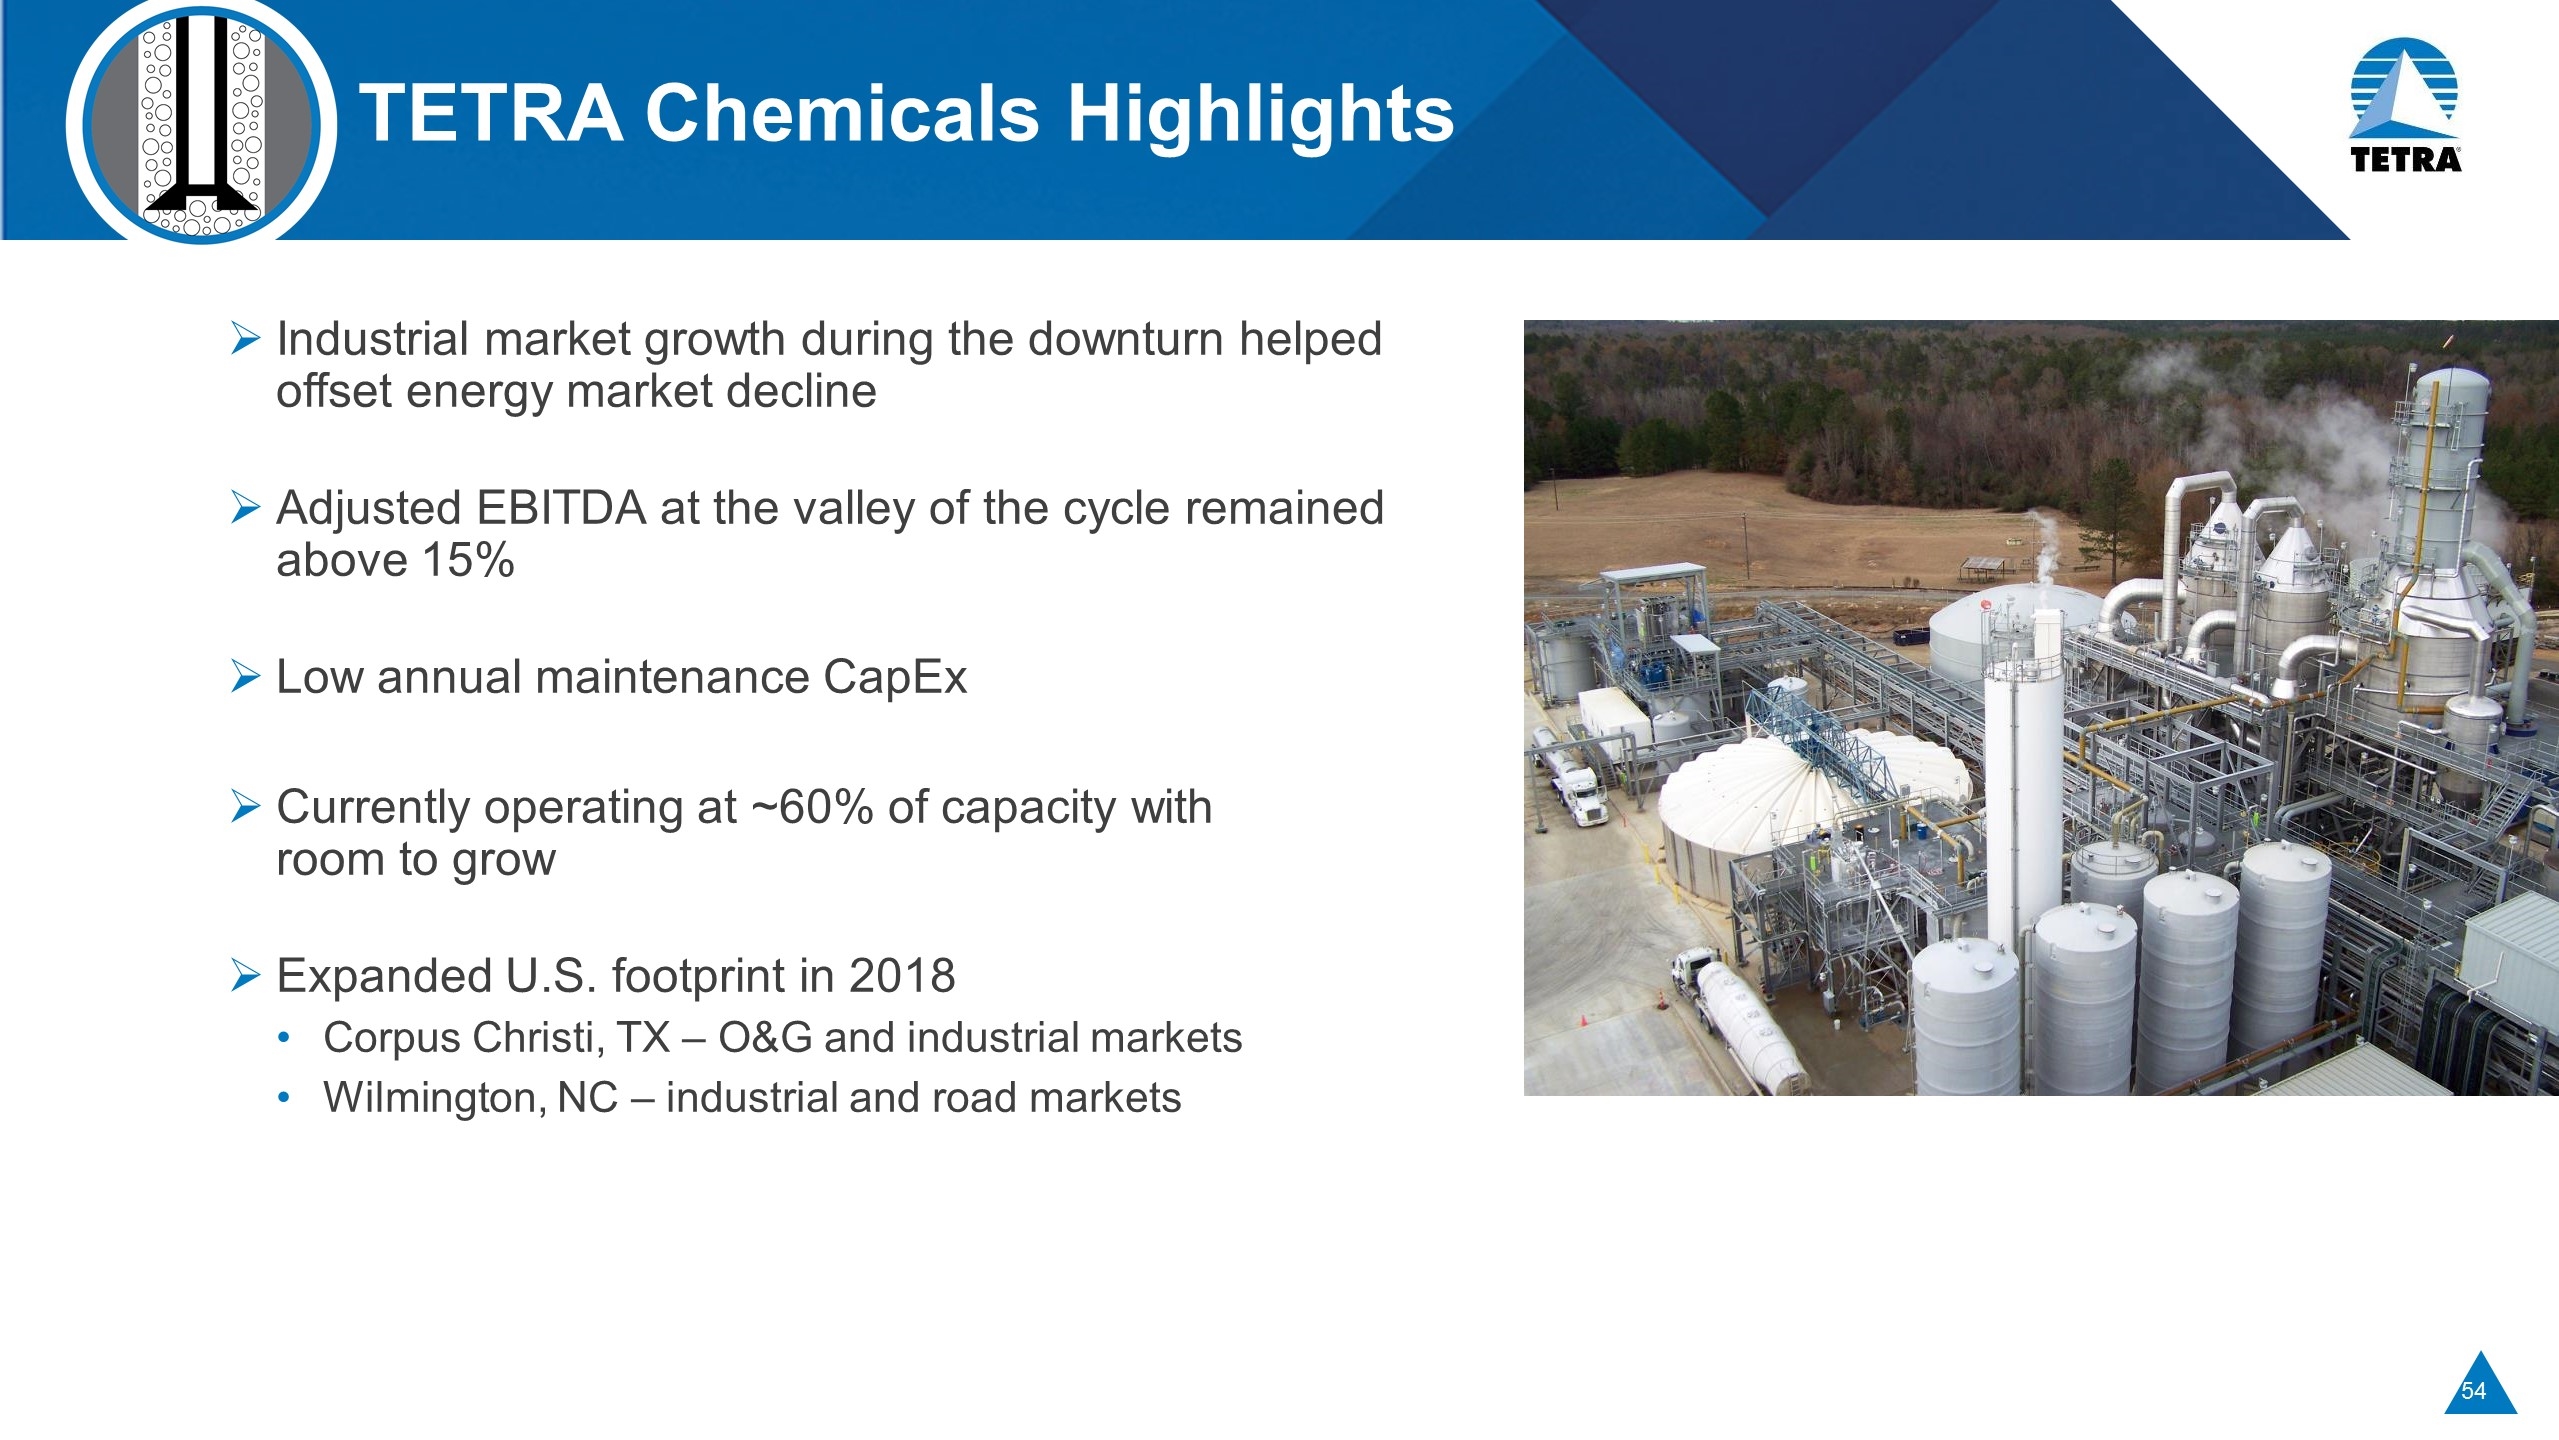
TETRA Chemicals Highlights Industrial market growth during the downturn helped offset energy market decline Adjusted EBITDA at the valley of the cycle remained above 15% Low annual maintenance CapEx Currently operating at ~60% of capacity with room to grow Expanded U.S. footprint in 2018 Corpus Christi, TX – O&G and industrial markets Wilmington, NC – industrial and road markets
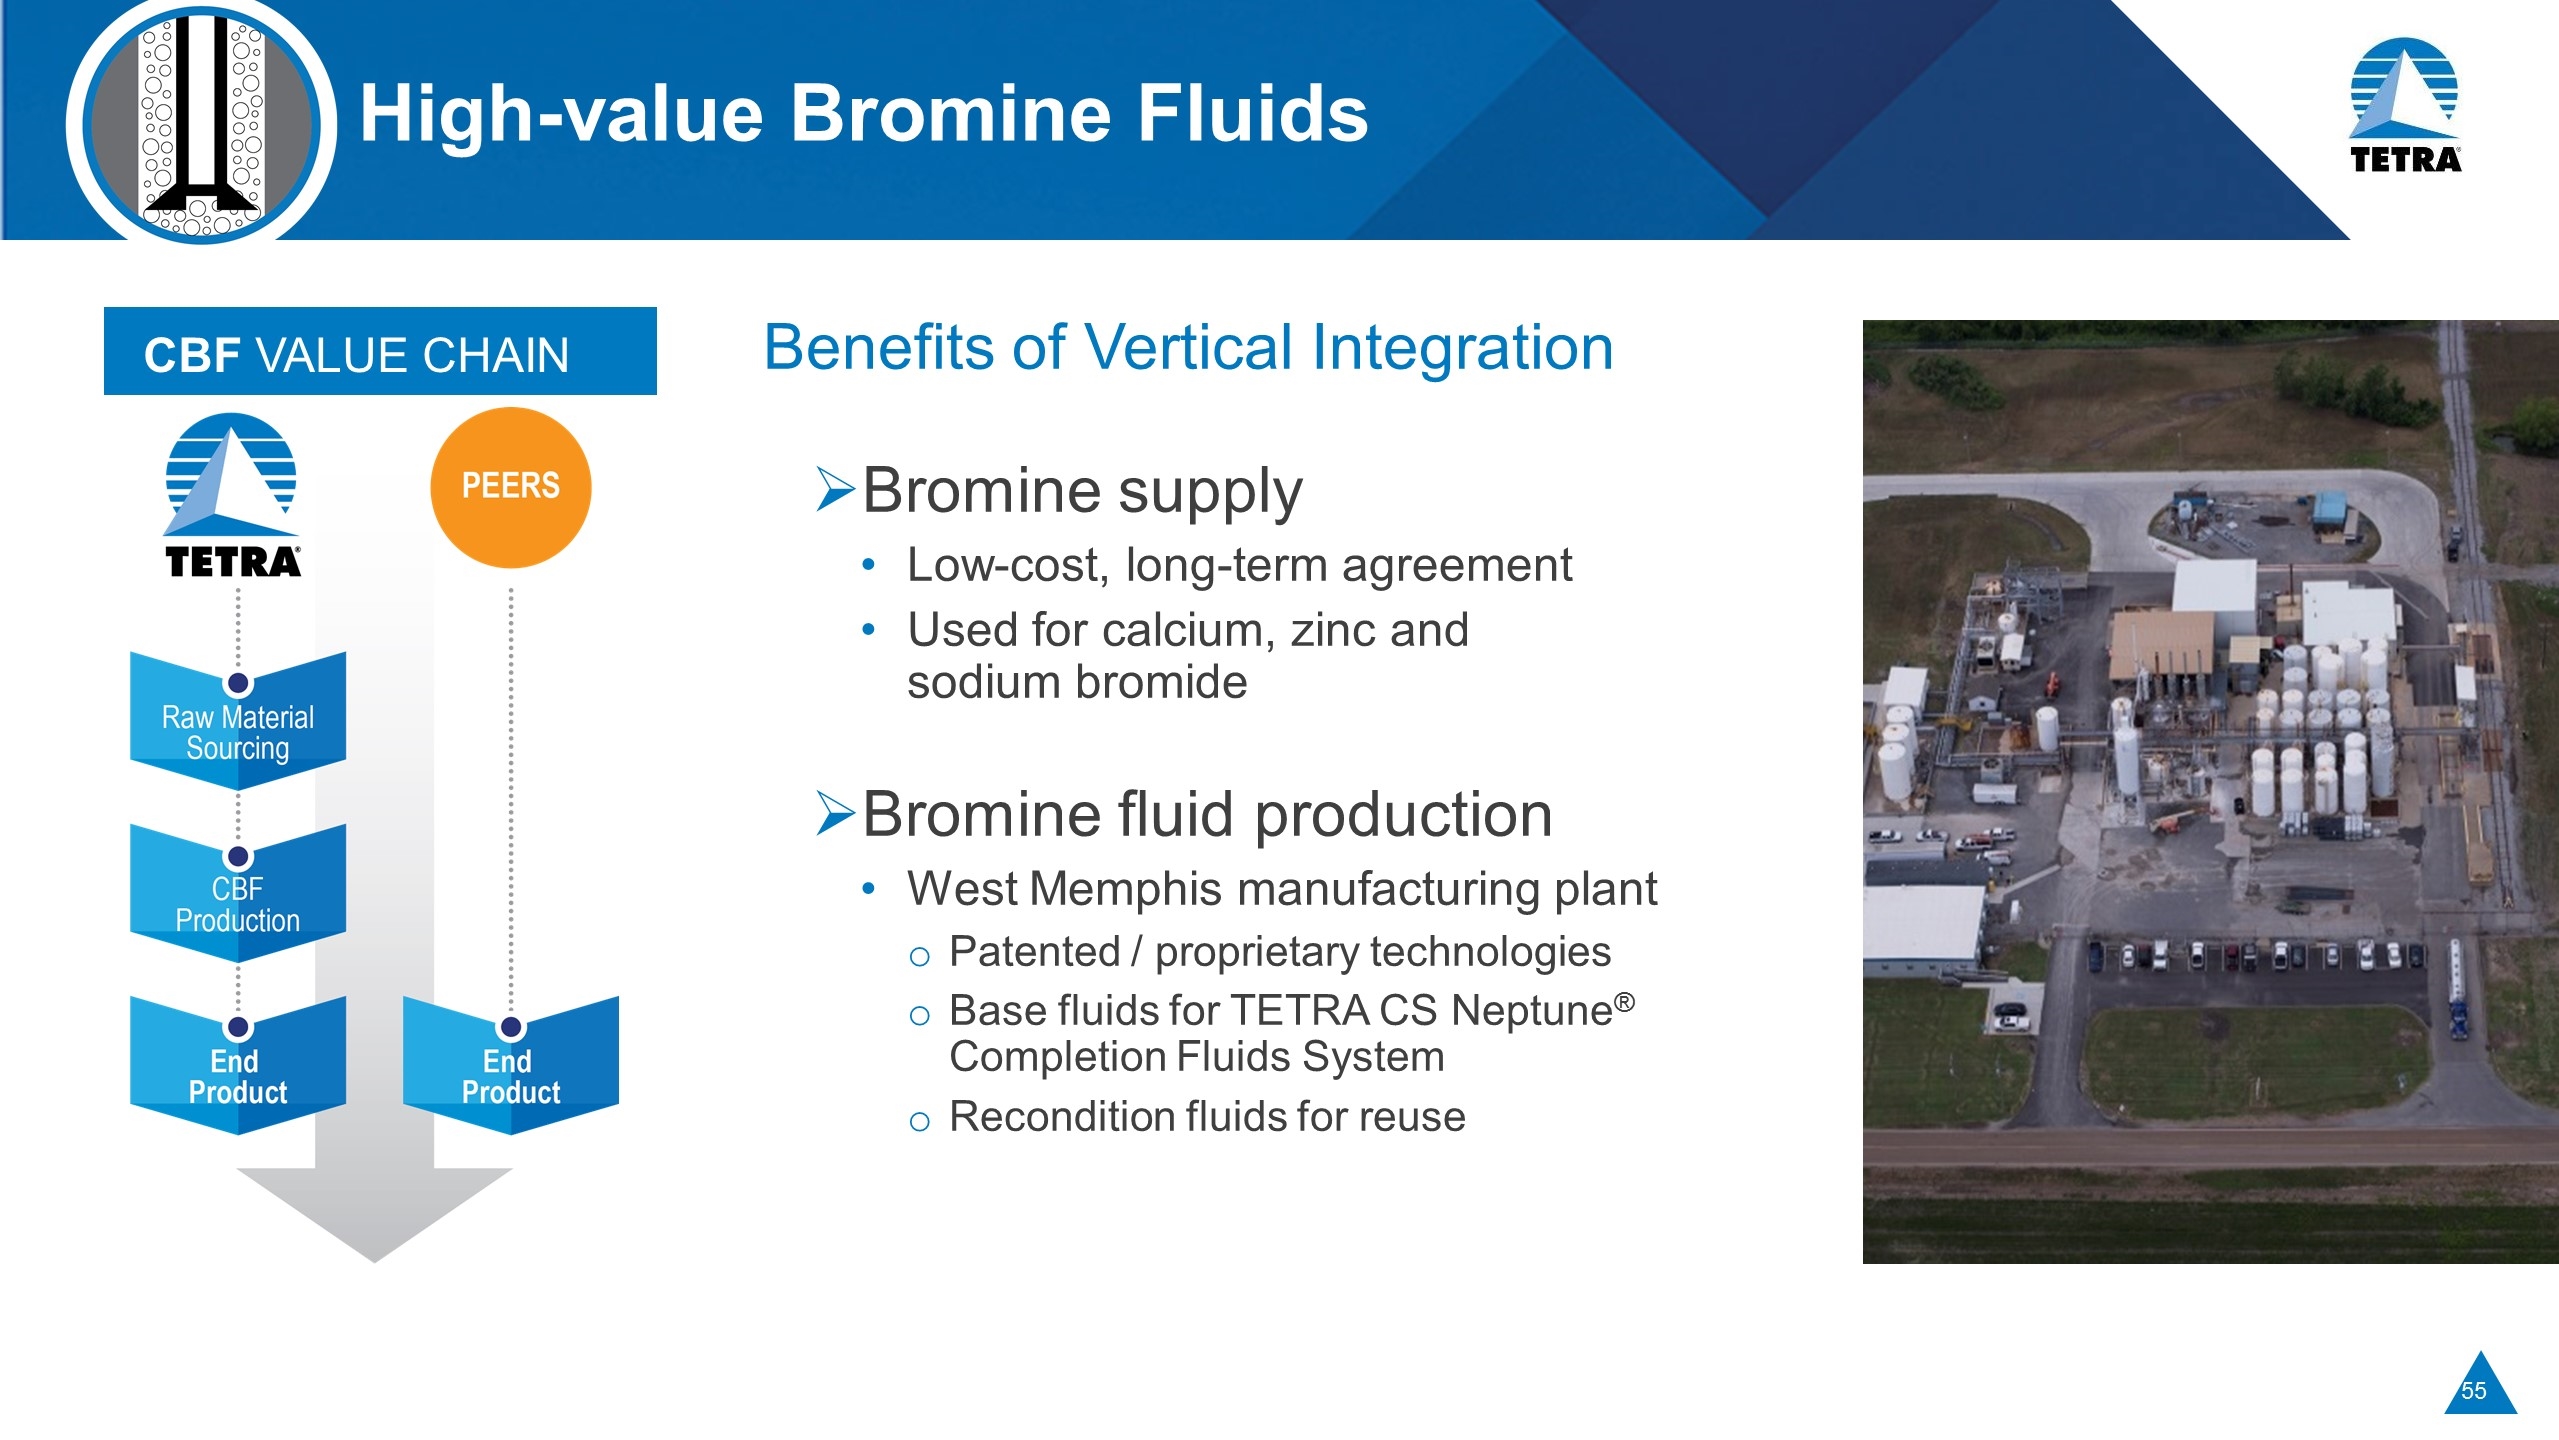
High-value Bromine Fluids Benefits of Vertical Integration Bromine supply Low-cost, long-term agreement Used for calcium, zinc and sodium bromide Bromine fluid production West Memphis manufacturing plant Patented / proprietary technologies Base fluids for TETRA CS Neptune® Completion Fluids System Recondition fluids for reuse CBF VALUE CHAIN
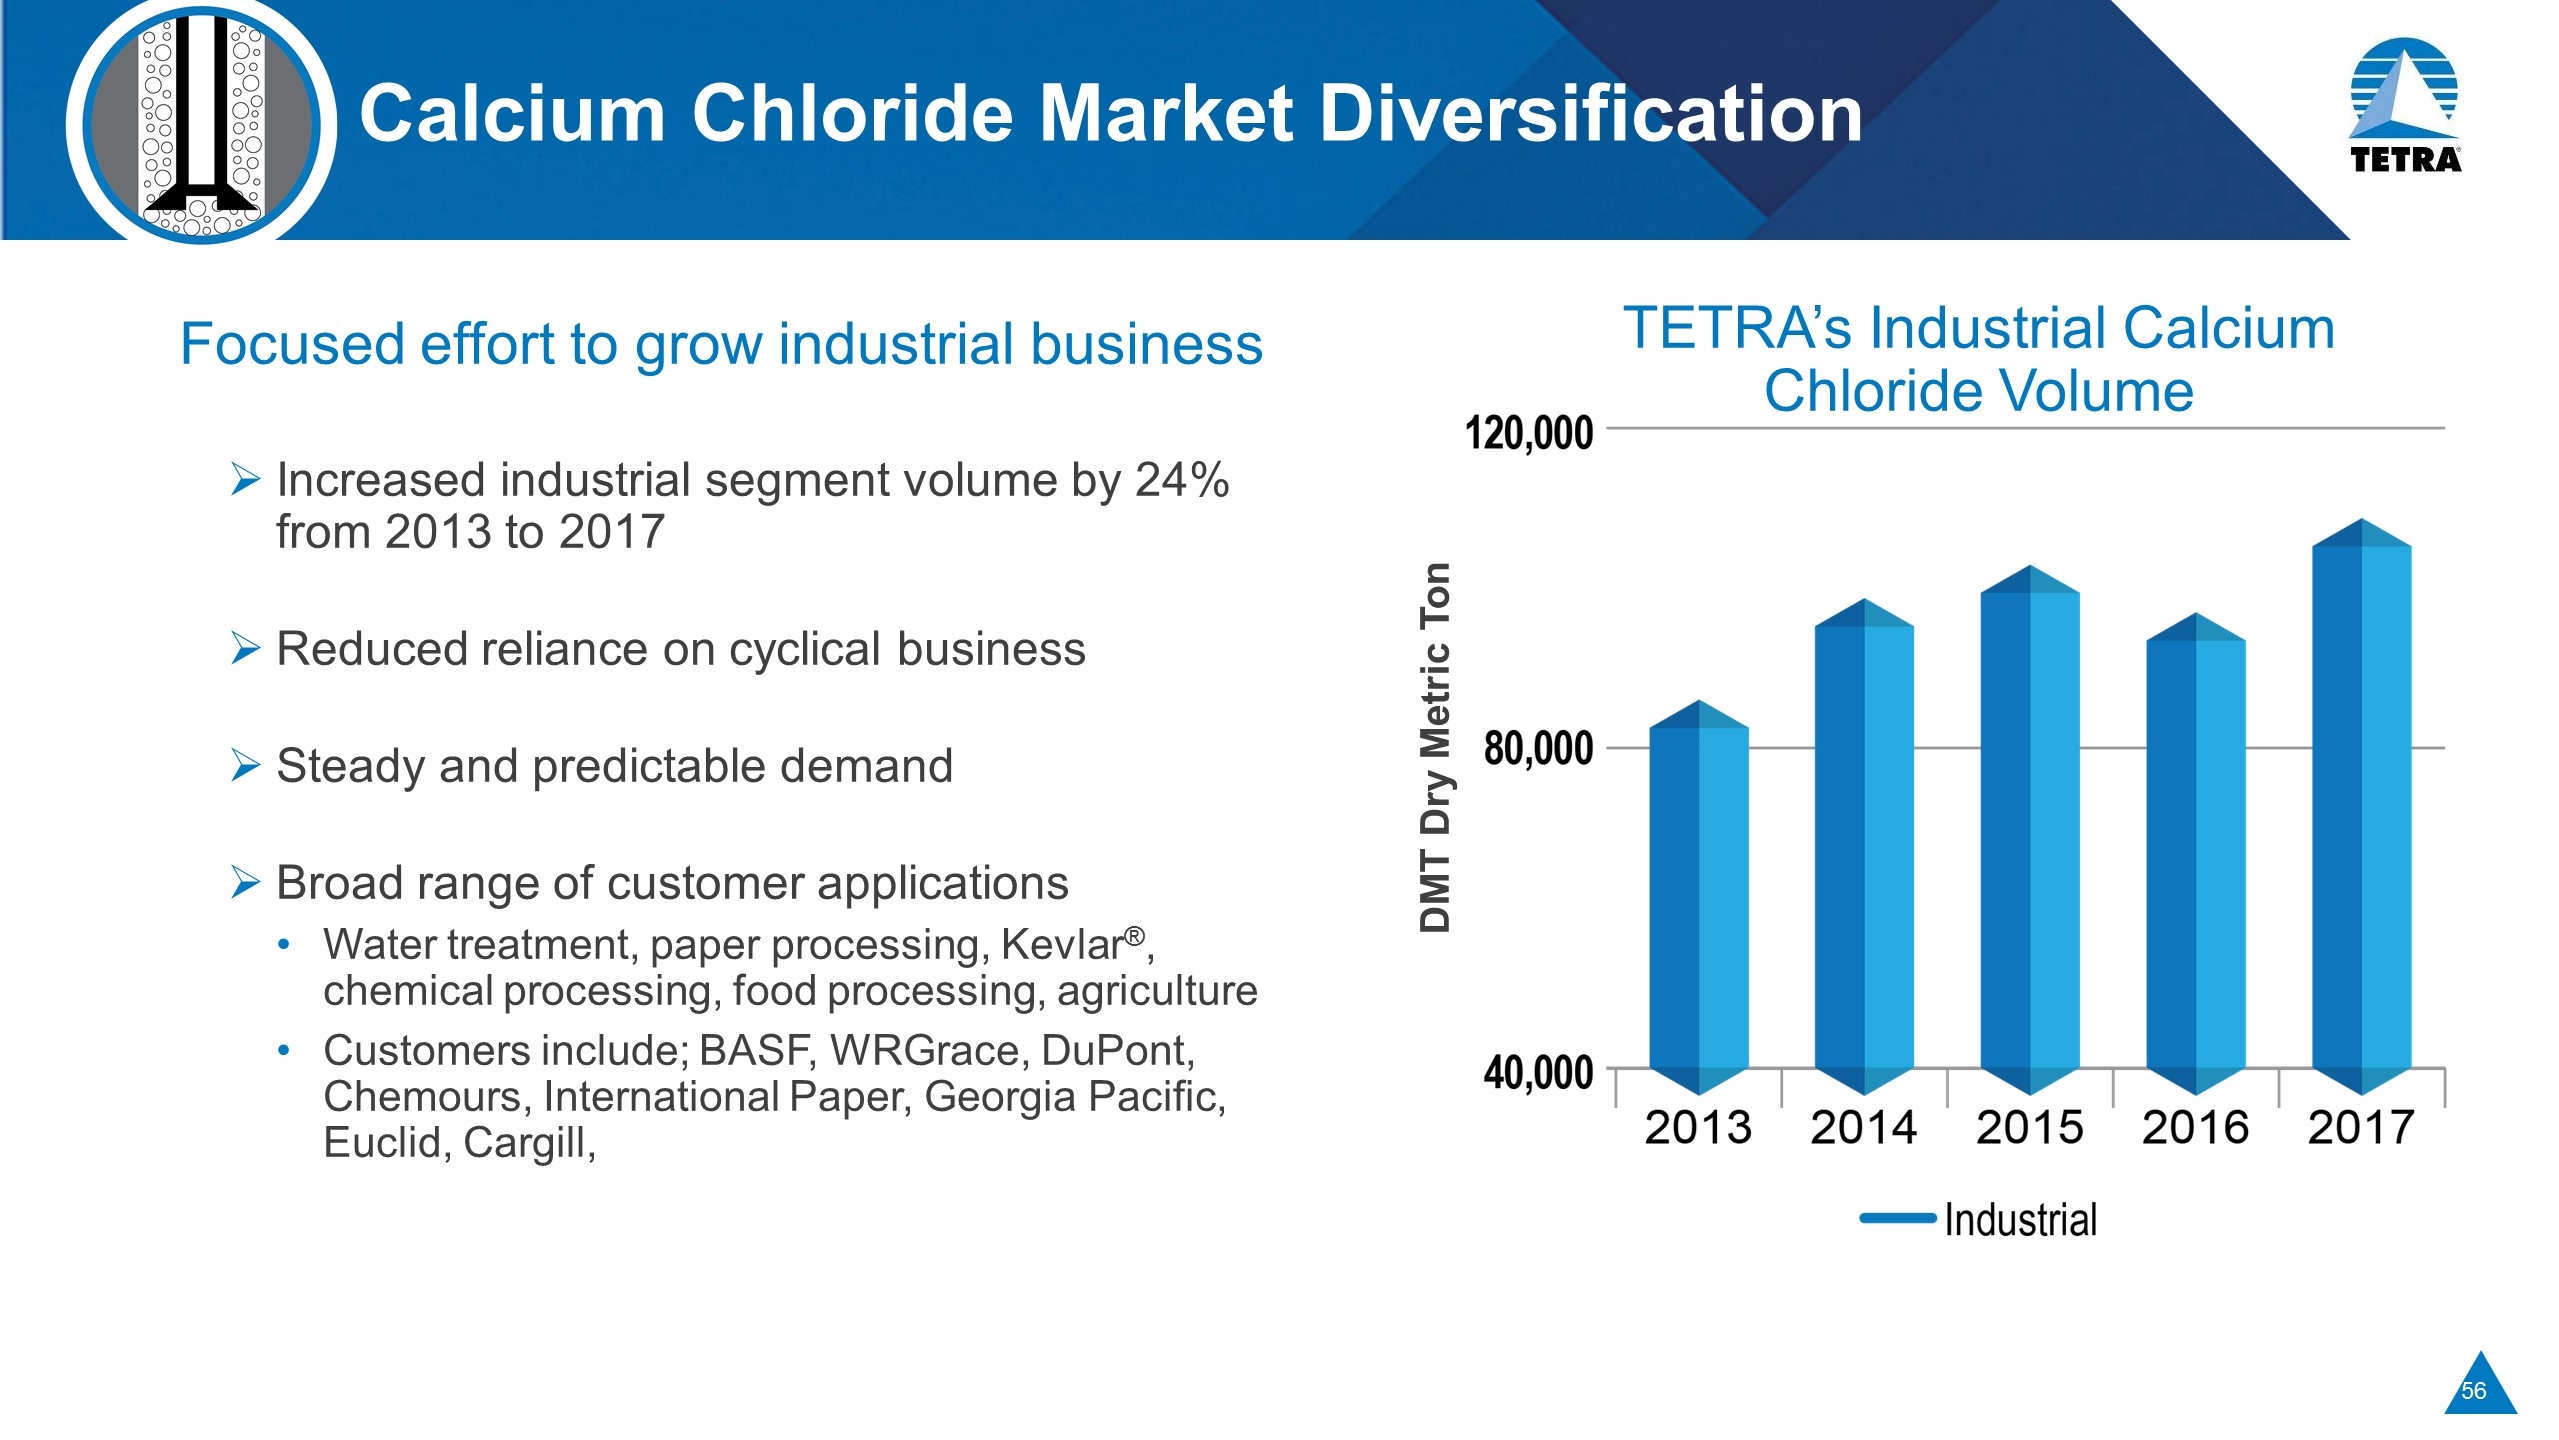
Calcium Chloride Market Diversification Focused effort to grow industrial business Increased industrial segment volume by 24% from 2013 to 2017 Reduced reliance on cyclical business Steady and predictable demand Broad range of customer applications Water treatment, paper processing, Kevlar®, chemical processing, food processing, agriculture Customers include; BASF, WRGrace, DuPont, Chemours, International Paper, Georgia Pacific, Euclid, Cargill, TETRA’s Industrial Calcium Chloride Volume DMT Dry Metric Ton
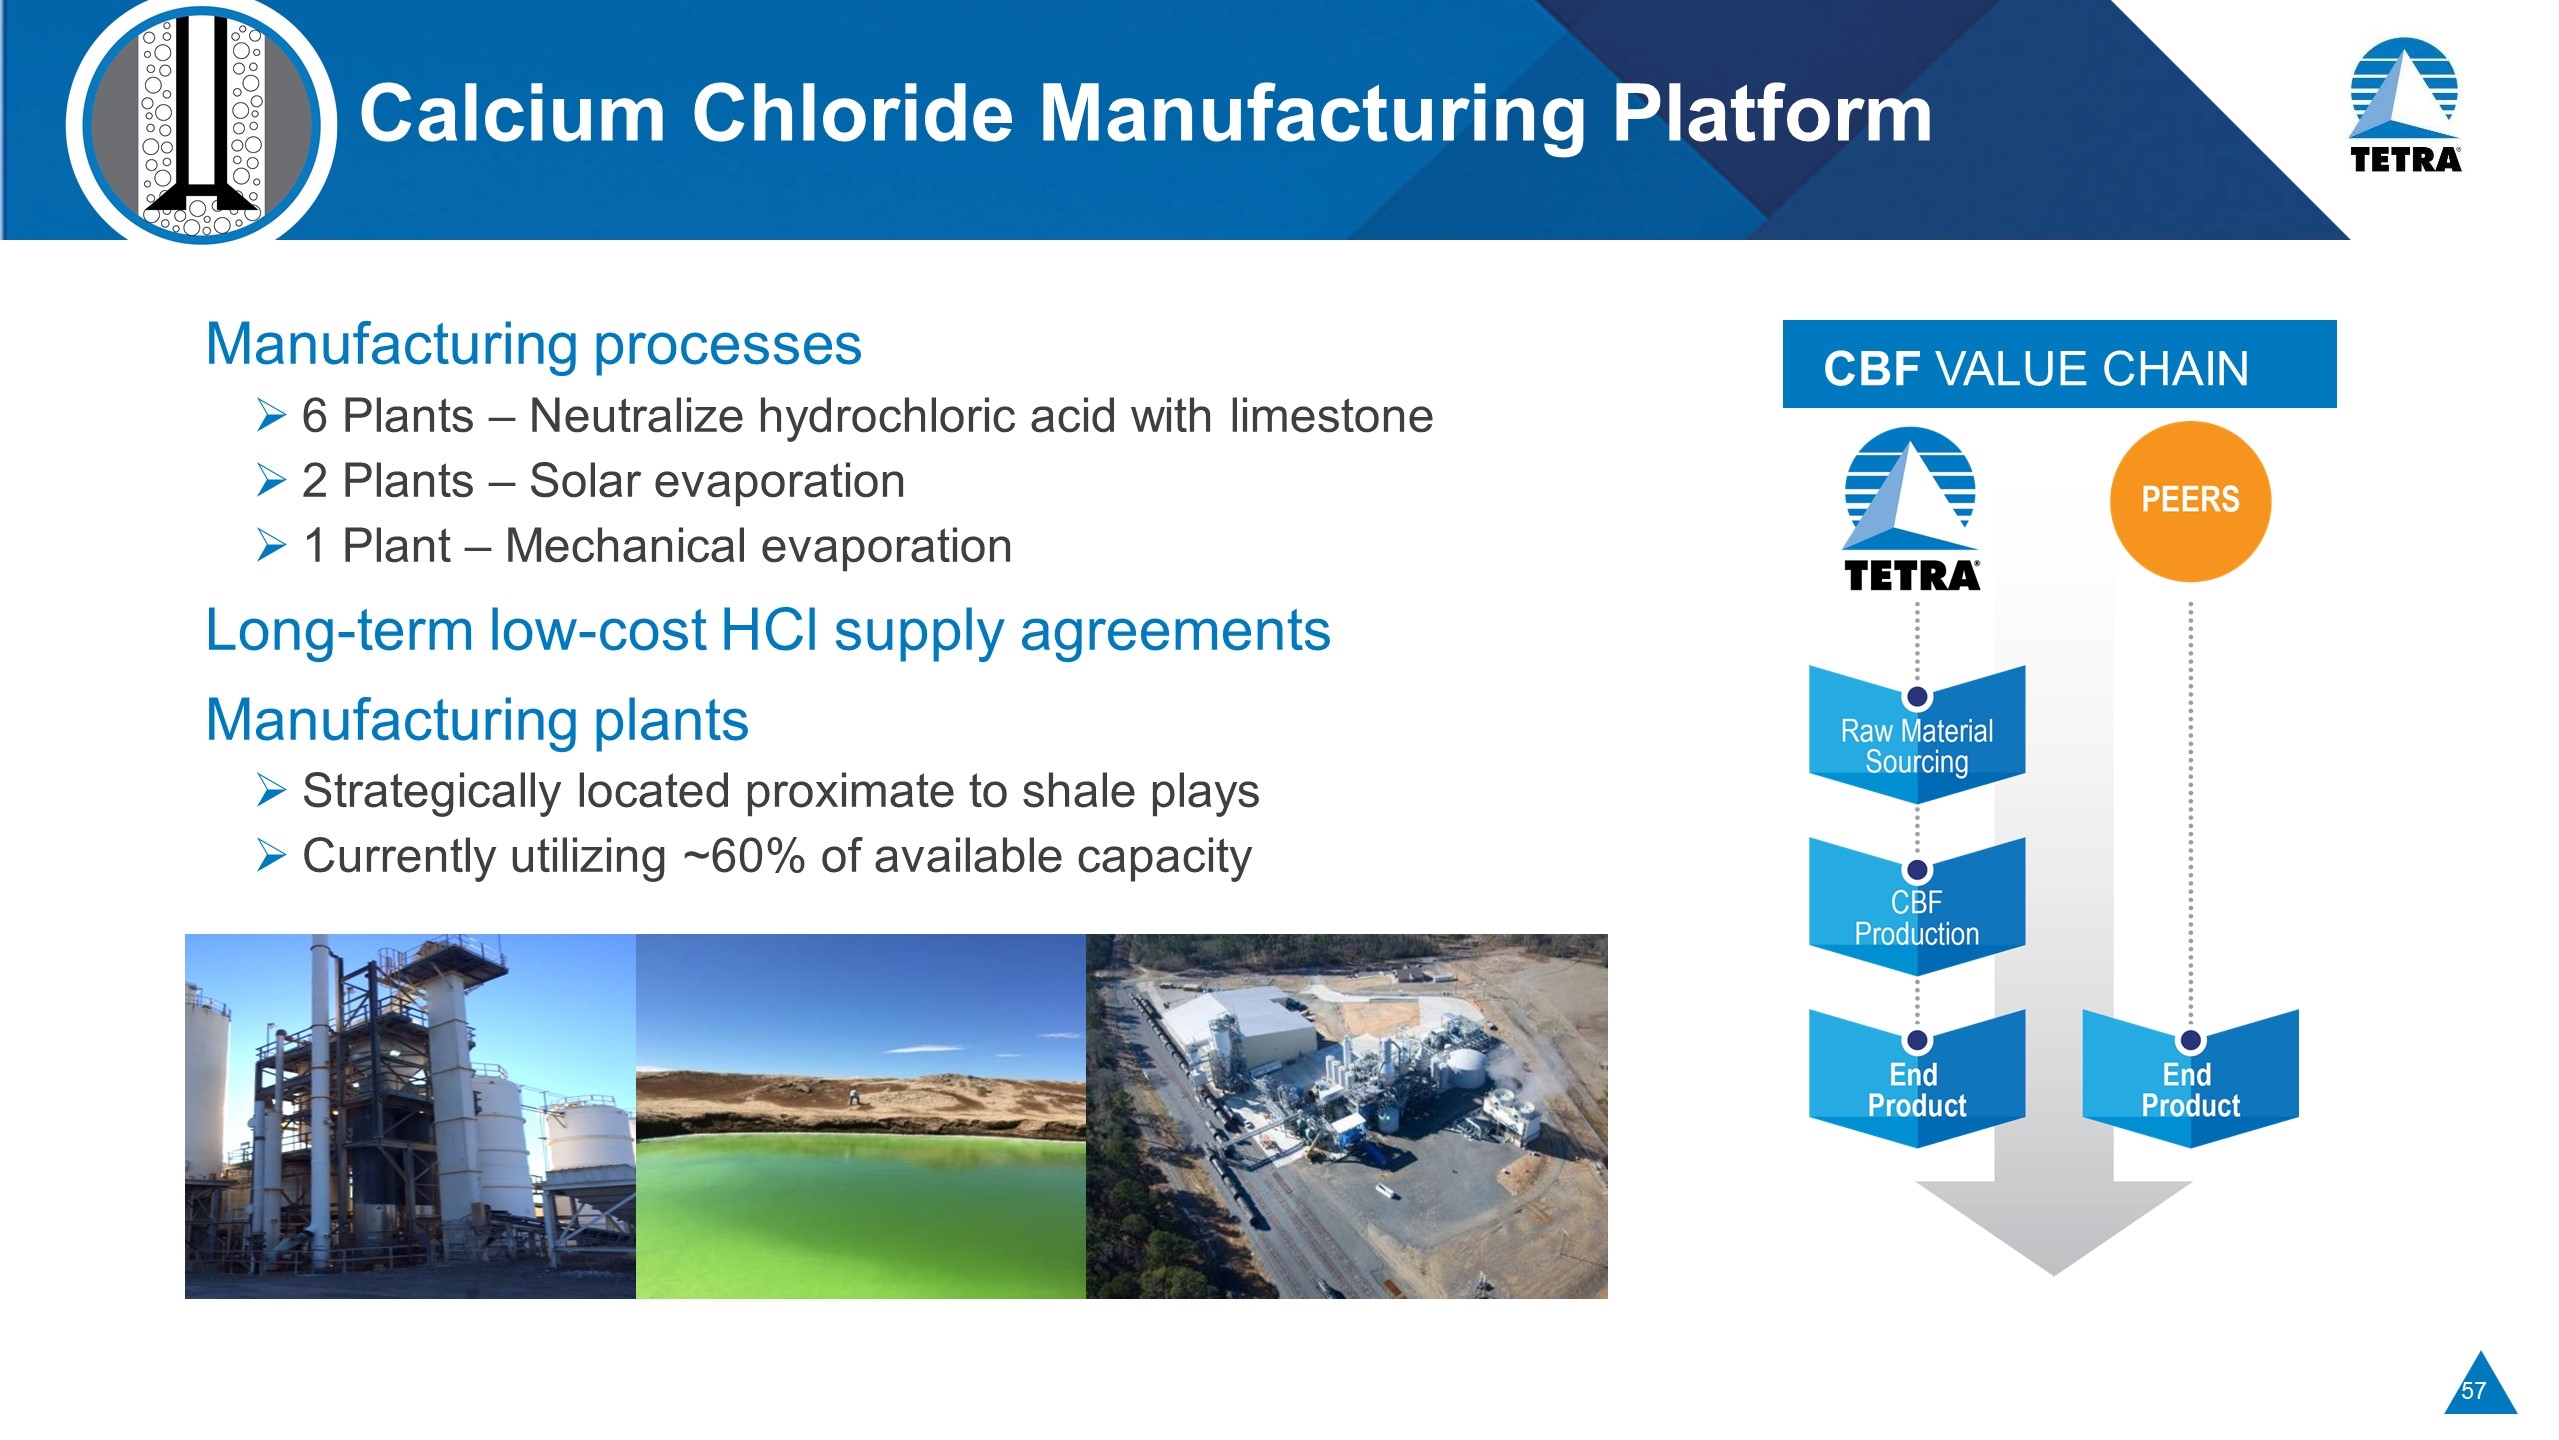
Calcium Chloride Manufacturing Platform Manufacturing processes 6 Plants – Neutralize hydrochloric acid with limestone 2 Plants – Solar evaporation 1 Plant – Mechanical evaporation Long-term low-cost HCl supply agreements Manufacturing plants Strategically located proximate to shale plays Currently utilizing ~60% of available capacity CBF VALUE CHAIN
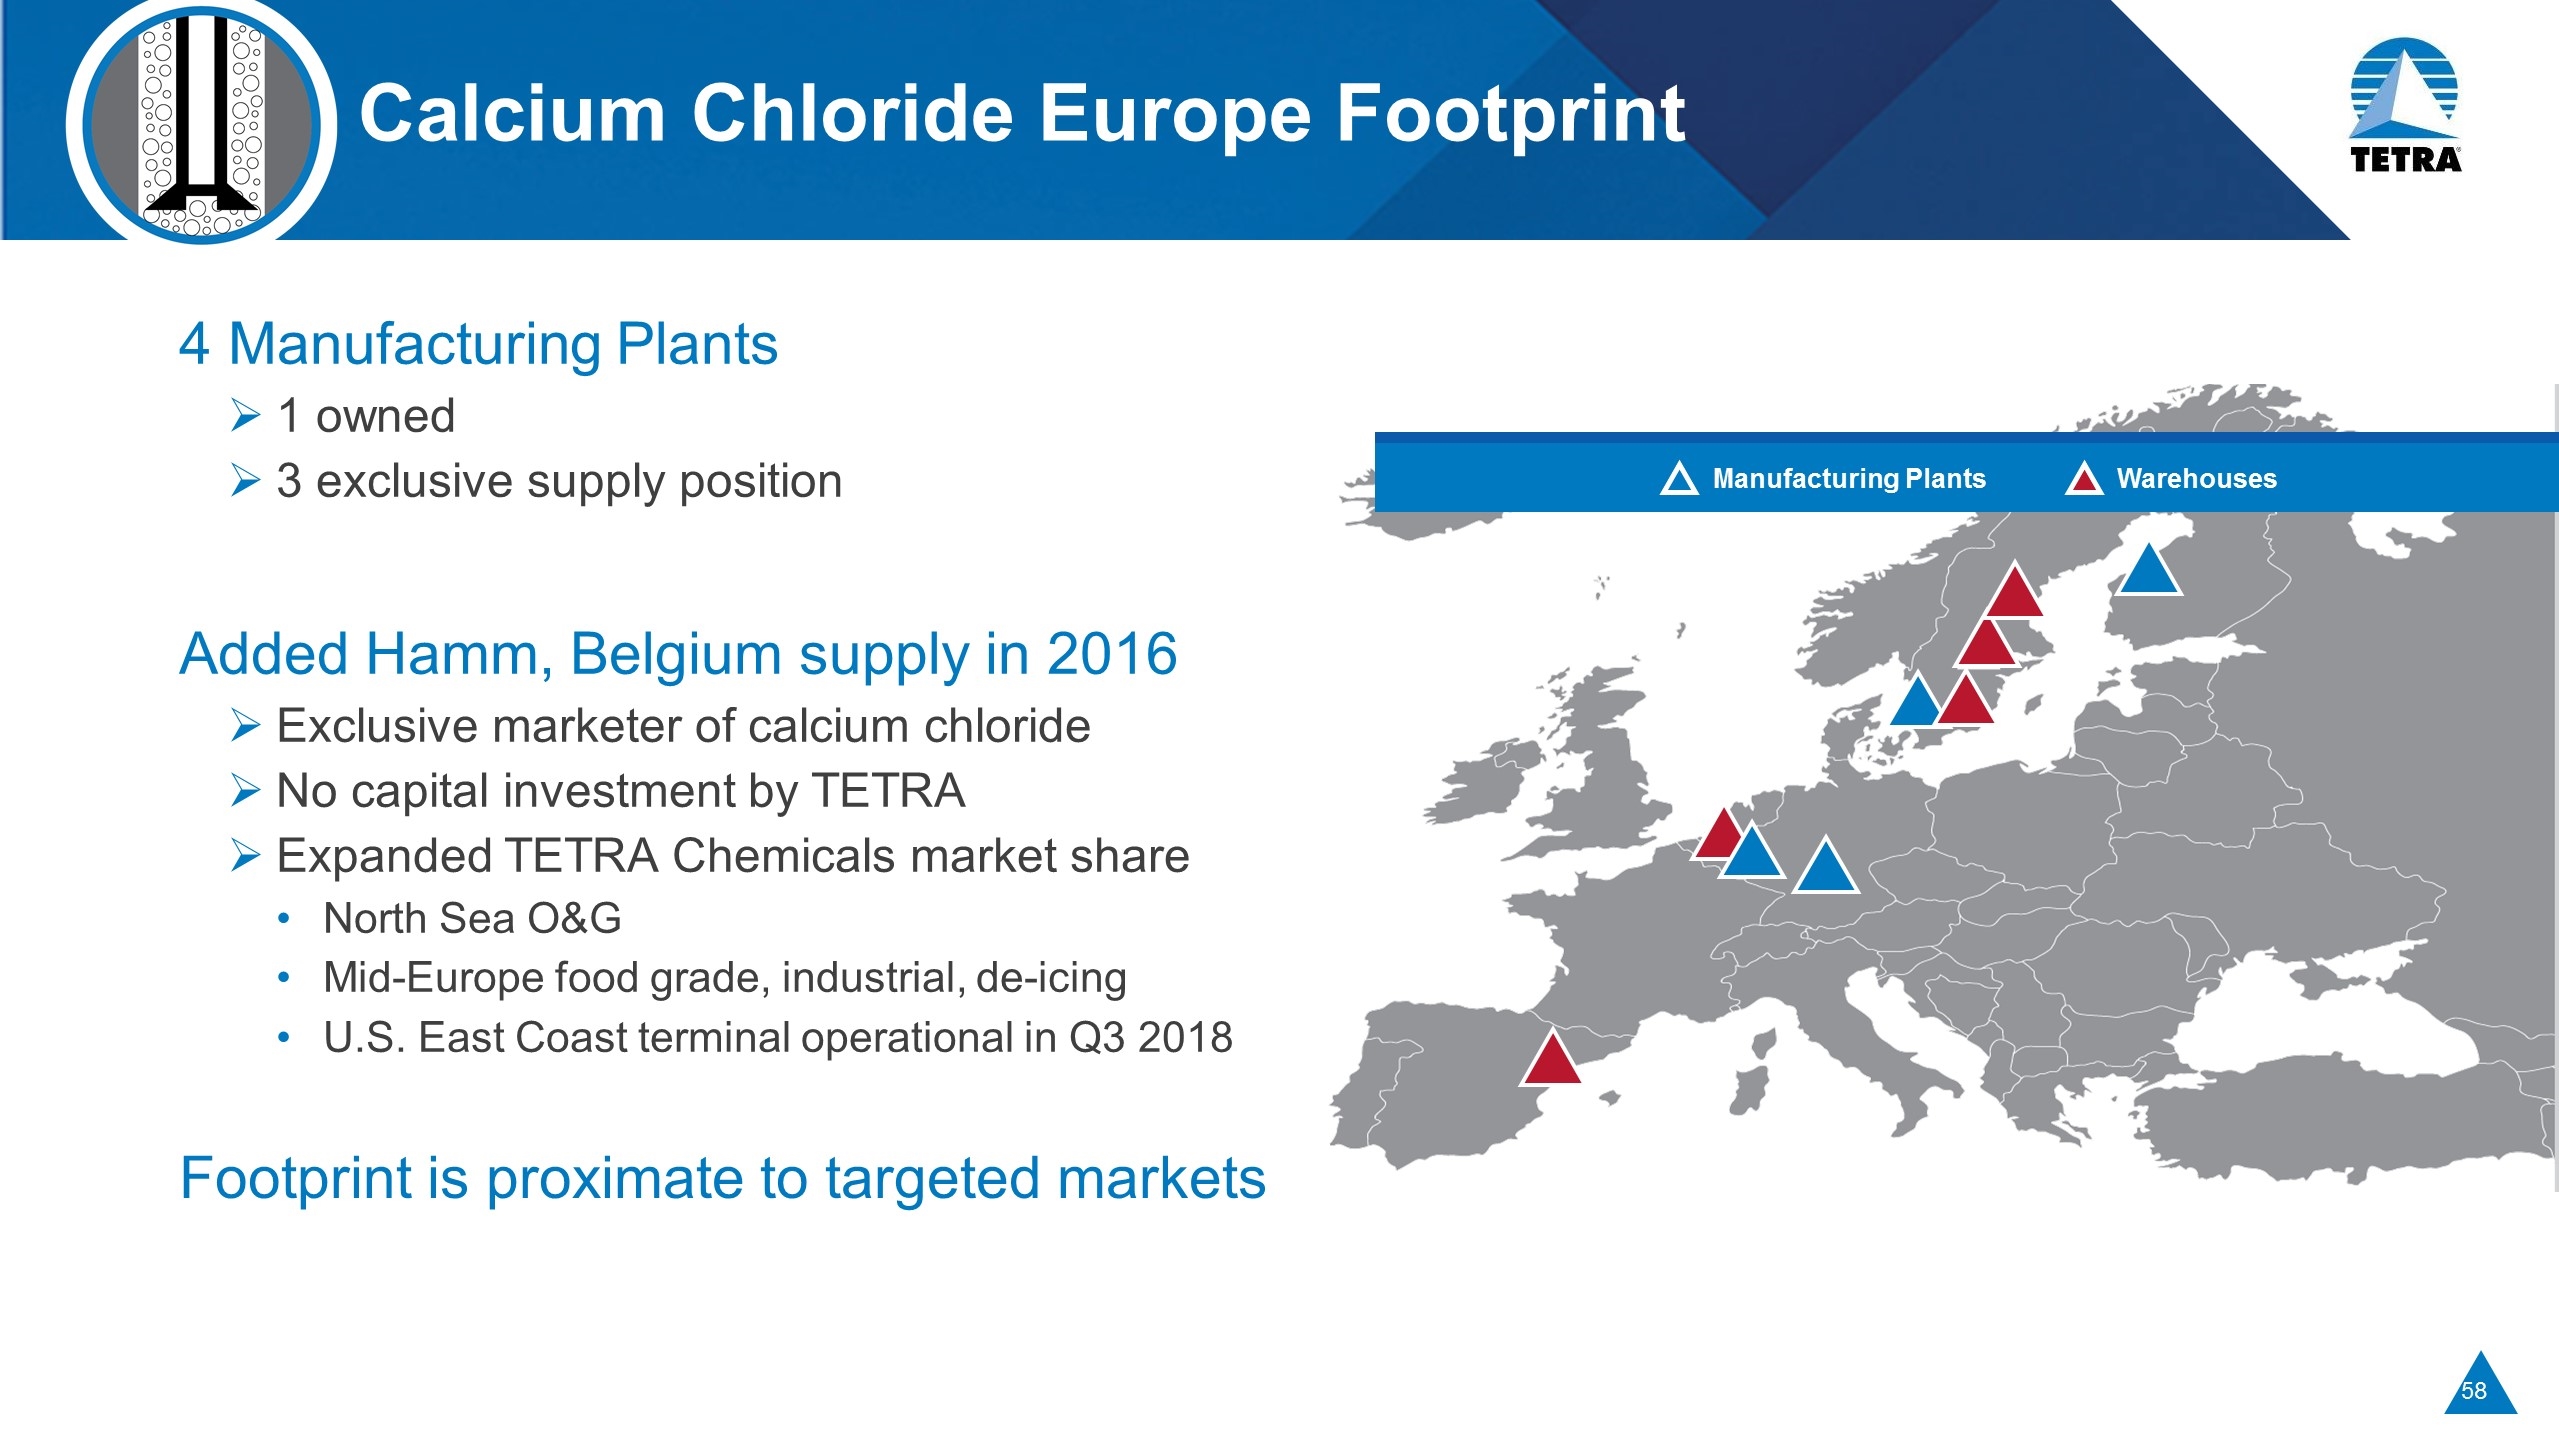
Calcium Chloride Europe Footprint 4 Manufacturing Plants 1 owned 3 exclusive supply position Added Hamm, Belgium supply in 2016 Exclusive marketer of calcium chloride No capital investment by TETRA Expanded TETRA Chemicals market share North Sea O&G Mid-Europe food grade, industrial, de-icing U.S. East Coast terminal operational in Q3 2018 Footprint is proximate to targeted markets Manufacturing Plants Warehouses
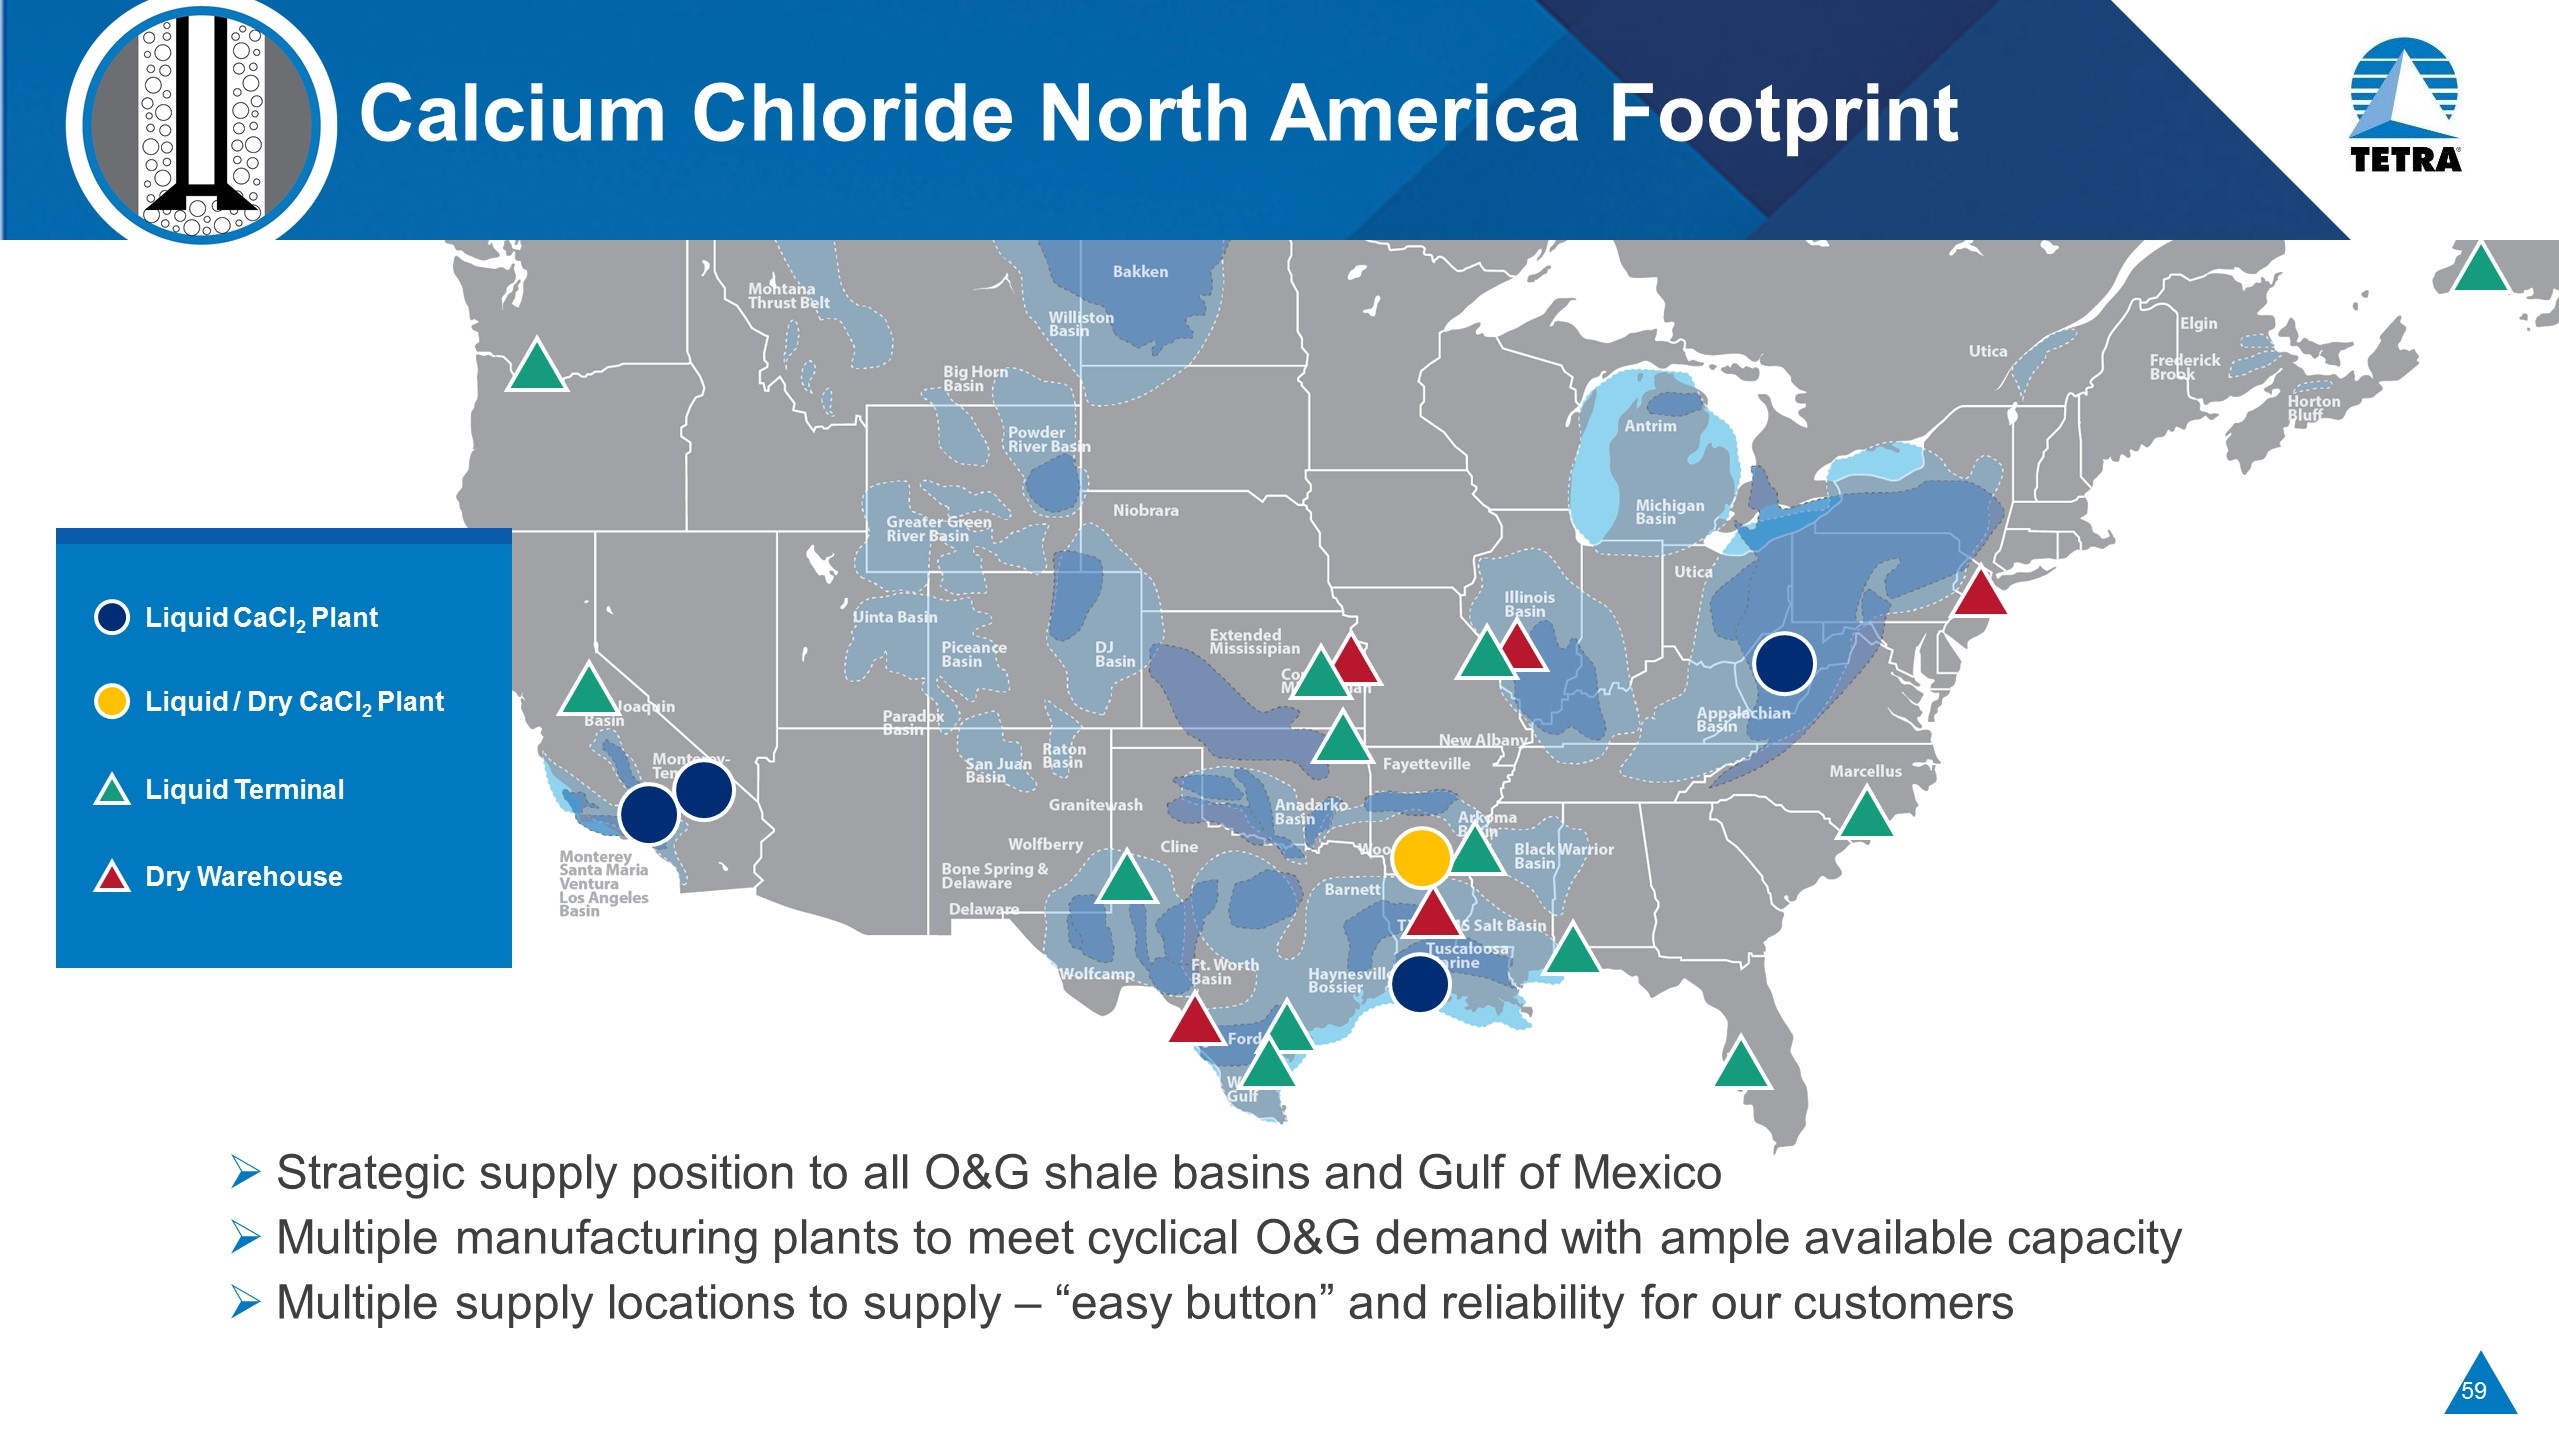
Calcium Chloride North America Footprint Strategic supply position to all O&G shale basins and Gulf of Mexico Multiple manufacturing plants to meet cyclical O&G demand with ample available capacity Multiple supply locations to supply – “easy button” and reliability for our customers Liquid CaCl2 Plant Liquid / Dry CaCl2 Plant Liquid Terminal Dry Warehouse
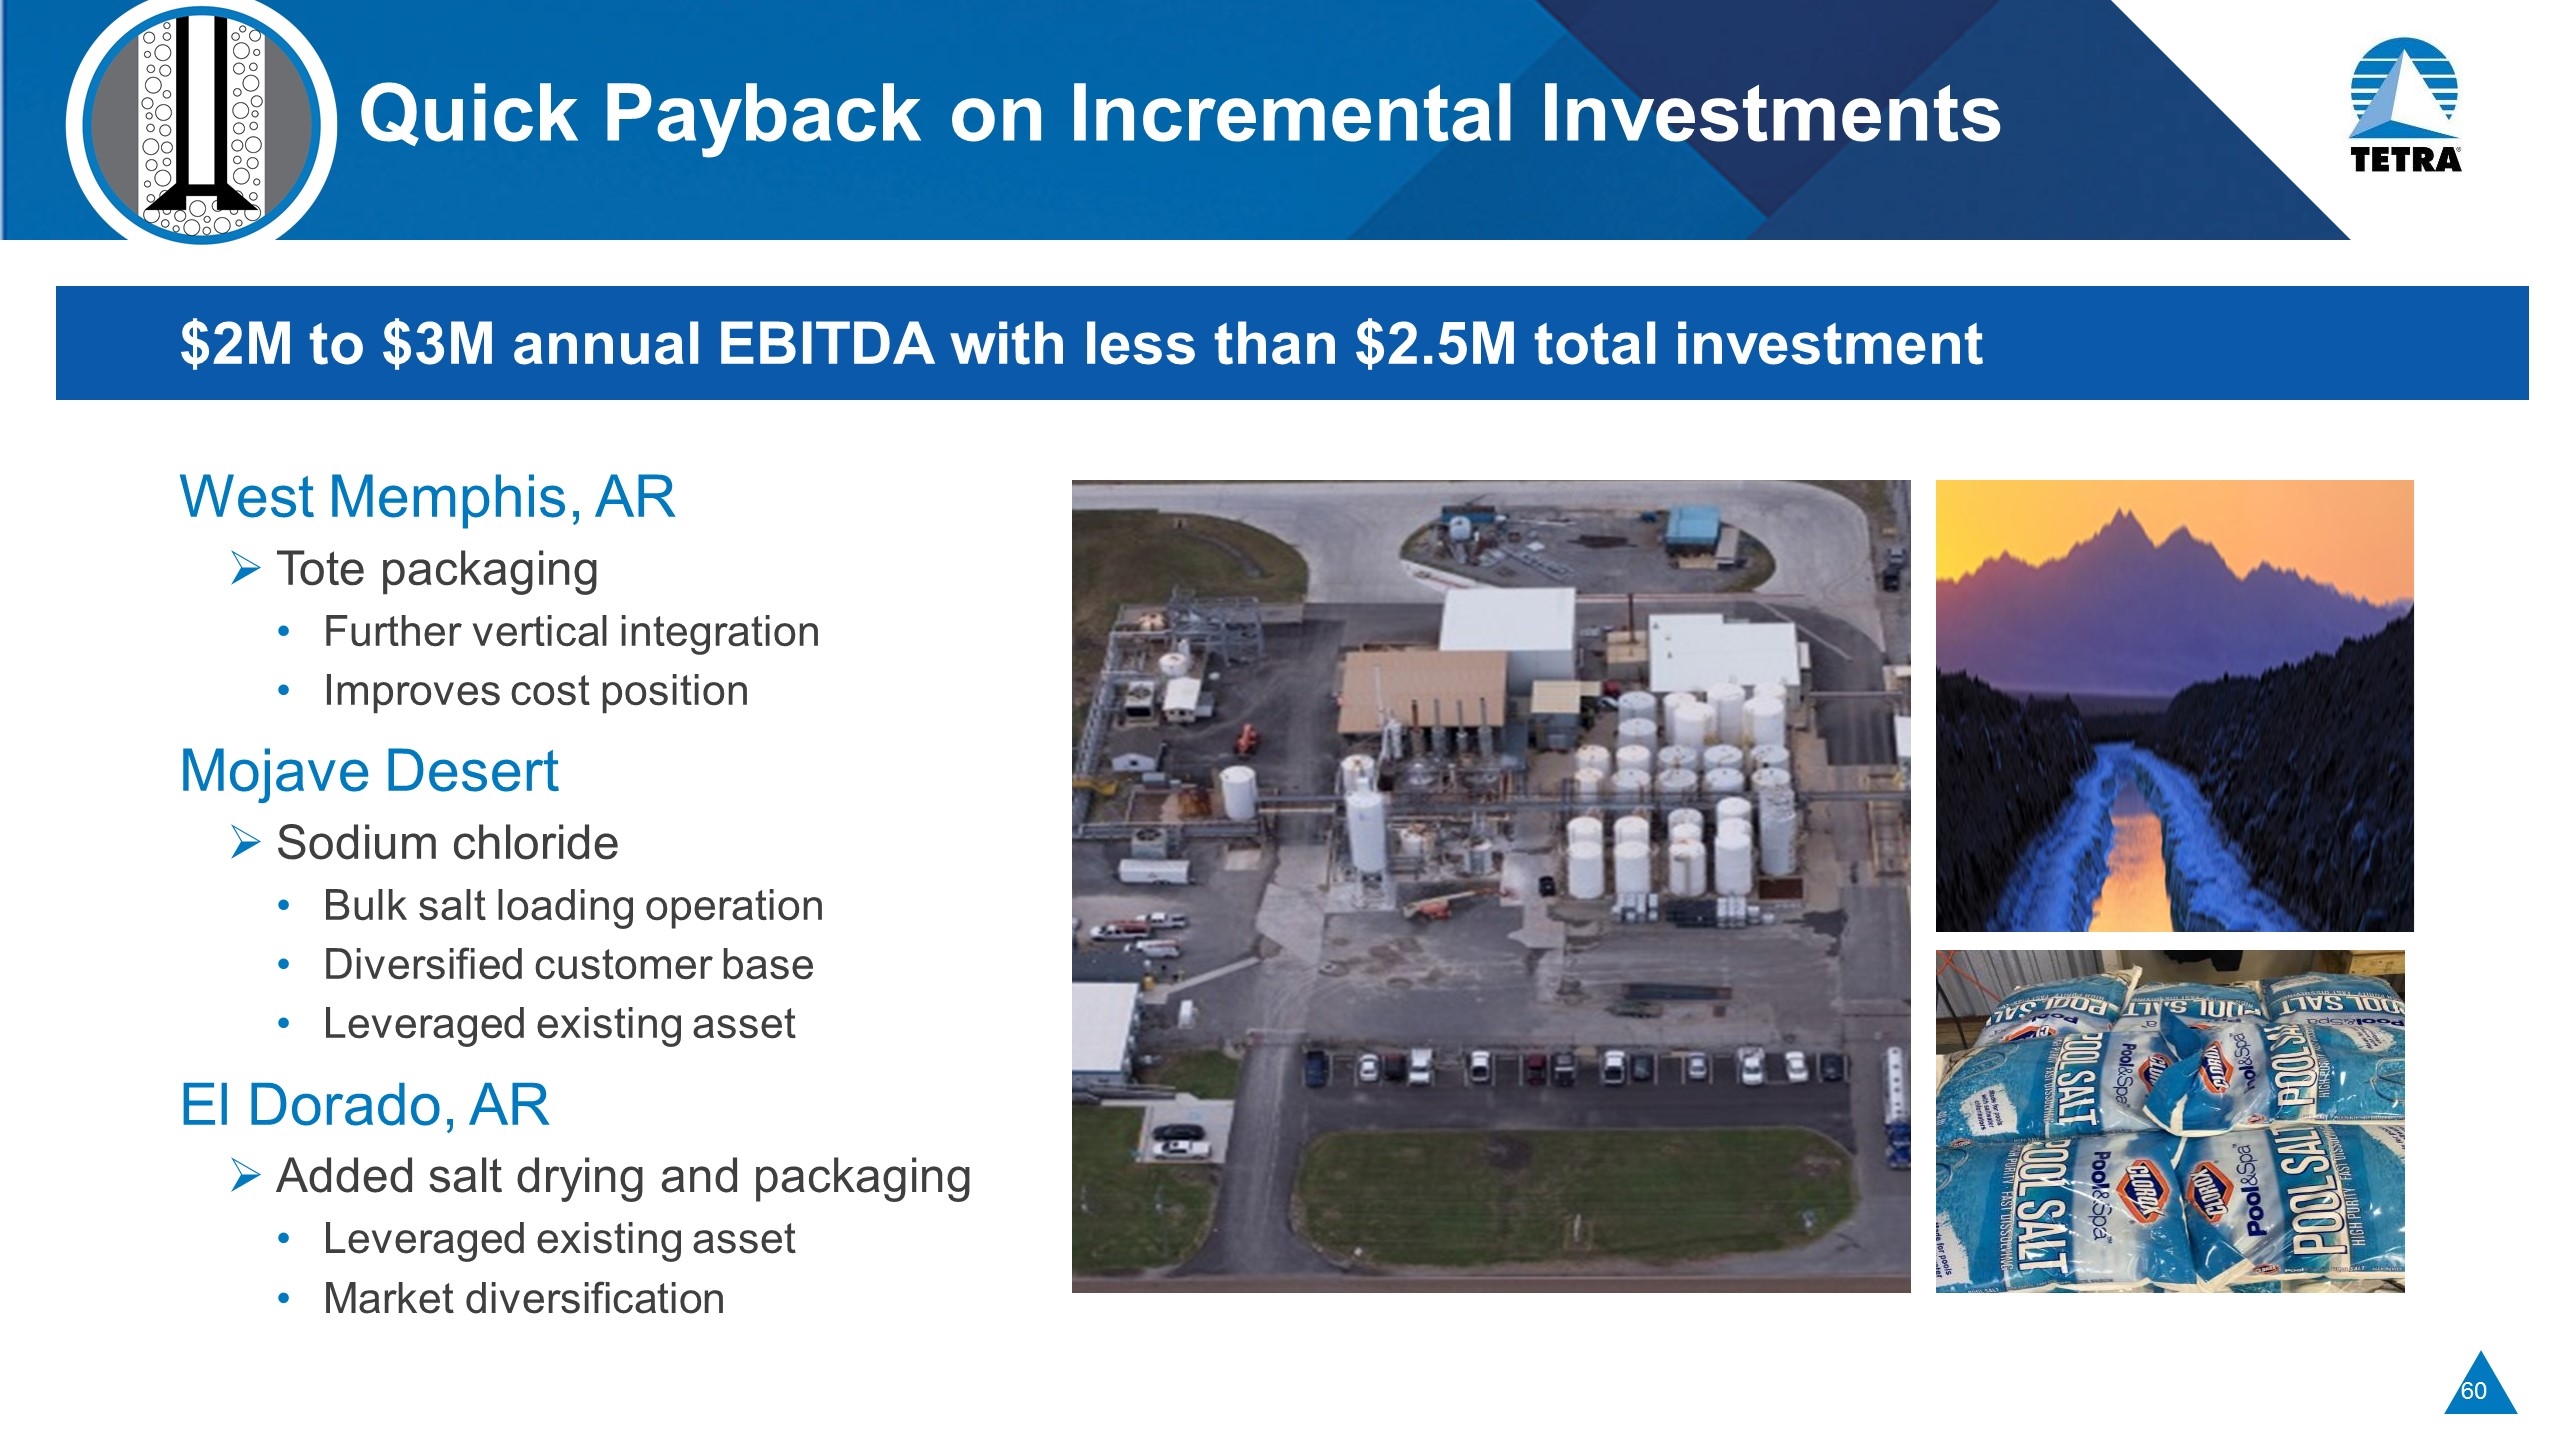
Quick Payback on Incremental Investments $2M to $3M annual EBITDA with less than $2.5M total investment West Memphis, AR Tote packaging Further vertical integration Improves cost position Mojave Desert Sodium chloride Bulk salt loading operation Diversified customer base Leveraged existing asset El Dorado, AR Added salt drying and packaging Leveraged existing asset Market diversification
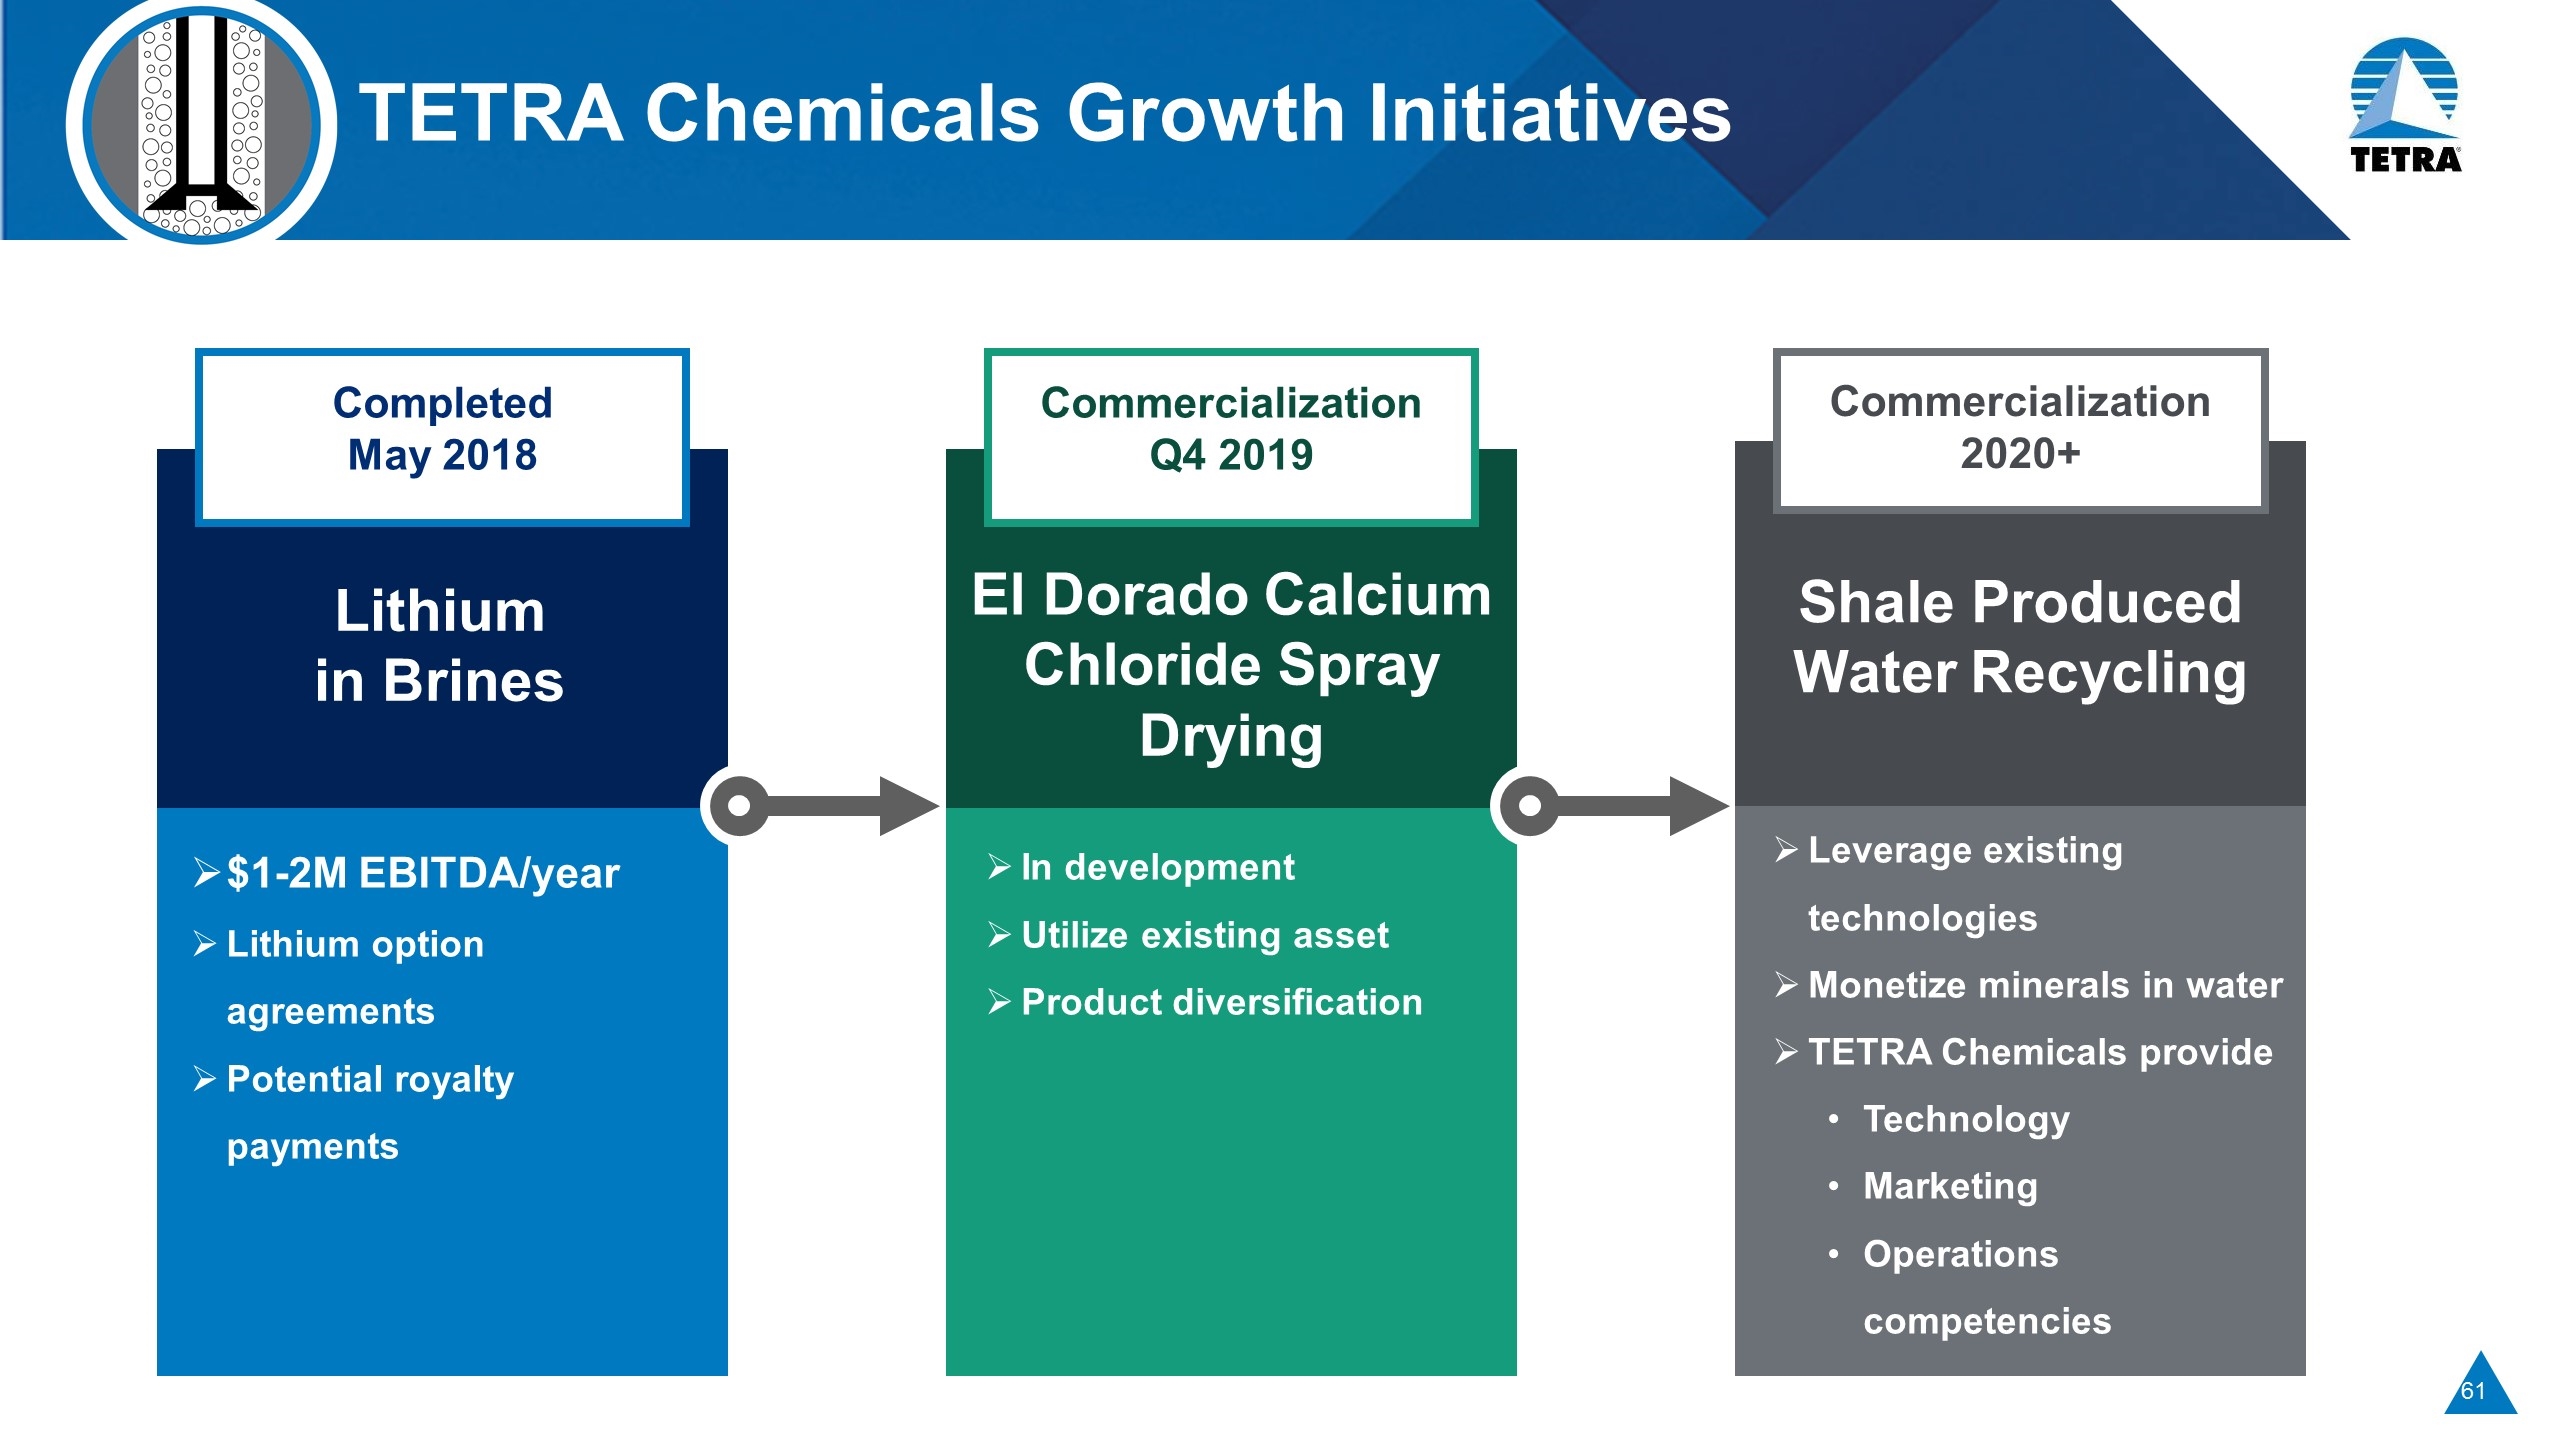
TETRA Chemicals Growth Initiatives Completed May 2018 Lithium in Brines $1-2M EBITDA/year Lithium option agreements Potential royalty payments Commercialization Q4 2019 El Dorado Calcium Chloride Spray Drying In development Utilize existing asset Product diversification Commercialization 2020+ Shale Produced Water Recycling Leverage existing technologies Monetize minerals in water TETRA Chemicals provide Technology Marketing Operations competencies

TETRA Chemicals Summary Only producer positioned to supply all shale segments Unique CBF vertical integration position Well diversified calcium chloride position Plants have capacity to meet growing demand Growing share in sodium chloride market Good pipeline of growth opportunities
Permian Basin Hunter Morris Vice President Permian Operations
Market Leader in Permian through SwiftWater SwiftWater significantly expands TETRA’s presence in the Permian Basin Leading water service employer in the basin Strong, talented and proven leadership team 400+ employees Emphasizes TETRA’s strategic water management focus Nominal customer overlap between TETRA and SwiftWater Excellent cross-selling opportunities Provides enhanced, more efficient, diverse and strategically positioned portfolio of services Strategic rationale of SwiftWater acquisition
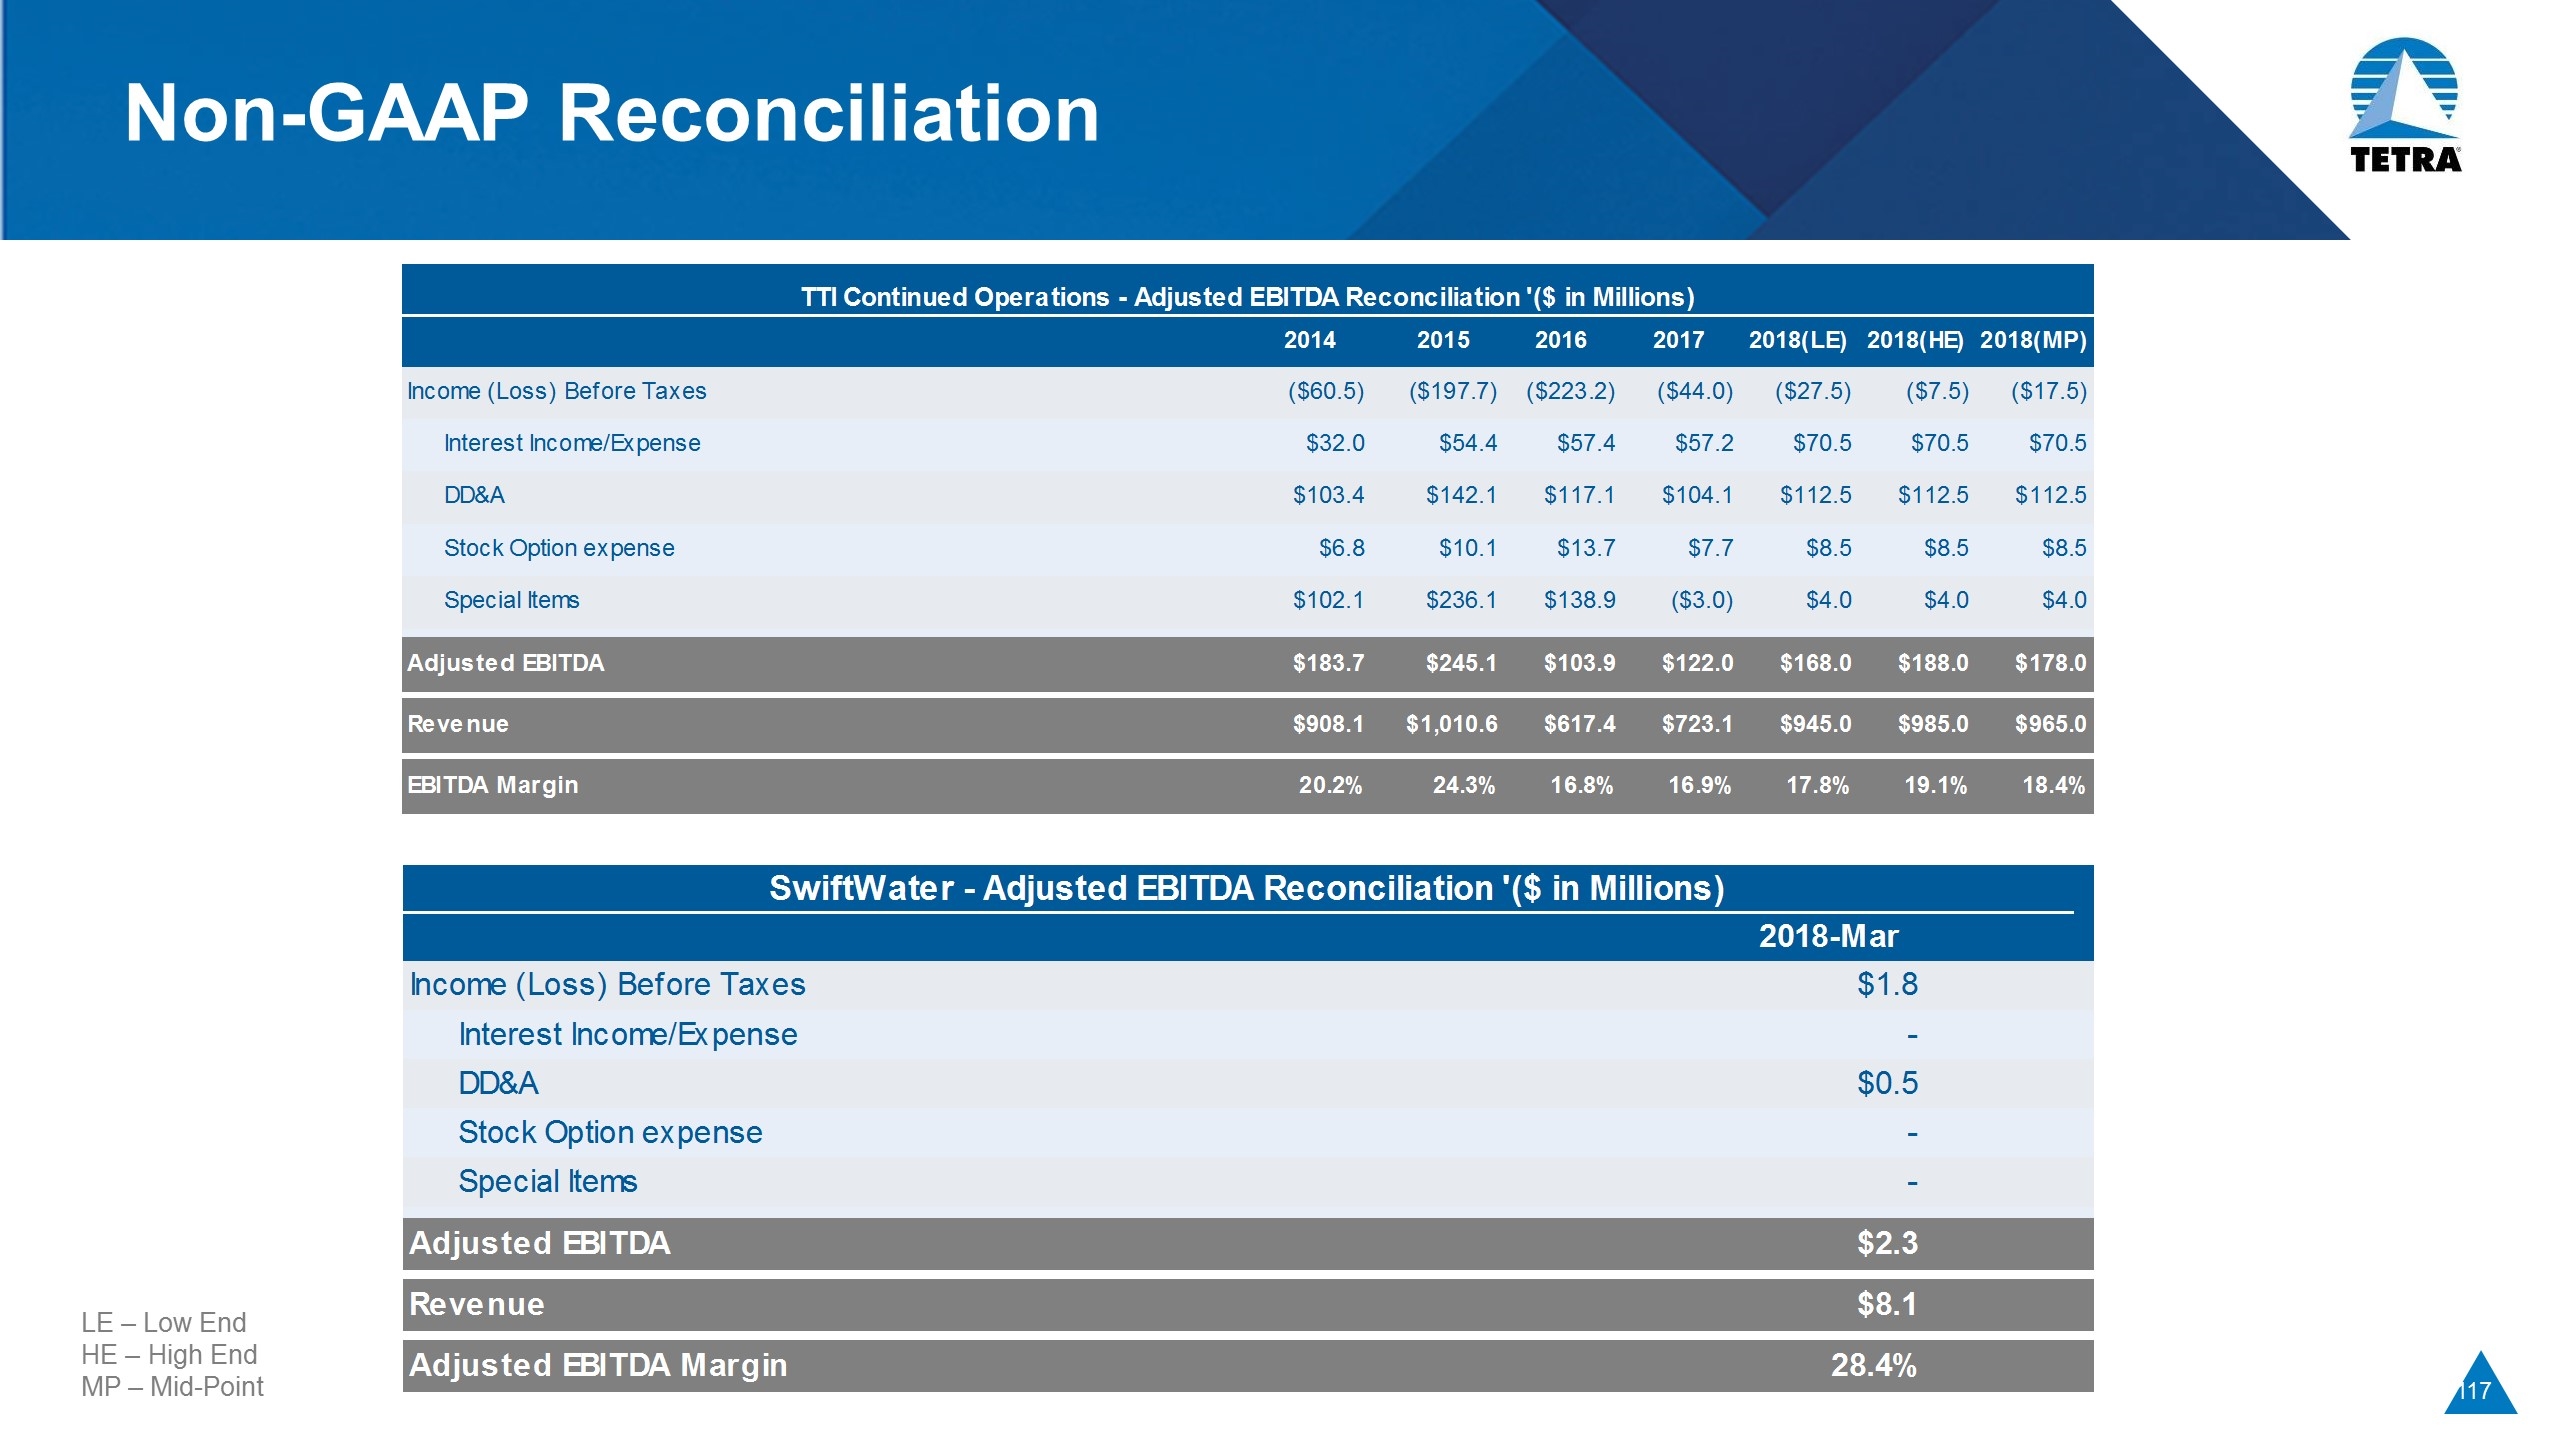
SwiftWater Financial & Operational Highlights SwiftWater revenues grew over 3x during the downturn Post-closing projections of annualized $16M to $20M EBITDA(1) March 2018 SwiftWater results: $8.1M revenue $2.3M EBITDA (1) Successful integration (1) See appendix for reconciliation to nearest GAAP measures
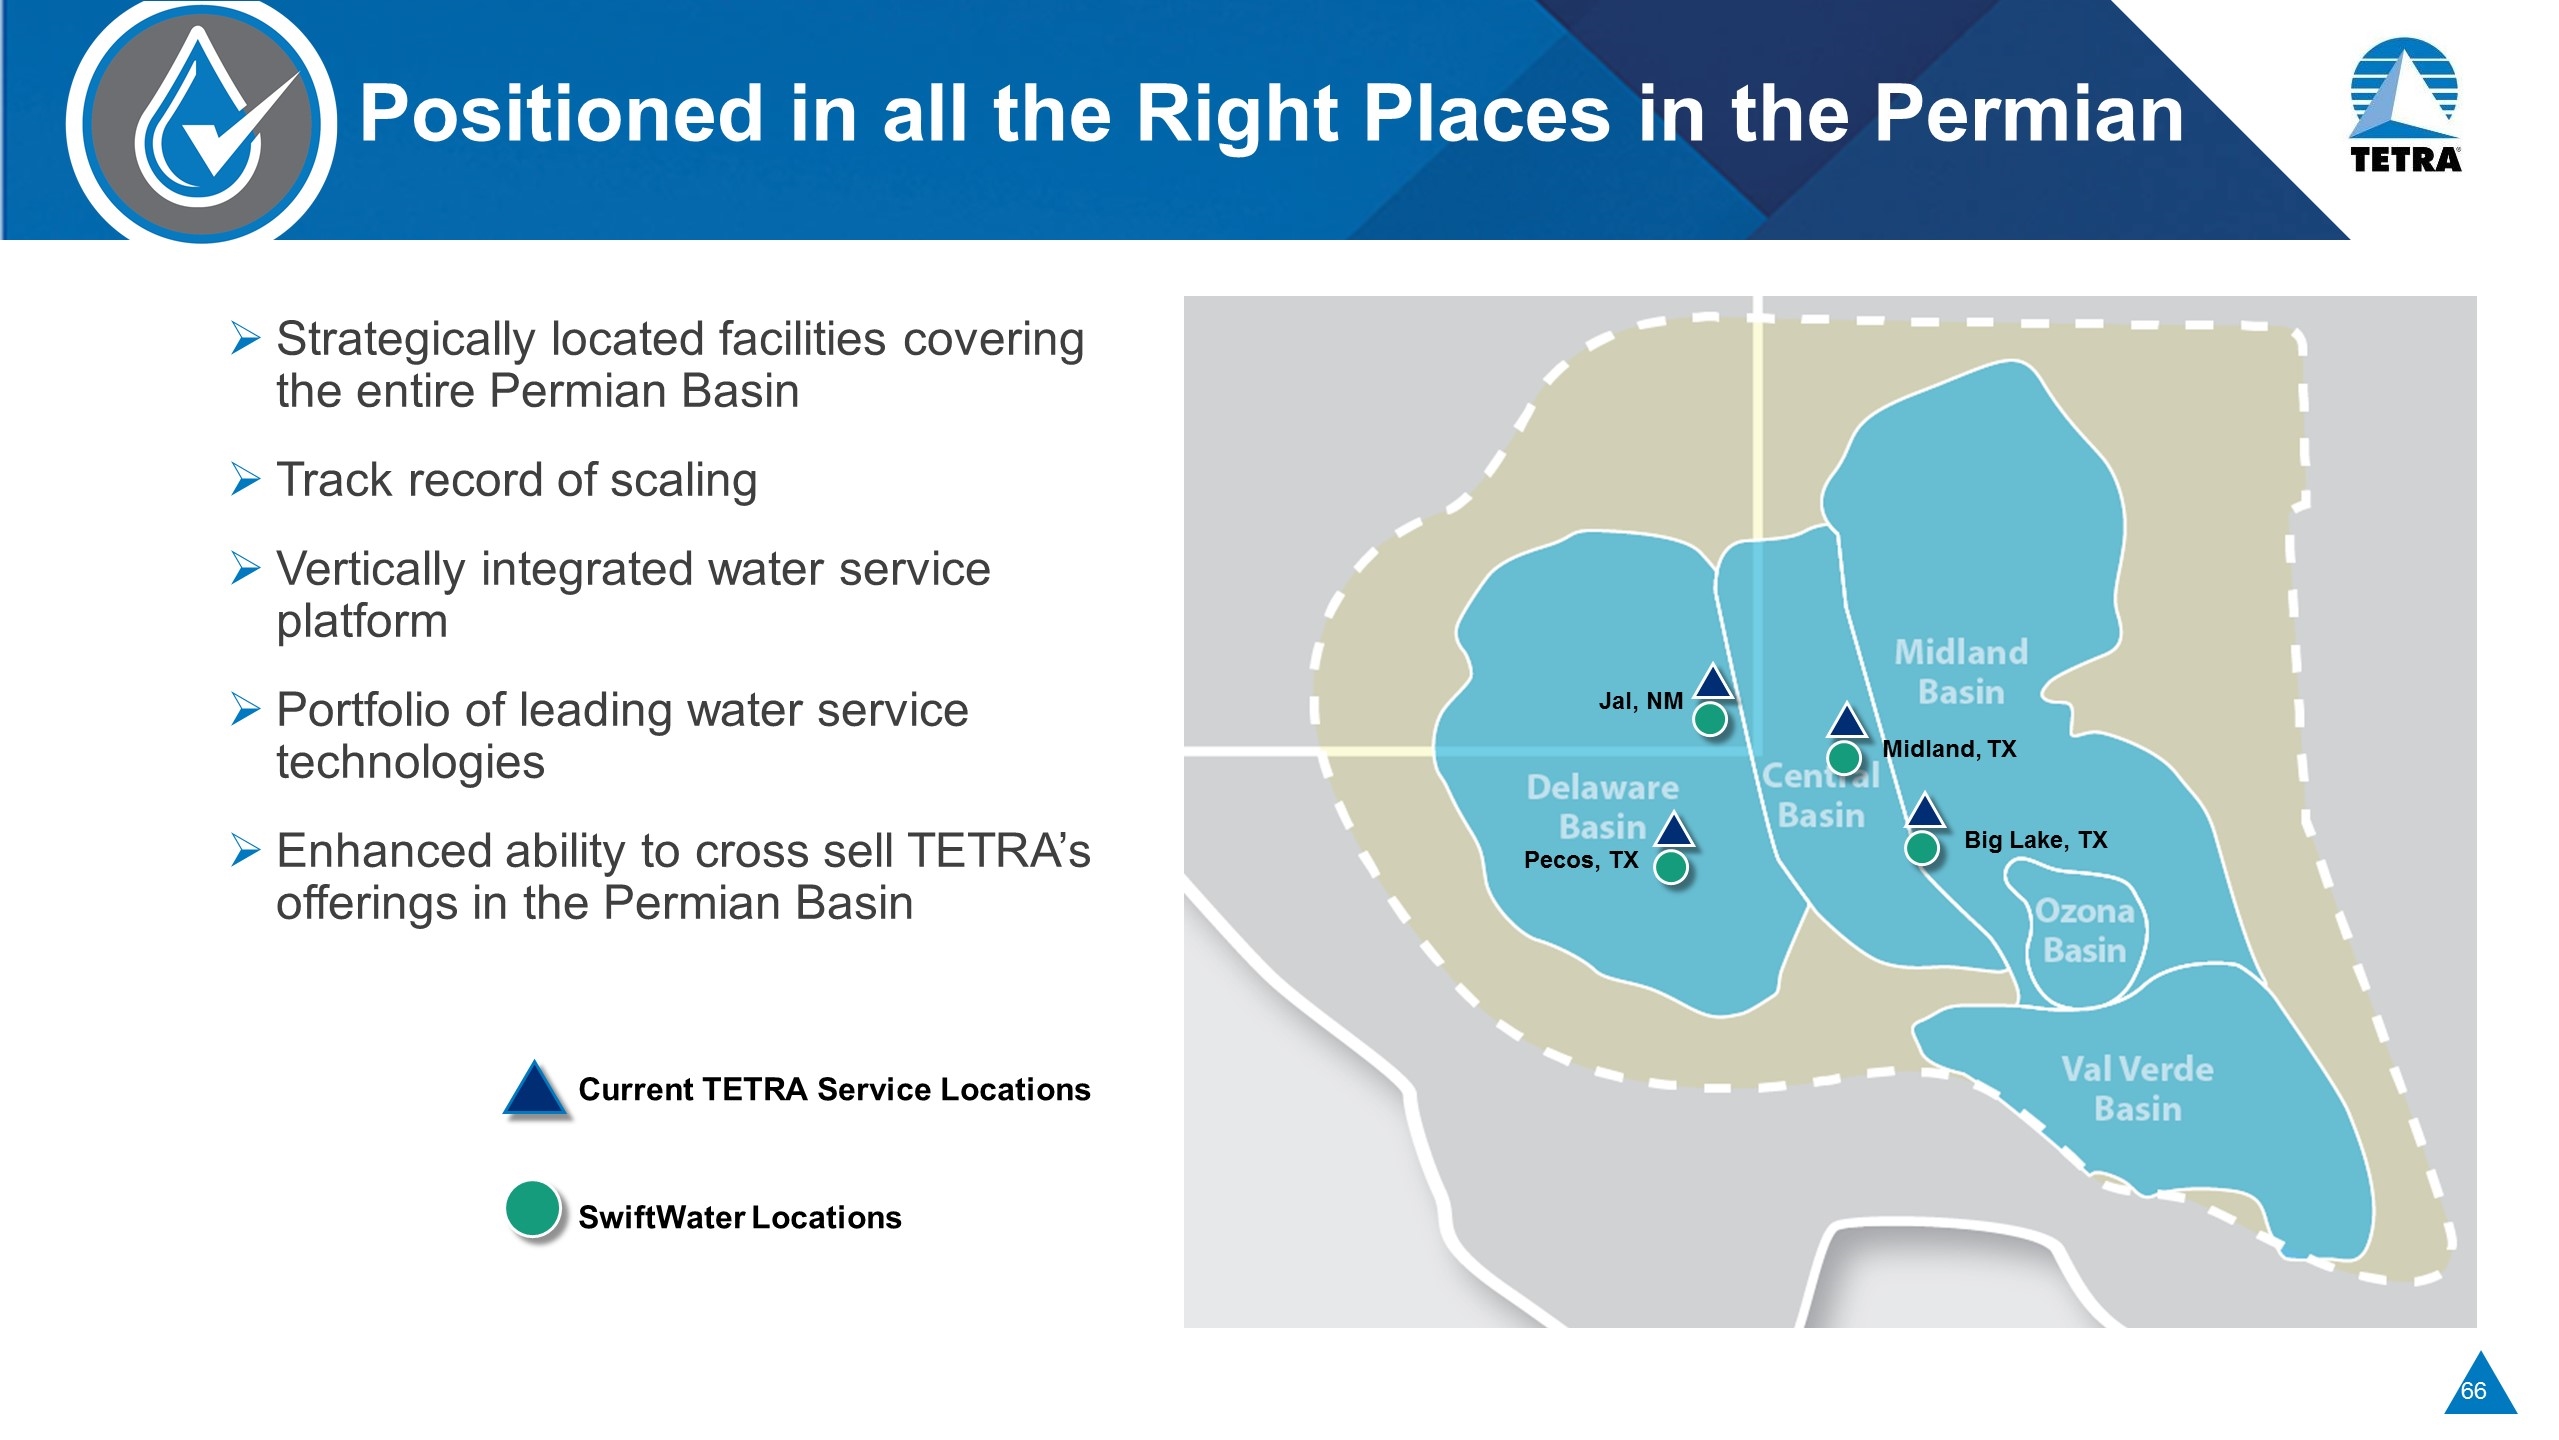
Strategically located facilities covering the entire Permian Basin Track record of scaling Vertically integrated water service platform Portfolio of leading water service technologies Enhanced ability to cross sell TETRA’s offerings in the Permian Basin Positioned in all the Right Places in the Permian Current TETRA Service Locations SwiftWater Locations Big Lake, TX Jal, NM Midland, TX Pecos, TX
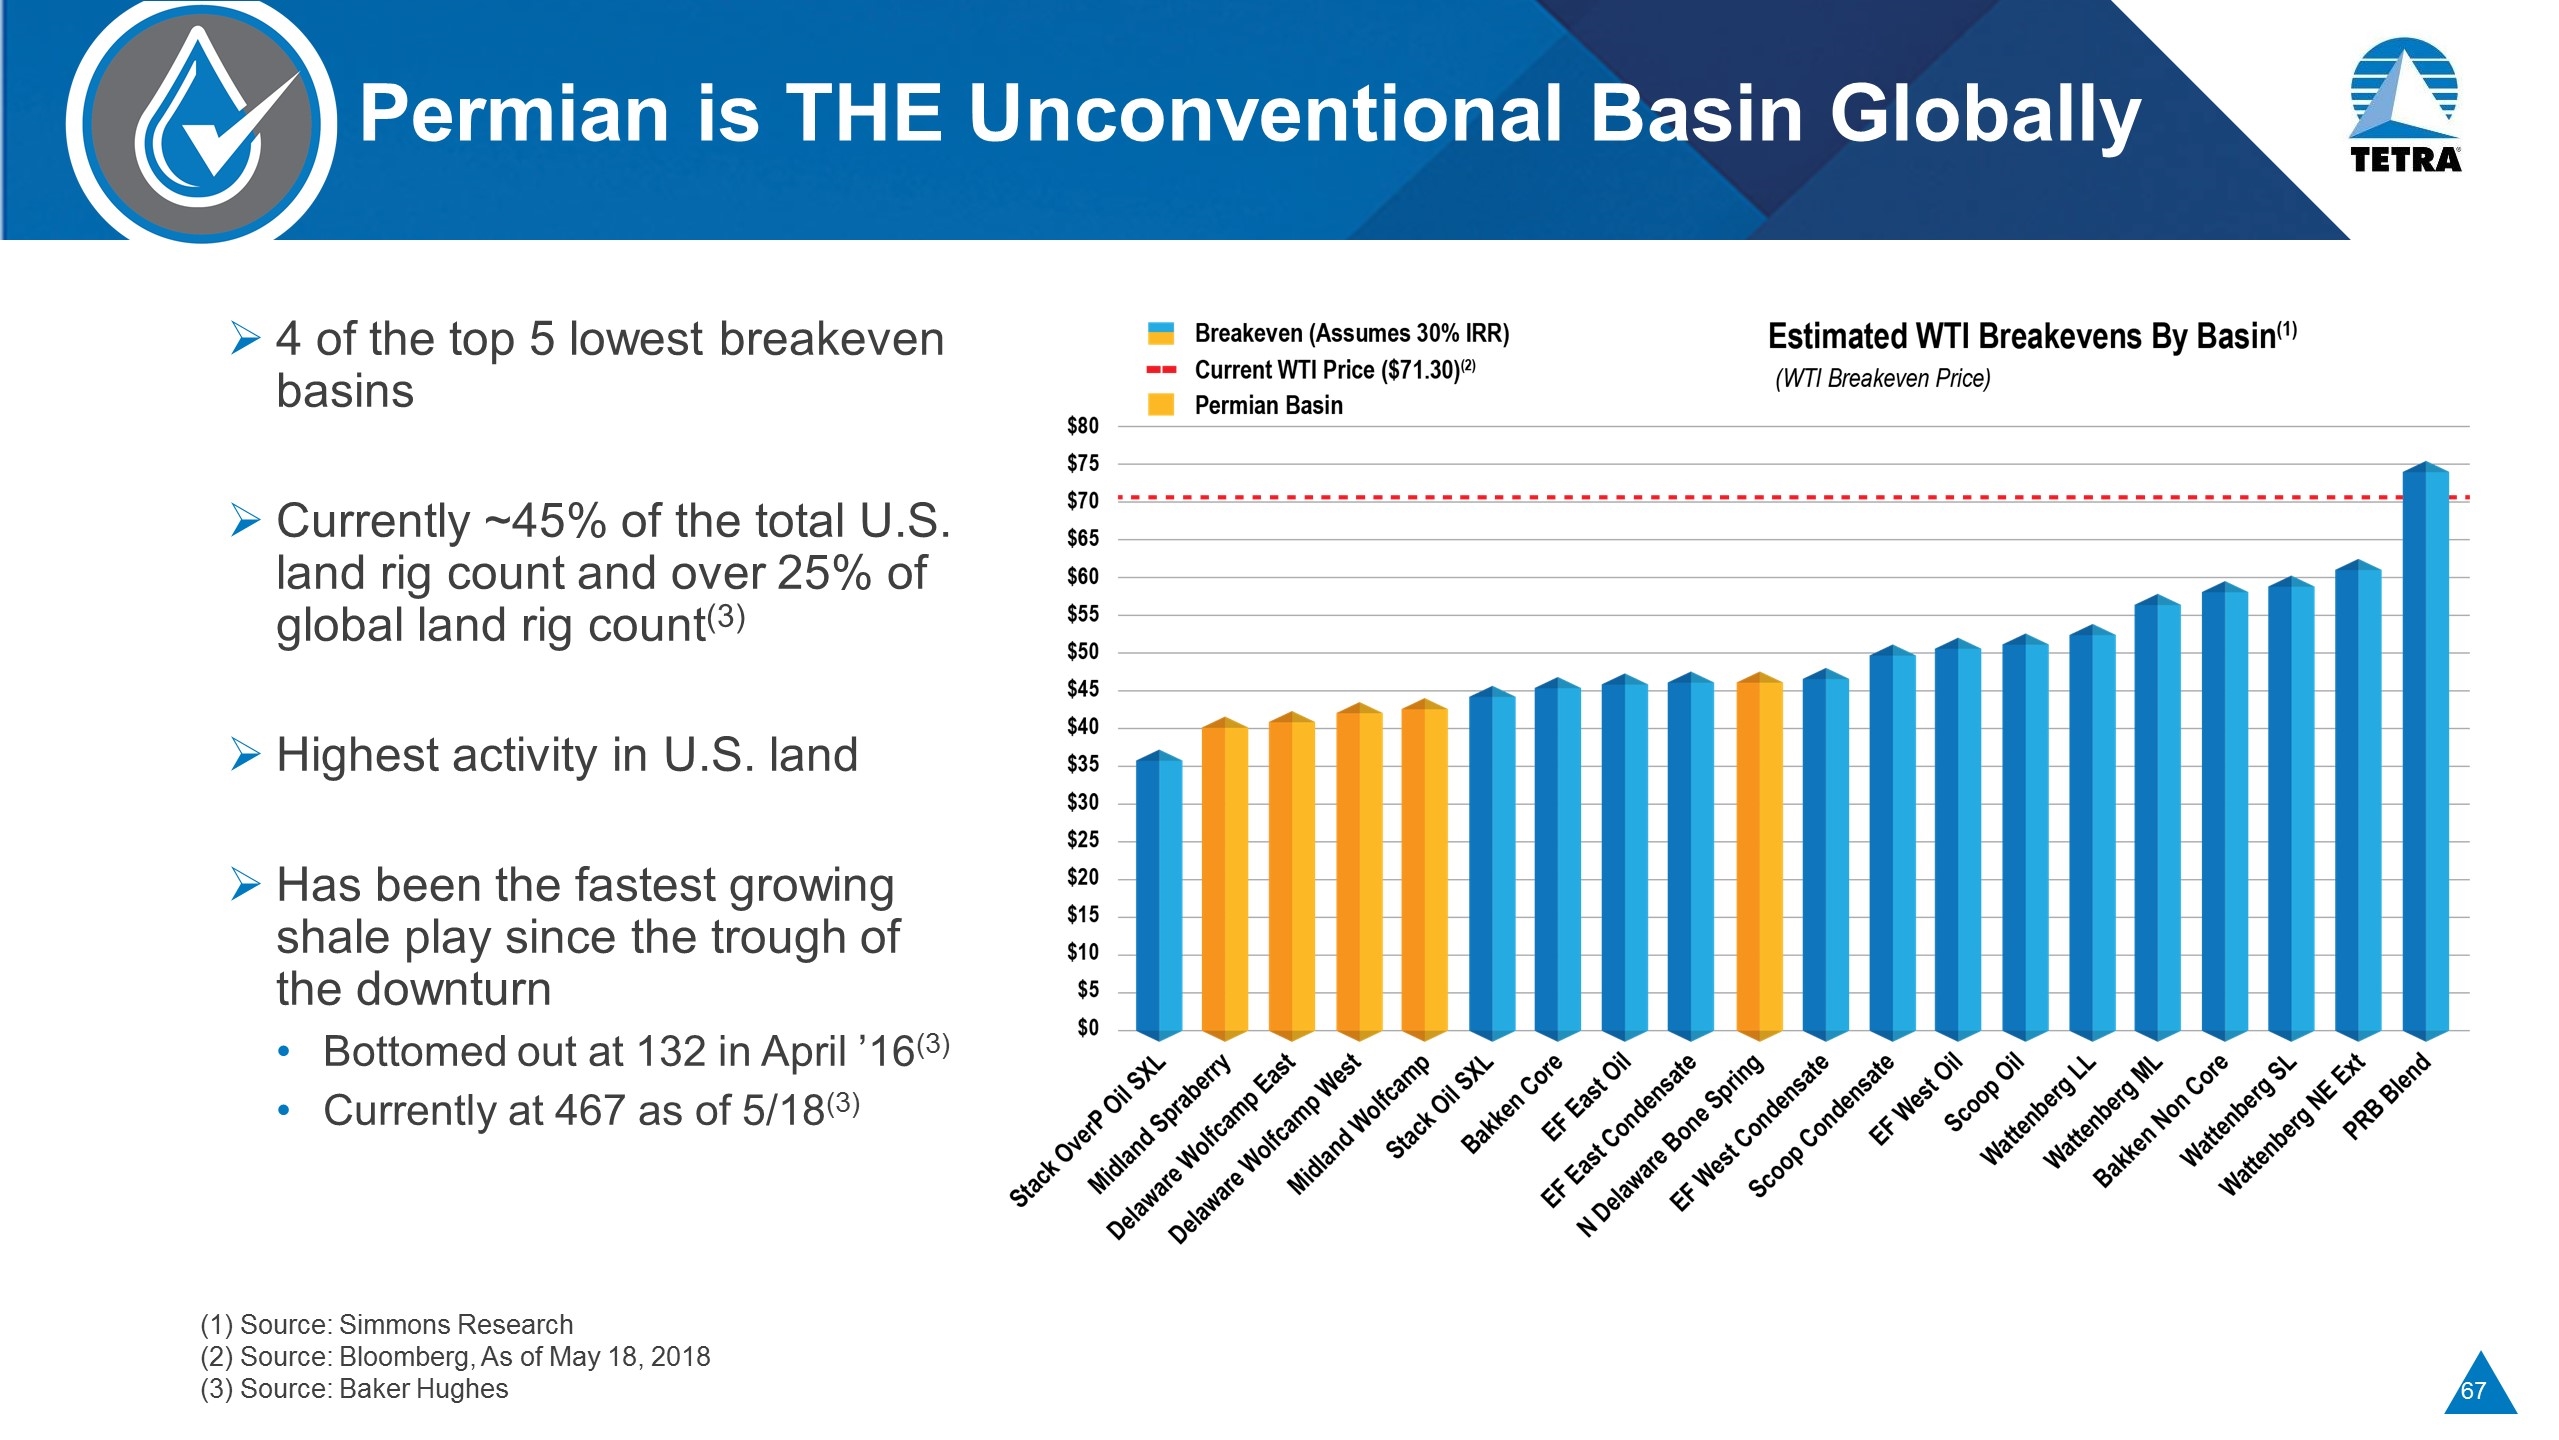
Permian is THE Unconventional Basin Globally 4 of the top 5 lowest breakeven basins Currently ~45% of the total U.S. land rig count and over 25% of global land rig count(3) Highest activity in U.S. land Has been the fastest growing shale play since the trough of the downturn Bottomed out at 132 in April ’16(3) Currently at 467 as of 5/18(3) (1) Source: Simmons Research (2) Source: Bloomberg, As of May 18, 2018 (3) Source: Baker Hughes
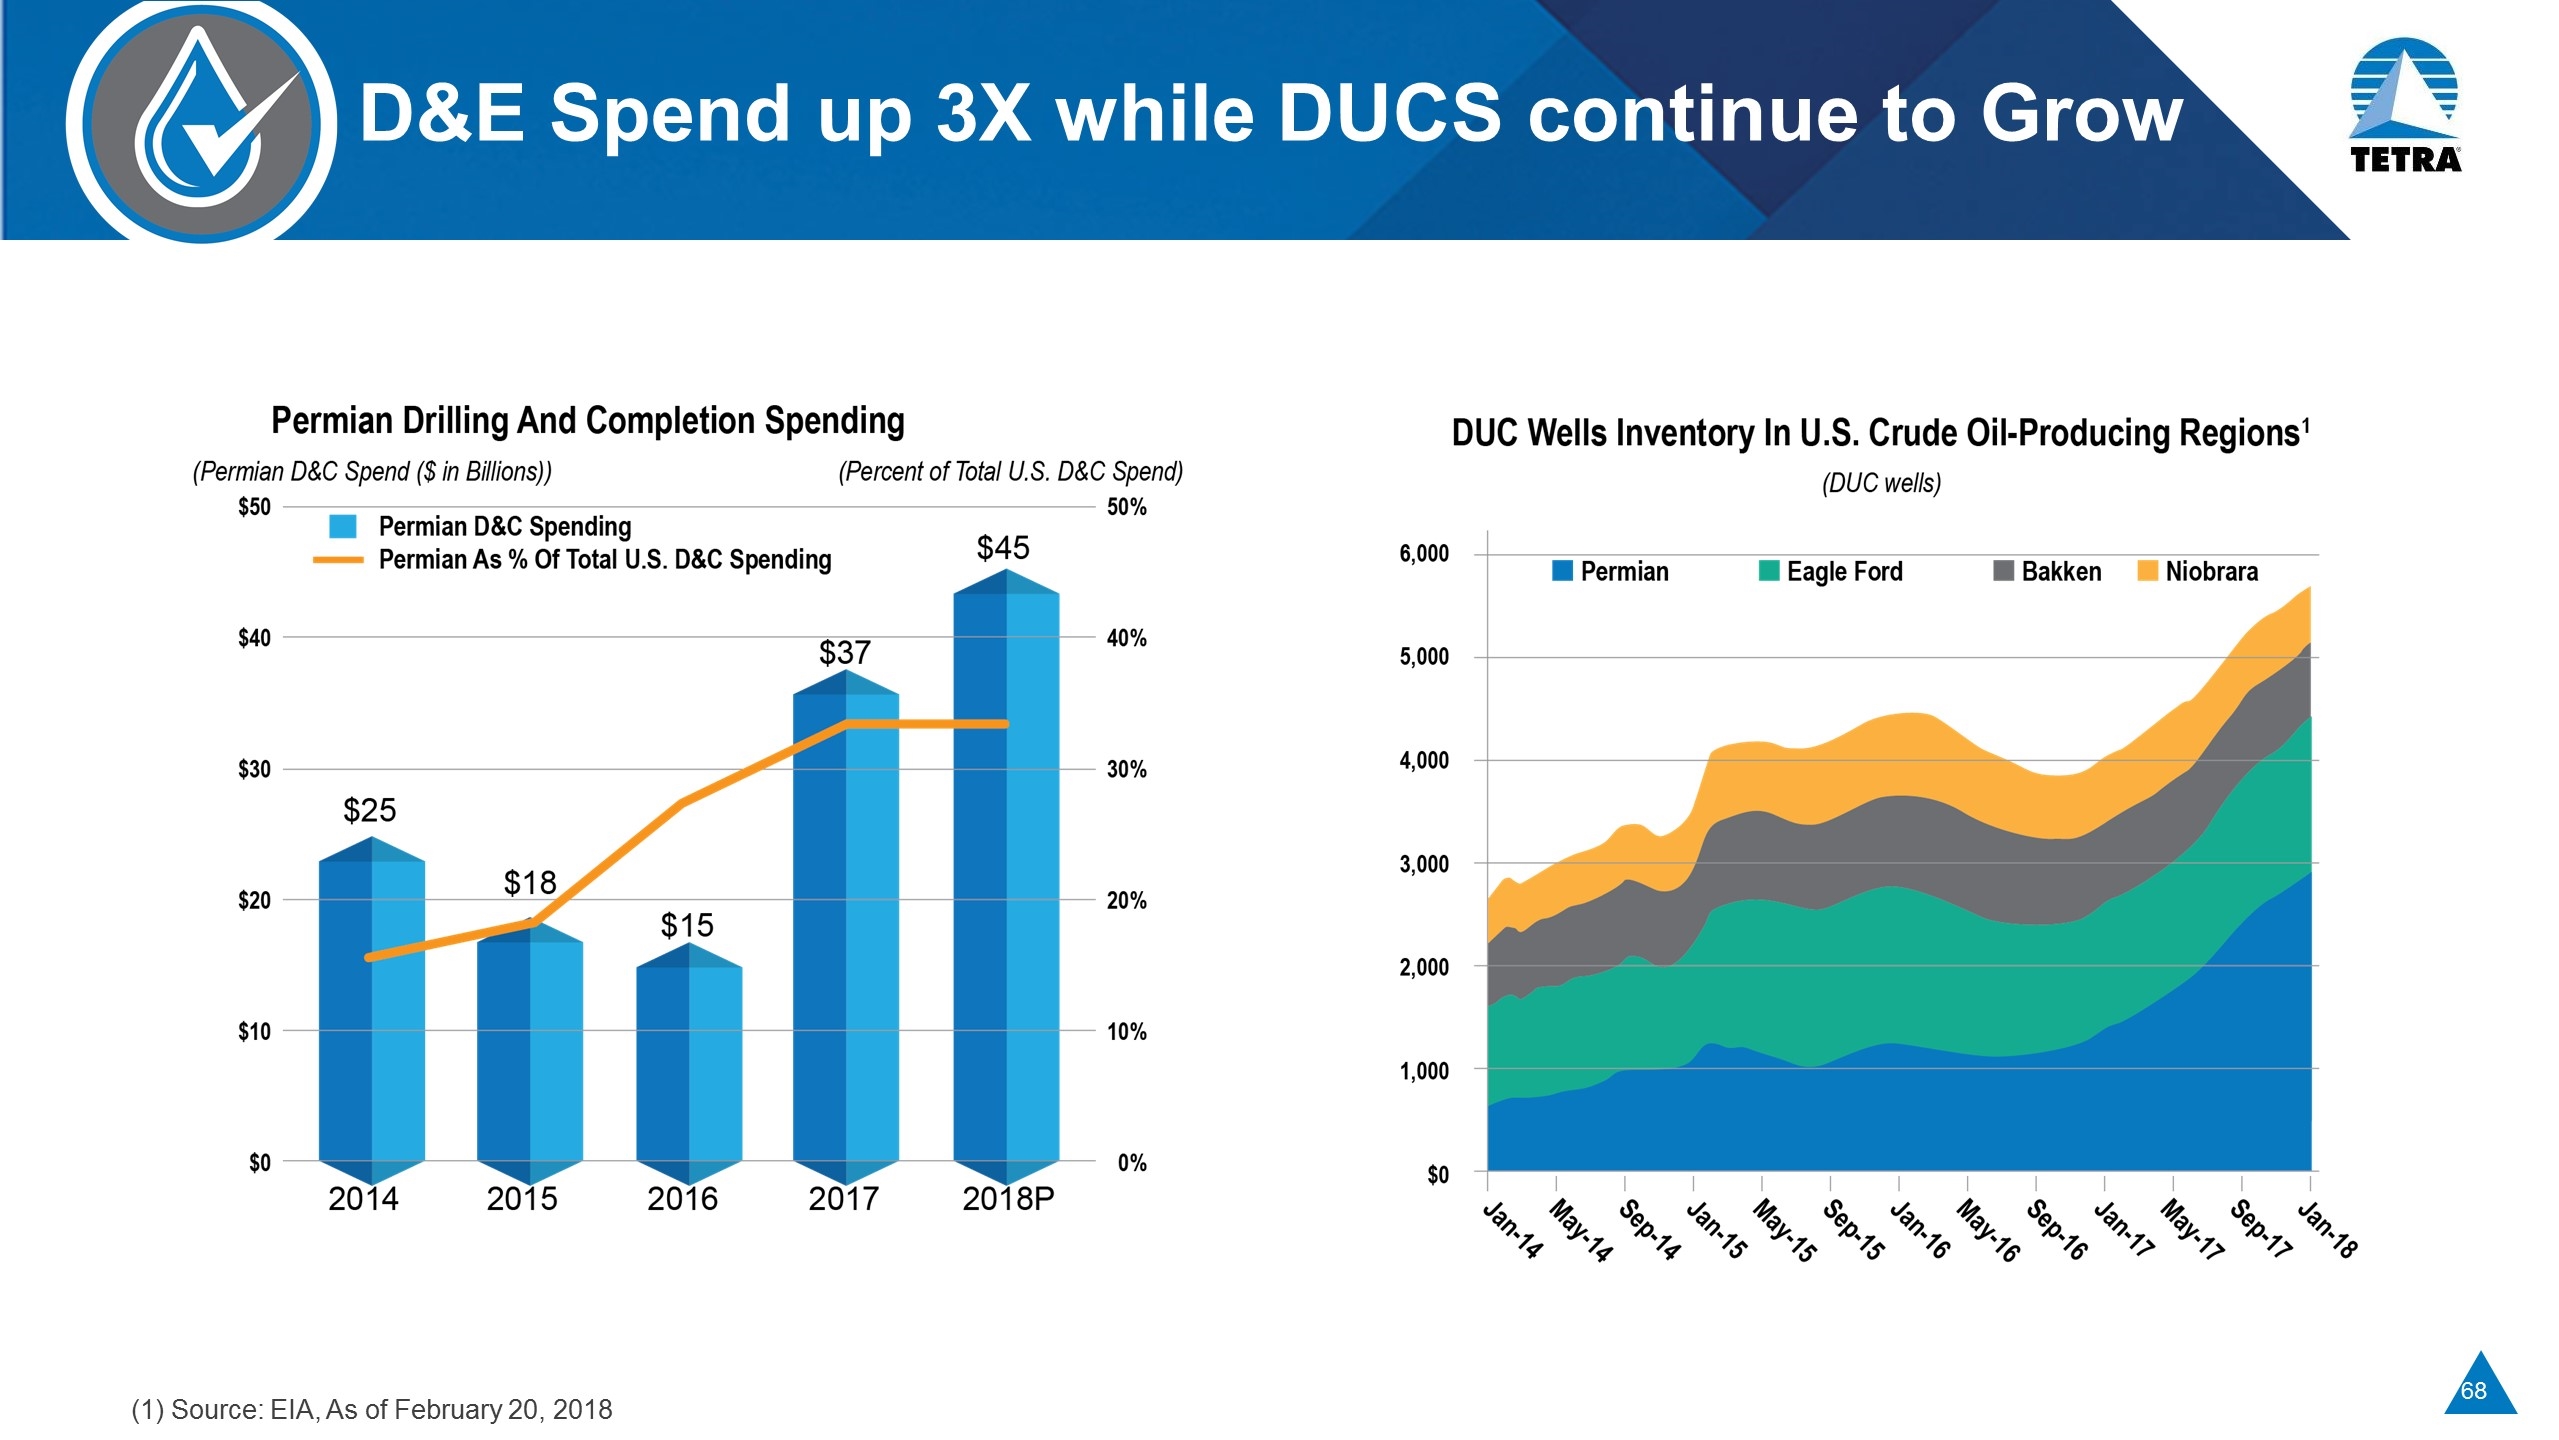
D&E Spend up 3X while DUCS continue to Grow (1) Source: EIA, As of February 20, 2018
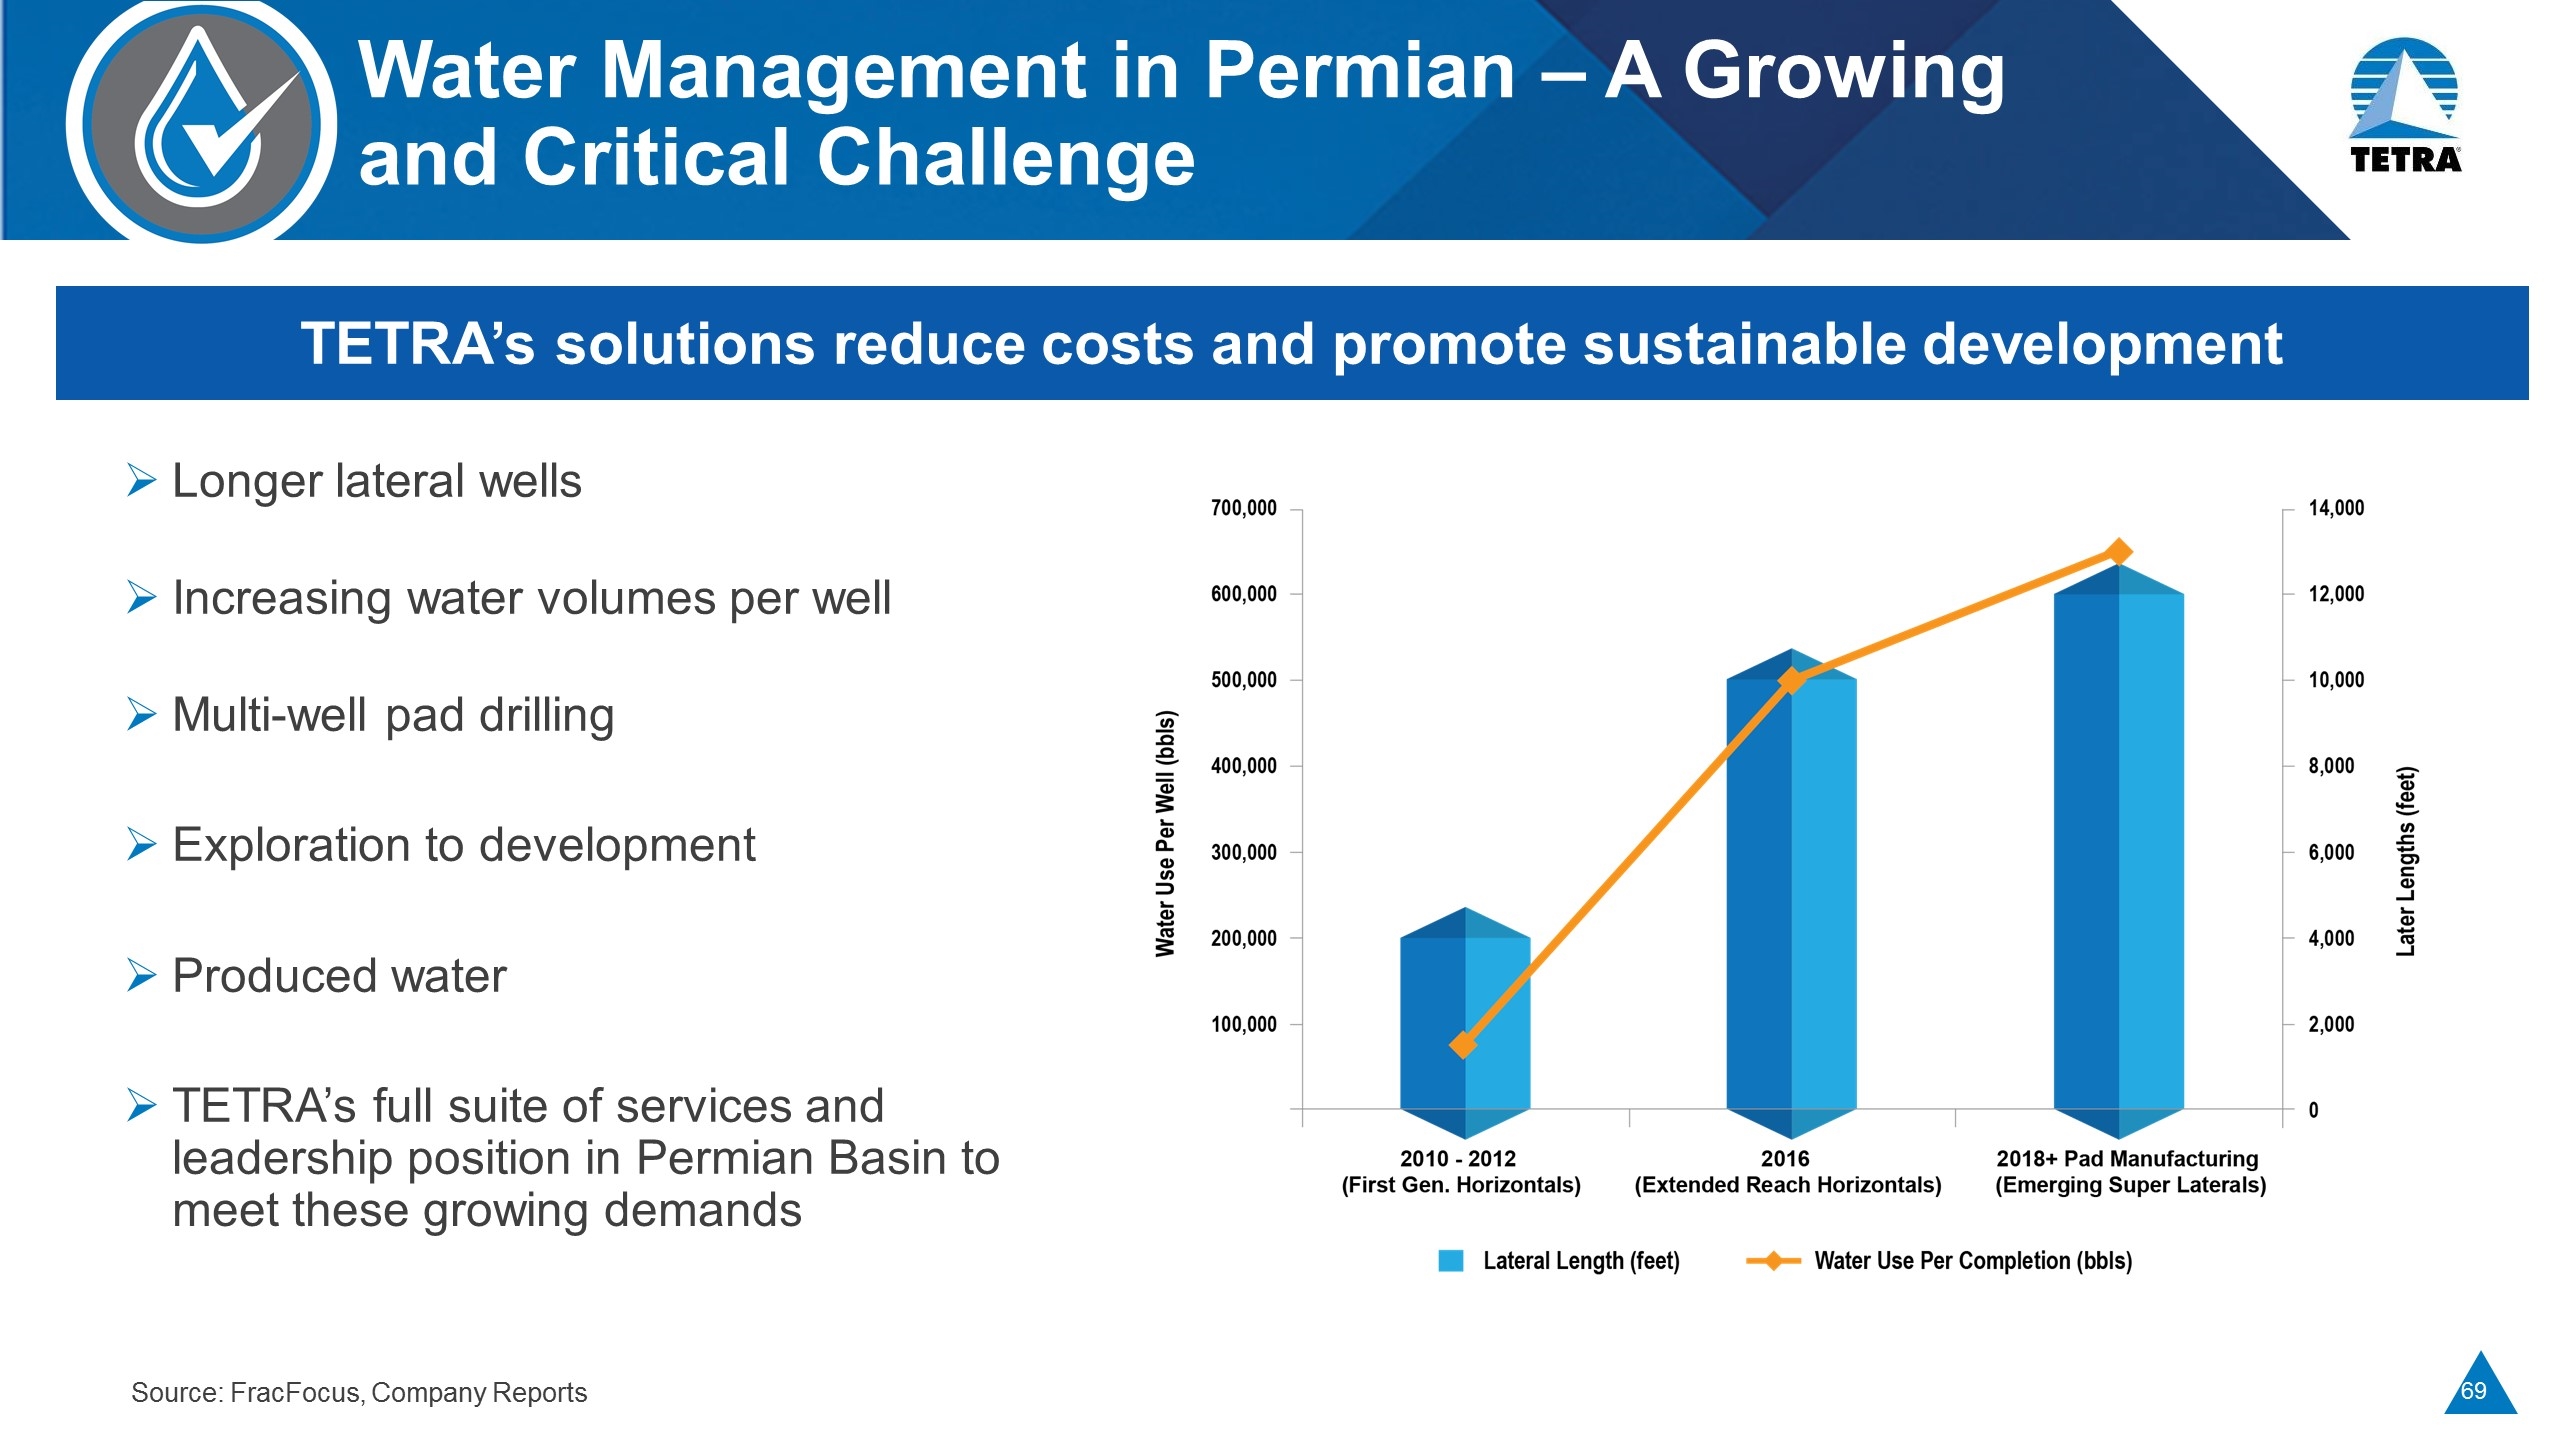
TETRA’s solutions reduce costs and promote sustainable development Longer lateral wells Increasing water volumes per well Multi-well pad drilling Exploration to development Produced water TETRA’s full suite of services and leadership position in Permian Basin to meet these growing demands Water Management in Permian – A Growing and Critical Challenge Source: FracFocus, Company Reports
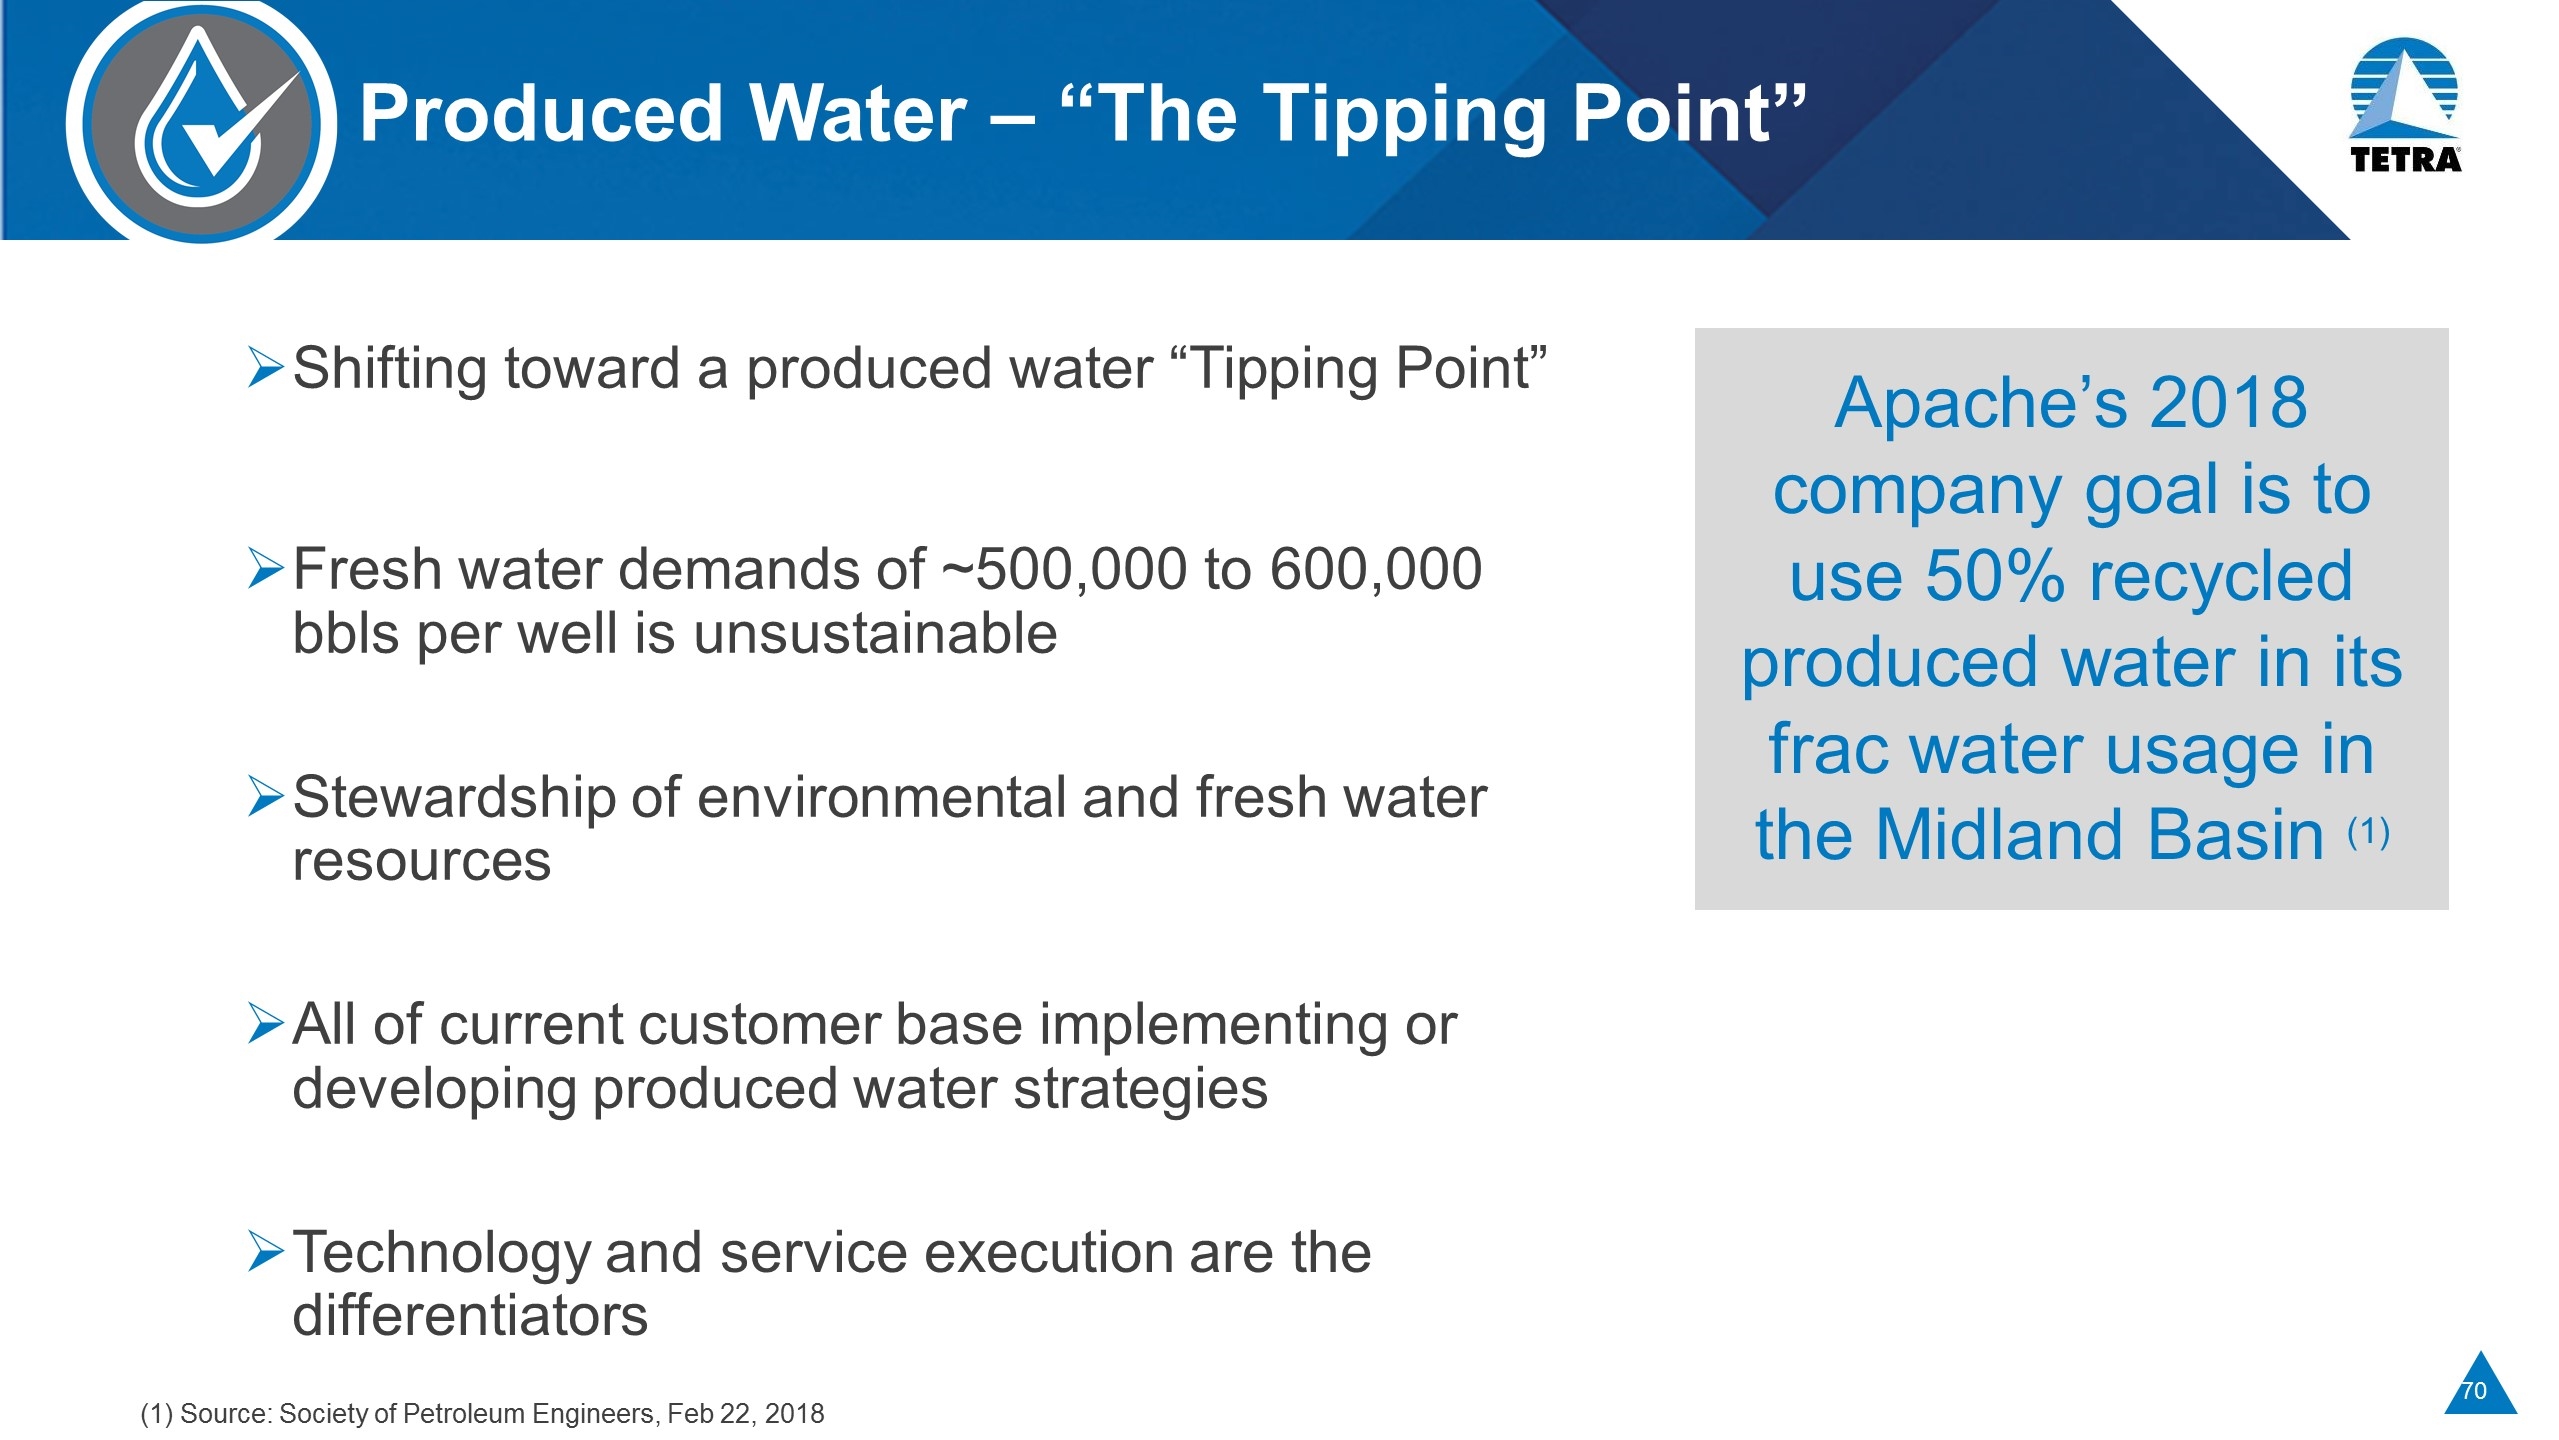
Produced Water – “The Tipping Point” Shifting toward a produced water “Tipping Point” Fresh water demands of ~500,000 to 600,000 bbls per well is unsustainable Stewardship of environmental and fresh water resources All of current customer base implementing or developing produced water strategies Technology and service execution are the differentiators Apache’s 2018 company goal is to use 50% recycled produced water in its frac water usage in the Midland Basin (1) (1) Source: Society of Petroleum Engineers, Feb 22, 2018
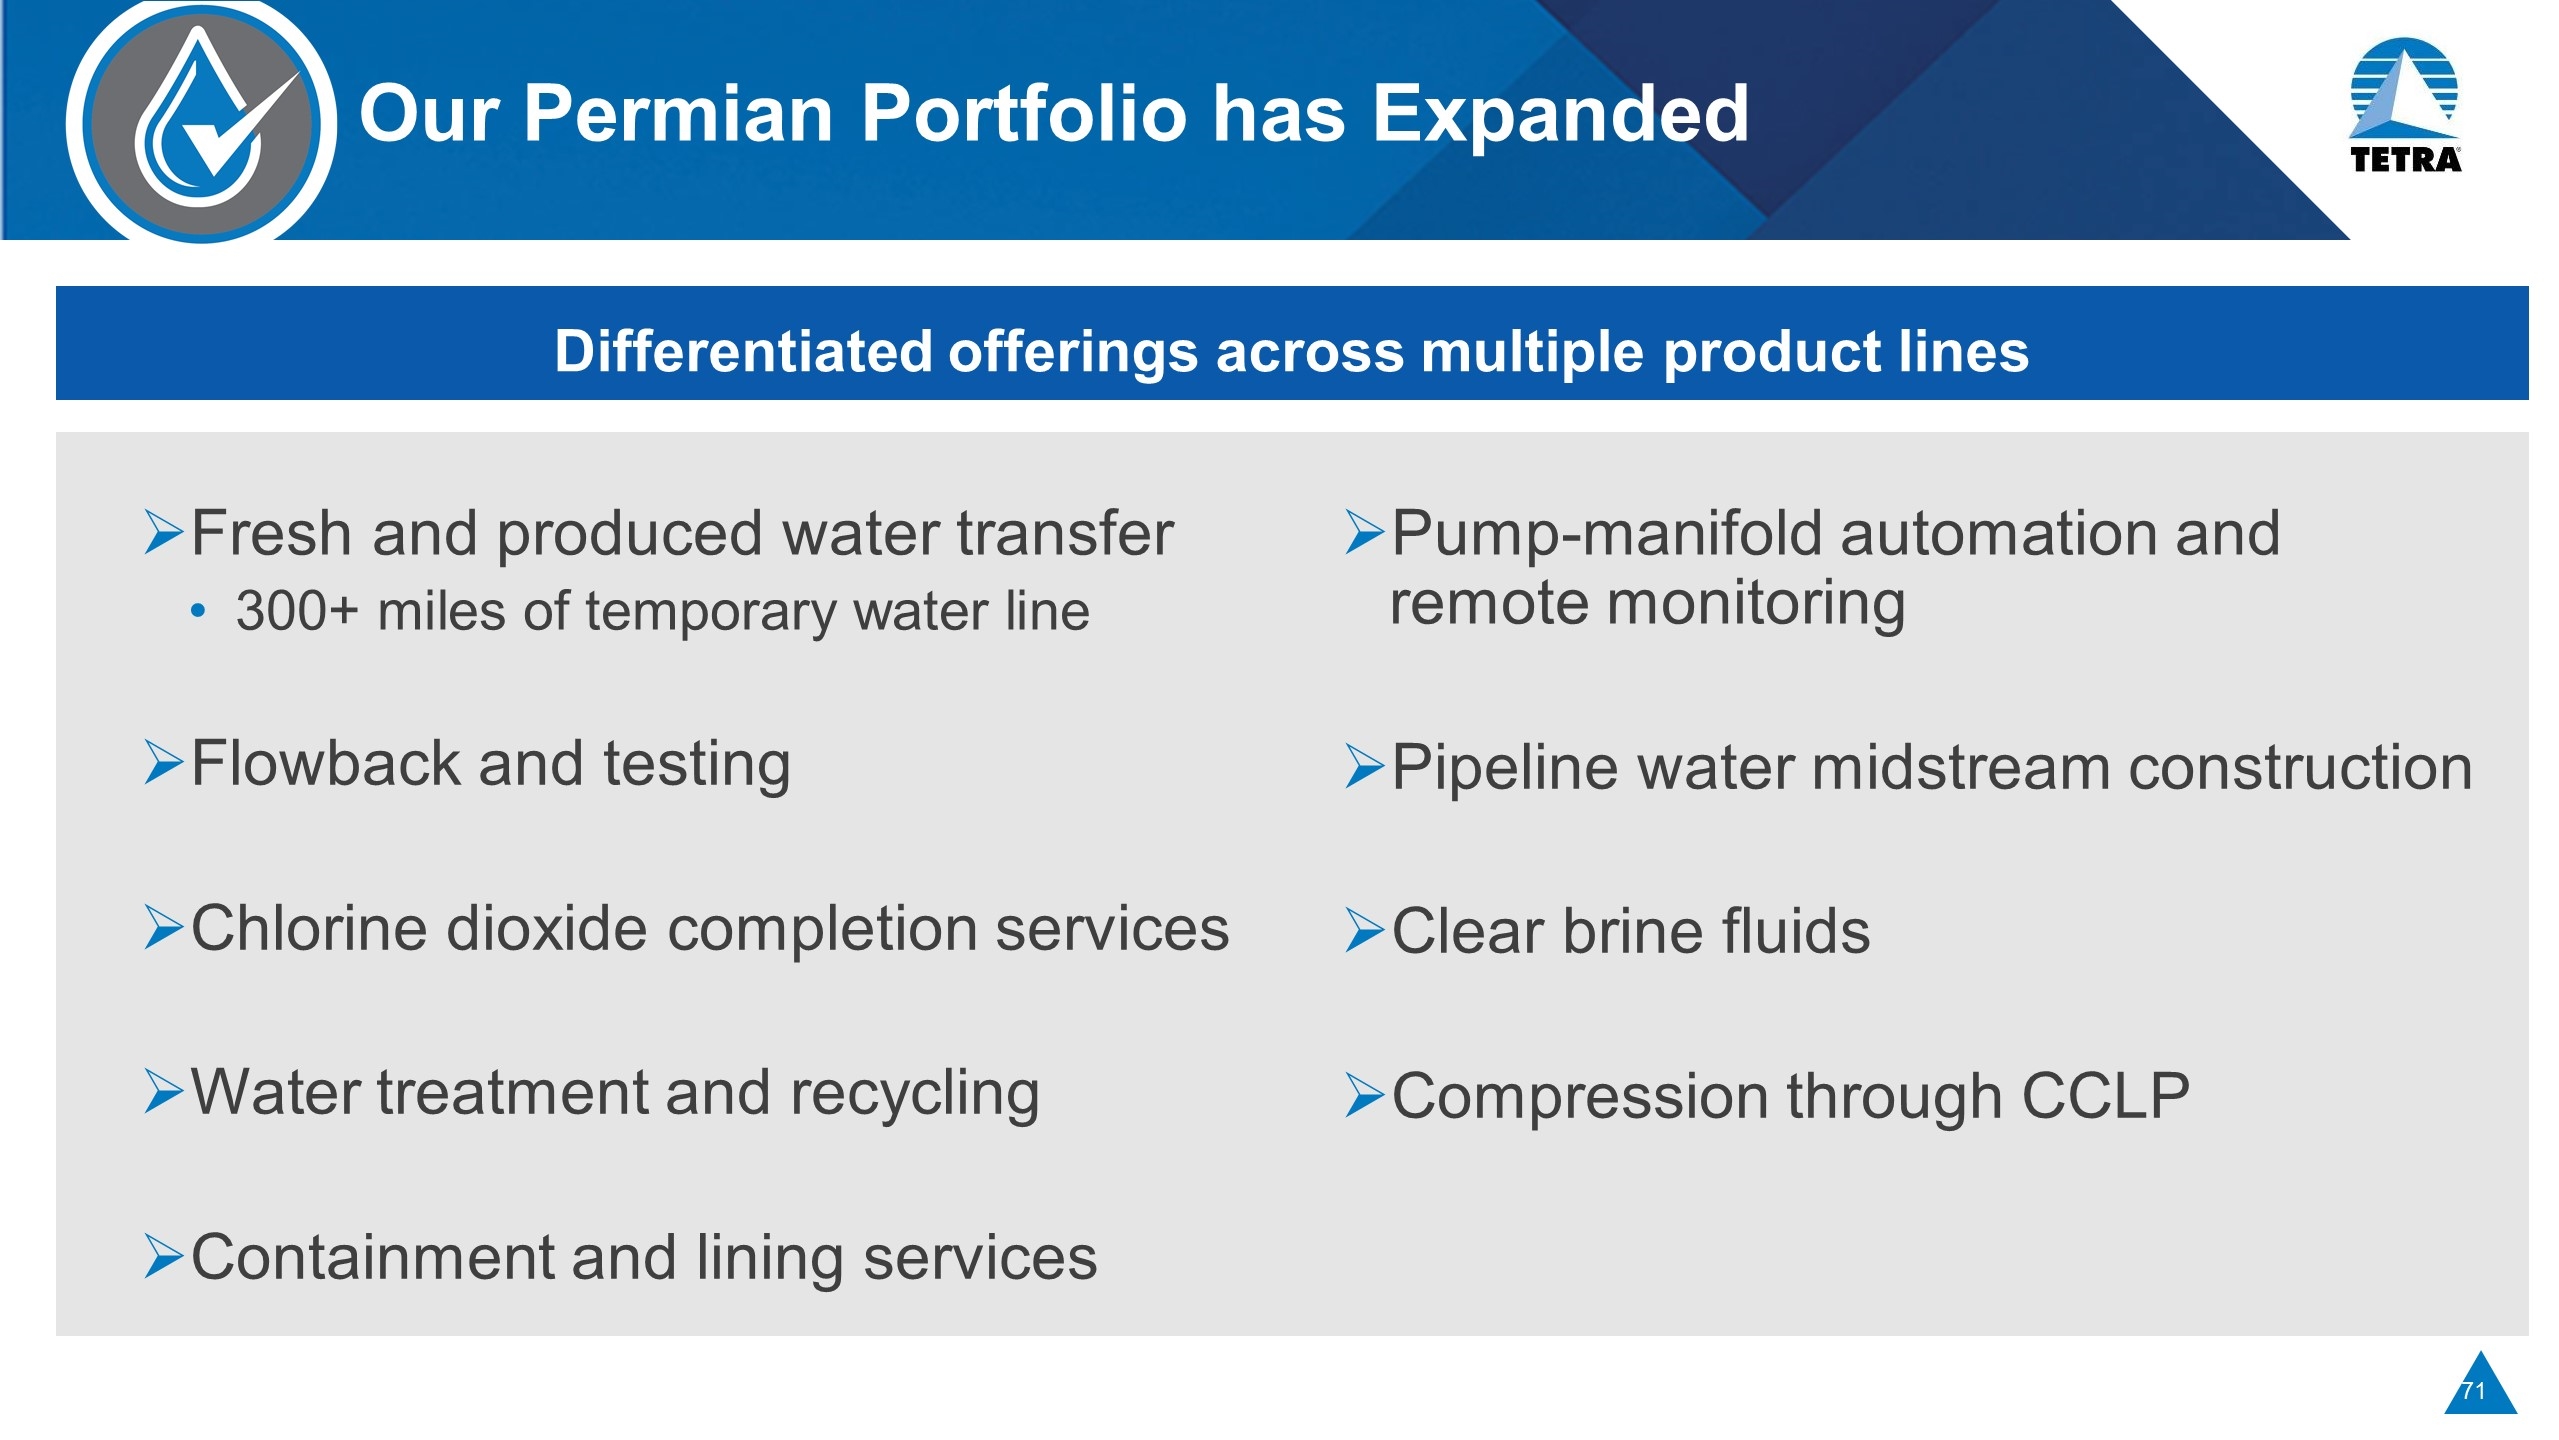
Our Permian Portfolio has Expanded Fresh and produced water transfer 300+ miles of temporary water line Flowback and testing Chlorine dioxide completion services Water treatment and recycling Containment and lining services Pump-manifold automation and remote monitoring Pipeline water midstream construction Clear brine fluids Compression through CCLP Differentiated offerings across multiple product lines
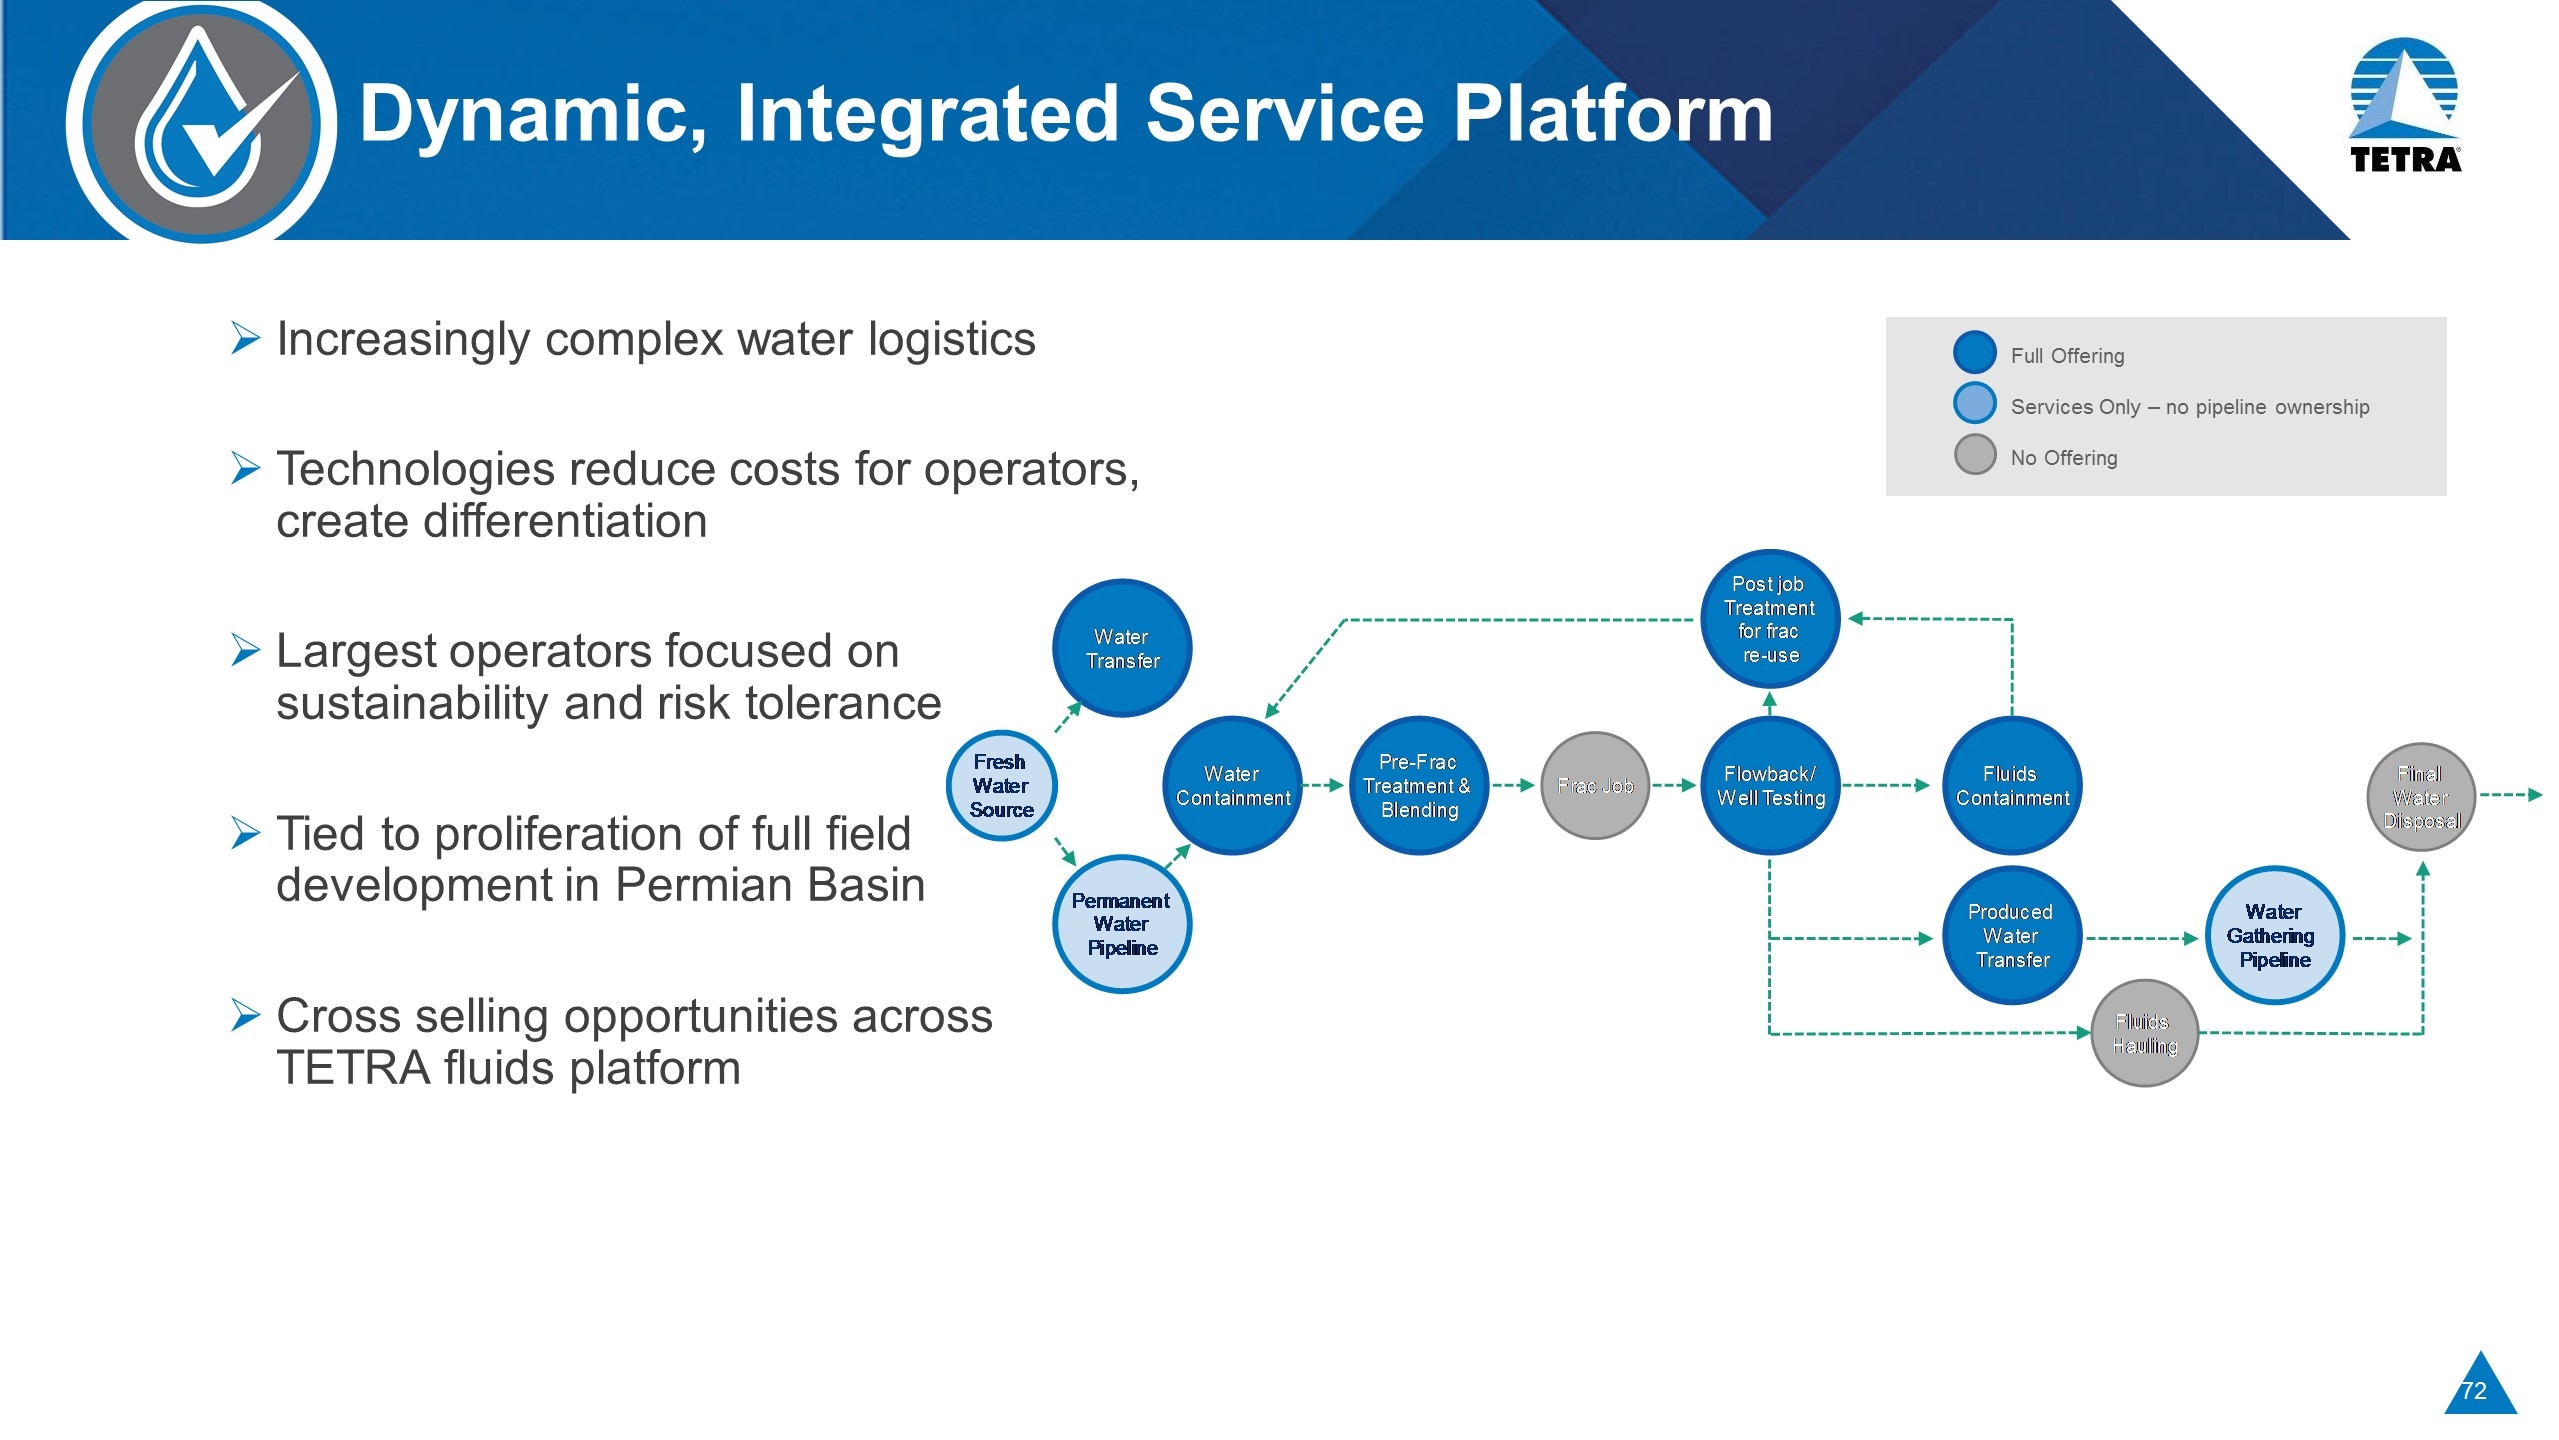
Dynamic, Integrated Service Platform Increasingly complex water logistics Technologies reduce costs for operators, create differentiation Largest operators focused on sustainability and risk tolerance Tied to proliferation of full field development in Permian Basin Cross selling opportunities across TETRA fluids platform Full Offering Services Only – no pipeline ownership No Offering
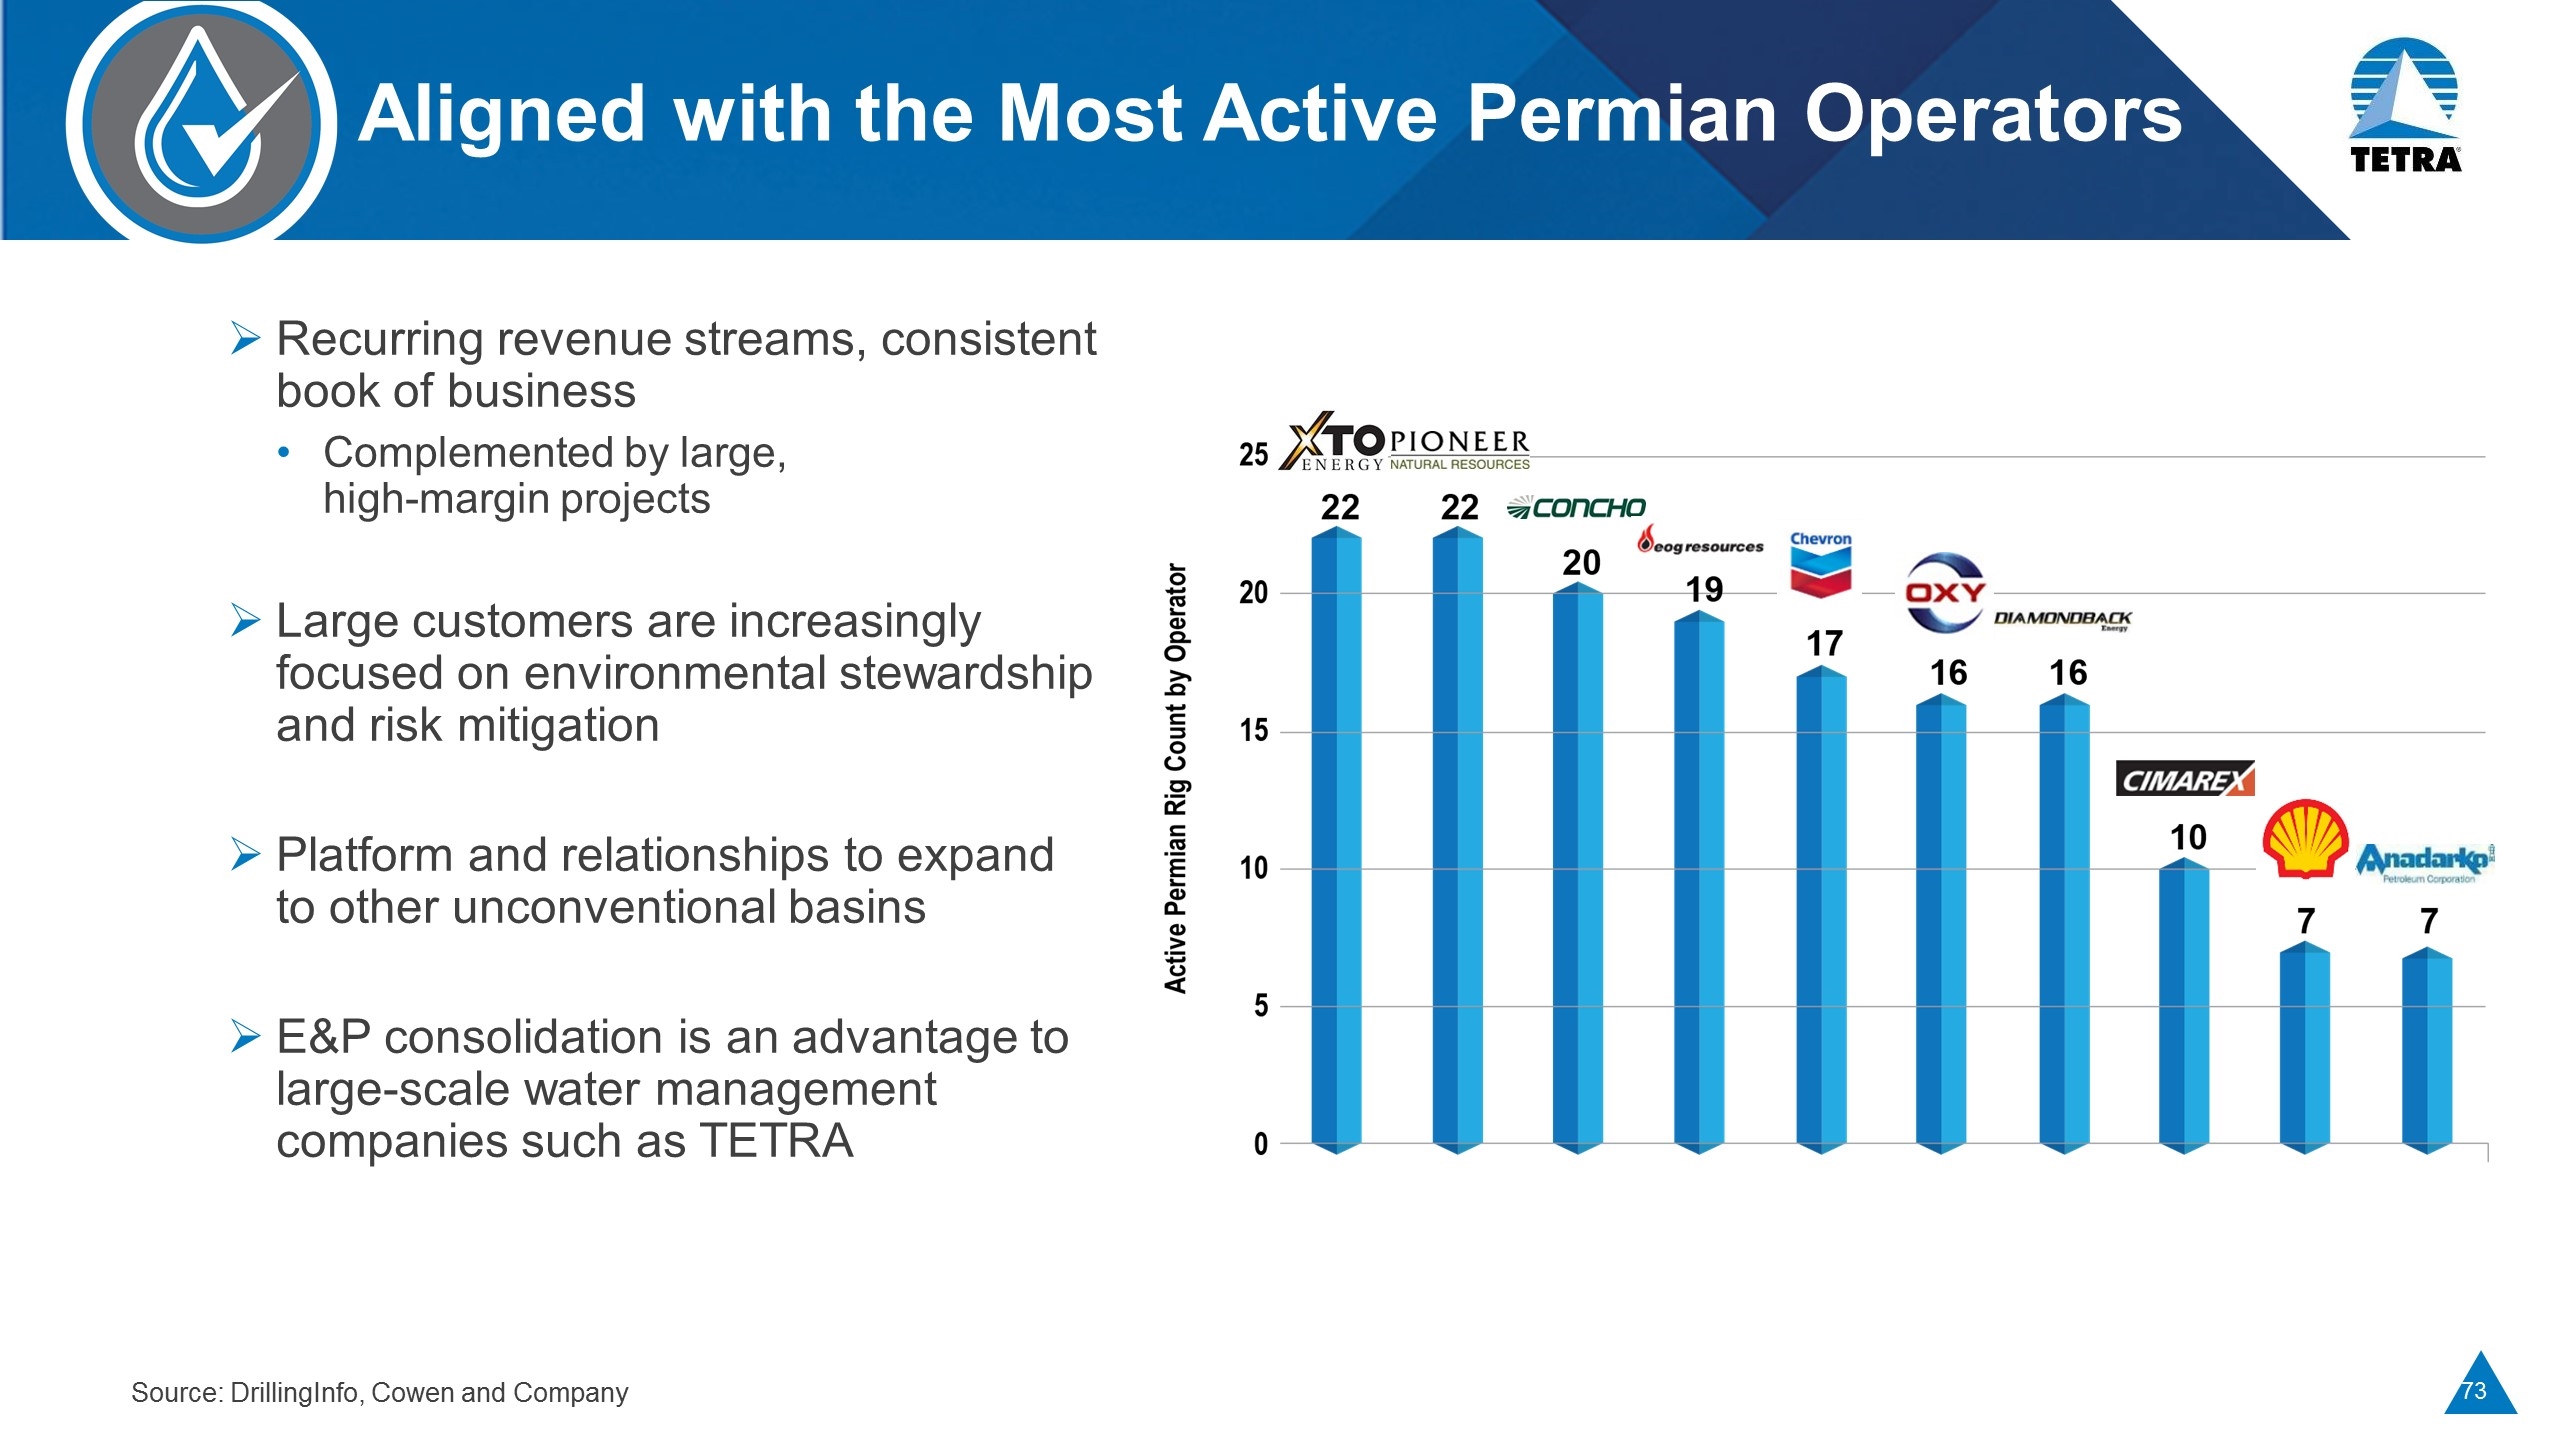
Aligned with the Most Active Permian Operators Recurring revenue streams, consistent book of business Complemented by large, high-margin projects Large customers are increasingly focused on environmental stewardship and risk mitigation Platform and relationships to expand to other unconventional basins E&P consolidation is an advantage to large-scale water management companies such as TETRA Source: DrillingInfo, Cowen and Company
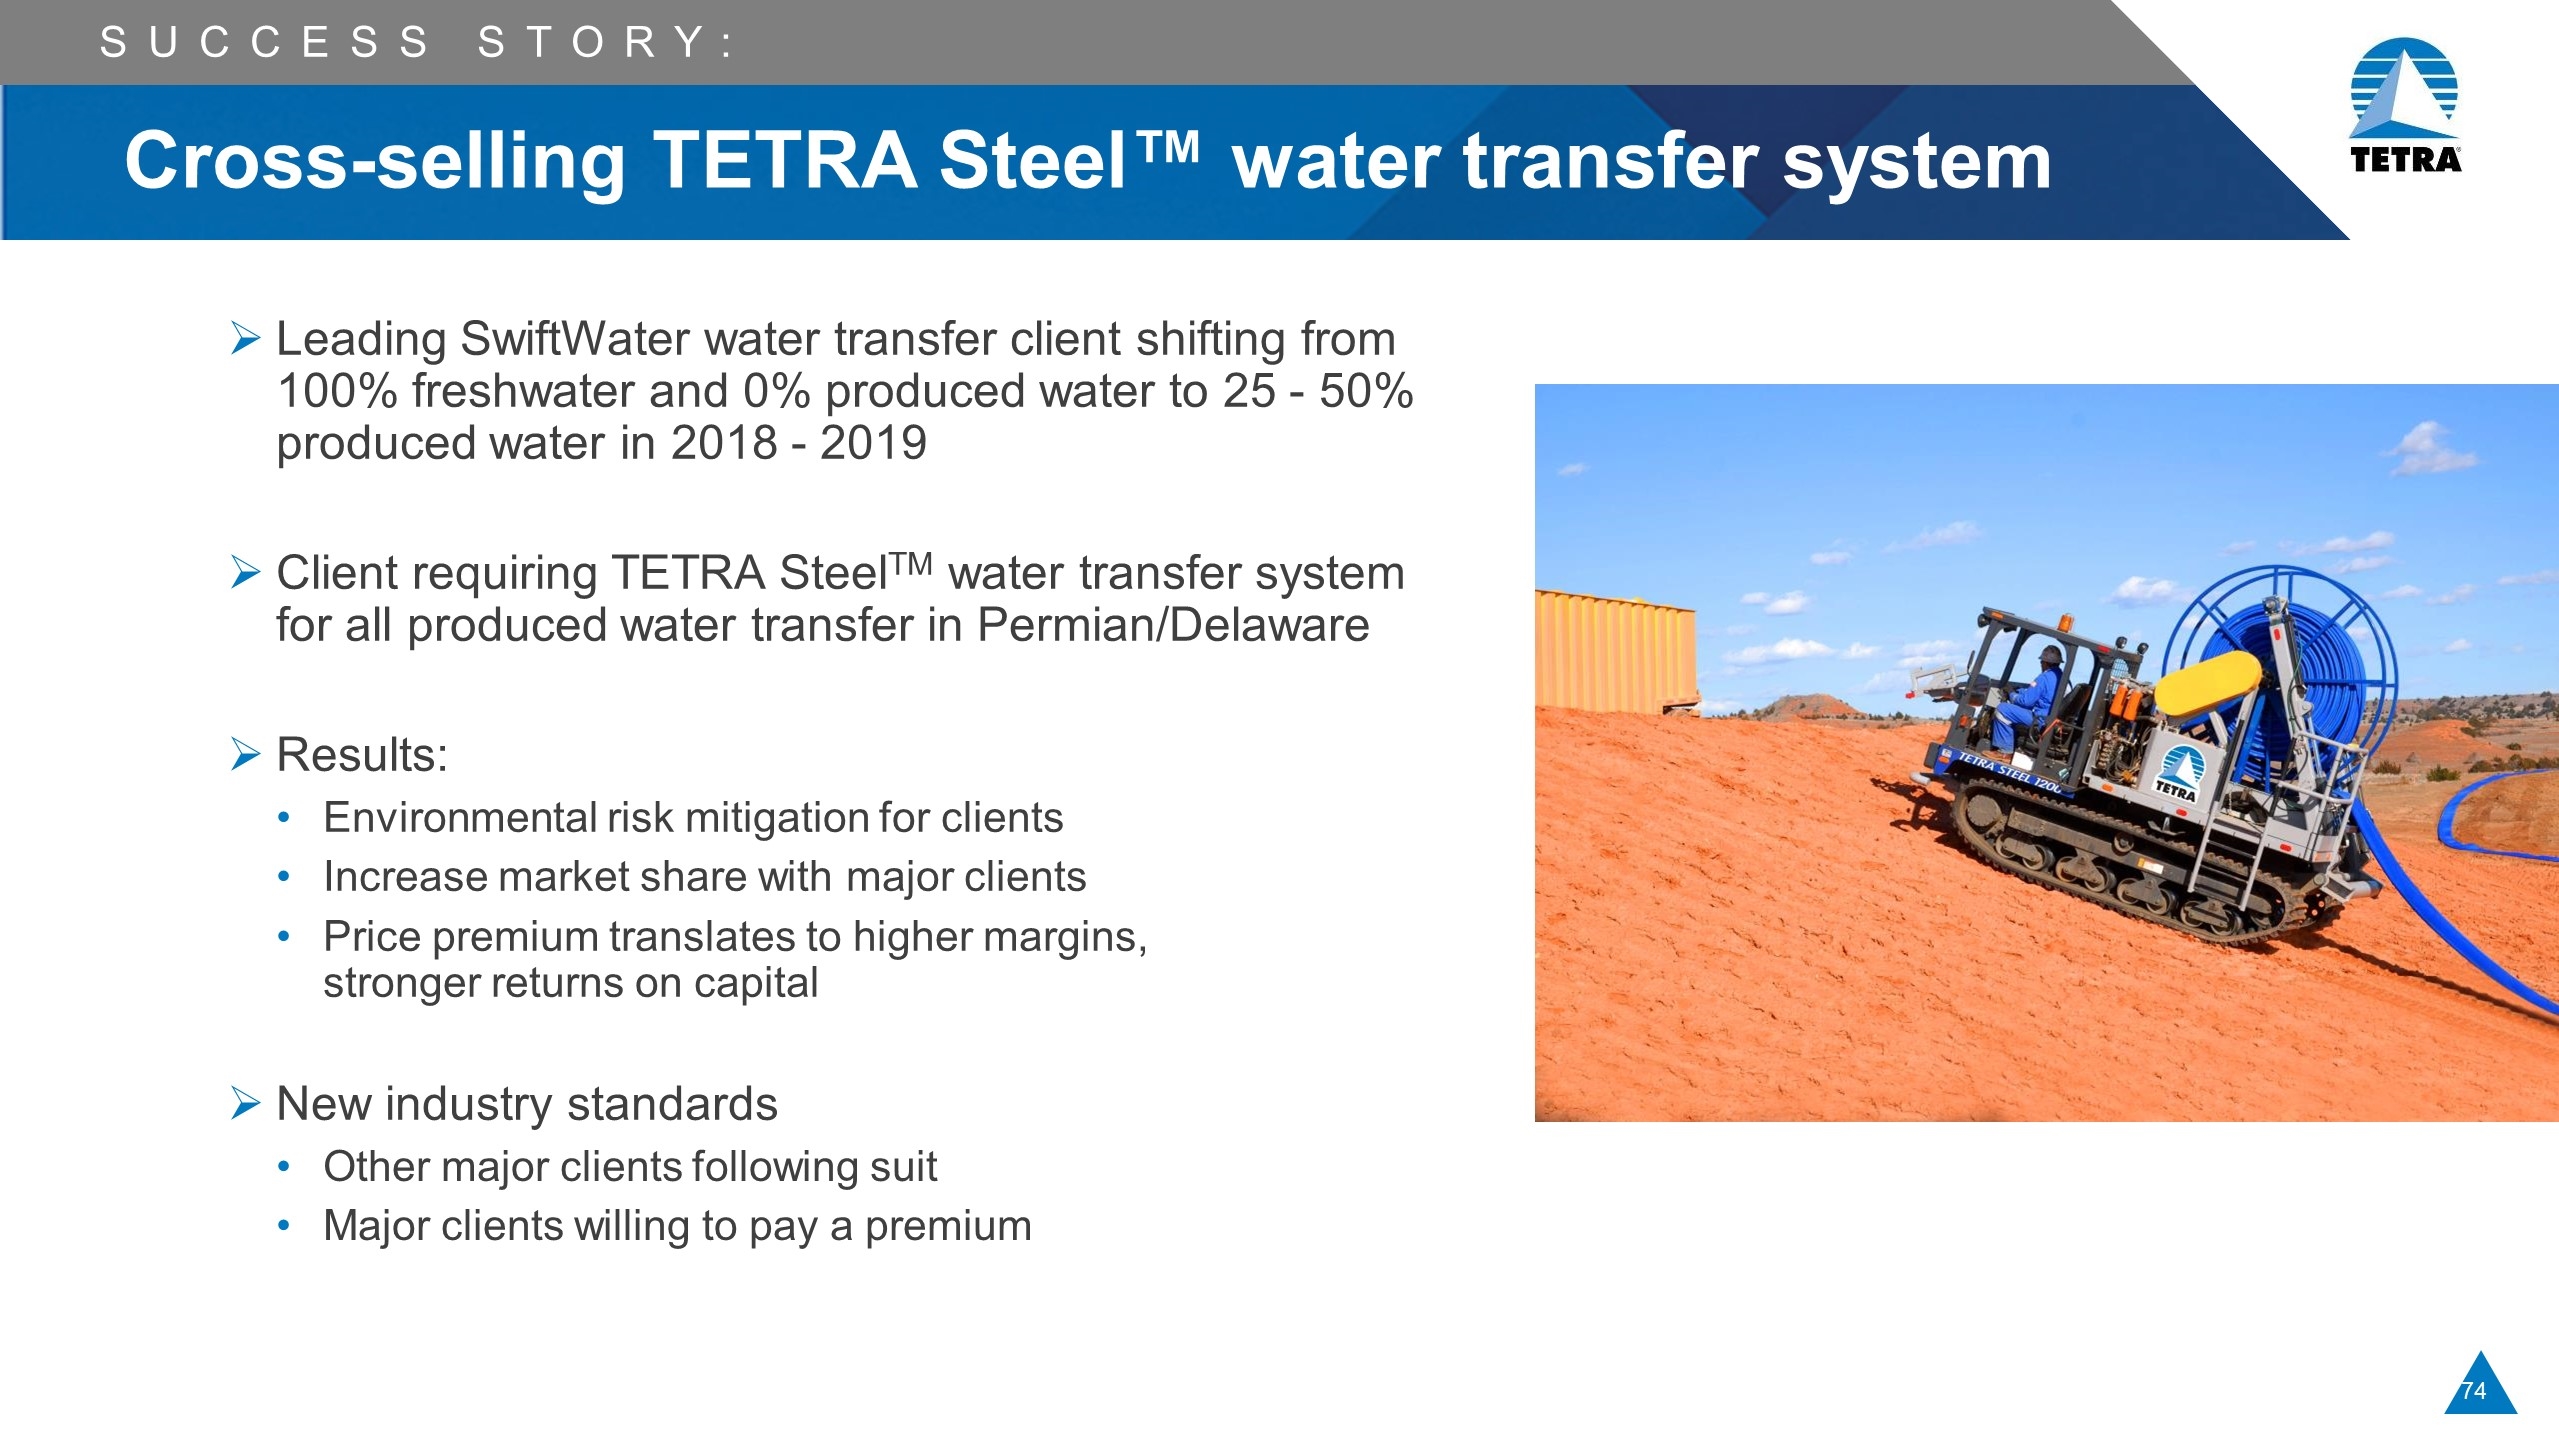
Cross-selling TETRA Steel™ water transfer system Leading SwiftWater water transfer client shifting from 100% freshwater and 0% produced water to 25 - 50% produced water in 2018 - 2019 Client requiring TETRA SteelTM water transfer system for all produced water transfer in Permian/Delaware Results: Environmental risk mitigation for clients Increase market share with major clients Price premium translates to higher margins, stronger returns on capital New industry standards Other major clients following suit Major clients willing to pay a premium Success Story:
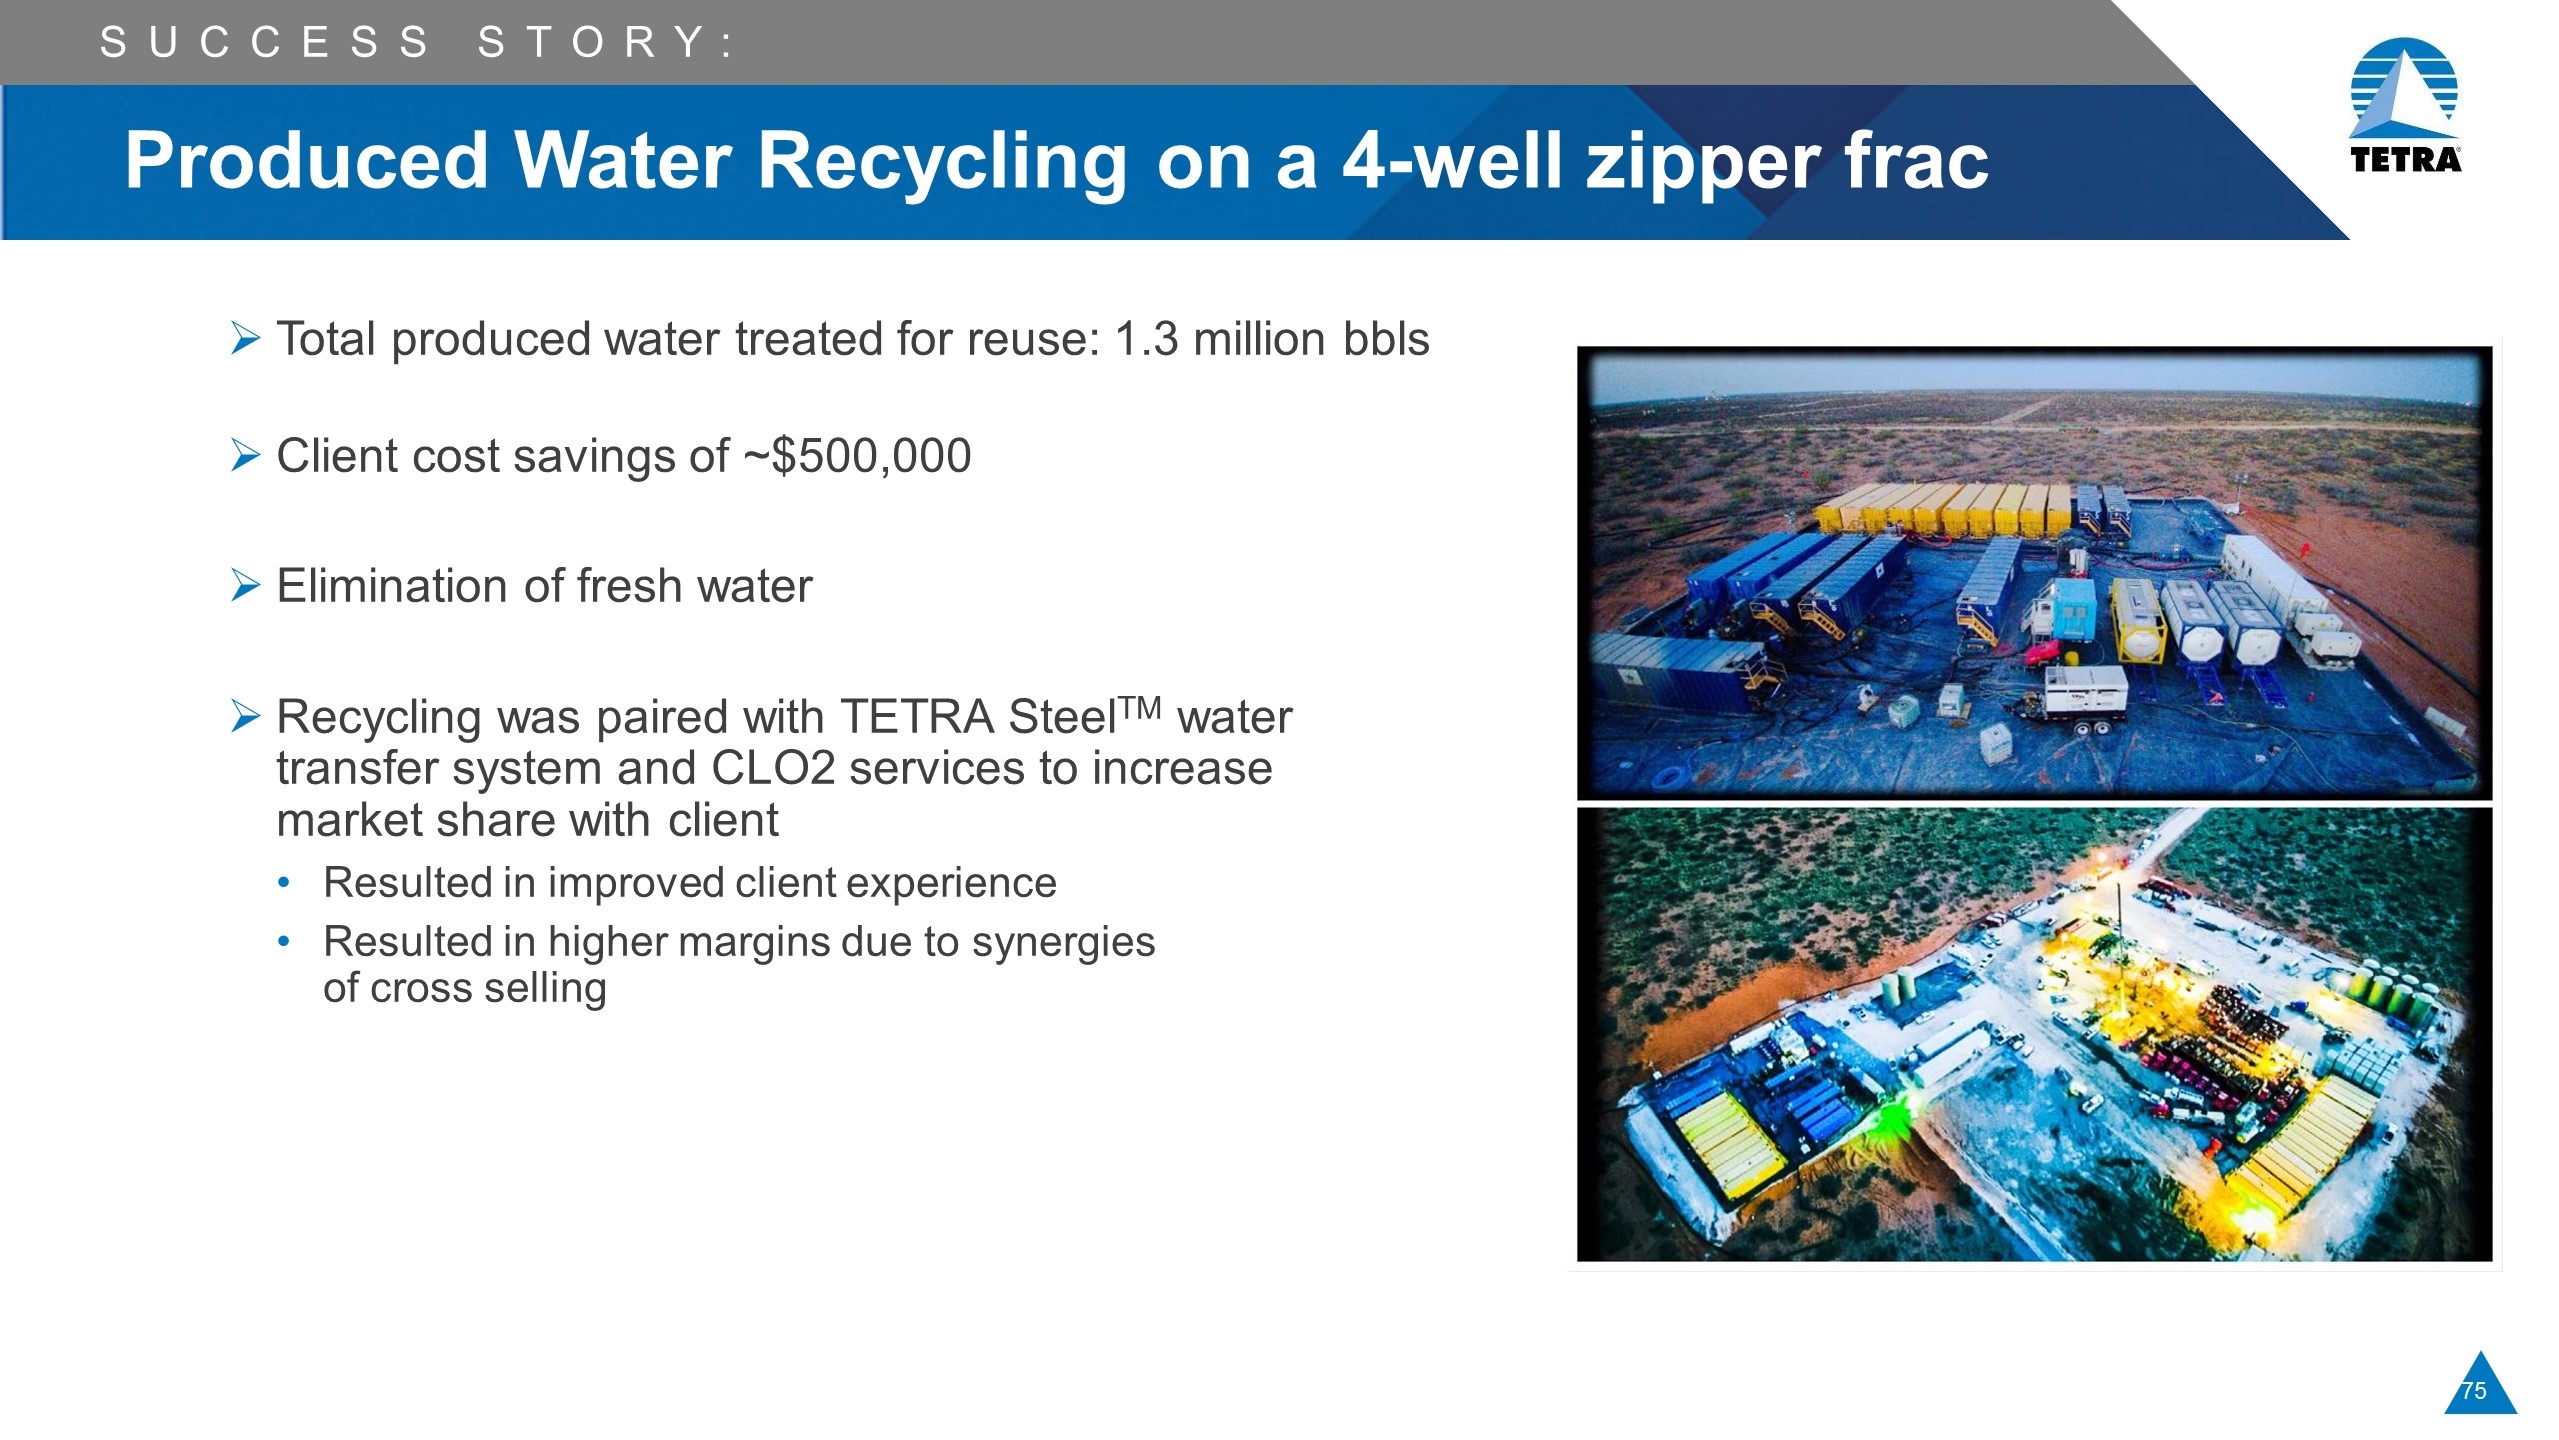
Produced Water Recycling on a 4-well zipper frac Total produced water treated for reuse: 1.3 million bbls Client cost savings of ~$500,000 Elimination of fresh water Recycling was paired with TETRA SteelTM water transfer system and CLO2 services to increase market share with client Resulted in improved client experience Resulted in higher margins due to synergies of cross selling Success Story:
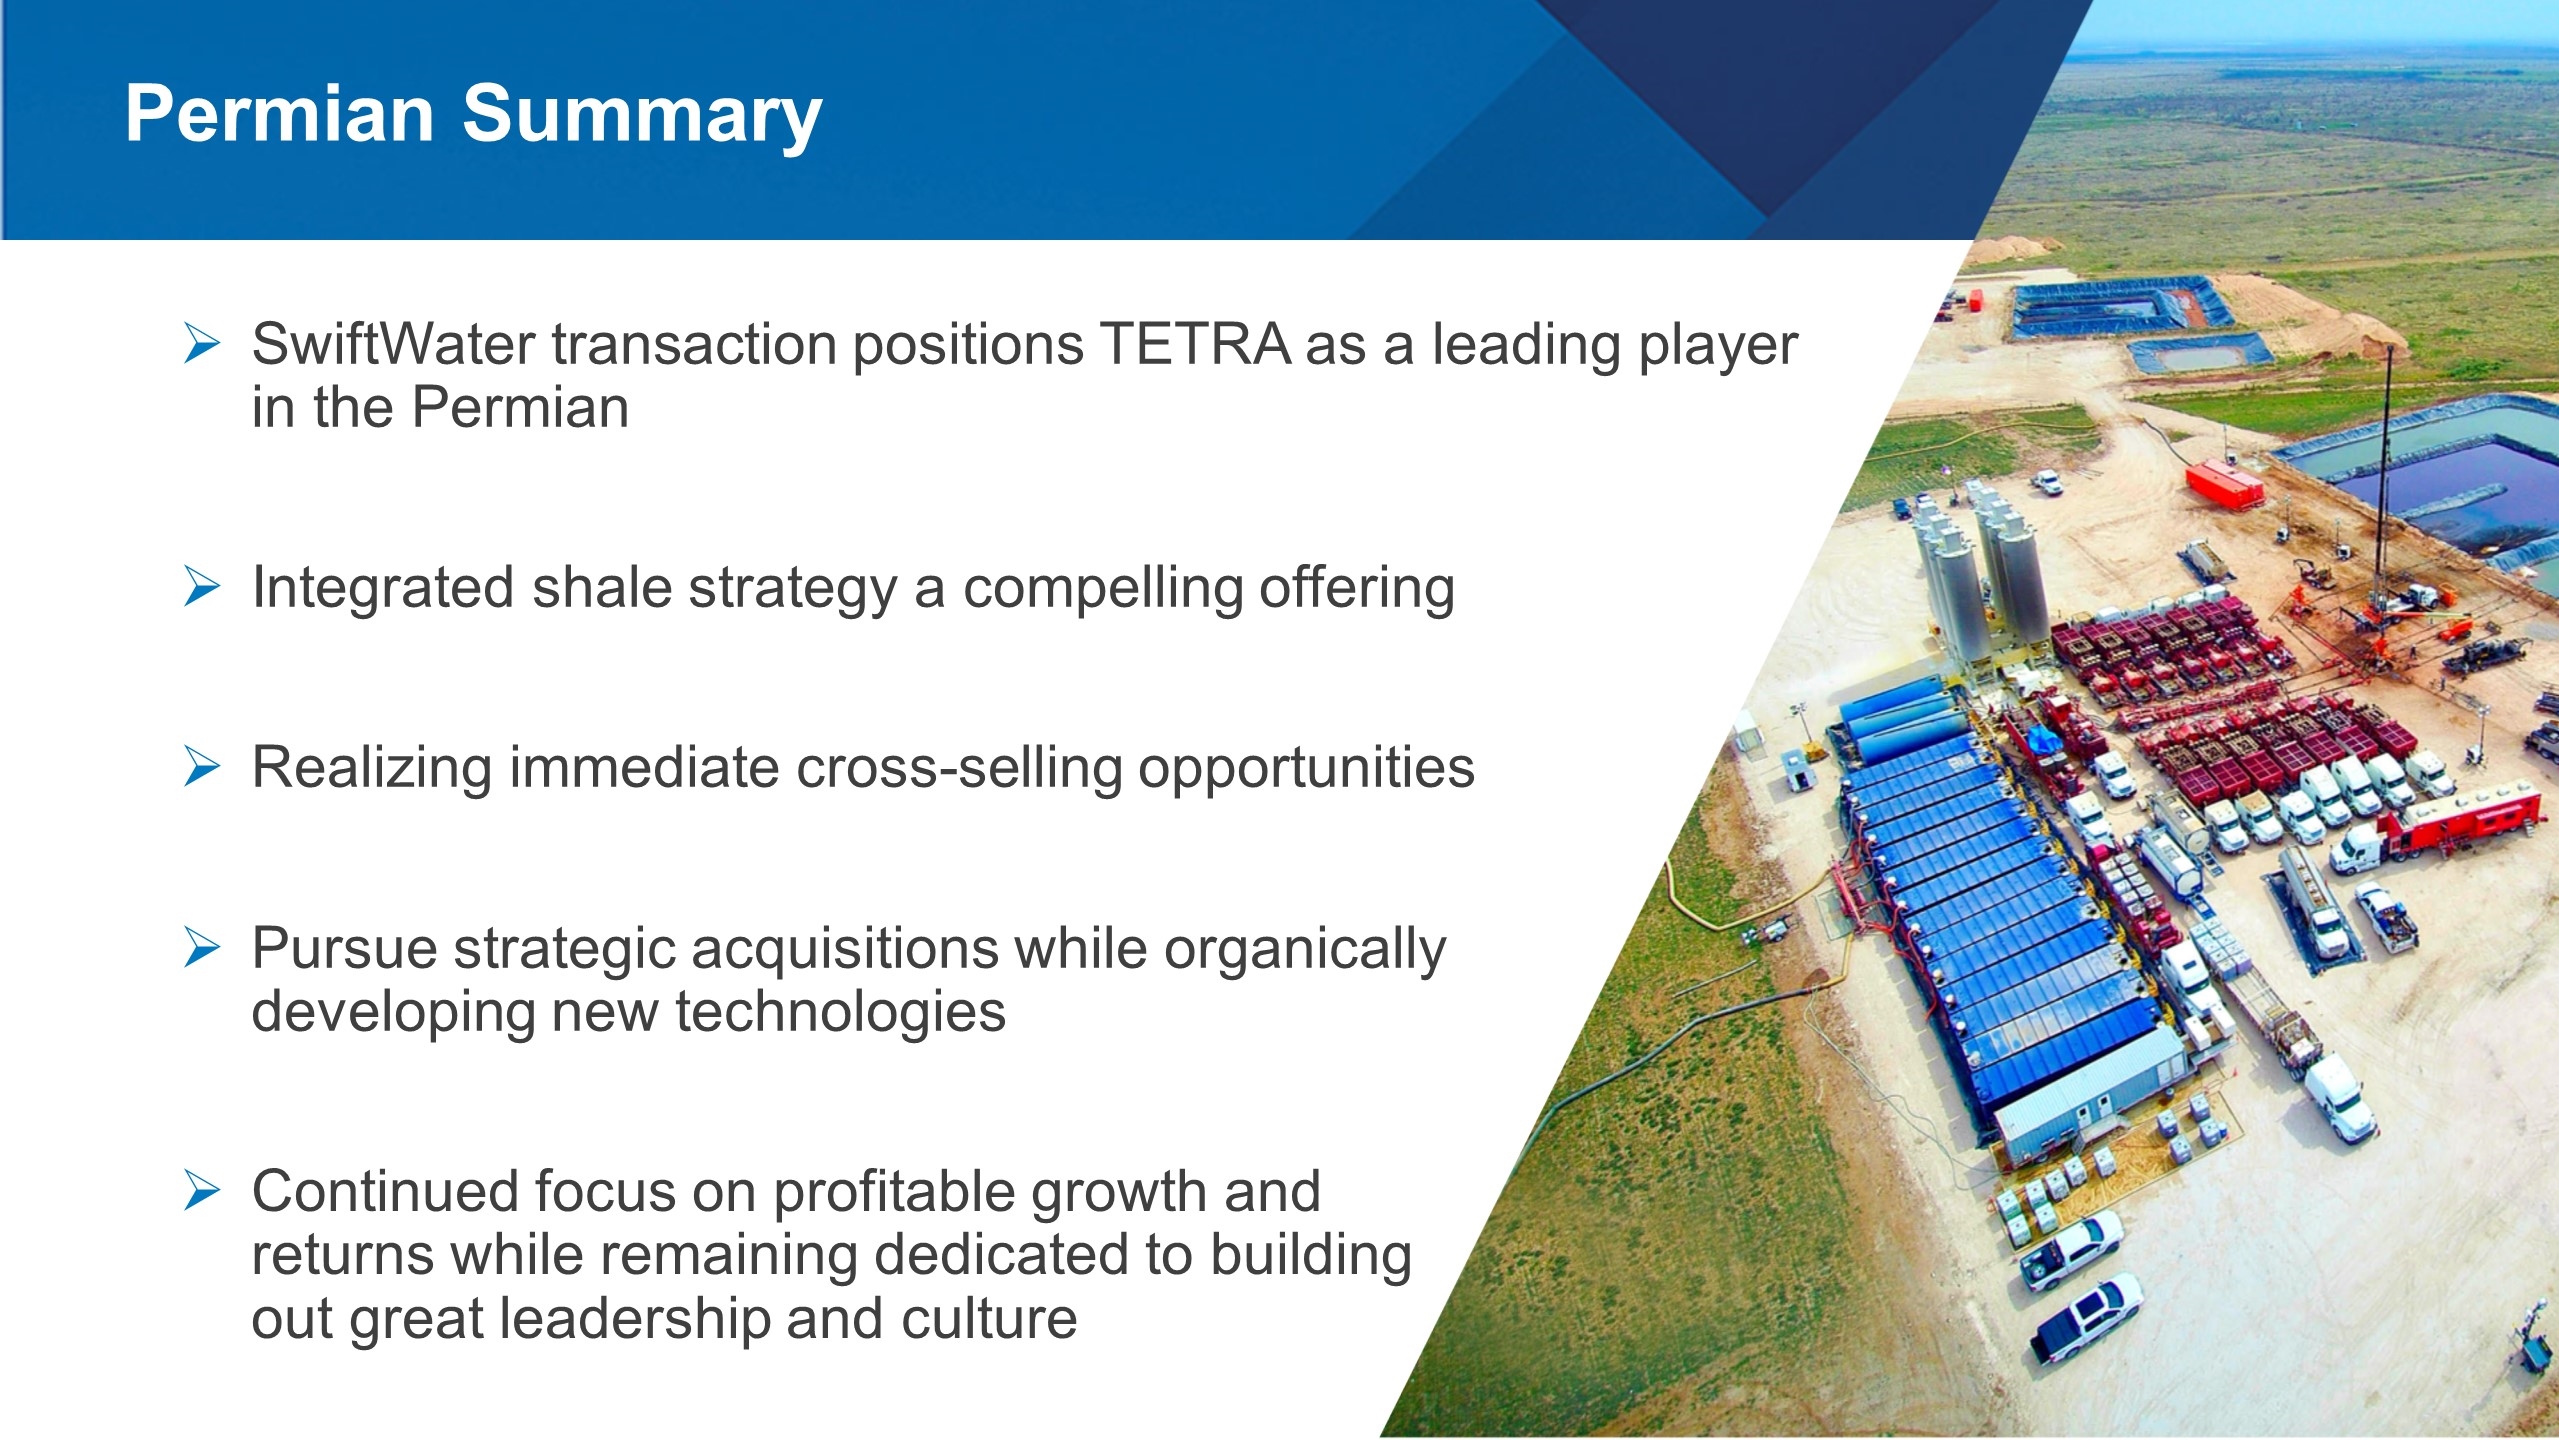
Permian Summary SwiftWater transaction positions TETRA as a leading player in the Permian Integrated shale strategy a compelling offering Realizing immediate cross-selling opportunities Pursue strategic acquisitions while organically developing new technologies Continued focus on profitable growth and returns while remaining dedicated to building out great leadership and culture
Q&A
15 Minutes
Owen Serjeant, President, CSI Compressco Levent Caglar, Vice President, Sales
Financial Highlights & Objectives CSI COMPRESSCO
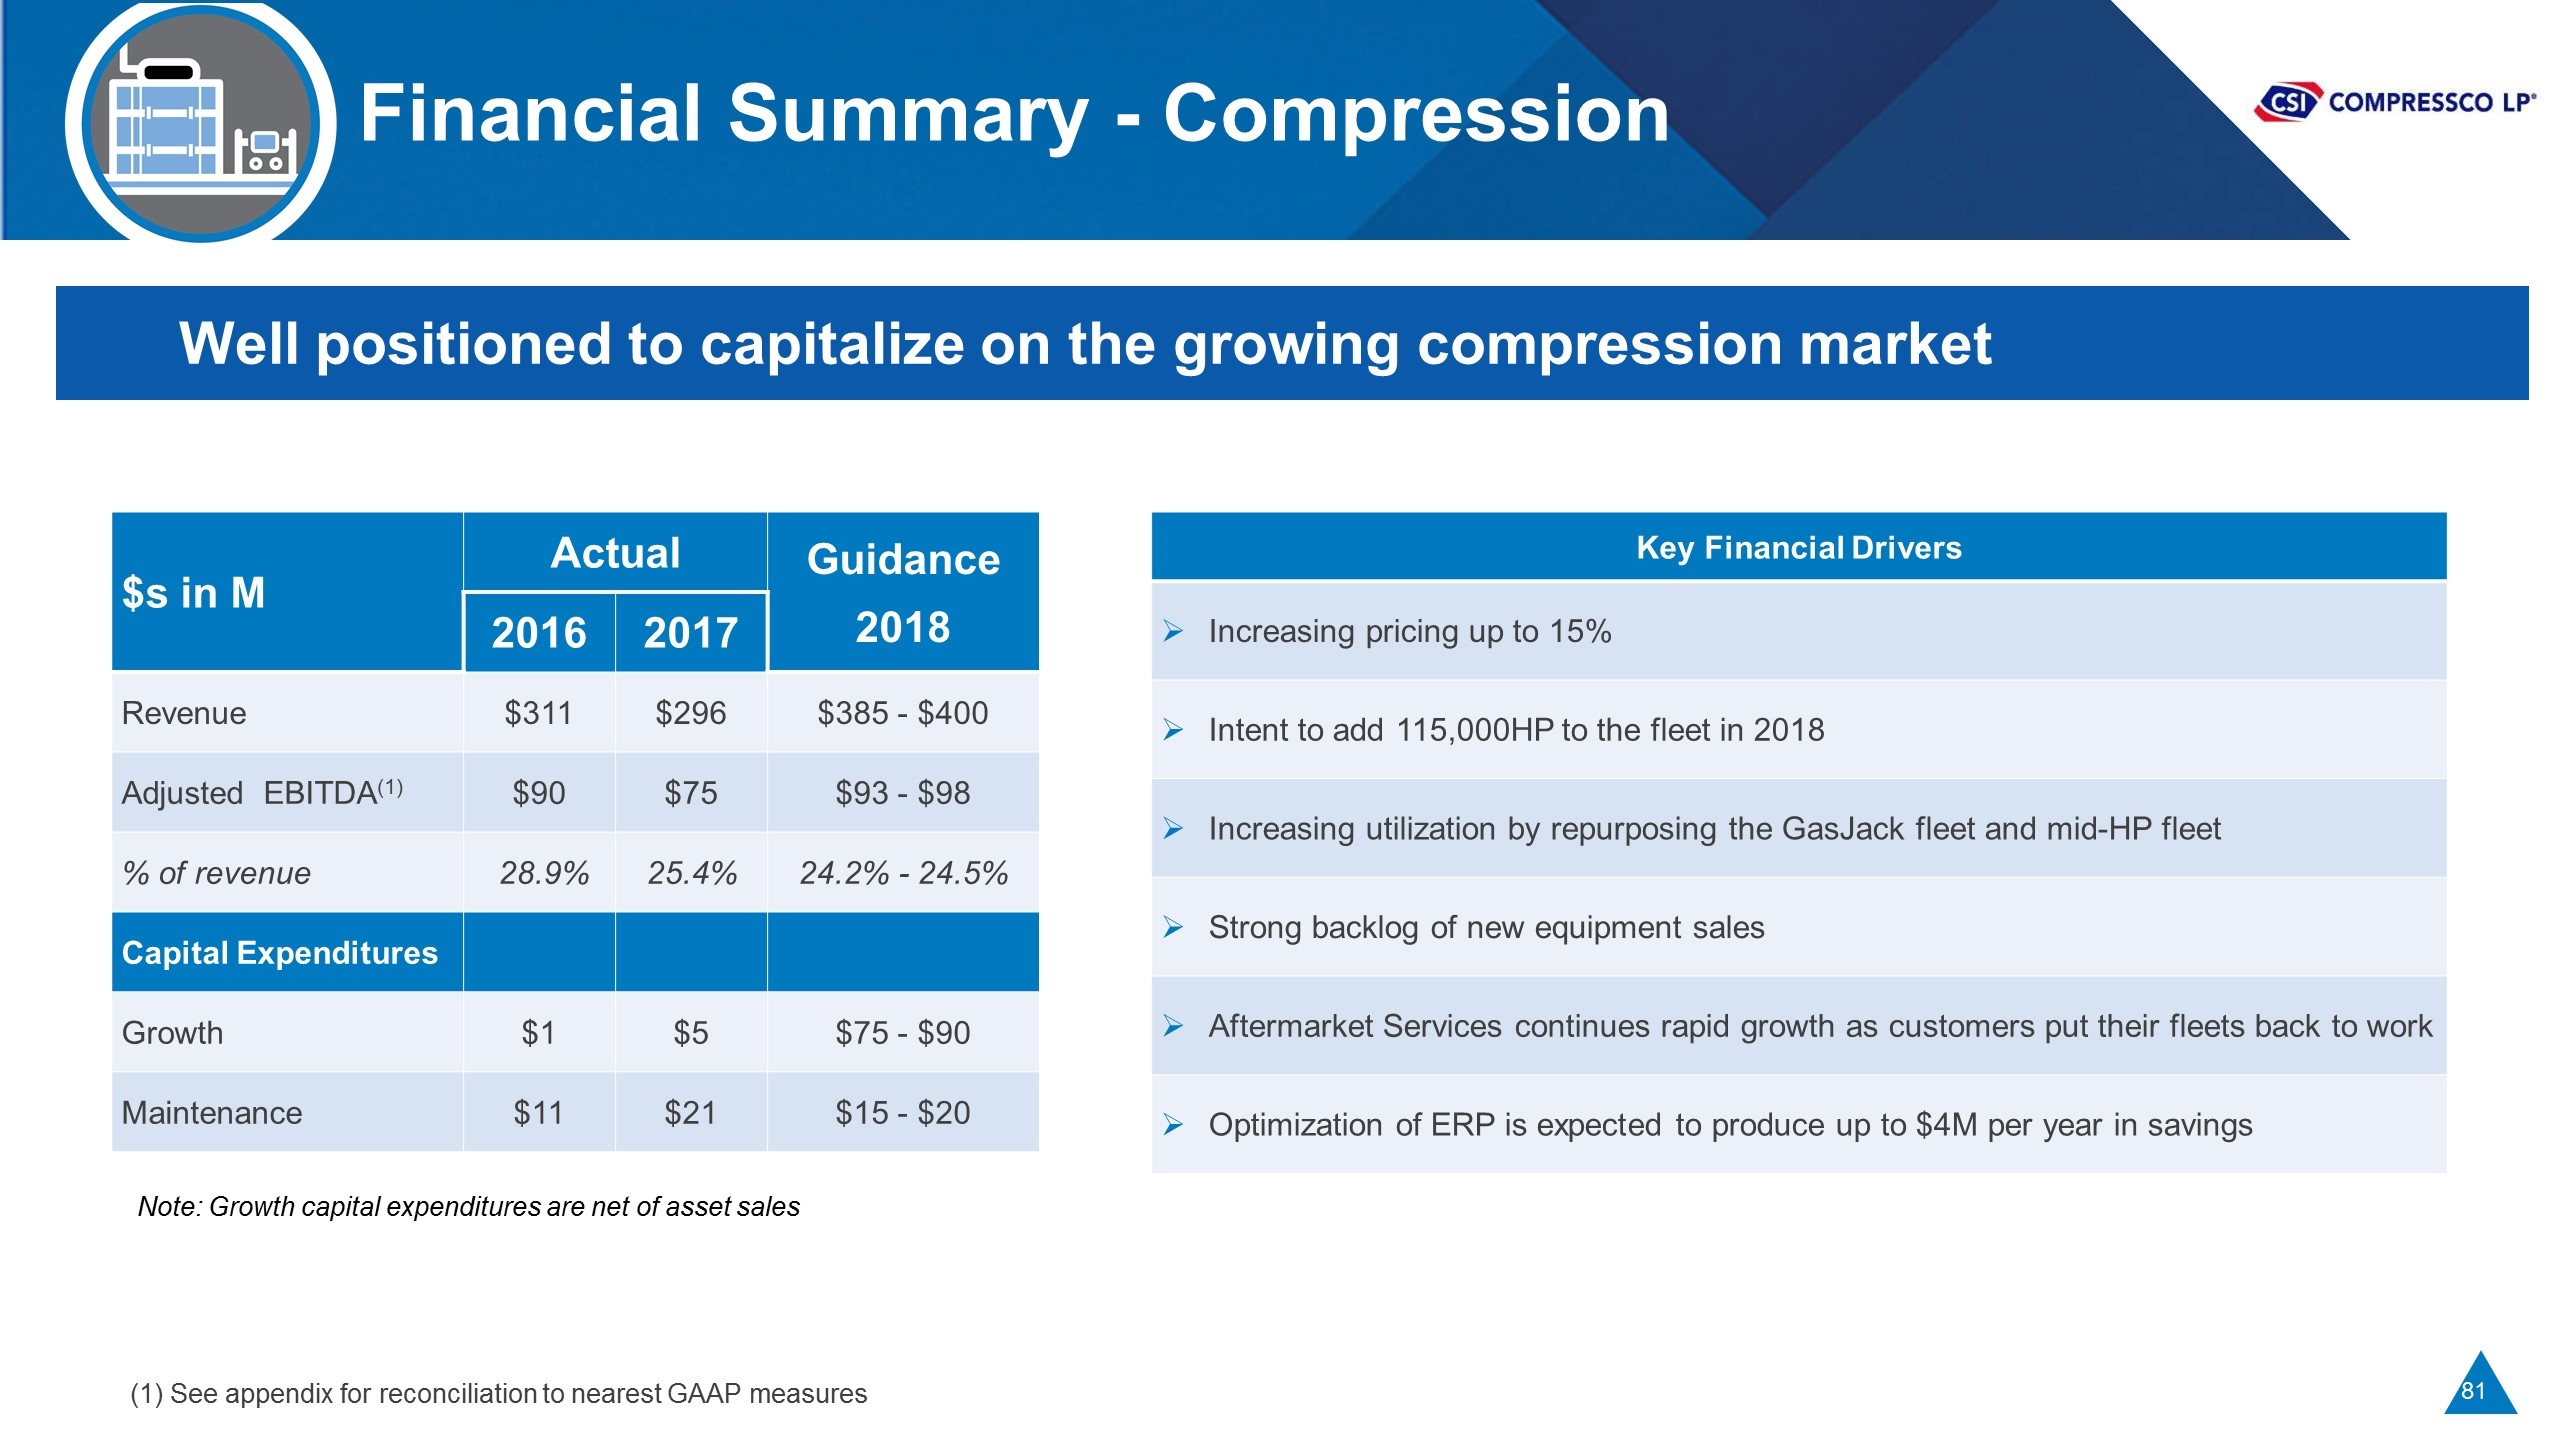
Financial Summary - Compression Well positioned to capitalize on the growing compression market $s in M Actual Guidance 2018 2016 2017 Revenue $311 $296 $385 - $400 Adjusted EBITDA(1) $90 $75 $93 - $98 % of revenue 28.9% 25.4% 24.2% - 24.5% Capital Expenditures Growth $1 $5 $75 - $90 Maintenance $11 $21 $15 - $20 Key Financial Drivers Increasing pricing up to 15% Intent to add 115,000HP to the fleet in 2018 Increasing utilization by repurposing the GasJack fleet and mid-HP fleet Strong backlog of new equipment sales Aftermarket Services continues rapid growth as customers put their fleets back to work Optimization of ERP is expected to produce up to $4M per year in savings Note: Growth capital expenditures are net of asset sales (1) See appendix for reconciliation to nearest GAAP measures
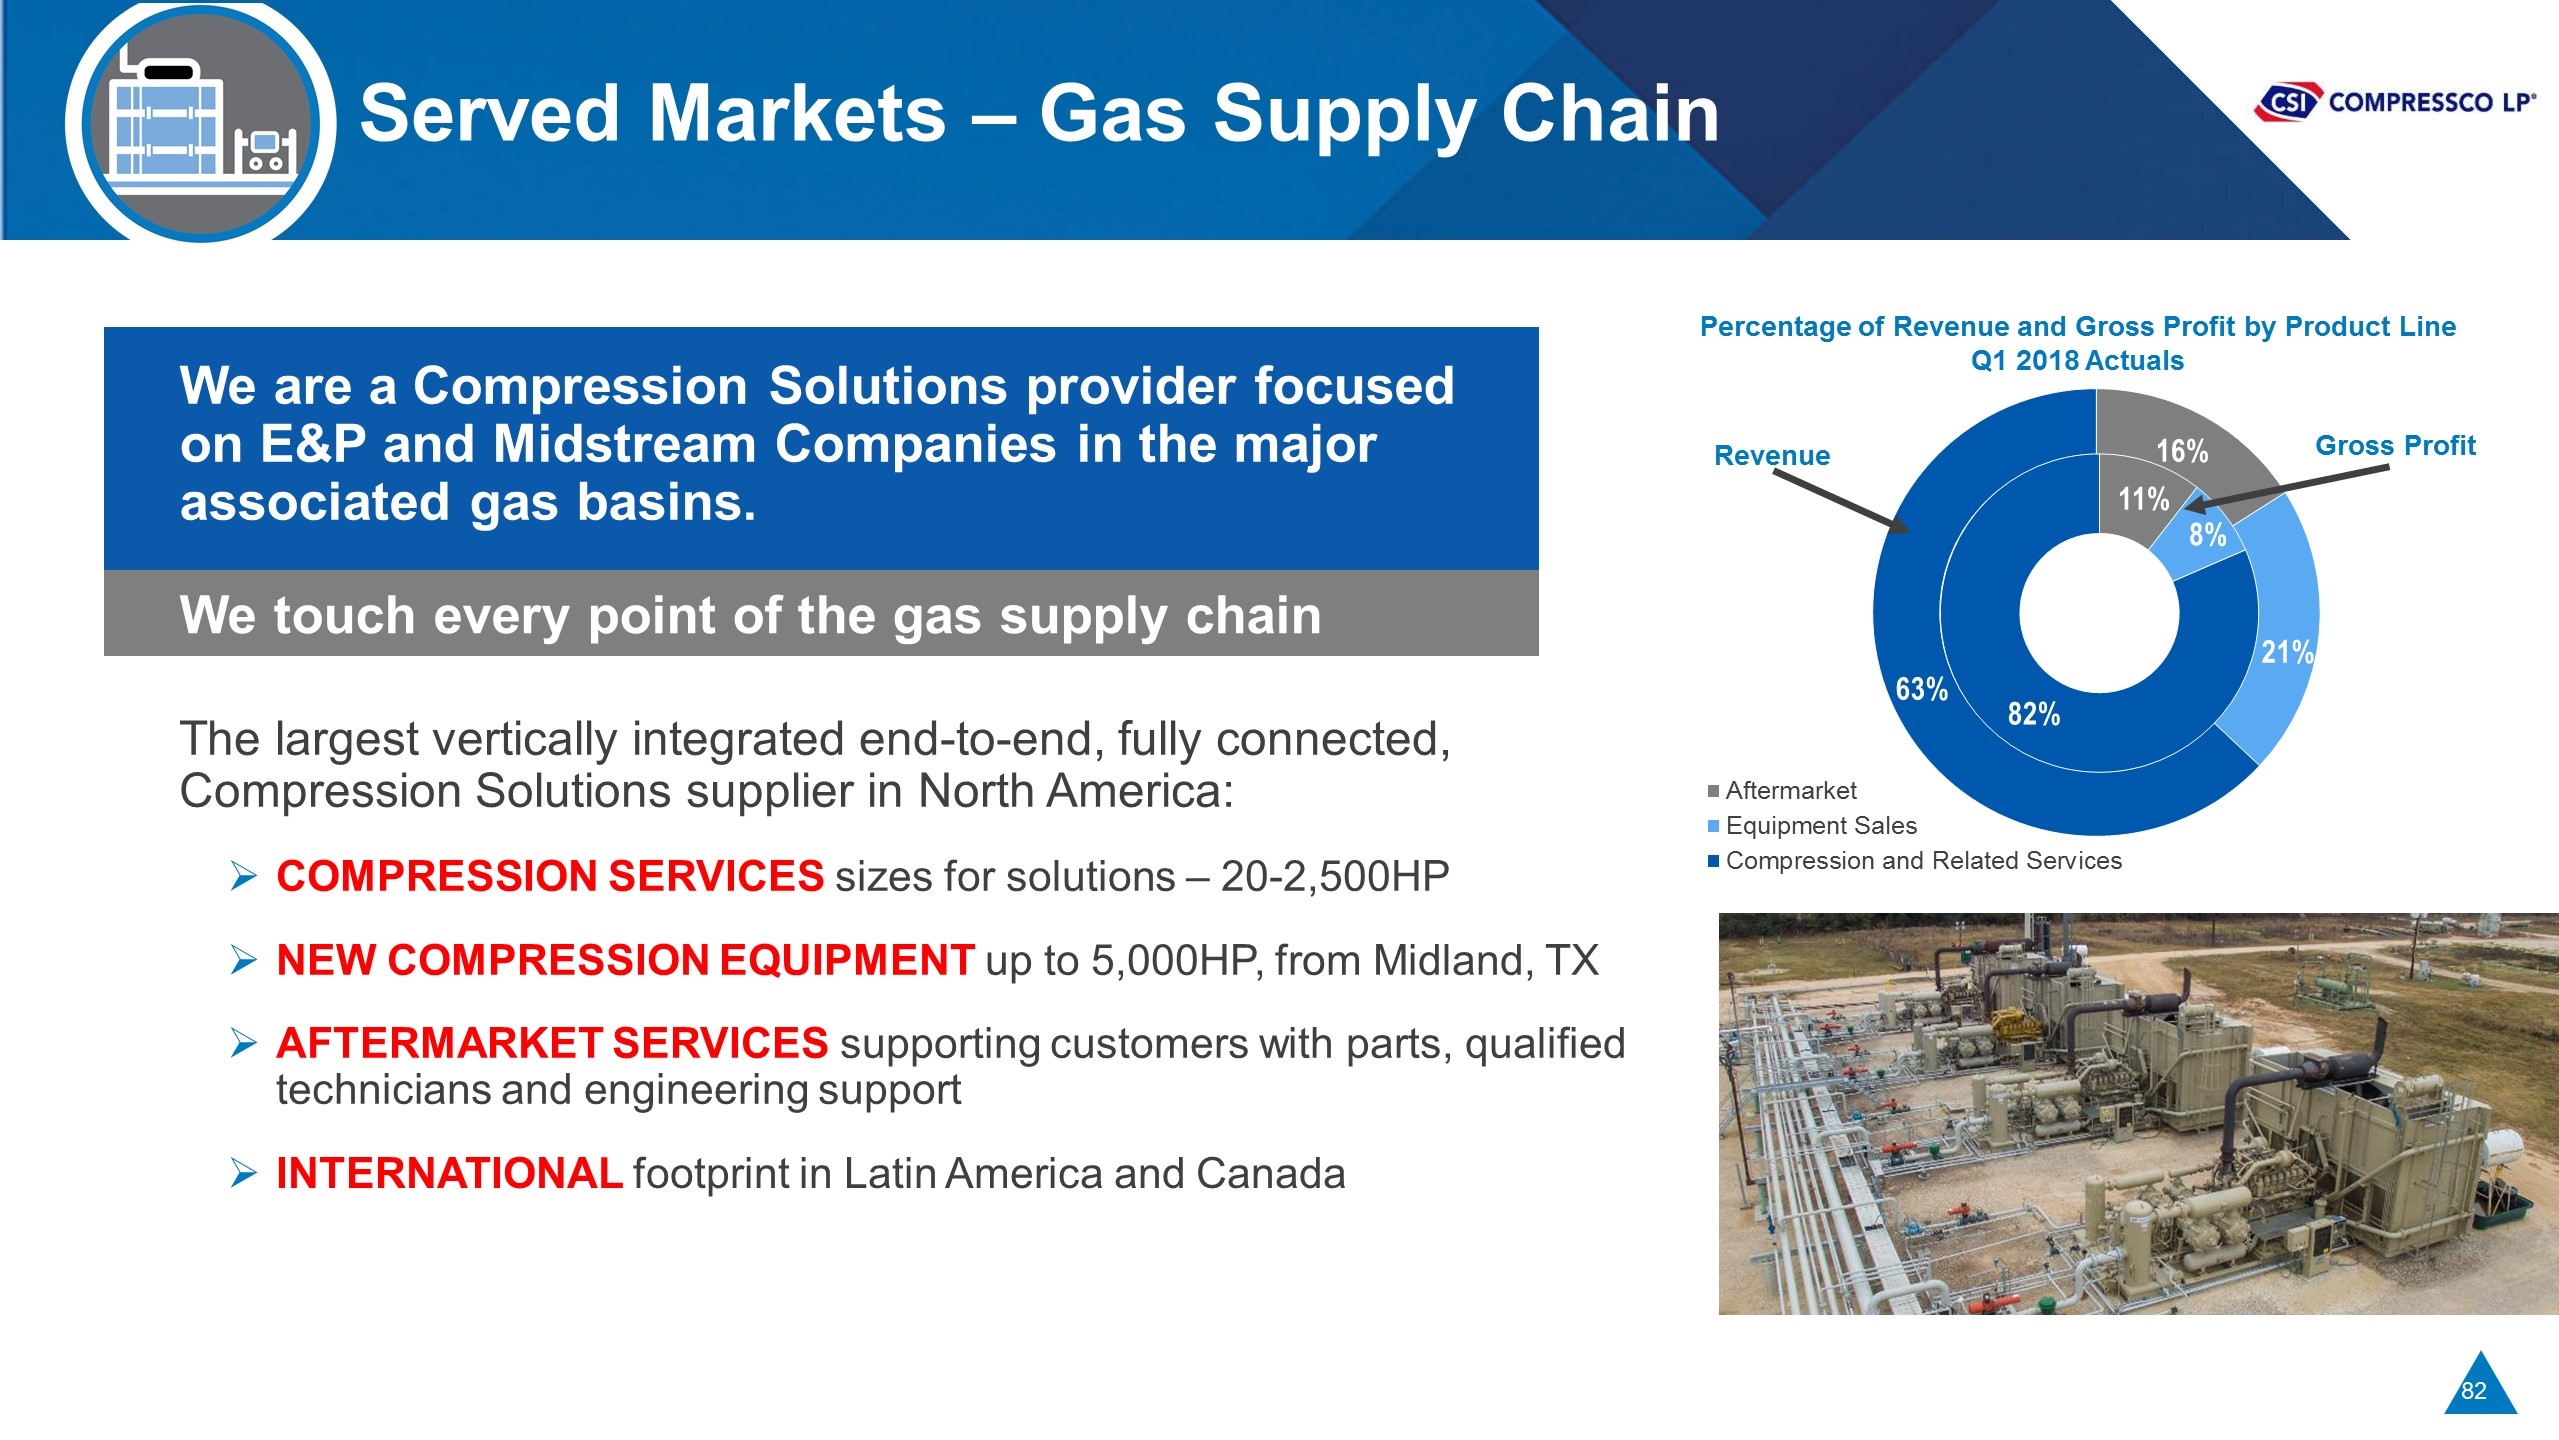
Served Markets – Gas Supply Chain The largest vertically integrated end-to-end, fully connected, Compression Solutions supplier in North America: COMPRESSION SERVICES sizes for solutions – 20-2,500HP NEW COMPRESSION EQUIPMENT up to 5,000HP, from Midland, TX AFTERMARKET SERVICES supporting customers with parts, qualified technicians and engineering support INTERNATIONAL footprint in Latin America and Canada We touch every point of the gas supply chain We are a Compression Solutions provider focused on E&P and Midstream Companies in the major associated gas basins. Percentage of Revenue and Gross Profit by Product Line Q1 2018 Actuals Revenue Gross Profit
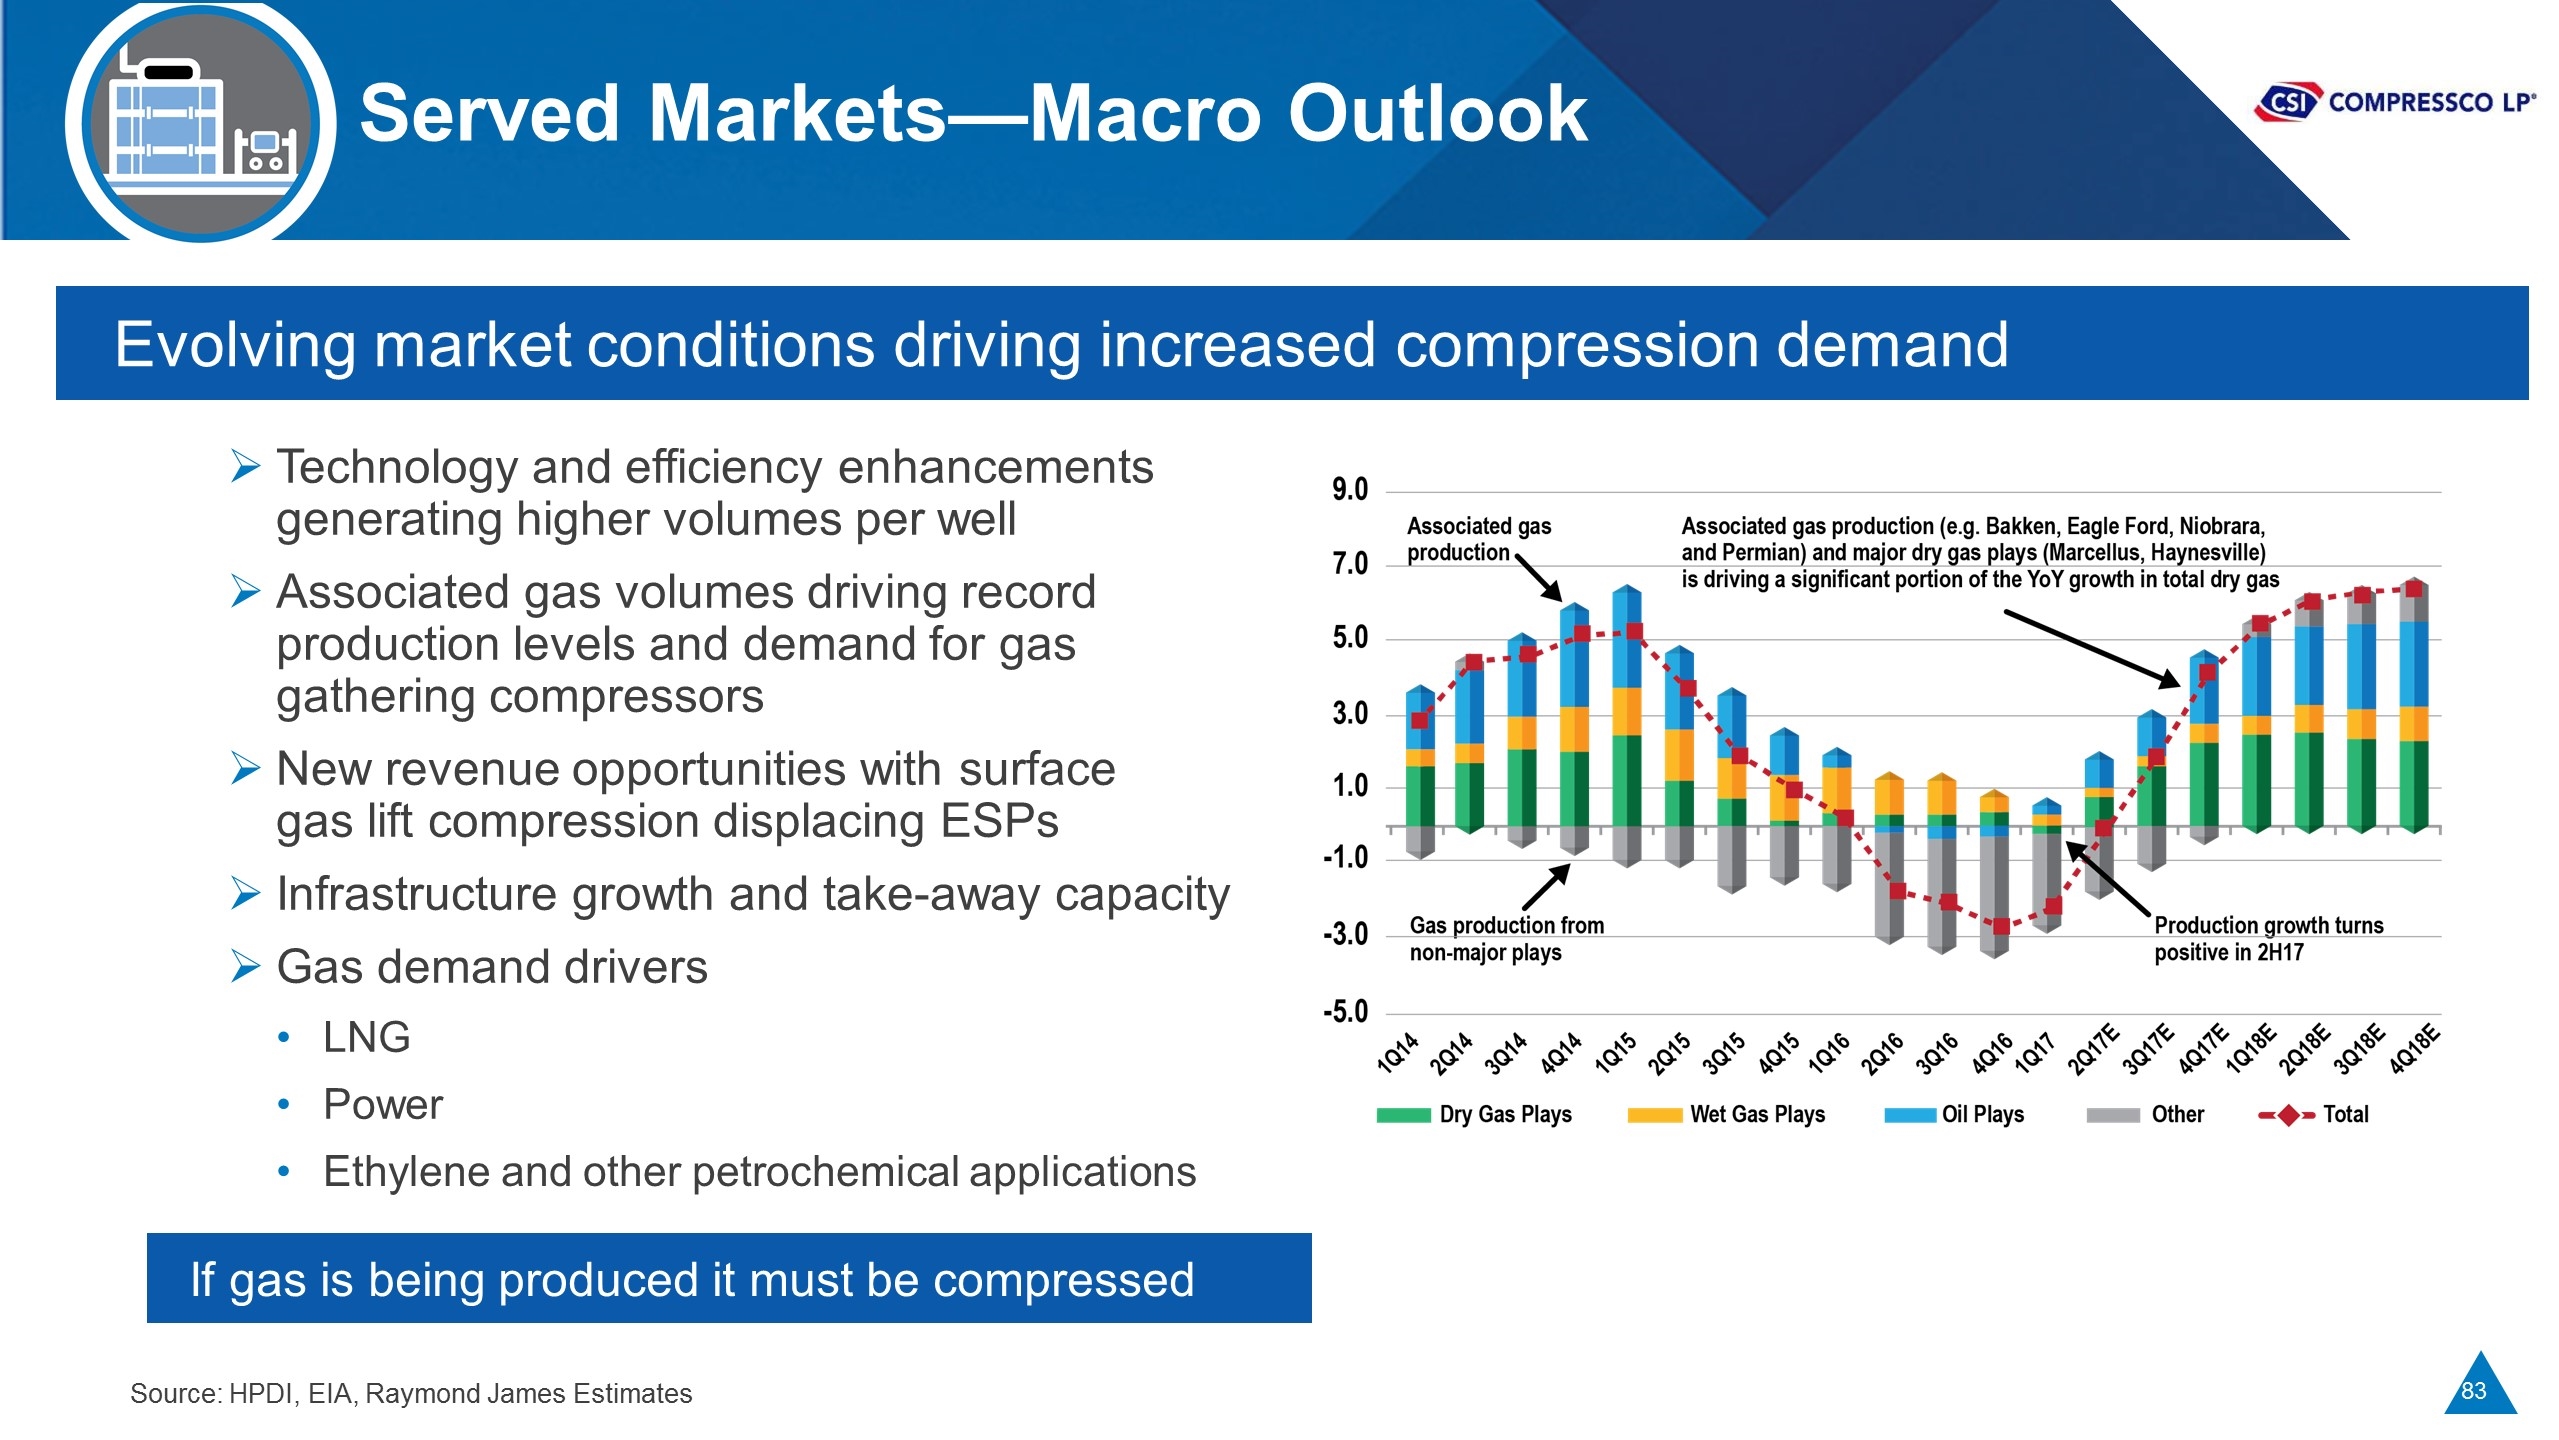
Served Markets—Macro Outlook Technology and efficiency enhancements generating higher volumes per well Associated gas volumes driving record production levels and demand for gas gathering compressors New revenue opportunities with surface gas lift compression displacing ESPs Infrastructure growth and take-away capacity Gas demand drivers LNG Power Ethylene and other petrochemical applications Evolving market conditions driving increased compression demand If gas is being produced it must be compressed Source: HPDI, EIA, Raymond James Estimates
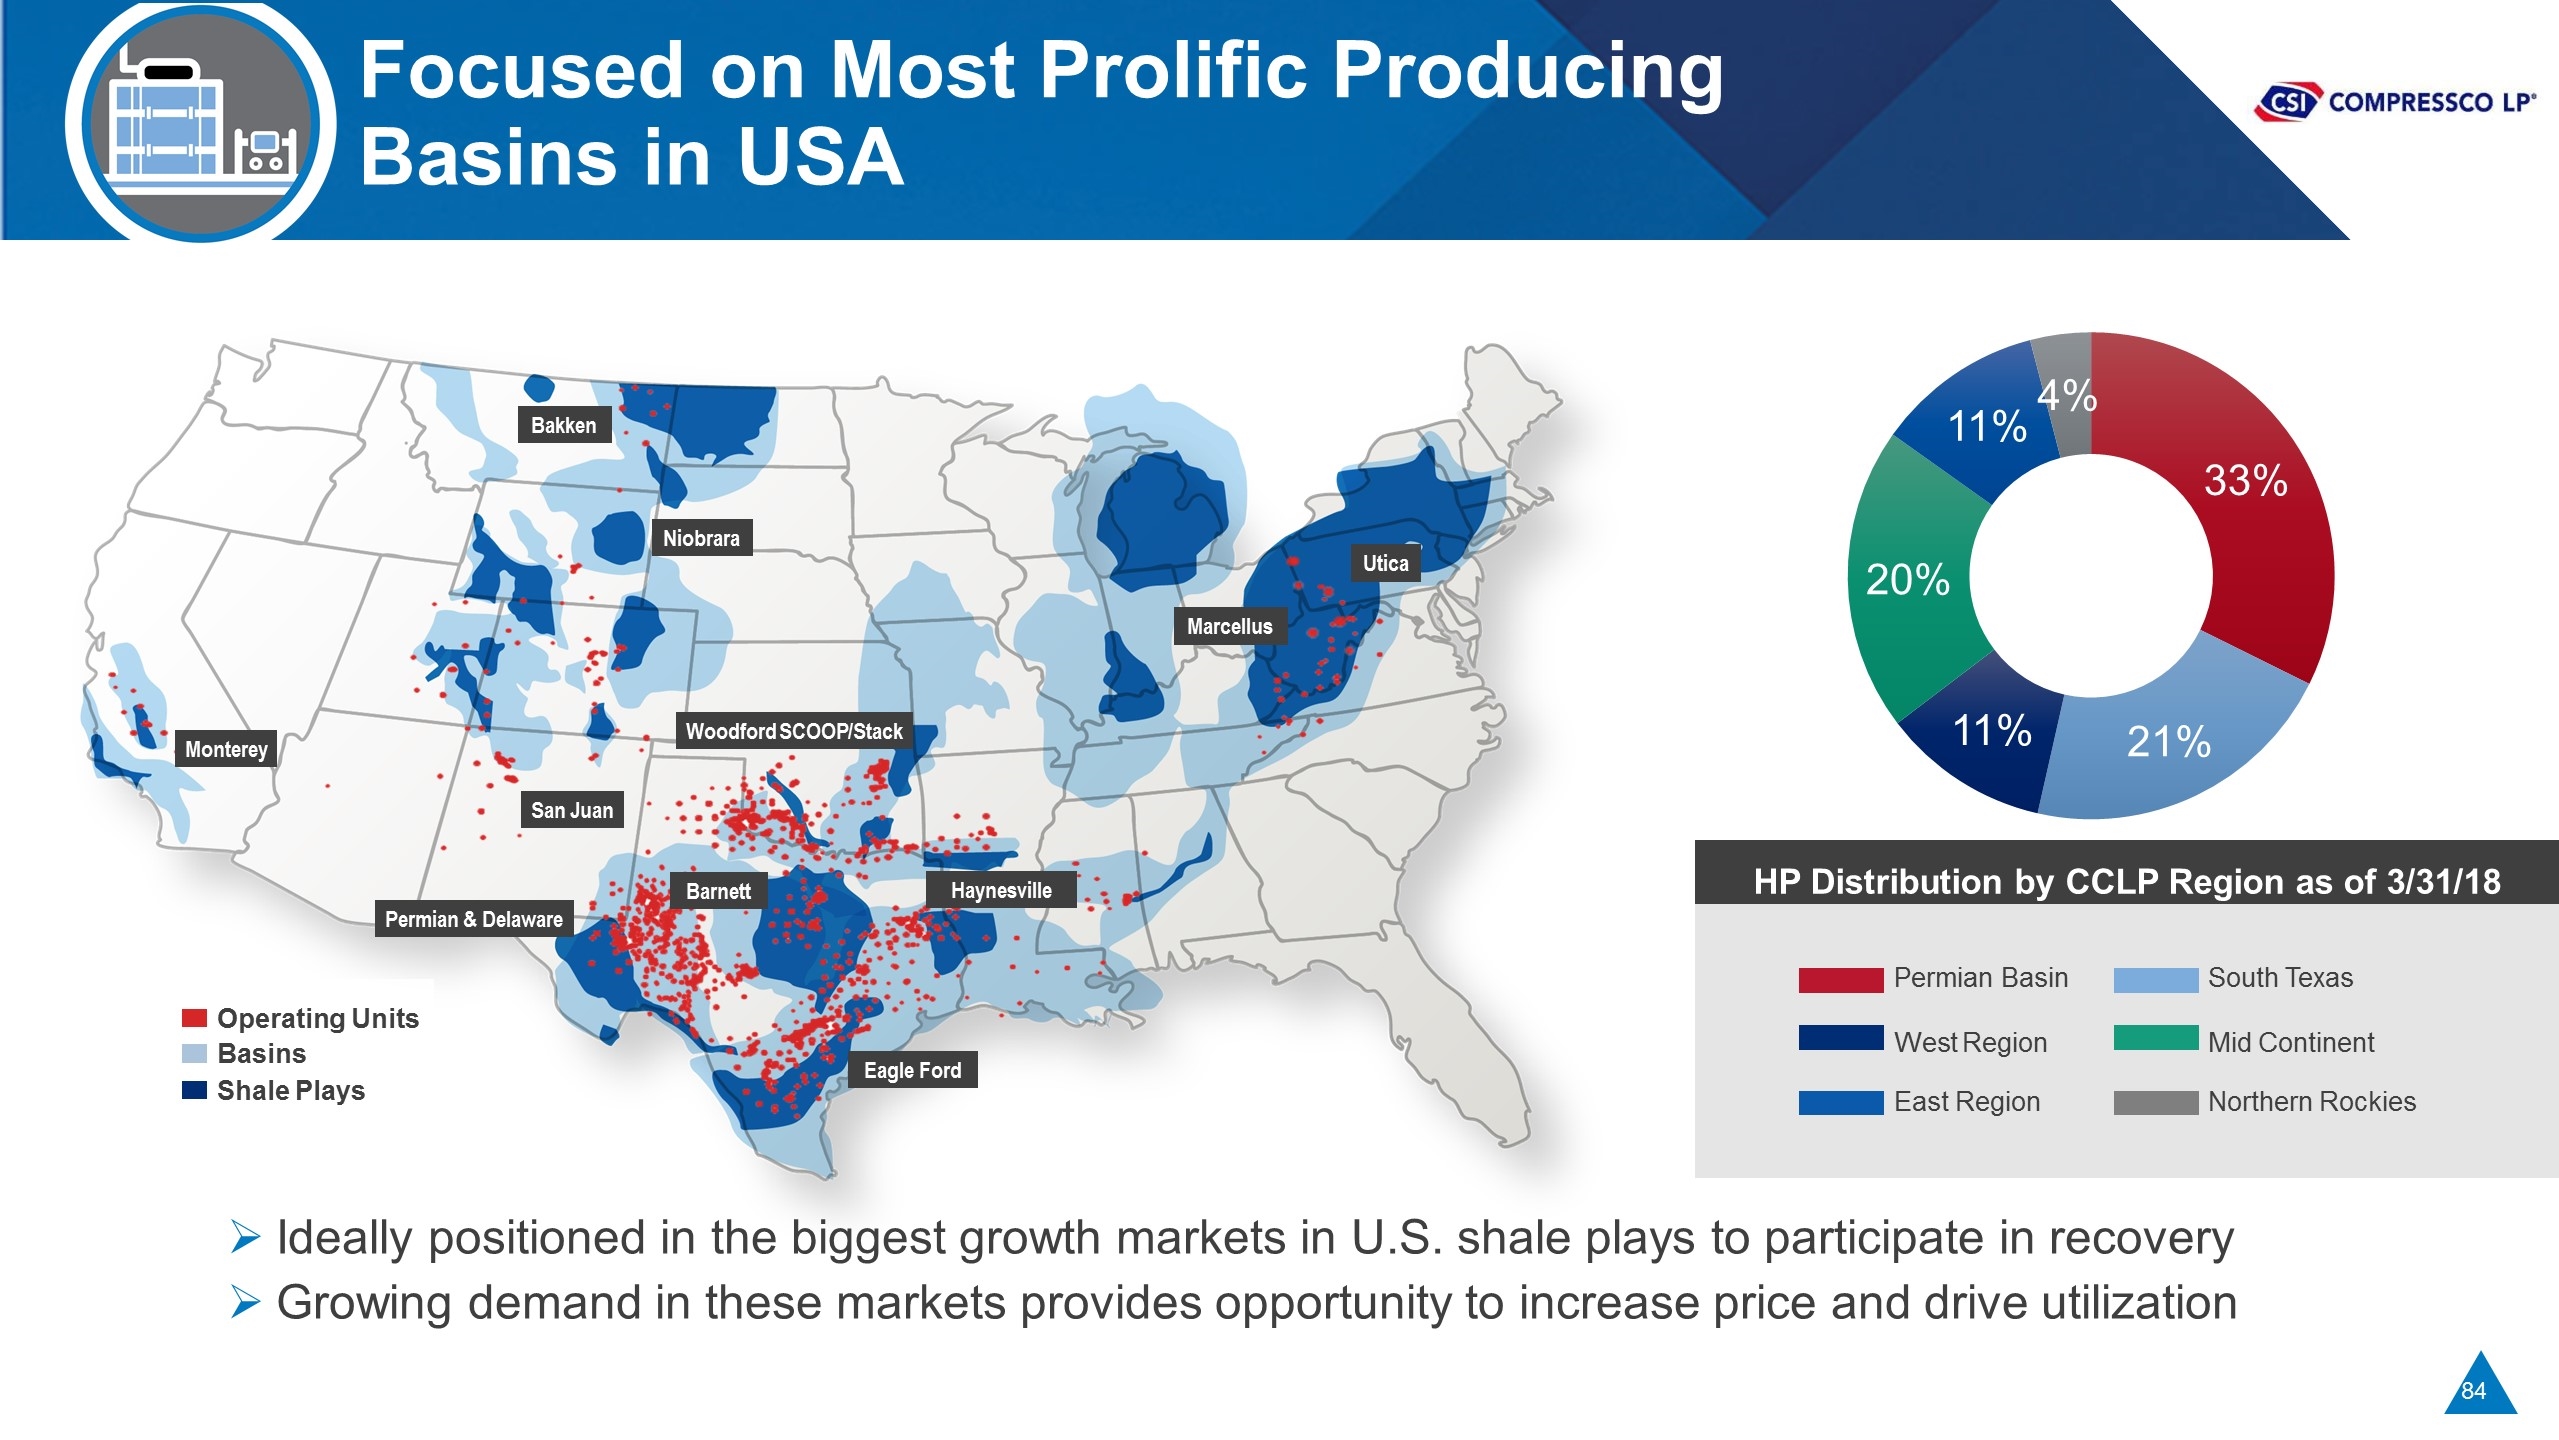
Permian Basin West Region East Region South Texas Mid Continent Northern Rockies HP Distribution by CCLP Region as of 3/31/18 Focused on Most Prolific Producing Basins in USA Ideally positioned in the biggest growth markets in U.S. shale plays to participate in recovery Growing demand in these markets provides opportunity to increase price and drive utilization Eagle Ford Marcellus Utica Permian & Delaware Barnett Haynesville Bakken Niobrara Monterey San Juan Woodford SCOOP/Stack Operating Units Basins Shale Plays
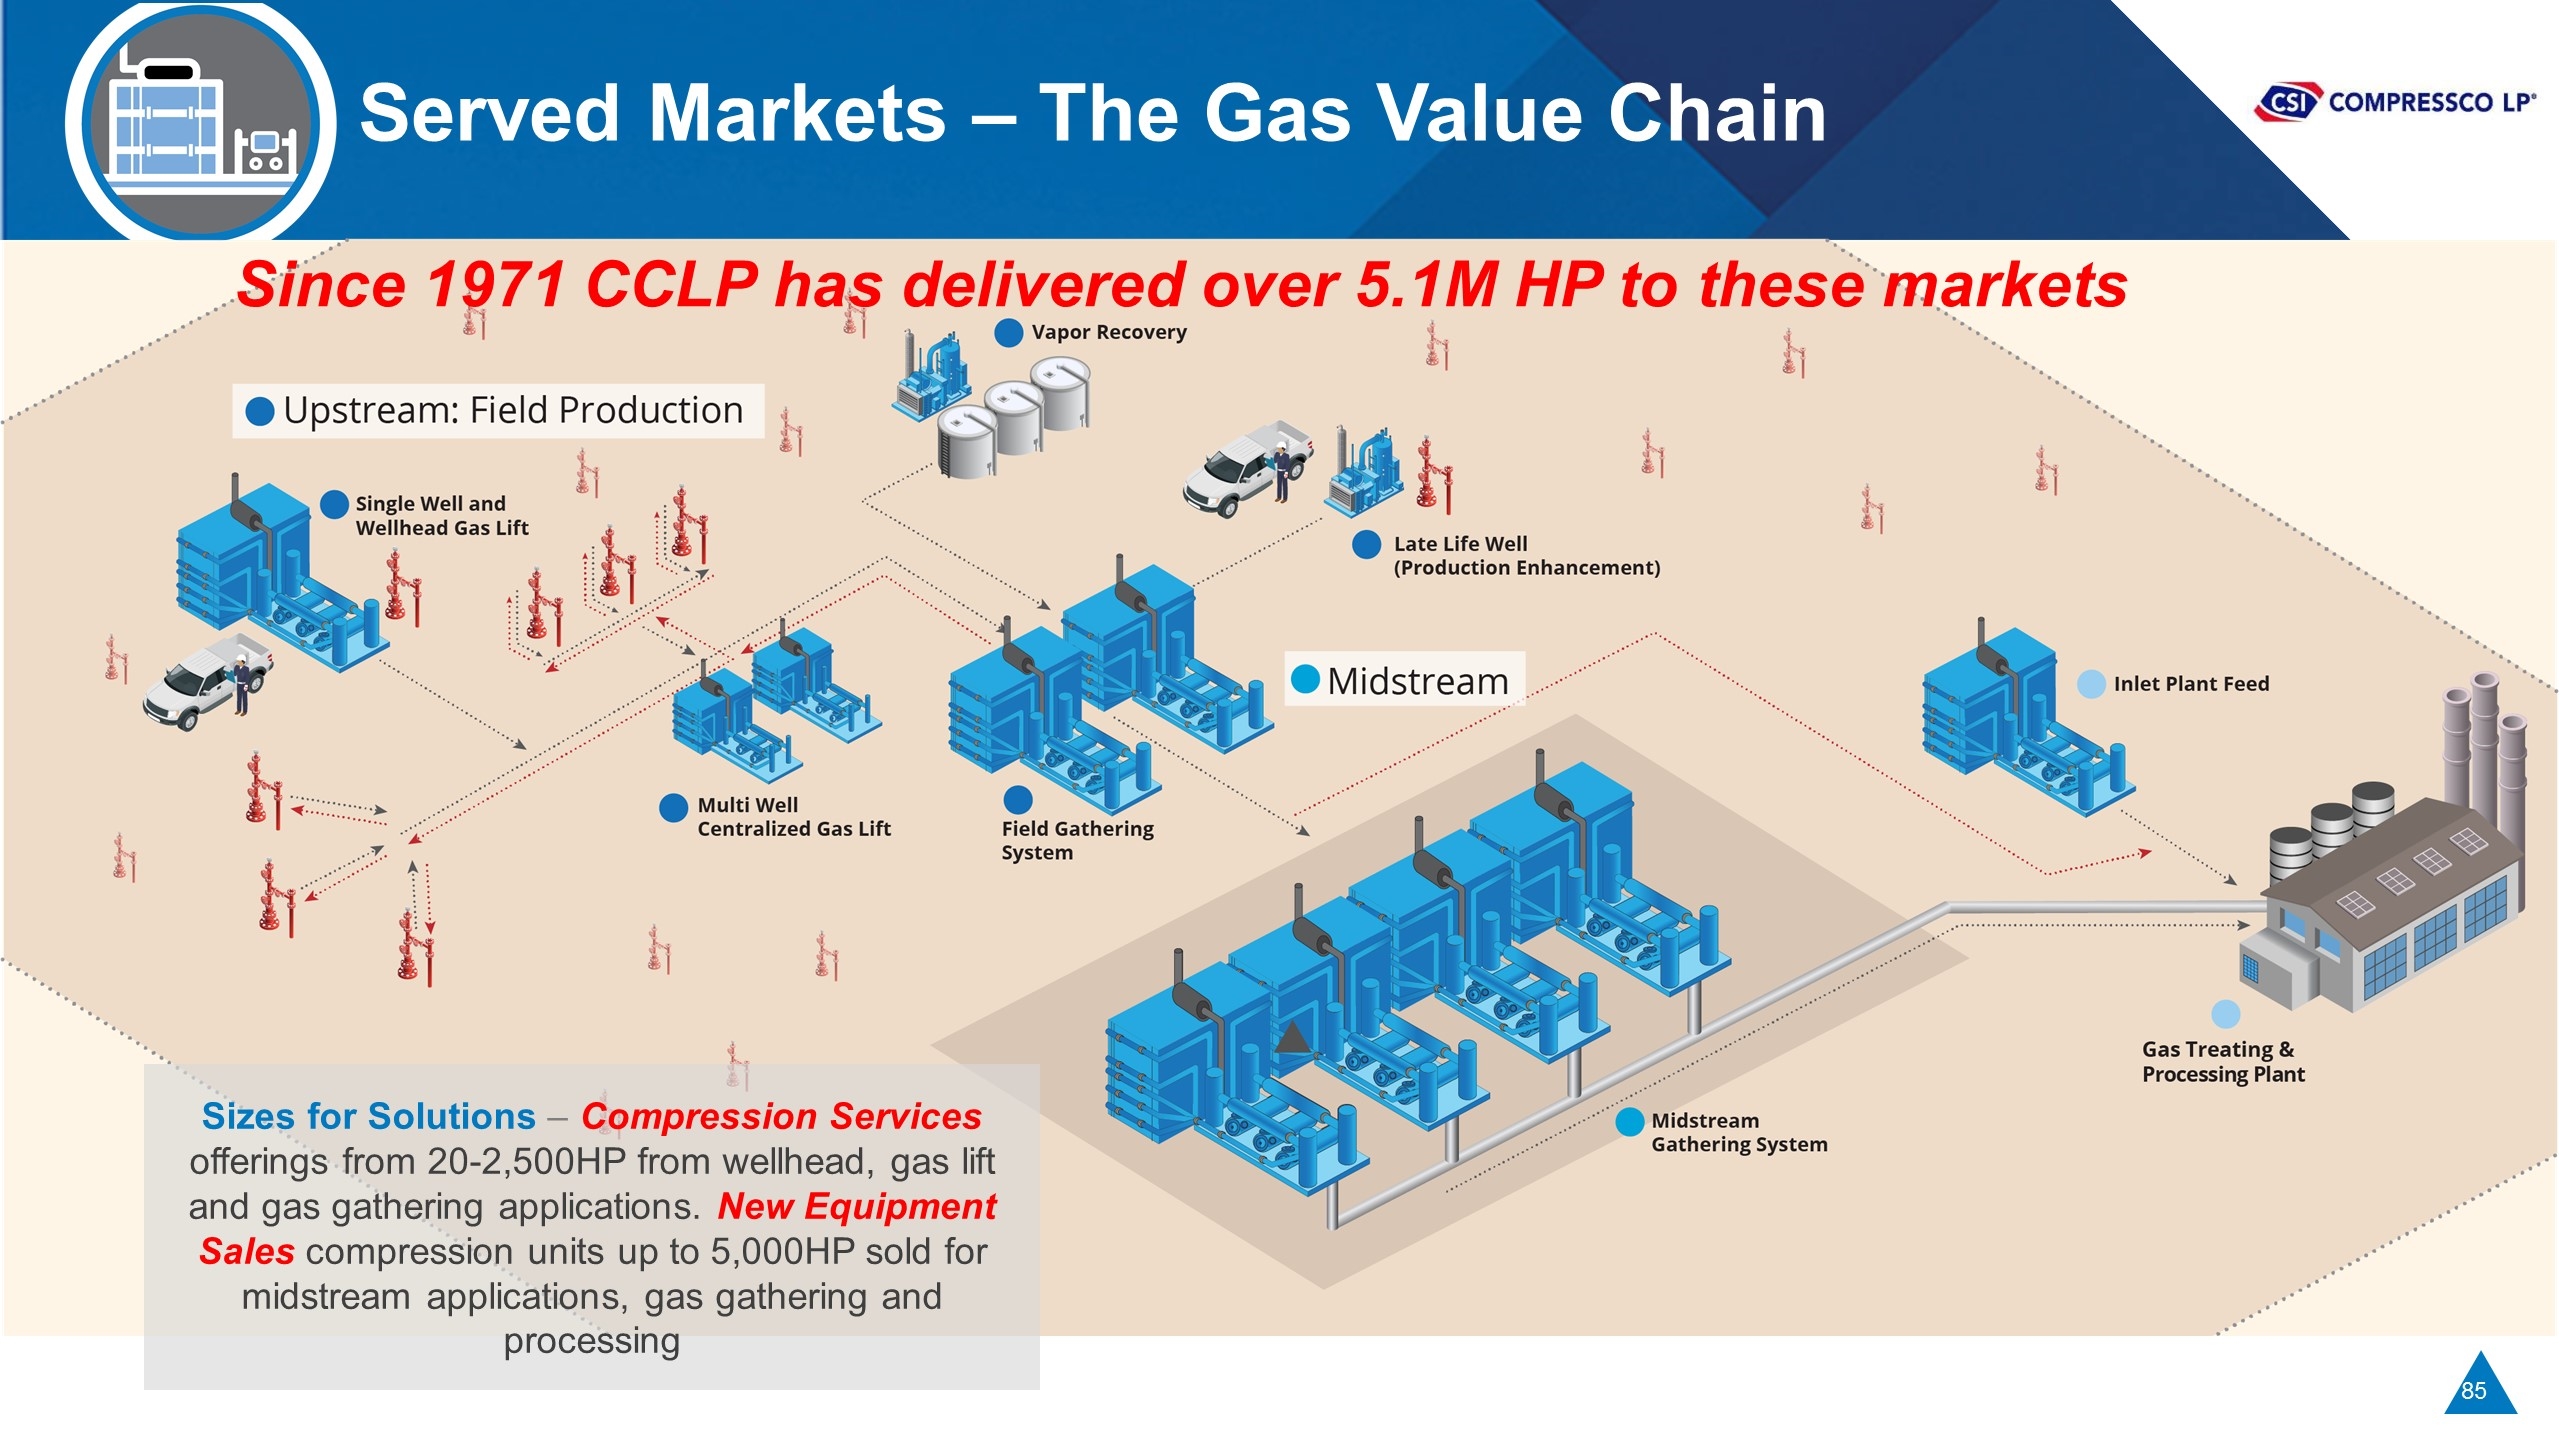
Served Markets – The Gas Value Chain Sizes for Solutions – Compression Services offerings from 20-2,500HP from wellhead, gas lift and gas gathering applications. New Equipment Sales compression units up to 5,000HP sold for midstream applications, gas gathering and processing Since 1971 CCLP has delivered over 5.1M HP to these markets
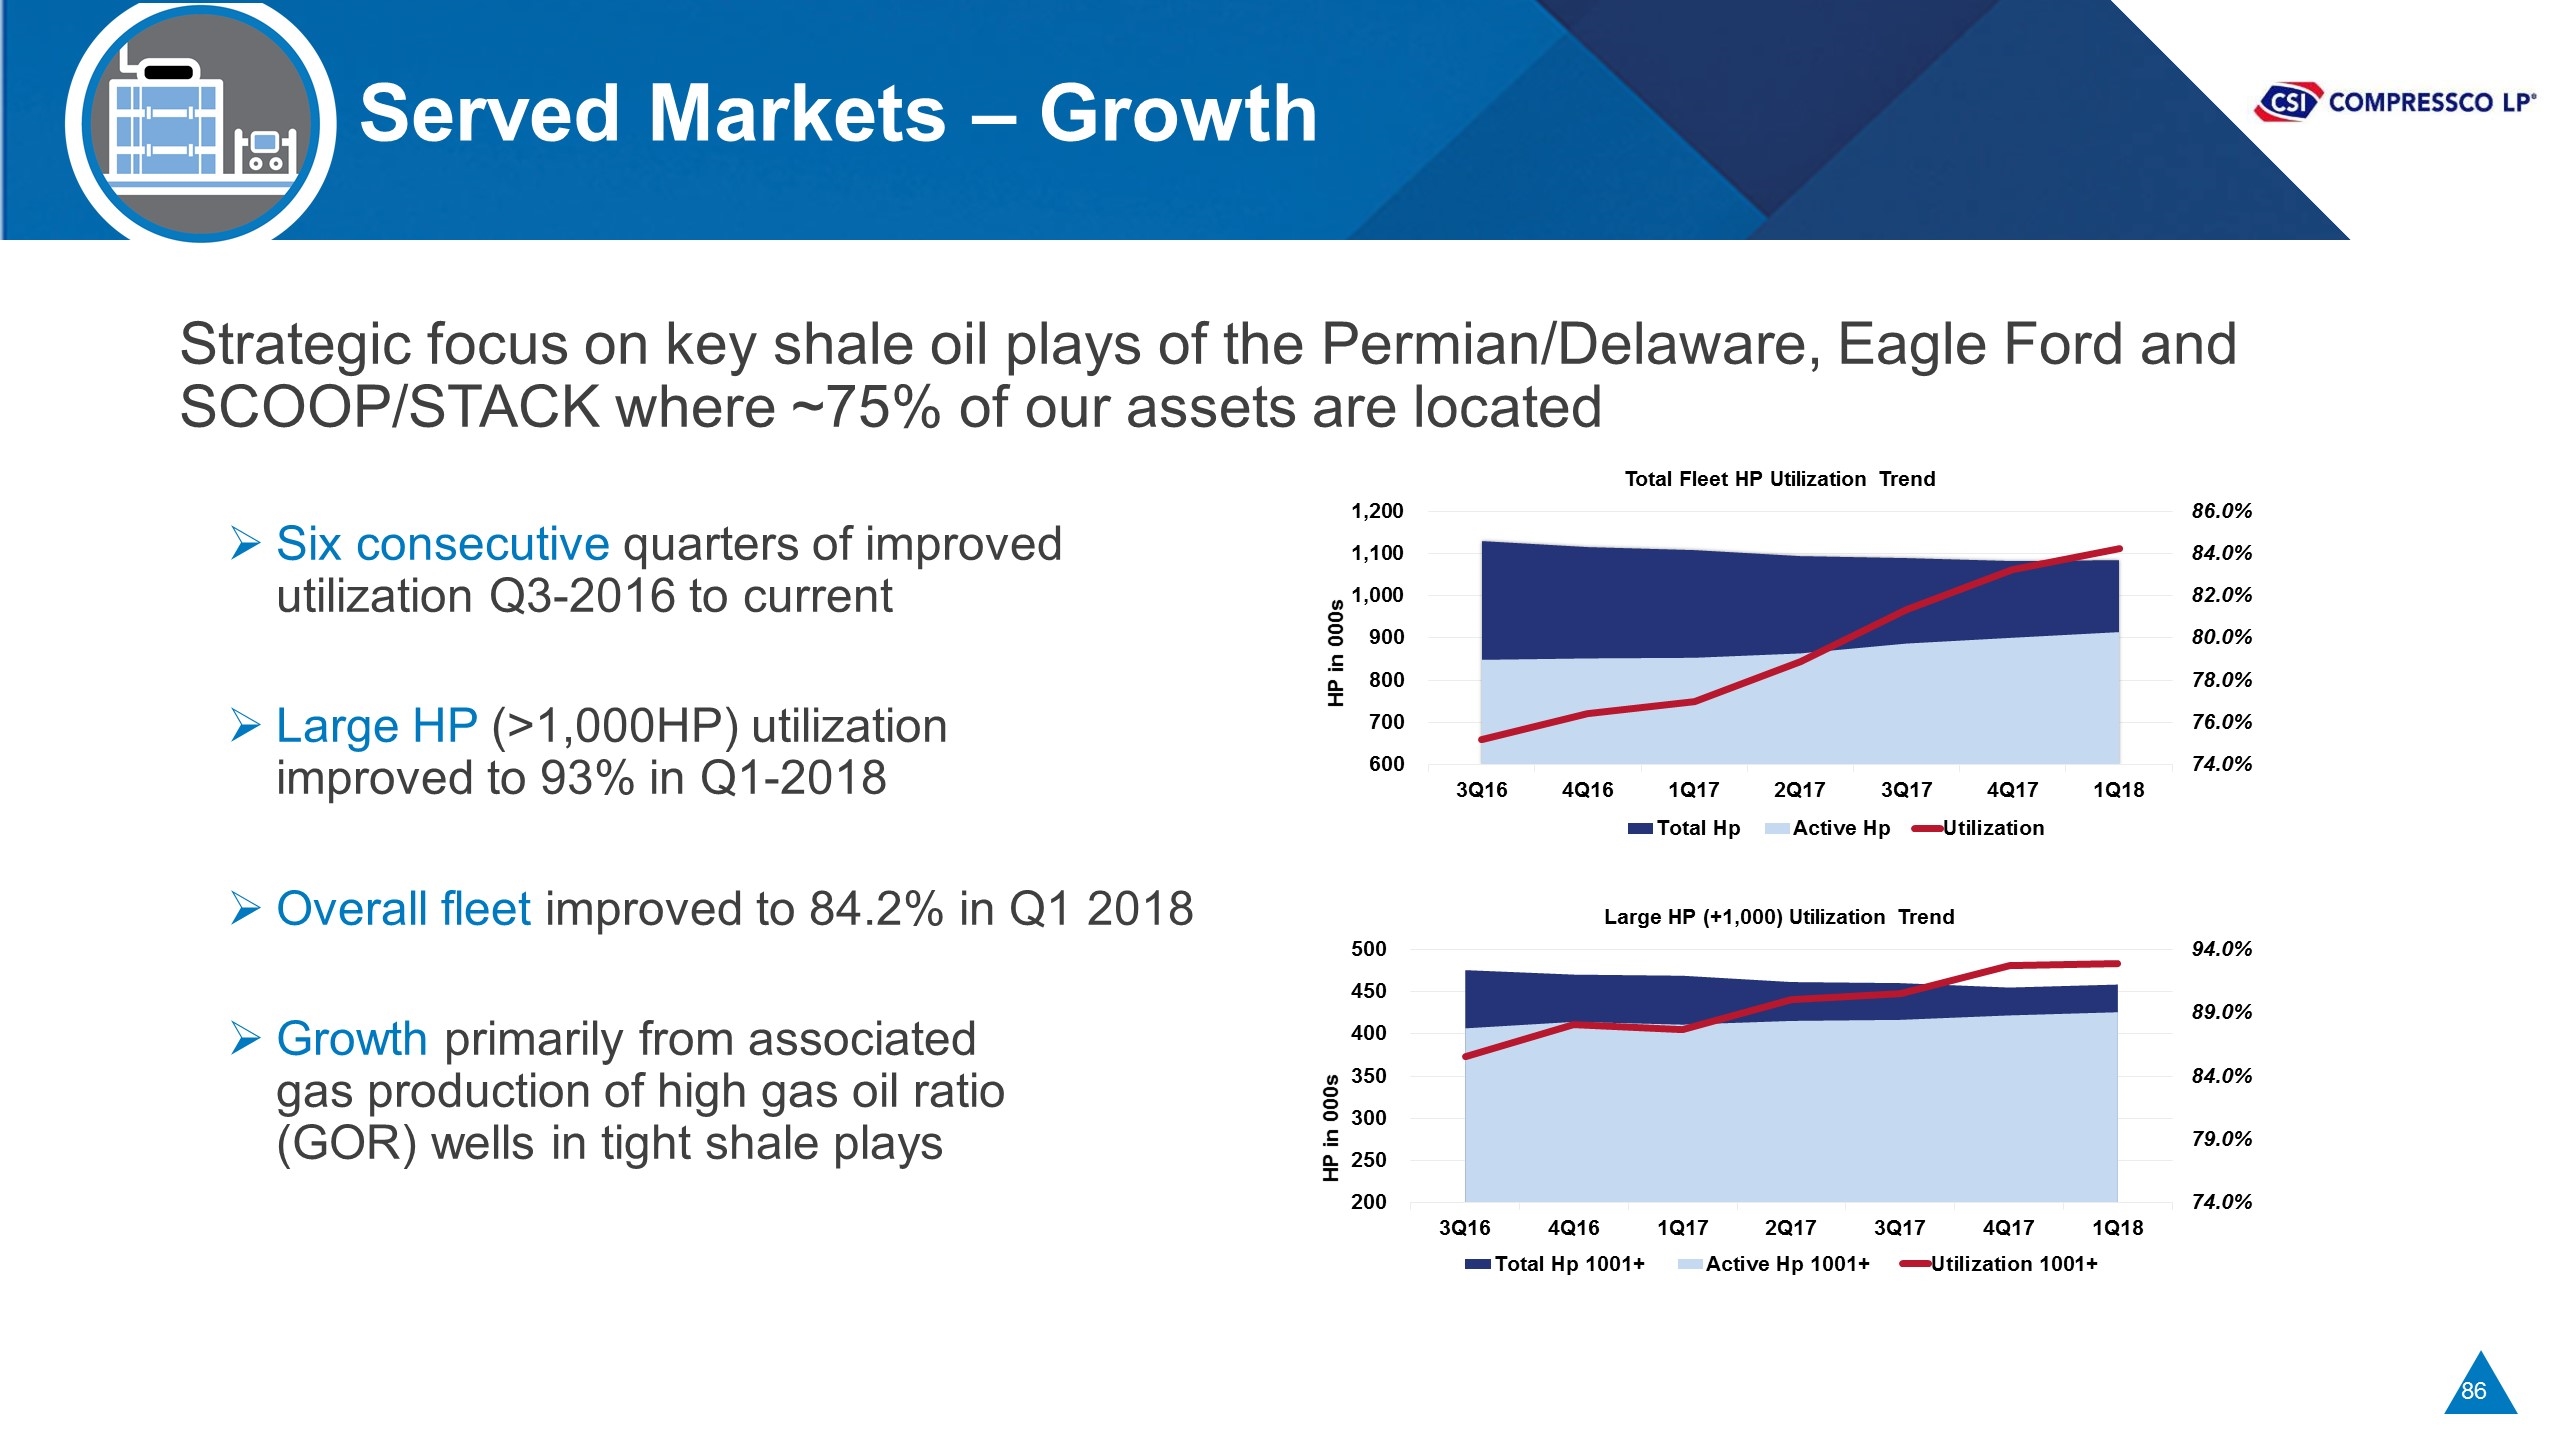
Served Markets – Growth Strategic focus on key shale oil plays of the Permian/Delaware, Eagle Ford and SCOOP/STACK where ~75% of our assets are located Six consecutive quarters of improved utilization Q3-2016 to current Large HP (>1,000HP) utilization improved to 93% in Q1-2018 Overall fleet improved to 84.2% in Q1 2018 Growth primarily from associated gas production of high gas oil ratio (GOR) wells in tight shale plays
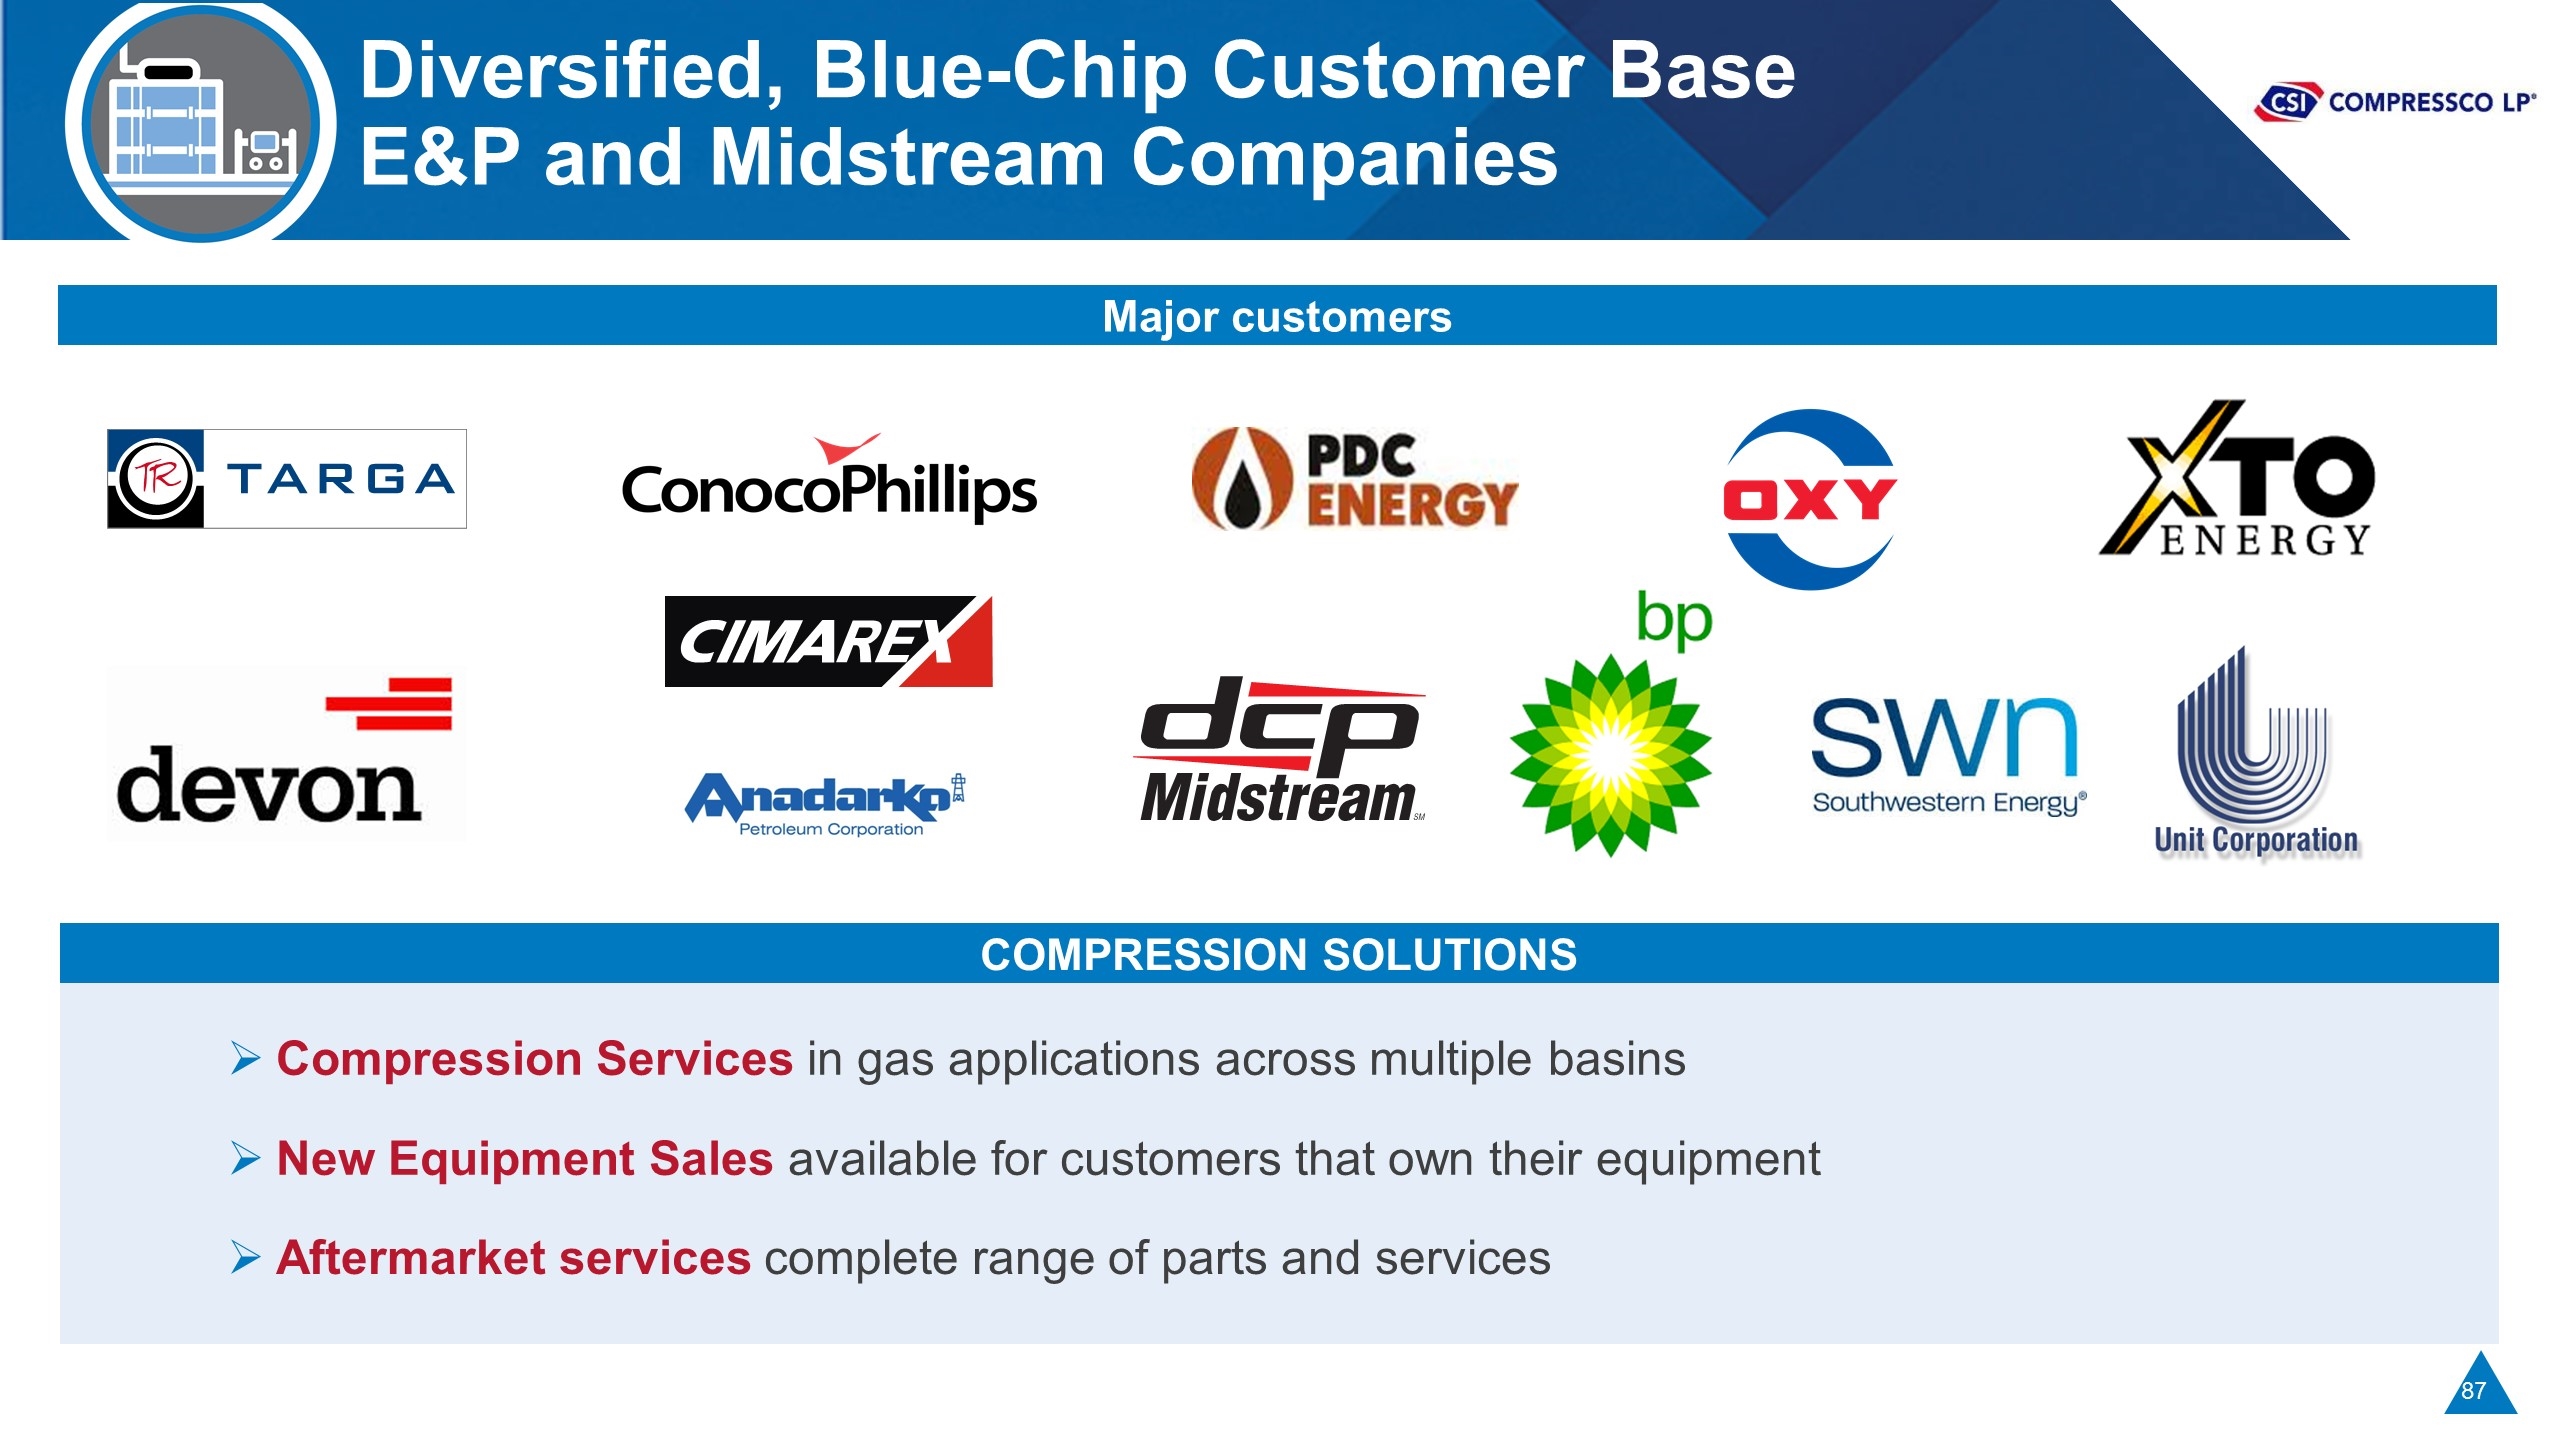
Diversified, Blue-Chip Customer Base E&P and Midstream Companies Major customers COMPRESSION SOLUTIONS Compression Services in gas applications across multiple basins New Equipment Sales available for customers that own their equipment Aftermarket services complete range of parts and services
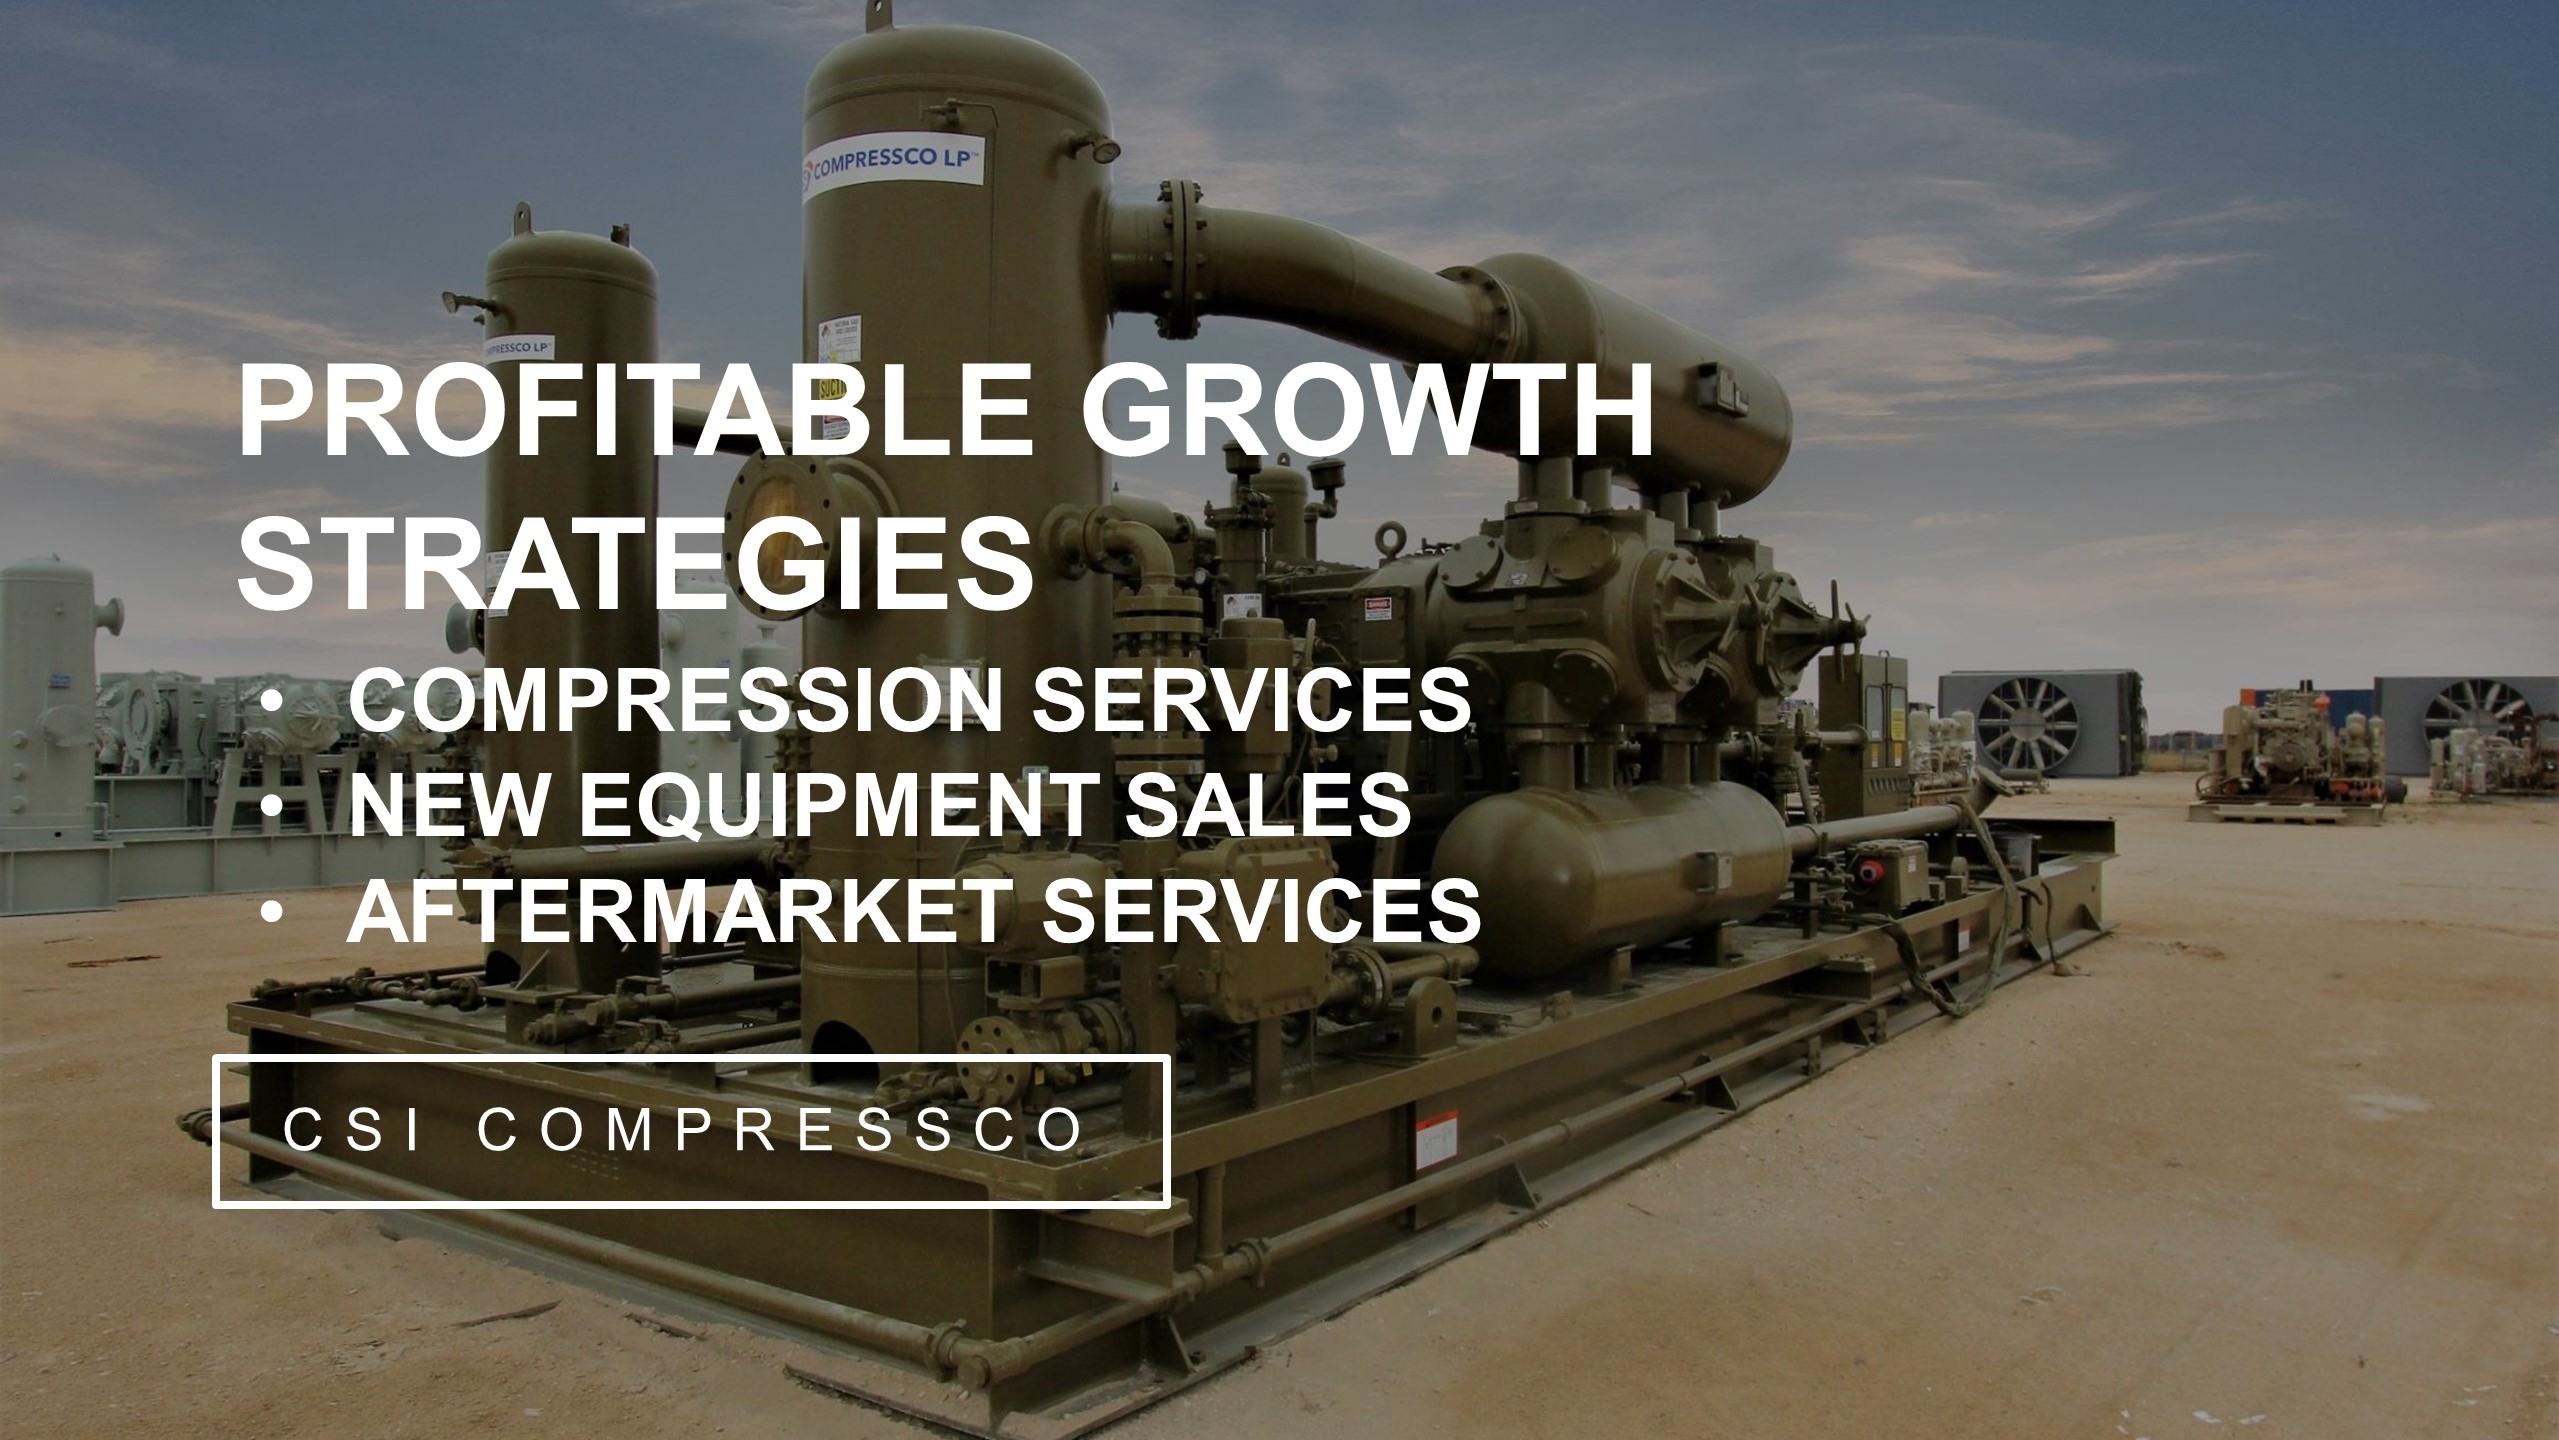
Profitable Growth Strategies CSI COMPRESSCO Compression Services New Equipment Sales Aftermarket Services
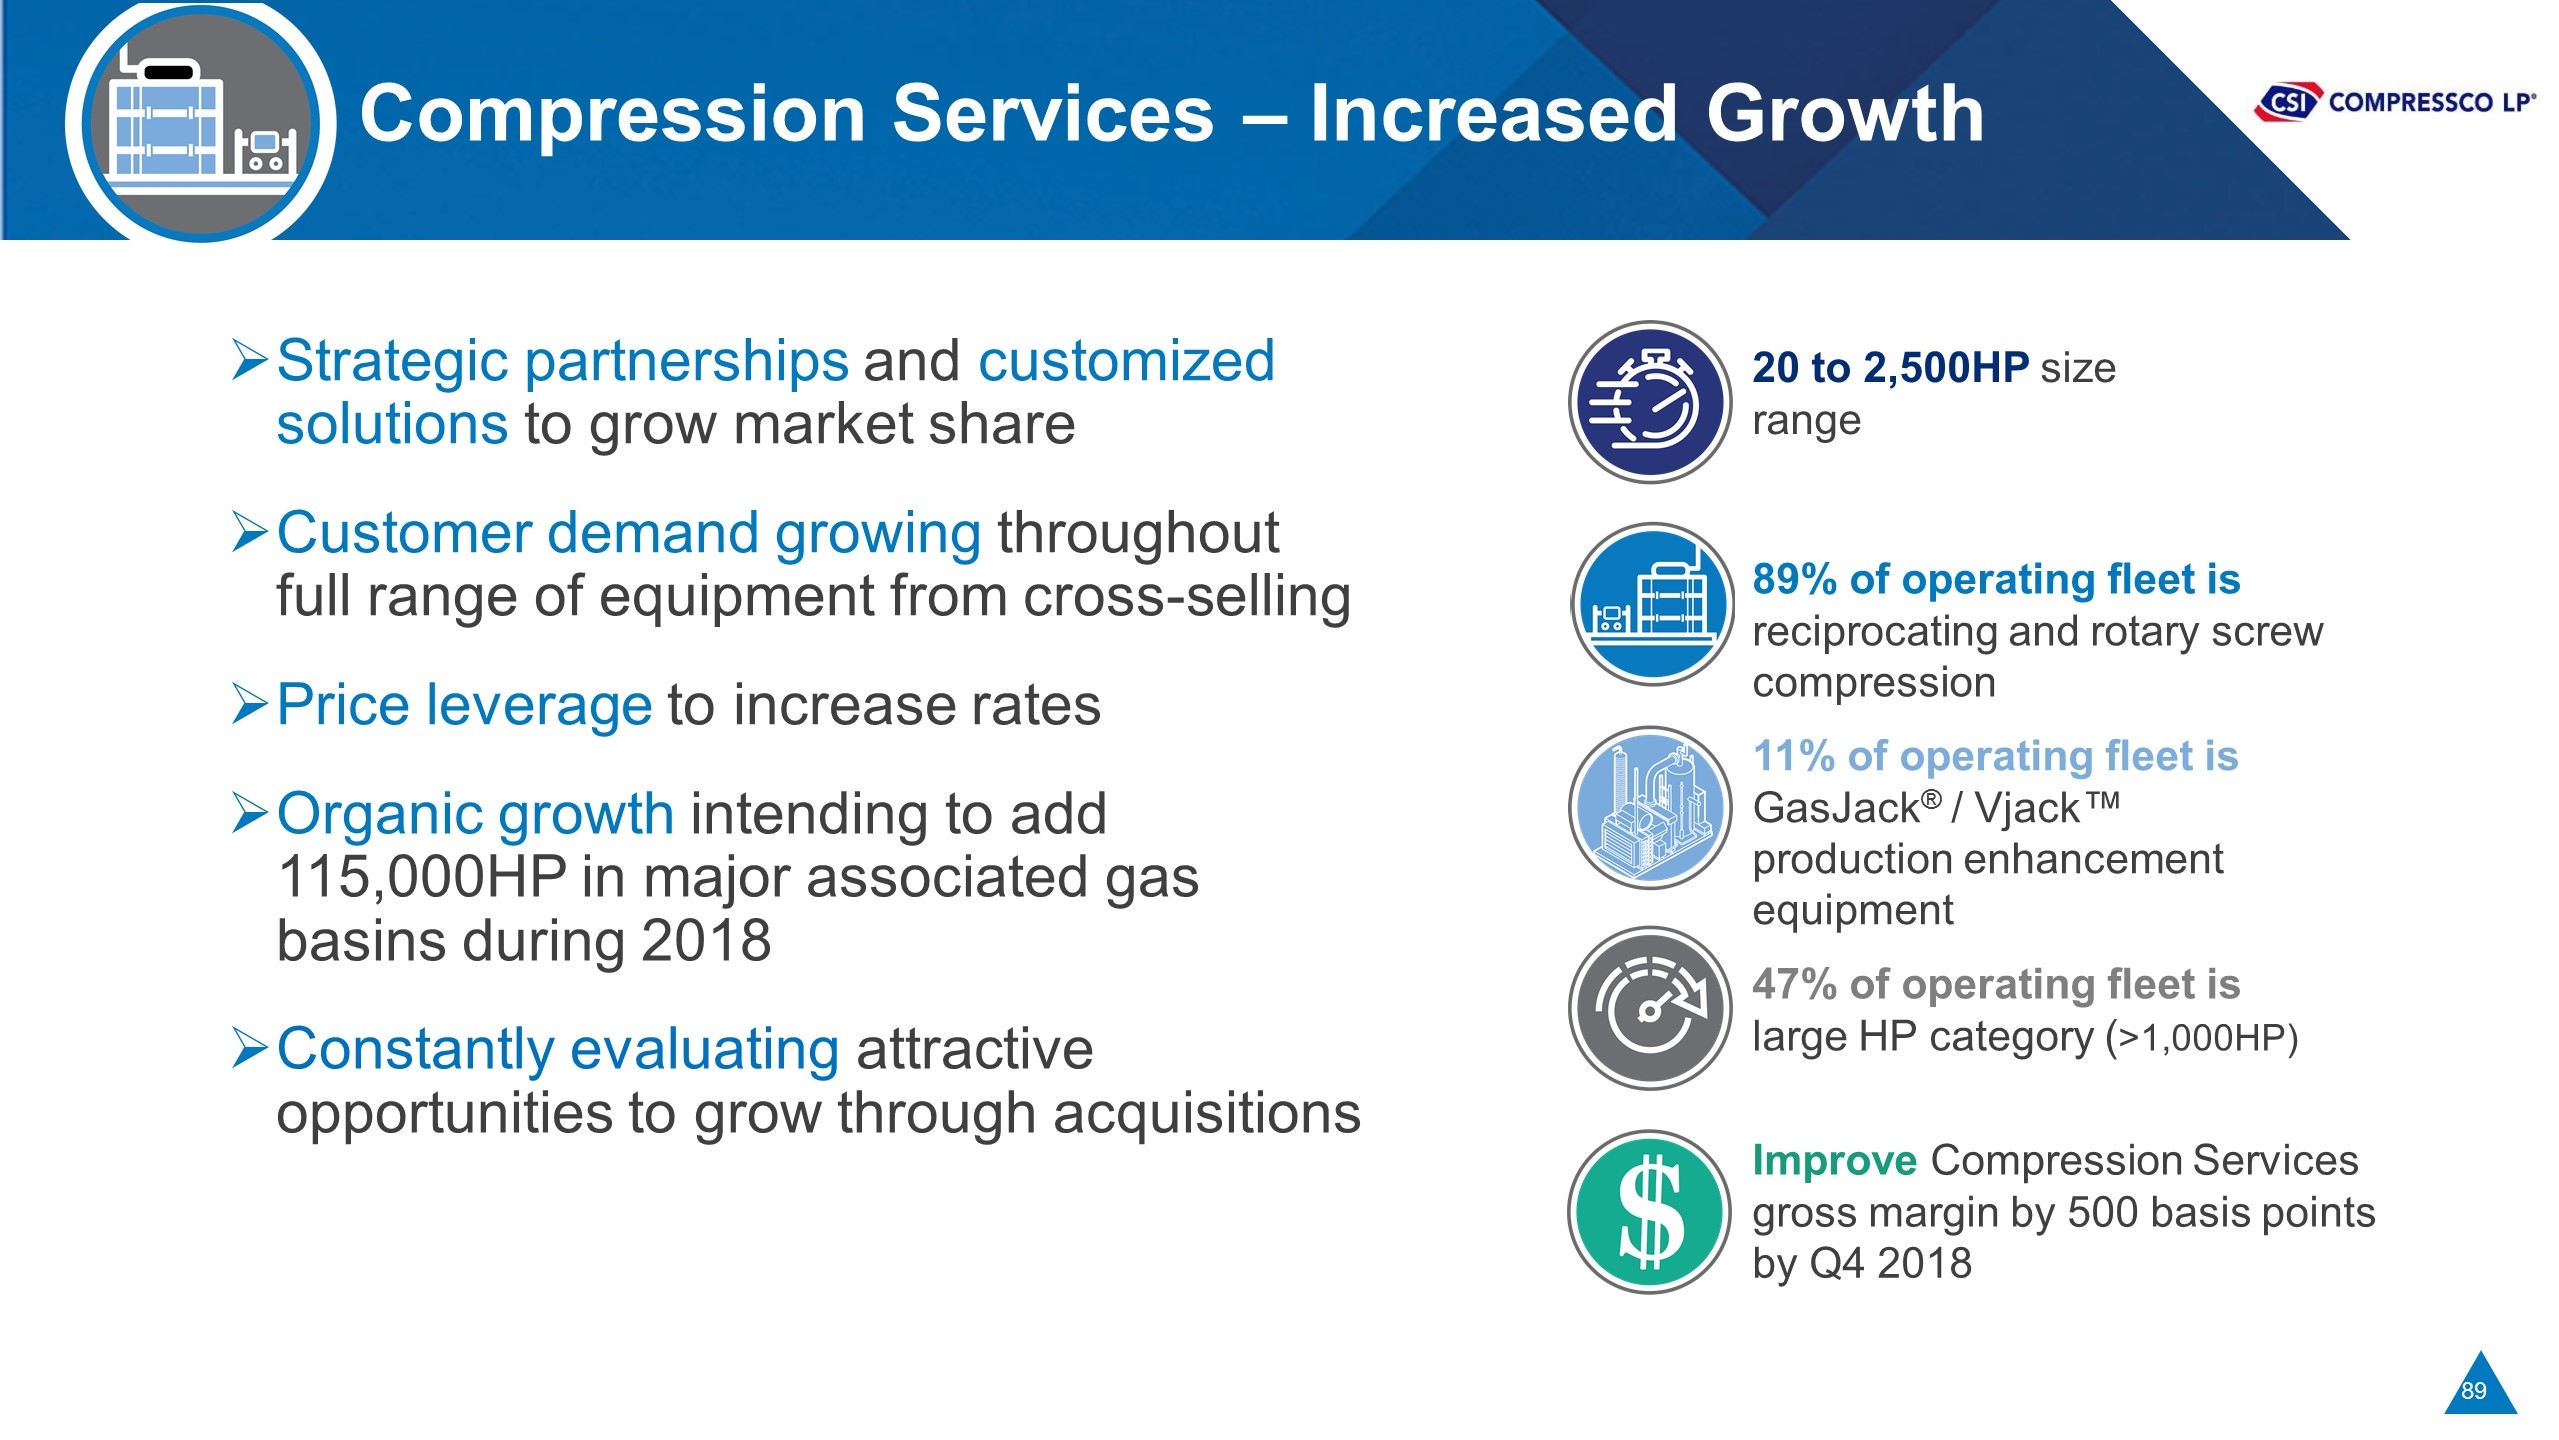
Compression Services – Increased Growth Strategic partnerships and customized solutions to grow market share Customer demand growing throughout full range of equipment from cross-selling Price leverage to increase rates Organic growth intending to add 115,000HP in major associated gas basins during 2018 Constantly evaluating attractive opportunities to grow through acquisitions 20 to 2,500HP size range 89% of operating fleet is reciprocating and rotary screw compression 11% of operating fleet is GasJack® / Vjack™ production enhancement equipment 47% of operating fleet is large HP category (>1,000HP) Improve Compression Services gross margin by 500 basis points by Q4 2018
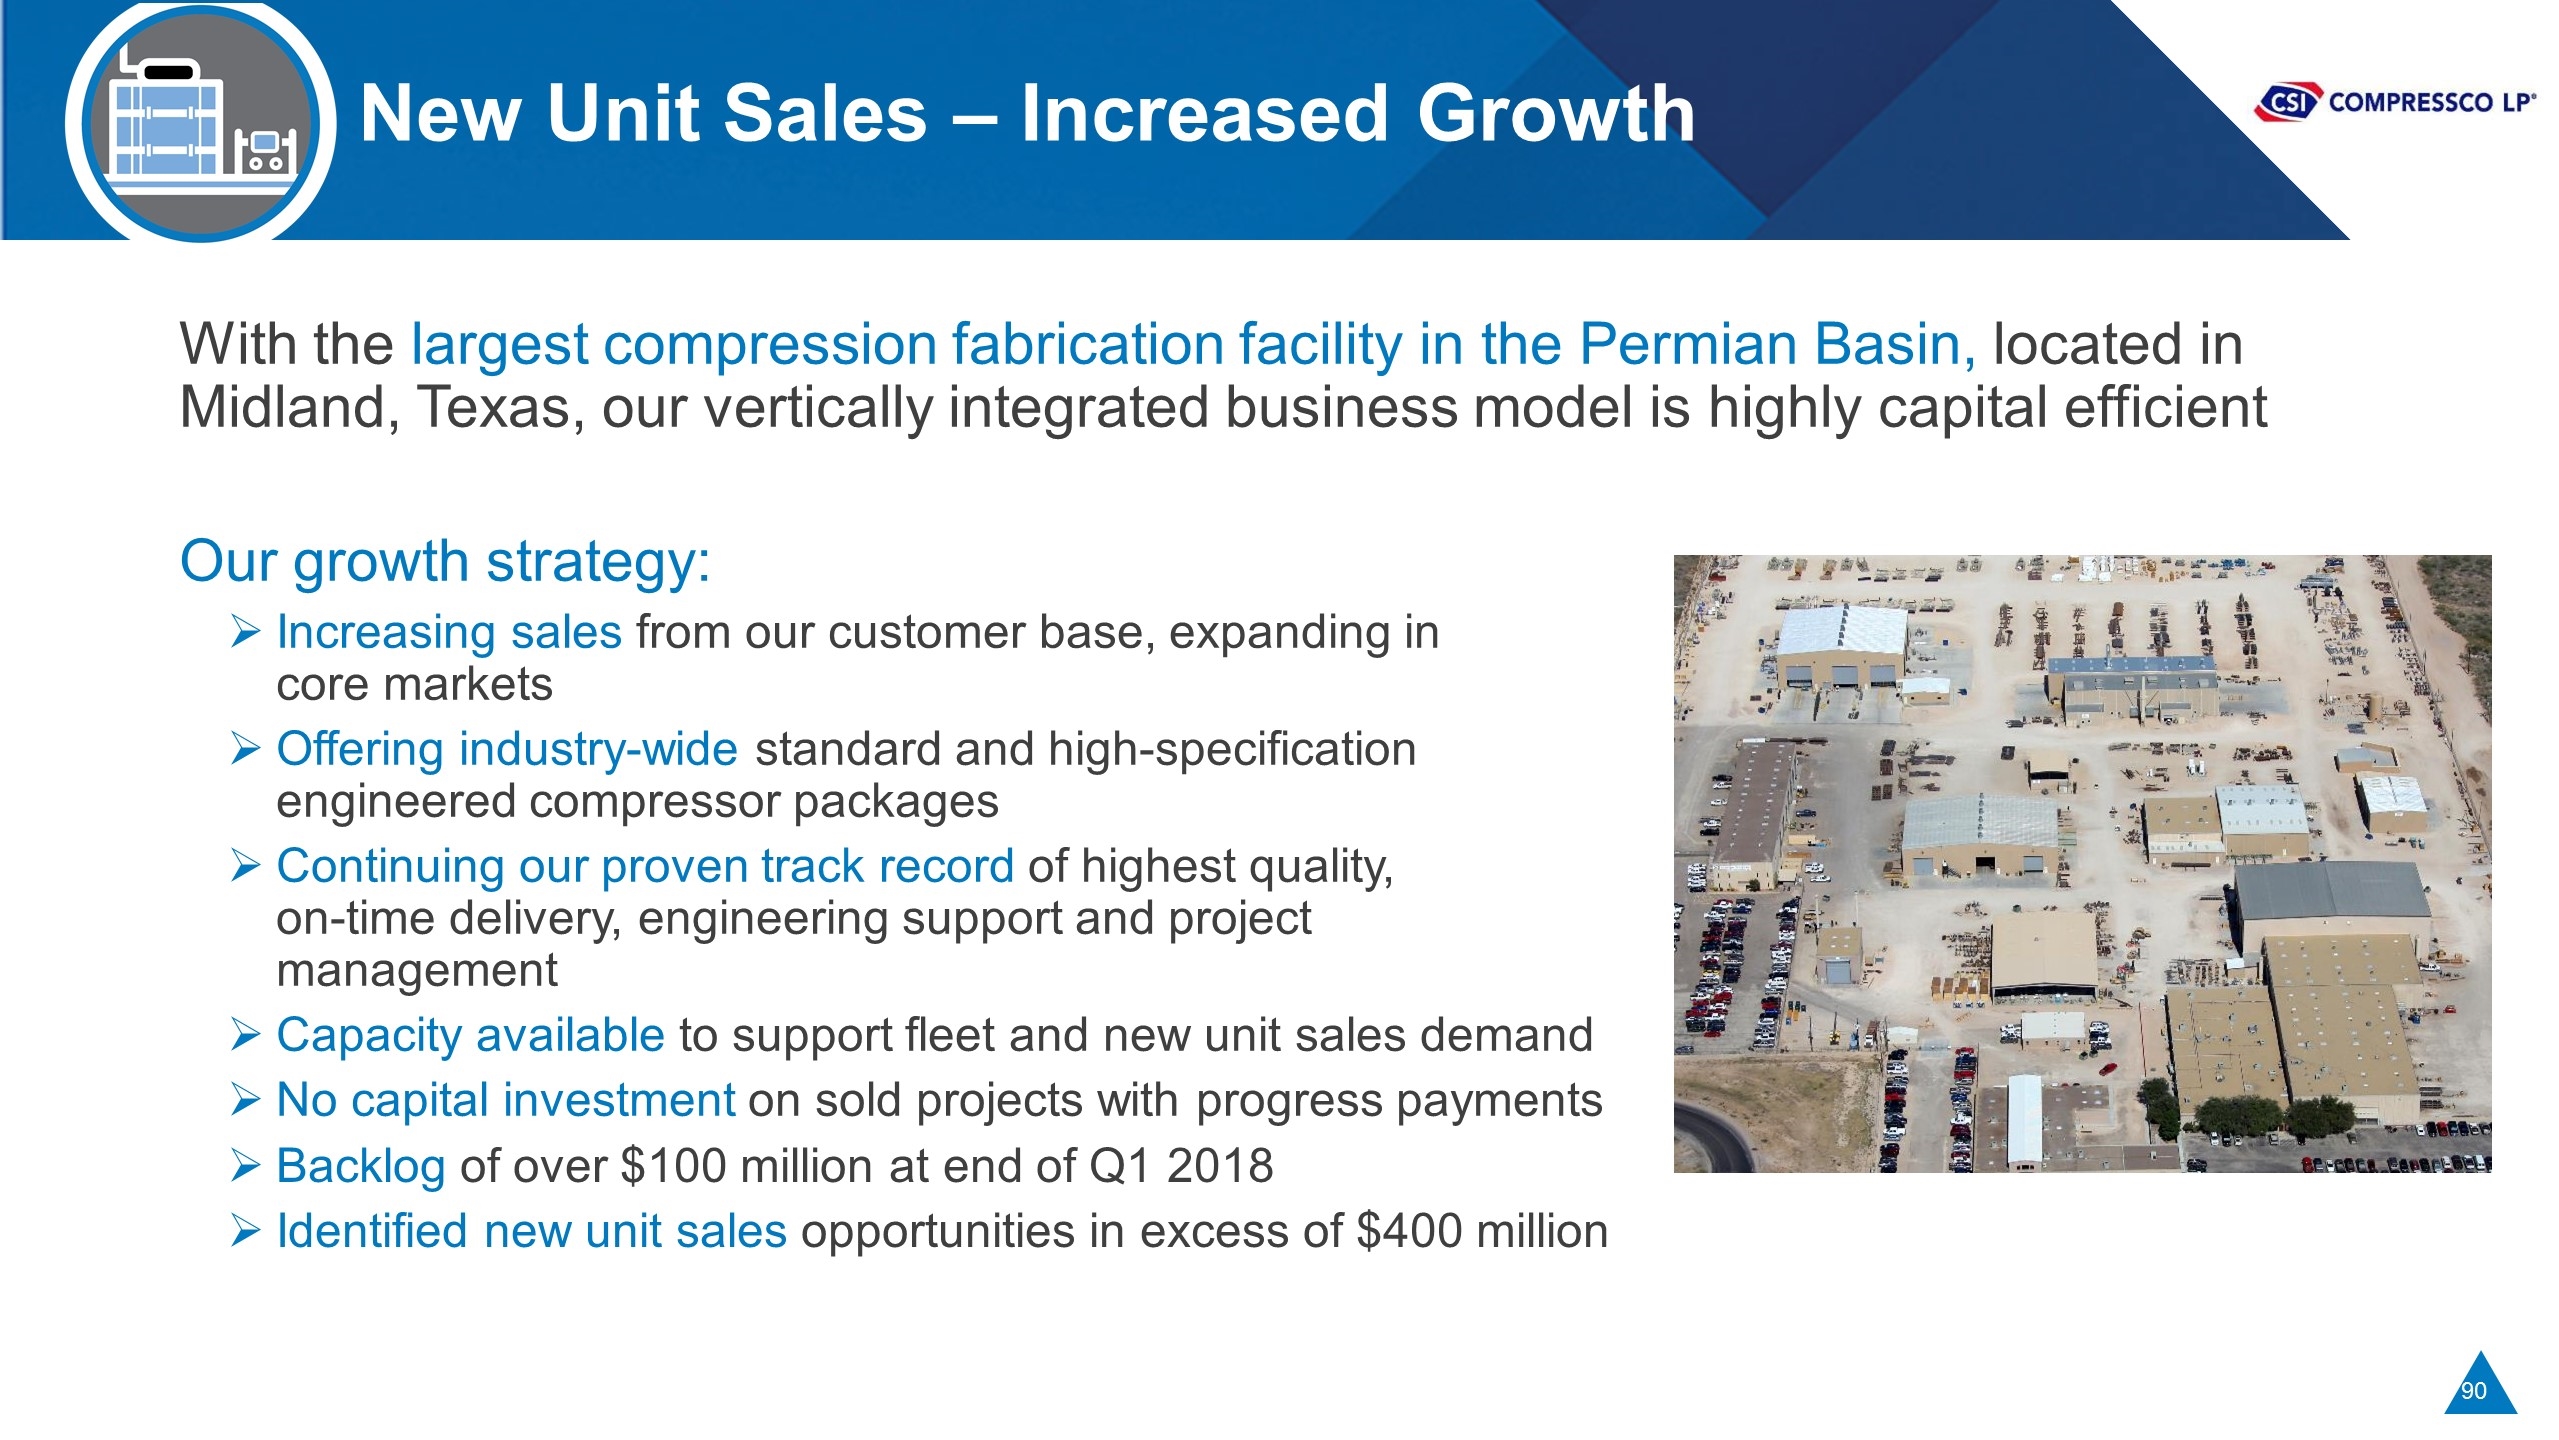
New Unit Sales – Increased Growth With the largest compression fabrication facility in the Permian Basin, located in Midland, Texas, our vertically integrated business model is highly capital efficient Our growth strategy: Increasing sales from our customer base, expanding in core markets Offering industry-wide standard and high-specification engineered compressor packages Continuing our proven track record of highest quality, on-time delivery, engineering support and project management Capacity available to support fleet and new unit sales demand No capital investment on sold projects with progress payments Backlog of over $100 million at end of Q1 2018 Identified new unit sales opportunities in excess of $400 million

Aftermarket Services – Increased Growth Implementation of strategies that increase our share of Aftermarket Services and Parts Market Drivers and Growth Strategy: Growing customer installed base Deferred maintenance and Idle equipment deployment Pull-through revenue from New Unit sales Utilize our technical and application skills Expanding our parts sales and services network No capital required, solid returns and price upside Accelerating Revenue Growth $000s 33% CAGR
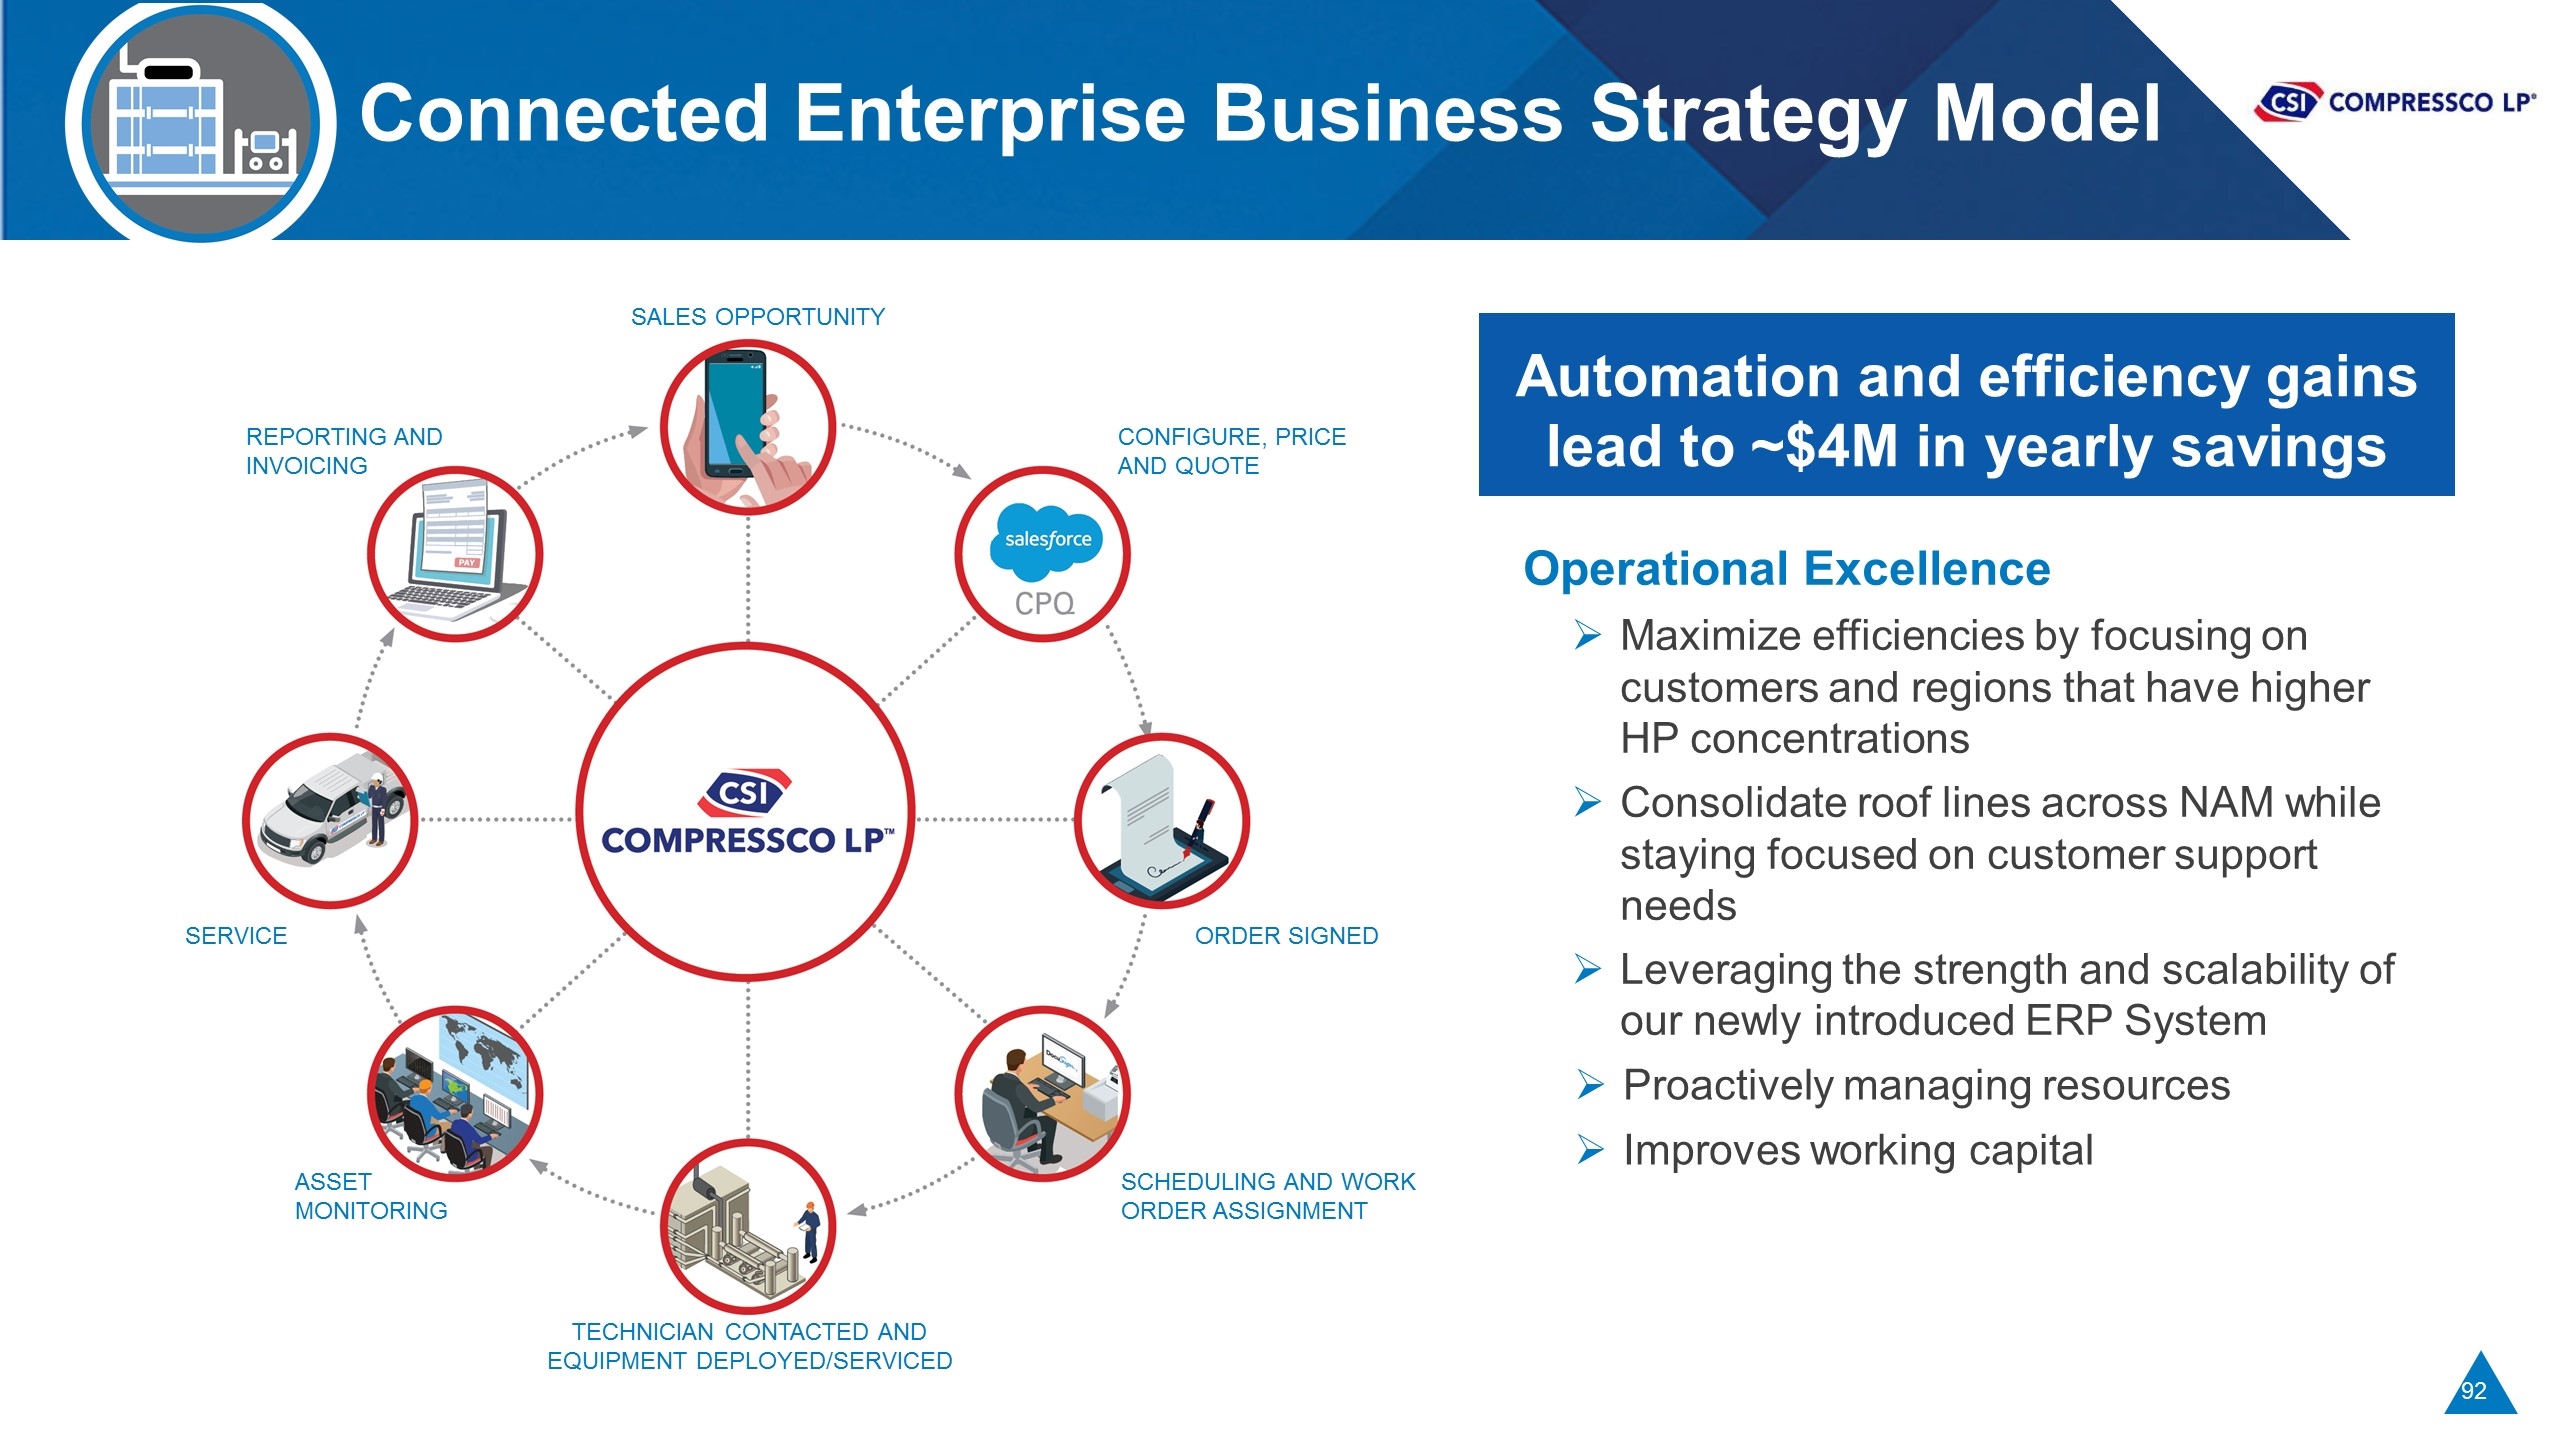
SALES OPPORTUNITY CONFIGURE, PRICE AND QUOTE TECHNICIAN CONTACTED AND EQUIPMENT DEPLOYED/SERVICED ASSET MONITORING SERVICE REPORTING AND INVOICING ORDER SIGNED SCHEDULING AND WORK ORDER ASSIGNMENT Connected Enterprise Business Strategy Model Operational Excellence Maximize efficiencies by focusing on customers and regions that have higher HP concentrations Consolidate roof lines across NAM while staying focused on customer support needs Leveraging the strength and scalability of our newly introduced ERP System Proactively managing resources Improves working capital Automation and efficiency gains lead to ~$4M in yearly savings
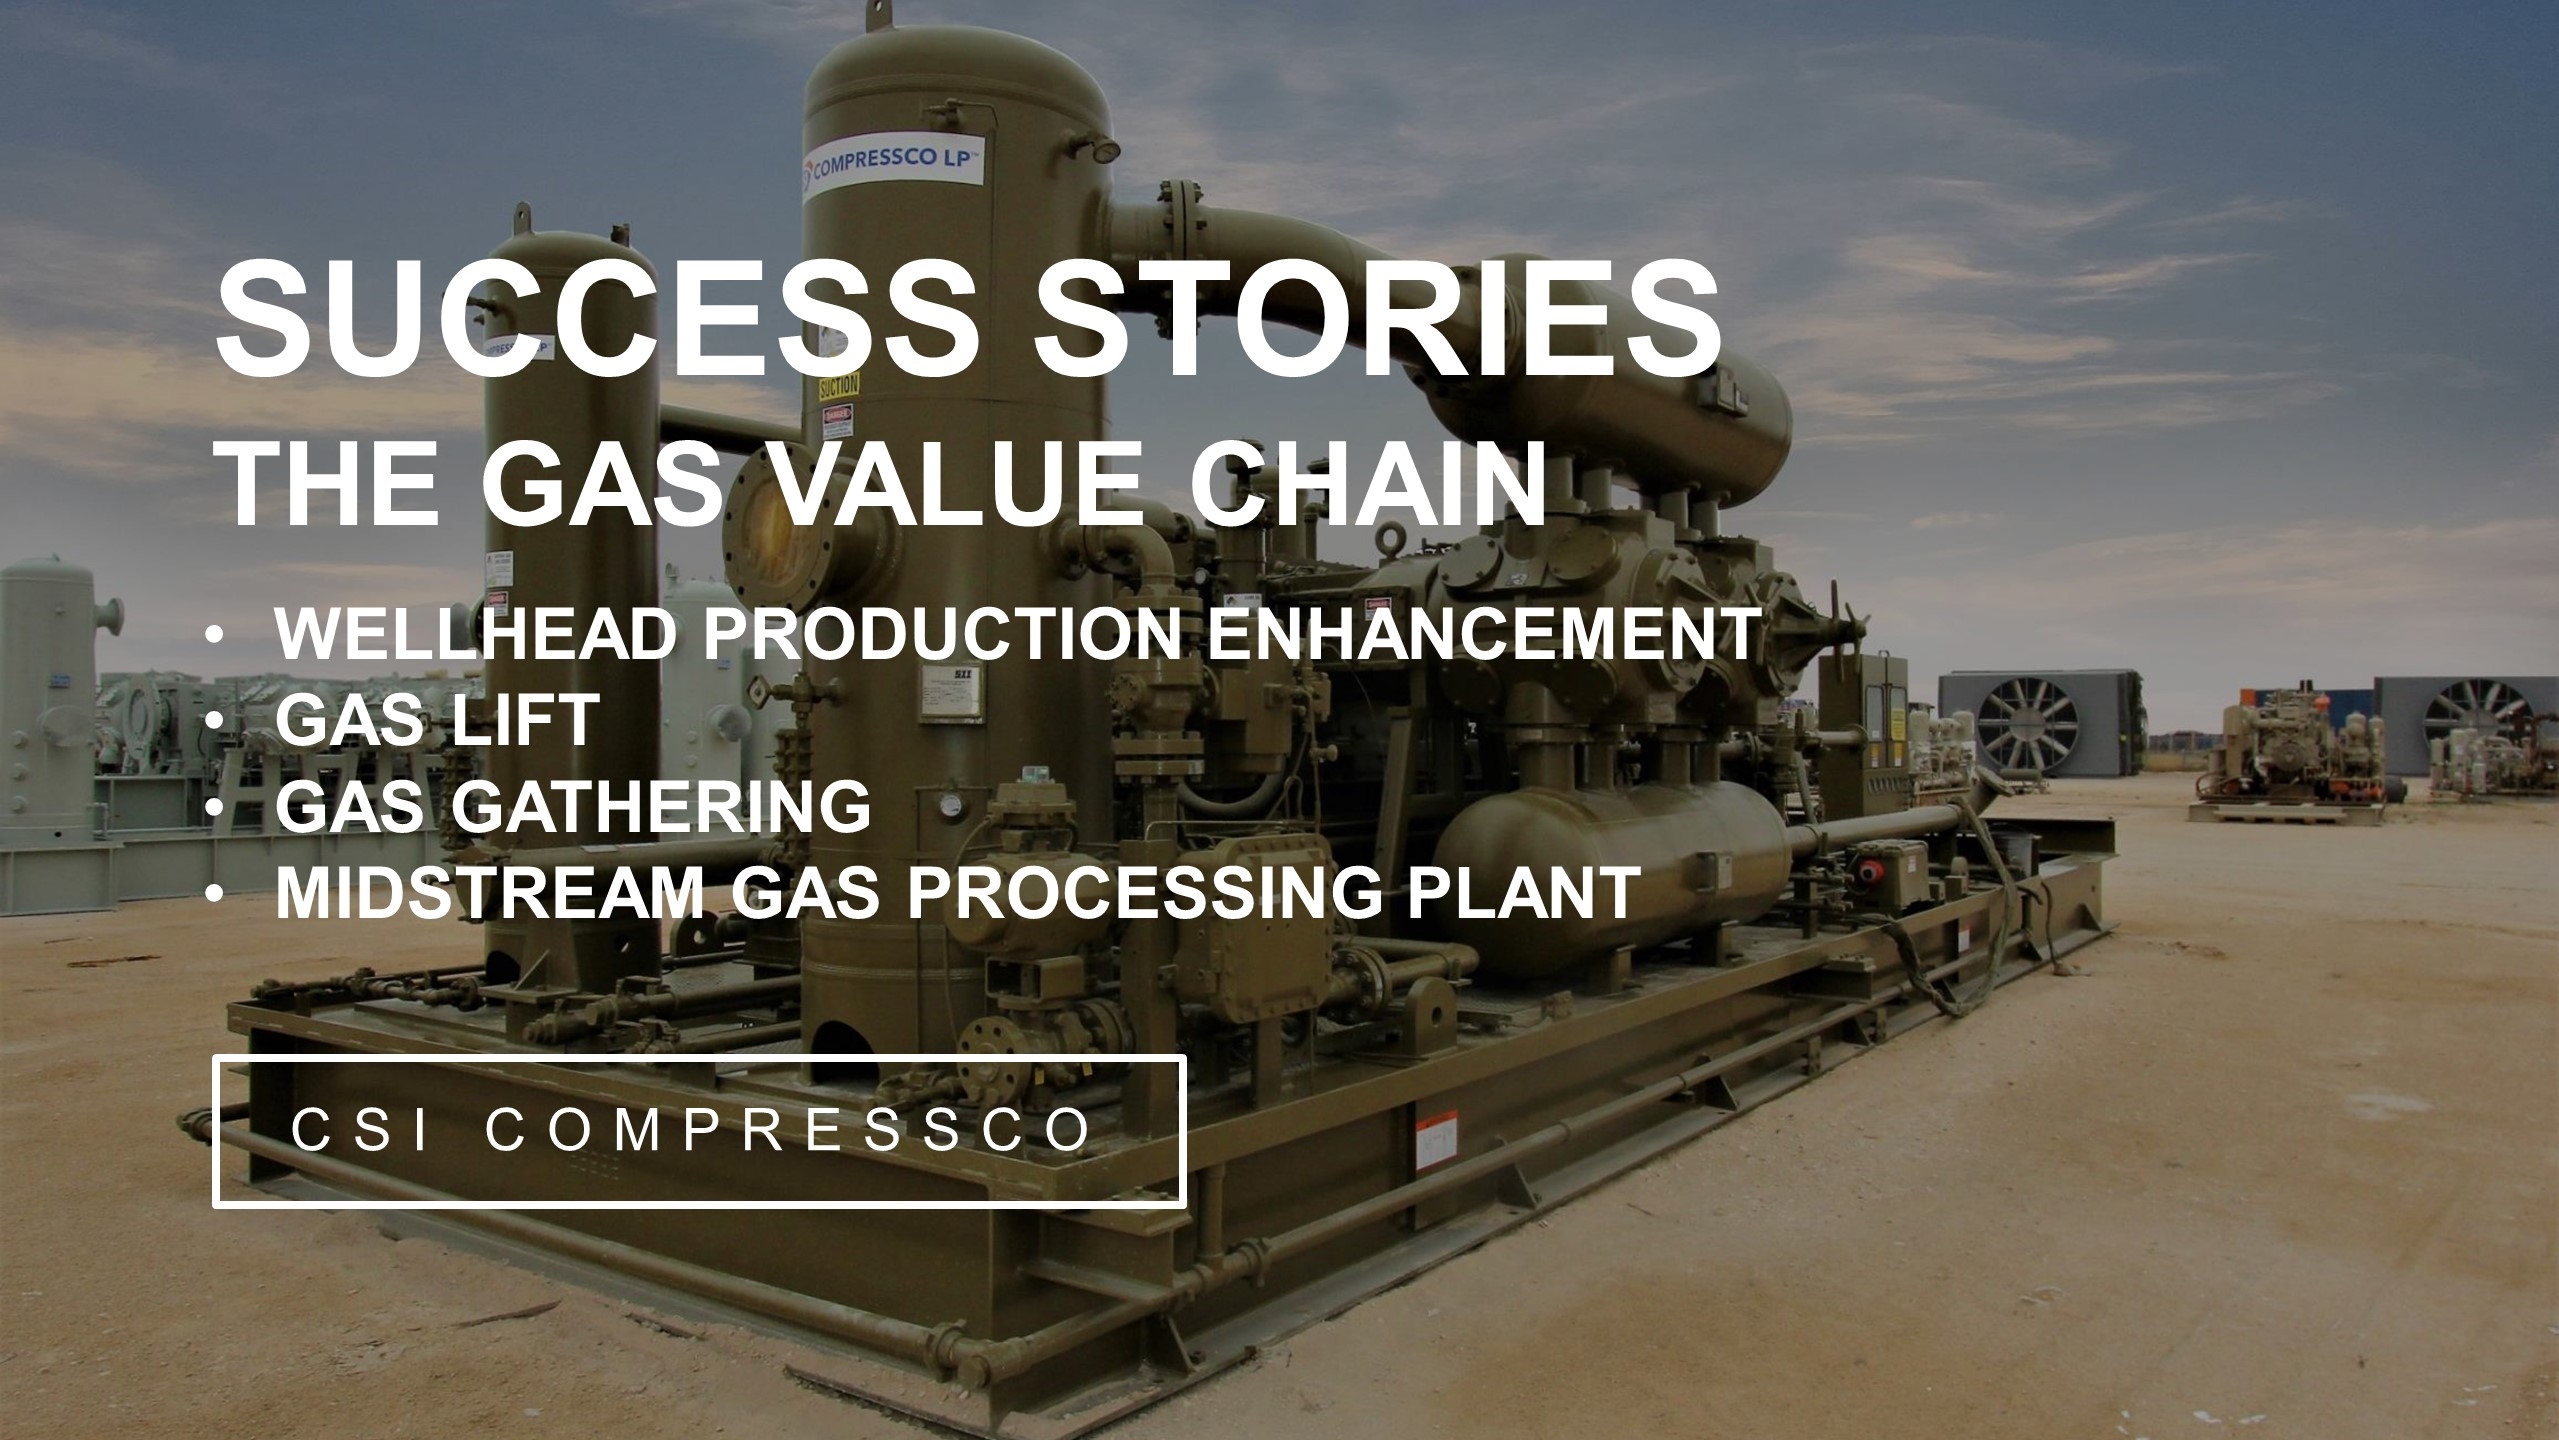
Success Stories The Gas Value Chain CSI COMPRESSCO WELLHEAD PRODUCTION ENHANCEMENT GAS LIFT GAS GATHERING MIDSTREAM GAS PROCESSING PLANT
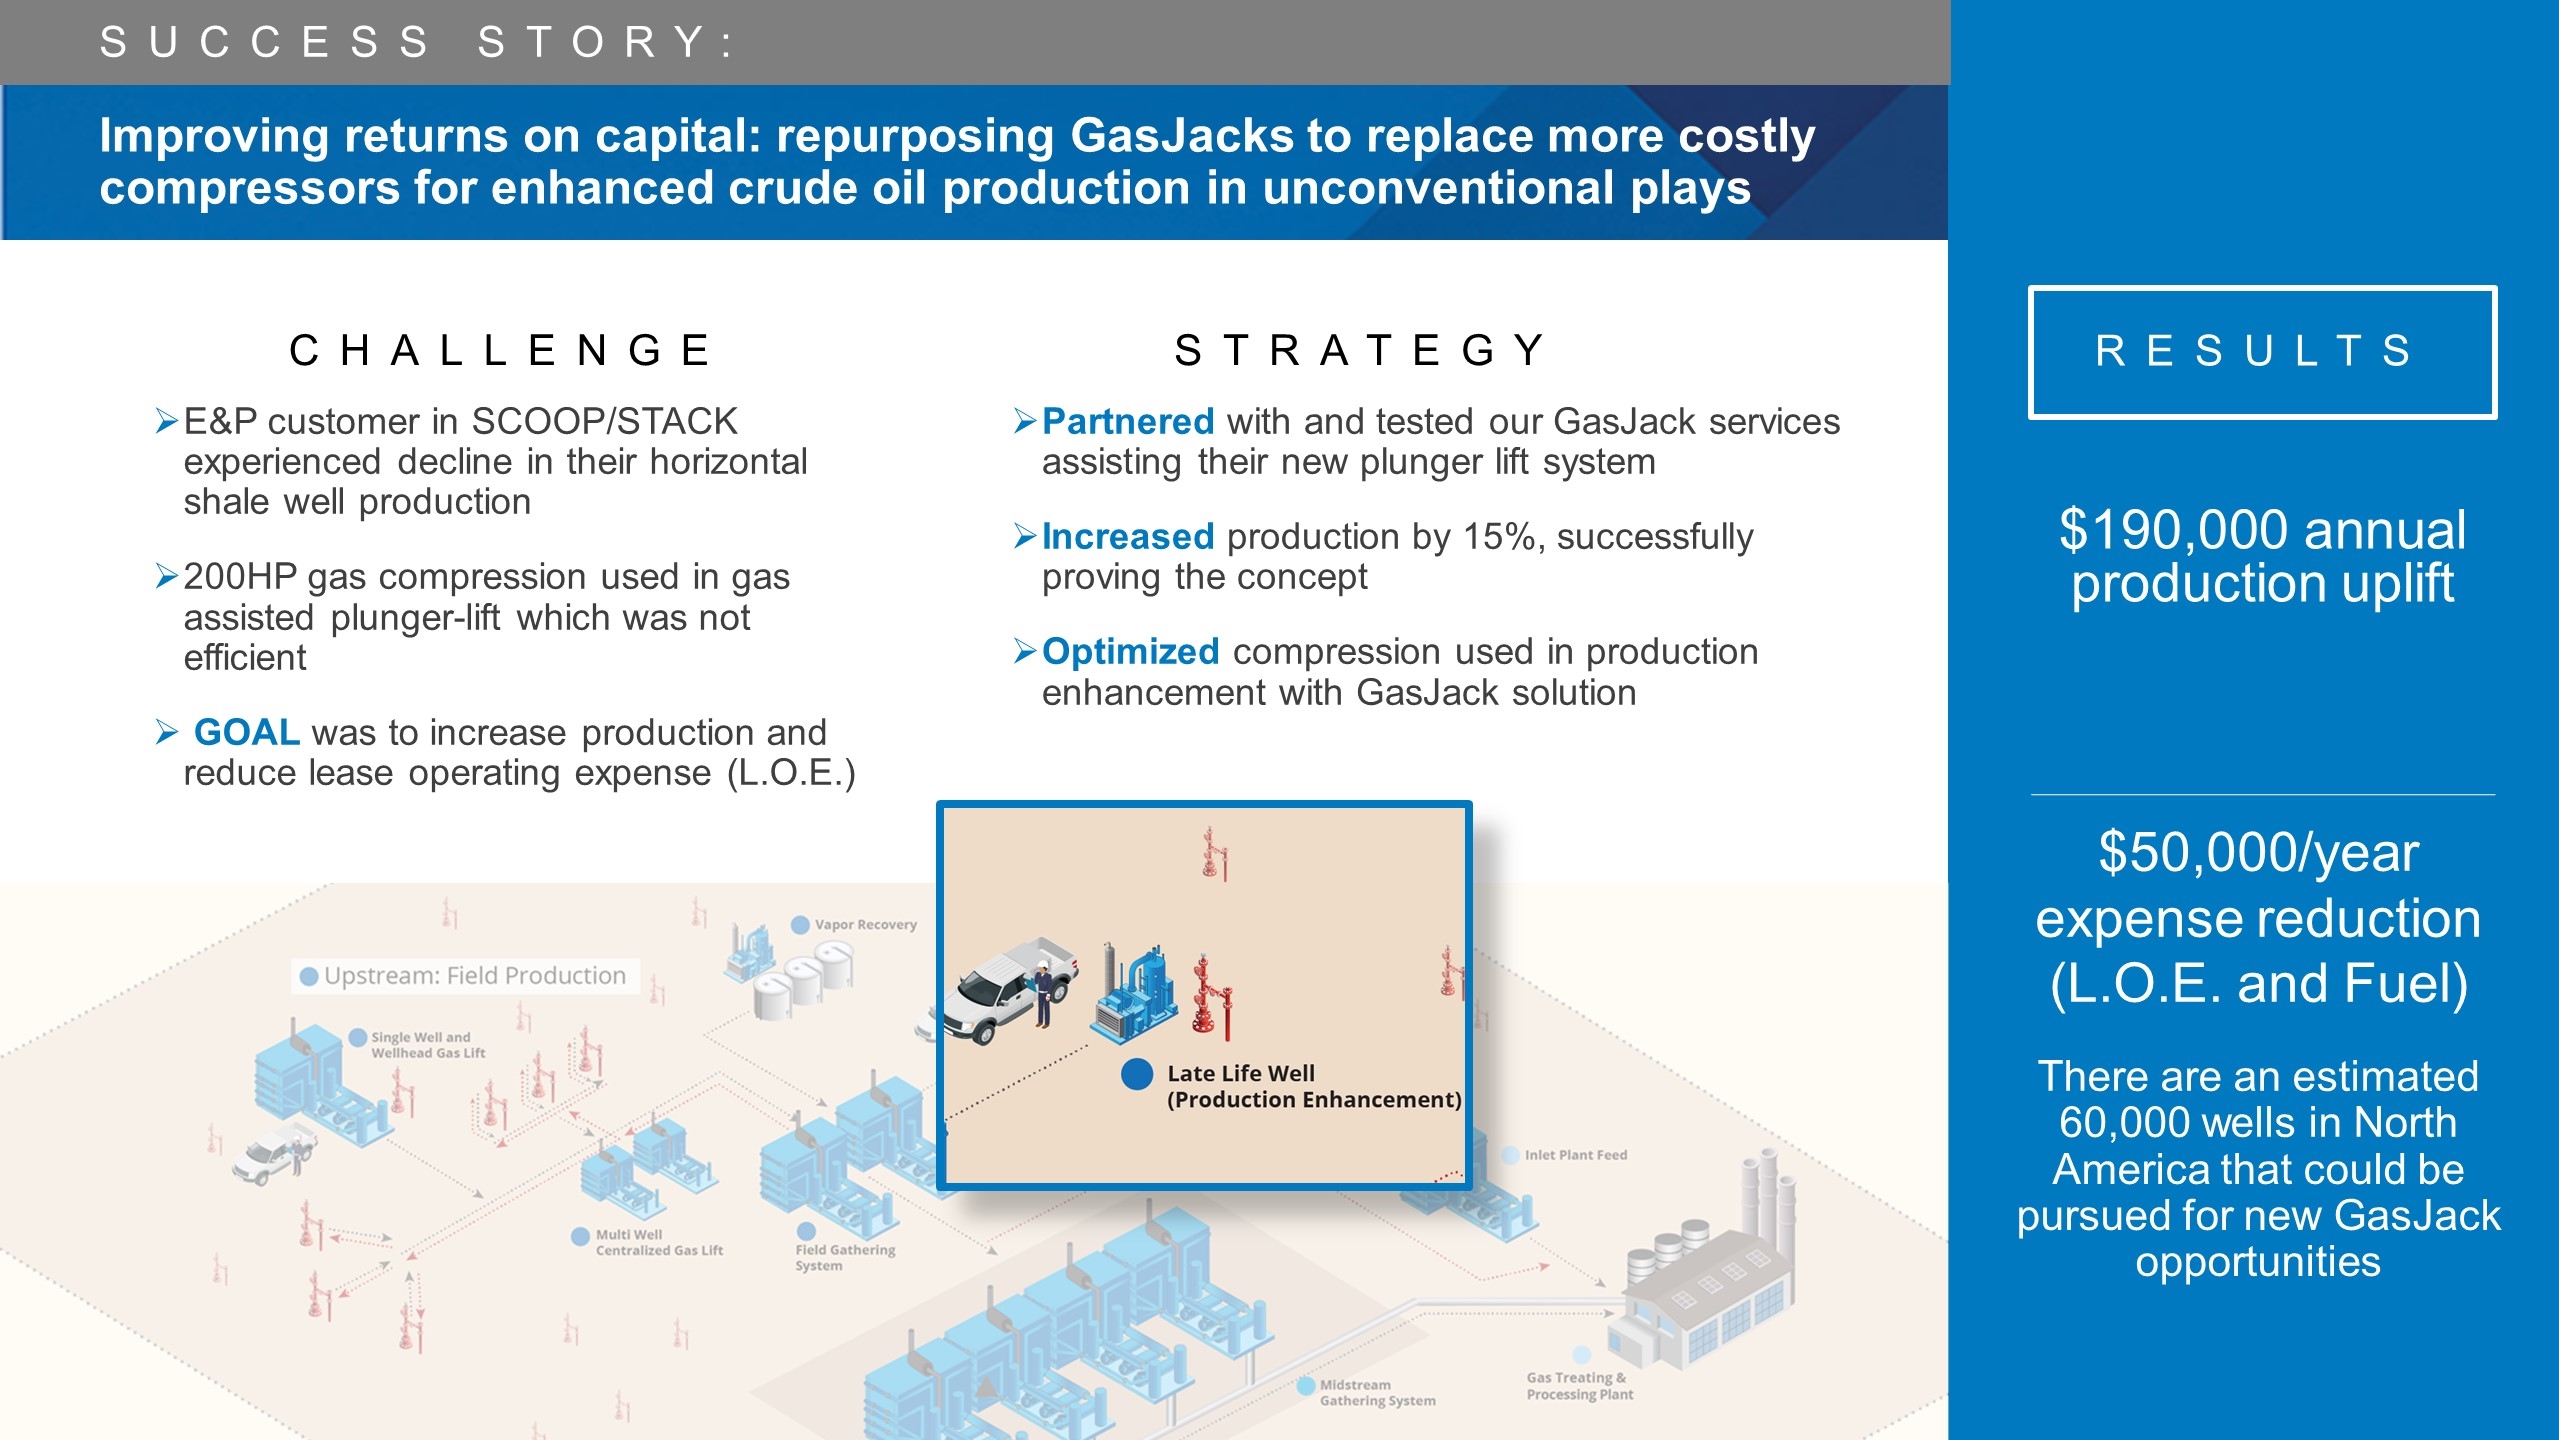
$50,000/year expense reduction (L.O.E. and Fuel) E&P customer in SCOOP/STACK experienced decline in their horizontal shale well production 200HP gas compression used in gas assisted plunger-lift which was not efficient GOAL was to increase production and reduce lease operating expense (L.O.E.) There are an estimated 60,000 wells in North America that could be pursued for new GasJack opportunities $190,000 annual production uplift RESULTS Improving returns on capital: repurposing GasJacks to replace more costly compressors for enhanced crude oil production in unconventional plays Challenge Strategy Partnered with and tested our GasJack services assisting their new plunger lift system Increased production by 15%, successfully proving the concept Optimized compression used in production enhancement with GasJack solution Success Story:
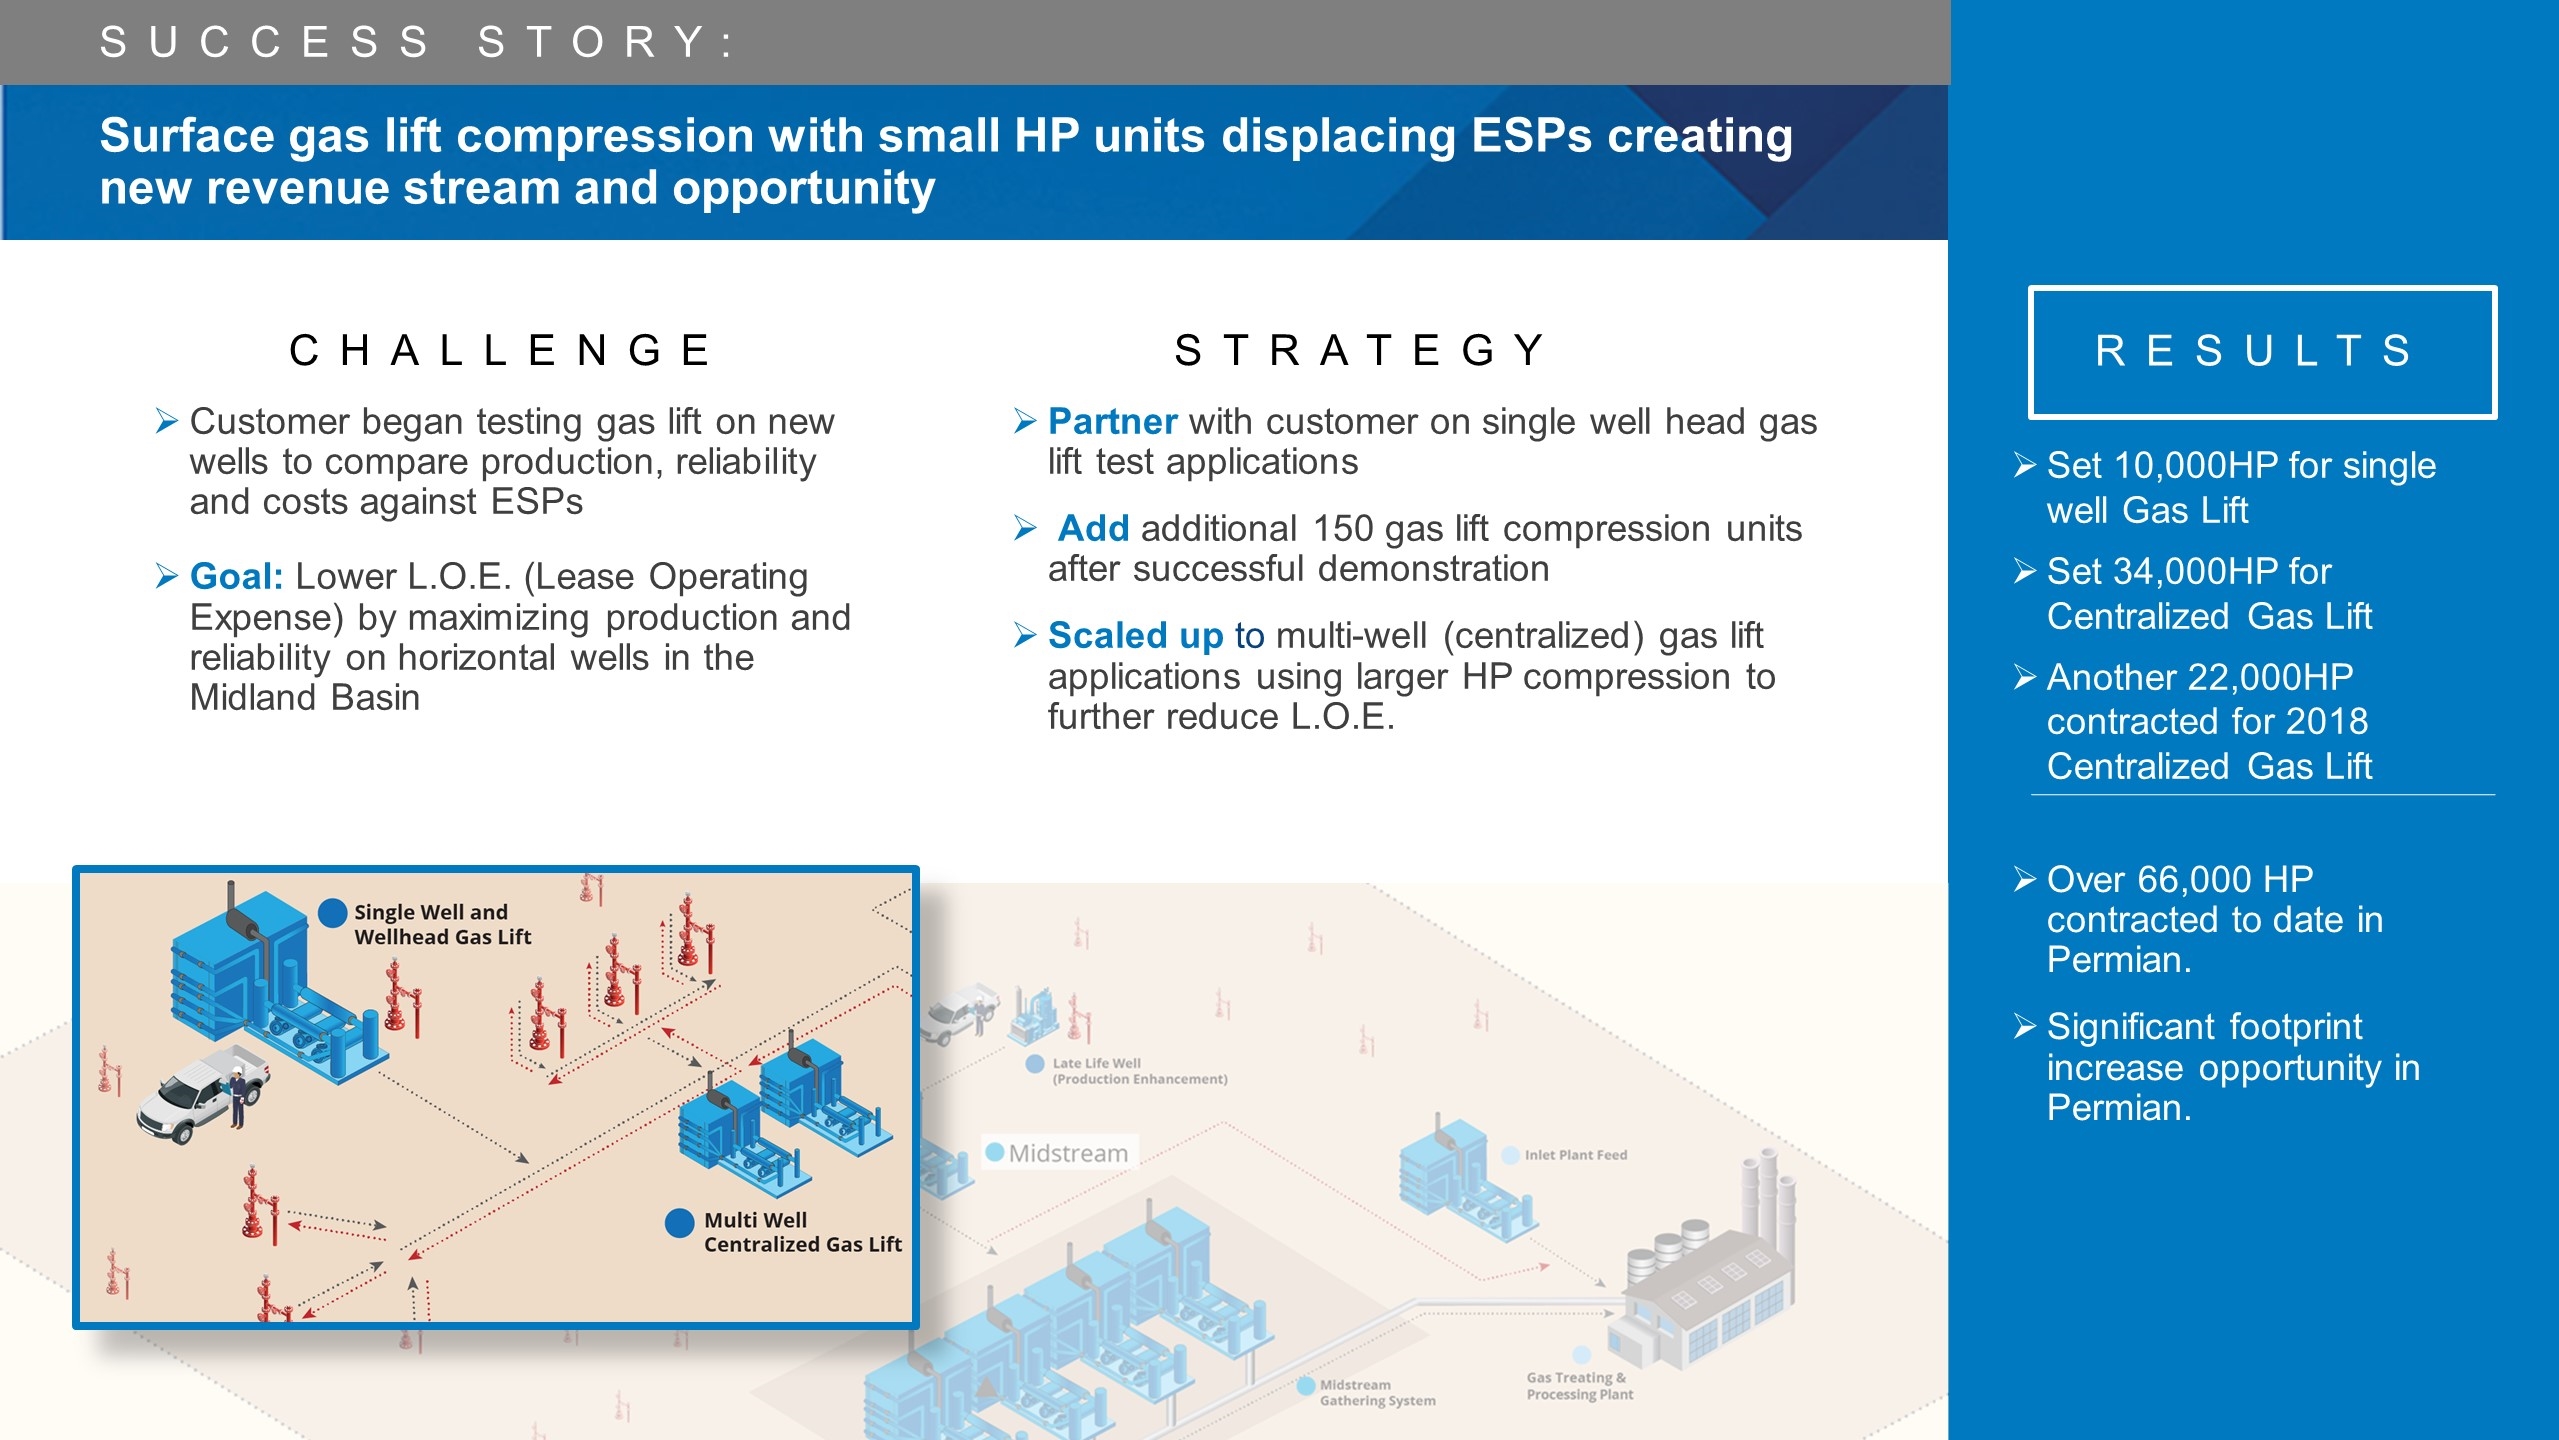
Customer began testing gas lift on new wells to compare production, reliability and costs against ESPs Goal: Lower L.O.E. (Lease Operating Expense) by maximizing production and reliability on horizontal wells in the Midland Basin Over 66,000 HP contracted to date in Permian. Significant footprint increase opportunity in Permian. Set 10,000HP for single well Gas Lift Set 34,000HP for Centralized Gas Lift Another 22,000HP contracted for 2018 Centralized Gas Lift RESULTS Surface gas lift compression with small HP units displacing ESPs creating new revenue stream and opportunity Challenge Strategy Partner with customer on single well head gas lift test applications Add additional 150 gas lift compression units after successful demonstration Scaled up to multi-well (centralized) gas lift applications using larger HP compression to further reduce L.O.E. Success Story:
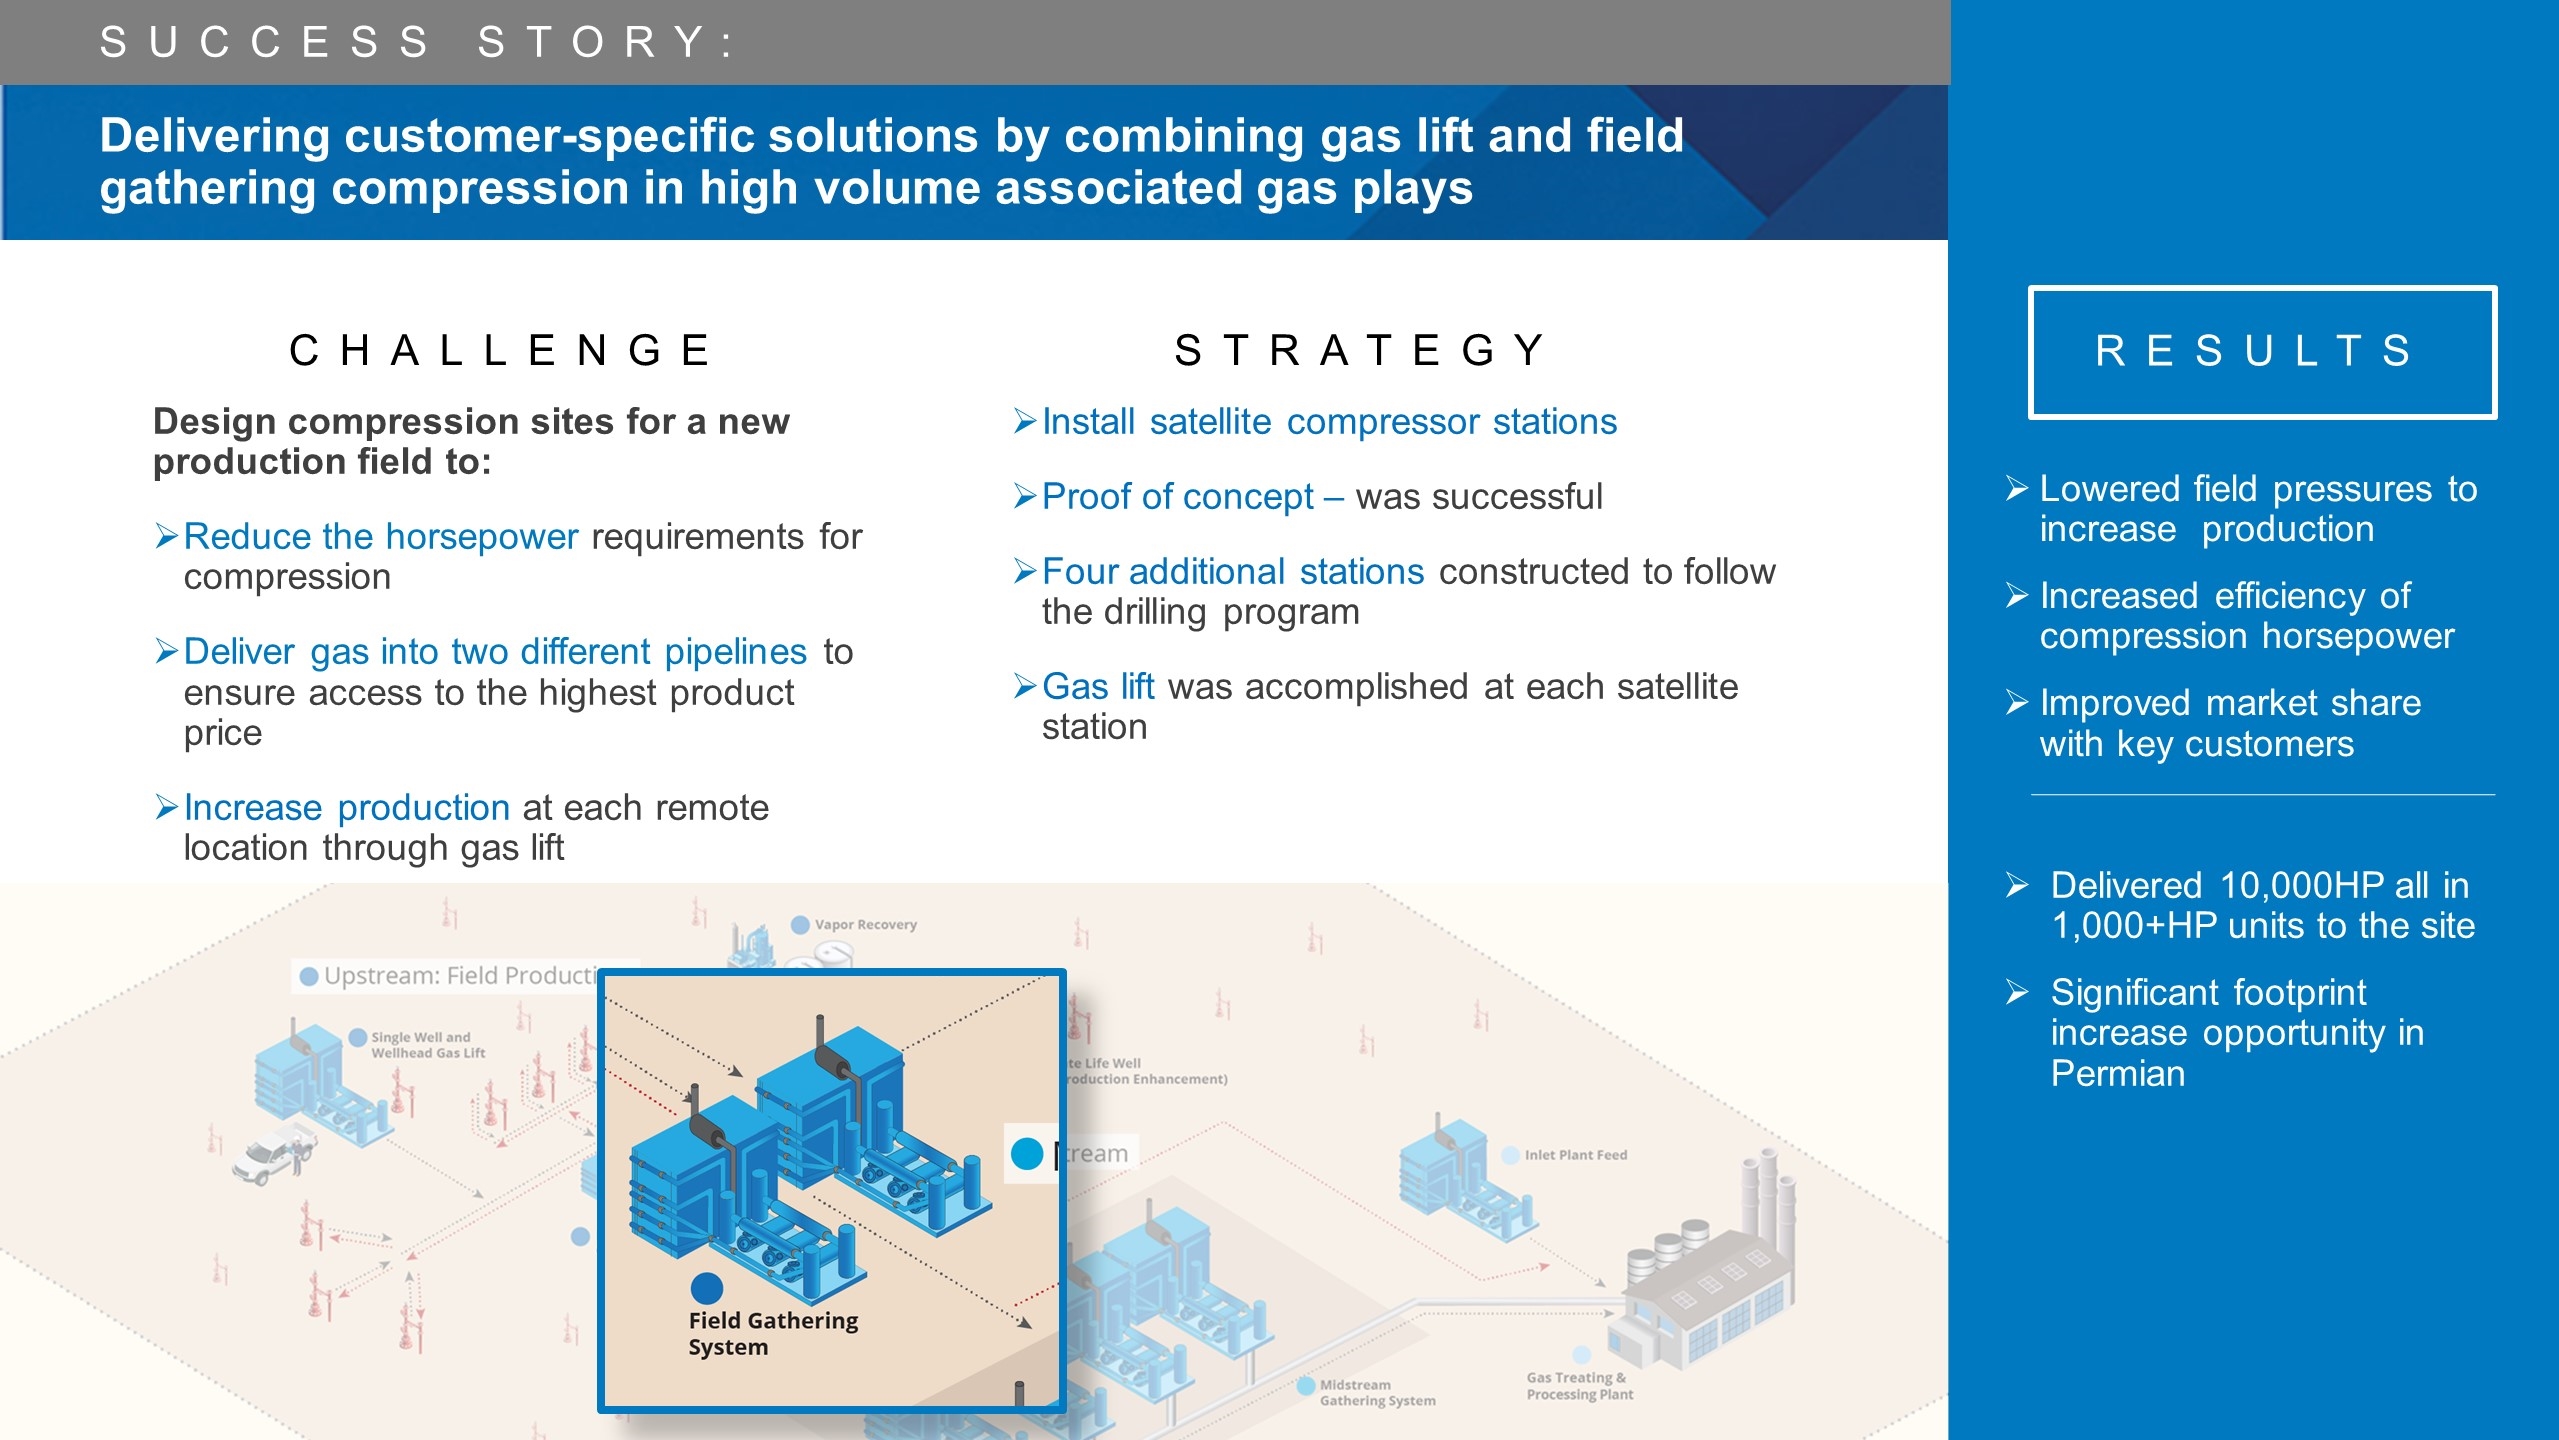
Design compression sites for a new production field to: Reduce the horsepower requirements for compression Deliver gas into two different pipelines to ensure access to the highest product price Increase production at each remote location through gas lift Delivered 10,000HP all in 1,000+HP units to the site Significant footprint increase opportunity in Permian Lowered field pressures to increase production Increased efficiency of compression horsepower Improved market share with key customers RESULTS Delivering customer-specific solutions by combining gas lift and field gathering compression in high volume associated gas plays Challenge Strategy Install satellite compressor stations Proof of concept – was successful Four additional stations constructed to follow the drilling program Gas lift was accomplished at each satellite station Success Story:
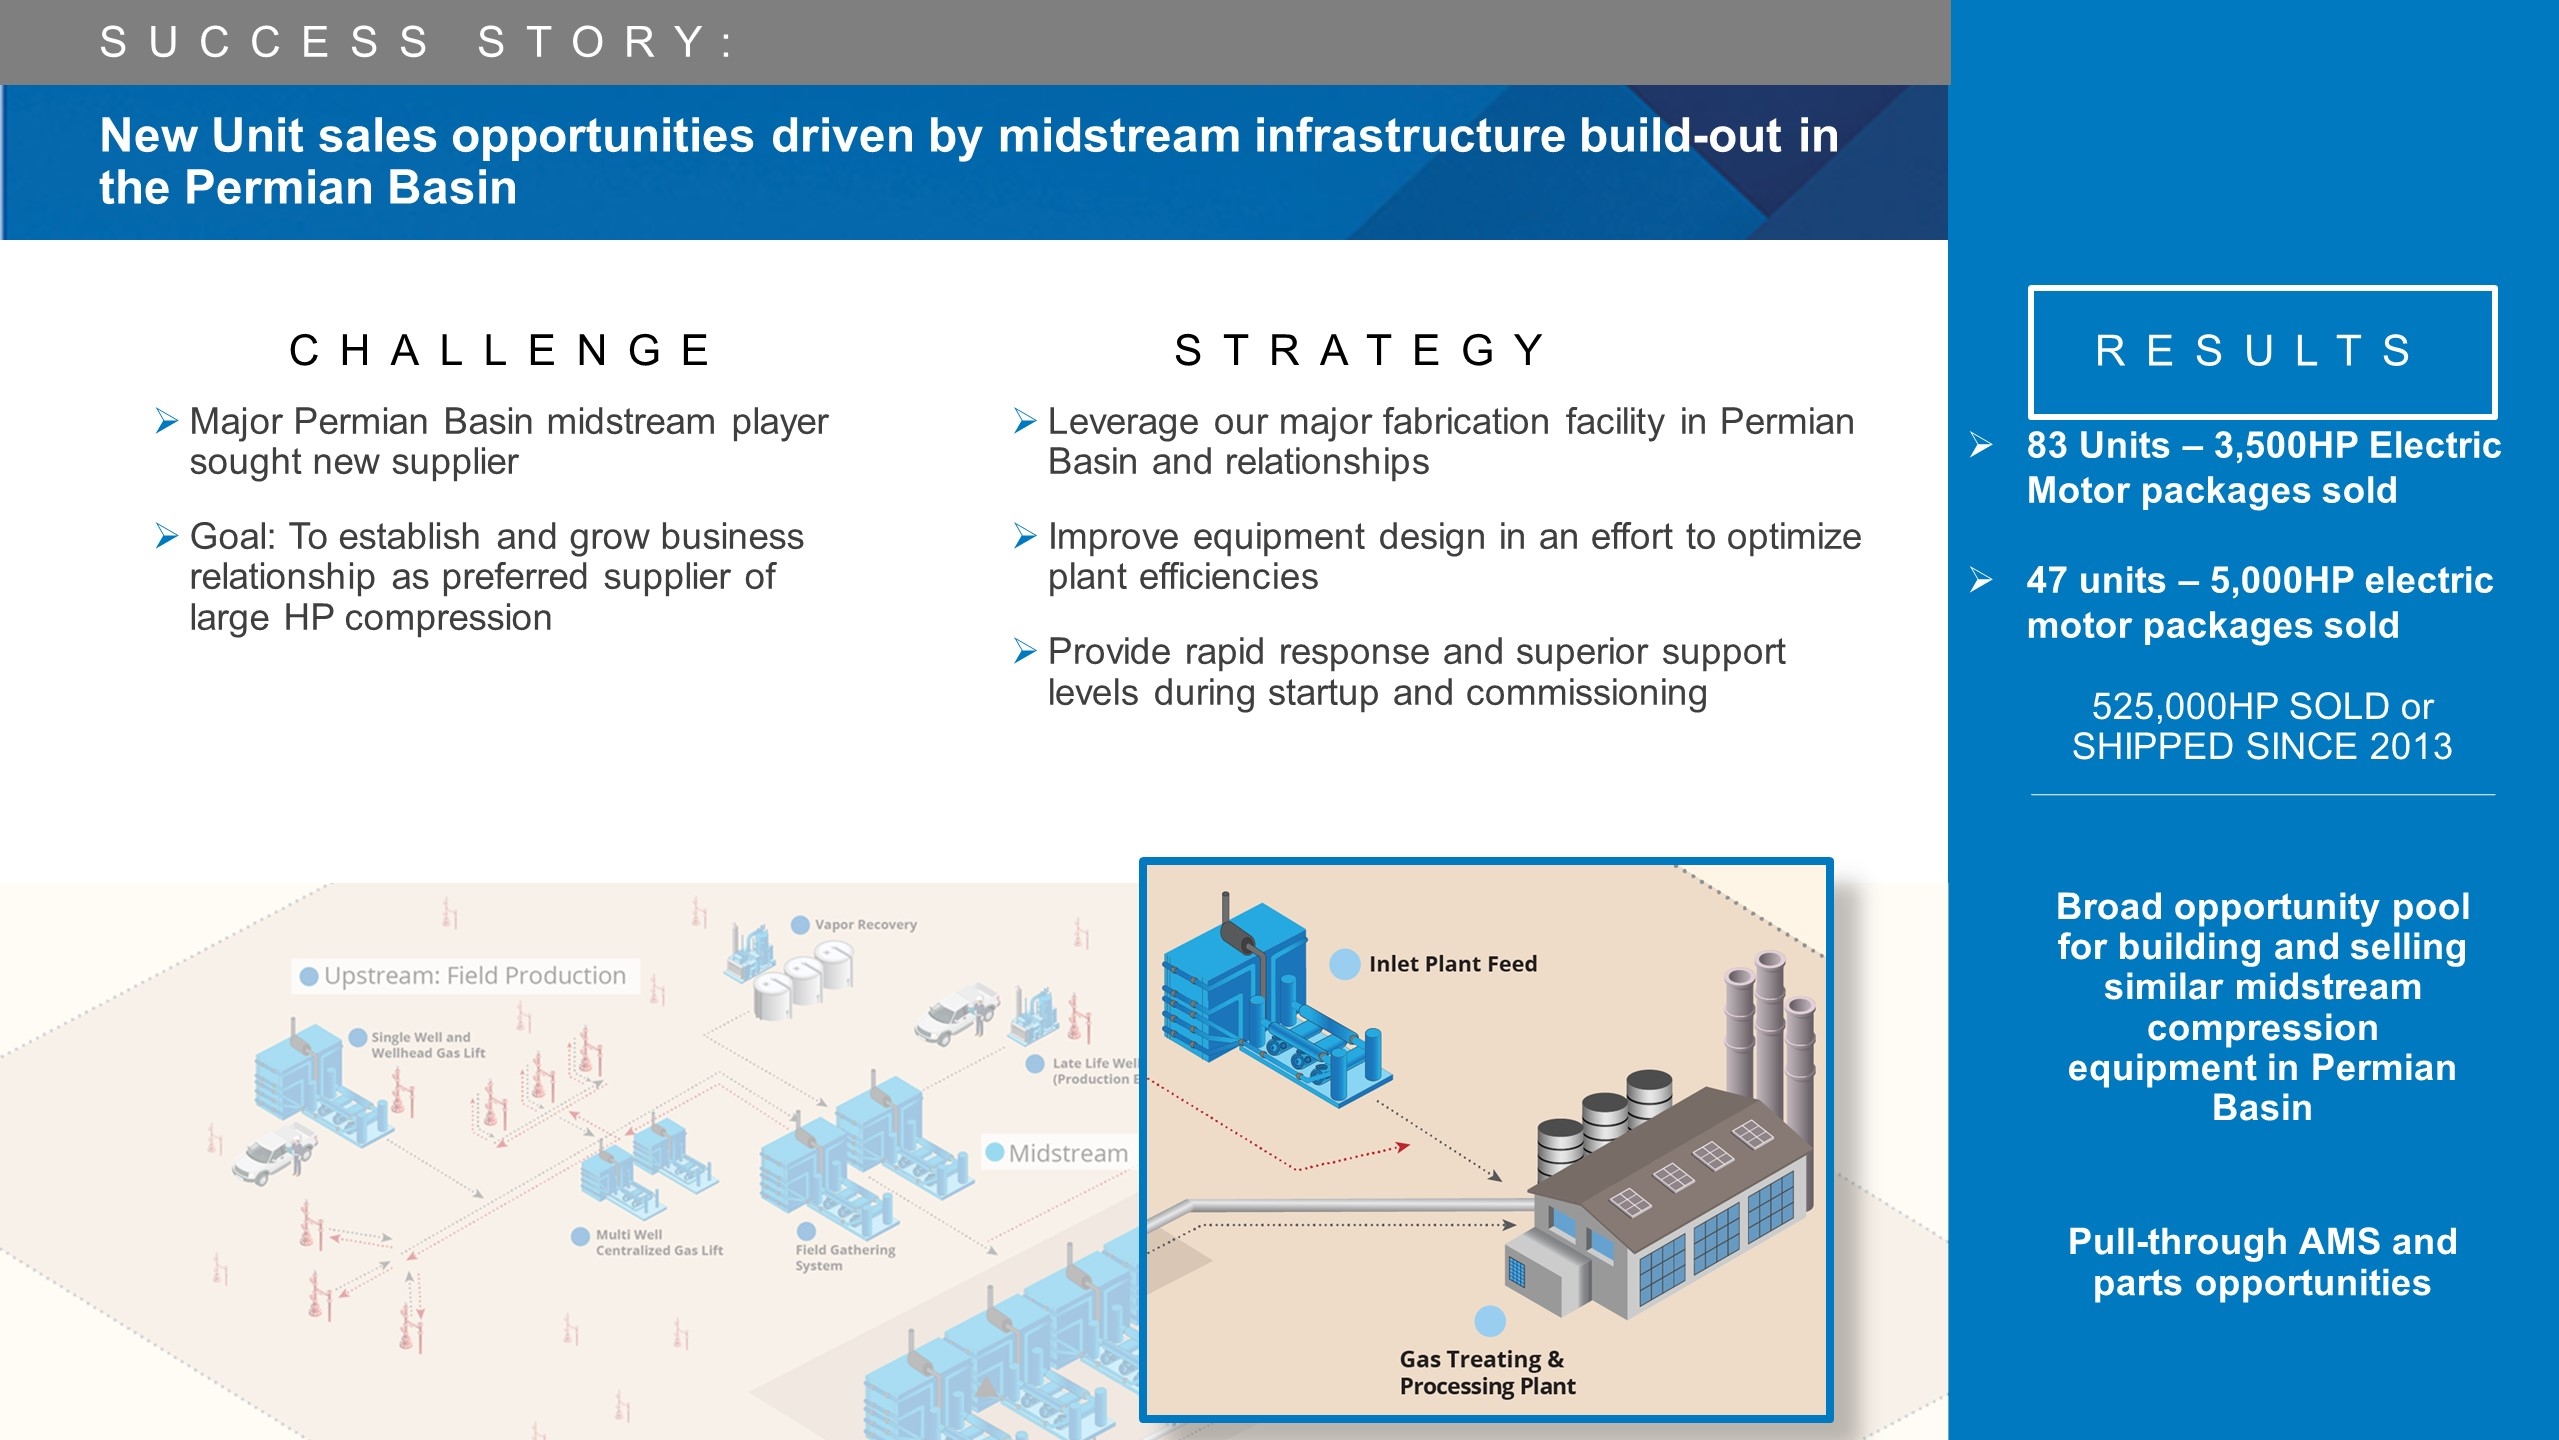
Major Permian Basin midstream player sought new supplier Goal: To establish and grow business relationship as preferred supplier of large HP compression Broad opportunity pool for building and selling similar midstream compression equipment in Permian Basin Pull-through AMS and parts opportunities 525,000HP SOLD or SHIPPED SINCE 2013 RESULTS New Unit sales opportunities driven by midstream infrastructure build-out in the Permian Basin Challenge Strategy Leverage our major fabrication facility in Permian Basin and relationships Improve equipment design in an effort to optimize plant efficiencies Provide rapid response and superior support levels during startup and commissioning Success Story: 83 Units – 3,500HP Electric Motor packages sold 47 units – 5,000HP electric motor packages sold
Summary CSI COMPRESSCO
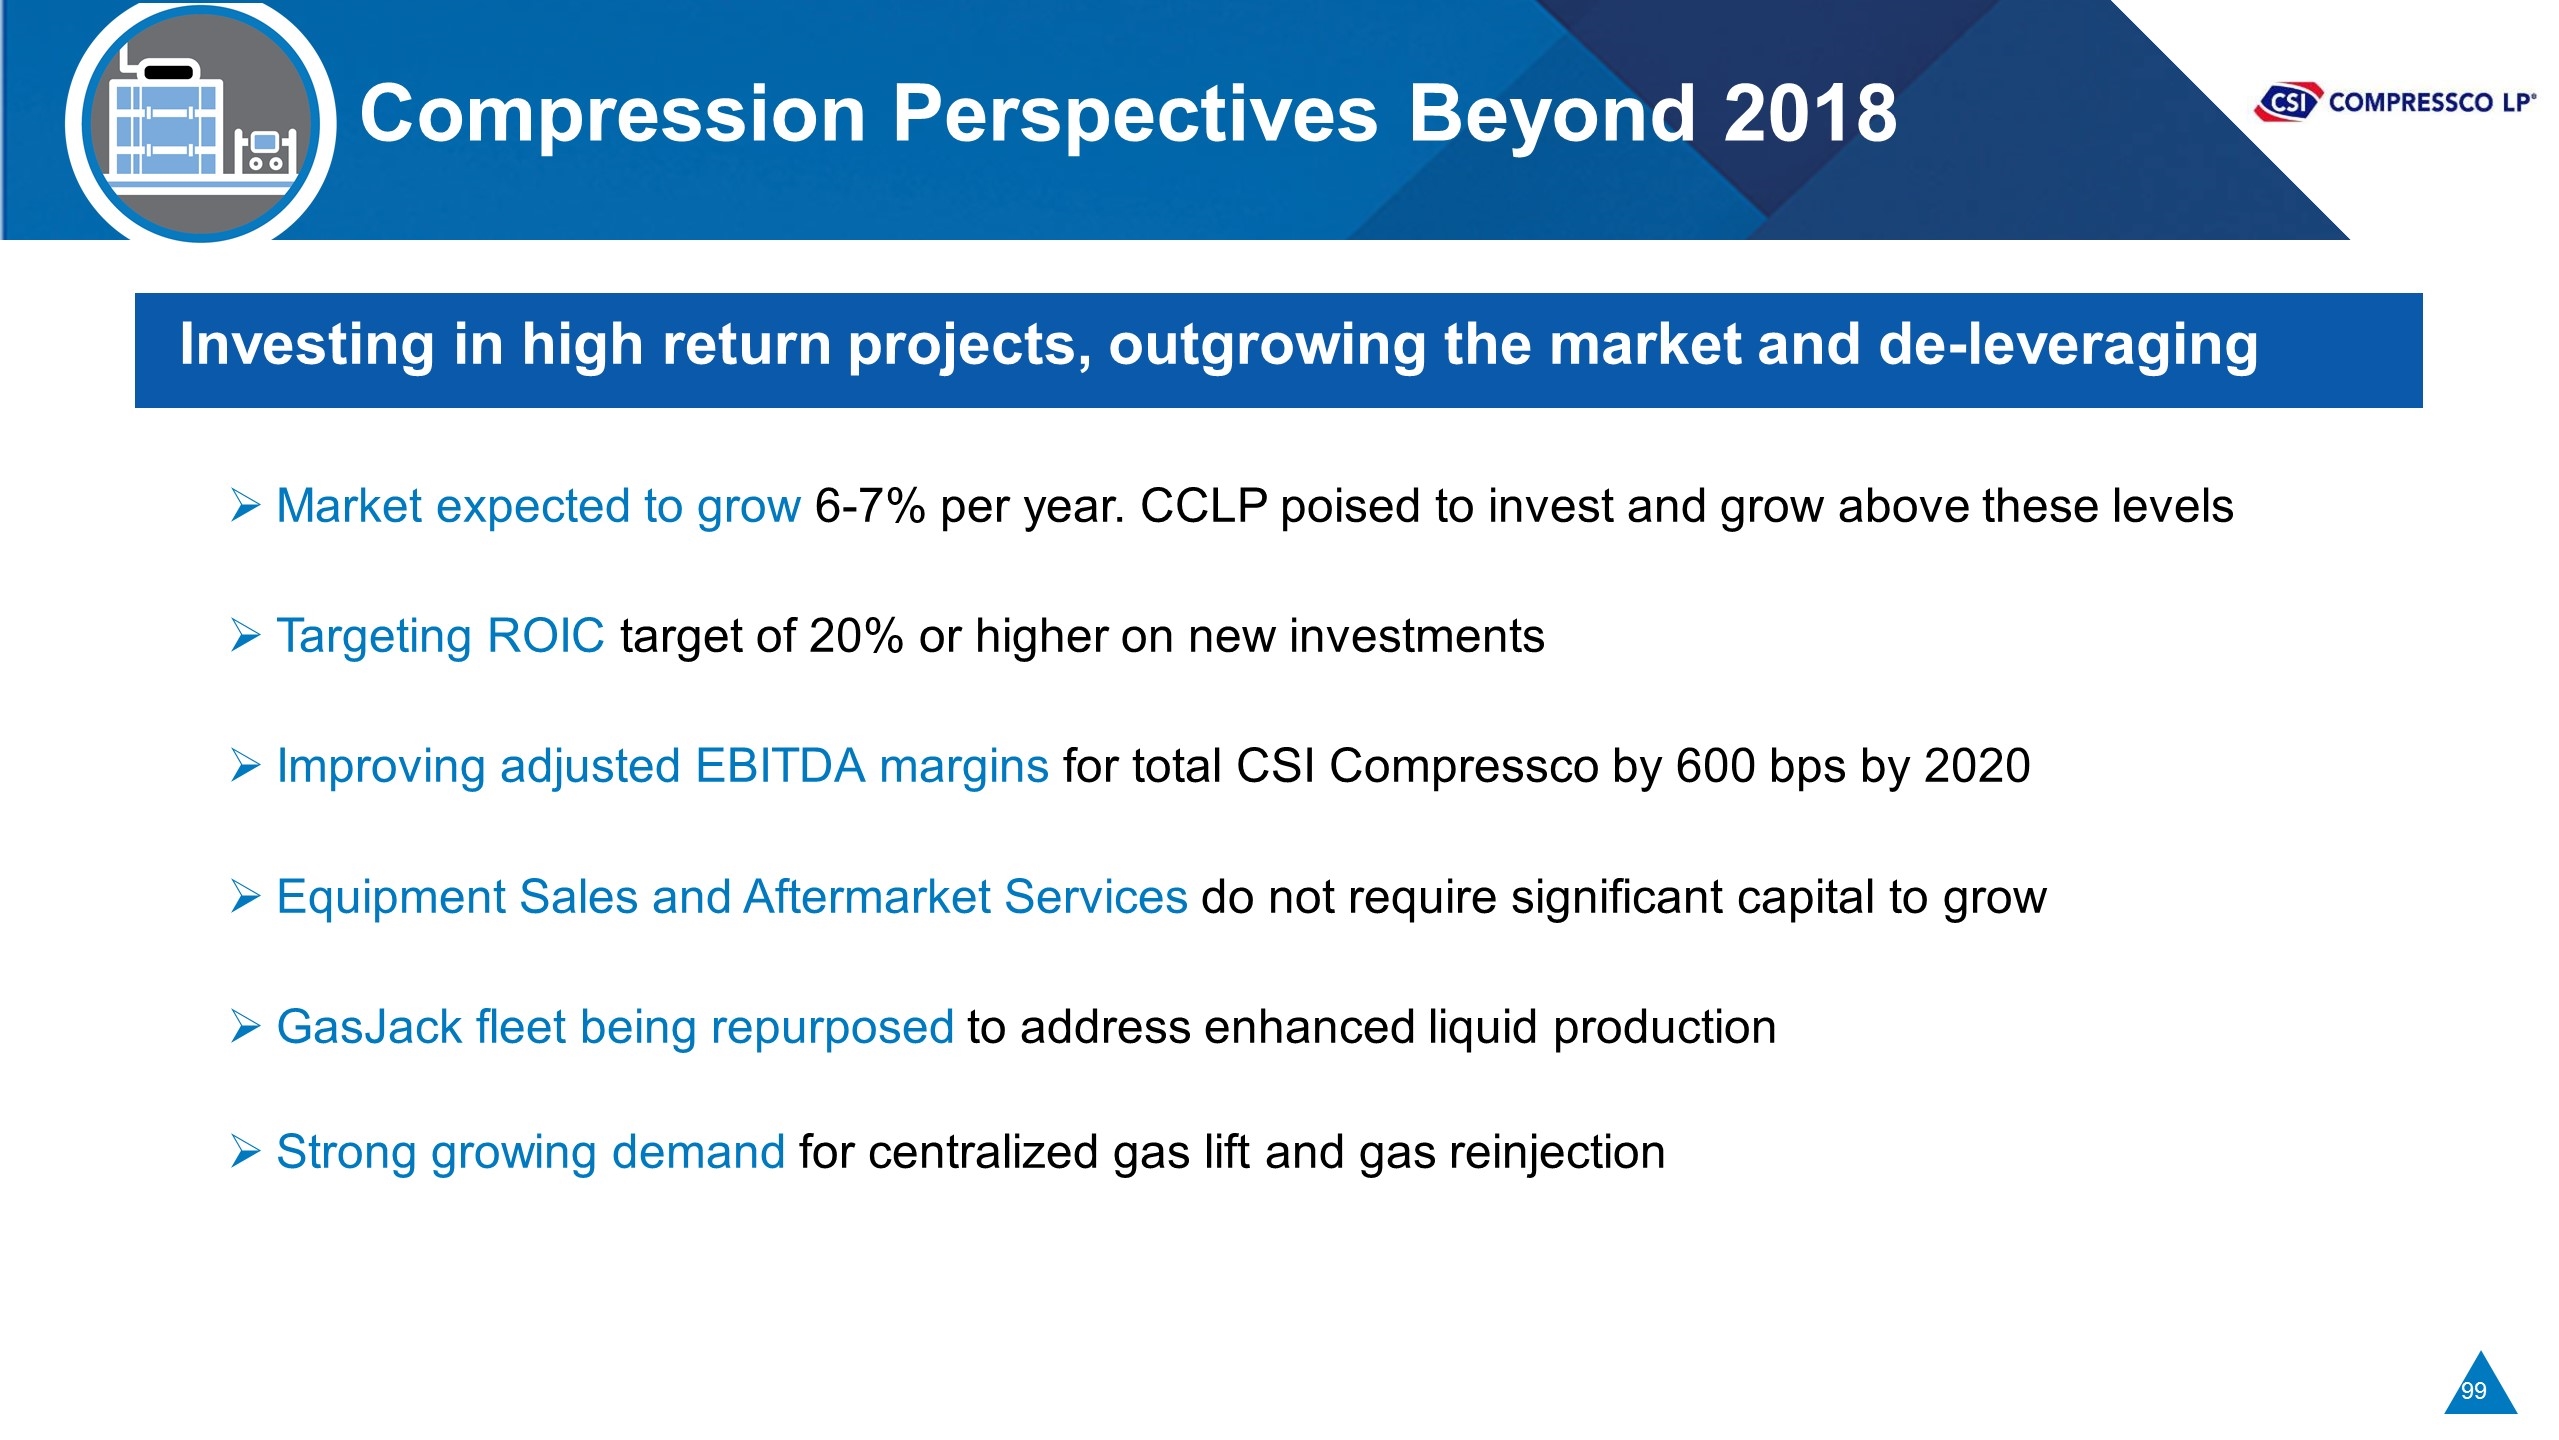
Compression Perspectives Beyond 2018 Investing in high return projects, outgrowing the market and de-leveraging Market expected to grow 6-7% per year. CCLP poised to invest and grow above these levels Targeting ROIC target of 20% or higher on new investments Improving adjusted EBITDA margins for total CSI Compressco by 600 bps by 2020 Equipment Sales and Aftermarket Services do not require significant capital to grow GasJack fleet being repurposed to address enhanced liquid production Strong growing demand for centralized gas lift and gas reinjection
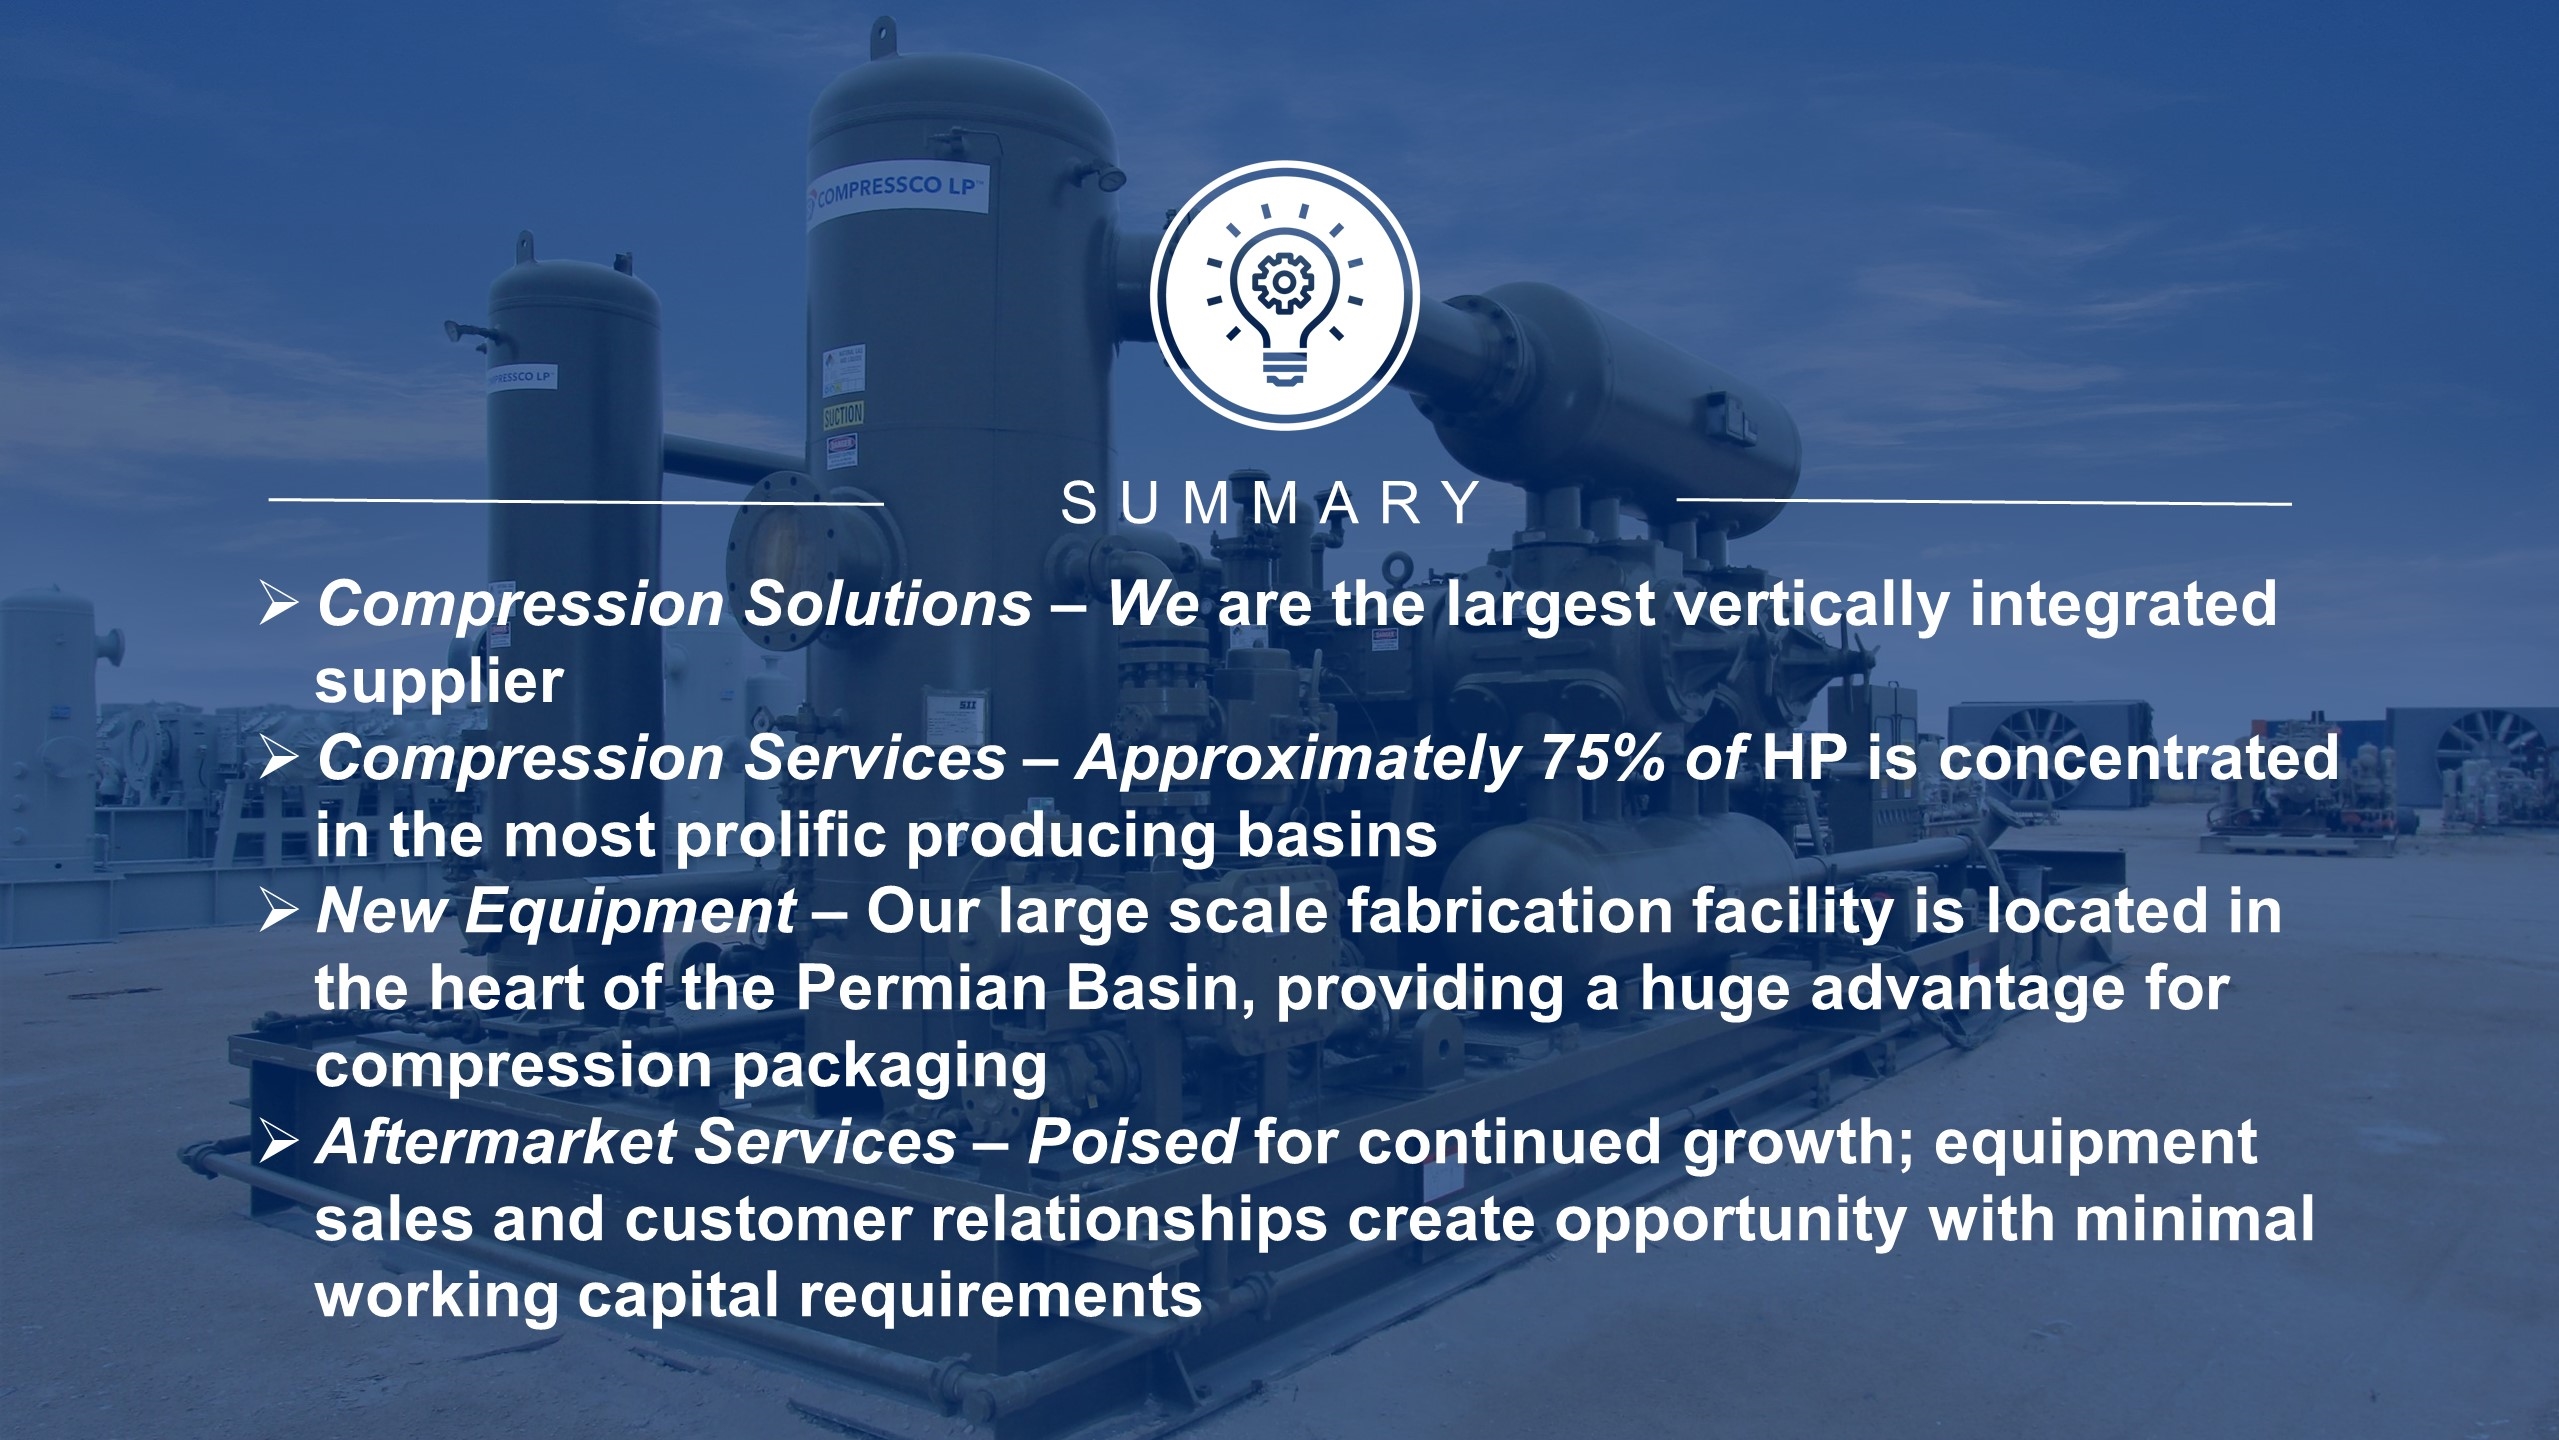
SUMMARY Compression Solutions – We are the largest vertically integrated supplier Compression Services – Approximately 75% of HP is concentrated in the most prolific producing basins New Equipment – Our large scale fabrication facility is located in the heart of the Permian Basin, providing a huge advantage for compression packaging Aftermarket Services – Poised for continued growth; equipment sales and customer relationships create opportunity with minimal working capital requirements
Q&A
Financial Position and Direction Elijio Serrano, Chief Financial Officer
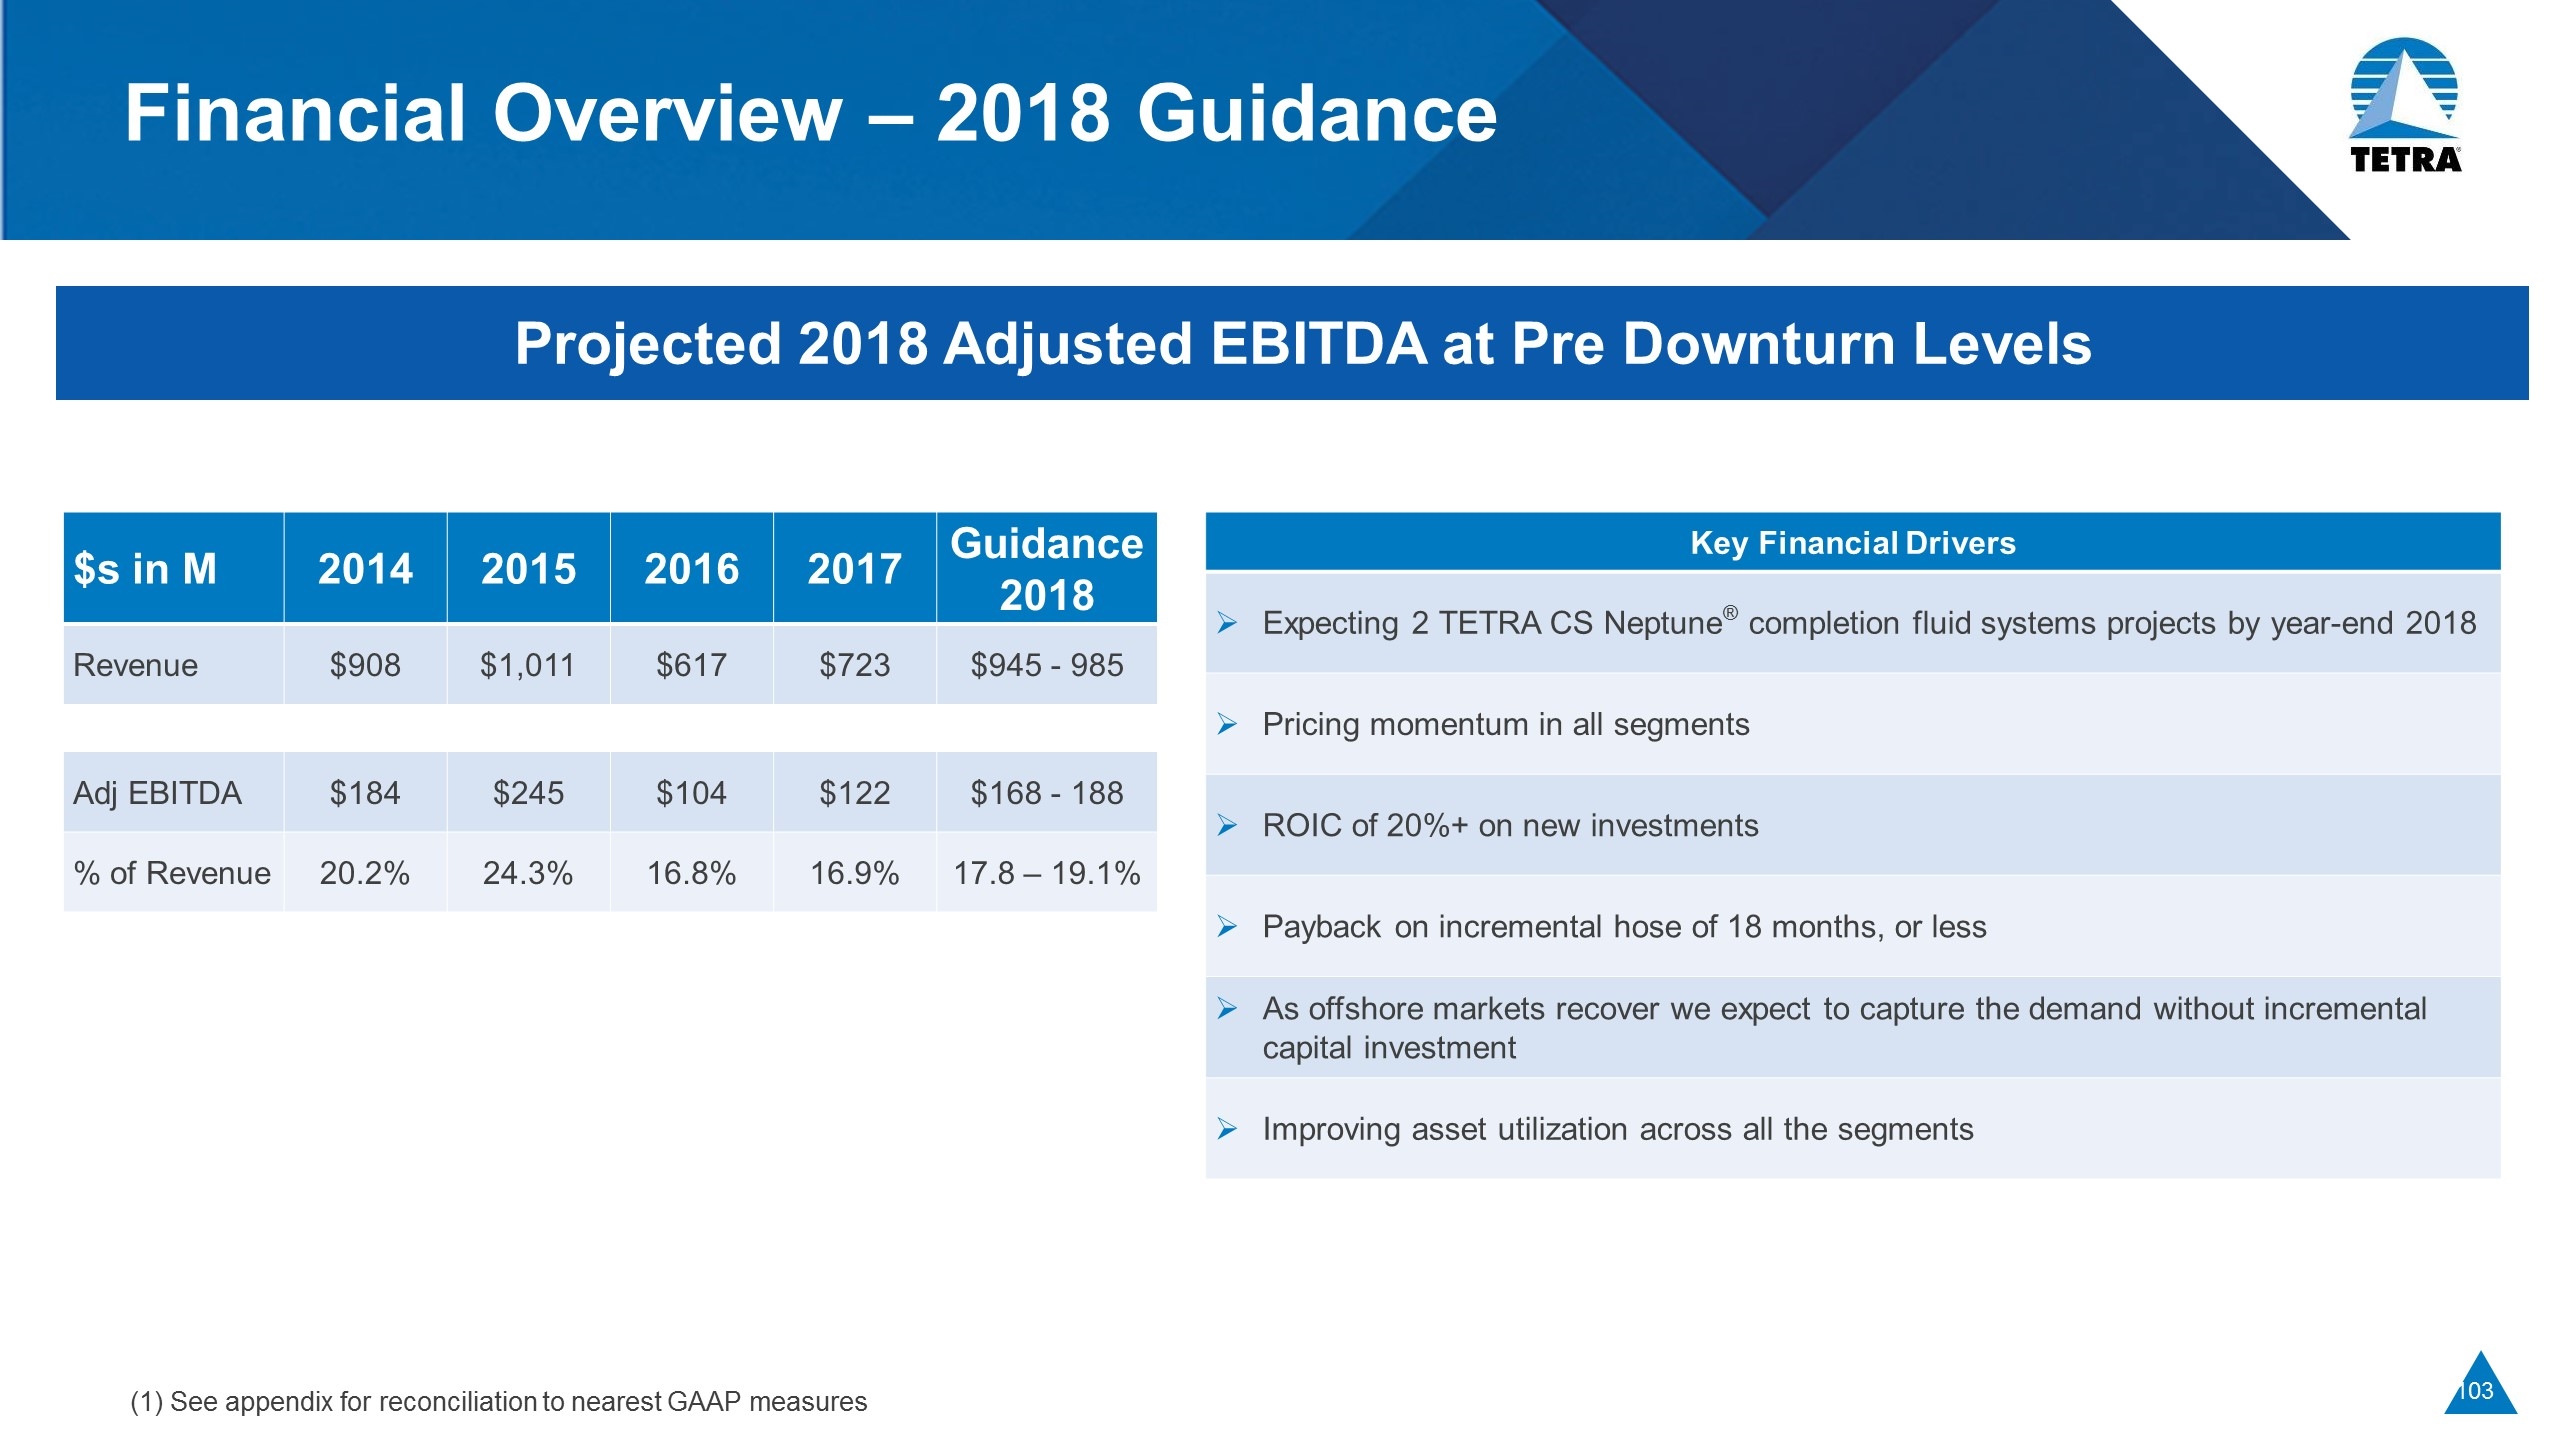
Financial Overview – 2018 Guidance Projected 2018 Adjusted EBITDA at Pre Downturn Levels Key Financial Drivers Expecting 2 TETRA CS Neptune® completion fluid systems projects by year-end 2018 Pricing momentum in all segments ROIC of 20%+ on new investments Payback on incremental hose of 18 months, or less As offshore markets recover we expect to capture the demand without incremental capital investment Improving asset utilization across all the segments $s in M 2014 2015 2016 2017 Guidance 2018 Revenue $908 $1,011 $617 $723 $945 - 985 Adj EBITDA $184 $245 $104 $122 $168 - 188 % of Revenue 20.2% 24.3% 16.8% 16.9% 17.8 – 19.1% (1) See appendix for reconciliation to nearest GAAP measures
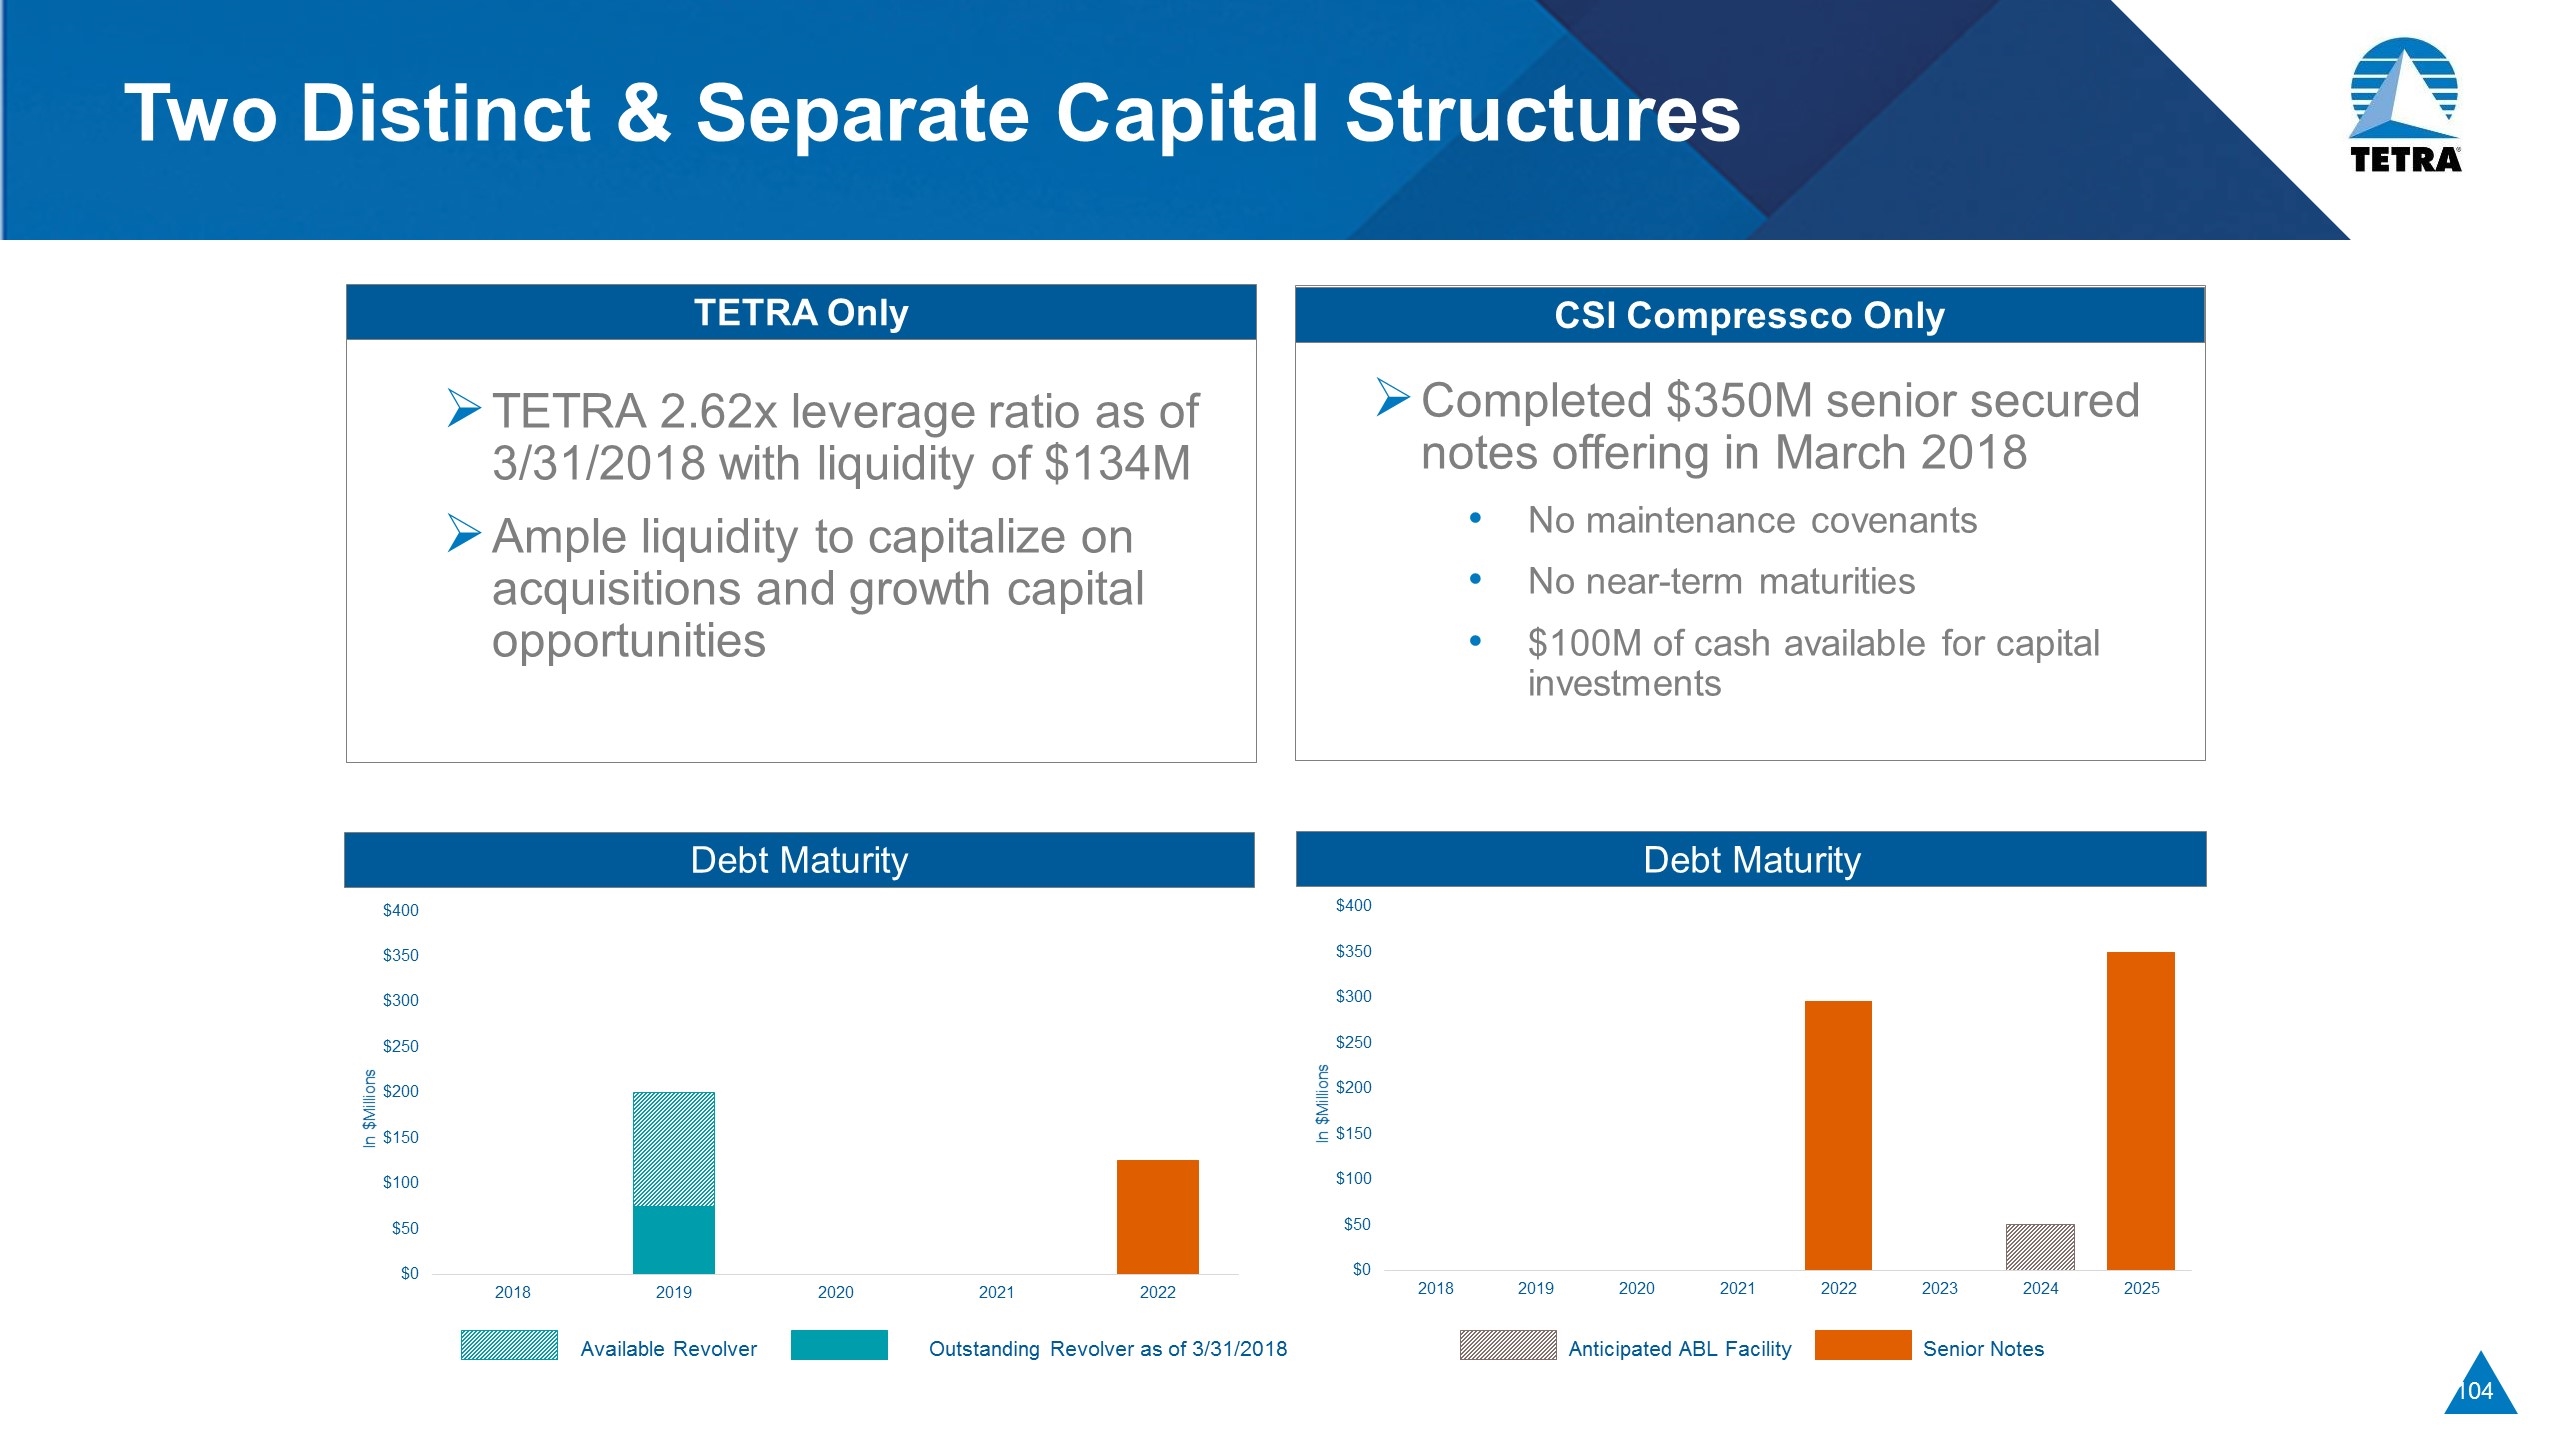
Two Distinct & Separate Capital Structures TETRA Only CSI Compressco Only Completed $350M senior secured notes offering in March 2018 No maintenance covenants No near-term maturities $100M of cash available for capital investments TETRA 2.62x leverage ratio as of 3/31/2018 with liquidity of $134M Ample liquidity to capitalize on acquisitions and growth capital opportunities Debt Maturity Debt Maturity Available Revolver Senior Notes Outstanding Revolver as of 3/31/2018 Anticipated ABL Facility

Balance Sheet Philosophy Generated positive adjusted EBITDA and FCF for all segments during the down cycle Moving TETRA and CSI Compressco towards a debt structure with no material maintenance covenants TETRA total leverage goals of 2.0x peak cycle and 3.5x at the valley CSI Compressco leverage goals of 4.5x peak cycle and 5.75x at the valley Projecting 5.2x-5.4x at year-end 2018 based on Q4 run rate adjusted EBITDA (1) Based on projected Q4-18 annualized EBITDA and anticipated debt outstanding
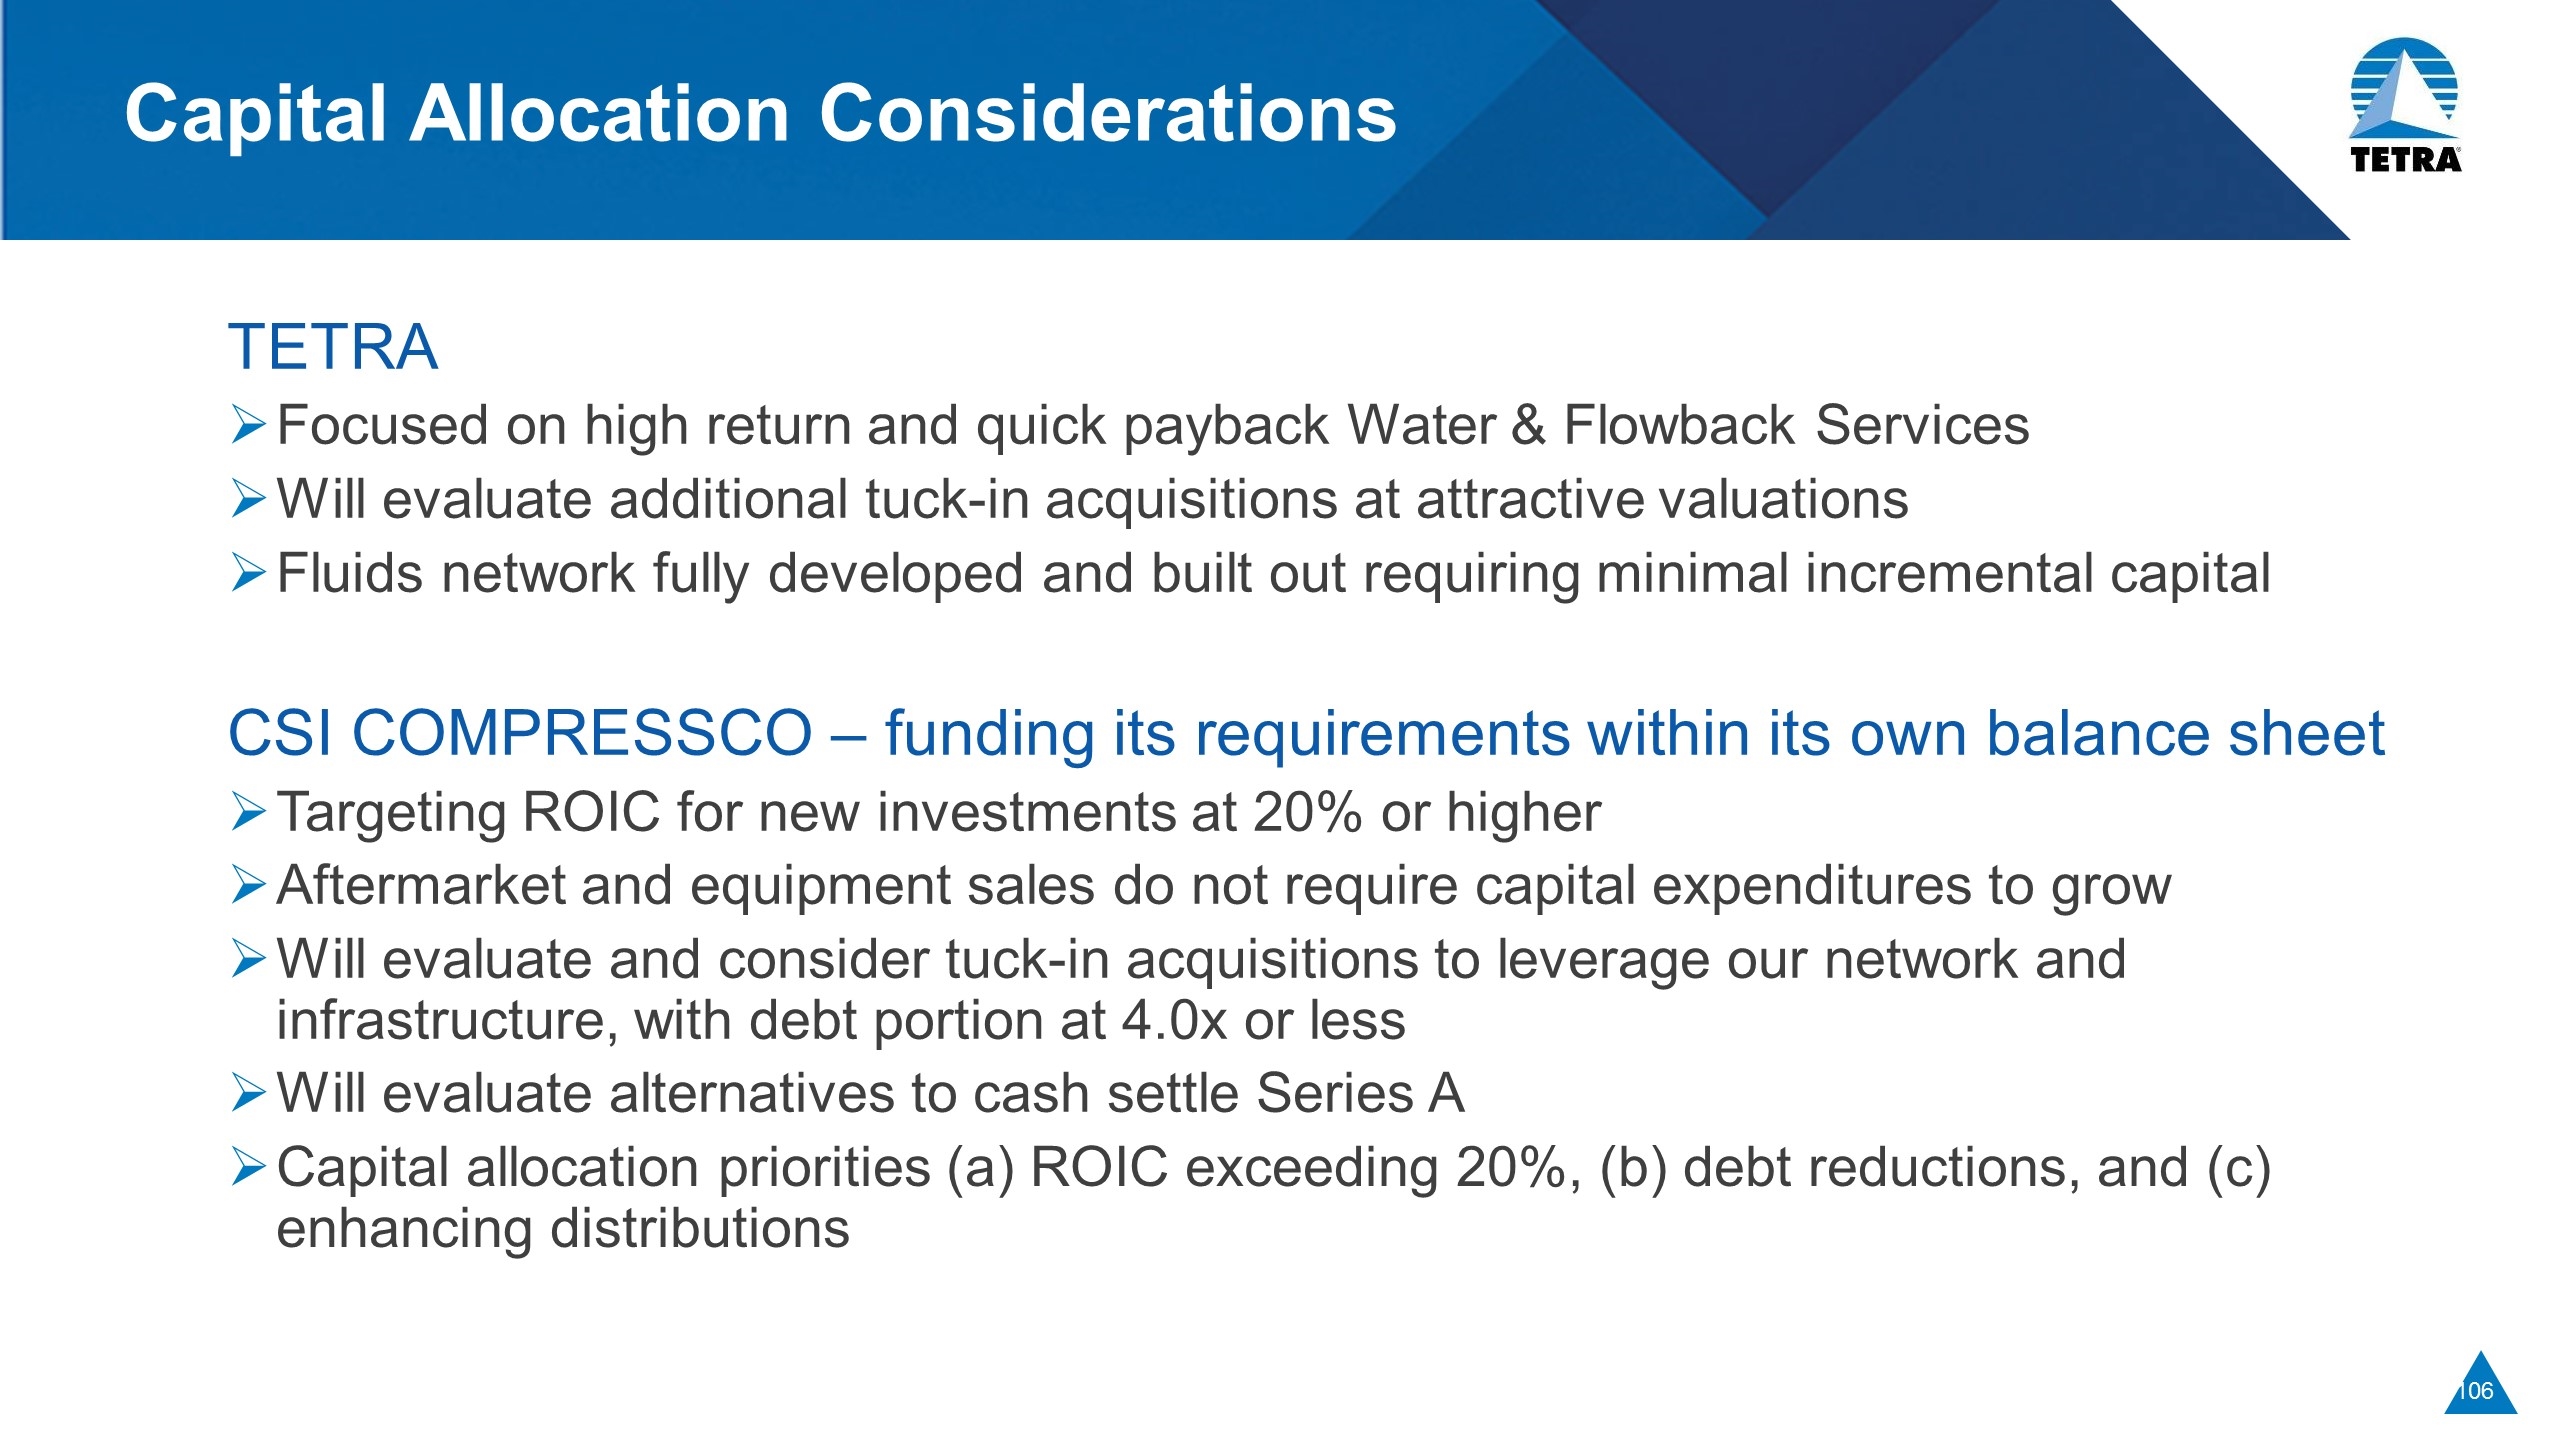
Capital Allocation Considerations TETRA Focused on high return and quick payback Water & Flowback Services Will evaluate additional tuck-in acquisitions at attractive valuations Fluids network fully developed and built out requiring minimal incremental capital CSI COMPRESSCO – funding its requirements within its own balance sheet Targeting ROIC for new investments at 20% or higher Aftermarket and equipment sales do not require capital expenditures to grow Will evaluate and consider tuck-in acquisitions to leverage our network and infrastructure, with debt portion at 4.0x or less Will evaluate alternatives to cash settle Series A Capital allocation priorities (a) ROIC exceeding 20%, (b) debt reductions, and (c) enhancing distributions
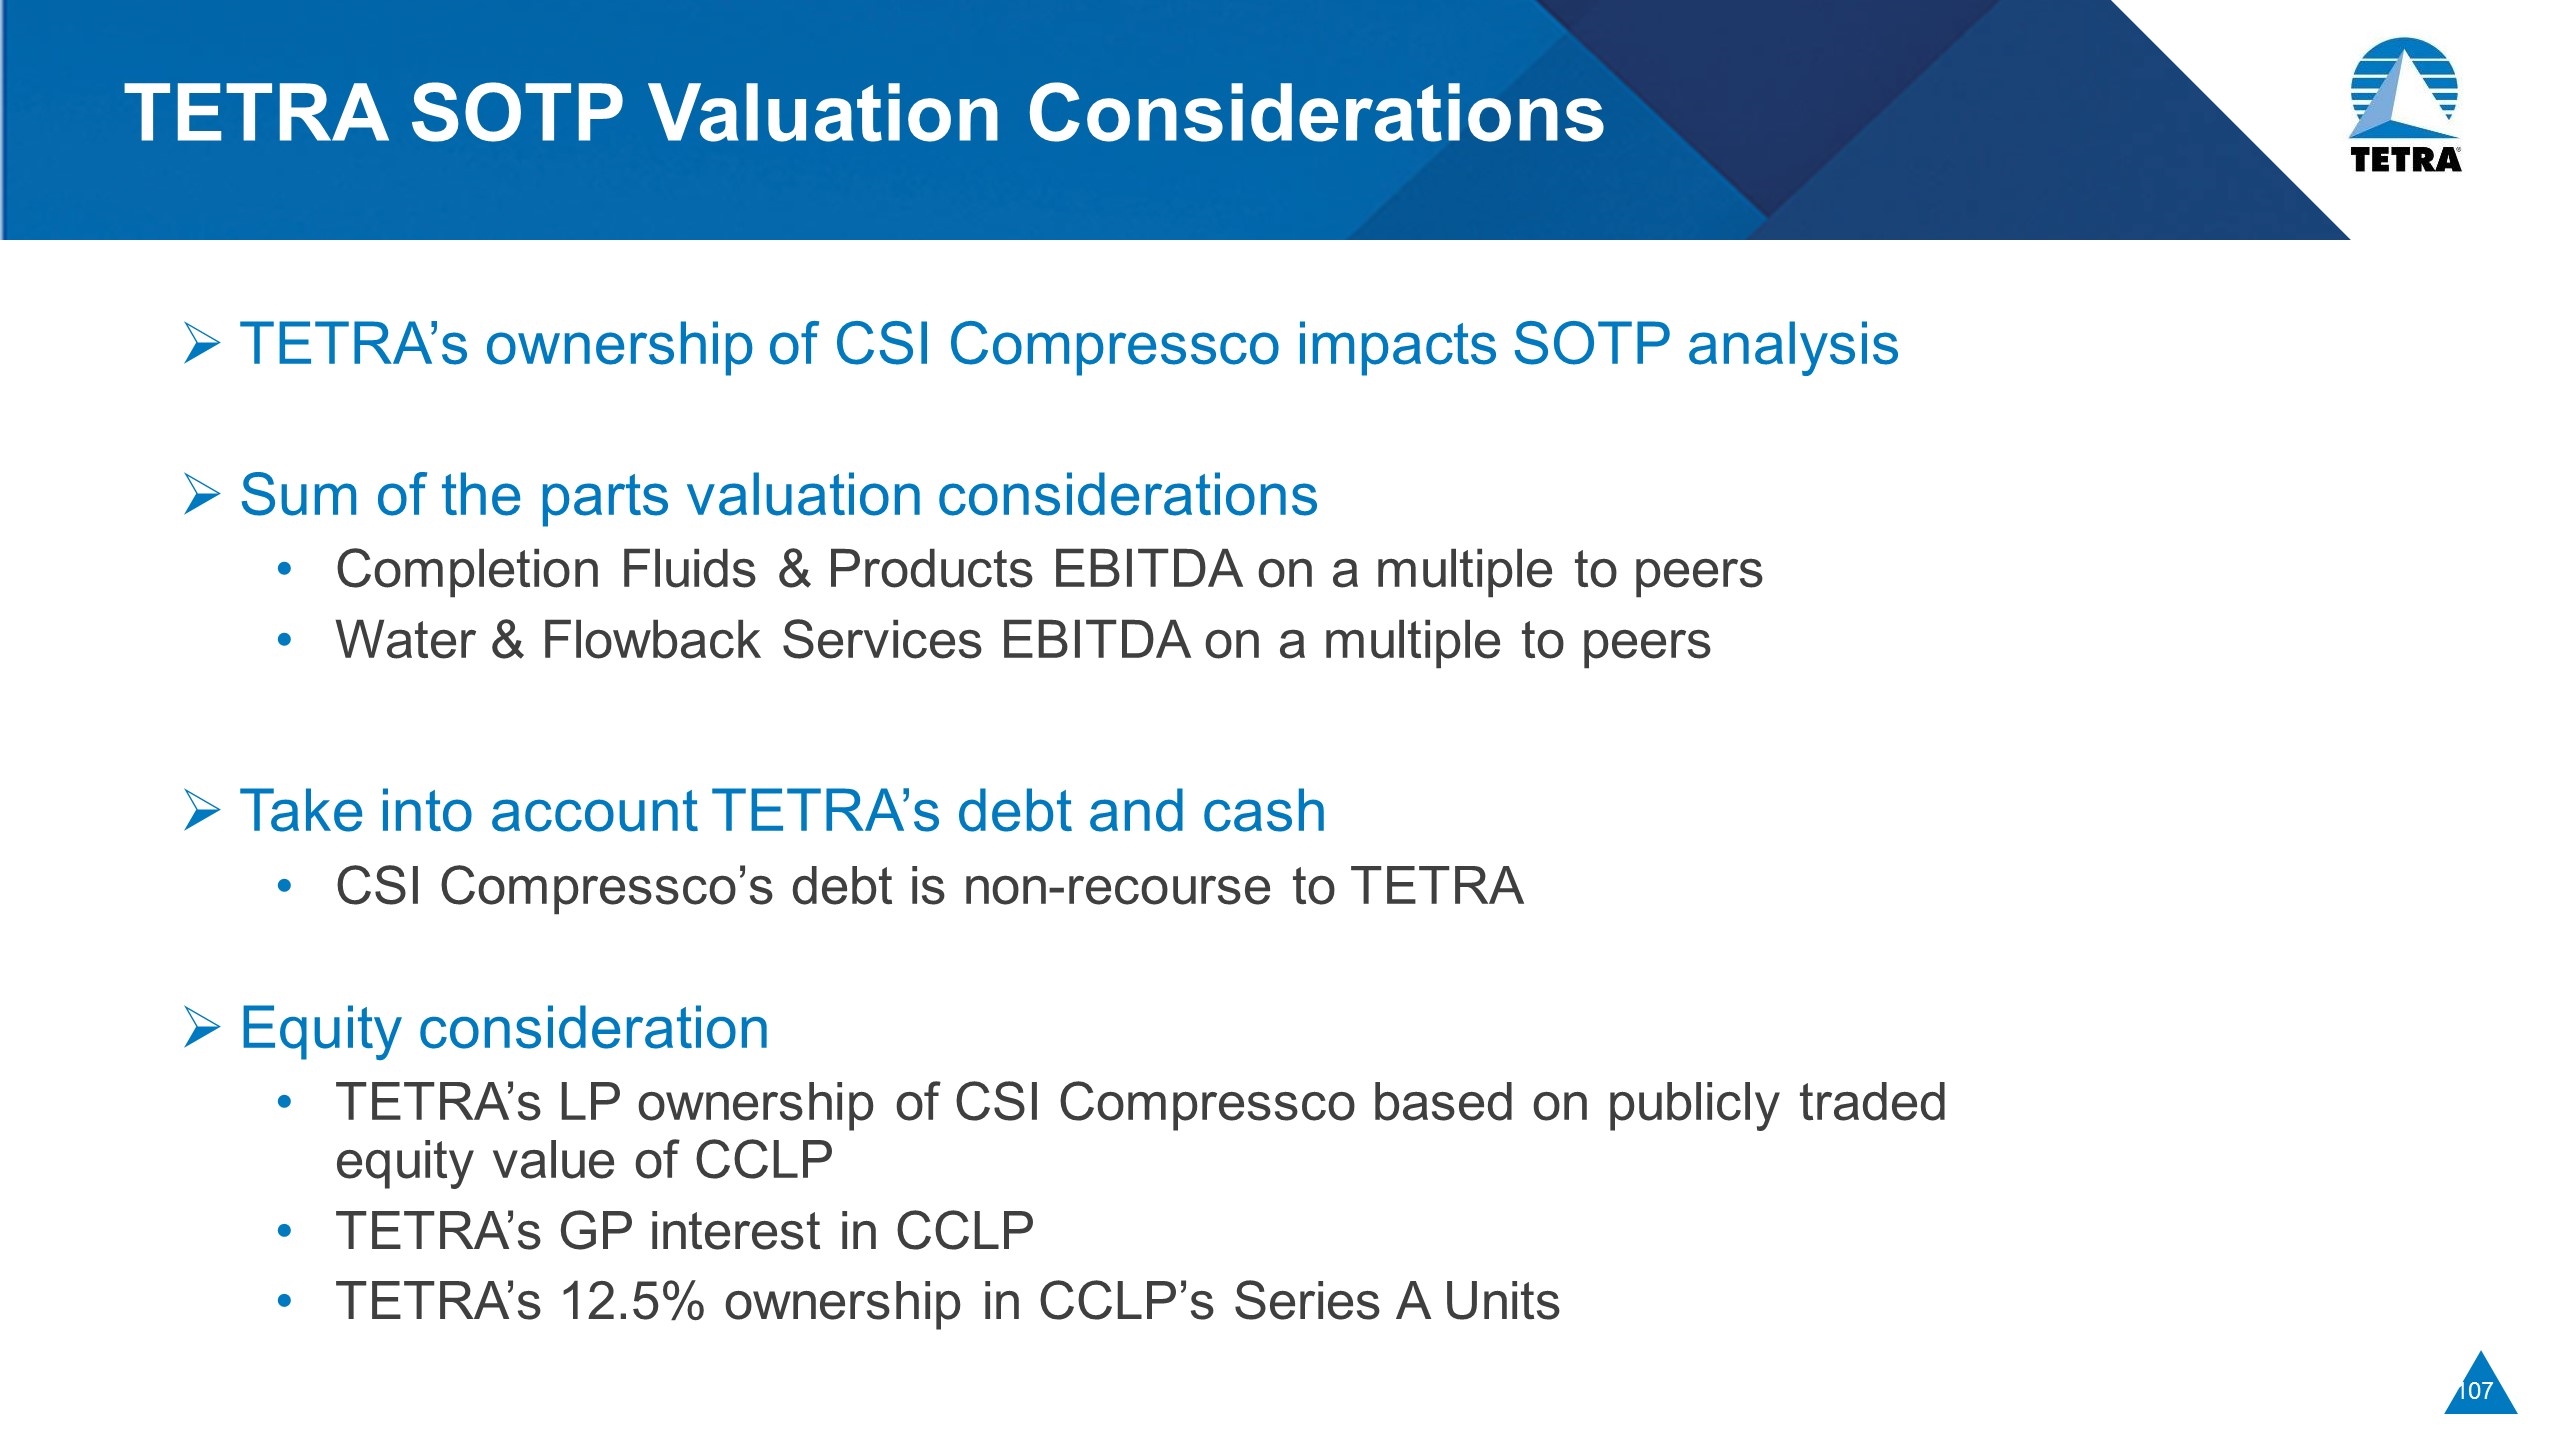
TETRA SOTP Valuation Considerations TETRA’s ownership of CSI Compressco impacts SOTP analysis Sum of the parts valuation considerations Completion Fluids & Products EBITDA on a multiple to peers Water & Flowback Services EBITDA on a multiple to peers Take into account TETRA’s debt and cash CSI Compressco’s debt is non-recourse to TETRA Equity consideration TETRA’s LP ownership of CSI Compressco based on publicly traded equity value of CCLP TETRA’s GP interest in CCLP TETRA’s 12.5% ownership in CCLP’s Series A Units
Closing Comments Stu Brightman, CEO of TETRA Technologies, Inc. and Chairman of the Board of Directors of CSI Compressco LP
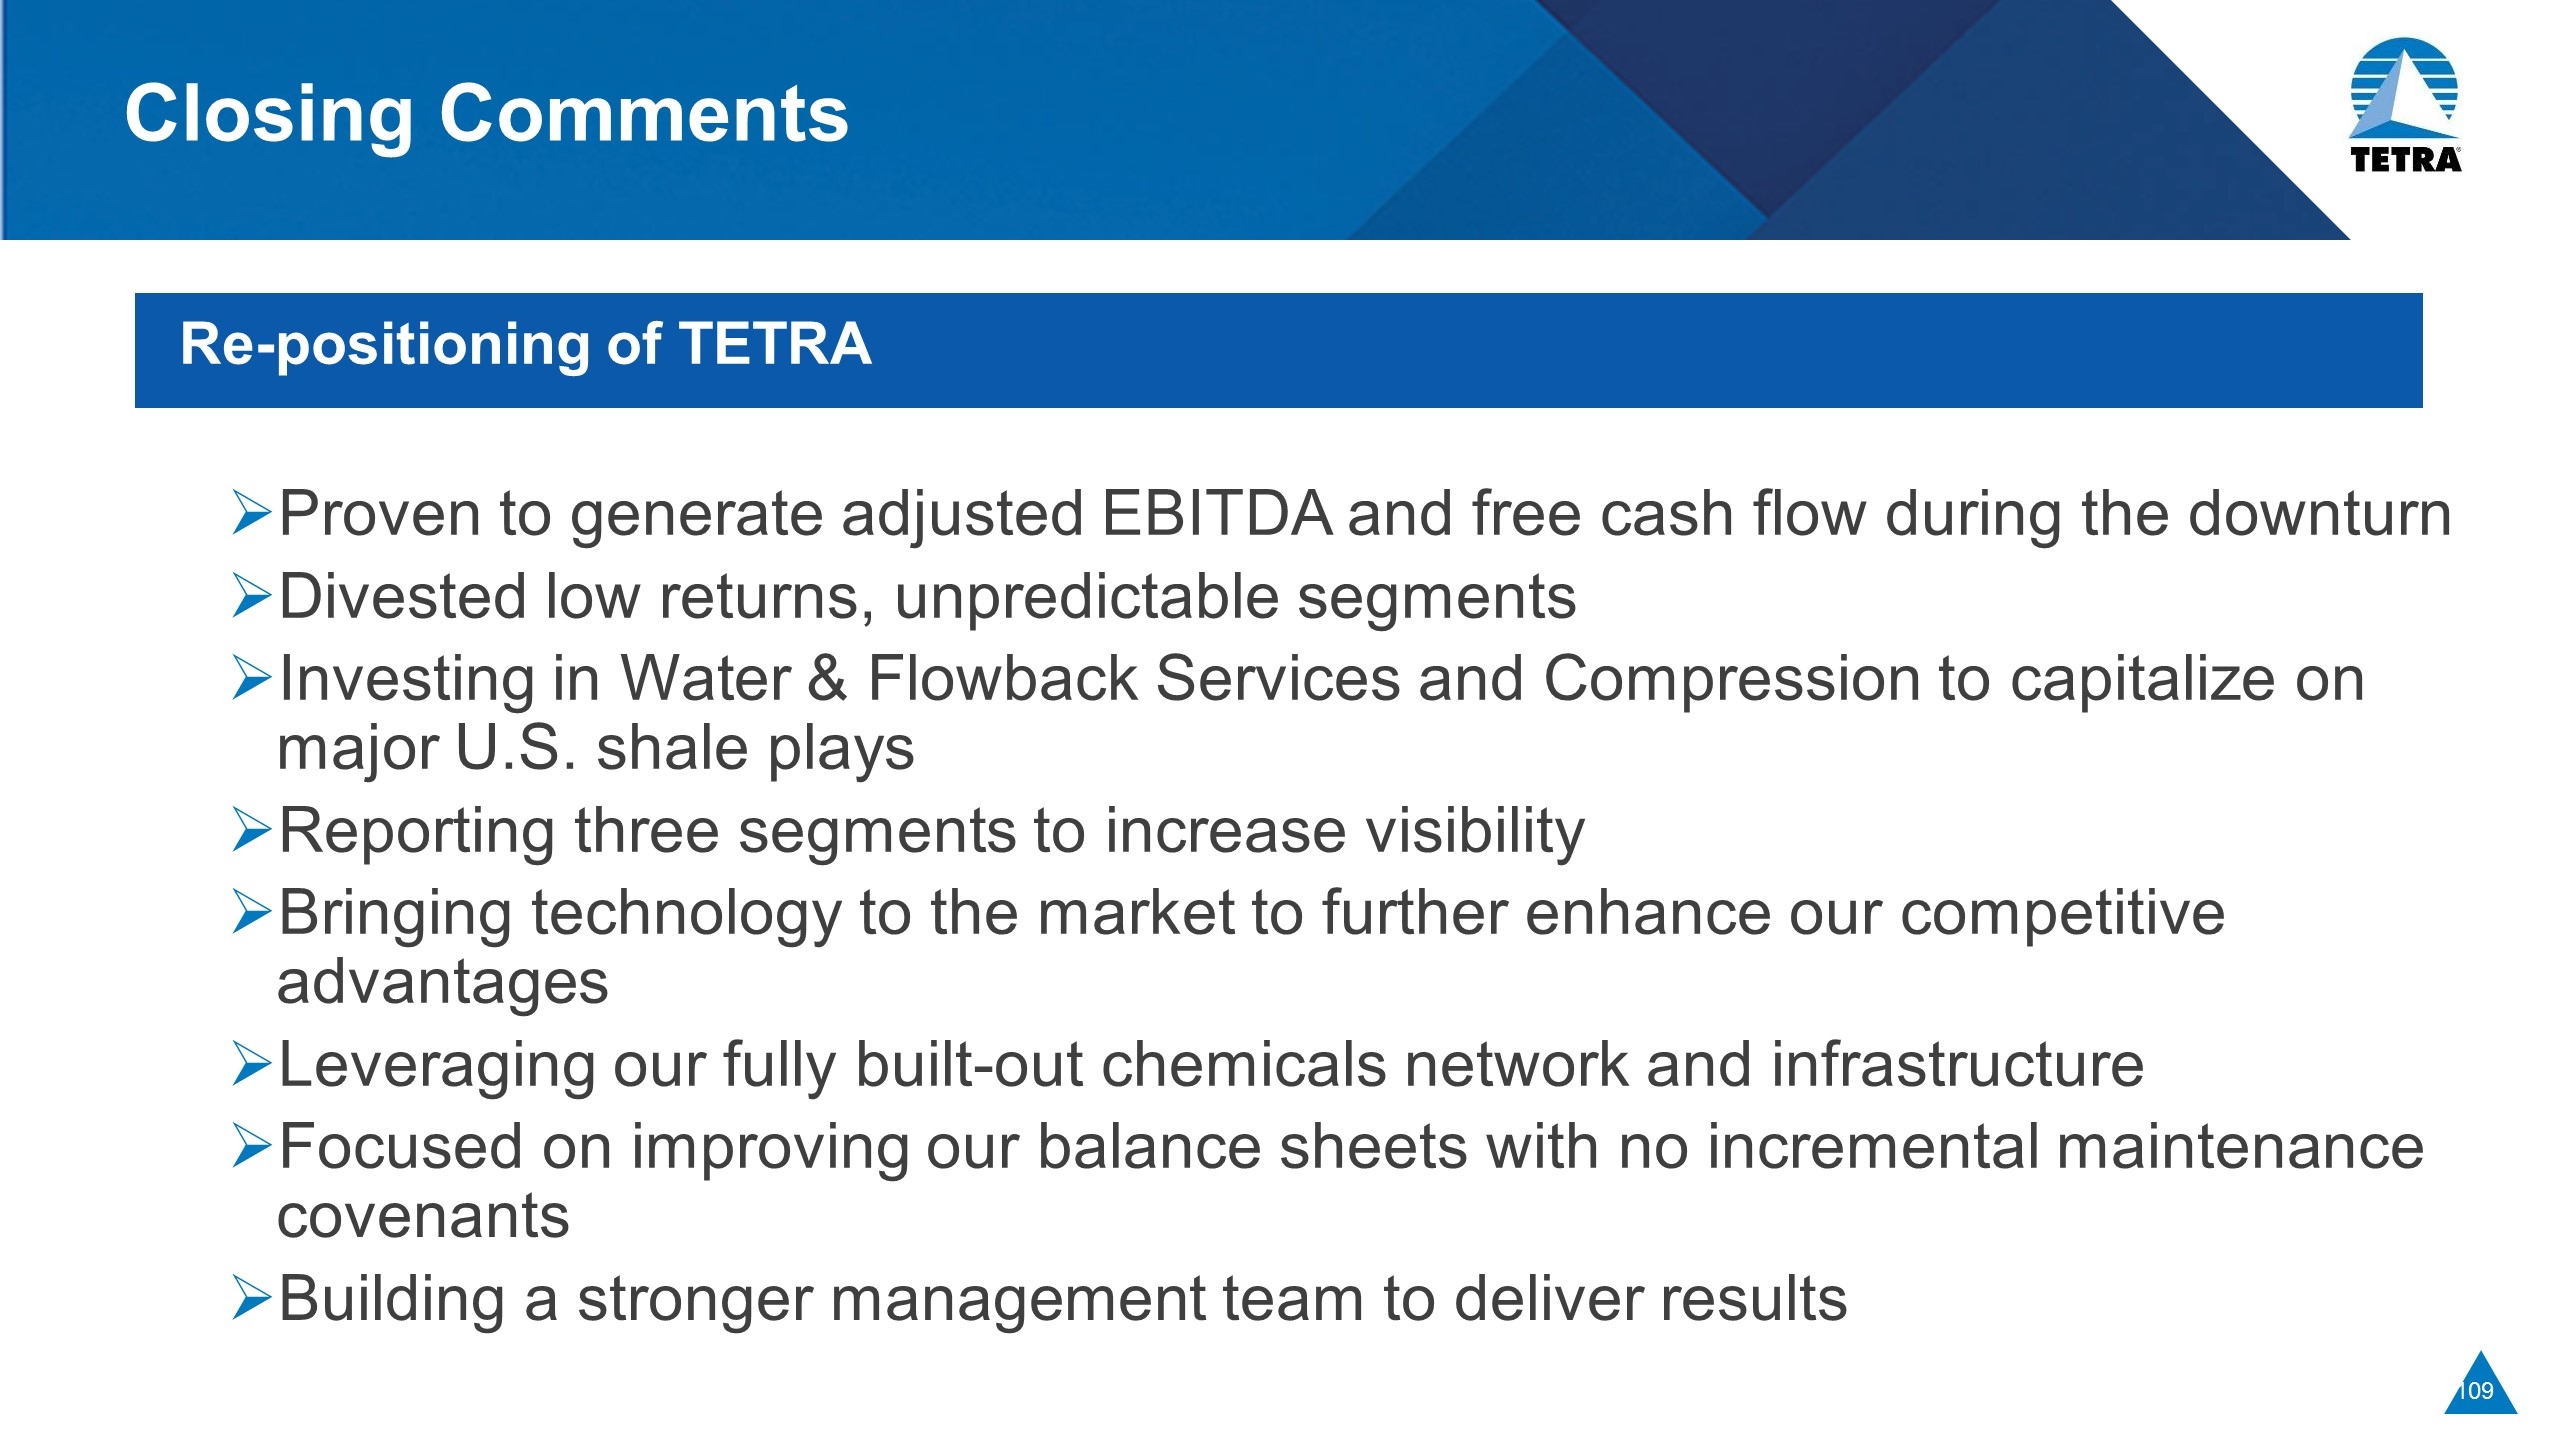
Closing Comments Re-positioning of TETRA Proven to generate adjusted EBITDA and free cash flow during the downturn Divested low returns, unpredictable segments Investing in Water & Flowback Services and Compression to capitalize on major U.S. shale plays Reporting three segments to increase visibility Bringing technology to the market to further enhance our competitive advantages Leveraging our fully built-out chemicals network and infrastructure Focused on improving our balance sheets with no incremental maintenance covenants Building a stronger management team to deliver results
Q&A Followed by reception at The Lamb Club 2nd floor, 132 W. 44th St
Appendix Reconciliation Tables
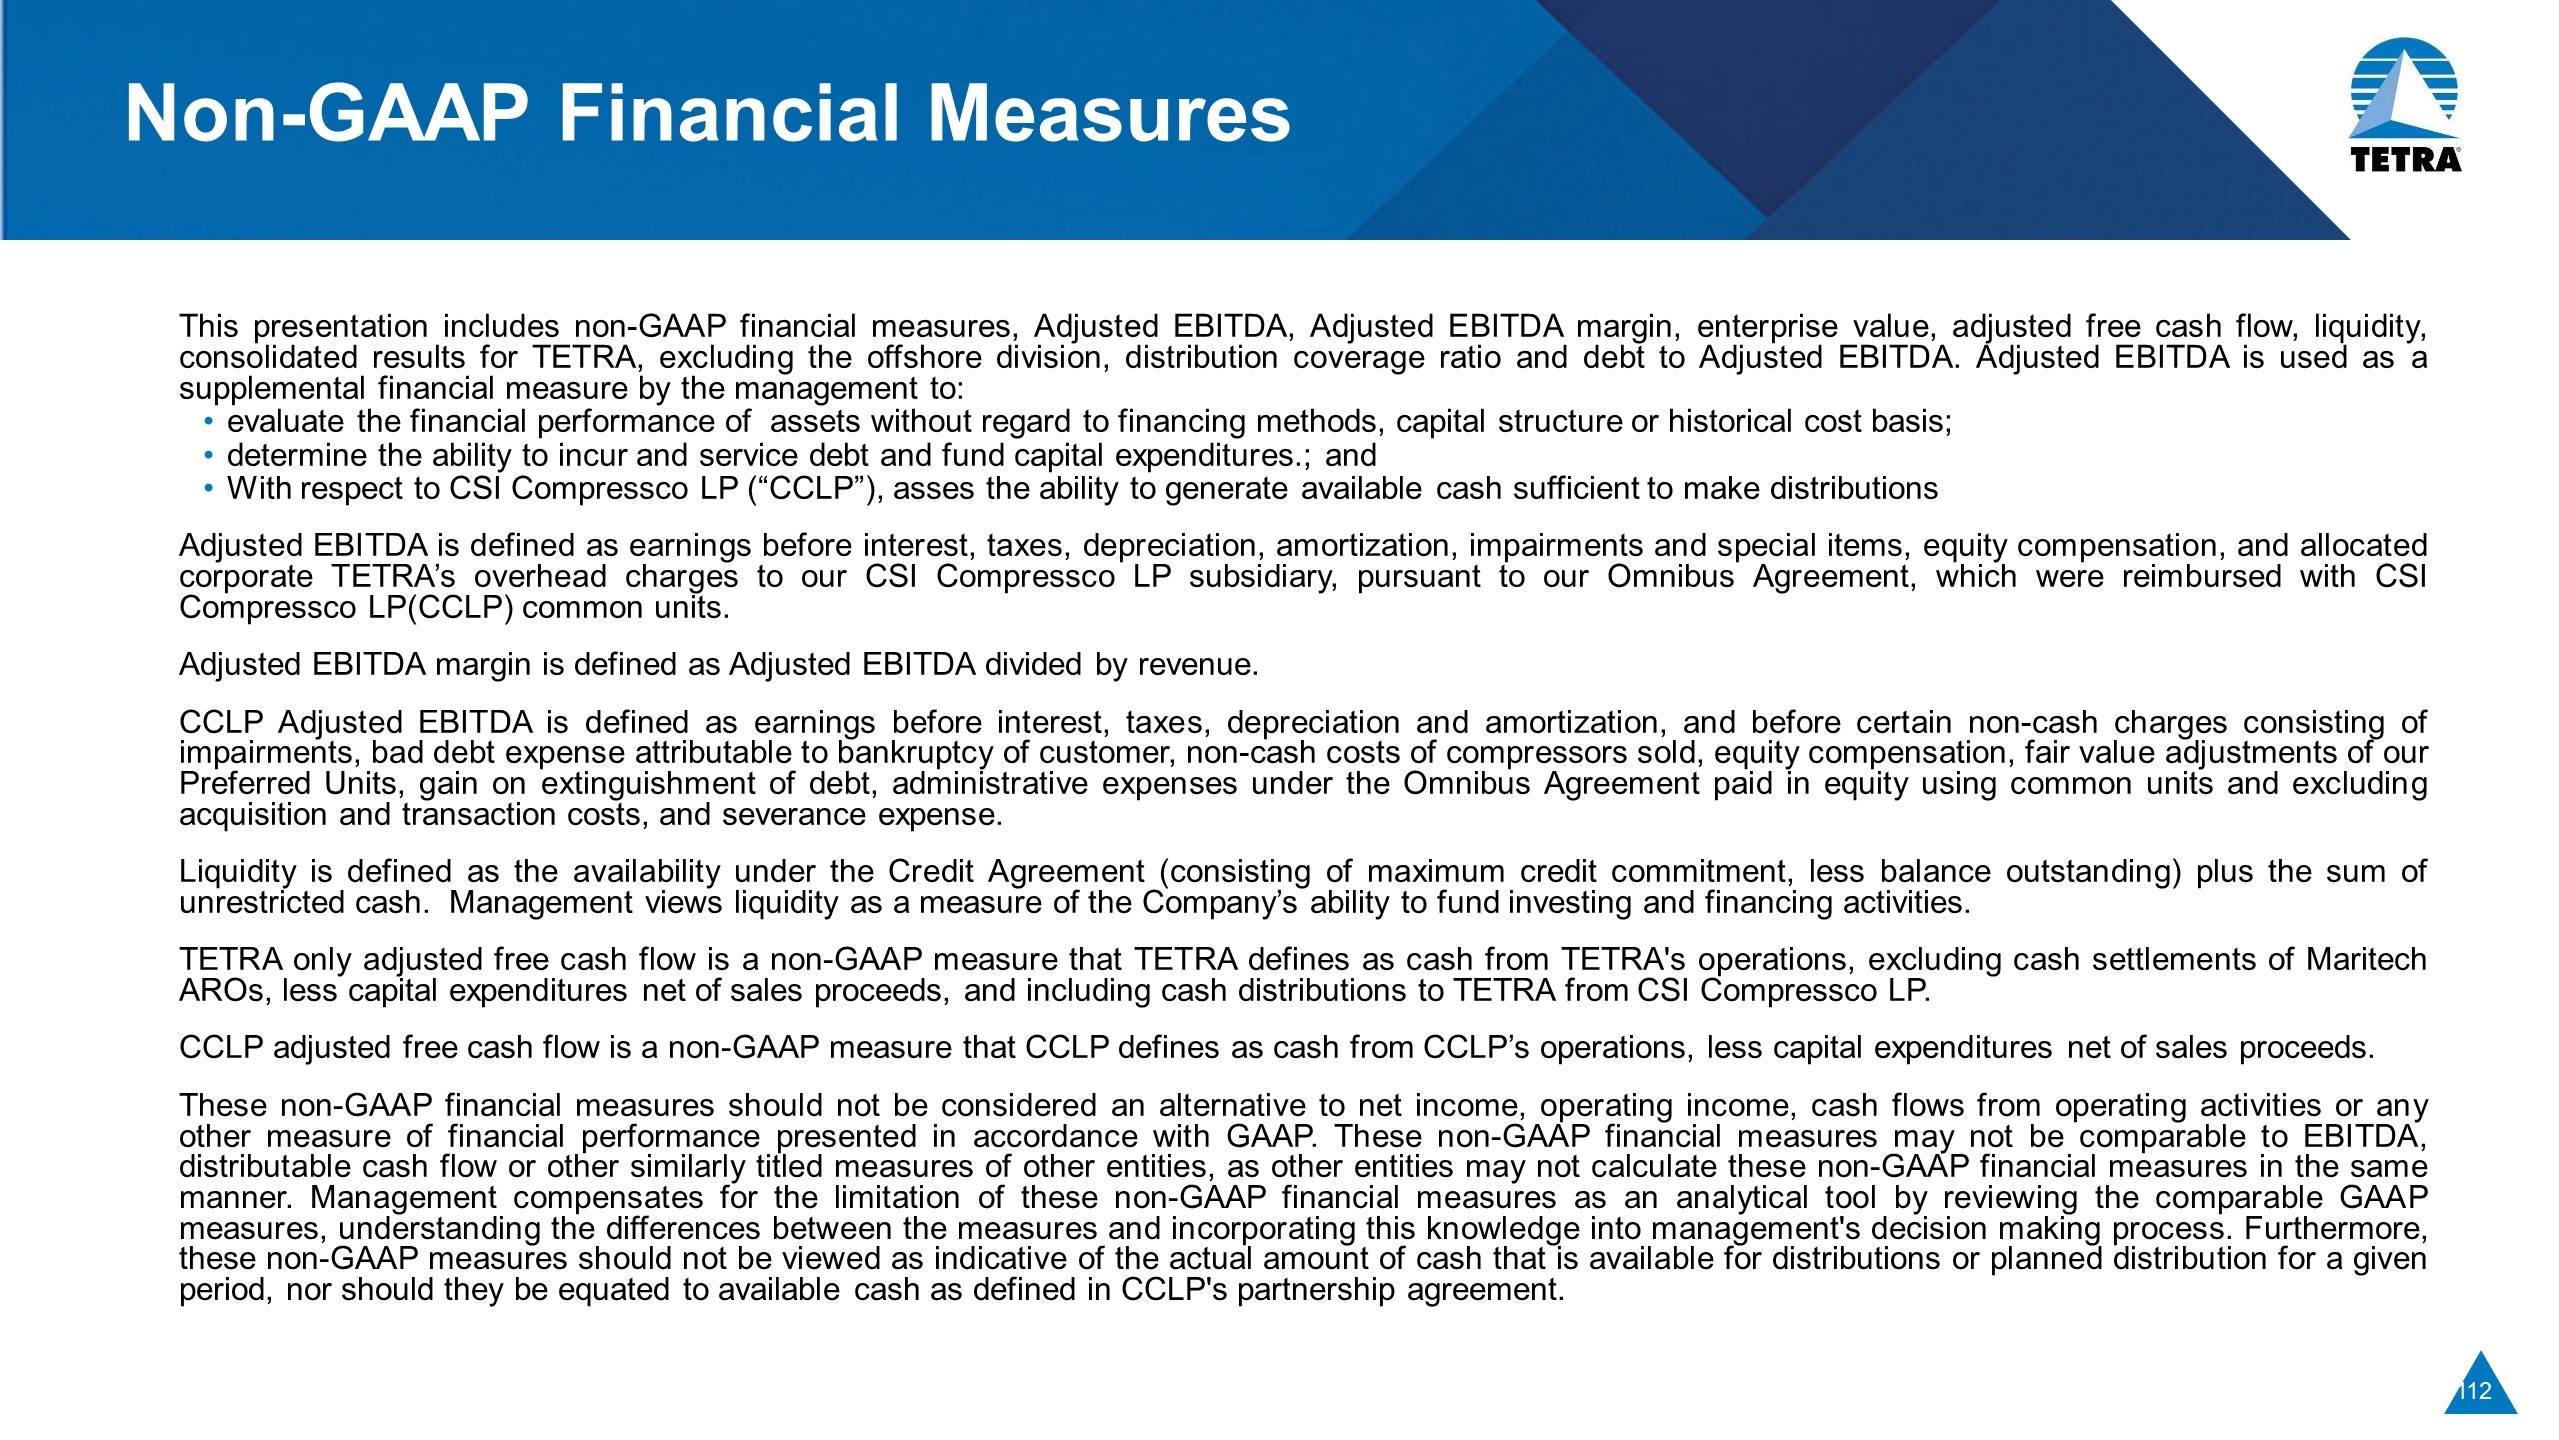
Non-GAAP Financial Measures This presentation includes non-GAAP financial measures, Adjusted EBITDA, Adjusted EBITDA margin, enterprise value, adjusted free cash flow, liquidity, consolidated results for TETRA, excluding the offshore division, distribution coverage ratio and debt to Adjusted EBITDA. Adjusted EBITDA is used as a supplemental financial measure by the management to: evaluate the financial performance of assets without regard to financing methods, capital structure or historical cost basis; determine the ability to incur and service debt and fund capital expenditures.; and With respect to CSI Compressco LP (“CCLP”), asses the ability to generate available cash sufficient to make distributions Adjusted EBITDA is defined as earnings before interest, taxes, depreciation, amortization, impairments and special items, equity compensation, and allocated corporate TETRA’s overhead charges to our CSI Compressco LP subsidiary, pursuant to our Omnibus Agreement, which were reimbursed with CSI Compressco LP(CCLP) common units. Adjusted EBITDA margin is defined as Adjusted EBITDA divided by revenue. CCLP Adjusted EBITDA is defined as earnings before interest, taxes, depreciation and amortization, and before certain non-cash charges consisting of impairments, bad debt expense attributable to bankruptcy of customer, non-cash costs of compressors sold, equity compensation, fair value adjustments of our Preferred Units, gain on extinguishment of debt, administrative expenses under the Omnibus Agreement paid in equity using common units and excluding acquisition and transaction costs, and severance expense. Liquidity is defined as the availability under the Credit Agreement (consisting of maximum credit commitment, less balance outstanding) plus the sum of unrestricted cash. Management views liquidity as a measure of the Company’s ability to fund investing and financing activities. TETRA only adjusted free cash flow is a non-GAAP measure that TETRA defines as cash from TETRA's operations, excluding cash settlements of Maritech AROs, less capital expenditures net of sales proceeds, and including cash distributions to TETRA from CSI Compressco LP. CCLP adjusted free cash flow is a non-GAAP measure that CCLP defines as cash from CCLP’s operations, less capital expenditures net of sales proceeds. These non-GAAP financial measures should not be considered an alternative to net income, operating income, cash flows from operating activities or any other measure of financial performance presented in accordance with GAAP. These non-GAAP financial measures may not be comparable to EBITDA, distributable cash flow or other similarly titled measures of other entities, as other entities may not calculate these non-GAAP financial measures in the same manner. Management compensates for the limitation of these non-GAAP financial measures as an analytical tool by reviewing the comparable GAAP measures, understanding the differences between the measures and incorporating this knowledge into management's decision making process. Furthermore, these non-GAAP measures should not be viewed as indicative of the actual amount of cash that is available for distributions or planned distribution for a given period, nor should they be equated to available cash as defined in CCLP's partnership agreement.
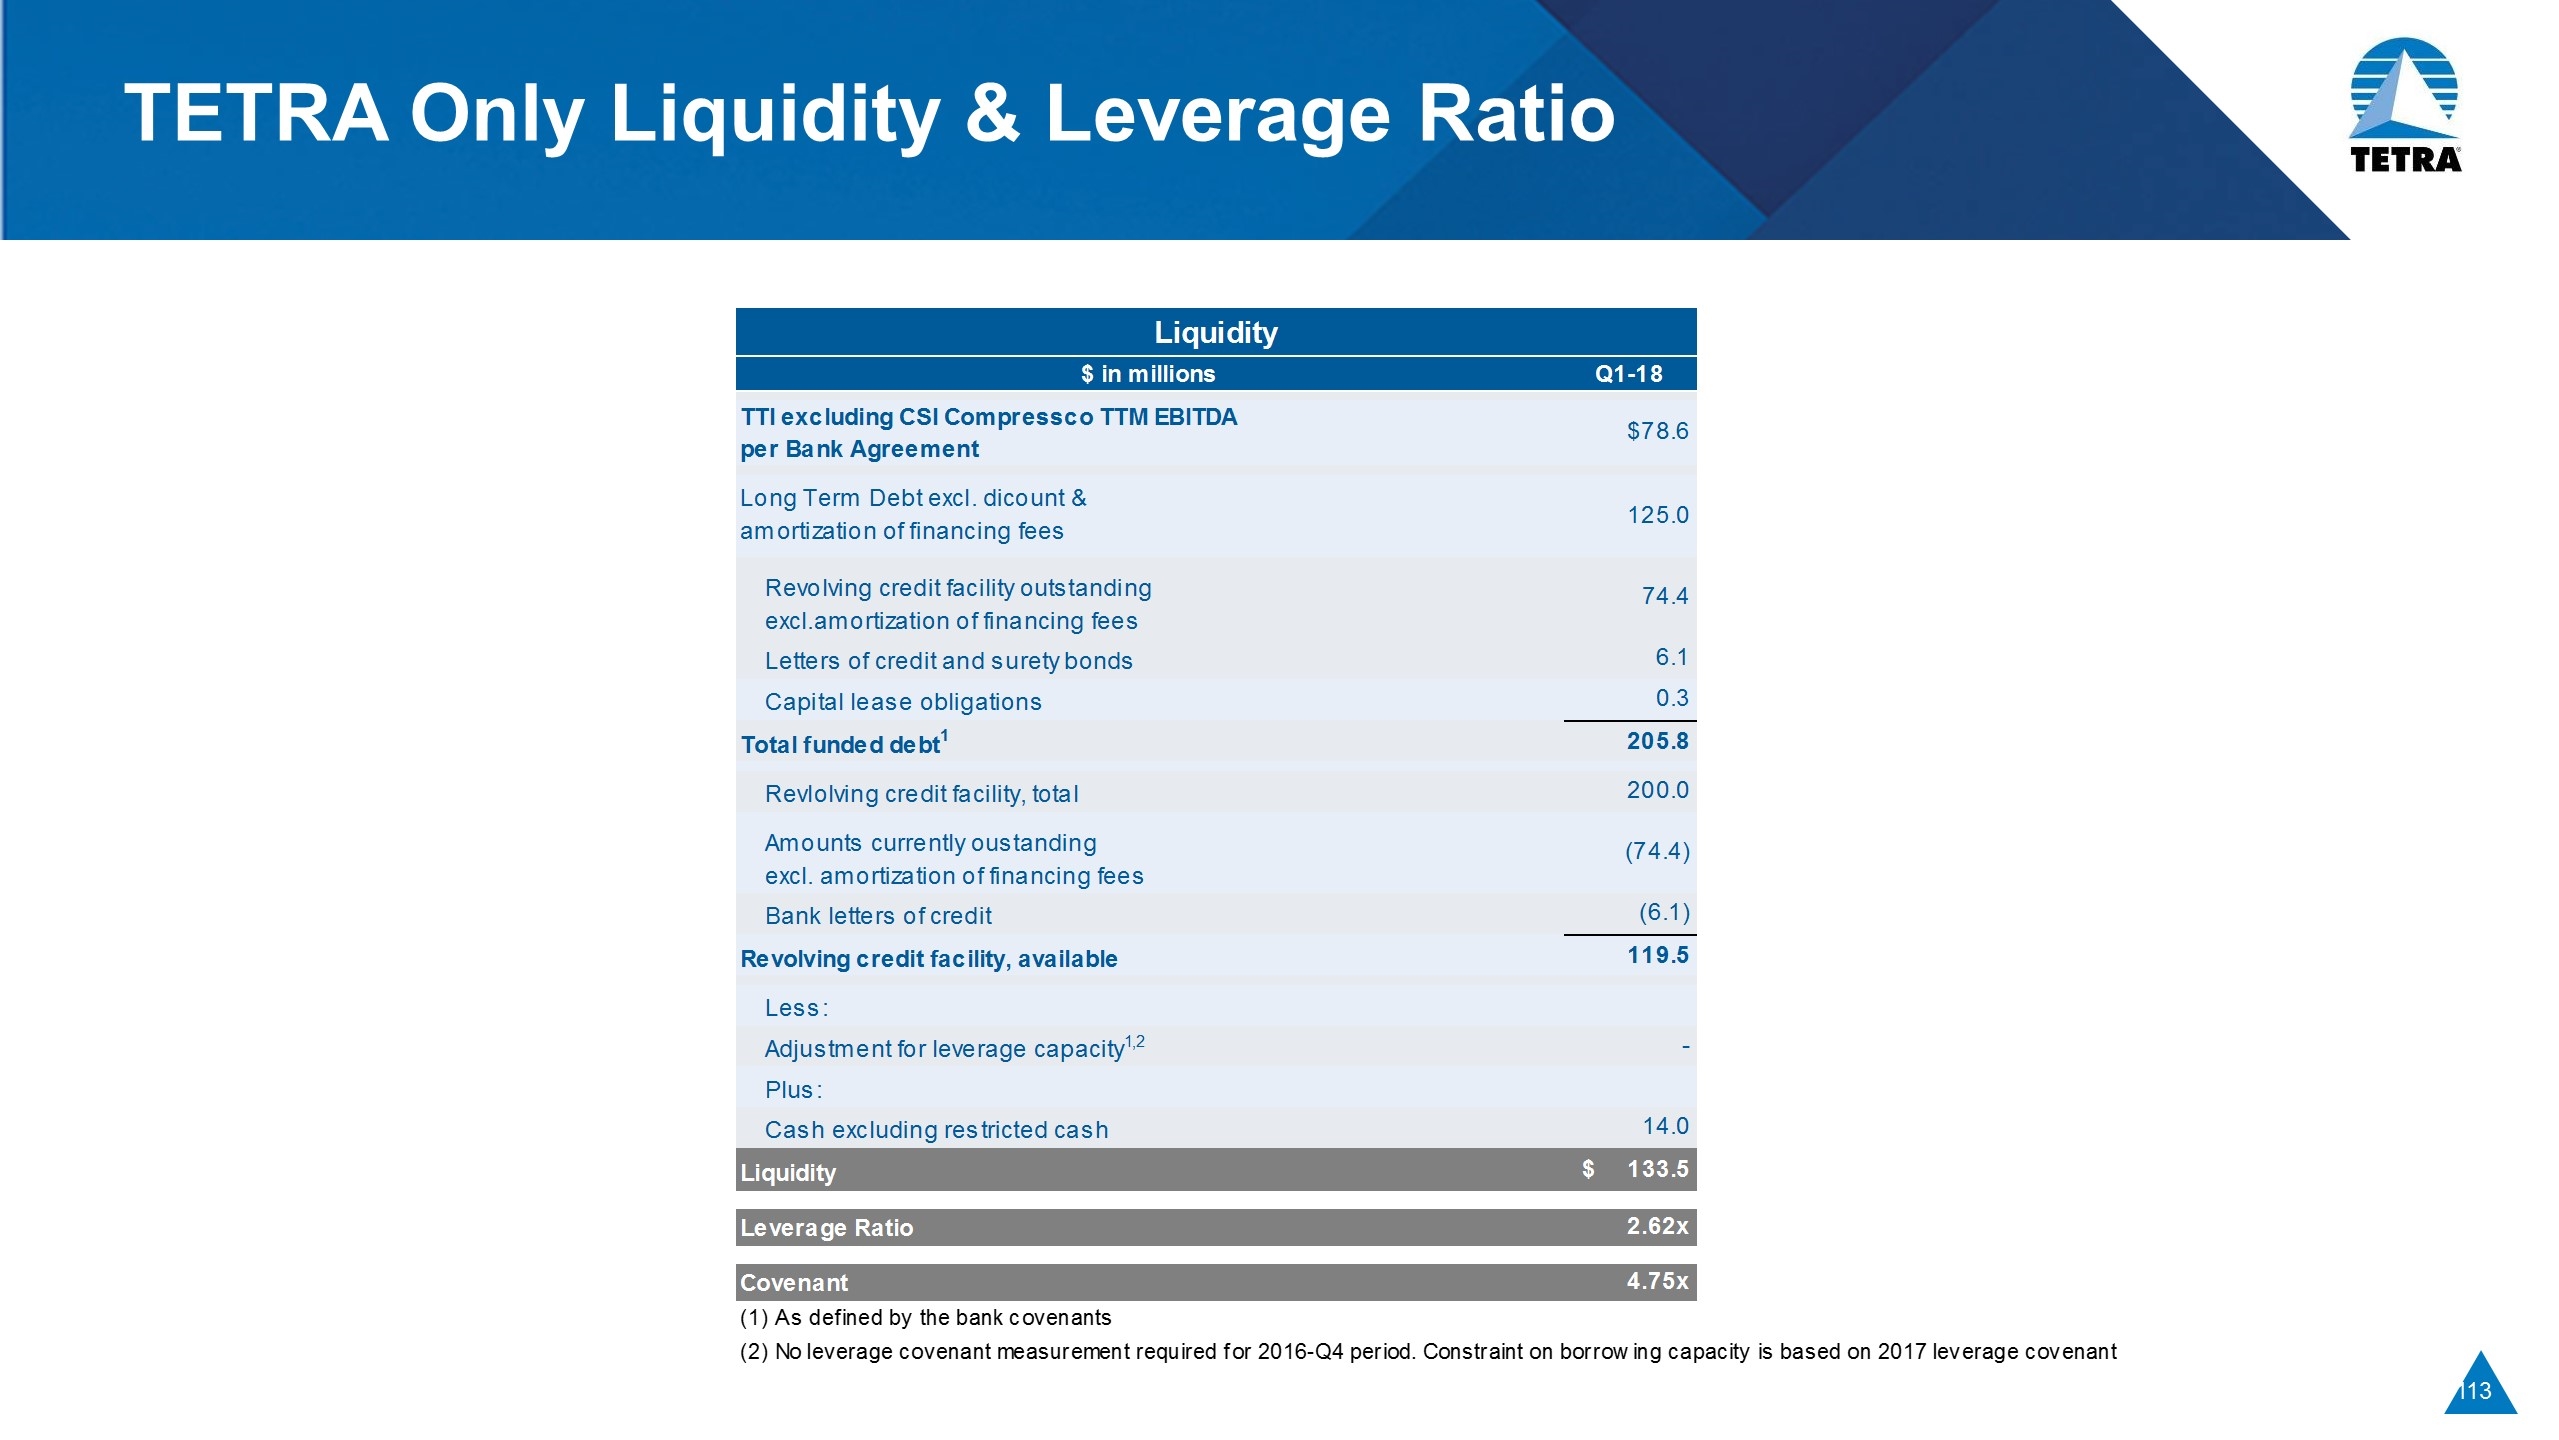
TETRA Only Liquidity & Leverage Ratio
Non-GAAP Reconciliation
Non-GAAP Reconciliation
Non-GAAP Reconciliation LE – Low End HE – High End MP – Mid-Point
Non-GAAP Reconciliation LE – Low End HE – High End MP – Mid-Point


