FORM 6-K
SECURITIES AND EXCHANGE COMMISSION
Washington, D.C. 20549
Report to Foreign Issuer
Pursuant to Rule 13a-16 or 15d-16 of
the Securities Exchange Act of 1934
For the month of August, 2003
Commission File Number:
Origin Energy Limited
(Translation of registrant’s name into English)
Level 39
AMP Centre
50 Bridge Street
SYDNEY NSW 2000
(Address of principal executive offices)
Indicate by check mark whether the registrant files or will file annual reports under cover Form 20-F or Form 40-F.
Form 20-F x Form 40-F ¨
Indicate by check mark if the registrant is submitting the Form 6-K in paper as permitted by Regulation S-T Rule 101(b)(1):
Note: Regulation S-T Rule 101(b)(1) only permits the submission in paper of a Form 6-K if submitted solely to provide an attached annual report to security holders.
Indicate by check mark if the registrant is submitting the Form6-K in paper as permitted by Regulation S-T Rule 101(b)(1)(7):
Note: Regulation S-T Rule 101(b)(1)(7) only permits the submission in paper of a Form 6-K if submitted to furnish a report or other document that the registrant foreign private issuer must furnish and make public under the laws of the jurisdiction in which the registrant is incorporated, domiciled or legally organized (the registrant’s “home country”), or under the rules of the home country exchange on which the registrant’s securities are traded, as long as the report or other document is not a press release, is not required to be and has not been distributed to the registrant’s security holders, and, if discussing a material event, has already been the subject of a Form 6-K submission or other Commission filing on EDGAR.
Indicate by check mark whether the registrant by furnishing the information contained in this Form is also thereby furnishing the information to the Commission pursuant to Rule 12g3-2(b) under the Securities Exchange Act of 1934. Yes ¨ No x
If “Yes” is marked, indicate below the file number assigned to the registrant in connection with Rule 12g3-2(b): 82-
INDEX TO EXHIBITS
Item | ||
1. | ASX announcement “Results for Year ended June 30, 2003” dated August 20, 2003 | |
2. | Media Release “Strong contributions by existing businesses and recent acquisitions drive 26% increase in net profit” dated August 20, 2003 | |
3. | Directors’ Report of Results for the year ended June 30, 2003 dated August 20, 2003 | |
4. | ASX Appendix Form 4E Final Report dated August 20, 2003 | |
5. | ASX announcement “Results Announcement year ended June 30, 2003 – Presentation” dated August 20, 2003 | |
6. | Final Results Announcement full year ended June 30, 2003 presentation dated August 20, 2003 | |
7. | ASX announcement “Exploration and Production Presentation” dated August 21, 2003 | |
8. | Exploration and Production Presentation dated August 21, 2003 |
The information contained in this report is incorporated by reference into the Registration Statement on Form F-3 (file no. 333-103886).

Item 1.
To | Company Announcements Office | Facsimile | 1300 300 021 | |||
Company | Australian Stock Exchange Limited | Date | 20 August 2003 | |||
From | Bill Hundy | Pages | 44 | |||
Subject | Results for Year Ended 30 June 2003 | |||||
This Transmittal is confidential. If you have received this document in error, please contact Origin Energy immediately.
We attach the following documents relating to Origin Energy’s Results for the year ended 30 June 2003:
1. Media Release
2. Directors’ Review
3. Final Report – ASX Appendix 4E
Regards

Bill Hundy
Company Secretary
02 9220 6467 – bill.hundy@originenergy.com.au
Item 2.
Media Release
20 August 2003
Strong contributions by existing businesses and recent acquisitions drive 26% increase in net profit
Origin Energy announced today a profit after tax and outside equity interests of $162 million for the year ended 30 June 2003, a 26% increase on the profit for the same period last year. Earnings per share increased by 23% to 24.8 cents.
Highlights
| • | Revenue up 38% to $3,352 million. |
| • | EBITDA up 21% to $491.3 million. |
| • | Net profit after tax up 26% to $162 million. |
| • | Free cash flow up 37% to $350 million. |
| • | Earnings per share increased 23% to 24.8 cents per share. |
| • | Capital expenditure up 30% to $523 million. |
| • | Strong balance sheet with net debt to capitalisation of 29%. |
| • | Total dividends for the full year of 10 cents per share franked to 4 cents. |
| • | Dividend Reinvestment Plan 2.5% discount to apply. |
In announcing the final dividend the Chairman, Mr Kevin McCann said ���Based on the strength of the company’s current and expected cash flows Directors had previously advised of their intention to target dividend payments at around 40% of earnings per share.
“In line with this objective, we are pleased to announce a 5 cent final dividend franked to 2 cents will be paid on 3 October 2003 to shareholders of record on 19 September 2003 for which the dividend reinvestment plan (DRP) will apply. A 2.5% discount under the DRP will apply for this dividend.
This brings total dividends for the year to 10 cents per share (four cents franked), a doubling of the dividend paid last year.” Mr McCann said.
The increased profit for the year has been mainly driven by contributions from the retail business reflecting the acquisition of CitiPower and good returns from electricity purchase contracts. Initial contributions from oil production in the Perth Basin and the Mt Stuart Power Station also boosted results.
Commenting on the result, Managing Director Mr Grant King said “The Retail business increased contribution to EBITDA by 39% to $232 million. Our investments in the electricity retail business in particular have delivered results with energy retailing contributing close to half of our total EBITDA.”
“A particularly pleasing feature of this year’s result has been the strength of the Company’s cash flow which has largely funded capital expenditure of $523 million. Borrowings increased by only $99 million with gearing at year end a modest 29%,” he said.
Commenting on the outlook for the coming year, Mr King said: “While retail earnings will benefit from reduced costs following the integration of recently acquired businesses and the cessation of agency payments to the Victorian Government, higher electricity purchasing costs will offset these gains. A significant increase in oil production from the Hovea and Jingemia fields in the Perth Basin and a full year contribution from the Mt Stuart Power Station will add to performance.”
“Looking further ahead, the prospects for the company remain strong with development of the BassGas Project, Otway Gas Project, SEA Gas Pipeline and Coal Seam Gas on schedule and within budgeted costs. These projects will all contribute to growth in the medium term.”
“The company’s modest gearing and strong cash flow sees the company well placed to fund our major capital projects and take advantage of opportunities that continue to arise in the energy sector.”
“Taking these factors into account the outlook for the coming year is for Origin to achieve its long-term target for growth in earnings per share of 10-15% per annum.”
For further information on this media release, please contact:
Mr Grant King | Mr Angus Guthrie | |
Managing Director | Manager, Investor Relations | |
Origin Energy | Origin Energy | |
Telephone: (02) 9220 6435 | Telephone: (02) 9220 6558 |
Item 3.
20 August 2003
Directors’ Review of Results for the year ended 30 June 2003
The Directors submit their review of the results for the year ended 30 June 2003.
Financial Review
Profit and Dividend Declaration
Origin Energy reported a net profit after tax and outside equity interests of $162.0 million for the year ended 30 June 2003, a 26% increase on the profit in the prior year.
Earnings per share increased by 23% to 24.8 cents per share. A final dividend of 5 cents per share, franked to 2 cents, will be paid on 3 October 2003 to shareholders of record on 19 September 2003. Origin shares will trade ex-dividend as from 15 September 2003. This final dividend will lift the total dividend paid for the year to 10 cents per share (4 cents franked) from 5 cents per share (fully franked) in the prior year.
The Board has also determined that the Dividend Reinvestment Plan will continue to apply and that for this dividend, a discount of 2.5% will apply to the shares allotted under the Plan.
Financial Highlights
2002/03 ($m) | 2001/02 ($m) | % Change | ||||||
Revenue | 3,352 | 2,429 | 38 | |||||
Net after Tax Profit | 162.0 | 128.7 | 26 | |||||
EBITDA | 491.3 | 404.6 | 21 | |||||
Free Cash Flow | 350 | 256 | 37 | |||||
Capital Expenditure | 524 | 403 | 30 | |||||
Earnings per Share | 24.8 cents | 20.2 cents | 23 | |||||
Net Debt/Capitalisation | 29 | % | 28 | % | ||||
OCAT/Funds Employed | 15.6 | % | 13.7 | % |
The main factors contributing to the profit improvement include:
| • | Higher oil prices and oil sales from new producing fields in the Perth Basin; |
| • | Increased contribution from retailing following the acquisition of the CitiPower retail business in July 2002, reduction in electricity purchasing costs due to favourable electricity contracts and pool prices and a further reduction in retained profit payments to the Victorian Government; and |
| • | Increased contribution from power generation with the acquisition of the Mt Stuart Power Station in December 2002. |
The funding requirements for growth capital and acquisitions has seen net debt increase from $633 million at 30 June 2002 to $732 million at 30 June 2003, resulting in a final net debt to capitalisation ratio of 29%.
Subsequent to the end of the financial year Origin has made a takeover offer for the shares in Oil Company of Australia Limited (OCA) that it does not already own. Origin had an 85.23% interest in OCA and has offered $4.25 per share for the remaining shares. The total acquisition cost is expected to be $74 million and the offer is due to close on 22 September 2003.
Financial Performance
Total revenue increased by 38% to $3,352.3 million and includes distributions from Envestra of $12.8 million.
External sales revenue increased to $3,326.5 million from $2,389.2 million in the prior year. The increase was due mainly to the initial contribution from the electricity retail business acquired from CitiPower, the cessation of the Gascor agency arrangement and the full year effect of prior year tariff increases.
Segment contributions to EBITDA were:
| EBITDA $m | ||||||
| 2002/03 | 2001/02 | % change | ||||
Exploration & Production | 187.6 | 185.2 | 1 | |||
Retail | 232.1 | 166.8 | 39 | |||
Generation | 48.3 | 30.2 | 60 | |||
Networks | 23.4 | 22.5 | 4 | |||
Total | 491.3 | 404.6 | 21 | |||
Year on year comparisons are provided in the divisional highlights section below. This year’s EBITDA includes a provision for $4.5 million to fully cover deficiencies under the Group’s defined benefit superannuation plan.
Depreciation and amortisation expense increased by 13% to $196.1 million reflecting new capital expenditure (detailed below) and increased amortisation of intangibles and retail systems.
EBIT again showed strong growth with a 28% improvement to $295.3 million.
Net interest expense for the year was $48.7 million, up 14% from the prior year. The increase is largely due to the costs associated with funding of acquisitions totalling $276 million and consequent higher average debt balances during the year.
Tax expense for the year totalled $80.2 million, an increase of 48% on the prior year. The increase primarily reflects the higher pre-tax earnings and the non-recognition of tax loss benefits from Envestra. As advised in the December half results, these loss benefits have been deferred pending resolution of their availability with the Australian Tax Office. There has been no significant progress in this matter over the last six months.
Capital Expenditure
Capital expenditure on growth and stay-in-business projects was $249 million, 3% higher than the prior year.
Stay-in-business capital expenditure associated with the maintenance of ongoing operations was $97 million. The Exploration and Production segment accounted for $74 million of this expenditure, of which two thirds was attributable to the Cooper Basin.
Growth capital expenditure associated with new business initiatives was $152 million. This included:
| • | $62 million on development of the BassGas Project and the Otway gas Project in the offshore Otway Basin; |
| • | $30 million exploring and developing coal seam gas (CSG) resources in Queensland; |
| • | $24 million on exploration and development in the Perth Basin; |
| • | $14 million on systems for full retail contestability (FRC) in electricity and natural gas; |
| • | $9 million on exploration and development activities around the producing centres of the Cooper Basin, Surat Basin, Denison Trough and Otway Basin; and |
| • | $13 million on a variety of other growth projects. |
Capital expenditure on acquisitions totalled $276 million, which included the acquisition of the CitiPower retail business for $132 million, the purchase of the Mt Stuart Power Station and contracts for $89 million and acquisition of additional CSG interests for $50 million.
Total capital expenditure including acquisitions, was $524 million, 30% higher than the prior year.
The company expects to outlay $74 million during the first quarter of the current financial year should the proposed acquisition of the minority interests in OCA be successful.
Cash Flow
The primary measure used by the company to measure its performance is operating cash flow after tax over average funds employed (referred to as the OCAT Ratio). The measure is calculated from EBITDA as the primary source of cash contribution, but adjusted for non-cash items, stay-in-business capital expenditure, changes in working capital and tax paid. Funds employed are averaged over the year. Funds employed increased significantly following the various acquisitions during the year. However, the strong performance in EBITDA, management of working capital and control of stay-in-business capital expenditure resulted in proportionately greater improvement in operating cash flow.
These factors produced an OCAT Ratio of 15.6% for the year ended 30 June 2003.
Cash flow available for funding growth and distributions to shareholders (free cash flow) was $350 million compared with $256 million in the prior year, an increase of 37%.
Funding and Capital Management
The company’s balance sheet remains strong with a net debt to capitalisation ratio of 29% as at 30 June 2003. This compares with 28% as at 30 June 2002. Additional equity of $33.6 million was raised through the operation of the Dividend Reinvestment Plan and exercise of share options under the Senior Executive Option Plan. Net borrowings have increased from $633 million at 30 June 2002 to $732 million at 30 June 2003. The increase is primarily the result of increased expenditure on acquisitions and major capital projects (totalling $524.3 million) significantly offset by strong cash flow from operations resulting in an increase in net debt of $99 million. Interest cover as measured by EBIT/interest expense remains robust at 6.1 times.
Origin completed a US$250 million US Private Placement issuance with all proceeds hedged to Australian dollars. The issuance has provided 7 to 15 year debt finance significantly extending the group’s debt maturity profile.
Risk Management
The company continued to hedge a significant portion of its exposure to both the oil price and the USD exchange rate. Currently, the company has hedged 58% of exposure to oil and related products over the 12 months to 30 June 2004 at prices averaging over $US24.50 per barrel. A US$1.00 movement in the price of oil over the next year will impact Origin’s EBITDA by approximately $1.9 million.
With regard to foreign exchange, due to a combination of external hedging and ongoing US dollar expenditure associated with major upstream projects, Origin is significantly hedged over the next 12 months and expects that variability in the USD exchange rate will have minimal impact on group profitability.
Origin only undertakes energy contracting and trading activities as part of optimising the value of its physical assets and energy retailing activities.
The Board oversees the commodity risk management policies, which incorporate short-term and long-term risk limits for the trading of electricity and natural gas, oil and renewable energy credits (RECs). The Board monitors compliance with these policies and continues to review risk management strategies on a regular basis.
Returns to Shareholders
A final dividend of 5 cents per share, franked to 2 cents per share has been declared, payable on 3 October 2003 to shareholders of record on 19 September 2003.
The Dividend Reinvestment Plan will continue to operate and for this dividend a discount of 2.5% will apply to the shares allotted under the Plan.
The final dividend will lift total dividends for the year to 10 cents per share (franked to 4 cents) from 5 cents per share (fully franked) in the prior year.
Origin will have limited capacity to frank dividends for several years. The introduction of the new tax consolidation regime may further defer the payment of tax by Origin and its wholly owned subsidiaries.
Employee Share and Option Plans
During the year the company issued 2,630,000 options under the Senior Executive Option Plan at an exercise price of $3.56 each. The options were issued subject to Origin performance hurdles and the exercise price was equal to the market price at the date of approval.
Under the Employee Share Plan, 445,626 shares were purchased on market for issuance to employees. The cost of shares purchased for the Employee Share Plan have been expensed and an amount of $1.8 million charged against profit before tax.
Details regarding a review of the operation and accounting of the Employee Share and Option Plans are provided in the Divisional Highlights under People, Health, Safety and Environment.
Issued Capital
An additional 7,547,299 shares were issued during the period under Origin’s Dividend Reinvestment Plan and 2,333,300 shares were issued as a result of the exercise of options. As at 30 June 2003, Origin had 657,709,751 shares on issue.
Corporate Governance
The Australian Stock Exchange (ASX) Corporate Governance Council issued the Principles of Good Corporate Governance and Best Practice Recommendations (“the Principles”) on 31 March 2003.
Origin has reviewed its current practices and established that it is substantially in compliance with the Principles. Origin has updated many of its practices and policies and will continue to review those to enable it to make a full statement on its compliance with the Principles in its 2004 Annual Report.
The 2003 Annual Report, which is due to be released on 16 September 2003, will provide a statement of Corporate Governance and will report by reference to the Principles. At the same time Origin will launch a Corporate Governance section of its website which will be progressively updated during the year. The Chairman will make a further report on Corporate Governance at the Annual General Meeting on 16 October 2003.
Divisional Performance Highlights
Exploration and Production
2002/03 $m | 2001/02 $m | % Change | ||||
EBITDA | 187.6 | 185.2 | 1 | |||
EBIT | 103.3 | 103.2 | — |
Sales Volumes
| 2002/03 | 2001/02 | % change | |||||
Natural Gas (PJ) | 74.0 | 72.5 | 2 | ||||
Crude Oil (kbbls) | 853.8 | 804.1 | 6 | ||||
Condensate/naphtha (kbbls) | 644.2 | 676.4 | (5 | ) | |||
LPG (ktonnes) | 62.3 | 61.4 | 1 | ||||
Ethane (ktonnes) | 35.5 | 46.9 | (24 | ) | |||
Total (PJe) | 87.4 | 86.3 | 1 | ||||
External sales revenue for the Exploration and Production segment increased by 9% to $286 million as revenue from Perth Basin oil sales, higher oil prices, and increased gas sales more than offset revenues foregone following the sale of Eromanga Basin oil assets in the previous year.
EBITDA for the period was $187.6 million, up $2.4 million or 1% on the previous year. EBIT was steady at $103.3 million.
Total gas sales were 74 PJ, an increase of 2%. CSG sales continued to grow and now represent 12% of total gas sales.
Oil production was boosted by three Perth Basin oil fields coming on stream in the second half of the year. As a result, oil sales increased by 6% to 853,800 bbls, despite the sale of the Bodalla oil field and associated assets in the Eromanga Basin midway through the prior year.
Origin’s 2P reserves increased by 38% to 1,573 PJe largely as a result of the inclusion of reserves from the Thylacine and Geographe fields, additions through CSG acquisitions and the reappraisal of the Myall Creek gas field in the Surat Basin. A total of 83 development and appraisal wells and 36 exploration wells were drilled during the year with 95 wells cased for future production providing an overall success rate of 80%.
Cooper Basin (Queensland/South Australia)
The Cooper Basin is Australia’s largest onshore gas production province and is a significant supplier of gas to southern and eastern Australia. Under a long-term gas supply arrangement signed with AGL in December, Origin and the other Cooper Basin producers will supply up to 505 PJ of gas over 14 years from 2003. Origin’s share of the contract is 71 PJ.
Coal Seam Gas (CSG)
In December 2002 Origin, and 85% owned Oil Company of Australia Limited (OCA), signed an agreement with AGL to supply 340 PJ of gas for 15 years from May 2005. About 52% will be supplied from OCA’s CSG interests in central Queensland.
This contract enhanced OCA’s position as the largest CSG producer in Australia. CSG supplies about 25% of Queensland’s total gas demand. OCA’s CSG production is 30 TJ/day from three fields, which have a current production capacity of 55 TJ/day.
Through acquisition and appraisal drilling, CSG reserves increased from 296 PJ to 472 PJ, and recent drilling on the Durham field is expected to substantially increase these reserves. Significant progress has been made in the development planning of the Durham field with the granting of production and pipeline licences and the approval of an Indigenous Land Usage Agreement with native titleholders.
Other producing CSG fields have maintained strong performances with the Dawson Valley (Moura) fields reaching record production levels.
To date $225 million has been invested by Origin and OCA in the acquisition and development of CSG interests including $50 million in additional interests in the Fairview and Durham fields acquired in the prior year. Total development cost for CSG is expected to be several hundred million dollars over future years and in the coming year a further $100 million will be spent building a gas processing plant at the Durham field; developing the Mungi field at Moura; and appraising the Talinga field, which is based on the Walloon Coals near the Wallumbilla to Brisbane gas pipeline.
Perth Basin
Origin continued a highly successful gas and oil exploration program in the Perth Basin.
Following last year’s oil discovery at Hovea, the field was successfully appraised and developed and is now producing at about 4,000 barrels of oil per day (bopd).
Long term production tests were undertaken during the June quarter on the Jingemia and Eremia fields in the Perth Basin and established flow rates of around 1,800 and 1,000 bopd respectively.
By July 2003 these fields combined had produced more than one million barrels of oil (Origin’s share 500,000 barrels). Origin’s share of proved and probable reserves is currently estimated at 5.4 million barrels.
The Beharra Springs North 1 gas field, discovered in late 2001, commenced production in July 2002, increasing gas sales from the Beharra Springs gas plant by 32%. A further small gas pool was discovered in the exploration well Hovea 2 during 2002 and is yet to be developed.
Origin has embarked on another significant drilling program in the Perth Basin to appraise and develop the Hovea, Eremia and Jingemia oil fields and explore for gas close to the Beharra Springs gas plant and in areas further north. The program, which may include the drilling of up to 10 wells, began in July 2003 and is expected to further lift production rates.
BassGas Project (Yolla field: Tasmania/Victoria)
The BassGas Project is scheduled to deliver 20 PJ of gas per annum to Victoria from July 2004, representing about 10% of that State’s natural gas demand. Origin holds a 37.5% interest and is the operator. Origin’s Retail Division will purchase the gas for sale to residential and business customers.
Following State and Federal environmental approvals, construction began in January 2003 and the project is now 45% complete.
The project will cost $450 million (Origin’s share $170 million) and will include an un-manned offshore platform over the Yolla gas field, a 147-kilometre subsea pipeline to a shore crossing near Kilcunda and a 32-kilometre onshore pipeline to a gas plant under construction at Lang Lang.
Otway Gas Project (Thylacine and Geographe fields: Tasmania/Victoria)
The Otway Gas Project will develop the Thylacine and Geographe gas fields and is designed to deliver 60PJ of sales gas each year to South Australia and Victoria by mid 2006, as well as significant volumes of condensate and LPG. During the year the interests of the joint venturers, Woodside, Benaris, CalEnergy and Origin were equalised across both fields. Origin has a 29.75% interest in the project, which is operated by Woodside Petroleum Limited.
The project received joint venture approval late in 2002 to proceed to development. Environmental impact statements were released for public exhibition in June and a preliminary development concept has been submitted to the Victorian and Federal Governments.
Phase 1 of the project will involve the development of the Thylacine field including a platform, subsea pipeline and a gas processing plant with anticipated expenditure of around $750 million (Origin’s share $220 million). Phase 2 will see the subsea development of the Geographe field and tie-in to the Thylacine facility. Phase 3 will add compression at the gas plant to maximise recovery from the fields. Total project cost is estimated at around $1 billion.
Greenfields Exploration
Origin’s exploration program focussed on gas prone areas close to developed infrastructure.
Origin participated in seven exploration and appraisal wells in greenfield areas. Of the successful wells, three were in the onshore Perth Basin, and the Morangie 1 well in the offshore Perth Basin which, although unsuccessful, recorded encouraging residual oil shows.
Origin extended its exploration efforts in the Surat Basin around existing gas fields. A reappraisal of the Myall Creek area resulted in a further five wells drilled in that area, four of which successfully tested gas at commercial rates.
During the year, Origin and Woodside were awarded a near-shore Otway Basin permit VIC/P37(V) and in July 2003 were awarded permit T/34P in Tasmanian waters southwest and adjoining the Thylacine permit. Exploration in VIC/P37 (V), which is operated by Origin, will begin in late 2003, while the work program for T/34P (operated by Woodside) includes the acquisition of 3D seismic survey data in 2004 and the drilling of a well in 2005.
In New Zealand, Origin will participate in the deepening of the gas exploration well at Tuihi. In the Bass Basin, Origin will participate in the drilling of the Trefoil prospect near Yolla.
Retail
2002/03 $m | 2001/02 $m | % Change | ||||
EBITDA | 232.1 | 166.8 | 39 | |||
EBIT | 143.8 | 92.0 | 56 | |||
Customers (‘000) | 2,010 | 1,777 | 13 | |||
| Natural Gas* | Electricity | LPG | ||||
Revenue (A$m) | 841 | 1,547 | 417 | |||
Gross Margin (A$m) | 131 | 285 | 114 | |||
Sales – (PJ) | 123 | |||||
Sales – (TWh) | 15 | |||||
Sales – (ktonnes) | 479 | |||||
Total Sales (PJe) | 123 | 54 | 24 | |||
Customer # (‘000) | 986 | 851 | 200+ | |||
| * | Revenue for natural gas is the gross revenue received from customers including the Retained Profit component which terminated in Sept 2002. Gross margin is after payment of Retained Profit. |
Revenue from the Retail segment increased 46% to $2.8 billion. EBITDA increased by 39% to $232 million mostly due to the contribution of the CitiPower retail business purchased in July
2002, reductions in electricity purchasing costs due to favourable electricity contracts and pool prices and the cessation of retained profits paid to the Victorian Government.
The CitiPower acquisition, which added 264,000 customers in Melbourne’s CBD and surrounding suburbs, makes Origin the largest energy retailer in Victoria and the second largest nationally.
The integration of the CitiPower business with existing gas and electricity businesses was a major focus for the year. Work will be completed on the integration of billing systems and conversion of customer data in August 2003.
Having common back office systems will help reduce costs, improve the service levels and ability to access customers in competitive markets. While there were cost increases associated with the CitiPower integration and the introduction of FRC, the expanded customer base will deliver reduced cost to serve in the next financial year.
FRC was introduced in Victoria in January 2002 for electricity and October 2002 for natural gas. Churn in the electricity market grew modestly until the introduction of contestability for natural gas, after which there was a spike in activity for both fuels. Churn appears to have stabilised at rates of 5-10% per annum which is in line with industry expectation. FRC for electricity was introduced in South Australia in January 2003, but no official statistics are available for this market.
Overall during financial year ended June 2003 Origin maintained its gas customer numbers and achieved a modest growth in electricity customer numbers. Early losses of mass market customers in the Victorian electricity market due to transfers in progress at the time of the CitiPower acquisition were reversed by gains later in the year in both Victoria and South Australia.
Electricity
Origin supplies electricity predominantly to customers in Victoria, and also participates in competitive markets in New South Wales, Queensland and South Australia.
Electricity revenue increased by over $700 million and gross margins increased by over $125 million to $285 million largely due to the CitiPower retail acquisition in July 2002.
The Victorian Government continues to cap prices for mass market customers and in January 2003 rejected proposed tariff increases for electricity supplied to customers in the former Powercor area and implemented a 4% tariff reduction for customers in the former CitiPower area.
Notwithstanding these caps Origin is rebalancing individual tariff categories to cover the costs of buying electricity and costs to serve in an increasingly competitive market. This will deliver reduced tariffs to customers who have been receiving competitive market offers while un-profitable segments of the market will continue to have their tariffs adjusted on a gradual basis.
At the wholesale level the industry has undergone a degree of consolidation with the withdrawal of several retail competitors. Despite the consolidation, the National Electricity Market continues to be vigorously competitive. Even with this competitive environment Origin has managed to increase its market share renewing most existing contracts and signing new contracts with major customers in Victoria, New South Wales, South Australia and Queensland.
Electricity purchase costs, while increasing due to the replacement of long-term favourable contracts with current market contracts, benefited from generally low pool price volatility. Origin entered into a number of electricity purchase contracts that enabled Origin to take advantage of low pool prices while maintaining appropriate cover against periods of high pool prices. The combination of these factors meant that Retail profitability was maintained on a unit margin basis and improved overall because of the increased retail and wholesale customer sales volumes.
Natural Gas
Origin supplies natural gas mainly to customers in Victoria, South Australia, Queensland and New South Wales.
Natural gas revenues increased mainly due to the termination of the Gascor Agency Agreement and cessation of retained profit payments to the Victorian Government following the introduction of FRC in the Victorian gas market in October 2002. The profit retained by the State under the Gascor Agency Agreement reduced to $14 million from $29 million in the prior year.
In the mass market the natural gas business benefited from tariff increases of 2.5% in Victoria in January 2002; 6% in South Australia in July 2002; and 6.7% increase in Queensland in March 2002. However as a result of an unsuccessful application for a Victorian tariff increase in January 2003, prices were flat in Victoria during the later half of this year.
Sales volumes were also impacted by mild winter weather in Victoria. The measure of average degree-days, which provides an indication of heating requirements, continued to be well below long-term averages.
The deregulated natural gas market for commercial and industrial customers in South Australia and Queensland is moving into a more challenging phase with the emergence of effective competition. Nationally commercial and industrial sales decreased by 6% to 51 PJ.
LPG
Origin is a retailer and wholesaler of LPG in Australia, New Zealand and the near Pacific.
The LPG business continued the strong performance reported last year despite a reduction in sales volumes of 2% and an increase of 17% in the unit purchase cost of LPG. The Contract Price (CP) - the international benchmark price for LPG - was up by $74 per tonne to $517 per tonne average for the year.
Sales volumes were impacted by the drought, which particularly affected sales to commercial and industrial customers in many parts of rural Australia. Autogas volumes declined in the face of competition from alternative fuels. However these reductions were offset by an improvement in sales to the Pacific Islands.
Operating costs were reduced $2.9 million while a focus on credit management delivered an improved debtor performance compared to the prior year of $4.6 million and contributed to operating cash flow returns in excess of 20%.
Margins were maintained despite the increased costs of LPG, through a favourable change in the mix of sales towards the higher margin customers. As a result gross margins were steady at $114 million.
During the year Origin acquired the Treston Gas business in Shepparton, Victoria. This business, which will continue to operate under the Treston brand name, will deliver additional sales of 12,000 tonnes per annum and provide opportunities for multi fuel offerings to Origin’s electricity and natural gas customer base in the region.
Generation
2002/03 $m | 2001/02 $m | % Change | ||||
EBITDA | 48.3 | 30.2 | 60 | |||
EBIT | 26.5 | 15.6 | 70 | |||
| 2002/03 | 2001/02 | % Change | ||||
Total Sales (TWh) | 1.90 | 1.86 | 2 | |||
The Generation segment recorded a 54% growth in total sales revenue to $97 million. EBITDA rose 60% to $48.3 million. This was largely due to the implementation of a tolling agreement between Origin’s Retail and Generation Divisions and the acquisition of the Mt Stuart Power Station in Townsville Queensland.
Contract Plant
The acquisition of the Mt Stuart Power Station increased the capacity of contracted plant by 86% to 622 MW.
Mt Stuart supplies peaking power to the Queensland Government owned entity, Enertrade, under a long-term power purchase agreement. The plant, commissioned in December 1998, currently runs on kerosene but can be readily converted to natural gas and could be expanded by a further 150 MW through conversion to combined cycle mode.
Origin’s 50% owned cogeneration plants at the Worsley Alumina refinery in Western Australia and the Osborne Cogeneration Plant in South Australia operated at high levels of availability and efficiency.
Availability of the cogeneration plant at BP’s Bulwer Island refinery (50% interest) improved during the year following the implementation of a technical remediation plan to reduce the level of outages experienced in the prior year. During the early part of 2003/04 both gas turbines will be upgraded to full design rating.
Construction of the energy centres at the Toowoomba and Baillie Henderson Hospitals in Queensland proceeded satisfactorily, with the Toowoomba Base Hospital works completed just prior to year-end. The energy centres will deliver electricity, steam and hot and chilled water to each hospital.
Merchant Plant
Origin owns and operates three merchant plants - Roma Power Station in central Queensland, Ladbroke Grove Power Station and Quarantine Power Station in South Australia - all maintained high availability and reliability during the year.
The maturity of the national electricity market has enabled Origin to implement a market based tolling arrangement whereby capacity provided by its electricity merchant plant is charged to Origin’s Retail businesses. This has allowed the stabilisation of Generation income and quarantined the volatility of the electricity spot market to the Retail business where that volatility is managed across Origin’s entire portfolio of electricity purchases and sales.
Renewable Generation
Throughout the year Origin continued to develop a portfolio of renewable energy projects.
This included the acquisition of an option to develop the Troubridge Point wind farm near Edithburgh on the Yorke Peninsula in South Australia, and an option to acquire a 50% interest in the Challicum Hills wind farm in Victoria. Development is also underway for the Kemiss Hill Road wind farm, near Yankalilla in South Australia. Wind monitoring is being conducted on a further two potential wind farm locations.
Origin has also funded research to develop lower cost solar energy. During the year Origin and the Australian National University announced the development ofSLIVER® Solar Cell technology which uses one tenth of the silicon used in conventional solar panels while matching power, performance and efficiency.
Testing confirmed that solar panels using this technology could be commercially competitive. An automated approach to module assembly was developed and planning for a pilot production facility is well advanced.
In August 2003 Origin announced the acquisition of a 19% interest in Geodynamics Limited for a consideration of $5 million. The company has been exploring and seeking to develop geothermal sources of energy including the hot dry rock geothermal resource in the Cooper Basin. Under a Power Purchase Agreement, Origin will have the right to purchase 50% of the power generated by Geodynamics’ projects including RECs and environmental credits at a discount to the prevailing market price. The acquisition is subject to approval by shareholders of Geodynamics.
Networks
2002/03 $m | 2001/02 $m | % Change | ||||
EBITDA | 23.4 | 22.5 | 4 | |||
EBIT | 21.6 | 19.9 | 9 |
The Network segment EBITDA of $23.4 million was 4% higher than the prior year.
Origin increased its holding in Envestra by 17.4 million shares to 19.14% in April 2002. As a consequence distributions received from Envestra increased by $1.2 million.
There was a steady increase in management fees earned from Envestra, reflecting the underlying growth in its business but this was largely offset by changes to other fees.
During the year, total natural gas connections increased by 2.5% to 905,500. This increase was largely driven by the continued strength of the domestic housing market. About 300 km of new mains were laid and 105 km of existing mains replaced.
FRC was introduced for Victorian natural gas customers in October 2002, allowing consumers to change retailers. New Information systems and processes were introduced to ensure cost
efficient metering and billing of consumers serviced by Envestra’s networks in the new competitive environment. Work has commenced on introducing similar systems and processes in South Australia where the natural gas market will open to full competition in 2004.
In a joint venture with United Utilities, Origin won a contract for the management of the water network and treatment assets of Coliban Water in regional Victoria. The 10-year contract commencing 1 July 2003 is a significant win for the joint venturers and will generate more than $120 million in revenue over the contract term.
SEA Gas Pipeline
The SEA Gas Partnership (33.3% Origin, 33.3% International Power, 33.3% TXU) is constructing the SEA Gas Pipeline that will travel 680 km linking Origin’s new gas production interests in Victoria to retail gas markets and growing generation assets in South Australia.
By mid August 2003, 530 km of the pipeline had been completed, and the project remained on budget and on schedule for commercial operation in January 2004.
People, Health, Safety and Environment
Employee numbers increased 5% to 2,857 reflecting the growth in the retail business.
A continued focus on safety performance has assisted in reducing the Lost Time Injury Frequency Rate by 25% from 3.6 to 2.7. Regrettably, an incident at a drilling rig resulted in the death of an employee of a contractor engaged to drill an appraisal well for OCA. The incident will be the subject of a coronial enquiry and investigations into the cause of the incident have not yet been completed.
There were no significant environmental incidents during the year and there were no breaches of significant environmental regulations that relate to the company’s operations.
During the year Origin produced its first Sustainability Report, which provided a detailed report to stakeholders on the company’s social, environmental and economic impacts.
Over the past two years employees with at least 12 months’ service have been able to become Origin shareholders under the Employee Share Plan, in recognition of the financial performance of the company and the achievement of a significantly improved safety record. A further issue under this Plan will be made in recognition of 2002/03 performance. The cost of $2.2 million before tax has been provided for in the current year result.
In October 2002 Origin announced that it would undertake a review of its equity based compensation programs.
This review has been undertaken covering the Executive Option Plan, Employee and Executive Share Plans including an assessment of the impact of proposed changes to the accounting and tax treatment of options.
The review has concluded that the use of equity as part of the company’s remuneration program is an effective means of providing long-term incentives that motivate and reward employees for acting in the best interests of shareholders. The Board acknowledges that the plans are part of a remuneration strategy that must adhere to appropriate corporate governance principles and has concluded that they meet these objectives.
For the Employee Share Plans, the company will purchase all shares on market for distribution to employees under these plans, the cost of which will be treated as an expense.
The Board has concluded that the Executive Option Plan with its existing exercise hurdles and market exercise price meets best practice and is in the interests of shareholders. The plan has been reinstated as part of Origin’s remuneration plan.
The Australian Accounting Standards Board has released an exposure draft (ED108) on how to account for share-based payments, including employee options. The company has not adopted ED108 as there are a number of unresolved issues, and the final form of the AASB and IASB standards may well change from that currently on issue. Accordingly, the reported net profit after tax of $162.0 million does not include any amount for the expensing of options. However, if the draft standard were applied Origin would have reported an expense of $1.8 million in the past year in respect of options issued.
When the accounting standards have been determined and the tax implications are clear, Origin will again review the use of options as the long-term incentive component of executive remuneration.
Further details of the Executive Option Plan and Employee Share Plans will be included in Origin’s 2003 Annual Report.
Outlook
In the year ahead Origin will continue to build upon the performance to date and further develop opportunities for growth.
Performance of the Exploration and Production segment will be boosted by increased oil production from the Perth Basin.
Retail will continue to benefit from cessation of the Gascor retained profit payment and the drive to reduce costs from the integration of recently acquired businesses. As current favourable contracts for the purchase of electricity roll off they are being replaced at competitive prices and the wholesale margin gained in the last financial year is unlikely to be sustained.
The Generation segment will benefit from a full year contribution from the Mt Stuart Power Station and Networks segment earnings will benefit from the Coliban Water contract.
Based on these factors the outlook for the coming year is for Origin to achieve its long-term target for growth in earnings per share of 10-15% per annum.
During the coming year the company will also continue to develop opportunities that provide the basis for growth in the medium term. These include the BassGas Project, Otway Gas Project, SEAGas Pipeline and development of coal seam gas.
In the longer term Origin expects to benefit from new opportunities in its Greenfield exploration portfolio, further investment in power generation and development of opportunities in renewable generation.
Notwithstanding the recent acquisitions and capital expenditure on new projects Origin maintains a conservatively geared balance sheet. This, combined with the company’s strong cash flows, means that Origin is well placed to take advantage of opportunities that continue to arise from the rationalisation and growth that is occurring in the energy sector.
Origin Energy Key Financials
2002/2003 ($m) | 2001/2002 ($m) | % change | ||||||||
Total revenue | 3,352 | 2,429 | 38 | |||||||
EBITDA | 491.3 | 404.6 | 21 | |||||||
EBIT | 295.3 | 230.7 | 28 | |||||||
Profit before tax | 246.6 | 187.9 | 31 | |||||||
Profit after tax | 166.3 | 133.6 | 24 | |||||||
Profit after tax and outside equity interests | 162.0 | 128.7 | 26 | |||||||
Free cash flow | 350 | 256 | 37 | |||||||
OCAT ratio | 15.6 | % | 13.7 | % | 14 | |||||
Capital expenditure | 524 | 403 | 30 | |||||||
Total assets | 3,409 | 2,958 | 15 | |||||||
Net debt | 732 | 633 | 16 | |||||||
Shareholders equity | 1,790 | 1,626 | 10 | |||||||
Key Ratios | ||||||||||
Earnings per share | 24.8 cents | 20.2 cents | 23 | |||||||
Free cash flow(1) per share | 53.7 cents | 40.1 cents | 34 | |||||||
Total dividend per share(2) | 10 cents | 5 cents | 100 | |||||||
Net asset backing per share | $ | 2.70 | $ | 2.50 | 8 | |||||
Net debt to capitalisation | 29 | % | 28 | % | ||||||
Net debt to equity | 41 | % | 39 | % | ||||||
EBIT Interest cover | 6.1 times | 5.4 times | ||||||||
Return on equity | 9.2 | % | 8.1 | % | ||||||
Segment Analysis (EBITDA) (3) | ||||||||||
Exploration & Production | 187.6 | 185.2 | 1 | |||||||
Retail | 232.1 | 166.8 | 39 | |||||||
Generation | 48.3 | 30.2 | 60 | |||||||
Networks | 23.4 | 22.5 | 4 | |||||||
| (1) | Cash flow available for funding growth and distributions to shareholders |
| (2) | Final dividend 5 cents per share (franked to 2 cents), interim dividend 5 cents per share (franked to 2 cents) |
| (3) | The Corporate segment reported in previous results announcements has now been allocated across the four operational business segments |
Item 4.
[GRAPHIC APPEARS HERE]
ASX APPENDIX 4E
FINAL REPORT
For the year ended 30 June 2003
Origin Energy Limited and its Controlled Entities
ABN 30 000 051 696
Results for announcement to the market:
| A$’000 | |||||||||
Revenues from ordinary activities | up | 38.0 | % | to | 3,352,303 | ||||
Profit from ordinary activites after tax attributable to members | up | 25.9 | % | to | 161,952 | ||||
Net profit for the period attributable to members | up | 25.9 | % | to | 161,952 | ||||
Earnings per share - Basic | up | 22.8 | % | to | 24.8 cents | ||||
Earnings per share - Diluted | up | 22.9 | % | to | 24.7 cents |
Dividends | Amount per security | Franked amount per security at 30% tax | ||
Final dividend declared subsequent to 30 June 2003 | 5 cents | 2 cents | ||
Previous corresponding period | 3 cents | 3 cents | ||
Date for determining entitlements to the dividend | 19 September 2003 | |||
Brief explanation of any of the figures reported above or other item(s) of importance not previously released to the market:
Nil
Discussion and Analysis of the results for the year ended 30 June 2003
Refer to the Directors’ Review for commentary.
1
STATEMENT OF FINANCIAL PERFORMANCE
Origin Energy Limited and Controlled Entities
| Consolidated | Consolidated | |||||||
| for year ended 30 June | Note | 2003 A$’000 | 2002 A$’000 | |||||
Revenue from ordinary activities | 3 | 3,352,303 | 2,428,808 | |||||
Expenses from ordinary activities excluding borrowing costs | 3 | (3,068,179 | ) | (2,204,790 | ) | |||
Borrowing costs | (50,138 | ) | (44,476 | ) | ||||
Share of net profits of associates and joint venture entities accounted for using the equity method | 12 | 12,565 | 8,338 | |||||
Profit from ordinary activities before related income tax expense | 246,551 | 187,880 | ||||||
Income tax expense relating to ordinary activities | 4 | 80,248 | 54,280 | |||||
Net profit | 166,303 | 133,600 | ||||||
Net profit attributable to outside equity interests | 4,351 | 4,940 | ||||||
Net profit attributable to members of the parent entity, Origin Energy Limited | 10 | 161,952 | 128,660 | |||||
Non-owner transaction changes in equity | ||||||||
Net decrease in retained profits on initial adoption of revised AASB 1028 “Employee Benefits” | (283 | ) | — | |||||
Net exchange difference relating to self-sustaining foreign operations | (1,779 | ) | (1,444 | ) | ||||
Total revenues, expenses and valuation adjustments attributable to members of Origin Energy Limited recognised directly in equity | (2,062 | ) | (1,444 | ) | ||||
Total changes in equity from non-owner related transactions attributable to members of the parent entity, Origin Energy Limited | 10 | 159,890 | 127,216 | |||||
Basic earnings per share | 9 | 24.8 | ¢ | 20.2 | ¢ | |||
Diluted earnings per share | 9 | 24.7 | ¢ | 20.1 | ¢ |
The Statement of Financial Performance should be read in conjunction with the notes to the financial statements set out on pages 5 to 19.
2
STATEMENT OF FINANCIAL POSITION
Origin Energy Limited and Controlled Entities
| Consolidated | Consolidated | |||||
| as at 30 June | Note | 2003 A$’000 | 2002 A$’000 | |||
CURRENT ASSETS | ||||||
Cash assets | 16,431 | 17,255 | ||||
Receivables | 621,085 | 485,538 | ||||
Inventories | 53,913 | 46,392 | ||||
Other | 43,063 | 37,064 | ||||
TOTAL CURRENT ASSETS | 734,492 | 586,249 | ||||
NON-CURRENT ASSETS | ||||||
Receivables | 31,675 | 21,499 | ||||
Investments accounted for using the equity method | 55,272 | 53,347 | ||||
Other financial assets | 170,713 | 196,135 | ||||
Property, plant and equipment | 1,352,527 | 1,155,372 | ||||
Exploration, evaluation and development expenditure | 154,300 | 130,655 | ||||
Intangible assets | 777,948 | 634,436 | ||||
Deferred tax assets | 123,192 | 171,654 | ||||
Other | 8,622 | 8,587 | ||||
TOTAL NON-CURRENT ASSETS | 2,674,249 | 2,371,685 | ||||
TOTAL ASSETS | 3,408,741 | 2,957,934 | ||||
CURRENT LIABILITIES | ||||||
Payables | 475,026 | 371,534 | ||||
Interest-bearing liabilities | 85,522 | 85,238 | ||||
Current tax liabilities | 546 | 3,290 | ||||
Provisions | 71,330 | 67,451 | ||||
TOTAL CURRENT LIABILITIES | 632,424 | 527,513 | ||||
NON-CURRENT LIABILITIES | ||||||
Payables | 11,840 | 6,100 | ||||
Interest-bearing liabilities | 663,012 | 565,139 | ||||
Deferred tax liabilities | 243,904 | 197,055 | ||||
Provisions | 67,957 | 36,088 | ||||
TOTAL NON-CURRENT LIABILITIES | 986,713 | 804,382 | ||||
TOTAL LIABILITIES | 1,619,137 | 1,331,895 | ||||
NET ASSETS | 1,789,604 | 1,626,039 | ||||
EQUITY | ||||||
Contributed equity | 7 | 418,612 | 385,039 | |||
Reserves | 110,764 | 112,347 | ||||
Retained profits | 10 | 1,223,977 | 1,095,158 | |||
Total parent entity interest | 1,753,353 | 1,592,544 | ||||
Outside equity interests | 36,251 | 33,495 | ||||
TOTAL EQUITY | 10 | 1,789,604 | 1,626,039 | |||
The Statement of Financial Position should be read in conjunction with the notes to the financial statements set out on pages 5 to 19.
Net Tangible Asset Backing
Consolidated 2003 | Consolidated 2002 | |||||
Net tangible asset backing per ordinary security | $ | 1.48 | $ | 1.48 | ||
3
STATEMENT OF CASH FLOWS
Origin Energy Limited and Controlled Entities
| Consolidated | Consolidated | |||||||
| for year ended 30 June | Note | 2003 A$’000 | 2002 A$’000 | |||||
CASH FLOWS FROM OPERATING ACTIVITIES | ||||||||
Cash receipts in the course of operations | 3,703,004 | 2,553,539 | ||||||
Cash payments in the course of operations | (3,193,463 | ) | (2,155,062 | ) | ||||
Dividends/distributions received from associates/joint venture entities | 10,998 | 6,000 | ||||||
Other dividends received | 413 | 409 | ||||||
Interest received | 1,832 | 1,785 | ||||||
Borrowing costs | (50,571 | ) | (44,919 | ) | ||||
Income taxes paid | (39,619 | ) | (22,455 | ) | ||||
Subvention payments | (10,000 | ) | (18,000 | ) | ||||
Net cash provided by operating activities | 422,594 | 321,297 | ||||||
CASH FLOWS FROM INVESTING ACTIVITIES | ||||||||
Payments for purchases of property, plant and equipment | (146,776 | ) | (169,464 | ) | ||||
Payments for exploration, development and mine properties | (132,454 | ) | (135,379 | ) | ||||
Proceeds from sale of non-current assets | 3,494 | 18,613 | ||||||
Payments for purchases of investments | (459 | ) | (15,904 | ) | ||||
Payments for purchases of businesses | 6(C) | (131,614 | ) | — | ||||
Payments for purchases of controlled entities | 6(C) | (93,107 | ) | (87,452 | ) | |||
Net cash used in investing activities | (500,916 | ) | (389,586 | ) | ||||
CASH FLOWS FROM FINANCING ACTIVITIES | ||||||||
Proceeds from borrowings | 1,092,626 | 385,591 | ||||||
Repayment of borrowings | (987,675 | ) | (485,000 | ) | ||||
Dividends paid | (25,858 | ) | (35,282 | ) | ||||
Proceeds from issue of securities | 7 | 5,417 | 198,465 | |||||
Net cash provided by financing activities | 84,510 | 63,774 | ||||||
NET INCREASE / (DECREASE) IN CASH HELD | 6,188 | (4,515 | ) | |||||
Cash and cash equivalents at the beginning of the year | 10,551 | 15,910 | ||||||
Effect of exchange rate changes on cash | (308 | ) | (844 | ) | ||||
CASH AND CASH EQUIVALENTS AT THE END OF THE YEAR | 6(A) | 16,431 | 10,551 | |||||
The Statement of Cash Flows should be read in conjunction with the notes to the financial statements set out on pages 5 to 19.
4
NOTES TO THE FINANCIAL INFORMATION
Origin Energy Limited and Controlled Entities
FOR THE YEAR ENDED 30 JUNE 2003
1. BASIS OF PREPARATION OF THE FINAL REPORT
The ASX 4E Report has been prepared in accordance with Accounting Standard AASB 1039 “Concise Financial Reports” (excluding the discussion and analysis requirements of the standard) and applicable Urgent Issues Group Consensus Views. It has been prepared on the basis of historical costs and, except where stated, does not take into account changing money values or current valuations of non-current assets. The accounting policies have been consistently applied by each entity in the consolidated entity and, except where there is a change in an accounting policy, are consistent with those of the previous year.
Changes in accounting policy
PROVISIONS & CONTINGENT LIABILITIES - The consolidated entity has applied AASB 1044 “Provisions, Contingent Liabilities and Contingent Assets” for the first time from 1 July 2002. Dividends are now recognised at the time they are declared, determined or publicly recommended. Previously, final dividends were recognised in the financial year to which they related, despite the dividends being announced after the end of that financial year. The adjustments to the consolidated financial report as at 1 July 2002 as a result of this change were an increase of $19,435,000 in opening retained profits (refer note 10) and a corresponding reduction in the provision for the dividend reported in current provisions at the beginning of the current financial year. Had the new accounting policy been applied in the previous financial year, the provision for dividend of $19,435,000 would have been nil.
EMPLOYEE BENEFITS - The consolidated entity has applied the revised AASB 1028 “Employee Benefits” for the first time from 1 July 2002. The liability for wages and salaries, annual leave and sick leave is now calculated using the remuneration rates the company expects to pay as at each reporting date, not wage and salary rates current at reporting date. The initial adjustments to the consolidated financial report as at 1 July 2002 as a result of this change were an increase of $404,000 in provision for employee benefits, a decrease of $283,000 in opening retained profits, and an increase of $121,000 in future income tax benefit.
FOREIGN CURRENCY TRANSLATION: The consolidated entity has applied the revised AASB1012 “Foreign Currency Translation” for the first time from 1 July 2002. For hedges of specific purchases or sales, the costs (or gains) of entering the hedge and the unrealised exchange differences up to the date of the specific purchase or sale are now deferred and recognised as assets or liabilities on the statement of financial position from the inception of the hedge contract, not when the specific purchase or sale occurs. As a result of this change in accounting policy, payables and receivables were increased by $15,843,000 representing deferred foreign currency hedge exchange gains and a net hedge receivable as at 30 June 2003.
5
Origin Energy Limited and Controlled Entities
2. SEGMENTS
(a) Primary Reporting - Business Segments
| Exploration and Production | Retail | Generation | Networks | Consolidated | |||||||||||||||||||||
2003 A$’000 | 2002 A$’000 | 2003 A$’000 | 2002 A$’000 | 2003 A$’000 | 2002 A$’000 | 2003 A$’000 | 2002 A$’000 | 2003 A$’000 | 2002 A$’000 | ||||||||||||||||
REVENUE | |||||||||||||||||||||||||
Total Sales | 330,302 | 304,736 | 2,836,474 | 1,937,770 | 97,308 | 63,174 | 149,270 | 125,382 | 3,413,354 | 2,431,062 | |||||||||||||||
Intersegment Sales Elimination ** | (43,989 | ) | (41,884 | ) | — | — | (42,816 | ) | — | — | — | (86,805 | ) | (41,884 | ) | ||||||||||
External Sales Revenue | 286,313 | 262,852 | 2,836,474 | 1,937,770 | 54,492 | 63,174 | 149,270 | 125,382 | 3,326,549 | 2,389,178 | |||||||||||||||
Other Revenue | 1,534 | 24,116 | 4,681 | 1,172 | 1,667 | 2 | 14,490 | 12,037 | 22,372 | 37,327 | |||||||||||||||
Total Segment Revenue | 287,847 | 286,968 | 2,841,155 | 1,938,942 | 56,159 | 63,176 | 163,760 | 137,419 | 3,348,921 | 2,426,505 | |||||||||||||||
Unallocated Revenue | 3,382 | 2,303 | |||||||||||||||||||||||
Revenue from Ordinary Activities | 3,352,303 | 2,428,808 | |||||||||||||||||||||||
RESULT | |||||||||||||||||||||||||
Segment Result | 103,272 | 103,209 | 142,123 | 91,341 | 15,677 | 7,904 | 21,632 | 19,892 | 282,704 | 222,346 | |||||||||||||||
Share of Net Profits of Associates and Joint Venture Entities | — | — | 1,694 | 686 | 10,871 | 7,652 | — | — | 12,565 | 8,338 | |||||||||||||||
EARNINGS BEFORE INTEREST AND TAX (EBIT) | 103,272 | 103,209 | 143,817 | 92,027 | 26,548 | 15,556 | 21,632 | 19,892 | 295,269 | 230,684 | |||||||||||||||
Net Interest Expense | (48,718 | ) | (42,804 | ) | |||||||||||||||||||||
Profit from Ordinary Activities Before Income Tax | 246,551 | 187,880 | |||||||||||||||||||||||
Income Tax Expense | (80,248 | ) | (54,280 | ) | |||||||||||||||||||||
Net Profit | 166,303 | 133,600 | |||||||||||||||||||||||
EARNINGS BEFORE INTEREST, TAX, DEPRECIATION AND AMORTISATION (EBITDA) | 187,565 | 185,180 | 232,055 | 166,755 | 48,258 | 30,202 | 23,448 | 22,473 | 491,326 | 404,610 | |||||||||||||||
DEPRECIATION AND AMORTISATION | 84,293 | 81,971 | 88,238 | 74,728 | 21,710 | 14,646 | 1,816 | 2,581 | 196,057 | 173,926 | |||||||||||||||
OTHER NON-CASH EXPENSES | 23,600 | 15,501 | 10,270 | 18,494 | 694 | 1,122 | 963 | 3,059 | 35,527 | 38,176 | |||||||||||||||
ACQUISITIONS OF NON-CURRENT ASSETS (includes capital expenditure) | 253,604 | 184,632 | 169,628 | 86,308 | 100,579 | 116,312 | 538 | 15,932 | 524,349 | 403,184 | |||||||||||||||
6
Origin Energy Limited and Controlled Entities
2. SEGMENTS (continued)
Exploration and Production | Retail | Generation | Networks | Consolidated | ||||||||||||||||
2003 A$’000 | 2002 A$’000 | 2003 A$’000 | 2002 A$’000 | 2003 A$’000 | 2002 A$’000 | 2003 A$’000 | 2002 A$’000 | 2003 A$’000 | 2002 A$’000 | |||||||||||
ASSETS | ||||||||||||||||||||
Segment Assets | 1,081,787 | 886,348 | 1,633,050 | 1,405,555 | 309,183 | 232,894 | 189,826 | 190,881 | 3,213,846 | 2,715,678 | ||||||||||
Equity accounted investments | — | — | 5,966 | 4,265 | 48,956 | 49,082 | 350 | — | 55,272 | 53,347 | ||||||||||
Total Segment Assets | 1,081,787 | 886,348 | 1,639,016 | 1,409,820 | 358,139 | 281,976 | 190,176 | 190,881 | 3,269,118 | 2,769,025 | ||||||||||
Unallocated Assets * | 139,623 | 188,909 | ||||||||||||||||||
Total Assets | 3,408,741 | 2,957,934 | ||||||||||||||||||
LIABILITIES | ||||||||||||||||||||
Segment Liabilities | 110,284 | 82,681 | 464,108 | 349,912 | 12,298 | 10,086 | 39,463 | 38,494 | 626,153 | 481,173 | ||||||||||
Unallocated Liabilities * | 992,984 | 850,722 | ||||||||||||||||||
Total Liabilities | 1,619,137 | 1,331,895 | ||||||||||||||||||
| * | Unallocated assets consists of cash and deferred tax assets. Unallocated liabilities consists of current and non-current interest bearing liabilities and current and deferred tax liabilities. |
| ** | Intersegment pricing is determined on an arm’s length basis. Intersegment sales are eliminated on consolidation. With effect from 1 July 2002, a tolling arrangement was put in place between Retail and Generationin relation to the consolidated entity’s three merchant power stations. The tolling arrangement pricing is at commercial rates. The external revenue from the merchant power stations is now recognised in Retail’s revenuewhile Generation receives a tolling fee from Retail for the capacity provided and costs incurred by these power stations. Comparative amounts for 2002 have not been restated. |
Corporate costs are allocated across business segments on the basis of external sales revenue.
Industry Segments: | Products and Services: | |
Exploration and Production | Natural gas and oil | |
Retail | Natural gas, electricity, LPG, energy related products and services | |
Generation | Natural gas-fired cogeneration and power generation | |
Networks | Infrastructure investment and management services | |
(b) Secondary Reporting - Geographical Segments
The consolidated entity operates predominantly in Australia. More than 90% of revenue, profit, assets and acquisition of non-current assets relate to operations in Australia.
7
Origin Energy Limited and Controlled Entities
3. PROFIT FROM ORDINARY ACTIVITIES
(a) Revenue from ordinary activities
| Consolidated | Consolidated | |||||
2003 $’000 | 2002 $’000 | |||||
Revenue from operating activities: | ||||||
Revenue from sale of goods | 3,176,888 | 2,263,727 | ||||
Revenue from rendering of services | 149,661 | 125,451 | ||||
Total sales revenue | 3,326,549 | 2,389,178 | ||||
Revenue from outside operating activities | 25,754 | 39,630 | ||||
Revenue from ordinary activities | 3,352,303 | 2,428,808 | ||||
(b) Expenses from ordinary activities excluding borrowing costs | ||||||
Expenses by nature: | ||||||
Raw materials and consumables used, and changes in finished goods and work in progress | 2,263,030 | 1,535,775 | ||||
Advertising | 18,448 | 13,190 | ||||
Bad and doubtful debts | 6,760 | 8,850 | ||||
Consultancy costs | 24,391 | 8,177 | ||||
Contracting costs | 102,439 | 88,657 | ||||
Depreciation and amortisation | 196,057 | 173,926 | ||||
Employee expenses | 206,683 | 157,495 | ||||
Exploration and production costs | 57,677 | 48,999 | ||||
Motor vehicle expenses | 15,957 | 16,259 | ||||
Occupancy expenses | 26,172 | 20,422 | ||||
Repairs and maintenance | 18,963 | 17,140 | ||||
Royalties | 26,134 | 26,978 | ||||
Administration and other expenses from ordinary activities | 105,468 | 88,922 | ||||
| 3,068,179 | 2,204,790 | |||||
Profit before tax/revenue | ||||||
Profit from ordinary activities before related income tax expense as a percentage of revenue from ordinary activities | 7.4 | % | 7.7 | % | ||
Profit after tax/equity interests | ||||||
Net profit from ordinary activities after tax attributable to members of the parent entity as a percentage of members equity at the end of the period | 9.2 | % | 8.1 | % |
8
Origin Energy Limited and Controlled Entities
4. INCOME TAX EXPENSE
| Consolidated | Consolidated | |||||
2003 $’000 | 2002 $’000 | |||||
Income tax expense/(benefit) on pre-tax accounting profit: | ||||||
(i) at Australian tax rate of 30% | 73,965 | 56,363 | ||||
(ii) adjustment for difference between Australian and overseas tax rates | (7 | ) | 63 | |||
Income tax expense on pre-tax accounting profit at standard rates | 73,958 | 56,426 | ||||
Add/(subtract) tax effect of major items causing permanent differences: | ||||||
Non-taxable distributions received | (2,649 | ) | (2,458 | ) | ||
Depreciation and amortisation | 12,615 | 16,491 | ||||
Recoupment of capital losses not previously recognised | (918 | ) | (2,066 | ) | ||
Share of associates’ net profit | (3,598 | ) | (2,131 | ) | ||
Recoupment of tax losses not previously brought to account | (165 | ) | (527 | ) | ||
Under/(Over) provision for tax in previous years | 733 | (981 | ) | |||
Net benefit of subvention payments | — | (11,301 | ) | |||
Other | 272 | 827 | ||||
| 6,290 | (2,146 | ) | ||||
Income tax expense relating to ordinary activities | 80,248 | 54,280 | ||||
9
Origin Energy Limited and Controlled Entities
5. DIVIDENDS
Date the dividend is payable | 3 October 2003 | ||||||
Date to determine entitlements to the dividend (ie on the basis of registrable transfers received by 5.00pm if securities are not CHESS approved, or security holding balances established by 5.00pm or such later time permitted by SCH Business Rules if securities are CHESS approved) and the last date for receipt of election notices for the dividend. | 19 September 2003 | ||||||
| Consolidated | Consolidated | ||||||
| Note | 2003 $’000 | 2002 $’000 | |||||
(a) Dividend Reconciliation | |||||||
Final prior year dividend under/(over) provided | (1 | ) | 1,818 | ||||
Interim dividend of 5 cents per share, franked to 2 cents per share at 30% paid 24 March 2003 (2002: 2 cents per share, fully franked at 30%) | 32,655 | 12,950 | |||||
Nil (2002: Final dividend of 3 cents per share, fully franked at 30% paid 21 October 2002) | — | 19,435 | |||||
| 10 | 32,654 | 34,203 | |||||
Restatement adjustment: | |||||||
Final dividend previously recognised in the year ended 30 June 2002, now recognized in the current financial year as a result of the initial adoption of AASB 1044 “Provisions, Contingent Liabilities and Contingent Assets” (refer note 1). | 10 | 19,435 | — | ||||
| 52,089 | 34,203 | ||||||
(b) Subsequent Event | |||||||
Since the end of the financial year, the Directors have declared a final dividend of 5 cents per share, franked to 2 cents per share at 30%, payable 3 October 2003. | 32,885 | — | |||||
The financial effect of this dividend has not been brought to account in the financial statements for the year ended 30
June 2003 and will be recognised in subsequent financial reports.
(c) Dividend Franking Account
Origin Energy Limited has no available franking credits.
10
Origin Energy Limited and Controlled Entities
6. NOTES TO THE STATEMENT OF CASH FLOWS
| Consolidated | Consolidated | ||||
2003 $’000 | 2002 $’000 | ||||
(A) Reconciliation of cash and cash equivalents | |||||
Cash includes cash on hand, at bank and short term deposits at call, net of outstanding bank overdrafts. | |||||
Cash as at the end of the financial period as shown in the Statement of Cash Flows is reconciled to the related items in the Statement of Financial Position as follows: | |||||
Cash | 16,431 | 17,255 | |||
Bank overdrafts | — | (6,704 | ) | ||
| 16,431 | 10,551 | ||||
(B) The following non cash financing and investing activities have not been included in the Statement of Cash Flows: | |||||
Issue of shares in respect of the Dividend Reinvestment Plan | 28,156 | 8,117 | |||
11
Origin Energy Limited and Controlled Entities
6. NOTES TO THE STATEMENT OF CASH FLOWS (continued)
(C) The consolidated entity acquired entities/businesses during the year ended 30 June 2003 for total consideration
of $225 million (30 June 2002: $87 million). The total assets and liabilities acquired are as follows:
| Consolidated | Consolidated | |||
| as at 30 June | 2003 $’000 | 2002 $’000 | ||
CURRENT ASSETS | ||||
Receivables | 133,327 | 7,168 | ||
Inventories | 3,470 | 5,663 | ||
Other | 3,377 | 14,573 | ||
TOTAL CURRENT ASSETS | 140,174 | 27,404 | ||
NON-CURRENT ASSETS | ||||
Receivables | 363 | — | ||
Property, plant and equipment | 93,011 | 70,572 | ||
Deferred tax assets | 15,258 | 229 | ||
TOTAL NON-CURRENT ASSETS | 108,632 | 70,801 | ||
TOTAL ASSETS | 248,806 | 98,205 | ||
CURRENT LIABILITIES | ||||
Payables | 99,906 | 7,129 | ||
Provisions | 37,183 | 1,623 | ||
TOTAL CURRENT LIABILITIES | 137,089 | 8,752 | ||
NON-CURRENT LIABILITIES | ||||
Deferred tax liabilities | — | 1,282 | ||
Provisions | 36,305 | 719 | ||
TOTAL NON-CURRENT LIABILITIES | 36,305 | 2,001 | ||
TOTAL LIABILITIES | 173,394 | 10,753 | ||
NET ASSETS | 75,412 | 87,452 | ||
Goodwill on acquisition | 149,309 | — | ||
CONSIDERATION | 224,721 | 87,452 | ||
12
Origin Energy Limited and Controlled Entities
7. CONTRIBUTED EQUITY
| Consolidated | Consolidated | |||||
| Note | 2003 $’000 | 2002 $’000 | ||||
ISSUED AND PAID-UP CAPITAL | ||||||
657,709,751 (2002: 647,829,152) ordinary shares, fully paid | 418,612 | 385,039 | ||||
ORDINARY SHARE CAPITAL | ||||||
Balance at the beginning of the financial year | 385,039 | 178,457 | ||||
Shares issued: | ||||||
- 2,333,300 (2002: 761,650) shares in accordance with the Senior Executive Option Plan | 5,417 | 1,570 | ||||
- 7,547,299 (2002: 2,693,165) shares in accordance with the Dividend Reinvestment Plan | 28,156 | 8,117 | ||||
- Nil (2002: 44,196,526) shares in accordance with the Share Placement | — | 123,332 | ||||
- Nil (2002: 26,500,287) shares in accordance with the Share Purchase Plan | — | 73,563 | ||||
- Nil (2002: 629,145) shares in accordance with the Employee Share Plan | — | — | ||||
Total movements in ordinary share capital | 10 | 33,573 | 206,582 | |||
| 418,612 | 385,039 | |||||
Terms and conditions
Holders of ordinary shares are entitled to receive dividends as declared from time to time and are entitled to one vote per share at
shareholders’ meetings. In the event of winding up of the company, ordinary shareholders rank after creditors, and are fully entitled
to any proceeds of liquidation.
13
Origin Energy Limited and Controlled Entities
8. ISSUED AND QUOTED SECURITIES AT 30 JUNE 2003
Category of securities | Number issued | Number quoted | ||
Ordinary securities | 657,709,751 | 657,709,751 | ||
Changes during year ended 30 June 2003 Increases through issues in accordance with: | ||||
(a) the Dividend Reinvestment Plan | 3,062,208 | 3,062,208 | ||
| 4,485,091 | 4,485,091 | |||
| 7,547,299 | 7,547,299 | |||
(b) the Senior Executive Option Plan (refer Exercised details below) | 2,333,300 | 2,333,300 | ||
| 9,880,599 | 9,880,599 | |||
Options | Number | Exercise price | Expiry date | ||||
On issue at 30 June 2003 | 365,000 | $ | 1.66 | 4 Dec 2003 | |||
| 50,000 | $ | 1.50 | 4 Dec 2003 | ||||
| 30,000 | $ | 1.66 | 19 Jan 2004 | ||||
| 1,250,000 | $ | 2.24 | 1 Feb 2004 | ||||
| 881,500 | $ | 1.76 | 6 Dec 2004 | ||||
| 55,500 | $ | 1.78 | 6 Dec 2004 | ||||
| 2,230,000 | $ | 1.27 | 1 Mar 2005 | ||||
| 495,000 | $ | 2.74 | 31 Aug 2006 | ||||
| 3,495,000 | $ | 3.20 | 16 Dec 2006 | ||||
| 30,000 | $ | 3.20 | 14 Jan 2007 | ||||
| 2,630,000 | $ | 3.56 | 19 Dec 2007 | ||||
Issued during year ended 30 June 2003 | 2,630,000 | $ | 3.56 | 19 Dec 2007 | |||
Exercised during year ended 30 June 2003 | 1,125,000 | $ | 2.92 | 11 Dec 2002 | |||
| 280,000 | $ | 1.66 | 4 Dec 2003 | ||||
| 30,000 | $ | 2.92 | 2 Mar 2003 | ||||
| 30,000 | $ | 1.66 | 19 Jan 2004 | ||||
| 784,400 | $ | 1.76 | 6 Dec 2004 | ||||
| 83,900 | $ | 1.78 | 6 Dec 2004 | ||||
Expired during year ended 30 June 2003 | 35,000 | $ | 2.92 | 11 Dec 2002 | |||
| 70,000 | $ | 5.02 | 11 Dec 2002 | ||||
14
Origin Energy Limited and Controlled Entities
9. EARNINGS PER SHARE (EPS)
| Consolidated | Consolidated | |||
2003 cents | 2002 cents | |||
Details of basic and diluted EPS reported separately in accordance with paragraph 9 and 18 ofAASB1027 “Earnings Per Share” are as follows. | ||||
Basic EPS | 24.8 cents | 20.2 cents | ||
Diluted EPS | 24.7 cents | 20.1 cents | ||
| Weighted average number of shares used as the denominator | ||||
2003 Number | 2002 Number | |||
Number for basic earnings per share | ||||
Ordinary Shares | 652,380,401 | 637,291,869 | ||
Number for diluted earnings per share | ||||
Ordinary Shares | 652,380,401 | 637,291,869 | ||
Effect of executive share options on issue | 4,061,388 | 2,996,168 | ||
| 656,441,739 | 640,288,037 | |||
| Reconciliation of earnings used in calculating EPS: | ||||
2003 $’000 | 2002 $’000 | |||
Basic and diluted EPS | ||||
Net profit | 166,303 | 133,600 | ||
Less: Outside equity interests | 4,351 | 4,940 | ||
Amount used as numerator in calculating basic and diluted EPS | 161,952 | 128,660 | ||
Information concerning the classification of securities
(a) Fully paid ordinary shares
Fully paid ordinary shares are classified as ordinary shares for the purposes of calculating basic and diluted earnings
per share.
(b) Share Options
Share options granted under the Senior Executive Option Plan have been classified as potential ordinary shares and
have been included in the determination of diluted earnings per share. The options have not been included in the
determination of basic earnings per share.
15
Origin Energy Limited and Controlled Entities
10. RETAINED PROFITS AND TOTAL EQUITY
| Consolidated | Consolidated | |||||||
| Note | 2003 $’000 | 2002 $’000 | ||||||
Retained profits reconciliation | ||||||||
Previously reported retained profits at the end of the previous financial year | 1,095,158 | 999,223 | ||||||
Adjustment resulting from initial adoption of revised AASB 1028 “Employee Benefits” | (283 | ) | — | |||||
Adjustment to dividends resulting from initial adoption of revised AASB 1044 “Provisions, Contingent Liabilities and Contingent Assets” | 19,435 | — | ||||||
Restated retained profits at the beginnng of the financial year | 1,114,310 | 999,223 | ||||||
Dividends recognised in the current year as a result of the initial adoption of AASB 1044 “Provisions, Contingent Liabiities and Contingent Assets” | 5 | (19,435 | ) | — | ||||
Current year dividend paid during the year | 5 | (32,654 | ) | (34,203 | ) | |||
Net profit attributable to members of the parent entity, Origin Energy Limited | 161,952 | 128,660 | ||||||
Aggregate of amounts transferred (to)/from reserves | (196 | ) | 1,478 | |||||
Retained profits at the end of the financial year | 1,223,977 | 1,095,158 | ||||||
Total equity reconciliation | ||||||||
Total equity at the beginning of the financial year | 1,626,039 | 1,328,372 | ||||||
Total changes in parent entity interest in equity recognised in the Statement of Financial Performance | 159,890 | 127,216 | ||||||
Transactions with owners as owners: | ||||||||
Contributions of equity | 7 | 33,573 | 206,582 | |||||
Dividends recognised during the year | 5 | (32,654 | ) | (34,203 | ) | |||
Total changes in outside equity interests | 2,756 | (1,928 | ) | |||||
Total equity at the end of the financial year | 1,789,604 | 1,626,039 | ||||||
16
Origin Energy Limited and Controlled Entities
11. CONTROL GAINED OVER ENTITIES HAVING MATERIAL EFFECT
Name of entity | AES Australia Holding BV AES Mt Stuart BV AES Mt Stuart General Partnership | |||
| Consolidated operating profit and extraordinary items after tax of the entity since the date in the current period on which control was acquired | $762,000 | |||
Date from which such profit has been calculated | 13 December 2002 | |||
17
Origin Energy Limited and Controlled Entities
12. INTERESTS IN ENTITIES WHICH ARE NOT CONTROLLED ENTITIES
| Percentage of ownership interest held at the end of the period | Contribution to net profit | |||||||||
Consolidated % | Consolidated 2002 % | Consolidated 2003 $’000 | Consolidated 2002 $’000 | |||||||
Equity accounted associates and | ||||||||||
BIEP Pty Ltd | 33.3 | 33.3 | — | — | ||||||
BIEP Security Pty Ltd | 33.3 | 33.3 | — | — | ||||||
Bulwer Island Energy Partnership | 50.0 | 50.0 | 5,244 | 5,073 | ||||||
Campaspe Asset Management Services Pty Ltd | 50.0 | — | — | — | ||||||
CUBE Pty Ltd* | 50.0 | 50.0 | 5,627 | 2,579 | ||||||
Gas Industry Superannuation Pty Ltd | 50.0 | 50.0 | — | — | ||||||
Rockgas Ltd | 50.0 | 50.0 | 1,694 | 686 | ||||||
SEA Gas Partnership | 50.0 | 50.0 | — | — | ||||||
Vitalgas Pty Limited | 50.0 | 50.0 | — | — | ||||||
WEBE Pty Ltd | 50.0 | 50.0 | — | — | ||||||
Total | 12,565 | 8,338 | ||||||||
Other material interests: | ||||||||||
Envestra Limited | 19.1 | % | 19.1 | % | 12,821 | 11,591 | ||||
Total | 12,821 | 11,591 | ||||||||
| * | Osborne Cogeneration Pty Ltd, a company incorporated in SA, is a wholly-owned controlled entity of CUBE Pty Ltd. |
18
Origin Energy Limited and Controlled Entities
13. CONTINGENT LIABILITIES
Details of contingent liabilities and contingent assets where the probability of future payments/receipts is not considered remote are set out below, as well as details of contingent liabilities and contingent assets, which although considered remote, the Directors consider should be disclosed. The Directors are of the opinion that provisions are not required in respect of these matters, as it is not probable that a future sacrifice of economic benefits will be required or the amount is not capable of reliable measurement.
| Consolidated | Consolidated | |||
| 2003 $’000 | 2002 $’000 | |||
Contingent liabilities not considered remote: | ||||
Unsecured: | ||||
Bank guarantees | 169,811 | 99,566 | ||
Origin Energy Limited has given to its bankers letters of responsibility in respect of accommodation provided from time to time by the banks to Origin Energy Limited’s wholly or partly owned controlled entities.
Warranties and indemnities have been given by entities in the consolidated entity in relation to environmental liabilities for certain properties as part of the terms and conditions of divestments.
A number of sites within the consolidated entity have been identified as contaminated, all of which are subject to ongoing environmental management programmes to ensure appropriate controls are in place and clean-up requirements are implemented. For sites where the requirements can be assessed and costs estimated, the estimated cost of remediation has been expensed or provided for. The contamination has generally resulted from prior activities conducted at the sites.
Certain entities within the consolidated entity are subject to various lawsuits and claims, including claims for additional income tax, stamp duty and penalties, native title claims and a cross-claim arising from an action brought against Esso/BHP in relation to the Longford explosion in 1998. Any liabilities arising from such lawsuits and claims are not expected to have a material adverse effect on the consolidated financial statements.
A Demerger Deed was entered into in the 2000 year containing certain indemnities and other agreements between Origin Energy Limited and Boral Limited and their respective controlled entities covering the transfer of the businesses, investments, debt and assets of Boral Limited and some temporary shared arrangements.
14. EVENTS SUBSEQUENT TO BALANCE DATE
Dividends declared subsequent to 30 June 2003
Refer Note 5.
Oil Company of Australia Limited
On 11 July 2003 Origin announced an off-market cash offer to acquire all the ordinary shares in Oil Company of Australia Limited (“OCA”) that it does not already own. At 30 June 2003 Origin held 85.23% of the issued capital of OCA. If successful, the anticipated purchase price of the remaining OCA shares is expected to be approximately $74 million.
The financial effects of the above transactions have not been brought to account in the financial report for the year ended 30 June 2003.
19
| Annual Meeting | ||
The annual meeting will be held as follows: | ||
Place | Wesley Conference Centre | |
220 Pitt Street | ||
Sydney NSW 2000 | ||
Date | 16 October 2003 | |
Time | 10:30am | |
Approximate date the annual report will be available | 16 September 2003 | |
Compliance statement
| 1 | This report has been prepared in accordance with Accounting Standard AASB 1039 “Concise Financial Reports” (excluding the discussion and analysis requirements of the standard) and applicable Urgent Issues Group Consensus Views. |
| 2 | This report and the accounts upon which the report is based, use the same accounting policies. |
| 3 | This report does give a true and fair view of the matters disclosed. |
| 4 | This report is based on accounts to which one of the following applies. |
þ The accounts have been audited. | ¨ The accounts have been subject to review. | |
¨ The accounts are in the process of being audited or subject to review. | ¨ The accounts havenot yet been audited or reviewed. | |
| 5 | The audit report is attached. |
| 6 | The entity has a formally constituted audit committee. |
Sign here: |
| Date: | 20 August 2003 | |||
(Company secretary) | ||||||
Print name: | W M Hundy | |||||
20
Item 5.
To | Company Announcements Office | Facsimile | 1300 300 021 | |||
Company | Australian Stock Exchange Limited | Date | 20 August 2003 | |||
From | Bill Hundy | Pages | 21 | |||
Subject | Results Announcement Year Ended 30 June 2003 - Presentation | |||||
This Transmittal is confidential. If you have received this document in error, please contact Origin Energy immediately.
Please find attached a presentation to be given to the Media and Financial Markets today regarding Origin Energy’s Results for the Full Year Ended 30 June 2003.
Regards
Bill Hundy
Company Secretary
Item 6.

[GRAPHIC APPEARS HERE]
Outline
| • | Performance Highlights |
| • | Financial Review |
| • | Operational Review |
| • | Outlook |
Unless otherwise stated, all comparative data are in relation to the prior corresponding period, the financial year ended 30 June, 2002.
[LOGO]
2

[GRAPHIC APPEARS HERE]
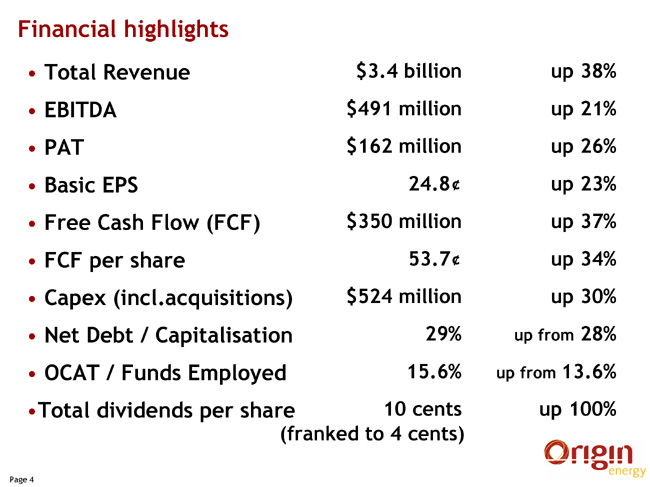
Financial highlights
• Total Revenue | $ | 3.4 billion | up 38 | % | |||
• EBITDA | $ | 491 million | up 21 | % | |||
• PAT | $ | 162 million | up 26 | % | |||
• Basic EPS | 24.8 | ¢ | up 23 | % | |||
• Free Cash Flow (FCF) | $ | 350 million | up 37 | % | |||
• FCF per share | 53.7 | ¢ | up 34 | % | |||
• Capex (incl.acquisitions) | $ | 524 million | up 30 | % | |||
• Net Debt / Capitalisation | 29 | % | up from 28 | % | |||
• OCAT / Funds Employed | 15.6 | % | up from 13.6 | % | |||
• Total dividends per share (franked to 4 cents) | 10 cents | up 100 | % |
[LOGO]
4
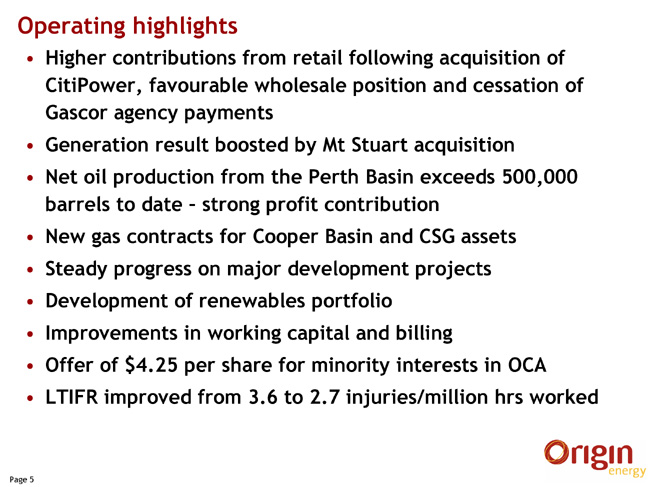
Operating highlights
| • | Higher contributions from retail following acquisition of CitiPower, favourable wholesale position and cessation of Gascor agency payments |
| • | Generation result boosted by Mt Stuart acquisition |
| • | Net oil production from the Perth Basin exceeds 500,000 barrels to date - strong profit contribution |
| • | New gas contracts for Cooper Basin and CSG assets |
| • | Steady progress on major development projects |
| • | Development of renewables portfolio |
| • | Improvements in working capital and billing |
| • | Offer of $4.25 per share for minority interests in OCA |
| • | LTIFR improved from 3.6 to 2.7 injuries/million hrs worked |
[LOGO]
5

[GRAPHIC APPEARS HERE]
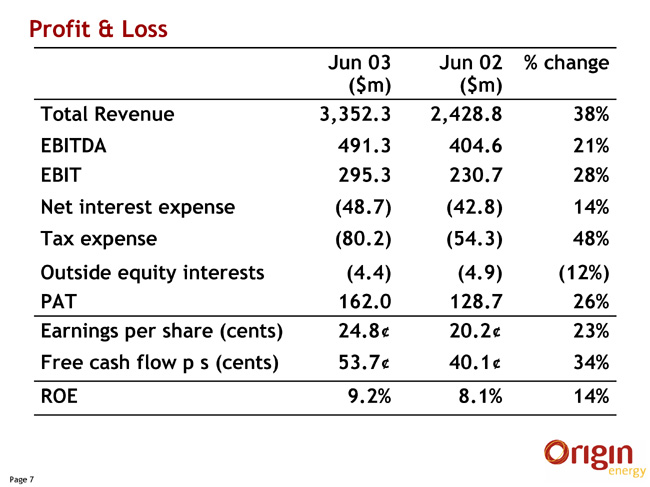
Profit & Loss
| Jun 03 ($m) | Jun 02 ($m) | % change | |||||||
Total Revenue | 3,352.3 | 2,428.8 | 38 | % | |||||
EBITDA | 491.3 | 404.6 | 21 | % | |||||
EBIT | 295.3 | 230.7 | 28 | % | |||||
Net interest expense | (48.7 | ) | (42.8 | ) | 14 | % | |||
Tax expense | (80.2 | ) | (54.3 | ) | 48 | % | |||
Outside equity interests | (4.4 | ) | (4.9 | ) | (12 | )% | |||
PAT | 162.0 | 128.7 | 26 | % | |||||
Earnings per share (cents) | 24.8 | ¢ | 20.2 | ¢ | 23 | % | |||
Free cash flow p s (cents) | 53.7 | ¢ | 40.1 | ¢ | 34 | % | |||
ROE | 9.2 | % | 8.1 | % | 14 | % | |||
[LOGO]
7
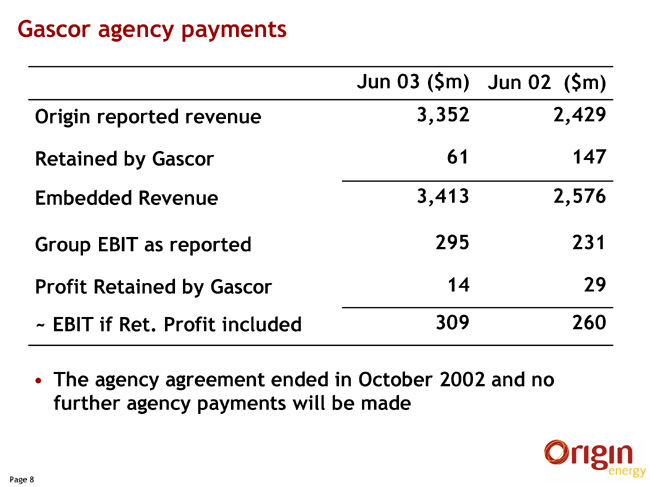
Gascor agency payments
| Jun 03 ($m) | Jun 02 ($m) | |||
Origin reported revenue | 3,352 | 2,429 | ||
Retained by Gascor | 61 | 147 | ||
Embedded Revenue | 3,413 | 2,576 | ||
Group EBIT as reported | 295 | 231 | ||
Profit Retained by Gascor | 14 | 29 | ||
~ EBIT if Ret. Profit included | 309 | 260 |
| • | The agency agreement ended in October 2002 and no further agency payments will be made |
[LOGO]
8
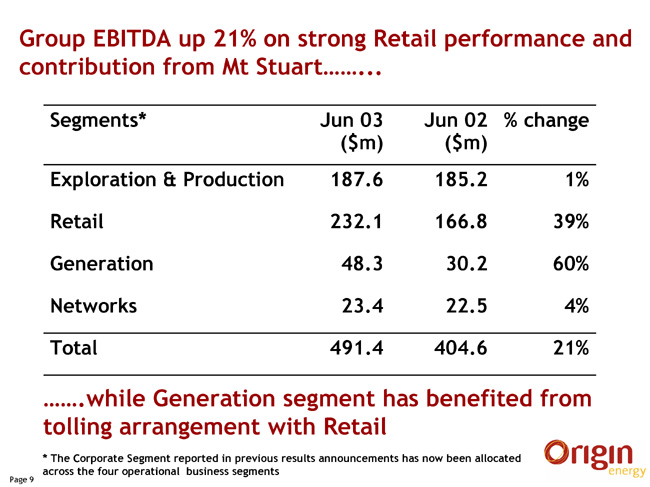
Group EBITDA up 21% on strong Retail performance and contribution from Mt Stuart......
Segments* | Jun 03 ($m) | Jun 02 ($m) | % change | ||||
Exploration & Production | 187.6 | 185.2 | 1 | % | |||
Retail | 232.1 | 166.8 | 39 | % | |||
Generation | 48.3 | 30.2 | 60 | % | |||
Networks | 23.4 | 22.5 | 4 | % | |||
Total | 491.4 | 404.6 | 21 | % | |||
......while Generation segment has benefited from tolling arrangement with Retail
| * | The Corporate Segment reported in previous results announcements has now been allocated across the four operational business segments |
[LOGO]
9
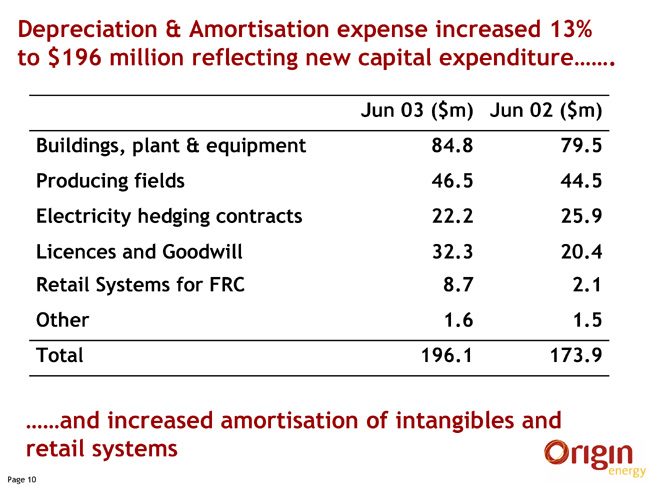
Depreciation & Amortisation expense increased 13% to $196 million reflecting new capital expenditure.......
| Jun 03 ($m) | Jun 02 ($m) | |||
Buildings, plant & equipment | 84.8 | 79.5 | ||
Producing fields | 46.5 | 44.5 | ||
Electricity hedging contracts | 22.2 | 25.9 | ||
Licences and Goodwill | 32.3 | 20.4 | ||
Retail Systems for FRC | 8.7 | 2.1 | ||
Other | 1.6 | 1.5 | ||
Total | 196.1 | 173.9 | ||
......and increased amortisation of intangibles and retail systems
[LOGO]
10

Profit & Loss
| Jun 03 ($m) | Jun 02 ($m) | % change | |||||||
Total Revenue | 3,352.3 | 2,428.8 | 38 | % | |||||
EBITDA | 491.3 | 404.6 | 21 | % | |||||
EBIT | 295.3 | 230.7 | 28 | % | |||||
Net interest expense | (48.7 | ) | (42.8 | ) | 14 | % | |||
Tax expense | (80.2 | ) | (54.3 | ) | 48 | % | |||
Outside equity interests | (4.4 | ) | (4.9 | ) | (12 | )% | |||
PAT | 162.0 | 128.7 | 26 | % | |||||
Earnings per share (cents) | 24.8 | ¢ | 20.2 | ¢ | 23 | % | |||
Free cash flow p s (cents) | 53.7 | ¢ | 40.1 | ¢ | 34 | % | |||
ROE | 9.2 | % | 8.1 | % | 14 | % | |||
[LOGO]
11
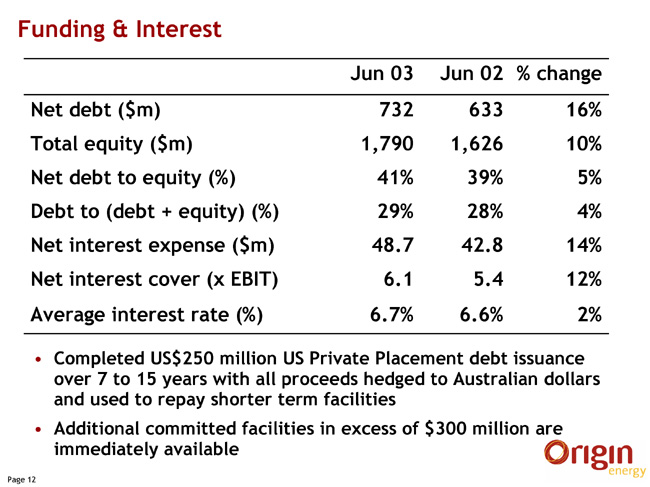
Funding & Interest
| Jun 03 | Jun 02 | % change | |||||||
Net debt ($m) | 732 | 633 | 16 | % | |||||
Total equity ($m) | 1,790 | 1,626 | 10 | % | |||||
Net debt to equity (%) | 41 | % | 39 | % | 5 | % | |||
Debt to (debt + equity) (%) | 29 | % | 28 | % | 4 | % | |||
Net interest expense ($m) | 48.7 | 42.8 | 14 | % | |||||
Net interest cover (x EBIT) | 6.1 | 5.4 | 12 | % | |||||
Average interest rate (%) | 6.7 | % | 6.6 | % | 2 | % |
| • | Completed US$250 million US Private Placement debt issuance over 7 to 15 years with all proceeds hedged to Australian dollars and used to repay shorter term facilities |
| • | Additional committed facilities in excess of $300 million are immediately available |
[LOGO]
12
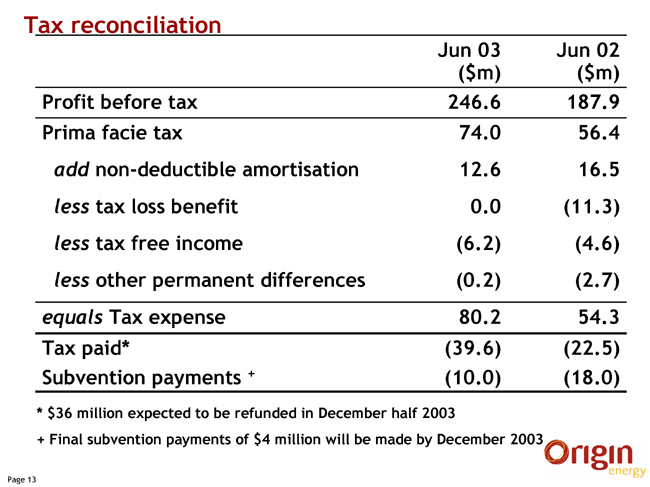
Tax reconciliation
| Jun 03 ($m) | Jun 02 ($m) | |||||
Profit before tax | 246.6 | 187.9 | ||||
Prima facie tax | 74.0 | 56.4 | ||||
add non-deductible amortisation | 12.6 | 16.5 | ||||
less tax loss benefit | 0.0 | (11.3 | ) | |||
less tax free income | (6.2 | ) | (4.6 | ) | ||
less other permanent differences | (0.2 | ) | (2.7 | ) | ||
equals Tax expense | 80.2 | 54.3 | ||||
Tax paid* | (39.6 | ) | (22.5 | ) | ||
Subvention payments+ | (10.0 | ) | (18.0 | ) | ||
| * | $36 million expected to be refunded in December half 2003 |
| + | Final subvention payments of $4 million will be made by December 2003 |
[LOGO]
13

The OCAT ratio improved largely due to immediate cash flow from acquisitions
| Jun 03 ($m) | Jun 02($m) | |||||
EBITDA | 491 | 405 | ||||
Non-cash items (net) | 13 | (17 | ) | |||
Change in Working Capital | 39 | 16 | ||||
Stay in business Capex (net) | (94 | ) | (65 | ) | ||
Tax/Subvention Payments | (50 | ) | (40 | ) | ||
OCAT | 399 | 299 | ||||
Net Interest Paid | (49 | ) | (43 | ) | ||
Free cash flow | 350 | 256 | ||||
Funds Employed | 2,465 | 2,189 | ||||
OCAT Ratio | 15.6 | % | 13.7 | % | ||
[LOGO]
14
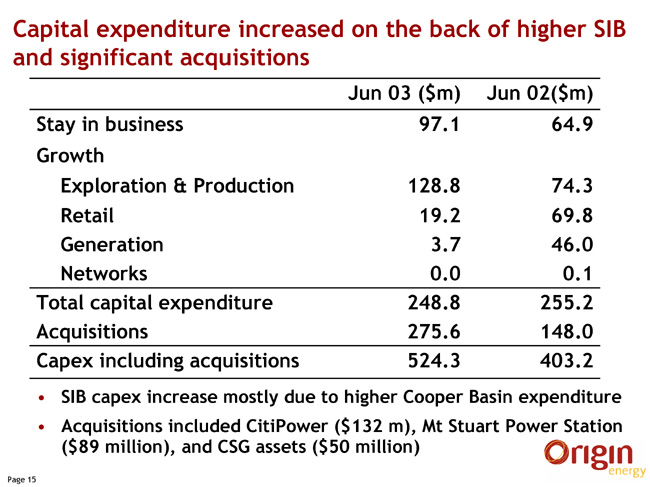
Capital expenditure increased on the back of higher SIB and significant acquisitions
| Jun 03 ($m) | Jun 02($m) | |||
Stay in business | 97.1 | 64.9 | ||
Growth | ||||
Exploration & Production | 128.8 | 74.3 | ||
Retail | 19.2 | 69.8 | ||
Generation | 3.7 | 46.0 | ||
Networks | 0.0 | 0.1 | ||
Total capital expenditure | 248.8 | 255.2 | ||
Acquisitions | 275.6 | 148.0 | ||
Capex including acquisitions | 524.3 | 403.2 | ||
| • | SIB capex increase mostly due to higher Cooper Basin expenditure |
| • | Acquisitions included CitiPower ($132 m), Mt Stuart Power Station ($89 million), and CSG assets ($50 million) |
[LOGO]
15
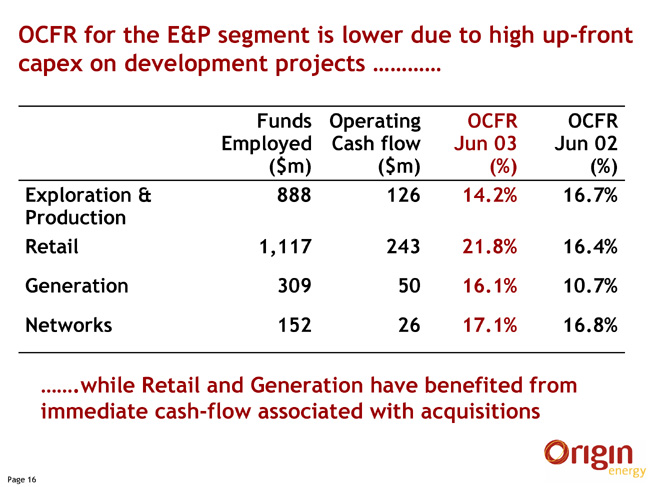
OCFR for the E&P segment is lower due to high up-front capex on development projects ............
| Funds Employed ($m) | Operating Cash flow ($m) | OCFR Jun 03 (%) | OCFR Jun 02 (%) | |||||||
Exploration & Production | 888 | 126 | 14.2 | % | 16.7 | % | ||||
Retail | 1,117 | 243 | 21.8 | % | 16.4 | % | ||||
Generation | 309 | 50 | 16.1 | % | 10.7 | % | ||||
Networks | 152 | 26 | 17.1 | % | 16.8 | % |
.......while Retail and Generation have benefited from immediate cash-flow associated with acquisitions
[LOGO]
16
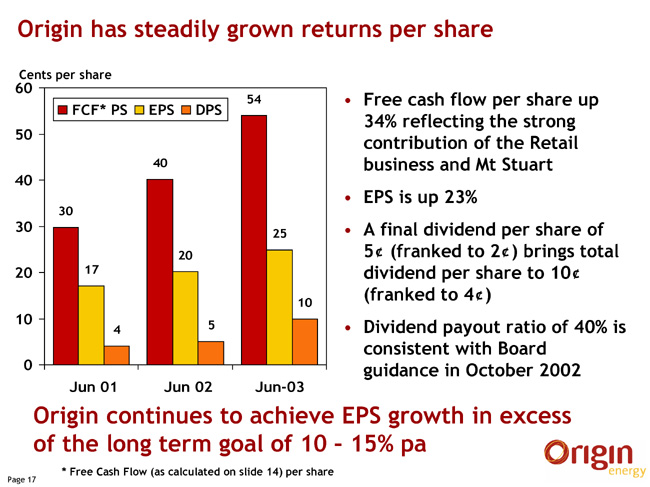
Origin has steadily grown returns per share
[GRAPHIC APPEARS HERE]
| • | Free cash flow per share up 34% reflecting the strong contribution of the Retail business and Mt Stuart |
| • | EPS is up 23% |
| • | A final dividend per share of 5¢ (franked to 2¢) brings total dividend per share to 10¢ (franked to 4¢) |
| • | Dividend payout ratio of 40% is consistent with Board guidance in October 2002 |
Origin continues to achieve EPS growth in excess of the long term goal of 10 - 15% pa
| * | Free Cash Flow (as calculated on slide 14) per share |
[LOGO]
17

[GRAPHIC APPEARS HERE]
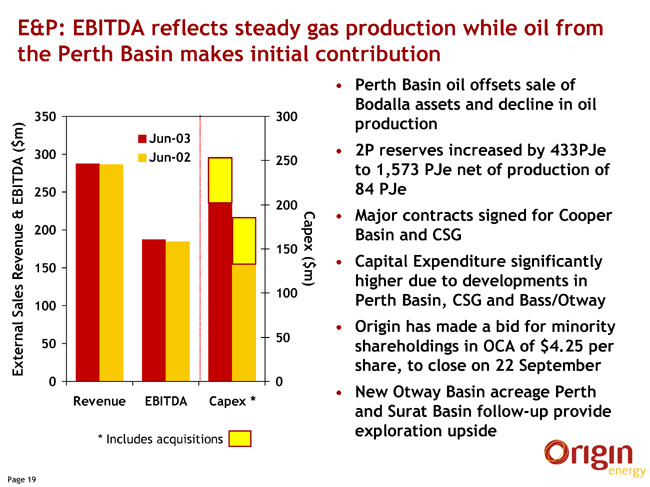
E&P: EBITDA reflects steady gas production while oil from the Perth Basin makes initial contribution
[GRAPHIC APPEARS HERE]
| * | Includes acquisitions¨ |
| • | Perth Basin oil offsets sale of Bodalla assets and decline in oil production |
| • | 2P reserves increased by 433PJe to 1,573 PJe net of production of 84 PJe |
| • | Major contracts signed for Cooper Basin and CSG |
| • | Capital Expenditure significantly higher due to developments in Perth Basin, CSG and Bass/Otway |
| • | Origin has made a bid for minority shareholdings in OCA of $4.25 per share, to close on 22 September |
| • | New Otway Basin acreage Perth and Surat Basin follow-up provide exploration upside |
[LOGO]
19
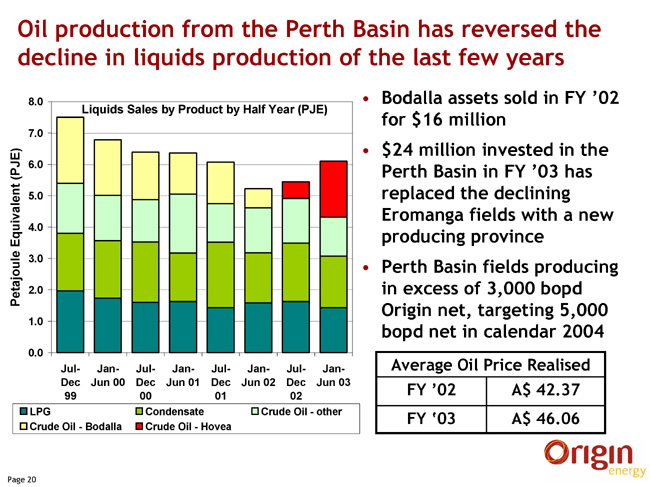
Oil production from the Perth Basin has reversed the decline in liquids production of the last few years
[GRAPHIC APPEARS HERE]
| • | Bodalla assets sold in FY ’02 for $16 million |
| • | $24 million invested in the Perth Basin in FY ’03 has replaced the declining Eromanga fields with a new producing province |
| • | Perth Basin fields producing in excess of 3,000 bopd Origin net, targeting 5,000 bopd net in calendar 2004 |
Average Oil Price Realised | ||
FY ’02 | A$ 42.37 | |
FY ‘03 | A$ 46.06 | |
[LOGO]
20
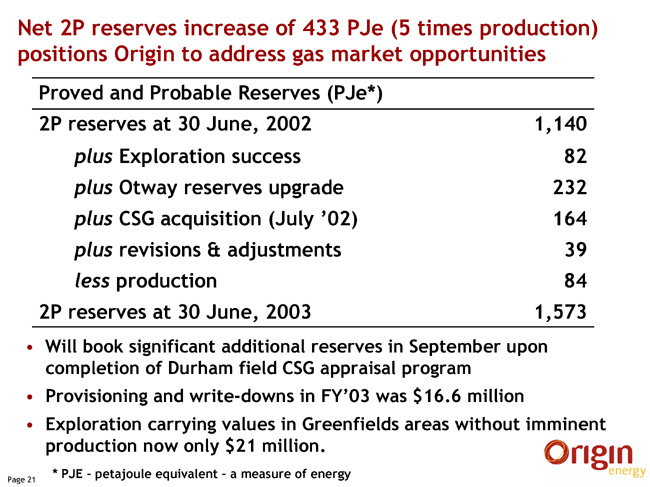
Net 2P reserves increase of 433 PJe (5 times production) positions Origin to address gas market opportunities
[GRAPHIC APPEARS HERE]
Proved and Probable Reserves (PJe*) | ||
2P reserves at 30 June, 2002 | 1,140 | |
plus Exploration success | 82 | |
plus Otway reserves upgrade | 232 | |
plus CSG acquisition (July ’02) | 164 | |
plus revisions & adjustments | 39 | |
less production | 84 | |
2P reserves at 30 June, 2003 | 1,573 | |
| • | Will book significant additional reserves in September upon completion of Durham field CSG appraisal program |
| • | Provisioning and write-downs in FY’03 was $16.6 million |
| • | Exploration carrying values in Greenfields areas without imminent production now only $21 million. |
| * | PJE - petajoule equivalent - a measure of energy |
[LOGO]
21
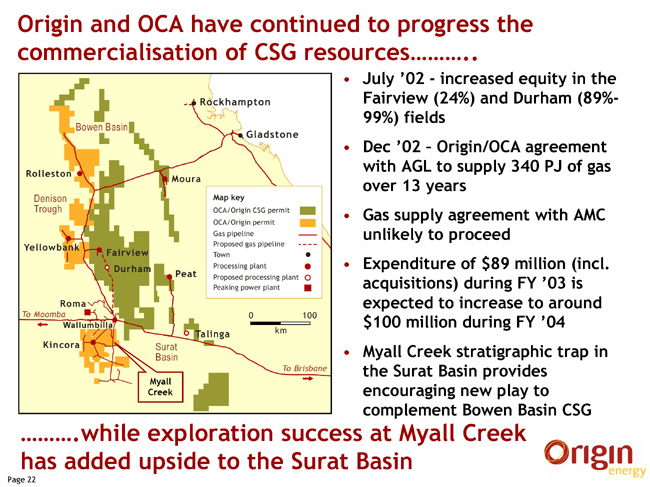
Origin and OCA have continued to progress the commercialisation of CSG resources...........
[GRAPHIC APPEARS HERE]
| • | July ’02 - increased equity in the Fairview (24%) and Durham (89%-99%) fields |
| • | Dec ’02 - Origin/OCA agreement with AGL to supply 340 PJ of gas over 13 years |
| • | Gas supply agreement with AMC unlikely to proceed |
| • | Expenditure of $89 million (incl. acquisitions) during FY ’03 is expected to increase to around $100 million during FY ’04 |
| • | Myall Creek stratigraphic trap in the Surat Basin provides encouraging new play to complement Bowen Basin CSG |
..........while exploration success at Myall Creek has added upside to the Surat Basin
[LOGO]
22
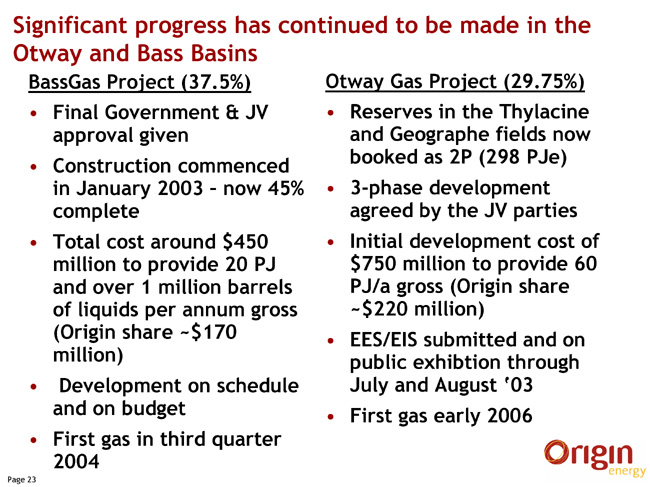
Significant progress has continued to be made in the Otway and Bass Basins
BassGas Project (37.5%) | Otway Gas Project (29.75%) | |
• Final Government & JV approval given | • Reserves in the Thylacine and Geographe fields now booked as 2P (298 PJe) | |
• Construction commenced in January 2003 - now 45% complete |
• 3-phase development agreed by the JV parties | |
• Total cost around $450 million to provide 20 PJ and over 1 million barrels of liquids per annum gross (Origin share ~$170 million) | • Initial development cost of $750 million to provide 60 PJ/a gross (Origin share ~$220 million) | |
• Development on schedule and on budget | • EES/EIS submitted and on public exhibtion through July and August ‘03 | |
• First gas in third quarter 2004 | • First gas early 2006 | |
[LOGO]
23
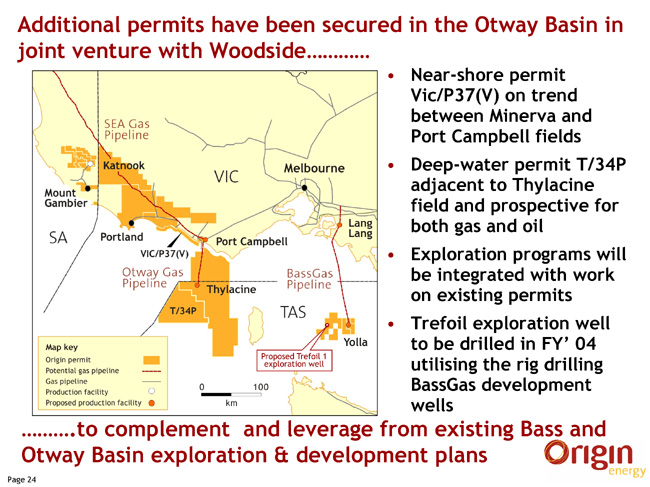
Additional permits have been secured in the Otway Basin in joint venture with Woodside............
[GRAPHIC APPEARS HERE]
| • | Near-shore permit Vic/P37(V) on trend between Minerva and Port Campbell fields |
| • | Deep-water permit T/34P adjacent to Thylacine field and prospective for both gas and oil |
| • | Exploration programs will be integrated with work on existing permits |
| • | Trefoil exploration well to be drilled in FY’ 04 utilising the rig drilling BassGas development wells |
..........to complement and leverage from existing Bass and Otway Basin exploration & development plans
[LOGO]
24
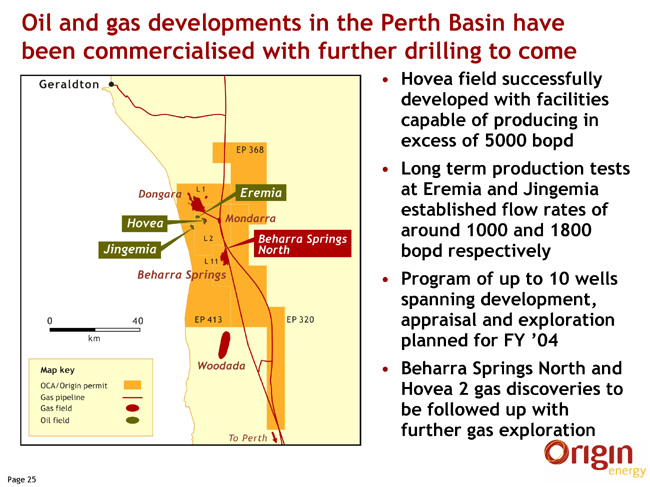
Oil and gas developments in the Perth Basin have been commercialised with further drilling to come
[GRAPHIC APPEARS HERE]
| • | Hovea field successfully developed with facilities capable of producing in excess of 5000 bopd |
| • | Long term production tests at Eremia and Jingemia established flow rates of around 1000 and 1800 bopd respectively |
| • | Program of up to 10 wells spanning development, appraisal and exploration planned for FY ’04 |
| • | Beharra Springs North and Hovea 2 gas discoveries to be followed up with further gas exploration |
[LOGO]
25
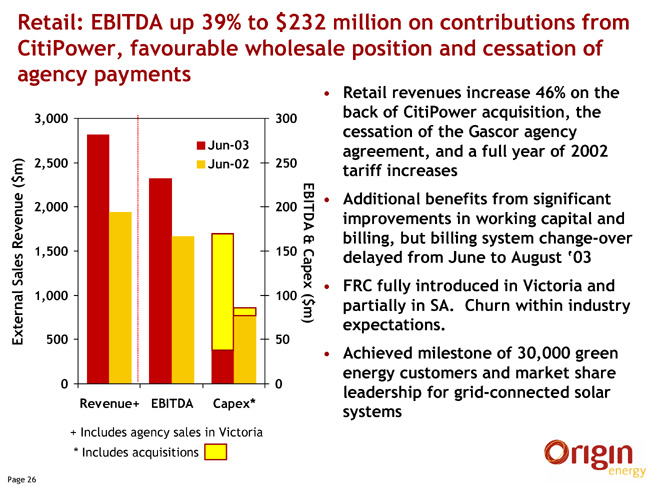
Retail: EBITDA up 39% to $232 million on contributions from CitiPower, favourable wholesale position and cessation of agency payments
[GRAPHIC APPEARS HERE]
| + | Includes agency sales in Victoria |
| * | Includes acquisitions¨ |
| • | Retail revenues increase 46% on the back of CitiPower acquisition, the cessation of the Gascor agency agreement, and a full year of 2002 tariff increases |
| • | Additional benefits from significant improvements in working capital and billing, but billing system change-over delayed from June to August ‘03 |
| • | FRC fully introduced in Victoria and partially in SA. Churn within industry expectations. |
| • | Achieved milestone of 30,000 green energy customers and market share leadership for grid-connected solar systems |
[LOGO]
26

Retail business: all areas contributed to the result
| Natural Gas * | Electricity | LPG | ||||
Revenue (A$m) | 841 | 1,547 | 417 | |||
Gross Margin (A$m) | 131 | 285 | 114 | |||
Sales - (PJ) | 123 | |||||
Sales - (TWh) | 15 | |||||
LPG (Ktonnes) | 479 | |||||
Total Sales (PJe) | 123 | 54 | 24 | |||
Customer # (‘000) | 986 | 851 | 200+ | |||
| * | Gross revenue received from customers (including Retained Profit component). Gross Margin is after payment of Retained Profit |
[LOGO]
27
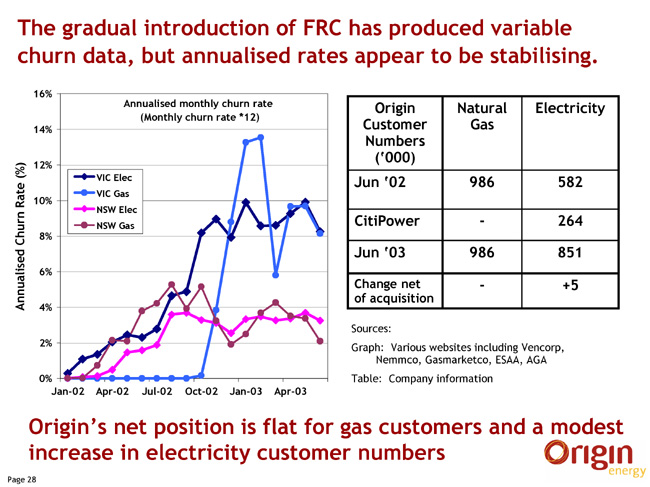
The gradual introduction of FRC has produced variable churn data, but annualised rates appear to be stabilising.
[GRAPHIC APPEARS HERE]
Origin Customer Numbers (‘000) | Natural Gas | Electricity | ||
Jun ‘02 | 986 | 582 | ||
CitiPower | — | 264 | ||
Jun ‘03 | 986 | 851 | ||
Change net of acquisition | — | +5 |
Sources:
Graph: Various websites including Vencorp, Nemmco, Gasmarketco, ESAA, AGA
Table: Company information
Origin’s net position is flat for gas customers and a modest increase in electricity customer numbers
[LOGO]
28

A well structured portfolio of contracts enabled access to low pool prices whilst maintaining a well covered position
[GRAPHIC APPEARS HERE]
| • | The pool price is not a good indication of true purchasing costs |
| • | Historic forward curves tend to reflect trends in the rolling annual spot curve |
| • | These historic curves approximate the buying costs of retailers |
| • | Effective management of electricity exposures requires purchase costs to be locked in 6-24 months or more ahead |
[LOGO]
29

LPG margins have been maintained despite increased purchasing costs
[GRAPHIC APPEARS HERE]
| • | Cost of LPG benchmark CP up $74 per tonne (17%) on previous year |
| • | Pacific volumes up but Australian volumes affected by drought and decline in Autogas sector. Overall volumes down 2% |
| • | Margins were maintained despite these pressures |
| • | Government announcement re the abolition of the “excise free” status of auto LPG unlikely to have a major impact for several years |
[LOGO]
30
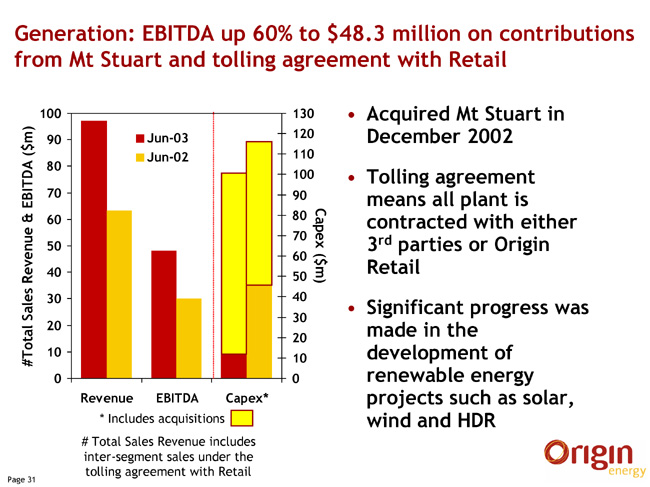
Generation: EBITDA up 60% to $48.3 million on contributions from Mt Stuart and tolling agreement with Retail
[GRAPHIC APPEARS HERE]
| * | Includes acquisitions ¨ |
| # | Total Sales Revenue includes inter-segment sales under the tolling agreement with Retail |
| • | Acquired Mt Stuart in December 2002 |
| • | Tolling agreement means all plant is contracted with either 3rd parties or Origin Retail |
| • | Significant progress was made in the development of renewable energy projects such as solar, wind and HDR |
[LOGO]
31
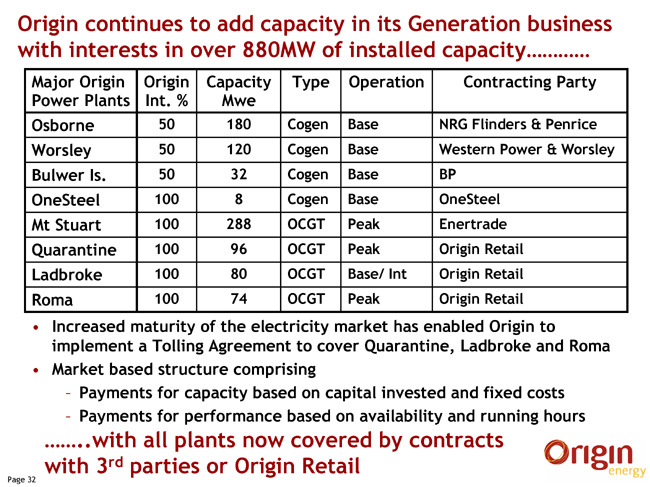
Origin continues to add capacity in its Generation business with interests in over 880MW of installed capacity............
Major Origin Power Plants | Origin Int. % | Capacity Mwe | Type | Operation | Contracting Party | |||||
Osborne | 50 | 180 | Cogen | Base | NRG Flinders & Penrice | |||||
Worsley | 50 | 120 | Cogen | Base | Western Power & Worsley | |||||
Bulwer Is. | 50 | 32 | Cogen | Base | BP | |||||
OneSteel | 100 | 8 | Cogen | Base | OneSteel | |||||
Mt Stuart | 100 | 288 | OCGT | Peak | Enertrade | |||||
Quarantine | 100 | 96 | OCGT | Peak | Origin Retail | |||||
Ladbroke | 100 | 80 | OCGT | Base/ Int | Origin Retail | |||||
Roma | 100 | 74 | OCGT | Peak | Origin Retail |
| • | Increased maturity of the electricity market has enabled Origin to implement a Tolling Agreement to cover Quarantine, Ladbroke and Roma |
| • | Market based structure comprising |
| - | Payments for capacity based on capital invested and fixed costs |
| - | Payments for performance based on availability and running hours |
........with all plants now covered by contracts with 3rd parties or Origin Retail
[LOGO]
32
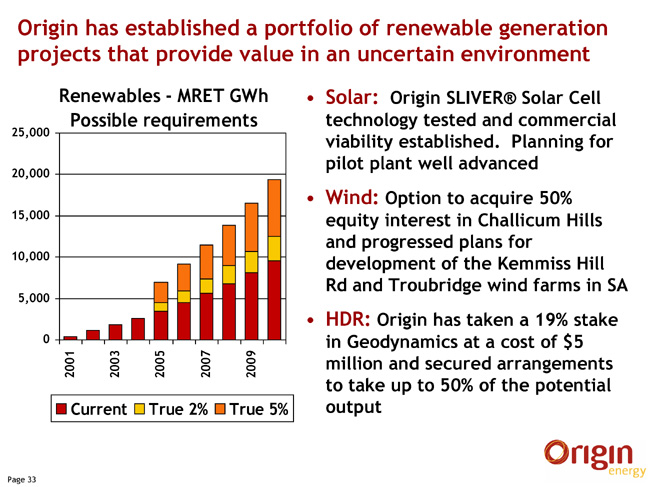
Origin has established a portfolio of renewable generation projects that provide value in an uncertain environment
[GRAPHIC APPEARS HERE]
| • | Solar: Origin SLIVER® Solar Cell technology tested and commercial viability established. Planning for pilot plant well advanced |
| • | Wind: Option to acquire 50% equity interest in Challicum Hills and progressed plans for development of the Kemmiss Hill Rd and Troubridge wind farms in SA |
| • | HDR: Origin has taken a 19% stake in Geodynamics at a cost of $5 million and secured arrangements to take up to 50% of the potential output |
[LOGO]
33

Networks: EBITDA up 4% to $23.4 million including higher distributions from Envestra
[GRAPHIC APPEARS HERE]
| * | excludes acquisitions |
| • | Distributions from Envestra were $1.2 million higher due to increased shareholding |
| • | Steady increase in Management fees offset by changes to other fees earned from Envestra |
| • | More than 25,000 customers added to networks under management, 300 km of new pipe laid and 105 km of mains replaced. |
| • | In JV with United Utilities won a 10 year contract for management of water network & treatment assets of Coliban Water in country Victoria. Revenues of $120 million over ten years expected. |
[LOGO]
34

SEA Gas pipeline: Steady progress made in construction - on budget and on schedule with 530 km laid to mid August
[GRAPHIC APPEARS HERE]
Commissioning scheduled for October 2003 and first commercial gas January 2004
[LOGO]
35

[GRAPHIC APPEARS HERE]

There are a number of factors influencing the profit outlook for FY ’04.........................
Positives | Negatives | |
• Increased oil production from the Perth Basin | • Gas production volumes will remain steady prior to additional sales from BassGas and CSG in FY ‘05 | |
• Full integration of the CitiPower business will reduce costs | • Additional costs associated with gradual introduction of FRC in SA | |
• Compared to prior period no Gascor payments | • Continued Government capping of energy tariffs creates uncertainty in margins | |
• Full year contribution from Mt Stuart power station | • Lower contribution from electricity purchasing contracts | |
• SEA Gas pipeline will commence operation in early 2004 | ||
....while increased capital expenditure on development projects will continue to drive growth
[LOGO]
37
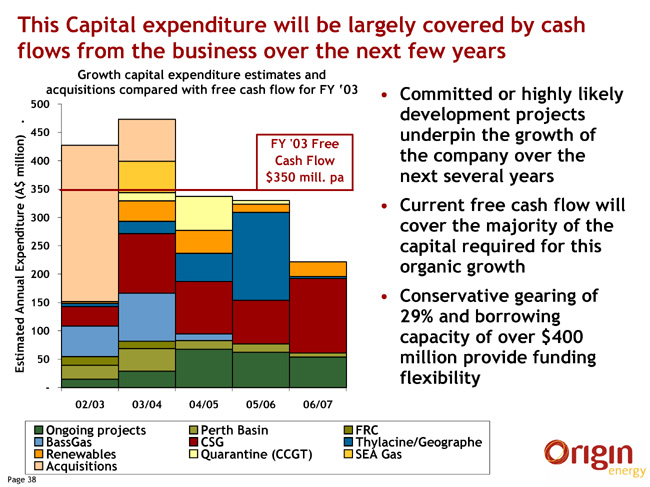
This Capital expenditure will be largely covered by cash flows from the business over the next few years
[GRAPHIC APPEARS HERE]
| • | Committed or highly likely development projects underpin the growth of the company over the next several years |
| • | Current free cash flow will cover the majority of the capital required for this organic growth |
| • | Conservative gearing of 29% and borrowing capacity of over $400 million provide funding flexibility |
[LOGO]
38
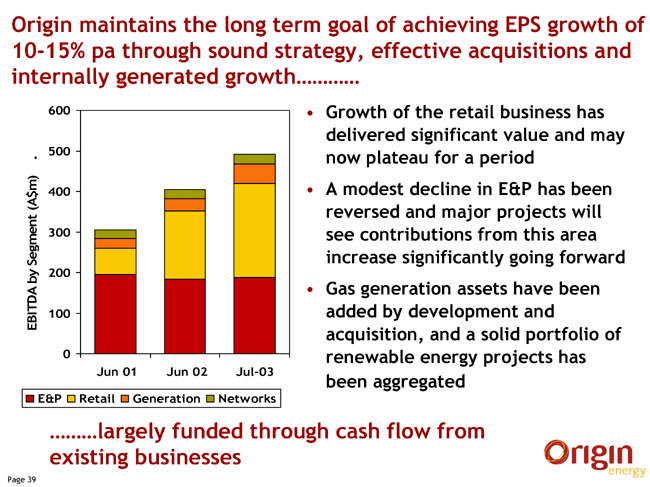
Origin maintains the long term goal of achieving EPS growth of 10-15% pa through sound strategy, effective acquisitions and internally generated growth............
[GRAPHIC APPEARS HERE]
| • | Growth of the retail business has delivered significant value and may now plateau for a period |
| • | A modest decline in E&P has been reversed and major projects will see contributions from this area increase significantly going forward |
| • | Gas generation assets have been added by development and acquisition, and a solid portfolio of renewable energy projects has been aggregated |
.........largely funded through cash flow from existing businesses
[LOGO]
39

[GRAPHIC APPEARS HERE]
Item 7.
To | Company Announcements Office | Facsimile | 1300 300 021 | |||
Company | Australian Stock Exchange Limited | Date | 21 August 2003 | |||
From | Bill Hundy | Pages | 8 | |||
Subject | EXPLORATION AND PRODUCTION PRESENTATION | |||||
Please find attached a copy of a presentation that Mr Rob Willink, General Manager, Exploration will deliver to the financial market today.
A copy of this presentation can also be obtained from our websitewww.originenergy.com.au under the Investor Centre - Presentations section.
Regards
Bill Hundy
Company Secretary
Item 8.

[GRAPHIC APPEARS HERE]
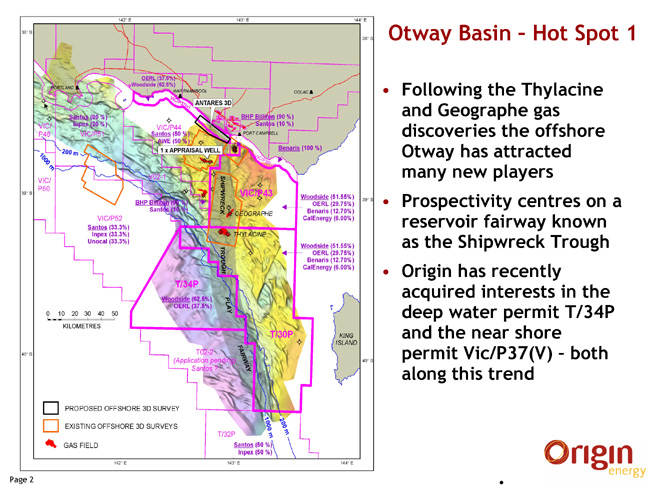
Otway Basin - Hot Spot 1
[GRAPHIC APPEARS HERE]
| • | Following the Thylacine and Geographe gas discoveries the offshore Otway has attracted many new players |
| • | Prospectivity centres on a reservoir fairway known as the Shipwreck Trough |
| • | Origin has recently acquired interests in the deep water permit T/34P and the near shore permit Vic/P37(V) - both along this trend |
[LOGO]
2
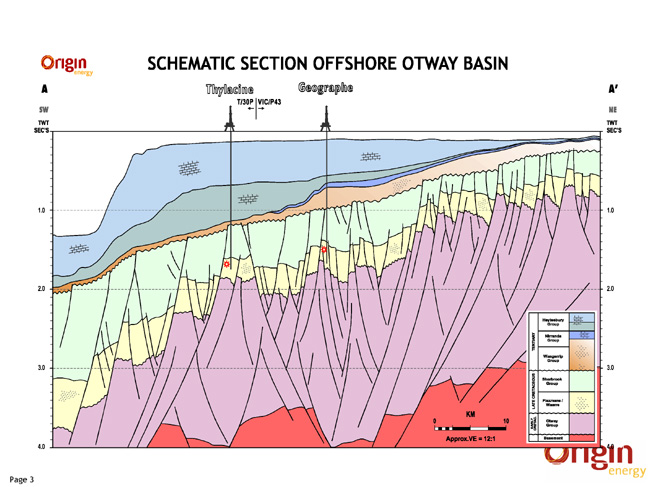
SCHEMATIC SECTION OFFSHORE OTWAY BASIN
[GRAPHIC APPEARS HERE]
[LOGO]
3
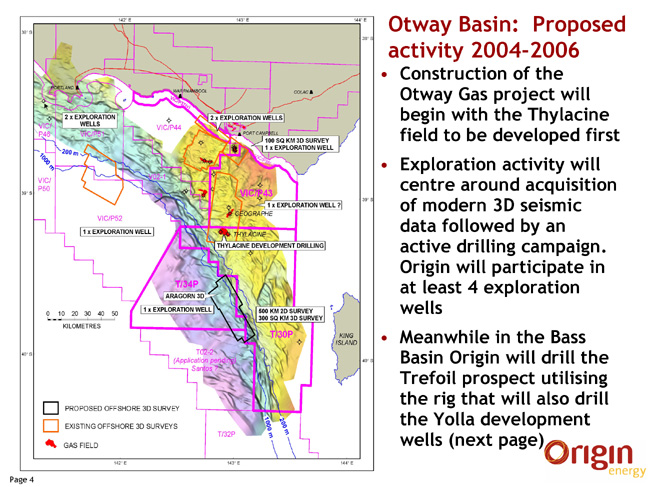
Otway Basin: Proposed activity 2004-2006
[GRAPHIC APPEARS HERE]
| • | Construction of the Otway Gas project will begin with the Thylacine field to be developed first |
| • | Exploration activity will centre around acquisition of modern 3D seismic data followed by an active drilling campaign. Origin will participate in at least 4 exploration wells |
| • | Meanwhile in the Bass Basin Origin will drill the Trefoil prospect utilising the rig that will also drill the Yolla development wells (next page) |
[LOGO]
4
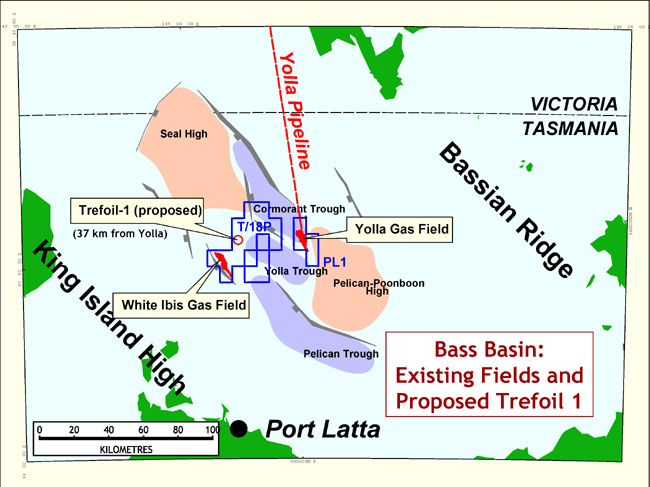
[GRAPHIC APPEARS HERE]
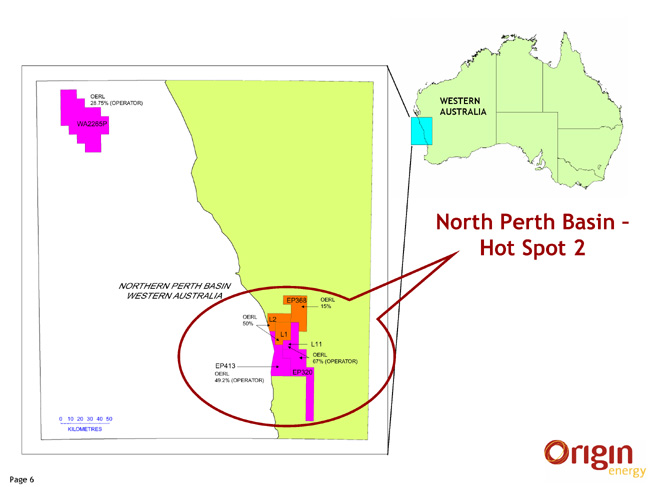
North Perth Basin – Hot Spot 2
[GRAPHIC APPEARS HERE]
[LOGO]
6

North Perth Basin – Hot Spot 2
[GRAPHIC APPEARS HERE]
| • | Hovea, Jingemia, Eremia and Cliff Head discoveries have changed industry perception of region from poorly prospective for gas to highly prospective for both gas and oil |
| • | Current target is for 10,000 bopd gross by end of calendar year (5,000 bopd Origin net) |
| • | Onshore discoveries can be rapidly developed to provide early cash flow |
| • | 3D seismic is again providing new insights into this geologically complex area |
[LOGO]
7
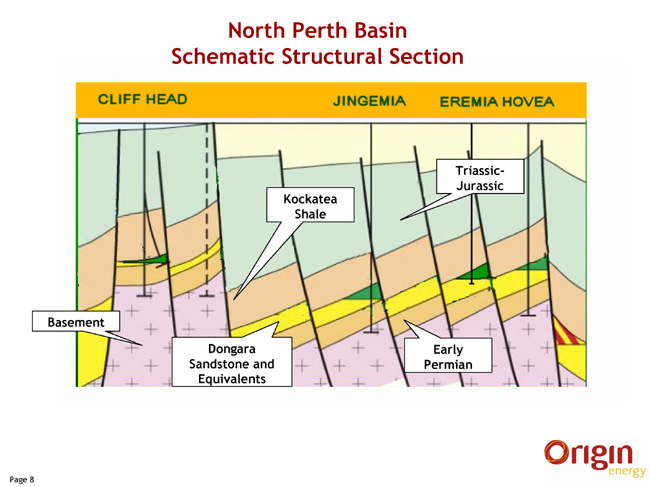
North Perth Basin
Schematic Structural Section
[GRAPHIC APPEARS HERE]
[LOGO]
8
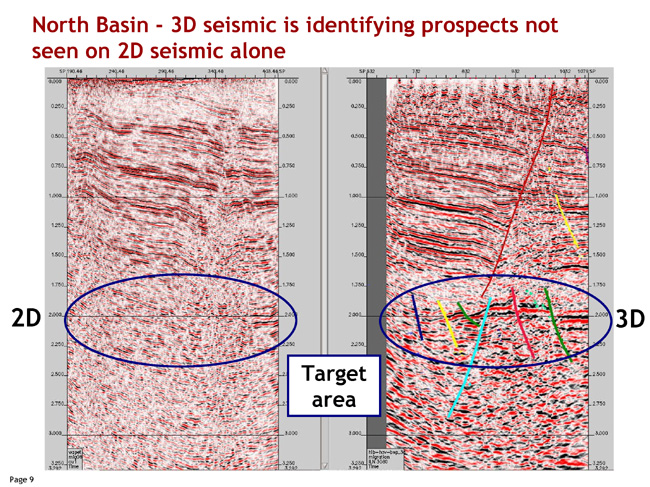
North Basin - 3D seismic is identifying prospects not seen on 2D seismic alone
[GRAPHIC APPEARS HERE]
9
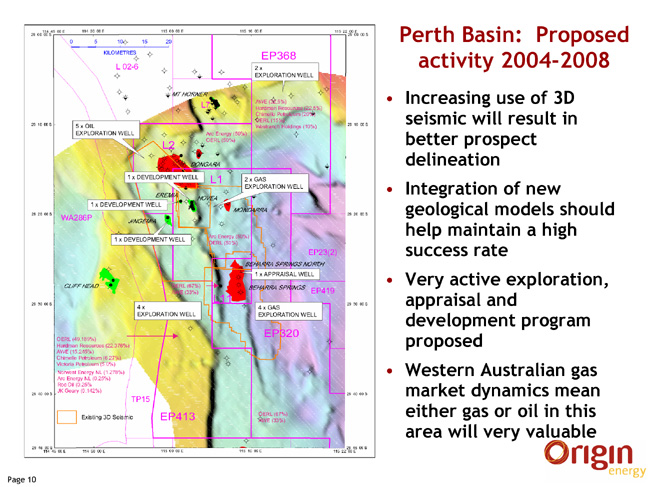
Perth Basin: Proposed activity 2004-2008
[GRAPHIC APPEARS HERE]
| • | Increasing use of 3D seismic will result in better prospect delineation |
| • | Integration of new geological models should help maintain a high success rate |
| • | Very active exploration, appraisal and development program proposed |
| • | Western Australian gas market dynamics mean either gas or oil in this area will very valuable |
[LOGO]
10
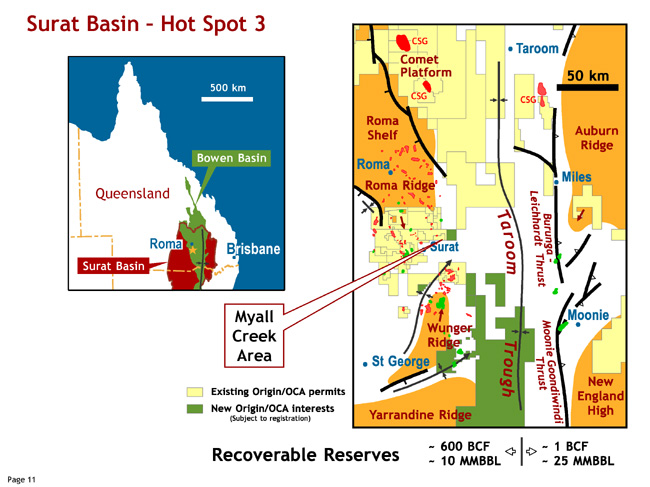
Surat Basin - Hot Spot 3
[GRAPHIC APPEARS HERE]
11
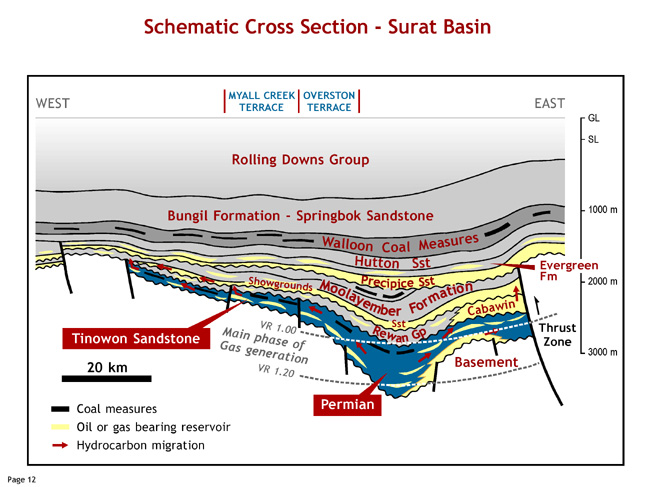
Schematic Cross Section - Surat Basin
[GRAPHIC APPEARS HERE]
12
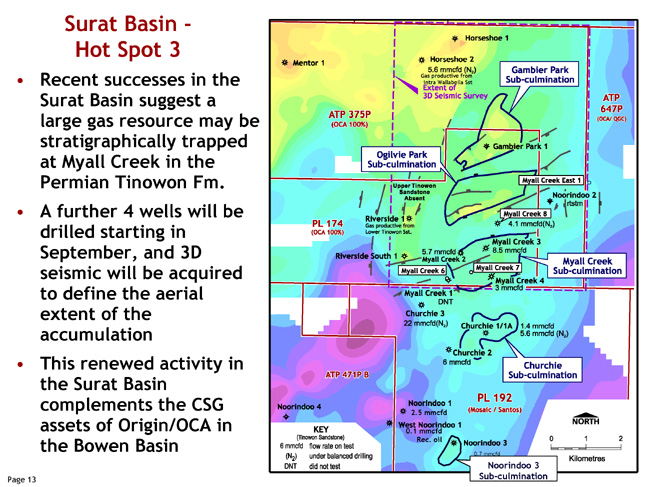
Surat Basin - Hot Spot 3
| • | Recent successes in the Surat Basin suggest a large gas resource may be stratigraphically trapped at Myall Creek in the Permian Tinowon Fm. |
| • | A further 4 wells will be drilled starting in September, and 3D seismic will be acquired to define the aerial extent of the accumulation |
| • | This renewed activity in the Surat Basin complements the CSG assets of Origin/OCA in the Bowen Basin |
[GRAPHIC APPEARS HERE]
13
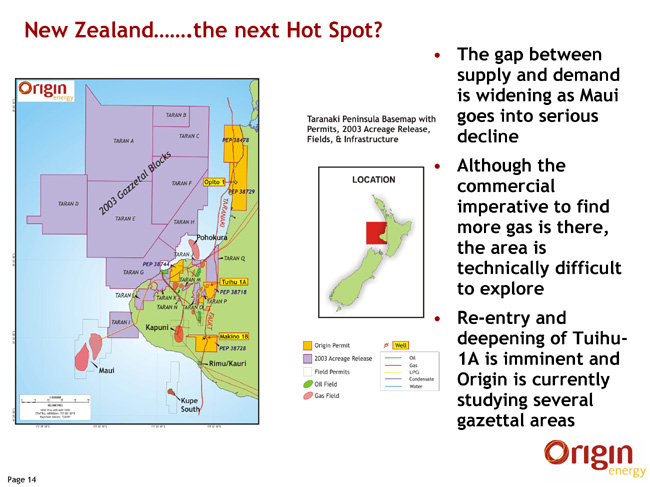
New Zealand.......the next Hot Spot?
[GRAPHIC APPEARS HERE]
| • | The gap between supply and demand is widening as Maui goes into serious decline |
| • | Although the commercial imperative to find more gas is there, the area is technically difficult to explore |
| • | Re-entry and deepening of Tuihu-1A is imminent and Origin is currently studying several gazettal areas |
[LOGO]
14
Signatures
Pursuant to the requirements of theSecurities Exchange Act of 1934, the registrant has duly caused this report to be signed on its behalf by the undersigned, thereunto duly authorized.
Origin Energy Limited | ||
By: | /s/ WILLIAM HUNDY | |
Name: | William Hundy | |
Title: | Company Secretary | |
Date: September 4, 2003