SECURITIES AND EXCHANGE COMMISSION
Washington, D.C. 20549
FORM 6-K
Report to Foreign Issuer
Pursuant to Rule 13a-16 or 15d-16 of
the Securities Exchange Act of 1934
For the period from September 14, 2003 to October 3, 2003
Commission File Number:_________________
Origin Energy Limited
(Translation of registrant’s name into English)
Level 39
AMP Centre
50 Bridge Street
SYDNEY NSW 2000
(Address of principal executive offices)
Indicate by check mark whether the registrant files or will file annual reports under cover Form 20-F or Form 40-F.
Form 20-F x Form 40-F ¨
Indicate by check mark if the registrant is submitting the Form 6-K in paper as permitted by Regulation S-T Rule 101(b)(1):_______
Note: Regulation S-T Rule 101(b)(1) only permits the submission in paper of a Form 6-K if submitted solely to provide an attached annual report to security holders.
Indicate by check mark if the registrant is submitting the Form6-K in paper as permitted by Regulation S-T Rule 101(b)(1)(7):______
Note: Regulation S-T Rule 101(b)(1)(7) only permits the submission in paper of a Form 6-K if submitted to furnish a report or other document that the registrant foreign private issuer must furnish and make public under the laws of the jurisdiction in which the registrant is incorporated, domiciled or legally organized (the registrant’s “home country”), or under the rules of the home country exchange on which the registrant’s securities are traded, as long as the report or other document is not a press release, is not required to be and has not been distributed to the registrant’s security holders, and, if discussing a material event, has already been the subject of a Form 6-K submission or other Commission filing on EDGAR.
Indicate by check mark whether the registrant by furnishing the information contained in this Form is also thereby furnishing the information to the Commission pursuant to Rule 12g3-2(b) under the Securities Exchange Act of 1934.
Yes ¨ No x
If “Yes” is marked, indicate below the file number assigned to the registrant in connection with Rule 12g3-2(b): 82-
INDEX TO EXHIBITS
| Item | ||
| 1. | ASX Release “Onshore Taranaki Basin New Zealand-Tuihu-1A Re-entry Weekly Progress Report”, dated September 15, 2003 | |
| 2. | Presentation “European and US Roadshow” | |
| 3. | ASX Release “Onshore Taranaki Basin New Zealand–Tuihu-1A Weekly Progress Report”, dated September 15, 2003 | |
| 4. | ASX Announcement “ Origin Energy Limited: Takeover Bid for Oil Company of Australia Limited”, dated September 23, 2003 | |
| 5. | ASX Announcement Coversheet “Origin Energy Limited: Takeover of Oil Company of Australia Limited” enclosing a pro-forma Form 6021 “Notice of compulsory acquisition following takeover bid, dated September 23, 2003 | |
| 6. | ASX Release “Jingemia 3 Weekly Progress Report, Onshore Perth Basin, Western Australia”, dated September 25, 2003 | |
| 7. | ASX Release “Onshore Taranaki Basin New Zealand-Tuihu-1A Weekly Progress Report”, dated October 1, 2003 | |
| 8. | ASX Announcement Coversheet “ Initial Substantial Holder Notice” enclosing Form 603 Notice of initial substantial holder, dated October 2, 2003 | |
| 9. | ASX Release “Jingemia 2 Progress Report, Onshore Perth Basin, Western Australia”, dated September 15, 2003 | |
| 10. | ASX Announcement Coversheet “Appendix 3Y Notices” enclosing Appendix 3Y Change of Director’s interest notices for C Carter, J Williams, H Nugent, T Bourne dated October 3, 2003 | |
| 11. | ASX Release “Origin reaches compulsory acquisition threshold in its bid for Oil Company of Australia”, dated September 16, 2003 | |
| 12. | Origin 2003 Annual Accounts | |
| 13. | ASX Announcement Coversheet “Substantial Holder-change of interests” enclosing Form 604 Notice of Change of Interests of Substantial Holder, dated September 17, 2003 | |
| 14. | ASX Announcement Coversheet “Appendix 3B Notice” enclosing Appendix 3B exercise of options under the Senior Executive Option Plan, dated September 19, 2003 | |
| 15. | ASX Release “Jingemia 2 Weekly Progress Report, Onshore Perth Basin, Western Australia” dated, September 19, 2003 | |
| 16. | ASX Announcement Coversheet “Overseas Share Sale Facility” enclosing correspondence to registered shareholders, dated September 22, 2003 | |
| 17. | ASX Announcement “Presentation to investment institutions”, dated September 22, 2003 | |
The information contained in this report is incorporated by reference into the Registration Statement on Form F-3 (file no. 333-103886).

Item 1
ASX Release
15 September 2003
Onshore Taranaki Basin New Zealand—Tuihu-1A Re-entry Weekly Progress Report
Origin Energy Resources (NZ) has been advised by the Operator, that the Tuihu-1A re-entry well, located in onshore Taranaki Basin permit PEP 38718, New Zealand, was side-tracked to a depth of 4310m, and 7” liner has been cemented. Current operations were changing to a synthetic oil-based mud system, and preparing to drill ahead.
The Tuihu-1A re-entry well is designed to deepen the Tuihu-1 exploration well that was drilled in late 2000/early 2001 to a total depth of 4530m. During drilling of this well significant gas shows were encountered in fractured Oligocene sandstones. As a result, Tuihu-1 was suspended at that time pending further geological investigation.
Forward operations at the Tuihu-1A well are expected to take another 9 days to drill to a total depth of 5100m. The primary targets are reservoirs within the Tariki Sandstone and the Kapuni Formation.
Tuihu-1A is located 6 kilometres from the Tariki gas pipeline, and if successful, could be brought on production rapidly.
Participants in the Tuihu-1A well are
Swift Energy New Zealand Limited | 50 % | (Operator) | ||
Origin Energy Resources NZ Limited | 20 % | |||
New Zealand Oil and Gas Limited | 20 % | |||
Indo Pacific NL (subject to regulatory approvals) | 10 % | |||
For further information contact:
Rob Willink
General Manager Exploration
Telephone: 07 3858 0676
Email: rob.willink@upstream.originenergy.com.au
Origin Energy Limited ABN 30 000 051 696Ÿ Level 39, AMP Centre, 50 Bridge Street Sydney NSW 2000
GPO Box 5376, Sydney NSW 2001Ÿ Telephone (02) 9220 6400Ÿ Facsimile (02) 9235 1661Ÿ www.originenergy.com.au
Item 2
[LOGO]
Strategy, Performance, and Growth
Delivering Value for Shareholders
September 2003
| • | Overview |
| – | Australian energy market |
| – | Origin Energy |
| • | Financial Performance and Outlook |
| • | Opportunities for Further Development |
| • | Appendix |
| – | Full Year Results Announcement – August 2003 |
[LOGO]
Page 2

[LOGO]
Overview
Australian energy market
Origin Energy
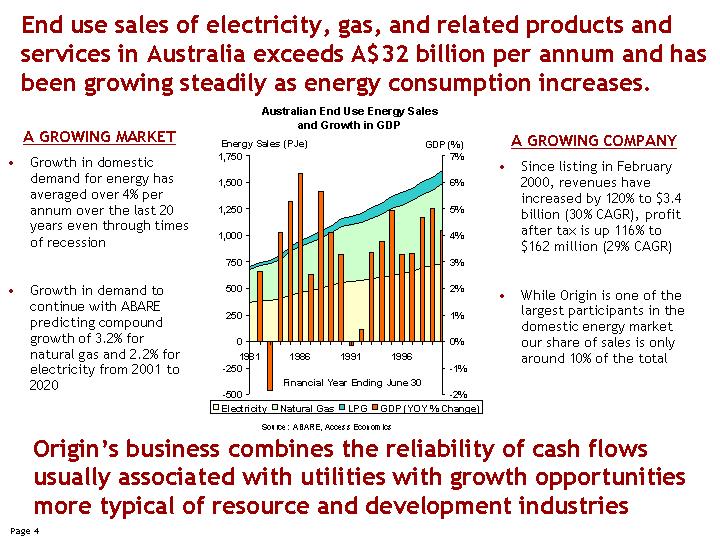
End use sales of electricity, gas, and related products and services in Australia exceeds A$32 billion per annum and has been growing steadily as energy consumption increases.
Australian End Use Energy Sales and Growth in GDP | ||||
A GROWING MARKET | [GRAPHIC] | A GROWING COMPANY | ||
• Growth in domestic demand for energy has averaged over 4% per annum over the last 20 years even through times of recession | • Since listing in February 2000, revenues have increased by 120% to $3.4 billion (30% CAGR), profit after tax is up 116% to $162 million (29% CAGR) | |||
• Growth in demand to continue with ABARE predicting compound growth of 3.2% for natural gas and 2.2% for electricity from 2001 to 2020 | • While Origin is one of the largest participants in the domestic energy market our share of sales is only around 10% of the total | |||
| Source: ABARE, Access Economics |
Origin’s business combines the reliability of cash flows usually associated with utilities with growth opportunities more typical of resource and development industries
Page 4
Origin’s strategy is to focus on the competitive segments of the energy market and pursue opportunities characterised by the ability to:
| • | Develop sustainable competitive advantage |
| • | Identify additional value through operational or strategic synergies |
| • | Establish internal hedges against other exposures that reduce the overall risk in the business |
| • | Access and use skills that will provide new opportunities for growth and can leverage into other areas of related business (eg oil exploration, infrastructure management) |
This strategy provides opportunities for growth while effectively managing risks associated with changes in the industry
[LOGO]
Page 5
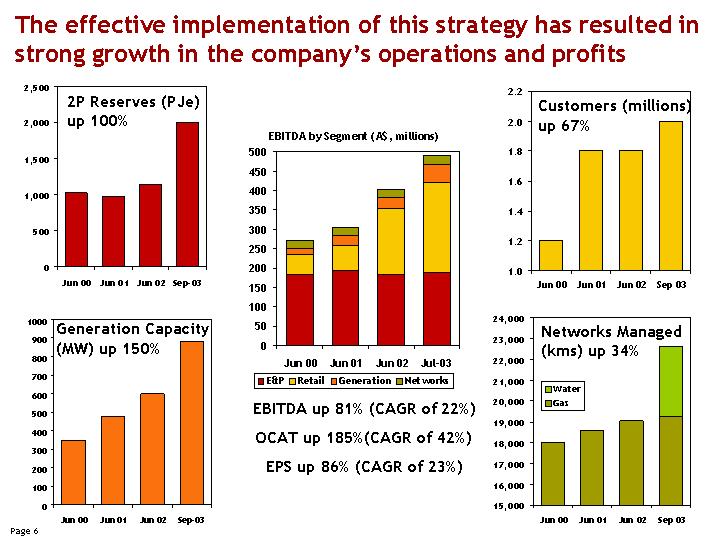
The effective implementation of this strategy has resulted in strong growth in the company’s operations and profits
2P Reserves (PJe) up 100% [GRAPHIC] | EBITDA by Segment (A$, millions) [GRAPHIC] | Customers (millions) up 67% [GRAPHIC] | ||
Generation Capacity (MW) up 150% [GRAPHIC] | EBITDA up 81% (CAGR of 22%) | Networks Managed (kms) up 34% [GRAPHIC] | ||
OCAT up 185%(CAGR of 42%) | ||||
EPS up 86% (CAGR of 23%) |
Page 6
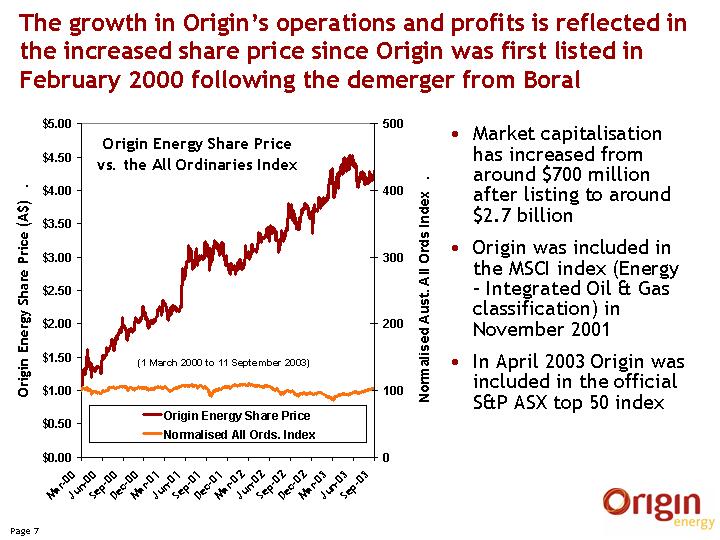
The growth in Origin’s operations and profits is reflected in the increased share price since Origin was first listed in February 2000 following the demerger from Boral
Origin Energy Share Price vs. the All Ordinaries Index | • Market capitalisation has increased from around $700 million after listing to around $2.7 billion | |
[GRAPHIC] | • Origin was included in the MSCI index (Energy – Integrated Oil & Gas classification) in November 2001 | |
• In April 2003 Origin was included in the official S&P ASX top 50 index | ||
[LOGO]
Page 7
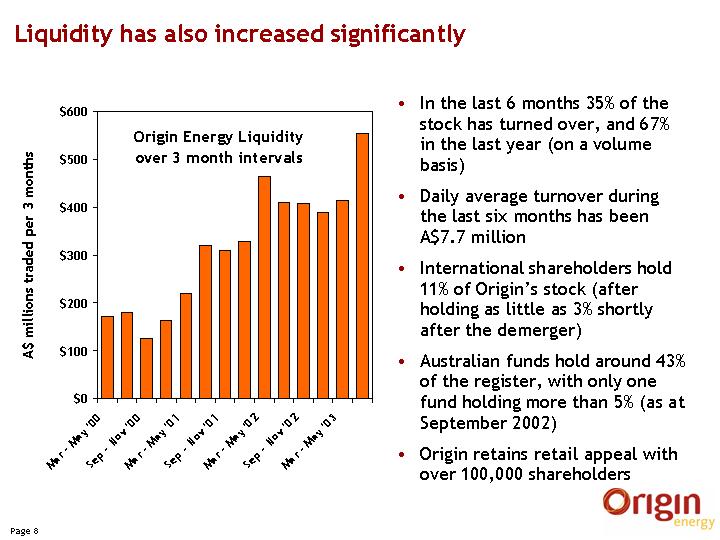
Liquidity has also increased significantly
Origin Energy Liquidity over 3 month intervals | • In the last 6 months 35% of the stock has turned over, and 67% in the last year (on a volume basis) | |
• Daily average turnover during the last six months has been A$7.7 million | ||
[GRAPHIC] | • International shareholders hold 11% of Origin’s stock (after holding as little as 3% shortly after the demerger) | |
• Australian funds hold around 43% of the register, with only one fund holding more than 5% (as at September 2002) | ||
• Origin retains retail appeal with over 100,000 shareholders | ||
Page 8
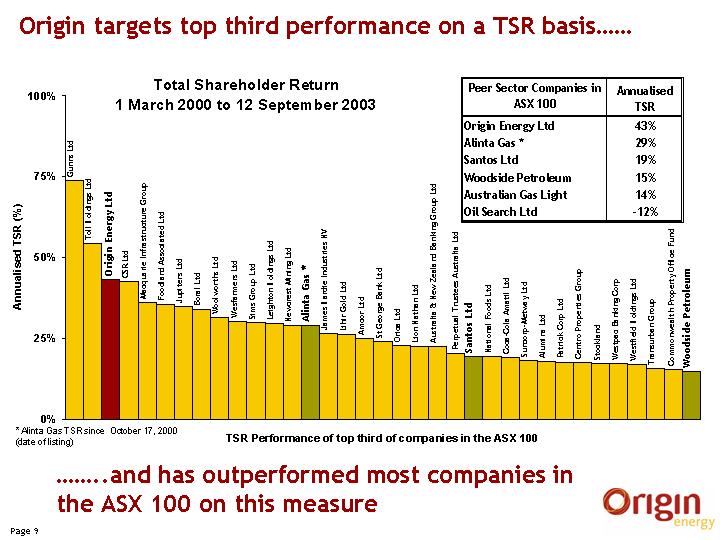
Origin targets top third performance on a TSR basis.....
Total Shareholder Return
1 March 2000 to 12 September 2003
Peer Sector Companies in ASX 100 | Annualised TSR | ||
Origin Energy Ltd | 43 | % | |
Alinta Gas * | 29 | % | |
Santos Ltd | 19 | % | |
Woodside Petroleum | 15 | % | |
Australian Gas Light | 14 | % | |
Oil Search Ltd | -12 | % |
* Alinta Gas TSR since October 17, 2000 (date of listing)
TSR Performance of top third of companies in the ASX 100
.....and has outperformed most companies in the ASX 100 on this measure
[LOGO]
Page 9

[LOGO]
Financial Performance and Outlook
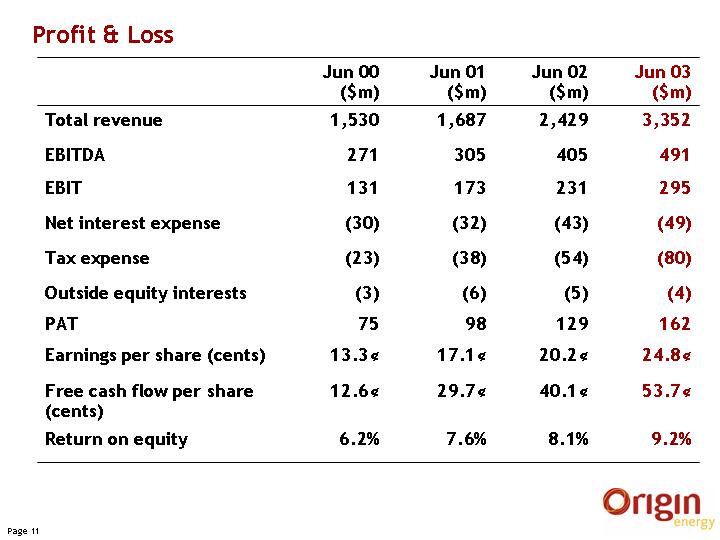
| Profit & Loss | ||||||||||||
| Jun 00 ($m) | Jun 01 ($m) | Jun 02 ($m) | Jun 03 ($m) | |||||||||
Total revenue | 1,530 | 1,687 | 2,429 | 3,352 | ||||||||
EBITDA | 271 | 305 | 405 | 491 | ||||||||
EBIT | 131 | 173 | 231 | 295 | ||||||||
Net interest expense | (30 | ) | (32 | ) | (43 | ) | (49 | ) | ||||
Tax expense | (23 | ) | (38 | ) | (54 | ) | (80 | ) | ||||
Outside equity interests | (3 | ) | (6 | ) | (5 | ) | (4 | ) | ||||
PAT | 75 | 98 | 129 | 162 | ||||||||
Earnings per share (cents) | 13.3 | ¢ | 17.1 | ¢ | 20.2 | ¢ | 24.8 | ¢ | ||||
Free cash flow per share (cents) | 12.6 | ¢ | 29.7 | ¢ | 40.1 | ¢ | 53.7 | ¢ | ||||
Return on equity | 6.2 | % | 7.6 | % | 8.1 | % | 9.2 | % | ||||
[LOGO]
Page 11
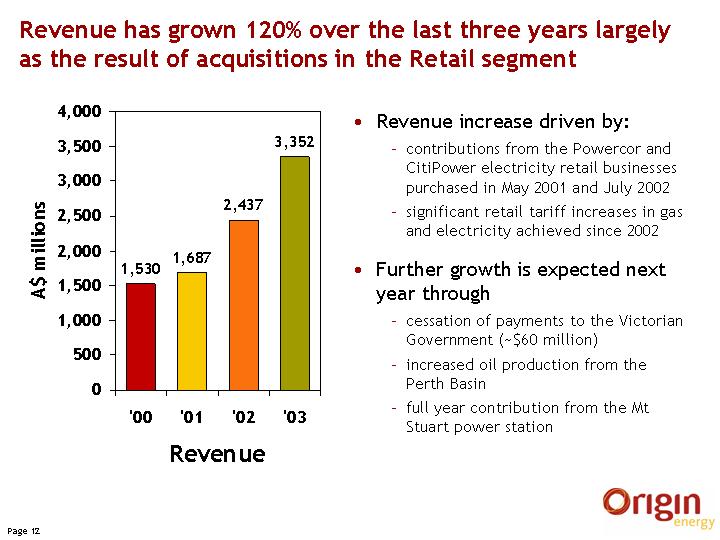
Revenue has grown 120% over the last three years largely as the result of acquisitions in the Retail segment
‘00 | ‘01 | ‘02 | ‘03 | |||
1,530 | 1,687 | 2,437 | 3,352 | |||
Revenue
| • | Revenue increase driven by: |
| – | contributions from the Powercor and CitiPower electricity retail businesses purchased in May 2001 and July 2002 |
| – | significant retail tariff increases in gas and electricity achieved since 2002 |
| • | Further growth is expected next year through |
| – | cessation of payments to the Victorian Government (~$60 million) |
| – | increased oil production from the Perth Basin |
| – | full year contribution from the Mt Stuart power station |
[LOGO]
Page 12
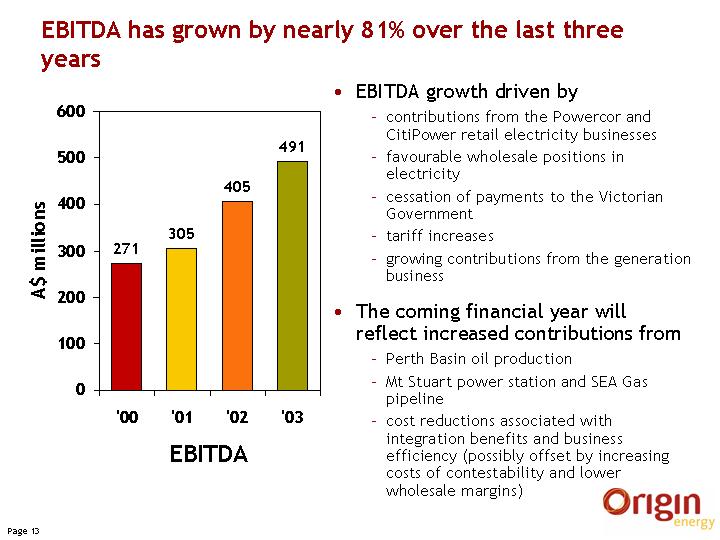
EBITDA has grown by nearly 81% over the last three years
| ‘00 | ‘01 | ‘02 | ‘03 | |||
| 271 | 305 | 405 | 491 |
EBITDA
| • | EBITDA growth driven by |
| – | contributions from the Powercor and CitiPower retail electricity businesses |
| – | favourable wholesale positions in electricity |
| – | cessation of payments to the Victorian Government |
| – | tariff increases |
| – | growing contributions from the generation business |
| • | The coming financial year will reflect increased contributions from |
| – | Perth Basin oil production |
| – | Mt Stuart power station and SEA Gas pipeline |
| – | cost reductions associated with integration benefits and business efficiency (possibly offset by increasing costs of contestability and lower wholesale margins) |
[LOGO]
Page 13
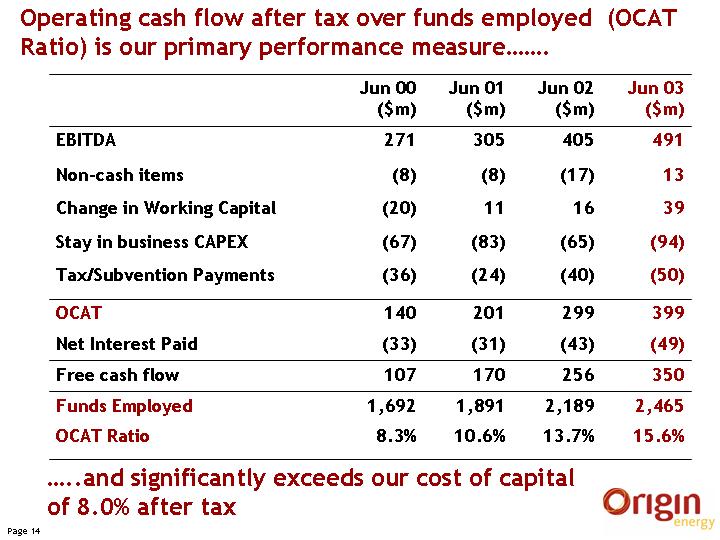
Operating cash flow after tax over funds employed (OCAT Ratio) is our primary performance measure......
| Jun 00 ($m) | Jun 01 ($m) | Jun 02 ($m) | Jun 03 ($m) | |||||||||
EBITDA | 271 | 305 | 405 | 491 | ||||||||
Non-cash items | (8 | ) | (8 | ) | (17 | ) | 13 | |||||
Change in Working Capital | (20 | ) | 11 | 16 | 39 | |||||||
Stay in business CAPEX | (67 | ) | (83 | ) | (65 | ) | (94 | ) | ||||
Tax/Subvention Payments | (36 | ) | (24 | ) | (40 | ) | (50 | ) | ||||
OCAT | 140 | 201 | 299 | 399 | ||||||||
Net Interest Paid | (33 | ) | (31 | ) | (43 | ) | (49 | ) | ||||
Free cash flow | 107 | 170 | 256 | 350 | ||||||||
Funds Employed | 1,692 | 1,891 | 2,189 | 2,465 | ||||||||
OCAT Ratio | 8.3 | % | 10.6 | % | 13.7 | % | 15.6 | % | ||||
......and significantly exceeds our cost of capital of 8.0% after tax
[LOGO]
Page 14
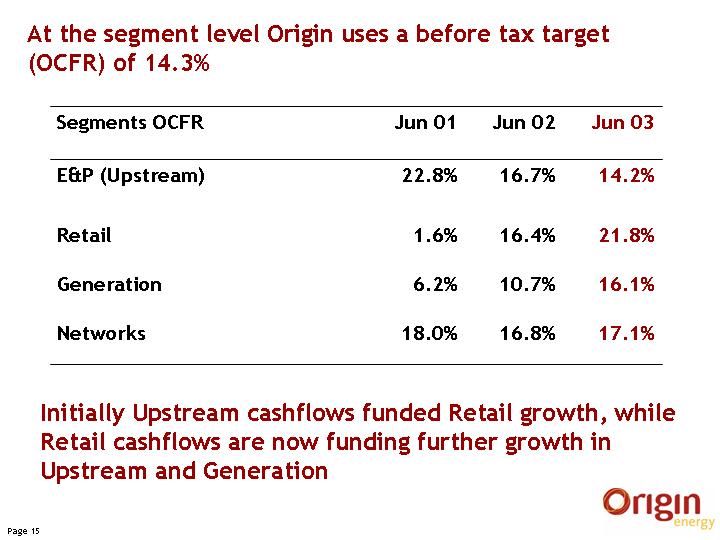
At the segment level Origin uses a before tax target (OCFR) of 14.3%
| Segments OCFR | Jun 01 | Jun 02 | Jun 03 | ||||||
E&P (Upstream) | 22.8 | % | 16.7 | % | 14.2 | % | |||
Retail | 1.6 | % | 16.4 | % | 21.8 | % | |||
Generation | 6.2 | % | 10.7 | % | 16.1 | % | |||
Networks | 18.0 | % | 16.8 | % | 17.1 | % | |||
Initially Upstream cashflows funded Retail growth, while Retail cashflows are now funding further growth in Upstream and Generation
[LOGO]
Page 15
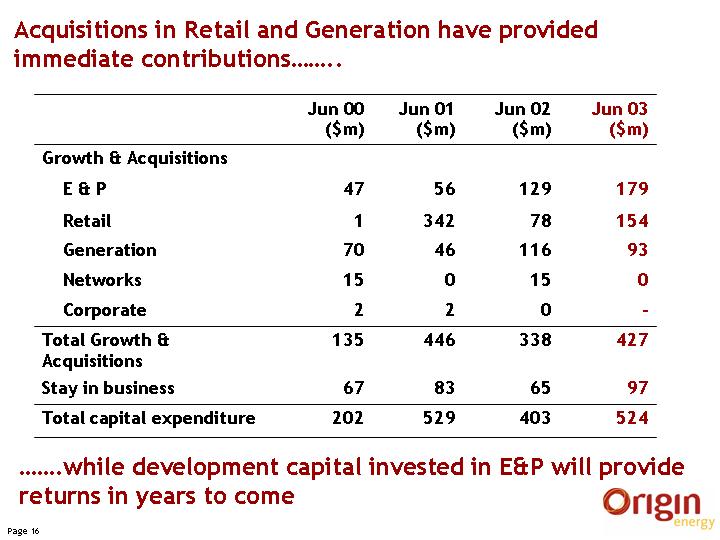
Acquisitions in Retail and Generation have provided immediate contributions.......
| Jun 00 ($m) | Jun 01 ($m) | Jun 02 ($m) | Jun 03 ($m) | |||||
Growth & Acquisitions | ||||||||
E & P | 47 | 56 | 129 | 179 | ||||
Retail | 1 | 342 | 78 | 154 | ||||
Generation | 70 | 46 | 116 | 93 | ||||
Networks | 15 | 0 | 15 | 0 | ||||
Corporate | 2 | 2 | 0 | — | ||||
Total Growth & | 135 | 446 | 338 | 427 | ||||
Acquisitions | ||||||||
Stay in business | 67 | 83 | 65 | 97 | ||||
Total capital expenditure | 202 | 529 | 403 | 524 | ||||
......while development capital invested in E&P will provide returns in years to come
[LOGO]
Page 16

In the medium term growth projects requiring capital expenditure of $1.4 billion are already being developed.....
| FY ‘03 Free Cash Flow $350 mill. pa | • Current free cash flow will cover the majority of the capital required for this organic growth | |
| [GRAPHIC] | • Conservative gearing of 29% and borrowing capacity of over $400 million provide funding flexibility | |
| .....and will underpin the growth of the company over the next several years | ||
Ongoing projects | Perth Basin | FRC | ||
BassGas | CSG | Thylacine/Geographe | ||
Renewables | Quarantine (CCGT) | SEA Gas | ||
Acquisitions |
[LOGO]
Page 17
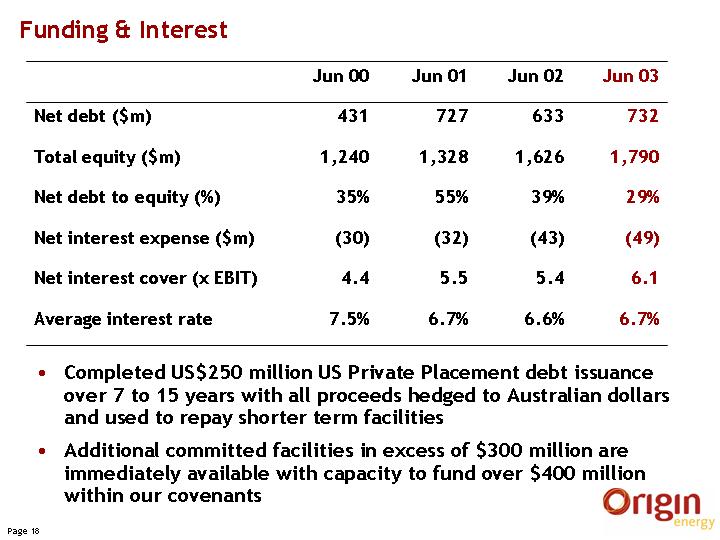
Funding & Interest
| Jun 00 | Jun 01 | Jun 02 | Jun 03 | |||||||||
Net debt ($m) | 431 | 727 | 633 | 732 | ||||||||
Total equity ($m) | 1,240 | 1,328 | 1,626 | 1,790 | ||||||||
Net debt to equity (%) | 35 | % | 55 | % | 39 | % | 29 | % | ||||
Net interest expense ($m) | (30 | ) | (32 | ) | (43 | ) | (49 | ) | ||||
Net interest cover (x EBIT) | 4.4 | 5.5 | 5.4 | 6.1 | ||||||||
Average interest rate | 7.5 | % | 6.7 | % | 6.6 | % | 6.7 | % | ||||
| • | Completed US$250 million US Private Placement debt issuance over 7 to 15 years with all proceeds hedged to Australian dollars and used to repay shorter term facilities |
| • | Additional committed facilities in excess of $300 million are immediately available with capacity to fund over $400 million within our covenants |
[LOGO]
Page 18
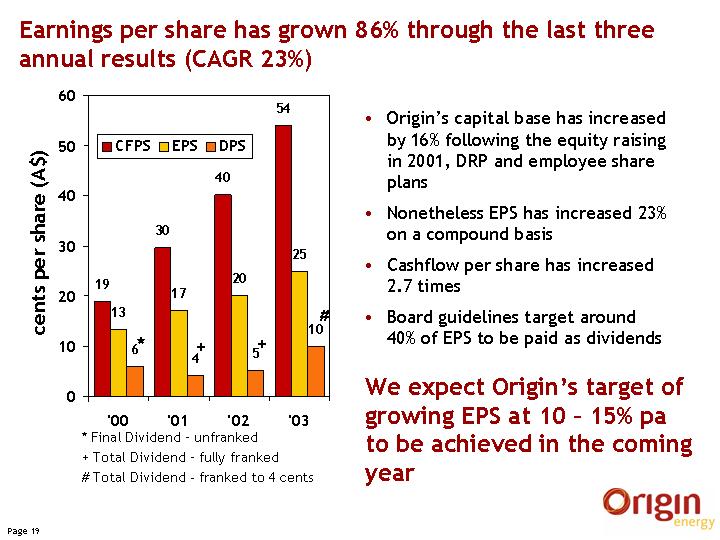
Earnings per share has grown 86% through the last three annual results (CAGR 23%)
• Origin’s capital base has increased by 16% following the equity raising in 2001, DRP and employee share plans | ||
| [GRAPHIC] | • Nonetheless EPS has increased 23% on a compound basis | |
• Cashflow per share has increased 2.7 times | ||
• Board guidelines target around 40% of EPS to be paid as dividends | ||
| ‘00 | ‘01 | ‘02 | ‘03 | |||||||||
CFPS | 19 | 30 | 40 | 54 | ||||||||
EPS | 13 | 17 | 20 | 25 | ||||||||
DPS | 6 | * | 4+ | 5+ | 10 | # | ||||||
* Final Dividend – unfranked + Total Dividend – fully franked # Total Dividend – franked to 4 cents | We expect Origin’s target of growing EPS at 10 –15% pa to be achieved in the coming year | |||||||||
[LOGO]
Page 19

[LOGO]
Opportunities for Further Development

| [GRAPHIC] | Longer term the energy industry in Australia provides continuing opportunities for new developments
• Upstream
– Perth Basin
– Offshore Otway and Bass Basins
– Surat Basin / Myall Creek
– Coal seam gas (CSG)
• Retail
– Further consolidation
– Margin growth
• Generation
– Demand growth substantial for gas fired and renewable generation
– Power requirements of the Retail business reduce development risk
• Network opportunities |
[LOGO]
Page 21

| [GRAPHIC] | New infrastructure and acreage awards are opening up opportunities in the Otway and Bass Basins
• Following the Thylacine and Geographe gas discoveries the offshore Otway has attracted many new players
• Prospectivity centres on a reservoir fairway known as the Shipwreck Trough
• Origin has recently acquired interests in the deep water permit T/34P and the near shore permit Vic/P37(V) –both along this trend
• In the Bass Basin the Trefoil prospect will be drilled in 2004 at the same time as the development wells for the BassGas project | |
[LOGO]
Page 22
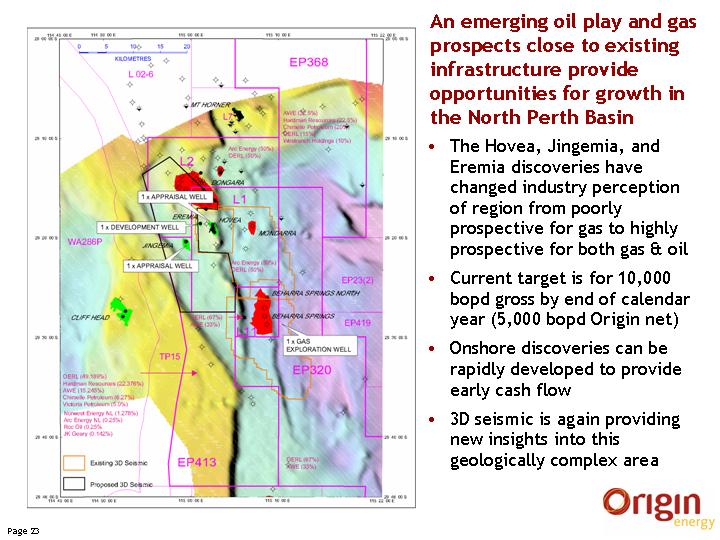
| [GRAPHIC] | An emerging oil play and gas prospects close to existing infrastructure provide opportunities for growth in the North Perth Basin
• The Hovea, Jingemia, and Eremia discoveries have changed industry perception of region from poorly prospective for gas to highly prospective for both gas & oil
• Current target is for 10,000 bopd gross by end of calendar year (5,000 bopd Origin net)
• Onshore discoveries can be rapidly developed to provide early cash flow
• 3D seismic is again providing new insights into this geologically complex area | |
[LOGO]
Page 23
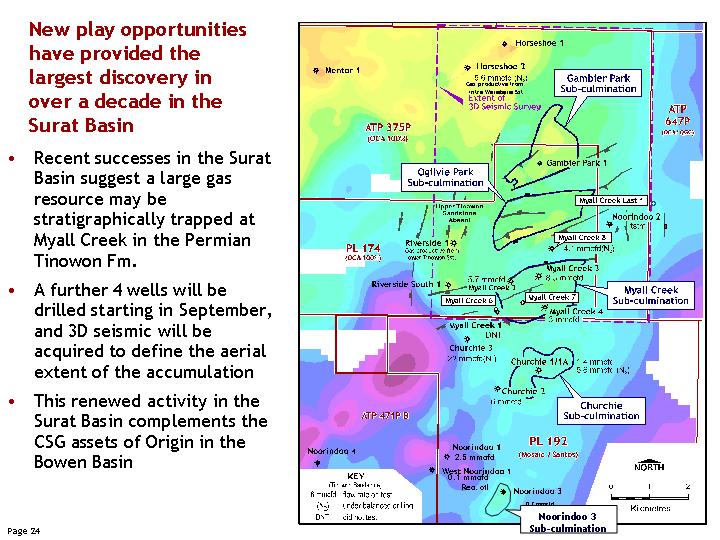
New play opportunities have provided the largest discovery in over a decade in the Surat Basin
• Recent successes in the Surat Basin suggest a large gas resource may be stratigraphically trapped at Myall Creek in the Permian Tinowon Fm.
• A further 4 wells will be drilled starting in September, and 3D seismic will be acquired to define the aerial extent of the accumulation
• This renewed activity in the Surat Basin complements the CSG assets of Origin in the Bowen Basin | [GRAPHIC] |
Page 24
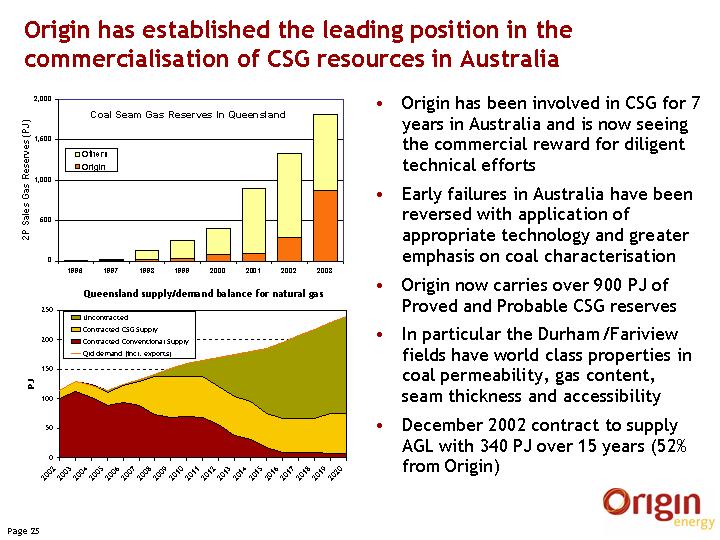
Origin has established the leading position in the commercialisation of CSG resources in Australia
| [GRAPHIC] | • Origin has been involved in CSG for 7 years in Australia and is now seeing the commercial reward for diligent technical efforts | |
• Early failures in Australia have been reversed with application of appropriate technology and greater emphasis on coal characterisation | ||
• Origin now carries over 900 PJ of Proved and Probable CSG reserves | ||
• In particular the Durham/Fariview fields have world class properties in coal permeability, gas content, seam thickness and accessibility | ||
• December 2002 contract to supply AGL with 340 PJ over 15 years (52% from Origin) | ||
[LOGO]
Page 25
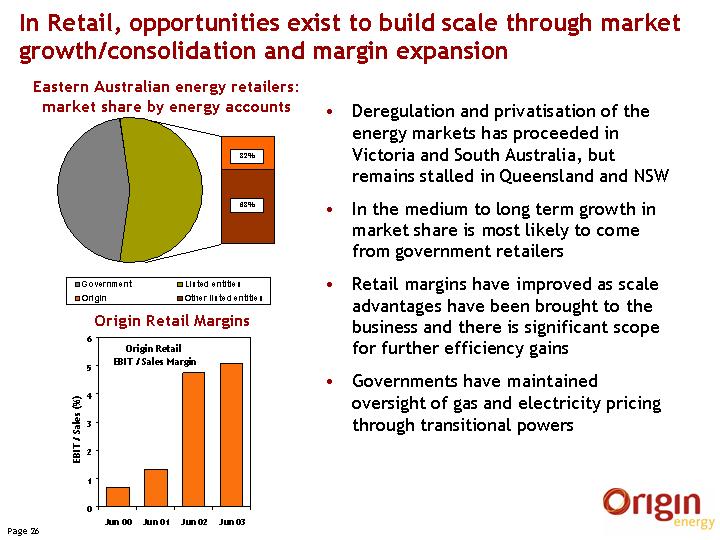
In Retail, opportunities exist to build scale through market growth/consolidation and margin expansion
Eastern Australian energy retailers: market share by energy accounts | • Deregulation and privatisation of the energy markets has proceeded in Victoria and South Australia, but remains stalled in Queensland and NSW | |
| [GRAPHIC] | • In the medium to long term growth in market share is most likely to come from government retailers | |
| Origin Retail Margins | • Retail margins have improved as scale advantages have been brought to the business and there is significant scope for further efficiency gains | |
| [GRAPHIC] | • Governments have maintained oversight of gas and electricity pricing through transitional powers | |
[LOGO]
Page 26
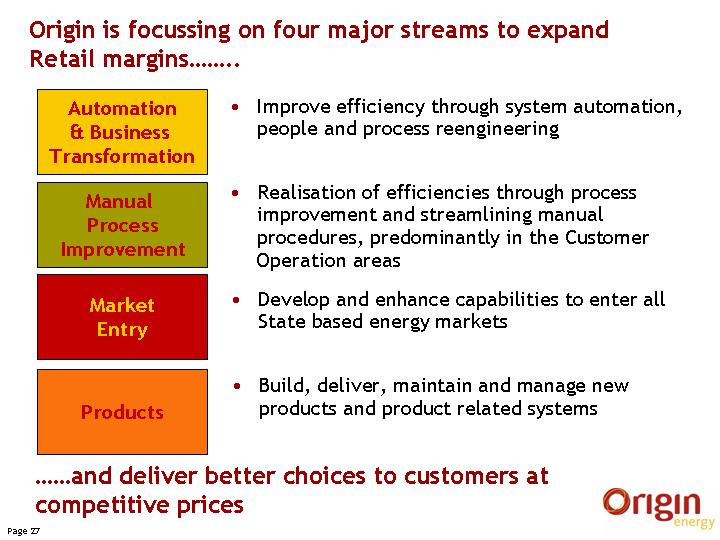
Origin is focussing on four major streams to expand Retail margins........
Automation & Business Transformation | • | Improve efficiency through system automation, people and process reengineering | ||
Manual Process Improvement | • | Realisation of efficiencies through process improvement and streamlining manual procedures, predominantly in the Customer Operation areas | ||
Market Entry | • | Develop and enhance capabilities to enter all State based energy markets | ||
Products | • | Build, deliver, maintain and manage new products and product related systems | ||
......and deliver better choices to customers at competitive prices
[LOGO]
Page 27
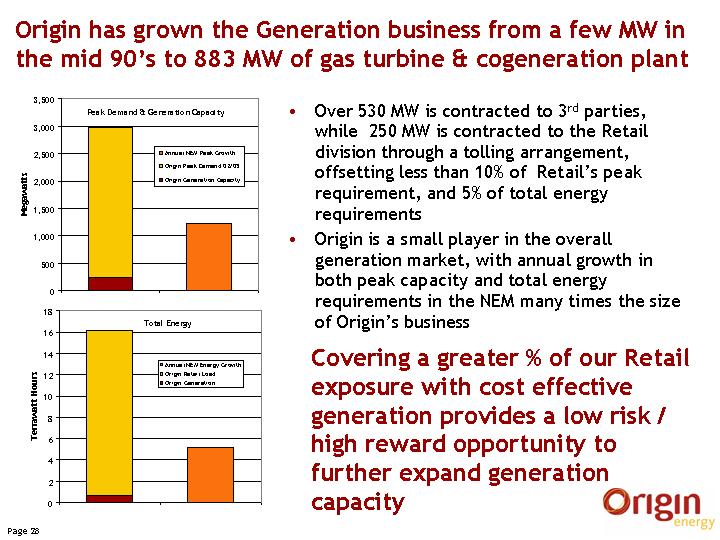
Origin has grown the Generation business from a few MW in the mid 90’s to 883 MW of gas turbine & cogeneration plant
Peak Demand & Generation Capacity
[GRAPHIC] | • Over 530 MW is contracted to 3rdparties, while 250 MW is contracted to the Retail division through a tolling arrangement, offsetting less than 10% of Retail’s peak requirement, and 5% of total energy requirements | |
Total Energy
[GRAPHIC] | • Origin is a small player in the overall generation market, with annual growth in both peak capacity and total energy requirements in the NEM many times the size of Origin’s business | |
Covering a greater % of our Retail exposure with cost effective generation provides a low risk / high reward opportunity to further expand generation capacity
[LOGO]
Page 28
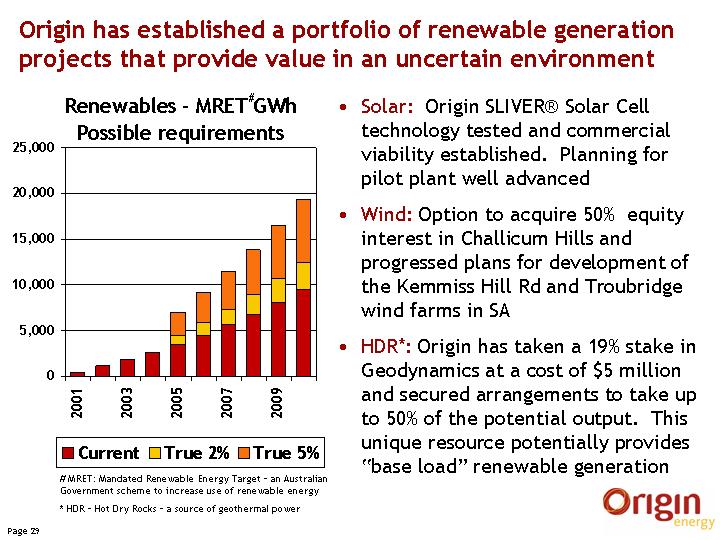
Origin has established a portfolio of renewable generation projects that provide value in an uncertain environment
Renewables—MRET#GWh Possible requirements | • Solar: Origin SLIVER® Solar Cell technology tested and commercial viability established. Planning for pilot plant well advanced | |
| [LOGO] | • Wind: Option to acquire 50% equity interest in Challicum Hills and progressed plans for development of the Kemmiss Hill Rd and Troubridge wind farms in SA | |
• HDR*: Origin has taken a 19% stake in Geodynamics at a cost of $5 million and secured arrangements to take up to 50% of the potential output. This unique resource potentially provides “base load” renewable generation | ||
# MRET: Mandated Renewable Energy Target – an Australian Government scheme to increase use of renewable energy
* HDR – Hot Dry Rocks – a source of geothermal power | ||
[LOGO]
Page 29
Origin does not own regulated assets but invests in them through its 19% holding in Envestra and manages assets on behalf of third parties. Assets continue to churn in this area.......
| • | Aquila / UEL / Alinta transaction in early 2003 |
| • | EPIC is in the process of selling pipeline assets in Western Australia and eastern Australia with a total value in excess of $2 billion |
| • | Other underutilised assets include Duke’s Longford to Sydney and Longford to Tasmania gas pipelines with construction costs in excess of $1 billion |
| • | TXU has confirmed it is examining an IPO for up to 49% of its Australian assets, with an estimated enterprise value of more than $4 billlion |
| • | Regional water authorities in Victoria and NSW are under pressure to improve efficiencies and reduce costs |
......providing the opportunity to benefit from further rationalisation of the regulated utility businesses
[LOGO]
Page 30
Origin will continue to deliver value to shareholders through:
| • | A strategic position that has differentiated Origin from other energy companies in Australia |
| • | A focus on risk management and improving the performance of existing businesses |
| • | Growth from prospects generated within the business and acquisition of value adding businesses |
Origin maintains the long term goal of achieving growth of 10-15% pa and expects to continue to achieve this over the next few years
[LOGO]
Page 31

[LOGO]

For more information.
For more information on Origin Energy please contact
Angus Guthrie
Manager, Investor Relations
Email:angus.guthrie@originenergy.com.au
Office: +61-2-9220 6558
Mobile: + 61-4-1786 4255
Fax: +61-2-9235 1661
Alternatively visit our website
www.originenergy.com.au
and follow the prompts to the Investor Centre
[LOGO]
Page 33
Item 3
ASX Release
22 September 2003
Onshore Taranaki Basin New Zealand—Tuihu-1A Weekly Progress Report
Origin Energy Resources (NZ) has been advised by the Operator, that the Tuihu-1A re-entry well, located in onshore Taranaki Basin permit PEP 38718, New Zealand, was drilling at 4390m in the side-tracked hole.
The Tuihu-1A re-entry well is designed to deepen the Tuihu-1 exploration well that was drilled in late 2000/early 2001 to a total depth of 4530m. During drilling of this well significant gas shows were encountered in fractured Oligocene sandstones. As a result, Tuihu-1 was suspended at that time pending further geological investigation.
Forward operations at the Tuihu-1A well are expected to take another one to two weeks to drill to a total depth of 5100m. The primary targets are reservoirs within the Tariki Sandstone and the Kapuni Formation.
Tuihu-1A is located 6 kilometres from the Tariki gas pipeline, and if successful, could be brought on production rapidly.
Participants in the Tuihu-1A well are:
Swift Energy New Zealand Limited | 50 | % (Operator) | |
Origin Energy Resources NZ Limited | 20 | % | |
New Zealand Oil and Gas Limited | 20 | % | |
Indo Pacific Energy Limited | 10 | % |
For further information contact:
Dr Rob Willink
General Manager – Exploration
Phone: 07 3858 0676
Email: rob.willink@upstream.originenergy.com.au
Origin Energy Limited ABN 30 000 051 696Ÿ Level 39, AMP Centre, 50 Bridge Street Sydney NSW 2000
GPO Box 5376, Sydney NSW 2001Ÿ Telephone (02) 9220 6400Ÿ Facsimile (02) 9235 1661Ÿ www.originenergy.com.au
Item 4
| To | Company Announcements Office | Date | 23 September 2003 | |||||
| Company | Australian Stock Exchange Limited | Pages | 1 | |||||
| From | Bill Hundy | |||||||
| Subject | Origin Energy Limited (“ORG”) Takeover Bid for Oil Company of Australia Limited (“OCA”) | |||||||
We refer to ORG’s takeover bid for all the shares in OCA. The takeover bid closed at 5.00pm on 22 September 2003. In accordance with Listing Rule 3.3, ORG hereby gives notice that:
| 1. | ORG and its associates currently have a relevant interest in 99.69% of OCA shares; |
| 2. | ORG will proceed to compulsory acquisition of the outstanding OCA shares. |
Regards |
 |
Bill Hundy |
Company Secretary |
02 9220 6467 – bill.hundy@originenergy.com.au
Origin Energy Limited ABN 30 000 051 696Ÿ Level 39, AMP Centre, 50 Bridge Street Sydney NSW 2000
GPO Box 5376, Sydney NSW 2001Ÿ Telephone (02) 9220 6400Ÿ Facsimile (02) 9235 1661Ÿ www.originenergy.com.au
Item 5
| To | Company Announcements Office | Date | 23 September 2003 | |||||
| Company | Australian Stock Exchange Limited | Pages | 2 | |||||
| From | Bill Hundy | |||||||
| Subject | Origin Energy Limited: Takeover of Oil Company of Australia Limited | |||||||
In accordance with section 661B(1)(d) of the Corporations Act 2001 we enclose a copy of a pro-forma Form 6021 Notice of compulsory acquisition following takeover bid, lodged earlier today with the Australian Securities and Investments Commission.
Regards |
|
Bill Hundy |
Company Secretary |
02 9220 6467 – bill.hundy@originenergy.com.au
Origin Energy Limited ABN 30 000 051 696Ÿ Level 39, AMP Centre, 50 Bridge Street Sydney NSW 2000
GPO Box 5376, Sydney NSW 2001Ÿ Telephone (02) 9220 6400Ÿ Facsimile (02) 9235 1661Ÿ www.originenergy.com.au
| ASIC registered agent number |
|
| ||||||||
| lodging party or agent name | Clayton Utz | |||||||||
| office, level, building name or PO | Levels 22-35 | |||||||||
| street number & name | No.1 O’Connell Street | |||||||||
| suburb/city | Sydney state/territory NSW postcode 2000 | |||||||||
| telephone | (02) 9353 4000 |
| ||||||||
| facsimile | (02) 8220 6700 | ASS. | ¨ | RE | ||||||
| DX number | 370 suburb/city Sydney | CASH. | ¨ | RE | ||||||
| PROC. | ¨ | |||||||||
| Australian Securities & Investments Commission | form 6021 | |||||||||
Notice of compulsory acquisition following takeover bid | Corporations Act 2001 661B(1)(a) | |||||||||
| DPID | ||||||||||
| <<ADDRESS 1>> | ||||||||||
| <<ADDRESS 2>> | ||||||||||
| To | <<ADDRESS 3>> | |||||||||
| <<ADDRESS 4>> | ||||||||||
| <<ADDRESS 5>> | ||||||||||
| <<ADDRESS 6>> | ||||||||||
Ordinary shares (“shares”) of | Oil Company of Australia Limited ABN 68 001 646 331 | (“the Company”) | ||||||||
| 1. | Under an Off Market Bid offers were made by | Origin Energy Limited ABN 30 000 051 696 (“the Bidder”) | ||||||||
in respect of the acquisition of shares in the Company. The offers closed on 22 September 2003 at 5.00 pm (Sydney Time). | ||||||||||
| 2. | You are, or are entitled to be, registered as the holder of shares in respect of which an offer was made, but have not accepted the takeover offer. | |||||||||
| 3. | The bidder hereby gives you notice under subsection 661B(1) of the Corporations Act 2001 (“the Act”) that the bidder elects and has bec ome entitled pursuant to subsections 661A(1) and (4) of the Act to compulsorily acquire all your shares and desires to acquire all your shares. | |||||||||
| 4. | Under section 661D of the Act, you have the right, by notice in writing given to the bidder within one month after this notice is lodged with ASIC, to ask the bidder for a written statement of the names and addresses of everyone else the bidder has given this notice to. This notice is lodged with ASIC on 23 September 2003. | |||||||||
| 5. | Under section 661E of the Act, you have the right to apply to the Court for an order that the shares not be compulsorily acquired. You must apply:
(a) by 27 October 2003; or
(b) if you ask for the statement referred to in paragraph 4 of this notice, within 14 days after being given that statement; whichever is later | |||||||||
| 6. | The bidder is entitled and bound to acquire the shares on the terms that applied under the takeover bid immediately before the end of the offer period. | |||||||||
| 7. | Unless on application made by you referred to in paragraph 5 of this notice the Court otherwise orders, the bidder must comply with paragraph 6 of this notice. | |||||||||
| Signature | ||||||||||
| print name | Bruce G Beeren capacity Director | |||||||||
| sign here | date 23 / 9 / 2003 | |||||||||
Origin Energy Limited ABN 30 000 051 696Ÿ Level 39, AMP Centre, 50 Bridge Street Sydney NSW 2000
GPO Box 5376, Sydney NSW 2001Ÿ Telephone (02) 9220 6400Ÿ Facsimile (02) 9235 1661Ÿ www.originenergy.com.au
Item 6
ASX Release
25 September 2003
Jingemia 3 Weekly Progress Report, Onshore Perth Basin, Western Australia
Origin Energy Resources Limited* advises that the appraisal well Jingemia 3 located in the onshore Perth Basin Exploration Permit 413 was at 0630 hours WST running 7 inch casing at a total measured depth of 2,625 metres.
Jingemia 3 intersected the primary objective Dongara Sandstone at a measured depth of 2,533.5 (2411mTVDSS) metres, 31 metres low to Jingemia 1 and 30 metres high to Jingemia 2. Analysis of the Dongara Sandstone reservoir in the well has confirmed it to be in pressure communication with Jingemia 1. The oil water contact in the well is estimated to be 2,414 metres subsea. This compares to an assumed oil water contact for the field of approximately 2,411 metres subsea prior to the drilling of Jingemia 2 and 3. Reservoir quality is interpreted to be suitable for water injection and the well will now be completed to provide pressure support.
Following completion of the well, other associated activities and obtaining necessary approvals, it is anticipated that a second Extended Production Test of the field will commence in October.
Once the drilling rig is released from Jingemia 3 it will move to Hovea 9 with drilling of this well expected to occur in mid October.
Participants in EP 413 and Jingemia 3 are:
Origin Energy Developments Pty Limited* (Operator) | 49.189 | % | |||
Hardman Oil and Gas Pty Ltd | 22.376 | % | |||
AWE (Perth Basin) Pty Ltd | 15.245 | % | |||
Voyager Energy Limited | 6.270 | % | |||
Victoria Petroleum NL | 5.000 | % | |||
Norwest Energy NL | 1.278 | % | |||
Roc Oil (WA) Pty Limited | 0.250 | % | |||
ARC Energy NL | 0.250 | % | |||
John Kevin Geary | 0.142 | % |
Origin Energy Limited ABN 30 000 051 696Ÿ Level 39, AMP Centre, 50 Bridge Street Sydney NSW 2000
GPO Box 5376, Sydney NSW 2001Ÿ Telephone (02) 9220 6400Ÿ Facsimile (02) 9235 1661Ÿ www.originenergy.com.au
Participants in Hovea 9 are:
Origin Energy Developments Pty Limited* (Operator) | 50.00% | |
ARC Energy NL | 50.00% |
*a wholly owned subsidiary of Origin Energy Limited
For further information contact:
John Piper
Executive General Manager—Oil and Gas Production
Origin Energy
Phone: 07 3858 0681
Email: john.piper@upstream.originenergy.com.au
Item 7
ASX Release
1 October 2003
Onshore Taranaki Basin New Zealand—Tuihu-1A
Weekly Progress Report
Origin Energy Resources (NZ) has been advised by the Operator that as from 0600 hours on 30 September 2003 the Tuihu-1A re-entry well, located in onshore Taranaki Basin permit PEP 38718, New Zealand, was tripping for a bit change at 4577m in the side-tracked hole.
The Tuihu-1A re-entry well is designed to deepen the Tuihu-1 exploration well that was drilled in late 2000/early 2001 to a total depth of 4530m. During drilling of this well significant gas shows were encountered in fractured Oligocene sandstones. As a result, Tuihu-1 was suspended at that time pending further geological investigation.
Forward operations at the Tuihu-1A well are expected to take another one to two weeks to drill to a total depth of 5100m. The primary targets are reservoirs within the Tariki Sandstone and the Kapuni Formation.
Tuihu-1A is located 6 kilometres from the Tariki gas pipeline, and if successful, could be brought on production rapidly.
Participants in the Tuihu-1A well are:
Swift Energy New Zealand Limited | 50 | %(Operator) | |
Origin Energy Resources NZ Limited | 20 | % | |
New Zealand Oil and Gas Limited | 20 | % | |
Pacific Energy Limited Indo | 10 | % |
For further information contact:
Dr Rob Willink
General Manager – Exploration
Phone: 07 3858 0676
Email: rob.willink@upstream.originenergy.com.au
Origin Energy Limited ABN 30 000 051 696 · Level 39,AMP Centre, 50 Bridge Street Sydney NSW 2000
GPO Box 5376, Sydney NSW 2001 · Telephone (02) 9220 6400 · Facsimilie (02) 9235 1661 · www.originenergy.com.au
Item 8
To | Company Announcements Office | Facsimile | 1300 300 021 | |||||
Company | Australian Stock Exchange | Date | 2 October 2003 | |||||
From | Bill Hundy | Pages | 8 | |||||
Subject | INITIAL SUBSTANTIAL HOLDER NOTICE | |||||||
We wish to advise that Origin Energy Limited has a substantial shareholding in Geodynamics Limited (GDY) and attach the Form 603 Notice of initial substantial holder.
Regards
|
| Bill Hundy |
| Company Secretary |
02 9220 6467 – bill.hundy@originenergy.com.au
Copy to: Company Secretary
Geodynamics Limited
Origin Energy Limited ABN 30 000 051 696 · Level 39,AMP Centre, 50 Bridge Street Sydney NSW 2000
GPO Box 5376, Sydney NSW 2001 · Telephone (02) 9220 6400 · Facsimilie (02) 9235 1661 · www.originenergy.com.au
604 page 1 15 July 2001
Form 603
Corporations Act 2001
Section 671B
Notice of initial substantial holder
To Company Name/Scheme | Geodynamics Limited | |||
ACN/ARSN | 095 006 090 | |||
| 1. Details of substantial holder (1) | ||||
Name | Origin Energy Limited | |||
ACN/ARSN (if applicable) | 000 051 696 | |||
The holder became a substantial holder on | 30 / 09 / 2003 | |||
2. Details of voting power
The total number of votes attached to all the voting shares in the company or voting interests in the scheme that the substantial holder or an associate (2) had a relevant interest (3) in on the date the substantial holder became a substantial holder are as follows:
| Class of securities (4) | Number of securities | Person’s votes (5) | Voting power (6) | |||
Ordinary | 10,000,000 | 10,000,000 | 19.56% | |||
3. Details of relevant interests
The nature of the relevant interest the substantial holder or an associate had in the following voting securities on the date the substantial holder became a substantial holder are as follows:
| Holder of relevant interest | Nature of relevant interest (7) | Class and number of securities | ||
Origin Energy Limited | Legal and Beneficial owner as acquired pursuant to Investment Deed, the terms of which are set out in the Notice of Meeting attached as “Annexure A” | 10,000,000 Ordinary | ||
4. Details of present registered holders
The persons registered as holders of the securities referred to in paragraph 3 above are as follows:
6. Addresses
The addresses of persons named in this form are as follows:
| Name | Address | |
Origin Energy Limited | Level 39, AMP Centre, 50 Bridge Street, Sydney, NSW 2000 | |
Signature
print name | William M Hundy | capacity Secretary | ||
sign here |
| date 2 / 10 / 2003 | ||
DIRECTIONS
| (1) | If there are a number of substantial holders with similar or related relevant interests (eg. a corporation and its related corporations, or the manager and trustee of an equity trust), the names could be included in an annexure to the form. If the relevant interests of a group of persons are essentially similar, they may be referred to throughout the form as a specifically named group if the membership of each group, with the names and addresses of members is clearly set out in paragraph 7 of the form. |
| (2) | See the definition of “associate” in section 9 of the Corporations Act 2001. |
| (3) | See the definition of “relevant interest” in sections 608 and 671B(7) of the Corporations Act 2001. |
| (4) | The voting shares of a company constitute one class unless divided into separate classes. |
| (5) | The total number of votes attached to all the voting shares in the company or voting interests in the scheme (if any) that the person or an associate has a relevant interest in. |
| (6) | The person’s votes divided by the total votes in the body corporate or scheme multiplied by 100. |
| (7) | Include details of: |
| (a) | any relevant agreement or other circumstances by which the relevant interest was acquired. If subsection 671B(4) applies, a copy of any document setting out the terms of any relevant agreement, and a statement by the person giving full and accurate details of any contract, scheme or arrangement, must accompany this form, together with a written statement certifying this contract, scheme or arrangement; and |
| (b) | any qualification of the power of a person to exercise, control the exercise of, or influence the exercise of, the voting powers or disposal of the securities |
| See the definition of “relevant agreement” in section 9 of the Corporations Act 2001. |
| (8) | If the substantial holder is unable to determine the identity of the person ( eg. if the relevant interest arises because of an option) write “unknown”. |
| (9) | Details of the consideration must include any and all benefits, money and other, that any person from whom a relevant interest was acquired has, or may, become entitled to receive in relation to that acquisition. Details must be included even if the benefit is conditional on the happening or not of a contingency. Details must be included of any benefit paid on behalf of the substantial holder or its associate in relation to the acquisitions, even if they are not paid directly to the person from whom the relevant interest was acquired. |
Item 9
ASX Release
15 September 2003
Jingemia 2 Progress Report, Onshore Perth Basin, Western Australia
Origin Energy Resources Limited* advises that the appraisal well Jingemia 2 located in the onshore Perth Basin Exploration Permit 413 was at 0630 hours WST finalising wireline logging at a total measured depth of 2781metres.
Analysis of the Dongara Sandstone reservoir in the well has indicated it to be of poor reservoir quality and unsuitable for water injection likely due to thinning of the section from Jingemia 1. It has therefore been agreed to sidetrack the well to a revised bottom hole location to intersect improved reservoir quality.
Participants in EP 413 and Jingemia 2 are:
Origin Energy Developments Pty Limited* (Operator) | 49.189 | % | |
Hardman Oil and Gas Pty Ltd | 22.376 | % | |
AWE (Perth Basin) Pty Ltd | 15.245 | % | |
Victoria Petroleum NL | 5.000 | % | |
Voyager Energy Limited | 6.270 | % | |
Norwest Energy NL | 1.278 | % | |
Roc Oil (WA) Pty Limited | 0.250 | % | |
ARC Energy NL | 0.250 | % | |
John Kevin Geary | 0.142 | % |
*a wholly owned subsidiary of Origin Energy Limited
For further information contact:
John Piper
Executive General Manager - Oil and Gas Production
Phone: 07 3858 0681
Email: john.piper@upstream.originenergy.com.au
Origin Energy Limited ABN 30 000 051 696 · Level 39, AMP Centre, 50 Bridge Street Sydney NSW 2000
GPO Box 5376, Sydney NSW 2001 · Telephone (02) 9235 1661 · www.originenergy.com.au
Item 10
To | Company Announcements Office | Facsimile | 1300 300 021 | |||||
Company | Australian Stock Exchange Limited | Date | 3 October 2003 | |||||
From | Bill Hundy | Pages | 9 | |||||
Subject | APPENDIX 3Y NOTICES | |||||||
Please find attached Appendix 3Y – Change of Director’s Interest Notices for:
| • | C B Carter |
| • | J R Williams |
| • | H M Nugent |
| • | T Bourne |
Regards
Bill Hundy
Company Secretary
02 9220 6467 –bill.hundy@originenergy.com.au
Origin Energy Limited ABN 30 000 051 696 · Level 39, AMP Centre, 50 Bridge Street Sydney NSW 2000
GPO Box 5376, Sydney NSW 2001 · Telephone (02) 9235 1661 · www.originenergy.com.au
Appendix 3Y
Change of Director’s Interest Notice
Rule 3.19A.2
Appendix 3Y
Change of Director’s Interest Notice
Information or documents not available now must be given to ASX as soon as available. Information and documents given to ASX become ASX’s property and may be made public.
Introduced 30/9/2001.
| Name of entity | ORIGIN ENERGY LIMITED | |
| ABN | 30 000 051 696 | |
We (the entity) give ASX the following information under listing rule 3.19A.2 and as agent for the director for the purposes of section 205G of the Corporations Act.
| Name of Director | Colin B Carter | |
Date of last notice | 5 March 2003 | |
Part 1—Change of director’s relevant interests in securities
In the case of a trust, this includes interests in the trust made available by the responsible entity of the trust
| Direct or indirect interest | Direct and Indirect | |||
Nature of indirect interest (including registered holder) Note: Provide details of the circumstances giving rise to the relevant interest. | Shares held in: • Colangie Nominees Pty Ltd—Colin Carter a Director • Origin Energy Non-Executive Directors’ Share Plan | |||
Date of change | 30 September 2003 | |||
No. of securities held prior to change | 5,000 | Ordinary Fully Paid Shares held directly | ||
| 11,000 | Ordinary Fully Paid Shares held indirectly | |||
Class | Ordinary | |||
Number acquired | 2,204 | |||
Number disposed | Nil | |||
| + | See chapter 19 for defined terms. |
30/9/2001 | Appendix 3Y |
Appendix 3Y
Change of Director’s Interest Notice
Value/Consideration | $4.1397 | |||||
Note: | If consideration is non-cash, provide details and estimated valuation | |||||
No. of securities held after change | 5,000 | Ordinary Fully Paid Shares held directly | ||||
| 13,204 | Ordinary Fully Paid Shares held indirectly | |||||
Nature of change Example: on-market trade, off-market trade, exercise of options, issue of securities under dividend reinvestment plan, participation in buy-back | Purchase of securities under Non-Executive Directors’ Share Plan | |||||
Part 2—Change of director’s interests in contracts
| Detail of contract | N/A | |
| Nature of interest | N/A | |
Name of registered holder (if issued securities) | N/A | |
| Date of change | N/A | |
No. and class of securities to which interest related prior to change Note: Details are only required for a contract in relation to which the interest has changed | N/A | |
| Interest acquired | N/A | |
| Interest disposed | N/A | |
Value/Consideration Note: If consideration is non-cash, provide details and an estimated valuation | N/A | |
Interest after change | N/A | |
| + | See chapter 19 for defined terms. |
30/9/2001 | Appendix 3Y |
Appendix 3Y
Change of Director’s Interest Notice
Rule 3.19A.2
Appendix 3Y
Change of Director’s Interest Notice
Information or documents not available now must be given to ASX as soon as available. Information and documents given to ASX become ASX’s property and may be made public.
Introduced 30/9/2001.
| Name of entity | ORIGIN ENERGY LIMITED | |
ABN | 30 000 051 696 | |
We (the entity) give ASX the following information under listing rule 3.19A.2 and as agent for the director for the purposes of section 205G of the Corporations Act.
Name of Director | James Roland Williams | |
Date of last notice | 24 March 2003 | |
Part 1—Change of director’s relevant interests in securities
In the case of a trust, this includes interests in the trust made available by the responsible entity of the trust
| Direct or indirect interest | Direct and Indirect | |||||
Nature of indirect interest (including registered holder) Note: Provide details of the circumstances giving rise to the relevant interest. | Shares held in: • Origin Energy Non-Executive Directors’ Share Plan | |||||
Date of change | 30 September 2003 | |||||
No. of securities held prior to change | 17,178 | Ordinary Fully Paid Shares held directly | ||||
Class | Ordinary | |||||
Number acquired | 2,645 | |||||
Number disposed | Nil | |||||
Value/Consideration | $4.1397 | |||||
Note: | If consideration is non-cash, provide details and estimated valuation | |||||
No. of securities held after change | 17,178 | Ordinary Fully Paid Shares held directly | ||||
| 2,645 | Ordinary Fully Paid Shares held indirectly | |||||
| + | See chapter 19 for defined terms. |
30/9/2001 | Appendix 3Y |
Appendix 3Y
Change of Director’s Interest Notice
Nature of change | ||
Example: on-market trade, off-market trade, exercise of options, issue of securities under dividend reinvestment plan, participation in buy-back | Purchase of securities under Non-Executive Directors’ Share Plan | |
Part 2—Change of director’s interests in contracts
| Detail of contract | N/A | |
| Nature of interest | N/A | |
Name of registered holder (if issued securities) | N/A | |
| Date of change | N/A | |
No. and class of securities to which interest related prior to change Note: Details are only required for a contract in relation to which the interest has changed | N/A | |
| Interest acquired | N/A | |
| Interest disposed | N/A | |
Value/Consideration Note: If consideration is non-cash, provide details and an estimated valuation | N/A | |
Interest after change | N/A | |
| + | See chapter 19 for defined terms. |
30/9/2001 | Appendix 3Y |
Appendix 3Y
Change of Director’s Interest Notice
Rule 3.19A.2
Appendix 3Y
Change of Director’s Interest Notice
Information or documents not available now must be given to ASX as soon as available. Information and documents given to ASX become ASX’s property and may be made public.
Introduced 30/9/2001.
| Name of entity | ORIGIN ENERGY LIMITED | |
| ABN | 30 000 051 696 | |
We (the entity) give ASX the following information under listing rule 3.19A.2 and as agent for the director for the purposes of section 205G of the Corporations Act.
| Name of Director | Helen M Nugent | |
| Date of last notice | 25 March 2003 | |
Part 1—Change of director’s relevant interests in securities
In the case of a trust, this includes interests in the trust made available by the responsible entity of the trust
| Direct or indirect interest | Direct and Indirect | |
Nature of indirect interest (including registered holder) Note: Provide details of the circumstances giving rise to the relevant interest. | Shares held in: • Origin Energy Non-Executive | |
Date of change | 30 September 2003 | |
No. of securities held prior to change | 2,000 Ordinary Fully Paid Shares held directly | |
Class | Ordinary | |
Number acquired | 2,048 | |
Number disposed | Nil | |
Value/Consideration Note: If consideration is non-cash, provide details and estimated valuation | $4.1397 | |
No. of securities held after change | 2,000 Ordinary Fully Paid Shares held directly 2,048 Ordinary Fully Paid Shares held indirectly | |
| + | See chapter 19 for defined terms. |
30/9/2002 | Appendix 3Y |
Appendix 3Y
Change of Director’s Interest Notice
| Nature of change | ||||
Example: on-market trade, off-market trade, exercise of options, issue of securities under dividend reinvestment plan, participation in buy-back | Purchase of securities under Non-Executive Directors’ Share Plan | |||
Part 2 – Change of director’s interests in contracts
| ||||
Detail of contract
| N/A | |||
Nature of interest
| N/A | |||
Name of registered holder (if issued securities)
| N/A | |||
Date of change
| N/A | |||
No. and class of securities to which interest related prior to change Note: Details are only required for a contract in relation to which the interest has changed
| N/A | |||
Interest acquired
| N/A | |||
Interest disposed
| N/A | |||
Value/Consideration Note: If consideration is non- cash, provide details and an estimated valuation
| N/A | |||
Interest after change
| N/A | |||
| + | See chapter 19 for defined terms. |
30/9/2001 | Appendix 3Y |
Appendix 3Y
Change of Director’s Interest Notice
Rule 3.19A.2
Appendix 3Y
Change of Director’s Interest Notice
Information or documents not available now must be given to ASX as soon as available. Information and documents given to ASX become ASX’s property and may be made public.
Introduced 30/9/2001.
| Name of entity | ORIGIN ENERGY LIMITED | |
ABN | 30 000 051 696 | |
We (the entity) give ASX the following information under listing rule 3.19A.2 and as agent for the director for the purposes of section 205G of the Corporations Act.
Name of Director | Trevor Bourne | |
Date of last notice | 24 March 2003 | |
Part 1—Change of director’s relevant interests in securities
In the case of a trust, this includes interests in the trust made available by the responsible entity of the trust
| Direct or indirect interest | Direct and Indirect | |||||
Nature of indirect interest (including registered holder) Note: Provide details of the circumstances giving rise to the relevant interest. | Shares held in: • Origin Energy Non-Executive Directors’ Share Plan | |||||
Date of change | 30 September 2003 | |||||
No. of securities held prior to change | 16,658 | Ordinary Fully Paid Shares held directly | ||||
Class | Ordinary | |||||
Number acquired | 2,351 | |||||
Number disposed | Nil | |||||
Value/Consideration | $4.1397 | |||||
Note: | If consideration is non-cash, provide details and estimated valuation | |||||
No. of securities held after change | 16,658 | Ordinary Fully Paid Shares held directly | ||||
| 2,351 | Ordinary Fully Paid Shares held indirectly | |||||
| + | See chapter 19 for defined terms. |
30/9/2001 | Appendix 3Y |
Appendix 3Y
Change of Director’s Interest Notice
Nature of change | ||
Example: on-market trade, off-market trade, exercise of options, issue of securities under dividend reinvestment plan, participation in buy-back | Purchase of securities under Non-Executive Directors’ Share Plan | |
Part 2—Change of director’s interests in contracts
| Detail of contract | N/A | |
| Nature of interest | N/A | |
Name of registered holder (if issued securities) | N/A | |
| Date of change | N/A | |
No. and class of securities to which interest related prior to change Note: Details are only required for a contract in relation to which the interest has changed | N/A | |
| Interest acquired | N/A | |
| Interest disposed | N/A | |
Value/Consideration Note: If consideration is non-cash, provide details and an estimated valuation | N/A | |
Interest after change | N/A | |
| + | See chapter 19 for defined terms. |
30/9/2001 | Appendix 3Y |
Item 11
ASX Release
16 September 2003
Origin reaches compulsory acquisition threshold in its bid for Oil Company of Australia
Origin Energy Limited today announced that the acceptance by Santos Ltd of Origin’s off-market take-over offer of $4.25 per Oil Company of Australia (“OCA”) share has taken Origin’s interest in OCA to 99.1%.
Origin’s offer closes at 5.00 pm Sydney time on Monday, 22 September 2003, following which Origin intends to proceed to compulsory acquisition of the remaining shares in OCA in accordance with the provisions of the Corporations Act.
For further information contact:
Bruce Beeren
Executive Director, Commercial
Origin Energy
Telephone: (02) 9220 6301
Mobile: 0419 617 901
Item 12
To | Company Announcements Office | Facsimile | 1300 300 021 | |||
Company | Australian Stock Exchange Limited | Date | 16 September 2003 | |||
From | Bill Hundy | Pages | 121 | |||
Subject | ANNUAL ACCOUNTS | |||||
We attach the audited accounts of Origin Energy Limited and controlled entities for the financial year ended 30 June 2003 comprising:
| 1. | the Financial Statements |
| 2. | the Concise Annual Report including Directors’ Report |
| 3. | Notice of Annual General Meeting and Proxy Appointment Form |
These documents are being sent to shareholders today.
We confirm that the Company will be treated as having lodged the reports with the Australian Securities and Investments Commission by reason of having given them to you.
| Regards |
|
Bill Hundy Company Secretary |
02 9220 6467 –bill.hundy@originenergy.com.au
Origin Energy Limited ACN 000 051 696Ÿ Level 39, AMP Centre, 50 Bridge Street Sydney NSW 2000
GPO Box 5376, Sydney NSW 2001Ÿ Telephone (02) 9220 6400Ÿ Facsimile (02) 9235 1661Ÿ www.originenergy.com.au
1/1
...value.
Our focus on strategy, performance and growth is the key driver of increased shareholder value. Our Total Shareholder Return since listing in February 2000 has averaged more than 40% per year making Origin Energy one of the best performing companies on the ASX.
Origin Energy Limited ABN 30 000 051 696
Contents
| 2 | ||||||
| 3 | ||||||
| 4 | ||||||
Notes to the financial statements | ||||||
1. | 5 | |||||
2. | 10 | |||||
3. | 12 | |||||
4. | Income tax expense/(benefit) relating to ordinary activities | 15 | ||||
5. | 15 | |||||
6. | 16 | |||||
7. | 16 | |||||
8. | 17 | |||||
9. | 17 | |||||
10. | 17 | |||||
11. | 18 | |||||
12. | 20 | |||||
13. | 20 | |||||
14. | 20 | |||||
15. | 21 | |||||
16. | 21 | |||||
17. | 22 | |||||
18. | 22 | |||||
19. | 22 | |||||
20. | 24 | |||||
21. | 24 | |||||
22. | 25 | |||||
23. | 25 | |||||
24. | 26 | |||||
25. | 28 | |||||
26. | 28 | |||||
27. | 29 | |||||
28. | Details of credit facilities available to the consolidated entity | 30 | ||||
29. | 30 | |||||
30. | 34 | |||||
31. | 34 | |||||
32. | 37 | |||||
33. | 39 | |||||
34. | 40 | |||||
35. | 44 | |||||
36. | 47 | |||||
37. | 47 | |||||
38. | 49 | |||||
39. | 49 | |||||
| 50 | ||||||
| 52 | ||||||
Directory | back cover | |||||
These are the Financial Statements referred to in the Annual Report.
Origin Energy Limited and Controlled Entities1
Statements of Financial Performance
for year ended 30 June
| Consolidated | Origin Energy Limited | |||||||||||||
| Note | 2003 $’000 | 2002 $’000 | 2003 $’000 | 2002 $’000 | ||||||||||
Revenue from ordinary activities | 3(a) | 3,352,303 | 2,428,808 | 153,078 | 155,860 | |||||||||
Expenses from ordinary activities excluding borrowing costs | 3(b) | (3,068,179 | ) | (2,204,790 | ) | (29,485 | ) | (26,433 | ) | |||||
Borrowing costs | 3(c) | (50,138 | ) | (44,476 | ) | (84,970 | ) | (67,507 | ) | |||||
Share of net profits of associates and joint venture entities accounted for using the equity method | 12,565 | 8,338 | — | — | ||||||||||
Profit from ordinary activities before related income tax expense | 246,551 | 187,880 | 38,623 | 61,920 | ||||||||||
Income tax expense/(benefit) relating to ordinary activities | 4 | 80,248 | 54,280 | (9,726 | ) | 3,545 | ||||||||
Net profit | 166,303 | 133,600 | 48,349 | 58,375 | ||||||||||
Net profit attributable to outside equity interests | 4,351 | 4,940 | — | — | ||||||||||
Net profit attributable to members of the parent entity, Origin Energy Limited | 22 | 161,952 | 128,660 | 48,349 | 58,375 | |||||||||
Non-owner transaction changes in equity: | ||||||||||||||
Net decrease in retained profits on initial adoption of revised AASB 1028 “Employee Benefits” | (283 | ) | — | (7 | ) | — | ||||||||
Net exchange difference relating to self-sustaining foreign operations | 21 | (1,779 | ) | (1,444 | ) | — | — | |||||||
Total revenues, expenses and valuation adjustments attributable to members of Origin Energy Limited recognised directly in equity | (2,062 | ) | (1,444 | ) | (7 | ) | — | |||||||
Total changes in equity from non-owner related transactions attributable to members of the parent entity, Origin Energy Limited | 22 | 159,890 | 127,216 | 48,342 | 58,375 | |||||||||
Basic earnings per share | 38 | 24.8 cents | 20.2 cents | |||||||||||
Diluted earnings per share | 38 | 24.7 cents | 20.1 cents | |||||||||||
The Statements of Financial Performance should be read in conjunction with the accompanying notes set out on pages 5 to 49, which form an integral part of the financial statements.
2 Financial statements 2003
Statements of Financial Position
as at 30 June
| Consolidated | Origin Energy Limited | |||||||||
| Note | 2003 $’000 | 2002 $’000 | 2003 $’000 | 2002 $’000 | ||||||
Current assets | ||||||||||
Cash assets | 16,431 | 17,255 | 37,036 | �� | 7,933 | |||||
Receivables | 6 | 621,085 | 485,538 | 3,008,290 | 3,108,179 | |||||
Inventories | 7 | 53,913 | 46,392 | — | — | |||||
Other | 8 | 43,063 | 37,064 | 4,159 | 3,966 | |||||
Total current assets | 734,492 | 586,249 | 3,049,485 | 3,120,078 | ||||||
Non-current assets | ||||||||||
Receivables | 6 | 31,675 | 21,499 | 12,173 | 19,000 | |||||
Investments accounted for using the equity method | 9 | 55,272 | 53,347 | — | — | |||||
Other financial assets | 10 | 170,713 | 196,135 | 790,559 | 780,665 | |||||
Property, plant and equipment | 11 | 1,352,527 | 1,155,372 | 2,021 | 851 | |||||
Exploration, evaluation and development expenditure | 12 | 154,300 | 130,655 | — | — | |||||
Intangible assets | 13 | 777,948 | 634,436 | — | — | |||||
Deferred tax assets | 14 | 123,192 | 171,654 | 1,342 | 6,421 | |||||
Other | 8 | 8,622 | 8,587 | — | — | |||||
Total non-current assets | 2,674,249 | 2,371,685 | 806,095 | 806,937 | ||||||
Total assets | 3,408,741 | 2,957,934 | 3,855,580 | 3,927,015 | ||||||
Current liabilities | ||||||||||
Payables | 15 | 475,026 | 371,534 | 1,664,252 | 1,777,031 | |||||
Interest-bearing liabilities | 16 | 85,522 | 85,238 | 25,000 | 92,775 | |||||
Current tax liabilities | 18 | 546 | 3,290 | — | 18,428 | |||||
Provisions | 19 | 71,330 | 67,451 | 15,840 | 29,761 | |||||
Total current liabilities | 632,424 | 527,513 | 1,705,092 | 1,917,995 | ||||||
Non-current liabilities | ||||||||||
Payables | 15 | 11,840 | 6,100 | — | 4,000 | |||||
Interest-bearing liabilities | 16 | 663,012 | 565,139 | 663,012 | 565,000 | |||||
Deferred tax liabilities | 18 | 243,904 | 197,055 | 59 | 797 | |||||
Provisions | 19 | 67,957 | 36,088 | 5,180 | 6,247 | |||||
Total non-current liabilities | 986,713 | 804,382 | 668,251 | 576,044 | ||||||
Total liabilities | 1,619,137 | 1,331,895 | 2,373,343 | 2,494,039 | ||||||
Net assets | 1,789,604 | 1,626,039 | 1,482,237 | 1,432,976 | ||||||
Equity | ||||||||||
Contributed equity | 20 | 418,612 | 385,039 | 418,612 | 385,039 | |||||
Reserves | 21 | 110,764 | 112,347 | 5,723 | 5,723 | |||||
Retained profits | 22 | 1,223,977 | 1,095,158 | 1,057,902 | 1,042,214 | |||||
Total parent entity interest | 1,753,353 | 1,592,544 | 1,482,237 | 1,432,976 | ||||||
Outside equity interests | 23 | 36,251 | 33,495 | — | — | |||||
Total equity | 22 | 1,789,604 | 1,626,039 | 1,482,237 | 1,432,976 | |||||
The Statements of Financial Position should be read in conjunction with the accompanying notes set out on pages 5 to 49, which form an integral part of the financial statements.
Origin Energy Limited and Controlled Entities3
for year ended 30 June
| Consolidated | Origin Energy Limited | ||||||||||||||
| Note | 2003 $’000 | 2002 $’000 | 2003 $’000 | 2002 $’000 | |||||||||||
Cash flows from operating activities | |||||||||||||||
Cash receipts in the course of operations | 3,703,004 | 2,553,539 | 26,702 | 19,916 | |||||||||||
Cash payments in the course of operations | (3,193,463 | ) | (2,155,062 | ) | (17,376 | ) | (17,026 | ) | |||||||
Dividends/distributions received from associates/ joint venture entities | 10,998 | 6,000 | — | — | |||||||||||
Other dividends received | 413 | 409 | 18,547 | 39,947 | |||||||||||
Interest received | 1,832 | 1,785 | 121,560 | 104,584 | |||||||||||
Borrowing costs paid | (50,571 | ) | (44,919 | ) | (85,983 | ) | (67,951 | ) | |||||||
Income taxes paid | (39,619 | ) | (22,455 | ) | (3,888 | ) | — | ||||||||
Subvention payments | (10,000 | ) | (18,000 | ) | (10,000 | ) | (18,000 | ) | |||||||
Net cash provided by operating activities | 24 | (d) | 422,594 | 321,297 | 49,562 | 61,470 | |||||||||
Cash flows from investing activities | |||||||||||||||
Payments for purchases of property, plant and equipment | (146,776 | ) | (169,464 | ) | (1,433 | ) | (335 | ) | |||||||
Payments for exploration, development and mine properties | (132,454 | ) | (135,379 | ) | — | — | |||||||||
Payments for purchases of businesses | 24 | (e) | (131,614 | ) | — | — | — | ||||||||
Proceeds from sale of non-current assets | 3,494 | 18,613 | — | 16 | |||||||||||
Payments for purchases of investments | (459 | ) | (15,904 | ) | — | (15,178 | ) | ||||||||
Payments for purchases of controlled entities | 24 | (e) | (93,107 | ) | (87,452 | ) | (89,025 | ) | — | ||||||
Net cash used in investing activities | (500,916 | ) | (389,586 | ) | (90,458 | ) | (15,497 | ) | |||||||
Cash flows from financing activities | |||||||||||||||
Proceeds from borrowings | 1,092,626 | 385,591 | 896,626 | 385,500 | |||||||||||
Repayments of borrowings | (987,675 | ) | (485,000 | ) | (852,114 | ) | (485,000 | ) | |||||||
Dividends paid | (25,858 | ) | (35,282 | ) | (23,947 | ) | (29,554 | ) | |||||||
Proceeds from issues of securities | 5,417 | 198,465 | 5,417 | 198,465 | |||||||||||
Net movement in loans with controlled entities | — | — | 58,292 | (131,602 | ) | ||||||||||
Net cash provided by/ (used in) financing activities | 84,510 | 63,774 | 84,274 | (62,191 | ) | ||||||||||
Net increase/(decrease) in cash held | 6,188 | (4,515 | ) | 43,378 | (16,218 | ) | |||||||||
Cash and cash equivalents at the beginning of the year | 10,551 | 15,910 | (6,342 | ) | 9,876 | ||||||||||
Effect of exchange rate changes on cash | (308 | ) | (844 | ) | — | — | |||||||||
Cash and cash equivalents at the end of the year | 24 | (a) | 16,431 | 10,551 | 37,036 | (6,342 | ) | ||||||||
The Statements of Cash Flows should be read in conjunction with the accompanying notes set out on pages 5 to 49, which form an integral part of the financial statements.
4 Financial statements 2003
Notes to the financial statements
| 1. | Statement of significant accounting policies |
| Basis of preparation: |
The following is a summary of significant accounting policies which have been adopted in the presentation of these financial statements which is a general purpose financial report prepared in accordance with Accounting Standards, Urgent Issues Group Consensus Views, other authoritative pronouncements of the Australian Accounting Standards Board and the Corporations Act 2001. The financial statements have been prepared on a historical cost accounting basis. These accounting policies have been consistently applied by each entity in the consolidated entity and, except where there is a change in accounting policy, are consistent with those of the previous year.
| Principles of consolidation: |
The consolidated financial statements of the consolidated entity include the financial statements of Origin Energy Limited and all entities in which it had a controlling interest. The effects of transactions between entities incorporated in the consolidated financial statements are eliminated. Outside interests in the contributed equity, reserves and results of entities that are under the control of Origin Energy Limited are shown as a separate item in the consolidated financial statements. Where control of entities commenced or ceased during the year, the results are included only from the date control commenced or up to the date control ceased. Associates are those entities, other than partnerships, over which the consolidated entity exercises significant influence and which are not intended for sale in the near future. In the consolidated financial statements, investments in associates are accounted for using equity accounting principles.
| Acquisition of assets: |
All assets acquired including property, plant and equipment and intangibles other than goodwill are initially recorded at their cost of acquisition at the date of acquisition, being the fair value of the consideration provided plus incidental costs directly attributable to the acquisition. When equity instruments are issued as consideration, their market price at the date of acquisition is used as fair value. Transaction costs arising on the issue of equity instruments are recognised directly in equity.
| Receivables: |
The collectibility of debts is assessed at balance date and a specific provision is made for any doubtful accounts. Unbilled debtors are net of realisation costs.
| Inventories and work in progress: |
Inventories and work in progress are valued at the lower of cost and net realisable value. Cost is determined predominantly on the first-in-first-out basis of valuation.
| Deferred expenses: |
Expenditure is deferred to the extent that it is probable that future economic benefits embodied in the expenditure will eventuate and can be reliably measured. Deferred expenses are amortised on a straight-line basis over the period in which the related benefits are expected to be realised.
| Recoverable amount of non-current assets: |
The carrying amounts of non-current assets, excluding exploration and development expenditure (refer below), are reviewed at each reporting date to ensure that the carrying amounts are not in excess of recoverable amounts. If the carrying amount of a non-current asset exceeds the recoverable amount, the asset is written down to the recoverable amount. In assessing recoverable amounts the relevant cash flows are discounted to their present value.
| Intangibles: |
Goodwill:Goodwill, being the excess of the cost of acquisition incurred over the fair value of the identifiable net assets acquired, is amortised to the Statements of Financial Performance using the straight-line method of calculation over the period of time during which the benefits are expected to arise, but not exceeding twenty years. The unamortised balance of goodwill is reviewed at each reporting date and recognised as an expense in the Statements of Financial Performance to the extent that future benefits are no longer probable. The methodology applied in carrying out the review of the unamortised balance of goodwill does include, but is not limited to, an analysis of expected future cash flows discounted to their present value.
Other intangibles:Other identifiable intangible assets are initially recorded at cost and amortised on a straight-line basis over the useful life of the asset, being the estimated period of time over which the future economic benefits are expected to be realised.
| Commodity hedging contracts: |
Commodity hedging contracts acquired are recorded at their cost of acquisition at the date of acquisition, being the assessed net fair value at that time. The carrying value of the contracts is amortised over the duration of the contracts in accordance with the pattern of benefits which are expected to be realised.
| Exploration and development expenditure: |
Exploration, evaluation and development expenditure in relation to separate areas of interest is accumulated and carried forward in the Statements of Financial Position. The ultimate recoupment of exploration and evaluationexpenditure is dependent on successful development and/or commercial exploitation of the areas of interest. Each area is reviewed at each reporting date to determine whether expenditure should continue to be carried forward in respect of that area of interest. Where an area of interest is abandoned or there is considered to be a permanent diminution in the value of that area of interest, the costs in respect of that area of interest are written off or a provision is raised for tenement write-down. On commencement of production in an area of interest, accumulated exploration and development expenditure is amortised over the life of the area of interest based on the rate of depletion of the economically recoverable reserves.
Origin Energy Limited and Controlled Entities5
Notes to the financial statements (continued)
| 1. | Statement of significant accounting policies (continued) |
| Investments: |
Interests in listed and unlisted companies which are not controlled entities, associated entities or joint venture entities are treated as investments and are carried at cost. The carrying values are reviewed at each reporting date to ensure that they do not exceed recoverable amounts. Investments in associates and joint venture entities are accounted for using equity accounting principles. An associate is an entity that the consolidated entity exercises significant influence over. Investments in associates and joint venture entities are carried at the lower of the equity accounted amount and the recoverable amount. The consolidated entity’s share of the associates’ or joint venture entities’ net profit or loss after tax is recognised as revenue in the consolidated Statements of Financial Performance from the date significant influence commences until the date significant influence ceases. Movements in other reserves are recognised directly in consolidated reserves.
| Property, plant and equipment: |
Items of property, plant and equipment are initially recorded at cost. Depreciation and amortisation are charged at rates which provide for the write-down from cost over the anticipated period of their useful life to the consolidated entity. Predominantly the straight-line method of depreciation and amortisation has been used for items of property, plant and equipment.
Leased plant and equipment:Leases of plant and equipment which are classified as finance leases are capitalised and amortised over the period during which benefits are anticipated. Other leases are classified as operating leases and the lease costs are expensed as incurred.
| Operating leases: |
Payments made under operating leases are expensed on a straight-line basis over the term of the lease, except where an alternative basis is more representative of the pattern of benefits to be derived from the leased property. Lease incentives are recognised as liabilities. Lease rental payments are allocated between rental expense and reduction of the liability, on a straight-line basis over the period of the incentive.
| Joint venture operations: |
The consolidated entity’s interests in unincorporated joint ventures are brought to account by including its proportionate share of the joint ventures’ assets, liabilities and expenses and the consolidated entity’s revenue from the sale of its share of output on a line-by-line basis, from the date joint control commences to the date joint control ceases.
| Payables: |
Liabilities are recognised for amounts to be paid in the future for goods and services received.
| Interest bearing liabilities: |
Bank loans are recognised at their principal amount, subject to set-off arrangements. Interest expense is accrued at the contracted rate in “trade creditors and accruals”. Borrowings are recognised at their face value. Any premium or discount is booked as prepaid interest and is amortised over the period to maturity.
| Employee benefits: |
Provision is made in the financial statements for benefits accruing to employees in relation to long service leave and annual leave. The provision for employee benefits for annual leave expected to be settled within 12 months of the year end has been calculated at undiscounted amounts based on remuneration wage and salary rates that the consolidated entity expects to pay as at the reporting date including related on-costs. The provision for employee benefits for long service leave represents the present value of the future cash outflows. The provision is calculated using expected future increases in wage and salary rates including related on-costs and expected settlement dates based on turnover history and is discounted using rates at the reporting date that closely match the terms of maturity of related liabilities. The unwinding of the discount is treated as long service leave expense.
| Superannuation plans: |
Employee contributory superannuation funds exist to provide benefits for employees and their dependents on retirement, disability or death. Contributions are recognised as an expense as payments are made. The company’s defined benefit superannuation plan has a deficit of accrued liabilities over fund assets as at 30 June 2003. The company has provided in full for this deficit in the year ended 30 June 2003 and will release the provision as and when additional contributions are made by the company to make good the shortfall.
| Provisions: |
A provision is recognised when there is a legal, equitable or constructive obligation as a result of a past event and it is probable that a future sacrifice of economic benefits will be required to settle the obligation, the timing or amount of which is uncertain. If the effect is material, a provision is determined by discounting the expected future cash flows required to settle the obligation at a pre-tax rate that reflects current market assessments of the time value of money and the risks specific to the liability, being risk free rates on government bonds most closely matching the expected future payments, except where noted below. When some or all of the economic benefits required to settle a provision are expected to be recovered from a third party, the recovery receivable is recognised as an asset when it is probable that the recovery will be received and is measured on a basis consistent with the measurement of the related provision. In the Statements of Financial Performance, the expense recognised in respect of a provision is presented net of the recovery.
In the Statements of Financial Position, the provision is recognised net of the recovery receivable only when the entity has a legally recognised right to set-off the recovery receivable and the provision, and intends to settle on a net basis, or to realise the asset and settle the provision simultaneously. A provision for dividend payable is recognised in the reporting period in which the dividends are declared, for the entire undistributed amount, regardless of the extent to which they will be paid in cash.
6 Financial statements 2003
| 1. | Statement of significant accounting policies (continued) |
Restoration:Provisions are made for estimated costs relating to the remediation of soil, groundwater and untreated waste as soon as the need is identified. Provisions are made for field site rehabilitation and restoration on an incremental basis during the course of field life (which includes the field closure phase). Provisions, which are determined on an undiscounted basis, include the following costs: reclamation, plant closure, waste site closure and monitoring activities. These costs have been determined on the basis of current costs, current legal requirements and current technology. Changes in estimates are dealt with on a prospective basis. Significant uncertainties exist as to the amount of the restoration obligations that will be incurred due to uncertainty as to the remaining life of existing operating sites and the impact of changes in environmental legislation.
Restructuring and employee termination benefits:A provision for restructuring, including employee termination benefits, related to an acquired entity or operation is recognised at the date of acquisition where the main features of the restructuring were announced, implementation of the restructuring commenced, or contracts were entered into by the date of acquisition, or a detailed formal plan is developed by the earlier of three months after the date of the acquisition and the completion of this financial report. The provision only relates to costs associated with the acquired entity, and is included in the determination of the fair value of the net assets acquired. The provision includes liabilities for termination benefits that will be paid to employees of the acquired entity as a result of the restructuring.
Other provisions for restructuring or termination benefits are only recognised when a detailed plan has been approved and the restructuring or termination benefits has either commenced or been publicly announced, or firm contracts related to the restructuring or termination benefits have been entered into. Costs related to ongoing activities are not provided for. The liabilities for termination benefits that will be paid as a result of the restructuring have been included in the provision for employee benefits.
Onerous contracts:A provision for onerous contracts is recognised after impairment losses on assets dedicated to the contract have been recognised and when the expected benefits are less than the unavoidable costs of meeting the contractual obligations. A provision is recognised to the extent that the contractual obligations exceed unrecognised assets.
| Revenue recognition: |
Sales revenue:Sales revenue comprises revenue earned (net of returns, discounts and allowances) from the provision of products or services to entities outside the consolidated entity. Sales revenue is recognised in accordance with the contractual arrangements where applicable and only once title to the goods passes from the company to the customer or when services have been rendered to the customer and collectibility is reasonably assured. In practice the above revenue recognition approach is applied to the company’s business segments as follows:
| - | Revenue from the sale of oil and gas in the Exploration and Production business segment is recognised when the commodities have been loaded for shipment and title passes to the customer. |
| - | Revenue from electricity and gas supplied by our Retail business segment is recognised once the electricity and gas has been delivered and is measured through a regular review of usage meters. |
| - | The Generation business segment recognises revenues from the generation of electricity when the electricity has been supplied to customers. With effect from 1 July 2002, a tolling arrangement at commercial rates was established between the Retail and Generation business segments in relation to the consolidated entity’s three merchant power stations. The external revenue generated by the merchant power stations is now recognised in Retail’s revenue while Generation receives a tolling fee from Retail for the capacity provided and costs incurred by these power stations. |
| - | The revenues earned by the Networks business segment for managing gas distribution networks are recognised once the management services are rendered. |
Interest revenue:Interest revenue is recognised as it accrues.
Asset sales:The gross proceeds of asset sales are included as revenue. The profit or loss on disposal of assets is brought to account at the date that substantially all the risks and benefits of ownership have passed to the purchaser.
Dividends:Revenue from distributions from controlled entities is recognised by the parent entity when they are declared by the controlled entities. Revenue from dividends from associates and other investments is recognised when dividends are received. Dividends received out of pre-acquisition reserves are eliminated against the carrying amount of the investment and not recognised in revenue.
| Goods and services tax: |
Revenues, expenses and assets are recognised net of the amount of goods and services tax (GST), except where the amount of GST incurred is not recoverable from the Australian Tax Office (ATO). In these circumstances the GST is recognised as part of the cost of acquisition of the asset or as part of an item of the expense. Receivables and payables are stated with the amount of GST included. The net amount of GST recoverable from, or payable to, the ATO is included as a current asset or liability in the Statements of Financial Position. Cash flows are included in the Statements of Cash Flows on a gross basis. The GST components of cash flows arising from investing and financing activities which are recoverable from, or payable to, the ATO are classified as operating cash flows.
Origin Energy Limited and Controlled Entities7
Notes to the financial statements (continued)
| 1. | Statement of significant accounting policies (continued) |
| Income tax: |
The income statement liability method of tax effect accounting has been adopted whereby income tax expense for the period has been matched with accounting profit after allowing for permanent differences relating to deductibility or assessability for income tax purposes of certain items. No liability has been provided for in the financial statements in respect of possible future capital gains tax that may arise on the disposal of assets. Such a liability is provided for at the time of disposal of assets. Deferred tax assets are not brought to account unless realisation of the asset is assured beyond reasonable doubt. Deferred tax assets in relation to tax losses are only recognised when their realisation is virtually certain. The tax effect of capital losses is not recorded unless their realisation is virtually certain.
| Borrowing costs: |
Borrowing costs include interest, interest rate swap interest, amortisation of discounts or premiums relating to borrowings, amortisation of ancillary costs incurred in connection with arrangement of borrowings, foreign exchange differences net of hedged amounts on borrowings and lease finance charges. Borrowing costs are expensed as incurred unless they relate to qualifying assets. Qualifying assets are assets which take more than 12 months to prepare for their intended use or sale. Where funds are borrowed specifically for the acquisition, construction or production of a qualifying asset, the amount of borrowing costs capitalised is that which is incurred in relation to that borrowing, net of any interest earned on those borrowings. Where funds are borrowed in relation to a qualifying asset, borrowing costs are capitalised using a weighted average capitalisation rate.
| Derivatives: |
The consolidated entity is exposed to financial risk as a result of fluctuations occurring in interest and foreign exchange rates, electricity prices and certain commodity prices. Accordingly, the consolidated entity uses derivative financial instruments having an off-balance sheet risk to minimise the economic volatility these exposures create. Derivative financial instruments are not held for speculative purposes. Where derivative financial instruments are designated as a hedge of an anticipated transaction, gains and losses on the derivative financial instrument arising up to the date of the anticipated transaction, are deferred and included in the measurement of the anticipated transaction when the transaction has occurred. When the anticipated transaction is no longer expected to occur as designated, the deferred gains and losses relating to the derivative financial instrument are recognised immediately in the Statements of Financial Performance. Option premiums are recorded as prepayments when paid and amortised over the term of the option.
| Foreign currencies: |
Transactions in foreign currencies are recorded in the financial statements at rates of exchange applicable at the dates of the transactions. Amounts receivable and payable in foreign currencies at balance date are converted to Australian dollars at the exchange rates ruling at balance date. Exchange differences arising from amounts receivable and payable are treated as operating revenue or expense in the period in which they arise. Exchange differences in respect of overseas controlled entities that are self-sustaining, resulting from the translation of assets and liabilities at exchange rates ruling at balance date and revenue and expense items at average rates for the period, together with exchange differences in respect of any long term foreign currency borrowings which have been designated as being hedged against the net assets of overseas controlled entities, have been taken to the foreign currency translation reserve on consolidation, net of income tax where applicable.
For foreign currency hedges of specific purchases or sales, the costs (or gains) of entering the hedge and the exchange differences up to the date of the purchase or sale are deferred and recognised as assets or liabilities on the Statements of Financial Position from the inception of the hedge contract. The gains or losses on the foreign currency hedges are included in the measurement of the hedged transaction, when the transaction has occurred.
| Equity-based compensation: |
Equity-based compensation benefits are provided to employees via the Senior Executive Option Plan, Employee Share Plan and the Executive Share Plan. Further information regarding these plans is provided in note 34. The accounting policies regarding each of these plans is as follows:
| - | Senior Executive Option Plan: No accounting entries are made in relation to options issued under the options plan until the options are exercised, at which time the proceeds received by the company from the exercise of the options are recognised in the Statements of Financial Position as share capital. |
| - | Employee Share Plan and the Executive Share Plan: Where shares allocated to the benefit of employees are purchased by the company on market, the fair value of the shares is recognised as a liability in the Statements of Financial Position until paid and included in employee benefit costs in the Statements of Financial Performance. |
| Earnings per share: |
Basic earnings per share is determined by dividing net profit after tax attributable to members of the company by the weighted average number of ordinary shares outstanding during the financial year, adjusted for bonus elements in ordinary shares issued during the year. Diluted earnings per share adjusts the figures used in the determination of basic earnings per share to take into account the after income tax effect of financing costs associated with dilutive potential shares and the effect on revenue and expenses of conversion to ordinary shares associated with the dilutive potential ordinary shares, by the weighted average number of shares.
| Revisions of accounting estimates: |
Revisions to accounting estimates are recognised prospectively in current and future periods only.
| Comparative amounts: |
Where necessary, the figures for the previous period have been reclassified to facilitate comparison.
| Rounding of amounts to the nearest $’000: |
The company is of a kind referred to in ASIC Class Order 98/100 dated 10 July 1998 and in accordance with that Class Order, amounts in the financial report and Directors’ report have been rounded off to the nearest thousand dollars, unless otherwise stated.
8Financial statements 2003
| 1. | Statement of significant accounting policies (continued) |
| Changes in accounting policies: |
Provisions, contingent liabilities and contingent assets: The consolidated entity has applied AASB 1044 “Provisions, Contingent Liabilities and Contingent Assets” for the first time from 1 July 2002. Dividends are now recognised at the time they are declared, determined or publicly recommended. Previously, final dividends were recognised in the financial year to which they related, despite the dividends being announced after the end of that financial year. The adjustments to the financial statements as at 1 July 2002 as a result of this change were an increase of $19,435,000 in opening retained profits (refer note 22) and a corresponding reduction in the provision for dividends reported in current provisions at the beginning of the current financial year. Had the new accounting policy been applied in the previous financial year, the provision for dividends of $19,435,000 would have been nil.
Employee benefits:The consolidated entity has applied the revised AASB 1028 “Employee Benefits” for the first time from 1 July 2002. The liabilities for wages and salaries, annual leave and sick leave are measured at the amounts expected to be paid when the liabilities are settled. The initial adjustments to the consolidated financial statements as at 1 July 2002 as a result of this change were an increase of $404,000 in provision for employee benefits, a decrease of $283,000 in opening retained profits, and an increase of $121,000 in future income tax benefit.
Foreign currency translation: The consolidated entity has applied the revised AASB 1012 “Foreign Currency Translation” for the first time from 1 July 2002. For hedges of specific purchases or sales, the costs (or gains) of entering the hedge and the unrealised exchange differences up to the date of the specific purchase or sale are now deferred and recognised as assets or liabilities in the Statements of Financial Position from the inception of the hedge contract, not when the specific purchase or sale occurs. As a result of this change in accounting policy, payables and receivables were increased by $15,843,000 representing deferred foreign currency hedge exchange gains and a net hedge receivable as at 30 June 2003.
Origin Energy Limited and Controlled Entities9
Notes to the financial statements (continued)
| Exploration and Production | ||||||
| 2003 $’000 | 2002 $’000 | |||||
(a) Primary reporting – business segments | ||||||
Revenue | ||||||
Total sales | 330,302 | 304,736 | ||||
Intersegment sales elimination * | (43,989 | ) | (41,884 | ) | ||
External sales revenue | 286,313 | 262,852 | ||||
Other revenue | 1,534 | 24,116 | ||||
Total segment revenue | 287,847 | 286,968 | ||||
Unallocated revenue | ||||||
Revenue from ordinary activities | ||||||
Result | ||||||
Segment result | 103,272 | 103,209 | ||||
Share of net profits of associates and joint venture entities | — | — | ||||
Earnings before interest and tax (EBIT) | 103,272 | 103,209 | ||||
Net interest expense | ||||||
Profit from ordinary activities before income tax | ||||||
Income tax expense | ||||||
Net profit | ||||||
Earnings before interest, tax, depreciation and amortisation (EBITDA) | 187,565 | 185,180 | ||||
Depreciation and amortisation | 84,293 | 81,971 | ||||
Other non-cash expenses | 23,600 | 15,501 | ||||
Acquisitions of non-current assets (includes capital expenditure) | 253,604 | 184,632 | ||||
Assets | ||||||
Segment assets | 1,081,787 | 886,348 | ||||
Equity accounted investments | — | — | ||||
Total segment assets | 1,081,787 | 886,348 | ||||
Unallocated assets ** | ||||||
Total assets | ||||||
Liabilities | ||||||
Segment liabilities | 110,284 | 82,681 | ||||
Unallocated liabilities ** | ||||||
Total liabilities | ||||||
| * | Intersegment pricing is determined on an arm’s-length basis. Intersegment sales are eliminated on consolidation. With effect from 1 July 2002, a tolling arrangement was established between Retail and Generation in relation to the consolidated entity’s three merchant power stations. The tolling arrangement pricing is at commercial rates. The external revenue from the merchant power stations is now recognised in Retail’s revenue while Generation receives a tolling fee from Retail for the capacity provided and costs incurred by these power stations. Comparative amounts have not been restated. |
| ** | Unallocated assets consists of cash and deferred tax assets. Unallocated liabilities consists of current and non-current interest-bearing liabilities and current and deferred tax liabilities. |
Corporate revenue and expenses are allocated across business segments on the basis of external sales revenue. Corporate assets and liabilities are allocated across business segments based on their share of total assets and total liabilities.
Industry segments: | Products and services: | |
Exploration and Production | Natural gas and oil | |
Retail | Natural gas, electricity, LPG, energy related products and services | |
Generation | Natural gas-fired cogeneration and power generation | |
Networks | Infrastructure investment and management services |
| (b) Secondary reporting – geographical segments |
The consolidated entity operates predominantly in Australia. More than 90% of revenue, profit, assets and acquisitions of non-current assets relate to operations in Australia.
10 Financial statements 2003
Notes to the financial statements (continued)
| Retail | Generation | Networks | Consolidated | ||||||||||||||||
| 2003 $’000 | 2002 $’000 | 2003 $’000 | 2002 $’000 | 2003 $’000 | 2002 $’000 | 2003 $’000 | 2002 $’000 | ||||||||||||
(a) Primary reporting –business segments | |||||||||||||||||||
Revenue | |||||||||||||||||||
Total sales | 2,836,474 | 1,937,770 | 97,308 | 63,174 | 149,270 | 125,382 | 3,413,354 | 2,431,062 | |||||||||||
Intersegment sales elimination * | — | — | (42,816 | ) | — | — | — | (86,805 | ) | (41,884 | ) | ||||||||
External sales revenue | 2,836,474 | 1,937,770 | 54,492 | 63,174 | 149,270 | 125,382 | 3,326,549 | 2,389,178 | |||||||||||
Other revenue | 4,681 | 1,172 | 1,667 | 2 | 14,490 | 12,037 | 22,372 | 37,327 | |||||||||||
Total segment revenue | 2,841,155 | 1,938,942 | 56,159 | 63,176 | 163,760 | 137,419 | 3,348,921 | 2,426,505 | |||||||||||
Unallocated revenue | 3,382 | 2,303 | |||||||||||||||||
Revenue from ordinary activities | 3,352,303 | 2,428,808 | |||||||||||||||||
Result | |||||||||||||||||||
Segment result | 142,123 | 91,341 | 15,677 | 7,904 | 21,632 | 19,892 | 282,704 | 222,346 | |||||||||||
Share of net profits of associates and joint venture entities | 1,694 | 686 | 10,871 | 7,652 | — | — | 12,565 | 8,338 | |||||||||||
Earnings before interest and tax (EBIT) | 143,817 | 92,027 | 26,548 | 15,556 | 21,632 | 19,892 | 295,269 | 230,684 | |||||||||||
Net interest expense | (48,718 | ) | (42,804 | ) | |||||||||||||||
Profit from ordinary activities before income tax | 246,551 | 187,880 | |||||||||||||||||
Income tax expense | (80,248 | ) | (54,280 | ) | |||||||||||||||
Net profit | 166,303 | 133,600 | |||||||||||||||||
Earnings before interest, tax, depreciation and amortisation (EBITDA) | 232,055 | 166,755 | 48,258 | 30,202 | 23,448 | 22,473 | 491,326 | 404,610 | |||||||||||
Depreciation and amortisation | 88,238 | 74,728 | 21,710 | 14,646 | 1,816 | 2,581 | 196,057 | 173,926 | |||||||||||
Other non-cash expenses | 10,270 | 18,494 | 694 | 1,122 | 963 | 3,059 | 35,527 | 38,176 | |||||||||||
Acquisitions of non-current assets (includes capital expenditure) | 169,628 | 86,308 | 100,579 | 116,312 | 538 | 15,932 | 524,349 | 403,184 | |||||||||||
Assets | |||||||||||||||||||
Segment assets | 1,633,050 | 1,405,555 | 309,183 | 232,894 | 189,826 | 190,881 | 3,213,846 | 2,715,678 | |||||||||||
Equity accounted investments | 5,966 | 4,265 | 48,956 | 49,082 | 350 | — | 55,272 | 53,347 | |||||||||||
Total segment assets | 1,639,016 | 1,409,820 | 358,139 | 281,976 | 190,176 | 190,881 | 3,269,118 | 2,769,025 | |||||||||||
Unallocated assets ** | 139,623 | 188,909 | |||||||||||||||||
Total assets | 3,408,741 | 2,957,934 | |||||||||||||||||
Liabilities | |||||||||||||||||||
Segment liabilities | 464,108 | 349,912 | 12,298 | 10,086 | 39,463 | 38,494 | 626,153 | 481,173 | |||||||||||
Unallocated liabilities ** | 992,984 | 850,722 | |||||||||||||||||
Total liabilities | 1,619,137 | 1,331,895 | |||||||||||||||||
Origin Energy Limited and Controlled Entities11
Notes to the financial statements (continued)
| Consolidated | Origin Energy Limited | |||||||
| 2003 $’000 | 2002 $’000 | 2003 $’000 | 2002 $’000 | |||||
(a) Revenue from ordinary activities | ||||||||
Revenue from operating activities: | ||||||||
Revenue from sale of goods | 3,176,888 | 2,263,727 | — | — | ||||
Revenue from rendering of services | 149,661 | 125,451 | — | — | ||||
Total sales revenue | 3,326,549 | 2,389,178 | — | — | ||||
Revenue from outside operating activities# | 25,754 | 39,630 | 153,078 | 155,860 | ||||
Revenue from ordinary activities | 3,352,303 | 2,428,808 | 153,078 | 155,860 | ||||
Share of net profits of associates and joint venture entities | 12,565 | 8,338 | — | — | ||||
Total | 3,364,868 | 2,437,146 | 153,078 | 155,860 | ||||
# Revenue from outside operating activities: | ||||||||
Interest received or receivable from: | ||||||||
Wholly owned controlled entities | — | — | 121,377 | 103,953 | ||||
Other parties | 1,420 | 1,672 | 184 | 108 | ||||
| 1,420 | 1,672 | 121,561 | 104,061 | |||||
Dividends received or receivable from: | ||||||||
Wholly owned controlled entities | — | — | 11,960 | 17,992 | ||||
Partly owned controlled entities | — | — | 6,587 | 21,955 | ||||
Other parties | 413 | 409 | — | — | ||||
| 413 | 409 | 18,547 | 39,947 | |||||
Other distributions received | 12,821 | 11,591 | 12,821 | 11,591 | ||||
Proceeds on sale of assets | 3,494 | 18,613 | — | 16 | ||||
Net foreign exchange gain | 669 | — | — | 10 | ||||
Government subsidies received and receivable | 1,293 | 608 | 149 | 235 | ||||
Insurance proceeds | 1,664 | 5,827 | — | — | ||||
Other income | 3,980 | 910 | — | — | ||||
| 25,754 | 39,630 | 153,078 | 155,860 | |||||
12 Financial statements 2003
| Consolidated | Origin Energy Limited | |||||||
| 2003 $’000 | 2002 $’000 | 2003 $’000 | 2002 $’000 | |||||
3. Profit from ordinary activities (continued) | ||||||||
(b) Expenses from ordinary activities excluding borrowing costs | ||||||||
Expenses by nature: | ||||||||
Raw materials and consumables used, and changes in finished goods and work in progress | 2,263,030 | 1,535,775 | — | 5 | ||||
Advertising | 18,448 | 13,190 | 26 | 25 | ||||
Bad and doubtful debts | 6,760 | 8,850 | — | — | ||||
Consultancy costs | 24,391 | 8,177 | 3,655 | 1,669 | ||||
Contracting costs | 102,439 | 88,657 | 1,618 | 1,114 | ||||
Depreciation and amortisation | 196,057 | 173,926 | 258 | 266 | ||||
Employee expenses | 206,683 | 157,495 | 20,244 | 14,604 | ||||
Exploration and production costs | 57,677 | 48,999 | — | — | ||||
Motor vehicle expenses | 15,957 | 16,259 | 486 | 393 | ||||
Occupancy expenses | 26,172 | 20,422 | 1,604 | 2,266 | ||||
Repairs and maintenance | 18,963 | 17,140 | 41 | 28 | ||||
Royalties | 26,134 | 26,978 | — | — | ||||
Administration and other expenses from ordinary activities | 105,468 | 88,922 | 1,553 | 6,063 | ||||
Total expenses from ordinary activities excluding borrowing costs | 3,068,179 | 2,204,790 | 29,485 | 26,433 | ||||
(c) Borrowing costs | ||||||||
Borrowing costs paid or payable to: | ||||||||
Wholly owned controlled entities | — | — | 39,876 | 22,969 | ||||
Partly owned controlled entities | — | — | 207 | 3,298 | ||||
Other parties | 50,138 | 44,473 | 44,887 | 41,240 | ||||
| 50,138 | 44,473 | 84,970 | 67,507 | |||||
Finance charges on capitalised leases | — | 3 | — | — | ||||
Total borrowing costs | 50,138 | 44,476 | 84,970 | 67,507 | ||||
Borrowing costs capitalised | 861 | — | — | — | ||||
Origin Energy Limited and Controlled Entities13
Notes to the financial statements (continued)
| Consolidated | Origin Energy Limited | |||||||||||
| 2003 $’000 | 2002 $’000 | 2003 $’000 | 2002 $’000 | |||||||||
3. Profit from ordinary activities (continued) | ||||||||||||
(d) Profit from ordinary activities before income tax expense has been arrived at after charging/(crediting) the following items: | ||||||||||||
Cost of goods sold | 2,245,899 | 1,520,661 | — | — | ||||||||
Depreciation and amortisation: | ||||||||||||
Buildings | 1,198 | 1,046 | 94 | 94 | ||||||||
Plant and equipment | 92,320 | 80,601 | 164 | 172 | ||||||||
Leased assets capitalised | 9 | 81 | — | — | ||||||||
Mine properties | 46,452 | 44,521 | — | — | ||||||||
Commodity hedging contracts | 22,178 | 25,851 | — | — | ||||||||
Goodwill | 14,824 | 5,630 | — | — | ||||||||
Licences | 17,476 | 14,711 | — | — | ||||||||
Other | 1,600 | 1,485 | — | — | ||||||||
| 196,057 | 173,926 | 258 | 266 | |||||||||
Net expense/(income) from movements in provision for: | ||||||||||||
Doubtful debts | (3,155 | ) | 3,366 | — | — | |||||||
Inventories | (1,235 | ) | 1,682 | — | — | |||||||
Diminution in value of investments | 3,352 | 1,437 | — | — | ||||||||
Diminution in value of land and buildings | — | 1,485 | — | — | ||||||||
Write-down of exploration, development and mine properties | 15,484 | 2,370 | — | — | ||||||||
Employee benefits | 14,721 | 13,250 | 428 | 329 | ||||||||
Restoration and environmental rehabilitation | 1,314 | 1,260 | — | — | ||||||||
Superannuation defined benefit plan deficit | 4,533 | — | 4,533 | — | ||||||||
Other provisions | 3,926 | 2,458 | 4,110 | 3,157 | ||||||||
| 38,940 | 27,308 | 9,071 | 3,486 | |||||||||
Net foreign exchange loss | — | 127 | 180 | — | ||||||||
Bad debts written off: | ||||||||||||
Trade debtors | 9,915 | 5,484 | — | — | ||||||||
Exploration and development expenditure written off | 1,136 | 5,420 | — | — | ||||||||
Government royalties paid and payable | 20,424 | 20,462 | — | — | ||||||||
Research and development costs | 1,437 | 4,755 | 4 | 18 | ||||||||
Operating lease rental charges | 20,848 | 16,224 | 1,737 | 2,450 | ||||||||
Net gain/(loss) on disposal of non-current assets: | ||||||||||||
Property, plant and equipment | (2,522 | ) | 769 | (11 | ) | (6 | ) | |||||
Investments | — | 3 | — | — | ||||||||
Other assets | (5 | ) | (868 | ) | — | — | ||||||
| (2,527 | ) | (96 | ) | (11 | ) | (6 | ) | |||||
14 Financial statements 2003
Origin Energy Limited and Controlled Entities15
Notes to the financial statements (continued)
| Consolidated | Origin Energy Limited | |||||||
| 2003 $’000 | 2002 $’000 | 2003 $’000 | 2002 $’000 | |||||
5. Dividends (continued) | ||||||||
(b) Subsequent event | ||||||||
Since the end of the financial year, the directors have declared a final dividend of 5 cents per share, franked to 2 cents per share at 30%, payable 3 October 2003. | 32,885 | — | 32,885 | — | ||||
The financial effect of this dividend has not been brought to account in the financial statements for the year ended 30 June 2003 and will be recognised in subsequent financial statements. | ||||||||
(c) Dividend franking account | ||||||||
Origin Energy Limited has no available franking credits. | ||||||||
Current | ||||||||
Trade and accrued debtors | 539,263 | 460,961 | — | — | ||||
Receivables from associated entities and related parties | 22,958 | 20,220 | — | — | ||||
| 562,221 | 481,181 | — | — | |||||
Less: Provision for doubtful debts | 14,347 | 14,265 | — | — | ||||
| 547,874 | 466,916 | — | — | |||||
Loans to wholly owned controlled entities | — | — | 2,995,215 | 3,086,560 | ||||
Loans to partly owned controlled entities | — | — | — | 997 | ||||
| — | — | 2,995,215 | 3,087,557 | |||||
Other debtors | 73,354 | 19,109 | 13,075 | 20,622 | ||||
Less: Provision for non-recovery | 143 | 487 | — | — | ||||
| 73,211 | 18,622 | 13,075 | 20,622 | |||||
| 621,085 | 485,538 | 3,008,290 | 3,108,179 | |||||
Non-current | ||||||||
Receivables from associated entities | 10,122 | 14,825 | — | — | ||||
Less: Provision for non-recovery | 3,897 | 5,146 | — | — | ||||
| 6,225 | 9,679 | — | — | |||||
Other debtors | 25,450 | 11,820 | 12,173 | 19,000 | ||||
| 31,675 | 21,499 | 12,173 | 19,000 | |||||
Raw materials and stores – at cost | 25,935 | 26,008 | — | — | ||||
Less: Provision for diminution | 435 | — | — | — | ||||
| 25,500 | 26,008 | — | — | |||||
Finished goods – at cost | 27,485 | 21,798 | — | — | ||||
Less: Provision for diminution | 24 | 2,264 | — | — | ||||
| 27,461 | 19,534 | — | — | |||||
Work in progress – at cost | 952 | 850 | — | — | ||||
| 53,913 | 46,392 | — | — | |||||
16Financial statements 2003
| Consolidated | Origin Energy Limited | |||||||||
| Note | 2003 $’000 | 2002 $’000 | 2003 $’000 | 2002 $’000 | ||||||
Current | ||||||||||
Prepayments | 42,302 | 35,691 | 4,159 | 3,966 | ||||||
Deposits | 52 | 81 | — | — | ||||||
Deferred expenses | 709 | 1,292 | — | — | ||||||
| 43,063 | 37,064 | 4,159 | 3,966 | |||||||
Non-current | ||||||||||
Deferred expenses | 8,228 | 8,587 | — | — | ||||||
Prepayments | 394 | — | — | — | ||||||
| 8,622 | 8,587 | — | — | |||||||
Associates | 32(a) | 15,096 | 12,417 | — | — | |||||
Joint venture entities | 32(b) | 40,176 | 40,930 | — | — | |||||
| 55,272 | 53,347 | — | — | |||||||
Non-current | ||||||||||
Shares in wholly owned controlled entities – at cost | — | — | 526,275 | 516,460 | ||||||
Shares in partly owned listed controlled entities – at cost# | — | — | 137,270 | 137,191 | ||||||
| — | — | 663,545 | 653,651 | |||||||
Listed shares – at cost## * | 17,654 | 17,545 | — | — | ||||||
Less: Provision for diminution in value | 7,416 | 4,064 | — | — | ||||||
| 10,238 | 13,481 | — | — | |||||||
Listed stapled securities – at cost### ** | 127,014 | 127,014 | 127,014 | 127,014 | ||||||
Other corporations – at cost | 6 | 6 | — | — | ||||||
Commodity hedging contracts – at cost | 82,028 | 82,028 | — | — | ||||||
Less: Accumulated amortisation | 48,573 | 26,394 | — | — | ||||||
| 33,455 | 55,634 | — | — | |||||||
| 170,713 | 196,135 | 790,559 | 780,665 | |||||||
# Market value of shares in partly owned listed controlled entities | — | — | 390,861 | 430,949 | ||||||
## Market value of shares in listed corporations (refer note 29(e)) | 9,002 | 13,518 | — | — | ||||||
### Market value of listed stapled securities | 144,402 | 112,013 | 144,402 | 112,013 | ||||||
| * | The carrying amount of the investments in listed shares is appropriate although being above market value. Internal analysis, including analysis of discounted future cash flows, supports the carrying value of these investments. |
| ** | Investment in listed stapled securities is comprised of an investment of 18.55% (2002: 19.14%) in Envestra Limited . The principal activities of Envestra Limited are the provision of natural gas haulage services to retailers through the transmission pipelines and distribution networks it owns and manages, and the development of the business through expansion of the existing networks, construction of new networks and acquisitions. |
Origin Energy Limited and Controlled Entities17
Notes to the financial statements (continued)
| 11. | Property, plant and equipment |
Land and buildings are carried at cost. The latest independent valuation of land and buildings at 30 June 2002 was on the basis of market value for existing use in respect of specialised property or vacant possession for non-specialised property and property where specialist use has ceased. The majority of sites were valued on the aforementioned basis, however the Directors consider that the value of certain land, which is contaminated as a result of prior activities conducted, should take into account the estimated cost of remediation. This cost of remediation is reflected in the provision for remediation.
The independent valuation of land and buildings resulted in a valuation of $61,386,000. The valuation excluded land and buildings located in the Pacific region, land and buildings acquired during the 2002 year, buildings constructed during the 2002 year, and leasehold land and buildings. The valuation related to land and buildings with a written down value of $41,033,000 at 30 June 2002. As land and buildings are recorded at cost, the valuation has not been brought to account.
| Consolidated | Origin Energy Limited | |||||||||
| 2003 $’000 | 2002 $’000 | 2003 $’000 | 2002 $’000 | |||||||
Land and buildings: | ||||||||||
At deemed cost | 73,652 | 66,656 | 376 | 376 | ||||||
Less: Provision for remediation | 14,920 | 15,105 | — | — | ||||||
Less: Accumulated depreciation and amortisation | 7,201 | 6,107 | 188 | 94 | ||||||
Less: Provision for write-down | 1,249 | 1,485 | — | — | ||||||
| 50,282 | 43,959 | 188 | 282 | |||||||
Plant and equipment: | ||||||||||
At cost | 1,548,076 | 1,342,599 | 2,409 | 1,144 | ||||||
Less: Accumulated depreciation | 597,304 | 524,585 | 697 | 575 | ||||||
| 950,772 | 818,014 | 1,712 | 569 | |||||||
Leased plant and equipment capitalised | 28 | 225 | — | — | ||||||
Less: Accumulated amortisation | 28 | 178 | — | — | ||||||
| — | 47 | — | — | |||||||
| 950,772 | 818,061 | 1,712 | 569 | |||||||
Mine properties: | ||||||||||
Areas of interest in the production phase – at cost | 799,910 | 693,837 | 121 | — | ||||||
Less: Accumulated amortisation | 362,179 | 315,727 | — | — | ||||||
Less: Provision for write-down | 86,258 | 84,758 | — | — | ||||||
| 351,473 | 293,352 | 121 | — | |||||||
| 1,352,527 | 1,155,372 | 2,021 | 851 | |||||||
Class of asset | Average depreciation/ amortisation rate | |||||||||
Buildings | 1.7 | % | 1.6 | % | ||||||
Plant and equipment | 6.4 | % | 6.5 | % | ||||||
Mine properties | 6.2 | % | 6.5 | % | ||||||
18 Financial statements 2003
| 11. | Property, plant and equipment (continued) |
Reconciliations
Reconciliations of the carrying amounts of each class of property, plant and equipment are set out below.
| 2003 $’000 | ||||||||||||
| Land and buildings | Plant and equipment | Mine properties | Total | |||||||||
Consolidated | ||||||||||||
Carrying amount at the beginning of the financial year | 43,959 | 818,061 | 293,352 | 1,155,372 | ||||||||
Additions | 8,163 | 138,342 | 106,394 | 252,899 | ||||||||
Disposals | (1,856 | ) | (3,894 | ) | (169 | ) | (5,919 | ) | ||||
Additions through acquisition of entities/operations | 1,293 | 91,718 | — | 93,011 | ||||||||
Depreciation/amortisation expense | (1,198 | ) | (92,329 | ) | (46,452 | ) | (139,979 | ) | ||||
Write-down to recoverable amount | — | — | (152 | ) | (152 | ) | ||||||
Provision for remediation movement | 185 | — | — | 185 | ||||||||
Provision for write-down | — | — | (1,500 | ) | (1,500 | ) | ||||||
Foreign currency exchange differences | (264 | ) | (1,126 | ) | — | (1,390 | ) | |||||
Carrying amount at the end of the financial year | 50,282 | 950,772 | 351,473 | 1,352,527 | ||||||||
Origin Energy Limited | ||||||||||||
Carrying amount at the beginning of the financial year | 282 | 569 | — | 851 | ||||||||
Additions | — | 1,318 | 121 | 1,439 | ||||||||
Disposals | — | (11 | ) | — | (11 | ) | ||||||
Depreciation/amortisation expense | (94 | ) | (164 | ) | — | (258 | ) | |||||
Carrying amount at the end of the financial year | 188 | 1,712 | 121 | 2,021 | ||||||||
| 2002 $’000 | ||||||||||||
| Land and buildings | Plant and equipment | Mine properties | Total | |||||||||
Consolidated | ||||||||||||
Carrying amount at the beginning of the financial year | 41,301 | 686,683 | 281,468 | 1,009,452 | ||||||||
Additions | 2,697 | 149,467 | 67,954 | 220,118 | ||||||||
Disposals | (130 | ) | (3,515 | ) | (12,597 | ) | (16,242 | ) | ||||
Additions through acquisition of entities/operations | 2,977 | 67,595 | — | 70,572 | ||||||||
Depreciation/amortisation expense | (1,046 | ) | (80,682 | ) | (44,521 | ) | (126,249 | ) | ||||
Provision for remediation movement | 129 | — | — | 129 | ||||||||
Provision for (write-down)/reversal | (1,485 | ) | — | 1,048 | (437 | ) | ||||||
Foreign currency exchange differences | (484 | ) | (1,487 | ) | — | (1,971 | ) | |||||
Carrying amount at the end of the financial year | 43,959 | 818,061 | 293,352 | 1,155,372 | ||||||||
Origin Energy Limited | ||||||||||||
Carrying amount at the beginning of the financial year | 376 | 336 | — | 712 | ||||||||
Additions | — | 427 | — | 427 | ||||||||
Disposals | — | (22 | ) | — | (22 | ) | ||||||
Depreciation/amortisation expense | (94 | ) | (172 | ) | — | (266 | ) | |||||
Carrying amount at the end of the financial year | 282 | 569 | — | 851 | ||||||||
Origin Energy Limited and Controlled Entities19
Notes to the financial statements (continued)
| Consolidated | Origin Energy Limited | |||||||||
| 2003 $’000 | 2002 $’000 | 2003 $’000 | 2002 $’000 | |||||||
Net costs carried forward in respect of areas of interest in: | ||||||||||
Exploration and evaluation phase | 165,081 | 137,800 | — | — | ||||||
Development phase | 15,379 | 5,031 | — | — | ||||||
Less: Provision for write-down | 26,160 | 12,176 | — | — | ||||||
| 154,300 | 130,655 | — | — | |||||||
The ultimate recoupment of costs carried forward for exploration and evaluation phases is dependent on the successful development and commercial exploitation or sale of the respective areas. | ||||||||||
Goodwill – at cost | 270,642 | 109,522 | — | — | ||||||
Less: Accumulated amortisation | 38,441 | 23,830 | — | — | ||||||
| 232,201 | 85,692 | — | — | |||||||
Licences – at cost | 600,686 | 586,207 | — | — | ||||||
Less: Accumulated amortisation | 54,939 | 37,463 | — | — | ||||||
| 545,747 | 548,744 | — | — | |||||||
| 777,948 | 634,436 | — | — | |||||||
Class of asset | Amortisation rate | |||||||||
Goodwill | 5.0 | % | 5.0 | % | ||||||
Licences | 2.5 | % | 2.5 | % | ||||||
| Consolidated | Origin Energy Limited | |||||||||
| 2003 $’000 | 2002 $’000 | 2003 $’000 | 2002 $’000 | |||||||
Future income tax benefit | ||||||||||
Comprises the estimated benefit at the applicable income tax rate of 30% in respect of the following items: | ||||||||||
Timing differences | 83,247 | 84,716 | 1,342 | 6,421 | ||||||
Tax losses carried forward | 39,945 | 86,938 | — | — | ||||||
| 123,192 | 171,654 | 1,342 | 6,421 | |||||||
Future income tax benefits not brought to account | ||||||||||
Potential future income tax benefits at 30% that have not been brought to account in respect of tax losses where recovery is not virtually certain: | ||||||||||
Revenue losses | 96,125 | 7,789 | — | — | ||||||
Capital losses | 76,608 | 88,709 | 75,605 | 87,706 | ||||||
The potential future income tax benefits will only be obtained if:
| (i) | the relevant entities derive future assessable income of a nature and an amount sufficient to enable the benefit to be realised, or the benefit can be utilised by another company in the consolidated entity in accordance with Div 170 of the Income Tax Assessment Act 1997; |
| (ii) | the relevant economic entities continue to comply with the conditions for deductibility imposed by the law; and |
| (iii) | no changes in tax legislation adversely affect the relevant entities in realising the benefit. |
20Financial statements 2003
| Consolidated | Origin Energy Limited | |||||||||
| Note | 2003 $’000 | 2002 $’000 | 2003 $’000 | 2002 $’000 | ||||||
Current | ||||||||||
Trade creditors and accruals | 467,821 | 369,835 | 18,169 | 21,497 | ||||||
Loans from wholly owned controlled entities | — | — | 1,618,487 | 1,711,936 | ||||||
Loans from partly owned controlled entities | — | — | 27,596 | 43,598 | ||||||
Payable to related parties | — | 1,699 | — | — | ||||||
Deferred foreign currency hedge exchange gains | 7,205 | — | — | — | ||||||
| 475,026 | 371,534 | 1,664,252 | 1,777,031 | |||||||
Non-current | ||||||||||
Other creditors | 3,202 | 6,100 | — | 4,000 | ||||||
Deferred foreign currency hedge exchange gains | 8,638 | — | — | — | ||||||
| 11,840 | 6,100 | — | 4,000 | |||||||
Current | ||||||||||
Bank loans – unsecured | 85,500 | 78,500 | 25,000 | 78,500 | ||||||
Bank overdrafts – unsecured | — | 6,704 | — | 14,275 | ||||||
Lease liabilities – secured | 17 | — | 34 | — | — | |||||
Other loans – unsecured | 22 | — | — | — | ||||||
| 28 | 85,522 | 85,238 | 25,000 | 92,775 | ||||||
Non-current | ||||||||||
Capital market borrowings – unsecured | 663,012 | 365,000 | 663,012 | 365,000 | ||||||
Bank loans – unsecured | — | 200,000 | — | 200,000 | ||||||
Other loans – unsecured | — | 49 | — | — | ||||||
Lease liabilities – secured | 17 | — | 90 | — | — | |||||
| 28 | 663,012 | 565,139 | 663,012 | 565,000 | ||||||
Interest rates applicable to:
Borrowings including interest rate swap contracts: 4.82% to 7.38% per annum at a weighted average of 6.69% per annum (2002: 4.95% to 10.29% per annum at a weighted average of 6.59% per annum).
Lease liabilities: 5.45% to 8.09% per annum at a weighted average of 6.66% per annum (2002: 5.45% to 8.46% per annum at a weighted average of 6.86% per annum).
The applicable weighted average interest rate for interest-bearing debt as at 30 June 2003 was 5.72% (2002: 5.92%).
Refer to note 29(a) for interest rate risk.
Origin Energy Limited and Controlled Entities21
Notes to the financial statements (continued)
| Consolidated | Origin Energy Limited | |||||||||
| Note | 2003 $’000 | 2002 $’000 | 2003 $’000 | 2002 $’000 | ||||||
Finance leases: | ||||||||||
Lease commitments in respect of finance leases of plant and equipment are payable as follows: | ||||||||||
not later than one year | — | 35 | — | — | ||||||
later than one year but not later than five years | — | 90 | — | — | ||||||
| — | 125 | — | — | |||||||
Deduct: Future finance charges and executory costs | — | 1 | — | — | ||||||
| — | 124 | — | — | |||||||
Operating leases: | ||||||||||
Lease commitments in respect of operating leases are payable as follows: | ||||||||||
not later than one year | 15,534 | 15,598 | — | — | ||||||
later than one year but not later than five years | 28,188 | 27,260 | — | — | ||||||
later than five years | 14,117 | 11,538 | — | — | ||||||
| 57,839 | 54,396 | — | — | |||||||
The consolidated entity leases property, plant and equipment under operating leases with terms of one to six years.
| ||||||||||
Current | ||||||||||
Provision for income tax | 546 | 3,290 | — | 18,428 | ||||||
Non-current | ||||||||||
Deferred tax liabilities | ||||||||||
Provision for deferred income tax at the applicable income tax rate of 30% | 243,904 | 197,055 | 59 | 797 | ||||||
Current | ||||||||||
Dividends | — | 19,451 | — | 19,451 | ||||||
Employee benefits | 34 | 36,274 | 30,063 | 2,078 | 1,638 | |||||
Onerous contracts acquired | 2,133 | — | — | — | ||||||
Commodity hedge losses acquired | 6,061 | — | — | — | ||||||
Transaction and integration costs on acquisition | 5,448 | — | — | — | ||||||
Superannuation defined benefit plan deficit | 1,600 | — | 1,600 | — | ||||||
Other | 19,814 | 17,937 | 12,162 | 8,672 | ||||||
| 71,330 | 67,451 | 15,840 | 29,761 | |||||||
Non-current | ||||||||||
Employee benefits | 34 | 3,360 | 2,949 | 9 | 9 | |||||
Restoration and environmental rehabilitation | 27,443 | 26,432 | — | — | ||||||
Onerous contracts acquired | 23,894 | — | — | — | ||||||
Commodity hedge losses acquired | 7,938 | — | — | — | ||||||
Superannuation defined benefit plan deficit | 2,933 | — | 2,933 | — | ||||||
Other | 2,389 | 6,707 | 2,238 | 6,238 | ||||||
| 67,957 | 36,088 | 5,180 | 6,247 | |||||||
22 Financial statements 2003
| 19. | Provisions (continued) |
| Reconciliations |
Reconciliations of the carrying amounts of each class of provision, except employee benefits and restoration and environmental rehabilitation, are set out below.
2003 $’000 | ||||||||||||||||||
| Dividends | Onerous contracts acquired | Commodity hedge losses acquired | Transaction and costs on | Superannuation defined benefit plan deficit | Other | |||||||||||||
Consolidated | ||||||||||||||||||
Current | ||||||||||||||||||
Carrying amount at beginning of year | 19,451 | — | — | — | — | 17,937 | ||||||||||||
Provisions recognised during the year, net of write-backs | 32,654 | — | — | — | 1,600 | 10,164 | ||||||||||||
Provisions acquired during the year | — | 1,482 | 6,227 | 21,395 | — | 7,103 | ||||||||||||
Payments/utilisation during the year | (52,089 | ) | (1,189 | ) | — | (15,947 | ) | (267 | ) | (15,951 | ) | |||||||
Transfer from/(to) non-current | — | 1,840 | (166 | ) | — | 267 | 561 | |||||||||||
Other adjustment | (16 | ) | — | — | — | — | — | |||||||||||
Carrying amount at end of year | — | 2,133 | 6,061 | 5,448 | 1,600 | 19,814 | ||||||||||||
Non-current | ||||||||||||||||||
Carrying amount at beginning of year | — | — | — | — | — | 6,707 | ||||||||||||
Provisions recognised during the year, net of write-backs | — | — | — | — | 3,200 | (6,238 | ) | |||||||||||
Provisions acquired during the year | — | 25,734 | 7,772 | — | — | 2,799 | ||||||||||||
Payments/utilisation during the year | — | — | — | — | — | (318 | ) | |||||||||||
Transfer from/(to) current | — | (1,840 | ) | 166 | — | (267 | ) | (561 | ) | |||||||||
Carrying amount at end of year | — | 23,894 | 7,938 | — | 2,933 | 2,389 | ||||||||||||
Origin Energy Limited | ||||||||||||||||||
Current | ||||||||||||||||||
Carrying amount at beginning of year | 19,451 | — | — | — | — | 8,672 | ||||||||||||
Provisions recognised during the year, net of write-backs | 32,654 | — | — | — | 1,600 | 10,348 | ||||||||||||
Provisions acquired during the year | — | — | — | — | — | 1,079 | ||||||||||||
Payments/utilisation during the year | (52,089 | ) | — | — | — | (267 | ) | (8,498 | ) | |||||||||
Transfer from non-current | — | — | — | — | 267 | 561 | ||||||||||||
Other adjustment | (16 | ) | — | — | — | — | — | |||||||||||
Carrying amount at end of year | — | — | — | — | 1,600 | 12,162 | ||||||||||||
Non-current | ||||||||||||||||||
Carrying amount at beginning of year | — | — | — | — | — | 6,238 | ||||||||||||
Provisions recognised during the year, net of write-backs | — | — | — | — | 3,200 | (6,238 | ) | |||||||||||
Provisions acquired during the year | — | — | — | — | — | 2,799 | ||||||||||||
Transfer to current | — | — | — | — | (267 | ) | (561 | ) | ||||||||||
Carrying amount at end of year | — | — | — | — | 2,933 | 2,238 | ||||||||||||
Origin Energy Limited and Controlled Entities23
Notes to the financial statements (continued)
| Consolidated | Origin Energy Limited | |||||||||||
| Note | 2003 $’000 | 2002 $’000 | 2003 $’000 | 2002 $’000 | ||||||||
Issued and paid-up capital | ||||||||||||
657,709,751 (2002: 647,829,152) ordinary shares, fully paid | 418,612 | 385,039 | 418,612 | 385,039 | ||||||||
Ordinary share capital | ||||||||||||
Balance at the beginning of the financial year | 385,039 | 178,457 | 385,039 | 178,457 | ||||||||
Shares issued: | ||||||||||||
- 2,333,300 (2002: 761,650) shares in accordance with the Senior Executive Option Plan | 5,417 | 1,570 | 5,417 | 1,570 | ||||||||
- 7,547,299 (2002: 2,693,165) shares in accordance with the Dividend Reinvestment Plan | 28,156 | 8,117 | 28,156 | 8,117 | ||||||||
- Nil (2002: 44,196,526) shares in accordance with the Share Placement | — | 123,332 | — | 123,332 | ||||||||
- Nil (2002: 26,500,287) shares in accordance with the Share Purchase Plan | — | 73,563 | — | 73,563 | ||||||||
- Nil (2002: 629,145) shares in accordance with the Employee Share Plan | — | — | — | — | ||||||||
Total movements in ordinary share capital | 22 | 33,573 | 206,582 | 33,573 | 206,582 | |||||||
Ordinary share capital at the end of the financial year | 418,612 | 385,039 | 418,612 | 385,039 | ||||||||
Terms and conditions | ||||||||||||
Holders of ordinary shares are entitled to receive dividends as declared from time to time and are entitled to one vote per share at shareholders’ meetings. | ||||||||||||
In the event of the winding up of the company, ordinary shareholders rank after creditors, and are fully entitled to any proceeds of liquidation. | ||||||||||||
Asset revaluation | 104,823 | 104,627 | 5,723 | 5,723 | ||||||||
Foreign currency translation | 5,941 | 7,720 | — | — | ||||||||
| 110,764 | 112,347 | 5,723 | 5,723 | |||||||||
Asset revaluation reserve: | ||||||||||||
Asset revaluation reserve at the beginning of the financial year | 104,627 | 106,105 | 5,723 | 5,723 | ||||||||
Transfer (to)/from retained earnings on sale of property | 22 | 196 | (1,478 | ) | — | — | ||||||
Asset revaluation reserve at the end of the financial year | 104,823 | 104,627 | 5,723 | 5,723 | ||||||||
Foreign currency translation reserve: | ||||||||||||
Foreign currency translation reserve at the beginning of the financial year | 7,720 | 9,164 | — | — | ||||||||
Net exchange loss on translation of assets and liabilities of overseas controlled entities | (1,779 | ) | (1,444 | ) | — | — | ||||||
Foreign currency translation reserve at the end of the financial year | 5,941 | 7,720 | — | — | ||||||||
| Nature and purpose of reserves: |
| Asset revaluation reserve |
The asset revaluation reserve includes the net revaluation increments and decrements arising from the revaluation of non-current assets in prior years.
Foreign currency reserve
The foreign currency translation reserve records the foreign currency differences arising from the translation of self-sustaining foreign operations, and the translation of transactions that hedge the company’s net investments in foreign operations. Refer to accounting policy in note 1.
24 Financial statements 2003
| Consolidated | Origin Energy Limited | |||||||||||||
| Note | 2003 $’000 | 2002 $’000 | 2003 $’000 | 2002 $’000 | ||||||||||
Retained profits reconciliation | ||||||||||||||
Previously reported retained profits at the end of the previous financial year | 1,095,158 | 999,223 | 1,042,214 | 1,018,042 | ||||||||||
Adjustment resulting from initial adoption of revised AASB 1028 “Employee Benefits” | (283 | ) | — | (7 | ) | — | ||||||||
Adjustment to dividends resulting from initial adoption of AASB 1044 “Provisions, Contingent Liabilities and Contingent Assets” | 19,435 | — | 19,435 | — | ||||||||||
Restated retained profits at the beginning of the financial year | 1,114,310 | 999,223 | 1,061,642 | 1,018,042 | ||||||||||
Dividends recognised during the current year as a result of the initial adoption of AASB 1044 “Provisions, Contingent Liabilities and Contingent Assets” | 5 | (19,435 | ) | — | (19,435 | ) | — | |||||||
Current year dividends paid during the year | 5 | (32,654 | ) | (34,203 | ) | (32,654 | ) | (34,203 | ) | |||||
Net profit attributable to members of the parent entity, Origin Energy Limited | 161,952 | 128,660 | 48,349 | 58,375 | ||||||||||
Aggregate of amounts transferred (to)/from reserves | 21 | (196 | ) | 1,478 | — | — | ||||||||
Retained profits at the end of the financial year | 1,223,977 | 1,095,158 | 1,057,902 | 1,042,214 | ||||||||||
Total equity reconciliation | ||||||||||||||
Total equity at the beginning of the financial year | 1,626,039 | 1,328,372 | 1,432,976 | 1,202,222 | ||||||||||
Total changes in parent entity interest in equity recognised in the Statements of Financial Performance | 159,890 | 127,216 | 48,342 | 58,375 | ||||||||||
Transactions with owners as owners: | ||||||||||||||
Contributions of equity | 20 | 33,573 | 206,582 | 33,573 | 206,582 | |||||||||
Dividends recognised during the year | 5 | (32,654 | ) | (34,203 | ) | (32,654 | ) | (34,203 | ) | |||||
Total changes in outside equity interests | 2,756 | (1,928 | ) | — | — | |||||||||
Total equity at the end of the financial year | 1,789,604 | 1,626,039 | 1,482,237 | 1,432,976 | ||||||||||
Contributed equity | 16,563 | 16,563 | — | — | ||||||||||
Asset revaluation reserve | 840 | 840 | — | — | ||||||||||
Foreign currency translation reserve | (5,093 | ) | (4,636 | ) | — | — | ||||||||
Retained profits | 23,941 | 20,728 | — | — | ||||||||||
| 36,251 | 33,495 | — | — | |||||||||||
Origin Energy Limited and Controlled Entities25
Notes to the financial statements (continued)
| Consolidated | Origin Energy Limited | |||||||||||||
| 2003 $’000 | 2002 $’000 | 2003 $’000 | 2002 $’000 | |||||||||||
(a) Reconciliation of cash and cash equivalents | ||||||||||||||
Cash includes cash on hand, at bank and short-term deposits at call, net of outstanding bank overdrafts. | ||||||||||||||
Cash as at the end of the financial year as shown in the Statements of Cash Flows is reconciled to the related items in the Statements of Financial Position as follows: | ||||||||||||||
Cash | 16,431 | 17,255 | 37,036 | 7,933 | ||||||||||
Bank overdrafts | 16 | — | (6,704 | ) | — | (14,275 | ) | |||||||
| 16,431 | 10,551 | 37,036 | (6,342 | ) | ||||||||||
(b) The following non-cash financing and investing activities have not been included in the Statements of Cash Flows: | ||||||||||||||
Issue of shares in respect of the Dividend Reinvestment Plan | 28,156 | 8,117 | 28,156 | 8,117 | ||||||||||
(c) Details of credit standby arrangements and loan facilities are included in note 28. | ||||||||||||||
(d) Reconciliation of net profit to net cash provided by operating activities: | ||||||||||||||
Net profit | 166,303 | 133,600 | 48,349 | 58,375 | ||||||||||
Adjustments to reconcile net profit to net cash provided by operating activities: | ||||||||||||||
Depreciation and amortisation | 196,057 | 173,926 | 258 | 266 | ||||||||||
Net expense from movements in provisions | 38,940 | 27,308 | 9,071 | 3,486 | ||||||||||
Increase/(decrease) in deferred taxes | (1,610 | ) | 4,401 | (5,815 | ) | (1,036 | ) | |||||||
Loss on sale of assets | 2,527 | 96 | 11 | 6 | ||||||||||
Non-cash share of associates’ and joint venture entities’ net profit | (1,567 | ) | (2,338 | ) | — | — | ||||||||
Tax loss transfers | — | — | — | (5,010 | ) | |||||||||
Changes in assets and liabilities, net of effects from acquisitions/disposals: | ||||||||||||||
- Receivables | (6,984 | ) | (1,638 | ) | 1,532 | 6,477 | ||||||||
- Inventories | (2,103 | ) | (2,730 | ) | — | — | ||||||||
- Payables | 12,223 | (22,861 | ) | (6,809 | ) | 5,029 | ||||||||
- Provisions | (12,622 | ) | (39,815 | ) | 3,161 | (5,613 | ) | |||||||
- Other | 31,430 | 51,348 | (196 | ) | (510 | ) | ||||||||
Total adjustments | 256,291 | 187,697 | 1,213 | 3,095 | ||||||||||
Net cash provided by operating activities | 422,594 | 321,297 | 49,562 | 61,470 | ||||||||||
26 Financial statements 2003
| Consolidated | ||||
| 2003 $’000 | 2002 $’000 | |||
24. Notes to the Statements of Cash Flows (continued) | ||||
(e) The consolidated entity acquired entities/businesses during the year ended 30 June 2003 (refer to note 30) for a total consideration of $225 million (2002: $87 million). The total assets and liabilities acquired are as follows: | ||||
Current assets | ||||
Receivables | 133,327 | 7,168 | ||
Inventories | 3,470 | 5,663 | ||
Other | 3,377 | 14,573 | ||
Total current assets | 140,174 | 27,404 | ||
Non-current assets | ||||
Receivables | 363 | — | ||
Property, plant and equipment | 93,011 | 70,572 | ||
Deferred tax assets | 15,258 | 229 | ||
Total non-current assets | 108,632 | 70,801 | ||
Total assets | 248,806 | 98,205 | ||
Current liabilities | ||||
Payables | 99,906 | 7,129 | ||
Current tax liabilities | 81 | — | ||
Provisions: | ||||
Employee benefits | 895 | — | ||
Onerous contracts | 1,482 | — | ||
Commodity hedge losses | 6,227 | — | ||
Transaction and integration costs | 21,395 | — | ||
Other | 7,103 | 1,623 | ||
Total provisions | 37,102 | 1,623 | ||
Total current liabilities | 137,089 | 8,752 | ||
Non-current liabilities | ||||
Deferred tax liabilities | — | 1,282 | ||
Provisions: | ||||
Onerous contracts | 25,734 | — | ||
Commodity hedge losses | 7,772 | — | ||
Other | 2,799 | 719 | ||
Total provisions | 36,305 | 719 | ||
Total non-current liabilities | 36,305 | 2,001 | ||
Total liabilities | 173,394 | 10,753 | ||
Net assets | 75,412 | 87,452 | ||
Goodwill on acquisition | 149,309 | — | ||
Consideration | 224,721 | 87,452 | ||
Origin Energy Limited and Controlled Entities27
Notes to the financial statements (continued)
| Consolidated | Origin Energy Limited | |||||||
| 2003 $’000 | 2002 $’000 | 2003 $’000 | 2002 $’000 | |||||
Amounts received or due and receivable for audit services by: | ||||||||
Auditors of Origin Energy Limited (KPMG) | ||||||||
Audits and review of the financial reports | 711 | 580 | 55 | 42 | ||||
Other regulatory audit services | 102 | 103 | 9 | 7 | ||||
| 813 | 683 | 64 | 49 | |||||
Other auditors (PWC)* | 149 | 53 | — | — | ||||
Amounts received or due and receivable for other services by: | ||||||||
Auditors of Origin Energy Limited (KPMG) | ||||||||
Acquisition audit and accounting advice | 426 | 470 | 41 | — | ||||
Taxation services | 61 | 126 | 13 | 69 | ||||
Other assurance services | 198 | — | — | — | ||||
| 685 | 596 | 54 | 69 | |||||
Other auditors (PWC) ** | 952 | 684 | 1,362 | 20 | ||||
| 2,599 | 2,016 | 1,480 | 138 | |||||
| * | PriceWaterhouseCoopers (“PWC”) audit financial reports of certain controlled entities located in various Pacific Island countries. |
| ** | Includes amounts for internal audit, taxation, information technology and accounting advice. |
| 26. | Contingent liabilities |
Details of contingent liabilities and contingent assets where the probability of future payments/receipts is not considered remote are set out below, as well as details of contingent liabilities and contingent assets, which although considered remote, the Directors consider should be disclosed. The Directors are of the opinion that provisions are not required in respect of these matters, as it is not probable that a future sacrifice of economic benefits will be required or the amount is not capable of reliable measurement.
| Consolidated | Origin Energy Limited | |||||||
| 2003 $’000 | 2002 $’000 | 2003 $’000 | 2002 $’000 | |||||
Bank guarantees – unsecured | 169,811 | 99,566 | — | — | ||||
Origin Energy Limited has given to its bankers letters of responsibility in respect of accommodation provided from time to time by the banks to Origin Energy Limited’s wholly or partly owned controlled entities.
Warranties and indemnities have been given by entities in the consolidated entity in relation to environmental liabilities for certain properties as part of the terms and conditions of divestments.
A number of sites within the consolidated entity have been identified as contaminated, all of which are subject to ongoing environmental management programmes to ensure appropriate controls are in place and clean-up requirements are implemented. For sites where the requirements can be assessed and costs estimated, the estimated cost of remediation has been expensed or provided for. The contamination has generally resulted from prior activities conducted at the sites.
Certain entities within the consolidated entity are subject to various lawsuits and claims, including claims for additional income tax, stamp duty and penalties, native title claims and a cross-claim arising from an action brought against Esso/BHP in relation to the Longford explosion in 1998. Any liabilities arising from such lawsuits and claims are not expected to have a material adverse effect on the consolidated financial statements.
A Demerger Deed was entered into in the 2000 year containing certain indemnities and other agreements between Origin Energy Limited and Boral Limited and their respective controlled entities covering the transfer of the businesses, investments, debt and assets of Boral Limited and some temporary shared arrangements.
The company, as a venturer in certain joint ventures, is severally liable for 100% of all liabilities incurred by these joint ventures (refer note 33).
Deed of cross guarantee
Under the terms of ASIC Class Order 98/1418 (as amended by Class Order 98/2017) certain wholly owned controlled entities have been granted relief from the requirement to prepare audited financial reports. Origin Energy Limited has entered into an approved deed of indemnity for the cross-guarantee of liabilities with those controlled entities (refer note 31).
A consolidated Statement of Financial Performance and a consolidated Statement of Financial Position, comprising the company and controlled entities which are a party to the Deed of Cross Guarantee, after eliminating all transactions between parties to the Deed, at 30 June 2003 are set out in note 37.
28 Financial statements 2003
| 27. | Commitments |
| Consolidated | ||||
| 2003 $’000 | 2002 $’000 | |||
Capital expenditure commitments: * | ||||
Contracted but not provided for and payable: | ||||
not later than one year | 317 | 431 | ||
| 317 | 431 | |||
Joint venture commitments: | ||||
Share of exploration and development commitments not provided for and payable: | ||||
not later than one year | 19,011 | 59,093 | ||
later than one year but not later than five years | 41,820 | 21,507 | ||
later than five years | 3,563 | — | ||
| 64,394 | 80,600 | |||
| * | The capital expenditure commitments are in regard to the purchase of plant and equipment and exclude joint venture commitments. |
Refer to note 17 for lease commitments.
Employee superannuation funds:
At 30 June 2003, there were in existence a number of superannuation plans in which the consolidated entity participates for the benefit of its employees in Australia and overseas. The major plans are managed throughequipsuper.
The principal types of benefit provided for under the plans are lump sums payable on retirement, termination, death or total disability.
Contributions to the plans by both employees and entities in the consolidated entity are predominantly based on percentages of the salaries or wages of employees.
Entities in the consolidated entity contribute to the plans in accordance with the governing Trust Deeds subject to certain rights to vary, suspend or terminate such contributions and thus are not legally obliged to contribute to those plans.
In relation to defined benefits, actuarial estimates of the assets and liabilities of the defined benefit plans withinequipsuper was undertaken as at 30 June 2003.
The name and qualifications of the actuary who made those estimates is D A Scott, BA, FIAA.
Accrued benefits and fund assets at market value are as follows:
| Consolidated | |||||
| 2003 $’000 | 2002 $’000 | ||||
Fund assets at net market value | 94,000 | 91,056 | |||
Accrued benefits | 98,800 | 90,822 | |||
Vested benefits | 98,800 | 90,822 | |||
Fund assets less accrued liabilities(1) | (4,800 | ) | 234 | ||
Superannuation expense recognised during the year: | |||||
Employer contributions during the year(2) | 3,429 | 2,441 | |||
Net movement in provision for superannuation defined benefit plan deficit (1) | 4,533 | — | |||
Superannuation expense for the year | 7,962 | 2,441 | |||
| (1) | The excess of fund liabilities over assets was recognised as an expense for the year ended 30 June 2003. |
(2) Employer contributions payable/accrued as at 30 June 2003 were $436,000 (2002: $235,000).
Ongoing contributions are being made to the defined benefit plans on the basis of estimates of the actuary’s assessment of the funding rate required to eliminate the deficit over a three year period, commencing May 2003.
Accrued benefits, fund assets and vested benefits have been based on amounts estimated by the actuary.
Based on the abovementioned actuarial assessments and the market value of assets after meeting liabilities, funds are available after additional contributions by the company to satisfy all benefits that would have been vested under each of the major plans in the event of:
| (i) | termination of the plan, |
| (ii) | voluntary termination of the employment of each employee on the initiative of that employee, or |
| (iii) | compulsory termination of the employment of each employee by an entity in the consolidated entity. |
Origin Energy Limited and Controlled Entities29
Notes to the financial statements (continued)
| 28. | Details of credit facilities available to the consolidated entity |
Short Term Facilities – unsecured
Working Capital Facility Agreement–A$100 million (2002: A$100 million) fully underwritten revolving facility provided by an international bank. The facility has a fixed maturity of February 2004, and as at 30 June 2003, A$25 million was utilised.
Short Term Bridge Facility– A$100 million (2002: A$Nil) fully underwritten facility provided by an international bank. The facility has a fixed maturity date of October 2003, and as at 30 June 2003, A$60.5 million was utilised.
Electronic Promissory Note Program (EPN) – unsecured
A non-underwritten revolving facility whereby issuances by Origin Energy Limited are conducted through a panel of five dealers. Notes to the value of A$320 million can be issued for periods not exceeding 364 days from the date of issue, with the applicable interest rate benchmark referenced to the Bank Bill Swap Rate. This program was implemented in January 2002 and as at 30 June 2003, A$60 million was utilised.
Term Facilities – unsecured
US Private Placement– US$250 million (A$423 million equivalent) (2002: US$Nil). A non-underwritten facility where Origin Energy Limited issued a series of 7, 12 and 15 year USD-denominated bonds to international investors in the US Private Placement Market. The bonds were issued in March 2003 and as at 30 June 2003 there was a total of US$250 million (A$423 million equivalent) (2002: US$Nil) on issue. All USD proceeds from the issue of notes have been fully hedged to Australian dollars.
Medium Term Note Program– A non-underwritten revolving facility whereby issuances by Origin Energy Limited are conducted through a panel of five dealers. Notes can be issued for a period greater than 365 days, with the applicable interest rate being either fixed or floating, this being agreed to between the issuer and the purchaser prior to issuance. This program was implemented in January 2002 and as at 30 June 2003 there was one issue outstanding of A$180 million with a maturity of April 2007.
Loan Note Subscription Agreement–A$320 million (2002: A$520 million) fully underwritten and provided by a syndicate of international banks with a fixed maturity of October 2004. This facility is utilised as a Standby Facility for the Electronic Promissory Note Program. At 30 June 2003, this facility was un-drawn.
Revolving Cash Advance Loan Facility–A$75 million (2002: A$Nil) fully underwritten revolving facility provided by an international bank. The facility has a fixed maturity date of August 2007. At 30 June 2003, this facility was un-drawn.
| 29. | Financial instruments |
The consolidated entity is exposed to financial risk as a result of fluctuations occurring in interest and foreign exchange rates and certain commodity prices. Accordingly, the consolidated entity uses financial instruments to minimise the economic volatility these exposures create on its Statements of Financial Performance and Statements of Financial Position.
(a) Interest risk rate
The consolidated entity enters into interest rate swap transactions with the purpose of controlling the interest cost of funding associated with external debt raised.
Interest rate swaps provide to the consolidated entity the flexibility to raise term borrowings at variable or fixed interest rates, which subsequently can either be locked into fixed interest rates in order to remove the interest cost uncertainty attached to variable interest rate external debt or alternatively converted to variable interest rates.
The maturity profile of existing swap transactions is less than 15 years and in accordance with financial market convention each swap requires a quarterly or semi-annual fixed payment or receipt of interest and a corresponding receipt or payment of interest at variable rates. The swap contract allows settlement to occur on the basis that either a net amount of interest is payable by or receivable to the consolidated entity or for cross currency swap transactions settlement occurs on a gross interest basis with principal exchange at the end of term of the transaction. At 30 June 2003, fixed rates applicable to the consolidated entity’s interest rate swap portfolio range between 4.82% and 7.38% (weighted average 5.77%) which compares with a 90 day BBSW floating rate at balance date of 4.68%.
The following tables provide the consolidated entity’s exposure to interest rate risk and the weighted average interest rate for the various categories of financial assets and financial liabilities existing at balance date, as well as the net fair value of various assets and liabilities (refer note 29(e)).
30 Financial statements 2003
| 29. | Financial instruments (continued) |
| 2003 | ||||||||||||||||||||
| Floating interest rate | Fixed interest maturing in: | Non interest bearing | Total | Weighted average interest rate | Net fair value | |||||||||||||||
| $’000 | 1 year or less $’000 | Over 1 to 5 years $’000 | More than 5 years $’000 | $’000 | $’000 | % | $’000 | |||||||||||||
Financial assets | ||||||||||||||||||||
Cash | 16,431 | — | — | — | — | 16,431 | 3.9 | 16,431 | ||||||||||||
Receivables | — | — | — | — | 652,760 | 652,760 | — | 652,760 | ||||||||||||
Other financial assets | — | — | — | — | 170,713 | 170,713 | — | 186,865 | ||||||||||||
Financial liabilities | ||||||||||||||||||||
Payables | — | — | — | — | 486,866 | 486,866 | — | 486,866 | ||||||||||||
Interest-bearing liabilities | 145,522 | — | 180,000 | 423,012 | — | 748,534 | 5.7 | 773,854 | ||||||||||||
Employee benefits** | — | — | — | — | 39,634 | 39,634 | 4.3 | 39,634 | ||||||||||||
Off-balance sheet | ||||||||||||||||||||
Interest rate swaps* | ||||||||||||||||||||
– underlying debt (pay fixed) | (483,198 | ) | 95,000 | 315,000 | 73,198 | — | — | 5.8 | (10,456 | ) | ||||||||||
– underlying debt (pay floating) | 523,012 | — | (100,000 | ) | (423,012 | )# | — | — | 4.7 | 19,253 | ||||||||||
| 2002 | |||||||||||||||||||
| Floating interest rate | Fixed interest maturing in: | Non interest bearing | Total | Weighted average interest rate | Net fair value | ||||||||||||||
| $’000 | 1 year or less $’000 | Over 1 to 5 years $’000 | More than 5 years $’000 | $’000 | $’000 | % | $’000 | ||||||||||||
Financial assets | |||||||||||||||||||
Cash | 17,255 | — | — | — | — | 17,255 | 4.5 | 17,255 | |||||||||||
Receivables | — | — | — | — | 507,037 | 507,037 | — | 507,037 | |||||||||||
Other financial assets | — | — | — | — | 196,135 | 196,135 | — | 181,171 | |||||||||||
Financial liabilities | |||||||||||||||||||
Payables | — | — | — | — | 377,634 | 377,634 | — | 377,634 | |||||||||||
Interest-bearing liabilities | 470,344 | 33 | 180,000 | — | — | 650,377 | 5.9 | 650,377 | |||||||||||
Employee benefits** | — | — | — | — | 33,012 | 33,012 | 4.3 | 33,012 | |||||||||||
Off-balance sheet | |||||||||||||||||||
Interest rate swaps* | |||||||||||||||||||
– underlying debt (pay fixed) | (405,000 | ) | 95,000 | 310,000 | — | — | — | 6.2 | (3,301 | ) | |||||||||
– underlying debt (pay floating) | 100,000 | — | (100,000 | ) | — | — | — | 4.6 | 179 | ||||||||||
| * | Represents notional principal amounts |
| ** | Employee benefits to be settled in cash fall under the definition of financial liabilities. The weighted average interest rate is the discount rate used to calculate the long service leave liability. |
| # | This derivative transaction converts a US dollar fixed rate debt obligation to an Australian dollar floating rate debt obligation. |
Origin Energy Limited and Controlled Entities31
Notes to the financial statements (continued)
| 29. | Financial instruments (continued) |
(b) Foreign exchange risk
The consolidated entity is exposed to foreign currency exchange risk. This occurs as a result of the sale of oil, the sale and purchase of LPG, the purchase of plant and equipment and the translation of its investment in overseas domiciled operations. In order to mitigate the economic volatility caused by fluctuations in foreign currency rates, the consolidated entity enters into foreign exchange forward contracts to hedge certain firm purchase and sale commitments denominated in foreign currency.
At balance date the consolidated entity has the following contracts outstanding which are required to hedge the foreign exchange exposures outlined in the above paragraph.
| 2003 | 2002 | |||||||
| Contract amounts A$’000 | Net fair value A$’000 | Contract amounts A$’000 | Net fair value A$’000 | |||||
Foreign currency forward contracts | ||||||||
Buy AUD/Sell USD | ||||||||
Not longer than one year | 49,334 | 7,205 | 50,246 | 2,080 | ||||
Longer than one year | 55,841 | 8,638 | 76,024 | 2,386 | ||||
| 105,175 | 15,843 | 126,270 | 4,466 | |||||
Unrealised gains/losses together with other costs relating to those contracts entered into for purchases and sales denominated in foreign currencies are deferred and recognised as assets or liabilities on the Statement of Financial Position from the inception of the hedge contract. The gain or loss is included in the measurement of the hedged transaction when the transaction has occurred. The weighted average AUD/USD foreign exchange rate for the forward contracts referred to above as at 30 June 2003 was 0.5640 for one year or less and 0.5359 for greater than one year.
(c) Commodity price risk
Oil
The consolidated entity has exposure to fluctuations in crude oil and fuel oil commodity prices associated with the sale of oil and natural gas. In order to eliminate the adverse financial effects caused by unfavourable price movements, fixed rate swaps are utilised.
| 2003 | 2002 | |||||||||
| Contract amounts A$’000 | Net fair value A$’000 | Contract amounts A$’000 | Net fair value A$’000 | |||||||
Crude oil sales | ||||||||||
Receive fixed/pay floating swaps | ||||||||||
Not longer than one year | 44,499 | (1,486 | ) | 43,625 | (1,863 | ) | ||||
Longer than one year | 4,988 | (112 | ) | 8,671 | (966 | ) | ||||
Fuel oil sales | ||||||||||
Receive fixed/pay floating swaps | ||||||||||
Not longer than one year | 11,002 | (991 | ) | 12,396 | (483 | ) | ||||
| 60,489 | (2,589 | ) | 64,692 | (3,312 | ) | |||||
| Electricity |
The consolidated entity enters into forward electricity pricing contracts, futures and options contracts, to hedge electricity sales under retail contracts in the Eastern and South Eastern Australian markets. The terms of these contracts may range from one half hour in the short term, to five years commencing immediately or at a date in the future. Electricity trading activities are conducted in accordance with a Board approved policy which regulates price and volume market exposure against Board approved limits. Realised gains and losses from this activity are included in the result for the year. The nature of these contracts is similar to interest rate swaps undertaken in the financial markets, in that fixed and variable price components apply and it is the variable price component which creates the exposure that is Origin’s electricity price risk.
32 Financial statements 2003
| 29. | Financial instruments (continued) |
| 2003 | 2002 | ||||||||
| Contract amounts GWh | Net fair value A$’000 | Contract amounts GWh | Net fair value A$’000 | ||||||
Receive fixed/pay floating | |||||||||
Not longer than one year | 4,446 | 24,050 | 6,328 | 9,843 | |||||
Longer than one year | 2,682 | 12,533 | 2,531 | 39 | |||||
Pay fixed/receive floating | |||||||||
Not longer than one year | 18,602 | (72,061 | ) | 12,717 | 51,140 | ||||
Longer than one year | 18,135 | 71,412 | 14,387 | 135,508 | |||||
Options | |||||||||
Not longer than one year | — | (4,980 | ) | — | 12,103 | ||||
Longer than one year | — | 4,552 | — | 15,832 | |||||
| 43,865 | 35,506 | 35,963 | 224,465 | ||||||
Certain electricity trading contracts were acquired in the 2001 financial year and further trading contracts were acquired in the current year. The net fair value of these contracts at acquisition, together with customer supply contracts, was recognised as commodity hedging contracts (see note 10) and commodity hedge losses and onerous contracts (see note 19).
| (d) Credit risk |
Credit risk represents the loss that would be incurred if counterparties to financial transactions fail to fulfil their obligations as contracted at maturity.
The consolidated entity minimises its exposure to credit risk through the adoption of counterparty credit limits which are determined in accordance with international credit ratings. At balance date, the only significant concentration of credit risk with any single counterparty is to Eraring Energy, which is wholly owned by the NSW Government, in relation to commodity hedging contracts.
The credit risk relating to financial assets of the consolidated entity which are recognised on the Statement of Financial Position, is the carrying amount, net of any provision for doubtful debts.
Credit risk relating to derivative contracts is minimised by applying a Board approved policy under which the exposure limit applicable to each respective counterparty is determined with reference to the credit rating assigned by the international rating agencies.
Credit exposures relating to foreign currency, commodity and interest rate derivatives is represented by the net fair value position of the contracts, as disclosed, subject to the counterparties performing as contracted.
| (e) Net fair value of financial assets and liabilities |
Net fair values of financial assets and liabilities are determined by the consolidated entity using the following criteria:
| - | Monetary financial assets and financial liabilities not readily traded in an organised financial market are determined by valuing them at the present value of contractual future cash flows on amounts due from customers or due to suppliers. The carrying amounts of bank term deposits, receivables, payables, bank loans and dividends payable approximate net fair value. |
| - | Net fair value of listed investments is defined as the quoted market price in an active and liquid market. The carrying amount of the investment in listed shares is appropriate although being above net fair value. Internal analysis, including analysis of discounted future cash flows, supports the carrying value of this investment. |
| - | The valuation of derivative contracts detailed in this note reflects the estimated amounts which the consolidated entity would pay or receive on termination of the contracts (net of transaction costs) or replacement of the contracts at their current market prices as at the balance date. This is determined using independent market quotations and adopting conventional market valuation techniques. The fair value of the contracts has been determined by valuing them at the present value of future cash flows. |
Origin Energy Limited and Controlled Entities33
Notes to the financial statements (continued)
| 30. | Acquisition/disposal of controlled entities |
Date of acquisition/ disposal | Net tangible assets acquired $’000 | Consideration paid/ (received) $’000 | Beneficial ownership % | |||||
The following controlled entities were acquired during the current financial year: | ||||||||
AES Australia Holding BV and AES Mt Stuart BV | 13 December 2002 | 89,025 | 89,025 | 100 | ||||
Hylemit Pty Ltd | 30 June 2003 | 3,378 | 4,082 | 100 | ||||
The following entities were sold during the current financial year: | ||||||||
OE SEA Gas SPV1 Pty Ltd | 3 September 2002 | — | — | |||||
The following controlled entities were incorporated during the current financial year: | ||||||||
Origin Energy Solar Pty Ltd | 100 | |||||||
Origin Energy NZ Share Plan Ltd | 100 | |||||||
Origin Energy Asset Management Services Pty Ltd | 100 | |||||||
Origin Energy Water Management Pty Ltd | 100 | |||||||
OCA Holdings Pty Ltd | 85.23 | |||||||
The following controlled entities were incorporated during the previous financial year: | ||||||||
OCA (CSG) Pty Ltd | 85.23 | |||||||
The following controlled entities were acquired during the previous financial year: | ||||||||
Gasmart (Vic) Pty Ltd | 14 November 2001 | 7,651 | 7,651 | 100 | ||||
Transfield CSM Pty Ltd | 20 February 2002 | 10,262 | 10,262 | 100 | ||||
Fletcher Challenge South West Cogeneration Ltd | 1 July 2001 | 69,539 | 69,539 | 100 | ||||
The following controlled entities were de-registered during the previous financial year: | ||||||||
Sagini Pty Ltd | — | |||||||
| 31. | Controlled entities |
| Carrying on business in a place other than Australia: |
American Samoa: | Papua New Guinea: | |||||
Origin Energy American Samoa Inc | Origin Energy PNG Ltd | |||||
Cook Islands: | Solomon Islands: | |||||
Origin Energy Cook Islands Ltd | Origin Energy Solomons Ltd | |||||
Fiji: | Tonga: | |||||
The Fiji Gas Co Ltd | Tonga Gas Ltd | |||||
New Zealand: | Vanuatu: | |||||
Origin Energy Resources NZ Ltd | Origin Energy Vanuatu Ltd | |||||
Origin Energy Industries Ltd | Western Samoa: | |||||
Origin Energy NZ Share Plan Ltd | Origin Energy Samoa Ltd | |||||
Name changes during the financial period: | ||||||
AES Australia Holding BV | to | Origin Energy Australia Holding BV | ||||
AES Mt Stuart BV | to | Origin Energy Mt Stuart BV | ||||
34 Financial statements 2003
| 331. | Controlled entities (continued) |
| Incorporated in | Consolidated entity | Origin Energy Limited | Consolidated entity | Origin Energy Limited | ||||||
2003 % | 2003 % | 2002 % | 2002 % | |||||||
Origin Energy Limited | NSW | |||||||||
Huddart Parker Ltd*< | Vic | 100 | 100 | 100 | 100 | |||||
Raenniks Ltd (in voluntary liquidation) | Vic | 100 | 100 | 100 | 100 | |||||
Origin Energy NZ Share Plan Ltd | NZ | 100 | — | |||||||
FRL Pty Ltd*< | WA | 100 | 100 | 100 | 100 | |||||
BTS Pty Ltd*< | WA | 100 | 100 | |||||||
Origin Energy Power Ltd*< | SA | 100 | 100 | |||||||
Origin Energy Solar Pty Ltd< | NSW | 100 | — | |||||||
Origin Energy SWC Ltd< | WA | 100 | 100 | |||||||
BESP Pty Ltd | Vic | 100 | 100 | |||||||
Origin Energy Holdings Ltd*< | Vic | 100 | 95.39 | 100 | 95.39 | |||||
Origin Energy Retail Ltd*< | SA | 100 | 100 | |||||||
Origin Energy (Vic) Pty Ltd*< | Vic | 100 | 100 | |||||||
Gasmart (Vic) Pty Ltd< | Vic | 100 | 100 | |||||||
Origin Energy Electricity Ltd*< | Vic | 100 | 100 | |||||||
Origin Energy PNG Ltd | PNG | 66.7 | 66.7 | |||||||
Origin Energy Tasmania Ltd*< | Tas | 100 | 100 | |||||||
The Fiji Gas Co Ltd | Fiji | 51 | 51 | |||||||
Tonga Gas Ltd | Tonga | 51 | 51 | |||||||
Origin Energy Contracting Ltd*< | Qld | 100 | 100 | |||||||
Origin Energy LPG Ltd*< | NSW | 100 | 100 | |||||||
Origin (LGC) (Aust) Pty Ltd*< | NSW | 100 | 100 | |||||||
Origin Energy SA Pty Ltd*< | SA | 100 | 100 | |||||||
Hylemit Pty Ltd | Vic | 100 | — | |||||||
Origin Energy Industries Ltd | NZ | 100 | 100 | |||||||
Origin Energy (WA) Pty Ltd*< | WA | 100 | 100 | |||||||
Origin Energy Services Ltd*< | SA | 100 | 100 | |||||||
Origin Energy Asset Management Services Pty Ltd | NSW | 100 | — | |||||||
Origin Energy Water Management Pty Ltd | NSW | 100 | — | |||||||
Origin Energy Asset Management Ltd*< | SA | 100 | 100 | |||||||
Origin Energy Pipelines Pty Ltd*< | NT | 100 | 100 | |||||||
Origin Energy Pipelines (Vic) Holdings Pty Ltd*< | Vic | 100 | 100 | |||||||
Origin Energy Pipelines (Vic) Pty Ltd*< | Vic | 100 | 100 | |||||||
Origin Energy Solomons Ltd | Solomon Islands | 80 | 80 | |||||||
Origin Energy Cook Islands Ltd | Cook Islands | 100 | 100 | |||||||
Origin Energy Vanuatu Ltd | Vanuatu | 100 | 100 | |||||||
Origin Energy Samoa Ltd | Western Samoa | 100 | 100 | |||||||
Origin Energy American Samoa Inc | American Samoa | 99.9 | 99.9 | |||||||
Origin Energy Limited and Controlled Entities35
Notes to the financial statements (continued)
| 31. | Controlled entities (continued) |
| Incorporated in | Consolidated entity | Origin Energy Limited | Consolidated entity | Origin Energy Limited | ||||||
| 2003% | 2003% | 2002% | 2002% | |||||||
Origin Energy Resources Ltd*< | SA | 100 | 100 | 100 | 100 | |||||
Origin Energy Bonaparte Pty Ltd*< | SA | 100 | 100 | |||||||
Origin Energy Developments Pty Ltd*< | ACT | 100 | 100 | |||||||
Origin Energy Zoca 91-08 Pty Ltd*< | SA | 100 | 100 | |||||||
Origin Energy Petroleum Pty Ltd*< | Qld | 100 | 100 | |||||||
Origin Energy Northwest Ltd | UK | 100 | 100 | |||||||
Sagasco Southeast Inc | Panama | 100 | 100 | |||||||
Origin Energy Resources NZ Ltd | NZ | 100 | 100 | |||||||
Sagasco NT Pty Ltd*< | SA | 100 | 100 | |||||||
Sagasco Amadeus Pty Ltd*< | SA | 100 | 100 | |||||||
Origin Energy Amadeus NL*< | Qld | 100 | 100 | |||||||
Amadeus United States Pty Ltd*< | Qld | 100 | 100 | |||||||
Oil Company of Australia Ltd | NSW | 85.23 | 62.24 | 85.23 | 62.24 | |||||
OCA (CSG) Pty Ltd | Qld | 85.23 | 85.23 | |||||||
Angari Pty Ltd | SA | 85.23 | 85.23 | |||||||
Oil Investments Ltd | SA | 85.23 | 85.23 | |||||||
OCA (Durham ) Pty Ltd | WA | 85.23 | 85.23 | |||||||
OCA Holdings Pty Ltd | Qld | 85.23 | — | |||||||
OCA (Moura) Pty Ltd | Qld | 85.23 | 85.23 | |||||||
OCA (Moura) Transmissions Pty Ltd | WA | 85.23 | 85.23 | |||||||
Origin Energy Finance Company Pty Ltd< | Vic | 100 | 100 | |||||||
OE JV Co Pty Ltd< | Vic | 100 | 100 | |||||||
OE SEA Gas Holdings Pty Ltd | Vic | 100 | 100 | |||||||
OE SEA Gas SPV1 Pty Ltd | Vic | — | 100 | |||||||
OE SEA Gas SPV2 Pty Ltd | Vic | 100 | 100 | |||||||
OE SEA Gas SPV3 Pty Ltd | Vic | 100 | 100 | |||||||
Origin Energy Australia Holding BV | Netherlands | 100 | 100 | — | — | |||||
Origin Energy Mt Stuart BV | Netherlands | 100 | 100 | — | — | |||||
Parbond Pty Ltd | NSW | 100 | 100 | 100 | 100 | |||||
| < | Entered into a cross guarantee with Origin Energy Limited (refer note 26). |
| * | Granted relief by the Australian Securities and Investments Commission from specified accounting requirements in accordance with a Class Order. |
All the shares held by Origin Energy Limited in controlled entities are ordinary shares other than those indicated by a symbol above.
Vic Gas Distribution Pty Limited (“Vic Gas”) and its controlled entity Albury Gas Company Limited (“AGC”) are owned 100% (2002: 100%) by Origin Energy Pipelines (Vic) Pty Ltd. However, Vic Gas and AGC are not considered to be controlled entities of Origin Energy Limited as Origin Energy Limited does not have the right to appoint a simple majority of directors and does not have the capacity to dominate the decision-making, directly or indirectly, in relation to the financial and operating policies of Vic Gas and AGC. Vic Gas and AGC are managed and controlled by Envestra Victoria Pty Ltd (“EnVic”) (a non-related company), via a Business Management Agreement between Origin Energy and EnVic. Accordingly, Vic Gas and AGC have been excluded from the consolidation of the consolidated entity.
36 Financial statements 2003
| 32. | Equity accounted investments |
| Details of investments in associates and joint venture entities are as follows: |
| Ownership interest Consolidated | Investment carrying amount Consolidated | |||||||||||||
| Principal activity | Place of incorporation | Reporting date | 2003 % | 2002 % | 2003 $’000 | 2002 $’000 | ||||||||
Associates: | ||||||||||||||
BIEP Pty Ltd | Cogeneration | Vic | 30 June | 50.0 | 50.0 | — | — | |||||||
BIEP Security Pty Ltd | Cogeneration | Vic | 30 June | 50.0 | 50.0 | — | — | |||||||
CUBE Pty Ltd* | Cogeneration | SA | 30 June | 50.0 | 50.0 | 8,780 | 8,153 | |||||||
Gas Industry | Superannuation | |||||||||||||
Superannuation Pty Ltd | Trustee | SA | 30 June | 50.0 | 50.0 | — | — | |||||||
Rockgas Ltd | LPG distributor | NZ | 31 Dec | 50.0 | 50.0 | 5,966 | 4,264 | |||||||
Vitalgas Pty Limited | Autogas distributor | NSW | 31 Dec | 50.0 | 50.0 | — | — | |||||||
WEBE Pty Ltd | Cogeneration | SA | 30 June | 50.0 | 50.0 | — | — | |||||||
Campaspe Asset Management | Water infrastructure | |||||||||||||
Services Pty Ltd | asset management | SA | 30 June | 50.0 | — | 350 | — | |||||||
| 15,096 | 12,417 | |||||||||||||
Joint venture entities: | ||||||||||||||
Bulwer Island Energy Partnership | Cogeneration | Qld | 30 June | 50.0 | 50.0 | 40,176 | 40,930 | |||||||
SEA Gas Partnership | Pipeline construction | SA | 30 June | 33.3 | 50.0 | — | — | |||||||
TOTAL | 55,272 | 53,347 | ||||||||||||
* Osborne Cogeneration Pty Ltd, a company incorporated in SA, is a wholly-owned controlled entity of CUBE Pty Ltd.
| (a) Investments in associates |
| Consolidated | ||||||
| 2003 $’000 | 2002 $’000 | |||||
Results of associates: | ||||||
Share of associates’ profit before income tax | 13,100 | 7,330 | ||||
Share of associates’ income tax attributable to net profit | (5,779 | ) | (4,065 | ) | ||
Share of associates’ net profit | 7,321 | 3,265 | ||||
Share of post-acquisition retained profits attributable to associates: | ||||||
Share of associates’ retained profits at the beginning of the financial year | 9,819 | 6,448 | ||||
Share of associates’ net profit | 7,321 | 3,265 | ||||
Less: Dividends from associates | (5,000 | ) | — | |||
Effect of exchange rate changes | (14 | ) | 106 | |||
Share of associates’ retained profits at the end of the financial year | 12,126 | 9,819 | ||||
Movements in carrying amount of investments in associates: | ||||||
Carrying amount of investments in associates at the beginning of the financial year | 12,417 | 8,851 | ||||
Investments in associates acquired during the year | 350 | — | ||||
Share of associates’ net profit | 7,321 | 3,265 | ||||
Less: Dividends from associates | (5,000 | ) | — | |||
Effect of exchange rate changes | 8 | 301 | ||||
Carrying amount of investments in associates at the end of the financial year | 15,096 | 12,417 | ||||
Origin Energy Limited and Controlled Entities37
Notes to the financial statements (continued)
| Consolidated | ||||||
| 2003 $’000 | 2002 $’000 | |||||
32. Equity accounted investments (continued) | ||||||
(a) Investments in associates (continued) | ||||||
Share of associates’ capital expenditure commitments contracted but not provided for and payable: | ||||||
Not later than one year | 2,949 | 1,695 | ||||
Share of associates’ operating lease commitments payable: | ||||||
Not later than one year | 95 | 449 | ||||
Later than one year but not later than five years | 868 | 896 | ||||
Later than five years | 591 | 266 | ||||
| 1,554 | 1,611 | |||||
Summary of performance and financial position of associates: | ||||||
The consolidated entity’s share of aggregate profits, assets and liabilities of associates are as follows: | ||||||
Net profit after tax | 7,321 | 3,265 | ||||
Current assets | 16,479 | 14,286 | ||||
Non-current assets | 96,731 | 96,286 | ||||
Total assets | 113,210 | 110,572 | ||||
Current liabilities | 17,058 | 13,637 | ||||
Non-current liabilities | 81,056 | 84,518 | ||||
Total liabilities | 98,114 | 98,155 | ||||
Net assets | 15,096 | 12,417 | ||||
(b) Investments in joint venture entities | ||||||
Results of joint venture entities: | ||||||
Share of joint venture entities’ profit before income tax | 5,244 | 5,073 | ||||
Share of joint venture entities’ income tax attributable to net profit | — | — | ||||
Share of joint venture entities’ net profit | 5,244 | 5,073 | ||||
Share of post-acquisition retained profits attributable to joint venture entities: | ||||||
Share of joint venture entities’ retained profits at the beginning of the financial year | 7,929 | 2,856 | ||||
Share of joint venture entities’ net profit | 5,244 | 5,073 | ||||
Share of joint venture entities’ retained profits at the end of the financial year | 13,173 | 7,929 | ||||
Movements in carrying amount of investments in joint venture entities: | ||||||
Carrying amount of investments in joint venture entities at the beginning of the financial year | 40,930 | 41,134 | ||||
Further investments in joint venture entities during the year | — | 723 | ||||
Distributions received | (5,998 | ) | (6,000 | ) | ||
Share of joint venture entities’ net profit | 5,244 | 5,073 | ||||
Carrying amount of investments in joint venture entities at the end of the financial year | 40,176 | 40,930 | ||||
Share of joint ventures entities’ capital expenditure commitments contracted but not provided for and payable: | ||||||
Not later than one year | 34,404 | 51,497 | ||||
Later than one year but not later than five years | 841 | 4,586 | ||||
| 35,245 | 56,083 | |||||
38 Financial statements 2003
| Consolidated | ||||
| 2003 $’000 | 2002 $’000 | |||
32. Equity accounted investments (continued) | ||||
(b) Investments in joint venture entities (continued) | ||||
Summary of performance and financial position of joint venture entities: | ||||
The consolidated entity’s share of aggregate profits, assets and liabilities of joint venture entities are as follows: | ||||
Net profit after tax | 5,244 | 5,073 | ||
Current assets | 7,189 | 7,947 | ||
Non-current assets | 150,624 | 55,138 | ||
Total assets | 157,813 | 63,085 | ||
Current liabilities | 2,129 | 2,625 | ||
Non-current liabilities | 115,508 | 19,530 | ||
Total liabilities | 117,637 | 22,155 | ||
Net assets | 40,176 | 40,930 | ||
Included in the assets and liabilities of the company and the consolidated entity are the following items which represent the company’s and the consolidated entity’s interest in the assets and liabilities employed in unincorporated joint ventures, recorded in accordance with the accounting policies described in note 1: | ||||||||
| Consolidated | Origin Energy Limited | |||||||
| 2003 $’000 | 2002 $’000 | 2003 $’000 | 2002 $’000 | |||||
Current assets | ||||||||
Cash assets | 5,006 | 6,614 | — | — | ||||
Receivables | 3,571 | 1,208 | — | — | ||||
Inventories | 16,627 | 15,239 | — | — | ||||
Other | 2,089 | 1,930 | — | — | ||||
Total current assets | 27,293 | 24,991 | — | — | ||||
Non-current assets | ||||||||
Mine properties | 310,236 | 264,607 | — | — | ||||
Other property, plant and equipment | 413,220 | 347,087 | — | — | ||||
Exploration, evaluation and development expenditure | 142,487 | 118,896 | — | — | ||||
Other | 1,980 | 2,757 | — | — | ||||
Total non-current assets | 867,923 | 733,347 | — | — | ||||
Total assets | 895,216 | 758,338 | — | — | ||||
Current liabilities | ||||||||
Payables | 47,835 | 40,522 | — | — | ||||
Provisions | 50 | — | — | — | ||||
Total current liabilities | 47,885 | 40,522 | — | — | ||||
Non-current liabilities | ||||||||
Provisions | 1,578 | 1,511 | — | — | ||||
Total non-current liabilities | 1,578 | 1,511 | — | — | ||||
Total liabilities | 49,463 | 42,033 | — | — | ||||
Net investment in joint ventures | 845,753 | 716,305 | — | — | ||||
Origin Energy Limited and Controlled Entities39
Notes to the financial statements (continued)
| 33. | Interest in joint venture operations (continued) |
The consolidated entity holds interests in a number of unincorporated joint ventures.
| Consolidated | ||||||||||
| Note | 2003 $’000 | 2002 $’000 | ||||||||
Other joint venture information | ||||||||||
Sales value of products directly received | 313,787 | 274,135 | ||||||||
Contribution to net profit before tax | 111,533 | 108,073 | ||||||||
Contingent liabilities (included in note 26) | 3,914 | 970 | ||||||||
Capital commitments (included in note 27) | 64,394 | 34,735 | ||||||||
Interest range | ||||||||||
2003 % | 2002 % | |||||||||
Major areas of interest | ||||||||||
SA & SWQ Cooper Basin | 10.5/27.0 | 10.5/27.0 | ||||||||
Bowen Basin | 50.0 | 50.0 | ||||||||
T/RL1 Bass Basin | 37.5 | 37.5 | ||||||||
The principal activities of most of these joint ventures are oil and/or gas exploration, development and production. | ||||||||||
| Consolidated | Origin Energy Limited | |||||||||
| 2003 $’000 | 2002 $’000 | 2003 $’000 | 2002 $’000 | |||||||
Aggregate liability for employee benefits, including on-costs | ||||||||||
Current | 19 | 36,274 | 30,063 | 2,078 | 1,638 | |||||
Non-current | 19 | 3,360 | 2,949 | 9 | 9 | |||||
| 39,634 | 33,012 | 2,087 | 1,647 | |||||||
Number of employees at year end | 2,857 | 2,721 | 43 | 47 | ||||||
| Employee superannuation funds |
Refer to note 27.
| Equity-based instruments: |
Senior Executive Option Plan
The company’s Senior Executive Option Plan was approved at the annual general meeting on 13 November 1995. Staff eligible to participate in the plan are those senior executives invited by the Board, with invitation based on performance and the role the individual plays in guiding the future success of the company. Options granted under the plan entitle the holder to subscribe for one fully paid ordinary share. The exercise price of the options is based on the weighted average price of the company’s shares during a five day period determined by the Board to be representative of the company’s position at the time. The options are exercisable at any time after the third anniversary of the grant and prior to the fifth anniversary of the grant, provided that relevant performance hurdles are met. The performance hurdles that must be met prior to an option becoming exercisable vary by option tranche and are discussed in the footnotes to the Senior Executive Options table in this note. Options granted under the plan do not carry any dividend or voting rights.
During the year, the company issued 2,630,000 options at an exercise price of $3.56. The company does not record an expense on either the granting of options to employees or upon the subsequent exercise of the options by employees. The company has, however, estimated the cost attributable to the current year of all options issued by the company in the current and prior years, using the guidance in the Australian Accounting Standards Board’s Exposure Draft 108 “Request for comment on IASB ED 2 Share-based Payment” (ED 108) to be $1.8 million (2002: $1.2 million). ED 108 prescribes that options be measured at fair value at the date of grant and amortised over the period to vesting date.
The amount recognised in contributed equity in the financial statements of the company for the financial year represents the proceeds received from exercise of options and is detailed as follows:
40 Financial statements 2003
| Consolidated | Origin Energy Limited | |||||||||
| Note | 2003 $’000 | 2002 $’000 | 2003 $’000 | 2002 $’000 | ||||||
34. Employee benefits (continued) | ||||||||||
Issued ordinary share capital | 20 | 5,417 | 1,570 | 5,417 | 1,570 | |||||
Details of options outstanding at the beginning and the end of the financial year and movements during the year are provided in the senior executives options table in this note.
| Employee Share Plan |
The Origin Board of Directors approved the Origin Energy Employee Share Plan (Origin ESP) on 20 March 2001. All Origin full time and permanent part-time employees based in Australia with at least one year of service qualify for participation in the Origin ESP. Under the Origin ESP, up to $1,000 worth of fully paid shares are offered to all qualifying employees, in each year in which the Origin ESP is in effect, for no consideration.
Shares are awarded under the terms of the Origin ESP in recognition of the contribution employees make to the overall success of Origin, based on performance hurdles established each year. The Origin ESP has been established as a qualifying plan under the Income Tax Assessment Act.
Origin Energy Limited shares awarded under the Origin ESP to Australian-based employees are registered as restricted shares which cannot be sold for three years from the date of award. The shares awarded in the name of the qualifying employee are not subject to forfeiture and vest at the date of award to the employee. Shares awarded under the Origin ESP rank equally with other fully paid ordinary shares on issue and carry full voting and dividend rights.
To enable Origin employees based in New Zealand to receive benefits similar to those of Australian-based employees, the Board of Directors has approved the Origin Energy New Zealand Employee Share Plan (New Zealand ESP). The terms and benefits awarded under the New Zealand ESP are similar to those of the Origin ESP and all full time and permanent part-time employees with at least one year of service qualify for participation in the plan. Under the New Zealand ESP, up to $1,000 worth of fully paid shares are offered to all qualifying employees, in each year in which the New Zealand ESP is in effect, for no consideration. Shares awarded under the New Zealand ESP are restricted shares which cannot be sold for three years from the date of award and employees may elect to either receive the shares in their name at the time of award or have the shares placed into trust. Shares received by employees in their name at the date of award are not subject to forfeiture and vest at the date of award.
Shares held in trust are subject to a three year vesting period before being allocated to employees and may be forfeited if employees do not remain employees of Origin for the full three year vesting period.
Separate plans and procedures, adapting for local laws, have also been implemented to enable employees not based in Australia or New Zealand to receive benefits similar to those awarded under the Origin ESP and New Zealand ESP.
Shares awarded under employee share plans in the year ended 30 June 2003 were purchased on-market. Shares awarded in the year ended 30 June 2002 and prior years were issued out of the company’s share capital.
The cost of shares awarded under employee share plans during the year ended 30 June 2003 with respect to the company’s performance in the 2002 financial year was $1,686,000 (2002: $1,907,000 fair value) and this amount was expensed as part of employee benefit costs.
A further amount of $2,240,000 being the estimated cost of shares expected to be awarded under employee share plans for the year ended 30 June 2003 has been accrued at 30 June 2003.
The following table details the shares awarded under employee share plans and the fair value of those shares:
Date shares granted | Number of shares granted | Cost per share | Total cost $’000 | ||||
Year ended 2003 | |||||||
1 December 2002 | 427,429 | $ | 3.77 | 1,613 | |||
30 June 2003(1) | 17,869 | $ | 4.05 | 73 | |||
| 445,298 | 1,686 | ||||||
Date shares granted | Number of shares granted | Fair value per share (3) | Total fair value $’000(3) | ||||
Year ended 2002 | |||||||
1 October 2001 | 506,872 | $ | 2.94 | 1,490 | |||
17 May 2002(2) | 75,400 | $ | 3.44 | 259 | |||
28 June 2002(1) | 46,873 | $ | 3.37 | 158 | |||
| 629,145 | 1,907 | ||||||
| (1) | Shares awarded to New Zealand based employees. |
| (2) | Shares awarded to employees not based in Australia or New Zealand. |
| (3) | The fair value of shares is measured as the volume-weighted average market price of the company’s shares on the Australian Stock Exchange over the five trading days prior to the date of award. |
Origin Energy Limited and Controlled Entities41
Notes to the financial statements (continued)
| 34. | Employee benefits (continued) |
Equity-based instruments (continued):
Under the New Zealand ESP, employees may elect to either receive the shares awarded to them in their name or have the shares placed in trust at the date of award.
Shares placed in trust have a three year vesting period. During the year ended 30 June 2003, 14,954 (2002: 35,813) shares were vested to the trust under the New Zealand ESP. During the year ended 30 June 2003, 3,360 (2002: Nil) shares held in trust vested to employees, with a vesting date of 24 July 2002 and a fair value at this date of $3.18 per share. The number of shares held in trust under the New Zealand ESP as at 30 June 2003 is 47,407 (2002: 35,813).
Executive Share Plan
Origin makes annual contributions to the Executive Share Plan according to a proportion of the variable incentive component of participating executives remuneration. The trustee of the plan applies to purchase shares on-market at prices prevailing at the time and allocates these shares to accounts of executives in accordance with directions from the Directors. Shares allocated to the benefit of participating executives in the year ended 30 June 2003 and the prior year were awarded in the name of the participating executive and were not subject to any trading or vesting restrictions. The shares rank equally with other fully paid shares on issue and carry both dividend and voting rights. Shares awarded under the Executive Share Plan were purchased on-market for both the year ended 30 June 2003 and 2002.
During the year ended 30 June 2003, 224,471 shares were allocated to the accounts of executives under the Executive Share Plan at a fair value equal to the volume weighted average market price of the shares of $3.65 per share (2002: 329,265 shares, fair value $3.02). The aggregate fair value of shares issued under the Executive Share Plan, $820,000 (2002: $994,000) was recognised as part of employee benefits expense in the financial statements of the consolidated entity.
In years prior to 30 June 2002, shares awarded under the Executive Share Plan were placed in trust and subject to a vesting period before the shares were distributed to individual executives. Shares held in trust under the Executive Share Plan may be forfeited if executives do not remain employees of Origin for the full vesting period applicable under the rules of the trust.
The following table details the movements in Origin Energy Limited shares held in trust for Origin executives under the Executive Share Plan:
Year ended 30 June 2003 | Number of shares | Fair value per share* | |||
Shares held in trust at 30 June 2002 | 580,328 | ||||
Shares distributed to executives during the year: | |||||
3 July 2002 | 930 | $ | 3.30 | ||
4 October 2002 | 931 | $ | 3.43 | ||
25 November 2002 | 3,293 | $ | 3.72 | ||
1 December 2002 | 111,188 | $ | 3.61 | ||
10 January 2003 | 5,493 | $ | 3.84 | ||
6 March 2003 | 2,277 | $ | 4.20 | ||
7 March 2003 | 5,996 | $ | 4.22 | ||
22 April 2003 | 1,186 | $ | 4.27 | ||
Shares held in trust at 30 June 2003 | 449,034 | ||||
Year ended 30 June 2002 |
Number of | Fair value per share* | |||
Shares held in trust at 30 June 2001 | 636,235 | ||||
Shares distributed to executives during the year: | |||||
27 July 2001 | 6,571 | $ | 2.95 | ||
27 August 2001 | 703 | $ | 3.15 | ||
3 October 2001 | 15,265 | $ | 3.11 | ||
2 November 2001 | 1,305 | $ | 3.17 | ||
21 November 2001 | 413 | $ | 2.98 | ||
28 November 2001 | 18,939 | $ | 2.94 | ||
13 December 2001 | 1,319 | $ | 2.80 | ||
24 December 2001 | 2,777 | $ | 2.84 | ||
1 February 2002 | 2,126 | $ | 2.93 | ||
11 April 2002 | 2,067 | $ | 3.11 | ||
16 April 2002 | 4,422 | $ | 3.18 | ||
Shares held in trust at 30 June 2002 | 580,328 | ||||
| * | The fair value of shares is the weighted average market share price on the Australian Stock Exchange on the date the shares were distributed to executives. |
42 Financial statements 2003
34. Employee benefits (continued) | |||||||||||||||||||||||
Summary of senior executive options | |||||||||||||||||||||||
Year ended 30 June 2003 | |||||||||||||||||||||||
Grant date | First exercise date | Expiry date | Exercise price per option | Hurdle price per share | Balance at start of the year | Issued during the year | Exercised during the year | Lapsed during the year | Balance at end of the year | Vested at end of the year | |||||||||||||
11 Dec 1997 | 11 Dec 2000 | 11 Dec 2002 | $ | 2.92 | $ | 3.51 | (1) | 1,160,000 | — | 1,125,000 | 35,000 | — | — | ||||||||||
11 Dec 1997 | 11 Dec 2000 | 11 Dec 2002 | $ | 5.02 | $ | 6.02 | (1) | 70,000 | — | — | 70,000 | — | — | ||||||||||
2 Mar 1998 | 2 Mar 2001 | 2 Mar 2003 | $ | 2.92 | $ | 3.51 | (1) | 30,000 | — | 30,000 | — | — | — | ||||||||||
4 Dec 1998 | 4 Dec 2001 | 4 Dec 2003 | $ | 1.66 | $ | 2.00 | (1) | 645,000 | — | 280,000 | — | 365,000 | 365,000 | ||||||||||
4 Dec 1998 | 4 Dec 2001 | 4 Dec 2003 | $ | 1.50 | $ | 1.80 | (1) | 50,000 | — | — | — | 50,000 | 50,000 | ||||||||||
19 Jan 1999 | 19 Jan 2002 | 19 Jan 2004 | $ | 1.66 | $ | 2.00 | (1) | 60,000 | — | 30,000 | — | 30,000 | 30,000 | ||||||||||
1 Feb 1999 | 1 Feb 2002 | 1 Feb 2004 | $ | 2.24 | (2) | 1,250,000 | — | — | — | 1,250,000 | 1,250,000 | ||||||||||||
6 Dec 1999 | 6 Dec 2002 | 6 Dec 2004 | $ | 1.76 | (2) | 1,665,900 | — | 784,400 | — | 881,500 | 881,500 | ||||||||||||
6 Dec 1999 | 6 Dec 2002 | 6 Dec 2004 | $ | 1.78 | (2) | 139,400 | — | 83,900 | — | 55,500 | 55,500 | ||||||||||||
1 Mar 2000 | 1 Mar 2003 | 1 Mar 2005 | $ | 1.27 | (3) | 2,230,000 | — | — | — | 2,230,000 | 2,230,000 | ||||||||||||
31 Aug 2001 | 31 Aug 2004 | 31 Aug 2006 | $ | 2.74 | (4) | 495,000 | — | — | — | 495,000 | — | ||||||||||||
16 Dec 2001 | 16 Dec 2004 | 16 Dec 2006 | $ | 3.20 | (4) | 3,495,000 | — | — | — | 3,495,000 | — | ||||||||||||
14 Jan 2002 | 14 Jan 2005 | 14 Jan 2007 | $ | 3.20 | (4) | 30,000 | — | — | — | 30,000 | — | ||||||||||||
19 Dec 2002 | 19 Dec 2005 | 19 Dec 2007 | $ | 3.56 | (4) | — | 2,630,000 | — | — | 2,630,000 | — | ||||||||||||
| 11,320,300 | 2,630,000 | 2,333,300 | 105,000 | 11,512,000 | 4,862,000 | ||||||||||||||||||
Year ended 30 June 2002
During the year ended 30 June 2002, 4,020,000 options were issued during the year with the following terms:
| |||||||||||||||||||||||
Grant date | First exercise date | Expiry date | Exercise price per option | Hurdle price per share | Number of Options granted | ||||||||||||||||||
31 Aug 2001 | 31 Aug 2004 | 31 Aug 2006 | $ | 2.74 | (4 | ) | 495,000 | ||||||||||||||||
16 Dec 2001 | 16 Dec 2004 | 16 Dec 2006 | $ | 3.20 | (4 | ) | 3,495,000 | ||||||||||||||||
14 Jan 2002 | 14 Jan 2005 | 14 Jan 2007 | $ | 3.20 | (4 | ) | 30,000 | ||||||||||||||||
During the year ended 30 June 2002, 761,650 options were exercised and the details of these options are included in the summary of senior executive options exercised table in this note. No options lapsed during the year.
| (1) | The exercise hurdle requires that the company share price achieve the hurdle price for at least 20 consecutive days from date of grant to expiry date. The options were issued prior to the Boral Limited Demerger in February 2000. |
| (2) | The performance hurdle for these options is based on an improvement in the Total Shareholder Return (TSR) index, i.e. the index measuring total shareholder returns maintained by the Australian Stock Exchange that calculates the share price movement of ordinary shares after notional reinvestment of dividends. The TSR must increase from the issue date by a specified percentage during a period of 20 consecutive trading days beginning 21/2years from the date of issue. |
| (3) | The performance hurdle for these options is based on the Total Shareholder Return (TSR) index, i.e. the index measuring total shareholder returns maintained by the Australian Stock Exchange that calculates the share price movement of ordinary shares after notional reinvestment of dividends. Whether the exercise hurdle is satisfied within the exercise period is determined by comparing the TSR index of the company with the TSR index of a predetermined reference group of Australian listed companies. The percentage of options that may be exercised is calculated on a sliding scale dependent upon the company’s performance against the reference group of companies. The percentage of options that may be exercised is Nil% if the TSR fails to reach the 25th percentile of the reference group of companies, 25% if the TSR reaches the 25th percentile, 50% if it reaches the 50th percentile and 100% if it reaches the 75th percentile. |
| (4) | The performance hurdle for these options is based on the Total Shareholder Return (TSR) index, i.e. the index measuring total shareholder returns maintained by the Australian Stock Exchange that calculates the share price movement of ordinary shares after notional reinvestment of dividends. Whether the exercise hurdle is satisfied within the exercise period is determined by comparing the TSR index of the company with the TSR index of a predetermined reference group of Australian listed companies. The percentage of options that may be exercised is calculated on a sliding scale dependent upon the company’s performance against the reference group of companies. If the Origin TSR reaches the 50th percentile, 50% of the options may be exercised and if it reaches the 75th percentile, 100% of the options may be exercised. The reference group of companies is available to shareholders and may be accessed via the company’s website. |
Origin Energy Limited and Controlled Entities43
Notes to the financial statements (continued)
| 34. | Employee benefits (continued) |
| Summary of senior executive options exercised |
The following table details the options exercised during the financial year and number of shares issued to employees on the exercise of options.
| Year ended 30 June 2003 |
Exercise date | Exercise price | Number of shares | Fair value at date of exercise * | |||||
10 Jul 2002 | $ | 1.66 | 15,000 | $ | 3.24 | |||
1 Aug 2002 | $ | 1.66 | 15,000 | $ | 3.37 | |||
8 Aug 2002 | $ | 1.66 | 15,000 | $ | 3.23 | |||
22 Aug 2002 | $ | 1.66 | 15,000 | $ | 3.41 | |||
30 Aug 2002 | $ | 1.66 | 15,000 | $ | 3.72 | |||
5 Sep 2002 | $ | 1.66 | 20,000 | $ | 3.70 | |||
17 Sep 2002 | $ | 1.66 | 30,000 | $ | 3.60 | |||
26 Sep 2002 | $ | 2.92 | 105,000 | $ | 3.54 | |||
3 Oct 2002 | $ | 2.92 | 35,000 | $ | 3.49 | |||
10 Oct 2002 | $ | 2.92 | 15,000 | $ | 3.45 | |||
11 Oct 2002 | $ | 2.92 | 15,000 | $ | 3.46 | |||
11 Oct 2002 | $ | 1.66 | 30,000 | $ | 3.46 | |||
14 Oct 2002 | $ | 2.92 | 50,000 | $ | 3.46 | |||
14 Oct 2002 | $ | 1.66 | 50,000 | $ | 3.46 | |||
18 Oct 2002 | $ | 2.92 | 15,000 | $ | 3.62 | |||
18 Oct 2002 | $ | 1.66 | 15,000 | $ | 3.62 | |||
24 Oct 2002 | $ | 2.92 | 40,000 | $ | 3.72 | |||
25 Oct 2002 | $ | 2.92 | 15,000 | $ | 3.71 | |||
28 Oct 2002 | $ | 2.92 | 60,000 | $ | 3.72 | |||
29 Oct 2002 | $ | 2.92 | 40,000 | $ | 3.69 | |||
1 Nov 2002 | $ | 2.92 | 50,000 | $ | 3.75 | |||
4 Nov 2002 | $ | 2.92 | 35,000 | $ | 3.73 | |||
5 Nov 2002 | $ | 2.92 | 15,000 | $ | 3.71 | |||
8 Nov 2002 | $ | 2.92 | 35,000 | $ | 3.79 | |||
18 Nov 2002 | $ | 2.92 | 30,000 | $ | 3.75 | |||
22 Nov 2002 | $ | 2.92 | 20,000 | $ | 3.76 | |||
25 Nov 2002 | $ | 2.92 | 20,000 | $ | 3.72 | |||
2 Dec 2002 | $ | 2.92 | 35,000 | $ | 3.59 | |||
6 Dec 2002 | $ | 2.92 | 15,000 | $ | 3.65 | |||
11 Dec 2002 | $ | 2.92 | 480,000 | $ | 3.47 | |||
13 Dec 2002 | $ | 1.76 | 43,600 | $ | 3.46 | |||
16 Dec 2002 | $ | 1.76 | 24,050 | $ | 3.48 | |||
17 Dec 2002 | $ | 1.76 | 13,950 | $ | 3.51 | |||
9 Jan 2003 | $ | 1.76 | 73,850 | $ | 3.89 | |||
10 Jan 2003 | $ | 1.76 | 18,050 | $ | 3.84 | |||
14 Jan 2003 | $ | 1.76 | 27,900 | $ | 3.86 | |||
17 Jan 2003 | $ | 1.76 | 118,150 | $ | 3.76 | |||
29 Jan 2003 | $ | 2.92 | 30,000 | $ | 3.80 | |||
29 Jan 2003 | $ | 1.66 | 30,000 | $ | 3.80 | |||
29 Jan 2003 | $ | 1.76 | 40,450 | $ | 3.80 | |||
3 Feb 2003 | $ | 1.76 | 27,800 | $ | 3.85 | |||
17 Feb 2003 | $ | 1.76 | 42,700 | $ | 3.93 | |||
3 Mar 2003 | $ | 1.66 | 10,000 | $ | 4.26 | |||
3 Mar 2003 | $ | 1.76 | 261,200 | $ | 4.26 | |||
3 Mar 2003 | $ | 1.78 | 83,900 | $ | 4.26 | |||
4 Mar 2003 | $ | 1.66 | 20,000 | $ | 4.19 | |||
14 Mar 2003 | $ | 1.66 | 15,000 | $ | 3.92 | |||
8 May 2003 | $ | 1.76 | 14,500 | $ | 4.38 | |||
29 May 2003 | $ | 1.66 | 15,000 | $ | 4.50 | |||
29 May 2003 | $ | 1.76 | 20,800 | $ | 4.50 | |||
30 May 2003 | $ | 1.76 | 57,400 | $ | 4.50 | |||
| 2,333,300 | ||||||||
| Year ended 30 June 2002 |
Exercise date | Exercise price | Number of shares | Fair value at date of exercise * | |||||
10 Aug 2001 | $ | 2.57 | 125,000 | $ | 2.99 | |||
26 Sep 2001 | $ | 2.57 | 41,500 | $ | 2.97 | |||
18 Oct 2001 | $ | 1.66 | 15,000 | $ | 3.17 | |||
18 Oct 2001 | $ | 1.76 | 18,650 | $ | 3.17 | |||
22 Oct 2001 | $ | 2.57 | 171,500 | $ | 3.16 | |||
12 Nov 2001 | $ | 1.66 | 15,000 | $ | 3.22 | |||
17 Dec 2001 | $ | 1.50 | 20,000 | $ | 2.78 | |||
25 Feb 2002 | $ | 1.66 | 15,000 | $ | 3.09 | |||
26 Feb 2002 | $ | 1.66 | 40,000 | $ | 3.09 | |||
12 Mar 2002 | $ | 1.66 | 15,000 | $ | 2.98 | |||
18 Mar 2002 | $ | 1.66 | 20,000 | $ | 3.04 | |||
19 Mar 2002 | $ | 1.66 | 20,000 | $ | 3.07 | |||
20 Mar 2002 | $ | 1.66 | 15,000 | $ | 3.15 | |||
25 Mar 2002 | $ | 1.66 | 140,000 | $ | 3.15 | |||
4 Apr 2002 | $ | 1.66 | 15,000 | $ | 3.09 | |||
8 Apr 2002 | $ | 1.66 | 15,000 | $ | 3.08 | |||
9 Apr 2002 | $ | 1.66 | 40,000 | $ | 3.06 | |||
11 Apr 2002 | $ | 1.66 | 20,000 | $ | 3.11 | |||
| 761,650 | ||||||||
| * | The fair value of the shares issued as a result of exercising options is the weighted average market share price of the shares of the company on the Australian Stock Exchange on the date the options were exercised. |
| 35. | Related party disclosures |
| Controlled entities and partly owned controlled entities |
Interests held in controlled entities and partly owned controlled entities are set out in note 31.
During the year, the company entered into transactions with certain of these entities primarily involving loans and recharges to the company which were conducted on normal arm’s-length terms and conditions. Interest is charged on inter-company loan amounts at commercially comparable rates.
| Associated entities |
Interests held in associated entities are set out in notes 9 and 32. The business activities of a number of these entities are conducted under joint venture arrangements. Associated entities conduct business transactions with various controlled entities. Such transactions and resulting year end balances, which are immaterial in amount, include purchases and sales of certain products, dividends and interest. All such transactions are conducted on the basis of normal arm’s-length commercial terms and conditions.
| Directors |
The following persons held the position of Director of Origin Energy Limited during the financial year:
| BG Beeren | T Bourne | CB Carter | ||
| GA King | HK McCann | Dr JR Williams |
Dr HM Nugent (appointed 25 March 2003)
In accordance with the constitution of Origin Energy Limited shareholders approved the aggregate for non-executive Directors’ fees of $650,000 in 1989. The actual amount paid in 2003 was $541,454 (2002: $368,000) inclusive of superannuation and contributions to the Non-Executive Directors’ Share Plan. The amount of benefits accrued during the year under the Non-Executive Directors’ Retirement Scheme (terminated at 31 December 2002) was $87,924 (2002: $101,319). The total of accrued benefits and amounts paid during the year was $629,378.
44 Financial statements 2003
| Consolidated | Origin Energy Limited | |||||||
| 2003 $’000 | 2002 $’000 | 2003 $’000 | 2002 $’000 | |||||
35. Related party disclosures (continued) | ||||||||
Loans to Directors | ||||||||
There were no Employee Share Plan loans or any other loans made to Directors of the company and its controlled entities during the financial year. | ||||||||
Aggregate amount of outstanding loans to executive Directors (there are no outstanding loans to non-executive Directors) | — | — | — | — | ||||
| �� | ||||||||
Aggregate amount of Employee Share Plan loan repayments received from executive Directors during the financial year | — | 2 | — | 1 | ||||
The names of executive Directors of controlled entities who made loan repayments during the previous financial year were: IJ Bulmer, WM Fowler, JA Hayward, MP Middleton, JM Piper, RW Tardif, PJ Thompson, GL White, JR Williams, RJ Willink, AR Wood.
| Other Transactions |
Transactions entered into during the year with Directors of Origin Energy Limited and controlled entities which are within normal employee, customer or supplier relationships on terms and conditions no more favourable than dealings in the same circumstances on an arm’s-length basis include:
| • | the receipt of dividends from Origin Energy Limited; |
| • | participation in the Employee Share Plan, the Executive Share Plan and the Senior Executive Option Plan; |
| • | terms and conditions of employment; |
| • | reimbursement of expenses; and |
| • | purchases of goods and services. |
Certain non-executive Directors of Origin Energy Limited are associated with legal and consulting firms which derive fees for work performed for Origin Energy Limited and controlled entities.
Mr CB Carter was during the year Senior Advisor of Boston Consulting Group and Mr HK McCann was Chairman of Partners of Allens Arthur Robinson Solicitors. In the financial year and during the period of directorship of the relevant Directors, Origin Energy Limited and controlled entities paid fees of $Nil (2002: $7,076) to Boston Consulting Group and $Nil (2002: $24,578) to Allens Arthur Robinson.
Dr HM Nugent was appointed as a non-executive Director of Freehills on 1 April 2003. Dr HM Nugent was not a partner, nor did she share in any profits of Freehills. During the period in which Dr HM Nugent was a non-executive Director of both Freehills and Origin Energy Limited, no fees were paid to Freehills.
The work was performed within a normal adviser and client relationship on terms and conditions no more favourable than dealings with other clients on an arm’s-length basis in similar circumstances.
Mr HK McCann and Dr HM Nugent are also non-executive Directors of Macquarie Bank Limited. During the year, Origin Energy Limited and its controlled entities paid an amount to Macquarie Bank of $Nil (2002: $1,744,340 was paid as an underwriting fee to Macquarie Equity Capital Markets Ltd on the raising of $125 million by a private equity placement in July 2001. The underwriting fee was negotiated on an arm’s-length basis following a competitive tender and was more favourable to the company than all competing bids received at the time).
Origin Energy Limited and/or controlled entities have entered into agreements with Envestra Limited and/or certain of its controlled entities under which a controlled entity manages natural gas distribution networks for Envestra and Envestra provides a controlled entity with access to the networks. During the financial year, controlled entities received $64,890,000 (2002: $57,461,000) from Envestra for managing the networks, received $76,291,000 (2002: $69,302,000) from Envestra as reimbursement for capital expenditure on the networks, paid $209,569,000 (2002: $203,239,000) to Envestra for transporting gas through the networks, and received $5,880,000 (2002: $18,845,000) from Envestra for system use gas and industry support expenditure. Subvention payments of $10,000,000 (2002: $18,000,000) were made during the year.
During the year, Origin Energy Limited subscribed for $Nil (2002: $15,178,000) of stapled securities in Envestra Limited.
Messrs. GA King and BG Beeren, Directors of a number of controlled entities, are Directors of Envestra and Ms. KA Moses, Director of a number of controlled entities, is a Director of a controlled entity of Envestra Limited.
Directors and their Director-related entities held 426,506 shares (2002: 362,681 shares) and 2,236,750 options (2002: 2,286,750 options) to subscribe for fully paid ordinary shares at year end. During the year Directors acquired 77,379 shares (2002: 43,690 shares) in on-market transactions and Nil options (2002: 1,000,000 options) were granted under the Senior Executive Option Plan on the same terms and conditions as those granted to other employees. The estimated value of these options issued during the year was $Nil (2002: $688,000) calculated at the date of agreement to grant the options.
Origin Energy Limited and Controlled Entities45
Notes to the financial statements (continued)
| 35. | Related party disclosures (continued) |
| Remuneration of Directors |
The number of Directors of Origin Energy Limited, including any executive Director, whose total income received, or due and receivable, directly or indirectly, from Origin Energy Limited or from any related party, falls within each band of income of $10,000 as follows:
| Origin Energy Limited | ||||||||||
| 2003 | 2002 | |||||||||
| $20,000 | – | $29,999 | 1 | — | ||||||
| $70,000 | – | $79,999 | — | 2 | ||||||
| $80,000 | – | $89,999 | — | 1 | ||||||
| $100,000 | – | $109,999 | 1 | — | ||||||
| $110,000 | – | $119,999 | 1 | — | ||||||
| $120,000 | – | $129,999 | 1 | — | ||||||
| $150,000 | – | $159,999 | — | 1 | ||||||
| $250,000 | – | $259,999 | 1 | — | ||||||
| $570,000 | – | $579,999 | — | 1 | ||||||
| $770,000 | – | $779,999 | 1 | — | ||||||
| $1,190,000 | – | $1,199,999 | — | 1 | ||||||
| $1,350,000 | – | $1,359,999 | 1 | — | ||||||
| 7 | 6 | |||||||||
The remuneration bands are not consistent with the emoluments disclosed in the Director’s report as the basis of calculation differs due to the differing requirements of the Corporations Act 2001 and the Accounting Standards.
| Consolidated | Origin Energy Limited | |||||||
| 2003 $’000 | 2002 $’000 | 2003 $’000 | 2002 $’000 | |||||
Total income received, or due and receivable, including Directors’ fees paid by Origin Energy Limited of $541,000 (2002: $368,000), received by all Directors of each entity in the consolidated entity, including executive Directors except those who are Directors of wholly owned controlled entities only, directly or indirectly, from the entities of which they are Directors or from any related party. | 5,513 | 4,676 | 4,195 | 2,158 | ||||
Non-executive Directors appointed prior to 31 December 2002 were entitled to a retirement benefit under the retirement benefit scheme that was approved by shareholders in 1989. | ||||||||
The scheme was terminated at 31 December 2002 and entitlements under the scheme were frozen as a multiple of annual average fees over the final three years of service. The accrued benefits under the scheme from the date of the Director’s appointment to the termination of the scheme were: | ||||||||
| 2003 $ | ||||||||
HK McCann | 154,111 | |||||||
T Bourne | 52,179 | |||||||
JR Williams | 64,731 | |||||||
CB Carter | 48,747 | |||||||
Since 1 January 2003 amounts equivalent to the retirement benefit have been directed to the acquisition of shares under the Non-Executive Directors’ Share Plan, approved by shareholders in October 1999. The first acquisition of shares under the Non-Executive Directors’ Share Plan will occur in the month following the announcement of the year end results in accordance with the rules of the plan. Non-executive Directors are required to own up to 25,000 shares in Origin Energy Limited after which the retirement benefit may be directed to superannuation.
46 Financial statements 2003
| 36. | Remuneration of executives |
The number of executive officers of the consolidated entity whose total income received, or due and receivable, directly or indirectly, from the entities in the consolidated entity or any related party, in connection with the operational management and strategic direction of the entities in the consolidated entity, whether as executive officers or otherwise, which fall within each band of income over $100,000 is set out below.
| Consolidated | Origin Energy Limited | Consolidated | Origin Energy Limited | |||||||||||||||||||
| 2003 | 2002 | 2003 | 2002 | 2003 | 2002 | 2003 | 2002 | |||||||||||||||
$100,000 – $109,999 | 1 | — | 1 | — | $370,000 | – | $379,999 | — | 1 | — | 1 | |||||||||||
$190,000 – $199,999 | — | 1 | — | — | $390,000 | – | $399,999 | 1 | — | 1 | — | |||||||||||
$200,000 – $209,999 | — | 1 | — | — | $400,000 | – | $409,999 | — | 1 | — | 1 | |||||||||||
$210,000 – $219,999 | 2 | 1 | 1 | — | $420,000 | – | $429,999 | 1 | — | 1 | — | |||||||||||
$220,000 – $229,999 | 2 | — | — | — | $430,000 | – | $439,999 | 1 | 2 | 1 | 1 | |||||||||||
$230,000 – $239,999 | — | 2 | — | 2 | $460,000 | – | $469,999 | 1 | 1 | 1 | 1 | |||||||||||
$240,000 – $249,999 | 1 | 1 | 1 | 1 | $470,000 | – | $479,999 | 1 | 1 | — | 1 | |||||||||||
$260,000 – $269,999 | — | 1 | — | 1 | $480,000 | – | $489,999 | 1 | 2 | 1 | 1 | |||||||||||
$270,000 – $279,999 | 2 | 2 | 2 | 2 | $510,000 | – | $519,999 | 1 | — | 1 | — | |||||||||||
$280,000 – $289,999 | 2 | — | 2 | — | $540,000 | – | $549,999 | 2 | — | 1 | — | |||||||||||
$290,000 – $299,999 | — | 2 | — | — | $570,000 | – | $579,999 | — | 1 | — | 1 | |||||||||||
$300,000 – $309,999 | — | 1 | — | 1 | $600,000 | – | $609,999 | — | 1 | — | 1 | |||||||||||
$310,000 – $319,999 | 2 | 1 | — | 1 | $660,000 | – | $669,999 | 1 | — | 1 | — | |||||||||||
$330,000 – $339,999 | 1 | 2 | 1 | 2 | $770,000 | – | $779,999 | 1 | — | 1 | — | |||||||||||
$340,000 – $349,999 | 1 | 1 | 1 | 1 | $1,190,000 | – | $1,199,999 | — | 1 | — | 1 | |||||||||||
$350,000 – $359,999 | 1 | — | 1 | — | $1,350,000 | – | $1,359,999 | 1 | — | 1 | — | |||||||||||
$360,000 – $369,999 | 2 | — | 2 | — | 29 | 27 | 22 | 20 | ||||||||||||||
| Consolidated | Origin Energy Limited | |||||||
| 2003 $’000 | 2002 $’000 | 2003 $’000 | 2002 $’000 | |||||
Total income received, or due and receivable, by those executive officers from the entities in the consolidated entity or any related party, whose income was at least $100,000. | 62,647 | 46,384 | 50,620 | 37,077 | ||||
The remuneration bands are not consistent with the emoluments disclosed in the Director’s report as the basis of calculation differs due to the differing requirements of the Corporations Act 2001 and the Accounting Standards.
| 37. | Deed of cross guarantee |
The following consolidated Statement of Financial Performance and Statement of Financial Position comprises the company and its controlled entities which are party to the Deed of Cross Guarantee (refer note 26), after eliminating all transactions between parties to the Deed.
| Consolidated | ||||||
for year ended 30 June | 2003 $’000 | 2002 $’000 | ||||
Summarised Statement of Financial Performance and Retained Profits | ||||||
Profit from ordinary activities before income tax | 199,061 | 130,673 | ||||
Income tax expense | 69,336 | 39,711 | ||||
Net profit | 129,725 | 90,962 | ||||
Retained profits at the beginning of the financial year | 960,059 | 901,822 | ||||
Adjustment resulting from initial adoption of revised AASB 1028 “Employee Benefits” | (283 | ) | — | |||
Adjustment resulting from initial adoption of AASB 1044 “Provisions, Contingent Liabilities and Contingent Assets” | 19,435 | — | ||||
Dividends recognised during the year | (52,089 | ) | (34,203 | ) | ||
Aggregate of amounts transferred (to)/from reserves | (351 | ) | 1,478 | |||
Retained profits at the end of the financial year | 1,056,496 | 960,059 | ||||
Origin Energy Limited and Controlled Entities47
Notes to the financial statements (continued)
| Consolidated | ||||
as at 30 June | 2003 $’000 | 2002 $’000 | ||
37. Deed of cross guarantee (continued) | ||||
Statement of Financial Position | ||||
Current assets | ||||
Cash assets | 11,910 | 8,725 | ||
Receivables | 595,379 | 424,839 | ||
Inventories | 38,189 | 35,949 | ||
Other | 39,126 | 36,613 | ||
Total current assets | 684,604 | 506,126 | ||
Non-current assets | ||||
Receivables | 23,941 | 16,630 | ||
Investments accounted for using the equity method | 9,130 | 8,154 | ||
Other financial assets | 182,122 | 196,131 | ||
Property, plant and equipment | 1,044,948 | 983,339 | ||
Exploration, evaluation and development expenditure | 74,474 | 81,648 | ||
Intangibles | 776,581 | 633,560 | ||
Deferred tax assets | 108,649 | 168,080 | ||
Other | 8,573 | 8,504 | ||
Total non-current assets | 2,228,418 | 2,096,046 | ||
Total assets | 2,913,022 | 2,602,172 | ||
Current liabilities | ||||
Payables | 241,126 | 224,947 | ||
Interest-bearing liabilities | 85,522 | 85,051 | ||
Current tax liabilities | 2,376 | 3,776 | ||
Provisions | 62,509 | 65,600 | ||
Total current liabilities | 391,533 | 379,374 | ||
Non-current liabilities | ||||
Payables | 9,557 | 6,036 | ||
Interest-bearing liabilities | 663,012 | 565,139 | ||
Deferred tax liabilities | 198,074 | 166,767 | ||
Provisions | 66,078 | 28,490 | ||
Total non-current liabilities | 936,721 | 766,432 | ||
Total liabilities | 1,328,254 | 1,145,806 | ||
Net assets | 1,584,768 | 1,456,366 | ||
Equity | ||||
Contributed equity | 418,612 | 385,039 | ||
Reserves | 109,660 | 111,268 | ||
Retained profits | 1,056,496 | 960,059 | ||
Total equity | 1,584,768 | 1,456,366 | ||
48 Financial statements 2003
| Consolidated | ||||
| 2003 | 2002 | |||
Basic earnings per share | 24.8 cents | 20.2 cents | ||
Diluted earnings per share | 24.7 cents | 20.1 cents | ||
Weighted average number of shares used as the denominator: | ||||
Number of ordinary shares for basic earnings per share calculation | 652,380,401 | 637,291,869 | ||
Effect of executive share options on issue | 4,061,338 | 2,996,168 | ||
Number of ordinary shares for diluted earnings per share calculation | 656,441,739 | 640,288,037 | ||
| Reconciliation of earnings used in calculating basic and diluted earnings per share: |
for year ended 30 June | 2003 $’000 | 2002 $’000 | ||||
Net profit | 166,303 | 133,600 | ||||
Net profit attributable to outside equity interests | (4,351 | ) | (4,940 | ) | ||
Earnings used in calculating earnings per share | 161,952 | 128,660 | ||||
| Information concerning the classification of securities |
(a) Fully paid ordinary shares
Fully paid ordinary shares are classified as ordinary shares for the purposes of calculating basic and diluted earnings per share.
(b) Share options
Share options granted under the Senior Executive Option Plan have been classified as potential ordinary shares and have been included in the determination of diluted earnings per share. The options have not been included in the determination of basic earnings per share.
| Information about basic and diluted earnings per share |
During the year 2,438,300 (2002: 761,650) options were exercised or lapsed. The diluted earnings per share calculation includes that portion of these options assumed to be issued for nil consideration, weighted with reference to the date of conversion. The weighted average number included is 467,427 (2002: 282,511).
The following Senior Executive Share Options have not been included in the calculation of diluted earnings per share as they are not dilutive:
Expiry date 11 December 2002 70,000 options
Full details of these options are set out in note 34.
There was 145,400 (2002: 95,000) shares issued as a result of the exercise of options between the reporting date and the completion of the financial report. These shares were not included in the calculation of basic earnings per share.
There were no options issued between the reporting date and the time of completion of the financial report.
| 39. | Events subsequent to balance date |
| Dividends declared subsequent to 30 June 2003 |
Refer to note 5.
| Oil Company of Australia Limited |
On 11 July 2003 Origin announced an off-market cash offer to acquire all the ordinary shares in Oil Company of Australia Limited (“OCA”) that it does not already own. At 30 June 2003 Origin held 85.23% of the issued capital of OCA. If successful, the anticipated purchase price of the remaining OCA shares is expected to be approximately $74 million.
The financial effects of the above transactions have not been brought to account in the financial statements for the year ended 30 June 2003.
Origin Energy Limited and Controlled Entities49
Statutory statements – Directors’ declaration
In the opinion of the Directors of Origin Energy Limited:
| a) | the financial statements and notes, set out on pages 2 to 49, are in accordance with the Corporations Act 2001, including: |
| i) | giving a true and fair view of the financial position of the company and consolidated entity as at 30 June 2003 and of their performance, as represented by the results of their operations and their cash flows, for the year ended on that date; and |
| ii) | complying with Accounting Standards in Australia and the Corporations Regulations 2001; and |
| b) | there are reasonable grounds to believe that the company will be able to pay its debts as and when they become due and payable. |
There are reasonable grounds to believe that the company and the controlled entities identified in note 31 to the financial statements will be able to meet any obligations or liabilities to which they are or may become subject to by virtue of the Deed of Cross Guarantee between the company and those controlled entities pursuant to ASIC Class Order 98/1418.
Signed in accordance with a resolution of the Directors:
/s/ H KEVIN MCCANN |
| H Kevin McCann, Chairman |
Sydney, 20 August 2003 |
50Financial statements 2003
Statutory statements – Independent audit report
to the members of Origin Energy Limited
Scope
The financial report and Directors’ responsibility
The financial report comprises the Statements of Financial Position, Statements of Financial Performance, Statements of Cash Flows, accompanying notes to the financial statements, and the Directors’ declaration for both Origin Energy Limited (the “company”) and its controlled entities (the “consolidated entity”), for the year ended 30 June 2003. The consolidated entity comprises both the company and the entities it controlled during that year.
The Directors of the company are responsible for the preparation and true and fair presentation of the financial report in accordance with the Corporations Act 2001. This includes responsibility for the maintenance of adequate accounting records and internal controls that are designed to prevent and detect fraud and error, and for the accounting policies and accounting estimates inherent in the financial report.
Audit approach
We conducted an independent audit in order to express an opinion to the members of the company. Our audit was conducted in accordance with Australian Auditing Standards in order to provide reasonable assurance as to whether the financial report is free of material misstatement. The nature of an audit is influenced by factors such as the use of professional judgement, selective testing, the inherent limitations of internal control, and the availability of persuasive rather than conclusive evidence. Therefore, an audit cannot guarantee that all material misstatements have been detected.
We performed procedures to assess whether in all material respects the financial report presents fairly, in accordance with the Corporations Act 2001, Australian Accounting Standards and other mandatory financial reporting requirements in Australia, a view which is consistent with our understanding of the company’s and the consolidated entity’s financial position, and of their performance as represented by the results of their operations and cash flows.
We formed our audit opinion on the basis of these procedures, which included:
| • | examining, on a test basis, information to provide evidence supporting the amounts and disclosures in the financial report, and |
| • | assessing the appropriateness of the accounting policies and disclosures used and the reasonableness of significant accounting estimates made by the Directors. |
While we considered the effectiveness of management’s internal controls over financial reporting when determining the nature and extent of our procedures, our audit was not designed to provide assurance on internal controls.
Independence
In conducting our audit, we followed applicable independence requirements of Australian professional ethical pronouncements and the Corporations Act 2001.
Audit opinion
In our opinion, the financial report of Origin Energy Limited is in accordance with:
| a) | theCorporations Act 2001, including: |
| i. | giving a true and fair view of the company’s and consolidated entity’s financial position as at 30 June 2003 and of their performance for the financial year ended on that date; and |
| ii. | complying with Accounting Standards in Australia and the Corporations Regulations 2001; and |
| b) | other mandatory professional reporting requirements in Australia. |
/s/ KPMG | /s/ DAVID ROGERS | |||
KPMG Sydney, 20 August 2003 | David Rogers, Partner | |||
Origin Energy Limited and Controlled Entities51
Share and shareholder information
Information set out below was applicable as at 22 August 2003.
Ordinary shares
Size of holding | Number of shareholders | % of issued shares | ||
1-1,000 | 39,741 | 3.36 | ||
1,001-5,000 | 50,305 | 17.82 | ||
5,001-10,000 | 8,662 | 9.14 | ||
10,001-100,000 | 4,302 | 12.82 | ||
100,001 and above | 163 | 56.86 | ||
2,427 shareholders hold less than a marketable parcel. |
Substantial shareholders
The company has not been given any substantial shareholder notices which are current.
20 largest shareholders | Number of shares | % of issued shares | ||
Westpac Custodian Nominees Limited | 80,086,494 | 12.18 | ||
JP Morgan Nominees Australia Limited | 68,030,031 | 10.34 | ||
National Nominees Limited | 58,755,982 | 8.93 | ||
Citicorp Nominees Pty Limited | 28,650,117 | 4.36 | ||
RBC Global Services Australia Nominees Pty Limited | 19,050,556 | 2.90 | ||
AMP Life Limited | 17,156,360 | 2.61 | ||
Cogent Nominees Pty Limited | 13,506,605 | 2.05 | ||
Commonwealth Custodial Services Limited | 12,293,974 | 1.87 | ||
Queensland Investment Corporation | 10,682,465 | 1.62 | ||
PSS Board | 5,723,703 | 0.87 | ||
CSS Board | 5,146,496 | 0.78 | ||
Australian Foundation Investment Company Limited | 3,600,688 | 0.55 | ||
ANZ Nominees Limited | 3,257,126 | 0.50 | ||
IOOF Investment Management Limited | 2,643,922 | 0.40 | ||
Bond Street Custodians Limited | 2,548,538 | 0.39 | ||
Sandhurst Trustees Limited | 2,457,295 | 0.37 | ||
Argo Investments Limited | 2,183,665 | 0.33 | ||
Invia Custodian Pty Limited | 2,169,265 | 0.33 | ||
Government Superannuation Office | 1,914,594 | 0.29 | ||
Merrill Lynch (Australia) Nominees Pty Ltd | 1,818,158 | 0.28 | ||
| 341,676,034 | 51.95 | |||
52 Financial statements 2003
Shareholder enquiries
Shareholder queries or notifications regarding shareholdings or dividends should be directed to Origin’s share registry on 1300 664 446.
When contacting the share registry, shareholders should quote their security holder reference number, which can be found on your holding or dividend statements.
Dividends
Origin will pay a final dividend for the 2002/2003 year of 5 cents per share (franked to 2 cents) on 3 October 2003.
Origin offers its shareholders the convenience of having their dividends paid directly into a bank, building society or credit union account in Australia. The payment of dividends will be electronically credited on the dividend payment date and confirmed by payment advices sent through the mail. Should shareholders wish to take advantage of this service, they will need to contact the share registry for an application form.
Dividend alternatives
As an alternative to receiving cash dividends, shareholders may elect to participate in the Dividend Reinvestment Plan (DRP). The DRP enables shareholders to use cash dividends to purchase additional fully paid Origin shares. If a shareholder wishes to participate in the DRP they must notify the share registry in writing.
Tax File Number
For resident shareholders who have not provided the share registry with their Tax File Number (TFN) or exemption category details, tax at the top marginal tax rate (plus Medicare levy) will be deducted from dividends to the extent they are not fully franked. For those shareholders who have not as yet provided their TFN or exemption category details, forms are available from the share registry. Shareholders are not obliged to provide this information if they do not wish to do so.
Annual Report mailing lists
Shareholders not wishing to receive the Annual Report should advise the share registry in writing so that their names can be removed from the mailing list. Unless shareholders have advised the share registry that they require no Annual Report or the full set of financial statements, they will be sent the Annual Report containing a concise set of financial statements.
Change of address
Shareholders who are Issuer Sponsored should notify any changes of address to the share registry promptly in writing. For your protection you should quote your security holder reference number. Broker Sponsored holders should advise their sponsoring broker of any change.
Information on Origin Energy
The main source of information for shareholders is the Annual Report and the Full Financial Statements. Both the Annual Report and Full Financial Statements will be provided to shareholders on request and free of charge.
Stock Exchange listing
Origin shares are traded on the Australian Stock Exchange Limited (ASX). The symbol under which Origin shares are traded is ‘ORG’.
Voting rights of members
At a meeting of members, each member who is entitled to attend and vote may attend and vote in person or by proxy, attorney or representative. On a show of hands, every person present who is a member, proxy, attorney or representative, shall have one vote and on a poll every member who is present in person or by proxy, attorney or representative shall have one vote for each fully paid share held.


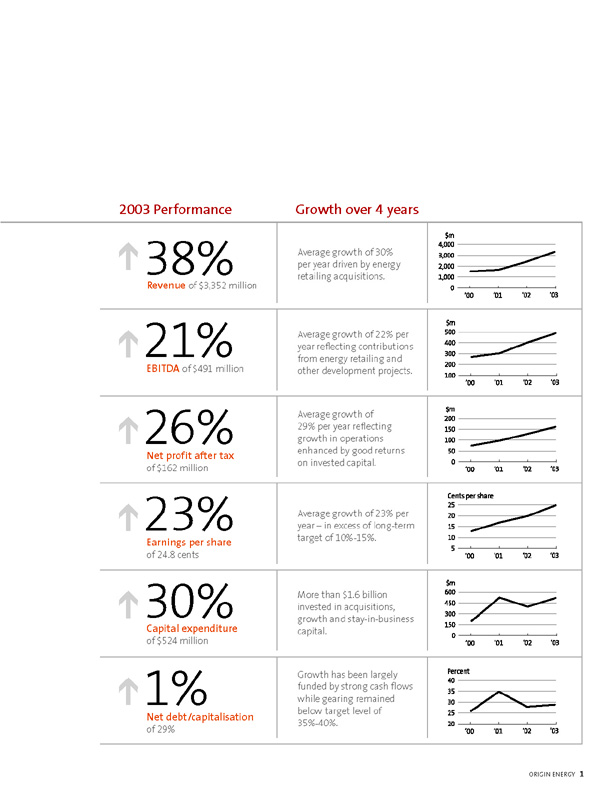
Chairman’s Message
Over the past year, Origin Energy has continued to consolidate its position as a major integrated producer and retailer of energy in Australia. Recent acquisitions and development projects undertaken within the company have provided the basis for continued growth and increased profitability.
Origin’s net profit after tax increased by 26% to $162 million and earnings per share increased 23% to 24.8 cents per share. Operating cash flow after tax paid increased 31% to $399 million.
Growth in profits and cash flow has enabled us to increase dividends to 10 cents per share (4 cents franked). This is consistent with the objective outlined at last year’s Annual General Meeting to lift dividends paid to around 40% of earnings per share.
During the year, capital expenditure on development projects increased to $152 million. We spent $276 million on acquisitions which included the CitiPower retail business, the Mt Stuart Power Station and additional coal seam gas (CSG) interests in central Queensland.
These developments and acquisitions were largely funded from cash flow with net borrowings increasing by only $99 million. This has resulted in the company growing strongly while maintaining a conservative gearing level of 29% net debt to capitalisation as at 30 June 2003. Interest cover remains strong at 6.1 times.
Over the next few years the company has a significant program of development projects which will involve capital expenditure of approximately $1.5 billion. These projects include the development of natural gas reserves in the offshore Otway and Bass Basins off Victoria, CSG interests in Queensland and the SEA Gas Pipeline. We also expect to participate further in power generation and renewable energy projects.
In addition to monitoring the development and implementation of the company’s strategy and reviewing performance, there were a number of important issues the Board addressed during the year.
| Risk and compliance |
The Board has maintained its focus on the management of risk. This included a review of contracting and risk management strategies resulting in enhancements to the Commodity and Risk Management System. This has improved our ability to manage exposures that arise from the purchase and sale of electricity, natural gas, oil and renewable energy credits. Treasury policies and exposure limits and the company’s systems for the management of health, safety and environmental performance have also been reviewed.
| Corporate governance |
In Australia, public interest in corporate governance is focused on restoring confidence in the integrity of Boards and management of public companies. Origin has reviewed its corporate governance practices and policies and established that the company substantially complies with the ASX Corporate Governance Council Best Practice Recommendations.

2 ANNUAL REPORT 2003
We believe that ultimately corporate governance requires sustainable performance as well as conformance with appropriate structures and processes.
We enhanced the skills and experience of the Board with the appointment of Dr Helen Nugent as a Director in March this year. Dr Nugent brings her considerable experience in marketing, strategy and financial services to the Board.
In our corporate governance review, we followed best practice by terminating the Non-Executive Directors’ Retirement Benefit Plan. In future, amounts equivalent to the benefits under this plan will be paid to the non-executive Directors as fees which must be within shareholder-approved limits. These amounts are to be directed to the purchase of Origin shares under the Non-Executive Directors’ Share Plan or to superannuation.
| Equity-based remuneration |
At the last Annual General Meeting, I announced we would suspend further operation of the Senior Executive Option Plan and undertake a review of the company’s equity-based remuneration programs. The Board assessed the appropriatness of equity-based remuneration and the impact of proposed changes to the accounting and taxation treatment of employee share and option plans. The Board has concluded that an equity-based remuneration program, with appropriate performance hurdles, is an effective means of providing long-term incentives that motivate and reward employees to act in the best interests of the company and its shareholders. Accordingly, the Senior Executive Option Plan with its challenging performance hurdles has been reinstated as part of Origin’s remuneration strategy.
| Public policy issues |
The Board is also mindful of important public policy issues that impact directly on the energy industry and that are currently the subject of significant debate at all levels of Government.
Completing the deregulation of the energy industry, through the establishment of effective retail competition, and implementing a co-ordinated national response to climate change are issues that must be resolved in the near future. The company’s management is actively involved ensuring that outcomes on these two issues provide more certainty for investment in important energy infrastructure.
| Outlook |
We have a number of major projects currently being developed. We are also in a strong financial position and have the capacity to fund these projects and other opportunities as they are developed. The outlook for the company in the immediate future is for continued revenue and earnings growth.
I would like to thank my fellow Directors for their time and effort in ensuring continued success in the development and growth of Origin.
| ||
Kevin McCann, Chairman | ||
[GRAPHIC APPEARS HERE]
ORIGIN ENERGY3
Managing Director’s Review
The past year has been another successful year for Origin Energy. This success has been achieved by:
| • | maintaining a strong strategic focus on Origin’s business and the energy industry in which we operate; |
| • | further improvements in financial performance; and |
| • | continued development and growth of the business. |
| Maintaining our strategic focus |
We have maintained our focus on gas and electricity markets in Australia, and the near Pacific region. Our strategy is to develop our business primarily in the competitive segments of these markets and in particular in the segments of gas production, power generation and energy retailing. Activities closely related to these segments include oil production, utility network management and investment in energy infrastructure.
This strategy has provided Origin with significant opportunities for growth while allowing the company to effectively manage the risks associated with the major changes still occurring in the industry in which we operate.
In the three years since the demerger from Boral our market capitalisation has increased fourfold to approximately $2.7 billion. Over this period, Origin has been one of the best performing top 100 companies listed on the Australian Stock Exchange, when measured on a Total Shareholder Return basis.
During the year, significant achievements that demonstrate the continued development and implementation of the company’s strategy include:
| • | the successful integration of the recently acquired CitiPower retail business. This acquisition makes Origin the second largest energy retailer in Australia. Over the past three years earnings before interest, tax, depreciation and amortisation (EBITDA) from energy retailing has increased from $50 million to $232 million. In the year just ended, energy retailing became the largest contributor (47%) to Origin’s EBITDA and is now a major generator of cash flow. |
| • | an increase in our net 2P reserves of 433 to 1,573 PJe (87% natural gas). The commercialisation of these reserves was progressed through the signing of major sales contracts with AGL for gas from the Cooper Basin and our CSG interests. In addition, development of the BassGas and offshore Otway Projects and the SEA Gas Pipeline have been facilitated by Origin’s own requirements for gas. |
| • | the discovery of oil in the Perth Basin. In conjunction with the company’s gas focused exploration program, these discoveries have arrested the decline in our oil production, made a significant contribution to earnings in the current year and will make a major contribution to increased earnings over the next few years. |
| • | the continued development of our Generation business. Generation capacity increased to more than 880 MW following the acquisition of Mt Stuart Power Station. In addition, the implementation of a tolling arrangement between our Generation and Retail businesses means that all our generation capacity has been contracted to external and internal customers who benefit from its capacity, and are better placed to manage the risks of changing wholesale electricity prices. Our peaking plants also provide opportunities for Origin to increase our intermediate and base load generation should market conditions in coming years provide the economic incentive to do so. |
JULY 2002 | SEPTEMBER 2002 | NOVEMBER 2002 | DECEMBER 2002 | |||
CitiPower retail | SEA Gas Pipeline from | Origin and The Australian | Major long-term gas | |||
business acquired, | Victoria to South | National University | supply arrangements | |||
increasing customer | Australia expanded | announce new | signed with AGL. | |||
based by 264,000 | by 44% | lower cost solar cell. |

4 ANNUAL REPORT 2003
| • | opportunities for Origin to increase our intermediate and base load generation should market conditions in coming years provide the economic incentive to do so. |
| • | good progress in developing a number of renewable generation projects and opportunities to meet the growing demand for electricity generated from zero greenhouse gas emission sources. |
| • | the development of the SEA Gas Pipeline, which demonstrates our ability to facilitate development of gas resources. Our success in a joint venture with United Utilities, in securing the Coliban Water asset management contract, also demonstrates our ability to leverage our skills into related areas of asset management. |
We can again reflect on a year of significant achievement in the implementation of the company’s strategy and remain confident that we should maintain the same strategic focus in the coming year.
Further improvements in financial performance and strong cash flow
Our financial performance for this year also illustrates the continual development of the company. Total revenue increased 38% to $3.4 billion, EBITDA increased 21% to $491 million and profit after tax was up 26% to $162 million. Earnings per share is up 23% to 24.8 cents per share.
At an EBITDA level, the main contributor to this result was the 39% increase in Retail EBITDA to $232.1 million.
The increase in Retail contribution follows the acquisition of the CitiPower Retail business in July 2002, reduction in electricity purchasing costs due to favourable electricity contracts and pool prices, and the cessation of retained profit payments to the Victorian Government.
Over the past two years, EBITDA from our Retail businesses has increased threefold demonstrating that we have been able to successfully acquire and integrate major new businesses into Origin.
Contributions from recent oil discoveries in the Perth Basin are a major new contributor to earnings in our Exploration and Production business. However, this increase in the current year has been offset by the sale of the more mature oil producing fields in the Eromanga Basin in south west Queensland and natural decline in other oil producing assets.
A 60% increase in EBITDA in our Generation business to $48.3 million reflects the acquisition of the Mt Stuart Power Station in Townsville. A market-based tolling arrangement whereby Generation contracts its capacity to our Retail businesses has also boosted results.
Our investments in energy networks and asset management showed a 4% increase in contribution. This is consistent with the steady growth that characterises the utility nature of this business.
During the year, our capital expenditure increased to $524 million, which was 30% higher than the prior year. The program included expenditure of $276 million on acquisitions, $152 million on growth and $97 million on stay-in-business capital projects.
DECEMBER 2002 | JANUARY 2003 | MARCH 2003 | JUNE 2003 | |||
Mt Stuart Power Station acquired, increasing generation capacity to more than 880 MW. | BassGas Project approved for construction | $250 million US Private Placement debt issue completed. | Official opening of Hovea oil production facilities. Now producing 5,000 bopd. |

ORIGIN ENERGY5
Managing Director’s Review
A particularly pleasing feature of this year’s results has been the strength of the company’s cash flow. Growth in earnings together with improved management of working capital has resulted in free cash flow of $350 million, up 37% on the prior year.
As a result, net debt increased only $99 million to $732 million and the company’s gearing at year end was 29% on a debt/capitalisation basis.
As a result of our modest gearing and the success of a US Private Placement debt issue of US$250 million, the company ended the year with a strong balance sheet and significant capacity to fund further growth.
| A track record of growth |
Over the past four years, our revenue and profit after tax have grown 30% and 29% respectively per annum. Growth in earnings per share has averaged 23%.
One of our objectives is to achieve an average growth in earnings per share of 10%-15%. We have clearly exceeded this objective. Over the past four years, we have been able to add a number of acquisitions to the growth developed from within the company. These acquisitions have been effectively integrated into our business and made immediate contributions to earnings.
Over the next few years, we will implement a major program of capital expenditure on new projects.
These include:
| • | the completion of the BassGas and the SEA Gas Projects. Both projects are now more than 50% complete and scheduled for completion during 2004. |
| • | the offshore Otway Gas Project where environmental submissions to Federal and State Governments await approval. |
| • | the continued development of Oil Company of Australia’s (OCA) CSG interests in central Queensland. Our view of the potential of these resources is evidenced by our offer to acquire the outstanding shares in OCA. |
| • | the commercialisation of recent exploration successes in the Otway, Perth and Surat Basins. In addition, new acreage in the offshore Otway Basin and new gas production infrastructure being established in the Bass and Otway Basins has opened up significant exploration potential for the company. |
| • | Investment opportunities for our Generation business created by our electricity purchase requirements. We will also continue to develop renewable generation opportunities. |
In addition to these investment opportunities, we will focus on improving the performance and contribution from our Retail business and further growing our activities in utility asset management.
Based on our achievements in the past few years and the opportunities we currently have before us, we expect to be able to meet our growth objectives. Furthermore, we expect these projects can be funded from our strong cash flows and existing borrowing capacity.
| Our people and the communities in which we operate |
Our employee numbers increased during the year by 5% to 2,857 mainly reflecting continued growth in the Retail business and the need to add specific skills to effectively pursue development projects.
In yet another year of both challenge and achievement, we are pleased that we have maintained our focus on health, safety and environmental performance. Our Lost Time Injury Frequency Rate was further reduced by 25% to 2.7 lost time injuries per million hours worked.
1. Recent oil discoveries in the Perth Basin, Western Australia made a significant contribution to earnings this year. Picture is drilling at the Hovea field. | 3. The Mt Stuart Power Station in Townsville north Queensland delivers peaking power under a long-term contract to Queensland Government-owned entity, Enertrade. | |
2. In July, Origin acquired the CitiPower retail business that added 264,000 customers in Melbourne’s CBD and inner suburbs. | 4. Work continues on the SEA Gas Pipeline near Palmer in South Australia. The pipeline is scheduled for completion in January 2004. |

6 ANNUAL REPORT 2003
Regrettably, an incident at a drilling rig resulted in the death of an employee of a contractor engaged to drill an appraisal well for OCA. The incident will be the subject of a coronial inquiry and investigations into the cause of the incident have not yet been completed.
Our Employee Share Plan, which is one way we can help all employees participate in the success of the company, is now well established and a further issue of shares will be made to employees based on this year’s performance. We again thank our employees for their continuing efforts and contribution to the success of the company.
In order for the broader community to have a fuller appreciation of the environmental, social and economic impact of the company, we produced our first Sustainability Report. More detail on the impact of our operations on the communities in which we operate is included in this report, which is available on our website.
Outlook
Over the past few years we have effectively developed the company through a period of major change in the energy industry. We are in a strong financial position and believe that by maintaining a sound strategic understanding of our business, we will see further improvements in financial performance and continued growth.
To maintain the continued development and growth of the company in the coming year, our main focus will be on:
| • | effective execution of the major capital projects previously discussed in this review; |
| • | consolidation and improvement in performance of our Retail business, following the integration of recent acquisitions, and the introduction of full retail contestability in the Victorian and South Australian markets; |
| • | rapid commercialisation and follow up of recent oil discoveries in the Perth Basin in Western Australia; |
| • | effective risk management in relation to the sale and purchase of electricity, gas, oil and renewable energy credits; |
| • | identification and development of further opportunities in power generation; |
| • | active participation in major policy debates on further reform and deregulation in the energy industry and appropriate responses to climate change; |
| • | ensuring that governance and management processes are effective in protecting and enhancing shareholder interests; and |
| • | continually improving the environmental, social and economic sustainability of our activities. |
We look forward to reporting progress on these and many other opportunities in the year ahead.
|
Grant King, Managing Director |

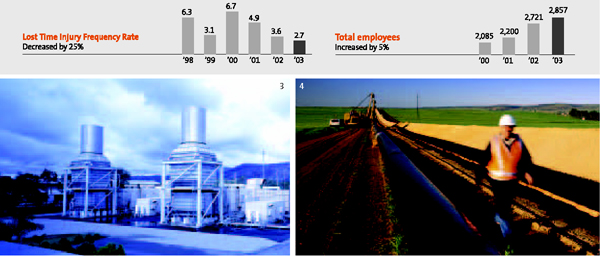
ORIGIN ENERGY7

An Overview of Origin Energy
Origin Energy
[GRAPHIC APPEARS HERE]
Origin’s strategy of focusing across the competitive segments of the energy market provides opportunities for growth while effectively managing the risks associated with major changes occurring in the industry. Our integrated view of the market is supported by a common approach to energy supply and demand, risk management, management systems, opportunity analysis and investment criteria. | Exploration and Production [GRAPHIC APPEARS HERE] | Gas and oil exploration and production activity is focused on Australia and New Zealand, with most current gas production supplying eastern Australian markets. To diversify production, Origin is focusing on the Bass and Otway Basins offshore Victoria, the Perth Basin in Western Australia, and Queensland’s coal seam gas areas. These projects (see details next page) will contribute to the strong growth of our Exploration and Production business, and provide new opportunities for Origin to supply gas and power generation markets.
| ||
Retail [GRAPHIC APPEARS HERE] | Origin is the second largest retailer of energy products (natural gas, electricity and LPG) in Australia, with over two million customers. Of these, 65% are in Victoria, Australia’s most energy-intensive market. The ability to offer gas and electricity to a large number of customers delivers a significant scale advantage. Origin’s ownership of electricity and gas production reduces risk and enables us to be more responsive to changing market requirements.
| |||
Generation [GRAPHIC APPEARS HERE] | Electricity generation capacity totals 883 MW and includes gas-fired cogeneration and peaking plants. Cogeneration plants operate as base load capacity under long-term contracts. Peaking plants operate when wholesale electricity prices exceed the marginal operating costs of the plants and are generally located close to Origin-owned gas fields, providing a market for the gas. These plants also provide a hedge against wholesale electricity price spikes that may negatively impact the Retail business.
| |||
Networks [GRAPHIC APPEARS HERE] | Origin’s Networks business includes a 19% stake in Envestra Limited; contracts held by Origin Energy Asset Management (OEAM) to manage gas and water infrastructure assets; and a one-third interest in the SEA Gas Pipeline (see details on the next page). Envestra is Australia’s largest distributor of natural gas through 18,000 km of regulated networks, which OEAM manages on Envestra’s behalf. Distributions from Envestra and network management fees provide a relatively steady and predictable return. |
[ GRAPHIC APPEARS HERE]
8 ANNUAL REPORT 2003
Future growth
1. Coal seam gas (CSG)Through subsidiary, Oil Company of Australia Limited (OCA), Origin is Australia’s largest owner of CSG production and reserves, which are located in the central Queensland coalfields. Queensland’s CSG resources supply about 25% of Queensland’s gas consumption and will be a major source of gas for southern States. Origin has spent $225 million to acquire and develop its CSG interests, which will be further developed over the coming years to supply long-term contracts.
2. Full retail contestability (FRC)All energy consumers in Victoria, South Australia, ACT and New South Wales can, or soon will be offered, the opportunity to choose their preferred gas and/or electricity provider. In this new competitive environment, our focus is to reduce costs, consolidate Origin’s scale advantage and deliver more attractive product choices to more customers.
3. BassGas Project – Bass BasinThe BassGas Project will commercialise gas from the Yolla field. First gas is scheduled for delivery in late 2004 and is expected to meet 10% of Victoria’s gas demand for 15 years. Origin is the operator of the project and has a 37.5% interest.
4. Thylacine and Geographe gas fields – Offshore Otway BasinThe Thylacine and Geographe fields are the largest gas discoveries off Victoria outside of the Gippsland Basin – currently the predominant supplier to the Victorian market. Origin has equity in the combined discoveries of 29.75%. Located just 80 km offshore and close to existing pipeline infrastructure, first gas is expected in 2006.
5. SEA Gas PipelineThe 680 km SEA Gas underground pipeline will transport gas from Port Campbell in Victoria to Adelaide in South Australia. The South Australian market is almost entirely dependent on gas supplies from the Cooper Basin in central Australia. When it begins commercial operations from early 2004, the SEA Gas Pipeline will deliver up to 125 PJ per annum to service South Australian industry and gas-fired power plants. It will also provide access to new markets for Victorian gas – eventually including supplies from the Yolla, Thylacine and Geographe gas fields.
6. Solar manufacturingBy installing solar panel power systems, householders and businesses can generate their own “green” electricity. A joint venture between The Australian National University and Origin
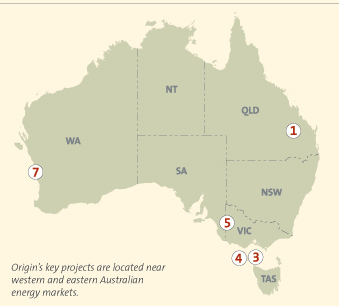
has developed a new type of solar cell designed to lower the costs of solar systems. The Origin SLIVER® Solar Cells use just one-tenth of the silicon used in conventional solar panels while matching power, performance and efficiency. The technology is in the development stage, and planning is underway for a pilot plant to commercially manufacture the cells from 2004.
7. Perth BasinOil discoveries at the Hovea, Jingemia and Eremia fields, are the first in the region since the 1960s and are now producing over 5,000 barrels of oil per day (Origin share 50%). Gas discoveries at Beharra Springs North 1 and Hovea 2 were the first commercial gas discoveries in the Perth Basin since 1991. Both fields are close to the Beharra Springs and Dongara gas plants, ensuring cost effective development. Gas from Beharra Springs is sold into long-term contracts and provides a supply closer to customers than the State’s north west fields.
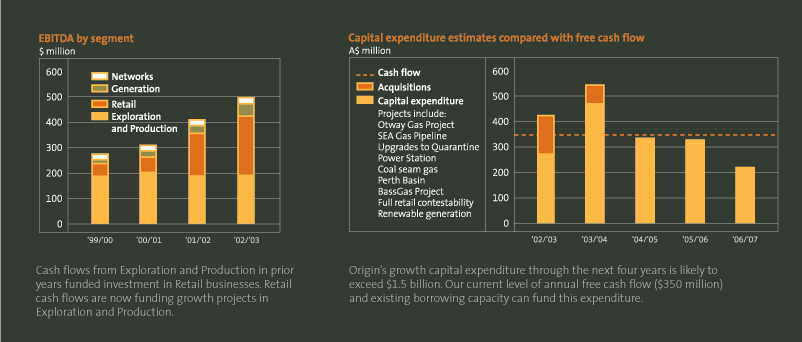
ORIGIN ENERGY9
Operations Review – Exploration and Production
Origin Energy and 85% owned subsidiary, Oil Company of Australia Limited (OCA), have gas and oil exploration and production interests near key Australian and New Zealand energy markets.
External sales revenue increased by 9% to $286 million as a result of increased revenue from Perth Basin oil sales, higher oil prices and increased gas sales.
EBITDA was $187.6 million, up 1% on the prior year.
Total gas sales were 74 PJ, an increase of 2%. Coal seam gas (CSG) sales continued to grow and now represent 12% of total gas sales.
Three Perth Basin oil fields came on stream and, as a result, oil sales increased by 6% to 854,000 bbls, despite the sale of the Eromanga Basin oil assets in the prior year.
Origin’s 2P reserves increased by 38% to 1,573 PJe largely due to the inclusion of the Thylacine and Geographe fields, additions through CSG acquisitions, and the reappraisal of the Myall Creek gas field in the Surat Basin.
| Cooper Basin (Queensland/ SouthAustralia) |
The Cooper Basin is Australia’s largest onshore gas production province and is a significant supplier of gas to southern and eastern Australia. Under a long-term gas supply arrangement signed with AGL in December, Origin and the other Cooper Basin producers will supply up to 505 PJ of gas over 14 years from 2003. Origin’s share of the contract is 71 PJ.
| Surat and Bowen Basins (Queensland) |
OCA’s extensive CSG reserves are located in the Surat and Bowen Basins in central Queensland.
Through acquisition and appraisal drilling, CSG reserves increased from 296 PJ to 472 PJ, and further drilling on the Durham field is expected to increase these reserves substantially.
In December, Origin and OCA signed a separate agreement with AGL to supply 340 PJ of gas for 15 years from May 2005. About 52% will be supplied from OCA’s CSG interests.
This contract enhanced OCA’s position as the largest CSG producer in Australia. CSG supplies about 25% of Queensland’s total gas demand. OCA’s CSG production is 30 TJ/day from three fields, which have a production capacity of 55 TJ/day.
2002/2003 Drilling program results
Area | Exploration | Appraisal | Development | Total | Wells cased for production | Success rate % (Cased wells) | ||||||||
Cooper Basin | 3 | 12 | 28 | 43 | 39 | 91 | ||||||||
Denison Trough | 1 | 1 | — | 2 | 2 | 100 | ||||||||
Surat Basin | 1 | 4 | — | 5 | 4 | 80 | ||||||||
Coal seam gas | 25 | 28 | 2 | 55 | * | 44 | 80 | |||||||
Onshore Otway Basin | 2 | — | — | 2 | — | — | ||||||||
Onshore Perth Basin | 2 | 8 | + | — | 10 | + | 6 | 60 | ||||||
Offshore Perth Basin | 1 | — | — | 1 | — | — | ||||||||
New Zealand | 1 | — | — | 1 | — | — | ||||||||
Total | 36 | 53 | 30 | 119 | 95 | 80 | ||||||||
| * | Includes 10 cored non-production exploration or appraisal wells. |
| + | Includes four sidetracks. All wells and sidetracks successful but not all cased for production. |

10 ANNUAL REPORT 2003
Other producing CSG fields have maintained strong performances with the Dawson Valley (Moura) fields reaching record production levels.
To date, $225 million has been invested on CSG acquisitions and development. This includes $50 million of additional interests in the Fairview and Durham fields acquired in July 2002.
We expect to spend several hundred millions dollars developing our CSG interests over future years including $100 million next year on building a gas processing plant at the Durham field, developing the Mungi field at Moura, and appraising the Talinga field, which is based on the Walloon Coals near the Wallumbilla to Brisbane gas pipeline.
Conventional natural gas sales in the Surat Basin increased due to the commencement of a contract with ACI, but were lower in the Denison Trough due to marginally lower demand from Queensland Alumina Limited.
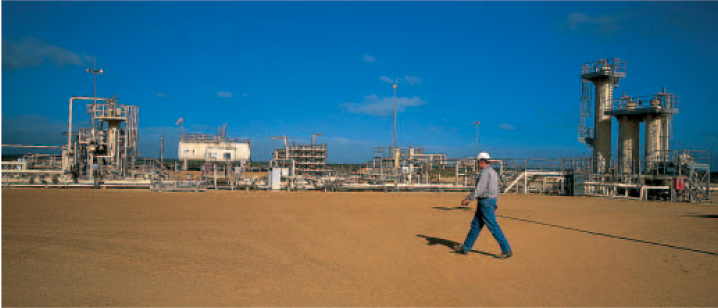
| 74PJ gas sales, up 2% | 854,000bbls oil sales, up 6% | 1,573PJe 2P reserves, up 38% | Last year’s gas discoveries in the Perth Basin have been successfully commercial. Production began from the Beharra Springs North 1 gas field in July 2002, increasing gas sales from the Beharra Springs gas plant (pictured above) by 32%. |
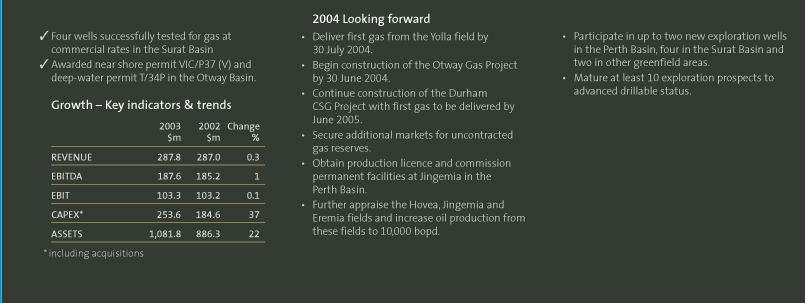
ORIGIN ENERGY 11
Operations Review –Exploration and Production
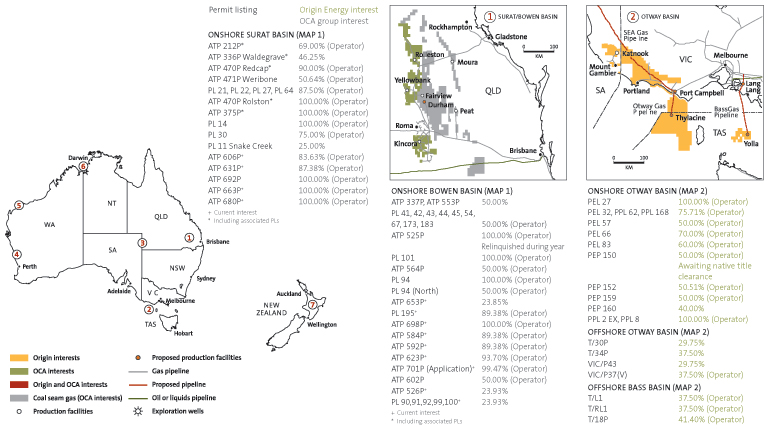
| Perth Basin (Western Australia) |
Origin continued a highly successful gas and oil exploration program in the Perth Basin.
Following last year’s oil discovery at Hovea, this field is producing at about 4,000 barrels of oil per day (bopd), and two new field discoveries at Jingemia 1 and Eremia 1 have produced under long-term production tests at rates varying between 1,000 and 2,000 bopd.
By July 2003, these fields combined had produced more than one million barrels of oil (Origin’s share 500,000 barrels). Origin’s share of 2P reserves is estimated at 5.4 million barrels.
Sales volumes by asset (PJe) | 2003 | 2002 | ||
Cooper Basin (South Australia/Queensland) | 47.7 | 48.2 | ||
Surat Basin (Queensland) | 4.1 | 3.6 | ||
Denison Trough (Queensland) | 7.9 | 8.3 | ||
Moura (CSG) (Queensland) | 3.1 | 2.7 | ||
Peat (CSG) (Queensland) | 5.2 | 5.2 | ||
Fairview (CSG) (Queensland) | 0.7 | 0.1 | ||
Katnook/Ladbroke Grove (South Australia) | 6.8 | 6.6 | ||
Beharra Springs (Western Australia) | 2.8 | 2.1 | ||
Perth Basin oil (Western Australia) | 2.3 | 0.1 | ||
Tubridgi (Western Australia) | 6.7 | 7.2 | ||
The Beharra Springs North 1 gas field, discovered in late 2001, began producing in July 2002, increasing gas sales from the Beharra Springs gas plant by 32%.
Another significant drilling program began in July 2003 to appraise and develop the Hovea, Eremia and Jingemia oil fields, and explore for gas close to the Beharra Springs gas plant and in areas further north.
| Bass Basin (Tasmania/Victoria) |
The BassGas Project is developing the Yolla field 147 km off the Victorian coast, and is scheduled to deliver 20 PJ of gas per annum to Victoria from July 2004. Origin’s Retail division will purchase the gas for sale to our residential and business customers.
Following State and Federal environmental approvals, construction began in January 2003 and the project is 50% complete.
Costing $450 million (Origin’s share $170 million), the project includes an unmanned offshore platform over the Yolla gas field; a 147 km subsea pipeline to a shore crossing near Kilcunda; and a 32 km onshore pipeline to a gas plant under construction at Lang Lang.
Origin is the operator of the BassGas Project and holds a 37.5% interest.
| Otway Basin (Tasmania/Victoria) |
In the offshore Otway Basin, the Otway Gas Project will develop the Thylacine and Geographe gas fields. The project is designed to deliver 60 PJ of sales gas each year to South Australia and Victoria by mid 2006, as well as significant volumes of condensate and LPG. Origin has a 29.75% interest in the project, which is operated by Woodside Energy Limited.
The project received joint venture approval late in 2002 to proceed to final development planning. Environmental impact statements went on public exhibition in June 2003 and a preliminary development concept has been submitted to the Victorian and Federal Governments.
Phase one of the project will involve the development of the Thylacine field including a platform, subsea pipeline and a gas processing plant. Phase two will see the subsea development of the Geographe field and tie-in to the Thylacine facility. Phase three will add compression at the gas plant to maximise recovery from the fields. The total project is expected to cost around $1 billion.
12 ANNUAL REPORT 2003
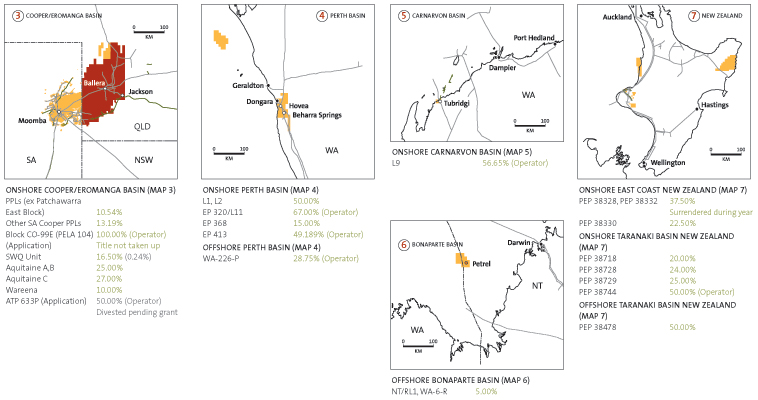
In the onshore Otway Basin, gas sales increased from the Katnook and Ladbroke Grove fields in South Australia, due to increased demand from existing customers.
| Greenfields exploration |
Origin continued an active exploration program focusing on gas prone areas close to developed infrastructure including:
| • | participation in seven exploration and appraisal wells in greenfield areas including three successful wells in the onshore Perth Basin. The Morangie 1 well in the offshore Perth Basin, which although unsuccessful, recorded encouraging residual oil shows. |
| • | reappraisal of the Myall Creek area of the Surat Basin which resulted in four wells successfully testing gas at commercial rates. The Myall Creek field is potentially the largest Surat Basin gas field discovered for more than 20 years. |
| Origin’s share of 2P reserves |
| Sales gas PJ | LPG Kt | Condensate Kbbl | Crude oil Kbbl | Total PJe | |||||||||||
2P at 30 June 2002 | 973 | 1,120 | 11,515 | 8,383 | 1,140 | ||||||||||
Additions and revisions | 468 | 510 | 3,566 | 872 | 517 | ||||||||||
Production | 73 | 68 | 617 | 780 | 84 | ||||||||||
2P at 30 June 2003 | 1,368 | 1,562 | 14,464 | 8,475 | 1,573 | ||||||||||
% of reserves | 87 | % | 5 | % | 5 | % | 3 | % | 100 | % | |||||
| BY BASIN/ASSET | |||||||||||||||
Cooper/Eromanga Basin | 379 | 615 | 4,941 | 2,912 | 453 | ||||||||||
Western Australian Basins | 10 | — | 11 | 5,411 | 42 | ||||||||||
Central Queensland Basins* | 125 | 84 | 660 | 152 | 134 | ||||||||||
Otway and Bass Basins | 382 | 863 | 8,852 | — | 472 | ||||||||||
Coal seam gas | 472 | — | — | — | 472 | ||||||||||
| * | Excludes coal seam gas areas. Reserves shown are 2P in accordance with the definitions of the Society of Petroleum. |
| Engineers and the Worldwide Petroleum Congress. OCA’s reserves are included in full. |
2002/2003 Potential drilling program
| No. of wells | Cost $m* | |||
Cooper Basin | 66 | 32 | ||
Other producing basins | 23 | 34 | ||
Coal seam gas | 80 | 28 | ||
Greenfields | 3 | 10 | ||
Total | 172 | 104 | ||
| * | Origin’s share |
| • | securing two new exploration permits in the offshore Otway Basin with Woodside. Permit VIC/P37(V) lies immediately off the Victorian coast near the Minerva field and is operated by Origin. The exploration program for this permit will begin in late 2003 with the recording of a 3D seismic survey. Permit T/34P lies to the west of the Thylacine and Geographe fields. Operated by Woodside, the exploration program for T/34P includes recording of a 3D seismic survey in 2004 and the drilling of a well in 2005. |
ORIGIN ENERGY13
Operations Review – Retail
Origin Energy retails energy and related products and services to more than two million customers in all Australian states, New Zealand and the Pacific.
Sales revenue increased 47% to $2.8 billion and EBITDA increased by 39% to $232 million due to the contribution of the CitiPower retail business purchased in July 2002, a reduction in electricity purchase costs and the cessation of retained profit payments to the Victorian Government.
A further contributor to the improved performance was the continuing focus on natural gas and electricity billing and debtor management, which resulted in significant working capital improvements.
The CitiPower acquisition, which added 264,000 customers in Melbourne’s CBD and surrounding suburbs, makes Origin the largest retailer in Victoria and the second largest nationally.
CitiPower’s customer service and billing systems were successfully integrated with our existing natural gas and electricity systems by August 2003.
Having completed this integration, our focus is now on reducing costs, improving our level of service and ability to access customers in competitive markets.
Full retail contestability (FRC) was introduced for Victorian natural gas customers in October 2002 and South Australian electricity customers in January 2003.
Through this period, Origin invested $104 million on the design, testing and implementation of FRC systems, and a further $12 million will be spent in the coming year for the introduction of FRC for South Australian natural gas customers in June 2004.
In the Victorian electricity market, customer churn grew modestly until the introduction of contestability for natural gas, after which there was a spike in activity for both fuels. Churn appears to have stabilised at 8%-10% per annum in line with industry expectations.
Overall, Origin maintained its natural gas customer numbers and achieved a modest growth in electricity customers.
We successfully entered the South Australian electricity market, winning the contract to supply electricity to 4,000 State and Local Government sites for the next three years.
Origin is developing sales channels through which we can secure new customer contracts in competitive markets. During the year, the progress on these initiatives included:
| • | offering gas and electricity contracts through our Origin Energy Shops. The rebranding of the company-owned and authorised dealer network was completed, and several under performing stores were closed. |
| • | expansion of the Origin Energy 24direct gas appliance service, installation and repair service to cover the whole natural gas network in Victoria. Electrical appliance installation capability was established in South Australia to complement the existing gas appliance service. Residential service jobs totalled almost 40,000, up 40% on the previous year. |
| • | arrangements with five of Victoria’s top 10 homebuilders who will offer Origin gas and electricity connections in their new homes. This represents about 4,000 new homes each year. |

14 ANNUAL REPORT 2003

2.04 million customers, up 15% | 201 PJe energy sales, up 17% | Origin is the largest energy retailer in Victoria providing electricity, natural gas and LPG and related services to 1.4 million customers. Origin began serving customers in the Melbourne CBD and inner suburbs following the acquisition of the CitiPower retail business in July 2002. |
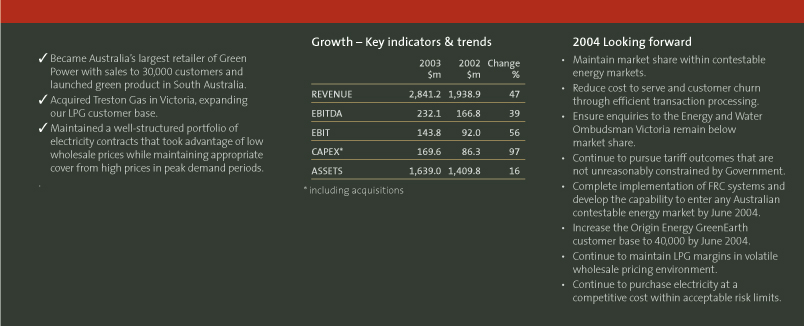
ORIGIN ENERGY15
Operations Review – Retail
| Electricity |
Origin supplies electricity predominantly to customers in Victoria, and also participates in competitive markets in New South Wales, Queensland and South Australia.
Electricity revenue increased by more than $700 million and gross margins by more than $125 million to $285 million largely due to the CitiPower retail acquisition.
The Victorian Government continues to cap prices for mass-market customers, and in January 2003, rejected proposed tariff increases for electricity supplied to customers in the former Powercor area and implemented a 4% tariff reduction to customers in the former CitiPower area.
Origin is rebalancing individual tariff categories to cover the cost of buying electricity and of serving customers in an increasingly competitive market. This will deliver reduced tariffs to customers who have been receiving competitive market offers while non-profitable segments will continue to have their tariffs adjusted on a gradual basis.
The market for large industrial electricity contracts continues to be vigorously competitive. Despite this, we have increased our market share in volume, renewing most existing contracts and signing new contracts with major customers in Victoria, New South Wales, South Australia and Queensland.
Margins in the electricity business benefited from a favourable portfolio of electricity purchase contracts that enabled us to take advantage of low pool prices while maintaining appropriate cover against periods of price volatility. The combination of effective purchasing and higher sales volume improved overall profitability.
To support sales of our green energy products (see details on page 17) and meet our obligations under the Federal Government’s Mandatory Renewable Energy Target, we will purchase the entire output of the Challicum Hills Wind Farm near Ararat in Victoria. This is in addition to the energy we already purchase from the Codrington and Toora Wind Farms in Victoria. Challicum Hills is due to commence operations later in 2003.
| Natural gas |
Origin supplies natural gas to customers mostly in Victoria, South Australia, Queensland and New South Wales.
When the Victorian Government sold its gas retail business to Origin in 1999, it retained a part of the revenue and profit stream until the introduction of FRC for natural gas in October 2002. As a direct result of the end of the retained profit payments to the Government, natural gas revenue increased by $86 million and EBIT by $15 million.
Our mass-market natural gas business also benefited from tariff increases of 6% in South Australia in July 2002 and 6.7% in Queensland in March 2002. However, prices were flat in Victoria due to an unsuccessful application for a tariff increase in that State.
Sales volumes were impacted by mild winter weather in Victoria. The measure of average heating degree-days, which provides an indication of heating requirements, continued to be well below long-term averages.
The deregulated natural gas market for commercial and industrial customers in South Australia and Queensland is moving into a more challenging phase with the emergence of effective competition. Nationally, commercial and industrial sales decreased 6% to 51 PJ.
| Origin supplies LPG through seven strategically located seaboard terminals close to eastern Australian markets. Pictured is the Townsville terminal, north Queensland. | Origin became Australia’s most successful retailer of green energy with 30,000 sales in Victoria and New South Wales. Origin Energy GreenEarth, which is partially sourced from the Codrington Wind Farm in Victoria, pictured below, was also successfully launched in South Australia in June. |

16 ANNUAL REPORT 2003
| LPG |
Origin is a retailer and wholesaler of LPG in Australia, New Zealand and the near Pacific.
The LPG business continued its strong performance despite a reduction in sales volumes of 2% and a 17% increase in the average purchase cost of LPG. The contract price (CP) – the international benchmark price for LPG – increased by $74 per tonne to $517 per tonne.
Sales volumes were impacted by the drought, which particularly affected sales to commercial and industrial customers in many parts of rural Australia. Autogas volumes declined in the face of competition from alternative fuels. However, these reductions were offset by improvements in sales to the Pacific Islands.
Operating costs were reduced $2.9 million, while a focus on credit management delivered an improved debtor performance compared to the prior year of $4.6 million and contributed to operating cash flow returns in excess of 20%.
Margins were maintained by a change in the mix of sales towards higher margin customers. As a result, gross margins were steady at $114 million.
The LPG business was expanded with the acquisition of Treston Gas in Shepparton, Victoria. The business, which will continue to operate under the Treston brand name, will deliver additional sales of 12,000 tonnes per annum and provide opportunities for multi-fuel offerings to Origin’s electricity and natural gas customer base in the region.
In its May budget, the Federal Government announced the abolition of the “excise free” status of automotive LPG from 2008. The impact on the LPG business is being reviewed.
| Clean energy products |
Energy production and use are a major source of greenhouse gases – particularly carbon dioxide. Origin is committed to reducing the carbon intensity and amount of energy consumption. This year, we further established our position as a leading provider of clean energy product choices. Significant developments included:
| • | becoming Australia’s most successful retailer of green energy with sales to more than 30,000 customers in Victoria and New South Wales. Origin Energy GreenEarth, which is sourced from wind and hydro generators, was successfully launched in South Australia in June. |
| • | securing market share leadership in Victoria and South Australia with sales of grid-connected solar systems of $1.5 million. Solar systems were installed at several landmark sites including the Queen Victoria Markets in Melbourne (200 kW), the South Australian Museum (19.8 kW) and the Australian Conservation Foundation headquarters in Melbourne (9.6 kW). |
| • | providing energy efficiency services to major Australian companies such as Amcor, Telstra and BHP Steel. Our Energy Efficiency Team won a Telstra Vendor Award for its innovative energy efficiency work. |
| • | doubling refrigerant gas sales due to the introduction of 34m, a medium temperature ozone safe refrigerant for commercial refrigeration and air-conditioning applications. |
| • | successful refocusing of the natural gas transport fuels business on city bus and forklift fleets. Origin was selected as preferred tenderer for two refuelling stations to serve a fleet of 99 buses in Perth. |
15TWh | 123 PJ | 479 Ktonnes | ||
electricity sales, up 79% | natural gas sales, up 4% | LPG sales, down 2% |
Our focus in Retail will be on
reducing costs and improving
our level of service and ability
to access customers in
competitive markets.
ORIGIN ENERGY17
Operations Review – Generation
Generation recorded increases in sales revenue and EBITDA driven by the acquisition of the Mt Stuart Power Station and a new market-based tolling arrangement whereby the output of our merchant plants is contracted to our Retail business. As a result total sales revenue, including internal sales, increased by 54% to $97 million and EBITDA increased by 60% to $48.3 million.
In December 2002, we acquired the 288 MW Mt Stuart Power Station in Townsville, north Queensland. Mt Stuart’s capacity is contracted to Queensland Government-owned entity, Enertrade. Commissioned in December 1998, the Mt Stuart plant runs on kerosene but can be readily converted to natural gas and could be expanded by a further 150 MW through conversion to combined cycle mode.
Origin has a 50% share in cogeneration plants at the Worsley Alumina Refinery in Western Australia and the BP Bulwer Island Refinery in Queensland, as well as in the Osborne Cogeneration Plant in South Australia. These plants operated at high levels of availability and efficiency, including the BP Bulwer Island plant where technical improvements reduced the level of outages experienced in the prior year.
Origin owns and operates the Roma Power Station in central Queensland, and the Quarantine and Ladbroke Grove Power Stations in South Australia. These plants are gas fired and sell directly into the National Electricity Market (NEM) when wholesale prices exceed the marginal operating cost of the plant.
The maturity of the NEM has enabled Origin to implement a market-based tolling arrangement whereby capacity provided by our merchant plants is contracted to Origin’s Retail business.
This has stabilised Generation’s income and quarantined the volatility of the spot market to our Retail business where it can be managed across Origin’s entire portfolio of electricity purchases and sales. This also means all Origin’s generation plants are now fully contracted.
Construction of the energy centres at the Toowoomba and Baillie Henderson Hospitals in Queensland proceeded satisfactorily, with the Toowoomba Base Hospital works completed just prior to year end. The energy centres will deliver electricity, steam, and hot and chilled water to each hospital.
| Renewable generation |
Government regulation through the Mandatory Renewable Energy Target (MRET) and increasing customer preferences for clean energy choices are providing a significant growth opportunity in the renewable energy sector. The MRET, which provides an incentive for investment in new renewable generation, is designed to ensure new renewables make up 9,500 GWh of Australia’s total energy
Major power plants
Plants | % interest | Capacity (MWe) | Type* | Operation | Contracted to | |||||
| NRG Flinders | ||||||||||
Osborne | 50 | 180 | Cogen | Base | Penrice Soda Products | |||||
| Western Power | ||||||||||
Worsley | 50 | 120 | Cogen | Base | Worsley Alumina | |||||
Bulwer Island | 50 | 32 | Cogen | Base | BP | |||||
OneSteel | 100 | 8 | Cogen | Base | OneSteel | |||||
Mt Stuart | 100 | 288 | OCGT | Peak | Enertrade | |||||
Quarantine | 100 | 96 | OCGT | Peak | Origin Retail | |||||
| Base/ | ||||||||||
Ladbroke | 100 | 80 | OCGT | Intermediate | Origin Retail | |||||
Roma | 100 | 74 | OCGT | Peak | Origin Retail |
| * | Cogen: Cogeneration |
| * | OCGT: Open cycle gas turbine |
18 ANNUAL REPORT 2003
supply by 2010. This year, our progress in developing a set of renewable technologies options, which produce power without greenhouse gas emissions included:
| • | development in conjunction with The Australian National University of SLIVER®Solar Cell technology, which uses one-tenth of the silicon of conventional solar panels while matching power, performance and efficiency. Testing confirmed solar panels made using the SLIVER® Solar Cell technology could be commercially competitive. An automated approach to module assembly was developed and planning for a pilot plant to commercialise the technology is well advanced. |
| • | securing an option to acquire 50% of the 52.5 MW Challicum Hills Wind Farm near Ararat in Victoria, which is currently Australia’s largest. Origin is also developing the Kemmiss Hill Road Wind Farm, near Yankalilla in South Australia and has acquired an option to develop the Troubridge Point Wind Farm near Edithburgh on the Yorke Peninsula also in South Australia. Wind monitoring is underway at a further two potential wind farm locations. |
| • | agreeing to acquire a 19% interest in Geodynamics Limited, which is developing a world-class hot rock geothermal resource in South Australia’s Cooper Basin. Geodynamics is aiming to harvest heat from about 4.5 km below the earth’s surface to generate zero-emission electricity. Origin will have the right to purchase 50% of the power. |

1.9 TWh total sales, up 2% | 883 MW capacity, up almost 50% | Planning for a pilot production plant to manufacture SLIVER® Solar Cells is well advanced. Solar panels using the new cells will be produced for roof-top systems such as the one installed by Origin and our project partners at the Queen Victoria Market in Melbourne. |

ORIGIN ENERGY19
Operations Review – Networks
Origin Energy’s Networks business manages utility networks and invests in energy infrastructure through a shareholding in Envestra Limited.
In April 2002, we increased our holding in Envestra to 19%. As a result, distributions received from Envestra increased by $1.2 million. EBITDA of $23.4 million was up 4% on the previous year.
On behalf of Envestra, Origin manages and operates 1,100 km of transmission pipelines and 18,000 km of distribution networks which supply natural gas to homes and businesses in all States and the Northern Territory.
There was a steady increase in management fees earned from Envestra, reflecting the underlying growth in the business. However, these increases were offset by changes to other fees following the implementation of South Australian and Queensland access arrangements, which replaced the haulage agreement between Origin and Envestra.
During the year, total natural gas connections increased by 2.5% to 905,000 largely due to the continued strength of the domestic housing market. About 300 km of new mains were laid and 105 km of existing mains replaced.
Full retail contestability was introduced for Victorian natural gas customers in October 2002, allowing consumers to change retailers. Origin introduced new information systems and processes to ensure cost efficient metering and billing of the consumers serviced by Envestra’s networks. Work has commenced on introducing new systems and processes in South Australia where the natural gas market will open to full competition in 2004.
In a joint venture with United Utilities, Origin won a contract for the management of the water network and treatment assets of Coliban Water in Victoria. The 10-year contract from 1 July 2003 is a significant win for the joint venture and will generate more than $120 million in revenue over the contract term.
Coliban Water provides water and wastewater services to 130,000 customers across 16,500 square kilometres of regional Victoria. The joint venture will operate 1,800 km of water mains, 1,100 km of sewer mains, 490 km of rural channels and most of Coliban’s wastewater treatment plants and pumping stations. The contract also includes the operation of meter reading, billing and debt collection services.
| SEA Gas Pipeline |
The SEA Gas Pipeline will travel 680 km, linking Origin’s new gas production interests in Victoria to Origin’s retail gas markets and generation assets in South Australia.
In September 2002, the project was expanded to a capacity of 125 PJ per annum when TXU joined International Power and Origin to become an equal equity participant.
By August 2003, 530 km of the pipeline had been completed, and the project remained on budget and on schedule for commercial operation in January 2004.
In a joint venture with United Utilities, Origin won a contract to manage the water network and treatment assets of Coliban Water. The 10-year contract will generate more than $120 million in revenue.

20 ANNUAL REPORT 2003

115 PJ natural gas delivered, up 1% | 905 thousand to natural gas, up 2.5% | Origin has a 19% investment in Envestra and operates Envestra’s distribution networks which supply natural gas to homes and business in all States and the Northern Territory. | ||
Growth – Key indicators & trends
2003 $m | 2002 $m | Change % | |||||
REVENUE | 163.8 | 137.4 | 19 | ||||
EBITDA | 23.4 | 22.5 | 4 | ||||
EBIT | 21.6 | 19.9 | 9 | ||||
CAPEX* | 0.5 | 15.9 | (97 | ) | |||
ASSETS | 190.2 | 190.9 | (0.4 | ) | |||
| * | Including Acquisitions |
2004 Looking forward
| • | Further increase utilisation of networks under management. |
| • | Achieve further reductions in operating and capital costs. |
| • | Effectively transition the operation and maintenance of the Cohban Water assets to the joint venture. |
| • | Continue to expand assets management services to new customers. |
ORIGIN ENERGY21
Operations Review – Corporate
Origin Energy’s Corporate groups provide services to the business and manage interactions with shareholders, Government, media and other external groups. They also provide and maintain corporate systems such as the Health, Safety and Environment Management System, Performance Management and Commodity and Risk Management Systems.
| Human resources |
Origin’s workforce grew by 5% to 2,857. We welcomed 137 people who joined Origin from CitiPower, and new employees with specialist expertise were recruited to work on a range of capital projects.
Our aim is to maintain a satisfying and rewarding working environment for all our employees. One key reward mechanism is the Employee Share Plan. This year, up to $910 of Origin shares were awarded to eligible employees for exceeding our financial performance target and significant progress towards the achievement of our health and safety target.
| Health and safety |
Origin’s employee safety performance improved significantly this year on a number of indicators.
| • | The Lost Time Injury Frequency Rate, improved by 25% from 3.6 to 2.7 lost time injuries per million hours worked. |
| • | The Total Reportable Case Frequency Rate, which includes medical treatment injuries as well as lost time injuries, improved from 33.7 to 25.0 injuries per million hours worked. |
| • | The severity of employee injuries improved from 1,207 to 821 hours lost per million hours worked, approximately 0.01% of the total hours worked. |
Regrettably, an incident at a drilling rig resulted in the death of an employee of a contractor engaged to drill an appraisal well for Origin subsidiary, Oil Company of Australia. The incident will be the subject of a Coroner’s inquiry, and investigations into the cause are continuing.
| Environment |
Prior to the introduction of natural gas, towns gas was manufactured from coal and other products in purpose built sites known as manufactured gas plants (MGP). Some of these sites operated from the mid 1800s.
Origin’s workforce grew by 5% and we welcomed 137 new employees from CitiPower.
22 ANNUAL REPORT 2003
Origin manages 19 MGP sites that have been affected by some degree of residual contamination. There were two significant MGP site activities this year:
| • | A remediation plan submitted to the Department of Primary Industry, Water and the Environment in Tasmania for the Launceston site last year was approved. |
| • | Following the approval of the Newstead Riverpark Masterplan in December 2002, the Queensland Environmental Protection Agency approved the Remediation Action Plan for the Newstead site in May. A remediation contractor is being selected through a competitive tender process and works, which will start in January 2004, should be completed by August 2005. |
The remediation of the Newstead site is part of a sale process in which Origin and Brisbane City Council (BCC) agreed to sell a portion of their adjoining Newstead properties to a developer. The balance of the combined Origin/BCC property is in the process of being sold in a competitive tender process that will conclude in the first quarter of 2004.
There were no significant environmental incidents during the year and no breaches of significant environmental regulations that relate to the company’s operations.
| Government |
During the year, Origin made more than 60 submissions to Governments including the Council of Australian Governments (CoAG) Energy Market Review and associated market reform activities such as the Cabinet Committees on Energy and Sustainable Environment, the Mandatory Renewable Energy Target Review and the Business Greenhouse Roundtable.

This year we produced our first Sustainability
Report which outlines Origin’s environmental,
social and economic impacts.
| ü | Employee numbers increased 5% to 2,857 including 127 former CitiPower employees, |
| ü | There was no time lost due to industrial disputes. |
| ü | Remediation Action Plan for the Newstead site approved in May 2003. |
| ü | Produced Origin’s first Sustainability Report in April 2003. |
| ü | More than 60 submissions were made to Government including the Council of Australian Governments (CoAG) Energy Market Review, the Cabinet Committees on Energy and Sustainable Environment, the Market Renewable Energy largest Review and the Business Greenhouse Roundtable. |
ORIGIN ENERGY23
Operations Review – Corporate
| Community consultation |
Origin’s activities have an impact on many differing communities, whose goodwill and support we rely on to allow access to land and resources. We participate in ongoing community consultations, which this year included:
| • | the negotiation and approval of an Indigenous Land Usage Agreement with native titleholders in relation to the Durham Project in central Queensland. |
| • | extensive due diligence to protect areas of cultural heritage significance on all pipeline and upstream projects. |
| • | in the SEA Gas and BassGas Projects, the signing of easement contracts with nearly 600 private landowners to provide access arrangements over the preferred pipeline routes. Five compulsory acquisition proceedings were initiated along the SEA Gas route and Origin is in negotiation with three landowners in areas associated with the BassGas Project. |
| Corporate community involvement |
Our corporate community involvement activities focused on the communities in which we operate and this year included:
| • | Environmental educationWe launched sponsorships of ‘Ollie Saves the Planet’ an interactive environmental CD ROM distributed to schools across Australia, and the Origin Energy Park and EcoHouse in Melbourne, which attracts 15,000 students annually to learn about energy, and its impact on the environment. |
| • | Community hardshipSome of our customers in eastern States experienced considerable hardship in devastating bushfires last summer. Origin funded $100,000 of global positioning and geographic information systems to help country fire authorities plan and map future fire containment activities. |
| • | Employee involvementOrigin’s staff ambassador program gives employees the opportunity to participate in a range of community and environmental programs, such as conservation days. A matched-giving program was introduced with employee contributions raised for the Australian Red Cross Bali Appeal and the Salvation Army’s Bushfire Appeal matched by the company. |
This year, we published our first Sustainability Report for the year ended June 2002 where we identified a series of environmental, social and economic objectives, which are the drivers of sustainable performance in our business.
More information on Origin’s environmental and social performance and activities is available in the report atwww.originenergy.com.au. Origin’s second report is due for release early in 2004.
Supported by Origin Energy, the CERES Community Environment Park and EcoHouse in Melbourne provide energy education programs to more than 15,000 school students each year.

24ANNUAL REPORT 2003
Senior Executives
John PiperAged 57
Executive General Manager Oil and Gas Production
Responsible for oil and gas production activities and exploration in areas where Origin Energy has established production. Previously Managing Director of Oil Company of Australia (1990-95), General Manager of Brisbane Gas Company (1981-83) and General Manager and Director of Gas Corporation of Queensland (1983-90). Fellow of the Australian Institute of Company Directors and Australian Institute of Petroleum. Bachelor of Commerce degree, University of Queensland.
Robbert Willink Aged 50
General Manager Exploration
Responsible for greenfields exploration since 1995. Previously Exploration Manager at SAGASCO Resources (1988-95). Former Petroleum Geologist with Shell in Australia, Oman and Turkey and Senior Lecturer in Petroleum Geology at University of Adelaide (1997). Science degree (Honours), University of Tasmania, Doctorate in Philosophy (Geology), The Australian National University.
Karen Moses Aged 46
Executive General Manager Wholesale and Trading
Responsible for the wholesale supply of natural gas, electricity and LPG for sale by Origin Energy’s Retail businesses, energy sales to wholesale customers, the management of risks associated with commodities bought and sold by Origin and assessment of the long-term strategic risk. Also responsible for LPG operations in Australia, New Zealand and the Pacific. Previously held development and trading roles in the Exxon Group (1983-94). Economics degree and Diploma of Education, University of Sydney. World LP Gas Association Industry Council Member.
Peter VinesAged 53
Executive General Manager Retail
Responsible for natural gas and electricity retailing nationally including marketing, sales and customer service. Joined Origin Energy in June 2001. Previously Executive Director of Powercor Australia. Former Vice-President, International Development with PacifiCorp Inc in the United States. Led its original acquisition of Powercor and its interest in Hazelwood Power in Australia. A Civil Engineer, holds Commerce degree from University of Melbourne and Masters of Business Administration, Deakin University.
Andrew StockAged 51
Executive General Manager Generation
Responsible for developing and operating the Generation business including power generation, renewables and cogeneration; managing the company’s Clean Energy Advantage product range; and contracting gas and transportation services including development of the SEA Gas Pipeline Project. Previously held senior commercial and operations management roles in industrial energy marketing, oil and gas developments and petrochemical industries. National President of the Australian Business Council for Sustainable Energy. Fellow of Institution of Engineers, Australia. Chemical Engineering degree (Honours), University of Adelaide.
Robert TardifAged 51
General Manager Asset Management
Responsible for infrastructure management services since 1997. Previously General Manager, Adelaide Region (1995-97) and Group Manager Distribution, SAGASCO (1987-95). Held various engineering and operational positions at Mobil Oil from 1975 to 1987. Chemical Engineering degree, University of Adelaide.
Bruce BeerenAged 54
Executive Director Commercial
Responsible for the finance, procurement and IT functions, investor relations, planning and development. Formerly Chief Executive Officer of VENCorp and held senior management positions at AGL, including Chief Financial Officer and General Manager, Pipelines. Director of Envestra Limited andequipsuper Pty Ltd. Science degree, Commerce degree and Masters of Business Administration from University of New South Wales. Fellow of CPA Australia, and the Australian Institute of Company Directors.
Frank CalabriaAged 35
Chief Financial Officer
Responsible for the finance function. Joined Origin Energy in November 2001. Previously held senior finance positions with Pioneer International Limited, Hanson plc and Hutchison Telecommunications. Economics degree from Macquarie University, Masters of Business Administration (Executive) from the Australian Graduate School of Management. Associate of the Institute of Chartered Accountants in Australia and the Securities Institute of Australia.
William HundyAged 45
Company Secretary
Responsible for the company secretarial, legal and insurance functions. Joined Origin Energy in July 2001. Previously Company Secretary of Email Limited and Placer Pacific Limited. Law and Economics degree, University of New South Wales. Fellow of the Chartered Institute of Secretaries and the Australian Institute of Company Directors.
John HaywardAged 48
General Manager Human Resources, Health, Safety and Environment
Responsible for human resources and the company’s Health, Safety and Environment Management System. Formerly Commercial Analyst (1989-90) and Commercial Manager (1990-94) with SAGASCO. Worked in the Reservoir Engineering and Planning Departments of Petro Canada (1984-88). Chemical Engineering degree (Honours), University of Waterloo (Canada).
Tony WoodAged 52
General Manager Public and Government Affairs
Responsible for corporate relationship with Governments, the media and the community since June 2001. Previously General Manager, Retail. Held several positions with the ICI group (1976-94) including General Manager of dangerous goods transport company and Incitec subsidiary, Chemtrans. Masters degree in Science (Physical Chemistry), University of Queensland. Post graduate diploma in Business Administration, Queensland Institute of Technology. Chairman of Energy Retailers Association of Australia, and a Director of the Electricity Supply Association of Australia and the Australian Gas Association.
ORIGIN ENERGY25

Corporate Governance
Origin Energy’s Board and management are committed to acting responsibly, ethically and with the highest standards of integrity as the company strives to create shareholder value.To achieve this, requires sound corporate governance practices and policies that have been adopted by the Board and implemented throughout all levels of management. This corporate governance statement reflects the practices of Origin during the year.
The Australian Stock Exchange (ASX) Corporate Governance Council released Principles of Good Corporate Governance and Best Practice Recommendations (“the Principles”) on 31 March 2003. Origin has reviewed its current practices and established that it is substantially in accordance with the Principles.
Origin is continuing to review its policies and practices and will make a full statement on its compliance with the Principles in its 2004 Annual Report.
This statement includes information on Origin’s compliance with the Principles for the year ended 30 June 2003 and describes what steps will be taken to respond to the Principles over the coming year.
Origin has developed a corporate governance section on its website at www.originenergy.com.au that will be progressively updated. It includes more information on the company’s governance arrangements and summaries of our relevant policies and charters.
Responsibilities of the Board
The Board is accountable to shareholders and the community for the performance of the company. The specific responsibilities of the Board include:
| • | approving the strategic direction, policies and budgets of the company and ensuring that these are followed. |
| • | approving major investments and monitoring the return of those investments. |
| • | monitoring financial performance including approval of the annual and half year financial statements and reports. |
| • | appointing the Managing Director and monitoring the performance of the Managing Director and senior management. |
| • | overseeing the remuneration, development and succession planning for the Managing Director and senior management, and ensuring that appropriate human resource management systems are in place. |
| • | ensuring appropriate risk management systems are established and reports on performance are regularly reviewed. |
| • | reviewing and approving the company’s compliance systems and corporate governance principles. |
| • | ensuring that the company provides continuous disclosure of information to the investment community, and that shareholders have available all information they reasonably require to make informed assessments of the company’s prospects. |
| • | overseeing the company’s commitment to its values, sustainable development, the environment and the health and safety of employees, contractors, customers and the community. |
| • | enhancing and protecting the reputation of the company. |
The work of the Board
The Board delegates responsibility for the conduct of the company’s businesses to the Managing Director, but remains responsible for overseeing the performance of management. The Board has established delegated limits of authority, which define the matters that are delegated to management and those which require Board approval. The delegated limits of authority are reviewed on a regular basis.
The full Board meets on at least 10 days each year including a strategic planning session over a two-day period. If required, the Board meets at other times by telephone conference or other agreed means to deal with urgent matters. For each Board meeting, Directors receive comprehensive Board papers in advance as well as monthly operating reports, health, safety and environment reports, and reports from the Chief Financial Officer. Senior management regularly attend Board meetings to report on particular matters and communicate directly with Directors.
In conjunction with or in addition to scheduled Board meetings, the non-executive Directors meet together without the presence of the executive Directors.
The Board has a program of site visits over the year to further Directors’ understanding of the company’s activities and enhance communication with management.
The number of meetings of the company’s Board and of each Board committee held during the year ended 30 June 2003, and the number of meetings attended by each Director is disclosed in the Directors’ Report on page 33.
The Board undertakes a review of its performance and its operations each year. If appropriate, it will seek the assistance of external facilitation to undertake the review and provide recommendations to the Board.
Composition of the Board
The Board comprises five non-executive Directors and two executive Directors, being the Managing Director and the Executive Director, Commercial. All five non-executive Directors are considered independent under the Principles and under the definition of independence that has been adopted by the Board.
The Chairman is an independent non-executive Director appointed by the Board. The Chairman is responsible for leading the Board, ensuring that Board activities are organised and efficiently conducted and for ensuring Directors are properly briefed for meetings. The Managing Director is responsible for implementing company strategies and policies. The Board recognises that these are separate roles to be undertaken by separate people.
ORIGIN ENERGY27
Corporate Governance
Origin’s Constitution requires the Board to determine the number of Directors, which should be not less than five and no more than 12. The size of the Board has been set in accordance with the Constitution at seven Directors.
Details of the members of the Board, their experience, expertise, qualifications, and independent status are set out on page 26.
Board member selection criteria
The whole Board decides the selection of members of the Board and the making of recommendations to shareholders for election of Directors. In considering membership of the Board, Directors take into account the appropriate skills and characteristics needed by the Board to maximise its effectiveness and the blend of skills, knowledge and experience for the present and future needs of the company. The current Board provides a broad range of expertise covering technical, commercial, financial, legal and operational management with all members bringing the benefits of experience from other boards, companies and industries.
Other important attributes that Directors bring to the Board include business acumen, experience, an enquiring mind and personal integrity. In addition, the Board as a whole must work together effectively to combine and leverage the skills, knowledge and experience of its members to provide leadership to the company in generating value for shareholders and meet any expectations of other stakeholders. The deliberations of the Board should foster open and constructive debate. The Board must also be supported by robust structures and processes that facilitate depth and breadth of understanding of the company’s businesses, and clearly define roles and responsibilities.
New Directors are provided with a letter of appointment setting out their responsibilities, rights and the terms and conditions of their employment. New Directors participate in a comprehensive induction program through which they are briefed by management on financial, strategic, operations and risk management issues.
Origin’s Constitution provides for new Directors appointed by the Board to stand for election by the shareholders at the following Annual General Meeting and for all Directors, other than the Managing Director, to stand for re-election every three years. An election of Directors is held at every Annual General Meeting.
Directors’ independence
Origin recognises that independent Directors have an important role in ensuring the Board fulfils its responsibilities and holds management accountable for the performance of the company.
Accordingly, the Board has adopted a policy that its composition should include a majority of non-executive Directors and a majority of independent Directors. The Board has determined a definition of an independent Director based on its assessment of best practice and having regard to the nature of Origin and its businesses.
The Board has determined that an independent Director is a Director who is not a member of management (a non-executive Director) and who meets the following criteria:
| • | is not a shareholder holding more that 10% of the company’s shares or an officer of, or otherwise associated directly or indirectly with, a shareholder holding more than 10% of the company’s share’s |
| • | has not within the last three years been employed in an executive capacity by the company or been a Director after ceasing to hold any such employment. |
| • | is not a principal or employee of a professional adviser of the company whose billings exceed 5% of the adviser’s total revenues. A Director who is a principal or employee of a professional adviser will not participate in any consideration of the possible appointment of the professional adviser and will not participate in the provision of any service to the company by the professional adviser. |
| • | is not a significant supplier or customer of the company or an officer or otherwise associated directly or indirectly with a significant supplier or customer. A significant supplier is defined as one whose revenues from the company exceeds 5% of the supplier’s total revenue. A significant customer is one as whose amounts payable to the company exceeds 5% of the customer’s total operating costs. The Board may determine that a Director is independent if the arrangements are usually and customarily offered to customers by the company, have been awarded as a result of a competitive tender or otherwise are on substantially similar terms as those prevailing at the time for comparable transactions with other customers under similar circumstances. The Director concerned will not participate in the determination of his/her own independence. |
| • | has no other material contractual relationship with the company other than as a Director of the company. |
| • | has no interest or relationship that could interfere with the Director’s ability to act in the best interests of the company and independently of management. |
The Board, excluding the Director in question, assesses the independence of each non-executive Director at least annually in light of the interests disclosed by that Director, as part of its overall commitment to adopt standards of corporate governance in accordance with best practice.
28 ANNUAL REPORT 2003
Mr McCann is a partner of Allens Arthur Robinson, a national law firm, which in past years has provided legal advisory services to the company. Allens Arthur Robinson is not the primary provider of legal services to the company and no fees were paid in the financial year (2002: $24,578). The Board has determined that Allens Arthur Robinson is not a material professional adviser for the purposes of determining Mr McCann’s independence.
Mr Carter is Senior Advisor of The Boston Consulting Group, which has in prior years provided consulting services to Origin. The major services were provided to the company prior to the Boral demerger and the appointment of Mr Carter to the Board. During the financial year, the company paid no fees (2002: $7,076) to The Boston Consulting Group. The Board has determined that The Boston Consulting Group is not a material professional adviser for the purposes of determining the independence of Mr Carter.
Dr Nugent was appointed as a non-executive Director of Freehills on 1 April 2003. Freehills is a national law firm which has provided legal advisory services to the company. Dr Nugent was not a partner, nor did she share in any profits of Freehills. Freehills is not the primary provider of legal services to Origin and, during the period in which Dr Nugent has been a non-executive Director of both Freehills and Origin, no fees were paid to Freehills. The Board has determined that Freehills is not a material professional adviser for the purposes of determining the independence of Dr Nugent.
Dr Williams is a Director of Boral Limited, which purchased energy supplies from Origin on terms that are substantially similar terms as those prevailing for comparable transactions with other customers under similar circumstances. The Board has determined that Boral is not a significant customer for the purposes of determining Dr Williams’ independence.
Mr Bourne is considered by the Board to not have any relationship or interest which may affect his independence.
It is the policy of the Board that a majority of the members of the Audit Committee, the Remuneration Committee and the Nomination Committee be independent Directors.
Remuneration of non-executive Directors
In accordance with Origin’s Constitution, shareholders have approved the aggregate for non-executive Director fees of $650,000 in 1989. The payment of non-executive Director’s fees within the limit set by shareholders is reviewed annually using external data and advice to ensure that such fees are reasonable and consistent with market norms.
Board fees were last reviewed with effect from 1 July 2002. For the past year, the Chairman’s base fees were $175,000 and $70,000 for other non-executive Directors.
The Chairman and non-executive Directors receive additional fees for their work on Board Committees. The additional annual fee for Remuneration Committee Chairman is $10,000 and $5,000 for a member. The additional annual fee for the Audit Committee Chairman is $20,000 and $10,000 for a member.
Non-executive Directors were entitled to a retirement benefit under a retirement benefit scheme that was approved by shareholders in 1989. The Directors have decided to terminate the operation of this scheme and freeze entitlements as at 31 December 2002.
Since 1 January 2003, the amount of this benefit has been paid as fees to Directors and will therefore be required to be within the annual shareholder-approved limit for fees. Directors are required to sacrifice these additional fees for the acquisition of shares in Origin under the Non-Executive Director’s Share Plan until acquiring 25,000 shares, after which the fees may be paid to the Directors as superannuation.
The actual amount paid to non-executive Directors in 2003 was $541,454 (2002: $368,000) inclusive of superannuation and contributions to the Non-Executive Director’s Share Plan. The amount of benefits accrued during the year under the Non-Executive Director’s Retirement Scheme (terminated at 31 December 2002) was $87,924 (2002: $101,319). The total of accrued benefits and amounts paid during the year was $629,378.
At the Annual General Meeting on 16 October 2003, shareholder approval will be sought to increase the maximum fees payable to non-executive Directors to $950,000 per annum.
Board committees
The Board has established a number of committees to assist in the execution of its duties and to allow detailed consideration of complex issues. Current committees of the Board are the Audit, Health, Safety and Environment (HSE), Nomination and Remuneration Committees.
Each of these committees has its own written charter setting out its role and responsibilities, composition, structure, membership requirements and the manner in which the committee is to operate. All of these charters are reviewed on an annual basis and are available on the company website. All matters determined by committees are submitted to the full Board as recommendations for Board decision.
Minutes of committee meetings are tabled at the immediately subsequent Board meeting. Additional requirements for specific reporting by the committees to the Board are addressed in the charter of the individual committees.
Audit Committee
The structure that safeguards the company’s financial reporting is overseen by the Audit Committee. The Audit Committee consists of three independant non-executive
Directors:
Dr R J Williams (Chairman)
Mr H K McCann
Dr H M Nugent.
ORIGIN ENERGY29
Corporate Governance
The Audit Committee has appropriate financial expertise and all members have a working knowledge of the industries in which the company operates.
The Chairman of the Audit Committee may not be Chairman of the Board. Both internal and external auditors attend the meetings. The Managing Director and Executive Director, Commercial attend at the invitation of the Chairman of the Committee. The Committee meets a minimum of four times a year. An agenda for each meeting is prepared with comprehensive papers circulated to the committee members before each meeting.
The Audit Committee operates under a charter, which has been approved by the Board. The charter addresses functions and processes of the committee and the key responsibilities, accountabilities and entitlements of the committee.
The committee requires the Managing Director and senior management to state in writing to the Board that the company’s financial reports present a true and fair view, in all material respects, of the company’s financial condition, operational results and are in accordance with relevant accounting standards.
Prior to announcement of results, the Audit Committee reviews the half yearly and annual reports, and makes recommendations to the Board on the adoption of financial statements and reports. The Committee gives the Board additional assurance regarding the quality and reliability of financial information for use by the Board or inclusion in its financial reports.
The internal auditor and the external auditor have direct access to the Chairman of the Audit Committee and, if necessary, the Chairman of the Board. The Audit Committee meets with the external auditor and internal auditors without management present at each scheduled committee meeting. The Audit Committee has authority, within the scope of its responsibilities, to seek any information it requires from any employee or external party. The Charter of the Audit Committee is available on the company’s website.
Remuneration Committee
Four independent non-executive Directors comprise this committee:
Mr T Bourne (Chairman)
Mr H K McCann
Mr C B Carter
Dr H M Nugent.
The aims of the committee are to ensure that the Remuneration Policy is consistent with market practice and that the company is able to attract, develop and retain its people. As required by the committee, the Managing Director is invited to attend meetings to discuss senior executives’ performance and remuneration.
The remuneration of the Managing Director and senior executives is reviewed annually by this committee, which considers the performance of both the company and the individual. Recommendations are made to the Board in this regard.
The committee oversees and monitors the company’s policies on remuneration including:
| • | general remuneration practices; |
| • | performance management; |
| • | share plans and incentive schemes; |
| • | superannuation; and |
| • | recruitment and termination. |
The Remuneration Committee Charter is available on the company’s website.
Health, Safety and Environment Committee
To oversee Origin’s commitment to health, safety and environment (HSE), Origin has formed an HSE Committee that comprises the full Board:
Mr C B Carter (Chairman)
Mr H K McCann
Dr H M Nugent
Mr T Bourne
Dr J R Williams
Mr B G Beeren
Mr G A King.
A report on health, safety and environment is made to each Board meeting and the HSE Committee meets separately on two occasions each year to undertake a comprehensive review. The committee seeks to establish, maintain and monitor practices that protect employees, contractors and the general public as well as achieving best standards in sustainable environmental management.
The HSE Committee Charter is available on the company’s website.
Nomination Committee
Five independent non-executive Directors comprise this committee:
Mr H K McCann (Chairman)
Mr C B Carter
Dr H M Nugent
Mr T Bourne
Dr J R Williams.
The Nomination Committee supports and advises the Board in ensuring the Board is comprised of individuals who are best able to discharge the responsibilities of Directors by:
| • | assessing the skills required by the Board. |
| • | establishing reviews of the whole Board. |
| • | establishing processes for identification of suitable candidates for appointment to the Board. |
| • | make recommendations to the full Board on Directors’ appointments or Board and committee structure. |
The Nomination Committee operates under a charter approved by the Board which is available on the company’s website.
30 ANNUAL REPORT 2003
Resources available to the Board
Directors have the right of access to company employees, advisers and records.
In relation to their duties and responsibilities, Directors have access to the advice and counsel of the Chairman and the Company Secretary, and have the right to seek independent professional advice at the company’s expense if required, after prior consultation with the Chairman.
As approved by shareholders, the company has entered into deeds of access with each Director giving them a right of access to all documents that were provided to them during their time in office for a period of seven years after ceasing to be a Director.
Ethical standards
Compliance with legislative requirements and acting with a high level of integrity is expected of all Directors and employees. Directors and employees are expected to conduct themselves in accordance with the company’s policies and the principles contained in this statement. Origin has developed a set of values that are shown in detail on page 4.Commitment to these values is required of all employees and is part of the company’s performance management system. Over the coming year, Origin will develop a code of conduct that will encompass its ethical standards.
Related party transactions and conflict of interests
Where any transactions are to be considered by the Board that relate to Directors or their related parties or where any potential conflicts of interest arise, the Directors concerned are required to declare their interests in any dealings between the company and their related parties. In appropriate cases, Directors with such interests take no part in decisions relating to them and do not participate in discussions nor receive any papers from the company pertaining to those matters. The Board regularly reviews the register of Director’s interests and related parties and all new declarations by Directors are advised to each other Director.
Securities dealings by Directors and management
Origin has adopted a policy concerning trading in the company’s securities by Directors, officers and employees.
The policy precludes Directors and employees of Origin and its subsidiaries from dealing in securities in the company from 1 July each year until announcement of preliminary final results and from 1 January each year until announcement of half yearly results. Share trading is prohibited at any time by a Director, or any officer or employee of the company, If in possession of price sensitive information that is not available to the market and that could reasonably be expected to influence the market. Directors and employees may not engage in short-term dealings in securities of the company at any time.
Directors and senior management must give prior notification for any proposed dealing to the Company Secretary. Any transaction conducted by Directors in shares of the company is notified to the ASX and all company Directors. Each Director has entered into an agreement with the company to provide information to allow the company to notify ASX of any share transaction within five business days.
Origin’s Trading in Securities Policy is available on the company’s website.
Continuous disclosure and shareholder communications
Origin has established written policies and procedures to ensure compliance with its continuous disclosure obligations and to ensure accountability at a senior management level for that compliance.
Origin is committed to the provision of timely, full and accurate disclosure and keeps the market informed by quarterly releases detailing its exploration, development and production activities, as well as providing an annual report and half yearly report to shareholders.
The company has complied with its obligations to provide continuous disclosure of information to the market. The Company Secretary is primarily responsible for communications with ASX and compliance with the company’s listing rules obligations. Origin’s continuous disclosure policy is available on the company’s website.
The company regularly provides updates on its exploration and development activities to the market and discloses material matters to ASX and the media immediately as required by ASX Listing Rules. All releases are posted on the company’s website immediately after release to the ASX.
Copies of investment presentations are released to ASX and promptly posted to the company’s website, as are other announcements not material enough for an ASX announcement.
Origin broadcasts its major results announcements and Annual General Meeting on its website.
Shareholders are able to subscribe to an email notification service to receive immediate notice of any announcements released by the company.
It is a requirement of the terms of engagement that Origin’s external auditors are present at the Annual General Meeting of shareholders. Shareholders’ right to ask questions of the auditors as to conduct of the audit and the preparation of the auditor’s report is respected.
ORIGIN ENERGY31
Corporate Governance
Risk management, compliance and internal controls
The Board is responsible for ensuring there are adequate policies in relation to risk oversight and management, and internal control systems. The company’s policies are designed to ensure strategic, operational, legal, reputational and financial risks are identified, assessed, addressed and monitored to enable achievement of the company’s business objectives.
Specific financial risk are covered by insurance and Board approved policies for hedging of interest, foreign exchange and commodities. A separate policy has been established to manage commodity trading risk which is developed and monitored by the Contracts and Risk Management Committee as discussed below.
The Board requires the company and executives to conduct all business activities in a manner that complies both with the law and delegated limits of authority. Controls exist at the Board, executive and business unit levels designed to safeguard the company’s interests which include compliance with authority limits, occupational health and safety, employment practices, environmental matters and trade practices.
Considerable importance is placed on maintaining a strong control environment. There is an organisation structure with clearly drawn lines of accountability and delegation of authority. Detailed control procedures cover management accounting, financial reporting, project appraisal, environment, health and safety, IT security, compliance and other risk management issues. The internal audit function has a mandate for reviewing and recommending improvement to controls, processes and procedures used by the company across its corporate and business activities and reports to both relevant business unit management and the Audit Committee.
Apart from regular management review, detailed questionnaires on all aspects of operational and financial risks are completed on a half yearly basis and reviewed by senior management and the Audit Committee and reported to the Board.
Contracts and Risk Management Committee
Origin operates in a deregulating environment and is subject to business risks as its major energy markets are opened to competition.
The Managing Director has established a Contracts and Risk Management Committee which includes the Managing Director, the Executive Director, Commercial, and the Executive General Manager Wholesale and Trading as well as senior executives from the operating businesses. This committee meets regularly to assess business risks facing the company in the energy markets and to review and monitor the company’s Commodity and Risk Management System. Minutes of the committee are provided to the Board on a monthly basis.
The committee considers and reviews any major capital investments or contract decisions involving significant business risk. It provides ongoing assistance to the Managing Director and provides advice to the Board on the identification and management of risk.
Executive performance and remuneration
The Board is responsible for ensuring that executive remuneration is fair and reasonable, having regard to the need to attract, retain and develop talented people and deliver value to shareholders. Origin’s remuneration policies seek to pay executives at the median for comparable positions with the opportunity to earn at the top quartile through short-term incentives for outstanding achievement.
Remuneration for senior executives comprises both fixed remuneration and short-term and long-term incentives. The incentives are based on a combination of the company’s results and individual performance levels. Short-term incentives paid are dependent upon the achievement of operating and financial targets set at the beginning of each year. Long-term incentives have included a shareholder-approved Senior Executive Option Plan under which options have been awarded to key executives as a reward for performance during a year and as an incentive for future performance.
Details of the remuneration, including options issued under the rules of the Senior Executive Option Plan and performance hurdles are provided in the Directors’ Report on pages 34 and 35.
At year end, the number of options held by executives was 1.4% of the issued capital.
The Board has reviewed the future operation of the Senior Executive Option Plan and concluded that the use of equity-based incentives should be part of a remuneration strategy. The Board has concluded that Origin’s plan, with appropriate exercise hurdles and market-based exercise prices, achieves this objective and has reinstated the plan for 2003. Details of the plan terms are included in the Directors’ Report on pages 34 and 35.
Details of key executive’s remuneration are shown on pages 34 and 35 of this report and set out the value of options issued to those executives.
Sustainability
Origin is committed to ensuring that all aspects of its activities as they impact on shareholders, the environment and the community in which it operates are sustainable. Origin has issued a Sustainability Report, which provides a detailed report to stakeholders on the company’s environmental, social and economic impacts. This report is available on the company’s website
32 ANNUAL REPORT 2003
Directors’ Report
In accordance with the Corporations Act 2001,the Directors of Origin Energy Limited report on the company and the consolidated entity, being the company and its controlled entities (“the Company”), for the year ended 30 June 2003.
Directors
The Directors of Origin Energy Limited at any time during or since the end of the financial year are: H Kevin McCann (Chairman), Grant A King (Managing Director), Bruce G Beeren (Executive Director, Commercial), Trevor Bourne, Colin B Carter, Dr J Roland Williams, and Dr Helen M Nugent (appointed 25 March 2003).
Directors’ qualifications, experience and special responsibilities
Information relating to current Directors’ qualifications, experience and special responsibilities is set out on page 26.
Directors’ meetings
The number of Directors’ meetings, including Board committee meetings, and the number of meetings attended by each Director during the financial year are shown in the table below:
| Meetings of Board committees | ||||||||||||||||||||
| Board meetings | Audit | Remuneration | HSE | Nomination | ||||||||||||||||
Directors | H | A | H | A | H | A | H | A | H | A | ||||||||||
H K McCann | 9 | 9 | 3 | 3 | 2 | 2 | 2 | 2 | ||||||||||||
G A King | 9 | 9 | 2 | 2 | 2 | 2 | ||||||||||||||
B G Beeren | 9 | 9 | 2 | 2 | 2 | 2 | ||||||||||||||
T Bourne | 9 | 9 | 1 | 1 | 2 | 2 | 2 | 2 | ||||||||||||
C B Carter | 9 | 9 | 1 | 1 | 2 | 2 | 2 | 2 | ||||||||||||
Dr J R Williams | 9 | 9 | 3 | 3 | 2 | 2 | 2 | 2 | ||||||||||||
Dr H M Nugent | 3 | 3 | 1 | 1 | ||||||||||||||||
| H: | Number of meetings held during the time that the Director held office or was a member of the committee during the year |
| A: | Number of meetings attended |
Directors’ shareholdings
The relevant interest of each Director in the shares, debentures, interests in registered schemes and rights or options over such instruments issued by the companies within the consolidated entity and other related bodies corporate, as notified by the Directors to the Australian Stock Exchange in accordance with S205G (1) of the Corporations Act 2001, at the date of this report is as follows:
Director | Ordinary shares and prescribed interests as at 20 Aug 2003 | Options over ordinary shares as at 20 Aug 2003 | |||
H K McCann | 204,220 | — | |||
G A King | 100,986 | 1,586,750 | (1) | ||
B G Beeren | 69,464 | 650,000 | (2) | ||
T Bourne | 16,658 | — | |||
C B Carter | 16,000 | — | |||
Dr J R Williams | 17,178 | — | |||
Dr H M Nugent | 2,000 | — | |||
Exercise price for options:
| (1) | 50,000:$1.66,36,750 :$1.76,750,000:$1.27,750,000: $3.20 |
| (2) | 400,000: $1.27,250,000: $3.20 |
Dividends
Dividends paid during the year by Origin Energy Limited were as follows:
| $’000 | ||
Final dividend of 3.0 cents per ordinary share fully franked at 30% for the year ended 30 June 2002 paid 21 October 2002 | 19,435 | |
Interim dividend of 5.0 cents per ordinary share franked to 2.0 cents at 30% for the half year ended 31 December 2002 paid 24 March 2003 | 32,655 | |
In respect of the current financial year, the Directors have declared a final dividend as follows:
| $’000 | ||
Final dividend of 5.0 cents per ordinary share franked to 2.0 cents per share at 30% for the year ended 30 June 2003 payable 3 October 2003 | 32,885 | |
Principal activities
The Company operates energy businesses including:
| • | exploration and production of oil and gas; |
| • | electricity generation; |
| • | wholesale and retail sale of electricity and gas; and |
| • | investment in, and the management of, utility infrastructure. |
Review of operations
The Directors’ review of the operations of the Company during the year and the results of those operations are as stated in the Managing Director’s Review on pages 4 to 7 and the Operations Review on pages 10 to 24.
Significant changes in the state of affairs
There were no significant changes in the state of affairs of the Company other than those described in the Managing Director’s Review and the Operations Review.
Environmental regulation and performance
The Company’s operations are subject to significant environmental regulation under both Commonwealth and State legislation. The Company’s performance in relation to the environmental regulation is detailed on pages 22 and 23.
Events subsequent to balance date
No matters or circumstances have arisen since 30 June 2003, which have significantly affected, or may significantly affect:
| i) | the Company’s operations in future financial years; or |
| ii) | results of those operations in future financial years; or |
| iii) | the Company’s state of affairs in future financial years; |
other than as follows:
| • | On 11 July 2003, Origin Energy Limited announced a takeover offer of $4.25 per share for the shares in Oil Company of Australia Limited (“OCA”) that it did not already own. An offer was made to OCA shareholders on 20 August 2003 and the offer is scheduled to close on 22 September 2003. If successful, the acquisition is expected to cost $74 million. |
| • | Since the end of the financial year, the Directors have declared a final dividend of 5 cents per share, franked to 2 cents per share at 30%, payable 3 October 2003. |
The financial effects of the above transactions have not been brought to account in the financial statements for the year ended 30 June 2003.
Future developments and expected results of operations
Likely developments of the Company’s operations in future financial years and the expected results of those operations are referred to in the Chairman’s Message, Managing Director’s Review and the Operations Review from page 2.
Further information about likely developments in the operations of the Company and the expected results of those operations in future financial years has not been included in this report because disclosure of the information would be likely to result in unreasonable prejudice to the Company.
ORIGIN ENERGY33
Directors’ Report
Directors’ and senior executives’ emoluments
The Board Remuneration Committee is responsible for decisions on remuneration policies and packages applicable to the Board and senior executives of the Company.
The Company’s remuneration policy is described in the Corporate Governance section from page 29.
Details of the nature and amount of each element of the emoluments of each Director of Origin Energy Limited and the five named officers of the Company receiving the highest emolument during the year are set out in the table below.
Options
During or since the end of the financial year, Origin Energy Limited granted options over unissued ordinary shares under the Senior Executive Option Plan. The Directors’ and senior executives’ emoluments table shows the value of those options (as allocated per note (b) on page 35) that were issued to Directors and to the five most highly remunerated officers of the Company as part of their remuneration.
Options granted under the Senior Executive Option Plan entitle the holder to subscribe for one fully paid ordinary share at an exercise price determined by the prevailing market price at the time of the issuance of the options. The options are exercisable at any time after the third anniversary of the grant and prior to the fifth anniversary of the grant, provided that relevant exercise hurdle rates are met within this period (as described in the options table on page 35).
As at the date of this report, unissued shares of Origin Energy Limited under option are set out in the options table on page 35.
Full details of persons who hold options are entered in the register of option holders at ASX Perpetual Registrars Limited, Securities Registration Service, 580 George Street, Sydney, New South Wales. The register may be inspected free of charge by shareholders.
During or since the end of the financial year, Origin Energy Limited issued ordinary shares as a result of the exercise of options, which are set out in the table on page 35. These options were exercised by Origin and Boral employees, and former employees who had received options, prior to the Boral demerger. There were no amounts unpaid on the shares issued.
Indemnities and insurance for officers and Directors
Origin Energy Limited has agreed to indemnify the current Directors and certain former Directors against all liabilities to other persons (other than the Company or a related body corporate) that may arise from their positions as Directors of Origin Energy Limited and its controlled entities, except where the liability arises out of conduct involving a lack of good faith. The agreements stipulate that Origin Energy Limited will meet the full amount of any such liabilities, including costs and expenses.
Since the end of the previous financial year, the Company has paid insurance premiums in respect of Directors’ and officers’ liability, and legal expense insurance contracts for current and former Directors and officers, including executive officers and Directors of Origin senior Energy Limited and executive officers and secretaries of its controlled entities. A condition of the insurance contracts is that the nature of the liability indemnified and the related premium not be disclosed.
Rounding off
Origin Energy Limited is a company of a kind referred to in ASIC Class Order 98/100 dated 10 July 1998 and in accordance with that class order, amounts in the financial report and Directors’ Report have been rounded off to the nearest thousand dollars unless otherwise stated.
Signed in accordance with a resolution of Directors:
/s/ H KEVIN MCCANN |
H Kevin McCann, Chairman Sydney, 20 August 2003 |
Directors’ and senior executives’ emoluments
| Fixed remuneration $ | Variable remuneration $ | Non-cash benefits $ | Super - annuation contributions $ | Accrued retirement/ NED Share Plan benefits (a) $ | Value of options issued Past years (b) $ | Value of options issued Current year (b) $ | Total $ | Number of options issued Current year (c) | ||||||||||
Directors | ||||||||||||||||||
Non-executive | ||||||||||||||||||
Mr H K McCann | 185,000 | — | — | 30,833 | 41,178 | — | — | 257,011 | — | |||||||||
Mr T Bourne | 80,000 | — | — | 10,444 | 21,278 | — | — | 111,722 | — | |||||||||
Mr C B Carter | 75,000 | — | — | 9,792 | 19,457 | — | — | 104,249 | — | |||||||||
Dr J R Williams | 90,000 | — | — | 11,750 | 25,883 | — | — | 127,633 | — | |||||||||
Dr H M Nugent | 21,587 | — | — | 1,943 | 5,233 | — | — | 28,763 | — | |||||||||
Executive | ||||||||||||||||||
Mr G A King | 865,976 | 422,000 | 45,709 | 25,000 | — | 245,353 | — | 1,604,038 | — | |||||||||
Mr B G Beeren | 481,720 | 267,000 | 24,681 | — | — | 156,029 | — | 929,430 | — | |||||||||
Executive officers (excluding Directors) | ||||||||||||||||||
Ms K A Moses | 414,612 | 167,000 | 45,699 | 34,681 | — | 80,497 | 38,036 | 780,525 | 200,000 | |||||||||
Mr A M Stock | 345,167 | 137,000 | 2,429 | 58,333 | — | 69,476 | 24,724 | 637,129 | 130,000 | |||||||||
Mr J M Piper | 318,832 | 137,000 | 30,063 | 58,604 | — | 59,839 | 24,724 | 629,062 | 130,000 | |||||||||
Mr P J Vines | 377,728 | 123,000 | 11,336 | — | — | 54,783 | 24,724 | 591,571 | 130,000 | |||||||||
Dr R J Willink | 267,851 | 124,000 | 34,484 | 46,999 | — | 48,463 | 19,018 | 540,815 | 100,000 | |||||||||
34 ANNUAL REPORT 2003
Footnotes to Directors’ and senior executive’ emoluments table
| (a) | Non-executive Directors appointed prior to 31 December 2002 were entitled to a retirement benefit under the Retirement Benefit Scheme that was approved by shareholders in 1989. The scheme was terminated at 31 December 2002 and entitlements under the scheme were frozen as a multiple of annual average fees over the final three years of service. The accrued benefits under the scheme from the date of Directors’ appointments to the termination of the scheme were: H K McCann $154,111, T Bourne $52,179, J R Williams $64,731 and C B Carter $48,747. |
Since 1 January 2003, amounts equivalent to the retirement benefit have been directed to the acquisition of shares under the Non-Executive Directors’ Share Plan, approved by shareholders in October 1999.
The first acquisition of shares under the Non-Executive Directors’ Share Plan will occur in the month following the announcement of the year-end results in accordance with the rules of the Plan. Non-executive Directors are required to own up to 25,000 shares in Origin Energy Limited after which the retirement benefit may be directed to superannuation.
| (b) | The value of options issued has been determined at the date of grant in accordance with the ASIC “Guidelines to Valuing Options in Annual Directors’ Reports” dated 30 June 2003. |
The options have been independently valued by Mercer using a Monte Carlo simulation technique. This approach adopts the same principles and assumptions utilised in the Black-Scholes formula but allows for the Total Shareholder Return (TSR) Performance Hurdles to be incorporated into the valuation process in an appropriate manner. In the absence of the performance hurdles and assuming that all options are held for the full term to expiry, the Monte Carlo and Black-Scholes techniques would produce the same results. The valuation was completed at the date the options were granted or shareholder approval received, where applicable. The key parameters used in the valuation of options issued during the year ended 30 June 2003 were a risk free rate of 4.78% per annum, a volatility factor of 29.7%, dividend yield of 2.5% and an option term of five years.
The fair value of these options at the date of grant has been allocated equally over the vesting period and the amount applicable to the current year has been included as remuneration in the table above. In accordance with Australian Accounting Standards these amounts are not required to be expensed in the Statement of Financial Performance.
| (c) | All options have an exercise price of $3.56. |
Options
| Senior Executive Option Plan | Other(5) | First exercise date | Expiry date | Exercise price per share $ | Hurdle price per share $ | |||||||
Pre demerger | 180,000 | 165,000 | 4 Dec 2001 | 4 Dec 2003 | 1.66 | 2.00(1) | ||||||
| — | 50,000 | 4 Dec 2001 | 4 Dec 2003 | 1.50 | 1.80(1) | |||||||
| — | 1,250,000 | 1 Feb 2002 | 1 Feb 2004 | 2.24 | (2) | |||||||
| 239,050 | 547,050 | 6 Dec 2002 | 6 Dec 2004 | 1.76 | (2) | |||||||
| — | 55,500 | 6 Dec 2002 | 6 Dec 2004 | 1.78 | (2) | |||||||
Post demerger | 2,230,000 | — | 1 Mar 2003 | 1 Mar 2005 | 1.27 | (3) | ||||||
| 495,000 | — | 31 Aug 2004 | 31 Aug 2006 | 2.74 | (4) | |||||||
| 3,495,000 | — | 16 Dec 2004 | 16 Dec 2006 | 3.20 | (4) | |||||||
| 30,000 | — | 14 Jan 2005 | 14 Jan 2007 | 3.20 | (4) | |||||||
| 2,630,000 | — | 19 Dec 2005 | 19 Dec 2007 | 3.56 | (4) | |||||||
Shares issued by the exercise of options during or since the end of the financial year
No. of shares | Amount paid on each share | ||
1,155,000 | $ | 2.92 | |
360,000 | $ | 1.66 | |
879,800 | $ | 1.76 | |
83,900 | $ | 1.78 | |
Footnotes to options table
| (1) | The exercise hurdle requires that the company share price achieve the hurdle price for at least 20 consecutive days from date of grant to expiry date. The options were issued prior to the Boral demerger in February 2000. |
| (2) | The performance hurdle for these options is based on an improvement in the TSR index, i.e. the index measuring Total Shareholder Returns maintained by the Australian Stock Exchange that calculates the share price movement of ordinary shares after notional reinvestment of dividends. The TSR index must increase from the issue date by a specified percentage during a period of 20 consecutive trading days beginning 2.5 years from the date of issue. |
| (3) | The performance hurdle for these options is based on the TSR index, i.e. the index measuring total shareholder returns maintained by the Australian Stock Exchange that calculates the share price movement of ordinary shares after notional reinvestment of dividends. Whether the exercise hurdle is satisfied within the exercise period is determined by comparing the TSR index of the Company with the TSR index of a predetermined reference group of Australian listed companies. The percentage of options that may be exercised is calculated on a sliding scale dependent upon the company’s performance against the reference group of companies. The percentage of options that may be exercised is 0% if the TSR fails to reach the 25th percentile of the reference group of companies, 25% if the TSR reaches the 25th percentile, 50% if it reaches the 50th percentile and 100% if it reaches the 75th percentile. |
| (4) | The performance hurdle for these options is based on the TSR index, i.e. the index measuring total shareholder returns maintained by the Australian Stock Exchange that calculates the share price movement of ordinary shares after notional reinvestment of dividends. Whether the exercise hurdle is satisfied within the exercise period is determined by comparing the TSR index of the company with the TSR index of a predetermined reference group of Australian listed companies. The percentage of options that may be exercised is calculated on a sliding scale dependent upon the company’s performance against the reference group of companies. If the Origin TSR reaches the 50th percentile, 50% of the options may be exercised and if it reaches the 75th percentile, 100% of the options may be exercised. The reference group of companies is available to shareholders and may be accessed via the company’s website. |
| (5) | Options issued prior to the Boral demerger held by non-employees pursuant to the terms of the demerger. |
ORIGIN ENERGY35
Discussion and Analysis – Statement of Financial Performance
Origin Energy recorded a net profit after tax of $162.0 million for the year ended 30 June 2003, an increase of 26% on the prior year. The increased result was driven predominantly by:
| • | the strong contribution from electricity following the acquisition of the electricity retail business from CitiPower; |
| • | a reduction in electricity purchasing costs due to favourable electricity contracts and pool prices; |
| • | a further reduction in retained profit payments to the Victorian Government; |
| • | an increased contribution from power generation reflecting the acquisition of the Mt Stuart Power Station; and |
| • | higher oil prices and sales from new producing fields in the Perth Basin. |
Basic earnings per share increased by 4.6 cents or 23% in comparison to the prior year, to 24.8 cents per share, while diluted earnings per share increased by 4.6 cents to 24.7 cents per share.
Total revenue for the year was up 38% to $3.4 billion. Sales revenue increased by $937.4 million, which largely represents additional revenue in Retail attributable to the electricity retail business acquired from CitiPower on 19 July 2002 for $131.6 million.
The strong performance by Retail and Generation contributed to a 21% increase in earnings before interest, tax, depreciation and amortisation (EBITDA) to $491.3 million compared with $404.6 million in the prior year. Earnings before interest and t tax (EBIT) increased 28% on the prior year to $295.3 million.
Borrowing costs for the year were $50.1 million, an increase of $5.7 million on the prior year. The increase in borrowing costs is primarily due to higher average debt levels during the current year that arose from investing activities, and in particular, the electricity retail business acquisition from CitiPower.
Income tax expense for the year totalled $80.2 million, an increase of $26.0 million in comparison to the prior year. Prima facie tax expense on net profit increased by $17.5 million to $74.0 million (2002: $56.4 million). Also included in tax expense is non-deductible depreciation and amortisation of licences, goodwill and certain exploration assets of $12.6 million (2002: $16.5 million). No benefits from subvention payments were recognised in the current year (2002: $11.3 million).
36 ANNUAL REPORT 2003
Statement of Financial Performance
for year ended 30 June
Note | Consolidated $’000 | Consolidated $’000 | ||||||
Revenue from ordinary activities | 3 | 3,352,303 | 2,428,808 | |||||
Expenses from ordinary activities excluding borrowing costs | 3 | (3,068,179 | ) | (2,204,790 | ) | |||
Borrowing costs | (50,138 | ) | (44,476 | ) | ||||
Share of net profits of associates and joint venture entities accounted for using the equity method | 12,565 | 8,338 | ||||||
Profit from ordinary activities before related income tax expense | 246,551 | 187,880 | ||||||
Income tax expense relating to ordinary activities | 4 | 80,248 | 54,280 | |||||
Net profit | 166,303 | 133,600 | ||||||
Net profit attributable to outside equity interests | 4,351 | 4,940 | ||||||
Net profit attributable to members of the parent entity, Origin Energy Limited | 10 | 161,952 | 128,660 | |||||
Non-owner transaction changes in equity: | ||||||||
Net decrease in retained profits on initial adoption of revised AASB 1028 “Employee Benefits” | (283 | ) | — | |||||
Net exchange difference relating to self-sustaining foreign operations | (1,779 | ) | (1,444 | ) | ||||
Total revenues, expenses and valuation adjustments attributable to members of Origin Energy Limited recognised directly in equity | (2,062 | ) | (1,444 | ) | ||||
Total changes in equity from non-owner related transactions attributable to members of the parent entity, Origin Energy Limited | 10 | 159,890 | 127,216 | |||||
Basic earnings per share | 9 | 24.8 | ¢ | 20.2 | ¢ | |||
Diluted earnings per share | 9 | 24.7 | ¢ | 20.1 | ¢ | |||
The Statement of Financial Performance should be read in conjunction with the Discussion and Analysis on page 36 and the accompanying notes to the financial statements set out on pages 42 to 49.
ORIGIN ENERGY37
Discussion and Analysis – Statement of Financial Position
Total assets of the consolidated entity increased by $451 million over the year to $3.41 billion while total liabilities increased by $287 million to $1.62 billion at 30 June 2003. Thus net assets of the consolidated entity increased by $164 million, from $1.63 billion to $1.79 billion. Net tangible assets per share remained at $1.48 at 30 June 2003.
Total assets of the consolidated entity increased by $451 million, principally as a result of:
| - | an increase in current and non-current receivables of $146 million primarily due to new customers acquired through the acquisition of the electricity retail business of CitiPower ($86 million), income tax prepayments of $37 million and foreign currency hedge receivables of $16 million; |
| - | an increase in inventories of $8 million primarily due to the acquisition of inventories of $5 million as part of the acquisition of the Mt Stuart Power Station; |
| - | an increase of $6 million in other current assets due to additional prepayments of $3 million and purchases of renewable energy certificates of $3 million; |
| - | a reduction in other financial assets of $25 million due to the amortisation of commodity hedging contracts of $22 million and a $3 million provision for write-down of an investment in listed shares; |
| - | increases in property, plant and equipment of $197 million and exploration, evaluation and development expenditure of $24 million, mainly comprising: |
| - | the acquisition of the Mt Stuart Power Station ($89 million); |
| - | acquisitions of coal seam gas interests and further expenditure to explore and develop coal seam gas resources in Queensland ($80 million); |
| - | BassGas and Offshore Otway Gas Projects ($62 million); |
| - | further spending on Retail systems development ($14 million); |
| - | stay-in-business capital expenditure ($97 million); |
| - | exploration and development in the Perth Basin ($24 million); |
| - | other exploration and development in producing areas ($9 million); |
| - | other growth projects ($13 million); and |
| - | depreciation and amortisation of $140 million and provision for write-down of exploration and evaluation costs of $14 million; |
| - | an increase in intangible assets of $144 million resulting from goodwill acquired as part of the acquisition of the electricity retail business of CitiPower of $149 million, amortisation of $32 million, and restatements of $26 million relating to tax assets and tax liabilities acquired through acquisition; and |
| - | a reduction of deferred tax assets of $48 million primarily arising from the restatement of future income tax benefits acquired through past acquisitions and utilisation of tax losses. |
Total liabilities of the consolidated entity, excluding interest-bearing liabilities, increased by $189 million, principally as a result of:
| - | an increase in current and non-current payables of $109 million, mainly due to additional payables resulting from the acquisition of the electricity retail business of CitiPower ($82 million), increased payables of $20 million due to the timing of growth capital expenditure, recognition of deferred gains in relation to foreign currency hedges of $16 million, offset by subvention payments of $10 million; |
| - | an increase in current and non-current provisions of $36 million, comprising: |
| - | provisions for loss-making contracts of $38 million, provision for legal dispute of $6 million and provisions for transaction and integration costs of $5 million, all arising from the acquisition of the electricity retail business of CitiPower; |
| - | a reduction in the provision for dividends of $19 million, due to a change in accounting policy, refer note 1; |
| - | recognition of a provision for the current deficit in the superannuation defined benefit plan of $5 million; |
| - | provision for an interest rate swap of $3 million acquired as part of the acquisition of the Mt Stuart Power Station; |
| - | reversal of an insurance loss provision of $6 million; |
| - | a reduction representing payments against other provisions of $6 million; and |
| - | an increase in employee related provisions of $7 million; and |
| - | a reduction in current tax liabilities of $3 million offset by an increase in deferred tax liabilities of $47 million, which largely reflects movements in balances that are deductible or assessable for tax purposes in a period different to that for accounting purposes. |
Interest-bearing liabilities increased by $98 million largely as a result of the funding of acquisitions and capital expenditure during the year, offset by funds generated from operating activities.
Contributed equity (share capital) increased by $33.6 million during the year as a result of the issue of 7.5 million shares for $28.2 million in accordance with the Dividend Reinvestment Plan, and 2.3 million shares for $5.4 million in accordance with the Senior Executive Option Plan.
An interim dividend of 5 cents per share franked to 2 cents per share, totalling $32.7 million, was paid on 24 March 2003. Subsequent to year end, the company declared a final dividend of 5 cents per share, franked to 2 cents per share of $32.9 million. This will result in a final dividend payout ratio of 40.5% of current year profit.
38 ANNUAL REPORT 2003
Statement of Financial Position
as at 30 June
Note | Consolidated $’000 | Consolidated $’000 | ||||
Current assets | ||||||
Cash assets | 16,431 | 17,255 | ||||
Receivables | 621,085 | 485,538 | ||||
Inventories | 53,913 | 46,392 | ||||
Other | 43,063 | 37,064 | ||||
Total current assets | 734,492 | 586,249 | ||||
Non-current assets | ||||||
Receivables | 31,675 | 21,499 | ||||
Investments accounted for using the equity method | 55,272 | 53,347 | ||||
Other financial assets | 170,713 | 196,135 | ||||
Property, plant and equipment | 1,352,527 | 1,155,372 | ||||
Exploration, evaluation and development expenditure | 154,300 | 130,655 | ||||
Intangible assets | 777,948 | 634,436 | ||||
Deferred tax assets | 123,192 | 171,654 | ||||
Other | 8,622 | 8,587 | ||||
Total non-current assets | 2,674,249 | 2,371,685 | ||||
Total assets | 3,408,741 | 2,957,934 | ||||
Current liabilities | ||||||
Payables | 475,026 | 371,534 | ||||
Interest-bearing liabilities | 85,522 | 85,238 | ||||
Current tax liabilities | 546 | 3,290 | ||||
Provisions | 71,330 | 67,451 | ||||
Total current liabilities | 632,424 | 527,513 | ||||
Non-current liabilities | ||||||
Payables | 11,840 | 6,100 | ||||
Interest-bearing liabilities | 663,012 | 565,139 | ||||
Deferred tax liabilities | 243,904 | 197,055 | ||||
Provisions | 67,957 | 36,088 | ||||
Total non-current liabilities | 986,713 | 804,382 | ||||
Total liabilities | 1,619,137 | 1,331,895 | ||||
Net assets | 1,789,604 | 1,626,039 | ||||
Equity | ||||||
Contributed equity | 7 | 418,612 | 385,039 | |||
Reserves | 110,764 | 112,347 | ||||
Retained profits | 10 | 1,223,977 | 1,095,158 | |||
Total parent entity interest | 1,753,353 | 1,592,544 | ||||
Outside equity interests | 36,251 | 33,495 | ||||
Total equity | 10 | 1,789,604 | 1,626,039 | |||
The Statement of Financial Position should be read in conjunction with the Discussion and Analysis on page 38 and the accompanying notes to the financial statements set out on pages 42 to 49.
ORIGIN ENERGY39
Discussion and Analysis – Statement of Cash Flows
Earnings before interest, tax, depreciation and amortisation (EBITDA) increased 21% to $491 million compared to $405 million last year. Refer to commentary in the Discussion and Analysis of the Statement of Financial Performance.
Distributions and dividends from equity accounted joint venture entities and associated entities totalling $11 million were received during the year, compared to $6 million in the prior year.
Net interest paid increased from $43 million to $49 million, primarily due to the higher level of average debt during the year compared to the prior year.
Income tax paid during the year increased by $17 million to $40 million due to tax being paid in accordance with the Australian Taxation Office instalment rate. Subvention payments made during the year totalled $10 million, a reduction of $8 million from the prior year.
Net cash provided by operating activities thus increased by $102 million, from $321 million to $423 million for the year ended 30 June 2003.
Capital expenditure on property, plant and equipment and exploration and development for the year totalled $279 million excluding acquisitions, down $26 million from the prior year. Stay-in-business capital expenditure increased $31 million from $66 million to $97 million. Exploration and production activities accounted for $74 million of this expenditure, of which two-thirds was attributable to the Cooper Basin. Growth capital expenditure decreased $57 million from $239 million in the prior year to $182 million. The major components of growth capital expenditure in the current year were:
| - | $43 million on development of the BassGas Project and the Thylacine and Geographe fields in the offshore Otway Basin; |
| - | $50 million on purchase of additional coal seam gas interests; |
| - | $30 million on exploration and development of coal seam gas resources in Queensland; |
| - | $24 million on exploration and development in the Perth Basin; |
| - | $9 million on exploration and development activities around the producing centres of the Cooper Basin, Surat Basin and Otway Basin; and |
| - | $14 million on systems for full retail contestability in electricity and natural gas. |
Proceeds from the sale of non-current assets decreased $15 million from the prior year, while payments for investments decreased $15 million from the prior year. Included in the prior year were proceeds from the sale of upstream non-current assets and an additional investment in Envestra Limited.
Origin acquired the electricity retail business of CitiPower for $132 million in July 2002, and also acquired the following controlled entities:
| - | AES Australia Holding BV and AES Mt Stuart BV (which hold the Mt Stuart Power Station) for $89 million in December 2002; and |
| - | Hylemit Pty Ltd (trading as Treston Gas) for $4 million in June 2003. |
The prior year amount of $87 million related to the acquisition of Fletcher Challenge South West Cogeneration Ltd, Transfield CSM Pty Ltd and Gasmart (Vic) Pty Ltd.
Proceeds from the issue of shares in accordance with the Senior Executive Option Plan totalled $5 million during the year. Dividends paid, net of dividends reinvested, in the current year totalled $26 million, compared to $35 million in the prior year.
Net proceeds from borrowings were $105 million in the current year, compared to a net repayment of borrowings of $99 million in the prior year. The net debt to capitalisation ratio at 30 June 2003 was 29% (2002: 28%).
40 ANNUAL REPORT 2003
Statement of Cash Flows
for year ended 30 June
| Note | Consolidated 2003 $’000 | Consolidated 2002 $’000 | |||||||
Cash flows from operating activities | |||||||||
Cash receipts in the course of operations | 3,703,004 | 2,553,539 | |||||||
Cash payments in the course of operations | (3,193,463 | ) | (2,155,062 | ) | |||||
Dividends/distributions received from associates/joint venture entities | 10,998 | 6,000 | |||||||
Other dividends received | 413 | 409 | |||||||
Interest received | 1,832 | 1,785 | |||||||
Borrowing costs paid | (50,571 | ) | (44,919 | ) | |||||
Income taxes paid | (39,619 | ) | (22,455 | ) | |||||
Subvention payments | (10,000 | ) | (18,000 | ) | |||||
Net cash provided by operating activities | 422,594 | 321,297 | |||||||
Cash flows from investing activities | |||||||||
Payments for purchases of property, plant and equipment | (146,776 | ) | (169,464 | ) | |||||
Payments for exploration, development and mine properties | (132,454 | ) | (135,379 | ) | |||||
Proceeds from sale of non-current assets | 3,494 | 18,613 | |||||||
Payments for purchases of investments | (459 | ) | (15,904 | ) | |||||
Payments for purchases of businesses | 6 | (c) | (131,614 | ) | — | ||||
Payments for purchases of controlled entities | 6 | (c) | (93,107 | ) | (87,452 | ) | |||
Net cash used in investing activities | (500,916 | ) | (389,586 | ) | |||||
Cash flows from financing activities | |||||||||
Proceeds from borrowings | 1,092,626 | 385,591 | |||||||
Repayments of borrowings | (987,675 | ) | (485,000 | ) | |||||
Dividends paid | (25,858 | ) | (35,282 | ) | |||||
Proceeds from issues of securities | 7 | 5,417 | 198,465 | ||||||
Net cash provided by financing activities | 84,510 | 63,774 | |||||||
Net increase/(decrease) in cash held | 6,188 | (4,515 | ) | ||||||
Cash and cash equivalents at the beginning of the year | 10,551 | 15,910 | |||||||
Effect of exchange rate changes on cash | (308 | ) | (844 | ) | |||||
Cash and cash equivalents at the end of the year | 6 | (a) | 16,431 | 10,551 | |||||
The Statement of Cash Flows should be read in conjunction with the Discussion and Analysis on page 40 and the accompanying notes to the financial statements set out on pages 42 to 49.
ORIGIN ENERGY41
Notes to the Financial Statements
| 1. | Basis of preparation of the Concise Financial Report |
The Concise Financial Report has been prepared in accordance with the Corporations Act 2001, Accounting Standard AASB 1039 “Concise Financial Reports” and applicable Urgent Issues Group Consensus Views. The financial statements and specific disclosures required by AASB 1039 have been derived from the consolidated entity’s Full Financial Statements for the financial year. Other information included in the Concise Financial Report is consistent with the consolidated entity’s Full Financial Statements. The Concise Financial Report does not, and cannot be expected to, provide as full an understanding of the financial performance, financial position and financing and investing activities of the consolidated entity as the Full Financial Statements. It has been prepared on the basis of historical costs and, except where stated, does not take into account changing money values or current valuations of non-current assets.
The accounting policies have been consistently applied by each entity in the consolidated entity and, except where there is a change in an accounting policy, are consistent with those of the previous year.
A full description of the accounting policies adopted by the consolidated entity may be found in the consolidated entity’s Full Financial Statements.
| Changes in accounting policies |
Provisions, contingent liabilities and contingent assets
The consolidated entity has applied AASB 1044 “Provisions, Contingent Liabilities and Contingent Assets” for the first time from 1 July 2002. Dividends are now recognised at the time they are declared, determined or publicly recommended. Previously, final dividends were recognised in the financial year to which they related, despite the dividends being announced after the end of that financial year. The adjustments to the consolidated financial report as at 1 July 2002 as a result of this change were an increase of $19,435,000 in opening retained profits (refer note 10) and a corresponding reduction in the provision for dividends reported in current provisions at the beginning of the current financial year. Had the new accounting policy been applied in the previous financial year, the provision for dividends of $19,435,000 would have been nil.
Employee benefits
The consolidated entity has applied the revised AASB 1028 “Employee Benefits” for the first time from 1 July 2002. The liabilities for wages and salaries, annual leave and sick leave are measured at the amounts expected to be paid when the liabilities are settled. The initial adjustments to the consolidated financial report as at 1 July 2002 as a result of this change were an increase of $404,000 in provision for employee benefits, a decrease of $283,000 in opening retained profits, and an increase of $121,000 in future income tax benefit.
Foreign currency translation
The consolidated entity has applied the revised AASB 1012 “Foreign Currency Translation” for the first time from 1 July 2002. For hedges of specific purchases or sales, the costs (or gains) of entering the hedge and the unrealised exchange differences up to the date of the specific purchase or sale are now deferred and recognised as assets or liabilities in the Statement of Financial Position from the inception of the hedge contract, not when the specific purchase or sale occurs. As a result of this change in accounting policy, payables and receivables were increased by $15,843,000 representing deferred foreign currency hedge exchange gains and a net hedge receivable as at 30 June 2003.
42 ANNUAL REPORT 2003
| 2. | Segments |
(a) Primary reporting – | Exploration and Production | Retail | Generation | Networks | Consolidated | ||||||||||||||||||||
| 2003 $’000 | 2002 $’000 | 2003 $’000 | 2002 $’000 | 2003 $’000 | 2002 $’000 | 2003 $’000 | 2002 $’000 | 2003 $’000 | 2002 $’000 | ||||||||||||||||
Revenue | |||||||||||||||||||||||||
Total sales | 330,302 | 304,736 | 2,836,474 | 1,937,770 | 97,308 | 63,174 | 149,270 | 125,382 | 3,413,354 | 2,431,062 | |||||||||||||||
Intersegment sales elimination* | (43,989 | ) | (41,884 | ) | — | — | (42,816 | ) | — | — | — | (86,805 | ) | (41,884 | ) | ||||||||||
External sales revenue | 286,313 | 262,852 | 2,836,474 | 1,937,770 | 54,492 | 63,174 | 149,270 | 125,382 | 3,326,549 | 2,389,178 | |||||||||||||||
Other revenue | 1,534 | 24,116 | 4,681 | 1,172 | 1,667 | 2 | 14,490 | 12,037 | 22,372 | 37,327 | |||||||||||||||
Total segment revenue | 287,847 | 286,968 | 2,841,155 | 1,938,942 | 56,159 | 63,176 | 163,760 | 137,419 | 3,348,921 | 2,426,505 | |||||||||||||||
Unallocated revenue | 3,382 | 2,303 | |||||||||||||||||||||||
Revenue from ordinary activities | 3,352,303 | 2,428,808 | |||||||||||||||||||||||
Result | |||||||||||||||||||||||||
Segment result | 103,272 | 103,209 | 142,123 | 91,341 | 15,677 | 7,904 | 21,632 | 19,892 | 282,704 | 222,346 | |||||||||||||||
Share of net profits of associates and joint venture entities | — | — | 1,694 | 686 | 10,871 | 7,652 | — | — | 12,565 | 8,338 | |||||||||||||||
Earnings before interest and tax (EBIT) | 103,272 | 103,209 | 143,817 | 92,027 | 26,548 | 15,556 | 21,632 | 19,892 | 295,269 | 230,684 | |||||||||||||||
Net interest expense | (48,718 | ) | (42,804 | ) | |||||||||||||||||||||
Profit from ordinary activities before income tax | 246,551 | 187,880 | |||||||||||||||||||||||
Income tax expense | (80,248 | ) | (54,280 | ) | |||||||||||||||||||||
Net profit | 166,303 | 133,600 | |||||||||||||||||||||||
Earnings before interest, tax, depreciation and amortisation (EBITDA) | 187,565 | 185,180 | 232,055 | 166,755 | 48,258 | 30,202 | 23,448 | 22,473 | 491,326 | 404,610 | |||||||||||||||
Depreciation and amortisation | 84,293 | 81,971 | 88,238 | 74,728 | 21,710 | 14,646 | 1,816 | 2,581 | 196,057 | 173,926 | |||||||||||||||
Other non-cash expenses | 23,600 | 15,501 | 10,270 | 18,494 | 694 | 1,122 | 963 | 3,059 | 35,527 | 38,176 | |||||||||||||||
Acquisitions of non-current assets (includes capital expenditure) | 253,604 | 184,632 | 169,628 | 86,308 | 100,579 | 116,312 | 538 | 15,932 | 524,349 | 403,184 | |||||||||||||||
Assets | |||||||||||||||||||||||||
Segment assets | 1,081,787 | 886,348 | 1,633,050 | 1,405,555 | 309,183 | 232,894 | 189,826 | 190,881 | 3,213,846 | 2,715,678 | |||||||||||||||
Equity accounted investments | — | — | 5,966 | 4,265 | 48,956 | 49,082 | 350 | — | 55,272 | 53,347 | |||||||||||||||
Total segment assets | 1,081,787 | 886,348 | 1,639,016 | 1,409,820 | 358,139 | 281,976 | 190,176 | 190,881 | 3,269,118 | 2,769,025 | |||||||||||||||
Unallocated assets** | 139,623 | 188,909 | |||||||||||||||||||||||
Total assets | 3,408,741 | 2,957,934 | |||||||||||||||||||||||
Liabilities | |||||||||||||||||||||||||
Segment liabilities | 110,284 | 82,681 | 464,108 | 349,912 | 12,298 | 10,086 | 39,463 | 38,494 | 626,153 | 481,173 | |||||||||||||||
Unallocated liabilities** | 992,984 | 850,722 | |||||||||||||||||||||||
| �� | |||||||||||||||||||||||||
Total liabilities | 1,619,137 | 1,331,895 | |||||||||||||||||||||||
| * | Intersegment pricing is determined on an arm’s-length basis. Intersegment sales are eliminated on consolidation. With effect from 1 July 2002, a tolling arrangement was established between Retail and Generation in relation to the consolidated entity’s three merchant power stations. The tolling arrangement pricing is at commercial rates. The external revenue from the merchant power stations is now recognized in Retail’s revenue while Generation receives a tolling fee from Retail for the capacity provided and costs incurred by these power stations. Comparative amounts have not been restated. |
| ** | Unallocated assets consists of cash and deferred tax assets. Unallocated liabilities consists of current and non-current interest-bearing liabilities and current and deferred tax liabilities. |
Corporate revenue and expenses are allocated across business segments on the basis of external sales revenue. Corporate assets and liabilities are allocated across business segments based on their share of total assets and total liabilities.
| Industry segments: | Products and services: | |
Exploration and Production | Natural gas and oil | |
Retail | Natural gas, electricity, LPG, energy related products and services | |
Generation | Natural gas-fired cogeneration and power generation | |
Networks | Infrastructure investment and management services |
| (b) Secondary reporting – geographical segments |
The consolidated entity operates predominantly in Australia. More than 90% of revenue, profit, assets and acquisitions of non-current assets relate to operations in Australia.
ORIGIN ENERGY43
Notes to the Financial Statements
| Consolidated 2003 $’000 | Consolidated 2002 $’000 | |||||
3. Profit from ordinary activities | ||||||
(a) Revenue from ordinary activities | ||||||
Revenue from operating activities: | ||||||
Revenue from sale of goods | 3,176,888 | 2,263,727 | ||||
Revenue from rendering of services | 149,661 | 125,451 | ||||
Total sales revenue | 3,326,549 | 2,389,178 | ||||
Revenue from outside operating activities | 25,754 | 39,630 | ||||
Revenue from ordinary activities | 3,352,303 | 2,428,808 | ||||
(b) Expenses from ordinary activities excluding borrowing costs | ||||||
Expenses by nature: | ||||||
Raw materials and consumables used, and changes in finished goods and work in progress | 2,263,030 | 1,535,775 | ||||
Advertising | 18,448 | 13,190 | ||||
Bad and doubtful debts | 6,760 | 8,850 | ||||
Consultancy costs | 24,391 | 8,177 | ||||
Contracting costs | 102,439 | 88,657 | ||||
Depreciation and amortisation | 196,057 | 173,926 | ||||
Employee expenses | 206,683 | 157,495 | ||||
Exploration and production costs | 57,677 | 48,999 | ||||
Motor vehicle expenses | 15,957 | 16,259 | ||||
Occupancy expenses | 26,172 | 20,422 | ||||
Repairs and maintenance | 18,963 | 17,140 | ||||
Royalties | 26,134 | 26,978 | ||||
Administration and other expenses from ordinary activities | 105,468 | 88,922 | ||||
Expenses from ordinary activities | 3,068,179 | 2,204,790 | ||||
4. Income tax expense | ||||||
Income tax expense/(benefit) on pre-tax accounting profit: | ||||||
(i) at Australian tax rate of 30% | 73,965 | 56,363 | ||||
(ii) adjustment for difference between Australian and overseas tax rates | (7 | ) | 63 | |||
Income tax expense on pre-tax accounting profit at standard rates | 73,958 | 56,426 | ||||
Add/(subtract) tax effect of major items causing permanent differences: | ||||||
Non-taxable distributions received | (2,649 | ) | (2,458 | ) | ||
Depreciation and amortisation | 12,615 | 16,491 | ||||
Recoupment of capital losses not previously recognised | (918 | ) | (2,066 | ) | ||
Share of net profits of associates and joint venture entities | (3,598 | ) | (2,131 | ) | ||
Recoupment of tax losses not previously brought to account | (165 | ) | (527 | ) | ||
Under/(over) provision for tax in previous years | 733 | (981 | ) | |||
Net benefit of subvention payments | — | (11,301 | ) | |||
Other | 272 | 827 | ||||
| 6,290 | (2,146 | ) | ||||
Income tax expense relating to ordinary activities | 80,248 | 54,280 | ||||
44 ANNUAL REPORT 2003
| Note | Consolidated 2003 $’000 | Consolidated $’000 | ||||||
5. Dividends | ||||||||
(a) Dividend reconciliation | ||||||||
Final prior year dividend (over)/under provided | (1 | ) | 1,818 | |||||
Interim dividend of 5 cents per share, franked to 2 cents per share at 30%, paid 24 March 2003 (2002: 2 cents per share, fully franked at 30%) | 32,655 | 12,950 | ||||||
Nil final dividend (2002: final dividend of 3 cents per share, fully franked at 30%, paid 21 October 2002) | — | 19,435 | ||||||
| 10 | 32,654 | 34,203 | ||||||
Restatement adjustment: | ||||||||
Final dividend previously recognised in the year ended 30 June 2002, now recognised in the current financial year as a result of the initial adoption of AASB 1044 “Provisions, Contingent Liabilities and Contingent Assets” (refer note 1) | 10 | 19,435 | — | |||||
| 52,089 | 34,203 | |||||||
(b) Subsequent event | ||||||||
Since the end of the financial year, the Directors have declared a final dividend of 5 cents per share, franked to 2 cents per share at 30%, payable 3 October 2003. | 32,885 | — | ||||||
The financial effect of this dividend has not been brought to account in the financial statements for the year ended 30 June 2003 and will be recognised in subsequent financial statements. | ||||||||
(c) Dividend franking account | ||||||||
Origin Energy Limited has no available franking credits. | ||||||||
6. Notes to the Statement of Cash Flows | ||||||||
(a) Reconciliation of cash and cash equivalents | ||||||||
Cash includes cash on hand, at bank and short-term deposits at call, net of outstanding bank overdrafts. Cash as at the end of the financial year as shown in the Statement of Cash Flows is reconciled to the related items in the Statement of Financial Position as follows: | ||||||||
Cash | 16,431 | 17,255 | ||||||
Bank overdrafts | — | (6,704 | ) | |||||
| 16,431 | 10,551 | |||||||
(b) The following non-cash financing and investing activities have not been included in the Statement of Cash Flows: | ||||||||
Issue of shares in respect of the Dividend Reinvestment Plan | 28,156 | 8,117 | ||||||
ORIGIN ENERGY45
Notes to the Financial Statements
| Note | Consolidated 2003 $’000 | Consolidated 2002 $’000 | ||||
6. Notes to the Statement of Cash Flows (continued) | ||||||
(c) The consolidated entity acquired entities/businesses during the year ended 30 June 2003 for a total consideration of $225 million (2002: $87 million). The total assets and liabilities acquired are as follows: | ||||||
Current assets | ||||||
Receivables | 133,327 | 7,168 | ||||
Inventories | 3,470 | 5,663 | ||||
Other | 3,377 | 14,573 | ||||
Total current assets | 140,174 | 27,404 | ||||
Non-current assets | ||||||
Receivables | 363 | — | ||||
Property, plant and equipment | 93,011 | 70,572 | ||||
Deferred tax assets | 15,258 | 229 | ||||
Total non-current assets | 108,632 | 70,801 | ||||
Total assets | 248,806 | 98,205 | ||||
Current liabilities | ||||||
Payables | 99,906 | 7,129 | ||||
Current tax liabilities | 81 | — | ||||
Provisions | 37,102 | 1,623 | ||||
Total current liabilities | 137,089 | 8,752 | ||||
Non-current liabilities | ||||||
Deferred tax liabilities | — | 1,282 | ||||
Provisions | 36,305 | 719 | ||||
Total non-current liabilities | 36,305 | 2,001 | ||||
Total liabilities | 173,394 | 10,753 | ||||
Net assets | 75,412 | 87,452 | ||||
Goodwill on acquisition | 149,309 | — | ||||
Consideration | 224,721 | 87,452 | ||||
7. Contributed equity | ||||||
Issued and paid-up capital | ||||||
657,709,751 (2002: 647,829,152) ordinary shares, fully paid | 418,612 | 385,039 | ||||
Ordinary share capital | ||||||
Balance at the beginning of the financial year | 385,039 | 178,457 | ||||
Shares issued: | ||||||
- 2,333,300 (2002: 761,650) shares in accordance with the Senior Executive Option Plan | 5,417 | 1,570 | ||||
- 7,547,299 (2002: 2,693,165) shares in accordance with the Dividend Reinvestment Plan | 28,156 | 8,117 | ||||
- Nil (2002: 44,196,526) shares in accordance with the Share Placement | — | 123,332 | ||||
- Nil (2002: 26,500,287) shares in accordance with the Share Purchase Plan | — | 73,563 | ||||
- Nil (2002: 629,145) shares in accordance with the Employee Share Plan | — | — | ||||
Total movements in ordinary share capital | 10 | 33,573 | 206,582 | |||
| 418,612 | 385,039 | |||||
| Terms and conditions |
Holders of ordinary shares are entitled to receive dividends as declared from time to time and are entitled to one vote per share at shareholders’meetings. In the event of the winding up of the company, ordinary shareholders rank after creditors, and are fully entitled to any proceeds of liquidation.
46 ANNUAL REPORT 2003
| 8. | Issued and quoted securities |
Category of securities | Number issued | Number quoted | ||
Ordinary securities | ||||
On issue at 30 June 2003 | 657,709,751 | 657,709,751 | ||
Changes during the year ended 30 June 2003 | ||||
Increases through issues in accordance with: | ||||
(a) the Dividend Reinvestment Plan | 3,062,208 | 3,062,208 | ||
| 4,485,091 | 4,485,091 | |||
| 7,547,299 | 7,547,299 | |||
(b) the Senior Executive Option Plan (refer exercised details below) | 2,333,300 | 2,333,300 | ||
| 9,880,599 | 9,880,599 | |||
| Options | Number | Exercise price | Expiry date | ||||
On issue at 30 June 2003 | 365,000 | $ | 1.66 | 4 Dec 2003 | |||
| 50,000 | $ | 1.50 | 4 Dec 2003 | ||||
| 30,000 | $ | 1.66 | 19 Jan 2004 | ||||
| 1,250,000 | $ | 2.24 | 1 Feb 2004 | ||||
| 881,500 | $ | 1.76 | 6 Dec 2004 | ||||
| 55,500 | $ | 1.78 | 6 Dec 2004 | ||||
| 2,230,000 | $ | 1.27 | 1 Mar 2005 | ||||
| 495,000 | $ | 2.74 | 31 Aug 2006 | ||||
| 3,495,000 | $ | 3.20 | 16 Dec 2006 | ||||
| 30,000 | $ | 3.20 | 14 Jan 2007 | ||||
| 2,630,000 | $ | 3.56 | 19 Dec 2007 | ||||
Issued during the year ended 30 June 2003 | 2,630,000 | $ | 3.56 | 19 Dec 2007 | |||
Exercised during the year ended 30 June 2003 | 1,125,000 | $ | 2.92 | 11 Dec 2002 | |||
| 280,000 | $ | 1.66 | 4 Dec 2003 | ||||
| 30,000 | $ | 2.92 | 2 Mar 2003 | ||||
| 30,000 | $ | 1.66 | 19 Jan 2004 | ||||
| 784,400 | $ | 1.76 | 6 Dec 2004 | ||||
| 83,900 | $ | 1.78 | 6 Dec 2004 | ||||
Expired during the year ended 30 June 2003 | 35,000 | $ | 2.92 | 11 Dec 2002 | |||
| 70,000 | $ | 5.02 | 11 Dec 2002 | ||||
ORIGIN ENERGY47
Notes to the Financial Statements
| Consolidated 2003 | Consolidated 2002 | |||
9. Earnings per share | ||||
Basic earnings per share | 24.8 cents | 20.2 cents | ||
Diluted earnings per share | 24.7 cents | 20.1 cents | ||
Weighted average number of shares used as the denominator: | ||||
Number of ordinary shares for basic earnings per share calculation | 652,380,401 | 637,291,869 | ||
Effect of executive share options on issue | 4,061,338 | 2,996,168 | ||
Number of ordinary shares for diluted earnings per share calculation | 656,441,739 | 640,288,037 | ||
| $’000 | $’000 | |||||
Reconciliation of earnings used in calculating basic and diluted earnings per share: | ||||||
Net profit | 166,303 | 133,600 | ||||
Net profit attributable to outside equity interests | (4,351 | ) | (4,940 | ) | ||
Earnings used in calculating earnings per share | 161,952 | 128,660 | ||||
| Information concerning the classification of securities |
| (a) | Fully paid ordinary shares |
Fully paid ordinary shares are classified as ordinary shares for the purposes of calculating basic and diluted earnings per share.
| (b) | Share options |
Share options granted under the Senior Executive Option Plan have been classified as potential ordinary shares and have been included in the determination of diluted earnings per share. The options have not been included in the determination of basic earnings per share.
| Note | Consolidated 2003 $’000 | Consolidated 2002 $’000 | ||||||
10. Retained profits and total equity | ||||||||
Retained profits reconciliation | ||||||||
Previously reported retained profits at the end of the previous financial year | 1,095,158 | 999,223 | ||||||
Adjustment resulting from initial adoption of revised AASB 1028 “Employee Benefits” | (283 | ) | — | |||||
Adjustment to dividends resulting from initial adoption of AASB 1044 “Provisions, Contingent Liabilities and Contingent Assets” | 19,435 | — | ||||||
Restated retained profits at the beginning of the financial year | 1,114,310 | 999,223 | ||||||
Dividends recognised in the current year as a result of the initial adoption of AASB 1044 “Provisions, Contingent Liabilities and Contingent Assets” | 5 | (19,435 | ) | — | ||||
Current year dividends paid during the year | 5 | (32,654 | ) | (34,203 | ) | |||
Net profit attributable to members of the parent entity, Origin Energy Limited | 161,952 | 128,660 | ||||||
Aggregate of amounts transferred (to)/from reserves | (196 | ) | 1,478 | |||||
Retained profits at the end of the financial year | 1,223,977 | 1,095,158 | ||||||
Total equity reconciliation | ||||||||
Total equity at the beginning of the financial year | 1,626,039 | 1,328,372 | ||||||
Total changes in parent entity interest in equity recognised in the Statement of Financial Performance | 159,890 | 127,216 | ||||||
Transactions with owners as owners: | ||||||||
– Contributions of equity | 7 | 33,573 | 206,582 | |||||
– Dividends recognised during the year | 5 | (32,654 | ) | (34,203 | ) | |||
Total changes in outside equity interests | 2,756 | (1,928 | ) | |||||
Total equity at the end of the financial year | 1,789,604 | 1,626,039 | ||||||
48 ANNUAL REPORT 2003
| 11. | Contingent liabilities |
Details of contingent liabilities and contingent assets where the probability of future payments/receipts is not considered remote are set out below, as well as details of contingent liabilities and contingent assets, which although considered remote, the Directors consider should be disclosed. The Directors are of the opinion that provisions are not required in respect of these matters, as it is not probable that a future sacrifice of economic benefits will be required or the amount is not capable of reliable measurement.
| Consolidated 2003 $’000 | Consolidated 2002 $’000 | |||
Bank guarantees – unsecured | 169,811 | 99,566 | ||
Origin Energy Limited has given to its bankers letters of responsibility in respect of accommodation provided from time to time by the banks to Origin Energy Limited’s wholly or partly owned controlled entities.
Warranties and indemnities have been given by entities in the consolidated entity in relation to environmental liabilities for certain properties as part of the terms and conditions of divestments.
A number of sites within the consolidated entity have been identified as contaminated, all of which are subject to ongoing environmental management programmes to ensure appropriate controls are in place and clean-up requirements are implemented. For sites where the requirements can be assessed and costs estimated, the estimated cost of remediation has been expensed or provided for. The contamination has generally resulted from prior activities conducted at the sites.
Certain entities within the consolidated entity are subject to various lawsuits and claims, including claims for additional income tax, stamp duty and penalties, native title claims and a cross-claim arising from an action brought against Esso/BHP in relation to the Longford explosion in 1998. Any liabilities arising from such lawsuits and claims are not expected to have a material adverse effect on the consolidated financial statements.
A Demerger Deed was entered into in the 2000 year containing certain indemnities and other agreements between Origin Energy Limited and Boral Limited and their respective controlled entities covering the transfer of the businesses, investments, debt and assets of Boral Limited and some temporary shared arrangements.
| 12. | Events subsequent to balance date |
Dividends declared subsequent to 30 June 2003
Refer to note 5.
Oil Company of Australia Limited
On 11 July 2003, Origin announced an off-market cash offer to acquire all the ordinary shares in Oil Company of Australia Limited (OCA) that it does not already own. At 30 June 2003, Origin held 85.23% of the issued capital of OCA. If successful, the anticipated purchase price of the remaining OCA shares is expected to be approximately $74 million.
The financial effects of the above transactions have not been brought to account in the financial statements for the year ended 30 June 2003.
ORIGIN ENERGY49
Statutory Statements
Directors’ declaration
In the opinion of the Directors of Origin Energy Limited, the accompanying Concise Financial Report of the consolidated entity, comprising Origin Energy Limited and its controlled entities, for the year ended 30 June 2003 set out on pages 36 to 49:
i) has been derived from or is consistent with the Full Financial Report for the financial year; and
ii) complies with Australian Accounting Standard AASB 1039 “Concise Financial Reports”.
Signed in accordance with a resolution of the Directors:
| /s/ H KEVIN MCCANN |
H Kevin McCann, Chairman Sydney, 20 August 2003 |
Independent audit report
on the Concise Financial Report to the members of Origin Energy Limited
Scope
We have audited the Concise Financial Report of Origin Energy Limited and its controlled entities for the financial year ended 30 June 2003, consisting of the Statement of Financial Performance, Statement of Financial Position, Statement of Cash Flows, accompanying notes 1 to 12, and the accompanying discussion and analysis on the Statement of Financial Performance, Statement of Financial Position and Statement of Cash Flows in order to express an opinion on it to the members of the company. The company’s Directors are responsible for the Concise Financial Report.
Our audit has been conducted in accordance with Australian Auditing Standards to provide reasonable assurance whether the Concise Financial Report is free of material misstatement. We have also performed an independent audit of the Full Financial Report of Origin Energy Limited and its controlled entities for the year ended 30 June 2003. Our audit report on the Full Financial Report was signed on 20 August 2003, and was not subject to any qualification.
Our procedures in respect of the audit of the Concise Financial Report included testing that the information in the Concise Financial Report is consistent with the Full Financial Report and examination, on a test basis, of evidence supporting the amounts, discussion and analysis, and other disclosures which were not directly derived from the Full Financial Report. These procedures have been undertaken to form an opinion whether, in all material respects, the Concise Financial Report is presented fairly in accordance with Australian Accounting Standard AASB 1039 “Concise Financial Reports”.
The audit opinion expressed in this report has been formed on the above basis.
Audit opinion
In our opinion, the Concise Financial Report of Origin Energy Limited and its controlled entities for the year ended 30 June 2003 complies with Australian Accounting Standard AASB 1039 “Concise Financial Reports”.
| /s/ KPMG | /s/ DAVID ROGERS | |||
KPMG Sydney, 20 August 2003 | David Rogers, Partner | |||
50 ANNUAL REPORT 2003
Share and Shareholder Information
Information set out below was applicable as at 22 August 2003.
| Ordinary | shares |
Size of holding | Number of shareholders | % of issued shares | ||
1-1,000 | 39,741 | 3.36 | ||
1,001-5,000 | 50,305 | 17.82 | ||
5,001-10,000 | 8,662 | 9.14 | ||
10,001-100,000 | 4,302 | 12.82 | ||
100,001 and above | 163 | 56.86 | ||
2,427 shareholders hold less than a marketable parcel.
Substantial shareholders
The company has not been given any substantial shareholder notices which are current.
20 largest shareholders | Number of shares | % of issued shares | ||
Westpac Custodian Nominees Limited | 80,086,494 | 12.18 | ||
JP Morgan Nominees Australia Limited | 68,030,031 | 10.34 | ||
National Nominees Limited | 58,755,982 | 8.93 | ||
Citicorp Nominees Pty Ltd | 28,650,117 | 4.36 | ||
RBC Global Services Australia Nominees Pty Ltd | 19,050,556 | 2.90 | ||
AMP Life Limited | 17,156,360 | 2.61 | ||
Cogent Nominees Pty Ltd | 13,506,605 | 2.05 | ||
Commonwealth Custodial Services Limited | 12,293,974 | 1.87 | ||
Queensland Investment Corporation | 10,682,465 | 1.62 | ||
PSS Board | 5,723,703 | 0.87 | ||
CSS Board | 5,146,496 | 0.78 | ||
Australian Foundation Investment Company Limited | 3,600,688 | 0.55 | ||
ANZ Nominees Limited | 3,257,126 | 0.50 | ||
IOOF Investment Management Limited | 2,643,922 | 0.40 | ||
Bond Street Custodians Limited | 2,548,538 | 0.39 | ||
Sandhurst Trustees Limited | 2,457,295 | 0.37 | ||
Argo Investments Ltd | 2,183,665 | 0.33 | ||
Invia Custodian Pty Ltd | 2,169,265 | 0.33 | ||
Government Superannuation Office | 1,914,594 | 0.29 | ||
Merrill Lynch (Australia) Nominees Pty Ltd | 1,818,158 | 0.28 | ||
| 341,676,034 | 51.95 | |||
ORIGIN ENERGY51
Share and Shareholder Information
Shareholder enquiries
Shareholder queries or notifications regarding shareholdings or dividends should be directed to Origin Energy’s share registry on 1300 664 446.
When contacting the share registry, shareholders should quote their securityholder reference number, which can be found on your holding or dividend statements.
Dividends
Origin will pay a final dividend for the 2002/2003 year of 5 cents per share (franked to 2 cents) on 3 October 2003.
Origin offers its shareholders the convenience of having their dividends paid directly into a bank, building society or credit union account in Australia. The payment of dividends will be electronically credited on the dividend payment date and confirmed by payment advices sent through the mail. Should shareholders wish to take advantage of this service, they will need to contact the share registry for an application form.
Dividend alternatives
As an alternative to receiving cash dividends, shareholders may elect to participate in the Dividend Reinvestment Plan (DRP). The DRP enables shareholders to use cash dividends to purchase additional fully paid Origin shares. If a shareholder wishes to participate in the DRP, they must notify the share registry in writing.
Tax File Number
For resident shareholders who have not provided the share registry with their tax file number (TFN) or exemption category details, tax at the top marginal tax rate (plus Medicare levy) will be deducted from dividends to the extent they are not fully franked. For those shareholders who have not as yet provided their TFN or exemption category details, forms are available from the share registry. Shareholders are not obliged to provide this information if they do not wish to do so.
Annual Report mailing lists
Shareholders not wishing to receive the Annual Report should advise the share registry in writing so that their names can be removed from the mailing list. Unless shareholders have advised the share registry that they require no Annual Report or the full set of financial statements, they will be sent the Annual Report containing a concise set of financial statements.
Change of address
Shareholders who are issuer sponsored should notify any changes of address to the share registry promptly in writing. For your protection you should quote your security holder reference number. Broker sponsored holders should advise their sponsoring broker of any change.
Information on Origin Energy
The main source of information for shareholders is the Annual Report and the Full Financial Statements. Both the Annual Report and Full Financial Statements will be provided to shareholders on request and free of charge.
Stock exchange listing
Origin shares are traded on the Australian Stock Exchange (ASX). The symbol under which Origin shares are traded is ‘ORG’.
Voting rights of members
At a meeting of members, each member who is entitled to attend and vote may attend and vote in person or by proxy, attorney or representative. On a show of hands, every person present who is a member, proxy, attorney or representative, shall have one vote and on a poll every member who is present in person or by proxy, attorney or representative shall have one vote for each fully paid share held.
52ANNUAL REPORT 2003

| [LOGO] | Origin Energy Limited ABN 30 000 051 696
Level 39, AMP Centre 50 Bridge Street, Sydney GPO Box 5376, Sydney NSW 2001
Telephone (02) 9220 6400 Facsimile (02) 9235 1661 |
Notice of Annual General Meeting
Dear Shareholder
Accompanying this letter is the Notice of Meeting for the Annual General Meeting of the company, which will be held in the Wesley Conference Centre, 220 Pitt Street, Sydney, New South Wales at 10.30am on Thursday, 16 October 2003.
Attending the meeting or appointing a proxy
If you are able to attend the Meeting, please bring the proxy form with you to facilitate your registration. The bar coding on the Appointment of Proxy will enable shareholders to be easily registered.
Registration will be available from 9.30am and shareholders are encouraged to arrive before the starting time of 10.30am to avoid any last minute congestion.
If you are not able to attend the Meeting, you may wish to complete the attached Appointment of Proxy. Alternatively you can appoint your proxy on-line at www.originenergy.com.au/agm
Any corporate shareholder of Origin Energy Limited shares wishing to appoint a person to act as its representative at the meeting may do so by providing that person with a duly executed letter authorising him or her to do so.
Business of the meeting
The Notice of Meeting covers all of the business to be conducted. Included in the Explanatory Notes is information on the Directors’ seeking re-election which will be of assistance to you in considering your vote on item 2. The Explanatory Notes also provide information on the special business being items 3-6.
Shareholders unable to attend
If shareholders who are unable to attend have any questions which would ordinarily be covered at the Meeting, they can be sent to this office prior to the Meeting and we will be pleased to reply.
Any questions regarding the Annual General Meeting or the Appointment of Proxy should be directed to ASX Perpetual Registrars Limited on (02) 8280 7155 or 1300 664 446.
| Yours sincerely |
 |
Kevin McCann Chairman Origin Energy Limited |
| You can appoint your proxy on-line at:www.originenergy.com.au/agm |
1
Notice of Annual General Meeting
Notice is given that the Annual General Meeting of shareholders of Origin Energy Limited (“the company”) will be held in the Wesley Conference Centre, 220 Pitt Street, Sydney, New South Wales at 10.30am on Thursday,16 October 2003.
| Ordinary | Business |
| 1. | To receive and consider the Statements of Financial Position and Statements of Financial Performance of the company and the entities it controlled during the year for the year ended 30 June 2003 and the reports of the Directors and Auditors thereon. |
| 2. | To elect Directors |
Helen M Nugent, H Kevin McCann, Bruce G Beeren and Colin B Carter, being eligible, offer themselves for election.
Details of their qualifications and experience are set out in the attached Explanatory Notes.
Shareholders should note that a separate resolution will be put in relation to each of the candidates.
Special Business
| 3. | Grant of options to Mr Grant A King – Managing Director |
To consider and, if thought fit, pass the following resolution as an ordinary resolution:
“That the grant to Managing Director, Mr Grant A King of options to subscribe for up to one million (1,000,000) fully paid ordinary shares in the company at an exercise price equal to the Origin Energy market price and otherwise on the terms as set out in the Explanatory Notes which accompanied the Notice convening this Meeting and the allotment to Mr Grant A King of up to one million (1,000,000) fully paid ordinary shares in the company pursuant to the valid exercise of those options is hereby approved.”
| 4. | Grant of options to Mr Bruce G Beeren – Executive Director |
To consider and, if thought fit, pass the following resolution as an ordinary resolution:
“That the grant to Executive Director, Mr Bruce G Beeren of options to subscribe for up to five hundred and fifty thousand (550,000) fully paid ordinary shares in the company at an exercise price equal to the Origin Energy market price and otherwise on the terms as set out in the Explanatory Notes which accompanied the Notice convening this Meeting and the allotment to Mr Bruce G Beeren of up to five hundred and fifty thousand (550,000) fully paid ordinary shares in the company pursuant to the valid exercise of those options is hereby approved.”
Voting exclusion
The company will disregard any vote cast on Resolutions 3 and 4 by Mr King, Mr Beeren and their associates.
However the company need not disregard a vote if:
| • | it is cast by a person as proxy for a person who is entitled to vote, in accordance with the directions on the proxy form; or |
| • | it is cast by the person chairing the meeting as proxy for a person who is entitled to vote, in accordance with a direction on the proxy form to vote as the proxy decides. It is the intention of the Chairman of the Meeting acting as proxy to cast any such votes in favour of all of the resolutions. |
| 5. | Increase in Directors’ fees |
To consider and, if thought fit, pass the following resolution as an ordinary resolution:
“That the maximum sum of fees payable to the Directors of the company and its unlisted subsidiaries be increased by $300,000 to $950,000 per annum.”
2
Voting exclusion
The company will disregard any vote cast on Resolution 5 by any of the Directors and their associates.
However the company need not disregard a vote if:
| • | it is cast by a person as proxy for a person who is entitled to vote, in accordance with the directions on the proxy form; or |
| • | it is cast by the person chairing the meeting as proxy for a person who is entitled to vote, in accordance with a direction on the proxy form to vote as the proxy decides. It is the intention of the Chairman of the meeting acting as proxy to cast any such votes in favour of all of the resolutions. |
| 6. | Constitution Change – Proportional takeover bids |
To consider and, if thought fit, pass the following resolution as a special resolution:
“That the Constitution of the company be amended by re-inserting the following provision as Article 64:
Proportional takeover bid approval
64. (a) In this Article:
| “Approving Resolution” means a resolution to approve a proportional takeover bid in accordance with this Article 64. |
| “Deadline” means the 14th day before the last day of the bid period for a takeover bid. |
| “Voter” means a person (other than the bidder under a proportional takeover bid or an associate of that bidder) who, as at the end of the day on which the first offer under that bid was made, held bid class securities for that bid. |
| (b) | The company must refuse to register a transfer of shares giving effect to a takeover contract for a proportional takeover bid unless and until an Approving Resolution is passed in accordance with this Article 64. |
| (c) | This Article 64 ceases to apply on the third anniversary of its last adoption, or last renewal, in accordance with the Corporations Act. |
| (d) | Where offers are made under a proportional takeover bid, the Directors must, subject to the Corporations Act, call and arrange to hold a meeting of Voters for the purpose of voting on an Approving Resolution before the Deadline. |
| (e) | The provisions of this Constitution concerning meetings of members (with the necessary changes) apply to a meeting held under paragraph (d). |
| (f) | Subject to this Constitution, every Voter present at the meeting held under paragraph (d) is entitled to one vote for each share in the bid class securities that the Voter holds. |
| (g) | To be effective, an Approving Resolution must be passed before the Deadline. |
| (h) | An Approving Resolution that has been voted on is taken to have been passed if the proportion that the number of votes in favour of the resolution bears to the total number of votes on the resolution is greater than 50%, and otherwise is taken to have been rejected. |
| (i) | If no Approving Resolution has been voted on as at the end of the day before the Deadline, an Approving Resolution is taken, for the purposes of this Article 64, to have been passed in accordance with this Article 64.” |
| By order of the Board |
|
William Hundy Secretary Sydney, 8th September 2003 |
Notes
| (i) | Pursuant to Regulation 7.11.37 of the Corporations Act Regulations, the company has determined that for the purpose of the meeting, all shares in the company will be taken to be held by the persons who held them as registered shareholders at 7.00pm (Sydney time) on Tuesday,14 October 2003. |
| (ii) | A member has a right to appoint a proxy. A member who is entitled to cast two or more votes may appoint two proxies and may specify the proportion or number of the member’s votes each proxy is entitled to exercise. Where a shareholder appoints more than one (1) proxy, neither proxy is entitled to vote on a show of hands. |
| (iii) | A proxy need not be a member of the company. |
| (iv) | Details for completion and lodgement of proxies are on the reverse side of the Appointment of Proxy Form. A proxy must be received by the company’s share registry, ASX Perpetual Registrars Limited, by 10.30 am on Tuesday, 14 October 2003. A proxy may be mailed to ASX Perpetual Registrars Limited at Locked Bag A14, Sydney NSW 1235, hand delivered to ASX Perpetual Registrars Limited at 580 George Street, Sydney NSW or sent by facsimile to ASX Perpetual Registrars Limited on (02) 8280 7646. |
3
Explanatory Notes
Resolution 2 – Candidates for Election as Directors
Helen M Nugent,
Independent non-executive Director,
Aged 54
Dr Nugent joined the Board in March 2003 and is a member of the Audit, Remuneration, Nomination and HSE Committees. Previously Director of Strategy for Westpac Banking Corporation from 1994 to 1999, and a Director of United Energy Limited from 1999 to 2002, Dr Nugent is currently Chairman of Swiss Re Australia and Funds SA, and a Director of Macquarie Bank Limited, Carter Holt Harvey Limited, Freehills, Australia Post and UNiTAB Limited. Dr Nugent holds a Bachelor of Arts, a Doctorate of Philosophy, and a Masters of Business Administration. She is a Fellow of the Australian Institute of Company Directors.
H Kevin McCann,
Independent non-Executive Chairman,
Aged 62
Mr McCann joined the Board and was appointed Chairman in February 2000. He is a member of the Audit, Nomination, Remuneration and HSE Committees. As Chairman of Allens Arthur Robinson, Mr McCann practises as a commercial lawyer specialising in mergers and acquisitions, mineral and resource law and capital market transactions. He is Chairman of Healthscope Limited, Triako Resources Limited and Sydney Harbour Federation Trust, and a Director of Macquarie Bank Limited and BHP Steel Limited. He is also a member of the Takeovers Panel. Mr McCann has an Arts degree, a Law degree (Honours), a Masters in Law and is a Fellow of the Australian Institute of Company Directors.
Bruce G Beeren,
Executive Director, Commercial,
Aged 54
Mr Beeren joined the Board in March 2000. With over 25 years experience in the energy industry, Mr Beeren was establishment Chief Executive Officer of VENCorp and held a number of senior management positions at AGL, including Chief Financial Officer and General Manager, AGL Pipelines. Mr Beeren is a Director of Envestra Limited and equipsuper Pty Ltd. He has a Science Degree, a Bachelor of Commerce and a Masters of Business Administration and is a Fellow of CPA Australia and the Australian Institute of Company Directors.
Colin B Carter,
Independent non-executive Director,
Aged 60
Mr Carter joined the Board in February 2000 and is a member of the Remuneration, Nomination and HSE Committees. Previously a management consultant at The Boston Consulting Group, Mr Carter is now a Senior Advisor to that firm. Mr Carter is a Commissioner of the Australian Football League and currently holds directorships of Melbourne 2006 Commonwealth Games Pty Ltd, Wesfarmers Limited and several not-for-profit organisations. He has a Commerce degree and a Masters of Business Administration.
Directors’ recommendation
All of the Directors, other than those Directors standing for re-election, recommend that you vote in favour of the re-election of each of Helen M Nugent, H Kevin McCann, Bruce G Beeren and Colin B Carter, having regard to their respective qualifications to act as Directors of your company.
Resolution 3 – Grant of options to Mr Grant A King
This resolution is being put to shareholders to obtain shareholder approval for the grant to Mr King of options to subscribe for up to one million (1,000,000) fully paid ordinary shares in the company with an exercise price of equal to the Origin Energy market price (“options”) and to the allotment to Mr King of up to one million (1,000,000) fully paid ordinary shares in the company on the exercise of those options. ASX Listing Rule 10.14.1 requires shareholder approval for the grant of options to Mr King as he is a Director of the company. No more than 50% of the options will be issued within six months of shareholder approval and no more than the balance will be issued within 18 months of shareholder approval.
A summary of the terms of the options, and the Directors’ recommendation in relation to resolution 3, are set out in the explanatory note relating to resolution 4 below.
Resolution 4 – Grant of options to Mr Bruce G Beeren
This resolution is being put to shareholders to obtain shareholder approval for the grant to Mr Beeren of options to subscribe for up to five hundred and fifty thousand (550,000) fully paid ordinary shares in the company with an exercise price of equal to the Origin Energy market price (“options”) and to the allotment to Mr Beeren of up to five hundred and fifty thousand (550,000) fully paid ordinary shares in the company on the exercise of those options. ASX Listing Rule 10.14.1 requires shareholder approval for the grant of options to Mr Beeren as he is a Director of the company. No more than 50% of the options will be issued within six months of shareholder approval and no more than the balance will be issued within 18 months of shareholder approval.
Summary of the terms of the options to be granted to Mr Grant A King and Mr Bruce G Beeren
The options will be granted pursuant to the Origin Energy Senior Executive Option Plan which forms part of Origin’s long term incentives program designed to motivate executives and create shareholder wealth over the longer term.
The terms of the proposed options are summarised below.
The exercise price of the options will be equal to the Origin Energy market price. This will be determined by dividing the total of the sale values of the company’s Shares on each of the five trading days immediately prior to the Board approving an offer of options to Mr King or Mr Beeren on the stockmarket conducted by ASX (excluding sales reported as special crossings, New Zealand Stock Exchange purchases or sales, Recognised Stock Exchange (as referred to in the ASX Business Rules) purchases or sales, late or overnight purchases or sales or option exercises on those days under the ASX Business Rules) by the number of the company’s shares the subject of sales on those days.
The exercise of the options will be subject to the achievement of a performance hurdle which will be measured by comparing the performance of the company with the performance of other companies in which shareholders may potentially invest. This is in line with the approach of other major Australian companies.
Accordingly it is intended that the options are capable of exercise depending on the maximum Total Shareholder Return of the company relative to the Total Shareholder Return of a group of companies during the exercise period of the options. This group of companies (the “reference group”) consists of not less than 50 companies selected by the company’s Directors from
4
the ASX Top 100 from time to time. The current list of the companies in the reference group is set out below.
Determination of Total Shareholder Return will be made on the basis of movements in the share price and dividends, calculated in a similar manner to the Accumulation Index of the ASX.
The period over which the Total Shareholder Return of the company is compared with the Total Shareholder Return of the reference group commences three years after the grant of the options.
The percentage of options capable of exercise is based on a sliding scale as follows:
If at any time during the exercise period of the options the Total Shareholder Return of the company: | The percentage of options which become exercisable is: | ||
Does not reach the 50th percentile of the TSR of the companies in the reference group | 0 | % | |
Reaches the 50th percentile of the TSR of the companies in the reference group | 50 | %* | |
Reaches or exceeds the 75th percentile of the TSR of the companies in the reference group | 100 | % | |
| * | The percentage of options which become exercisable increases proportionately from the 50th percentile up to the 75th percentile. |
Reference group of companies
BHP Billiton | Sky City | Coles Myer | CSR | |||
CC Amatil | Entertainment | BHP Steel | Patrick Corp | |||
Newcrest Mining | Fosters Brewing | Air New Zealand | WMC Resources | |||
Telstra | Orica | Amcor | Boral | |||
One Steel | Ansell | Mayne Group | Oil Search | |||
Rio Tinto | Woodside | Soul Pattinson | AGL | |||
Southcorp | Lion Nathan | Qantas | Coal & Allied | |||
Toll Holdings | Billabong | Leighton | Alintagas | |||
Woolworths | Westfield Holdings | Burns Philp | Lend Lease | |||
CSL | Harvey Norman | Macquarie | Transurban | |||
Paperlinx | TAB (NSW) | Infrastructure Trust | Macquarie Airports | |||
Wesfarmers | Telecom Corp NZ | Caltex Australia | Brambles | |||
James Hardie | Mirvac Group | Santos | Flight Centre | |||
Lihir Gold | Fletcher Building | Tabcorp | ||||
Foodland |
Subject to the satisfaction of the exercise hurdle and the terms of the Origin Energy Senior Executive Option Plan, the options may be exercised at any time after the third anniversary of the grant of the options and no later than the fifth anniversary.
The options may also be exercisable at any time or prior to the third anniversary of the grant of the options, if an acquisition of all of the issued shares in Origin Energy is made or notice is given of a proposal to make an acquisition of more than 20% of the shares in the company and on the termination of Mr King or Mr Beeren’s employment as a consequence of his death, permanent disablement or other circumstances in which the company’s Board determines in its absolute discretion that the options should be exercisable.
The options will lapse if not exercised within the period specified above or in the event that Mr King’s or Mr Beeren’s employment is terminated for cause.
The options will be unlisted and will be granted for no consideration. The shares issued on exercise of the options will rank equally with other ordinary shares from their date of issue. The company will apply to ASX for official quotation of shares issued on exercise of the options. The company will not provide any loan to Mr King or Mr Beeren in relation to either the grant of the options or the exercise of the options.
Other terms of the options relate to the manner of exercise of options and adjustment for a rights issue, a bonus issue or reconstruction of the company’s share capital, in each such case in accordance with the ASX Listing Rules.
Details of any options granted pursuant to resolutions 3 and 4 will be published in each annual report of the company relating to a period in which such options were granted, together with a statement that approval for the grant of the options (and the allotment of fully paid ordinary shares in the company pursuant to the valid exercise of those options) was approved under ASX Listing Rule 10.14.
Any persons referred to in ASX Listing Rule 10.14 (being principally directors of the company and their associates),other than Mr King and Mr Beeren, who become entitled to participate in the Origin Energy Senior Executive Option Plan will not participate until approval is obtained under ASX Listing Rule 10.14.
A copy of the rules of the Origin Energy Senior Executive Option Plan may be obtained free of charge from the company’s registered office at Level 39, 50 Bridge Street, Sydney, New South Wales.
Directors’ interests and recommendations
None of the Directors other than Mr King and Mr Beeren, has any interest in the outcome of resolutions 3 and 4 except to provide an appropriate incentive to Mr King and Mr Beeren to maximise shareholder wealth.
All of the Directors, other than Mr King and Mr Beeren who will abstain from voting on the resolution, recommend that you vote in favour of the resolutions.
Resolution 5 – Increase in Directors’ fees
Shareholders previously fixed the maximum sum of fees payable to the Directors by the company and its unlisted subsidiaries at $650,000 per annum at the Annual General Meeting of Shareholders in 1989.
To recognise the significant growth of the company since it listed as Origin Energy in 2000, and the additional duties and responsibilities imposed on Directors, approval is sought to fix the limit at which fees may be payable to the Directors at $950,000 per annum.
In considering this resolution shareholders should note that the maximum level of fees was last set in 1989.The need to increase the level of maximum fees arises from the following factors:
| 1. | The number of non-executive Directors has increased from four to five Directors. In addition, the number of Directors on Committees has also been increased to ensure these Committees meet best practice corporate governance guidelines. |
5
| 2. | The work load and responsibilities of Directors on the Board and Committees has increased in line with the growth of the company since the demerger in 2000. |
| 3. | A market review of fee levels has established that non-executive Directors fees have been below fees paid to comparable companies of Origin’s size and complexity. This has occurred because of the significant growth in the size of the company since it became Origin Energy in 2000. |
| 4. | In accordance with best practice corporate governance guidelines the Board has terminated the non-executive Directors’ retirement benefit and replaced it with fees that Directors are required to apply to the acquisition of Origin Energy shares until they hold a minimum of 25,000 shares in the company. Once a Director (or interests associated with the Director) has acquired this number of shares the additional fees may be directed to superannuation. The amount of the benefit previously accruing under the Non-Executive Directors’ Retirement Plan was not included in the amount of fees approved by shareholders so that these payments will now require approval of shareholders as part of the fees which are authorised for payment to the Directors. |
Directors Grant King and Bruce Beeren, being executive Directors who will not receive any Directors’ fees under this resolution, recommend approval of the resolution, based on the company’s need to attract and retain qualified Directors and having regard to the increased duties and responsibilities being imposed on Directors.
Resolution 6 – Constitution amendments – Proportional takeover bids
Under the Corporations Act, a company is empowered to include in its constitution a provision to enable the company to refuse to register shares acquired under a proportional takeover bid unless a resolution is passed by the shareholders in general meeting approving the offer.
At the General Meeting of the company held on 11 April 2001 shareholders voted in favour of renewing such a provision. The provision ceases to have effect on the third anniversary of its adoption. The Directors of the company consider that it is appropriate to reinstate the provision for a further term of three years before it would otherwise expire in April 2004.
Proportional takeover bid
A proportional takeover bid is a takeover offer sent to all shareholders but only in respect of a specified portion of each shareholder’s shares. Accordingly, if a shareholder accepts in full the offer under a proportional takeover bid, the shareholder will dispose of the specified portion of shareholder’s share in the company and retain the balance of the shares.
Effect of proportional takeover provision
The effect of the proposed Article 64 is that if a proportional takeover bid is made to shareholders, the Directors are obliged to convene a meeting of shareholders to be held 15 days or more before the offer closes. The purpose of the meeting is to vote upon a resolution to approve the proportional takeover bid.
If no such resolution is voted on within the required timeframe, the resolution is deemed to have been approved. This in effect means that the shareholders as a body may only prohibit a proportional takeover bid by rejecting such a resolution.
If the resolution is approved or deemed to have been approved, transfers of shares under the proportional takeover bid (provided they are in all other respects in order for registration) will be registered.
If the resolution is rejected, registration of transfers under the proportional takeover bid are prohibited and the offer is deemed by the Corporations Act to have been withdrawn.
The proposed Article 64 expires three years after adoption unless renewed by a further special resolution.
A proportional takeover provision does not apply to full takeover bids.
Reasons for proposing the resolution
A proportional takeover bid may result in effective control of Origin Energy changing hands without shareholders having the opportunity of disposing of all their shares. Shareholders could be at risk of passing control to the offeror without payment of an adequate control premium for all their shares whilst leaving themselves as part of a minority interest in the company.
The proposed Article 64 can prevent this occurring by giving shareholders the opportunity to decide whether a proportional takeover bid is acceptable and should be permitted to proceed.
Presently proposed acquisitions
As at the date of these Explanatory Notes, no Director of Origin Energy is aware of any proposal by any person to acquire or to increase the extent of a substantial interest in the company.
Potential advantages and disadvantages for the Directors and shareholders
The Directors consider that it is a potential advantage to all shareholders that they have the opportunity to consider and vote upon any proposed proportional takeover bid. For a proportional takeover bid to be approved, it must be approved by more than half of the shares voted at the meeting excluding the shares of the offeror and its associates, and accordingly the existence of the Article is likely to cause an intending offeror to formulate its offer in a way that would be attractive to a majority of shareholders. It may also have the effect of not allowing control of the company to pass without payment of a control premium.
The Directors consider that it would be an advantage to them to have the opportunity to ascertain the views of shareholders on any proportional takeover bid.
As to the possible disadvantages of such an Article, it may be perceived by some shareholders that its presence may make a proportional takeover bid less likely to succeed and that therefore the chances of receiving an opportunity to dispose of part of their shares would be reduced because potential offerors may be discouraged from making a proportional takeover bid. This may be thought to potentially remove or reduce any speculative element of the market price of Origin Energy’s shares arising from the possibility of a proportional takeover bid. Some shareholders may consider the presence of the Article to be a restriction on their freedom to deal as they see fit with their shares.
During the period in which the previous proportional takeover provision was in effect, the advantages and disadvantages set out above have applied.
Directors’ recommendation
The Directors of the company consider the proposed Article 64 to be in the interest of shareholders and recommend that you vote in favour of the resolution.
6
Appointment of Proxy | Origin Energy Limited ABN 30 000 051 696 All registry communications to: C/ - ASX Perpetual Registrars Limited Level 8,580 George Street, Sydney NSW 2000 Locked Bag A14, Sydney South NSW 1235 Telephone: 1300 664 446, Facsimile: 02 8280 7646 ASX Code: ORG | |||
| If you propose to attend and vote at the Annual General Meeting, please bring this form with you. This will assist in registering your attendance. | You can appoint your proxy on-line at www.originenergy.com.au/agm | |||
Please complete in black ink
I/We being a member(s) of Origin Energy Limited and entitled to attend and vote hereby appoint
A the Chairman of the Meeting (mark box) | ¨ OR Write here the name of the person (excluding the registered securityholder) you are appointing if this person is someone other than the Chairman of the Meeting | |||
or failing the person named, or if no person is named, the Chairman of the Meeting, as my/our proxy to act generally at the meeting on my/our behalf and to vote in accordance with the following instructions (or if no directions have been given, as the proxy sees fit) at the Annual General Meeting of the company to be held at 10.30am on Thursday 16 October 2003 and at any adjournment of that meeting. Where more than one proxy is to be appointed or where voting intentions cannot be adequately expressed using this form an additional Appointment of Proxy Form is available on request from the share registry. Proxies will only be valid and accepted by the company if they are signed and received in the registry’s office no later than 48 hours before the meeting. Where a shareholder appoints more than one (1) proxy, neither proxy is entitled to vote on a show of hands.
| Important: for Items 3, 4 & 5 below |
| ¨ | If the Chairman of the Meeting is to be your proxy and you have not directed your proxy how to vote on Items 3, 4 & 5 below, please place a mark in this box. By marking this box you acknowledge that the Chairman of the Meeting may exercise your proxy even if he has an interest in the outcome of those Items and that votes cast by him, other than as proxy holder, would be disregarded because of that interest. If you do not mark this box, and you have not directed your proxy how to vote, the Chairman of the Meeting will not cast your votes on Items 3,4 & 5 and your votes will not be counted in computing the required majority if a poll is called on these Items. The Chairman of the Meeting intends to vote undirected proxies in favour of each of the resolutions, including those referred to in Items 3,4 & 5. |
Should you desire to direct your proxy how to vote on any resolution please insert (X) in the appropriate box below.
| Ordinary business | For | Against | Abstain* | Special Business | For | Against | Abstain* | |||||||||||
2. Election of Directors Helen M Nugent | ¨ | ¨ | ¨ | 3. Grant of options to Grant A King | ¨ | ¨ | ¨ | |||||||||||
H Kevin McCann | ¨ | ¨ | ¨ | 4. Grant of options to Bruce G Beeren | ¨ | ¨ | ¨ | |||||||||||
Bruce G Beeren | ¨ | ¨ | ¨ | 5. Increase in Directors’ fees | ¨ | ¨ | ¨ | |||||||||||
Colin B Carter | ¨ | ¨ | ¨ | 6. Constitutional change – Proportional takeover bids | ¨ | ¨ | ¨ | |||||||||||
| * | If you mark the abstain box for a particular item, you are directing your proxy not to vote on your behalf on a show of hands or on a poll and your votes will not be counted in computing the required majority on a poll. |
B | Signature of shareholder/s – this must be completed | |
Securityholder 1 (Individual) | Joint securityholder 2 (Individual) | Joint securityholder 3 (Individual) | ||
Sole Director and Sole Company Secretary | Director/Company Secretary (Delete one) | Director | ||
This form should be signed by the securityholder. If a joint holding, either securityholder can sign. If signed by the securityholder’s attorney, the power of attorney must have been previously noted by the registry or a certified copy attached to this form. If executed by a company, the form must be executed in accordance with the securityholder’s constitution and the Corporations Act 2001 (Cwlth).
ORG PRX042
| Appointment | of Proxy |
| • | If you are unable to attend and vote at the Annual General Meeting of Origin Energy Limited on Thursday, 16 October 2003 or any adjournment thereof and wish to appoint a person who is attending as your proxy, please complete and return this Appointment of Proxy Form. A proxy need not be a shareholder. |
| • | Shareholders are entitled to appoint up to two persons (whether shareholders or not), to attend the meeting and vote. If you wish to appoint two proxies, please obtain a second proxy form by telephoning 1300 664 446 or (02) 8280 7155. Both forms should be completed with the nominated number or percentage of your voting rights on each form. If you appoint two proxies and the appointment does not specify the proper number of your votes that the proxies may exercise, each such proxy may exercise one half. Please return both proxy forms together. Where a shareholder appoints more than one proxy, neither proxy is entitled to vote on a show of hands. |
Signing instructions
| • | The form of proxy must be signed by the shareholder (for joint shareholders either can sign) or by his/her/their joint authorised attorney(s). |
| • | If the shareholder is a corporation, this Appointment of Proxy should be signed in a manner which is legally binding on the corporation, for example: |
| - | under the common seal of the company by two Directors, or a Director and a Secretary; or |
| - | by two Directors, or a Director and a Secretary; or |
| - | in the case of a proprietary company that has a sole Director who is also the sole Company Secretary, by that Director; or |
| - | under the hand of a duly authorised officer or attorney |
| • | If signed under Power of Attorney, the attorney hereby states that no notice of revocation of the power has been received. If the Power of Attorney or other authority (if any) has not been previously noted by the company’s share registry, it must be produced for noting to ASX Perpetual Registrars Limited, by posting it to Locked Bag A14, Sydney South NSW 1235 or sending it by facsimile to ASX Perpetual Registrars Limited on (02) 8280 7646, by 10.30am on Tuesday, 14 October 2003. A certified copy of a Power of Attorney is acceptable. |
| • | If you require further information on how to complete the Appointment of Proxy Form telephone Origin Energy’s share registry on 1300 664 446 or (02) 8280 7155. |
Lodgement details
| • | The Appointment of Proxy must be received by the company’s share registry, ASX Perpetual Registrars Limited, by 10.30am on Tuesday, 14 October 2003. Shareholders are requested to return the Appointment of Proxy in the reply paid envelope provided, or post to Locked Bag A14, Sydney South NSW 1235 in sufficient time so that it reaches ASX Perpetual Registrars Limited by that time and date. |
| • | Alternatively, the Appointment of Proxy can be hand delivered to ASX Perpetual Registrars Limited, Level 8, 580 George Street, Sydney, sent by facsimile to ASX Perpetual Registrars Limited on (02) 8280 7646, by 10.30am on Tuesday, 14 October 2003. |
ASX Perpetual Registrars Limited advises that Chapter 2C of the Corporations Act 2001 requires information about you as a securityholder (including your name, address and details of the securities you hold) to be included in the public register of the entity in which you hold securities. This information must continue to be included in the public register if you cease to be a securityholder. These statutory obligations are not altered by the Privacy Amendment (Private Sector) Act 2000. Information is collected to administer your security holding and if some or all of the information is not collected then it might not be possible to administer your security holding. ASX Perpetual Registrar’s privacy policy is available on their website (www.asxperpetual.com.au).
Origin Energy Limited Level 39, AMP Centre
|
Item 13
| To | Company Announcements Office | Facsimile | 1300 300 021 | |||||
| Company | Australian Stock Exchange | Date | 17 September 2003 | |||||
| From | Bill Hundy | Pages | 7 | |||||
| Subject | SUBSTANTIAL HOLDER – CHANGE OF INTERESTS | |||||||
We wish to advise that the substantial shareholding of Origin Energy Limited group in Oil Company of Australia Limited (OCA) has altered and attach the Form 604 Notice of Change of Interests of Substantial Holder.
| Regards |
| |
Bill Hundy Company Secretary |
02 9220 6467 – bill.hundy@originenergy.com.au
Copy to: Company Secretary Oil Company of Australia Limited |
Form 604
Corporations Act 2001
Section 671B
Notice of change of interests of substantial holder
| To Company Name/Scheme | Oil Company of Australia Limited | |||||||
| ACN/ARSN | 001 646 331 | |||||||
| 1. Details of substantial holder (1) | ||||||||
| Name | Origin Energy Limited and the other bodies corporate as set out in Annexure A (“Origin”) | |||||||
| ACN/ARSN (if applicable) | 000 051 696 | |||||||
| There was a change in the interests of the substantial holder on | The dates set out in paragraph 3 | |||||||
| The previous notice was given to the company on | 12 /09 / 2003 | |||||||
| The previous notice was dated | 12 /09 / 2003 | |||||||
| 2. Previous and present voting power | ||||||||
The total number of votes attached to all the voting shares in the company or voting interests in the scheme that the substantial holder or an associate (2) had a relevant interest (3) in when last required, and when now required, to give a substantial holding notice to the company or scheme, are as follows:
| Class of Securities (4) | Previous notice | Present notice | ||||||||||||
| Person’s votes | Voting Power (5) | Person’s votes | voting power (5) | |||||||||||
| ORD | 104,627,623 | 88.97% | 116,735,091 | 99.27% | ||||||||||
3. Changes in relevant interests
Particulars of each change in, or change in the nature of, a relevant interest of the substantial holder or an associate in voting securities of the company or scheme, since the substantial holder was last required to give a substantial holding notice to the company or scheme are as follows: | ||||||||||
| Date of change | Person whose relevant interest changed | Nature of change (6) | Consideration to change (7) | Class and number of securities affected | Person’s votes affected | |||||
| 15/09/2003 | Origin Energy Limited | Acquisition of a relevant interest as a result of purchases of ordinary shares through on-market transaction on ASX | $4.24 per share | ORD 1,345 | 1,345 | |||||
| 15/09/2003 to 16/09/2003 | Origin Energy Limited | Origin’s relevant interest in OCA has increased under section 608(1) as a result of acceptances being received by Origin in respect of the offers made by Origin under its takeover bid to acquire all of the ordinary shares in OCA, the terms of which are set out in the bidder’s statement which is dated 6 August 2003 and which has previously been sent to OCA and ASX on 20 August 2003 (“Takeover Bid”). | $4.25 per share | 12,106,123 Ordinary Shares
15/09/03 – 89,277 16/09/03 – 12,016,846 | 12,106,123 | |||||
180
| 4. Present relevant interests | ||||||||||||||
Particulars of each relevant interest of the substantial holder in voting securities after the change are as follows:
| ||||||||||||||
Holder of relevant interest | Registered holder of securities | Person entitled to be registered as holder (8) | Nature of relevant interest (6) | Class and number of securities | Person’s votes | |||||||||
Origin Energy Limited | Origin Energy Limited | Origin Energy Limited | Holder of securities | 116,735,087 | 116,735,087 | |||||||||
Origin Energy Holdings Limited | Origin Energy Holdings Limited | Origin Energy Holdings Limited | Holder of securities | 1 | 1 | |||||||||
Origin Energy Limited | Origin Energy Resources Limited | Origin Energy Limited | Beneficial Holder of securities | 1 | 1 | |||||||||
Origin Energy Retail Limited | Origin Energy Retail Limited | Origin Energy Retail Limited | Holder of Securities | 1 | 1 | |||||||||
Origin Energy Limited | Origin Energy Services Limited | Origin Energy Limited | Beneficial Holder of Securities | 1 | 1 | |||||||||
| 5. Changes in association | ||||||||||||||
The persons who have become associates (2) of, ceased to be associates of, or have changed the nature of their association (9)
| ||||||||||||||
| Name and ACN/ARSN (if applicable | Nature of association | |||||||||||||
| N/A | ||||||||||||||
6. Addresses
The addresses of persons named in this form are as follows:
| ||||||||||||||
| Name | Address | |||||||||||||
| Origin Energy Limited | Level 39, AMP Centre, 50 Bridge Street, Sydney, NSW 2000 | |||||||||||||
| Bodies corporate set out in Annexure A | See Annexure A | |||||||||||||
| Signature | ||||||||||||||
| print name | William M Hundy | Capacity Secretary | ||||||||||||
| sign here | Date 16/ 9 / 2003 | |||||||||||||
DIRECTIONS | ||||||||||||||
(1) If there are a number of substantial holders with similar or related relevant interests (eg. a corporation and its related | ||||||||||||||
(2) See the definition of “associate” in section 9 of the Corporations Act 2001. | ||||||||||||||
(3) See the definition of “relevant interest” in sections 608 and 671B(7) of the Corporations Act 2001. | ||||||||||||||
(4) The voting shares of a company constitute one class unless divided into separate classes. | ||||||||||||||
(5) The person’s votes divided by the total votes in the body corporate or scheme multiplied by 100. | ||||||||||||||
(6) Include details of: | ||||||||||||||
(a) any relevant agreement or other circumstances by which the relevant interest was acquired. If subsection 671B(4) | ||||||||||||||
(b) any qualification of the power of a person to exercise, control the exercise of, or influence the exercise of, the voting | ||||||||||||||
See the definition of “relevant agreement” in section 9 of the Corporations Act 2001. | ||||||||||||||
(7) Details of the consideration must include any and all benefits, money and other, that any person from whom a relevant | ||||||||||||||
(8) If the substantial holder is unable to determine the identity of the person ( eg. if the relevant interest arises because of an | ||||||||||||||
(9) Give details, if appropriate, of the present association and any change in that association since the last substantial holding | ||||||||||||||
ANNEXURE A
This is Annexure A of 4 pages referred to in Form 604 signed by me and dated 16 September 2003.
Signed:
Dated: 16 September 2003
The following is a list of the related bodies corporate of Origin Energy Limited:
| Entity | Address | |
| Amadeus United States Pty Ltd | Level 2, South Tower, John Oxley Centre, 339 Coronation Drive, Milton QLD 4064 | |
| Angari Pty Ltd | Level 1, North Tower, John Oxley Centre, 339 Coronation Drive, Milton QLD 4064 | |
| BESP Pty Ltd | Level 6, 1 King William Street, Adelaide SA 5000 | |
| BTS Pty Limited | Level 6, 1 King William Street, Adelaide SA 5000 | |
| FRL Pty Limited | Level 6, 1 King William Street, Adelaide SA 5000 | |
| Gasmart (Vic) Pty Ltd | Level 6, 1 King William Street, Adelaide SA 5000 | |
| Huddart Parker Limited | Level 6, 1 King William Street, Adelaide SA 5000 | |
| Hylemit Pty Limited | 78 Wyndham Street, Shepparton VIC 3630 | |
| OCA (CSG) Pty Limited | Level 1, North Tower, John Oxley Centre, 339 Coronation Drive, Milton QLD 4064 | |
| OCA (Durham) Pty Limited | Level 1, North Tower, John Oxley Centre, 339 Coronation Drive, Milton QLD 4064 | |
| OCA Holdings Pty Limited | Level 1, North Tower, John Oxley Centre 339 Coronation Drive, Milton QLD 4064 | |
| OE JV Co Pty Ltd | Level 39, 50 Bridge Street, Sydney NSW 2000 | |
| OE SEA Gas Holdings Pty Ltd | Level 39, 50 Bridge Street, Sydney NSW 2000 | |
| OE SEA Gas SPV2 Pty Ltd | Level 39, 50 Bridge Street, Sydney NSW 2000 | |
| OE SEA Gas SPV3 Pty Ltd | Level 39, 50 Bridge Street, Sydney NSW 2000 | |
| Oil Company of Australia (Moura) Pty Ltd | Level 1, North Tower, John Oxley Centre, 339 Coronation Drive, Milton QLD 4064 | |
| Oil Company of Australia (Moura) Transmissions Pty Ltd | Level 1, North Tower, John Oxley Centre, 339 Coronation Drive, Milton QLD 4064 | |
| Oil Company of Australia Ltd | Level 1, North Tower, John Oxley Centre, 339 Coronation Drive, Milton QLD 4064 | |
| Oil Investments Ltd | Level 1, North Tower, John Oxley Centre, 339 Coronation Drive, Milton QLD 4064 | |
| Origin (LGC) (Aust) Pty Ltd | Level 6, 1 King William Street, Adelaide SA 5000 | |
| Origin Energy (Vic) Pty Ltd | Level 6, 1 King William Street, Adelaide SA 5000 | |
| Origin Energy Amadeus NL | Level 2, South Tower, John Oxley Centre, 339 Coronation Drive, Milton QLD 4064 | |
| Origin Energy American Samoa Inc | Nu’uuli, American Samoa | |
| Origin Energy Asset Management Ltd | Level 6, 1 King William Street, Adelaide SA 5000 | |
| Origin Energy Asset Management Services Pty Ltd | Level 39, 50 Bridge Street, Sydney NSW 2000 | |
| Origin Energy Australia Holding BV | Level 39, 50 Bridge Street, Sydney NSW 2000 | |
| Origin Energy Bonaparte Pty Ltd | Level 2, South Tower, John Oxley Centre, 339 Coronation Drive, Milton QLD 4064 | |
| Origin Energy Contracting Limited | Level 6, 1 King William Street, Adelaide SA 5000 | |
| Origin Energy Cook Islands Ltd | Avarua, Rarotonga, Cook Islands | |
| Origin Energy Developments Pty Ltd | Level 2, South Tower, John Oxley Centre, 339 Coronation Drive, Milton QLD 4064 | |
| Origin Energy Electricity Limited | Level 6, 1 King William Street, Adelaide SA 5000 | |
| Origin Energy Finance Company Pty Limited | Level 39, 50 Bridge Street, Sydney NSW2000 | |
| Origin Energy Holdings Limited | Level 6, 1 King William Street, Adelaide SA 5000 | |
| Origin Energy Industries Limited | 12 Waione Street, Petone, Wellington New Zealand | |
| Origin Energy LPG Limited | Level 6, 1 King William Street, Adelaide SA 5000 | |
| Origin Energy Ltd | Level 39 AMP Centre, 50 Bridge Street, Sydney NSW 2000 | |
| Origin Energy Mt Stuart BV | Level 39, 50 Bridge Street, Sydney NSW 2000 | |
| Origin Energy Northwest Ltd | Level 2, South Tower, John Oxley Centre, 339 Coronation Drive, Milton QLD 4064 | |
| Origin Energy NZ Share Plan Limited | 12 Waione Street, Petone, New Zealand | |
| Origin Energy Petroleum Pty Ltd | Level 2, South Tower, John Oxley Centre, 339 Coronation Drive, Milton QLD 4064 | |
| Origin Energy Pipelines (Vic) Holdings Pty Ltd | Level 6, 1 King William Street, Adelaide SA 5000 | |
| Origin Energy Pipelines (Vic) Pty Ltd | Level 6, 1 King William Street, Adelaide SA 5000 | |
| Origin Energy Pipelines Pty Limited | Level 6, 1 King William Street, Adelaide SA 5000 | |
| Origin Energy PNG Ltd | Napa Napa Road, Kanudi, Port Moresby | |
| Origin Energy Power Ltd | Level 6, 1 King William Street, Adelaide SA 5000 | |
| Origin Energy Resources Ltd | Level 2, South Tower, John Oxley Centre, 339 Coronation Drive, Milton QLD 4064 | |
| Origin Energy Resources NZ Ltd | 12 Waione Street, Petone, Wellington, New Zealand | |
| Origin Energy Retail Ltd | Level 6, 1 King William Street, Adelaide SA 5000 | |
| Origin Energy SA Pty Limited | Level 6, 1 King William Street, Adelaide SA 5000 | |
| Origin Energy Samoa Ltd | Sogi, Samoa | |
| Origin Energy Services Limited | Level 6, 1 King William Street, Adelaide SA 5000 | |
| Origin Energy Solar Pty Limited | Level 39, 50 Bridge Street, Sydney NSW 2000 | |
| Origin Energy Solomons Ltd | Mendana Avenue, Honiara, Solomon Islands | |
| Origin Energy SWC Limited | Level 18, 1 Spring Street, Melbourne VIC 3000 | |
| Origin Energy Tasmania Limited | Level 6, 1 King William Street, Adelaide SA 5000 | |
| Origin Energy Vanuatu Ltd | Rue Pasteur, Port Vila, Vanuatu | |
| Origin Energy WA Pty Ltd | Level 6, 1 King William Street, Adelaide SA 5000 | |
| Origin Energy Water Management Pty Ltd | Level 39, 50 Bridge Street, Sydney NSW 2000 | |
| Origin Energy Zoca 91-08 Pty Ltd | Level 2, South Tower, John Oxley Centre, 339 Coronation Drive, Milton QLD 4064 | |
| Parbond Pty Limited | Level 39, 50 Bridge Street, Sydney NSW 2000 | |
| Sagasco Amadeus Pty Ltd | Level 2, South Tower, John Oxley Centre, 339 Coronation Drive, Milton QLD 4064 | |
| Sagasco NT Pty Ltd | Level 2, South Tower, John Oxley Centre, 339 Coronation Drive, Milton QLD 4064 | |
| Sagasco Southeast Inc | Level 2, South Tower, John Oxley Centre, 339 Coronation Drive, Milton QLD 4064 | |
| The Albury Gas Company Limited | Level 6, 1 King William Street, Adelaide SA 5000 | |
| The Fiji Gas Co. Ltd | Cnr Amra Street & Foster Road, Walu Bay, Suva Fiji | |
| Tonga Gas Ltd | Cnr Amra Street & Foster Road, Walu Bay, Suva Fiji | |
| Vic Gas Distribution Pty Ltd | Level 6, 1 King William Street, Adelaide SA 5000 | |
Item 14
To | Company Announcements Office | Facsimile | 1300 300 021 | |||||
Company | Australian Stock Exchange Limited | Date | 19 September 2003 | |||||
From | Bill Hundy | Pages | 9 | |||||
Subject | APPENDIX 3B NOTICE | |||||||
Please find attached an Appendix 3B regarding the exercise of options under the Senior Executive Option Plan.
Regards
Bill Hundy
Company Secretary
02 9220 6467 –bill.hundy@originenergy.com.au
Appendix 3B
New issue announcement
Rule 2.7, 3.10.3, 3.10.4, 3.10.5
Appendix 3B
New issue announcement,
application for quotation of additional securities
and agreement
Information or documents not available now must be given to ASX as soon as available. Information and documents given to ASX become ASX’s property and may be made public.
Introduced 1/7/96. Origin: Appendix 5. Amended 1/7/98, 1/9/99, 1/7/2000, 30/9/2001, 11/3/2002.
Name of entity
ORIGIN ENERGY LIMITED
ABN
30 000 051 696
We (the entity) give ASX the following information.
Part 1—All issues
You must complete the relevant sections (attach sheets if there is not enough space).
1 | +Class of+securities issued or to be issued | Ordinary Fully Paid Shares | ||
2 | Number of+securities issued or to be issued (if known) or maximum number which may be issued | 33,550 | ||
3 | Principal terms of the+securities (eg, if options, exercise price and expiry date; if partly paid+securities, the amount outstanding and due dates for payment; if+convertible securities, the conversion price and dates for conversion) | Fully Paid Ordinary Shares | ||
+ See chapter 19 for defined terms.
11/3/2002
Appendix 3B Page 2
Appendix 3B
New issue announcement
4 | Do the+securities rank equally in all respects from the date of allotment with an existing+class of quoted+securities? |
Yes | ||||
If the additional securities do not rank equally, please state: | ||||||
• the date from which they do | ||||||
• the extent to which they participate for the next dividend, (in the case of a trust, distribution) or interest payment | ||||||
• the extent to which they do not rank equally, other than in relation to the next dividend, distribution or interest payment | ||||||
5 | Issue price or consideration | $1.76 | ||||
6 | Purpose of the issue (If issued as consideration for the acquisition of assets, clearly identify those assets) | Issued as a result of the exercise of Options issued pursuant to the
| ||||
7 | Dates of entering+securities into uncertificated holdings or despatch of certificates | 17 September 2003 | ||||
| Number | +Class | |||||
8 | Number and+class of all+securities quoted on ASX (including the securities in clause 2 if applicable) | 657,993,351 | Ordinary | |||
+ See chapter 19 for defined terms.
11/3/2002
Appendix 3B Page 3
Appendix 3B
New issue announcement
| Number | +Class | |||||
9 | Number and+class of all+securities not quoted on ASX (including the securities in clause 2 if applicable) | 11,228,400
| Options | |||
10 | Dividend policy (in the case of a trust, distribution policy) on the increased capital (interests) | All Shares Participate Equally | ||||
Part 2 - Bonus issue or pro rata issue
| ||||||
11 | Is security holder approval required? | N/A
| ||||
12 | Is the issue renounceable or non-renounceable? | N/A | ||||
13 | Ratio in which the +securities will be offered | N/A | ||||
14 | +Class of +securities to which the offer relates | N/A | ||||
15 | +Record date to determine entitlements | N/A
| ||||
16 | Will holdings on different registers (or subregisters) be aggregated for calculating entitlements? | N/A | ||||
17 | Policy for deciding entitlements in relation to fractions | N/A | ||||
18 | Names of countries in which the entity has +security holders who will not be sent new issue documents
Note: Security holders must be told how their entitlements are to be dealt with.
Cross reference: rule 7.7. | N/A | ||||
19 | Closing date for receipt of acceptances or renunciations | N/A | ||||
+ See chapter 19 for defined terms.
11/3/2002
Appendix 3B Page 4
Appendix 3B
New issue announcement
20 | Names of any underwriters | N/A
| ||
21 | Amount of any underwriting fee or commission | N/A
| ||
22 | Names of any brokers to the issue | N/A
| ||
23 | Fee or commission payable to the broker to the issue | N/A
| ||
24 | Amount of any handling fee payable to brokers who lodge acceptances or renunciations on behalf of +security holders | N/A | ||
25 | If the issue is contingent on+security holders’ approval, the date of the meeting | N/A | ||
26 | Date entitlement and acceptance form and prospectus or Product Disclosure Statement will be sent to persons entitled | N/A | ||
27 | If the entity has issued options, and the terms entitle option holders to participate on exercise, the date on which notices will be sent to option holders | N/A | ||
28 | Date rights trading will begin (if applicable) | N/A
| ||
29 | Date rights trading will end (if applicable) | N/A
| ||
30 | How do+security holders sell their entitlementsin full through a broker? | N/A | ||
31 | How do+security holders sellpart of their entitlements through a broker and accept for the balance? | N/A | ||
+See chapter 19 for defined terms.
11/3/2002
Appendix 3B Page 5
Appendix 3B
New issue announcement
32 | How do+security holders dispose of their entitlements (except by sale through a broker)? | N/A | ||||
33 | +Despatch date | N/A | ||||
Part 3—Quotation of securities
You need only complete this section if you are applying for quotation of securities | ||||||
34 | Type of securities (tick one) | |||||
(a) | x | Securities described in Part 1 | ||||
(b) | ¨ | All other securities
Example: restricted securities at the end of the escrowed period, partly paid securities that become fully paid, employee incentive share securities when restriction ends, securities issued on expiry or conversion of convertible securities | ||||
Entities that have ticked box 34(a)
Additional securities forming a new class of securities (If the additional securities do not form a new class, go to 43) | ||||||
Tick to indicate you are providing the information or documents | ||||||
35 | ¨ | If the+securities are+equity securities, the names of the 20 largest holders of the additional+securities, and the number and percentage of additional+securities held by those holders | ||||
36 | ¨ | If the+securities are+equity securities, a distribution schedule of the additional+securities setting out the number of holders in the categories 1 – 1,000 1,001 – 5,000 5,001 – 10,000 10,001 – 100,000 100,001 and over | ||||
37 | ¨ | A copy of any trust deed for the additional +securities | ||||
(now go to 43)
| + | See chapter 19 for defined terms |
11/3/2002 | Appendix 3B Page 6 |
Appendix 3B
New issue announcement
Entities that have ticked box 34(b)
38 | Number of securities for which+quotation is sought | |||||
39 | Class of+securities for which quotation is sought | |||||
40 | Do the+securities rank equally in all respects from the date of allotment with an existing+class of quoted+securities?
If the additional securities do not rank equally, please state: | |||||
• the date from which they do | ||||||
• the extent to which they participate for the next dividend, (in the case of a trust, distribution) or interest payment | ||||||
• the extent to which they do not rank equally, other than in relation to the next dividend, distribution or interest payment | ||||||
41 | Reason for request for quotation now
Example: In the case of restricted securities, end of restriction period
(if issued upon conversion of another security, clearly identify that other security)
| |||||
| Number | +Class | |||||
42 | Number and+class of all+securities quoted on ASX (including the securities in clause 38) | |||||
(now go to 43)
| + | See chapter 19 for defined terms |
11/3/2002 | Appendix 3B Page 7 |
Appendix 3B
New issue announcement
All entities
Fees
| 43 | Payment method (tick one) | |
¨ Cheque attached
| ||
¨ Electronic payment made
| ||
| Note: Payment may be made electronically if Appendix 3B is given to ASX electronically at the same time. | ||
x Periodic payment as agreed with the home branch has been arranged | ||
Note: Arrangements can be made for employee incentive schemes that involve frequent issues of securities. |
Quotation agreement
| 1 | +Quotation of our additional+securities is in ASX’s absolute discretion. ASX may quote the+securities on any conditions it decides. |
| 2 | We warrant the following toASX. |
| • | The issue of the+securities to be quoted complies with the law and is not for an illegal purpose. |
| • | There is no reason why those+securities should not be granted+quotation. |
| • | An offer of the+securities for sale within 12 months after their issue will not require disclosure under section 707(3) or section 1012C(6) of the Corporations Act. |
Note: An entity may need to obtain appropriate warranties from subscribers for the securities in order to be able to give this warranty
| • | Section 724 or section 1016E of the Corporations Act does not apply to any applications received by us in relation to any+securities to be quoted and that no-one has any right to return any+securities to be quoted under sections 737, 738 or 1016F of the Corporations Act at the time that we request that the+securities be quoted. |
| • | We warrant that if confirmation is required under section 1017F of the Corporations Act in relation to the+securities to be quoted, it has been provided at the time that we request that the+securities be quoted. |
| + | See chapter 19 for defined terms |
11/3/2002 | Appendix 3B Page1 |
Appendix 3B
New issue announcement
| • | If we are a trust, we warrant that no person has the right to return the+securities to be quoted under section 1019B of the Corporations Act at the time that we request that the+securities be quoted. |
| 3 | We will indemnify ASX to the fullest extent permitted by law in respect of any claim, action or expense arising from or connected with any breach of the warranties in this agreement. |
| 4 | We give ASX the information and documents required by this form. If any information or document not available now, will give it to ASX before+quotation of the+securities begins. We acknowledge that ASX is relying on the information and documents. We warrant that they are (will be) true and complete. |
| Sign here: | | Date: 19 September 2003 | ||
| Company Secretary | ||||
Print name: William M Hundy
| + | See chapter 19 for defined terms |
11/3/2002 | Appendix 3B Page 2 |
Item 15
ASX Release
19 September 2003
Jingemia 2 Weekly Progress Report, Onshore Perth Basin, Western Australia
Origin Energy Resources Limited* advises that the appraisal well Jingemia 2 located in the onshore Perth Basin Exploration Permit 413 was plugged and sidetracked on 17 September 2003.
Jingemia 2 reached a total measured depth of 2781 metres on 9 September 2003. The Dongara Sandstone was intersected approximately 42 metres below the prognosed intersection and approximately 62 metres low to Jingemia 1. Evaluation of the Dongara Sandstone has indicated that the reservoir has thinned from Jingemia 1, is of poor quality and unsuitable for water injection. It has not been possible to determine if the oil shows recorded at the top of the Dongara Sandstone represent a residual saturation of oil or the base of a live oil column.
The Joint Venture agreed to abandon the Jingemia 2 well bore and sidetrack to a location approximately 400m north of the Jingemia 2 top Dongara Sandstone location. This sidetrack is designated Jingemia 3. Jingemia 3 is designed to intersect improved reservoir quality and provide a point for water injection to provide reservoir pressure support.
The sidetracked (Jingemia 3) was commenced on 17 September 2003. At 06:00 hours WST the sidetrack hole was drilling ahead at a measured depth of 1899 metres.
Participants in EP 413, Jingemia 2 and Jingemia 3 are:
Origin Energy Developments Pty Limited* (Operator) | 49.189 | % | |
Hardman Oil and Gas Pty Ltd | 22.376 | % | |
AWE (Perth Basin) Pty Ltd | 15.245 | % | |
Victoria Petroleum NL | 5.000 | % | |
Voyager Energy Limited | 6.270 | % | |
Norwest Energy NL | 1.278 | % | |
Roc Oil (WA) Pty Limited | 0.250 | % | |
ARC Energy NL | 0.250 | % | |
John Kevin Geary | 0.142 | % |
*a wholly owned subsidiary of Origin Energy Limited
For further information contact:
John Piper
Executive General Manager - Oil and Gas Production
Phone: 07 3858 0681
Email: john.piper@upstream.originenergy.com.au
Item 16
| To | Company Announcements Office | Facsimile | 1300 300 021 | |||
| Company | Australian Stock Exchange Limited | Date | 22 September 2003 | |||
| From | Bill Hundy | Pages | 13 | |||
| Subject | Overseas Share Sale Facility | |||||
Attached herewith is a copy of correspondence sent to registered US and overseas shareholders in relation to the extension of the Overseas Share Sale Facility.
The Overseas Share Sale Facility is designed to help reduce the cost of servicing small shareholders in foreign countries and is not available to residents of Australia, New Zealand or other countries where Origin has employees or registered subsidiaries.
Regards
Bill Hundy
Company Secretary
02 9220 6467 – bill.hundy@originenergy.com.au
Dear Shareholder,
| • | Share Sale Facility closing |
| • | Final opportunity to sell your Origin Energy shares & convert dividends at no cost |
Origin Energy is writing to advise you that due to a strong response we have extended our voluntary Share Sale Facility. The program will now close onTuesday October 7, 2003.
As explained in more detail below the Share Sale Facility allows you as a holder of less than 2,000 shares in Origin Energy to conveniently:
| • | Sell all of your shares in Origin Energy at no cost to you. |
| • | Receive proceeds from this sale in U.S. dollars |
| • | Have all your uncashed Australian dollar dividend checks replaced by a check in U.S. dollars |
| • | Receive your October 2003 dividend by check in U.S. dollars |
You are not obligated to take up this offer, but we advise that this is your final opportunity under the program to sell your Origin Energy shares and convert your dividends to US dollars at no cost to you. If you wish to take advantage of this facility you should act promptly to ensure that your completed form is received by Georgeson Shareholder before Tuesday October 7, 2003.
The attached instruction and acceptance forms contain further background and details regarding the Share Sale Facility. If you have any questions or need additional information in relation to this offer, please call Georgeson Shareholder at 866-274-2459.
If you have already returned your Share Sale Facility Instruction Form please disregard this notice.
2
Introduction
On August 4, 2003 we wrote to you to advise you of a Share Sale Facility provided by Origin Energy that was open until Tuesday September 9, 2003 or such later date as we elected, and that allowed you as a holder of less than 2,000 shares in Origin Energy to conveniently:
| • | Sell all of your shares in Origin Energy at no cost to you. |
| • | Receive proceeds from this sale in U.S. dollars, and |
| • | Have all your uncashed Australian dollar dividend checks replaced by a check in U.S. dollars. |
Origin Energy has now elected to extend the Share Sale Facility until Tuesday October 7, 2003.
| • | In addition, we now also offer the opportunity to receive your October 2003 dividend by check in U.S. dollars. |
In extending the Share Sale Facility we note that shareholders who sell their shares after Monday, September 15, 2003 will remain entitled to the final dividend for the financial year ending June 30, 2003 (the “Final Dividend”) of A$0.05 per share (five Australian cents per share) that is scheduled to be paid on October 3, 2003. If you participate in the Share Sale Facility we will also ensure that you receive this dividend check as an equivalent amount in U.S. dollars at the time of payment.
The Share Sale Facility is designed to save you the time, uncertainty and expense of selling small parcels of shares on a foreign stock market, and the expense of converting proceeds from the sale of shares into U.S. dollars. Origin Energy shares do not trade on the New York Stock Exchange or on any stock exchange in U.S. dollars. The only market where our shares are actively traded is the Australian Stock Exchange (“ASX”) and trading occurs in Australian dollars. In addition if you take advantage of this facility, and you have any outstanding dividend checks in Australian dollars that have not yet been cashed, we will replace your Australian dollar dividend checks with U.S. dollar dividend checks (see “Uncashed Dividend Checks” on subsequent pages), and provide your check for the Final Dividend in U.S. dollars.
You are not obligated to take up this offer. As an alternative, should you wish to sell your shares in Origin Energy, you would need to make your own inquiries into market conditions and your own arrangements with an Australian broker to execute the trade on your behalf on the ASX, and receive a check for the proceeds in Australian dollars, which you will have to convert to U.S. dollars at your own time and expense. Your outstanding dividend checks, including the Final Dividend check, will also need to be converted to U.S. dollars at your own time and expense.
This Share Sale Facility will provide you with a convenient means to realise your investment in Origin Energy and will help us reduce our long run costs.
3
Following the closing of the Share Sale Facility should the total number of shareholders of record in the United States fall below 300 Origin Energy will seek to deregister in the United States and we will no longer have to conform to certain reporting requirements in the United States. All shareholders will however continue to receive Origin Energy’s periodic reports that are lodged with the ASX. To assist in the execution of this Share Sale Facility, Georgeson Shareholder Communications (“Georgeson”) will act as an information agent and co-ordinator, while Citigroup Global Markets Australia Pty Ltd (“CGMA”) will act as Stock and Transfer Agent. Our share registrar in Australia, ASX Perpetual Registrars Limited (“Perpetual”), will also be involved in facilitating these sales which will be conducted as regular transactions on the Australian Stock Exchange.
Please read the accompanying material carefully and, should you choose to take advantage of this facility, return the completed documentation in the reply paid envelope supplied to Georgeson by no later thanTuesday, October 7, 2003 or such other later date determined by Origin Energy and Georgeson (“Final Date”).
The accompanying material consists of:
| • | An acceptance form for the sale of your entire shareholding in Origin Energy |
| • | Instructions for participation in the Share Sale Facility |
| • | A short form Prospectus relating to the Share Sale Facility. We have filed the prospectus with the U.S. Securities and Exchange Commission as part of a registration statement on Form F-3. The SEC declared the prospectus effective on July 31, 2003. |
Should you have any questions please contact Georgeson Shareholder on the Toll Free line in the United States of 866-274-2459. Eligible Shareholders outside the United States should call +1-212-440-9800, but are notified that this is not a toll free number.
Should you wish to verify that Origin Energy is the originator of this correspondence we invite you to either:
| • | Visit the Origin Energy website at www.originenergy.com.au and proceed to the “Investor Centre” and “Foreign Share Sale Facility”; or |
| • | You may obtain a copy of our most recent annual report on Form 20-F and our other periodic reports on Form 6-K free of charge from Georgeson or by visiting the SEC’s website at www.sec.gov and searching for filings for Origin Energy. |
Background
Origin Energy is a company listed on the ASX whose primary activities include the sale of natural gas, liquefied petroleum gas (LPG) and electricity throughout Australia, the distribution of LPG in New Zealand and parts of the Asia-Pacific region, the exploration for and production of oil and gas in Australia and New Zealand, the development and operation of gas-fired cogeneration and power
4
generation facilities in Australia, and management of gas transmission and distribution assets on behalf of third parties in Australia.
The company evolved from the demerger of Boral Ltd (“Old Boral”), a company listed on the ASX which had a combination of building and construction material businesses and energy businesses. Old Boral was for a period of time in the 1990’s listed on the Nasdaq and ran an American Depository Receipt (“ADR”) program in the United States. The company had many overseas operations, including building and construction material businesses in the United States.
A Scheme of Arrangement to separate Old Boral’s building and construction materials businesses from its energy businesses was approved at a meeting of shareholders on 17 February 2000. Consequently, two industry specific Australian listed companies, Boral Limited (“New Boral”) and Origin Energy, were created from the Old Boral. The mechanisms of the Scheme of Arrangement were such that each holder subsequently held one New Boral and one Origin Energy share for every two (2) Old Boral shares held. The record date for the issue of New Boral and Origin Energy shares was 25 February 2000.
Origin Energy is aware that many holders acquired Old Boral shares to invest in an international building and construction materials company and may not wish to continue an association with an Australian energy company. It is also apparent that many shareholders in the United States and other countries outside of Australia hold small parcels of shares. Sale of these shares would ordinarily be subject to significant transaction costs and payment would normally be received in a foreign currency (Australian dollars).
Origin Energy is therefore giving selected investors outside of Australia holding less than 2000 Origin Energy shares the opportunity to dispose of their entire holding without incurring brokerage or transaction costs, and to receive payment in U.S. dollars. In addition if you take advantage of this facility, and you have any outstanding dividend checks in Australian dollars that have not yet been cashed, we will replace your Australian dollar dividend checks with U.S. dollar dividend checks. As outlined above this convenience is also extended to the Final Dividend.
Details Regarding the Share Sale Facility
Origin Energy can make no representations regarding the price that will be received for the sale of shares sold through the Share Sale Facility.
Sales will be made on market on the ASX on Friday of each week commencing from Friday, August 15, 2003. Normally, if your completed forms are received by Georgeson by the Tuesday of a particular week (in the United States) the shares will be sold on the ASX in Australia on Friday of that same week. The share price received will be the Volume Weighted Average Share Price (VWAP) in Australian dollars for all Origin Energy shares sold on that day. The sale proceeds will be converted into U.S. dollars from Australian dollars at the noon buying rate in New York City for cable transfers in Australian dollars as reported by The Federal Reserve Bank of New York (the “Noon Buying Rate”) on the date of sale. Settlement of the sale of shares will take place three days after the trade, as per
5
standard ASX procedures. Documentation of the sale, preparation of tax forms and issuance of U.S. dollar checks will then be undertaken by Georgeson, and it is anticipated that the proceeds will be mailed to you by close of business on the Friday following the date of sale of your shares.
Should the return forms submitted be incomplete, or should your shareholding need to be transferred from an Australian Broker Sponsored account to an Issuer Sponsored account (see “Broker Sponsored Holdings” below) then there may be a delay in selling your shares while the appropriate documentation is being completed.
Broker Sponsored Holdings
If your shareholding in Origin Energy is held through a Clearing House Electronic Sub-register System (“CHESS”) Broker Sponsored account this will be noted on the “Share Sale Facility Instruction Form”. To take advantage of this Share Sale Facility and the free brokerage offered it is essential that your holding is first changed from a Broker Sponsored account to an Issuer Sponsored account. This can be done simply on the “Share Sale Facility Instruction Form”, which contains a box for you to tick to acknowledge your desire to transfer your holding to an Issuer Sponsored account. If you tick this box our share registrar in Australia, ASX Perpetual Registrars Limited will, in accordance with your instructions, contact your broker and request them to complete the transfer documentation.
Uncashed Dividend Checks
If by our records you hold uncashed dividend checks from Origin Energy a listing of all uncashed dividend checks will appear on page 2 of the “Share Sale Facility Instruction Form”. If you agree to participate in this share sale facility we offer to replace your uncashed Australian dollar dividend checks with one U.S. dollar dividend check. This will save you the time and expense of converting these Australian dollar dividend checks into U.S. dollars. If you wish to take advantage of this offer please tick the appropriate box on the “Share Sale Facility Instruction Form.”
On receipt of these forms Origin Energy will cancel the Australian dollars checks in your possession and issue a new check denominated in U.S. dollars. Conversion to U.S. dollars will take place at the same exchange rate that is applicable to the sale of your shares.
Note that you may only take advantage of this offer to convert uncashed dividend checks if you are selling all your shares in Origin Energy through this Share Sale Facility.It is not available to shareholders who do not participate in the Share Sale Facility.
Final Dividend
Shareholders who sell their shares after Monday, September 15, 2003 will remain entitled to the final dividend for the financial year ending June 30, 2003 (the “Final Dividend”) of A$0.05 per share (five Australian cents per share) that is scheduled to be paid on October 3, 2003. If you participate in the Share Sale Facility
6
we will also ensure that you receive this dividend check as an equivalent amount in U.S. dollars at the time of payment.
Backup withholding and substitute IRS Form W-9
US shareholders may be subject to U.S. federal income tax backup withholding equal to 28% of the gross proceeds payable to U.S. shareholders for ordinary shares sold on the Australian Stock Exchange pursuant to the Share Sale Facility. Certain shareholders (including all U.S. corporations and non-U.S. holders) are exempt from backup withholding.
If as a U.S. shareholder you do not otherwise establish an exemption, you must provide Georgeson with your correct taxpayer identification number and provide certain other information by completing the Substitute Internal Revenue Service Form W-9 on page 5 of the Share Sale Facility Instruction Form. Failure to do so will result in U.S. federal income tax backup withholding equal to 28% of the gross proceeds from the sale of your shares on the Australian Stock Exchange being deducted from the amount provided to you.
Form W-9 and instructions relating to its completion are included on pages 5, 6 and 7 of the Share Sale Facility Instruction Form.
Participating in the Share Sale Facility
Shareholders wishing to take advantage of this offer to sell their entire Origin Energy share holdings should fill in all sections of the attached Share Sale Facility Instruction Form and return the completed Instruction Form to Georgeson in the enclosed envelope. Note that shareholders electing to participate in the Share Sale Facility must sell their entire holding of Origin Energy shares.
If your shares in Origin Energy are held through a Broker Sponsored account you will need to tick the box “Change from Broker Sponsored to Issuer Sponsored”. For details see “Broker Sponsored Holdings” above.
If you have uncashed dividend checks from Origin Energy and wish to have these checks converted to U.S. dollars at no charge, please tick the box “Conversion of Uncashed Dividend Checks to U.S. dollars.” For details see “Uncashed Dividend Checks” above.
Shareholders should note that:
| (a) | This offer is only open to applications received in good order by Georgeson by mail prior to close of business in New York on the Final Date, being currently Tuesday, October 7, 2003, subject to the complete discretion of Georgeson and Origin Energy to extend; |
| (b) | After an acceptance form has been submitted by a shareholder it cannot be withdrawn; |
| (c) | Although Origin Energy has engaged Georgeson to arrange the Share Sale Facility and CGMA to sell the shares, the shares will be sold directly on |
7
market on the ASX and neither Georgeson, CGMA nor Origin Energy will have or take any interest in the shares; |
| (d) | Origin Energy, Georgeson and CGMA can give no representation as to the price that will be realised on the sale of the shares as this will be determined by market conditions on the ASX at the time of sale; and |
| (e) | If the number of U.S. holders of Origin Energy shares falls below a certain level, Origin Energy intends to deregister its shares with the U.S. Securities and Exchange Commission so that it will no longer have to comply with certain U.S. reporting requirements to which it is currently subject. |
If you have any questions or need additional information in relation to this offer, please call Georgeson at 866-274-2459.
Yours sincerely,
Bill Hundy
Company Secretary
Origin Energy Limited
September 18, 2003
8
SHARE SALE FACILITY
INSTRUCTION FORM
INSTRUCTION TO SELL YOUR SHAREHOLDING
IN ORIGIN ENERGY LIMITED (“ORIGIN ENERGY”)
A | Share Sale Offer | |||||
| To agree to sell your entire holding of Origin Energy Shares please tick (x) this box. You must also sign where indicated in section C below. | ¨ | |||||
| Change from Brokered Sponsored to Issuer Sponsored | ||||||
If your shareholding in Origin Energy is currently indicated above as “Broker Sponsored” and you agree to transfer your holding from “Broker Sponsored” to “Issuer Sponsored” please tick (x) this box. For an explanation of this item see “Broker Sponsored Accounts” in the accompanying letter. | ¨ | |||||
| Conversion of Uncashed Dividend Checks to U.S. Dollars | ||||||
| If by our records you hold uncashed dividend checks from Origin Energy a listing of all uncashed dividend checks will appear on the following page 2 of this election form. To agree to have these checks cancelled and replaced by one check of equivalent value in U.S. dollars please tick (x) this box. For an explanation of this item see “Uncashed Dividend Checks” in the accompanying letter. (Please note you must participate in the “Share Sale Offer” in order to have your uncashed dividend checks converted to U.S. dollars.) | ¨ | |||||
B | Contact Details | |||||
Please provide a telephone number where we may reach you during business hours if we have any questions about this form | ( ) -
__________________ | |||||
| C | Signing – Refer overleaf for signing instructions |
I/We named above agree to be bound by the terms of the Shareholder Warranties and Acknowledgements and this Instruction Form.
Signature of Security Holder/s | Companies Only Common Seal | |||
| Signature | Director/Sole Director | |||
/ / Date | / / Date | |||
| Signature | Director/Secretary | |||
/ / Date | / / Date | |||
| Executed By: |
| |||
In accordance with the Company’s Constitution | ||||
List of Uncashed Dividend Checks
2
Shareholder Warranties and Acknowledgements
I/We warrant and acknowledge that by returning this Instruction Form:
| 1. | I am/we are the legal and beneficial owner of my/our Shares. |
| 2. | I am/we are absolutely free to sell my/our Shares and my/our Shares have not been mortgaged, charged or otherwise encumbered in any way. |
| 3. | Origin Energy and / or its agents may reject in its absolute discretion any Instruction Form. |
| 4. | I/we acknowledge that by signing and submitting this form I/we are instructing that my/our entire shareholding be sold through the Share Sale Facility in accordance with the Share Sale Facility Term Sheet and that this instruction is irrevocable. |
Signing Instructions
| a) | The instruction form must be signed by the shareholder (for joint shareholders all must sign) or by his/her/their joint authorised attorney(s). |
| b) | If the shareholder is a corporation, this form should be signed: |
under the common seal of the company by two directors, or a director and a secretary;
or
by two directors, or a director and a secretary;
or
in the case of a proprietary company that has a sole director who is also the sole company secretary, by that director; or under the hand of a duly authorised officer or attorney.
| c) | If signed under a Power of Attorney, the attorney hereby states that no notice of revocation of the power has been received. |
Delivery Details
Return your completed Instruction Form in the postage paid reply envelope or to:
By Mail: | By Overnight Courier: | By Hand: | ||
Alpine Fiduciary Service, Inc. | Alpine Fiduciary Services, Inc. | Alpine Fiduciary Services | ||
C/o Georgeson Shareholder | c/o Georgeson Shareholder | c/o Securities Transfer and | ||
Communications, Inc. | Communications, Inc. | Reporting Srvices, Inc. | ||
PO Box 2065 | 219 Murray Hill Parkway | 100 Williams Street | ||
South Hackensack, NJ 07606 | East Rutherford, NJ 07073 | Lower Gallaria | ||
| Attn: Corporate Actions Dept. | New York, NY 10038 | |||
By Facsimile Transmission: | ||||
(201) 528-2733 | ||||
Terms used on this Instruction Form have the same meaning in the Sale Facility Term Sheet.
3
SALE FACILITY TERM SHEET
| 1 | KEY TERMS |
“Company” means Origin Energy Limited, ACN 000 051 696 (“Origin Energy”).
“Broker Sponsored” means that you have entered into an agreement with a licensed sharebroker in Australia to transact your shareholding solely through that broker.
“CGMA” means Citigroup Global Markets Australia Pty Ltd.
“Controlling Participant” means your sponsoring broker should your shareholding in Origin Energy be “Broker Sponsored”.
“Eligible Shareholder” means a registered holder of shares in Origin Energy, with a registered address in the United States of America or certain other countries as specified in the enclosed Prospectus, holding less than 2000 shares in Origin Energy.
“Final Dividend” means the final dividend for the financial year ended June 30, 2003
“Georgeson” means Georgeson Shareholder Communications Corporation.
“Instruction Form” means this instruction form pursuant to which Eligible Shareholders instruct Georgeson to facilitate the sales of their Shares on the Australian Stock Exchange.
“Noon Buying Rate” the noon buying rate in New York City for cable transfers in Australian dollars as reported by The Federal Reserve Bank of New York.
“Sale Amount” means the amount described in section 5.2.
“Share Sale Facility” means the facility offered to Eligible Shareholders to sell their entire holding of Shares in the Company.
“Share Sale Facility Offer Period” means the period from Monday, August 4, 2003 to Tuesday, October 7, 2003, subject to the complete discretion of Georgeson and Origin Energy to extend.
“Sale Shares” means the shareholding in the Company that an Eligible Shareholder has offered to sell in the Share Sale Facility being all Shares held by the Eligible Shareholder at the time of lodging the Instruction Form with Georgeson.
“Shares” means ordinary shares in the Company.
“Volume Weighted Average Price” or “VWAP” means the price obtained by dividing the total proceeds from the sale of shares in the Company on a particular day by the number of shares in the Company sold on that day on the ASX.
| 2 | TERMS OF PARTICIPATION |
| 2.1 | Only an Eligible Shareholder may participate in the Share Sale Facility. An Eligible Shareholder electing to participate in the Share Sale Facility must sell all Shares held by that shareholder |
| 2.2 | An Eligible Shareholder may only participate once in the Share Sale Facility. |
| 2.3 | Only Instruction Forms received prior to the expiration of the Share Sale Facility Offer Period will be regarded as valid. |
| 2.4 | A valid Instruction Form received from an Eligible Shareholder will be an irrevocable instruction to sell such shares on behalf of such Eligible Shareholder. |
| 3 | CHARGE TO SHAREHOLDERS |
| 3.1 | Eligible Shareholders will not be required to bear the brokerage charge in selling their Shares through the Share Sale Facility. However, any other tax, duty, charge, or expense on the sale of the Shares will be for the account of Eligible Shareholders. |
| 4 | SHAREHOLDER INSTRUCTIONS |
| 4.1 | Eligible Shareholders may participate in the Share Sale Facility by completing this Instruction Form pursuant to which each Eligible Shareholder irrevocably instructs Georgeson to sell their entire share holding in the Company through the Share Sale Facility on these terms. |
| 5 | SALE FACILITY MECHANICS |
| 5.1 | Georgeson in its discretion, will accept offers to participate in the Share Sale Facility which are made by Eligible Shareholders returning duly completed Instruction Forms to Georgeson (“Participating Shareholders”). |
| 5.2 | The amount to be paid to the Eligible Shareholder shall be the VWAP in Australian dollars for all shares traded on the ASX on the particular day that an Eligible Shareholder’s shares are sold, multiplied by the Noon Buying Rate that day. |
| 5.3 | Georgeson will endeavour to send a covering letter and pre-printed check to Participating Shareholders in respect of the Sale Amount by 5:00 pm on the Friday in the United States one week after the shares are sold on the ASX. |
4
SUBSTITUTE
FORM W-9 Department of the Treasury Internal Revenue Service
Payer’s Request For Taxpayer Identification Number (“TIN”) | Part 1—Please provide your correct TIN
Name
Social Security Number
Employer Identification Number
| Part 2—For Payees exempt from backup withholding, see the enclosed Guidelines for Certification of Taxpayer Identification Number on Substitute Form W-9 and complete as instructed therein. | ||||
Under penalties of perjury, I certify that:
1. The number shown on this form is my correct taxpayer identification number (or I am waiting for a number to be issued to me),and
2. I am not subject to backup withholding because:(a) I am exempt from backup withholding, or(b) I have not been notified by the Internal Revenue Service (IRS) that I am subject to backup withholding as result of a failure to report all interest or dividends, or (c) the IRS has notified me that I am no longer subject to backup withholding,and
3. I am a U.S. person (including a U.S. resident alien).
Certification instructions.You must cross out item2 above if you have been notified by the IRS that you are currently subject to backup withholding because you have failed to report all interest and dividends on your tax return. For real estate transactions, item2 does not apply. For mortgage interest paid, acquisition or abandonment of secured property, cancellation of debt, contributions to an individual retirement arrangement (IRA), and generally, payments other than interest and dividends, you are not required to sign the Certification, but you must provide your correct TIN. (See instructions on page 2.)
| ||||||
| ADDRESS |
|
Date
Signature
| ||||
| ||||||
| NOTE: | FAILURE TO COMPLETE AND RETURN THIS FORM MAY RESULT IN BACKUP WITHHOLDING OF THE APPROPRIATE PERCENTAGE OF ANY PAYMENTS MADE TO YOU PURSUANT TO THE SHARE SALE FACILITY. PLEASE REVIEW THE ENCLOSED GUIDELINES FOR CERTIFICATION OF TAXPAYER IDENTIFICATION NUMBER ON SUBSTITUTE FORM W-9 AND SEE INSTRUCTIONS HEREIN FOR ADDITIONAL DETAILS. |
5
GUIDELINES FOR CERTIFICATION OF TAXPAYER IDENTIFICATION
NUMBER ON SUBSTITUTE FORM W-9
Guidelines for Determining the Proper Identification Number to Give the Payer Social Security numbers have nine digits separated by two hyphens: i.e., 000-00-0000. Employer identification numbers have nine digits separated by only one hyphen: i.e., 00-0000000. The table below will help to determine the number to give the payer.
For this type of account: | Give the SOCIAL SECURITY number of— | For this type of account: | Give the EMPLOYER IDENTIFICATION number of— | |||
1. An individual’s account | The individual | 7. A valid trust estate, or pension trust
| Legal entity (Do not furnish the identifying number of the personal representative or trustee unless the legal entity itself is not designated in the account title.) (4) | |||
2. Two or more individuals (joint account) | The actual owner of the account or, if combined funds, any one of the individuals (1) | 8. Corporate account | The Corporation | |||
3. Husband and wife (joint account) | The actual owner of the account or, if joint funds, either person (1) | 9. Religious, charitable, or educational organization account | The organization | |||
4. Custodian account of a minor (Uniform gift to Minors Act) | The minor (2) | 10. Partnership account held in the name of the business | The partnership | |||
5. a. The usual revocable savings trust account (grantor is also trustee) | The grantor-trustee (1) | 11. Association, club, or other tax-exempt organization | The organization | |||
b. So-called trust account that is not a legal or valid trust under State law | The actual owner (1) | 12. A broker or registered nominee | The broker or nominee | |||
6. Sole proprietorship account | The Owner (3) | 13. Account with the Department of Agriculture in the name of a public entity (such as a State or local government, school, district or prison) that received agricultural program payments
| The public entity | |||
| (1) | List first and circle the name of the person whose number you furnish. |
| (2) | Circle the minor’s name and furnish the minor’s social security number. |
| (3) | Show the name of the owner. |
| (4) | List first and circle the name of the legal trust, estate, or pension trust. |
Note:If no name is circled when there is more than one name, the number will be considered to be that of the first name listed.
7
GUIDELINES FOR CERTIFICATION OF TAXPAYER IDENTIFICATION
NUMBER ON SUBSTITUTE FORM W-9
(Section references are to the Internal Revenue Code)
Page 2
Obtaining a Number
If you don’t have a taxpayer identification number or if you don’t know your number, obtain Form SS-5, Application for a Social Security Number Card, or Form SS-4, Application for Employer Identification Number at the local office of the Social Security Administration or the Internal Revenue Service and apply got a number.
Payees Exempt from Backup Withholding
Payees specifically exempted from backup withholding on ALL payments include the following:
| • | A corporation. |
| • | A financial institution. |
| • | An organization exempt from tax under section 501(a), or an individual requirement plan. |
| • | The United States |
| • | or any agency or instrumentality thereof. |
| • | A State, the District of Columbia, a possession of the United States, or any subdivision or instrumentality thereof. |
| • | A foreign government, a political subdivision of a foreign government, or any agency or instrumentality thereof. |
| • | An international organization or any agency, or instrumentality thereof. |
| • | A registered dealer in securities or commodities registered in the U.S. or a possession of the U.S. |
| • | A real estate investment trust. |
| • | An common trust fund operated by a bank under section 584(a). |
| • | An exempt charitable remainder trust, or a non-exempt trust described in section 4947(a)(1). |
| • | An entity registered at all times under the Investment Company Act of 1940. |
| • | A foreign central bank of issue. |
Payments of dividends and patronage dividends not generally subject to backup withholding including the following:
| • | Payments to nonresident aliens subject to withholding under section 1441. |
| • | Payments to partnerships not engaged in a trade or business in the U.S. and which have at least one nonresident partner. |
| • | Payments of patronage dividends where the amount received is not paid in money. |
| • | Payments made by certain foreign organizations. |
| • | Payments of interest not generally subject to backup withholding include the following: |
Note:You may be subject to backup withholding if this interest is $600 or more and is paid in the course of the payer’s trade or business and you have not provided your correct taxpayer identification number to the payer.
| • | Payments described in section 6049(b)(5) to nonresident aliens. |
| • | Payments on tax-free covenant bonds under section 1451. |
| • | Payments made by certain foreign organizations. |
Exempt payees described above should file Form W-9 to avoid possible erroneous backup withholding. FILE THIS FORM WITH THE PAYER, FURNISH YOUR TAXPAYER IDENTIFICATION NUMBER, WRITE “EXEMPT” ON THE FACE OF THE FORM, AND RETURN IT TO THE PAYER. IF THE PAYMENTS ARE INTEREST, DIVIDENDS, OR PATRONAGE DIVIDENDS, ALSO SIGN AND DATE THE FORM.
Certain payments other than interest, dividends and patronage dividends, that are not subject to information reporting are also not subject to backup withholding. For details, see the regulation under sections 6041, 6041A(a), 6045 and 6050A.
Privacy Act Notice.Section 6109 requires most recipients of dividend, interest, or other payments to give taxpayer identification numbers to payers who must report the payments to IRS. IRS uses the numbers for identification purposes. Payers must be given the numbers whether or not the recipients are required to file tax returns. Payers must generally withhold 31% of taxable interest, dividend, and certain other payments to a payee who does not furnish a taxpayer identification number to a payer. Certain penalties may also apply.
Penalties
(1)Penalty for Failure to Furnish Taxpayer Identification Number.If you fail to furnish your taxpayer identification number to a payer, you are subject to a penalty of $50 for each such failure unless your failure is due to reasonable cause and not to willful neglect.
(2)Civil Penalty for False Information With Respect to Withholding.If you make a false statement with no reasonable basis which results in no imposition of backup withholding, you are subject to a penalty of $500.
(3)Criminal Penalty for Falsifying Information.Willfully falsifying certifications or affirmations may subject you to criminal penalties including fines and/or imprisonment.
FOR ADDITIONAL INFORMATION CONTACT YOUR TAX CONSULTANT OR THE IRS
Item 17
To | Company Announcements Office | Facsimile | 1300 300 021 | |||||
Company | Australian Stock Exchange Limited | Date | 22 September 2003 | |||||
From | Bill Hundy | Pages | 34 | |||||
Subject | PRESENTATION TO INVESTMENT INSTITUTIONS | |||||||
Please find attached a copy of a presentation that Managing Director, Mr Grant King and Executive Director, Commercial, Mr Bruce Beeren will deliver to investment institutions in Europe and the United States this week.
A copy of this presentation can also be obtained from our websitewww.originenergy.com.au under the Investor Centre – Presentations section.
Regards
| |
| Bill Hundy |
| Company Secretary |
02 9220 6467 – bill.hundy@originenergy.com.au
Origin Energy Limited ABN 30 000 051 696 · Level 39, AMP Centre, 50 Bridge Street Sydney NSW 2000
GPO Box 5376, Sydney NSW 2001 · Telephone (02) 9220 6400 · Facsimilie (02) 9235 1661 · www.originenergy.com.au
Signatures
Pursuant to the requirements of theSecurities Exchange Act of 1934, the registrant has duly caused this report to be signed on its behalf by the undersigned, thereunto duly authorized.
| Origin Energy Limited | ||
| By: | /s/ WILLIAM HUNDY | |
| Name: | William Hundy | |
| Title: | Company Secretary | |
Date: October 13, 2003