Table of Contents
UNITED STATES
SECURITIES AND EXCHANGE COMMISSION
Washington, D.C. 20549
FORM N-CSR
CERTIFIED SHAREHOLDER REPORT OF REGISTERED
MANAGEMENT INVESTMENT COMPANIES
Investment Company Act file number: 811-05749
THE CHINA FUND, INC.
(Exact name of registrant as specified in charter)
C/O BROWN BROTHERS HARRIMAN & CO.
50 POST OFFICE SQ.
BOSTON, MA 02110
ATTENTION SUZAN BARRON
(Address of principal executive offices)(Zip code)
Copy to:
Suzan Barron Brown Brothers Harriman & Co. 50 Post Office Sq. Boston, MA 02110 | Laura E. Flores, Esq. Morgan, Lewis & Bockius LLP 1111 Pennsylvania Avenue, NW Washington, DC 20004-2541 | |
| (Name and Address of Agent for Service) |
Registrant’s telephone number, including area code: (888) 246-2255
Date of fiscal year end: October 31
Date of reporting period: April 30, 2021
Form N-CSR is to be used by management investment companies to file reports with the Commission not later than 10 days after the transmission to stockholders of any report that is required to be transmitted to stockholders under Rule 30e-1 under the Investment Company Act of 1940 (17 CFR 270.30e-1). The Commission may use the information provided on Form N-CSR in its regulatory, disclosure review, inspection, and policymaking roles.
A registrant is required to disclose the information specified by Form N-CSR, and the Commission will make this information public. A registrant is not required to respond to the collection of information contained in Form N-CSR unless the Form displays a currently valid Office of Management and Budget (“OMB”) control number. Please direct comments concerning the accuracy of the information collection burden estimate and any suggestions for reducing the burden to Secretary, Securities and Exchange Commission, 450 Fifth Street, NW, Washington, DC 20549-0609. The OMB has reviewed this collection of information under the clearance requirements of 44 U.S.C. § 3507.
Table of Contents
Item 1. Report to Stockholders.
(a)
Table of Contents
THE CHINA FUND, INC.
|
SEMI-ANNUAL REPORT
April 30, 2021 (Unaudited)
| The China Fund, Inc. | ||||
| Table of Contents | ||||
| Page | ||||
| 1 | ||||
| 2 | ||||
| 3 | ||||
| 4 | ||||
| 6 | ||||
| 8 | ||||
| 9 | ||||
| 13 | ||||
| 17 | ||||
| 25 | ||||
Dividends and Distributions: Summary of Dividend Reinvestment and Cash Purchase Plan | 29 | |||
Table of Contents
THE CHINA FUND, INC.
| FUND DATA | ||
| NYSE Stock Symbol | CHN | |
| Listing Date | July 10, 1992 | |
| Shares Outstanding | 10,432,703 | |
| Total Net Assets (4/30/21) | $341,377,336 | |
| Net Asset Value Per Share (4/30/21) | $32.72 | |
| Market Price Per Share (4/30/21) | $29.74 | |
| TOTAL RETURN(1) | ||||||||
Performance as of 4/30/21: | Net Asset Value | Market Price | ||||||
1-Year Cumulative | 50.42% | 60.15% | ||||||
3-Year Cumulative | 60.57% | 63.56% | ||||||
3-Year Annualized | 17.10% | 17.82% | ||||||
5-Year Cumulative | 144.06% | 154.93% | ||||||
5-Year Annualized | 19.54% | 20.58% | ||||||
10-Year Cumulative | 135.26% | 134.69% | ||||||
10-Year Annualized | 8.93% | 8.91% | ||||||
| DIVIDEND HISTORY | ||||||||
| Record Date | Income | Capital Gains | ||||||
12/28/20 | $0.1502 | $2.1621 | ||||||
12/30/19 | $0.1320 | $1.2523 | ||||||
12/21/18 | $0.1689 | $0.3712 | ||||||
12/19/17 | $0.5493 | — | ||||||
12/19/16 | $0.4678 | — | ||||||
12/28/15 | $0.2133 | $1.2825 | ||||||
12/22/14 | $0.2982 | $3.4669 | ||||||
12/23/13 | $0.4387 | $2.8753 | ||||||
12/24/12 | $0.3473 | $2.9044 | ||||||
12/23/11 | $0.1742 | $2.8222 | ||||||
(1) Total investment returns reflect changes in net asset value or market price, as the case may be, during each period and assumes that dividends and capital gains distributions, if any, were reinvested in accordance with the dividend reinvestment plan. The net asset value returns are not an indication of the performance of a stockholder’s investment in the Fund, which is based on market price. Total investment returns do not reflect the deduction of taxes that a stockholder would pay on Fund distributions or the sale of Fund shares. Total investment returns are historical and do not guarantee future results. Market price returns do not reflect broker commissions in connection with the purchase or sale of Fund shares.
1
Table of Contents
THE CHINA FUND, INC.
ASSET ALLOCATION AS OF April 30, 2021 (unaudited)
| Ten Largest Listed Equity Investments* | ||
AlibabaGroup Holding, Ltd. | 10.2% | |
TencentHoldings, Ltd. | 9.9% | |
ChinaConstruction Bank Corp. | 4.6% | |
ChinaMerchants Bank Co., Ltd. | 4.5% | |
ChinaInternational Capital Corp., Ltd. | 3.4% | |
CITICSecurities Co., Ltd. | 3.0% | |
JD.com,Inc. ADR | 2.8% | |
JD.com,Inc. | 2.8% | |
MeituanDianping | 2.8% | |
AIA Group, Ltd. | 2.3% | |
| * | Percentages based on net assets. |
2
Table of Contents
Industry Allocation (as a percentage of net assets)
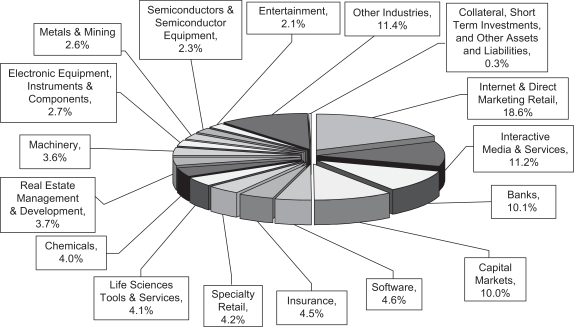
Fund holdings are subject to change and percentages shown above are based on net assets at April 30, 2021. A complete list of holdings at April 30, 2021 is contained in the Schedule of Investments included in this report. The most current available data regarding portfolio holdings can be found on our website, www.chinafundinc.com. You may also obtain holdings by calling 1-888-246-2255.
3
Table of Contents
THE CHINA FUND, INC.
CHAIRMAN’S STATEMENT (unaudited)
Dear Fellow Stockholders:
We have much pleasure in providing the interim report of The China Fund, Inc. (the “Fund”) covering the first half of its fiscal year, from November 1, 2020 to April 30, 2021 — otherwise referred to herein as the “Period”.
The Stock Market
The China market proved more volatile through the Period than in the recent nine months of 2020. Whilst stock prices continued the strong upward move commenced in March 2020 to peak in February, thereafter they backed and filled to this Period-end. Industry sectors that led the initial rally — particularly information technology, consumer staples and discretionary sectors — subsequently gave way to the cyclically oriented, “recovery” names within the energy, real estate, industrials and materials sectors. Notwithstanding heightened regulatory headwinds for the major technology companies, this consolidation seems more technical, as opposed to being fundamentally driven, particularly given the big increase in prices through 2020. The corporate earnings growth expectations of the Fund’s investment manager, Matthews International Capital Management, LLC, continue to reflect optimism in profitability thereby supporting current valuations. Your investment manager’s forecasts continue to demonstrate a robust recovery in China’s economic growth prospects but insufficient to spur significant central bank policy tightening beyond that which markets have already witnessed.
Your investment manager identifies the difficulty of comparing economic numbers between last and this year given the deep recession as reflected in the statistics in first quarter 2020 when China was shuttered in response to COVID-19. Your investment manager’s encouraging forecasts of real retail sales demonstrate a dramatic V-shaped recovery to levels above those witnessed as far back as 2009. Consumption therefore reflects a healthy, sustainable, domestic-demand-driven economy, albeit one which has not yet fully shaken off all the impact of the pandemic and, it estimates, has further to go to catch up to its pre-COVID growth, as lingering health concerns continue to depress the desire to gather indoors.
Rotation from growth to cyclical names may continue as profits from the industrial sector are expected to remain strong whilst growth-oriented companies within sectors such as consumer discretionary, health care, communication services and consumer staples have room to resume their gains as prices have corrected meaningfully since mid-February. Valuations have declined but remain at relatively higher levels and we welcome a further healthy correction of the market.
Portfolio Performance
Following the almost doubling of the China stock market from its March 2020 low to its February 2021 high, perhaps it is not surprising that it has witnessed some consolidation over the final 10-odd weeks of the Period.
For the Period, your Fund’s net asset value increased 11.86% whilst the share price increased 14.74%. These figures compare with a 9.11% increase in your Fund’s benchmark, the MSCI China All Share Index.
During the Period your Fund’s discount relative to its net asset value (“NAV”) narrowed by 2.3% from 11.4% to 9.1% thereby enhancing the market price performance relative to its NAV. Viewing these numbers in an annualized format, your Fund’s NAV increased 50.42%, and the share price has increased 60.15% whilst its benchmark has increased 45.39% all in the 12 months ending April 30, 2021.
4
Table of Contents
THE CHINA FUND, INC.
CHAIRMAN’S STATEMENT (continued) (unaudited)
It is most encouraging that your investment manager has added real alpha over the past against the benchmark although we must as always stress that investment returns are historical and do not guarantee future results.
Share Discount Management
Your Board has continued its discount management program through the Period that, at least in part, has been responsible for narrowing the share discount relative to its NAV from the 14%+ level to almost 5% and ending the Period at 9.11%. Your Board will continue to monitor this situation and endeavour to maintain the discount at reasonable levels.
Total Expense Ratio
Your board remains vigilant on containing operational and administrative costs. Projections for the current fiscal year have the Fund’s expense ratio trending down further toward 1.00%, a level well below the vast majority of the International Equity closed-end fund peer group.
Board Diversification
In response to a comment from a stockholder at the time of the recent Annual Meeting of Stockholders, I’d like to take this opportunity to state that the Board agrees that board diversity is important. Further, we are committed to prioritizing diversity in our consideration of the future composition of the Board in a manner consistent with the best interests of the Fund and its shareholders. As long-term shareholders of the Fund know, we have consistently considered diversity an important board characteristic as reflected in its composition prior to reducing the size of the Board in response to shareholder demand to significantly reduce the Fund’s expenses. While your current Board members bring a diversified skill set and more than 135 years of combined and varied investment industry experience to their oversight of the Fund, we will continue to actively consider ways to promote other diverse characteristics, including through the possible future expansion of the Board if such decision is consistent with the best interests of the Fund and the expressed investment priorities of the Fund’s shareholders.
I thank all stockholders for their support through the Period.
Yours very sincerely
Julian Reid
For and on Behalf of
The China Fund, Inc.
5
Table of Contents
THE CHINA FUND, INC.
INVESTMENT MANAGER’S STATEMENT (unaudited)
Market Environment
Despite volatility, Chinese equities generated attractive returns for the six months ending April 30, 2021. Looking back to November 2020, Chinese equities were higher as market participants believed the incoming administration of U.S. President-elect Biden might focus less on trade related issues, in favor of a multi-lateral approach on topics related to market access, climate change and human rights. In December, Chinese equities rose again, but lagged broader emerging and developed markets. Sentiment was driven by positive news around China’s continued economic recovery and a low number of Covid-19 cases despite headlines around additional U.S. sanctions and the impact of new reforms on internet companies. In January, Chinese equities led emerging markets higher despite the worst wave of Covid-19 cases in China since the initial outbreak of the pandemic. Health officials tightened social distancing measures and reinstated some locally based lockdown measures and travel bans.
Chinese equities then fell in February and March, reflecting a healthy correction following earlier periods of market gains, before rebounding slightly in April. The sell-off in Chinese shares seemed technical in nature in our view, as opposed to fundamentally driven. Earnings growth expectations continue to reflect optimism in corporate profits supporting current valuations. Chinese year-over-year economic growth may have peaked reflecting the end of the low base effects experienced early in 2020. Monetary policy already reflects an economy having largely recovered whereby the government may be less accommodative going forward yet not ready to tighten. Regulatory pressures broadened within the internet-based consumer and IT sectors. Meanwhile, U.S.-China trade relations have been somewhat quieter in the media headlines during the month of April, following a contentious bi-lateral meeting in Alaska held in March.
Performance, Contributors and Detractors
For the six months ended April 30, 2021, the Fund returned 11.86%, while its benchmark, the MSCI China All Shares Index, returned 9.11%. From a sector perspective, the Fund’s holdings in information technology contributed to performance. In contrast, the Fund’s holdings in consumer discretionary detracted from performance.
A contributor among individual stocks was Xinyi Glass Holdings, Ltd. (Xinyi), a leading glass producer in China. The company manufactures glass for solar panels, as well as float glass, which gets refined into architectural glass. Xinyi’s vertically integrated business model benefits from growing demand for many different types of glass in China. In terms of solar panels, demand for solar glass is growing, as solar energy prices in China become more competitive with energy prices associated with fossil fuels. In terms of demand for architectural glass, many construction projects that were delayed during the first half of the year due to the COVID pandemic are resuming, so we expect to see a pickup in demand as projects get underway again. In addition, the government has been restricting new companies from entering the space to prevent overproduction of glass.
A detractor among individual stocks was e-commerce company JD.com Inc. (JD.com), which experienced some price volatility amid rising regulatory pressures. While sentiment was weak in the reporting period, we remain constructive on the company over the long term. As the second largest e-commerce company in China, JD.com has a broad reach and its profitability is improving. China has many metropolitan densities and the complexity of
6
Table of Contents
THE CHINA FUND, INC.
INVESTMENT MANAGER’S STATEMENT (continued) (unaudited)
making deliveries to most households is high, creating a competitive moat for an e-commerce player such as JD.com.
Outlook
We remain optimistic about both the near-term and long-term growth prospects in China. Keeping the coronavirus under control is key to maintaining China’s V-shaped economic recovery. While China is only in the very early stages of its vaccination program, its strict border controls and data-driven approach to minimizing outbreaks remains highly successful. China’s approach to combatting the virus has been more effective than any other large economy. Because COVID is largely under control in China, people have been able to resume a largely normal life. Consumption is rising, auto sales are growing, restaurants have long lines and consumers feel comfortable gathering indoors.
Over the long term, we expect that China’s growth will continue to be driven by growing domestic consumption. The depth and diversity of the opportunity set in China continues to expand, with a notable uptick in Initial Public Offerings over the past 12 months. Key themes that we are following include technology upgrades, health and wellness trends, services that enhance quality of life and premium consumer goods. The team continues to look for attractive long-term growth opportunities driven by the Chinese consumer.
7
Table of Contents
THE CHINA FUND, INC.
PORTFOLIO MANAGEMENT (unaudited)
Matthews International Capital Management, LLC (“Matthews Asia”), the largest dedicated Asia investment specialist in the United States, is an independent, privately owned firm with a focus on long-term investment performance.
Andrew Mattock serves as the Lead Manager for the Fund’s portfolio of listed securities. Prior to joining Matthews Asia in 2015, he was a Fund Manager at Henderson Global Investors for 15 years, first in London and then in Singapore, managing Asia Pacific equities. Andrew holds a Bachelor of Business majoring in Accounting from ACU. He began his career at PricewaterhouseCoopers and qualified as a Chartered Accountant.
8
Table of Contents
THE CHINA FUND, INC.
April 30, 2021 (unaudited)
Name of Issuer and Title of Issue | Shares | Value (Note A) | ||||||||||
| COMMON STOCK | ||||||||||||
| CHINA — “A” SHARES | ||||||||||||
| Banks — 4.5% | ||||||||||||
China Merchants Bank Co., Ltd. — A | 1,920,747 | $ | 15,620,416 | |||||||||
|
| |||||||||||
| Beverages — 1.1% | ||||||||||||
Kweichow Moutai Co., Ltd. — A | 5,578 | 1,726,567 | ||||||||||
Wuliangye Yibin Co., Ltd. — A | 42,396 | 1,859,317 | ||||||||||
|
| |||||||||||
| 3,585,884 | ||||||||||||
|
| |||||||||||
| Chemicals — 4.0% | ||||||||||||
Shandong Sinocera Functional Material Co., Ltd. — A | 951,800 | 7,251,697 | ||||||||||
Sinoma Science & Technology Co., Ltd. — A | 1,500,886 | 5,088,357 | ||||||||||
Wanhua Chemical Group Co., Ltd. — A | 98,643 | 1,564,960 | ||||||||||
|
| |||||||||||
| 13,905,014 | ||||||||||||
|
| |||||||||||
| Construction Materials — 0.9% | ||||||||||||
Anhui Conch Cement Co., Ltd. — A | 405,069 | 3,064,944 | ||||||||||
|
| |||||||||||
| Electrical Equipment — 1.9% | ||||||||||||
Sungrow Power Supply Co., Ltd. — A | 464,900 | 6,410,603 | ||||||||||
|
| |||||||||||
| Electronic Equipment, Instruments & Components — 2.7% | ||||||||||||
Luxshare Precision Industry Co., Ltd. — A | 195,639 | 1,112,542 | ||||||||||
Wingtech Technology Co., Ltd. — A | 335,100 | 4,401,831 | ||||||||||
Wuxi Lead Intelligent Equipment Co., Ltd. — A | 267,000 | 3,647,159 | ||||||||||
|
| |||||||||||
| 9,161,532 | ||||||||||||
|
| |||||||||||
| Health Care Providers & Services — 0.7% | ||||||||||||
Dian Diagnostics Group Co., Ltd. — A | 377,900 | 2,274,274 | ||||||||||
|
| |||||||||||
| Household Durables — 1.8% | ||||||||||||
Midea Group Co., Ltd. — A | 501,829 | 6,195,625 | ||||||||||
|
| |||||||||||
| Insurance — 2.2% | ||||||||||||
Ping An Insurance Group Co., of China Ltd. — A | 671,328 | 7,510,732 | ||||||||||
|
| |||||||||||
| Life Sciences Tools & Services — 3.1% | ||||||||||||
Hangzhou Tigermed Consulting Co., Ltd. — A | 130,700 | 3,151,654 | ||||||||||
Pharmaron Beijing Co., Ltd. — A | 294,565 | 7,376,997 | ||||||||||
|
| |||||||||||
| 10,528,651 | ||||||||||||
|
| |||||||||||
| Machinery — 3.6% | ||||||||||||
Estun Automation Co., Ltd. — A* | 1,318,400 | 6,560,458 | ||||||||||
Weichai Power Co., Ltd. — A | 2,008,356 | 5,610,849 | ||||||||||
|
| |||||||||||
| 12,171,307 | ||||||||||||
|
| |||||||||||
See notes to financial statements.
9
Table of Contents
THE CHINA FUND, INC.
SCHEDULE OF INVESTMENTS (continued)
April 30, 2021 (unaudited)
Name of Issuer and Title of Issue | Shares | Value (Note A) | ||||||||||
| COMMON STOCK (continued) | ||||||||||||
| CHINA — “A” SHARES (continued) | ||||||||||||
| Semiconductors & Semiconductor Equipment — 2.3% | ||||||||||||
LONGi Green Energy Technology Co., Ltd. — A | 288,000 | $ | 4,421,048 | |||||||||
NAURA Technology Group Co., Ltd. — A | 61,602 | 1,566,672 | ||||||||||
Shenzhen SC New Energy Technology Corp. — A | 115,600 | 1,969,282 | ||||||||||
|
| |||||||||||
| 7,957,002 | ||||||||||||
|
| |||||||||||
| Software — 1.4% | ||||||||||||
Thunder Software Technology Co., Ltd. — A | 228,662 | 4,753,515 | ||||||||||
|
| |||||||||||
TOTAL CHINA — “A” SHARES — (Cost $78,913,159) | 30.2 | % | 103,139,499 | |||||||||
|
|
|
| |||||||||
| HONG KONG | ||||||||||||
| Biotechnology — 0.9% | ||||||||||||
Innovent Biologics, Inc. 144A* | 272,000 | 2,953,924 | ||||||||||
|
| |||||||||||
| Building Products — 1.6% | ||||||||||||
Xinyi Glass Holdings, Ltd. | 1,534,000 | 5,442,660 | ||||||||||
|
| |||||||||||
| Capital Markets — 1.8% | ||||||||||||
Hong Kong Exchanges & Clearing, Ltd. | 103,200 | 6,236,453 | ||||||||||
|
| |||||||||||
| Diversified Consumer Services — 0.5% | ||||||||||||
New Oriental Education & Technology Group, Inc. ADR* | 104,000 | 1,587,040 | ||||||||||
|
| |||||||||||
| Entertainment — 2.1% | ||||||||||||
Bilibili, Inc. ADR(1)* | 64,459 | 7,145,925 | ||||||||||
|
| |||||||||||
| Gas Utilities — 1.0% | ||||||||||||
ENN Energy Holdings, Ltd. | 201,300 | 3,439,057 | ||||||||||
|
| |||||||||||
| Health Care Providers & Services — 0.0% | ||||||||||||
New Horizon Health, Ltd. 144A* | 10,500 | 92,642 | ||||||||||
|
| |||||||||||
| Insurance — 2.3% | ||||||||||||
AIA Group, Ltd. | 602,600 | 7,696,344 | ||||||||||
|
| |||||||||||
| Interactive Media & Services — 11.2% | ||||||||||||
Kuaishou Technology Co., Ltd. 144A* | 129,500 | 4,365,719 | ||||||||||
Tencent Holdings, Ltd. | 421,400 | 33,866,022 | ||||||||||
|
| |||||||||||
| 38,231,741 | ||||||||||||
|
| |||||||||||
| Internet & Direct Marketing Retail — 18.6% | ||||||||||||
Alibaba Group Holding, Ltd.* | 1,200,008 | 34,740,017 | ||||||||||
JD.com, Inc. ADR* | 125,050 | 9,673,868 | ||||||||||
JD.com, Inc.* | 249,150 | 9,589,208 | ||||||||||
Meituan Dianping 144A* | 248,500 | 9,515,994 | ||||||||||
|
| |||||||||||
| 63,519,087 | ||||||||||||
|
| |||||||||||
See notes to financial statements.
10
Table of Contents
THE CHINA FUND, INC.
SCHEDULE OF INVESTMENTS (continued)
April 30, 2021 (unaudited)
Name of Issuer and Title of Issue | Shares | Value (Note A) | ||||||||||
| COMMON STOCK (continued) | ||||||||||||
| HONG KONG (continued) | ||||||||||||
| IT Services — 1.0% | ||||||||||||
Kingsoft Cloud Holdings, Ltd. ADR(1)* | 77,400 | $ | 3,399,408 | |||||||||
|
| |||||||||||
| Life Sciences Tools & Services — 1.0% | ||||||||||||
Wuxi Biologics Cayman, Inc. 144A* | 247,500 | 3,479,460 | ||||||||||
|
| |||||||||||
| Metals & Mining — 1.5% | ||||||||||||
MMG, Ltd.* | 8,072,000 | 5,259,651 | ||||||||||
|
| |||||||||||
| Real Estate Management & Development — 3.7% | ||||||||||||
CIFI Holdings Group Co., Ltd. | 8,534,000 | 7,633,554 | ||||||||||
Times China Holdings, Ltd. | 3,543,000 | 5,053,780 | ||||||||||
|
| |||||||||||
| 12,687,334 | ||||||||||||
|
| |||||||||||
| Software — 3.2% | ||||||||||||
Kingdee International Software Group Co., Ltd.* | 548,000 | 1,812,816 | ||||||||||
Kingsoft Corp., Ltd. | 820,000 | 5,814,300 | ||||||||||
Weimob, Inc. 144A* | 1,551,000 | 3,425,566 | ||||||||||
|
| |||||||||||
| 11,052,682 | ||||||||||||
|
| |||||||||||
| Specialty Retail — 4.2% | ||||||||||||
China Yongda Automobiles Services Holdings, Ltd. | 3,840,000 | 6,978,225 | ||||||||||
Zhongsheng Group Holdings, Ltd. | 970,500 | 7,362,866 | ||||||||||
|
| |||||||||||
| 14,341,091 | ||||||||||||
|
| |||||||||||
TOTAL HONG KONG — (Cost $112,060,518) | 54.6 | % | 186,564,499 | |||||||||
|
|
|
| |||||||||
| HONG KONG — “H” SHARES | ||||||||||||
| Banks — 5.6% | ||||||||||||
China Construction Bank Corp. | 19,969,000 | 15,811,603 | ||||||||||
Industrial & Commercial Bank of China, Ltd. | 4,851,000 | 3,158,510 | ||||||||||
|
| |||||||||||
| 18,970,113 | ||||||||||||
|
| |||||||||||
| Capital Markets — 8.2% | ||||||||||||
China International Capital Corp., Ltd. 144A* | 4,666,000 | 11,753,863 | ||||||||||
China Merchants Securities Co., Ltd. 144A | 4,450,000 | 6,234,263 | ||||||||||
CITIC Securities Co., Ltd. | 4,170,500 | 10,072,211 | ||||||||||
|
| |||||||||||
| 28,060,337 | ||||||||||||
|
| |||||||||||
See notes to financial statements.
11
Table of Contents
THE CHINA FUND, INC.
SCHEDULE OF INVESTMENTS (continued)
April 30, 2021 (unaudited)
Name of Issuer and Title of Issue | Shares | Value (Note A) | ||||||||||
| COMMON STOCK (continued) | ||||||||||||
| HONG KONG — “H” SHARES (continued) | ||||||||||||
| Metals & Mining — 1.1% | ||||||||||||
Zijin Mining Group Co., Ltd. | 2,704,000 | $ | 3,808,614 | |||||||||
|
| |||||||||||
TOTAL HONG KONG — “H” SHARES — (Cost $47,522,491) | 14.9 | % | 50,839,064 | |||||||||
|
|
|
| |||||||||
TOTAL HONG KONG (INCLUDING “H” SHARES)) — (Cost $159,583,009) | 69.5 | % | 237,403,563 | |||||||||
|
|
|
| |||||||||
TOTAL COMMON STOCK — (Cost $238,496,168) | 99.7 | % | 340,543,062 | |||||||||
|
|
|
| |||||||||
| COLLATERAL FOR SECURITIES ON LOAN | ||||||||||||
| Money Market Funds — 2.7% | ||||||||||||
Fidelity Investments Money Market Government Portfolio, 0.01%¥ — (Cost $9,077,233) | 9,077,233 | 9,077,233 | ||||||||||
|
| |||||||||||
TOTAL COLLATERAL FOR SECURITIES ON LOAN — (Cost $9,077,233) | 2.7 | % | 9,077,233 | |||||||||
|
|
|
| |||||||||
Principal | ||||||||||||
| SHORT TERM INVESTMENTS | ||||||||||||
| Time Deposits — 0.3% | ||||||||||||
Barclays — London, 0.01%, 5/3/2021 | USD 1,127,964 | 1,127,964 | ||||||||||
|
| |||||||||||
TOTAL SHORT TERM INVESTMENTS — (Cost $1,127,964) | 0.3 | % | 1,127,964 | |||||||||
|
|
|
| |||||||||
TOTAL INVESTMENTS — (Cost $248,701,365) | 102.7 | % | 350,748,259 | |||||||||
|
|
|
| |||||||||
OTHER ASSETS AND LIABILITIES | (2.7 | )% | (9,370,923 | ) | ||||||||
|
|
|
| |||||||||
NET ASSETS | 100.0 | % | $ | 341,377,336 | ||||||||
|
|
|
| |||||||||
Footnotes to Schedule of Investments
| * | Denotes non-income producing security. |
| ¥ | Rate shown is the 7-day yield as of April 30, 2021 |
| (1) | A security (or a portion of the security) is on loan. As of April 30, 2021, the market value of securities loaned was $8,638,336. The loaned securities were secured with cash collateral of $9,077,233. Collateral is calculated based on prior day’s prices. |
144A Securities exempt from registration under Rule 144a of the Securities Act of 1933. These securities may be resold in transactions exempt from registration, normally to qualified institutional buyers. At April 30, 2021, these restricted securities amounted to $41,821,431, which represented 12.3% of total net assets.
ADR American Depositary Receipt
USD — United States dollar
See notes to financial statements.
12
Table of Contents
THE CHINA FUND, INC.
STATEMENT OF ASSETS AND LIABILITIES
April 30, 2021 (unaudited)
ASSETS | ||||
Investments in securities, at value (cost $248,701,365) (including securities on loan, at value, $8,638,336) (Note A) | $ | 350,748,259 | ||
Cash | 329 | |||
Prepaid expenses and other receivables | 95,036 | |||
|
| |||
TOTAL ASSETS | 350,843,624 | |||
|
| |||
LIABILITIES | ||||
Payable upon return of collateral for securities on loan | 9,077,233 | |||
Payable for shares redeemed | 9,092 | |||
Investment management fee payable (Note B) | 194,988 | |||
Chief Compliance Officer fees payable | 3,056 | |||
Directors’ fees payable (Note B) | 32,451 | |||
Other accrued expenses | 149,468 | |||
|
| |||
TOTAL LIABILITIES | 9,466,288 | |||
|
| |||
TOTAL NET ASSETS | $ | 341,377,336 | ||
|
| |||
COMPOSITION OF NET ASSETS: | ||||
Par value, 100,000,000 shares authorized, 10,432,703 shares outstanding (Note C) | 104,327 | |||
Paid in capital in excess of par | 183,228,579 | |||
Distributable earnings | 158,044,430 | |||
|
| |||
TOTAL NET ASSETS | $ | 341,377,336 | ||
|
| |||
NET ASSET VALUE PER SHARE | ||||
($341,377,336/10,432,703 shares of common stock outstanding) | $32.72 | |||
|
| |||
See notes to financial statements.
13
Table of Contents
THE CHINA FUND, INC.
STATEMENT OF OPERATIONS
Six Months Ended April 30, 2021 (unaudited)
INVESTMENT INCOME: | ||||
Dividend income (net of tax withheld of $31,996) | $ | 349,259 | ||
Securities lending income | 20,364 | |||
Interest income | 174 | |||
|
| |||
TOTAL INVESTMENT INCOME | 369,797 | |||
|
| |||
EXPENSES | ||||
Investment Management fees (Note B) | 1,211,002 | |||
Directors’ fees and expenses | 111,515 | |||
Insurance | 62,660 | |||
Custodian fees (Note B) | 57,834 | |||
Legal fees | 57,028 | |||
Administration fees (Note B) | 49,882 | |||
Chief Compliance Officer fee | 29,721 | |||
Principal Financial Officer fee | 29,630 | |||
Audit and tax service fees | 27,826 | |||
Printing and postage | 21,394 | |||
Fund accounting fees | 17,300 | |||
Stock exchange listing fee | 12,366 | |||
Transfer agent fees | 8,945 | |||
Shareholder service fees | 6,673 | |||
Fund Secretary fee | 5,236 | |||
Miscellaneous expenses | 24,852 | |||
|
| |||
TOTAL EXPENSES | 1,733,864 | |||
|
| |||
NET INVESTMENT LOSS | (1,364,067 | ) | ||
|
| |||
NET REALIZED AND UNREALIZED GAIN (LOSS) ON INVESTMENTS AND FOREIGN CURRENCY TRANSACTIONS | ||||
Net realized gain on investments | 59,688,461 | |||
Net realized gain on foreign currency transactions | 7,481 | |||
|
| |||
| 59,695,942 | ||||
|
| |||
Net change in unrealized appreciation/depreciation on investments | (21,700,977 | ) | ||
Net change in unrealized appreciation/depreciation on foreign currency transactions | (2,140 | ) | ||
|
| |||
| (21,703,117 | ) | |||
|
| |||
NET REALIZED AND UNREALIZED GAIN ON INVESTMENTS AND FOREIGN CURRENCY TRANSACTIONS | 37,992,825 | |||
|
| |||
NET INCREASE IN NET ASSETS FROM OPERATIONS | $ | 36,628,758 | ||
|
| |||
See notes to financial statements.
14
Table of Contents
THE CHINA FUND, INC.
STATEMENT OF CHANGES IN NET ASSETS
| Six Months Ended April 30, 2021 | Year Ended October 31, 2020 | |||||||
| (unaudited) | ||||||||
INCREASE (DECREASE) IN NET ASSETS FROM OPERATIONS | ||||||||
Net investment income (loss) | $ | (1,364,067 | ) | $ | 675,279 | |||
Net realized gain on investments and foreign currency transactions | 59,695,942 | 22,464,055 | ||||||
Net change in unrealized (depreciation)/appreciation on investments and foreign currency translations | (21,703,117 | ) | 82,430,201 | |||||
|
|
|
| |||||
Net increase in net assets from operations | 36,628,758 | 105,569,535 | ||||||
|
|
|
| |||||
DISTRIBUTIONS TO SHAREHOLDERS FROM: | ||||||||
Distributable earnings | (24,148,077 | ) | (14,642,447 | ) | ||||
|
|
|
| |||||
Total distributions to shareholders | (24,148,077 | ) | (14,642,447 | ) | ||||
|
|
|
| |||||
CAPITAL SHARE TRANSACTIONS: | ||||||||
Cost of share repurchased (Note D) | (515,442 | ) | (4,451,708 | ) | ||||
|
|
|
| |||||
Net decrease in net assets from capital share transactions | (515,442 | ) | (4,451,708 | ) | ||||
|
|
|
| |||||
NET INCREASE IN NET ASSETS | 11,965,239 | 86,475,380 | ||||||
|
|
|
| |||||
NET ASSETS: | ||||||||
Beginning of Period | 329,412,097 | 242,936,717 | ||||||
|
|
|
| |||||
End of Period | $ | 341,377,336 | $ | 329,412,097 | ||||
|
|
|
| |||||
See notes to financial statements.
15
Table of Contents
THE CHINA FUND, INC.
FINANCIAL HIGHLIGHTS
Selected data for a share of common stock outstanding for the periods indicated
| Six Months Ended April 30, 2021 | Year Ended October 31, | |||||||||||||||||||
| 2020 | 2019(1) | 2018 | 2017 | |||||||||||||||||
| (unaudited) | ||||||||||||||||||||
Per Share Operating Performance | ||||||||||||||||||||
Net asset value, beginning of period | $ | 31.52 | $ | 22.80 | $ | 18.98 | $ | 23.31 | $ | 18.78 | ||||||||||
|
|
|
|
|
|
|
|
|
| |||||||||||
Net investment income (loss)* | (0.13 | ) | 0.06 | 0.13 | 0.14 | 0.18 | (2) | |||||||||||||
Net realized and unrealized gain (loss) on investments and foreign currency transactions | 3.63 | 9.98 | 4.09 | (3.92 | ) | 4.82 | ||||||||||||||
|
|
|
|
|
|
|
|
|
| |||||||||||
Total from investment operations | 3.50 | 10.04 | 4.22 | (3.78 | ) | 5.00 | ||||||||||||||
|
|
|
|
|
|
|
|
|
| |||||||||||
Less dividends and distributions: | ||||||||||||||||||||
Dividends from net investment income | (0.15 | ) | (0.13 | ) | (0.17 | ) | (0.55 | ) | (0.47 | ) | ||||||||||
Distributions from net realized gains | (2.16 | ) | (1.25 | ) | (0.37 | ) | — | — | ||||||||||||
|
|
|
|
|
|
|
|
|
| |||||||||||
Total dividends and distributions | (2.31 | ) | (1.38 | ) | (0.54 | ) | (0.55 | ) | (0.47 | ) | ||||||||||
|
|
|
|
|
|
|
|
|
| |||||||||||
Capital Share Transactions: | ||||||||||||||||||||
Accretion (Dilution) to net asset value resulting from share repurchase program, tender offer or issuance of shares in stock dividend | 0.01 | 0.06 | 0.14 | — | — | |||||||||||||||
|
|
|
|
|
|
| �� |
|
| |||||||||||
Net asset value, end of period | $ | 32.72 | $ | 31.52 | $ | 22.80 | $ | 18.98 | $ | 23.31 | ||||||||||
|
|
|
|
|
|
|
|
|
| |||||||||||
Market price, end of period | $ | 29.74 | $ | 27.93 | $ | 20.08 | $ | 16.98 | $ | 21.10 | ||||||||||
|
|
|
|
|
|
|
|
|
| |||||||||||
Total Investment Return (Based on Market Price) | 14.74 | % | 47.84 | % | 21.86 | % | (17.53 | )% | 34.38 | %(3) | ||||||||||
|
|
|
|
|
|
|
|
|
| |||||||||||
Total Investment Return (Based on Net Asset Value) | 11.86 | % | 46.94 | % | 23.79 | % | (16.55 | )% | 27.90 | %(3) | ||||||||||
|
|
|
|
|
|
|
|
|
| |||||||||||
Ratios and Supplemental Data | ||||||||||||||||||||
Net assets, end of period (000’s) | $ | 341,377 | $ | 329,412 | $ | 242,937 | $ | 298,469 | $ | 366,541 | ||||||||||
Ratio of gross expenses to average net assets | 1.00 | % | 1.08 | % | 1.41 | % | 1.91 | % | 1.49 | % | ||||||||||
Ratio of net expenses to average net assets | 1.00 | % | 1.08 | % | 1.41 | % | 1.91 | % | 1.49 | % | ||||||||||
Ratio of net investment income to average net assets | (0.79 | )% | 0.25 | % | 0.61 | % | 0.62 | % | 0.92 | %(2) | ||||||||||
Portfolio turnover rate | 45 | % | 60 | % | 132 | % | 50 | % | 31 | % | ||||||||||
| * | Per share amounts have been calculated using the average share method. |
| (1) | Effective January 1, 2019, Matthews International Capital Management, LLC became the investment manager. Prior to January 1, 2019, the Fund’s investment manager was Allianz Global Investors. |
| (2) | Amount includes a non-recurring receipt of a refund for over-billing of prior years’ custody out of pocket expense which amounted to $0.02 per share and 0.12% of average net assets during 2016 and less than $0.01 per share and less than 0.005% of net assets during 2017. |
| (3) | The performance has been restated to reflect an adjustment to the dividend reinvestment price applied in 2016, which had the effect of modestly understating performance for the period. |
See notes to financial statements.
16
Table of Contents
THE CHINA FUND, INC.
April 30, 2021 (unaudited)
NOTE A — SUMMARY OF SIGNIFICANT ACCOUNTING POLICIES
The China Fund, Inc. (the “Fund”) was incorporated under the laws of the State of Maryland on April 28, 1992, and is a non-diversified, closed-end management investment company registered under the Investment Company Act of 1940, as amended (the “1940 Act”). The Fund’s investment objective is long-term capital appreciation which it seeks to achieve by investing primarily in equity securities (i) of companies for which the principal securities trading market is the People’s Republic of China (“China”), (ii) of companies for which the principal securities trading market is outside of China, or constituting direct equity investments in companies organized outside of China, that in both cases derive at least 50% of their revenues from goods and services sold or produced, or have at least 50% of their assets, in China and (iii) constituting direct equity investments in companies organized in China (“Direct Investments”). The following is a summary of significant accounting policies followed by the Fund in the preparation of its financial statements. The Fund’s investment manager is Matthews International Capital Management, LLC (“Matthews Asia” or the “Investment Manager”).
The Fund is an investment company and accordingly follows the investment company accounting and reporting guidance of the Financial Accounting Standards Board Accounting Standard Codification Topic 946 “Financial Services — Investment Companies.”
The financial statements are prepared in accordance with U.S. generally accepted accounting principles (“GAAP”), which require management to make estimates and assumptions that affect the reported amounts of assets and liabilities. Actual results could differ from those estimates. The following summarizes the significant accounting policies of the Fund:
Security Valuation: Portfolio securities listed on recognized U.S. or foreign security exchanges are valued at the last quoted sales price in the principal market where they are traded. Listed securities with no such sales price and unlisted securities are valued at the mean between the current bid and asked prices, if any, from brokers. Short-term investments having maturities of sixty days or less are valued at amortized cost (original purchase cost as adjusted for amortization of premium or accretion of discount) which when combined with accrued interest approximates market value. Securities for which market quotations are not readily available or are deemed unreliable are valued at fair value in good faith by or at the direction of the Board of Directors (the “Board”) considering relevant factors, data and information including, if relevant, the market value of freely tradable securities of the same class in the principal market on which such securities are normally traded. For securities listed on non-North American exchanges the Fund fair values those securities daily using fair value factors provided by a third party pricing service if certain thresholds determined by the Board are met. Direct Investments, if any, are valued at fair value as determined by or at the direction of the Board based on financial and other information supplied by the Direct Investment Manager regarding each Direct Investment. Forward currency contracts are valued at the current cost of offsetting the contract. Equity linked securities, if any, are valued at fair value primarily based on the value(s) of the underlying security (or securities), which normally follows the same methodology as the valuation of securities listed on recognized exchanges.
Factors used in determining fair value may include, but are not limited to, the type of security, the size of the holding, the initial cost of the security, the existence of any contractual restrictions on the security’s disposition, the
17
Table of Contents
NOTES TO FINANCIAL STATEMENTS (continued) (unaudited)
price and extent of public trading in similar securities of the issuer or of comparable companies, the availability of quotations from broker-dealers, the availability of values of third parties other than the Investment Manager, information obtained from the issuer, analysts, and/or the appropriate stock exchange (if available), an analysis of the company’s financial statements, an evaluation of the forces that influence the issuer and the market(s) in which the security is purchased and sold and with respect to debt securities, the maturity, coupon, creditworthiness, currency denomination, and the movement of the market in which they trade.
Securities Lending: The Fund may lend up to 33 1/3% of the Fund’s total assets held by Brown Brothers Harriman & Co. (“BBH”) as custodian to certain qualified brokers, except those securities which the Fund specifically identifies as not being available. By lending its investment securities, the Fund attempts to increase its net investment income through the receipt of interest on the loan. Any gain or loss in the market price of the securities loaned that might occur and any interest or dividends declared during the term of the loan would accrue to the account of the Fund. Risks of delay in recovery of the securities or even loss of rights in the collateral may occur should the borrower of the securities fail financially. Upon entering into a securities lending transaction, the Fund receives cash as collateral in an amount equal to or exceeding 100% of the current market value of the loaned securities with respect to securities of the U.S. government or its agencies, 102% of the current market value of the loaned securities with respect to U.S. securities and 105% of the current market value of the loaned securities with respect to foreign securities. Any cash received as collateral is generally invested by BBH, acting in its capacity as securities lending agent (the “Agent”), in the Fidelity Investments Money Market Government Portfolio. A portion of the dividends received on the collateral may be rebated to the borrower of the securities and the remainder is split between the Agent and the Fund.
| Remaining Contractual Maturity of the Agreements As of April 30, 2021 | ||||||||||||||||||||
| Overnight and Continuous | <30 days | Between 30 & 90 days | >90 days | Total | ||||||||||||||||
Securities Lending Transactions | ||||||||||||||||||||
Money Market Fund | $ | 9,077,233 | $ | — | $ | — | $ | — | $ | 9,077,233 | ||||||||||
|
|
|
|
|
|
|
|
|
| |||||||||||
Total Borrowings | $ | 9,077,233 | $ | — | $ | — | $ | — | $ | 9,077,233 | ||||||||||
|
|
|
|
|
|
|
|
|
| |||||||||||
Gross amount of recognized liabilities for securities lending transactions | $ | 9,077,233 | ||||||||||||||||||
As of April 30, 2021, the Fund had loaned securities which were collateralized by cash. The value of the securities on loan and the value of the related collateral were as follows:
| Value of Securities | Value of Cash Collateral | Value of Non-Cash Collateral* | Total Collateral | |||||||||||
| $8,638,336 | $ | 9,077,233 | $ | — | $ | 9,077,233 | ||||||||
| * | Fund cannot repledge or dispose of this collateral, nor does the Fund earn any income or receive dividends with respect to this collateral. |
18
Table of Contents
NOTES TO FINANCIAL STATEMENTS (continued) (unaudited)
| Gross Amounts Not Offset in the Statement of Assets and Liabilities | ||||||||||||||
| Gross Asset Amounts Presented in Statement of Assets and Liabilities | Financial Instrument | Collateral Received | Net Amount | |||||||||||
| $9,077,233 | $ | — | $ | (9,077,233 | ) | $ | 0 | |||||||
Time Deposits: The Fund places excess cash balances into overnight time deposits with one or more eligible deposit institutions that meet credit and risk standards approved by the Fund. These are classified as short term investments in Schedule of Investments.
Foreign currency translations: The records of the Fund are maintained in U.S. dollars. Foreign currencies, investments and other assets and liabilities are translated into U.S. dollars at the current exchange rates. Purchases and sales of investment securities and income and expenses are translated on the respective dates of such transactions. Net realized gains and losses on foreign currency transactions represent net gains and losses from the disposition of foreign currencies, currency gains and losses realized between the trade dates and settlement dates of security transactions, and the difference between the amount of net investment income accrued and the U.S. dollar amount actually received. The effects of changes in foreign currency exchange rates on investments in securities are not segregated in the Statement of Operations from the effects of changes in market prices of those securities, but are included in realized and unrealized gain or loss on investments. Net unrealized foreign currency gains and losses arise from changes in the value of assets and liabilities, other than investments in securities, as a result of changes in exchange rates.
Forward Foreign Currency Contracts: The Fund may enter into forward foreign currency contracts to hedge against foreign currency exchange rate risks. A forward currency contract is an agreement between two parties to buy or sell currency at a set price on a future date. Upon entering into these contracts, risks may arise from the potential inability of counterparties to meet the terms of their contracts and from unanticipated movements in the value of the foreign currency relative to the U.S. dollar. The U.S. dollar value of forward currency contracts is determined using forward exchange rates provided by quotation services. Daily fluctuations in the value of such contracts are recorded as unrealized gain or loss on the Statement of Assets and Liabilities. When the contract is closed, the Fund records a realized gain or loss equal to the difference between the value at the time it was opened and the value at the time it was closed. Such gain or loss is disclosed in the realized and unrealized gain or loss on foreign currency in the Fund’s accompanying Statement of Operations. At April 30, 2021, the Fund did not hold forward foreign currency contracts.
Option Contracts: The Fund may purchase and write (sell) call options and put options provided the transactions are for hedging purposes and the initial margin and premiums do not exceed 5% of total assets. Option contracts are valued daily and unrealized gains or losses are recorded on the Statement of Assets and Liabilities based upon the last sales price on the principal exchange on which the options are traded. The Fund will realize a gain or loss upon the expiration or closing of the option contract. Such gain or loss is disclosed in the realized and unrealized gain or loss on options in the Fund’s accompanying Statement of Operations. When an option is exercised, the proceeds on sales of the underlying security for a written call option, the purchase cost of the security for a written put option, or the cost of the security for a purchased put or call option is adjusted by the amount of premium received or paid.
19
Table of Contents
NOTES TO FINANCIAL STATEMENTS (continued) (unaudited)
The risk in writing a call option is that the Fund gives up the opportunity for profit if the market price of the security increases and the option is exercised. The risk in writing a put option is that the Fund may incur a loss if the market price of the security decreases and the option is exercised. The risk in buying an option is that the Fund pays a premium whether or not the option is exercised. Risks may also arise from an illiquid secondary market or from the inability of a counterparty to meet the terms of the contract. At April 30, 2021, the Fund did not hold any option contracts.
Equity-Linked Securities: The Fund may invest in equity-linked securities such as linked participation notes, equity swaps and zero-strike options and securities warrants. Equity-linked securities may be used by the Fund to gain exposure to countries that place restrictions on investments by foreigners. To the extent that the Fund invests in equity-linked securities whose return corresponds to the performance of a foreign securities index or one or more foreign stocks, investing in equity-linked securities will involve risks similar to the risks of investing in foreign securities. In addition, the Fund bears the risk that the issuer of any equity-linked securities may default on its obligation under the terms of the arrangement with the counterparty. Equity-linked securities are often used for many of the same purposes as, and share many of the same risks with, derivative instruments. In addition, equity-linked securities may be considered illiquid. At April 30, 2021, the Fund did not hold equity-linked securities.
Direct Investments: The Fund may invest up to 25% of the net proceeds from its offering of its outstanding common stock in Direct Investments; however, the Board of the Fund has suspended additional investments in Direct Investments. Direct Investments are generally restricted and do not have a readily available resale market. Because of the absence of any public trading market for these investments, the Fund may take longer to liquidate these positions than would be the case for publicly traded securities. Although these securities may be resold in privately negotiated transactions, the prices on these sales could be less than those originally paid by the Fund. Issuers whose securities are not publicly traded may not be subject to public disclosure and other investor protections requirements applicable to publicly traded securities. At April 30, 2021, the Fund did not hold Direct Investments.
Indemnification Obligations: Under the Fund’s organizational documents, its Officers and Directors are indemnified against certain liabilities arising out of the performance of their duties to the Fund. In addition, in the normal course of business the Fund enters into contracts that provide general indemnifications to other parties. The Fund’s maximum exposure under these arrangements is unknown as this would involve future claims that may be made against the Fund that have not yet occurred.
Security transactions and investment income: Security transactions are recorded as of the trade date. Realized gains and losses from securities sold are recorded on the identified cost basis. Dividend income is recorded on the ex-dividend date, or, in the case of dividend income on foreign securities, on the ex-dividend date or when the Fund becomes aware of its declaration. Interest income is recorded on the accrual basis. All premiums and discounts are amortized/accreted for both financial reporting and federal income tax purposes.
Dividends and distributions: The Fund intends to distribute to its stockholders, at least annually, substantially all of its net investment income and any net realized capital gains. Distributions to stockholders are recorded on the
20
Table of Contents
NOTES TO FINANCIAL STATEMENTS (continued) (unaudited)
ex-dividend date. Income and capital gains distributions are determined in accordance with federal income tax regulations, which may differ from U.S. generally accepted accounting principles. Certain capital accounts in the financial statements are periodically adjusted for permanent differences in order to reflect their tax character. These adjustments have no impact on net assets or net asset value per share. Temporary differences which arise from recognizing certain items of income, expense, gain or loss in different periods for financial statement and tax purposes will reverse at some time in the future. Unless the Board elects to make distributions in shares of the Fund’s common stock, the distributions will be paid in cash, except with respect to stockholders who have elected to participate in the Fund’s Dividend Reinvestment and Cash Purchase Plan.
Federal Taxes: It is the Fund’s policy to qualify each year as a regulated investment company under Subchapter M of the Internal Revenue Code, as amended (“Code”) and to distribute to stockholders each year substantially all of its income. Accordingly, no provision for federal income tax is necessary. As of and during the period ended April 30, 2021, the Fund did not have a liability for any uncertain tax positions. The Fund recognizes interest and penalties, if any, related to tax liabilities as income tax expense in the Statement of Operations. For the previous three years the Fund remains subject to examination by the Fund’s major tax jurisdictions, which include the United States of America and the State of Maryland. The Fund may be subject to taxes imposed by governments of countries in which it invests. Such taxes are generally based on either income or gains earned or repatriated. The Fund accrues and applies such taxes to net investment income, net realized gains and net unrealized gains as income and/or gains are earned.
At April 30, 2021, the cost of investments for federal income tax purposes was $248,701,365. Gross unrealized appreciation of investments was $106,953,863 while gross unrealized depreciation of investments was $4,906,969, resulting in net unrealized appreciation of investments of $102,046,894.
NOTE B — ADVISORY FEE AND OTHER TRANSACTIONS
Effective January 1, 2019, Matthews Asia is the investment manager for the Fund’s listed assets (“Listed Assets”). Matthews Asia receives a fee, computed and accrued daily and paid monthly at a rate of 0.70% if assets exceed $150 million and 0.80% if assets do not exceed $150 million. Prior to January 1, 2019, Allianz Global Investors (“AGI”) was the investment manager for the Fund’s Listed Assets and Direct Investments. AGI received a fee, computed weekly and payable monthly, at the following annual rates: 0.70% of the first US$315 million of the Fund’s average weekly net assets invested in Listed Assets; and 0.50% of the Fund’s average weekly net assets invested in Listed Assets in excess of US$315 million. For the period ended April 30, 2021, the investment management fee rate was equivalent to an annual effective rate of 0.70% of the Fund’s average daily net assets. For the six months ended April 30, 2021, no fees were paid for Direct Investments as the Fund held no such investments during the period.
No director, officer or employee of Matthews Asia, AGI, or any affiliates of those entities receives any compensation from the Fund for serving as an officer or director of the Fund.
BBH provides, or arranges for the provision of certain administrative services for the Fund, including preparing certain reports and other documents required by federal and/or state laws and regulations. The Fund pays BBH a fee that is calculated daily and paid monthly at an annual rate based on aggregate average daily assets of the Fund. The
21
Table of Contents
NOTES TO FINANCIAL STATEMENTS (continued) (unaudited)
Fund also pays BBH an annual fee for certain legal administration services, including corporate secretarial services and preparing regulatory filings.
The Fund has also contracted with BBH to provide custody and fund accounting services to the Fund. For these services, the Fund pays BBH asset-based fees that vary according to the number of positions and transactions plus out-of-pocket expenses.
NOTE C — FUND SHARES
At April 30, 2021 there were 100,000,000 shares of $0.01 par value capital stock authorized, of which 10,432,703 were issued and outstanding.
For the period ended April 30, 2021, the Fund repurchased 17,289 shares of its common stock, valued at $515,442 from stockholders participating in the repurchases under the Fund’s discount management program.
| For Period Ended April 30, 2021 | For Year Ended October 31, 2020 | |||||||
Shares outstanding at beginning of period | 10,449,992 | 10,655,325 | ||||||
Shares repurchased | (17,289 | ) | (205,333 | ) | ||||
|
|
|
| |||||
Shares outstanding at end of period | 10,432,703 | 10,449,992 | ||||||
|
|
|
| |||||
NOTE D — DISCOUNT MANAGEMENT PROGRAM
On February 6, 2019, the Fund announced that its Board of Directors approved a Discount Management Program (the “Program”) which authorizes management to make open market purchases in an aggregate amount up to 10% of the Fund’s common shares outstanding as of the close of business on October 31 of the prior year. This limit may be increased or decreased by the Board at any time. Under the Program, the Fund will repurchase its common shares in the open market on any trading day that the Fund’s shares are trading above the discount threshold, which is currently 9.5%. On each day that shares are repurchased, the Fund repurchases its shares to the maximum extent permitted by law unless the Board and the Program Manager determine that such repurchase would be detrimental to the Fund and its stockholders. The Program is intended to enhance stockholder value, as repurchases made at a discount may have the effect of increasing the per share NAV of the Fund’s remaining shares. There is no assurance, however, that the market price of the Fund’s shares, either absolutely or relative to NAV, will increase as a result of any share repurchases. These repurchases may be commenced or suspended at any time or from time to time without any notice. On March 16, 2020, in light of the effects of the COVID-19 pandemic on global economies and stock markets and the resulting volatility in stock prices, the Board initiated a temporary suspension of the Program. On June 2, 2020, the Board resumed the operation of the Program. Any repurchases will be disclosed in the Fund’s stockholder reports for the relevant fiscal periods.
For the period ended April 30, 2021, the Fund repurchased 17,289 of its shares at an average price of $29.81 per share (including brokerage commissions) at an average discount of 10.05%. These repurchases had a total cost of $515,442. The Board will continue to review the Program and its effectiveness, and, as appropriate, may make further enhancements as it believes are necessary.
22
Table of Contents
NOTES TO FINANCIAL STATEMENTS (continued) (unaudited)
NOTE E — INVESTMENT TRANSACTIONS
For the six months ended April 30, 2021, the Fund’s cost of purchases and proceeds from sales of investment securities, other than short-term securities, were $150,269,422 and $173,712,835, respectively.
NOTE F — INVESTMENTS IN CHINA
The Fund’s investments in Chinese companies involve certain risks not typically associated with investments in securities of U.S. companies or the U.S. Government, including risks relating to (1) social, economic and political uncertainty; (2) price volatility, lesser liquidity and smaller market capitalization of securities markets in which securities of Chinese companies trade; (3) currency exchange fluctuations, currency blockage and higher rates of inflation; (4) controls on foreign investment and limitations on repatriation of invested capital and on the Fund’s ability to exchange local currencies for U.S. dollars; (5) governmental involvement in and control over the economy; (6) risk of nationalization or expropriation of assets; (7) the nature of the smaller, less seasoned and newly organized Chinese companies, particularly in China; and (8) the absence of uniform accounting, auditing and financial reporting standards, practices and disclosure requirements and less government supervision and regulation.
In June 2021, the President of the United States issued an Executive Order (the “Order”) to prohibit, among other things, any transaction by any U.S. person in publicly traded securities of certain companies determined to be involved with China’s surveillance technology sector. The Order, which takes effect on August 2, 2021, expands the scope of a previously issued Executive Order that prohibited U.S. persons’ transactions in companies determined to be affiliated with China’s military. The Order, and any similar future actions by the United States government, may limit the securities in which the Fund may invest, and adversely affect the Fund’s performance.
NOTE G — FAIR VALUE MEASUREMENT
The Fund has adopted fair valuation accounting standards which establish a definition of fair value and set out a hierarchy for measuring fair value. These standards require additional disclosures about the various inputs and valuation techniques used to develop the measurements of fair value and a discussion of changes in valuation techniques and related inputs during the period. These inputs are summarized in the three broad levels listed below:
| • | Level 1 — Inputs that reflect unadjusted quoted prices in active markets for identical assets or liabilities that the Fund has the ability to access at the measurement date; |
| • | Level 2 — Inputs other than quoted prices that are observable for the asset or liability either directly or indirectly, including inputs in markets that are not considered to be active; |
| • | Level 3 — Inputs that are unobservable. |
23
Table of Contents
NOTES TO FINANCIAL STATEMENTS (continued) (unaudited)
The following is a summary of the inputs used as of April 30, 2021 in valuing the Fund’s investments carried at value:
ASSETS VALUATION INPUT
Description* | Level 1 | Level 2 | Level 3 | Total | ||||||||||||
Common Stock | $ | 21,806,241 | $ | 318,736,821 | $ | — | $ | 340,543,062 | ||||||||
Collateral For Securities On Loan | 9,077,233 | — | — | 9,077,233 | ||||||||||||
Short Term Investments | 1,127,964 | — | — | 1,127,964 | ||||||||||||
|
|
|
|
|
|
|
| |||||||||
TOTAL INVESTMENTS | $ | 32,011,438 | $ | 318,736,821 | $ | — | $ | 350,748,259 | ||||||||
|
|
|
|
|
|
|
| |||||||||
| * | Please refer to the Schedule of Investments for additional security details. |
NOTE H — DERIVATIVE INSTRUMENTS AND HEDGING ACTIVITIES
The Fund did not enter into any derivatives transactions or hedging activities for the six months ended April 30, 2021.
NOTE I — CORONAVIRUS (COVID-19) PANDEMIC
The ongoing global crisis caused by the COVID-19 pandemic continues to adversely affect consumer demand and economic output, disrupting supply chains and markets, resulting in travel restrictions and quarantines, and adversely impacting local and global economies. While widespread vaccination efforts and signs that the economy is reopening are positive recent events, investors should be aware that in light of the uncertainty currently and with respect to the long-term implications of the COVID-19 pandemic, COVID-19 may continue to adversely affect, the global economy, the economies of certain nations, and individual issuers, all of which may negatively impact both the Fund’s performance and the performance of the securities in which it invests. Firms through which investors invest with the Fund, the Fund, its service providers, the markets in which it invests and market intermediaries also continue to be affected by quarantines and similar measures intended to contain the ongoing pandemic, which can obstruct their functioning and subject them to heightened operational risks.
24
Table of Contents
THE CHINA FUND, INC.
Board Deliberations Regarding Approval of Continuance of Investment Advisory and Management Agreement
The Investment Company Act of 1940, as amended (the “1940 Act”), requires that any investment advisory agreement be approved initially, as well as annually after its initial two-year term, by the Board, including by a majority of the Directors who are not “interested persons,” as defined in the 1940 Act (“Independent Directors”), of any party to the investment advisory agreement, by vote cast in person at a meeting called for the purpose of voting on such approval. In connection with their consideration of the approval of such investment advisory agreement, the Independent Directors must request and evaluate such information as may reasonably be necessary to make a reasonable business judgment with respect to the approval of the investment advisory agreement, and the adviser is required to provide such information.
In considering the approval of the Investment Advisory and Management Agreement between the Fund and Matthews International Capital Management, LLC (“Matthews Asia”) (the “Agreement”), the Board of Directors, all of whom are Independent Directors (the “Board”), took into account all the materials provided prior to and during the meeting of the Board held on December 15, 2020 (the “Meeting”) which included, among other things, comparative fee and expense data, the presentations made during the Meeting, and the comprehensive discussions had during the Meeting. The Board also requested and received assistance and advice regarding applicable legal standards from counsel to the Fund.
The information prepared specifically for the review of the Agreement supplemented the information provided to the Board throughout the year. The Board met regularly during the year and the information provided and topics discussed at such meetings were relevant to the review of the Agreement. Some of these reports and other data included, among other things, materials that outlined the Fund’s investment performance; compliance, regulatory, and risk management matters; the trading practices of Matthews Asia; valuation of securities; fund expenses; and overall market and regulatory developments. The Independent Directors considered the review of the Agreement to be an ongoing process and employed the accumulated information, knowledge, and experience they had gained during their tenure on the Board governing the Fund and working with Matthews Asia in their review of the Agreement.
The conclusions that the Independent Directors reached were based on a comprehensive evaluation of all information provided by Matthews Asia and were not the result of any single factor. Each Independent Director may have afforded different weight to the various factors in reaching his conclusions with respect to the Management Agreement.
Although the 1940 Act requires that continuance of the Agreement be approved by the in-person vote of a majority of the Independent Directors, the Meeting was held virtually through the internet in view of the health risks associated with holding an in-person meeting during the COVID-19 pandemic and governmental restrictions on gatherings. The Meeting was held in reliance on an order issued by the Securities and Exchange Commission on March 13, 2020, as extended on March 25, 2020 and June 19, 2020, which provided registered investment companies temporary relief from the in-person voting requirements of the 1940 Act with respect to the approval of a fund’s advisory agreement in response to the challenges arising in connection with the COVID-19 pandemic.
25
Table of Contents
THE CHINA FUND, INC.
OTHER INFORMATION (continued) (unaudited)
In evaluating the Agreement, the Board received and considered information, during the Meeting and during the past year, regarding: (i) the nature, extent and quality of services provided to the Fund by the Matthews Asia; (ii) performance of the Fund, fees and expenses incurred by the Fund, and the profitability of Matthews; and (iii) economies of scale. With respect to materials, the Board specifically noted that such materials included information with respect to the fee, comparative fees and expense ratios, performance figures and profitability analysis with respect to the Fund and each service provided by Matthews Asia. The Independent Directors considered brokerage policies and practices, the standards applied in seeking best execution and policies and practices regarding soft dollars.
The Board also based its decision on the extent to which economies of scale would be realized if and as the Fund grows and whether the fee levels in the Agreement reflects these economies of scale. The Board did not identify any consideration that was all important or controlling, and each Director may have attributed different weights to the various factors. The Board concluded that the services were extensive in nature and that Matthews Asia consistently delivered a high level of service for the Fund.
Nature, Extent and Quality of the Services Provided by the Investment Adviser. The Board considered the nature, extent, and quality of the services provided by Matthews Asia to the Fund. The Board considered the Fund’s investment strategies and Matthews Asia’s expertise with respect to such strategies; the experience, capability, and integrity of Matthews Asia’s respective senior management; the financial resources of Matthews Asia; the continuous and regular management and services provided by Matthews Asia and the risks assumed and borne; and the professional qualifications of Matthews Asia’s portfolio management team.
The Board considered the technical capabilities of Matthews Asia, including the design and implementation of its disaster recovery and business continuity infrastructure. In this regard, the Board took into account the operation of Matthews Asia’s business continuity plan during the current COVID-19 pandemic. The Board also considered information regarding Matthews Asia’s compliance resources, risk assessment and other compliance initiatives and programs. The Board concluded that Matthews Asia has implemented a robust and diligent compliance process, and demonstrates a strong commitment to a culture of compliance. The Board also noted the significant role played by Matthews Asia with respect to the valuation of portfolio securities, including research and analysis related to fair valued securities.
Based on the factors discussed above, as well as those discussed below, the Board concluded that it was satisfied with the nature, extent, and quality of the services provided to the Fund by Matthews Asia.
Performance, Fees and Expenses of the Fund. The Board received and considered performance information for the Fund. The Board considered the short-term and long-term performance of the Fund on both an absolute basis and in comparison to appropriate peer funds and benchmark indices for various time periods. As part of this review, the Board considered the composition of the peer group and selection criteria. In evaluating the performance of the Fund, the Board considered risk expectations for the Fund, the impact of relevant market or regulatory factors, as well as the level of Fund performance in the context of its review of Fund expenses and Matthews Asia’s profitability. In addition to the information received by the Board at this Meeting, the Board received detailed
26
Table of Contents
THE CHINA FUND, INC.
OTHER INFORMATION (continued) (unaudited)
performance information for the Fund at each regular Board meeting during the year. The Board concluded that the Fund’s overall performance was satisfactory when viewed in the context of its investment style and was consistent with the Fund’s investment approach consistently communicated to investors.
The Board considered the fee rate paid by the Fund to Matthews Asia in light of the nature, extent and quality of the services provided to the Fund and in comparison to the management fees of other funds in the Fund’s relevant peer group. The Board considered that the Fund’s management fee was toward the lower end of the range of fees paid by funds in the peer group. The Board considered the depth and range of services provided under the Agreement.
The Board reviewed Matthews Asia’s profitability data for the Fund using data as of June 30, 2020. The Board also reviewed the allocation methods used in preparing the profitability data. In considering profitability information, the Board considered the effect of fall-out benefits on Matthews Asia’s expenses, such as the increased visibility of Matthews Asia’s investment management business due to the availability of the Fund through various broker-dealer platforms as well as the research services acquired by Matthews Asia through soft dollars. The Board focused on profitability of Matthews Asia’s relationships with the Fund before taxes and distribution expenses. The Board noted that Matthews Asia’s commitment of resources to the Fund resulted in it assuming entrepreneurial and other risks, for which it may reasonably seek to be compensated. The Board concluded that Matthews Asia’s profitability was not excessive in light of the nature, extent and quality of services provided to the Fund.
Economies of Scale. The Board considered the potential benefits from economies of scale that the Fund’s stockholders could be afforded. The Board considered the breakpoint structure of the advisory fee and noted that because of the level of the Fund’s assets, the Fund is able to take advantage of a lower advisory fee. Based on its consideration of this factor and the factors above, the Board determined that there was a reasonable sharing of any realized economies of scale under the Agreement at the present time.
General Conclusions. After considering and weighing all of the above factors and having requested and received such information from Matthews Asia as the Independent Directors believed to be reasonably necessary to evaluate the terms of the Agreement, and as assisted by the advice of counsel, the Board concluded that it would be in the best interest of the Fund and its stockholders to approve the continuance of the Agreement.
Results of Annual Stockholder Meeting held on March 9, 2021
1. Election of Director — The stockholders of the Fund elected the following Director to serve for a three-year term expiring on the date on which the annual meeting of stockholders is held in 2024 or until his successor is duly elected and qualified.
Director | Votes Cast for | Votes Against/ Withheld | ||||||
Julian Reid | 7,513,494 | 1,385,991 | ||||||
27
Table of Contents
THE CHINA FUND, INC.
OTHER INFORMATION (continued) (unaudited)
PRIVACY POLICY
Privacy Notice
The China Fund, Inc. collects nonpublic personal information about its stockholders from the following sources:
◾ Information it receives from stockholders on applications or other forms; and
◾ Information about stockholder transactions with the Fund.
The Fund’s policy is to not disclose nonpublic personal information about its stockholders to nonaffiliated third parties (other than disclosures permitted by law).
The Fund restricts access to nonpublic personal information about its stockholders to those agents of the Fund who need to know that information to provide products or services to stockholders. The Fund maintains physical, electronic and procedural safeguards that comply with federal standards to guard its stockholders’ nonpublic personal information. |
QUARTERLY PORTFOLIO OF INVESTMENTS
The Fund files a monthly portfolio investments report with the Securities and Exchange Commission (“SEC”) within 60 days after the end of the first and third quarters of each fiscal year on Form N-PORT. The N-PORT reports are available on the Fund’s website at www.chinafundinc.com or on the SEC’s website at www.sec.gov.
PROXY VOTING POLICIES & PROCEDURES
A description of the policies and procedures that the Fund has adopted to determine how to vote proxies relating to portfolio securities and information about how the Fund voted proxies relating to portfolio securities held during the most recent twelve-month period ended June 30 is available (i) without charge, upon request, by calling the Fund’s stockholder servicing agent at 1-888-246-2255; (ii) on the Fund’s website at www.chinafundinc.com; and (iii) on the Securities and Exchange Commission website at www.sec.gov.
CERTIFICATIONS
The Fund’s chief executive officer has certified to the New York Stock Exchange that, as of March 25, 2021, he was not aware of any violation by the Fund of applicable New York Stock Exchange corporate governance listing standards. The Fund also has included the certifications of the Fund’s chief executive officer and chief financial officer required by Section 302 and Section 906 of the Sarbanes-Oxley Act of 2002 in the Fund’s Form N-CSR filed with the Securities and Exchange Commission, for the period of this report.
28
Table of Contents
SUMMARY OF DIVIDEND REINVESTMENT AND CASH PURCHASE PLAN (unaudited)
The Fund will distribute to stockholders, at least annually, substantially all of its net investment income from dividends and interest earnings and expects to distribute any net realized capital gains annually. Pursuant to the Dividend Reinvestment and Cash Purchase Plan (the “Plan”), adopted by the Fund, each stockholder will automatically be a participant (a “Participant”) in the Plan unless Computershare Trust Company, N.A., the Plan Agent, is otherwise instructed by the stockholder in writing, to have all distributions, net of any applicable U.S. withholding tax, paid in cash. Stockholders who do not participate in the Plan will receive all distributions in cash paid by check in U.S. dollars mailed directly to the stockholder by Computershare Trust Company, N.A., as paying agent. Stockholders who do not wish to have distributions automatically reinvested should notify the Fund by contacting Computershare Trust Company, N.A. c/o The China Fund, Inc. at P.O. Box 505000 Louisville, Kentucky 40233-5000, by telephone at 1-800-426-5523 or via the Internet at www.computershare.com/investor.
Whenever the Directors of the Fund declare a capital gains distribution or an income dividend payable only in shares of the Fund’s common stock (including such a declaration that provides an option to receive cash), Participants will take such distribution or dividend entirely in shares of common stock to be issued by the Fund, and the Plan Agent shall automatically receive such shares of common stock, including fractions, for the Participant’s account.
Whenever a dividend or distribution is declared payable in cash or shares of the Fund’s common stock, the Plan will operate as follows: (i) whenever the market price per share of common stock equals or exceeds the net asset value per share at the time shares of common stock are valued for the purpose of determining the number of shares of common stock equivalent to the dividend or distribution (the “Valuation Date”), Participants will be issued shares of common stock by the Fund valued at net asset value or, if the net asset value is less than 95% of the market price on the Valuation Date, then Participants will be issued shares valued at 95% of the market price; and (ii) whenever the net asset value per share of the common stock on the Valuation Date exceeds the market price of a share of the common stock on the Valuation Date, Participants will receive shares of common stock of the Fund purchased in the open market. The Plan Agent will, as purchasing agent for the Participants, buy shares of common stock in the open market, on the New York Stock Exchange (the “Exchange”) or elsewhere, with the cash in respect of such dividend or distribution for the Participants’ accounts on, or shortly after, the payment date.
If the Fund should declare an income dividend or capital gains distribution payable only in cash, the Plan Agent will, as purchasing agent for the Participants, buy shares of common stock in the open market, on the Exchange or elsewhere, with the cash in respect of such dividend or distribution for the Participants’ accounts on, or shortly after, the payment date.
Participants in the Plan have the option of making additional payments to the Plan Agent annually, in any amount from $100 to $3,000 for investment in the Fund’s Common Stock. The Plan Agent will use all funds received from participants (as well as any dividends and capital gains distributions received in cash) to purchase Fund shares in the open market on January 15 of each year or the next trading day if January 15th is not a trading day. Participants may make voluntary cash payments by sending a check (in U.S. dollars and drawn on a U.S. Bank) made payable to “Computershare” along with a completed transaction form which is attached to each statement a Participant receives. The Plan Agent will not accept cash, traveler’s checks, money orders or third party checks. Any voluntary
29
Table of Contents
DIVIDENDS AND DISTRIBUTIONS:
SUMMARY OF DIVIDEND REINVESTMENT AND CASH PURCHASE PLAN (continued) (unaudited)
cash payments received more than thirty-five days prior to such date will be returned by the Plan Agent, and interest will not be paid on any such amounts. To avoid unnecessary cash accumulations, and also to allow ample time for receipt and processing by the Plan Agent, participants should send in voluntary cash payments to be received by the Plan Agent approximately two days before January 15. A participant may withdraw a voluntary cash payment by written notice, if the notice is received by the Plan Agent not less than 48 hours before such payment is to be invested. In the event that a Participant’s check for a voluntary cash payment is returned unpaid for any reason, the Plan Agent will consider the request for investment of such funds null and void, and shall immediately remove from the Participant’s account those shares, if any, purchased upon the prior credit of such funds. The Plan Agent shall be entitled to sell shares to satisfy any uncollected amount plus any applicable fees. If the net proceeds of the sale of such shares are insufficient to satisfy the balance of such uncollected amounts, the Plan Agent shall be entitled to sell such additional shares from the Participant’s account as may be necessary to satisfy the uncollected balance.
For all purposes of the Plan: (a) the market price of shares of common stock of the Fund on a particular date shall be the last sales price on the Exchange on the close of the previous trading day or, if there is no sale on the Exchange on that date, then the mean between the closing bid and asked quotations for such stock on the Exchange on such date, (b) Valuation Date shall be the dividend or distribution payment date or, if that date is not an Exchange trading day, the next preceding trading day, and (c) net asset value per share of common stock on a particular date shall be as determined by or on behalf of the Fund.
The open-market purchases provided for above may be made on any securities exchange where the shares of common stock of the Fund are traded, in the over-the-counter market or in negotiated transactions, and may be on such terms as to price, delivery and otherwise as the Plan Agent shall determine. In every case the price to the Participant shall be the weighted average purchase price obtained by the Plan Agent’s broker, net of fees. Funds held by the Plan Agent will not bear interest. In addition, it is understood that the Plan Agent shall have no liability (other than as provided in the Plan) in connection with any inability to purchase shares of common stock within 30 days after the payment date of any dividend or distribution as herein provided or with the timing of any purchases effected. The Plan Agent shall have no responsibility as to the value of the shares of common stock of the Fund acquired for any Participant’s account. Whenever the Plan Agent, as purchasing agent for the Participants, is to buy shares of common stock in the open market, on the Exchange or elsewhere, with the cash in respect of a dividend or distribution, to the extent the Plan Agent is able to do so and, before the Plan Agent has completed its purchases, the market price exceeds the net asset value of the common stock, the average per share purchase price paid by the Plan Agent may exceed the net asset value of the common stock, resulting in the acquisition of fewer shares of common stock than if the income dividend or capital gains distribution had been paid in common stock issued by the Fund. The Plan Agent will apply all cash received as an income dividend or capital gains distribution to purchase shares of common stock on the open market as soon as practicable after the payment date of such dividend or capital gains distributions, but in no event later than 30 days after such date, except where necessary to comply with applicable provisions of the federal securities laws.
The Plan Agent will confirm in writing, each trade for a Participant’s account and each share deposit or share transfer promptly after the account activity occurs. The statement will show the number of shares held, the number
30
Table of Contents
DIVIDENDS AND DISTRIBUTIONS:
SUMMARY OF DIVIDEND REINVESTMENT AND CASH PURCHASE PLAN (continued) (unaudited)
of shares for which dividends are being reinvested, any cash received for purchase of shares, the price per share for any purchases or sales, and any applicable fees for each transaction charged the Participant. In the event the only activity in a Participant’s account is the reinvestment of dividends, this activity will be confirmed in a statement on at least a quarterly basis. If the Fund pays an annual dividend and the only activity in a Participant’s account for the calendar year is the reinvestment of such dividend, the Participant will receive an annual statement. These statements are a Participant’s continuing record of the cost basis of purchases and should be retained for income tax purposes.
The Plan Agent will hold shares of common stock acquired pursuant to the Plan in non-certificated form in the name of the Participant for whom such shares are being held and each Participant’s proxy will include those shares of common stock held pursuant to the Plan. The Plan Agent will forward to each Participant any proxy solicitation material received by it. In the case of stockholders, such as banks, brokers or nominees, which hold shares for others who are the beneficial owners, the Plan Agent will administer the Plan on the basis of the number of shares certified from time to time by the stockholder as representing the total amount registered in the name of such Participants and held for the account of beneficial owners who participate in the Plan. Upon a Participant’s Internet, telephone or written request, the Plan Agent will deliver to her or him, without charge, a certificate or certificates representing all full shares of common stock held by the Plan Agent pursuant to the Plan for the benefit of such Participant.
Participants will not be charged a fee in connection with the reinvestment of dividends or capital gains distributions. The Plan Agent’s transaction fees for the handling of the reinvestment of dividends and distributions will be paid by the Fund. However, Participants will be charged a per share fee (currently $0.05) incurred with respect to the Plan Agent’s open market purchases in connection with the reinvestment of dividends or capital gains distributions and with purchases from voluntary cash payments made by the Participant. A $2.50 transaction fee and a per share fee of $0.15 will also be charged by the Plan Agent upon any request for sale. Per share fees include any brokerage commissions the Plan Agent is required to pay.
The automatic reinvestment of dividends and distributions will not relieve participants of any income tax which may be payable on such dividends and distributions. Participants will receive tax information annually for their personal records and to help them prepare their federal income tax return. For further information as to tax consequences of participation in the Plan, Participants should consult with their own tax advisors.
These terms and conditions may be amended or supplemented by the Plan Agent or the Fund at any time or times but, except when necessary or appropriate to comply with applicable law or the rules or policies of the Securities and Exchange Commission or any other regulatory authority, only by mailing to the Stockholders appropriate written notice at least 30 days prior to the effective date thereof. The amendment or supplement shall be deemed to be accepted by the Participants unless, prior to the effective date thereof, the Plan Agent receives written notice of the termination of a Participant’s account under the Plan. Any such amendment may include an appointment by the Plan Agent in its place and stead of a successor Plan Agent under these terms and conditions, with full power and authority to perform all or any of the acts to be performed by the Plan Agent under these terms and conditions. Upon any such appointment of a successor Plan Agent for the purposes of receiving dividends and distributions, the Fund will be authorized to pay to such successor Plan Agent, for the Participants’ accounts, all dividends and distributions
31
Table of Contents
DIVIDENDS AND DISTRIBUTIONS:
SUMMARY OF DIVIDEND REINVESTMENT AND CASH PURCHASE PLAN (continued) (unaudited)
payable on the shares of common stock held in the Participants’ name or under the Plan for retention or application by such successor Plan Agent as provided in these terms and conditions.
Requests for copies of the Plan, which sets forth all of the terms of the Plan, and all correspondence concerning the Plan should be directed to Computershare Trust Company, N.A., the Plan Agent for The China Fund, Inc., in writing at P.O. Box 505000 Louisville, Kentucky 40233-5000, by telephone at 1-800-426-5523 or via the Internet at www.computershare.com/investor.
32
Table of Contents
THE CHINA FUND, INC.
United States Address
The China Fund, Inc.
c/o Brown Brothers Harriman & Co.
Fund Administration, 7th Floor
50 Post Office Square
Boston, MA 02110
Directors and Officers
Julian Reid, Chairman of the Board, Investment Committee, Discount Management Committee and Governance,
Nomination & Compensation Committee and Director
Richard Silver, Chairman of the Audit, Valuation and Compliance Committee and Director
George Iwanicki, Director
Frank Wheeler, President
Patrick Keniston, Chief Compliance Officer and Secretary
Monique Labbe, Treasurer
Investment Manager
Matthews International Capital Management, LLC
Shareholder Servicing Agent
AST Fund Solutions
Administrator, Accounting Agent and Custodian
Brown Brothers Harriman & Co.
Transfer Agent, Dividend Paying Agent and Registrar
Computershare Trust Company, N.A.
Independent Registered Public Accounting Firm
Tait, Weller & Baker, LLP
Legal Counsel
Morgan, Lewis & Bockius, LLP
Notice is hereby given in accordance with Section 23(c) of the Investment Company Act of 1940 that from time to time the Fund may purchase shares of its common stock in the open market at prevailing market prices.
Table of Contents
| (b) | Not applicable. |
Item 2. Code of Ethics.
Not required for this filing.
Item 3. Audit Committee Financial Expert.
Not required for this filing.
Item 4. Principal Accountant Fees and Services.
Not required for this filing.
Item 5. Audit Committee of Listed Registrants.
Not required for this filing.
Item 6. Investments.
| a. | Schedule of Investments is included as part of Item 1. |
| b. | Not applicable. |
Item 7. Disclosure of Proxy Voting Policies and Procedures for Closed-End Investment Companies.
Not required for this filing.
Item 8. Portfolio Managers of Closed-End Management Investment Companies.
| a. | Not required for this filing. |
Item 9. Purchases of Equity Securities by Closed-End Management Investment Company and Affiliated Purchasers.
During the six month period ended April 30, 2021, the following purchases were made by or on behalf of the Fund as that term is defined in Rule 10b-18 under the Exchange Act.
Table of Contents
| (a) Total Number of Shares (or Units) Purchased | (b) Average Price Paid per Share (or Unit) | (c) Total Number of Shares (or Units) Purchased as Part of Publicly Announced Plans or Programs | (d) Maximum Number (or Approximate Dollar Value) of Shares (or Units) that May Yet Be Purchased Under the Plans or Programs | |||||||||||||
November 1, 2020 through November 30, 2020 | 5,329 | $ | 29.64 | 5,329 | 1,039,670 | |||||||||||
December 1, 2020 through December 31, 2020 | 1,348 | $ | 29.74 | 1,348 | 1,038,322 | |||||||||||
January 1, 2021 through January 31, 2021 | — | N/A | — | 1,038,322 | ||||||||||||
February 1, 2021 through February 28, 2021 | 1,821 | $ | 34.46 | 1,821 | 1,036,501 | |||||||||||
March 1, 2021 through March 31, 2021 | 4,830 | $ | 28.96 | 4,830 | 1,031,671 | |||||||||||
April 1, 2021 through April 30, 2021 | 3,961 | $ | 28.97 | 3,961 | 1,027,710 | |||||||||||
|
|
|
|
|
|
|
| |||||||||
Total | 17,289 | 29.81 | 17,289 | 1,027,710 | ||||||||||||
|
|
|
|
|
|
|
| |||||||||
Item 10. Submission of Matters to a Vote of Security Holders.
There have been no material changes to the procedures by which shareholders may recommend nominees to the registrant’s Board of Directors during the period covered by this Form N-CSR filing.
Item 11. Controls and Procedures.
| (a) | The registrant’s principal executive and principal financial officers have concluded that the registrant’s disclosure controls and procedures (as defined in Rule 30a-3(c) under the Investment Company Act of 1940, as amended (the “1940 Act”) (17 CFR 270.30a-3(c))) are effective, as of a date within 90 days of the filing date of this Form N-CSR based on their evaluation of these controls and procedures required by Rule 30a-3(b) under the 1940 Act (17 CFR 270.30a-3(b)) and Rules 13a-15(b) or 15d-15(b) under the 1934 Act (17 CFR 240.13a-15(b) or 240.15d-15(b)). |
| (b) | There were no changes in the registrant’s internal control over financial reporting (as defined in Rule 30a-3(d) under the 1940 Act (17 CFR 270.30a-3(d))) that occurred during the registrant’s second fiscal quarter that has materially affected, or is reasonably likely to materially affect, the registrant’s internal control over financial reporting. |
Item 12. Disclosure of Securities Lending Activities for Closed-End Management Investment Companies.
| (a) |
| (1) | Gross income from securities lending activities:$37,686.53 |
| (2) | All fees and/or compensation for each of the following securities lending activities and related services: |
| i. | any share of revenue generated by the securities lending program paid to the securities lending agent(s) (“revenue split”):$6,989.76 |
| ii. | fees paid for cash collateral management services (including fees deducted from a pooled cash collateral reinvestment vehicle) that are not included in the revenue split: $9,724.57 |
| iii. | administrative fees that are not included in the revenue split: $0 |
| iv. | fees for indemnification that are not included in the revenue split: $0 |
Table of Contents
| v. | rebates paid to borrowers: $0 |
| vi. | any other fees relating to the securities lending program that are not included in the revenue split, including a description of those other fees: $0 |
| (3) | Aggregate fees/compensation $16,714.33 |
| (4) | Net income from securities lending activities: $20,972.20 |
| (b) | Securities Lending: The Fund may lend up to 33 1/3% of the Fund’s total assets held by Brown Brothers Harriman & Co. (“BBH”) as custodian to certain qualified brokers, except those securities which the Fund or the Investment Manager specifically identifies as not being available. By lending its investment securities, the Fund attempts to increase its net investment income through the receipt of interest on the loan. Any gain or loss in the market price of the securities loaned that might occur and any interest or dividends declared during the term of the loan would accrue to the account of the Fund. Risks of delay in recovery of the securities or even loss of rights in the collateral may occur should the borrower of the securities fail financially. Upon entering into a securities lending transaction, the Fund receives cash as collateral in an amount equal to or exceeding 100% of the current market value of the loaned securities with respect to securities of the U.S. government or its agencies, 102% of the current market value of the loaned securities with respect to U.S. securities and 105% of the current market value of the loaned securities with respect to foreign securities. Any cash received as collateral is generally invested by BBH, acting in its capacity as securities lending agent (the “Agent”), in the Fidelity Investments Money Market Government Portfolio. A portion of the dividends received on the collateral may be rebated to the borrower of the securities and the remainder is split between the Agent and the Fund. |
Item 13. Exhibits.
| (a)(1) | Not required for this filing. | |
| (a)(2) | The certifications required by Rule 30a-2 of the 1940 Act are attached hereto. | |
| (a)(3) | Not applicable. | |
| (a)(4) | Not applicable. | |
| (b) | The certifications required by Rule 30a-2(b) of the 1940 Act and Section 906 of the Sarbanes-Oxley Act of 2002 are attached hereto. | |
Table of Contents
SIGNATURES
Pursuant to the requirements of the Securities Exchange Act of 1934 and the Investment Company Act of 1940, the registrant has duly caused this report to be signed on its behalf by the undersigned, thereunto duly authorized.
| THE CHINA FUND, INC. | ||
| By: | /s/ Frank Wheeler | |
| Frank Wheeler | ||
| President of The China Fund, Inc. | ||
Date: July 2, 2021
Pursuant to the requirements of the Securities Exchange Act of 1934 and the Investment Company Act of 1940, this report has been signed below by the following persons on behalf of the registrant and in the capacities and on the dates indicated.
| By: | /s/ Frank Wheeler | |
| Frank Wheeler | ||
| President of The China Fund, Inc. |
Date: July 2, 2021
| By: | /s/ Monique Labbe | |
| Monique Labbe | ||
| Treasurer of The China Fund, Inc. |
Date: July 2, 2021