
Manager’s Commentary
Market Review
The recovery seen after the Chinese New Year continued into March. The MSCI Golden Dragon Index (the "benchmark index") rallied more than 10% in US dollar terms, helping to offset the weakness seen earlier in the year. This strength in the market coincides with the recent weakness in the US dollar which has allowed the Renminbi to stabilize and even modestly strengthen. The easing of capital outflows has alleviated some of the previous pressure on the market.
There was a growing degree of respite with respect to the economic outlook in March. Near term economic data appears to be stabilizing and announcements from the National People's Congress have been encouraging. Premier Li Keqiang commented that the Chinese government has "ample" room and several policy tools to stimulate the economy to sustain the growth rate. This was widely interpreted as the government refocusing on growth.
The stocks hit hardest by the downturn have typically experienced the strongest rebounds, with deep value sectors such as energy and Chinese materials leading the rally. In Taiwan, sentiment regarding iPhone demand remained cautious despite the fact that many hardware component manufacturers saw a recovery in share price.
Fund Review
In March, the Fund's Net Asset Value ("NAV") price was almost in line with the benchmark index. Economically sensitive sectors where our exposure is limited led the market higher. Our lack of exposure to these sectors was partially offset by successful stock selection in the IT and industrial sectors.
Relative to the benchmark, our lack of exposure to Chinese banks and brokers was the largest drag on performance. We have been rather cautious on the asset quality of the banking sector and have preferred to gain financial exposure through life insurance and property companies. We believe the longer term growth outlook of the banking sector remains challenged despite its recent rebound. We have not yet found compelling proof to increase our exposure in this area.
Conversely, Zhuzhou CRRC Times Electric Co. Ltd., a mid-cap railway component manufacturer in China, rebounded strongly in March after better than expected quarterly results. Earlier in 2016, the company's share price was weak due to concerns over the growth of domestic railway demand and rising international competition. We believed that the share price overreacted during market drawdown, and added to our position given our confidence with the company's strong track record, ability to maintain high margins and good relationship with its clients.
Key Transactions
More recently we have also found some depressed stocks in more cyclical sectors which were previously shunned by the market. For example, we added back to the energy sector via CNOOC Ltd. We believe the stock was overly punished in the market sell down and expect it to benefit from stabilizing oil prices and significant cost cutting efforts.
Outlook
The recent rally in the China and Hong Kong equity markets has been primarily driven by a re-rating from an overly depressed level. While the weakness of the US dollar and the more recent statements from the US Federal Reserve should lend some support to the current re-rating process, we believe a sustainable recovery requires more concrete signs of earnings stabilization and improvement.
In this environment, we believe selecting stocks with sustainable and visible earnings growth is key. We often find that companies with these characteristics experience a turnaround driven from either a shift in business strategy, a change in management or an improving industry outlook. This approach resulted in the portfolio positioning more towards companies that should benefit from the ongoing economic rebalancing in China, including consumer services, industrial upgrade, healthcare and the growth of e- commerce.
In Brief
Fund Data
| Description | Seeks to achieve longterm capital appreciation through investments in China companies. |
| Listing Date (NYSE) | July 10, 1992 |
| Total Fund Assets (millions) | $268.5 |
| Median Market Cap (in billions) | $9.3 |
| Distribution Frequency | Annual |
| Management Firm | Allianz Global Investors U.S. LLC |
| Portfolio Management | Christina Chung, CFA, CMA Lead Portfolio Manager |
Performance (US$ Returns)
(as of 03/31/16)
| Fund | Benchmark1 |
| One Month | 10.13% | 10.49% |
| Three Month | -3.89% | -0.82% |
| One Year | -14.71% | -13.46% |
| Three Year | 3.98% | 2.70% |
Net Asset Value / Market Price
| Net Asset Value (NAV) / Market Price at Inception | $13.15 / $14.26 |
| NAV / Market Price (as of 3/31/16) | $17.07 / $14.74 |
| High / Low Ranges (52-Week) |
| High / Low NAV | $26.04 / $14.65 |
| High / Low Market Price | $22.22 / $12.85 |
| Premium/Discount to NAV (as of 3/31/16) | -13.65% |
| Fund Data (Common Shares) |
| Shares Outstanding | 15,722,674 |
| Average Daily Volume | 47,326 |
| Expense Ratio | 1.34% |
Fund Manager

Christina Chung, CFA, CMA
Lead Portfolio Manager
1. MSCI Golden Dragon Index.
The China Fund, Inc.
Investment Objective
The investment objective of the Fund is to achieve long-term capital appreciation. The Fund seeks to achieve its objective through investment in the equity securities of companies and other entities with significant assets, investments, production activities, trading or other business interests in China or which derive a significant part of their revenue from China.
The Fund has an operating policy that the Fund will invest at least 80% of its assets in China companies. For this purpose, 'China companies' are (i) companies for which the principal securities trading market is in China; (ii) companies for which the principal securities trading market is outside of China or in companies organized outside of China, that in both cases derive at least 50% of their revenues from goods or services sold or produced, or have a least 50% of their assets in China; or (iii) companies organized in China. Under the policy, China means the People's Republic of China, including Hong Kong, and Taiwan. The Fund will provide its stockholders with at least 60 days' prior notice of any change to this policy.
| Returns For Periods Ending 1 March 31, 2016* | ||||||||
| 1 Month | 3 Month | YTD | 1 Year | 3 Year | 5 Year | 10 Year | Inception | |
| NAV | 10.13% | -3.89% | -3.89% | -14.71% | 3.98% | 0.36% | 10.62% | 9.89% |
| Market Price | 9.51% | -5.03% | -5.03% | -16.23% | 2.45% | -0.99% | 8.96% | 8.84% |
| MSCI Golden Dragon Index | 10.49% | -0.82% | -0.82% | -13.46% | 2.70% | 1.36% | 6.19% | — |
| Calendar Year Returns | ||||||||
| 2008 | 2009 | 2010 | 2011 | 2012 | 2013 | 2014 | 2015 | |
| NAV | -46.95% | 72.83% | 27.26% | -24.37% | 12.12% | 18.31% | 7.82% | -5.51% |
| Market Price | -40.65% | 72.19% | 23.60% | -27.51% | 20.52% | 12.70% | 5.29% | -6.38% |
| MSCI Golden Dragon Index | -49.37% | 67.12% | 13.60% | -18.35% | 22.65% | 7.25% | 8.06% | -7.12% |
Past performance is not a guide to future returns.
| * | Annualized for periods greater than one year. |
Source: State Street Bank and Trust Company. Source for index data: MSCI as at March 31,2016. Investment returns are historical and do not guarantee future results. Investment returns reflect changes in net asset value and market price per share during each period and assumes that dividends and capital gains distributions, if any, were reinvested. The net asset value (NAV) percentages are not an indication of the performance of a shareholder's investment in the Fund, which is based on market price. NAV performance includes the deduction of management fees and other expenses. Market price performance does not include the deduction of brokerage commissions and other expenses of trading shares and would be lower had such commissions and expenses been deducted. It is not possible to invest directly in an index.
Premium/Discount

Sector Allocation
| Fund | Benchmark1 |
| Information Technology | 31.78% | 27.72% |
| Financials | 23.24% | 35.69% |
| Industrials | 17.18% | 7.71% |
| Consumer Discretionary | 12.95% | 6.25% |
| Telecom Services | 4.90% | 6.73% |
| Health Care | 3.55% | 1.17% |
| Energy | 2.98% | 3.90% |
| Consumer Staples | 1.42% | 2.44% |
| Materials | 0.32% | 3.23% |
| Utilities | 0.00% | 5.04% |
| Other assets & liabilities | 1.67% | 0.00% |
Source: IDS GmbH - Analysis and Reporting Services, a subsidiary of Allianz SE.
Country Allocation
| Fund | Benchmark1 |
| China | 78.01% | 73.73% |
| Hong Kong Red Chips | 31.39% | 11.31% |
| Hong Kong 'H' shares | 11.70% | 22.97% |
| Equity linked securities ('A' shares) | 3.59% | 0.00% |
| China 'A' & 'B' shares | 0.00% | 0.19% |
| Other Hong Kong securities | 31.33% | 32.48% |
| Others | 0.00% | 6.78% |
| Taiwan | 20.33% | 26.27% |
| Other assets & liabilities | 1.66% | 0.00% |
Top 10 Holdings
| TAIWAN SEMIC CO LTD (Taiwan) | 8.36% |
| TENCENT HOLDINGS LTD (China) | 5.76% |
| CK HUTCHISON HOLDINGS LTD (H.K.) | 5.13% |
| CHINA OVERSEAS LAND & INV (China) | 5.10% |
| DIGITAL CHINA HOLDINGS LTD (China) | 4.66% |
| HONG KONG EXCHANGES AND CLEARING LTD (H.K.) | 4.28% |
| PING AN INSURANCE (China) | 3.77% |
| CHINA MERCHANTS BANK CO LTD (China) | 3.39% |
| QINGLING MOTORS CO LTD (China) | 3.39% |
| CHINA MOBILE LTD (China) | 3.32% |
Portfolio Characteristics
| Fund | Benchmark1 |
| P/E Ratio | 13.59 | 11.69 |
| P/B Ratio | 1.53 | 1.29 |
| Issues in Portfolio | 38 | 287 |
| Foreign Holdings (%) | 98.33 | 100.00 |
| Other assets & liabilities (%) | 1.67 | 0.00 |
| Yield (%) | 2.85 | 3.37 |
1. MSCI Golden Dragon Index.
The China Fund, Inc.
Distribution History (10 Year)
| Declaration Date | Ex-dividend Date | Record Date | Payable Date | Distribution/ Share | Income | Long-term Capital Gain | Short-term Capital Gain |
| 12/8/06 | 12/19/06 | 12/21/06 | 12/29/06 | $4.01170 | $0.29960 | $2.73090 | $0.98120 |
| 12/7/07 | 12/19/07 | 12/21/07 | 1/25/08 | $12.12000 | $0.28000 | $9.00000 | $2.84000 |
| 12/8/08 | 12/22/08 | 12/24/08 | 1/23/09 | $5.81740 | $0.48130 | $5.33610 | — |
| 12/9/09 | 12/22/09 | 12/24/09 | 12/29/09 | $0.25570 | $0.25570 | — | — |
| 12/8/10 | 12/21/10 | 12/24/10 | 12/29/10 | $2.27420 | $0.37460 | $1.89960 | — |
| 12/8/11 | 12/21/11 | 12/23/11 | 12/29/11 | $2.99640 | $0.17420 | $2.82220 | — |
| 12/10/12 | 12/20/12 | 12/24/12 | 12/28/12 | $3.25170 | $0.34730 | $2.90440 | — |
| 12/13/13 | 12/19/13 | 12/23/13 | 12/27/13 | $3.31400 | $0.43870 | $2.87530 | — |
| 12/8/14 | 12/18/14 | 12/22/14 | 1/5/15 | $3.76510 | $0.29820 | $3.46690 | — |
| 12/16/15 | 12/23/15 | 12/28/15 | 1/6/16 | $1.49580 | $0.21330 | $0.84620 | $0.43630 |
Distribution/Share includes Income, Long-term Capital gains and Short-term Capital gains.
The China Fund NAV Performance of $10,000 since inception
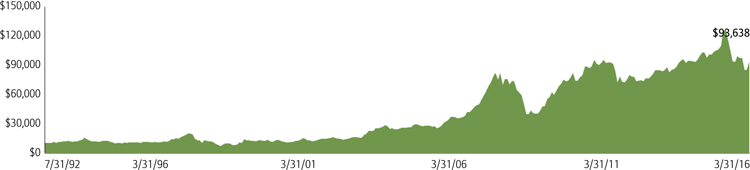
Past performance is not a guide to future returns.
Index Description
MSCI Golden Dragon Index
The MSCI Golden Dragon Index captures the equity market performance of large and mid cap China securities (H shares, B shares, Red-Chips and P-Chips) and non-domestic China securities listed in Hong Kong and Taiwan.
It is not possible to invest directly in an index.
The China Fund, Inc.
| Portfolio in Full |
| Sector | Company (exchange ticker) | Market Price | Holding | Value US$ | % of net assets |
| Information Technology | 31.74 | ||||
| TAIWAN SEMICONDUCTOR MANUFACTURING CO LTD | 2330 | 162.00 | 4,461,000 | 22,454,698 | 8.36 |
| TENCENT HOLDINGS LTD | 700 | 158.50 | 757,500 | 15,478,516 | 5.76 |
| DIGITAL CHINA HOLDINGS LTD | 861 | 10.38 | 9,360,000 | 12,525,371 | 4.66 |
| DELTA ELECTRONICS INC | 2308 | 142.00 | 1,680,359 | 7,413,963 | 2.76 |
| ADVANTECH CO LTD | 2395 | 236.50 | 798,841 | 5,870,181 | 2.19 |
| ALIBABA GROUP HOLDING LTD | BABA | 79.03 | 60,998 | 4,820,672 | 1.79 |
| BAIDU INC | BIDU | 190.88 | 23,473 | 4,480,526 | 1.67 |
| SEMICONDUCTOR MANUFACTURING INTERNATIONAL CORP | 981 | 0.67 | 48,792,000 | 4,214,449 | 1.57 |
| LARGAN PRECISION CO LTD | 3008 | 2,495.00 | 41,000 | 3,178,443 | 1.18 |
| CATCHER TECHNOLOGY CO LTD | 2474 | 264.00 | 304,000 | 2,493,661 | 0.93 |
| GOLDPAC GROUP LTD | 3315 | 3.27 | 5,521,000 | 2,327,464 | 0.87 |
| Financials | 23.23 | ||||
| CHINA OVERSEAS LAND & INVESTMENT LTD | 688 | 24.55 | 4,324,000 | 13,685,308 | 5.10 |
| HONG KONG EXCHANGES AND CLEARING LTD | 388 | 186.60 | 477,900 | 11,496,511 | 4.28 |
| PING AN INSURANCE GROUP CO OF CHINA LTD | 2318 | 37.15 | 2,112,000 | 10,115,099 | 3.77 |
| CHINA MERCHANTS BANK CO LTD | 3968 | 16.30 | 4,337,500 | 9,114,744 | 3.39 |
| SUN HUNG KAI PROPERTIES LTD | 16 | 94.75 | 688,000 | 8,403,981 | 3.13 |
| FUBON FINANCIAL HOLDING CO LTD | 2881 | 41.00 | 4,270,000 | 5,439,659 | 2.03 |
| CATHAY FINANCIAL HOLDING CO LTD | 2882 | 38.55 | 3,462,000 | 4,146,784 | 1.54 |
| Industrials | 17.18 | ||||
| CK HUTCHISON HOLDINGS LTD | 1 | 100.50 | 1,064,000 | 13,785,582 | 5.13 |
| ZHUZHOU CRRC TIMES ELECTRIC CO LTD | 3898 | 45.20 | 1,511,500 | 8,807,730 | 3.28 |
| CHINA EVERBRIGHT INTERNATIONAL LTD | 257 | 8.69 | 7,256,000 | 8,128,950 | 3.03 |
| BEIJING ENTERPRISES HOLDINGS LTD | 392 | 42.45 | 1,182,500 | 6,471,370 | 2.41 |
| CN STATE CONSTRUCTION INTERNATIONAL HOLDINGS LTD | 3311 | 11.56 | 2,110,000 | 3,144,544 | 1.17 |
| QINGDAO PORT INTERNATIONAL CO LTD | 6198 | 3.61 | 6,596,000 | 3,069,766 | 1.14 |
| ZHENGZHOU YUTONG BUS CO A | 600066 | 19.39 | 910,530 | 2,729,788 | 1.02 |
| Consumer Discretionary | 12.94 | ||||
| QINGLING MOTORS CO LTD | 1122 | 2.44 | 28,960,000 | 9,109,736 | 3.39 |
| SANDS CHINA LTD | 1928 | 31.55 | 1,634,800 | 6,649,384 | 2.48 |
| LI & FUNG LTD | 494 | 4.60 | 9,798,000 | 5,810,489 | 2.16 |
| CITIGROUP GLOBAL MARKETS HOLD (exch. for CHINA CYTS TOURS HOLDIN) | N/A | 3.23 | 1,635,575 | 5,282,907 | 1.97 |
| MERIDA INDUSTRY CO LTD | 9914 | 142.50 | 805,000 | 3,564,271 | 1.33 |
| CLSA GLOBAL MARKETS PTE LTD (exch. for CHONG QING CHANGAN AUTO) | N/A | 2.43 | 739,970 | 1,798,127 | 0.67 |
| CITIGROUP GLOBAL MARKETS HOLD (exch. for CHONG QING CHANGAN AUTO) | N/A | 2.44 | 558,897 | 1,363,709 | 0.51 |
| HSBC BANK PLC (exch. for CHONG QING CHANGAN AUTO) | N/A | 2.44 | 487,000 | 1,190,228 | 0.44 |
| Telecom Services | 4.90 | ||||
| CHINA MOBILE LTD | 941 | 86.40 | 801,000 | 8,922,030 | 3.32 |
| CHINA UNICOM HONG KONG LTD | 762 | 10.24 | 3,214,000 | 4,242,904 | 1.58 |
| Health Care | 3.55 | ||||
| CSPC PHARMACEUTICAL GROUP LTD | 1093 | 7.01 | 5,804,000 | 5,245,209 | 1.95 |
| 3SBIO INC | 1530 | 10.50 | 3,175,500 | 4,298,519 | 1.60 |
| Energy | 2.99 | ||||
| CNOOC LTD | 883 | 9.17 | 6,788,000 | 8,024,696 | 2.99 |
| Consumer Staples | 1.42 | ||||
| WANT WANT CHINA HOLDINGS LTD | 151 | 5.75 | 5,143,000 | 3,812,429 | 1.42 |
| Materials | 0.33 | ||||
| TIANGONG INTERNATIONAL CO LTD | 826 | 0.61 | 11,240,000 | 883,921 | 0.33 |
Source: State Street Bank and Trust Company, IDS GmbH - Analysis and Reporting Services, a subsidiary of Allianz SE.
The China Fund, Inc.
Important Information:
Holdings are subject to change daily. The Fund seeks to achieve its objective through investment in the equity securities of companies and other entities with significant assets, investments, production activities, trading or other business interests in China or which derive a significant part of their revenue from China. Investing in non-U.S. securities entails additional risks, including political and economic risk and the risk of currency fluctuations, as well as lower liquidity. These risks, which can result in greater price volatility, will generally be enhanced in less diversified funds that concentrate investments in a particular geographic region.
The information contained herein has been obtained from sources believed to be reliable but Allianz Global Investors U.S. LLC and its affiliates do not warrant the information to be accurate, complete or reliable. The opinions expressed herein are subject to change at any time and without notice. Past performance is not indicative of future results. This material is not intended as an offer or solicitation for the purchase or sale of any financial instrument. Investors should consider the investment objectives, risks, charges and expenses of any mutual fund carefully before investing. This and other information is contained in the fund's annual and semiannual reports, proxy statement and other fund information, which may be obtained by contacting your financial advisor or visiting the fund's website at www.chinafundinc.com. This information is unaudited and is intended for informational purposes only. It is presented only to provide information on the Fund's holdings, performance and strategies. The Fund is a closed-end exchange traded management investment company. This material is presented only to provide information and is not intended for trading purposes. Closed-end funds, unlike open-end funds, are not continuously offered. After the initial public offering by a closed-end fund, its shares can be purchased and sold on the open market through a stock exchange, where shares may trade at a premium or a discount. The market price of holdings is subject to change daily.
P/E is a ratio of security price to earnings per share. Typically, an undervalued security is characterized by a low P/E ratio, while an overvalued security is characterized by a high P/E ratio. P/B is a ratio of the current stock price to the book value. This is used to identify undervalued stocks. Dividend yield is the annual percentage of return earned by an investor on a common or preferred stock. The average dividend yield is the dividend rate divided by current share price.
©2016 Allianz Global Investors Distributors LLC.
| Investment Products: Not FDIC Insured | May Lose Value | Not Bank Guaranteed | FS-CHN-0316 |