
Data as of 4/30/16
Manager’s Commentary
Market Review
Government fiscal stimulus and monetary easing policies have started to yield positive results. In March, macroeconomic readings pointed toward stabilization in the economy, with export growth, industrial production and manufacturing Purchasing Managers' Index ("PMI") all reversing the previously declining trends. As a result of the government's efforts to manage its capital account and foreign exchange market, the Renminbi rebounded slightly versus the US dollar. In March, the foreign exchange reserve unexpectedly increased - alleviating investors' concern of capital flight out of China. Overall, fears of a "hard landing" scenario in China have receded; however, we believe investors need a longer period of consistent improvement before they become optimistic about China.
While Hong Kong and China remained largely flat month over month, Taiwan's stock market experienced a significant correction in April. The main headwinds were a slowdown in domestic economic growth, as well as gloomy global smartphone demand. Technology companies in Taiwan that focus on the smartphone supply chain, including component makers and semiconductor foundries, led the correction.
Fund Review
During the month, the Fund's Net Asset Value ("NAV") price underperformed the MSCI Golden Dragon Index (the "Benchmark Index"). The lack of exposure to cyclical areas, such as energy, and stock selection in Information Technology ("IT") were the main detractors from performance.
One of the top detractors during the month was Digital China Holdings Ltd., a small-cap Chinese IT service provider that we have held for a long time. During the past year, the company has managed to gradually transform from an IT distributor to an IT services company, focusing more on value added businesses such as the cloud, big data, agricultural IT and smart city initiatives. The company also used the funding of an IT distribution divestment to pay a special dividend of HK$3.20 per share in April. We believe the success of this transition will take time and gradually lead to a re-rating of the company's share price going forward.
Conversely, China Merchants Bank Co., Ltd., a mid-sized bank with strong brand recognition in the personal and private banking business in China, was the largest contributor to performance. The bank reported better than expected first quarter results, driven by healthy fee income growth and a strong retail franchise. We believe the bank's unique positioning within the personal banking sector and its strong management track record will enable it to become a winner in this space over the long term.
Key Transactions
We trimmed our position in Taiwan downstream technology companies, in view of the slowing global demand for smartphones. We used the proceeds to increase some of our existing positions, including China Merchants Bank Co., Ltd.
Outlook
While the economy has shown some signs of stabilization, visibility of reform and the efforts to restructure the economy remain low. The subdued trading activity in April suggests that investors are generally side-lined, waiting for more evidence of a sustainable pick-up in economic activity in China.
In the current environment, we firmly believe that selecting stocks with sustainable and visible earnings growth is crucial. Overall, we are not chasing the rally, as many cyclical companies that have outperformed still face significant over-capacity issues which will take time to resolve. We may, however add to economically-sensitive companies on a selective basis where we see an earnings recovery and reasonable valuations. This approach has resulted in positioning the portfolio more towards companies that should benefit from the ongoing economic rebalancing in China, including consumer services, industrial upgrade, healthcare and the growth of e-commerce.
| In Brief | |
Fund Data | |
| Description | Seeks to achieve longterm capital appreciation through investments in China companies |
| Listing Date (NYSE) | July 10, 1992 |
| Total Fund Assets (millions) | $262.7 |
| Median Market Cap (in billions) | $9.4 |
| Distribution Frequency | Annual |
| Management Firm | Allianz Global Investors U.S. LLC |
| Portfolio Management | Christina Chung, CFA, CMA Lead Portfolio Manager |
Performance (US$ Returns) (as of 4/30/16) | ||
| Fund | Benchmark1 | |
| One Month | -2.11% | -1.28% |
| Three Month | 8.16% | 8.76% |
| One Year | -26.93% | -23.46% |
| Three Year | 2.70% | 1.49% |
| Net Asset Value / Market Price | |
| Net Asset Value (NAV) / Market Price at Inception | $13.15 / $14.26 |
| NAV / Market Price (as of 4/30/16) | $16.71 / $14.54 |
| High / Low Ranges (52-Week) | |
| High / Low NAV | $26.04 / $14.65 |
| High / Low Market Price | $22.18 / $12.85 |
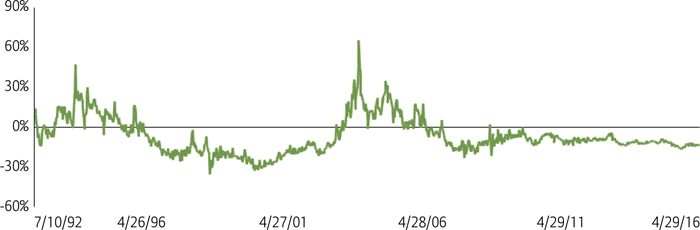
| Premium/Discount to NAV (as of 4/30/16) | -12.99% |
| Fund Data (Common Shares) | |
| Shares Outstanding | 15,722,674 |
| Average Daily Volume | 41,400 |
| Expense Ratio | 1.34% |
Fund Manager

Christina Chung, CFA, CMA
Lead Portfolio Manager
1 | MSCI Golden Dragon Index. |

The China Fund, Inc.
Investment Objective
The investment objective of the Fund is to achieve long-term capital appreciation. The Fund seeks to achieve its objective through investment in the equity securities of companies and other entities with significant assets, investments, production activities, trading or other business interests in China or which derive a significant part of their revenue from China.
The Fund has an operating policy that the Fund will invest at least 80% of its assets in China companies. For this purpose, ‘China companies’ are (i) companies for which the principal securities trading market is in China; (ii) companies for which the principal securities trading market is outside of China or in companies organized outside of China, that in both cases derive at least 50% of their revenues from goods or services sold or produced, or have a least 50% of their assets in China; or (iii) companies organized in China. Under the policy, China means the People’s Republic of China, including Hong Kong, and Taiwan. The Fund will provide its stockholders with at least 60 days’ prior notice of any change to this policy.
| Returns For Periods Ending April 30, 2016* | ||||||||
| 1 Month | 3 Month | YTD | 1 Year | 3 Year | 5 Year | 10 Year | Inception | |
| NAV | -2.11% | 8.16% | -5.91% | -26.93% | 2.70% | -0.73% | 9.55% | 9.76% |
| Market Price | -1.36% | 7.62% | -6.31% | -27.02% | 1.88% | -1.64% | 7.09% | 8.75% |
| MSCI Golden Dragon Index | -1.28% | 8.76% | -2.09% | -23.46% | 1.49% | 0.44% | 5.30% | — |
| Calendar Year Returns | ||||||||
| 2008 | 2009 | 2010 | 2011 | 2012 | 2013 | 2014 | 2015 | |
| NAV | -46.95% | 72.83% | 27.26% | -24.37% | 12.12% | 18.31% | 7.82% | -5.51% |
| Market Price | -40.65% | 72.19% | 23.60% | -27.51% | 20.52% | 12.70% | 5.29% | -6.38% |
| MSCI Golden Dragon Index | -49.37% | 67.12% | 13.60% | -18.35% | 22.65% | 7.25% | 8.06% | -7.12% |
Past performance is not a guide to future returns.
*Annualized for periods greater than one year.
Source: State Street Bank and Trust Company. Source for index data: MSCI as at April 30, 2016. Investment returns are historical and do not guarantee future results. Investment returns reflect changes in net asset value and market price per share during each period and assumes that dividends and capital gains distributions, if any, were reinvested. The net asset value (NAV) percentages are not an indication of the performance of a shareholder's investment in the Fund, which is based on market price. NAV performance includes the deduction of management fees and other expenses. Market price performance does not include the deduction of brokerage commissions and other expenses of trading shares and would be lower had such commissions and expenses been deducted. It is not possible to invest directly in an index.
Premium/Discount
Sector Allocation | Fund | Benchmark1 |
| Information Technology | 28.40% | 26.81% |
| Financials | 24.39% | 36.22% |
| Industrials | 17.07% | 7.58% |
| Consumer Discretionary | 12.28% | 6.15% |
| Telecom Services | 4.94% | 6.92% |
| Health Care | 3.43% | 1.14% |
| Energy | 3.22% | 4.26% |
| Consumer Staples | 1.51% | 2.60% |
| Materials | 0.35% | 3.28% |
| Utilities | 0.00% | 4.95% |
| Other assets & liabilities | 4.41% | 0.00% |
Source: IDS GmbH - Analysis and Reporting Services, a subsidiary of Allianz SE.
Country Allocation | Fund | Benchmark1 |
| China | 76.76% | 74.72% |
| Hong Kong Red Chips | 31.78% | 11.58% |
| Hong Kong 'H' shares | 12.58% | 23.22% |
| Equity linked securities ('A' shares) | 2.89% | 0.00% |
| China 'A' & 'B' shares | 0.00% | 0.19% |
| Other Hong Kong securities | 29.51% | 32.99% |
| Others | 0.00% | 6.75% |
| Taiwan | 18.84% | 25.28% |
| Other assets & liabilities | 4.40% | 0.00% |
Top 10 Holdings
| TAIWAN SEMIC CO LTD (Taiwan) | 7.90% |
| TENCENT HOLDINGS LTD (China) | 5.91% |
| CHINA OVERSEAS LAND & INV (China) | 5.25% |
| CK HUTCHISON HOLDINGS LTD (H.K.) | 4.85% |
| HONG KONG EXCHANGES AND CLEARING LTD (H.K.) | 4.61% |
| CHINA MERCHANTS BANK CO LTD (China) | 3.97% |
| PING AN INSURANCE (China) | 3.80% |
| QINGLING MOTORS CO LTD (China) | 3.61% |
| CHINA MOBILE LTD (China) | 3.50% |
| SUN HUNG KAI PROPERTIES LTD (H.K.) | 3.31% |
Portfolio Characteristics | Fund | Benchmark1 |
| P/E Ratio | 13.26 | 11.67 |
| P/B Ratio | 1.52 | 1.25 |
| Issues in Portfolio | 37 | 285 |
| Foreign Holdings (%) | 95.59 | 100.00 |
| Other assets & liabilities (%) | 4.41 | 0.00 |
| Yield (%) | 2.98 | 3.19 |
1. MSCI Golden Dragon Index.
The China Fund, Inc.
Distribution History (10 Year)
| Declaration Date | Ex-dividend Date | Record Date | Payable Date | Distribution/ Share | Income | Long-term Capital Gain | Short-term Capital Gain |
| 12/8/06 | 12/19/06 | 12/21/06 | 12/29/06 | $4.01170 | $0.29960 | $2.73090 | $0.98120 |
| 12/7/07 | 12/19/07 | 12/21/07 | 1/25/08 | $12.12000 | $0.28000 | $9.00000 | $2.84000 |
| 12/8/08 | 12/22/08 | 12/24/08 | 1/23/09 | $5.81740 | $0.48130 | $5.33610 | — |
| 12/9/09 | 12/22/09 | 12/24/09 | 12/29/09 | $0.25570 | $0.25570 | — | — |
| 12/8/10 | 12/21/10 | 12/24/10 | 12/29/10 | $2.27420 | $0.37460 | $1.89960 | — |
| 12/8/11 | 12/21/11 | 12/23/11 | 12/29/11 | $2.99640 | $0.17420 | $2.82220 | — |
| 12/10/12 | 12/20/12 | 12/24/12 | 12/28/12 | $3.25170 | $0.34730 | $2.90440 | — |
| 12/13/13 | 12/19/13 | 12/23/13 | 12/27/13 | $3.31400 | $0.43870 | $2.87530 | — |
| 12/8/14 | 12/18/14 | 12/22/14 | 1/5/15 | $3.76510 | $0.29820 | $3.46690 | — |
| 12/16/15 | 12/23/15 | 12/28/15 | 1/6/16 | $1.49580 | $0.21330 | $0.84620 | $0.43630 |
Distribution/Share includes Income, Long-term Capital gains and Short-term Capital gains.
The China Fund NAV Performance of $10,000 since inception
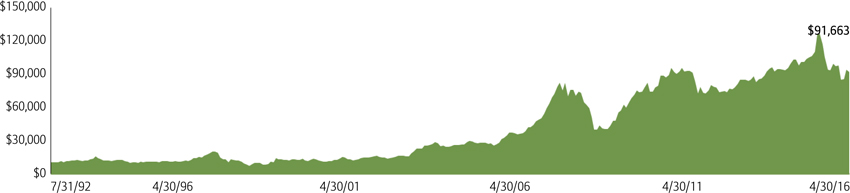
Past performance is not a guide to future returns.
Index Description
MSCI Golden Dragon Index
The MSCI Golden Dragon Index captures the equity market performance of large and mid cap China securities (H shares, B shares, Red-Chips and P-Chips) and non-domestic China securities listed in Hong Kong and Taiwan.
It is not possible to invest directly in an index.
The China Fund, Inc.
| Portfolio in Full | |||||
| Sector | Company (exchange ticker) | Market Price | Holding | Value US$ | % of net assets |
| Information Technology | 28.40 | ||||
| TAIWAN SEMICONDUCTOR MANUFACTURING CO LTD | 2330 | 150.00 | 4,461,000 | 20,746,907 | 7.90 |
| TENCENT HOLDINGS LTD | 700 | 158.90 | 757,500 | 15,516,578 | 5.91 |
| DELTA ELECTRONICS INC | 2308 | 150.00 | 1,680,359 | 7,814,896 | 2.98 |
| DIGITAL CHINA HOLDINGS LTD | 861 | 5.38 | 9,360,000 | 6,491,537 | 2.47 |
| ADVANTECH CO LTD | 2395 | 228.00 | 798,841 | 5,647,095 | 2.15 |
| ALIBABA GROUP HOLDING LTD | BABA | 76.94 | 60,998 | 4,693,186 | 1.79 |
| BAIDU INC | BIDU | 194.30 | 23,473 | 4,560,804 | 1.74 |
| SEMICONDUCTOR MANUFACTURING INTERNATIONAL CORP | 981 | 0.63 | 48,792,000 | 3,962,585 | 1.51 |
| LARGAN PRECISION CO LTD | 3008 | 2,270.00 | 41,000 | 2,885,623 | 1.10 |
| GOLDPAC GROUP LTD | 3315 | 3.13 | 5,521,000 | 2,227,673 | 0.85 |
| Financials | 24.40 | ||||
| CHINA OVERSEAS LAND & INVESTMENT LTD | 688 | 24.75 | 4,324,000 | 13,795,908 | 5.25 |
| HONG KONG EXCHANGES AND CLEARING LTD | 388 | 196.40 | 477,900 | 12,099,514 | 4.61 |
| CHINA MERCHANTS BANK CO LTD | 3968 | 17.08 | 4,731,500 | 10,417,803 | 3.97 |
| PING AN INSURANCE GROUP CO OF CHINA LTD | 2318 | 36.65 | 2,112,000 | 9,978,317 | 3.80 |
| SUN HUNG KAI PROPERTIES LTD | 16 | 98.05 | 688,000 | 8,696,118 | 3.31 |
| FUBON FINANCIAL HOLDING CO LTD | 2881 | 39.25 | 4,270,000 | 5,196,338 | 1.98 |
| CATHAY FINANCIAL HOLDING CO LTD | 2882 | 36.25 | 3,462,000 | 3,891,033 | 1.48 |
| Industrials | 17.09 | ||||
| CK HUTCHISON HOLDINGS LTD | 1 | 92.95 | 1,064,000 | 12,749,127 | 4.85 |
| ZHUZHOU CRRC TIMES ELECTRIC CO LTD | 3898 | 44.35 | 1,468,000 | 8,392,843 | 3.20 |
| CHINA EVERBRIGHT INTERNATIONAL LTD | 257 | 8.75 | 7,256,000 | 8,184,549 | 3.12 |
| BEIJING ENTERPRISES HOLDINGS LTD | 392 | 40.75 | 1,182,500 | 6,211,810 | 2.37 |
| CN STATE CONSTRUCTION INTERNATIONAL HOLDINGS LTD | 3311 | 12.10 | 2,110,000 | 3,291,222 | 1.25 |
| QINGDAO PORT INTERNATIONAL CO LTD | 6198 | 3.71 | 6,596,000 | 3,154,598 | 1.20 |
| ZHENGZHOU YUTONG BUS CO A | 600066 | 20.51 | 910,530 | 2,879,940 | 1.10 |
| Consumer Discretionary | 12.30 | ||||
| QINGLING MOTORS CO LTD | 1122 | 2.54 | 28,960,000 | 9,482,475 | 3.61 |
| LI & FUNG LTD | 494 | 4.81 | 9,798,000 | 6,075,359 | 2.31 |
| SANDS CHINA LTD | 1928 | 27.80 | 1,634,800 | 5,858,667 | 2.23 |
CITIGROUP GLOBAL MARKETS HOLD (exch. for CHINA CYTS TOURS HOLDIN) | N/A | 3.07 | 1,635,575 | 5,021,215 | 1.91 |
| MERIDA INDUSTRY CO LTD | 9914 | 132.50 | 805,000 | 3,307,057 | 1.26 |
CITIGROUP GLOBAL MARKETS HOLD (exch. for CHONG QING CHANGAN AUTO) | N/A | 2.47 | 558,897 | 1,380,476 | 0.53 |
| HSBC BANK PLC (exch. for CHONG QING CHANGAN AUTO) | N/A | 2.45 | 487,000 | 1,193,637 | 0.45 |
| Telecom Services | 4.95 | ||||
| CHINA MOBILE LTD | 941 | 88.95 | 801,000 | 9,184,761 | 3.50 |
| CHINA UNICOM HONG KONG LTD | 762 | 9.16 | 3,214,000 | 3,795,166 | 1.45 |
| Health Care | 3.42 | ||||
| CSPC PHARMACEUTICAL GROUP LTD | 1093 | 6.88 | 5,804,000 | 5,147,605 | 1.96 |
| 3SBIO INC | 1530 | 9.39 | 3,175,500 | 3,843,856 | 1.46 |
| Energy | 3.22 | ||||
| CNOOC LTD | 883 | 9.66 | 6,788,000 | 8,452,951 | 3.22 |
| Consumer Staples | 1.51 | ||||
| WANT WANT CHINA HOLDINGS LTD | 151 | 5.97 | 5,143,000 | 3,958,041 | 1.51 |
| Materials | 0.35 | ||||
| TIANGONG INTERNATIONAL CO LTD | 826 | 0.63 | 11,240,000 | 912,843 | 0.35 |
Source: State Street Bank and Trust Company, IDS GmbH - Analysis and Reporting Services, a subsidiary of Allianz SE.
The China Fund, Inc.
Important Information:
Holdings are subject to change daily. The Fund seeks to achieve its objective through investment in the equity securities of companies and other entities with significant assets, investments, production activities, trading or other business interests in China or which derive a significant part of their revenue from China. Investing in non-U.S. securities entails additional risks, including political and economic risk and the risk of currency fluctuations, as well as lower liquidity. These risks, which can result in greater price volatility, will generally be enhanced in less diversified funds that concentrate investments in a particular geographic region.
The information contained herein has been obtained from sources believed to be reliable but Allianz Global Investors U.S. LLC and its affiliates do not warrant the information to be accurate, complete or reliable. The opinions expressed herein are subject to change at any time and without notice. Past performance is not indicative of future results. This material is not intended as an offer or solicitation for the purchase or sale of any financial instrument. Investors should consider the investment objectives, risks, charges and expenses of any mutual fund carefully before investing. This and other information is contained in the fund's annual and semiannual reports, proxy statement and other fund information, which may be obtained by contacting your financial advisor or visiting the fund's website at www.chinafundinc.com. This information is unaudited and is intended for informational purposes only. It is presented only to provide information on the Fund's holdings, performance and strategies. The Fund is a closed-end exchange traded management investment company. This material is presented only to provide information and is not intended for trading purposes. Closed-end funds, unlike open-end funds, are not continuously offered. After the initial public offering by a closed-end fund, its shares can be purchased and sold on the open market through a stock exchange, where shares may trade at a premium or a discount. The market price of holdings is subject to change daily.
P/E is a ratio of security price to earnings per share. Typically, an undervalued security is characterized by a low P/E ratio, while an overvalued security is characterized by a high P/E ratio. P/B is a ratio of the current stock price to the book value. This is used to identify undervalued stocks. Dividend yield is the annual percentage of return earned by an investor on a common or preferred stock. The average dividend yield is the dividend rate divided by current share price.
©2016 Allianz Global Investors Distributors LLC.
| Investment Products: Not FDIC Insured | May Lose Value | Not Bank Guaranteed | FS-CHN-0416 |