
Data as of 5/31/17
Market Review
After taking a pause in April, Greater China equity markets resumed strong momentum in May with the MSCI Golden Dragon Index (the "benchmark") returning more than 4%. China saw the strongest returns, followed by Hong Kong and Taiwan. The rally in China was partially supported by easing concerns over a potential economic slowdown in the second half of 2017. Recent Caixin Manufacturing Purchasing Manager's Index ("PMI") readings appeared to suggest the slowdown would be milder than expected by most investors. In terms of sectors, strong performance was seen in technology, real estate, consumer discretionary and healthcare. In particular, China internet names and Taiwan based technology component names continued to perform well. Select names within Chinese real estate also enjoyed a nice rally, despite the regulatory tightening in China's real estate market. Conversely, the commodity rally seemed to have lost some steam with energy and materials stocks lagging the broader market.
Fund Review
The China Fund, Inc. (the "Fund") underperformed the benchmark in May. The Fund's main detractors came from stock selection in real estate, information technology and industrials. The top detractor over the month was Sun Hung Kai Properties Ltd. ("Sun Hung Kai Properties") one of the leading property developers and landlords in Hong Kong. Its share price reacted negatively to the Hong Kong government's new regulation on home mortgages, established in an effort to cool down the overheating property market. However, we see the impact as mild, and in fact, the share price began rebounding in the later part of May. Apart from Sun Hung Kai Properties, detractors in the real estate sector were mainly companies which we don't hold in the portfolio. In particular, we missed those companies that dominated sector performance, including The Evergrande Group, Sunac China Holdings Limited and Country Garden. We believe, in some cases, that stock performance outpaced improvements in physical markets. In the past, strong sales in lower tier cities have generally signaled the peak of the cycle. Therefore, we remain cautious and prefer high quality names with exposure in higher tier cities.
In contrast, our conviction holding within the financials sector was beneficial with China Merchants Bank Co., Ltd., which significantly outperformed other China state-owned banks. We believe that, with its strong retail banking business and asset management capabilities, it will benefit from the borrowing power of Chinese households. We expect that this holding will remain one of the top overweights within the portfolio.
Key Transactions
The Fund remained consistent over the month with limited transactions. We trimmed the weighting in Qingling Motors Co., Ltd. as the share price continued to outperform.
Outlook
Unlike previous cases where small-cap and mid-cap names outperformed in rising markets, the current rally of Greater China equities is dominated by large-cap stocks. For example, seven out of the top ten benchmark names outperformed the benchmark over the past year. This phenomenon continued in May when investors herded to the benchmark heavyweights with strong momentum and positive earnings announcements, especially in internet stocks. This market environment is particularly tough for active managers who focus on identifying underappreciated growth opportunities that are more commonly seen in the small-cap and mid-cap space. Currently, the Greater China small-cap and mid-cap stocks are trading at even lower valuations compared to their large-cap peers, which is almost unseen over the past five years. As a result, many of our existing positions remain ignored by investors though growth potential remains intact. We see catch up potential once the market mean reverses itself. Our experience tells us that such a recovery is generally more powerful than many expect, and these turnaround situations have repeatedly contributed to portfolio performance in the past.
| In Brief | |
| Fund Data | |
| Description | Seeks to achieve long-term capital appreciation through investments in China companies. |
| Listing Date (NYSE) | July 10, 1992 |
| Total Fund Assets (millions) | $316.4 |
| Median Market Cap (in billions) | $9.9 |
| Distribution Frequency | Annual |
| Management Firm | Allianz Global Investors U.S. LLC |
| Portfolio Management | Christina Chung, CFA, CMA Lead Portfolio Manager |
Performance (US$ Returns) (as of 5/31/17) | ||
| Fund | Benchmark1 | |
| One Month | 3.66% | 4.17% |
| Three Month | 6.62% | 9.29% |
| One Year | 24.99% | 30.34% |
| Three Year | 5.84% | 8.21% |
| Net Asset Value / Market Price | |
| Net Asset Value (NAV) / Market Price at Inception | $13.15 / $14.26 |
| NAV / Market Price (as of 5/31/17) | $20.12 / $18.04 |
| High / Low Ranges (52-Week) | |
| High / Low NAV | $20.29 / $16.15 |
| High / Low Market Price | $18.17 / $13.76 |
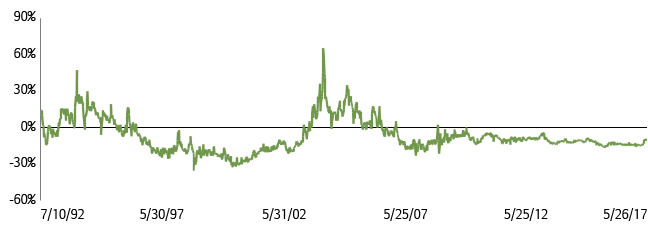
| Premium/Discount to NAV (as of 5/31/17) | -10.34% |
| Fund Data (Common Shares) | |
| Shares Outstanding | 15,722,675 |
| Average Daily Volume | 28,110 |
| Expense Ratio | 1.53% |
Fund Manager

Christina Chung, CFA, CMA
Lead Portfolio Manager
| 1. | MSCI Golden Dragon Index. |

The China Fund, Inc.
Proposed Manager Change
On March 31, 2017, the Fund announced that its Board of Directors had selected Open Door Investment Management, Ltd. ("Open Door") to become its Investment Manager, subject to stockholder approval at a Special Meeting of Stockholders expected to be held in June. Open Door, with offices in Shanghai and San Francisco, is expected to provide the Fund with a Greater China investment strategy that focuses more on smaller capitalization and entrepreneurial companies than do most other investment funds investing in the Greater China markets. Open Door believes that this strategy will differentiate the Fund from other closed-end funds and exchange-traded funds, with index-anchored, large-capitalization approaches to investing in Greater China.
Investment Objective
The investment objective of the Fund is to achieve long-term capital appreciation. The Fund seeks to achieve its objective through investment in the equity securities of companies and other entities with significant assets, investments, production activities, trading or other business interests in China or which derive a significant part of their revenue from China.
The Fund has an operating policy that the Fund will invest at least 80% of its assets in China companies. For this purpose, 'China companies' are (i) companies for which the principal securities trading market is in China; (ii) companies for which the principal securities trading market is outside of China or in companies organized outside of China, that in both cases derive at least 50% of their revenues from goods or services sold or produced, or have at least 50% of their assets in China; or (iii) companies organized in China. Under the policy, China means the People's Republic of China, including Hong Kong, and Taiwan. The Fund will provide its stockholders with at least 60 days' prior notice of any change to this policy.
Returns For Periods Ended May 31, 2017* | ||||||||
| 1 Month | 3 Month | YTD | 1 Year | 3 Year | 5 Year | 10 Year | Inception | |
| NAV | 3.66% | 6.62% | 15.57% | 24.99% | 5.84% | 9.12% | 6.76% | 10.24% |
| Market Price | 2.56% | 11.70% | 19.87% | 29.47% | 6.36% | 8.83% | 7.62% | 9.41% |
| MSCI Golden Dragon Index | 4.17% | 9.29% | 20.50% | 30.34% | 8.21% | 10.34% | 5.70% | — |
| Calendar Year Returns | ||||||||
| 2009 | 2010 | 2011 | 2012 | 2013 | 2014 | 2015 | 2016 | |
| NAV | 72.83% | 27.26% | -24.37% | 12.12% | 18.31% | 7.82% | -5.50% | 0.59% |
| Market Price | 72.19% | 23.60% | -27.51% | 20.52% | 12.70% | 5.29% | -6.38% | -0.47% |
| MSCI Golden Dragon Index | 67.12% | 13.60% | -18.35% | 22.65% | 7.25% | 8.06% | -7.12% | 5.75% |
Past performance is not a guide to future returns.
| * | Annualized for periods greater than one year. |
Source: State Street Bank and Trust Company. Source for index data: MSCI as at May 31, 2017. Investment returns are historical and do not guarantee future results. Investment returns reflect changes in net asset value and market price per share during each period and assumes that dividends and capital gains distributions, if any, were reinvested. The net asset value (NAV) percentages are not an indication of the performance of a shareholder's investment in the Fund, which is based on market price. NAV performance includes the deduction of management fees and other expenses. Market price performance does not include the deduction of brokerage commissions and other expenses of trading shares and would be lower had such commissions and expenses been deducted. It is not possible to invest directly in an index.
Premium/Discount
| Sector Allocation | ||
| Fund | Benchmark1 | |
| Information Technology | 39.51% | 34.59% |
| Financials | 19.45% | 24.23% |
| Industrials | 10.37% | 6.28% |
| Telecom Services | 9.18% | 5.02% |
| Real Estate | 6.73% | 7.87% |
| Consumer Discretionary | 6.01% | 8.82% |
| Energy | 2.38% | 3.23% |
| Consumer Staples | 1.59% | 2.08% |
| Utilities | 1.16% | 3.77% |
| Health Care | 1.12% | 1.29% |
| Materials | 0.23% | 2.80% |
| Other assets & | 2.27% | 0.00% |
Source: IDS GmbH - Analysis and Reporting Services, a subsidiary of Allianz SE.
| Country Allocation | ||
| Fund | Benchmark1 | |
| China | 72.93% | 75.70% |
| Hong Kong Red Chips | 26.19% | 9.01% |
| Hong Kong 'H' shares | 16.03% | 19.82% |
| Equity linked securities ('A' shares) | 0.79% | 0.00% |
| China 'A' & 'B' shares | 0.00% | 0.11% |
| Other Hong Kong securities | 29.92% | 31.74% |
| Others | 0.00% | 15.02% |
| Taiwan | 24.80% | 24.30% |
| Other assets & liabilities | 2.27% | 0.00% |
| Top 10 Holdings | |
| TAIWAN SEMIC CO LTD (Taiwan) | 9.26% |
| TENCENT HOLDINGS LTD (China) | 8.26% |
| ALIBABA GROUP HOLDING LTD (China) | 5.52% |
| CHINA MERCHANTS BANK CO LTD (China) | 5.43% |
| SUN HUNG KAI PROPERTIES LTD (H.K.) | 5.29% |
| PING AN INSURANCE (China) | 3.87% |
| CHINA UNICOM HONG KONG LTD (China) | 3.38% |
| HK EXCHANGES & CLEARING LTD (H.K.) | 3.35% |
| CHINA CONSTRUCTION BANK CORP (China) | 2.82% |
| HON HAI PRECISION INDU (Taiwan) | 2.75% |
| Portfolio Characteristics | ||
| Fund | Benchmark1 | |
| P/E Ratio | 14.84 | 14.11 |
| P/B Ratio | 1.69 | 1.61 |
| Issues in Portfolio | 47 | 285 |
| Foreign Holdings (%) | 97.73 | 100.00 |
| Other assets & liabilities (%) | 2.27 | 0.00 |
| Yield (%) | 2.42 | 2.52 |
Source: IDS GmbH - Analysis and Reporting Services, a subsidiary of Allianz SE.
| 1. | MSCI Golden Dragon Index. |
The China Fund, Inc.
Distribution History (10 Year)
| Declaration Date | Ex-dividend Date | Record Date | Payable Date | Distribution/ Share | Income | Long-term Capital Gain | Short-term Capital Gain |
| 12/7/07 | 12/19/07 | 12/21/07 | 1/25/08 | $12.12000 | $0.28000 | $9.00000 | $2.84000 |
| 12/8/08 | 12/22/08 | 12/24/08 | 1/23/09 | $5.81740 | $0.48130 | $5.33610 | — |
| 12/9/09 | 12/22/09 | 12/24/09 | 12/29/09 | $0.25570 | $0.25570 | — | — |
| 12/8/10 | 12/21/10 | 12/24/10 | 12/29/10 | $2.27420 | $0.37460 | $1.89960 | — |
| 12/8/11 | 12/21/11 | 12/23/11 | 12/29/11 | $2.99640 | $0.17420 | $2.82220 | — |
| 12/10/12 | 12/20/12 | 12/24/12 | 12/28/12 | $3.25170 | $0.34730 | $2.90440 | — |
| 12/13/13 | 12/19/13 | 12/23/13 | 12/27/13 | $3.31400 | $0.43870 | $2.87530 | — |
| 12/8/14 | 12/18/14 | 12/22/14 | 1/5/15 | $3.76510 | $0.29820 | $3.46690 | — |
| 12/16/15 | 12/23/15 | 12/28/15 | 1/6/16 | $1.49580 | $0.21330 | $0.84620 | $0.43630 |
| 12/9/16 | 12/19/16 | 12/21/16 | 1/5/17 | $0.46780 | $0.46780 | — | — |
Distribution/Share includes Income, Long-term Capital gains and Short-term Capital gains.
The China Fund NAV Performance of $10,000 since inception
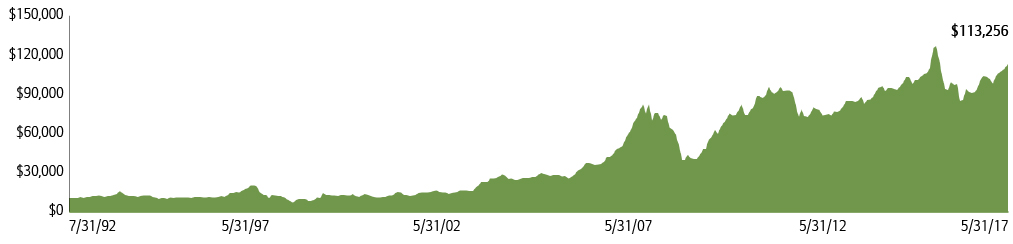
Past performance is not a guide to future returns.
Index Description
MSCI Golden Dragon Index
The MSCI Golden Dragon Index captures the equity market performance of large and mid cap China securities (H shares, B shares, Red-Chips and P-Chips) and non-domestic China securities listed in Hong Kong and Taiwan.
It is not possible to invest directly in an index.
The China Fund, Inc.
Portfolio in Full
| Sector | Company (exchange ticker) | Market Price | Holding | Value US$ | % of net assets |
| Information Technology | 39.51 | ||||
| TAIWAN SEMICONDUCTOR MANUFACTURING CO LTD | 2330 | 203.00 | 4,341,000 | 29,296,951 | 9.26 |
| TENCENT HOLDINGS LTD | 700 | 267.60 | 760,900 | 26,127,166 | 8.26 |
| ALIBABA GROUP HOLDING LTD | BABA | 122.46 | 142,647 | 17,468,552 | 5.52 |
| HON HAI PRECISION INDUSTRY CO LTD | 2317 | 103.00 | 2,537,100 | 8,687,832 | 2.75 |
| LARGAN PRECISION CO LTD | 3008 | 4,750.00 | 54,000 | 8,527,544 | 2.70 |
| DELTA ELECTRONICS INC | 2308 | 166.00 | 1,274,359 | 7,032,933 | 2.22 |
| DIGITAL CHINA HOLDINGS LTD | 861 | 6.12 | 7,444,000 | 5,845,698 | 1.85 |
| ADVANTECH CO LTD | 2395 | 244.00 | 703,841 | 5,709,538 | 1.80 |
| BAIDU INC | BIDU | 186.10 | 24,101 | 4,485,196 | 1.42 |
| PRIMAX ELECTRONICS LTD | 4915 | 58.50 | 1,985,000 | 3,860,584 | 1.22 |
| YY INC | YY | 58.34 | 62,990 | 3,674,837 | 1.16 |
| SEMICONDUCTOR MANUFACTURING INTERNATIONAL CORP | 981 | 8.21 | 2,470,900 | 2,603,017 | 0.82 |
| GOLDPAC GROUP LTD | 3315 | 2.58 | 5,021,000 | 1,662,220 | 0.53 |
| Financials | 19.45 | ||||
| CHINA MERCHANTS BANK CO LTD | 3968 | 23.40 | 5,723,500 | 17,185,262 | 5.43 |
| PING AN INSURANCE GROUP CO OF CHINA LTD | 2318 | 49.95 | 1,911,000 | 12,248,271 | 3.87 |
| HONG KONG EXCHANGES & CLEARING LTD | 388 | 196.70 | 419,700 | 10,593,072 | 3.35 |
| CHINA CONSTRUCTION BANK CORP | 939 | 6.44 | 10,814,000 | 8,936,158 | 2.82 |
| CATHAY FINANCIAL HOLDING CO LTD | 2882 | 47.10 | 2,880,000 | 4,509,724 | 1.43 |
| FUBON FINANCIAL HOLDING CO LTD | 2881 | 45.85 | 2,805,000 | 4,275,716 | 1.35 |
| CITIC SECURITIES CO LTD | 6030 | 16.34 | 1,810,000 | 3,794,978 | 1.20 |
| Industrials | 10.37 | ||||
| CHINA EVERBRIGHT INTERNATIONAL LTD | 257 | 9.95 | 5,616,000 | 7,170,159 | 2.27 |
| CN STATE CONSTRUCTION INTERNATIONAL HOLDINGS LTD | 3311 | 13.52 | 2,906,000 | 5,041,397 | 1.59 |
| CK HUTCHISON HOLDINGS LTD | 1 | 101.60 | 310,000 | 4,041,420 | 1.28 |
| KING SLIDE WORKS CO LTD | 2059 | 446.00 | 239,000 | 3,543,801 | 1.12 |
| QINGDAO PORT INTERNATIONAL CO LTD | 6198 | 4.39 | 6,077,000 | 3,423,201 | 1.08 |
| BEIJING ENTERPRISES HOLDINGS LTD | 392 | 36.95 | 704,500 | 3,340,212 | 1.06 |
| JARDINE MATHESON HOLDINGS LTD | J36 | 63.89 | 51,100 | 3,264,779 | 1.03 |
| ZHUZHOU CRRC TIMES ELECTRIC CO LTD | 3898 | 41.15 | 565,500 | 2,985,940 | 0.94 |
| Telecom Services | 9.19 | ||||
| CHINA UNICOM HONG KONG LTD | 762 | 11.18 | 7,466,000 | 10,710,467 | 3.38 |
| CHINA MOBILE LTD | 941 | 86.45 | 709,000 | 7,864,839 | 2.49 |
| PCCW LTD | 8 | 4.54 | 8,623,000 | 5,023,343 | 1.59 |
| CHUNGHWA TELECOM CO LTD | 2412 | 107.50 | 846,000 | 3,023,538 | 0.96 |
| HUTCHISON TELECOMMUNICATIONS HK HOLDINGS LTD | 215 | 2.37 | 7,974,000 | 2,424,952 | 0.77 |
| Real Estate | 6.73 | ||||
| SUN HUNG KAI PROPERTIES LTD | 16 | 115.30 | 1,132,000 | 16,747,668 | 5.29 |
| CHINA OVERSEAS LAND & INVESTMENT LTD | 688 | 23.40 | 1,516,000 | 4,551,910 | 1.44 |
| Consumer Discretionary | 6.02 | ||||
| JD.com | JD | 40.03 | 159,569 | 6,387,547 | 2.02 |
| QINGLING MOTORS CO LTD | 1122 | 2.69 | 14,816,000 | 5,114,013 | 1.62 |
| SANDS CHINA LTD | 1928 | 35.95 | 810,800 | 3,740,169 | 1.18 |
| CITIGROUP GLOBAL MARKETS HOLD (exch. for CHINA CYTS TOURS HOLDIN) | N/A | 2.80 | 888,827 | 2,487,569 | 0.79 |
| LI & FUNG LTD | 494 | 3.21 | 3,128,000 | 1,288,399 | 0.41 |
| Energy | 2.38 | ||||
| CNOOC LTD | 883 | 8.90 | 4,815,000 | 5,498,762 | 1.74 |
| CHINA OILFIELD SERVICES LTD | 2883 | 6.75 | 2,338,000 | 2,025,009 | 0.64 |
| Consumer Staples | 1.59 | ||||
| CHINA MENGNIU DAIRY CO LTD | 2319 | 15.76 | 1,508,000 | 3,049,553 | 0.96 |
| VINDA INTERNATIONAL HOLDINGS LTD | 3331 | 15.80 | 984,000 | 1,994,944 | 0.63 |
The China Fund, Inc.
Portfolio in Full
| Sector | Company (exchange ticker) | Market Price | Holding | Value US$ | % of net assets |
| Utilities | 1.16 | ||||
| CHINA RESOURCES POWER HOLDINGS CO LTD | 836 | 16.08 | 1,778,000 | 3,668,567 | 1.16 |
| Health Care | 1.12 | ||||
| CSPC PHARMACEUTICAL GROUP LTD | 1093 | 11.66 | 2,364,000 | 3,536,915 | 1.12 |
| Materials | 0.23 | ||||
| TIANGONG INTERNATIONAL CO LTD | 826 | 0.66 | 8,612,000 | 729,334 | 0.23 |
Source: State Street Bank and Trust Company, IDS GmbH - Analysis and Reporting Services, a subsidiary of Allianz SE.
Important Information:
Holdings are subject to change daily. The Fund seeks to achieve its objective through investment in the equity securities of companies and other entities with significant assets, investments, production activities, trading or other business interests in China or which derive a significant part of their revenue from China. Investing in non-U.S. securities entails additional risks, including political and economic risk and the risk of currency fluctuations, as well as lower liquidity. These risks, which can result in greater price volatility, will generally be enhanced in less diversified funds that concentrate investments in a particular geographic region.
The information contained herein has been obtained from sources believed to be reliable but Allianz Global Investors U.S. LLC and its affiliates do not warrant the information to be accurate, complete or reliable. The opinions expressed herein are subject to change at any time and without notice. Past performance is not indicative of future results. This material is not intended as an offer or solicitation for the purchase or sale of any financial instrument. Investors should consider the investment objectives, risks, charges and expenses of any mutual fund carefully before investing. This and other information is contained in the Fund's annual and semiannual reports, proxy statement and other Fund information, which may be obtained by contacting your financial advisor or visiting the Fund's website at www.chinafundinc.com. This information is unaudited and is intended for informational purposes only. It is presented only to provide information on the Fund's holdings, performance and strategies. The Fund is a closed-end exchange traded management investment company. This material is presented only to provide information and is not intended for trading purposes. Closed-end funds, unlike open-end funds, are not continuously offered. After the initial public offering by a closed-end fund, its shares can be purchased and sold on the open market through a stock exchange, where shares may trade at a premium or a discount. The market price of holdings is subject to change daily.
P/E is a ratio of security price to earnings per share. Typically, an undervalued security is characterized by a low P/E ratio, while an overvalued security is characterized by a high P/E ratio. P/B is a ratio of the current stock price to the book value. This is used to identify undervalued stocks. Dividend yield is the annual percentage of return earned by an investor on a common or preferred stock. The average dividend yield is the dividend rate divided by current share price.
| ©2017 Allianz Global Investors Distributors LLC. | |
| Investment Products: Not FDIC Insured | May Lose Value | Not Bank Guaranteed | FS-CHN-0517 |