
Data as of 9/30/17
Manager's Commentary
Market Review
In September, Greater China equities were slightly lower with gains in China being offset by a weaker market in Taiwan. The weakness in Taiwan came mainly from the technology sector. In particular, the delay in the rollout of new iPhone models, and potentially lower-than-expected demand for the iPhone 8, caused some sell-off in smartphone component makers. Generally, we saw some profit taking across the markets in the second half of the month, with the real estate sector in China selling off after the imposition of new measures designed to curb rapid price increases in residential properties. Broader concerns about slowing economic activity also impacted the financials sector, although these were somewhat alleviated after month-end by a cut by The Peoples' Bank of China ("PBoC") in the Reserve Ratio Requirement ("RRR"), a central bank regulation employed by most, but not all, of the world's central banks, that sets the minimum amount of reserves that must be held by a commercial bank.
Fund Review
The China Fund, Inc. (the "Fund") slightly lagged its benchmark in September. At the stock level, China Merchants Bank Co. Ltd was the top detractor. The stock is our preferred name in the Chinese banking sector, due to its focus on retail banking and strong management with a proven track record. There were no company announcements during the month and we believe the weakness in September was due to profit taking after a very strong rally. Post month-end, the stock rebounded sharply following the announcement of the RRR cut.
On the other hand, we saw positive contributions from the technology sector. Taiwan-listed Globalwafers Co. Ltd, a maker of silicon wafers for semiconductors and Hong Kong-listed ASM Pacific Technology Ltd, also in the semiconductor value chain, were both resilient in the technology sell-off.
Outlook
We believe that, the profit taking in Greater China equity markets in the second half of September was a healthy event, given the very strong rally that has occurred year-to-date. The pre-emptive action by regulators to tighten controls in the property market is also to be welcomed. This policy should be seen alongside others - such as the clampdown on bitcoin exchanges and peer-to-peer lending - as an effort to build greater macro and market stability. The upcoming National Party Congress will now come into focus. Specific policy announcements are unlikely, but commentators will be watching closely for signals of commitment to much-needed reform.
We believe that in the short-term, the announcement of the RRR cut targeted at stimulating credit support for smaller- and micro-sized companies will be modestly positive and select banks will benefit from improved margins. We also believe this signals that authorities are prepared to take action to mitigate any economic deceleration as we head into 2018.
In terms of the portfolio, the Fund's key positioning remains in place. We continue to have significant exposure to the technology sector across a range of companies that we believe have sustainable growth potential, either because of the industry dynamics or because of their specialist product positioning. In recent months we have reduced exposure to telecommunication stocks, where we increasingly believe that high ongoing levels of capital expenditure will dampen the earnings outlook. At the same time, we have increased allocations to other areas with better growth momentum, such as consumer-related stocks.
| In Brief | |
| Fund Data | |
| Description | Seeks to achieve long-term capital appreciation through investments in China companies. |
| Listing Date (NYSE) | July 10, 1992 |
| Total Fund Assets (millions) | $349.1 |
| Median Market Cap (in billions) | $11.0 |
| Distribution Frequency | Annual |
| Management Firm | Allianz Global Investors U.S. LLC |
| Portfolio Management | Christina Chung, CFA, CMA Lead Portfolio Manager |
Performance (US$ Returns) (as of 9/30/17) | ||
| Fund | Benchmark1 | |
| One Month | -0.85% | -0.24% |
| Three Month | 7.98% | 9.53% |
| One Year | 20.10% | 26.75% |
| Three Year | 8.65% | 11.61% |
| Net Asset Value / Market Price | |
| Net Asset Value (NAV) / Market Price at Inception | $13.15 / $14.26 |
| NAV / Market Price (as of 9/30/17) | $22.20 / $20.35 |
| High / Low Ranges (52-Week) | |
| High / Low NAV | $22.88 / $17.00 |
| High / Low Market Price | $20.99 / $14.53 |
| Premium/Discount to NAV (as of 9/30/17) | -8.33% |
| Fund Data (Common Shares) | |
| Shares Outstanding | 15,722,675 |
| Average Daily Volume | 27,043 |
| Expense Ratio | 1.53% |
Fund Manager

Christina Chung, CFA, CMA
Lead Portfolio Manager
| 1. | MSCI Golden Dragon Index. |

The China Fund, Inc.
Investment Objective
The investment objective of the Fund is to achieve long-term capital appreciation. The Fund seeks to achieve its objective through investment in the equity securities of companies and other entities with significant assets, investments, production activities, trading or other business interests in China or which derive a significant part of their revenue from China.
The Fund has an operating policy that the Fund will invest at least 80% of its assets in China companies. For this purpose, 'China companies' are (i) companies for which the principal securities trading market is in China; (ii) companies for which the principal securities trading market is outside of China or in companies organized outside of China, that in both cases derive at least 50% of their revenues from goods or services sold or produced, or have at least 50% of their assets in China; or (iii) companies organized in China. Under the policy, China means the People's Republic of China, including Hong Kong, and Taiwan. The Fund will provide its stockholders with at least 60 days' prior notice of any change to this policy.
| Returns For Periods Ended September 30, 2017* | ||||||||
| 1 Month | 3 Month | YTD | 1 Year | 3 Year | 5 Year | 10 Year | Inception | |
| NAV | -0.85% | 7.98% | 27.51% | 20.10% | 8.65% | 10.35% | 4.81% | 10.54% |
| Market Price | -1.55% | 8.94% | 35.22% | 27.03% | 9.86% | 10.64% | 5.58% | 9.80% |
| MSCI Golden Dragon Index | -0.24% | 9.53% | 35.26% | 26.75% | 11.61% | 10.66% | 3.77% | — |
| Calendar Year Returns | ||||||||
| 2009 | 2010 | 2011 | 2012 | 2013 | 2014 | 2015 | 2016 | |
| NAV | 72.83% | 27.26% | -24.37% | 12.12% | 18.31% | 7.82% | -5.51% | 0.60% |
| Market Price | 72.19% | 23.60% | -27.51% | 20.52% | 12.70% | 5.29% | -6.38% | -0.47% |
| MSCI Golden Dragon Index | 67.12% | 13.60% | -18.35% | 22.65% | 7.25% | 8.06% | -7.12% | 5.75% |
Past performance is not a guide to future returns.
| * | Annualized for periods greater than one year. |
Source: State Street Bank and Trust Company. Source for index data: MSCI as at September 30, 2017. Investment returns are historical and do not guarantee future results. Investment returns reflect changes in net asset value and market price per share during each period and assumes that dividends and capital gains distributions, if any, were reinvested. The net asset value (NAV) percentages are not an indication of the performance of a shareholder's investment in the Fund, which is based on market price. NAV performance includes the deduction of management fees and other expenses. Market price performance does not include the deduction of brokerage commissions and other expenses of trading shares and would be lower had such commissions and expenses been deducted. It is not possible to invest directly in an index.
Premium/Discount

| Sector Allocation | ||
| Fund | Benchmark1 | |
| Information Technology | 43.85% | 37.61% |
| Financials | 20.62% | 22.90% |
| Consumer Discretionary | 7.52% | 8.92% |
| Industrials | 7.28% | 5.78% |
| Real Estate | 6.68% | 8.09% |
| Telecom Services | 5.17% | 4.27% |
| Energy | 2.51% | 2.96% |
| Consumer Staples | 1.74% | 2.10% |
| Health Care | 1.13% | 1.17% |
| Utilities | 0.92% | 3.47% |
| Materials | 0.28% | 2.73% |
| Other assets & liabilities | 2.28% | 0.00% |
Source: IDS GmbH - Analysis and Reporting Services, a subsidiary of Allianz SE.
| Country Allocation | ||
| Fund | Benchmark1 | |
| China | 74.37% | 77.42% |
| Hong Kong Red Chips | 19.51% | 8.36% |
| Hong Kong 'H' shares | 18.29% | 18.73% |
| Equity linked securities ('A' shares) | 0.00% | 0.00% |
| China 'A' & 'B' shares | 0.00% | 0.10% |
| Other Hong Kong securities | 36.57% | 33.17% |
| Others | 0.00% | 17.07% |
| Taiwan | 22.35% | 22.58% |
| United States | 1.00% | 0.00% |
| Other assets & liabilities | 2.28% | 0.00% |
| Top 10 Holdings | |
| TENCENT HOLDINGS LTD (China) | 9.64% |
| ALIBABA GROUP HOLDING LTD (China) | 9.14% |
| TAIWAN SEMIC CO LTD (Taiwan) | 8.88% |
| CHINA CONSTRUCTION BANK CORP (China) | 5.68% |
| SUN HUNG KAI PROPERTIES LTD (H.K.) | 5.27% |
| CHINA MERCHANTS BANK CO LTD (China) | 4.77% |
| PING AN INSURANCE (China) | 4.20% |
| LARGAN PRECISION CO LTD (Taiwan) | 2.72% |
| HK EXCHANGES & CLEARING LTD (H.K.) | 2.27% |
| CHINA EVERBRIGHT INTL (China) | 2.21% |
| Portfolio Characteristics | ||
| Fund | Benchmark¹ | |
| P/E Ratio | 15.66 | 14.96 |
| P/B Ratio | 1.84 | 1.68 |
| Issues in Portfolio | 47 | 283 |
| Foreign Holdings (%) | 97.72 | 100.00 |
| Other assets & liabilities (%) | 2.28 | 0.00 |
| Yield (%) | 2.31 | 2.36 |
Source: IDS GmbH - Analysis and Reporting Services, a subsidiary of Allianz SE
| 1. | MSCI Golden Dragon Index. |
The China Fund, Inc.
Distribution History (10 Year)
| Declaration Date | Ex-dividend Date | Record Date | Payable Date | Distribution/ Share | Income | Long-term Capital Gain | Short-term Capital Gain |
| 12/7/07 | 12/19/07 | 12/21/07 | 1/25/08 | $12.12000 | $0.28000 | $9.00000 | $2.84000 |
| 12/8/08 | 12/22/08 | 12/24/08 | 1/23/09 | $5.81740 | $0.48130 | $5.33610 | — |
| 12/9/09 | 12/22/09 | 12/24/09 | 12/29/09 | $0.25570 | $0.25570 | — | — |
| 12/8/10 | 12/21/10 | 12/24/10 | 12/29/10 | $2.27420 | $0.37460 | $1.89960 | — |
| 12/8/11 | 12/21/11 | 12/23/11 | 12/29/11 | $2.99640 | $0.17420 | $2.82220 | — |
| 12/10/12 | 12/20/12 | 12/24/12 | 12/28/12 | $3.25170 | $0.34730 | $2.90440 | — |
| 12/13/13 | 12/19/13 | 12/23/13 | 12/27/13 | $3.31400 | $0.43870 | $2.87530 | — |
| 12/8/14 | 12/18/14 | 12/22/14 | 1/5/15 | $3.76510 | $0.29820 | $3.46690 | — |
| 12/16/15 | 12/23/15 | 12/28/15 | 1/6/16 | $1.49580 | $0.21330 | $0.84620 | $0.43630 |
| 12/9/16 | 12/19/16 | 12/21/16 | 1/5/17 | $0.46780 | $0.46780 | — | — |
Distribution/Share includes Income, Long-term Capital gains and Short-term Capital gains.
The China Fund NAV Performance of $10,000 since inception
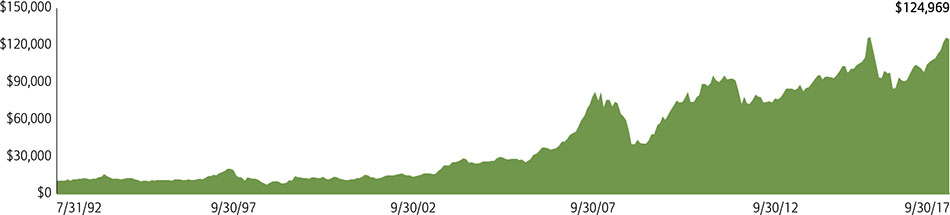
Past performance is not a guide to future returns.
Index Description
MSCI Golden Dragon Index
The MSCI Golden Dragon Index captures the equity market performance of large and mid cap China securities (H shares, B shares, Red-Chips and P-Chips) and non-domestic China securities listed in Hong Kong and Taiwan.
It is not possible to invest directly in an index.
The China Fund, Inc.
Portfolio in Full
| Sector | Company (exchange ticker) | Market Price | Holding | Value US$ | % of net assets |
| Information Technology | 43.86 | ||||
| TENCENT HOLDINGS LTD | 700 | 336.20 | 781,600 | 33,640,660 | 9.64 |
| ALIBABA GROUP HOLDING LTD | BABA | 172.71 | 184,832 | 31,922,335 | 9.14 |
| TAIWAN SEMICONDUCTOR MANUFACTURING CO LTD | 2330 | 216.50 | 4,341,000 | 30,992,827 | 8.88 |
| LARGAN PRECISION CO LTD | 3008 | 5,330.00 | 54,000 | 9,491,492 | 2.72 |
| HON HAI PRECISION INDUSTRY CO LTD | 2317 | 105.00 | 2,054,100 | 7,112,535 | 2.04 |
| BAIDU INC | BIDU | 247.69 | 24,101 | 5,969,577 | 1.71 |
| DIGITAL CHINA HOLDINGS LTD | 861 | 4.40 | 9,305,000 | 5,241,448 | 1.50 |
| ASM PACIFIC TECHNOLOGY LTD | 522 | 112.50 | 351,200 | 5,058,122 | 1.45 |
| PRIMAX ELECTRONICS LTD | 4915 | 75.00 | 1,779,000 | 4,399,980 | 1.26 |
| MEDIATEK INC | 2454 | 284.50 | 456,000 | 4,278,195 | 1.23 |
| GLOBALWAFERS CO LTD | 6488 | 296.00 | 403,000 | 3,933,782 | 1.13 |
| DELTA ELECTRONICS INC | 2308 | 156.00 | 676,359 | 3,479,488 | 1.00 |
| ADVANTECH CO LTD | 2395 | 216.00 | 442,199 | 3,149,815 | 0.90 |
| SEMICONDUCTOR MANUFACTURING INTERNATIONAL CORP | 981 | 8.82 | 2,470,900 | 2,790,012 | 0.80 |
| GOLDPAC GROUP LTD | 3315 | 2.55 | 4,970,000 | 1,622,478 | 0.46 |
| Financials | 20.62 | ||||
| CHINA CONSTRUCTION BANK CORP | 939 | 6.48 | 23,898,000 | 19,825,256 | 5.68 |
| CHINA MERCHANTS BANK CO LTD | 3968 | 27.45 | 4,737,000 | 16,646,693 | 4.77 |
| PING AN INSURANCE GROUP CO OF CHINA LTD | 2318 | 59.95 | 1,911,000 | 14,666,690 | 4.20 |
| HONG KONG EXCHANGES & CLEARING LTD | 388 | 210.00 | 294,300 | 7,912,101 | 2.27 |
| CATHAY FINANCIAL HOLDING CO LTD | 2882 | 48.20 | 2,880,000 | 4,577,760 | 1.31 |
| FUBON FINANCIAL HOLDING CO LTD | 2881 | 47.30 | 2,805,000 | 4,375,297 | 1.25 |
| CITIC SECURITIES CO LTD | 6030 | 17.18 | 1,810,000 | 3,980,925 | 1.14 |
| Consumer Discretionary | 7.53 | ||||
| JD.COM INC ADR | JD | 38.20 | 198,940 | 7,599,508 | 2.18 |
| QINGLING MOTORS CO LTD | 1122 | 2.55 | 14,816,000 | 4,836,747 | 1.39 |
| SAIC MOTOR CORP LTD A | 600104 | 30.20 | 999,407 | 4,543,580 | 1.30 |
| SANDS CHINA LTD | 1928 | 40.65 | 810,800 | 4,219,457 | 1.21 |
| NEW ORIENTAL EDUCATION & TECHNOLOGY GROUP | EDU | 88.26 | 39,421 | 3,479,297 | 1.00 |
| LI & FUNG LTD | 494 | 3.92 | 3,128,000 | 1,569,766 | 0.45 |
| Industrials | 7.28 | ||||
| CHINA EVERBRIGHT INTERNATIONAL LTD | 257 | 9.80 | 6,146,000 | 7,710,825 | 2.21 |
| CN STATE CONSTRUCTION INTERNATIONAL HOLDINGS LTD | 3311 | 11.38 | 2,906,000 | 4,233,700 | 1.21 |
| QINGDAO PORT INTERNATIONAL CO LTD | 6198 | 5.00 | 6,077,000 | 3,889,927 | 1.11 |
| BEIJING ENTERPRISES HOLDINGS LTD | 392 | 42.00 | 653,500 | 3,513,801 | 1.01 |
| KING SLIDE WORKS CO LTD | 2059 | 413.00 | 239,000 | 3,255,078 | 0.93 |
| ZHUZHOU CRRC TIMES ELECTRIC CO LTD | 3898 | 43.75 | 505,300 | 2,830,151 | 0.81 |
| Real Estate | 6.68 | ||||
| SUN HUNG KAI PROPERTIES LTD | 16 | 126.90 | 1,132,000 | 18,390,363 | 5.27 |
| CHINA OVERSEAS LAND & INVESTMENT LTD | 688 | 25.40 | 1,516,000 | 4,929,639 | 1.41 |
| Telecom Services | 5.18 | ||||
| CHINA UNICOM HONG KONG LTD | 762 | 10.86 | 4,162,000 | 5,786,476 | 1.66 |
| CHINA MOBILE LTD | 941 | 79.15 | 462,500 | 4,686,460 | 1.34 |
| PCCW LTD | 8 | 4.23 | 8,623,000 | 4,669,614 | 1.34 |
| CHUNGHWA TELECOM CO LTD | 2412 | 104.50 | 846,000 | 2,915,414 | 0.84 |
| Energy | 2.52 | ||||
| CHINA OILFIELD SERVICES LTD | 2883 | 7.15 | 5,860,000 | 5,363,965 | 1.54 |
| CHINA PETROLEUM & CHEMICAL CORP | 386 | 5.85 | 4,552,000 | 3,409,105 | 0.98 |
| Consumer Staples | 1.74 | ||||
| CHINA MENGNIU DAIRY CO LTD | 2319 | 21.85 | 1,508,000 | 4,218,276 | 1.21 |
| VINDA INTERNATIONAL HOLDINGS LTD | 3331 | 14.68 | 984,000 | 1,849,283 | 0.53 |
The China Fund, Inc.
Portfolio in Full
| Sector | Company (exchange ticker) | Market Price | Holding | Value US$ | % of net assets |
| Health Care | 1.13 | ||||
| CSPC PHARMACEUTICAL GROUP LTD | 1093 | 13.08 | 2,364,000 | 3,958,562 | 1.13 |
| Utilities | 0.92 | ||||
| CHINA RESOURCES POWER HOLDINGS CO LTD | 836 | 14.10 | 1,778,000 | 3,209,468 | 0.92 |
| Materials | 0.28 | ||||
| TIANGONG INTERNATIONAL CO LTD | 826 | 0.89 | 8,612,000 | 981,242 | 0.28 |
Source: State Street Bank and Trust Company, IDS GmbH - Analysis and Reporting Services, a subsidiary of Allianz SE.
Important Information:
Holdings are subject to change daily. The Fund seeks to achieve its objective through investment in the equity securities of companies and other entities with significant assets, investments, production activities, trading or other business interests in China or which derive a significant part of their revenue from China. Investing in non-U.S. securities entails additional risks, including political and economic risk and the risk of currency fluctuations, as well as lower liquidity. These risks, which can result in greater price volatility, will generally be enhanced in less diversified funds that concentrate investments in a particular geographic region.
The information contained herein has been obtained from sources believed to be reliable but Allianz Global Investors U.S. LLC and its affiliates do not warrant the information to be accurate, complete or reliable. The opinions expressed herein are subject to change at any time and without notice. Past performance is not indicative of future results. This material is not intended as an offer or solicitation for the purchase or sale of any financial instrument. Investors should consider the investment objectives, risks, charges and expenses of any mutual fund carefully before investing. This and other information is contained in the Fund's annual and semiannual reports, proxy statement and other Fund information, which may be obtained by contacting your financial advisor or visiting the Fund's website at www.chinafundinc.com. This information is unaudited and is intended for informational purposes only. It is presented only to provide information on the Fund's holdings, performance and strategies. The Fund is a closed-end exchange traded management investment company. This material is presented only to provide information and is not intended for trading purposes. Closed-end funds, unlike open-end funds, are not continuously offered. After the initial public offering by a closed-end fund, its shares can be purchased and sold on the open market through a stock exchange, where shares may trade at a premium or a discount. The market price of holdings is subject to change daily.
P/E is a ratio of security price to earnings per share. Typically, an undervalued security is characterized by a low P/E ratio, while an overvalued security is characterized by a high P/E ratio. P/B is a ratio of the current stock price to the book value. This is used to identify undervalued stocks. Dividend yield is the annual percentage of return earned by an investor on a common or preferred stock. The average dividend yield is the dividend rate divided by current share price.
©2017 Allianz Global Investors Distributors LLC.
| Investment Products: Not FDIC Insured | May Lose Value | Not Bank Guaranteed | FS-CHN-0917 |