
Data as of 10/31/17
Manager's Commentary
Market Review
In October, Greater China stocks rose on favorable market sentiment. Notably, Chinese equities ratcheted higher and hit a two-year high during the month. The rally initially was supported by the cut in the Reserve Ratio Requirement ("RRR") by the People's Bank of China, and then subsequently boosted by the strengthened position of President Xi Jinping after the 19th National Party Conference ("NPC").
Positive sentiment plus improving asset quality of Chinese banks supported the strong performance of Chinese financials in October. Another area of strength came from the technology sector, helped by optimism ahead of the iPhone X launch and high expectations of earnings growth of Chinese internet companies.
Consumer discretionary names, particularly the online-related segment, saw some profit-taking activities on positive earnings results.
Fund Review
The China Fund, Inc. (the "Fund") outperformed its benchmark, the MSCI Golden Dragon Index, in October. At a stock level, the China Merchants Bank Co., Ltd. was the top contributor to the Fund's performance during October, after being the top detractor during September. The stock rebounded sharply after the People's Bank of China announced the RRR cut. Hardware components producers also delivered positive returns with the launch of new iPhone models.
In October, the Fund's top detractor in performance was New Oriental Education & Technology Group Inc., the largest private educational service provider in China. Despite the stronger-than-expected earnings growth, a decline in the firm's operating margin triggered some profit-taking activities.
However, we believe this short-term margin decline to be a natural result of its faster capacity expansion, and we expect a margin recovery going forward. We have added to our positions as we believe the company's strong brand and scalable business model should lead to continuous market share gain within China's growing, yet highly fragmented, private education market.
Outlook
The 19th NPC, which took place in late October, reinforced our long-term positive view on China equity markets. In the medium-to-longer term, the policy direction in China will be focused on maintaining a relatively stable economy which will provide more room for financial deleveraging.
In specific areas of the economy, for example, the property market, this will include pre-emptive actions to prevent excessive price appreciation. Though this may not generate exciting newspaper headlines, the commitment to reducing risks in the financial system is, in the long-term, beneficial for markets. The lower risk premium should, over time, translate into higher valuations for the equity markets.
At the same time, the pursuit of sustainable economic growth driven by innovation and consumption means that many of our long-term investment themes remain in place. For example, we continue to favor technology and industrial companies which focus on manufacturing upgrades and can provide substitute for imports of higher-end products.
Another multi-year trend is the consumption habits of an increasingly affluent population in China. As this population's taste becomes more expensive, the Fund is positioned for this opportunity through companies which have a diversified product range including offerings in premium segments. For instance, we recently initiated a position in WH Group Ltd., the dominant meat product producer in China, which offers higher-end meat products.
Further, we believe the improvement in asset quality in China will ultimately be reflected in the share price of Chinese banks, many of which are still trading at deep discounts compared to their book values.
| In Brief | |
| Fund Data | |
| Description | Seeks to achieve longterm capital appreciation through investments in China companies. |
| Listing Date (NYSE) | July 10, 1992 |
| Total Fund Assets (millions) | $366.5 |
| Median Market Cap (in billions) | $14.8 |
Distribution Frequency | Annual |
Management Firm | Allianz Global Investors U.S. LLC |
Portfolio Management | Christina Chung, CFA, CMA Lead Portfolio Manager |
Performance (US$ Returns) (as of 10/31/17) | ||
| Fund | Benchmark1 | |
| One Month | 5.00% | 3.81% |
| Three Month | 7.27% | 6.81% |
| One Year | 27.38% | 32.83% |
| Three Year | 9.31% | 11.41% |
| Net Asset Value / Market Price | |
| Net Asset Value (NAV) / Market Price at Inception | $13.15 / $14.26 |
| NAV / Market Price (as of 10/31/17) | $23.31 / $21.10 |
| High / Low Ranges (52-Week) | |
| High / Low NAV | $23.39 / $17.00 |
| High / Low Market Price | $21.24 / $14.53 |
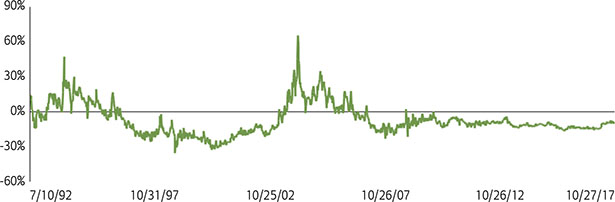
| Premium/Discount to NAV (as of 10/31/17) | -9.48% |
| Fund Data (Common Shares) | |
| Shares Outstanding | 15,722,675 |
| Average Daily Volume | 27,021 |
| Expense Ratio | 1.53% |
Fund Manager

Christina Chung, CFA, CMA
Lead Portfolio Manager
| 1. | MSCI Golden Dragon Index |

The China Fund, Inc.
Investment Objective
The investment objective of the Fund is to achieve long-term capital appreciation. The Fund seeks to achieve its objective through investment in the equity securities of companies and other entities with significant assets, investments, production activities, trading or other business interests in China or which derive a significant part of their revenue from China.
The Fund has an operating policy that the Fund will invest at least 80% of its assets in China companies. For this purpose, 'China companies' are (i) companies for which the principal securities trading market is in China; (ii) companies for which the principal securities trading market is outside of China or in companies organized outside of China, that in both cases derive at least 50% of their revenues from goods or services sold or produced, or have at least 50% of their assets in China; or (iii) companies organized in China. Under the policy, China means the People's Republic of China, including Hong Kong, and Taiwan. The Fund will provide its stockholders with at least 60 days' prior notice of any change to this policy.
Returns For Periods Ended October 31, 2017*
| 1 Month | 3 Month | YTD | 1 Year | 3 Year | 5 Year | 10 Year | Inception | |
| NAV | 5.00% | 7.27% | 33.89% | 27.38% | 9.31% | 11.56% | 4.84% | 10.71% |
| Market Price | 3.69% | 7.71% | 40.20% | 33.83% | 10.11% | 11.89% | 5.45% | 9.93% |
| MSCI Golden Dragon Index | 3.81% | 6.81% | 40.41% | 32.83% | 11.41% | 11.23% | 3.01% | — |
| Calendar Year Returns | ||||||||
| 2009 | 2010 | 2011 | 2012 | 2013 | 2014 | 2015 | 2016 | |
| NAV | 72.83% | 27.26% | -24.37% | 12.12% | 18.31% | 7.82% | -5.51% | 0.60% |
| Market Price | 72.19% | 23.60% | -27.51% | 20.52% | 12.70% | 5.29% | -6.38% | -0.47% |
| MSCI Golden Dragon Index | 67.12% | 13.60% | -18.35% | 22.65% | 7.25% | 8.06% | -7.12% | 5.75% |
Past performance is not a guide to future returns.
| * | Annualized for periods greater than one year. |
Source: State Street Bank and Trust Company. Source for index data: MSCI as at October 31,2017. Investment returns are historical and do not guarantee future results. Investment returns reflect changes in net asset value and market price per share during each period and assumes that dividends and capital gains distributions, if any, were reinvested. The net asset value (NAV) percentages are not an indication of the performance of a shareholder's investment in the Fund, which is based on market price. NAV performance includes the deduction of management fees and other expenses. Market price performance does not include the deduction of brokerage commissions and other expenses of trading shares and would be lower had such commissions and expenses been deducted. It is not possible to invest directly in an index.
Premium/Discount
| Sector Allocation | ||
| Fund | Benchmark1 | |
Information Technology | 43.28% | 38.46% |
| Financials | 21.29% | 23.16% |
Consumer Discretionary | 8.24% | 8.47% |
| Industrials | 6.95% | 5.69% |
| Real Estate | 5.96% | 7.89% |
| Telecom Services | 4.48% | 4.10% |
| Consumer Staples | 3.18% | 2.09% |
| Energy | 2.33% | 2.90% |
| Health Care | 1.12% | 1.20% |
| Utilities | 0.93% | 3.39% |
| Materials | 0.28% | 2.65% |
| Other assets & liabilities | 1.96% | 0.00% |
Source: IDS GmbH - Analysis and Reporting Services, a subsidiary of Allianz SE.
| Country Allocation | ||
| Fund | Benchmark1 | |
| China | 77.39% | 76.85% |
| Hong Kong Red Chips | 20.63% | 8.18% |
| Hong Kong 'H' shares | 19.33% | 19.06% |
| Equity linked securities ('A' shares) | 0.00% | 0.00% |
| China 'A' & 'B' shares | 0.00% | 0.10% |
| Other Hong Kong securities | 37.43% | 32.74% |
| Others | 0.00% | 16.78% |
| Taiwan | 20.66% | 23.15% |
| Other assets & liabilities | 1.95% | 0.00% |
| Top 10 Holdings | |
| TENCENT HOLDINGS LTD (China) | 9.56% |
| TAIWAN SEMIC CO LTD (Taiwan) | 9.54% |
| ALIBABA GROUP HOLDING LTD (China) | 8.89% |
| CHINA CONSTRUCTION BANK CORP (China) | 5.82% |
| SUN HUNG KAI PROPERTIES LTD (H.K.) | 4.62% |
| PING AN INSURANCE (China) | 4.06% |
| CHINA MERCHANTS BANK CO LTD (China) | 3.71% |
| LARGAN PRECISION CO LTD (Taiwan) | 2.79% |
| CHINA EVERBRIGHT INTL (China) | 2.36% |
| BANK OF CHINA LTD (China) | 2.11% |
| Portfolio Characteristics | ||
| Fund | Benchmark1 | |
| P/E Ratio | 16.03 | 15.38 |
| P/B Ratio | 1.89 | 1.77 |
| Issues in Portfolio | 49 | 283 |
| Foreign Holdings (%) | 98.04 | 100.00 |
| Other assets & liabilities (%) | 1.96 | 0.00 |
| Yield (%) | 2.23 | 2.29 |
Source: IDS GmbH - Analysis and Reporting Services, a subsidiary of Allianz SE.
The China Fund, Inc.
Distribution History (10 Year)
| Declaration Date | Ex-dividend Date | Record Date | Payable Date | Distribution/ | Income | Long-term Capital Gain | Short-term Capital Gain |
| 12/7/07 | 12/19/07 | 12/21/07 | 1/25/08 | $12.12000 | $0.28000 | $9.00000 | $2.84000 |
| 12/8/08 | 12/22/08 | 12/24/08 | 1/23/09 | $5.81740 | $0.48130 | $5.33610 | — |
| 12/9/09 | 12/22/09 | 12/24/09 | 12/29/09 | $0.25570 | $0.25570 | — | — |
| 12/8/10 | 12/21/10 | 12/24/10 | 12/29/10 | $2.27420 | $0.37460 | $1.89960 | — |
| 12/8/11 | 12/21/11 | 12/23/11 | 12/29/11 | $2.99640 | $0.17420 | $2.82220 | — |
| 12/10/12 | 12/20/12 | 12/24/12 | 12/28/12 | $3.25170 | $0.34730 | $2.90440 | — |
| 12/13/13 | 12/19/13 | 12/23/13 | 12/27/13 | $3.31400 | $0.43870 | $2.87530 | — |
| 12/8/14 | 12/18/14 | 12/22/14 | 1/5/15 | $3.76510 | $0.29820 | $3.46690 | — |
| 12/16/15 | 12/23/15 | 12/28/15 | 1/6/16 | $1.49580 | $0.21330 | $0.84620 | $0.43630 |
| 12/9/16 | 12/19/16 | 12/21/16 | 1/5/17 | $0.46780 | $0.46780 | — | — |
Distribution/Share includes Income, Long-term Capital gains and Short-term Capital gains.
The China Fund NAV Performance of $10,000 since inception
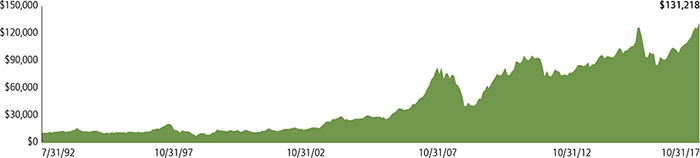
Past performance is not a guide to future returns.
Index Description
MSCI Golden Dragon Index
TheMSCI Golden Dragon Indexcaptures the equity market performance of large and mid cap China securities (H shares, B shares, Red-Chips and P-Chips) and non-domestic China securities listed in Hong Kong and Taiwan.
It is not possible to invest directly in an index
The China Fund, Inc.
Portfolio in Full
| Sector | Company (exchange ticker) | Market Price | Holding | Value US$ | % of net assets |
| Information Technology | 43.27 | ||||
| TENCENT HOLDINGS LTD | 700 | 349.80 | 781,600 | 35,043,667 | 9.56 |
| TAIWAN SEMICONDUCTOR MANUFACTURING CO LTD | 2330 | 243.00 | 4,341,000 | 34,976,144 | 9.54 |
| ALIBABA GROUP HOLDING LTD ADR | BABA | 184.89 | 176,328 | 32,601,284 | 8.89 |
| LARGAN PRECISION CO LTD | 3008 | 5,715.00 | 54,000 | 10,232,597 | 2.79 |
| ASM PACIFIC TECHNOLOGY LTD | 522 | 113.50 | 420,300 | 6,114,493 | 1.67 |
| BAIDU INC ADR | BIDU | 243.94 | 24,101 | 5,879,198 | 1.60 |
| HON HAI PRECISION INDUSTRY CO LTD | 2317 | 112.00 | 1,548,100 | 5,749,008 | 1.57 |
| DIGITAL CHINA HOLDINGS LTD | 861 | 4.72 | 9,305,000 | 5,629,419 | 1.54 |
| MEDIATEK INC | 2454 | 342.50 | 456,000 | 5,178,468 | 1.41 |
| GLOBALWAFERS CO LTD | 6488 | 348.50 | 403,000 | 4,656,758 | 1.27 |
| PRIMAX ELECTRONICS LTD | 4915 | 78.20 | 1,779,000 | 4,612,736 | 1.26 |
| SEMICONDUCTOR MANUFACTURING INTERNATIONAL CORP | 981 | 11.96 | 2,470,900 | 3,787,839 | 1.03 |
| CHUNGHWA PRECISION TEST TECH CO LTD | 6510 | 1,095.00 | 74,000 | 2,686,716 | 0.73 |
| GOLDPAC GROUP LTD | 3315 | 2.37 | 4,970,000 | 1,509,767 | 0.41 |
| Financials | 21.31 | ||||
| CHINA CONSTRUCTION BANK CORP | 939 | 6.96 | 23,898,000 | 21,319,449 | 5.82 |
| PING AN INSURANCE GROUP CO OF CHINA LTD | 2318 | 68.50 | 1,693,500 | 14,868,973 | 4.06 |
| CHINA MERCHANTS BANK CO LTD | 3968 | 29.75 | 3,565,500 | 13,596,045 | 3.71 |
| BANK OF CHINA LTD | 3988 | 3.89 | 15,500,000 | 7,728,345 | 2.11 |
| HONG KONG EXCHANGES & CLEARING LTD | 388 | 217.20 | 262,200 | 7,299,577 | 1.99 |
| CATHAY FINANCIAL HOLDING CO LTD | 2882 | 49.80 | 2,880,000 | 4,755,517 | 1.30 |
| FUBON FINANCIAL HOLDING CO LTD | 2881 | 48.05 | 2,805,000 | 4,468,915 | 1.22 |
| CITIC SECURITIES CO LTD | 6030 | 17.32 | 1,810,000 | 4,018,201 | 1.10 |
| Consumer Discretionary | 8.24 | ||||
| JD.COM INC ADR | JD | 37.52 | 152,727 | 5,730,317 | 1.56 |
| NEW ORIENTAL EDUCATION & TECHNOLOGY GROUP ADR | EDU | 83.24 | 67,468 | 5,616,036 | 1.53 |
| QINGLING MOTORS CO LTD | 1122 | 2.65 | 14,816,000 | 5,032,480 | 1.37 |
| SAIC MOTOR CORP LTD A | 600104 | 31.50 | 999,407 | 4,750,177 | 1.30 |
| LI & FUNG LTD | 494 | 3.93 | 6,520,000 | 3,284,319 | 0.90 |
| SANDS CHINA LTD | 1928 | 36.75 | 670,000 | 3,156,002 | 0.86 |
| GALAXY ENTERTAINMENT GROUP LTD | 27 | 53.10 | 386,000 | 2,627,163 | 0.72 |
| Industrials | 6.95 | ||||
| CHINA EVERBRIGHT INTERNATIONAL LTD | 257 | 11.00 | 6,146,000 | 8,665,436 | 2.36 |
| QINGDAO PORT INTERNATIONAL CO LTD | 6198 | 5.51 | 6,077,000 | 4,291,865 | 1.17 |
| CN STATE CONSTRUCTION INTERNATIONAL HOLDINGS LTD | 3311 | 10.96 | 2,906,000 | 4,082,360 | 1.11 |
| BEIJING ENTERPRISES HOLDINGS LTD | 392 | 46.35 | 653,500 | 3,882,402 | 1.06 |
| KING SLIDE WORKS CO LTD | 2059 | 403.50 | 213,000 | 2,849,699 | 0.78 |
| ZHUZHOU CRRC TIMES ELECTRIC CO LTD | 3898 | 45.65 | 292,000 | 1,708,554 | 0.47 |
| Real Estate | 5.96 | ||||
| SUN HUNG KAI PROPERTIES LTD | 16 | 127.60 | 1,035,000 | 16,927,632 | 4.62 |
| CHINA OVERSEAS LAND & INVESTMENT LTD | 688 | 25.30 | 1,516,000 | 4,916,148 | 1.34 |
| Telecom Services | 4.49 | ||||
| CHINA UNICOM HONG KONG LTD | 762 | 11.08 | 3,660,000 | 5,197,877 | 1.42 |
| PCCW LTD | 8 | 4.30 | 8,623,000 | 4,752,608 | 1.30 |
| CHINA MOBILE LTD | 941 | 78.35 | 356,500 | 3,580,171 | 0.98 |
| CHUNGHWA TELECOM CO LTD | 2412 | 103.00 | 846,000 | 2,889,239 | 0.79 |
| Consumer Staples | 3.18 | ||||
| CHINA MENGNIU DAIRY CO LTD | 2319 | 21.60 | 1,905,000 | 5,274,168 | 1.44 |
| WH GROUP LTD | 288 | 7.90 | 4,337,500 | 4,392,095 | 1.20 |
| VINDA INTERNATIONAL HOLDINGS LTD | 3331 | 15.76 | 984,000 | 1,987,726 | 0.54 |
| Energy | 2.33 | ||||
| CHINA OILFIELD SERVICES LTD | 2883 | 6.91 | 5,860,000 | 5,190,161 | 1.42 |
The China Fund, Inc.
Portfolio in Full
| Sector | Company (exchange ticker) | Market Price | Holding | Value US$ | % of net assets |
| CHINA PETROLEUM & CHEMICAL CORP | 386 | 5.73 | 4,552,000 | 3,343,198 | 0.91 |
| Health Care | 1.12 | ||||
| CSPC PHARMACEUTICAL GROUP LTD | 1093 | 13.56 | 2,364,000 | 4,108,775 | 1.12 |
| Utilities | 0.93 | ||||
| CHINA RESOURCES POWER HOLDINGS CO LTD | 836 | 15.00 | 1,778,000 | 3,418,442 | 0.93 |
| Materials | 0.28 | ||||
| TIANGONG INTERNATIONAL CO LTD | 826 | 0.92 | 8,612,000 | 1,015,540 | 0.28 |
Source: State Street Bank and Trust Company, IDS GmbH - Analysis and Reporting Services, a subsidiary of Allianz SE.
Important Information:
Holdings are subject to change daily. The Fund seeks to achieve its objective through investment in the equity securities of companies and other entities with significant assets, investments, production activities, trading or other business interests in China or which derive a significant part of their revenue from China. Investing in non-U.S. securities entails additional risks, including political and economic risk and the risk of currency fluctuations, as well as lower liquidity. These risks, which can result in greater price volatility, will generally be enhanced in less diversified funds that concentrate investments in a particular geographic region.
The information contained herein has been obtained from sources believed to be reliable but Allianz Global Investors U.S. LLC and its affiliates do not warrant the information to be accurate, complete or reliable. The opinions expressed herein are subject to change at any time and without notice. Past performance is not indicative of future results. This material is not intended as an offer or solicitation for the purchase or sale of any financial instrument. Investors should consider the investment objectives, risks, charges and expenses of any mutual fund carefully before investing. This and other information is contained in the Fund's annual and semiannual reports, proxy statement and other Fund information, which may be obtained by contacting your financial advisor or visiting the Fund's website at www.chinafundinc.com. This information is unaudited and is intended for informational purposes only. It is presented only to provide information on the Fund's holdings, performance and strategies. The Fund is a closed-end exchange traded management investment company. This material is presented only to provide information and is not intended for trading purposes. Closed-end funds, unlike open-end funds, are not continuously offered. After the initial public offering by a closed-end fund, its shares can be purchased and sold on the open market through a stock exchange, where shares may trade at a premium or a discount. The market price of holdings is subject to change daily.
P/E is a ratio of security price to earnings per share. Typically, an undervalued security is characterized by a low P/E ratio, while an overvalued security is characterized by a high P/E ratio. P/B is a ratio of the current stock price to the book value. This is used to identify undervalued stocks. Dividend yield is the annual percentage of return earned by an investor on a common or preferred stock. The average dividend yield is the dividend rate divided by current share price.
©2017 Allianz Global Investors Distributors LLC.
| Investment Products: Not FDIC Insured | May Lose Value | Not Bank Guaranteed | FS-CHN-1017 |