
Data as of 11/30/17
Manager's Commentary
Market Review
In November, Greater China equities rose despite a more volatile period. After starting the month on a positive trend, Chinese equities gave back most of the monthly gains due to investor concerns on rising domestic bond yields and the government's measures to tackle excessive debt. In Hong Kong, the Hang Seng Index exceeded 30,000 points for the first time in a decade before falling back under 30,000 points, due in part to slumping stocks in mainland China.
The Taiwan equity market, which is dominated by hardware component makers including Apple suppliers, retreated with technology-led profit-taking. On the economic front, although retail sales and industrial production data pointed to a slowdown in the Chinese economy, the official manufacturing purchasing managers' index unexpectedly strengthened in November. That said, industrials was the weakest sector, while health care and financials were the strongest.
Fund Review
The China Fund, Inc. (the "Fund") slightly underperformed its benchmark, the MSCI Golden Dragon Index, in November. Information technology stocks saw some weakness; however, the strongest performing company was Globalwafers Co. Ltd., a specialized silicon wafer manufacturer. This Taiwan listed information technology company benefited from rising prices due to tight supply and demand conditions along the semiconductor supply chain.
Elsewhere, Ping An Insurance Group Co. of China Ltd. ("Ping An Insurance Group"), a leading insurer in China, was also a contributor. Recent management guidance pointed to a potential spinoff of its fintech investments, which has lifted expectations of its enterprise value being crystallized. Ping An Insurance Group has been our preferred name in the financials sector, with the productivity of its agency force and cross-selling capabilities well ahead of the industry.
Conversely, Largan Precision Co. Ltd., a smartphone camera lens producer, and Taiwan Semiconductor Manufacturing Co. Ltd. ("TSMC"), the world's largest chipmaker, were detractors. These two Taiwan-based hardware component producers within the Apple supply chain saw some profit taking amid concerns over delayed shipments of the iPhone X.
Outlook
Fundamentally, we believe the outlook for Greater China equities remains positive over the medium to longer term. Corporate earnings and cash flows continue to improve, and as a result, balance sheets have generally been strengthened. Given the strength of the rally year-to-date, it would not be surprising to see a period of consolidation. However, because this has primarily been an earnings-led market, valuations remain in line with longer-term averages.
In 2017, there has been a heavy concentration of returns in the technology sector. The three largest stocks, Tencent Holdings Ltd. ("Tencent"), Alibaba Group Holding Ltd. ("Alibaba"), and TSMC account for almost 25% of the MSCI Golden Dragon Index. Tencent and Alibaba have both delivered over 100% returns year-to-date. Although we believe their business outlooks remains strong, given this performance, we are increasingly finding better risk-reward opportunities elsewhere.
In recent months, we have added to our consumer staples sector holdings, with China Mengniu Dairy Co. Ltd., a leading dairy producer in China, and China International Travel Services, the biggest duty-free store operator in China. We believe that their dominant market positions will allow them to benefit from the spending power of the increasingly wealthy Chinese population.
| In Brief | |
| Fund Data | |
| Description | Seeks to achieve long-term capital appreciation through investments in China companies. |
| Listing Date (NYSE) | July 10, 1992 |
| Total Fund Assets (millions) | $368.7 |
| Median Market Cap (in billions) | $13.9 |
| Distribution Frequency | Annual |
| Management Firm | Allianz Global Investors U.S. LLC |
| Portfolio Management | Christina Chung, CFA, CMA Lead Portfolio Manager |
Performance (US$ Returns) (as of 11/30/17) | ||
| Fund | Benchmark1 | |
| One Month | 0.60% | 0.77% |
| Three Month | 4.73% | 4.35% |
| One Year | 30.51% | 35.98% |
| Three Year | 9.44% | 11.21% |
| Net Asset Value / Market Price | |
| Net Asset Value (NAV) / Market Price at Inception | $13.15 / $14.26 |
| NAV / Market Price (as of 11/30/17) | $23.45 / $21.48 |
| High / Low Ranges (52-Week) | |
| High / Low NAV | $24.49 / $17.00 |
| High / Low Market Price | $22.26 / $14.53 |
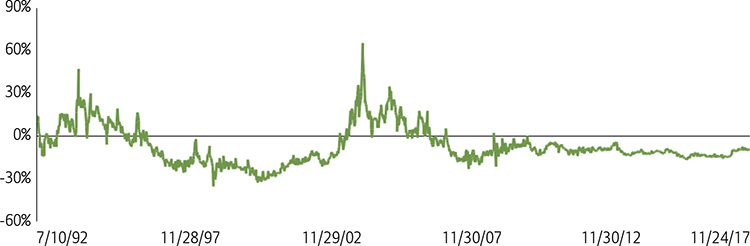
| Premium/Discount to NAV (as of 11/30/17) | -8.40% |
| Fund Data (Common Shares) | |
| Shares Outstanding | 15,722,675 |
| Average Daily Volume | 26,804 |
| Expense Ratio | 1.53% |
Fund Manager

Christina Chung, CFA, CMA
Lead Portfolio Manager
| 1. | MSCI Golden Dragon Index. |

The China Fund, Inc.
Investment Objective
The investment objective of the Fund is to achieve long-term capital appreciation. The Fund seeks to achieve its objective through investment in the equity securities of companies and other entities with significant assets, investments, production activities, trading or other business interests in China or which derive a significant part of their revenue from China.
The Fund has an operating policy that the Fund will invest at least 80% of its assets in China companies. For this purpose, 'China companies' are (i) companies for which the principal securities trading market is in China; (ii) companies for which the principal securities trading market is outside of China or in companies organized outside of China, that in both cases derive at least 50% of their revenues from goods or services sold or produced, or have at least 50% of their assets in China; or (iii) companies organized in China. Under the policy, China means the People's Republic of China, including Hong Kong, and Taiwan. The Fund will provide its stockholders with at least 60 days' prior notice of any change to this policy.
Returns For Periods Ended November 30, 2017*
| 1 Month | 3 Month | YTD | 1 Year | 3 Year | 5 Year | 10 Year | Inception | |
| NAV | 0.60% | 4.73% | 34.69% | 30.51% | 9.44% | 11.27% | 5.81% | 10.70% |
| Market Price | 1.80% | 3.92% | 42.72% | 38.21% | 9.95% | 11.55% | 6.44% | 9.97% |
| MSCI Golden Dragon Index | 0.77% | 4.35% | 41.49% | 35.98% | 11.21% | 10.60% | 4.23% | — |
Calendar Year Returns
| 2009 | 2010 | 2011 | 2012 | 2013 | 2014 | 2015 | 2016 | |
| NAV | 72.83% | 27.26% | -24.37% | 12.12% | 18.31% | 7.82% | -5.51% | 0.60% |
| Market Price | 72.19% | 23.60% | -27.51% | 20.52% | 12.70% | 5.29% | -6.38% | -0.47% |
| MSCI Golden Dragon Index | 67.12% | 13.60% | -18.35% | 22.65% | 7.25% | 8.06% | -7.12% | 5.75% |
Past performance is not a guide to future returns.
| * | Annualized for periods greater than one year. |
Source: State Street Bank and Trust Company. Source for index data: MSCI as at November 30, 2017. Investment returns are historical and do not guarantee future results. Investment returns reflect changes in net asset value and market price per share during each period and assumes that dividends and capital gains distributions, if any, were reinvested. The net asset value (NAV) percentages are not an indication of the performance of a shareholder's investment in the Fund, which is based on market price. NAV performance includes the deduction of management fees and other expenses. Market price performance does not include the deduction of brokerage commissions and other expenses of trading shares and would be lower had such commissions and expenses been deducted. It is not possible to invest directly in an index.
Premium/Discount
| Sector Allocation | ||
| Fund | Benchmark1 | |
| Information Technology | 41.09% | 38.78% |
| Financials | 21.56% | 23.46% |
| Consumer Discretionary | 9.88% | 8.35% |
| Industrials | 6.20% | 5.42% |
| Real Estate | 5.89% | 7.74% |
| Telecom Services | 4.60% | 4.06% |
| Consumer Staples | 3.88% | 2.06% |
| Energy | 2.35% | 2.80% |
| Health Care | 1.27% | 1.35% |
| Utilities | 0.91% | 3.25% |
| Materials | 0.27% | 2.73% |
| Other assets & liabilities | 2.11% | 0.00% |
Source: IDS GmbH - Analysis and Reporting Services, a subsidiary of Allianz SE.
| Country Allocation | ||
| Fund | Benchmark1 | |
| China | 81.05% | 77.67% |
| Hong Kong Red Chips | 20.40% | 8.06% |
| Hong Kong 'H' shares | 19.21% | 18.61% |
| Equity linked securities ('A' shares) | 0.00% | 0.00% |
| China 'A' & 'B' shares | 0.00% | 0.05% |
| Other Hong Kong securities | 41.44% | 34.66% |
| Others | 0.00% | 16.29% |
| Taiwan | 16.85% | 22.33% |
| Other assets & liabilities | 2.10% | 0.00% |
| Top 10 Holdings | |
| TENCENT HOLDINGS LTD (China) | 10.29% |
| TAIWAN SEMIC CO LTD (Taiwan) | 8.38% |
| ALIBABA GROUP HOLDING LTD (China) | 8.00% |
| CHINA CONSTRUCTION BANK CORP (China) | 5.65% |
| SUN HUNG KAI PROPERTIES LTD (H.K.) | 4.59% |
| PING AN INSURANCE (China) | 4.28% |
| CHINA MERCHANTS BANK CO LTD (China) | 3.79% |
| GLOBALWAFERS CO LTD (Taiwan) | 2.65% |
| LARGAN PRECISION CO LTD (Taiwan) | 2.51% |
| CHINA EVERBRIGHT INTL (China) | 2.24% |
| Portfolio Characteristics | ||
| Fund | Benchmark1 | |
| P/E Ratio | 15.91 | 15.35 |
| P/B Ratio | 1.97 | 1.82 |
| Issues in Portfolio | 48 | 290 |
| Foreign Holdings (%) | 97.89 | 100.00 |
| Other assets & liabilities (%) | 2.11 | 0.00 |
| Yield (%) | 2.23 | 2.25 |
Source: IDS GmbH - Analysis and Reporting Services, a subsidiary of Allianz SE.
| 1. | MSCI Golden Dragon Index. |
The China Fund, Inc.
Distribution History (10 Year)
| Declaration Date | Ex-dividend Date | Record Date | Payable Date | Distribution/ Share | Income | Long-term Capital Gain | Short-term Capital Gain |
| 12/7/07 | 12/19/07 | 12/21/07 | 1/25/08 | $12.12000 | $0.28000 | $9.00000 | $2.84000 |
| 12/8/08 | 12/22/08 | 12/24/08 | 1/23/09 | $5.81740 | $0.48130 | $5.33610 | — |
| 12/9/09 | 12/22/09 | 12/24/09 | 12/29/09 | $0.25570 | $0.25570 | — | — |
| 12/8/10 | 12/21/10 | 12/24/10 | 12/29/10 | $2.27420 | $0.37460 | $1.89960 | — |
| 12/8/11 | 12/21/11 | 12/23/11 | 12/29/11 | $2.99640 | $0.17420 | $2.82220 | — |
| 12/10/12 | 12/20/12 | 12/24/12 | 12/28/12 | $3.25170 | $0.34730 | $2.90440 | — |
| 12/13/13 | 12/19/13 | 12/23/13 | 12/27/13 | $3.31400 | $0.43870 | $2.87530 | — |
| 12/8/14 | 12/18/14 | 12/22/14 | 1/5/15 | $3.76510 | $0.29820 | $3.46690 | — |
| 12/16/15 | 12/23/15 | 12/28/15 | 1/6/16 | $1.49580 | $0.21330 | $0.84620 | $0.43630 |
| 12/9/16 | 12/19/16 | 12/21/16 | 1/5/17 | $0.46780 | $0.46780 | — | — |
Distribution/Share includes Income, Long-term Capital gains and Short-term Capital gains.
The China Fund NAV Performance of $10,000 since inception
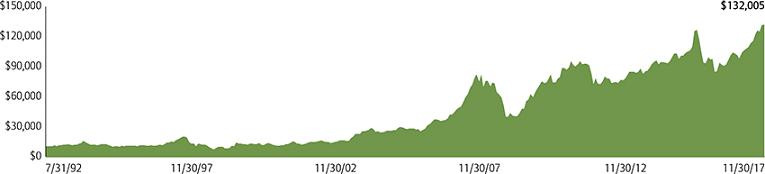
Past performance is not a guide to future returns.
Index Description
MSCI Golden Dragon Index
TheMSCI Golden Dragon Index captures the equity market performance of large and mid cap China securities (H shares, B shares, Red-Chips and P-Chips) and non-domestic China securities listed in Hong Kong and Taiwan.
It is not possible to invest directly in an index.
The China Fund, Inc.
Portfolio in Full
| Sector | Company (exchange ticker) | Market Price | Holding | Value US$ | % of net assets |
| Information Technology | 41.11 | ||||
| TENCENT HOLDINGS LTD | 700 | 398.00 | 744,000 | 37,915,925 | 10.29 |
| TAIWAN SEMICONDUCTOR MANUFACTURING CO LTD | 2330 | 226.00 | 4,100,000 | 30,892,845 | 8.38 |
| ALIBABA GROUP HOLDING LTD ADR | BABA | 177.08 | 166,500 | 29,483,820 | 8.00 |
| GLOBALWAFERS CO LTD | 6488 | 403.50 | 726,000 | 9,766,653 | 2.65 |
| LARGAN PRECISION CO LTD | 3008 | 5,140.00 | 54,000 | 9,253,851 | 2.51 |
| ASM PACIFIC TECHNOLOGY LTD | 522 | 112.20 | 433,500 | 6,227,986 | 1.69 |
| BAIDU INC ADR | BIDU | 238.58 | 24,101 | 5,750,017 | 1.56 |
| NANYA TECHNOLOGY CORP | 2408 | 77.80 | 1,986,000 | 5,151,390 | 1.40 |
| MEDIATEK INC | 2454 | 326.00 | 456,000 | 4,956,191 | 1.34 |
| DIGITAL CHINA HOLDINGS LTD | 861 | 4.15 | 9,305,000 | 4,944,588 | 1.34 |
| CHUNGHWA PRECISION TEST TECH CO LTD | 6510 | 1,135.00 | 99,000 | 3,746,249 | 1.02 |
| PRIMAX ELECTRONICS LTD | 4915 | 83.00 | 736,000 | 2,036,674 | 0.55 |
| GOLDPAC GROUP LTD | 3315 | 2.18 | 4,970,000 | 1,387,326 | 0.38 |
| Financials | 21.55 | ||||
| CHINA CONSTRUCTION BANK CORP | 939 | 6.81 | 23,898,000 | 20,838,877 | 5.65 |
| PING AN INSURANCE GROUP CO OF CHINA LTD | 2318 | 77.00 | 1,599,000 | 15,765,394 | 4.28 |
| CHINA MERCHANTS BANK CO LTD | 3968 | 30.60 | 3,565,500 | 13,970,357 | 3.79 |
| HONG KONG EXCHANGES & CLEARING LTD | 388 | 235.20 | 262,200 | 7,896,518 | 2.14 |
| BANK OF CHINA LTD | 3988 | 3.79 | 15,500,000 | 7,522,056 | 2.04 |
| CATHAY FINANCIAL HOLDING CO LTD | 2882 | 51.70 | 2,880,000 | 4,964,193 | 1.35 |
| FUBON FINANCIAL HOLDING CO LTD | 2881 | 49.05 | 2,805,000 | 4,587,092 | 1.24 |
| CITIC SECURITIES CO LTD | 6030 | 16.90 | 1,810,000 | 3,916,796 | 1.06 |
| Consumer Discretionary | 9.88 | ||||
| NEW ORIENTAL EDUCATION & TECHNOLOGY GROUP ADR | EDU | 84.86 | 67,468 | 5,725,334 | 1.55 |
| JD.COM INC ADR | JD | 37.45 | 152,727 | 5,719,626 | 1.55 |
| SANDS CHINA LTD | 1928 | 37.95 | 1,058,400 | 5,143,127 | 1.40 |
| QINGLING MOTORS CO LTD | 1122 | 2.51 | 14,816,000 | 4,761,791 | 1.29 |
| SAIC MOTOR CORP LTD | 600104 | 30.89 | 999,407 | 4,669,957 | 1.27 |
| CHINA INTERNATIONAL TRAVEL | 601888 | 41.70 | 640,632 | 4,041,078 | 1.10 |
| LI & FUNG LTD | 494 | 3.44 | 8,120,000 | 3,576,680 | 0.97 |
| GALAXY ENTERTAINMENT GROUP LTD | 27 | 56.15 | 386,000 | 2,775,254 | 0.75 |
| Industrials | 6.22 | ||||
| CHINA EVERBRIGHT INTERNATIONAL LTD | 257 | 10.48 | 6,146,000 | 8,247,446 | 2.24 |
| CN STATE CONSTRUCTION INTERNATIONAL HOLDINGS LTD | 3311 | 10.14 | 3,602,000 | 4,676,784 | 1.27 |
| QINGDAO PORT INTERNATIONAL CO LTD | 6198 | 5.19 | 6,077,000 | 4,038,520 | 1.10 |
| BEIJING ENTERPRISES HOLDINGS LTD | 392 | 45.00 | 591,000 | 3,405,380 | 0.92 |
| KING SLIDE WORKS CO LTD | 2059 | 410.00 | 185,000 | 2,528,839 | 0.69 |
| Real Estate | 5.90 | ||||
| SUN HUNG KAI PROPERTIES LTD | 16 | 127.60 | 1,035,000 | 16,910,509 | 4.59 |
| CHINA OVERSEAS LAND & INVESTMENT LTD | 688 | 24.80 | 1,516,000 | 4,814,116 | 1.31 |
| Telecom Services | 4.60 | ||||
| CHINA UNICOM HONG KONG LTD | 762 | 11.32 | 3,660,000 | 5,305,095 | 1.44 |
| PCCW LTD | 8 | 4.64 | 8,623,000 | 5,123,208 | 1.39 |
| CHINA MOBILE LTD | 941 | 79.25 | 356,500 | 3,617,633 | 0.98 |
| CHUNGHWA TELECOM CO LTD | 2412 | 103.50 | 846,000 | 2,919,284 | 0.79 |
| Consumer Staples | 3.88 | ||||
| CHINA MENGNIU DAIRY CO LTD | 2319 | 19.84 | 2,872,000 | 7,296,116 | 1.98 |
| WH GROUP LTD | 288 | 8.29 | 4,713,500 | 5,003,382 | 1.36 |
| VINDA INTERNATIONAL HOLDINGS LTD | 3331 | 15.88 | 984,000 | 2,000,835 | 0.54 |
| Energy | 2.35 | ||||
| CHINA OILFIELD SERVICES LTD | 2883 | 7.20 | 5,860,000 | 5,402,512 | 1.47 |
| CHINA PETROLEUM & CHEMICAL CORP | 386 | 5.58 | 4,552,000 | 3,252,386 | 0.88 |
The China Fund, Inc.
Portfolio in Full
| Sector | Company (exchange ticker) | Market Price | Holding | Value US$ | % of net assets |
| Health Care | 1.27 | ||||
| CSPC PHARMACEUTICAL GROUP LTD | 1093 | 15.50 | 2,364,000 | 4,691,858 | 1.27 |
| Utilities | 0.91 | ||||
| CHINA RESOURCES POWER HOLDINGS CO LTD | 836 | 14.70 | 1,778,000 | 3,346,684 | 0.91 |
| Materials | 0.27 | ||||
| TIANGONG INTERNATIONAL CO LTD | 826 | 0.89 | 8,612,000 | 981,431 | 0.27 |
Source: State Street Bank and Trust Company, IDS GmbH - Analysis and Reporting Services, a subsidiary of Allianz SE.
Important Information:
Holdings are subject to change daily. The Fund seeks to achieve its objective through investment in the equity securities of companies and other entities with significant assets, investments, production activities, trading or other business interests in China or which derive a significant part of their revenue from China. Investing in non-U.S. securities entails additional risks, including political and economic risk and the risk of currency fluctuations, as well as lower liquidity. These risks, which can result in greater price volatility, will generally be enhanced in less diversified funds that concentrate investments in a particular geographic region.
The information contained herein has been obtained from sources believed to be reliable but Allianz Global Investors U.S. LLC and its affiliates do not warrant the information to be accurate, complete or reliable. The opinions expressed herein are subject to change at any time and without notice. Past performance is not indicative of future results. This material is not intended as an offer or solicitation for the purchase or sale of any financial instrument. Investors should consider the investment objectives, risks, charges and expenses of any mutual fund carefully before investing. This and other information is contained in the Fund's annual and semiannual reports, proxy statement and other Fund information, which may be obtained by contacting your financial advisor or visiting the Fund's website atwww.chinafundinc.com. This information is unaudited and is intended for informational purposes only. It is presented only to provide information on the Fund's holdings, performance and strategies. The Fund is a closed-end exchange traded management investment company. This material is presented only to provide information and is not intended for trading purposes. Closed-end funds, unlike open-end funds, are not continuously offered. After the initial public offering by a closed-end fund, its shares can be purchased and sold on the open market through a stock exchange, where shares may trade at a premium or a discount. The market price of holdings is subject to change daily.
P/E is a ratio of security price to earnings per share. Typically, an undervalued security is characterized by a low P/E ratio, while an overvalued security is characterized by a high P/E ratio. P/B is a ratio of the current stock price to the book value. This is used to identify undervalued stocks. Dividend yield is the annual percentage of return earned by an investor on a common or preferred stock. The average dividend yield is the dividend rate divided by current share price.
©2017 Allianz Global Investors Distributors LLC.
| Investment Products: Not FDIC Insured | May Lose Value | Not Bank Guaranteed | FS-CHN-1117 |