
Data as of 1/31/18
Manager's Commentary
Market Review
Investor sentiment remained upbeat in January, driving Greater China Equities up close to 10% in U.S. Dollar ("USD") terms. Contrary to the technology led rally in 2017, market winners became broader based in early 2018. For example, the top performing sectors included energy and financials, both of which happened to be laggards in the 2017 bull market.
Fund Review
2017 was a year when investors crowded into high growth, high valuation names. The rotation out of winners into laggards in 2018, in our view, signals that market participants are becoming more rational and are increasingly focused on underappreciated growth potential. This is typically favorable for our strategy, where the strongest alpha names are often found in previously underappreciated areas.
For example, the top active contributor was China Construction Bank Corp. The Chinese banking sector has long been an underweighted area by international investors, due to concerns over the asset quality and shadow banking systems in China. However, starting in the second half of 2017, our channel checks suggested stabilization of asset quality in China, which was later confirmed by the non-performing loan formation data reported by Chinese banks. We believe this sector was overly punished and added to our position in China Construction Bank Corp., which we believe enjoys the best asset quality among the big four banks. This decision started to bear fruit in 2018.
Conversely, the top detractor was Digital China Holdings Ltd., one of the leading information technology ("IT") services providers in China. After a strong rebound in December 2017, this stock became a victim of profit taking in January. This is despite a positive business development for the company - it entered into a strategic cooperation agreement with Guangzhou City Construction & Development Co., Ltd. and GRG Banking Equipment Co., Ltd. in new smart city initiatives. We believe Digital China Holdings Ltd. is gradually showcasing its capabilities in IT services and should, over time, build investors' confidence.
Overall in January, our portfolio outperformed the benchmark by 1.81%.
Outlook
After the strong market performance over the past few months, it was not surprising to see a setback in early February. While there have been many reasons cited for the market pullback, we believe the correction in Greater China Equities is driven more by sentiment than fundamentals. Structurally, we see this as a short term setback in the continuation of a longer term up-market in emerging markets, underpinned by a more stable economic environment in China, good momentum in corporate earnings growth, a structural underweight position in emerging markets by many global investors, and reasonable valuations.
Such a market reset is also a good reason for investors to revisit their portfolios and carefully choose stocks with good risk-return profiles rather than chasing the momentum. Therefore, we do not expect to see a repeat of the 2017 one-sided, tech driven rally. Areas where we tend to find more underappreciated opportunities include the Chinese banking sector, consumer brands and entertainment companies. In particular, we prefer to invest in those with company specific catalysts, such as increasing market share, product upgrades and efficiency improvement. Lastly, we are also adding back some positions in high quality players along the semiconductor supply chain, which we believe have overly corrected in the recent tech sell off.
| In Brief | |
| Fund Data | |
| Description | Seeks to achieve longterm capital appreciation through investments in China companies. |
| Listing Date (NYSE) | July 10, 1992 |
| Total Fund Assets (millions) | $411.4 |
| Median Market Cap (in billions) | $14.7 |
| Distribution Frequency | Annual |
| Management Firm | Allianz Global Investors U.S. LLC |
| Portfolio Management | Christina Chung, CFA, CMA Lead Portfolio Manager |
Performance (US$ Returns) (as of 1/31/18) | ||
| Fund | Benchmark1 | |
| One Month | 11.69% | 9.88% |
| Three Month | 15.06% | 12.83% |
| One Year | 45.28% | 48.73% |
| Three Year | 12.96% | 14.88% |
| Net Asset Value / Market Price | |
| Net Asset Value (NAV) / Market Price at Inception | $13.15 / $14.26 |
| NAV / Market Price (as of 1/31/18) | $26.17 / $24.00 |
| High / Low Ranges (52-Week) | |
| High / Low NAV | $26.38 / $18.41 |
| High / Low Market Price | $24.70 / $15.74 |
| Premium/Discount to NAV (as of 1/31/18) | -8.29% |
| Fund Data (Common Shares) | |
| Shares Outstanding | 15,722,674 |
| Average Daily Volume | 24,898 |
| Expense Ratio | 1.49% |
Fund Manager

Christina Chung, CFA, CMA
Lead Portfolio Manager
| 1. | MSCI Golden Dragon Index. |
The China Fund, Inc.
Investment Objective
The investment objective of The China Fund, Inc. (the "Fund") is to achieve long-term capital appreciation. The Fund seeks to achieve its objective through investment in the equity securities of companies and other entities with significant assets, investments, production activities, trading or other business interests in China or which derive a significant part of their revenue from China.
The Fund has an operating policy that the Fund will invest at least 80% of its assets in China companies. For this purpose, 'China companies' are (i) companies for which the principal securities trading market is in China; (ii) companies for which the principal securities trading market is outside of China or in companies organized outside of China, that in both cases derive at least 50% of their revenues from goods or services sold or produced, or have at least 50% of their assets in China; or (iii) companies organized in China. Under the policy, China means the People's Republic of China, including Hong Kong, and Taiwan. The Fund will provide its stockholders with at least 60 days' prior notice of any change to this policy.
| Returns For Periods Ended January 31, 2018* | ||||||||
| 1 Month | 3 Month | YTD | 1 Year | 3 Year | 5 Year | 10 Year | Inception | |
| NAV | 11.69% | 15.06% | 11.69% | 45.28% | 12.96% | 12.29% | 8.07% | 11.21% |
| Market Price | 10.85% | 16.57% | 10.85% | 56.26% | 14.05% | 11.48% | 8.93% | 10.48% |
| MSCI Golden Dragon Index | 9.88% | 12.83% | 9.88% | 48.73% | 14.88% | 11.76% | 7.50% | — |
| Calendar Year Returns | ||||||||
| 2010 | 2011 | 2012 | 2013 | 2014 | 2015 | 2016 | 2017 | |
| NAV | 27.26% | -24.37% | 12.12% | 18.31% | 7.82% | -5.51% | 0.60% | 37.92% |
| Market Price | 23.60% | -27.51% | 20.52% | 12.70% | 5.29% | -6.38% | -0.47% | 47.41% |
| MSCI Golden Dragon Index | 13.60% | -18.35% | 22.65% | 7.25% | 8.06% | -7.12% | 5.75% | 44.19% |
Past performance is not a guide to future returns.
| * | Annualized for periods greater than one year. |
Source: State Street Bank and Trust Company. Source for index data: MSCI as at January 31, 2018. Investment returns are historical and do not guarantee future results. Investment returns reflect changes in net asset value and market price per share during each period and assumes that dividends and capital gains distributions, if any, were reinvested. The net asset value (NAV) percentages are not an indication of the performance of a shareholder's investment in the Fund, which is based on market price. NAV performance includes the deduction of management fees and other expenses. Market price performance does not include the deduction of brokerage commissions and other expenses of trading shares and would be lower had such commissions and expenses been deducted. It is not possible to invest directly in an index.
Premium/Discount

| Sector Allocation | ||
| Fund | Benchmark1 | |
| Information Technology | 38.95% | 38.36% |
| Financials | 23.72% | 24.13% |
| Consumer Discretionary | 10.80% | 8.47% |
| Industrials | 6.64% | 5.15% |
| Real Estate | 5.47% | 7.88% |
| Consumer Staples | 4.26% | 2.16% |
| Telecom Services | 3.46% | 3.78% |
| Energy | 2.56% | 3.01% |
| Health Care | 1.28% | 1.39% |
| Utilities | 0.80% | 2.93% |
| Materials | 0.51% | 2.75% |
| Other assets & liabilities | 1.56% | 0.00% |
Source: IDS GmbH - Analysis and Reporting Services, a subsidiary of Allianz SE.
| Country Allocation | ||
| Fund | Benchmark1 | |
| China | 85.92% | 78.31% |
| Hong Kong Red Chips | 20.85% | 7.91% |
| Hong Kong 'H' shares | 20.75% | 19.77% |
| Equity linked securities ('A' shares) | 0.00% | 0.00% |
| China 'A' & 'B' shares | 0.00% | 0.05% |
| Other Hong Kong securities | 44.32% | 34.22% |
| Others | 0.00% | 16.37% |
| Taiwan | 12.53% | 21.69% |
| Other assets & liabilities | 1.55% | 0.00% |
| Top 10 Holdings | |
| TENCENT HOLDINGS LTD (China) | 10.36% |
| ALIBABA GROUP HOLDING LTD (China) | 8.27% |
| TAIWAN SEMIC CO LTD (Taiwan) | 7.08% |
| CHINA CONSTRUCTION BANK CORP (China) | 6.70% |
| PING AN INSURANCE (China) | 4.30% |
| SUN HUNG KAI PROPERTIES LTD (H.K.) | 4.04% |
| CHINA MERCHANTS BANK CO LTD (China) | 4.00% |
| HK EXCHANGES & CLEARING LTD (H.K.) | 2.71% |
| GLOBALWAFERS CO LTD (Taiwan) | 2.45% |
| CHINA EVERBRIGHT INTL (China) | 2.28% |
| Portfolio Characteristics | ||
| Fund | Benchmark1 | |
| P/E Ratio | 17.00 | 16.37 |
| P/B Ratio | 2.25 | 1.97 |
| Issues in Portfolio | 48 | 290 |
| Foreign Holdings (%) | 98.44 | 100.00 |
| Other assets & liabilities (%) | 1.56 | 0.00 |
| Yield (%) | 1.91 | 2.04 |
Source: IDS GmbH - Analysis and Reporting Services, a subsidiary of Allianz SE.
| 1. | MSCI Golden Dragon Index. |
The China Fund, Inc.
Distribution History (10 Year)
| Declaration Date | Ex-dividend Date | Record Date | Payable Date | Distribution/ Share | Income | Long-term Capital Gain | Short-term Capital Gain |
| 12/8/08 | 12/22/08 | 12/24/08 | 1/23/09 | $5.81740 | $0.48130 | $5.33610 | — |
| 12/9/09 | 12/22/09 | 12/24/09 | 12/29/09 | $0.25570 | $0.25570 | — | — |
| 12/8/10 | 12/21/10 | 12/24/10 | 12/29/10 | $2.27420 | $0.37460 | $1.89960 | — |
| 12/8/11 | 12/21/11 | 12/23/11 | 12/29/11 | $2.99640 | $0.17420 | $2.82220 | — |
| 12/10/12 | 12/20/12 | 12/24/12 | 12/28/12 | $3.25170 | $0.34730 | $2.90440 | — |
| 12/13/13 | 12/19/13 | 12/23/13 | 12/27/13 | $3.31400 | $0.43870 | $2.87530 | — |
| 12/8/14 | 12/18/14 | 12/22/14 | 1/5/15 | $3.76510 | $0.29820 | $3.46690 | — |
| 12/16/15 | 12/23/15 | 12/28/15 | 1/6/16 | $1.49580 | $0.21330 | $0.84620 | $0.43630 |
| 12/9/16 | 12/19/16 | 12/21/16 | 1/5/17 | $0.46780 | $0.46780 | — | — |
| 12/8/17 | 12/18/17 | 12/19/17 | 1/4/18 | $0.54930 | $0.54930 | — | — |
Distribution/Share includes Income, Long-term Capital gains and Short-term Capital gains.
The China Fund NAV Performance of $10,000 since inception
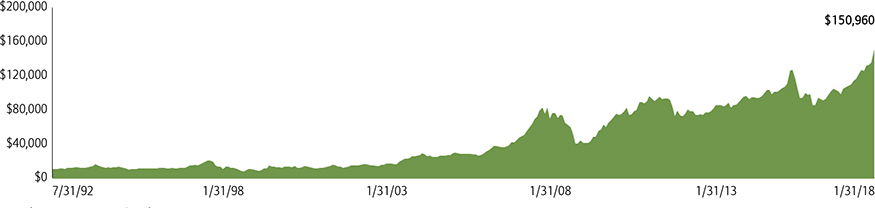
Past performance is not a guide to future returns.
Index Description
MSCI Golden Dragon Index
TheMSCI Golden Dragon Index captures the equity market performance of large and mid cap China securities (H shares, B shares, Red-Chips and P-Chips) and non-domestic China securities listed in Hong Kong and Taiwan.
It is not possible to invest directly in an index.
The China Fund, Inc.
Portfolio in Full
| Sector | Company (exchange ticker) | Market Price | Holding | Value US$ | % of net assets |
| Information Technology | 38.95 | ||||
| TENCENT HOLDINGS LTD | 700 | 463.60 | 719,000 | 42,618,030 | 10.36 |
| ALIBABA GROUP HOLDING LTD ADR | BABA | 204.29 | 166,500 | 34,014,285 | 8.27 |
| TAIWAN SEMICONDUCTOR MANUFACTURING CO LTD | 2330 | 255.00 | 3,332,000 | 29,152,356 | 7.08 |
| GLOBALWAFERS CO LTD | 6488 | 446.00 | 660,000 | 10,099,672 | 2.45 |
| NANYA TECHNOLOGY CORP | 2408 | 79.40 | 2,724,000 | 7,420,892 | 1.80 |
| LARGAN PRECISION CO LTD | 3008 | 4,005.00 | 52,000 | 7,145,528 | 1.74 |
| BAIDU INC ADR | BIDU | 246.92 | 24,101 | 5,951,019 | 1.45 |
| ASM PACIFIC TECHNOLOGY LTD | 522 | 106.80 | 433,500 | 5,919,451 | 1.44 |
| DIGITAL CHINA HOLDINGS LTD | 861 | 4.67 | 9,305,000 | 5,555,899 | 1.35 |
| WIN SEMICONDUCTORS CORP | 3105 | 261.00 | 501,000 | 4,486,490 | 1.09 |
| CHUNGHWA PRECISION TEST TECH CO LTD | 6510 | 1,190.00 | 99,000 | 4,042,133 | 0.98 |
| FOCUS MEDIA INFORMATION TE A | 002027 | 14.30 | 1,066,340 | 2,423,808 | 0.59 |
| GOLDPAC GROUP LTD | 3315 | 2.24 | 4,970,000 | 1,423,395 | 0.35 |
| Financials | 23.73 | ||||
| CHINA CONSTRUCTION BANK CORP | 939 | 9.02 | 23,898,000 | 27,560,631 | 6.70 |
| PING AN INSURANCE GROUP CO OF CHINA LTD | 2318 | 92.65 | 1,495,000 | 17,709,556 | 4.30 |
| CHINA MERCHANTS BANK CO LTD | 3968 | 38.35 | 3,356,500 | 16,457,849 | 4.00 |
| HONG KONG EXCHANGES & CLEARING LTD | 388 | 296.40 | 293,800 | 11,133,996 | 2.71 |
| BANK OF CHINA LTD | 3988 | 4.71 | 15,500,000 | 9,334,126 | 2.27 |
| CATHAY FINANCIAL HOLDING CO LTD | 2882 | 54.60 | 2,880,000 | 5,395,275 | 1.31 |
| FUBON FINANCIAL HOLDING CO LTD | 2881 | 54.20 | 2,805,000 | 5,216,277 | 1.27 |
| CITIC SECURITIES CO LTD | 6030 | 20.80 | 1,810,000 | 4,813,522 | 1.17 |
| Consumer Discretionary | 10.81 | ||||
| JD.COM INC ADR | JD | 49.23 | 152,727 | 7,518,750 | 1.83 |
| GALAXY ENTERTAINMENT GROUP LTD | 27 | 69.30 | 747,000 | 6,618,733 | 1.61 |
| NEW ORIENTAL EDUCATION & TECHNOLOGY GROUP ADR | EDU | 92.09 | 67,468 | 6,213,128 | 1.51 |
| SAIC MOTOR CORP LTD A | 600104 | 34.40 | 999,407 | 5,464,713 | 1.33 |
| CHINA INTERNATIONAL TRAVEL A | 601888 | 51.00 | 640,632 | 5,193,323 | 1.26 |
| QINGLING MOTORS CO LTD | 1122 | 2.64 | 14,816,000 | 5,000,990 | 1.22 |
| SANDS CHINA LTD | 1928 | 46.60 | 714,800 | 4,258,842 | 1.04 |
| LI & FUNG LTD | 494 | 3.99 | 8,120,000 | 4,142,380 | 1.01 |
| Industrials | 6.64 | ||||
| CHINA EVERBRIGHT INTERNATIONAL LTD | 257 | 11.96 | 6,146,000 | 9,398,202 | 2.28 |
| CN STATE CONSTRUCTION INTERNATIONAL HOLDINGS LTD | 3311 | 11.32 | 3,602,000 | 5,213,282 | 1.27 |
| QINGDAO PORT INTERNATIONAL CO LTD | 6198 | 5.76 | 6,077,000 | 4,475,409 | 1.09 |
| BEIJING ENTERPRISES HOLDINGS LTD | 392 | 48.05 | 591,000 | 3,630,797 | 0.88 |
| KING SLIDE WORKS CO LTD | 2059 | 395.50 | 185,000 | 2,510,422 | 0.61 |
| AIRTAC INTERNATIONAL GROUP | 1590 | 463.00 | 133,000 | 2,112,813 | 0.51 |
| Real Estate | 5.47 | ||||
| SUN HUNG KAI PROPERTIES LTD | 16 | 135.90 | 957,000 | 16,628,476 | 4.04 |
| CHINA OVERSEAS LAND & INVESTMENT LTD | 688 | 30.30 | 1,516,000 | 5,873,039 | 1.43 |
| Consumer Staples | 4.26 | ||||
| CHINA MENGNIU DAIRY CO LTD | 2319 | 25.55 | 2,872,000 | 9,382,021 | 2.28 |
| WH GROUP LTD | 288 | 9.69 | 5,069,500 | 6,280,728 | 1.53 |
| VINDA INTERNATIONAL HOLDINGS LTD | 3331 | 14.68 | 984,000 | 1,846,895 | 0.45 |
| Telecom Services | 3.45 | ||||
| CHINA UNICOM HONG KONG LTD | 762 | 11.72 | 3,660,000 | 5,484,408 | 1.33 |
| PCCW LTD | 8 | 4.51 | 8,623,000 | 4,972,285 | 1.21 |
| CHINA MOBILE LTD | 941 | 82.60 | 356,500 | 3,764,962 | 0.91 |
| Energy | 2.57 | ||||
| CHINA OILFIELD SERVICES LTD | 2883 | 9.33 | 5,540,000 | 6,608,646 | 1.61 |
| CHINA PETROLEUM & CHEMICAL CORP | 386 | 6.76 | 4,552,000 | 3,934,323 | 0.96 |
The China Fund, Inc.
Portfolio in Full
| Sector | Company (exchange ticker) | Market Price | Holding | Value US$ | % of net assets |
| Health Care | 1.28 | ||||
| CSPC PHARMACEUTICAL GROUP LTD | 1093 | 17.36 | 2,364,000 | 5,247,087 | 1.28 |
| Utilities | 0.80 | ||||
| CHINA RESOURCES POWER HOLDINGS CO LTD | 836 | 14.44 | 1,778,000 | 3,282,615 | 0.80 |
| Materials | 0.51 | ||||
| TIANGONG INTERNATIONAL CO LTD | 826 | 1.33 | 12,250,000 | 2,083,094 | 0.51 |
Source: State Street Bank and Trust Company, IDS GmbH - Analysis and Reporting Services, a subsidiary of Allianz SE.
Important Information:
Holdings are subject to change daily. The Fund seeks to achieve its objective through investment in the equity securities of companies and other entities with significant assets, investments, production activities, trading or other business interests in China or which derive a significant part of their revenue from China. Investing in non-U.S. securities entails additional risks, including political and economic risk and the risk of currency fluctuations, as well as lower liquidity. These risks, which can result in greater price volatility, will generally be enhanced in less diversified funds that concentrate investments in a particular geographic region.
The information contained herein has been obtained from sources believed to be reliable but Allianz Global Investors U.S. LLC and its affiliates do not warrant the information to be accurate, complete or reliable. The opinions expressed herein are subject to change at any time and without notice. Past performance is not indicative of future results. This material is not intended as an offer or solicitation for the purchase or sale of any financial instrument. Investors should consider the investment objectives, risks, charges and expenses of any mutual fund carefully before investing. This and other information is contained in the Fund's annual and semiannual reports, proxy statement and other Fund information, which may be obtained by contacting your financial advisor or visiting the Fund's website atwww.chinafundinc.com. This information is unaudited and is intended for informational purposes only. It is presented only to provide information on the Fund's holdings, performance and strategies. The Fund is a closed-end exchange traded management investment company. This material is presented only to provide information and is not intended for trading purposes. Closed-end funds, unlike open-end funds, are not continuously offered. After the initial public offering by a closed-end fund, its shares can be purchased and sold on the open market through a stock exchange, where shares may trade at a premium or a discount. The market price of holdings is subject to change daily.
P/E is a ratio of security price to earnings per share. Typically, an undervalued security is characterized by a low P/E ratio, while an overvalued security is characterized by a high P/E ratio. P/B is a ratio of the current stock price to the book value. This is used to identify undervalued stocks. Dividend yield is the annual percentage of return earned by an investor on a common or preferred stock. The average dividend yield is the dividend rate divided by current share price.
©2018 Allianz Global Investors Distributors LLC.
| Investment Products: Not FDIC Insured | May Lose Value | Not Bank Guaranteed | FS-CHN-0118 |