
Data as of 2/28/18
Manager's Commentary
Market Review
Contrary to strong performance in recent months, Greater China Equities retreated in February. Sentiment was affected by a drop in China's official manufacturing purchasing manager's index, and was further impacted by volatility in the US equity market. China's domestic liquidity also became tighter around the Chinese New Year, and weighed on the performance of China A-Shares. On the political front, the annual meeting of the National People's Congress ("NPC") and the meeting of the National Committee of the Chinese People's Political Consultative Conference ("CPPCC") will kick off in early March. President Xi's consolidation of power intensified as the NPC looked ready to remove the two-term limit on China's presidency. Taiwan and Hong Kong equities remained relatively defensive in February compared to Chinese equities.
Fund Review
In February, The China Fund, Inc. (the "Fund") slightly underperformed the MSCI Golden Dragon Index (the "benchmark"). On the positive side, the trend of rotation from winners to laggards continued. Sectors that struggled in 2017, including consumer sectors and industrials, outperformed the market. The Fund benefited from owning quality names in these sectors. For example, the top contributor over the month was China Everbright International Ltd, a leading waste and water treatment company in China. Strong capacity addition over the next two years, along with attractive valuation, led to the outperformance of this company during broad-based market correction.
Conversely, the Chinese banking sector was a clear detractor from performance with China Merchants Bank Co., Ltd ("China Merchant Bank") and China Construction Bank Corp. being the top two laggards.
The weakness in this sector was partly driven by concerns over overtightening by the Chinese Central Bank, especially given the policy uncertainty after the NPC and CPPCC meetings in March. However, from a fundamental perspective, we remain constructive on Chinese banks, given the healthy trend of nonperforming loan stabilization and undemanding valuations. In particular, we focus on banks with a strong deposit base which allows them to benefit in a tightening environment. Banks with a strong retail franchise, such as China Merchants Bank, also remain long term quality names to ride the household leveraging trend in China.
Outlook
First readings from the NPC meeting are encouraging. China set a 2018 Gross Domestic Product ("GDP") growth target at around 6.5% and omits the phrase "higher if possible" as mentioned last year. For 2018, stronger emphasis is put on quality of growth and financial stability. In particular, we should expect to see steady supply side reforms and consistent financial tightening and deleveraging efforts. This should contribute to the long-term sustainability of China's banking sector, while reducing systemic risk; therefore translating into lower equity risk premia. Of course, near term we could see potential credit risk amid escalating efforts to clean up companies having a difficult time operating without bailouts or unable to reduce debts , also known as "zombie companies", in China. But this should be largely priced in by the current depressed valuation of Chinese banks.
On the other hand, the "new economy" sectors such as information technology, green energy and advanced materials in China should continue to see healthy growth and become increasingly important contributors to GDP growth. We believe much of the growth will come from healthy consumer demand especially in terms of consumption upgrade. This is then translated into profitable growth for consumer companies that are willing to embrace a profitability focused business model rather than just chasing scale growth. Within our portfolio, we mainly focus on companies that continue to improve their product offerings. In other secular growth areas such as internet, environmental protection, infrastructure construction and hardware manufacturing, we focus on industry leaders with good execution track records and advanced technologies.
| In Brief | |
| Fund Data | |
| Description | Seeks to achieve long-term capital appreciation through investments in China companies. |
| Listing Date (NYSE) | July 10, 1992 |
| Total Fund Assets (millions) | $390.2 |
| Median Market Cap (in billions) | $14.0 |
| Distribution Frequency | Annual |
| Management Firm | Allianz Global Investors U.S. LLC |
| Portfolio Management | Christina Chung, CFA, CMA Lead Portfolio Manager |
Performance (US$ Returns) (as of 2/28/18) | ||
| Fund | Benchmark1 | |
| One Month | -5.20% | -5.08% |
| Three Month | 8.43% | 6.28% |
| One Year | 34.74% | 36.40% |
| Three Year | 10.44% | 11.98% |
| Net Asset Value / Market Price | |
| Net Asset Value (NAV) / Market Price at Inception | $13.15 / $14.26 |
| NAV / Market Price (as of 2/28/18) | $24.81 / $22.41 |
| High / Low Ranges (52-Week) | |
| High / Low NAV | $26.38 / $18.74 |
| High / Low Market Price | $24.70 / $16.00 |
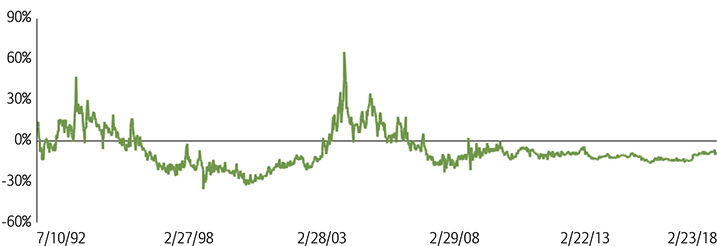
| Premium/Discount to NAV (as of 2/28/18) | -9.67% |
| Fund Data (Common Shares) | |
| Shares Outstanding | 15,722,675 |
| Average Daily Volume | 25,061 |
| Expense Ratio | 1.49% |
Fund Manager

Christina Chung, CFA, CMA
Lead Portfolio Manager
| 1. | MSCI Golden Dragon Index. |

The China Fund, Inc.
Investment Objective
The investment objective of The China Fund, Inc. (the "Fund") is to achieve long-term capital appreciation. The Fund seeks to achieve its objective through investment in the equity securities of companies and other entities with significant assets, investments, production activities, trading or other business interests in China or which derive a significant part of their revenue from China.
The Fund has an operating policy that the Fund will invest at least 80% of its assets in China companies. For this purpose, 'China companies' are (i) companies for which the principal securities trading market is in China; (ii) companies for which the principal securities trading market is outside of China or in companies organized outside of China, that in both cases derive at least 50% of their revenues from goods or services sold or produced, or have at least 50% of their assets in China; or (iii) companies organized in China. Under the policy, China means the People's Republic of China, including Hong Kong, and Taiwan. The Fund will provide its stockholders with at least 60 days' prior notice of any change to this policy.
| Returns For Periods Ended February 28, 2018* | ||||||||
| 1 Month | 3 Month | YTD | 1 Year | 3 Year | 5 Year | 10 Year | Inception | |
| NAV | -5.20% | 8.43% | 5.89% | 34.74% | 10.44% | 11.07% | 6.64% | 10.94% |
| Market Price | -6.62% | 6.92% | 3.51% | 42.21% | 10.93% | 10.98% | 7.96% | 10.16% |
| MSCI Golden Dragon Index | -5.08% | 6.28% | 4.30% | 36.40% | 11.98% | 11.04% | 6.09% | — |
| Calendar Year Returns | ||||||||
| 2010 | 2011 | 2012 | 2013 | 2014 | 2015 | 2016 | 2017 | |
| NAV | 27.26% | -24.37% | 12.12% | 18.31% | 7.82% | -5.51% | 0.60% | 37.92% |
| Market Price | 23.60% | -27.51% | 20.52% | 12.70% | 5.29% | -6.38% | -0.47% | 47.41% |
| MSCI Golden Dragon Index | 13.60% | -18.35% | 22.65% | 7.25% | 8.06% | -7.12% | 5.75% | 44.19% |
Past performance is not a guide to future returns.
* Annualized for periods greater than one year.
Source: State Street Bank and Trust Company. Source for index data: MSCI as at February 28, 2018. Investment returns are historical and do not guarantee future results. Investment returns reflect changes in net asset value and market price per share during each period and assumes that dividends and capital gains distributions, if any, were reinvested. The net asset value (NAV) percentages are not an indication of the performance of a shareholder's investment in the Fund, which is based on market price. NAV performance includes the deduction of management fees and other expenses. Market price performance does not include the deduction of brokerage commissions and other expenses of trading shares and would be lower had such commissions and expenses been deducted. It is not possible to invest directly in an index.
Premium/Discount
| Sector Allocation | ||
| Fund | Benchmark1 | |
| Information Technology | 38.26% | 38.36% |
| Financials | 22.71% | 23.73% |
| Consumer Discretionary | 11.53% | 8.79% |
| Industrials | 6.99% | 5.21% |
| Real Estate | 5.46% | 7.75% |
| Consumer Staples | 4.75% | 2.26% |
| Telecom Services | 3.33% | 3.64% |
| Energy | 2.44% | 2.91% |
| Health Care | 1.40% | 1.46% |
| Utilities | 0.79% | 3.04% |
| Materials | 0.77% | 2.85% |
| Other assets & liabilities | 1.56% | 0.00% |
Source: IDS GmbH - Analysis and Reporting Services, a subsidiary of Allianz SE.
| Country Allocation | ||
| Fund | Benchmark1 | |
| China | 85.58% | 77.86% |
| Hong Kong Red Chips | 21.45% | 7.76% |
| Hong Kong 'H' shares | 19.67% | 19.02% |
| Equity linked securities ('A' shares) | 0.00% | 0.00% |
| China 'A' & 'B' shares | 0.00% | 0.05% |
| Other Hong Kong securities | 44.46% | 34.59% |
| Others | 0.00% | 16.44% |
| Taiwan | 12.86% | 22.14% |
| Other assets & liabilities | 1.56% | 0.00% |
| Top 10 Holdings | |
| TENCENT HOLDINGS LTD (China) | 10.18% |
| ALIBABA GROUP HOLDING LTD (China) | 7.21% |
| TAIWAN SEMIC CO LTD (Taiwan) | 7.20% |
| CHINA CONSTRUCTION BANK CORP (China) | 6.38% |
| SUN HUNG KAI PROPERTIES LTD (H.K.) | 4.10% |
| PING AN INSURANCE (China) | 4.09% |
| CHINA MERCHANTS BANK CO LTD (China) | 3.63% |
| HK EXCHANGES & CLEARING LTD (H.K.) | 2.73% |
| GLOBALWAFERS CO LTD (Taiwan) | 2.47% |
| CHINA EVERBRIGHT INTL (China) | 2.44% |
| Portfolio Characteristics | ||
| Fund | Benchmark1 | |
| P/E Ratio | 15.99 | 15.55 |
| P/B Ratio | 2.12 | 1.92 |
| Issues in Portfolio | 49 | 291 |
| Foreign Holdings (%) | 98.44 | 100.00 |
| Other assets & liabilities (%) | 1.56 | 0.00 |
| Yield (%) | 2.08 | 2.21 |
Source: IDS GmbH - Analysis and Reporting Services, a subsidiary of Allianz SE.
| 1. | MSCI Golden Dragon Index. |
The China Fund, Inc.
Distribution History(10 Year)
| Declaration Date | Ex-dividend Date | Record Date | Payable Date | Distribution/ Share | Income | Long-term Capital Gain | Short-term Capital Gain |
| 12/8/08 | 12/22/08 | 12/24/08 | 1/23/09 | $5.81740 | $0.48130 | $5.33610 | — |
| 12/9/09 | 12/22/09 | 12/24/09 | 12/29/09 | $0.25570 | $0.25570 | — | — |
| 12/8/10 | 12/21/10 | 12/24/10 | 12/29/10 | $2.27420 | $0.37460 | $1.89960 | — |
| 12/8/11 | 12/21/11 | 12/23/11 | 12/29/11 | $2.99640 | $0.17420 | $2.82220 | — |
| 12/10/12 | 12/20/12 | 12/24/12 | 12/28/12 | $3.25170 | $0.34730 | $2.90440 | — |
| 12/13/13 | 12/19/13 | 12/23/13 | 12/27/13 | $3.31400 | $0.43870 | $2.87530 | — |
| 12/8/14 | 12/18/14 | 12/22/14 | 1/5/15 | $3.76510 | $0.29820 | $3.46690 | — |
| 12/16/15 | 12/23/15 | 12/28/15 | 1/6/16 | $1.49580 | $0.21330 | $0.84620 | $0.43630 |
| 12/9/16 | 12/19/16 | 12/21/16 | 1/5/17 | $0.46780 | $0.46780 | — | — |
| 12/8/17 | 12/18/17 | 12/19/17 | 1/4/18 | $0.54930 | $0.54930 | — | — |
Distribution/Share includes Income, Long-term Capital gains and Short-term Capital gains.
The China Fund NAV Performance of $10,000 since inception
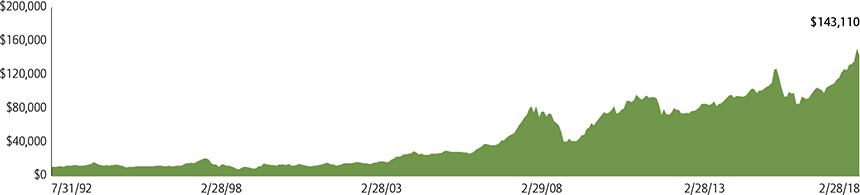
Past performance is not a guide to future returns.
Index Description
MSCI Golden Dragon Index
The MSCI Golden Dragon Index captures the equity market performance of large and mid cap China securities (H shares, B shares, Red-Chips and P-Chips) and non-domestic China securities listed in Hong Kong and Taiwan.
It is not possible to invest directly in an index.
The China Fund, Inc.
Portfolio in Full
| Sector | Company (exchange ticker) | Market Price | Holding | Value US$ | % of net assets |
| Information Technology | 38.28 | ||||
| TENCENT HOLDINGS LTD | 700 | 432.20 | 719,000 | 39,706,094 | 10.18 |
| ALIBABA GROUP HOLDING LTD ADR | BABA | 186.14 | 151,115 | 28,128,546 | 7.21 |
| TAIWAN SEMICONDUCTOR MANUFACTURING CO LTD | 2330 | 246.00 | 3,332,000 | 28,075,286 | 7.20 |
| GLOBALWAFERS CO LTD | 6488 | 426.00 | 660,000 | 9,630,251 | 2.47 |
| NANYA TECHNOLOGY CORP | 2408 | 80.80 | 2,724,000 | 7,538,806 | 1.93 |
| LARGAN PRECISION CO LTD | 3008 | 3,695.00 | 52,000 | 6,581,151 | 1.69 |
| ASM PACIFIC TECHNOLOGY LTD | 522 | 112.50 | 433,500 | 6,231,393 | 1.60 |
| BAIDU INC ADR | BIDU | 252.34 | 24,101 | 6,081,646 | 1.56 |
| DIGITAL CHINA HOLDINGS LTD | 861 | 4.43 | 9,305,000 | 5,267,004 | 1.35 |
| WIN SEMICONDUCTORS CORP | 3105 | 268.50 | 501,000 | 4,607,508 | 1.18 |
| CHUNGHWA PRECISION TEST TECH CO LTD | 6510 | 1,060.00 | 99,000 | 3,594,390 | 0.92 |
| FOCUS MEDIA INFORMATION TE A | 002027 | 15.02 | 1,066,340 | 2,529,442 | 0.65 |
| GOLDPAC GROUP LTD | 3315 | 2.08 | 4,970,000 | 1,320,880 | 0.34 |
| Financials | 22.72 | ||||
| CHINA CONSTRUCTION BANK CORP | 939 | 8.15 | 23,898,000 | 24,886,434 | 6.38 |
| PING AN INSURANCE GROUP CO OF CHINA LTD | 2318 | 83.45 | 1,495,000 | 15,940,834 | 4.09 |
| CHINA MERCHANTS BANK CO LTD | 3968 | 33.05 | 3,356,500 | 14,174,300 | 3.63 |
| HONG KONG EXCHANGES & CLEARING LTD | 388 | 284.00 | 293,800 | 10,661,385 | 2.73 |
| BANK OF CHINA LTD | 3988 | 4.27 | 15,500,000 | 8,456,742 | 2.17 |
| CATHAY FINANCIAL HOLDING CO LTD | 2882 | 54.50 | 2,880,000 | 5,376,171 | 1.38 |
| FUBON FINANCIAL HOLDING CO LTD | 2881 | 52.20 | 2,805,000 | 5,015,191 | 1.29 |
| CITIC SECURITIES CO LTD | 6030 | 17.72 | 1,810,000 | 4,098,131 | 1.05 |
| Consumer Discretionary | 11.54 | ||||
| JD.COM INC ADR | JD | 47.15 | 152,727 | 7,201,078 | 1.85 |
| GALAXY ENTERTAINMENT GROUP LTD | 27 | 68.50 | 747,000 | 6,538,147 | 1.68 |
| NEW ORIENTAL EDUCATION & TECHNOLOGY GROUP ADR | EDU | 91.39 | 67,468 | 6,165,901 | 1.58 |
| SAIC MOTOR CORP LTD A | 600104 | 33.66 | 999,407 | 5,312,704 | 1.36 |
| CHINA INTERNATIONAL TRAVEL A | 601888 | 52.36 | 640,632 | 5,297,456 | 1.36 |
| QINGLING MOTORS CO LTD | 1122 | 2.52 | 14,816,000 | 4,770,622 | 1.22 |
| LI & FUNG LTD | 494 | 3.95 | 8,120,000 | 4,098,233 | 1.05 |
| SANDS CHINA LTD | 1928 | 44.15 | 532,400 | 3,003,394 | 0.77 |
| MGM CHINA HOLDINGS LTD | 2282 | 23.05 | 883,600 | 2,602,377 | 0.67 |
| Industrials | 6.98 | ||||
| CHINA EVERBRIGHT INTERNATIONAL LTD | 257 | 12.12 | 6,146,000 | 9,517,846 | 2.44 |
| CN STATE CONSTRUCTION INTERNATIONAL HOLDINGS LTD | 3311 | 10.66 | 3,602,000 | 4,906,191 | 1.26 |
| QINGDAO PORT INTERNATIONAL CO LTD | 6198 | 5.68 | 6,077,000 | 4,410,431 | 1.13 |
| BEIJING ENTERPRISES HOLDINGS LTD | 392 | 43.55 | 591,000 | 3,288,661 | 0.84 |
| KING SLIDE WORKS CO LTD | 2059 | 426.00 | 185,000 | 2,699,389 | 0.69 |
| AIRTAC INTERNATIONAL GROUP | 1590 | 535.00 | 133,000 | 2,437,191 | 0.62 |
| Real Estate | 5.47 | ||||
| SUN HUNG KAI PROPERTIES LTD | 16 | 130.70 | 957,000 | 15,981,997 | 4.10 |
| CHINA OVERSEAS LAND & INVESTMENT LTD | 688 | 27.50 | 1,516,000 | 5,326,911 | 1.37 |
| Consumer Staples | 4.75 | ||||
| CHINA MENGNIU DAIRY CO LTD | 2319 | 25.85 | 2,872,000 | 9,486,117 | 2.43 |
| WH GROUP LTD | 288 | 9.70 | 5,726,000 | 7,096,866 | 1.82 |
| VINDA INTERNATIONAL HOLDINGS LTD | 3331 | 15.52 | 984,000 | 1,951,328 | 0.50 |
| Telecom Services | 3.34 | ||||
| PCCW LTD | 8 | 4.46 | 8,623,000 | 4,914,018 | 1.26 |
| CHINA UNICOM HONG KONG LTD | 762 | 10.14 | 3,660,000 | 4,742,011 | 1.22 |
| CHINA MOBILE LTD | 941 | 73.40 | 356,500 | 3,343,483 | 0.86 |
| Energy | 2.44 | ||||
| CHINA OILFIELD SERVICES LTD | 2883 | 8.26 | 5,540,000 | 5,847,003 | 1.50 |
The China Fund, Inc.
Portfolio in Full
| Sector | Company (exchange ticker) | Market Price | Holding | Value US$ | % of net assets |
| CHINA PETROLEUM & CHEMICAL CORP | 386 | 6.30 | 4,552,000 | 3,664,260 | 0.94 |
| Health Care | 1.40 | ||||
| CSPC PHARMACEUTICAL GROUP LTD | 1093 | 18.08 | 2,364,000 | 5,461,217 | 1.40 |
| Utilities | 0.79 | ||||
| CHINA RESOURCES POWER HOLDINGS CO LTD | 836 | 13.62 | 1,778,000 | 3,094,228 | 0.79 |
| Materials | 0.77 | ||||
| TIANGONG INTERNATIONAL CO LTD | 826 | 1.50 | 15,766,000 | 3,021,734 | 0.77 |
Source: State Street Bank and Trust Company, IDS GmbH - Analysis and Reporting Services, a subsidiary of Allianz SE.
Important Information:
Holdings are subject to change daily. The Fund seeks to achieve its objective through investment in the equity securities of companies and other entities with significant assets, investments, production activities, trading or other business interests in China or which derive a significant part of their revenue from China. Investing in non-U.S. securities entails additional risks, including political and economic risk and the risk of currency fluctuations, as well as lower liquidity. These risks, which can result in greater price volatility, will generally be enhanced in less diversified funds that concentrate investments in a particular geographic region.
The information contained herein has been obtained from sources believed to be reliable but Allianz Global Investors U.S. LLC and its affiliates do not warrant the information to be accurate, complete or reliable. The opinions expressed herein are subject to change at any time and without notice. Past performance is not indicative of future results. This material is not intended as an offer or solicitation for the purchase or sale of any financial instrument. Investors should consider the investment objectives, risks, charges and expenses of any mutual fund carefully before investing. This and other information is contained in the Fund's annual and semiannual reports, proxy statement and other Fund information, which may be obtained by contacting your financial advisor or visiting the Fund's website at www.chinafundinc.com. This information is unaudited and is intended for informational purposes only. It is presented only to provide information on the Fund's holdings, performance and strategies. The Fund is a closed-end exchange traded management investment company. This material is presented only to provide information and is not intended for trading purposes. Closed-end funds, unlike open-end funds, are not continuously offered. After the initial public offering by a closed-end fund, its shares can be purchased and sold on the open market through a stock exchange, where shares may trade at a premium or a discount. The market price of holdings is subject to change daily.
P/E is a ratio of security price to earnings per share. Typically, an undervalued security is characterized by a low P/E ratio, while an overvalued security is characterized by a high P/E ratio. P/B is a ratio of the current stock price to the book value. This is used to identify undervalued stocks. Dividend yield is the annual percentage of return earned by an investor on a common or preferred stock. The average dividend yield is the dividend rate divided by current share price.
© 2018 Allianz Global Investors Distributors LLC.
| Investment Products: Not FDIC Insured | May Lose Value | Not Bank Guaranteed | FS-CHN-0218 |