
Data as of 5/31/18
| Manager's Commentary |
Market Review
The Greater China equity markets ended May with positive returns in U.S. Dollar ("USD") terms. The positive returns could mostly be attributed to new economy areas such as consumers, health care and information technology ("IT"), while macro sensitive sectors such as financials and real estate lagged behind over concerns of an economic slowdown and liquidity tightening in mainland China. On a country level, the Taiwan equity market continued to lag Hong Kong and China, as slowing smartphone demand continued to cast a shadow on the Taiwan-based hardware component makers.
Fund Review
The China Fund, Inc. (the "Fund") outperformed its benchmark in May 2018. Stock selection in the consumer discretionary and IT sectors was the main contributor. Among the top contributors was China International Travel Service Limited, a China A-Shares listed, nationwide duty free store operator in China. The company's key growth driver is the rising affluence of the Chinese population and their desire to travel, both within China and around the world. This is a good example of how the Fund utilizes the Shanghai-Hong Kong Stock Connect to buy China A-Shares that complement our other China equity exposure. The Fund typically focuses on names that are difficult to find in stock exchanges outside of China. Another stock that contributed significantly was Globalwafers Co. Ltd., a specialist wafer manufacturer based in Taiwan. We expect the silicon wafer industry to be a sellers' market with steady demand growth, driven by memory demand, and disciplined industry capacity planning. While fundamentals stay solid, the stock has re-rated significantly over the past year and we have been taking some profit on this name.
The top detractors came mainly from the banking sector, including China Merchants Bank Co. Ltd. and China Construction Bank Corporation. The overall Chinese banking sector traded lower in May due to concerns over liquidity tightening and a slowdown in mainland China. However, we believe large banks with a strong deposit base and well-known consumer banking franchises should be able to distinguish themselves during the tough times. Many of the stronger quality names are still trading at attractive valuations, especially compared to their Asian peers.
Outlook
Over the month, the trade conflict between the United States and China again took center stage. In particular, the Untied States has indicated imposing tariffs on a list of imports from China which could include high tech products. There may also be investment restrictions related to acquisitions of industrially significant technology. Again, these announcements reiterated our thesis that this round of trade conflicts is intended to ensure the technology leadership of the Untied States. Therefore, we expect a continuous news flow on the trade topic in the near term, which will likely be a headwind for the Greater China equity market, especially for export-related and macro-sensitive names.
Under such an environment, we believe companies that mainly capture the domestic growth story should continue to benefit. It is also quite encouraging to see good earnings momentum from these areas as well. For example, one area where we continue to find interesting ideas is the consumer sector. We primarily focus on names that can benefit from the rising consumption power of Chinese tourists and consumers, including duty free stores, after school education, e-commerce, leisure and entertainment, and high end consumer brands. Within technology, we take a relatively diversified approach and own names that should benefit from different growth drivers such as internet gaming, smart city, smartphone function upgrade and semiconductor upcycle. At the same time, we are maintaining our long-term conviction names in areas such as environmental protection and infrastructure build-out. These positions are funded by underweights in ex-growth areas such as materials and Taiwan financials.
| In Brief | |
| Fund Data | |
| Description | Seeks to achieve longterm capital appreciation through investments in China companies. |
| Listing Date (NYSE) | July 10, 1992 |
| Total Fund Assets (millions) | $385.9 |
| Median Market Cap (in billions) | $15.7 |
| Distribution Frequency | Annual |
| Management Firm | Allianz Global Investors U.S. LLC |
| Portfolio Management | Christina Chung, CFA, CMA Lead Portfolio Manager |
Performance (US$ Returns) (as of 5/31/18) | ||
| Fund | Benchmark1 | |
| One Month | 2.04% | 1.17% |
| Three Month | -1.09% | -1.44% |
| One Year | 25.00% | 23.01% |
| Three Year | 3.84% | 7.76% |
| Net Asset Value / Market Price | |
| Net Asset Value (NAV) / Market Price at Inception | $13.15 / $14.26 |
| NAV / Market Price (as of 5/31/18) | $24.54 / $22.07 |
| High / Low Ranges (52-Week) | |
| High / Low NAV | $26.38 / $20.11 |
| High / Low Market Price | $24.70 / $17.93 |
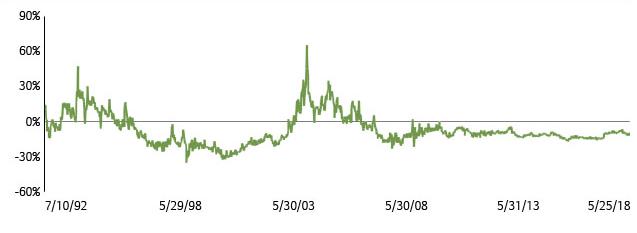
| Premium/Discount to NAV (as of 5/31/18) | -10.07% |
| Fund Data (Common Shares) | |
| Shares Outstanding | 15,722,675 |
| Average Daily Volume | 24,562 |
| Expense Ratio | 1.49% |
Fund Manager

Christina Chung, CFA, CMA
Lead Portfolio Manager
1. MSCI Golden Dragon Index.
The China Fund, Inc.
| Investment Objective |
The investment objective of The China Fund, Inc. (the "Fund") is to achieve long-term capital appreciation. The Fund seeks to achieve its objective through investment in the equity securities of companies and other entities with significant assets, investments, production activities, trading or other business interests in China or which derive a significant part of their revenue from China.
The Fund has an operating policy that the Fund will invest at least 80% of its assets in China companies. For this purpose, 'China companies' are (i) companies for which the principal securities trading market is in China; (ii) companies for which the principal securities trading market is outside of China or in companies organized outside of China, that in both cases derive at least 50% of their revenues from goods or services sold or produced, or have at least 50% of their assets in China; or (iii) companies organized in China. Under the policy, China means the People's Republic of China, including Hong Kong, and Taiwan. The Fund will provide its stockholders with at least 60 days' prior notice of any change to this policy.
| Returns For Periods Ended May 31,2018* | ||||||||
| 1 Month | 3 Month | YTD | 1 Year | 3 Year | 5 Year | 10 Year | Inception | |
| NAV | 2.04% | -1.09% | 4.74% | 25.00% | 3.84% | 10.09% | 6.91% | 10.79% |
| Market Price | 2.84% | -1.52% | 1.94% | 25.38% | 5.66% | 10.94% | 7.09% | 9.99% |
| MSCI Golden Dragon Index | 1.17% | -1.44% | 2.80% | 23.01% | 7.76% | 11.03% | 5.96% | — |
| Calendar Year Returns | ||||||||
| 2010 | 2011 | 2012 | 2013 | 2014 | 2015 | 2016 | 2017 | |
| NAV | 27.26% | -24.37% | 12.12% | 18.31% | 7.82% | -5.51% | 0.60% | 37.92% |
| Market Price | 23.60% | -27.51% | 20.52% | 12.70% | 5.29% | -6.38% | -0.47% | 47.41% |
| MSCI Golden Dragon Index | 13.60% | -18.35% | 22.65% | 7.25% | 8.06% | -7.12% | 5.75% | 44.19% |
Past performance is not a guide to future returns.
| * | Annualized for periods greater than one year. |
Source: State Street Bank and Trust Company. Source for index data: MSCI as at May 31, 2018. Investment returns are historical and do not guarantee future results. Investment returns reflect changes in net asset value and market price per share during each period and assumes that dividends and capital gains distributions, if any, were reinvested. The net asset value (NAV) percentages are not an indication of the performance of a shareholder's investment in the Fund, which is based on market price. NAV performance includes the deduction of management fees and other expenses. Market price performance does not include the deduction of brokerage commissions and other expenses of trading shares and would be lower had such commissions and expenses been deducted. It is not possible to invest directly in an index.
Premium/Discount
| Sector Allocation | ||
| Fund | Benchmark1 | |
Information Technology | 38.06% | 36.21% |
| Financials | 22.64% | 23.24% |
Consumer Discretionary | 11.28% | 8.71% |
| Industrials | 6.19% | 5.41% |
| Real Estate | 5.85% | 8.21% |
| Consumer Staples | 4.74% | 2.52% |
| Telecom Services | 2.57% | 3.42% |
| Energy | 2.44% | 3.23% |
| Health Care | 1.79% | 2.32% |
| Utilities | 1.69% | 3.41% |
| Materials | 0.98% | 3.30% |
| Other assets & liabilities | 1.77% | 0.00% |
Source: IDS GmbH - Analysis and Reporting Services, a subsidiary of Allianz SE.
| Country Allocation | ||
| Fund | Benchmark1 | |
| China | 80.16% | 79.05% |
| Hong Kong Red Chips | 12.32% | 8.05% |
| Hong Kong 'H' shares | 19.87% | 19.08% |
| Equity linked securities ('A' shares) | 0.00% | 0.00% |
| China 'A' & 'B' shares | 2.98% | 0.84% |
| Other Hong Kong securities | 44.99% | 34.54% |
| Others | 0.00% | 16.54% |
| Taiwan | 18.07% | 20.95% |
| Other assets & liabilities | 1.77% | 0.00% |
| Top 10 Holdings | ||
| TENCENT HOLDINGS LTD (China) | 9.48% | |
| ALIBABA GROUP HOLDING LTD (China) | 6.95% | |
| TAIWAN SEMIC CO LTD (Taiwan) | 6.45% | |
| CHINA CONSTRUCTION BANK CORP (China) | 6.25% | |
| SUN HUNG KAI PROPERTIES LTD (H.K.) | 3.91% | |
| CHINA MERCHANTS BANK CO LTD (China) | 3.58% | |
| AIA GROUP LTD (H.K.) | 3.09% | |
| CHINA EVERBRIGHT INTL (China) | 2.49% | |
| HK EXCHANGES & CLEARING LTD (H.K.) | 2.46% | |
| NANYA TECHNOLOGY CORP (Taiwan) | 2.35% |
| Portfolio Characteristics | ||
| Fund | Benchmark1 | |
| P/E Ratio | 14.12 | 13.74 |
| P/B Ratio | 1.86 | 1.68 |
| Issues in Portfolio | 52 | 583 |
| Foreign Holdings (%) | 98.23 | 100.00 |
| Other assets & liabilities (%) | 1.77 | 0.00 |
| Yield (%) | 2.20 | 2.44 |
Source: IDS GmbH - Analysis and Reporting Services, a subsidiary of Allianz SE.
1. MSCI Golden Dragon Index.
| The China Fund, Inc. |
| Distribution History (10 Year) |
| Declaration Date | Ex-dividend Date | Record Date | Payable Date | Distribution/ Share | Income | Long-term Capital Gain | Short-term Capital Gain |
| 12/8/08 | 12/22/08 | 12/24/08 | 1/23/09 | $5.81740 | $0.48130 | $5.33610 | — |
| 12/9/09 | 12/22/09 | 12/24/09 | 12/29/09 | $0.25570 | $0.25570 | — | — |
| 12/8/10 | 12/21/10 | 12/24/10 | 12/29/10 | $2.27420 | $0.37460 | $1.89960 | — |
| 12/8/11 | 12/21/11 | 12/23/11 | 12/29/11 | $2.99640 | $0.17420 | $2.82220 | — |
| 12/10/12 | 12/20/12 | 12/24/12 | 12/28/12 | $3.25170 | $0.34730 | $2.90440 | — |
| 12/13/13 | 12/19/13 | 12/23/13 | 12/27/13 | $3.31400 | $0.43870 | $2.87530 | — |
| 12/8/14 | 12/18/14 | 12/22/14 | 1/5/15 | $3.76510 | $0.29820 | $3.46690 | — |
| 12/16/15 | 12/23/15 | 12/28/15 | 1/6/16 | $1.49580 | $0.21330 | $0.84620 | $0.43630 |
| 12/9/16 | 12/19/16 | 12/21/16 | 1/5/17 | $0.46780 | $0.46780 | — | — |
| 12/8/17 | 12/18/17 | 12/19/17 | 1/4/18 | $0.54930 | $0.54930 | — | — |
| Distribution/Share includes Income, Long-term Capital gains and Short-term Capital gains. |
| The China Fund NAV Performance of $10,000 since inception |
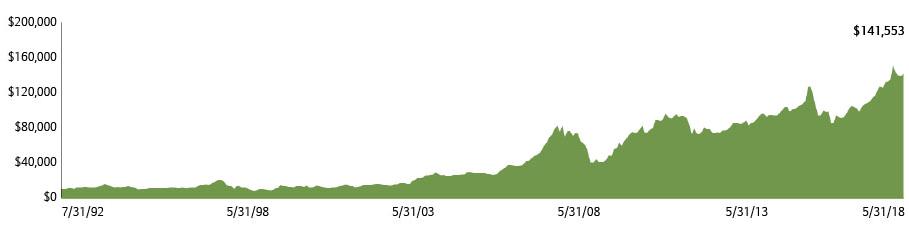
| Past performance is not a guide to future returns. |
| Index Description |
MSCI Golden Dragon Index
The MSCI Golden Dragon Index captures the equity market performance of large and mid cap China securities (H shares, B shares, Red-Chips and P-Chips) and non-domestic China securities listed in Hong Kong and Taiwan.
It is not possible to invest directly in an index. |
The China Fund, Inc.
Portfolio in Full
| Sector | Company (exchange ticker) | Market Price | Holding | Value US$ | % of net assets |
| Information Technology | 38.03 | ||||
| TENCENT HOLDINGS LTD | 700 | 399.20 | 719,000 | 36,590,704 | 9.48 |
| ALIBABA GROUP HOLDING LTD ADR | BABA | 198.01 | 135,464 | 26,823,227 | 6.95 |
| TAIWAN SEMICONDUCTOR MANUFACTURING CO LTD | 2330 | 224.00 | 3,332,000 | 24,910,902 | 6.45 |
| NANYA TECHNOLOGY CORP | 2408 | 99.60 | 2,724,000 | 9,055,301 | 2.35 |
| GLOBALWAFERS CO LTD | 6488 | 593.00 | 379,000 | 7,501,193 | 1.94 |
| MEDIATEK INC | 2454 | 311.50 | 669,000 | 6,955,376 | 1.80 |
| DIGITAL CHINA HOLDINGS LTD | 861 | 5.12 | 9,305,000 | 6,073,481 | 1.57 |
| BAIDU INC ADR | BIDU | 242.56 | 24,101 | 5,845,939 | 1.51 |
| ASM PACIFIC TECHNOLOGY LTD | 522 | 103.00 | 433,500 | 5,692,167 | 1.47 |
| FOCUS MEDIA INFORMATION TE A | 002027 | 12.49 | 2,616,305 | 5,105,085 | 1.32 |
| WIN SEMICONDUCTORS CORP | 3105 | 243.50 | 501,000 | 4,071,675 | 1.05 |
| CHUNGHWA PRECISION TEST TECH CO LTD | 6510 | 807.00 | 138,000 | 3,716,970 | 0.96 |
| AAC TECHNOLOGIES HOLDINGS INC | 2018 | 118.10 | 208,500 | 3,139,116 | 0.81 |
| GOLDPAC GROUP LTD | 3315 | 2.23 | 4,970,000 | 1,412,904 | 0.37 |
| Financials | 22.63 | ||||
| CHINA CONSTRUCTION BANK CORP | 939 | 7.92 | 23,898,000 | 24,128,931 | 6.25 |
| CHINA MERCHANTS BANK CO LTD | 3968 | 32.30 | 3,356,500 | 13,821,033 | 3.58 |
| AIA GROUP LTD | 1299 | 72.00 | 1,300,200 | 11,934,219 | 3.09 |
| HONG KONG EXCHANGES & CLEARING LTD | 388 | 253.80 | 293,800 | 9,505,933 | 2.46 |
| BANK OF CHINA LTD | 3988 | 4.10 | 15,500,000 | 8,101,527 | 2.10 |
| PING AN INSURANCE GROUP CO OF CHINA LTD | 2318 | 76.90 | 778,500 | 7,631,964 | 1.98 |
| FUBON FINANCIAL HOLDING CO LTD | 2881 | 52.10 | 2,805,000 | 4,877,610 | 1.26 |
| CITIC SECURITIES CO LTD | 6030 | 19.78 | 1,482,500 | 3,738,284 | 0.97 |
| CATHAY FINANCIAL HOLDING CO LTD | 2882 | 53.60 | 2,030,000 | 3,631,594 | 0.94 |
| Consumer Discretionary | 11.29 | ||||
| NEW ORIENTAL EDUCATION & TECHNOLOGY GROUP ADR | EDU | 99.47 | 67,468 | 6,711,042 | 1.74 |
| GALAXY ENTERTAINMENT GROUP LTD | 27 | 69.05 | 747,000 | 6,575,604 | 1.70 |
| CHINA INTERNATIONAL TRAVEL A | 601888 | 67.73 | 603,932 | 6,390,301 | 1.66 |
| QINGLING MOTORS CO LTD | 1122 | 2.62 | 14,816,000 | 4,948,614 | 1.28 |
| BRILLIANCE CHINA AUTOMOTIVE HOLDINGS LTD | 1114 | 14.66 | 2,440,000 | 4,560,108 | 1.18 |
| MGM CHINA HOLDINGS LTD | 2282 | 22.80 | 1,536,000 | 4,464,547 | 1.16 |
| JD.COM INC ADR | JD | 35.18 | 100,616 | 3,539,671 | 0.92 |
| SANDS CHINA LTD | 1928 | 46.95 | 532,400 | 3,186,581 | 0.83 |
| LI & FUNG LTD | 494 | 3.05 | 8,120,000 | 3,157,237 | 0.82 |
| Industrials | 6.19 | ||||
| CHINA EVERBRIGHT INTERNATIONAL LTD | 257 | 11.72 | 6,422,000 | 9,595,094 | 2.49 |
| QINGDAO PORT INTERNATIONAL CO LTD | 6198 | 6.27 | 6,077,000 | 4,857,448 | 1.26 |
| CN STATE CONSTRUCTION INTERNATIONAL HOLDINGS LTD | 3311 | 9.69 | 3,602,000 | 4,449,578 | 1.15 |
| KING SLIDE WORKS CO LTD | 2059 | 438.00 | 185,000 | 2,704,471 | 0.70 |
| AIRTAC INTERNATIONAL GROUP | 1590 | 515.00 | 133,000 | 2,286,101 | 0.59 |
| Real Estate | 5.86 | ||||
| SUN HUNG KAI PROPERTIES LTD | 16 | 126.60 | 934,000 | 15,074,118 | 3.91 |
| CHINA OVERSEAS LAND & INVESTMENT LTD | 688 | 26.25 | 1,622,000 | 5,427,896 | 1.41 |
| COUNTRY GARDEN HOLDINGS CO LTD | 2007 | 15.38 | 1,062,000 | 2,082,247 | 0.54 |
| Consumer Staples | 4.74 | ||||
| CHINA MENGNIU DAIRY CO LTD | 2319 | 28.50 | 2,439,000 | 8,861,516 | 2.30 |
| WH GROUP LTD | 288 | 8.05 | 5,726,000 | 5,876,227 | 1.52 |
| VINDA INTERNATIONAL HOLDINGS LTD | 3331 | 14.06 | 1,984,000 | 3,556,136 | 0.92 |
| Telecom Services | 2.57 | ||||
| CHINA UNICOM HONG KONG LTD | 762 | 10.66 | 3,660,000 | 4,973,815 | 1.29 |
| CHINA MOBILE LTD | 941 | 70.00 | 356,500 | 3,181,331 | 0.82 |
| PCCW LTD | 8 | 4.62 | 3,006,000 | 1,770,444 | 0.46 |
The China Fund, Inc.
Portfolio in Full
| Sector | Company (exchange ticker) | Market Price | Holding | Value US$ | % of net assets |
| Energy | 2.44 | ||||
| CHINA OILFIELD SERVICES LTD | 2883 | 8.20 | 4,768,000 | 4,984,269 | 1.29 |
| CHINA PETROLEUM & CHEMICAL CORP | 386 | 7.67 | 4,552,000 | 4,450,912 | 1.15 |
| Health Care | 1.79 | ||||
| CSPC PHARMACEUTICAL GROUP LTD | 1093 | 24.55 | 2,208,000 | 6,910,380 | 1.79 |
| Utilities | 1.69 | ||||
| BEIJING ENTERPRISES HOLDINGS LTD | 392 | 43.35 | 591,000 | 3,266,088 | 0.85 |
| CHINA RESOURCES POWER HOLDINGS CO LTD | 836 | 16.06 | 1,582,000 | 3,238,943 | 0.84 |
| Materials | 0.96 | ||||
| TIANGONG INTERNATIONAL CO LTD | 826 | 1.61 | 17,970,000 | 3,688,292 | 0.96 |
Source: State Street Bank and Trust Company, IDS GmbH - Analysis and Reporting Services, a subsidiary of Allianz SE.
Important Information:
Holdings are subject to change daily. The Fund seeks to achieve its objective through investment in the equity securities of companies and other entities with significant assets, investments, production activities, trading or other business interests in China or which derive a significant part of their revenue from China. Investing in non-U.S. securities entails additional risks, including political and economic risk and the risk of currency fluctuations, as well as lower liquidity. These risks, which can result in greater price volatility, will generally be enhanced in less diversified funds that concentrate investments in a particular geographic region.
The information contained herein has been obtained from sources believed to be reliable but Allianz Global Investors U.S. LLC and its affiliates do not warrant the information to be accurate, complete or reliable. The opinions expressed herein are subject to change at any time and without notice. Past performance is not indicative of future results. This material is not intended as an offer or solicitation for the purchase or sale of any financial instrument. Investors should consider the investment objectives, risks, charges and expenses of any mutual fund carefully before investing. This and other information is contained in the Fund's annual and semiannual reports, proxy statement and other Fund information, which may be obtained by contacting your financial advisor or visiting the Fund's website at www.chinafundinc.com. This information is unaudited and is intended for informational purposes only. It is presented only to provide information on the Fund's holdings, performance and strategies. The Fund is a closed-end exchange traded management investment company. This material is presented only to provide information and is not intended for trading purposes. Closed-end funds, unlike open-end funds, are not continuously offered. After the initial public offering by a closed-end fund, its shares can be purchased and sold on the open market through a stock exchange, where shares may trade at a premium or a discount. The market price of holdings is subject to change daily.
P/E is a ratio of security price to earnings per share. Typically, an undervalued security is characterized by a low P/E ratio, while an overvalued security is characterized by a high P/E ratio. P/B is a ratio of the current stock price to the book value. This is used to identify undervalued stocks. Dividend yield is the annual percentage of return earned by an investor on a common or preferred stock. The average dividend yield is the dividend rate divided by current share price.
©2018 Allianz Global Investors Distributors LLC.
| Investment Products: Not FDIC Insured | May Lose Value | Not Bank Guaranteed | FS-CHN-0518 |