Manager's Commentary
Market Review
The Greater China equity markets declined in June. The main factors behind the decline included a slowdown in China's economic growth, tighter liquidity and the rising trade tensions between the United States and China, all of which impacted market sentiment. In response to concerns about the potential downside risks to the economy, the People's Bank of China, China's central bank, reduced the reserve requirement ratio for most banks by 0.5%. In terms of sectors, economically sensitive areas saw the most weakness. Health care names also saw profit-taking after previously strong performance. In contrast, select defensive sectors such as telecommunications and consumer staples only retreated slightly and were relative outperformers.
Fund Review
The China Fund, Inc. (the "Fund") underperformed its benchmark in June 2018. The main area of detraction came from information technology, where a number of the previous outperformers, especially Taiwan hardware makers, corrected sharply. We believe this is more associated with the negative sentiment rather than changes to the fundamental outlook. Areas we particularly like, and therefore continue to hold the stocks through this period of weakness, include 3D sensing and industrial automation.
On the other hand, we benefited from not owning shares in Industrial and Commercial Bank of China Limited ("ICBC"), one of the largest state-owned banks in China. The entire banking sector traded lower over concerns about trade conflict and macro deleveraging in China. At the same time, select small-caps stayed relatively resilient during the recent broad-based correction, including our holdings in a specialist steel product maker and a light truck manufacturer in China. These companies are driven by specific growth drivers and therefore were relatively less sensitive to the change in macro sentiment.
Outlook
China equities have corrected by close to 15% in U.S. Dollar ("USD") terms since the January 2018 peak. This correction has triggered concerns over whether this will be a repeat of the very severe 2015 market decline. We believe, however, there are significant differences. Current economic and corporate fundamentals are on a much sounder footing compared to two-and-half-years ago. For example, on a macroeconomic level, key indicators such as the Purchasing Manager Index ("PMI") and industrial profit growth are both significantly higher than in 2015. Corporate earnings have continued to see upward revisions even when risk concerns escalated in June. The difference this time is that China is faced with higher external risks, including trade conflict escalation, which are likely to remain as a headwind for the equity markets in the near term.
The government policy environment is also very different now compared to the period in 2015, which was characterized by monetary and fiscal easing. In contrast, the Chinese government is now focused on financial deleveraging in response to the significant credit growth in recent years. These policies have resulted in tighter liquidity, contributing to the recent poor performance in China equities. Over the long term, controlling the leverage in the economy should lead to a more sustainable growth profile for China, thus translating into lower-risk premia and stronger investor confidence. We expect the liquidity squeeze to ease if economic growth slows significantly, and would not be surprised to see easier monetary and fiscal policies in coming months.
The Fund maintains its focus on domestic growth opportunities. After the recent sell down, we believe many domestic growth stocks are trading at increasingly attractive valuations, allowing us to buy on weakness. Recent additions include Hong Kong banking stocks that can benefit from a rising interest rate environment. We also added to the Macau gaming sector, especially those with new project openings to attract more tourist visitations. The renewable energy sector and other environment-related companies have been our long-term investment themes, and we have also taken the opportunity to add on weakness. These positions are funded by reducing exposure to Hong Kong telecommunication companies and Chinese banks.
| In Brief | |
| Fund Data | |
| Description | Seeks to achieve long-term capital appreciation through investments in China companies. |
| Listing Date (NYSE) | July 10, 1992 |
| Total Fund Assets (millions) | $359.7 |
| Median Market Cap (in billions) | $12.6 |
| Distribution Frequency | Annual |
| Management Firm | Allianz Global Investors U.S. LLC |
| Portfolio Management | Christina Chung, CFA, CMA Lead Portfolio Manager |
Performance (US$ Returns (as of 6/30/2018) | ||
| Fund | Benchmark1 | |
| One Month | -6.76% | -4.35% |
| Three Month | -5.42% | -3.65% |
| One Year | 14.05% | 14.82% |
| Three Year | 4.13% | 7.72% |
| Net Asset Value / Market Price | |
| Net Asset Value (NAV) / Market Price at Inception | $13.15 / $14.26 |
| NAV / Market Price (as of 6/30/2018) | $22.88 / $20.90 |
| High / Low Ranges (52-Week) | |
| High / Low NAV | $26.38 / $20.26 |
| High / Low Market Price | $24.70 / $18.58 |
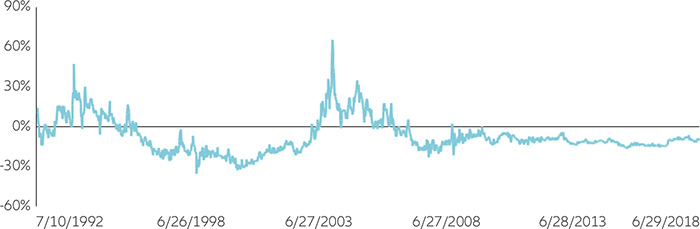
| Premium/Discount to NAV (as of 6/30/2018) | -8.65% |
| Fund Data (Common Shares) | |
| Shares Outstanding | 15,722,675 |
| Average Daily Volume | 24,395 |
| Expense Ratio | 1.49% |
Fund Manager

Christina Chung,
CFA, CMA
Lead Portfolio Manager
| 1. | MSCI Golden Dragon Index. |
Investment Products: NOT FDIC INSURED | MAY LOSE VALUE | NOT BANK GUARANTEED
1
Monthly Insights| As of 6/30/2018 | The China Fund, Inc.
Investment Objective
The investment objective of The China Fund, Inc. (the "Fund") is to achieve long-term capital appreciation. The Fund seeks to achieve its objective through investment in the equity securities of companies and other entities with significant assets, investments, production activities, trading or other business interests in China or which derive a significant part of their revenue from China.
The Fund has an operating policy that the Fund will invest at least 80% of its assets in China companies. For this purpose, 'China companies' are (i) companies for which the principal securities trading market is in China; (ii) companies for which the principal securities trading market is outside of China or in companies organized outside of China, that in both cases derive at least 50% of their revenues from goods or services sold or produced, or have at least 50% of their assets in China; or (iii) companies organized in China. Under the policy, China means the People's Republic of China, including Hong Kong, and Taiwan. The Fund will provide its stockholders with at least 60 days' prior notice of any change to this policy.
| Returns For Periods Ended June 30, 2018* | ||||||||
| 1 Month | 3 Month | YTD | 1 Year | 3 Year | 5 Year | 10 Year | Inception | |
| NAV | -6.76% | -5.42% | -2.35% | 14.05% | 4.13% | 9.91% | 7.49% | 10.45% |
| Market Price | -5.30% | -5.60% | -3.46% | 14.66% | 6.75% | 11.01% | 8.02% | 9.72% |
| MSCI Golden Dragon Index | -4.35% | -3.65% | -1.67% | 14.82% | 7.72% | 11.22% | 6.79% | — |
| Calendar Year Returns | ||||||||
| 2010 | 2011 | 2012 | 2013 | 2014 | 2015 | 2016 | 2017 | |
| NAV | 27.26% | -24.37% | 12.12% | 18.31% | 7.82% | -5.51% | 0.60% | 37.92% |
| Market Price | 23.60% | -27.51% | 20.52% | 12.70% | 5.29% | -6.38% | -0.47% | 47.41% |
| MSCI Golden Dragon Index | 13.60% | -18.35% | 22.65% | 7.25% | 8.06% | -7.12% | 5.75% | 44.19% |
Past performance is not a guide to future returns.
| * | Annualized for periods greater than one year. |
Source: State Street Bank and Trust Company. Source for index data: MSCI as at June 30, 2018. Investment returns are historical and do not guarantee future results. Investment returns reflect changes in net asset value and market price per share during each period and assumes that dividends and capital gains distributions, if any, were reinvested. The net asset value (NAV) percentages are not an indication of the performance of a shareholder's investment in the Fund, which is based on market price. NAV performance includes the deduction of management fees and other expenses. Market price performance does not include the deduction of brokerage commissions and other expenses of trading shares and would be lower had such commissions and expenses been deducted. It is not possible to invest directly in an index.
Premium/Discount
| Sector Allocation | ||
| Fund | Benchmark1 | |
| Information Technology | 36.28% | 36.65% |
| Financials | 22.87% | 22.83% |
| Consumer Discretionary | 9.11% | 8.66% |
| Real Estate | 6.32% | 8.10% |
| Industrials | 5.85% | 5.29% |
| Consumer Staples | 4.55% | 2.59% |
| Telecom Services | 2.52% | 3.56% |
| Energy | 2.38% | 3.25% |
| Health Care | 1.85% | 2.25% |
| Utilities | 1.81% | 3.46% |
| Materials | 1.06% | 3.36% |
| Other assets & liabilities | 5.39% | 0.00% |
Source: IDS GmbH - Analysis and Reporting Services, a subsidiary of Allianz SE.
| Country Allocation | ||
| Fund | Benchmark1 | |
| China | 77.96% | 78.56% |
| Hong Kong Red Chips | 13.22% | 8.14% |
| Hong Kong 'H' shares | 17.42% | 18.22% |
| Equity linked securities ('A' shares) | 0.00% | 0.00% |
| China 'A' & 'B' shares | 2.19% | 0.80% |
| Other Hong Kong securities | 45.13% | 34.61% |
| Others | 0.00% | 16.79% |
| Taiwan | 16.63% | 21.44% |
| Other assets & liabilities | 5.41% | 0.00% |
| Top 10 Holdings | |
| TENCENT HOLDINGS LTD (China) | 10.03% |
| ALIBABA GROUP HOLDING LTD (China) | 6.99% |
| TAIWAN SEMIC CO LTD (Taiwan) | 6.58% |
| CHINA CONSTRUCTION BANK CORP (China) | 5.63% |
| AIA GROUP LTD (H.K.) | 3.67% |
| HK EXCHANGES & CLEARING LTD (H.K.) | 2.46% |
| SUN HUNG KAI PROPERTIES LTD (H.K.) | 2.42% |
| CHINA EVERBRIGHT INTL (China) | 2.31% |
| CHINA MENGNIU DAIRY CO LTD (China) | 2.30% |
| BANK OF CHINA LTD (China) | 2.14% |
| Portfolio Characteristics | ||
| Fund | Benchmark1 | |
| P/E Ratio | 13.64 | 13.31 |
| P/B Ratio | 1.68 | 1.61 |
| Issues in Portfolio | 52 | 583 |
| Foreign Holdings (%) | 94.61 | 100.00 |
| Other assets & liabilities (%) | 5.39 | 0.00 |
| Yield (%) | 2.25 | 2.58 |
Source: IDS GmbH - Analysis and Reporting Services, a subsidiary of Allianz SE.
| 1. | MSCI Golden Dragon Index. |
Investment Products: NOT FDIC INSURED | MAY LOSE VALUE | NOT BANK GUARANTEED
2
Monthly Insights| As of 6/30/2018 | The China Fund, Inc.
| Distribution History (10 Year) | |||||||
| Declaration Date | Ex-dividend Date | Record Date | Payable Date | Distribution/ Share | Income | Long-term Capital Gain | Short-term Capital Gain |
| 12/8/2008 | 12/22/2008 | 12/24/2008 | 1/23/2009 | $5.81740 | $0.48130 | $5.33610 | — |
| 12/9/2009 | 12/22/2009 | 12/24/2009 | 12/29/2009 | $0.25570 | $0.25570 | — | — |
| 12/8/2010 | 12/21/2010 | 12/24/2010 | 12/29/2010 | $2.27420 | $0.37460 | $1.89960 | — |
| 12/8/2011 | 12/21/2011 | 12/23/2011 | 12/29/2011 | $2.99640 | $0.17420 | $2.82220 | — |
| 12/10/2012 | 12/20/2012 | 12/24/2012 | 12/28/2012 | $3.25170 | $0.34730 | $2.90440 | — |
| 12/13/2013 | 12/19/2013 | 12/23/2013 | 12/27/2013 | $3.31400 | $0.43870 | $2.87530 | — |
| 12/8/2014 | 12/18/2014 | 12/22/2014 | 1/5/2015 | $3.76510 | $0.29820 | $3.46690 | — |
| 12/16/2015 | 12/23/2015 | 12/28/2015 | 1/6/2016 | $1.49580 | $0.21330 | $0.84620 | $0.43630 |
| 12/9/2016 | 12/19/2016 | 12/21/2016 | 1/5/2017 | $0.46780 | $0.46780 | — | — |
| 12/8/2017 | 12/18/2017 | 12/19/2017 | 1/4/2018 | $0.54930 | $0.54930 | — | — |
Distribution/Share includes Income, Long-term Capital gains and Short-term Capital gains.
The China Fund NAV Performance of $10,000 since inception
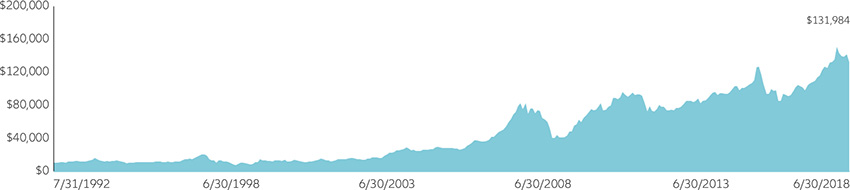
Past performance is not a guide to future returns.
Index Description
MSCI Golden Dragon Index
TheMSCI Golden Dragon Indexcaptures the equity market performance of large and mid cap China securities (H shares, B shares, Red-Chips and P-Chips) and non-domestic China securities listed in Hong Kong and Taiwan.
It is not possible to invest directly in an index.
Investment Products: NOT FDIC INSURED | MAY LOSE VALUE | NOT BANK GUARANTEED
3
Monthly Insights| As of 6/30/2018 | The China Fund, Inc.
| Portfolio in Full | |||||
| Sector | Company (exchange ticker) | Market Price | Holding | Value US$ | % of net assets |
| Information Technology | 36.28 | ||||
| TENCENT HOLDINGS LTD | 700 | 393.80 | 719,000 | 36,086,079 | 10.03 |
| ALIBABA GROUP HOLDING LTD | BABA | 185.53 | 135,464 | 25,132,636 | 6.99 |
| TAIWAN SEMICONDUCTOR MANUFACTURING CO LTD | 2330 | 216.50 | 3,332,000 | 23,660,659 | 6.58 |
| MEDIATEK INC | 2454 | 300.00 | 669,000 | 6,582,810 | 1.83 |
| GLOBALWAFERS CO LTD | 6488 | 507.00 | 379,000 | 6,302,475 | 1.75 |
| BAIDU INC | BIDU | 243.00 | 24,101 | 5,856,543 | 1.63 |
| ASM PACIFIC TECHNOLOGY LTD | 522 | 99.20 | 433,500 | 5,480,698 | 1.52 |
| DIGITAL CHINA HOLDINGS LTD | 861 | 4.30 | 9,305,000 | 5,099,410 | 1.42 |
| FOCUS MEDIA INFORMATION TE A | 002027 | 9.57 | 3,139,566 | 4,534,987 | 1.26 |
| CHUNGHWA PRECISION TEST TECH CO LTD | 6510 | 807.00 | 138,000 | 3,652,722 | 1.02 |
| WIN SEMICONDUCTORS CORP | 3105 | 219.50 | 501,000 | 3,606,917 | 1.00 |
| NANYA TECHNOLOGY CORP | 2408 | 83.20 | 1,188,000 | 3,241,931 | 0.90 |
| GOLDPAC GROUP LTD | 3315 | 1.98 | 4,970,000 | 1,254,171 | 0.35 |
| Financials | 22.87 | ||||
| CHINA CONSTRUCTION BANK CORP | 939 | 7.25 | 21,935,000 | 20,267,993 | 5.63 |
| AIA GROUP LTD | 1299 | 68.60 | 1,511,000 | 13,210,634 | 3.67 |
| HONG KONG EXCHANGES & CLEARING LTD | 388 | 236.00 | 293,800 | 8,836,879 | 2.46 |
| BANK OF CHINA LTD | 3988 | 3.89 | 15,500,000 | 7,684,514 | 2.14 |
| PING AN INSURANCE GROUP CO OF CHINA LTD | 2318 | 72.20 | 778,500 | 7,163,593 | 1.99 |
| BOC HONG KONG HOLDINGS LTD | 2388 | 36.95 | 1,471,500 | 6,929,626 | 1.93 |
| CHINA MERCHANTS BANK CO LTD | 3968 | 28.95 | 1,870,500 | 6,901,466 | 1.92 |
| FUBON FINANCIAL HOLDING CO LTD | 2881 | 51.10 | 2,805,000 | 4,701,297 | 1.31 |
| CATHAY FINANCIAL HOLDING CO LTD | 2882 | 53.80 | 2,030,000 | 3,582,138 | 1.00 |
| CITIC SECURITIES CO LTD | 6030 | 15.68 | 1,482,500 | 2,962,619 | 0.82 |
| Consumer Discretionary | 9.12 | ||||
| GALAXY ENTERTAINMENT GROUP LTD | 27 | 60.75 | 793,000 | 6,139,805 | 1.71 |
| QINGLING MOTORS CO LTD | 1122 | 2.41 | 14,816,000 | 4,550,751 | 1.27 |
| BRILLIANCE CHINA AUTOMOTIVE HOLDINGS LTD | 1114 | 14.16 | 2,440,000 | 4,403,400 | 1.22 |
| MGM CHINA HOLDINGS LTD | 2282 | 18.20 | 1,778,000 | 4,124,186 | 1.15 |
| JD.COM INC | JD | 38.95 | 100,616 | 3,918,993 | 1.09 |
| CHINA INTERNATIONAL TRAVEL A | 601888 | 64.49 | 342,932 | 3,338,065 | 0.93 |
| NEW ORIENTAL EDUCATION & TECHNOLOGY GROUP | EDU | 94.66 | 34,958 | 3,309,124 | 0.92 |
| LI & FUNG LTD | 494 | 2.88 | 8,120,000 | 2,980,462 | 0.83 |
| Real Estate | 6.32 | ||||
| SUN HUNG KAI PROPERTIES LTD | 16 | 118.40 | 576,000 | 8,691,791 | 2.42 |
| SWIRE PACIFIC LTD | 19 | 83.10 | 523,000 | 5,539,082 | 1.54 |
| CHINA OVERSEAS LAND & INVESTMENT LTD | 688 | 25.85 | 1,622,000 | 5,343,754 | 1.49 |
| COUNTRY GARDEN HOLDINGS CO LTD | 2007 | 13.80 | 1,786,000 | 3,141,200 | 0.87 |
| Industrials | 5.87 | ||||
| CHINA EVERBRIGHT INTERNATIONAL LTD | 257 | 10.14 | 6,422,000 | 8,299,336 | 2.31 |
| QINGDAO PORT INTERNATIONAL CO LTD | 6198 | 5.88 | 6,077,000 | 4,554,090 | 1.27 |
| CN STATE CONSTRUCTION INTERNATIONAL HOLDINGS LTD | 3311 | 8.05 | 3,602,000 | 3,695,513 | 1.03 |
| KING SLIDE WORKS CO LTD | 2059 | 430.50 | 185,000 | 2,612,214 | 0.73 |
| AIRTAC INTERNATIONAL GROUP | 1590 | 433.50 | 133,000 | 1,891,057 | 0.53 |
| Consumer Staples | 4.56 | ||||
| CHINA MENGNIU DAIRY CO LTD | 2319 | 26.60 | 2,439,000 | 8,268,534 | 2.30 |
| WH GROUP LTD | 288 | 6.39 | 5,726,000 | 4,663,235 | 1.30 |
| VINDA INTERNATIONAL HOLDINGS LTD | 3331 | 13.62 | 1,984,000 | 3,443,926 | 0.96 |
| Telecom Services | 2.52 | ||||
| CHINA UNICOM HONG KONG LTD | 762 | 9.80 | 3,660,000 | 4,571,327 | 1.27 |
| CHINA MOBILE LTD | 941 | 69.70 | 356,500 | 3,166,849 | 0.88 |
| PCCW LTD | 8 | 4.42 | 2,341,000 | 1,318,739 | 0.37 |
| Energy | 2.38 | ||||
| CHINA OILFIELD SERVICES LTD | 2883 | 7.41 | 4,768,000 | 4,502,871 | 1.25 |
| CHINA PETROLEUM & CHEMICAL CORP | 386 | 7.01 | 4,552,000 | 4,066,824 | 1.13 |
Investment Products: NOT FDIC INSURED | MAY LOSE VALUE | NOT BANK GUARANTEED
4
Monthly Insights| As of 6/30/2018 | The China Fund, Inc.
| Sector | Company (exchange ticker) | Market Price | Holding | Value US$ | % of net assets |
| Health Care | 1.85 | ||||
| CSPC PHARMACEUTICAL GROUP LTD | 1093 | 23.70 | 2,208,000 | 6,669,335 | 1.85 |
| Utilities | 1.81 | ||||
| CHINA LONGYUAN POWER GROUP CORP LTD | 916 | 6.32 | 4,521,000 | 3,641,553 | 1.01 |
| BEIJING ENTERPRISES HOLDINGS LTD | 392 | 38.20 | 591,000 | 2,877,305 | 0.80 |
| Materials | 1.06 | ||||
| TIANGONG INTERNATIONAL CO LTD | 826 | 1.66 | 17,970,000 | 3,801,817 | 1.06 |
Source: State Street Bank and Trust Company, IDS GmbH - Analysis and Reporting Services, a subsidiary of Allianz SE.
Important Information:
Holdings are subject to change daily. The Fund seeks to achieve its objective through investment in the equity securities of companies and other entities with significant assets, investments, production activities, trading or other business interests in China or which derive a significant part of their revenue from China. Investing in non-U.S. securities entails additional risks, including political and economic risk and the risk of currency fluctuations, as well as lower liquidity. These risks, which can result in greater price volatility, will generally be enhanced in less diversified funds that concentrate investments in a particular geographic region.
The information contained herein has been obtained from sources believed to be reliable but Allianz Global Investors U.S. LLC and its affiliates do not warrant the information to be accurate, complete or reliable. The opinions expressed herein are subject to change at any time and without notice. Past performance is not indicative of future results. This material is not intended as an offer or solicitation for the purchase or sale of any financial instrument. Investors should consider the investment objectives, risks, charges and expenses of any mutual fund carefully before investing. This and other information is contained in the Fund's annual and semiannual reports, proxy statement and other Fund information, which may be obtained by contacting your financial advisor or visiting the Fund's website at Investment Products: NOT FDIC INSURED | MAY LOSE VALUE | NOT BANK GUARANTEED. This information is unaudited and is intended for informational purposes only. It is presented only to provide information on the Fund's holdings, performance and strategies. The Fund is a closed-end exchange traded management investment company. This material is presented only to provide information and is not intended for trading purposes. Closed-end funds, unlike open-end funds, are not continuously offered. After the initial public offering by a closed-end fund, its shares can be purchased and sold on the open market through a stock exchange, where shares may trade at a premium or a discount. The market price of holdings is subject to change daily.
P/E is a ratio of security price to earnings per share. Typically, an undervalued security is characterized by a low P/E ratio, while an overvalued security is characterized by a high P/E ratio. P/B is a ratio of the current stock price to the book value. This is used to identify undervalued stocks. Dividend yield is the annual percentage of return earned by an investor on a common or preferred stock. The average dividend yield is the dividend rate divided by current share price.
| ©2018 Allianz Global Investors Distributors LLC, 1633 Broadway, New York, NY | FS-CHN-0618 |
Investment Products: NOT FDIC INSURED | MAY LOSE VALUE | NOT BANK GUARANTEED
5