
Manager's Commentary
Market Review
Contrary to the overall modest gain by global equities, the Greater China equity markets stayed largely flat during the month of July. This was predominately driven by the correction in China equities, which suffered from concerns over escalating trade conflicts with the United States, as well as a slowdown in domestic economic growth. This has led to some downward corporate earnings revisions and previously high expectations being reset amidst uncertainties. As a result, we saw profit taking in previous outperforming sectors including health care, information technology, consumer discretionary and real estate.
The Hong Kong and Taiwan markets ended the month higher in U.S. Dollar ("USD") terms. In particular, large-cap Taiwan tech giants led the market especially after the semiconductor leader Taiwan Semiconductor Manufacturing Co., Ltd. reported better than expected earnings. In Hong Kong, non-China related, domestic focused names performed well, including Hong Kong banks, utilities and select property developers.
Fund Review
The China Fund, Inc. (the "Fund") underperformed its benchmark in July 2018, driven by unfavorable country allocation and stock selection effects. In particular, an underweight in Taiwan equities hurt relative performance, especially given the resilient performance of that market. In terms of stock specifics, Brilliance China Automotive Holdings Ltd. continued to be a major detractor. This is a Chinese automobile manufacturer which operates a joint venture with BMW in China. The shares have been weak due to trade tensions with the United States, as well as a potentially unfavorable change to the joint venture shareholding structure. Early in August, the second quarter 2018 results came in above expectations. Furthermore, we believe the ownership situation is not as bad as feared by the market. Therefore the share price correction should have moved more than priced in the negative news. Another detractor was Win Semiconductors Corp., a Taiwan semiconductor company, which we believe should be a major beneficiary of the rising adoption of 3D sensing technology. While our long term view remains unchanged, we expect weak near term momentum due to high inventory levels, which need some time to be absorbed and have led to a short term earnings shortfall.
Positive contributors over the month were mainly turnaround names benefiting from structural trends in China. For example, among the top contributors was China Longyuan Power Group Corp., Ltd., the largest wind power producer in China. The company benefited from a recovery in wind farm utilization in June. Over the longer term, we believe this company is well positioned to enjoy rising demand for renewable energy in China. The valuation is also attractive with the price to book ratio below one.
Outlook
An important feature of our strategy is to look for underappreciated companies with turnaround potential and secular growth opportunities. With the recent external uncertainty, we have been increasingly focusing on names with good earnings visibility that are still ignored by the market. As a result, we have added to areas such as renewable energy, environmental protection and Chinese insurance. In particular, we prefer industry leaders where we are very comfortable with the management quality and competitive positioning. Another name which we recently initiated was a high end hotel operator. We believe the hotel industry downturn is coming to an end and with rising demand for travel and entertainment in China, this name should see a turnaround in its hotel and catering services.
Over the past months, China A-Shares have underperformed other Greater China markets, as domestic investors in China tend to be overly bearish under the current market headwinds. We have also utilized this opportunity to buy into high quality growth names which can be a good complement to the offshore China equity positioning. For example, we recently added to a health care company specializing in diabetes treatment in China.
| In Brief | |
| Fund Data | |
| Description | Seeks to achieve long-term capital appreciation through investments in China companies. |
| Listing Date (NYSE) | July 10, 1992 |
| Total Fund Assets (millions) | $354.0 |
| Median Market Cap (in billions) | $13.9 |
Distribution Frequency | Annual |
Management Firm | Allianz Global Investors U.S. LLC |
Portfolio Management | Christina Chung, CFA, CMA Lead Portfolio Manager |
Performance (US$ Returns) (as of 7/31/2018) | ||
| Fund | Benchmark1 | |
| One Month | -1.62% | 0.02% |
| Three Month | -6.40% | -3.21% |
| One Year | 6.16% | 7.87% |
| Three Year | 7.50% | 10.67% |
| Net Asset Value / Market Price | |
| Net Asset Value (NAV) / Market Price at Inception | $13.15 / $14.26 |
| NAV / Market Price (as of 7/31/2018) | $22.51 / $20.59 |
| High / Low Ranges (52-Week) | |
| High / Low NAV | $26.38 / $21.40 |
| High / Low Market Price | $24.70 / $19.45 |
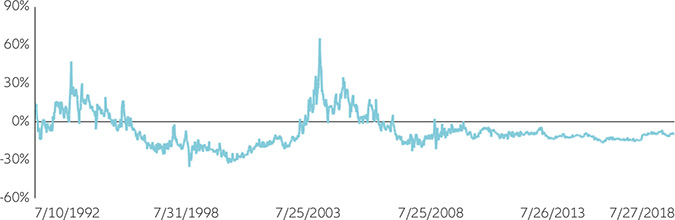
| Premium/Discount to NAV (as of 7/31/2018) | -8.53% |
| Fund Data (Common Shares) | |
| Shares Outstanding | 15,722,675 |
| Average Daily Volume | 24,043 |
| Expense Ratio | 1.49% |
Fund Manager

Christina Chung,
CFA, CMA
Lead Portfolio Manager
| 1. | MSCI Golden Dragon Index. |
Investment Products: NOT FDIC INSURED | MAY LOSE VALUE | NOT BANK GUARANTEED
Monthly Insights| As of 7/31/2018 | The China Fund, Inc.
Investment Objective
The investment objective of The China Fund, Inc. (the "Fund") is to achieve long-term capital appreciation. The Fund seeks to achieve its objective through investment in the equity securities of companies and other entities with significant assets, investments, production activities, trading or other business interests in China or which derive a significant part of their revenue from China.
The Fund has an operating policy that the Fund will invest at least 80% of its assets in China companies. For this purpose, 'China companies' are (i) companies for which the principal securities trading market is in China; (ii) companies for which the principal securities trading market is outside of China or in companies organized outside of China, that in both cases derive at least 50% of their revenues from goods or services sold or produced, or have at least 50% of their assets in China; or (iii) companies organized in China. Under the policy, China means the People's Republic of China, including Hong Kong, and Taiwan. The Fund will provide its stockholders with at least 60 days' prior notice of any change to this policy.
| Returns For Periods Ended July 31, 2018* | ||||||||
| 1 Month | 3 Month | YTD | 1 Year | 3 Year | 5 Year | 10 Year | Inception | |
| NAV | -1.62% | -6.40% | -3.93% | 6.16% | 7.50% | 8.84% | 7.63% | 10.35% |
| Market Price | -1.48% | -4.05% | -4.90% | 7.71% | 10.29% | 10.09% | 8.02% | 9.63% |
| MSCI Golden Dragon Index | 0.02% | -3.21% | -1.66% | 7.87% | 10.67% | 10.52% | 6.93% | — |
| Calendar Year Returns | ||||||||
| 2010 | 2011 | 2012 | 2013 | 2014 | 2015 | 2016 | 2017 | |
| NAV | 27.26% | -24.37% | 12.12% | 18.31% | 7.82% | -5.51% | 0.60% | 37.92% |
| Market Price | 23.60% | -27.51% | 20.52% | 12.70% | 5.29% | -6.38% | -0.47% | 47.41% |
| MSCI Golden Dragon Index | 13.60% | -18.35% | 22.65% | 7.25% | 8.06% | -7.12% | 5.75% | 44.19% |
Past performance is not a guide to future returns.
*Annualized for periods greater than one year.
Source: State Street Bank and Trust Company. Source for index data: MSCI as at July 31, 2018. Investment returns are historical and do not guarantee future results. Investment returns reflect changes in net asset value and market price per share during each period and assumes that dividends and capital gains distributions, if any, were reinvested. The net asset value (NAV) percentages are not an indication of the performance of a shareholder's investment in the Fund, which is based on market price. NAV performance includes the deduction of management fees and other expenses. Market price performance does not include the deduction of brokerage commissions and other expenses of trading shares and would be lower had such commissions and expenses been deducted. It is not possible to invest directly in an index.
Premium/Discount
| Sector Allocation | ||
| Fund | Benchmark1 | |
| Information Technology | 34.62% | 36.64% |
| Financials | 23.00% | 22.93% |
| Consumer Discretionary | 8.92% | 8.14% |
| Industrials | 6.59% | 5.48% |
| Real Estate | 6.56% | 8.20% |
| Consumer Staples | 3.74% | 2.53% |
| Energy | 3.48% | 3.28% |
| Utilities | 2.49% | 3.67% |
| Telecom Services | 2.18% | 3.58% |
| Health Care | 2.04% | 2.10% |
| Materials | 1.02% | 3.45% |
| Other assets & liabilities | 5.36% | 0.00% |
Source: IDS GmbH - Analysis and Reporting Services, a subsidiary of Allianz SE.
| Country Allocation | ||
| Fund | Benchmark1 | |
| China | 77.64% | 77.62% |
| Hong Kong Red Chips | 13.64% | 8.17% |
| Hong Kong 'H' shares | 19.84% | 18.39% |
| Equity linked securities ('A' shares) | 0.00% | 0.00% |
| China 'A' & 'B' shares | 3.18% | 0.79% |
| Other Hong Kong securities | 40.98% | 33.62% |
| Others | 0.00% | 16.66% |
| Taiwan | 17.00% | 22.38% |
| Other assets & liabilities | 5.36% | 0.00% |
| Top 10 Holdings | |
| TENCENT HOLDINGS LTD (China) | 8.12% |
| TAIWAN SEMIC CO LTD (Taiwan) | 7.84% |
| ALIBABA GROUP HOLDING LTD (China) | 6.66% |
| CHINA CONSTRUCTION BANK CORP (China) | 5.61% |
| AIA GROUP LTD (H.K.) | 3.73% |
| PING AN INSURANCE (China) | 2.78% |
| CHINA EVERBRIGHT INTL (China) | 2.67% |
| SUN HUNG KAI PROPERTIES LTD (H.K.) | 2.55% |
| HK EXCHANGES & CLEARING LTD (H.K.) | 2.45% |
| CHINA MERCHANTS BANK CO LTD (China) | 2.06% |
| Portfolio Characteristics | ||
| Fund | Benchmark | |
| P/E Ratio | 13.40 | 13.47 |
| P/B Ratio | 1.59 | 1.59 |
| Issues in Portfolio | 53 | 583 |
| Foreign Holdings (%) | 94.64 | 100.00 |
| Other assets & liabilities (%) | 5.36 | 0.00 |
| Yield (%) | 2.30 | 2.62 |
Source: IDS GmbH - Analysis and Reporting Services, a subsidiary of Allianz SE.
| 1. | MSCI Golden Dragon Index. |
Investment Products: NOT FDIC INSURED | MAY LOSE VALUE | NOT BANK GUARANTEED
Monthly Insights| As of 7/31/2018 | The China Fund, Inc.
| Distribution History (10 Year) | |||||||
| Declaration Date | Ex-dividend Date | Record Date | Payable Date | Distribution/ Share | Income | Long-term Capital Gain | Short-term Capital Gain |
| 12/8/2008 | 12/22/2008 | 12/24/2008 | 1/23/2009 | $5.81740 | $0.48130 | $5.33610 | — |
| 12/9/2009 | 12/22/2009 | 12/24/2009 | 12/29/2009 | $0.25570 | $0.25570 | — | — |
| 12/8/2010 | 12/21/2010 | 12/24/2010 | 12/29/2010 | $2.27420 | $0.37460 | $1.89960 | — |
| 12/8/2011 | 12/21/2011 | 12/23/2011 | 12/29/2011 | $2.99640 | $0.17420 | $2.82220 | — |
| 12/10/2012 | 12/20/2012 | 12/24/2012 | 12/28/2012 | $3.25170 | $0.34730 | $2.90440 | — |
| 12/13/2013 | 12/19/2013 | 12/23/2013 | 12/27/2013 | $3.31400 | $0.43870 | $2.87530 | — |
| 12/8/2014 | 12/18/2014 | 12/22/2014 | 1/5/2015 | $3.76510 | $0.29820 | $3.46690 | — |
| 12/16/2015 | 12/23/2015 | 12/28/2015 | 1/6/2016 | $1.49580 | $0.21330 | $0.84620 | $0.43630 |
| 12/9/2016 | 12/19/2016 | 12/21/2016 | 1/5/2017 | $0.46780 | $0.46780 | — | — |
| 12/8/2017 | 12/18/2017 | 12/19/2017 | 1/4/2018 | $0.54930 | $0.54930 | — | — |
Distribution/Share includes Income, Long-term Capital gains and Short-term Capital gains.
The China Fund NAV Performance of $10,000 since inception
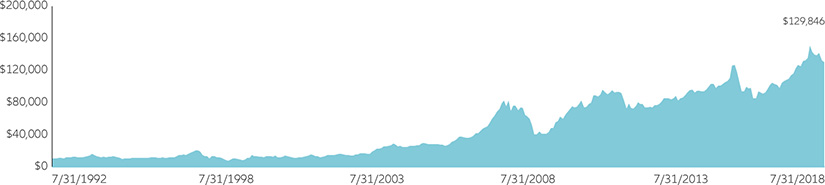
Past performance is not a guide to future returns.
Index Description
MSCI Golden Dragon Index
TheMSCI Golden Dragon Indexcaptures the equity market performance of large and mid cap China securities (H shares, B shares, Red-Chips and P-Chips) and non-domestic China securities listed in Hong Kong and Taiwan.
It is not possible to invest directly in an index.
Investment Products: NOT FDIC INSURED | MAY LOSE VALUE | NOT BANK GUARANTEED
Monthly Insights| As of 7/31/2018 | The China Fund, Inc.
| Portfolio in Full | |||||
| Sector | Company (exchange ticker) | Market Price | Holding | Value US$ | % of net assets |
| Information Technology | 34.62 | ||||
| TENCENT HOLDINGS LTD | 700 | 355.20 | 635,300 | 28,750,892 | 8.12 |
| TAIWAN SEMICONDUCTOR MANUFACTURING CO LTD | 2330 | 246.00 | 3,452,000 | 27,738,682 | 7.84 |
| ALIBABA GROUP HOLDING LTD | BABA | 187.23 | 125,962 | 23,583,865 | 6.66 |
| BAIDU INC | BIDU | 247.18 | 24,101 | 5,957,285 | 1.68 |
| MEDIATEK INC | 2454 | 254.00 | 669,000 | 5,550,598 | 1.57 |
| HON HAI PRECISION INDUSTRY CO LTD | 2317 | 83.80 | 1,910,000 | 5,228,262 | 1.48 |
| ASM PACIFIC TECHNOLOGY LTD | 522 | 94.45 | 433,500 | 5,216,636 | 1.47 |
| FOCUS MEDIA INFORMATION TE A | 002027 | 10.60 | 3,139,566 | 4,875,031 | 1.38 |
| DIGITAL CHINA HOLDINGS LTD | 861 | 4.08 | 9,305,000 | 4,837,000 | 1.37 |
| GLOBALWAFERS CO LTD | 6488 | 517.00 | 277,000 | 4,677,892 | 1.32 |
| CHUNGHWA PRECISION TEST TECH CO LTD | 6510 | 780.00 | 138,000 | 3,516,038 | 0.99 |
| WIN SEMICONDUCTORS CORP | 3105 | 148.00 | 277,000 | 1,339,126 | 0.38 |
| GOLDPAC GROUP LTD | 3315 | 2.01 | 4,970,000 | 1,272,776 | 0.36 |
| Financials | 22.99 | ||||
| CHINA CONSTRUCTION BANK CORP | 939 | 7.11 | 21,935,000 | 19,870,406 | 5.61 |
| AIA GROUP LTD | 1299 | 68.50 | 1,511,000 | 13,187,259 | 3.73 |
| PING AN INSURANCE GROUP CO OF CHINA LTD | 2318 | 72.80 | 1,061,000 | 9,841,159 | 2.78 |
| HONG KONG EXCHANGES & CLEARING LTD | 388 | 231.60 | 293,800 | 8,669,416 | 2.45 |
| CHINA MERCHANTS BANK CO LTD | 3968 | 30.65 | 1,870,500 | 7,304,453 | 2.06 |
| BANK OF CHINA LTD | 3988 | 3.68 | 15,500,000 | 7,267,399 | 2.05 |
| BOC HONG KONG HOLDINGS LTD | 2388 | 38.00 | 1,471,500 | 7,124,319 | 2.01 |
| FUBON FINANCIAL HOLDING CO LTD | 2881 | 50.70 | 2,805,000 | 4,645,375 | 1.31 |
| CATHAY FINANCIAL HOLDING CO LTD | 2882 | 52.70 | 2,030,000 | 3,494,512 | 0.99 |
| Consumer Discretionary | 8.92 | ||||
| GALAXY ENTERTAINMENT GROUP LTD | 27 | 63.05 | 793,000 | 6,370,269 | 1.80 |
| QINGLING MOTORS CO LTD | 1122 | 2.25 | 14,816,000 | 4,247,301 | 1.20 |
| MGM CHINA HOLDINGS LTD | 2282 | 16.88 | 1,778,000 | 3,823,875 | 1.08 |
| JD.COM INC | JD | 35.86 | 100,616 | 3,608,090 | 1.02 |
| CHINA INTERNATIONAL TRAVEL A | 601888 | 70.25 | 309,732 | 3,187,383 | 0.90 |
| NEW ORIENTAL EDUCATION & TECHNOLOGY GROUP | EDU | 86.04 | 34,958 | 3,007,786 | 0.85 |
| LI & FUNG LTD | 494 | 2.66 | 8,120,000 | 2,751,929 | 0.78 |
| BRILLIANCE CHINA AUTOMOTIVE HOLDINGS LTD | 1114 | 10.24 | 1,884,000 | 2,457,991 | 0.69 |
| SHANGRI-LA ASIA LTD | 69 | 12.84 | 1,292,000 | 2,113,621 | 0.60 |
| Industrials | 6.59 | ||||
| CHINA EVERBRIGHT INTERNATIONAL LTD | 257 | 9.56 | 7,761,000 | 9,453,118 | 2.67 |
| CN STATE CONSTRUCTION INTERNATIONAL HOLDINGS LTD | 3311 | 9.35 | 4,574,000 | 5,448,880 | 1.54 |
| QINGDAO PORT INTERNATIONAL CO LTD | 6198 | 5.72 | 6,077,000 | 4,428,787 | 1.25 |
| KING SLIDE WORKS CO LTD | 2059 | 422.00 | 185,000 | 2,550,140 | 0.72 |
| AIRTAC INTERNATIONAL GROUP | 1590 | 333.50 | 133,000 | 1,448,863 | 0.41 |
| Real Estate | 6.56 | ||||
| SUN HUNG KAI PROPERTIES LTD | 16 | 123.00 | 576,000 | 9,026,660 | 2.55 |
| SWIRE PACIFIC LTD | 19 | 85.10 | 523,000 | 5,670,623 | 1.60 |
| CHINA OVERSEAS LAND & INVESTMENT LTD | 688 | 24.65 | 1,622,000 | 5,094,098 | 1.44 |
| COUNTRY GARDEN HOLDINGS CO LTD | 2007 | 12.16 | 2,208,000 | 3,420,835 | 0.97 |
| Consumer Staples | 3.74 | ||||
| CHINA MENGNIU DAIRY CO LTD | 2319 | 24.30 | 1,627,000 | 5,037,248 | 1.42 |
| WH GROUP LTD | 288 | 6.30 | 5,726,000 | 4,596,120 | 1.30 |
| VINDA INTERNATIONAL HOLDINGS LTD | 3331 | 14.30 | 1,984,000 | 3,614,741 | 1.02 |
| Energy | 3.48 | ||||
| CHINA PETROLEUM & CHEMICAL CORP | 386 | 7.57 | 4,552,000 | 4,390,335 | 1.24 |
| CHINA OILFIELD SERVICES LTD | 2883 | 7.20 | 4,768,000 | 4,373,894 | 1.24 |
| PETROCHINA CO LTD H | 857 | 5.99 | 4,644,000 | 3,544,203 | 1.00 |
| Utilities | 2.49 | ||||
| CHINA LONGYUAN POWER GROUP CORP LTD | 916 | 7.31 | 5,340,000 | 4,973,454 | 1.41 |
| BEIJING ENTERPRISES HOLDINGS LTD | 392 | 38.15 | 787,000 | 3,825,329 | 1.08 |
Investment Products: NOT FDIC INSURED | MAY LOSE VALUE | NOT BANK GUARANTEED
Monthly Insights| As of 7/31/2018 | The China Fund, Inc.
| Sector | Company (exchange ticker) | Market Price | Holding | Value US$ | % of net assets |
| Telecom Services | 2.18 | ||||
| CHINA UNICOM HONG KONG LTD | 762 | 9.67 | 3,660,000 | 4,509,279 | 1.27 |
| CHINA MOBILE LTD | 941 | 70.80 | 356,500 | 3,215,824 | 0.91 |
| Health Care | 2.04 | ||||
| CSPC PHARMACEUTICAL GROUP LTD | 1093 | 20.50 | 1,544,000 | 4,032,744 | 1.14 |
| TONGHUA DONGBAO PHARMACEUT A | 600867 | 21.75 | 997,982 | 3,179,683 | 0.90 |
| Materials | 1.03 | ||||
| TIANGONG INTERNATIONAL CO LTD | 826 | 1.59 | 17,970,000 | 3,640,363 | 1.03 |
Source: State Street Bank and Trust Company, IDS GmbH - Analysis and Reporting Services, a subsidiary of Allianz SE.
Important Information:
Holdings are subject to change daily. The Fund seeks to achieve its objective through investment in the equity securities of companies and other entities with significant assets, investments, production activities, trading or other business interests in China or which derive a significant part of their revenue from China. Investing in non-U.S. securities entails additional risks, including political and economic risk and the risk of currency fluctuations, as well as lower liquidity. These risks, which can result in greater price volatility, will generally be enhanced in less diversified funds that concentrate investments in a particular geographic region.
The information contained herein has been obtained from sources believed to be reliable but Allianz Global Investors U.S. LLC and its affiliates do not warrant the information to be accurate, complete or reliable. The opinions expressed herein are subject to change at any time and without notice. Past performance is not indicative of future results. This material is not intended as an offer or solicitation for the purchase or sale of any financial instrument. Investors should consider the investment objectives, risks, charges and expenses of any mutual fund carefully before investing. This and other information is contained in the Fund's annual and semiannual reports, proxy statement and other Fund information, which may be obtained by contacting your financial advisor or visiting the Fund's website at Investment Products: NOT FDIC INSURED | MAY LOSE VALUE | NOT BANK GUARANTEED. This information is unaudited and is intended for informational purposes only. It is presented only to provide information on the Fund's holdings, performance and strategies. The Fund is a closed-end exchange traded management investment company. This material is presented only to provide information and is not intended for trading purposes. Closed-end funds, unlike open-end funds, are not continuously offered. After the initial public offering by a closed-end fund, its shares can be purchased and sold on the open market through a stock exchange, where shares may trade at a premium or a discount. The market price of holdings is subject to change daily.
P/E is a ratio of security price to earnings per share. Typically, an undervalued security is characterized by a low P/E ratio, while an overvalued security is characterized by a high P/E ratio. P/B is a ratio of the current stock price to the book value. This is used to identify undervalued stocks. Dividend yield is the annual percentage of return earned by an investor on a common or preferred stock. The average dividend yield is the dividend rate divided by current share price.
| ©2018 Allianz Global Investors Distributors LLC, 1633 Broadway, New York, NY | FS-CHN-0718 |
Investment Products: NOT FDIC INSURED | MAY LOSE VALUE | NOT BANK GUARANTEED