Manager's Commentary
Market Review
The Greater China equity markets retreated sharply in October 2018, posting the worst monthly returns since the Asian financial crisis. In particular, the China A-Share market reached its lowest level in nearly four years, taking its year to date decline to over 25% in US dollar ("USD") terms. As to macro-economic data, China's gross domestic product expanded at an annualized rate of 6.5% in the third quarter, the slowest quarterly pace of growth since early 2009. October's official purchasing managers' index of manufacturing activity slowed to its lowest level in two years, reinforcing concerns over the trade conflict with the United States. Reacting to these weak data points, the Chinese government pledged to provide measures to support the economy and financial markets, and the People's Bank of China announced a further cut to banks' reserve requirement ratio.
Fund Review
The China Fund Inc. (the "Fund") slightly underperformed its benchmark in October 2018. Stock selection within industrials and financials were the major detractors; while an underweight position in communication services, as well as stock selection in materials helped. On a stock level, the top detractor was China State Construction International, one of the major construction companies in China. We feel the risk reward of this stock is deteriorating given the funding issue for its public-private partnership projects, as well as the company's move to non-core businesses. Although the company's current valuation already prices in a bear case scenario, we don't see a near term catalyst for this company and have trimmed the Fund's position in this name. Another detractor was Angel Yeast Co. Ltd., the largest yeast manufacturer in China.
We like the company's dominant market share, defensive growth profile and well incentivized management. If share price has been weak due to concerns over margin pressure. Over the long term we still like this company as a high quality beneficiary of the consumption upgrade story in China.
On the contributor side, top contribution came from the Fund's underweight position in Tencent Holdings Ltd., the leading online gaming and advertisement giant. The Fund has trimmed its position in this name amid policy uncertainties, but the company's business model, strong execution and well established ecosystem are still positives. Valuation of this company is now approaching a more reasonable level.
Outlook
Developments in the United States-China trade conflicts, volatility in the Renminbi, and slower growth momentum in the Chinese economy mean that earnings expectations of China / Hong Kong companies will inevitably face some pressure. That said, valuation of Greater China equities has come off significantly since peaking in January - the price to earnings ratio for MSCI China, MSCI Golden Dragon and Hang Seng Index are now 9.7x, 11.9x and 9.4x, respectively, as of end October. In the near term, we don't rule out a possible short term rebound driven by positive news flow on the trade front; however, we believe more fundamental improvements in corporate earnings is needed to support a sustainable recovery.
The Chinese regulators need to find the right balance between deleveraging and addressing near term pains in the economy. In recent months, we have seen rising supportive measures to help support both the economy and financial markets. We continue to like the companies that can benefit from policy stimulus measures, including infrastructure related names. The recent correction in technology has also allowed us to buy quality names on weakness.
In Brief
| Fund Data | |
| Description | Seeks to achieve long-term capital appreciation through investments in China companies. |
| Listing Date (NYSE) | July 10, 1992 |
| Total Fund Assets (millions) | $298.5 |
| Median Market Cap (in billions) | $11.6 |
DistributionFrequency | Annual |
ManagementFirm | Allianz Global Investors U.S. LLC |
PortfolioManagement | Christina Chung, CFA, CMA Lead Portfolio Manager |
Performance (US$ Returns)
(as of 10/31/2018)
| Fund | Benchmark1 | |
| One Month | -11.97% | -11.48% |
| Three Month | -15.68% | -14.28% |
| One Year | -16.55% | -13.43% |
| Three Year | 3.31% | 7.26% |
Net Asset Value / Market Price
| Net Asset Value (NAV) / Market Price at Inception | $13.15 / $14.26 |
| NAV / Market Price (as of 10/31/2018) | $18.98 / $16.98 |
High / Low Ranges (52-Week)
| High / Low NAV | $26.38 / $18.45 |
| High / Low Market Price | $24.70 / $16.63 |
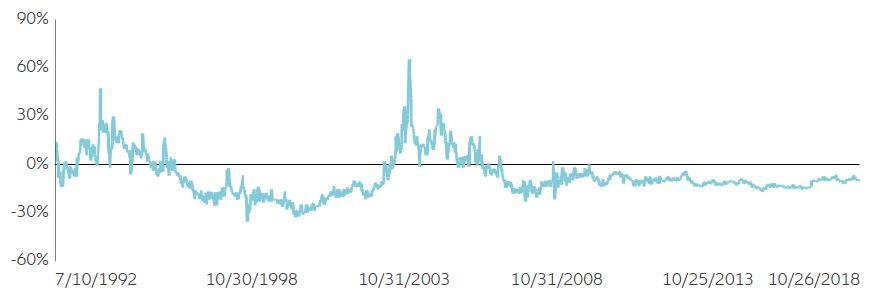
| Premium/Discount to NAV (as of 10/31/2018) | -10.54% |
Fund Data (Common Shares)
| Shares Outstanding | 15,722,675 |
| Average Daily Volume | 24,972 |
| Expense Ratio | 1.49% |
Fund Manager

Christina Chung,
CFA, CMA
Lead Portfolio Manager
| 1. | MSCI Golden Dragon Index. |
Investment Products: NOT FDIC INSURED | MAY LOSE VALUE | NOT BANK GUARANTEED
1
Monthly Insights| As of 10/31/2018 | The China Fund, Inc.
Investment Objective
The investment objective of The China Fund, Inc. (the "Fund") is to achieve long-term capital appreciation. The Fund seeks to achieve its objective through investment in the equity securities of companies and other entities with significant assets, investments, production activities, trading or other business interests in China or which derive a significant part of their revenue from China.
The Fund has an operating policy that the Fund will invest at least 80% of its assets in China companies. For this purpose, 'China companies' are (i) companies for which the principal securities trading market is in China; (ii) companies for which the principal securities trading market is outside of China or in companies organized outside of China, that in both cases derive at least 50% of their revenues from goods or services sold or produced, or have at least 50% of their assets in China; or (iii) companies organized in China. Under the policy, China means the People's Republic of China, including Hong Kong, and Taiwan. The Fund will provide its stockholders with at least 60 days' prior notice of any change to this policy.
Returns For Periods Ended October 31, 2018*
| 1 Month | 3 Month | YTD | 1 Year | 3 Year | 5 Year | 10 Year | Inception | |
| NAV | -11.97% | -15.68% | -18.99% | -16.55% | 3.31% | 3.49% | 10.69% | 9.53% |
| Market Price | -13.37% | -17.53% | -21.57% | -17.53% | 3.94% | 3.85% | 10.44% | 8.73% |
| MSCI Golden Dragon Index | -11.48% | -14.28% | -15.70% | -13.43% | 7.26% | 5.41% | 10.74% | — |
Calendar Year Returns
| 2010 | 2011 | 2012 | 2013 | 2014 | 2015 | 2016 | 2017 | |
| NAV | 27.26% | -24.37% | 12.12% | 18.31% | 7.82% | -5.51% | 0.60% | 37.92% |
| Market Price | 23.60% | -27.51% | 20.52% | 12.70% | 5.29% | -6.38% | -0.47% | 47.41% |
| MSCI Golden Dragon Index | 13.60% | -18.35% | 22.65% | 7.25% | 8.06% | -7.12% | 5.75% | 44.19% |
Past performance is not a guide to future returns.
| *Annualized | for periods greater than one year. |
Source: State Street Bank and Trust Company. Source for index data: MSCI as at October 31, 2018. Investment returns are historical and do not guarantee future results. Investment returns reflect changes in net asset value and market price per share during each period and assumes that dividends and capital gains distributions, if any, were reinvested. The net asset value (NAV) percentages are not an indication of the performance of a shareholder's investment in the Fund, which is based on market price. NAV performance includes the deduction of management fees and other expenses. Market price performance does not include the deduction of brokerage commissions and other expenses of trading shares and would be lower had such commissions and expenses been deducted. It is not possible to invest directly in an index.
Premium/Discount
Sector Allocation
| Fund | Benchmark1 | |
| Financials | 23.71% | 24.41% |
InformationTechnology | 13.72% | 15.22% |
ConsumerDiscretionary | 13.00% | 14.24% |
CommunicationServices | 8.93% | 16.47% |
| Energy | 7.18% | 3.69% |
| Real Estate | 6.82% | 7.93% |
| Industrials | 6.65% | 5.98% |
| Consumer Staples | 4.56% | 2.64% |
| Utilities | 4.27% | 3.90% |
| Health Care | 1.72% | 2.00% |
| Materials | 1.34% | 3.52% |
Other assets &liabilities | 8.10% | 0.00% |
Source: IDS GmbH - Analysis and Reporting Services, a subsidiary of Allianz SE.
Country Allocation
| Fund | Benchmark1 | |
| China | 78.07% | 76.96% |
| Hong Kong Red Chips | 16.63% | 9.04% |
| Hong Kong 'H' shares | 23.83% | 19.66% |
| Equity linked securities ('A' shares) | 0.00% | 0.00% |
| China 'A' & 'B' shares | 1.61% | 1.54% |
| Other Hong Kong securities | 36.00% | 31.64% |
| Others | 0.00% | 15.08% |
| Taiwan | 13.80% | 23.03% |
Other assets &liabilities | 8.13% | 0.00% |
Top 10 Holdings
| TAIWAN SEMICONDUCTOR MANUFAC (Taiwan) | 8.96% |
| CHINA CONSTRUCTION BANK H (China) | 5.83% |
| TENCENT HOLDINGS LTD (China) | 5.19% |
| ALIBABA GROUP HOLDING SP ADR (China) | 5.17% |
| PETROCHINA CO LTD H (China) | 4.18% |
| AIA GROUP LTD (H.K.) | 4.09% |
| PING AN INSURANCE GROUP CO H (China) | 3.90% |
| CHINA EVERBRIGHT INTL LTD (China) | 3.16% |
| HONG KONG EXCHANGES + CLEAR (H.K.) | 3.08% |
| SUN HUNG KAI PROPERTIES (H.K.) | 2.51% |
Portfolio Characteristics
| Fund | Benchmark1 | |
| P/E Ratio | 11.62 | 11.85 |
| P/B Ratio | 1.27 | 1.38 |
| Issues in Portfolio | 46 | 597 |
| Foreign Holdings (%) | 91.90 | 100.00 |
| Other assets & liabilities (%) | 8.10 | 0.00 |
| Yield (%) | 2.82 | 3.11 |
Source: IDS GmbH - Analysis and Reporting Services, a subsidiary of Allianz SE.
| 1. | MSCI Golden Dragon Index. |
Investment Products: NOT FDIC INSURED | MAY LOSE VALUE | NOT BANK GUARANTEED
2
Monthly Insights| As of 10/31/2018 | The China Fund, Inc.
Distribution History (10 Year)
| Declaration Date | Ex-dividend Date | Record Date | Payable Date | Distribution/ | Income | Long-term Capital Gain | Short-term Capital Gain |
| 12/8/2008 | 12/22/2008 | 12/24/2008 | 1/23/2009 | $5.81740 | $0.48130 | $5.33610 | — |
| 12/9/2009 | 12/22/2009 | 12/24/2009 | 12/29/2009 | $0.25570 | $0.25570 | — | — |
| 12/8/2010 | 12/21/2010 | 12/24/2010 | 12/29/2010 | $2.27420 | $0.37460 | $1.89960 | — |
| 12/8/2011 | 12/21/2011 | 12/23/2011 | 12/29/2011 | $2.99640 | $0.17420 | $2.82220 | — |
| 12/10/2012 | 12/20/2012 | 12/24/2012 | 12/28/2012 | $3.25170 | $0.34730 | $2.90440 | — |
| 12/13/2013 | 12/19/2013 | 12/23/2013 | 12/27/2013 | $3.31400 | $0.43870 | $2.87530 | — |
| 12/8/2014 | 12/18/2014 | 12/22/2014 | 1/5/2015 | $3.76510 | $0.29820 | $3.46690 | — |
| 12/16/2015 | 12/23/2015 | 12/28/2015 | 1/6/2016 | $1.49580 | $0.21330 | $0.84620 | $0.43630 |
| 12/9/2016 | 12/19/2016 | 12/21/2016 | 1/5/2017 | $0.46780 | $0.46780 | — | — |
| 12/8/2017 | 12/18/2017 | 12/19/2017 | 1/4/2018 | $0.54930 | $0.54930 | — | — |
Distribution/Share includes Income, Long-term Capital gains and Short-term Capital gains.
The China Fund NAV Performance of $10,000 since inception
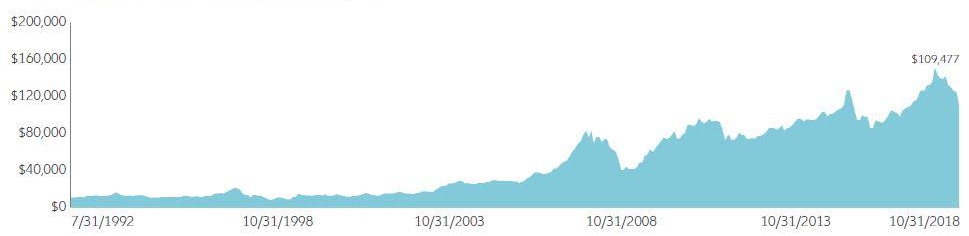
Past performance is not a guide to future returns.
Index Description
MSCI Golden Dragon Index
TheMSCI Golden Dragon Indexcaptures the equity market performance of large and mid cap China securities (H shares, B shares, Red-Chips and P-Chips) and non-domestic China securities listed in Hong Kong and Taiwan.
It is not possible to invest directly in an index.
Investment Products: NOT FDIC INSURED | MAY LOSE VALUE | NOT BANK GUARANTEED
3
Monthly Insights| As of 10/31/2018 | The China Fund, Inc.
Portfolio in Full
| Sector | Company (exchange ticker) | Market Price | Holding | Value US$ | % of net assets |
| Financials | 23.71 | ||||
| CHINA CONSTRUCTION BANK H | 939 | 6.22 | 21,935,000 | 17,403,845 | 5.83 |
| AIA GROUP LTD | 1299 | 59.35 | 1,611,400 | 12,199,478 | 4.09 |
| PING AN INSURANCE GROUP CO H | 2318 | 73.85 | 1,235,000 | 11,634,149 | 3.90 |
| HONG KONG EXCHANGES + CLEAR | 388 | 208.00 | 346,200 | 9,185,601 | 3.08 |
| CHINA MERCHANTS BANK H | 3968 | 30.20 | 1,870,500 | 7,205,794 | 2.42 |
| BOC HONG KONG HOLDINGS LTD | 2388 | 29.30 | 1,471,500 | 5,499,777 | 1.84 |
| FUBON FINANCIAL HOLDING CO | 2881 | 48.45 | 2,805,000 | 4,392,019 | 1.47 |
| CATHAY FINANCIAL HOLDING CO | 2882 | 49.00 | 2,030,000 | 3,214,620 | 1.08 |
| Information Technology | 13.72 | ||||
| TAIWAN SEMICONDUCTOR MANUFAC | 2330 | 234.00 | 3,536,000 | 26,740,264 | 8.96 |
| MEDIATEK INC | 2454 | 227.50 | 669,000 | 4,918,641 | 1.65 |
| DIGITAL CHINA HOLDINGS LTD | 861 | 3.76 | 9,305,000 | 4,462,944 | 1.50 |
| ASM PACIFIC TECHNOLOGY | 522 | 67.70 | 228,600 | 1,974,159 | 0.66 |
| FOCUS MEDIA INFORMATION TE A | 2027 | 6.00 | 1,907,366 | 1,640,957 | 0.55 |
| GOLDPAC GROUP LTD | 3315 | 1.90 | 4,970,000 | 1,204,556 | 0.40 |
| Consumer Discretionary | 13.01 | ||||
| ALIBABA GROUP HOLDING SP ADR | BABA | 142.28 | 108,358 | 15,417,176 | 5.17 |
| GALAXY ENTERTAINMENT GROUP L | 27 | 42.40 | 1,024,000 | 5,538,383 | 1.86 |
| SHANGRI LA ASIA LTD | 69 | 10.70 | 3,110,000 | 4,244,840 | 1.42 |
| QINGLING MOTORS CO LTD H | 1122 | 2.03 | 14,816,000 | 3,836,579 | 1.29 |
| MGM CHINA HOLDINGS LTD | 2282 | 11.08 | 2,305,200 | 3,258,109 | 1.09 |
| CTRIP.COM INTERNATIONAL ADR | CTRP | 33.28 | 84,376 | 2,808,033 | 0.94 |
| NEW ORIENTAL EDUCATIO SP ADR | EDU | 58.51 | 34,958 | 2,045,393 | 0.69 |
| BRILLIANCE CHINA AUTOMOTIVE | 1114 | 6.84 | 1,884,000 | 1,643,820 | 0.55 |
| Communication Services | 8.93 | ||||
| TENCENT HOLDINGS LTD | 700 | 267.00 | 454,700 | 15,486,504 | 5.19 |
| CHINA MOBILE LTD | 941 | 73.30 | 510,000 | 4,768,605 | 1.60 |
| CHINA UNICOM HONG KONG LTD | 762 | 8.14 | 3,660,000 | 3,800,342 | 1.27 |
| BAIDU INC SPON ADR | BIDU | 190.06 | 13,605 | 2,585,766 | 0.87 |
| Energy | 7.18 | ||||
| PETROCHINA CO LTD H | 857 | 5.74 | 17,048,000 | 12,482,527 | 4.18 |
| CHINA OILFIELD SERVICES H | 2883 | 7.35 | 4,770,000 | 4,472,217 | 1.50 |
| CHINA PETROLEUM + CHEMICAL H | 386 | 6.36 | 3,666,000 | 2,974,177 | 1.00 |
| CHINA SHENHUA ENERGY CO H | 1088 | 17.76 | 656,500 | 1,487,287 | 0.50 |
| Real Estate | 6.82 | ||||
| SUN HUNG KAI PROPERTIES | 16 | 101.90 | 576,000 | 7,487,104 | 2.51 |
| SWIRE PACIFIC LTD CL A | 19 | 81.35 | 523,000 | 5,427,207 | 1.82 |
| CHINA OVERSEAS LAND + INVEST | 688 | 24.55 | 1,622,000 | 5,079,483 | 1.70 |
| COUNTRY GARDEN HOLDINGS CO | 2007 | 8.39 | 2,208,000 | 2,363,079 | 0.79 |
| Industrials | 6.64 | ||||
| CHINA EVERBRIGHT INTL LTD | 257 | 6.25 | 11,811,221 | 9,416,554 | 3.16 |
| CHINA STATE CONSTRUCTION INT | 3311 | 5.59 | 6,912,000 | 4,928,704 | 1.65 |
| QINGDAO PORT INTERNATIONAL H | 6198 | 4.57 | 6,077,000 | 3,542,604 | 1.19 |
| KING SLIDE WORKS CO LTD | 2059 | 321.50 | 185,000 | 1,922,163 | 0.64 |
| Consumer Staples | 4.57 | ||||
| WH GROUP LTD | 288 | 5.49 | 5,726,000 | 4,009,968 | 1.34 |
| CHINA MENGNIU DAIRY CO | 2319 | 23.10 | 1,224,000 | 3,606,705 | 1.21 |
| ANGEL YEAST CO LTD A | 600298 | 21.60 | 1,019,300 | 3,156,949 | 1.06 |
| VINDA INTERNATIONAL HOLDINGS | 3331 | 11.32 | 1,984,000 | 2,864,872 | 0.96 |
| Utilities | 4.27 | ||||
| BEIJING ENTERPRISES HLDGS | 392 | 42.40 | 1,229,000 | 6,647,141 | 2.23 |
| CHINA LONGYUAN POWER GROUP H | 916 | 5.96 | 8,023,000 | 6,099,584 | 2.04 |
| Health Care | 1.72 | ||||
| CSPC PHARMACEUTICAL GROUP LT | 1093 | 16.54 | 2,436,000 | 5,139,608 | 1.72 |
| Materials | 1.34 |
Investment Products: NOT FDIC INSURED | MAY LOSE VALUE | NOT BANK GUARANTEED
4
Monthly Insights| As of 10/31/2018 | The China Fund, Inc.
| Sector | Company (exchange ticker) | Market Price | Holding | Value US$ | % of net assets |
| TIANGONG INTL CO LTD | 826 | 1.74 | 17,970,000 | 3,988,545 | 1.34 |
Source: State Street Bank and Trust Company, IDS GmbH - Analysis and Reporting Services, a subsidiary of Allianz SE.
Important Information:
Holdings are subject to change daily. The Fund seeks to achieve its objective through investment in the equity securities of companies and other entities with significant assets, investments, production activities, trading or other business interests in China or which derive a significant part of their revenue from China. Investing in non-U.S. securities entails additional risks, including political and economic risk and the risk of currency fluctuations, as well as lower liquidity. These risks, which can result in greater price volatility, will generally be enhanced in less diversified funds that concentrate investments in a particular geographic region.
The information contained herein has been obtained from sources believed to be reliable but Allianz Global Investors U.S. LLC and its affiliates do not warrant the information to be accurate, complete or reliable. The opinions expressed herein are subject to change at any time and without notice. Past performance is not indicative of future results. This material is not intended as an offer or solicitation for the purchase or sale of any financial instrument. Investors should consider the investment objectives, risks, charges and expenses of any mutual fund carefully before investing. This and other information is contained in the Fund's annual and semiannual reports, proxy statement and other Fund information, which may be obtained by contacting your financial advisor or visiting the Fund's website at Investment Products: NOT FDIC INSURED | MAY LOSE VALUE | NOT BANK GUARANTEED. This information is unaudited and is intended for informational purposes only. It is presented only to provide information on the Fund's holdings, performance and strategies. The Fund is a closed-end exchange traded management investment company. This material is presented only to provide information and is not intended for trading purposes. Closed-end funds, unlike open-end funds, are not continuously offered. After the initial public offering by a closed-end fund, its shares can be purchased and sold on the open market through a stock exchange, where shares may trade at a premium or a discount. The market price of holdings is subject to change daily.
P/E is a ratio of security price to earnings per share. Typically, an undervalued security is characterized by a low P/E ratio, while an overvalued security is characterized by a high P/E ratio. P/B is a ratio of the current stock price to the book value. This is used to identify undervalued stocks. Dividend yield is the annual percentage of return earned by an investor on a common or preferred stock. The average dividend yield is the dividend rate divided by current share price.
©2018 Allianz Global Investors Distributors LLC, 1633 Broadway, New York, NY
FS-CHN-1018
Investment Products: NOT FDIC INSURED | MAY LOSE VALUE | NOT BANK GUARANTEED