UNITED STATES
SECURITIES AND EXCHANGE COMMISSION
WASHINGTON, D. C. 20549
FORM 10-K
| x | ANNUAL REPORT PURSUANT TO SECTION 13 OR 15(d) OF THE SECURITIES EXCHANGE ACT OF 1934 |
For the Fiscal Year Ended: December 31, 2007
OR
| ¨ | TRANSITION REPORT PURSUANT TO SECTION 13 OR 15(d) OF THE SECURITIES EXCHANGE ACT OF 1934 |
Commission File Number: 000-18908
INFOCUS CORPORATION
(Exact name of registrant as specified in its charter)
| | |
| Oregon | | 93-0932102 |
(State or other jurisdiction of incorporation
or organization) | | (I.R.S. Employer
Identification No.) |
| | |
| 27500 SW Parkway Avenue, Wilsonville, Oregon | | 97070 |
| (Address of principal executive offices) | | (Zip Code) |
Registrant’s telephone number, including area code: 503-685-8888
Securities registered pursuant to Section 12(b) of the Act:
| | |
Title of each class | | Name of each exchange on which registered |
| Common stock, without par value | | NASDAQ Global Market |
Securities registered pursuant to Section 12(g) of the Act: None
Indicate by check mark if the Registrant is a well-known seasoned issuer, as defined in Rule 405 of the Securities Act:
Yes ¨ No x
Indicate by check mark if the Registrant is not required to file reports pursuant to Section 13 or Section 15(d) of the Act: ¨
Indicate by check mark whether the Registrant (1) has filed all reports required to be filed by Section 13 or 15(d) of the Securities Exchange Act of 1934 during the preceding 12 months (or for such shorter period that the Registrant was required to file such reports), and (2) has been subject to such filing requirements for the past 90 days.
Yes x No ¨
Indicate by check mark if disclosure of delinquent filers pursuant to Item 405 of Regulation S-K is not contained herein, and will not be contained, to the best of Registrant’s knowledge, in definitive proxy or information statements incorporated by reference in Part III of this Form 10-K, or any amendment to this Form 10-K. x
Indicate by check mark whether the registrant is a large accelerated filer, an accelerated filer, a non-accelerated filer or a smaller reporting company. See definition of “accelerated filer,” “large accelerated filer” and “smaller reporting company” in Rule 12b-2 of the Exchange Act.
Large accelerated filer ¨ Accelerated filer x Non-accelerated filer ¨ Smaller reporting company ¨
(Do not check if a smaller reporting company)
Indicate by check mark whether the registrant is a shell company (as defined in Rule 12b-2 of the Exchange Act).
Yes ¨ No x
The aggregate market value of the voting and non-voting common equity held by non-affiliates, computed by reference to the last sales price ($2.23) as reported by the NASDAQ Global Market, as of the last business day of the Registrant’s most recently completed second fiscal quarter (June 29, 2007), was $79,437,903.
The number of shares outstanding of the Registrant’s Common Stock as of March 5, 2008 was 40,869,963 shares.
Documents Incorporated by Reference
The Registrant has incorporated into Part III of Form 10-K, by reference, portions of its Proxy Statement for its 2008 Annual Meeting of Shareholders.
INFOCUS CORPORATION
2007 FORM 10-K ANNUAL REPORT
TABLE OF CONTENTS
1
PART I
Forward Looking Statements and Factors Affecting Our Business and Prospects
Some of the statements in this annual report on Form 10-K are forward-looking statements, as defined in the Private Securities Litigation Reform Act of 1995, or the PSLRA. Forward-looking statements in this Form 10-K are being made pursuant to the PSLRA and with the intention of obtaining the benefits of the “safe harbor” provisions of the PSLRA. Forward-looking statements are those that do not relate solely to historical fact. They include, but are not limited to, any statement that may predict, forecast, indicate or imply future results, performance, achievements or events. You can identify these statements by the use of words like “intend,” “plan,” “believe,” “anticipate,” “project,” “may,” “will,” “could,” “continue,” “expect” and variations of these words or comparable words or phrases of similar meaning. They may relate to, among other things:
| | • | | our ability to operate profitably; |
| | • | | our ability to successfully introduce new products; |
| | • | | our ability to compete in the market, including our ability to compete against alternate technologies; |
| | • | | the wind-down of South Mountain Technologies (“SMT”), our 50-50 joint venture with TCL Corporation; |
| | • | | the supply of components, subassemblies, and projectors manufactured for us; |
| | • | | fluctuations in our revenues and results of operations; |
| | • | | the impact of regulatory actions by authorities in the markets we serve; |
| | • | | anticipated outcome of legal disputes; |
| | • | | uncertainties associated with the activities of our contract manufacturing partners; |
| | • | | expectations regarding results and charges associated with restructuring our business and other changes to reduce or simplify the cost structure of the business; |
| | • | | our ability to grow the business; and |
| | • | | our various expenses and expenditures, including marketing and sales expenses, research and development expenses, general and administrative expenses and expenditures for property and equipment. |
These forward-looking statements reflect our current views with respect to future events and are based on assumptions and are subject to risks and uncertainties, including, but not limited to, economic, competitive, governmental and technological factors outside of our control, which may cause actual results to differ materially from trends, plans or expectations set forth in the forward-looking statements. The forward-looking statements contained in this annual report speak only as of the date on which they are made and we do not undertake any obligation to update any forward-looking statements to reflect events or circumstances after the date of this filing. See Item 1A. Risk Factors below for further discussion of factors that could cause actual results to differ from these forward-looking statements.
Where You Can Find More Information
We file annual reports, quarterly reports, current reports, proxy statements and other information with the Securities and Exchange Commission (“SEC”) under the Securities Exchange Act of 1934, as amended (“Exchange Act”). You can inspect and copy our reports, proxy statements and other information filed with the SEC at the offices of the SEC’s Public Reference Room in Washington, D.C. Please call the SEC at 1-800-SEC-0330 for further information on the Public Reference Room. The SEC maintains an Internet site at http://www.sec.gov/ where you can obtain most of our SEC filings. We also make available, free of charge on our website atwww.infocus.com, our annual reports on Form 10-K, quarterly reports on Form 10-Q, current reports on Form 8-K, and amendments to those reports filed or furnished pursuant to Section 13(a) or 15(d) of the Exchange Act as soon as reasonably practicable after they are filed electronically with the SEC. The information found on our website is not part of this Form 10-K. You can also obtain copies of these reports by contacting our investor relations department at (503) 685-8576.
2
Company Profile
InFocus Corporation is the industry pioneer and a worldwide leader in digital projection technology. We have over twenty years of innovative experience allowing us to constantly improve our product offerings and deliver a compelling immersive visual experience in business, education and home entertainment environments. Our products include projectors and related accessories for use in the conference room, board room, auditorium, classroom and living room. With one of the largest installed bases of projectors in the industry, we are also the most recognized brand in the U.S. projector market according to TFCinfo, the premiere market research organization for advanced display technologies.
Current Products
Projectors:
InFocus offers a range of projection products and services in four main categories.
| | • | | Mobile projectors are designed for small teams working in groups of three to eight people on screen sizes between 50” and 100”. Mobile projectors are often taken on business trips and moved around the office or campus and are sometimes used in the home; |
| | • | | Meeting room projectors are designed for medium sized teams working in groups of eight to twenty-five people on screen sizes between 80” and 120”. Portable projectors are usually used on a table or cart but can also be installed on the ceiling in a classroom, conference room or home; |
| | • | | Large opportunity projectors are entry level products targeted primarily for emerging markets, retail channels and government and education tenders. |
| | • | | Large venue projectors are designed for venues such as auditoriums and home cinemas where groups of people gather for events on screen sizes up to and sometimes exceeding 150”. Large venue projectors are almost always integrated into a value-added system including audio, signal distribution, touch panel controls, etc. |
InFocus is our primary brand sold worldwide in all channels. In addition, many of our products are also offered under our global reseller brand, ASK Proxima, to allow qualified value added dealers to create a unique value proposition, bundling our projectors with their other product and service offerings. We also have a limited number of private label OEM arrangements with companies that resell our projectors under their own brand.
Our current projector product offerings are as follows:
Mobile projectors (IN1X series):
| | • | | IN10 – The IN10 is a 2.4 lb XGA DLP® projector that packs 1,800 lumens into the footprint of a DVD case |
| | • | | IN12 – The IN12 is a 3.9 lb XGA projector that packs 2,000 lumens into the size and shape of a notebook PC; and |
| | • | | IN15 – The IN15 is a 3.9 lb XGA projector that packs 2,500 lumens into the size and shape of a notebook PC. |
All three of these projectors are also available under the ASK-Proxima brand name.
Meeting room projectors (IN2X series and IN3X series):
| | • | | IN2X series – The IN2X series is a 2,500 lumen mainstream portable projector using DLP® technology available in three resolutions: IN2102 (SVGA), IN2104 (XGA) and IN2106 (WXGA); and |
| | • | | IN3X series – The IN3X series is a premium portable projector using DLP® technology available in three performance levels: IN35 (2,500 lumens XGA), IN35W (2,500 lumens WXGA) and IN37 (3,000 lumens XGA). |
The IN2Xand IN3X series are also available under the ASK-Proxima brand name.
3
Large Opportunity projectors (X series):
| | • | | X series – The X series is a 2,000 lumen entry level portable projector designed primarily for emerging markets, retail channels and tender business. The X series uses DLP® technology and is available in two resolutions: X6 (SVGA) and X7 (XGA): |
Large venue projectors (LP series, IN4X series, IN8X series):
| | • | | LP860 – The LP860 is a 3,500 lumen SXGA+ LCD installation projector; |
| | • | | IN4X series – The IN4X series is a 4000 lumen LCD installation projector available in two resolutions: IN43 (XGA) and IN45 (WXGA); and |
| | • | | IN8X series – The IN8X series is a 1080p high definition DLP® home theater projector available in three different contrast levels: IN81 (3,000:1 contrast), IN82 (4,000:1 contrast) and IN83 (5,000:1 contrast). |
The LP860 and IN4X series are also available under the ASK-Proxima brand name.
We continue to leverage our technological expertise and experience to deliver products that include true multimedia capabilities, can be integrated with other technologies and have user friendly features to improve ease of use for our end customers.
Our products are compatible with all major personal computers and video sources used in business, education and home entertainment. Users can connect to a variety of sources including, but not limited to, digital and analog PCs, DVD players, HDTV, S-video, VCRs, workstations, laser disc players and gaming devices.
Two key characteristics of our products are resolution and video performance. Resolution is defined by using standard industry terms SVGA, XGA, WXGA, SXGA, SXGA+ and UXGA, which are terms that define the number of pixels in a display. An SVGA display has 480,000 pixels (800X600), an XGA has 786,432 pixels (1,024X768), a WXGA has 1,024,000 pixels (1,280x800), an SXGA has 1,310,720 pixels (1,280X1,024), an SXGA+ has 1,470,000 pixels (1,400X1,050) and a UXGA has 1,920,000 pixels (1,600X1,200). Video resolution in home entertainment projectors is defined as either 480p (854X480), 576p (1,024X576), 720p (1,280X720) or 1080p (1,920X1,080). We utilize the latest in video electronics to improve the video performance over normal projection devices.
Licensing our Intellectual Property
We have royalty arrangements with third parties for various projection related technologies. Current royalties being earned under these arrangements are not material.
In addition to our projection intellectual property, we also generate licensing profits from Motif, our 50/50 joint venture with Motorola. Motif has executed numerous licenses for its active addressing technology, with additional licenses under negotiation. Motif results are not consolidated with our results, but we report our share of the net income of Motif as a component of other income. Our 50% share of Motif income for 2007 was $0.9 million.
Product and Technology Development
We continue to invest in research and development primarily for advanced development of new projection technology and complementary products and solutions. We plan to continue to invest in research and development to enable continued innovation in our product and solution offerings.
We expended $14.1 million, $18.0 million and $20.8 million on research and development activities for the years ended December 31, 2007, 2006 and 2005, respectively.
Routes to Market
As our industry has grown and matured, our marketing and sales distribution strategy has evolved so that we can reach end-user customers with our products when and where they want to buy. We sell our products through multiple distribution channels, including direct and indirect resellers that procure our
4
products from our distributor customers. Over the years, we have devoted significant resources to develop and support a well-trained reseller network with the ability to demonstrate and sell our products to a wide range of end-users worldwide. In the U.S., we offer our products through authorized professional audiovisual dealers and direct marketing resellers. We also sell our products through wholesale distributors, which in turn sell to audiovisual resellers, PC resellers, online resellers, and direct marketing resellers.
In addition, we sell our products and services directly to large multinational organizations via our Strategic Accounts Program. Strategic Accounts customers work with our teams to identify their presentation technology needs company-wide, then consolidate their purchase and support requirements across geographic boundaries. Sales of projectors and services are fulfilled either directly by us or through one of our local authorized business partners.
We also offer customers the ability to purchase many of our products and accessories directly from our online store in the U.S.
Outside the U.S., we sell our products to distributors and dealers worldwide. These distributors sell our products to audiovisual dealers, PC resellers and, in some cases, directly to end-users. Sales subsidiaries, located in Singapore, China, Norway, Germany, Sweden, France and The Netherlands, work with international distributors and local direct dealers to sell and support our products.
Geographic revenues as a percentage of total revenues, based on shipment destination, were as follows:
| | | | | | | | | |
Year Ended December 31, | | 2007 | | | 2006 | | | 2005 | |
U.S. | | 56.9 | % | | 63.9 | % | | 62.4 | % |
Europe | | 26.6 | | | 21.8 | | | 23.5 | |
Asia | | 11.3 | | | 7.4 | | | 8.1 | |
Other | | 5.2 | | | 6.9 | | | 6.0 | |
| | | | | | | | | |
| | 100.0 | % | | 100.0 | % | | 100.0 | % |
| | | | | | | | | |
Long-lived assets by geographic region were as follows (in thousands):
| | | | | | |
December 31, | | 2007 | | 2006 |
U.S. | | $ | 3,227 | | $ | 4,479 |
Europe | | | 373 | | | 168 |
Asia | | | 434 | | | 503 |
| | | | | | |
| | $ | 4,034 | | $ | 5,150 |
| | | | | | |
Seasonality
Given the buying patterns of various geographies and market segments, our revenues are subject to certain elements of seasonality during various portions of the year. The first quarter of each year is typically down from the immediately preceding fourth quarter due to corporate buying trends and typical aggressive competition from our Asian competitors with March 31 fiscal year ends. In addition, we sell our products into the education and government markets that typically see seasonal peaks in the U.S. in the second and third quarter of each year. Historically, between 20% and 30% of our revenues have come from Europe and, as such, we typically experience a seasonal downturn due to the vacation season in mid-summer, which results in decreased revenues from that region in the third quarter compared to the second quarter. Conversely, we typically experience a strong resurgence of revenue from Europe in the fourth quarter.
Sales Returns and Incentives
Some distributor and dealer agreements allow for limited partial return of products and/or price protection. Such return rights are generally limited to a contractually defined short-term stock rotation and defective or damaged product, although we have granted retailers return policies consistent with the retailers’ return policies for their customers. We also have incentive programs for dealers and distributors whereby
5
rebates are offered based upon exceeding quarterly and annual volume goals or to promote sell through of our products to end users.
Service
Our global service solutions include, but are not limited to, a mix of outsourced and in-house call center and Internet customer support, factory repair, authorized service center repair, accessories, service parts, remanufactured projectors, technology upgrade program, warranty extension contracts, service contracts, service-related training, service engineering and technical publications (including service guides, technical bulletins and user guides). Design and consulting support is available for our authorized product integration resellers.
Our in-house service organization has personnel in Wilsonville, Oregon, Almere, The Netherlands and our Singapore corporate offices. In addition, we have outsourced our U.S. call center function to a third party provider in India. Factory repair is performed in partnership with UPS Supply Chain Solutions in the U.S. and The Netherlands, as well as in partnership with PCS Peripherals Pte Ltd in Singapore and China.
In addition, personnel in approximately 90 Authorized Service Centers worldwide are trained by us to provide warranty, product repair, technical support and training to their resellers and end-user customers.
Customers have access via telephone and email in the U.S., Europe and Asia or the worldwide web to technical specialists who answer application and hardware questions. All products are covered by a warranty for parts and labor with varying terms depending on the product and geography. Extended service agreements are available for purchase.
Manufacturing and Supply
The principal components of our projectors are imaging devices, including various types of DMDs (digital micromirror devices) and LCDs, integrated circuits, light sources, optical components and lenses, plastic housing parts and electronic sub-assemblies. We qualify certain parts manufactured to our specifications and also design and deliver certain electronic components for sub-assembly. The DMD imaging engines are produced in class 10,000 clean room environments, requiring exacting design, specification and handling of precision optics. The manufacture of finished projectors includes precise alignment of optical elements and 100% image quality testing. We are currently focusing the majority of our development efforts on DMD devices based on DLP® technology from Texas Instruments.
In 2007, we outsourced the manufacturing of our projectors primarily to Funai Electric Company and Hon Hai Precision Industry Company Limited, commonly known as “Foxconn.” We are in the process of winding down our business relationship with Funai Electric Company, and, going into 2008, our two main contract manufacturers will be Foxconn and Coretronic. All three contract manufacturers are predominantly manufacturing our products in China. Each of the contract manufacturers is sourcing components directly with suppliers. Reliance on suppliers raises several risks, including the possibility of defective parts, reduced control over the availability and delivery schedule for parts and the possibility of increases in component costs. Manufacturing efficiencies and our profitability can be adversely affected by each of these risks. See Item 1A Risk Factors below for a further discussion of these risks.
Customers
We sell our products to a large number of customers worldwide. Ingram Micro accounted for 22.1%, 19.5% and 15.1%, respectively, of total revenues for the years ended December 31, 2007, 2006 and 2005 and accounted for 24.0% and 26.0%, respectively, of our accounts receivable balance at December 31, 2007 and 2006. In addition, Tech Data accounted for 11.7% and 12.7%, respectively, of total revenues for the years ended December 31, 2007 and 2006 and accounted for 20.0% and 16.0%, respectively, of our accounts receivable balance at December 31, 2007 and 2006. In addition, one other customer accounted for 6.5% of our accounts receivable balance at December 31, 2007.
6
Backlog
We had backlog of approximately $6.6 million at December 31, 2007, compared to approximately $9.5 million at December 31, 2006. Backlog is not necessarily indicative of sales for any future period nor is a backlog any assurance that we will realize a profit from filling the orders.
Competition
Our ability to compete depends on factors within and outside our control, including the success and timing of product introductions, product performance and price, product distribution and customer support. We believe that our twenty years of leadership in developing technologies and our focused effort on development activities give us a competitive advantage.
We face competition for our projectors from over 40 branded competitors, ten of which, including us, make up approximately 70% of the products sold in the industry. We expect continued competition as new technologies, applications and products are introduced. Our principal current competitors include Epson, NEC, Hitachi, BenQ, Optoma, Toshiba, Panasonic, Sanyo and Dell. Our products also face competition from alternate technologies such as LCD and plasma televisions and displays.
Patents, Trademarks and Licenses
We have been issued approximately 225 U.S. patents and numerous corresponding foreign patents covering various aspects of our products. In addition, numerous applications for U.S. patents are pending on inventions that enable our products to be lighter, easier to use, and produce brighter optimized images. Corresponding applications for selected inventions are pending internationally through the Patent Cooperation Treaty and at foreign Patent Offices.
We attempt to protect our proprietary information through agreements with customers and suppliers. We require our employees, consultants and advisors to execute confidentiality agreements on the commencement of employment with, or service to, us. While we have enhanced our ability to compete by aggressively protecting our intellectual property, we believe the rapid pace of technological change in the industry will mean that our ability to develop new technologies and distribute new products on a timely basis will be of greater importance in maintaining our competitive position.
We maintain and pursue an extensive worldwide trademark portfolio. We have rights and claim ownership to numerous trademarks including “InFocus,” “In Focus,” “Proxima,” “LP,” “LitePro,” “LiteShow,” “ASK,” “ScreenPlay,” “SP,” “LitePort,” “The Big Picture,” “ProjectorNet,” “ASK Proxima,” Work Big,” “Play Big,” ‘Learn Big,” “IN” and associated design marks.
Employees
As of December 31, 2007, we had 337 employees, including 29 temporary personnel primarily engaged through the services of an employment agency. We believe relations with our employees are good.
Because of the following factors, as well as other variables affecting our operating results, past financial performance may not be a reliable indicator of future performance, and historical trends should not be used to anticipate results or trends in future periods.
We may need to raise additional financing if our financial results do not improve.
We sustained an operating loss of $27.5 million and $49.8 million, respectively, during the year ended December 31, 2007 and 2006, contributing to a decrease in net working capital of $15.0 million and $42.1 million during the respective time periods. If we continue to experience significant operating losses and reductions in net working capital, we may need to obtain additional debt or equity financing to continue current business operations. There is no guarantee that we will be able to raise additional funds on favorable terms, if at all.
7
Our restructuring plans may not be successful.
Over the last three years, we have implemented a series of restructuring plans with the goal of simplifying the business and returning the company to profitability. As part of the restructuring plans, we have implemented actions to reduce our cost to serve customers, improve our supply chain efficiency, reduce our product costs and reduce our operating expenses. Our goal as a result of these actions was to improve gross margins to 16% to 18% and reduce our operating expenses to a level that will allow us to achieve breakeven or better results. We have faced a number of challenges related to our restructuring plans including uncertainties associated with the impact of our actions on revenues and gross margins.
While we have made significant progress toward achieving our goals, we continue to focus on increasing revenues, increasing gross margins, and further reducing our cost structure to continue the path towards sustainable operating profitability.
If our contract manufacturers or other outsourced service providers experience any delay, disruption or quality control problems in their operations, we could lose market share and revenues, and our reputation may be harmed.
We have outsourced the manufacturing of our products to third party manufacturers. We rely on our contract manufacturers to procure components, provide spare parts in support of our warranty and customer service obligations, and in some cases, subcontract engineering work. We generally commit the manufacturing of each product platform to a single contract manufacturer. In addition, going forward, we will be placing more reliance on our contract manufacturers for design activities related to our core projection products, as we move to outsource a larger percentage of our research and development work.
Our reliance on contract manufacturers exposes us to the following risks over which we may have limited control:
| | • | | Unexpected increases in manufacturing and repair costs; |
| | • | | Interruptions in shipments if our contract manufacturer is unable to complete production; |
| | • | | Inability to completely control the quality of finished products; |
| | • | | Inability to completely control delivery schedules; |
| | • | | Unpredictability of manufacturing yields; |
| | • | | Changes in our contract manufacturer’s business models or operations; |
| | • | | Potential loss of differentiation in our products compared to our competitors; |
| | • | | Potential lack of adequate capacity to manufacture all or a part of the products we require; and |
| | • | | Reduced control over the availability of our products. |
Our contract manufacturers are located in Asia and may be subject to disruption by natural disasters, as well as political, social or economic instability. The temporary or permanent loss of the services of any of our primary contract manufacturers could cause a significant disruption in our product supply chain and operations and delays in product shipments. In addition, we do not have long-term contracts with any of our third-party contract manufacturers and these contracts are terminable by either party on relatively short notice.
In addition, we outsourced our U.S. customer service and technical support call center to a third party provider. We rely on this third party to provide efficient and effective support to our customers and partners. To the extent our customers are not satisfied with the level of service provided by our third party provider we may lose market share and our revenues and corporate reputation could be negatively affected.
Our competitors may have greater resources and technology, and we may be unable to compete with them effectively.
The markets for our products are highly competitive and we expect aggressive price competition in our industry, especially from Asian manufacturers, to continue into the foreseeable future. Some of our current and prospective competitors have, or may have, significantly greater financial, technical, manufacturing and marketing resources than we have.
8
In order to compete effectively, we must continue to reduce the cost of our products, our manufacturing and other overhead costs, focus on the right channel sales models and reduce our operating expenses in order to offset declining selling prices for our products, while at the same time growing our presence in the markets we are in and driving our products into new markets. There is no assurance we will be able to compete successfully with respect to these factors.
Our products face competition from alternate technologies and we may be unable to compete with them effectively.
In addition to competition within the projector industry, our products also face competition from alternate technologies such as LCD and plasma televisions and displays. Our ability to compete depends on factors within and outside our control, including the success and timing of product introductions, product performance and price, product distribution and customer support and adoption of our products. Our inability to successfully manage these factors could lead to reduced revenues or a greater chance of our customers shifting their purchases to alternate technologies.
If we are unable to manage the cost of older products or successfully introduce new products with higher gross margins, our revenues may decrease or our gross margins may decline.
The market in which we compete is subject to technological advances with continual new product releases and aggressive price competition. As a result, the price at which we can sell our products typically declines over the life of the product. The price at which a product is sold is generally referred to as the average selling price (“ASP”). In order to sell products that have a declining ASP and still maintain our gross margins, we need to continually reduce our product costs. To manage product-sourcing costs, we must collaborate with our contract manufacturers to engineer the most cost-effective design for our products. In addition, we must carefully monitor the price paid by our contract manufacturers for the significant components used in our products. We must also successfully manage our freight and inventory holding costs to reduce overall product costs. We also need to continually introduce new products with improved features and increased performance at lower costs in order to maintain our overall gross margins. Our inability to successfully manage these factors could reduce revenues or result in declining gross margins. In addition, our increased reliance on our contract manufacturers for design and development work could enhance the risks described above.
Our revenues and profitability can fluctuate from period to period and are often difficult to predict for particular periods due to factors beyond our control.
Our results of operations for any individual quarter or for the year are not necessarily indicative of results to be expected in future periods. Our operating results have historically been, and are expected to continue to be, subject to quarterly and yearly fluctuations as a result of a number of factors, including:
| | • | | The introduction and market acceptance of new technologies, products and services; |
| | • | | Variations in product selling prices and costs and the mix of products sold; |
| | • | | The size and timing of customer orders, which, in turn, often depend upon the success of our customers’ business or specific products or services; |
| | • | | Changes in the conditions in the markets for projectors and alternative technologies; |
| | • | | The size and timing of capital expenditures by our customers; |
| | • | | Conditions in the broader markets for information technology and communications equipment; |
| | • | | The timing and availability of products coming from our offshore contract manufacturing partners; |
| | • | | Changes in the supply of components; and |
| | • | | Seasonality of markets such as education, government and consumer retail, which vary quarter to quarter and are influenced by outside factors such as overall consumer confidence, budgets and political party changes. |
These trends and factors could harm our business, operating results and financial condition in any particular period.
9
Our operating expenses and portions of our costs of revenues are relatively fixed and we may have limited ability to reduce expenses quickly in response to any revenue shortfalls.
Our operating expenses, warranty costs, inbound freight and inventory handling costs are relatively fixed. Because we typically recognize a significant portion of our revenues in the last month of each quarter, we may not be able to adjust our operating expenses or other costs sufficiently to adequately respond to any revenue shortfalls. If we are unable to reduce operating expenses or other costs quickly in response to any revenue shortfall, it could negatively impact our financial results.
If we are unable to accurately predict the future needs of our customer base as it relates to sales channel inventory levels we may incur unexpected declines in revenues and gross margins.
If factors in the marketplace change that negatively impact the purchase of our products or we are not able to accurately predict the sales channel inventory needs of our larger customers, we may experience declines in our revenue and gross margins. If demand for our products declines or is not sufficient to deplete existing inventory in our sales channels this will generally have an adverse effect on future revenues.
If we do not effectively manage our sales channel inventory and product mix, we may incur costs associated with excess inventory or experience declining gross margins.
If we are unable to properly monitor, control and manage our sales channel inventory and maintain an appropriate level and mix of products with our customers within our sales channels, we may incur increased and unexpected costs associated with this inventory. We generally allow distributors, dealers and retailers to return a limited amount of our products in exchange for placing an order for other new products. In addition, under our price protection policy, subject to certain conditions which vary around the globe, if we reduce the list price of a product, we may issue a credit in an amount equal to the price reduction for each of the products held in inventory by our distributors, dealers and retailers. If these events occur, we could incur increased expenses associated with rotating and reselling product, or inventory reserves associated with writing down returned inventory, or suffer declining gross margins.
If we cannot continually develop new and innovative products and integrate them into our business, we may be unable to compete effectively in the marketplace.
Our industry is characterized by continuing improvements in technology and rapidly evolving industry standards. Consequently, short product life cycles and significant price fluctuations are common. Product transitions present challenges and risks for all companies involved in the data/video digital projector and display markets. Demand for our products and the profitability of our operations may be adversely affected if we fail to effectively manage product transitions.
Advances in product technology require continued investment in research and development and product engineering to maintain our market position. There are no guarantees that such investment will result in the right products being introduced to the market at the right time. In addition, our increased reliance on our contract manufacturers for design and development work could enhance the risks described above.
If we are unable to provide our contract manufacturers with an accurate forecast of our product requirements, we may experience delays in the manufacturing of our products and the costs of our products may increase.
We provide our contract manufacturers with a rolling forecast of demand which they use to determine their material and component requirements. Lead times for ordering materials and components vary significantly and depend on various factors, such as the specific supplier, contract terms and supply and demand for a component at a given time. Some of our components have long lead times measuring as much as 4 to 6 months from the point of order.
If our forecasts are less than our actual requirements, our contract manufacturers may be unable to manufacture sufficient products to meet actual demand in a timely manner. If our forecasts are too high, our contract manufacturers may be unable to use the components they have purchased. The cost of the components used in our products tends to decline as the product platform and technologies mature. Therefore, if our contract manufacturers are unable to promptly use components purchased on our
10
behalf, our cost of producing products may be higher than our competitors due to an over-supply of higher-priced components. Moreover, if they are unable to use certain components, we may be required to reimburse them for any potential inventory exposure they incur within lead time.
Our failure to anticipate changes in the supply of product components or customer demand may result in excess or obsolete inventory that could adversely affect our gross margins.
Substantially all of our products are made for immediate delivery on the basis of purchase orders rather than long-term agreements. As a result, contract manufacturing activities are scheduled according to a monthly sales and production forecast rather than on the receipt of product orders or purchase commitments. From time to time in the past, we have experienced significant variations between actual orders and our forecasts.
If there were to be a sudden and significant decrease in demand for our products, or if there were a higher incidence of inventory obsolescence because of rapidly changing prices of product components, rapidly changing technology and customer requirements or an increase in the supply of products in the marketplace, we could be required to write-down our inventory and our gross margins could be adversely affected.
Our contract manufacturers may be unable to obtain critical components from suppliers, which could disrupt or delay our ability to procure our products.
We rely on a limited number of third party manufacturers for the product components used by our contract manufacturers. Reliance on suppliers raises several risks, including the possibility of defective parts, reduced control over the availability and delivery schedule for parts and the possibility of increases in component costs. Manufacturing efficiencies and our profitability can be adversely affected by each of these risks.
Certain components used in our products are now available only from single sources. Most importantly, DLP® devices are only available from Texas Instruments. The majority of our current products are based on DLP® technology making the continued availability of DLP® devices increasingly important.
Our contract manufacturers also purchase other single or limited-source components for which we have no guaranteed alternative source of supply, and an extended interruption in the supply of any of these components could adversely affect our results of operations. We have worked to improve the availability of lamps and other key components to meet our future needs, but there is no guarantee that we will secure all the supply we need to meet demand for our products.
Furthermore, many of the components used in our products are purchased from suppliers located outside the U.S. Trading policies adopted in the future by the U.S. or foreign governments could restrict the availability of components or increase the cost of obtaining components. Any significant increase in component prices or decrease in component availability could have an adverse effect on our results of operations.
Product defects resulting in a large-scale product recall or successful product liability claims against us could result in significant costs or negatively impact our reputation and could adversely affect our business results and financial condition.
As with any high tech manufacturing company, we are sometimes exposed to warranty and potential product liability claims in the normal course of business. There can be no assurance that we will not experience material product liability losses arising from such potential claims in the future and that these will not have a negative impact on our reputation and, consequently, our revenues. We generally maintain insurance against most product liability risks and record warranty provisions based on historical defect rates, but there can be no assurance that this insurance coverage and these warranty provisions will be adequate for any potential liability ultimately incurred. In addition, there is no assurance that insurance will continue to be available on terms acceptable to us. A successful claim that exceeds our available insurance coverage or a significant product recall could have a material adverse impact on our financial condition and results of operations.
11
SMT, our joint venture with TCL Corporation, has not been successful in implementing its business plan and is in the process of winding down its business.
SMT, our 50-50 joint venture with TCL Corporation, has not been successful in executing its business plan, primarily a result of failing to secure third party OEM customers for its products. As a result, the parent companies sought alternatives for funding ongoing operations at SMT without success. During the third quarter of 2006, SMT began the process of winding down its operations in an orderly fashion, including the sale of its assets and the negotiation of the settlement of its outstanding liabilities. At December 31, 2007, the majority of SMT employees had been laid off and only those employees working on the wind-down of the company remained. During 2006, we completely wrote off our initial investment in SMT and also recorded a charge for our share of estimated additional wind-down costs. We are uncertain how long it may take to complete the liquidation of SMT. There can be no assurance that we will not incur additional costs as SMT completes the wind-down process.
Customs or other issues involving product delivery from our contract manufacturers could prevent us from timely delivering our products to our customers.
Our business depends on the free flow of products. Due to continuing threats of terrorist attacks, U.S. Customs has increased security measures for products being imported into the U.S. In addition, increased freight volumes and work stoppages at west coast ports have, in the past, and may, in the future, cause delays in freight traffic. Each of these situations could result in delay of receipt of products from our contract manufacturers and delay fulfillment of orders to our customers. Any significant disruption in the free flow of our products may result in a reduction of revenues, an increase of in-transit inventory, or an increase in administrative and shipping costs.
A deterioration in general global economic condition could adversely affect demand for our products.
Our business is subject to the overall health of the global economy. Purchase decisions for our products are made by corporations, governments, educational institutions, and consumers based on their overall available budget for information technology products. Any number of factors impacting the global economy including geopolitical issues, balance of trade concerns, inflation, interest rates, currency fluctuations and consumer confidence can impact the overall spending climate, both positively and negatively, in one or more geographies for our products. Deterioration in any one or combination of these factors could change overall industry dynamics and demand for discretionary products like ours and negatively impact our results of operations.
We are subject to risks associated with exporting products outside the U.S.
To the extent we export products outside the U.S., we are subject to U.S. laws and regulations governing international trade and exports, including, but not limited to, the International Traffic in Arms Regulations, the Export Administration Regulations and trade sanctions against embargoed countries, which are administered by the Office of Foreign Assets Control within the Department of the Treasury. A determination that we have failed to comply with one or more of these export controls could result in civil and/or criminal sanctions, including the imposition of fines upon us, the denial of export privileges, and debarment from participation in U.S. government contracts. Any one or more of such sanctions could have a material adverse effect on our business, financial condition and results of operations.
We are exposed to risks associated with our international operations.
Revenues outside the U.S. accounted for approximately 43% of our revenues in 2007, 36% of our revenues in 2006 and 38% of our revenues in 2005. The success and profitability of our international operations are subject to numerous risks and uncertainties, including:
| | • | | local economic and labor conditions; |
| | • | | unexpected changes in the regulatory environment; |
| | • | | trade protection measures; |
| | • | | foreign currency exchange rates. |
12
Currency exchange rate fluctuations may lead to decreases in our financial results.
To the extent that we incur costs in one currency and make our sales in another, our gross margins may be affected by changes in the exchange rates between the two currencies. Although our general policy is to hedge against these currency transaction risks on a monthly basis, given the volatility of currency exchange rates, we cannot provide assurance that we will be able to effectively manage these risks. Volatility in currency exchange rates may generate foreign exchange losses, which could have an adverse effect on our financial condition or results of operations.
Our reliance on third-party logistics and customer service providers may result in customer dissatisfaction or increased costs.
We have outsourced all of our logistics and service repair functions worldwide. We are reliant on our third-party providers to effectively and accurately manage our inventory, service repair, and logistics functions. This reliance includes timely and accurate shipment of our products to our customers and quality service repair work. Reliance on third parties requires proper training of employees, creating and maintaining proper controls and procedures surrounding both forward and reverse logistics functions, and timely and accurate inventory reporting. In addition, reliance on third parties requires adherence to product specifications in order to ensure quality and reliability of our products. Failure of our third parties to deliver in any one of these areas could have an adverse effect on our results of operations.
In addition, we outsourced our U.S. customer service and technical support call center to a third-party provider. We rely on this third party to provide efficient and effective support to our customers and partners. To the extent our customers are not satisfied with the level of service provided by our third-party provider we may lose market share and our revenues and corporate reputation could be negatively impacted.
We may be unsuccessful in protecting our intellectual property rights.
Our ability to compete effectively against other companies in our industry depends, in part, on our ability to protect our current and future proprietary technology under patent, copyright, trademark, trade secret and other intellectual property laws. We utilize contract manufacturers in China and Taiwan, and anticipate doing increased business in these markets and elsewhere around the world including other emerging markets. These emerging markets may not have the same protections for intellectual property that are available in the U.S. We cannot make assurances that our means of protecting our intellectual property rights in the U.S. or abroad will be adequate, or that others will not develop technologies similar or superior to our trade secrets or design around our patents. In addition, management may be distracted by, and we may incur substantial costs in, attempting to protect our intellectual property.
Also, despite the steps taken by us to protect our intellectual property rights, it may be possible for unauthorized third parties to copy or reverse-engineer trade secret aspects of our products, develop similar technology independently or otherwise obtain and use information that we regard as our trade secrets, and we may be unable to successfully identify or prosecute unauthorized uses of our intellectual property rights. Further, with respect to our issued patents and patent applications, we cannot provide assurance that pending patent applications (or any future patent applications) will be issued, that the scope of any patent protection will exclude competitors or provide competitive advantages to us, that any of our patents will be held valid if subsequently challenged, or that others will not claim rights in or ownership of the patents (and patent applications) and other intellectual property rights held by us.
If we become subject to intellectual property infringement claims, we could incur significant expenses and could be prevented from selling specific products.
We are periodically subject to claims that we infringe the intellectual property rights of others. We cannot provide assurance that, if and when made, these claims will not be successful. Intellectual property litigation is, by its nature, expensive and unpredictable. Any claim of infringement could cause us to incur substantial costs defending against the claim even if the claim is invalid, and could distract management from other business. Any potential judgment against us could require substantial payment in damages and also could include an injunction or other court order that could prevent us from offering certain products.
13
We rely on large distributors, national retailers and other large customers for a significant portion of our revenues, and changes in price or purchasing patterns could lower our revenues or gross margins.
We sell our products through large distributors such as Ingram Micro, Tech Data and CDW and through a number of other customers and channels. We rely on our larger distributors and other large customers for a significant portion of our total revenues in any particular period. We have no minimum purchase commitments or long-term contracts with any of these customers. Our customers, including our largest customers, could decide at any time to discontinue, decrease or delay their purchases of our products. In addition, the prices that our distributors pay for our products are subject to competitive pressures and change frequently.
If any of our major customers change their purchasing patterns or refuse to pay the prices that we set for our products, our net revenues and operating results could be negatively impacted. If our large distributors and retailers increase the size of their product orders without sufficient lead-time for us to process the order, our ability to fulfill product demand could be compromised. In addition, because our accounts receivable are concentrated within our largest customers, the failure of any of them to pay on a timely basis, or at all, could reduce our cash flow or result in a significant bad debt expense.
In order to compete, we must attract, retain and motivate key employees, and our failure to do so could have an adverse effect on our results of operations.
In order to compete, we must attract, retain and motivate key employees, including those in managerial, operations, engineering, service, sales, marketing, and support positions. Hiring and retaining qualified employees in all areas of the company is critical to our business. Each of our employees is an “at will employee” and may terminate his/her employment without notice and without cause or good reason.
We depend on our officers, and, if we are not able to retain them, our business may suffer.
Due to the specialized knowledge each of our officers possess with respect to our business and our operations, the loss of service of any of our officers could adversely affect our business. We do not carry key person life insurance on our officers. Each of our officers is an “at will employee” and may terminate his/her employment without notice and without cause or good reason.
During 2007 we experienced several changes in our executive officers, including our Chief Executive Officer and our Chief Financial Officer. Changes at the executive officer level may cause delays in achieving our operational goals and plans as new individuals learn the business.
Our results of operations could vary as a result of the methods, estimates and judgments we use in applying our accounting policies.
The methods, estimates and judgments we use in applying our accounting policies have a significant impact on our results of operations (see “Critical Accounting Policies and Estimates” in Item 7 below). Such methods, estimates and judgments are, by their nature, subject to substantial risks, uncertainties and assumptions, and factors may arise that lead us to change our methods, estimates and judgments. Changes in those methods, estimates and judgments could significantly affect our results of operations. For example, we are required to make judgments or take certain tax positions in relation to income taxes in both U.S. and foreign tax jurisdictions. To the extent a taxing authority takes a position different from ours and we are unsuccessful in defending our position, the outcome of that decision could impact the amount of income tax expense recorded in the period these new positions are known.
| Item 1B. | Unresolved Staff Comments |
None.
14
We lease a 140,000 square foot corporate headquarters facility in Wilsonville, Oregon. This lease is non-cancelable and expires in October 2011. We also lease space in Fredrikstad, Norway, Almere, The Netherlands, Singapore, Shenzhen, China and Hilversum, The Netherlands, under leases expiring on February 1, 2011, July 1, 2010, March 31, 2009, August 2009 and September 30, 2008, respectively.
We closed our Hilversum, The Netherlands facility in October 2002. We have sublet this entire facility for a portion of the lease obligation value. We also closed our Fredrikstad, Norway office during 2005 as part of our December 2004 restructuring. We are currently subletting a portion of this facility to various tenants and are actively working on subletting the remaining spaces. Due to reduced space needs, in January 2007, we consolidated floors in our corporate headquarters building in Wilsonville, Oregon from four floors to three floors and in December 2007 we consolidated to two and one half floors. We are actively looking for a tenant to sub-lease the vacant space.
In addition, we have several operating leases for smaller sites internationally to support our local sales and support activities.
From time to time, we become involved in ordinary, routine or regulatory legal proceedings incidental to the business. When a loss is deemed probable and reasonably estimable an amount is recorded in our financial statements. While the ultimate results of these matters cannot presently be determined, management does not expect that they will have a material adverse effect on our results of operations or financial position. Therefore, no adjustments have been made to the accompanying financial statements relative to these routine matters.
| Item 4. | Submission of Matters to a Vote of Security Holders |
No matters were submitted to a vote of our shareholders during the quarter ended December 31, 2007.
PART II
| Item 5. | Market for Registrant’s Common Equity, Related Stockholder Matters and Issuer Purchases of Equity Securities |
Stock Prices and Dividends
Our common stock trades on the NASDAQ Global Market under the symbol INFS. The high and low sales prices on the NASDAQ Global Market for the two years in the period ended December 31, 2007 were as follows:
| | | | | | |
2006 | | High | | Low |
Quarter 1 | | $ | 4.75 | | $ | 3.65 |
Quarter 2 | | | 5.10 | | | 2.76 |
Quarter 3 | | | 2.92 | | | 2.47 |
Quarter 4 | | | 3.00 | | | 2.39 |
| | |
2007 | | High | | Low |
Quarter 1 | | $ | 2.93 | | $ | 2.52 |
Quarter 2 | | | 2.82 | | | 2.23 |
Quarter 3 | | | 2.49 | | | 1.54 |
Quarter 4 | | | 1.82 | | | 1.43 |
15
The approximate number of beneficial shareholders and the number of shareholders of record at March 1, 2008 was 4,500 and 800, respectively.
There were no cash dividends declared or paid in 2007 or 2006 and we do not anticipate declaring cash dividends in the foreseeable future.
Equity Compensation Plan Information
Information regarding securities authorized for issuance under equity compensation plans is included in Part III, Item 12.
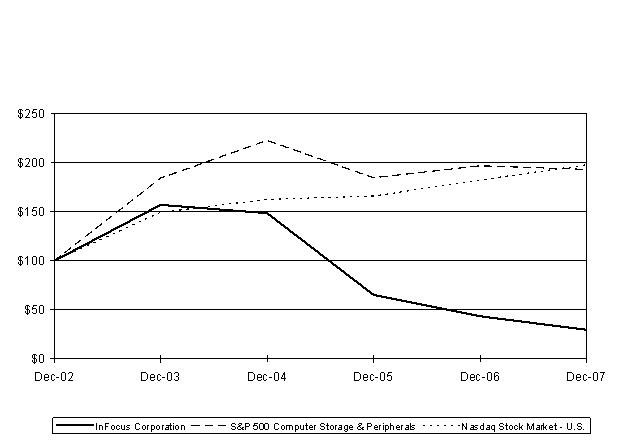
Stock Performance Graph
The SEC requires that registrants include in their annual report a line-graph presentation comparing cumulative five-year shareholder returns on an indexed basis, assuming a $100 initial investment and reinvestment of dividends, of (a) the registrant, (b) a broad-based equity market index and (c) an industry-specific index. The broad-based market index used is the NASDAQ Stock Market Total Return Index – U.S. and the industry-specific index used is the S&P 500 Computer Storage and Peripherals Index.
| | | | | | | | | | | | | | | | | | |
| | | Base
Period | | Indexed Returns
Year Ended |
Company/Index | | 12/31/02 | | 12/31/03 | | 12/31/04 | | 12/31/05 | | 12/31/06 | | 12/31/07 |
InFocus Corporation | | $ | 100.00 | | $ | 157.14 | | $ | 148.70 | | $ | 65.10 | | $ | 43.34 | | $ | 29.55 |
S&P 500 Computer Storage and Peripherals | | | 100.00 | | | 184.44 | | | 222.99 | | | 184.80 | | | 197.17 | | | 193.24 |
NASDAQ U.S. Index | | | 100.00 | | | 149.52 | | | 162.72 | | | 166.18 | | | 182.57 | | | 197.98 |
16
| Item 6. | Selected Financial Data |
| | | | | | | | | | | | | | | | | | | | |
| IN THOUSANDS | | Year Ended December 31, | |
(except per share amounts) | | 2007 | | | 2006 | | | 2005 | | | 2004 | | | 2003 | |
Statement of Operations Data | | | | | | | | | | | | | | | | | | | | |
Revenues | | $ | 308,181 | | | $ | 374,752 | | | $ | 532,099 | | | $ | 648,941 | | | $ | 604,490 | |
Cost of revenues | | | 257,426 | | | | 320,866 | | | | 499,327 | | | | 535,031 | | | | 545,049 | |
| | | | | | | | | | | | | | | | | | | | |
Gross margin | | | 50,755 | | | | 53,886 | | | | 32,772 | | | | 113,910 | | | | 59,441 | |
Operating expenses: | | | | | | | | | | | | | | | | | | | | |
Marketing and sales | | | 35,777 | | | | 49,107 | | | | 64,292 | | | | 70,421 | | | | 73,123 | |
Research and development | | | 14,135 | | | | 17,997 | | | | 20,847 | | | | 28,864 | | | | 33,214 | |
General and administrative | | | 19,938 | | | | 21,730 | | | | 23,360 | | | | 24,423 | | | | 27,673 | |
Restructuring costs | | | 8,375 | | | | 5,425 | | | | 11,050 | | | | 1,950 | | | | 6,650 | |
Impairment of long-lived assets | | | — | | | | — | | | | 9,813 | | | | — | | | | 26,400 | |
Regulatory assessments | | | — | | | | 9,392 | | | | 1,600 | | | | — | | | | — | |
| | | | | | | | | | | | | | | | | | | | |
Loss from operations | | | (27,470 | ) | | | (49,765 | ) | | | (98,190 | ) | | | (11,748 | ) | | | (107,619 | ) |
Other income (expense): | | | | | | | | | | | | | | | | | | | | |
Interest expense | | | (507 | ) | | | (401 | ) | | | (612 | ) | | | (191 | ) | | | (242 | ) |
Interest income | | | 2,715 | | | | 2,446 | | | | 1,772 | | | | 1,407 | | | | 1,734 | |
Other, net(1) | | | (349 | ) | | | (13,451 | ) | | | 17,130 | | | | 16,704 | | | | 113 | |
| | | | | | | | | | | | | | | | | | | | |
Income (loss) before income taxes | | | (25,611 | ) | | | (61,171 | ) | | | (79,900 | ) | | | 6,172 | | | | (106,014 | ) |
Provision (benefit) for income taxes | | | (29 | ) | | | 749 | | | | (106 | ) | | | (1,401 | ) | | | 3,499 | |
| | | | | | | | | | | | | | | | | | | | |
Net income (loss) | | $ | (25,582 | ) | | $ | (61,920 | ) | | $ | (79,794 | ) | | $ | 7,573 | | | $ | (109,513 | ) |
| | | | | | | | | | | | | | | | | | | | |
Basic net income (loss) per share | | $ | (0.64 | ) | | $ | (1.56 | ) | | $ | (2.02 | ) | | $ | 0.19 | | | $ | (2.78 | ) |
| | | | | | | | | | | | | | | | | | | | |
Diluted net income (loss) per share | | $ | (0.64 | ) | | $ | (1.56 | ) | | $ | (2.02 | ) | | $ | 0.19 | | | $ | (2.78 | ) |
| | | | | | | | | | | | | | | | | | | | |
| |
| | | December 31, | |
| | | 2007 | | | 2006 | | | 2005 | | | 2004 | | | 2003 | |
Balance Sheet Data | | | | | | | | | | | | | | | | | | | | |
Cash, restricted cash and marketable securities | | $ | 84,110 | | | $ | 76,233 | | | $ | 80,117 | | | $ | 69,468 | | | $ | 144,235 | |
Working capital | | | 83,287 | | | | 98,260 | | | | 140,358 | | | | 240,206 | | | | 214,853 | |
Property and equipment, net | | | 2,973 | | | | 3,961 | | | | 2,747 | | | | 16,747 | | | | 15,890 | |
Total assets | | | 172,991 | | | | 182,256 | | | | 263,888 | | | | 383,873 | | | | 366,098 | |
Short-term borrowings | | | — | | | | — | | | | — | | | | 16,198 | | | | — | |
Shareholders’ equity | | | 83,698 | | | | 100,263 | | | | 155,191 | | | | 266,633 | | | | 237,879 | |
| (1) | Other, net included the following for the years ended December 31, 2007, 2006, 2005, and 2004: |
| | | | | | | | | | | | | | | |
| | | Year Ended December 31, |
| | | 2007 | | | 2006 | | | 2005 | | | 2004 |
Net realized gain on the sale of equity securities | | $ | — | | | $ | 809 | | | $ | 19,396 | | | $ | 13,245 |
Impairment charge on valuation of equity securities | | | (124 | ) | | | (261 | ) | | | — | | | | — |
Income related to the profits of Motif, 50-50 joint venture | | | 857 | | | | 1,555 | | | | 3,722 | | | | 2,361 |
Expense related to losses of SMT, 50-50 joint venture | | | — | | | | (2,709 | ) | | | (5,185 | ) | | | — |
Write-down of equity method investment in SMT, 50-50 joint venture | | | — | | | | (2,106 | ) | | | — | | | | — |
Charge for estimated costs to wind-down SMT | | | — | | | | (1,126 | ) | | | — | | | | — |
Impairment charge related to TUN | | | — | | | | (1,117 | ) | | | — | | | | — |
Gains (losses) related to foreign currency transactions | | | (1,133 | ) | | | (1,519 | ) | | | (853 | ) | | | 826 |
Recovery (write-down) of certain cost-based investments in technology companies | | | 202 | | | | (7,474 | ) | | | — | | | | — |
Gain on sale of land | | | — | | | | 636 | | | | — | | | | — |
Other | | | (151 | ) | | | (139 | ) | | | 50 | | | | 272 |
| | | | | | | | | | | | | | | |
| | $ | (349 | ) | | $ | (13,451 | ) | | $ | 17,130 | | | $ | 16,704 |
| | | | | | | | | | | | | | | |
There were no significant unusual items in other, net in 2003.
17
| Item 7. | Management’s Discussion and Analysis of Financial Condition and Results of Operations |
Overview
During 2007, we focused our attention on stabilizing our operating performance. Specifically, we addressed the key drivers influencing gross margins, operating expenses and cash. We directed our sales and marketing activities at improving gross margins through product mix improvements and we also continued to focus on improving our operations and supply chain efficiencies. The improved performance in these areas resulted in gross margin improvement of 2.1 percentage points to 16.5% in 2007 compared to 14.4% achieved in 2006.
We experienced gross margin improvements throughout the year, beginning the year with gross margins in the first quarter of 2007 of 10.9% and finishing in the fourth quarter of 2007 with gross margins of 20.4%. The improvements were generated by the continued introduction of new products with higher realizable margins, efficiencies in the area of supply chain management and improved product quality.
Complementing the gross margin improvements were reductions in our operating expenses, which were reduced by $25.4 million in 2007 compared to 2006. Operating expenses, excluding charges for restructuring and regulatory assessments, were $69.9 million in 2007 compared to $88.8 million in 2006. The $18.9 million reduction in these expenses in 2007 compared to 2006 was attributed to continued efforts to better align our cost structure with our anticipated revenues and profits. Operating expenses, excluding restructuring charges, decreased $1.7 million to $15.4 million in the fourth quarter of 2007 compared to $17.1 million in the third quarter of 2007.
Revenue reported for 2007 was $308.2 million, a reduction of 17.8% from 2006 reported revenues of $374.8 million. Unit volumes increased by 3%, from 331,000 units sold in 2006 to 342,000 units sold in 2007, offset by a decline in average selling prices (ASPs) of 18% compared to 2006. The ASP reduction was driven by falling prices in the market-place, compounded by a product mix shift and InFocus selling a higher percentage of entry level products in 2007 compared to 2006.
At December 31, 2007 we had approximately 5 weeks of inventory in the channel, which compared to 4 weeks of inventory in the channel at both December 31, 2006 and September 30, 2007. To the extent that the demand for our products weakens, the increase in channel inventory levels may have a negative impact on our subsequent period revenues and gross margins. As economic conditions in the U.S. market place continue to soften the risk of such revenue and gross margin declines will increase for both our customers and us.
In 2007 we realized an operating loss of $27.5 million compared to an operating loss of $49.8 million reported in 2006. Included in the operating loss in 2007 and 2006, respectively, is $8.4 million and $14.8 million of charges for restructuring and regulatory assessments. In addition, our efforts to sustain and grow cash were directed at working capital initiatives and resulted in positive cash flows generated from operations of $5.4 million in 2007.
In 2007, we focused on providing the market with new products in all our projector categories. In total we introduced 17 new projectors to the market, 12 of which were targeted at the meeting/class room segment where we retain strong brand recognition and believe additional growth potential exists. With the introduction of these products, we have the most robust product offering in our recent history, which allows us to offer our customers a broad portfolio of market leading products.
In 2007, we incurred restructuring charges totaling $8.4 million, which included the following:
| | • | | a $2.4 million charge in the first quarter of 2007 primarily related to estimated lease losses on vacated or partially vacated facilities at our corporate headquarters and various European office locations; |
18
| | • | | a $2.1 million charge in the second quarter of 2007 primarily related to severance costs for personnel reductions; |
| | • | | a $0.2 million charge in the third quarter of 2007 for estimated employee severance costs; and |
| | • | | a $3.7 million charge in the fourth quarter of 2007 for estimated lease losses on vacated or partially vacated facilities. Included in the $3.7 million charge was a $2.7 million charge for changes in estimates of prior period sub-lease assumptions and the remaining $1.0 million charge was for remaining obligations for facilities space that was vacated in the fourth quarter of 2007. |
A portion of the $2.1 million charge recorded in the second quarter of 2007 for severance costs was related to a shift in our research and development model to outsource more of the design functions to our contract manufacturers, which allows us to reduce necessary in-house research and development resources.
We finished 2007 with $84.1 million of cash and cash equivalents and restricted cash and had no outstanding borrowings. The increase in cash and cash equivalents, restricted cash and marketable securities of $7.9 million in 2007 was primarily attributed to positive changes in working capital cash flows from inventory, accounts receivable and accounts payable to more closely match the timing of payments to suppliers with receipts from customers for sales activities, partially offset by our operating loss.
The Company announced in October 2006 that it had engaged Banc America Securities to assist with the evaluation of strategic alternatives. The process yielded several outside parties expressing interest, but no offer was considered to be in the best interests of shareholders. In October of 2007, the Board of Directors terminated the strategic alternatives process and redirected our focus to managing the business and to maximizing shareholder value.
Results of Operations
| | | | | | | | | | | | | | | | | | | | | |
| | | Year Ended December 31,(1) | |
| | | 2007 | | | 2006 | | | 2005 | |
(Dollars in thousands) | | Dollars | | | % of
revenues | | | Dollars | | | % of
revenues | | | Dollars | | | % of
revenues | |
Revenues | | $ | 308,181 | | | 100.0 | % | | $ | 374,752 | | | 100.0 | % | | $ | 532,099 | | | 100.0 | % |
Cost of revenues | | | 257,426 | | | 83.5 | | | | 320,866 | | | 85.6 | | | | 499,327 | | | 93.8 | |
| | | | | | | | | | | | | | | | | | | | | |
Gross margin | | | 50,755 | | | 16.5 | | | | 53,886 | | | 14.4 | | | | 32,772 | | | 6.2 | |
Operating expenses: | | | | | | | | | | | | | | | | | | | | | |
Marketing and sales | | | 35,777 | | | 11.6 | | | | 49,107 | | | 13.1 | | | | 64,292 | | | 12.1 | |
Research and development | | | 14,135 | | | 4.6 | | | | 17,997 | | | 4.8 | | | | 20,847 | | | 3.9 | |
General and administrative | | | 19,938 | | | 6.5 | | | | 21,730 | | | 5.8 | | | | 23,360 | | | 4.4 | |
Restructuring costs | | | 8,375 | | | 2.7 | | | | 5,425 | | | 1.4 | | | | 11,050 | | | 2.1 | |
Impairment of long-lived assets | | | — | | | — | | | | — | | | — | | | | 9,813 | | | 1.8 | |
Regulatory assessments | | | — | | | — | | | | 9,392 | | | 2.5 | | | | 1,600 | | | 0.3 | |
| | | | | | | | | | | | | | | | | | | | | |
| | | 78,225 | | | 25.4 | | | | 103,651 | | | 27.7 | | | | 130,962 | | | 24.6 | |
| | | | | | | | | | | | | | | | | | | | | |
Loss from operations | | | (27,470 | ) | | (8.9 | ) | | | (49,765 | ) | | (13.3 | ) | | | (98,190 | ) | | (18.5 | ) |
Other income (expense): | | | | | | | | | | | | | | | | | | | | | |
Interest expense | | | (507 | ) | | (0.2 | ) | | | (401 | ) | | (0.1 | ) | | | (612 | ) | | (0.1 | ) |
Interest income | | | 2,715 | | | 0.9 | | | | 2,446 | | | 0.7 | | | | 1,772 | | | 0.3 | |
Other, net | | | (349 | ) | | (0.1 | ) | | | (13,451 | ) | | (3.6 | ) | | | 17,130 | | | 3.2 | |
| | | | | | | | | | | | | | | | | | | | | |
Loss before income taxes | | | (25,611 | ) | | (8.3 | ) | | | (61,171 | ) | | (16.3 | ) | | | (79,900 | ) | | (15.0 | ) |
Provision (benefit) for income taxes | | | (29 | ) | | — | | | | 749 | | | 0.2 | | | | (106 | ) | | — | |
| | | | | | | | | | | | | | | | | | | | | |
Net loss | | $ | (25,582 | ) | | (8.3 | )% | | $ | (61,920 | ) | | (16.5 | )% | | $ | (79,794 | ) | | (15.0 | )% |
| | | | | | | | | | | | | | | | | | | | | |
(1) | Percentages may not add due to rounding. |
19
Revenues
Revenues decreased $66.6 million, or 17.8%, in 2007 compared to 2006 and decreased $157.3 million, or 29.6%, in 2006 compared to 2005.
The decrease in revenue in 2007 compared to 2006 was due primarily to an 18% decrease in ASPs, due to both lower overall pricing across various products and a shift toward a greater weighting of overall sales being derived from our lower-priced entry-level meeting room, classroom and home products. In the first quarter of 2007, compounding the pressure on ASPs already experienced due to the above, we recognized a higher volume of sales of our IN24 and IN26 products at lower margins, as we worked to deplete existing inventory in order to transition the market to the higher-margin and better featured IN24+ and IN26+. Also contributing to the ASP declines in 2007 was increased unit sales of the IN72 entry level home entertainment product. In the first half of 2007, we aggressively sold a large quantity of the IN72 product to deplete existing inventory as the product moved to end of life.
The decrease in revenue attributable to the lower ASPs was partially offset by an increase in total projector units sold to 342,000 units in 2007 compared to 331,000 units in 2006. This increase was primarily due to the increase in sales of entry-level meeting room and classroom products discussed above.
The decrease in revenue in 2006 compared to 2005 was due to the following:
| | • | | a $16.6 million decrease in engine and display revenues as we completely exited those markets in late 2005; |
| | • | | a 71% decrease in OEM unit sales as we continued to deemphasize our OEM business in 2006; |
| | • | | a 66,000 unit decrease in total projector units sold to 331,000 units in 2006 compared to 397,000 units in 2005; and |
| | • | | a 15.5% decrease in ASPs, due to both lower overall pricing and a shift in product mix. |
Geographic Revenues
Revenue by geographic area and as a percentage of total revenue, based on shipment destination, was as follows (dollars in thousands):
| | | | | | | | | | | | | | | | | | |
| | | Year Ended December 31, | |
| | | 2007 | | | 2006 | | | 2005 | |
U.S. | | $ | 175,219 | | 56.9 | % | | $ | 239,258 | | 63.9 | % | | $ | 331,988 | | 62.4 | % |
Europe | | | 81,999 | | 26.6 | % | | | 81,825 | | 21.8 | % | | | 124,939 | | 23.5 | % |
Asia | | | 34,926 | | 11.3 | % | | | 27,701 | | 7.4 | % | | | 43,350 | | 8.1 | % |
Other | | | 16,037 | | 5.2 | % | | | 25,968 | | 6.9 | % | | | 31,822 | | 6.0 | % |
| | | | | | | | | | | | | | | | | | |
| | $ | 308,181 | | | | | $ | 374,752 | | | | | $ | 532,099 | | | |
| | | | | | | | | | | | | | | | | | |
U.S. revenues in 2007 decreased 26.8% compared to 2006, primarily due to a 7.6% decline in unit sales and a 21.6% decline in ASPs. The ASP decline was affected by the greater weighting towards sales of lower-margin entry-level meeting room, classroom and home entertainment products in 2007 compared to 2006. The overall declines in units and ASPs in 2007 compared to 2006 reflect the continued industry dynamics including intense competition from our Asian competitors and a decline in revenue in the value added reseller channel.
European revenues were relatively flat in 2007 compared to 2006, primarily due to a 23.1% increase in unit sales, mostly offset by a 15.4% decline in ASPs.
Asian revenues increased 26.1% in 2007 compared to 2006 as we focused more of our sales efforts in this region, which contributed to increases in unit sales and market share. The increase in unit sales of 55% was partially offset by a decrease in ASPs of 18.6%.
20
Other revenues primarily consist of sales in Canada and Latin America. Other revenues decreased 38.2% in 2007 compared to 2006. Unit sales decreased 23.0% in 2007 compared to 2006, primarily due to the sale of 8,500 units, which resulted in $6.2 million of revenue, in the first quarter of 2006 related to an education tender order in Mexico that did not reoccur in 2007. Revenue in 2007 was also impacted by a 19.8% decrease in ASPs compared to 2006.
U.S. revenues were down 28% in 2006 compared to 2005 primarily due to the lack of engine and display revenue in 2006, as well as the decreases in units and ASPs, as discussed above. The decreases in units and ASPs in 2006 compared to 2005 reflect industry dynamics including intense competition, slower than expected adoption of front projectors by consumers, difficult product transitions that resulted in missed market opportunities, and a decline in revenues from our value added reseller channel. While we experienced a decline in revenues in the value added reseller channel, the overall market for that channel experienced above average growth during the year.
European revenues were down 35% in 2006 compared to 2005 primarily due to decreases in units sold and ASPs. In addition, European revenues were negatively impacted by product availability for our new main stream meeting room products as our old products in this category did not meet new European regulatory requirements which went into effect on July 1, 2006. Our entire product line is now in compliance with these new regulations.
Asian revenues were down 36% in 2006 compared to 2005 primarily due to a decrease in units, partially due to the lack of availability of China manufactured versions of our new products earlier in 2006, and decreases in ASPs.
Backlog
At December 31, 2007, we had backlog of approximately $6.6 million, compared to approximately $9.5 million at December 31, 2006. Given current supply and demand estimates, it is anticipated that a majority of the current backlog will turn over by the end of the first quarter of 2008. The stated backlog is not necessarily indicative of sales for any future period, nor is a backlog any assurance that we will realize a profit from filling the orders.
Gross Margin
We achieved a gross margin percentage of 16.5% in 2007, 14.4% in 2006 and 6.2% in 2005.
The improvement in our gross margin percentage in 2007 compared to 2006 was due primarily to the following:
| | • | | continued efficiencies achieved within our supply chain, including increased focus on the timing of inventory procurement to better match the timing of product costs with revenues; |
| | • | | lower costs associated with warranty repair activities; |
| | • | | introduction of new products with improved gross margins; |
| | • | | improved management of product mix between sales of higher performance and higher margin generating products and sales of lower cost and lower margin generating value products; and |
| | • | | a $5.1 million charge for inventory write-downs during 2007 compared to a charge of $8.7 million in 2006. |
These improvements were offset by price reductions across our product portfolio as discussed above.
The improvement in our gross margin percentage in 2006 compared to 2005 was due to the following:
| | • | | efficiencies achieved within our supply chain, including the reduction of inventory in order to better match the timing of product costs with revenues; |
| | • | | reduced warranty costs; |
| | • | | introduction of new products with improved gross margins; |
21
| | • | | greater product cost reductions; |
| | • | | an $8.7 million charge for inventory write-downs and accelerated tooling depreciation during 2006 compared to a charge of $26.6 million in 2005; |
| | • | | reductions in our overall cost to serve customers, including reductions in customer program costs; and |
| | • | | a settlement charge related to a patent infringement case during the second quarter of 2005, with no similar charges in 2006. |
The charge for inventory write-downs in 2007 related primarily to declines in market value on specific slow moving finished goods inventory and write-downs on service parts inventory. The write-downs for service parts inventory related to the decline in usage of service parts for warranty and non-warranty repair activities, as our warranty repair activities were significantly reduced in 2007. The charge for inventory write-downs in 2006 related primarily to end-of-life costs for various product platforms and a decline in market value on slow moving finished goods. The inventory write-downs reduced our gross margin percentage by 1.6 percentage points in 2007, 2.3 percentage points in 2006 and 5.0 percentage points in 2005.
We continue to focus on improving our gross margin percentage through managing the mix of products sold and continuing to improve our supply chain efficiencies by working closely with our contract manufacturers to control product costs, improve quality and reduce product freight, handling and storage costs.
Marketing and Sales Expense
Marketing and sales expense decreased $13.3 million, or 27.1%, to $35.8 million in 2007 compared to $49.1 million in 2006 and decreased $15.2 million, or 23.6%, in 2006 compared to $64.3 million in 2005.
The decrease in marketing and sales expense in 2007 compared to 2006 was primarily due to a reduced cost structure. The reduced cost structure was as a result of our previous restructuring activities and continued focus on management of expenses, which included reductions in personnel related costs and other discretionary spending. We also achieved decreases in overall spending for sales and marketing programs and advertising related spending. Offsetting these factors was a $0.5 million charge in the second quarter of 2007 related to the impairment of a trade show booth that was adjusted to estimated fair market value.
The decrease in marketing and sales expense in 2006 compared to 2005 was primarily due to efficiencies gained related to our previous restructuring activities, which included reductions in payroll related costs as well as reductions in sales and marketing related travel expenses. In addition, due to a conscious effort to reduce marketing program spending, we recognized large decreases in overall spending for sales and marketing programs, such as cooperative advertising, which directly correlate with trends in revenue. Also contributing to the decrease was a $1.4 million reduction in the amount of IT and facilities expenses allocated to sales and marketing. These decreases were partially offset by increased advertising expenses related to the launch of several new products and a new branding campaign.
Stock-based compensation included as a component of marketing and sales totaled $391,000 in 2007, $359,000 in 2006 and $98,000 in 2005.
Research and Development Expense
Research and development expense decreased $3.9 million, or 21.5%, to $14.1 million in 2007 compared to $18.0 million in 2006 and decreased $2.8 million, or 13.7%, in 2006 compared to $20.8 million in 2005.
The decrease in research and development expense in 2007 compared to 2006 was primarily due to a reduced cost structure. The reduced cost structure was a result of our previous restructuring activities, including a decrease in personnel related costs and other discretionary spending due to a shift in our research and development model to outsource more of the design functions to our contract manufacturers, which allows us to reduce necessary in-house research and development resources. In
22
the future, our remaining internal research and development group will be focused on advanced development and the design work related to our core projection products will be outsourced.
The decrease in 2006 compared to 2005 was primarily due to efficiencies gained through our previous restructuring activities, as well as a decrease in labor related costs resulting from a reduction in headcount related to our wireless initiatives that took place late in the second quarter of 2006. Also contributing to the decrease was a $1.0 million reduction in the amount of IT and facilities expenses allocated to research and development. As overall IT and facilities expenses have decreased, allocations to other functional areas have decreased proportionately.
Stock-based compensation included as a component of research and development totaled $304,000 in 2007, $151,000 in 2006 and $0 in 2005.
General and Administrative Expense
General and administrative expense decreased $1.8 million, or 8.2%, to $19.9 million in 2007 compared to $21.7 million in 2006, and decreased $1.7 million, or 7.0%, in 2006 from $23.4 million in 2005.
Included in general and administrative expense in 2007 was $1.3 million of costs incurred for various external advisors engaged as part of our strategic alternatives evaluation process. This evaluation process was suspended during the third quarter of 2007 and, accordingly, we do not anticipate any additional costs for this process in future quarters. In addition, included in general and administrative expense in 2007 was $0.4 million of costs incurred in relation to the hiring of a new Chief Executive Officer. Included in general and administrative expense in 2006 was $1.8 million of costs related to our audit committee investigations, which concluded in the second quarter of 2006. We also realized decreased overall spending in 2007 compared to 2006 as a result of our previous restructuring activities.
General and administrative expense in 2006 included approximately $1.8 million of costs related to our audit committee investigations. Bad debt expense increased $0.9 million in 2006 compared to 2005. In 2005, we had a net bad debt recovery of $0.4 million compared to bad debt expense of $0.5 million in 2006. Other areas of increased spending included fees for tax consulting and expenses related to filing and defending patents and trademarks. These increases were offset by efficiencies gained related to our previous restructuring activities. These efficiencies included lower headcount costs, lower travel expenses and lower rent expense related to facility consolidations.
Stock-based compensation included as a component of general and administrative totaled $416,000 in 2007, $489,000 in 2006 and $92,000 in 2005.
Restructuring
Restructuring charges totaled $8.4 million in 2007 and included the following:
| | • | | a $3.7 million charge in the fourth quarter of 2007 for estimated lease losses on vacated or partially vacated facilities. Included in the $3.7 million charge was a $2.7 million charge for changes in estimates of prior period sub-lease assumptions and the remaining $1.0 million charge was for remaining obligations for facilities space that was vacated in the fourth quarter of 2007; |
| | • | | a $0.2 million charge in the third quarter of 2007 for estimated employee severance costs; |
| | • | | a $2.1 million charge in the second quarter of 2007 primarily related to severance costs for personnel reductions; and |
| | • | | a $2.4 million charge in the first quarter of 2007 primarily related to estimated lease losses on vacated or partially vacated facilities at our corporate headquarters and various European office locations. |
A portion of the $2.1 million charge recorded in the second quarter of 2007 for severance costs was related to a shift in our research and development model to outsource more of the design functions to our
23
contract manufacturers, which allows us to reduce necessary in-house research and development resources.
Restructuring charges totaled $5.4 million in 2006 and included the following:
| | • | | a $1.1 million charge related to international facility consolidation activities that were completed during the first quarter of 2006; |
| | • | | an $850,000 charge in the second quarter of 2006 primarily related to our contractual obligation for severance for former InFocus employees terminated by SMT during the second quarter of 2006; |
| | • | | an $850,000 charge in the third quarter of 2006 for severance costs primarily related to the decision to outsource our U.S. call center to a third party as well as other headcount reductions initiated during the third quarter; and |
| | • | | a $2.7 million charge in the fourth quarter of 2006 for headcount reductions and for changes in estimates for prior period sub-lease assumptions on facility reductions. Included in the $2.7 million charge was a charge of $0.4 million related to severance for former InFocus employees who were terminated by SMT during the fourth quarter of 2006. |
Restructuring charges totaled $11.1 million in 2005 and included the following:
| | • | | a $6.3 million charge primarily related to reductions in headcount as part of a restructuring plan that was announced in September 2005. The majority of these actions, including the elimination of several senior executive and management positions, as well as other headcount reductions, were completed over a three quarter period; |
| | • | | a $1.1 million charge in the second quarter of 2005 primarily associated with severance charges for changes in supply chain management and realignment of our European sales force; and |
| | • | | $3.7 million of charges related to our December 2004 plan of restructuring associated with streamlining our operations in Fredrikstad, Norway, which consisted primarily of costs to vacate space under long-term lease arrangements, additional severance charges in the U.S. and Europe and non-cash stock-based compensation expense related to former employees who transitioned to SMT. |
Impairment of Long-Lived Assets
During the third quarter of 2005, we performed an expected present value analysis with multiple cash flow scenarios, weighted by estimated probabilities, using a risk-free interest rate to estimate fair value. This analysis indicated that the book value of our long-lived assets exceeded the undiscounted cash flows expected to result from the use and eventual disposition of the assets. Based on our analyses, we determined that all of our long-lived assets, other than tooling equipment related to current products, were fully impaired. Accordingly, we recorded a non-cash impairment charge totaling $9.8 million in the third quarter of 2005 in order to write-off the remaining book value of our long-lived assets other than tooling equipment used in the production of current products. Of the $9.8 million charge, $7.1 million was allocated to property and equipment and $2.7 million was allocated to other intangible assets, including the carrying value of patents and trademarks. The majority of the impaired long-lived assets continue to be used in operations.
Regulatory Assessments
Regulatory assessments of $9.4 million in 2006 included charges totaling $10.7 million related to the initial settlement of our Shanghai customs case, offset by the $1.3 million reversal of our remaining 2005 $1.6 million accrual related to our closed Office of Foreign Assets Control case. See Note 16 of Notes to Consolidated Financial Statements for more details regarding Regulatory Assessments.
24
Other Income (Expense)
Interest income in 2007 was $2.7 million compared to $2.4 million in 2006 and $1.8 million in 2005. The increases in interest income in 2007 compared to 2006 and in 2006 compared to 2005 were due to increasing interest rates over the past two years. In addition, our average cash and investment balance was $29.2 million, $28.3 million and $35.2 million, respectively, in 2007, 2006 and 2005.
Other, net included the following (in thousands):
| | | | | | | | | | | | |
| | | Year Ended December 31, | |
| | | 2007 | | | 2006 | | | 2005 | |
Net realized gain on the sale of equity securities | | $ | — | | | $ | 809 | | | $ | 19,396 | |
Impairment charge for valuation of equity securities | | | (124 | ) | | | (261 | ) | | | — | |
Income related to the profits of Motif, 50-50 joint venture | | | 857 | | | | 1,555 | | | | 3,722 | |
Expense related to losses of SMT, 50-50 joint venture | | | — | | | | (2,709 | ) | | | (5,185 | ) |
Write-down of equity method investment in SMT, 50-50 joint venture | | | — | | | | (2,106 | ) | | | — | |
Charge for estimated costs to wind-down SMT | | | — | | | | (1,126 | ) | | | — | |
Impairment charge related to TUN | | | — | | | | (1,117 | ) | | | — | |
Losses related to foreign currency transactions | | | (1,133 | ) | | | (1,519 | ) | | | (853 | ) |
Recovery (write-down) of certain cost-based investments in technology companies | | | 202 | | | | (7,474 | ) | | | — | |
Gain on sale of land | | | — | | | | 636 | | | | — | |
Other | | | (151 | ) | | | (139 | ) | | | 50 | |
| | | | | | | | | | | | |
| | $ | (349 | ) | | $ | (13,451 | ) | | $ | 17,130 | |
| | | | | | | | | | | | |
Motif license fees are recognized when licensees report sales and resultant royalties, which are currently contractually required on a semi-annual basis and primarily fall in the first and third quarters of each year. The decreased income related to our Motif joint venture was due to lower reported revenues by Motif’s licensees and an increase in tax expense as Motif has now utilized the majority of its income tax loss carry forwards.
SMT is currently winding down its operations, including the sale of its assets and the settlement of its liabilities. The $1.1 million charge included as a component of other, net in 2006 is our best estimate of our share of the costs for the wind-down.
Income Taxes
Income tax benefit of $29,000 in 2007 was made up of $41,000 of income tax expense from U.S. operations offset by $70,000 of income tax benefit from foreign operations. The $40,000 of tax expense from U.S. operations was the result of withholding tax on foreign royalty payments received and state income taxes. The $70,000 of income tax benefits from foreign operations was primarily comprised of a $270,000 tax benefit related to the resolution of a penalty dispute with the Dutch Tax Authorities offset by a $200,000 net tax expense from foreign operations.
Income tax expense of $0.7 million in 2006 was made up of $0.1 million and $0.6 million of income tax expense from U.S. operations and foreign operations, respectively. The $0.1 million of tax expense from U.S. operations was the result of withholding tax on foreign royalty payments received and state income taxes net of 2005 return to provision adjustments. The $0.6 million of tax expense from foreign operations was primarily comprised of $0.3 million for anticipated transfer pricing adjustments, $0.2 million for adjustments to various deferred tax assets that were not offset by valuation allowances, and $0.1 million net tax expense on foreign operations.
Income tax benefit of $0.1 million in 2005 was related to $0.8 million of tax benefit from closing out foreign tax exposures in prior years and $0.2 million net true-up benefit from our 2004 tax provision to our actual 2004 tax returns. These tax benefits were offset by $0.6 million of 2005 tax expense in certain foreign and state tax jurisdictions and $0.3 million of tax expense due to valuation allowance applied to certain foreign deferred tax assets.
25
See Note 7 of Notes to Consolidated Financial Statements for more details concerning our income tax provision.
Inflation
We believe that the impact of inflation was minimal on our business in 2007, 2006 and 2005.
Liquidity and Capital Resources
Total cash and cash equivalents and restricted cash and marketable securities were $84.1 million at December 31, 2007. At December 31, 2007, we had working capital of $83.3 million, which included $61.2 million of unrestricted cash and cash equivalents. The current ratio at December 31, 2007 and December 31, 2006 was 2.0 to 1 and 2.2 to 1, respectively.
We sustained an operating loss of $27.5 million in 2007, contributing to a decrease in net working capital of $15.0 million for the period. If we continue to experience significant operating losses and reductions in net working capital, we may need to obtain additional debt or equity financing to continue current business operations. There is no guarantee that we will be able to raise additional funds on favorable terms, if at all.
We have a line of credit facility with Wells Fargo Foothill, Inc. (“Wells Fargo”). On March 28, 2007, we entered into an amendment to extend the maturity date of the credit facility to August 31, 2007 and re-set future financial covenants. This credit facility was amended again on August 30, 2007 to extend the maturity date to February 28, 2008. This amendment also established certain future financial covenants. This credit facility was subsequently amended on February 28, 2008 to extend the maturity date to March 14, 2008. As of the date of filing of this annual report we are engaged in negotiations with Wells Fargo Foothill for another amendment that, if completed, we expect will include an extension of the maturity date to August 31, 2008 and establish certain future financial covenants. As of December 31, 2007 there were no borrowings outstanding under the agreement and we were in compliance with all financial covenants.
We anticipate that our current cash and cash equivalents and marketable securities, along with cash we anticipate generating from operations, will be sufficient to fund our known operating and capital requirements for at least the next 12 months. However, to the extent our operating results fall below our expectations, we may need to raise additional capital through debt or equity financings. We may also need additional capital if we pursue other strategic growth opportunities. There is no guarantee that we will be able to raise additional funds on favorable terms, if at all.
At December 31, 2007, we had one outstanding letter of credit totaling $20 million, which expired on February 2, 2008. The letter of credit was subsequently amended with a new expiration date of May 2, 2008 and the outstanding amount was reduced to $11 million. This letter of credit secures our obligations to a supplier for the purchase of finished goods inventory. The reduction in the value of the letter of credit is linked to reduced obligations for purchases of finished goods inventory as we wind down our business relationship with that supplier. The fair value of this letter of credit approximates its contract value. The letter of credit was collateralized by $21.1 million of cash and marketable securities at December 31, 2007, and, as such, was reported as restricted on the consolidated balance sheets. The remaining restricted cash and marketable securities of $1.8 million at December 31, 2007 secured our merchant credit card processing account, deposits for building leases and value added taxes in foreign jurisdictions.
Accounts receivable decreased $3.8 million to $46.3 million at December 31, 2007 compared to $50.1 million at December 31, 2006, due primarily to lower sales in the fourth quarter of 2007 compared to the fourth quarter of 2006 and a decrease in days sales outstanding (“DSO”) of 3 days in the fourth quarter of 2007 compared to the fourth quarter of 2006. DSO was 51 days at December 31, 2007 compared to 54 days at December 31, 2006.
Total inventories, including consigned inventories, decreased $9.1 million to $31.0 million at December 31, 2007 compared to $40.1 million at December 31, 2006. During 2007, we continued to work closely
26
with our contract manufacturers to better align incoming product levels with expected sales needs in order to allow us to reduce finished goods inventory. Finished goods inventory, including inventory held on consignment until sold, decreased $7.3 million during 2007. Lamps and accessories and service inventories, which consist of service parts held for warranty or customer repair activities, remanufactured projectors and projectors in the process of being repaired, were reduced $1.8 million during 2007. See Note 5 of Notes to Consolidated Financial Statements for a summary of the components of inventory as of these dates.
At December 31, 2007 and December 31, 2006, we had approximately 5 weeks and 4 weeks of inventory, respectively, in the Americas channel. Annualized inventory turns were approximately 7 times for the quarters ended December 31, 2007 and 2006.
Expenditures for property and equipment totaled $3.2 million in 2007 and were primarily for purchases of product tooling. Total expenditures for property and equipment are expected to be between $4.0million and $6.0 million in 2008.
Accounts payable increased $14.0 million to $64.1 million at December 31, 2007 compared to $50.1 million at December 31, 2006 due primarily to modifications of payment terms with our contract manufacturers to more closely align the timing of payments for purchases of inventory with the timing of payments from customers for sales of inventory.
Related party accounts payable decreased $0.3 million to $1.6 million at December 31, 2007 compared to $1.9 million at December 31, 2006 and represent outstanding payables to SMT primarily for the purchase of projectors.
Marketing incentives payable decreased $2.9 million to $3.7 million at December 31, 2007 compared to $6.6 million at December 31, 2006 due primarily to reductions in marketing promotional activity in 2007.
Accrued warranty costs, both short and long-term, decreased $3.2 million to $9.8 million at December 31, 2007 compared to $13.0 million at December 31, 2006. The reduction in the accrued warranty costs was the outcome of improved product quality in our projectors, as well as reductions in the costs of the parts being used in repair activities.
Contractual Payment Obligations
A summary of our contractual commitments and obligations as of December 31, 2007 was as follows (in thousands):
| | | | | | | | | | | | | | | |
| | | Payments Due By Period |
Contractual Obligation | | Total | | 2008 | | 2009 and
2010 | | 2011 and
2012 | | 2013 and
beyond |
Letters of Credit(1) | | $ | 20,000 | | $ | 20,000 | | $ | — | | $ | — | | $ | — |
Purchase Order Commitments | | | 22,556 | | | 22,556 | | | — | | | — | | | — |
Operating Leases | | | 11,478 | | | 4,238 | | | 5,310 | | | 1,930 | | | — |
| | | | | | | | | | | | | | | |
| | $ | 54,034 | | $ | 46,794 | | $ | 5,310 | | $ | 1,930 | | $ | — |
| | | | | | | | | | | | | | | |
| (1) | The letter of credit collateralized our obligations for outstanding accounts payable and future purchase commitments to a supplier for the purchase of finished goods inventory. |
Seasonality
Given the buying patterns of various geographies and market segments, our revenues are subject to certain elements of seasonality during various portions of the year. The first quarter of each year is typically down from the immediately preceding fourth quarter due to corporate buying trends and typical aggressive competition from our Asian competitors with March 31 fiscal year ends. In addition, we sell
27
our products into the education and government markets that typically see seasonal peaks in the United States in the second and third quarter of each year. Historically, between 20% and 30% of our revenues have come from Europe. As such, we typically experience a seasonal downturn due to the vacation season in mid-summer, which results in decreased revenues from that region in the third quarter compared to the second quarter. Conversely, we typically experience a strong resurgence of revenue from Europe in the fourth quarter.
Critical Accounting Policies and Use of Estimates
The preparation of our financial statements requires us to make estimates and judgments that affect the reported amounts of assets, liabilities, revenues and expenses. Our estimates are based on historical experience and on various other assumptions that are believed to be reasonable under the circumstances, the results of which form the basis for making judgments about the carrying values of assets and liabilities that are not readily apparent from other sources. Following is a discussion of our critical accounting estimates. See Note 1 of Notes to Consolidated Financial Statements,Summary of Significant Accounting Policies, for additional information.
Allowance for Uncollectible Trade Accounts Receivable
Credit limits are established through a process of reviewing the financial history and stability of each customer. Where appropriate, we obtain credit rating reports and financial statements of the customer to initiate and modify their credit limits. We regularly evaluate the collectibility of our trade accounts receivable balances based on a combination of factors. When a customer’s account becomes past due, we initiate dialogue with the customer to determine the cause. If it is determined that the customer will be unable to meet its financial obligation, such as in the case of a bankruptcy filing, deterioration in the customer’s operating results or financial position or other material events impacting their business, we record a specific reserve for bad debt to reduce the related receivable to the amount we expect to recover given all information presently available. In certain situations, if an account is determined to be a bad debt, we may use collection agencies to work with the customer to receive payment in return for a fee. If circumstances related to specific customers change, our estimates of the recoverability of receivables could materially change. Bad debt expense (recovery), net totaled $(0.1) million, $0.5 million and $(0.4) million, respectively, in 2007, 2006 and 2005. Our allowance for uncollectible accounts totaled $2.0 million and $2.4 million at December 31, 2007 and 2006, respectively, and is included on the consolidated balance sheets as a reduction of accounts receivable. See Schedule II, Valuation and Qualifying Accounts, for additional information.
Allowance for Sales Returns and Other Deductions from Revenue
Some distributor, dealer, and retailer agreements allow for partial return of products and/or price protection under certain conditions within limited time periods. Such return rights are generally limited to contractually defined, short-term stock rotation and defective or damaged product although we have granted retailers return policies consistent with the retailers’ return policies for their customers. We maintain a reserve for sales returns and price adjustments based on historical experience and other qualitative factors. We also have incentive programs for dealers and distributors whereby rebates are offered based upon exceeding volume goals. Estimated sales returns, price protection and rebates are deducted from revenue.
Historical return rates are monitored on a product-by-product basis. As new products are introduced, these historical rates are used to establish initial sales returns reserves and are adjusted as better information becomes available. We also regularly monitor and track channel inventory with our significant customers. Variability in channel inventory levels from quarter to quarter is further used to qualitatively adjust our sales returns reserves. Typically, return rates, on a worldwide basis, have averaged 2% to 4% of sales to customers who are granted such rights. If a dramatic change in the rate of returns were to occur, our estimate of our sales return accrual could change significantly.
28
One of the factors we consider in estimating future returns, for customers who are granted such rights, is the sell through of products by our distributors and dealers. We have controls in place to monitor channel inventory levels with these customers. We believe the risk of returns increases when inventory held by any particular customer exceeds their near term needs. Accordingly, we defer recognition of revenue on certain channel inventory estimated to be in excess of 60 days.
Our reserves deducted from revenues and accounts receivable for sales returns, price protection and other rebates totaled $2.7 million and $4.6 million, respectively, at December 31, 2007 and 2006. Historically, our actual experience for sales returns, price protection and other sales incentives has not differed materially from our estimates. See Schedule II, Valuation and Qualifying Accounts, for additional information.
Inventory Valuation
We regularly evaluate the realizability of our inventory based on a combination of factors including the following: historical usage rates, forecasted sales or usage, estimated service period, product end-of-life dates, estimated current and future market values, service inventory requirements and new product introductions, as well as other factors. Purchasing requirements and alternative usage avenues are explored within these processes to mitigate any identified inventory exposure. Lamps, accessories and service inventories with quantities in excess of forecasted usage are reviewed at least quarterly by our service planning, operations and finance personnel for obsolescence. Resultant write-downs are typically caused by decreased usage of parts in service repair activity and product end of life adjustments in the market. Finished goods are reviewed quarterly by sales, finance and operations personnel to determine if inventory carrying costs exceed market selling prices and demand. Service inventory is systematically and judgmentally reviewed for write downs based on the estimated remaining service life of the inventory. We record write-downs for inventory based on the above factors and take into account worldwide quantities and demand in our analysis. If circumstances related to our inventories change, our estimates of the realizability of inventory could materially change. At December 31, 2007 and 2006, our inventory reserves totaled $4.7 million and $7.7 million, respectively, and were recorded as a reduction of inventory on our consolidated balance sheets. See Note 5 of Notes to Consolidated Financial Statements for additional information.
Product Warranties
We evaluate our obligations related to product warranties on a quarterly basis. In general, we offer a standard two-year warranty and, for certain customers, products and regions, we offer a three year warranty. We monitor failure rates on a product category basis through data collected by our manufacturing sites, factory repair centers and authorized service providers. The service organizations also track costs to repair each unit. Costs include labor to repair the projector, replacement parts for defective items, freight costs, and other incidental costs associated with warranty repairs. Any cost recoveries from warranties offered to us by our suppliers covering defective components are also considered, as well as any cost recoveries of defective parts and material, which may be repaired at a factory repair center or through a third party. This data is then used to calculate our future warranty liability based on actual sales for each projector category and remaining warranty periods. For new product introductions, our quality control department estimates the initial failure rates based on test and manufacturing data and historical experience for similar platform projectors. If circumstances change, or a dramatic change in the failure rates were to occur, our estimate of the warranty liability could change significantly. As our contract manufacturing partners have improved the manufacturing quality of the projectors we sell, we have begun the transition towards purchasing warranty coverage as part of the product we source. This shift is in line with our continued warranty cost reduction strategy and, over time, we expect that this will reduce our warranty liability necessary to cover future repair activities. It will take multiple years to fully implement this new model and fully recognize the benefits. Revenue generated from sales of extended warranty contracts is deferred and recognized as revenue over the term of the extended warranty coverage. Deferred warranty revenue totaled $2.1 million and $2.7 million, respectively, at December 31, 2007 and 2006 and was included in other current liabilities on our consolidated balance sheets. Our warranty liability at December 31, 2007 totaled $9.8 million, of which $6.2 million was classified as a component of current liabilities and $3.6 million was classified as other
29
long-term liabilities on our consolidated balance sheets. The reduction in the warranty liability of $3.2 million from December 31, 2006 to December 31, 2007 is the outcome of the improved product quality discussed above as well as reductions in the cost of parts used in repair activities. See Note 1 of Notes to Consolidated Financial Statements for additional information.
Income Taxes
We account for income taxes in accordance with SFAS No. 109, “Accounting for Income Taxes.” Deferred tax assets arise from the tax benefit of amounts expensed for financial reporting purposes but not yet deducted for tax purposes and from unutilized tax credits and NOL carry forwards. We evaluate our deferred tax assets on a regular basis to determine if a valuation allowance is required. To the extent it is determined the recoverability of the deferred tax assets is unlikely; we record a valuation allowance against deferred tax assets. At December 31, 2007 and 2006, we had a valuation allowance of $273.2 million and $267.9 million against deferred tax assets, which resulted in a net deferred tax asset balance of $1.1 million and $1.0 million, respectively. See Note 7 of Notes to Consolidated Financial Statements for additional information.
Effective January 1, 2007, we also follow the guidance of FASB Interpretation No. 48, “Accounting for Uncertainty in Income Taxes,” which defines the threshold for recognizing the benefits of tax return positions in the financial statements as “more-likely-than-not” to be sustained by the taxing authority. The interpretation applies to all income tax related positions.
As a result of the implementation of Interpretation No. 48, there was no change in the liability for unrecognized tax benefits, and no adjustments were made to the January 1, 2007 balance of retained earnings. As of the date of adoption, our unrecognized tax benefits totaled $0.2 million, the disallowance of which would not materially affect the annual effective income tax rate. Unrecognized tax benefits did not change during 2007.
Long-Lived Asset Impairment
Long-lived assets held and used by us and intangible assets with determinable lives are reviewed for impairment whenever events or circumstances indicate that the carrying amount of assets may not be recoverable in accordance with SFAS No. 144, “Accounting for the Impairment or Disposal of Long Lived Assets.” We evaluate recoverability of assets to be held and used by comparing the carrying amount of an asset to future net undiscounted cash flows to be generated by the asset. If such assets are considered to be impaired, the impairment to be recognized is measured as the amount by which the carrying amount of the assets exceeds the fair value of the assets. Such reviews assess the fair value of the assets based upon our estimates of future cash flows that the assets are expected to generate. Based on these reviews, we recorded an impairment charge totaling $9.8 million in the third quarter of 2005. See Note 1 of Notes to Consolidated Financial Statements for additional information regarding these impairment charges.
New Accounting Pronouncements
See Note 2 of Notes to Consolidated Financial Statements for a discussion of the impact of new accounting pronouncements.
Off-Balance Sheet Arrangements
Other than disclosed above under Contractual Payment Obligations, we do not have any off-balance sheet arrangements that have or are reasonably likely to have a material current or future effect on our financial condition, changes in financial condition, revenues or expenses, results of operations, liquidity, capital expenditures or capital resources.
30
| Item 7A. | Quantitative and Qualitative Disclosures About Market Risk |
Foreign Currency Exposure
Our financial market risk arises from fluctuations in foreign currencies and interest rates.
Our net investment exposure in foreign subsidiaries translated into U.S. Dollars using the period-end exchange rates at December 31, 2007, was approximately $76.8 million. The potential loss in fair value resulting from a hypothetical 10% adverse change in foreign exchange rates would be approximately $7.7 million at December 31, 2007. At December 31, 2007 we had no formal plans of liquidating any of our operating foreign subsidiaries, and therefore, foreign exchange rate gains or losses on our foreign investments are reflected as a cumulative translation adjustment and do not affect our results of operations. In 2008, we are planning to liquidate two foreign subsidiaries in Norway that are currently not being used for operating activities, leaving one remaining sales subsidiary in that region. At the point in time the liquidations of the two foreign subsidiaries are substantially completed we will record the foreign exchange rate gains and losses in our income statement as a component of the net gain or loss upon liquidation of that entity. The liquidation of these two entities is expected to be completed in the fourth quarter of 2008.
We are exposed to changes in exchange rates through the sale of products denominated in non-functional foreign currencies. Our purchases of inventory are largely denominated in U.S. Dollars and we anticipate that we will continue to purchase in U.S. Dollars in the foreseeable future, therefore we are not exposed to foreign currency fluctuations on these purchases. We have established a foreign currency derivative program; utilizing foreign currency forward contracts (“forward contracts”) to mitigate certain foreign currency transaction exposures. Under this program, increases or decreases in our foreign currency transactions are substantially offset by gains and losses on the forward contracts, so as to mitigate foreign currency transaction gains and losses. We do not use forward contracts as speculative instruments for trading purposes. The effect of an immediate 10% change in our foreign currency forward contracts would not have a material effect on our results of operations. These forward contracts are not designated as qualifying hedges and, accordingly, are marked to market at the end of each period, with the resulting gain or loss being recorded as a component of other income or expense on our consolidated statement of operations.
The table below summarizes, by major currency, the contractual amounts of our forward exchange contracts translated to U.S. dollars as of December 31, 2007 and 2006. The forward contracts outstanding as of December 31, 2007 mature within 31 days of year end. The “bought” amounts represent the net U.S. dollar equivalents of commitments to purchase foreign currencies, and the “sold” amounts represent the net U.S. dollar equivalent of commitments to sell foreign currencies.
Forward contracts outstanding were as follows at December 31, 2007 and 2006 (in thousands):
| | | | | | | | |
| | | Bought (Sold) | |
Foreign Currency | | 2007 | | | 2006 | |
Euro | | $ | (51,024 | ) | | $ | (38,600 | ) |
British Pound | | | 6,633 | | | | 5,684 | |
Singapore Dollar | | | (7,313 | ) | | | (5,887 | ) |
Swedish Krona | | | 541 | | | | 163 | |
Norwegian Kroner | | | 1,131 | | | | 484 | |
| | | | | | | | |
Net amount outstanding | | $ | (50,032 | ) | | $ | (38,156 | ) |
| | | | | | | | |
31
Interest Rate Risk
Our exposure to market risk for changes in interest rates relates to our line of credit and our investment portfolio.
Our line of credit facility with Wells Fargo bears interest on outstanding borrowings at prime plus 1.5%, however, at no time will the interest rate be below 4%. During the year ended December 31, 2007, we did not borrow under our line of credit and, therefore, a change in the prime rate would not have had any effect on our financial condition or results of operations.
We mitigate interest rate risk on our investment portfolio by diversifying investments among high credit quality securities in accordance with our investment policy. As of December 31, 2007, our investment portfolio included marketable debt securities of $6.2 million, exclusive of $23.1 million invested in money market funds. The marketable debt securities are carried at amortized cost, but are subject to interest rate risk, and will decline in value if interest rates increase. At December 31, 2007, the fair market value of our marketable debt securities totaled $6.2 million. Due to the short duration of our investment portfolio, an immediate 10% increase or decrease in interest rates would not have a material effect on our financial condition or results of operations.
| Item 8. | Financial Statements and Supplementary Data |
The financial statements and notes thereto required by this item begin on page F-1 of this document, as listed in Item 15 of Part IV. Unaudited quarterly financial data for each of the eight quarters in the two-year period ended December 31, 2007 was as follows:
| | | | | | | | | | | | | | | | |
In thousands, except per share data | | 1st Quarter | | | 2nd Quarter | | | 3rd Quarter | | | 4th Quarter | |
2006 | | | | | | | | | | | | | | | | |
Revenues | | $ | 112,019 | | | $ | 97,642 | | | $ | 81,231 | | | $ | 83,860 | |
Gross margin | | | 16,743 | | | | 14,681 | | | | 10,331 | | | | 12,131 | |
Net loss(1) (2) (3) (4) | | | (16,357 | ) | | | (12,831 | ) | | | (19,406 | ) | | | (13,326 | ) |
Basic and diluted net loss per share | | | (0.41 | ) | | | (0.32 | ) | | | (0.49 | ) | | | (0.34 | ) |
2007 | | | | | | | | | | | | | | | | |
Revenues | | $ | 77,655 | | | $ | 73,633 | | | $ | 75,790 | | | $ | 81,103 | |
Gross margin | | | 8,480 | | | | 11,984 | | | | 13,764 | | | | 16,527 | |
Net loss(5) (6) (7) (8) | | | (13,047 | ) | | | (7,788 | ) | | | (2,820 | ) | | | (1,927 | ) |
Basic and diluted net loss per share | | | (0.33 | ) | | | (0.20 | ) | | | (0.07 | ) | | | (0.05 | ) |
| (1) | The first quarter of 2006 included a $1.1 million restructuring charge, a $7.5 million write-down of cost method investments, a $0.7 million charge related to our audit committee investigations and a $0.8 million gain on the sale of marketable equity securities. |
| (2) | The second quarter of 2006 included a $0.9 million restructuring charge, a $2.1 million write-down related to SMT, a $1.1 million charge related to our audit committee investigations, a $0.3 million loss on the sale of marketable equity securities and a $0.6 million gain on the sale of land. |
| (3) | The third quarter of 2006 included a $1.4 million charge related to the write-down of assets related to The University Network, a net charge of $5.1 million related to regulatory assessments and a $1.1 million charge for estimated costs to wind-down the operations of SMT. |
| (4) | The fourth quarter of 2006 included a $2.7 million restructuring charge, a $4.3 million charge for regulatory assessments and a $0.5 million expense for our retention bonus program. |
| (5) | The first quarter of 2007 included a $2.4 million restructuring charge. |
| (6) | The second quarter of 2007 included a $2.1 million restructuring charge and a $0.5 million charge related to the impairment of a trade show booth that was adjusted to estimated fair market value. |
| (7) | The third quarter of 2007 included a $0.2 million restructuring charge. |
| (8) | The fourth quarter of 2007 included a $3.7 million restructuring charge and a $0.5 million credit to correct previously recorded stock-based compensation expense from the first, second and third quarters of 2007. |
32
| Item 9. | Changes in and Disagreements with Accountants on Accounting and Financial Disclosure |
None.
| Item 9A. | Controls and Procedures |
Management’s Report on Internal Control Over Financial Reporting
Our management is responsible for establishing and maintaining adequate internal control over financial reporting, as such term is defined in Exchange Act Rules 13a –15(f). Under the supervision and with the participation of our management, including our principal executive officer and principal financial officer, we conducted an evaluation of the effectiveness of our internal control over financial reporting based on the framework inInternal Control – Integrated Framework issued by the Committee of Sponsoring Organizations of the Treadway Commission. Based on our evaluation under the framework inInternal Control – Integrated Framework, our management concluded that our internal control over financial reporting was effective as of December 31, 2007.
The effectiveness of our internal control over financial reporting as of December 31, 2007 was audited by KPMG LLP, an independent registered public accounting firm, as stated in their report included below.
Changes in Internal Control Over Financial Reporting
There has been no change in our internal control over financial reporting that occurred during our last fiscal quarter that has materially affected or is reasonably likely to materially affect our internal control over financial reporting.
Disclosure Controls and Procedures
Our management has evaluated, under the supervision and with the participation of our Chief Executive Officer and Interim Chief Financial Officer, the effectiveness of our disclosure controls and procedures as of the end of the period covered by this report pursuant to Rule 13a- 15(b) under the Securities Exchange Act of 1934, as amended (Exchange Act). Based on that evaluation, our Chief Executive Officer and our Interim Chief Financial Officer have concluded that, as of the end of the period covered by this report, our disclosure controls and procedures are effective in ensuring that information required to be disclosed in our Exchange Act reports is (1) recorded, processed, summarized and reported in a timely manner, and (2) accumulated and communicated to our management, including our Chief Executive Officer and our Interim Chief Financial Officer, as appropriate, to allow timely decisions regarding required disclosure.
Management does not expect that our disclosure controls and procedures will prevent and detect all errors and fraud. Any control system, no matter how well designed and operated, is based on certain assumptions and can provide only reasonable, not absolute assurance, that its objectives will be met. Further, no evaluation of controls can provide absolute assurance that misstatements due to error or fraud will not occur or that all control issues and instances of fraud, if any, within the company have been detected.
33
Report of Independent Registered Public Accounting Firm
The Board of Directors and
Shareholders of InFocus Corporation:
We have audited InFocus Corporation (an Oregon corporation) and subsidiaries internal control over financial reporting as of December 31, 2007, based on criteria established inInternal Control - Integrated Framework issued by the Committee of Sponsoring Organizations of the Treadway Commission (COSO).InFocus Corporation’s management is responsible for maintaining effective internal control over financial reporting and for its assessment of the effectiveness of internal control over financial reporting, included in the accompanyingManagement’s Report on Internal Control over Financial Reporting. Our responsibility is to express an opinion on the Company’s internal control over financial reporting based on our audit.
We conducted our audit in accordance with the standards of the Public Company Accounting Oversight Board (United States). Those standards require that we plan and perform the audit to obtain reasonable assurance about whether effective internal control over financial reporting was maintained in all material respects. Our audit included obtaining an understanding of internal control over financial reporting, assessing the risk that a material weakness exists, and testing and evaluating the design and operating effectiveness of internal control based on the assessed risk. Our audit also included performing such other procedures as we considered necessary in the circumstances. We believe that our audit provides a reasonable basis for our opinion.
A company’s internal control over financial reporting is a process designed to provide reasonable assurance regarding the reliability of financial reporting and the preparation of financial statements for external purposes in accordance with generally accepted accounting principles. A company’s internal control over financial reporting includes those policies and procedures that (1) pertain to the maintenance of records that, in reasonable detail, accurately and fairly reflect the transactions and dispositions of the assets of the company; (2) provide reasonable assurance that transactions are recorded as necessary to permit preparation of financial statements in accordance with generally accepted accounting principles, and that receipts and expenditures of the company are being made only in accordance with authorizations of management and directors of the company; and (3) provide reasonable assurance regarding prevention or timely detection of unauthorized acquisition, use, or disposition of the company’s assets that could have a material effect on the financial statements.
Because of its inherent limitations, internal control over financial reporting may not prevent or detect misstatements. Also, projections of any evaluation of effectiveness to future periods are subject to the risk that controls may become inadequate because of changes in conditions, or that the degree of compliance with the policies or procedures may deteriorate.
In our opinion, InFocus Corporation maintained, in all material respects, effective internal control over financial reporting as of December 31, 2007, based on criteria established in Internal Control - Integrated Framework issued by the Committee of Sponsoring Organizations of the Treadway Commission.
We also have audited, in accordance with the standards of the Public Company Accounting Oversight Board (United States), the consolidated balance sheets of InFocus Corporation as of December 31, 2007 and 2006, and the related consolidated statements of operations, shareholders’ equity and comprehensive income (loss), and cash flows for each of the years in the three-year period ended December 31, 2007, and our report dated March 11, 2008 expressed an unqualified opinion on those consolidated financial statements.
KPMG LLP
Portland, Oregon
March 11, 2008
34
| Item 9B. | Other Information |
None.
PART III
| Item 10. | Directors, Executive Officers and Corporate Governance |
Information required by this item is included under the captionsNominees for Director,Meetings and Committees of the Board of Directors,Audit Committee Financial Expert,Executive OfficersandSection 16(a) Beneficial Ownership Reporting Compliancein our Proxy Statement for our 2008 Annual Meeting of Shareholders and is incorporated herein by reference.
Code of Ethics
We adopted the InFocus Corporation Code of Conduct, which is a code of conduct and ethics that applies to all of our directors, officers and employees, including our principal executive officer and our principal financial officer. We filed a copy of our Amended and Restated Code of Conduct as exhibit 14 to our Form 8-K filed with the Securities and Exchange Commission on August 8, 2006. You can also access our Code of Conduct on our website atwww.infocus.com. We will provide without charge a copy of our Code of Conduct upon written request from any shareholder. Written requests should be mailed to the Secretary, InFocus Corporation, 27500 SW Parkway Avenue, Wilsonville, Oregon 97070.
| Item 11. | Executive Compensation |
Information required by this item is included under the captionsDirector Compensation, Executive Compensation, Compensation Committee Report, Compensation Discussion and Analysis, Potential Payments on Termination or Change-In-Control, and Compensation Committee Interlocks and Insider Participationin our Proxy Statement for our 2008 Annual Meeting of Shareholders and is incorporated herein by reference.
| Item 12. | Security Ownership of Certain Beneficial Owners and Management and Related Stockholder Matters |
Equity Securities Authorized for Issuance
The following table summarizes equity securities authorized for issuance with respect to compensation plans as of December 31, 2007:
| | | | | | | |
Plan Category | | Number of securities
to be issued upon
exercise of
outstanding options,
warrants and rights
(a) | | Weighted average
exercise price of
outstanding options,
warrants and rights
(b) | | Number of securities
remaining available for future
issuance under equity
compensation plans
(excluding securities reflected
in column (a))
(c) |
Equity compensation plans approved by shareholders | | 2,512,760 | | $ | 5.50 | | 2,518,518 |
Equity compensation plans not approved by shareholders | | — | | | — | | — |
| | | | | | | |
Total | | 2,512,760 | | $ | 5.50 | | 2,518,518 |
| | | | | | | |
Additional information required by this item is included under the captionSecurity Ownership of Certain Beneficial Owners and Management in our Proxy Statement for our 2008 Annual Meeting of Shareholders and is incorporated herein by reference.
35
| Item 13. | Certain Relationships and Related Transactions, and Director Independence |
Information required by this item is included under the captionsDirector Independence andCertain Relationships and Related Transactions in our Proxy Statement for our 2008 Annual Meeting of Shareholders and is incorporated herein by reference.
| Item 14. | Principal Accountant Fees and Services |
Information required by this item is included under the captionFees Paid to KPMG LLP Related to Fiscal 2007 and 2006 in the Proxy Statement for our 2008 Annual Meeting of Shareholders and is incorporated herein by reference.
PART IV
| Item 15. | Exhibits and Financial Statement Schedules |
Financial Statements and Schedules
Exhibits
The following exhibits are filed herewith and this list is intended to constitute the exhibit index. An asterisk (*) beside the exhibit number indicates the exhibits containing a management contract, compensatory plan or arrangement, which are required to be identified in this report.
| | |
Exhibit No. | | |
| |
| 3.1 | | 1990 Restated Articles of Incorporation, as Amended. Incorporated by reference to Exhibit 3.1 to form 8-K dated June 23, 2000, as filed with the Securities and Exchange Commission on July 7, 2000. |
| |
| 3.2 | | Amendment to 1990 Articles of Incorporation. Incorporated by reference to Exhibit 3.2 to Form 8-K dated June 23, 2000, as filed with the Securities and Exchange Commission on July 7, 2000. |
| |
| 3.3 | | Amendments to 1990 Articles of Incorporation. Incorporated by reference to Exhibit 3.3 to Form 8-K dated June 23, 2000, as filed with the Securities and Exchange Commission on July 7, 2000. |
| |
| 3.4 | | 1997 Restated Bylaws. Incorporated by reference to Exhibit 3.4 to form 8-K dated June 23, 2000 as filed with the Securities and Exchange Commission on July 7, 2000. |
| |
| 3.5 | | Amendment to 1997 Restated Bylaws. Incorporated by reference to Exhibit 3.5 to Form 8-K dated June 23, 2000, as filed with the Securities and Exchange Commission on July 7, 2000. |
| |
| 3.6 | | Amendment to 1997 Restated Bylaws. Incorporated by reference to Exhibit 3.6 to Form 10-K for the year ended December 31, 2002, as filed with the Securities and Exchange Commission on March 12, 2003. |
| |
| 3.7 | | Amendment to 1997 Restated Bylaws. Incorporated by reference to Exhibit 3.7 to Form 10-K for the year ended December 31, 2003, as filed with the Securities and Exchange Commission on March 10, 2004. |
36
| | |
Exhibit No. | | |
| |
| 3.8 | | Amendment to 1997 Restated Bylaws. Incorporated by reference to Exhibit 3.1 to Form 8-K dated June 7, 2007, as filed with the Securities and Exchange Commission on June 7, 2000. |
| |
| 4.1 | | See Article VII of Exhibit 3.1 |
| |
| 10.1* | | 1988 Combination Stock Option Plan, as amended. Incorporated by reference to Exhibit 10.1 to Form 10-K for the year ended December 31, 1991, as filed with the Securities and Exchange Commission on March 30, 1992. |
| |
| 10.2* | | Amendment No. 5 to 1988 Combination Stock Option Plan. Incorporated by reference to Exhibit 4.2 to Form S-8 (Commission File No. 33-47449), as filed with the Securities and Exchange Commission on April 24, 1992. |
| |
| 10.3* | | Amendment No. 6 to 1988 Combination Stock Option Plan. Incorporated by reference to Exhibit 10.3 to Form 10-K for the year ended December 31, 1992, as filed with the Securities and Exchange Commission on March 31, 1993. |
| |
| 10.4* | | Amendment No. 7 to 1988 Combination Stock Option Plan. Incorporated by reference to Exhibit 10.4 to Form 10-K for the year ended December 31, 1994, as filed with the Securities and Exchange Commission on March 16, 1995. |
| |
| 10.5* | | Amendment No. 8 to 1988 Combination Stock Option Plan. Incorporated by reference to Exhibit 4.1.1 to Form S-8 (Commission File No. 333-15235) as filed with the Securities and Exchange Commission on October 31, 1996. |
| |
| 10.6* | | Amendment No. 9 to 1988 Combination Stock Option Plan. Incorporated by reference to Exhibit 10.6 to Form 10-K for the year ended December 31, 1996, as filed with the Securities and Exchange Commission on March 14, 1997. |
| |
| 10.7* | | 1998 Stock Incentive Plan. Incorporated by reference to Exhibit 10 to Form 10-Q for the quarter ended March 31, 1998, as filed with the Securities and Exchange Commission on May 12, 1998. |
| |
| 10.8* | | First Amendment to 1998 Stock Incentive Plan. Incorporated by reference to Exhibit 99.2 to InFocus’ Registration Statement on Form S-8 (Commission File No. 333-41012), as filed with the Securities and Exchange Commission on July 7, 2000. |
| |
| 10.9* | | Second Amendment to 1998 Stock Incentive Plan. Incorporated by reference to Exhibit 99.3 to InFocus’ Registration Statement on Form S-8 (Commission File No. 333-41012), as filed with the Securities and Exchange Commission on July 7, 2000. |
| |
| 10.10* | | Third Amendment to 1998 Stock Incentive Plan. Incorporated by reference to Exhibit 4.4 to Form S-8 (Commission File No. 333-105800), as filed with the Securities and Exchange Commission on June 3, 2003. |
| |
| 10.11* | | Amendment to 1998 Stock Incentive Plan. Incorporated by reference to Exhibit 10 to Form 8-K filed with the Securities and Exchange Commission on January 9, 2006. |
| |
| 10.12* | | 2005 Stock Option Acceleration. Incorporated by reference to Form 8-K filed with the Securities and Exchange Commission on December 13, 2005. |
| |
| 10.13* | | Form of Incentive Stock Option Agreement. Incorporated by reference to Exhibit 10.8 to Form 10-K for the year ended December 31, 1998, as filed with the Securities and Exchange Commission on March 19, 1999. |
| |
| 10.14* | | Form of Non-Qualified Stock Option Agreement. Incorporated by reference to Exhibit 10.9 to Form 10-K for the year ended December 31, 1998, as filed with the Securities and Exchange Commission on March 19, 1999. |
| |
| 10.15* | | 2008 Executive Bonus Plan and Stock Option Awards for 2008. Incorporated by reference to Form 8-K filed with the Securities and Exchange Commission on February 19, 2008. |
| |
| 10.16* | | Officer and Director Stock Ownership Program, effective April 22, 1998, as amended January 22, 1999 and October 18, 2000. Incorporated by reference to Exhibit 10.10 to Form 10-K for the year ended December 31, 2002, as filed with the Securities and Exchange Commission on March 12, 2003. |
37
| | |
Exhibit No. | | |
| |
| 10.17* | | Form of Restricted Stock Agreement. Incorporated by reference to Exhibit 10.10 to Form 10-K for the year ended December 31, 1998, as filed with the Securities and Exchange Commission on March 19, 1999. |
| |
| 10.18* | | Directors’ Stock Option Plan. Incorporated by reference to Exhibit 4.3 to InFocus’ Registration Statement on Form S-8 (Commission File No. 33-57488), as filed with the Securities and Exchange Commission on January 26, 1993. |
| |
| 10.19* | | Amendment No. 1 to Directors’ Stock Option Plan. Incorporated by reference to Exhibit 10.8 to Form 10-K for the year ended December 31, 1995, as filed with the Securities and Exchange Commission on March 14, 1996. |
| |
| 10.20* | | Amendment No. 2 to Directors’ Stock Option Plan. Incorporated by reference to Exhibit 4.2.2 to Form S-8 (Commission File No. 333-15235), as filed with the Securities and Exchange Commission on October 31, 1996. |
| |
| 10.21* | | Amendment No. 3 to Directors’ Stock Option Plan. Incorporated by reference to Exhibit 10.14 to Form 10-K for the year ended December 31, 1998, as filed with the Securities and Exchange Commission on March 19, 1999. |
| |
| 10.22* | | Amendment No. 4 to Directors’ Stock Option Plan. Incorporated by reference to Exhibit 10.15 to Form 10-K for the year ended December 31, 1998, as filed with the Securities and Exchange Commission on March 19, 1999. |
| |
| 10.23* | | Form of Directors’ Stock Option Agreement. Incorporated by reference to Exhibit 4.3.1 to Form S-8 (Commission File No. 33-57488), as filed with the Securities and Exchange Commission on January 26, 1993. |
| |
| 10.24* | | 2006 Restated Corporate Executive Severance Pay Plan and Summary Plan Description. Incorporated by reference to Exhibit 10.1 to Form 8-K filed with the Securities and Exchange Commission on December 4, 2006. |
| |
| 10.25* | | Officer retention bonus plan approved October 27, 2006. Incorporated by reference to Form 10-Q for the quarter ended September 30, 2006, as filed with the Securities and Exchange Commission on November 9, 2006. |
| |
| 10.26* | | Amendment to Non-employee Director Stock Option Package. Incorporated by reference to Form 8-K filed with the Securities and Exchange Commission on May 19, 2006. |
| |
| 10.27 | | Commercial Lease Agreement for the Company’s facilities in Wilsonville, Oregon, dated January 1999, by and between Mentor Graphics Corporation and InFocus Corporation. Incorporated by reference to Exhibit 10.21 to Form 10-K for the year ended December 31, 1998, as filed with the Securities and Exchange Commission on March 19, 1999. |
| |
| 10.28 | | Lease Agreement - Basic Lease Information by and between GED-IFC, LLC and InFocus Corporation, dated August 28, 2000. Incorporated by reference to Exhibit 10.24 to Form 10-K for the year ended December 31, 2000, as filed with the Securities and Exchange Commission on March 19, 2001. |
| |
| 10.29 | | Facility Lease Agreement, dated October 1, 2002 between Maatschap World Trade Center Amsterdam and InFocus International B.V. Incorporated by reference to Exhibit 10.31 to Form 10-K for the year ended December 31, 2002, as filed with the Securities and Exchange Commission on March 12, 2003. |
| |
| 10.30 | | Facility Lease Agreement, dated June 9, 2000 between Vaerste AS and InFocus Corporation. Incorporated by reference to Exhibit 10.32 to Form 10-K for the year ended December 31, 2002, as filed with the Securities and Exchange Commission on March 12, 2003. |
| |
| 10.31 | | Development, Purchase and License Agreement between InFocus Corporation and Funai Electric Co., Ltd. Dated September 13, 2002. Incorporated by reference to Exhibit 10.33 to Form 10-K for the year ended December 31, 2004, as filed with the Securities and Exchange Commission on March 4, 2005. Confidential treatment has been requested for certain portions of this exhibit. |
38
| | |
Exhibit No. | | |
| |
| 10.32 | | Second Amendment to Development, Purchase and License Agreement between InFocus Corporation and Funai Electric Co., Ltd. dated January 13, 2005 (Note - there is no First Amendment to this agreement). Incorporated by reference to Exhibit 10.34 to Form 10-K for the year ended December 31, 2004, as filed with the Securities and Exchange Commission on March 4, 2005. |
| |
| 10.33 | | Credit Agreement between InFocus Corporation and Wells Fargo Foothill, Inc. dated as of October 25, 2004. Incorporated by reference to Exhibit 10.35 to Form 10-K for the year ended December 31, 2004, as filed with the Securities and Exchange Commission on March 4, 2005. |
| |
| 10.34 | | First Amendment to Credit Agreement, Security Agreement, and Waiver between InFocus Corporation and Well Fargo Foothill, Inc., dated November 29, 2004. Incorporated by reference to Exhibit 10.36 to Form 10-K for the year ended December 31, 2004, as filed with the Securities and Exchange Commission on March 4, 2005. |
| |
| 10.35 | | Second Amendment to Credit Agreement between InFocus Corporation and Wells Fargo Foothill, Inc., dated December 13, 2004. Incorporated by reference to Exhibit 10.37 to Form 10-K for the year ended December 31, 2004, as filed with the Securities and Exchange Commission on March 4, 2005. |
| |
| 10.36 | | Third Amendment to Credit Agreement and Waiver between InFocus Corporation and Wells Fargo Foothill, Inc. dated May 6, 2005. Incorporated by reference to Exhibit 10.3 to Form 10-Q for the quarter ended March 31, 2005 as filed with the Securities and Exchange Commission on May 10, 2005. |
| |
| 10.37 | | Fourth Amendment to Credit Agreement, Second Amendment to Security Agreement and Waiver between InFocus Corporation and Wells Fargo Foothill, Inc. dated November 4, 2005. Incorporated by reference to Exhibit 10.2 to Form 10-Q for the quarter ended September 30, 2005, as filed with the Securities and Exchange Commission on November 9, 2005. |
| |
| 10.38 | | Fifth Amendment to Credit Agreement between InFocus Corporation and Wells Fargo Foothill, Inc. dated June 7, 2006. Incorporated by reference to Exhibit 10.1 to Form 8-K as filed with the Securities and Exchange Commission on June 9, 2006. |
| |
| 10.39 | | Sixth Amendment to Credit Agreement by and between the Company and Wells Fargo Foothill, Inc. dated October 25, 2006. Incorporated by reference to Exhibit 10.1 to Form 8-K filed with the Securities and Exchange Commission on October 31, 2006. |
| |
| 10.40 | | Seventh Amendment to Credit Agreement by and between the Company and Wells Fargo Foothill, Inc. dated February 6, 2007. Incorporated by reference to Exhibit 10.1 to Form 8-K filed with the Securities and Exchange Commission on February 7, 2007. |
| |
| 10.41 | | Eighth Amendment, dated March 28, 2007, to Credit Agreement by and between the Company and Wells Fargo Foothill, Inc. dated October 25, 2004. Incorporated by reference to Exhibit 10.1 to Form 8-K/A filed with the Securities and Exchange Commission on August 2, 2007. |
| |
| 10.42 | | Ninth Amendment, dated August 30, 2007, to Credit Agreement by and between the Company and Wells Fargo Foothill, Inc. dated October 25, 2004. Incorporated by reference to Exhibit 10.1 to Form 8-K filed with the Securities and Exchange Commission on September 5, 2007. |
| |
| 10.43 | | Tenth Amendment, dated December 28, 2007, to Credit Agreement by and between the Company and Wells Fargo Foothill, Inc. dated October 25, 2004. |
| |
| 10.44 | | Eleventh Amendment, dated February 28, 2008, to Credit Agreement by and between the Company and Wells Fargo Foothill, Inc. dated October 25, 2004. Incorporated by reference to Exhibit 10.1 to Form 8-K filed with the Securities and Exchange Commission on March 5, 2008. |
| |
| 10.45 | | Interim Executive Services Agreement dated June 15, 2007 by and between InFocus Corporation and Tatum, LLC. Incorporated by reference from the Company’s current report on Form 8-K filed with the Commission on June 19, 2007. |
| |
| 10.46* | | Employment Agreement dated as of September 29, 2007 by and between InFocus Corporation and Robert G. O’Malley. Incorporated by reference to Exhibit 10.1 to Form 8-K filed with the Securities and Exchange Commission on September 11, 2007. |
39
| | |
Exhibit No. | | |
| |
| 10.47* | | Employment Agreement dated as of January 21, 2008 by and between InFocus Corporation and Lisa K. Prentice. Incorporated by reference to Exhibit 10.1 to Form 8-K filed with the Securities and Exchange Commission on January 17, 2008. |
| |
| 10.48 | | Shareholders Agreement among InFocus Corporation, a Cayman subsidiary of InFocus Corporation, TCL Corporation and TCL Optoelectronic Tech (Shenzhen) Co. Ltd., dated as of December 14, 2004, with respect to South Mountain Technologies, Ltd. Incorporated by reference to Exhibit 10.1 to Form 8-K as filed with the Securities and Exchange Commission on December 20, 2004. |
| |
| 10.49 | | Manufacturing and Supply Agreement, dated May 25, 2006, by and between InFocus Corporation and Hon Hai Precision Industry Company Limited. Incorporated by reference to Exhibit 10.1 to Form 8-K as filed with the Securities and Exchange Commission on June 1, 2006. Confidential treatment has been requested for certain portions of this exhibit. |
| |
| 10.50 | | Original Equipment Manufacturer Agreement, effective December 1, 2005, by and between InFocus Corporation and Texas Instruments Confidential treatment has been requested for certain portions of this exhibit. Incorporated by reference to Exhibit 10.42 to Form 10-K for the year ended December 31, 2005 as filed with the Securities and Exchange Commission on June 26, 2006. |
| |
| 10.51 | | Settlement Agreement between InFocus Corporation and Caxton Associates, L.L.C, a Delaware limited liability company, dated February 23, 2007. Incorporated by reference to exhibit 10.1 to Form 8-K filed with the Securities and Exchange Commission on February 23, 2007. |
| |
| 14 | | Amended and Restated Code of Conduct. Incorporated by reference to Exhibit 14.1 to Form 8-K filed with the Securities and Exchange Commission on August 8, 2006. |
| |
| 21 | | Subsidiaries of the Registrant. |
| |
| 23 | | Consent of KPMG LLP, Independent Registered Public Accounting Firm. |
| |
| 31.1 | | Certification of Chief Executive Officer pursuant to Rule 13a-14(a) or Rule 15d-14(a) of the Securities Exchange Act of 1934. |
| |
| 31.2 | | Certification of Chief Financial Officer pursuant to Rule 13a-14(a) or Rule 15d-14(a) of the Securities Exchange Act of 1934. |
| |
| 32.1 | | Certification of Chief Executive Officer pursuant to Rule 13a-14(b) or Rule 15d-14(b) of the Securities Exchange Act of 1934 and 18 U.S.C. Section 1350. |
| |
| 32.2 | | Certification of Chief Financial Officer pursuant to Rule 13a-14(b) or Rule 15d-14(b) of the Securities Exchange Act of 1934 and 18 U.S.C. Section 1350. |
40
SIGNATURES
Pursuant to the requirements of Section 13 or 15(d) of the Securities Exchange Act of 1934, the Registrant has duly caused this report to be signed on its behalf by the undersigned, thereunto duly authorized.
| | | | | | | | |
| Date: March 12, 2008 | | | | INFOCUS CORPORATION |
| | | | |
| | | | | | By | | /s/ ROBERT G. O’MALLEY |
| | | | | | | | Robert G. O’Malley |
| | | | | | | | Director, President and |
| | | | | | | | Chief Executive Officer |
Pursuant to the requirements of the Securities Exchange Act of 1934, this report has been signed below by the following persons on behalf of the Registrant and in the capacities indicated on March 12, 2008:
| | | | |
Signature | | Title | | |
| | |
/s/ ROBERT G. O’MALLEY Robert G. O’Malley | | Director, President and Chief Executive Officer
(Principal Executive Officer) | | |
| | |
/s/ MARK H. PERRY Mark H. Perry | | Interim Chief Financial Officer
(Principal Financial and Accounting Officer) | | |
| | |
/s/ JOHN D. ABOUCHAR John D. Abouchar | | Director | | |
| | |
/s/ PETER D. BEHRENDT Peter D. Behrendt | | Director | | |
| | |
/s/ BRUCE BERKOFF Bruce Berkoff | | Director | | |
| | |
/s/ MICHAEL R. HALLMAN Michael R. Hallman | | Director | | |
| | |
/s/ ROBERT B. LADD Robert B. Ladd | | Director | | |
| | |
/s/ BERNARD T. MARREN Bernard T. Marren | | Director | | |
41
Report of Independent Registered Public Accounting Firm
The Board of Directors and
Shareholders of InFocus Corporation:
We have audited the accompanying consolidated balance sheets of InFocus Corporation (an Oregon corporation) and subsidiaries as of December 31, 2007 and 2006, and the related consolidated statements of operations, shareholders’ equity and comprehensive income (loss), and cash flows for each of the years in the three-year period ended December 31, 2007. In connection with our audits of the consolidated financial statements, we also have audited financial statement schedule II. These consolidated financial statements and financial statement schedule are the responsibility of the Company’s management. Our responsibility is to express an opinion on these consolidated financial statements and financial statement schedule based on our audits.
We conducted our audits in accordance with the standards of the Public Company Accounting Oversight Board (United States). Those standards require that we plan and perform the audit to obtain reasonable assurance about whether the financial statements are free of material misstatement. An audit includes examining, on a test basis, evidence supporting the amounts and disclosures in the financial statements. An audit also includes assessing the accounting principles used and significant estimates made by management, as well as evaluating the overall financial statement presentation. We believe that our audits provide a reasonable basis for our opinion.
In our opinion, the consolidated financial statements referred to above present fairly, in all material respects, the financial position of InFocus Corporation and subsidiaries as of December 31, 2007 and 2006, and the results of their operations and their cash flows for each of the years in the three-year period ended December 31, 2007, in conformity with U.S. generally accepted accounting principles. Also in our opinion, the related financial statement schedule II, when considered in relation to the basic consolidated financial statements taken as a whole, presents fairly, in all material respects, the information set forth therein.
As discussed in Note 1 to the Consolidated Financial Statements, effective January 1, 2006, the Company adopted the provisions of Statement of Financial Accounting Standards No. 123 (revised 2004), Share-Based Payment.
We also have audited, in accordance with the standards of the Public Company Accounting Oversight Board (United States), InFocus Corporation’s internal control over financial reporting as of December 31, 2007, based on criteria established inInternal Control -Integrated Framework issued by the Committee of Sponsoring Organizations of the Treadway Commission (COSO) and our report dated March 11, 2008 expressed an unqualified opinion on the effectiveness of the Company’s internal control over financial reporting.
KPMG LLP
Portland, Oregon
March 11, 2008
F-1
InFocus Corporation
Consolidated Balance Sheets
(In thousands, except share amounts)
| | | | | | | | |
| | | December 31, | |
| | | 2007 | | | 2006 | |
Assets | | | | | | | | |
Current Assets: | | | | | | | | |
Cash and cash equivalents | | $ | 61,187 | | | $ | 53,716 | |
Marketable securities | | | — | | | | 104 | |
Restricted cash, cash equivalents, and marketable securities | | | 22,923 | | | | 22,413 | |
Accounts receivable, net of allowances of $4,695 and $6,995 | | | 46,315 | | | | 50,060 | |
Inventories | | | 28,421 | | | | 36,833 | |
Consigned inventories | | | 2,563 | | | | 3,274 | |
Other current assets | | | 7,548 | | | | 10,706 | |
| | | | | | | | |
Total Current Assets | | | 168,957 | | | | 177,106 | |
Property and equipment, net of accumulated depreciation of $24,198 and $19,527 | | | 2,973 | | | | 3,961 | |
Other assets, net | | | 1,061 | | | | 1,189 | |
| | | | | | | | |
Total Assets | | $ | 172,991 | | | $ | 182,256 | |
| | | | | | | | |
Liabilities and Shareholders' Equity | | | | | | | | |
Current Liabilities: | | | | | | | | |
Accounts payable | | $ | 64,140 | | | $ | 50,141 | |
Related party accounts payable | | | 1,624 | | | | 1,905 | |
Payroll and related benefits payable | | | 1,848 | | | | 2,220 | |
Marketing incentives payable | | | 3,710 | | | | 6,629 | |
Accrued warranty | | | 6,235 | | | | 9,917 | |
Other current liabilities | | | 8,113 | | | | 8,034 | |
| | | | | | | | |
Total Current Liabilities | | | 85,670 | | | | 78,846 | |
Long-Term Liabilities | | | 3,623 | | | | 3,147 | |
Shareholders' Equity: | | | | | | | | |
Common stock, 150,000,000 shares authorized; shares issued and outstanding: 40,779,413 and 39,747,880 | | | 90,493 | | | | 90,604 | |
Additional paid-in capital | | | 78,385 | | | | 76,861 | |
Accumulated other comprehensive income: | | | | | | | | |
Cumulative currency translation adjustment | | | 38,246 | | | | 30,662 | |
Unrealized loss on equity securities | | | — | | | | (20 | ) |
Accumulated deficit | | | (123,426 | ) | | | (97,844 | ) |
| | | | | | | | |
Total Shareholders' Equity | | | 83,698 | | | | 100,263 | |
| | | | | | | | |
Total Liabilities and Shareholders' Equity | | $ | 172,991 | | | $ | 182,256 | |
| | | | | | | | |
See accompanying Notes to Consolidated Financial Statements.
F-2
InFocus Corporation
Consolidated Statements of Operations
(In thousands, except per share amounts)
| | | | | | | | | | | | |
| | | For the Year Ended December 31, | |
| | | 2007 | | | 2006 | | | 2005 | |
Revenues | | $ | 308,181 | | | $ | 374,752 | | | $ | 532,099 | |
Cost of revenues | | | 257,426 | | | | 320,866 | | | | 499,327 | |
| | | | | | | | | | | | |
Gross margin | | | 50,755 | | | | 53,886 | | | | 32,772 | |
Operating expenses: | | | | | | | | | | | | |
Marketing and sales | | | 35,777 | | | | 49,107 | | | | 64,292 | |
Research and development | | | 14,135 | | | | 17,997 | | | | 20,847 | |
General and administrative | | | 19,938 | | | | 21,730 | | | | 23,360 | |
Restructuring costs | | | 8,375 | | | | 5,425 | | | | 11,050 | |
Impairment of long-lived assets | | | — | | | | — | | | | 9,813 | |
Regulatory assessments | | | — | | | | 9,392 | | | | 1,600 | |
| | | | | | | | | | | | |
| | | 78,225 | | | | 103,651 | | | | 130,962 | |
| | | | | | | | | | | | |
Loss from operations | | | (27,470 | ) | | | (49,765 | ) | | | (98,190 | ) |
Other income (expense): | | | | | | | | | | | | |
Interest expense | | | (507 | ) | | | (401 | ) | | | (612 | ) |
Interest income | | | 2,715 | | | | 2,446 | | | | 1,772 | |
Other, net | | | (349 | ) | | | (13,451 | ) | | | 17,130 | |
| | | | | | | | | | | | |
| | | 1,859 | | | | (11,406 | ) | | | 18,290 | |
| | | | | | | | | | | | |
Loss before income taxes | | | (25,611 | ) | | | (61,171 | ) | | | (79,900 | ) |
Provision (benefit) for income taxes | | | (29 | ) | | | 749 | | | | (106 | ) |
| | | | | | | | | | | | |
Net loss | | $ | (25,582 | ) | | $ | (61,920 | ) | | $ | (79,794 | ) |
| | | | | | | | | | | | |
Basic net loss per share | | $ | (0.64 | ) | | $ | (1.56 | ) | | $ | (2.02 | ) |
| | | | | | | | | | | | |
Diluted net loss per share | | $ | (0.64 | ) | | $ | (1.56 | ) | | $ | (2.02 | ) |
| | | | | | | | | | | | |
Shares used in per share calculations: | | | | | | | | | | | | |
Basic | | | 39,741 | | | | 39,696 | | | | 39,598 | |
| | | | | | | | | | | | |
Diluted | | | 39,741 | | | | 39,696 | | | | 39,598 | |
| | | | | | | | | | | | |
See accompanying Notes to Consolidated Financial Statements.
F-3
InFocus Corporation
Consolidated Statements of Shareholders’ Equity and Comprehensive Loss
For The Years Ended December 31, 2007, 2006 and 2005
(In thousands, except share amounts)
| | | | | | | | | | | | | | | | | | | | | |
| | | Common Stock | | | Additional
Paid-In
Capital | | Retained
Earnings
(Accumulated
Deficit) | | | Accumulated
Other
Comprehensive
Income
(Loss) | | | Total
Shareholders
Equity | |
| | | Shares | | Amount | | | | | |
Balance at December 31, 2004 | | 39,635,771 | | $ | 89,777 | | | $ | 75,835 | | $ | 43,870 | | | $ | 57,151 | | | $ | 266,633 | |
Comprehensive loss: | | | | | | | | | | | | | | | | | | | | | |
Net loss | | — | | | — | | | | — | | | (79,794 | ) | | | — | | | | (79,794 | ) |
Currency translation adjustment | | — | | | — | | | | — | | | — | | | | (11,159 | ) | | | (11,159 | ) |
Unrealized loss on marketable equity securities | | — | | | — | | | | — | | | — | | | | (21,047 | ) | | | (21,047 | ) |
| | | | | | | | | | | | | | | | | | | | | |
| | | | | | | | | | | | | | | | | | | | (112,000 | ) |
Stock-based compensation | | — | | | — | | | | 298 | | | — | | | | — | | | | 298 | |
Shares issued pursuant to stock plans | | 75,807 | | | 260 | | | | — | | | — | | | | — | | | | 260 | |
| | | | | | | | | | | | | | | | | | | | | |
Balance at December 31, 2005 | | 39,711,578 | | | 90,037 | | | | 76,133 | | | (35,924 | ) | | | 24,945 | | | | 155,191 | |
Comprehensive loss: | | | | | | | | | | | | | | | | | | | | | |
Net loss | | — | | | — | | | | — | | | (61,920 | ) | | | — | | | | (61,920 | ) |
Currency translation adjustment | | — | | | — | | | | — | | | — | | | | 6,462 | | | | 6,462 | |
Unrealized loss on marketable equity securities | | — | | | — | | | | — | | | — | | | | (765 | ) | | | (765 | ) |
| | | | | | | | | | | | | | | | | | | | | |
| | | | | | | | | | | | | | | | | | | | (56,223 | ) |
Stock-based compensation | | — | | | — | | | | 728 | | | — | | | | — | | | | 728 | |
Shares issued pursuant to stock plans | | 36,302 | | | 567 | | | | — | | | — | | | | — | | | | 567 | |
| | | | | | | | | | | | | | | | | | | | | |
Balance at December 31, 2006 | | 39,747,880 | | | 90,604 | | | | 76,861 | | | (97,844 | ) | | | 30,642 | | | | 100,263 | |
Comprehensive loss: | | | | | | | | | | | | | | | | | | | | | |
Net loss | | — | | | — | | | | — | | | (25,582 | ) | | | — | | | | (25,582 | ) |
Currency translation adjustment | | — | | | — | | | | — | | | — | | | | 7,584 | | | | 7,584 | |
Unrealized gain on marketable equity securities | | — | | | — | | | | — | | | — | | | | 20 | | | | 20 | |
| | | | | | | | | | | | | | | | | | | | | |
| | | | | | | | | | | | | | | | | | | | (17,978 | ) |
Stock-based compensation | | — | | | — | | | | 1,524 | | | — | | | | — | | | | 1,524 | |
Shares issued pursuant to stock plans | | 1,031,533 | | | (111 | ) | | | — | | | — | | | | — | | | | (111 | ) |
| | | | | | | | | | | | | | | | | | | | | |
Balance at December 31, 2007 | | 40,779,413 | | $ | 90,493 | | | $ | 78,385 | | $ | (123,426 | ) | | $ | 38,246 | | | $ | 83,698 | |
| | | | | | | | | | | | | | | | | | | | | |
See accompanying Notes to Consolidated Financial Statements.
F-4
InFocus Corporation
Consolidated Statements of Cash Flows
(In thousands)
| | | | | | | | | | | | |
| | | For the Year Ended December 31, | |
| | | 2007 | | | 2006 | | | 2005 | |
Cash flows from operating activities: | | | | | | | | | | | | |
Net loss | | $ | (25,582 | ) | | $ | (61,920 | ) | | $ | (79,794 | ) |
Adjustments to reconcile net loss to net cash flows provided by (used in) operating activities: | | | | | | | | | | | | |
Depreciation and amortization | | | 4,063 | | | | 3,759 | | | | 8,730 | |
Stock-based compensation | | | 1,413 | | | | 1,144 | | | | 485 | |
(Gain) loss on sale of property and equipment | | | 22 | | | | (698 | ) | | | (104 | ) |
Gain on sale of marketable securitiies | | | — | | | | (809 | ) | | | (19,406 | ) |
Deferred income taxes | | | 28 | | | | 256 | | | | 1,545 | |
Long-lived asset impairment | | | — | | | | — | | | | 9,813 | |
Non-cash write-down of cost-based investments | | | — | | | | 7,474 | | | | — | |
Non-cash write-down of equity method investments | | | — | | | | 3,232 | | | | — | |
Non-cash impairment of TUN assets | | | — | | | | 1,452 | | | | — | |
Non-cash regulatory assessments | | | — | | | | 9,392 | | | | — | |
Cash (deposited with) refunded from China customs | | | — | | | | 4,000 | | | | (2,145 | ) |
Other non-cash expense | | | (746 | ) | | | 1,500 | | | | 1,470 | |
(Increase) decrease in: | | | | | | | | | | | | |
Restricted cash | | | (510 | ) | | | (5,823 | ) | | | (3,706 | ) |
Accounts receivable | | | 7,017 | | | | 22,281 | | | | 30,322 | |
Inventories | | | 8,535 | | | | 21,793 | | | | 80,625 | |
Consigned inventories | | | 711 | | | | 4,752 | | | | 2,348 | |
Other current assets | | | 3,944 | | | | (1,577 | ) | | | 3,351 | |
Increase (decrease) in: | | | | | | | | | | | | |
Accounts payable | | | 13,285 | | | | (20,240 | ) | | | 8,770 | |
Related party accounts payable | | | (281 | ) | | | (3,508 | ) | | | 4,706 | |
Payroll and related benefits payable | | | (470 | ) | | | (147 | ) | | | (2,592 | ) |
Marketing incentives payable, accrued warranty and other current liabilities | | | (6,485 | ) | | | (3,017 | ) | | | 1,054 | |
Other long-term liabilities | | | 422 | | | | 75 | | | | 230 | |
| | | | | | | | | | | | |
Net cash provided by (used in) operating activities | | | 5,366 | | | | (16,629 | ) | | | 45,702 | |
Cash flows from investing activities: | | | | | | | | | | | | |
Purchase of marketable securities | | | — | | | | — | | | | (11,678 | ) |
Maturities of marketable securities | | | — | | | | 9,223 | | | | 18,670 | |
Proceeds from sale of marketable securities | | | — | | | | 878 | | | | 20,497 | |
Payments for purchase of property and equipment | | | (3,171 | ) | | | (5,320 | ) | | | (6,883 | ) |
Proceeds from sale property and equipment | | | 3 | | | | 5,766 | | | | 104 | |
Payments for investments in patents and trademarks | | | — | | | | — | | | | (1,355 | ) |
Dividend payments received from joint venture | | | 1,013 | | | | 1,710 | | | | 2,960 | |
Cash paid for investments in joint ventures | | | — | | | | — | | | | (10,000 | ) |
Cash paid for acquisitions and cost-based technology investments | | | — | | | | — | | | | (3,737 | ) |
Other assets, net | | | 45 | | | | 638 | | | | 83 | |
| | | | | | | | | | | | |
Net cash provided by (used in) investing activities | | | (2,110 | ) | | | 12,895 | | | | 8,661 | |
Cash flows from financing activities: | | | | | | | | | | | | |
Repayments on short-term borrowings | | | — | | | | — | | | | (16,198 | ) |
Proceeds from sale of common stock | | | — | | | | 131 | | | | 66 | |
| | | | | | | | | | | | |
Net cash provided by (used in) financing activities | | | — | | | | 131 | | | | (16,132 | ) |
Effect of exchange rate on cash | | | 4,215 | | | | 4,214 | | | | (2,158 | ) |
| | | | | | | | | | | | |
Increase in cash and cash equivalents | | | 7,471 | | | | 611 | | | | 36,073 | |
Cash and cash equivalents: | | | | | | | | | | | | |
Beginning of year | | | 53,716 | | | | 53,105 | | | | 17,032 | |
| | | | | | | | | | | | |
End of year | | $ | 61,187 | | | $ | 53,716 | | | $ | 53,105 | |
| | | | | | | | | | | | |
Supplemental Cash Flow Information | | | | | | | | | | | | |
Cash paid during the period for interest | | $ | 507 | | | $ | 401 | | | $ | 612 | |
Cash paid during the period for income taxes | | $ | 274 | | | $ | 270 | | | $ | 432 | |
See accompanying Notes to Consolidated Financial Statements.
F-5
INFOCUS CORPORATION
NOTES TO CONSOLIDATED FINANCIAL STATEMENTS
| 1. | SUMMARY OF SIGNIFICANT ACCOUNTING POLICIES: |
Principles of Consolidation
The consolidated financial statements include the accounts of InFocus Corporation and its wholly-owned subsidiaries. All intercompany accounts and transactions have been eliminated.
Nature of Operations
We are the industry pioneer and a worldwide leader in digital projection technology. We have over twenty years of innovative experience allowing us to constantly improve our product offerings and deliver a compelling immersive visual experience in business, education, and home entertainment environments. Our products include projectors and related accessories for use in the conference room, board room, auditorium, classroom and living room.
Estimates
The preparation of financial statements in conformity with U.S. generally accepted accounting principles requires management to make estimates and assumptions that affect the reported amounts of assets and liabilities at the date of the financial statements and the reported amounts of revenues and expenses during the reporting period. Actual results could differ from those estimates. Management believes that the estimates used are reasonable. Significant estimates made by management include: allowance for uncollectible trade accounts receivables, inventory valuation, sales reserves, product warranties, income taxes, restructuring charges, stock-based compensation and long-lived asset impairment.
Reclassifications
Certain prior year amounts have been reclassified to conform to current year presentation.
Cash Equivalents and Marketable Securities
Cash equivalents consist of highly liquid investments with maturities at the date of purchase of 90 days or less. Unrestricted cash equivalents at December 31, 2007 and 2006 totaled $7.8 million and $7.7 million, respectively. Marketable securities consist of government and corporate debt instruments and marketable equity securities. Our marketable securities are classified as either “held to maturity” or “available for sale.” See Note 4 below for additional details regarding our marketable securities.
Letter of Credit and Restricted Cash, Cash Equivalents and Marketable Securities
At December 31, 2007, we had one outstanding letter of credit totaling $20 million, which expired on February 2, 2008. The letter of credit was subsequently amended with a new expiration date of May 2, 2008 and the outstanding amount was reduced to $11 million. This letter of credit secures our obligations to a supplier for the purchase of finished goods inventory. The reduction in the value of the letter of credit is linked to reduced obligations for purchases of finished goods inventory as we wind down our business relationship with that supplier. The fair value of this letter of credit approximates its contract value. The letter of credit was collateralized by $21.1 million of cash and marketable securities at December 31, 2007, and, as such, was reported as restricted on the consolidated balance sheets. The remaining restricted cash and marketable securities of $1.8 million secures our merchant credit card processing account, deposits for building leases and value added taxes in foreign jurisdictions.
Allowance for Uncollectible Trade Accounts Receivables
Credit limits are established through a process of reviewing the financial history and stability of each customer. Where appropriate, we obtain credit rating reports and financial statements of the customer to initiate and modify their credit limits. We regularly evaluate the collectibility of our trade accounts receivable balances based on a combination of factors. When a customer’s account becomes past due, we initiate dialogue with the customer to determine the cause. If it is determined that the customer will be
F-6
unable to meet its financial obligation, such as in the case of a bankruptcy filing, deterioration in the customer’s operating results or financial position or other material events impacting their business, we record a specific reserve for bad debt to reduce the related receivable to the amount we expect to recover given all information presently available. In certain situations, if an account is determined to be a bad debt, we may use collection agencies to work with the customer to receive payment in return for a fee. If circumstances related to specific customers change, our estimates of the recoverability of receivables could materially change. Bad debt expense (recovery), net totaled $(0.1) million, $0.5 million and $(0.4) million, respectively, in 2007, 2006 and 2005. Our allowance for uncollectible accounts totaled $2.0 million and $2.4 million at December 31, 2007 and 2006, respectively, and is included on the consolidated balance sheets as a reduction of accounts receivable.
Inventories
Inventories are valued at the lower of purchased cost or market, using average purchase costs, which approximates the first-in, first-out (FIFO) method. For finished goods inventory, the average purchase costs include overhead items, such as inbound freight and other logistics costs. We regularly evaluate the realizability of our inventory based on a combination of factors including the following: historical usage rates, forecasted sales or usage, estimated service period, product end-of-life dates, estimated current and future market values, service inventory requirements and new product introductions, as well as other factors. Purchasing requirements and alternative usage avenues are explored within these processes to mitigate any identified inventory exposure. Lamps, accessories and service inventories with quantities in excess of forecasted usage are reviewed at least quarterly by our service planning, operations and finance personnel for obsolescence. The resultant write-downs are typically caused by decreased usage of parts in service repair activity and product end of life adjustments in the market. Finished goods are reviewed quarterly by sales, finance and operations personnel to determine if inventory carrying costs exceed market selling prices and demand. Service inventory is systematically and judgmentally reviewed for write-downs based on the estimated remaining service life of the inventory. We record write-downs for inventory based on the above factors and take into account worldwide quantities and demand in our analysis. If circumstances related to our inventories change, our estimates of the realizability of inventory could materially change. At December 31, 2007 and 2006, our inventory reserves totaled $4.7 million and $7.7 million, respectively, and were recorded as a reduction of inventory on our consolidated balance sheets. See Note 5 below for additional details regarding our inventories.
Long-Lived Assets
Long-lived assets held and used by us and intangible assets with determinable lives are reviewed for impairment whenever events or circumstances indicate that the carrying amount of assets may not be recoverable in accordance with Statement of Financial Accounting Standards (“SFAS”) No. 144, “Accounting for the Impairment or Disposal of Long-Lived Assets.” We evaluate recoverability of assets to be held and used by comparing the carrying amount of an asset to future net undiscounted cash flows to be generated by the asset. If such assets are considered to be impaired, the impairment to be recognized is measured as the amount by which the carrying amount of the assets exceeds the fair value of the assets. Such reviews assess the fair value of the assets based upon estimates of future cash flows that the assets are expected to generate.
Based on our 2005 operating losses and other market conditions, we performed a review and evaluation of the carrying value of our long-lived assets for impairment in the third quarter of 2005. Pursuant to SFAS No. 144, we performed an expected present value analysis with multiple cash flow scenarios, weighted by estimated probabilities, using a risk-free interest rate to estimate fair value. This analysis indicated that the book value of our long-lived assets exceeded the undiscounted cash flows expected to result from the use and eventual disposition of the assets. Based on our analysis, we determined that all of our long-lived assets, other than tooling equipment related to current products, were fully impaired. Accordingly, we recorded a non-cash impairment charge totaling $9.8 million in the third quarter of 2005. SeeProperty and Equipment below for additional details.
F-7
Property and Equipment
Property and equipment are stated at cost. Depreciation and amortization are provided using the straight-line method over the estimated useful lives of the assets (approximately two to five years). Major repairs and maintenance that extend the useful life are capitalized and amortized over the estimated extended useful life of the related asset. Leasehold improvements are amortized over the lease term or the estimated useful life of the asset, whichever is shorter. See Note 6 below for additional details regarding our property and equipment.
Property and equipment are reviewed for impairment at least annually in accordance with SFAS No. 144. As discussed above, we recorded a non-cash impairment charge totaling $9.8 million in the third quarter of 2005 in order to write-off all of the remaining book value of our long-lived assets other than tooling equipment used in the production of current products. Of the $9.8 million charge, $7.1 million was allocated to property and equipment and $2.7 million was allocated to other intangible assets, including the carrying value of capitalized patent and trademark costs. The impaired long-lived assets are continuing to be used in operations. In 2007 and 2006, we reviewed our long-lived assets for impairment and determined there was no additional impairment required.
Other Assets
Other assets include investments in technology companies accounted for under the cost method, the carrying amount of investments in unconsolidated joint ventures, and deposits for facilities leases. Investments in technology companies accounted for under the cost method are analyzed for impairment quarterly based on current market conditions and other factors relevant to that investment. As of December 31, 2006, we had fully written down our cost method investments.
During the first quarter of 2006, we recorded a charge of $7.5 million related to the write-down of two separate cost-based investments, Reflectivity and VST International, both start-up technology companies. The write-down of $7.5 million in the first quarter of 2006 effectively reduced the carrying value of these cost based investments to zero. Subsequently, Reflectivity sold substantially all of its assets at a price whereby it was unlikely we would receive any return on our investment. However, in the third quarter of 2007 the funds from the sale cleared escrow and we received $0.2 million as our share of the distribution to shareholders. This distribution was recorded as a component of other, net on our consolidated statements of operations. We do not expect any further recoveries on our investment in Reflectivity. VST International merged its operating assets with another company and became a 50% owner of the new combined entity. We continue to monitor the status of VST and will record any recovery of our investment, if any, upon receipt. In the second quarter of 2006, we recorded a charge of $2.1 million, as a component of other, net to write off the remaining value of our investment in SMT. In addition, in the third quarter of 2006, we recorded a charge of $1.1 million as a component of other, net related to our estimate of our share of costs to wind-down SMT. SMT is currently winding down its operations, including the sale of its assets and the settlement of its liabilities.
During the third quarter of 2006, we incurred an impairment charge of $1.4 million related to the write-down of assets associated with TUN. The write down recorded was to value the assets on our consolidated balance sheet equivalent to the estimated proceeds expected from the sale of the assets. The charge of $1.4 million consisted of $1.1 million recorded to other, net for writing down the original purchase cost allocated to intangible assets related to TUN and $0.3 million as a component of cost of revenues for the write down of the fixed assets deployed by TUN to their fair market value. We sold the assets associated with TUN in the fourth quarter of 2006. This sale did not result in any additional gain or loss being recorded.
Other intangible assets, with the exception of patents and trademarks, are accounted for in accordance with SFAS No. 142, “Goodwill and Other Intangible Assets,” which requires that intangible assets with estimable useful lives be amortized over their respective estimated useful lives to their estimated residual values, and be reviewed for impairment when changes in circumstances indicate that their carrying amounts may not be recoverable in accordance with SFAS No. 144. Other intangible assets at both December 31, 2007 and 2006 were $0. Expenses related to patent and trademark filings are not considered material and are expensed as incurred.
F-8
Other assets consist of carrying amounts of unconsolidated joint ventures and long term building deposits. Other assets are analyzed for impairment in accordance with SFAS No. 144, as discussed above under Long-Lived Assets. Other assets at December 31, 2007 and 2006, respectively, were $1.1 million and $1.2 million.
Marketing Incentives Payable
Marketing incentives payable primarily includes volume rebates, cooperative advertising and other marketing promotions. Estimated volume rebates and other sales incentives are recorded as a reduction of revenue when the related revenue is recognized. Estimated cooperative advertising amounts are classified as sales and marketing expense or as a reduction of revenue and are recorded when earned based on a percentage of revenue. The classification of cooperative advertising either as marketing expense or a reduction of revenue is in accordance with EITF 01-09 “Accounting for Consideration Given by a Vendor to a Customer.”
Product Warranties
We evaluate our obligations related to product warranties on a quarterly basis. In general, we offer a standard two-year warranty and, for certain customers, products and regions, we offer a three year warranty. We monitor failure rates on a product category basis through data collected by our manufacturing sites, factory repair centers and authorized service providers. The service organizations also track costs to repair each unit. Costs include labor to repair the projector, replacement parts for defective items, freight costs, and other incidental costs associated with warranty repairs. Any cost recoveries from warranties offered to us by our suppliers covering defective components are also considered, as well as any cost recoveries of defective parts and material, which may be repaired at a factory repair center or through a third party. This data is then used to calculate our future warranty liability based on actual sales for each projector category and remaining warranty periods. For new product introductions, our quality control department estimates the initial failure rates based on test and manufacturing data and historical experience for similar platform projectors. If circumstances change, or a dramatic change in the failure rates were to occur, our estimate of the warranty liability could change significantly. As our contract manufacturing partners have improved the manufacturing quality of the projectors we sell, we have begun the transition towards purchasing warranty coverage as part of the product we source. Revenue generated from sales of extended warranty contracts is deferred and recognized as revenue over the term of the extended warranty coverage. Deferred warranty revenue totaled $2.1 million and $2.7 million, respectively, at December 31, 2007 and 2006 and was included in other current liabilities on our consolidated balance sheets. Our warranty liability at December 31, 2007 totaled $9.8 million, of which $6.2 million was classified as a component of current liabilities and $3.6 million was classified as other long-term liabilities on our consolidated balance sheets.
The following is a reconciliation of the changes in the aggregate warranty liability (in thousands):
| | | | | | | | | | | | |
| | | Year Ended December 31, | |
| | | 2007 | | | 2006 | | | 2005 | |
Balance, beginning of period | | $ | 13,049 | | | $ | 13,767 | | | $ | 13,767 | |
Reductions for warranty payments made | | | (7,779 | ) | | | (14,913 | ) | | | (19,018 | ) |
Warranties issued | | | 9,261 | | | | 13,051 | | | | 14,753 | |
Adjustments and changes in estimates | | | (4,685 | ) | | | 1,144 | | | | 4,265 | |
| | | | | | | | | | | | |
Balance, end of period | | $ | 9,846 | | | $ | 13,049 | | | $ | 13,767 | |
| | | | | | | | | | | | |
Income Taxes
In establishing our deferred income tax assets and liabilities, we make judgments and interpretations based on the enacted tax laws and published tax guidance that are applicable to our operations. We record deferred tax assets and liabilities and periodically evaluate the need for a valuation allowance to reduce deferred tax assets to realizable amounts in accordance with SFAS No. 109, “Accounting for Income Taxes.” The likelihood of a material change in our expected realization of these assets is dependent on future taxable income, future capital gains, final U.S. and foreign tax settlements and the effectiveness of our tax planning strategies in the various relevant jurisdictions. We are also subject to
F-9
examination of our income tax returns for multiple years by the IRS and other tax authorities. We periodically assess the likelihood of adverse outcomes resulting from these examinations to determine the adequacy of our provision and related accruals for income taxes.
Effective January 1, 2007, we also follow the guidance of the Financial Accounting Standards Board (“FASB”) Interpretation No. 48, “Accounting for Uncertainty in Income Taxes,” which defines the threshold for recognizing the benefits of tax return positions in the financial statements as “more-likely-than-not” to be sustained by the taxing authority. The interpretation applies to all income tax related positions.
See Note 7 below for additional details regarding our income taxes.
Fair Value of Financial Assets and Liabilities
We estimate the fair value of our monetary assets and liabilities based upon comparison of such assets and liabilities to the current market values for instruments of a similar nature and degree of risk. Our monetary assets and liabilities include cash and cash equivalents, marketable securities, accounts receivable, short-term borrowings and accounts payable. We estimate that the recorded value of our monetary assets and liabilities approximated fair value as of December 31, 2007 and 2006.
Foreign Currency Translation
The assets and liabilities of our foreign operations are translated into U.S. dollars at current exchange rates, and revenues and expenses are translated at the ending exchange rate from the prior period which materially approximates the average exchange rates for each period. Resulting translation adjustments are reflected as other comprehensive income within shareholders’ equity. Transaction gains and losses that arise from exchange rate fluctuations on transactions denominated in a currency other than the functional currency, except those transactions which operate as a hedge of a foreign currency investment position or are of a long term-investment nature, are included in the results of operations as incurred.
Derivatives and Hedging
We are exposed to changes in foreign currency exchange rates through the sale of products denominated in non-functional foreign currencies. Our purchases of inventory are largely denominated in U.S. Dollars and we anticipate that we will continue to purchase in U.S. Dollars in the foreseeable future, therefore we are not exposed to foreign currency fluctuations on these purchases. We use foreign currency forward contracts (“forward contracts”) to mitigate certain foreign currency transaction exposures. As a result, increases or decreases in the value of our foreign currency transactions are substantially offset by gains and losses on the forward contracts, so as to mitigate foreign currency transaction gains and losses. We do not use forward contracts as speculative instruments for trading purposes. All non-functional foreign currency transactions and all outstanding forward contracts are marked-to-market at the end of each period with realized and unrealized gains and losses included in other income (expense). These forward contracts are not designated as hedges for accounting purposes.
F-10
The table below summarizes, by major currency, the contractual amounts of our forward exchange contracts translated to U.S. dollars as of December 31, 2007 and 2006. The forward contracts outstanding as of December 31, 2007 mature within 31 days of year end. The “bought” amounts represent the net U.S. dollar equivalents of commitments to purchase foreign currencies, and the “sold” amounts represent the net U.S. dollar equivalent of commitments to sell foreign currencies.
Forward contracts outstanding were as follows at December 31, 2007 and 2006 (in thousands):
| | | | | | | | |
| | | Bought (Sold) | |
Foreign Currency | | 2007 | | | 2006 | |
Euro | | $ | (51,024 | ) | | $ | (38,600 | ) |
British Pound | | | 6,633 | | | | 5,684 | |
Singapore Dollar | | | (7,313 | ) | | | (5,887 | ) |
Swedish Krona | | | 541 | | | | 163 | |
Norwegian Kroner | | | 1,131 | | | | 484 | |
| | | | | | | | |
Net amount outstanding | | $ | (50,032 | ) | | $ | (38,156 | ) |
| | | | | | | | |
Our net investment exposure in foreign subsidiaries translated into U.S. Dollars using period-end exchange rates was approximately $76.8 million and $68.2 million at December 31, 2007 and 2006, respectively.
Revenue Recognition
Revenue from the sale of products is recognized when title transfers and risk of loss has passed to the customer, which is generally at time of shipment. Revenue from the sale of extended warranty contracts is recognized ratably over the life of the service contract.
Some distributor, dealer, and retailer agreements allow for partial return of products and/or price protection under certain conditions within limited time periods. Such return rights are generally limited to contractually defined, short-term stock rotation and defective or damaged product although we have granted retailers return policies consistent with the retailers’ return policies for their customers. We maintain a reserve for sales returns and price adjustments based on historical experience and other qualitative factors. We also have incentive programs for dealers and distributors whereby rebates are offered based upon exceeding volume goals. Estimated sales returns, price protection and rebates are deducted from revenue.
Historical return rates are monitored on a product-by-product basis. As new products are introduced, these historical rates are used to establish initial sales returns reserves and are adjusted as better information becomes available. We also regularly monitor and track channel inventory with our significant customers. Variability in channel inventory levels from quarter to quarter is further used to qualitatively adjust our sales returns reserves. Typically, return rates, on a worldwide basis, have averaged 2% to 4% of sales to customers who are granted such rights. If a dramatic change in the rate of returns were to occur, our estimate of our sales return accrual could change significantly.
One of the factors we consider in estimating future returns, for customers who are granted such rights, is the sell through of products by our distributors and dealers. We have controls in place to monitor channel inventory levels with these customers. We believe the risk of returns increases when inventory held by any particular customer exceeds their near term needs. Accordingly, we defer recognition of revenue on certain channel inventory estimated to be in excess of 60 days.
Our reserves deducted from revenues and accounts receivable for sales returns, price protection and other rebates totaled $2.7 million and $4.6 million, respectively, at December 31, 2007 and 2006. Historically, our actual experience for sales returns, price protection and other sales incentives has not differed materially from our estimates.
F-11
Concentrations of Risk
We rely on third party manufacturers for substantially all of our product components. Reliance on suppliers raises several risks, including the possibility of defective parts, reduced control over the availability and delivery schedule for parts, and the possibility of increases in component costs. Our supply of products and profitability can be adversely affected by each of these risks.
Certain components used in our products are now available only from single sources. Most importantly, Digital Light Processing® (“DLP®”) devices are only available from Texas Instruments. We are currently focusing a significant portion of future product development on DLP® technology, which makes the continued availability of DLP® devices increasingly important.
We also purchase other single-source components for which we have no guaranteed alternative source of supply, and an extended interruption in the supply of any of these components could adversely affect our results of operations. Furthermore, many of the components used in our products are purchased from suppliers located outside the U.S. Trading policies adopted in the future by the U.S. or foreign governments could restrict the availability of components or increase the cost of obtaining components. Any significant increase in component prices or decrease in component availability could have an adverse effect on our results of operations.
We have outsourced the manufacturing of our projectors primarily to two main contract manufacturers, which are both manufacturing our products predominantly in China. The risks mentioned above related to reliance on component suppliers also extend to our contract manufacturers. In addition, we are reliant on our contract manufacturers’ ability to maintain suitable manufacturing facilities, train manufacturing employees, effectively manage the supply chain, manufacture a quality product and provide spare parts in support of our warranty and customer service obligations. Failure of our contract manufacturers to deliver in any one of these areas could have an adverse effect on our results of operations.
We have also outsourced our logistics and service repair functions, most notably to UPS Supply Chain Solutions (“UPS”). We are reliant on UPS and other service providers to effectively and accurately manage our inventory, service repair and logistics functions. Reliance on these third parties requires training of employees, creating and maintaining proper controls and procedures surrounding both forward and reverse logistics functions, and timely and accurate inventory reporting. Failure to deliver in any one of these areas could have an adverse effect on our results of operations.
We sell our products to a large number of customers worldwide. One distribution customer accounted for 22.1%, 19.5% and 15.1%, respectively, of total revenues for the years ended December 31, 2007, 2006 and 2005. This customer accounted for 24.0% and 26.2%, respectively, of our accounts receivable balance at December 31, 2007 and 2006. In addition, another customer accounted for 11.7% and 12.7%, respectively, of total revenues for the years ended December 31, 2007 and 2006 and 20.0% and 16.4%, respectively, of our accounts receivable balance at December 31, 2007 and 2006. In addition, one other customer accounted for 6.5% of our accounts receivable balance at December 31, 2007.
We invest our excess cash with high credit quality financial institutions, which bear minimal risk, and by policy, we limit the amount of credit exposure to any one financial institution.
Employee Benefit Plans
We provide a defined benefit pension plan and a 401(k) plan for certain employees. The 401(k) plan does not allow for direct investment in our common stock. We have a defined benefit plan for certain of our Norwegian employees. The net pension liability related to the defined benefit pension plan was $39,000 and $35,000 at December 31, 2007 and 2006, respectively. Detailed information pursuant to SFAS No. 87, “Employers’ Accounting for Pensions,” and SFAS No. 132 (Revised 2003), “Employer’s Disclosures about Pensions and Other Postretirement Benefits,” is not provided due to the immateriality of the defined benefit pension amounts. We match U.S. employee 401(k) contributions up to $6,000, or 5%, of the employee’s pay. We also have various retirement plans in Singapore and certain European regions. The total expense related to all of the plans was $1.0 million, $1.1 million and $2.0 million, respectively, for the years ended December 31, 2007, 2006 and 2005.
F-12
Research and Development
Amounts spent on research and development activities are expensed as incurred as research and development expense on the consolidated statements of operations.
Advertising Costs
Advertising costs, which are included in marketing and sales expenses, are expensed as incurred in accordance with SOP 93-7. We have certain cooperative advertising programs with our customers based on pre-established percentages of revenue generated from these customers. These obligations are reflected in the statements of operations as a marketing and sales expense in accordance with EITF 01-09 “Accounting for Consideration Given by a Vendor to a Customer.” Advertising expense was $3.4 million, $5.9 million and $8.0 million, respectively, for the years ended December 31, 2007, 2006 and 2005.
Stock-Based Compensation
Effective January 1, 2006, we adopted SFAS No. 123R, “Share-Based Payment.” We elected to use the modified prospective transition method as provided by SFAS No. 123R and, accordingly, financial statement amounts for the prior periods have not been restated to reflect the fair value method of expensing stock-based compensation. Under this method, the provisions of SFAS No. 123R apply to all awards granted or modified after the date of adoption. Our deferred compensation balance of $535,000 as of December 31, 2005, which was accounted for under Accounting Principles Board (“APB”) Opinion No. 25, “Accounting for Stock Issued to Employees,” was reclassified to additional paid in capital upon the adoption of SFAS No. 123R. In addition, the unrecognized expense of awards not yet vested at the date of adoption is being recognized in the periods after the date of adoption over the remaining requisite service period of each grant.
Prior to January 1, 2006, we accounted for stock options using the intrinsic value method as prescribed by APB 25. We provided disclosures of net loss and net loss per share for these prior periods prescribed by SFAS No. 123, “Accounting for Stock-Based Compensation,” as follows (in thousands, except per share amounts):
| | | | |
Year Ended December 31, | | 2005 | |
Net loss, as reported | | $ | (79,794 | ) |
Add - stock-based employee compensation expense included in reported net loss | | | 485 | |
Deduct - total stock-based employee compensation expense determined under the fair value based method for all awards | | | (7,731 | ) |
| | | | |
Net loss, pro forma | | $ | (87,040 | ) |
| | | | |
Net loss per share – basic and diluted, as reported | | $ | (2.02 | ) |
| | | | |
Net loss per share – basic and diluted, pro forma | | $ | (2.20 | ) |
| | | | |
Net Loss Per Share
Basic net loss per share (“EPS”) and diluted EPS are computed using the methods prescribed by SFAS No. 128, “Earnings per Share.” Basic and diluted EPS were the same for 2007, 2006 and 2005 as we were in a net loss position.
Potentially dilutive securities that were not included in the diluted EPS calculations because they would be antidilutive included the following:
| | | | | | |
Year Ended December 31, | | 2007 | | 2006 | | 2005 |
Stock options | | 2.5 million | | 4.0 million | | 5.2 million |
Restricted stock | | 1.0 million | | 0.1 million | | 0.1 million |
| | | | | | |
| | 3.5 million | | 4.1 million | | 5.3 million |
| | | | | | |
Comprehensive Loss
Comprehensive loss includes foreign currency translation gains and losses and unrealized gains and losses on marketable equity securities available for sale that are recorded directly to shareholders’ equity.
F-13
Taxes Assessed by a Governmental Authority
We account for all taxes assessed by a governmental authority that are directly imposed on a revenue-producing transaction (i.e., sales, use, value added) on a net (excluded from revenues) basis.
Segment Reporting
We comply with SFAS No. 131, “Disclosures about Segments of an Enterprise and Related Information.” Based upon definitions contained within SFAS No. 131, we have determined that we operated in one segment during 2007, 2006 and 2005.
| 2. | NEW ACCOUNTING PRONOUNCEMENTS: |
SFAS No. 141R and SFAS No. 160
In December 2007, the FASB issued SFAS No. 141R, “Business Combinations,” and SFAS No. 160, “Noncontrolling Interests in Consolidated Financial Statements.” SFAS Nos. 141R and 160 require most identifiable assets, liabilities, noncontrolling interests and goodwill acquired in a business combination to be recorded at “full fair value” and require noncontrolling interests (previously referred to as minority interests) to be reported as a component of equity, which changes the accounting for transactions with noncontrolling interest holders. Both statements are effective for periods beginning on or after December 15, 2008 and earlier adoption is prohibited. SFAS No. 141R will be applied to business combinations occurring after the effective date and SFAS No. 160 will be applied prospectively to all noncontrolling interests, including any that arose before the effective date. We do not have any noncontrolling interests and, accordingly, we do not expect the adoption of SFAS Nos. 141R and 160 to have any effect on our financial position or results of operations.
EITF 07-3
In June 2007, the Emerging Issues Task Force (“EITF”) issued EITF 07-3, “Accounting for Advance Payments for Goods or Services to Be Used in Future Research and Development Activities,” which states that non-refundable advance payments for services that will be consumed or performed in a future period in conducting research and development activities on behalf of the company should be recorded as an asset when the advance payment is made and then recognized as an expense when the research and development activities are performed. EITF 07-3 is applicable prospectively to new contractual arrangement entered into in fiscal years beginning after December 15, 2007. We will account for any future advance payments for research and development activities in accordance with EITF 07-3. We do not believe that the adoption of EITF 07-3 will have a material effect on our financial position or results of operations.
SFAS No. 159
In February 2007, the FASB issued SFAS No. 159, “The Fair Value Option for Financial Assets and Financial Liabilities,” which allows companies to elect to measure specified financial instruments, warranty and insurance contracts at fair value on a contract-by-contract basis with changes in fair value recognized in earnings each reporting period. The election is called the “fair value option.” SFAS No. 159 applies to all reporting entities and contains financial statement presentation and disclosure requirements for assets and liabilities reported at fair value under the fair value option. SFAS No. 159 is effective as of the beginning of the first fiscal year that begins after November 15, 2007. We do not believe the adoption of SFAS No. 159 will have any effect on our financials position or results of operations.
SFAS No. 157
In September 2006, the FASB issued SFAS No. 157, “Fair Value Measurements,” which establishes a single authoritative definition of fair value, sets out a framework for measuring fair value and requires additional disclosures about fair-value measurements. SFAS No. 157 is effective for fiscal years beginning after November 15, 2007. We do not believe that the adoption of SFAS No. 157 will have a material effect on our financial position or results of operations.
F-14
FASB Interpretation No. 48
Effective January 1, 2007, we adopted FASB Interpretation No. 48, “Accounting for Uncertainty in Income Taxes,” which defines the threshold for recognizing the benefits of tax return positions in the financial statements as “more-likely-than-not” to be sustained by the taxing authority. The interpretation applies to all income tax related positions. As a result of the implementation of Interpretation No. 48, there was no change in the liability for unrecognized tax benefits, and no adjustments were made to the January 1, 2007 balance of retained earnings. As of the date of adoption, our unrecognized tax benefits totaled $0.2 million, the disallowance of which would not materially affect the annual effective income tax rate.
We recorded restructuring charges of $8.4 million, $5.4 million and $11.1 million, respectively, for the years ended December 31, 2007, 2006 and 2005.
In 2007, we incurred restructuring charges totaling $8.4 million, which included the following:
| | • | | a $2.4 million charge in the first quarter of 2007 primarily related to estimated lease losses on vacated or partially vacated facilities at our corporate headquarters and various European office locations; |
| | • | | a $2.1 million charge in the second quarter of 2007 primarily related to severance costs for personnel reductions; |
| | • | | a $0.2 million charge in the third quarter of 2007 for estimated employee severance costs; and |
| | • | | a $3.7 million charge in the fourth quarter of 2007 for estimated lease losses on vacated or partially vacated facilities. Included in the $3.7 million charge was a $2.7 million charge for changes in estimates of prior period sub-lease assumptions on facility reductions and the remaining $1.0 million charge was for remaining obligations for facilities space that was vacated in the fourth quarter of 2007. |
In 2006, we incurred restructuring charges totaling $5.4 million, which included the following:
| | • | | a $1.1 million charge related to international facility consolidation activities that were completed during the first quarter of 2006; |
| | • | | an $850,000 charge in the second quarter of 2006 primarily related to our contractual obligation for severance for former InFocus employees terminated by SMT during the second quarter of 2006; |
| | • | | an $850,000 charge in the third quarter of 2006 for severance costs primarily related to the decision to outsource our U.S. call center to a third party as well as other headcount reductions initiated during the third quarter of 2006; and |
| | • | | a $2.7 million charge in the fourth quarter of 2006 for headcount reductions and for changes in estimates for prior period sub-lease assumptions on facility reductions. Included in the $2.7 million charge is a charge of $0.4 million related to severance for former InFocus employees who were terminated by SMT during the fourth quarter of 2006. Also included in the $2.7 million charge is a charge of $0.6 million related to executive severance payment obligations. |
In 2005, we incurred restructuring charges totaling $11.1 million primarily related to reductions in headcount that took place as part of a restructuring plan that was announced in September 2005. The majority of these actions, including the elimination of several senior executive and management positions, as well as other headcount reductions, were completed over a period of nine months after the plan was announced. These actions resulted in a total charge of $6.3 million that was recorded in the third and fourth quarters of 2005. The 2005 restructuring charge also included $1.1 million related to severance charges for changes in supply chain management and realignment of our European sales force and $3.7 million related to our December 2004 plan of restructuring to streamline our operations in Fredrikstad, Norway.
F-15
At December 31, 2007, we had $5.4 million of restructuring costs accrued on our consolidated balance sheet classified as other current liabilities. We expect the majority of the severance and related costs to be paid by the end of 2008, and the lease loss to be paid over the related lease terms through 2011, net of estimated sub-lease rentals.
The following table displays a roll-forward of the accruals established for restructuring (in thousands):
| | | | | | | | | | | | | | | | | |
| | | Accrual at
December 31,
2006 | | 2007
Charges | | 2007
Changes in
Estimates | | | 2007
Amounts
Paid | | | Accrual at
December 31,
2007 |
Severance and related costs | | $ | 1,492 | | $ | 2,605 | | $ | — | | | $ | (3,007 | ) | | $ | 1,090 |
Lease loss reserve | | | 2,114 | | | 3,170 | | | 2,670 | | | | (3,718 | ) | | | 4,236 |
Other | | | 190 | | | — | | | (70 | ) | | | (53 | ) | | | 67 |
| | | | | | | | | | | | | | | | | |
Total | | $ | 3,796 | | $ | 5,775 | | $ | 2,600 | | | $ | (6,778 | ) | | $ | 5,393 |
| | | | | | | | | | | | | | | | | |
The total restructuring charges in 2007, 2006 and 2005 were as follows (in thousands):
| | | | | | | | | | |
Year Ended December 31, | | 2007 | | | 2006 | | 2005 |
Severance and related costs | | $ | 2,605 | | | $ | 3,815 | | $ | 6,615 |
Lease loss reserve | | | 5,840 | | | | 1,451 | | | 3,155 |
Stock-based compensation | | | — | | | | — | | | 293 |
Other | | | (70 | ) | | | 159 | | | 987 |
| | | | | | | | | | |
Total | | $ | 8,375 | | | $ | 5,425 | | $ | 11,050 |
| | | | | | | | | | |
We account for our marketable securities in accordance with SFAS No. 115, “Accounting for Certain Investments in Debt and Equity Securities.” Accordingly, the held to maturity securities are recorded at amortized cost and the available for sale securities are recorded at fair value with unrealized gains and losses reported in a separate component of shareholders’ equity. Certain information regarding our marketable securities, which include cash equivalents, was as follows (in thousands):
| | | | | | |
Held to Maturity | | December 31,
2007 | | December 31,
2006 |
Fair Market Value | | $ | 29,283 | | $ | 28,785 |
| | | | | | |
Amortized Cost: | | | | | | |
Federal Government | | $ | 6,189 | | $ | — |
Corporate | | | 23,092 | | | 28,784 |
| | | | | | |
Total | | $ | 29,281 | | $ | 28,784 |
| | | | | | |
Maturity Information: | | | | | | |
Less than one year | | $ | 29,281 | | $ | 28,784 |
One to five years | | | — | | | — |
| | | | | | |
Total | | $ | 29,281 | | $ | 28,784 |
| | | | | | |
| | |
Available for Sale | | December 31,
2007 | | December 31,
2006 |
Fair market value of corporate equities | | $ | — | | $ | 104 |
| | | | | | |
Cost of corporate equities | | $ | — | | $ | 124 |
| | | | | | |
At December 31, 2007 and 2006, our marketable securities had future maturity dates of less than 90 days and contained no mortgage backed securities.
Gains and losses on the sale of marketable securities are calculated using the specific identification method. We record, as a separate component of shareholders’ equity, the unrealized gains and losses on available for sale securities. At December 31, 2006, we had no unrealized gains or unrealized losses included in our available for sale securities balance.
F-16
We recognized realized gains on sales of equity securities in 2007, 2006 and 2005 of $0, $0.8 million and $19.4 million, respectively, which were recorded as a component of other income on our consolidated statements of operations. In addition, we recognized a realized loss of $0.1 million and $0.3 million in 2007 and 2006, respectively, related to an “other-than-temporary” impairment on an equity security, which was recorded as a component of other, net. See Note 13 below.
The components of inventory were as follows (in thousands):
| | | | | | |
December 31, | | 2007 | | 2006 |
Lamps and accessories | | $ | 4,487 | | $ | 2,186 |
Service inventories | | | 4,413 | | | 8,537 |
Finished goods | | | 19,521 | | | 26,110 |
| | | | | | |
Total non-consigned inventories | | $ | 28,421 | | $ | 36,833 |
| | | | | | |
Consigned finished good inventories | | $ | 2,563 | | $ | 3,274 |
| | | | | | |
Total inventories | | $ | 30,984 | | $ | 40,107 |
| | | | | | |
We classify our inventory in four categories: lamps and accessories, service inventories, finished goods and consigned finished goods inventories. Lamps and accessories consist of replacement lamps and other new accessory products such as screens, remotes and ceiling mounts. These items can either be sold as new or can be consumed in service repair activities. Service inventories consist of service parts held for warranty or customer repair activities, remanufactured projectors and projectors in the process of being repaired. Finished goods inventory consists of new projectors in our logistics centers and new projectors in transit from our contract manufacturers where title transfers at shipment. Consigned finished goods inventories consist of new projectors held by certain retailers on consignment until sold. Inventories are reported on the consolidated balance sheets net of write downs for obsolete and excess inventories of $4.7 million and $7.7 million, respectively, as of December 31, 2007 and 2006.
| 6. | PROPERTY AND EQUIPMENT: |
The components of property and equipment were as follows (in thousands):
| | | | | | | | | | |
| | | | | December 31, | |
| | | Estimated Useful Lives | | 2007 | | | 2006 | |
Furniture and fixtures | | 3 -5 years | | $ | 1,577 | | | $ | 1,512 | |
Manufacturing equipment | | 1.5 to 3 years | | | 13,552 | | | | 11,678 | |
Engineering equipment | | 5 years | | | 1,807 | | | | 1,780 | |
Computer software and equipment | | 3 to 5 years | | | 7,942 | | | | 7,216 | |
Buildings, land and improvements | | Shorter of 10 years or
life of lease | | | 2,293 | | | | 1,302 | |
| | | | | | | | | | |
| | | | | 27,171 | | | | 23,488 | |
Less accumulated depreciation | | | | | (24,198 | ) | | | (19,527 | ) |
| | | | | | | | | | |
| | | | $ | 2,973 | | | $ | 3,961 | |
| | | | | | | | | | |
F-17
The components of loss before income taxes and the provision (benefit) for income taxes were as follows (in thousands):
| | | | | | | | | | | | |
Year Ended December 31, | | 2007 | | | 2006 | | | 2005 | |
Loss before income taxes: | | | | | | | | | | | | |
U.S. | | $ | (27,037 | ) | | $ | (59,120 | ) | | $ | (64,039 | ) |
Foreign | | | 1,426 | | | | (2,051 | ) | | | (15,861 | ) |
| | | | | | | | | | | | |
| | $ | (25,611 | ) | | $ | (61,171 | ) | | $ | (79,900 | ) |
| | | | | | | | | | | | |
Tax provision (benefit): | | | | | | | | | | | | |
Federal and State: | | | | | | | | | | | | |
Current | | $ | 41 | | | $ | 142 | | | $ | 383 | |
Deferred | | | (7,639 | ) | | | (25,030 | ) | | | (39,863 | ) |
Increase in valuation allowance | | | 7,639 | | | | 25,030 | | | | 39,863 | |
| | | | | | | | | | | | |
| | | 41 | | | | 142 | | | | 383 | |
Foreign: | | | | | | | | | | | | |
Current | | | (112 | ) | | | 431 | | | | (2,076 | ) |
Deferred | | | 191 | | | | (880 | ) | | | (6,180 | ) |
Increase in valuation allowance | | | (149 | ) | | | 1,056 | | | | 7,767 | |
| | | | | | | | | | | | |
| | | (70 | ) | | | 607 | | | | (489 | ) |
| | | | | | | | | | | | |
Total | | $ | (29 | ) | | $ | 749 | | | $ | (106 | ) |
| | | | | | | | | | | | |
Income taxes have been provided for foreign operations based upon the various tax laws and rates of the countries in which operations are conducted.
The reconciliation between the effective income tax rate and the U.S. federal statutory income tax rate was as follows:
| | | | | | | | | |
Year Ended December 31, | | 2007 | | | 2006 | | | 2005 | |
U.S. federal statutory income tax rate | | (35.0 | )% | | (35.0 | )% | | (35.0 | )% |
State income taxes, net of federal benefit | | (2.8 | ) | | (2.6 | ) | | 0.1 | |
Effect of foreign taxes, net | | (0.7 | ) | | 0.8 | | | 0.1 | |
Change in valuation allowance | | 40.1 | | | 41.2 | | | 35.0 | |
Reduction of tax reserves for resolved items | | — | | | — | | | (1.0 | ) |
Income from equity investments | | (1.0 | ) | | (3.5 | ) | | 0.8 | |
Other | | (0.7 | ) | | 0.3 | | | (0.1 | ) |
| | | | | | | | | |
Effective income tax rate | | (0.1 | )% | | 1.2 | % | | (0.1 | )% |
| | | | | | | | | |
Deferred income taxes reflect the net tax effects of temporary differences between the basis of assets and liabilities for financial statement reporting and income tax purposes. Deferred tax assets are reduced by a valuation allowance if, based on the weight of available evidence, it is more likely than not that some portion or all of the deferred tax assets will not be realized.
F-18
Our deferred tax assets and liabilities consisted of the following (in thousands):
| | | | | | | | |
December 31, | | 2007 | | | 2006 | |
Current Deferred Tax Assets Accounts receivable allowances | | $ | 1,731 | | | $ | 2,886 | |
Inventory reserves | | | 1,083 | | | | 818 | |
Tax loss and credit carry forwards | | | 879 | | | | 1,345 | |
Accrued warranty | | | 2,739 | | | | 4,363 | |
Accrued expenses | | | 4,068 | | | | 4,426 | |
Deferred loss | | | 3,750 | | | | 3,750 | |
Other | | | — | | | | 753 | |
| | | | | | | | |
Total Current Deferred Tax Assets | | | 14,250 | | | | 18,341 | |
Current Deferred Tax Liabilities | | | | | | | | |
Deferred gains | | | — | | | | (1,406 | ) |
Prepaid expenses | | | (388 | ) | | | (865 | ) |
Other | | | (841 | ) | | | — | |
| | | | | | | | |
Total Current Deferred Tax Liabilities | | | (1,229 | ) | | | (2,271 | ) |
Valuation Allowance | | | (11,920 | ) | | | (15,104 | ) |
| | | | | | | | |
Total Current Deferred Taxes | | $ | 1,101 | | | $ | 966 | |
| | | | | | | | |
Non-Current Deferred Tax Assets | | | | | | | | |
Tax loss and credit carry forwards | | $ | 168,510 | | | $ | 156,010 | |
Accrued warranty | | | 1,317 | | | | 909 | |
Capitalized research and development costs | | | 4,123 | | | | 4,507 | |
Depreciation differences | | | 7,238 | | | | 6,901 | |
Goodwill | | | 67,290 | | | | 78,007 | |
Other | | | 12,811 | | | | 6,507 | |
| | | | | | | | |
Total Non-Current Deferred Tax Assets | | $ | 261,289 | | | $ | 252,841 | |
Valuation Allowance | | | (261,289 | ) | | | (252,841 | ) |
| | | | | | | | |
Total Non-Current Deferred Taxes | | $ | — | | | $ | — | |
| | | | | | | | |
Total Deferred Taxes | | $ | 1,101 | | | $ | 966 | |
| | | | | | | | |
SFAS No. 109 requires that the tax benefits described above be recorded as an asset. We then assess such assets to determine if it is “more likely than not” they will be realized; if not, a valuation allowance is required to be recorded. Based on this guidance, we currently record a valuation allowance against substantially all of our net deferred tax assets. At December 31, 2007, we had U.S. federal NOLs and U.S. state NOLs totaling approximately $337.4 million and $302.8 million, respectively. The federal NOLs begin to expire in the year 2022 whereas the state NOLs begin to expire between 2008 and 2024 depending on the state. We also have foreign NOLs totaling approximately $86.7 million, of which approximately $36.4 million relate to the Netherlands that begin to expire in increments each year until completely expiring in 2010. The Netherlands’ NOLs have a full valuation allowance against them. The remaining foreign NOLs primarily have an unlimited carry forward period. Additionally, we have various U.S. and foreign tax credits available aggregating $7.8 million expiring in the years 2010 through 2023 and AMT tax credits available aggregating $2.1 million that have no expiration date.
Total deferred tax assets increased to $275.5 million as of December 31, 2007 from $271.2 million as of December 31, 2006, primarily due to current year NOLs in U.S. and foreign tax jurisdictions. Total deferred tax liabilities decreased to $1.2 million as of December 31, 2007 from $2.3 million at December 31, 2006. Our total valuation allowance increased to $273.2 million as of December 31, 2007 from $267.9 million as of December 31, 2006, primarily due to uncertainties of realizing certain U.S. and foreign net operating loss carry forwards.
Pursuant to Internal Revenue Code Sections 382 and 383, the utilization of net operating losses and other tax attributes may be substantially limited due to cumulative changes in ownership greater than 50% that may have occurred or could occur during applicable testing periods. We have not performed a Section 382 analysis to determine the possible limitation on our net operating losses. It is possible that our ability to utilize carryforwards may be subject to an annual limitation in future periods.
F-19
We have undistributed earnings of foreign subsidiaries of approximately $0.7 million as of December 31, 2007, for which deferred taxes have not been provided. Such earnings are considered indefinitely invested outside of the U.S. Upon distribution of those earnings in the form of dividends or otherwise, we could be subject to both U.S. income taxes (subject to an adjustment for foreign tax credits and an offset against U.S. NOLs) and withholding taxes payable to the various foreign countries. Based on our analysis it is anticipated that the amount would not be material.
We operate in numerous taxing jurisdictions and are subject to regular examinations by various U.S. federal, state and foreign jurisdictions for various tax periods. The U.S. federal income returns for the years 2005 and forward remain open. Additionally, various state and foreign income tax returns are open to examination and presently several foreign income tax returns are under examination. To the best of our knowledge, we are no longer subject to state and local or foreign income tax examinations by tax authorities for years before 2000. Such examinations could result in challenges to tax positions taken and, accordingly, we may record adjustments to provisions based on the outcomes of such matters. However, we believe that the resolution of these matters, after considering amounts accrued, will not have a material effect on our results of operations.
The ongoing 2004 tax examination in Norway relates to an operating loss incurred for that year which resulted in a refund claim for prior year taxes paid of approximately $1.8 million. The operating loss was attributable, in part, to the closure of our Fredrikstad facility. The Norwegian tax authority assessment board and the appeals assessment board have concluded that their analysis of the facts and circumstances does not support the ultimate collection of the receivable. Accordingly, our next course of action will be to litigate the case in the Norwegian court system. We continue to believe the facts and circumstances surrounding the facility closure support our position that it is more-likely-than-not that we will receive the refund. However, it is possible that we could be denied the claimed refund which would have an unfavorable impact on our results of operations in the quarter the decision is finalized.
At December 31, 2007, unrecognized tax benefits totaled $0.2 million, the disallowance of which would not materially affect the annual effective income tax rate. Unrecognized tax benefits did not change during 2007. Our continuing practice is to recognize interest and penalties related to income tax matters in income tax expense. As of December 31, 2007, we had $0.1 million accrued for interest and penalties, which reflects a reduction of $0.2 million due to the resolution of a penalty dispute with the Dutch tax authorities during the fourth quarter of 2007. Interest and penalties recognized as a component of income tax expense during 2007 totaled $0.2 million.
We have a $15 million line of credit facility to finance future working capital requirements with Wells Fargo Foothill, Inc. (“Wells Fargo”) that was scheduled to expire February 28, 2008. See Note 17 for a discussion of amendments to this line of credit facility. Pursuant to the terms of the credit agreement, we may borrow against the line subject to a borrowing base determined on eligible accounts receivable.
Interest on outstanding borrowings is at prime plus 1.5% and at no time will the interest rate be below 4%. At December 31, 2007 the interest rate was 8.75%. We may issue letters of credit under the credit facility in amounts up to $15 million. Fees for letters of credit are 1.5% of the principal amount of the letter of credit. The agreement requires us to pay a 0.5% commitment fee over the term and an additional 0.375% per annum on the unused portion of the credit facility.
The credit facility contains various restrictive covenants. Such restrictions are subject to usual and customary exceptions, which would be typical for a credit facility of this nature. The restrictions include, among others, maintaining a minimum level of earnings, a maximum amount of capital expenditures per annum, not creating liens on our assets or incurring additional debt, limiting investments and acquisitions and preventing dissolution, liquidation, merger or a sale of our assets without prior consent of Wells Fargo. The credit facility also contains usual and customary events of default (subject to certain threshold
F-20
amounts and grace periods) on the occurrence of such things as nonpayment of amounts due under the credit facility, violation of the restrictive covenants referred to above, or violation of other contract provisions. If an event of default occurs and is continuing, the interest rate on any outstanding borrowings increases 2%, and we may be required to repay any outstanding borrowings under the credit facility.
As of December 31, 2007, we were in compliance with the financial covenants and we did not have any amounts outstanding under this credit agreement.
We lease a 140,000 square foot corporate headquarters facility in Wilsonville, Oregon. This lease is non-cancelable and expires in October 2011. We also lease space in Fredrikstad, Norway, Almere, The Netherlands, Singapore, Shenzhen, China and Hilversum, The Netherlands, under leases expiring on March 31, 2009, July 1, 2010, March 31, 2009, August 2009 and September 30, 2008, respectively. We closed our Hilversum, The Netherlands facility in October 2002. We have sublet this entire facility for a portion of the lease obligation value. We also closed our Fredrikstad, Norway office during 2005 as part of our December 2004 restructuring. We are currently subletting a portion of this facility to various tenants and are actively working on subletting the remaining spaces. Also, due to reduced space needs, in the first quarter of 2007, we consolidated floors in our corporate headquarters building in Wilsonville, Oregon from four floors to three floors and in the fourth quarter of 2007 we consolidated to two and one half floors. We are actively looking for a tenant to sub-lease the vacated space.
In addition, we have several operating leases for smaller sites internationally to support our local sales and support activities. We also lease certain equipment pursuant to operating leases.
Future minimum lease payments, net of estimated sub-lease income, including amounts due for closed facilities for which we have remaining future obligations as of December 31, 2007 were as follows (in thousands):
| | | |
Year Ending December 31, | | |
2008 | | $ | 4,238 |
2009 | | | 2,846 |
2010 | | | 2,464 |
2011 | | | 1,930 |
2012 | | | — |
Thereafter | | | — |
| | | |
Total minimum lease payments | | $ | 11,478 |
| | | |
As discussed above, we entered into agreements to sub-lease portions of our facilities in Europe. Within the next twelve months, we also anticipate entering into a sub-lease agreement for a portion of the vacant space in our headquarters building in Wilsonville, Oregon. We have included an estimate for future sub-lease income on this space in the chart above. Sub-lease income is expected to be approximately $0.3 million in 2008, $0.7 million in 2009, $0.6 million in 2010 and $0.5 million in 2011. Future minimum lease payments listed above are net of expected sub-lease income.
Rental expense for the years ended December 31, 2007, 2006 and 2005 was $5.3 million, $5.3 million and $5.7 million, respectively. There were no capital leases at December 31, 2007.
F-21
| 10. | CONTRACTUAL PAYMENT OBLIGATIONS: |
The following is a summary of our contractual commitments and obligations as of December 31, 2007 (in thousands):
| | | | | | | | | | | | | | | |
| | | Payments Due By Period |
Contractual Obligation | | Total | | 2008 | | 2009 and
2010 | | 2011 and
2012 | | 2013 and
beyond |
Letters of Credit(1) | | $ | 20,000 | | $ | 20,000 | | $ | — | | $ | — | | $ | — |
Purchase Order Commitments | | | 22,556 | | | 22,556 | | | — | | | — | | | — |
Operating Leases, Net | | | 11,478 | | | 4,238 | | | 5,310 | | | 1,930 | | | — |
| | | | | | | | | | | | | | | |
| | $ | 54,034 | | $ | 46,794 | | $ | 5,310 | | $ | 1,930 | | $ | — |
| | | | | | | | | | | | | | | |
| (1) | The letter of credit collateralized our obligations for outstanding accounts payable and future purchase commitments to a supplier for the purchase of finished goods inventory. The letter of credit was amended on February 2, 2008 to reduce the contractual obligation amount to $11.0 million. |
| 11. | INVESTMENT IN SOUTH MOUNTAIN TECHNOLOGIES AND RELATED PARTY DISCLOSURES FOR SOUTH MOUNTAIN TECHNOLOGIES: |
We account for our investment in our 50/50 joint venture with TCL Corporation, South Mountain Technologies (“SMT”), using the equity method of accounting. The equity method requires us to increase or decrease the carrying amount of our investment by recording our share of the operating results as a component of other, net based on our percentage of ownership of the joint venture and by recording any dividends received from the joint venture. At December 31, 2007 and 2006, the carrying amount of our investment in SMT was zero. We did not record any dividends from SMT in 2007, 2006 or 2005.
In the second quarter of 2006, we recorded a charge of $2.1 million, as a component of other, net to write off the remaining value of our investment in SMT. In addition, in the third quarter of 2006, we recorded a charge of $1.1 million as a component of other, net related to our estimate of our share of costs to wind-down SMT. SMT is currently winding down its operations, including the sale of its assets and the negotiation of the settlement of its outstanding liabilities. We are uncertain how long it may take to complete the liquidation of SMT.
In addition, at December 31, 2007 and 2006, respectively, related party payables to SMT totaled $1.6 million and $1.9 million, respectively. Related party payables to SMT are for the purchase of product manufactured by SMT for us and other associated liabilities.
| 12. | INVESTMENT IN MOTIF AND RELATED PARTY DISCLOSURES FOR MOTIF: |
We account for our investment in Motif, our 50/50 joint venture with Motorola, using the equity method of accounting. The equity method requires us to increase or decrease the carrying amount of our investment by recording our share of the operating results as a component of other, net based on our percentage of ownership of the joint venture and by recording any dividends received from the joint venture. The carrying amount of our investment in Motif is reported as a component of other assets on our consolidated balance sheets and, at December 31, 2007 and 2006, had a carrying amount of $0.8 million and $0.9 million, respectively. We recorded dividends from Motif totaling $1.0 million, $1.0 million and $3.7 million, respectively, during 2007, 2006 and 2005. We have no material related party receivables or payables with Motif.
Certain statement of operations information related to Motif was as follows (in thousands):
| | | | | | | | | |
| | | Year Ended December 31, |
| | | 2007 | | 2006 | | 2005 |
Motif | | | | | | | | | |
Revenues | | $ | 2,069 | | $ | 4,187 | | $ | 8,742 |
Income from operations | | | 1,993 | | | 4,003 | | | 8,588 |
Net income | | | 1,715 | | | 3,110 | | | 7,444 |
F-22
Certain balance sheet information related to Motif was as follows (in thousands):
| | | | | | |
| | | December 31, |
| | | 2007 | | 2006 |
Motif | | | | | | |
Current assets | | $ | 1,913 | | $ | 2,341 |
Non-current assets | | | 625 | | | 625 |
| | | | | | |
Total assets | | $ | 2,538 | | $ | 2,966 |
| | | | | | |
Current liabilities | | $ | 1,002 | | $ | 1,145 |
Non-current liabilities | | | — | | | — |
| | | | | | |
Total liabilities | | $ | 1,002 | | $ | 1,145 |
| | | | | | |
Other, net related to our share of Motif profits were $0.9 million, $1.6 million and $3.7 million, respectively, in 2007, 2006 and 2005.
Other, net, included as a component of other income (expense), included the following (in thousands):
| | | | | | | | | | | | |
| | | Year Ended December 31, | |
| | | 2007 | | | 2006 | | | 2005 | |
Net realized gain on the sale of equity securities | | $ | — | | | $ | 809 | | | $ | 19,396 | |
Impairment charge for valuation of equity securities | | | (124 | ) | | | (261 | ) | | | — | |
Income related to the profits of Motif, 50-50 joint venture | | | 857 | | | | 1,555 | | | | 3,722 | |
Expense related to losses of SMT, 50-50 joint venture | | | — | | | | (2,709 | ) | | | (5,185 | ) |
Write-down of equity method investment in SMT, 50-50 joint venture | | | — | | | | (2,106 | ) | | | — | |
Charge for estimated costs to wind-down SMT | | | — | | | | (1,126 | ) | | | — | |
Impairment charge related to TUN | | | — | | | | (1,117 | ) | | | — | |
Losses related to foreign currency transactions | | | (1,133 | ) | | | (1,519 | ) | | | (853 | ) |
Recovery (write-down) of certain cost-based investments in technology companies | | | 202 | | | | (7,474 | ) | | | — | |
Gain on sale of land | | | — | | | | 636 | | | | — | |
Other | | | (151 | ) | | | (139 | ) | | | 50 | |
| | | | | | | | | | | | |
| | $ | (349 | ) | | $ | (13,451 | ) | | $ | 17,130 | |
| | | | | | | | | | | | |
| 14. | STOCK-BASED COMPENSATION PLAN INFORMATION: |
Stock-Based Compensation
Certain information regarding our stock-based compensation is as follows (in thousands, except per share amounts):
| | | | | | | | | |
Year Ended December 31, | | 2007 | | 2006 | | 2005 |
Weighted average grant-date per share fair value of option shares granted | | $ | 0.86 | | $ | 1.76 | | $ | 3.13 |
Total intrinsic value of share options exercised | | | — | | | 26 | | | 28 |
Total fair value of shares vested | | | 177 | | | 171 | | | 44 |
Stock-based compensation recognized in results of operations | | | 1,413 | | | 1,144 | | | 485 |
Cash received from options exercised and shares purchased under all share-based arrangements | | | — | | | 131 | | | 66 |
There was no tax benefit related to stock options recognized in our statements of operations, no stock-based compensation capitalized to fixed assets, inventory or other assets, nor tax deductions realized related to stock options exercised in the years ended December 31, 2007, 2006 or 2005.
F -23
Our stock-based compensation was included in our statements of operations as follows (in thousands):
| | | | | | | | | |
Year Ended December 31, | | 2007 | | 2006 | | 2005 |
Cost of revenues | | $ | 302 | | $ | 145 | | $ | 2 |
Marketing and sales | | | 391 | | | 359 | | | 98 |
Research and development | | | 304 | | | 151 | | | — |
General and administrative | | | 416 | | | 489 | | | 92 |
Restructuring | | | — | | | — | | | 293 |
| | | | | | | | | |
| | $ | 1,413 | | $ | 1,144 | | $ | 485 |
| | | | | | | | | |
The $0.3 million of stock-based compensation included in our statement of operations as a component of restructuring for the year ended December 31, 2005 was related to a non-cash stock-based compensation charge for employees who transferred to SMT.
To determine the fair value of stock-based awards granted, we used the Black-Scholes option pricing model and the following weighted average assumptions:
| | | | | | | | | |
Year Ended December 31, | | 2007 | | | 2006 | | | 2005 | |
Risk-free interest rate | | 3.26 - 4.93 | % | | 4.59 - 5.24 | % | | 3.72% - 4.35 | % |
Expected dividend yield | | 0.00 | % | | 0.00 | % | | 0.00 | % |
Expected lives (years) | | 0.5 - 4.2 | | | 2.9 - 3.9 | | | 3.9 | |
Expected volatility | | 31.6 - 56.5 | % | | 52.1 - 71.1 | % | | 71.5% - 78.6 | % |
Discount for post vesting restrictions | | 0.00 | % | | 0.00 | % | | 0.00 | % |
The risk-free rate used is based on the U.S. Treasury yield over the estimated life of the options granted. Our option pricing model utilizes the simplified method accepted under Staff Accounting Bulletin No. 107 to estimate the expected life of the option. The expected volatility for options granted pursuant to our stock incentive plans is calculated based on our historical volatility over the estimated term of the options granted. We have not paid cash dividends in the past and we do not expect to pay cash dividends in the future resulting in the dividend rate assumption above.
We amortize stock-based compensation on a straight-line basis over the vesting period of the individual award with estimated forfeitures considered. Shares to be issued upon the exercise of stock options will come from newly issued shares.
In May 2005 and December 2005, the Compensation Committee of our Board of Directors approved an acceleration of vesting of certain employee stock options. As a result of the acceleration, we reduced our future stock-based compensation expense.
Following is information regarding the accelerations:
| | | | | | | | | | | | | | |
Acceleration date | | Number
of options
affected | | Price of
affected
options | | Percentage
of total
outstanding
options | | | Estimated
stock-based
compensation
savings in 2006 | | Estimated
stock-based
compensation
savings in 2007 |
May 3, 2005 | | 889,633 | | >$ | 5.46 | | 17 | % | | $ | 1.4 million | | $ | 1.2 million |
December 8, 2005 | | 540,382 | | >$ | 5.43 | | 10 | % | | $ | 0.7 million | | $ | 0.4 million |
1988 Combination Stock Option Plan and 1998 Stock Incentive Plan
Our 1988 Combination Stock Option Plan, as amended (the “1988 Plan”) expired in December 1998. Our 1998 Stock Incentive Plan (the “1998 Plan” together with the 1988 Plan, the “Plans”) was approved by the Shareholders in April 1998. The 1998 Plan provides for the issuance of incentive stock options to our employees and restricted stock and non-statutory stock options to our employees, officers, directors and consultants. Under the Plans, the exercise price of all stock options cannot be less than the fair market value of our common stock at the date of grant. Options granted generally vest over a three or four-year
F-24
period and expire either five or ten years from the date of grant. Options canceled under the 1988 Plan are not added back to the pool of shares available for grant. At December 31, 2007, we had 4,850,769 shares of common stock reserved for issuance under the 1998 Plan, of which 1,295,364 shares had been granted and vested, 1,036,887 shares had been granted and remained unvested, and 2,518,518 shares remained available for future grants or awards. We also had 73,049 shares of common stock reserved for issuance under our 1988 Plan, all of which were granted and vested at December 31, 2007.
Stock option activity under the Plans for the year ended December 31, 2007 was as follows (shares in thousands):
| | | | | | |
| | | Options
Outstanding | | | Weighted
Average
Exercise Price |
Outstanding at December 31, 2006 | | 3,841 | | | $ | 7.69 |
Granted | | 1,037 | | | | 2.05 |
Exercised | | — | | | | — |
Expired | | (1,778 | ) | | | 9.47 |
Forfeited | | (695 | ) | | | 3.80 |
| | | | | | |
Outstanding at December 31, 2007 | | 2,405 | | | $ | 5.07 |
| | | | | | |
In the first quarter of 2006, we issued performance-based stock options to certain employees under the 1998 Plan. Performance-based stock options are a form of option award in which the number of options that ultimately vest depends on performance against specified performance targets. The performance period for the options issued in the first quarter of 2006 was January 1, 2006 through December 31, 2006. The performance targets were not achieved and, therefore, we did not record any stock-based compensation expense related to the performance stock options in our consolidated statement of operations. In the first quarter of 2007, all 314,800 performance-based stock options, previously granted in 2006, with an exercise price of $3.95 were cancelled. The 314,800 options are included in the table above for options outstanding at December 31, 2006 and are also included in the number forfeited during 2007.
On May 31, 2007, the Compensation Committee of the Board of Directors authorized the issuance of 809,300 restricted shares to current non-temporary employees under the 1998 Stock Incentive Plan. The restricted shares vest 100% one year from date of grant contingent upon the employee’s continuous employment over that period. The fair market value of our common stock on the date of grant was $2.46 per share. The value of the 809,300 restricted shares was $2.0 million and is being amortized over the one-year vesting period. As a result of employee terminations, as of December 31, 2007, 174,050 shares, with a related fair value of $0.4 million, had been forfeited.
Also on May 31, 2007, the Compensation Committee of the Board of Directors authorized the issuance of 65,000 performance restricted shares and 200,000 stock options to our executive officers. The vesting of the performance restricted share awards is contingent upon the achievement of operating income goals for the fourth quarter of 2007 and the second quarter of 2008. At the end of the performance period, if the performance targets are met, each performance share will fully vest on July 31, 2008. If one of the two specified performance goals is achieved, each performance share will vest as to 50% of the total shares on July 31, 2008 and, if neither performance goal is achieved, the shares will be cancelled. The performance goal for the fourth quarter of 2007 was achieved, and therefore 50% of the total shares will vest on July 31, 2008. The 200,000 stock options granted on May 31, 2007 vest 25% on the first anniversary of the grant date and 1/48th per month thereafter over the remaining three years, subject to the executive’s continued employment during the vesting period. Of the performance restricted shares and the stock options issued, 25,000 and 75,000, respectively, cancelled on July 2, 2007 in connection with the departure of our Chief Financial Officer on that date. The value of the performance restricted shares and the stock options, net of the effect of those cancelled, was $0.1 million and $0.1 million, respectively, and is being recognized over the vesting period of the awards
F-25
Restricted stock activity under the 1998 Plan for the year ended December 31, 2007 was as follows (shares in thousands):
| | | | | | |
| | | Restricted
Stock
Outstanding | | | Weighted Average
Grant Date Fair
Value |
Unvested at December 31, 2006 | | 86 | | | $ | 4.37 |
Granted | | 1,250 | | | | 2.26 |
Vested | | (76 | ) | | | 2.32 |
Forfeited | | (226 | ) | | | 2.65 |
| | | | | | |
Unvested at December 31, 2007 | | 1,034 | | | $ | 2.28 |
| | | | | | |
Directors’ Stock Option Plan
Our Directors’ Stock Option Plan, as amended (the “Directors’ Plan”) provided for the issuance of stock options covering a total of 400,000 shares of our common stock to members of our board of directors who were not employees at any time during the preceding year (“Eligible Directors”). The Directors’ Plan expired August 22, 2002 and, therefore, no options have been granted under this plan since that time. All Eligible Director options vested six months after the date of grant. At December 31, 2007 we had reserved 107,460 shares of common stock for issuance under the Directors’ Plan. Stock option activity under the Directors’ Plan for the year ended December 31, 2007 was as follows (shares in thousands):
| | | | | | |
| | | Options
Outstanding | | | Weighted
Average
Exercise Price |
Outstanding at December 31, 2006 | | 167 | | | $ | 16.79 |
Granted | | — | | | | — |
Exercised | | — | | | | — |
Forfeited | | (60 | ) | | | 19.67 |
| | | | | | |
Outstanding at December 31, 2007 | | 107 | | | $ | 15.19 |
| | | | | | |
Summary of All Plans
Certain information regarding all options outstanding, exclusive of restricted stock, as of December 31, 2007 was as follows (shares in thousands):
| | | | | | |
| | | Options
Outstanding | | Options
Exercisable |
Number | | | 2,512 | | | 1,476 |
Weighted average exercise price | | $ | 5.50 | | $ | 7.74 |
Aggregate intrinsic value | | $ | 61,795 | | | — |
Weighted average remaining contractual term | | | 3.7 years | | | 2.6 years |
As of December 31, 2007, unrecognized stock-based compensation related to outstanding, but unvested options and restricted stock was $3.2 million, which will be recognized over the remaining weighted average vesting period of 2.0 years.
| 15. | GEOGRAPHIC INFORMATION: |
Geographic revenue information, based on shipment destination, was as follows (in thousands):
| | | | | | | | | |
Year Ended December 31, | | 2007 | | 2006 | | 2005 |
United States | | $ | 175,219 | | $ | 239,258 | | $ | 331,988 |
Europe | | | 81,999 | | | 81,825 | | | 124,939 |
Asia Pacific | | | 34,926 | | | 27,701 | | | 43,350 |
Other | | | 16,037 | | | 25,968 | | | 31,822 |
| | | | | | | | | |
| | $ | 308,181 | | $ | 374,752 | | $ | 532,099 |
| | | | | | | | | |
F-26
Long-lived assets by geographic region were as follows (in thousands):
| | | | | | |
December 31, | | 2007 | | 2006 |
United States | | $ | 3,227 | | $ | 4,479 |
Europe | | | 373 | | | 168 |
Asia Pacific | | | 434 | | | 503 |
| | | | | | |
| | $ | 4,034 | | $ | 5,150 |
| | | | | | |
| 16. | LEGAL CLAIMS AND OTHER CONTINGENCIES: |
From time to time, we become involved in ordinary, routine or regulatory legal proceedings incidental to our business. When a loss is deemed probable and reasonably estimable an amount is recorded in our financial statements. No adjustments have been made to the accompanying financial statements relative to these routine matters. While the ultimate results of these matters cannot presently be determined, management does not expect that they will have a material adverse effect on our results of operations or financial position.
Line of Credit Amendment
On February 28, 2008 we amended our line of credit facility with Wells Fargo to extend the maturity date to March 14, 2008. As of the date of the filing for this annual report we are engaged in negotiations with Wells Fargo Foothill for another amendment that, if completed, we expect will include an extension of the maturity date to August 31, 2008 and establish certain future financial covenants.
F-27
SCHEDULE II
InFocus Corporation
Valuation and Qualifying Accounts
Years Ended December 31, 2007, 2006 and 2005
(In thousands)
| | | | | | | | | | | | | | | | |
Column A | | Column B | | Column C | | Column D | | | Column E |
Description | | Balance
at Beginning
of Period | | Charged
to Costs and
Expenses | | Charged to
Other Accounts -
Describe | | Deductions -
Describe (a) | | | Balance
at End
of Period |
Year Ended December 31, 2005: | | | | | | | | | | | | | | | | |
Allowance for uncollectible accounts and sales allowances | | $ | 11,152 | | $ | 24,911 | | $ | — | | $ | (26,910 | ) | | $ | 9,153 |
Year Ended December 31, 2006: | | | | | | | | | | | | | | | | |
Allowance for uncollectible accounts and sales allowances | | $ | 9,153 | | $ | 11,977 | | $ | — | | $ | (14,135 | ) | | $ | 6,995 |
Year Ended December 31, 2007: | | | | | | | | | | | | | | | | |
Allowance for uncollectible accounts and sales allowances | | $ | 6,995 | | $ | 11,504 | | $ | — | | $ | (13,804 | ) | | $ | 4,695 |
| (a) | Charges to the accounts included in this column are for the purposes for which the reserves were created. |
F-28