GRANT PARK FUTURES FUND
LIMITED PARTNERSHIP
________________________________________________
Supplement dated February 8, 2011
to
Prospectus and Disclosure Document
dated April 1, 2010
________________________________________________
THIS SUPPLEMENT CONTAINS INFORMATION WHICH AMENDS, SUPPLEMENTS OR MODIFIES CERTAIN INFORMATION CONTAINED IN THE PROSPECTUS AND DISCLOSURE DOCUMENT OF THE GRANT PARK FUTURES FUND LIMITED PARTNERSHIP DATED APRIL 1, 2010, AND SHOULD BE READ TOGETHER THEREWITH.
YOU SHOULD CAREFULLY CONSIDER THE “RISK FACTORS” BEGINNING ON PAGE 19 OF THE PROSPECTUS BEFORE YOU DECIDE TO INVEST.
NEITHER THE SECURITIES AND EXCHANGE COMMISSION NOR ANY STATE SECURITIES COMMISSION HAS APPROVED OR DISAPPROVED OF THESE SECURITIES OR PASSED UPON THE ACCURACY OR ADEQUACY OF THIS PROSPECTUS SUPPLEMENT. ANY REPRESENTATION TO THE CONTRARY IS A CRIMINAL OFFENSE.
THE COMMODITY FUTURES TRADING COMMISSION HAS NOT PASSED UPON THE MERITS OF PARTICIPATING IN THIS POOL NOR HAS THE COMMODITY FUTURES TRADING COMMISSION PASSED ON THE ADEQUACY OR ACCURACY OF THIS DISCLOSURE DOCUMENT SUPPLEMENT.
SUMMARY
This supplement revises and replaces the second paragraph on page 2 of the Prospectus under the heading “Summary – Legacy 1 Class and Legacy 2 Class units” in its entirety as follows:
Through their respective trading companies, each of Rabar Market Research, Inc., EMC Capital Management, Inc., Eckhardt Trading Company, or ETC, Winton Capital Management Limited, Welton Investment Corporation, Global Advisors Jersey Limited, Transtrend B.V., Sunrise Capital Partners, LLC, Amplitude Capital International Limited, Quantitative Investment Management, LLC, or QIM and effective February 1, 2011, Alder Capital Limited or Alder, and Denali Asset Management, LLLP or Denali, serve as Grant Park’s commodity trading advisors with respect to the Legacy 1 Class and Legacy 2 Class units. The trading advisors and their respective asset allocations with respect to the Legacy 1 Class and Legacy 2 Class units are the same as with respect to the fund’s existing Class A and Class B units. Effective February 1, 2011, with respect to the Class A and Class B units and the Legacy 1 Class and Legacy 2 Class units of the fund, each of EMC, Winton and Welton will manage between 10% to 20% of Grant Park’s net assets, and each of Rabar, ETC, Global Advisors, Transtrend, QIM, Sunrise, Amplitude, Alder and Denali will be allocated less than 10% of Grant Park’s net assets to manage.
This supplement revises and replaces the fourth paragraph on page 2 of the Prospectus under the heading “Summary – Global 1 Class, Global 2 Class and Global 3 Class units” in its entirety as follows:
Through their respective trading companies, each of EMC, ETC, Winton, Transtrend, QIM, Sunrise, Amplitude and effective February 1, 2011, Alder, Denali and Welton serve as Grant Park’s commodity trading advisors with respect to the Global 1 Class, Global 2 Class and Global 3 Class units. As of February 1, 2011, with respect to the Global 1 Class, Global 2 Class and Global 3 Class units, each of ETC, Winton, Transtrend, QIM and Welton will manage between 10% and 20% of Grant Park’s net assets, and Sunrise, EMC, Amplitude, Alder, and Denali will be allocated less than 10% of Grant Park’s assets to manage.
This supplement revises and replaces the second paragraph on page 5 of the Prospectus under the heading “Summary – What is the difference between the Legacy 1 Class, the Legacy 2 Class, the Global 1 Class, the Global 2 Class and the Global 3 Class units?” in its entirety as follows:
Trading for the Legacy 1 Class and Legacy 2 Class units, on the one hand, and the Global 1 Class, Global 2 Class and Global 3 Class units, on the other hand, will be directed by different trading advisors, and such trading advisors will pursue different trading strategies. Effective February 1, 2011, the trading advisors for the Legacy 1 Class and Legacy 2 Class units will be Rabar, EMC, ETC, Winton, Welton, Global Advisors, Transtrend, QIM, Sunrise, Amplitude, Alder and Denali and such advisors will generally pursue a technical trend trading philosophy. The trading advisors, asset allocations and trading philosophy with respect to the Legacy 1 Class and Legacy 2 Class units are the same as those utilized for Grant Park’s existing Class A and Class B units. Effective February 1, 2011, the trading advisors for the Global 1 Class, Global 2 Class and Global 3 Class units will be EMC, ETC, Winton, Transtrend, QIM, Sunrise, Amplitude, Alder, Denali and Welton and such trading advisors will generally pursue technical trend trading philosophies, as well as pattern recognition philosophies focused on relatively shorter timeframes than the Legacy 1 Class and Legacy 2 Class units.
This supplement revises and replaces the text on page 3 of the Prospectus under the heading “Summary - Breakeven Amounts for Each Class of Units” and the Breakeven Analysis tables on pages 12-17 of the Prospectus under the heading “Summary – Breakeven Analysis” in its entirety as follows:
Break-Even Amounts for Each Class of Units
The following summarizes the approximate dollar returns and percentage returns required for the redemption value of a hypothetical $1,000 initial investment in offered units to equal the amount invested 12 months after the investment was made. The breakeven summary for the Global 3 Class units shows the amount required to “break-even” both with and without an early redemption fee which, for purposes of this summary, has been averaged to approximate the effect that payment of an early redemption fee will have on a redemption of such units during the first year of investment.
| · | Legacy 1 Class: 5.27% (or $52.65). |
| · | Legacy 2 Class: 5.57% (or $55.69). |
| · | Global 1 Class: 4.67% (or $46.71). |
| · | Global 2 Class: 4.98% (or $49.76). |
| · | Global 3 Class: 7.18% (or $71.76) without average early redemption fee, or 8.18% (or $81.76) with average early redemption fee. |
See “Summary – Breakeven Analysis” beginning on page 11 for detailed breakeven analysis of the offered units.
Breakeven Analysis
The breakeven analysis below indicates the approximate dollar returns and percentage required for the redemption value of a hypothetical $1,000 initial investment in offered units to equal the amount invested 12 months after the investment was made. The breakeven analysis for Global 3 Class units shows the amount required to “break-even” both with and without an early redemption fee which, for purposes of this analysis, has been averaged to approximate the effect that payment of an early redemption fee will have on a redemption of such units during the first year of investment. The breakeven analysis is an approximation only.
Legacy 1 Class Breakeven Analysis
| | | Legacy 1 Class Units | |
Assumed initial selling price per unit(1) | | $ | 1,000.00 | |
Trading advisors’ incentive fees(2) | | $ | 4.65 | |
Brokerage charge(3) (5.00%) | | $ | 50.00 | |
Operating expenses(4) (0.25%) | | $ | 2.50 | |
Offering expenses(5) (0.30%) | | $ | 3.00 | |
Interest income(6) (0.75%) | | $ | (7.50 | ) |
| Amount of trading income required for the redemption value at the end of one year to equal the initial selling price of the unit | | $ | 52.65 | |
| Percentage of initial selling price per Legacy 1 Class unit | | | 5.27 | % |
_______________
| (1) | The minimum investment required to invest in the Legacy 1 Class units is $10,000. For ease of comparability, $1,000 will be deemed to be the assumed selling price per unit of a Legacy 1 Class |
| | unit, and, as described below, a Legacy 2 Class unit, a Global 1 Class unit, a Global 2 Class unit and a Global 3 Class unit, for purposes of the breakeven analysis. |
| (2) | Reflects incentive fees payable to Amplitude, EMC, ETC, Rabar, Winton, Welton, Global Advisors, Transtrend, QIM, Sunrise, Alder and Denali assuming they manage between 5% and 20% of invested assets and assuming each of the advisors have equivalent performance returns for the 12-month period. Actual incentive fees are calculated quarterly on the basis of each trading advisor’s individual performance, not the overall performance of Grant Park or the Legacy 1 Class units. Because incentive fees payable to certain of these trading advisors are calculated on the basis of trading profits realized on the assets they manage after deduction for the allocable portion of only certain expenses charged to Grant Park, these advisors would receive an incentive fee before Grant Park has recouped all expenses and reaches the “break-even” level. Incen tive fees payable to certain other of these trading advisors are calculated after deduction for the allocable portion of expenses charged to Grant Park. These advisors would not receive an incentive fee before Grant Park has recouped all expenses. |
| (3) | The brokerage charge is paid to the general partner on a monthly basis. Effective the initial closing date, the brokerage charge for the Legacy 1 Class units equals 0.4167 % per month, a rate of 5.00% annually, of such units’ month-end adjusted net assets. Out of this amount, the general partner pays all clearing, execution and give-up, floor brokerage, exchange and NFA fees, any other transaction costs, selling agent compensation, selling agent service fees and consulting fees to the trading advisors. The general partner retains the balance as payment for its services to Grant Park. Bid-ask spreads on Grant Park’s forward and other non-exchange traded contracts are not included in this breakeven table due to the difficulty of determining those spreads. |
| (4) | Grant Park is responsible for ongoing operating expenses, up to an amount not to exceed 0.25% of Grant Park’s average net assets per year. This amount is used for purposes of this breakeven analysis. |
| (5) | Grant Park’s organization and offering expenses are paid by the general partner and then reimbursed to the general partner by Grant Park. To pay this reimbursement, effective the initial closing date, Legacy 1 Class units are assessed at an annual rate of 30 basis points (0.30%) of adjusted net assets, calculated and payable monthly on the basis of month-end adjusted net assets of the applicable class. |
| (6) | Grant Park earns interest on free cash balances held in its futures trading accounts. Interest is estimated for these purposes at a rate of 0.75% per year. |
Legacy 2 Class Breakeven Analysis
| | | Legacy 2 Class Units | |
Assumed initial selling price per unit(1) | | $ | 1,000.00 | |
Trading advisors’ incentive fees(2) | | $ | 5.19 | |
Brokerage charge(3) (5.25%) | | $ | 52.50 | |
Operating expenses(4) (0.25%) | | $ | 2.50 | |
Offering expenses(5) (0.30%) | | $ | 3.00 | |
Interest income(6) (0.75%) | | $ | (7.50 | ) |
| Amount of trading income required for the redemption value at the end of one year to equal the initial selling price of the unit | | $ | 55.69 | |
| Percentage of initial selling price per Legacy 2 Class unit | | | 5.57 | % |
_______________
| (1) | The minimum investment required to invest in the Legacy 2 Class units is $10,000. For ease of comparability, $1,000 will be deemed to be the assumed selling price per unit of a Legacy 2 Class unit, and, as described above, a Legacy 1 Class unit, and, as described below, a Global 1 Class unit, a Global 2 Class unit and a Global 3 Class unit, for purposes of the breakeven analysis. |
| (2) | Reflects incentive fees payable to Amplitude, EMC, ETC, Rabar, Winton, Welton, Global Advisors, Transtrend, QIM, Sunrise, Alder and Denali assuming they manage between 5% and 20% of invested assets and assuming each of the advisors have equivalent performance returns for the 12-month period. Actual incentive fees are calculated quarterly on the basis of each trading advisor’s individual performance, not the overall performance of Grant Park or the Legacy 1 Class units. Because incentive fees payable to certain of these trading advisors are calculated on the basis of trading profits realized on the assets they manage after deduction for the allocable portion of only certain expenses charged to Grant Park, these advisors would receive an incentive fee before Grant Park has recouped all expenses and reaches the “break-even” level. Incen tive fees payable to certain other of these trading advisors are calculated after deduction for the allocable portion of expenses charged to Grant Park. These advisors would not receive an incentive fee before Grant Park has recouped all expenses. |
| (3) | The brokerage charge is paid to the general partner on a monthly basis. Effective the initial closing date, the brokerage charge for the Legacy 2 Class units equals 0.4375% per month, a rate of 5.25% annually, of such units’ month-end adjusted net assets. Out of this amount, the general partner pays all clearing, execution and give-up, floor brokerage, exchange and NFA fees, any other transaction costs, selling agent compensation, selling agent service fees and consulting fees to the trading advisors. The general partner retains the balance as payment for its services to Grant Park. Bid-ask spreads on Grant Park’s forward and other non-exchange traded contracts are not included in this breakeven table due to the difficulty of determining those spreads. |
| (4) | Grant Park is responsible for ongoing operating expenses, up to an amount not to exceed 0.25% of Grant Park’s average net assets per year. This amount is used for purposes of this breakeven analysis. |
| (5) | Grant Park’s organization and offering expenses are paid by the general partner and then reimbursed to the general partner by Grant Park. To pay this reimbursement, effective the initial closing date, Legacy 2 Class units are assessed at an annual rate of 30 basis points (0.30%) of adjusted net assets, calculated and payable monthly on the basis of month-end adjusted net assets of the applicable class. |
| (6) | Grant Park earns interest on free cash balances held in its futures trading accounts. Interest is estimated for these purposes at a rate of 0.75% per year. |
Global 1 Class Breakeven Analysis
| | | Global 1 Class Units | |
Assumed initial selling price per unit(1) | | $ | 1,000.00 | |
Trading advisors’ incentive fees(2) | | $ | 4.21 | |
Brokerage charge(3) (4.45%) | | $ | 44.50 | |
Operating expenses(4) (0.25%) | | $ | 2.50 | |
Offering expenses(5) (0.30%) | | $ | 3.00 | |
Interest income(6) (0.75%) | | $ | (7.50 | ) |
| Amount of trading income required for the redemption value at the end of one year to equal the initial selling price of the unit | | $ | 46.71 | |
| Percentage of initial selling price per Global 1 Class unit | | | 4.67 | % |
________________
| (1) | The minimum investment required to invest in the Global 1 Class units is $5,000. For ease of comparability, $1,000 will be deemed to be the assumed selling price per unit of a Global 1 Class unit, and, as described above, a Legacy 1 Class unit and a Legacy 2 Class unit, and, as described below, a Global 2 Class unit and a Global 3 Class unit, for purposes of the breakeven analysis. |
| (2) | Reflects incentive fees payable to Amplitude, EMC, ETC, Winton, Welton, Transtrend, QIM, Sunrise, Alder and Denali assuming they manage between 5% and 20% of invested assets and assuming each of the advisors have equivalent performance returns for the 12-month period. Actual incentive fees are calculated quarterly on the basis of each trading advisor’s individual performance, not the overall performance of Grant Park or the Global 1 Class units. Because incentive fees payable to certain of these trading advisors are calculated on the basis of trading profits realized on the assets they manage after deduction for the allocable portion of only certain expenses charged to Grant Park, these advisors would receive an incentive fee before Grant Park has recouped all expenses and reaches the “break-even” level. Incentive fees payable to cer tain other of these trading advisors are calculated after deduction for the allocable portion of expenses charged to Grant Park. These advisors would not receive an incentive fee before Grant Park has recouped all expenses. |
| (3) | The brokerage charge is paid to the general partner on a monthly basis. Effective the initial closing date, the brokerage charge for the Global 1 Class units equals 0.3708% per month, a rate of 4.45% annually, of such units’ month-end adjusted net assets. Out of this amount, the general partner pays all clearing, execution and give-up, floor brokerage, exchange and NFA fees, any other transaction costs, selling agent compensation, selling agent service fees and consulting fees to the trading advisors. The general partner retains the balance as payment for its services to Grant Park. Bid-ask spreads on Grant Park’s forward and other non-exchange traded contracts are not included in this breakeven table due to the difficulty of determining those spreads. |
| (4) | Grant Park is responsible for ongoing operating expenses, up to an amount not to exceed 0.25% of Grant Park’s average net assets per year. This amount is used for purposes of this breakeven analysis. |
| (5) | Grant Park’s organization and offering expenses are paid by the general partner and then reimbursed to the general partner by Grant Park. To pay this reimbursement, effective the initial closing date, Global 1 Class units are assessed at an annual rate of 30 basis points (0.30%) of adjusted net assets, calculated and payable monthly on the basis of month-end adjusted net assets of the applicable class. |
| (6) | Grant Park earns interest on free cash balances held in its futures trading accounts. Interest is estimated for these purposes at a rate of 0.75% per year. |
Global 2 Class Breakeven Analysis
| | | Global 2 Class Units | |
Assumed initial selling price per unit(1) | | $ | 1,000.00 | |
Trading advisors’ incentive fees(2) | | $ | 4.76 | |
Brokerage charge(3) (4.70%) | | $ | 47.00 | |
Operating expenses(4) (0.25%) | | $ | 2.50 | |
Offering expenses(5) (0.30%) | | $ | 3.00 | |
Interest income(6) (0.75%) | | $ | (7.50 | ) |
| Amount of trading income required for the redemption value at the end of one year to equal the initial selling price of the unit | | $ | 49.76 | |
| Percentage of initial selling price per Global 2 Class unit | | | 4.98 | % |
_______________
| (1) | The minimum investment required to invest in the Global 2 Class units is $5,000. For ease of comparability, $1,000 will be deemed to be the assumed selling price per unit of a Global 2 Class unit, and, as described above, a Legacy 1 Class unit, a Legacy 2 Class unit and a Global 1 Class unit, and, as described below, a Global 3 Class unit, for purposes of the breakeven analysis. |
| (2) | Reflects incentive fees payable to Amplitude, EMC, ETC, Winton, Welton, Transtrend, QIM, Sunrise, |
| | Alder and Denali assuming they manage between 5% and 20% of invested assets and assuming each of the advisors have equivalent performance returns for the 12-month period. Actual incentive fees are calculated quarterly on the basis of each trading advisor’s individual performance, not the overall performance of Grant Park or the Global 2 Class units. Because incentive fees payable to certain of these trading advisors are calculated on the basis of trading profits realized on the assets they manage after deduction for the allocable portion of only certain expenses charged to Grant Park, these advisors would receive an incentive fee before Grant Park has recouped all expenses and reaches the “break-even” level. Incentive fees payable to certain other of these trading advisors are calculated after deduction for the allocable portion of e xpenses charged to Grant Park. These advisors would not receive an incentive fee before Grant Park has recouped all expenses. |
| (3) | The brokerage charge is paid to the general partner on a monthly basis. Effective the initial closing date, the brokerage charge for the Global 2 Class units equals 0.3917% per month, a rate of 4.70% annually, of such units’ month-end adjusted net assets. Out of this amount, the general partner pays all clearing, execution and give-up, floor brokerage, exchange and NFA fees, any other transaction costs, selling agent compensation, selling agent service fees and consulting fees to the trading advisors. The general partner retains the balance as payment for its services to Grant Park. Bid-ask spreads on Grant Park’s forward and other non-exchange traded contracts are not included in this breakeven table due to the difficulty of determining those spreads. |
| (4) | Grant Park is responsible for ongoing operating expenses, up to an amount not to exceed 0.25% of Grant Park’s average net assets per year. This amount is used for purposes of this breakeven analysis. |
| (5) | Grant Park’s organization and offering expenses are paid by the general partner and then reimbursed to the general partner by Grant Park. To pay this reimbursement, effective the initial closing date, Global 2 Class units are assessed at an annual rate of 30 basis points (0.30%) of adjusted net assets, calculated and payable monthly on the basis of month-end adjusted net assets of the applicable class. |
| (6) | Grant Park earns interest on free cash balances held in its futures trading accounts. Interest is estimated for these purposes at a rate of 0.75% per year. |
Global 3 Class Breakeven Analysis
| | | Global 3 Class Units | |
Assumed initial selling price per unit(1) | | $ | 1,000.00 | |
Trading advisors’ incentive fees(2) | | $ | 9.26 | |
Brokerage charge(3) (6.45%) | | $ | 64.50 | |
Operating expenses(4) (0.25%) | | $ | 2.50 | |
Offering expenses(5) (0.30%) | | $ | 3.00 | |
Interest income(6) (0.75%) | | $ | (7.50 | ) |
| | | | | |
| Amount of trading income required for the redemption value at the end of one year to equal the initial selling price of the unit, without early redemption fee | | $ | 71.76 | |
| | | | | |
| Percentage of initial selling price per unit, without early redemption fee | | | 7.18 | % |
Early redemption fee(7) (1.00%) | | $ | 10.00 | |
| | | | | |
| | | | | |
| Amount of trading income required for the redemption value at the end of one year to equal the initial selling price per Global 3 Class unit, with average early redemption fee | | $ | 81.76 | |
| | | | | |
| Percentage of initial selling price per Global 3 Class unit, with average early redemption fee | | | 8.18 | % |
_______________
| (1) | The minimum investment required to invest in the Global 3 Class units is $5,000. For ease of comparability, $1,000 will be deemed to be the assumed selling price per unit of a Global 3 Class unit, and, as described above, a Legacy 1 Class unit, a Legacy 2 Class unit and a Global 1 Class unit, and a Global 2 Class unit, for purposes of the breakeven analysis. |
| (2) | Reflects incentive fees payable to Amplitude, EMC, ETC, Winton, Welton, Transtrend, QIM, Sunrise, Alder and Denali assuming they manage between 5% and 20% of invested assets and assuming each of the advisors have equivalent performance returns for the 12-month period. Actual incentive fees are calculated quarterly on the basis of each trading advisor’s individual performance, not the overall performance of Grant Park or the Global 3 Class units. Because incentive fees payable to certain of these trading advisors are calculated on the basis of trading profits realized on the assets they manage after deduction for the allocable portion of only certain expenses charged to Grant Park, these advisors would receive an incentive fee before Grant Park has recouped all expenses and reaches the “break-even” level. Incentive fees pa yable to certain other of these trading advisors are calculated after deduction for the allocable portion of expenses charged to Grant Park. These advisors would not receive an incentive fee before Grant Park has recouped all expenses. |
| (3) | The brokerage charge is paid to the general partner on a monthly basis. Effective the initial closing date, the brokerage charge for the Global 3 Class units equals 0.5375% per month, a rate of 6.45% annually, of such units’ month-end adjusted net assets. Out of this amount, the general partner pays all clearing, execution and give-up, floor brokerage, exchange and NFA fees, any other transaction costs, selling agent compensation, selling agent service fees and consulting fees to the trading advisors. The general partner retains the balance as payment for its services to Grant Park. Bid-ask spreads on Grant Park’s forward and other non-exchange traded contracts are not included in this breakeven table due to the difficulty of determining those spreads. |
| (4) | Grant Park is responsible for ongoing operating expenses, up to an amount not to exceed 0.25% of Grant Park’s average net assets per year. This amount is used for purposes of this breakeven analysis. |
| (5) | Grant Park’s organization and offering expenses are paid by the general partner and then reimbursed to the general partner by Grant Park. To pay this reimbursement, effective the initial closing date, Global 3 Class units are assessed at an annual rate of 30 basis points (0.30%) of adjusted net assets, calculated and payable monthly on the basis of month-end adjusted net assets of the applicable class. |
| (6) | Grant Park earns interest on free cash balances held in its futures trading accounts. Interest is estimated for these purposes at a rate of 0.75% per year. |
| (7) | Global 3 Class limited partners are prohibited from redeeming such units for three months following the subscription for units. Thereafter, Global 3 Class limited partners causing redemption of their units on or before the one-year anniversary of their subscription for the redeemed units will pay an early redemption fee of 1.5%, 1.0% or 0.5% of the net asset value of the redeemed units, depending on when the units are redeemed during the first year. For purposes of this breakeven analysis, the early redemption fee has been presented as an average of the three different early redemption fees to approximate the effect a payment of an early redemption fee would have on a redemption of Global 3 Class units at an undetermined point during the first year of investment. Because the early redemption fee has been averaged and the other fees and expenses shown assume an investment in Grant Park for one year, the breakeven analysis does not reflect the actual amount required to “break-even” for Global 3 Class units that are redeemed prior to the one-year anniversary of the investment, which will vary depending on the date of redemption. |
This supplement revises and replaces the paragraphs on page 8 of the Prospectus under the heading “Summary – The Trading Advisors” in their entirety as follows:
Effective February 1, 2011, Grant Park trades through its twelve independent professional commodity trading advisors: Rabar Market Research, Inc., EMC Capital Management, Inc., Eckhardt Trading Company (or ETC), Winton Capital Management Limited, Welton Investment Corporation, Global Advisors Jersey Limited, Transtrend B.V., Quantitative Investment Management LLC (or QIM), Alder Capital Limited and Denali Asset Management, LLLP. Effective January 1, 2009, the portion of Grant Park’s net assets allocated to Winton Capital Management was reallocated to GP 1, LLC. Each of the trading advisors is registered as a commodity trading advisor under the Commodity Exchange Act and is a member of the NFA. The General Partner may terminate or replace any or all of the trading advisors, or add additional trading advisors, at any time in its sole discretion.
Rabar Market Research, Inc. is located at 10 Bank Street, Suite 830, White Plains, New York 10606, and its telephone number is (914) 682-8363. EMC Capital Management, Inc. is located at 2201 Waukegan Road, Suite West 240, Bannockburn, Illinois 60015, and its telephone number is (847) 267-8700. ETC is located at 1314 North Dearborn Parkway, Carriage House, Chicago, Illinois 60610, and its telephone number is (312) 787-1107. Winton Capital Management is located at 1-5 St. Mary Abbott’s Place, London, W8 6LS, United Kingdom, and its telephone number is +44-20-7610-5350. Welton Investment Corporation is located at the Eastwood Building, San Carlos between 5th and 6th, Carmel, California 93921, and its telephone number is (831) 626-5190. Global Advisors Jersey Limited’s offices are located at Spectrum, Gloucester Street, St. Helier, JE2 3DE, Channel Islands, and its telephone number is +44-153-451-3100. The business office of Transtrend B.V. is located at Weena 723, Unit C5.070, 3013 AM Rotterdam, The Netherlands and its telephone number is +31-10-453-6500. QIM is located at 401 East Market Street, Suite 104, Charlottesville, Virginia 22902, and its telephone number is (434) 817-4800. Sunrise Capital Partners, LLC is located at 990 Highland Drive, Suite 303, Solana Beach, California 92075, and its telephone number is (858)259-8911. Amplitude Capital International Limited is located at Grand Pavilion Commercial Centre, 1st Floor, 802 West Bay Road, P.O. Box 31855, KY1 1207 Cayman Islands, and its telephone number is (345)943-2295. Alder Capital Limited is located at 61 Merrion Square, Dublin 2, Ireland and its telephone number is +353-1-614-7232. Denali Asset Management, LLLP is located at 5020 Anchor Way, 2nd Floor, Christiansted, Virgin Islands 00820-4633 and its telephone number is (340)778-7744.
This supplement revises and replaces the paragraph on page 10 of the Prospectus under the heading “Fees and Expenses – Incentive Fees” in its entirety as follows:
Incentive Fees—Grant Park currently pays each trading advisor a quarterly incentive fee based on any new trading profits achieved on the trading advisor’s allocated net assets at the end of each calendar quarter. Generally, new trading profits means the net increase in trading profits, realized and unrealized, experienced by the trading advisor on its allocated net assets from the most recent prior quarter in which an incentive fee was paid to the trading advisor, or if an incentive fee has yet to be paid to that trading advisor, the trading advisor’s initial allocation of net assets. Currently, the incentive fees payable to each of Grant Park’s trading advisors that are allocated 10% or more of the fund’s assets are as follows: 22.5% to E MC, 24% to ETC, 20% to Winton and 20% to Welton. Grant Park pays incentive fees ranging between 20% and 26% to each of Rabar, Global Advisors, Transtrend, QIM, Sunrise, Amplitude, and effective February 1, 2011, Alder and Denali. The method of calculating new trading profits on the allocated net assets of each trading advisor is described in “Fees and Expenses—Incentive Fees.”
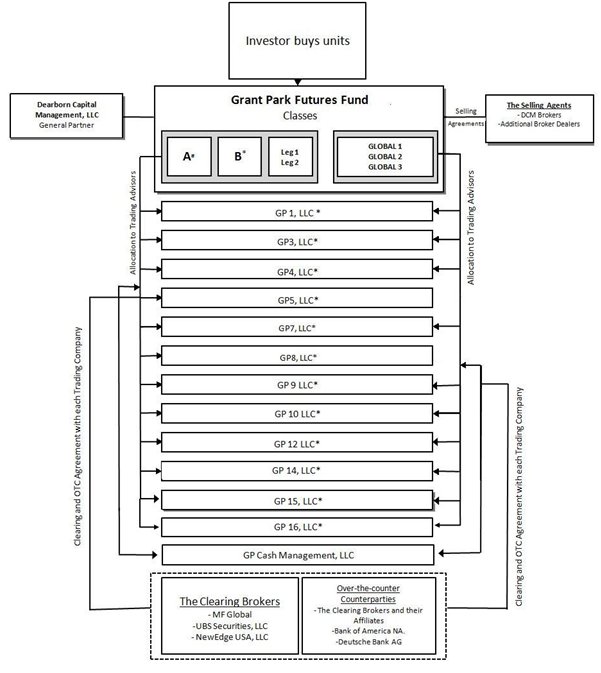
This supplement revises and replaces the chart included on page 18 & 74 of the Prospectus under the heading “Summary – Organizational Chart” in its entirety as follow:
Notes:
| # | Classes A and B are closed to new investment. These classes are no longer offered by the Selling Agents. |
| * | Grant Park invests through an individual Trading Company for each Trading Advisor. An Advisory Agreement is entered by each Advisor, its corresponding Trading Company, Grant Park and Dearborn Capital Management LLC, as General Partner and, in the case of some Advisors, Grant Park. |
RISK FACTORS
This supplement revises and replaces the paragraph on page 29 of the Prospectus under the heading “Risk Factors – The General Partner places significant reliance on the trading advisors and their key personnel” in its entirety as follows:
The General Partner relies on the trading advisors to achieve trading gains for Grant Park, entrusting each of them with the responsibility for, and discretion over, the investment of their allocated portions of Grant Park’s assets. The trading advisors, in turn, are dependent on the services of a limited number of persons to develop and refine their trading approaches and strategies and execute Grant Park’s transactions. The loss of the services of any trading advisor’s principals or key employees, or the failure of those principals or key employees to function effectively as a team, may have an adverse effect on that trading advisor’s ability to manage its trading activities successfully or may cause the trading advisor to cease operations ent irely, either of which, in turn, could negatively impact Grant Park’s performance. Each of Grant Park’s trading advisors is controlled, directly or indirectly, by single individuals, or, in the case of Transtrend, of which 100% of the voting interest is owned by Robeco Netherlands BV, by its managing directors. These individuals, Paul Rabar at Rabar, Elizabeth Cheval at EMC, William Eckhardt at ETC, David Winton Harding at Winton, Patrick Welton at Welton, Russell Newton at Global Advisors, Johannes P.A. van den Broek and Harold M. De Boer at Transtrend, Jaffrey Woodriff, Michael Geismar and Ryan Vaughn at QIM, Dr. Gary B. Davis at Sunrise, Karsten Schroeder at Amplitude, Mark Caslin at Alder and Scott T. Ramsey at Denali. The death, incapacity or other prolonged unavailability of such individuals likely would greatly hinder these trading advisors’ operations, and could result in their ceasing operations entirely, which could adversely affect the value of your inv estment in Grant Park.
THE TRADING ADVISORS
This supplement revises and replaces the first five paragraphs and chart on page 40 of the Prospectus under the heading “The Trading Advisors” in its entirety as follows:
The General Partner has retained Rabar Market Research, Inc., EMC Capital Management, Inc., Eckhardt Trading Company, or ETC, Global Advisors Jersey Limited, Transtrend B.V., Quantitative Investment Management LLC, or QIM, Winton Capital Management Limited, Welton Investment Corporation, Sunrise Capital Partners, LLC, Amplitude Capital International Limited, and effective February 1, 2011, Alder Capital Limited and Denali Asset Management, LLLP as Grant Park’s trading advisors. The table below illustrates the trading advisors for each class of Grant Park’s outstanding limited partnership units:
| | Alder | Amplitude | Denali | EMC | ETC | Global Advisors | DIM | Rabar | Sunrise | Transtrend | Welton | Winton |
| Class A | X | X | X | X | X | X | X | X | X | X | X | X |
| Class B | X | X | X | X | X | X | X | X | X | X | X | X |
| Legacy 1 | X | X | X | X | X | X | X | X | X | X | X | X |
| Legacy 2 | X | X | X | X | X | X | X | X | X | X | X | X |
| Global 1 | X | X | X | X | X | | X | | X | X | X | X |
| Global 2 | X | X | X | X | X | | X | | X | X | X | X |
| Global 3 | X | X | X | X | X | | X | | X | X | X | X |
The trading advisors and their respective asset allocations with respect to the Legacy 1 Class and the Legacy 2 Class units are the same as with respect to our existing Class A and Class B units.
Effective February 1, 2011, the General Partner will allocate Grant Park’s net assets among the trading advisors with respect to the existing Class A, Class B, Legacy 1 Class and Legacy 2 Class units as follows: EMC, Winton and Welton managed between 10% to 20% of Grant Park’s net assets and Rabar, ETC, Global Advisors, Transtrend, QIM, Sunrise, Amplitude, Alder and Denali will be allocated less than 10% of Grant Park’s net assets to manage. The trading advisors for the Legacy 1 Class and Legacy 2 Class units will pursue a technical trend trading philosophy, which is the same trading philosophy the trading advisors have historically used for the existing Class A and Class B units.
Effective February 1, 2011, for the Global 1 Class, Global 2 Class and Global 3 Class units, between 10% and 20% of Grant Park’s assets are allocated to each of ETC, Transtrend, QIM, Welton and Winton, while EMC, Sunrise, Amplitude, Alder and Denali are allocated less than 10% of Grant Park’s net assets. The trading advisors for the Global 1 Class, Global 2 Class and Global 3 Class units will pursue technical trend trading philosophies, as well as pattern recognition philosophies focused on relatively shorter timeframes than the Legacy 1 Class and Legacy 2 Class units.
The General Partner may, in its sole discretion, reallocate assets among the trading advisors upon termination of a trading advisor or retention of any new trading advisors, or at the commencement of any month. Consequently, the current apportionment for all classes of units is subject to change.
Rabar and EMC have been trading on behalf of Grant Park since January 1989 and ETC has been trading on behalf of Grant Park since April 1998. Winton began trading for Grant Park on August 1, 2004. Welton began trading for Grant Park on March 1, 2006. Transtrend and Global Advisors each began trading on July 1, 2008 and QIM began trading for Grant Park on October 1, 2008. As of January 1, 2010, Sunrise began trading for Grant Park and as of February 1, 2010, Amplitude began trading on behalf of Grant Park as well. Sunrise and Amplitude were each allocated less than 10% of Grant Park’s net assets to manage. Effective February 1, 2011, Alder and Denali will begin trading for Grant Park and will each be allocated less than 10% of Grant Park’s assets to manage. The General Partner may, in its sole discretion, reallocate assets among the trading advisors upon termination of a trading advisor or retention of any new trading advisors, or at the commencement of any month. Consequently, the current apportionment is subject to change.
This supplement revises and updates the discussion in the Prospectus under the heading “The Trading Advisors” by removing the 35 paragraphs on pages 47 through 53 under the heading “Graham Capital Management, L.P.” and the 12 paragraphs on pages 63 through 64 under the heading “Revolution Capital Management LLC (RCM)” in their entirety and by adding the following paragraphs on page 69 immediately following the last paragraph under the heading “Amplitude Capital Management International Limited - Management”:
Alder Capital Limited (Alder)
Alder Capital Limited is a limited liability company which was incorporated in Ireland on December 7, 1999. Alder is regulated by the Central Bank of Ireland and received its Financial Regulator authorization in May 2000. In May of 2001, Alder became a member of the NFA and was registered as a commodity trading advisor with the CFTC. Since March 2002, Alder has been registered with the Financial Services Authority in the UK and since October 2003, Alder has been registered with the L'Autorité des Marchés Financiers in France. Alder’s offices are located at 61 Merrion Square, Dublin 2, Ireland and its phone number is +353-1-614-7232.
The listed principals of Alder Limited are Mark Caslin, Brian McCarthy, John Caslin, Richard Spring and Ceall O’Dunlaing.
Mark Caslin is the managing director of Alder. He has been registered as an Associated Person and approved as a Principal of Alder by the NFA since May 2001. In May 2000, Mr. Caslin founded Alder with Brian McCarthy. Mr. Caslin is both an Entrance Exhibitor and a Scholar of Trinity College Dublin from which he holds a B.A. Mod in Mathematical Sciences.
Brian McCarthy is an executive director of Alder. Mr. McCarthy founded Alder with Mark Caslin in May 2000. Brian McCarthy was registered as an Associated Person and was approved as a Principal of Alder by the NFA in May 2001. Mr. McCarthy graduated from the University College Dublin with a Masters Degree in Economic Science in 1991.
John Caslin is an executive director of Alder having joined the firm in September 2003 from Eagle Star Life Assurance Company of Ireland (ultimate parent Zurich Financial Services) where he held the position of General Manager Investment & Financial Solutions, was a member of the senior management team and a member of the Investment Committee of the board of Eagle Star Life Assurance Company of Ireland. John joined Eagle Star Life Assurance Company of Ireland in January 1991. John Caslin was registered as an Associated Person of Alder in March 2005 by the NFA. He was approved as a Principal of Alder by the NFA in May 2005. From March 2004 to June 2008, Mr. Caslin served as a non-executive director of iShares plc a Dublin-domiciled exchange traded fund which, as of February 2008, had approximately $20 billion in assets under management. Mr. Caslin was awarded a degree in mathematics and a first class honors degree and gold medal in engineering from Trinity College Dublin in 1991.
Richard Spring is a non-executive director of Alder. He was appointed to this position in May 2000. Mr. Spring does not take part in any trading or operational activities of Alder nor does he actively market Alder’s services. Mr. Spring was approved as a Principal of Alder by the NFA in May 2001. Mr. Spring is a graduate of Trinity College Dublin and King’s Inns.
Ceall O’Dunlaing, F.I.A. F.S.A.I., does not take part in any trading or operational activities of Alder nor does he actively market Alder’s services. Mr. O’Dunlaing was approved as a Principal of Alder by the NFA in June 2008. He is currently the director of Financial Risk Solutions Limited, for which he was the founding director in November 1999. Financial Risk Solutions Limited is one of the leading providers of investment administration software to the life and pensions industry in Europe. Mr. O’Dunlaing is a Fellow of the Institute of Actuaries, London and a Fellow of the Society of Actuaries in Ireland.
Trading Method
Alder uses a program known as Alder Global 20 in trading for Grant Park. Alder’s trading system is grounded in the following philosophies:
| - | Trends in the value of some currency pairs or combinations of currency pairs tend to persist for periods of three weeks and upwards. |
| - | Movements in the value of some other currency pairs or combinations of currency pairs tend to self correct. |
| - | Currencies with higher interest rates tend to attract capital relative to currencies with lower interest rates. |
| - | All customers have a limited tolerance for risk. |
Remaining consistent with these philosophies, Alder believes that in order to take advantage of trends, self-correcting movements and interest rate differentials currency risk must be taken. Since currency risk is constantly changing Alder makes a reasonable effort to measure these changes and to limit a client's maximum portfolio ‘Forecast Risk’ at each time of trading to an agreed level in light of whatever market risk can be forecasted using its ‘CALM’ risk management system.
Alder trades over-the-counter spot and forward contracts in the following currencies: euro, US dollar, Japanese yen, British pound, Swiss franc, Swedish krona, Australian dollar, and Canadian dollar. Their trading system is 100% systematic and at no point does it rely on discretionary trading. At least once in each trading day Alder calculates the expected trend, the interest rate differential and the ‘Forecast Risk’, as applicable, for each currency pair or combination of currency pairs. The expected trend for a currency pair or portfolio of currencies is calculated using historical prices; the interest rate differentials are sourced from the market; and the ‘Forecast Risk’ is calculated using Alder’s risk forecasting system, CALM. These parameters are the inputs to Alder’s proprietary optimization process which determines the ‘quality of the opportunity set’, the currency trades and their size with the objective of maximizing the long-term Sharpe ratio of the portfolio subject to certain constraints including those that apply at the time of trading.
Denali Asset Management, LLLP (Denali)
Denali Asset Management, LLLP, is a U.S. Virgin Islands Limited Liability Limited Partnership organized in 1994. It has been registered as a commodity trading advisor since February 1994 and as a commodity pool operator since April 2000. Denali was approved as a member of the NFA in February 1994. Denali was also approved as a forex firm by the NFA in October 2010. Denali’s offices are located at 5020 Anchor Way, 2nd Floor, Christiansted, Virgin Islands, 00820-4633 and its telephone number is (340)778-7744.
Management
The principals of Denali Asset Management are Scott T. Ramsey, Brad Lenhart and Ascent Capital LLC.
Scott T. Ramsey is Chief Executive Officer of Denali and is the chief trader. Mr. Ramsey launched Denali in 1994 to manage money for institutional investors. He was registered as an associated person and approved as a principal of Denali by the NFA in February 1994. Mr. Ramsey studied mechanical engineering at the University of Missouri.
Brad E. Lenhart is Chief Operating Officer of Denali and is responsible for all of Denali’s operations including accounting, compliance, risk, and personnel. Mr. Lenhart initially joined Denali in this capacity in January 1997 and left the firm for several years beginning in September 1998. From September 1998 through November 2002, Mr. Lenhart was a Director for H2O Plus, a privately held manufacturer and retailer for skincare products based in Chicago. Mr. Lenhart rejoined Denali in December 2002 and assumed his current responsibilities in December 2002. He became a principal of Denali in April 2003, an associated person in June 2005 and a forex associated person in October 2010. Mr. Lenhart holds a BA from the University of Kansas and has studied at Imperial C ollege, London.
Ascent Capital, LLC, a U.S. Virgin Islands limited liability company, became the general partner to Denali Asset Management, LLLP in June 2000 and is owned and controlled by Scott T. Ramsey. It was registered as a principal of Denali in April 2003.
Denali’s Trading Program
Denali’s trading strategy is a discretionary global macro strategy that trades financial futures, foreign currencies, individual equities and commodities using a flexible, opportunistic trading approach. The strategy seeks to capitalize on market volatility that results in significant price movements consistent with its overall macro-economic outlook, while actively adjusting position size on a short-term basis depending on market developments. The strategy utilizes macroeconomic fundamental research,
technical analysis and disciplined money management to identify trading opportunities. The vast majority of the trades are directional, with a limited amount of options used to capture directional moves.
This supplement revises and replaces the four paragraphs under the heading “The Trading Advisors - Welton Investment Corporation – Welton’s Trading Program” on pages 56 through 57 of the Prospectus, in their entirety as follows:
Welton’s Trading Program
Since its inception, Welton has offered managed futures advisory services to trading manager, institutional and high net worth clients. Welton will use its Alternative Equity Strategies Program (AES), Global Non-Correlated Portfolio (GNP) and Global Directional Portfolio program (GDP), described below, in managing assets for Grant Park.
Welton’s three investment programs combine various elements of the firm’s proprietary research and trading. All programs are intended to generate investment performance with a low correlation to traditional investments such as equities and hedge funds. Each program also exhibits a low performance correlation to each other. By so doing, Welton strives to make each of its offered programs distinctive in their approach, but uniformly consistent in their ability to diversify and complement the vast majority of investors’ portfolios.
AES Program
The Welton Alternative Equity Strategies portfolio (AES) is a multi-strategy investment program implemented across equity securities, listed options and broad based ETFs. AES trades a complementary and diverse group of strategies each with a different underlying basis of return. AES utilizes mean reversionary, relative value and variance-driven strategies. The strategies are typically best applied within a diverse yet like-kind instrument universe. These strategies were developed within the broader Welton research pipeline, with the specific purpose of diversifying the market breadth and strategic core momentum strategies within Welton’s flagship portfolio, the Global Directional Portfolio (GDP). The program’s overarching goal is to provide investors with a reliable source of returns non-correlated to global equity markets and equity-based hedge funds.
GNP Program
The Welton Global Non-Correlated Portfolio (GNP) is a multi-strategy investment program implemented across global exchange-traded futures and foreign exchange. GNP trades a complementary and diverse group of strategies each with a different underlying basis of return. GNP utilizes mean reversion, fundamental and short-term driven strategies. These strategies were developed within the Welton Global Directional Portfolio’s broader research pipeline and are currently strategies all utilized at various allocation levels to diversify GDP’s momentum strategy suite. The program’s overarching goal is to provide investors with a reliable source of returns non-correlated to both global equity markets, hedge funds, and Managed Futures programs.
GDP Program
The Welton Global Directional Portfolio (GDP) is a multi-strategy investment program implemented across global exchange-traded futures and foreign exchange. GDP trades a complementary and diverse group of strategies each with a different underlying basis of return. GDP utilizes momentum, mean reversion, and fundamental driven strategies. GDP began trading in June 2004, and is the firm’s flagship investment program today. The program’s overarching goal is to provide investors with a reliable source of returns non-correlated to both global equity markets and hedge funds, while generally mirroring, but outperforming, the performance path of broad based Managed Futures and Global Macro indices.
This supplement revises and replaces the table on page 70 of the Prospectus captioned “Performance of Grant Park – Class A Units” in its entirety as follows:
PERFORMANCE OF GRANT PARK - CLASS A UNITS
(Unaudited)
As required by CFTC regulations, the past performance record of Grant Park’s Class A units for the last five full calendar years is presented below. While the performance record set forth in the table below has not been independently audited, the General Partner believes that the information presented is accurate. All performance information is shown net of fees and expenses.
| | |
| Name | Grant Park Futures Fund Limited Partnership (Class A units) |
| Type | Privately offered (through February 2003); Publicly offered beginning June 30, 2003; Multi-advisor |
| Inception of Trading | January 1989 |
| Aggregate Gross Subscriptions at 12/31/10 | $147,153,661 |
| Net Asset Value at 12/31/10 | $64,565,072 |
Worst Monthly Percentage Draw-Down (Since 1/05)(1) | -7.95% 01/10 |
Worst Peak-to-Valley Draw-Down (Since 1/05)(2) | -21.18% (Start of 02/04 - End of 04/05) |
| | Rate of Return(3) |
| | 2010 | | 2009 | | 2008 | | 2007 | | 2006 |
| | | | | | | | | | |
| January | -7.95% | | -0.91% | | 2.49% | | 1.25% | | 3.49% |
| February | 0.63% | | -0.80% | | 9.66% | | -4.18% | | -3.28% |
| March | 4.08% | | -3.26% | | -0.63% | | -4.55% | | 4.06% |
| April | 1.80% | | -1.73% | | -0.13% | | 5.23% | | 9.46% |
| May | -3.83% | | 1.64% | | 2.11% | | 4.60% | | -0.81% |
| June | -0.21% | | -3.41% | | 3.06% | | 4.16% | | -2.85% |
| July | -1.66% | | -1.26% | | -5.06% | | -3.72% | | -3.66% |
| August | 2.77% | | 1.15% | | -2.41% | | -3.71% | | 2.20% |
| September | 3.24% | | 1.17% | | 1.31% | | 8.78% | | -1.10% |
| October | 4.33% | | -2.59% | | 4.76% | | 5.23% | | -0.64% |
| November | -2.58% | | 4.24% | | 2.76% | | -0.66% | | 3.59% |
| December | 4.57% | | -3.57% | | 1.08% | | 0.63% | | -0.92% |
| Year | 4.45% | | -9.23% | | 19.91% | | 12.63% | | 9.11% |
| (1) | Worst Monthly Percentage Draw-Down is the largest monthly loss experienced by Grant Park in any calendar month expressed as a percentage of total equity in Grant Park and includes the month and year of that draw-down. |
| (2) | Worst Peak-to-Valley Draw-Down is the greatest cumulative percentage decline in month-end net asset value of Grant Park due to losses sustained by Grant Park during a period in which the initial month-end net asset value of Grant Park is not equaled or exceeded by a subsequent month-end net asset value of Grant Park and includes the time period in which the draw-down occurred. |
| (3) | The monthly rate of return is computed by dividing monthly performance by beginning monthly equity plus additions less redemptions. The monthly rates are then compounded to arrive at the annual rate of return. |
PAST PERFORMANCE IS NOT NECESSARILY INDICATIVE OF FUTURE RESULTS
This supplement revises and replaces the table on page 71 of the Prospectus captioned “Performance of Grant Park – Class B Units” in its entirety as follows:
PERFORMANCE OF GRANT PARK - CLASS B UNITS
(Unaudited)
As required by CFTC regulations, the past performance record of Grant Park’s Class B units for the last five full calendar years is presented below. While the performance record set forth in the table below has not been independently audited, the General Partner believes that the information presented is accurate. All performance information is shown net of fees and expenses.
| | |
| Name | Grant Park Futures Fund Limited Partnership (Class B units) |
| Type | Public; Multi-advisor |
| Inception of Trading | August 2003 |
| Aggregate Gross Subscriptions at 12/31/10 | $ 872,734,726 |
| Net Asset Value at 12/31/10 | $ 634,047,022 |
Worst Monthly Percentage Draw-Down(1) (Since 1/05) | -8.00% 01/10 |
Worst Peak-to-Valley Draw-Down(2) (Since 1/05) | -22.03% (Start of 02/04 - End of 04/05) |
| | Rate of Return(3) |
| | 2010 | | 2009 | | 2008 | | 2007 | | 2006 |
| | | | | | | | | | |
| January | -8.00% | | -0.98% | | 2.42% | | 1.18% | | 3.41% |
| February | 0.57% | | -0.88% | | 9.58% | | -4.25% | | -3.35% |
| March | 4.03% | | -3.33% | | -0.70% | | -4.62% | | 3.98% |
| April | 1.74% | | -1.78% | | -0.20% | | 5.15% | | 9.38% |
| May | -3.88% | | 1.58% | | 2.03% | | 4.52% | | -0.88% |
| June | -0.27% | | -3.46% | | 2.99% | | 4.09% | | -2.92% |
| July | -1.71% | | -1.32% | | -5.12% | | -3.79% | | -3.73% |
| August | 2.71% | | 1.09% | | -2.48% | | -3.78% | | 2.12% |
| September | 3.21% | | 1.12% | | 1.24% | | 8.70% | | -1.17% |
| October | 4.27% | | -2.64% | | 4.69% | | 5.16% | | -0.71% |
| November | -2.63% | | 4.19% | | 2.69% | | -0.73% | | 3.51% |
| December | 4.52% | | -3.63% | | 1.01% | | 0.64% | | -0.90% |
| Year | 3.80% | | -9.87% | | 18.88% | | 11.76% | | 8.28% |
_______________
| (1) | Worst Monthly Percentage Draw-Down is the largest monthly loss experienced by Grant Park in any calendar month expressed as a percentage of total equity in Grant Park and includes the month and year of that draw-down. |
| (2) | Worst Peak-to-Valley Draw-Down is the greatest cumulative percentage decline in month-end net asset value of Grant Park due to losses sustained by Grant Park during a period in which the initial month-end net asset value of Grant Park is not equaled or exceeded by a subsequent month-end net asset value of Grant Park and includes the time period in which the draw-down occurred. |
| (3) | The monthly rate of return is computed by dividing monthly performance by beginning monthly equity plus additions less redemptions. The monthly rates are then compounded to arrive at the annual rate of return. |
PAST PERFORMANCE IS NOT NECESSARILY INDICATIVE OF FUTURE RESULTS
This supplement revises and replaces the table on page 72 of the Prospectus captioned “Performance of Grant Park - Legacy 1 Units” in its entirety as follows:
PERFORMANCE OF GRANT PARK - Legacy 1 Units
(Unaudited)
As required by CFTC regulations, the past performance record of Grant Park’s Legacy 1 Class units from April 1, 2009 through December 31, 2010, is presented below. While the performance record set forth in the table below has not been independently audited, the general partner believes that the information presented is accurate. All performance information is shown net of fees and expenses.
| | |
| Name | Grant Park Futures Fund Limited Partnership (Legacy 1 Class) |
| Type | Public |
| Inception of Trading | April 2009 |
| Aggregate Gross Subscriptions at 12/31/10 | $ 7,268,103 |
| Net Asset Value at 12/31/10 | $ 7,105,762 |
Worst Monthly Percentage Draw-Down (Since April 2009)(1) | -7.77% 01/10 |
Worst Peak-to-Valley Draw-Down (Since April 2009)(2) | -10.93% (Start of 05/09 - End of 01/10) |
| | Rate of Return(3) |
| | 2010 | | 2009 |
| | | | |
| January | -7.77% | | — |
| February | 0.82% | | — |
| March | 4.15% | | — |
| April | 1.77% | | -1.59% |
| May | -3.53% | | 1.66% |
| June | -0.03% | | -3.10% |
| July | -1.50% | | -1.08% |
| August | 2.86% | | 1.27% |
| September | 3.24% | | 1.21% |
| October | 4.35% | | -2.42% |
| November | -2.32% | | 4.04% |
| December | 4.67% | | -3.19% |
| Year | 6.09% | | -3.39% |
_______________
| (1) | Worst Monthly Percentage Draw-Down is the largest monthly loss experienced by Grant Park in any calendar month expressed as a percentage of total equity in Grant Park and includes the month and year of that draw-down. |
| (2) | Worst Peak-to-Valley Draw-Down is the greatest cumulative percentage decline in month-end net asset value of Grant Park due to losses sustained by Grant Park during a period in which the initial month-end net asset value of Grant Park is not equaled or exceeded by a subsequent month-end net asset value of Grant Park and includes the time period in which the draw-down occurred. |
| (3) | The monthly rate of return is computed by dividing monthly performance by beginning monthly equity plus additions less redemptions. The monthly rates are then compounded to arrive at the annual rate of return. |
PAST PERFORMANCE IS NOT NECESSARILY INDICATIVE OF FUTURE RESULTS
This supplement revises and replaces the table on page 73 of the Prospectus captioned “Performance of Grant Park - Legacy 2 Units” in its entirety as follows:
PERFORMANCE OF GRANT PARK - Legacy 2 Units
(Unaudited)
As required by CFTC regulations, the past performance record of Grant Park’s Legacy 2 Class units from April 1, 2009 through December 31, 2010, is presented below. While the performance record set forth in the table below has not been independently audited, the general partner believes that the information presented is accurate. All performance information is shown net of fees and expenses.
| Name | Grant Park Futures Fund Limited Partnership (Legacy 2 Class) |
| Type | Public |
| Inception of Trading | April 2009 |
| Aggregate Gross Subscriptions at 12/31/10 | $ 7,524,731 |
| Net Asset Value at 12/31/10 | $ 5,506,761 |
Worst Monthly Percentage Draw-Down (Since April 2009)(1) | -7.79% 01/10 |
Worst Peak-to-Valley Draw-Down (Since April 2009)(2) | -11.06% (Start of 03/09 - End of 01/10) |
| | Rate of Return(3) |
| | 2010 | | 2009 |
| | | | |
| January | -7.79% | | — |
| February | 0.80% | | — |
| March | 4.13% | | — |
| April | 1.72% | | -1.61% |
| May | -3.53% | | 1.62% |
| June | -0.05% | | -3.12% |
| July | -1.52% | | -1.09% |
| August | 2.82% | | 1.26% |
| September | 3.20% | | 1.21% |
| October | 4.31% | | -2.44% |
| November | -2.34% | | 4.04% |
| December | 4.62% | | -3.22% |
| Year | 5.73% | | -3.55% |
_______________
| (1) | Worst Monthly Percentage Draw-Down is the largest monthly loss experienced by Grant Park in any calendar month expressed as a percentage of total equity in Grant Park and includes the month and year of that draw-down. |
| (2) | Worst Peak-to-Valley Draw-Down is the greatest cumulative percentage decline in month-end net asset value of Grant Park due to losses sustained by Grant Park during a period in which the initial month-end net asset value of Grant Park is not equaled or exceeded by a subsequent month-end net asset value of Grant Park and includes the time period in which the draw-down occurred. |
| (3) | The monthly rate of return is computed by dividing monthly performance by beginning monthly equity plus additions less redemptions. The monthly rates are then compounded to arrive at the annual rate of return. |
PAST PERFORMANCE IS NOT NECESSARILY INDICATIVE OF FUTURE RESULTS
This supplement revises and replaces the table on page 74 of the Prospectus captioned “Performance of Grant Park - Global 1 Units” in its entirety as follows:
PERFORMANCE OF GRANT PARK - Global 1 Units
(Unaudited)
As required by CFTC regulations, the past performance record of Grant Park’s Global 1 Class units from April 1, 2009 through December 31, 2010 is presented below. While the performance record set forth in the table below has not been independently audited, the general partner believes that the information presented is accurate. All performance information is shown net of fees and expenses.
| Name | Grant Park Futures Fund Limited Partnership (Global 1 Class) |
| Type | Public |
| Inception of Trading | April 2009 |
| Aggregate Gross Subscriptions at 12/31/10 | $ 11,382,980 |
| Net Asset Value at 12/31/10 | $ 11,003,386 |
Worst Monthly Percentage Draw-Down (Since April 2009)(1) | -7.80% 01/10 |
Worst Peak-to-Valley Draw-Down (Since April 2009)(2) | -13.28% (Start of 05/09 - End of 01/10) |
| | Rate of Return(3) |
| | 2010 | | 2009 |
| | | | |
| January | -7.80% | | — |
| February | 0.71% | | |
| March | 3.65% | | |
| April | 1.52% | | -0.28% |
| May | -2.21% | | 2.02% |
| June | 0.29% | | -3.21% |
| July | -2.51% | | -1.26% |
| August | 2.71% | | 1.11% |
| September | 1.97% | | 1.18% |
| October | 3.70% | | -3.22% |
| November | -2.13% | | 3.75% |
| December | 3.59% | | -4.21% |
| Year | 2.88% | | -4.32% |
_______________
| (1) | Worst Monthly Percentage Draw-Down is the largest monthly loss experienced by Grant Park in any calendar month expressed as a percentage of total equity in Grant Park and includes the month and year of that draw-down. |
| (2) | Worst Peak-to-Valley Draw-Down is the greatest cumulative percentage decline in month-end net asset value of Grant Park due to losses sustained by Grant Park during a period in which the initial month-end net asset value of Grant Park is not equaled or exceeded by a subsequent month-end net asset value of Grant Park and includes the time period in which the draw-down occurred. |
| (3) | The monthly rate of return is computed by dividing monthly performance by beginning monthly equity plus additions less redemptions. The monthly rates are then compounded to arrive at the annual rate of return. |
PAST PERFORMANCE IS NOT NECESSARILY INDICATIVE OF FUTURE RESULTS
This supplement revises and replaces the table on page 75 of the Prospectus captioned “Performance of Grant Park - Global 2 Units” in its entirety as follows:
PERFORMANCE OF GRANT PARK - Global 2 Units
(Unaudited)
As required by CFTC regulations, the past performance record of Grant Park’s Global 2 Class units from April 1, 2009 through December 31, 2010, is presented below. While the performance record set forth in the table below has not been independently audited, the general partner believes that the information presented is accurate. All performance information is shown net of fees and expenses.
| | |
| Name | Grant Park Futures Fund Limited Partnership (Global 2 Class) |
| Type | Public |
| Inception of Trading | April 2009 |
| Aggregate Gross Subscriptions at 12/31/10 | $ 19,571,983 |
| Net Asset Value at 12/31/10 | $ 19,376,873 |
Worst Monthly Percentage Draw-Down (Since April 2009)(1) | -7.82% 01/10 |
Worst Peak-to-Valley Draw-Down (Since April 2009)(2) | -13.53% (Start of 05/09 - End of 01/10) |
| | Rate of Return(3) |
| | 2010 | | 2009 |
| | | | |
| January | -7.82% | | — |
| February | 0.69% | | — |
| March | 3.56% | | — |
| April | 1.50% | | -0.30% |
| May | -2.24% | | 1.97% |
| June | 0.29% | | -3.24% |
| July | -2.53% | | -1.28% |
| August | 2.70% | | 1.09% |
| September | 1.94% | | 1.10% |
| October | 3.68% | | -3.24% |
| November | -2.15% | | 3.61% |
| December | 3.56% | | -4.17% |
| Year | 2.56% | | -4.64% |
_______________
| (1) | Worst Monthly Percentage Draw-Down is the largest monthly loss experienced by Grant Park in any calendar month expressed as a percentage of total equity in Grant Park and includes the month and year of that draw-down. |
| (2) | Worst Peak-to-Valley Draw-Down is the greatest cumulative percentage decline in month-end net asset value of Grant Park due to losses sustained by Grant Park during a period in which the initial month-end net asset value of Grant Park is not equaled or exceeded by a subsequent month-end net asset value of Grant Park and includes the time period in which the draw-down occurred. |
| (3) | The monthly rate of return is computed by dividing monthly performance by beginning monthly equity plus additions less redemptions. The monthly rates are then compounded to arrive at the annual rate of return. |
PAST PERFORMANCE IS NOT NECESSARILY INDICATIVE OF FUTURE RESULTS
This supplement revises and replaces the table on page 76 of the Prospectus captioned “Performance of Grant Park - Global 3 Units” in its entirety as follows:
PERFORMANCE OF GRANT PARK - Global 3 Units
(Unaudited)
As required by CFTC regulations, the past performance record of Grant Park’s Global 3 Class units from April 1, 2009 through December 31, 2010 is presented below. While the performance record set forth in the table below has not been independently audited, the general partner believes that the information presented is accurate. All performance information is shown net of fees and expenses.
| | |
| Name | Grant Park Futures Fund Limited Partnership (Global 3 Class) |
| Type | Public |
| Inception of Trading | April 2009 |
| Aggregate Gross Subscriptions at 12/31/10 | $ 148,501,347 |
| Net Asset Value at 12/31/10 | $ 148,307,899 |
Worst Monthly Percentage Draw-Down (Since April 2009)(1) | -7.95% 01/10 |
Worst Peak-to-Valley Draw-Down (Since April 2009)(2) | -14.63% (Start of 05/09 - End of 01/10) |
| | Rate of Return(3) |
| | 2010 | | 2009 |
| | | | |
| January | -7.95% | | — |
| February | 0.54% | | — |
| March | 3.40% | | — |
| April | 1.33% | | -0.44% |
| May | -2.38% | | 1.77% |
| June | 0.10% | | -3.49% |
| July | -2.67% | | -1.43% |
| August | 2.54% | | 0.94% |
| September | 1.79% | | 0.96% |
| October | 3.51% | | -3.38% |
| November | -2.28% | | 3.52% |
| December | 3.40% | | -4.36% |
| Year | 0.68% | | -6.04% |
| (1) | Worst Monthly Percentage Draw-Down is the largest monthly loss experienced by Grant Park in any calendar month expressed as a percentage of total equity in Grant Park and includes the month and year of that draw-down. |
| (2) | Worst Peak-to-Valley Draw-Down is the greatest cumulative percentage decline in month-end net asset value of Grant Park due to losses sustained by Grant Park during a period in which the initial month-end net asset value of Grant Park is not equaled or exceeded by a subsequent month-end net asset value of Grant Park and includes the time period in which the draw-down occurred. |
| (3) | The monthly rate of return is computed by dividing monthly performance by beginning monthly equity plus additions less redemptions. The monthly rates are then compounded to arrive at the annual rate of return. |
This supplement revises and replaces the eighteen paragraphs on pages 92-95 of the Prospectus under the heading “The Clearing Brokers – MF Global Inc. – Legal Proceedings” in its entirety as follows:
Legal Proceedings
At any given time, MF Global is involved in numerous legal actions and administrative proceedings, which in the aggregate, MF Global has advised the general partner are not expected to have a material effect upon its condition, financial or otherwise, or to the services it will render to Grant Park. There have been no administrative, civil or criminal proceedings pending, on appeal or concluded against MF Global or its principals within the five years preceding the date of this prospectus that MF Global would deem material for purposes of Part 4 of the Regulations of the Commodity Futures Trading Commission (the “CFTC”), except as follows:
In May 2006, MF Global was sued by the Receiver for Philadelphia Alternate Asset Fund (“PAAF”) and associated entities for common law negligence common law fraud, violations of the Commodity Exchange Act and RICO violations (the “Litigation”). In December 2007, without admitting any liability of any party to the Litigation to any other party to the Litigation, the Litigation was settled with MF Global agreeing to pay $69 million, plus $6 million of legal expenses, to the receiver, in exchange for releases from all applicable parties and the dismissal of the Litigation with prejudice. In a related action, MF Global settled a CFTC administrative proceeding (In the Matter of MF Global, f/k/a Man Financial Inc., and Thomas Gilmartin) brought by the CFTC against MF Global and one of its employees for failure to supervise and recordkeeping violations. Without admitting or denying the allegations, MF Global agreed to pay a civil monetary penalty of $2 million and accept a cease and desist order.
On February 20, 2007, MF Global settled a CFTC administrative proceeding (In the Matter of Steven M. Camp and Man Financial Inc., CFTC Docket No. 07-04) in which MF Global was alleged to have failed to supervise one of its former associated persons (“AP”) who was charged with fraudulently soliciting customers to open accounts at MF Global. The CFTC alleged that the former AP misrepresented the profitability of a web-based trading system and of a purported trading system to be traded by a commodity trading advisor. Without admitting or denying the allegation, MF Global agreed to pay restitution to customers amounting to $196,900.44 and a civil monetary penalty of $120,000. MF Global also agreed to a cease and desist order and to strengthen its sup ervisory system for overseeing sales solicitations by employees in connection with accounts to be traded under letters of direction in favor of third party system providers.
On March 6, 2008, and thereafter, five virtually identical proposed class action securities suits were filed against MF Global’s parent, MF Global Ltd., certain of its officers and directors, and Man Group plc. These suits have now been consolidated into a single action. The complaints seek to hold defendants liable under Sections 11, 12 and 15 of the Securities Act of 1933 by alleging that the registration statement and prospectus issued in connection with MF Global Ltd.’s initial public offering in July 2007 were materially false and misleading to the extent that representations were made regarding MF Global Ltd.’s risk management policies, procedures and systems. The allegations are based upon MF Global Ltd.’s disclosure of $141.5 million in tradin g losses incurred in a single day by an associated person in his personal trading account (“Trading Incident”), which losses MF Global Ltd. was responsible to pay as an exchange clearing member. The consolidated cases have been dismissed on a motion to dismiss by defendants. Plaintiffs have appealed.
On December 17, 2009, MF Global settled a CFTC administrative proceeding in connection with the Trading Incident and three other matters without admitting or denying any allegations and accepting a charge of failing to supervise (In the Matter of MF Global Inc. CFTC Docket No. 10-03). The three
additional matters that were settled involved allegations that MF Global failed to implement procedures to ensure proper transmissions of price information for certain options that were sent to a customer, specifically that the price indications reflected a consensus taken on [a particular] time and date and were derived from different sources in the market place; failed to diligently supervise the proper and accurate preparation of trading cards and failed to maintain appropriate written authorization to conduct trades for a certain customer. Under the CFTC’s order, MF Global agreed to pay an aggregate civil monetary penalty of $10 million (which it had previously accrued) and agreed to a cease and desist order. In addition, MF Global agreed to specific undertakings related to its supervisory practices and procedures and MF Global agreed that it would engage an independent outside firm to review and assess the implementation of the undertakings and certain recommendations that MF Global previously accepted. At the same time, MF Global, without admitting or denying the allegations made by the CME, settled a CME disciplinary action relating to the Trading Incident by paying a fine of $495,000.
On August 28, 2009, Bank of Montreal (“BMO”) instituted suit against MF Global and its former broker, Joseph Saab (“Saab”) (as well as a firm named Optionable, Inc. and five of its principals or employees), in the United States District Court for the Southern District of New York. In its complaint, BMO asserts various claims against all defendants for their alleged misrepresentation of price quotes to BMO’s Market Risk Department (“MRD”) as independent quotes when defendants knew, or should have known, that David Lee (“Lee”), BMO’s trader, created the quotes which, in circular fashion, were passed on to BMO through MF Global’s broker, thereby enabling Lee substantially to overvalue his book at BMO. BMO further all eges that MF Global and Saab knew that Lee was fraudulently misrepresenting prices in his options natural gas book and aided and abetted his ability to do so by MF Global’s actions in sending price indications to the BMO MRD, and substantially assisted Lee’s breach of his fiduciary duties to BMO as its employee. The complaint seeks to hold all defendants jointly and severally liable and, although it does not specify an exact damage claim, it claims CAD 680.0 million (approximately $635.9 million) as a pre-tax loss for BMO in its natural gas trading, claims that it would not have paid brokerage commissions to MF Global (and Optionable), would not have continued Lee and his supervisor as employees at substantial salaries and bonuses, and would not have incurred substantial legal costs and expenses to deal with the Lee mispricing. MF Global has made a motion to dismiss, which is pending.
In or about October 2003, MF Global uncovered an apparent fraudulent scheme conducted by third parties unrelated to MF Global that may have victimized a number of its clients. CCPM, a German Introducing Broker, introduced to MF Global all the clients that may have been victimized. An agent of CCPM, Michael Woertche (and his associates), apparently engaged in a Ponzi scheme in which allegedly unauthorized transfers from and trading in accounts maintained at MF Global were utilized to siphon money out of these accounts, on some occasions shortly after they were established. MF Global was involved in two arbitration proceedings relating to these CCPM introduced accounts. The first arbitration involved claims made by two claimants before a NFA panel.& #160; The second arbitration involves claims made by four claimants before a FINRA panel. The claims in both arbitrations are based on allegations that MF Global and an employee assisted CCPM in engaging in, or recklessly or negligently failed to prevent, unauthorized transfers from, and trading in, accounts maintained by MF Global. Damages sought in the NFA arbitration proceeding were approximately $1.7 million in compensatory damages, unspecified punitive damages and attorney’s fees in addition to the rescission of certain deposit agreements. The NFA arbitration was settled for $200,000 as to one claimant and a net of $240,000 as to the second claimant during fiscal 2008. Damages sought in the FINRA proceeding were approximately $6 million in compensatory damages and $12 million in punitive damages. During the year ended March 31, 2009, the FINRA arbitration was settled for an aggregate of $800,000.
MF Global was named as a co-defendant in an action filed in Florida State Court by Eagletech Communications Inc. (“Eagletech”) and three of its alleged shareholders against 21 defendants, including banks, broker-dealers and clearing brokers, as well as “100 John Doe defendants or their nominee entities”. The complaint alleges that the defendants engaged in a criminal conspiracy designed to manipulate the publicly traded share price of Eagletech stock. Plaintiffs seek unspecified compensatory and special damages, alleging that “Man Group PLC d/b/a Man Financial Inc” participated in the
conspiracy by acting as a clearing broker for a broker-dealer that traded in Eagletech stock. The complaint asserts claims under RICO, the Florida Securities and Investor Protection Act, the Florida Civil Remedies for Criminal Practices Act and a related negligence claim. On May 9, 2007, defendants filed a notice removing the State Court action to the United States District Court for the Southern District of Florida pursuant to 28 U.S.C. Section 1441(a). On October 2, 2007, plaintiffs filed a first amended complaint in the Federal Court action asserting additional claims against MF Global under Florida common law, including civil conspiracy, conversion and trespass to chattels. On February 26, 2008, the financial institution defendants, including MF Global Inc., filed a motion to dismiss seeking dismissal of all claims asse rted in the amended complaint on the ground that the claims are barred by the Private Securities Litigation Reform Act (“PSLRA”) and preempted by the federal securities laws. On June 27, 2008, the Court partially granted the motion, holding that the federal RICO claims are barred by the PSLRA and dismissing the RICO claims with prejudice. The Court declined to exercise supplemental jurisdiction over the state law claims and remanded those claims to the Florida State Court. On July 25, 2008, plaintiffs filed a notice of appeal of the Court’s June 27, 2008 decision to the United States Court of Appeals for the Eleventh Circuit but subsequently withdrew its appeal.
In December 2007, MF Global, along with four other futures commission merchants (“FCMs”), were named as defendants in an action filed in the United States District Court in Corpus Christi, Texas by 47 individuals who were investors in a commodity pool (RAM I LLC) operated by Renaissance Asset Management LLC. The complaint alleges that MF Global and the other defendants violated the Commodity Exchange Act and alleges claims of negligence, common law fraud, violation of a Texas statute relating to securities fraud and breach of fiduciary duty for allegedly failing to conduct due diligence on the commodity pool operator and commodity trading advisor, having accepted executed trades directed by the commodity trading advisor, which was engaged in a fraudulent scheme with respect to t he commodity pool, and having permitted the improper allocation of trades among accounts. The plaintiffs claim damages of $32.0 million, plus exemplary damages, from all defendants. All of the FCM defendants moved to dismiss the complaint for failure to state a claim upon which relief may be granted. Following an initial pre-trial conference, the court granted plaintiffs leave to file an amended complaint. On May 9, 2008, plaintiffs filed an amended complaint in which plaintiffs abandoned all claims except a claim alleging that the FCM defendants aided and abetted violations of the Commodity Exchange Act. Plaintiffs now seek $17.0 million in claimed damages plus exemplary damages from all defendants. MF Global filed a motion to dismiss the amended complaint which was granted by the court and appealed by the plaintiffs.
The Liquidation Trustee (“Trustee”) for Sentinel Management Group, Inc. (“Sentinel”) sued MF Global in June 2009 on the theory that MF Global’s withdrawal of $50.2 million within 90 days of the filing of Sentinel’s bankruptcy petition on August 17, 2007 is a voidable preference under Section 547 of the Bankruptcy Code and, therefore, recoverable by the Trustee, along with interest and costs.
In May 2009, investors in a venture set up by Nicholas Cosmo (“Cosmo”) sued Bank of America and MF Global, among others, in the United States District Court for the Eastern District of New York, alleging that MF Global, among others, aided and abetted Cosmo and related entities in a Ponzi scheme in which investors lost $400 million. MF Global has made a motion to dismiss which is currently pending before the court.
In the late spring of 2009, MF Global was sued in Oklahoma State Court by customers who were substantial investors with Mark Trimble (“Trimble”) and/or Phidippides Capital Management (“Phidippides”). Trimble and Phidippides may have been engaged in a Ponzi scheme. Plaintiffs allege that MF Global “materially aided and abetted” Trimble’s and Phidippides’ violations of the anti-fraud provisions of the Oklahoma securities laws and they are seeking damages “in excess of” $10,000 each. MF Global made a motion to dismiss which was granted by the court. Plaintiffs have appealed.
MF Global and an affiliate, MF Global Market Services LLC (“Market Services”), are currently involved in litigation with a former customer of Market Services, Morgan Fuel & Heating Co., Inc.
(“Morgan Fuel”) and its principals, Anthony Bottini, Jr., Brian Bottini and Mark Bottini (the “Bottinis”). The litigations arise out of trading losses incurred by Morgan Fuel in over-the-counter derivative swap transactions, which were unconditionally guaranteed by the Bottinis.
On October 6, 2008, Market Services commenced an arbitration against the Bottinis to recover $8.3 million, which is the amount of the debt owed to Market Services by Morgan Fuel after the liquidation of the swap transactions. MF Global Market Services LLC v. Anthony Bottini, Jr., Brian Bottini and Mark Bottini, FINRA No. 08-03673. Each of the Bottinis executed a guaranty in favor of Market Services personally and unconditionally guaranteeing payment of the obligations of Morgan Fuel upon written demand by Market Services. Market Services asserted a claim of breach of contract based upon the Bottinis’ failure to honor the guarantees.
On October 21, 2008, Morgan Fuel commenced a separate arbitration proceeding before FINRA against MF Global and Market Services. Morgan Fuel claims that MF Global and Market Services caused Morgan Fuel to incur approximately $14.2 million in trading losses (Morgan Fuel v. MF Global and Market Services, FINRA No. 08-03879). Morgan Fuel seeks recovery of $5.9 million in margin payments that it allegedly made to Market Services and a declaration that it has no responsibility to pay Market Services for the remaining $8.3 million in trading losses because Market Services should not have allowed Morgan Fuel to enter into, or maintain, the swap transactions.
The Bottinis also asserted a third-party claim against Morgan Fuel, which in turn asserted a fourth-party claim against MF Global, Market Services and Steven Bellino (an MF Global employee) in the arbitration proceeding commenced by Market Services.
On December 12, 2008, MF Global settled three CME Group disciplinary actions involving allegations that on a number of occasions in 2006 and 2007, MF Global employees engaged in impermissible pre-execution communications in connection with trades executed on the e-cbot electronic trading platform, withheld customer orders that were executable in the market for the purpose of soliciting, and brokering contra-orders and crossed orders on the e-cbot trading platform without allowing for the minimum required exposure period between the entry of the orders. MF Global was also charged with failing to properly supervise its employees in connection with these trades. Without admitting or denying any wrongdoing, MF Global consented to an order of a CME Business Conduct Committee Panel which found th at MF Global violated legacy CBOT Rule 504.00 and Regulations 480.10 and 9B.13 and 9B.13(c) and ordered MF Global to pay a $400,000 fine, cease and desist from similar conduct and, in consultation with CME Market regulation Staff, enhance its training practices and supervisory procedures regarding electronic trading practices.
MF Global acts only as clearing broker for the futures accounts to be traded by Grant Park and as such is paid commissions for executing and clearing trades. The cases and settlements referenced above will not materially affect MF Global or its ability to perform as a clearing broker. MF Global has not passed upon the adequacy or accuracy of this prospectus and will not act in any supervisory capacity with respect to the general partner of the commodity pool or to the Commodity Trading Advisor, as the case may be, nor participate in the management of the general partner or of the commodity pool or of the Trading Advisor. Therefore, prospective investors should not rely on MF Global in deciding whether or not to invest in Grant Park.
This supplement revises and replaces the three paragraphs on page 96 of the Prospectus under the heading “The Clearing Brokers – NewEdge USA, LLC – Legal Proceedings” in its entirety as follows:
At any given time, Newedge USA is involved in numerous legal actions and administrative proceedings, which Newedge USA has advised the general partner are not, in the aggregate, as of the date of this prospectus, expected to have a material effect upon its condition, financial or otherwise, or to the services it renders to Grant Park. Newedge USA has also advised the general partner that, as of the date of this prospectus, there have been no material, administrative, civil or criminal proceedings pending, on appeal or concluded against Newedge USA, NAST or its principals within the last five years, except as follows.
In March 2008, Newedge USA settled, without admitting or denying the allegations, a disciplinary action brought by the New York Mercantile Exchange (“NYMEX”) alleging that Newedge USA violated NYMEX rules related to: numbering and time stamping orders by failing properly to record a floor order ticket; wash trading; failure to adequately supervise employees; and violation of a prior NYMEX cease and desist order, effective as of December 5, 2006, related to numbering and time stamping orders and block trades. Newedge USA paid a $100,000 fine to NYMEX in connection with this settlement.
Neither Newedge USA, NAST nor any affiliate, officer, director or employee thereof have passed on the merits of this prospectus, or give any guarantee as to the performance or any other aspect of Grant Park.
This supplement revises and replaces the eleven paragraphs on page 96-98 of the Prospectus under the heading “The Clearing Brokers – UBS Securities LLC – Legal Proceedings” in its entirety as follows:
Legal Proceedings
UBS Securities has advised the general partner that, except as set forth below, neither UBS Securities nor any of its principals have been involved in any administrative, civil or criminal proceeding, whether pending, on appeal or concluded, within the past five years that is in UBS Securities’ determination material to a decision whether to invest in Grant Park in light of all the circumstances. UBS Securities is and has been a defendant in numerous legal actions relating to its securities and commodities business that allege various violations of federal and state securities laws.
On June 27, 2007, the Securities Division of the Secretary of the Commonwealth of Massachusetts (“Massachusetts Securities Division”) filed an administrative complaint (the "Complaint") and notice of adjudicatory proceeding against UBS Securities, captioned In The Matter of UBS Securities, Docket No. E-2007-0049, which alleged that UBS Securities violated the Massachusetts Uniform Securities Act (“the “Act”) and related regulations by providing the advisers for certain hedge funds with gifts and gratuities in the form of below market office rents, personal loans with below market interest rates, event tickets, and other perks, in order to induce those hedge fund advisers to increase or retain their level of prime brokerage fees paid to UBS Securities. � 0;The Complaint seeks a cease and desist order from conduct that violates the Act and regulations, to censure UBS Securities, to require UBS Securities to pay an administrative fine of an unspecified amount, and to find as fact the allegations of the Complaint. The matter is still pending.
In the summer of 2008, the Massachusetts Securities Division, Texas State Securities Board, and the New York Attorney General (“NYAG”) all brought actions against UBS Securities and UBS Financial Services, Inc. (“UBS Financial”), alleging violations of various state law anti-fraud provisions in connection with the marketing and sale of auction rate securities.
On August 8, 2008, UBS Securities and UBS Financial reached agreements in principle with the SEC, the NYAG, the Massachusetts Securities Division and other state regulatory agencies represented by the North American Securities Administrators Association (“NASAA”) to restore liquidity to all remaining client’s holdings of auction rate securities by June 30, 2012. On October 2, 2008, UBS Securities and UBS
Financial entered into a final consent agreement with the Massachusetts Securities Division settling all allegations in the Massachusetts Securities Division’s administrative proceeding against UBS Securities and UBS Financial with regards to the auction rate securities matter. On December 11, 2008, UBS Securities and UBS Financial executed an Assurance of Discontinuance in the auction rate securities settlement with the NYAG. On the same day, UBS Securities and UBS Financial finalized settlements with the SEC. UBS paid penalties of $75 million to NYAG and an additional $75 million to be apportioned among the participating NASAA states. In March 2010, UBS and NASAA agreed on final settlement terms, pursuant to which, UBS agreed to provide client liquidity up to an additional $200 million.
On August 14, 2008 the New Hampshire Bureau of Securities Regulation filed an administrative action against UBS Securities relating to a student loan issuer, the New Hampshire Higher Education Loan Corp. (NHHELCO). The complaint alleges fraudulent and unethical conduct in violation of New Hampshire state statutes. On April 14, 2010, UBS Securities entered into a Consent Order resolving all of the Bureau’s claims. UBS paid $750,000 to the Bureau for all costs associated with the Bureau’s investigation. UBS entered a separate civil settlement with NHHELCO and provided a total financial benefit of $20 million to NHHELCO.
On April 29, 2010, the CFTC issued an order with respect to UBS Securities LLC and levied a fine of $200,000. The order stated that on February 6, 2009, UBS Securities’ employee broker aided and abetted UBS Securities’ customer’s concealment of material facts from the New York Mercantile Exchange (“NYMEX”) in violation of Section 9(a)(4) of the CEA, 7 U.S.C. Section 13(a)(4) (2006). Pursuant to NYMEX Rules, a block trade must be reported to NYMEX “within five minutes of the time of execution” consistent with the requirements of NYMEX Rule 6.21C(A)(6). Although the block trade in question was executed earlier in the day, UBS Securities’ employee broker aided and abetted its customer’s concealment of facts when, in re sponse to the customer’s request to delay reporting the trade until after the close of trading, UBS Securities’ employee did not report the trade until after the close. Because the employee broker undertook his actions within the scope of his employment, pursuant to Section 2(a)(1)(B) of the CEA, 7 U.S.C. Section 2(a)(1)(B) (2006), and Commission Regulation 1.2, 17 C.F.R. Section 1.2 (2009), UBS Securities is liable for the employee broker’s aiding and abetting of its customer’s violation of Section 9(a)(4) of the CEA. The fine has been paid and the matter is now closed.
UBS Securities will act only as clearing broker for Grant Park and as such will be paid commissions for executing and clearing trades on behalf of Grant Park. UBS Securities has not passed upon the adequacy or accuracy of this prospectus. UBS Securities neither will act in any supervisory capacity with respect to the general partner nor participate in the management of Grant Park.
This supplement revises and replaces the first and second paragraphs on page 101 of the Prospectus under the heading “Fees and Expenses – Fees and Expenses Paid by Grant Park – Incentive Fees” in their entirety as follows:
Grant Park pays each trading advisor a quarterly incentive fee based on any new trading profits achieved on that trading advisor’s allocated net assets as of the end of each calendar quarter. Generally, new trading profits means the net increase in trading profits, realized and unrealized, experienced by the trading advisor on its allocated net assets from the most recent prior quarter in which an incentive fee was paid to the trading advisor, or if an incentive fee has yet to be paid to that trading advisor, the trading advisor’s initial allocation of net assets. Currently, the incentive fees payable to each of Grant Park’s trading advisors that are allocated 10% or more of the fund’s assets are as follows: 22.5% to EMC, 24% to ETC, 20% to Winton and 20% to Welton.
Grant Park pays incentive fees ranging between 20% and 26% to each of Rabar, ETC, Global Advisors, Transtrend, QIM, Sunrise, Amplitude, and effective February 1, 2011, Alder and Denali.
This supplement revises and replaces the second paragraph on page 102 of the Prospectus under the heading “Fees and Expenses – Fees and Expenses Paid by Grant Park – Incentive Fees – Calculation of New Trading Profits” in its entirety as follows:
New trading profits on the allocated net assets of each trading advisor are calculated as the sum of (1) the net of any profits (excluding interest income) and losses realized on all trades closed out during the period of such allocated net assets, plus (2) the net of any unrealized profits and losses on open positions as of the end of such period on such allocated net asse ts, minus (3)(A) the net of any unrealized profits or losses on open positions as of the end of the preceding period on such allocated net assets, (B) all expenses (except the incentive fee payable to the trading advisor, if any, for the current period and applicable state taxes) attributable to such allocated net assets incurred or accrued during such period, including, without limitation, the brokerage charge and Grant Park’s ongoing expenses, and (C) cumulative net realized or unrealized trading losses on such allocated net assets (reduced by a proportionate share of realized and unrealized trading losses on such allocated net assets attributable to redeemed units or reallocated amounts as of any redemption or reallocation date), if any, carried forward from all preceding periods since the last period for which an incentive fee was payable to the trading advisor. The General Partner may, however, in its sole discretion, adjust the computation of new trading profits on the allocated net assets of any trading advisor to exclude or include all or a por tion of particular expenses for purposes of calculating that trading advisor’s incentive fee. In the case of ETC, Winton, Welton, Global Advisors, Transtrend, QIM, Sunrise, Amplitude and effective February 1, 2011, Alder and Denali only certain allocated expenses of Grant Park are included for the purpose of calculating such trading advisor’s incentive fee, while for EMC and Rabar; all allocated expenses of Grant Park are included.
This supplement revises and replaces the paragraph on page 106 of the Prospectus under the heading “Fees and Expenses – Fees and Expenses Paid by the General Partner – Trading Advisor Consulting Fees” in its entirety as follows:
Each trading advisor receives a consulting fee, payable by the General Partner not Grant Park, ranging from 0% to 2% per year, computed and accrued monthly on the basis of the trading advisor’s allocated net assets either at the beginning of the month or at month-end and paid monthly or quarterly. The consulting fees payable to each of Grant Park’s trading advisors that are allocated 10% or more of the fund’s assets are as follows: 1.5% to EMC, 1% to Winton and 1% to Welton for the GDP program, and 0% to Welton for both the AES and GNP programs. Grant Park pays consulting fees ranging between 0.25% and 3% to each of Rabar, Global Advisors, Transtrend, QIM, Sunrise, Amplitude, and effective February 1, 2011, Alder and Denali.
This supplement revises and replaces the last paragraph on page 187 of the Prospectus under the heading “Potential Advantages of Investment – Professional Trading” in its entirety as follows:
Grant Park’s trading decisions are currently made by Rabar Market Research, Inc., EMC Capital Management, Inc., Eckhardt Trading Company, Winton Capital Management Limited, Welton Investment Corporation, Global Advisors Jersey Limited, Transtrend B.V., Quantitative Investment Management LLC., Sunrise Capital Partners, LLC, Amplitude Capital International Limited, and effective February 1, 2011, Alder Capital Limited, and Denali Asset Management, LLLP. Each trading advisor uses its own proprietary trading program. Each of the trading advisors is a full-time commodity trading advisor with an established performance record and a dedicated staff of experienced alternative investment professionals.� 0; The General Partner may terminate or replace the trading advisors or retain additional trading advisors in its sole discretion.