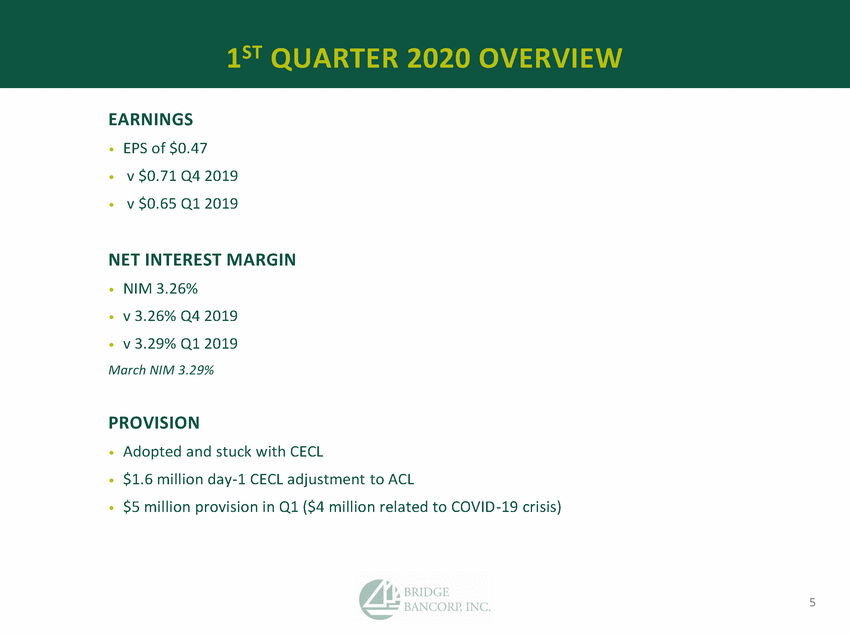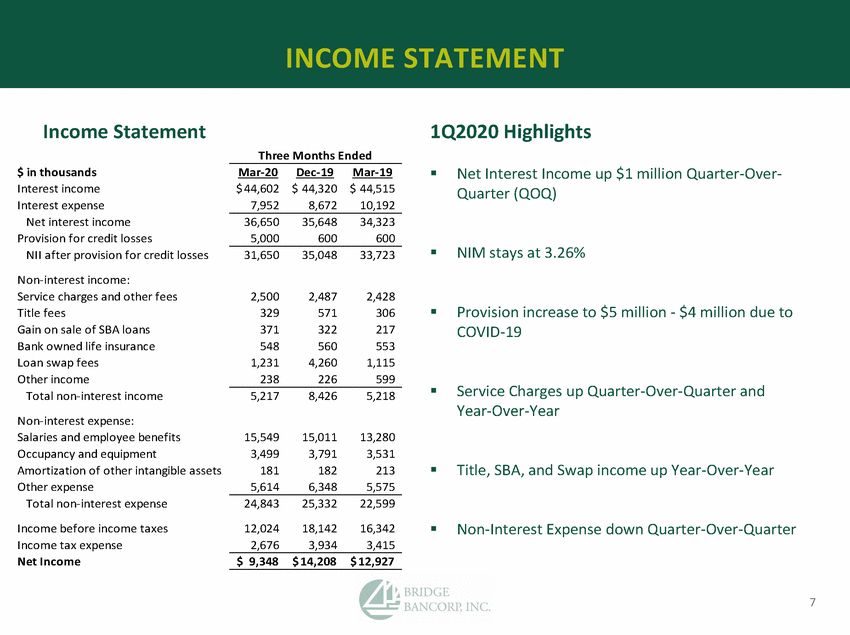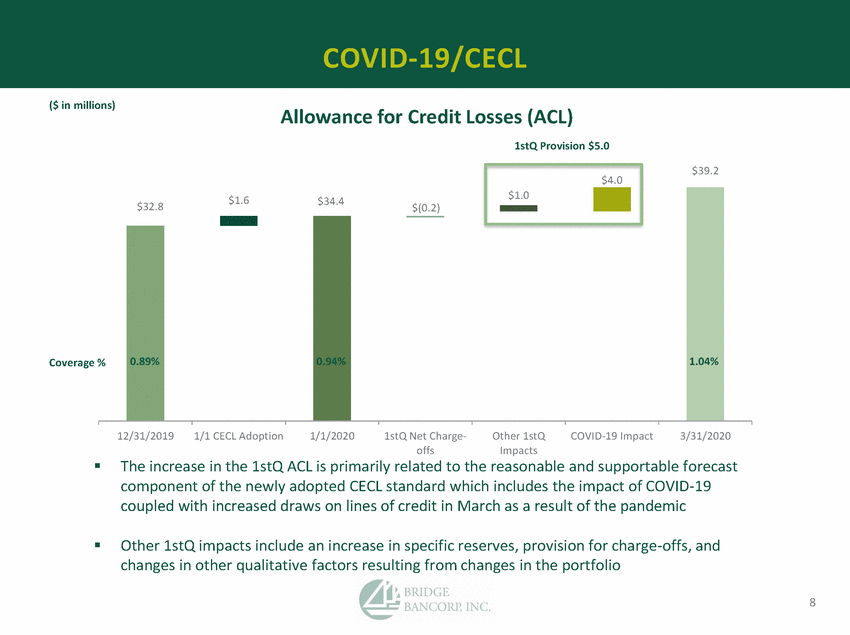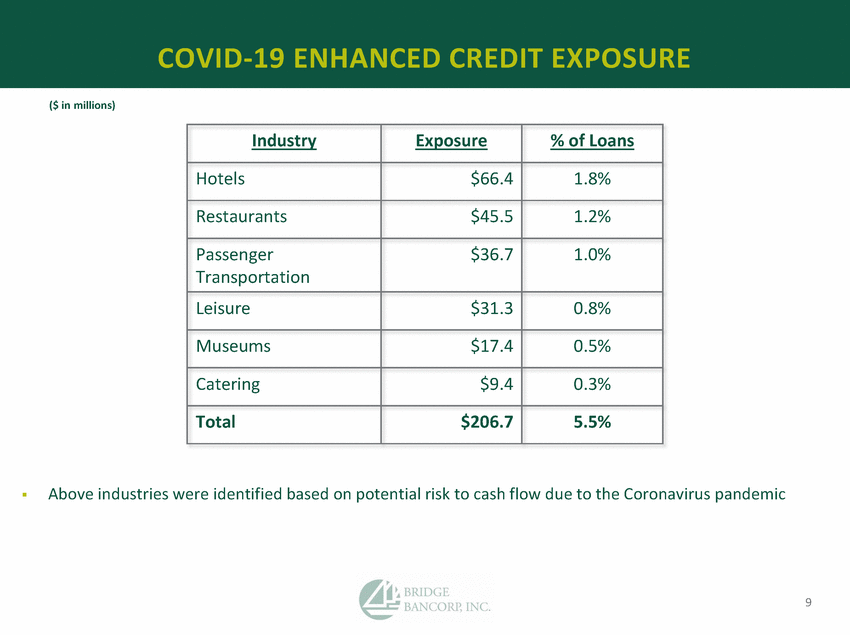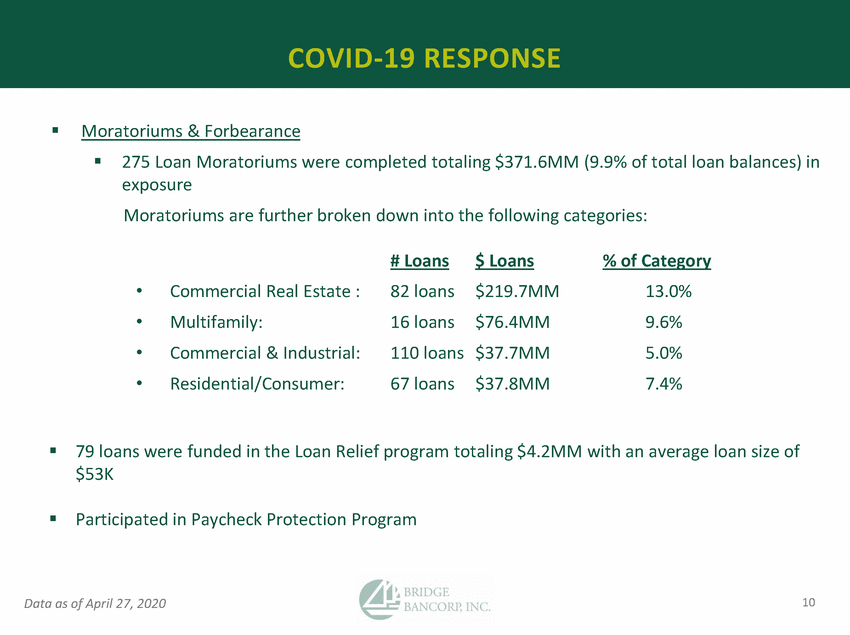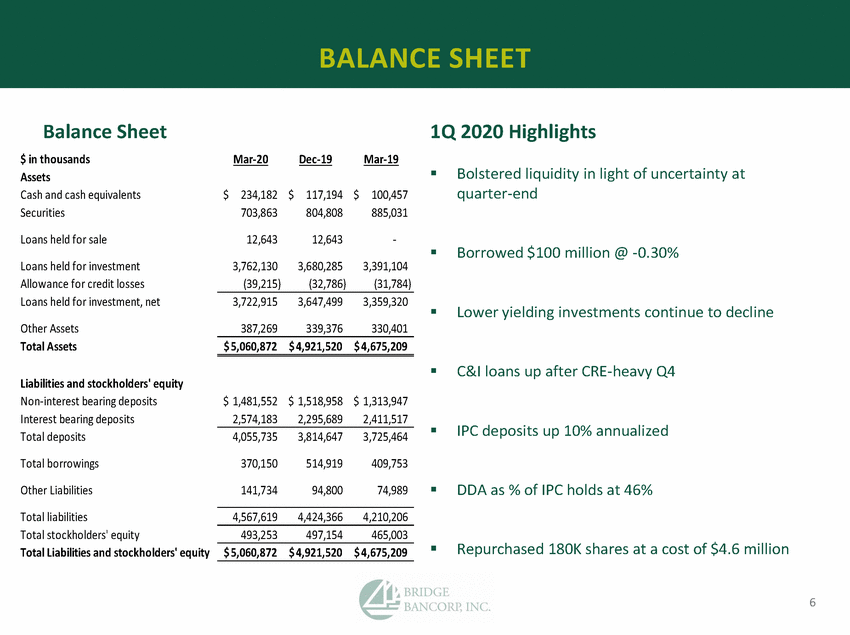
| BALANCE SHEET Balance Sheet $ in thousands Assets Cash and cash equivalents Securities Loans held for sale Loans held for investment Allowance for credit losses Loans held for investment, net Other Assets Total Assets 1Q 2020 Highlights Mar-20 Dec-19 Mar-19 ▪ Bolstered liquidity in light of uncertainty at quarter-end $ 234,182 703,863 12,643 3,762,130 (39,215) $ 117,194 804,808 12,643 3,680,285 (32,786) $ 100,457 885,031 - 3,391,104 (31,784) ▪ Borrowed $100 million @ -0.30% 3,722,915 387,269 3,647,499 339,376 3,359,320 330,401 ▪ Lower yielding investments continue to decline $ 5,060,872 $ 4,921,520 $ 4,675,209 ▪ C&I loans up after CRE-heavy Q4 Liabilities and stockholders' equity Non-interest bearing deposits Interest bearing deposits Total deposits Total borrowings Other Liabilities Total liabilities Total stockholders' equity Total Liabilities and stockholders' equity $ 1,481,552 2,574,183 $ 1,518,958 2,295,689 $ 1,313,947 2,411,517 ▪ IPC deposits up 10% annualized 4,055,735 370,150 141,734 3,814,647 514,919 94,800 3,725,464 409,753 74,989 ▪ DDA as % of IPC holds at 46% 4,567,619 4,424,366 4,210,206 493,253 497,154 465,003 ▪ Repurchased 180K shares at a cost of $4.6 million $ 5,060,872 $ 4,921,520 $ 4,675,209 6 |
