The Registrant has adopted a code of ethics that applies to the Registrant's principal executive officer, principal financial officer, principal accounting officer or controller, or persons performing similar functions. There have been no amendments to, or waivers in connection with, the Code of Ethics during the period covered by this Report.
| Item 3. | Audit Committee Financial Expert. |
The Registrant's Board has determined that Gina D. France, a member of the Audit Committee of the Board, is an audit committee financial expert as defined by the Securities and Exchange Commission (the "SEC"). Ms. France is "independent" as defined by the SEC for purposes of audit committee financial expert determinations.
| Item 4. | Principal Accountant Fees and Services. |
(a) Audit Fees. The aggregate fees billed for each of the last two fiscal years (the "Reporting Periods") for professional services rendered by the Registrant's principal accountant (the "Auditor") for the audit of the Registrant's annual financial statements or services that are normally provided by the Auditor in connection with the statutory and regulatory filings or engagements for the Reporting Periods, were $36,261 in 2023 and $36,986 in 2024.
(b) Audit-Related Fees. The aggregate fees billed in the Reporting Periods for assurance and related services by the Auditor that are reasonably related to the performance of the audit of the Registrant's financial statements and are not reported under paragraph (a) of this Item 4 were $8,038 in 2023 and $7,332 in 2024. These services consisted of one or more of the following: (i) agreed upon procedures related to compliance with Internal Revenue Code section 817(h), (ii) security counts required by Rule 17f-2 under the Investment Company Act of 1940, as amended, (iii) advisory services as to the accounting or disclosure treatment of Registrant transactions or events and (iv) advisory services to the accounting or disclosure treatment of the actual or potential impact to the Registrant of final or proposed rules, standards or interpretations by the Securities and Exchange Commission, the Financial Accounting Standards Boards or other regulatory or standard-setting bodies.
The aggregate fees billed in the Reporting Periods for non-audit assurance and related services by the Auditor to the Registrant's investment adviser (not including any sub-investment adviser whose role is primarily portfolio management and is subcontracted with or overseen by another investment adviser), and any entity controlling, controlled by or under common control with the investment adviser that provides ongoing services to the Registrant ("Service Affiliates"), that were reasonably related to the performance of the annual audit of the Service Affiliate, which required pre-approval by the Audit Committee were $0 in 2023 and $0 in 2024.
(c) Tax Fees. The aggregate fees billed in the Reporting Periods for professional services rendered by the Auditor for tax compliance, tax advice, and tax planning ("Tax Services") were $4,763 in 2023 and $4,763 in 2024. These services consisted of: (i) review or preparation of U.S. federal, state, local and excise tax returns; (ii) U.S. federal, state and local tax planning, advice and assistance regarding statutory, regulatory or administrative developments; (iii) tax advice regarding tax qualification matters and/or treatment of various financial instruments held or proposed to be acquired or held, and (iv) determination of Passive Foreign Investment Companies. The aggregate fees billed in the Reporting Periods for Tax Services by the Auditor to Service Affiliates, which required pre-approval by the Audit Committee were $3,737 in 2023 and $3,194 in 2024.
(d) All Other Fees. The aggregate fees billed in the Reporting Periods for products and services provided by the Auditor, other than the services reported in paragraphs (a) through (c) of this Item,
were $57 in 2023 and $70 in 2024. These services consisted of a review of the Registrant's anti-money laundering program.
The aggregate fees billed in the Reporting Periods for Non-Audit Services by the Auditor to Service Affiliates, other than the services reported in paragraphs (b) through (c) of this Item, which required pre-approval by the Audit Committee, were $0 in 2023 and $0 in 2024.
(e)(1) Audit Committee Pre-Approval Policies and Procedures. The Registrant's Audit Committee has established policies and procedures (the "Policy") for pre-approval (within specified fee limits) of the Auditor's engagements for non-audit services to the Registrant and Service Affiliates without specific case-by-case consideration. The pre-approved services in the Policy can include pre-approved audit services, pre-approved audit-related services, pre-approved tax services and pre-approved all other services. Pre-approval considerations include whether the proposed services are compatible with maintaining the Auditor's independence. Pre-approvals pursuant to the Policy are considered annually.
(e)(2) Note. None of the services described in paragraphs (b) through (d) of this Item 4 were approved by the Audit Committee pursuant to paragraph (c)(7)(i)(C) of Rule 2-01 of Regulation S-X.
(f) None of the hours expended on the principal accountant's engagement to audit the registrant's financial statements for the most recent fiscal year were attributed to work performed by persons other than the principal accountant's full-time, permanent employees.
Non-Audit Fees. The aggregate non-audit fees billed by the Auditor for services rendered to the Registrant, and rendered to Service Affiliates, for the Reporting Periods were $1,865,667 in 2023 and $1,429,804 in 2024.
Auditor Independence. The Registrant's Audit Committee has considered whether the provision of non-audit services that were rendered to Service Affiliates, which were not pre-approved (not requiring pre-approval), is compatible with maintaining the Auditor's independence.
| Item 5. | Audit Committee of Listed Registrants. |
Not applicable.
Not applicable.
BNY Mellon Stock Index Fund, Inc.
ANNUAL FINANCIALS AND OTHER INFORMATION
IMPORTANT NOTICE – CHANGES TO ANNUAL AND SEMI-ANNUAL REPORTS
The Securities and Exchange Commission (the “SEC”) has adopted rule and form amendments which have resulted in changes to the design and delivery of annual and semi-annual fund reports (“Reports”). Reports are now streamlined to highlight key information. Certain information previously included in Reports, including financial statements, no longer appear in the Reports but will be available online within the Semi-Annual and Annual Financials and Other Information, delivered free of charge to shareholders upon request, and filed with the SEC.
Save time. Save paper. View your next shareholder report online as soon as it’s available. Log into www.bny.com/investments and sign up for eCommunications. It’s simple and only takes a few minutes.
The views expressed in this report reflect those of the portfolio manager(s) only through the end of the period covered and do not necessarily represent the views of BNY Mellon Investment Adviser, Inc. or any other person in the BNY Mellon Investment Adviser, Inc. organization. Any such views are subject to change at any time based upon market or other conditions and BNY Mellon Investment Adviser, Inc. disclaims any responsibility to update such views. These views may not be relied on as investment advice and, because investment decisions for a fund in the BNY Mellon Family of Funds are based on numerous factors, may not be relied on as an indication of trading intent on behalf of any fund in the BNY Mellon
Family of Funds.
Not FDIC-Insured • Not Bank-Guaranteed • May Lose Value
Contents
Please note the Annual Financials and Other Information only contains Items 7-11 required in Form N-CSR. All other required items will be filed with the SEC.
Item 7. Financial Statements and Financial Highlights for Open-End Management Investment Companies. BNY Mellon Stock Index Fund, Inc.Statement of Investments
| | | | | |
|
Automobiles & Components — 2.5% |
| | | | | |
| | | | | |
| | | | | |
| | | | | |
| | | | | |
| | | | | |
|
| | | | | |
| | | | | |
Citizens Financial Group, Inc. | | | | | |
| | | | | |
Huntington Bancshares, Inc. | | | | | |
| | | | | |
| | | | | |
| | | | | |
| | | | | |
The PNC Financial Services Group, Inc. | | | | | |
| | | | | |
| | | | | |
| | | | | |
| | | | | |
|
| | | | | |
| | | | | |
| | | | | |
| | | | | |
Axon Enterprise, Inc. (a) | | | | | |
Builders FirstSource, Inc. (a) | | | | | |
| | | | | |
| | | | | |
| | | | | |
| | | | | |
| | | | | |
| | | | | |
| | | | | |
| | | | | |
| | | | | |
| | | | | |
Generac Holdings, Inc. (a) | | | | | |
| | | | | |
| | | | | |
Honeywell International, Inc. | | | | | |
| | | | | |
| | | | | |
Huntington Ingalls Industries, Inc. | | | | | |
| | | | | |
Illinois Tool Works, Inc. | | | | | |
| | | | | |
Statement of Investments (continued)
| | | | | |
Common Stocks — 97.9% (continued) |
Capital Goods — 5.5% (continued) |
Johnson Controls International PLC | | | | | |
L3Harris Technologies, Inc. | | | | | |
Lennox International, Inc. | | | | | |
| | | | | |
| | | | | |
| | | | | |
| | | | | |
| | | | | |
| | | | | |
| | | | | |
| | | | | |
Quanta Services, Inc. (b) | | | | | |
Rockwell Automation, Inc. | | | | | |
| | | | | |
| | | | | |
Stanley Black & Decker, Inc. | | | | | |
| | | | | |
| | | | | |
| | | | | |
| | | | | |
| | | | | |
| | | | | |
Westinghouse Air Brake Technologies Corp. | | | | | |
| | | | | |
| | | | | |
Commercial & Professional Services — 1.1% |
Automatic Data Processing, Inc. | | | | | |
Broadridge Financial Solutions, Inc. | | | | | |
| | | | | |
| | | | | |
| | | | | |
| | | | | |
| | | | | |
| | | | | |
| | | | | |
| | | | | |
| | | | | |
| | | | | |
| | | | | |
| | | | | |
| | | | | |
| | | | | |
Consumer Discretionary Distribution & Retail — 6.0% |
| | | | | |
| | | | | |
| | | | | |
| | | | | |
| | | | | |
| | | | | |
| | | | | |
Common Stocks — 97.9% (continued) |
Consumer Discretionary Distribution & Retail — 6.0% (continued) |
| | | | | |
| | | | | |
O’Reilly Automotive, Inc. (a) | | | | | |
| | | | | |
| | | | | |
| | | | | |
| | | | | |
| | | | | |
| | | | | |
| | | | | |
Consumer Durables & Apparel — .7% |
| | | | | |
Deckers Outdoor Corp. (a) | | | | | |
| | | | | |
| | | | | |
| | | | | |
Lululemon Athletica, Inc. (a) | | | | | |
Mohawk Industries, Inc. (a) | | | | | |
| | | | | |
| | | | | |
| | | | | |
| | | | | |
| | | | | |
| | | | | |
|
| | | | | |
| | | | | |
Caesars Entertainment, Inc. (a) | | | | | |
| | | | | |
Chipotle Mexican Grill, Inc. (a) | | | | | |
| | | | | |
| | | | | |
| | | | | |
Hilton Worldwide Holdings, Inc. | | | | | |
Las Vegas Sands Corp. (b) | | | | | |
Marriott International, Inc., Cl. A | | | | | |
| | | | | |
MGM Resorts International (a) | | | | | |
Norwegian Cruise Line Holdings Ltd. (a) | | | | | |
Royal Caribbean Cruises Ltd. | | | | | |
| | | | | |
| | | | | |
| | | | | |
| | | | | |
Consumer Staples Distribution & Retail — 1.9% |
| | | | | |
| | | | | |
| | | | | |
| | | | | |
Statement of Investments (continued)
| | | | | |
Common Stocks — 97.9% (continued) |
Consumer Staples Distribution & Retail — 1.9% (continued) |
| | | | | |
| | | | | |
Walgreens Boots Alliance, Inc. (b) | | | | | |
| | | | | |
| | | | | |
|
| | | | | |
| | | | | |
| | | | | |
| | | | | |
| | | | | |
| | | | | |
| | | | | |
| | | | | |
| | | | | |
| | | | | |
| | | | | |
| | | | | |
| | | | | |
| | | | | |
Occidental Petroleum Corp. | | | | | |
| | | | | |
| | | | | |
| | | | | |
| | | | | |
Texas Pacific Land Corp. (b) | | | | | |
The Williams Companies, Inc. | | | | | |
| | | | | |
| | | | | |
Equity Real Estate Investment Trusts — 1.9% |
Alexandria Real Estate Equities, Inc. (c) | | | | | |
| | | | | |
AvalonBay Communities, Inc. (c) | | | | | |
| | | | | |
Camden Property Trust (c) | | | | | |
| | | | | |
Digital Realty Trust, Inc. (c) | | | | | |
| | | | | |
| | | | | |
Essex Property Trust, Inc. (c) | | | | | |
Extra Space Storage, Inc. (c) | | | | | |
Federal Realty Investment Trust (c) | | | | | |
Healthpeak Properties, Inc. (c) | | | | | |
Host Hotels & Resorts, Inc. (c) | | | | | |
Invitation Homes, Inc. (c) | | | | | |
| | | | | |
| | | | | |
Mid-America Apartment Communities, Inc. (c) | | | | | |
| | | | | |
| | | | | |
Common Stocks — 97.9% (continued) |
Equity Real Estate Investment Trusts — 1.9% (continued) |
| | | | | |
| | | | | |
Regency Centers Corp. (c) | | | | | |
SBA Communications Corp. (c) | | | | | |
Simon Property Group, Inc. (c) | | | | | |
| | | | | |
| | | | | |
VICI Properties, Inc. (c) | | | | | |
| | | | | |
| | | | | |
| | | | | |
Financial Services — 8.0% |
| | | | | |
Ameriprise Financial, Inc. | | | | | |
Apollo Global Management, Inc. | | | | | |
Berkshire Hathaway, Inc., Cl. B (a) | | | | | |
| | | | | |
| | | | | |
Capital One Financial Corp. | | | | | |
Cboe Global Markets, Inc. | | | | | |
| | | | | |
| | | | | |
Discover Financial Services | | | | | |
FactSet Research Systems, Inc. | | | | | |
Fidelity National Information Services, Inc. | | | | | |
| | | | | |
Franklin Resources, Inc. (b) | | | | | |
| | | | | |
Intercontinental Exchange, Inc. | | | | | |
| | | | | |
Jack Henry & Associates, Inc. | | | | | |
| | | | | |
MarketAxess Holdings, Inc. | | | | | |
| | | | | |
| | | | | |
| | | | | |
| | | | | |
| | | | | |
| | | | | |
PayPal Holdings, Inc. (a) | | | | | |
Raymond James Financial, Inc. | | | | | |
| | | | | |
| | | | | |
| | | | | |
T. Rowe Price Group, Inc. | | | | | |
The Bank of New York Mellon Corp. | | | | | |
| | | | | |
Statement of Investments (continued)
| | | | | |
Common Stocks — 97.9% (continued) |
Financial Services — 8.0% (continued) |
The Goldman Sachs Group, Inc. | | | | | |
| | | | | |
| | | | | |
Food, Beverage & Tobacco — 2.3% |
| | | | | |
Archer-Daniels-Midland Co. (a) | | | | | |
Brown-Forman Corp., Cl. B (b) | | | | | |
| | | | | |
| | | | | |
Constellation Brands, Inc., Cl. A | | | | | |
| | | | | |
| | | | | |
| | | | | |
| | | | | |
Lamb Weston Holdings, Inc. | | | | | |
| | | | | |
Molson Coors Beverage Co., Cl. B | | | | | |
Mondelez International, Inc., Cl. A | | | | | |
Monster Beverage Corp. (a) | | | | | |
| | | | | |
Philip Morris International, Inc. | | | | | |
| | | | | |
| | | | | |
| | | | | |
| | | | | |
| | | | | |
| | | | | |
| | | | | |
Health Care Equipment & Services — 4.2% |
| | | | | |
Align Technology, Inc. (a) | | | | | |
Baxter International, Inc. | | | | | |
Becton, Dickinson and Co. | | | | | |
Boston Scientific Corp. (a) | | | | | |
| | | | | |
| | | | | |
| | | | | |
| | | | | |
| | | | | |
| | | | | |
Edwards Lifesciences Corp. (a) | | | | | |
| | | | | |
GE HealthCare Technologies, Inc. | | | | | |
| | | | | |
| | | | | |
| | | | | |
| | | | | |
IDEXX Laboratories, Inc. (a) | | | | | |
| | | | | |
| | | | | |
Common Stocks — 97.9% (continued) |
Health Care Equipment & Services — 4.2% (continued) |
Intuitive Surgical, Inc. (a) | | | | | |
| | | | | |
| | | | | |
| | | | | |
Molina Healthcare, Inc. (a) | | | | | |
| | | | | |
| | | | | |
| | | | | |
| | | | | |
| | | | | |
| | | | | |
| | | | | |
The Cooper Companies, Inc. (a) | | | | | |
| | | | | |
Universal Health Services, Inc., Cl. B | | | | | |
Zimmer Biomet Holdings, Inc. | | | | | |
| | | | | |
Household & Personal Products — 1.2% |
Church & Dwight Co., Inc. | | | | | |
| | | | | |
| | | | | |
| | | | | |
| | | | | |
The Estee Lauder Companies, Inc., Cl. A | | | | | |
The Procter & Gamble Company | | | | | |
| | | | | |
|
| | | | | |
American International Group, Inc. | | | | | |
| | | | | |
| | | | | |
| | | | | |
| | | | | |
| | | | | |
| | | | | |
Cincinnati Financial Corp. | | | | | |
Erie Indemnity Co., Cl. A | | | | | |
| | | | | |
| | | | | |
| | | | | |
Marsh & McLennan Cos., Inc. | | | | | |
| | | | | |
Principal Financial Group, Inc. | | | | | |
Prudential Financial, Inc. | | | | | |
| | | | | |
The Hartford Financial Services Group, Inc. | | | | | |
| | | | | |
The Travelers Companies, Inc. | | | | | |
Statement of Investments (continued)
| | | | | |
Common Stocks — 97.9% (continued) |
Insurance — 2.0% (continued) |
| | | | | |
| | | | | |
| | | | | |
|
Air Products and Chemicals, Inc. | | | | | |
| | | | | |
| | | | | |
| | | | | |
| | | | | |
| | | | | |
CF Industries Holdings, Inc. | | | | | |
| | | | | |
| | | | | |
| | | | | |
| | | | | |
| | | | | |
| | | | | |
| | | | | |
International Flavors & Fragrances, Inc. | | | | | |
International Paper Co. (b) | | | | | |
| | | | | |
LyondellBasell Industries NV, Cl. A | | | | | |
Martin Marietta Materials, Inc. | | | | | |
| | | | | |
| | | | | |
Packaging Corp. of America | | | | | |
| | | | | |
| | | | | |
| | | | | |
| | | | | |
The Sherwin-Williams Company | | | | | |
| | | | | |
| | | | | |
Media & Entertainment — 8.3% |
| | | | | |
| | | | | |
Charter Communications, Inc., Cl. A (a),(b) | | | | | |
| | | | | |
| | | | | |
| | | | | |
| | | | | |
Live Nation Entertainment, Inc. (a) | | | | | |
Match Group, Inc. (a),(b) | | | | | |
Meta Platforms, Inc., Cl. A | | | | | |
| | | | | |
| | | | | |
| | | | | |
| | | | | |
Paramount Global, Cl. B (b) | | | | | |
| | | | | |
Common Stocks — 97.9% (continued) |
Media & Entertainment — 8.3% (continued) |
Take-Two Interactive Software, Inc. (a) | | | | | |
The Interpublic Group of Companies, Inc. | | | | | |
| | | | | |
Warner Bros Discovery, Inc. (a) | | | | | |
| | | | | |
Pharmaceuticals, Biotechnology & Life Sciences — 5.7% |
| | | | | |
Agilent Technologies, Inc. | | | | | |
| | | | | |
| | | | | |
| | | | | |
| | | | | |
Charles River Laboratories International, Inc. (a) | | | | | |
| | | | | |
| | | | | |
| | | | | |
| | | | | |
| | | | | |
| | | | | |
| | | | | |
Mettler-Toledo International, Inc. (a) | | | | | |
| | | | | |
| | | | | |
Regeneron Pharmaceuticals, Inc. (a) | | | | | |
| | | | | |
Thermo Fisher Scientific, Inc. | | | | | |
Vertex Pharmaceuticals, Inc. (a) | | | | | |
| | | | | |
| | | | | |
West Pharmaceutical Services, Inc. | | | | | |
| | | | | |
| | | | | |
Real Estate Management & Development — .1% |
CBRE Group, Inc., Cl. A (a) | | | | | |
| | | | | |
| | | | | |
Semiconductors & Semiconductor Equipment — 11.2% |
Advanced Micro Devices, Inc. (a) | | | | | |
| | | | | |
| | | | | |
| | | | | |
Enphase Energy, Inc. (a),(b) | | | | | |
| | | | | |
| | | | | |
| | | | | |
| | | | | |
Microchip Technology, Inc. | | | | | |
| | | | | |
Monolithic Power Systems, Inc. | | | | | |
Statement of Investments (continued)
| | | | | |
Common Stocks — 97.9% (continued) |
Semiconductors & Semiconductor Equipment — 11.2% (continued) |
| | | | | |
| | | | | |
ON Semiconductor Corp. (a) | | | | | |
| | | | | |
| | | | | |
| | | | | |
| | | | | |
| | | | | |
Software & Services — 11.3% |
| | | | | |
| | | | | |
Akamai Technologies, Inc. (a) | | | | | |
| | | | | |
| | | | | |
Cadence Design Systems, Inc. (a) | | | | | |
Cognizant Technology Solutions Corp., Cl. A | | | | | |
CrowdStrike Holdings, Inc., Cl. A (a) | | | | | |
| | | | | |
| | | | | |
| | | | | |
| | | | | |
| | | | | |
| | | | | |
International Business Machines Corp. | | | | | |
| | | | | |
| | | | | |
| | | | | |
Palantir Technologies, Inc., Cl. A (a) | | | | | |
Palo Alto Networks, Inc. (a) | | | | | |
| | | | | |
| | | | | |
| | | | | |
| | | | | |
| | | | | |
Tyler Technologies, Inc. (a) | | | | | |
| | | | | |
| | | | | |
| | | | | |
Technology Hardware & Equipment — 9.2% |
| | | | | |
| | | | | |
Arista Networks, Inc. (a) | | | | | |
| | | | | |
| | | | | |
| | | | | |
Dell Technologies, Inc., Cl. C | | | | | |
| | | | | |
Hewlett Packard Enterprise Co. | | | | | |
| | | | | |
| | | | | |
Common Stocks — 97.9% (continued) |
Technology Hardware & Equipment — 9.2% (continued) |
| | | | | |
| | | | | |
Keysight Technologies, Inc. (a) | | | | | |
| | | | | |
| | | | | |
Seagate Technology Holdings PLC | | | | | |
Super Micro Computer, Inc. (a) | | | | | |
| | | | | |
Teledyne Technologies, Inc. (a) | | | | | |
| | | | | |
Western Digital Corp. (a) | | | | | |
Zebra Technologies Corp., Cl. A (a) | | | | | |
| | | | | |
Telecommunication Services — .9% |
| | | | | |
| | | | | |
Verizon Communications, Inc. | | | | | |
| | | | | |
|
C.H. Robinson Worldwide, Inc. | | | | | |
| | | | | |
| | | | | |
Expeditors International of Washington, Inc. | | | | | |
| | | | | |
J.B. Hunt Transport Services, Inc. | | | | | |
| | | | | |
Old Dominion Freight Line, Inc. | | | | | |
Southwest Airlines Co. (b) | | | | | |
Uber Technologies, Inc. (a) | | | | | |
| | | | | |
United Airlines Holdings, Inc. (a) | | | | | |
United Parcel Service, Inc., Cl. B | | | | | |
| | | | | |
|
| | | | | |
| | | | | |
American Electric Power Co., Inc. | | | | | |
American Water Works Co., Inc. | | | | | |
| | | | | |
| | | | | |
| | | | | |
Consolidated Edison, Inc. | | | | | |
Constellation Energy Corp. | | | | | |
| | | | | |
| | | | | |
| | | | | |
| | | | | |
| | | | | |
| | | | | |
Statement of Investments (continued)
| | | | | |
Common Stocks — 97.9% (continued) |
Utilities — 2.3% (continued) |
| | | | | |
| | | | | |
| | | | | |
| | | | | |
| | | | | |
| | | | | |
| | | | | |
Pinnacle West Capital Corp. | | | | | |
| | | | | |
Public Service Enterprise Group, Inc. | | | | | |
| | | | | |
| | | | | |
| | | | | |
| | | | | |
| | | | | |
| | | | | |
| | | | | |
Total Common Stocks
(cost $668,089,800) | | | | | |
| | | | | |
Investment Companies — 2.0% |
Registered Investment Companies — 2.0% |
Dreyfus Institutional Preferred Government Plus Money Market Fund, Institutional (cost $69,658,059) | | | | | |
Investment of Cash Collateral for Securities Loaned — .0% | | | | | |
Registered Investment Companies — .0% | | | | | |
Dreyfus Institutional Preferred Government Plus Money Market Fund, Institutional (cost $292,105) | | | | | |
Total Investments (cost $738,039,964) | | | | | |
Cash and Receivables (Net) | | | | | |
| | | | | |
| Non-income producing security. |
| Security, or portion thereof, on loan. At December 31, 2024, the value of the fund’s securities on loan was $49,978,672 and the value of the collateral was $51,127,940, consisting of cash collateral of $292,105 and U.S. Government & Agency securities valued at $50,835,835. In addition, the value of collateral may include pending sales that are also on loan. |
| Investment in real estate investment trust within the United States. |
| Investment in affiliated issuer. The investment objective of this investment company is publicly available and can be found within the investment company’s prospectus. |
|
| | | | | Dividends/
Distributions ($) |
Registered Investment Companies - 2.0% |
Dreyfus Institutional Preferred Government Plus Money Market Fund, Institutional Shares - 2.0% | | | | | |
Investment of Cash Collateral for Securities Loaned - .0% | |
Dreyfus Institutional Preferred Government Plus Money Market Fund, Institutional Shares - .0% | | | | | |
| | | | | |
| Includes reinvested dividends/distributions. |
| Represents securities lending income earned from the reinvestment of cash collateral from loaned securities, net of fees and collateral investment expenses, and other payments to and from borrowers of securities. |
| | | | | |
| | | | | Unrealized
(Depreciation) ($) |
| | | | | |
Standard & Poor’s 500 E-mini | | | | | |
Gross Unrealized Depreciation | | | | | |
See notes to financial statements.
STATEMENT OF ASSETS AND LIABILITIES
December 31, 2024
| | |
| | |
Investments in securities—See Statement of Investments
(including securities on loan, valued at $49,978,672)—Note 1(c): | | |
| | |
| | |
Cash collateral held by broker—Note 4 | | |
Dividends and securities lending income receivable | | |
Receivable for shares of Common Stock subscribed | | |
| | |
| | |
| | |
Due to BNY Mellon Investment Adviser, Inc. and affiliates—Note 3(c) | | |
Payable for shares of Common Stock redeemed | | |
Liability for securities on loan—Note 1(c) | | |
Payable for futures variation margin—Note 4 | | |
Directors’ fees and expenses payable | | |
| | |
| | |
| | |
Composition of Net Assets ($): | | |
| | |
Total distributable earnings (loss) | | |
| | |
Net Asset Value Per Share | | |
| | |
| | |
Net Asset Value Per Share ($) | | |
See notes to financial statements.
Year Ended December 31, 2024
| |
| |
| |
Cash dividends (net of $10,866 foreign taxes withheld at source): | |
| |
| |
| |
Income from securities lending—Note 1(c) | |
| |
| |
| |
Directors’ fees and expenses—Note 3(d) | |
Distribution fees—Note 3(b) | |
Prospectus and shareholders’ reports | |
| |
Loan commitment fees—Note 2 | |
Chief Compliance Officer fees—Note 3(c) | |
Shareholder servicing costs—Note 3(c) | |
| |
| |
| |
Less—reduction in fees due to earnings credits—Note 3(c) | |
| |
| |
Realized and Unrealized Gain (Loss) on Investments—Note 4 ($): | |
Net realized gain (loss) on investments | |
Net realized gain (loss) on futures | |
| |
Net change in unrealized appreciation (depreciation) on investments | |
Net change in unrealized appreciation (depreciation) on futures | |
Net Change in Unrealized Appreciation (Depreciation) | |
Net Realized and Unrealized Gain (Loss) on Investments | |
Net Increase in Net Assets Resulting from Operations | |
See notes to financial statements.
STATEMENT OF CHANGES IN NET ASSETS
| |
| | |
| | |
| | |
Net realized gain (loss) on investments | | |
Net change in unrealized appreciation (depreciation) on investments | | |
Net Increase (Decrease) in Net Assets Resulting from Operations | | |
| | |
Distributions to shareholders: | | |
| | |
| | |
| | |
Capital Stock Transactions ($): | | |
Net proceeds from shares sold: | | |
| | |
| | |
Distributions reinvested: | | |
| | |
| | |
| | |
| | |
| | |
Increase (Decrease) in Net Assets from Capital Stock Transactions | | |
Total Increase (Decrease) in Net Assets | | |
| | |
| | |
| | |
| |
| | |
Capital Share Transactions (Shares): | | |
| | |
| | |
Shares issued for distributions reinvested | | |
| | |
Net Increase (Decrease) in Shares Outstanding | | |
| | |
| | |
Shares issued for distributions reinvested | | |
| | |
Net Increase (Decrease) in Shares Outstanding | | |
See notes to financial statements.
The following tables describe the performance for each share class for the fiscal periods indicated. All information (except portfolio turnover rate) reflects financial results for a single fund share. Net asset value total return is calculated assuming an initial investment made at the net asset value at the beginning of the period, reinvestment of all dividends and distributions at net asset value during the period, and redemption at net asset value on the last day of the period. Net asset value total return includes adjustments in accordance with accounting principles generally accepted in the United States of America and as such, the net asset value for financial reporting purposes and the returns based upon those net asset values may differ from the net asset value and returns for shareholder transactions. The fund’s total returns do not reflect expenses associated with variable annuity or insurance contracts.
| |
| | | | | |
| | | | | |
Net asset value, beginning of period | | | | | |
| | | | |
| | | | | |
Net realized and unrealized gain (loss) on investments | | | | | |
Total from Investment Operations | | | | | |
| | | | | |
Dividends from net investment income | | | | | |
Dividends from net realized gain on investments | | | | | |
| | | | | |
Net asset value, end of period | | | | | |
| | | | | |
Ratios/Supplemental Data (%): | | | | |
Ratio of total expenses to average net assets | | | | | |
Ratio of net expenses to average net assets | | | | | |
Ratio of net investment income to average net assets | | | | | |
| | | | | |
Net Assets, end of period ($ x 1,000) | | | | | |
| Based on average shares outstanding. |
See notes to financial statements.
FINANCIAL HIGHLIGHTS (continued)
| |
| | | | | |
| | | | | |
Net asset value, beginning of period | | | | | |
| | | | |
| | | | | |
Net realized and unrealized gain (loss) on investments | | | | | |
Total from Investment Operations | | | | | |
| | | | | |
Dividends from net investment income | | | | | |
Dividends from net realized gain on investments | | | | | |
| | | | | |
Net asset value, end of period | | | | | |
| | | | | |
Ratios/Supplemental Data (%): | | | | |
Ratio of total expenses to average net assets | | | | | |
Ratio of net expenses to average net assets | | | | | |
Ratio of net investment income to average net assets | | | | | |
| | | | | |
Net Assets, end of period ($ x 1,000) | | | | | |
| Based on average shares outstanding. |
See notes to financial statements.
NOTES TO FINANCIAL STATEMENTS
NOTE 1—
Significant Accounting Policies:
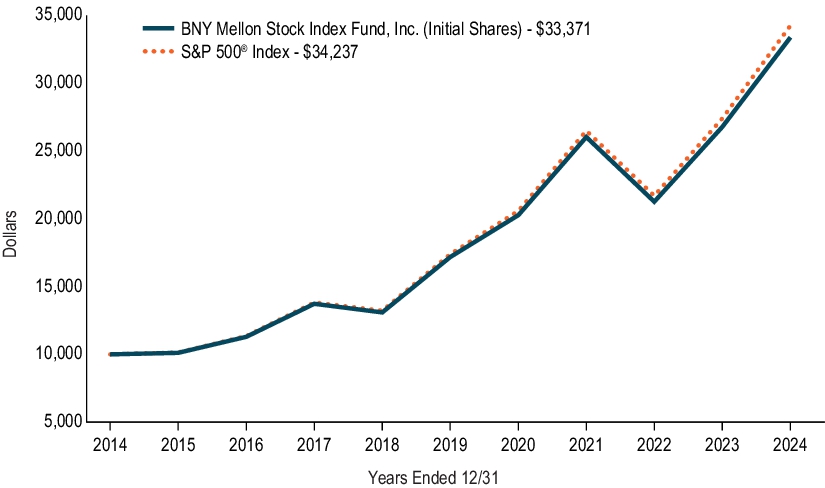
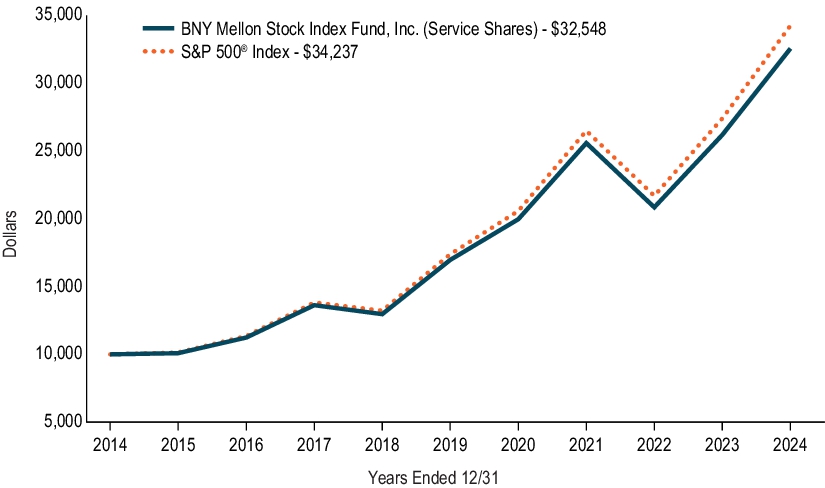
BNY Mellon Stock Index Fund, Inc. (the “fund”), which is registered under the Investment Company Act of 1940, as amended (the “Act”), is a diversified open-end management investment company. The fund is only offered to separate accounts established by insurance companies to fund variable annuity contracts and variable life insurance policies.The fund’s investment objective is to seek to match the total return of the S&P 500® Index. BNY Mellon Investment Adviser, Inc. (the “Adviser”), a wholly-owned subsidiary of The Bank of New York Mellon Corporation (“BNY”), serves as the fund’s investment adviser. Mellon Investments Corporation, an indirect wholly-owned subsidiary of BNY and an affiliate of the Adviser, serves as the fund’s index manager (the “Index Manager”).
BNY Mellon Securities Corporation (the “Distributor”), a wholly-owned subsidiary of the Adviser, is the distributor of the fund’s shares, which are sold without a sales charge. The fund is authorized to issue 400 million shares of $.001 par value of Common Stock in each of the following classes of shares: Initial shares (250 million shares authorized) and Service shares (150 million shares authorized). Initial shares are subject to a Shareholder Services Plan fee and Service shares are subject to a Distribution Plan fee. Each class of shares has identical rights and privileges, except with respect to the Distribution Plan, Shareholder Services Plan and the expenses borne by each class, the allocation of certain transfer agency costs and certain voting rights. Income, expenses (other than expenses attributable to a specific class), and realized and unrealized gains or losses on investments are allocated to each class of shares based on its relative net assets.
The Financial Accounting Standards Board (“FASB”) Accounting Standards Codification (“ASC”) is the exclusive reference of authoritative U.S. generally accepted accounting principles (“GAAP”) recognized by the FASB to be applied by nongovernmental entities. Rules and interpretive releases of the SEC under authority of federal laws are also sources of authoritative GAAP for SEC registrants. The fund is an investment company and applies the accounting and reporting guidance of the FASB ASC Topic 946 Financial Services-Investment Companies. The fund’s financial statements are prepared in accordance with GAAP, which may require the use of management estimates and assumptions. Actual results could differ from those estimates.
The fund enters into contracts that contain a variety of indemnifications. The fund’s maximum exposure under these arrangements is unknown. The fund does not anticipate recognizing any loss related to these arrangements.
(a) Portfolio valuation: The fair value of a financial instrument is the amount that would be received to sell an asset or paid to transfer a liability in an orderly transaction between market participants at the measurement date (i.e., the exit price). GAAP establishes a fair value hierarchy that prioritizes the inputs of valuation techniques used to measure fair value. This hierarchy gives the highest priority to unadjusted quoted prices in active markets for identical assets or liabilities (Level 1 measurements) and the lowest priority to unobservable inputs (Level 3 measurements).
Additionally, GAAP provides guidance on determining whether the volume and activity in a market has decreased significantly and whether such a decrease in activity results in transactions that are not orderly. GAAP requires enhanced disclosures around valuation inputs and techniques used during annual and interim periods.
Various inputs are used in determining the value of the fund’s investments relating to fair value measurements. These inputs are summarized in the three broad levels listed below:
Level 1—unadjusted quoted prices in active markets for identical investments.
Level 2—other significant observable inputs (including quoted prices for similar investments, interest rates, prepayment speeds, credit risk, etc.).
Level 3—significant unobservable inputs (including the fund’s own assumptions in determining the fair value of investments).
The inputs or methodology used for valuing securities are not necessarily an indication of the risk associated with investing in those securities.
Changes in valuation techniques may result in transfers in or out of an assigned level within the disclosure hierarchy. Valuation techniques used to value the fund’s investments are as follows:
The fund’s Board of Directors (the “Board”) has designated the Adviser as the fund’s valuation designee to make all fair value determinations with respect to the fund’s portfolio investments, subject to the Board’s oversight and pursuant to Rule 2a-5 under the Act.
Investments in equity securities are valued at the last sales price on the securities exchange or national securities market on which such securities are primarily traded. Securities listed on the National Market System for which market quotations are available are valued at the official closing price or, if there is no official closing price that day, at the last sales price. For open short positions, asked prices are
NOTES TO FINANCIAL STATEMENTS (continued)
used for valuation purposes. Bid price is used when no asked price is available. Registered investment companies that are not traded on an exchange are valued at their net asset value. All of the preceding securities are generally categorized within Level 1 of the fair value hierarchy.
Securities not listed on an exchange or the national securities market, or securities for which there were no transactions, are valued at the average of the most recent bid and asked prices. These securities are generally categorized within Level 2 of the fair value hierarchy.
Fair valuing of securities may be determined with the assistance of a pricing service using calculations based on indices of domestic securities and other appropriate indicators, such as prices of relevant American Depositary Receipts and futures. Utilizing these techniques may result in transfers between Level 1 and Level 2 of the fair value hierarchy.
When market quotations or official closing prices are not readily available, or are determined not to accurately reflect fair value, such as when the value of a security has been significantly affected by events after the close of the exchange or market on which the security is principally traded, but before the fund calculates its net asset value, the fund may value these investments at fair value as determined in accordance with the procedures approved by the Board. Certain factors may be considered when fair valuing investments such as: fundamental analytical data, the nature and duration of restrictions on disposition, an evaluation of the forces that influence the market in which the securities are purchased and sold, and public trading in similar securities of the issuer or comparable issuers. These securities are either categorized within Level 2 or 3 of the fair value hierarchy depending on the relevant inputs used.
For securities where observable inputs are limited, assumptions about market activity and risk are used and such securities are generally categorized within Level 3 of the fair value hierarchy.
Futures, which are traded on an exchange, are valued at the last sales price on the securities exchange on which such securities are primarily traded or at the last sales price on the national securities market on each business day and are generally categorized within Level 1 of the fair value hierarchy.
The following is a summary of the inputs used as of December 31, 2024 in valuing the fund’s investments:
| Level 1 -
Unadjusted
Quoted Prices | Level 2- Other
Significant
Observable Inputs | Level 3-
Significant
Unobservable
Inputs | |
| | | | |
Investments in Securities:† | | | | |
Equity Securities -
Common Stocks | | | | |
| | | | |
| | | | |
Other Financial Instruments: | | | | |
| | | | |
| See Statement of Investments for additional detailed categorizations, if any. |
| Amount shown represents unrealized appreciation (depreciation) at period end, but only variation margin on exchange-traded and centrally cleared derivatives, if any, are reported in the Statement of Assets and Liabilities. |
(b) Foreign taxes: The fund may be subject to foreign taxes (a portion of which may be reclaimable) on income, stock dividends, realized and unrealized capital gains on investments or certain foreign currency transactions. Foreign taxes are recorded in accordance with the applicable foreign tax regulations and rates that exist in the foreign jurisdictions in which the fund invests. These foreign taxes, if any, are paid by the fund and are reflected in the Statement of Operations, if applicable. Foreign taxes payable or deferred or those subject to reclaims as of December 31, 2024, if any, are disclosed in the fund’s Statement of Assets and Liabilities.
(c) Securities transactions and investment income: Securities transactions are recorded on a trade date basis. Realized gains and losses from securities transactions are recorded on the identified cost basis. Dividend income is recognized on the ex-dividend date and interest income, including, where applicable, accretion of discount and amortization of premium on investments, is recognized on the accrual basis.
Pursuant to a securities lending agreement with BNY, the fund may lend securities to qualified institutions. It is the fund’s policy that, at origination, all loans are secured by collateral of at least 102% of the value of U.S. securities loaned and 105% of the value of foreign
NOTES TO FINANCIAL STATEMENTS (continued)
securities loaned. Collateral equivalent to at least 100% of the market value of securities on loan is maintained at all times. Collateral is either in the form of cash, which can be invested in certain money market mutual funds managed by the Adviser, or U.S. Government and Agency securities. Any non-cash collateral received cannot be sold or re-pledged by the fund, except in the event of borrower default, and is not reflected in the Statement of Assets and Liabilities. The securities on loan, if any, are also disclosed in the fund’s Statement of Investments. The fund is entitled to receive all dividends, interest and distributions on securities loaned, in addition to income earned as a result of the lending transaction. Should a borrower fail to return the securities in a timely manner, BNY is required to replace the securities for the benefit of the fund or credit the fund with the market value of the unreturned securities and is subrogated to the fund’s rights against the borrower and the collateral. Additionally, the contractual maturity of security lending transactions are on an overnight and continuous basis. During the period ended December 31, 2024, BNY earned $6,788 from the lending of the fund’s portfolio securities, pursuant to the securities lending agreement.
For financial reporting purposes, the fund elects not to offset assets and liabilities subject to a securities lending agreement, if any, in the Statement of Assets and Liabilities. Therefore, all qualifying transactions are presented on a gross basis in the Statement of Assets and Liabilities. As of December 31, 2024, the fund had securities lending and the impact of netting of assets and liabilities and the offsetting of collateral pledged or received, if any, based on contractual netting/set-off provisions in the securities lending agreement are detailed in the following table:
| | |
Gross amount of securities loaned, at value, as disclosed in the Statement
of Assets and Liabilities | | |
Collateral (received)/posted not offset
in the Statement of
Assets and Liabilities | | |
| | |
| The value of the related collateral received by the fund exceeded the value of the securities loaned by the fund pursuant to the securities lending agreement. In addition, the value of collateral may include pending sales that are also on loan. See Statement of Investments for detailed information regarding collateral received for open securities lending. |
(d) Affiliated issuers: Investments in other investment companies advised by the Adviser are considered “affiliated” under the Act.
(e) Market Risk: The value of the securities in which the fund invests may be affected by political, regulatory, economic and social developments, and developments that impact specific economic sectors, industries or segments of the market. In addition, turbulence in financial markets and reduced liquidity in equity, credit and/or fixed-income markets may negatively affect many issuers, which could adversely affect the fund. Global economies and financial markets are becoming increasingly interconnected, and conditions and events in one country, region or financial market may adversely impact issuers in a different country, region or financial market. These risks may be magnified if certain events or developments adversely interrupt the global supply chain; in these and other circumstances, such risks might affect companies world-wide.
Indexing Strategy Risk: The fund uses an indexing strategy. It does not attempt to manage market volatility, use defensive strategies or reduce the effects of any long-term periods of poor index performance. The correlation between fund and index performance may be affected by the fund’s expenses, changes in securities markets, changes in the composition of the index and the timing of purchases and redemptions of fund shares.
(f) Dividends and distributions to shareholders: Dividends and distributions are recorded on the ex-dividend date. Dividends from net investment income are normally declared and paid quarterly. Dividends from net realized capital gains, if any, are normally declared and paid annually, but the fund may make distributions on a more frequent basis to comply with the distribution requirements of the Internal Revenue Code of 1986, as amended (the “Code”). To the extent that net realized capital gains can be offset by capital loss carryovers, it is the policy of the fund not to distribute such gains. Income and capital gain distributions are determined in accordance with income tax regulations, which may differ from GAAP.
(g) Federal income taxes: It is the policy of the fund to continue to qualify as a regulated investment company, if such qualification is in the best interests of its shareholders, by complying with the applicable provisions of the Code, and to make distributions of taxable income and net realized capital gain sufficient to relieve it from substantially all federal income and excise taxes.
NOTES TO FINANCIAL STATEMENTS (continued)
As of and during the period ended December 31, 2024, the fund did not have any liabilities for any uncertain tax positions. The fund recognizes interest and penalties, if any, related to uncertain tax positions as income tax expense in the Statement of Operations. During the period ended December 31, 2024, the fund did not incur any interest or penalties.
Each tax year in the four-year period ended December 31, 2024 remains subject to examination by the Internal Revenue Service and state taxing authorities.
At December 31, 2024, the components of accumulated earnings on a tax basis were as follows: undistributed ordinary income $3,630,235, undistributed capital gains $196,970,132 and unrealized appreciation $2,683,481,721.
The tax character of distributions paid to shareholders during the fiscal years ended December 31, 2024 and December 31, 2023 were as follows: ordinary income $37,798,883 and $38,604,101, and long-term capital gains $201,452,260 and $101,976,152, respectively.
During the period ended December 31, 2024, as a result of permanent book to tax differences, primarily due to tax treatment for Kimco Realty Corp long-term capital gain adjustments, the fund decreased total distributable earnings (loss) by $13,676 and increased paid-in capital by the same amount. Net assets and net asset value per share were not affected by this reclassification.
(h) Operating segment reporting: In this reporting period, the fund adopted FASB Accounting Standards Update 2023-07, Segment Reporting (Topic 280) - Improvements to Reportable Segment Disclosures (“ASU 2023-07”). Adoption of the new standard impacted financial statement disclosures only and did not affect the fund’s financial position or the results of its operations. The ASU 2023-07 is effective for public entities for fiscal years beginning after December 15, 2023, and requires retrospective application for all prior periods presented within the financial statements.
Since its commencement, the fund operates and is managed as a single reportable segment deriving returns in the form of dividends, interest and/or gains from the investments made in pursuit of its single stated investment objective as outlined in the fund’s prospectus. The accounting policies of the fund are consistent with those described in these Notes to Financial Statements. The chief operating decision maker (“CODM”) is represented by BNY Investments, the management of the fund’s Adviser, comprising of Senior Management and Directors. The CODM considers net increase in net assets resulting from operations in deciding whether to purchase additional investments or to make distributions to its shareholders. Detailed financial information for the fund is disclosed within these financial statements with total assets and liabilities disclosed on the Statement of Assets and Liabilities, investments held on the Statement of Investments, results of operations and significant segment expenses on the Statement of Operations and other information about the fund’s performance, including total return, portfolio turnover and ratios within the Financial Highlights.
NOTE 2—
Bank Lines of Credit:
The fund participates with other long-term open-end funds managed by the Adviser in a $738 million unsecured credit facility led by Citibank, N.A. (the “Citibank Credit Facility”) and a $300 million unsecured credit facility provided by BNY (the “BNY Credit Facility”), each to be utilized primarily for temporary or emergency purposes, including the financing of redemptions (each, a “Facility”). The Citibank Credit Facility is available in two tranches: (i) Tranche A is in an amount equal to $618 million and is available to all long-term open-ended funds, including the fund, and (ii) Tranche B is an amount equal to $120 million and is available only to BNY Mellon Floating Rate Income Fund, a series of BNY Mellon Investment Funds IV, Inc. In connection therewith, the fund has agreed to pay its pro rata portion of commitment fees for Tranche A of the Citibank Credit Facility and the BNY Credit Facility. Interest is charged to the fund based on rates determined pursuant to the terms of the respective Facility at the time of borrowing. During the period ended December 31, 2024, the fund did not borrow under either Facility.
NOTE 3—
Management Fee, Index-Management Fee and Other Transactions with Affiliates:
(a) Pursuant to a management agreement with the Adviser, the management fee is computed at the annual rate of .245% of the value of the fund’s average daily net assets and is payable monthly.
Pursuant to an index-management agreement (the “Index Agreement”), the Adviser has agreed to pay the Index Manager a monthly index-management fee at the annual rate of .095% of the value of the fund’s average daily net assets. Pursuant to the Index Agreement, the Index Manager pays The Bank of New York Mellon (the “Custodian”), a subsidiary of BNY and an affiliate of the Adviser, for its services to the fund.
(b) Under the Distribution Plan adopted pursuant to Rule 12b-1 under the Act, Service shares pay the Distributor for distributing its shares, for servicing and/or maintaining Service shares’ shareholder accounts and for advertising and marketing for Service shares. The Distribution Plan provides for payments to be made at an annual rate of .25% of the value of the Service shares’ average daily net assets.
NOTES TO FINANCIAL STATEMENTS (continued)
The Distributor may make payments to Participating Insurance Companies and to brokers and dealers acting as principal underwriter for their variable insurance products. The fees payable under the Distribution Plan are payable without regard to actual expenses incurred. During the period ended December 31, 2024, Service shares were charged $156,283 pursuant to the Distribution Plan.
(c) Under the Shareholder Services Plan, Initial shares reimburse the Distributor at an amount not to exceed an annual rate of .25% of the value of its average daily net assets for certain allocated expenses with respect to servicing and/or maintaining Initial shares’ shareholder accounts. During the period ended December 31, 2024, Initial shares were charged $9,155 pursuant to the Shareholder Services Plan.
The fund has an arrangement with BNY Mellon Transfer, Inc., (the “Transfer Agent”), a subsidiary of BNY and an affiliate of the Adviser, whereby the fund may receive earnings credits when positive cash balances are maintained, which are used to offset Transfer Agent fees. For financial reporting purposes, the fund includes transfer agent net earnings credits, if any, as an expense offset in the Statement of Operations.
The fund has an arrangement with the Custodian whereby the fund will receive interest income or be charged overdraft fees when cash balances are maintained. For financial reporting purposes, the fund includes this interest income and overdraft fees, if any, as interest income in the Statement of Operations.
The fund compensates the Transfer Agent, under a transfer agency agreement, for providing transfer agency and cash management services for the fund. The majority of Transfer Agent fees are comprised of amounts paid on a per account basis, while cash management fees are related to fund subscriptions and redemptions. During the period ended December 31, 2024, the fund was charged $1,541 for transfer agency services. These fees are included in Shareholder servicing costs in the Statement of Operations. These fees were partially offset by earnings credits of $548.
During the period ended December 31, 2024, the fund was charged $19,576 for services performed by the fund’s Chief Compliance Officer and his staff. These fees are included in Chief Compliance Officer fees in the Statement of Operations.
The components of “Due to BNY Mellon Investment Adviser, Inc. and affiliates” in the Statement of Assets and Liabilities consist of: Management fee of $731,087, Distribution Plan fees of $14,138, Chief Compliance Officer fees of $4,057 and Transfer Agent fees of $582.
(d) Each board member of the fund also serves as a board member of other funds in the BNY Mellon Family of Funds complex. Annual retainer fees and attendance fees are allocated to each fund based on net assets.
NOTE 4—
Securities Transactions:
The aggregate amount of purchases and sales of investment securities, excluding short-term securities and derivatives, during the period ended December 31, 2024, amounted to $83,931,516 and $274,048,576, respectively.
Derivatives: A derivative is a financial instrument whose performance is derived from the performance of another asset. Rule 18f-4 under the Act regulates the use of derivatives transactions for certain funds registered under the Act. The fund is deemed a “limited” derivatives user under the rule and is required to limit its derivatives exposure so that the total notional value of applicable derivatives does not exceed 10% of fund’s net assets, and is subject to certain reporting requirements. Each type of derivative instrument that was held by the fund during the period ended December 31, 2024 is discussed below.
Deposits with Broker: The amount included in deposits held with broker represents cash balances that are held by a broker including collateral required for derivative contracts within Cash collateral held by broker in the Statement of Asset and Liabilities. Any income earned on cash balances held by a broker is recorded as interest income to the fund.
Futures: In the normal course of pursuing its investment objective, the fund is exposed to market risk, including equity price risk, as a result of changes in value of underlying financial instruments. The fund invests in futures in order to manage its exposure to or protect against changes in the market. A futures contract represents a commitment for the future purchase or a sale of an asset at a specified date. Upon entering into such contracts, these investments require initial margin deposits with a counterparty, which consist of cash or cash equivalents. The amount of these deposits is determined by the exchange or Board of Trade on which the contract is traded and is subject to change. Accordingly, variation margin payments are received or made to reflect daily unrealized gains or losses which are recorded in the Statement of Operations. When the contracts are closed, the fund recognizes a realized gain or loss which is reflected in the Statement of Operations. There is minimal counterparty credit risk to the fund with futures since they are exchange traded, and the exchange guarantees the futures against default. Futures open at December 31, 2024 are set forth in the Statement of Investments.
NOTES TO FINANCIAL STATEMENTS (continued)
The following tables show the fund’s exposure to different types of market risk as it relates to the Statement of Assets and Liabilities and the Statement of Operations, respectively.
Fair value of derivative instruments as of December 31, 2024 is shown below:
| | | Derivative
Liabilities ($) |
| | | |
Gross fair value of derivative contracts | | | |
Statement of Assets and Liabilities location: |
| Includes cumulative appreciation (depreciation) on futures as reported in the Statement of Investments, but only the unpaid variation margin is reported in the Statement of Assets and Liabilities. |
The effect of derivative instruments in the Statement of Operations during the period ended December 31, 2024 is shown below:
Amount of realized gain (loss) on derivatives recognized in income ($) |
| | |
| | |
| | |
Net change in unrealized appreciation (depreciation) on derivatives recognized in income ($) |
| | |
| | |
| | |
Statement of Operations location: |
| Net realized gain (loss) on futures. |
| Net change in unrealized appreciation (depreciation) on futures. |
The following table summarizes the monthly average market value of derivatives outstanding during the period ended December 31, 2024:
At December 31, 2024, the cost of investments for federal income tax purposes was $755,385,398; accordingly, accumulated net unrealized appreciation on investments was $2,683,481,721, consisting of $2,728,017,856 gross unrealized appreciation and $44,536,135 gross unrealized depreciation.
REPORT OF INDEPENDENT REGISTERED PUBLIC ACCOUNTING FIRM
To the Shareholders and the Board of Directors of BNY Mellon Stock Index Fund, Inc.
Opinion on the Financial Statements
We have audited the accompanying statement of assets and liabilities of BNY Mellon Stock Index Fund, Inc. (the “Fund”), including the statement of investments, as of December 31, 2024, and the related statement of operations for the year then ended, the statements of changes in net assets for each of the two years in the period then ended, the financial highlights for each of the five years in the period then ended and the related notes (collectively referred to as the “financial statements”). In our opinion, the financial statements present fairly, in all material respects, the financial position of the Fund at December 31, 2024, the results of its operations for the year then ended, the changes in its net assets for each of the two years in the period then ended and its financial highlights for each of the five years in the period then ended, in conformity with U.S. generally accepted accounting principles.
These financial statements are the responsibility of the Fund’s management. Our responsibility is to express an opinion on the Fund’s financial statements based on our audits. We are a public accounting firm registered with the Public Company Accounting Oversight Board (United States) (“PCAOB”) and are required to be independent with respect to the Fund in accordance with the U.S. federal securities laws and the applicable rules and regulations of the Securities and Exchange Commission and the PCAOB.
We conducted our audits in accordance with the standards of the PCAOB. Those standards require that we plan and perform the audit to obtain reasonable assurance about whether the financial statements are free of material misstatement, whether due to error or fraud. The Fund is not required to have, nor were we engaged to perform, an audit of the Fund’s internal control over financial reporting. As part of our audits, we are required to obtain an understanding of internal control over financial reporting but not for the purpose of expressing an opinion on the effectiveness of the Fund’s internal control over financial reporting. Accordingly, we express no such opinion.
Our audits included performing procedures to assess the risks of material misstatement of the financial statements, whether due to error or fraud, and performing procedures that respond to those risks. Such procedures included examining, on a test basis, evidence regarding the amounts and disclosures in the financial statements. Our procedures included confirmation of securities owned as of December 31, 2024, by correspondence with the custodian, brokers and others; when replies were not received from brokers and others, we performed other auditing procedures. Our audits also included evaluating the accounting principles used and significant estimates made by management, as well as evaluating the overall presentation of the financial statements. We believe that our audits provide a reasonable basis for our opinion. 
We have served as the auditor of one or more investment companies in the BNY Mellon Family of Funds since at least 1957, but we are unable to determine the specific year.
New York, New York
February 11, 2025
IMPORTANT TAX INFORMATION (Unaudited)
For federal tax purposes, the fund hereby reports 100% of the ordinary dividends paid during the fiscal year ended December 31, 2024 as qualifying for the corporate dividends received deduction. Shareholders will receive notification in early 2025 of the percentage applicable to the preparation of their 2024 income tax returns.The fund also hereby reports $4.8000 per share as a long-term capital gain distribution and $.0084 per share as a short-term capital gain distribution paid March 28, 2024.
Item 8. Changes in and Disagreements with Accountants for Open-End Management Investment Companies (Unaudited)
Item 9. Proxy Disclosures for Open-End Management Investment Companies (Unaudited)
Item 10. Remuneration Paid to Directors, Officers, and Others of Open-End Management Investment Companies (Unaudited)
Each board member also serves as a board member of other funds in the BNY Mellon Family of Funds complex. Annual retainer fees and attendance fees are allocated to each fund based on net assets. Directors fees paid by the fund are within Item 7. Statement of Operations as Directors’ fees and expenses.
Item 11. Statement Regarding Basis for Approval of Investment Advisory Contracts (Unaudited)
© 2025 BNY Mellon Securities CorporationCode-0763NCSRAR1224
| Item 12. | Disclosure of Proxy Voting Policies and Procedures for Closed-End Management Investment Companies. |
Not applicable.
| Item 13. | Portfolio Managers for Closed-End Management Investment Companies. |
Not applicable.
| Item 14. | Purchases of Equity Securities By Closed-End Management Investment Companies and Affiliated Purchasers. |
Not applicable.
| Item 15. | Submission of Matters to a Vote of Security Holders. |
There have been no material changes to the procedures applicable to Item 15.
| Item 16. | Controls and Procedures. |
| (a) | The Registrant's principal executive and principal financial officers have concluded, based on their evaluation of the Registrant's disclosure controls and procedures as of a date within 90 days of the filing date of this report, that the Registrant's disclosure controls and procedures are reasonably designed to ensure that information required to be disclosed by the Registrant on Form N-CSR is recorded, processed, summarized and reported within the required time periods and that information required to be disclosed by the Registrant in the reports that it files or submits on Form N-CSR is accumulated and communicated to the Registrant's management, including its principal executive and principal financial officers, as appropriate to allow timely decisions regarding required disclosure. |
| (b) | There were no changes to the Registrant's internal control over financial reporting that occurred during the period covered by this report that have materially affected, or are reasonably likely to materially affect, the Registrant's internal control over financial reporting. |
| Item 17. | Disclosure of Securities Lending Activities for Closed-End Management Investment Companies. |
Not applicable.
| Item 18. | Recovery of Erroneously Awarded Compensation. |
Not applicable.
(a)(1) Code of ethics referred to in Item 2.
(a)(3) Not applicable.
SIGNATURES
Pursuant to the requirements of the Securities Exchange Act of 1934 and the Investment Company Act of 1940, the Registrant has duly caused this Report to be signed on its behalf by the undersigned, thereunto duly authorized.
BNY Mellon Stock Index Fund, Inc.
By: /s/ David J. DiPetrillo
David J. DiPetrillo
President (Principal Executive Officer)
Date: February 7, 2025
Pursuant to the requirements of the Securities Exchange Act of 1934 and the Investment Company Act of 1940, this Report has been signed below by the following persons on behalf of the Registrant and in the capacities and on the dates indicated.
By: /s/ David J. DiPetrillo
David J. DiPetrillo
President (Principal Executive Officer)
Date: February 7, 2025
By: /s/ James Windels
James Windels
Treasurer (Principal Financial Officer)
Date: February 7, 2025
EXHIBIT INDEX
| (a)(1) | Code of ethics referred to in Item 2. |
| (a)(2) | Certifications of principal executive and principal financial officers as required by Rule 30a-2(a) under the Investment Company Act of 1940. (EX-99.CERT) |
| (b) | Certification of principal executive and principal financial officers as required by Rule 30a-2(b) under the Investment Company Act of 1940. (EX-99.906CERT) |