Exhibit 99.1
Lakeland Bancorp, inc.
Nasdaq: “LBAI”
Thomas J. Shara, President & CEO Joseph F. Hurley, EVP & CFO
First Quarter 2010
1
Lakeland Bancorp,inc.
Statement Regarding
Forward-Looking Information
The information disclosed in this document includes various forward-looking statements that are made in reliance upon the safe harbor provisions of the Private Securities Litigation Reform Act of 1994 with respect to credit quality (including delinquency trends and the allowance for loan and lease losses), corporate objectives, and other financial and business matters. The words “anticipates”, “projects”, “intends”, “estimates”, “ expects”, “believes”, “plans”, “may”, “will”, “should”, “could”, and other similar expressions are intended to identify such forward-looking statements are necessarily speculative and speak only as of the date made, and are subject to numerous assumptions, risks, and uncertainties, all of which may change over time. Actual results could differ materially from such forward-looking statements.
In addition to the risk factors disclosed elsewhere in this document, the following factors, among others, could cause the Company’s actual results to differ materially and adversely from such forward-looking statements: changes in the financial services industry and the U.S. and global capital markets, changes in economic conditions nationally, regionally and in the Company’s markets, the nature and timing of actions of the Federal Reserve Board and other regulators, the nature and timing of legislature affecting the financial services industry, government intervention in the U.S. financial system, passage by the U.S. Congress of legislation which unilaterally amends the terms of the U.S. Department of the Treasury’s preferred stock investment in the Company, changes in the levels of market interest rates, pricing pressures of the loan and deposit products, credit risks of the Company’s lending and leasing activities, customers’ acceptance of the Company’s products and services competition.
The above-listed risk factors are not necessarily exhaustive, particularly as to possible future events, and new risk factors may emerge from time to time. Certain events may occur that could cause the Company’s actual results to be materially different than those described in the Company’s periodic filings with the Securities and Exchange Commission. Any statements made by the Company that are not historical facts should be considered to be forward-looking statements. The Company is not obligated to update and does not undertake to update any of its forward-looking statements made herein.
2
2
Lakeland Bancorp,inc.
Corporate Profile
$2.8 Billion Commercial Bank
3rd largest publicly held commercial bank headquartered in New Jersey (6th largest including thrifts)
40-year history
48 branches
3
Lakeland Bancorp,inc.
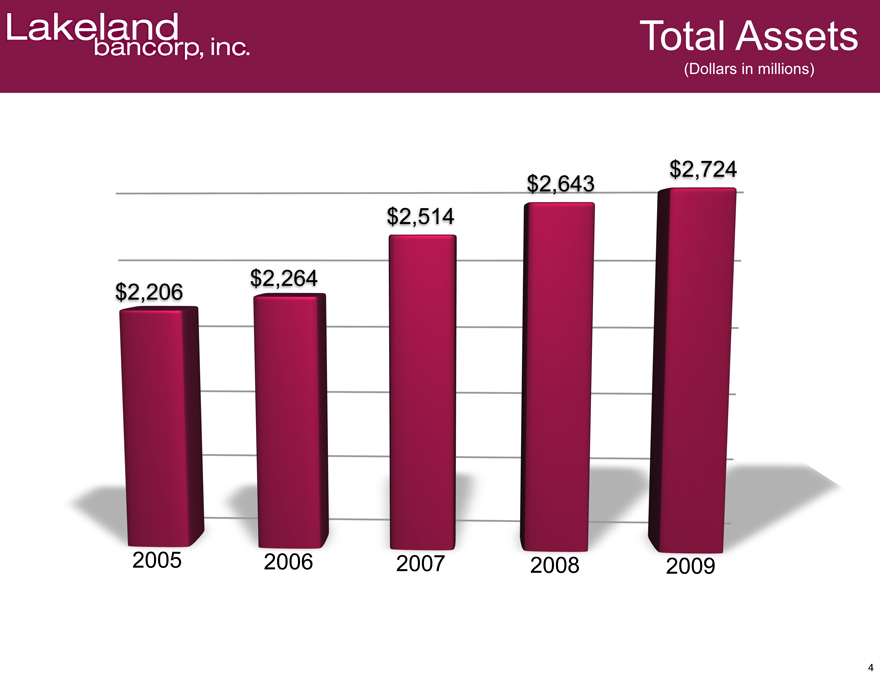
Total Assets
(Dollars in millions)
$2,206
$2,264
$2,514
$2,643
$2,724
2005
2006
2007
2008
2009
4
Lakeland Bancorp,inc.
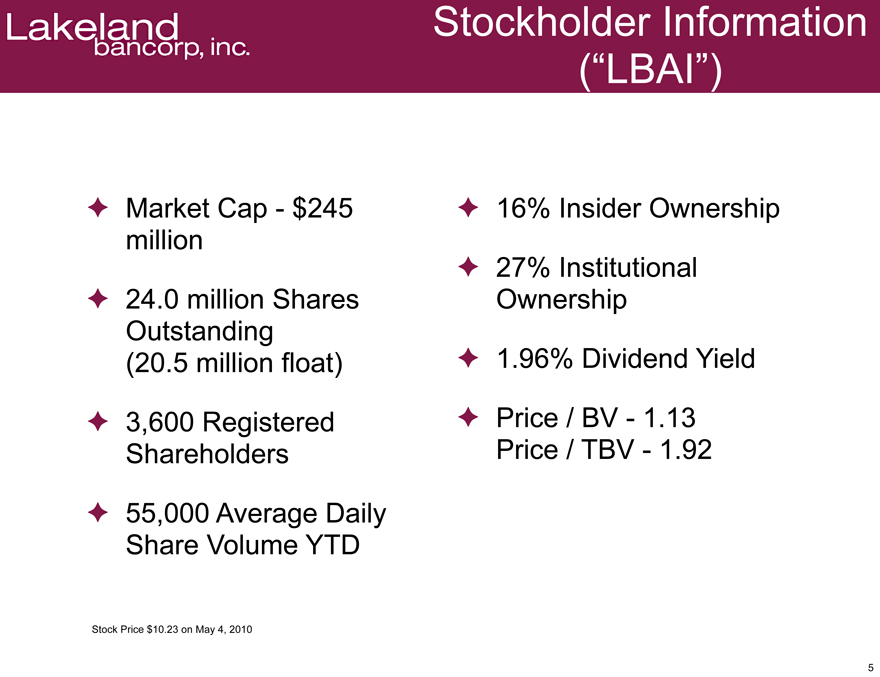
Stockholder Information (“LBAI”)
Market Cap—$245 million
24.0 million Shares Outstanding (20.5 million float)
3,600 Registered Shareholders
55,000 Average Daily Share Volume YTD
16% Insider Ownership
27% Institutional Ownership
1.96% Dividend Yield
Price / BV—1.13 Price / TBV—1.92
Stock Price $10.23 on May 4, 2010
5
Lakeland Bancorp,inc.
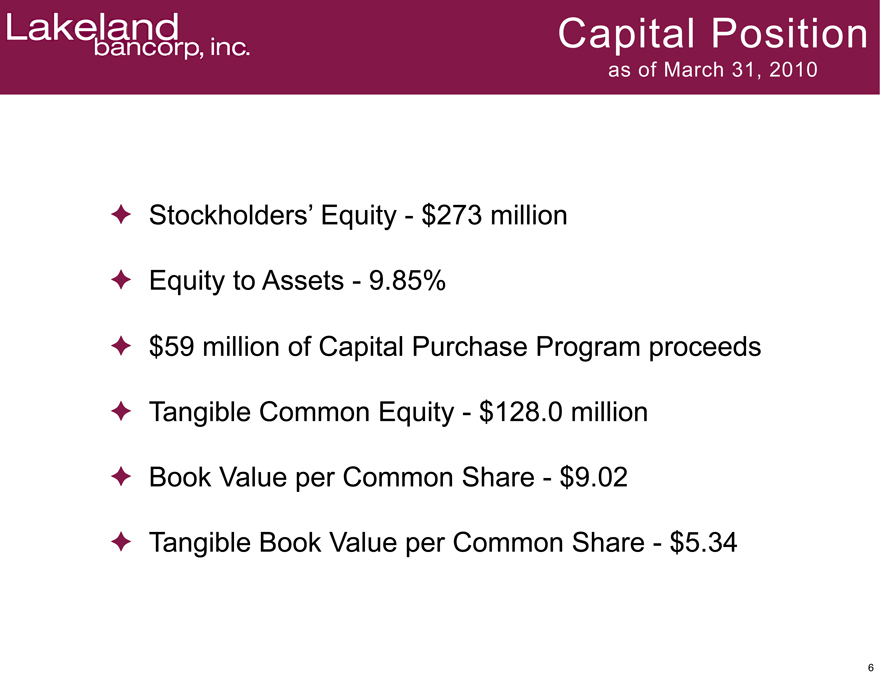
Capital Position
as of March 31, 2010
Stockholders’ Equity—$273 million Equity to Assets—9.85% $59 million of Capital Purchase Program proceeds Tangible Common Equity—$128.0 million Book Value per Common Share—$9.02 Tangible Book Value per Common Share—$5.34
6
Lakeland Bancorp,inc.
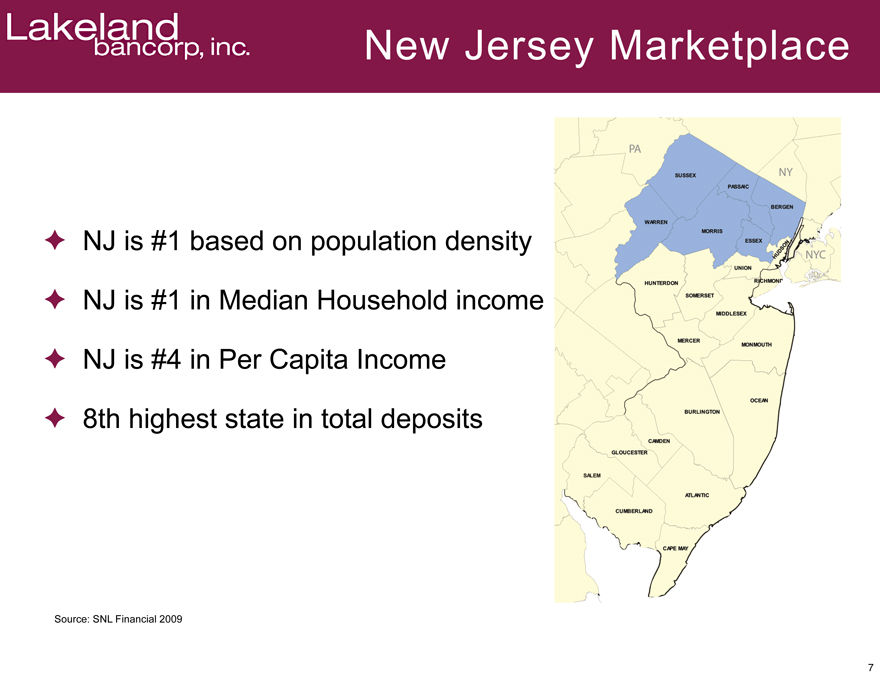
New Jersey Marketplace
NJ is #1 based on population density NJ is #1 in Median Household income NJ is #4 in Per Capita Income 8th highest state in total deposits
Source: SNL Financial 2009
7
Lakeland Bancorp,inc.
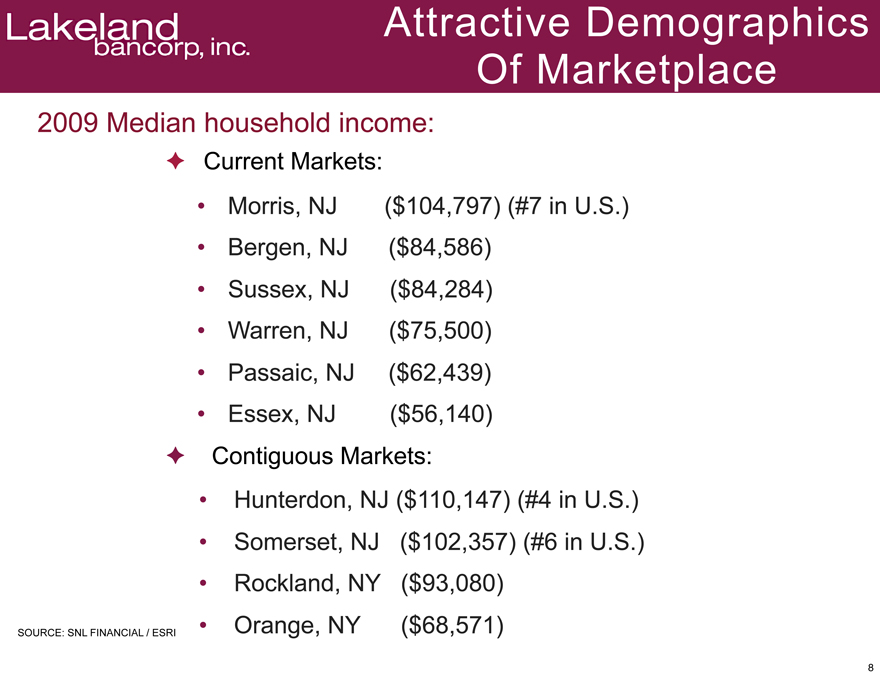
Attractive Demographics Of Marketplace
2009 Median household income:
Current Markets:
Morris, NJ ($104,797) (#7 in U.S.) Bergen, NJ ($84,586) Sussex, NJ ($84,284) Warren, NJ ($75,500) Passaic, NJ ($62,439) Essex, NJ ($56,140)
Contiguous Markets:
Hunterdon, NJ ($110,147) (#4 in U.S.) Somerset, NJ ($102,357) (#6 in U.S.) Rockland, NY ($93,080) Orange, NY ($68,571)
SOURCE: SNL FINANCIAL / ESRI
8
Lakeland Bancorp,inc.
Expansion Strategy
County State Total Deposits # of Small in Markets ($M) (1) Businesses (2)
Current counties of operation
Bergen NJ $ 37,055 32,828 Essex NJ $ 19,900 19,858 Morris NJ $ 15,872 17,370 Passaic NJ $ 9,594 12,046 Sussex NJ $ 2,330 3,641 Warren NJ $ 2,244 2,803
Total $ 86,995 88,546
Contiguous counties
Hudson NJ $ 22,184 13,059 Middlesex NJ $ 21,130 21,218 Union NJ $ 15,917 14,449 Rockland NY $ 7,877 9,093 Somerset NJ $ 8,062 9,783 Orange NY $ 5,468 8,975 Hunterdon NJ $ 3,254 4,128
Total $ 83,892 80,705 Grand Total $ 170,887 169,251
SOURCE: SNL FINANCIAL / ESRI (1) Data As Of June 30, 2009
(2) Data As Of 2008; Small Businesses Defined As Those With Less Than 100 Employees
9
Lakeland Bancorp,inc.
Capitalize on Recent Consolidation Activity
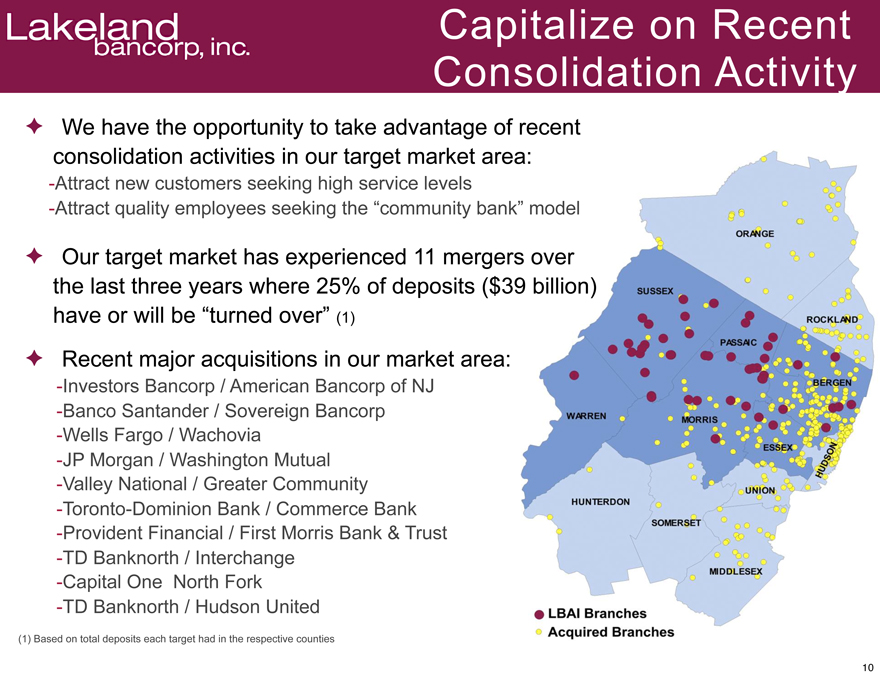
-Attract new customers seeking high service levels
-Attract quality employees seeking the “community bank” model
We have the opportunity to take advantage of recent consolidation activities in our target market area:
Our target market has experienced 11 mergers over the last three years where 25% of deposits ($39 billion) have or will be “turned over” (1)
Recent major acquisitions in our market area:
Investors Bancorp / American Bancorp of NJ
Banco Santander / Sovereign Bancorp -Wells Fargo / Wachovia -JP Morgan / Washington Mutual -Valley National / Greater Community -Toronto-Dominion Bank / Commerce Bank -Provident Financial / First Morris Bank & Trust -TD Banknorth / Interchange -Capital One North Fork -TD Banknorth / Hudson United
(1) Based on total deposits each target had in the respective counties
10
Lakeland Bancorp,inc.
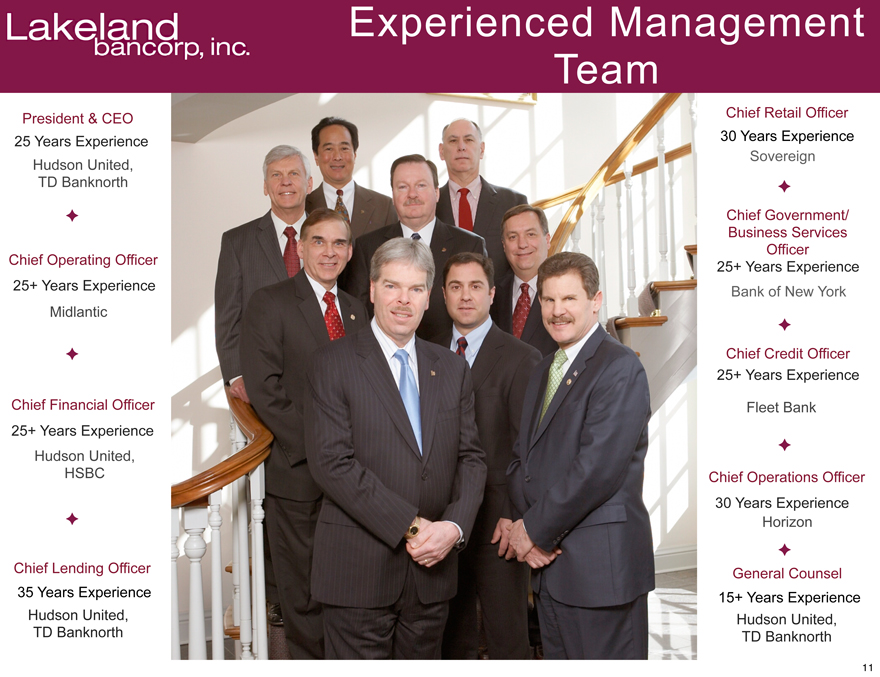
Experienced Management Team
President & CEO
25 Years Experience Hudson United, TD Banknorth
Chief Operating Officer 25+ Years Experience
Midlantic
Chief Financial Officer 25+ Years Experience Hudson United, HSBC
Chief Lending Officer
35 Years Experience Hudson United, TD Banknorth
Chief Retail Officer
30 Years Experience Sovereign
Chief Government/ Business Services Officer 25+ Years Experience Bank of New York
Chief Credit Officer 25+ Years Experience
Fleet Bank
Chief Operations Officer
30 Years Experience
Horizon
General Counsel 15+ Years Experience Hudson United, TD Banknorth
11
Lakeland Bancorp,inc.
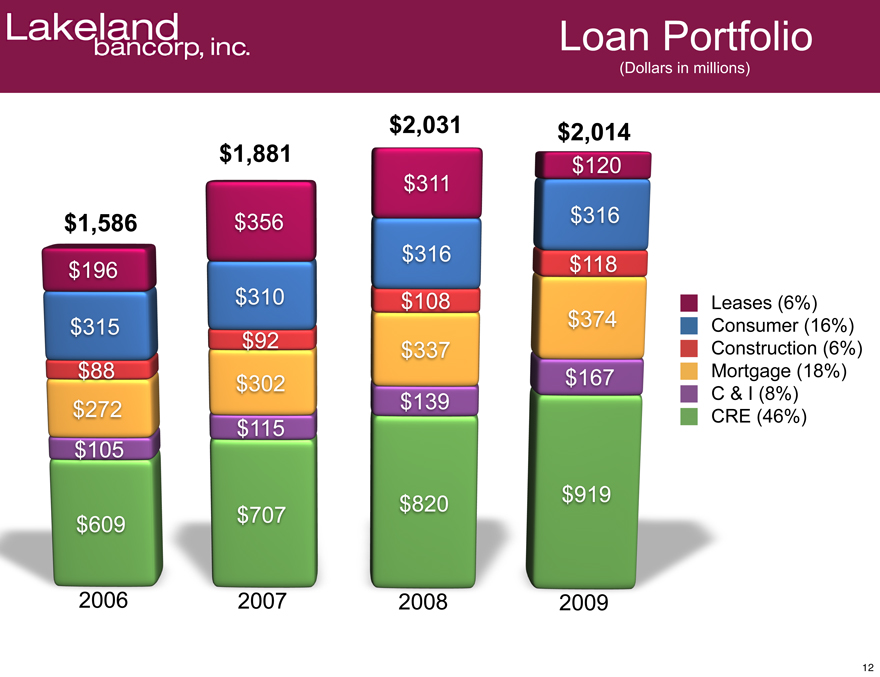
Loan Portfolio
(Dollars in millions)
$1,586
$1,881
$2,031
$2,014
$196
$315
$88
$272
$105
$609
2006
$356
$310
$92
$302
$115
$707
2007
$311
$316
$108
$337
$139
$820
2008
$120
$316
$118
$374
$167
$919
2009
Leases (6%) Consumer (16%) Construction (6%) Mortgage (18%) C & I (8%) CRE (46%)
12
Lakeland Bancorp,inc.
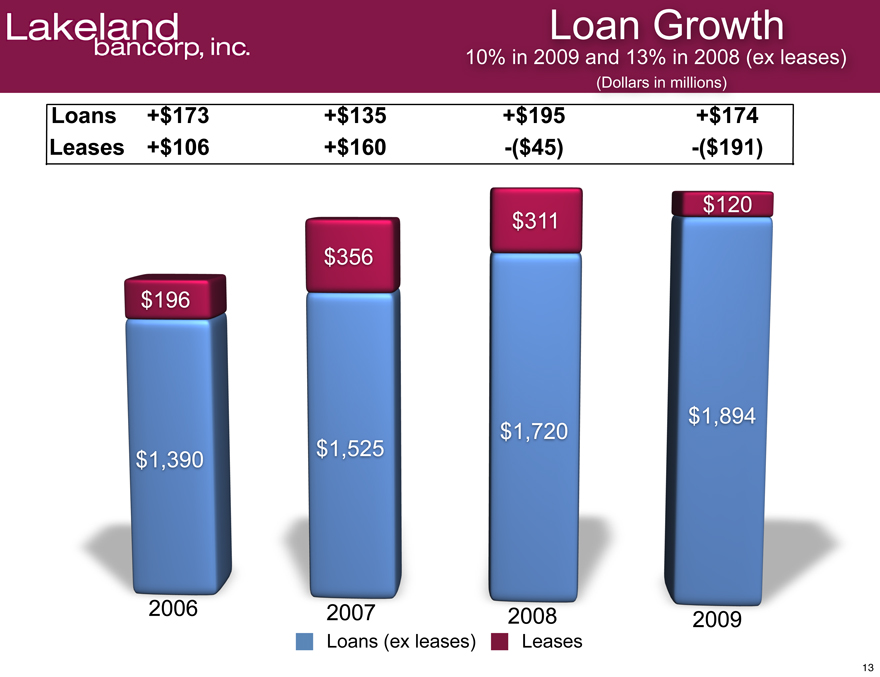
Loan Growth
10% in 2009 and 13%in 2008(ex leases)(Dollars in millions)
Loans +$173 +$135 +$195 +$174
Leases +$106 +$160 –($45) –($191)
$196 $1,390 2006
$356 $1525 2007
$311 $1,720 2008
$120 $1,894 2009
Loans(ex leases) Leases
13
Lakeland Bancorp,inc.
Commercial Lending
Commercial Lending
Six NJ Lending offices
Legal lending limit—$40m, House limit—$27m
Only seventeen borrowers with over $10 million exposure Average Commercial loan size approximately $500k Centralized lending approval No Shared National Credits
C & I Lending
New Chief Lending Officer
Established specialized C&I Lending Teams Integrated C&I Lenders into other lending teams Relationship Banking
14
Lakeland Bancorp,inc.
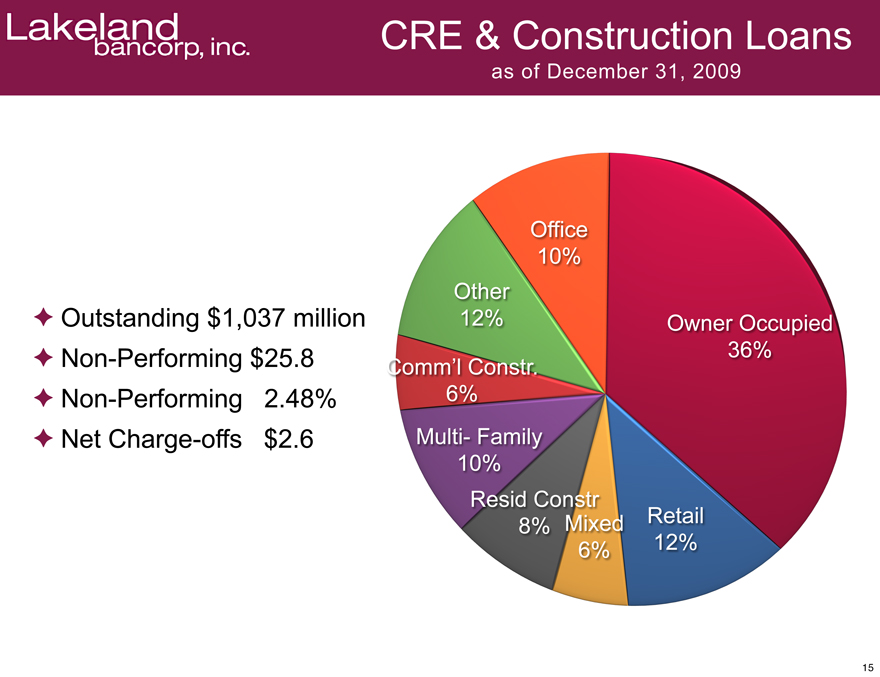
CRE & Construction Loans
as of December 31, 2009
Outstanding $1,037 million Non-Performing $25.8 Non-Performing 2.48% Net Charge-offs $2.6
Office 10%
Owner Occupied 36%
Other 12%
Comm’l Constr. 6%
Multi- Family 10%
Retail 12%
Mixed 6%
Resid Constr 8%
15
Lakeland Bancorp,inc.
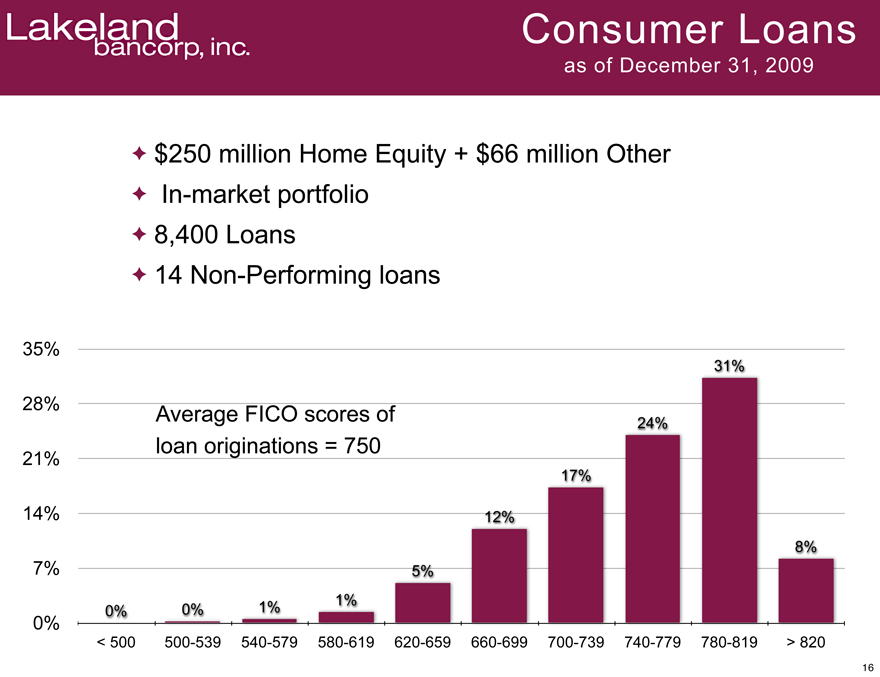
Consumer loans as of December 31,2009
$250 millins Home Equity + $66 million other
In-market portfolio
8,400 Loans
14 Non-Performing Loans
Average FICO scores of loan originations=750
35% 28% 21% 14% 7% 0%
0% 0% 1% 1% 5% 12% 17% 24% 31% 8%
<500 500-539 540-579 580-619 620-659 660-699 700-739 740-779 780-819 >200
16
Lakeland Bancorp,inc.
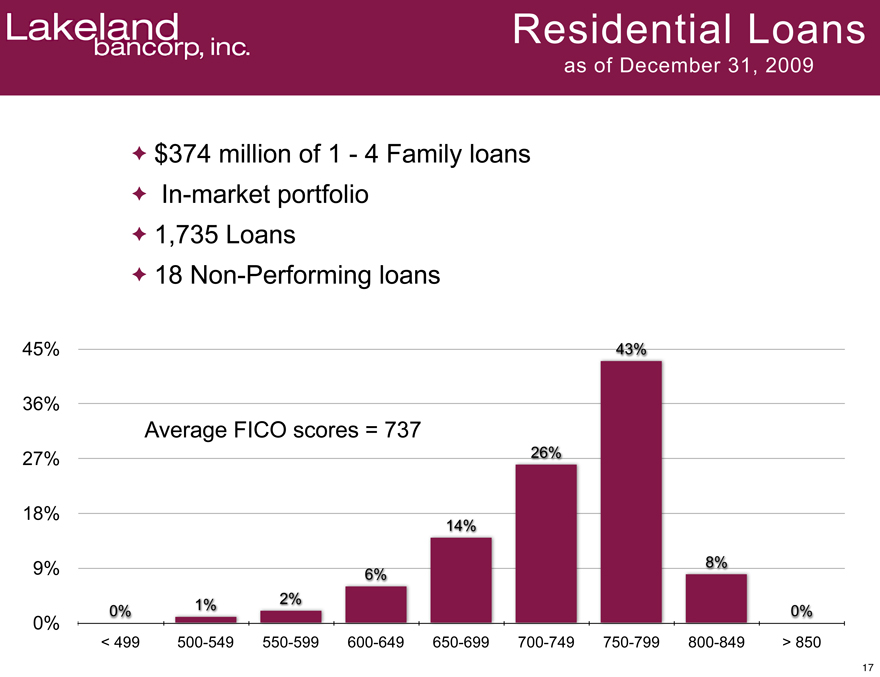
Residential Loans as of December 31, 2009
$374 million of 1-4 Family Loans
In-market portfolio
1,735 Loans
18 Non-Performing loans
45% 36% 27% 18% 9% 0%
Average FICO scores=737
0% 1% 2% 6% 14% 26% 43% 8% 0%
<499 500-549 550-599 600-649 650-699 700-749 750-799 800-849 >850
17
Lakeland bancorp, inc.
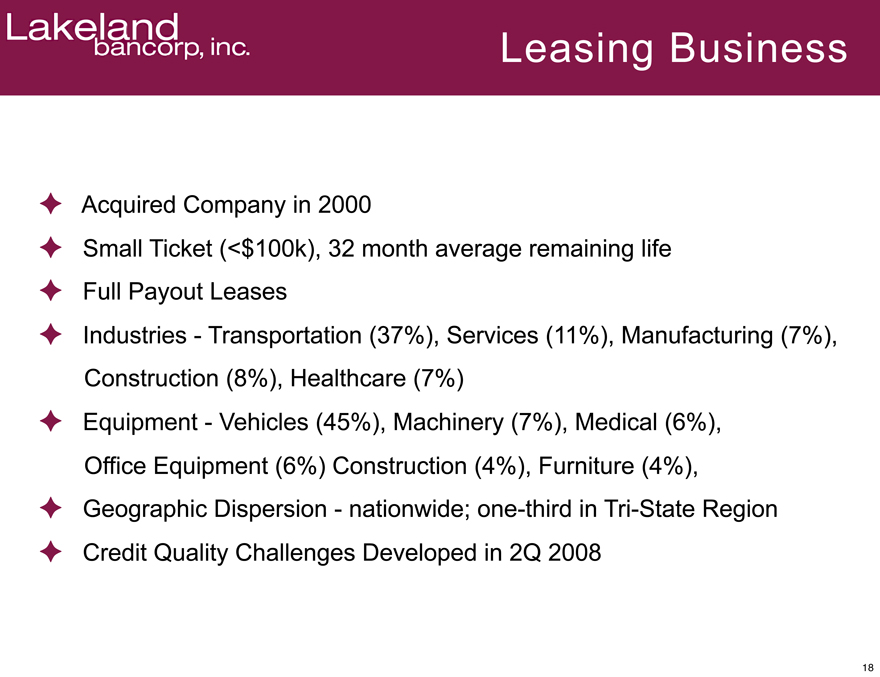
Leasing Business
Acquired Company in 2000
Small Ticket (<$100k), 32 month average remaining life
Full Payout Leases
Industries—Transportation (37%), Services (11%), Manufacturing (7%), Construction (8%), Healthcare (7%)
Equipment—Vehicles (45%), Machinery (7%), Medical (6%), Office Equipment (6%) Construction (4%), Furniture (4%),
Geographic Dispersion—nationwide; one-third in Tri-State Region
Credit Quality Challenges Developed in 2Q 2008
18
Lakeland
bancorp, inc.
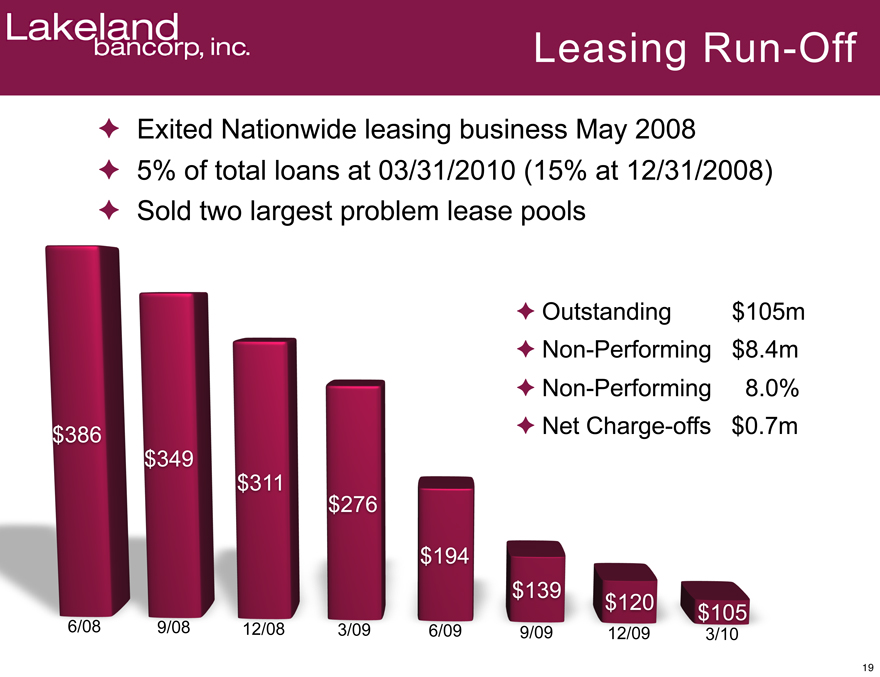
Leasing Run-Off
Exited Nationwide leasing business May 2008 5% of total loans at 03/31/2010 (15% at 12/31/2008) Sold two largest problem lease pools
Outstanding $105m Non-Performing $8.4m Non-Performing 8.0% Net Charge-offs $0.7m
$386
$349
$311
$276
$194
$139
$120
$105
6/08
9/08
12/08
3/09
6/09
9/09
12/09
3/10
19
Lakeland
bancorp, inc.
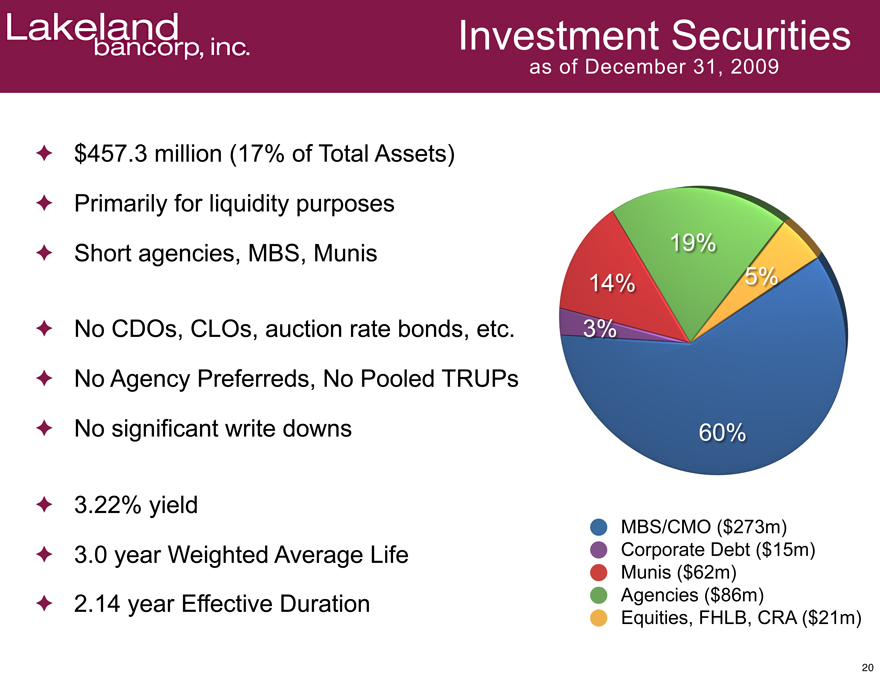
Investment Securities
as of December 31, 2009
$457.3 million (17% of Total Assets) Primarily for liquidity purposes Short agencies, MBS, Munis
No CDOs, CLOs, auction rate bonds, etc. No Agency Preferreds, No Pooled TRUPs No significant write downs
3.22% yield
3.0 year Weighted Average Life
2.14 year Effective Duration
MBS/CMO ($273m) Corporate Debt ($15m) Munis ($62m) Agencies ($86m) Equities, FHLB, CRA ($21m)
20
3%
14%
19%
5%
60%
Lakeland Bancorp,inc.
2009 Deposit Initiatives
New Head of Retail Banking
New Head of Retail Sales
Outbound Call Center initiatives
Three new branches, two branch closures
Renewed DDA focus
Proactively managed deposit pricing metrics
21
Lakeland
bancorp, inc.
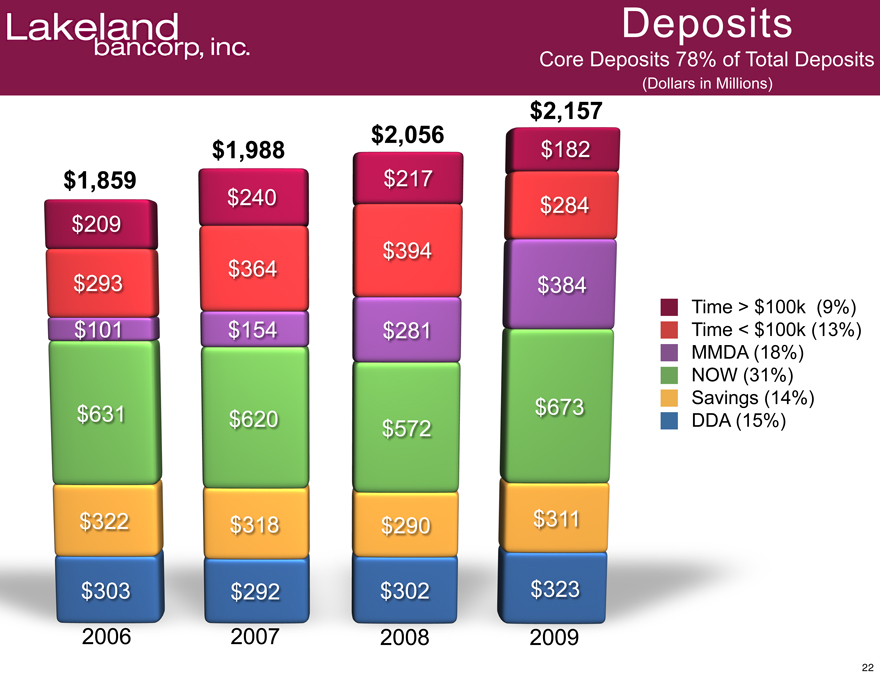
Deposits
Core Deposits 78% of Total Deposits
(Dollars in Millions)
Time > $100k (9%) Time < $100k (13%) MMDA (18%) NOW (31%) Savings (14%) DDA (15%)
$1,859
$1,988
$2,056
$2,157
$209
$240
$217
$182
$293
$364
$394
$284
$101
$154
$281
$384
$631
$620
$572
$673
$322
$318
$290
$311
$303
$292
$302
$323
2006
2007
2008
2009
22
Lakeland
bancorp, inc.
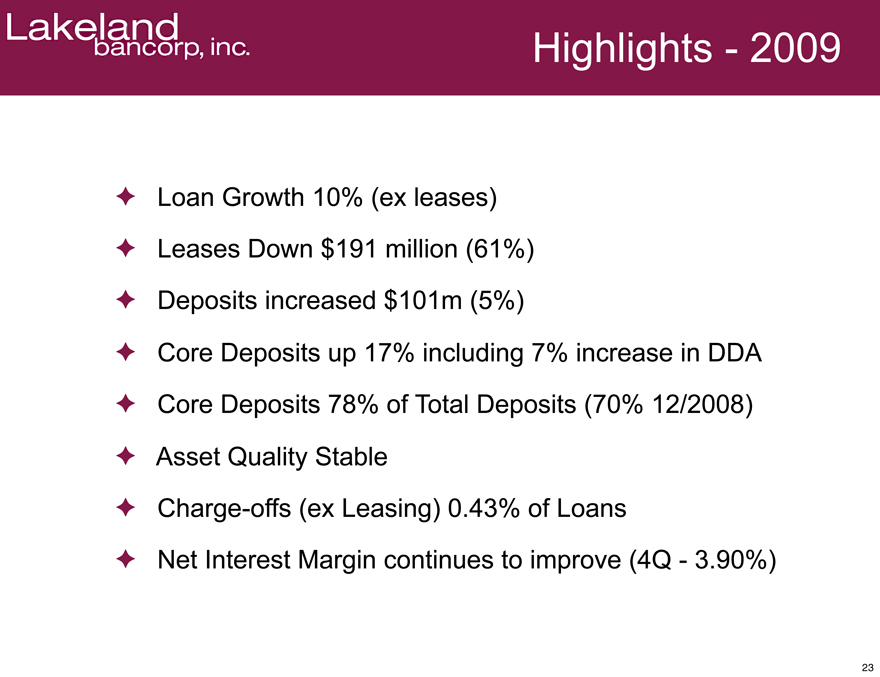
Highlights—2009
Loan Growth 10% (ex leases) Leases Down $191 million (61%) Deposits increased $101m (5%)
Core Deposits up 17% including 7% increase in DDA Core Deposits 78% of Total Deposits (70% 12/2008) Asset Quality Stable Charge-offs (ex Leasing) 0.43% of Loans Net Interest Margin continues to improve (4Q—3.90%)
23
Lakeland
bancorp, inc.
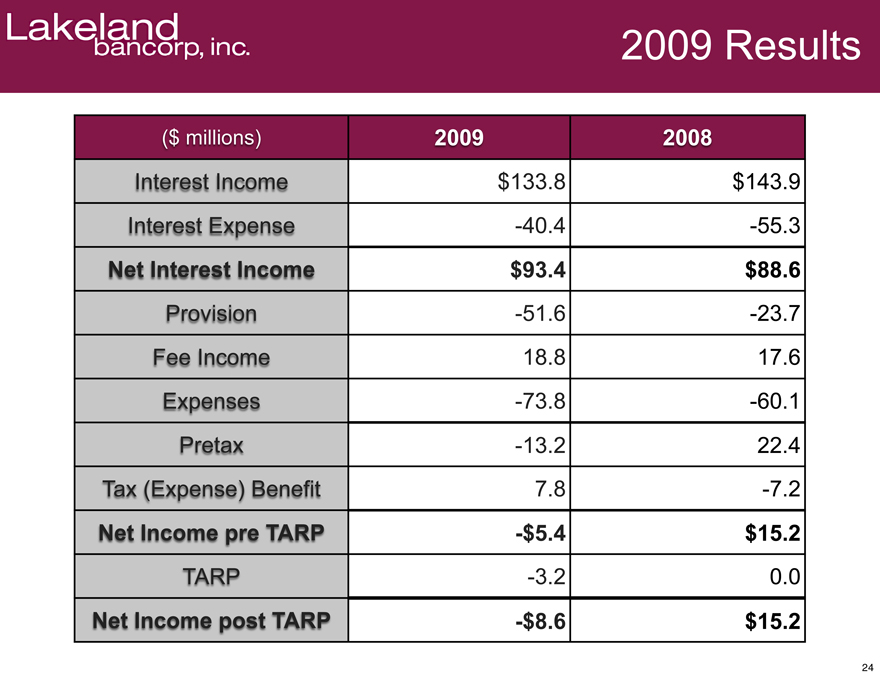
2009 Results
($ millions)
2009
2008
Interest Income
$133.8
$143.9
Interest Expense
-40.4
-55.3
Net Interest Income
$93.4
$88.6
Provision
-51.6
-23.7
Fee Income
18.8
17.6
Expenses
-73.8
-60.1
Pretax
-13.2
22.4
Tax (Expense) Benefit
7.8
-7.2
Net Income pre TARP
-$5.4
$15.2
TARP
-3.2
0.0
Net Income post TARP
-$8.6
$15.2
24
Lakeland
bancorp, inc.
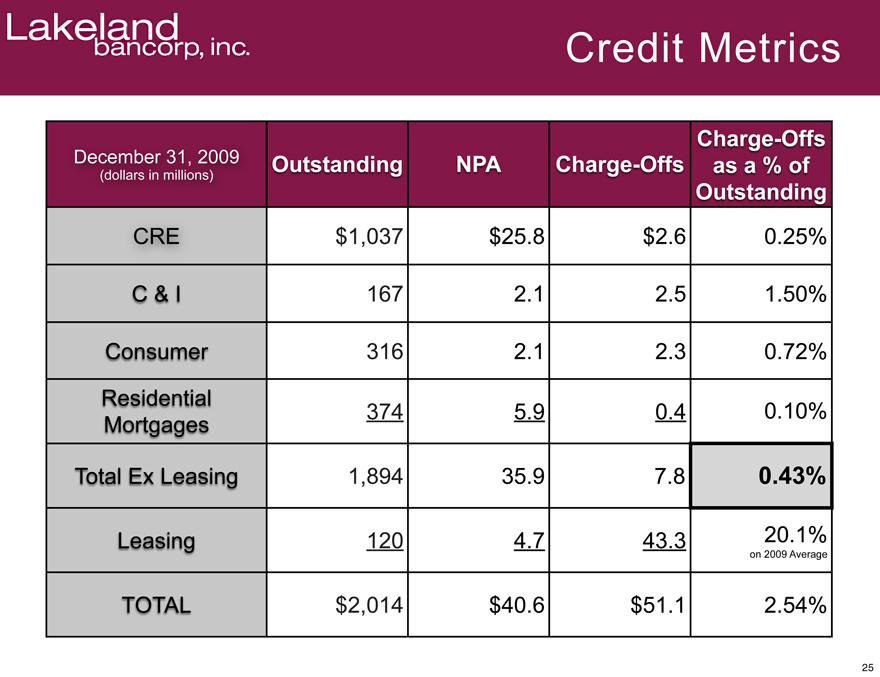
Credit Metrics
December 31, 2009
(dollars in millions)
Outstanding
NPA
Charge-Offs
Charge-Offs as a % of Outstanding
CRE
$1,037
$25.8
$2.6
0.25%
C & I
167
2.1
2.5
1.50%
Consumer
316
2.1
2.3
0.72%
Residential Mortgages
374
5.9
0.4
0.10%
Total Ex Leasing
1,894
35.9
7.8
0.43%
Leasing
120
4.7
43.3
20.1%
on 2009 Average
TOTAL
$2,014
$40.6
$51.1
2.54%
25
Lakeland
bancorp, inc.
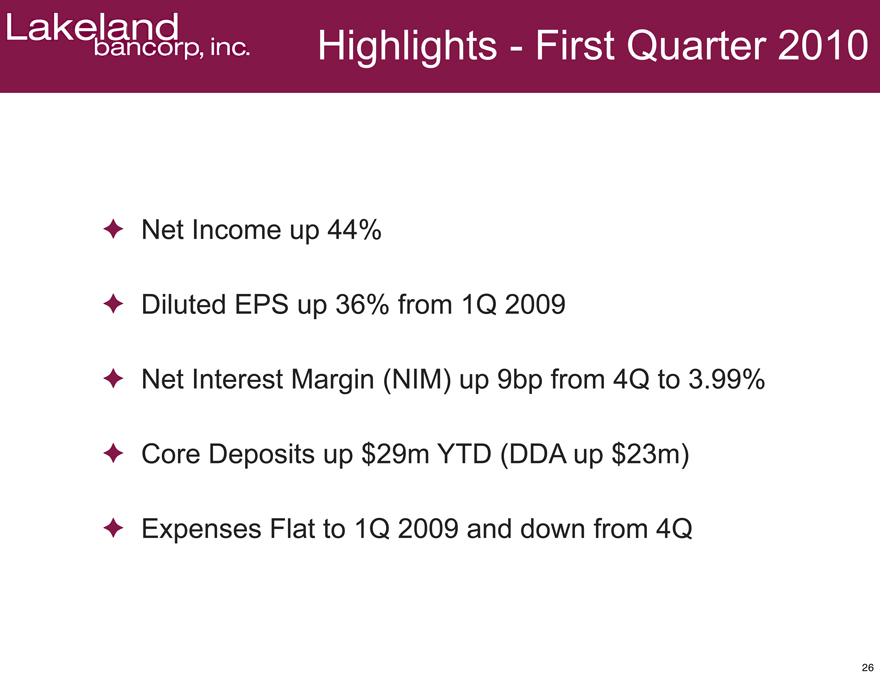
Highlights—First Quarter 2010
Net Income up 44%
Diluted EPS up 36% from 1Q 2009
Net Interest Margin (NIM) up 9bp from 4Q to 3.99% Core Deposits up $29m YTD (DDA up $23m) Expenses Flat to 1Q 2009 and down from 4Q
26
Lakeland
bancorp, inc.
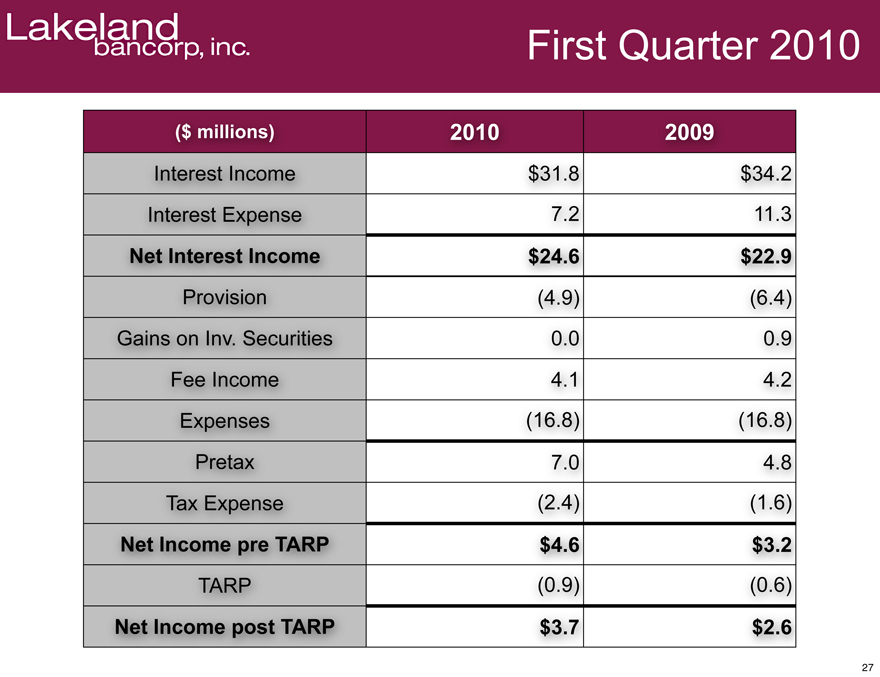
First Quarter 2010
($ millions)
2010
2009
Interest Income
$31.8
$34.2
Interest Expense
7.2
11.3
Net Interest Income
$24.6
$22.9
Provision
(4.9)
(6.4)
Gains on Inv. Securities
0.0
0.9
Fee Income
4.1
4.2
Expenses
(16.8)
(16.8)
Pretax
7.0
4.8
Tax Expense
(2.4)
(1.6)
Net Income pre TARP
$4.6
$3.2
TARP
(0.9)
(0.6)
Net Income post TARP
$3.7
$2.6
27
Lakeland
bancorp, inc.
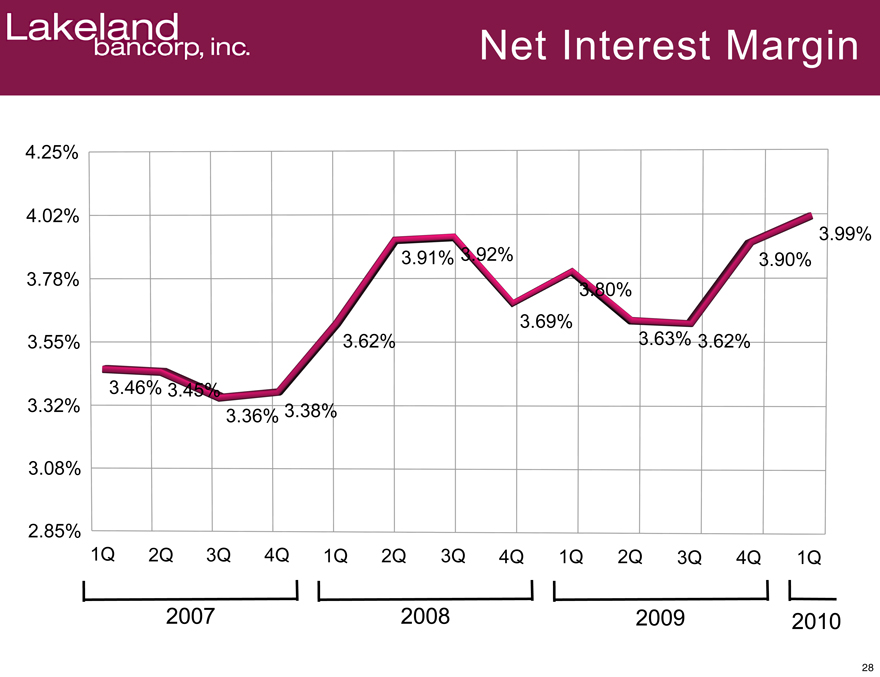
Net Interest Margin
4.25%
4.02%
3.78%
3.55%
3.32%
3.08%
2.85%
1Q
2Q
3Q
4Q
1Q
2Q
3Q
4Q
1Q
2Q
3Q
4Q
1Q
2007
2008
2009
2010
3.46%
3.45%
3.36%
3.38%
3.62%
3.91%
3.92%
3.69%
3.80%
3.63%
3.62%
3.90%
3.99%
28
Lakeland
bancorp, inc.
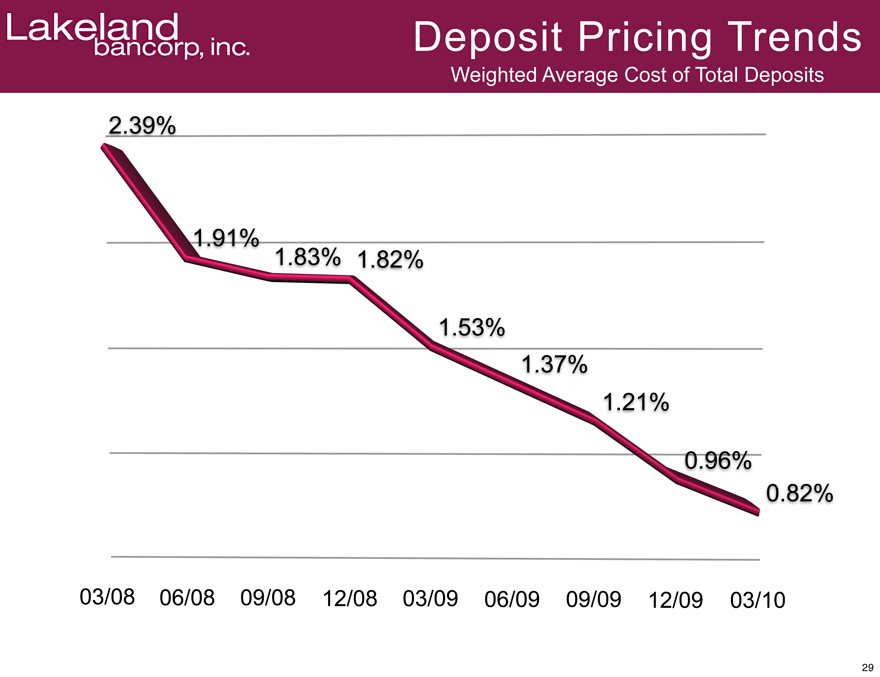
Deposit Pricing Trends
Weighted Average Cost of Total Deposits
2.39%
1.91%
1.83%
1.82%
1.53%
1.37%
1.21%
0.96%
0.82%
03/08
06/08
09/08
12/08
03/09
06/09
09/09
12/09
03/10
29
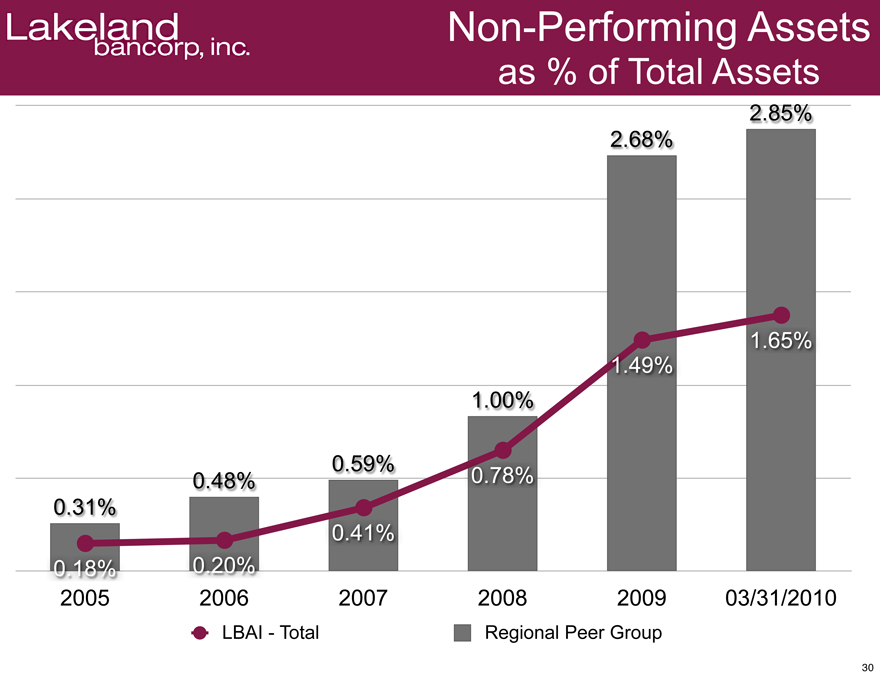
Non-Performing Assets as % of TotalAssets
0.31%
0.48%
0.59%
1.00%
2.68%
2.85%
0.18%
0.20%
0.41%
0.78%
1.49%
1.65%
2005
2006
2007
2008
2009
03/31/2010
LBAI – Total
Regional Peer Group
30
Lakeland
bancorp, inc.
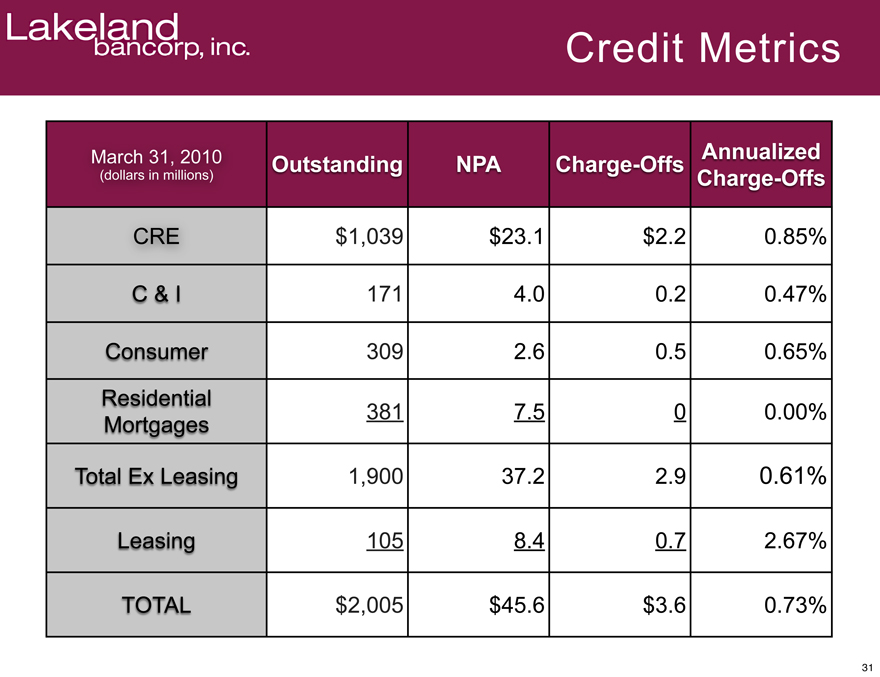
Credit Metrics
March 31, 2010
(dollars in millions)
Outstanding
NPA
Charge-Offs
Annualized Charge-Offs
CRE
$1,039
$23.1
$2.2
0.85%
C & I
171
4.0
0.2
0.47%
Consumer
309
2.6
0.5
0.65%
Residential Mortgages
381
7.5
0
0.00%
Total Ex Leasing
1,900
37.2
2.9
0.61%
Leasing
105
8.4
0.7
2.67%
TOTAL
$2,005
$45.6
$3.6
0.73%
31
Lakeland
bancorp, inc.
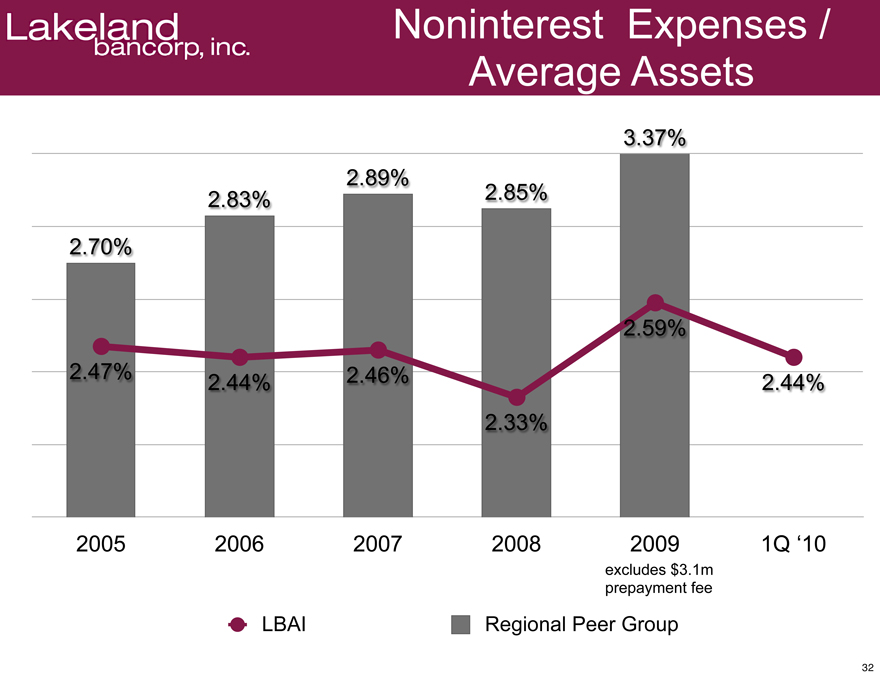
Noninterest Expenses / Average Assets
2.70%
2.83%
2.89%
2.85%
3.37%
2.47%
2.44%
2.46%
2.33%
2.59%
2.44%
2005
2006
2007
2008
2009
1Q ‘10
Excludes $3.1m
Prepayment fee
LBAI
Regional Peer Group
32
Lakeland
bancorp, inc.
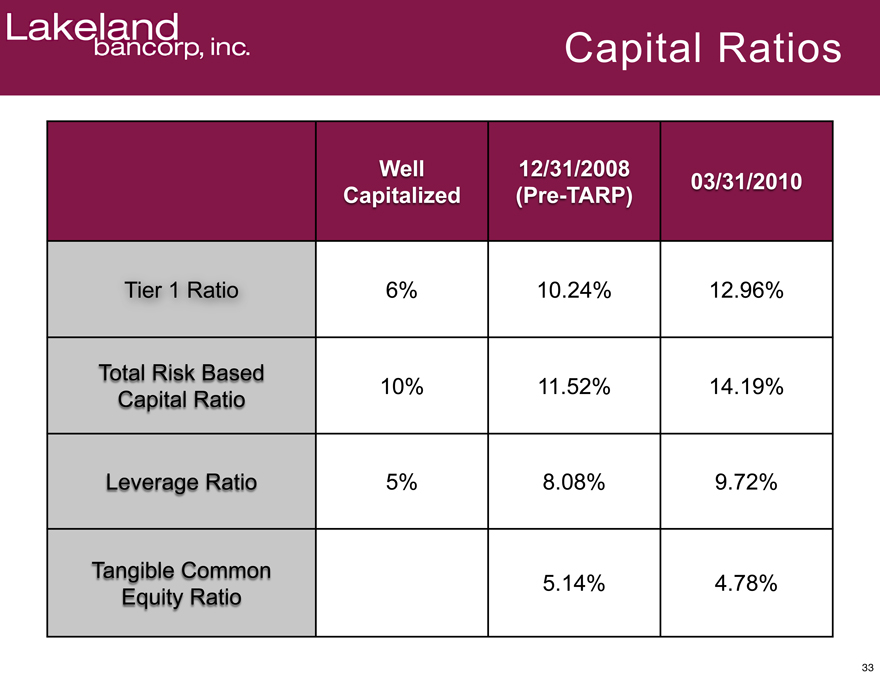
Capital Ratios
Well Capitalized
12/31/2008 (Pre-TARP)
03/31/2010
Tier 1 Ratio
6%
10.24%
12.96%
Total Risk Based Capital Ratio
10%
11.52%
14.19%
Leverage Ratio
5%
8.08%
9.72%
Tangible Common Equity Ratio
5.14%
4.78%
33
Lakeland
bancorp, inc.
LBAI Investment Considerations
Attractive market demographics
Growing loan and deposit market share
One of the largest commercial banks in Northern NJ Leasing issues addressed Relatively low NPA’s and Past Dues Solid Core Bank performance
34
Lakeland
bancorp, inc.
Regional Peer Group
Financial Institutions (FISI)
Harleysville National (HNBC) (through 12/31/2009) Hudson Valley Holding Corp. (HUVL) S & T Bancorp (STBA) Sandy Spring Bancorp (SASR) Smithtown Bancorp (SMTB) Sterling Bancorp (STL) Sun Bancorp (SNBC) Tompkins Financial (TMP)
35