File No. 0-17551
SECURITIES AND EXCHANGE COMMISSION
Washington, D.C. 20549
FORM 6-K
Report on Foreign Issuer
Pursuant to Rule 13a-16 or 15d-16
Of the Securities Exchange Act of 1934
For the Period of May 14, 2003
DYNAMIC OIL & GAS, INC.
(Registrant’s name)
Airport Executive Park
#205, 10711 Cambie Road
Richmond, B.C.
Canada V6X 3G5
(Address of principal executive offices)
Indicate by check mark whether the Registrant files or will file annual reports under cover of Form 20F or Form 40-F
| Form 20-F X | Form 40-F |
Indicate by check mark whether the Registrant by furnishing the information contained in this Form is also thereby furnishing the information to the Commission pursuant to Rule 12g3-2(b) under the Securities Exchange Act of 1934
| Yes | No X |
If “Yes” is marked, indicate below the file number assigned to the Registrant in connection with Rule 12g3-2(b): Not applicable.
Signatures
Pursuant to the requirements of the Securities Exchange Act of 1934, the registrant has duly caused this report to be signed on its behalf by the undersigned, thereunto duly authorized.
| Dynamic Oil & Gas, Inc | |
| (Registrant) | |
| Dated: 05-14-03 | By: /s/ Mike Bardell |
| Mike Bardell, Chief Financial Officer & | |
| Corporate Secretary |
-2-
DYNAMIC OIL & GAS, INC.
| Suite 205 - 10711 Cambie Road | Suite 230 - 10991 Shellbridge Way |
| Richmond, British Columbia V6X 3G5 | Richmond, British Columbia V6X 3C6 |
| (Before May 26, 2003) | (After May 26, 2003) |
NOTICE OF ANNUAL GENERAL MEETING
NOTICE IS HEREBY GIVEN THAT the annual general meeting of the members of DYNAMIC OIL & GAS, INC. (the “Company”) will be held at the Holiday Inn, 10720 Cambie Road, Richmond, British Columbia, on Thursday, June 19, 2003, at the hour of 1:00 p.m., Vancouver time, for the following purposes:
| 1. | To receive and consider the report of the directors to the members and the financial statements of the Company together with the auditor's report thereon for the financial year ended December 31, 2002. |
| 2. | To fix the number of directors at seven. |
| 3. | To elect three directors for the ensuing year. |
| 4. | To appoint the auditor for the ensuing year. |
| 5. | To authorize the directors to fix the remuneration to be paid to the auditor. |
| 6. | To adopt and approve the 2003 Stock Option Plan as further described in the accompanying information circular. |
| 7. | To adopt and approve the 2003 Stock Bonus Plan as further described in the accompanying information circular. |
| 8. | To approve certain non-discretionary stock options to unrelated directors and new employees. |
| 9. | To transact such further or other business as may properly come before the meeting and any adjournments thereof. |
The accompanying information circular provides additional information relating to the matters to be dealt with at the meeting and is deemed to form part of this notice.
If you are unable to attend the meeting in person, please complete, sign and date the enclosed form of proxy and return the same in the enclosed return envelope provided for that purpose within the time and to the location set out in the form of proxy accompanying this notice.
DATED this 5th day of May, 2003.
| BY ORDER OF THE BOARD: | /s/ Wayne J. Babcock |
| WAYNE J. BABCOCK | |
| President, Chief Executive Officer and Director |
DYNAMIC OIL & GAS, INC.
| Suite 205 - 10711 Cambie Road | Suite 230 - 10991 Shellbridge Way |
| Richmond, British Columbia V6X 3G5 | Richmond, British Columbia V6X 3C6 |
| (Before May 26, 2003) | (After May 26, 2003) |
INFORMATION CIRCULAR
(As at May 5, 2003, except as indicated)
This management information circular is furnished in connection with the solicitation of proxies by the management of DYNAMIC OIL & GAS, INC. (the “Company”) for use at the annual general meeting of the Company to be held on Thursday, June 19, 2003 and at any adjournments thereof. The solicitation will be conducted by mail and may be supplemented by telephone or other personal contact to be made without special compensation by officers and employees of the Company. The cost of solicitation will be borne by the Company.
ADVANCE NOTICE OF ANNUAL GENERAL MEETING
Advance notice of the meeting was published in The Vancouver Province newspaper on April 15, 2003 pursuant to Section 111 of theCompany Act of British Columbia. Further disclosure was made as required by National Instrument 54-101.
NOTICE TO BENEFICIAL SHAREHOLDERS
The information set forth in this section is of significant importance to many shareholders, as a substantial number of shareholders do not hold Common shares is their own name. Please read this section carefully.
Only registered Shareholders or duly appointed proxyholders are permitted to vote at the Meeting.Shareholders who do not hold their Common shares in their own name (referred to herein as “Beneficial Shareholders”) are advised that only proxies from Shareholders of record can be recognized and voted at the Meeting.Beneficial Shareholders who complete and return an instrument of proxy must indicate thereon the person (usually a brokerage house) who holds their Common shares as registered Shareholder. Every intermediary (broker) has its own mailing procedure, and provides its own return instructions, which should be carefully followed. The instrument of proxy supplied to Beneficial Shareholders is identical to that provided to registered members. However, its purpose is limited to instructing the registered Shareholder how to vote on behalf of the Beneficial Shareholder.
If Common shares are listed in an account statement provided to a Shareholder by a broker, then in almost all cases those common shares will not be registered in such Shareholder’s name on the records of the Company. Such Common shares will more likely be registered under the name of the Shareholder’s broker or agent of that broker. In Canada, the vast majority of such shares are registered under the name of CDS & Co. (the registration name for the Canadian Depository for Securities, which company acts as nominee for many Canadian brokerage firms). Common shares held by brokers or their nominees can only be voted (for or against resolutions) upon the instructions of the Beneficial Shareholder. Without specific instructions, brokers/nominees are prohibited from voting shares for their clients. The directors and officers of the Company do not know for whose benefit the common shares registered in the name of CDS & Co. are held.
| Dynamic Oil & Gas, Inc. | Information Circular |
| Page 2 | |
Therefore, each Beneficial Shareholder should ensure that voting instructions are communicated to the appropriate person well in advance of the Meeting.
In accordance with National Instrument 54-101 of the Canadian Securities Administrators, the Company has distributed copies of the Notice of Meeting, this Circular and the Proxy to the clearing agencies and intermediaries for onward distribution to non-registered Shareholders. Existing regulatory policy requires brokers and other intermediaries to seek voting instructions from Beneficial Shareholders in advance of Members’ meetings unless the Beneficial Shareholders have waived the right to receive Meeting materials. Every broker or intermediary has its own mailing procedures and provides its own return instructions, which should be carefully followed by Beneficial Shareholders in order to ensure that their Common shares are voted at the Meeting. Often the form of proxy is supplied to a Beneficial Shareholder by its broker is identical to the form of proxy provided by the Company to the registered Shareholders. However, its purpose is limited to instructing the registered Shareholder how to vote on behalf of the Beneficial Shareholder. Should a non-registered Shareholder receive such a form wish to vote at the Meeting, the non-registered Shareholder should strike out the names of the Management Proxyholders in the form and insert the non-registered Shareholder’s name in the blank provided. The majority of brokers now delegate the responsibility for obtaining instructions from clients to Independent ADP Investor Communications (“ADP”). ADP typically applies a special sticker to the proxy forms, mails those forms to the Beneficial Shareholders and asks Beneficial Shareholders to return the proxy forms to ADP. ADP then tabulates the results of all instructions received and provides appropriate instructions respecting the voting of common shares to be represented at the Meeting.A Beneficial Shareholder receiving a proxy with an ADP sticker on it cannot use that proxy to vote common shares directly at the Meeting - the proxy must be returned to ADP well in advance of the Meeting in order to have the common shares voted. If you have any questions respecting the voting of Common shares held through a broker or other intermediary, please contact that broker or other intermediary for assistance.
All references to Shareholders in this Circular and the accompanying form of Proxy and Notice of Meeting are to Shareholders of record unless specifically stated otherwise.
VOTING SHARES AND PRINCIPAL HOLDERS THEREOF
The Company is authorized to issue 60,000,000 common shares without par value (the “common shares”), of which 21,051,196 common shares are issued and outstanding as at May 5, 2003. The holders of common shares (“shareholders”) are entitled to one vote for each common share held. Holders of common shares of record at the close of business on May 5, 2003 will be entitled to receive notice of and vote at the meeting. The Company has only one class of shares. On all matters to be voted upon that are set out in this Information Circular the motions to pass those matters require only a simple majority of the votes cast in person or by proxy at the meeting voting in favour of the motion.
To the knowledge of the directors and senior officers of the Company, no person beneficially owns, directly or indirectly, or exercises control or direction over shares carrying more than 10% of the voting rights attached to all shares of the Company.
| Dynamic Oil & Gas, Inc. | Information Circular |
| Page 3 | |
VOTING OF PROXIES
A SHAREHOLDER HAS THE RIGHT TO APPOINT A PERSON (WHO NEED NOT BE A SHAREHOLDER) TO ATTEND AND ACT FOR HIM AND ON HIS BEHALF AT THE MEETING OTHER THAN THE PERSONS DESIGNATED IN THE ACCOMPANYING FORM OF PROXY. TO EXERCISE THIS RIGHT, THE SHAREHOLDER MAY INSERT THE NAME OF THE DESIRED PERSON IN THE BLANK SPACE PROVIDED IN THE PROXY AND STRIKE OUT THE OTHER NAMES OR MAY SUBMIT ANOTHER PROXY. THE SHARES REPRESENTED BY PROXY IN FAVOUR OF MANAGEMENT WILL BE VOTED ON ANY BALLOT (UNLESS OTHERWISE INDICATED ON THE PROXY) IN FAVOUR OF THE MATTERS DESCRIBED IN THE PROXY.
REVOCABILITY OF PROXY
The persons named in the accompanying form of proxy are directors or officers of the Company.
Any shareholder returning the enclosed form of proxy may revoke the same at any time insofar as it has not been exercised. In addition to revocation in any other manner permitted by law, a proxy may be revoked by instrument in writing executed by the shareholder or by his attorney authorized in writing or, if the shareholder is a corporation, under its corporate seal or by an officer or attorney thereof duly authorized, and deposited at the registered office of the Company, at any time up to and including the last business day preceding the day of the meeting, or any adjournment thereof, or with the chairman of the meeting prior to the commencement of the meeting.
ELECTION OF DIRECTORS
The Company will propose at the annual general meeting two resolutions with respect to the election of directors. First, shareholders will be asked to fix the number of directors at seven. Second, shareholders will be asked to consider three nominations for the position of director (of which management’s nominees are listed below). At the annual general meeting held on August 27, 1998, shareholders approved amending the Articles of the Company to provide that approximately one-third of the members of the Board of Directors be elected annually for three year terms. As a result, three directors are to be elected at this annual general meeting for a three-year term. At the 2002 annual general meeting, John Lagadin and David J. Jennings were elected to serve until 2005. At the 2001 annual general meeting, and Donald Umbach and Wayne J. Babcock were elected to serve until 2004. At the 2000 annual general meeting, John A. Greig and Jonathan A. Rubenstein were elected to serve until 2003. In December 2002, William B. Thompson was appointed to the Board of Directors to serve until the next annual general meeting. Directors chosen to fill vacancies on the Board of Directors shall hold office until the next election of the class for which directors shall have been chosen, or until the shareholders duly elect their successors.
| Dynamic Oil & Gas, Inc. | Information Circular |
| Page 4 | |
Management of the Company proposes to nominate John A. Greig, Jonathan A. Rubenstein and William Thompson for election as directors for a three year term. Information concerning those persons and other directors whose term of office will continue after the annual general meeting, as furnished by those individuals, is as set out in the following table:
| Number of | ||||
| Principal Occupation or | Common | |||
| employment and, if not a | Shares | |||
| previously elected | beneficially | |||
| director, occupation | Year | owned or, | ||
| during the past 5 years | that | directly or | ||
| Name, Municipality of Residence | Previous | Term of | indirectly, | |
| and Position | Service | Office | Controlled(8) | |
| as a Director | Expires | |||
| WAYNE J. BABCOCK | President and Chief | Since April 11, | 2004 | 839,893 |
| President, Chief Executive Officer | Executive Officer | 1980 | ||
| and Director | ||||
| Vancouver, B.C. | ||||
| DONALD K. UMBACH | Vice-President | Since | 2004 | 417,016 |
| Vice-President and Chief Operating | August 26, | |||
| Officer, | 1988 | |||
| Delta, B.C. | ||||
| DAVID J. JENNINGS(3) | Barrister and solicitor, | Since August | 2005 | Nil |
| Director | Irwin, White & Jennings | 24, 1999 | ||
| North Vancouver, B.C. | (1999 to present), Partner, | |||
| DuMoulin Black (1995-99) | ||||
| JOHN A. GREIG(1) (3) | Geologist, President of | Since July 13, | 2003(5) | 140,377 |
| Director | Redfern Resources Ltd. | 1990 | ||
| Delta, B.C. | ||||
| JOHN LAGADIN(4) | Geological Engineer, | Since August | 2005 | Nil |
| Director | President of J.L Transport | 17, 2000 | ||
| Calgary, Alberta | Inc., Independent Business | |||
| Man. | ||||
| JONATHAN RUBENSTEIN(1)(2)(3) | Vice-President of | Since July 13, | 2003(6) | 52,363 |
| Director | Corporate Affairs for | 1990 | ||
| Vancouver, B.C. | Sutton Resources Ltd. | |||
| WILLIAM B. THOMPSON(1)(2)(4) | Geophysicist and | Since | 2003(7) | Nil |
| Director | Geoscientist Consultant | December 17, | ||
| Kelowna, B.C. | (2001 to 2002) and | 2002 | ||
| Manager & Vice-President | ||||
| Petro-Canada (1976 to | ||||
| 2000) |
| (1) | The Company is required to have an audit committee, of which these persons are members. |
| (2) | These members qualify as “financial experts” under US regulatory requirements. |
| (3) | The Company has a corporate governance committee and a compensation committee. These persons are members of both of these committees. |
| Dynamic Oil & Gas, Inc. | Information Circular |
| Page 5 | |
| (4) | The Company has an audit reserves committee, of which these persons are members. (5) If re-elected, Mr. Grieg would serve until the Annual General Meeting of Year 2006. |
| (6) | If re-elected, Mr. Rubenstein would serve until the Annual General Meeting of Year 2006. |
| (7) | If elected, Mr. Thompson would serve until the Annual General Meeting of Year 2006. |
| (8) | Shares beneficially owned, directly or indirectly, or over which control or direction is exercised, as at May 5, 2003, based upon information furnished to the Company by individual directors. Unless otherwise indicated, such shares are held directly. |
EXECUTIVE COMPENSATION
The Company changed its financial year end from March 31 to December 31 effective December 31, 2002. For reference purposes, the most recently-completed financial reporting period covering the nine-months ended December 31, 2002 will be termed, “Fiscal Transition 2002”.
The following table (presented in accordance with applicable Canadian securities regulations (the “Regulation”) sets forth all annual and long term compensation for services in all capacities to the Company for the three most recently completed financial reporting periods (to the extent required by the Regulation) in respect of each of the individuals comprised of the Chief Executive Officer as at December 31, 2002 and the other four most highly compensated executive officers of the Company as at December 31, 2002 whose individual total compensation for Fiscal Transition 2002 exceeded $100,000 and any individual who would have satisfied these criteria but for the fact that the individual was not serving as an officer at the end of Fiscal Transition 2002 (collectively “the Named Executive Officers”).
Summary Compensation Table
| Annual Compensation(1) | Long-Term Compensation | |||||||
| Awards | Payouts | |||||||
| Name and Principal Position | Year(2) | Salary | Bonus | Other Annual Compensation(3) | Securities Under Options/SARs Granted(4) | Restricted Shares or Restricted Share Units | LTIP Payouts(5) | All Other Compensation |
| Wayne J. Babcock President, CEO | Dec. 2002 Mar. 2002 Mar. 2001 | 85,210 112,008 112,008 | Nil Nil 1,000 | 199,738 318,841 237,239 | 305,000 305,000 387,600 | Nil Nil Nil | Nil Nil Nil | Nil Nil Nil |
| Donald K. Umbach Vice President, COO | Dec. 2002 Mar. 2002 Mar. 2001 | 85,210 112,008 112,008 | Nil Nil 1,000 | 199,73 318,841 237,239 | 260,000 260,000 362,500 | Nil Nil Nil | Nil Nil Nil | Nil Nil Nil |
| David G. Grohs, | Dec. 2002 Mar. 2002 Mar. 2001 | 102,701 133,875 Nil | 20,250 Nil Nil | Nil Nil Nil | 30,000 Nil Nil | Nil Nil Nil | Nil Nil Nil | Nil Nil Nil |
| Dynamic Oil & Gas, Inc. | Information Circular |
| Page 6 | |
| Annual Compensation(1) | Long-Term Compensation | |||||||
| Awards | Payouts | |||||||
| Name and Principal Position | Year(2) | Salary | Bonus | Other Annual Compensation(3) | Securities Under Options/SARs Granted(4) | Restricted Shares or Restricted Share Units | LTIP Payouts(5) | All Other Compensation |
| Michael A. Bardell, CFO & Corp. Sect’y | Dec. 2002 Mar. 2002 Mar. 2001 | 74,275 100,000 72,000 | 30,500 33,500 14,500 | Nil Nil Nil | 135,000 135,000 241,000 | Nil Nil Nil | Nil Nil Nil | Nil Nil Nil |
| James R. Britton, Vice President, Exploratiom | Dec. 2002 Mar. 2002 Mar. 2001 | 54,774 72,000 72,000 | Nil Nil 1,000 | 199,738 318,841 237,239 | 135,000 135,000 166,500 | Nil Nil Nil | Nil Nil Nil | Nil Nil Nil |
| (1)(2) | The Company changed its financial year end from March 31 to December 31 effective December 31, 2002. As a result, the transition year from the old financial year to the new financial year is the nine-month period ended December 31, 2002. “Annual Compensation” amounts for December 2002 cover the nine months of Fiscal Transition 2002 rather than a twelve-month period. |
| (3) | The Other Annual Compensation paid in each of the past three reporting periods is in respect to payments made to each of the Named Executive Officers pursuant to royalty agreements previously approved by shareholders. The Company pays an overriding royalty interest of 1% of the Company’s share of gross monthly production of all petroleum substances produced or deemed to be produced and marketed from or allocated to each well on all lands acquired by the Company since June 1, 1986 (for two Named Executive Officers) and June 1, 1987 (for the third Named Executive Officer). These amounts include payments made for compensation earned in the current and prior three reporting periods. |
| (4) | Total number of stock options exercisable by the Named Executive Officers at the end of each reporting period noted. No stock appreciation rights (“SARs”) have been granted by the Company. |
| (5) | Long-Term Incentive Plan (“LTIP”)- any plan providing compensation intended to serve as incentive for performance to occur over a period longer than one financial year. |
During Fiscal Transition 2002, the Company paid cash compensation to its officers in the aggregate sum of $929,183.
Long Term Incentive Plan (LTIP) Awards
The Company does not have a LTIP pursuant to which cash or non-cash compensation may be paid or distributed by the Company as an incentive for performance.
| Dynamic Oil & Gas, Inc. | Information Circular |
| Page 7 | |
Option/Stock Appreciation Rights (“SAR”)
Grants during Fiscal Transition 2002
No grants of stock options during Fiscal Transition 2002 were made to any of the Named Executive Officers.
Options/SAR Exercises in Fiscal Transition 2002and Fiscal Transition 2002
Year-End Option/SAR Values
The following table (presented in accordance with the Regulation) sets forth details of all exercises of stock options during Fiscal Transition 2002 by each of the Named Executive Officers, the number of stock options held as at the end of Fiscal Transition 2002 by each of the Named Executive Officers and the value of unexercised in-the-money options/SAR’s on an aggregated basis as at the end of Fiscal Transition 2002.
| Name | Securities (#) | Aggregate ($) | Unexercised Exercisable/ | Value of Unexercised ($)(1)(2) Exercisable/ |
| Wayne J. Babcock | Nil | Nil | 305,000/60,000 | 602,500/124,200 |
| Donald K. Umbach | Nil | Nil | 260,000/60,000 | 508,000/124,200 |
| David G. Grohs | Nil | Nil | 30,000/ 80,000 | 63,600/168,600 |
| Michael A. Bardell | Nil | Nil | 135,000/40,000 | 264,500/82,800 |
| James R. Britton | Nil | Nil | 135,000/30,000 | 264,500/62,100 |
| (1) | As freestanding SARs have not been granted, the numbers relate solely to stock options. |
| (2) | Value of unexercised in-the-money options calculated using the closing price of common shares of the Company on The Toronto Stock Exchange on December 31, 2002, less the exercise price of in-the-money stock options. |
Option and SAR Repricings
The Company did not reprice any stock options under the Stock Option Plan or otherwise during Fiscal Transition 2002 to each of the Named Executive Officers.
Retirement and Pension Plans
The Company does not provide any retirement or pension plan benefits to its directors or executive officers.
Termination of Employment, Changes in Responsibility and Employment Contracts
As at the end of the Company's Fiscal Transition 2002, the Company had employment contracts with all of the Named Executive Officers. Each of the contracts provides for standard employment provisions including salary, benefits, vacation time, non-competition and confidentiality provisions. In addition, each of the contracts requires the Named Executive
| Dynamic Oil & Gas, Inc. | Information Circular |
| Page 8 | |
Officer not to voluntarily leave the employ of the Company during actions taken by third parties to acquire control of the Company. If a Named Executive Officer resigns within 6 months of a change of control of the Company for the sole reason that a change of control of the Company has occurred, the Named Executive Officer may receive a severance package including an amount equal to 12 months’ salary and the economic benefit of any stock options then outstanding. If the Named Executive Officer is terminated by the Company without cause, a severance package including an amount equal to 24 months’ salary, the economic benefit of any stock options then outstanding, and certain health and insurance benefits for a period not to exceed 12 months.
Other than the employment contracts described above, the Company had as at the end of Fiscal Transition 2002 no compensatory plan or arrangement in respect of compensation received or that may be received by the Named Executive Officers in the Company's Fiscal Transition 2002 to compensate such executive officers in the event of the termination of employment (resignation, retirement, change of control) or in the event of a change in responsibilities following a change in control, where in respect of the Named Executive Officer the value of such compensation exceeds $100,000.
Compensation Committee
In 1991 the Company established its Compensation Committee (the “Compensation Committee”) for the purpose of considering and making recommendations to the Board of Directors for appropriate compensation packages for the Company’s executive officers and directors. The guiding philosophy of the Compensation Committee in determining compensation for executives has been to provide a compensation package that is flexible, entrepreneurial and geared towards attracting, retaining and motivating executive officers. The policies of the Compensation Committee will encourage performance by executives to enhance the growth and profitability of the Company. Achievement of these objectives will contribute to an increase in shareholder value. The Compensation Committee expects to accomplish this through defining the key components for executive officer compensation, being a base salary comparable to executive salaries in established junior companies, and long-term incentives in the form of stock options. Short-term incentives in the form of a cash bonus could be paid for significant contributions to the Company. In combination, these elements are designed to recognize those activities of management that advance the short and long-term business objectives of the Company. The Compensation Committee meets as required, but not less than annually.
The Compensation Committee consists of three independent outside directors of the Company, namely, Mr. Rubenstein (Chair), Mr. Greig and Mr. Jennings. None of the members of the Compensation Committee have any indebtedness to the Company nor have they any material interest, or have any associates or affiliates which have any material interest, direct or indirect, in any actual or proposed transaction in Fiscal Transition 2002 which has materially affected or would materially affect the Company.
| Dynamic Oil & Gas, Inc. | Information Circular |
| Page 9 | |
Report of the Compensation Committee
The Compensation Committee met three times during Fiscal Transition 2002. The Company has never provided compensation in the form of any plan providing compensation intended to serve as incentive for performance to occur over a period longer than one financial year or pensions. However, the shareholders previously approved royalty agreements with Named Executive Officers whereby the Company pays annually an overriding royalty interest of 1% of the Company’s share of gross monthly production of all petroleum substances produced or deemed to be produced and marketed from or allocated to each well on all lands acquired by the Company since June 1, 1986 (two Named Executive Officers) and since June 1, 1987 (the third Named Executive Officer). During Fiscal Transition 2002, members of the Compensation Committee recommended, and the Board of Directors approved, the granting of 15,000 options to employees of the Company. There were no option repricings during Fiscal Transition 2002. Also, during Fiscal Transition 2002, the Compensation Committee made no recommendations to the Board to change the level of compensation or the form of compensation for directors, officers or employees.
In 1999 the Compensation Committee retained the services of William M. Mercer Inc. (“Mercer”) of Calgary, Alberta to conduct a thorough executive compensation review. As a result of the Mercer report, the Compensation Committee found that the salary levels of the Company’s executives were “outside and below the ranges of salaries for executives in comparable positions in the peer group of oil and gas producing companies”. On June 30, 1999, the Committee resolved to increase by $40,000, the base salary levels of each of the President and Chief Executive Officer, and the Vice President and Chief Operating Officer. After giving effect to these adjustments, the salary of these three executives would be in the lowest quartile of the peer group of companies. Also on June 30, 1999, the Compensation Committee resolved to increase, the salary levels of three other executive positions by percentages ranging from 43% to 47% over base salary. No subsequent increases, other than cost of living increases, have been made to the salary levels.
The Compensation Committee further resolved that, consistent with the peer group of companies, all the above executive positions would be eligible for discretionary stock option participation.
Jonathan Rubenstein, Chairman
John Greig
David Jennings
| Dynamic Oil & Gas, Inc. | Information Circular |
| Page 10 | |
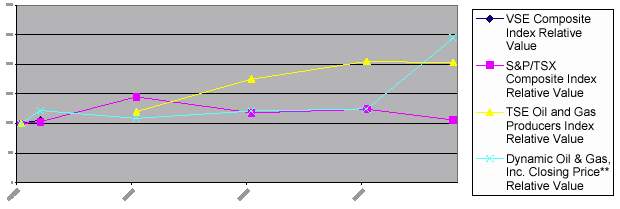
Comparative Shareholder Return Performance Graph
The graph below compares the yearly percentage change in the cumulative total shareholder return on the Company's shares against the cumulative total shareholder return on the VSE Stock Index, the S&P/TSX Composite Index and the TSE Oil and Gas Producers Index from the commencement of the five fiscal reporting periods ended March 31, 1999, 2000, 2001 and 2002 and December 31, 2002 immediately prior to the beginning of Fiscal Transition 2002, assuming a $100 initial investment with all dividends reinvested.
| Year Ended(1) | VSE Composite Index | S&P/TSX Composite Index | TSE Oil and Gas Producers Index | Dynamic Oil & Gas Closing Price** | ||||
| Index Value | Relative Value | Index Value | Relative Value | Index Value | Relative Value | CAD $ | Relative Value | |
| Mar. 31, 1999 | 424.72 | 100 | 13,937.91 | 100 | 4,104.43 | 100 | 1.56 | 100 |
| May 26, 1999 | 450.58 | 14,353.87 | 1.90 | |||||
| Mar. 31, 2000 | n/a | 20,277.29 | 4,938.65 | 1.70 | ||||
| Mar. 31, 2001 | n/a | 16,503.59 | 7,186.91 | 1.88 | ||||
| Mar. 31, 2002 | n/a | 17,308.41 | 8,404.05 | 1.95 | ||||
| Dec. 31, 2002 | n/a | 14,782.01 | 8,341.44 | 3.82 | ||||
| (1) | The Company changed its financial year end from March 31 to December 31 effective December 31, 2002. As a result, the transition year from the old financial year to the new financial year is the nine-month period ended December 31, 2002. April 1, 2002 has been used as the year ended date instead of March 31, 2002, as the Toronto Stock Exchange was not open for trading on March 31, 2002. |
| ** | The price is taken from the Vancouver Stock Exchange until May 26, 1999 and the Toronto Stock Exchange thereafter. On May 26, 1999 the Company commenced trading on the Toronto Stock Exchange and closed trading that day at $1.90. While the Company has traded on the Toronto Stock Exchange only in Canada since May 26, 1999, five year historical data for the S&P/TSX Composite Index and the TSE Oil and Gas Producers Index has been provided for comparison purposes. |
Comparison of Cumulative Total Shareholder Return (“CSR”) on Common Shares of the
Company and the (i) VSE Composite Index, (ii) S&P/TSX Composite Index, and
(iii) TSE Oil and Gas Producers Index
| Dynamic Oil & Gas, Inc. | Information Circular |
| Page 11 | |
Compensation of Directors
The Company has no arrangements, standard or otherwise, pursuant to which directors are compensated by the Company for their services in their capacity as directors, or for committee participation, involvement in special assignments or for services as consultant or expert during Fiscal Transition 2002 or subsequently, up to and including the date of this Information Circular.
The Company does have a formalized stock option plan for the granting of incentive stock options to the officers, employees and directors. At the 2000 annual general meeting, shareholders approved an amendment to the stock option plan that replaced discretionary grants of options to directors with a predetermined number of options granted twice a year. The Company granted 117,500 stock options to the directors pursuant to the shareholder approved mandatory provisions of the plan during Fiscal Transition 2002.
CORPORATE GOVERNANCE
The Toronto Stock Exchange Committee on Corporate Governance in Canada has issued a series of proposed guidelines for effective corporate governance (the “TSE Report”), and the Toronto Stock Exchange now requires listed companies to disclose their corporate governance system in their annual reports or information circulars.
The Company’s Board of Directors has reviewed the TSE Report and the Company's own corporate governance practices. The Company's policy and practices are compared to the TSE Report in Schedule “A” to this Circular, which indicates and explains differences between the Company's corporate governance system and that set out in the TSE Report.
The present board of directors is composed of 7 directors, 5 of whom would be considered unrelated directors by the TSE Report.
The TSE Report defines a significant shareholder as a shareholder with the ability to exercise a majority of votes for the election of the board of directors. The Company does not have a significant shareholder.
INDEBTEDNESS TO COMPANY OF DIRECTORS, EXECUTIVE OFFICERS AND SENIOR OFFICERS
There is no indebtedness of any director, executive officer, senior officer, proposed nominee for election as a director or associate of them, to or guaranteed or supported by the Company either pursuant to an employee stock purchase program of the Company or otherwise, during the most recently completed financial year other than routine indebtedness.
INTEREST OF INSIDERS IN MATERIAL TRANSACTIONS
No insider or proposed nominee for election as a director of the Company and no associate or affiliate of the foregoing persons has or has had any material interest, direct or indirect, in any transaction since the commencement of the Company's last completed financial year or in any proposed transaction which in either such case has materially affected or will materially affect the Company.
| Dynamic Oil & Gas, Inc. | Information Circular |
| Page 12 | |
APPOINTMENT OF AUDITOR
Unless otherwise instructed, the proxies given pursuant to this solicitation will be voted for the appointment of Ernst & Young LLP, Chartered Accountants, of Vancouver, British Columbia, as the auditor of the Company to hold office for the ensuing year at a remuneration to be fixed by the directors.
MANAGEMENT CONTRACTS
No management functions of the Company are performed to any substantial degree by a person other than the directors or senior officers of the Company.
INTEREST OF CERTAIN PERSONS IN MATTERS TO BE ACTED UPON
Except as set out herein with respect to the grant and amendment of stock options, no director or senior officer of the Company or any proposed nominee of management of the Company for election as a director of the Company, nor any associate or affiliate of the foregoing persons, has any substantial interest, direct or indirect, by way of beneficial ownership or otherwise, in matters to be acted upon at the meeting.
PARTICULARS OF OTHER MATTERS TO BE ACTED UPON
ADOPTION OF A NEW INCENTIVE STOCK OPTION PLAN
At the Company’s 2002 annual general meeting, shareholders adopted an incentive stock option plan to incorporate certain changes as a result of Canadian court decisions on employment issues and stock options plans (the “Current Plan”). Recently, directors proposed changes to the Current Plan that would incorporate the Company’s enhanced corporate governance principles into a new incentive stock option plan (the “New Plan”). These proposed changes are, in the opinion of the independent directors and management, positive for shareholders of the Company. Virtually all of the provisions of the Current Plan are identical to the New Plan, except as summarized below. For full particulars, please refer to the text of the proposed New Plan, a copy of which is available from the Company’s Secretary, Michael A. Bardell, who can be reached by telephone at (604) 214-0550, by telecopier at (604) 214-0551, or by electronic mail at mbar@dynamicoil.com.
Continuing Provisions between Current Plan and New Plan
The Current Plan and the New Plan both are designed to assist the Company in attracting, retaining and motivating directors, officers and employees of the Company and will be administered by the Board of Directors in accordance with the rules and policies of The Toronto Stock Exchange and NASDAQ.
The Current Plan initially authorized and reserved for distribution 2,046,223 common shares, representing that number of shares equal to 10% of the issued and outstanding share capital of the Company in July 2002. If the New Plan is adopted, all of the shares at present under the Current Plan will be incorporated into the New Plan so that no “double-counting” will occur. As of April 30, 2003, there were 1,403,250 options outstanding. The New Plan will initially
| Dynamic Oil & Gas, Inc. | Information Circular |
| Page 13 | |
authorize and reserve for distribution as stock options 2,055,119 common shares, representing less than 10% of the issued and outstanding share capital of the Company as at the date of the date of this Information Circular. There are 1,403,250 stock options outstanding under the Current Plan, and as a result, shareholders are being asked to approve the listing of an additional 651,869 common shares under the New Plan. Combined with a stock bonus plan (see next section for details) that provides for up to 50,000 common shares to be issued, the maximum number of Bonus Shares issuable under the Bonus Plan and the maximum number of shares issuable under the 2003 Stock Option Plan will in aggregate be 2,105,119 common shares, which is equal to 10% of the issued and outstanding share capital of the Company.
The exercise price for each optioned share will continue to be based on the closing price of the shares of the Company for the trading day immediately preceding the date of the grant of the stock option.
Each option under the Current Plan expires on the earlier of (i) 30 days after the optionee ceases to be a person qualified to receive an option, if as a result of early retirement, voluntary resignation or termination other than for cause; (ii) immediately upon the optionee ceasing to be a person qualified to receive an option, if as a result of termination for cause; (iii) ten years from the date the option is granted (although such term is at present reduced to five years pursuant to the existing policy of the Board of Directors with respect to options granted to inside directors, officers and employees); and (iv) 365 days after the optionee dies, retires in accordance with the Company's retirement policy or is permanently disabled.
Under the New Plan, management proposes that the expiration date for stock options granted after the adoption of the New Plan be reduced from ten (10) years to the earlier of five (5) years and three (3) years after the director, officer or employee ceases to be a director, officer or employee of the Company, for whatever reason. Under the New Plan, any option issued will not expire until the end of the original term of the option, notwithstanding that the holder of the option has ceased to be a person qualified to receive an option by virtue of early retirement, voluntary resignation, termination other than for cause, termination for cause or the death of the optionee.
The options granted under the Current Plan and the New Plan may vest over time as determined by the Board of Directors. If a change of control of the Company occurs, the vesting provisions may, in certain circumstances, be deemed to have been satisfied and the options deemed to have been vested. The number of options granted may adjust if any share reorganization, special distribution or corporate reorganization occurs, subject to the approval of The Toronto Stock Exchange.
Under the Current Plan and the New Plan, the Board of Directors is entitled to suspend, terminate or discontinue the incentive plan or amend or revise the terms of the incentive plan, subject to the approval, in certain circumstances, of The Toronto Stock Exchange and the shareholders of the Company. Under the New Plan, the Board of Directors may delegate their responsibilities to administer the New Plan to a Committee of independent directors.
The maximum number of shares available to any one optionee under the Current Plan and the New Plan is 5% of the outstanding shares of the Company.
Benefits of the New Plan
| Dynamic Oil & Gas, Inc. | Information Circular |
| Page 14 | |
Change of Expiration Date of Options
Under the New Plan, the maximum expiration date for stock options will be reduced from the current ten (10) years to the earlier of five (5) years and three (3) years after the director, officer or employee ceases to be a director, officer or employee of the Company. The Company’s independent directors and management believe that reducing the number of years an option may remain outstanding will provide even greater incentive to optionholders to maximize shareholder value within the 5 year term of the options. As well, it is important that optionholders be rewarded for their efforts and not those of optionholders several years later.
In addition, the Company’s independent directors and management believe that having accelerated expiration dates that are within 30 days after a director, officer or employee ceases to be a director, officer or employee is unfairly prejudicial to the optionholder, the Company and the shareholders. Many employees may elect not to leave their employment with the Company until a later date when they are not subject to blackout periods. Likewise, the Company may not be able to terminate non-productive employees during a blackout period without incurring substantial legal damages for such termination. A blackout period is an interval of time in which employees may not trade in securities of the Company because they may be in possession of insider information. If an optionholder were to retire, resign or be terminated during a blackout period, or a blackout period occurred during the 30-day period, that individual would be unable to exercise their options without breaching securities laws. Such changes would only apply to stock options granted after the adoption of the New Plan.
Delegation to a Committee
Under the New Plan, the Board of Directors may delegate their responsibilities for the administration of the New Plan to a Committee of independent directors. While the Board will retain independent and concurrent power to administer the New Plan, the Committee of independent directors will administer the New Plan within the framework of corporate governance principles established by the Company. The independent directors and management believe this is of benefit because it will enable the Committee to make grants of stock options and the issuance of bonus shares independent of management and non-independent directors.
| Dynamic Oil & Gas, Inc. | Information Circular |
| Page 15 | |
Recommendation
Shareholders of the Company will be asked to pass an ordinary resolution in the following terms:
“RESOLVED, that the (i) “2003 Incentive Stock Option Plan”, the form of which has been made available to the Company’s Shareholders, including the number of shares, subject to the 2003 Incentive Stock Option Plan of 2,055,119 be adopted and approved by the Company, and that all grants of stock options by the Company occurring on or after June 19, 2003, be pursuant to the “2003 Incentive Stock Option Plan” and that no further grants of stock options by the Company be pursuant to the 2002 Stock Option Plan adopted by the Company in 2002, and (ii) an additional 651,869 common shares be approved for listing on the Toronto Stock Exchange.”
ADOPTION OF AN INCENTIVE STOCK BONUS PLAN
Directors have also proposed that the Company adopt an incentive stock bonus plan separate from the 2003 Incentive Stock Option Plan which would also incorporate enhanced corporate governance principles (the “Bonus Plan”). The Bonus Plan is, in the opinion of the independent directors and management, positive for shareholders of the Company. As part of a complete compensation package, the Company believes that the issuance of bonus shares to those directors, officers and employees who provide extraordinary contributions reflects a share compensation arrangement that further ties the interests of shareholders and directors, officers and employees. Many companies have chosen to adopt this compensation method as a complement to an effective incentive stock option plan.
Under the Bonus Plan, directors, officers and employees who are deemed to have provided extraordinary contributions to the Company will be eligible to receive grants of common shares of the Company (the “Bonus Shares”) as determined by the independent directors. Bonus Shares will be awarded based upon the review of the performance of the director, officer or employee, and the Bonus Shares will be granted as compensation for that performance by the eligible director, officer or employee. The material aspects of the Bonus Plan are as follows:
The Bonus Plan will provide for a total of 50,000 Bonus Shares in the aggregate to be issued to eligible directors, officers or employees.
The issue price for each Bonus Share will also be based on the closing price of the shares of the Company for the trading day immediately preceding the date of the issue of the Bonus Shares.
The maximum number of Bonus Shares and options under the 2003 Incentive Stock Option Plan available to any one eligible director, officer or employee under the Bonus Plan and the 2003 Incentive Stock Option Plan is 5% of the outstanding shares of the Company.
The maximum number of Bonus Shares issuable under the Bonus Plan and the maximum number of shares issuable under the 2003 Stock Option Plan will in aggregate be 2,046,223 common shares, which is equal to the number of common shares issuable under the 2002 Stock Option Plan.
| Dynamic Oil & Gas, Inc. | Information Circular |
| Page 16 | |
Recommendation
The independent directors believe that the adoption of a limited share bonus plan would result in less dilution for shareholders than otherwise would occur if only stock options were provided as incentives. A number of shareholder groups have encouraged the use of stock bonus plans to reward past behaviour, particularly as generally fewer number of shares are issued as part of a stock bonus plan than stock options under a stock option plan. The independent directors would award these bonus shares based on past activities that have added extraordinary value to the Company.
The Company’s independent directors and management also believe that allowing for Bonus Shares will provide a greater incentive to directors, officers and employees to maximize shareholder value, since directors, officers and employees who receive Bonus Shares will earn Bonus Shares on the basis of an assessment of their direct contribution to the Company.
Policies of the Toronto Stock Exchange require that the 2003 Incentive Stock Bonus Plan be approved by a majority of the votes cast at the shareholders’ meeting other than votes attaching to shares beneficially owned by insiders of the Company and their associates.
Shareholders of the Company will be asked to pass an ordinary resolution in the following terms:
“RESOLVED, that the “2003 Incentive Stock Bonus Plan”, the form of which has been made available to the Company’s Shareholders, including the number of shares, subject to the 2003 Stock Bonus Plan of 50,000 be adopted and approved by the Company, and that all grants of bonus shares by the Company occurring on or after June 19, 2003, be pursuant to the “2003 Stock Bonus Plan”.”
APPROVAL OF NON-DISCRETIONARY AND OTHER OPTIONS
Under the Current Plan, independent directors of the Company receive non-discretionary grants of options upon first election and thereafter annually upon their anniversary of election. In addition, independent directors receive options annually on April 30 for serving as chairpersons or members of standing committees. These non-discretionary grant provisions were approved and adopted by shareholders at the 2000 Annual General Meeting. At that meeting, shareholders considered the following in approving the adoption of non-discretionary grant provisions:
Fairvest Securities Corporation, a company that reviews compensation plans for institutional investor clients, had indicated that it generally favours non-discretionary grants as avoiding issues of “self-dealing”
A number of major Canadian companies have plans in place with similar provisions
Management of the Company believes that non-discretionary grants of options for independent directors are of benefit to the Company to enhance their independence from management, since the grants of options need not be recommended by management. As of April 30, 2003, the Company was obligated under the Current Plan to issue 107,500 non-discretionary options. However, the Current Plan does not have enough shares reserved for issuance available for
| Dynamic Oil & Gas, Inc. | Information Circular |
| Page 17 | |
grants to permit these non-discretionary grants to occur. Under the Current Plan, where there are insufficient options available for grant, these non-discretionary options are required to be delayed until such time as options are available. However, the Company is seeking the approval of shareholders for these non-discretionary grants at this time in order to support the independence of the independent directors (referred to as “unrelated directors” under the policies of the Toronto Stock Exchange).
In addition, the Company is also seeking the approval of shareholders for the grant by the Company of options to purchase an additional 58,193 common shares issued to a new director and new employees of the Company. Since 2002, the Company has added five new employees, mostly in the areas of production and administration. New hires by the Company require that the Company issue new stock options however, as discussed above, under the Current Plan, the number of shares reserved for issuance is insufficient to permit these grants to occur without shareholder approval, and as a result, these grants were made subject to the approval of shareholders. The Company believes that the addition of these new employees if of benefit to the Company and as a result, is seeking the approval of shareholders for the grants of options to new employees.
The non-discretionary options and the additional employee options would be included in the common shares issuable under the new 2003 Incentive Stock Option Plan and would not increase the number of shares issuable under that plan. The Company is seeking the approval of a resolution on the following terms:
Policies of the Toronto Stock Exchange require that the non-discretionary options and the additional employee options be approved by a majority of the votes cast at the shareholders’ meeting other than votes attaching to shares beneficially owned by insiders of the Company and their associates to whom options will be issued as part of the non-discretionary options and the additional employee options.
Shareholders of the Company will be asked to pass an ordinary resolution in the following terms.
“RESOLVED that the 165,693 non-discretionary stock option grants to unrelated directors and committee members and new employees are hereby approved and authorized.”
OTHER MATTERS
Management of the Company is not aware of any matter to come before the meeting other than as set forth in the notice of meeting. If any other matter properly comes before the meeting, it is the intention of the persons named in the enclosed form of proxy to vote the shares represented thereby in accordance with their best judgment on such matter.
DATED this 5th day of May, 2003.
| BY ORDER OF THE BOARD: | |
| WAYNE J. BABCOCK | |
| President, Chief Executive Officer and Director |
SCHEDULE “A”
| Does the | ||||
| TSE Corporate Governance | Company | |||
| Committee Guidelines | Align? | Comments | ||
| 1 | Board of Directors should | |||
| explicitly assume responsibility | ||||
| for the stewardship of the | ||||
| corporation and specifically | ||||
| for: | ||||
| a. | Adoption of a strategic | Yes | The Company actively manages a portfolio of oil and gas | |
| planning process. | properties in Western Canada. The Company reviews on an | |||
| ongoing basis new and existing properties for the purpose of | ||||
| efficiently allocating Company resources and maximizing returns | ||||
| from production. The Company’s strategy has been to focus on a | ||||
| number of specific projects in Western Canada. The Company’s | ||||
| strategy is under constant review by the Board of Directors and | ||||
| senior management. | ||||
| b. | Identification of specific risks | Yes | The Audit Committee and the Board of Directors in conjunction | |
| and implementing risk | with the Company’s auditors will regularly review the | |||
| management systems. | Company’s principal operational and strategic risks and will | |||
| develop any additional appropriate risk management systems | ||||
| deemed necessary. The Company has contracts and insurance to | ||||
| limit its operational liabilities and has used long-term sales | ||||
| contracts to address fluctuations in commodity prices. | ||||
| c. | Succession planning and | Yes | The Board of Directors has active directors. It appoints or | |
| monitoring senior management. | proposes to the shareholders that they elect appropriately skilled | |||
| members to the Board of Directors. The reporting structure | ||||
| contemplates senior management reporting to the CEO and the | ||||
| CEO reporting to the Board. All of senior management regularly | ||||
| attend and report to the Board of Directors. To date, no formal | ||||
| training or monitoring processes for directors have been | ||||
| considered necessary but will be considered as the Company | ||||
| grows. | ||||
| d. | Communications policy. | Yes | The Board of Directors has ensured that the Company has | |
| effective communication with its shareholders and the public. | ||||
| The Company provides appropriate disclosure of all material | ||||
| information as required by law. All material press releases are | ||||
| reviewed by legal counsel. The Company has had and has | ||||
| specific people responsible for investor relations. | ||||
| e. | Integrity of internal control and | Yes | The Board of Directors and the Audit Committee regularly | |
| management of information | review the adequacy of the Company’s internal controls. Internal | |||
| systems. | controls and management of information are regularly upgraded | |||
| as is required for the Company’s continuing and growing | ||||
| operations. |
| Dynamic Oil & Gas, Inc. | Information Circular |
| Page 19 | |
| Does the | ||||
| TSE Corporate Governance | Company | |||
| Committee Guidelines | Align? | Comments | ||
| 2 | . | Majority of directors should be | Yes | The majority of the Board of Directors are independent from |
| “unrelated” (independent of | management and free from any interest, business or other | |||
| management). | relationship that could, or could reasonably be perceived to, | |||
| materially interfere with the director’s ability to act in the best | ||||
| interests of the Company. | ||||
| 3 | . | Disclose for each director | Yes | Wayne Babcock and Don Umbach are members of senior |
| whether he or she is related, | management and are the only Board Members who are related. | |||
| and how that conclusion was | David Jennings is a member of a law firm that provides legal | |||
| reached. | services to the Company, but that position does not interfere with | |||
| his ability to act with a view to the best interests of the Company | ||||
| and as such is independent of the Company. John Greig, John | ||||
| Lagadin, Jonathan Rubenstein and William Thompson are also | ||||
| unrelated. | ||||
| 4 | .a. | Appoint a committee | Yes | The Corporate Governance Committee has the mandate to: |
| responsible for | (a) annually recommend candidates for the Board of Directors; | |||
| appointment/assessment of | (b) review credentials of nominees for election; | |||
| directors. | (c) recommend candidates for filing vacancies on the Board of | |||
| Directors; and | ||||
| (d) ensure qualifications are maintained. | ||||
| b. | Composed exclusively of | Yes | The Corporate Governance Committee is comprised of Mr. | |
| outside, non-management | Greig, Mr. Jennings and Mr. Rubenstein. | |||
| directors, the majority of whom | ||||
| are unrelated. | ||||
| 5 | . | Implement a process for | Yes | The Corporate Governance Committee is mandated to monitor |
| assessing the effectiveness of | the quality of the relationship between management and the | |||
| the board of directors, its | Board of Directors and to assess the effectiveness of the Board of | |||
| committees and individual | Directors, its committees and individual directors, and | |||
| directors. | recommend improvements. The assessment process is ad-hoc. | |||
| Given the small size of the Board of Directors, performance of | ||||
| the directors as members of the Board of Directors and its | ||||
| Committees is readily apparent. | ||||
| 6 | . | Provide orientation and | Yes | While there is no formal program, the Company’s operations are |
| education programs for new | regularly reviewed at meeting of the Board of Directors. | |||
| directors. | ||||
| 7 | . | The board of directors should | Yes | The present number of directors is seven, which allows both the |
| examine its size and where | COO and CEO as directors while at the same time having a | |||
| appropriate reduce the number | majority of the directors independent of the Company. | |||
| of directors, with a view to | ||||
| improving effectiveness. | ||||
| 8 | . | Review compensation of | Yes | The current policy is not to compensate any directors. The |
| directors to reflect risk and | Compensation Committee intends to develop a policy regarding | |||
| responsibility. | compensation levels for independent directors. Management | |||
| members of the Board of Directors will not be compensated as | ||||
| directors. |
| Dynamic Oil & Gas, Inc. | Information Circular |
| Page 20 | |
| Does the | ||||
| TSE Corporate Governance | Company | |||
| Committee Guidelines | Align? | Comments | ||
| 9 | Committees should generally | Yes | All committees are composed exclusively of unrelated directors. | |
| be composed of non- | ||||
| management directors. | ||||
| 10 | Assign a committee responsible | Yes | The Corporate Governance Committee is generally mandated to | |
| for approach to Corporate | be responsible for developing policies and implementing | |||
| Governance. | procedures as approved by the Board of Directors. | |||
| 11 | Define limits to management's | |||
| responsibilities by developing | ||||
| mandates for: | ||||
| a. | the board of directors. | Yes | The Board of Directors principal responsibilities are: to plan and | |
| approve corporate strategies and goals; to ensure effective | ||||
| communications systems are in place among the Company, its | ||||
| shareholders and the public; to supervise and evaluate | ||||
| management, including the establishment of executive | ||||
| limitations; to provide oversight of the conduct of the business; | ||||
| and to monitor organizational performance against those goals | ||||
| and executive limitations to derive balanced judgments about | ||||
| issues confronting the Company from time to time. | ||||
| b. | the Chief Executive Officer. | Yes | The CEO’s objectives include the general mandate to maximize | |
| shareholder value and to fulfill strategic plans of the Company. | ||||
| The CEO is also required to formulate and propose to the | ||||
| directors the various strategies regarding exploration, | ||||
| development and future acquisitions. As a key force in the | ||||
| Company’s business, the CEO has no limits to his mandate but | ||||
| does regularly report to, and when appropriate seek approval | ||||
| from, the Board of Directors. The Board of Directors is in the | ||||
| process of prescribing financial authorization for the CEO and | ||||
| other senior management which will serve as a financial control | ||||
| of the Company. | ||||
| c. | board of directors should | Yes | The Board of Directors is active in the regular reviews of the | |
| approve Chief Executive | Company’s strategic plan including corporate objectives. | |||
| Officer's corporate objectives. | ||||
| 12 | Establish structures and | No | The Board of Directors is aware of the need for it to function | |
| procedures to ensure the board | independently of management. All the committees of the Board | |||
| of directors can function | are, at present, comprised only of directors independent of | |||
| independently of management. | management and the Board will establish further independent | |||
| committees when independent functions are required. At present | ||||
| the Chairman’s function is only to call for and chair meetings of | ||||
| the Board and shareholders. If the Chairman is to be mandated | ||||
| with executive functions, then the Board will consider appointing | ||||
| an independent chairman at that time. |
| Dynamic Oil & Gas, Inc. | Information Circular |
| Page 21 | |
| Does the | ||||
| TSE Corporate Governance | Company | |||
| Committee Guidelines | Align? | Comments | ||
| 13 | .a. | Establish an Audit Committee | Yes | The Audit Committee is mandated to (i) assist the board of |
| with a specifically defined | directors in fulfilling its fiduciary responsibilities relating to | |||
| mandate. | accounting and reporting practices and internal controls, (ii) | |||
| review audited financial statements and management’s | ||||
| discussion and analysis of operations with the auditors, (iii) | ||||
| review the annual report and all interim reports of the auditors, | ||||
| (iv) ensure that no restrictions are placed by management on the | ||||
| scope of the auditor's review and examination of the Company's | ||||
| accounts and (v) recommend to the board of directors the firm of | ||||
| auditors to be nominated by the board for appointment by the | ||||
| shareholders at the annual general meeting. | ||||
| b. | All members should be non- | Yes | As stated above, all members of the audit committee are | |
| management directors. | unrelated directors. | |||
| 14 | . | Implement a system to enable | Yes | The Board of Directors has formalized a process to enable |
| individual directors to engage | individual directors to engage outside advisors, at the Company’s | |||
| outside advisors at the | expense, with the authorization of the Corporate Governance | |||
| Company’s expense. | Committee. As is noted above, the Audit Committee is | |||
| encouraged to speak directly with the Company’s external | ||||
| auditors on matters pertaining to its mandate. |
![]()
ANNUAL RETURN CARD FORM
(REQUEST FOR INTERIM FINANCIAL STATEMENTS)
| TO: | REGISTERED AND NON-REGISTERED SHAREHOLDERS |
| OFDYNAMIC OIL & GAS, INC. (the “Company”) | |
| CUSIP NO. 267906 10 5 |
Shareholders may elect annually to have their name added to an issuer’s SUPPLEMENTAL MAILING LIST in order to receive interim financial statements of the Company. If you are interested in receiving such statements or other selective shareholder communications, please complete, sign and mail this form the CIBC Mellon Trust Company, Suite 1600 - 1066 West Hastings Street, Vancouver, British Columbia, V6E 3X1
| Name of Registered/ | Address: | |
| Non-Registered Shareholder: | ||
| ______________________________________ | ______________________________________ | |
| (Please print) | ||
| ______________________________________ | ||
| Signature: ______________________________ | Postal/Zip Code: _________________________ | |
| Date: _______________, 2003 |
I CERTIFY THAT I AM A REGISTERED / NON-REGISTERED
(please circle which one)
SHAREHOLDER OF DYNAMIC OIL & GAS, INC.
***************************
![]()
DYNAMIC OIL & GAS, INC. IS A RAPIDLY GROWING, TSX
AND NASDAQ SMALL CAP, NATURAL GAS AND CRUDE OIL ENERGY
COMPANY WITH A STRONG POSITION IN WESTERN CANADA.
| ABBREVIATIONS | |
| bbl or bbls | barrel or barrels |
| mcf | thousand cubic feet |
| bbl/d | barrels per day |
| mcf/d | thousand cubic feet per day |
| mbbl | thousand barrels |
| mmcf | million cubic feet |
| boe | barrels of oil equivalent (6 mcf = 1 bbl) |
| mmcf/d | million cubic feet per day |
| boe/d | barrels of oil equivalent per day |
| NGL’s | natural gas liquids |
| mboe | thousand barrels of oil equivalent |
In 2003, North America will need 25.6 trillion cubic feet of natural gas to heat homes and fuel industry. Almost 7% of the total energy consumed is used by the Internet.
In 2002, U.S. natural gas production history shows an average 29% decline rate. Almost half of total current production is coming from wells less than five years old.
In 2003, North America will consume 22.3 million barrels of oil per day. The U.S. will import 10.7 million barrels per day or 53% of their total consumption.
Dynamic’s market cap increased by 103% to $81.1 million, based primarily on the December 31, 2002 market price.
5
2002 HIGHLIGHTS
Our last annual report covered the twelve-month period ended March 31, 2002. Since then, we changed our fiscal year end to December 31. This report covers the nine-month transition period ended December 31, 2002.
| Nine Months | Twelve Months | |||||||
| Ended Dec 31 | Ended Mar 31 | |||||||
| 2002 | 2002 | Change | % Change | |||||
| Operations | ||||||||
| Daily production | ||||||||
| Natural gas (mcf/d) | 14,174 | 15,107 | (933 | ) | (6 | ) | ||
| Natural gas liquids(bbls/d) | 698 | 631 | 67 | 11 | ||||
| Crude oil(bbls/d) | 271 | 76 | 195 | 257 | ||||
| All products(boe/d) | 3,332 | 3,225 | 107 | 3 | ||||
| Total annual production(mboe) | 916 | 1,177 | (261 | ) | (22 | ) | ||
| Prices – weighted average | ||||||||
| Natural gas($/mcf) | 4.36 | 3.81 | 0.55 | 14 | ||||
| Natural gas liquids($/bbl) | 20.90 | 19.30 | 1.60 | 8 | ||||
| Crude oil($/bbl) | 41.40 | 34.33 | 7.07 | 21 | ||||
| Corporate netback($/boe) | 14.59 | 12.08 | 2.51 | 21 | ||||
| Reserves – proved plus probable additional | �� | |||||||
| Natural gas(mmcf) | 43,285 | 44,740 | (1,455 | ) | (3 | ) | ||
| Natural gas liquids(bbls) | 1,779 | 1,905 | (126 | ) | (7 | ) | ||
| Crude oil(bbls) | 2,288 | 553 | 1,735 | 314 | ||||
| Total(boe) | 11,281 | 9,915 | 1,366 | 14 | ||||
| Undeveloped land | ||||||||
| Net acres | 110,745 | 69,162 | 41,583 | 60 | ||||
| Financial ($ thousands) | ||||||||
| Gross revenues | 24,123 | 26,402 | (2,279 | ) | (9 | ) | ||
| Cash flow from operations1 | 10,723 | 11,337 | (614 | ) | (5 | ) | ||
| Per common share | 0.53 | 0.55 | – | (4 | ) | |||
| Earnings (loss) | 1,978 | (3,519 | ) | 5,497 | 156 | |||
| Per common share | 0.10 | (0.17 | ) | – | 159 | |||
| Capital expenditures | 12,578 | 22,111 | (9,533 | ) | (43 | ) | ||
| Operating loan | 11,075 | 14,750 | (3,675 | ) | (25 | ) | ||
| Common shares outstanding | ||||||||
| Basic | 20,357,153 | 20,365,031 | (7,878 | ) | – | |||
| Diluted | 20,554,231 | 20,466,543 | 87,688 | – | ||||
- Cash flow from operations = “Cash provided by operating activities” plus “Changes in non-cash working capital affecting operating activities” in the Statements of Cash Flows. Cash flow from operations is a non-GAAP measure that does not have standardized meaning as prescribed by GAAP and is therefore unlikely to be comparable to similar measures presented by other companies. We consider it a key measure as it demonstrates our ability to generate cash flow necessary to fund future growth through capital investment and to repay debt.
DYNAMIC OIL & GAS, INC. ANNUAL REPORT DECEMBER 31, 2002
6
PRESIDENT'S MESSAGE
In my mind, the word that best describes the nine-month period ended December 31, 2002 ischange. Some changes have been small and may even seem insignificant; others will have a lasting effect on our company and how we do business.
Some of the pressure for changes has come from outside the Company – from analysts, brokers and shareholders. Other changes have been driven internally as we strive to add value and become a larger, more efficient company.
Most of you know that we changed our corporate fiscal year end to December 31st from March 31st – an importantchangethat parallels a wide majority of our peer group companies and allows for more ready comparison. We welcome this kind of attention and believe it can add value to our Company.
Anotherchangehas been in the area of reserve evaluations. During this nine-month period, we hired Sproule Associates Limited of Calgary, Alberta to evaluate our reserves. Sproule is considered one of the top oil and natural gas evaluation firms in North America and we believe their certification of our reserves is an added benefit to our shareholders.
We have increased our staff over the past few months, from 11 employees at the start of 2002, to a total of 16 employees at the beginning of 2003. Additions have been mostly in the area of production and administration. Over the coming year, we expect to staff up in the key areas of exploration and land.
This past nine-month period has seen us receiving regular coverage and reports from analysts in the brokerage community. With the market attention we have been getting, I expect to see even more coverage in the near future.
I recently had an opportunity to participate as a speaker, in a provincial energy conference hosted by the British Columbia Government. The message I delivered was that B.C. is the best place in North America right now to be exploring for large new reserves of natural gas. I urged the Government to speed up development of the physical infrastructure such as roads and power, while at the same time improve educational and employment opportunities for the local people.
The sweetestchangethis year has been the stock price. Through calendar 2002 we saw a 125% increase in the value of our securities on both the TSX and Nasdaq exchanges. Most shareholders know our upward movement has continued into 2003, surging forward again after the end of the first quarter. What is responsible for this increase? Well, some of the changes we have been talking about certainly played a part. Our successful exploration strategy and a sharp increase in commodity prices have been a major factor, too. Natural gas has been a star performer this year because of a cold winter and storage falling to its lowest level in many years. Did I say cold winter? In fact, it was a 'normal' winter based on average temperatures over the last 25 years. Many of us have forgotten what winter can really be like with the kind of mild winters we have seen recently.
DYNAMIC OIL & GAS, INC. ANNUAL REPORT DECEMBER 31, 2002
7
Anotherchange– climate change – has been on everyone's mind. It used to be called 'global warming' and you will still hear that term occasionally. Most scientists know that the climate is constantly changing – always getting warmer or getting colder, never remaining constant. Have fossil fuels had an impact? They have almost certainly modulated the normal trend…but by how much? Here, no one can agree – we simply do not know. I believe the actual impact has been moderate to small. Only time will tell, but what I see before me is a strong natural gas market, driven and constrained by many diverse factors in an industry struggling to meet current demands. I expect continued strong pricing through the summer months as facilities across the country try to meet power and air conditioning demands, and at the same time store enough gas for next winter.
As I gaze into my crystal ball again this year, a couple of things seem to stand out. Oil prices are likely to remain unstable due to war related political issues in the Arab world. OPEC however, will almost certainly try and keep prices above the $25 U.S. benchmark. Natural gas will entrench with solid prices, strong demand and weather-based upside fluctuations. The scariest thing I know is that almost 50% of the natural gas currently produced in North America is coming from wells found in the last five years and most of those wells are in small fields with high decline rates.
I want to leave you with an idea and a prediction – at Dynamic, we're explorers and we are growing our Company through the drill bit. Solid ideas and performance is what is needed and what we're good at – and that isnotgoing tochange.

Wayne J. Babcock,
President & Chief Executive Officer
DYNAMIC OIL & GAS, INC. ANNUAL REPORT DECEMBER 31, 2002
We added new growth opportunities and continued drilling and completion activities.
DYNAMIC OIL & GAS, INC. ANNUAL REPORT DECEMBER 31, 2002
9
REVIEW OF OPERATIONS
For discussion purposes, we may refer to the nine-month period ended December 31, 2002 as “Fiscal Transition 2002” and the twelve-month period ended March 31, 2002 as “Fiscal 2002”.
During Fiscal Transition 2002, we continued to strengthen our technical team with the addition of highly-experienced talent. We added new growth opportunities at Cypress/Chowade and Wimborne and we continued drilling and completion activities at St. Albert and Halkirk. Further, we added to our undeveloped land holdings and seismic database at Orion, Cypress/Chowade and Wimborne. These, we believe, are higher-risk, higher-reward properties that afford pure exploration opportunities.
Our primary strategy is to grow through the drill bit and consistent with that strategy, we have formed a team that is expert in exploration and development growth-oriented activities. During the nine-month period, we stepped-up our daily average production by 107 boe/d or 3%, to 3,332 boe/d and increased our total corporate reserves by 1,366 mboe or 14%, to 11,281 mboe. However, at St. Albert, we did not meet our drilling schedule due to unexpected delays in receiving regulatory approvals for our drilling program. To carry out our near-term objectives and ensure our longer-term ability to fully utilize the St. Albert field, we have begun a public consultation process to provide information to the community and to expand liaison with local authorities and landowners.
We believe we are well positioned to achieve growth through exploration and development of our significant undeveloped land position and our solid inventory of drillable prospects.
Drilling Activity
| Nine Months | Twelve Months | Twelve Months | |||||
| Ended | Ended | Ended | |||||
| Dec 31, 2002 | Mar 31, 2002 | Mar 31, 2001 | |||||
| Gross | Net | Gross | Net | Gross | Net | ||
| Natural gas | 7 | 4.3 | 9 | 7.5 | 14 | 10.7 | |
| Crude oil | 2 | 1.5 | 1 | 0.7 | 1 | 0.9 | |
| Dry | – | – | 4 | 2.8 | 2 | 1.9 | |
| Total | 9 | 5.8 | 14 | 11.0 | 17 | 12.5 | |
| Success rate | 100% | 75% | 85% | ||||
We operated or participated in nine drilled wells and one re-completed well over the nine months, resulting in seven natural gas wells and three oil wells for an overall success rate of 100%. Of the seven natural gas wells, five were drilled as exploratory outpost wells at Cypress/Chowade in northeast British Columbia and two were drilled as development wells at St. Albert and Halkirk, Alberta. Of the three oil wells, two were drilled and one was a re-completed, previous natural gas well at St. Albert.
DYNAMIC OIL & GAS, INC. ANNUAL REPORT DECEMBER 31, 2002
10
Land Holdings (acres)
As at December 31, 2002
| Developed | Undeveloped | Total | Weighted | |||||
| Area | Gross | Net | Gross | Net | Gross | Net | Avg WI %1 | |
| Alberta | ||||||||
| St. Albert | 9,379 | 6,101 | 5,372 | 3,936 | 14,751 | 10,037 | 68% | |
| Halkirk | 3,840 | 3,456 | 3,200 | 3,182 | 7,040 | 6,638 | 94% | |
| Peavey/Morinville | 7,203 | 4,931 | 5,069 | 3,758 | 12,272 | 8,689 | 71% | |
| Quirk Creek | 640 | 320 | 10,720 | 5,360 | 11,360 | 5,680 | 50% | |
| Wimborne | – | – | 3,200 | 3,200 | 3,200 | 3,200 | 100% | |
| Other | 3,689 | 2,731 | 3,360 | 3,072 | 7,049 | 5,803 | 82% | |
| 24,751 | 17,539 | 30,921 | 22,508 | 55,672 | 40,047 | 72% | ||
| British Columbia | ||||||||
| Cypress/Chowade | 3,499 | 1,749 | 12,010 | 4,028 | 15,509 | 5,777 | 37% | |
| Orion | 1,920 | 960 | 64,485 | 45,682 | 66,405 | 46,642 | 70% | |
| Fraser Valley | – | – | 54,502 | 18,278 | 54,502 | 18,278 | 34% | |
| 5,419 | 2,709 | 130,997 | 67,988 | 136,416 | 70,697 | 52% | ||
| Total to Dec 31, 2002 | 30,170 | 20,248 | 161,918 | 90,496 | 192,088 | 110,744 | 58% | |
| Total to Mar 31, 2002 | 24,110 | 17,089 | 126,061 | 69,162 | 150,171 | 86,251 | 57% | |
| Increase (decrease) | 6,060 | 3,159 | 35,857 | 21,334 | 41,917 | 24,493 | 1% | |
| Increase (decrease) % | 25% | 18% | 28% | 31% | 28% | 28% | 1% | |
- WI% means our net working interest through joint venture participation.
Our total land holdings increased during the year by 41,917 gross acres (24,443 net) or 28%, to 192,088 gross acres (110,744 net). This increase was spread among three key properties, Wimborne in Alberta, and Cypress/Chowade and Orion in British Columbia. Of our total land interests, 161,918 gross acres (90,496 net) were over 80% undeveloped. We expect to continue to diversify and strengthen our land holdings in fiscal 2003.
Our weighted average working interests of all our Alberta properties was 72% versus 52% in British Columbia. In total, our weighted average working interests increased by 1%, to 58%
Highlights of our properties and the key developments achieved during the nine-month period ended December 31, 2002, are described in further detail below.
DYNAMIC OIL & GAS, INC. ANNUAL REPORT DECEMBER 31, 2002
11
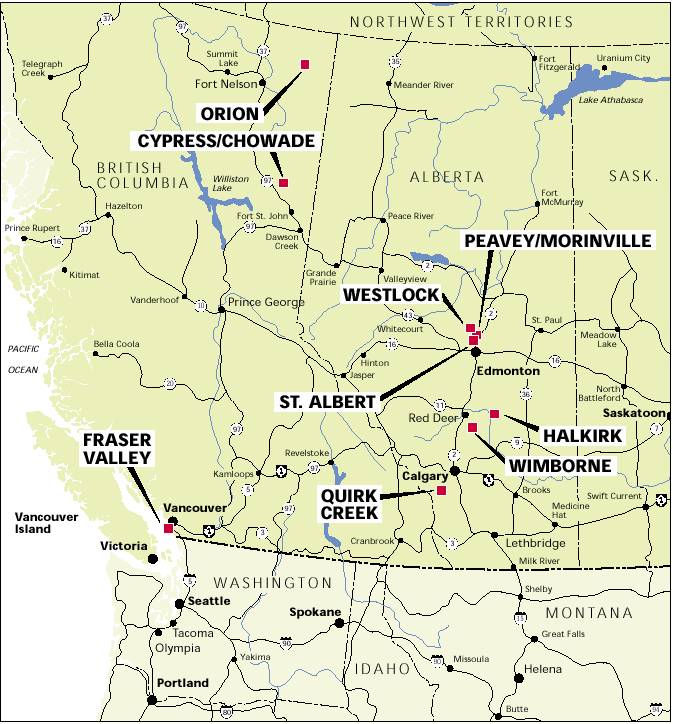
DYNAMIC OIL & GAS, INC. ANNUAL REPORT DECEMBER 31, 2002
12
ALBERTA PROPERTIES
| St. Albert | ||
| Location | • | St. Albert is located in central Alberta near the City of Edmonton. |
| Geological Description | • | St. Albert is comprised of sixteen separate Cretaceous-aged natural gas and Devonian-aged crude oil pools |
| stacked in seven productive formations, four natural gas and three crude oil. We consider the St. Albert | ||
| property as several core properties in one, as this high concentration of pools in one property is industry | ||
| unique. | ||
| • | Historically, the property has produced in excess of 22.5 million barrels of crude oil and 109 billion cubic feet | |
| of raw natural gas. | ||
| • | The area is prospective for remaining recoverable crude oil from six established pools in the Leduc (D-3), | |
| Nisku (D-2) and Wabamun (D-1) formations. | ||
| Land Holdings | • | We hold 14,751 acres (10,037 net) under lease. |
| Wells and Facilities | • | We own a 75% WI in 22 producing natural gas wells. |
| • | Our ownership ranges from 44% to 77% WI in four producing natural gas wells. | |
| • | We own a 75% WI in eight producing crude oil wells. | |
| • | We own a 75% WI in one oil battery, one solution gas plant, one sour gas compressor, two sweet gas | |
| compressors and a 13-km , 6" sour gas pipeline. | ||
| Operating Activities | • | We drilled a successful D-3 oil well (location 06-25) by re-entering a previously suspended well bore, cutting |
| a window in the casing below the Mannville formation and directionally drilling to a new seismically | ||
| identified bottom hole location. | ||
| • | The oil well (location 06-25) confirmed our long-held belief that commercial quantities of D-3 oil reserves | |
| remained trapped in an attic position within the reef above the production interval in the original, 1950’s- | ||
| vintage vertical wells. | ||
| • | During the initial eight-hour production test of the 06-25 well, it flowed at an average rate of 990 boe/d and | |
| averaged 498 boe/d in 61 operating days. | ||
| • | We drilled a successful Ostracod A natural gas well at 07-26. | |
| • | We drilled a successful well targeting crude oil in the Nisku (D-2) formation at 12-25. | |
| • | An oil well re-completion was successful in the Wabamun (D-1) formation at 10-36. | |
| • | Drilling and completion activity increased the production of oil and natural gas liquids during Fiscal | |
| Transition 2002 by an average of 259 boe/d or 37% to 959 boe/d over Fiscal 2002. | ||
| • | Natural gas production declined during Fiscal Transition 2002 by an average of 124 boe/d or 6% to 1,893 | |
| boe/d over Fiscal 2002, in response to an expected decline in reservoir pressure. | ||
| • | In total, we increased our average daily production rates at St. Albert in Fiscal Transition 2002 by a net of | |
| 135 boe/d or 5%, to 3.852 boe/d over Fiscal 2002 to a daily average of 2,852 boe/d. | ||
| • | Overall, reserves and production at St. Albert were added while minimizing surface and environmental | |
| impact by re-entering existing well bores and surface facilities. | ||
| Looking Ahead to 2003 | • | We have identified several drilling targets prospective for incremental crude oil and natural gas recovery. |
| • | We have budgeted 8 new wells at St. Albert in 2003, 6 targeting remaining crude oil potential in established | |
| pools and 2 targeting accelerated natural gas production from the Ostracod A pool. | ||
| • | We plan to address declining reservoir pressures in various natural gas pools by adding third-party | |
| compression at the inlet to processing facilities located at Villenueve and Carbondale gas plants. | ||
DYNAMIC OIL & GAS, INC. ANNUAL REPORT DECEMBER 31, 2002
13
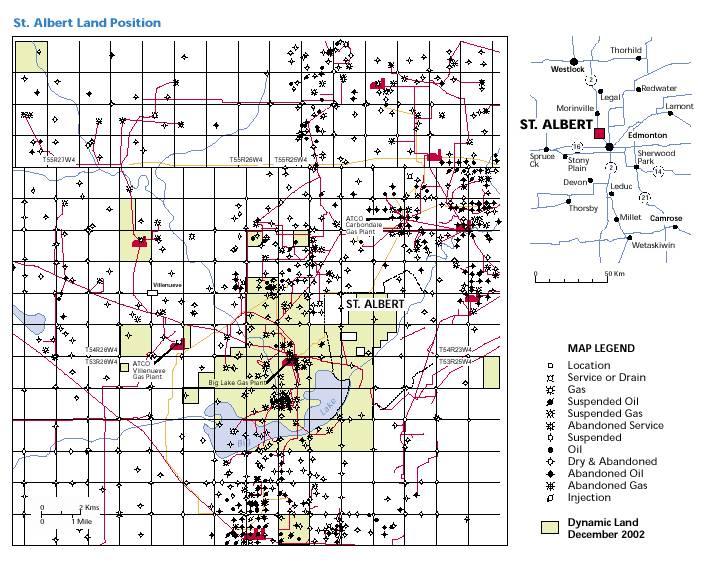
DYNAMIC OIL & GAS, INC. ANNUAL REPORT DECEMBER 31, 2002
14
| Halkirk | ||
| Location | • | Halkirk is in central Alberta approximately 168 kilometres (kms) northeast of Calgary. |
| Geological Description | • | This area is prospective for multiple, sweet natural gas-bearing Cretaceous-aged sandstone |
| reservoirs. | ||
| • | The primary target for reserves is the Viking “C” sand with an average net pay thickness of | |
| approximately five metres. | ||
| Land Holdings | • | We have 7,040 gross acres (6,638 net) under lease. |
| Wells and Facilities | • | We own a 100% working interest (WI) in four producing gas wells and one suspended well. |
| • | We also own an 80% WI BPO (before payout) and a 48% WI APO (after payout) in | |
| three producing gas wells. | ||
| • | All our natural gas production is processed at the Maple Glen Refrigeration Plant under a | |
| third-party custom processing agreement. | ||
| Operating Activities | • | We drilled one successful Viking C natural gas well at location 12-30 and successfully re- |
| completed a previously abandoned well bore in the Viking C sand at location 6-24. | ||
| • | We conducted several work-over operations on existing wells during Fiscal Transition 2002. | |
| • | Production of natural gas and natural gas liquids decreased in Fiscal Transition 2002 by 32 | |
| boe or 10%, to 288 boe/d on an operating day basis over Fiscal 2002 reflecting an expected | ||
| decrease in reservoir pressure and tight reservoir permeability in the Viking C sand. | ||
| • | To date, our reserves at Halkirk are based on a 320-acre drainage area; in the future we will | |
| need to drill infill wells to increase reserve allocations. | ||
| Looking Ahead to 2003 | • | We expect to maintain current production rates by drilling two infill wells in 2003 and |
| adding third-party compression services at the Maple Glen gas plant. | ||
DYNAMIC OIL & GAS, INC. ANNUAL REPORT DECEMBER 31, 2002
15

DYNAMIC OIL & GAS, INC. ANNUAL REPORT DECEMBER 31, 2002
16
| Wimborne | ||
| Location | • | Wimborne is located in south-central Alberta approximately 112 kms northeast of Calgary. |
| Geological Description | • | This area is prospective for multiple Cretaceous-aged sandstone reservoirs containing natural |
| gas and natural gas liquids. | ||
| • | Additional potential exists for crude oil and natural gas within deeper Mississippian | |
| carbonate reservoirs in the Pekisko formation. | ||
| Wells and Facilities | • | We have not drilled any wells to date. |
| • | The property is in close proximity to existing natural gas pipelines and processing facilities. | |
| Land Holdings | • | We own 3,200 gross acres (3,200 net) of petroleum and natural gas (P&NG) rights. |
| Operating Activities | • | During the period, we participated in a large multi-client 3D seismic shoot and conducted |
| our own 3D proprietary seismic program. In total, we shot and acquired over 160 kms2of | ||
| high quality 3D seismic, a database that is expected to provide a long-term exploration and | ||
| development strategy for the area. | ||
| • | We acquired a 100% WI in one new section (640 acres) of crown P&NG lands. | |
| Looking Ahead to 2003 | • | Since December 31, 2002, we acquired 4,480 gross acres (4,480 net) of new crown P&NG |
| leases. | ||
| • | We have identified through seismic up to twelve exploration and development targets on | |
| our lands and plan to drill three exploration wells in 2003. | ||
DYNAMIC OIL & GAS, INC. ANNUAL REPORT DECEMBER 31, 2002
17
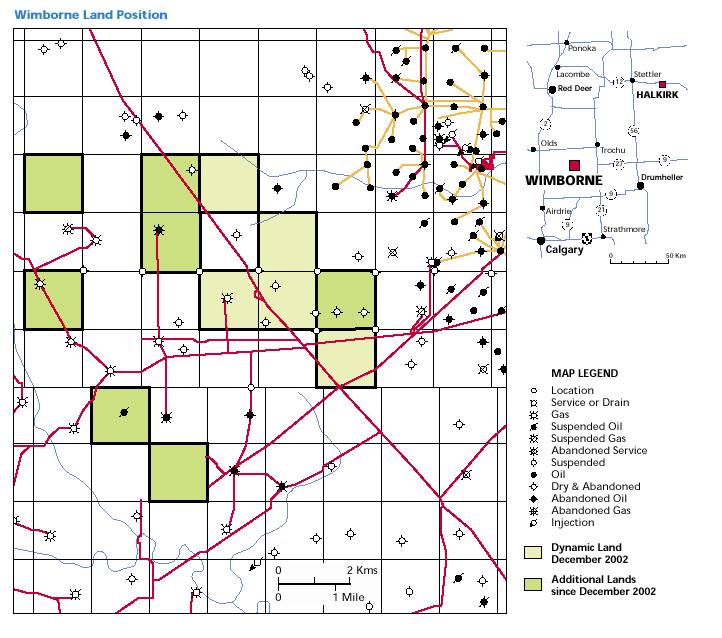
DYNAMIC OIL & GAS, INC. ANNUAL REPORT DECEMBER 31, 2002
18
BRITISH COLUMBIA PROPERTIES
| Cypress/Chowade | ||
| Location | • | Cypress/Chowade is located in the foothills of northern British Columbia approximately |
| 100 kms northwest of Fort St. John. | ||
| Geological Description | • | The area is prospective for multiple, natural gas-bearing Triassic sandstone and deep |
| Mississippian carbonate reservoirs contained within classic foothill anticlines that trend | ||
| northwest-southeast through the area. | ||
| Land Holdings | • | We have under lease 15,509 gross acres (5,778 net). |
| Wells and Facilities | • | We own a 50% WI BPO and a 30% WI APO in 5 natural gas wells. |
| • | A major expansion of pipeline and processing is required. | |
| Operating Activities | • | Dynamic participated in drilling five exploration wells under two, separate farmin |
| agreements targeting multi-zone natural gas bearing reservoirs of Triassic age. All five wells | ||
| were cased as new-pool natural gas discoveries. | ||
| • | Initial independent estimates of productivity from the five wells are in excess of 20 mmcf/d | |
| (10 mmcf/d net to Dynamic), based on drill-stem and production testing. | ||
| Looking Ahead to 2003 | • | Natural gas discoveries to date justify the partnership to finance a major expansion of |
| existing natural gas production and transportation facilities. | ||
| • | We expect to have two wells on stream during the summer and three more on by late fall 2003. | |
| • | We have assembled a large, 2D seismic database on our lands and have mapped multiple | |
| prospect fairways on which the land strategy was based. We have seismically identified more | ||
| than 20 potential exploration and development locations. | ||
| • | We plan to drill up to six outpost wells in 2003, three exploratory and three development. | |
| • | Since December 31, 2002, we have acquired a total of 24,100 gross acres (7,799 net) of P&NG | |
| rights at two separate crown land sales. This brings our total land holdings to 36,609 gross | ||
| acres (13,467 net). | ||
| • | We plan to continue an aggressive land acquisition strategy under an expanded area of mutual | |
| interest with our two industry partners, encompassing approximately 750,000 gross acres. | ||
DYNAMIC OIL & GAS, INC. ANNUAL REPORT DECEMBER 31, 2002
19
![]()
DYNAMIC OIL & GAS, INC. ANNUAL REPORT DECEMBER 31, 2002
20
| Orion | ||
| Location | • | Orion is strategically located between the Sierra and Helmet natural gas fields approximately |
| 56 kms west of the Alberta border and 112 kms south of the Northwest Territories border. | ||
| The property is dissected by the Sierra Yoyo Desan Road, which provides year-round access | ||
| for drilling operations. | ||
| Geological Description | • | The area is prospective for natural gas exploration and development in the Jean Marie, |
| Bluesky, Debolt and deeper Slave Point formations. | ||
| Land Holdings | • | We hold under lease 66,405 gross acres (46,642 net). |
| • | Approximately 59% of these lands are owned by Dynamic (50%) and its partner. We own | |
| 100% working interest in the balance. | ||
| Wells and Facilities | • | We own a 100% WI in one potential Bluesky and one horizontal Jean Marie natural gas well. |
| • | In one horizontal Jean Marie potential natural gas well we own a 15% gross overriding BPO | |
| and a 50% WI APO. | ||
| • | Our property is located at the termination of two major pipeline systems. The Duke Energy | |
| Pipeline System connects to Fort Nelson for delivery to Washington State and the Duke | ||
| Energy Field Services Pipeline System connects to Tooga Compressor Station for delivery to | ||
| Alberta. Both pipelines are approximately 7 kms from our property. | ||
| Operating Activities | • | A horizontal well was drilled and completed as a potential Jean Marie natural gas well. The |
| well was drilled by a large, independent Canadian oil and gas partner pursuant to a farmin | ||
| agreement. | ||
| • | We pursued an aggressive land acquisition program by adding 36,401 gross acres (23,308 | |
| net) of P&NG leases. | ||
| Looking Ahead to 2003 | • | A large independent Canadian oil and gas company has used the term, ‘The Greater Sierra |
| Gas Play’ to refer to the regional Jean Marie, and has described the area as the largest gas | ||
| play discovered in Western Canada. Our lands form a part of the area and are a key element | ||
| in our long-term growth strategy. | ||
| • | We plan to drill one horizontal exploration test well into the Jean Marie formation and | |
| shoot 90 kms2of proprietary 3D seismic in 2003 in preparation for future drilling. | ||
DYNAMIC OIL & GAS, INC. ANNUAL REPORT DECEMBER 31, 2002
21
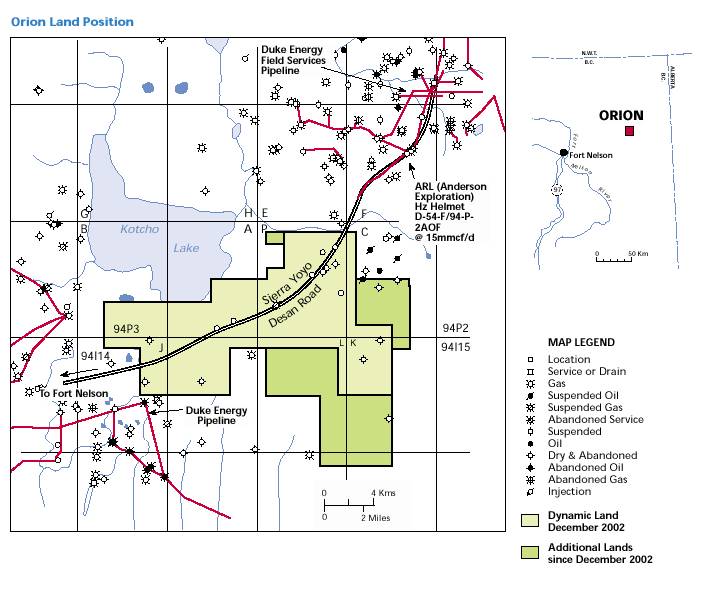
DYNAMIC OIL & GAS, INC. ANNUAL REPORT DECEMBER 31, 2002
22
| Fraser Valley | ||
| Location | • | The property is located in the Lower Mainland area of southwest British Columbia near the |
| port City of Vancouver. | ||
| Land holdings | • | Under a joint venture agreement with Conoco Canada Limited, we continue to hold |
| approximately 54,502 gross acres (18,279 net) of onshore and offshore P&NG rights | ||
| associated with Permit 802, a validated British Columbia Exploration Permit. | ||
| • | Permit 802 is under Provincial jurisdiction and includes offshore P&NG rights in the Georgia | |
| Basin, located in the Strait of Georgia between the Lower Mainland and Vancouver Island. | ||
| Looking ahead to 2003 | • | Presently, areas offshore are subject to a restricted access moratorium for petroleum and |
| natural gas activities; however, discussions are underway between the Provincial and Federal | ||
| Governments in regards to lifting the moratorium. The Provincial Government has indicated | ||
| its desire to move forward and the Federal Government is currently conducting a public | ||
| review to identify environmental and social concerns arising from offshore activities along | ||
| the Pacific West Coast. A final decision is expected in 2004. | ||
| • | While commercial natural gas is yet to be discovered in this area, we have identified | |
| additional drill targets that are prospective for natural gas accumulation. The presence on | ||
| our lands of a large structural feature (Robert’s Bank Gravity Anomaly) approximately 19 | ||
| kms2in size has been supported by government gravity and onshore seismic data. | ||
| • | The Geological Survey of Canada has assigned the Georgia Basin a reserve estimate of 6.5 | |
| trillion cubic feet of natural gas. | ||
| Other Non-Core Properties | ||
| • | Peavey/Morinville, Alexander, Simonette, Stanmore and Westlock in Alberta comprise 19,321 | |
| gross acres (14,491 net) with a weighted average WI of 75% and generated 8% of our | ||
| production in the nine-month period ended December 31, 2002. | ||
| • | We own a 50% working interest in 11,360 gross acres (5,680 net) of petroleum and natural | |
| gas leases at Quirk Creek. There are no producing wells on the property. Dynamic was | ||
| inactive there during Fiscal Transition 2002 and expects to be inactive in Fiscal 2003. | ||
DYNAMIC OIL & GAS, INC. ANNUAL REPORT DECEMBER 31, 2002
23
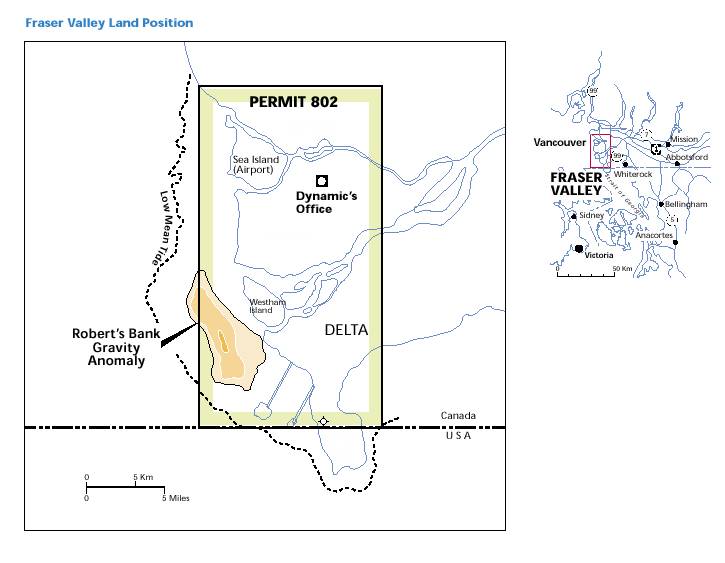
DYNAMIC OIL & GAS, INC. ANNUAL REPORT DECEMBER 31, 2002
We increased our total corporate reserves by
1,366 mboe or 14%, to 11,281 mboe.
DYNAMIC OIL & GAS, INC. ANNUAL REPORT DECEMBER 31, 2002
25
RESERVES
Our independent reserves estimates effective January 1, 2003 are prepared by Sproule Associates Limited of Calgary, Alberta (“Sproule”) and are shown in the following tables.
Reserves of Natural Gas, Natural Gas Liquids and Crude Oil
(Before royalties)| Natural Gas | ||||||||
| Natural Gas | Liquids | Crude Oil | Equivalent | |||||
| (mmcf) | (mbbls) | (mbbls) | (mboe) | |||||
| Proved producing | 19,690 | 1,122 | 667 | 5,070 | ||||
| Proved non-producing | 12,004 | 361 | 739 | 3,100 | ||||
| Total proved (P) | 31,694 | 1,483 | 1,406 | 8,170 | ||||
| Probable additional (PA) | 11,591 | 296 | 883 | 3,111 | ||||
| Total P+PA as of December 31, 2002 | 43,285 | 1,779 | 2,288 | 11,281 | ||||
| Total P+PA as of March 31, 2002 | 44,740 | 1,905 | 553 | 9,915 | ||||
| Increase (decrease) | (1,455 | ) | (126 | ) | 1,735 | 1,366 | ||
| Increase (decrease) % | (3.3)% | (7.1)% | 313.7% | 13.8% | ||||
Natural gas
During the nine-month period ended December 31, 2002, our estimated proved plus probable (P+PA) natural gas reserves decreased by a net of 1,455 mmcf or 3.3%, to 43,285 mmcf from the twelve-month period ended March 31, 2002. Factors contributing to this net decrease were production of 3,898 mmcf and a downward revision of 10,444 mmcf to previous reserve estimates made on our Peavey/Morinville and Halkirk properties. These factors were largely offset by new reserves acquired at St. Albert of 588 mmcf, and new extensions and discoveries at St. Albert and Cypress of 12,299 mmcf.
Natural gas liquids
During the nine-month period ended December 31, 2002, our natural gas liquids P+PA reserves decreased by a net of 125 mbbls or 7.1%, to 1,779 mbbls from the twelve-month period ended March 31, 2002. Most of our production of 192 mbbls originated from liquid-rich natural gas at St. Albert. Acquisitions, estimates, extensions and discoveries at St. Albert served to increase reserves by 66 mbbls.
Crude oil
During the nine-month period ended December 31, 2002, our estimated crude oil P+PA reserves increased by a net of 1,735 mbbls or 313.7% to 2,288 mbbls from the twelve-month period ended March 31, 2002. This net increase was due to new extensions, discoveries and revisions totaling 1,810 mbbls less production of 75 mbbls. All of our crude oil originates from the St. Albert field.
DYNAMIC OIL & GAS, INC. ANNUAL REPORT DECEMBER 31, 2002
26
Reconciliation of Proved (P) + Probable Additional (PA) Reserves
| Natural Gas | ||||||||
| Natural Gas | Liquids | Crude Oil | Equivalent | |||||
| (mmcf) | (mbbls) | (mbbls) | (mboe) | |||||
| Opening reserves as at March 31, 2002 | 44,740 | 1,905 | 553 | 9,915 | ||||
| Acquisitions | 588 | 18 | – | 116 | ||||
| Revision of previous estimates | (10,444 | ) | 18 | 1,180 | (544 | ) | ||
| Production | (3,898 | ) | (192 | ) | (75 | ) | (916 | ) |
| Extensions and discoveries | 12,299 | 30 | 630 | 2,710 | ||||
| Year-end reserves as at December 31, 2002 | 43,285 | 1,779 | 2,288 | 11,281 | ||||
Our net present value (“NPV”) of P+PA reserves was determined according to the Canadian Provincial Securities Administrators’ National Policy No. 2-B, using a constant gas price of $C5.50 per mcf and a constant oil price of $C43.43 per barrel. These prices were our actual weighted average commodity prices received in December 2002, and along with associated operating costs, were assumed constant over the life of the reserves.
Our estimated 10% discounted net present value (npv) of P+PA reserves as at December 31, 2002 increased by $66.9 million or 87.4%, to $143.4 million over our npv as at March 31, 2002. This represented an increase in our npv per share of $3.31 or 88.5%, to $7.05 per share based on our number of shares outstanding as at the end of each period (December 31, 2002 and March 31, 2002 – 20.4 million, basic).
Discounted net present value $(000’s)
(Before taxes, after royalties)
| 0% | 10% | 15% | ||||
| Proved producing | 106,503 | 74,117 | 65,512 | |||
| Proved non-producing | 58,241 | 35,534 | 29,469 | |||
| Total proved (P) | 164,744 | 109,651 | 94,981 | |||
| Probable additional (PA) | 62,787 | 33,775 | 27,339 | |||
| Total P+PA as at December 31, 2002 | 227,531 | 143,426 | 122,320 | |||
| Total P+PA as at March 31, 2002 | 116,510 | 76,526 | 65,239 | |||
| Increase (decrease) | 111,021 | 66,900 | 56,991 | |||
| Increase (decrease) % | 95.3% | 87.4% | 87.4% | |||
Reserve Life Indices
| Nine-Month | ||||||
| Period Ended | Twelve-Month | Twelve-Month | ||||
| Dec 31, 2002 | Period Ended | Period Ended | ||||
| Annualized1 | Mar 31, 2002 | Mar 31, 2001 | ||||
| Proved (yrs) | 6.7 | 7.5 | 8.4 | |||
| Proved plus probable additional (yrs) | 9.2 | 8.4 | 9.5 | |||
- To be meaningful and comparable, our reserve life index for the nine-month period ended December 31, 2002 is annualized by multiplying the period’s production of 916 mboe by four-thirds to arrive at 1,222 mboe.
Our proved reserve life indices have, over the past three reporting periods, shown steadily improving exploitation of proved reserves. Proved plus probable additional reserve indices show we have opportunity to optimize reserve extraction.
DYNAMIC OIL & GAS, INC. ANNUAL REPORT DECEMBER 31, 2002
27
MANAGEMENT'S DISCUSSION AND ANALYSIS OF FINANCIAL CONDITION
AND RESULTS OF OPERATIONS
The following should be read in conjunction with the Financial Statements and the Notes to the Financial Statements included in this report. The Financial Statements have been prepared in accordance with Canadian generally accepted accounting principles (GAAP). The impact of the significant differences between Canadian and United States (US) generally accepted accounting principles on the Financial Statements is disclosed in Note 12 to the Financial Statements.
Unless otherwise noted, tabular amounts are in thousands of Canadian dollars, and sales volumes, production volumes and reserves are before royalties. We have presented our working interest before royalties, as we measure our performance on this basis consistent with other Canadian oil and gas companies. See the Review of Operations section in this annual report for our production and reserves after royalties.
OUR MOST RECENTLY FILED ANNUAL REPORT COVERED THE TWELVE-MONTH PERIOD ENDED MARCH 31, 2002. SINCE THEN, WE CHANGED OUR FISCAL YEAR END TO DECEMBER 31. THIS REPORT COVERS THE NINE-MONTH TRANSITION PERIOD ENDED DECEMBER 31, 2002. WHERE USEFUL FOR COMPARISON PURPOSES, ANNUALIZED NUMBERS ARE PRESENTED BY APPLYING THE NINE-MONTH TRANSITION NUMBERS MULTIPLIED BY FOUR-THIRDS, HOWEVER, THIS METHOD DOES NOT REFLECT ACTUAL RESULTS FOR THE THREE-MONTH EXTRAPOLATED PERIOD AND SUCH RESULTS MAY DIFFER FROM THE RESULT ACHIEVED BY THIS CALCULATION. ALSO, FOR EASE OF READING, WE MAY REFER TO THE NINE-MONTH PERIOD ENDED DECEMBER 31, 2002 AS “FISCAL TRANSITION 2002”; THE TWELVE-MONTH PERIOD ENDED MARCH 31, 2002 AS “FISCAL 2002”, AND THE TWELVEMONTH PERIOD ENDED MARCH 31, 2001 AS “FISCAL 2001”.
DYNAMIC OIL & GAS, INC. ANNUAL REPORT DECEMBER 31, 2002
28
| TABLE OF CONTENTS | |
| PAGE | |
| Highlights | 29 |
| Strategy | 30 |
| List of Properties and Capital Investment | 31 |
| Financial Results | |
| Cash Flow from Operations and Earnings | 33 |
| Revenue | 34 |
| Daily Average Production Rates and Annual Production | 34 |
| Weighted Average Commodity Prices | 36 |
| Royalties, Mineral Taxes and Alberta Royalty Tax Credits | 36 |
| Production Costs | 37 |
| Amortization and Depletion Expense | 37 |
| Exploration Expenses | 38 |
| Gain on Sale of Natural Gas and Oil Interests | 39 |
| Interest Expense and Interest Income | 39 |
| General and Administrative Expenses | 39 |
| Income Taxes and Tax Pools | 40 |
| Liquidity and Capital Resources | 40 |
| Outlook for 2003 | 41 |
| Commitments | 41 |
| Business Risk Management | 41 |
| Market Risk Management | 43 |
| Critical Accounting Policies | 45 |
| Recently Issued Accounting Standard | 46 |
DYNAMIC OIL & GAS, INC. ANNUAL REPORT DECEMBER 31, 2002
29
HIGHLIGHTS
(Cdn$ thousands)| Dec 31, 2002 | % Chg | Mar 31, 2002 | % Chg | Mar 31, 2001 | ||||||
| Earnings | 1,978 | 156 | (3,519 | ) | (136 | ) | 9,714 | |||
| Earnings per share | 0.10 | 159 | (0.17 | ) | (135 | ) | 0.49 | |||
| Cash flow from operations1 | 10,723 | (5 | ) | 11,337 | (38 | ) | 18,168 | |||
| Cash flow from operations per share1 | 0.53 | (4 | ) | 0.55 | (38 | ) | 0.91 | |||
| Natural gas, liquids and oil production (boe/d)2 | 3,332 | 3 | 3,225 | 22 | 2,644 | |||||
| Capital expenditures | 12,578 | (43 | ) | 22,111 | 91 | 11,582 | ||||
| Established reserve additions (mboe) | 1,366 | 84 | 741 | 247 | (504 | ) | ||||
| Debt3 | 16,818 | 27 | 13,281 | – | – | |||||
| Debt to cash flow (times)4 | 1.6:1 | 1.2:1 | – | |||||||
| Debt to cash flow annualized (times)5 | 1.2:1 | 1.2:1 | – | |||||||
- Cash flow from operations is a non-GAAP measure that does not have standardized meaning as prescribed by GAAP and is therefore unlikely to be comparable to similar measures presented by other companies. We consider it a key measure as it demonstrates our ability to generate the cash flow necessary to fund future growth through capital investment and to repay debt.
- Production and reserves include our working interest before royalties. We have presented our working interest before royalties as we measure our performance on this basis consistent with other Canadian oil and gas companies.
- Debt is working capital, as we do not have any long-term debt.
- Debt divided by cash flow from operations.
- Debt divided by annualized cash flow from operations.
| Dec 31, 2002 | % Chg | Mar 31, 2002 | % Chg | Mar 31, 2001 | ||||||
| Cash flow from operating activities | 11,370 | 16 | 9,779 | (49 | ) | 19,264 | ||||
| Changes in non-cash working capital | (647 | ) | (142 | ) | 1,559 | 242 | (1,096 | ) | ||
| Cash flow from operations | 10,723 | (5 | ) | 11,337 | (38 | ) | 18,168 | |||
DYNAMIC OIL & GAS, INC. ANNUAL REPORT DECEMBER 31, 2002
30
STRATEGY
Growth strategy
We believe shareholder value is best served by focusing on a grassroots, exploration-led strategy. Further, we believe the Canadian oil and gas industry is healthy and, in particular, the sedimentary basins of western Canada offer solid prospects to continue to find, develop, replace and grow reserves. As these basins mature, we believe that oil and gas companies, like Dynamic, will continue to play a key role in future energy development.
To supplement our main strategy, we believe in targeted acquisitions that provide future exploration and development prospects.
Our fundamental goal is enhancing shareholder value. As part of the process, we focus on key industry comparatives and regularly report such metrics as cash flow and earnings per share, daily production levels, independent reserves, and net present value estimations.
To succeed, we must continue to build a team of individuals with proven, exploration and development backgrounds in Western Canada. Their collective skills help us to pursue our corporate strategy in the following ways:
Natural-gas weighting
We believe that natural gas is increasing as a fuel of choice because it is key to meeting the future energy and environmental needs of the fast-growing residential and industrial sectors of North America.
As part of our strategy, we continue seeking properties that target multiple natural gas zones in areas where the prospects for near-term tie-ins are sound and feasible. Over the past five years, our portfolio of established reserves has averaged 75% natural gas-based versus crude oil and we intend to maintain approximately that commodity mix in the future.
Risk portfolio balancing
As a guide in pursuing our strategy, we believe in a portfolio of blended-risk properties. It is our belief that a property inventory of low and medium-risk natural gas targets combined with higher-risk exploration opportunities offers our shareholders a risk-moderated opportunity for value growth.
Technology endorsing
We use modern seismic and advanced drilling techniques to execute our strategy.
Risk-reward sharing
We generally use oil and gas joint ventures to manage our aggregate corporate risk. We believe such ventures are a practical way to share technical knowledge, cash resources and to reduce exploration and development risks. Aligning our interests with joint venture partners often enhances the economics of a given project in which we might otherwise compete.
Working interest maximizing
To maximize returns, we try to maintain significant working interests in the majority of our core assets and where plausible, we prefer to operate them. This provides us greater influence and control over offsetting acreage and future infrastructure development.
Socially-responsible operating
Our corporate culture is one of integrity and social responsibility in every area of our operations. We believe in a strong, conscientious safeguarding of the public interest and the environment.
DYNAMIC OIL & GAS, INC. ANNUAL REPORT DECEMBER 31, 2002
31
LIST OF PROPERTIES AND CAPITAL INVESTMENT
Following is a list of properties and some of their key characteristics:
List of Properties| Percentage of | New Frontier | Future Prospects | Reserves | 20034 Activity | ||
| Production1 | Core2 | Exploration3 | for Development | Established | Planned | |
| Alberta | ||||||
| St. Albert | 85 | |||||
| Halkirk | 7 | |||||
| Peavey/Morinville | 3 | |||||
| Alexander | 2 | |||||
| Simonette | 1 | |||||
| Stanmore | 1 | |||||
| Westlock | 1 | |||||
| Quirk Creek | ||||||
| Wimborne | ||||||
| 100 | ||||||
| British Columbia | ||||||
| Cypress/Chowade | ||||||
| Orion | ||||||
| Fraser Valley | ||||||
- Based on total production during the nine-month period ended December 31, 2002.
- Core properties are those that presently provide or are expected to provide a significant portion of new cash flows.
- New frontier exploration properties are remote from current known production sources and have no current prouction.
- For details of 2003 planned activity, see “OUTLOOK FOR 2003”.
Following is a table showing our capital investment over our latest three reporting periods:
Capital Expenditures
| Nine Months | Twelve Months | Twelve Months | ||||||||
| Ended | Ended | Ended | ||||||||
| Dec 31, 2002 | % Chg | Mar 31, 2002 | % Chg | Mar 31, 2001 | ||||||
| Drilling, completions, tie-ins | 9,146 | 19 | 7,678 | 106 | 6,939 | |||||
| Facilities | 780 | (56 | ) | 1,757 | (50 | ) | 3,522 | |||
| Land acquisitions | 2,568 | (80 | ) | 12,560 | 1105 | 1,042 | ||||
| Corporate office | 84 | (28 | ) | 116 | 47 | 79 | ||||
| Total | 12,578 | (43 | ) | 22,111 | 91 | 11,582 | ||||
DYNAMIC OIL & GAS, INC. ANNUAL REPORT DECEMBER 31, 2002
32
Nine Month Period Ended December 31, 2002Our capital expenditures were $12.6 million in Fiscal Transition 2002, a 43% decrease from the amount invested in Fiscal 2002. Although some of this decrease is due to the different lengths of the reporting periods, the main reason for it was due to the acquisition of additional working interests at St. Albert during Fiscal 2002 that were not repeated in Fiscal Transition 2002. In Fiscal Transition 2002, we invested as follows:
- 49% in Alberta development properties to maintain and grow existing production levels;
- 51% in British Columbia exploration properties for potential longer-term production growth.
We invested our capital in the following specific areas:
Alberta
- Exploration – drilling, completions and tie-ins totalled $0.2 million, most of which was spent at Halkirk;
- Development of core properties – drilling, completions and tie-ins totalled $4.0 million, 74% of which was spent at St. Albert and 26% at Halkirk;
- Facilities – $0.8 million to acquire an increased interest in gas processing facilities at St. Albert pursuant to a Sale and Leaseback arrangement, as described in Note 5 to our Financial Statements; and
- Land – acquisitions totalled $1.2 million, 94% of which was to purchase various working and royalty interests at St. Albert.
British Columbia
- Exploration – drilling, completions and tie-ins totalled $5.0 million, all of which was spent in the Cypress/Chowade area; and
- Land – acquisitions totalled $1.4 million, 90% of which was spent at Orion.
Twelve Month Period Ended March 31, 2002
We invested our capital in the following specific areas:
Alberta- Exploration and Development – drilling, completions and tie-ins totalled $7.7 million, of which 95% was spent at St. Albert; and
- Facilities and Land – totalled $14.4 million, most of which was spent to acquire additional working interests at St. Albert.
Twelve Month Period Ended March 31, 2001
We invested our capital in the following areas:
Alberta- Exploration and Development – drilling, completions and tie-ins totalled $5.7 million, 53% of which was spent at St. Albert and the balance at Peavey/Morinville; and
- Facilities and Land – totalled $4.6 million, most of which was spent at Peavey/Morinville and Halkirk.
British Columbia
- Exploration and Development – drilling, completions and tie-ins totalled $1.3 million, all of which was spent at Orion.
DYNAMIC OIL & GAS, INC. ANNUAL REPORT DECEMBER 31, 2002
33
FINANCIAL RESULTS
Cash Flow from Operations and Earnings
Nine Months Ended December 31, 2002 vs Twelve Months Ended March 31, 2002
Cash flow from operations decreased by a net $0.6 million or 5%,to $10.7 million mainly due to the following factors:
- A decrease due to the comparatively shorter reporting period;
- A decrease of $5.3 million due to a 22% decrease in total production;
- An increase of $3.0 million due to an 18% aggregate increase in weighted average commodity prices; and
- An increase of $1.7 million due mainly to a 16% decrease in royalties expense.
Earnings increased by a net $5.5 million or 156%, to $2.0 million mainly due to the following factors:
- A net decrease of $0.6 million from the same factors affecting our cash flow from operations explained above;
- An increase of $5.7 million due to a decrease in depletion expense;
- An increase of $3.3 million due to a decrease in exploration expenses; and
- A decrease of $2.9 million due to an increase in future income tax expense.
Twelve Months Ended March 31, 2002 vs Twelve Months Ended March 31, 2001
Cash flow from operations decreased by a net $6.8 million or 38%, to $11.3 million mainly due to the following factors:
- An increase of $5.2 million due to a 22% increase in total production;
- A decrease of $13.2 million due to a 38% aggregate decrease in weighted average commodity prices; and
- An increase of $1.2 million due mainly to a 32% decrease in royalties expense.
Earnings decreased by a net $13.2 million or 136%, to $(3.5) million mainly due to the following factors:
- A net decrease of $6.8 million due to the same factors affecting our cash flow from operations explained above;
- A decrease of $9.2 million due to an increase in depletion expense, $6.8 million of which related to a ceiling test write-down of Peavey/Morinville assets and the balance related to additional working interests acquired at St. Albert;
- A decrease of $2.7 million due to an increase in exploration expense;
- A decrease of $0.6 million due to a decrease in gains on the sale of land interests; and
- An increase of $6.1 million due to a reduction to future income tax expense.
The following provides additional detail on the components affecting various increases and decreases itemized above in cash flow from operations and earnings.
DYNAMIC OIL & GAS, INC. ANNUAL REPORT DECEMBER 31, 2002
34
Revenue
Nine Months Ended December 31, 2002 vs Twelve Months Ended March 31, 2002
Revenues decreased by $2.3 million or 9%, to $24.1 million. The following table shows price-volume variances.
| Price | Volume | Total | ||||
| Natural gas | 2,152 | (6,095 | ) | (3,943 | ) | |
| Natural gas liquids | 307 | (737 | ) | (430 | ) | |
| Crude oil | 521 | 1,573 | 2,094 | |||
| Total | 2,980 | (5,259 | ) | (2,279 | ) | |
On an annualized basis, revenues would have increased by $5.8 million or 22%, to $32.2 million.
Twelve Months Ended March 31, 2002 vs Twelve Months Ended March 31, 2001
Revenues decreased by $8.1 million or 23%, to $26.4 million. The following table shows price-volume variances.
| Price | Volume | Total | ||||
| Natural gas | (10,851 | ) | 3,846 | (7,005 | ) | |
| Natural gas liquids | (2,197 | ) | 704 | (1,493 | ) | |
| Crude oil | (111 | ) | 548 | 437 | ||
| Total | (13,159 | ) | 5,098 | (8,061 | ) | |
Daily Average Production Rates and Annual Production
| Nine Months | Twelve Months | Twelve Months | ||||||||
| Ended | Ended | Ended | ||||||||
| Dec 31, 2002 | % Chg | Mar 31, 2002 | % Chg | Mar 31, 2001 | ||||||
| Natural gas (mcf/d) | 14,174 | (6 | ) | 15,107 | 21 | 12,486 | ||||
| Natural gas liquids (bbl/d) | 698 | 11 | 631 | 19 | 530 | |||||
| Crude oil (bbl/d) | 271 | 257 | 76 | 130 | 33 | |||||
| Equivalent (boe/d) | 3,332 | 3 | 3,225 | 22 | 2,644 | |||||
| Total production (mboe) | 916 | (22 | ) | 1,177 | 22 | 965 | ||||
| Gas weighting (%) | 71 | (9 | ) | 78 | (1 | ) | 79 | |||
| Annualized production (mboe) | 1,221 | 4 | 1,177 | 22 | 965 | |||||
Nine Months Ended December 31, 2002 vs Twelve Months Ended March 31, 2002
Our total production decreased by 261 mboe or 22%, to 916 mboe mainly due to the comparatively shorter reporting period. On an annualized basis, however, total production would increase by 44 mboe or 4%, to 1,221 mboe.
Corporate production
Daily average production rates
- Our total daily average production rate increased by a net 107 boe/d or 3%, to 3,332 boe/d. Of this net increase, natural gas decreased by 155 boe/d or 6%, to 2,362 boe/d (14.2 mmcf), natural gas liquids increased by 67 boe/d or 11%, to 698 boe/d, while crude oil increased by 195 boe/d or 257%, to 271 boe/d.
2003 expected daily average production exit rates
- In 2003 we anticipate an increase in daily average production of approximately 1,900 boe/d or 57%, to 5,200 boe/d.
DYNAMIC OIL & GAS, INC. ANNUAL REPORT DECEMBER 31, 2002
35
The following are discussion and variance analyses of our major fields and their individual impacts on our total daily average production rates:
St. Albert, Alberta
Daily average production rates
- Natural gas and natural liquids production rates decreased by 71 boe/d or 3%, to 2,574 boe/d (15.4 mmcf/d) due mainly to natural decline in reservoir pressures; and
- Crude oil output increased by 188 boe/d or 229%, to 261 boe/d due to the addition of three new oil wells at St. Albert, the largest of which commenced production for 61 days at a daily average rate of 498 boe/d net to us.
2003 expected daily average production exit rates
- Natural gas and natural liquids production exit rates are expected to remain at current levels, as we plan to mitigate natural declines in reservoir pressures through third-party compression; and
- Crude oil rates are expected to increase by approximately 1,450 boe/d to a total of 1,725 boe/d through added drilling and wellbore re-entries. While discoveries may have greater daily production potential, our on-site battery capacity limits us at 1,725 boe/d.
Halkirk, Alberta
Daily average production rates
- Production of natural gas and natural gas liquids decreased by 32 boe or 10%, to 288 boe/d on an operating day basis over Fiscal 2002, due to decreasing reservoir pressures.
2003 expected daily average production exit rates
- We expect to offset natural decline rates by drilling and tying-in additional wells and adding third-party compression at this property.
Peavey/Morinville, Alberta
Daily average production rates• Natural gas rates decreased by 161 boe/d or 61%, to 104 boe/d (0.6 mmcf/d) due mainly to production declines.
2003 expected daily average production exit rates
- In 2003, we anticipate a continued decline in production rate because we do not plan to spend further capital or add new production at this property.
Cypress/Chowade, NE British Columbia
Daily average production rates
- We drilled and completed five natural gas wells that did not produce in Fiscal Transition 2002 because they were not yet tied-in.
2003 expected daily average production exit rates
- We expect to add 450 boe/d (2.7 mmcf/d) by tying-in two natural gas wells. We believe it possible to tie-in the three remaining wells and add 850 boe/d (5.1 mmcf/d), however, tie-ins are not contemplated in our aggregate production exit rate, as they are not expected until late 2003.
Twelve Months Ended March 31, 2002 vs Twelve Months Ended March 31, 2001
Our total production increased by 212 mboe or 22%, to 1,177 mboe mainly due to the acquisition of additional working interests at St. Albert.
DYNAMIC OIL & GAS, INC. ANNUAL REPORT DECEMBER 31, 2002
36
Weighted Average Commodity Prices| Nine Months | Twelve Months | Twelve Months | ||||||||
| Ended | Ended | Ended | ||||||||
| Dec 31, 2002 | % Chg | Mar 31, 2002 | % Chg | Mar 31, 2001 | ||||||
| Natural gas ($/mcf) | 4.36 | 14 | 3.81 | (39 | ) | 6.22 | ||||
| Natural gas liquids ($/bbl) | 20.90 | 8 | 19.30 | (37 | ) | 30.64 | ||||
| Crude oil ($/bbl) | 41.40 | 21 | 34.33 | (21 | ) | 43.60 | ||||
Nine Months Ended December 31, 2002 vs Twelve Months Ended March 31, 2002
Our weighted average prices of all commodities produced by us increased by percentage changes ranging from between 8% to 21%.
- Market prices during Fiscal Transition 2002 for natural gas were relatively strong until July 2002, at which time they plummeted. Later in the period, as cold weather in the eastern United States settled in, increased demand and supply concerns resulted in stronger regional prices.
- Prices for crude oil were strong during Fiscal Transition 2002 due to strengthening of the West Texas Intermediate benchmark price, reflecting geo-political uncertainties and tighter crude oil supplies.
- Our natural gas liquids are 45% natural-gas based and 55% crude-oil based; therefore, liquids prices follow the respective commodity price trends.
Our weighted average prices of all commodities produced by us decreased by percentage changes ranging from between 21% to 39%.
- Prices for natural gas in Fiscal 2002 softened from those of Fiscal 2001, as North American inventories rose. Prices for crude oil softened from those of the previous period, as sluggish demand after September 11, 2001 and increased inventory levels drove down prices.
Royalties, Mineral Taxes and Alberta Royalty Tax Credits (ARTC)
| Nine Months | Twelve Months | Twelve Months | ||||||||
| Ended | Ended | Ended | ||||||||
| Dec 31, 2002 | % Chg | Mar 31, 2002 | % Chg | Mar 31, 2001 | ||||||
| Crown | 1,252 | (5 | ) | 1,317 | (55 | ) | 2,958 | |||
| Freehold and overriding | 3,327 | (18 | ) | 4,067 | (37 | ) | 6,106 | |||
| Freehold mineral taxes * | 943 | (16 | ) | 1,116 | 41 | 794 | ||||
| ARTC | (178 | ) | 12 | (159 | ) | 68 | (499 | ) | ||
| Total | 5,344 | (16 | ) | 6,341 | (32 | ) | 9,359 | |||
| Per boe ($) | 5.83 | 8 | 5.39 | (44 | ) | 9.70 | ||||
| * | Based on current industry trend, we have reclassified mineral taxes from Production Costs to Royalties during the twelve months ended March 31, 2002. For comparison purposes, prior year amounts have been restated in the Statement of Operations and Deficit. |
Nine Months Ended December 31, 2002 vs Twelve Months Ended March 31, 2002
Total royalties expense decreased by $1.0 million or 16%, to $5.3 million due mainly to the comparatively shorter reporting period. Unit royalties expense increased by $0.44 or 8%, to $5.83 per boe due primarily to royalty obligations associated with production of prior periods, higher commodity prices and a mineral tax reassessment related to Fiscal 2002.
DYNAMIC OIL & GAS, INC. ANNUAL REPORT DECEMBER 31, 2002
37
Twelve Months Ended March 31, 2002 vs Twelve Months Ended March 31, 2001
Total royalties decreased by a net of $3.0 million or 32%, to $6.3 million and unit royalties decreased by $4.31 or 44%, to $5.39 per boe, due mainly to lower commodity prices that affect royalties and our purchase of an overriding royalty interest at St. Albert in Fiscal 2002. Partially offsetting these decreases was a non-recurring increase due to a payment in the last period of certain mineral taxes associated with production of Fiscal 2001.
| Nine Months | Twelve Months | Twelve Months | ||||||||
| Ended | Ended | Ended | ||||||||
| Dec 31, 2002 | % Chg | Mar 31, 2002 | % Chg | Mar 31, 2001 | ||||||
| Production costs * – total | 5,470 | (6 | ) | 5,846 | (55 | ) | 4,580 | |||
| Per boe ($) | 5.97 | 20 | 4.97 | 5 | 4.75 | |||||
| * | Based on current industry trend, we have reclassified mineral taxes from Production Costs to Royalties during the twelve months ended March 31, 2002. For comparison purposes, prior year amounts have been restated in the Statement of Operations and Deficit. |
Nine Months Ended December 31, 2002 vs Twelve Months Ended March 31, 2002
Production costs decreased by $0.4 million or 6%, to $5.5 million due mainly to the comparatively shorter reporting period. Unit production costs increased by $1.00 or 20%, to $5.97 per boe mainly due to the following:
- An increase of $0.33 per boe from higher electricity costs at St. Albert;
- An increase of $0.22 per boe from plant and battery maintenance costs at St. Albert not conducted in Fiscal 2002.
- An increase of $0.45 per boe was due to increases in field compression charges and well maintenance costs.
In 2003, we expect unit production costs to change from current levels by:
- A decrease of $0.51 per boe due to the elimination of monthly sales and leaseback charges at St. Albert (see Note 5 to our Financial Statements);
- A savings of $0.22 per boe, as the plant and battery maintenance costs performed in Fiscal Transition 2002 will not be required; and
- An increase in compression charges for natural gas produced from St. Albert. At the time of filing this report, we continue to negotiate compression charges; however, we expect them to be within industry-acceptable norms.
Twelve Months Ended March 31, 2002 vs Twelve Months Ended March 31, 2001
Production costs increased by $1.3 million or 55%, to $5.8 million and unit production costs increased by $0.22 or 5%, to $4.97 per boe, due mainly to the acquisition of additional working interests at St. Albert, resulting in greater volumes of higher-cost, liquid-rich natural gas being processed.
| Nine Months | Twelve Months | Twelve Months | ||||||||
| Ended | Ended | Ended | ||||||||
| Dec 31, 2002 | % Chg | Mar 31, 2002 | % Chg | Mar 31, 2001 | ||||||
| A&D before the following: | 5,924 | 11 | 5,336 | 72 | 3,097 | |||||
| Ceiling test adjustment | 445 | (93 | ) | 6,783 | – | 36 | ||||
| Future removal and site restoration provision | 167 | (41 | ) | 284 | 54 | 185 | ||||
| Amortization of deferred Items | (109 | ) | 53 | (230 | ) | 26 | (311 | ) | ||
| Total A&D | 6,427 | (47 | ) | 12,173 | 305 | 3,007 | ||||
| Per boe ($) | 7.02 | (32 | ) | 10.34 | 231 | 3.12 | ||||
DYNAMIC OIL & GAS, INC. ANNUAL REPORT DECEMBER 31, 2002
38
Nine Months Ended December 31, 2002 vs Twelve Months Ended March 31, 2002
Our total A&D decreased by $5.7 million or 47%, to $6.4 million due mainly to the comparatively shorter reporting period. Unit A&D costs decreased by a net of $3.32 or 32%, to $7.02 per boe due to the following reasons:
- An increase of $0.34 per boe mostly due to added depletion in two new fields, Alexander and Halkirk that commenced production late in the previous period;
- A decrease of $3.66 per boe mainly due to the Peavey/Morinville ceiling test adjustment taken in Fiscal 2002.
Twelve Months Ended March 31, 2002 vs Twelve Months Ended March 31, 2001
Total A&D increased by $9.2 million or 305%, to $12.2 million. Unit A&D costs increased by $7.22 or 231%, to $10.34 per boe due primarily to the following:
- An increase of $5.31 per boe mainly due to the Peavey/Morinville ceiling test adjustment taken in the last period;
- An increase of $1.76 per boe due to new production coming on at St. Albert and Halkirk at higher finding and development cost levels.
| Nine Months | Twelve Months | Twelve Months | ||||||||
| Ended | Ended | Ended | ||||||||
| Dec 31, 2002 | % Chg | Mar 31, 2002 | % Chg | Mar 31, 2001 | ||||||
| Drilling | 325 | (91 | ) | 3,821 | 472 | 668 | ||||
| Seismic data activity | 847 | 31 | 649 | (41 | ) | 1,102 | ||||
| Other | 187 | 6 | 176 | 14 | 153 | |||||
| Total | 1,359 | (71 | ) | 4,646 | 142 | 1,923 | ||||
| Per boe ($) | 1.48 | (63 | ) | 3.95 | 98 | 1.99 | ||||
Nine Months Ended December 31, 2002 vs Twelve Months Ended March 31, 2002
Exploration costs decreased by $3.3 million or 71%, to $1.4 million. Unit exploration expenses decreased by $2.47 or 63%, to $1.48 per boe due mainly to the following:
- A decrease in costs associated with unsuccessful drilling attempts of $2.63 per boe, offset by an increase of $0.15 per boe in seismic expenses. All drilling attempts were successful in Fiscal Transition 2002; however, in Fiscal 2002 a total of ten wells were written off to dry hole expense, six of which were at Peavey/Morinville, one each at Quirk Creek, Alexander and Orion, and one re-entry/workover at St. Albert.
Our 2003 budget of $2.8 million for exploration expenses is to acquire 3D and 2D seismic data.
Twelve Months Ended March 31, 2002 vs Twelve Months Ended March 31, 2001
Exploration costs increased by $2.7 million or 142%, to $4.6 million. Unit exploration expenses increased by $1.96 or 98%, to $3.95 per boe due mainly to the following:
- An increase in dry hole costs of $2.27 per boe, offset by a decrease in seismic costs of $0.32 per boe. Dry hole expense increased significantly over Fiscal 2001, as discussed above.
DYNAMIC OIL & GAS, INC. ANNUAL REPORT DECEMBER 31, 2002
39
Gain on Sale of Natural Gas and Oil Interests
Nine Months Ended December 31, 2002 vs Twelve Months Ended March 31, 2002
There were no significant transactions to report in either of these two periods.
Twelve Months Ended March 31, 2002 vs Twelve Months Ended March 31, 2001
We sold a 50% working interest in a portion of our Orion leases in Fiscal 2001 The proceeds on the sale were $1.0 million for a gain of $0.6 million.
Interest Expense and Interest Income (Net Interest)
| Nine Months | Twelve Months | Twelve Months | ||||||||
| Ended | Ended | Ended | ||||||||
| Dec 31, 2002 | % Chg | Mar 31, 2002 | % Chg | Mar 31, 2001 | ||||||
| Interest expense | 454 | (8 | ) | 494 | 106 | 240 | ||||
| Interest income | (2 | ) | (91 | ) | (22 | ) | (12 | ) | (25 | ) |
| Interest expense – net | 452 | (4 | ) | 472 | 120 | 215 | ||||
| Per boe ($) | 49 | 23 | 40 | 82 | 22 | |||||
Nine Months Ended December 31, 2002 vs Twelve Months Ended March 31, 2002
There was no material variance between periods in our net interest expense because our operating loan was used for nine months in each period at an average balance outstanding of approximately $12.5 million. The effective interest rate was 5.0% and 4.7% for Fiscal Transition 2002 and Fiscal 2002, respectively.
Twelve Months Ended March 31, 2002 vs Twelve Months Ended March 31, 2001
Our average loan-level usage was $12.7 million in Fiscal 2002 compared to $3.4 million in Fiscal 2001.
| Nine Months | Twelve Months | Twelve Months | ||||||||
| Ended | Ended | Ended | ||||||||
| Dec 31, 2002 | % Chg | Mar 31, 2002 | % Chg | Mar 31, 2001 | ||||||
| General & administrative | 1,926 | (18 | ) | 2,347 | 50 | 1,569 | ||||
| Per boe ($) | 2.10 | 6 | 1.99 | 22 | 1.63 | |||||
Nine Months Ended December 31, 2002 vs Twelve Months Ended March 31, 2002
G&A decreased by $0.4 million or 18%, to $1.9 million due mainly to the comparatively shorter reporting period. Unit G&A costs increased by $0.11 or 6%, to $2.10 per boe due mainly to the following:
- A decrease of $0.05 per boe in overhead credits that we earn when operating properties. In the Fiscal Transition 2002, we operated fewer capital projects than in Fiscal 2002
- Geophysical costs increased by $0.03 per boe due to increased costs for software and support; and
- Insurance premiums increased by $0.02 per boe and fees relating to regulatory filing obligations increased by $0.01 per boe.
Our G&A budget for 2003 is $2.4 million, an amount required to maintain continuing growth expectations.
Twelve Months Ended March 31, 2002 vs Twelve Months Ended March 31, 2001
G&A increased by $0.8 million or 50%, to $2.3 million. Unit G&A costs increased by $0.36 or 22%, to $1.99 per boe due to salaries, interest, insurance and professional fees related to our acquisition of additional working interests at St. Albert.
DYNAMIC OIL & GAS, INC. ANNUAL REPORT DECEMBER 31, 2002
40
INCOME TAXES
Income tax expense| Nine Months | Twelve Months | Twelve Months | ||||||||
| Ended | Ended | Ended | ||||||||
| Dec 31, 2002 | % Chg | Mar 31, 2002 | % Chg | Mar 31, 2001 | ||||||
| Current | 207 | 257 | 58 | (90 | ) | 572 | ||||
| Future | 961 | 149 | (1958 | ) | (147 | ) | 4,163 | |||
| Total | 1,168 | 161 | (1,900 | ) | (140 | ) | 4,735 | |||
We use the liability method of tax allocation in accounting for income taxes. Future tax assets and liabilities are determined based on differences between the financial reporting and tax bases of assets and liabilities, and measured using the substantially enacted rates and laws that will be in effect when the differences are expected to reverse.
Nine Months Ended December 31, 2002 vs Twelve Months Ended March 31, 2002
Total income tax expense increased to $1.2 million from a recovery of $1.9 million. This expense was consistent with our pre-tax earnings. Our effective tax rate was 37.1% which is in line with statutory tax rates.
Twelve Months Ended March 31, 2002 vs Twelve Months Ended March 31, 2001
Total income taxes in Fiscal 2002 reflect a recovery of $1.9 million versus an expense in Fiscal 2001 of $4.7 million. This recovery was consistent with our pre-tax loss.
Income tax pools available for deduction against future taxable income
| Nine Months | Twelve Months | Twelve Months | Maximum | |||||
| Ended | Ended | Ended | Annual | |||||
| Dec 31, 2002 | Mar 31, 2002 | Mar 31, 2001 | Deduction | |||||
| Cdn exploration expense | 1,586 | – | – | 100 | % | |||
| Non-capital losses | – | – | – | 100 | % | |||
| Share issue costs | – | – | – | 100 | % | |||
| Cdn development expense | 5,246 | 3,772 | 3,307 | 30 | % | |||
| Undepreciated capital costs | 10,356 | 10,297 | 5,554 | 20% – 100 | % | |||
| Cdn oil/gas property expense | 17,417 | 16,471 | 3,986 | 10 | % | |||
| Total | 34,605 | 30,540 | 12,847 | |||||
LIQUIDITY AND CAPITAL RESOURCES
Our capital resources at December 31, 2002 consisted of cash flow from operations and available lines of bank credit.
Our 2003 capital investment and exploration expense budgets are $23.7 million and $2.8 million, respectively, totaling $26.5 million. We expect to fund this total mainly from cash flow provided by operations and our revolving bank operating loan (see Note 4 to our Financial Statements). Also during 2003, we expect 780,000 stock options to be exercised which will provide $1.3 million.
Our working capital and debt levels are primarily dependent upon our operating cash flows, the amount of our capital investment and the timing of incurred field activities.
DYNAMIC OIL & GAS, INC. ANNUAL REPORT DECEMBER 31, 2002
41
OUTLOOK FOR 2003
2003 Capital Investment Program
Our 2003 capital budget component is $23.7 million. We plan to invest this capital as follows:
- $8.7 million or 37% in Alberta to maintain and grow production levels on existing core properties;
- $4.8 million or 20% in British Columbia to bring into production a new core property;
- $2.8 million or 12% in Alberta to explore for new reserves;
- $6.5 million or 27% in British Columbia to explore new frontier properties; and
- $0.9 million or 4% other.
Of the total budget amount, $10.8 million is for drilling, $6.1 million for new land acquisitions, $5.4 million for completions and tie-ins and $1.4 million for facilities.
Our drilling program for 2003 includes 20 wells, 14 of which are new and 6 re-entries. Of the 14 new wells, 7 are planned for exploratory work in northeast British Columbia, 3 for exploratory and 4 for development work in Alberta.
This program is consistent with our strategy to grow reserves and production by the drill bit and is our largest-ever capital spending budget.
2003 Daily Production
We expect our daily production exit rate to reach 5,200 boe per day, a 57% increase over our daily average production levels for Fiscal Transition 2002 of 3,332 boe per day, a difference of approximately 1,900 boe per day. This difference is comprised of 1,450 boe per day of crude oil and 450 boe per day (2.7 mmcf/d) of natural gas.
COMMITMENTS
We have an operating lease on our office premises covering 3,809 square feet.
We are committed to removal from and restoration of all sites upon which we have drilled or placed surface facilities. (See Note 13 to our Financial Statements.)
BUSINESS RISK MANAGEMENT
The natural gas and oil industry is highly competitive, particularly in the following areas:
- searching for and developing new reserves of natural gas and crude oil;
- constructing pipelines and facilities required to transport or process produced commodities, and
- operating facilities related to the production of natural gas and crude oil.
Our competitors include major integrated oil and gas companies and numerous other independent oil and gas companies.
Estimating of Reserves and Future Net Cash Flows Risk
Estimating natural gas, natural gas liquids and crude oil reserves, and future net cash flows includes numerous uncertainties, many of which may be beyond our control. Such estimates are essential in our decision-making, as to whether further investment is warranted. These estimates are derived from several factors and assumptions, some of which are:
DYNAMIC OIL & GAS, INC. ANNUAL REPORT DECEMBER 31, 2002
42
- reservoir characteristics based on variable geological, geophysical and engineering assessments;
- future rates of production based on historical draw-down rates;
- future net cash flows based on commodity price/quality assumptions, production costs, taxes and investment decisions;
- recoverable reserves based on estimated future net cash flows, and
- compliance expectations based on assumed federal, provincial and environmental laws and regulations.
Our recoverable reserves are estimated annually by independent qualified engineering consultants. Our Board of Directors has established a Reserves Audit Committee (Reserves Committee) to assist the Board in fulfilling their oversight responsibilities with respect to our annual reserves estimates. The Reserves Committee is comprised of two independent directors who have a working familiarity with the process of estimating reserves. The Reserves Committee meets independently with the consultants to examine their work scope, information access, resolved opinion differences and independence.
Ultimately, actual production rates, reserves recovered, commodity prices, production costs, government regulation or taxation may differ materially from those assumed in earlier reserve estimates. Higher or lower differences could materially impact our production, revenues, production costs, depletion expense, taxes and capital expenditures.
Our reserve estimates and net present values reported in the Review of Operations section of this Annual Report are based on estimated constant commodity prices and associated production costs as of the estimate date. Actual future prices and costs may be materially higher or lower.
Operating Risk
Exploring and developing for natural gas and crude oil involves many risks, some of which are:
- unexpected formations or pressures;
- equipment failures and other accidents;
- uncontrolled hydrocarbon releases;
- adverse weather conditions;
- government and political actions;
- premature reservoir declines, and
- environmental impacts.
Although we maintain customary industry insurance, we cannot fully insure against all of these risks. Losses resulting from the occurrence of these risks could have a material adverse impact.
As our reserves of natural gas, natural gas liquids and crude oil decline, our success at replacing and adding to them is highly reliant on further exploration and development. To the extent we succeed, our operating cash flows and other capital sources may become insufficient so as to impair our ability to re-invest capital.
Restoration, Safety and Environmental Risk
All our operations are in western Canada and, in particular, the western provinces of Alberta and British Columbia. Certain laws and regulations exist that require companies engaged in petroleum activities to obtain necessary safety and environmental permits to operate. Such legislation may restrict or delay us from conducting operations in certain geographical areas. Further, such laws and regulations may impose liability on us for remedial and clean-up costs, personal injuries related to safety and environmental damages.
DYNAMIC OIL & GAS, INC. ANNUAL REPORT DECEMBER 31, 2002
43
To ensure that we provide for future estimated removal and site restoration costs, we recognized $0.2 million in our Statement of Operations and Deficit during the nine months ended December 31, 2002, bringing our total recognized amount in our December 31, 2002 Balance Sheet to $1.0 million. We engage independent engineering consultants to assist in assessing our total future liabilities related to removal and clean-up costs. While we cannot predict their ultimate cost, we currently estimate the future cost to clean up all our operating facilities to be $2.1 million.
While our safety and environmental activities have been prudent and have enabled us to operate successfully in managing such risks, there can be no assurance that we will always be successful in protecting ourselves from the impact of all such risks. Consistent with our growth in other areas, we seek opportunities for performance improvement in our operating practices.
Kyoto Protocol Risk
The Kyoto Protocol treaty (Protocol) was established to reduce emissions of greenhouse gases (GHG) that are believed to contribute to increasing Earth’s surface temperatures and affecting the global climate change. Canada adopted the Kyoto Protocol in December 1997. The Protocol establishes commitments to reduce GHG internationally and Canada has committed to meet a 6% reduction over base-year 1990 during the period 2008 to 2012. While we believe we are a low-emission producer, it is not possible for us to predict the impact of how Protocol-related issues will ultimately be resolved and to what extent their impact will affect our future unit operating costs and capital expenditures.
MARKET RISK MANAGEMENT
Our results are impacted by external market risks associated with fluctuations in commodity prices, interest rates and credit, details of which are outlined below.
Commodities Price Risk
Our future financial performance remains closely linked to hydrocarbon commodity prices, which can be influenced by many factors including global and regional supply and demand, worldwide political events and weather. These factors, among others, can result in a high degree of price volatility.
Natural gas
Our natural gas portfolio is split between two primary markets, one is the Alberta Spot Market which trades at the AECO storage hub (www.encanastorage.com), the other is an aggregator pool called ProGas (www.progas.com).
AECO, an intra-Alberta trading hub, offers producers the opportunity to participate in natural gas transactions for terms of one day, one month, summer and winter blocks, and annually.
We are currently selling our uncommitted natural gas volumes into the AECO daily spot market, however, our marketing strategy includes securing monthly and term deals, if optimal.
ProGas, a wholly-owned subsidiary of BP Canada, ‘aggregates’ supplies of natural gas to sell into a basket of daily, short term (less than one year) and long-term contracts, both domestic and export. Producers realize a netback price for their natural gas, which is a blend of all contract types weighted toward NYMEX-based prices.
During the nine-month period ending December 31, 2002, we sold 51% of our natural gas to ProGas and 49% into the AECO daily spot market. During the two twelve-month periods ending March 31, 2002 and 2001, we sold 53% and 77% to ProGas, respectively, and the balances at AECO.
DYNAMIC OIL & GAS, INC. ANNUAL REPORT DECEMBER 31, 2002
44
Natural gas liquids and crude oil
We market our natural gas liquids and crude oil based on monthly prices posted by the major purchasers at Edmonton, Alberta. These prices correlate closely to the price of West Texas Intermediate, allowing for quality adjustments and location differentials.
To summarize, we currently have no hedge positions, however, we manage our potential exposure to commodity price volatilities through diversification as follows:
- Commodity mix – our sales portfolio is comprised of natural gas, crude oil and natural gas liquids. Crude oil and natural gas liquids are sold at prices with volatilities that differ from those of natural gas; and
- Natural gas pricing mix – AECO pricing typically has a close correlation to NYMEX pricing, however, when the two become disconnected due to market dynamics, we are well-positioned to take advantage of premium pricing in either market area.
The following table shows the effect on cash flow of certain changes in volume, price and interest rates. Numbers presented reflect the sensitivity impact on our estimated 2003 activity.
Sensitivities| Changes in | Effect on Cash Flow | ||||||||||
| Volume | Price | Rate | $(000’s) | $/share | |||||||
| Production | – natural gas (mcf/d) | 1,000 | – | – | 1,430 | 0.068 | |||||
| – natural gas liquids (bbls/d)) | 100 | – | – | 570 | 0.027 | ||||||
| – crude oil (bbls/d) | 100 | – | – | 758 | 0.036 | ||||||
| Price | – natural gas ($/mcf) | – | 0.50 | – | 2,136 | 0.101 | |||||
| – natural gas liquids ($/bbl) | – | 1.00 | – | 232 | 0.011 | ||||||
| – crude oil ($/bbl) | – | 1.00 | – | 319 | 0.015 | ||||||
| Interest rate (%) | – | – | 1 | 150 | 0.007 | ||||||
Interest Rate Risk
We use a revolving, floating rate credit facility, therefore, we are exposed to fluctuations in short-term interest rates. Our current borrowing rate applied to the facility is Canadian Dollar Prime plus 3/8% per annum. To minimize our exposure to rate variability, we occasionally invest a portion of our undrawn borrowing capacity in Banker’s Acceptances (BA’s). We are charged a standby fee of 1/8% per annum on our undrawn borrowing capacity.
At December 31, 2002, we had floating debt outstanding of $11.1 million (March 31, 2002 – $14.8 million; March 31, 2001 – nil).
Credit Risk
All of our accounts receivable are with customers in the energy industry and are subject to normal industry credit risk. While there can be no assurance that our no-loss record will continue, the parties who are obligated to us contractually have been consistently reliable in the past.
DYNAMIC OIL & GAS, INC. ANNUAL REPORT DECEMBER 31, 2002
45
CRITICAL ACCOUNTING POLICIES
Our critical accounting policies are defined as those that are important both to the portrayal of our financial position and operations and require us to make judgments based on underlying estimates and assumptions about future events and their effects. Such underlying estimates and assumptions are based on historical experience and other factors that we believe to be reasonable under the circumstances. These estimates and assumptions are subject to change as new events occur, as more industry experience is acquired, as additional information is obtained and as our operating environment changes. We believe the following are the most critical areas where estimates and our accounting policies can materially impact our financial statements. For information concerning our other significant accounting policies, see Note 2 to our Financial Statements.
Reserves Estimates
On an annual basis, we engage independent petroleum consultants to conduct evaluations of our reserves. The accuracy of reserves estimates is a matter of interpretation and judgment and is a function of the quality and quantity of available data gathered over time. For further details and a discussion of the risks involved in the reserves estimating process, see “BUSINESS RISK MANAGEMENT, Estimating of Reserves and Future Net Cash Flows Risk”.
Natural Gas and Oil Interests
We follow the successful efforts method of accounting for our natural gas and oil activities, as described in Note 1 to our Financial Statements. The application of this method requires us to make significant judgments and decisions based on available geological, geophysical, engineering and economic data. The results from drilling can take considerable time to analyze and when it is determined that drilling has been unsuccessful in establishing commercial reserves, the costs of drilling are written off immediately and reported as exploration expense. Drilling costs for wells that have been successful in establishing commercial reserves are capitalized as natural gas and oil interests on our balance sheet.
Where we assess that the estimated undiscounted future cash flows of a property are either partially or fully below its book value as recorded in our natural gas and oil interests (“ceiling test”), we either partially or fully adjust the book value downward and record a depletion expense on our income statement accordingly (“ceiling test adjustment”).
Estimates of undiscounted future cash flows that we use for conducting ceiling tests are subject to significant judgment decisions based on assumptions of highly uncertain future factors such as, natural gas and crude oil prices, production quantities, estimates of recoverable reserves and operating costs. Given the significant assumptions required and the strong possibility that actual future factors will differ, we consider the ceiling test to be a critical accounting procedure.
In the period ended December 31, 2002, our property ceiling tests resulted in partial ceiling test adjustments to the book values of four properties: Alexander, Halkirk, Morinville/Peavey and Virgo. Total adjustments amounted to a $0.4 million reduction, Halkirk accounting for 74% and Alexander 21% of the total.
In the period ended March 31, 2002, ceiling test adjustments totaled $6.8 million, 99% of which related to the Peavey/Morinville property. The ceiling test adjustment recorded in the period ended March 31, 2001 was negligible.
DYNAMIC OIL & GAS, INC. ANNUAL REPORT DECEMBER 31, 2002
46
RECENTLY ISSUED ACCOUNTING STANDARD
Asset Retirement Obligations
A new Canadian standard “Asset Retirement Obligations” (ARO) substantially harmonizes Canadian GAAP with U.S. GAAP (see Note 12[e]). The standard requires that a liability associated with the retirement of property, plant and equipment be recognized when incurred. The liability would be measured initially at fair value and the resulting costs capitalized. Capitalized costs would be amortized according to normal amortization practices. Subsequent to initial recognition, the ARO liability would be adjusted for the accretion of discount and changes in the amount or timing of the underlying future cash flows. The standard is effective no later than January 1, 2004. We are evaluating the impact of the standard.
SPECIAL NOTE REGARDING FORWARD-LOOKING STATEMENTS
Certain statements in this report, including those appearing under the caption, “Management’s Discussion and Analysis”, constitute “forward-looking statements” within the meaning of the United States Private Securities Litigation Reform Act of 1995, Section 21E of the United States Securities Exchange Act of 1934, as amended, and Section 27A of the United States Securities Act of 1933, as amended. Such statements are generally identifiable by the terminology used such as “plans”, “expects, “estimates”, “budgets”, “intends”, anticipates”, “believes”, “projects”, “indicates”, “targets”, “objective”, “could”, “may” or other similar words.
The forward-looking statements are subject to known and unknown risks and uncertainties and other factors which may cause actual results, levels of activity and achievements to differ materially from those expressed or implied by such statements. Such factors include, among others: market prices for natural gas, natural gas liquids and oil products; the ability to produce and transport natural gas, natural gas liquids and oil; the results of exploration and development drilling and related activities; economic conditions in the country and provinces in which the Company carries on business; actions by governmental authorities including increases in taxes, changes in environmental and other regulations, and renegotiations of contracts; political uncertainty, including actions by insurgent groups or other conflict and the negotiation and closing of material contracts. The impact of any one factor on a particular forward-looking statement is not determinable with certainty as such factors are interdependent upon other factors, and management’s course of action would depend upon its assessment of the future considering all information then available. In that regard, any statements as to future natural gas, natural gas liquids or oil production levels, capital expenditures, the allocation of capital expenditures to exploration and development activities, sources of funding for its capital program, drilling of new wells, demand for natural gas, natural gas liquids and oil products, expenditures and allowances relating to environmental matters, dates by which certain areas will be developed or will come on-stream, dates by which transactions are expected to close, cash flows, debt levels and changes in any of the foregoing are forward-looking statements, and there can be no assurance that the expectations conveyed by such forward-looking statements will, in fact, be realized.
Although the Company believes that the expectations conveyed by the forward-looking statements are reasonable based on information available to it on the date such forward-looking were made, no assurances can be given as to future results, levels of activity and achievements. All subsequent forward-looking statements, whether written or oral, attributable to the Company or persons acting on its behalf are expressly qualified in their entirety by the cautionary statements.
DYNAMIC OIL & GAS, INC. ANNUAL REPORT DECEMBER 31, 2002
47
REPORT OF MANAGEMENT
The accompanying financial statements and all information in the Annual Report are the responsibility of management. The financial statements have been prepared in accordance with accounting policies detailed in the notes to the financial statements and in accordance with generally accepted Canadian accounting principles, and where necessary includes amounts based on management’s informed judgements and estimates.
Financial information throughout the Annual Report is consistent with the financial statements.
Management maintains an appropriate system of accounting and administrative controls to provide reasonable assurance that transactions are appropriately authorized, assets are safeguarded and financial records are properly maintained to provide reliable financial statements.
Ernst & Young LLP, the Company’s external auditors, have audited the financial statements in accordance with generally accepted auditing standards in Canada. Their examination included a review of accounting systems and detailed audit procedures were performed on all material transactions. Their report appears below.
The Board of Directors, through its Audit Committee, is responsible for assuring that management fulfills its financial reporting responsibilities. This Committee reviews the financial statements and gives its recommendation for approval to the Board of Directors.
 |  |
Wayne J. Babcock | Michael A. Bardell |
DYNAMIC OIL & GAS, INC. ANNUAL REPORT DECEMBER 31, 2002
48
AUDITORS’ REPORT
To the Shareholders of Dynamic Oil & Gas, Inc.
We have audited the balance sheets of Dynamic Oil & Gas, Inc. as of December 31, 2002 and March 31, 2002 and the statements of operations and deficit and cash flows for the nine months ended December 31, 2002 and for the years ended March 31, 2002 and March 31, 2001. These financial statements are the responsibility of the Company’s management. Our responsibility is to express an opinion on these financial statements based on our audit.
We conducted our audit in accordance with auditing standards generally accepted in Canada and the United States. Those standards require that we plan and perform an audit to obtain reasonable assurance whether the financial statements are free of material misstatement. An audit includes examining, on a test basis, evidence supporting the amounts and disclosures in the financial statements. An audit also includes assessing the accounting principles used and significant estimates made by management, as well as evaluating the overall financial statement presentation.
In our opinion, these financial statements present fairly, in all material respects, the financial position of the Company as at December 31, 2002 and March 31, 2002 and the results of its operations and its cash flows for the nine months ended December 31, 2002 and for the years ended March 31, 2002 and March 31, 2001 in accordance with Canadian generally accepted accounting principles. As required by the Company Act of British Columbia, we report that, in our opinion, these principles have been applied, except for the change in the method of accounting for stock-based compensation as explained in note 2, on a basis consistent with that of the preceding year.
Vancouver, Canada, March 20, 2003.

Chartered Accountants
DYNAMIC OIL & GAS, INC. ANNUAL REPORT DECEMBER 31, 2002
49
BALANCE SHEETS
(in Canadian dollars)| December 31 | March 31 | |||
| 2002 | 2002 | |||
| $ | $ | |||
| ASSETS[note 4] | ||||
| Current | ||||
| Accounts receivable[note 10] | 6,426,761 | 5,979,532 | ||
| Prepaid expenses | 351,771 | 365,227 | ||
| Income taxes receivable | 131,772 | – | ||
| Total current assets | 6,910,304 | 6,344,759 | ||
| Future income tax asset[note 7] | – | 279,000 | ||
| Natural gas and oil interests[note 3] | 36,568,076 | 30,365,636 | ||
| Capital assets[note 3] | 168,366 | 162,499 | ||
| 43,646,746 | 37,151,894 | |||
| LIABILITIES AND SHAREHOLDERS’ EQUITY | ||||
| Current | ||||
| Bank indebtedness | 1,519,923 | 842,812 | ||
| Operating loan[note 4] | 11,075,000 | 14,750,000 | ||
| Accounts payable and accrued liabilities | 11,133,844 | 3,611,314 | ||
| Income taxes payable | – | 421,360 | ||
| Total current liabilities | 23,728,767 | 19,625,486 | ||
| Deferred gain on sale[note 5] | – | 109,327 | ||
| Provision for future removal and site restoration | 990,982 | 824,098 | ||
| Future income tax liability[note 7] | 682,300 | – | ||
| Total liabilities | 25,402,049 | 20,558,911 | ||
| Share capital[note 6] | 20,720,629 | 20,914,522 | ||
| Deficit | (2,475,932 | ) | (4,321,539 | ) |
| Total shareholders’ equity | 18,244,697 | 16,592,983 | ||
| 43,646,746 | 37,151,894 | |||
Commitment[note 14]
See accompanying notes and schedules.
On behalf of the Board: | |
| Director | Director |
DYNAMIC OIL & GAS, INC. ANNUAL REPORT DECEMBER 31, 2002
50
STATEMENTS OF OPERATIONS AND DEFICIT
(in Canadian dollars)| Nine Months | ||||||
| Ended | ||||||
| December 31 | Years Ended March 31 | |||||
| 2002 | 2002 | 2001 | ||||
| $ | $ | $ | ||||
| REVENUE | ||||||
| Natural gas, liquids and oil sales | 24,122,754 | 26,401,872 | 34,462,676 | |||
| Royalties[note 11] | (5,521,583 | ) | (6,500,447 | ) | (9,857,954 | ) |
| Production costs | (5,470,467 | ) | (5,845,958 | ) | (4,579,845 | ) |
| 13,130,704 | 14,055,467 | 20,024,877 | ||||
| Alberta royalty tax credit | 178,098 | 159,274 | 498,773 | |||
| 13,308,802 | 14,214,741 | 20,523,650 | ||||
| EXPENSES | ||||||
| General and administrative[schedule 1] | 1,926,162 | 2,347,212 | 1,569,175 | |||
| Interest expense on operating loan | 454,251 | 494,685 | 240,420 | |||
| Interest income | (1,732 | ) | (22,066 | ) | (25,601 | ) |
| 2,378,681 | 2,819,831 | 1,783,994 | ||||
| Earnings from operations before the following: | 10,930,121 | 11,394,910 | 18,739,656 | |||
| Amortization and depletion[schedule 2] | 6,426,785 | 12,172,943 | 3,006,964 | |||
| Exploration expenses[schedule 3] | 1,359,512 | 4,646,018 | 1,923,194 | |||
| Gain on sale of natural gas and oil interests | (2,139 | ) | (4,566 | ) | (639,532 | ) |
| Earnings (loss) before taxes | 3,145,963 | (5,419,485 | ) | 14,449,030 | ||
| Income tax expense (recovery) [note 7] | ||||||
| – Current | 207,000 | 57,600 | 572,000 | |||
| – Future | 961,300 | (1,958,000 | ) | 4,163,000 | ||
| Net earnings (loss) | 1,977,663 | (3,519,085 | ) | 9,714,030 | ||
| Deficit, beginning of year | (4,321,539 | ) | (695,279 | ) | (10,379,392 | ) |
| Premium on purchase and cancellation of common shares[note 6[d]] | (132,056 | ) | (107,175 | ) | (29,917 | ) |
| Deficit, end of year | (2,475,932 | ) | (4,321,539 | ) | (695,279 | ) |
| Earnings per share[note 8] | ||||||
| basic | 0.10 | (0.17 | ) | 0.49 | ||
| diluted | 0.10 | (0.17 | ) | 0.48 | ||
See accompanying notes and schedules.
DYNAMIC OIL & GAS, INC. ANNUAL REPORT DECEMBER 31, 2002
51
STATEMENTS OF CASH FLOWS
(in Canadian dollars)| Nine Months | ||||||
| Ended | ||||||
| December 31 | Years Ended March 31 | |||||
| 2002 | 2002 | 2001 | ||||
| $ | $ | $ | ||||
| OPERATING ACTIVITIES | ||||||
| Net earnings (loss) | 1,977,663 | 9,714,030 | ||||
| Add (deduct) items not involving cash: | ||||||
| Amortization and depletion | 6,426,785 | 12,172,943 | 3,006,964 | |||
| Future income tax expense | 961,300 | (1,958,000 | ) | 4,163,000 | ||
| Exploration expenses | 1,359,512 | 4,646,018 | 1,923,194 | |||
| Gain on sale of natural gas and oil interests | (2,139 | ) | (4,566 | ) | (639,532 | ) |
| Cash flow from operations | 10,723,121 | 11,337,310 | 18,167,656 | |||
| Changes in non-cash working capital affecting | ||||||
| operating activities [note 9[a]] | 646,829 | (1,558,807 | ) | 1,096,162 | ||
| Cash provided by operating activities | 11,369,950 | 9,778,503 | 19,263,818 | |||
| FINANCING ACTIVITIES | ||||||
| Bank indebtedness | 677,111 | 842,812 | – | |||
| Operating loan | (3,675,000 | ) | 14,750,000 | (6,000,000 | ) | |
| Shares issued for cash | – | 455,420 | 200,000 | |||
| Share repurchases | (325,948 | ) | (289,793 | ) | (89,689 | ) |
| Cash (used in) provided by financing activities | (3,323,837 | ) | 15,758,439 | (5,889,689 | ) | |
| INVESTING ACTIVITIES | ||||||
| Purchase of capital assets | (84,420 | ) | (116,180 | ) | (78,749 | ) |
| Natural gas and oil interests | (12,493,116 | ) | (21,994,897 | ) | (11,502,902 | ) |
| Exploration expenses | (1,359,512 | ) | (4,646,018 | ) | (1,923,194 | ) |
| Proceeds on sale of natural gas and oil interests | 2,139 | 4,566 | 1,072,395 | |||
| Changes in non-cash working capital affecting | ||||||
| investing activities [note 9[b]] | 5,888,796 | (2,277,861 | ) | 1,109,888 | ||
| Cash used in investing activities | (8,046,113 | ) | (29,030,390 | ) | (11,322,562 | ) |
| (Decrease) increase in cash and cash equivalents | – | (3,493,448 | ) | 2,051,567 | ||
| Cash and cash equivalents, beginning of year | – | 3,493,448 | 1,441,881 | |||
| Cash and cash equivalents, end of year | – | – | 3,493,448 | |||
| Supplemental disclosures of cash flow information | ||||||
| Cash paid during the year for: | ||||||
| Interest | 459,237 | 589,549 | 259,230 | |||
| Income taxes | 760,132 | 1,167,720 | 26,856 | |||
See accompanying notes and schedules.
DYNAMIC OIL & GAS, INC. ANNUAL REPORT DECEMBER 31, 2002
52
NOTES TO FINANCIAL STATEMENTS
(in Canadian dollars)
1. DESCRIPTION OF BUSINESS
Dynamic Oil & Gas, Inc. (the “Company”) was incorporated under the laws of the Province of British Columbia on March 27, 1979. The Company’s principle business is the acquisition, exploration, development and production of natural gas and oil interests in Western Canada.
2. SUMMARY OF SIGNIFICANT ACCOUNTING POLICIES
Accounting principles
The Company prepares its accounts in accordance with Canadian generally accepted accounting principles which, as applied in these financial statements, conform in all material respects with United States generally accepted accounting principles, except as explained in Note 12.
Change in fiscal year end
The Company changed its fiscal year end from March 31 to December 31, effective December 31, 2002. The following is a summary of selected financial information for the comparative twelve and nine-month periods ended December 31, 2002 and 2001.
Results of Operations| Twelve Months Ended | Nine Months Ended | |||||||
| December 31 | December 31 | December 31 | December 31 | |||||
| 2002 | 2001 | 2002 | 2001 | |||||
| (unaudited) | (unaudited) | (audited) | (unaudited) | |||||
| Revenue | 30,730,477 | 31,658,397 | 24,122,754 | 19,794,149 | ||||
| Net earnings (loss) | 287,145 | 2,248,205 | 1,977,663 | (1,828,567 | ) | |||
| Net earnings (loss) per share | ||||||||
| basic | 0.01 | 0.11 | 0.10 | (0.09 | ) | |||
| diluted | 0.01 | 0.11 | 0.10 | (0.08 | ) | |||
| Cash flows | ||||||||
| – provided by operating activities | 15,128,790 | 14,949,163 | 11,369,950 | 6,019,663 | ||||
| – (used in) provided by financing activities | (4,331,528 | ) | 12,972,031 | (3,323,837 | ) | 16,766,130 | ||
| – used in investing activities | (10,814,155 | ) | (29,877,314 | ) | (8,046,113 | ) | (26,262,348 | ) |
Stock-based compensation
Effective April 1, 2002, the Company adopted the new standard (“CICA 3870”) recommended by The Canadian Institute of Chartered Accountants, Stock-Based Compensation and Other Stock-Based Payments. The new standard requires stock-based payments to non-employees, direct awards of stock and awards that call for settlement in cash to be accounted for using the fair value method. Under the fair value method, compensation expense is measured at the grant date and recognized over the service period using an option-pricing model.
DYNAMIC OIL & GAS, INC. ANNUAL REPORT DECEMBER 31, 2002
53
While the Company accounts for stock-based payments to non-employees using the fair value method, it has elected to continue to use the intrinsic value method of accounting for stock options granted to employees and directors under its stock option plan. The Company has disclosed the required pro forma effect on earnings and earnings per share as if the fair value method of accounting as prescribed in CICA 3870 had been applied [see Note 6[c]].
Natural gas and oil interests
The Company uses the successful efforts method to account for its natural gas and oil interests. Lease acquisition costs are amortized over their holding period prior to the discovery of proved producing reserves. Geological and geophysical costs are expensed in the period in which they are incurred and costs of drilling an unsuccessful well are expensed when it becomes known the well did not result in a discovery of proved reserves. All other costs of exploring and developing for proved reserves become capitalized natural gas and oil interests.
The cost of proved producing interests including related plant and equipment are depleted on a unit-of-production basis, based on proved producing natural gas and oil reserves.
Natural gas and oil interests are recorded at cost less accumulated provisions for depreciation, depletion and amortization. Natural gas and oil interests are assessed periodically for impairment whenever events or conditions indicate that their net carrying amount may not be recoverable from estimated future cash flows.
Joint interests
Substantially all acquisition, exploration, development and production activities of the Company are conducted jointly with others. These financial statements reflect only the Company’s proportionate interest in such activities.
Earnings per share
The Company utilizes the treasury stock method in the determination of diluted per share amounts. Under this method, the diluted weighted average number of shares is calculated assuming the proceeds, that arise from the exercise of outstanding in-the-money options, are used to purchase common shares of the Company at their average market price for the period.
Future removal and site restoration
Costs for the future removal and site restoration of natural gas and oil interests are based on estimates of liabilities and year of abandonment. The estimates of the liabilities are based on engineering estimates, which consider past experience, current regulations, technology and industry standards. Costs are amortized to earnings on a straight-line basis to the year of abandonment.
Capital assets
Capital assets are recorded at cost, less accumulated amortization. Amortization is provided on a straight-line basis at the following rates:
| Furniture, fixtures and equipment | – 10.0% per annum |
| Computer equipment | – 33.3% per annum |
DYNAMIC OIL & GAS, INC. ANNUAL REPORT DECEMBER 31, 2002
54
2. SUMMARY OF SIGNIFICANT ACCOUNTING POLICIES (cont’d.)
Use of estimates
The preparation of financial statements in conformity with Canadian generally accepted accounting principles requires management to make certain estimates and assumptions that affect the reported amounts of assets and liabilities and disclosure of contingent assets and liabilities as of the date of the financial statements and the reported amounts of revenues and expenses during the reporting period. Actual results may differ from these estimates.
Income taxes
The liability method is used in accounting for income taxes. Under this method, future income tax assets and liabilities are determined based on differences between the financial reporting and tax bases of assets and liabilities, and measured using the substantially enacted tax rates and laws that will be in effect when the differences are expected to reverse.
Foreign currency translation
The Company follows the temporal method of accounting for the translation of foreign currency amounts into Canadian dollars. Under this method, all monetary assets and liabilities expressed in foreign currencies are translated at rates of exchange in effect at the end of the year. All other assets and liabilities are translated at the rates prevailing at the dates the assets were acquired or liabilities incurred. The resulting foreign currency translation gains and losses are included in the determination of net income. Revenues and expenses are translated at the average exchange rate for the period.
Measurement uncertainty
The amounts recorded for depletion and amortization of natural gas and oil interests and the provision for future removal and site restoration are based on estimates. Assessments for impairments in asset carrying costs are based on estimates of proved producing reserves, production rates, natural gas and oil prices, future costs and other relevant assumptions. By their nature these estimates are subject to measurement uncertainty and the effect on the financial statements of changes in such estimates in future years could be significant.
Revenue recognition
Revenues from crude oil, natural gas and natural gas liquids are recorded when title passes to customers.
Deferred gain on sale and lease back
The deferred gain has been amortized to income over the lease back term [see Note 5].
DYNAMIC OIL & GAS, INC. ANNUAL REPORT DECEMBER 31, 2002
55
3. NATURAL GAS AND OIL INTERESTS, AND CAPITAL ASSETS
| Accumulated | ||||
| Amortization and | Net Book | |||
| Cost | Depletion | Value | ||
| $ | $ | $ | ||
| December 31, 2002 | ||||
| Natural gas and oil interests | 61,657,575 | 25,089,499 | 36,568,076 | |
| Furniture, fixtures and computer equipment | 538,153 | 369,787 | 168,366 | |
| March 31, 2002 | ||||
| Natural gas and oil interests | 49,453,746 | 19,088,110 | 30,365,636 | |
| Furniture, fixtures and computer equipment | 453,733 | 291,234 | 162,499 | |
At December 31, 2002, costs of $8,796,000 [March 31, 2002 – $2,542,000] related to non-producing properties have been excluded from the depletion calculation.
In the nine-month period ended December 31, 2002, the Company recorded asset write-downs of $445,467 [year ended March 31, 2002 – $6,783,248; year ended March 31, 2001 – $35,712] to reflect the excess of the net book value of the Company’s natural gas and oil interests over its estimated recoverable amounts. The write-downs were included in amortization and depletion expense.
4. OPERATING LOAN
Through the National Bank of Canada, the Company has available a revolving, demand credit facility of $21,000,000. Principal balances outstanding bear interest at prime plus 3/8% (bank prime rate at December 31, 2002 – 4.5%; March 31, 2002 – 3.8%) and are collateralized by a general assignment of book debts and a floating charge debenture of $35,000,000 covering all the assets of the Company. The effective average interest paid during the nine-month period ended December 31, 2002 was 5.0% [March 31, 2002 – 4.7%]. A standby fee of 0.125% per annum is levied on the unused portion of the facility.
5. ST. ALBERT SALE AND LEASEBACK
On December 18, 1997, the Company agreed to sell and lease back, for an initial term of five years, its St. Albert gas processing facilities to Enercap Corporation of Calgary, Alberta (“Enercap”). The impact on the Company of the sale was a reduction of natural gas and oil interests of $3,427,846, the elimination of a debenture payable in 1998 to Enercap of $4,832,352 and a gain on sale of $1,404,506. This gain on sale was deferred and amortized to income over the leaseback term up to December 31, 2002.
Pursuant to the sale and leaseback agreement, the Company had the option to repurchase the St. Albert gas processing facilities from Enercap at the end of the five-year term. The Company exercised its option on December 31, 2002 for an option price of $780,000.
DYNAMIC OIL & GAS, INC. ANNUAL REPORT DECEMBER 31, 2002
56
6. SHARE CAPITAL
The Company is authorized to issue 60,000,000 common shares without par value.
[a] Issued and Outstanding
The following table sets forth the issued and outstanding common shares:| Number of | ||||
| Shares | $ | |||
| Balance, March 31, 2001 | 20,145,930 | 20,641,720 | ||
| Stock options exercised | 495,100 | 455,420 | ||
| Share repurchases and cancellations [note 6[d]] | (178,800 | ) | (182,618 | ) |
| Balance, March 31, 2002 | 20,462,230 | 20,914,522 | ||
| Share repurchases and cancellations [note 6[d]] | (189,700 | ) | (193,893 | ) |
| Balance, December 31, 2002 | 20,272,530 | 20,720,629 | ||
[b] Stock Option Plan and Options Outstanding
Under the Company’s stock option plan, the Company has granted options to inside directors, officers, employees and consultants with a maximum term of five years. Those granted prior to February 28, 2001 vest upon date of grant; those granted on February 28, 2001 and thereafter, vest in equal amounts over three years from the date of grant. In addition, under the plan, options granted to the Company’s outside directors have a maximum term of ten years and vest upon date of grant.
During the nine months ended December 31, 2002, all options issued were to either employees or outside directors.
The exercise price of each option granted under the plan equals the amount designated in the individual agreement, which is based on the fair value of the stock at the date of grant.
A summary of the status of the Company’s stock option plan as of December 31, 2002, March 31, 2002, and March 31, 2001 is presented below:
| December 31 | March 31 | March 31 | ||||||||||
| 2002 | 2002 | 2001 | ||||||||||
| Number | Weighted | Number | Weighted | Number | Weighted | |||||||
| of | average | of | average | of | average | |||||||
| shares | option price | shares | option price | shares | option price | |||||||
| # | $ | # | $ | # | $ | |||||||
| Outstanding at beginning of period | 1,930,250 | 1.83 | 1,855,350 | 1.29 | 1,599,100 | 1.29 | ||||||
| Granted | 147,500 | 1.88 | 570,000 | 1.87 | 535,250 | 2.00 | ||||||
| Exercised | – | – | (495,100 | ) | 0.92 | (279,000 | ) | 0.72 | ||||
| Outstanding at period end | 2,077,750 | 1.83 | 1,930,250 | 1.83 | 1,855,350 | 1.29 | ||||||
| Options exercisable at period end | 1,641,250 | 1.84 | 1,458,750 | 1.84 | 1,855,350 | 1.29 | ||||||
Exercise prices for the options outstanding as of December 31, 2002 ranged from 1.45 to 2.95 per share. These options have a weighted average remaining contractual life of 2.90 years.
DYNAMIC OIL & GAS, INC. ANNUAL REPORT DECEMBER 31, 2002
57
[c] Pro Forma Net Income – Fair-Value Based Method of Accounting for Stock Options
The following shows pro forma net income and earnings per common share had the Company applied the fair value based method of accounting for all stock options outstanding.
| December 31 | ||
| 2002 | ||
| $ | ||
| Net Earnings: | ||
| – as reported | 1,977,663 | |
| – pro forma | 1,771,987 | |
| Basic earnings per common share: | ||
| – as reported | 0.10 | |
| – pro forma | 0.09 | |
| Diluted earnings per common share: | ||
| – as reported | 0.10 | |
| – pro forma | 0.09 | |
The Black-Scholes options valuation model was used to estimate the fair value of non-employee options, which have no vesting restrictions and are fully transferable. In addition, option valuation models require the input of highly subjective assumptions including the expected stock price volatility. As the Company’s employee and director stock options have characteristics different from those of non-employee options, and changes in the subjective input assumptions can materially affect the fair value estimate, the existing models do not necessarily provide a reliable single measure of the fair value of its employee and director stock options. The fair value of option grants using the Black-Scholes model is estimated on the date of grant using the following weighted-average assumptions:
| December 31 | ||
| 2002 | ||
| $ | ||
| Dividend yield | 0% | |
| Expected volatility | 47% | |
| Risk-free interest rate | 5% | |
| Expected lives | 3 years | |
The weighted average fair value per share of stock options granted during the nine month period ended December 31, 2002 is $0.91.
[d] Issuer Bids
Pursuant to the following normal course issuer bids, the Company was authorized to repurchase and cancel common shares on the open market through the facilities of the Toronto Stock Exchange and NASDAQ:
| Normal course issuer bid date of | Share repurchases/ | ||||
| Commencement | Termination | cancellations authorized | |||
| 1-May-02 | 31-Mar-03 | 1,000,000 | |||
| 9-Apr-01 | 31-Mar-02 | 1,000,000 | |||
| 1-Oct-99 | 30-Sep-00 | 1,000,000 | |||
DYNAMIC OIL & GAS, INC. ANNUAL REPORT DECEMBER 31, 2002
58
6. SHARE CAPITAL (cont’d.)
Under these normal course issuer bids, the Company purchased and recorded the following:
| December 31 2002 | March 31 2002 | March 31 2001 | ||||||||||
| # | $ | # | $ | # | $ | |||||||
| Bid termination date: 31-Mar-03 | (189,700 | ) | (325,948 | ) | ||||||||
| Bid termination date: 31-Mar-02 | – | – | (178,800 | ) | (289,793 | ) | – | – | ||||
| Bid termination date: 30-Sep-00 | – | – | – | – | (58,100 | ) | (89,689 | ) | ||||
| (189,700 | ) | (325,948 | ) | (178,800 | ) | (289,793 | ) | (58,100 | ) | (89,689 | ) | |
| Average purchase price | $1.72 | $1.62 | $1.54 | |||||||||
| Recorded as an increase of deficit | 132,056 | 107,175 | 29,917 | |||||||||
| Recorded as a reduction of share capital | (193,892 | ) | (182,618 | ) | (59,772 | ) | ||||||
7. INCOME TAXES
Future income taxes reflect the net tax effects of temporary differences between the carrying amounts of assets and liabilities for financial reporting purposes and the amounts used for income tax purposes. Significant components of the Company’s future tax assets and liabilities are as follows:
| December 31 | March 31 | |||
| 2002 | 2002 | |||
| $ | $ | |||
| Long term future tax assets (liabilities): | ||||
| CCA in excess of book depreciation | (1,015,300 | ) | (46,000 | ) |
| Finance charges | 1,000 | 2,000 | ||
| Deferred gain recognized for tax purposes | – | 46,000 | ||
| Provision for future removal and site restoration costs | 332,000 | 277,000 | ||
| Net future tax (liabilities) assets | (682,300 | ) | 279,000 | |
The reconciliation of income tax attributable to operations computed at the statutory tax rates to income tax (recovery) expense is:
| December 31 2002 | March 31 2002 | March 31 2002 | |||||||
| $ | % | $ | % | $ | % | ||||
| Tax at combined federal and provincial rates | 1,333,000 | 42.37 | (2,371,000 | ) | 43.75 | 6,483,000 | 44.87 | ||
| Tax effect of non-deductible crown royalties | 898,400 | 1,068,000 | 1,329,000 | ||||||
| Tax effect of income not taxable | (70,500 | ) | (64,900 | ) | (224,000 | ) | |||
| Tax effect of resource allowance | (1,017,600 | ) | (1,290,300 | ) | (2,295,000 | ) | |||
| Large Corporation Tax in excess of surtax | 25,000 | 49,000 | 19,000 | ||||||
| Effect of changes in tax rates | – | 708,800 | (577,000 | ) | |||||
| 1,168,300 | (1,900,400 | ) | 4,735,000 | ||||||
DYNAMIC OIL & GAS, INC. ANNUAL REPORT DECEMBER 31, 2002
59
8 . EARNINGS PER SHARE
Basic net earnings (loss) per share was calculated on the basis of the weighted average number of shares outstanding for the nine-month period ended December 31, 2002 of 20,357,153 [March 31, 2002 – 20,365,031; March 31, 2001 –19,937,585]. The weighted average number of shares outstanding for the diluted calculation in the nine-month period ended December 31, 2002 was 20,554,231 [March 31, 2002 – 20,466,543; March 31, 2001 – 20,444,979].
| December 31 | March 31 | March 31 | ||||
| 2002 | 2002 | 2001 | ||||
| $ | $ | $ | ||||
| Numerator | ||||||
| Net earnings (loss) for the period | 1,977,663 | (3,519,085 | ) | 9,714,030 | ||
| Denominator | ||||||
| Weighted average number of common shares outstanding | 20,357,153 | 20,365,031 | 19,937,585 | |||
| Effect of dilutive stock options | 197,078 | 101,512 | 507,934 | |||
| 20,554,231 | 20,466,543 | 20,444,979 | ||||
| Basic earnings (loss) per share | 0.10 | (0.17 | ) | 0.49 | ||
| Diluted earnings (loss) per share | 0.10 | (0.17 | ) | 0.48 | ||
9. CHANGES IN NON-CASH WORKING CAPITAL BALANCES
[a] Changes affecting operating activities comprise:
| December 31 | March 31 | March 31 | ||||
| 2002 | 2002 | 2001 | ||||
| $ | $ | $ | ||||
| Accounts receivable | (968,683 | ) | (581,264 | ) | (2,463,146 | ) |
| Prepaid expenses | 13,456 | (124,761 | ) | (122,782 | ) | |
| Accounts payable and accrued liabilities | 2,155,188 | (728,998 | ) | 3,136,946 | ||
| Income taxes payable | (553,132 | ) | (123,784 | ) | 545,144 | |
| 646,829 | (1,558,807 | ) | 1,096,162 | |||
[b] Changes affecting investing activities comprise:
| December 31 | March 31 | March 31 | ||||
| 2002 | 2002 | 2001 | ||||
| $ | $ | $ | ||||
| Accounts receivable | 521,453 | (953,434 | ) | 217,404 | ||
| Accounts payable | 5,367,343 | (1,324,427 | ) | 892,484 | ||
| 5,888,796 | (2,277,861 | ) | 1,109,888 | |||
DYNAMIC OIL & GAS, INC. ANNUAL REPORT DECEMBER 31, 2002
60
10.FINANCIAL INSTRUMENTS
The Company’s financial instruments consist of accounts receivable, bank indebtedness, operating loan, accounts payable and income taxes payable. The carrying values of these financial instruments approximate their fair value.
Substantially all of the Company’s accounts receivable at December 31, 2002, and March 31, 2002 result from the sale of natural gas, natural gas liquids and oil to other companies in the oil and gas industry. This concentration of customers may impact the Company’s overall credit risk, either positively or negatively, in that such entities may be similarly affected by industry-wide changes in economic or other conditions. Historically to date, the Company has not incurred credit losses against its receivables. At December 31, 2002 five customers represent 56% of the accounts receivable balance.
11.OVERRIDING ROYALTY
Three of the Company’s officers receive compensation pursuant to royalty agreements that have previously been approved by shareholders. The Company pays an overriding royalty interest of 1% of the Company’s share of gross monthly production of all petroleum substances produced or deemed to be produced and marketed from or allocated to each well on all lands acquired by the Company since June 1, 1986 for two of the three officers and June 1, 1987 for the third officer. In the nine-month period ending December 31, 2002, the overriding royalty expense included in royalties is $681,493 [years ended March 31, 2002 – $745,994; March 31, 2001 – $934,338].
12.RECONCILIATION OF GENERALLY ACCEPTED ACCOUNTING PRINCIPLES
The Company prepares its accounts in accordance with Canadian generally accepted accounting principles (Canadian GAAP), which for the most part, are similar to United States generally accepted accounting principles (U.S. GAAP). The following tables reflect the major differences in accounting principles.
Consolidated net earnings (loss) under U.S. GAAP would be:
| For the Nine Months | For the Year | For the Year | ||||
| Ended December 31 | Ended March 31 | Ended March 31 | ||||
| 2002 | 2002 | 2001 | ||||
| $ | $ | $ | ||||
| Net earnings (loss) under Canadian GAAP | 1,977,663 | (3,519,085 | ) | 9,714,030 | ||
| Options issued for services[a] | (4,933 | ) | – | (20,100 | ) | |
| Ceiling test adjustment to natural gas properties[b] | (332,000 | ) | (216,100 | ) | – | |
| Income taxes[c] | 141,400 | 669,100 | (577,000 | ) | ||
| Net earnings (loss) and comprehensive earnings (loss) under U.S. GAAP | 1,782,130 | (3,066,085 | ) | 9,116,930 | ||
| Common shares – weighted average | 20,357,153 | 20,365,031 | 19,937,585 | |||
| Net earnings (loss) per common share under U.S. GAAP | ||||||
| – basic | 0.09 | (0.15 | ) | 0.46 | ||
| – diluted | 0.09 | (0.15 | ) | 0.45 | ||
DYNAMIC OIL & GAS, INC. ANNUAL REPORT DECEMBER 31, 2002
61
After adjusting for certain differences, selected consolidated balance sheet items under U.S. GAAP would be:
| December 31 | March 31 | |||||||
| 2002 | 2002 | |||||||
| Canadian | U.S. | Canadian | U.S. | |||||
| Basis | Basis | Basis | Basis | |||||
| $ | $ | $ | $ | |||||
| Future income tax asset[c] | – | – | 279,000 | 371,100 | ||||
| Future income tax liability[c] | 682,300 | 540,900 | – | – | ||||
| Natural gas and oil interests[b] | 36,568,076 | 36,236,076 | 30,365,636 | 30,149,536 | ||||
| Share capital[a, d] | 20,720,629 | 21,693,722 | 20,914,522 | 21,882,682 | ||||
| Deficit[a, b, c, d] | (2,015,480 | ) | (1,640,052 | ) | (4,321,539 | ) | (3,297,578 | ) |
[a]Stock-based compensation
Prior to the adoption of CICA 3870, no compensation expense was recognized under Canadian GAAP when stock options were issued to directors, employees or consultants. This resulted in a U.S. GAAP difference for the years ended March 31, 2002 and 2001 as the Company is required to account for stock-based compensation arrangements using the intrinsic value method in accordance with the provisions of Accounting Principles Board Opinion No. 25, “Accounting for Stock Issued to Employees” (“APB 25”) for employees and directors and the fair value method under Statement of Financial Accounting Standards No. 123, “Accounting for Stock-Based Compensation” (“SFAS 123”) for consultants. Under APB 25, compensation expense for employees and directors is based on the difference between the fair value of the Company’s stock and the exercise price if any, on the date of the grant. Under SFAS 123, the Company accounts for stock options issued to consultants at fair value. While the Company follows APB 25 for employees and directors, it does comply with the disclosure provisions of SFAS 123.
The Company has adopted the disclosure-only provisions of SFAS 123, “Accounting for Stock-Based Compensation” for stock based awards to employees and directors, consistent with current disclosure requirements under CICA 3870. Had compensation cost for the Company’s stock option plan been determined based on the fair value at the grant date for awards in the years ended March 31, 2002 and 2001 consistent with the provisions of SFAS No. 1223, the Company’s net earnings (loss) would have been decreased to the pro forma amounts indicated below:
| March 31 | March 31 | |||
| 2002 | 2001 | |||
| $ | $ | |||
| Net Earnings: | ||||
| – as reported | (3,519,085 | ) | 9,714,030 | |
| – pro forma | (3,356,108 | ) | 9,313,819 | |
| Basic earnings per common share: | ||||
| – as reported | (0.17 | ) | 0.49 | |
| – pro forma | (0.16 | ) | 0.47 | |
| Diluted earnings per common share: | ||||
| – as reported | (0.17 | ) | 0.48 | |
| – pro forma | (0.16 | ) | 0.46 | |
DYNAMIC OIL & GAS, INC. ANNUAL REPORT DECEMBER 31, 2002
62
12. RECONCILIATION OF GENERALLY ACCEPTED ACCOUNTING PRINCIPLES (cont’d.)
For the nine months ended December 31, 2002, the net earnings (loss) that would be disclosed to SFAS No. 123 is consistent with the amounts shown in note 6[c]. The weighted average assumptions used in the Black-Scholes valuation (refer to note 6[c] for discussion of the model) for the years ended March 31, 2002 and 2001 were as follows:
| March 31 | March 31 | |||
| 2002 | 2001 | |||
| $ | $ | |||
| Dividend yield | 0% | 0% | ||
| Expected volatility | 57% | 48% | ||
| Risk-free interest rate | 5% | 6% | ||
| Expected lives | 3 years | 3 years | ||
[b]Under the successful efforts method of accounting, according to Canadian GAAP, the net carrying cost of oil and gas properties in producing cost centres is limited to an estimated recoverable amount, which is the aggregate of future net operating revenues from proved producing reserves net of certain costs (the “Canadian ceiling test”). Under U.S. GAAP, costs accumulated in each cost centre are limited to an amount equal to the present value, using an annual cash flow discount rate of 10%, of the estimated future net operating revenues from proved producing reserves (the “U.S. ceiling test”).
[c]Effective April 1, 1999, the Company adopted the new Canadian GAAP recommendations with respect to income taxes which requires application of the liability method of tax allocation, similar to the requirements under U.S. GAAP. However, there remains a difference between Canadian and U.S. GAAP, as Canadian GAAP requires that deferred income tax balances be adjusted to reflect substantively enacted rates rather than the current legislated tax rates under U.S. GAAP.
[d]Share issue costs are charged directly to retained earnings under Canadian GAAP and are charged directly to share capital under U.S. GAAP. The total share issue costs charged to share capital was $570,961.
[e]Recent Developments in US Accounting Standards
In June 2001, the Financial Accounting Standards Board issued Statement No. 143, “Accounting for Asset Retirement Obligations” (FAS 143), which is effective for all fiscal years beginning after June 15, 2002. The Statement requires legal obligations associated with the retirement of long-lived assets to be recognized at their fair value at the time that the obligations are incurred. Upon initial recognition of the liability, that cost should be capitalized as part of the related long-lived asset and allocated to expense over the useful life of the asset. The liability accretes until the Company expects to settle the retirement obligation. The Company will adopt FAS 143 on January 1, 2003, however due to the extensive number of documents that must be reviewed and estimates that must be made to assess the effects of the Statement, the expected impact of the adoption of FAS 143 on the Company’s financial position or results of operations has not yet been determined.
DYNAMIC OIL & GAS, INC. ANNUAL REPORT DECEMBER 31, 2002
63
13.COMMITMENTS
[a]Operating lease
The Company has entered into an operating lease in respect of its office premises. Minimum payments under this lease commitment, including estimated operating costs over the next two years are $72,329 and $6,027 for the fiscal years ending December 31, 2003 and 2004, respectively.
[b]Future removal and site restoration costs
The Company is responsible for the future removal and site restoration related to its natural gas and oil properties at the end of their useful lives. The Company currently estimates the total amount of this future liability to be approximately $2,110,750, of which $166,883 has been accrued in the current year with $1,085,113 remaining to be accrued in the future. Actual costs may differ from those estimated due to changes in legislation and estimated costs.
14.ECONOMIC DEPENDENCY
The St. Albert property in Alberta is a core property of the Company and the majority of gas production from the property is pipelined and processed through facilities owned and operated by Atco Midstream (“Atco”) of Calgary, Alberta.
Effective November 1, 1997, the Company and its then joint interest partner, Fletcher Challenge Energy Canada Inc. signed a ten-year, firm service, sour gas processing and transportation agreement with Atco for a maximum daily quantity of 15 million cubic feet of gas per day to be processed at Atco’s Carbondale plant.
Effective December 15, 1998, a similar agreement was signed by the partners and Atco to process sweet gas at Atco’s Villenueve plant, also for a maximum daily quantity of 15 million cubic feet of gas per day.
Both agreements include an automatic renewal for a further ten years, subject to fee re-negotiation.
DYNAMIC OIL & GAS, INC. ANNUAL REPORT DECEMBER 31, 2002
64
SCHEDULE 1 GENERAL AND ADMINISTRATIVE
(in Canadian dollars)| Nine Months Ended | ||||||
| December 31 | Years Ended March 31 | |||||
| 2002 | 2002 | 2001 | ||||
| $ | $ | $ | ||||
| Advertising and promotion | 180,249 | 250,792 | 218,880 | |||
| Insurance | 121,427 | 122,583 | 43,034 | |||
| Interest | 32,967 | 98,087 | 18,469 | |||
| Office and printing | 387,029 | 432,947 | 231,490 | |||
| Professional fees | 474,120 | 530,203 | 402,925 | |||
| Provincial capital taxes | 17,836 | 83,062 | 37,000 | |||
| Regulatory and other fees | 81,523 | 72,472 | 70,219 | |||
| Rent | 66,410 | 89,581 | 84,646 | |||
| Salaries and benefits (1) | 783,706 | 1,086,958 | 633,601 | |||
| Telephone | 16,076 | 16,423 | 13,354 | |||
| Travel | 39,689 | 23,054 | 20,361 | |||
| Cost recoveries | (274,870 | ) | (458,950 | ) | (204,804 | ) |
| 1,926,162 | 2,347,212 | 1,569,175 | ||||
(1) The Company also paid overriding royalties to three officers as described in Note 11.
SCHEDULE 2 AMORTIZATION AND DEPLETION
(in Canadian dollars)| Nine Months Ended | ||||||
| December 31 | Years Ended March 31 | |||||
| 2002 | 2002 | 2001 | ||||
| $ | $ | $ | ||||
| Amortization and depletion | 6,369,230 | 12,118,849 | 3,132,663 | |||
| Future removal and site restoration provision | 166,883 | 284,368 | 184,925 | |||
| Amortization of deferred financing costs | – | – | 1,412 | |||
| Amortization of deferred gain on sale | (109,328 | ) | (230,274 | ) | (312,036 | ) |
| 6,426,785 | 12,172,943 | 3,006,964 | ||||
SCHEDULE 3 EXPLORATION EXPENSES
(in Canadian dollars)| Nine Months Ended | ||||||
| December 31 | Years Ended March 31 | |||||
| 2002 | 2002 | 2001 | ||||
| $ | $ | $ | ||||
| Drilling | 325,477 | 3,821,374 | 667,684 | |||
| Seismic data activity | 846,984 | 649,216 | 1,101,969 | |||
| Non-producing lease rentals | 138,051 | 64,605 | 51,856 | |||
| Property investigations | 49,000 | 110,823 | 101,685 | |||
| 1,359,512 | 4,646,018 | 1,923,194 | ||||
DYNAMIC OIL & GAS, INC. ANNUAL REPORT DECEMBER 31, 2002
CORPORATE INFORMATION
| Directors | |
| Wayne J. Babcock | Vancouver, British Columbia |
| John A. Greig | Vancouver, British Columbia |
| David J. Jennings | Vancouver, British Columbia |
| John Lagadin | Calgary, Alberta |
| Jonathan A. Rubenstein | Vancouver, British Columbia |
| William B. Thompson | Kelowna, British Columbia |
| Donald K. Umbach | Vancouver, British Columbia |
| Officers | |
| Wayne J. Babcock | President and Chief Executive Officer |
| Donald K. Umbach | Vice President and Chief Operating Officer |
| James R. Britton | Vice President, Exploration |
| David G. Grohs | Vice President, Production |
| Michael A. Bardell | Chief Financial Officer and Corporate Secretary |
| Head Office | |
| before May 26, 2003 | |
| Suite 205 – 10711 Cambie Road | |
| Richmond, British Columbia Canada V6X 3G5 | |
| after May 26, 2003 | |
| Suite 230 – 10991 Shellbridge Way | |
| Richmond, British Columbia Canada V6X 3C6 | |
| Tel: 604/214-0550 | Toll free: 1-800/663-8072 |
| Fax: 604/214-0551 | E-mail: infodynamic@dynamicoil.com |
| Website: www.dynamicoil.com | |
| Regulatory filings website: www.sedar.com | |
| Consulting Engineers | Trading Symbols |
| Sproule Associates LimitedCalgary, Alberta | TSE : DOL NASDAQ : DYOLF |
| Corporate Reserves Evaluator | |
| Capital Stock | |
| Status Engineering Associates Ltd.Calgary, Alberta | Common Outstanding: 21,051,196 to April 30, 2003 |
| Solicitors | Annual Meeting |
| Irwin, White & JenningsVancouver, British Columbia | The Annual General Meeting of the Shareholders will be held |
| Perkins Coie LLPSanta Monica, California | in the Fraser Room of the Holiday Inn, 10720 Cambie Road, |
| Richmond, B.C. on Thursday, June 19, 2003 at 1:00 pm. | |
| Auditors | |
| Ernst & Young LLPVancouver, British Columbia | Form 20F |
| A copy of the Company’s latest report on Form 20F, as filed | |
| Bankers | with the Securities and Exchange Commission is available |
| National Bank of CanadaCalgary, Alberta | without charge, upon written request to the Corporate |
| Secretary. | |
| Registrar and Transfer Agent | |
| CIBC Mellon Trust CompanyVancouver, British Columbia |
Creative Design: XY3 Design + Communications Inc., West Vancouver BC
Webmaster: Webhead Studios, Sammamish, WA
Printed in Canada on 30% post consumer; EcoLogo certified
