
2003 Annual Report
Dynamic Oil & Gas, Inc. is a Canadian-based energy company engaged in the production and exploration of western Canada’s natural gas and oil reserves. We own working interests in producing and early-stage exploration properties located in various areas of southwestern and northeastern British Columbia and central Alberta.
Dynamic’s common shares trade on The Toronto Stock Exchange under the symbol “DOL” and on the NASDAQ under the symbol “DYOLF”
| Abbreviations |
| bbl or bbls | barrel or barrels |
| mcf | thousand cubic feet |
| bbl/d | barrels per day |
| mcf/d | thousand cubic feet per day |
| mbbl | thousand barrels |
| mmcf | million cubic feet |
| bcf | billion cubic feet |
| boe | barrels of oil equivalent (6 mcf = 1 bbl) |
| mmcf/d | million cubic feet per day |
| boe/d | barrels of oil equivalent per day |
| NGL’s | natural gas liquids |
| mboe | thousand barrels of oil equivalent |
[GRAPHIC OMITTED]
Our focus is set firmly on the horizon.
[GRAPHIC OMITTED]
“When you get right down to it, what we do is pretty simple.
All we have to do in our search for fossil fuel is finance it, find it, produce it, process it and get it to our customers.
The difficulty, however, is that Mother Nature has hidden her energy gems in the most rugged and diverse spots on the earth, at various depths and in almost every kind of rock.”
Wayne Babcock, President & CEO
2
2003 Highlights
| | Twelve Months | | Nine Months | | Twelve Months | |
| | Ended | | Ended | | Ended | |
| | December 31, | | December 31, | | March 31, | |
| | 2003 | | 2002 | | 2002 | |
| | | | | | | |
| Daily production | | | | | | |
| Natural gas(mcf/d) | 13,050 | | 14,174 | | 15,107 | |
| Natural gas liquids(bbls/d) | 662 | | 698 | | 631 | |
| Crude oil(bbls/d) | 610 | | 271 | | 76 | |
| All products(boe/d) | 3,447 | | 3,332 | | 3,225 | |
| Total annual production(mboe) | 1,258 | | 916 | | 1,177 | |
| Prices – weighted average | | | | | | |
| Natural gas($/mcf) | 6.56 | | 4.36 | | 3.81 | |
| Natural gas liquids($/bbl) | 27.68 | | 20.90 | | 19.30 | |
| Crude oil($/bbl) | 42.98 | | 41.40 | | 34.33 | |
| Corporate netback($/boe) | 21.86 | | 14.53 | | 12.08 | |
| Reserves – proved plus probable | | | | | | |
| Natural gas(mmcf) | 42,158 | | 37,489 | | 44,740 | |
| Natural gas liquids(mbbls) | 1,393 | | 1,631 | | 1,905 | |
| Crude oil(mbbls) | 800 | | 1,846 | | 553 | |
| Total(mboe) | 9,219 | | 9,725 | | 9,915 | |
| Undeveloped land | | | | | | |
| Net acres | 121,921 | | 110,744 | | 69,162 | |
| Financial($ 000’s, unless otherwise stated) | | | | | | |
| Gross revenues | 46,848 | | 24,123 | | 26,402 | |
| Cash flow from operations(1) | 23,097 | | 10,810 | | 11,337 | |
| Per common share | 1.07 | | 0.53 | | 0.55 | |
| Net earnings (loss) | 4,978 | | 2,004 | | (3,412 | ) |
| Per common share | 0.23 | | 0.10 | | (0.17 | ) |
| Capital expenditures | 31,747 | | 12,578 | | 22,111 | |
| Operation loan | 13,250 | | 11,075 | | 14,750 | |
| Common shares outstanding | | | | | | |
| Basic | 21,393,902 | | 20,357,153 | | 20,365,031 | |
| Diluted | 21,947,801 | | 20,554,231 | | 20,466,543 | |
| (1) | Cash flow from operations = “Cash provided by operating activities” plus “Changes in non-cash working capital affecting operating activities” in the Statements of Cash Flows. Cash flow from operations is a non-GAAP measure that does not have standardized meaning as prescribed by GAAP and is therefore unlikely to be comparable to similar measures presented by other companies. We consider it a key measure as it demonstrates our ability to generate cash flow necessary to fund future growth through capital investment and to repay debt. |
3
President's Message
Last year, my message was about change. In 2002, we made some important structural changes to our Company and the way we do business, including a change to our financial year-end and corporate reserves evaluations. We also increased our staff from 12 employees at end of 2001 to 16 at the end of 2002. And now, that number has risen to 21.
My theme this year is, ‘transition’. This is a transition year for our Company and, in a broader sense, for the world industry. We are beginning to see a transition from reliance on mid-east oil to a western hemisphere strategy involving West Africa and South America as increasingly important players. China, too, is making the transition from a third-world economy to a major consumer with huge awakening demands for fossil energy.
In Canada, this year is a transition year in terms of how we measure our reserves. Now, the majority of our peers in Canada are required to have their oil and gas reserves determined according to a new set of definitions referred to as NI51-101. In the quest for higher confidence that estimated reserves will be recoverable, the new definitions have tended to decrease reported reserve numbers across-the-board. The definitions are now more conservative than those used by US reporting issuers and larger competitors who report their reserves without independent audit.
Dynamic is transitioning for growth. Transitions are not always smooth and this year, we saw a few bumps in the road as St. Albert crude oil production dropped sooner than anticipated, and Cypress natural gas production was delayed by operational and third-party processing issues.
Dynamic is striving for more success in northeastern British Columbia. Our aim is to become less dependent on mature fields like St. Albert and Halkirk in Alberta. The kind of discoveries we've made so far wouldn't have been possible in any of the more mature North American basins. That's why we are here confronting the majors, arm-wrestling over new lands, and building our own transportation and processing infrastructure.
Dynamic has also begun to secure more recognition in the business world. In their “Top 100 Public Companies in British Columbia”, the Sun newspaper group chose Dynamic 19th best company overall and fourth best in terms of employee productivity. For the third consecutive year, I have been nominated by Ernst & Young to compete for 'Entrepreneur of the Year' in the Pacific region of Canada. Aside from being very satisfying honors, these are clear indications that Dynamic is heading in the right direction.
When you get right down to it, what we do is pretty simple. All we have to do in our search for fossil fuel is finance it, find it, produce it, process it and get it to our customers. The difficulty, however, is that Mother Nature has hidden her energy gems in the most rugged and diverse spots on the earth, at various depths and in almost every kind of rock.
4
There's another thing. A good many other folks are trying to do the same thing – mostly they are bigger than we are and have already found the easy stuff. But you know what? These are exactly the things that make it so much fun. The excitement and sense of adventure in what we do, is one of the reasons I've been able to assemble such a dedicated team of explorers and developers and why I believe Dynamic will continue to grow and prosper.
We continue to see uncertainty in global energy markets, not just political uncertainty but uncertainty in reserves as well. Several of the major middle-east producing countries have started to see dwindling reserve-based production. The most recent model calls for worldwide production declines in oil to begin about the year 2008. From then on, it's down hill, because existing and new discoveries will not be able to keep up with production demands.
Today, in North America, we have approximately a seven-year supply of natural gas to meet our current demands. But that cushion is rapidly shrinking. Twenty years ago, we had a fifteen-year supply of forward reserves. We live in a society that is entirely dependent on inexpensive sources of energy – most of us never even think about it when we fill our gas tank (with mostly imported oil) or flick a light switch (from natural gas-fired generators). The next time you do one of these things, I'd like you, as a consumer and a shareholder, to think of Dynamic Oil & Gas and our great team of dedicated individuals.
What does this mean for you as a Dynamic shareholder? Remember Mother Nature – every day we're out searching and exploring for her hidden treasure. I've built a company dedicated to finding new energy in western Canada. Our focus is natural gas – nature's cleanest-burning fossil fuel. Whether natural gas pipelines cross northeast British Columbia or travel up the Gulf Coast, they tie our populations together. When proposed plans go ahead, we'll see a new pipeline connecting the ‘lower forty-eight,’ running through northern British Columbia right up to the Alaska North Slope and the Polar Shelf. That pipeline will open up new opportunities for frontier explorers like Dynamic – and we plan to be ready.

Wayne J. Babcock,
President & Chief Executive Officer
5
[GRAPHIC OMITTED]
Review of Drilling, Land and Properties
We changed our fiscal year end to December 31 from March 31 beginning with December 31, 2002. For discussion purposes, we may refer to the nine-month period ended December 31, 2002 as “Nine-Month Fiscal Transition 2002” and the twelve-month periods ended March 31, 2003 and 2002 as “Fiscal 2003” and “Fiscal 2002,” respectively.
Drilling Activity
| | Fiscal 2003 | | Nine-Month Fiscal Transition 2002 | | Fiscal 2002 | |
| | Gross | | Net | | Gross | | Net | | Gross | | Net | |
| | | | | | | | | | | | | |
| Natural gas | 8 | | 5.3 | | 7 | | 4.3 | | 9 | | 7.5 | |
| Crude oil | 4 | | 3 | | 2 | | 1.5 | | 1 | | 0.7 | |
| Dry | 2 | | 2 | | – | | – | | 4 | | 2.8 | |
| Total | 14 | | 10.3 | | 9 | | 5.8 | | 14 | | 11.0 | |
| Success rate | | | 80 | % | | | 100 | % | | | 75 | % |
During Fiscal 2003, we operated or participated in 14 drilled wells resulting in eight gas wells, four oil wells and two dry wells for an overall success rate of 80%. Of the 12 successful wells, six development wells were drilled at St. Albert, two exploration wells were drilled at Wimborne, one development well at Halkirk, Alberta and three exploration wells were drilled at Cypress/Chowade in British Columbia.
6
Land Holdings (acres)
As at December 31, 2003
| | Developed | | Undeveloped | | Total | | Weighted | |
| Area | Gross | | Net | | Gross | | Net | | Gross | | Net | | Avg WI % | |
| | | | | | | | | | | | | | | |
| | | | | | | | | | | | | | | |
| Alberta | | | | | | | | | | | | | | |
| St. Albert | 9,308 | | 6,060 | | 4,442 | | 3,150 | | 13,750 | | 9,210 | | 67% | |
| Halkirk | 3,840 | | 3,456 | | 2,880 | | 2,880 | | 6,720 | | 6,336 | | 94% | |
| Peavey/Morinville | 6,787 | | 4,921 | | 4,766 | | 2,954 | | 11,553 | | 7,875 | | 68% | |
| Quirk Creek | – | | – | | 6,560 | | 3,280 | | 6,560 | | 3,280 | | 50% | |
| Wimborne | 640 | | 640 | | 9,035 | | 8,555 | | 9,675 | | 9,195 | | 95% | |
| Other | 3,527 | | 2,689 | | 3,340 | | 3,072 | | 6,867 | | 5,761 | | 84% | |
| | 24,102 | | 17,766 | | 31,023 | | 23,891 | | 55,125 | | 41,657 | | 76% | |
| | | | | | | | | | | | | | | |
| British Columbia | | | | | | | | | | | | | | |
| Cypress/Chowade | 5,976 | | 2,564 | | 39,154 | | 12,953 | | 45,130 | | 15,517 | | 34% | |
| Orion | 2,003 | | 1,335 | | 64,611 | | 45,134 | | 66,614 | | 46,469 | | 70% | |
| Fraser Valley | – | | – | | 54,502 | | 18,278 | | 54,502 | | 18,278 | | 34% | |
| | 7,979 | | 3,899 | | 158,267 | | 76,365 | | 166,246 | | 80,264 | | 48% | |
| Total to Dec 31, 2003 | 32,081 | | 21,665 | | 189,290 | | 100,256 | | 221,371 | | 121,921 | | 55% | |
| Total to Dec 31 2002 | 30,170 | | 20,248 | | 161,918 | | 90,496 | | 192,088 | | 110,744 | | 58% | |
| Increase (decrease) | 1,911 | | 1,417 | | 27,372 | | 9,760 | | 29,283 | | 11,177 | | | |
| Increase (decrease) % | 6% | | 7% | | 17% | | 11% | | 15% | | 10% | | | |
Our total land holdings increased during the year by 11,177 net acres (29,283 gross) or 10%. This increase was mainly spread among two key properties, Wimborne, Alberta and Cypress/Chowade in British Columbia. Some of the net increase was offset with minor land reductions at St. Albert, Halkirk and Peavey/Morinville, Alberta. We had significant land reductions at Quirk Creek, Alberta of 2,400 net acres (4,800 gross). Of our total land holdings, 100,256 net acres (189,290 gross) or 82% was undeveloped.
Our weighted average working interest of all our Alberta properties was 76% versus 48% in British Columbia. In total, our weighted average working interests decreased by 3% to 55%.
7
Alberta Properties
St. Albert/Big Lake
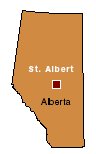
St. Albert is located in central Alberta, northwest of the City of Edmonton and near the City of St. Albert.
Geological Description
The property is comprised of two Devonian-aged reef structures, which are associated with 16, separate Cretaceous-aged natural gas and Devonian-aged crude oil pools stacked in seven productive formations, four are natural gas and three crude oil. For purposes of project identification, we refer to these structures as the “north pool” and the “south pool”. Historically, the property has produced in excess of 22.5 million barrels of crude oil and 109 billion cubic feet of raw natural gas from both pools. They continue to remain prospective for recoverable oil from six established Devonian-aged pools in the Leduc D-3, Nisku D-2 and Wabamun D-1 formations.
Land Holdings
We hold 9,210 net acres (13,750 gross) of various crown and freehold petroleum and natural gas (“P&NG”) leases for a weighted average working interest of 67%.
Seismic
We own a 37.5% working interest in a proprietary 3D seismic database covering 12 square kilometers.
Wells and Facilities
We own a 75% working interest in 17 producing gas wells; from a 44% to 77% working interest in another four; and a 75% working interest in seven producing oil wells. In addition, we own a 75% working interest in one oil battery, one solution gas plant, one sour gas compressor, two sweet gas compressors and a 13 kilometer, 6” sour gas pipeline.
2003 Activities
In the south pool, we drilled three wells targeting remaining Devonian-aged oil reserves. Two of these wells encountered oil pay in the Leduc formation and one well, while unsuccessful in the Leduc formation, was later completed as a Nisku oil well. In the north pool, we drilled one well also targeting remaining Devonian-aged oil reserves. While the well was unsuccessful in the Leduc formation, it was later completed as a Nisku oil well.
We drilled two successful wells targeting remaining natural gas in the Ostracod formation. We were able to minimize surface and environmental impacts by re-entering existing well bores in all of our drilling activity. We addressed declining reservoir pressures in various gas pools by adding third-party owned compression at nearby Villeneuve and Carbondale gas plants.
2004 Outlook
Our budget for the year focuses on continued optimization of the field. All projects are geared toward recovery of remaining crude oil and natural gas reserves from known pools. Our development drilling, re-completions and work-overs will specifically target the Leduc D-3, and Nisku D-2 oil zones, and the Ostracod and Belly River gas zones. Our investment at St. Albert includes numerous wells and facilities. For this reason, we strive to early-inform and consult with the public in the area and work closely with government regulators.
8
 | |  |
| | Our budget for 2004 focuses
on continued optimization of our
field at St. Albert/Big Lake. |
9
Halkirk
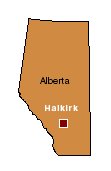
Halkirk is located in central Alberta approximately 168 kilometers northeast of Calgary.
Geological Description
This area is prospective for multiple, sweet natural gas-bearing Cretaceous-aged sandstone reservoirs. The primary target for reserves is the Viking “C” sand with an average net pay thickness of approximately five meters.
Land Holdings
We own 6,336 net acres (6,720 gross) of crown and freehold P&NG leases for a weighted average working interest of 94%.
Wells and Facilities
We own a 100% working interest in five producing gas wells and two standing wells. We also own an 80% before payout working interest and a 48% after payout working interest in three producing gas wells. All of our natural gas production is processed at the Maple Glen Gas Plant under a third-party custom processing agreement.
2003 Activities
We drilled one successful infill Viking gas well and one unsuccessful step-out well. We acquired 320 net acres (100%) of new P&NG rights.
2004 Outlook
Our reserves at Halkirk are based on a 160-acre drainage area. We have identified opportunities to down-space production in the future by drilling additional infill wells to increase reserve allocations and production. No new wells are budgeted.
10
 | |  |
| | We own a 100% working interest
in five producing and two standing
natural gas wells at Halkirk. |
11

Wimborne
Wimborne is located in south-central Alberta approximately 112 kilometers northeast of Calgary.
Geological Description
The area is prospective for multiple Cretaceous-aged sandstone reservoirs containing natural gas and natural gas liquids. Additional potential exists for crude oil and natural gas within deeper Mississippian and Devonian carbonate reservoirs.
Land Holdings
We own 9,195 net acres (9,675 gross) of P&NG rights for a weighted average working interest of 95%. Of our total net holdings, 93% is undeveloped.
Seismic
We own a licensed copy of a high quality, 3D seismic database covering 260 square kilometers.
Wells and Facilities
We own a 100% working interest in one standing gas well. The property is in close proximity to existing natural gas pipelines and processing facilities.
2003 Activities
We drilled one successful gas well and one unsuccessful well. We acquired a 100% working interest in approximately ten new sections (6,475 acres) of crown P&NG leases.
2004 Outlook
Our large 3D seismic database is expected to enhance our long-term exploration and development strategy for the area. Through it, we have identified up to six exploration targets on our lands, three of which are planned for drilling this year.
12
 | |  |
| | Our large 3D seismic database is
expected to enhance our long-term
exploration and development
strategy for the Wimborne area. |
13
BRITISH COLUMBIA PROPERTIES 
Cypress/Chowade
Cypress/Chowade is located in the foothills of northern British Columbia approximately 100 kilometers northwest of Fort St. John.
Geological Description
The area is prospective for multiple, natural gas-bearing Triassic sandstone and carbonate reservoirs and deep Mississippian carbonate reservoirs contained within classic foothill anticlines that trend northwest-southeast through the area.
Land Holdings
We have crown P&NG leases over 15,517 net acres (45,130 gross) for a weighted average working interest of 34%. Of our total net acreage, 83% is undeveloped.
Seismic
We own a licensed copy of a large 2D seismic database and a 100% working interest in 15 kilometers of 2D proprietary seismic data.
Wells and Facilities
We own between 30% - 50% working interests in two producing gas wells and six standing shut-in gas wells. In five of these eight wells, our interest converts from 50% working interest to 30% working interest at payout. All of our fiscal 2003 gas production was processed at Cypress Gas Plant under a third-party custom processing agreement. A major expansion of pipeline and processing facilities is required to develop this area.
2003 Activities
We participated in drilling two successful exploration wells targeting multi-zone natural gas bearing reservoirs of Triassic age. We also participated in one exploration well to test and evaluate the Mississippian-aged Debolt formation. While the well was unsuccessful in the Debolt formation, it was cased as a potential gas well in two Triassic-aged zones. We acquired a weighted average working interest of 33% in 28,350 gross acres, equipped four wells for tie-in and added a field compressor.
2004 Outlook
We plan to drill three exploratory outpost wells and three development wells. We have budgeted to cover our half of the cost to construct a 30 mmcf/d sour gas plant, acid gas injection facilities and a 32 kilometer, 8” diameter sales pipeline to Sikanni. The initial leg of the proposed 8” diameter sales pipeline is scheduled for construction in the first quarter. We plan to have three of our six standing shut-in gas wells on stream in the first quarter and the remaining three wells on stream later in the year. We have seismically identified more than 30 potential exploration and development locations on company-owned lands. We plan to continue an aggressive land acquisition strategy.
14
 | |  |
| | We have seismically identified
more than 30 potential exploration
and development locations on
company-interest lands. |
15
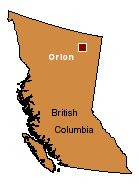
Orion
Orion is strategically located between the Sierra and Helmet natural gas fields approximately 56 kilometers west of the Alberta border and 112 kilometers south of the Northwest Territories border. The property is dissected by the Sierra Yoyo Desan Road, which provides year-round access for drilling operations.
A large independent Canadian oil and gas company has referred to the regional Jean Marie carbonate reservoir in this area as ‘The Greater Sierra Gas Play’ and has described the area as the largest gas play discovered in Western Canada. Orion is a part of this area and is a key element in our long-term growth strategy.
Geological Description
The area is prospective for natural gas exploration and development in Cretaceous-aged Bluesky sandstone reservoirs and Mississippian and Devonian-aged Debolt, Jean Marie and Slave Point carbonate reservoirs.
Land Holdings
We hold under lease 46,469 net acres (66,614 gross) for a weighted average working interest of 70%. Approximately 97% of our net holdings are undeveloped.
Wells and Facilities
The property presently has three potential gas wells; one Bluesky and two Jean Marie horizontal wells. All three wells are standing awaiting further evaluation. We own a 100% working interest in the Bluesky and one Jean Marie well, a 15% gross overriding royalty (before payout) and a 50% working interest (after payout) in the other Jean Marie well.
Two major pipeline systems terminate at the edge of our property. To the southwest, the Duke Energy Pipeline System connects to Fort Nelson for delivery to Washington State and to the northeast, the Duke Energy Field Services Pipeline System connects to Tooga Compressor Station for delivery to Alberta.
2003 Activities
We drilled one horizontal well at 100% working interest to test the Jean Marie formation. The well tested gas in the Jean Marie formation at rates below commercial quantities and is being retained as a potential gas well pending further evaluation.
2004 Outlook
We plan to drill two 100% working interest exploration wells; one to test the Slave Point formation and one to test the Bluesky formation. We plan to shoot 90 square kilometers of proprietary 3D seismic.
16
 | |  |
| | Orion forms part of
“The Greater Sierra Gas Play”
and is a key element in our
long-term growth strategy. New 3D seismic has defined
multiple drilling targets for 2004. |
17

Fraser Valley
The property is located in the Lower Mainland area of southwest British Columbia near the port city of Vancouver.
Land Holdings
Under a joint venture agreement with Conoco Canada Limited, we continue to hold approximately 18,278 net acres (54,502 gross) of onshore and offshore P&NG rights associated with Permit 802, a validated British Columbia Exploration Permit. Permit 802 is under provincial jurisdiction and includes offshore P&NG rights in the Georgia Basin, located in the Strait of Georgia between the Lower Mainland and Vancouver Island.
2004 Outlook
Presently, areas offshore are subject to a restricted access moratorium for petroleum and natural gas activities, however, discussions are underway between the Provincial and Federal Governments in regards to lifting the moratorium. The Provincial Government has indicated its desire to move forward and the Federal Government is currently conducting a public review to identify environmental and social concerns arising from offshore activities along the Pacific West Coast. A final decision is expected in 2004. We have identified a large structural feature approximately 19 square kilometers in size (the Robert’s Bank Gravity Anomaly) which is supported by government-acquired gravity data and proprietary onshore 2D seismic data. The Geological Survey of Canada has assigned the Georgia Basin a reserve estimate of 6.5 trillion cubic feet of natural gas. A commercial quantity of gas is yet to be discovered in the area. We plan to be inactive in the Fraser Valley in 2004.
Other Non-Core Properties
Peavey/Morinville, Quirk Creek, Alexander, Simonette, Stanmore, and Westlock in Alberta and Elmore and Rapdan in Saskatchewan comprise 16,916 net acres (24,980 gross) with a weighted average working interest of 68%.
2004 Look Ahead
Looking ahead to 2004, we have changed our focus away from Alberta to northeast British Columbia. In Fiscal 2004, we plan to invest $26.1 million or 71% of our total capital budget in northeast British Columbia compared to $9.4 million or 25% of our total capital budget in Alberta.
Our primary strategy is to grow organically through the drill bit by pursuing a fundamentally sound, forward-looking exploration strategy. We believe that northeast British Columbia offers some of the best opportunities in the western Canadian sedimentary basin for long-term sustainable growth. Of our current total net undeveloped land holdings, 76% are located in British Columbia.
British Columbia has become an attractive province for oil and gas investment by implementing several new initiatives: enhancing existing energy policies; streamlining regulations; increasing investments in infrastructure; and implementing new royalty incentives.
18
 | |  |
| | The Geological Survey of
Canada has assigned the
Georgia Basin a reserve
estimate of 6.5 trillion cubic
feet of natural gas. |
19
Health, Safety and the Environment
As an upstream oil and gas company we recognize our business and social responsibilities. We are cognizant of the processes and practices we use and the ways in which they may impact the lives of people and the environment.
Managing Health and Safety
Our health and safety program is in effect throughout the organization. It helps to provide and manage a more structured approach to health and safety at the workplace on a daily basis. The program defines and specifies policies, procedures and practices that are to be followed in the prevention of potential adverse health and safety issues affecting employees and the public.
Our goal is to have zero injuries and zero illnesses. We have achieved that mark on a regular basis through the stellar performance of our employees and we will continue to monitor our systems and procedures.
Managing the Environment
We practice sound environmental stewardship. This is clearly stated in our Corporate Health, Safety and Environmental Policy and supported by the implementation of strict practices and procedures. We continuously strive to add or improve our practices and procedures to eliminate or minimize our impact on the environment.
In 2003, we participated with the Canadian Association of Petroleum Producers in a stewardship benchmarking program and will be submitting our first report in the spring of 2004. We will report on a variety of environmental, health, safety, and operational benchmarks that allow us to track our progress from year-to-year compared to our industry peers. This will be a valuable tool to assist us with our environmental performance and the enhancement of our practices and procedures.
Through our newly-developed St. Albert Synergy Group, we are able to receive input from local stakeholders and enhance opportunities for mutual education and communication.
We have monitoring programs in place to self-check operations that affect the environment and we continually maintain and enhance them. Our intention is to have a positive impact on our environment and we conscientiously work towards that objective.
20
[GRAPHIC OMITTED]
We practice sound environmental stewardship.
21
Summary of Reserves
The reserve data set out in the summary table below is based on an independent engineering evaluation of our estimated oil and gas reserves effective January 1, 2004, as conducted by Sproule Associates Limited. This evaluation was prepared in accordance with National Instrument 51-101Standards of Disclosure for Oil and Gas Activities(NI51-101).
Summary of Company Interest Reserves (Before Royalties)
| | Light and | | | | Natural | | Natural Gas | | | |
| | Medium Oil | | Heavy Oil | | Gas(1) | | Liquids | | Total | |
| | (mbbl) | | (mbbl) | | (mmcf) | | (mbbl) | | (mboe) | |
| | | | | | | | | | | |
| Proved | | | | | | | | | | |
| Developed producing | 261 | | 5 | | 18,249 | | 962 | | 4,269 | |
| Developed non-producing | 79 | | – | | 2,710 | | 5 | | 535 | |
| Undeveloped | 158 | | – | | 3,691 | | 20 | | 794 | |
| Total proved | 498 | | 5 | | 24,650 | | 987 | | 5,598 | |
| Probable | 295 | | 1 | | 17,508 | | 406 | | 3,620 | |
| Total proved + probable | | | | | | | | | | |
| Dec. 31, 2003 | 793 | | 6 | | 42,158 | | 1,393 | | 9,218 | |
| Total proved + probable | | | | | | | | | | |
| Dec. 31, 2002 | 1,843 | | 3 | | 37,489 | | 1,631 | | 9,725 | |
| Increase (decrease) | (1,050 | ) | 3 | | 4,669 | | (238 | ) | (507 | ) |
| Increase (decrease) % | (57.0 | )% | 100 | % | 12.5 | % | (14.6 | )% | (5.2 | )% |
(1) Estimates of reserves of natural gas includes solution gas.
Reserves Reconciliation
The following reconciliation shows the changes in our estimated reserves before royalties that occurred during Fiscal 2003. Opening reserves as at January 1, 2003 were evaluated pursuant to the standards in effect at that time entitled,“Guide for Engineers and Geologists Submitting Oil and Gas Reports to Canadian Provincial Securities Administrators”(National Policy 2-B) while closing reserves as at January 1, 2004 were determined pursuant to the definitions of NI51-101. Reserve definitions under these two standards differ and therefore are not directly comparable. For reconciliation purposes, the industry standard is to use ‘proved plus one-half probable’ reserves under National Policy 2-B as roughly equivalent to ‘proved plus probable’ reserves under NI51-101.
Our total estimated proved plus probable reserves are 9,218 mboe as at January 1, 2004, a decrease of 5% from last year. Technical revisions, including adjustments for new reserve definitions under NI51-101 increased proved plus probable reserves by 314 mboe or 3%. Extensions and discoveries through exploration activity added 437 mboe replacing 35% of production.
Compared to Nine-Month Fiscal Transition 2002, proved plus probable reserves of natural gas increased by 4,669 mmcf or 12%, to 42,158 mmcf. This increase was the net result of extensions, discoveries and technical revisions totaling 9,432 mmcf, less Fiscal 2003 production of 4,763 mmcf.
During Fiscal 2003, proved plus probable reserves of light, medium and heavy crude oil declined by 1,047 mmbls or 57%, to 799 mmbls. The main factors contributing to this decrease were Fiscal 2003 production of 223 mbbls and a downward revision of 936 mbbls to previous reserve estimates made on our St. Albert property.
Reconciliation of Company Interest Reserves (Before Royalties)
| | Light, Medium and Heavy Oil | | Natural Gas | | Natural Gas Liquids | | Total | |
| | | | | | | | | | | | | | | | | | | | | | | | | |
| | | | | | Proved | | | | | | Proved | | | | | | Proved | | | | | | Proved | |
| | | | | | Plus | | | | | | Plus | | | | | | Plus | | | | | | Plus | |
| | Proved | | Probable | | Probable | | Proved | | Probable | | Probable | | Proved | | Probable | | Probable | | Proved | | Probable | | Probable | |
| | (mbbl) | | (mbbl) | | (mbbl) | | (mmcf) | | (mmcf) | | (mmcf)(2) | | (mbbl) | | (mbbl) | | (mbbl) | | (mboe) | | (mboe) | | (mboe) | |
| | | | | | | | | | | | | | | | | | | | | | | | | |
| Dec. 31, 2002 | 1,405 | | 441 | (1) | 1,846 | (2) | 31,694 | | 5,795 | (1) | 37,489 | (2) | 1,483 | | 148 | (1) | 1,631 | (2) | 8,170 | | 1,555 | (1) | 9,725 | (2) |
| Extensions | 102 | | 10 | | 112 | | 527 | | 163 | | 690 | | 3 | | – | | 3 | | 193 | | 37 | | 230 | |
| Discoveries | – | | – | | – | | 608 | | 634 | | 1,242 | | – | | – | | – | | 101 | | 106 | | 207 | |
| Revisions | (781 | ) | (155 | ) | (936 | ) | (3,416 | ) | 10,916 | | 7,500 | | (257 | ) | 258 | | 1 | | (1,608 | ) | 1,922 | | 314 | |
| Production | (223 | ) | – | | (223 | ) | (4,763 | ) | – | | (4,763 | ) | (242 | ) | – | | (242 | ) | (1,258 | ) | – | | (1,258 | ) |
| Dec. 31, 2003 | 503 | | 296 | | 799 | | 24,650 | | 17,508 | | 42,158 | | 987 | | 406 | | 1,393 | | 5,598 | | 3,620 | | 9,218 | |
| (1) | Probable figures for December 31, 2002 are equal to 50% of probable reserves reported in our January 1, 2003 reserves report. |
| (2) | Proved plus probable figures for December 31, 2002 represent proved plus 50% probable (established) reserves from our January 1, 2003 reserves report. |
22
Net Present Values of Reserves
Under NI51-101, minimum disclosure requirements for estimated net present values are:
- Proved – using constant prices and costs of the last day of the financial year.
- Proved and probable – using forecasted commodity prices and costs.
In the following two tables, we present Sproule’s estimated net present values effective January 1, 2004. It should not be implicit that the undiscounted and discounted net present values presented represent the fair market values of our reserves, as the use of other assumptions could give rise to different results.
Net Present Value of Company Interest Reserves
Based on constant commodity prices and costs, before income taxes
| ($000’s) | | | | | Discounted at | | | |
| | Undiscounted | | 5% | | 10% | | 15% | | 20% | |
| | | | | | | | | | | |
| Proved | | | | | | | | | | |
| Developed producing | 99,917 | | 83,986 | | 72,958 | | 64,894 | | 58,741 | |
| Developed non-producing | 4,684 | | 3,586 | | 2,756 | | 2,113 | | 1,605 | |
| Undeveloped | 16,445 | | 14,006 | | 12,229 | | 10,867 | | 9,782 | |
| Total proved | 121,046 | | 101,578 | | 87,943 | | 77,874 | | 70,128 | |
| Probable | 76,545 | | 55,502 | | 42,693 | | 34,188 | | 28,173 | |
| Total proved + probable | | | | | | | | | | |
| Dec. 31, 2003 | 197,591 | | 157,080 | | 130,636 | | 112,062 | | 98,301 | |
Based on forecasted commodity prices and costs, before income taxes
| ($000’s) | | | | | Discounted at | | | |
| | Undiscounted | | 5% | | 10% | | 15% | | 20% | |
| | | | | | | | | | | |
| Proved | | | | | | | | | | |
| Developed producing | 72,899 | | 61,982 | | 54,405 | | 48,850 | | 44,600 | |
| Developed non-producing | 1,736 | | 1,047 | | 527 | | 127 | | (187 | ) |
| Undeveloped | 11,294 | | 9,669 | | 8,479 | | 7,562 | | 6,826 | |
| Total proved | 85,929 | | 72,698 | | 63,411 | | 56,539 | | 51,239 | |
| Probable | 51,247 | | 36,699 | | 27,900 | | 22,095 | | 18,012 | |
| Total proved + probable | | | | | | | | | | |
| Dec. 31, 2003 | 137,176 | | 109,397 | | 91,311 | | 78,634 | | 69,251 | |
In the process of estimating our proved and probable reserves on a constant-pricing basis, and their associated net present values, Sproule assumed that our actual December 31, 2003 weighted average commodity prices received and our associated operating costs incurred would remain constant over the life of the reserves. The prices used for natural gas, natural gas liquids and crude oil were $6.18 per mcf, $25.38 per barrel and $39.69 per barrel, respectively.
In the process of estimating our proved and probable reserves on a forecasted-pricing basis, and their associated net present values, Sproule’s commodity price forecasts effective January 1, 2004 were as follows:
Forecast of Commodity Prices
| | | | | Edmonton | | Alberta | | | | | |
| | | WTI Cushing(1) | | Par Price | | AECO-C | | | | Edmonton | |
| Forecast | | Oklahoma | | 40° API | | Spot | | Henry Hub | | Butanes | |
| Year | | ($US/bbl) | | ($Cdn/bbl) | | ($Cdn/MMBTU) | | ($US/MMBtu) | | ($Cdn/bbl) | |
| | | | | | | | | | | | |
| 2004 | | 29.63 | | 37.99 | | 6.04 | | 5.32 | | 31.15 | |
| 2005 | | 26.80 | | 34.24 | | 5.36 | | 4.81 | | 25.52 | |
| 2006 | | 25.76 | | 32.87 | | 4.80 | | 4.39 | | 23.28 | |
| 2007 | | 26.14 | | 33.37 | | 4.91 | | 4.46 | | 23.63 | |
| 2008 | | 26.53 | | 33.87 | | 4.98 | | 4.52 | | 23.98 | |
| 2009 | | 26.93 | | 34.38 | | 5.05 | | 4.59 | | 24.34 | |
| 2010 | | 27.34 | | 34.90 | | 5.14 | | 4.66 | | 24.71 | |
| 2011 | | 27.75 | | 35.43 | | 5.24 | | 4.73 | | 25.08 | |
| 2012 | | 28.16 | | 35.96 | | 5.33 | | 4.80 | | 25.46 | |
| 2013 | | 28.58 | | 36.50 | | 5.43 | | 4.87 | | 25.85 | |
| 2014 | | 29.01 | | 37.05 | | 5.52 | | 4.95 | | 26.24 | |
| 2015 | | 29.45 | | 37.61 | | 5.62 | | 5.02 | | 26.63 | |
Escalation rate of 1.5% thereafter.
| (1) | 40 degrees API, 0.4% sulphur |
Additional information regarding our estimated reserves will be included on exhibit Form 51-101F1 forming part of our Form 20-F, which will be available on SEDAR, EDGAR and our website on or prior to May 19, 2004.
23
Management’s Discussion and Analysis of
Financial Condition and Results of Operations
The following should be read in conjunction with our Financial Statements and the Notes to the Financial Statements included in this Annual Report. The Financial Statements have been prepared in accordance with Canadian generally accepted accounting principles (GAAP). The impact of significant differences between GAAP in Canada and the United States is disclosed in Note 12 to our Financial Statements.
Unless otherwise noted, tabular amounts are in thousands of Canadian dollars, and sales volumes, production volumes and reserves are before royalties. We have presented our working interest before royalties, as we measure our performance on this basis, which is consistent with other Canadian oil and gas companies.
Fiscal 2003 coincides with the calendar year and is the first full year since we changed our fiscal year end to December 31 from March 31. Fiscal 2002, our transition year, covered the period April 1 to December 31, 2002. For ease of reading, we refer throughout this discussion and analysis to the periods reported as follows:
Reported Periods Referred to as
| January 1, 2003 – December 31, 2003 | Fiscal 2003 |
| April 1, 2002 – December 31, 2002 | Nine-Month Fiscal Transition 2002 |
| April 1, 2001 – March 31, 2002 | Fiscal 2002 |
Due to the differing lengths of the reporting periods in this discussion and analysis, results in these periods are not comparable. Accordingly, percentage changes in these results are not meaningful. In the tables in this discussion and analysis, such results are indicated as “n/m”.
Where useful for comparison purposes, annualized numbers relating to Nine-Month Fiscal Transition 2002 are presented by multiplying the nine-month numbers by four-thirds. This method, however, does not reflect actual results for the applicable extrapolated period and as such differs from the results achieved by this calculation.
Due to certain accounting policy changes effected in Fiscal 2003, we have restated prior comparative information in order to conform to the presentation adopted (see Note 3 to our Financial Statements on page 46).
24
Executive Overview
Key Measures for the Comparative Periods Presented
| ($ 000’s unless otherwise stated) | | | | | | |
| | | | Nine-Month | | | |
| | | | Fiscal | | | |
| | Fiscal | | Transition | | Fiscal | |
| | 2003 | | 2002 | | 2002 | |
| | | | | | | |
| Gross revenues | 46,848 | | 24,123 | | 26,402 | |
| Cash flow from operations(1) | 23,097 | | 10,810 | | 11,337 | |
| Cash flow from operations | | | | | | |
| per share ($/share)(1) | 1.08 | | 0.53 | | 0.56 | |
| Net earnings (loss) | 4,978 | | 2,004 | | (3,412 | ) |
| Net earnings (loss) per share ($/share) | 0.23 | | 0.10 | | (0.17 | ) |
| Daily average production (boe/d) | 3,447 | | 3,332 | | 3,225 | |
| Total production(mboe) | 1,258 | | 916 | | 1,177 | |
| Capital expenditures | 31,747 | | 12,578 | | 22,111 | |
| Net debt(2) | 19,313 | | 16,818 | | 13,281 | |
| Net debt to cash flow (times)(3) | 0.8:1 | | 1.6:1 | | 1.2:1 | |
| Net debt to cash flow annualized | | | | | | |
| (times)(4) | 0.8:1 | | 1.2:1 | | 1.2:1 | |
| (1) | Cash flow from operations is a non-GAAP measure that does not have standardized meaning as prescribed by GAAP and therefore may or may not be comparable to similar measures presented by other companies. We consider it a key measure as it demonstrates our ability to generate the cash flow necessary to fund future growth through capital investment and to repay debt. |
| | ($ 000’s) | | | | | | |
| | | | | Nine-Month | | | |
| | | | | Fiscal | | | |
| | | Fiscal | | Transition | | Fiscal | |
| | | 2003 | | 2002 | | 2002 | |
| | | | | | | | |
| | Cash provided by operating activities (GAAP) | 28,294 | | 11,457 | | 9,779 | |
| | Changes in non-cash working capital | | | | | | |
| | affecting operating (GAAP) | (5,197 | ) | (647 | ) | 1,558 | |
| | Cash flow from operations (non-GAAP) | 23,097 | | 10,810 | | 11,337 | |
| | | | | | | | |
| (2) | Net debt is working capital. We have no long-term debt. |
| (3) | Net debt divided by cash flow from operations. |
| (4) | Net debt divided by cash flow from operations annualized. |
Our gross revenues, cash flow from operations and total production were record highs during Fiscal 2003.
Comparisons of our results of Fiscal 2003 versus Nine-Month Fiscal Transition 2002 were significantly affected by the three-month difference in period length. Two other significant factors contributed to the difference in many of our key measures between the two periods – gross revenues were greater in Fiscal 2003 due to a 50% increase in our weighted average price for natural gas and our crude oil sales increased by 125%.
Daily average production of all commodities grew by 3% to 3,447 boe/d. Total production of all products was 1,258 mboe versus 916 mboe. This would have represented a 3% increase, had Nine-Month Fiscal Transition 2002 been annualized at 1,221 mboe.
Our net earnings for Fiscal 2003 were the second highest in corporate history. The main reasons for this were the same key factors that generated higher gross revenues, cash flow from operations and total production outlined above. The impact of these factors on net earnings was lessened, however, by two main areas of expense - amortization and depletion, and exploration expenses which were higher by $5.7 million and $2.4 million, respectively. Amortization and depletion expense reflected: new capital expenditures related to production optimizations and leasehold acquisitions; the effects of transitioning to new reserve definitions (discussed below); and the repurchase of certain gross overriding royalty interests that previously burdened our total current and future corporate production by 3%. Exploration expenses reflected higher costs for seismic data gathering and for the drilling of two unsuccessful wells, compared to none in Nine-Month Fiscal Transition 2002.
Effective January 1, 2004, our reserves were independently determined according to a new standard adopted by Canadian regulatory authorities entitled, “National Instrument 51-101 – Standards of Disclosure for Oil and Gas Activities” (NI51-101).The previous standard was entitled,“Guide for Engineers and Geologists Submitting Oil and Gas Reports to Canadian Provincial Securities Administrators” (National Policy 2-B).Reserve definitions under these two standards differ and therefore are not directly comparable. To be more comparable to NI51-101, however, the industry has established for year-over-year reconciliation purposes that January 1, 2003 estimated reserves under National Policy 2-B be restated from “proved plus probable” reserves to “proved plus one-half probable” reserves.
Under NI51-101, proved reserves ‘assigned’ must have at least a 90% certainty that quantities recovered will equal or exceed their ‘estimates’ and proved plus probable reserves must have a minimum of 50% certainty that quantities recovered will equal or exceed their ‘estimates’. Independent engineers are henceforth expected to strive for elimination of downward revisions to proved reserves.
25
During Fiscal 2003, our total proved plus probable ‘assigned’ reserves decreased by 506 mboe or 5%, to 9,218 mboe. We added 294 mboe to proved reserves through extensions and discoveries, however, under NI51-101, revisions decreased by 1,608 mboe. Taking into account annual production, proved reserves decreased by 2,572 mboe or 31%, to 5,598 mboe, 73% of which was natural gas. We added 143 mboe to probable reserves through extensions and discoveries, and 1,922 through revisions. Overall, probable reserves increased by 2,065 mboe or 133%, to 3,620 mboe, 81% of which was natural gas. (For additional disclosure of our estimated reserves and their net present values, see page 22).
Capital Investment by Classification for the Comparative Periods Presented
| ($000’s) | | | | | | |
| | | | Nine-Month | | | |
| | | | Fiscal | | | |
| | Fiscal | | Transition | | Fiscal | |
| | 2003 | | 2002 | | 2002 | |
| | | | | | | |
| Land acquisitions | 5,103 | | 2,568 | | 12,560 | |
| | | | | | | |
| Gross overriding royalty | | | | | | |
| interest acquisition(1) | 9,711 | | – | | – | |
| Drilling, completions and equipping: | | | | | | |
| Exploratory | 5,717 | | 4,914 | | – | |
| Development | 9,460 | | 4,232 | | 7,678 | |
| Facilities and pipelining | 1,448 | | 780 | | 1,757 | |
| Other | 308 | | 84 | | 116 | |
| Total | 31,747 | | 12,578 | | 22,111 | |
| (1) | This amount is comprised of a total payment of $6.5 million paid to the vendors, plus a non-cash adjustment to the carrying value of $3.2 million, as required by Canadian GAAP. The non-cash adjustment represents a future tax liability that is created due to the total payment being part shares and part cash. (See further details in note 7[d] to our Financial Statements). |
Our primary strategy is to build the company through grassroots exploration and development. In particular, we remain committed to natural gas-based projects, as we believe it is a clean, secure and abundant energy source. Our secondary strategy is to target specific acquisitions that we believe will lead to higher returns and future prospects for exploration and development. Throughout 2003, we increased our total capital investment to $31.7 million and advanced our strategies in the following ways:
During Fiscal 2003, we spent $5.1 million on the acquisition of new lands. Our land holdings targeting natural gas increased by 11,177 net acres (29,283 gross). This new acreage was located at Wimborne, Alberta and Cypress/Chowade, British Columbia.
In addition, we repurchased a gross overriding royalty interest that previously burdened our total current and future corporate production from all producing and prospectively-producing properties by 3%;
- We invested $15.2 million in the drilling of 14 gross exploratory and development wells (10.3 net), with an overall success rate of 80%. Of these wells, ten targeted natural gas and four targeted crude oil. Of the ten natural gas wells, two were unsuccessful. Four of the eight successful gas wells were drilled in British Columbia, three at Cypress/Chowade and one at Orion. The remaining four were drilled in Alberta, two at St. Albert, one at Halkirk and one at Wimborne. All four successful crude oil wells were at St. Abert; and
- Our investment in facilities, pipelining and other assets grew by $1.8 million. Half of this capital was incurred at St. Albert to expand infrastructure that supports production optimization of existing reserves, while most of the balance was spent at Cypress/Chowade for new facilities construction.
In order to finance our record-high capital investment program described above, we took certain measures to expand our liquidity and capital resources. We issued 1.1 million common shares from treasury at a deemed price of $5.25 per share, to pay for 85% of the repurchase of the gross overriding royalty interests referred to above and we increased our revolving, demand bank operating loan facility to $25.0 million from $21.0 million. These measures, accompanied by record cash flows and $1.5 million from option exercises allowed us to improve our net debt-to-cash-flow ratio from 1.2:1 to 0.9:1.
Our planned activity for Fiscal 2004 continues to demonstrate the effects of our primary strategy. We have budgeted to invest a record-high $37.1 million on capital expenditures and exploration expenses. The allocation of this budget reflects our changing focus – to invest proportionately more in northeast British Columbia. Seventy-one percent of our investment is budgeted for Cypress/Chowade and Orion, British Columbia. The majority of the remainder is earmarked for St. Albert and Wimborne, Alberta.
We expect a 13% growth in daily average production in Fiscal 2004, subject mostly to timing of regulatory approvals, third-party transportation and processing negotiations, and equipment availability. Based on our forecast of strong commodity prices and supported by our bank loan facility, we expect to meet our 2004 cash requirements.
26
Properties and Capital Investment
We follow the successful efforts method of accounting for our natural gas and crude oil activities. When it is determined that drilling has been unsuccessful in establishing commercial reserves, the costs of drilling are written off and reported as exploration expenses on our Statements of Operations and Retained Earnings (see the section entitled, Exploration Expenses on page 31). All other capital expenditures are reported as natural gas and oil interests on our Balance Sheets.
Fiscal 2003
Capital Investment by Property and Classification(1)
| ($ 000’s) | | | | | | | | | | |
| | | | | | | | | | | |
| | Land and | | | | | | | | | |
| | Gross | | Drilling, | | | | | | | |
| | Overriding | | Completions | | Facilities | | | | | |
| | Royalty | | and | | and | | | | | |
| | Acquisitions | | Equipping | | Pipelining | | Other | | Total | |
| | | | | | | | | | | |
| Alberta | | | | | | | | | | |
| St. Albert | 49 | | 5,951 | | 882 | | – | | 6,882 | |
| Wimborne | 1,694 | | 626 | | – | | – | | 2,320 | |
| Halkirk | – | | 537 | | 27 | | – | | 564 | |
| Peavey/Morinville | – | | 160 | | 44 | | – | | 204 | |
| Other Alberta | – | | 42 | | 1 | | – | | 43 | |
| Total Alberta | 1,743 | | 7,316 | | 954 | | – | | 10,013 | |
| British Columbia | | | | | | | | | | |
| Cypress/Chowade | 2,779 | | 5,689 | | 494 | | – | | 8,962 | |
| Orion | 581 | | 2,172 | | – | | – | | 2,753 | |
| Total British Columbia | 3,360 | | 7,861 | | 494 | | – | | 11,715 | |
| Gross overriding royalty | | | | | | | | | | |
| acquisition and other | 9,711 | | – | | – | | 308 | | 10,019 | |
| Total | 14,814 | | 15,177 | | 1,448 | | 308 | | 31,747 | |
| (1) | For seismic costs, see Exploration Expenses on page 31 of our Management’s Discussion and Analysis. |
Land and Gross Overriding Royalty Acquisitions
During Fiscal 2003, our investment in land increased by $5.1 million in the following areas: $2.8 million at Cypress/Chowade (9,740 net acres); $1.7 million at Wimborne (5,995 net acres); and $0.6 million at Orion (8,545 net acres).
Also during the year, we invested $6.5 million in the repurchase of certain gross overriding royalty interests (“GORR”) that previously burdened our total current and future corporate production by 3%. The carrying value of the repurchase has been adjusted upward by a non-cash amount of $3.2 million, as required by Canadian GAAP. This non-cash adjustment represents a future tax liability that is created due to the total payment being part shares and part cash. The resulting $9.7 million has been allocated to all properties with proved, producing reserves as of July 7, 2003, the effective date of the repurchase. (For further details of the GORR repurchase, see Note 7[d] to our Financial Statements).
Drilling, Completions, Equipping, Facilities and Pipelining
During Fiscal 2003, expenditures incurred on drilling, completions, equipping, facilities and pipelining totaled $16.6 million. These expenditures were split evenly between Alberta and British Columbia, as follows:
Alberta
St. Albert– A total of six wells were drilled, four targeting crude oil and two targeting natural gas. All wells were successful and each was completed in a single zone. Crude oil completions were in the Nisku D-2 and the Leduc D-3 zones, while natural gas completions were in the Ostracod A pool. Upgrades to field compression, salt water injection facilities and our crude oil tank farm were also conducted.
Wimborne– During the year, we drilled our first-ever tests for natural gas at Wimborne. We drilled two Cretaceous wells, one of which was successful and completed as a standing gas well.
Halkirk– Two development wells targeting natural gas in the Viking zone were drilled during the year. One was successful and completed as a producing well.
British Columbia
Cypress/Chowade– During the year, we participated in drilling three natural gas exploration wells, targeting Triassic-aged reservoirs. All three wells were cased and tied-in. A field compressor was also added.
Nine-Month Fiscal Transition 2002
During this period, we invested $12.6 million, $6.2 million or 49% of which was spent on Alberta properties and $6.4 million or 51% on British Columbia properties. Of the amount invested in Alberta, $5.0 million was for land, drilling, completions, equipping and facilities at St. Albert and the balance of $1.2 million was for drilling, completions and equipping at Halkirk. Of the amount invested in British Columbia, $5.0 million was for drilling, completions and equipping at Cypress/Chowade and the balance of $1.2 million was for land acquisitions at Orion.
27
Fiscal 2002
During this period, we invested $22.1 million, $7.3 million of which was spent at St. Albert for drilling, completions and equipping. The balance of $14.8 million was spent mostly to acquire additional working interests at St. Albert.
Financial Results
Cash Flow from Operations and Net Earnings
Fiscal 2003 vs Nine-Month Fiscal Transition 2002
Cash flow from operations was $23.1 million versus $10.8 million. In accounting for the difference of $12.3 million between these two results, there are two variance types:
Variances involving revenue
Our variance analysis table on this page shows greater cash flow from operations in Fiscal 2003 mainly due to:
A volume-based variance of $12.7 million that mainly reflects the reporting periods differed in length by three months; and
A price-based variance of $10.0 million that reflects we realized higher weighted average prices in Fiscal 2003 than in Nine-Month Fiscal Transition 2002.
Variances involving cash expenses
The main expense categories that accounted for $10.4 million lesser cash flows from operations, in Fiscal 2003 were:
- Royalties expense – greater by $7.0 million;
- Production costs – greater by $1.5 million;
- General and administrative expenses – greater by $1.6 million; and
- Net interest expense – greater by $0.3 million.
Net earnings were $5.0 million versus $2.0 million. In accounting for the difference of $3.0 million between these two results, the same variances that affected our cash flows from operations referred to above were further affected by the following:
Variances involving non-cash expenses
- Amortization and depletion expense – greater by $5.7 million;
- Exploration expenses – greater by $2.6 million; and
- Future income taxes and various other expenses – greater by $1.0 million.
Nine-Month Fiscal Transition 2002 vs Fiscal 2002
Cash flow from operations was $10.8 million versus $11.3 million. In accounting for the difference of $0.5 million between these two results, higher weighted average prices realized in all commodities added $3.0 million. Due mainly to the differing
lengths of the reporting periods, cash flow from operations was less by a net of $3.5 million - $5.3 million that related to the smaller volume of sales and $1.8 million that related to greater royalties expense.
Net earnings were $2.0 million versus a deficit of $3.4 million. In accounting for the difference of $5.4 million between these two results, the same variances that affected our cash flows from operations referred to above were further affected by less non-cash net expenses of $6.1 million as follows: $5.7 million that related to less amortization and depletion expense; $3.3 million that related to less exploration expense; and $2.9 million that related to greater future income tax expense.
The cash and non-cash expense variances discussed in this section reflect mainly the differing lengths of the reporting periods to which we refer. Later in this discussion and analysis, we analyze significant increases and decreases to these expense categories as they relate to the production levels of each period.
Revenue
Revenue Variances by Commodity between the Comparative Periods Presented
| ($ 000’s) | | | | | | | | | | | | |
| | Fiscal 2003 vs | | Nine-Month Fiscal | |
| | Nine-Month Fiscal | | Transition 2002 vs | |
| | Transition 2002 | | Fiscal 2002 | |
| | Volume- | | Price- | | | | Volume- | | Price- | | | |
| | based | | based | | Total | | based | | based | | Total | |
| | | | | | | | | | | | | |
| Natural gas | 4,984 | | 8,607 | | 13,591 | | (6,090 | ) | 2,152 | | (3,943 | ) |
| Natural gas liquids | 1,332 | | 1,302 | | 2,634 | | (737 | ) | 307 | | (430 | ) |
| Crude oil | 6,384 | | 116 | | 6,500 | | 1,573 | | 521 | | 2,094 | |
| Total | 12,700 | | 10,025 | | 22,725 | | (5,259 | ) | 2,980 | | (2,279 | ) |
Fiscal 2003 vs Nine-Month Fiscal Transition 2002
Revenues were $46.8 million versus $24.1 million, a change of $22.7 million. While much of this change is a result of comparing a twelve-month period to a nine-month period, $12.7 million was due to volume-based variances and $10.0 million was due to price-based variances.
Nine-Month Fiscal Transition 2002 vs Fiscal 2002
Revenues were $24.1 million versus $26.4 million, a downward net change of $2.3 million. While much of this change is a result of comparing a nine-month period to a twelve-month period, a decrease of $5.3 million was due to volume-based variances and an increase of $3.0 million was due to price-based variances.
28
Daily Average Production Rates and Total Production
Daily Average Production Rates by Commodity and Field, and Total Production For the Comparative Periods Presented
| (Units as stated) | | | | | | | | | | |
| | | | | | Nine-Month | | | | | |
| | | | | | Fiscal | | | | | |
| | Fiscal | | | | Transition | | | | Fiscal | |
| | 2003 | | % Chg | | 2002 | | % Chg | | 2002 | |
| Daily average production rates | | | | | | | | | | |
| Natural gas(mcf/d) | | | | | | | | | | |
| St. Albert | 9,936 | | (13 | ) | 11,360 | | (6 | ) | 12,101 | |
| Halkirk | 1,188 | | (13 | ) | 1,368 | | 67 | | 822 | |
| Peavey/Morinville | 504 | | (26 | ) | 678 | | (60 | ) | 1,716 | |
| Other Alberta | 666 | | (13 | ) | 768 | | (55 | ) | 468 | |
| Cypress/Chowade, British Columbia | 756 | | – | | – | | – | | – | |
| Total natural gas (mcf/d) | 13,050 | | (8 | ) | 14,174 | | (6 | ) | 15,107 | |
| Total natural gas (boe/d 6:1) | 2,175 | | (8 | ) | 2,363 | | (6 | ) | 2,518 | |
| Natural gas liquids (bbl/d) | | | | | | | | | | |
| St. Albert | 656 | | (5 | ) | 689 | | 10 | | 627 | |
| Other Alberta | 6 | | (33 | ) | 9 | | 125 | | 4 | |
| Total natural gas liquids (bbl/d) | 662 | | (5 | ) | 698 | | 11 | | 631 | |
| Crude oil (bbl/d) | | | | | | | | | | |
| St. Albert | 609 | | 126 | | 270 | | 275 | | 72 | |
| Other, Saskatchewan | 1 | | – | | 1 | | (75 | ) | 4 | |
| Total crude oil (bbl/d) | 610 | | 125 | | 271 | | 257 | | 76 | |
| Total daily average production (boe/d) | 3,447 | | 3 | | 3,332 | | 3 | | 3,225 | |
| Total production all products (mboe) | 1,258 | | n/m | | 916 | | n/m | | 1,177 | |
Fiscal 2003 vs Nine-Month Fiscal Transition 2002
Total production of all products was 1,258 mboe versus 916 mboe. This would have represented an increase of 3%, had Nine-Month Fiscal Transition 2002 been annualized at 1,221 mboe.
Our total daily average production of all commodities increased by 115 boe/d or 3%, to 3,447 boe/d. Of this increase, natural gas and natural gas liquids decreased in aggregate by 224 boe/d or 7%, while crude oil increased by 339 boe/d or 125%. The aggregate decrease in natural gas and natural gas liquids was mostly the net result of a decrease due to natural declines in reservoir pressures at St. Albert and an increase due to the start-up of two new wells at Cypress/Chowade. The increase in average daily crude oil production was due to the start up of two new wells in Fiscal 2003 and of one well in late Nine-Month Fiscal Transition 2002. All three crude oil wells were at St. Albert.
Nine-Month Fiscal Transition 2002 vs Fiscal 2002
Total daily average production of all products increased by a net 107 boe/d or 3%, to 3,332 boe/d. Of this net increase, natural gas and natural gas liquids decreased in aggregate by 88 boe/d or 3%, while crude oil increased by 195 boe/d or 257%. For the most part, the decrease in natural gas and natural gas liquids was due to naturally declining reservoir pressures at St. Albert. The increase in crude oil was due to the start-up of flush production from a new oil well at St. Albert.
Weighted Average Commodity Prices
Weighted Average Commodity Prices for the Comparative Periods Presented
| (Units as stated) | | | | | | | | | | |
| | | | | | Nine-Month | | | | | |
| | | | | | Fiscal | | | | | |
| | Fiscal | | | | Transition | | | | Fiscal | |
| | 2003 | | % Chg | | 2002 | | % Chg | | 2002 | |
| | | | | | | | | | | |
| Natural gas ($/mcf) | 6.56 | | 50 | | 4.36 | | 14 | | 3.81 | |
| Natural gas liquids ($/bbl) | 27.68 | | 32 | | 20.90 | | 8 | | 19.30 | |
| Crude oil ($/bbl) | 42.98 | | 4 | | 41.40 | | 21 | | 34.33 | |
Fiscal 2003 vs Nine-Month Fiscal Transition 2002
Our weighted average prices of natural gas, natural gas liquids and crude oil increased by 50%, 32% and 4%, respectively.
At the beginning of Fiscal 2003, stronger industry-wide prices for natural gas reflected an extended period of winter cold and lower inventory supplies in North America. Late in the year, natural gas prices again strengthened due to fears of cold weather in the east. During most of Fiscal 2003, industry-wide prices for crude oil were stronger, due in large measure to continuing geo-political uncertainties and tighter North American supplies. Additionally, demand for crude oil in Asia grew and the relative value of the U.S. dollar declined.
Our natural gas liquids were 45% natural gas-based and 55% crude oil-based, therefore, our weighted average price for liquids followed the respective trends mentioned above.
Nine-Month Fiscal Transition 2002 vs Fiscal 2002
Weighted average prices realized from the sale of all our commodities increased by percentages ranging from 8% to 21%.
29
Hedging
We have no hedge positions, however, by varying our product sales mix of natural gas, natural gas liquids and crude oil, we manage the potential risk of single-product price volatility. Further, we vary our natural gas sales mix between AECO-spot prices and aggregator-based prices (which are, in turn, based on a blend of AECO-spot, long-term and NYMEX contracts).
Royalties, Mineral Taxes and Royalty Credits
Royalites, Mineral Taxes, Royalty Credits and Unit Total Royalties For the Comparative Periods Presented
| ($ 000’s unless otherwise stated) | | | | | | | | | | |
| | | | | | Nine-Month | | | | | |
| | | | | | Fiscal | | | | | |
| | Fiscal | | | | Transition | | | | Fiscal | |
| | 2003 | | % Chg | | 2002 | | % Chg | | 2002 | |
| | | | | | | | | | | |
| Crown | 4,698 | | n/m | | 1,252 | | n/m | | 1,317 | |
| Freehold and overriding | 6,818 | | n/m | | 3,327 | | n/m | | 4,067 | |
| Freehold mineral taxes | 1,346 | | n/m | | 943 | | n/m | | 1,116 | |
| Royalty tax credit (Alberta) | (401 | ) | n/m | | (178 | ) | n/m | | (159 | ) |
| Royalty drilling credit | | | | | | | | | | |
| (British Columbia) | (122 | ) | – | | – | | – | | – | |
| Total royalties | 12,339 | | n/m | | 5,344 | | n/m | | 6,341 | |
| Unit total royalties per boe($) | 9.81 | | 68 | | 5.83 | | 8 | | 5.39 | |
Fiscal 2003 vs Nine-Month Fiscal Transition 2002
Total royalties were $12.3 million versus $5.3 million. This would have represented an increase of 73%, had Nine-Month Fiscal Transition 2002 been annualized at $7.1 million.
Unit royalties expense increased by a net $3.98 or 68%, to $9.81 per boe. The main factors causing increases in unit royalties expense were higher commodity prices and heavier-than-average obligations applied to two new St. Albert oil wells. The main factor causing a decrease in unit royalties was the July 7, 2003 repurchase of gross overriding royalty interests that previously burdened our total current and future corporate production by 3% (see Note 7[d] to our Financial Statements on page 50 for further details).
Nine-Month Fiscal Transition 2002 vs Fiscal 2002
Total royalties were $5.3 million versus $6.3 million. This would have represented an increase of 13%, had Nine-Month Fiscal Transition 2002 been annualized at $7.1 million.
Unit royalties expense increased by $0.44 or 8% to $5.83 per boe primarily due to royalty obligations associated with production of prior periods and higher commodity prices.
Production Costs
Production Costs and Unit Production Costs for the Comparative Periods Presented
| ($ 000’s unless otherwise stated) | | | | | | | | | | |
| | | | | | Nine-Month | | | | | |
| | | | | | Fiscal | | | | | |
| | Fiscal | | | | Transition | | | | Fiscal | |
| | 2003 | | % Chg | | 2002 | | % Chg | | 2002 | |
| | | | | | | | | | | |
| Production costs | 7,011 | | n/m | | 5,470 | | n/m | | 5,846 | |
| Unit production costs per boe ($) | 5.57 | | (7) | | 5.97 | | 20 | | 4.97 | |
Fiscal 2003 vs Nine-Month Fiscal Transition 2002
Total production costs were $7.0 million versus $5.5 million. This would have represented a decrease of 4%, had Nine-Month Fiscal Transition 2002 been annualized at $7.3 million.
Unit production costs decreased by a net of $0.40 or 7%, to $5.57 per boe mainly due to the elimination of monthly processing charges for St. Albert facilities acquired at the close of the prior period, pursuant to a sales and leaseback agreement.
Nine-Month Fiscal Transition 2002 vs Fiscal 2002
Total production costs were $5.5 million versus $5.8 million. This would have represented an increase of 26%, had Nine-Month Fiscal Transition 2002 been annualized at $7.3 million.
Unit production costs increased by $1.00 or 20%, to $5.97 per boe mainly due to higher costs for electricity, facilities maintenance and field compression charges, most of which were at St. Albert.
30
Amortization and Depletion Expense (A&D)
A&D Expense and Unit A&D Expense for the Comparative Periods Presented
| ($ 000’s unless otherwise stated) | | | | | | | | | | |
| | | | | | Nine-Month | | | | | |
| | | | | | Fiscal | | | | | |
| | Fiscal | | | | Transition | | | | Fiscal | |
| | 2003 | | % Chg | | 2002 | | % Chg | | 2002 | |
| A&D before the following: | 11,606 | | n/m | | 5,924 | | n/m | | 5,336 | |
| Ceiling test adjustment | 316 | | 29 | | 445 | | (93 | ) | 6,783 | |
| Depletion of asset retirement cost | 99 | | 57 | | 63 | | (7 | ) | 68 | |
| Amortization of deferred items | – | | – | | (109 | ) | 53 | | (230 | ) |
| Total A&D expense | 12,021 | | n/m | | 6,323 | | n/m | | 11,957 | |
| Unit A&D expense per boe ($) | 9.55 | | 38 | | 6.90 | | (32 | ) | 10.16 | |
Fiscal 2003 vs Nine-Month Fiscal Transition 2002
Our total A&D expense was $12.0 million versus $6.3 million. This would have represented an increase of 43%, had Nine-Month Fiscal Transition 2002 been annualized at $8.4 million.
Unit A&D expense increased by a net of $2.65 or 38%, to $9.55 per boe due mainly to the following:
An increase of $1.23 per boe due to higher capital-to-reserve ratios. Most of this increase is for recent crude oil discoveries and natural gas optimizations at St. Albert;
An increase of $0.98 per boe due to additional depletion related to the July 7, 2003 repurchase of gross overriding royalty interests that previously burdened our total current and future corporate production by 3% (see Note 7[d] to our Financial Statements on page 50 for further details); and
An increase of $0.55 per boe due to significant growth in our leasehold base.
Nine-Month Fiscal Transition 2002 vs Fiscal 2002
Our total A&D expense was $6.3 million versus $12.0 million. This would have represented a decrease of 30%, had Nine-Month Fiscal Transition 2002 been annualized at $8.4 million.
Unit A&D expense decreased by a net of $3.26 or 32%, to $6.90 per boe due primarily to a Peavey/Morinville ceiling test adjustment recorded in Fiscal 2002.
Exploration Expenses
Exploration Expenses and Unit Exploration Expenses for the Comparative Periods Presented
| ($ 000’s unless otherwise stated) | | | | | | | | | | |
| | | | | | Nine-Month | | | | | |
| | | | | | Fiscal | | | | | |
| | Fiscal | | | | Transition | | | | Fiscal | |
| | 2003 | | % Chg | | 2002 | | % Chg | | 2002 | |
| Drilling(1) | 1,278 | | n/m | | 325 | | n/m | | 3,821 | |
| Seismic data activity | 2,349 | | n/m | | 934 | | n/m | | 649 | |
| Other | 439 | | n/m | | 187 | | n/m | | 176 | |
| Total exploration expenses | 4,066 | | n/m | | 1,446 | | (n/m | | 4,646 | |
| Unit exploration expenses per boe ($) | 3.23 | | 104 | | 1.58 | | (60) | | 3.95 | |
| (1) | We follow the successful efforts method of accounting, whereby costs of drilling an unsuccessful well are expensed when it becomes known the well did not result in a discovery of proved reserves. |
Fiscal 2003 vs Nine-Month Fiscal Transition 2002
Total exploration expenses were $4.1 million versus $1.4 million. This would have represented an increase of 116%, had Nine-Month Fiscal Transition 2002 been annualized at $1.9 million.
Unit exploration expenses increased by $1.65 or 104%, to $3.23 per boe. While we recognized one unsuccessful drilling attempt at each of Wimborne and Halkirk, there were none in Nine-Month Fiscal Transition 2002. Costs of seismic data also increased due to the gathering of data at Wimborne, Cypress/Chowade and Orion.
Nine-Month Fiscal Transition 2002 vs Fiscal 2002
Total exploration expenses were $1.4 million versus $4.6 million. This would have represented a decrease of 59%, had Nine-Month Fiscal Transition 2002 been annualized at $1.9 million.
Unit exploration expenses decreased by $2.37 or 60%, to $1.58 per boe. The main reason for this decrease was that all drilling attempts were successful in Nine-Month Fiscal Transition 2002 compared to a total of ten unsuccessful wells in Fiscal 2002, six at Peavey/Morinville, one each at Quirk Creek, Alexander and Orion, and one reentry/workover at St. Albert.
31
Interest Expense – Net
Net Interest Expense and Unit Net Interest Expense for the Comparative Periods Presented
| ($ 000’s unless otherwise stated) | | | | | | | | | | |
| | | | | | Nine-Month | | | | | |
| | | | | | Fiscal | | | | | |
| | Fiscal | | | | Transition | | | | Fiscal | |
| | 2003 | | % Chg | | 2002 | | % Chg | | 2002 | |
| Net interest expense | 713 | | n/m | | 453 | | n/m | | 472 | |
| Unit net interest expense per boe ($) | 0.57 | | 16 | | 0.49 | | 23 | | 0.40 | |
Fiscal 2003 vs Nine-Month Fiscal Transition 2002
Net interest was $0.7 million versus $0.5 million. This would have represented minimal change, had Nine-Month Fiscal Transition 2002 been annualized at $0.7 million.
The average daily balance of our bank operating facility increased by $1.8 million or 14%, to $14.3 million, and the closing balance was $13.3 million. The effective interest rates were 5.1% in Fiscal 2003 and 5.0% in Nine-Month Fiscal Transition 2002.
Nine-Month Fiscal Transition 2002 vs Fiscal 2002
There was no material variance between periods in our net interest expense because our operating loan was used for nine months in both periods at an average balance outstanding of approximately $12.5 million. The effective interest rates in Nine-Month Fiscal Transition 2002 and Fiscal 2002 were 5.0% and 4.7%, respectively.
General and Administrative Expenses (G&A)
G&A Expenses and Unit G&A Expenses for the Comparative Periods Presented
| ($ 000’s unless otherwise stated) | | | | | | | | | | |
| | | | | | Nine-Month | | | | | |
| | | | | | Fiscal | | | | | |
| | Fiscal | | | | Transition | | | | Fiscal | |
| | 2003 | | % Chg | | 2002 | | % Chg | | 2002 | |
| G&A expenses | 3,415 | | n/m | | 1,839 | | n/m | | 2,347 | |
| Unit G&A expenses per boe ($) | 2.71 | | 35 | | 2.01 | | (4) | | 1.99 | |
Fiscal 2003 vs Nine-Month Fiscal Transition 2002
Our G&A expenses were $3.4 million versus $1.8 million. This would have represented an increase of 42%, had Nine-Month Fiscal Transition 2002 been annualized at $2.4 million.
Unit G&A expenses increased by a net $0.70 or 35%, to $2.71 per boe. Of this increase, 40% was due to the first-time recognition of stock-based compensation made available to directors and employees under our corporate stock option plan (see Note 3 to our Financial Statements on page 46 for further details). Other increases were mainly attributed to: new staff hires and certain salary adjustments; computer technical and software support; gas marketing advice; and other essential professional services.
Nine-Month Fiscal Transition 2002 vs Fiscal 2002
Our G&A expenses were $1.8 million versus $2.3 million. This would have represented an increase of 4%, had Nine-Month Fiscal Transition 2002 been annualized at $2.4 million. Unit G&A expenses remained relatively unchanged between periods.
Income Tax Expense
We use the liability method of tax allocation in accounting for income taxes. Future tax assets and liabilities are determined based on differences between the financial reporting and tax bases of assets and liabilities, and measured using the substantially-enacted rates and laws that will be in effect when the differences are expected to reverse.
Current and Future Income Tax Expenses (Recoveries) for the Comparative Periods Presented
| ($ 000’s) | | | | | | | | | | |
| | | | | | Nine-Month | | | | | |
| | | | | | Fiscal | | | | | |
| | Fiscal | | | | Transition | | | | Fiscal | |
| | 2003 | | % Chg | | 2002 | | % Chg | | 2002 | |
| Current income tax expense | 632 | | n/m | | 207 | | n/m | | 58 | |
| Future income tax expense | 1,579 | | n/m | | 975 | | n/m | | (1,904 | ) |
| Total income tax expense | 2,211 | | n/m | | 1,182 | | n/m | | (1,846 | ) |
Fiscal 2003 vs Nine-Month Fiscal Transition 2002
Total income tax expense increased to $2.2 million from $1.2 million. This increase was consistent with our pre-tax earnings. Our effective tax rate was 30.9%, which was in line with statutory tax rates.
32
Nine-Month Fiscal Transition 2002 vs Fiscal 2002
Total income tax expense increased to $1.2 million from a recovery of $1.8 million. This increase was consistent with our pre-tax earnings. Our effective tax rate was 37.1%, which was in line with statutory tax rates.
Income Tax Pools Available for Deduction Against Future Taxable Income For the Comparative Periods Presented
| ($ 000’s) | | | | | | | | |
| | | | Nine-Month | | | | | |
| | | | Fiscal | | | | Maximum | |
| | Fiscal | | Transition | | Fiscal | | Annual | |
| | 2003 | | 2002 | | 2002 | | Deduction | |
| | | | | | | | | |
| Canadian exploration expense | – | | 1,586 | | – | | 100% | |
| Canadian development expense | 8,893 | | 5,246 | | 3,772 | | 30% | |
| Undepreciated capital costs | 10,934 | | 10,356 | | 10,297 | | 20% –100% | |
| Canadian oil and gas | | | | | | | | |
| property expense | 21,168 | | 17,417 | | 16,471 | | 10% | |
| Total income tax pools | 40,995 | | 34,605 | | 30,540 | | | |
At the end of each comparative period presented above, we had total income tax pools available for deduction against future taxable income, each pool allowing maximum annual deductions ranging from 10% – 100%.
Outlook for 2004
Our Fiscal 2004 target daily average and exit production rates are 3,900 per boe and 4,400 per boe, respectively. Our target production rates do not include potential increases resulting from work being conducted during the year on certain undeveloped properties. A discussion of these properties, the amount of capital budgeted for them in 2004 and their potential impact on 2004 production follows the table below (see “Undeveloped Properties – Not Considered in 2004 Target Production Rates”):
2004 Target Daily Averages (by Property) and Exit Production Rates
| (Units as stated) | | |
| | Target Daily | |
| | Production Rates | |
| | | |
| Natural gas (mcf/d) | | |
| St. Albert | 9,320 | |
| Halkirk | 965 | |
| Peavey/Morinville | 785 | |
| Other Alberta (four properties) | 790 | |
| Cypress/Chowade, British Columbia | 4,850 | |
| Total natural gas (mcf/d) | 16,710 | |
| Total natural gas (boe/d 6:1) | 2,785 | |
| Natural gas liquids (bbl/d) | | |
| St. Albert | 600 | |
| Other Alberta (four properties) | 10 | |
| Total natural gas liquids (bbl/d) | 610 | |
| Crude oil | | |
| St. Albert | 505 | |
| Total crude oil (bbl/d) | 505 | |
| Target daily average production rate (boe/d) | 3,900 | |
| Target daily exit production rate (boe/d) | 4,400 | |
Our Fiscal 2004 capital budget focuses on three primary objectives:
33
In Fiscal 2004, we plan to invest $37.1 million, 25% in Alberta, 71% in British Columbia and 4% in properties yet to be allocated between the two provinces. (For further details, see the table below entitled, “2004 Capital Investment and Exploration Expense Budget by Property and Classification”). The primary areas of planned expenditures are discussed below:
Developed Properties (Those Considered in 2004 Target Production Rates)
Alberta
St. Albert– As stated above, work will continue to optimize production throughout the year. Crude oil zones of continuing interest to us are the Wabamum D-1, Nisku D-2, and Leduc D-3, while natural gas zones of interest are the Ostracod and Belly River. The timing of our activities is subject to seasonal road-use restrictions and regulatory approvals.
British Columbia
Cypress/Chowade– Included in our budget is our 50% share of a 32 kilometer, 8” sales pipeline to the Sikanni area and a 30 mmcf/d sour gas plant. The initial leg of the pipeline is scheduled for construction in the first quarter of 2004. The second leg of the pipeline and the gas plant are scheduled for construction in the fourth quarter of 2004. The impact of these facilities is expected to have a marginal impact on our 2004 target production rates due to the estimated timing of their start-up. Timing is subject to regulatory approvals, negotiation of third-party processing agreements and the availability of equipment.
Undeveloped Properties (Those Not Considered in 2004 Target Production Rates)
Alberta
Wimborne– We have budgeted three exploration gas wells, scheduled for drilling in the third quarter of 2004. Our estimated resource potential of each well is eight bcf with approximate production rates ranging from four – six mmcf/d. Each well is budgeted at 30% working interest.
We are prospecting for Cretaceous-aged sandstone reservoirs in a complex, fluvial environment using an extensive database of 3D seismic. Each well is targeting a separate and distinct seismic anomaly. One of these seismic anomalies is analogous to a multi-well producing gas pool approximately ten kilometers away.
The area is accessible year round and is in close proximity to third-party transportation and processing facilities. If successful, we expect tie-in to occur late in 2004, subject to regulatory approvals and negotiation of third-party agreements.
British Columbia
Cypress/Chowade– We have budgeted three, exploration multi-zone outpost gas wells, scheduled for drilling in the second and third quarters of 2004. Based on nearby wells, our estimated resource potential of each of our wells ranges between three and five bcf per zone, and approximate production rates range between one –five mmcf/d per zone. Each well is budgeted at 30% working interest.
During 2003, we participated in nine wells resulting in eight gas wells and one unsuccessful well, for an overall drilling success rate of 89%. Our 2004 wells are targeting multi-zone, natural gas-bearing Triassic-aged sandstone and carbonate reservoirs. Our locations have been selected by correlating 2D seismic data and drilling results.
Orion– We have budgeted two 100% exploration gas wells, scheduled for drilling in the third quarter of 2004. One is drilling for a Slave Point target and the other a Bluesky target.
Based on information available to us on an offset Slave Point producing well, we estimate our Slave Point well could encounter an estimated pool size of 25 bcf and produce between five – ten mmcf/d. Similar information on several producing offset Bluesky wells suggests we could reasonably expect our Bluesky well to encounter an estimated pool size of 12 bcf and produce between one – three mmcf/d per well.
The proposed Slave Point well is approximately two kilometers away from a producing Slave Point gas well in the adjacent spacing unit. The proposed Bluesky well is offset by a multi-well, producing Bluesky gas pool approximately the same distance away. Both wells are targeting seismic features identified on our lands using 3D seismic data.
The nearest tie-in point for the wells is two kilometers away. If one or both wells are successful, tie-ins are expected to occur in late 2004 or early 2005. Tie-ins are subject to regulatory approvals, winter access-only conditions, availability of equipment, and negotiation of third-party transportation and processing.
34
2004 Capital Investment and Exploration Expense Budget by Property and Classification
| ($ 000’s) | | | | | | | | | | |
| | | | Drilling, | | | | | | | |
| | | | Completions | | Facilities | | Seismic | | | |
| | Land | | and | | and | | and | | | |
| | Acquisitions | | Equipping | | Pipelining | | Other | | Total | |
| | | | | | | | | | | |
| Alberta | | | | | | | | | | |
| St. Albert | – | | 5,587 | | 1,256 | | – | | 6,843 | |
| Wimborne | – | | 842 | | 49 | | – | | 891 | |
| Halkirk | – | | – | | 100 | | – | | 100 | |
| Peavey/Morinville | – | | – | | – | | 256 | | 256 | |
| Alexander | – | | – | | 350 | | – | | 350 | |
| Other | 937 | | – | | – | | – | | 937 | |
| Total Alberta | 937 | | 6,429 | | 1,755 | | 256 | | 9,377 | |
| British Columbia | | | | | | | | | | |
| Cypress/Chowade | 3,015 | | 9,169 | | 8,902 | | 550 | | 21,636 | |
| Orion | – | | 2,988 | | 300 | | 1,200 | | 4,488 | |
| Total British Columbia | 3,015 | | 12,157 | | 9,202 | | 1,750 | | 26,124 | |
| Contingency | – | | – | | – | | 1,550 | | 1,550 | |
| Total | 3,952 | | 18,586 | | 10,957 | | 3,556 | | 37,051 | |
Liquidity and Capital Resources
Sources and Uses of Cash
Our main business strategy is to focus on growth through full-cycle exploration and development. We supplement our main strategy with targeted acquisitions when appropriate. To carry out these capital-intensive strategies, we require cash flow from operations and an operating bank line of credit. If warranted, we would seek term debt to finance construction of long-life facilities and equity to fuel accelerated, project exploration plans.
Operating activities– In any given year, our operating activities may result in cash flow timing differences where capital expenditures exceed cash flow from operations. The two key underlying drivers behind this are (see five-year historical review information below):
- Volatility in our weighted average commodity prices; and
- Cash flow timing differences arising from the development of longer-term projects.
Five-Year Historical Cash Flow Information
| ($ 000’s unless otherwise stated) | | | | | | | | | | | | | | | |
| | | | | Nine-Month | | | | | | | | | | |
| | | | | Fiscal | | | | | | | | | | |
| | Fiscal | | Transition | | Fiscal | | Fiscal | | Fiscal | |
| | 2003 | | 2002 | | 2002 | | 2001 | | 2000 | |
| | | | | | | | | | | | | | | | |
| Weighted average commodity price volatility: | | | | | | | | | | | | | | | |
| Natural gas | $ | 6.56 | | $ | 4.36 | | $ | 3.81 | | $ | 6.22 | | $ | 2.72 | |
| Crude oil | $ | 42.98 | | $ | 41.40 | | $ | 34.33 | | $ | 43.60 | | $ | 16.74 | |
| Timing differences between: | | | | | | | | | | | | | | | |
| Cash flow from | | | | | | | | | | | | | | | |
| operations(1); and | | 23,097 | | | 10,810 | | | 11,337 | | | 18,168 | | | 5,634 | |
| Capital expenditures, exploration | | | | | | | | | | | | | | | |
| expenses and proceeds on sale | | | | | | | | | | | | | | | |
| of natural gas and oil interests | | (27,102 | ) | | (14,022 | ) | | (26,753 | ) | | (12,432 | ) | | (7,026 | ) |
| Total timing differences | | (4,005 | ) | | (3,212 | ) | | (15,416 | ) | | 5,736 | | | (1,392 | ) |
| Cash used in investing activities: | | | | | | | | | | | | | | | |
| Bank operating indebtedness | | 2,041 | | | (2,997 | ) | | 15,593 | | | (6,000 | ) | | 3,750 | |
| Issuance of common shares | | 1,511 | | | – | | | 455 | | | 200 | | | 117 | |
| Repurchases of common shares | | – | | | (326 | ) | | (290 | ) | | (90 | ) | | (1,377 | ) |
| | | 3,552 | | | (3,323 | ) | | 15,758 | | | (5,890 | ) | | 2,490 | |
| Changes in non-cash working capital | | (453 | ) | | (6,535 | ) | | 342 | | | (154 | ) | | 1,098 | |
| (1) | Included in our cash flow from operations are payments relating to the leasing of our office space (see Contractual Obligations and Commitments below). |
Financing activities– In 1999, we first established a revolving, demand bank operating loan facility with our corporate bank. On May 16, 2003, our loan was increased to $25.0 million from $21.0 million. Principle balances outstanding are charged interest at prime plus 3/8% (at December 31, 2003, the bank’s prime rate was 4.5%) and are collateralized by a general assignment of book debts and a floating charge debenture of $35.0 million covering all our assets. A standby fee of 1/8% per annum is levied on the unused portion of the facility.
The facility is subject to a semi-annual review. The next review will be undertaken before May 15, 2004. This review will include assessments of our January 1, 2004 reserves and daily production estimates and a full evaluation of our financial position and operations.
During Fiscal 2003, we repurchased certain gross overriding royalty interests that previously burdened our total current and future production by 3%. The transaction was financed through the payment of $1.0 million in cash and the issuance of 1.1 million common shares at a deemed price of $5.25 per share.
35
As at December 31, 2003, our authorized capital was 60,000,000 common shares without par value, of which 22,194,778 were issued and outstanding. Also outstanding were 1,615,834 options at prices ranging from $1.45 to $5.43 per share, each option entitling the holder to acquire one common share. The weighted average remaining contractual life of these options was 4.3 years. As at December 31, 2003, we had 1,970,870 common shares reserved for issuance under our 2003 Stock Option Plan.
Working capital– Changes in our working capital and net debt levels are primarily dependent upon our cash flow from operations, the amount of our capital expenditures and exploration expenses, and the timing of incurred field activities.
Our sales receivables and trade payables are settled in accordance with normal industry standards while we maintain our working capital liquidity by drawing from and repaying our unutilized bank credit facility as needed.
Our year-end debt level, comprised of working capital and the outstanding balance of our operating bank loan, reflects a debt-to-cash-flow ratio of 0.8:1 (Nine-Month Fiscal Transition 2002 – 1.2:1 annualized; Fiscal 2002 – 1.2:1, Fiscals 2001 and 2000 – nil).
Cash Requirements
Our future liquidity is dependent upon cash flows generated from our operational activities, our capital investment programs and the flexibility of capital sources. Changes in the weighted average prices we obtain for the sales of our commodities will impact our cash flow from operations and the extent to which we may draw from, or have made available to us, bank operating credit for 2004 (see “Sensitivities” in the Commodities Price Risk section below).
Our 2004 capital and exploration expense program was based on our targeted daily average production rates (see Outlook for 2004 above) and estimated weighted average prices for natural gas ranging from $5.84 to $6.95 per mcf and for crude oil from $36.44 to $43.09 per barrel. While we do not currently anticipate any difficulties in meeting the majority of our obligations with operating cash flows and our bank credit facility, our board of directors may choose to modify our spending plans in order to fine-tune our cash flow timing differences or seek equity financing for projects of high impact potential.
Cash Management
As in most upstream oil and gas companies, we manage our cash throughout both positive and negative commodity price cycles. We work toward accomplishing all projects specified in our annual capital expenditures and exploration expense budget, however, in the event prices increase or decrease materially, we may choose to expand or contract our spending plans, as warranted.
Increases or decreases in our capital spending activities may have corresponding effects on our production, net revenues, operating loan interest expense and income-related taxes, and counter-effects on our amortization and depletion expense.
Contractual Obligations and Commitments
We have an operating lease in respect of our office premises, as discussed in Note 13[a] to our Financial Statements. Additionally, we have asset retirement obligations relating to the clean up and restoration of wellsites and associated production facilities.
Commitments – Cash and Non-Cash Type Obligations
| ($ 000’s) | | | Payments or Work Commitments | |
| | | | | | Due By Period | | | |
| | | | < 1 | | 1– 3 | | 4– 5 | | > 5 | |
| | Total | | Year | | Years | | Years | | Years | |
| | | | | | | | | | | |
| Cash type: operating lease | | | | | | | | | | |
| obligations (office space) | 912 | | 203 | | 620 | | 89 | | – | |
| Non-cash type: asset retirement | | | | | | | | | | |
| obligations(1) | 3,308 | | 149 | | 93 | | 92 | | 2,974 | |
| Total | 4,220 | | 352 | | 713 | | 181 | | 2,974 | |
| (1) | Asset retirement obligations represent estimates of clean-up and restoration commitments and are undiscounted. |
As at December 31, 2003, we recognized $1.6 million on our Balance Sheet for future asset retirement obligations. We engage independent engineering consultants to assist in assessing our total future asset retirement liabilities. While we cannot predict their ultimate cost, we currently estimate the total cost to clean up all our operating facilities to be $3.3 million.
Business Risk Management
The natural gas and oil industry is highly competitive, particularly in the following areas:
Our competitors include major integrated oil and gas companies and numerous other independent oil and gas companies.
36
Estimating of Reserves and Future Net Cash Flows Risk
Estimating natural gas, natural gas liquids and crude oil reserves, and future net cash flows includes numerous uncertainties, many of which may be beyond our control. Such estimates are essential in our decision-making, as to whether further investment is warranted. These estimates are derived from several factors and assumptions, some of which are:
Our recoverable reserves are estimated annually by independent qualified engineering consultants. Our Board of Directors has established a Reserves Audit Committee (Reserves Committee) to assist the Board in fulfilling their oversight responsibilities with respect to our annual reserves estimates. The Reserves Committee is comprised of two independent directors who have a working familiarity with the process of estimating reserves. The Reserves Committee meet independently with the consultants to examine their work scope, information access, opinion differences resolved and independence.
Ultimately, actual production rates, reserves recovered, commodity prices, production costs, government regulation or taxation may differ materially from those assumed in earlier reserve estimates. Higher or lower differences could materially impact our production, revenues, production costs, depletion expense, taxes and capital expenditures.
Our reserve estimates and net present values are based on estimated constant commodity prices and associated production costs as of the estimate date. Actual future prices and costs may be materially higher or lower.
Operating Risk
Exploring and developing for natural gas and crude oil involves many risks, some of which are:
- unexpected formations or pressures;
- equipment failures and other accidents;
- uncontrolled hydrocarbon releases;
- adverse weather conditions;
- government and political actions;
- premature reservoir declines; and
- environmental impacts.
Although we maintain customary industry insurance, we cannot fully insure against all of these risks. Losses resulting from the occurrence of these risks could have a material adverse impact.
As our reserves of natural gas, natural gas liquids and crude oil decline, our success at replacing and adding to them is highly reliant on further exploration and development. To the extent we succeed, our operating cash flows and other capital sources may become insufficient so as to impair our ability to re-invest capital.
Restoration, Safety and Environmental Risk
All our operations are in western Canada and, in particular, the western provinces of Alberta and British Columbia. Certain laws and regulations exist that require companies engaged in petroleum activities to obtain necessary safety and environmental permits to operate. Such legislation may restrict or delay us from conducting operations in certain geographical areas. Further, such laws and regulations may impose liability on us for remedial and clean-up costs, and personal injuries related to safety and environmental damages.
While our safety and environmental activities have been prudent and have enabled us to operate successfully in managing such risks, there can be no assurance that we will always be successful in protecting ourselves from the impact of all such risks. Consistent with our growth in other areas, we seek opportunities for performance improvement in our operating practices.
Kyoto Protocol Risk
The Kyoto Protocol treaty (Protocol) was established in 1997 to reduce emissions of greenhouse gases (GHG) that are believed to be responsible for increasing the Earth's surface temperatures and affecting the global climate change. Canada ratified the Protocol in December 2002. Since the implementation of the Protocol, approximately 160 countries have committed to reduce GHG internationally. Canada alone has committed to meet a 6% reduction of emissions over base-year 1990 during the period 2008 to 2012. Canadian government assurances of cost and volume limits suggest that incremental risks and liabilities attributable to addressing Protocol related policies are manageable. While we believe we are a low-emission producer, it is not possible to predict the impact of how the Protocol related issues will ultimately be resolved and to what extent their impact will affect our future unit operating costs and capital expenditures.
37
Market Risk Management
Our results are impacted by external market risks associated with fluctuations in commodity prices, interest rates and credit, details of which are outlined below.
Commodities Price Risk
Our future financial performance remains closely linked to hydrocarbon commodity prices, which can be influenced by many factors including global and regional supply and demand, worldwide political events and weather. These factors, among others, can result in a high degree of price volatility.
Ournatural gasportfolio is split between two primary markets, one the Alberta Spot Market which trades at the AECO storage hub (www.encanastorage.com), the other being an aggregator pool called ProGas (www.progas.com).
AECO, an intra-Alberta trading hub, offers producers the opportunity to participate in natural gas transactions for terms of one day, one month, summer and winter blocks, and annually. We are currently selling our uncommitted natural gas volumes into AECO daily spot market, however, our marketing strategy includes securing monthly and term deals, if optimal.
ProGas, a wholly-owned subsidiary of BP Canada, ‘aggregates’ supplies of natural gas to sell into a basket of daily, short term (less than one year) and long-term contracts, both domestic and export. Producers realize a netback price for their natural gas, which is a blend of all contract types and weighted toward NYMEX-based prices.
During Fiscal 2003, we sold 46% of our natural gas to ProGas and 54% into the AECO daily spot market. During Nine-Month Fiscal Transition 2002 and Fiscal 2002, we sold 51% and 53% to ProGas, respectively, and the balances at AECO.
We market ournatural gas liquids and crude oilbased on monthly prices posted by the major purchasers at Edmonton, Alberta. These prices correlate closely to the price of West Texas Intermediate, allowing for quality adjustments and location differentials.
To summarize, we currently have no hedge positions, however, the market and commodity diversity within our overall sales portfolio provides a ‘natural hedge’ as follows:
Commodity mix – our sales portfolio is comprised of natural gas, natural gas liquids and crude oil. Natural gas liquids and crude oil are sold at prices with volatilities that differ from those of natural gas; and
Natural gas pricing mix – AECO pricing typically has a close correlation to NYMEX pricing, however, when the two become disconnected due to market dynamics, we are well-positioned to take advantage of premium pricing in either market area.
The following table shows the effect on cash flow of certain changes in volume, price and interest rates. Numbers presented reflect the sensitivity impact on our estimated 2004 activity.
Sensitivities
| | | | Changes in | | | | Effect on Cash Flow | |
| | Volume | | Price | | Rate | | $(000’s) | |
| | | | | | | | | |
| Production | | | | | | | | |
| Natural gas (mmcf/d) | 1 | | – | | – | | 2,310 | |
| Natural gas liquids (bbl/d) | 100 | | – | | – | | 931 | |
| Crude oil (bbl/d) | 100 | | – | | – | | 1,406 | |
| Price | | | | | | | | |
| Natural gas ($/mcf) | – | | 0.50 | | – | | 3,073 | |
| Natural gas liquids ($/bbl) | – | | 1.00 | | – | | 192 | |
| Crude oil ($/bbl) | – | | 1.00 | | – | | 128 | |
| Interest rate (%) | – | | – | | 1 | | 230 | |
Interest Rate Risk
We use a revolving, floating rate credit facility, therefore, we are exposed to fluctuations in short-term interest rates. Our current borrowing rate applied to the facility is Canadian Dollar Prime plus 3/8% per annum. To minimize our exposure to rate variability, we occasionally invest a portion of our undrawn borrowing capacity in Banker’s Acceptances (BA’s). We are charged a standby fee of 1/8% per annum on our undrawn borrowing capacity.
At December 31, 2003, we had floating debt outstanding of $13.3 million (December 31, 2002, $11.1 million; March 31, 2002 – $14.8 million).
Credit Risk
All of our accounts receivable are with customers in the energy industry and are subject to normal industry credit risk. While there can be no assurance that our no-loss record will continue, parties contractually obligated to us have been consistently reliable.
38
Critical Accounting Policies
Our critical accounting policies are defined as those that are important to the portrayal of our financial position and operations and require us to make judgments based on underlying estimates and assumptions about future events and their effects. Such underlying estimates and assumptions are based on historical experience and other factors that we believe to be reasonable under the circumstances. These estimates and assumptions are subject to change as new events occur, as more industry experience is acquired, as additional information is obtained and as our operating environment changes. We believe the following are the most critical areas where estimates and our accounting policies can materially impact our financial statements. For information concerning our other significant accounting policies, see Note 2 to our Financial Statements on page 45.
Reserves Estimates
On an annual basis, we engage independent petroleum consultants to conduct evaluations of our reserves. The accuracy of reserves estimates is a matter of interpretation and judgment and is a function of the quality and quantity of available data gathered over time. For further details and a discussion of the risks involved in the reserves estimating process, see, “Business Risk Management – Estimating of Reserves and Future Net Cash Flows Risk” on page 37.
Natural Gas and Oil Interests
We follow the successful efforts method of accounting for our natural gas and oil activities, as described in Note 2 to our Financial Statements. The application of this method requires us to make significant judgments and decisions based on available geological, geophysical, engineering and economic data. The results from drilling can take considerable time to analyze and when it is determined that drilling has been unsuccessful in establishing commercial reserves, the costs of drilling are written off and reported as exploration expense. Drilling costs for wells that have been successful in establishing commercial reserves are capitalized as natural gas and oil interests on our balance sheet.
Where we assess that the estimated undiscounted future cash flows are either partially or fully below the book value of a property as recorded in our natural gas and oil interests (“ceiling test”), we either partially or fully adjust the book value downward and record a depletion expense on our income statement accordingly (“ceiling test adjustment”).
Estimates of undiscounted future cash flows that we use for conducting ceiling tests are subject to significant judgment decisions based on assumptions of highly uncertain future factors such as, natural gas and crude oil prices, production quantities, estimates of recoverable reserves and operating costs. Given the significant assumptions required and the strong possibility that actual future factors will differ, we consider the ceiling test to be a critical accounting procedure.
During Fiscal 2003, property ceiling tests resulted in adjustments to the book value of our Cypress/Chowade property. The total adjustment amounted to $0.3 million.
During Nine-Month Transition 2002, our property ceiling tests resulted in ceiling test adjustments to the book values of four properties: Alexander, Halkirk, Morinville/Peavey and Virgo. Total adjustments amounted of $0.4 million, Halkirk accounting for 74% and Alexander 21% of the total.
During Fiscal 2002, ceiling test adjustments totaled $6.8 million, 99% of which related to the Peavey/Morinville property.
Selected Historical Financial Information
| | Fiscal 2003 | | Nine-Month Fiscal Transition 2002 | | Fiscals | |
| | Q1(1) | | Q2(2) | | Q3(3) | | Q4(4) | | Year | | Q1(5) | | Q2(6) | | Q3(7) | | Year | | 2002 | | 2001 | | 2000 | |
| | | | | | | | | | | | | | | | | | | | | | | | | |
| Statements of Operations and (Deficit) | | | | | | | | | | | | | | | | | | | | | | | | |
| Revenue | 14,308 | | 10,924 | | 11,980 | | 9,636 | | 46,848 | | 7,195 | | 6,418 | | 10,510 | | 24,123 | | 26,402 | | 34,463 | | 15,770 | |
| Earnings | 3,322 | | 1,472 | | 965 | | (781 | ) | 4,978 | | 824 | | 490 | | 690 | | 2,004 | | (3,412 | ) | 9,714 | | 4,079 | |
| basic | 0.16 | | 0.07 | | 0.04 | | (0.04 | ) | 0.23 | | 0.04 | | 0.02 | | 0.04 | | 0.10 | | (0.17 | ) | 0.49 | | 0.21 | |
| diluted | 0.16 | | 0.07 | | 0.04 | | (0.04 | ) | 0.23 | | 0.04 | | 0.02 | | 0.04 | | 0.10 | | (0.17 | ) | 0.48 | | 0.20 | |
| Cash flow from operations | 6,592 | | 5,434 | | 4,866 | | 6,205 | | 23,097 | | 2,655 | | 3,032 | | 5,123 | | 10,810 | | 11,337 | | 18,168 | | 5,634 | |
| basic | 0.32 | | 0.26 | | 0.22 | | 0.28 | | 1.08 | | 0.13 | | 0.15 | | 0.25 | | 0.53 | | 0.56 | | 0.91 | | 0.29 | |
| diluted | 0.31 | | 0.25 | | 0.22 | | 0.27 | | 1.05 | | 0.13 | | 0.15 | | 0.25 | | 0.53 | | 0.55 | | 0.84 | | 0.26 | |
| | | | | | | | | | | | | | | | | | | | | | | | | |
| Balance Sheets | | | | | | | | | | | | | | | | | | | | | | | | |
| Total assets | 48,794 | | 52,038 | | 59,395 | | 64,768 | | 64,768 | | 34,081 | | 38,158 | | 44,227 | | 44,227 | | 37,732 | | 29,991 | | 18,811 | |
| Total liabilities | 27,030 | | 27,511 | | 28,364 | | 33,837 | | 33,837 | | 16,174 | | 20,508 | | 25,659 | | 25,659 | | 20,816 | | 10,044 | | 8,771 | |
(1)Jan 1 – Mar 31, 2003;(2)Apr 1 – Jun 30, 2003;(3)Jul 1 – Sep 30, 2003;(4)Oct 1 – Dec 31, 2003;(5)Apr 1 – Jun 30, 2002;(6)Jul 1 – Sep 30, 2002;(7)Oct 1 – Dec 31, 2002
39
Accounting Policy Changes
Effective December 31, 2003, we early-adopted the amended standard CICA 3870,Stock-Based Compensation and Other Stock-Based Payments.The amended standard has an expanded requirement to apply the fair-value based method of accounting for all stock-based payments, direct awards of stock and awards that call for settlement in cash, including those granted to directors, employees and non-employees. Prior to its amendment, CICA 3870 was first adopted by us on April 1, 2002. During the period April 1, 2002 to December 31, 2002, we used the fair-value based method to account only for stock options granted to non-employees. (See Note 3 to our Financial Statements on page 46 for further details).
In December 2002, the Canadian Institute of Chartered Accountants (“CICA”) approved a new standard (“CICA 3110”),Asset Retirement Obligations.Although it is effective for fiscal years beginning on or after January 1, 2004, we early-adopted it as of December 31, 2003. The standard requires liability recognition for long-lived asset retirement obligations such as our wellsites and associated facilities. Initial measurement of the liabilities is their fair values, which is based on their discounted future value. This fair value is capitalized as part of the cost of the related assets and depleted to expense on the unit-of-production method. The liabilities accrete until we expect to settle the obligations. (See Note 3 to our Financial Statements on page 47 for further details).
Special Note Regarding Forward-looking Statements
Certain statements in this Interim Report constitute “forward-looking statements” within the meaning of the United States Private Securities Litigation Reform Act of 1995, Section 21E of the United States Securities Exchange Act of 1934, as amended, and Section 27A of the United States Securities Act of 1933, as amended. Additionally, forward-looking statements may be made orally or in press releases, conferences, reports, on our worldwide website or otherwise, in the future, by or on behalf of us. Such statements are generally identifiable by the terminology used such as “plans”, “expects, “estimates”, “budgets”, “intends”, anticipates”, “believes”, “projects”, “indicates”, “targets”, “objective”, “could”, “may” or other similar words.
The forward-looking statements are subject to known and unknown risks and uncertainties and other factors that may cause actual results, levels of activity and achievements to differ materially from those expressed or implied by such statements. Such factors include, among others: market prices for natural gas, natural gas liquids and crude oil products; the ability to produce and transport natural gas, natural gas liquids and crude oil; the results of exploration and development drilling and related activities; economic conditions in the countries and provinces in which we carry on business, especially economic slowdown; actions by governmental authorities including increases in taxes, changes in environmental and other regulations, and renegotiations of contracts; political uncertainty, including actions by insurgent groups or other conflict and the negotiation and closing of material contracts. The impact of any one factor on a particular forward-looking statement is not determinable with certainty as such factors are interdependent upon other factors; our course of action would depend upon our assessment of the future considering all information then available. In that regard, any statements as to future natural gas, natural gas liquids or crude oil production levels; capital expenditures; the allocation of capital expenditures to exploration and development activities; sources of funding for our capital program; drilling of new wells; demand for natural gas, natural gas liquids and crude oil products; expenditures and allowances relating to environmental matters; dates by which certain areas will be developed or will come on-stream; expected finding and development costs; future production rates; ultimate recoverability of reserves; dates by which transactions are expected to close; cash flows; uses of cash flows; collectibility of receivables; availability of trade credit; expected operating costs; expenditures and allowances relating to environmental matters; debt levels; and changes in any of the foregoing are forward-looking statements, and there can be no assurance that the expectations conveyed by such forward-looking statements will, in fact, be realized.
Although we believe that the expectations conveyed by the forward-looking statements are reasonable based on information available to us on the date such forward-looking statements were made, no assurances can be given as to future results, levels of activity, achievements or financial condition.
We wish to caution readers not to place undue reliance on any forward-looking statement and to recognize that the statements are predictions of future results, which may not occur as anticipated. Actual results could differ materially from those anticipated in the forward-looking statements and from historical results, due to the risks and uncertainties described above, as well as others not now anticipated. The foregoing statements are not exclusive and further information concerning us, including factors that potentially could materially affect our financial results, may emerge from time to time. We assume no obligation to update forward-looking statements to reflect actual results or changes in factors or assumptions affecting such forward-looking statements.
40
Report of Management
The accompanying financial statements and all information in the Annual Report are the responsibility of management. Management has prepared the financial statements in accordance with accounting policies detailed in the notes to the financial statements and in accordance with Canadian generally accepted accounting principles, and where necessary includes amounts based on management’s informed judgments and estimates. Financial information throughout the Annual Report is consistent with the financial statements.
Management has developed and maintains appropriate systems of accounting and administrative controls to provide reasonable assurances that transactions are appropriately authorized, timely disclosures and communications with the regulators of any material information are met, assets are safeguarded and financial records are properly maintained to provide factual and reliable financial statements. Management also believes that the financial statements are prepared in accordance with applicable securities rules and regulations.
Ernst & Young, LLP, the Company’s external auditors, have audited the financial statements in accordance with auditing standards generally accepted in Canada and the United States. Their examination included a review of accounting systems and their detailed audit procedures covered all material transactions.
The Board of Directors, through its Audit and Reserves Audit Committees, is responsible for assuring that management fulfills its financial reporting responsibilities. The Audit Committee reviews our financial statements, considers the independence of external auditors and reviews the list of audit and non-audit services and fees to be provided to us by the external auditors. The Reserves Audit Committee reviews our annual estimates of crude oil and natural gas reserves and considers the qualifications and independence of the consulting reservoir engineers. Both Committees are comprised of independent directors. Each Committee gives its respective recommendation for approval to the Board of Directors. The Board of Directors has approved the information contained in the Annual Report.
|  |
| Wayne J. Babcock | Michael A. Bardell |
| | |
| President & Chief Executive Officer | Chief Financial Officer & Corporate Secretary |
Auditors’ Report
To the Shareholders of Dynamic Oil & Gas, Inc.
We have audited the balance sheets ofDynamic Oil & Gas, Inc.as of December 31, 2003 and 2002 and the statements of operations and retained earnings and cash flows for the year ended December 31, 2003, the nine months ended December 31, 2002 and the year ended March 31, 2002. These financial statements are the responsibility of the Company’s management. Our responsibility is to express an opinion on these financial statements based on our audits.
We conducted our audits in accordance with auditing standards generally accepted in Canada and the United States. Those standards require that we plan and perform an audit to obtain reasonable assurance whether the financial statements are free of material misstatement. An audit includes examining, on a test basis, evidence supporting the amounts and disclosures in the financial statements. An audit also includes assessing the accounting principles used and significant estimates made by management, as well as evaluating the overall financial statement presentation.
In our opinion, these financial statements present fairly, in all material respects, the financial position of the Company as at December 31, 2003 and 2002 and the results of its operations and its cash flows for the year ended December 31, 2003, the nine months ended December 31, 2002 and the year ended March 31, 2002 in accordance with Canadian generally accepted accounting principles. As required by the Company Act of British Columbia, we report that, in our opinion, these principles have been applied, except for the change in the method of accounting for stock-based compensation and asset retirement obligations as explained in note 3, on a basis consistent with that of the preceding year.
| Vancouver, Canada, |  |
| |
| March 22, 2004. | Chartered Accountants |
41
Balance Sheets
(in Canadian dollars) As at December 31
| | 2003 | | 2002 | |
| | $ | | $ | |
| | | | | |
| ASSETS[note 5] | | | | |
| Current | | | | |
| Accounts receivable [note 11] | 6,962,387 | | 6,426,761 | |
| Prepaid expenses | 356,449 | | 351,771 | |
| Income taxes receivable | – | | 131,772 | |
| Total current assets | 7,318,836 | | 6,910,304 | |
| Natural gas and oil interests [note 4] | 57,083,789 | | 37,148,539 | |
| Capital assets [note 4] | 365,561 | | 168,366 | |
| | 64,768,186 | | 44,227,209 | |
| LIABILITIES AND SHAREHOLDERS’ EQUITY | | | | |
| Current | | | | |
| Bank indebtedness | 1,386,238 | | 1,519,923 | |
| Operating loan [note 5] | 13,250,000 | | 11,075,000 | |
| Accounts payable and accrued liabilities | 11,335,946 | | 11,133,844 | |
| Income taxes payable | 659,519 | | – | |
| Total current liabilities | 26,631,703 | | 23,728,767 | |
| Asset retirement obligations [note 6] | 1,587,733 | | 1,087,223 | |
| Future income tax liability [note 8] | 5,617,723 | | 843,581 | |
| Total liabilities | 33,837,159 | | 25,659,491 | |
| Commitments [note 13] | | | | |
| | | | | |
| | | | | |
| Shareholders’ equity | | | | |
| Share capital [note 7] | 27,747,487 | | 20,720,629 | |
| Contributed surplus [note 7[c]] | 358,229 | | – | |
| Retained earnings (deficit) | 2,825,311 | | (2,152,991 | ) |
| Total shareholders’ equity | 30,931,027 | | 18,567,638 | |
| | 64,768,186 | | 44,227,209 | |
See accompanying notes.
On behalf of the Board:
|  |
| Director | Director |
42
Statements of Operations and Retained Earnings
(in Canadian dollars)
| | Year Ended
December 31,
2003
$ | | Nine Months
Ended
December 31,
2002
$ | | Year Ended
March 31,
2002
$ | |
| REVENUE | | | | | | |
| Natural gas, liquids and oil sales | 46,847,927 | | 24,122,754 | | 26,401,872 | |
| Royalties[note 7[d]] | (12,861,990 | ) | (5,521,583 | ) | (6,500,447 | ) |
| Production costs | (7,010,610 | ) | (5,470,467 | ) | (5,845,958 | ) |
| | 26,975,327 | | 13,130,704 | | 14,055,467 | |
| Royalty tax credit – Alberta | 401,365 | | 178,098 | | 159,274 | |
| Royalty credit – British Columbia | 121,913 | | – | | – | |
| | 27,498,605 | | 13,308,802 | | 14,214,741 | |
| EXPENSES | | | | | | |
| General and administrative | 3,414,751 | | 1,839,496 | | 2,347,212 | |
| Interest expense | 724,897 | | 454,251 | | 494,685 | |
| Interest income | (11,675 | ) | (1,732 | ) | (22,066 | ) |
| Accretion of asset retirement obligation[note 6] | 93,843 | | 63,876 | | 55,286 | |
| | 4,221,816 | | 2,355,891 | | 2,875,117 | |
| Earnings from operations before the following: | 23,276,789 | | 10,952,911 | | 11,339,624 | |
| Amortization and depletion [note 4] | 12,021,474 | | 6,322,863 | | 11,956,944 | |
| Exploration expenses | 4,065,885 | | 1,446,178 | | 4,646,018 | |
| Gain on sale of natural gas and oil interests | — | | (2,139 | ) | (4,566 | ) |
| Earnings (loss) before taxes | 7,189,430 | | 3,186,009 | | (5,258,772 | ) |
| Income tax expense (recovery)[note 8] | | | | | | |
| Current | 632,294 | | 207,000 | | 57,600 | |
| Future | 1,578,834 | | 974,703 | | (1,903,920 | ) |
| Net earnings (loss) | 4,978,302 | | 2,004,306 | | (3,412,452 | ) |
| | | | | | | |
| Deficit, beginning of period – as previously reported | (2,475,932 | ) | (4,321,539 | ) | (695,279 | ) |
| Retroactive adjustment for changes in accounting policy [note 3[b]] | 322,941 | | 296,298 | | 189,665 | |
| Deficit, beginning of period – as restated | (2,152,991 | ) | (4,025,241 | ) | (505,614 | ) |
| Premium on purchase and cancellation of common shares [note 7[e]] | – | | (132,056 | ) | (107,175 | ) |
| Retained earnings (deficit), end of period | 2,825,311 | | (2,152,991 | ) | (4,025,241 | ) |
| Net earnings (loss) per share[note 9] | | | | | | |
| basic | 0.23 | | 0.10 | | (0.17 | ) |
| diluted | 0.23 | | 0.10 | | (0.17 | ) |
See accompanying notes.
43
Statements of Cash Flows
(in Canadian dollars)
| | Year Ended
December 31,
2003
$ | | Nine Months
Ended
December 31,
2002
$ | | Year Ended
March 31,
2002
$ | |
| OPERATING ACTIVITIES | | | | | | |
| Net earnings (loss) | 4,978,302 | | 2,004,306 | | (3,412,452 | ) |
| Add (deduct) items not involving cash: | | | | | | |
| Accretion of asset retirement obligation[note 6] | 93,843 | | 63,876 | | 55,286 | |
| Amortization and depletion | 12,021,474 | | 6,322,863 | | 11,956,944 | |
| Stock based compensation [note 3[a]] | 358,229 | | – | | – | |
| Future income tax expense (recovery) | 1,578,834 | | 974,703 | | (1,903,920 | ) |
| Exploration expenses | 4,065,885 | | 1,446,178 | | 4,646,018 | |
| Gain on sale of natural gas and oil interests | – | | (2,139 | ) | (4,566 | ) |
| | 23,096,567 | | 10,809,787 | | 11,337,310 | |
| Changes in non-cash working capital affecting operating activities[note 10[a]] | 5,197,611 | | 646,829 | | (1,558,807 | ) |
| Cash provided by operating activities | 28,294,178 | | 11,456,616 | | 9,778,503 | |
| | | | | | | |
| FINANCING ACTIVITIES | | | | | | |
| Bank indebtedness | (133,685 | ) | 677,111 | | 842,812 | |
| Operating loan | 2,175,000 | | (3,675,000 | ) | 14,750,000 | |
| Shares issued for cash | 1,510,858 | | – | | 455,420 | |
| Share repurchases | – | | (325,948 | ) | (289,793 | ) |
| Cash provided by (used in) financing activities | 3,552,173 | | (3,323,837 | ) | 15,758,439 | |
| | | | | | | |
| INVESTING ACTIVITIES | | | | | | |
| Purchase of capital assets | (308,387 | ) | (84,420 | ) | (116,180 | ) |
| Natural gas and oil interests | (22,727,557 | ) | (12,493,116 | ) | (21,994,897 | ) |
| Exploration expenses | (4,065,885 | ) | (1,446,178 | ) | (4,646,018 | ) |
| Proceeds on sale of natural gas and oil interests | – | | 2,139 | | 4,566 | |
| Changes in non-cash working capital affecting investing activities [note 10[b]] | (4,744,522 | ) | 5,888,796 | | (2,277,861 | ) |
| Cash used in investing activities | (31,846,351 | ) | (8,132,779 | ) | (29,030,390 | ) |
| Decrease in cash and cash equivalents | – | | – | | (3,493,448 | ) |
| Cash and cash equivalents, beginning of period | – | | – | | 3,493,448 | |
| Cash and cash equivalents, end of period | – | | – | | – | |
| | | | | | | |
| Supplemental disclosures of cash flow information | | | | | | |
| Cash paid during the year for: | | | | | | |
| Interest | 555,536 | | 459,237 | | 589,549 | |
| Income taxes | (150,408 | ) | 760,132 | | 1,167,720 | |
See accompanying notes.
44
Notes to Financial Statements
(in Canadian dollars)
December 31, 2003
1. Description of Business
Dynamic Oil & Gas, Inc. (the “Company”) was incorporated under the laws of the Province of British Columbia on March 27, 1979. The Company’s principle business is the acquisition, exploration, development and production of natural gas and oil interests in western Canada.
2. Summary of Significant Accounting Policies
Accounting principles
The Company prepares its accounts in accordance with Canadian generally accepted accounting principles which, as applied in these financial statements, conform in all material respects with the accounting principles generally accepted in the United States, except as explained in Note 12.
Change in fiscal year end
Effective December 31, 2002, the Company changed its fiscal year end from March 31 to December 31. The following is a summary of selected financial information for the comparative twelve month periods ended December 31, 2003, 2002 and 2001.
Results of operations and cash flows
| Twelve months ended | | | | | | |
| | December 31,
2003
$ | | December 31,
2002
$ | | December 31,
2001
$ | |
| | [audited] | | [unaudited] | | [unaudited] | |
| | | | | | | |
| Revenue | 46,847,927 | | 30,730,477 | | 31,658,397 | |
| Net earnings | 4,978,302 | | 2,034 | | 2,449,690 | |
| Net earnings per share | | | | | | |
| basic | 0.23 | | 0.02 | | 0.12 | |
| diluted | 0.23 | | 0.02 | | 0.12 | |
| Cash flows | | | | | | |
| provided by operating activities | 28,294,178 | | 15,215,456 | | 14,949,163 | |
| provided by (used in) | | | | | | |
| financing activities | 3,552,173 | | (4,331,528 | ) | 12,972,031 | |
| used in investing activities | (31,846,351 | ) | (10,900,821 | ) | (29,877,314 | ) |
Use of estimates
The preparation of financial statements in conformity with Canadian generally accepted accounting principles requires management to make certain estimates and assumptions that affect the reported amounts of assets and liabilities and disclosure of contingent assets and liabilities as of the date of the financial statements and the reported amounts of revenues and expenses during the reporting period. Actual results may differ from these estimates.
Natural gas and oil interests
The Company uses the successful efforts method to account for its natural gas and oil interests. Lease acquisition costs are amortized over their holding period prior to the discovery of proved producing reserves. Geological and geophysical costs are expensed in the period in which they are incurred and costs of drilling an unsuccessful well are expensed when it becomes known the well did not result in a discovery of proved reserves. All other costs of exploring and developing for proved reserves become capitalized natural gas and oil interests.
The costs of proved producing interests including related plant and equipment are depleted on a unit-of-production basis, based on gross proved producing natural gas and oil reserves.
Natural gas and oil interests are recorded at cost less accumulated provisions for potential, amortization and depletion. Natural gas and oil interests are assessed periodically for potential impairment on a field-by-field basis. Any impairment loss is the difference between the carrying value of the asset and its net recoverable amount (undiscounted).
Joint interests
Substantially all acquisition, exploration, development and production activities of the Company are conducted jointly with others. These financial statements reflect only the Company’s proportionate interest in such activities.
Capital assets
Capital assets are recorded at cost, less accumulated amortization. Amortization is provided on a straight-line basis at the following rates:
| Furniture and fixtures | – 10.0% per annum |
| Computer equipment | – 33.3% per annum |
45
Income taxes
The liability method is used in accounting for income taxes. Under this method, future income tax assets and liabilities are determined based on differences between the financial reporting and tax bases of assets and liabilities, and measured using the substantially enacted tax rates and laws that will be in effect when the differences are expected to reverse.
Asset retirement obligations
The Company recognizes the fair value of an asset retirement obligation (“ARO”) in the period in which it is incurred when a reasonable estimate of the fair value can be made. The fair value of the estimated ARO is recorded as a long-term liability, with a corresponding increase in the carrying amount of the related asset. The capitalized amount is depleted on a unit-of-production basis over the life of associated proved producing reserves. The liability amount is increased each reporting period due to the passage of time and the amount of accretion is charged to net earnings in the period. Revisions to the estimated timing of cash flows or to the original estimated undiscounted cost also result in an increase or decrease to the ARO. Actual costs incurred upon settlement of the ARO are charged against the ARO to the extent of the accreted liability recorded. Any difference between the actual costs incurred upon settlement of the ARO and the recorded liability is recognized as a gain or loss in the Company’s net earnings at that time.
Revenue recognition
Revenues from natural gas, natural gas liquids and crude oil are recorded when delivered and title passes to customers.
Stock-based compensation
The Company grants stock options to employees, directors and consultants pursuant to a stock option plan described in note 7(b). The Company uses the fair value method of accounting for all stock-based awards granted, modified or settled since January 1, 2003 [note 3]. For awards granted, modified or settled prior to January 1, 2003, the Company discloses the pro forma effects to the net earnings (loss) and net earnings (loss) per share for the period as if the fair market value had been used at the date of grant. The pro forma information is presented in note 7(c).
Foreign currency translation
All monetary assets and liabilities expressed in foreign currencies are translated at rates of exchange in effect at the end of the year. All other assets and liabilities are translated at the rates prevailing at the dates the assets were acquired or liabilities incurred. The resulting foreign currency translation gains and losses are included in the determination of net earnings. Revenues and expenses are translated at the average exchange rate for the period.
Measurement uncertainty
The amounts recorded for depletion and amortization of natural gas and oil interests and asset retirement obligations are based on estimates. Assessments for impairments in asset carrying costs are based on estimates of proved producing reserves, production rates, natural gas and oil prices, future costs and other relevant assumptions. By their nature these estimates are subject to measurement uncertainty and the effect on the financial statements of changes in such estimates in future years could be significant.
Earnings per share
The Company utilizes the treasury stock method in the determination of diluted per share amounts. Under this method, the diluted weighted average number of shares is calculated assuming that the proceeds arising from the exercise of outstanding, in-the-money options, are used to purchase common shares of the Company at their average market price for the period.
Comparative figures
Certain of the comparative figures have been restated to conform to the current period’s presentation.
3. Change in Accounting Policies
[a] Stock-based compensation
Effective January 1, 2003, the Company early-adopted the amended standard of accounting for stock-based compensation as required by CICA Handbook section 3870,“Stock-based compensation and other stock-based payments” (“CICA 3870”). The amended standard has an expanded requirement to apply the fair-value based method of accounting for all stock-based payments, direct awards of stock and awards that call for settlement in cash and other assets. Prior to its amendment, CICA 3870 was first adopted by the Company on April 1, 2002. During the period April 1, 2002 to December 31, 2002, the Company used the fair-value based method to account for stock options granted to non-employees and elected to use the intrinsic value method to account for stock options granted to directors and employees under its stock option plan.
Under the fair-value based method, compensation costs attributable to all share options are measured at fair value at the grant date and expensed over the vesting period with a corresponding increase to contributed surplus. Pursuant to the
46
transition rules relating to the amended standard, the expense recognized relates to all stock options granted during the year ended December 31, 2003. Consideration paid for shares on exercise of the share options is credited to share capital.
The adoption of the amended standard resulted in the Company recognizing an expense of $358,229 or $0.02 per share for the year ended December 31, 2003 [note 7[c]].
[b] Asset retirement obligations
Effective January 1, 2003, the Company early-adopted the new recommendations for accounting for obligations associated with the retirement of tangible long-lived assets and the associated asset retirement costs as required by CICA Handbook section 3110,“Asset Retirement Obligations” (“CICA 3110”)[see note 6]. CICA 3110 requires liability recognition for retirement obligations associated with tangible long-lived assets, such as producing wellsites and associated facilities, and includes those for which a company faces a legal settlement obligation or has made promissory estoppel.
The estimates of the obligations are based on engineering estimates, which consider past experience, current regulations, technology and industry standards. The amount of the liability is subject to re-measurement at each reporting period. The associated retirement costs are capitalized as part of the carrying amount of the long-lived assets and depleted over time on a unit-of-production basis. This differs from the prior practice, which involved accruing for the estimated removal and site restoration liability through charges to net earnings over the estimated life of reserves. The Company has applied the changes retroactively and prior periods have been restated, for comparative purposes. The restatement did not impact the net earnings per share for those periods.
Following is a summary of the after-tax changes reflected in the statements of operations and balance sheets presented:
| | Year Ended
December 31,
2003
$ | | Nine Months
Ended
December 31,
2002
$ | | Year Ended
March 31,
2002
$ | |
| | | | | | | |
| Net increase (decrease) in net earnings | | | | | | |
| before tax | (67,733 | ) | 40,046 | | 160,713 | |
| Net increase (decrease) in future | | | | | | |
| income tax expense | – | | 13,043 | | 54,030 | |
| Net increase (decrease) in net earnings | (67,733 | ) | 26,643 | | 106,633 | |
| Assets (natural gas and oil interests) | 859,573 | | 580,463 | | 520,449 | |
| Liabilities | 377,688 | | 257,442 | | 416,829 | |
4. Natural Gas and Oil Interests, and Capital Assets
| | | | Accumulated | | | |
| | | | Amortization and | | Net Book | |
| | Cost | | Depletion | | Value | |
| | $ | | $ | | $ | |
| December 31, 2003 | | | | | | |
| Natural gas and oil interests | 94,425,822 | | 37,342,033 | | 57,083,789 | |
| Furniture, fixtures and | | | | | | |
| computer equipment | 770,910 | | 405,349 | | 365,561 | |
| | | | | | | |
| December 31, 2002 | | | | | | |
| Natural gas and oil interests | 62,580,290 | | 25,431,751 | | 37,148,539 | |
| Furniture, fixtures and | | | | | | |
| computer equipment | 538,153 | | 369,787 | | 168,366 | |
At December 31, 2003, costs of $16,238,852 [2002 – $8,796,000] related to non-producing assets have been excluded from the calculation of amortization and depletion.
In the year ended December 31, 2003, the Company recorded asset write-downs of $316,213 [nine-month period ended December 31, 2002 – $445,467; year ended March 31, 2002 – $6,783,248] to reflect the excess of the net book value of the Company’s natural gas and oil interests over its estimated recoverable amounts. The write-downs were included in amortization and depletion expense.
5. Operating Loan
During 2003, the Company’s bank, the National Bank of Canada, increased to $25,000,000 from $21,000,000, the amount made available to the Company under a revolving, demand credit facility. Principal balances outstanding bear interest at prime plus 3/8% (bank prime rate at December 31, 2003 – 4.5%; December 31, 2002 –4.5%). They are collateralized by a general assignment of book debts and a floating charge debenture of $38,000,000 covering all the assets of the Company. The effective average interest paid during the year ended December 31, 2003 was 5.1% [during the nine-month period ended December 31, 2002 – 5.0%; year ended March 31, 2002 – 4.7%]. A standby fee of 0.125% per annum is levied on the unused portion of the facility and is included in interest expense.
47
6. Asset Retirement Obligation
The following table presents the reconciliation of the beginning and ending aggregate carrying amount of the obligation associated with the retirement of oil and gas properties:
| | December 31, | | December 31, | | March 31, | |
| | 2003 | | 2002 | | 2002 | |
| | $ | | $ | | $ | |
| | | | | | | |
| Asset retirement obligation, | | | | | | |
| beginning of period | 1,087,223 | | 956,559 | | 776,711 | |
| Liabilities incurred | 406,667 | | 66,788 | | 124,562 | |
| Accretion expense | 93,843 | | 63,876 | | 55,286 | |
| Asset retirement obligation, | | | | | | |
| end of period | 1,587,733 | | 1,087,223 | | 956,559 | |
The total undiscounted amount of estimated cash flows required to settle the obligation is $3,308,669 [for the nine-months ended December 31, 2002 –$2,109,750; year ended March 31, 2002 – $2,304,984], which has been discounted using an average credit-adjusted risk free rate of 6.6%. These payments are expected to be made over the next 53 years with the majority of costs incurred between 2018 and 2020.
7. Share Capital
The Company is authorized to issue 60,000,000 common shares without par value.
[a] Issued and outstanding
The following table sets forth the issued and outstanding common shares:
| | Number of | | | |
| | Shares | | $ | |
| | | | | |
| Balance, December 31, 2002 | 20,272,530 | | 20,720,629 | |
| Stock options exercised | 871,582 | | 1,510,858 | |
| Shares issued to repurchase gross overriding | | | | |
| royalty interests[note 7[d]] | 1,050,666 | | 5,516,000 | |
| Balance, December 31, 2003 | 22,194,778 | | 27,747,487 | |
[b] Stock option plan and options outstanding
Under the Company’s stock option plan, the Company has the ability to grant options to inside directors, officers, employees and non-employees with a maximum term of five years. Those granted prior to February 28, 2001 vest upon date of grant; those granted on February 28, 2001 and thereafter, vest in equal amounts over three years from the date of grant.
In addition, options granted to the Company’s outside directors prior to June 19, 2003 had a maximum term of ten years and those granted on June 19, 2003 and thereafter, have a maximum term of five years. All options granted to outside directors vest upon date of grant.
During the year ended December 31, 2003, options issued totaled 421,000 [268,500 to either inside directors, officers, employees or non-employees; 152,500 to outside directors]. The exercise price of each option granted under the plan equals the amount designated in the individual agreement, which is based on the fair value of the stock at the date of grant.
A summary of the status of the Company’s stock option plan as of December 31, 2003 is presented below:
| | December 31, | | December 31, | | March 31, | |
| | 2003 | | 2002 | | 2002 | |
| | | | Weighted | | | | | | Weighted | | Weighted | |
| | Number | | Average | | Number | | Number | | Average | | Average | |
| | of | | Option | | of | | of | | Option | | Option | |
| | Shares | | Price | | Shares | | Shares | | Price | | Price | |
| | # | | $ | | # | | # | | $ | | $ | |
| | | | | | | | | | | | | |
| Outstanding at beginning | | | | | | | | | | | | |
| of period | 2,077,750 | | 1.83 | | 1,930,250 | | 1.83 | | 1,855,350 | | 1.29 | |
| | | | | | | | | | | | | |
| Granted | 421,000 | | 4.61 | | 147,500 | | 1.88 | | 570,000 | | 1.87 | |
| | | | | | | | | | | | | |
| Exercised | (871,582 | ) | 1.73 | | – | | – | | (495,100 | ) | 0.92 | |
| | | | | | | | | | | | | |
| Forfeited | (11,334 | ) | 2.83 | | – | | – | | – | | – | |
| | | | | | | | | | | | | |
| Outstanding at period end | 1,615,834 | | 2.61 | | 2,077,750 | | 1.83 | | 1,930,250 | | 1.83 | |
| | | | | | | | | | | | | |
| Options exercisable at | | | | | | | | | | | | |
| period end | 1,081,667 | | 2.33 | | 1,641,250 | | 1.84 | | 1,458,750 | | 1.84 | |
48
Exercise prices for the options outstanding as of December 31, 2003 ranged from $1.45 to $5.43 per share. These options have a weighted average remaining contractual life of 4.33 years.
At December 31, 2003 the following stock options were outstanding and exercisable:
| | | Options Outstanding | | Options Exercisable | |
| | | | | | | | | | | | |
| | | | | | | Weighted | | | | | |
| | | | | Weighted | | Average | | Number of | | Weighted | |
| | | Number of | | Average | | Remaining | | Options | | Average | |
| Exercise | | Shares Under | | Exercise | | Contractual | | Currently | | Exercise | |
| Price | | Option | | Price | | Life | | Exercisable | | Price | |
| $ | | # | | $ | | (Years) | | # | | $ | |
| | | | | | | | | | | | |
| 1.00 – 1.49 | | 45,000 | | 1.45 | | 1.07 | | 45,000 | | 1.45 | |
| 1.50 – 1.99 | | 588,334 | | 1.73 | | 4.76 | | 356,667 | | 1.72 | |
| 2.00 – 2.49 | | 549,500 | | 2.12 | | 3.19 | | 512,500 | | 2.11 | |
| 2.50 – 2.99 | | 15,000 | | 2.95 | | 8.97 | | 15,000 | | 2.95 | |
| 3.50 – 3.99 | | 42,500 | | 3.83 | | 5.70 | | 12,500 | | 3.91 | |
| 4.00 – 4.99 | | 65,000 | | 4.10 | | 9.33 | | 65,000 | | 4.10 | |
| 4.50 – 4.99 | | 235,500 | | 4.66 | | 4.54 | | – | | – | |
| 5.00 – 5.49 | | 75,000 | | 5.35 | | 4.54 | | 75,000 | | 5.35 | |
| | | 1,615,834 | | 2.61 | | 4.33 | | 1,081,667 | | 2.33 | |
[c] Pro forma net earnings – fair value based method of accounting for stock options
During the year ended December 31, 2003, the Company used the fair-value based method to account stock options granted to directors, employees and non-employees, resulting in a decrease to earnings and a corresponding increase to contributed surplus of $358,229. During the nine-month period ended December 31, 2002, the Company used the same method to expense only those stock options granted to non-employees.
The following table shows pro forma net earnings and net earnings per common share had the Company applied the fair-value based method of accounting for all stock options outstanding:
| | | | Nine months | |
| | Year ended | | ended | |
| | December 31, | | December 31, | |
| | 2003 | | 2002 | |
| | $ | | $ | |
| | | | | |
| Net earnings: | | | | |
| as reported | 4,978,302 | | 2,004,306 | |
| pro forma | 4,856,567 | | 1,798,630 | |
| Basic net earnings per common share: | | | | |
| as reported | 0.23 | | 0.10 | |
| pro forma | 0.23 | | 0.09 | |
| Diluted net earnings per common share: | | | | |
| as reported | 0.23 | | 0.10 | |
| pro forma | 0.22 | | 0.09 | |
The Black-Scholes options valuation model was used to estimate the fair value of stock options. In addition, option valuation models require the input of highly subjective assumptions including the expected stock price volatility. As the Company’s director and employee stock options may have characteristics different from those of non-employee options, and changes in the subjective input assumptions can materially affect the fair value estimate, the existing models do not necessarily provide a reliable single measure of the fair value of its stock options. The fair value of option grants using the Black-Scholes model is estimated on the date of grant using the following weighted-average assumptions:
| | | | Nine months | |
| | Year ended | | ended | |
| | December 31, | | December 31, | |
| | 2003 | | 2002 | |
| | $ | | $ | |
| Dividend yield | 0% | | 0% | |
| Expected volatility | 51% | | 57% | |
| Risk-free interest rate | 4% | | 5% | |
| Expected lives | 3 years | | 3 years | |
The weighted average fair value per share of stock options granted during the year ended December 31, 2003 was $1.78 [nine-month period ended December 31, 2002 – $0.91].
49
[d] Repurchase of gross overriding royalty interests
Three of the Company’s officers were entitled to receive compensation pursuant to royalty agreements that had previously been approved by shareholders. The royalty agreements provided for payment of an overriding interest of 1% of the Company’s share of gross production of all petroleum substances on lands acquired by the Company since June 1, 1986 for two of the three officers and June 1, 1987 for the third officer.
On July 7, 2003, the Company repurchased from the three Company officers their gross overriding royalty interests for $6,516,000. The aggregate purchase price was paid by the issuance of 1,050,666 common shares of the Company and the payment of $1,000,000 in cash. The number of common shares was based on a price of $5.25 per share, such price being the daily volume-weighted average price for July 7, 2003. The transaction was recorded at the exchange amount determined by an independent valuation.
The gross overriding royalty expense pursuant to the agreements, was $752,362 during the period January 1 to July 7, 2003 [nine-month period ended December 31, 2002 – $68,493; year ended March 31, 2002 – $745,994].
The repurchased overriding royalty interest included in natural gas and oil interests in these financial statements is $9,711,308. This carrying value is comprised of the aggregate repurchase price of $6,516,000 paid to the vendors, plus the related future income taxes of $3,195,308 which require recognition in accordance with current accounting rules under CICA Handbook section 3465.
[e] Issuer bids
Pursuant to the following normal course issuer bids, the Company was authorized to repurchase and cancel common shares on the open market through the facilities of the Toronto Stock Exchange and NASDAQ:
| Normal course issuer bid date of | | Authorized Share | |
| Commencement | | Termination | | Repurchases/Cancellations | |
| 1-May-02 | | 31-Mar-03 | | 1,000,000 | |
| 9-Apr-01 | | 31-Mar-02 | | 1,000,000 | |
Under these normal course issuer bids, the Company purchased and recorded the following:
| | Year Ended | | Nine Months Ended | | Year Ended | |
| | December 31, | | December 31, | | March 31, | |
| | 2003 | | 2002 | | 2002 | |
| | # | | $ | | # | | $ | | # | | $ | |
| | | | | | | | | | | | | |
| Bid termination date: 31-Mar-03 | – | | – | | (189,700 | ) | (325,948 | ) | – | | – | |
| Bid termination date: 31-Mar-02 | – | | – | | – | | – | | (178,800 | ) | (289,793 | ) |
| | – | | – | | (189,700 | ) | (325,948 | ) | (178,800 | ) | (289,793 | ) |
| Average purchase price | – | | | | $1.72 | | | | $1.62 | | | |
| Recorded as an increase | | | | | | | | | | | | |
| of deficit | | | – | | | | 132,056 | | | | 107,175 | |
| Recorded as a reduction | | | | | | | | | | | | |
| of share capital | | | – | | | | (193,892 | ) | | | (182,618 | ) |
8. Income Taxes
Future income taxes reflect the net tax effects of temporary differences between the carrying amounts of assets and liabilities for financial reporting purposes and the amounts used for income tax purposes. Significant components of the Company’s future tax assets and liabilities are as follows:
| | December 31, | | December 31, | |
| | 2003 | | 2002 | |
| | $ | | $ | |
| | | | | |
| Long term future tax assets (liabilities): | | | | |
| CCA in excess of book depreciation | (5,843,546 | ) | (1,015,300 | ) |
| Finance charges | 100 | | 1,000 | |
| Provision for asset retirement obligations | 225,723 | | 170,719 | |
| Net future tax (liabilities) assets | (5,617,723 | ) | (843,581 | ) |
50
The reconciliation of income tax attributable to operations computed at the statutory tax rates to income tax (recovery) expense is:
| | Year Ended | | Nine Months Ended | | Year Ended | |
| | December 31, | | December 31, | | March 31, | |
| | 2003 | | 2002 | | 2002 | |
| | $ | | % | | $ | | % | | $ | | % | |
| | | | | | | | | | | | | |
| Tax at combined federal | | | | | | | | | | | | |
| and provincial rates | 2,962,000 | | 41.20 | | 1,350,000 | | 42.37 | | (2,300,700 | ) | 43.75 | |
| | | | | | | | | | | | | |
| Tax effect of: | | | | | | | | | | | | |
| Non-deductible | | | | | | | | | | | | |
| expenses | 1,929,000 | | | | 898,400 | | | | 1,068,000 | | | |
| Income not taxable | (165,400 | ) | | | (70,500 | ) | | | (64,900 | ) | | |
| Resource allowance | (2,218,342 | ) | | | (1,021,197 | ) | | | (1,306,520 | ) | | |
| Large corporation tax in | | | | | | | | | | | | |
| excess of surtax | 90,000 | | | | 25,000 | | | | 49,000 | | | |
| Effect of changes in | | | | | | | | | | | | |
| tax rates | (386,130 | ) | | | – | | | | 708,800 | | | |
| | 2,211,128 | | | | 1,181,703 | | | | (1,846,320 | ) | | |
9. Net Earnings Per Share
Basic net earnings (loss) per share were calculated on the basis of the weighted average number of shares outstanding for the year ended December 31, 2003 of 21,393,902 [the nine-month period ended December 31, 2002 – 20,357,153; year ended March 31, 2002 – 20,365,031]. The weighted average number of shares outstanding for the diluted calculation for the year ended December 31, 2003 was 21,947,801 [nine-month period ended December 31, 2002 – 20,554,231; year ended March 31, 2002 – 20,466,543].
| | | | Nine Months | | | |
| | Year Ended | | Ended | | Year Ended | |
| | December 31, | | December 31, | | March 31, | |
| | 2003 | | 2002 | | 2002 | |
| | $ | | $ | | $ | |
| | | | | | | |
| Numerator | | | | | | |
| Net earnings (loss) for the period | 4,978,302 | | 2,004,306 | | (3,412,452 | ) |
| | | | | | | |
| Denominator | | | | | | |
| Weighted average number of common | | | | | | |
| shares outstanding | 21,393,902 | | 20,357,153 | | 20,365,031 | |
| Effect of dilutive stock options | 553,899 | | 197,078 | | 101,512 | |
| | 21,947,801 | | 20,554,231 | | 20,466,543 | |
| Basic earnings (loss) per share | 0.23 | | 0.10 | | (0.17 | ) |
| Diluted earnings (loss) per share | 0.23 | | 0.10 | | (0.17 | ) |
10. Changes in Non-cash Working Capital Balances
[a] Changes affecting operating activities comprise:
| | December 31, | | December 31, | | March 31, | |
| | 2003 | | 2002 | | 2002 | |
| | $ | | $ | | $ | |
| | | | | | | |
| Accounts receivable | 1,299,019 | | (968,683 | ) | (581,264 | ) |
| Prepaid expenses | (4,678 | ) | 13,456 | | (124,761 | ) |
| Accounts payable and accrued liabilities | 3,111,979 | | 2,155,188 | | (728,998 | ) |
| Income taxes payable | 791,291 | | (553,132 | ) | (123,784 | ) |
| | 5,197,611 | | 646,829 | | (1,558,807 | ) |
[b] Changes affecting investing activities comprise:
| | December 31, | | December 31, | | March 31, | |
| | 2003 | | 2002 | | 2002 | |
| | $ | | $ | | $ | |
| | | | | | | |
| Accounts receivable | (1,834,645 | ) | 521,453 | | (953,434 | ) |
| Accounts payable and accrued liabilities | (2,909,877 | ) | 5,367,343 | | (1,324,427 | ) |
| | (4,744,522 | ) | 5,888,796 | | (2,277,861 | ) |
51
11. Financial Instruments
The Company’s financial instruments consist of accounts receivable, bank indebtedness, operating loan, accounts payable and income taxes payable. The carrying values of these financial instruments approximate their fair value.
Substantially all of the Company’s accounts receivable at December 31, 2003, and 2002 result from the sale of natural gas, natural gas liquids and oil to other companies in the oil and gas industry. This concentration of customers may impact the Company’s overall credit risk, either positively or negatively, in that such entities may be similarly affected by industry-wide changes in economic or other conditions. Historically to date, the Company has not incurred credit losses against its receivables. At December 31, 2003 nine customers represent 80% of the accounts receivable balance, [December 31, 2002 – five customers represent 56% of accounts receivable].
12. Reconciliation to US Generally Accepted Accounting Principles
The Company prepares its accounts in accordance with Canadian generally accepted accounting principles (Canadian GAAP), which for the most part, are similar to United States generally accepted accounting principles (U.S. GAAP). The following tables reflect the major differences in accounting principles.
Consolidated net earnings (loss) under U.S. GAAP would be:
| | | | Nine Months | | | |
| | Year Ended | | Ended | | Year Ended | |
| | December 31, | | December 31, | | March 31, | |
| | 2003 | | 2002 | | 2002 | |
| | $ | | $ | | $ | |
| | | | | | | |
| Net earnings (loss) under | | | | | | |
| Canadian GAAP | 4,978,302 | | 2,004,306 | | (3,412,452 | ) |
| Amortization and depletion [a] | – | | (65,471 | ) | (140,399 | ) |
| Accretion of asset retirement | | | | | | |
| obligation[a] | – | | 40,242 | | 35,936 | |
| Options issued for services [b] | – | | (3,108 | ) | – | |
| Write-down on natural gas and oil | | | | | | |
| properties[c] | (125,580 | ) | (209,160 | ) | (140,465 | ) |
| Income taxes [d] | – | | – | | 708,800 | |
| Net earnings (loss) before cumulative | | | | | | |
| effect of change in accounting | | | | | | |
| principle under U.S. GAAP | 4,852,722 | | 1,766,809 | | (2,948,580 | ) |
| Cumulative effect of change in | | | | | | |
| accounting principle, net of | | | | | | |
| applicable taxes[a] | 133,276 | | – | | – | |
| Net earnings (loss) under | | | | | | |
| U.S. GAAP after cumulative effect | | | | | | |
| of change in accounting principle | 4,985,998 | | 1,766,809 | | (2,948,580 | ) |
| Net earnings (loss) per common share | | | | | | |
| under U.S. GAAP, before change in | | | | | | |
| accounting policy | | | | | | |
| basic | 0.23 | | 0.09 | | (0.14 | ) |
| diluted | 0.22 | | 0.09 | | (0.14 | ) |
| Net earnings (loss) per common share | | | | | | |
| under U.S. GAAP, after change in | | | | | | |
| accounting policy | | | | | | |
| basic | 0.23 | | 0.09 | | (0.14 | ) |
| diluted | 0.23 | | 0.09 | | (0.14 | ) |
52
After certain differences have been adjusted for, selected balance sheet items under Canadian and U.S. GAAP would be:
| | December 31, 2003 | | December 31, 2002 | |
| | | | | | | | | |
| | Canadian | | U.S. | | Canadian | | U.S. | |
| | GAAP | | GAAP | | GAAP | | GAAP | |
| | $ | | $ | | $ | | $ | |
| | | | | | | | | |
| Future income tax liability[d] | – | | – | | 843,581 | | 540,900 | |
| Natural gas and oil interests [c] | 57,083,789 | | 56,901,789 | | 37,148,539 | | 36,236,076 | |
| Share capital [b, e] | 27,747,487 | | 28,720,580 | | 20,720,629 | | 21,693,722 | |
| Retained earnings (deficit) | | | | | | | | |
| [a, b, c, d, e] | 2,825,311 | | 1,331,150 | | (2,152,991 | ) | (3,635,999 | ) |
[a] Asset retirement obligation
During 2003, the Company early-adopted CICA Handbook section 3110 –“Asset Retirement Obligations”for Canadian GAAP and SFAS 143 –“Accounting for Asset Retirement Obligations”for U.S. GAAP. The transitional provisions differ between Canadian GAAP and U.S. GAAP in that Canadian GAAP requires restatement of comparative amounts whereas U.S. GAAP does not allow restatement, but rather requires a cumulative catch-up adjustment to net earnings. An adjustment to net earnings under Canadian GAAP has been recorded to reflect the December 31, 2002 and March 31, 2002 comparative amounts prior to restatement in accordance with U.S. GAAP.
[b] Stock-based compensation
Prior to the adoption of CICA 3870, on April 1, 2002, no compensation expense was recognized under Canadian GAAP when stock options were issued to directors, employees or non-employees. This resulted in a U.S. GAAP difference for the years ended March 31, 2002 as the Company had adopted the disclosure-only provisions of Statement of Financial Accounting Standards No. 123,“Accounting for Stock-Based Compensation”for stock-based awards to employees and directors, which were adopted subsequently in the December 31, 2002 financial statements for Canadian GAAP under the original disclosure requirements of CICA 3870. Had compensation cost for the Company’s stock option plan been determined based on the fair value at the grant date for awards in the year ended March 31, 2002 consistent with the provisions of SFAS No. 123, the Company’s net loss and net loss per share would have been increased to the pro forma amounts indicated below:
| | Year Ended | |
| | March 31, | |
| | 2002 | |
| | $ | |
| Net earnings (loss) | | |
| as reported | (3,412,452 | ) |
| pro forma | (3,249,470 | ) |
| Basic net earnings (loss) per common share | | |
| as reported | (0.17 | ) |
| pro forma | (0.16 | ) |
| Diluted net earnings (loss) per common share | | |
| as reported | (0.17 | ) |
| pro forma | (0.16 | ) |
For the years ended December 31, 2003, and 2002, the net earnings (loss) that would be disclosed for SFAS No. 123 is consistent with the amounts shown in note 7[c]. The weighted average assumptions used in the Black-Scholes valuation (refer to note 7[c] for discussion of the model) for the year ended March 31, 2002 were as follows:
| | Year Ended | |
| | March 31, | |
| | 2002 | |
| | $ | |
| Dividend yield | 0% | |
| Expected volatility | 57% | |
| Risk-free interest rate | 5% | |
| Expected lives | 3 years | |
[c]Under both Canadian and U.S. GAAP, property, plant and equipment must be assessed for potential impairments. Under U.S. GAAP, if the sum of the expected future cash flows (undiscounted and without interest charges) is less than the carrying amount of the asset, then an impairment loss (the amount by which the carrying amount of the asset exceeds the fair value of the asset) should be recognized. Fair value is calculated as the present value of estimated expected future cash flows. As disclosed in note 1, under Canadian GAAP, the impairment loss is the difference between the carrying value of the asset and its net recoverable amount (undiscounted). The resulting differences in recorded carrying values of impaired assets result in further differences in amortization and depletion expense in subsequent years. The CICA has adopted a new standard effective for 2004 that will eliminate this Canadian/U.S. GAAP difference.
53
[d]Effective April 1, 1999, the Company adopted the new Canadian GAAP recommendations with respect to income taxes which requires application of the liability method of tax allocation, similar to the requirements under U.S. GAAP. There remains, however, a difference between Canadian and U.S. GAAP, as Canadian GAAP requires that future income tax balances be adjusted to reflect substantively enacted rates rather than the currently legislated tax rates used to account for deferred income taxes under U.S. GAAP.
[e]Share issue costs are charged directly to retained earnings under Canadian GAAP and to share capital under U.S. GAAP. The total share issue costs charged to share capital were $570,961.
[f] New accounting pronouncements
In January 2003, the FASB issued Interpretation No. 46 “Consolidation of Variable Interest Entities” (FIN No. 46R) (revised December 2003). FIN No. 46R clarifies the application of Accounting Research Bulletin No. 51, Consolidated Financial Statements, to only certain entities in which equity investors do not have the characteristics of a controlling financial interest or do not have sufficient equity at risk for the entity to finance its activities without additional subordinated financial support from other parties. FIN No. 46R applies immediately to variable interest entities created after January 31, 2003, and the variable interest entities obtained after that date. It applies at the end of the first annual reporting period beginning after June 15, 2003, to variable interest in which an enterprise holds a variable interest which was acquired before February 1, 2003. Adoption of FIN No. 46R on January 1, 2004 does not impact the Company’s financial position or results of operations.
A similar guideline has been introduced in Canada, Accounting Guideline 15 “Consolidation of Variable Interest Entities”. This guideline applies to annual and interim periods beginning on or after November 1, 2004.
13. Commitments
The Company has entered into an operating lease in respect of its office premises.
The minimum payments under this lease commitment, including estimated operating costs are as follows:
| | $ | |
| 2004 | 202,905 | |
| 2005 | 208,461 | |
| 2006 | 202,905 | |
| 2007 | 208,461 | |
| 2008 | 89,364 | |
| | 912,096 | |
14. Economic Dependency
The St. Albert property in Alberta is a core property of the Company and the majority of gas production from the property is pipelined and processed through facilities owned and operated by Atco Midstream (“Atco”) of Calgary, Alberta.
Effective November 1, 1997, the Company and its then joint interest partner, Fletcher Challenge Energy Canada Inc. signed a ten-year, firm service, sour gas processing and transportation agreement with Atco for a maximum daily quantity of 15 million cubic feet of gas per day to be processed at Atco’s Carbondale plant.
Effective December 15, 1998, a similar agreement was signed by the partners and Atco to process sweet gas at Atco’s Villenueve plant, also for a maximum daily quantity of 15 million cubic feet of gas per day.
Both agreements include an automatic renewal for a further ten years, subject to fee renegotiation.
54
Corporate Information
Directors
 |  |  |  |
| Wayne J. Babcock | John A. Greig | David J. Jennings | John Lagadin |
| Vancouver, | Vancouver, | Vancouver, | Calgary, |
| British Columbia | British Columbia | British Columbia | Alberta |
 |  |  |
| Jonathan A. Rubenstein | William B. Thompson | Donald K. Umbach |
| Vancouver, | Kelowna, | Vancouver, |
| British Columbia | British Columbia | British Columbia |
Officers
| Wayne J. Babcock | President and Chief Executive Officer |
| Donald K. Umbach | Vice President and Chief Operating Officer |
| David G. Grohs | Vice President, Production |
| Michael A. Bardell | Chief Financial Officer and Corporate Secretary |
Head Office
Suite 230 – 10991 Shellbridge Way
Richmond, British Columbia Canada V6X 3C6
Tel: 604-214-0550 Toll free: 1-800-663-8072
Fax: 604-214-0551 E-mail: infodynamic@dynamicoil.com
Website: www.dynamicoil.com
Regulatory filings website: www.sedar.com
Annual Meeting
The Annual General Meeting of the Shareholders will be held in the Fraser Room of the Holiday Inn, 10720 Cambie Road, Richmond, B.C. on Friday, June 18, 2004 at 1:00 pm.
Form 20-F
A copy of the Company’s latest report on Form 20-F, as filed with the Securities and Exchange Commission is available without charge, upon written request to the Corporate Secretary.
Consulting Engineers
Sproule Associates Limited Calgary, Alberta
Corporate Reserves Evaluator
Status Engineering Associates Ltd. Calgary, Alberta
Solicitors
Irwin, White & Jennings Vancouver, British Columbia
Perkins Coie LLP Santa Monica, California
Auditors
Ernst & Young LLP Vancouver, British Columbia
Bankers
National Bank of Canada Calgary, Alberta
Registrar and Transfer Agent
CIBC Mellon Trust Company Vancouver, British Columbia
Trading Symbols
TSX : DOL NASDAQ : DYOLF
Capital Stock
Common Outstanding: 22,207,311 to April 30, 2004
Creative Design: XY3 Design + Communications Inc., West Vancouver BC Webmaster:
Webhead Studios, Sammamish, WA
Printed in Canada on 30% post consumer; EcoLogo certified
www.dynamicoil.com
[GRAPHIC OMITTED]
www.dynamicoil.com