
2004 Annual Report
Dynamic Oil & Gas, Inc. is a Canadian-based energy company engaged in the production and exploration of western Canada’s natural gas and oil reserves. We own working interests in producing and early-stage exploration properties located in various areas of southwestern and northeastern British Columbia, central Alberta and southwestern Saskatchewan.
Dynamic’s common shares trade on The Toronto Stock Exchange under the symbol “DOL” and on the NASDAQ under the symbol “DYOLF”
Abbreviations
| bbl or bbls | barrel or barrels |
| mcf | thousand cubic feet |
| bbl/d | barrels per day |
| mcf/d | thousand cubic feet per day |
| mbbl | thousand barrels |
| mmcf | million cubic feet |
| bcf | billion cubic feet |
| boe | barrels of oil equivalent (6 mcf = 1 bbl) |
| mmcf/d | million cubic feet per day |
| boe/d | barrels of oil equivalent per day |
| NGL’s | natural gas liquids |
| mboe | thousand barrels of oil equivalent |
DYNAMIC OIL & GAS, INC. 2004 ANNUAL REPORT
2004 HIGHLIGHTS
| | Twelve Months | | Twelve Months | | Twelve Months | |
| | Ended Dec 31 | | Ended Dec 31 | | Ended Dec 31 | |
| | 2004 | | 2003 | | 2002 | |
| |
| DAILY PRODUCTION | | | | | | |
| Natural gas(mcf/d) | 12,518 | | 13,050 | | 14,174 | |
| Natural gas liquids(bbls/d) | 572 | | 662 | | 698 | |
| Light/medium crude oil(bbls/d) | 174 | | 610 | | 271 | |
| Heavy crude oil(bbls/d) | 61 | | - | | - | |
| All products(boe/d) | 2,893 | | 3,447 | | 3,332 | |
| Total annual production(mboe) | 1,059 | | 1,258 | | 916 | |
| |
| PRICES – WEIGHTED AVERAGE | | | | | | |
| Natural gas($/mcf) | 6.67 | | 6.56 | | 4.36 | |
| Natural gas liquids($/bbl) | 30.21 | | 27.68 | | 20.90 | |
| Light/medium crude oil(bbls/d) | 50.03 | | 42.98 | | 41.40 | |
| Heavy crude oil(bbls/d) | 21.07 | | - | | - | |
| Corporate netback($/boe) | 21.97 | | 21.86 | | 14.53 | |
| |
| RESERVES – PROVED PLUS PROBABLE | | | | | | |
| Natural gas(mmcf) | 27,181 | | 42,158 | | 37,489 | |
| Natural gas liquids(mbbls) | 1,232 | | 1,393 | | 1,631 | |
| Light/medium crude oil(bbls/d) | 650 | | 793 | | 1,846 | |
| Heavy crude oil(bbls/d) | 1,332 | | 6 | | - | |
| Total(mboe) | 7,744 | | 9,218 | | 9,725 | |
| |
| UNDEVELOPED LAND | | | | | | |
| Net acres | 130,747 | | 121,921 | | 110,744 | |
| |
| FINANCIAL($ 000’s, unless otherwise stated) | | | | | | |
| Gross revenues | 40,806 | | 46,848 | | 24,123 | |
| Cash flow from operations(1) | 19,421 | | 23,097 | | 10,810 | |
| Per common share | 0.82 | | 1.07 | | 0.53 | |
| Net (loss) earnings | (12,281 | ) | 4,978 | | 2,004 | |
| Per common share | (0.52 | ) | 0.23 | | 0.10 | |
| Capital investment program(2) | 36,836 | | 35,374 | | 13,837 | |
| Operating loan | 15,550 | | 13,250 | | 11,075 | |
| Common shares outstanding | | | | | | |
| Basic | 23,665,110 | | 21,393,902 | | 20,357,153 | |
| Diluted | 23,665,110 | | 21,947,801 | | 20,554,231 | |
| (1) | Cash flow from operations is a non-GAAP measure that does not have a standardized meaning as prescribed by GAAP and therefore may or may not be comparable to similar measures presented by other companies. We consider it a key measure as it demonstrates our ability to generate the cash flow necessary to fund future growth through capital investment and to repay debt. |
| |
| (2) | For Fiscal 2004, we changed the method of reporting capital transactions. We now report capital transactions under the title, “Capital Investment Program” instead of the former title, “Capital Expenditures”. The difference in methods is that Capital Investment Program includes exploration expenses relating to seismic and unsuccessful drilling efforts, whereas Capital Expenditures did not. Seismic and unsuccessful drilling costs comprise the majority of our Exploration expense as reported in our Statements of Operations and Deficit. Capital expenditures are reported on our Balance Sheets. When combined, annual expenditures for capital, and annual expenses for seismic and unsuccessful drilling, represent the sum total of our yearly Capital Investment Program. All comparative amounts have been restated accordingly. |
| |
PRESIDENT'S MESSAGE
As I write this message to shareholders, I am looking at near record-high oil prices and no relief in sight for consumers. In fact, just the opposite is true. The world is reaching its peak ability to produce and there is very little spare capacity left. All of this is occurring at a time when nations like China are increasing demand at a remarkable rate as they begin to westernize their economies.
Shortly after I started the Company in 1979, I had the opportunity to participate in acquiring and drilling some oil properties in Saskatchewan. We were part of a consortium consisting of a major US producer and two or three small juniors. We were very successful – the key property, West Hastings, ultimately yielded more than a million barrels of medium-gravity crude oil from just a couple sections of land. Our interest was small – only about 10% – but it got us started. Another two nearby properties, Elmore and Rapdan, are still on our books and, after almost 25 years, continue to produce commercial quantities of crude oil.
In October, 2004, we returned to Saskatchewan and were successful yet again. Our discovery, east of the Mantario pool in SW Saskatchewan, is part of a large Basal Mannville oil trend. Independent estimates of proved and probable reserves indicate there is a lot more oil here than at our previous discoveries in Saskatchewan, but because the oil is heavier and recovery factors are lower, it is not clear how much of it will ultimately be produced. Unlike earlier times, our working interest at Mantario is much higher, at 75%, and we have the advantage of being field operator.
Prior to October 2004, our last Saskatchewan well was drilled in 1983. Why did we leave the area? We never really did, but our attention was focused on the chance of building a much larger reserve base in Alberta and British Columbia. Today, we’ve grown to a land base of over 38,000 net working interest acres of developed and undeveloped Alberta properties and nearly 85,000 net acres in producing and early-stage exploration lands in British Columbia. This compares to our recent build-up to 7,500 net acres in Saskatchewan.
On May 19, 2004, we completed a brokered private placement financing that raised net proceeds of $11.6 million. Upon closing of the private placement, we issued 2.0 million flow-through shares at $5.60 per share and 280,000 common shares (non flow-through) at $4.55 per share. These proceeds funded most of our exploratory work at Cypress in 2004 and funded our new pool heavy oil discovery at Mantario.
DYNAMIC OIL & GAS, INC. 2004 ANNUAL REPORT
The biggest lure has been in northeastern British Columbia, where much of the basin is rugged and unexplored and no one really knows what lies just beneath the surface. After a great exploration start at Cypress in 2002, we have been disappointed by recent drilling results and poor well performance, major factors that contributed to our financial write-downs this year. Although our 2005 spending plans at Cypress are more conservative, we need to remember that less than one-quarter of the 20,000 some-odd net acres we hold have been ‘developed’ to date. The remoteness and tough operating conditions up north means that for the cost of one outpost exploratory well, we can drill up to five wells in Saskatchewan.
St. Albert is a core Alberta property and in 2004 we focused on optimization of our sweet gas compressor system as well as upgrading our salt-water disposal facilities. We also acquired a new water-disposal well to address future water handling and increase incremental oil production. In 2005, several of our projects at St. Albert are designed to slow natural production declines and further enhance recovery of nearly 4.7 million barrels of oil equivalent, which is our estimated share of remaining proved and probable oil and natural gas reserves.
One of the challenges we face in having heavy oil as a portion of our production base is the differential in price between heavy crude and light crude oil. This ‘differential’ depends on several factors including crude quality and refining capacity. Most refiners are equipped to handle only light crude. But since light crude is now in shorter supply throughout the world, more refiners will have to convert to handle the heavier products. Just recently, we have seen Saudi Arabia bringing more heavy crude onto the world market as their lighter crude stocks rapidly decline. As demand increases, this differential will narrow, especially for the better quality heavy crude similar to our Mantario product.
Our planned strategy for 2005 is to take a slightly more conservative approach to our exploration program than in 2004, while at the same time rapidly developing our new-pool oil discovery at Mantario and enhancing our oil and gas production at St. Albert. At Cypress, we look forward to production growth as two new wells come on stream and additional compression is installed.
Over the past twelve months we have looked at a number of opportunities for enhancing shareholder value. Going forward, we intend to widen our scope by looking at a number of plausible strategic transactions that may be a fit for our unique asset base. As our plans unfold, I look forward to keeping you informed of our progress.

WAYNE J. BABCOCK,
President & Chief Executive Officer

PROPERTIES, PLANT AND EQUIPMENT
We own various interests in certain properties located in the Western Provinces of Canada. For purposes of identification, discussion and differentiation, we have named them based on their location. They are as follows:
| Alberta | | British Columbia | Saskatchewan |
| St. Albert | Westlock | Cypress/Chowade | Mantario East |
| Halkirk | Simonette | Orion | Elmore |
| Peavey/Morinville | Wimborne | Fraser Valley | Rapdan |
| Alexander | Quirk Creek | | Flaxcombe |
| Stanmore | | | Sandgren |
Our total land holdings increased during Fiscal 2004 by 8,826 net acres (22,269 gross), or 7%. Of this increase, 85% was due to newly-acquired interests in three new properties in Southern Saskatchewan: Mantario East; Flaxcombe; and Sandgren. The remaining 15% was the net result of new acquisitions at Cypress/Chowade and Orion, and minor land reductions at St. Albert and Peavey/Morinville. Our total land holdings were 130,747 net acres, of which 101,878 net acres, or 78%, were undeveloped.
DYNAMIC OIL & GAS, INC. 2004 ANNUAL REPORT
LAND HOLDINGS (ACRES)
As at December 31, 2004
| | Developed | | Undeveloped | | Total | | Weighted | |
| Area | Gross | | Net | | Gross | | Net | | Gross | | Net | | Avg WI % | |
| |
| ALBERTA | | | | | | | | | | | | | | |
| St. Albert | 8,901 | | 5,873 | | 3,938 | | 2,228 | | 12,839 | | 8,101 | | 63% | |
| Halkirk | 3,840 | | 3,456 | | 2,880 | | 2,880 | | 6,720 | | 6,336 | | 94% | |
| Peavey/Morinville | 6,467 | | 4,708 | | 3,776 | | 2,290 | | 10,243 | | 6,998 | | 68% | |
| Wimborne | 2,560 | | 1,760 | | 7,115 | | 5,995 | | 9,675 | | 7,755 | | 80% | |
| Other | 3,527 | | 2,690 | | 9,920 | | 6,352 | | 13,447 | | 9,042 | | 67% | |
| | 25,295 | | 18,487 | | 27,629 | | 19,745 | | 52,924 | | 38,232 | | 72% | |
| |
| BRITISH COLUMBIA | | | | | | | | | | | | | | |
| Cypress/Chowade | 10,978 | | 4,925 | | 45,697 | | 14,986 | | 56,675 | | 19,911 | | 35% | |
| Orion | 5,340 | | 4,005 | | 61,274 | | 42,797 | | 66,614 | | 46,802 | | 70% | |
| Fraser Valley | - | | - | | 54,502 | | 18,278 | | 54,502 | | 18,278 | | 34% | |
| | 16,318 | | 8,930 | | 161,473 | | 76,061 | | 177,791 | | 84,991 | | 48% | |
| |
| SASKATCHEWAN | | | | | | | | | | | | | | |
| Mantario East | 967 | | 745 | | 2,928 | | 2,206 | | 3,895 | | 2,951 | | 76% | |
| Flaxcombe | 40 | | 30 | | 6,085 | | 3,153 | | 6,125 | | 3,183 | | 52% | |
| Sandgren | 680 | | 655 | | 1,903 | | 713 | | 2,583 | | 1,368 | | 53% | |
| Rapdan | 160 | | 14 | | - | | - | | 160 | | 14 | | 9% | |
| Elmore | 162 | | 8 | | - | | - | | 162 | | 8 | | 5% | |
| | 2,009 | | 1,452 | | 10,916 | | 6,072 | | 12,925 | | 7,524 | | 58% | |
| Total to Dec 31, 2004 | 43,622 | | 28,869 | | 200,018 | | 101,878 | | 243,640 | | 130,747 | | 54% | |
| Total to Dec 31, 2003 | 32,081 | | 21,665 | | 189,290 | | 100,256 | | 221,371 | | 121,921 | | 55% | |
| Increase (decrease) | 11,541 | | 7,204 | | 10,728 | | 1,622 | | 22,269 | | 8,826 | | | |
| Increase (decrease) % | 36% | | 33% | | 6% | | 1.6% | | 10% | | 7% | | | |
Our weighted average working interests in our properties were: Alberta - 72%, British Columbia – 48%; and Saskatchewan – 58%. Our total weighted average working interest in Fiscal 2004 was 54% compared to 55% in Fiscal 2003.
PROPERTIES, PLANT & EQUIPMENT
ALBERTA PROPERTIES
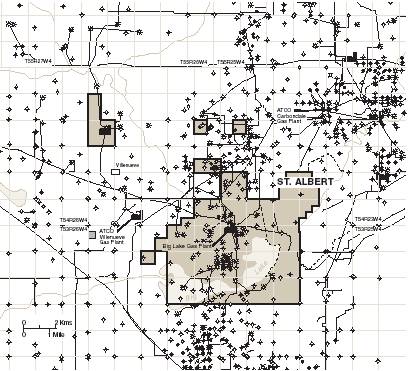
 ST. ALBERT
St. Albert is located in central Alberta, northwest of the City of Edmonton and near the City of St. Albert.
GEOLOGICAL DESCRIPTION
The property is comprised of two reef structures that are associated with 16 separate pools of Cretaceous Age natural gas and Devonian Age crude oil that are stacked in seven productive formations. Four of the productive formations are natural gas and three are crude oil. For purposes of project identification, we refer to the two reef structures as the “north pool” and the “south pool”. In aggregate, both structures have historically produced in excess of 23.7 million barrels of crude oil and 121 billion cubic feet of raw natural gas.
LAND HOLDINGS
We own 8,101 net acres (12,839 gross) of various crown and freehold petroleum and natural gas leases for a weighted average working interest of 63%. Of our net acreage, 28% is undeveloped.
SEISMIC
We own a 37.5% working interest in a proprietary 3D seismic database covering 12 square kilometers.
WELLS AND FACILITIES
We own a weighted average 75% working interest in 16 producing gas wells and a 75% working interest in nine producing oil wells. In addition, we own a 75% working interest in one oil battery, two saltwater disposal wells, one solution gas plant, one sour gas compressor, two sweet gas compressors and a 13 kilometer, 6” sour gas pipeline.
FISCAL 2004 ACTIVITIES
In the north pool we drilled one successful well targeting remaining oil reserves in the Leduc D-3 formation and Wabamun D-1 formation. The well is completed in both formations and is presently producing oil from the Wabumun D-1 formation. Also in the north pool, we drilled one unsuccessful well targeting shallow gas in the Belly River and Edmonton formations. In the south pool, we acquired a new water disposal well to address future water handling and disposal associated with our oil production.
We completed untested zones in two existing natural gas wells in the Ostracod formation to further optimize sweet gas production. Further, we optimized our sweet gas compressor and upgraded our salt-water disposal facilities.
FISCAL 2005 OUTLOOK
Our Fiscal 2005 budget continues to focus on production optimization. Two capital projects are planned to slow the natural decline rate of oil and gas production and to improve operating efficiencies. All projects are geared toward enhanced recovery of remaining crude oil and natural gas reserves from known pools.
One development well is planned for Fiscal 2005 targeting remaining oil in the Leduc D-3 and Wabamun D-1 formations. Our investment at St. Albert includes numerous wells and facilities in close proximity to urban areas. For this reason, we will continue our commitment to “STAMP” (“St. Albert and Area Multi-Stakeholder Project”), which we helped create to bring oil and gas operators, regulators, local government and special interest groups together in a forum for open dialog and information exchange.
DYNAMIC OIL & GAS, INC. 2004 ANNUAL REPORT
St. Albert
 | MAP LEGEND 
|
PROPERTIES, PLANT & EQUIPMENT
 HALKIRK
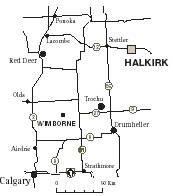
Halkirk is located in central Alberta approximately 168 kilometers northeast of Calgary.
GEOLOGICAL DESCRIPTION
This area is prospective for multiple, sweet natural gas-bearing Cretaceous Age sandstone reservoirs. The primary target for reserves is the Viking formation with an average net pay thickness of approximately five meters.
LAND HOLDINGS
We own 6,336 net acres (6,720 gross) of crown and freehold petroleum and natural gas leases for a weighted average working interest of 94%. Of our net acreage, 45% is undeveloped.
WELLS AND FACILITIES
We own a 100% working interest in four producing Viking gas wells and an 80% working interest (before payout of our initial capital expenditures), in three producing Viking gas wells. After payout, our working interest will convert to 48%. All of our natural gas production is processed at the Maple Glen Gas Plant under a custom processing agreement with the plant’s third-party owner.
FISCAL 2004 ACTIVITIES
During the year, production operations were maintained without significant capital expenditures.
FISCAL 2005 OUTLOOK
Two infill development wells are planned and will target sweet natural gas in the Viking formation. Our existing gathering system will accommodate production from these wells.
Halkirk
 | MAP LEGEND  |
DYNAMIC OIL & GAS, INC. 2004 ANNUAL REPORT
Peavey/Morinville
 | MAP LEGEND |
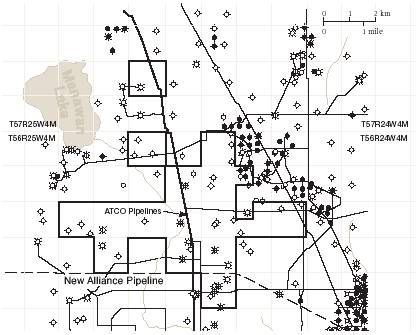
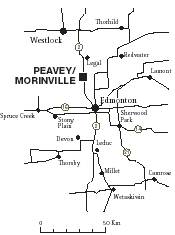 PEAVEY/MORINVILLE
Peavey/Morinville is located a short distance from our St. Albert field and is approximately 19 kilometers north of the City of Edmonton.
GEOLOGICAL DESCRIPTION
The area is comprised of natural-gas bearing sandstones and shales of Cretaceous Age that are structurally draped over highs in the Leduc D-3 formation.
LAND HOLDINGS
We own 6,998 net acres (10,243 gross) of petroleum and natural gas rights for a weighted average working interest of 68%. Of our total net holdings, 33% is undeveloped.
SEISMIC
We own a licensed copy of a high quality, 3D seismic database covering 14 square kilometers.
WELLS AND FACILITIES
We own a weighted average working interest of 77% in six producing natural gas wells.
FISCAL 2004 ACTIVITIES
During the year, we equipped, tied in and began producing from one natural gas well that was drilled in a prior year. All other production operations were maintained without significant capital expenditures.
FISCAL 2005 OUTLOOK
Tie-in of one well and recompletion of another is planned for early in Fiscal 2005.
PROPERTIES, PLANT & EQUIPMENT
Wimborne
 | MAP LEGEND |
 WIMBORNE
Wimborne is located in south-central Alberta approximately 112 kilometers northeast of Calgary.
GEOLOGICAL DESCRIPTION
The area is prospective for multiple Cretaceous Age sandstone reservoirs containing natural gas and natural gas liquids. Additional potential exists for crude oil and natural gas within deeper Mississippian and Devonian Age carbonate reservoirs.
LAND HOLDINGS
We own 7,755 net acres (9,675 gross) of petroleum and natural gas rights for a weighted average working interest of 80%. Of our total net holdings, 74% is undeveloped.
SEISMIC
We own a licensed copy of a high quality, 3D seismic database covering 260 square kilometers.
WELLS AND FACILITIES
We own a 100% working interest in one cased and standing gas well. The property is in close proximity to existing natural gas pipelines and processing facilities.
FISCAL 2004 ACTIVITIES
We participated at a 50% working interest in the drilling of two wells targeting gas in Cretaceous Age formations. Both wells were unsuccessful.
FISCAL 2005 OUTLOOK
Our large 3D seismic database has identified multiple undrilled exploration targets on our lands. While we have no drilling plans for Fiscal 2005, the area remains prospective for third-party farmout opportunities.
DYNAMIC OIL & GAS, INC. 2004 ANNUAL REPORT
BRITISH COLUMBIA PROPERTIES
 CYPRESS/CHOWADE
Cypress/Chowade is located in the foothills of northern British Columbia approximately 100 kilometers northwest of Fort St. John.
GEOLOGICAL DESCRIPTION
The area is prospective for multiple, natural gas-bearing Triassic Age and deep Mississippian Age carbonate reservoirs contained within classic foothill anticlines that trend northwest/southeast through the area.
LAND HOLDINGS
We have crown petroleum and natural gas leases over 19,911 net acres (56,675 gross) for a weighted average working interest of 35%. Of our total net acreage, 75% is undeveloped.
SEISMIC
Our seismic database contains a total of 440 kilometers of licensed, trade 2D seismic data, as well as a 100% working interest in 15 kilometers of 2D proprietary seismic data.
WELLS AND FACILITIES
We have four producing and six cased and standing natural gas wells. In the four producing wells, we own a 50% working interest. Our working interests in the six cased and standing wells are: 50% in three wells; 100% in one; 30%
Cypress/Chowade

| MAP LEGEND |
PROPERTIES, PLANT & EQUIPMENT
in one; and 20% in the remaining well. In four of the ten wells in which we own a 50% working interest, our interest converts to a 30% working interest after payout. In addition, we own approximately 40% of an 8” 19-kilometer pipeline that crosses beneath the Halfway River and connects Cypress to the Sikanni Gas plant.
We split delivery of our 2004 gas production to Cypress Gas Plant and Sikanni Gas Plant under separate third party custom processing agreements.
FISCAL 2004 ACTIVITIES
We participated in drilling five wells and in completing an untested zone in an existing wellbore. These wells targeted multi-zone, natural-gas bearing reservoirs of Triassic and Mississippian Ages. Our working interests in the wells were: one at 100% working interest; three at 50%; and two at 30%. Of the five wells that were drilled, three were cased and standing as potential natural gas wells and two were unsuccessful. We also participated in the construction of the 8” 19-kilometer pipeline mentioned above. We also acquired 4,394 net acres (11,544 gross).
During Fiscal 2004, costs related to three wells that were drilled and completed in Fiscal 2003 were expensed due to unsuccessful efforts to develop proved reserves. Our working interest was 30% in two of these wells and 50% in the third.
FISCAL 2005 OUTLOOK
We plan to participate, at a 30% working interest, in drilling two exploratory outpost wells and shooting 15 kilometers of 2D seismic. We also plan to have two of our six cased and standing shut-in gas wells on stream in the first quarter of Fiscal 2005. The remaining two shut-in wells require further development in the area to meet threshold reserves necessary for tie-in.
In addition, we have budgeted for our 30% share of the cost to add field compression. The current processing capacities of two gas plants in the area are expected to meet our processing needs in Fiscal 2005. We will continue to monitor and evaluate land acquisition opportunities in the area.
 ORION
ORION
Orion is strategically located between the Sierra and Helmet natural gas fields approximately 56 kilometers west of the Alberta border and 112 kilometers south of the Northwest Territories border. The property is dissected by the Sierra Yoyo Desan Road, which provides year-round access for drilling operations.
A large independent Canadian oil and gas company has referred to the regional Devonian Age Jean Marie carbonate reservoir in this area as “The Greater Sierra Gas Play” and has described the area as the largest gas play discovered in Western Canada. Orion is a part of this area and is a key element in our long-term growth strategy.
GEOLOGICAL DESCRIPTION
The area is prospective for natural gas exploration and development in Cretaceous Age Bluesky sandstone reservoirs and Mississippian and Devonian Age Debolt, Jean Marie and Slave Point formation carbonate reservoirs.
LAND HOLDINGS
We hold under lease 46,802 net acres (66,614 gross) for a weighted average working interest of 70%. Approximately 91% of our net holdings are undeveloped.
WELLS AND FACILITIES
We own a 15% gross overriding royalty interest (before payout of our initial capital expenditures) in one cased and standing potential Jean Marie gas well and a 100% working interest in one cased and standing potential Bluesky formation gas well. The gross overriding royalty interest will convert to a 50% working interest after payout. Both wells are cased and standing and awaiting further evaluation and area development. We also own a 100% working interest in two other standing cased wells with potential value for purposes of side-track drilling or water disposal.
DYNAMIC OIL & GAS, INC. 2004 ANNUAL REPORT
Two major pipeline systems terminate at the edge of our property. To the southwest, the Duke Energy Pipeline System connects to Fort Nelson for delivery to Washington State and to the northeast. The Duke Energy Field Services Pipeline System connects to Tooga Compressor Station for delivery to Alberta.
FISCAL 2004 ACTIVITIES
During the first quarter, we conducted a two-phase 3D seismic program covering 90 square kilometers of the property. Interpretation of the seismic data has identified several drillable targets on our land. During the third and fourth quarters, we drilled three wells targeting gas in the Bluesky and Jean Marie formations. Two of these wells were drilled at a 100% working interest and one well was drilled at a 50% working interest. One of the 100% wells has been cased as a potential standing gas well and the other two wells were unsuccessful.
We drilled one well at 100% working interest, targeting gas in the Slave Point formation. The Slave Point well was cased and production tested but did not produce commercial quantities of gas. The well is a cased and standing gas well with further sidetrack drilling potential.
During Fiscal 2004, costs related to two wells that were drilled and completed in Fiscal 2003 were expensed due to unsuccessful efforts to develop proved reserves. Our working interest in these two these wells was 100%.
FISCAL 2005 OUTLOOK
We plan to drill one development well in the first quarter, targeting gas in a producing Bluesky gas pool that directly offsets company-owned lands. We also plan to drill one exploration well in the fourth quarter targeting gas in a similar, but separate, Bluesky structure. Both wells are planned at 100% working interest.
Orion
 | MAP LEGEND |
PROPERTIES, PLANT & EQUIPMENT
FRASER VALLEY
The property is located in the Lower Mainland area of southwest British Columbia near Vancouver.
LAND HOLDINGS
Under a joint venture agreement with Conoco Canada Limited, we continue to hold a weighted average working interest of 34% in approximately 18,278 net acres (54,502 gross) of undeveloped onshore and offshore petroleum and natural gas rights associated with Permit 802, a validated British Columbia Exploration Permit. Permit 802 is under provincial jurisdiction and includes offshore petroleum and natural gas rights in the Georgia Basin, located in the Strait of Georgia between the Lower Mainland and Vancouver Island.
FISCAL 2004 ACTIVITIES
We were inactive in the Fraser Valley area during Fiscal 2004.
FISCAL 2005 OUTLOOK
Areas offshore are subject to a restricted-access moratorium for petroleum and natural gas activities; however, discussions are underway between the Provincial and Federal Governments in regards to lifting the moratorium. The Provincial Government has indicated its desire to move forward, and the Federal Government is currently conducting a public review to identify environmental and social concerns arising from offshore activities along the Pacific West Coast. A final decision on the matter is not expected in 2005.
We have identified, through analysis of our proprietary onshore 2D seismic data, a large structural feature approximately 19 square kilometers in size extending offshore. Government-owned gravity data supports our interpretations and refers to the feature as the Robert’s Bank Gravity Anomaly. The Geological Survey of Canada has assigned the Georgia Basin a reserve estimate of 6.5 trillion cubic feet of natural gas. A commercial quantity of gas is yet to be discovered in the area. We plan to be inactive in the Fraser Valley in 2005.
OTHER NON-CORE PROPERTIES
Alberta properties include: Alexander; Stanmore; Westlock; Simonette; and Quirk Creek. Saskatchewan properties include: Elmore; and Rapdan. In total, these properties comprise 9,064 net acres (13,769 gross) with a weighted average working interest of 66%. Of our total net acreage, 71% is undeveloped.
S.W. SASKATCHEWAN PROPERTIES
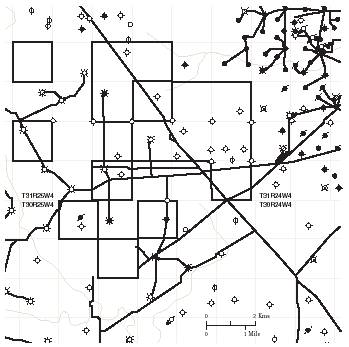
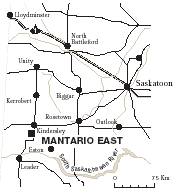 MANTARIO EAST AND SURROUNDING AREAS
Mantario East is located 30 kilometers southwest of the Town of Kindersley and 30 kilometers east of the Alberta Border.
GEOLOGICAL DESCRIPTION
The area is prospective for multiple Cretaceous, Mississippian and Devonian aged sandstone and carbonate reservoirs. Primary targets include natural gas-bearing Viking, Upper Mannville and Bakken formations and heavy-oil in the Basal Mannville and Birdbear formations.
LAND HOLDINGS
We hold under lease 7,524 net acres (12,925 gross) for a weighted average working interest of 58%. Approximately 81% of our net holdings are undeveloped.
WELLS AND FACILITIES
We have 11 heavy-oil wells at Mantario East, five of which are in production and six of which are cased and standing awaiting tie-in. In three of the five producing wells, our ownership is a 100% working interest (before payout of our original capital expenditures), converting to a 75% working interest after payout. In the other two producing and the six cased and standing wells, we own a 75% working interest. At Sandgren, we own a 100% working interest before payout in one cased and standing gas well that converts to a 75% working interest after payout.
DYNAMIC OIL & GAS, INC. 2004 ANNUAL REPORT
FISCAL 2004 ACTIVITIES
We discovered a new pool of oil in the Basal Mannville at Mantario East. The oil is classified by regulation as Basal Mannville heavy-gravity crude. The nearest analogs to our heavy-oil discovery is located directly west of us on lands owned by others (non-owned) at Marengo, Mantario North, and Mantario East. The nearest pools on non-owned lands at Mantario East, have produced over three million barrels of heavy-oil from 36 wells in pool sizes of approximately 800 acres. On our lands at Mantario East, the number of pools and their sizes has not yet been determined.
In total, we drilled 15 wells in the Mantario area during the third and fourth quarters of Fiscal 2004. Of these, five were earning wells drilled at a 100% working interest under a farmout agreement and 10 were non-earning wells drilled at a 75% working interest with an industry partner. The 15-well drilling program resulted in five producing, and six cased and standing heavy crude oil wells, one cased and standing natural gas well, and three unsuccessful wells.
FISCAL 2005 OUTLOOK
We have budgeted to drill four exploration oil and/or natural gas wells and to conduct a 15-well, in-fill drilling program targeting Basal Mannville oil. We also have budgeted to build a gathering system and a heavy crude oil battery facility in Fiscal 2005. We also plan to equip and tie-in two of six cased and standing heavy crude oil wells in the first quarter of Fiscal 2005 and the remaining four in the second quarter. Funds have also been budgeted to acquire additional lands and seismic data in the area.
The gathering system and heavy crude oil battery is a two-phase construction project. Phase I is scheduled for completion by April 1, 2005 and will include tie-in of eight heavy crude oil wells to a central battery facility capable of processing up to 1,500 barrels per day. Phase II will include tie-in of remaining wells as they are drilled and will expand the processing capacity of the battery to 2,500 barrels per day from an estimated 25 wells.
Mantario East
 | MAP LEGEND |
HEALTH, SAFETY AND THE ENVIRONMENT
The protection of the public, environment and our employees is an essential cornerstone of our conduct in all areas where we have operations. We understand our duty to provide for the health and safety of others and to promote environmentally-sound business practices and processes.
Our commitment to a sound health and safety program enables us to identify and address risks and hazards that may affect others at or near our places of work. Through the exemplary efforts of our employees, we strive toward preventative measures that lead to zero ongoing injuries and illnesses.
In 2004, we achieved industry recognition for performance in environmental management and stewardship by being awarded the “Steward of Excellence Award”, an acknowledgement made by the Canadian Association of Petroleum Producers (“CAPP”). We believe this is confirmation that our environmental practices and procedures are working.
As a CAPP member, we also participate in their annual health, safety and environmental stewardship-benchmarking program. In 2005, we plan to submit our report on a variety of benchmarks that allow us in tracking our yearly progress compared with industry peers. This will be an invaluable tool to help us compare the soundness of our programs against current practices and procedures.
Our continued participation in the Alberta synergy group known as the St. Albert and Area Multi-Stakeholder Project, enables us to gather important input from local stakeholders. This enhances the opportunity for mutual education and communication.
DYNAMIC OIL & GAS, INC. 2004 ANNUAL REPORT
SUMMARY OF RESERVES
The reserve data set out in the summary table below is based on an independent engineering evaluation of our estimated oil and gas reserves effective December 31, 2004, as conducted by Sproule Associates Limited. These reserves are reported on a before-royalties basis under constant prices and operating cost assumptions. The evaluation was prepared in accordance with Canadian National Instrument 51-101 “Standards of Disclosure for Oil and Gas Activities” (NI 51-101).
Summary of Company Interest Reserves (Before Royalties)
| Light and | | | Heavy | | Natural | | Natural Gas | | | |
| Medium Oil | | | Oil | | Gas(1) | | Liquids | | Total | |
| | (mbbl) | | (mbbl) | | (mmcf) | | (mbbl) | | (mboe) | |
| Proved | | | | | | | | | | |
| Developed producing | 205 | | 314 | | 14,300 | | 835 | | 3,738 | |
| Developed non-producing | 13 | | 83 | | 672 | | 7 | | 215 | |
| Undeveloped | 23 | | 223 | | 1,165 | | 11 | | 451 | |
| Total proved | 241 | | 620 | | 16,137 | | 853 | | 4,404 | |
| Probable | 409 | | 712 | | 11,044 | | 379 | | 3,340 | |
| Total proved + probable - Dec. 31, 2004 | 650 | | 1,332 | | 27,181 | | 1,232 | | 7,744 | |
| Total proved + probable - Dec. 31, 2003 | 793 | | 6 | | 42,158 | | 1,393 | | 9,218 | |
| Increase (decrease) | (143 | ) | 1,326 | | (14,977 | ) | (161 | ) | (1,474 | ) |
| Increase (decrease) % | (18 | )% | - | | (36 | )% | (12 | )% | (16 | )% |
(1) Estimates of reserves of natural gas includes solution gas.
Effective December 31, 2004, our proved reserves on a before-royalties, constant-price basis were independently estimated at 4,404 mboe, as compared with 5,572 mboe last year. This is a net decrease of 1,168 mboe or 21%, comprised of total additions to proved reserves of 1,138 mboe, less production of 1,059 mboe, and less technical revisions and economic factors of 1,247 mboe.
The total proved reserve additions of 1,138 mboe during Fiscal 2004 were made up of 432 mboe added through extensions and improved recovery, 571 mboe added through discoveries, and 135 mboe added through acquisitions. These total additions represented a 7% growth over our production of 1,059 mboe, before consideration of technical revisions.
The decrease in proved reserves of 1,247 mboe due to technical revisions and economic factors, were primarily associated with our Cypress/Chowade field. Cypress revisions were effected by a combination of higher-than-expected decline rates from four producing wells and lower reserve expectations in two, recently drilled development wells.
Cypress is an early-stage exploration area and our land base is significant, totaling 56,675 gross acres (19,911 net). Initial drilling results were highly favourable, with the first five wells being classified as new-pool discoveries. Recent results, including our two latest wells, have been much less favourable. Of our total gross acreage at Cypress, 81% is as-yet undeveloped
Also included in technical revisions to our proved natural gas reserves was a decrease of approximately 650 mmcf due to third-party, acid-gas contamination of a single Ostracod sweet gas well at St. Albert that, since March 1, 2004, was no longer able to produce into existing facilities. In early 2005, we expect to receive full cash value for the loss of reserves and production associated with this well.
On a before-royalties constant-price basis, our proved plus probable reserves were estimated at 7,744 mboe, as compared with 9,207 mboe last year. The net decrease of 1,463 mboe between periods is mostly due to the same factors discussed above that decreased our proved reserves at Cypress/Chowade and St. Albert. Extensions, discoveries and improved recoveries increased our estimated proved plus probable reserves of natural gas and natural gas liquids by 2,246 mmcf and 105 mbbls, respectively. The majority of this was due to our success with various optimization projects that were designed to mitigate natural production declines at St. Albert.
SUMMARY OF RESERVES
At St. Albert, an increase of 85 mbbls to estimated light/medium crude oil proved plus probable reserves was mainly due to extensions and improved recovery, while a decrease of 164 mbbls was mainly due to revisions. The revisions were largely based upon disappointing drilling results in the Wabamun and Leduc formations. One or two drill targets that could recover a portion of the revisions are being considered for Fiscal 2005.
Estimated proved plus probable reserves of heavy oil increased by 1,332 mbbl due mainly to the discovery of a new oil pool (1,115 mbbls) and subsequent acquisition of a partner’s interest (278 mbbls) at Mantario East in southwestern Saskatchewan. We operate and own a 76% weighted average interest in 2,951 net acres (3,895 gross) in the Mantario East area.
Reserves Reconciliation
The following reconciliation shows the changes that occurred during Fiscal 2004 in our estimated reserves before royalties under constant price and operating cost assumptions.
Reconciliation of Company Interest Reserves (Before Royalties)
| | Light/Medium Crude Oil | | Heavy Crude Oil | | Natural Gas | | Natural Gas Liquids | | Total | |
| | | | Proved | | | | Proved | | | | Proved | | | | Proved | | | | Proved | |
| | | | Plus | | | | Plus | | | | Plus | | | | Plus | | | | Plus | |
| | Proved | | Probable | | Proved | | Probable | | Proved | | Probable | | Proved | | Probable | | Proved | | Probable | |
| | (mbbl) | | (mbbl) | | (mbbl) | | (mbbl) | | (mmcf) | | (mmcf) | | (mbbl) | | (mbbl) | | (mboe) | | (mboe) | |
| Dec. 31, 2003 | 498 | | 793 | | 5 | | 6 | | 24,493 | | 42,158 | | 987 | | 1,393 | | 5,572 | | 9,218 | |
| Acquisitions | - | | - | | 133 | | 278 | | 9 | | 18 | | - | | - | | 135 | | 281 | |
| Extensions | 36 | | 36 | | - | | - | | 146 | | 462 | | 5 | | 15 | | 65 | | 128 | |
| Discoveries | - | | - | | 535 | | 1,115 | | 220 | | 415 | | - | | - | | 571 | | 1,184 | |
| Improved recovery | 49 | | 49 | | - | | - | | 1,369 | | 1,369 | | 90 | | 90 | | 367 | | 367 | |
| Revisions | (278 | ) | (164 | ) | (31 | ) | (45 | ) | (5,519 | ) | (12,660 | ) | (20 | ) | (57 | ) | (1,247 | ) | (2,375 | ) |
| Production | (64 | ) | (64 | ) | (22 | ) | (22 | ) | (4,581 | ) | (4,581 | ) | (209 | ) | (209 | ) | (1,059 | ) | (1,059 | ) |
| Dec.31, 2004 | 241 | | 650 | | 620 | | 1,332 | | 16,137 | | 27,181 | | 853 | | 1,232 | | 4,404 | | 7,744 | |
Net Present Values of Reserves
In the following two tables, we present Sproule’s estimated net present values effective December 31, 2004. The estimated net present values, before tax, are reported under assumptions of constant prices and operating costs or forecasted prices and operating costs. It should not be implicit that the undiscounted and discounted net present values presented represent the fair market values of our reserves, as the use of other assumptions could give rise to different results.
Net Present Value of Company Interest Reserves
Based on constant commodity prices and costs, before income taxes
| ($000’s) | | | Discounted at | |
| Undiscounted | | 5 % | | 10 % | | 15 % | |
| Proved | | | | | | | | |
| Developed producing | 73,892 | | 63,780 | | 56,325 | | 50,641 | |
| Developed non-producing | 2,694 | | 2,236 | | 1,905 | | 1,655 | |
| Undeveloped | 3,719 | | 2,936 | | 2,357 | | 1,914 | |
| Total proved | 80,305 | | 68,952 | | 60,587 | | 54,210 | |
| Probable | 52,089 | | 36,794 | | 27,726 | | 21,726 | |
| Total proved + probable – Dec. 31, 2004 | 132,394 | | 105,746 | | 88,313 | | 75,936 | |
DYNAMIC OIL & GAS, INC. 2004 ANNUAL REPORT
Based on forecasted commodity prices and costs, before income taxes
| ($000’s) | | | Discounted at | |
| Undiscounted | | 5% | | 10% | | 15% | |
| Proved | | | | | | | | |
| Developed producing | 60,991 | | 54,781 | | 49,834 | | 45,855 | |
| Developed non-producing | 3,137 | | 2,769 | | 2,481 | | 2,248 | |
| Undeveloped | 4,526 | | 3,884 | | 3,379 | | 2,973 | |
| Total proved | 68,654 | | 61,434 | | 55,694 | | 51,076 | |
| Probable | 44,483 | | 33,113 | | 26,181 | | 21,458 | |
| Total proved + probable – Dec. 31, 2004 | 113,137 | | 94,547 | | 81,875 | | 72,534 | |
In the process of estimating our proved and probable reserves on a constant-pricing basis, and their associated net present values, Sproule assumed that the December 31, 2004 benchmark prices shown in the following table would remain constant over the life of the reserves.
Summary of Pricing Assumptions
Based on Constant Prices and Costs
| Crude Oil | | Natural Gas | | Natural Gas Liquids |
| Edmonton Par | Hardisty Heavy, | | Alberta | B.C. West | | | | Pentanes |
| Price | 12° API Oil | | AECO-C | Coast Stn 2 | | Propane | Butane | Plus |
| ($Cdn/stb) | ($Cdn/stb) | | ($Cdn/MMBtu) | ($Cdn/MMBtu) | | ($Cdn/bbl) | ($Cdn/bbl) | ($Cdn/bbl) |
| 46.51 | 15.26 | | 6.78 | 6.68 | | 36.11 | 39.78 | 51.80 |
In the process of estimating our proved and probable reserves on a forecasted-pricing basis, and their associated net present values, Sproule used the following future prices and inflation rates.
Summary of Pricing and Inflation Rate Assumptions
Based on Forecast Prices and Costs
| | Crude Oil | | Natural Gas | | Natural Gas Liquids | | | | | |
| | WTI | | Edmonton | | Hardisty | | Natural Gas(1) | | Pentanes plus | | Butanes | | | | | |
| | Cushing | | Par Price | | Heavy | | AECO Gas | | FOB Field | | FOB Field | | Inflation | | Exchange | |
| | Oklahoma | | 40° API | | 12° API | | Prices | | Gate | | Rates | | Rates | | Rate(3 ) | |
| Year | ($US/bbl) | | ($Cdn/bbl) | | ($Cdn/bbl) | | ($Cdn/bbl) | | ($Cdn/MMBtu) | | ($Cdn/bbl) | | %/Yr (2 ) | | ($US/$Cdn) | |
| 2005 | 44.29 | | 51.25 | | 28.91 | | 6.97 | | 52.49 | | 38.20 | | 2.5 | | 0.840 | |
| 2006 | 41.60 | | 48.03 | | 28.12 | | 6.66 | | 49.19 | | 34.01 | | 2.5 | | 0.840 | |
| 2007 | 37.09 | | 42.64 | | 26.19 | | 6.21 | | 43.67 | | 30.20 | | 2.5 | | 0.840 | |
| 2008 | 33.46 | | 38.31 | | 25.06 | | 5.73 | | 39.23 | | 27.13 | | 2.5 | | 0.840 | |
| 2009 | 31.84 | | 36.36 | | 23.60 | | 5.37 | | 37.24 | | 25.75 | | 1.5 | | 0.840 | |
| Thereafter | | | | | Various Escalation Rates | | | | | | | |
| (1) | This summary table identifies benchmark reference pricing schedules that might apply to a reporting issuer. |
| |
| (2) | Inflation rates for forecasting prices and costs. |
| |
| (3) | Exchange rates used to generate the benchmark reference prices in this table. |
Notes: Product sale prices will reflect these reference prices with further adjustments for quality and transportation to point of sale.
Additional information regarding Dynamic’s estimated reserves will be included on exhibit Form 51-101 forming part of our Form 20-F, which is available on www.sedar.com, www.sec.gov/edgar and our website @ www.dynamicoil.com.
MANAGEMENT’S DISCUSSION & ANALYSIS
MANAGEMENT’S DISCUSSION & ANALYSISOF FINANCIAL CONDITION AND RESULTS OF OPERATIONS
TABLE OF CONTENTS
| Executive Overview. | 21 |
| Properties and Capital Investment. | 24 |
| Financial Results | |
| Cash Flow from Operations and Net (Loss) Earnings | 26 |
| Revenue Variances by Commodity | 27 |
| Daily Average Production Rates and Total Production | 28 |
| Weighted Average Commodity Prices. | 29 |
| Royalties, Mineral Taxes and Royalty Credits. | 30 |
| Production Costs | 30 |
| Amortization and Depletion Expense | 31 |
| Exploration Expenses | 31 |
| Interest Expense - Net | 32 |
| General and Administrative Expenses | 33 |
| Income Tax Expense and Tax Pools | 33 |
| Outlook for Fiscal 2005. | 34 |
| Liquidity and Capital Resources | 36 |
| Contractual Obligations and Commitments | 38 |
| Business Risk Management | 39 |
| Market Risk Management | 40 |
| Critical Accounting Policies | 42 |
| Summary of Results and Identifiable Trend Factors | |
| for Eight Most Recently Completed Quarters. | 43 |
| Accounting Policy Changes. | 44 |
The following should be read in conjunction with our Financial Statements, the Notes to the Financial Statements and our Report of Management and Directors on Oil and Gas Disclosure Form 51-101 (NI 51-101). The Financial Statements have been prepared in accordance with Canadian GAAP. The impact of significant differences between GAAP in Canada and the United States is disclosed in Note 11 to our Financial Statements. Our NI 51-101 report has been prepared in accordance with National Instrument 51-101“Standards of Disclosure for Oil and Gas Activities”issued by the Canadian Securities Administrators.
The year covered by this discussion and analysis, Fiscal 2004, coincides with the calendar year and is the second full year since we changed our fiscal year-end to December 31 from March 31. Prior to this filing, our most recently filed, twelve-month period covered was from January 1, 2003 to December 31, 2003. In this discussion and analysis, we may refer to the 12-month period ending December 31, 2004 as “Fiscal 2004”, the 12-month period ended December 31, 2003 as “Fiscal 2003” and the nine-month period ended December 31, 2002 as “Nine-Month Fiscal Transition 2002”, respectively. Similarly, in discussion of certain forward-looking information, the 12-month period ended December 31, 2005, may be referred to as “Fiscal 2005”.
Where useful for comparison purposes, we indicated that we annualized our Nine-Month Fiscal Transition 2002 numbers by multiplying the numbers by four-thirds. However, this method does not reflect actual results for the three-month extrapolated period and such results may differ from the outcome achieved by this calculation.
Due to the differing lengths of the reporting periods in this discussion and analysis, results in these periods are not comparable. Accordingly, percentage changes in these results are not meaningful. In the tables in this discussion and analysis, these are indicated as “n/m”.
Unless otherwise noted, tabular amounts are in thousands of Canadian dollars, and production volumes and reserves are before royalties. We have presented our working interest before royalties, as we measure our performance on this basis, which is consistent with other Canadian oil and gas companies.
Throughout this discussion and analysis, we analyze expense factors on a unit cost of production basis. It is industry practice among our peer-group to monitor trends in expenses against daily average production volumes and the common unit of production used is the barrel of oil equivalent (“boe”). We do not analyze expense trends based on gross revenues, as commodity price volatility may lead to less reliable trending results.
DYNAMIC OIL & GAS, INC. 2004 ANNUAL REPORT
Executive Overview
Key Measures for the Comparative Periods Presented
($ 000’s unless otherwise stated)| | Fiscal | | Fiscal | | Nine-Month Fiscal | |
| | 2004 | | 2003 | | Transition 2002 | |
| Gross revenues | 40,806 | | 46,848 | | 24,123 | |
| Cash flow from operations(1) | 19,421 | | 23,097 | | 10,810 | |
| Cash flow from operations per share($/share)(1) | 0.82 | | 1.08 | | 0.53 | |
| Net (loss) earnings | (12,281 | ) | 4,978 | | 2,004 | |
| Net (loss) earnings per share($/share) | (0.52 | ) | 0.23 | | 0.10 | |
| Daily average production(boe/d) | 2,893 | | 3,447 | | 3,332 | |
| Total production(mboe) | 1,059 | | 1,258 | | 916 | |
| Capital investment program(2) | 36,836 | | 35,374 | | 13,837 | |
| Net debt(3) | 25,513 | | 19,313 | | 16,818 | |
| Net debt to cash flow(times)(4) | 1.3:1 | | 0.8:1 | | 1.6:1 | |
| Net debt to cash flow annualized(times)(5) | 1.3:1 | | 0.8:1 | | 1.2:1 | |
| (1) | Cash flow from operations is a non-GAAP measure that does not have standardized meaning as prescribed by GAAP and therefore may or may not be comparable to similar measures presented by other companies. We consider it a key measure as it demonstrates our ability to generate the cash flow necessary to fund future growth through capital investment and to repay debt. The following table shows how we derive our non- GAAP measure from GAAP measures. |
| | |
| | | Fiscal | | Fiscal | | Nine-Month Fiscal | |
| | | 2004 | | 2003 | | Transition 2002 | |
| | Cash provided by operating activities (GAAP) | 15,111 | | 28,294 | | 11,457 | |
| | Changes in non-cash working capital affecting operating (GAAP) | 4,310 | | (5,197 | ) | (647 | ) |
| | Cash flow from operations (non-GAAP) | 19,421 | | 23,097 | | 10,810 | |
| (2) | For Fiscal 2004, we changed the method of reporting capital transactions. We now report capital transactions under the title, “Capital Investment Program” instead of the former title, “Capital Expenditures”. The difference in methods is that Capital Investment Program includes exploration expenses relating to seismic and unsuccessful drilling efforts, whereas Capital Expenditures did not. Seismic and unsuccessful drilling costs comprise the majority of our Exploration expense as reported in our Statements of Operations and Deficit. Capital expenditures are reported on our Balance Sheets. When combined, annual expenditures for capital, and annual expenses for seismic and unsuccessful drilling, represent the sum total of our yearly Capital Investment Program. All comparative amounts have been restated accordingly. |
| |
| (3) | Net debt is working capital. We have no long-term debt. |
| |
| (4) | Net debt divided by cash flow from operations. |
| |
| (5) | Net debt divided by cash flow from operations annualized. |
Record-high weighted average prices received for natural gas of $6.67 per mcf and light/medium crude oil of $50.03 per barrel led the way in ranking our Fiscal 2004 gross revenues and cash flow from operations as second-highest in our corporate history, behind Fiscal 2003. Gross revenues in Fiscal 2004 were $40.8 million compared to $46.8 million in Fiscal 2003 and cash flow from operations was $19.4 million compared to $23.1 million, respectively. The effect of our weighted average prices is the first key performance measure that impacts our gross revenue, cash flow from operations and ultimately net earnings. Their record-high impact in Fiscal 2004 increased gross revenues over Fiscal 2003 by $2.7 million.
After accounting for price variances, which are largely controlled by the market forces of supply/demand for our commodities, the second key performance measure that impacts us is the variance in our levels of production between periods. Our Fiscal 2004 production levels were 16% below those for Fiscal 2003, which decreased gross revenues by $8.7 million. Total production in Fiscal 2004 was 1,059 mboe and total daily average production was 2,893 boe per day, compared to 1,258 mboe and 3,447 boe per day, respectively, in Fiscal 2003.
Of the decrease in gross revenues attributed to volume changes between Fiscals 2004 and 2003, over 90% was due to production decreases in light/medium crude oil. Most of these decreases related to relatively sharp production declines in two St. Albert wells, both of which reached payout of our original capital expenditures within a few weeks after first coming into production in early Fiscal 2003. Volume changes that contributed to the remaining decrease in gross revenues were the net result of production decreases in natural gas liquids and production increases in heavy crude oil.
In October 2004, we made a new-pool discovery of heavy crude oil at Mantario East. After drilling our discovery well, we followed up with an aggressive drilling program and by the year-end, we had drilled 13 wells, resulting
MANAGEMENT’S DISCUSSION & ANALYSIS
in five producing, six cased and standing and two unsuccessful wells. Heavy crude oil production commencing in the last two months of Fiscal 2004 increased gross revenues by $0.5 million.
During Fiscal 2004, $0.9 million of our gross revenues decrease was due to declining production of liquid-rich natural gas. Our liquid-rich natural gas originates from our St. Albert field, where we are experiencing a predictable rate of natural decline.
While volumes of liquid-rich natural gas declined at St. Albert during Fiscal 2004, new volumes of lean natural gas came into production at Cypress/Chowade due to the start-up of three new wells. The impact of these increases and decreases in natural gas volumes was a net decrease in our gross revenues of $0.4 million.
After accounting for the two key performance measures discussed above - price and volume variances - cash flow from operations decreased by $1.9 million due to an increase in our cost of production. On a per boe basis, unit production costs may differ according to product-type, field location and age of field. As an example, in Fiscal 2004, unit production costs increased by 52% to $8.44 per boe. Approximately half of the increase was due to remoteness associated with new natural gas production in northeast British Columbia, where time is needed to build economies of scale. The other half of the increase is mainly due to additional variable costs associated with compression fees, and the general effect caused by coverage of fixed costs by declining production from our Alberta fields.
Our net loss in Fiscal 2004 of $12.3 million was contributed to in a significant way by the third key performance measure - the degree of our success in establishing or replacing proved reserves. The costs of unsuccessful drilling efforts and downward revision to proved reserves are reflected in two expense categories – exploration expenses, and amortization and depletion expense.
Exploration expenses increased in Fiscal 2004 by $10.3 million over Fiscal 2003, contributing significantly to our net loss. Our strategies have consistently been to grow proved reserves primarily through drilling and specific, targeted acquisitions. Accordingly, in Fiscal 2004, we participated in drilling a corporate record-high of 28 wells, ten of which were unsuccessful, compared to 14 wells in Fiscal 2003, two of which were unsuccessful. This difference, combined with failed efforts to establish proved reserves in five other wells that were drilled prior to Fiscal 2004 explains most of the increase in our exploration expenses.
Amortization and depletion expense was another significant contributor to our net loss. It increased in Fiscal 2004 by $12.2 million, 88% of which was mainly due to a decrease in proved producing reserves at Cypress/Chowade. The balance was due to higher capital-to-reserve ratios in connection with most of our Alberta properties, increased amortization for leaseholds acquired during Fiscal 2004, and new depletion associated with our Mantario East assets.
Capital Investment Program
During Fiscal 2004, we changed our method of reporting capital transactions. We now gather capital transactions under the title, “Capital Investment Program” instead of the former title, “Capital Expenditures”. The difference in methods is that Capital Investment Program includes exploration expenses relating to seismic and unsuccessful drilling efforts, whereas Capital Expenditures did not. Seismic and unsuccessful drilling costs comprise the majority of our Exploration expense as reported in our Statements of Operations and Deficit. Capital expenditures are reported on our Balance Sheets. When combined, annual expenditures for capital, and annual expenses for seismic and unsuccessful drilling represent the sum total of our yearly Capital Investment Program. All comparative amounts have been restated accordingly.
Capital Investment Program by Classification for the Comparative Periods Presented(1)
| ($000’s) | Fiscal | | Fiscal | | Nine-Month Fiscal | |
| | 2004 | | 2003 | | Transition 2002 | |
| Land acquisitions | 4,154 | | 5,103 | | 2,568 | |
| Drilling, completions and equipping: | | | | | | |
| Exploratory(2) | 14,819 | | 6,232 | | 5,215 | |
| Development | 7,239 | | 10,223 | | 4,256 | |
| Facilities and pipelining | 6,730 | | 1,448 | | 780 | |
| Seismic | 3,669 | | 2,349 | | 934 | |
| Other | 225 | | 308 | | 84 | |
| Gross overriding royalty interest acquisition | - | | 9,711 | | - | |
| Total | 36,836 | | 35,374 | | 13,837 | |
| (1) | We follow the successful efforts method of accounting, whereby costs of drilling an unsuccessful well are recorded as exploration expense when it becomes known the well did not result in a discovery of proved reserves or where one year has elapsed since the completion of drilling and near-term efforts to establish proved reserves are not foreseeable, intended, or in our control. |
| |
DYNAMIC OIL & GAS, INC. 2004 ANNUAL REPORT
| (2) | As at December 31, 2004, exploratory well-drilling costs of $8.7 million remain capitalized on our balance sheet. These costs relate to seven wells. Various projects are planned in Fiscal 2005 to determine if proved reserves can be assigned to each of the wells. The wells are as follows: three at Cypress/Chowade ($4.9 million); two at Orion ($3.4 million); one at Sandgren ($0.3 million); and one at Peavey/Morinville ($0.1 million). Drilling operations were completed on six of the wells in Fiscal 2004 and on the remaining well in Fiscal 2002. The Fiscal 2002 well, at Peavey/Morinville, was assigned proved reserves and is expected to commence production in Fiscal 2005. |
We incurred $36.8 million on our Fiscal 2004 Capital Investment Program and advanced our strategies in the following ways:
We spent $4.2 million on the acquisition of new lands, over half of which was spent in the Cypress/Chowade area. Most of the remainder was spent at Mantario East and on other associated Saskatchewan properties;
We drilled and completed 28 wells (22.0 net) and equipped most of them for a total cost of $22.1 million. Our overall net working interest drilling success rate was 68%. Of twelve wells that targeted natural gas, six were unsuccessful. The other six, three at Cypress/Chowade, two at Orion and one at Sandgren, were completed as cased and standing wells. We drilled two wells that targeted light/medium crude oil at St.Albert, one of which was successful. The remaining 14 wells targeted heavy crude oil at Mantario East and Flaxcombe, 11 of which were either producing or cased and standing as at December 31, 2004. Three were unsuccessful;
Our investment in facilities, pipelining and other assets grew by $6.7 million. Over 85% of this amount was invested in northeast B.C., most of which was for our participation in the construction of an 8”, 19 kilometer pipeline at Cypress/Chowade. The remaining 15% was primarily for the optimization and upgrading of certain production facilities at St. Albert; and
We invested $3.7 million on seismic data activity, over 87% of which was for a two-phase, 3D seismic program covering 90 square kilometers on our early-stage exploration property at Orion.
In order to finance our Capital Investment Program described above, we took certain measures in Fiscal 2004 to expand our liquidity and capital resources. Mid-year, we completed a private placement resulting in cash proceeds, net of fees and financing costs, of approximately $11.6 million. Upon closing, we issued 2,000,000 flow-through shares at $5.60 per share and 280,000 common shares (non-flow-through) at $4.55 per share.
The gross proceeds of the flow-through portion of the private placement were $11.2 million, all of which must be spent by December 31, 2005 on qualifying expenses for exploration-only activities that are specifically defined in the Income Tax Act (Canada). As at December 31, 2004, we had incurred approximately 67% and committed another 20% toward the required obligation. In Fiscal 2005, we will be renouncing the tax benefits of the exploration expenses in favour of the flow-through shareholders, in an amount equal to the gross proceeds. Net proceeds of the non-flow-through portion of the financing were earmarked for general working capital.
After accounting for the spending on our Capital Investment Program, the private placement measures discussed above, strong cash flows and $0.2 million from option exercises, our year-end net debt-to-cash-flow ratio was 1.3:1 compared to 0.8:1 last year.
While we do not consider income taxes as a key performance measure, they did impact our bottom-line results significantly in Fiscal 2004. Consistent with our pre-tax loss of $19.7 million, our total current and future income taxes changed from an expense of $2.2 million in Fiscal 2003 to a recovery of $7.4 million in Fiscal 2004. After accounting for certain reconciling items, the effective rate of our income tax recovery was 37.7% .
Effective December 31, 2004, our proved reserves on a before-royalties, constant-price basis were independently estimated at 4,404 mboe, as compared with 5,572 mboe last year. This is a net decrease of 1,168 mboe or 21%, comprised of total additions to proved reserves of 1,138 mboe, less production of 1,059 mboe, and less technical revisions and economic factors of 1,247 mboe.
The total proved reserve additions of 1,138 mboe during Fiscal 2004 were made up of 432 mboe added through extensions and improved recovery, 571 mboe added through discoveries, and 135 mboe added through acquisitions. These total additions represented a 7% growth over our production of 1,059 mboe, before consideration of technical revisions.
The decrease in proved reserves of 1,247 mboe due to technical revisions and economic factors, were primarily associated with our Cypress/Chowade field. Cypress revisions were effected by a combination of higher-than-expected decline rates from four producing wells and lower reserve expectations in two, recently drilled development wells.
Cypress is an early-stage exploration area and our land base is significant, totaling 56,675 gross acres (19,911 net). Initial drilling results were highly favourable, with the first five wells being classified as new-pool discoveries. Recent results, including our two latest wells, have been much less favourable. Of our total gross acreage at Cypress, 81% is as-yet undeveloped
MANAGEMENT’S DISCUSSION & ANALYSIS
Also included in technical revisions to our proved natural gas reserves was a decrease of approximately 650 mmcf due to third-party, acid-gas contamination of a single Ostracod sweet gas well at St. Albert that, since March 1, 2004, was no longer able to produce into existing facilities. In early 2005, we expect to receive full cash value for the loss of reserves and production associated with this well.
On a before-royalties constant-price basis, our proved plus probable reserves were estimated at 7,744 mboe, as compared with 9,207 mboe last year. The net decrease of 1,463 mboe between periods is mostly due to the same factors discussed above that decreased our proved reserves at Cypress/Chowade and St. Albert. Extensions, discoveries and improved recoveries increased our estimated proved plus probable reserves of natural gas and natural gas liquids by 2,246 mmcf and 105 mbbls, respectively. The majority of this was due to our success with various optimization projects that were designed to mitigate natural production declines at St. Albert.
At St. Albert, an increase of 85 mbbls to estimated light/medium crude oil proved plus probable reserves was mainly due to extensions and improved recovery, while a decrease of 164 mbbls was mainly due to revisions. The revisions were largely based upon disappointing drilling results in the Wabamun and Leduc formations. One or two drill targets that could recover a portion of the revisions are being considered for Fiscal 2005.
Estimated proved plus probable reserves of heavy oil increased by 1,332 mbbl due mainly to the discovery of a new oil pool (1,115 mbbls) and subsequent acquisition of a partner’s interest (278 mbbls) at Mantario East in southwestern Saskatchewan. We operate and own a 76% weighted average interest in 2,951 net acres (3,895 gross) in the Mantario East area.
As mentioned above, one of our growth strategies is to target specific acquisitions that we believe will lead to future increases in reserves and prospects for exploration and development. In Fiscal 2004, we acquired an additional 25% working interest in our new-pool heavy crude oil producing property, bringing our working interest to approximately 76% in Mantario East and other associated lands. In Fiscal 2005 we intend to continue this strategy with a focus on lower-risk, lower-cost projects, such as development and production enhancement opportunities.
Our planned strategy for Fiscal 2005 is to take a more conservative approach to our exploration program while we develop our new pool discovery at Mantario East and enhance production at St. Albert. We have budgeted to invest approximately $21.9 million toward our Capital Investment Program. The allocation of this budget shifts our focus in Fiscal 2005 proportionately away from higher-risk exploration targets towards other more conservative ways of enhancing shareholder value.
We will also continue to focus on our secondary strategy, which is to target specific acquisitions that we believe will lead to higher returns and future prospects for exploration and development.
We are targeting a 10% year-over-year growth in daily average production in Fiscal 2005, subject mostly to timing issues, equipment availability and adequate funding. Our daily average production levels have a direct impact on our cash flow from operations. If warranted, we may seek term debt to re-finance certain assets and equity to fuel accelerated project exploration or acquisition opportunities. In the event commodities prices increase or decrease materially, we may choose to expand or contract our spending plans. Based on our production targets, our forecasts of strong commodity prices, and support from our bank loan facility, we expect to have adequate resources to meet our Fiscal 2005 cash requirements.
Properties and Capital Investment Program
We follow the successful efforts method of accounting for our natural gas and crude oil activities, whereby costs of drilling an unsuccessful well are recorded as exploration expense when it becomes known the well did not result in a discovery of proved reserves or where one year has elapsed since the completion of drilling and near-term efforts to establish proved reserves are not foreseeable, intended, or in our control.
DYNAMIC OIL & GAS, INC. 2004 ANNUAL REPORT
Fiscal 2004
During Fiscal 2004, our Capital Investment Program expenditures totaled $36.8 million, an amount that was allocated by property and classification as shown in the table that follows:
Capital Investment Program in Fiscal 2004 by Property and Classification
(Including Exploration Expense Related to Drilling and Seismic)
| ($ 000’s) | | | | | | | | |
| | | Drilling, | Facilities | | | | | |
| | | Completions | and | | | | | |
| | Land | and Equipping | Pipelining | Seismic | | Other | Total | |
| Alberta | | | | | | | | |
| St. Albert | 66 | 2,758 | 857 | - | | - | 3,681 | |
| Wimborne | 16 | 521 | - | - | | - | 537 | |
| Halkirk | - | 87 | - | - | | - | 87 | |
| Peavey/Morinville | - | 118 | 133 | (17 | ) | - | 234 | |
| Total Alberta | 82 | 3,484 | 990 | (17 | ) | - | 4,539 | |
| British Columbia | | | | | | | | |
| Cypress/Chowade | 2,399 | 8,503 | 5,429 | 407 | | - | 16,738 | |
| Orion | - | 5,314 | 300 | 3,195 | | - | 8,809 | |
| Total British Columbia | 2,399 | 13,817 | 5,729 | 3,602 | | - | 25,547 | |
| Saskatchewan | | | | | | | | |
| Mantario East | 839 | 3,972 | 11 | 34 | | - | 4,856 | |
| Flaxcombe | 632 | 235 | - | 50 | | - | 917 | |
| Sandgren | 202 | 550 | - | - | | - | 752 | |
| Total Saskatchewan | 1,673 | 4,757 | 11 | 84 | | - | 6,525 | |
| Other | - | - | - | - | | 225 | 225 | |
| Total | 4,154 | 22,058 | 6,730 | 3,669 | | 225 | 36,836 | |
Land
During Fiscal 2004, our investment in land increased by $4.2 million, most of which was at Cypress/Chowade ($2.4 million for 4,394 net acres) and at Mantario East and other associated Saskatchewan properties ($1.7 million for 7,502 net acres).
Drilling, Completions, Equipping, Facilities and Pipelining
During Fiscal 2004, expenditures incurred on drilling, completions, equipping, facilities and pipelining totaled $28.8 million. These expenditures were split among Alberta ($4.5 million), British Columbia, ($19.5 million) and Saskatchewan ($4.8 million) and were incurred mainly on the following:
Seismic and Other
Also during Fiscal 2005, we invested $3.7 million on seismic data activity, over 87% of which was for a two-phase, 3D seismic program covering 90 square kilometers on our early-stage exploration property at Orion.
Alberta
St. Albert– We invested $3.6 million on the drilling of two light/medium crude oil wells targeting Leduc D-3, Wabamun D-1, Belly River and Edmonton formations. One of the two wells was successful and is now producing from the Wabamun D-1 formation. The other well was unsuccessful. We completed untested zones in two existing natural gas wells in the Ostracod formation to further optimize sweet gas production. We also optimized our sweet gas compressor and upgraded our salt-water disposal facilities.
Wimborne –Two wells targeting natural gas in the Cretaceous Age formation were drilled for $0.5 million, both of which were unsuccessful.
Halkirk –Surface field equipment for the maintenance of production operations cost $0.1 million.
Peavey/Morinville –We equipped, tied in and began producing from one natural gas well that was drilled in a prior year. Our total investment related to this work was $0.2 million, net of a sale of seismic data.
British Columbia
Cypress/Chowade –During the year, we invested $8.5 million to drill five wells and to complete an untested zone in an existing wellbore. Our working interests in these wells were: one at 100% working interest; three at 50%; and two at 30%. Of the five wells that were drilled, three were completed as cased and standing natural gas wells and
MANAGEMENT’S DISCUSSION & ANALYSIS
two were unsuccessful. We also participated in the construction of an 8” 19-kilometer pipeline, most of which was at a 40% working interest.
Orion –We invested $5.6 million to drill four wells targeting gas in the Bluesky, Jean Marie and Slave Point formations. Three of these wells were drilled at 100% working interest and one well was drilled at a 50% working interest. Two of the 100% wells have been cased as potential standing gas wells and the other two wells were unsuccessful.. The Slave Point well was cased and production tested but did not produce commercial quantities of gas. The well is a cased and standing gas well with further sidetrack drilling potential. We also invested $3.2 million on a two-phase, 3D seismic program covering 90 square kilometers.
Saskatchewan
Mantario East, Flaxcombe & Sandgren –During the year, we invested approximately $4.8 million at Mantario East, Flaxcombe and Sandgren. In total, we drilled 15 wells, five of which were earning wells drilled at 100% working interest under a farmout agreement and 10 of which were non-earning wells drilled at a 75% working interest with an industry partner. The 15-well drilling program resulted in 11 successful heavy-oil wells in a newly-discovered pool at Mantario East and one cased and standing potential natural gas well at Sandgren. There were two unsuccessful wells at Mantario East and one at Flaxcombe.
Fiscal 2003
During this period, we invested an aggregate of $35.4 million, $12.3 million, or 35%, of which was spent on Alberta properties and $13.0 million, or 37%, on British Columbia properties. The amount invested in Alberta was for land, drilling, completions, equipping and facilities on the following properties: St. Albert - $7.1 million; Wimborne – $3.9 million; Halkirk - $1.1 million; and Peavey/Morinville and Other - $0.2 million. The amount invested in British Columbia was invested on similar expenditures at: Cypress/Chowade - $9.9 million; and Orion - $3.1 million.
Also during Fiscal 2003, we repurchased for $6.5 million (1.1 million shares and $1.0 million in cash), certain gross overriding royalty interests (“GORR”) that previously burdened our total current and future corporate production by 3%. The carrying value of the repurchase was adjusted upward by a non-cash amount of $3.2 million, as required by Canadian GAAP. This non-cash adjustment represented a future tax liability that was created due to the total payment being part shares and part cash. The resulting $9.7 million has been allocated to all properties with proved, producing reserves as of July 7, 2003, the effective date of the repurchase. (For further details of the GORR repurchase, see Note 6[d] to our Financial Statements).
Nine-Month Fiscal Transition 2002
During this period, we invested an aggregate of $13.8 million, $7.3 million or 53% of which was spent on Alberta properties and $6.5 million or 47% on British Columbia properties. Of the amount invested in Alberta, $5.4 million was for land, drilling, completions, equipping and facilities at St. Albert, $1.2 million was for drilling, completions and equipping at Halkirk, and the balance of $0.7 million was for a seismic program at Wimborne. Of the amount invested in British Columbia, $5.1 million was for drilling, completions and equipping at Cypress/Chowade and the balance of $1.4 million was for land acquisitions at Orion.
Financial Results
Cash Flow from Operations and Net (Loss) Earnings
Fiscal 2004 vs Fiscal 2003
Cash flow from operations was $19.4 million versus $23.1 million, a decrease between periods of $3.7 million or 16%. This decrease was due to net variances in revenue and cash expenses as discussed below.
Revenue from natural gas, natural gas liquids and crude oil sales decreased cash flow from operations by $6.0 million or 13% ($40.8 million versus $46.8 million) due mainly to the net result of lower volume sales and higher prices in natural gas, natural gas liquids and light/medium crude oil. Our introduction in Fiscal 2004 of heavy crude oil sales increased our cash flow from operations. A breakdown of the volume/price-based variances by commodity is shown in the table below.
DYNAMIC OIL & GAS, INC. 2004 ANNUAL REPORT
Revenue Variances by Commodity between the Comparative Periods Presented | ($000’s) | | | | | | | | | | | | |
| Fiscal 2004 vs | | Fiscal 2003 vs Nine-Month | |
| | Fiscal 2003 | | Fiscal Transition 2002 | |
| Volume- | | Price- | | | | Volume- | | Price- | | | |
| | based | | based | | Total | | based | | based | | Total | |
| Natural gas | (362 | ) | 514 | | 152 | | 4,984 | | 8,607 | | 13,591 | |
| Natural gas liquids | (920 | ) | 607 | | (313 | ) | 1,332 | | 1,302 | | 2,634 | |
| Light/medium crude oil | (7,917 | ) | 1,567 | | (6,350 | ) | 6,384 | | 116 | | 6,500 | |
| Heavy crude oil | 469 | | - | | 469 | | - | | - | | - | |
| Total | (8,730 | ) | 2,688 | | (6,042 | ) | 12,700 | | 10,025 | | 22,725 | |
The change in cash expenses between periods increased cash flow from operations by $2.3 million. This was the net result of certain decreases and increases. The decreases were in royalties ($3.7 million) and current income taxes ($0.6 million). The increases were in production costs ($1.9 million), and net expenses related to net interest, and general and administrative costs ($0.1 million).
Net (loss) earnings decreased between periods by $17.3 million (a loss of $12.3 million from net earnings of $5.0 million) due to the $3.7 million decrease in cash flow from operations discussed above and a net increase of $13.6 million in non-cash expenses. Increases in non-cash expenses were to amortization and depletion expense ($12.2 million), exploration expenses ($10.3 million), and various other expenses ($0.1 million). A decrease in non-cash expenses was in future income taxes ($9.0 million).
Fiscal 2003 vs Nine-Month Fiscal Transition 2002
Cash flow from operations was $23.1 million versus $10.8 million, an increase between periods of $12.3 million or 114%. This increase was due to net variances in revenue and cash expenses as discussed below.
Revenue from natural gas, natural gas liquids and crude oil sales increased by $22.7 million ($46.8 million versus $24.1 million) due to two factors. The first factor was a difference of $12.7 million in volume sales, reflecting that the reporting periods differed in length by three months. The second factor was a $10.0 million increase due to higher weighted average prices realized in Fiscal 2003 than in Nine-Month Fiscal Transition 2002. A breakdown of the volume/price-based variances by commodity is shown in the above table.
Cash expenses decreased by $10.4 million. This was the result of increases in royalties ($7.0 million), production costs ($1.5 million), and net interest and general and administrative costs ($1.9 million).
Net earnings increased between periods by $3.0 million (to $5.0 million versus $2.0 million) due to the net result of the $12.3 million increase in cash flow from operations discussed above and an increase of $9.3 million in non-cash expenses. The increase in non-cash expenses was the net result of certain increases and decreases. The increases were in amortization and depletion expense ($5.7 million) and exploration expenses ($2.6 million). The decreases were in future income taxes and various other expenses ($1.0 million).
The cash and non-cash expense variances discussed in this section reflect mainly the differing lengths of the reporting periods to which we refer. Later in this discussion and analysis, we analyze significant increases and decreases to these expense categories as they relate to the production levels of each period.
MANAGEMENT’S DISCUSSION & ANALYSIS
Daily Average Production Rates and Total Production
Daily Average Production Rates by Commodity and Field, and Total Production for the Comparative Periods Presented
| (Units as stated) | | | | | | | | | | |
| | | | | | | | | | Nine-Month | |
| | Fiscal | | | | Fiscal | | | | Fiscal | |
| | 2004 | | % Chg | | 2003 | | % Chg | | Transition 2002 | |
| Daily average production rates | | | | | | | | | | |
| Natural gas(mcf/d) | | | | | | | | | | |
| St. Albert | 7,593 | | (24 | ) | 9,936 | | (13 | ) | 11,360 | |
| Halkirk | 922 | | (22 | ) | 1,188 | | (13 | ) | 1,368 | |
| Peavey/Morinville | 408 | | (19 | ) | 504 | | (26 | ) | 678 | |
| Other Alberta | 626 | | (6 | ) | 666 | | (13 | ) | 768 | |
| Cypress/Chowade, British Columbia | 2,969 | | 293 | | 756 | | - | | - | |
| Total natural gas(mcf/d) | 12,518 | | (4 | ) | 13,050 | | (8 | ) | 14,174 | |
| Total natural gas(boe/d 6:1) | 2,086 | | (4 | ) | 2,175 | | (8 | ) | 2,363 | |
| Natural gas liquids(bbl/d) | | | | | | | | | | |
| St. Albert | 568 | | (13 | ) | 656 | | (5 | ) | 689 | |
| Other Alberta | 4 | | (33 | ) | 6 | | (33 | ) | 9 | |
| Total natural gas liquids(bbl/d) | 572 | | (14 | ) | 662 | | (5 | ) | 698 | |
| Light/medium crude oil(bbl/d) | | | | | | | | | | |
| St. Albert | 173 | | (72 | ) | 609 | | 126 | | 270 | |
| Other, Saskatchewan | 1 | | - | | 1 | | - | | 1 | |
| Total light/medium crude oil(bbl/d) | 174 | | (74 | ) | 610 | | 126 | | 271 | |
| Heavy crude oil(bbl/d) | | | | | | | | | | |
| Mantario East | 61 | | - | | - | | - | | - | |
| Total heavy crude oil(bbl/d) | 61 | | - | | - | | - | | - | |
| Total daily average production(boe/d) | 2,893 | | (16 | ) | 3,447 | | 3 | | 3,332 | |
| Total production all products(mboe) | 1,059 | | (16 | ) | 1,258 | | n/m | | 916 | |
Fiscal 2004 vs Fiscal 2003
Total production of all products was 1,059 mboe versus 1,258 mboe and our total daily average production was 2,893 boe/d versus 3,447 boe/d. This represented a net decrease in average production of 554 boe/d or 16%. Of this net decrease, natural gas, natural gas liquids, and light/medium crude oil production all decreased, while heavy crude oil production increased.
The decrease in natural gas production was mainly the net result of decreases from all our Alberta properties and an increase from our British Columbia property at Cypress/Chowade. Decreases in our Alberta properties of 2,745 mcf/d (458 boe/d) were the result of naturally-declining reservoir pressures, a factor that also explains the corresponding decrease in the production of natural gas liquids. An increase in natural gas production of 2,213 mcf/d (369 boe/d) from the Cypress/Chowade field was primarily the result of the start-up of three new wells.
The decrease in daily average production of light/medium crude oil was primarily due to declining production of two St. Albert wells.
At Mantario East, we made a new-pool heavy crude oil discovery in Fiscal 2004 that added 61 boe/d to our production base.
Fiscal 2003 vs Nine-Month Fiscal Transition 2002
Total production of all products was 1,258 mboe versus 916 mboe. This would have represented an increase of 3%, had Nine-Month Fiscal Transition 2002 been annualized to 1,221 mboe.
Our total daily average production of all commodities increased by 115 boe/d or 3%, to 3,447 boe/d. Of this increase, natural gas and natural gas liquids decreased in aggregate by 224 boe/d or 7%, while crude oil increased by 339 boe/d or 125%. The aggregate decrease in natural gas and natural gas liquids was mostly the net result of a decrease due to natural declines in reservoir pressures at St. Albert and an increase due to the start-up of two new wells at Cypress/Chowade. The increase in average daily light/medium crude oil production was due to the start-up of two new wells in Fiscal 2003 and of one well in late Nine-Month Fiscal Transition 2002. All three wells were at St. Albert.
DYNAMIC OIL & GAS, INC. 2004 ANNUAL REPORT
Weighted Average Commodity Prices
Our weighted average natural gas prices are a reflection of the posted New York Mercantile Exchange (NYMEX) price at the Henry Hub in Louisiana, adjusted for exchange rates, prices of competing fuels and transportation (“differentials”) back to various trading points that apply to us in Alberta and British Columbia. The natural gas price indices that affect us are the AECO-C Spot in Alberta and the B.C. Westcoast Station 2 in British Columbia.
Our weighted average light/medium crude oil prices are based on prices for West Texas Intermediate (WTI) at Cushing, Oklahoma, adjusted for differentials back to Edmonton, Alberta. The Edmonton index par price is for a 40° to 45° crude having less than 1/2% sulphur content. The actual wellhead price for our light/medium crude varies with the quality of the oil and the cost of transportation to Edmonton.
We estimate our natural gas liquids to be 45% natural gas-based and 55% crude oil-based. Therefore, our weighted average price for liquids generally follows the above-mentioned respective indices.
Our weighted average heavy crude oil prices are based on the index, Hardisty Heavy 12° API, for heavy crude oil in the proximity of southern Saskatchewan. Production from our new Mantario East field is, for the most part, approximately 13.4° API.
Sproule Associates Limited, an engineering firm in Calgary, Alberta independently evaluates our reserves each year. They maintain a website showing historical and forecasted prices, which help to provide trends of the above-described indices affecting our weighted average prices. The website address is: www.sproule.com/prices/ defaultprices.htm.
Management regularly employs price-trending information for its internal cash flow forecasting purposes from the websites of two firms that regularly market hydrocarbon commodities. They are www.progas.com and www.nexenmarketing.com.
Weighted Average Commodity Prices for the Comparative Periods Presented
| (Units as stated) | | | | | | | | | | |
| | | | | | | | | | Nine-Month | |
| | Fiscal | | | | Fiscal | | | | Fiscal | |
| | 2004 | | % Chg | | 2003 | | % Chg | | Transition 2002 | |
| Natural gas($/mcf) | 6.67 | | 2 | | 6.56 | | 50 | | 4.36 | |
| Natural gas liquids($/bbl) | 30.21 | | 9 | | 27.68 | | 32 | | 20.90 | |
| Light/medium crude oil($/bbl) | 50.03 | | 7 | | 42.98 | | 4 | | 41.40 | |
| Heavy crude oil($/bbl) | 21.07 | | - | | - | | - | | - | |
Fiscal 2004 vs Fiscal 2003
Our weighted average prices of natural gas, natural gas liquids and light/medium crude oil increased by 2%, 9% and 7%, respectively. As Fiscal 2004 was our first year for production of heavy crude oil, there are no weighted average price comparisons to prior periods.
Fiscal 2003 vs Nine-Month Fiscal Transition 2002
Weighted average prices realized from the sale of all our commodities increased by percentages ranging from 4% to 50%, as shown in the above table.
Hedging
We have no hedge positions. However, by varying our product sales mix of natural gas, natural gas liquids and crude oil, we manage the potential risk of single-product price volatility. Further, we vary our natural gas sales mix between AECO-spot prices and aggregator-based prices (which are, in turn, based on a blend of AECO-spot, long-term and NYMEX contracts).
Since 1997, we committed to sell our future natural gas production from St. Albert through Progas under a life-of-reserves agreement. As other fields have come on stream, we have elected to sell the uncommitted natural gas into the AECO daily spot market. Management believes that this current allocation of our gas production into the two markets provides an optimum balanced portfolio.
MANAGEMENT’S DISCUSSION & ANALYSIS
Royalties, Mineral Taxes and Royalty Credits
Royalties, Mineral Taxes, Royalty Credits and Unit Total Royalties For the Comparative Periods Presented| ($ 000’s unless otherwise stated) | | | | | | | | | | |
| | | | | | | | | | Nine-Month | |
| | Fiscal | | | | Fiscal | | | | Fiscal | |
| | 2004 | | % Chg | | 2003 | | % Chg | | Transition 2002 | |
| Crown | 2,826 | | (40 | ) | 4,698 | | n/m | | 1,252 | |
| Freehold and overriding | 5,085 | | (25 | ) | 6,818 | | n/m | | 3,327 | |
| Freehold mineral taxes | 1,091 | | (19 | ) | 1,346 | | n/m | | 943 | |
| Provincial royalty credits | (399 | ) | 24 | | (523 | ) | - | | (178 | ) |
| Total royalties(1) | 8,603 | | (30 | ) | 12,339 | | n/m | | 5,344 | |
| Unit total royalties per boe($)(1) | 8.12 | | (17 | ) | 9.81 | | 68 | | 5.83 | |
(1) Total royalties includes mineral taxes and provincial royalty credits.
Fiscal 2004 vs Fiscal 2003
Total royalties were $8.6 million versus $12.3 million. Unit total royalties expense decreased by $1.69 or 17% to $8.12 per boe. Of this decrease, 64% was mostly due to lower light/medium crude oil production that attracted heavier-than-average royalty obligations. The remainder of the decrease was due to the elimination of a gross overriding royalty charge that burdened all our production by 3%. The overriding royalty rights were acquired from the holders on July 7, 2003.
Weighted average price differentials were not a significant factor in changes to total royalty costs between the two periods.
Fiscal 2003 vs Nine-Month Fiscal Transition 2002
Total royalties were $12.3 million versus $5.3 million. This would have represented an increase of 73%, had Nine-Month Fiscal Transition 2002 been annualized to $7.1 million.
Unit total royalties expense increased by a net $3.98 or 68%, to $9.81 per boe. The main factors causing increases in unit total royalties expense were higher commodity prices and heavier-than-average royalty obligations applied to two new St. Albert oil wells. The main factor causing a decrease in unit total royalties was our July 7, 2003 repurchase of three gross overriding royalty interests that previously burdened our total current and future corporate production by an aggregate of 3% (see Note 6[d] to our Financial Statements for further details).
Production Costs
Production Costs and Unit Production Costs for the Comparative Periods Presented| ($ 000’s unless otherwise stated) | | | | | | | | | | |
| | | | | | | | | | Nine-Month | |
| | Fiscal | | | | Fiscal | | | | Fiscal | |
| | 2004 | | % Chg | | 2003 | | % Chg | | Transition 2002 | |
| Production costs | 8,941 | | 28 | | 7,011 | | n/m | | 5,470 | |
| Unit production costs per($) | 8.44 | | 52 | | 5.57 | | (7 | ) | 5.97 | |
Fiscal 2004 vs Fiscal 2003
Total production costs were $8.9 million versus $7.0 million. Unit production costs increased by a net of $2.87 or 52%, to $8.44 per boe. Approximately half of this unit increase was due to our having proportionately greater production originating from the Cypress/Chowade fields this year, where the costs for transportation, processing, salt-water disposal and fixed costs are significantly higher than our other fields. The remainder of the increase was mainly due to additional variable costs associated with compression fees, and the continued incurrence of fixed costs versus declining production from our Alberta fields.
Fiscal 2003 vs Nine-Month Fiscal Transition 2002
Total production costs were $7.0 million versus $5.5 million. This would have represented a decrease of 4%, had Nine-Month Fiscal Transition 2002 been annualized to $7.3 million.
Unit production costs decreased by a net of $0.40 or 7%, to $5.57 per boe mainly due to the elimination of monthly processing charges for St. Albert facilities acquired at the close of Nine-Month Fiscal Transition 2002, pursuant to a sales and leaseback agreement.
DYNAMIC OIL & GAS, INC. 2004 ANNUAL REPORT
Amortization and Depletion Expense (A&D)
A&D Expense and Unit A&D Expense for the Comparative Periods Presented
| ($ 000’s unless otherwise stated) | | | | | | | | | | |
| | | | | | | | | | Nine-Month | |
| | Fiscal | | | | Fiscal | | | | Fiscal | |
| | 2004 | | % Chg | | 2003 | | % Chg | | Transition 2002 | |
| A&D before the following: | 19,904 | | 71 | | 11,606 | | n/m | | 5,924 | |
| Impairment test adjustment | 3,835 | | - | | 316 | | 29 | | 445 | |
| Depletion of asset retirement cost | 443 | | 347 | | 99 | | 57 | | 63 | |
| Amortization of deferred items | - | | - | | - | | - | | (109 | ) |
| Total A&D expense | 24,182 | | 101 | | 12,021 | | n/m | | 6,323 | |
| Unit A&D expense per boe($) | 22.83 | | 139 | | 9.55 | | 38 | | 6.90 | |
Fiscal 2004 vs Fiscal 2003
Our total A&D expense was $24.2 million versus $12.0 million. Unit A&D expense increased by $13.28 or 139%, to $22.83 per boe. Of this increase, $3.37 per boe or 25%, was due to impairment test adjustments, of which Cypress/Chowade accounted for 95%. The reason for the Cypress/Chowade adjustment was the downward technical revisions to our natural gas reserves caused by a combination of higher-than-expected decline rates from four producing wells, and lower reserves than expected in Fiscal 2003 from two recently-drilled development wells.
After removing the impact of the impairment test adjustments discussed above, our unit A&D expense increased by $9.91 per boe ($13.28 less $3.37 per boe). The main factors accounting for this increase were:
The same reasons as discussed above at Cypress/Chowade ($8.46 per boe);
Increased capital-to-reserve ratios in connection with our fields at Alexander, Morinville/Peavey, Simonette and St. Albert ($0.52 per boe);
Depletion expense first-recognized in Fiscal 2004 related to our new-pool heavy crude oil discovery at Mantario East ($0.22 per boe); and
Amortization of new petroleum natural gas rights ($0.65 per boe).
Fiscal 2003 vs Nine-Month Fiscal Transition 2002
Our total A&D expense was $12.0 million versus $6.3 million. This would have represented an increase of 43%, had Nine-Month Fiscal Transition 2002 been annualized to $8.4 million.
Unit A&D expense increased by a net of $2.65 or 38%, to $9.55 per boe due mainly to the following increases: $1.23 per boe due to higher capital-to-reserve ratios related to crude oil discoveries and natural gas optimizations at St. Albert in Fiscal 2003; $0.55 per boe due to significant growth in our Fiscal 2003 leasehold base; and $0.98 per boe due to additional depletion related to the July 7, 2003 repurchase of gross overriding royalty interests that previously burdened our total current and future corporate production by 3% (see Note 6[d] to our Financial Statements for further details).
Exploration Expenses
We follow the successful efforts method of accounting, whereby costs of drilling an unsuccessful well are expensed immediately if it is known the well did not result in a discovery of proved reserves. If the economic importance was not immediately known after drilling, the expensing of our drilling costs may be temporarily deferred. We expense such deferred costs after one year if near-term efforts to establish proved reserves are not foreseeable, intended, or in our control. Collectively, we report these costs as “Drilling” in the table below.
While we report our budgeted annual drilling costs, it is difficult to forecast year-over-year drilling success rates. However, three factors tend to increase or decrease our exploration expenses as they relate to drilling. They are as follows:
Exploratory wells generally involve a greater degree of risk than development wells, due to the increased uncertainty in establishing proved reserves;
Outpost wells generally involve more expense due to remoteness and inaccessibility to oilfield services; and
Wells in which we participate at higher working interests increase costs accordingly.
The amount of our exploration expenses each year also depends upon how much seismic data we add to our library. Although seismic science does not remove all uncertainty, we incur such expenses in order to improve our knowledge base, develop new prospects and decrease the risk of drilling failures.
MANAGEMENT’S DISCUSSION & ANALYSIS
Exploration Expenses and Unit Exploration Expenses for the Comparative Periods Presented| ($ 000’s unless otherwise stated) | | | | | | | | | | |
| | | | | | | | | | Nine-Month | |
| | Fiscal | | | | Fiscal | | | | Fiscal | |
| | 2004 | | % Chg | | 2003 | | % Chg | | Transition 2002 | |
| Drilling | 10,167 | | 696 | | 1,278 | | n/m | | 325 | |
| Seismic data activity | 3,669 | | 56 | | 2,349 | | n/m | | 934 | |
| Other | 565 | | 29 | | 439 | | n/m | | 187 | |
| Total exploration expenses | 14,401 | | 254 | | 4,066 | | n/m | | 1,446 | |
| Unit exploration expenses per boe($) | 12.85 | | 298 | | 3.23 | | 104 | | 1.58 | |
Fiscal 2004 vs Fiscal 2003
Total exploration expenses were $14.4 million versus $4.1 million. Unit exploration expenses increased by $9.62 or 298%, to $12.85 per boe. This unit increase is due mainly to expensing costs related to 15 unsuccessful drilling attempts, ten of which were drilled in Fiscal 2004. This compares to the expensing of one unsuccessful drilling attempt at each of Wimborne and Halkirk in Fiscal 2003. The remainder of the increase was mostly due to a proprietary, 44-square kilometer, 3D seismic program shot at Orion, compared to our share of a smaller, multi-client program shot at Wimborne in Fiscal 2003.
The following two lists show the ten wells drilled in Fiscal 2004 and the $4.5 million related to our working interest percentage share of expensed drilling costs:
Development Wells Drilled
Cypress/Chowade natural gas targets – two wells (one at 50%, one at 30%) for $1.5 million;
Mantario East area heavy crude oil targets – two wells (each at 75%) for $0.4 million; and
St. Albert light/medium crude oil target – one well (at 75%) for $0.2 million.
Exploratory Wells Drilled
Orion natural gas targets - two wells (one at 100%, one at 50%) for $1.6 million;
Wimborne natural gas targets - two wells (each at 50%) for $0.6 million; and
Flaxcombe light/medium crude oil target – one well (at 75%) for $0.2 million.
The following two lists show the five wells drilled prior to, but expensed in Fiscal 2004 for $5.7 million, representing our working interest share. Costs of $4.9 million related to the drilling of four of these five wells were deferred as capital since Fiscal 2003. The remaining costs of $0.8 million relate to a remote, outpost well that were deferred as capital since Fiscal 2001 pending Fiscal 2004 drilling results.
Development Wells Drilled
- Halkirk natural gas target – one well (at 100%) for $0.5 million.
Exploratory Wells Drilled
Orion natural gas target - two wells (one at 100%, one at 50%) for $3.0 million;
Cypress/Chowade natural gas target - one well (at 30%) for $1.7 million; and
Wimborne natural gas target – one well (at 100%) for $0.5 million.
Fiscal 2003 vs Nine-Month Fiscal Transition 2002
Total exploration expenses were $4.1 million versus $1.4 million. This would have represented an increase of 116%, had Nine-Month Fiscal Transition 2002 been annualized to $1.9 million.
Unit exploration expenses increased by $1.65 or 104%, to $3.23 per boe. While we recognized one unsuccessful drilling attempt at each of Wimborne and Halkirk, there were none in Nine-Month Fiscal Transition 2002. Costs of seismic data also increased due to the gathering of data at Wimborne, Cypress/Chowade and Orion.
Interest Expense – Net
Net Interest Expense and Unit Net Interest Expense for the Comparative Periods Presented| ($ 000’s unless otherwise stated) | | | | | | | | | | |
| | | | | | | | | | Nine-Month | |
| | Fiscal | | | | Fiscal | | | | Fiscal | |
| | 2004 | | % Chg | | 2003 | | % Chg | | Transition 2002 | |
| Net interest expense | 576 | | (137 | ) | 713 | | n/m | | 453 | |
| Unit interest expense per boe($) | 0.54 | | (5 | ) | 0.57 | | 16 | | 0.49 | |
DYNAMIC OIL & GAS, INC. 2004 ANNUAL REPORT
Fiscal 2004 vs Fiscal 2003
Net interest was $0.6 million versus $0.7 million. The average daily balance of our credit line operating facility decreased by $1.2 million or 8%, to $13.1 million, and the closing balance was $15.6 million.
A key factor in the decrease between periods in our operating line facility usage was a May 19, 2004 private placement financing wherein we sold 2,000,000 flow-through shares at a price of $5.60 per share and 280,000 non-flow-through shares at a price of $4.55 per share. On May 18, 2004, our facility balance was $19.3 million and on May 19, 2004, it decreased by $11.7 million to $7.6 million. This difference represented proceeds of the private placement, net of fees and expenses to date.
The effective interest rates applicable to our borrowings in Fiscal 2004 and Fiscal 2003 were 4.4% and 5.1%, respectively.
Fiscal 2003 vs Nine-Month Fiscal Transition 2002
Net interest was $0.7 million versus $0.5 million. This would have represented a minimal change, had Nine-Month Fiscal Transition 2002 been annualized to $0.7 million.
The average daily balance of our bank operating facility increased by $1.8 million or 14%, to $14.3 million, and the closing balance was $13.3 million. The effective interest rates were 5.1% in Fiscal 2003 and 5.0% in Nine-Month Fiscal Transition 2002.
General and Administrative Expenses (G&A)
G&A Expenses and Unit G&A Expenses for the Comparative Periods Presented| ($ 000’s unless otherwise stated) | | | | | | | | | | |
| | | | | | | | | | Nine-Month | |
| | Fiscal | | | | Fiscal | | | | Fiscal | |
| | 2004 | | % Chg | | 2003 | | % Chg | | Transition 2002 | |
| Cash G&A expenses | 3,317 | | 9 | | 3,057 | | n/m | | 1,839 | |
| Non-cash G&A (stock-based compensation) | 399 | | 11 | | 358 | | - | | - | |
| Total G&A | 3,716 | | 9 | | 3,415 | | | | 1,839 | |
| Unit G&A expenses per boe($) | 3.51 | | 30 | | 2.71 | | 35 | | 2.01 | |
Fiscal 2004 vs Fiscal 2003
Our G&A expenses were $3.7 million versus $3.4 million. Both reporting periods contained $0.4 million in stock-based compensation expense, which is a non-cash expense. On a unit basis, our G&A costs increased by $0.80 or 30%, to $3.51 per boe. Our total G&A increased mainly due to new staff hires and certain salary increases, however, most of the increase in our unit G&A is due to decreased production being applied as the denominator.
Fiscal 2003 vs Nine-Month Fiscal Transition 2002
Our G&A expenses were $3.4 million versus $1.8 million. This would have represented an increase of 42%, had Nine-Month Fiscal Transition 2002 been annualized to $2.4 million.
Unit G&A expenses increased by a net $0.70 or 35%, to $2.71 per boe. Of this increase, 40% was due to the first-time recognition in Fiscal 2003 of stock-based compensation made available to directors and employees under our corporate stock option plan (see Note 2 to our Financial Statements for further details). Other increases were mainly attributed to: new staff hires and certain salary adjustments; computer technical and software support; gas marketing advice; and other essential professional services.
Income Tax Expense
We use the liability method of tax allocation in accounting for income taxes. Future tax assets and liabilities are determined based on differences between the financial reporting and tax bases of assets and liabilities, and measured using the substantially-enacted rates and laws that will be in effect when the differences are expected to reverse.
Current and Future Income Tax (Recoveries) Expenses for the Comparative Periods Presented| ($000’s) | | | | | | | | | | |
| | | | | | | | | Nine-Month | |
| Fiscal | | | | Fiscal | | | | Fiscal | |
| 2004 | | % Chg | | 2003 | | % Chg | | Transition 2002 | |
| Current income tax (recovery) expense | (52 | ) | (108 | ) | 632 | | n/m | | 207 | |
| Future income tax (recovery) expense | (7,384 | ) | (568 | ) | 1,579 | | n/m | | 975 | |
| Total income tax (recovery) expense | (7,436 | ) | (436 | ) | 2,211 | | n/m | | 1,182 | |
MANAGEMENT’S DISCUSSION & ANALYSIS
Fiscal 2004 vs Fiscal 2003
Total income tax recovery increased to $7.4 million from an income tax expense of $2.2 million. The recovery was consistent with our pre-tax loss and after accounting for certain reconciling items the effective rate was 37.7%, which was in line with statutory tax rates.
Fiscal 2003 vs Nine-Month Fiscal Transition 2002
Total income tax expense increased to $2.2 million from $1.2 million. This increase was consistent with our pre-tax earnings. After accounting for certain reconciling items, our effective tax rate was 30.9%, which was in line with statutory tax rates.
Income Tax Pools Available for Deduction Against Future Taxable Income for the Comparative Periods Presented| ($000’s) | | | | | | | | |
| | | | | Nine-Month | | | |
| | | | | Fiscal | | Maximum | |
| Fiscal | | Fiscal | | Transition | | Annual | |
| 2004 | | 2003 | | 2002 | | Deduction | |
| Canadian exploration expense(1) | 12,607 | | - | | 1,586 | | 100% | |
| Canadian development expense | 9,276 | | 8,893 | | 5,246 | | 30% | |
| Undepreciated capital cost | 14,832 | | 10,934 | | 10,356 | | 20% -100% | |
| Canadian oil and gas property expense | 22,876 | | 21,168 | | 17,417 | | 10% | |
| Total income tax pools | 59,591 | | 40,995 | | 34,605 | | | |
| (1) | The Fiscal 2004 pool balance is before taking into account the renunciation of $7.5 million to flow-through shareholders of Canadian exploration expense (see Notes 6[a] and 14 to our Financial Statements for further details). |
At the end of each comparative period presented above, we had total income tax pools available for deduction against future taxable income, each pool allowing maximum annual deductions ranging from 10% – 100%.
Outlook for Fiscal 2005
Our primary strategy is to grow organically through the drill bit by pursuing a business model that focuses on exploration and development. At a secondary level, our strategy is to target specific acquisitions that we believe will lead to increased productivity and future prospects for exploration and development. While we believe that northeast British Columbia offers some of the best exploration opportunities in Canada for long-term sustainable growth, we intend to focus in Fiscal 2005 on a number of lower-risk projects, such as development opportunities in Saskatchewan and production enhancements in Alberta.
Our capital expenditure and exploration expense budget for Fiscal 2005 is $21.9 million. The allocation of the budget is 17% to Alberta, 31% to British Columbia, 45% to Saskatchewan and 7% to properties yet to be allocated between the three provinces. (For full details, see Item 4 Our Information – “Fiscal 2005 – Budgeted Capital Investment Program”).
Developed Properties (80% of our Fiscal 2005 Capital Investment Program Budget)
In our Fiscal 2005 Capital Investment Program budget, we have allowed for the drilling, completion and equipping of 19 development wells. Of these wells, 18 have been considered in our 2005 target production rate table shown below. The one development well that is not considered in our 2005 target production rates is at Orion. We have also allowed for other development projects that are designed to add new production and enhance existing production.
Our planned Fiscal 2005 drilling and development projects by target, project type and property, accompanied by our expected participating working interests, are as follows:
Development Drilling Wells Planned
Natural gas targets
Halkirk – two infill Viking formation wells are planned, each at 100%
Orion – one well budgeted at 100% is nearby existing production owned by a third-party in the Bluesky formation
Light/medium crude oil target
- St. Albert – one Leduc D-3/Wabamun D-1 well at 75% is to be drilled
Heavy crude oil targets
- Mantario East – fifteen in-fill, Basal Mannville wells are planned, each at 75%
DYNAMIC OIL & GAS, INC. 2004 ANNUAL REPORT
Other Development Projects Planned
Production enhancements
St. Albert – upgrades to our salt water disposal system and miscellaneous well work-overs are planned to slow the natural decline rate of natural gas, natural liquids and light/medium crude oil production and to improve operating efficiencies, at 75%
- Cypress/Chowade – our 30% share of the cost to add natural gas compression is budgeted
- Mantario East - construction of a gathering system and heavy crude oil battery is planned at 75%
Re-completions (completions of untested zones in existing wellbores), and tie-ins of wells previously drilled
Peavey/Morinville – one natural gas well is to be re-completed at 100% and one is to be tied-in at 35%
Mantario East – six cased and standing heavy crude oil wells are to be equipped and tied-in at 75%
Cypress/Chowade – two cased and standing natural gas wells are to be tied-in, both at 50%
Undeveloped Properties (20% of our Fiscal 2005 Capital Investment Program Budget)
In our Fiscal 2005 Capital Investment Program budget, we have allowed for the drilling, completion, equipping and tie-in of seven exploration wells. The outcome of these wells has not been considered in our 2005 target production rate table below.
Our planned Fiscal 2005 exploration projects by target and property, accompanied by our expected participating working interests are as follows:
Exploratory Drilling Wells Planned
Natural gas targets
Other Exploration Projects Planned
Land acquisitions and seismic data activity
Cypress/Chowade – an allowance for land acquisitions and for a 15 kilometer, 2D seismic shoot is budgeted at 30%
Unspecified Saskatchewan Properties – a general allowance for land acquisitions and seismic data is factored into our budget at 75%
Our Fiscal 2005 target daily average and exit production rates are 3,300 and 3,400 boe per day, respectively. Our peak production target mid-year is 3,600 boe per day. Our target production rates do not include potential increases resulting from work being conducted during the year on certain undeveloped properties. A discussion of these properties and their potential impact on 2005 production follows the table below (see Item 5 Operating and Financial Review and Prospects - “Undeveloped Properties”):
Fiscal 2005 Target Daily Averages (by Property) and Exit Production Rates| (Units as stated) | | |
| | Target Daily | |
| | Production Rates | |
| Natural gas(mcf/d) | | |
| St. Albert | 6,784 | |
| Halkirk | 642 | |
| Peavey/Morinville | 594 | |
| Other Alberta (three properties) | 522 | |
| Cypress/Chowade, British Columbia | 1,254 | |
| Total natural gas(mcf/d) | 9,796 | |
| Total natural gas(boe/d 6:1) | 1,633 | |
| Natural gas liquids – St. Albert(bbl/d) | 481 | |
| Light/medium crude oil – St. Albert(bbl/d) | 190 | |
| Heavy crude oil – Mantario East –(bbl/d) | 996 | |
| Target daily average production rate(boe/d) | 3,300 | |
| Target daily exit production rate(boe/d) | 3,400 | |
MANAGEMENT’S DISCUSSION & ANALYSIS
Fiscal 2005 – Budgeted Capital Investment Program
During Fiscal 2005, our budgeted Capital Investment Program totals $21.9 million, an amount that is broken down by spending classification and property in the following table:
Fiscal 2005 – Budgeted Capital Investment Program
| ($000’s) | | | | | | | | | | |
| | | Drilling, | | Facilities | | Seismic | | | |
| Land | | Completions | | and | | and | | | |
| | Acquisitions | | and Equipping | | Pipelining | | Other | | Total | |
| Alberta | | | | | | | | | | |
| St. Albert | - | | 1,595 | | 675 | | 150 | | 2,420 | |
| Halkirk | - | | 1,010 | | - | | - | | 1,010 | |
| Peavey/Morinville | - | | 180 | | - | | 80 | | 260 | |
| Total Alberta | - | | 2,785 | | 675 | | 230 | | 3,690 | |
| British Columbia | | | | | | | | | | |
| Cypress/Chowade | 150 | | 2,935 | | 1,895 | | 300 | | 5,280 | |
| Orion | - | | 1,575 | | - | | - | | 1,575 | |
| Total British Columbia | 150 | | 4,510 | | 1,895 | | 300 | | 6,855 | |
| Saskatchewan | | | | | | | | | | |
| Mantario East and Area | 39 | | 7,151 | | 2,531 | | 114 | | 9,835 | |
| Total Saskatchewan | 39 | | 7,151 | | 2,531 | | 114 | | 9,835 | |
| Contingency/Other | - | | - | | - | | 1,475 | | 1,475 | |
| Total – All Provinces | 189 | | 14,446 | | 5,101 | | 2,119 | | 21,855 | |
Our Fiscal 2005 Capital Investment Program budget focuses on three primary objectives:
To continue to optimize production and cash flow from our St. Albert and Mantario East properties. As our primary producing assets, St. Albert and Mantario East are expected to contribute 55% and 26 % of our total 2005 production targets, respectively;
To generate reserve and production growth in 2005 through the development of new drilling opportunities, pipelining and facility projects; and
To establish new core areas for future growth through our exploration efforts at Orion, Cypress/Chowade and in the Mantario East area.
In total, our budget for Fiscal 2005, is allocated 17% to Alberta, 31% to British Columbia, 45% to Saskatchewan, and 7% to properties yet to be allocated between the three provinces.
Our 2005 Capital Investment Program is based on our targeted daily average production rates (see Item 5 – “Outlook for Fiscal 2004”), and estimated weighted average prices for our commodities (see Item 5 – “Liquidity and Capital Resources – Sources and Uses of Cash”). We expect to finance our 2005 Capital Investment Program from operating cash flows, supported by a revolving line of credit with our corporate bank. From time to time, as warranted, we may seek term debt to finance long-life facilities and equity to fuel accelerated project exploration plans, and we may make amendments to our Capital Investment Program.
Liquidity and Capital Resources
Sources and Uses of Cash
Our main business strategy is to focus on growth through full-cycle exploration and development. We supplement our main strategy with targeted acquisitions when appropriate. To carry out these capital-intensive strategies, we require cash flow from operations and an operating bank line of credit. If warranted, we would seek term debt to finance construction of long-life facilities and equity to fuel accelerated project exploration plans.
Operating activities -In any given year, our operating activities may result in cash flow timing differences where capital expenditures exceed cash flow from operations. The two key underlying drivers behind this are:
DYNAMIC OIL & GAS, INC. 2004 ANNUAL REPORT
Five-Year Historical Cash Flow Information
| ($ 000’s unless otherwise stated) | | | | | | | | | | |
| | | | | | Nine-Month | | | | | |
| | | | | | Fiscal | | | | | |
| | Fiscal | | Fiscal | | Transition | | Fiscal | | Fiscal | |
| | 2004 | | 2003 | | 2002 | | 2002 | | 2001 | |
| Natural gas | $6.67 | | $6.56 | | $4.36 | | $3.81 | | $6.22 | |
| Light/medium crude oil | $50.03 | | $42.98 | | $41.40 | | $34.33 | | $43.60 | |
| Heavy crude oil | $21.07 | | - | | - | | - | | - | |
| Cash flow from operations;(1)and | 19,421 | | 23,097 | | 10,810 | | 11,337 | | 18,168 | |
| Capital investment program, capital | | | | | | | | | | |
| Assets and other | (37,410 | ) | (27,102 | ) | (14,022 | ) | (26,753 | ) | (12,432 | ) |
| Total timing differences | (17,989 | ) | (4,005 | ) | (3,212 | ) | (15,416 | ) | 5,736 | |
| Bank operating indebtedness | 1,997 | | 2,041 | | (2,997 | ) | 15,593 | | (6,000 | ) |
| Issuance of common shares | 11,789 | | 1,511 | | - | | 455 | | 200 | |
| Repurchases of common shares | - | | - | | (326 | ) | (290 | ) | (90 | ) |
| | 13,786 | | 3,552 | | (3,323 | ) | 15,758 | | (5,890 | ) |
| Changes in non-cash working capital | (4,203 | ) | (453 | ) | (6,535 | ) | 342 | | (154 | ) |
| (1) | Included in our cash flow from operations are payments relating to the leasing of our office space (see “Contractual Obligations and Commitments” below). |
Financing activities –In 1999, we established a revolving, demand bank operating loan facility with our corporate bank. On May 16, 2003, our loan was increased to $25.0 million from $21.0 million. Principal balances outstanding are charged interest at prime plus three-eighths of a percent (at December 31, 2004, the bank’s prime rate was 4.25%) and are collateralized by a general assignment of book debts and a floating charge debenture of $35.0 million covering all our assets. A standby fee of one-eighth of a percent per annum is levied on the unused portion of the facility.
The facility is subject to a semi-annual review. The next review is scheduled for April 30, 2005. This review will include assessments of our December 31, 2004 reserves and daily production estimates and a full evaluation of our financial position and operations. As at December 31, 2004, the undrawn balance of our loan facility was $9.4 million, after allowing for bank indebtedness of $8.4 million. Repayment is in full, monthly. Our loan agreement contains covenants that require prior approval of our bank (e.g. mergers, capital distributions, other pledges of security and asset disposals). At December 31, 2004, we were compliant with all covenants and we expect to remain in compliance.
The winter season is often the best time for our drilling activities, therefore, dependence on our borrowing facility may tend to be heavier at those times.
On May 19, 2004, we closed a bought-deal private placement resulting in cash proceeds, net of fees and financing costs, of approximately $11.6 million. In exchange for the cash proceeds, we issued 2,000,000 flow-through shares at $5.60 per share and 280,000 common shares (non-flow-through) at $4.55 per share (see Note 6[a] to our Financial Statements for further details). The gross proceeds of the flow-through private placement must be spent by December 31, 2005 on qualifying expenses for exploration-only activities that are specifically defined in the Income Tax Act (Canada). Net proceeds of the non-flow-through became general working capital.
At December 31, 2004, our authorized capital was 60,000,000 common shares without par value, of which 24,558,978 were issued and outstanding. Also outstanding were 1,768,300 options at prices ranging from $1.45 to $5.43 per share, each option entitling the holder to acquire one common share. The weighted average remaining contractual exercise life of these options was 3.65 years.
During Fiscal 2004, we received cash of $0.2 million from holders of stock options upon their exercise into 84,200 shares of our common stock at a weighted average exercise price of $1.99 per share.
Working capital –Changes in our working capital and net debt levels are primarily dependent upon our cash flow from operations, the size of our capital investment program, and the timing of incurred field activities.
Our sales receivables and trade payables are settled in accordance with normal industry standards while we maintain our working capital liquidity by drawing from and repaying our unutilized bank credit facility as needed.
MANAGEMENT’S DISCUSSION & ANALYSIS
Our year-end net debt level, comprised of working capital and the outstanding balance of our operating bank loan, reflects a debt-to-cash-flow ratio of 1.3:1 (Fiscal 2003 – 0.8:1; Nine-Month Fiscal Transition 2002 – 1.2:1 annualized; Fiscal 2002 – 1.2:1, Fiscal 2001 - nil).
Cash Requirements
Our future liquidity is dependent upon cash flows generated from our operational activities, our capital investment programs and the flexibility of capital sources. Changes in our daily average production levels and the weighted average prices we obtain for the sales of our commodities will impact our cash flow from operations and the extent to which we may draw from, or have made available to us, bank operating credit (See Item 5 Operating and Financial Review and Prospects – “Outlook for Fiscal 2005” and Item 11 Quantitative and Qualitative Disclosures About Market Risk - “Weighted Average Prices and the Effect of Adversity”).
We may seek term debt to re-finance certain assets and equity to fuel accelerated project exploration or acquisition opportunities. In the event commodities prices increase or decrease materially, we may choose to expand or contract our spending plans. Based on our production targets, our forecasts of strong commodity prices, and support from our bank loan facility that is currently established at $25.0 million, we expect to have adequate resources to meet our Fiscal 2005 cash requirements will be met.
Cash Management
As in most upstream oil and gas companies, we manage our cash throughout both positive and negative commodity price cycles. We work toward accomplishing all projects specified in our annual capital investment program budget, however, in the event our commodity prices increase or decrease materially, we may choose to expand or contract our spending plans, as warranted.
Increases or decreases in our capital spending activities may have corresponding effects on our production, net revenues, operating loan interest expense and income-related taxes, and counter-effects on our amortization and depletion expense.
Contractual Obligations and Commitments
We have an operating lease in respect of our office premises, as discussed in Note 12 to our Financial Statements. Additionally, we have asset retirement obligations relating to the clean up and restoration of wellsites and associated production facilities (see Note 5 to our Financial Statements).
Contractual Obligations and Commitments
| ($000’s) | | | Payments or Work Commitments Due By Period | |
| Total | | < 1 Year | | 1 - 3 Years | | 4 – 5 Years | | > 5 Years | |
| Operating lease obligations (office space) | 696 | | 204 | | 492 | | - | | - | |
| Asset retirement obligations(1) | 4,661 | | 129 | | 883 | | 277 | | 3,372 | |
| Total | 5,357 | | 333 | | 1,375 | | 277 | | 3,372 | |
| (1) | Asset retirement obligations represent estimates of future clean-up and restoration commitments and are undiscounted. |
As at December 31, 2004, we recognized $2.6 million on our balance sheet for future asset retirement obligations. We engage independent engineering consultants to assist in assessing our total future asset retirement liabilities. While we cannot predict their ultimate cost, we currently estimate the total cost to clean up all our operating facilities to be $4.7 million.
On May 19, 2004, we completed a flow-through private placement resulting in gross cash proceeds of $11.2 million. Under the private placement agreements, we are committed to spend by December 31, 2004, the $11.2 million on qualifying expenses for exploration-only activities as defined by the Income Tax Act (Canada). On February 28, 2005, we renounced the tax benefits of the exploration expenses in favour of the original flow-through shareholders. (See Note 14 to our Financial Statements for further details).
DYNAMIC OIL & GAS, INC. 2004 ANNUAL REPORT
Business Risk Management
Competition
The natural gas and oil industry is highly competitive. We experience competition in all aspects of our business, including searching for, developing and acquiring reserves, obtaining pipeline and/or facilities processing capacity, leases, licenses and concessions, and obtaining the equipment and labor needed to conduct operations and market natural gas and oil. Our competitors include multinational energy companies, other independent natural gas and oil concerns and individual producers and operators. Because both natural gas and oil are fungible commodities, the principal form of competition with respect to product sales is price competition. Many competitors have financial and other resources substantially greater than those available to us and, accordingly, may be better positioned to acquire and exploit prospects, hire personnel and market production. In addition, many of our larger competitors may be better able to respond to factors such as changes in worldwide natural gas or oil prices, levels of production, the cost and availability of alternative fuels or the application of government regulations. Such factors, which are beyond our control, may affect demand for our natural gas and oil production. We expect a high degree of competition to continue.
Estimating of Reserves and Future Net Cash Flows Risk
Estimating natural gas, natural gas liquids and crude oil reserves, and future net cash flows includes numerous uncertainties, many of which may be beyond our control. Such estimates are essential in our decision-making, as to whether further investment is warranted. These estimates are derived from several factors and assumptions, some of which are:
reservoir characteristics based on variable geological, geophysical and engineering assessments;
future rates of production based on historical draw-down rates;
future net cash flows based on commodity price/quality assumptions, production costs, taxes and investment decisions;
recoverable reserves based on estimated future net cash flows; and
compliance expectations based on assumed federal, provincial and environmental laws and regulations.
Ultimately, actual production rates, reserves recovered, commodity prices, production costs, government regulations or taxation may differ materially from those assumed in earlier reserve estimates. Higher or lower differences could materially impact our production, revenues, production costs, depletion expense, taxes and capital expenditures.
Reserve estimates and net present values reported by us elsewhere in this Report are based on estimated commodity prices and associated production costs that are assumed constant for the life of the reserves. Actual future prices and costs may be materially higher or lower.
We have historically invested a significant portion of our capital budget in drilling exploratory wells in search of unproved oil and gas reserves. We cannot be certain that the exploratory wells we drill will be productive or that we will recover all or any portion of our investments. In order to increase the chances for exploratory success, we often invest in seismic or other geoscience data to assist us in identifying potential drilling objectives. Additionally, the cost of drilling, completing and testing exploratory wells is often uncertain at the time of our initial investment. Depending on complications encountered while drilling, the final cost of the well may significantly exceed that which we originally estimated.
Exploration and Development Risks
Exploration and development of natural gas and oil involves a high degree of risk that no commercial production will be obtained or that the production will be insufficient to recover drilling and completion costs. The costs of drilling, completing and operating wells is sometimes uncertain, and cost overruns in exploration and development operations can adversely affect the economics of a project. Our drilling operations may be curtailed, delayed or canceled as a result of numerous factors, including title problems, joint venture partner and/or operator decisions, equipment failures, weather conditions, marine accidents, fires and explosions, compliance with governmental requirements, and shortages or delays in the delivery of equipment. Furthermore, completion of a well does not ensure a profit on the investment or a recovery of drilling, completion and tie-in costs.
Replacement of Reserves
In general, the rate of production from natural gas and oil properties declines as reserves are depleted. The rate of decline depends on reservoir characteristics and other factors. Except to the extent we acquire properties containing proved reserves or conduct successful exploration and development activities, or both, our estimated proved reserves
MANAGEMENT’S DISCUSSION & ANALYSIS
will decline as reserves are produced. Our future natural gas and oil production, and therefore cash flow from operations and net earnings, are highly dependent upon our level of success in finding or acquiring additional economically recoverable reserves. The business of exploring for, developing and acquiring reserves is capital intensive. To the extent cash flow from operations is reduced and external sources of capital become limited or unavailable, our ability to make the necessary capital investment to maintain or expand our asset base of natural gas and oil reserves could be materially impaired.
Dependence on One Major Property
During Fiscal 2004 and Fiscal 2003, our core property at St. Albert, Alberta, contributed 69% and 85% of our total production, respectively. While the St. Albert property has developed into 16 separate, mutually-exclusive oil and gas pools stacked in seven productive formations (four natural gas and three crude oil), each pool has its own reserves and future production risk, and thus it is important for us to establish producing fields in other areas. Unless we can successfully drill for or acquire economically viable reserves of natural gas and crude oil in other areas, as our production depletes the reserves at St. Albert, our revenue may be materially adversely affected.
Restoration, Safety and Environmental Risk
All our operations are in western Canada and, in particular, the western provinces of Alberta, British Columbia, and Saskatchewan. Certain laws and regulations exist that require companies engaged in petroleum activities to obtain necessary safety and environmental permits to operate. Such legislation may restrict or delay us from conducting operations in certain geographical areas. Further, such laws and regulations may impose liabilities on us for remedial and clean-up costs, personal injuries related to safety and environmental damages, such liabilities collectively referred to by us as “asset retirement obligations”.
To ensure that we provide for future estimated asset retirement obligations, we recognized $0.1 million in our Statement of Operations and Deficit during Fiscal 2004. This, combined with newly-recognized liabilities of $0.9 million, brings our total recognized amount in our Fiscal 2004 Balance Sheet to $2.6 million. We engage independent engineering consultants to assist in assessing our total asset retirement obligations related to removal and clean-up costs. While we cannot predict their ultimate cost, we currently estimate the future cost to clean up all our operating facilities to be $4.7 million.
While our safety and environmental activities have been prudent and have enabled us to operate successfully in managing such risks, there can be no assurance that we will always be successful in protecting ourselves from the impact of all such risks.
Kyoto Protocol Risk
The Kyoto Protocol treaty (Protocol) was established in 1997 to reduce emissions of greenhouse gases (GHG) that are believed to be responsible for increasing the Earth’s surface temperatures and affecting the global climate change. Canada ratified the Protocol in December 2002. Since the implementation of the Protocol, approximately 160 countries have committed to reduce GHG internationally. The Protocol was legally made effective internationally on February 16, 2005 and Canada has committed to meet a 6% reduction of emission over base-year 1990 during the period 2008 to 2012. Canadian government assurances of cost and volume limits suggest that incremental risks and liabilities attributable to addressing Protocol related policies are manageable. While we believe we are a low-emission producer, it is not possible to predict the impact of how Protocol-related issues will ultimately be resolved and to what extent their impact will affect our future unit operating costs and capital expenditures.
Market Risk Management
Our results are impacted by external market risks associated with fluctuations in commodity prices, interest rates and credit, details of which are outlined below.
Commodities Price Risk
Our future financial performance remains closely linked to hydrocarbon commodity prices, which can be influenced by many factors including global and regional supply and demand, worldwide political events and weather. These factors, among others, can result in a high degree of price volatility.
Natural gas -Our natural gas portfolio is split between two primary markets, one is the Alberta Spot Market, which trades at the AECO storage hub (www.encanastorage.com/), the other is an aggregator pool called ProGas (www.progas.com).
DYNAMIC OIL & GAS, INC. 2004 ANNUAL REPORT
AECO, an intra-Alberta trading hub, offers producers the opportunity to participate in natural gas transactions for terms of one day, one month, summer and winter blocks, and annually. We are currently selling our uncommitted natural gas volumes into the AECO daily spot market, however, our marketing strategy includes securing monthly and term deals, if optimal.
ProGas, a wholly-owned subsidiary of BP Canada, ‘aggregates’ supplies of natural gas to sell into a basket of daily, short term (less than one year) and long-term contracts, both domestic and export. Producers realize a netback price for their natural gas, which is a blend of all contract types and weighted toward NYMEX-based prices.
During Fiscal 2004, we sold 40% of our natural gas to ProGas and 60% into the AECO daily spot market. During Fiscal 2003, we sold 46% of our natural gas to ProGas and 54% into the AECO daily spot market. During Nine-Month Fiscal Transition 2002, we sold 51% to ProGas, and 49% into the AECO daily spot market.
Natural gas liquids and crude oil -We market our natural gas liquids and light/medium crude oil based on monthly prices posted by the major purchasers at Edmonton, Alberta. Our heavy crude oil is marketed based on monthly prices posted at Hardisty, Saskatchewan. The trends in these posted prices tend to correlate with the West Texas Intermediate crude oil benchmark price (one of the world’s benchmarks followed by market analysts, investors and industry), allowing for quality adjustments and location differentials.
We currently have no hedge positions, however, we manage our potential exposure to commodity price volatilities through diversification as follows:
Commodity mix –our sales portfolio is comprised of natural gas, crude oil and natural gas liquids. Crude oil and natural gas liquids are sold at prices with volatilities that differ from those of natural gas; and
Natural gas pricing mix –AECO pricing typically has a close correlation to NYMEX pricing, however, when the two become disconnected due to market dynamics, we are well-positioned to take advantage of premium pricing in either market area.
A financial swap is a derivative instrument whereby we and a third party agree to settle, at specified intervals, the difference between an agreed fixed commodity price, interest rate or exchange rate and floating prices or rates calculated by reference to an agreed notional volume or principal amount. We are currently not using swap contracts and have no obligation to deliver or receive quantities of natural gas, natural gas liquids or crude oil pursuant to a swap.
Sensitivity Analysis
The following table shows the effect on cash flow of certain changes in volume, price and interest rates. Numbers presented reflect the sensitivity impact on our estimated Fiscal 2005 activity.
Sensitivities
| | | | | | | | | | Effect on | |
| | | | Changes in | | Cash Flow | |
| | | | Volume | | Price | | Rate | | $(000’s) | |
| Production | – | natural gas(mmcf/d) | 1 | | - | | - | | 2,430 | |
| | – | natural gas liquids(bbl/d) | 100 | | - | | - | | 1,275 | |
| | – | light/medium crude oil(bbl/d) | 100 | | - | | - | | 2,148 | |
| | – | heavy crude oil(bbl/d) | 100 | | - | | - | | 37 | |
| Price | – | natural gas($/mcf) | - | | 0.50 | | - | | 1,995 | |
| | – | natural gas liquids($/bbl) | - | | 1.00 | | - | | 168 | |
| | – | light/medium crude oil(bbl/d) | - | | 1.00 | | - | | 54 | |
| | – | heavy crude oil($/bbl) | - | | 1.00 | | - | | 311 | |
| Interest rate(%) | - | | - | | 1 | | 250 | |
Credit Risk
In addition to market risk, our financial instruments involve, to varying degrees, risk associated with trade credit and risk associated with operatorship of joint venture properties. Substantially all of our accounts receivable result from the sale of our commoditites and from the collection of parner liabilities pursuant to joint venture agreements under which we have operatorship responsibilities. They are subject to normal industry credit risk. For example, approximately 74% of our December 31, 2004 balance of accounts receivable is due from nine customers, subject to normal credit risk. Further, while our largest producing properties during Fiscal 2004 were self-operated, seven out of ten active properties in which we have interests are operated by other industry companies.
MANAGEMENT’S DISCUSSION & ANALYSIS
We do not require collateral or other security to support financial instruments nor do we provide collateral or security to counterparties. Currently, we do not expect non-performance by any counterparty. While there can be no assurance that our no-loss record will continue, the parties who are obligated to us contractually have been consistently reliable in the past.
Interest Rate Risk
We use a revolving, floating rate credit facility, therefore, we are exposed to fluctuations in short-term interest rates. Our current borrowing rate applied to the facility is Canadian Dollar Prime plus three-eighths of a percent per annum. To minimize our exposure to rate variability, we occasionally invest a portion of our undrawn borrowing capacity in Banker’s Acceptances. We are charged a standby fee of one-eighth of a percent per annum on our undrawn borrowing capacity.
We do not engage in interest rate swaps to hedge the interest rate exposure associated with the credit agreement. If market interest rates for short-term borrowings increase by 1%, the increase in our interest expense would be immaterial (see Item 5 - “Liquidity and Capital Resources - Sensitivity Analysis”).
At December 31, 2004, we had floating debt outstanding of $15.5 million (December 31, 2003 – $13.3 million; December 31, 2002 – $11.1 million).
Critical Accounting Policies
Our critical accounting policies are defined as those that are important to the portrayal of our financial position and operations and require us to make judgments based on underlying estimates and assumptions about future events and their effects. Such underlying estimates and assumptions are based on historical experience and other factors that we believe to be reasonable under the circumstances. These estimates and assumptions are subject to change as new events occur, as more industry experience is acquired, as additional information is obtained and as our operating environment changes. We believe the following are the most critical areas where estimates and our accounting policies can materially impact our Financial Statements. For information concerning our other significant accounting policies, see Note 2 to our Financial Statements.
Reserves Estimates
On an annual basis, we engage independent petroleum consultants to conduct evaluations of our reserves. The accuracy of reserves estimates is a matter of interpretation and judgment and is a function of the quality and quantity of available data gathered over time. For further details and a discussion of the risks involved in the reserves estimating process, see Item 3 under “Risk Factors - Estimating of Reserves and Future Net Cash Flows Risk”.
Natural Gas and Oil Interests
We follow the successful efforts method of accounting for our natural gas and oil activities, as described in Note 2 to our Financial Statements. The application of this method requires us to make significant judgments and decisions based on available geological, geophysical, engineering and economic data. The results from drilling can take considerable time to analyze. When it is determined that drilling has been unsuccessful in establishing proved reserves or where one year has elapsed since the completion of drilling and near-term efforts to establish proved reserves are not foreseeable, intended, or in our control, the costs of drilling are written off and reported as exploration expense. Drilling costs for wells that have been successful in establishing proved reserves are capitalized as natural gas and oil interests on our balance sheet.
Where we assess that the estimated undiscounted future cash flows are either partially or fully below the book value of a property as recorded in our natural gas and oil interests (“impairment test”), we either partially or fully adjust the book value downward and record a depletion expense on our income statement accordingly (“impairment test adjustment”).
Estimates of undiscounted future cash flows that we use for conducting impairment tests are subject to significant judgment decisions based on assumptions of highly uncertain future factors such as, natural gas and crude oil prices, production quantities, estimates of recoverable reserves and operating costs. Given the significant assumptions required and the strong possibility that actual future factors will differ, we consider the impairment test to be a critical accounting procedure.
During Fiscal 2004, property impairment tests resulted in an adjustment of $3.8 million to the book value of our properties at Cypress/Chowade ($3.6 million) and Peavey/Morinville ($0.2 million).
During Fiscal 2003, property impairment tests resulted in an adjustment to the book value of our Cypress/Chowade property. The total adjustment amounted to $0.3 million.
DYNAMIC OIL & GAS, INC. 2004 ANNUAL REPORT
During Nine-Month Transition 2002, our property impairment tests resulted in adjustments to the book values of four properties: Alexander, Halkirk, Morinville/Peavey and Virgo. Total adjustments amounted to $0.4 million, Halkirk accounting for 74% and Alexander 21% of the total.
Summary of Results and Identifiable Trend Factors For Eight Most Recently Completed Quarters
The following table shows certain financial information for the eight most recently compeleted quarters.
Summary of Results for Eight Most Recently Completed Quarters
| | 2004- | | 2004- | | 2004- | | 2004- | | 2003- | | 2003- | | 2003- | | 2003- | |
| | Q4 | | Q3 | | Q2 | | Q1 | | Q4 | | Q3 | | Q2 | | Q1 | |
| Revenue | 9,822 | | 9,689 | | 10,320 | | 10,975 | | 9,636 | | 11,980 | | 10,924 | | 14,308 | |
| Net (loss) earnings | (11,528 | ) | (378 | ) | 413 | | (788 | ) | (781 | ) | 965 | | 1,472 | | 3,322 | |
| Net (loss) earnings per share | | | | | | | | | | | | | | | | |
| Basic | (0.49 | ) | (0.01 | ) | 0.02 | | (0.04 | ) | (0.04 | ) | 0.04 | | 0.07 | | 0.16 | |
| Diluted | (0.49 | ) | (0.01 | ) | 0.02 | | (0.04 | ) | (0.04 | ) | 0.04 | | 0.07 | | 0.16 | |
Changes in revenues between quarters are affected by three identifiable trend factors. They are changes in total and daily production volumes of commodities, changes in prices of commodities, and changes in daily production volume-mix between commodities. Changes in net (loss) earnings and net (loss) earnings per share between quarters are mainly affected by the following identifiable trend factors: changes affecting revenues as discussed above; changes in amortization and depletion (A&D) expense; and changes in exploration expenses.
The table below shows identifiable trend factors that affect changes in revenues, net (loss) earnings and net (loss) earnings per share for the eight most recent quarters.
Identifiable Trend Factors of Eight Most Recently Completed Quarters
| | 2004- | | 2004- | | 2004- | | 2004- | | 2003- | | 2003- | | 2003- | | 2003- | |
| | Q4 | | Q3 | | Q2 | | Q1 | | Q4 | | Q3 | | Q2 | | Q1 | |
| Total production(mboe) | 256 | | 250 | | 259 | | 294 | | 304 | | 353 | | 292 | | 309 | |
| Daily average production rates: | | | | | | | | | | | | | | | | |
| Natural gas(mcf/d) | 11,073 | | 12,435 | | 12,936 | | 13,644 | | 14,010 | | 14,292 | | 11,615 | | 12,252 | |
| Natural gas liquids(bbl/d) | 554 | | 538 | | 512 | | 684 | | 724 | | 707 | | 576 | | 639 | |
| Light/medium crude oil(bbl/d) | 145 | | 111 | | 170 | | 273 | | 253 | | 742 | | 695 | | 756 | |
| Heavy crude oil(bbl/d) | 242 | | - | | - | | - | | - | | - | | - | | - | |
| Weighted average commodity prices: | | | | | | | | | | | | | | | | |
| Natural gas($/mcf) | 6.70 | | 6.51 | | 6.90 | | 6.56 | | 5.73 | | 5.80 | | 6.87 | | 8.09 | |
| Natural gas liquids($/boe) | 33.25 | | 32.85 | | 28.25 | | 26.99 | | 25.58 | | 26.17 | | 26.02 | | 33.28 | |
| Light/medium crude oil(bbl/d) | 57.14 | | 55.02 | | 49.57 | | 44.30 | | 36.94 | | 40.53 | | 40.70 | | 49.58 | |
| Heavy crude oil(bbl/d) | 21.07 | | - | | - | | - | | - | | - | | - | | - | |
| A&D expense | 14,863 | | 3,467 | | 2,812 | | 3,040 | | 4,550 | | 3,396 | | 1,890 | | 2,185 | |
| Exploration expenses(1) | 7,850 | | 1,400 | | 935 | | 4,216 | | 1,552 | | 565 | | 848 | | 897 | |
| (1) | We follow the successful efforts method of accounting, whereby costs of drilling an unsuccessful well (“dry hole”) are expensed when it becomes known the well did not result in a discovery of proved reserves. |
2003-Q1 –Revenue of $14.3 million was a corporate record high, partially due to record-high natural gas and crude oil prices that similarly affected prices for natural gas liquids. Crude oil production was a record-high due to the startup of one new well at St. Albert. Net earnings were a record-high of $3.3 million. Exploration expenses were $0.9 million, most of which was for our share of a 3D seismic shoot at Wimborne.
2003-Q2 –Revenue of $10.9 million was the result of slightly weaker commodity prices and lower production. Lower production was mainly the result of an annual two-week plant turnaround at St. Albert. Net earnings were $1.5 million after accounting for relatively lower A&D expense of $1.9 million, primarily due to lower production. Exploration expenses of $0.8 million included the cost of one dry hole at Wimborne.
2003-Q3 –Revenue of $12.0 million was our second highest on record. This was the net result of record-high production against comparatively weaker commodity prices. Net earnings were $1.0 million after accounting for $3.4 million in A&D expense, which was due to higher production volumes combined with a significant increase in our depletable asset base. Our depletable assets increased due to the repurchase of gross overriding interests that previously burdened our total current and future production by 3%. Exploration expenses were $0.6 million, most of which related to one dry hole at Halkirk.
MANAGEMENT’S DISCUSSION & ANALYSIS
2003-Q4 –Revenue of $9.6 million reflected a significant decrease in crude oil prices and production volumes. Crude oil decreased at St. Albert mainly due to declining productivity in two wells. Net earnings were a loss of $0.8 million. A&D expense of $4.6 million reflected a lower producing reserve base due to year-end independent reserve estimations. Exploration expenses were $1.6 million, most of which was for our share of 3D, seismic data-gathering costs at Cypress/Chowade.
2004-Q1 –Revenue of $11.0 million reflected strengthening prices in all commodities. Net earnings were a loss of $0.8 million after accounting for a significant increase in exploration expenses. Exploration expenses were $4.2 million due mainly to a 44 square-kilometer, 3D proprietary seismic program at Orion and the recognition of two unsuccessful drilling attempts at Cypress/Chowade.
2004-Q2 –Revenue of $10.3 million reflected comparatively stronger prices and lower production in all commodities. Lower production was mainly the net result of natural production declines and an annual two-week gas plant turnaround at St. Albert, and the start-up of three new natural gas wells at Cypress/Chowade. Net earnings were $0.4 million after accounting for relatively unchanged A&D burdens and $0.9 million in exploration expenses. There were no dry holes reported in the period.
2004-Q3 –Revenue of $9.7 million reflected slightly lower production. Lower production was mainly the result of natural declines in production from our Alberta properties and a temporary shutdown of our sour gas compressor at St. Albert. Net earnings were a loss of $0.4 million after accounting for $1.4 million in exploration expenses, due mainly to the recognition of one unsuccessful drilling attempt at Wimborne.
2004-Q4 –Revenue of $9.8 million reflected a net decrease in production due to lower natural gas production at Cypress/Chowade and the introduction of heavy crude oil production at Mantario East. Net earnings were a loss of $11.5 million after accounting for significant charges to A&D expense ($14.9 million) and exploration expenses ($7.9 million). A&D expense reflected a significant decrease in our December 31, 2004 independent estimate of proved producing reserves at Cypress/Chowade. Exploration expense reflected costs associated with unsuccessful efforts to discover proved reserves in 12 wells that were drilled or worked on during the quarter. The well-locations and their number-count were as follows: Orion - four, Cypress/Chowade - one, Wimborne - two, Halkirk - one, St.Albert - one, Mantario East - two, and Flaxcombe - one.
Off-Balance Sheet Arrangements
As at December 31, 2004, we had no off-balance sheet arrangements.
Accounting Policy Changes
Canadian Pronouncements
The following pronouncements have been issued by the CICA during Fiscal 2004. While we are not materially affected by these pronouncements, we will continue to assess their applicability.
Financial Instruments – Disclosure and Presentation
In January 2004, the AcSB amended CICA 3860, Financial Instruments – Disclosure and Presentation, to require certain obligations that must or may be settled, at the issuer's option, by a variable number of the issuer's own equity instruments, to be presented as liabilities. These instruments were formerly presented as equity.
The AcSB concluded that when the number of an entity's own shares or other equity instruments required to settle the obligation varies with changes in their fair value, so that the total fair value of the equity instruments to be delivered is based solely or predominantly on the amount of the contractual obligation, the counterparty does not hold a residual interest in the entity until it has received the equity instruments. These instruments indicate a relationship that is more like that of a debtor–creditor relationship than an ownership one, because the amount of consideration does not vary with changes in the fair value of the issuer's own equity instruments.
Companies that have issued these types of instruments should assess the implications on debt-to-equity and other financial ratio requirements to ensure continued compliance.
These amendments harmonize the recognition of these instruments with the provisions of SFAS 150, Accounting for Certain Financial Instruments with Characteristics of Both Liabilities and Equities.
The amendments apply to fiscal years beginning on or after November 1, 2004, although earlier application is encouraged. The amendments are to be applied on a retroactive basis with restatement of prior periods. Prior period earnings will be affected since carrying costs will be presented as earnings rather than equity transactions.
Financial Instruments – Recognition and Measurement
The proposed CICA 3855 puts forward comprehensive requirements for recognition and measurement of financial instruments. An entity would recognize a financial asset or financial liability only when the entity becomes a party to the contractual provisions of the financial instrument. Financial assets and financial liabilities would, with
DYNAMIC OIL & GAS, INC. 2004 ANNUAL REPORT
certain exceptions, be initially measured at fair value. For financial assets and financial liabilities not classified as held for trading, the initial value recorded would include transaction costs that are directly attributable to the acquisition or issuance of the financial asset or liability.
After initial recognition, the measurement of financial assets would vary depending on the category of the asset -financial assets held for trading, held-to-maturity investments, loans and receivables, and available-for-sale financial assets.
Assets classified as trading or available-for-sale would be recorded at fair value. Unrealized gains and losses on assets classified as trading would be recorded in income. Unrealized gains and losses on assets classified as available-for-sale would be recorded in comprehensive income.
Held-to-maturity investments and loans and receivables would be recorded at amortized cost.
Financial liabilities that are classified as held for trading would be subsequently measured at fair value.
All other financial liabilities would be subsequently measured at amortized cost using the effective interest method.
A differential reporting option would be available to qualifying companies. These companies may measure financial assets classified as "available for sale" that are not designated as a hedging instrument and have no quoted market price in an active market at cost or amortized cost.
Hedges
The purpose of the proposed CICA 3865 is to set standards on when and how hedge accounting may be applied. As compared with AcG-13, Hedging Relationships, the re-exposure draft further restricts which hedging relationships qualify for hedge accounting. For example, it restricts the ability to designate a non-derivative financial instrument as the hedging instrument to hedge certain foreign currency risks.
The re-exposure draft classifies qualifying hedging relationships into three types:
- Fair value hedges – hedges of the exposure to changes in fair value;
- Cash flow hedges – hedges of the exposure to variability in cash flows; and
- Hedges of foreign currency exposures of net investments in self-sustaining foreign operations.
Though the accounting treatment for each type of hedging relationship is different, for perfectly effective hedges all three treatments result in the recognition of offsetting changes in earnings in the same period. For hedges that are not perfectly effective, the ineffective portion of the change in fair value of derivatives would be included in earnings in the period of the change. The accounting treatments proposed in this re-exposure draft are expected to result in changes from current practice under Canadian GAAP.
Comprehensive Income
This new section will set the standards for the reporting and display of comprehensive income. Comprehensive income is defined as the change in equity (net assets) of an enterprise during a period from transactions and other events and circumstances from non-owner sources. It includes all changes in equity during a period, except those resulting from investments by owners and distributions to owners.
A statement of comprehensive income would be included in a full set of financial statements for both interim and annual periods. The new statement would present net income and each component to be recognized in other comprehensive income. These components would include, for example, exchange gains and losses arising on translation of the financial statements of self-sustaining foreign operations, which are currently included in a separate component of shareholders' equity.
Changes in Accounting Policies and Estimates, and Errors
The AcSB has issued an Exposure Draft with a view to replacing CICA 1506, Accounting Changes, with a new Section, Changes in Accounting Policies and Estimates, and Errors. The Exposure Draft proposes the following key changes:
An entity would be permitted to change an accounting policy only when it is required by a primary source of GAAP, or when the change results in a reliable and more relevant presentation in the financial statements;
Changes in accounting policy would be applied retroactively, unless specific transitional provisions in a primary source of GAAP permit otherwise or application to comparative information is impractical (the standard provides specific guidance as to what is considered impractical);
Expanded disclosures about the effects of changes in accounting policy, estimates and errors on the financial statements; and
Disclosure of new primary sources of GAAP that have been issued but have not yet come into effect and have not yet been adopted by the entity.
MANAGEMENT’S DISCUSSION & ANALYSIS
The proposed revised Section is expected to be harmonized with the FASB draft standard on accounting changes and error corrections, which is scheduled to be finalized by the third quarter of 2004. The expected effective date will be for fiscal years beginning on or after January 1, 2005.
Subsequent Events
This Exposure Draft proposes several significant enhancements:
Extension of the period during which subsequent events are required to be considered to include events that occur between the date of the balance sheet and the date the financial statements are authorized for issue (currently, CICA 3820 requires consideration to the date of completion of the financial statements).
"Date of authorization for issue" is defined as the date on which those charged with governance, such as the board of directors, approve the issuance of the financial statements, including the related notes.
Requirement to disclose in the financial statements the date when the financial statements were authorized for issue and who gave that authorization.
Requirement to update disclosures for adjusting subsequent events in light of new information received up to the date of authorization for issue of the financial statements.
The AcSB has indicated its intent to converge with IASB standards and harmonize with U.S. GAAP. The AcSB plans to issue its amendments in the fourth quarter of 2004 and expects them to be effective for fiscal periods beginning on or after January 1, 2005.
Special Note Regarding Forward-Looking Statements
Certain statements in this Report, including those appearing under this Item 5, constitute “forward-looking statements” within the meaning of the United States Private Securities Litigation Reform Act of 1995, Section 21E of the United States Securities Exchange Act of 1934, as amended, and Section 27A of the United States Securities Act of 1933, as amended. Additionally, forward-looking statements may be made orally or in press releases, conferences, reports, on our website or otherwise, in the future, by us on our behalf. Such statements are generally identifiable by the terminology used such as “plans”, “expects, “estimates”, “budgets”, “intends”, anticipates”, “believes”, “projects”, “indicates”, “targets”, “objective”, “could”, “may” or other similar words.
The forward-looking statements are subject to known and unknown risks and uncertainties and other factors that may cause actual results, levels of activity and achievements to differ materially from those expressed or implied by such statements. Such factors include, among others: market prices for natural gas, natural gas liquids and oil products; the ability to produce and transport natural gas, natural gas liquids and oil; the results of exploration and development drilling and related activities; economic conditions in the countries and provinces in which we carry on business, especially economic slowdown; actions by governmental authorities including increases in taxes, changes in environmental and other regulations, and renegotiations of contracts; political uncertainty, including actions by insurgent groups or other conflict; the negotiation and closing of material contracts; and the other factors discussed in Item 3 Key Information – “Risk Factors”, and in other documents that we file with the United States Securities and Exchange Commission. The impact of any one factor on a particular forward-looking statement is not determinable with certainty as such factors are interdependent upon other factors; our course of action would depend upon our assessment of the future considering all information then available. In that regard, any statements as to future natural gas, natural gas liquids or oil production levels; capital expenditures; the allocation of capital expenditures to exploration and development activities; sources of funding for our capital program; drilling of new wells; demand for natural gas, natural gas liquids and oil products; expenditures and allowances relating to environmental matters; dates by which certain areas will be developed or will come on-stream; expected finding and development costs; future production rates; ultimate recoverability of reserves; dates by which transactions are expected to close; cash flows; uses of cash flows; collectibility of receivables; availability of trade credit; expected operating costs; expenditures and allowances relating to environmental matters; debt levels; and changes in any of the foregoing are forward-looking statements, and there can be no assurance that the expectations conveyed by such forward-looking statements will, in fact, be realized.
Although we believe that the expectations conveyed by the forward-looking statements are reasonable based on information available to us on the date such forward-looking statements were made, no assurances can be given as to future results, levels of activity, achievements or financial condition.
Readers should not place undue reliance on any forward-looking statement and should recognize that the statements are predictions of future results, which may not occur as anticipated. Actual results could differ materially from those anticipated in the forward-looking statements and from historical results, due to the risks and uncertainties described above, as well as others not now anticipated. The foregoing statements are not exclusive and further information concerning us, including factors that potentially could materially affect our financial results, may emerge from time to time. We do not intend to update forward-looking statements to reflect actual results or changes in factors or assumptions affecting such forward-looking statements.
DYNAMIC OIL & GAS, INC. 2004 ANNUAL REPORT
REPORT OF MANAGEMENT
The accompanying financial statements and all information in the Annual Report are the responsibility of management. Management has prepared the financial statements in accordance with accounting policies detailed in the notes to the financial statements and in accordance with Canadian generally accepted accounting principles, and where necessary includes amounts based on management’s informed judgments and estimates. Financial information throughout the Annual Report is consistent with the financial statements.
Management has developed and maintains appropriate systems of accounting and administrative controls to provide reasonable assurances that transactions are appropriately authorized, timely disclosures and communications with the regulators of any material information are met, assets are safeguarded and financial records are properly maintained to provide factual and reliable financial statements. Management also believes that the financial statements are prepared in accordance with applicable securities rules and regulations.
Ernst & Young, LLP, the Company’s external auditors, have audited the financial statements in accordance with auditing standards generally accepted in Canada and the United States. Their examination included a review of accounting systems and their detailed audit procedures covered all material transactions.
The Board of Directors, through its Audit and Reserves Audit Committees, is responsible for assuring that management fulfills its financial reporting responsibilities. The Audit Committee reviews our financial statements, considers the independence of external auditors and reviews the list of audit and non-audit services and fees to be provided to us by the external auditors. The Reserves Audit Committee reviews our annual estimates of crude oil and natural gas reserves and considers the qualifications and independence of the consulting reservoir engineers. Both Committees are comprised of independent directors. Each Committee gives its respective recommendation for approval to the Board of Directors. The Board of Directors has approved the information contained in the Annual Report.
WAYNE J. BABCOCK
President & Chief Executive Officer | 
MICHAEL A. BARDELL
Chief Financial Officer & Corporate Secretary |
REPORT OF INDEPENDENT REGISTERED PUBLIC ACCOUNTING FIRM
To the Shareholders of Dynamic Oil & Gas, Inc.
We have audited the balance sheets of Dynamic Oil & Gas, Inc. as at December 31, 2004 and 2003 and the statements of operations and (deficit) retained earnings and cash flows for the years ended December 31, 2004 and December 31, 2003 and the nine months ended December 31, 2002. These financial statements are the responsibility of the Company’s management. Our responsibility is to express an opinion on these financial statements based on our audits.
We conducted our audits in accordance with Canadian generally accepted auditing standards and the standards of the Public Company Accounting Oversight Board (United States). Those standards require that we plan and perform the audit to obtain reasonable assurance about whether the financial statements are free of material misstatement. We were not engaged to perform an audit of the Company’s internal control over financial reporting. An audit includes consideration of internal control over financial reporting as a basis for designing audit procedures that are appropriate in the circumstances, but not for the purpose of expressing an opinion on the effectiveness of the Company’s internal control over financial reporting. Accordingly, we express no such opinion. An audit also includes examining, on a test basis, evidence supporting the amounts and disclosures in the financial statements, assessing the accounting principles used and significant estimates made by management, and evaluating the overall financial statement presentation. We believe that our audits provide a reasonable basis for our opinion.
In our opinion, these financial statements present fairly, in all material respects, the financial position of the Company as at December 31, 2004 and December 31, 2003 and the results of its operations and its cash flows for the years ended December 31, 2004 and December 31, 2003 and the nine months ended December 31, 2002 in accordance with Canadian generally accepted accounting principles.
Vancouver, Canada,
March 7, 2005. | 
Chartered Accountant |
FINANCIAL STATEMENTS
BALANCE SHEETS
(in Canadian dollars)
As at December 31
| | 2004 | | 2003 | |
| | $ | | $ | |
| ASSETS[note 4] | | | | |
| Current | | | | |
| Accounts receivable[note 10] | 7,565,975 | | 6,962,387 | |
| Prepaid expenses | 361,277 | | 356,449 | |
| Income taxes receivable | 541,487 | | — | |
| Total current assets | 8,468,739 | | 7,318,836 | |
| Natural gas and oil interests[note 3] | 56,726,494 | | 57,083,789 | |
| Capital assets[note 3] | 414,913 | | 365,561 | |
| Future income tax asset[note 7] | 2,082,092 | | — | |
| | 67,692,238 | | 64,768,186 | |
| | | | | |
| LIABILITIES AND SHAREHOLDERS’ EQUITY | | | | |
| Current | | | | |
| Bank indebtedness | 1,083,000 | | 1,386,238 | |
| Operating loan[note 4] | 15,550,000 | | 13,250,000 | |
| Accounts payable and accrued liabilities | 17,348,723 | | 11,335,946 | |
| Income taxes payable | — | | 659,519 | |
| Total current liabilities | 33,981,723 | | 26,631,703 | |
| Asset retirement obligations[note 5] | 2,555,756 | | 1,587,733 | |
| Future income tax liability[note 7] | — | | 5,617,723 | |
| Total liabilities | 36,537,479 | | 33,837,159 | |
| Commitments[note 12] | | | | |
| | | | | |
| Shareholders’ equity | | | | |
| Share capital[note 6] | 39,852,368 | | 27,747,487 | |
| Contributed surplus[note 6[c]] | 757,689 | | 358,229 | |
| (Deficit) retained earnings | (9,455,298 | ) | 2,825,311 | |
| Total shareholders’ equity | 31,154,759 | | 30,931,027 | |
| | 67,692,238 | | 64,768,186 | |
| See accompanying notes | | | | |
 |  |
DYNAMIC OIL & GAS, INC. 2004 ANNUAL REPORT
STATEMENTS OF OPERATIONS AND
(DEFICIT) RETAINED EARNINGS
(in Canadian dollars)
| | | | | | Nine Months | |
| | Year Ended | | Year Ended | | Ended | |
| | December 31, | | December 31, | | December 31, | |
| | 2004 | | 2003 | | 2002 | |
| | $ | | $ | | $ | |
| REVENUE | | | | | | |
| Natural gas, liquids and oil sales | 40,805,507 | | 46,847,927 | | 24,122,754 | |
| Royalties | (9,002,506 | ) | (12,861,990 | ) | (5,521,583 | ) |
| Production costs | (8,940,597 | ) | (7,010,610 | ) | (5,470,467 | ) |
| | 22,862,404 | | 26,975,327 | | 13,130,704 | |
| Provincial royalty credits | 399,223 | | 523,278 | | 178,098 | |
| | 23,261,627 | | 27,498,605 | | 13,308,802 | |
| EXPENSES | | | | | | |
| General and administrative | 3,715,663 | | 3,414,751 | | 1,839,496 | |
| Interest expense | 578,112 | | 724,897 | | 454,251 | |
| Interest income | (1,836 | ) | (11,675 | ) | (1,732 | ) |
| Accretion of asset retirement obligation[note 5] | 102,836 | | 93,843 | | 63,876 | |
| | 4,394,775 | | 4,221,816 | | 2,355,891 | |
| | | | | | | |
| Earnings from operations before the following: | 18,866,852 | | 23,276,789 | | 10,952,911 | |
| Amortization and depletion[note 3] | 24,182,205 | | 12,021,474 | | 6,322,863 | |
| Exploration expenses | 14,401,131 | | 4,065,885 | | 1,446,178 | |
| Gain on sale of natural gas and oil interests | — | | — | | (2,139 | ) |
| (Loss) earnings before taxes | (19,716,484 | ) | 7,189,430 | | 3,186,009 | |
| Income tax expense (recovery)[note 7] | | | | | | |
| – Current | (51,730 | ) | 632,294 | | 207,000 | |
| – Future | (7,384,145 | ) | 1,578,834 | | 974,703 | |
| Net (loss) earnings | (12,280,609 | ) | 4,978,302 | | 2,004,306 | |
| | | | | | | |
| Earnings (deficit), beginning of period | 2,825,311 | | (2,152,991 | ) | (4,025,241 | ) |
| Premium on purchase and cancellation of | | | | | | |
| common shares | — | | — | | (132,056 | ) |
| (Deficit) retained earnings, end of period | (9,455,298 | ) | 2,825,311 | | (2,152,991 | ) |
| | | | | | | |
| Net (loss) earnings per share[note 8] | | | | | | |
| basic | (0.52 | ) | 0.23 | | 0.10 | |
| diluted | (0.52 | ) | 0.23 | | 0.10 | |
See accompanying notes
FINANCIAL STATEMENTS
STATEMENTS OF CASH FLOWS
(in Canadian dollars)
| | | | | | Nine Months | |
| | Year Ended | | Year Ended | | Ended | |
| | December 31, | | December 31, | | December 31, | |
| | 2004 | | 2003 | | 2002 | |
| | $ | | $ | | $ | |
| OPERATING ACTIVITIES | | | | | | |
| Net (loss) earnings | (12,280,609 | ) | 4,978,302 | | 2,004,306 | |
| Add (deduct) items not involving cash: | | | | | | |
| Accretion of asset retirement obligation | 102,836 | | 93,843 | | 63,876 | |
| Amortization and depletion | 24,182,205 | | 12,021,474 | | 6,322,863 | |
| Stock based compensation | 399,460 | | 358,229 | | — | |
| Future income tax (recovery) expense | (7,384,145 | ) | 1,578,834 | | 974,703 | |
| Exploration expenses | 14,401,131 | | 4,065,885 | | 1,446,178 | |
| Gain on sale of natural gas and oil interests | — | | — | | (2,139 | ) |
| | 19,420,878 | | 23,096,567 | | 10,809,787 | |
| Changes in non-cash working capital affecting | | | | | | |
| operating activities[note 9[a]] | (4,309,893 | ) | 5,197,611 | | 646,829 | |
| Cash provided by operating activities | 15,110,985 | | 28,294,178 | | 11,456,616 | |
| | | | | | | |
| FINANCING ACTIVITIES | | | | | | |
| Bank indebtedness | (303,238 | ) | (133,685 | ) | 677,111 | |
| Operating loan | 2,300,000 | | 2,175,000 | | (3,675,000 | ) |
| Shares issued for cash | 11,789,211 | | 1,510,858 | | — | |
| Share repurchases | — | | — | | (325,948 | ) |
| Cash provided by (used in) financing activities | 13,785,973 | | 3,552,173 | | (3,323,837 | ) |
| | | | | | | |
| INVESTING ACTIVITIES | | | | | | |
| Purchase of capital assets | (225,087 | ) | (308,387 | ) | (84,420 | ) |
| Natural gas and oil interests | (22,774,931 | ) | (22,727,557 | ) | (12,493,116 | ) |
| Exploration expenses | (14,401,131 | ) | (4,065,885 | ) | (1,446,178 | ) |
| Settlement of asset retirement obligations | (9,057 | ) | — | | — | |
| Proceeds on sale of natural gas and oil interests | — | | — | | 2,139 | |
| Changes in non-cash working capital affecting | | | | | | |
| investing activities[note 9[b]] | 8,513,248 | | (4,744,522 | ) | 5,888,796 | |
| Cash used in investing activities | (28,896,958 | ) | (31,846,351 | ) | (8,132,779 | ) |
| | | | | | | |
| Decrease in cash and cash equivalents | — | | — | | — | |
| Cash and cash equivalents, beginning of period | — | | — | | — | |
| Cash and cash equivalents, end of period | — | | — | | — | |
| | | | | | | |
| Supplemental disclosures of cash flow information | | | | | | |
| Cash paid (received) during the year for: | | | | | | |
| Interest | 595,903 | | 555,536 | | 459,237 | |
| Income taxes | 1,148,276 | | (150,408 | ) | 760,132 | |
See accompanying notes
DYNAMIC OIL & GAS, INC. 2004 ANNUAL REPORT
NOTES TO FINANCIAL STATEMENTS
(in Canadian dollars)
December 31, 2004
1. Decription of Business
Dynamic Oil & Gas, Inc. (the “Company”) was incorporated under the laws of the Province of British Columbia on March 27, 1979. The Company’s principle business is the acquisition, exploration, development and production of natural gas and oil interests in Western Canada.
2. Summary of Significant Accounting Policies
Accounting principles
The Company prepares its accounts in accordance with Canadian generally accepted accounting principles which, as applied in these financial statements, conform in all material respects with the accounting principles generally accepted in the United States, except as explained in note 11.
Change in fiscal year end
Effective December 31, 2002, the Company changed its fiscal year end from March 31 to December 31. The following is a summary of selected financial information for the comparative twelve month periods ended December 31, 2004, 2003 and 2002. The selected financial information for the twelve months ended December 31, 2002 is unaudited.
Results of operations and cash flows
| | December 31, | | December 31, | | December 31, | |
| | 2004 | | 2003 | | 2002 | |
| Twelve months ended | $ | | $ | | $ | |
| Natural gas, liquids and oil sales | 40,805,507 | | 46,847,927 | | 30,730,477 | |
| Net (loss) earnings | (12,280,609 | ) | 4,978,302 | | 2,004,306 | |
| Net (loss) earnings per share | | | | | | |
| basic | (0.52 | ) | 0.23 | | 0.02 | |
| diluted | (0.52 | ) | 0.23 | | 0.02 | |
| Cash flows | | | | | | |
| provided by operating activities | 15,110,985 | | 28,294,178 | | 15,215,456 | |
| provided by (used in) financing activities | 13,785,973 | | 3,552,173 | | (4,331,528 | ) |
| used in investing activities | (28,896,958 | ) | (31,846,351 | ) | (10,900,821 | ) |
Use of estimates
The preparation of financial statements in conformity with Canadian generally accepted accounting principles requires management to make certain estimates and assumptions that affect the reported amounts of assets and liabilities and disclosure of contingent assets and liabilities as of the date of the financial statements and the reported amounts of revenues and expenses during the reporting period. Actual results may differ from these estimates.
Natural gas and oil interests
The Company uses the successful efforts method to account for its natural gas and oil interests. Lease acquisition costs are amortized over their holding period prior to the discovery of proved producing reserves. Geological and geophysical costs are expensed in the period in which they are incurred and costs of drilling an unsuccessful well are expensed when it becomes known the well did not result in a discovery of proved reserves or where one year has elapsed since the completion of drilling and near-term efforts to establish proved reserves are not foreseeable, intended, or in the Company’s control. All other costs of exploring and developing for proved reserves become capitalized natural gas and oil interests.
The costs of proved producing interests including related plant and equipment are depleted on a unit-of-production basis, based on the Company’s working interest share of proved producing natural gas and oil reserves, before royalties.
NOTES TO FINANCIAL STATEMENTS
Natural gas and oil interests are recorded at cost less accumulated amortization and depletion. Natural gas and oil interests are assessed periodically for potential impairment to ensure that the carrying value of properties on the balance sheet is recoverable. If a property's carrying value exceeds the sum of undiscounted future cash flows, its value is impaired. The property is then assigned a fair value equal to its estimated discounted future cash flows and the excess carrying value is charged to amortization and depletion expense.
Joint interests
Substantially all acquisition, exploration, development and production activities of the Company are conducted jointly with others. These financial statements reflect only the Company’s proportionate interest in such activities.
Capital assets
Capital assets are recorded at cost, less accumulated amortization. Amortization is provided on a straight-line basis at the following rates:
| Furniture and fixtures - 10.0% per annum | |
| Computer equipment - 33.3% per annum | |
Income taxes
The liability method is used in accounting for income taxes. Under this method, future income tax assets and liabilities are determined based on differences between the financial reporting and tax bases of assets and liabilities, and measured using the substantially enacted tax rates and laws that will be in effect when the differences are expected to reverse.
Asset retirement obligations
The Company’s asset retirement obligations relate primarily to retirement obligations associated with tangible assets, such as wellsites and associated facilities. The fair value of an asset retirement obligation (“ARO”) is recognized in the period in which it is incurred when a reasonable estimate of the fair value can be made. The fair value of the estimated ARO is recorded as a long-term liability, with a corresponding increase in the carrying amount of the related asset. The capitalized amount is depleted on a unit-of-production basis over the life of associated proved producing reserves. The liability amount is increased each reporting period due to the passage of time and the amount of accretion is charged to earnings in the period. Revisions to the estimated timing of cash flows or to the original estimated undiscounted costs also result in an increase or decrease to the ARO. Actual costs incurred upon settlement of the ARO are charged against the ARO to the extent of the accreted liability recorded. Any difference between the actual costs incurred upon settlement of the ARO and the recorded liability is recognized as a gain or loss in the Company’s earnings at that time.
Revenue recognition
Revenues from crude oil, natural gas and natural gas liquids are recorded when delivered and title passes to customers.
Stock-based compensation
The Company grants stock options to employees, directors and consultants pursuant to a stock option plan described in note 6[b]. The Company uses the fair value method of accounting for all stock-based awards granted, modified or settled since January 1, 2003. For awards granted, modified or settled prior to January 1, 2003, the Company discloses the pro forma effects to the net (loss) earnings and (loss) earnings per share for the period as if the fair market value had been used at the date of grant. The pro forma information is presented in note 6[c].
Foreign currency translation
All monetary assets and liabilities expressed in foreign currencies are translated at rates of exchange in effect at the end of the year. All other assets and liabilities are translated at the rates prevailing at the dates the assets were acquired or liabilities incurred. The resulting foreign currency translation gains and losses are included in the determination of net earnings. Revenues and expenses are translated at the average exchange rate for the period.
Measurement uncertainty
The amounts recorded for depletion and amortization of natural gas and oil interests and asset retirement obligations are based on estimates. Assessments for impairments in asset carrying costs are based on independent estimates of the future cash flows from the Company’s proved producing reserves. Such estimates result mainly from studies that combine well-by-well recovery factors, future commodity prices and field operating costs. By their nature these estimates are subject to measurement uncertainty and the effect on the financial statements of changes in such estimates in future years could be significant.
DYNAMIC OIL & GAS, INC. 2004 ANNUAL REPORT
Earnings per share
The Company utilizes the treasury stock method in the determination of diluted per share amounts. Under this method, the diluted weighted average number of shares is calculated assuming that the proceeds arising from the exercise of outstanding, in-the-money options, are used to purchase common shares of the Company at their average market price for the period.
3. Natural Gas and Oil Interests, and Capital Assets
| | | Accumulated | |
| | | Amortization and | Net Book |
| | Cost | Depletion | Value |
| | $ | $ | $ |
| December 31, 2004 | | | |
| Natural gas and oil interests | 116,246,542 | 59,520,048 | 56,726,494 |
| Furniture, fixtures and computer equipment | 709,089 | 294,176 | 414,913 |
| December 31, 2003 | | | |
| Natural gas and oil interests | 94,425,822 | 37,342,033 | 57,083,789 |
| Furniture, fixtures and computer equipment | 770,910 | 405,349 | 365,561 |
At December 31, 2004, costs of $14,580,869 [2003 - $16,238,852] related to non-producing assets have been excluded from the calculation of amortization and depletion.
In the year ended December 31, 2004, the Company recorded asset write-downs due to impairment tests of $3,835,468 [year ended December 31, 2003 - $316,213] to reflect the excess of the net book value of the Company’s natural gas and oil interests over its estimated recoverable amounts. The write-downs were included in amortization and depletion expense.
4. Operating Loan
During 2004, the Company’s bank, the National Bank of Canada, made available the amount of $25,000,000 [2003 - $25,000,000] to the Company under a revolving, demand credit facility. Principal balances outstanding bear interest at prime plus 3/8% [bank prime rate at December 31, 2004 - 4.25%; December 31, 2003 - 4.5%; December 31, 2002 - 4.5%] . They are collateralized by a general assignment of book debts and a floating charge debenture of $38,000,000 covering all the assets of the Company. The effective average interest paid during the year ended December 31, 2004 was 4.4% [during the year ended December 31, 2003 - 5.1%; during the nine-month period ended December 31, 2002 - 5.0%] . A standby fee of 0.125% per annum is levied on the unused portion of the facility and is included in interest expense.
5. Asset Retirement Obligation
The following table presents the reconciliation of the beginning and ending aggregate carrying amount of the obligation associated with the retirement of oil and gas properties:
| | December 31, | December 31, | December 31, |
| | 2004 | 2003 | 2002 |
| | $ | $ | $ |
| Asset retirement obligation, beginning of period | 1,587,733 | 1,087,223 | 956,559 |
| Liabilities incurred | 865,187 | 406,667 | 66,788 |
| Accretion expense | 102,836 | 93,843 | 63,876 |
| Asset retirement obligation, end of period | 2,555,756 | 1,587,733 | 1,087,223 |
The total undiscounted amount of estimated cash flows required to settle the obligation at December 31, 2004 is $4,661,369 [at December 31, 2003 - $3,308,669; at December 31, 2002 - $2,109,750], which has been discounted using an average credit-adjusted risk free rate of 5.5% . These payments are expected to be made over the next 50 years with 27% of the costs incurred within the next 5 years.
NOTES TO FINANCIAL STATEMENTS
6. Share Capital
The Company is authorized to issue 60,000,000 common shares without par value.
[a] Issued and outstanding
The following table sets forth the issued and outstanding common shares:
| | December 31, | December 31, | December 31, | |
| | 2004 | 2003 | 2002 | |
| | Number | | Number | | Number | | | |
| | of shares | | of shares | | of shares | | | |
| | # | $ | # | $ | # | | $ | |
| Balance at beginning | | | | | | | | |
| of period | 22,194,778 | 27,747,487 | 20,272,530 | 20,720,629 | 20,462,230 | | 20,914,522 | |
| Stock options exercised | 84,200 | 167,450 | 871,582 | 1,510,858 | — | | — | |
| Shares issued on | | | | | | | | |
| flow-through | | | | | | | | |
| private placement | 2,000,000 | 10,752,216 | — | — | — | | — | |
| Shares issued on | | | | | | | | |
| private placements | 280,000 | 1,185,215 | — | — | — | | — | |
| Shares issued to repurchase | | | | | | | | |
| gross overriding | | | | | | | | |
| royalty interests | | | | | | | | |
| [note 6[d]] | — | — | 1,050,666 | 5,516,000 | — | | — | |
| Share repurchases and | | | | | | | | |
| cancellations | — | — | — | — | (189,700 | ) | (193,893 | ) |
| Balance at period end | 24,558,978 | 39,852,368 | 22,194,778 | 27,747,487 | 20,272,530 | | 20,720,629 | |
On April 30, 2004 the Company issued 2,000,000 flow-through shares at $5.60 per share through private placement for total proceeds of $11,200,000 less a net reduction of $447,784 for fees and expenses of $763,454 and related future income tax asset of $315,670. The Company also issued 280,000 common shares at $4.55 per share for total proceeds of $1,274,000 net of issue costs of $88,785.
Gross proceeds from the flow-through shares will be used to incur qualifying Canadian Exploration Expense (“CEE”) as defined in the Income Tax Act (Canada), and the Company expects to renounce in 2005 such CEE in favour of the original holders of the flow-through shares in an amount equal to the issue price for each flow-through share. At that time a future income tax liability of approximately $3,949,000 will be recognized and share capital reduced by a like amount [see note 14].
[b] Stock option plan and options outstanding
Under the Company’s stock option plan, the Company has the ability to grant options to directors, officers, employees and non-employees with a maximum term of five years. Those granted prior to February 28, 2001 vest upon date of grant; those granted on February 28, 2001 and thereafter, vest in equal amounts over three years from the date of grant.
In addition, options granted to the Company’s outside directors prior to June 19, 2003 had a maximum term of ten years and those granted on June 19, 2003 and thereafter, have a maximum term of five years. All options to outside directors are automatically granted pursuant to the Company's stock option plan and are allocated at the time of the director's first election or annually based on the director's participation as a standing committee chair or member. All such options granted vest upon date of grant.
During the year ended December 31, 2004, options issued totaled 285,000 [145,000 to either inside directors, officers, employees or non-employees; 140,000 to outside directors]. The exercise price of each option granted under the plan equals the amount designated in the individual agreement, which is based on the fair value of the stock at the date of grant.
DYNAMIC OIL & GAS, INC. 2004 ANNUAL REPORT
A summary of the status of the Company’s stock option plan as of December 31, 2004 is presented below:
| | December 31, | December 31, | December 31, |
| | 2004 | 2003 | 2002 |
| | Number of | | Weighted | Number of | | Weighted | Number of | Weighted |
| | Shares | | Average | Shares | | Average | Shares | Average |
| | Under Option | | Exercise Price | Under Option | | Exercise Price | Under Option | Exercise Price |
| | # | | $ | # | | $ | # | $ |
| Outstanding at beginning | | | | | | | | |
| of period | 1,615,834 | | 2.61 | 2,077,750 | | 1.83 | 1,930,250 | 1.83 |
| Granted | 285,000 | | 4.03 | 421,000 | | 4.61 | 147,500 | 1.88 |
| Exercised | (84,200 | ) | 1.99 | (871,582 | ) | 1.73 | — | — |
| Forfeited | (48,334 | ) | 3.00 | (11,334 | ) | 2.83 | — | — |
| Outstanding at period end | 1,768,300 | | 2.86 | 1,615,834 | | 2.61 | 2,077,750 | 1.83 |
| Options exercisable at | | | | | | | | |
| period end | 1,371,300 | | 2.64 | 1,081,667 | | 2.33 | 1,641,250 | 1.84 |
Exercise prices for the options outstanding as of December 31, 2004 ranged from $1.45 to $5.43 per share. These options have a weighted average remaining contractual life of 3.65 years.
At December 31, 2004 the following stock options were outstanding and exercisable:
| | Options Outstanding | Options Exercisable |
| | | | Weighted | | |
| | | Weighted | Average | Number of | Weighted |
| | Number of | Average | Remaining | Options | Average |
| Exercise | Shares Under | Exercise | Contractual | Currently | Exercise |
| Price | Option | Price | Life | Exercisable | Price |
| $ | # | $ | (Years) | # | $ |
| 1.00 - 1.49 | 35,000 | 1.45 | 0.06 | 35,000 | 1.45 |
| 1.50 - 1.99 | 555,000 | 1.73 | 3.86 | 466,667 | 1.73 |
| 2.00 - 2.49 | 480,300 | 2.12 | 2.34 | 480,300 | 2.12 |
| 2.50 - 2.99 | 15,000 | 2.95 | 7.96 | 15,000 | 2.95 |
| 3.50 - 3.99 | 187,500 | 3.70 | 4.70 | 22,500 | 3.86 |
| 4.00 - 4.49 | 140,000 | 4.11 | 6.30 | 140,000 | 4.11 |
| 4.50 - 4.99 | 280,500 | 4.68 | 3.72 | 136,833 | 4.71 |
| 5.00 - 5.49 | 75,000 | 5.35 | 3.54 | 75,000 | 5.35 |
| | 1,768,300 | 2.86 | 3.65 | 1,371,300 | 2.64 |
[c] Accounting for stock options
During the years ended December 31, 2004 and 2003, the Company used the fair value based method to account for stock options granted to directors, employees and non-employees, resulting in a decrease to earnings and a corresponding increase to contributed surplus of $399,460 [year ended December 31, 2003 - $358,229]. During the nine-month period ended December 31, 2002, the Company used the same method to expense only those stock options granted to non-employees.
The following table shows pro forma net (loss) earnings and net (loss) earnings per common share had the Company applied the fair-value based method of accounting for all stock options outstanding:
| | | | | Nine Months |
| | Year Ended | | Year Ended | Ended |
| | December 31, | | December 31 | December 31, |
| | 2004 | | 2003 | 2002 |
| | $ | | $ | $ |
| Net (loss) earnings: | | | | |
| as reported | (12,280,609 | ) | 4,978,302 | 2,004,306 |
| pro forma | (12,381,302 | ) | 4,856,567 | 1,798,630 |
| Basic net (loss) earnings per common share: | | | | |
| as reported | (0.52 | ) | 0.23 | 0.10 |
| pro forma | (0.52 | ) | 0.23 | 0.09 |
| Diluted net (loss) earnings per common share: | | | | |
| as reported | (0.52 | ) | 0.23 | 0.10 |
| pro forma | (0.52 | ) | 0.22 | 0.09 |
NOTES TO FINANCIAL STATEMENTS
The Black-Scholes options valuation model was used to estimate the fair value of stock options. In addition, option valuation models require the input of highly subjective assumptions including the expected stock price volatility. As changes in the subjective input assumptions can materially affect the fair value estimate, the existing models do not necessarily provide a reliable single measure of the fair value of the Company’s stock options. The fair value of option grants using the Black-Scholes model is estimated on the date of grant using the following weighted-average assumptions:
| | | | Nine Months |
| | Year-Ended | Year-Ended | Ended |
| | December 31, | December 31, | December 31, |
| | 2004 | 2003 | 2002 |
| | $ | $ | $ |
| Dividend yield | 0% | 0% | 0% |
| Expected volatility | 47% | 51% | 57% |
| Risk-free interest rate | 4.25% | 4.00% | 5.00% |
| Expected lives | 3 years | 3 years | 3 years |
The weighted average fair value per share of stock options granted during the year ended December 31, 2004 was $1.44 [year ended December 31, 2003 - $1.78] .
[d] Repurchase of gross overriding royalty interests
Three of the Company’s officers were entitled to receive compensation pursuant to royalty agreements that had previously been approved by shareholders. The royalty agreements provided for payment of an overriding interest of 1% of the Company’s share of gross production of all petroleum substances on lands acquired by the Company since June 1, 1986 for two of the three officers and June 1, 1987 for the third officer.
On July 7, 2003, the Company repurchased from the three Company officers their gross overriding royalty interests for $6,516,000. The aggregate purchase price was paid by the issuance of 1,050,666 common shares of the Company and the payment of $1,000,000 in cash. The number of common shares was based on a price of $5.25 per share, such price being the daily volume-weighted average price for July 7, 2003. The transaction was recorded at the exchange amount determined by an independent valuation.
The gross overriding royalty expense pursuant to the agreements, was $752,362 during the period January 1 to July 7, 2003 [nine-month period ended December 31, 2002 - $681,493].
At the time of initial recognition, proved producing assets in natural gas and oil interests on the Company’s balance sheet included $9,711,308 for the repurchase of overriding royalty interest. This amount was comprised of the aggregate repurchase price of $6,516,000 paid to the vendors, plus the related future income taxes of $3,195,308 which requires recognition in accordance with accounting rules under CICA Handbook Section 3465. The carrying value of the repurchase is subject to depletion and periodic impairment assessments.
7. Income Taxes
Future income taxes reflect the net tax effects of temporary differences between the carrying amounts of assets and liabilities for financial reporting purposes and the amounts used for income tax purposes. Significant components of the Company’s future tax assets and liabilities are as follows:
| | December 31, | December 31, | |
| | 2004 | 2003 | |
| | $ | $ | |
| Long term future tax assets (liabilities): | | | |
| Tax basis of oil and gas interests | | | |
| and fixed assets greater than book basis | 1,397,107 | (5,843,546 | ) |
| Finance charges | 247,126 | 100 | |
| Asset retirement obligation | 437,359 | 225,723 | |
| Net future tax assets (liabilities) | 2,082,092 | (5,617,723 | ) |
During the year, deductions taken from the Company's available tax pools were exceeded by add-backs in amortization and depletion expense, and exploration expense, thereby creating a significant change in the temporary difference from the previous year.
DYNAMIC OIL & GAS, INC. 2004 ANNUAL REPORT
The reconciliation of income tax attributable to operations computed at the statutory tax rates to income tax (recovery) expense is:
| | | | | | | | Nine Months | | |
| | Year Ended | | | Year Ended | | | Ended | | |
| | December 31, 2004 | | | December 31, 2003 | | | December 31, 2002 | | |
| | $ | | % | $ | | % | $ | | % |
| Tax at combined federal and | | | | | | | | | |
| provincial rates | (7,870,820 | ) | 39.92 | 2,962,000 | | 41.20 | 1,350,000 | | 42.37 |
| Tax effect of: | | | | | | | | | |
| Non-deductible expenses | 1,198,057 | | | 1,929,000 | | | 898,400 | | |
| Income not taxable | (43,080 | ) | | (165,400 | ) | | (70,500 | ) | |
| Resource allowance | (1,343,458 | ) | | (2,218,342 | ) | | (1,021,197 | ) | |
| Large corporation tax in excess of surtax | — | | | 90,000 | | | 25,000 | | |
| Effect of changes in tax rates | 700,429 | | | (386,130 | ) | | — | | |
| Other | (77,003 | ) | | — | | | — | | |
| | (7,435,875 | ) | | 2,211,128 | | | 1,181,703 | | |
8. Net (Loss) Earnings Per Share
Basic net (loss) earnings per share were calculated on the basis of the weighted average number of shares outstanding for the year ended December 31, 2004 of 23,665,110 [year ended December 31, 2003 - 21,393,902; nine-months ended December 31, 2002 - 20,357,153]. The effect of any potential common share issuances in 2004 is anti-dilutive. The weighted average number of shares outstanding for the diluted calculation for the year ended December 31, 2003 was 21,947,801, and for the nine-months ended December 31, 2002 was 20,554,231.
| | | | | Nine Months |
| | Year Ended | | Year Ended | Ended |
| | December 31, | | December 31 | December 31, |
| | 2004 | | 2003 | 2002 |
| | $ | | $ | $ |
| Numerator | | | | |
| Net (loss) earnings for the period | (12,280,609 | ) | 4,978,302 | 2,004,306 |
| Denominator | | | | |
| Weighted average number of common | | | | |
| shares outstanding | 23,665,110 | | 21,393,902 | 20,357,153 |
| Effect of dilutive stock options | — | | 553,899 | 197,078 |
| | 23,665,110 | | 21,947,801 | 20,554,231 |
| Basic net (loss) earnings per share | (0.52 | ) | 0.23 | 0.10 |
| Diluted net (loss) earnings per share | (0.52 | ) | 0.23 | 0.10 |
9. Changes in Non-Cash Working Capital Balances
[a] Changes affecting operating activities comprise:
| | | | | | Nine Months | |
| | Year Ended | | Year Ended | | Ended | |
| | December 31, | | December 31 | | December 31, | |
| | 2004 | | 2003 | | 2002 | |
| | $ | | $ | | $ | |
| Accounts receivable | (932,140 | ) | 1,299,019 | | (968,683 | ) |
| Prepaid expenses | (4,829 | ) | (4,678 | ) | 13,456 | |
| Accounts payable and accrued liabilities | (2,713,405 | ) | 3,111,979 | | 2,155,188 | |
| Income taxes payable (receivable) | (659,519 | ) | 791,291 | | (553,132 | ) |
| | (4,309,893 | ) | 5,197,611 | | 646,829 | |
NOTES TO FINANCIAL STATEMENTS
[b] Changes affecting investing activities comprise:
| | | | | | Nine Months |
| | Year Ended | | Year Ended | | Ended |
| | December 31, | | December 31 | | December 31, |
| | 2004 | | 2003 | | 2002 |
| | $ | | $ | | $ |
| Accounts receivable | (212,934 | ) | (1,834,645 | ) | 521,453 |
| Accounts payable and accrued liabilities | 8,726,182 | | (2,909,877 | ) | 5,367,343 |
| | 8,513,248 | | (4,744,522 | ) | 5,888,796 |
10. Financial Instruments
The Company’s financial instruments consist of accounts receivable, income taxes receivable, bank indebtedness, operating loan, accounts payable and income taxes payable. The carrying values of these financial instruments approximate their fair value.
The Company’s accounts receivable principally result from the sale of its various hydrocarbon commodities and from the collection of partner liabilities pursuant to joint venture agreements under which it has operatorship responsibilities. Substantially all of the Company’s accounts receivable at December 31, 2004, and 2003 are from other companies in the oil and gas industry. This concentration of customers may impact the Company’s overall credit risk, either positively or negatively, in that such entities may be similarly affected by industry-wide changes in economic or other conditions. Historically to date, the Company has not incurred credit losses against its receivables. At December 31, 2004 one customer and two joint venture partners represent 38% of the accounts receivable balance with totals of 16%, 11% and 11% respectively [December 31, 2003 - two customers represent 39% of accounts receivable with totals of 22% and 17% respectively].
11. Reconciliation to U.S. Generally Accepted Accounting Principles
The Company prepares its accounts in accordance with Canadian generally accepted accounting principles (Canadian GAAP), which for the most part, are similar to United States generally accepted accounting principles (U.S. GAAP). The following tables reflect the major differences in accounting principles.
Consolidated net (loss) earnings under U.S. GAAP would be:
| | | | | | Nine Months | |
| | Year Ended | | Year Ended | | Ended | |
| | December 31, | | December 31 | | December 31, | |
| | 2004 | | 2003 | | 2002 | |
| | $ | | $ | | $ | |
| Net (loss) earnings under Canadian GAAP | (12,280,609 | ) | 4,978,302 | | 2,004,306 | |
| Amortization and depletion[a] | — | | — | | (65,471 | ) |
| Accretion of asset retirement obligation[a] | — | | — | | 40,242 | |
| Options issued for services[b] | — | | — | | (3,108 | ) |
| Write-down on natural gas and oil properties[c] | — | | (125,580 | ) | (209,160 | ) |
| Net (loss) earnings before cumulative | | | | | | |
| effect of change in accounting principle | | | | | | |
| under U.S. GAAP | (12,280,609 | ) | 4,852,722 | | 1,766,809 | |
| Cumulative effect of change in accounting | | | | | | |
| principle, net of applicable taxes[a] | — | | 133,276 | | — | |
| Net (loss) earnings under U.S. GAAP after | | | | | | |
| cumulative effect of change in accounting | | | | | | |
| principle | (12,280,609 | ) | 4,985,998 | | 1,766,809 | |
| Net (loss) earnings per common share under | | | | | | |
| U.S. GAAP, before change in accounting policy | | | | | | |
| – basic | (0.52 | ) | 0.23 | | 0.09 | |
| – diluted | (0.52 | ) | 0.22 | | 0.09 | |
| Net (loss) earnings per common share under U.S. GAAP, | | | | | | |
| after change in accounting policy | | | | | | |
| – basic | (0.52 | ) | 0.23 | | 0.09 | |
| – diluted | (0.52 | ) | 0.23 | | 0.09 | |
DYNAMIC OIL & GAS, INC. 2004 ANNUAL REPORT
After certain differences have been adjusted for, selected balance sheet items under Canadian and U.S. GAAP would be:
| | December 31 | | December 31 |
| | 2004 | | 2003 |
| | Canadian | | U.S. | | Canadian | U.S. |
| | GAAP | | GAAP | | GAAP | GAAP |
| | $ | | $ | | $ | $ |
| Natural gas and oil interests[c] | 56,726,494 | | 56,726,494 | | 57,083,789 | 56,901,789 |
| Share capital[b, d] | 39,852,368 | | 38,725,461 | | 27,747,487 | 28,720,580 |
| Accounts payable and accrued liabilities[d] | 17,348,723 | | 19,448,723 | | 11,335,946 | 11,335,946 |
| (Deficit) retained earnings[a, b, c] | (9,455,298 | ) | (10,949,459 | ) | 2,825,311 | 1,331,150 |
[a] During 2003, the Company early-adopted CICA Handbook section 3110 - “Asset Retirement Obligations” for Canadian GAAP and SFAS 143 - “Accounting for Asset Retirement Obligations” for U.S. GAAP. The transitional provisions differ between Canadian GAAP and U.S. GAAP in that Canadian GAAP requires restatement of comparative amounts whereas U.S. GAAP does not allow restatement, but rather requires a cumulative catch-up adjustment to earnings. An adjustment to net earnings under Canadian GAAP has been recorded to reflect the December 31, 2002 comparative amounts prior to restatement in accordance with U.S. GAAP.
[b] In December 2004, FASB issued SFAS No. 123 (Revised), “Share-Based Payments”. This statement requires an entity to recognize the grant-date fair value of stock options and other equity-based compensation issued to employees in the statement of operations. SFAS 123 (Revised) eliminates the ability to account for share-based compensation transactions using the intrinsic value method in APB Opinion 25. The Company, effective January 1, 2003, early adopted FASB Statement No. 123, “Accounting for Stock-Based Compensation - Transition and Disclosure”. Accordingly, these revisions to SFAS No. 123 did not have a significant impact on the Company’s financial statements.
[c] Under both U.S. and Canadian GAAP, property, plant and equipment must be assessed for potential impairments. Under U.S. GAAP, if the sum of the expected future cash flows (undiscounted and without interest charges) is less than the carrying amount of the asset, then an impairment loss (the amount by which the carrying amount of the asset exceeds the fair value of the asset) should be recognized. Fair value is calculated as the present value of estimated expected future cash flows. Prior to 2004, under Canadian GAAP, the impairment loss was recognized as the difference between the carrying value of the asset and its net recoverable amount (undiscounted). The Company has adopted a new standard effective for 2004 that has eliminated this U.S./Canadian GAAP difference.
[d] For U.S. GAAP, the premium received by the Company on the issuance of flow-through shares which is in excess of the fair value of common shares is required to be credited to liabilities. The liability is reversed when tax benefits are renounced and a deferred tax liability is recognized in respect of renounced Canadian exploration expenses at that time. Any difference arising between the liability and deferred tax liability is accounted for as an income tax expense. During 2004, total flow-through share premium received was $2,100,000.
[e] For U.S. GAAP, dry hole expenses of $10,166,601 for the year ended December 31, 2004 [year ended December 31, 2003 - $1,278,387; nine-month period ended December 31, 2002 - $325,478] included in investing activities on the statement of cash flows would be reported in operating activities. Under U.S. GAAP, separate subtotals within cash flow from operating activities are not presented.
NOTES TO FINANCIAL STATEMENTS
12. Commitments
[a] The Company has entered into an operating lease in respect of its office premises.
The minimum payments under this lease commitment, including estimated operating costs are as follows:
| | $ |
| 2005 | 203,657 |
| 2006 | 203,657 |
| 2007 | 203,657 |
| 2008 | 84,857 |
| | 695,828 |
[b] As part of the Company’s flow through share financing [see note 6[a]], the Company is committed to renounce CEE in favour of the original holders of the flow through shares. The Company expects to renounce CEE of $11,200,000 in 2005[see note 14].
13. Economic Dependency
[a] The St. Albert property in Alberta is a core property of the Company and the majority of gas production from the property is pipelined and processed through facilities owned and operated by Atco Midstream (“Atco”) of Calgary, Alberta.
Effective November 1, 1997, the Company and its then joint interest partner, Fletcher Challenge Energy Canada Inc. signed a ten-year, firm service, sour gas processing and transportation agreement with Atco for a maximum daily quantity of 15 million cubic feet of gas per day to be processed at Atco’s Carbondale plant.
Effective December 15, 1998, a similar agreement was signed by the partners and Atco to process sweet gas at Atco’s Villenueve plant, also for a maximum daily quantity of 15 million cubic feet of gas per day.
Both agreements include an automatic renewal for a further ten years, subject to fee renegotiation.
[b] During the year ended December 31, 2004, three customers accounted for 85% of the Company’s sales with totals of 45%, 30% and 10% respectively [year ended December 31, 2003 – three customers accounted for 82% of the Company’s sales with totals of 37%, 30% and 15% respectively; nine-month period ended December 31, 2002 – four customers accounted for 92% of the Company’s sales with totals of 35%, 33%, 13% and 11% respectively].
14. Subsequent Events
On February 28, 2005, the Company officially renounced $11,200,000 of taxable benefits relating to qualifying expenses in favour of shareholders that participated in the flow-through private placement that closed on May 19, 2004. Such qualifying expenditures are specifically defined in the Income Tax Act (Canada). As at December 31, 2004, the Company had incurred approximately 67% of the qualifying expenditures and committed another 20% toward the required obligation. The remainder of the qualifying expenditures must be incurred by December 31, 2005.
CORPORATE INFORMATION
| Directors | | Head Office |
| Wayne J. Babcock | Vancouver, British Columbia | Suite 230 – 10991 Shellbridge Way |
| John A. Greig | Vancouver, British Columbia | Richmond, British Columbia Canada V6X 3C6 |
| David J. Jennings | Vancouver, British Columbia | Tel: 604-214-0550 Toll free: 1-800-663-8072 |
| John Lagadin | Calgary, Alberta | Fax: 604-214-0551 E-mail: infodynamic@dynamicoil.com |
| Jonathan A. Rubenstein | Vancouver, British Columbia | Website: www.dynamicoil.com |
| William B. Thompson | Kelowna, British Columbia | Regulatory filings website: www.sedar.com |
| Donald K. Umbach | Vancouver, British Columbia | |
| | | Form 20-F |
| Officers | | A copy of the Company’s latest report on Form 20-F, as filed |
| Wayne J. Babcock | President & Chief Executive Officer | with the Securities and Exchange Commission is available |
| Donald K. Umbach | Vice President & | without charge, upon written request to the Corporate |
| | Chief Operating Officer | Secretary. |
| David G. Grohs | Vice President, Production | |
| Michael A. Bardell | Chief Financial Officer & | |
| | Corporate Secretary | |
| Consulting Engineers | Bankers |
| Status Engineering Associates Ltd. Calgary, Alberta | National Bank of Canada Calgary, Alberta |
| | |
| Corporate Reserves Evaluator | Registrar and Transfer Agent |
| Sproule Associates Limited Calgary, Alberta | CIBC Mellon Trust Company Vancouver, British Columbia |
| | |
| Solicitors | Trading Symbols |
| Irwin, White & JenningsVancouver, British Columbia | TSX: DOL NASDAQ: DYOLF |
| Perkins Coie LLP Santa Monica, California | |
| | Capital Stock |
| Auditors | Common Outstanding: 24,558,978 to March 31, 2005 |
| Ernst & Young LLP Vancouver, British Columbia | |
| |
| www.dynamicoil.com | |