UNITED STATES
SECURITIES AND EXCHANGE COMMISSION
WASHINGTON, D.C. 20549
FORM 10-Q
| | | |
| þ | | QUARTERLY REPORT PURSUANT TO SECTION 13 OR 15(d) OF THE SECURITIES EXCHANGE ACT OF 1934 |
For the quarterly period ended June 30, 2007
or
| | | |
| o | | TRANSITION REPORT PURSUANT TO SECTION 13 OR 15(d) OF THE SECURITIES EXCHANGE ACT OF 1934 |
For the transition period from to
Commission file number 1-3507
ROHM AND HAAS COMPANY
(Exact name of registrant as specified in its charter)
| | | |
DELAWARE
(State or other jurisdiction of
incorporation or organization) | | 23-1028370
(I.R.S. Employer
Identification No.) |
| | | |
100 INDEPENDENCE MALL WEST, PHILADELPHIA, PA
(Address of principal executive offices) | | 19106
(Zip Code) |
Registrant’s telephone number, including area code:(215) 592-3000
Indicate by check mark whether the registrant (1) has filed all reports required to be filed by Section 13 or 15(d) of the Securities Exchange Act of 1934 during the preceding 12 months, and (2) has been subject to such filing requirements for the past 90 days.
Yesþ Noo
Indicate by check mark whether the registrant is a large accelerated filer, an accelerated filer, or a non-accelerated filer. See definition of “accelerated filer and large accelerated filer” in Rule 12b-2 of the Exchange Act. (Check one):
Large accelerated filerþ Accelerated filero Non-accelerated filero
Indicate by check mark whether the registrant is a shell company (as defined in Rule 12b-2 of the Act).
Yeso Noþ
Common stock outstanding at July 23, 2007: 214,383,784 shares
ROHM AND HAAS COMPANY AND SUBSIDIARIES
FORM 10-Q
INDEX
1
Rohm and Haas Company and Subsidiaries
Consolidated Statements of Operations
| | | | | | | | | | | | | | | | | |
| | | Three Months Ended | | | Six Months Ended | |
| | | June 30, | | | June 30, | |
| | | 2007 | | | 2006 | | | 2007 | | | 2006 | |
| (in millions, except per share amounts) | | | | | | | | | | | | | | | | |
| (unaudited) | | | | | | | | | | | | | | | | |
| Net sales | | $ | 2,190 | | | $ | 2,081 | | | $ | 4,350 | | | $ | 4,139 | |
| Cost of goods sold | | | 1,586 | | | | 1,450 | | | | 3,137 | | | | 2,863 | |
| | | | | | | | | | | | | |
| | | | | | | | | | | | | | | | | |
| Gross profit | | | 604 | | | | 631 | | | | 1,213 | | | | 1,276 | |
| Selling and administrative expense | | | 277 | | | | 258 | | | | 537 | | | | 506 | |
| Research and development expense | | | 73 | | | | 70 | | | | 141 | | �� | | 139 | |
| Interest expense | | | 23 | | | | 27 | | | | 47 | | | | 52 | |
| Amortization of intangibles | | | 14 | | | | 14 | | | | 28 | | | | 27 | |
| Restructuring and asset impairments | | | 11 | | | | — | | | | 10 | | | | 4 | |
| Share of affiliate earnings, net | | | 6 | | | | 4 | | | | 11 | | | | 5 | |
| Other (income), net | | | (10 | ) | | | (2 | ) | | | (29 | ) | | | (16 | ) |
| | | | | | | | | | | | | |
Earnings from continuing operations before income taxes, and minority interest | | | 222 | | | | 268 | | | | 490 | | | | 569 | |
| Income taxes | | | 57 | | | | 73 | | | | 132 | | | | 163 | |
| Minority interest | | | 4 | | | | 3 | | | | 7 | | | | 7 | |
| | | | | | | | | | | | | |
Earnings from continuing operations | | | 161 | | | | 192 | | | | 351 | | | | 399 | |
| | | | | | | | | | | | | |
| | | | | | | | | | | | | | | | | |
| Discontinued operations: | | | | | | | | | | | | | | | | |
| Net (loss) earnings of discontinued lines of business, net of income tax (benefit)/expense of ($2), $18, ($2), and $18, respectively | | | (1 | ) | | | (26 | ) | | | 1 | | | | (26 | ) |
| | | | | | | | | | | | | |
Net earnings | | | 160 | | | | 166 | | | | 352 | | | | 373 | |
| | | | | | | | | | | | | |
| | | | | | | | | | | | | | | | | |
| Basic earnings per share (in dollars): | | | | | | | | | | | | | | | | |
| From continuing operations | | $ | 0.76 | | | $ | 0.88 | | | $ | 1.63 | | | $ | 1.81 | |
| Income (loss) from discontinued operations | | | (0.01 | ) | | | (0.13 | ) | | | 0.01 | | | | (0.12 | ) |
| | | | | | | | | | | | | |
Net earnings per share | | $ | 0.75 | | | $ | 0.75 | | | $ | 1.64 | | | $ | 1.69 | |
| | | | | | | | | | | | | |
| | | | | | | | | | | | | | | | | |
| Diluted earnings per share (in dollars): | | | | | | | | | | | | | | | | |
| From continuing operations | | $ | 0.75 | | | $ | 0.87 | | | $ | 1.61 | | | $ | 1.79 | |
| Income (loss) from discontinued operations | | | (0.01 | ) | | | (0.12 | ) | | | — | | | | (0.12 | ) |
| | | | | | | | | | | | | |
Net earnings per share | | $ | 0.74 | | | $ | 0.75 | | | $ | 1.61 | | | $ | 1.67 | |
| | | | | | | | | | | | | |
| | | | | | | | | | | | | | | | | |
| Weighted average common shares outstanding — basic | | | 213.7 | | | | 220.3 | | | | 215.1 | | | | 220.5 | |
| Weighted average common shares outstanding — diluted | | | 216.9 | | | | 222.6 | | | | 218.3 | | | | 222.8 | |
See Notes to Consolidated Financial Statements
2
Rohm and Haas Company and Subsidiaries
Consolidated Statements of Cash Flows
| | | | | | | | | |
| For the six months ended June 30, | | 2007 | | | 2006 | |
| (in millions) | | | | | | | | |
| (unaudited) | | | | | | | | |
Cash Flows from Operating Activities | | | | | | | | |
| Net earnings | | $ | 352 | | | $ | 373 | |
| Adjustments to reconcile net earnings to net cash provided by operating activities: | | | | | | | | |
| Loss on disposal of business, net of income taxes | | | 2 | | | | — | |
| (Gain) loss on sale of assets | | | (3 | ) | | | 4 | |
| Provision for allowance for doubtful accounts | | | 5 | | | | 2 | |
| Provision for deferred taxes | | | (49 | ) | | | (4 | ) |
| Restructuring and asset impairments | | | 10 | | | | 11 | |
| Depreciation | | | 206 | | | | 204 | |
| Amortization of finite-lived intangibles | | | 28 | | | | 29 | |
| Share-based compensation | | | 28 | | | | 27 | |
| Changes in assets and liabilities | | | | | | | | |
| Accounts receivable | | | (213 | ) | | | (92 | ) |
| Inventories | | | 71 | | | | (28 | ) |
| Prepaid expenses and other current assets | | | (9 | ) | | | (4 | ) |
| Accounts payable and accrued liabilities | | | (140 | ) | | | (175 | ) |
| Federal, foreign and other income taxes payable | | | (2 | ) | | | (14 | ) |
| Other, net | | | 5 | | | | 39 | |
| | | | | | | |
| Net cash provided by operating activities | | | 291 | | | | 372 | |
| | | | | | | |
| | | | | | | | | |
Cash Flows from Investing Activities | | | | | | | | |
| Acquisitions of businesses, affiliates and intangibles | | | (121 | ) | | | (28 | ) |
| Payments from disposal of business, net | | | (5 | ) | | | — | |
| Decrease in restricted cash | | | — | | | | 1 | |
| Proceeds from the sale of land, buildings and equipment | | | 30 | | | | 4 | |
| Capital expenditures for land, buildings and equipment | | | (187 | ) | | | (145 | ) |
| (Payments) proceeds to settle hedge of net investment in foreign subsidiaries | | | (24 | ) | | | 4 | |
| | | | | | | |
| Net cash used by investing activities | | | (307 | ) | | | (164 | ) |
| | | | | | | |
| | | | | | | | | |
Cash Flows from Financing Activities | | | | | | | | |
| Proceeds from issuance of long-term debt | | | 230 | | | | — | |
| Repayment of long-term debt | | | (234 | ) | | | (13 | ) |
| Purchase of common stock | | | (285 | ) | | | (167 | ) |
| Tax benefit on stock options | | | 4 | | | | 4 | |
| Proceeds from exercise of stock options | | | 27 | | | | 52 | |
| Net change in short-term borrowings | | | 67 | | | | (61 | ) |
| Payment of dividends | | | (152 | ) | | | (138 | ) |
| | | | | | | |
| Net cash used by financing activities | | | (343 | ) | | | (323 | ) |
| | | | | | | |
| Net (decrease) in cash and cash equivalents | | | (359 | ) | | | (115 | ) |
| Effect of exchange rate changes on cash and cash equivalents | | | 14 | | | | 41 | |
| Cash and cash equivalents at the beginning of the period | | | 593 | | | | 566 | |
| | | | | | | |
| Cash and cash equivalents at the end of the period | | $ | 248 | | | $ | 492 | |
| | | | | | | |
See Notes to Consolidated Financial Statements
3
Rohm and Haas Company and Subsidiaries
Consolidated Balance Sheets
| | | | | | | | | |
| | | June 30, | | | December 31, | |
| | | 2007 | | | 2006 | |
| (in millions, except share data) | | | | | | | | |
| (unaudited) | | | | | | | | |
Assets | | | | | | | | |
| Cash and cash equivalents | | $ | 248 | | | $ | 593 | |
| Restricted cash | | | 3 | | | | 3 | |
| Receivables, net | | | 1,793 | | | | 1,570 | |
| Inventories | | | 932 | | | | 984 | |
| Prepaid expenses and other current assets | | | 199 | | | | 254 | |
| Current assets of discontinued operations | | | — | | | | 7 | |
| | | | | | | |
| | | | | | | | | |
Total current assets | | | 3,175 | | | | 3,411 | |
| | | | | | | |
| | | | | | | | | |
| Land, buildings and equipment, net of accumulated depreciation | | | 2,682 | | | | 2,669 | |
| Investments in and advances to affiliates | | | 173 | | | | 112 | |
| Goodwill, net of accumulated amortization | | | 1,550 | | | | 1,541 | |
| Other intangible assets, net of accumulated amortization | | | 1,483 | | | | 1,487 | |
| Other assets | | | 340 | | | | 324 | |
| Other assets of discontinued operations | | | — | | | | 9 | |
| | | | | | | |
| | | | | | | | | |
Total Assets | | $ | 9,403 | | | $ | 9,553 | |
| | | | | | | |
| | | | | | | | | |
Liabilities and Stockholders’ Equity | | | | | | | | |
Liabilities: | | | | | | | | |
| Short-term obligations | | $ | 265 | | | $ | 393 | |
| Trade and other payables | | | 668 | | | | 684 | |
| Accrued liabilities | | | 685 | | | | 816 | |
| Income taxes payable | | | 7 | | | | 93 | |
| Current liabilities of discontinued operations | | | — | | | | 2 | |
| | | | | | | |
| | | | | | | | | |
Total current liabilities | | | 1,625 | | | | 1,988 | |
| | | | | | | |
| | | | | | | | | |
| Long-term debt | | | 1,905 | | | | 1,688 | |
| Employee benefits | | | 745 | | | | 735 | |
| Deferred income taxes | | | 688 | | | | 754 | |
| Other liabilities | | | 302 | | | | 230 | |
| Other liabilities of discontinued operations | | | — | | | | 5 | |
| | | | | | | |
| | | | | | | | | |
Total Liabilities | | | 5,265 | | | | 5,400 | |
| | | | | | | |
| | | | | | | | | |
| Minority Interest | | | 130 | | | | 122 | |
| | | | | | | | | |
| Commitments and contingencies | | | | | | | | |
| | | | | | | | | |
Stockholders’ Equity: | | | | | | | | |
| Preferred stock; par value — $1.00; authorized - 25,000,000 shares; issued — no shares | | | — | | | | — | |
| Common stock; par value — $2.50; authorized - 400,000,000 shares; issued - 242,078,349 shares | | | 605 | | | | 605 | |
| Additional paid-in capital | | | 2,228 | | | | 2,214 | |
| Retained earnings | | | 2,411 | | | | 2,218 | |
| | | | | | | |
| | | | | | | | | |
| | | | 5,244 | | | | 5,037 | |
| Treasury stock at cost (2007 - 27,456,773 shares; 2006 - 23,239,920 shares) | | | (858 | ) | | | (608 | ) |
| ESOP shares (2007 - 8,212,652 shares; 2006 - 8,585,684 shares) | | | (79 | ) | | | (82 | ) |
| Accumulated other comprehensive loss | | | (299 | ) | | | (316 | ) |
| | | | | | | |
| | | | | | | | | |
Total Stockholders’ Equity | | | 4,008 | | | | 4,031 | |
| | | | | | | |
| | | | | | | | | |
Total Liabilities and Stockholders’ Equity | | $ | 9,403 | | | $ | 9,553 | |
| | | | | | | |
See Notes to Consolidated Financial Statements
4
Rohm and Haas Company and Subsidiaries
Consolidated Statements of Stockholders’ Equity
| | | | | | | | | | | | | | | | | | | | | | | | | | | | | | | | | | | | | | | | | | |
| (unaudited) | | | | | | | | | | | | | | | | | | | | | | | | | | | | | | | | | | | | |
| For the period ended June 30, 2007 | | | | | | | | | | | | | | | | | | | | | | | | | | | | | | | | | | | | |
| | | Number of | | | | | | | | | | | | | | | | | | | | | | | | | | | | | | | | | | |
| | | Shares of | | | | | | | | | | | | | | | Number of | | | | | | | | | | | Accumulated | | | | | | | | |
| | | Common | | | | | | | Additional | | | | | | | Shares of | | | | | | | | | | | Other | | | Total | | | | Total | |
| | | Stock | | | Common | | | Paid-in | | | Retained | | | Treasury | | | Treasury | | | | | | | Comprehensive | | | Stockholders’ | | | | Comprehensive | |
| (in millions, except share amounts in thousands) | | Outstanding | | | Stock | | | Capital | | | Earnings | | | Stock | | | Stock | | | ESOP | | | Income (Loss) | | | Equity | | | | Income | |
| | | | |
| Balance January 1, 2007 | | | 218,839 | | | $ | 605 | | | $ | 2,214 | | | $ | 2,218 | | | | 23,240 | | | $ | (608 | ) | | $ | (82 | ) | | $ | (316 | ) | | $ | 4,031 | | | | | | |
| | | | | | | | |
| | | | | | | | | | | | | | | | | | | | | | | | | | | | | | | | | | | | | | | | | | |
2007 | | | | | | | | | | | | | | | | | | | | | | | | | | | | | | | | | | | | | | | | | |
| Net earnings | | | | | | | | | | | | | | | 352 | | | | | | | | | | | | | | | | | | | | 352 | | | | $ | 352 | |
| Current period changes in fair value, net of taxes of ($2) | | | | | | | | | | | | | | | | | | | | | | | | | | | | | | | 3 | | | | 3 | | | | | 3 | |
| Reclassification to earnings, net of taxes of $1 | | | | | | | | | | | | | | | | | | | | | | | | | | | | | | | (2 | ) | | | (2 | ) | | | | (2 | ) |
| Cumulative translation adjustment, net of taxes of ($1) | | | | | | | | | | | | | | | | | | | | | | | | | | | | | | | — | | | | — | | | | | — | |
| Pension and postretirement benefit adjustments, net of taxes of ($6) | | | | | | | | | | | | | | | | | | | | | | | | | | | | | | | 16 | | | | 16 | | | | | 16 | |
| | | | | | | | | | | | | | | | | | | | | | | | | | | | | | | | | | | | | | | | | |
| Total comprehensive income | | | | | | | | | | | | | | | | | | | | | | | | | | | | | | | | | | | | | | | $ | 369 | |
| | | | | | | | | | | | | | | | | | | | | | | | | | | | | | | | | | | | | | | | | |
| Cumulative Transition Adjustment for FIN 48 | | | | | | | | | | | | | | | (9 | ) | | | | | | | | | | | | | | | | | | | (9 | ) | | | | | |
| Repurchase of common stock | | | (5,437 | ) | | | | | | | | | | | | | | | 5,437 | | | | (285 | ) | | | | | | | | | | | (285 | ) | | | | | |
| Common stock issued: | | | | | | | | | | | | | | | | | | | | | | | | | | | | | | | | | | | | | | | | | |
| Stock-based compensation | | | 1,220 | | | | | | | | 14 | | | | | | | | (1,220 | ) | | | 35 | | | | | | | | | | | | 49 | | | | | | |
| ESOP | | | | | | | | | | | | | | | | | | | | | | | | | | | 3 | | | | | | | | 3 | | | | | | |
| Tax benefit on ESOP | | | | | | | | | | | | | | | 2 | | | | | | | | | | | | | | | | | | | | 2 | | | | | | |
| Common dividends ($0.37 per share) | | | | | | | | | | | | | | | (152 | ) | | | | | | | | | | | | | | | | | | | (152 | ) | | | | | |
| | | | | | | | | | | | | | | | | | | | | | | | | | | | | | | | | | | | | | | | | | |
| | | | | | | | |
| Balance June 30, 2007 | | | 214,622 | | | $ | 605 | | | $ | 2,228 | | | $ | 2,411 | | | | 27,457 | | | $ | (858 | ) | | $ | (79 | ) | | $ | (299 | ) | | $ | 4,008 | | | | | | |
| | | | | | | | |
See Notes to Consolidated Financial Statements
5
NOTES TO CONSOLIDATED FINANCIAL STATEMENTS
NOTE 1:Basis of Presentation
The accompanying unaudited consolidated financial statements of Rohm and Haas Company and its subsidiaries (the “Company”) have been prepared on a basis consistent with accounting principles generally accepted in the United States of America and are in accordance with the Securities and Exchange Commission (“SEC”) regulations for interim financial reporting. In the opinion of management, the financial statements reflect all adjustments, which are of a normal and recurring nature, which are necessary to present fairly the financial position, results of operations, and cash flows for the interim periods.
These financial statements should be read in conjunction with the financial statements, accounting policies and the notes included in our Form 8-K filed with the SEC on July 11, 2007, for the year ended December 31, 2006. The interim results are not necessarily indicative of results for a full year.
In the second quarter of 2006, our Board of Directors approved a plan to sell ourAutomotive Coatingsbusiness. The held-for-sale and discontinued operations criteria set forth in Statement of Financial Accounting Standards No. 144, “Accounting for the Impairment or Disposal of Long-Lived Assets” (“SFAS No. 144”) were met. Therefore, the results of ourAutomotive Coatingsbusiness are presented as a discontinued operation in our Consolidated Financial Statements for all periods presented herein. On October 1, 2006, we completed the sale of ourAutomotive Coatingsbusiness, excluding the business’ European operations which were sold on June 30, 2007. See Note 3 to the Consolidated Financial Statements.
On January 1, 2007, we reorganized our segments to create a more market-focused business structure. In addition to reorganizing our business structure, we adopted a simplified methodology for allocating shared service costs across all business units in order to provide improved management reporting through ease of administration and enhanced transparency of costs, as well as a simpler transfer pricing methodology which is intended to reduce volatility in earnings on internal sales and more accurately represent the value that is created in our integrated acrylic chain businesses. See Note 4 for further discussion.
Reclassifications
Certain reclassifications have been made to prior year amounts to conform to the current year presentation.
Variable Interest Entities
We are the primary beneficiary of a joint venture deemed to be a variable interest entity. Each joint venture partner holds several equivalent variable interests, with the exception of a royalty agreement held exclusively between the joint venture and our Company. In addition, the entire output of the joint venture is sold to our Company for resale to third party customers. As the primary beneficiary, we have consolidated the joint venture’s assets, liabilities and results of operations in our Consolidated Financial Statements. Creditors and other beneficial holders of the joint venture have no recourse to the general credit of our Company.
We also hold a variable interest in another joint venture, accounted for under the equity method of accounting. The variable interest relates to a cost-plus arrangement between the joint venture and each joint venture partner. We have determined that we are not the primary beneficiary and therefore have not consolidated the entity’s assets, liabilities and results of operations in our Consolidated Financial Statements. The entity provides manufacturing services to us and the other joint venture partner, and has been in existence since 1999. As of June 30, 2007, our investment in the joint venture totals approximately $33 million, representing our maximum exposure to loss.
6
NOTE 2:New Accounting Pronouncements
Fair Value Option for Financial Assets and Financial Liabilities
In February 2007, the Financial Accounting Standards Board (“FASB”) issued SFAS No. 159,“The Fair Value Option for Financial Assets and Financial Liabilities,”which provides companies with an option to report selected financial assets and liabilities at fair value in an attempt to reduce both complexity in accounting for financial instruments and the volatility in earnings caused by measuring related assets and liabilities differently. This Statement is effective as of the beginning of an entity’s first fiscal year beginning after November 15, 2007. We are currently assessing the impact of this Statement on our Consolidated Financial Statements.
Accounting for Planned Major Maintenance Activities
In September 2006, the FASB issued Staff Position (FSP)AUG AIR-1, which addresses the accounting for planned major maintenance activities. The FASB believes that the accrue-in-advance method of accounting for planned major maintenance activities results in the recognition of liabilities that do not meet the definition of a liability in FASB Concepts Statement No. 6,“Elements of Financial Statements,”because it causes the recognition of a liability in a period prior to the occurrence of the transaction or event obligating the entity. This FSP prohibits the use of the accrue-in-advance method of accounting for planned major maintenance activities in annual and interim financial reporting periods beginning January 1, 2007. We have adopted this FSP as of January 1, 2007 and it did not have a material impact to our Consolidated Financial Statements.
Fair Value Measurements
In September 2006, the FASB issued SFAS No. 157,“Fair Value Measurements,”which defines fair value, establishes a framework for measuring fair value in generally accepted accounting principles (GAAP), and expands disclosures about fair value measurements. It does not expand the use of fair value measurement. This Statement is effective for financial statements issued in 2008. We are currently assessing on the impact of this Statement on our Consolidated Financial Statements.
Accounting for Uncertainty in Income Taxes
In July 2006, the FASB issued Financial Accounting Standards Board Interpretation (“FIN”) No. 48,“Accounting for Uncertainty in Income Taxes.”FIN No. 48 is an interpretation of SFAS No. 109,“Accounting for Income Taxes.”FIN No. 48 prescribes a recognition threshold and measurement attribute for the financial statement recognition and measurement of a tax position taken or expected to be taken in an enterprise’s tax return. This interpretation also provides guidance on the derecognition, classification, interest and penalties, accounting in interim periods, disclosure, and transition of tax positions. The recognition threshold and measurement attribute is part of a two step tax position evaluation process prescribed in FIN No. 48. FIN No. 48 is effective after the beginning of an entity’s first fiscal year that begins after December 15, 2006. We have adopted FIN No. 48 as of January 1, 2007. The adoption resulted in a charge of $9 million recorded directly to retained earnings as a cumulative effect of an accounting change. See Note 6 for further discussion.
NOTE 3:Acquisitions and Dispositions of Assets
Acquisitions
On January 4, 2007, we completed the formation of Viance, LLC, a joint venture owned 50% by Rohm and Haas and 50% by Chemical Specialties, Inc. (CSI), a wholly owned subsidiary of Rockwood Holdings, Inc. Rohm and Haas paid CSI $77 million to create the new company, which combines the wood biocides business of Rohm and Haas and the wood protection chemicals business of CSI. The results of this joint venture are included in our Performance Materials Group segment as an equity method investment.
On June 15, 2007, we acquired the net assets of Eastman Kodak Company’s Light Management Films technology business, which produces advanced films that improve the brightness and efficiency of liquid crystal displays (LCD). Of the $40 million purchase price, $12 million was allocated to intangible assets,
7
primarily consisting of developed technology, and we recorded a charge of $3 million for acquired in-process research and development which is included in restructuring and asset impairments in the Consolidated Statement of Operations. The remainder of the purchase price was allocated to the tangible net assets acquired. The proforma results of operations for the three and six month periods ended June 30, 2007 and 2006, respectively, would not be material to the Rohm and Haas Consolidated Statements of Operations for those respective periods. The results of operations of the light management films business are included in our Electronic Materials Group segment as of the second quarter of 2007.
Dispositions
In the second quarter of 2006, we determined that the globalAutomotive Coatingsbusiness became an Asset Held for Sale and qualified for treatment as a discontinued operation. We have reflected this business as such in our financial statements for all periods presented. On October 1, 2006, we completed the sale of our globalAutomotive Coatingsbusiness, excluding that business’ European operations. Proceeds included $230 million in cash, plus working capital adjustments as defined in the sale agreement. In January of 2007, we paid $9 million in closing working capital adjustments.
The EuropeanAutomotive Coatingsbusiness’ operations were sold on June 30, 2007 for proceeds of $3 million. The sale resulted in a pre-tax loss of approximately $3 million.
The following table presents the results of operations of ourAutomotive Coatingsdiscontinued operation:
| | | | | | | | | | | | | | | | | |
| | | Three Months Ended | | Six Months Ended |
| | | June 30, | | June 30, |
| (in millions) | | 2007 | | 2006 | | 2007 | | 2006 |
| |
| Net sales from discontinued operation | | $ | 7 | | | $ | 24 | | | $ | 14 | | | $ | 49 | |
| | | |
| Loss from discontinued operation | | | (3 | ) | | | (8 | ) | | | (1 | ) | | | (8 | ) |
| Income tax benefit (provision) | | | 2 | | | | (18 | ) | | | 2 | | | | (18 | ) |
| | | |
| Net (loss) earnings from discontinued operation | | $ | (1 | ) | | $ | (26 | ) | | $ | 1 | | | $ | (26 | ) |
| | | |
In the second quarter of 2006, we acquired the net assets of Floralife®, Inc. (“Floralife”), a top global provider of post-harvest care products for the floral industry based in South Carolina, for approximately $22 million. In January of 2007, we sold Floralife with the exception of certain patented technologies (1-MCP) to enhance the growth of the AgroFresh business in the Performance Materials Group segment. This sale resulted in a pre-tax gain of approximately $3 million.
8
NOTE 4:Segment Information
On January 1, 2007, we reorganized our segments to create a more market-focused business structure. In addition to reorganizing our business structure, we adopted a simplified methodology for allocating shared service costs across all business units in order to provide improved management reporting through ease of administration and enhanced transparency of costs, as well as a simpler transfer pricing methodology which is intended to reduce volatility in earnings on internal sales and more accurately represent the value that is created in our integrated acrylic chain businesses. The following segment profiles reflect the new structure.
We operate six reportable segments: Primary Materials, Paint and Coatings Materials, Packaging and Building Materials, Electronic Materials Group, Performance Materials Group, and Salt. Paint and Coatings Materials, Packaging and Building Materials and Primary Materials are managed under one executive as the Specialty Materials Group. The reportable operating segments and the types of products from which their revenues are derived are discussed below.
| Ø | | Paint and Coatings Materials |
| |
| | | This business produces acrylic emulsions and additives that are used primarily to make decorative and industrial coatings. Its products are critical components used in the manufacture of architectural paints used by do-it-yourself consumers and professional contractors. Paint and Coatings Materials products are also used in the production of industrial coatings (for use on wood, metal, and in traffic paint); in construction applications (for use in roofing materials, insulation, and cement modification); and floor care products. |
| |
| Ø | | Packaging and Building Materials |
| |
| | | This business offers a broad range of polymers; additives; and formulated value-added products (which utilize a broad range of chemistries and technologies, including our world-class acrylic technology). Its products are used in a wide range of markets, including: packaging and paper, building and construction, durables and transportation, and other industrial markets. Product lines include: additives for the manufacture of plastic and vinyl products, packaging, pressure sensitive, construction, and transportation adhesives, as well as polymers and additives used in textile, graphic arts, nonwoven, paper and leather applications. |
| |
| Ø | | Primary Materials |
| |
| | | This business produces methyl methacrylate, acrylic acid and associated esters as well as specialty monomer products which are building blocks used in our downstream polymer businesses and which are also sold externally. Internal consumption of Primary Materials products is principally in the Paint and Coatings Materials and Packaging and Building Materials businesses. Primary Materials also provides polyacrylic acid (PAA) dispersants, opacifiers and rheology modifiers/thickeners to the global household and industrial markets. |
| |
| Ø | | Electronic Materials Group |
| |
| | | The Electronic Materials Segment provides cutting-edge technology for use in telecommunications, consumer electronics and household appliances. It is comprised of three aggregated businesses:Circuit Board Technologies,Packaging and Finishing Technologies, andSemiconductor Technologies. TheCircuit Board Technologiesbusiness develops and delivers the technology, materials and fabrication services for increasingly powerful, high-density circuit boards in computers, cell phones, automobiles and many other electronic devices. OurPackaging and Finishing Technologiesbusiness develops and delivers innovative materials and processes that boost the performance of a diverse range of electronic, optoelectronic and industrial packaging and finishing applications. TheSemiconductor Technologiesbusiness develops and supplies integrated products and technologies on a global basis enabling our customers to drive leading-edge semiconductor design to boost performance of semiconductor devices powered by smaller and faster chips. This business also develops and delivers materials used for chemical mechanical planarization, the process used to create the flawless surfaces required to allow manufacturers to make faster and more powerful integrated circuits and electronic substrates. |
9
| Ø | | Performance Materials Group |
| |
| | | This business group represents our expertise in enabling technologies that meet growing societal needs in the areas of water, food, health care and energy. It is comprised of the operating results of Process Chemicals and Biocides, Powder Coatings, and other smaller business units. Its products include: ion exchange resins; sodium borohydride, biocides, polymers and additives used in personal care applications and other niche technologies. |
| |
| Ø | | Salt |
| |
| | | The Salt business houses the Morton Salt name including the well known image of the Morton Salt Umbrella Girl and the familiar slogan, “when it rains it pours.” This business also encompasses the leading table salt brand in Canada, Windsor Salt. Salt’s product offerings extend well beyond the consumer market to include salts used for food processing, agriculture, water conditioning, highway ice control and industrial processing applications. |
The table below presents net sales by reportable segment. Segment eliminations are presented for intercompany sales between reportable segments.
Net Sales by Business Segment and Region
| | | | | | | | | | | | | | | | | |
| | | Three Months Ended | | Six Months Ended |
| (in millions) | | June 30, | | June 30, |
| | | 2007 | | 2006 | | 2007 | | 2006 |
| | | |
Business Segment | | | | | | | | | | | | | | | | |
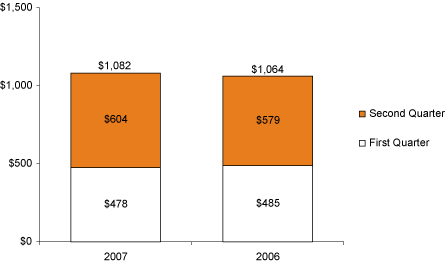
| Paint and Coatings Materials | | $ | 604 | | | $ | 579 | | | $ | 1,082 | | | $ | 1,064 | |
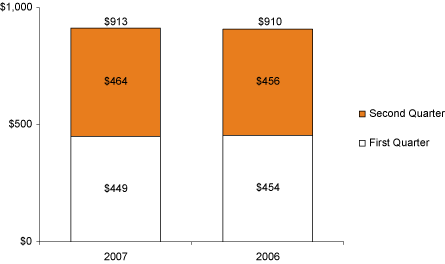
| Packaging and Building Materials | | | 464 | | | | 456 | | | | 913 | | | | 910 | |
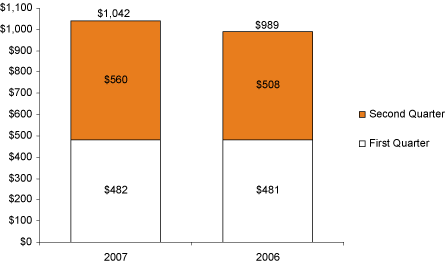
| Primary Materials | | | 560 | | | | 508 | | | | 1,042 | | | | 989 | |
| Elimination of Intersegment Sales | | | (312 | ) | | | (298 | ) | | | (563 | ) | | | (570 | ) |
| | | |
Specialty Materials Group | | $ | 1,316 | | | $ | 1,245 | | | $ | 2,474 | | | $ | 2,393 | |
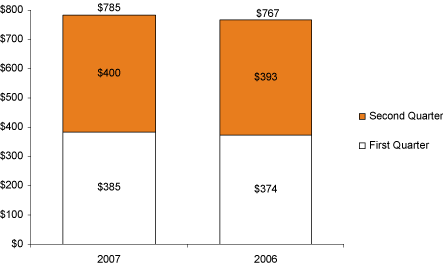
| Electronic Materials Group | | | 400 | | | | 393 | | | | 785 | | | | 767 | |
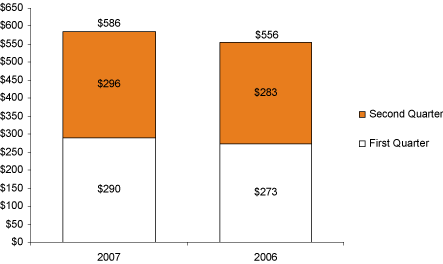
| Performance Materials Group | | | 296 | | | | 283 | | | | 586 | | | | 556 | |
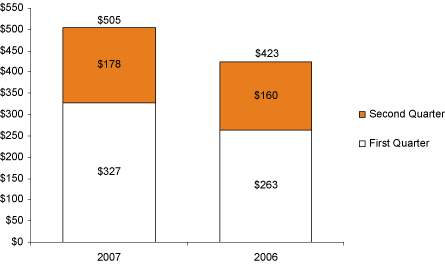
| Salt | | | 178 | | | | 160 | | | | 505 | | | | 423 | |
| | | |
Total net sales | | $ | 2,190 | | | $ | 2,081 | | | $ | 4,350 | | | $ | 4,139 | |
| | | |
| | | | | | | | | | | | | | | | | |
Customer Location | | | | | | | | | | | | | | | | |
| North America | | $ | 1,047 | | | $ | 1,061 | | | $ | 2,141 | | | $ | 2,164 | |
| Europe | | | 582 | | | | 521 | | | | 1,142 | | | | 1,013 | |
| Asia-Pacific | | | 471 | | | | 418 | | | | 893 | | | | 805 | |
| Latin America | | | 90 | | | | 81 | | | | 174 | | | | 157 | |
| | | |
Total net sales | | $ | 2,190 | | | $ | 2,081 | | | $ | 4,350 | | | $ | 4,139 | |
| | | |
10
Earnings (Loss) from Continuing Operations by Business Segment(1,2)
| | | | | | | | | | | | | | | | | |
| | | Three Months Ended | | Six Months Ended |
| (in millions) | | June 30, | | June 30, |
| | | 2007 | | 2006 | | 2007 | | 2006 |
| | | |
Business Segment | | | | | | | | | | | | | | | | |
| Paint and Coatings Materials | | $ | 76 | | | $ | 78 | | | $ | 129 | | | $ | 138 | |
| Packaging and Building Materials | | | 36 | | | | 39 | | | | 64 | | | | 76 | |
| Primary Materials | | | 17 | | | | 37 | | | | 47 | | | | 91 | |
| | | |
Specialty Materials Group | | $ | 129 | | | $ | 154 | | | $ | 240 | | | $ | 305 | |
| Electronic Materials Group | | | 69 | | | | 62 | | | | 129 | | | | 115 | |
| Performance Materials Group | | | 19 | | | | 16 | | | | 40 | | | | 34 | |
| Salt | | | 4 | | | | 2 | | | | 37 | | | | 20 | |
Corporate(3) | | | (60 | ) | | | (42 | ) | | | (95 | ) | | | (75 | ) |
| | | |
Earnings from continuing operations | | $ | 161 | | | $ | 192 | | | $ | 351 | | | $ | 399 | |
| | | |
| | |
| (1) | | Earnings (loss) for all segments except Corporate are tax effected using our overall consolidated effective tax rate excluding certain discrete items. |
| |
| (2) | | In the first quarter of 2007, we changed the methodology for allocating shared service costs across all business units to a simpler methodology we believe will provide improved management reporting. Also in the first quarter of 2007, we moved to a simpler transfer pricing methodology which is intended to reduce volatility in earnings on internal sales and more accurately represent where value is created in our integrated acrylic chain businesses. We have reclassified our 2006 results to conform to these changes. |
| |
| (3) | | Corporate includes certain corporate governance costs, interest income and expense, environmental remediation expense, insurance recoveries, exploratory research and development expense, currency gains and losses, any unallocated portion of shared services and certain discrete period tax items. |
NOTE 5:Restructuring and Asset Impairments
Severance and employee benefit costs associated with restructuring initiatives are primarily accounted for in accordance with SFAS No. 112, “Employers’ Accounting for Postemployment Benefits.” Asset impairment charges are accounted for in accordance with SFAS No. 144,“Accounting for the Impairment or Disposal of Long-Lived Assets.”The following net restructuring and asset impairment charges were recorded for the three months and six months ended June 30, 2007 and 2006, respectively as detailed below:
| | | | | | | | | | | | | | | | | |
| | | Three Months Ended | | Six Months Ended |
| | | June 30, | | June 30, |
| (in millions) | | 2007 | | 2006 | | 2007 | | 2006 |
| Severance and employee benefits | | $ | — | | | $ | — | | | $ | (1 | ) | | $ | 1 | |
| Other, including contract lease termination penalties | | | (1 | ) | | | — | | | | (1 | ) | | | — | |
| Asset impairments, net of gains | | | 12 | | | | — | | | | 12 | | | | 3 | |
| | | |
| Total | | $ | 11 | | | $ | — | | | $ | 10 | | | $ | 4 | |
| | | |
Restructuring and Asset Impairment by Business Segment
| | | | | | | | | | | | | | | | | |
| | | Three Months Ended | | Six Months Ended |
| | | June 30, | | June 30, |
| (in millions) | | 2007 | | 2006 | | 2007 | | 2006 |
Business Segment | | | | | | | | | | | | | | | | |
| Paint and Coatings Materials | | $ | — | | | $ | — | | | $ | — | | | $ | - | |
| Packaging and Building Materials | | | 1 | | | | (1 | ) | | | 1 | | | | 5 | |
| Primary Materials | | | — | | | | — | | | | — | | | | — | |
| | | |
Specialty Materials Group | | $ | 1 | | | $ | (1 | ) | | $ | 1 | | | $ | 5 | |
| Electronic Materials Group | | | (2 | ) | | �� | — | | | | (3 | ) | | | (1 | ) |
| Performance Chemicals Group | | | (1 | ) | | | — | | | | (1 | ) | | | — | |
| Salt | | | — | | | | — | | | | — | | | | — | |
| Corporate | | | 13 | | | | 1 | | | | 13 | | | | — | |
| | | |
| Total | | $ | 11 | | | $ | — | | | $ | 10 | | | $ | 4 | |
| | | |
11
| | | | | | | | | | | | | |
| | | | | | | Contract and Lease | | |
| Restructuring by Initiative | | Severance and | | Termination and | | |
| (in millions) | | Employee Benefits | | Other Costs | | Total |
2006 Initiatives: | | | | | | | | | | | | |
| Initial charge | | $ | 26 | | | $ | — | | | $ | 26 | |
| Payments | | | (3 | ) | | | — | | | | (3 | ) |
| Changes in estimate | | | (1 | ) | | | — | | | | (1 | ) |
| | | |
| December 31, 2006 ending balance | | | 22 | | | | — | | | | 22 | |
| Payments | | | (13 | ) | | | — | | | | (13 | ) |
| Changes in estimate | | | (1 | ) | | | — | | | | (1 | ) |
| | | |
| June 30, 2007 ending balance | | | 8 | | | | — | | | | 8 | |
| | | |
| | | | | | | | | | | | | |
2005 Initiatives: | | | | | | | | | | | | |
| Initial charge | | $ | 36 | | | $ | 1 | | | $ | 37 | |
| Payments | | | (3 | ) | | | (1 | ) | | | (4 | ) |
| Changes in estimate | | | — | | | | — | | | | — | |
| | | |
| December 31, 2005 ending balance | | | 33 | | | | — | | | | 33 | |
| Payments | | | (19 | ) | | | — | | | | (19 | ) |
| Changes in estimate | | | (1 | ) | | | 2 | | | | 1 | |
| | | |
| December 31, 2006 ending balance | | | 13 | | | | 2 | | | | 15 | |
| Payments | | | (6 | ) | | | (2 | ) | | | (8 | ) |
| Changes in estimate | | | (1 | ) | | | — | | | | (1 | ) |
| | | |
| June 30, 2007 ending balance | | | 6 | | | | — | | | | 6 | |
| | | |
| | | | | | | | | | | | | |
Balance at June 30, 2007 | | $ | 14 | | | $ | — | | | $ | 14 | |
| | | |
The balance at June 30, 2007, recorded for severance and employee benefits, is included in accrued liabilities in our Consolidated Balance Sheet. The restructuring reserve balances presented are considered adequate to cover committed restructuring actions. Our restructuring initiatives are generally completed in 12 to 18 months.
Restructuring Initiatives
2007 Initiatives
For the three and six months ended June 30, 2007, there were no new restructuring charges recorded.
2006 Initiatives
For the three months ended June 30, 2006, we recorded approximately $1 million of expense for severance and associated employee benefits primarily associated with the elimination of 10 positions in our North American support services, as we continue to capitalize on the enhancements made possible by the implementation of our Enterprise Resource Planning system. This charge was offset by $1 million of favorable adjustments to appropriately reflect more accurate estimates of remaining obligations related to severance payments within our global Graphic Arts business initiative announced in the first quarter of 2006.
For the six months ended June 30, 2006, we recorded approximately $3 million, net of expense for severance and associated employee benefits primarily related to the restructuring of our global Graphics Arts business within our Packaging and Building Materials segment, and our North American support services restructuring, that affected 37 positions in total. In the first six months of both 2006 and 2007, we reversed $1 million of severance and employee benefit charges related to total 2006 initiatives.
12
Of the 329 positions identified under total 2006 restructuring initiatives, we reduced the total number of positions to be affected by 21 to 308 positions in total. As of June 30, 2007, 209 positions have been eliminated.
2005 Initiatives
For the three months ended June 30, 2005, we recorded a $2 million charge for severance and associated employee benefits primarily associated with the planned closure of our Wytheville plant and consolidation of our North AmericanPowder Coatingsoperations, in addition to a smaller reduction in the force effort within our Packaging and Building Materials business that affected 93 positions in total.
For the six months ended June 30, 2005, we recorded $3 million of expense for severance and associated employee benefits affecting 120 positions, primarily associated with the planned closure of our Wytheville plant and consolidation of our North AmericanPowder Coatingsoperations, in addition to a smaller reduction in the force effort within our Electronic Materials and Packaging and Building Materials businesses. In the first six months of both 2006 and 2007, we reversed $1 million of severance and employee benefit charges and contract lease obligations related to total 2005 initiatives.
Of the initial 590 positions identified under total 2005 restructuring initiatives, we reduced the total number of positions to be affected by 42 to 548 positions in total. As of June 30, 2007, 500 positions have been eliminated.
Prior Year Initiatives
In the six months of 2006, we recorded changes in estimates to reduce our reserve by $1 million for severance and employee benefit charges relating to total 2004 restructuring initiatives. All severance payments contemplated by these initiatives are materially complete. Of the initial 500 positions identified, we reduced the total number of positions to be affected by these initiatives by 123 to 377 positions in total. As of June 30, 2007, all positions have been eliminated.
Asset Impairments
2007 Impairments
For the three and six months ended June 30, 2007, we recorded net asset impairments of approximately $12 million. These impairments included the $13 million write-off of our investment in Elemica, an online chemicals e-marketplace, and the $3 million write-off of in process research and development relating to the Eastman Kodak Company Light Management Films business acquisition, partially offset by a $4 million gain on the sale of real estate previously written down.
2006 Impairments
For the three months ended June 30, 2006, no asset impairments were recognized in earnings from continuing operations.
For the six months ended June 30, 2006, we recognized $3 million of fixed asset impairment charges associated with the restructuring of our global Graphic Arts business within our Packaging and Building Materials segment.
We recorded a $7 million asset impairment related to our discontinued operation for the six months ended June 30, 2006. See Note 3 to the Consolidated Financial Statements for more information.
NOTE 6:Accounting for Uncertainty in Income Taxes
Effective January 1, 2007, we adopted Financial Accounting Standards Board Interpretation (“FIN”) FIN 48, “Accounting for Uncertainty in Income Taxes,” which provides a comprehensive model for the recognition, measurement and disclosure in financial statements of uncertain income tax positions that a company has taken or expects to take on a tax return. Under FIN 48, a company can recognize the benefit of an income tax position only if it is more likely than not (greater than 50%) that the tax position will be sustained upon tax examination, based solely on the technical merits of the tax position.
13
Otherwise, no benefit can be recognized. Additionally, companies are required to accrue interest and related penalties, if applicable, on all tax exposures for which reserves have been established consistent with jurisdictional tax laws.
The recognition threshold and measurement provisions of FIN 48 are different from those of SFAS 109. Under FIN 48 we determined that certain income tax positions did not meet the more-likely-than-not recognition threshold and, therefore, required a 100% reserve while other previously unrecognized income tax positions met the recognition threshold and did not require any reserve. Accordingly, as of January 1, 2007, we recorded a non-cash cumulative transition charge of approximately $9 million, recorded as a reduction to beginning retained earnings (see Consolidated Statement of Shareholders’ Equity). Additional interest and penalty charges associated with tax positions are classified as income tax expense in the Consolidated Financial Statements.
As of January 1, 2007, we have unrecognized income tax benefits totaling $70 million and related accrued interest and penalties of $18 million (net of any tax benefit). If recognized, $74 million of these amounts would be recorded as a benefit to income taxes on the Statement of Operations and, therefore, would impact the reported effective tax rate. The remaining $14 million relates to pre-acquisition contingencies and discontinued operations. We are currently under audit in many jurisdictions. Although it is not possible to predict the timing of the conclusion of all these pending audits with accuracy, we do anticipate that the IRS audit of the 2002 through 2004 year will be complete by the end of 2007. Given the various stages of completion of our audits we can not currently estimate significant changes in the amount of unrecognized income tax benefits over the next year.
As of January 1, 2007, the following tax years remained subject to examination by the major tax jurisdictions indicated:
| | | |
| Major | | |
| Jurisdictions | | Open Years |
| Canada | | 1999 through 2001, 2003 through 2006 |
| China | | 1997 through 2006 |
| France | | 2004 through 2006 |
| Germany | | 1999 through 2006 |
| Italy | | 2003 through 2006 |
| Japan | | 2000 through 2006 |
| Korea | | 2001 through 2006 |
| Netherlands | | 2003 through 2006 |
| South Africa | | 2001 through 2006 |
| Switzerland | | 2005 and 2006 |
| Taiwan | | 2005 and 2006 |
| United Kingdom | | 2003 through 2006 |
| United States | | 2002 through 2006 |
We are also subject to income taxes in many hundreds of state and local taxing jurisdictions in the U.S. and around the world, many of which are still open to tax examinations. Management does not believe these represent a significant financial exposure for the Company.
NOTE 7:Borrowings
During the second quarter of 2007, we re-entered the U.S. Commercial Paper market. As of June 30, 2007, we had $115 million in commercial paper outstanding.
In March of 2007, we retired our €160 million of 6.0% notes upon maturity, early retired, at par, $19 million of 8.74% notes, and issued €175 million of 4.50% Private Placement Senior Notes due March 9, 2014 with interest payable semi-annually in March and September at a rate of 4.50% annually.
14
NOTE 8:Comprehensive Income
The components of comprehensive income are as follows:
| | | | | | | | | | | | | | | | | |
| | | Three Months Ended | | Six Months Ended |
| | | June 30, | | June 30, |
| (in millions) | | 2007 | | 2006 | | 2007 | | 2006 |
| |
| Net earnings | | $ | 160 | | | $ | 166 | | | $ | 352 | | | $ | 373 | |
| Other comprehensive income: | | | | | | | | | | | | | | | | |
| Current period changes in fair value of derivative instruments qualifying as hedges, net of $0, $(2), $(2), and $(1), of income taxes, respectively | | | — | | | | 3 | | | | 3 | | | | 1 | |
| Reclassification to earnings of derivative instruments qualifying as hedges, net of $0, $1, $1, and $2 of income taxes, respectively | | | — | | | | (1 | ) | | | (2 | ) | | | (3 | ) |
| Cumulative translation adjustment, net of $6, $6, $(1), and $7 of income taxes, respectively | | | 6 | | | | 24 | | | | — | | | | 32 | |
| Pension and postretirement benefit adjustments, net of $(3), $0, $(6), and $0 of income taxes, respectively | | | 7 | | | | — | | | | 16 | | | | 1 | |
| | | |
Total comprehensive income | | $ | 173 | | | $ | 192 | | | $ | 369 | | | $ | 404 | |
| | | |
NOTE 9:Earnings from Continuing Operations per Share
The difference in common shares outstanding used in the calculation of basic and diluted earnings from continuing operations per common share is primarily due to the effect of stock options and non-vested restricted stock as reflected in the reconciliations that follow:
| | | | | | | | | | | | | | | | | | | | | | | | | |
| | | Three Months Ended June 30, | | Six Months Ended June 30, |
| | | Earnings | | | | | | | | | | Earnings | | | | |
| | | from | | | | | | | | | | from | | | | |
| | | continuing | | | | | | | | | | continuing | | | | |
| (in millions, except per share | | operations | | Shares | | Per Share | | operations | | Shares | | Per Share |
| amount) | | (Numerator) | | (Denominator) | | Amount | | (Numerator) | | (Denominator) | | Amount |
| |
2007 | | | | | | | | | | | | | | | | | | | | | | | | |
| Earnings from continuing operations available to stockholders (Basic) | | $ | 161 | | | | 213.7 | | | $ | 0.76 | | | $ | 351 | | | | 215.1 | | | $ | 1.63 | |
Dilutive effect of options and non-vested restricted stock(1) | | | — | | | | 3.2 | | | | (0.01 | ) | | | — | | | | 3.2 | | | | (0.02 | ) |
| | | |
| Diluted earnings from continuing operations per share | | $ | 161 | | | | 216.9 | | | $ | 0.75 | | | $ | 351 | | | | 218.3 | | | $ | 1.61 | |
| | | |
2006 | | | | | | | | | | | | | | | | | | | | | | | | |
| Earnings from continuing operations available to stockholders (Basic) | | $ | 192 | | | | 220.3 | | | $ | 0.88 | | | $ | 399 | | | | 220.5 | | | $ | 1.81 | |
Dilutive effect of options and non-vested restricted stock(1) | | | — | | | | 2.3 | | | | (0.01 | ) | | | — | | | | 2.3 | | | | (0.02 | ) |
| | | |
| Diluted earnings from continuing operations per share | | $ | 192 | | | | 222.6 | | | $ | 0.87 | | | $ | 399 | | | | 222.8 | | | $ | 1.79 | |
| | | |
| | |
| (1) | | For the three and six months ended June 30, 2007 and 2006, 0.4 million shares and 0.8 million shares, respectively, were excluded from the calculation of diluted earnings per share as the exercise price of the stock options was greater than the average market price. |
15
NOTE 10:Pensions and Other Post-Retirement Benefits
We sponsor and contribute to pension plans that provide defined benefits to U.S. and non-U.S. employees. Pension benefits earned are generally based on years of service and compensation during active employment. We provide health care and life insurance benefits (“Other Postretirement Benefits”) under numerous plans for substantially all of our domestic retired employees, for which we are self-insured. Most retirees are required to contribute toward the cost of such coverage. We also provide health care and life insurance benefits to some non-U.S. retirees, primarily in France and Canada.
The following disclosures include amounts for both the U.S. and significant foreign pension plans (primarily Canada, Germany, Japan, and the United Kingdom) and other postretirement benefits.
Estimated Components of Net Periodic Cost
| | | | | | | | | | | | | | | | | | | | | | | | | | | | | | | | | |
| | | Pension Benefits | | Other Postretirement Benefits |
| | | Three Months Ended | | Six Months Ended | | Three Months Ended | | Six Months Ended |
| | | June 30, | | June 30, | | June 30, | | June 30, |
| (in millions) | | 2007 | | 2006 | | 2007 | | 2006 | | 2007 | | 2006 | | 2007 | | 2006 |
| |
| Service cost | | $ | 21 | | | $ | 19 | | | $ | 41 | | | $ | 39 | | | $ | 1 | | | $ | 1 | | | $ | 2 | | | $ | 3 | |
| Interest cost | | | 35 | | | | 33 | | | | 71 | | | | 67 | | | | 6 | | | | 6 | | | | 13 | | | | 13 | |
| Expected return on plan assets | | | (47 | ) | | | (40 | ) | | | (93 | ) | | | (79 | ) | | | (1 | ) | | | (1 | ) | | | (1 | ) | | | (1 | ) |
| Amortization of prior service cost | | | 1 | | | | 1 | | | | 1 | | | | 2 | | | | — | | | | — | | | | (1 | ) | | | (1 | ) |
| Amortization of net loss | | | 5 | | | | 10 | | | | 11 | | | | 21 | | | | 1 | | | | — | | | | 1 | | | | — | |
| | | |
| | | $ | 15 | | | $ | 23 | | | $ | 31 | | | $ | 50 | | | $ | 7 | | | $ | 6 | | | $ | 14 | | | $ | 14 | |
| Recognized settlement gain | | | (1 | ) | | | — | | | | (1 | ) | | | — | | | | — | | | | — | | | | — | | | | — | |
| | | |
| Net periodic benefit cost | | $ | 14 | | | $ | 23 | | | $ | 30 | | | $ | 50 | | | $ | 7 | | | $ | 6 | | | $ | 14 | | | $ | 14 | |
| | | |
Employer Contributions
During the three months and six months ended June 30, 2007, we contributed approximately $20 million and $48 million, respectively, to our qualified and non-qualified pension and postretirement benefit plans. We anticipate making full-year contributions of approximately $90 million this year, which consist of $40 million to our foreign qualified pension plans, $10 million to our non-qualified pension plans, and $40 million to our postretirement benefit plans.
NOTE 11:Inventories
Inventories consist of the following:
| | | | | | | | | |
| (in millions) | | June 30, 2007 | | December 31, 2006 |
| |
| Finished products | | $ | 511 | | | $ | 517 | |
| Work in process | | | 246 | | | | 301 | |
| Raw materials | | | 130 | | | | 121 | |
| Supplies | | | 45 | | | | 45 | |
| | | |
| Total | | $ | 932 | | | $ | 984 | |
| | | |
16
NOTE 12:Goodwill and Other Intangible Assets
Goodwill
The changes in the carrying amount of goodwill for the six months ended June 30, 2007, by business segment, are as follows:
| | | | | | | | | | | | | | | | | | | | | | | | | | | | | |
| | | Paint | | Packaging | | | | | | | | | | | | |
| | | and | | and | | | | | | Electronic | | Performance | | | | |
| | | Coatings | | Building | | Primary | | Materials | | Materials | | | | |
| (in millions) | | Materials | | Materials | | Materials | | Group | | Group | | Salt | | Total |
| |
| Balance as of January 1, 2007 | | $ | 63 | | | $ | 517 | | | $ | 29 | | | $ | 368 | | | $ | 241 | | | $ | 323 | | | $ | 1,541 | |
Goodwill related to acquisitions(1) | | | — | | | | — | | | | — | | | | 4 | | | | — | | | | — | | | | 4 | |
Goodwill related to divestitures(2) | | | — | | | | — | | | | — | | | | — | | | | (4 | ) | | | — | | | | (4 | ) |
Currency effects(3) | | | 1 | | | | 3 | | | | — | | | | — | | | | 2 | | | | 3 | | | | 9 | |
| | | |
| Balance as of June 30, 2007 | | $ | 64 | | | $ | 520 | | | $ | 29 | | | $ | 372 | | | $ | 239 | | | $ | 326 | | | $ | 1,550 | |
| | | |
| | |
| (1) | | Goodwill related to acquisitions is due to the following: $4 million- Electronic Materials Group – buyback of additional shares of Rodel. |
| |
| (2) | | Goodwill related to divestitures is due to the following: $4 million- Performance Materials- related to the sale of Floralife®in 2007. |
| |
| (3) | | Certain goodwill amounts are denominated in foreign currencies and are translated using the appropriate U.S. dollar exchange rate. |
17
Intangible Assets
The following table provides information regarding changes to our finite-lived intangible assets, subject to amortization, and indefinite-lived intangible assets, which are not subject to amortization.
Gross Asset Value
| | | | | | | | | | | | | | | | | | | | | | | | | | | | | |
| | | Finite Lived | | Indefinite Lived | | | | |
| | | | | | | | | | | | | | | Patents, | | | | | | |
| | | Developed | | Customer | | | | | | Licenses & | | | | | | |
| (in millions) | | Technology | | Lists | | Tradename | | Other | | Strategic | | Tradename | | Total |
| |
| Balance as of January 1, 2007 | | $ | 398 | | | $ | 881 | | | $ | 141 | | | $ | 172 | | | $ | 75 | | | $ | 329 | | | $ | 1,996 | |
Currency effects(1) | | | 2 | | | | 10 | | | | 1 | | | | — | | | | 4 | | | | 3 | | | | 20 | |
Acquisitions(3) | | | 9 | | | | — | | | | — | | | | — | | | | — | | | | — | | | | 9 | |
Divestitures(2) | | | — | | | | (3 | ) | | | — | | | | (1 | ) | | | — | | | | (1 | ) | | | (5 | ) |
| |
| Balance as of June 30, 2007 | | $ | 409 | | | $ | 888 | | | $ | 142 | | | $ | 171 | | | $ | 79 | | | $ | 331 | | | $ | 2,020 | |
| | | |
Accumulated Amortization
| | | | | | | | | | | | | | | | | | | | | | | | | | | | | |
| | | Finite Lived | | Indefinite Lived | | | | |
| | | | | | | | | | | | | | | Patents, | | | | | | |
| | | Developed | | Customer | | | | | | Licenses & | | | | | | |
| (in millions) | | Technology | | Lists | | Tradename | | Other | | Strategic | | Tradename | | Total |
| |
| Balance as of January 1, 2007 | | $ | (176 | ) | | $ | (170 | ) | | $ | (33 | ) | | $ | (104 | ) | | $ | (5 | ) | | $ | (21 | ) | | $ | (509 | ) |
| Expense | | | (12 | ) | | | (11 | ) | | | (2 | ) | | | (3 | ) | | | — | | | | — | | | | (28 | ) |
Currency effects(1) | | | (1 | ) | | | (4 | ) | | | 1 | | | | — | | | | — | | | | — | | | | (4 | ) |
Divestitures(2) | | | — | | | | 1 | | | | 3 | | | | — | | | | — | | | | — | | | | 4 | |
| |
| Balance as of June 30, 2007 | | $ | (189 | ) | | $ | (184 | ) | | $ | (31 | ) | | $ | (107 | ) | | $ | (5 | ) | | $ | (21 | ) | | $ | (537 | ) |
| | | |
Net Book Value | | $ | 220 | | | $ | 704 | | | $ | 111 | | | $ | 64 | | | $ | 74 | | | $ | 310 | | | $ | 1,483 | |
| | | |
| | |
| (1) | | Certain intangible assets are denominated in foreign currencies and are translated using the appropriate U.S. dollar exchange rate. |
| |
| (2) | | Divestiture relates to the sale of Floralife® assets. |
| |
| (3) | | Finite-lived intangible assets increased by a net $9 million as a result of our acquisition of the Kodak Light Management Films technology business, in June of 2007. See Note 3 for further discussion of this acquisition. |
Amortization expense for finite-lived intangible assets was $14 million and $28 million for the three and six months ended June 30, 2007 and $14 million and $27 million for the three and six months ended June 30, 2006 respectively. Amortization expense is estimated to be $56 million for the full 2007 year and for each of the subsequent four years.
Annual SFAS No. 142 Impairment Review
In accordance with the provisions of SFAS No. 142,“Goodwill and Other Intangible Assets,”we are required to perform, at a reporting unit level, an annual impairment review of goodwill and indefinite-lived intangible assets, or more frequently if an event occurs or circumstances change that would more likely than not reduce the fair value of a reporting unit below its carrying amount. For purposes of this review, we primarily utilize discounted cash flow analyses for estimating the fair value of the reporting units. We completed our annual recoverability review as of May 31, 2007, and determined that goodwill and indefinite-lived intangible assets were fully recoverable as of this date.
SFAS No. 144 Impairment Review
Finite-lived intangible assets are amortized over their estimated useful lives and are reviewed for impairment whenever changes in circumstances indicate the carrying value may not be recoverable in accordance with SFAS No. 144,“Accounting for the Impairment or Disposal of Long-Lived Assets.”
18
NOTE 13:Contingent Liabilities, Guarantees and Commitments
We are a party in various government enforcement and private actions associated with former waste disposal sites, many of which are on the U.S. Environmental Protection Agency’s (“EPA”) National Priority List, where remediation costs have been or may be incurred under the Federal Comprehensive Environmental Response, Compensation and Liability Act (“CERCLA”) and similar state statutes. In some of these matters we may also be held responsible for alleged property damage. We have provided for future costs, on an undiscounted basis, at certain of these sites. We are also involved in corrective actions at some of our manufacturing facilities.
We consider a broad range of information when we determine the amount necessary for remediation accruals, including available facts about the waste site, existing and proposed remediation technology and the range of costs of applying those technologies, prior experience, government proposals for this or similar sites, the liability of other parties, the ability of other potentially responsible parties (“PRPs”) to pay costs apportioned to them and current laws and regulations. We assess the accruals quarterly and update these as additional technical and legal information becomes available. However, at certain sites, we are unable, due to a variety of factors, to assess and quantify the ultimate extent of our responsibility for study and remediation costs.
| Ø | | Remediation Reserves and Reasonably Possible Amounts |
Reserves for environmental remediation that we believe to be probable and estimable are recorded appropriately as current and long-term liabilities in the Consolidated Balance Sheets. The reserves for remediation were $142 million at June 30, 2007 and $141 million at December 31, 2006. The amounts charged to earnings for environmental remediation and related charges were $9 million and $14 million for the three and six months ended June 30, 2007, and $4 million and $8 million for the three and six months ended June 30, 2006, respectively, and are recorded as cost of goods sold in the Consolidated Statements of Operations.
In addition to accrued environmental liabilities, there are costs which have not met the definition of probable, and accordingly, are not recorded in the Consolidated Balance Sheets. We have identified reasonably possible loss contingencies related to environmental matters of approximately $127 million and $120 million at June 30, 2007 and December 31, 2006, respectively.
Further, we have identified other sites where future environmental remediation may be required, but these loss contingencies cannot be reasonably estimated at this time. These matters involve significant unresolved issues, including the number of parties found liable at each site and their ability to pay, the interpretation of applicable laws and regulations, the outcome of negotiations with regulatory authorities, and alternative methods of remediation.
Except as noted below, we believe that these matters, when ultimately resolved, which may be over an extended period of time, will not have a material adverse effect on our consolidated financial position, but could have a material adverse effect on consolidated results of operations or cash flows in any given period.
Our significant sites are described in more detail below.
| Ø | | Wood-Ridge/Berry’s Creek |
The Wood-Ridge, New Jersey site (“Site”), and Berry’s Creek, which runs past this Site, are areas of environmental significance to the Company. The Site is the location of a former mercury processing plant acquired many years ago by a company later acquired by Morton International, Inc. (“Morton”). Morton and Velsicol Chemical Corporation (“Velsicol”) have been held jointly and severally liable for the cost of remediation of the Site. The New Jersey Department of Environmental Protection (“NJDEP”) issued the Record of Decision documenting the clean-up requirements for the manufacturing site in October 2006. The Company has submitted a work plan to implement the remediation, and will enter into an agreement or an order to perform the work in 2007. In April 2007, NJDEP issued remediation directives to approximately a dozen parties who were major customers or neighbors of the
19
plant, directing them to participate in the remediation. The Company will negotiate with these parties to assist in the funding of the work at the former processing plant. If any of the parties refuses to participate or cannot reach agreement with us, the directive gives parties performing the remediation the right to treble recovery from those parties who fail to comply with the directive. Our ultimate exposure at the Site will depend on clean-up costs and on the level of contribution from these other parties. Velsicol’s liabilities for Site response costs will be addressed through a bankruptcy trust fund established under a court-approved settlement with Velsicol, and other parties, including the government.
With regard to Berry’s Creek, and the surrounding wetlands, the EPA has issued letters to over 150 PRPs for performance of a broad scope investigation of risks posed by contamination in Berry’s Creek. Performance of this study is expected to take at least six years to complete. The PRPs have formed a representative group of over 100 PRPs, and have hired common counsel and a consultant to negotiate with the EPA. The PRPs have reached an agreement with EPA to perform a preliminary study to provide background information before the larger study is conducted. Today, there is much uncertainty as to what will be required to address Berry’s Creek, but investigation and clean-up costs, as well as potential resource damage assessments, could be very high and our share of these costs could possibly be material to the results of our operations, cash flows and consolidated financial position.
During 1996, the EPA notified Morton of possible irregularities in water discharge monitoring reports filed by its Moss Point, Mississippi plant in early 1995. Morton investigated and identified other environmental issues at the plant. An agreement with the EPA, the Department of Justice and the State of Mississippi resolving these historical environmental issues received court approval in early 2001. The accruals established for this matter were sufficient to cover the costs of the settlement. All operations at this Moss Point facility have now been terminated. Environmental investigation and interim remedial measures are proceeding pursuant to the Court approved agreement.
In December 2002, a complaint was filed in Mississippi on behalf of over 700 plaintiffs against Morton, Rohm and Haas, Joseph Magazzu, a former Morton employee, and the Mississippi Department of Environmental Quality alleging personal injury and property damage caused by environmental contamination. In April 2005, this complaint was dismissed, without prejudice, with respect to all the plaintiffs. Similar complaints were filed in Mississippi on behalf of approximately 1,800 other plaintiffs; however, all but about 40 of these plaintiffs failed to comply with a court ruling that required plaintiffs to provide basic information on their claims to avoid dismissal. The remaining plaintiffs are individual plaintiffs since Mississippi procedural rules do not permit class actions. At this time, we see no basis for the claims of any of the plaintiffs. On April 4, 2007, the Court issued several rulings in the Company’s favor including a ruling on a motion for partial summary judgment regarding chemicals in the wells of certain plaintiffs which the Court found resulted from the chlorination of the Moss Point Water System. In addition, the Court granted partial summary judgment regarding certain chemicals not found on the property of another plaintiff. The Court also granted the Company’s motion for sanctions against plaintiffs’ attorneys because there was no legal proof for 98 percent of the cases they had filed which were dismissed.
We closed the former Morton plant at Paterson, New Jersey in December 2001, and are currently undertaking remediation of the site under New Jersey’s Industrial Site Recovery Act. We removed contaminated soil from the site and constructed an on-site remediation system for residual soil and groundwater contamination. Off-site investigation of contamination is ongoing.
| Ø | | Martin Aaron Superfund Site |
Rohm and Haas is a PRP at this Camden, New Jersey former drum recycling site. We are participating in a PRP group to address cost allocation and technical issues. U.S. EPA Region 2 has issued a Record of Decision (“ROD”) specifying a remedy for the site. The New Jersey Department of Environmental Protection (“NJDEP”) presented a past cost and Natural Resource Damages claim to the PRP Group.
20
The PRP Group is negotiating a Consent Decree with EPA and NJDEP to conduct a remediation at the site.
| Ø | | Groundwater Treatment and Monitoring |
Major remediation for certain sites, such as Kramer, Whitmoyer, Woodlands and Goose Farm has been completed. We are continuing groundwater remediation and monitoring programs. Reserves for these costs have been established.
We also have accruals for enforcement and corrective action programs under governmental environmental laws at several of our manufacturing sites. The more significant of these accruals for corrective action, in addition to those presented above, have been recorded for the following sites: Bristol, Pennsylvania; Philadelphia, Pennsylvania; Houston, Texas; Louisville, Kentucky; Ringwood, Illinois; Apizaco, Mexico; Jacarei, Brazil; Jarrow, U.K.; Lauterbourg, France; and Mozzanica, Italy.
Insurance Litigation
We have actively pursued lawsuits over insurance coverage for certain environmental liabilities. It is our practice to reflect environmental insurance recoveries in the results of operations for the quarter in which the litigation is resolved through settlement or other appropriate legal processes. These resolutions typically resolve coverage for both past and future environmental spending and involve the “buy back” of the policies and have been included in cost of goods sold. In addition, litigation is pending regarding insurance coverage for certain Ringwood plant environmental lawsuits and certain premises asbestos cases regarding the Weeks Island facility.
Self-Insurance
We maintain deductibles for general liability, business interruption and property damage to owned, leased and rented property. These deductibles could be material to our earnings, but they should not be material to our overall financial position. We carry substantial excess general liability, property and business interruption insurance above our deductibles. In addition, we meet all statutory requirements for automobile liability and workers’ compensation.
Other Litigation
In December 2006, the federal government sued Waste Management of Illinois, Morton and Rohm and Haas for $1 million in unreimbursed costs and interest for the H.O.D. landfill, a closed waste disposal site, owned and operated by Waste Management and a predecessor company, located in Antioch, Lake County, Illinois.
In November 2006, a complaint was filed in the United States District Court for the Western District of Kentucky by individuals alleging that their persons or properties were invaded by particulate and air contaminants from the Louisville plant. The complaint seeks class action certification alleging that there are hundreds of potential plaintiffs residing in neighborhoods within two miles of the plant. We believe that this lawsuit is without merit.
In April 2006 and thereafter, lawsuits were filed against Rohm and Haas claiming that the Company’s Ringwood, Illinois plant contaminated groundwater and air that allegedly reached properties a mile south of the plant site. Also sued were the owner of a plant site neighboring our facility and a company which leases a portion of our facility. An action brought in federal court in Philadelphia, Pennsylvania, seeks certification of a class comprised of the owners and residents of about 500 homes in McCullom Lake Village, seeking medical monitoring and compensation for alleged property value diminution, among other things. In addition, lawsuits were filed in the Philadelphia Court of Common Pleas by seventeen individuals who claim that contamination from the plants has resulted in tumors (primarily of the brain) and one individual whose claims relate to cirrhosis of the liver. We believe that these lawsuits are without merit.
Rohm and Haas, Minnesota Mining and Manufacturing Company (3M) and Hercules, Inc. have been engaged in remediation of the Woodland Sites (“Sites”), two waste disposal locations in the New Jersey
21
Pinelands, under various NJDEP orders since the early 1990s. Remediation is complete at one site and substantially complete at the other. In February 2006, a lawsuit was filed in state court in Burlington County, New Jersey by the NJDEP and the Administrator of the New Jersey Spill Compensation Fund against these three companies and others for alleged natural resource damages relating to the Sites. In June 2006, after the lawsuit was served, the defendants filed a notice of removal of the action to the federal court in Camden, New Jersey. On July 5, 2007, the federal court remanded the case to state court. This lawsuit presents significant legal and public policy issues, including the fundamental issue of whether there are any “damages,” and the Company intends to defend it vigorously.
In January 2006 and thereafter, civil lawsuits were filed against Rohm and Haas and other chemical companies in U.S. federal court, alleging violation of antitrust laws in the production and sale of methyl methacrylate (“MMA”) and polymethylmethacrylates (“PMMA”). The various plaintiffs sought to represent a class of direct or indirect purchasers of MMA or PMMA in the United States from January 1, 1995 through December 31, 2003. The lawsuits referred to an investigation of certain chemical producers by the European Commission in which Rohm and Haas was not involved in any way. However, in September 2006, both the direct purchasers and the indirect purchasers filed amended complaints in which Rohm and Haas was not named as a defendant, and therefore the Company is no longer a party to these lawsuits. In addition, another United States complaint brought in late 2006 has been dismissed. Although Rohm and Haas remains a defendant in a similar lawsuit filed in Canada, we believe the Canadian lawsuit is without merit as to Rohm and Haas, and if the Company is not dropped from the lawsuit, we intend to defend it vigorously.
In late January 2006, Morton Salt was served with a Grand Jury subpoena in connection with an investigation by the Department of Justice into possible antitrust law violations in the “industrial salt” business. Neither Morton Salt, nor any Morton Salt employee has been charged with any wrongdoing. We are cooperating fully with the governmental investigation.
On December 22, 2005, a federal judge in Indiana issued a decision purporting to grant a class of participants in the Rohm and Haas pension plan the right to a cost-of-living adjustment (“COLA”) as part of the retirement benefit for those who elect a lump sum benefit. The decision contravenes the plain language of the plan, which clearly and expressly excludes a discretionary COLA for participants who elect a lump sum benefit. Were the decision to stand, the pension trust could be required to pay a COLA benefit to those plan participants who elected a lump sum benefit during the class period. We feel strongly that our plan fully complies with applicable law and therefore the judge’s decision is contrary to law. The judge certified the question for an immediate appeal to the Seventh Circuit Court of Appeals, which appeal was argued in June 2007, and we await the decision.
In August 2005, three actions were filed in the Philadelphia Court of Common Pleas relating to brain cancer incidence among employees who worked at our Spring House, Pennsylvania research facility. Two actions, which are now stayed pending the outcome of parallel workers’ compensation proceedings, were filed on behalf of individuals; the third is a class-action complaint which seeks a medical monitoring program for about 6,000 current and former Spring House employees. The complaint alleges that the number of brain cancer cases exceeds normal occurrence rates and alleges that the cancers were caused by workplace chemical exposure. Our ongoing epidemiological studies have not found an association between anything in the Spring House workplace and brain cancer. The Company believes that these actions have no merit and is actively defending against them. In April 2006, the Court dismissed the medical monitoring case as barred by Pennsylvania Workers’ Compensation Law and later stayed the case. The dismissal is now on appeal, and the plaintiff filed a Workers’ Compensation Petition seeking medical monitoring on his behalf and on behalf of others similarly situated. On June 26, 2007, the Commonwealth Court dismissed an action filed by the plaintiff, holding that Workers’ Compensation does not allow a class-action procedure but that the plaintiff could proceed with an individual worker’s compensation petition to have a determination made on his claim.
In February 2003, the United States Department of Justice and antitrust enforcement agencies in the European Union, Canada and Japan initiated investigations into possible antitrust violations in the
22
plastics additives industry. In April 2006, we were notified that the grand jury investigation in the United States had been terminated and no further actions would be taken against any parties. In August of 2006, Rohm and Haas was informed by the Canadian Competition Bureau that it was terminating its investigation having found insufficient evidence to warrant a referral to the Attorney General of Canada. In January 2007, we were advised that the European Commission has closed its impact modifier investigation and in April 2007, we were informed that the European Commission had closed its heat stabilizer investigation as well. We previously reported that the Japanese Fair Trade Commission brought proceedings against named Japanese plastics additives producers but did not initiate action against Rohm and Haas and no further action is expected. All of the criminal investigations initiated in February 2003 have now been terminated with no finding of any misconduct by the Company.
In civil litigation on plastics additives matters, we are a party to nine private federal court civil antitrust actions that have been consolidated in the U.S. District Court for the Eastern District of Pennsylvania, including one that originally had been filed in State Court in Ohio and another involving an individual direct purchaser claim that was filed in federal court in Ohio. These actions have been brought against Rohm and Haas and other producers of plastics additives products by direct purchasers of these products and seek civil damages as a result of alleged violations of the antitrust laws. The named plaintiffs in all but one of these actions are seeking to sue on behalf of all similarly situated purchasers of plastics additives products. Federal law provides that persons who have been injured by violations of Federal antitrust law may recover three times their actual damages plus attorneys’ fees. In the fall of 2006, the Court issued an order certifying six subclasses of direct purchasers premised on the types of plastics additives products that have been identified in the litigation. On April 9, 2007, the Third Circuit Court of Appeals agreed to hear an appeal from the Court’s certification order. As a result of the appeal, the lower court has stayed indefinitely the consolidated direct purchaser cases. In addition, in August 2005, a new indirect purchaser class action antitrust complaint was filed in the U.S. District Court for the Eastern District of Pennsylvania, consolidating all but one of the indirect purchaser cases that previously had been filed in various state courts, including Tennessee, Vermont, Nebraska, Arizona, Kansas and Ohio. The Court has dismissed from the consolidated action the claims arising from the states of Nebraska, Kansas and Ohio, and allowed the claims from Arizona, Tennessee and Vermont to continue. Because of the significant effect that the decision of the Third Circuit on the appeal of class certification in the direct purchaser cases may have on the indirect purchaser class, the parties agreed to stay this case pending the outcome of the appeal. The only remaining state court indirect action is the one filed in California which is dormant. Our internal investigation has revealed no wrongdoing. We believe these cases are without merit as to Rohm and Haas.
As a result of the bankruptcy of asbestos producers, plaintiffs’ attorneys have focused on peripheral defendants, including our company, which had asbestos on its premises. Historically, these premises cases have been dismissed or settled for minimal amounts because of the minimal likelihood of exposure at our facilities. We have reserved amounts for premises asbestos cases that we currently believe are probable and estimable.
There are also pending lawsuits filed against Morton related to employee exposure to asbestos at a manufacturing facility in Weeks Island, Louisiana with additional lawsuits expected. We expect that most of these cases will be dismissed because they are barred under workers’ compensation laws. However, cases involving asbestos-caused malignancies may not be barred under Louisiana law. Subsequent to the Morton acquisition, we commissioned medical studies to estimate possible future claims and recorded accruals based on the results.
Morton has also been sued in connection with asbestos-related matters in the former Friction Division of the former Thiokol Corporation, which merged with Morton in 1982. Settlement amounts to date have been minimal and many cases have closed with no payment. We estimate that all costs associated with future Friction Division claims, including defense costs, will be well below our insurance limits.
We are also parties to litigation arising out of the ordinary conduct of our business. Recognizing the amounts reserved for such items and the uncertainty of the ultimate outcomes, it is our opinion that the resolution of all these pending lawsuits, investigations and claims will not have a material adverse
23
effect, individually or in the aggregate, upon our results of operations, cash flows or consolidated financial position.
Indemnifications
In connection with the divestiture of several of our operating businesses, we have agreed to retain, and/or indemnify the purchaser against, certain liabilities of the divested business, including liabilities relating to defective products sold by the business or environmental contamination arising or taxes accrued prior to the date of the sale. Our indemnification obligations with respect to these liabilities may be indefinite as to duration and may or may not be subject to a deductible, minimum claim amount or cap. As such, it is not possible for us to predict the likelihood that a claim will be made or to make a reasonable estimate of the maximum potential loss or range of loss. No company assets are held as collateral for these indemnifications and no specific liabilities have been established for such guarantees.
NOTE 14:Subsequent Events
On July 16, 2007, our Board of Directors authorized a $2 billion share repurchase program and our intent to enter into a $1 billion accelerated share repurchase during the third quarter of 2007 to be funded by a debt issuance, with the remaining $1 billion of authorization to be utilized during 2008-2010 based on market conditions and available cash.
Also, on July 16, 2007, we declared a regular quarterly dividend of $0.37 per common share. This dividend will be payable on September 4, 2007 to shareholders of record at the close of business on August 10, 2007.
In July, we sold our UCD Colorants business for $6 million, resulting in an immaterial gain.
24
ITEM 2.Management’s Discussion and Analysis of Financial Condition and Results of Operations
The following commentary should be read in conjunction with the Consolidated Financial Statements and the accompanying Notes to the Consolidated Financial Statements for the year ended December 31, 2006, and Management’s Discussion and Analysis of Financial Condition and Results of Operations (“MD&A”) included in our 2006 annual report filed on Form 10-K with the Securities and Exchange Commission (“SEC”) on February 28, 2007, and updated on Form 8-K dated July 11, 2007, for the year ended December 31, 2006.
Within the following discussion, unless otherwise stated, “three month period” and “six month period” refers to the three and six months ended June 30, 2007, and “prior period” refers to comparisons with the corresponding period in the previous year.
Forward-Looking Information
This document contains forward-looking information so that investors will have a better understanding of our future prospects and make informed investment decisions. Forward-looking statements within the context of the Private Securities Litigation Reform Act of 1995 include statements anticipating future growth in sales, cost of sales, earnings, selling and administrative expense, research and development expense and cash flows. Words such as “anticipates,” “estimates,” “expects,” “projects,” “intends,” “plans,” “believes,” and similar language to describe prospects for future operations or financial condition identify such forward-looking statements. Forward-looking statements are based on management’s assessment of current trends and circumstances, which may be susceptible to uncertainty, change or any other unforeseen development. Results could differ materially depending on such factors as changes in business climate, economic and competitive uncertainties, the cost of raw materials, natural gas, and other energy sources and the ability to achieve price increases to offset such cost increases, foreign exchange rates, interest rates, acquisitions or divestitures, risks in developing new products and technologies, risks of doing business in emerging markets, the impact of new accounting standards, assessments for asset impairments, the impact of tax and other legislation and regulation in the jurisdictions in which we operate, changes in business strategies, manufacturing outages or the unanticipated costs of complying with environmental and safety regulations. As appropriate, additional factors are described in our 2006 annual report filed on Form 10-K with the SEC on February 28, 2007 and updated on Form 8-K dated July 11, 2007, for the year ended December 31, 2006. We are under no obligation to update or alter our forward-looking statements, as a result of new information, future events or otherwise.
Company Overview
Rohm and Haas Company was incorporated in 1917 under the laws of the State of Delaware. Our shares are traded on the New York Stock Exchange under the symbol “ROH”.
We are a global specialty materials company that began almost 100 years ago when a chemist, Otto Rohm, and a businessman, Otto Haas, decided to form a partnership to make a unique chemical product for the leather industry. That once tiny firm, now known as Rohm and Haas Company, reported sales of approximately $8.2 billion in 2006 on a portfolio of global businesses including specialty chemicals, electronic materials and salt. Today, we leverage science and technology to design materials and processes that enable our customers’ products to work. We serve a broad segment of dynamic markets, the largest of which include: building and construction, electronics, food and retail, household and personal care, industrial processes, packaging, transportation and water. To serve these markets, we have significant operations with approximately 100 manufacturing and 32 research facilities in 27 countries with approximately 15,800 employees.
25
Annual Net Sales(in millions)
Annual Net Sales by Region (in millions)
Industry Dynamics
Over the past decade, the global chemical industry has grown faster than the overall Gross Domestic Product. Projections for the next several years suggest this will likely continue. We expect the highest growth rates over the next ten years will be in the Asia-Pacific region.
The specialty materials industry is highly competitive. In some sectors, global value chain dynamics have placed specialty materials producers between the large global petrochemical producers and the large down stream retailers. In addition, the varying regional growth rates, the instant access to vast amounts of information, and highly efficient commercial transactions enabled by the internet are testing the historical industry business models. We believe growth opportunities exist for companies with the right business portfolio of value-added products, a global presence, and the flexibility to cope with the changing macro-industry trends.
26
Our Strategic Focus
Our focus is to grow both revenues and earnings through organic growth, as well as highly selective acquisitions and to deploy our strong cash generating capability in a balanced manner to provide sustained value for our stockholders while managing the company within the highest ethical standards. We are tuned to the changing global dynamics that impact the environment in which we operate; the trends in consumer demand and preferences; the shifting global demand and demographics; the greater emphasis on environmentally compatible products and renewable resources; and the increasing global competition.
In October 2006, we announced an evolution in our operating strategy, which we refer to as Vision 2010. The primary goal of Vision 2010 is to accelerate value creation. The key elements of this strategy are:
| | • | | Position Our Portfolio For Accelerated Growth –by leveraging our integrated acrylic monomer and polymer chain; accelerating investment in the Electronic Materials Group; creating or expanding platforms that address the growing needs in food, health, water, energy, and other areas in the developed and developing worlds; and supplementing our organic growth with highly selective acquisitions of a “bolt-on” nature, which bring a technology or geographic supplement to our core businesses or provide a new growth platform for the company. |
| |
| | • | | Build Value-Creating Business Models in Emerging Markets –through customizing products closer to customers; finding solutions that are affordable and meet local requirements; organizing in a manner that enables rapid decision-making; investing in local talent; and building plant facilities that can compete effectively with local and regional players as well as multinational players. |
| |
| | • | | Innovate with a Market / Customer Focus –by increasingly shifting the focus and delivery of technology programs closer to the customer, driving to faster and more tailored output. |
| |
| | • | | Drive Operational Excellence / Continuous Improvement– by maintaining conversion costs at the same absolute level, offsetting any inflation with productivity improvement; building more capital-efficient plants in emerging markets; continuing to optimize our global footprint; and increasing global sourcing, especially from low-cost countries. |
| |
| | • | | Deploy Right Talent in Right Places– by ensuring that leadership talent with the right depth and breadth is in place to drive the profitable growth of our businesses through shifting deployment of more key leaders to locations outside the U.S. and continuing to drive the nurturing and development of our global workforce. |
Complementing this operating strategy is a financial strategy aimed at providing sustained stockholder returns while providing the needed financial flexibility to support growth. Our financial strategy has three core elements:
| | • | | Disciplined deployment of our operating cash flow –We generated $840 million and $947 million in cash from operating activities during 2006 and 2005, respectively, and we expect to generate in excess of $1 billion during 2007. We plan to deploy this cash to enhance stockholder value through higher dividends, strategic investments in our core businesses and technologies, highly selective acquisitions, and share repurchases, as appropriate. |
| |
| | • | | Leveraging our balance sheet– Through the second quarter of 2007, our policy was to maintain credit ratios consistent with an “A” rating. Effective with the beginning of the third quarter of 2007, we are shifting away from targeting a specific credit rating. Rather, we intend to manage our debt levels in a manner consistent with maintaining investment grade quality ratios that are supported by our strong capability to generate cash from operating activities throughout the business cycle. Within these parameters, we intend to use our balance sheet to further enhance stockholder value. In July 2007, we determined that sufficient cash is expected to be generated from operating activities to support at least $1 billion in additional debt of investment grade credit quality, while retaining the financial flexibility needed to support our Vision 2010 strategy. |
| |
| | • | | Continued evaluation of and adjustment to our portfolio of businesses– We regularly evaluate the performance and strategic fit of our portfolio of businesses relative to our operating strategy and financial targets. If a business is identified as non-performing and/or non-strategic, we will evaluate options for that business with the intent of maximizing stockholder value. |
27
Our company was built upon a strong foundation of core values, which continue today. These values are the bedrock of our success. We strive to operate at the highest levels of integrity and ethics and, in support of this, require that all employees, as well as the members of our Board of Directors, receive compliance training and annually certify their compliance with our internal Code of Business Conduct and Ethics. Our core values are best summarized as:
| | • | | Ethical and legal behavior at all times; |
| |
| | • | | Integrity in all business interactions; and |
| |
| | • | | Trust by doing what we promise. |
Our Board of Directors devotes substantial time in reviewing our business practices with regard to the norms of institutional integrity. Our Board is comprised of 12 directors, of whom 11 are non-employees. The Audit, Nominating and Governance, and Executive Compensation committees of the Board are all entirely composed of independent directors.
Summary of Financial Results
In the second quarter of 2007, we reported sales of $2,190 million, a 5% increase over $2,081 million reported in the second quarter of 2006, reflecting higher demand, favorable currencies, and higher selling prices. Gross profit of $604 million in the quarter was 4% lower than the same period in 2006 and gross profit margin in the quarter was 27.6%, compared to 30.3% in the prior year period. The decrease was due to higher operating costs at the Houston, Texas plant and higher raw material costs, which were partially offset by strong global demand and favorable currencies. Selling and administrative expenses increased 7% versus the second quarter of 2006, largely reflecting increased spending to support growth initiatives, costs related to the establishment of the European Headquarters, and the negative impact of currencies. Research and development expense for the quarter was $73 million, up 4% from the prior year period, reflecting continued funding of research and development efforts in the key strategic growth areas. Income tax expense for the quarter was $57 million reflecting an effective tax rate of 25.7% versus 27.2% in the prior period. In the second quarter of 2007, we reported earnings from continuing operations of $161 million, or $0.75 per share, as compared to $192 million, or $0.87 per share in the second quarter of 2006.
Critical Accounting Estimates
Our Consolidated Financial Statements have been prepared in accordance with accounting principles generally accepted in the United States of America (GAAP). The preparation of these financial statements requires us to make estimates and assumptions that affect the reported amounts of revenues and expenses, assets and liabilities and the disclosure of contingent assets and liabilities. Management considers an accounting estimate to be critical to the preparation of our financial statements when:
| | • | | the estimate is complex in nature or requires a high degree of judgment, and |
| |
| | • | | the use of different estimates and assumptions could have a material impact on the Consolidated Financial Statements. |
Management has discussed the development and selection of our critical accounting estimates and related disclosures with the Audit Committee of our Board of Directors. Those estimates critical to the preparation of our Consolidated Financial Statements are listed below.
| Ø | | Litigation and Environmental Reserves |
We are involved in litigation in the ordinary course of business involving employee, personal injury, property damage and environmental matters. Additionally, we are involved in environmental remediation and spend significant amounts for both company-owned and third-party locations. In accordance with GAAP, we are required to assess these matters to: 1) determine if a liability is probable; and 2) record such a liability when the financial exposure can be reasonably estimated. The determination and estimation of these liabilities are critical to the preparation of our financial statements.
28
In reviewing such matters, we consider a broad range of information, including the claims, demands, settlement offers received from governmental authorities or private parties, estimates performed by independent third parties, identification of other responsible parties and an assessment of their ability to contribute as well as our prior experience, to determine if a liability is probable and if the value is estimable. If both of these conditions are met, we record a liability. If we believe that no best estimate exists, we accrue the minimum in a range of possible losses, and disclose any material, reasonably possible, additional losses. If we determine a liability to be only reasonably possible, we consider the same information to estimate the possible exposure and disclose any material potential liability.
Our most significant reserves are those that have been established for remediation and restoration costs associated with environmental issues. As of June 30, 2007, we have $142 million reserved for environmental-related costs. We conduct studies and site surveys to determine the extent of environmental contamination and necessary remediation. With the expertise of our environmental engineers and legal counsel, we determine our best estimates for remediation and restoration costs. These estimates are based on forecasts of future costs for remediation and change periodically as additional and better information becomes available. Changes to assumptions and considerations used to calculate remediation reserves could materially affect our results of operations or financial position. If we determine that the scope of remediation is broader than originally planned, discover new contamination, discover previously unknown sites or become subject to related personal injury or property damage claims, our estimates and assumptions could materially change.
We believe the current assumptions and other considerations used to estimate reserves for both our environmental and other legal liabilities are appropriate. These estimates are based in large part on information currently available and the current laws and regulations governing these matters. If additional information becomes available or there are changes to the laws or regulations or actual experience differs from the assumptions and considerations used in estimating our reserves, the resulting change could have a material impact on the results of our operations, financial position or cash flows.
Ø Income Taxes
The objective of accounting for income taxes is to recognize the amount of taxes payable or refundable for the current year and deferred tax liabilities and assets for the future tax consequences of events that have been recognized in our financial statements or tax returns.
In the determination of our current year tax provision, we have provided deferred income taxes on income from foreign subsidiaries which have not been reinvested abroad permanently because such earnings are taxable upon remittance to the United States. For foreign subsidiaries where earnings are permanently reinvested outside the United States, no accrual of United States income taxes has been provided. In addition, we operate within multiple taxing jurisdictions and are subject to audit within these jurisdictions. We record accruals for the estimated outcomes of these audits. We adjust these accruals, if necessary, upon the completion of tax audits or changes in tax law. Since significant judgment is required to assess the future tax consequences of events that have been recognized in our financial statements or tax returns, the ultimate resolution of these events could result in adjustments to our financial statements and such adjustments could be material. Therefore, we consider such estimates to be critical to the preparation of our financial statements.
We believe that the current assumptions and other considerations used to estimate the current year accrued and deferred tax positions are appropriate. However, if the actual outcome of future tax consequences differs from our estimates and assumptions, the resulting change to the provision for income taxes could have a material impact on our results of operations, financial position or cash flows.
Ø Restructuring
When appropriate, we record charges relating to efforts to strategically reposition our manufacturing footprint and support service functions. To the extent that exact amounts are not determinable, we have established reserves for such initiatives by calculating our best estimate of employee termination costs utilizing detailed restructuring plans approved by management. Reserve calculations are based upon various factors including an employee’s length of service, contract provisions, salary level and health
29
care benefit choices. We believe the estimates and assumptions used to calculate these restructuring provisions are appropriate, and although significant changes are not anticipated, actual costs could differ from the assumptions and considerations used in estimating reserves should changes be made in the nature or timing of our restructuring plans. The resulting change could have a material impact on our results of operations or financial position.
Ø Long-Lived Assets
Our long-lived assets include land, buildings and equipment, long-term investments, goodwill, indefinite-lived intangible assets and other intangible assets. Long-lived assets, other than investments, goodwill and indefinite-lived intangible assets, are depreciated over their estimated useful lives, and are reviewed for impairment whenever changes in circumstances indicate the carrying value may not be recoverable. Such circumstances would include a significant decrease in the market price of a long-lived asset, a significant adverse change in the manner in which the asset is being used or in its physical condition, or a history of operating or cash flow losses associated with the use of the asset. In addition, changes in the expected useful life of these long-lived assets may also be an impairment indicator. As a result, future decisions to change our manufacturing footprint or exit certain businesses could result in material impairment charges.
When such events or changes occur, we estimate the future cash flows expected to result from the assets’ use and, if applicable, the eventual disposition of the assets. The key variables that we must estimate include assumptions regarding sales volume, selling prices, raw material prices, labor and other employee benefit costs, capital additions and other economic factors. These variables require significant management judgment and include inherent uncertainties since they are forecasting future events. If such assets are considered impaired, they are written down to fair value, as appropriate.
Goodwill and indefinite-lived intangible assets are reviewed annually, or more frequently if changes in circumstances indicate the carrying value may not be recoverable. To test for recoverability, we typically utilize discounted estimated future cash flows to measure fair value for each reporting unit. This calculation is highly sensitive to both the estimated future cash flows of each reporting unit and the discount rate assumed in these calculations. These components are discussed below:
| | • | | Estimated future cash flows
The key variables that we must estimate to determine future cash flows include assumptions for sales volume, selling prices, raw material prices, labor and other employee benefit costs, capital additions and other economic or market-related factors. Significant management judgment is involved in estimating these variables, and they include inherent uncertainties since they are forecasting future events. For example, unanticipated changes in competition, customer sourcing requirements and product maturity would all have a significant impact on these estimates. |
| |
| | • | | Discount rate
We employ a Weighted Average Cost of Capital (“WACC”) approach to determine our discount rate for goodwill recoverability testing. Our WACC calculation includes factors such as the risk free rate of return, cost of debt and expected equity premiums. The factors in this calculation are largely external to our company, and therefore are beyond our control. The average WACC utilized in our annual test of goodwill recoverability in May 2007 was 9.88%, which was based upon average business enterprise value. A 1% increase in the WACC will result in an approximate 11% decrease in the computed fair value of our reporting units. A 1% decrease in the WACC will result in an approximate 16% increase in the computed fair value of our reporting units. The following table summarizes the major factors that influenced the rate: |
| | | | | | | | | |
| | | 2007 | | 2006 |
| |
| Risk free rate of return | | | 5.1 | % | | | 5.3 | % |
| Cost of debt | | | 6.2 | % | | | 7.6 | % |
| Market risk premium | | | 4.0 | % | | | 4.0 | % |
30
The decrease in the risk free rate of return is due to the overall decrease in U.S. long-term interest rates between the dates of our annual impairment testing in May 2006 and May 2007. The decrease in the cost of debt is due to debt refinancing at lower rates between the annual testing dates.
In the second quarter of 2007, we completed our 2007 annual FAS 142 impairment review and determined that goodwill and indefinite-lived intangible assets were not impaired as of May 31, 2007. We believe the current assumptions and other considerations used in the above estimates are reasonable and appropriate. A material adverse change in the estimated future cash flows of our business or significant increases in the WACC rate could result in the fair value falling below the book value of its net assets. This could result in a material impairment charge.
The fair values of our long-term investments are dependent on the financial performance and solvency of the entities in which we invest, as well as the volatility inherent in their external markets. In assessing potential impairment for these investments, we will consider these factors as well as the forecasted financial performance of these investment entities. If these forecasts are not met, we may have to record impairment charges.
Ø Pension and Other Employee Benefits
Certain assumptions are used to measure plan obligations and related assets of company-sponsored defined benefit pension plans, post-retirement benefits, post-employment benefits (e.g., medical, disability) and other employee liabilities. Plan obligations and annual expense calculations are based on a number of key assumptions. These assumptions include the weighted-average discount rate at which obligations can be effectively settled, the anticipated rate of future increases in compensation levels, the expected long-term rate of return on assets, increases or trends in health care costs and estimated mortality. We use independent actuaries to assist us in preparing these calculations and determining these assumptions. We believe that the current assumptions used to estimate plan obligations and annual expense are appropriate in the current economic environment. However, if economic conditions change, we may be inclined to change some of our assumptions, and the resulting change could have a material impact on the consolidated statements of operations and on the balance sheets. The weighted-average discount rate and the estimated return on plan assets used in our determination of pension expense is as follows:
| | | | | | | | | | | | | | | | | |
| | | 2007 | | 2006 |
| | | U.S. | | Non-U.S. | | U.S. | | Non-U.S. |
| |
| Discount rate | | | 5.90 | % | | | 5.09 | % | | | 5.70 | % | | | 4.77 | % |
| Estimated return on plan assets | | | 8.50 | % | | | 6.74 | % | | | 8.50 | % | | | 6.97 | % |
The following illustrates the annual impact on pension expense of a 100 basis point increase or decrease from the assumptions used to determine the net cost for the year ended December 31, 2006:
| | | | | | | | | | | | | | | | | | | | | | | | | |
| | | | | | | | | | | | | | | | | | | Combined |
| | | Weighted-Average | | Estimated Return on | | Increase/(Decrease) |
| | | Discount Rate | | Plan Assets | | Pension Expense |
(in millions) | | U.S. | | Non-U.S. | | U.S. | | Non-U.S. | | U.S. | | Non-U.S. |
| |
| 100 basis point increase | | $ | (28 | ) | | $ | (10 | ) | | $ | (14 | ) | | $ | (6 | ) | | $ | (42 | ) | | $ | (16 | ) |
| 100 basis point decrease | | | 30 | | | | 10 | | | | 14 | | | | 6 | | | | 44 | | | | 16 | |
31
The following illustrates the annual impact on postretirement benefit expense of a 100 basis point increase or decrease from the discount rate used to determine the net cost for the year ended December 31, 2006.
| | | | | | | | | |
| | | Weighted-Average Discount |
| | | Rate |
| (in millions) | | U.S. | | Non-U.S. |
| |
| 100 basis point increase | | $ | 1 | | | $ | (1 | ) |
| 100 basis point decrease | | | (1 | ) | | | 1 | |
Ø Share-Based Compensation
We account for share-based compensation in accordance with the fair value recognition provisions of SFAS No. 123R,“Share-Based Payment.”Prior to January 1, 2006, we accounted for share-based compensation in accordance with SFAS No. 123, “Accounting for Stock-Based Compensation.”Under the fair value recognition provisions of SFAS No. 123R, share-based compensation cost is measured at the grant date based on the value of the award and is recognized as expense over the vesting period. Determining the fair value of share-based awards at the grant date requires judgment, including estimation of the expected term of stock options, the expected volatility of our stock, expected dividends, and risk-free interest rates. If actual results differ significantly from these estimates, share-based compensation expense and our results of operations could be materially impacted.
JUNE 30, 2007 VERSUS JUNE 30, 2006 — CONSOLIDATED
Net Sales and Gross Profit
In the three months ended June 30, 2007, we reported consolidated net sales of $2,190 million, an increase of 5% or $109 million from prior period net sales of $2,081 million. In the six months ended June 30, 2007, we reported consolidated net sales of $4,350 million, an increase of 5% and $211 million from prior period net sales of $4,139 million. These increases are primarily driven by higher demand, favorable currencies and higher selling prices as reflected below.
| | | | | | | | | |
| | | Three months ended | | Six months ended |
| Sales Change June 30, 2007 and 2006 | | % | | % |
| |
| Demand | | | 3 | | | | 2 | |
| Currency | | | 2 | | | | 2 | |
| Price | | | 1 | | | | 1 | |
| Other | | | (1 | ) | | | — | |
| | | |
| Total change | | | 5 | | | | 5 | |
| | | |
Our gross profit for the second quarter of 2007 was $604 million, a decrease of 4% or $27 million from $631 million in the second quarter of 2006. Gross profit margin decreased to 27.6% from 30.3% in the second quarter of 2006. Our gross profit for the six months ended June 30, 2007 was $1,213 million, a decrease of 5% or $63 million from $1,276 million in the prior year period. These decreases reflect higher operating costs related to the Houston, Texas plant and higher raw material costs, which were partially offset by stronger global demand and favorable currencies.
Selling and Administrative Expense
In the second quarter of 2007, selling and administrative expenses were $277 million, an increase of 7% or $19 million from $258 million in the prior year period; however, up slightly from the prior year period as a percent of sales. In the six months ended June 30, 2007, selling and administrative expenses were $537 million, an increase of $31 million from $506 million in the prior year period and relatively flat as a percentage of sales. The increases reflect increased spending to support growth initiatives, costs related to the establishment of the European Headquarters, and the negative impact of currencies. Selling and administrative expenses were 12.6% of sales, slightly higher than the same period in 2006.
32
Research and Development Expense
Research and development expense for the second quarter of 2007 was $73 million, slightly higher than $70 million in the second quarter of 2006. In the six months ended June 30, 2007, research and development expenses were $141 million, an increase of 1% or $2 million from $139 million in the prior year period. The focus of our research and development spending continues to be in the Electronic Materials, Paint and Coatings Materials, and Performance Material segments.
Interest Expense
Interest expense for the second quarter of 2007 was $23 million, down from $27 million in the prior year period. Interest expense for the six months ended June 30, 2007 was $47 million, a decrease of 10%, or $5 million from $52 million in the prior year period. The decrease is due to lower average debt levels.
Amortization of Finite-lived Intangible Assets
Amortization of finite-lived assets was $14 million for the current quarter and for the prior year period. Amortization of finite-lived intangible assets was $28 million for the six months ended June 30, 2007, which was slightly more than $27 million in the prior year period. The slight increase is primarily due to the acquisition of Floralife®, which occurred in the second half of 2006.
Restructuring and Asset Impairments
For the six months ended June 30, 2007, we recorded approximately $2 million of benefit for severance and associated employee benefits and contract lease obligations and $12 million of net asset impairment charges. These impairments included the $13 million write-off of our investment in Elemica, an online chemicals e-marketplace, and the $3 million write-off of in-process research and development relating to the Eastman Kodak Company Light Management Films business acquisition, partially offset by a $4 million gain on the sale of real estate previously written down. All but $1 million of benefit for severance and associated employee benefits were recorded in the second quarter.
In the second quarter of 2006, we recorded approximately $1 million of expense for severance and associated employee benefit charges, which was offset by a $1 million reduction in estimates for prior period initiatives. There were no asset impairments from continuing operations in the second quarter of 2006
In the six months ended June 30, 2006, we recorded $4 million of expense related to restructuring and asset impairments. In the first quarter of 2006, we recorded approximately $3 million of expense for severance and associated employee benefits primarily related to the restructuring of our global Graphic Arts business within our former Coatings segment. This charge was offset by a change in estimate to prior period restructuring reserves of $2 million, due to lower than expected separation costs. In addition, in the first quarter of 2006, we recognized $3 million of fixed asset impairment charges associated with the restructuring of our global Graphic Arts business. Lastly, we recorded a $7 million asset impairment related to our discontinued operation in the second quarter of 2006.
Share of Affiliate Earnings, net
Affiliate net earnings for the three and six months ended June 30, 2007 and 2006 were $6 million and $11 million and $4 million and $5 million, respectively. The increases are primarily due to Viance, the new wood joint venture in our Performance Materials Group. The Viance joint venture is 50% owned by Rohm and Haas Company and 50% owned by Chemical Specialties, Inc., a wholly owned subsidiary of Rockwood Holdings, Inc.
Other (Income), net
Other income for the three months ended June 30, 2007 was $10 million, in comparison to $2 million in the prior year period. The increase was primarily due to a reduction in currency losses of $9 million.
In the six months ended June 30, 2007, other income, net was $29 million as compared to $16 million in the prior year period. This increase was primarily due to a reduction in currency losses of $13 million.
33
Effective Tax Rate
We recorded a provision for income tax expense of $57 million for the second quarter of 2007, reflecting an effective tax rate from continuing operations of 25.7% compared to a 27.2% effective rate for earnings in 2006. For the six months ended June 30, 2007, we recorded a provision for income tax expense of $132 million, reflecting an effective tax rate from continuing operations of 26.9% compared to a 28.6% effective rate for earnings in the prior year period. The decrease in the rate is mainly due to the re-enactment of the research tax credit in December of 2006 and lower taxes on foreign earnings. We expect the full year effective tax rate from continuing operations to be somewhat below 28%.
Minority Interest
In the second quarter of 2007 and 2006, we reported minority interest of $4 million, as compared to $3 million in the prior year period. In the six months ended June 30, 2007, we reported minority interest of $7 million, consistent with the same period in 2006. The majority of our minority interest relates to a consolidated joint venture recorded in our Electronic Materials Group reporting segment.
Loss from Discontinued Operation
As discussed in Note 3 to the Consolidated Financial Statements, in the second quarter of 2007, we completed the sale of our EuropeanAutomotive Coatingsbusiness within our former Coatings business segment. The results of the business for all periods presented are reported as a discontinued operation.
For the three and six months ended June 30, 2007, we reported a loss of $1 million and a gain of $1 million, after taxes, respectively, related to our discontinued operation, as compared to a loss of $26 million in the three and six months ended June 30, 2006. The 2006 loss includes $27 million, after-tax, attributable to the recognition of certain deferred tax liabilities as well as the impairment of certain intangible and fixed assets, triggered by the decision to sell the business, offset by $1 million in after-tax income from theAutomotive Coatingsoperations.
34
JUNE 30, 2007 VERSUS JUNE 30, 2006 – BY BUSINESS SEGMENT
Net Sales by Business Segment and Region
| | | | | | | | | | | | | | | | | |
| | | Three Months Ended | | | Six Months Ended | |
| (in millions) | | June 30, | | | June 30, | |
| | | 2007 | | | 2006 | | | 2007 | | | 2006 | |
| Business Segment | | | | | | | | | | | | | | | | |
| Paint and Coatings Materials | | $ | 604 | | | $ | 579 | | | $ | 1,082 | | | $ | 1,064 | |
| Packaging and Building Materials | | | 464 | | | | 456 | | | | 913 | | | | 910 | |
| Primary Materials | | | 560 | | | | 508 | | | | 1,042 | | | | 989 | |
| Elimination of Intersegment Sales | | | (312 | ) | | | (298 | ) | | | (563 | ) | | | (570 | ) |
| | | |
Specialty Materials Group | | $ | 1,316 | | | $ | 1,245 | | | $ | 2,474 | | | $ | 2,393 | |
| Electronic Materials Group | | | 400 | | | | 393 | | | | 785 | | | | 767 | |
| Performance Materials Group | | | 296 | | | | 283 | | | | 586 | | | | 556 | |
| Salt | | | 178 | | | | 160 | | | | 505 | | | | 423 | |
| | | |
Total net sales | | $ | 2,190 | | | $ | 2,081 | | | $ | 4,350 | | | $ | 4,139 | |
| | | |
| | | | | | | | | | | | | | | | | |
Customer Location | | | | | | | | | | | | | | | | |
| North America | | $ | 1,047 | | | $ | 1,061 | | | $ | 2,141 | | | $ | 2,164 | |
| Europe | | | 582 | | | | 521 | | | | 1,142 | | | | 1,013 | |
| Asia-Pacific | | | 471 | | | | 418 | | | | 893 | | | | 805 | |
| Latin America | | | 90 | | | | 81 | | | | 174 | | | | 157 | |
| | | |
Total net sales | | $ | 2,190 | | | $ | 2,081 | | | $ | 4,350 | | | $ | 4,139 | |
| | | |
Earnings (Loss) from Continuing Operations by Business Segment(1,2)
| | | | | | | | | | | | | | | | | |
| | | Three Months Ended | | | Six Months Ended | |
| (in millions) | | June 30, | | | June 30, | |
| | | 2007 | | | 2006 | | | 2007 | | | 2006 | |
| Business Segment | | | | | | | | | | | | | | | | |
| Paint and Coatings Materials | | $ | 76 | | | $ | 78 | | | $ | 129 | | | $ | 138 | |
| Packaging and Building Materials | | | 36 | | | | 39 | | | | 64 | | | | 76 | |
| Primary Materials | | | 17 | | | | 37 | | | | 47 | | | | 91 | |
| | | |
Specialty Materials Group | | $ | 129 | | | $ | 154 | | | $ | 240 | | | $ | 305 | |
| Electronic Materials Group | | | 69 | | | | 62 | | | | 129 | | | | 115 | |
| Performance Materials Group | | | 19 | | | | 16 | | | | 40 | | | | 34 | |
| Salt | | | 4 | | | | 2 | | | | 37 | | | | 20 | |
Corporate(3) | | | (60 | ) | | | (42 | ) | | | (95 | ) | | | (75 | ) |
| | | |
Earnings from continuing operations | | $ | 161 | | | $ | 192 | | | $ | 351 | | | $ | 399 | |
| | | |
| | |
| 1. | | Earnings (loss) for all segments except Corporate were tax effected using our overall consolidated effective tax rate excluding certain discrete items. |
| |
| 2. | | In the first quarter of 2007, we changed the methodology for allocating shared service costs across all business units to a simpler methodology we believe will provide improved management reporting. Also in the first quarter of 2007, we moved to a simpler transfer pricing methodology which is intended to reduce volatility in earnings on internal sales and more accurately represent where value is created in our integrated acrylic chain businesses. We have reclassified our 2006 results to conform to these changes. |
| |
| 3. | | Corporate includes certain corporate governance costs, interest income and expense, environmental remediation expense, insurance recoveries, exploratory research and development expense, currency gains and losses, any unallocated portion of shared services and certain discrete tax items. |
35
Provision for Restructuring and Asset Impairment by Business Segment
| | | | | | | | | | | | | | | | | |
| | | Three Months Ended | | | Six Months Ended | |
| | | June 30, | | | June 30, | |
| (in millions) | | 2007 | | | 2006 | | | 2007 | | | 2006 | |
| Business Segment | | | | | | | | | | | | | | | | |
| Paint and Coatings Materials | | $ | — | | | $ | — | | | $ | — | | | $ | — | |
| Packaging and Building Materials | | | 1 | | | | (1 | ) | | | 1 | | | | 5 | |
| Primary Materials | | | — | | | | — | | | | — | | | | — | |
| | | |
Specialty Materials Group | | $ | 1 | | | $ | (1 | ) | | $ | 1 | | | $ | 5 | |
| Electronic Materials Group | | | (2 | ) | | | — | | | | (3 | ) | | | (1 | ) |
| Performance Chemicals Group | | | (1 | ) | | | — | | | | (1 | ) | | | — | |
| Salt | | | — | | | | — | | | | — | | | | — | |
| Corporate | | | 13 | | | | 1 | | | | 13 | | | | — | |
| | | |
| Total | | $ | 11 | | | $ | — | | | $ | 10 | | | $ | 4 | |
| | | |
Specialty Materials Group
The Specialty Materials Group comprises three business units that represent the majority of the Company’s chemical businesses that serve a broad range of end-use markets. Overall sales for this Group (after intersegment elimination) were up 6% and 3% over the prior year period for the three and six months ended June 30, 2007, respectively. The increase reflects robust demand outside the U.S. and favorable currencies, which more than offset the continued softness in the U.S. building and construction markets. Earnings for this group declined 16% and 21% for the three and six months ended June 30, 2007, respectively over the same period in 2006, largely due to the unanticipated operating costs at the Houston, Texas facility and the impact of higher raw material costs. The results for the Specialty Materials Group are reported under three separate reportable segments as follows:
Paint and Coatings Materials
Second Quarter and Year-to-Date Net Sales(in millions)
36
Second quarter net sales for the Paint and Coatings Materials business were $604 million, an increase of 4%, or $25 million, from second quarter 2006 sales of $579 million, due to strong demand growth in Western Europe and the emerging markets of China, Turkey, Southeast Asia, and India, as well as favorable currencies and improved pricing in Europe and Asia. The business saw improved year-on-year sales comparisons over the first quarter of 2007, despite continued softness in the U.S. building and construction markets. Volumes in the U.S. for this business were down 1% in the second quarter compared with the prior year period, as opposed to 11% in the first quarter.
Second quarter earnings of $76 million in 2007 were down slightly from $78 million in 2006 as a result of the higher raw materials costs, partially offset by favorable currencies and higher selling prices.
In the six months ended June 30, 2007, net sales for the Paint and Coatings Materials business were $1,082 million, an increase of 2%, or $18 million, from $1,064 million in sales from the same period in 2006. Strong demand, sustained across all regions, other than the U.S., along with favorable currencies and slightly higher pricing more than offset the slowed demand in the U.S. The slowed demand in the U.S. was due to weakness in the architectural paint market reflecting the pronounced slowdown in home improvements as well as lower existing and new home sales.
Earnings for the six months ended June 30, 2007 were $129 million, down from $138 million in 2006 as a result of the lower demand in the U.S., partially offset by favorable currencies, higher selling prices and demand growth in other regions.
Packaging and Building Materials
Second Quarter and Year-to-Date Net Sales(in millions)
In the second quarter of 2007, net sales for Packaging and Building Materials were $464 million, an increase of 2%, or $8 million, from net sales of $456 million in 2006. The modest increase reflects the impacts of favorable currencies and pricing. Demand in the emerging markets of Asia, Latin America and Eastern Europe all had strong year-over-year growth; however this growth was more than offset by the ongoing softness in the building and construction related markets in the U.S.
37
While these market conditions have improved since the first quarter of 2007, there appears to be no sustainable market momentum.
Earnings of $36 million were down versus earnings of $39 million in the second quarter of 2006. The earnings decline reflects sharply increased raw material prices, primarily tin, which were partially offset by increased selling prices and favorable currencies.
In the six months ended June 30 2007, net sales for Packaging and Building Materials were $913 million, a slight increase of $3 million, from net sales of $910 million in 2006. The increase reflects the impacts of favorable currencies and slightly higher pricing, partially offset by lower demand in the U.S. building and construction markets. The overall lower demand is mainly the result of softness in the vinyl siding and windows profile markets in North America that use our plastics additives products.
Earnings of $64 million were down versus earnings of $76 million for the six months ended June 30, 2007 and 2006, respectively. 2006 results included a $3 million, after-tax, charge primarily for restructuring and other one-time costs related to our Graphic Arts business. The earnings decline reflects increased raw material costs and lower demand, partially offset by favorable currencies and increased selling prices.
Primary Materials
Second Quarter and Year-to-Date Net Sales(in millions)
Second quarter 2007 net sales for Primary Materials were $560 million, an increase of 10%, or $52 million over prior period net sales of $508 million. Primary Materials results include sales to our internal downstream monomer-consuming businesses, along with sales to third party customers of Merchant Monomers, Dispersants, and Industrial and Household Polymers. Sales to third party customers increased 18% to $248 million in the second quarter of 2007 from $210 million in the prior period, due to higher volumes, while third party pricing, as anticipated, was lower. Sales to downstream Rohm
38
and Haas specialty businesses were 5% higher, reflecting higher transfer pricing necessary to mitigate increased raw material costs.
| | | | | | | | | |
| | | Three Months Ended | |
| (in millions) | | June 30, | |
| | | 2007 | | | 2006 | |
| Total Sales | | $ | 560 | | | $ | 508 | |
| Elimination of Intersegment Sales | | | (312 | ) | | | (298 | ) |
| | | |
| Third Party Sales | | $ | 248 | | | $ | 210 | |
| | | |
Earnings of $17 million for the second quarter of 2007 decreased from $37 million in the prior period due to unplanned operating issues at our Houston, Texas facility associated with a scheduled maintenance turnaround. The operating issues resulted in higher than expected maintenance and freight costs, lost production, lower plant yields, and increased purchases from co-suppliers. The impact of these events on Primary Materials’ second quarter earnings was approximately $20 million, after tax. Despite the operating issues, the business was able to effectively manage internal and external commitments, partly due to the build-up of inventories prior to the scheduled maintenance turnaround. Favorable third party volumes and favorable currencies were offset by the unfavorable third party pricing, as noted above.
For the six months ended June 30, 2007, net sales for Primary Materials were $1,042 million, up 5%, or $53 million over prior period net sales of $989 million. Primary Materials results include sales to our internal downstream monomer-consuming businesses, primarily Paint and Coatings Materials and Packaging and Building Materials, along with sales to third party customers of Merchant Monomers, Dispersants and Industrial and Household Polymers markets. Sales to third party customers increased 14% to $479 million in the six months ended June 30, 2007 from $419 million in the prior period, primarily due to higher demand and favorable currencies, offset slightly by lower pricing for monomers, as anticipated. Sales to downstream Rohm and Haas specialty businesses were 1% lower, due primarily to lower volumes reflecting the weak market conditions in the U.S.
| | | | | | | | | |
| | | Six Months Ended | |
| (in millions) | | June 30, | |
| | | 2007 | | | 2006 | |
| Total Sales | | $ | 1,042 | | | $ | 989 | |
| Elimination of Intersegment Sales | | | (563 | ) | | | (570 | ) |
| | | |
| Third Party Sales | | $ | 479 | | | $ | 419 | |
| | | |
Earnings of $47 million for the six months ended June 30, 2007 decreased from $91 million in the prior period due to higher unanticipated plant costs, higher raw materials costs, reduced demand from our downstream businesses and lower selling prices to third party customers. The impact of the unanticipated plant maintenance costs on Primary Materials’ six month earnings was approximately $20 million, after tax. Despite the operating issues, the business was able to effectively manage internal and external commitments, partly due to the build-up of inventories prior to the scheduled maintenance turnaround.
We continue to see the effects of an increase in the global monomer supply during the early part of 2007 as a result of new production facilities that have come on line. We expect this additional supply to continue to apply downward pressure on Primary Material’s pricing through the remainder of 2007.
39
Electronic Materials Group
Second Quarter and Year-to-Date Net Sales(in millions)
Net sales for the Electronic Materials Group reached $400 million in the second quarter 2007, up 2%, or $7 million, versus sales of $393 million in the prior year. Excluding precious metals pass-through sales, sales in the second quarter were up 4% compared to the prior year and 6% versus the first quarter of 2007. A pick-up in semiconductor industry demand in Asia helped fuel double-digit sales gains there, while most of the businesses saw weaker year-over-year demand in North America and Europe. The businesses continue to deliver advanced technologies to meet the needs of a dynamic market. Sales of advanced technology product lines were up 10% versus the same period in 2006 and now account for approximately 42% of Electronic Materials sales.
Circuit Board Technologiessales grew 2% in the second quarter over the same period in 2006, reflecting good growth in Asia, offset by generally weak conditions in North America and Europe.Packaging and Finishing Technologiessales were down 8% versus last year primarily due to lower volumes of precious metal sales in North America, with process sales up 1% versus the same period last year. Sales fromSemiconductor Technologiesgrew 6% over the prior year quarter, reflecting continued strength in sales of Chemical Mechanical Planarization (CMP) pads and slurries as well as advanced photoresists and related products. Solid growth in Asia more than offset weaker demand in North America for semiconductor products.
Earnings of $69 million were up 11% from the $62 million earned in the second quarter of 2006, primarily reflecting increased demand driven by the advanced technology product lines. Included in 2007 earnings was a $1 million favorable after-tax restructuring adjustment, including a gain on the sale of real estate which had been previously impaired, partially offset by the write-off of in-process research and development costs related to the acquisition of Eastman Kodak Company’s Light Management Films technology business.
Net sales for the Electronic Materials Group reached $785 million in the six months ended June 30, 2007, up 2%, or $18 million, versus sales of $767 million in the prior year. The increase is mainly attributable to increased demand, particularly in Asia where there was a pick-up in the semiconductor
40
industry, which was partially offset by weaker demand across most of the businesses over the prior year period. The businesses continue to deliver innovative technologies to meet the needs of a dynamic market. Sales in advanced technology product lines were up 8% versus the same period in 2006.
For the six months ended June 30, 2007,Circuit Board Technologiessales grew 2% as solid growth in Asia more than offset weaker demand in North America and Europe.Packaging and Finishing Technologiessales were down 4% versus the same six month period in the prior year due to lower volumes of precious metal sales in North America, however, process sales were up 3% over the same period in 2006. Sales fromSemiconductor Technologiesgrew 5% over the prior year period, reflecting continued strength in sales of Chemical Mechanical Planarization (CMP) pads and slurries as well as advanced photoresists and related products. Solid growth in Asia more than offset weaker demand in North America for semiconductor products.
Earnings of $129 million were up 12% from the $115 million earned in the six months ended June 30, 2006, reflecting increased demand, particularly in the advanced technology product lines.
Performance Materials Group
Second Quarter and Year-to-Date Net Sales(in millions)
Net sales for the Performance Materials Group reached $296 million in the second quarter 2007, an increase of 5%, or $13 million, versus sales of $283 million in 2006. The increase was due to stronger demand in the Asia Pacific region, coupled with the impact of favorable currencies. In addition, the business group also saw strong continued growth of the patented 1-MCP technology of the AgroFresh business unit.
Net sales forProcess Chemicals and Biocideswere $191 million, an increase of 6%, or $10 million over second quarter 2006 sales with demand for ion exchange resins and biocides strong across all regions and markets, while the paper bleaching market in North America for sodium borohydride products remained weak. In the emerging markets, particularly China and Central and Eastern Europe and Turkey, the business saw increased demand in both the nutrition and industrial process markets. Net sales forPowder Coatings
41
were $86 million, relatively flat over second quarter 2006 sales due to the impact of favorable currencies and higher pricing, offset by lower demand. Net sales for the other businesses, includingAgroFresh, Advanced Materials and Digital Imaging,increased 17%, or $3 million, mainly driven by growth inAgroFresh.
Earnings of $19 million are $3 million, or 19%, ahead of the second quarter of 2006. The earnings increase is due to higher selling prices, increased demand, the favorable impact of currencies, and year-on-year improvement inPowder Coatings, which more than offset increased investment to support future growth.
Net sales for the Performance Materials Group reached $586 million for the six months ended June 30, 2007, an increase of 5%, or $30 million, versus sales of $556 million in 2006. Stronger demand in the Asia Pacific and Latin American regions, coupled with the impact of favorable currencies in Europe, more than offset overall weakness in North America. In addition, the business experienced rapid growth of the patented 1-MCP technology of the AgroFresh business unit.
Net sales forProcess Chemicals and Biocideswere $373 million, an increase of 6%, or $22 million over sales from the same six month period in 2006. Increases in demand for ion exchange resins and biocides were strong across all regions and markets were partially offset by weakness in the North America paper bleaching market for sodium borohydride products. In the emerging markets, particularly China and Central and Eastern Europe and Turkey, the business saw increased demand in both the nutrition and industrial process markets. The business also realized solid growth in new markets segments, such as polymeric media for the emerging biodiesel market. Net sales forPowder Coatingswere $173 million, an increase of 2%, or $3 million over sales from the same period in 2006. The sales increase was driven by the impact of favorable currencies and higher pricing, partially offset by weaker demand. Net sales for the other businesses, includingAgroFresh, Advanced Materials, and Digital Imaging, increased 20%, or $7 million, mainly driven by growth inAgroFresh andAdvanced Materials.
Earnings for the six months ended June 30, 2007 of $40 million are $6 million, or 18%, ahead of earnings for the same period of 2006. The earnings increase is due to higher selling prices, the favorable impact of currencies, and strong improvement over the prior year period in thePowder Coatingsbusiness. The 2007 results include additional investment in more advanced applications in ion exchange and biocides (such as bio-processing, advanced water treatment and microbial protection) and expansion of the ethylene management technology from our AgroFresh subsidiary (for additional high value applications in both horticultural and agronomic markets).
42
Salt
Second Quarter and Year-to-Date Net Sales(in millions)
In the second quarter of 2007, net sales from Salt were $178 million, an increase of 11%, or $18 million, versus the second quarter of 2006 sales of $160 million. The sales revenue increase is primarily due to improved product mix and pricing management in the industrial and consumer markets, as well as increased demand for ice-control salt and other bulk products.
Earnings for the quarter were $4 million, an increase of 100% over the $2 million earned in 2006, largely the result of increased sales, which offset the impact of operating costs.
For the six months ended June 30, 2007, net sales from Salt were $505 million, an increase of 19%, or $82 million, versus $423 million in sales for the same period of 2006. The sales revenue increase is the result of improved product line and pricing management in the industrial and consumer markets, as well as increased demand for ice-control salt and other bulk products.
Earnings for the six months ended June 30, 2007 were $37 million, an increase of 85% over the $20 million earned in 2006, in line with improved sales performance, offsetting higher operating costs.
43
Corporate
Second Quarter and Year-to-Date After-Tax Expenses(in millions)
Corporate expense of $60 million and $95 million, after-tax, respectively, for the three and six months ended June 30, 2007, up from $42 million and $75 million, after-tax, respectively for the three and six months ended June 30, 2006. The increase was directly attributable to non-recurring costs associated with the establishment of the European Headquarters in Switzerland and the write-off of our investment in Elemica, an online chemicals marketplace.
LIQUIDITY AND CAPITAL RESOURCES
Overview
During the second quarter of 2007, management re-evaluated our financial policies. Through the second quarter of 2007, our policy was to maintain credit ratios consistent with an “A” rating. Effective with the beginning of the third quarter of 2007, we are shifting away from targeting a specific credit rating. Rather, we intend to manage our debt levels in a manner consistent with maintaining investment grade quality ratios that are supported by our strong capability to generate cash from operating activities throughout the business cycle. As a result, we have decided to increase debt by $1.2 billion to purchase treasury stock during the third quarter of this year. As of June 30, 2007, our company’s debt ratio (total debt in proportion to total debt plus stockholders’ equity) was 35%, up from 34% as of December 31, 2006, and cash from operating activities for the rolling twelve months ended June 30, 2007, was approximately 35% of our quarter-end debt (cash from operating activities in proportion to total debt). We expect our debt ratio to be increased to approximately 50% by the end of the third quarter of 2007 and full year 2007 cash from operating activities to be approximately 35% of our debt. Maintenance of a strong balance sheet well-covered by our cash flows remains a key financial policy. Over the next several years, we expect to pursue growth strategies and provide cash returns to our stockholders while maintaining a debt ratio of approximately 50%. We intend to employ a balanced approach to cash deployment that will enhance stockholder value through:
44
| | • | | Reinvesting in core businesses to drive profitable growth through our capital expenditure program; |
| |
| | • | | Investing in new platforms that address the growing needs in health, water, energy, and other areas in the developed and developing worlds; |
| |
| | • | | Supplementing our organic growth with highly selective acquisitions which bring a growth platform technology or geographic supplement to our core businesses; |
| |
| | • | | Continuing to pay higher cash dividends to our stockholders (dividend payouts have increased at an average 10.6% compound annual growth rate since 1978); and |
| |
| | • | | Repurchasing shares to improve overall returns to our stockholders. |
In the six months ended June 30, 2007, our primary sources of cash were from balances on hand and operating activities. Our principal uses of cash were share repurchases, capital expenditures and dividends. These are summarized in the table below:
| | | | | | | | | |
| | | Six Months ended |
| | | June 30, |
| (in millions) | | 2007 | | 2006 |
| Cash provided by operations | | $ | 291 | | | $ | 372 | |
| Share repurchases | | | (285 | ) | | | (167 | ) |
| Capital expenditures | | | (187 | ) | | | (145 | ) |
| Dividends | | | (152 | ) | | | (138 | ) |
| Net debt increase/ (reduction) | | | 63 | | | | (74 | ) |
| Stock option exercise proceeds | | | 27 | | | | 52 | |
Our consolidated statement of cash flows includes the combined results of our continuing and discontinued operations for all periods presented.
Cash Provided by Operations
For the six months ended June 30, 2007, cash from operating activities were $291, trailing the prior year period by $81 million. The decrease in operating cash flows is due to an increase in working capital needs driven by an increase in accounts receivable which was only partially offset by a reduction in inventories. The increase in accounts receivable primarily relates to our Paint and Coatings Materials business due to a combination of selective increases in payment terms with certain large customers and changes in geographic customer mix. The period over period reduction in inventory relates to our Salt business resulting from excess inventory at December 31, 2006 due to a decrease in sales driven by lower demand for ice control salt caused by the unseasonably warm weather in the fourth quarter of 2006.
The cash flow we generate from operating activities is typically concentrated in the second half of the year due to working capital patterns in some of our core businesses, as well as the timing of certain annual payments such as employee bonuses, interest on debt and property taxes, which are concentrated in the first half of the year. We expect 2007 cash from operating activities to exceed $1 billion. Maintaining strong operating cash flow through earnings and working capital management continues to be an important objective.
45
Pension Plan and Postretirement Benefit Plan Funding and Liability
During 2006, we voluntarily increased U.S. pension and other postretirement employee benefit plan funding to the maximum tax-deductible amounts, $137 million and $12 million, respectively. Additional contributions made during 2006 were $108 million, consisting of $57 million for our foreign qualified pension plans, $40 million for our postretirement benefit plans, and $11 million for our non-qualified pension plans. Over half of the $57 million used to fund our foreign qualified pension trusts was used to fund shortfalls in our Canadian pension trust. In 2007, we expect to contribute approximately $90 million to our foreign qualified pension plans, non-qualified pension plan and other postretirement plans as required. As of June 30, 2007, we have contributed $48 million to these plans. Funding requirements for subsequent years are uncertain and will significantly depend on changes in assumptions used to calculate plan funding levels, the actual return on plan assets, changes in the employee groups covered by the plan, and any legislative or regulatory changes affecting plan funding requirements. For tax planning, financial planning, cash flow management or cost reduction purposes, we may increase, accelerate, decrease or delay contributions to the plan to the extent permitted by law.
Capital Expenditures
We intend to manage our capital expenditures to take advantage of growth and productivity improvement opportunities as well as to fund ongoing environmental protection and plant infrastructure requirements. We have a well-defined review procedure for the authorization of capital projects. Capital expenditures of $187 million through the first half of 2007 are above the prior year period expenditures primarily due to expected spend for a greater number of large projects focused on growth. These large projects include the purchase of a defect analysis tool for the Electronic Materials Group, the construction of new emulsion production facilities in Mexico and India, the expansion of capacity for several businesses in China, Italy, and India, the completion of several large environmental and end-of-life projects in our Houston plant combined with a planned shutdown during the second quarter, and spending for environmental compliance projects at several Salt plants. Projected capital expenditures for fiscal year 2007 of approximately $450 million, compared to $404 million in fiscal year 2006, are expected to be slightly higher than depreciation expense.
Dividends
Common stock dividends have been paid each year since 1927. The payout has increased at an average 10.6% compound annual growth rate since 1978. On May 7, 2007, we announced that the Board of Directors voted to increase dividends by 12% to $0.37 per share and on July 16, 2007, our Board of Directors declared a $0.37 per share dividend payable on September 1, 2007.
| | | | | | | | | | | | | | | | | | | | | | | | | | | |
| 2007 | | 2006 |
| | | Amount | | | | | | | | | | | | | | Amount | | | | | | | |
| | | (Per | | Amount | | | | | | | | | | | (Per | | | Amount | | | | |
| Date of dividend | | common | | (In | | | | | | | Date of dividend | | | common | | | (In | | | | |
| payment | | share) | | millions) | | | Record Date | | | payment | | | share) | | | millions) | | | Record Date | |
| March 1, 2007 | | $0.33 | | $ | 72 | | | February 16, 2007 | | March 1, 2006 | | $ | 0.29 | | | $ | 65 | | | February 17, 2006 |
| June 1, 2007 | | $0.37 | | $ | 80 | | | May 18, 2007 | | June 1, 2006 | | | 0.33 | | | | 73 | | | May 12, 2006 |
| September 4, 2007 | | $0.37 | | | | | | August 10, 2007 | | September 1, 2006 | | | 0.33 | | | | 73 | | | August 11, 2006 |
| | | | | | | | | | | | | December 1, 2006 | | | 0.33 | | | | 72 | | | November 3, 2006 |
Share Repurchase Program
In December 2004, our Board of Directors authorized the repurchase of up to $1 billion of our common stock through 2008, with the timing of the purchases depending on market conditions and other priorities for cash. As of June 30, 2007, we had repurchased $822 million of our stock or 17.1 million shares under the current authorization. During the second quarter of 2007, we used $187 million of available cash to repurchase 3.6 million of our outstanding shares and we intend to repurchase the remaining $178 million during the third quarter of 2007. On July 16, 2007, our Board of Directors authorized the repurchase of up to another $2 billion of our common stock, $1 billion of which will be used to repurchase shares during the third quarter of 2007, including an accelerated share repurchase
46
(ASR), which will be funded by the issuance of new debt. The remaining $1 billion will be used over 2008 through 2010, with the timing of purchases depending on market conditions. These purchases will be funded from available cash.
Liquidity and Debt
As of June 30, 2007, we had $251 million in cash, including restricted cash, and $2,170 million in debt compared with $596 million and $2,081 million, respectively, at December 31, 2006. A summary of our cash and debt balances is provided below:
| | | | | | | | | |
| | | June 30, | | | December 31, | |
| (in millions) | | 2007 | | | 2006 | |
| |
| Short-term obligations | | $ | 265 | | | $ | 393 | |
| Long-term debt | | | 1,905 | | | | 1,688 | |
| | | |
| Total debt | | $ | 2,170 | | | $ | 2,081 | |
| | | |
| | | | | | | | | |
| Cash and cash equivalents | | $ | 248 | | | $ | 593 | |
| Restricted cash | | | 3 | | | | 3 | |
| | | |
| Total cash | | $ | 251 | | | $ | 596 | |
| | | |
Debt
In March 2007, we issued €175 million of 4.50% Private Placement Senior Notes due March 9, 2014. We also retired our 6.0% notes for €160 million upon maturity and early retired at par $19 million of our 8.74% notes. We expect interest expense to increase in the third and fourth quarters of 2007, consistent with planned higher debt levels.
At June 30, 2007, we had $115 million in commercial paper outstanding. Other short-term debt was primarily composed of local bank borrowings. During 2007, our primary source of short-term liquidity has been cash from operating activities, commercial paper, and bank borrowings. In December 2006, we extended the term of our $500 million revolving credit facility with a syndicated group of banks. This facility is committed until December 2011 and is not contingent upon our credit rating. As of June 30, 2007, we have not drawn down any funds against this facility.
On July 16, 2007, our Board of Directors authorized the repurchase of up to another $2 billion of our common stock, $1 billion of which will be used to repurchase shares during the third quarter of 2007, including an accelerated share repurchase (ASR). Following this announcement, Standard and Poor’s and Fitch changed our senior unsecured debt rating from A minus to BBB and BBB+, respectively; Moody’s placed our A3 ratings under review for possible downgrade. Our short-term commercial paper ratings are unchanged at P2 and A2 by Moody’s and Standard and Poor’s, respectively. We believe investment grade ratings are consistent with the objectives of our long-term financial policies.
Use of Derivative Instruments to Manage Market Risk
We use derivative instruments to reduce uncertainties arising from conducting our business in a variety of currencies, financing at long- and short-term interest rates and pricing our raw materials at market prices. The policies and procedures applicable to our use of these derivative instruments are disclosed in Items 7a and 8 (Notes 1 and 5) of our 2006 Form 10-K.
During the six months ended June 30, 2007, the market value of our derivative instruments depreciated $3 million after-tax primarily driven by the Euro which strengthened by 2.4% during the first half of 2007. The strong Euro and other currencies favored our fundamental business positions, the net book value of which increased approximately $0.5 million, net of hedging during the period. During the same period, derivative instruments lowered interest expense by approximately $7 million, but slightly increased our effective cost of natural gas. Our total hedging cost was $0.01 per share for the six months ended June 30, 2007.
47
During the third quarter of this year, we expect to manage financial prices while borrowing $1 billion to finance our recently announced stock repurchases under business and economic conditions characterized by a weak dollar, a flat U.S. yield curve, and U.S. natural gas prices held in check by sufficient inventories. Our objectives are to preserve our earnings from potentially weaker local currencies, maintain or reduce our effective interest rate, and capture opportunities to increase protection against further natural gas price spikes.
Trading Activities
We do not have any trading activity that involves non-exchange traded contracts accounted for at fair value.
Unconsolidated Entities
All significant entities are consolidated. Any unconsolidated entities are de minimis in nature and there are no significant contractual requirements to fund losses of unconsolidated entities. See Note 1 to the Consolidated Financial Statements for our treatment of Variable Interest Entities.
Environmental Matters and Litigation
Our chemical operations, as those of other chemical manufacturers, involve the use and disposal of substances regulated under environmental protection laws. Our environmental policies and practices are designed to ensure compliance with existing laws and regulations and to minimize the risk of harm to the environment.
We have participated in the remediation of waste disposal and manufacturing sites as required under the Superfund and related laws. Remediation is well underway or has been completed at many sites. Nevertheless, we continue to face government enforcement actions, as well as private actions, related to past manufacturing and disposal and continues to focus on achieving cost-effective remediation where required.
Accruals
We have provided for costs to remediate former manufacturing and waste disposal sites, including Superfund sites, as well as our company facilities. We consider a broad range of information when we determine the amount necessary for remediation accruals, including available facts about the waste site, existing and proposed remediation technology and the range of costs of applying those technologies, prior experience, government proposals for these or similar sites, the liability of other parties, the ability of other Potentially Responsible Parties (“PRPs”) to pay costs apportioned to them and current laws and regulations. Reserves for environmental remediation that we believe to be probable and estimable are recorded appropriately as current and long-term liabilities in the Consolidated Balance Sheets. We assess the accruals quarterly and update them as additional technical and legal information becomes available. However, at certain sites, we are unable, due to a variety of factors, to assess and quantify the ultimate extent of our responsibility for study and remediation costs. The reserves for remediation were $142 million at June 30, 2007 and $141 million at December 31, 2006. The amounts charged to pre-tax earnings for environmental remediation and related charges were $9 million and $14 million for the three and six months ended June 30, 2007, and $4 million and $8 million for the three and six months ended June 30, 2006, respectively, and are recorded as cost of goods sold in the Consolidated Statements of Operations.
Wood-Ridge/Berry’s Creek
The Wood-Ridge, New Jersey site (“Site”), and Berry’s Creek, which runs past this Site, are areas of environmental significance to the Company. The Site is the location of a former mercury processing plant acquired many years ago by a company later acquired by Morton International, Inc. (“Morton”). Morton and Velsicol Chemical Corporation (“Velsicol”) have been held jointly and severally liable for the cost of remediation of the Site. The New Jersey Department of Environmental Protection (“NJDEP”) issued the Record of Decision documenting the clean-up requirements for the manufacturing site in October 2006. The Company has submitted a work plan to implement the remediation, and will enter into an agreement or order to perform the work in 2007. In April 2007, NJDEP issued remediation directives to approximately a dozen parties who were major customers or neighbors of the
48
plant, directing them to participate in the remediation. The Company will negotiate with these parties to assist in the funding of the work at the former processing plant. If any of the parties refuses to participate or cannot reach agreement with us, the directive gives parties performing the remediation the right to treble recovery from those parties who fail to comply with the directive. Our ultimate exposure at the Site will depend on clean-up costs and on the level of contribution from other parties. Velsicol’s liabilities for Site response costs will be addressed through a bankruptcy trust fund established under a court-approved settlement with Velsicol, and other parties, including the government.
With regard to Berry’s Creek, and the surrounding wetlands, the EPA has issued letters to over 150 PRPs for performance of a broad scope investigation of risks posed by contamination in Berry’s Creek. Performance of this study is expected to take at least six years to complete. The PRPs have formed a representative group of over 100 PRPs, and have hired common counsel and a consultant to negotiate with the EPA. The PRPs have reached an agreement with EPA to perform a preliminary study to provide background information before the larger study is conducted. Today, there is much uncertainty as to what will be required to address Berry’s Creek, but investigation and cleanup costs, as well as potential resource damage assessments, could be very high and our share of these costs could possibly be material to the results of our operations, cash flows and consolidated financial position.
Other Environmental Expenditures
The laws and regulations under which we operate require significant expenditures for capital improvements, operation of environmental protection equipment, environmental compliance and remediation. Our major competitors are confronted by substantially similar environmental risks and regulations. Future developments and even more stringent environmental regulations may require us to make unforeseen additional environmental expenditures.
Capital spending for new environmental protection equipment was $63 million, $42 million and $26 million in 2006, 2005 and 2004, respectively. Spending for 2007 and 2008 is expected to approximate $65 million and $33 million, respectively. Capital expenditures in this category include projects whose primary purposes are pollution control and safety, as well as environmental projects intended primarily to improve operations or increase plant efficiency. Capital spending does not include the cost of environmental remediation of waste disposal sites.
The cost of managing, operating and maintaining current pollution abatement facilities was $151 million, $153 million and $133 million in 2006, 2005 and 2004, respectively, and was charged against each year’s earnings.
Climate Change
There is an increasing global focus on issues related to climate change and particularly on ways to limit and control the emission of greenhouse gases, which are believed to be associated with climate change. Some initiatives on these topics are already well along in Europe, Canada and other countries, and related legislation has passed or is being introduced in some U.S. states. In addition, the Supreme Court decision inMassachusetts v. EPA, holding that greenhouse gases, including carbon dioxide (CO2), are “air pollutants” subject to regulation by EPA has increased the likelihood of federal regulatory or legislative action.
The Kyoto Protocol to the United Nations Framework Convention on Climate Change was adopted in 2005 in many countries. For instance, the European Union (EU) has a mandatory Emissions Trading Scheme to implement its objectives under the Kyoto Protocol. Four of our European locations currently exceed the threshold for participation in the EU Emissions Trading Scheme pursuant to the Kyoto Protocol and are currently implementing the requirements established by their respective countries. We are very much aware of the importance of these issues and the importance of addressing greenhouse gas emissions.
Due to the nature of our business, we have emissions of carbon dioxide (CO2) primarily from combustion sources, although we also have some minor process by-product CO2 emissions. Our
49
emissions of other greenhouse gases are infrequent and minimal as compared to CO2 emissions. We have therefore focused on ways to increase energy efficiency and curb increases in greenhouse gas emissions resulting from growth in production in addition to lowering the energy usage of existing operations. Although the general lack of specific legislation prevents any accurate estimates of the long-term impact on the Company, any legislation that limits CO2 emissions may create a potential restriction to business growth by capping consumption of traditional energy sources available to all consumers of energy, including Rohm and Haas. Capping consumption could result in: increased energy cost, additional capital investment to lower energy intensity and rationed usage with the need to purchase greenhouse gas emission credits. Our Manufacturing Council has a global effort underway to improve our energy efficiency at all of our locations through energy audits, sharing best practices and in some cases installation of more efficient equipment. We will continue to follow these climate change issues, work to improve the energy efficiencies of our operations, work to minimize any negative impacts on company operations and seek technological breakthroughs in energy supply and efficiency in both Company operations and product development.
Litigation
We are involved in various kinds of litigation, principally in the United States. We strive to resolve litigation where we can through negotiation and other alternative dispute resolution methods such as mediation. Otherwise, we vigorously prosecute or defend lawsuits in the Courts.
Significant litigation is described in Note 13 to the Consolidated Financial Statements, but we will comment here on several recent legal matters.
In November 2006, a complaint was filed in the United States District Court for the Western District of Kentucky by individuals alleging that their persons or properties were invaded by particulate and air contaminants from our Louisville plant. The complaint seeks class action certification alleging that there are hundreds of potential plaintiffs residing in neighborhoods within two miles of the plant. We believe that this lawsuit is without merit.
In April 2006 and thereafter, lawsuits were filed against Rohm and Haas claiming that the Company’s Ringwood, Illinois plant contaminated groundwater and air that allegedly reached properties a mile south of the plant site. Also sued were the owner of a plant site neighboring our facility and a company which leases a portion of our facility. An action brought in federal court in Philadelphia, Pennsylvania seeks certification of a class comprised of the owners and residents of about 500 homes in McCullom Lake Village, seeking medical monitoring and compensation for alleged property value diminution, among other things. In addition, lawsuits were filed in the Philadelphia Court of Common Pleas by seventeen individuals who claim that contamination from the plants has resulted in tumors (primarily of the brain) and one individual whose claims relate to cirrhosis of the liver. We believe that these lawsuits are without merit.
Rohm and Haas, Minnesota Mining and Manufacturing Company (3M) and Hercules, Inc. have been engaged in remediation of the Woodland Sites (“Sites”), two waste disposal locations in the New Jersey Pinelands, under various NJDEP orders since the early 1990s. Remediation is complete at one site and substantially complete at the other. In February 2006, a lawsuit was filed in state court in Burlington County, New Jersey by NJDEP and the Administrator of the New Jersey Spill Compensation Fund against these three companies and others for alleged natural resource damages relating to the Sites. In June 2006, after the lawsuit was served, the defendants filed a notice of removal of the action to the federal court in Camden, New Jersey. On July 5, 2007, the federal court remanded the case to state court. This lawsuit presents significant legal and public policy issues, including the fundamental issue of whether there are any “damages”, and we believe it is without merit.
In late January 2006, Morton Salt was served with a Grand Jury subpoena in connection with an investigation by the Department of Justice into possible antitrust law violations in the “industrial salt” business. Neither Morton Salt, nor any Morton Salt employee has been charged with any wrongdoing. We are cooperating fully with the governmental investigation.
50
ACCOUNTING PRONOUNCEMENTS ISSUED BUT NOT YET ADOPTED
Fair Value Option for Financial Assets and Financial Liabilities
In February 2007, the Financial Accounting Standards Board (“FASB”) issued SFAS No. 159,“The Fair Value Option for Financial Assets and Financial Liabilities,”which provides companies with an option to report selected financial assets and liabilities at fair value in an attempt to reduce both complexity in accounting for financial instruments and the volatility in earnings caused by measuring related assets and liabilities differently. This Statement is effective as of the beginning of an entity’s first fiscal year beginning after November 15, 2007. We are currently assessing the impact of this Statement on our Consolidated Financial Statements.
Fair Value Measurements
In September 2006, the FASB issued SFAS No. 157,“Fair Value Measurements,”which defines fair value, establishes a framework for measuring fair value in generally accepted accounting principles (GAAP), and expands disclosures about fair value measurements. It does not expand the use of fair value measurement. This Statement is effective for financial statements issued in 2008. We are currently assessing the impact of this Statement on our Consolidated Financial Statements.
ITEM 3.Quantitative and Qualitative Disclosures about Market Risk
Management’s discussion of market risk is incorporated herein by reference to Item 7a of the Form 10-K for the year ended December 31, 2006, filed with the Securities and Exchange Commission on February 28, 2007.
ITEM 4.Controls and Procedures
| a) | | Conclusion Regarding the Effectiveness of Disclosure Controls and Procedures |
| |
| | | Under the supervision and with the participation of our management, including our principal executive officer and principal financial officer, we conducted an evaluation of our disclosure controls and procedures, as such term is defined under Rule 13a-15(e) promulgated under the Securities Exchange Act of 1934, as amended (the “Exchange Act”). Based on this evaluation, our principal executive officer and our principal financial officer concluded that our disclosure controls and procedures were effective as of the end of the period covered by this quarterly report. Our principal executive officer and our principal financial officer have signed their certifications as required by the Sarbanes-Oxley Act of 2002. |
| |
| b) | | Changes in Internal Controls over Financial Reporting |
| |
| | | There have been no changes in our internal control over financial reporting that occurred during the quarter ended June 30, 2007 that have materially affected, or are likely to materially effect, our internal control over financial reporting. |
51
PART II — OTHER INFORMATION
ITEM 1.Legal Proceedings
For information related to Legal Proceedings, see Note 13:Contingent Liabilities, Guarantees and Commitmentsin the accompanying Notes to Consolidated Financial Statements.
ITEM 2.Unregistered Sales of Equity Securities and Use of Proceeds
The following table provides information relating to our purchases of our common stock during the quarter ended June 30, 2007:
| | | | | | | | | | | | | | | | | | | | | |
| | | | | | | | | | | | | | Total Number of Shares | | | | Approximate Dollar Value | |
| | | | Total Number | | | | Average Price | | | | Purchased as Part of | | | | of Shares that May Yet Be | |
| | | | of Shares | | | | Paid per | | | | Publicly Announced | | | | Purchased Under the Plans or | |
| Period | | | Purchased(1) | | | | Share(1) | | | | Plans or Programs(2) | | | | Programs(2) | |
| April 1, 2007 – April 30, 2007 | | | | 1,733,863 | | | | | 51.72 | | | | | 1,732,400 | | | | | 275,865,607 | |
| | | | | | | | | | | | | | | | | | | | | |
| May 1, 2007 – May 31, 2007 | | | | 942,449 | | | | | 52.46 | | | | | 935,000 | | | | | 226,823,447 | |
| | | | | | | | | | | | | | | | | | | | | |
| June 1, 2007 – June 30, 2007 | | | | 913,399 | | | | | 53.30 | | | | | 909,800 | | | | | 178,331,356 | |
| | | | | | | | | | | | | | | | | | | | | |
| Total | | | | 3,589,711 | | | | | 52.32 | | | | | 3,577,200 | | | | | 178,331,356 | |
Notes:
| | | |
| (1) | | 12,511 shares were purchased as a result of employee stock option exercises (stock swaps). |
| |
| (2) | | In December 2004, our Board of Directors authorized the repurchase of up to $1 billion of our common stock through 2008, with the timing of the purchases depending on market conditions and other priorities for cash. As of June 30, 2007, $822 million of the $1 billion has been used to repurchase 17 million shares of our stock. In July 2007, our Board of Directors authorized up to another $2 billion towards repurchasing our common stock through 2010. |
ITEM 4.Submission of Matters to a Vote of Security Holders
(a) The Company’s 89th annual meeting of stockholders was held on May 7, 2007, in Philadelphia, Pennsylvania.
(b) The following is a tabulation of the results of voting by security holders for the election of directors:
| | | | | | | | | |
| Nominees | | Votes For | | Votes Withheld |
| W.J. Avery | | | 205,741,108 | | | | 1,438,715 | |
| R. L. Gupta | | | 204,814,154 | | | | 2,365,670 | |
| D.W. Haas | | | 205,578,538 | | | | 1,601,286 | |
| T.W. Haas | | | 205,622,858 | | | | 1,556,965 | |
| R.L. Keyser | | | 205,248,364 | | | | 1,931,459 | |
| R.J. Mills | | | 206,097,500 | | | | 1,082,324 | |
| S.O. Moose | | | 204,800,365 | | | | 2,379,458 | |
| G.S. Omenn | | | 204,914,365 | | | | 2,265,458 | |
| G.L. Rogers | | | 205,919,404 | | | | 1,260,418 | |
| R.H. Schmitz | | | 204,976,043 | | | | 2,203,780 | |
| G.M. Whitesides | | | 205,757,967 | | | | 1,421,856 | |
| M.C. Whittington | | | 205,108,995 | | | | 2,070,828 | |
(c) The following is a tabulation of the results of voting by security holders for other matters:
Ratification of PricewaterhouseCoopers LLP as Rohm and Haas Company’s Independent Registered Public Accounting Firm for 2007:
| | | | | |
| For | | | 205,124,798 | |
| Against | | | 1,592,201 | |
| Abstain | | | 462,824 | |
52
ITEM 6.Exhibits
| | | |
| (31.1) | | Certification Pursuant to Rule 13a-14(a)/15d-14(a). |
| (31.2) | | Certification Pursuant to Rule 13a-14(a)/15d-14(a). |
| (32) | | Certification Furnished Pursuant to 18 U.S.C. Section 1350 Adopted Pursuant to Section 906 Sarbanes-Oxley Act of 2002. The exhibit attached to this Form 10-Q shall not be deemed “filed” for purposes of Section 18 of the Securities Exchange Act of 1934 (the “Exchange Act”) or otherwise subject to liability under that section, nor shall it be deemed incorporated by reference in any filing under the Securities Act of 1933, as amended, or the Exchange Act, except as expressly set forth by specific reference in such filing. |
53
SIGNATURES
Pursuant to the requirements of the Securities Exchange Act of 1934, the registrant has duly caused this report to be signed on its behalf by the undersigned thereunto duly authorized.
| | | | | |
| | | /s/Jacques M. Croisetiere | | |
| | | | | |
| | | Jacques M. Croisetiere | | |
| | | Executive Vice President and Chief Financial Officer | | |
| | | | | |
| DATE: July 27, 2007 | | ROHM AND HAAS COMPANY | | |
| | | (Registrant) | | |
54