Item 1. Report to Stockholders: ------------------------------------------- The following is a copy of the report transmitted to stockholders pursuantto Rule 30e-1 under the Investment Company Act of 1940: |

What makes Putnam different?

In 1830, Massachusetts Supreme Judicial Court Justice Samuel Putnam established The Prudent Man Rule, a legal foundation for responsible money management.
THE PRUDENT MAN RULE
All that can be required of a trustee to invest is that he shall conduct himself faithfully and exercise a sound discretion. He is to observe how men of prudence, discretion, and intelligence manage their own affairs, not in regard to speculation, but in regard to the permanent disposition of their funds, considering the probable income, as well as the probable safety of the capital to be invested.

A time-honored tradition in money management
Since 1937, our values have been rooted in a profound sense of responsibility for the money entrusted to us.
A prudent approach to investing
We use a research-driven team approach to seek consistent, dependable, superior investment results over time, although there is no guarantee a fund will meet its objectives.
Funds for every investment goal
We offer a broad range of mutual funds and other financial products so investors and their advisors can build diversified portfolios.
A commitment to doing what’s right for investors
We have stringent investor protections and provide a wealth of information about the Putnam funds.
Industry-leading service
We help investors, along with their financial advisors, make informed investment decisions with confidence.
| Putnam | |
| High Yield | |
| Municipal Trust | |
| 9 | 30 | 05 | |
| Semiannual Report | |
| Message from the Trustees | 2 |
| About the fund | 4 |
| Report from the fund managers | 7 |
| Performance | 12 |
| Your fund’s management | 14 |
| Terms and definitions | 17 |
| Trustee approval of management contract | 18 |
| Other information for shareholders | 23 |
| Financial statements | 24 |
| Federal tax information | 49 |
| Shareholder meeting results | 50 |
Cover photograph: © Richard H. Johnson
| Message from the Trustees |
Dear Fellow Shareholder
| Dear Fellow Shareholder: |
During the period ended September 30, 2005, domestic stock and bond markets advanced modestly while major markets outside the United States showed far greater strength. The Federal Reserve Board’s program of interest-rate increases and higher energy prices put pressure on U.S. consumer spending, and the impact of an unusually active hurricane season on the U.S. economy introduced a new cause of concern for financial markets. We believe that amid the uncertainties of this economic and market environment, the professional research, diversification, and active management that mutual funds provide continue to make them an intelligent choice for investors.
We also want you to know that Putnam Investments’ management team, under the leadership of Chief Executive Officer Ed Haldeman, continues to focus on investment performance and remains committed to putting the interests of shareholders first. In keeping with these goals, we have redesigned and expanded our shareholder reports to make it easier for you to learn more about your fund. Furthermore, on page 18 we provide information about the 2005 approval by the Trustees of your fund’s management contract with Putnam.
We would also like to take this opportunity to announce the retirement of one of your fund’s Trustees, Ronald J. Jackson, who has been an independent Trustee of the Putnam funds since 1996. We thank him for his service.
2
In the following pages, members of your fund’s management team discuss the fund’s performance and strategies, and their outlook for the months ahead. As always, we thank you for your support of the Putnam funds.
Putnam High Yield Municipal Trust: potential for high current income exempt from federal income tax
Two of the most significant challenges of fixed-income investing are low interest rates and taxes on income. Investing in municipal bonds through a fund such as Putnam High Yield Municipal Trust can help address these challenges. While the stated yields on municipal bonds are lower than those of taxable bonds, the income most of these bonds pay is exempt from federal tax. By targeting lower-rated higher-yielding bonds, this fund can pursue a higher level of income than higher-quality bond funds.
Municipal bonds are issued by states and local municipalities to raise funds for building and maintaining public facilities. These bonds are typically backed by either the issuing city or town, by revenues collected from usage fees, or by state tax revenues. The bonds carry varying degrees of credit risk (the risk that the issuer won’t be able to repay the bond).
Many high-yield municipal bonds are not rated by independent rating agencies such as Standard & Poor’s and Moody’s. This is mainly because many issuers decide not to pursue a rating that might be below investment grade. As a result, investment managers must do additional research to determine whether these bonds are prudent investments.
Evaluating a bond’s credit risk is one area in which Putnam has particular expertise. Putnam’s municipal bond research team analyzes each issue in depth and assigns non-rated bonds an agency-equivalent Putnam rating --instead of rating bonds on a pass/fail basis, which is a common practice in the industry. This analysis helps the management team in identifying bonds with attractive risk/return profiles from among the large number of bonds not rated by agencies.
Once the fund has invested in a bond, the fund’s management team continues to monitor
Municipal bonds may finance a range of projects in your community and thus play a key role in its development.

| Education | Health care | Housing | Industrials |
| School districts, | Hospitals, long-term | Single- and multi- | Chemical, container, |
| colleges, universities, | care facilities | family housing | paper, and waste |
| student loan programs | management companies | ||
4
developments that affect the bond market, the specific sector (for example, hospitals or utilities), and the issuer of the bond. Typically, higher-risk, lower-rated bonds are reviewed more frequently because of their greater potential risk.
This active management and in-depth research are invaluable for investors seeking to benefit from these bonds’ investment potential.
Capital gains, if any, are taxable for federal and, in most cases, state purposes. For some investors, investment income may be subject to the federal alternative minimum tax. Income from federally exempt funds may be subject to state and local taxes. Mutual funds that invest in bonds are subject to certain risks, including interest-rate risk, credit risk, and inflation risk. As interest rates rise, the prices of bonds fall. Long-term bonds are more exposed to interest-rate risk than short-term bonds. Unlike bonds, bond funds have ongoing fees and expenses.
How do closed-end funds differ from open-end funds?
More assets at work While open-end funds must maintain a cash position to meet redemptions, closed-end funds have no such requirement and can keep more of their assets invested in the market.
Traded like stocks Closed-end fund shares are traded on stock exchanges, and their prices fluctuate in response to supply and demand, among other factors.
Market price vs. net asset value Like an open-end fund’s net asset value (NAV) per share, the NAV of a closed-end fund share equals the current value of the fund’s assets, minus its liabilities, divided by the number of shares outstanding. When buying or selling closed-end fund shares, you pay or receive the market price, which may be higher or lower than the NAV.
Strategies for higher income Unlike open-end funds, closed-end funds have greater flexibility to use strategies such as “leverage” - -- for example, issuing preferred shares to raise capital, then seeking to invest that capital at higher rates to enhance income. Leverage can mean higher returns, but adds risk and may increase share price volatility.

Identified projects are not necessarily represented in your fund’s portfolio as of the date of this report, and your fund may invest in securities representing projects not shown here. Your fund’s holdings will vary over time. For more information on current fund holdings, see pages 9 and 25.
5
Putnam High Yield Municipal Trust is a leveraged fund that seeks to provide high current income free from federal income tax by investing in higher-yielding lower-rated municipal securities. The fund invests in a nationally diversified portfolio and draws on Putnam’s extensive research capabilities to help manage the additional risk associated with high-yield bonds. The fund may be suitable for investors seeking tax-exempt income who are willing to accept the risks associated with below-investment-grade bonds and the use of leverage.
Highlights
* For the six months ended September 30, 2005, Putnam High Yield Municipal Trust’s total return was 4.16% at net asset value (NAV) and 6.85% based on market price.
* The fund’s benchmark, the Lehman Municipal Bond Index, returned 2.80% .
* The average return for the Lipper High Yield Municipal Debt Funds (closed-end) category was 4.55% ..
* Additional fund performance, comparative performance, and Lipper data can be found in the performance section beginning on page 12.
Performance
It is important to note that a fund’s performance at market price may differ from its results at NAV. Although market price performance generally reflects investment results, it may also be influenced by several other factors, including changes in investor perceptions of the fund or its investment advisor, market conditions, fluctuations in supply and demand for the fund’s shares, and changes in fund distributions.
Total return for periods ended 9/30/05
| Since the fund’s inception (5/25/89), average annual return is 6.47% at NAV and 5.11% at market price. | |||||
| Average annual return | Cumulative return | ||||
| NAV | Market price | NAV | Market price | ||
| 10 years | 5.30% | 3.65% | 67.57% | 43.05% | |
| 5 years | 5.84 | 3.28 | 32.81 | 17.49 | |
| 1 year | 7.86 | 9.93 | 7.86 | 9.93 | |
| 6 months | -- | -- | 4.16 | 6.85 | |
| Data is historical. Past performance does not guarantee future results. More recent returns may be less or | |||||
| more than those shown. Investment return, net asset value, and market price will fluctuate, and you may have a | |||||
| gain or a loss when you sell your shares. Performance assumes reinvestment of distributions and does not | |||||
| account for taxes. | |||||
| 6 | |||||
Report from the fund managers
The period in review
Relatively low interest rates and an improving economy intensified demand and boosted prices for higher-yielding, lower-quality bonds during the six months ended September 30, 2005. In this environment, your fund’s results at NAV were ahead of its benchmark, which is composed of higher-quality, lower-yielding bonds. However, the portfolio’s duration was relatively short because we expected long-term interest rates to rise, depressing bond prices. This did not occur during the semiannual period, and consequently funds with longer duration benefited more from the price rally than your fund did. Also, there are different tiers of quality among lower-rated bonds and during the period, your fund’s overall quality was higher than the average fund in its Lipper group. As a result, the fund slightly underperformed its Lipper category average.
Market overview
Signs of solid economic growth, and the desire to curb the potential inflation that often accompanies growth, prompted the Federal Reserve Board (the Fed) to increase short-term interest rates four times in 0.25% increments during the first half of the fund’s fiscal year. As a result, the federal funds rate rose from 2.75% at the beginning of the period to 3.75% at period-end. The Fed’s gradual approach to reining in economic growth may have helped allay investor fears of higher longer-term rates, as long-term bond yields ended the period lower despite rising short-term rates. As shorter- and longer-term interest rates began to converge, the yield curve flattened significantly. The yield curve is a graphical representation of bond yields with the same quality plotted from the shortest to the longest maturity.
An improving economy and rising corporate earnings contributed to the strong performance of lower-rated bonds. Among uninsured bonds in general and especially bonds rated Baa and below, yield spreads tightened, and bond prices rose, benefiting from strong interest among buyers in search of higher yields. Based on continued favorable legal rulings, yields on tobacco settlement bonds declined, and their prices rose accordingly. Airline-related industrial development bonds (IDBs) exhibited a high level of volatility and ended on weakness as
7
both Northwest and Delta filed for bankruptcy in the final month of the period. No single state performed notably better than other states. Callable bonds (which can be redeemed by their issuers before maturity) outperformed non-callable bonds, as investors expect that bonds priced to reflect their potential call date will be less sensitive to interest-rate increases.
Strategy overview
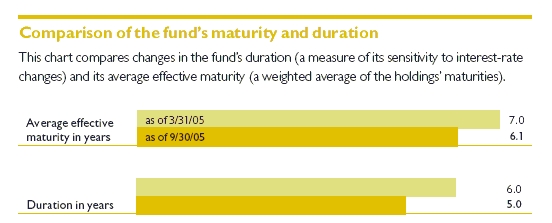
Given our expectation for rising interest rates, we maintained a relatively short (or defensive) duration position throughout the period. Duration is a measure of a fund’s sensitivity to changes in interest rates. Having a shorter-duration portfolio may help protect principal when interest rates are rising, but it can reduce the fund’s potential for appreciation when rates fall. Despite the Fed’s short-term interest-rate increases, rates on longer-term bonds trended downward for much of the period and the prices of these bonds rose as a result. The fund’s participation in this rally was somewhat limited by its overall defensive duration position.
Because we believed that short-term rates would continue to rise, we reduced the fund’s positions in inverse floating-rate securities during the period. These securities pay additional interest income as short-term rates fall and less interest income when short-term rates rise. By decreasing the fund’s exposure to these securities, we took a
Market sector performance
These indexes provide an overview of performance in different market sectors for the six months ended 9/30/05.
| Bonds | |
| Lehman Municipal Bond Index (tax-exempt bonds) | 2.80% |
| Lehman Aggregate Bond Index (broad bond market) | 2.31% |
| Lehman Government Bond Index (U.S. Treasury and agency securities) | 2.39% |
| Lehman Intermediate Treasury Bond Index | |
| (intermediate-maturity U.S. Treasury bonds) | 1.69% |
| Equities | |
| S&P 500 Index (broad stock market) | 5.02% |
| S&P Utilities Index (utilities stocks) | 17.26% |
| Russell 2000 Growth Index (small-company growth stocks) | 10.02% |
8
defensive position against rising short-term rates.
The fund’s underweight position in lower-rated bonds (compared to others in its peer group) detracted from results, as securities in this area of the credit spectrum rallied. Although we were able to increase this weighting, there were fewer opportunities in the sector due to the strong price appreciation of lower-quality bonds over the past two years. Our experience has shown that over a full credit cycle, it is generally better not to own bonds that we believe represent a high default risk.
Your fund’s holdings
The fund’s emphasis on tobacco settlement bonds helped offset the
disadvantages created by its shorter duration and higher credit quality during the period. Payments from these bonds are secured by income from tobacco companies’ settlement obligations to states and municipalities. In what has amounted to an ongoing threat to this income stream, the Department of Justice (DOJ) initiated a lawsuit in 1999 against the major tobacco companies, seeking billions of dollars that the DOJ claimed had been obtained fraudulently from the sale of cigarettes. This sector benefited from a February 4, 2005, ruling by a panel of the U.S. Circuit Court of Appeals for the District of Columbia against the federal government. Investors believe this has significantly mitigated the potential finan-cial impact of the DOJ’s lawsuit against
Average effective maturity also takes into account put and call features, where applicable, and reflects prepayments for mortgage-backed securities.
9
tobacco companies, and demand for these bonds has strengthened. The fund owns tobacco settlement bonds issued in several states, including New Jersey, Rhode Island, Washington, California, and Wisconsin.
The close attention paid by our team of analysts helped us avoid pitfalls other funds experienced by holding high-yielding industrial development bonds (IDBs) issued for Delta Airlines and
Northwest Airlines. IDBs are issued by municipalities but backed by the credit of the company or institution benefiting from the financing. Investor perceptions about the backing company’s health, or that of its industry group, affect the prices of these bonds more than the rating of the issuing municipality. We
eliminated IDBs issued for Delta and Northwest in the summer of 2004, and both airlines declared bankruptcy in September 2005. We continue to believe that airlines are a high-risk sector with poor credit fundamentals. Although the fund still holds small positions in IDBs issued for American Airlines, British Airways, and Continental Airlines, its weighting in airline-related bonds remains smaller than that of other, comparable funds.
Credit spreads (the difference in yields available from higher-rated versus lower-rated bonds) have been gradually narrowing in the past two years to a point where we no longer feel that the additional yield available on certain lower-rated bonds justifies the additional
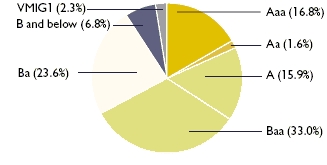
| Credit quality overview |
Credit qualities shown as a percentage of portfolio value as of 9/30/05. A bond rated Baa or higher is considered investment grade. The chart reflects Moody’s ratings; percentages may include bonds not rated by Moody's but considered by Putnam Management to be of comparable quality. Ratings will vary over time.
10
risk. We have been diversifying the fund’s portfolio, weighing the outlook for individual issuers -- or the company backing them -- versus their fundamental credit quality and such features as liquidity. This is especially true for riskier issues rated Baa and below. The portfolio is higher in overall quality than other, similar funds, which has been a negative recently. However, over the long term, we believe our security selection will benefit fund shareholders. There are times when external factors can influence the performance of a bond, such as when we sold bonds issued for Pocahontas Parkway, a toll road in Virginia. Yield-hungry investors were bidding up the price, but we believed the risk of default on the bonds was too great. Not owning these bonds has detracted from fund performance, as they continued to rise in value recently when an Australia-based transportation company stepped forward with a possible buyout of the road.
Please note that all holdings discussed in this report are subject to review in accordance with the fund’s investment strategy and may vary in the future.
| The outlook for your fund |
The following commentary reflects anticipated developments that could affect your fund over the next six months, as well as your management team’s plans for responding to them.
We expect the Fed to maintain its policy of increasing rates through 2005 and into 2006. We also expect more Fed tightening than is currently anticipated by the market, and believe that bond yields may begin to rise more quickly as other investors come to the same conclusion. We currently plan to maintain the fund’s defensive duration and to seek to continue to increase its exposure to callable bonds, which, in our opinion, are likely to outperform in a rising-rate cycle.
We have a positive view of the single-family housing sector and plan to add selectively to the fund’s positions. As the outperformance of lower-rated, higher-yielding bonds is slowing, we continue to reduce the fund’s exposure to this segment of the credit spectrum. We remain bearish on airline-related IDBs, while our view on tobacco settlement bonds is positive.
We will continue to search for the most attractive opportunities among tax-exempt securities, and work to balance the pursuit of current income with prudent risk management.
The views expressed in this report are exclusively those of Putnam Management. They are not meant as investment advice. Capital gains, if any, are taxable for federal and, in most cases, state purposes. For some investors, investment income may be subject to the federal alternative minimum tax. Income from federally exempt funds may be subject to state and local taxes. Mutual funds that invest in bonds are subject to certain risks, including interest-rate risk, credit risk, and inflation risk. As interest rates rise, the prices of bonds fall. Long-term bonds are more exposed to interest-rate risk than short-term bonds. Unlike bonds, bond funds have ongoing fees and expenses. Lower-rated bonds may offer higher yields in return for more risk. The fund’s shares trade on a stock exchange at market prices, which may be higher or lower than the fund’s net asset value. The fund uses leverage, which involves risk and may increase the volatility of the fund’s net asset value.
11
Your fund’s performance
This section shows your fund’s performance during the first half of its fiscal year, which ended September 30, 2005. Performance should always be considered in light of a fund’s investment strategy. Data represents past performance. Past performance does not guarantee future results. More recent returns may be less or more than those shown. Investment return, net asset value, and market price will fluctuate, and you may have a gain or a loss when you sell your shares.
| Fund performance | ||||
| Total return and comparative index results for periods ended 9/30/05 | ||||
| Lipper High Yield | ||||
| Municipal | ||||
| Lehman | Debt Funds | |||
| Market | Municipal | (closed-end) | ||
| NAV | price | Bond Index | category average* | |
| Annual average | ||||
| Life of fund | ||||
| (since 5/25/89) | 6.47% | 5.11% | 6.92% | 6.30% |
| 10 years | 67.57 | 43.05 | 80.18 | 76.87 |
| Annual average | 5.30 | 3.65 | 6.06 | 5.84 |
| 5 years | 32.81 | 17.49 | 35.98 | 38.93 |
| Annual average | 5.84 | 3.28 | 6.34 | 6.77 |
| 1 year | 7.86 | 9.93 | 4.05 | 9.82 |
| 6 months | 4.16 | 6.85 | 2.80 | 4.55 |
| Performance assumes reinvestment of distributions and does not account for taxes. | ||
| Index and Lipper results should be compared to fund performance at net asset value. Lipper calculations for reinvested dividends may differ from actual performance. | ||
| * | Over the 6-month and 1-, 5-, and 10-year periods ended 9/30/05, there were 15, 15, 12, and 12 funds, respectively, in this Lipper category. | |
| 12 | ||
| Fund price and distribution information | ||
| For the six-month period ended 9/30/05 | ||
| Distributions -- common shares | ||
| Number | 6 | |
| Income1 | $0.188400 | |
| Capital gains1 | -- | |
| Total | $0.188400 | |
| Series A | ||
| Distributions -- Preferred shares | (900 shares) | |
| Income1 | $613.90 | |
| Capital gains1 | -- | |
| Total | $613.90 | |
| Share value: | NAV | Market Price |
| 3/31/05 | $7.72 | $6.67 |
| 9/30/05 | 7.83 | 6.94 |
| Current yield (end of period) | ||
| Current dividend rate2 | 4.81% | 5.43% |
| Taxable equivalent3 | 7.40 | 8.35 |
| 1 | Capital gains, if any, are taxable for federal and, in most cases, state purposes. For some investors, investment income may be subject to the federal alternative minimum tax. Income from federally exempt funds may be subject to state and local taxes. |
| 2 | Most recent distribution, excluding capital gains, annualized and divided by NAV or market price at end of period. |
| 3 | Assumes maximum 35% federal tax rate for 2005. Results for investors subject to lower tax rates would not be as advantageous. |
| 13 | |
Your fund’s management
Your fund is managed by the members of the Putnam Tax Exempt Fixed-Income Team. David Hamlin is the Portfolio Leader, and Paul Drury, Susan McCormack, and James St. John are Portfolio Members of your fund. The Portfolio Leader and Portfolio Members coordinate the team’s management of the fund.
For a complete listing of the members of the Putnam Tax Exempt Fixed-Income Team, including those who are not Portfolio Leaders or Portfolio Members of your fund, visit Putnam’s Individual Investor Web site at www.putnam.com.
| Fund ownership by the Portfolio Leader and Portfolio Members | |||||||||
| The table below shows how much the fund’s current Portfolio Leader and Portfolio Members have invested in the fund (in dollar ranges). Information shown is as of September 30, 2005, | |||||||||
| and September 30, 2004. | |||||||||
| $1 – | $10,001 – | $50,001 – | $100,001 – | $500,001 – | $1,000,001 | ||||
| Year $0 | $10,000 | $50,000 | $100,000 | $500,000 | $1,000,000 | and over | |||
| David Hamlin | 2005 * | ||||||||
| | |||||||||
| Portfolio Leader | 2004 * | ||||||||
| Paul Drury | 2005 * | ||||||||
| | |||||||||
| Portfolio Member | 2004 * | ||||||||
| Susan McCormack | 2005 * | ||||||||
| | |||||||||
| Portfolio Member | 2004 * | ||||||||
| James St. John | 2005 * | ||||||||
| | |||||||||
| Portfolio Member | 2004 * | ||||||||
| 14 | |||||||||
| Fund manager compensation |
The total 2004 fund manager compensation that is attributable to your fund is approximately $50,000. This amount includes a portion of 2004 compensation paid by Putnam Management to the fund managers listed in this section for their portfolio management responsibilities, calculated based on the fund assets they manage taken as a percentage of the total assets they manage. The compensation amount also includes a portion of the 2004 compensation paid to the Chief Investment Officer of the team and the Group Chief Investment Officer of the fund’s broader investment category for their oversight responsibilities, calculated based on the fund assets they oversee taken as a percentage of the total assets they oversee. This amount does not include compensation of other personnel involved in research, trading, administration, systems, compliance, or fund operations; nor does it include non-compensation costs. These percentages are determined as of the fund’s fiscal period-end. For personnel who joined Putnam Management during or after 2004, the calculation reflects annualized 2004 compensation or an estimate of 2005 compensation, as applicable.
Other Putnam funds managed by the Portfolio Leader and Portfolio Members
David Hamlin is the Portfolio Leader and Paul Drury, Susan McCormack, and James St. John are Portfolio Members for Putnam’s tax-exempt funds for the following states: Arizona, California, Florida, Massachusetts, Michigan, Minnesota, New Jersey, New York, Ohio, and Pennsylvania. The same group also manages Putnam AMT-Free Insured Municipal Fund*, Putnam California Investment Grade Municipal Trust, Putnam Investment Grade Municipal Trust, Putnam Managed Municipal Income Trust, Putnam Municipal Bond Fund, Putnam Municipal Opportunities Trust, Putnam New York Investment Grade Municipal Trust, Putnam Tax Exempt Income Fund, Putnam Tax-Free Health Care Fund, and Putnam Tax-Free High Yield Fund.
David Hamlin, Paul Drury, Susan McCormack, and James St. John may also manage other accounts and variable trust funds advised by Putnam Management or an affiliate.
Changes in your fund’s Portfolio Leader and Portfolio Members
Your fund’s Portfolio Leader and Portfolio Members did not change during the year ended September 30, 2005.
| * Formerly Putnam Tax-Free Insured Fund. |
15
Fund ownership by Putnam’s Executive Board
The table below shows how much the members of Putnam’s Executive Board have invested in the fund (in dollar ranges). Information shown is as of September 30, 2005, and September 30, 2004.
| $1 – | $10,001 – | $50,001– | $100,001 | |||
| Year $0 | $10,000 | $50,000 | $100,000 | and over | ||
| Philippe Bibi | 2005 * | |||||
Chief Technology Officer | 2004 * | |||||
| Joshua Brooks | 2005 * | |||||
| Deputy Head of Investments | N/A | |||||
| William Connolly | 2005 * | |||||
| Head of Retail Management | N/A | |||||
| Kevin Cronin | 2005 * | |||||
| Head of Investments | 2004 * | |||||
| Charles Haldeman, Jr. | 2005 | * | ||||
| President and CEO | 2004 * | |||||
| Amrit Kanwal | 2005 * | |||||
| Chief Financial Officer | 2004 * | |||||
| Steven Krichmar | 2005 * | |||||
| Chief of Operations | 2004 * | |||||
| Francis McNamara, III | 2005 * | |||||
| General Counsel | 2004 * | |||||
| Richard Robie, III | 2005 * | |||||
| Chief Administrative Officer | 2004 * | |||||
| Edward Shadek | 2005 * | |||||
| Deputy Head of Investments | N/A | |||||
| Sandra Whiston | 2005 * | |||||
| Head of Institutional Management | N/A | |||||
| N/A indicates the individual was not a member of Putnam's Executive Board as of 9/30/04. | ||||||
| 16 | ||||||
| Terms and definitions |
| Important terms |
Total return shows how the value of the fund’s shares changed over time, assuming you held the shares through the entire period and reinvested all distributions in the fund.
Net asset value (NAV) is the value of all your fund’s assets, minus any liabilities and the net assets allocated to any outstanding preferred shares, divided by the number of outstanding common shares.
Market price is the current trading price of one share of the fund. Market prices are set by transactions between buyers and sellers on exchanges such as the American Stock Exchange and the New York Stock Exchange.
| Comparative indexes |
Lehman Aggregate Bond Index is an unmanaged index of U.S. investment-grade fixed-income securities.
Lehman Government Bond Index is an unmanaged index of U.S. Treasury and agency securities.
Lehman Intermediate Treasury Bond Index is an unmanaged index of U.S. Treasury securities with maturities between 1 and 10 years.
Lehman Municipal Bond Index is an unmanaged index of long-term fixed-rate investment-grade tax-exempt bonds.
Russell 2000 Growth Index is an unmanaged index of those companies in the small-cap Russell 2000 Index chosen for their growth orientation.
S&P 500 Index is an unmanaged index of common stock performance.
S&P Utilities Index is an unmanaged index of common stock issued by utility companies.
Indexes assume reinvestment of all distributions and do not account for fees. Securities and performance of a fund and an index will differ. You cannot invest directly in an index.
Lipper is a third-party industry ranking entity that ranks funds (without sales charges) with similar current investment styles or objectives as determined by Lipper. Lipper category averages reflect performance trends for funds within a category and are based on total return at net asset value.
17
| Trustee approval of management contract |
| General conclusions |
The Board of Trustees of the Putnam funds oversees the management of each fund and, as required by law, determines annually whether to approve the continuance of your fund’s management contract with Putnam Management. In this regard, the Board of Trustees, with the assistance of its Contract Committee consisting solely of Trustees who are not “interested persons” (as such term is defined in the Investment Company Act of 1940, as amended) of the Putnam funds (the “Independent Trustees”), requests and evaluates all information it deems reasonably necessary under the circumstances. Over the course of several months beginning in March and ending in June 2005, the Contract Committee met five times to consider the information provided by Putnam Management and other information developed with the assistance of the Board’s independent counsel and independent staff. The Contract Committee reviewed and discussed key aspects of this information with all of the Independent Trustees. Upon completion of this review, the Contract Committee recommended and the Independent Trustees approved the continuance of your fund’s management contract, effective July 1, 2005. This approval was based on the following conclusions:
- That the fee schedule currently in effect for your fund, subject to certain changes noted below, represents reasonable compensation in light of the nature and quality of the services being provided to the fund, the fees paid by competitive funds and the costs incurred by Putnam Management in providing such services, and
- That such fee schedule represents an appropriate sharing between fund shareholders and Putnam Management of such economies of scale as may exist in the management of the fund at current asset levels.
These conclusions were based on a comprehensive consideration of all information provided to the Trustees and were not the result of any single factor. Some of the factors that figured particularly in the Trustees’ deliberations and how the Trustees considered these factors are described below, although individual Trustees may have evaluated the information presented differently, giving different weights to various factors. It is also important to recognize that the fee arrangements for your fund and the other Putnam funds are the result of many years of review and discussion between the Independent Trustees and Putnam Management, that certain aspects of such arrangements may receive greater scrutiny in some years than others, and that the Trustees’ conclusions may be based, in part, on their consideration of these same arrangements in prior years.
18
Model fee schedules and categories; total expenses
The Trustees’ review of the management fees and total expenses of the Putnam funds focused on three major themes:
* Consistency. The Trustees, working in cooperation with Putnam Management, have developed and implemented a series of model fee schedules for the Putnam funds designed to ensure that each fund’s management fee is consistent with the fees for similar funds in the Putnam family of funds and compares favorably with fees paid by competitive funds sponsored by other investment advisors. Under this approach, each Putnam fund is assigned to one of several fee categories based on a combination of factors, including competitive fees and perceived difficulty of management, and a common fee schedule is implemented for all funds in a given fee category. The Trustees reviewed the model fee schedule currently in effect for your fund, including fee levels and breakpoints, and the assignment of the fund to a particular fee category under this structure. (“Breakpoints” refer to reductions in fee rates that apply to additional assets once specified asset levels are reached.)
Since their inception, Putnam’s closed-end funds have generally had management fees that are higher than those of Putnam’s open-end funds pursuing comparable investment strategies. These differences ranged from five to 20 basis points. The Trustees have reexamined this matter and recommend that these differences be conformed to a uniform five basis points. As a result, the Trustees approved a reduction in the management fees for your fund. Under the new fee schedule, the fund pays a quarterly fee to Putnam Management at the lower of the following rates:
| (a) | 0.55% of the fund’s average net assets |
| or | |
| (b) | 0.65% of the first $500 million of the fund’s average net assets; |
| 0.55% of the next $500 million; | |
| 0.50% of the next $500 million; | |
| 0.45% of the next $5 billion; | |
| 0.425% of the next $5 billion; | |
| 0.405% of the next $5 billion; | |
| 0.39% of the next $5 billion; and | |
| 0.38% thereafter. |
The new fee schedule for your fund will result in lower management fees paid by common shareholders. The Trustees approved the new fee schedule for your fund effective as of January 1, 2006, in order to provide Putnam Management an opportunity to accommodate the impact on revenues in its budget process for the coming year.
* Competitiveness. The Trustees also reviewed comparative fee and expense information for competitive funds, which indicated that, in a custom peer group of competitive funds selected by Lipper Inc., your fund ranked in the 75th percentile in management fees and in the 75th
19
- percentile in total expenses as of December 31, 2004 (the first percentile being the least expensive funds and the 100th percentile being the most expensive funds). The Trustees expressed their intention to monitor this information closely to ensure that fees and expenses of the Putnam funds continue to meet evolving competitive standards.
- Economies of scale. The Trustees concluded that the fee schedule currently in effect for your fund, subject to the changes noted above, represents an appropriate sharing of economies of scale at current asset levels. The Trustees examined the existing breakpoint structure of the Putnam funds’ management fees in light of competitive industry practices.
The Trustees considered various possible modifications to the Putnam funds’ current break- point structure, but ultimately concluded that the current breakpoint structure continues to serve the interests of fund shareholders. Accordingly, the Trustees continue to believe that the fee schedules currently in effect for the funds, subject to the changes noted above, represent an appropriate sharing of economies of scale at current asset levels.
In connection with their review of the management fees and total expenses of the Putnam funds, the Trustees also reviewed the costs of the services to be provided and profits to be realized by Putnam Management and its affiliates from the relationship with the funds. This information included trends in revenues, expenses and profitability of Putnam Management and its affiliates relating to the investment management and distribution services provided to the funds. In this regard, the Trustees also reviewed an analysis of Putnam Management’s revenues, expenses and profitability with respect to the funds’ management contracts, allocated on a fund-by-fund basis.
| Investment performance |
20
The Trustees recognized that, in recent years, Putnam Management has made significant changes in its investment personnel and processes and in the fund product line to address areas of underperformance. The Trustees indicated their intention to continue to monitor performance trends to assess the effectiveness of these changes and to evaluate whether additional remedial changes are warranted.
In the case of your fund, the Trustees considered that your fund’s common share performance at net asset value was in the following percentiles of its Lipper Inc. peer group (compared using tax-adjusted performance to recognize the different federal income tax treatment for capital gains distributions and exempt-interest distributions) for the one-, three- and five-year periods ended December 31, 2004 (the first percentile being the best-performing funds and the 100th percentile being the worst-performing funds):
| One-year period | Three-year period | Five-year period |
| 93rd | 84th | 84th |
(Because of the passage of time, these performance results may differ from the performance results for more recent periods shown elsewhere in this report.) The Trustees noted the disappointing performance for your fund for the one-, three- and five years ended December 31, 2004. In this regard, the Trustees considered that, over the past two years, the fund has implemented a redesigned investment process that includes placing greater focus on diversification among lower-rated issuers. The fund also generally uses less investment leverage than the other closed-end funds in its Lipper peer group. Because investment leverage has the potential to increase a fund’s yield under some market conditions, the fund’s lower use of leverage may at times cause its performance to trail the performance of its peer group.
As a general matter, the Trustees believe that cooperative efforts between the Trustees and Putnam Management represent the most effective way to address investment performance problems. The Trustees believe that investors in the Putnam funds have, in effect, placed their trust in the Putnam organization, under the oversight of the funds’ Trustees, to make appropriate decisions regarding the management of the funds. Based on the responsiveness of Putnam Management in the recent past to Trustee concerns about investment performance, the Trustees believe that it is preferable to seek change within Putnam Management to address performance shortcomings. In the Trustees’ view, the alternative of terminating a management contract and engaging a new investment advisor for an underper-forming fund would entail significant disruptions and would not provide any greater assurance of improved investment performance.
Brokerage and soft-dollar allocations; other benefits
The Trustees considered various potential benefits that Putnam Management may receive in connection with the services it provides under the management contract with your fund. These include principally benefits related to brokerage and soft-dollar allocations, whereby a portion
21
of the commissions paid by a fund for brokerage is earmarked to pay for research services that may be utilized by a fund’s investment advisor. The Trustees believe that soft-dollar credits and other potential benefits associated with the allocation of fund brokerage, which pertains mainly to funds investing in equity securities, represent assets of the funds that should be used for the benefit of fund shareholders. This area has been marked by significant change in recent years. In July 2003, acting upon the Contract Committee’s recommendation, the Trustees directed that allocations of brokerage to reward firms that sell fund shares be discontinued no later than December 31, 2003. In addition, commencing in 2004, the allocation of brokerage commissions by Putnam Management to acquire research services from third-party service providers has been significantly reduced, and continues at a modest level only to acquire research that is customarily not available for cash. The Trustees will continue to monitor the allocation of the funds’ brokerage to ensure that the principle of “best price and execution” remains paramount in the portfolio trading process.
The Trustees’ annual review of your fund’s management contract also included the review of your fund’s custodian agreement with Putnam Fiduciary Trust Company, which provides benefits to affiliates of Putnam Management.
Comparison of retail and institutional fee schedules
The information examined by the Trustees as part of their annual contract review has included for many years information regarding fees charged by Putnam Management and its affiliates to institutional clients such as defined benefit pension plans, college endowments, etc. This information included comparison of such fees with fees charged to the funds, as well as a detailed assessment of the differences in the services provided to these two types of clients. The Trustees observed, in this regard, that the differences in fee rates between institutional clients and the mutual funds are by no means uniform when examined by individual asset sectors, suggesting that differences in the pricing of investment management services to these types of clients reflect to a substantial degree historical competitive forces operating in separate market places. The Trustees considered the fact that fee rates across all asset sectors are higher on average for mutual funds than for institutional clients, as well as the differences between the services that Putnam Management provides to the Putnam funds and those that it provides to institutional clients of the firm, but have not relied on such comparisons to any significant extent in concluding that the management fees paid by your fund are reasonable.
22
| Other information for shareholders |
Important notice regarding share repurchase program
In October 2005, the Trustees of your fund authorized Putnam Investments to implement a repurchase program on behalf of your fund, which would allow your fund to repurchase up to 5% of its outstanding shares over the 12 months following the announcement.
| A note about duplicate mailings |
In response to investors’ requests, the SEC has modified mailing regulations for proxy statements, semiannual and annual reports, and prospectuses. Putnam is now able to send a single copy of these materials to customers who share the same address. This change will automatically apply to all shareholders except those who notify us. If you would prefer to receive your own copy, please call Putnam at 1-800-225-1581.
| Proxy voting |
Putnam is committed to managing our mutual funds in the best interests of our shareholders. The Putnam funds’ proxy voting guidelines and procedures, as well as information regarding how your fund voted proxies relating to portfolio securities during the 12-month period ended June 30, 2005, are available on the Putnam Individual Investor Web site, www.putnam.com/individual, and on the SEC’s Web site, www.sec.gov. If you have questions about finding forms on the SEC’s Web site, you may call the SEC at 1-800-SEC-0330. You may also obtain the Putnam funds’ proxy voting guidelines and procedures at no charge by calling Putnam’s Shareholder Services at 1-800-225-1581.
| Fund portfolio holdings |
The fund will file a complete schedule of its portfolio holdings with the SEC for the first and third quarters of each fiscal year on Form N-Q. Shareholders may obtain the fund’s Forms N-Q on the SEC’s Web site at www.sec.gov. In addition, the fund’s Forms N-Q may be reviewed and copied at the SEC’s public reference room in Washington, D.C. You may call the SEC at 1-800-SEC-0330 for information about the SEC’s Web site or the operation of the public reference room.
23
| Financial statements |
| A guide to financial statements |
These sections of the report, as well as the accompanying Notes, constitute the fund’s financial statements.
The fund’s portfolio lists all the fund’s investments and their values as of the last day of the reporting period. Holdings are organized by asset type and industry sector, country, or state to show areas of concentration and diversification.
Statement of assets and liabilities shows how the fund’s net assets and share price are determined. All investment and noninvestment assets are added together. Any unpaid expenses and other liabilities are subtracted from this total. The result is divided by the number of shares to determine the net asset value per share, which is calculated separately for each class of shares. (For funds with preferred shares, the amount subtracted from total assets includes the net assets allocated to remarketed preferred shares.)
Statement of operations shows the fund’s net investment gain or loss. This is done by first adding up all the fund’s earnings -- from dividends and interest income - -- and subtracting its operating expenses to determine net investment income (or loss). Then, any net gain or loss the fund realized on the sales of its holdings - -- as well as any unrealized gains or losses over the period -- is added to or subtracted from the net investment result to determine the fund’s net gain or loss for the fiscal period.
Statement of changes in net assets shows how the fund’s net assets were affected by the fund’s net investment gain or loss, by distributions to shareholders, and by changes in the number of the fund’s shares. It lists distributions and their sources (net investment income or realized capital gains) over the current reporting period and the most recent fiscal year-end. The distributions listed here may not match the sources listed in the Statement of operations because the distributions are determined on a tax basis and may be paid in a different period from the one in which they were earned.
Financial highlights provide an overview of the fund’s investment results, per-share distributions, expense ratios, net investment income ratios, and portfolio turnover in one summary table, reflecting the five most recent reporting periods. In a semiannual report, the highlight table also includes the current reporting period. For open-end funds, a separate table is provided for each share class.
24
| The fund’s portfolio 9/30/05 (Unaudited) | ||||
| Key to Abbreviations | ||||
| AMBAC AMBAC Indemnity Corporation | GNMA Coll. Government National Mortgage | |||
| COP Certificate of Participation | Association Collateralized | |||
| FGIC Financial Guaranty Insurance Company | G.O. Bonds General Obligation Bonds | |||
| FNMA Coll. Federal National Mortgage | MBIA MBIA Insurance Company | |||
| Association Collateralized | Q-SBLF Qualified School Board Loan Fund | |||
| FSA Financial Security Assurance | U.S. Govt. Coll. U.S. Government Collateralized | |||
| VRDN Variable Rate Demand Notes | ||||
| MUNICIPAL BONDS AND NOTES (123.8%)* | ||||
| Rating ** | Principal amount | Value | ||
| Alabama (0.8%) | ||||
| Butler, Indl. Dev. Board Solid Waste Disp. Rev. Bonds | ||||
| (GA. Pacific Corp.), 5 3/4s, 9/1/28 | BB+ | $ | 550,000 $ | 558,388 |
| Phenix City, Indl. Dev. Board Rev. Bonds (Mead | ||||
| Coated Board), Ser. A, 5.3s, 4/1/27 (Prerefunded) | AAA | 500,000 | 534,540 | |
| Sylacauga, Hlth. Care Auth. Rev. Bonds | ||||
| (Coosa Valley Med. Ctr.), Ser. A, 6s, 8/1/35 | B/P | 250,000 | 252,375 | |
| 1,345,303 | ||||
| Arizona (1.9%) | ||||
| AZ Hlth. Fac. Auth. Hosp. Syst. Rev. Bonds | ||||
| (John C. Lincoln Hlth. Network), 6 3/8s, 12/1/37 | BBB | 500,000 | 546,295 | |
| Casa Grande, Indl. Dev. Auth. Rev. Bonds (Casa | ||||
| Grande Regl. Med. Ctr.), Ser. A, 7 1/4s, 12/1/19 | B+/P | 1,000,000 | 1,090,790 | |
| Coconino Cnty., Poll. Control Rev. Bonds | ||||
| (Tuscon/Navajo Elec. Pwr.), Ser. A, 7 1/8s, 10/1/32 | Ba1 | 750,000 | 781,223 | |
| Pima Cnty., Indl Dev. Auth. Rev. Bonds | ||||
| (Horizon Cmnty. Learning Ctr.), 5.05s, 6/1/25 | BBB- | 325,000 | 325,881 | |
| Tempe, Indl. Dev. Auth. Sr. Living Rev. Bonds | ||||
| (Friendship Village), Ser. A, 5 3/8s, 12/1/13 | BB–/P | 500,000 | 513,410 | |
| 3,257,599 | ||||
| Arkansas (1.3%) | ||||
| Independence Cnty., Poll. Control Rev. Bonds | ||||
| (Entergy, Inc.), 5s, 1/1/21 | A– | 400,000 | 407,228 | |
| Northwest Regl. Arpt. Auth. Rev. Bonds, 7 5/8s, | ||||
| 2/1/27 (Prerefunded) | BB/P | 1,000,000 | 1,118,470 | |
25
| MUNICIPAL BONDS AND NOTES (123.8%)* continued | |||||
| Rating ** | Principal amount | Value | |||
| Arkansas continued | |||||
| Washington Cnty., Hosp. Rev. Bonds | |||||
| (Regl. Med. Ctr.), Ser. B | |||||
| 5s, 2/1/25 | Baa2 | $ | 285,000 | $ | 288,369 |
| 5s, 2/1/11 | Baa2 | 500,000 | 522,020 | ||
| 2,336,087 | |||||
| California (13.2%) | |||||
| CA Rev. Bonds (Stanford Hosp. & Clinics), | |||||
| Ser. A, 5s, 11/15/23 | A2 | 1,000,000 | 1,037,750 | ||
| CA Poll. Control Fin. Auth. Solid Waste Disp. | |||||
| Rev. Bonds (Waste Management, Inc.), | |||||
| Ser. A-2, 5.4s, 4/1/25 | BBB | 560,000 | 576,262 | ||
| CA State G.O. Bonds, 5s, 5/1/24 | A | 1,000,000 | 1,049,620 | ||
| CA State Dept. of Wtr. Resources | |||||
| Rev. Bonds, Ser. A, 5 1/4s, 5/1/20 | A2 | 1,500,000 | 1,619,850 | ||
| CA State Public Wks. Board (Dept. Mental Hlth.), | |||||
| Ser. A, MBIA, 5s, 6/1/25 | AAA | 2,500,000 | 2,606,850 | ||
| CA Statewide Cmnty. Dev. Auth. Rev. Bonds | |||||
| (Huntington Memorial Hosp.), 5s, 7/1/21 | A+ | 1,500,000 | 1,590,090 | ||
| (Thomas Jefferson School of Law), | |||||
| Ser. A, 4 7/8s, 10/1/35 | BBB– | 200,000 | 197,668 | ||
| CA Statewide Cmntys. Dev. Auth. Apt. Mandatory | |||||
| Put Bonds (Irvine Apt. Cmntys.), Ser. A-3, | |||||
| 5.1s, 5/17/10 | Baa2 | 875,000 | 910,201 | ||
| Cathedral City, Impt. Board Act of 1915 Special | |||||
| Assmt. Bonds (Cove Impt. Dist.), Ser. 04-02, | |||||
| 5.05s, 9/2/35 | BB+/P | 650,000 | 643,435 | ||
| Chula Vista, Cmnty. Fac. Dist. Special Tax Rev. Bonds | |||||
| (No. 06-1 Eastlake Woods Area), 6.1s, 9/1/21 | BB+/P | 1,000,000 | 1,055,020 | ||
| (No. 08-1 Otay Ranch Village Six), 6s, 9/1/33 | BB/P | 500,000 | 520,605 | ||
| (No 07-I-Otay Ranch Village Eleven), 5 7/8s, 9/1/34 | BB–/P | 250,000 | 256,870 | ||
| Folsom, Special Tax Rev. Bonds (Cmnty. Facs. | |||||
| Dist. No. 10), 5 7/8s, 9/1/28 | BB/P | 350,000 | 362,401 | ||
| Foothill/Eastern Corridor Agcy. Rev. Bonds | |||||
| (CA Toll Roads), 5 3/4s, 1/15/40 | Baa3 | 2,000,000 | 2,040,620 | ||
| Gilroy, Rev. Bonds (Bonfante Gardens Park), 8s, 11/1/25 | D/P | 385,000 | 315,138 | ||
| Golden State Tobacco Securitization Corp. Rev. Bonds, | |||||
| Ser. B, 5 5/8s, | |||||
| 6/1/38 (Prerefunded) | AAA | 1,000,000 | 1,127,980 | ||
26
| MUNICIPAL BONDS AND NOTES (123.8%)* continued | |||||
| Rating ** | Principal amount | Value | |||
| California continued | |||||
| Irvine, Impt. Board Act of 1915 Special Assmt. Bonds | |||||
| (Assmt. Dist. No. 00-18-GRP 3), 5.55s, 9/2/26 | BB+/P | $ | 500,000 | $ | 504,750 |
| Murrieta, Cmnty. Fac. Dist. Special Tax Rev. Bonds | |||||
| (No. 2 The Oaks Impt. Area A), 6s, 9/1/34 | BB–/P | 250,000 | 262,100 | ||
| Orange Cnty., Cmnty. Fac. Dist. Rev. Bonds | |||||
| (Ladera Ranch – No. 1), 6s, 8/15/25 | BBB/P | 1,000,000 | 1,087,890 | ||
| Orange Cnty., Cmnty. Fac. Dist. Special Tax | |||||
| Rev. Bonds (No. 02-1 Ladera Ranch), | |||||
| Ser. A, 5.55s, 8/15/33 | BBB/P | 250,000 | 256,573 | ||
| Roseville, Cmnty. Fac. Special Tax Rev. Bonds | |||||
| (Dist. No. 1-Westpark), 5 1/4s, 9/1/19 | BB/P | 100,000 | 102,558 | ||
| (Dist. No. 1-Westpark), 5s, 9/1/20 | BB/P | 500,000 | 498,935 | ||
| Santaluz Cmnty., Facs. Dist. No. 2 Special Tax | |||||
| Rev. Bonds (Impt. Area No. 1), Ser. B, 6 3/8s, 9/1/30 | BB+/P | 740,000 | 753,387 | ||
| Sunnyvale, Special Tax Rev. Bonds (Cmnty. Fac. | |||||
| Dist. No. 1), 7 3/4s, 8/1/32 | BB–/P | 835,000 | 897,759 | ||
| Thousand Oaks, Cmnty. Fac. Dist. Special Tax | |||||
| Rev. Bonds (Marketplace 94-1), zero %, 9/1/14 | B/P | 1,300,000 | 695,591 | ||
| Vallejo, COP (Marine World Foundation), 7.2s, 2/1/26 | BBB–/P | 2,000,000 | 2,105,580 | ||
| 23,075,483 | |||||
| Colorado (0.9%) | |||||
| CO. Hlth. Fac. Auth. Rev. Bonds (Evangelical Lutheran), | |||||
| Ser. B, 3 3/4s, 6/1/34 | A3 | 1,000,000 | 994,560 | ||
| Montrose, Memorial Hosp. Rev. Bonds, 6 3/8s, 12/1/23 | BBB– | 500,000 | 535,660 | ||
| 1,530,220 | |||||
| Connecticut (0.5%) | |||||
| CT State Dev. Auth. 1st. Mtg. Gross Rev. Hlth. Care | |||||
| Rev. Bonds (Elim Street Park Baptist, Inc.), | |||||
| 5.85s, 12/1/33 | BBB+ | 750,000 | 793,238 | ||
| Delaware (0.6%) | |||||
| GMAC Muni. Mtge. Trust 144A sub. notes, Ser. A1–2, | |||||
| 4.9s, 10/31/39 | A3 | 1,000,000 | 1,009,450 | ||
| District of Columbia (0.6%) | |||||
| DC G.O. Bonds, Ser. A, FSA, 5s, 6/1/27 | Aaa | 1,000,000 | 1,048,330 | ||
| Florida (7.3%) | |||||
| Cap. Trust Agcy. Rev. Bonds (Seminole Tribe | |||||
| Convention), Ser. A, 10s, 10/1/33 | B/P | 500,000 | 541,805 | ||
| CFM Cmnty., Dev. Dist. Rev. Bonds | |||||
| (Cap. Impt.), Ser. B, 5 7/8s, 5/1/14 | BB–/P | 750,000 | 774,675 | ||
27
| MUNICIPAL BONDS AND NOTES (123.8%)* continued | |||||
| Rating ** | Principal amount | Value | |||
| Florida continued | |||||
| Double Branch Cmnty. Dev. Dist. Rev. Bonds, Ser. A, | |||||
| 6.7s, 5/1/34 | BB/P | $ | 990,000 | $ | 1,071,833 |
| Fishhawk, Cmnty. Dev. Dist. II Rev. Bonds,Ser. B | |||||
| 5 1/8s, 11/1/09 | BB–/P | 235,000 | 236,603 | ||
| 5s, 11/1/07 | BB–/P | 75,000 | 75,278 | ||
| FL State Mid-Bay Bridge Auth. Rev. Bonds, Ser. A, | |||||
| 6.05s, 10/1/22 | BBB/P | 770,000 | 804,542 | ||
| Fleming Island, Plantation Cmnty. Dev. Dist. | |||||
| Special Assmt. Bonds, Ser. B, 7 3/8s, 5/1/31 | BB/P | 350,000 | 377,454 | ||
| Halifax, Hosp. Med. Ctr. Rev. Bonds, Ser. A, | |||||
| 7 1/4s, 10/1/29 | BBB+/F | 500,000 | 562,615 | ||
| Heritage Isle at Viera, Cmnty. Dev. Dist. | |||||
| Special Assmt. Bonds, Ser. B, 5s, 11/1/09 | BB/P | 430,000 | 430,456 | ||
| Islands at Doral III, Cmnty. Dev. Dist. | |||||
| Special Assmt. Bonds, Ser. 04-A, 5.9s, 5/1/35 | BB/P | 500,000 | 513,470 | ||
| Lee Cnty., Indl. Dev. Auth. Hlth. Care Fac. Rev. Bonds | |||||
| (Cypress Cove Hlth. Pk.), Ser. A, 6 3/8s, 10/1/25 | BB–/P | 1,100,000 | 1,113,651 | ||
| Lee Cnty., Indl. Dev. Auth. Rev. Bonds | |||||
| (Alliance Cmnty.), Ser. C, 5 1/2s, 11/15/29 | BBB– | 1,075,000 | 1,077,698 | ||
| Miami Beach, Hlth. Fac. Auth. Hosp. | |||||
| Rev. Bonds (Mount Sinai Med. Ctr.), | |||||
| Ser. A, 6.8s, 11/15/31 | BB+ | 600,000 | 654,708 | ||
| Old Palm, Cmnty. Dev. Dist. Special Assmt. Bonds | |||||
| (Palm Beach Gardens), Ser. A, 5.9s, 5/1/35 | BB/P | 500,000 | 513,025 | ||
| Orange Cnty., Hlth. Fac. Auth. Rev. Bonds | |||||
| (Orlando Regl. Hlth. Care), 5 3/4s, 12/1/32 | A2 | 500,000 | 539,430 | ||
| Reunion West, Cmnty. Dev. Dist. Special Assmt. | |||||
| Bonds, 6 1/4s, 5/1/36 | BB–/P | 750,000 | 790,110 | ||
| South Bay, Cmnty. Dev. Dist. Rev. Bonds, Ser. B–2, | |||||
| 5 3/8s, 5/1/13 | BB–/P | 750,000 | 756,975 | ||
| South Village, Cmnty. Dev. Dist. Rev. Bonds, Ser. A, | |||||
| 5.7s, 5/1/35 | BB–/P | 500,000 | 506,195 | ||
| Tern Bay, Cmnty. Dev. Dist. Rev. Bonds, Ser. B, 5s, | |||||
| 5/1/15 | BB–/P | 400,000 | 400,680 | ||
| Verandah, West Cmnty. Dev. Dist. Rev. Bonds | |||||
| (Cap. Impt.), Ser. A, 6 5/8s, 5/1/33 | BB/P | 490,000 | 512,937 | ||
| World Commerce Cmnty. Dev. Dist. Special Assmt. | |||||
| Bonds, Ser. A-1, 6 1/2s, 5/1/36 | BB–/P | 500,000 | 522,420 | ||
| 12,776,560 | |||||
28
| MUNICIPAL BONDS AND NOTES (123.8%)* continued | ||||
| Rating ** | Principal amount | Value | ||
| Georgia (5.5%) | ||||
| Burke Cnty., Poll. Control Dev. Auth. Mandatory Put | ||||
| Bonds (GA Power Co.), 4.45s, 12/1/08 | A2 $ | 2,000,000 | $ | 2,058,620 |
| Forsyth Cnty., Hosp. Auth. Rev. Bonds (Baptist Hlth. | ||||
| Care Syst.), U.S. Govt. Coll., 6 1/4s, 10/1/18 | AAA | 2,000,000 | 2,325,300 | |
| Fulton Cnty., Res. Care Fac. Rev. Bonds | ||||
| (Canterbury Court), Class A, 6 1/8s, 2/15/34 | B+/P | 175,000 | 176,783 | |
| GA Muni. Elec. Auth. Rev. Bonds, AMBAC, | ||||
| 5s, 1/1/26 | AAA | 1,750,000 | 1,835,103 | |
| Med. Ctr. Hosp. Auth. Rev. Bonds, MBIA, | ||||
| 6.367s, 8/1/10 | Aaa | 2,400,000 | 2,419,224 | |
| Rockdale Cnty., Dev. Auth. Solid Waste Disp. | ||||
| Rev. Bonds (Visay Paper, Inc.), 7.4s, 1/1/16 | B+/P | 780,000 | 784,672 | |
| 9,599,702 | ||||
| Illinois (1.8%) | ||||
| Chicago, O’Hare Intl. Arpt. Special Fac. Rev. Bonds | ||||
| (American Airlines, Inc.), 8.2s, 12/1/24 | Caa2 | 1,245,000 | 1,116,192 | |
| IL Dev. Fin. Auth. Hosp. Rev. Bonds (Adventist Hlth. | ||||
| Syst./Sunbelt Obligation), 5.65s, 11/15/24 | A+ | 750,000 | 787,095 | |
| IL Fin. Auth. Rev. Bonds (Friendship Village | ||||
| Schaumburg), Ser. A, 5 5/8s, 2/15/37 | B+/P | 200,000 | 202,232 | |
| IL Fin. Auth. Solid Waste Disposal | ||||
| (Waste Mgmt., Inc.), Ser. A, 5.05s, 8/1/29 | BBB | 250,000 | 248,815 | |
| IL Hlth. Fac. Auth. Rev. Bonds | ||||
| (Cmnty. Rehab. Providers Fac.), | ||||
| Ser. A, 7 7/8s, 7/1/20 | D/P | 219,898 | 197,031 | |
| (Elmhurst Memorial Hlth. Care), | ||||
| 5 5/8s, 1/1/28 | A2 | 500,000 | 527,750 | |
| 3,079,115 | ||||
| Indiana (2.7%) | ||||
| Indianapolis, Arpt. Auth. Rev. Bonds | ||||
| (Federal Express Corp.), 5.1s, 1/15/17 | Baa2 | 2,000,000 | 2,072,820 | |
| Jasper Hosp. Auth. Rev. Bonds (Memorial Hosp.), | ||||
| 5 1/2s, 11/1/32 | AA | 500,000 | 523,505 | |
| Rockport, Poll. Control Rev. Bonds | ||||
| (Indiana-Michigan Pwr.), Ser. A, 4.9s, 6/1/25 | Baa2 | 2,000,000 | 2,035,840 | |
| 4,632,165 | ||||
| Iowa (2.0%) | ||||
| IA Fin. Auth. Hlth. Care Fac. Rev. Bonds | ||||
| (Care Initiatives), 9 1/4s, 7/1/25 | BBB–/P | 2,400,000 | 2,891,904 | |
| IA Fin. Auth. Retirement Cmnty. Rev. Bonds | ||||
| (Friendship Haven), Ser. A, 6 1/8s, 11/15/32 | BB/P | 550,000 | 558,762 | |
| 3,450,666 | ||||
29
| MUNICIPAL BONDS AND NOTES (123.8%)* continued | |||||
| Rating ** | Principal amount | Value | |||
| Kentucky (0.2%) | |||||
| Kentucky Econ. Dev. Fin. Auth. Rev. Bonds (First Mtg.), | |||||
| Ser. IA, 6 1/2s, 1/1/29 | B+/P | $ | 305,000 | $ | 310,435 |
| Louisiana (1.3%) | |||||
| Desoto Parish, Rev. Bonds (Intl. Paper Co. Project), | |||||
| Ser. A, 5s, 10/1/12 | Baa2 | 500,000 | 520,625 | ||
| LA Local Govt. Env. Fac. Cmnty. Dev. Auth. | |||||
| Rev. Bonds (Hlth. Care - St. James Place), | |||||
| Ser. A, 7s, 11/1/26 | B–/P | 1,720,000 | 1,750,410 | ||
| 2,271,035 | |||||
| Maine (1.1%) | |||||
| ME State Hsg. Auth. Rev. Bonds, Ser. D-2-AMT, | |||||
| 5s, 11/15/27 | Aa1 | 890,000 | 915,846 | ||
| Rumford, Solid Waste Disp. Rev. Bonds | |||||
| (Boise Cascade Corp.), 6 7/8s, 10/1/26 | Ba1 | 1,000,000 | 1,070,770 | ||
| 1,986,616 | |||||
| Maryland (0.9%) | |||||
| MD State Hlth. & Higher Edl. Fac. Auth. Rev. Bonds | |||||
| (Medstar Hlth.), 5 3/4s, 8/15/15 | Baa1 | 500,000 | 552,150 | ||
| MD State Indl. Dev. Fin. Auth. Econ. Dev. Rev. Bonds | |||||
| (Our Lady of Good Counsel School), Ser. A, 6s, 5/1/35 | B/P | 200,000 | 204,562 | ||
| Westminster, Econ. Dev Rev. Bonds (Carroll Lutheran | |||||
| Village), Ser. A, 6 1/4s, 5/1/34 | BB/P | 600,000 | 624,162 | ||
| Westminster, Econ. Dev. Rev. Bonds (Carroll Lutheran | |||||
| Village), Ser. A, 5 7/8s, 5/1/21 | BB/P | 150,000 | 155,247 | ||
| 1,536,121 | |||||
| Massachusetts (6.2%) | |||||
| Boston, Indl. Dev. Fin. Auth. Rev. Bonds | |||||
| (Springhouse, Inc.), 6s, 7/1/28 | BB–/P | 1,000,000 | 1,013,030 | ||
| MA State Dev. Fin. Agcy. Rev. Bonds | |||||
| (Beverly Enterprises, Inc.), 7 3/8s, 4/1/09 | B+/P | 755,000 | 782,052 | ||
| (Boston Biomedical Research), 5 3/4s, 2/1/29 | Baa3 | 1,000,000 | 1,029,880 | ||
| MA State Hlth. & Edl. Fac. Auth. Rev. Bonds | |||||
| (Civic Investments), Ser. A, 9s, 12/15/15 | BBB–/P | 750,000 | 920,850 | ||
| (Jordan Hosp.), Ser. E, 6 3/4s, 10/1/33 | BBB– | 350,000 | 384,615 | ||
| (UMass Memorial), Ser. C, 6 1/2s, 7/1/21 | Baa2 | 1,575,000 | 1,694,700 | ||
| (Hlth. Care Syst. Covenant Hlth.), Ser. E, 6s, 7/1/31 | A | 1,350,000 | 1,463,076 | ||
| (Baystate Med. Ctr.), Ser. F, 5.7s, 7/1/27 | A1 | 1,000,000 | 1,058,880 | ||
| (Caritas Christi Oblig. Group), Ser. A, 5 1/4s, 7/1/08 | BBB | 500,000 | 514,980 | ||
| MA State Hsg. Fin. Agcy. Rev. Bonds, | |||||
| Ser. 53, MBIA, 6.15s, 12/1/29 | Aaa | 160,000 | 164,731 | ||
| MA State Indl. Fin. Agcy. R (TNG Marina | |||||
| Bay LLC Project), 7 1/2s, 12/1/27 | B/P | 400,000 | 423,320 | ||
30
| MUNICIPAL BONDS AND NOTES (123.8%)* continued | |||||
| Rating ** | Principal amount | Value | |||
| Massachusetts continued | |||||
| MA State Indl. Fin. Agcy. Rev. Bonds | |||||
| (1st Mtge. Stone Institution & Newton), 7.9s, 1/1/24 | BB–/P | $ | 250,000 | $ | 253,328 |
| (Evanswood Bethzatha), 7.85s, 1/15/17 (In default) | D/P | 1,531,530 | 1,914 | ||
| (1st Mtge. Berkshire Retirement), | |||||
| Ser. A, 6 5/8s, 7/1/16 | BBB– | 600,000 | 604,842 | ||
| (1st Mtge. Brookhaven), Ser. B, 5 1/4s, 1/1/17 | BBB/P | 500,000 | 503,380 | ||
| 10,813,578 | |||||
| Michigan (5.7%) | |||||
| Dickinson Cnty., Econ. Dev. Corp. Poll. Control | |||||
| Rev. Bonds (Intl. Paper Co.), Ser. A, 4.8s, 11/1/18 | Baa2 | 900,000 | 899,964 | ||
| Garden City, Hosp. Fin. Auth. Rev. Bonds | |||||
| (Garden City Hosp. OB Group), Ser. A, 5 3/4s, 9/1/17 | Ba1 | 500,000 | 491,940 | ||
| MI State Hosp. Fin. Auth. Rev. Bonds | |||||
| (Oakwood Hosp.), Ser. A, 5 3/4s, 4/1/32 | A2 | 1,000,000 | 1,058,520 | ||
| (Chelsea Cmnty. Hosp. Oblig.), 5s, 5/15/30 | BBB | 500,000 | 498,570 | ||
| MI State Hsg. Dev. Auth. Rev. Bonds, Ser. A, | |||||
| 3.9s, 6/1/30 | Aaa | 1,000,000 | 997,820 | ||
| MI State Strategic Fund Solid Waste Disp. Rev. Bonds | |||||
| (Genesee Pwr. Station), 7 1/2s, 1/1/21 | B/P | 600,000 | 593,892 | ||
| MI State Strategic Fund, Ltd. Rev. Bonds | |||||
| (Worthington Armstrong Venture), U.S. Govt. Coll., | |||||
| 5 3/4s, 10/1/22 | AAA/P | 1,350,000 | 1,541,970 | ||
| Midland Cnty., Econ. Dev. Corp. Rev. Bonds | |||||
| 6 7/8s, 7/23/09 | Ba3 | 500,000 | 522,885 | ||
| 6 3/4s, 7/23/09 | Ba3 | 250,000 | 261,453 | ||
| Whitmore Lake, Pub. School Dist. G.O. Bonds, FGIC, | |||||
| Q-SBLF, 5s, 5/1/28 | Aaa | 3,000,000 | 3,132,420 | ||
| 9,999,434 | |||||
| Minnesota (2.7%) | |||||
| Cohasset, Poll. Control Rev. Bonds (Allete, Inc.), | |||||
| 4.95s, 7/1/22 | A | 1,500,000 | 1,525,440 | ||
| Duluth, Econ. Dev. Auth. Hlth. Care Fac. Rev. Bonds | |||||
| (BSM Properties, Inc.), Ser. A, AMBAC, 5 7/8s, 12/1/28 | BB/P | 275,000 | 275,426 | ||
| Minneapolis, Rev. Bonds (Walker Methodist Sr. Svcs.), | |||||
| Ser. C, 6s, 11/15/28 | B+/P | 250,000 | 237,133 | ||
| MN State Higher Ed. Fac. Auth. Rev. Bonds | |||||
| (The College of St. Catherine), Ser. 5-N1, 5s, 10/1/18 | Baa1 | 1,000,000 | 1,036,980 | ||
| St. Paul, Hsg. & Hosp. Redev. Auth. Rev. Bonds | |||||
| (Healtheast), Ser. B, 6 5/8s, 11/1/17 | Baa3 | 955,000 | 957,645 | ||
31
| MUNICIPAL BONDS AND NOTES (123.8%)* continued | |||||
| Rating ** | Principal amount | Value | |||
| Minnesota continued | |||||
| St. Paul, Hsg. & Redev. Auth. Hosp. Rev. Bonds | |||||
| (Hlth. East), 6s, 11/15/25 | Baa3 | $ | 350,000 | $ | 380,681 |
| (Healtheast), Ser. B, 5.85s, 11/1/17 | Baa3 | 250,000 | 260,045 | ||
| 4,673,350 | |||||
| Mississippi (1.1%) | |||||
| Lowndes Cnty., Solid Waste Disp. & Poll. Control | |||||
| Rev. Bonds (Weyerhaeuser Co.), Ser. B, 6.7s, 4/1/22 | Baa2 | 1,000,000 | 1,213,470 | ||
| MS Home Corp. Rev. Bonds (Single Fam.), Ser. B-2, | |||||
| GNMA/FNMA Coll., 6.45s, 12/1/33 | Aaa | 635,000 | 673,545 | ||
| 1,887,015 | |||||
| Missouri (3.3%) | |||||
| Cape Girardeau Cnty., Indl. Dev. Auth. Hlth. Care Fac. | |||||
| Rev. Bonds (St. Francis Med. Ctr.), Ser. A, | |||||
| 5 1/2s, 6/1/16 | A+ | 1,000,000 | 1,071,450 | ||
| Kansas City, Indl. Dev. Auth. Hlth. Fac. Rev. Bonds | |||||
| (First Mtg. Bishop Spencer), Ser. A, 6 1/2s, 1/1/35 | BB–/P | 500,000 | 519,270 | ||
| MO Hsg. Dev. Comm. Rev. Bonds (Home Ownership), | |||||
| GNMA/FNMA Coll., 5.55s, 9/1/34 | Aaa | 1,665,000 | 1,743,255 | ||
| MO State Hsg. Dev. Comm. Mtge. Rev. Bonds | |||||
| (Single Fam. Homeowner Loan) | |||||
| Ser. A-1, GNMA/FNMA Coll, 7 1/2s, 3/1/31 | AAA | 575,000 | 593,918 | ||
| Ser. B-1, GNMA/FNMA Coll., 7.45s, 9/1/31 | AAA | 520,000 | 538,112 | ||
| Ser. A-2, GNMA Coll., 6.3s, 3/1/30 | AAA | 520,000 | 542,303 | ||
| MO State Hsg. Dev. Comm. Single Fam. Mtge. | |||||
| Rev. Bonds (Home Ownership Loan), Ser. A-1, | |||||
| GNMA/FNMA Coll., 6 3/4s, 3/1/34 | AAA | 765,000 | 794,980 | ||
| 5,803,288 | |||||
| Montana (0.6%) | |||||
| Forsyth, Poll. Control Mandatory Put Bonds | |||||
| (Avista Corp.), AMBAC, 5s, 12/30/08 | Aaa | 700,000 | 727,475 | ||
| MT State Board Inv. Exempt Fac. Rev. Bonds | |||||
| (Still Water Mining Project), 8s, 7/1/20 | B1 | 250,000 | 266,263 | ||
| 993,738 | |||||
| Nevada (4.2%) | |||||
| Clark Cnty., G.O. Bonds (Pk. & Regl. Justice Ctr.), FGIC, | |||||
| 5 5/8s, 11/1/19 (Prerefunded) | Aaa | 3,500,000 | 3,822,945 | ||
| Clark Cnty., Impt. Dist. Special Assmt. Bonds | |||||
| (Summerlin No. 151), 5s, 8/1/20 | BB–/P | 425,000 | 426,228 | ||
| Clark Cnty., Local Impt. Dist. Special Assmt. Bonds | |||||
| (No. 142), 6.1s, 8/1/18 | BB–/P | 250,000 | 257,633 | ||
32
| MUNICIPAL BONDS AND NOTES (123.8%)* continued | |||||
| Rating ** | Principal amount | Value | |||
| Nevada continued | |||||
| Henderson, Local Impt. Dist. Special Assmt. Bonds | |||||
| (No. T-14), 5.8s, 3/1/23 | BB–/P | $ | 240,000 | $ | 247,946 |
| (No. T-17), 5s, 9/1/18 | BB–/P | 100,000 | 100,547 | ||
| Henderson, Local Impt. Dist. Special Assmt. Bonds | |||||
| (No. T-14), 5.55s, 3/1/17 | BB–/P | 835,000 | 861,152 | ||
| Las Vegas, Local Impt. Board Special Assmt. Bonds | |||||
| (Dist. No. 607), 5.9s, 6/1/18 | BB–/P | 325,000 | 334,874 | ||
| Las Vegas, Special Impt. Dist. Rev. Bonds | |||||
| (No. 809 – Summerlin Area), 5.65s, 6/1/23 | BB/P | 250,000 | 253,840 | ||
| Washoe Cnty., Wtr. Fac. Mandatory Put Bonds | |||||
| (Sierra Pacific Pwr. Co.), 5s, 7/1/09 | Ba1 | 1,000,000 | 1,003,070 | ||
| 7,308,235 | |||||
| New Hampshire (2.3%) | |||||
| NH Higher Ed. & Hlth. Fac. Auth. Rev. Bonds | |||||
| (Riverwoods at Exeter), Ser. A, 6 3/8s, 3/1/13 | BB+/P | 670,000 | 685,852 | ||
| NH Higher Edl. & Hlth. Fac. Auth. Rev. Bonds, Ser. 05 | |||||
| 6 3/8s, 1/1/27 | BBB– | 605,000 | 624,650 | ||
| 6 3/8s, 1/1/27 (Prerefunded) | AAA/P | 220,000 | 233,248 | ||
| NH Higher Edl. & Hlth. Facs. Auth. Rev. Bonds | |||||
| (NH College), 6 3/8s, 1/1/27 (Prerefunded) | BBB– | 175,000 | 185,539 | ||
| NH Hlth. & Ed. Fac. Auth. Rev. Bonds | |||||
| (Huntington at Nashua), Ser. A, 6 7/8s, 5/1/33 | B/P | 600,000 | 621,582 | ||
| (Kendal at Hanover), Ser. A, 5s, 10/1/18 | BBB | 600,000 | 611,748 | ||
| NH State Bus. Fin. Auth. Rev. Bonds | |||||
| (Franklin Regl. Hosp. Assn.), Ser. A, 6.05s, 9/1/29 | BB–/P | 485,000 | 480,131 | ||
| NH State Bus. Fin. Auth. Poll. Control Rev. Bonds, | |||||
| 3 1/2s, 7/1/27 | Baa2 | 650,000 | 634,953 | ||
| NH State Bus. Fin. Auth. Swr. & Solid Waste | |||||
| Rev. Bonds (Crown Paper Co.), 7 7/8s, 7/1/26 | |||||
| (In default) | D/P | 1,394,189 | 14 | ||
| 4,077,717 | |||||
| New Jersey (5.1%) | |||||
| NJ Econ. Dev. Auth. Rev. Bonds | |||||
| (Cranes Mill), Ser. A, 7 1/2s, 2/1/27 (Prerefunded) | BB–/P | 600,000 | 647,232 | ||
| (Newark Arpt. Marriot Hotel), 7s, 10/1/14 | Ba3 | 1,500,000 | 1,547,490 | ||
| (United Methodist Homes), Ser. A-1, 6 1/4s, 7/1/33 | BB+ | 1,000,000 | 1,054,300 | ||
| (First Mtge. Lions Gate), Ser. A, 5 7/8s, 1/1/37 | B/P | 200,000 | 204,006 | ||
| (Cigarette Tax), 5 3/4s, 6/15/29 | Baa2 | 1,000,000 | 1,060,240 | ||
33
| MUNICIPAL BONDS AND NOTES (123.8%)* continued | |||||
| Rating ** | Principal amount | Value | |||
| New Jersey continued | |||||
| NJ Hlth. Care Fac. Fin. Auth. Rev. Bonds | |||||
| (Trinitas Hosp. Oblig. Group), 7 1/2s, 7/1/30 | Baa3 | $ | 500,000 | $ | 560,105 |
| Tobacco Settlement Fin. Corp. Rev. Bonds, | |||||
| 6 3/8s, 6/1/32 | BBB | 3,410,000 | 3,879,080 | ||
| 8,952,453 | |||||
| New Mexico (3.2%) | |||||
| Farmington, Poll. Control Mandatory Put Bonds | |||||
| (Pub. Svc. San Juan), Class B, 2.1s, 4/1/06 | Baa2 | 700,000 | 695,016 | ||
| Farmington, Poll. Control VRDN | |||||
| (AZ Pub. Svc. Co.), Ser. A, 2.85s, 5/1/24 | VMIG1 | 1,000,000 | 1,000,000 | ||
| (AZ Pub. Service Co.), Ser. B, 2.80s, 9/1/24 | VMIG1 | 3,900,000 | 3,900,000 | ||
| 5,595,016 | |||||
| New York (9.1%) | |||||
| Huntington, Hsg. Auth. Sr. Hsg. Fac. Rev. Bonds | |||||
| (Gurwin Jewish Sr. Residence), Ser. A, 6s, 5/1/29 | B+/P | 750,000 | 748,080 | ||
| Livingston Cnty., Indl. Dev. Agcy. Civic Fac. | |||||
| Rev. Bonds (Nicholas H. Noyes Memorial Hosp.) | |||||
| 5 3/4s, 7/1/15 | BB | 325,000 | 340,317 | ||
| 5s, 7/1/10 | BB | 175,000 | 177,714 | ||
| Metro. Trans. Auth. Svc. Contract Rev. Bonds, | |||||
| Ser. A , MBIA, 5 1/2s, 1/1/20 | Aaa | 1,000,000 | 1,103,300 | ||
| Nassau Cnty., Indl. Dev. Agcy. Rev. Bonds | |||||
| (Keyspan-Glenwood), 5 1/4s, 6/1/27 | A | 775,000 | 804,613 | ||
| Niagara Cnty., Indl. Dev. Agcy. Rev. Bonds, Ser. C, | |||||
| 5 5/8s, 11/15/24 | Baa3 | 400,000 | 424,108 | ||
| NY City, G.O. Bonds, Ser. C, 5 1/4s, 8/1/11 | A1 | 1,000,000 | 1,083,190 | ||
| NY City, Indl. Dev. Agcy. Rev. Bonds (Liberty-7 | |||||
| World Trade Ctr.), Ser. A, 6 1/4s, 3/1/15 | B–/P | 500,000 | 534,610 | ||
| NY City, Indl. Dev. Agcy. Civic Fac. Rev. Bonds | |||||
| (Staten Island U. Hosp.), Ser. A, 6 3/8s, 7/1/31 | B2 | 830,000 | 835,984 | ||
| (Brooklyn Polytech. U. Project J), 6 1/8s, 11/1/30 | BB+ | 200,000 | 201,412 | ||
| NY City, Indl. Dev. Agcy. Special Arpt. Fac. Rev. Bonds | |||||
| (Airis JFK I LLC), Ser. A, 5 1/2s, 7/1/28 | Baa3 | 1,300,000 | 1,301,781 | ||
| NY City, Indl. Dev. Agcy. Special Fac. Rev. Bonds | |||||
| (British Airways PLC), 5 1/4s, 12/1/32 | BB– | 1,300,000 | 1,173,237 | ||
| NY State Dorm. Auth. Rev. Bonds | |||||
| (Mt. Sinai NYU Hlth.), Ser. C, 5s, 7/1/11 | Ba1 | 500,000 | 507,885 | ||
| NY State Energy Research & Dev. Auth. Gas Fac. | |||||
| Rev. Bonds (Brooklyn Union Gas), 6.952s, 7/1/26 | A+ | 1,400,000 | 1,464,890 | ||
34
| MUNICIPAL BONDS AND NOTES (123.8%)* continued | |||||
| Rating ** | Principal amount | Value | |||
| New York continued | |||||
| Onondaga Cnty., Indl. Dev. Agcy. Rev. Bonds | |||||
| (Solvay Paperboard, LLC), 7s, 11/1/30 | |||||
| (acquired 12/9/98, cost $1,200,000) ‡ | BB/P | $ | 1,200,000 | $ | 1,267,008 |
| Port Auth. NY & NJ Rev. Bonds | |||||
| (Kennedy Intl. Arpt. - 5th Installment), | |||||
| 6 3/4s, 10/1/19 | BB+/P | 200,000 | 210,208 | ||
| (Kennedy Intl. Arpt. - 4th Installment), | |||||
| 6 3/4s, 10/1/11 | BB+/P | 500,000 | 525,670 | ||
| Port. Auth. NY & NJ Special Obligation | |||||
| Rev. Bonds, 7s, 10/1/07 | BB+/P | 200,000 | 204,870 | ||
| Suffolk Cnty., Indl. Dev. Agcy. Rev. Bonds | |||||
| (Peconic Landing), Ser. A, 8s, 10/1/30 | B+/P | 1,000,000 | 1,101,470 | ||
| Suffolk Cnty., Indl. Dev. Agcy. Cont. Care | |||||
| Retirement Rev. Bonds (Jefferson’s Ferry), | |||||
| Ser. A, 7 1/4s, 11/1/28 | BB–/P | 1,000,000 | 1,079,810 | ||
| Syracuse, Indl. Dev. Agcy. Rev. Bonds | |||||
| (1st Mtge. – Jewish Home), Ser. A, 7 3/8s, 3/1/21 | BB–/P | 800,000 | 845,800 | ||
| 15,935,957 | |||||
| North Carolina (2.7%) | |||||
| NC Eastern Muni. Pwr. Agcy. Syst. Rev. Bonds, | |||||
| Ser. C, 5.3s, 1/1/15 | Baa2 | 1,500,000 | 1,579,965 | ||
| NC Med. Care Cmnty. Healthcare Fac. Rev. Bonds | |||||
| (Deerfield), Ser. A, 5s, 11/1/23 | A–/P | 250,000 | 258,843 | ||
| NC Med. Care Comm. Retirement Fac. Rev. Bonds | |||||
| (1st Mtge. -Givens Estates), Ser. A, 6 1/2s, 7/1/32 | BB–/P | 750,000 | 795,000 | ||
| (First Mtg.), Ser. A-05, 5 1/2s, 10/1/35 | BB+/P | 690,000 | 693,395 | ||
| (First Mtg.), Ser. A-05, 5 1/4s, 10/1/25 | BB+/P | 100,000 | 101,408 | ||
| (First Mtge. United Methodist), Ser. C, | |||||
| 5 1/4s, 10/1/24 | BB+/P | 150,000 | 151,275 | ||
| NC State Muni. Pwr. Agcy. Rev. Bonds | |||||
| (No. 1, Catawba Elec.), Ser. B, 6 1/2s, 1/1/20 | A3 | 1,000,000 | 1,114,490 | ||
| 4,694,376 | |||||
| North Dakota (0.6%) | |||||
| Grand Forks, Hlth. Care Syst. Rev. Bonds | |||||
| (Altru Hlth. Syst. Oblig. Group), 7 1/8s, 8/15/24 | Baa2 | 1,000,000 | 1,121,450 | ||
| Ohio (3.9%) | |||||
| Coshocton Cnty., Env. Rev. Bonds | |||||
| (Smurfit-Stone Container), 5 1/8s, 8/1/13 | B | 600,000 | 591,414 | ||
| Cuyahoga Cnty., Rev. Bonds, Ser. A, 6s, 1/1/32 | Aa3 | 1,000,000 | 1,109,440 | ||
| Miami Cnty., Hosp. Fac. Rev. Bonds (Upper Valley | |||||
| Med. Ctr.), Ser. A, 6 3/8s, 5/15/26 | Baa1 | 500,000 | 516,215 | ||
35
| MUNICIPAL BONDS AND NOTES (123.8%)* continued | |||||
| Rating ** | Principal amount | Value | |||
| Ohio continued | |||||
| Montgomery Cnty., Hosp. Rev. Bonds (Kettering | |||||
| Med. Ctr.), 6 3/4s, 4/1/22 | A2 | $ | 1,500,000 | $ | 1,631,505 |
| OH State Higher Edl. Fac. Mandatory Put Bonds | |||||
| (Kenyon College Project), 4.85s, 7/1/14 | A2 | 1,000,000 | 1,056,820 | ||
| OH State Wtr. Dev. Auth. Poll. Control Fac. | |||||
| Mandatory Put Bonds (Cleveland Elec.), Class A, | |||||
| 3 3/4s, 10/1/08 | Baa2 | 1,250,000 | 1,253,150 | ||
| Toledo-Lucas Cnty., Port Auth. Rev. Bonds | |||||
| (CSX Transn, Inc.), 6.45s, 12/15/21 | Baa2 | 500,000 | 581,610 | ||
| 6,740,154 | |||||
| Oklahoma (1.0%) | |||||
| OK Hsg. Fin. Agcy. Single Fam. Rev. Bonds | |||||
| (Homeowner Loan), Ser. D-2, GNMA Coll., | |||||
| FNMA Coll., 7.1s, 9/1/26 | Aaa | 365,000 | 381,407 | ||
| (Homeownership Loan), Ser. C-2, | |||||
| GNMA Coll., FNMA Coll., 5.7s, 9/1/35 | Aaa | 250,000 | 270,978 | ||
| OK State Indl. Dev. Auth. Rev. Bonds (Hlth. Syst.), | |||||
| Ser. A, MBIA | |||||
| 5 3/4s, 8/15/29 | AAA | 580,000 | 624,811 | ||
| 5 3/4s, 8/15/29 (Prerefunded) | AAA | 420,000 | 463,113 | ||
| 1,740,309 | |||||
| Oregon (1.2%) | |||||
| Multnomah Cnty., Hosp. Fac. Auth. Rev. Bonds | |||||
| (Terwilliger Plaza), 6 1/2s, 12/1/29 | BB–/P | 1,000,000 | 1,017,610 | ||
| OR State Hsg. & Cmnty. Svcs. Dept. Rev. Bonds | |||||
| (Single Family Mtg.), Ser. K, 5 5/8s, 7/1/29 | Aa2 | 940,000 | 983,860 | ||
| 2,001,470 | |||||
| Pennsylvania (7.5%) | |||||
| Allegheny Cnty., Hosp. Dev. Auth. Rev. Bonds | |||||
| (Hlth. Syst.), Ser. B | |||||
| 9 1/4s, 11/15/22 | B1 | 195,000 | 233,710 | ||
| 9 1/4s, 11/15/15 | B1 | 605,000 | 728,141 | ||
| Allegheny Cnty., Indl. Dev. Auth. Rev. Bonds | |||||
| (Env. Impt. - USX Corp.), 6s, 1/15/14 | Baa1 | 750,000 | 789,862 | ||
| Carbon Cnty., Indl. Dev. Auth. Rev. Bonds | |||||
| (Panther Creek Partners), 6.65s, 5/1/10 | BBB– | 800,000 | 853,039 | ||
| Erie-Western PA Port Auth. Rev. Bonds, | |||||
| 6 1/4s, 6/15/10 | BBB–/F | 615,000 | 640,755 | ||
| Lancaster Cnty., Hosp. Auth. Rev. Bonds | |||||
| (Gen. Hosp.), 5 1/2s, 3/15/26 | A | 250,000 | 264,312 | ||
| Montgomery Cnty., Indl. Auth. Resource Recvy. | |||||
| Rev. Bonds (Whitemarsh Cont Care), 6 1/4s, 2/1/35 | B/P | 400,000 | 417,167 | ||
36
| MUNICIPAL BONDS AND NOTES (123.8%)* continued | |||||
| Rating ** | Principal amount | Value | |||
| Pennsylvania continued | |||||
| PA Convention Ctr. Auth. Rev. Bonds, Ser. A, | |||||
| 6 3/4s, 9/1/19 | Baa2 | $ | 750,000 | $ | 764,939 |
| PA Econ. Dev. Fin. Auth. Rev. Bonds (MacMillan Ltd. | |||||
| Partnership), 7.6s, 12/1/20 (Prerefunded) | Baa2 | 3,250,000 | 3,338,237 | ||
| PA State Econ. Dev. Fin. Auth. Resource Recvy. | |||||
| Rev. Bonds (Northampton Generating), Ser. A, | |||||
| 6.6s, 1/1/19 | BB | 2,000,000 | 2,015,199 | ||
| PA State Higher Edl. Fac. Auth. Rev. Bonds | |||||
| (Philadelphia College of Osteopathic Medicine), | |||||
| 5s, 12/1/12 | A | 1,280,000 | 1,352,370 | ||
| Philadelphia, Indl. Dev. Auth. Arpt. Rev. Bonds | |||||
| (Aero Philadelphia, LLC), 5 1/2s, 1/1/24 | BB/P | 750,000 | 751,110 | ||
| Scranton, G.O. Bonds, Ser. C, 7.1s, | |||||
| 9/1/31 (Prerefunded) | AAA/P | 750,000 | 893,775 | ||
| 13,042,616 | |||||
| Puerto Rico (0.6%) | |||||
| PR Indl. Tourist Edl. Med. & Env. Control Fac. | |||||
| Rev. Bonds (Cogen. Fac.-AES), 6 5/8s, 6/1/26 | Baa3 | 1,000,000 | 1,081,100 | ||
| Rhode Island (1.2%) | |||||
| Tobacco Settlement Fin. Corp. Rev. Bonds, Ser. A, | |||||
| 6 1/8s, 6/1/32 | BBB | 2,025,000 | 2,150,125 | ||
| South Carolina (1.8%) | |||||
| Lexington Cnty. Hlth. Svcs. Dist. Inc. Hosp. | |||||
| Rev. Bonds, 5 1/2s, 5/1/37 | A2 | 1,250,000 | 1,327,088 | ||
| SC Jobs Econ. Dev. Auth. Hosp. Fac. Rev. Bonds | |||||
| (Palmetto Hlth. Alliance) | |||||
| Ser. A, 7 3/8s, 12/15/21 (Prerefunded) | BBB+/F | 600,000 | 719,214 | ||
| Ser. C, 6s, 8/1/20 | Baa1 | 1,000,000 | 1,089,660 | ||
| 3,135,962 | |||||
| South Dakota (1.3%) | |||||
| SD Hsg. Dev. Auth. Rev. Bonds (Home Ownership | |||||
| Mtg.), Ser. H, 5s, 5/1/28 | AAA | 915,000 | 944,911 | ||
| SD State Hlth. & Edl. Fac. Auth. Rev. Bonds | |||||
| (Prairie Lakes), 5.65s, 4/1/22 | Baa1 | 1,250,000 | 1,316,475 | ||
| 2,261,386 | |||||
| Tennessee (1.9%) | |||||
| Johnson City, Hlth. & Edl. Fac. Board Hosp. | |||||
| Rev. Bonds (First Mtge. -Mountain States Hlth.), | |||||
| Ser. A, 7 1/2s, 7/1/33 | BBB+ | 1,500,000 | 1,775,820 | ||
| Johnson City, Hlth. & Edl. Facs. Board Retirement Fac. | |||||
| Rev. Bonds (Appalachian Christian Village), Ser. A, | |||||
| 6 1/4s, 2/15/32 | BB–/P | 400,000 | 405,756 | ||
37
| MUNICIPAL BONDS AND NOTES (123.8%)* continued | |||||
| Rating ** | Principal amount | Value | |||
| Tennessee continued | |||||
| Shelby Cnty., Hlth. Edl. & Hsg. Fac. Hosp. Board | |||||
| Rev. Bonds (Methodist Hlth. Care) | |||||
| 6 1/2s, 9/1/26 (Prerefunded) | A3 | $ | 625,000 | $ | 736,175 |
| 6 1/2s, 9/1/26 (Prerefunded) | A3 | 375,000 | 441,705 | ||
| 3,359,456 | |||||
| Texas (5.6%) | |||||
| Abilene, Hlth. Fac. Dev. Corp. Rev. Bonds | |||||
| (Sears Methodist Retirement), 5 7/8s, 11/15/18 | BB/P | 1,000,000 | 1,018,790 | ||
| Fort Worth, Higher Ed. Fin. Corp. Rev. Bonds | |||||
| (Wesleyan U.), Ser. A, 6s, 10/1/12 | Ba2 | 400,000 | 408,620 | ||
| Harris Cnty., Hlth. Fac. Dev. Corp. Hosp. | |||||
| Rev. Bonds (Memorial Hermann Hlth. Care Syst.), | |||||
| Ser. A, 5 1/4s, 12/1/18 | A2 | 700,000 | 751,492 | ||
| Houston, Arpt. Syst. Rev. Bonds | |||||
| (Continental Airlines, Inc.), Ser. E, 6 3/4s, 7/1/29 | B– | 1,450,000 | 1,255,657 | ||
| Ser. B, FSA, 5 1/2s, 7/1/30 | Aaa | 1,800,000 | 1,927,422 | ||
| Lufkin, Hlth. Fac. Dev. Corp. Rev. Bonds | |||||
| (Memorial Hlth. Syst. of East TX), 5.7s, 2/15/28 | BBB+ | 250,000 | 258,345 | ||
| Tomball, Hosp. Auth. Rev. Bonds | |||||
| (Tomball Regl. Hosp.), 6s, 7/1/29 | Baa3 | 2,150,000 | 2,203,148 | ||
| TX State Dept. of Hsg. & Cmnty. Affairs | |||||
| Rev. Bonds, Ser. C, GNMA/FNMA Coll., | |||||
| 6.9s, 7/2/24 # | AAA | 1,850,000 | 1,849,519 | ||
| 9,672,993 | |||||
| Utah (3.1%) | |||||
| Carbon Cnty., Solid Waste Disp. Rev. Bonds | |||||
| (Laidlaw Env.), Ser. A, 7 1/2s, 2/1/10 | BB– | 800,000 | 825,000 | ||
| Tooele Cnty., Harbor & Term. Dist. Port Fac. | |||||
| Rev. Bonds (Union Pacific), Ser. A, 5.7s, 11/1/26 | Baa2 | 1,500,000 | 1,562,790 | ||
| UT Cnty., Env. Impt. Rev. Bonds (Marathon Oil), | |||||
| 5.05s, 11/1/17 | Baa1 | 750,000 | 794,235 | ||
| UT State Board Regents Rev. Bonds (Hosp. U. UT), | |||||
| Ser. A, MBIA, 5s, 8/1/13 | Aaa | 2,000,000 | 2,162,400 | ||
| 5,344,425 | |||||
| Vermont (1.1%) | |||||
| VT Hsg. Fin. Agcy. Rev. Bonds, Ser. 19A, FSA, | |||||
| 4.62s, 5/1/29 | Aaa | 1,950,000 | 1,977,924 | ||
| Virginia (1.6%) | |||||
| Henrico Cnty. Econ. Dev. Auth. Rev. Bonds | |||||
| (United Methodist), Ser. A, 6.7s, 6/1/27 | BB+/P | 400,000 | 422,720 | ||
| Henrico Cnty., Econ. Dev. Auth. Rev. Bonds | |||||
| (United Methodist), Ser. A, 6 1/2s, 6/1/22 | BB+/P | 600,000 | 638,850 | ||
38
| MUNICIPAL BONDS AND NOTES (123.8%)* continued | |||||
| Rating ** | Principal amount | Value | |||
| Virginia continued | |||||
| James Cnty., Indl. Dev. Auth. Rev. Bonds | |||||
| (Williamsburg), Ser. A, 6 1/8s, 3/1/32 | BB–/P | $ | 500,000 | $ | 524,655 |
| Prince William Cnty., Indl. Dev. Auth. Hosp. | |||||
| Rev. Bonds (Potomac Hosp. Corp.), 5.35s, 10/1/36 | A3 | 1,000,000 | 1,044,850 | ||
| Winchester, Indl. Dev. Auth. Residential Care Fac. | |||||
| Rev. Bonds (Westminster-Canterbury), Ser. A, | |||||
| 5.2s, 1/1/27 | BB/P | 200,000 | 201,722 | ||
| 2,832,797 | |||||
| Washington (0.3%) | |||||
| Tobacco Settlement Auth. of WA Rev. Bonds, | |||||
| 6 1/2s, 6/1/26 | BBB | 490,000 | 544,459 | ||
| West Virginia (0.4%) | |||||
| Princeton, Hosp. Rev. Bonds (Cmnty. Hosp. | |||||
| Assn., Inc.), 6.1s, 5/1/29 | B2 | 825,000 | 732,039 | ||
| Wisconsin (1.9%) | |||||
| Badger Tobacco Settlement Asset Securitization Corp. | |||||
| Rev. Bonds, 6 3/8s, 6/1/32 | BBB | 1,500,000 | 1,628,670 | ||
| WI State Hlth. & Edl. Fac. Auth. Rev. Bonds | |||||
| (Wheaton Franciscan), 5 3/4s, 8/15/30 | A2 | 1,600,000 | 1,705,984 | ||
| 3,334,654 | |||||
| Total municipal bonds and notes (cost $207,105,539) | $ | 215,845,601 | |||
| COMMON STOCKS (--%)* (cost $1,428,766) | |||||
| Shares | Value | ||||
| Tembec, Inc. (Canada) † | 29,974 | $ | 67,166 | ||
| TOTAL INVESTMENTS | |||||
| Total investments (cost $208,534,305) | $ | 215,912,767 | |||
| * | Percentages indicated are based on net assets of $174,283,990. |
| ** | The Moody’s or Standard & Poor’s ratings indicated are believed to be the most recent ratings available at September 30, 2005 for the securities listed. Ratings are generally ascribed to securities at the time of issuance. While the agencies may from time to time revise such ratings, they undertake no obligation to do so, and the ratings do not necessarily represent what the agencies would ascribe to these securities at September 30, 2005.Securities rated by Fitch are indicated by “/F” . |
| Securities rated by Putnam are indicated by “/P” . Security ratings are defined in the Statement of Additional Information. | |
| † Non-income-producing security. |
++ Restricted, excluding 144A securities, as to public resale. The total market value of restricted securities held at September 30, 2005 was $1,267,008 or less than 0.7% of net assets.
++++ A portion of this security was pledged and segregated with the custodian to cover margin requirements for futures contracts at September 30, 2005.
39
144A after the name of a security represents those exempt from registration under Rule 144A of the Securities Act of 1933. These securities may be resold in transactions exempt from registration, normally to qualified institutional buyers. The rates shown on VRDN and Mandatory Put Bonds, are the current interest rates at September 30, 2005.
The dates shown on Mandatory Put Bonds are the next mandatory put dates.
The fund had the following industry group concentrations greater than 10% at September 30, 2005 (as a percentage of net assets):
| Health care | 46.0% | |||
| Utilities | 14.5 | |||
| Transportation | 11.3 | |||
| FUTURES CONTRACTS OUTSTANDING at 9/30/05 (Unaudited) | ||||
| Number of | Expiration | Unrealized | ||
| contracts | Value | date | appreciation | |
| U.S. Treasury Bond (Long) | 93 | $10,639,781 | Dec-05 | $206,069 |
The accompanying notes are an integral part of these financial statements.
40
| Statement of assets and liabilities 9/30/05 (Unaudited) | |
| ASSETS | |
| Investment in securities, at value (Note 1): | |
| Unaffiliated issuers (identified cost $208,534,305) | $215,912,767 |
| Cash | 919,455 |
| Interest and other receivables | 3,568,757 |
| Receivable for securities sold | 1,498,161 |
| Receivable for variation margin (Note 1) | 34,875 |
| Total assets | 221,934,015 |
| LIABILITIES | |
| Distributions payable to shareholders | 700,056 |
| Accrued preferred shares distribution payable (Note 1) | 6,657 |
| Payable for securities purchased | 1,427,168 |
| Payable for compensation of Manager (Note 2) | 391,304 |
| Payable for investor servicing and custodian fees (Note 2) | 26,324 |
| Payable for Trustee compensation and expenses (Note 2) | 38,935 |
| Payable for administrative services (Note 2) | 2,647 |
| Other accrued expenses | 56,934 |
| Total liabilities | 2,650,025 |
| Series A remarketed preferred shares: (8,000 shares authorized; | |
| 900 shares issued at $50,000 per share (Note 4) | 45,000,000 |
| Net assets | $174,283,990 |
| REPRESENTED BY | |
| Paid-in capital -- common shares (Unlimited shares authorized) (Note 1) | $201,220,227 |
| Undistributed net investment income (Note 1) | 17,429 |
| Accumulated net realized loss on investments (Note 1) | (34,538,197) |
| Net unrealized appreciation of investments | 7,584,531 |
| Total -- Representing net assets applicable to common shares outstanding | $174,283,990 |
| COMPUTATION OF NET ASSET VALUE | |
| Net asset value per common share | |
| ($174,283,990 divided by 22,267,310 shares) | $7.83 |
The accompanying notes are an integral part of these financial statements.
41
| Statement of operations Six months ended 9/30/05 (Unaudited) | |
| INTEREST INCOME | $5,895,672 |
| EXPENSES | |
| Compensation of Manager (Note 2) | 777,739 |
| Investor servicing fees (Note 2) | 43,608 |
| Custodian fees (Note 2) | 51,805 |
| Trustee compensation and expenses (Note 2) | 12,227 |
| Administrative services (Note 2) | 7,582 |
| Preferred share remarketing agent fees | 60,421 |
| Other | 88,252 |
| Total expenses | 1,041,634 |
| Expense reduction (Note 2) | (34,262) |
| Net expenses | 1,007,372 |
| Net investment income | 4,888,300 |
| Net realized gain on investments (Notes 1 and 3) | 163,491 |
| Net realized loss on futures contracts (Note 1) | (411,380) |
| Net unrealized appreciation of investments | |
| and futures contracts during the period | 2,587,334 |
| Net gain on investments | 2,339,445 |
| Net increase in net assets resulting from operations | $7,227,745 |
| DISTRIBUTIONS TO SERIES A REMARKETED PREFERRED SHAREHOLDERS: (NOTE 1) | |
| From tax exempt income | (552,511) |
| Net increase in net assets resulting from operations (applicable to common shareholders) | $6,675,234 |
The accompanying notes are an integral part of these financial statements.
42
| Statement of changes in net assets | ||
| INCREASE (DECREASE) IN NET ASSETS | ||
| Six month s ended | Year ended | |
| 9/30/05* | 3/31/05 | |
| Operations: | ||
| Net investment income | $ 4,888,300 | $ 9,623,015 |
| Net realized loss on investments | (247,889) | (4,427,854) |
| Net unrealized appreciation of investments | 2,587,334 | 3,194,399 |
| DISTRIBUTIONS TO SERIES A REMARKETED PREFERRED SHAREHOLDERS: (NOTE 1) | ||
| From tax exempt income | (552,511) | (644,013) |
| From ordinary income | -- | (2,126) |
| Net increase in net assets resulting | ||
| from operations (applicable to common shareholders) | 6,675,234 | 7,743,421 |
| DISTRIBUTIONS TO COMMON SHAREHOLDERS: (NOTE 1) | ||
| From tax exempt income | (4,194,933) | (8,717,234) |
| From ordinary income | -- | (37,852) |
| Total increase (decrease) in net assets | 2,480,301 | (1,011,665) |
| NET ASSETS | ||
| Beginning of period | 171,803,689 | 172,815,354 |
| End of period (including undistributed net investment | ||
| income of $17,429 and distributions in excess of net | ||
| investment income of $123,427, respectively) | $174,283,990 | $171,803,689 |
| NUMBER OF FUND SHARES | ||
| Common shares outstanding at beginning and end of period | 22,267,310 | 22,267,310 |
| Remarketed preferred shares outstanding at beginning | ||
| and end of period | 900 | 900 |
| * Unaudited | ||
The accompanying notes are an integral part of these financial statements.
43
Financial highlights (For a common share outstanding throughout the period)
| PER-SHARE OPERATING PERFORMANCE | ||||||
| Six months ended** | Year ended | |||||
| 9/30/05 | 3/31/05 | 3/31/04 | 3/31/03 | 3/31/02 | 3/31/01 | |
| Net asset value, | ||||||
| beginning of period | ||||||
| (common shares) | $7.72 | $7.76 | $7.53 | $7.79 | $8.22 | $8.18 |
| Investment operations: | ||||||
| Net investment income | .22 | .43 | .47 | .55 | .61 | .63 |
| Net realized and unrealized | ||||||
| gain (loss) on investments | .10 | (.05) | .22 | (.26) | (.46) | .06 |
| Total from | ||||||
| investment operations | .32 | .38 | .69 | .29 | .15 | .69 |
| Distributions to preferred shareholders: | ||||||
| From net investment income | (.02) | (.03) | (.02) | (.03) | (.04) | (.08) |
| Total from investment operations: | ||||||
| (applicable to | ||||||
| common shareholders) | .30 | .35 | .67 | .26 | .11 | .61 |
| Distributions to common shareholders: | ||||||
| From net investment income | (.19) | (.39) | (.44) | (.52) | (.54) | (.57) |
| Total distributions | (.19) | (.39) | (.44) | (.52) | (.54) | (.57) |
| Net asset value, end of period | ||||||
| (common shares) | $7.83 | $7.72 | $7.76 | $7.53 | $7.79 | $8.22 |
| Market value, end of period | ||||||
| (common shares) | $6.94 | $6.67 | $7.04 | $6.97 | $7.59 | $8.22 |
| Total return at | ||||||
| market value (%) | ||||||
| (common shares) (a) | 6.85* | 0.50 | 7.54 | (1.55) | (1.23) | 21.63 |
| RATIOS AND SUPPLEMENTAL DATA | ||||||
| Net assets, end of period | ||||||
| (common shares) | ||||||
| (in thousands) | $174,284 | $171,804 | $172,815 | $167,734 | $173,406 | $182,614 |
| Ratio of expenses to | ||||||
| average net assets (%)(b,c) | .60* | 1.19 | 1.16 | 1.17 | 1.15 | 1.14 |
| Ratio of net investment income | ||||||
| to average net assets (%)(b) | 2.48* | 5.26 | 5.84 | 6.70 | 7.04 | 6.74 |
| Portfolio turnover (%) | 10.76* | 24.67 | 36.95 | 34.56 | 18.38 | 12.30 |
* Not annualized.
** Unaudited.
(a) Total return assumes dividend reinvestment.
(b) Ratios reflect net assets available to common shares only; net investment income ratio also reflects reduction for dividend payments to preferred shareholders.
(c) The ratio of expenses to average net assets includes amounts paid through expense offset arrangements (Note 2).
The accompanying notes are an integral part of these financial statements.
44
Notes to financial statements 9/30/05 (Unaudited)
Note 1: Significant accounting policies
Putnam High Yield Municipal Trust (the “fund”), a Massachusetts business trust, is registered under the Investment Company Act of 1940, as amended, as a diversified, closed-end management investment company. The fund’s investment objective is to seek high current income exempt from federal income tax. The fund intends to achieve its objective by investing in high yielding tax-exempt municipal securities constituting a portfolio that the fund’s manager, Putnam Investment Management, LLC, (“Putnam Management”), an indirect wholly owned subsidiary of Putnam, LLC, believes to be consistent with prudent investment management. The fund invests in higher yielding, lower rated bonds that have a higher rate of default. In the normal course of business, the fund enters into contracts that may include agreements to indemnify another party under given circumstances. The fund’s maximum exposure under these arrangements is unknown as this would involve future claims that may be, but have not yet been, made against the fund. However, the fund expects the risk of material loss to be remote.
The following is a summary of significant accounting policies consistently followed by the fund in the preparation of its financial statements. The preparation of financial statements is in conformity with accounting principles generally accepted in the United States of America and requires management to make estimates and assumptions that affect the reported amounts of assets and liabilities in the financial statements and the reported amounts of increases and decreases in net assets from operations during the reporting period. Actual results could differ from those estimates.
A) Security valuation Tax-exempt bonds and notes are valued on the basis of valuations provided by an independent pricing service, approved by the Trustees. Such services use information with respect to transactions in bonds, quotations from bond dealers, market transactions in comparable securities and various relationships between securities in determining value. Other investments are valued at fair value following procedures approved by the Trustees. Such valuations and procedures are reviewed periodically by the Trustees.
B) Security transactions and related investment income Security transactions are recorded on the trade date (date the order to buy or sell is executed). Gains or losses on securities sold are determined on the identified cost basis. Interest income is recorded on the accrual basis. Non-cash dividends, if any, are recorded at the fair market value of the securities received. All premiums/discounts are amortized/accreted on a yield-to-maturity basis. The premium in excess of the call price, if any, is amortized to the call date; thereafter, any remaining premium is amortized to maturity.
C) Futures and options contracts The fund may use futures and options contracts to hedge against changes in the values of securities the fund owns or expects to purchase. The fund may also write options on securities it owns or in which it may invest, or swaps, to increase its current returns.
The potential risk to the fund is that the change in value of futures and options contracts may not correspond to the change in value of the hedged instruments. In addition, losses may arise from changes in the value of the underlying instruments, if there is an illiquid secondary market for the contracts, or if the counterparty to the contract is unable to perform. Risks may exceed amounts recognized on the statement of assets and liabilities. When the contract is closed, the fund records a realized gain or loss equal to the difference between the value of the contract at the time it was opened and the value at the time it was closed. Realized gains and losses on purchased options are included in realized gains and losses on investment securities. If a written call option is exercised, the premium originally received is recorded as an addition to sales proceeds. If a written put option is exercised, the premium originally received is recorded as a reduction to the cost of investments.
45
Futures contracts are valued at the quoted daily settlement prices established by the exchange on which they trade. The fund and the broker agree to exchange an amount of cash equal to the daily fluctuation in the value of the futures contract. Such receipts or payments are known as “variation margin.” Exchange traded options are valued at the last sale price, or if no sales are reported, the last bid price for purchased options and the last ask price for written options. Options traded over-the-counter are valued using prices supplied by dealers. Futures and written option contracts outstanding at period end, if any, are listed after the fund’s portfolio.
D) Federal taxes It is the policy of the fund to distribute all of its income within the prescribed time and otherwise comply with the provisions of the Internal Revenue Code of 1986 (the “Code”) applicable to regulated investment companies. It is also the intention of the fund to distribute an amount sufficient to avoid imposition of any excise tax under Section 4982 of the Code, as amended. Therefore, no provision has been made for federal taxes on income, capital gains or unrealized appreciation on securities held nor for excise tax on income and capital gains.
At March 31, 2005, the fund had a capital loss carryover of $32,983,001 available to the extent allowed by tax law to offset future capital gains, if any. The amount of the carryover and the expiration dates are:
| Loss Carryover | Expiration | |
| $ | 7,978,665 | March 31, 2006 |
| 3,861,203 | March 31, 2007 | |
| 1,445,345 | March 31, 2008 | |
| 1,742,951 | March 31, 2009 | |
| 865,353 | March 31, 2010 | |
| 678,750 | March 31, 2011 | |
| 12,315,216 | March 31, 2012 | |
| 4,095,518 | March 31, 2013 | |
Pursuant to federal income tax regulations applicable to regulated investment companies, the fund has elected to defer to its fiscal year ending March 31, 2006, $570,356 of losses recognized during the period November 1, 2004 to March 31, 2005.
The aggregate identified cost on a tax basis is $208,526,003, resulting in gross unrealized appreciation and depreciation of $11,348,990 and $3,962,226, respectively, or net unrealized appreciation of $7,386,764.
E) Distributions to shareholders Distributions to common and preferred shareholders from net investment income are recorded by the fund on the ex-dividend date. Distributions from capital gains, if any, are recorded on the ex-dividend date and paid at least annually. Dividends on remarketed preferred shares become payable when, as and if declared by the Trustees. Each dividend period for the remarketed preferred shares is generally a seven day period. The applicable dividend rate for the remarketed preferred shares on September 30, 2005 was 2.70% . The amount and character of income and gains to be distributed are determined in accordance with income tax regulations, which may differ from generally accepted accounting principles. Reclassifications are made to the fund’s capital accounts to reflect income and gains available for distribution (or available capital loss carryovers) under income tax regulations.
F) Determination of net asset value Net asset value of the common shares is determined by dividing the value of all assets of the fund, less all liabilities and the liquidation preference of any outstanding remarketed preferred shares, by the total number of common shares outstanding as of period end.
Note 2: Management fee, administrative services and other transactions
Putnam Management is paid for management and investment advisory services quarterly based on the average net assets of the fund. Such fee is
46
based on the annual rate of 0.70% of average weekly net assets attributable to common and preferred shares.
In June 2005, the Trustees and Putnam Management agreed to a reduced management fee structure for the fund that will go into effect on January 1, 2006. Effective on that date, the fund’s management fee is expected to be an annual rate of 0.55% of the weekly average net assets of the fund (based on the fund’s current asset level), with additional breakpoints leading to lower fee rates at higher asset levels.
If dividends payable on remarketed preferred shares during any dividend payment period plus any expenses attributable to remarketed preferred shares for that period exceed the fund’s gross income attributable to the proceeds of the remarketed preferred shares during that period, then the fee payable to Putnam Management for that period will be reduced by the amount of the excess (but not more than .70% of the liquidation preference of the remarketed preferred shares outstanding during the period).
The fund reimburses Putnam Management an allocated amount for the compensation and related expenses of certain officers of the fund and their staff who provide administrative services to the fund. The aggregate amount of all such reimbursements is determined annually by the Trustees.
Custodial functions for the fund’s assets are provided by Putnam Fiduciary Trust Company (“PFTC”), a subsidiary of Putnam, LLC. PFTC receives fees for custody services based on the fund’s asset level, the number of its security holdings and transaction volumes. Putnam Investor Services, a division of PFTC, provides investor servicing agent functions to the fund. Putnam Investor Services is paid a monthly fee for investor servicing at an annual rate of 0.05% of the fund’s average net assets. During the six months ended September 30, 2005, the fund paid PFTC $95,413 for these services.
The fund has entered into an arrangement with PFTC whereby credits realized as a result of uninvested cash balances are used to reduce a portion of the fund’s expenses. For the six months ended September 30, 2005, the fund’s expenses were reduced by $34,262 under these arrangements.
Each independent Trustee of the fund receives an annual Trustee fee, of which $256, as a quarterly retainer, has been allocated to the fund, and an additional fee for each Trustees meeting attended. Trustees receive additional fees for attendance at certain committee meetings. George Putnam III, who is not an independent Trustee, also receives the foregoing fees for his services as Trustee.
The fund has adopted a Trustee Fee Deferral Plan (the “Deferral Plan”) which allows the Trustees to defer the receipt of all or a portion of Trustees fees payable on or after July 1, 1995. The deferred fees remain invested in certain Putnam funds until distribution in accordance with the Deferral Plan. The fund has adopted an unfunded noncontribu-tory defined benefit pension plan (the “Pension Plan”) covering all Trustees of the fund who have served as a Trustee for at least five years. Benefits under the Pension Plan are equal to 50% of the Trustee’s average total retainer and meeting fees for the three years preceding retirement. Pension expense for the fund is included in Trustee compensation and expenses in the statement of operations. Accrued pension liability is included in Payable for Trustee compensation and expenses in the statement of assets and liabilities. The Trustees have terminated the Pension Plan with respect to any Trustee first elected after 2003.
Note 3: Purchases and sales of securities
During the six months ended September 30, 2005, cost of purchases and proceeds from sales of investment securities other than short-term investments aggregated $26,554,689 and $22,443,776, respectively. There were no purchases or sales of U.S. government securities.
47
Note 4: Remarketed preferred shares
The Series A shares are redeemable at the option of the fund on any dividend payment date at a redemption price of $50,000 per share, plus an amount equal to any dividends accumulated on a daily basis but unpaid through the redemption date (whether or not such dividends have been declared) and, in certain circumstances, a call premium.
It is anticipated that dividends paid to holders of remarketed preferred shares will be considered tax-exempt dividends under the Internal Revenue Code of 1986. To the extent that the fund earns taxable income and capital gains by the conclusion of a fiscal year, it may be required to apportion to the holders of the remarketed preferred shares throughout that year additional dividends as necessary to result in an after-tax equivalent to the applicable dividend rate for the period.
Under the Investment Company Act of 1940, the fund is required to maintain asset coverage of at least 200% with respect to the remarketed preferred shares as of the last business day of each month in which any such shares are outstanding. Additionally, the fund is required to meet more stringent asset coverage requirements under terms of the remarketed preferred shares and the shares’ rating agencies. Should these requirements not be met, or should dividends accrued on the remarketed preferred shares not be paid, the fund may be restricted in its ability to declare dividends to common shareholders or may be required to redeem certain of the remar-keted preferred shares. At September 30, 2005, no such restrictions have been placed on the fund.
Note 5: Regulatory matters and litigation
Putnam Management has entered into agreements with the Securities and Exchange Commission and the Massachusetts Securities Division settling charges connected with excessive short-term trading by Putnam employees and, in the case of the charges brought by the Massachusetts Securities Division, by participants in some Putnam-administered 401(k) plans. Pursuant to these settlement agreements, Putnam Management will pay a total of $193.5 million in penalties and restitution, with $153.5 million being paid to shareholders and the funds. The amount will be allocated to shareholders and funds pursuant to a plan developed by an independent consultant, and will be paid following approval of the plan by the SEC and the Massachusetts Securities Division.
The Securities and Exchange Commission’s and Massachusetts Securities Division’s allegations and related matters also serve as the general basis for numerous lawsuits, including purported class action lawsuits filed against Putnam Management and certain related parties, including certain Putnam funds. Putnam Management will bear any costs incurred by Putnam funds in connection with these lawsuits. Putnam Management believes that the likelihood that the pending private lawsuits and purported class action lawsuits will have a material adverse financial impact on the fund is remote, and the pending actions are not likely to materially affect its ability to provide investment management services to its clients, including the Putnam funds.
Putnam Management and Putnam Retail Management are named as defendants in a civil suit in which the plaintiffs allege that the management and distribution fees paid by certain Putnam funds were excessive and seek recovery under the Investment Company Act of 1940. Putnam Management and Putnam Retail Management have contested the plaintiffs’ claims and the matter is currently pending in the U.S. District Court for the District of Massachusetts. Based on currently available information, Putnam Management believes that this action is without merit and that it is unlikely to have a material effect on Putnam Management’s and Putnam Retail Management’s ability to provide services to their clients, including the fund.
48
| Federal tax information (Unaudited) |
The Form 1099 you receive in January 2006 will show the tax status of all distributions paid to your account in calendar 2005.
49
| Shareholder meeting results (Unaudited) |
The annual meeting of shareholders of the fund was held on October 28, 2005.
At the meeting, each of the nominees for Trustees was elected, as follows:
| Common and Preferred shares | |||
| Votes for | Votes withheld | ||
| Jameson A. Baxter | 18,012,538 | 1,147,389 | |
| Charles B. Curtis | 18,015,361 | 1,144,566 | |
| Myra R. Drucker | 18,028,681 | 1,131,246 | |
| Charles E. Haldeman, Jr. | 17,992,903 | 1,167,024 | |
| Paul L. Joskow | 18,023,900 | 1,136,027 | |
| Elizabeth T. Kennan | 18,014,791 | 1,145,136 | |
| John H. Mullin, III | 18,016,462 | 1,143,465 | |
| George Putnam, III | 18,005,283 | 1,154,644 | |
| W. Thomas Stephens | 18,028,900 | 1,131,027 | |
| Richard B. Worley | 18,012,023 | 1,147,904 | |
| Preferred shares | |||
| Votes for | Votes withheld | ||
| John A. Hill | 815 | 51 | |
| Robert E. Patterson | 815 | 51 | |
A proposal to convert the fund to an open-end investment company and approve certain related changes to the fund’s Agreement and Declaration of Trust was defeated as follows:
| Common shares | |||
| Votes for | Votes against | Abstentions | |
| 2,227,504 | 6,255,264 | 10,676,292 | |
| Preferred shares | |||
| Votes for | Votes against | Abstentions | |
| 0 | 380 | 486 | |
| All tabulations are rounded to nearest whole number. | |||
50
Fund information
About Putnam Investments
Founded over 65 years ago, Putnam Investments was built around the concept that a balance between risk and reward is the hallmark of a well-rounded financial program. We manage over 100 mutual funds in growth, value, blend, fixed income, and international.
| Investment Manager Putnam Investment Management, LLC One Post Office Square Boston, MA 02109 Marketing Services Putnam Retail Management One Post Office Square Boston, MA 02109 Custodian Putnam Fiduciary Trust Company Legal Counsel Ropes & Gray LLP Trustees John A. Hill, Chairman Jameson Adkins Baxter Charles B. Curtis Myra R. Drucker Charles E. Haldeman, Jr. Paul L. Joskow Elizabeth T. Kennan John H. Mullin, III Robert E. Patterson George Putnam, III |
| W. Thomas Stephens Richard B. Worley Officers George Putnam, III President Charles E. Porter Executive Vice President, Associate Treasurer and Principal Executive Officer Jonathan S. Horwitz Senior Vice President and Treasurer Steven D. Krichmar Vice President and Principal Financial Officer Michael T. Healy Assistant Treasurer and Principal Accounting Officer Daniel T. Gallagher Senior Vice President, Staff Counsel and Compliance Liaison Beth S. Mazor Vice President |
Vice President
Richard S. Robie, III
Vice President
Mark C. Trenchard
Vice President and BSA Compliance Officer
Francis J. McNamara, III
Vice President and Chief Legal Officer
Charles A. Ruys de Perez
Vice President and Chief Compliance Officer
Judith Cohen
Vice President, Clerk and Assistant Treasurer
Wanda M. McManus
Vice President, Senior Associate Treasurer and Assistant Clerk
Nancy T. Florek
Vice President, Assistant Clerk, Assistant Treasurer and Proxy Manager
51
Call 1-800-225-1581 weekdays from 9 a.m. to 5 p.m. Eastern Time, or visit our Web site (www.putnam.com) any time for up-to-date information about the fund’s NAV.
52

| Item 2. Code of Ethics: Not applicable Item 3. Audit Committee Financial Expert: Not applicable Item 4. Principal Accountant Fees and Services: Not applicable Item 5. Audit Committee: Not applicable Item 6. Schedule of Investments: Not applicable Item 7. Disclosure of Proxy Voting Policies and Procedures For Closed-End Management Investment Companies: Not applicable Item 8. Purchases of Equity Securities by Closed-End Management Investment Companies and Affiliated Purchasers: Not applicable Item 9. Submission of Matters to a Vote of Security Holders: Not applicable Item 10. Controls and Procedures: (a) The registrant's principal executive officer and principal financial officer have concluded, based on their evaluation of the effectiveness of the design and operation of the registrant's disclosure controls and procedures as of a date within 90 days of the filing date of this report, that the design and operation of such procedures are generally effective to provide reasonable assurance that information required to be disclosed by the registrant in this report is recorded, processed, summarized and reported within the time periods specified in the Commission's rules and forms. (b) Changes in internal control over financial reporting: Not applicable Item 11. Exhibits: (a) Not applicable (b) A separate certification for each principal executive officer and principal financial officer of the registrant as required by Rule 30a-2 under the Investment Company Act of 1940, as amended, and the officer |
certifications as required by Section 906 of the Sarbanes-Oxley Act of 2002 are filed herewith.
| SIGNATURES |
Pursuant to the requirements of the Securities Exchange Act of 1934 and the Investment Company Act of 1940, the registrant has duly caused this report to be signed on its behalf by the undersigned, thereunto duly authorized.
| NAME OF REGISTRANT By (Signature and Title): /s/ Michael T. Healy Michael T. Healy Principal Accounting Officer Date: November 29, 2005 |
Pursuant to the requirements of the Securities Exchange Act of 1934 and the Investment Company Act of 1940, this report has been signed below by the following persons on behalf of the registrant and in the capacities and on the dates indicated.
| By (Signature and Title): /s/ Charles E. Porter Charles E. Porter Principal Executive Officer Date: November 29, 2005 |
| By (Signature and Title): /s/Steven D. Krichmar Steven D. Krichmar Principal Financial Officer Date: November 29, 2005 |