August 14, 2013
Mr. Rufus Decker,
Accounting Branch Chief,
Securities and Exchange Commission,
100 F Street, N.E.,
Washington, DC 20549-4631,
USA.
Dear Mr. Decker,
Thank you for your letter of July 17, 2013 setting forth additional comments of the Staff of the Commission (the "Staff") relating to the Form 20-F for the year ended December 31, 2012 (the "2012 Form 20-F") (File Number 001-32846) of CRH plc (together with its subsidiaries, "CRH", the "Company" or the "Group").
To facilitate the Staff's review of our response, we have included in this letter the caption and numbered comments from the Staff's comment letter in italicised text, and have provided our response immediately following each comment.
Form 20-F for Fiscal Year Ended December 31, 2012
Note 15. Intangible Assets, page 115
Significant goodwill amounts, page 116
| 1. | We have reviewed your response to prior comment two from our letter dated June 19, 2013. We note that for 2012 you utilize the prior five years’ historical EBITDA margin for Europe Products to determine the assumed average EBITDA (as defined) margin used in the impairment testing of goodwill. We further note that the historical EBITDA (as defined) margin has decreased from 12.7% in 2007 to 7.3% in 2011. Please address the appropriateness of utilizing the average EBITDA (as defined) margin in light of a downward trending environment and your assessment that the recovery in the European market is now expected to take a number of years. Ensure your response addresses the following: |
| · | We note that the average EBITDA (as defined) margin for Europe Products for the past five years is approximately 8.1%, compared to the forecasted average EBITDA (as defined) margin included in the 2012 Strategic Plan for Europe Products of 9.4%. This reduction in average EBITDA (as defined) margin is greater than the .5 percentage points you identified as being the amount by which this assumption may decline to arrive at a zero excess of the present value of future cash flows over the book value of Europe Product’s net assets; |
| · | You indicate that the recovery in the European market is now expected to take a number of years. Please expand upon this statement and clarify what a number of years refers to; |
| · | Please tell us what your EBITDA margin (as defined) is for the year-to-date; and |
| · | Please address whether you have undertaken any additional significant cost saving and restructuring measures in 2013 to further ensure that you will be better placed to achieve stronger EBITDA margins once confidence and growth returns to the European market. |
1
Response:
We respectfully refer the Staff to Note 15 of the Consolidated Financial Statements (page 115 of the 2012 Form 20-F) where we note that the first 5 years of cash flow forecasts used for goodwill impairment testing are based on our 5-year strategic plan document approved by senior management and the Board of Directors (and not on a 5-year average of historical performance). While our 5-year strategic plan takes historical performance into account, the document is prepared using external data sources and market expectations (including forecasts from Euroconstruct, Buildsight in the Netherlands, the Construction Products Association in the UK and other external sources).
Details of the margins assumed for the first five years in respect of the Europe Products CGU were provided to the Staff in our prior response and a description of our modelling methodology is provided in Note 15 of the Consolidated Financial Statements (page 115 of the 2012 Form 20-F). For the purpose of assisting the Staff’s understanding of the calculations specific to the Europe Products CGU, we also provide the following information and background:
| · | The detailed basis for the year 6 cash flow calculation depends on the circumstances pertaining to each CGU. For Europe Products, it represents a modest increase in EBITDA margins with no increase in sales, with the consequent net cash flow adjusted for inflation |
| · | Thereafter a growth rate equal to inflation (2%) has been assumed for the cash flows |
| · | We average the year 6-10 cash flows and project this average forward for 20 more years; after adjusting for inflation so that there is no real growth, the terminal value is then discounted back to a year 10 value. This modelling methodology of taking 10 years of cashflows and projecting them forward for a further 20 years into a terminal value is in line with what is done for acquisition evaluation |
Historical EBITDA margins for each of the years 2006 to 2012 were included in our prior response to the Staff as they provide a basis for determining the reasonableness of EBITDA margins assumed in the value-in-use (VIU) model to arrive at a long-term (30 years in this case) valuation of the CGU. As noted in our prior response letter, historical EBITDA margins of up to 14% have been achieved by the Europe Products CGU prior to 2006. The historical margins include the effects of foreign exchange translation in addition to items such as restructuring costs during the period 2008 to 2012 and a one-off pension curtailment gain in 2011; the prospective EBITDA margins factored into our impairment modelling exclude these items, and could therefore be expected to be somewhat higher than the published historical EBITDA margins. Taking all these projected and historical factors into account, we consider that the average EBITDA margin of 9.4% assumed in the first 5 years of the value-in-use model was appropriate.
We respectfully submit to the Staff that the determination of EBITDA margins is one assumption amongst a series of key inputs used in determining the long-term cash flows and value-in-use of a CGU. In particular we refer the Staff to the use of a 20-year annuity-based terminal value beyond the initial (10 year) evaluation period and the assumption of zero real growth post year 6, both of which we consider to be prudent. Certain other companies in the building materials sector use assumptions of cash flows continuing into perpetuity in determining their terminal values. If, for example, CRH had used the perpetuity assumption in the case of the Europe Products CGU in 2012 (all other assumptions remaining the same), the excess of value-in-use over the carrying amount would have increased from €140m to approximately €500m. We also note the reduction of approximately 16% in the CGU’s value-in-use between 2011 and 2012 reflecting the changed political and economic environment in Europe, especially in relation to expectations of a prolonged period of lower growth before returning to more normalised growth levels.
2
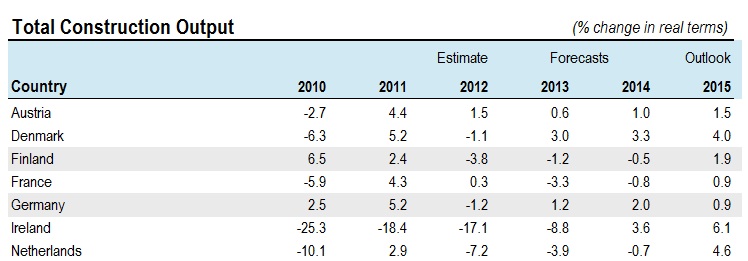
The outlook for the European economy continues to be very difficult to predict. What started out in 2009 / 2010 as a sovereign debt crisis that appeared to be isolated to the peripheral European economies of Greece, Ireland, Portugal and Spain has led to the establishment of a eurozone permanent bailout fund in February 2011, the passing of a European ‘fiscal pact’ in January 2012 and widespread austerity budgets in other eurozone countries since that time. The latest Euroconstruct forecast (extract below from June 2013) presented an updated outlook for the eurozone that showed a decline in construction output from the previous forecast (June 2012) and indicated that the recovery will now take longer than previously envisaged.
As the eurozone recession continues, CRH has continued to implement further cost saving measures in 2013 in the Europe Products CGU. These include further plant closures, rationalisations and re-organisations resulting in €10m of redundancy and re-organisation costs incurred to date in 2013.
Year-to-date sales and profits in Europe Products are currently behind 2012, mainly due to the prolonged winter conditions which severely disrupted new construction activity, especially in the early months of the year. Weather conditions improved somewhat in May and June, and the rate of decline moderated in these months. Our interim results for the 6 months ended 30 June 2013 are due to be released on August 20 and accordingly have not yet been made public. We expect to report an EBITDA margin for the first half of 2013 (after the restructuring costs of €10m referred to above) of 4.7% (5.6% excluding restructuring costs) which is approximately 2 percentage points lower than for the first half of 2012.
Comparison with Americas Products
In order to assist the Staff in better understanding our considerations in projecting the recovery of the Europe Products CGU, we note that a factor in our assessment has been the pattern of recovery in other markets. We have looked to our Americas Products market as an indicator of how market recovery can impact EBITDA margins and our analysis is presented below.
The US economy has seen unemployment fall in 2013 and as a result of improving consumer confidence, our Americas Products business segment is currently exceeding 2012 performance. The table below compares the historical EBITDA margins achieved in both our Europe Products and Americas Products segments.
| EBITDA % | 2012 | 2011 | 2010 | 2009 | 2008 | 2007 | 2006 |
| Americas Products | 7.3% | 6.9% | 6.2% | 6.8% | 11.4% | 13.3% | 14.2% |
| Europe Products | 6.1% | 7.3% | 7.0% | 9.4% | 10.6% | 12.7% | 11.3% |
3
The US economy experienced a severe decline in 2009 (following the collapse of Lehman Brothers) but has started to see evidence of a more sustained recovery since 2011. Our Oldcastle Building Products CGU (which forms part of our Americas Products segment) had previously been subject to sensitivity analysis for goodwill impairment testing but due to the gradual recovery of demand in the US market, coupled with margin benefits from decisive cost-cutting and restructuring, sensitivity analysis was not required in respect of this CGU in 2012. We would anticipate that a similar situation will occur in our Europe Products CGU and that margins will recover quickly once the eurozone economies stabilise and return to more normalised growth patterns.
Business performance in our industry is cyclical and can be difficult to predict, particularly in the current environment. Europe is currently at a low point in the business cycle but we anticipate that it will recover. The actions taken since 2011 by eurozone leaders and the European Central Bank have undoubtedly led to calmer markets but the effect of austerity and low consumer confidence continues to impact the results of the Europe Products CGU. CRH has implemented cost saving measures to ensure the business is well placed to take advantage of a recovery in the business cycle when it occurs (now forecast for 2015). As part of our impairment testing for 2013, the impact of the near-term reduction in the eurozone’s economic outlook and cost saving measures implemented by our management will also be assessed to determine whether they have an impact on the long-term valuation of the CGU. We believe that the CRH methodology in respect of goodwill impairment is prudent and well-supported by externally sourced information and that our 2012 value-in-use model for Europe Products established a supportable long-term valuation using the most reliable forecasts available at the time.
Note 33. Supplemental Guarantor Information, page 145
| 2. | We have reviewed your response to prior comment four from our letter dated June 19, 2013 and have the following additional comments: |
| · | Please tell us whether the operating companies that paid CRH plc €1,000m in dividends are reflected in the CRHA or Non-Guarantor Subsidiaries column. With reference to IAS 7.31 and 34 please separately quantify the dividends paid and indicate where such amounts are classified in each column; and |
| · | We note that in 2012 CRH plc made €695 million in advances to their Non-Guarantor Subsidiaries. With reference to IAS 7.17, please address the appropriateness of presenting these advances in the Non-Guarantor Subsidiaries column within investing activities as opposed to financing activities. Please also address this comment as it relates to the advances from/(to) subsidiary and parent undertaking activities in 2011 and 2010 |
Response:
The operating companies that paid CRH plc €1,000m in dividends in 2012 are reflected in the Non-Guarantor Subsidiaries column. The profit before tax within cash flow from operating activities includes dividends received in 2012 of €1,000m (€13m in 2011 and €9m in 2010) in the CRH column resulting in a net profit before tax for CRH of €672m in 2012 (€704m in 2011 and €527m in 2010); the equivalent dividends paid are included within profit before tax in the Non-Guarantor Subsidiaries column resulting in a net loss before tax for Non-Guarantor Subsidiaries of €340m in 2012 (net profit before tax of €647m in 2011 and net profit before tax of €505m in 2010).
In accordance with IAS 7.34 we have classified these dividends as a component of cash flows from operating activities in order to assist users in determining the ability of subsidiary entities to pay intercompany dividends out of their operating cash flows. The treatment applied in 2012 is consistent with that applied in 2011 and 2010.
4
The advances of €695m made in 2012 by CRH plc and CRHA to their subsidiaries represent intercompany loans granted to subsidiary companies (repayment of €277m of intercompany loans in 2011 and €1,721m in 2010). In accordance with IAS 7.16 (e) and (f) we believe these amounts should be classified as investing activities as they constitute either “cash advances and loans made to other parties (other than advances and loans made by a financial institution)” or “cash receipts from the repayment of advances and loans made to other parties (other than advances and loans of a financial institution)”.
* * *
We acknowledge that the Company is responsible for the adequacy and accuracy of the disclosure in its filings, that Staff comments or changes to disclosure in response to Staff comments do not foreclose the Commission from taking any action with respect to its filings, and that the Company may not assert Staff comments as a defence in any proceeding initiated by the Commission or any person under the federal securities laws of the United States.
* * *
We are available to discuss any of the foregoing with you at your convenience.
Yours sincerely,
/s/ Maeve Carton
Maeve Carton
Finance Director
| cc: | Jeffrey Gordon, Staff Accountant |
| Jeanne Baker, Assistant Chief Accountant | |
| (Securities and Exchange Commission) | |
| Kathryn A. Campbell | |
| (Sullivan & Cromwell LLP) | |
| Breffni Maguire | |
| (Ernst & Young) |
5