UNITED STATES SECURITIES AND EXCHANGE COMMISSION
WASHINGTON, D.C. 20549
FORM 20-F
(Mark One)
| ¨ | REGISTRATION STATEMENT PURSUANT TO SECTION 12(b) OR (g) OF THE SECURITIES EXCHANGE ACT OF 1934 |
OR
| x | ANNUAL REPORT PURSUANT TO SECTION 13 OR 15(d) OF THE SECURITIES EXCHANGE ACT OF 1934 |
For the fiscal year ended: December 31, 2013
OR
| ¨ | TRANSITION REPORT PURSUANT TO SECTION 13 OR 15(d) OF THE SECURITIES EXCHANGE ACT OF 1934 |
For the transition period from to
OR
| ¨ | SHELL COMPANY REPORT PURSUANT TO SECTION 13 OR 15(d) OF THE SECURITIES EXCHANGE ACT OF 1934 |
Date of event requiring this shell company report
Commission file number: 001-32846
CRH public limited company
(Exact name of Registrant as specified in its charter)
Republic of Ireland
(Jurisdiction of incorporation or organisation)
Belgard Castle, Clondalkin, Dublin 22, Ireland
(Address of principal executive offices)
Maeve Carton
Tel: +353 1 404 1000
Fax: +353 1 404 1007
Belgard Castle, Clondalkin, Dublin 22, Ireland
(Name, Telephone, Email and/or Facsimile number and Address of Company Contact Person)
Securities registered or to be registered pursuant to Section 12(b) of the Act.
| | |
Title of Each Class | | Name of Each Exchange On Which Registered |
CRH plc | | |
| Ordinary Shares/Income Shares of €0.34 each** | | The New York Stock Exchange* |
| American Depositary Shares, each representing the right to receive | | The New York Stock Exchange |
| one Ordinary Share | | |
CRH America Inc. | | |
| 4.125% Notes due 2016 guaranteed by CRH plc | | The New York Stock Exchange |
| 6.000% Notes due 2016 guaranteed by CRH plc | | The New York Stock Exchange |
| 8.125% Notes due 2018 guaranteed by CRH plc | | The New York Stock Exchange |
| 5.750% Notes due 2021 guaranteed by CRH plc | | The New York Stock Exchange |
| * | Not for trading but only in connection with the registration of American Depositary Shares, pursuant to the requirements of the Securities and Exchange Commission. |
Securities registered or to be registered pursuant to Section 12(g) of the Act. None
Securities for which there is a reporting obligation pursuant to Section 15(d) of the Act. None
Indicate the number of outstanding shares of each of the issuer’s classes of capital or common stock as of the close of the period covered by the annual report.
| | | | |
Ordinary Shares/Income Shares of€0.34 each ** | | | 739,231,600 | |
5% Cumulative Preference Shares of€1.27 each | | | 50,000 | |
7% ‘A’ Cumulative Preference Shares of€1.27 each | | | 872,000 | |
| ** | Each Income Share is tied to an Ordinary Share and may only be transferred or otherwise dealt with in conjunction with such Ordinary Share. |
Indicate by check mark if the registrant is a well-known seasoned issuer, as defined in Rule 405 of the Securities Act. Yesx No¨
If this report is an annual or transition report, indicate by check mark if the registrant is not required to file reports pursuant to Section 13 or 15(d) of the Securities Exchange Act of 1934. Yes¨ Nox
Note – Checking the box above will not relieve any registrant required to file reports pursuant to Section 13 or 15(d) of the Securities Exchange Act of 1934 from their obligations under those Sections.
Indicate by check mark whether the registrant (1) has filed all reports required to be filed by Section 13 or 15(d) of the Securities Exchange Act of 1934 during the preceding 12 months (or for such shorter period that the registrant was required to file such reports), and (2) has been subject to such filing requirements for the past 90 days. Yesx No¨
Indicate by check mark whether the registrant has submitted electronically and posted on its corporate Web site, if any, every Interactive Data File required to be submitted and posted pursuant to Rule 405 of Regulation S-T (§232.405 of this chapter) during the preceding 12 months (or for such shorter period that the registrant was required to submit and post such files).*** Yes¨ No¨
Indicate by check mark whether the registrant is a large accelerated filer, an accelerated filer, or a non-accelerated filer. See definition of “accelerated filer and large accelerated filer” in Rule 12b-2 of the Exchange Act. (Check one):
| | | | |
| Large accelerated filerx | | Accelerated filer¨ | | Non-accelerated filer¨ |
Indicate by check mark which basis of accounting the registrant has used to prepare the financial statements included in this filing:
| | | | |
| U.S. GAAP¨ | | International Financial Reporting Standards as issued | | Other¨ |
| | by the International Accounting Standards Boardx | | |
If “Other” has been checked in response to the previous question, indicate by check mark which financial statement item the registrant has elected to follow. Item 17¨ Item 18¨
If this is an annual report, indicate by check mark whether the registrant is a shell company (as defined in Rule 12b-2 of the Exchange Act).
Yes¨ Nox
| *** | This requirement does not yet apply to the registrant. |

Oldcastle Precast supplied concrete structures ranging
from 2.5 metres to 16 metres long in the Colton Crossing
Rail project, California, USA. The project included a
2.3 kilometres overpass that raised the Union Pacific
Railroad’s east-west tracks 13 metres over the BNSF
north-south tracks.

Cross Reference to Form 20-F
This table has been provided as a cross reference from the information included in this Annual Report to the requirements of this 20-F.
| | | | | | | | |
| | | | | | | Page | |
| |
| Introduction and Performance Measures | | | 5 | |
| |
| | | |
| PART I | | | | | | | | |
|
| |
| Item 1. | | Identity of Directors,
Senior Management and Advisors | | | n/a | |
| |
| | |
| Item 2. | | Offer Statistics and Expected Timetable | | | n/a | |
|
| |
| | |
| Item 3. | | Key Information | | | | |
| | | |
| | A - | | Selected financial data | | | 7, 182 | |
| | | |
| | B - | | Capitalisation and indebtedness | | | n/a | |
| | | |
| | C - | | Reasons for the offer and use of proceeds | | | n/a | |
| | | |
| | D - | | Risk factors | | | 34 | |
| |
| | |
| Item 4. | | Information on the Company | | | | |
| | | |
| | A - | | History and development of the Company | | | 9 | |
| | | |
| | B - | | Business overview | | | 8, 9, 12 | |
| | | |
| | C - | | Organisational structure | | | 9 | |
| | | |
| | D - | | Property, plants and equipment | | | 21 | |
| |
| | |
| Item 4A. | | Unresolved Staff Comments | | | None | |
|
| |
| | |
| Item 5. | | Operating and Financial Review and Prospects | | | | |
| | | |
| | A - | | Operating results | | | 23, 27,43 | |
| | | |
| | B - | | Liquidity and capital resources | | | 44 | |
| | | |
| | C - | | Research and development, patent and licenses, etc. | | | 23 | |
| | | |
| | D - | | Trend information | | | 43 | |
| | | |
| | E - | | Off-balance sheet arrangements | | | 44 | |
| | | |
| | F - | | Tabular disclosure of contractual obligations | | | 45 | |
| | | |
| | G - | | Safe Harbor | | | 7 | |
|
| |
| | |
| Item 6. | | Directors, Senior Management and Employees | | | | |
| | | |
| | A - | | Directors and senior management | | | 63 | |
| | | |
| | B - | | Compensation | | | 85 | |
| | | |
| | C - | | Board practices | | | 66 | |
| | | |
| | D - | | Employees | | | 3, 23 | |
| | | |
| | E - | | Share ownership | | | 100, 183 | |
|
| |
| | |
| Item 7. | | Major Shareholders and Related Party Transactions | | | | |
| | | |
| | A - | | Major shareholders | | | 181 | |
| | | |
| | B - | | Related party transactions | | | 171 | |
| | | |
| | C - | | Interests of experts and counsel | | | n/a | |
| |
| | |
| Item 8. | | Financial Information | | | | |
| | | |
| | A - | | Consolidated statements and other financial information | | | 117, 182 | |
| | | |
| | - | | Legal proceedings | | | 23 | |
| | | |
| | - | | Dividends | | | 182 | |
| | | |
| | B - | | Significant changes | | | 45 | |
| |
| | |
| Item 9. | | The Offer and Listing | | | | |
| | | |
| | A - | | Offer and listing details | | | 180 | |
| | | |
| | B - | | Plan of distribution | | | n/a | |
| | | |
| | C - | | Markets | | | 180 | |
| | | |


2 CRH

Chairman’s Introduction
Dear Shareholders,
As you will see from the key financial figures on page 7, 2013 was another challenging year for CRH. A delayed recovery in our European markets, together with the portfolio review commenced by the Board towards the end of 2013 which has identified a total of 45 business units for divestment, has resulted in a significant non-cash impairment charge. The aim of the portfolio review is to re-set CRH for growth and, as we look into 2014 and beyond, improving returns is a key strategic priority for the Group.
In respect of 2013, the Board is recommending a final dividend of 44c per share. If approved by shareholders at the 2014 Annual General Meeting, this will maintain the full-year dividend at 62.5c per share. The Board’s decision to maintain the dividend took into account the increased operating cash flow and also the levels of capital expenditure, development activity and portfolio rationalisation during 2013. The net after-tax loss of €295 million for 2013 reflects the total non-cash impairment charges of €755 million, primarily arising from the ongoing portfolio review.
Myles Lee retired as Chief Executive and from the Board on 31 December 2013, after an outstanding 32-year career with the Group, five years of which were spent as Finance Director prior to his taking up the Chief Executive role. I would like to thank Myles sincerely on behalf of the Board for his leadership of the Company over the past five years, a tenure which coincided with a period of remarkable uncertainty and crisis across the globe. During this very challenging period, Myles led the implementation of strategies and initiatives which have reduced CRH’s cost base by almost €2.4 billion, and managed the portfolio by investing €2.9 billion in value-adding acquisitions in attractive markets, while at the same time generating proceeds of approximately €1.9 billion from divestments and asset disposals. Myles leaves the Group in a strong financial condition, with one of the strongest balance sheets in the sector and well-positioned to avail of opportunities as CRH now looks forward to the next phase of its development.
Details of the process to appoint Myles’ successor, which took place over four months and concluded with the appointment of Albert Manifold as Chief Executive Designate in July 2013, are set out in the Corporate Governance report on page 79. We are very fortunate to have a replacement of Albert’s calibre, experience and skills within the Group.
After the 2014 Annual General Meeting, Jan Maarten de Jong will retire from the Board. He became a Director in 2004 and, between May 2007 and August 2013, was Chairman of CRH’s Audit Committee. Jan Maarten has been an exemplary non-executive Director and I thank him for his commitment and energy during his time on our Board.
Since the 2013 Annual General Meeting, we have appointed Don McGovern and Henk Rottinghuis as non-executive Directors. I welcome them to the Board and look forward to working with them in the years to come. The Corporate Governance report details the appointment process for new Directors and also covers our approach to important matters such as diversity on the CRH Board and shareholder engagement.
Each Director will retire at the Annual General Meeting on 7 May 2014, with those eligible offering themselves for re-election. Their biographies are set out on pages 63 to 65. I have conducted a formal evaluation of the performance of individual Directors, which included training needs where appropriate. I can confirm that each of the Directors continues to perform effectively and to demonstrate strong commitment to the role. I strongly recommend that shareholders vote in favour of each of the individuals putting themselves forward for re-election.
I would like to thank management for the significant contributions made by them in 2013, and in recent years, in very challenging circumstances. I have no doubt that we have the team, under Albert’s leadership, to meet the challenges and take advantage of the opportunities that the future holds for CRH.
Nicky HarteryChairman

Introduction and Performance Measures
CRH Website
Information on or accessible through our website, www.crh.com, does not form part of and is not incorporated into this document. The Group’s website provides the full text of the Annual and Interim Reports, the Annual Report on Form 20-F, which is filed annually with the United States Securities and Exchange Commission, trading statements, interim management statements and copies of presentations to analysts and investors. News releases are made available, in the News & Events section of the website, immediately after release to the Stock Exchanges.
Key Information
The Consolidated Financial Statements of CRH plc have been prepared in accordance with International Financial Reporting Standards (“IFRS”) as adopted by the International Accounting Standards Board.
Selected financial data have been presented for the five years ended on 31 December 2013 on page 7. For the three years ended 31 December 2013, the selected financial data are qualified in their entirety by reference to, and should be read in conjunction with, the audited Consolidated Financial Statements, the related Notes and the Business Performance Review section included elsewhere in this Annual Report on Form 20-F (“Annual Report” or “Form 20-F”).
Non-GAAP Performance Measures
CRH uses a number of non-GAAP performance measures to monitor financial performance. These are summarised below and discussed later in this report.
Net Debt. Net debt is used by management as it gives a more complete picture of the Group’s current debt situation than total interest-bearing loans and borrowings. Net debt is provided to enable investors to see the economic effect of gross debt, related hedges and cash and cash equivalents in total. Net debt is a non-GAAP measure and comprises current and non-current interest-bearing loans and borrowings, cash and cash equivalents and current and non-current derivative financial instruments. A reconciliation of total interest-bearing loans and borrowings to net debt is set out in note 21 to the Consolidated Financial Statements.
EBITDA (as defined). EBITDA is defined as earnings before interest, taxes, depreciation, amortisation, asset impairment charges, profit on disposals and the Group’s share of equity accounted investments’ result after tax and is quoted by management to aid investors in their analysis of the performance of the Group and to assist investors in the comparison of the Group’s performance with that of other companies. EBITDA (as defined) and operating profit results by segment are monitored by management in order to allocate resources between segments and to assess performance. Given that net finance costs and income tax are managed on a centralised basis, these items are not allocated between operating segments for the purpose of the information presented to the Chief Operating Decision-Maker.
| | | | | | | | | | | | | | | | | | | | | | | | | | | | | | | | | | | | | | | | | | | | | | | | |
Reconciliation of EBITDA (as defined)* and Operating Profit (by segment) to Group Profit | |
| | | | | | Continuing operations - year ended 31 December | |
| | | Materials | | | Products | | | Distribution | | | Total Group | |
| | | 2013 €m | | | 2012R1 €m | | | 2011 €m | | | 2013 €m | | | 2012R1 €m | | | 2011 €m | | | 2013 €m | | | 2012R1 €m | | | 2011 €m | | | 2013 €m | | | 2012R1 €m | | | 2011R1 €m | |
Group operating profit before depreciation and amortisation (EBITDA (as defined)*) | |
| | | | | | | | | | | | |
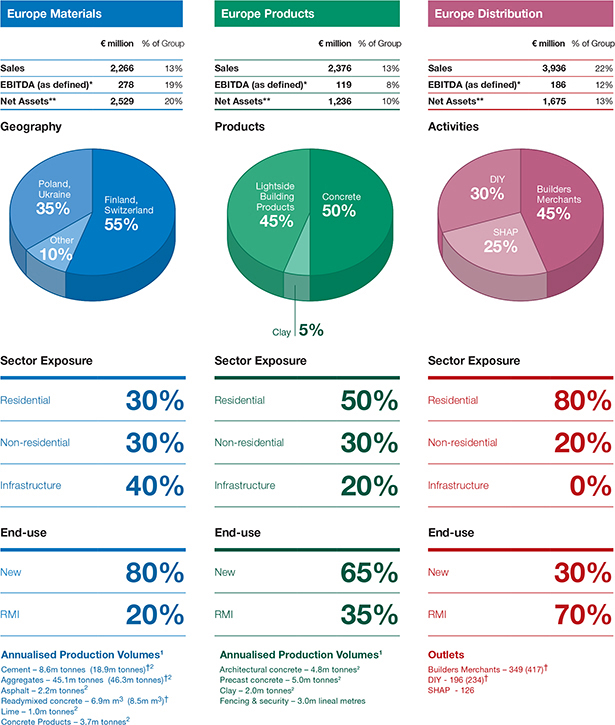
Europe | | | 278 | | | | 352 | | | | 436 | | | | 119 | | | | 152 | | | | 194 | | | | 186 | | | | 217 | | | | 267 | | | | 583 | | | | 721 | | | | 897 | |
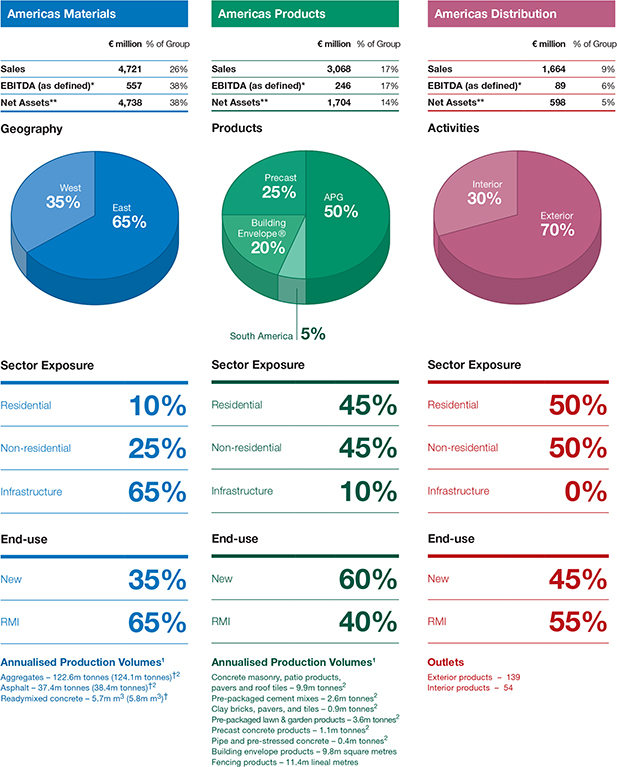
| Americas | | | 557 | | | | 555 | | | | 530 | | | | 246 | | | | 204 | | | | 164 | | | | 89 | | | | 83 | | | | 65 | | | | 892 | | | | 842 | | | | 759 | |
| | | | 835 | | | | 907 | | | | 966 | | | | 365 | | | | 356 | | | | 358 | | | | 275 | | | | 300 | | | | 332 | | | | 1,475 | | | | 1,563 | | | | 1,656 | |
|
Depreciation, amortisation and impairment | |
| | | | | | | | | | | | |
Europe | | | 239 | | | | 135 | | | | 172 | | | | 525 | | | | 133 | | | | 128 | | | | 80 | | | | 72 | | | | 77 | | | | 844 | | | | 340 | | | | 377 | |
| Americas | | | 331 | | | | 276 | | | | 266 | | | | 178 | | | | 118 | | | | 122 | | | | 22 | | | | 24 | | | | 20 | | | | 531 | | | | 418 | | | | 408 | |
| | | | 570 | | | | 411 | | | | 438 | | | | 703 | | | | 251 | | | | 250 | | | | 102 | | | | 96 | | | | 97 | | | | 1,375 | | | | 758 | | | | 785 | |
| | | | | | | | | | | | |
Group operating profit2 | | | | | | | | | | | | | | | | | | | | | | | | | | | | | | | | | | | | | | | | | | | | | | | | |
Europe | | | 39 | | | | 217 | | | | 264 | | | | (406 | ) | | | 19 | | | | 66 | | | | 106 | | | | 145 | | | | 190 | | | | (261 | ) | | | 381 | | | | 520 | |
| Americas | | | 226 | | | | 279 | | | | 264 | | | | 68 | | | | 86 | | | | 42 | | | | 67 | | | | 59 | | | | 45 | | | | 361 | | | | 424 | | | | 351 | |
| | | | 265 | | | | 496 | | | | 528 | | | | (338 | ) | | | 105 | | | | 108 | | | | 173 | | | | 204 | | | | 235 | | | | 100 | | | | 805 | | | | 871 | |
| | | | | | | | | | | | |
Profit on disposals | | | | | | | | | | | | | | | | | | | | | | | | | | | | | | | | | | | | | | | 26 | | | | 230 | | | | 55 | |
Finance costs less income | | | | | | | | | | | | | | | | | | | | | | | | | | | | | | | | | | | | | | | (249 | ) | | | (256 | ) | | | (229 | ) |
Other financial expense | | | | | | | | | | | | | | | | | | | | | | | | | | | | | | | | | | | | | | | (48 | ) | | | (49 | ) | | | (41 | ) |
| Share of equity accounted investments’ (loss)/profit | | | | | | | | | | | | | | | | | | | | (44 | ) | | | (84 | ) | | | 42 | |
(Loss)/profit before tax | | | | | | | | | | | | | | | | | | | | | | | | | | | | | | | | | | | | | | | (215 | ) | | | 646 | | | | 698 | |
| Income tax expense | | | | | | | | | | | | | | | | | | | | | | | | | | | | | | | | | | | | | | | (80 | ) | | | (106 | ) | | | (111 | ) |
| Group (loss)/profit for the financial year | | | | | | | | | | | | | | | | | | | | (295 | ) | | | 540 | | | | 587 | |
1 Details of the restatement are contained in the Accounting Policies on page 124 and in note 1 to the Consolidated Financial Statements. 2 Throughout this document, Group operating profit as shown in the Consolidated Financial Statements excludes profit on disposals. | |
| * | Defined as earnings before interest, taxes, depreciation, amortisation, asset impairment charges, profit on disposals and the Group’s share of equity accounted investments’ result after tax. |
Introduction and Performance Measures |continued
EBITDA (as defined)* Interest Cover. EBITDA (as defined)* interest cover is used by management as a measure which matches the earnings and cash generated by the business to the underlying funding costs. EBITDA (as defined)* interest cover is presented to provide a greater understanding of the impact of CRH’s debt and financing arrangements and, as discussed in note 24 to the Consolidated Financial Statements, is a metric used in lender covenants. It is the ratio of EBITDA (as defined)*
to finance costs less finance income and is calculated below. The definitions and calculations used in lender covenant agreements include certain specified adjustments to the amounts included in the Consolidated Financial Statements. The ratios as calculated on the basis of the definitions in those covenants are disclosed in note 24 to the Consolidated Financial Statements.
| | | | | | | | | | | | |
Calculation of EBITDA (as defined)* Interest Cover | |
| | | |
| | | 2013 | | | 2012R1 | | | 2011 | |
| | | €m | | | €m | | | €m | |
| | | |
Interest | | | | | | | | | | | | |
Finance costs2 | | | 262 | | | | 271 | | | | 262 | |
| Finance income2 | | | (13 | ) | | | (15 | ) | | | (33 | ) |
| Finance costs less income | | | 249 | | | | 256 | | | | 229 | |
EBITDA (as defined)* | | | 1,475 | | | | 1,563 | | | | 1,656 | |
| | | |
| | | | | | | | Times | | | | | |
| | | |
EBITDA (as defined)* interest cover (EBITDA (as defined)* divided by finance costs less income) | | | 5.9 | | | | 6.1 | | | | 7.2 | |
| | | | | | |
1 Details of the restatement are contained in the Accounting Policies on page 124 and in note 1 to the Consolidated Financial Statements. 2 These items appear on the Consolidated Income Statement on page 120. | | |
Organic Revenue, Organic Operating Profit. CRH pursues a strategy of growth through acquisitions and investments, with €720 million spent on acquisitions and investments (including debt acquired of €44 million and €144 million relating to the acquisition of Cementos Lemona as part of an asset exchange in Spain) in 2013 (2012: €548 million). Acquisitions completed in 2012 and 2013 contributed incremental sales revenue of €672 million and operating profit of €43 million in 2013. Proceeds (including net debt assumed by the purchaser and the transfer of Uniland as part of an asset exchange in Spain) from disposal of non-current assets and businesses amounted to €283 million (2012: €784 million). The sales impact of divested activities in 2013 was a negative €42 million and because these operations generated net losses in 2012, the disposal impact at operating profit level was a contribution of €2 million compared with 2012. During the year the euro strengthened by more than 3% against the dollar, resulting in an adverse impact on the Group’s results. Because of the impact of acquisitions, divestments, exchange translation
and other non-recurring items on reported results each year, the Group uses organic revenue and organic operating profit as additional performance indicators to assess performance of pre-existing (also referred to as underlying, heritage, like-for-like or ongoing) operations each year. Organic revenue and organic operating profit is arrived at by excluding the incremental revenue and operating profit contributions from current and prior year acquisitions and divestments, the impact of exchange translation and the impact of any non-recurring items. In the Business Performance Review section which follows, changes in organic revenue and organic operating profit are presented as additional measures of revenue and operating profit to provide a greater understanding of the performance of the Group. A reconciliation of the changes in organic revenue and organic operating profit to the changes in total revenue and operating profit for the Group and by segment is presented with the discussion of each segment’s performance in tables contained in the segment discussion commencing on page 46.
| * | Defined as earnings before interest, taxes, depreciation, amortisation, asset impairment charges, profit on disposals and the Group’s share of equity accounted investments’ result after tax. |
| | | | | | | | | | | | | | | | | | | | |
Selected Financial Data | | | | | | | | | | | | | | | |
Year ended 31 December (amounts in millions, except per share data and ratios) | | | | |
| | | | | |
| | | 20131 | | | 2012R2 | | | 2011R2 | | | 20102 | | | 20092 | |
| | | €m | | | €m | | | €m | | | €m | | | €m | |
Consolidated Income Statement Data | | | | | | | | | | | | | | | | | | | | |
Revenue | | | 18,031 | | | | 18,084 | | | | 18,081 | | | | 17,173 | | | | 17,373 | |
Group operating profit | | | 100 | | | | 805 | | | | 871 | | | | 698 | | | | 955 | |
(Loss)/profit attributable to equity holders of the Company | | | (296 | ) | | | 538 | | | | 580 | | | | 432 | | | | 592 | |
Basic (loss)/earnings per Ordinary Share | | | (40.6c | ) | | | 74.6c | | | | 81.2c | | | | 61.3c | | | | 88.3c | |
Diluted (loss)/earnings per Ordinary Share | | | (40.6c | ) | | | 74.5c | | | | 81.2c | | | | 61.2c | | | | 87.9c | |
Dividends paid during calendar year per Ordinary Share | | | 62.5c | | | | 62.5c | | | | 62.5c | | | | 62.5c | | | | 62.2c | |
Average number of Ordinary Shares outstanding3 | | | 729.2 | | | | 721.9 | | | | 714.4 | | | | 704.6 | | | | 670.8 | |
Ratio of earnings to fixed charges (times)4 | | | 0.7 | | | | 2.6 | | | | 2.4 | | | | 2.1 | | | | 2.4 | |
All data relates to continuing operations | | | | | | | | | | | | | | | | | | | | |
| | | | | |
Consolidated Balance Sheet Data | | | | | | | | | | | | | | | | | | | | |
Total assets | | | 20,429 | | | | 20,900 | | | | 21,384 | | | | 21,461 | | | | 20,283 | |
Net assets5 | | | 9,686 | | | | 10,589 | | | | 10,593 | | | | 10,411 | | | | 9,710 | |
Ordinary shareholders’ equity | | | 9,661 | | | | 10,552 | | | | 10,518 | | | | 10,327 | | | | 9,636 | |
Equity share capital | | | 251 | | | | 249 | | | | 247 | | | | 244 | | | | 241 | |
Number of Ordinary Shares3 | | | 739.2 | | | | 733.8 | | | | 727.9 | | | | 718.5 | | | | 710.5 | |
Number of Treasury Shares and own shares3 | | | 6.0 | | | | 7.4 | | | | 8.9 | | | | 9.5 | | | | 12.8 | |
Number of Ordinary Shares net of Treasury Shares and own shares3 | | | 733.2 | | | | 726.4 | | | | 719.0 | | | | 709.0 | | | | 697.7 | |
| | |
1 Group operating profit includes asset impairment charges of €650 million in 2013, with an additional €105 million impairment charge included in loss attributable to equity holders of the company in respect of equity accounted investments. Details are contained in note 3 to the Consolidated Financial Statements. 2 Details of the restatement are contained in the Accounting Policies on page 124 and in note 1 to the Consolidated Financial Statements. The 2010 and 2009 data has not been adjusted retrospectively for the adoption of IAS 19 Employee Benefits (revised) due to the practical difficulties associated with obtaining such information. 3 Shown in millions of shares. 4 For the purposes of calculating the ratio of earnings to fixed charges, in accordance with Item 503 of Regulation S-K, earnings have been calculated by adding: (loss)/profit before tax adjusted to exclude the Group’s share of equity accounted investments’ result after tax, fixed charges, and dividends received from equity accounted investments; and the fixed charges were calculated by adding interest expensed and capitalised, amortised premiums, discounts and capitalised expenses related to indebtedness, an estimate of the interest within rental expense and preference security dividend requirements of consolidated subsidiaries. 5 Net assets are calculated as the sum of total assets less total liabilities. | | |
Forward-Looking Statements
In order to utilise the “Safe Harbor” provisions of the United States Private Securities Litigation Reform Act of 1995, CRH public limited company (the “Company”), and its subsidiaries (collectively, “CRH” or the “Group”) is providing the following cautionary statement.
This document contains certain forward-looking statements with respect to the financial condition, results of operations and business of CRH and certain of the plans and objectives of CRH including the statements under: “Strategy Review – Chief Executive’s Introduction – Focus for 2014 and Portfolio Review” and “Business Performance Review – Finance Director’s Introduction” with respect to our belief that 2014 will be a year of profit growth and with respect to expectations for future impairment charges; in the “Business Performance Review” section with respect to our expectations regarding economic activity and fiscal developments in our operating regions, our expectation for growth in commercial and residential construction, our expectation for overall sales growth and our expectation for improvements in operating profits and/or margins in 2014 under the heading ‘Outlook’ in each of the six operating segment reviews. These forward-looking statements may generally, but not always, be identified by the use of words such as “will”, “anticipates”, “should”, “expects”, “is expected to”, “estimates”, “believes”, “intends” or similar expressions.
By their nature, forward-looking statements involve risk and uncertainty because they relate to events and depend on circumstances that may or may not occur in the future and reflect the Company’s current expectations and assumptions as to such future events and circumstances that may not prove accurate. A number of material factors could cause actual results and developments to differ materially from those expressed or implied by these forward-looking statements, certain of which are beyond our control and which include, among other things: economic and financial conditions generally in various countries and regions where we operate; the pace of recovery in the overall construction and building materials sector; demand for residential and non-residential construction in our geographic markets; increased competition and its impact on prices; increases in energy and/or raw materials costs; adverse changes to laws and regulations; adverse political developments in various countries and regions; failure to complete or successfully integrate acquisitions; and the specific factors identified in the discussions accompanying such forward-looking statements and under “Risk Factors” in this document.
Introduction and Performance Measures |continued
Statements Regarding Competitive Position and Construction Activity
Statements made in the Description of the Group and in the Business Performance Review sections referring to the Group’s competitive position are based on the Group’s belief, and in some cases rely on a range of sources, including investment analysts’ reports, independent market studies and the Group’s internal assessment of market share based on publicly available information about the financial results and performance of market participants.
Unless otherwise specified, references to construction activity or other market activity relate to the relevant market as a whole and are based on publicly available information from a range of sources, including independent market studies, construction industry data and economic forecasts for individual jurisdictions.
Seasonality
Activity in the construction industry is characterised by cyclicality and is dependent to a significant extent on the seasonal impact of weather in the Group’s operating locations, with activity in some markets reduced significantly in winter due to inclement weather. First-half sales accounted for 44% of full-year 2013 (2012: 46%), while EBITDA (as defined)* for the first six months of 2013 represented 27% of the full-year out-turn (2012: 35%).
Exchange Rates
In this Form 20-F, references to “US$”, “US Dollars” or “US cents” are to the United States currency, references to “euro”, “euro cent”, “cent”, “c” or “€” are to the euro currency and “Stg£” or “Sterling” are to the currency of the United Kingdom of Great Britain and Northern Ireland (“United Kingdom” or “UK”). Other currencies referred to in this Form 20-F include Polish Zloty (“PLN”), Swiss Franc (“CHF”), Canadian Dollar (“CAD”), Chinese Renminbi (“RMB”), Argentine Peso (“ARP”), Turkish Lira (“TRY”), Indian Rupee (“INR”), Ukrainian Hryvnia (“UAH”) and Israeli Shekel (“ILS”).
For the convenience of the reader, this Form 20-F contains translations of certain euro amounts into US Dollars at specified rates. These translations should not be construed as representations that the euro amounts actually represent such US Dollar amounts or could be converted into US Dollars at the rate indicated. The Federal Reserve Bank of New York Noon Buying Rate (the “FRB Noon Buying Rate”) on 31 December 2013 was €1 = US$1.3779 and on 7 March 2014 was €1 = US$1.3868.
The table below sets forth, for the periods and dates indicated, the average, high, low and end-of-period exchange rates in US Dollars per €1 (to the nearest cent) using the FRB Noon Buying Rate. These rates may vary slightly from the rates used for translating foreign currencies into euro in the preparation of the Consolidated Financial Statements (see page 130).
For a discussion on the effects of exchange rate fluctuations on the financial condition and results of the operations of the Group, see the Business Performance Review section beginning on page 42.
| | | | | | | | | | | | | | | | |
Exchange Rates | | | | | | | | | | | | |
| | | | |
Years ended 31 December | | Period End | | | Average Rate1 | | | High | | | Low | |
| | | | |
2009 | | | 1.43 | | | | 1.40 | | | | 1.51 | | | | 1.25 | |
2010 | | | 1.33 | | | | 1.32 | | | | 1.45 | | | | 1.20 | |
2011 | | | 1.30 | | | | 1.40 | | | | 1.49 | | | | 1.29 | |
2012 | | | 1.32 | | | | 1.29 | | | | 1.35 | | | | 1.21 | |
2013 | | | 1.38 | | | | 1.33 | | | | 1.38 | | | | 1.28 | |
2014 (through 7 March 2014) | | | 1.39 | | | | 1.37 | | | | 1.39 | | | | 1.35 | |
| | | | | | | | | | | | | | | | |
Months ended | | | | | | | | | | | | |
| | | | |
September 2013 | | | 1.35 | | | | 1.34 | | | | 1.35 | | | | 1.31 | |
October 2013 | | | 1.36 | | | | 1.36 | | | | 1.38 | | | | 1.35 | |
November 2013 | | | 1.36 | | | | 1.35 | | | | 1.36 | | | | 1.34 | |
December 2013 | | | 1.38 | | | | 1.37 | | | | 1.38 | | | | 1.36 | |
January 2014 | | | 1.35 | | | | 1.36 | | | | 1.37 | | | | 1.35 | |
February 2014 | | | 1.38 | | | | 1.37 | | | | 1.38 | | | | 1.35 | |
March 2014 (through 7 March 2014) | | | 1.39 | | | | 1.38 | | | | 1.39 | | | | 1.37 | |
| | |
1 The average of the US Dollar/euro exchange rate on the last day of each month during the period or in the case of monthly averages, the average of all days in the month, in each case using the FRB Noon Buying Rate. | | |
| * | Defined as earnings before interest, taxes, depreciation, amortisation, asset impairment charges, profit on disposals and the Group’s share of equity accounted investments’ result after tax. |
History, Development and Organisational Structure of the Company
CRH public limited company is the parent company of a diversified international group of building materials companies, which manufacture and distribute a diverse range of products servicing the breadth of construction needs.
The Group resulted from the merger in 1970 of two leading Irish public companies, Cement Limited (established in 1936) and Roadstone, Limited (incorporated in 1949). Cement Limited manufactured and supplied cement while Roadstone, Limited was primarily involved in the manufacture and supply of aggregates, readymixed concrete, mortar, coated macadam, asphalt and contract surfacing to the Irish construction industry.
The Company is incorporated and domiciled in the Republic of Ireland. CRH is a public limited company operating under the Companies Acts of Ireland, 1963 to 2013 and the Investment Funds, Companies and Miscellaneous Provisions Act, 2006, each as amended. The Group’s worldwide headquarters are located in Dublin, Ireland. Its principal executive offices are located at Belgard Castle, Clondalkin, Dublin 22 (telephone: +353 1 404 1000). The Company’s registered office is located at 42 Fitzwilliam Square, Dublin 2, Ireland and its US agent is Oldcastle, Inc., 900 Ashwood Parkway, Suite 600, Atlanta, Georgia 30338. The Company is the holding company of the Group, with direct and indirect share and loan interests in subsidiaries, joint ventures and associates. From Group headquarters, a small team of executives exercises strategic control over its decentralised operations.
CRH, which has a premium listing on The London Stock Exchange Limited (“London Stock Exchange”), is also one of the largest companies, based on market capitalisation, quoted on The Irish Stock Exchange Limited (“Irish Stock Exchange”) in Dublin. CRH’s American Depositary
Shares are listed on the New York Stock Exchange in the United States. The market capitalisation of CRH as of 31 December 2013 was €13.4 billion.
CRH is a constituent member of FTSE 100, ISEQ 20, Euro Stoxx 50 and the Euro Stoxx Select Dividend 30 equity indices, among others.
As outlined in note 2 to the Consolidated Financial Statements on page 134, for reporting purposes, the Group was organised into six business segments in 2013. These segments form the operational organisational structure and are outlined further in the sections that follow.
In the detailed description of the Group’s business that follows, estimates of the Group’s various aggregate and stone reserves have been provided by engineers employed by the individual operating companies. Details of product end-use by sector for each reporting segment are based on management estimates.
As a result of planned geographic diversification since the mid-1970s, and most particularly in the period 2001 to 2008, the Group has expanded by acquisition and organic growth into an international manufacturer and supplier of building materials. CRH is a leading international player in its industry, with operations in 35 countries worldwide. It is the largest building materials company in North America, a regional leader in Europe and has a growing presence in the Asian economies of India and China. In 2013, CRH subsidiary companies employed approximately 76,000 people at over 3,400 operating locations, and generated sales of €18 billion.
The principal subsidiary undertakings and equity accounted investments are listed in Exhibit 8.
Business Overview
The percentage of Group revenue and operating profit for each of the six reporting segments for 2013, 2012 and 2011 is as follows:
| | | | | | | | | | | | | | | | | | | | | | | | | | | | |
Business Overview | | | | | | | | | | | | | | | | | | | | | | |
| | | | | |
| | | 2013 | | | | | 2012R2 | | | | | 2011 | |
| | | | | | Operating | | | | | | | | Operating | | | | | | | | Operating | |
| | | Revenue | | | profit | | | | | Revenue | | | profit | | | | | Revenue | | | profit | |
| | | | | | | | |
Share of revenue and operating profit | | | | | | | | | | | | | | | | | | | | | | | | | | | | |
| | | | | | | | |
Europe Materials1 | | | 13% | | | | 39% | | | | | | 13% | | | | 27% | | | | | | 17% | | | | 30% | |
| | | | | | | | |
Americas Materials | | | 26% | | | | 226% | | | | | | 27% | | | | 35% | | | | | | 24% | | | | 30% | |
| | | | | | | | |
Europe Products1 | | | 13% | | | | (406%) | | | | | | 14% | | | | 2% | | | | | | 15% | | | | 8% | |
| | | | | | | | |
Americas Products | | | 17% | | | | 68% | | | | | | 15% | | | | 11% | | | | | | 13% | | | | 5% | |
| | | | | | | | |
Europe Distribution | | | 22% | | | | 106% | | | | | | 22% | | | | 18% | | | | | | 24% | | | | 22% | |
| | | | | | | | |
Americas Distribution | | | 9% | | | | 67% | | | | | | 9% | | | | 7% | | | | | | 7% | | | | 5% | |
| | | | | | | | |
Total | | | 100% | | | | 100% | | | | | | 100% | | | | 100% | | | | | | 100% | | | | 100% | |
| | |
¹ See “Business Operations in Europe Materials” and “Business Operations in Europe Products” on pages 12 and 16 for details of non-European countries grouped with Europe for reporting purposes. 2 Details of the restatement are contained in the Accounting Policies on page 124 and in note 1 to the Consolidated Financial Statements. | | |
CRH operational snapshot(sector exposure and end-use based on 2013 EBITDA
(as defined)*)
| * | Defined as earnings before interest, taxes, depreciation, amortisation, asset impairment charges, profit on disposals and the Group’s share of equity accounted investments’ result after tax. |
| ** | Net assets at 31 December 2013 comprise segment assets less segment liabilities as disclosed in note 2 to the Consolidated Financial Statements. |
| † | Including equity accounted investments. |
| 1 | Throughout this document annualised volumes have been used which reflect the full-year impact of acquisitions made during the year and may vary from actual volumes produced. |
| 2 | Throughout this document tonnes denote metric tonnes (i.e. 1,000 kilogrammes). |
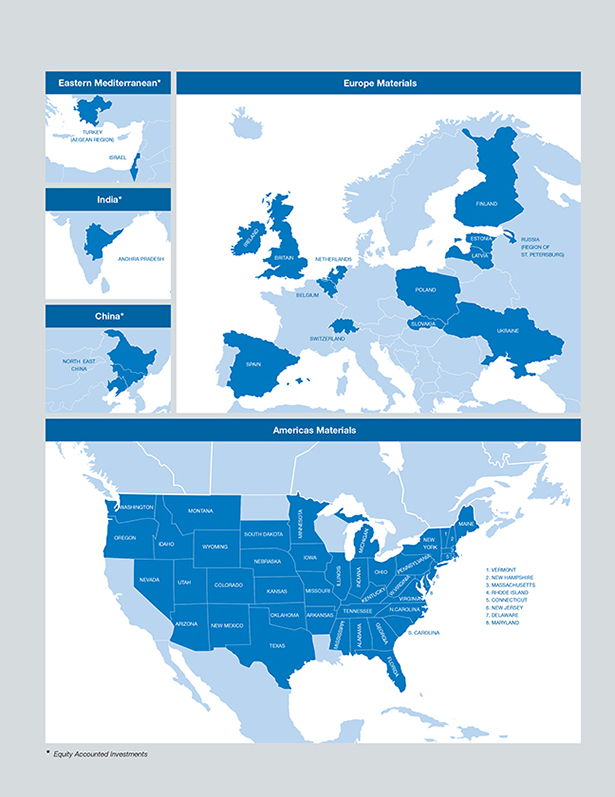
Business Operations in Europe Materials
Europe Materials’ strategy is to build strong vertically-integrated regional positions. Operating in 17 countries, the business is founded in resource-backed cement and aggregates assets which support the manufacture and supply of cement, aggregates, concrete and asphalt products. Extending reserves is an ongoing process and a key focus for Materials businesses. With a network of well-invested facilities, Europe Materials focusses on operational excellence initiatives which include production efficiencies, greater use of alternative fuels and manufacture of low carbon cements, while the scale of our operations provides economies in purchasing and logistics management. Early in 2014 the Group began a process of reorganising its European business by integrating its Products and Materials businesses into one European organisation. This will enable CRH to leverage the benefits of its operating plant network in both western and eastern European markets.
Development focus is centred on bolt-on acquisitions for synergies, reserves and further vertical integration in addition to opportunities in contiguous regions to extend and strengthen regional positions. Europe Materials has championed CRH’s entry into developing markets that offer long-term growth potential, with entry via cement and aggregates assets and the potential to roll out its operational excellence programmes and vertical integration approach over time. In total Europe Materials, excluding equity accounted investments, employs approximately 9,400 people at close to 600 locations.
Cement is a primary building material used in the construction industry. It is manufactured by reacting limestone with small quantities of other materials in a kiln through a carefully controlled high temperature process. This produces clinker, which is then milled into a fine powder to become cement. Cement production is capital-intensive. Cement is used principally as a binding agent to bind other materials together –most commonly it is mixed with sand, stone or other aggregates and water. Cement customers primarily comprise concrete producers and merchants supplying construction contractors and others. Where CRH has both cement and concrete operations, a significant portion of cement sales would typically be supplied to those concrete operations. While cement or clinker may be imported from other countries, competition comes mainly from other large cement producers located within each country. CRH’s cement activities in Belgium and the Netherlands relate to cement transport and trading.
Aggregates are naturally occurring sand, gravel or crushed stone deposits such as granite, limestone and sandstone. Recycled (end-of-life) concrete increasingly features as an aggregate. Cement plants, which are generally owned by CRH, are located at or near the limestone reserves used to supply the plants. In Finland, CRH buys the aggregates raw materials for its two cement plants as the Group does not own limestone reserves near the plants. For additional information on the location and adequacy of all of the Group’s mineral reserves, see the Mineral Reserves section on pages 20 and 21.
Aggregates, asphalt and related services are sold principally to local governmental highway authorities and to contractors, while readymixed concrete and concrete products (manufactured mainly at locations with aggregates on site and including block, masonry, pipe, rooftiles and paving) are sold to both the public and private construction sectors. Competition comes mainly from other large aggregates, asphalt, readymixed concrete and concrete products producers, as well as from a variety of smaller manufacturers in local economies.
Europe Materials is organised geographically by country/region.
Joint Venture Interests
CRH holds a 50% joint venture interest in Denizli Çimento, an integrated cement and readymixed concrete business in Turkey. In India, CRH holds a 50% joint venture interest in My Home Industries Limited (“MHIL”), a cement producer headquartered in Hyderabad serving the Andhra Pradesh region of southeast India. In August 2013, MHIL increased its market coverage through the acquisition of 100% of the shares of Sree Jayajothi Cements Limited (“SJCL”) a cement producer based in southern Andhra Pradesh.
Associate Interests
CRH holds a 26% equity interest in Yatai Building Materials Company’s cement operations (“Yatai Cement”), with cement and concrete operations in Jilin, Heilongjiang and Liaoning provinces in northeastern China.
CRH has a 25% equity interest in Mashav, the holding company for the sole producer of cement in Israel.
On 25 February 2013, in consideration for its 26% equity interest in Corporacion Uniland S.A., CRH acquired a 99% stake in Cementos Lemona S.A. an integrated cement, readymixed concrete and aggregates business located in Northern Spain.
Products and Services – Locations1
Cement
Belgium, Finland, Ireland, Netherlands, Poland, Spain, Switzerland, Ukraine, United Kingdom
Aggregates
Estonia, Finland, Ireland, Latvia, Netherlands, Poland, Slovakia, Spain, Switzerland, Ukraine
Asphalt
Ireland, Poland, Switzerland
Readymixed Concrete
Belgium, Estonia, Finland, Ireland, Netherlands, Poland, Russia, Spain, Switzerland, Ukraine
Lime
Ireland, Poland
Concrete Products
Estonia, Finland, Ireland, Netherlands, Poland, Spain, Ukraine
| | 1 | Excludes joint venture and associate interests. Results for these entities are equity accounted in the Consolidated Financial Statements. | |
Business Operations in Americas Materials
Americas Materials’ strategy is to build strong regional leadership positions underpinned by well-located, long-term reserves. Operating in 44 states with over 13 billion tonnes of permitted aggregates reserves of which c.80% are owned, this business is vertically integrated from primary resource quarries into aggregates, asphalt and readymixed concrete products. With 65% exposure to infrastructure, the business is further integrated into asphalt paving services, through which it is a principal supplier for highway repair and maintenance.
Our national network of operations and deep local market knowledge drive local performance and national synergies in procurement, cost management and operational excellence. In a largely unconsolidated sector, where the top ten industry participants account for just 30% of aggregates production, 25% of asphalt production and 20% of readymixed concrete production, CRH is structured and positioned to participate as the industry consolidates further. Americas Materials, excluding equity accounted investments, employs approximately 18,200 people at close to 1,200 operating locations.
CRH is the largest asphalt producer and the third-largest producer of both aggregates and readymixed concrete in the US. For additional information on the location and adequacy of all of the Group’s mineral reserves, see the Mineral Reserves section on pages 20 and 21.
Americas Materials is broadly self-sufficient in aggregates and its principal purchased raw materials are liquid asphalt and cement used in the manufacturing of asphalt and readymixed concrete respectively. These raw materials are available from a number of suppliers. There is a continued focus on improving bitumen and energy purchasing and we continue to source the lowest cost alternative energy for use in asphalt production.
Federal, state and local government authority road and infrastructural projects awarded by public bid represent a significant proportion of work carried out by the Division. Americas Materials also has a broad commercial base, supplying stone, readymixed concrete and asphalt for industrial, office, shopping mall and private residential development and refurbishment.
Americas Materials is organised geographically into East and West, containing four and three divisions respectively.
East:
Northeast (including operations in Maine, New Hampshire, Vermont, Massachusetts, Rhode Island, New York, New Jersey and Connecticut);
Mid-Atlantic (Pennsylvania, Delaware, Virginia, West Virginia, Maryland, Kentucky, eastern Tennessee and North Carolina);
Central (Ohio, Indiana and Michigan); and
Southeast (Alabama, Georgia, South Carolina and Florida).
West:
Central West (Texas, Oklahoma, Arkansas, Mississippi, western Tennessee, Missouri, Kansas, Iowa, Nebraska, Minnesota, Illinois and South Dakota);
Mountain West (Colorado, Wyoming, Utah, Montana, New Mexico, southern Idaho, Nevada and Arizona); and
Northwest (Washington, Oregon and northern Idaho).
Products and Services – Locations
Aggregates
United States
Asphalt
United States
Readymixed Concrete
United States
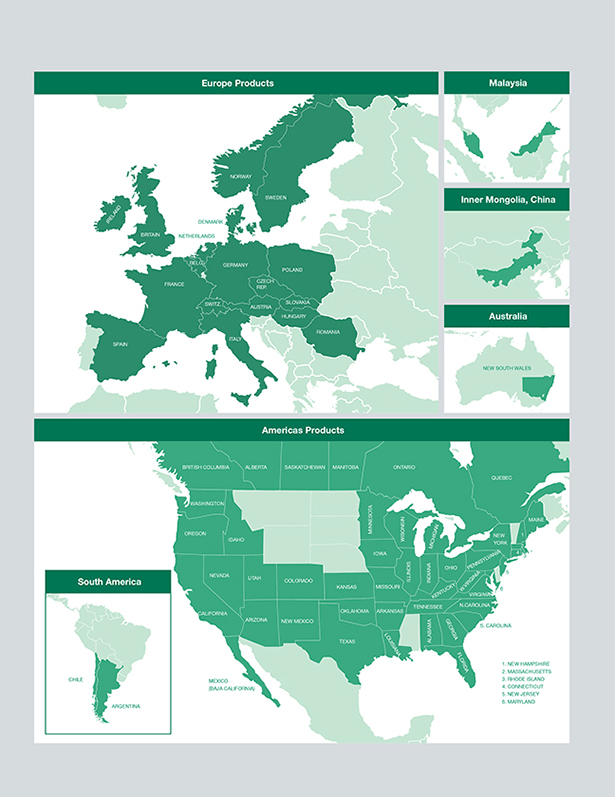
Business Operations in Europe Products
Europe Products’ strategy has been to build and grow scalable businesses in the large European construction markets by increasing the penetration of CRH products, developing positions to benefit from scale and best practice, creating competitive advantage through product, process and end-use innovation, while maintaining a balanced exposure to demand drivers. Early in 2014 the Group began a process of reorganising its European business by integrating its Products and Materials businesses into one European organisation. This will enable CRH to leverage the benefits of its operating plant network in both western and eastern European markets.
Operating in 21 countries, this business is a regional leader in concrete products, concrete landscaping, clay products, construction accessories and outdoor security. Leveraging the benefits of our regional platforms, we realise operational and procurement synergies across the network. Product development also provides construction solutions which increase efficiencies on site, creating more design freedom for architects while enhancing the built environment and reducing energy consumption of buildings. Europe Products’ development strategy is to continue to penetrate the growing repair, maintenance and improvement (“RMI”) markets of developed Europe and to broaden the product range in developing regions as construction markets in those regions become more sophisticated. This segment employs approximately 15,600 people at close to 360 operating locations.
Concrete Products
This group manufactures concrete products for two principal end-uses: pavers, tiles and blocks for architectural use, and floor and wall elements, beams and vaults for structural use. In addition, sand-lime bricks are produced for the residential market. Principal raw materials include cement, crushed stone and sand and gravel, all of which are readily available locally.
Clay Products
The Clay Products group principally produces clay facing bricks, pavers, blocks and rooftiles, with the Ibstock operation in the UK being the largest business.
Lightside Building Products
The Building Products group is the European market leader in outdoor security and construction accessories.
The Construction Accessories group supplies metal-based accessories, including stainless steel fixing systems, for the construction and precast concrete industries.
The Fencing & Security (“F&S”) business unit is mainly active in the non-residential construction market. F&S is a supplier of security solutions, which includes designing and manufacturing fencing and security gate systems for the building industry, manufacturing industry, sports and recreational areas, power stations and airports. Raw materials for fencing and security gate manufacturing comprise steel, aluminium, reinforced glass fibre, chain-link fabric and barbed wire purchased from a variety of sources.
The Shutters & Awnings group specialises in developing, assembling and distributing roller shutter and awning systems.
Products and Services – Locations
Concrete Products
Architectural Concrete: Belgium, Denmark, France, Germany, Netherlands, Slovakia, United Kingdom
Structural Concrete: Belgium, Denmark, France, Hungary, Poland, Romania, Switzerland, United Kingdom
Clay Products
Germany, Netherlands, Poland, United Kingdom
Lightside Building Products
Construction Accessories: Australia, Austria, Belgium, Czech Republic, France, Germany, Inner Mongolia, Ireland, Italy, Malaysia, Netherlands, Norway, Poland, Spain, Switzerland, Sweden, United Kingdom
Fencing & Security: France, Germany, Ireland, Netherlands, United Kingdom
Shutters & Awnings: Germany, Netherlands, United Kingdom
Business Operations in Americas Products
Americas Products’ strategy is to build an optimised portfolio of businesses which have leading positions across a balanced range of product markets and end-use segments. Our activities are organised into three product groups under the Oldcastle name: Architectural Products (concrete masonry and hardscapes, clay brick, packaged lawn and garden products, packaged cement mixes, fencing), Precast (utility, drainage and structural precast, construction accessories) and BuildingEnvelope® (glass and aluminium glazing systems). A coordinated approach at both a national and regional level achieves economies of scale and facilitates sharing of best practices which drive operational and commercial improvement. Through Oldcastle’s North American research and development centre, a pipeline of innovative value-added products and design solutions is maintained.
Operating in 40 US States and 6 Canadian provinces, CRH has the breadth of product range and national footprint to provide a national service to customers with the personal touch of a local supplier. Focussing on strategic and national accounts, the Oldcastle Building Solutions initiative provides an additional platform for growth as it is uniquely
positioned in the industry to offer solutions to customers across all phases of building construction. Employees total approximately 17,300 at over 400 locations.
Building Products
Architectural Products Group (“APG”) services the US and Canada from 257 operating locations in 39 States and six Canadian provinces. The residential and non-residential sectors combined account for 95% of APG’s output, a significant proportion of which is used in the RMI and Do-It-Yourself (“DIY”) sectors. Competition for APG arises primarily from other locally-owned products companies. Principal raw material supplies are readily available.
APG’s concrete masonry products are used for cladding and foundations. Hardscape products comprise pavers, retaining wall products and patio products. Lawn and garden products, mainly bagged and bulk mulch, soil and specialty stone products, are marketed to major DIY and homecenter chains across the United States. Cement mixes, marketed under the Sakrete® and ProSpec® brands, and lightweight aggregates are also important product lines. APG includes Glen-Gery Corporation, a clay brick producer located primarily in the northeast and midwest regions of the United States. Merchants Metals is also part of APG, a leading manufacturer and distributor of fencing and related products, used by the residential, non-residential and infrastructure sectors.
The Precast group produces precast, prestressed and polymer concrete products, small plastic box enclosures and concrete pipe in the US and Canada with 92 locations in 25 States and the province of Quebec.
The most significant precast concrete products are underground vaults sold principally to water, electrical and telephone utilities. Other precast items include drainage and sanitary sewer products such as pipe, manholes, inlets and catch basins, and street and highway products such as median barriers, culverts and short span bridges. In many instances, precast products are an alternative to poured-in-place concrete, which is a significant competing product. Plastic enclosures are also supplied to water, electrical and telephone utilities. Polymer trench is sold to the electric and railroad market.
The Precast group’s Building Systems and Modular business manufactures and installs pre-stressed concrete flooring plank, modular precast structures and other products. These products are used mainly in structures such as hotels, apartments, dormitories and prisons.
Concrete pipe is used for storm and sanitary sewer applications, which are largely local government projects. Competing materials include corrugated steel pipe and high-density polyethylene pipe in storm sewer applications and plastic pipe in sanitary sewer applications.
Precast also includes the Meadow Burke operations, which supplies thousands of specialised products used in concrete construction activities.
BuildingEnvelope® (“BE”) custom-manufactures architectural glass and engineered aluminium glazing systems for multi-storey commercial, institutional and residential construction. With over 4,800 people and 56 locations in 22 States and four Canadian provinces, BE is the largest supplier of high-performance glazing products and services in North America, delivering to all of the top 50 MSAs (Metropolitan Statistical Areas) in the US and to Canada.
Tempered glass and engineered aluminium glazing systems are building products with major applications in the RMI construction sector and have a wide range of architectural applications. The architectural glass product range includes insulated, spandrel, laminated, security and sound control glass manufactured in a variety of shapes, thicknesses, colours and qualities. Engineered aluminium glazing systems include a broad range of storefront and entrances, curtain wall and architectural windows.
South America
CRH operates six companies in Argentina and Chile. Canteras Cerro Negro is a clay roofing, wall and floor tiles producer. It owns two state-of-the-art production facilities in Olavarría, 330km southwest of Buenos Aires and a greenfield manufacturing facility in Cordoba. Cormela produces clay block at a facility in Campana, 60 kilometres from Buenos Aires. Ladrillos Olavarria (LOSA), acquired in 2013, produces clay blocks and floor tiles from a plant located in Olavarría. Superglass (Argentina) and Vidrios Dell Orto (Chile) fabricate tempered, laminated and insulated glass. Comercial Duomo is a specialised construction products retailer and wholesaler in Chile.
Products and Services – Locations
Architectural Concrete
Canada, United States
Clay
Argentina, United States
Precast Concrete, Pipe and Prestress Products
Canada, United States
Glass Fabrication
Argentina, Canada, Chile, United States
Glazing Systems
Canada, United States
Construction Accessories
United States
Fencing Products
Mexico, United States
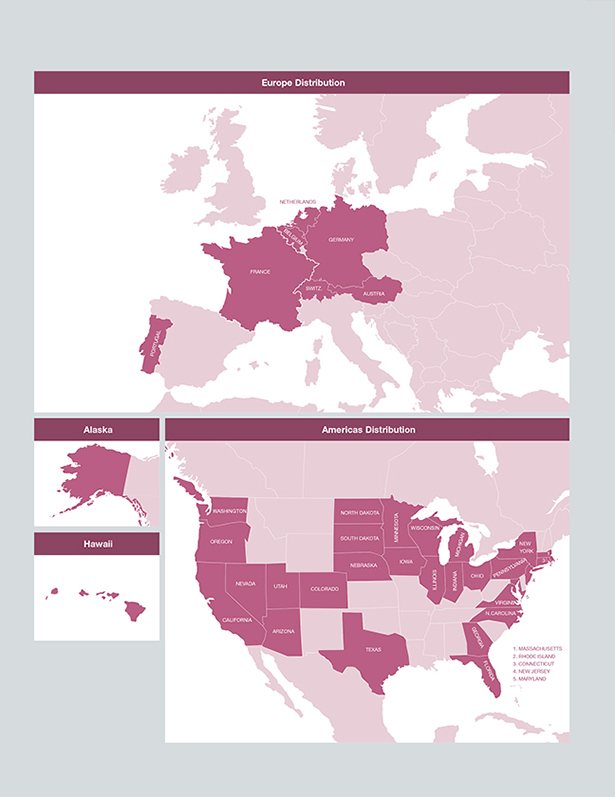
Business Operations in Europe Distribution
Europe Distribution’s strategy is to increase its network density in the largely unconsolidated core European markets while also investing in other attractive segments of building materials distribution. Organisational initiatives leverage expertise between DIY and Builders Merchants and use best-in-class IT to deliver operational excellence, optimise the supply chain and provide superior customer service.
From an established base in the Netherlands, CRH has expanded its leading Builders Merchants positions in Switzerland, Germany, Austria and France, in addition to growing its DIY “GAMMA” format in the Benelux. Substantial opportunities remain to expand our existing network in core European markets and to establish new platforms aimed at increasing our exposure to growing RMI market demand. An example is CRH’s entry into the developing Sanitary, Heating and Plumbing (“SHAP”) distribution market through the acquisition of a Swiss provider of high-end sanitary ware, since replicated in contiguous markets in Germany and Belgium. Europe Distribution, excluding equity accounted investments, employs approximately 11,300 people at 671 locations.
Builders Merchants
Professional Builders Merchants cater to the heavyside sector selling a range of bricks, cement, roofing and other building products mainly to small and medium-sized builders. Competition in merchanting is encountered primarily from other merchanting chains and local individual merchants. In Switzerland, the Group has a strong position as the largest builders merchant and the only country-wide supplier of SHAP products. CRH is a major regional distributor in France, with 49 locations. The Group also has a strong regional presence in the northwest of Germany where Bauking has 80 locations. Sax Sanitair, acquired in August 2010, is a leading SHAP distributor in Belgium where the group now has 40 SHAP locations.
DIY
The DIY Europe platform operates under four different brands: GAMMA (the Netherlands and Belgium), Karwei (the Netherlands), Hagebau (Germany) and Maxmat (Portugal) selling to DIY enthusiasts and home improvers. CRH operates 135 Karwei and GAMMA DIY stores in the Netherlands and 19 GAMMA stores in Belgium. The stores operate within the Intergamma franchise organisation, the largest DIY group in the Benelux. Buying and advertising is undertaken by Intergamma, which is owned by its franchisees. In Germany, Bauking operates 42 DIY stores under the brand name Hagebau. In Portugal, Maxmat is a 50% joint venture cash and carry DIY chain with 30 stores.
Associate Interests
CRH holds a 21.13% equity interest in Samse S.A., a publicly-quoted distributor of building materials to the merchanting sector in the Rhône-Alpes region.
Products and Services – Locations1
Builders Merchants
Austria, Belgium, France, Germany, Netherlands, Switzerland
Sanitary, Heating and Plumbing (“SHAP”)
Benelux, Germany, Switzerland
DIY Stores
Belgium, Germany, Netherlands
| | 1 | Excludes joint venture and associate interests. Results for these entities are equity accounted in the Consolidated Financial Statements. | |
Business Operations in Americas Distribution
Americas Distribution’s strategy is focussed on being the supplier of choice to the professional roofing and siding contractor and on applying this successful distribution model to the Interior Products demand segment. Demand in the Exterior Products business is largely influenced by residential and commercial replacement activity with the key products having an average life span of 25 years. The Interior Products division has less exposure to replacement activity as demand is largely driven by the new residential and commercial construction market. State-of-the-art IT, disciplined and focussed cash management, and well-established procurement and commercial systems support supply chain optimisation and enable CRH to provide superior customer service.
Operating in 31 States, growth opportunities include investment in new and existing markets, in complementary private label and energy-saving product offerings, and in other attractive building materials distribution segments that service professional dealer networks. Employees total approximately 3,700 at 193 locations.
Americas Distribution, trading primarily as Allied Building Products (“Allied”), is a large distributor in the Roofing/Siding segment in the United States. Allied’s Interior Products segment accounts for approximately 35% of annualised Distribution sales. The primary customers are drywall contractors who are mainly involved in new residential and new commercial construction.
Products and Services – Locations
Exterior Products (Roofing/Siding)
United States
Interior Products
United States
Mineral Reserves
| | | | | | | | | | | | | | | | | | | | | | | | | | | | | | | | | | | | | | | | |
Activities with Reserves Backing1 | |
| | | | | | | | |
| | | | | | | | | | Property acreage
(hectares)2 | | | | | | | | | Percentage of mineral reserves
by rock type | | | | |
| | | Physical
Location | | Number of quarries/ pits | | | | | Owned | | | Leased | | | Proven & probable resserves3 | | | Years to depletion4 | | | Hard rock | | | Sand & gravel | | | Other | | | 2013 Annualised extraction5 | |
| | | | | | | | | | | |
| Europe Materials | | | | | | | | | | | | | | | | | | | | | | | | | | | | | | | | | | | | | | | | |
| Cement | | Ireland | | | 2 | | | | | | 249 | | | | - | | | | 128 | | | | 83 | | | | 100% | | | | - | | | | - | | | | 1.6 | |
| | | Poland | | | 2 | | | | | | 293 | | | | - | | | | 47 | | | | 11 | | | | 93% | | | | 6% | | | | 1% | | | | 3.8 | |
| | | Spain | | | 1 | | | | | | 32 | | | | - | | | | 13 | | | | 87 | | | | 100% | | | | - | | | | - | | | | 0.1 | |
| | | Switzerland | | | 3 | | | | | | 165 | | | | - | | | | 27 | | | | 21 | | | | 92% | | | | - | | | | 8% | | | | 1.4 | |
| | | Ukraine | | | 8 | | | | | | 871 | | | | - | | | | 162 | | | | 44 | | | | 98% | | | | - | | | | 2% | | | | 3.4 | |
| Aggregates | | Finland | | | 159 | | | | | | 697 | | | | 410 | | | | 174 | | | | 13 | | | | 69% | | | | 31% | | | | - | | | | 12.3 | |
| | | Ireland | | | 102 | | | | | | 4,903 | | | | 70 | | | | 892 | | | | 89 | | | | 83% | | | | 17% | | | | - | | | | 10.6 | |
| | | Poland | | | 13 | | | | | | 649 | | | | 10 | | | | 209 | | | | 19 | | | | 66% | | | | 34% | | | | - | | | | 9.0 | |
| | | Spain | | | 12 | | | | | | 172 | | | | 184 | | | | 84 | | | | 32 | | | | 99% | | | | 1% | | | | - | | | | 2.5 | |
| | | Other | | | 30 | | | | | | 383 | | | | 549 | | | | 204 | | | | 26 | | | | 77% | | | | 23% | | | | - | | | | 7.9 | |
| Lime | | Ireland, Poland | | | 2 | | | | | | 111 | | | | - | | | | 47 | | | | 47 | | | | 100% | | | | - | | | | - | | | | 1.0 | |
| Subtotals | | | | | 334 | | | | | | 8,525 | | | | 1,223 | | | | 1,987 | | | | | | | | 83% | | | | 16% | | | | 1% | | | | | |
| | | | | | | | | | | |
| Americas Materials | | | | | | | | | | | | | | | | | | | | | | | | | | | | | | | | | | | | | | | | |
| Aggregates | | East | | | 261 | | | | | | 24,189 | | | | 4,300 | | | | 9,188 | | | | 130 | | | | 89% | | | | 11% | | | | - | | | | 70.7 | |
| | | West | | | 451 | | | | | | 21,202 | | | | 16,524 | | | | 4,207 | | | | 83 | | | | 38% | | | | 62% | | | | - | | | | 52.0 | |
| Subtotals | | | | | 712 | | | | | | 45,391 | | | | 20,824 | | | | 13,395 | | | | | | | | 73% | | | | 27% | | | | - | | | | | |
| | | | | | | | | | | |
| Europe Products | | | | | | | | | | | | | | | | | | | | | | | | | | | | | | | | | | | | | | | | |
| Clay | | UK, Poland | | | 47 | | | | | | 2,850 | | | | 169 | | | | 112 | | | | 53 | | | | - | | | | 5% | | | | 95% | | | | 2.2 | |
| | | | | | | | | | | |
| Americas Products | | | | | | | | | | | | | | | | | | | | | | | | | | | | | | | | | | | | | | | | |
| Clay | | United States | | | 25 | | | | | | 1,640 | | | | 308 | | | | 74 | | | | 65 | | | | - | | | | - | | | | 100% | | | | 1.2 | |
| Group totals | | | | | 1,118 | | | | | | 58,406 | | | | 22,524 | | | | 15,568 | | | | | | | | 73% | | | | 26% | | | | 1% | | | | | |
| | |
| | |
1 The disclosures made in this category refer to those facilities which are engaged in on-site processing of reserves in the various forms. 2 1 hectare equals approximately 2.47 acres. 3 Where reserves are leased, the data presented above is restricted to include only that material which can be produced over the life of the contractual commitment inherent in the lease; the totals shown pertain only to amounts which are proven and probable. All of the proven and probable reserves are permitted and are quoted in millions of tonnes. 4 Years to depletion is based on the average of the most recent three years’ annualised production. 5 Annualised extraction is quoted in millions of tonnes. | | |
| | |
The Group’s reserves for the production of primary building materials (which encompass cement, lime, aggregates (stone, sand and gravel), clay products, asphalt, readymixed concrete and concrete products) fall into a variety of categories spanning a wide number of rock types and geological classifications – see the table on the previous page setting out the activities with reserves backing.
Reserve estimates are generally prepared by third-party experts (i.e. geologists or engineers) prior to acquisition; this procedure is a critical component in the Group’s due diligence process in connection with any acquisition. Subsequent to acquisition, estimates are typically updated by company engineers and/or geologists and are reviewed annually by corporate and/or Divisional staff. However, where deemed appropriate by management, in the context of large or strategically important deposits, the services of third-party consultant geologists and/or engineers may be employed to validate reserves quantities outside of the aforementioned due diligence framework on an ongoing basis. The Group has not employed third-parties to review reserves over the three-year period ending 31 December 2013 other than in business combination activity and specific instances where such review was warranted.
Reserve estimates are subject to annual review by each of the relevant operating entities across the Group. The estimation process distinguishes between owned and leased reserves segregated into permitted and unpermitted as appropriate and includes only those permitted reserves which are proven and probable. The term “permitted” reserves refers to those tonnages which can currently be mined without any environmental or legal constraints. Permitted owned reserve estimates are based on estimated recoverable tonnes whilst permitted leased reserve estimates are based on estimated total recoverable tonnes which may be extracted over the term of the lease contract.
Proven and probable reserve estimates are based on recoverable tonnes only and are thus stated net of estimated production losses and other matters factored into the computation (e.g. required slopes/benches). In order for reserves to qualify for inclusion in the “proven and probable” category, the following conditions must be satisfied:
| • | | The reserves must be homogeneous deposits based on drill data and/or local geology; and |
| • | | The deposits must be located on owned land or on land subject to long-term lease. |
None of CRH’s mineral-bearing properties is individually material to the Group.
Sources of Availability of Raw Materials
CRH generally owns or leases the real estate on which its main raw materials, namely aggregates and clay reserves, are found. CRH is a significant purchaser of certain important materials or resources such as cement, bitumen, steel, gas, fuel and other energy supplies, the cost of which can fluctuate significantly and consequently have an adverse impact on CRH’s business. CRH is not generally dependent on any one source for the supply of these materials or resources, other than in certain jurisdictions with regard to the supply of gas and electricity. Competitive markets generally exist in the jurisdictions in which CRH operates for the supply of cement, bitumen, steel and fuel.
Property, Plants and Equipment
| | | | | | | | | | | | |
Significant Locations – Clinker Capacity | |
| | | |
Subsidiary | | Country | | | Number of plants | | | Clinker Capacity (tonnes per hour) | |
Irish Cement | | | Ireland | | | | 2 | | | | 440 | |
| Finnsementti | | | Finland | | | | 2 | | | | 180 | |
| Grupa Ożarów | | | Poland | | | | 1 | | | | 340 | |
| JURA-Holding | | | Switzerland | | | | 2 | | | | 116 | |
| OJSC Podilsky Cement | | | Ukraine | | | | 1 | | | | 445 | |
| Cementos Lemona | | | Spain | | | | 1 | | | | 94 | |
| | | | | | | | | | | | |
At 7 March 2014, CRH had a total of 2,558 building materials production locations and 864 Merchanting and DIY locations. 1,564 locations are leased, with the remaining 1,858 locations held on a freehold basis.
The most significant subsidiary locations are the cement facilities in Ireland, Finland, Poland, Switzerland, Ukraine and Spain. The capacity for these locations is set out in the table above. Further details on locations and products manufactured are provided in the Business Operations sections on pages 12 to 19. None of CRH’s individual properties is of material significance to the Group.
CRH believes that all the facilities are in good condition, adequate for their purpose and suitably utilised according to the individual nature and requirements of the relevant operations. CRH has a continuing programme of improvements and replacements to properties when considered appropriate to meet the needs of the individual operations. Further information in relation to the Company’s accounting policy and process governing any impairment of property, plant and equipment is given on page 126 and in note 14 to the Consolidated Financial Statements on page 145.
Mine Safety Disclosures
The information concerning mine safety violations and other regulatory matters required by Section 1503(a) of the Dodd-Frank Wall Street Reform and Consumer Protection Act is included in Exhibit 99.1 to this Annual Report on Form 20-F.
Development Review
Total acquisition and investment activity for 2013, including debt acquired of €44 million and €144 million relating to the asset exchange in Spain described below, amounted to €720 million (2012: €548 million) on a total of 28 bolt-on transactions which will contribute annualised sales of approximately €434 million, of which €306 million has been reflected in our 2013 results.
Seven transactions were completed by our Europe Materials operations, including the acquisition of Cementos Lemona in Spain as part of the asset swap in which we divested our 26% stake in Corporacion Uniland. In September the Group became the leading cement producer in Ukraine with the acquisition of Mykolaiv Cement in the Lviv region. Two other transactions by Europe Materials strengthened our aggregates position in Northern Ireland and expanded our network of cement import facilities in Britain. In Europe Products, an acquisition in Belgium established the Group as market leader in the pre-stressed hollowcore flooring segment, while three acquisitions in the Distribution segment added 13 branches to our network of builders merchants across the Benelux and France. Our joint venture business in India also strengthened its market position in Southern India with the acquisition of Sree Jayajothi Cement in August.
In the Americas, the Materials Division completed 10 bolt-on transactions across its operations, adding 457 million tonnes of strategically-located aggregates reserves, primarily in the Eastern region of the United States. Our Products business significantly expanded its presence in the high growth region of Western Canada with an acquisition which complements the footprint of our existing North American architectural products business and forms a platform for further bolt-on opportunities. Three other acquisitions in the Products segment strengthened our local market positions and are expected to deliver good synergies as we consolidate the acquired businesses with our existing operations. The Distribution business completed three acquisitions adding eight locations to our network.
Proceeds from divestments during the period, including €144 million relating to the transfer of Uniland, amounted to €283 million.
The €669 million of development activity during 2012 reflected CRH’s long-term, value-based approach to developing the Group’s balanced portfolio. Excluding net deferred payments, total acquisition spend for 2012 amounted to €548 million on a total of 36 bolt-on transactions. Expenditure of €263 million in the first half of 2012 included 18 acquisition and investment initiatives which strengthened our existing market positions and added valuable and well-located aggregates reserves. In the second half of 2012 the Group completed 18 transactions at a total cost of €404 million (€285 million cash spend excluding deferred payments), with the largest transaction being a majority stake in Trap Rock Industries, an integrated aggregates and asphalt business in New Jersey. Total proceeds from completed disposals in 2012 amounted to €784 million. The major disposals were the divestment in May 2012 of our 49% stake in Portuguese cement producer Secil and the sale in April of our wholly-owned Magnetic Autocontrol business.
Total acquisition spend for 2011 amounted to €610 million on a total of 45 bolt-on transactions. Expenditure of €163 million in the first half included 22 acquisition and investment initiatives across all six operating segments strengthening our existing market positions and adding valuable and well-located aggregates reserves. The second half of 2011 saw a step-up in the pace of development activity with expenditure of €447 million on 23 acquisitions including the VVM
Group in Belgium, an important strategic add-on for our existing Benelux-based Cementbouw business. Our Americas Distribution business added a total of 24 branches in 4 transactions in the second half of 2011. Total proceeds from completed disposals in 2011 amounted to €492 million. The divestments of Europe Products’ Insulation and Climate Control businesses, together with the disposal of our 35% associate investment in the Trialis distribution business in France, were completed in the first half of 2011, while the second half saw the sale of our seawater magnesia operation in Ireland.
The Environment and Government Regulations
The most important government regulations relevant to CRH as a building materials company are those environmental laws and regulations relevant to our extractive and production processes. In the European Union, operations are subject to national environmental laws and regulations, most of which now emanate from European Union Directives and Regulations. In the United States, operations are subject to Federal and State environmental laws and regulations. In other jurisdictions, national environmental laws apply.
Environmental Compliance Policy
In order to comply with environmental regulations, CRH has developed the following Group environmental policy, approved by the CRH Board and applied across all Group companies, which is to:
| • | | comply, as a minimum, with all applicable environmental legislation and continuously improve our environmental stewardship, aiming all the time to meet or exceed industry best practice; |
| • | | ensure that our employees and contractors respect their environmental responsibilities; |
| • | | address proactively the challenges and opportunities of climate change; |
| • | | optimise our use of energy and all resources; |
| • | | promote environmentally-driven product innovation and new business opportunities; and |
| • | | develop positive relationships and strive to be good neighbours in every community in which we operate. |
Achieving our environmental policy objectives at all our locations is a management imperative; this line responsibility continues right up to CRH Board level. Daily responsibility for ensuring that the Group’s environmental policy is effectively implemented lies with individual location managers, assisted by a network of Environmental Liaison Officers (“ELOs”). At each year-end, the ELOs assist the Group Sustainability Manager and his team in carrying out a detailed assessment of Group environmental performance, which is reviewed by the CRH Board.
Addressing Climate Change
CRH recognises that climate change is a major challenge facing humanity and is committed to playing its part in developing practical solutions. CRH is a core member of the Cement Sustainability Initiative (“CSI”) of the World Business Council for Sustainable Development (“WBCSD”). The CSI is a voluntary initiative by 24 of the world’s major cement producers, promoting greater sustainability in the cement industry.
In 2007, CRH committed to a 15% reduction in its specific net CO2 cement plant emissions by 2015 compared with the 1990 specific emissions for the same portfolio of plants. This reduction was achieved three years ahead of schedule in 2012 and CRH has now pledged a 25% reduction in specific net CO2 cement plant emissions by 2020. We are confident that our strategic programmes will deliver this.
CRH is operating successfully within the National Allocation Plans under the European Emissions Trading Scheme through actively implementing carbon reduction strategies. Through relevant trade associations and the CSI of the WBCSD, CRH is actively engaged in industry initiatives to develop appropriate carbon mitigation strategies.
CRH has implemented capital expenditure programmes in its cement operations in Europe to reduce carbon emissions in the context of the European Union commitment to reduce Greenhouse Gas emissions by 20% by 2020. The European Union is committed to increasing this target to 30% should an international agreement be concluded. Achieving such reductions would represent a significant extra constraint on cement operations in Europe.
US Federal and State laws are developing proactively to address carbon emissions. The Group will incur costs in monitoring and reporting emissions. Ultimately a “cap and trade” scheme may be implemented; depending on the scope of the legislation, this could significantly impact asphalt operations in the US. As of 7 March 2014, the Group is not aware of any schemes that would materially affect its US operations.
Possible Environmental Liabilities
At 7 March 2014 there were no material pending legal proceedings relating to environmental regulations or to site remediation which are anticipated to have a material adverse effect on the financial position or results of operations or liquidity of the Group, nor have internal reviews revealed any situations of likely material future environmental liability to the Group.
Governmental Policies
The overall level of government capital expenditures and the allocation by state entities of available funds to different projects, as well as interest rate and tax policies, directly affect the overall levels of construction activity. The terms and general availability of government permits required to conduct Group business also has an impact on the scope of Group operations. As a result such governmental decisions and policies can have a significant impact on the operating results of the Group.
Legal Proceedings
Group companies are parties to various legal proceedings, including some in which claims for damages have been asserted against the companies. Having taken appropriate advice, we believe that the aggregate outcome of such proceedings will not have a material effect on the Group’s financial condition, results of operations or liquidity.
In May 2012 the Group disposed of its 49% investment in its Portuguese joint venture Secil to our former joint venture partner, Semapa, following the ruling of the Arbitral Tribunal in Paris. As disclosed in our 2011 and 2012 Annual Reports, Semapa initiated legal proceedings in November 2011 to appeal against the Tribunal ruling and this continues to be the case. No provision has been made in respect of these proceedings in the Consolidated Financial Statements.
Research and Development
Research and development is not a significant focus of the Group. CRH’s policy is to expense all research and development costs as they occur.
Employees
The average number of employees for the past three financial years is disclosed in note 6 to the Consolidated Financial Statements on page 138 No significant industrial disputes have occurred at any of CRH’s factories or plants during the past five years. The Group believes that relations with its employees and labour unions are satisfactory.

24 CRH
Top: Sree Jayajothi Cements Limited was acquired in
2013 by My Home Industries (MHIL), CRH’s JV partner
in India. With an annual cement capacity of 3.2 million
tonnes, Sree Jayajothi makes MHIL market leader in
Andhra Pradesh, South India.
Centre: Expocrete, acquired in 2013, is a leader in
manufacturing and distributing specialised, high-quality
concrete hardscape and masonry products in western
Canada. Expocrete manufactured the c400m2 of Allan
Block Classic retaining wall used to create terraces at
this residence on Skaha Lake in Penticton, BC, Canada.
Bottom: BauKing, CRH’s leading distribution brand in
Germany, reopened this DIY store in Menden, after a
major renovation in October 2013. The store reopened as
a multi-channel location and BauKing customers can now
also order products online.

| | | | |
| | | | |
| | | | |
| | | | |
| | | | |
| | 2013 Key Financial Figures | | |
| | |
| | € million | |  |
| | Sales 18,031 | |
| | EBITDA (as defined)* 1,475 | |
| | Operating profit 100 | |
| | Loss before tax (215) | |
| | cent | |
| | Loss per share (40.6) | |
| | Dividend per share 62.5 | |
| | | |
| | | |
| | | |
| | | |
| | |
| | | | Albert Manifold with Myles Lee |
| | * Defined as earnings before interest, taxes, depreciation, amortisation, asset impairment charges, profit on disposals and the Group’s share of equity accounted investments’ result after tax. |
| | | | |
| | | | |
| | | | |
| | | | |
26 CRH
Strategy Review
Chief Executive’s Introduction1

2013 Performance
During the first six months of 2013, the severe and prolonged winter conditions which delayed the start of the construction season in our major markets, together with weaker trading in Europe, had a negative impact on our results. As the year progressed we saw markets beginning to stabilise in Europe, while the pick-up in economic activity in the US provided positive momentum for our Americas businesses.
Following a first-half decline of 6%, like-for-like sales were ahead by 2% in the second half, reducing the full-year decline to 2%. With the translation impact of the weaker US Dollar more than offset by contributions from acquisitions, sales of €18 billion for the year were in line with 2012. EBITDA (as defined) * for the year amounted to €1.48 billion, slightly ahead of guidance.
Against this backdrop, we continued to focus on improving our cost base, particularly in Europe, scaling our capacity and managing our costs to match shifting demand patterns across our businesses. Incremental savings of €195 million were delivered in the year. Our cumulative cost savings since the programme began in 2007 now amount to almost €2.4 billion.
We continued to generate strong cash flows from our operations, which, together with proceeds from divestments and asset disposals, resulted in net debt remaining in line with year-end 2012. This was after a spend on acquisitions and capital expenditure of approximately €1.2 billion and cash dividend payments of €0.37 billion.
For a closer look at the numbers, please refer to our Business Performance Review on pages 42 to 51, as introduced by our Finance Director.
Development Activity
During 2013 we remained active on the development front completing 28 transactions, at a total cost of €0.7 billion, which met our criteria of establishing and developing leading positions in attractive markets. We strengthened our cement positions in high-growth markets in Ukraine, India and China. We added to our aggregates positions in a number of key markets in the United States, extended our concrete products business in the attractive western Canada market and added to our Distribution network in both Europe and the United States.
In October, we opened a regional headquarters in Singapore, from which we will manage our developing Asian business. From a small start six years ago, we are now invested in companies employing 15,000 people in Asia.
Portfolio Review
With economic indicators now pointing to an improving outlook for the global economy, we are reshaping our portfolio for the future. There has been significant economic and financial change since 2007 and CRH responded proactively and decisively to that change. We are now focussed on positioning the Group for future growth as we enter the coming cycle.
In November 2013 we embarked on a comprehensive review to identify and focus on the businesses in our portfolio which offer the most attractive future returns and growth in the coming cycle. We have completed the initial phase of the review and have identified a total of 45 business units which will not meet our future returns objectives. An orderly disposal process is underway to dispose of these operations, which accounted for c.10% of the Group’s net assets at year-end 2013. With the next phase of the review underway, we have identified a further group of businesses, representing c.20% of our net assets, which require more detailed assessment; however, in the light of current conditions and outlook, we do not anticipate further impairment charges to arise should a decision be made to exit any of these businesses.
Over the years, we have built up a strong network of core businesses, which represent the majority of our net assets. By prioritising the allocation and reallocation of capital across these core businesses, our target is to restore margins and returns to peak levels in the coming cycle.
To facilitate this process, we are reorganising our European business by integrating our products and materials businesses into one organisation. This will better enable CRH to leverage the benefits of our operating plant network in both western and eastern European markets, which is complementary to our Distribution business in core European markets.
Focus for 2014
Dynamic allocation and reallocation of resources to optimise our portfolio, together with our traditional tight cost-control and capital discipline and our relentless focus on returns, will be key to driving growth and to rebuilding returns and margins in the coming years. We believe that 2013 represents the trough in our profits, and that 2014 will be a year of profit growth. We are encouraged by second half activity levels in 2013 and by the fact that, while it is still early in the season, trading so far in 2014 has been ahead of last year.
| 1 | See cautionary statement regarding forward-looking statements on page 7. |
| * | Defined as earnings before interest, taxes, depreciation, amortisation, asset impairment charges, profit on disposals and the Group’s share of equity accounted investments’ result after tax. |
CRH Vision and Strategy
CRH is one of the world’s leading building materials companies, with a business that spans 35 countries and which serves all segments of construction industry demand. CRH supplies raw materials and finished products for residential, non-residential and infrastructure construction applications. It also has distribution businesses that supply products to the professional building contractor and to the home-owner.
CRH’s vision is to be a responsible international leader in building materials, delivering superior and sustained shareholder returns.
The sections that follow outline CRH’s strategy and how CRH puts that strategy into action through its business model.
Strategy in Action
CRH’s strategy is to sustain and grow a geographically diversified business with exposure to a broad range of segments of construction demand, enabling CRH to achieve its vision of delivering industry-leading returns.
CRH delivers on its strategy by growing and developing its portfolio of core businesses in building materials, seeking balanced exposure to multiple demand drivers, building leadership positions in regional markets, investing in and continuously improving its operations, acquiring and growing well-run value-creating businesses, while seeking exposure to new development opportunities and creating platforms for future growth.
CRH actively positions the Group to take advantage of varying economic cycles and applies its strategy in both developed economies, where there is a requirement for continual renewal of the built environment, and also in developing economies where industrialisation and population growth drive construction and economic activity. In doing so, the Group has established businesses in some of the biggest regional markets in the world and has achieved the position of market leader in many of these markets.
Developed Economies
In Western Europe and North America, CRH has built a balanced portfolio across the spectrum of building materials which leaves the business uniquely positioned to provide a broad product offering to the construction industry. While CRH’s heavyside building materials operations support the Group’s exposure to new-build and also infrastructure repair, maintenance and improvement (RMI) construction, its lightside product range enables CRH to participate in the growing residential and non-residential RMI markets, typical of mature economies.
CRH’s strategic focus in these markets is to continue to reinvest in its established platforms and to develop these businesses further through bolt-on acquisitions which achieve vertical integration, add to reserves, and fill out regional and product-level positions.
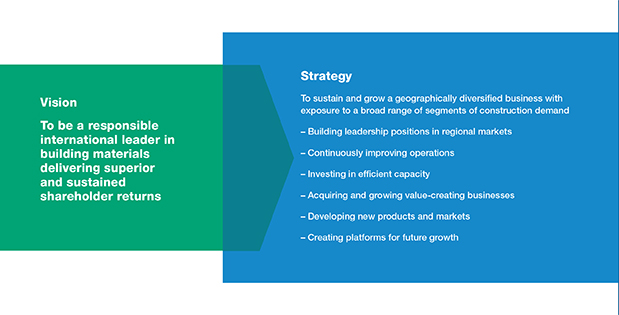
Developing Economies
In developing economies, CRH’s strategy is to target premium assets as an initial footprint. These entry platforms tend to be in cement and are often in partnership with strong, locally established businesses. Desirable entry points are those with well-located quality operations and good regional market positions. In addition, CRH targets businesses that have the potential to develop further downstream into integrated building materials businesses, as construction markets become more sophisticated over time.
In the mid-1990s, CRH applied this approach to its entry into the Polish market and today the Group is the leading integrated building materials company in Poland. CRH is now focussed on replicating this approach with its platforms in Ukraine, India and China.
Strategic Priorities
In looking to position the Group optimally for the future, CRH is currently conducting a detailed portfolio review, to identify those businesses and markets which offer the best potential for profit growth and returns in the cycle ahead.
A key strategic priority is to restore returns to levels seen during the course of the previous peak. Achievement of this will require the active management of CRH’s portfolio through the dynamic allocation and
reallocation of capital, the ongoing pursuit of excellence in operational performance, process and product innovation to promote differentiation and better serve customers’ needs, and successful integration of targeted acquisitions.
The Group has a track record of maintaining strong financial liquidity and capital resources. A key component of this success is CRH’s unwavering focus on cash generation and the retention of a strong capital base, both of which are essential to funding organic and acquisitive growth, and to CRH’s ability to fund dividend payments to shareholders.
CRH also recognises that excellence in sustainability, compliance, risk management and governance is key to achieving superior performance. The Group has policies and guidelines in place to support management in these important areas, which together enhance CRH’s reputation and underpin CRH’s ability to do business.
We continue to recruit and develop the best talent, as it is with exceptional management and operational teams that CRH implements its strategy, through its business model, in pursuit of superior and sustained returns and growth.
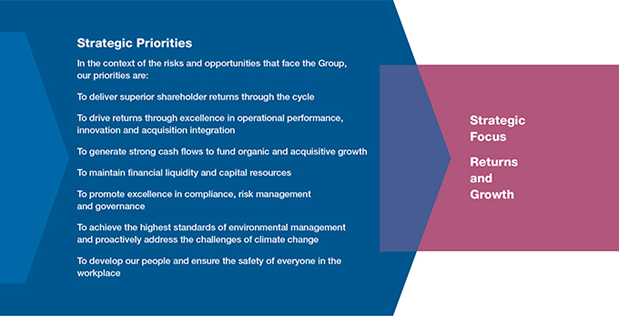
CRH Business Model
CRH’s subsidiaries employ approximately 76,000 people at over 3,400 locations around the world. The Group’s major businesses are in the developed markets of Europe and North America, and it has growing positions in certain developing economies in Asia.
A Balanced Portfolio
The portfolio is well balanced across products, geographies and sector end-uses and this concept lies at the core of CRH strategy. CRH’s geographic balance means that it is able to take advantage of differing regional demand cycles.
Sectoral and end-use balance reduces the effects of varying demand patterns across building and construction activity. Exposure in 2013 was broadly split 35% residential, 30% non-residential and 35% infrastructure, while the balance of new-build to RMI was 50:50.
Our Product Range
CRH’s business comprises Materials, Products and Distribution activities, which enable the Group to supply construction materials from initial site work, through the building phase, to fit-out and renewal of the built environment over time. In 2013, Materials activities generated 56% of Group EBITDA (as defined)*, while the Products segment delivered 25% and Distribution 19%.
CRH’s primaryMaterials businesses are vertically-integrated aggregates, cement, asphalt and readymixed concrete operations, which are backed by strategically-located, long-term reserves and used extensively in infrastructure applications.
The Group’sProducts businesses make a range of materials for use primarily in residential and non-residential construction. They include a broad range of architectural and structural products, and also accessories to assist in the construction process.
CRHdistributes building materials to general building contractors, specialist Sanitary, Heating and Plumbing (SHAP) contractors and Do-It-Yourself (DIY) customers in Europe, and to professional roofing/ siding and interior products contractors in the United States. These businesses are well-positioned to service growing RMI demand in mature markets.
Further information on the scale, footprint and strategy for these businesses can be found in the Introduction to this Annual Report and in the Business Performance Review section on pages 46 to 51.
How our Business Operates
CRH continuously improves its operations, develops its people and builds regional market leadership positions across an actively managed portfolio. CRH leverages the benefits of local market knowledge and experience with global scale and resources.

| * | Defined as earnings before interest, taxes, depreciation, amortisation, asset impairment charges, profit on disposals and the Group’s share |
| | of equity accounted investments’ result after tax. |
CRH expects strong management commitment to both the local operating company and to the CRH Group. Managers are supported from a Group centre which provides guidance, support and functional expertise in the areas of performance measurement, financial reporting, cash management, strategic planning, business development, talent management, governance, risk management and sustainability. This approach has attracted and retained exceptional management in the past and the Group has been strengthened by personnel with a range of skills including operational management, highly qualified business professionals and owner-entrepreneurs.
How we Manage our Finances
One of CRH’s guiding principles is a strong focus on cash generation, which gives it significant financial firepower for value-creating acquisitions and dividend payout. Strict capital discipline is a key characteristic of the Group, alongside good operational control and strong financial liquidity. The Group is committed to maintaining an investment grade credit rating. During 2013 CRH raised €1.5 billion in the eurobond market at record low coupons.
How we Generate Value
CRH’s approach to business has delivered industry-leading returns in the past and it is the Group’s intention to restore those returns and margins through the coming cycle.
At the core of CRH’s success is the pursuit of continuous improvement. The Group constantly challenges its businesses to do better and management recognises that continuous improvement requires a focus on measured performance, firm financial control, product and process innovation, and a rigorous approach to capital allocation.
CRH continues to invest and reinvest in its assets to improve the capacity, quality and efficiency of its operations. In addition, in a fragmented industry, CRH has the opportunity to grow by acquiring small to mid-sized companies which complement the existing network. From time to time, it completes larger deals where it sees compelling value.
This strategic approach and sustainable business model for value creation has enabled CRH to deliver superior performance and growth through previous cycles. Following the current portfolio review, it is CRH’s intention to accelerate the dynamic allocation and reallocation of resources within the Group, so that the businesses with the most potential in the next cycle will receive the most investment in the future.
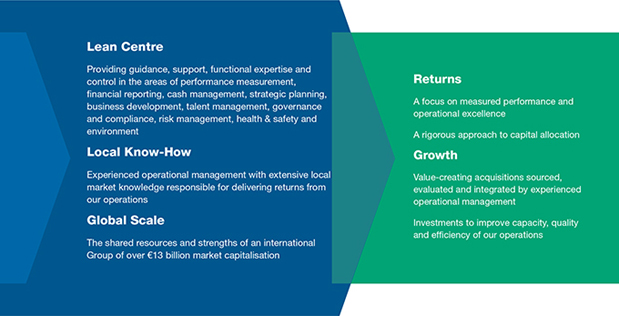
Sustainability and Governance
CRH has placed sustainability at the heart of its strategy and business model. In every area of business, CRH seeks to create long-term value for all stakeholders including investors (debt and equity), customers, partners, employees, suppliers, neighbours and local communities.
The Group is committed to safeguarding its employees, enhancing the environment, ensuring strong governance and risk management, and supporting and benefitting the communities in which it operates. In doing so, CRH can continue to extend its positive influence across the value chain, while building a strong and resilient business that is capable of delivering shareholder returns for the future.
Working Safely
With approximately 76,000 employees worldwide, keeping people safe is a priority. Close to €140 million has been invested in initiatives aimed at enhancing health and safety performance in the last five years. These efforts have resulted in an average 15% per annum reduction in the Group’s accident frequency rate over the decade, and encouragingly 92% of our active locations were accident free in 2013. However, despite the focus on safety, CRH deeply regrets the loss of nine lives (two employees and seven contractors) at its operations during 2013. With the assistance of independent specialists, the circumstances surrounding each of these individual tragedies have been examined in detail, the lessons learned communicated and changes implemented immediately. The elimination of fatalities is a fundamental objective of the Group.
Enhancing the Environment
As a global leader in building materials, CRH can play an important role in improving the sustainability of the built environment. In addition to our progress on CO2 reduction detailed below, CRH works with customers and the wider building materials industry to develop sustainable and innovative products and solutions.

Demand for lower carbon products such as warm-mix asphalt is increasing and this product now accounts for over 30% of CRH’s US asphalt sales. In Europe, an increasing proportion of CRH’s cement production is now of lower-carbon cements and 35% of CRH’s cement plant fuel requirements are met by alternative fuels. We recycled 17
million tonnes of externally-sourced alternative materials into new products, including recycled asphalt pavement and shingles which provides a fifth of asphalt requirements in our US operations.
Throughout the Group, extensive programmes are in place to improve energy and resource efficiency, achieve targeted air emission reductions, enhance biodiversity, and restore worked-out quarries.
Working with People and Communities
CRH operates in many communities and continued business success depends on the relationships it forms with all stakeholders. CRH actively supports social and community activities local to its operations and in 2013 held close to 700 stakeholder engagement days.
Our businesses know that developing our people is critical to sustaining competitive advantage and to achieving corporate growth over the long term. We believe in recruiting the best people and giving them a variety of development opportunities through which they can advance their careers, develop specialised expertise and grow professionally.
CRH is determined to create an inclusive workplace, with all recruitment, selection and promotion decisions made on individual merit. Achieving gender diversity is difficult in an industry which traditionally attracts more male employees and CRH’s current make-up reflects this. In 2013, 18% of employees were female. Of those, 11% of operational staff and 41% of clerical and administrative staff were female. At Board level, CRH has two female directors, including the Finance Director.
Protecting Human Rights
CRH is fully committed to human and labour rights and supports the principles set out in the articles of the United Nations’ Universal Declaration of Human Rights and the International Labour Organisation’s Core Labour Principles. Group companies are required to comply with the Group’s position on human rights when dealing with employees, contractors, customers and suppliers, as set out in the Code of Business Conduct and supporting policies.
In addition, CRH has launched an Ethical Procurement Code and a Supplier Code of Conduct, both of which outline processes and procedures to ensure compliance. A recent example of these procedures in practice was the temporary suspension of a supplier for failure to comply fully with our requirements; this necessitated alternative supply arrangements at a significant cost to CRH, until the issue was resolved and the supplier re-engaged.
Managing Risk
CRH has a formal Enterprise Risk Management (ERM) framework, which takes account of the perspectives of CRH’s diverse stakeholder interests, and is used to assess the rewards and mitigate the risks associated with day-to-day activities and strategic actions.
Through this framework, CRH seeks to minimise adverse outcomes by exercising control across all aspects of the Group’s operations and by evaluating carefully the risks of strategic decision-making prior to implementation. The tone is set from the top and is underpinned by CRH’s commitment to ethical principles, independent good faith reporting channels, a tolerance of challenge to the status quo and the rewarding of appropriate risk-taking. In line with leading practice, a “three lines of defence” model, incorporating (i) local management, (ii) divisional and head office oversight, and (iii) our internal audit function, has been in place for many years and is subject to ongoing refinement and development.
The combination of a high level of risk awareness and risk maturity and a well-developed and effective assurance framework, underline the integrity of CRH’s risk management systems as a whole and hence the Group’s capacity to assume risk.
The principal risks and uncertainties faced by the Group are discussed on pages 34 to 40 and are reported to the Audit Committee on a six-monthly basis.
Ensuring Excellence in Governance
Our governance procedures are rooted in a Group-wide commitment to core values which include integrity, honesty and respect for the law, and we expect unwavering compliance with the highest standards of business ethics. These principles underpin our strategy and reputation, as we develop and grow a diverse and global footprint in an increasingly demanding regulatory environment.
Our Compliance & Ethics team works closely with our business managers to implement all aspects of our compliance programme, which is designed to ensure that employees at all levels in the organisation understand that at CRH “there is never a good business reason to do the wrong thing”. In practice, this is achieved via a comprehensive Code of Business Conduct, with supporting policies, guidelines and training, effective monitoring and review, and an open and transparent culture where employees are encouraged and empowered to “speak up”.
In the past two years, over 30,000 employees have participated in Code of Business Conduct training and a further 10,000 have also undertaken advanced instruction on competition law, anti-bribery awareness and steps to counter the potential for corruption and fraud.
Further information is provided in the Corporate Governance section of this report on page 82.
Top: Oldcastle Materials’ Eugene Sand & Gravel company received a 2013 Oregon Excellence in Concrete Award, for concrete materials supplied to the Delta Ponds pedestrian bridge; a single-tower, cable-stayed bridge, with an innovative, V-shaped support tower design.
Centre: Zoontjens supplied over 3,000m2 of customised light-weight tiles from its Dreen® Combiplus range, for a unique architect designed rooftop square at the Erasmus University in the Netherlands.
Bottom: Allied Building Products, with over 190 outlets in the United States, provided materials for the renovation of the Lake Worth Casino, Florida. Pictured here are team members unloading materials, focussed always on safety when handling job-site deliveries.

CRH 33
Risk Factors
| | | | |
| | This section describes the principal risks and uncertainties that could affect the Group’s business. The risks and uncertainties listed below should be considered in connection with any forward-looking statements in this Form 20-F and the cautionary statements contained in “Introduction and Performance Measures – Forward – Looking Statements”. The Risk Factors have been grouped to focus on key strategic risks and key financial and reporting risks. |
| Key Strategic Risk Factors | | | | |
|
|
| | |
| Industry cyclicality | | | | |
| |
Risk Factor | | Discussion |
| The level of construction activity in local and national markets is inherently cyclical being influenced by a wide variety of factors including global and national economic circumstances, ongoing austerity programmes in the developed world, governments’ ability to fund infrastructure projects, consumer sentiment and weather conditions. The Group’s financial performance may also be negatively impacted by unfavourable swings in fuel and other commodity/ raw material prices. The adequacy and timeliness of management’s responses to unfavourable events are of critical importance. | | The Group’s operating and financial performance is influenced by general economic conditions and the state of the residential, industrial and commercial and infrastructure construction markets in the countries in which it operates, particularly in the European Union and North America. In general, economic uncertainty exacerbates negative trends in construction activity leading to postponement in orders. Construction markets are inherently cyclical and are affected by many factors that are beyond the Group’s control, including: |
| | • | | the price of fuel and principal energy-related raw materials such as bitumen and steel (which accounted for approximately 9% of annual Group sales revenues in 2013); |
| | • | | the performance of national economies in the 35 countries in which CRH operates; |
| | • | | monetary policies in the countries in which CRH operates — for example, an increase in interest rates typically reduces the volume of mortgage borrowings thus impacting residential construction activity; |
| | • | | the allocation of government funding for public infrastructure programmes, such as the development of highways in the United States under the Moving Ahead for Progress in the 21st Centruy Act (“MAP-21”); and |
| | • | | the level of demand for construction materials and services, with sustained adverse weather conditions leading to potential disruptions or curtailments in outdoor construction activity. |
| | A continuation of or deterioration in the current global economic downturn may result in further general reductions in construction activity. Against this backdrop, the adequacy and timeliness of the actions taken by CRH’s management team are of critical importance in maintaining financial performance at appropriate levels. |
| | Each of the above factors could have a material adverse effect on the Group’s operating results and the market price of CRH’s securities. |
|
|
| | |
| Political and economic uncertainty | | | | |
| |
Risk Factor | | Discussion |
| As an international business, CRH operates in many countries with differing, and in some cases potentially fast-changing economic, social and political conditions. Changes in these conditions, or in the governmental and regulatory requirements in any of the countries in which CRH operates (with particular reference to developing markets), may, for example, adversely affect CRH’s business thus leading to possible impairment of financial performance and/or restrictions on future growth opportunities. | | CRH operates mainly in Western Europe and North America as well as, to a lesser degree, in developing countries/emerging markets in Eastern Europe, South America, Turkey, China and India. The economies of these countries are at varying stages of socioeconomic and macroeconomic development which could give rise to a number of risks, uncertainties and challenges and could include the following: |
| | • | | changes in political, social or economic conditions; |
| | • | | trade protection measures and import or export licensing requirements; |
| | • | | potentially negative consequences from changes in tax laws; |
| | • | | labour practices and differing labour regulations; |
| | • | | procurement which contravenes ethical considerations; |
| | • | | unexpected changes in regulatory requirements; and |
| | • | | state-imposed restrictions on repatriation of funds. |
| | The outlook for Ukraine has become uncertain in recent weeks due to the political environment, and for now the implications for construction activity in 2014 are unclear. |
| | | | |
|
| | |
|
| |
| Commodity products and substitution | | |
| |
Risk Factor | | Discussion |
| CRH faces strong volume and price competition across its product lines. In addition, existing products may be replaced by substitute products which CRH does not produce or distribute. Against this backdrop, if CRH fails to generate competitive advantage through differentiation and innovation across the value chain (for example, through superior product quality, engendering customer loyalty or excellence in logistics), market share, and thus financial performance, may decline. | | The competitive environment in which the Group operates can be significantly impacted by general economic conditions in combination with local factors including the number of competitors, the degree of utilisation of production capacity and the specifics of product demand. Across the multitude of largely local markets in which the Group conducts business, downward pricing pressure is experienced from time to time and the Group may not always be in a position to recover increased operating expenses (caused by factors such as increased fuel and raw material prices) through higher sale prices. A number of the products sold by CRH (both those manufactured internally and those distributed) compete with other building products that do not feature in CRH’s product range. Any significant replacement of the Group’s products by substitute products, which CRH does not produce or distribute, could adversely impact market share and results of operations. |
|
|
| |
| Acquisition activity | | |
| |
Risk Factor | | Discussion |
| Growth through acquisition is a key element of CRH’s strategy. CRH may not be able to continue to grow as contemplated in its business plan if it is unable to identify attractive targets (including potential new platforms for growth), execute full and proper due diligence, raise funds on acceptable terms, complete such acquisition transactions, integrate the operations of the acquired businesses and realise anticipated levels of profitability and cash flows. | | The Group’s acquisition strategy focuses on value-enhancing mid-sized acquisitions supplemented from time to time by larger strategic acquisitions into new markets or new building products. As a result of the challenging trading backdrop for many of CRH’s businesses since the onset of the financial crisis and the ensuing global economic downturn, management’s focus continues to be limited to acquisition opportunities that offer compelling value and exceptional strategic fit. The realisation of CRH’s acquisition strategy is dependent on the ability to identify and acquire suitable assets at appropriate prices thus satisfying the stringent cash flow and return on investment criteria underpinning such activities. CRH may not be able to identify such companies, and, even if identified, may not be able to acquire them because of a variety of factors including the outcome of due diligence processes, the ability to raise funds (as required) on acceptable terms, the need for competition authority approval in certain instances and competition for transactions from peers and other entities exploring acquisition opportunities in the building materials sector. The Group’s ability to realise the expected benefits from acquisition activity depends, in large part, on its ability to integrate newly-acquired businesses in a timely and effective manner. Even if CRH is able to acquire suitable companies, it still may not be able to incorporate them successfully into the relevant legacy businesses and, accordingly, may be deprived of the expected benefits thus leading to potential dissipation and diversion of Group management resources and constraints on financial performance. |
|
|
| |
| Joint ventures and associates | | |
| |
Risk Factor | | Discussion |
| CRH does not have a controlling interest in certain of the businesses (i.e. joint ventures and associates) in which it has invested and may invest; the greater complexity inherent in these arrangements accompanied by the need for proactive relationship management may restrict the Group’s ability to generate adequate returns and to develop and grow its business. | | Due to the absence of full control of joint ventures (joint control only) and associates (significant influence), important decisions such as the approval of business plans and the timing and amount of cash distributions and capital expenditures, for example, may require the consent of CRH’s partners or may be approved without CRH’s consent, despite provisions in the purchase contract. These limitations could impair CRH’s ability to effectively manage and/or realise its strategic goals for these businesses. |
|
|
Risk Factorscontinued
| | |
|
| |
| Human resources | | |
| |
Risk Factor | | Discussion |
| Existing processes to recruit, develop and retain talented individuals and promote their mobility within a decentralised Group may be inadequate thus giving rise to management attrition and difficulties in succession planning and potentially impeding the continued realisation of the Group’s core strategy of performance and growth. | | The identification and subsequent assessment, management, development and deployment of talented individuals is of major importance in continuing to deliver on CRH’s core strategy of performance and growth and in ensuring that succession planning objectives for key executive roles throughout CRH’s international operations are satisfied. In recognition of these requirements, the human resource management framework focuses on the operation of integrated and targeted programmes of performance management, leadership development (including international assignments, where appropriate), coaching and mentoring inter alia; the appropriateness of these programmes is reviewed on a regular basis to ensure that they mirror best practices. |
|
|
| |
| Corporate communications | | |
| |
Risk Factor | | Discussion |
| As a publicly-listed company, CRH undertakes regular communication with its stakeholders. Given that these communications may contain forward- looking statements, which by their nature involve uncertainty, actual results and developments may differ from those communicated due to a variety of external and internal factors giving rise to reputational risk. | | CRH places great emphasis on timely and relevant corporate communications with overall responsibility for these matters being vested in senior management at the Group Head Office (largely the Chief Executive, the Finance Director, the Head of Corporate Communications and the Head of Investor Relations) supported by purposeful engagement with highly experienced external advisors, where appropriate. The strategic, operational and financial performance of the Group and of its constituent entities is reported to the Board on a monthly basis with all results announcements and other externally-issued documentation (e.g. the Annual Report on Form 20-F and the Corporate Sustainability Report) being discussed at the Board/Audit Committee prior to release. |
|
|
|
| Cyber and information technology |
| |
Risk Factor | | Discussion |
| As a result of the proliferation of information technology in the world today, CRH is exposed to security threats to its digital infrastructure which might lead to interference with production processes, the theft of private data or misrepresentation of information regarding CRH via digital media. In addition to potential irretrievability or corruption of critical data, CRH could suffer reputational losses and incur significant financial costs in remediation. | | CRH is aware of the importance of addressing security threats to its digital infrastructure and, given the increasing sophistication and evolving nature of this threat, CRH cannot rule out the possibility of such attacks occurring in the future. Such attacks may result in interference with production software, corruption or theft of sensitive data or reputational loss as a result of misrepresentation on social media sites. CRH has made a significant investment in upgrading its digital infrastructure with the overall objective of further enhancing system security, but cannot guarantee that future cyber-attacks will not be successful. |
|
|
| | |
|
| |
| Sustainability | | |
| |
Risk Factor | | Discussion |
| CRH is subject to stringent and evolving laws, regulations, standards and best practices in the area of sustainability (comprising corporate governance, environmental management and climate change (specifically capping of emissions), health and safety management and social performance) which may give rise to increased ongoing remediation and/or other compliance costs and may adversely affect the Group’s reported results and financial condition. | | CRH is subject to a broad and increasingly stringent range of existing and evolving governance, environmental, health and safety and other laws, regulations, standards and best practices in each of the jurisdictions in which the Group operates giving rise to significant compliance costs, potential legal liability exposure and potential limitations on the development of the Group’s operations. These laws, regulations, standards and best practices relate to, amongst other things, climate change, noise, emissions to air, water and soil, the use and handling of hazardous materials and waste disposal practices. Given the above, the risk of increased environmental and other compliance costs and unplanned capital expenditure is inherent in CRH’s business and the impact of future developments in these respects on the Group’s activities, products, operations, profitability and cash flow cannot be estimated; there can therefore be no assurance that material liabilities and costs will not be incurred in the future. |
| |
| | Environmental and health and safety and other laws, regulations and standards may expose CRH to the risk of substantial costs and liabilities, including liabilities associated with assets that have been sold and activities that have been discontinued. In addition, many of CRH’s manufacturing sites have a history of industrial use and, while CRH applies strict environmental operating standards and undertakes extensive environmental due diligence in relation to acquisitions, some soil and groundwater contamination has occurred in the past at a limited number of sites; the associated remediation costs incurred to date have not been material. Despite the Group’s policy and efforts to comply with all applicable environmental laws, CRH may face remediation liabilities and legal proceedings concerning environmental matters. |
| |
| | Based on information currently available, CRH has budgeted capital and revenue expenditures for environmental improvement projects and has established reserves for known environmental remediation liabilities that are probable and reasonably capable of estimation. These figures are not material in the context of CRH. However, CRH cannot predict environmental matters with certainty, and budgeted amounts and established reserves may not be adequate for all purposes. In addition, the development or discovery of new facts, events, circumstances or conditions, including future decisions to close plants, which may trigger remediation liabilities, and other developments such as changes in law or increasingly strict enforcement by governmental authorities, could result in increased costs and liabilities or prevent or restrict some of the Group’s operations, which in turn could have a material adverse effect on CRH’s reputation, business, results of operations and overall financial condition. |
| |
| | For additional information see also “Introduction – The Environment and Government Regulations”. |
|
|
| |
| Laws and regulations | | |
| |
Risk Factor | | Discussion |
| CRH is subject to many laws and regulations (both local and international), including those relating to competition law, corruption and fraud, throughout the many jurisdictions in which it operates and is thus exposed to changes in those laws and regulations and to the outcome of any investigations conducted by governmental, international and other regulatory authorities, which may result in the imposition of fines and/or sanctions for non-compliance and may damage the Group’s reputation. | | CRH is subject to various statutes, regulations and laws applicable to businesses generally in the countries and markets in which it operates. These include statutes, regulations and laws affecting land usage, zoning, labour and employment practices, competition, financial reporting, taxation, anti-bribery, anti-corruption, governance and other matters. CRH mandates that its employees comply with its Code of Business Conduct which stipulates best practice in relation to regulatory matters; however, CRH cannot guarantee that its operating units will at all times be successful in complying with all demands of regulatory agencies in a manner which will not materially adversely affect its business, financial condition or results of operations. |
|
|
Risk Factorscontinued
Key Financial and Reporting Risk Factors
| | |
|
| |
| Financial instruments | | |
| |
Risk Factor | | Discussion |
| CRH uses financial instruments throughout its businesses giving rise to interest rate, foreign currency, credit/ counterparty and liquidity risks. A downgrade of CRH’s credit ratings may give rise to increases in funding costs in respect of future debt and may impair the Group’s ability to raise funds on acceptable terms. In addition, insolvency of the financial institutions with which CRH conducts business (or a downgrade in their credit ratings) may lead to losses in CRH’s derivative assets and cash and cash equivalents balances or render it more difficult either to utilise the Group’s existing debt capacity or otherwise obtain financing for the Group’s operations. | | CRH has incurred and will continue to incur significant amounts of debt in order to finance its business and ongoing acquisition programme. As at 31 December 2013, CRH had outstanding net indebtedness of approximately €3.0 billion (2012: €2.9 billion). A significant portion of the cash generated from operational activity is dedicated to the payment of principal and interest on indebtedness and is not available for other purposes. If CRH’s earnings were to decline significantly, difficulties may be experienced in servicing its debt instruments. In addition, in raising debt, CRH has entered into certain financing agreements containing restrictive covenants requiring CRH to maintain a certain minimum interest coverage ratio and a certain minimum net worth and placing a maximum limit on the ratio of net debt to net worth. These restrictions may limit CRH’s flexibility in planning for and reacting to competitive pressures and changes in business, industry and general economic conditions and may limit its ability to undertake acquisition activity and capitalise on other business opportunities. For further information on financial covenants, please see note 24 to the Consolidated Financial Statements (page 157). CRH is exposed to movements in interest rates which affect the amount of interest paid on floating rate borrowings and the return generated on its cash investments. As at 31 December 2013, 129% (2012: 110%) of CRH’s net debt was at fixed interest rates. For additional information on the value of debt and the impact of movements in interest rates, see notes 21 and 22 to the Consolidated Financial Statements. Any material deterioration in CRH’s existing credit ratings may significantly reduce its access to the debt markets and result in increased interest rates on future debt. A down- grade in CRH’s credit ratings may result from factors specific to CRH or from other factors such as general economic weakness or sovereign credit rating ceilings. CRH holds significant cash balances on deposit with a variety of highly-rated financial institutions (typically invested on a short-term basis) which, together with cash and cash equivalents at 31 December 2013, totalled €2.5 billion (2012: €1.7 billion). In addition to the above, CRH enters into derivative transactions with a variety of highly-rated financial institutions giving rise to derivative assets and derivative liabilities; the relevant balances as at 31 December 2013 were €80 million and €53 million respectively (2012: €172 million and €20 million). The counterparty risks inherent in these exposures may give rise to losses in the event that the relevant financial institutions suffer a ratings downgrade or become insolvent. In addition, certain of the Group’s activities (e.g. highway paving in the United States) give rise to significant amounts receivable from counterparties at the balance sheet date; at year-end 2013, this balance was €0.4 billion (2012: €0.5 billion). In the current business environment, there is increased exposure to counterparty default, particularly as regards bad debts. For additional information on credit/counterparty and liquidity risks see note 22 to the Consolidated Financial Statements. |
|
|
| | |
|
| |
| Defined benefit pension schemes | | |
| |
Risk Factor | | Discussion |
| CRH operates a number of defined benefit pension schemes in certain of its operating jurisdictions. The assets and liabilities of these schemes may exhibit significant period-on-period volatility attributable primarily to asset valuations, changes in bond yields and longevity. In addition to future service contributions, significant cash contributions may be required to remediate deficits applicable to past service. | | The assumptions used in the recognition of pension assets, liabilities, income and expenses (including discount rates, rate of increase in future compensation levels, mortality rates and healthcare cost trend rates) are updated annually based on market and economic conditions at the balance sheet date and for any relevant changes to the terms and conditions of the pension and post-retirement plans. These assumptions can be affected by (i) for the discount rate, changes in the rates of return on high-quality fixed income investments; (ii) for future compensation levels, future labour market conditions and anticipated inflation; (iii) for mortality rates, changes in the relevant actuarial funding valuations or changes in best practice; and (iv) for healthcare cost trend rates, the rate of medical cost inflation in the relevant regions. The weighted average actuarial assumptions used and sensitivity analysis in relation to the significant assumptions employed in the determination of pension and other post-retirement liabilities are disclosed on pages 162 and 164. A prolonged period of financial market instability would have an adverse impact on the valuations of CRH’s pension scheme assets. |
| |
| | In addition, a number of the defined benefit pension schemes in operation throughout the Group have reported material funding deficits thus necessitating reparation either in accordance with legislative requirements or as agreed with the relevant regulators. These obligations are reflected in the contracted payments disclosure on page 45. The extent of such contributions may be exacerbated over time as a result of a prolonged period of instability in worldwide financial markets. |
|
|
| |
| Insurance counterparties | | |
| |
Risk Factor | | Discussion |
| In its worldwide insurance programme, the Group carries appropriate levels of insurance for typical business risks (including product liability) with various leading insurance companies. However, in the event of the failure of one or more of its insurance counterparties, the Group could be impacted by losses where recovery from such counterparties is not possible. | | The Group’s insurance arrangements require that the Group retain certain exposures in respect of a variety of liability/casualty, property damage and business interruption risks; amounts in excess of these predetermined self-insurance thresholds, together with umbrella arrangements, as appropriate, are arranged through leading, highly-rated global insurers and re-insurers giving rise to counterparty risks. The exposures borne by third-parties are, in general, subject to caps with any exposures in excess of those caps being borne by CRH. As at 31 December 2013, the total insurance provision, which is subject to periodic actuarial valuation and is discounted, amounted to €181 million (2012: €191 million); a substantial proportion of this figure pertained to claims which are classified as “incurred but not reported”. |
|
|
| |
| Foreign currency translation | | |
| |
Risk Factor | | Discussion |
| CRH’s activities are conducted primarily in the local currency of the country of operation resulting in low levels of foreign currency transactional risk. The principal foreign exchange risks to which the Consolidated Financial Statements are exposed pertain to adverse movements in reported results when translated into euro (which is the Group’s reporting currency) together with declines in the euro value of the Group’s net investments which are denominated in a wide basket of currencies other than the euro. | | A significant proportion of the Group’s revenues, expenses, assets and liabilities are denominated in currencies other than the euro, principally US Dollars, Swiss Francs, Polish Zlotys and Pounds Sterling. From year to year, adverse changes in the exchange rates used to translate these and other foreign currencies into euro have impacted and will continue to impact the Group’s consolidated results and net worth. It is the Group’s policy to hedge partially its investment in foreign currencies by ensuring that net worth, net debt and net interest are spread across the currencies in which the Group operates, but otherwise CRH does not generally engage in hedging transactions to reduce Group exposure to foreign exchange translation risk. For additional information on the impact of foreign exchange movements on the Group’s Consolidated Financial Statements for the year ended 31 December 2013, see the Business Performance Review section commencing on page 43 and note 22 to the Consolidated Financial Statements. |
|
|
| | |
|
| |
| Goodwill impairment | | |
| |
Risk Factor | | Discussion |
A review of CRH’s portfolio of businesses is currently ongoing, and an orderly disposal process is underway for 45 business units which do not meet the Group’s future returns objectives; this has given rise to a goodwill impairment charge of €373 million in the 2013 financial year. In the light of current conditions and outlook, the Group does not anticipate further impairment to arise as the portfolio review continues. Significant under-performance in any of CRH’s major cash-generating units or the divestment of businesses in the future may give rise to a further material write-down of goodwill which would have an additional substantial impact on the Group’s income and equity. | | An acquisition generates goodwill to the extent that the price paid by CRH exceeds the fair value of the net assets acquired. Under IFRS, goodwill and indefinite-lived intangible assets are not amortised but are subject to annual impairment testing. Other intangible assets deemed separable from goodwill arising on acquisitions are amortised. A detailed discussion of the impairment testing process, the key assumptions used, the results of that testing and the related sensitivity analysis is contained in note 15 to the Consolidated Financial Statements on pages 146 and 147. Whilst a goodwill impairment charge does not impact cash flow, a full write-down at 31 December 2013 would have resulted in a charge to income and a reduction in equity of €3.7 billion (2012: €4.1 billion). |
|
|
|
| Inspections by Public Company Accounting Oversight Board (“PCAOB”) |
| |
Risk Factor | | Discussion |
| Our auditors, like other independent registered public accounting firms operating in Ireland and a number of other European countries, are not currently permitted to be subject to inspection by the PCAOB, and as such, investors are deprived of the benefits of PCAOB inspections. | | As a public company, our auditors are required by United States law to undergo regular PCAOB inspections to assess their compliance with United States law and professional standards in connection with their audits of financial statements filed with the SEC. Under Irish law, the PCAOB is currently unable to inspect and evaluate the audit work and quality control procedures of auditors in Ireland. Accordingly investors who rely on our auditors’ audit reports are deprived of the benefits of PCAOB inspections of auditors. |
|
|
| | | | |
| | | | |
| | | | |
| | | | |
| | | | |
| | |
| | € million | |  |
| | EBITDA (as defined)*1,475 | |
| | Capital Expenditure 497 | |
| | Cash from Operating Activities 1,092 | |
| | Non-cash Impairment 755 | |
| | | |
| | Net Debt (€ billion) 2.97 | |
| | EBITDA (as defined)*/Net Interest (times) 5.9 | |
| | | |
| | | |
| | | |
| | | |
| | |
| | | | Maeve Carton Finance Director |
| | * Defined as earnings before interest, taxes, depreciation, amortisation, asset impairment charges, profit on disposals and the Group’s share of equity accounted investments’ result after tax. |
| | | | |
| | | | |
| | | | |
| | | | |
42 CRH
Business Performance Review1
Finance Director’s Introduction
Trading conditions in 2013 proved challenging, especially in the first half of the year, and the Group continued to focus on cash generation finishing the year in a strong and flexible financial position. With increased cash inflows from operations and proceeds from disposals, net debt at year-end 2013 remained broadly in line with 2012 despite a total spend of €1.2 billion on acquisitions, investments and capital expenditure and cash dividend payments which at €368 million were similar to last year.
While reported sales for 2013 were similar to 2012, organic sales from underlying operations fell by 2%, reflecting difficult market conditions in Europe and poor weather across the Group in the first half.
In Europe the decline in like-for-like sales moderated to less than 1% in the second half, a significant improvement on the weather-impacted decline of 10% in the first half. This results in a full-year reduction of 5% in underlying European sales, which was partly offset by contributions from acquisitions to give a 3% overall decline. Lower sales impacted EBITDA (as defined)* margin, which despite intense management focus and internal actions, fell in all European segments in response to competitive market pressures.
Against an improving backdrop as the year progressed, like-for-like sales in the Americas were up 5% in the second half, compared with a first half which saw organic volumes down by 1%. In our Materials business, which was impacted by unfavourable weather patterns in the early part of the year, like-for-like sales were 3% lower than last year; however, with good contributions from acquisitions overall US Dollar sales revenue was in line with last year. Our Products and Distribution businesses continued to benefit from improving demand, particularly
from new residential construction, and like-for-like sales were 8% ahead of 2012. With higher sales and good cost control, EBITDA (as defined)* margins improved in all three Americas segments.
Operating profit fell significantly from 2012, due principally to the non-cash impairment charge of €650 million taken largely as a result of the comprehensive portfolio review referred to in the Chief Executive’s Introduction on page 27 (see also note 3 to the Consolidated Financial Statements). The initial phase of this review has identified business units that will not meet our returns criteria, and an orderly disposal process is underway; the next phase will focus on allocating resources to those business that are central to restoring CRH returns to previous peak levels. Almost two-thirds of this impairment charge relates to our Products businesses, with the Europe segment accounting for the majority of the write-down. The portfolio review also identified further impairments of €105 million in respect of equity accounted investments. While the portfolio review is ongoing, in the light of current conditions and outlook, we do not anticipate any further impairment to arise as we complete the exercise during 2014.
During 2013 the euro strengthened by more than 3% against the US Dollar, resulting in an adverse translation impact on the Group’s results; this is the principal factor behind the exchange effects shown in the table below.
We continued to advance the significant cost-reduction initiatives which have been progressively implemented since 2007 and which by year-end had generated cumulative annualised savings of almost €2.4 billion. Total restructuring costs associated with these initiatives (which generated savings of €195 million in 2013) amounted to €71 million in 2013 (2012: €60 million) and were once again heavily focussed in our European Divisions.
| | | | | | | | | | | | | | | | | | | | | | | | | | | | |
Key Components of 2013 Performance | | | | | | | | | | | | | |
| | | | | | | |
€ million | | Revenue | | | EBITDA (as defined)* | | | Operating profit | | | Profit on disposals | | | Finance costs (net) | | | Equity accounted investments† | | | Pre-tax profit/(loss) | |
| | | | | | | |
2012 as restated | | | 18,084 | | | | 1,563 | | | | 805 | | | | 230 | | | | (305 | ) | | | (84 | ) | | | 646 | |
Exchange effects | | | (404 | ) | | | (36 | ) | | | (19 | ) | | | (1 | ) | | | 5 | | | | (2 | ) | | | (17 | ) |
| | | | | | | |
2012 at 2013 exchange rates | | | 17,680 | | | | 1,527 | | | | 786 | | | | 229 | | | | (300 | ) | | | (86 | ) | | | 629 | |
Incremental impact in 2013 of: | | | | | | | | | | | | | | | | | | | | | | | | | | | | |
- 2013 and 2012 acquisitions | | | 672 | | | | 73 | | | | 43 | | | | - | | | | (3 | ) | | | 3 | | | | 43 | |
- 2013 and 2012 divestments | | | (42 | ) | | | - | | | | 2 | | | | (191 | ) | | | (2 | ) | | | 4 | | | | (187 | ) |
- Restructuring costs | | | - | | | | (11 | ) | | | (11 | ) | | | - | | | | - | | | | - | | | | (11 | ) |
- Pension/CO2 gains | | | - | | | | (29 | ) | | | (29 | ) | | | - | | | | - | | | | - | | | | (29 | ) |
- Impairment charges | | | - | | | | - | | | | (622 | ) | | | - | | | | - | | | | 41 | | | | (581 | ) |
Ongoing operations | | | (279 | ) | | | (85 | ) | | | (69 | ) | | | (12 | ) | | | 8 | | | | (6 | ) | | | (79 | ) |
2013 | | | 18,031 | | | | 1,475 | | | | 100 | | | | 26 | | | | (297 | ) | | | (44 | ) | | | (215 | ) |
| | | | | | | | | | | | | | |
† CRH’s share of after-tax results of joint ventures and associated undertakings | | |
| | |
| 1 | See cautionary statement regarding forward-looking statements on page 7. |
| * | Defined as earnings before interest, taxes, depreciation, amortisation, asset impairment charges, profit on disposals and the Group’s share of equity accounted investments’ result after tax. |


Liquidity and Capital Resources – 2013 compared with 2012
The comments that follow refer to the major components of the Group’s cash flows as shown in the Consolidated Statement of Cash Flows on page 123.
Throughout 2013 the Group continued to keep a very sharp focus on cash management, targeting in particular working capital and capital expenditure. Year-end current working capital of €2.0 billion represented just 11.2% of sales, an improvement compared with year-end 2012 (11.5%). This performance delivered net inflows for the year of €77 million (2012: outflows of €58 million). CRH believes that its current working capital is sufficient for the Group’s present requirements. Strong control of spending on property, plant and equipment resulted in lower cash outflows of €497 million (2012: €544 million), with spend in 2013 representing 74% of depreciation (2012: 79%).
Other major cash flow movements during the year comprised acquisition spend of €676 million on 28 transactions, including €144 million in respect of the asset exchange in Spain which is also included in the total proceeds from disposals and investments of €266 million.
Cash dividend payments of €368 million and proceeds of €19 million from exercise of share options were very similar to last year.
Year-end interest-bearing loans and borrowings increased by €0.7 billion to €5.5 billion (2012: €4.8 billion). At year-end 2013, net debt of €2.97 million† was just€64 million higher than year-end 2012. The weaker US Dollar (1.3791 versus the euro compared with 1.3194 at year-end 2012) was the main factor in the positive translation and mark-to-market impact of €87 million on net debt.
The Group is in a strong financial position. It is well funded and basic interest cover (EBITDA (as defined)*/Net Interest) of 5.9 times is significantly higher than the minimum requirements in the Group covenant agreements – further details are set out in note 24 to the Consolidated Financial Statements.
We successfully completed two eurobond issues during 2013: in April €750 million of 10-year bonds was issued with a coupon of 3.125% and in October, a further €750 million of 7-year bonds was issued with a coupon of 2.75% . These were the lowest-ever coupons obtained by the Group and reflect CRH’s commitment to managing debt and maintaining an investment grade credit rating.
The Group also has considerable financial flexibility; the average maturity of the Group’s gross debt of €5.5 billion is 4.8 years and cash resources at year end amounted to more than €2.5 billion. Together with the availability of committed and undrawn facilities (amounting to a further €1.95 billion), the Group believes that it has sufficient resources to meet its debt obligations and capital and other expenditure requirements in 2014.
CRH’s share price increased by 20% in 2013 to €18.30 at year end; combined with the maintained dividend of 62.5c, shareholder returns were 24% in 2013 and resulted in net debt as a % of market capitalisation decreasing to 22% (2012: 26%).
Business Performance Review
The sections on pages 46 to 51 outline the scale of CRH’s business in 2013, and provide a more detailed review of performance in each of CRH’s six reporting segments.
2014 Outlook
In the United States, we expect GDP growth in 2014 to be similar to 2013. While federal funding for infrastructure in 2014 is expected to be in line with 2013, state fiscal conditions continue to improve with more states introducing additional infrastructure funding measures. The increase in the Transportation Infrastructure Finance and Innovation Act (TIFIA) funding should also give states greater opportunities and options to benefit from private sector involvement in highway projects; we expect the impact of these investments to be more medium to long-term. We expect that residential construction will continue to advance in 2014, and with the increase in housing, non-residential activity should also see an improvement. Against this backdrop, we expect 2014 to be another year of progress in the Americas.
In Europe we have seen an improving trend in the second half of 2013 with the economic backdrop stabilising as the year progressed. While underlying indicators for the Dutch economy are showing signs of a slight recovery, in the short term, we expect construction activity to remain subdued. Switzerland is expected to remain solid in 2014 with continuing strong activity in residential and infrastructure, while the outlook for Germany is broadly positive. In Finland, with continuing pressure in the residential segment, construction spend is expected to be relatively flat in 2014, with some pick-up in the second half of the year. The 2014 outlook for Ireland is for modest growth in overall construction activity while France and Spain are expected to remain challenging. The outlook for Ukraine has become uncertain in recent weeks due to the political environment, and for now the implications for construction activity in 2014 are unclear. In Poland, the improved activity during the second half of 2013 is expected to continue into 2014 with construction growth led by improving infrastructure activity.
The review of our portfolio aims to re-set the Group for growth. While this has resulted in significant non-cash impairment charges in 2013, we believe that dynamic allocation and reallocation of resources to optimise the portfolio, together with our traditional tight cost control and capital discipline and our relentless focus on returns, will be key to driving growth and to rebuilding returns and margins in the coming years. We believe that 2013 represents the trough in our profits, and that 2014 will be a year of profit growth. We are encouraged by second-half activity levels in 2013 and by the fact that, while it is still early in the season, trading so far in 2014 has been ahead of last year.
Off-Balance Sheet Arrangements
CRH does not have any off-balance sheet arrangements that have, or are reasonably likely to have a, current or future effect on CRH’s financial condition, changes in financial condition, revenues or expenses, results of operations, liquidity, capital expenditures or capital resources that is material to investors.
| * | Defined as earnings before interest, taxes, depreciation, amortisation, asset impairment charges, profit on disposals and the Group’s share of equity accounted investments’ result after tax. | |
| † | As disclosed in note 21 to the Consolidated Financial Statements, net debt comprises interest-bearing loans and borrowings, cash and cash equivalents, and derivative financial instruments. | |
Quantitative and Qualitative Information about Market Risk
The Group addresses the sensitivity of the Group’s interest rate swaps and debt obligations to changes in interest rates in a sensitivity analysis technique that measures the estimated impacts on the income statement and on equity of either an increase or decrease in market interest rates or a strengthening or weakening in the US Dollar against all other currencies, from the rates applicable at 31 December 2013, for each class of financial instrument with all other variables remaining constant. The technique used measures the estimated impact on profit before tax and on total equity arising on net year-end floating rate debt and on year-end equity, based on either an increase/decrease of 1% and 0.5% in floating interest rates or a 5% and 2.5% strengthening/weakening in the €/US$ exchange
rate. The €/US$ rate has been selected for this sensitivity analysis given the materiality of the Group’s activities in the United States. This analysis, set out in note 22 to the Consolidated Financial Statements (page 154), is for illustrative purposes only as in practice interest and foreign exchange rates rarely change in isolation.
Quantitative and Qualitative information and sensitivity analysis of market risk is contained in notes 21 to 25 to the Consolidated Financial Statements.
Significant Changes
No significant changes have occurred since the balance sheet date.
Contractual Obligations
An analysis of the maturity profile of debt, finance and operating leases, purchase obligations, deferred acquisition consideration and pension scheme contribution commitments at 31 December 2013 is as follows:
| | | | | | | | | | | | | | | | | | | | |
Contractual Obligations | | | | | | | | | | | | | | | |
| | | | | |
Payments due by period | | Total €m | | | Less than 1 year €m | | | 1-3 years €m | | | 3-5 years €m | | | More than 5 years €m | |
| | | | | |
Interest-bearing loans and borrowings1 | | | 5,428 | | | | 955 | | | | 1,556 | | | | 472 | | | | 2,445 | |
| | | | | |
Finance leases | | | 15 | | | | 3 | | | | 3 | | | | 7 | | | | 2 | |
| | | | | |
Estimated interest payments on contractually-committed debt and finance leases2 | | | 1,225 | | | | 264 | | | | 393 | | | | 250 | | | | 318 | |
| | | | | |
Deferred and contingent acquisition consideration | | | 208 | | | | 24 | | | | 68 | | | | 28 | | | | 88 | |
| | | | | |
Operating leases | | | 1,254 | | | | 301 | | | | 368 | | | | 228 | | | | 357 | |
| | | | | |
Purchase obligations3 | | | 223 | | | | 196 | | | | 20 | | | | 3 | | | | 4 | |
| | | | | |
Retirement benefit obligation commitments4 | | | 162 | | | | 25 | | | | 47 | | | | 43 | | | | 47 | |
| | | | | |
Total | | | 8,515 | | | | 1,768 | | | | 2,455 | | | | 1,031 | | | | 3,261 | |
| | |
| | |
1 Of the €5.4 billion total gross debt, €0.1 billion is drawn on revolving facilities which may be repaid and redrawn up to the date of maturity. The interest payments are estimated assuming these loans are repaid on facility maturity dates. 2 These amounts have been estimated on the basis of the following assumptions: (i) no change in variable interest rates; (ii) no change in exchange rates; (iii) that all debt is repaid as if it falls due from future cash generation; and (iv) none is re-financed by future debt issuance. 3 Includes capital expenditure contracted for. A summary of the Group’s future purchase commitments as at 31 December 2013 for capital expenditure are set out in note 14 to the Consolidated Financial Statements. These expenditures for replacement and new projects are in the ordinary course of business and will be financed from internal resources. 4 Represents the contracted payments related to our pension schemes in the United Kingdom and Ireland. | | |
| |
| | |


Europe Materials
| | | | | | | | | | | | | | | | | | | | | | | | | | |
| Results | | | | | | | | | | | | | | | | | | Analysis of change |
| € million | | %
Change | | 2013 | | 2012R | | Total Change | | | | | | | | Organic | | Acquisitions | | Divestments | | Restructuring/ Impairment | | Pension/ CO2 gains | | Exchange |
| Sales revenue | | -5% | | 2,266 | | 2,383 | | -117 | | | | | | | | -188 | | +111 | | -8 | | - | | - | | -32 |
| EBITDA (as defined)* | | -21% | | 278 | | 352 | | -74 | | | | | | | | -40 | | +7 | | +1 | | +6 | | -43 | | -5 |
| EBITDA (as defined)* margin | | 12.3% | | 14.8% | | | | | | | | | | | | | | | | | | | | |
| Operating profit | | -82% | | 39 | | 217 | | -178 | | | | | | | | -40 | | - | | +3 | | -95 | | -43 | | -3 |
Pension restructuring gains amounted to€10 million (2012: €30 million) | | | | | | | | Restructuring costs amounted to €7 million (2012: €13 million) Impairment charges of €101 million were incurred (2012: nil) |
Gains from CO2 trading were €8 million (2012: €31 million) | | | | | | | | |
| | | | | | | | |
EBITDA (as defined)* above includes pension restructuring gains and gains from CO2 trading. Operating profit is also stated after impairment charges; the net €83 million adverse impact of these items has been excluded from the commentary that follows.
After a weather-impacted first half which saw like-for-like sales decline by 16%, activity and profits in the second half of 2013 were almost in line with the second half of 2012. Like-for-like sales for the year overall decreased by 8% reflecting weak volumes in Poland and Benelux, in particular, combined with further, albeit more modest, declines in construction activity in Ireland. The benefit from our continued cost reduction and efficiency measures partly offset the impact of the lower volumes and overall EBITDA (as defined)* margin excluding pensions/CO2 gains was 11.5% compared with 12.2% in 2012.
On the development front during 2013, we concluded an asset swap in February in which we acquired Cementos Lemona in the Basque region in Spain in exchange for our 26% stake in Corporacion Uniland. In September we became the market leader in Ukraine through the acquisition of Mykolaiv Cement. We completed two smaller transactions strengthening our presence in Northern Ireland and expanding our network of cement import facilities in Britain.
Switzerland and Finland
Construction spend in Switzerland increased again in 2013 with the residential market remaining one of the major drivers of activity and infrastructure spend continuing at good levels. With the benefit of mild weather in the fourth quarter, construction remained strong to the end of the year. Our cement volumes were 12% higher than 2012 benefiting both from increased infrastructure projects and large individual projects. Aggregates and readymixed concrete volumes continued the slightly upward trend of recent years. Sales prices, particularly cement, saw some slippage in 2013 due to the continued strong Swiss Franc. Operating profit was ahead of 2012. In Finland, construction spend was down mainly due to reduced residential activity. The government introduced two stimulus packages related mainly to the residential and RMI sectors, but execution was slow. With increasing levels of public debt, spending on infrastructure was reduced and progress on a number of large projects was delayed. While our businesses delivered modest price increases in cement, aggregates and readymixed concrete, cement and aggregates volumes were lower and overall operating profit was below 2012.
Poland and Ukraine
A pick-up in second-half construction activity in Poland was insufficient to offset the weather-impacted first half; national construction output fell by an estimated 11% in 2013 and cement volumes fell 9%. The residential sector remained sluggish throughout 2013 with new starts down over 11%. Infrastructure activity picked up as the year progressed and the
second half saw the restart of a number of stalled projects. Mild weather late in the year enabled construction to continue until year-end. Against the improving backdrop our second-half cement volumes increased by 8% compared with 2012, reducing the decline in our full-year volumes to 11%. Our aggregates and readymixed concrete volumes also declined year-on-year. Prices for all products remained under pressure in very competitive markets, and overall operating profit in Poland was lower than 2012. In Ukraine, while the first half was negatively impacted by the prolonged winter conditions, demand was much stronger in the second half and national cement volumes for the year were down 3% compared with 2012. Our like-for-like volumes were 13% ahead of 2012 in the second half, bringing our full-year volumes almost in line with last year (down 1%) and overall operating profit in Ukraine was broadly similar to 2012.
Benelux, Ireland and Spain
Our businesses in the Netherlands and Belgium were impacted by falling construction activity in 2013. Lower volumes, together with pricing pressure in very competitive markets, resulted in lower overall operating profit in the Benelux in spite of the benefits from ongoing cost reduction programmes. The decline in construction activity in Ireland moderated in 2013 and cement volumes were similar to 2012 levels. With a lower cost base, operating losses declined. In Spain, while construction activity fell by a further 23% with declines across all sectors, our like-for-like results were in line with 2012 due to the benefit of previously-implemented cost reduction programmes. Trading in our newly-acquired cement business Cementos Lemona was in line with expectations.
Outlook
Switzerland is expected to remain solid in 2014 with continuing strong activity in residential and infrastructure. In Finland, with continuing pressure in the residential segment, construction spend is expected to be relatively flat in 2014, with some pick-up in the second half of the year. The improved activity in Poland during the second half of 2013 is expected to continue into 2014 with construction growth led by improving infrastructure activity. The outlook for Ukraine has become uncertain in recent weeks due to the political environment, and for now the implications for construction activity in 2014 are unclear; our main focus is to continue with margin improvement through cost efficiencies. The outlook for Benelux is for flat construction activity; with the benefits of cost efficiencies, we expect to improve margins in 2014. The 2014 outlook for Ireland is for modest growth in overall construction activity which, together with cost efficiencies, increased use of alternative fuels and increased export volumes, is expected to result in improved margins. In Spain, the outlook remains challenging with further volume declines expected in 2014; however, ongoing capacity reduction and cost efficiencies should help our businesses to improve margins.
| * | Defined as earnings before interest, taxes, depreciation, amortisation, asset impairment charges, profit on disposals and the Group’s share of equity accounted investments’ result after tax. | |
Americas Materials
| | | | | | | | | | | | | | | | | | | | | | | | |
| Results | | | | | | | | | | | | | | | | Analysis of change |
| € million | | %
Change | | 2013 | | 2012R | | Total
Change | | | | | | | | Organic | | Acquisitions | | Divestments | | Restructuring/ Impairment | | Exchange |
| Sales revenue | | -3% | | 4,721 | | 4,886 | | -165 | | | | | | | | -147 | | +141 | | - | | - | | -159 |
| EBITDA (as defined)* | | - | | 557 | | 555 | | +2 | | | | | | | | -15 | | +33 | | - | | +2 | | -18 |
| EBITDA (as defined)* margin | | 11.8% | | 11.4% | | | | | | | | | | | | | | | | | | |
| Operating profit | | -19% | | 226 | | 279 | | -53 | | | | | | | | -12 | | +26 | | - | | -58 | | -9 |
| | | | Restructuring costs amounted to €12 million (2012: €14 million) Impairment charges of €60 million were incurred (2012: nil) |
| | | | |
The commentary below excludes the adverse impact of impairment charges on operating profit.
Adverse weather conditions, which had resulted in a 25% decline in first-half US$ EBITDA (as defined)*, continued to impact operations in July and in the early weeks of August. Trading conditions proved much more favourable thereafter through to November and second-half US$ EBITDA (as defined)* was ahead of the corresponding period in 2012. Positive first-half trends in pricing continued into the second half. Though overall like-for-like sales revenue was 3% lower than last year, contributions from acquisitions resulted in overall US$ EBITDA (as defined)* for the year being 4% ahead of 2012.
A total of 10 acquisitions were completed in 2013 at a cost of €77 million, adding 457 million tonnes of reserves, 13 operating quarries, 5 strategic reserves locations, 6 asphalt plants and 7 readymixed concrete plants with annual production of 2.0 million tonnes of aggregates, 0.4 million tonnes of asphalt and 0.1 million cubic metres of readymixed concrete.
Energy and related costs: The price of bitumen, a key component of asphalt mix, declined by 4% in 2013 following a 7% increase in 2012. Prices for diesel and gasoline, important inputs to aggregates, readymixed concrete and paving operations, decreased by 2% and 3% respectively. The price of energy used at our asphalt plants, consisting of fuel oil, recycled oil, electricity and natural gas, fell by 1%. Recycled asphalt and shingles accounted for approximately 20% of total asphalt requirements in 2013. Wider use of warm-mix asphalt continues to deliver cost and customer benefits. With the positive effects of lower bitumen costs and further increased use of recycled asphalt, unit costs reduced by 2%.
Aggregates:Like-for-like volumes were slightly ahead of 2012 while total volumes including acquisitions increased 7%. Average prices increased by 3% on a like-for-like basis and 2% overall compared with 2012. Price increases together with efficient cost control resulted in an improved margin for this business.
Asphalt: Impacted by poor weather and a later start to paving projects, like-for-like volumes were down 7% with total volumes including acquisitions down 3%. While the average like-for-like sales price fell 1% and overall average price fell 2%, with the benefit of the 4% reduction in bitumen costs, margin per unit was maintained.
Readymixed Concrete: Like-for-like volumes decreased 2% while total volumes including acquisitions were up 2% compared with 2012. With average prices 4% higher on a like-for-like basis and up 5% overall, margins improved.
Paving and Construction Services: The poor first-half weather also contributed to a later start on paving projects, resulting in 5% lower sales revenue in total, and a reduction of 6% on a like-for-like basis. Pricing remained under pressure in a competitive bidding environment; however, efficiency improvements enabled an improvement in overall margin.
Regional Performance
East
The East region comprises operations in 22 states, the most important of which are Ohio, New York, Florida, Michigan, New Jersey, Pennsylvania and West Virginia. The adverse weather conditions in the first half had the greatest impact on the Mid-Atlantic division, which reported lower results than in 2012. In the Northeast division, 2013 results benefited from the inclusion of acquisitions completed at the end of 2012, and operating results improved. The Central division profits were broadly consistent with 2012 with lower volumes offset by improved prices. The residential market in Florida continued its upward trend contributing to strong volumes, better prices and margin growth, and positively impacting performance in the Southeast division. Overall operating profit for the East region was higher than 2012 with volumes 8%, 4% and 9% ahead of 2012 for aggregates, asphalt and readymixed concrete respectively.
West
The West region also has operations in 22 states, the most important of which are Utah, Texas, Washington, Missouri, Iowa, Kansas and Mississippi. Poor weather conditions that persisted through to mid-August affected results in both the Central West and Mountain West divisions, with a reduction in large infrastructure contracts in Utah further contributing to the lower outcome in Mountain West compared with 2012. More positively, the Northwest division saw substantial improvement over 2012’s record lows. With overall declines in asphalt and readymixed concrete volumes of 14% and 3% respectively, only partly offset by increases in aggregates volumes of 4%, operating profit was lower than in 2012.
Outlook
We expect that GDP growth in 2014 will be similar to 2013 and that residential construction will continue to advance. With the increase in housing, non-residential construction should also see an improvement. While Federal funding for infrastructure is expected to be in line with 2013; state fiscal conditions continue to improve with more states introducing additional infrastructure funding measures. The increase in the Transportation Infrastructure Finance and Innovation Act (TIFIA) funding should also give states greater opportunities and options to benefit from private sector involvement in highway projects; we expect the impact of these investments to be more medium to long-term.
Overall, we expect 2014 like-for-like volumes for aggregates and asphalt to be broadly similar to 2013 with readymixed concrete volumes expanding slightly due to an improving residential market. Targeted price increases in all product lines, combined with efficiency improvements and stability in the energy markets, are expected to lead to another year of margin expansion in 2014.
| * | Defined as earnings before interest, taxes, depreciation, amortisation, asset impairment charges, profit on disposals and the Group’s share of equity accounted investments’ result after tax. | |
Europe Products
| | | | | | | | | | | | | | | | | | | | | | | | | | |
| Results | | | | | | | | | | | | | | | | Analysis of change |
| € million | | %
Change | | 2013 | | 2012R | | Total
Change | | | | | | | | Organic | | Acquisitions | | Divestments | | Restructuring/ Impairment | | Pension
gains | | Exchange |
| Sales revenue | | -4% | | 2,376 | | 2,477 | | -101 | | | | | | | | -100 | | +47 | | -28 | | - | | - | | -20 |
| EBITDA (as defined)* | | -22% | | 119 | | 152 | | -33 | | | | | | | | -28 | | +4 | | -1 | | -9 | | +3 | | -2 |
| EBITDA (as defined)* margin | | 5.0% | | 6.1% | | | | | | | | | | | | | | | | | | | | |
| Operating profit | | n/m | | -406 | | 19 | | -425 | | | | | | | | -28 | | +1 | | -1 | | -399 | | +3 | | -1 |
Pension restructuring gains amounted to €3 million (2012: nil) | | | | Restructuring costs amounted to €36 million (2012: €27 million) Impairment charges of€414 million were incurred (2012: €24 million) |
| | | | |
| | | | |
EBITDA (as defined)* above includes pension restructuring gains and operating profit is also stated after impairment charges; the net €411 million adverse impact of these items has been excluded from the commentary that follows.
Our Products business in Europe is located primarily in the Netherlands, Belgium, Germany, the UK and France. Construction activity in most of these markets was severely impacted by the prolonged winter conditions in the early months of 2013. With improved trading conditions from May onwards, sales and EBITDA (as defined)* in the second half of the year were slightly ahead of 2012. Overall full-year like-for-like sales declined by 4% versus 2012. Our markets remained weak in the Netherlands where new-build activity continued to deteriorate, while Belgium and France were somewhat more resilient. The UK was the only major market showing growth, benefiting from strong residential markets. Despite a sharp focus on continued cost discipline, significant overcapacity in very competitive markets led to margin erosion, impacting negatively on overall profitability. In response to these challenging markets, as in prior years, we continued to engage in a number of restructuring measures to help realign our cost base to lower volumes.
During 2013 we acquired a manufacturer of pre-stressed hollow core elements in Belgium, expanding and strengthening our position as market leader in Belgium’s pre-stressed hollow core flooring segment.
Concrete Products
The adverse weather conditions across Europe negatively impacted on trading in the first half of the year. The decline moderated somewhat in the second half although trading conditions overall remained weak. Ongoing fragile consumer confidence contributed to poor residential demand, particularly in the Netherlands, while fiscal consolidation measures across Europe also impacted non-residential construction. Our concrete operations in the Netherlands, Denmark, Germany and France all saw weaker activity levels. Overall like-for-like sales declined by 7%.
OurArchitectural operations (tiles, pavers, blocks) were impacted by weaker consumer confidence and lower government and municipal spending. Despite an improved performance in the UK, driven by stronger residential markets, overall Architectural revenues were lower than 2012 mainly due to lower volumes in our German landscaping business. OurStructural operations (floors, walls and beams) also reported lower sales due to weaker Dutch and Danish markets. Additional restructuring measures were undertaken in the Netherlands in the second half of the year to further reduce our cost base. Profitability in our Structural Concrete business in Belgium was in line with 2012 with lower organic results offset by the contribution from the acquisition during the year.
Clay Products
New residential markets in the UK experienced significant growth due to the government’s “Help to Buy” scheme and industry brick volumes finished 9% ahead of 2012. Selling price increases were also achieved and, despite higher natural gas costs, operating profit was ahead of 2012. Our clay businesses in the Netherlands and Poland were impacted by weaker residential demand in very competitive markets, with volumes and prices under pressure. We decided to close part of our clay business in the Netherlands, contributing to the overall increase in restructuring charges compared with 2012. Operating results for our Clay business overall were broadly in line with 2012.
Lightside Building Products
With greater exposure to the repairs sector, activity in our lightside products business was less impacted than in our concrete business. While trading levels in the second half of the year were broadly in line with 2012, weaker trading in key markets in the first half led to a reduction in overall operating profit. With lower construction activity in its major markets, operating profit forConstruction Accessories was behind 2012 due to lower volumes and continuing margin pressure. TheOutdoor Security and Fencing businesses also experienced difficult markets and volumes were behind 2012; however, due to cost reduction measures, operating profit was ahead of last year. OurShutters & Awningsbusiness, which is concentrated in Germany and the Netherlands, benefited from stable demand and the contribution from 2012 acquisitions and operating profit was ahead of prior year.
Outlook
Management expect that results in 2014 will show improvement primarily driven by continued strong private housing demand in the UK and a recovery in our German Landscaping and Danish Structural Concrete businesses. Markets in the Netherlands are expected to decline again, especially in new-build construction, and further rationalisation programmes are being implemented to help counteract the negative impact on results. France is expected to remain challenging in 2014. The outlook for Construction Accessories and for Shutters & Awnings is more favourable. Overall sales for Europe Products are anticipated to increase slightly in 2014 and, combined with commercial and operational excellence programmes and the impact of previous restructuring and cost savings initiatives, should contribute to an improvement in operating profit.
| * | Defined as earnings before interest, taxes, depreciation, amortisation, asset impairment charges, profit on disposals and the Group’s share of equity accounted investments’ result after tax. | |
Americas Products
| | | | | | | | | | | | | | | | | | | | | | | | |
| Results | | | | | | | | | | | | | | | | Analysis of change |
| € million | | %
Change | | 2013 | | 2012R | | Total
Change | | | | | | | | Organic | | Acquisitions | | Divestments | | Restructuring/ Impairment | | Exchange |
| Sales revenue | | +9% | | 3,068 | | 2,806 | | +262 | | | | | | | | +219 | | +166 | | -6 | | - | | -117 |
| EBITDA (as defined)* | | +21% | | 246 | | 204 | | +42 | | | | | | | | +37 | | +21 | | - | | -9 | | -7 |
| EBITDA (as defined)* margin | | 8.0% | | 7.3% | | | | | | | | | | | | | | | | | | |
| Operating profit | | -21% | | 68 | | 86 | | -18 | | | | | | | | +49 | | +12 | | - | | -76 | | -3 |
| | | | | | Restructuring costs amounted to €11 million (2012: €2 million) |
| | | | | | Impairment charges of €71 million were incurred (2012: €4 million) |
| | | | | | |
| | | | | | |
The commentary below excludes the adverse impact of impairment charges on operating profit.
A recovery in residential construction in the United States and an ongoing pick-up in overall economic activity helped Americas Products improve its results in 2013. Like-for-like sales were 8% ahead of last year. The impact of input cost pressures was more than offset by a continued tight focus on operational efficiency and targeted pricing improvements. As a result, with the benefit of organic growth, modest pricing benefits, cost reduction initiatives and contributions from acquisitions, the segment achieved a significant increase in operating profit and margin.
Four acquisitions were completed in 2013 at a total spend of €123 million. Of particular note was the acquisition by our Architectural Products Group (“APG”) of hardscape and masonry operations both in Western Canada (seven facilities) and the Carolinas (14 plants), extending our footprints of core product categories into new markets. The Canadian acquisition establishes APG as the only coast-to-coast manufacturer of masonry and hardscape products.
Architectural Products
APG is a leading supplier of masonry and hardscape products, packaged lawn and garden products, clay brick and fencing solutions. In addition to contractor-based new construction, the DIY and professional RMI segments are significant end-users. After a slow start, the business benefited from improving new residential construction, increasing RMI spend and favourable weather in the second half of the year. However, overall growth was dampened somewhat by weak recovery in the non-residential segment. Generally activity was more robust in the West and South while remaining more challenged in the Northeast, Midwest and Eastern Canada. The improving housing market, together with product innovation and commercial initiatives, drove gains across most businesses while further cost reduction measures and selected price improvements offset the impact of higher input costs. Overall, APG recorded a higher operating profit for the year, reflecting a 3% increase in like-for-like sales, margin improvement and a solid contribution from recent acquisitions.
Precast
The Precast group manufactures a broad range of value-added concrete and polymer-based products primarily for utility infrastructure applications. The business saw an improved market environment in 2013 and registered solid gains as growth initiatives continued to deliver. Improvements were seen in most regions with particular progress in the Great Plains, northern California and Mid-Atlantic regions. Commercial and infrastructure markets remained generally subdued but residential demand, as well as energy and environment-related markets, continued
to show positive trends. In our traditional utility and structural precast products businesses volumes increased 5% over 2012 and higher input costs were recovered through price increases. Overall like-for-like sales increased by 6% and operating profit advanced significantly.
BuildingEnvelope®
The BuildingEnvelope® group is North America’s leading supplier of architectural glass and aluminium glazing systems to close the building envelope. New non-residential building activity, a key market segment for this business, was largely flat in 2013 resulting in challenging market conditions. Despite this backdrop, ongoing initiatives to gain market share and differentiate the business through innovative product and technology offerings drove solid top-line growth. Organic sales rose 14%, outpacing the overall market. The Architectural Glass and Storefront division benefited from an improved pricing environment, resilient non-residential RMI activity and a generally more favourable product mix. Our Engineered Glazing Systems division enjoyed increased activity as major project work progressed. With a tight focus on cost control, product quality and improved processes, the business delivered operating profit improvement.
South America
Results for our operations in Argentina improved compared with 2012; production and sales mix changes contributed to an increase in volumes, prices and marginal contribution in the floor and wall tile segments. Results from our businesses in Chile were down on 2012 with modest gains in specialised construction products offset by lower prices in our glass products due to increased competition. Overall sales and operating profit for our South American operations were higher than in 2012.
Outlook
With the backdrop of improving residential activity and some positive indicators for non-residential construction demand, we expect further organic sales growth in 2014. Combined with the impact of 2012 and 2013 acquisitions and the benefits of internal cost and process initiatives, we expect to record improved operating margin and profit in 2014.
| * | Defined as earnings before interest, taxes, depreciation, amortisation, asset impairment charges, profit on disposals and the Group’s share of equity accounted investments’ result after tax. | |
Europe Distribution
| | | | | | | | | | | | | | | | | | | | | | | | |
| Results | | | | | | | | | | | | | | | | Analysis of change |
| € million | | %
Change | | 2013 | | 2012R | | Total
Change | | | | | | | | Organic | | Acquisitions | | Restructuring/
Impairment | | Pension
gains | | Exchange |
| Sales revenue | | -1% | | 3,936 | | 3,956 | | -20 | | | | | | | | -175 | | +180 | | - | | - | | -25 |
| EBITDA (as defined)* | | -14% | | 186 | | 217 | | -31 | | | | | | | | -47 | | +7 | | -1 | | +11 | | -1 |
| EBITDA (as defined)* margin | | 4.7% | | 5.5% | | | | | | | | | | | | | | | | | | |
| Operating profit | | -27% | | 106 | | 145 | | -39 | | | | | | | | -48 | | +4 | | -5 | | +11 | | -1 |
Pension restructuring gains amounted to €11 million (2012: nil) | | | | | | Restructuring costs amounted to €4 million (2012: €3 million) Impairment charges of €4 million were incurred (2012: nil) |
| | | | | | |
EBITDA (as defined)* above includes pension restructuring gains and operating profit is also stated after impairment charges; the net €7 million impact of these items has been excluded from the commentary that follows.
The Distribution business was also impacted by the adverse first-half weather conditions. This together with weak construction activity and low consumer confidence, particularly in the Netherlands (which accounts for almost 30% of Distribution sales), contributed to a 4% reduction in like-for-like sales in 2013, the impact of which was largely offset by the incremental impact of acquisitions completed in 2012 and 2013. Following sharp profit reductions in the first half, the second half saw a moderation in the rate of decline which, combined with previous restructuring efforts and cost saving initiatives and certain pension curtailment benefits, limited the overall decline in full-year EBITDA (as defined)* to 14%.
Our professional builders merchants network was strengthened by three acquisitions during 2013. In the Benelux, we acquired a well-established seven-branch builders merchant, which complements our existing Dutch business, and a two-branch Belgian operator. We also acquired four branches in northern France increasing our Normandy network to 19 locations.
Professional Builders Merchants
Overall results for our wholly-owned professional builders merchants business, which operates 349 branches in six countries, were lower than in 2012. The incremental contribution from acquisitions more than offset the shortfall in like-for-like sales in the Benelux where weak markets, especially in Dutch residential and new-build, continued to impact performance. Despite strong cost control and economies of scale from acquisitions, operating profit was behind prior year. Sales levels in France were slightly lower for the year overall but operating profit improved due to the continued focus on pricing, purchasing and cost control. In Switzerland, the strength of the Swiss Franc continued to affect competitiveness contributing to a decline in sales and, despite the ongoing roll-out of various excellence programmes, both operating margin and profit were also lower. Sales levels in Austria were severely impacted by the bad weather in the first quarter and operational challenges due to a system implementation, resulting in operating profit that was significantly behind 2012. Despite the severe impact of the bad weather in early 2013, our builders merchants activities in Germany saw improved trading from April onwards and, together with better margins and good cost control, resulted in operating profit for the year that was in line with 2012.
DIY
Our wholly-owned DIY business operates 196 stores in the Netherlands, Germany and Belgium. Operating profit was lower than in 2012. In the Netherlands, the combination of the very severe weather during the first quarter and the continued weakness in consumer confidence resulted in sales levels in our Dutch DIY business that were significantly lower than last year and operating profit declined despite restructuring and cost-saving measures. In Belgium, our DIY activities proved more resilient and reported similar sales and operating profit to those achieved in 2012. In a challenging environment for the German DIY sector, sales in our German DIY business were also impacted by the adverse weather and, despite continued cost focus, operating profit and margin were lower.
Sanitary, Heating and Plumbing
Sales for our SHAP business, which operates 126 branches, were ahead of 2012 due to an organic improvement in our German and Belgian businesses together with the incremental impact of the two Belgian acquisitions completed in the second half of 2012. Due to the challenging market conditions in Switzerland, results were lower compared with 2012. Overall operating profit for our SHAP activities was ahead of 2012 assisted by the contribution from acquisitions.
Outlook
While underlying indicators for the Dutch economy are showing first signs of a slight recovery, we expect construction activity to remain subdued. The German market outlook is broadly positive and we expect Switzerland to remain stable, while results from our Austrian business are expected to improve. We also expect to make further progress in France. Overall 2014 is likely to be another challenging year, but we expect improved operating profit mainly due to further initiatives in commercial and operational excellence programmes and our continued focus on costs.
| * | Defined as earnings before interest, taxes, depreciation, amortisation, asset impairment charges, profit on disposals and the Group’s share of equity accounted investments’ result after tax. | |
Americas Distribution
| | | | | | | | | | | | | | | | | | | | | | | | |
| Results | | | | | | | | | | | | | | | | Analysis of change |
| € million | | %
Change | | 2013 | | 2012R | | Total
Change | | | | | | | | Organic | | Acquisitions | | Divestments | | Restructuring/ Impairment | | Exchange |
| Sales revenue | | +6% | | 1,664 | | 1,576 | | +88 | | | | | | | | +112 | | +27 | | - | | - | | -51 |
| EBITDA (as defined)* | | +7% | | 89 | | 83 | | +6 | | | | | | | | +8 | | +1 | | - | | - | | -3 |
| EBITDA (as defined)* margin | | 5.3% | | 5.3% | | | | | | | | | | | | | | | | | | |
| Operating profit | | +14% | | 67 | | 59 | | +8 | | | | | | | | +10 | | - | | - | | - | | -2 |
| | | | | | Restructuring costs amounted to €1 million (2012: €1 million) |
| | | | | | |
| | | | | | |
Americas Distribution, trading as Allied Building Products (“Allied”), experienced solid performance across its activities in 2013 and reported good overall results. Both business divisions continued to advance and sales and operating profit were ahead of 2012. Performance in our Exterior Products business was led by a strong Northeast and the rebuilding efforts following Hurricane Sandy. The Interior Products business continued to show growth as both volumes and pricing improved throughout the year.
In 2013, Allied management maintained its focus on streamlining administrative procedures and eliminating redundant processes through a significant internal initiative. This simplification of business processes, along with the ongoing evolution of our organisational structure, is aimed at improving acquisition integration and enhancing operating synergies and should allow for greater economies of scale as our business, and the overall markets, grow.
We completed three small transactions in 2013. A three-branch Interior Products company based in the Baltimore/Washington, D.C. market was acquired in April and a four-branch Interior Products business based in northern Florida was added in October. Certain assets of a small distressed business in Houston were also acquired to provide a platform for an Exterior Products strategy in Texas.
Progress continued to be made in 2013 to increase brand awareness of TriBuilt, Allied’s proprietary private label brand, as both sales and product offerings grew. Additionally, Allied implemented a new greenfield and service centre strategy in order to help drive growth in existing markets. The new service centre model will enable us to improve customer service, consolidate fixed costs and more efficiently leverage branch assets. This new customer service platform, together with our process and procedure streamlining efforts and our commitment to employee development, continue to further help differentiate Allied in the marketplace.
Exterior Products
Exterior Products are largely comprised of roofing and siding products, the demand for which is greatly influenced by residential and commercial replacement activity (75% of sales volume is RMI-related) with key products having an average life span of 25 years. Allied continues to maintain its position as one of the top three roofing and siding distributors in the United States. Strong growth was experienced in the Northeast driven by the rebuilding efforts following Hurricane Sandy. However, competitive pressures across the industry continued as the overall market contracted from 2012 leading to price pressure in all regions. A
regional restructuring was completed with the focus on reducing costs and improving customer service, which allowed us to maintain operating margin at a level consistent with 2012. Overall the Exterior Products division reported sales and operating profit ahead of 2012.
Interior Products
The Interior Products business sells wallboard, steel studs and acoustical ceiling systems to specialised contractors and is heavily dependent on the new residential and commercial construction market, having low exposure to weather-driven replacement activity. Allied is the third-largest Interior Products distributor in the United States. Performance in this business was strong in all markets with increased volumes and prices of our core products contributing to higher sales and improved operating margin, which further benefited from the lower cost base resulting from the cost savings initiatives undertaken in recent years.
Outlook
The overall outlook for 2014 is encouraging as commercial and residential construction is expected to grow. While the increased repair and renovation activity as a result of Hurricane Sandy was largely completed in 2013, our expanded Exterior Products network together with expected market growth should provide momentum in 2014. Another year of growth is expected in the Interior Products business as wallboard volumes and pricing are expected to increase. Overall, the benefit of our consolidation and streamlining measures combined with a positive market outlook should provide for a further year of operating profit improvement in 2014.
| * | Defined as earnings before interest, taxes, depreciation, amortisation, asset impairment charges, profit on disposals and the Group’s share of equity accounted investments’ result after tax. | |

Business Performance Review – Prior Year
Restatement for Adoption of New Accounting Policies
Since the adoption of IFRS 11Joint Arrangements on 1 January 2013, the Group accounts for its interest in joint ventures using the equity method of accounting. The change to equity accounting had no impact on the Group’s results after tax but impacted each line item in the Consolidated Income Statement. Prior to 2013, the Group’s share of its joint ventures’ assets, liabilities, revenue, income and expenses were proportionately consolidated. The 2013 results also reflect the adoption of IAS 19Employee Benefits(revised), which resulted in a change in how net interest expense on the Group’s retirement benefit obligation is calculated.
The 2012 numbers presented for comparative purposes in this report have been restated to reflect the impact of these changes on the previously reported figures for 2012; full details of the impact of adopting these standards are contained in the Accounting Policies on page 124 and in note 1 to the Consolidated Financial Statements.
The 2011 numbers presented for comparative purposes have been restated to reflect the impact of IAS 19 (revised) only; the Group has availed of the transitional exemption available under IFRS 11 and is not restating 2011 for IFRS 11. The net impact of the adoption of IAS 19 (revised) on the previously reported results for 2011 was a reduction of €13 million in profit before tax; sales, EBITDA (as defined)* and operating profit remain as reported. IAS 19 (revised) has no impact on the line items included in our segment reviews on pages 55 to 60.
Other than where indicated in the reviews that follow, these changes in accounting policies do not have a material impact on the business trends for 2011 and 2012.
2012 Operations
Results for 2012 reflected progress from our Americas operations helped by a strong recovery in residential construction and improving overall economic activity in the United States. Like-for-like sales for the Americas segments grew by 3% while, with the benefit of acquisitions and a stronger US Dollar exchange rate partly offset by the change in accounting for joint ventures, sales for our Americas activities rose by 14% and EBITDA (as defined)* was €0.84 billion (2011: €0.76 billion).
Americas Materials reported an increase in EBITDA (as defined)* to €0.56 billion (2011: €0.53 billion); while underlying volumes were slightly behind 2011 levels, acquisition effects resulted in flat overall volumes in aggregates and a modest increase in asphalt and readymixed concrete volumes. With the subdued volume backdrop, markets remained competitive and margins declined somewhat. Americas Products reported a 24% increase in EBITDA (as defined)* to €0.20 billion as private markets outpaced infrastructure while EBITDA (as defined)* in Americas Distribution moved ahead by 28% to €0.08 billion; both of these segments saw improvements in margins in 2012.
In contrast to the trading experience in the Americas, our European businesses had to contend with weakening consumer and investor confidence within the Eurozone. Like-for-like sales for these Divisions fell by 6% in 2012. Reported sales, including the impact of acquisitions, divestments and the exclusion of proportionately consolidated joint ventures from 2012 due to the adoption of the new accounting standard, fell by 12% and EBITDA (as defined)* was €0.72 billion (2011: €0.90 billion).
Europe Materials EBITDA (as defined)* was €0.35 billion (2011: €0.44 billion), with €0.05 billion of the decrease resulting from the change in accounting policy for joint ventures. Good operational and restructuring efforts saw margins broadly maintained at 2011 levels. Particularly tough trading in the Netherlands impacted EBITDA (as defined)* in both Europe Products (€0.15 billion, down 22% from 2011) and in Europe Distribution (€0.22 billion, down 19%). Although the second half of 2012 saw some margin stabilisation, most especially in Distribution, full-year margins fell in both segments.
During 2012 we continued to advance the significant cost reduction initiatives which have been progressively implemented since 2007 and which by year-end 2012 had generated cumulative annualised savings of €2.2 billion. Total restructuring costs associated with these initiatives and reflected in EBITDA (as defined)* amounted to €60 million in 2012 and were once again heavily focussed on our European Divisions (€43 million).
Of particular note during 2012 was a substantial step-up in alternative fuel usage in our European cement operations and increased usage of recycled asphalt in our paving activities in North America. These initiatives mitigated cost inflation in energy-related inputs.
While overall cost inflation was not as severe as in 2011, recovery of cost increases continued to be challenging in 2012. This was particularly the case in European markets as economic growth weakened throughout 2012. However, on a more positive note, we saw an improving price/cost dynamic in our operations in the United States as 2012 progressed.
| * | Defined as earnings before interest, taxes, depreciation, amortisation, asset impairment charges, profit on disposals and the Group’s share of equity accounted investments’ result after tax. | |
| | | | | | | | | | | | | | | | | | | | | | | | | | | | |
Key Components of 2012 Performance | | | | | | | | | | |
| | | | | | | |
| € million | | Revenue | | | EBITDA (as defined)* | | | Operating profit | | | Profit on disposals | | | Finance costs | | | Equity accounted investments’ profit/(loss) | | | Pre-tax profit | |
| | | | | | | |
2011 as reported | | | 18,081 | | | | 1,656 | | | | 871 | | | | 55 | | | | (257 | ) | | | 42 | | | | 711 | |
IAS 19Employee Benefits (revised)1 | | | - | | | | - | | | | - | | | | - | | | | (13 | ) | | | - | | | | (13 | ) |
Exchange effects | | | 748 | | | | 68 | | | | 32 | | | | 2 | | | | (12 | ) | | | 3 | | | | 25 | |
| | | | | | | |
2011 as restated1at 2012 exchange rates | | | 18,829 | | | | 1,724 | | | | 903 | | | | 57 | | | | (282 | ) | | | 45 | | | | 723 | |
Incremental impact in 2012 of: | | | | | | | | | | | | | | | | | | | | | | | | | | | | |
2011 and 2012 acquisitions | | | 603 | | | | 60 | | | | 33 | | | | - | | | | (3 | ) | | | - | | | | 30 | |
2011 and 2012 divestments | | | (389 | ) | | | (46 | ) | | | (23 | ) | | | 160 | | | | 2 | | | | - | | | | 139 | |
Restructuring costs | | | - | | | | 1 | | | | 1 | | | | - | | | | - | | | | - | | | | 1 | |
Impairment charges | | | - | | | | - | | | | (7 | ) | | | - | | | | - | | | | (135 | ) | | | (142 | ) |
IFRS 11Joint Arrangements1 | | | (575 | ) | | | (77 | ) | | | (40 | ) | | | - | | | | 2 | | | | 28 | | | | (10 | ) |
IAS 19Employee Benefits (revised)1 | | | - | | | | - | | | | - | | | | - | | | | (5 | ) | | | - | | | | (5 | ) |
Ongoing operations | | | (384 | ) | | | (99 | ) | | | (62 | ) | | | 13 | | | | (19 | ) | | | (22 | ) | | | (90 | ) |
2012 as restated1 | | | 18,084 | | | | 1,563 | | | | 805 | | | | 230 | | | | (305 | ) | | | (84 | ) | | | 646 | |
| | | | | | | | | | | | | | |
1 Details of the restatement are contained in the Accounting Policies on page 124 and in note 1 to the Consolidated Financial Statements. |
The table above analyses the change in results from 2011 as reported to 2012 as restated. Improved trading for our Americas segments in 2012, reflecting an overall pick-up in economic activity and a strong recovery in residential construction, was more than offset by the impact of slowing momentum in the economies of our major European markets.
An 8% strengthening of the US Dollar over 2011 was the main factor in the positive exchange effects for 2012, adding approximately 4% to both sales and pre-tax profits.
Acquisitions completed in 2011 and 2012 contributed incremental sales revenue of €603 million and operating profit of €33 million in 2012. The impact of divested activities was a negative €389 million in sales and €23 million at operating profit level.
We continued to review and extend our cost reduction programme. Costs of €60 million incurred in 2012 to implement these savings were similar to 2011.
Total impairment charges for 2012 at €174 million were significantly higher than 2011 (€32 million), and included €146 million related to our 26% associate stake in Uniland, the Spanish cement producer. The associates’ impairment of €11 million in 2011 related to our investment in French distribution business Trialis which was divested in March 2011.
Revenue from ongoing operations decreased by €384 million (2%) in 2012, with Europe segments declining 6% whereas Americas segments grew 3%. Competition remained intense, limiting our ability to recover
input cost increases, and as a result organic operating profit declined by €62 million.
Total net finance costs of €305 million in 2012 included discount unwinding and pension-related financial expenses of €49 million (2011: €41 million). Interest on net debt increased to €256 million (2011: €229 million), due to the stronger US Dollar, the ending of interest capitalisation on major cement plant projects, the additional cost of our early-2012 €500 million bond issue and lower interest income.
Earnings per share of 74.6c (2011: 81.2c) reflected the lower pre-tax profit for the year.
| * | Defined as earnings before interest, taxes, depreciation, amortisation, asset impairment charges, profit on disposals and the Group’s share of equity accounted investments’ result after tax. | |


The Group EBITDA (as defined)* margin declined by 0.6 percentage points in 2012 as the significant increase in input costs was not fully recovered in selling prices (0.4%) and as a result of the adoption of IFRS 11 (0.2%); operating profit margin declined to 4.5%. Management believes that the EBITDA (as defined)* interest cover ratio is useful to investors because it matches the earnings and cash generated by the business to the underlying funding costs. With a higher level of net interest in 2012, the multiple of EBITDA (as defined)* to debt-related interest reduced to 6.1 times (see calculation on page 6), well in excess of our covenant level of 4.5 times and in keeping with our commitment to maintaining an investment grade rating.
The effective tax rate of 16.4% of pre-tax profit was higher than 2011 (15.9%), reflecting the mix of Group profits by geographical region and the effect of the change in accounting policies.
The share price at 31 December 2012 was €15.30, little changed from the 2011 closing price (€15.36); however, with the 2012 dividend at 62.5c, the net return for shareholders for the year was a positive 4%. This followed returns of +3% in 2011, -16% in 2010 and +22% in 2009. At year-end 2012, CRH’s market capitalisation was €11.1 billion (2011: €11 billion), ranking the Group at number four in its building materials peer group.
Total shareholders’ equity remained unchanged at €10.6 billion, with net comprehensive income for 2012 of €0.4 billion offset by dividends of €0.4 billion. Year-end 2012 total interest-bearing loans and borrowings decreased to €4.8 billion (2011: €5.0 billion). Year-end 2012 net debt of €2.9 billion† was€0.6 billion lower than year-end 2011, and accordingly the percentage of net debt to total equity reduced to 27% (2011: 33%). With year-end 2012 market capitalisation broadly in line with year-end 2011, the debt/market capitalisation percentage was also lower at 26% (2011: 32%).
Liquidity and Capital Resources – 2012 compared with 2011
The comments that follow refer to the major components of the Group’s cash flows as shown in the Consolidated Statement of Cash Flows on page 123.
Cash flows from operations
Net operating cash inflows of €985 million were lower than 2011 (€1,026 million), due primarily to the exclusion of proportionately consolidated joint ventures from 2012 due to the adoption of the new accounting standard.
Net working capital outflow decreased by €153 million to €58 million (2011: €211 million). Working capital levels are driven by trends in overall sales and also by seasonal weather patterns.
Payments during 2012 to address deficits in the Group’s defined benefit pension schemes (included in other in the Consolidated Statement of Cash Flows) were €50 million higher than 2011.
Cash flows from investing and financing activities
Proceeds from disposal of non-current assets and businesses amounted to €782 million (2011: €442 million), primarily reflecting the divestment in May 2012 of our 49% stake in the Portuguese cement business Secil and the disposal of our wholly-owned Magnetic Autocontrol business in April 2012.
Capital expenditure of €544 million represented 3.0% of Group revenue (2011: 3.2%), amounting to 79% of depreciation (2011: 79%) as we continued to maintain our discipline while investing in the structure of the business.
The Group completed 36 acquisitions and investment transactions in 2012 at a total cost of €669 million. Excluding net deferred payments of €121 million and debt in acquired companies, the cash outflow for the year was €506 million (2011: €563 million).
Exchange rate movements during 2012 reduced the euro amount of cash and cash equivalents by €23 million principally due to the 2% weakening in the year-end exchange rate of the US Dollar versus the euro, from 1.2939 at end-2011 to 1.3194 at end-2012.
| * | Defined as earnings before interest, taxes, depreciation, amortisation, asset impairment charges, profit on disposals and the Group’s share of equity accounted investments’ result after tax. | |
| † | As disclosed in note 21 to the Consolidated Financial Statements, net debt comprises interest-bearing loans and borrowings, cash and cash equivalents, and derivative financial instruments. | |
The presentation in the segment reviews that follow reflects the restatement for the adoption of the new accounting policies as described in the ‘Restatement for Adoption of New Accounting Policies’ section on page 52.
Europe Materials– 2012
| | | | | | | | | | | | | | | | | | | | | | | | | | |
| Results | | | | | | | | | | | | | | | | | | Analysis of change |
| € million | | %
Change | | 2012R | | 2011 | | Total
Change | | | | | | | | Organic | | Acquisitions | | Divestments | | Restructuring | | Exchange | | IFRS 11 Impact |
| Sales revenue | | -20% | | 2,383 | | 2,985 | | -602 | | | | | | | | -222 | | +78 | | -182 | | - | | +26 | | -302 |
| EBITDA (as defined)* | | -19% | | 352 | | 436 | | -84 | | | | | | | | -11 | | +14 | | -40 | | +6 | | - | | -53 |
| Operating profit | | -18% | | 217 | | 264 | | -47 | | | | | | | | -8 | | +9 | | -24 | | +6 | | -1 | | -29 |
| EBITDA (as defined)* margin | | 14.8% | | 14.6% | | | | | | | | | | | | | | | | | | | | |
| Operating profit margin | | | | 9.1% | | 8.8% | | | | | | | | | | | | | | | | | | | | |
Gains from CO2 trading were €31 million (2011: €38 million) Pension curtailment gains were €30 million (2011: €12 million) | | | | | | Restructuring costs amounted to €13 million (2011: €19 million) No impairment charges were incurred (2011: nil) |
| | | | | | |
A slowdown in construction activity in central Europe together with continuing declines in western and southwestern Europe resulted in a reduction of 7% in like-for-like sales in 2012, and both EBITDA (as defined)* and operating profit were lower than 2011.
The results reported above include gains from pension curtailments and CO2 trading. Despite lower volumes, margins excluding these gains, which are also excluded from the regional comments below, were similar to 2011 reflecting the benefit of our continued focus on cost containment and efficiency measures.
Development spend of €103 million comprised four acquisitions/ investments, the more significant of which were the acquisition of a readymixed concrete and concrete products business in Finland together with further investment in our associate Yatai Building Materials as it continued to expand its presence in northeastern China. The divestment of the Group’s 49% holding in Secil in Portugal was completed in May.
Central and Eastern Europe
Construction activity in Poland contracted during 2012, reflecting completion of projects associated with the June 2012 European football championship and a sharp decline in infrastructure road projects as a number of contractors experienced financial difficulties. Notwithstanding this, construction activity in infrastructure remained at a level consistent with 2011. The residential market continued to be sluggish with the tightening of mortgage lending criteria and some weakening in residential prices. While national cement volumes for the year were down 17% in 2012, our volumes declined by 11%. Pricing remained under pressure throughout 2012 in most of our product lines and overall operating profit declined. In Ukraine the strong increase in cement volumes in the first half of 2012 was reversed in the second half of the year, affected by the completion of European football championship projects and the national cement market finished down 5% compared with 2011. However, with the benefit of our new cement plant and the acquisition in Odessa that was completed in 2011, our volumes increased by 32% and operating profit improved significantly due to better pricing and our low cost producer advantage.
Switzerland, Finland, Benelux
Overall construction spend in Switzerland was up slightly in 2012. The downstream businesses of aggregates and readymixed concrete remained strong; however, cement volumes were down 8% due mainly to poor weather in the early part of 2012. Sales prices, particularly in cement, remained under pressure due to the strong Swiss Franc, and operating profit was lower than in 2011. In Finland, construction output declined in 2012 mainly due to lower residential starts, and our cement volumes declined by 6%. While our businesses delivered price increases in cement, aggregates and readymixed concrete, operating profit was lower than in 2011. In the Benelux, our readymixed concrete and aggregates business in the Netherlands was impacted by a 7% decline in construction activity levels and operating profit was lower than in 2011. In Belgium the cement grinding business acquired in mid-2011 performed somewhat behind expectations.
Ireland, Spain
Construction activity in Ireland continued to fall with domestic cement volumes 17% lower than in 2011. Our cost and capacity reduction programmes continued during 2012 and with this lower cost base, operating losses reduced. In Spain, while construction activity fell by a further 30% in 2012 with declines across all sectors, with the benefit of the significant cost reduction initiatives implemented in prior years our results were in line with 2011.
| * | Defined as earnings before interest, taxes, depreciation, amortisation, asset impairment charges, profit on disposals and the Group’s share of equity accounted investments’ result after tax. | |
Americas Materials– 2012
| | | | | | | | | | | | | | | | | | | | | | | | | | |
| Results | | | | | | | | | | | | | | | | | | Analysis of change |
| € million | | %
Change | | 2012R | | 2011 | | Total
Change | | | | | | | | Organic | | Acquisitions | | Divestments | | Restructuring | | Exchange | | IFRS 11 Impact |
| Sales revenue | | +11% | | 4,886 | | 4,395 | | +491 | | | | | | | | +40 | | +168 | | - | | - | | +368 | | -85 |
| EBITDA (as defined)* | | +5% | | 555 | | 530 | | +25 | | | | | | | | -25 | | +20 | | - | | -5 | | +46 | | -11 |
| Operating profit | | +6% | | 279 | | 264 | | +15 | | | | | | | | -12 | | +12 | | - | | -5 | | +23 | | -3 |
| EBITDA (as defined)* margin | | 11.4% | | 12.1% | | | | | | | | | | | | | | | | | | | | |
| Operating profit margin | | | | 5.7% | | 6.0% | | | | | | | | | | | | | | | | | | | | |
| | | | | | Restructuring costs amounted to €14 million (2011: €9 million) No impairment charges were incurred (2011: nil) |
| | | | | | |
Benign weather conditions early in 2012 contributed to increased first-half volumes. However, second-half trading proved more challenging with a slower pace of highway contract awards and severe disruption to activity in the northeastern United States in late October/early November due to Hurricane Sandy. Despite this challenging backdrop, which saw a slight reduction in underlying volumes and higher input costs, the combination of focussed commercial and cost actions with solid acquisition contributions resulted in US Dollar operating profit being broadly in line with 2011.
Americas Materials completed 16 acquisitions/investments in 2012 at a total cost of €230 million (spend €108 million net of deferred payments), adding 560 million tonnes of reserves, seven operating quarries, 17 asphalt plants and 11 readymixed concrete plants with annual production of 4.6 million tonnes of aggregates, 1.8 million tonnes of asphalt and 0.4 million cubic metres of readymixed concrete.
Energy and related costs:The proportion that these costs represented of sales was maintained at 2011 levels due to efficiency improvements combined with increased use of recycled materials. The price of bitumen, a key component of asphalt mix, rose by 7% in 2012 following a 14% increase in 2011. Prices for diesel and gasoline, important inputs to aggregates, readymixed concrete and paving operations, increased by 3% and 2% respectively in 2012. The price of energy used at our asphalt plants, consisting of fuel oil, recycled oil, electricity and natural gas, decreased by 9% as many of our facilities converted to lower cost natural gas. Recycled asphalt and shingles accounted for 20% of total asphalt requirements in 2012, an increase from 18% in 2011. Wider use of warm mix asphalt continues to deliver cost benefits while also providing customers with a more workable and eco-friendly product.
Aggregates: Total volumes including acquisitions were flat in 2012, with like-for-like volumes down 2%. Compared with 2011, average prices increased by 2% on both an overall and like-for-like basis; however, margins declined slightly due to higher input costs.
Asphalt: While total volumes increased by 2% in 2012, like-for-like volumes fell by 2%. Despite the 7% increase in bitumen costs in 2012, we were able to limit unit cost increases to 4% due to lower energy input costs and greater use of recycled materials. With an average like-for-like asphalt price increase of 5%, our overall asphalt margin improved in 2012.
Readymixed Concrete:Total volumes including acquisitions increased by 2% in 2012, with like-for-like volumes flat compared with 2011. In a very competitive environment, average like-for-like prices increased by 1% in 2012 but, with a 3% increase in unit cost, margins declined. Operating profit in 2012 was similar to 2011 driven by acquisitions and lower fixed overhead.
Paving and Construction Services: Overall sales revenue for 2012 increased by 5% and by 1% on a like-for-like basis. Pricing remained under pressure in a competitive bidding environment; however, efficiency improvements enabled us to maintain overall margins in this segment at 2011 levels.
Regional Performance
East
The East region, comprising operations in 22 states, the most important being Ohio, New York, Florida, Michigan, New Jersey, Pennsylvania and West Virginia, is organised into four divisions. Our Central division delivered improved profits in 2012 with price increases and moderate volume growth offsetting higher costs. Our Mid-Atlantic division was bolstered by new acquisitions in 2012 as we focussed on expanding operations in this key market. An improving residential market positively impacted our Southeast division and led to better volumes, prices and profit growth. The Northeast division experienced a decline in operating profit in 2012 due mainly to the disruption caused by Hurricane Sandy. Overall US Dollar operating profit in our East region was slightly lower than in 2011.
West
The West region also has operations in 22 states, the most important of which are Utah, Texas, Washington, Missouri, Iowa, Kansas and Mississippi, and is organised into three divisions. Both the core Central West and the Mountain West divisions delivered higher operating profit in 2012 driven by strong asphalt pricing. The Northwest division experienced difficult market conditions in 2012 and the absence of large infrastructure projects combined with a tepid residential market led to lower profits. Overall operating profit for our West region was maintained in 2012.
| * | Defined as earnings before interest, taxes, depreciation, amortisation, asset impairment charges, profit on disposals and the Group’s share of equity accounted investments’ result after tax. | |
Europe Products– 2012
| | | | | | | | | | | | | | | | | | | | | | | | | | |
| Results | | | | | | | | | | | | | | | | | | Analysis of change |
| € million | | %
Change | | 2012R | | 2011 | | Total
Change | | | | | | | | Organic | | Acquisitions | | Divestments | | Restructuring/ Impairment | | Exchange | | IFRS 11 Impact |
| Sales revenue | | -6% | | 2,477 | | 2,648 | | -171 | | | | | | | | -111 | | +125 | | -207 | | - | | +26 | | -4 |
| EBITDA (as defined)* | | -22% | | 152 | | 194 | | -42 | | | �� | | | | | -51 | | +15 | | -6 | | -3 | | +3 | | - |
| Operating profit | | -71% | | 19 | | 66 | | -47 | | | | | | | | -48 | | +9 | | +1 | | -12 | | +2 | | +1 |
| EBITDA (as defined)* margin | | 6.1% | | 7.3% | | | | | | | | | | | | | | | | | | | | |
| Operating profit margin | | | | 0.8% | | 2.5% | | | | | | | | | | | | | | | | | | | | |
Pension curtailment gains were nil (2011: €17 million) | | | | | | Restructuring costs amounted to €27 million (2011: €24 million) Impairment charges of €24 million were incurred (2011: €15 million) |
| | | | | | |
Europe Products experienced very difficult trading conditions in 2012. In particular, the first quarter was significantly impacted by an extremely harsh winter and Eurozone economic difficulties continued to affect business confidence, especially in the Netherlands. Although the negative trend eased somewhat in the second half of 2012, overall like-for-like sales were down 4% on 2011. In response to these difficult trading conditions, we implemented significant cost reductions, rationalisation and plant closures.
Acquisition spend for 2012 amounted to €151 million on a total of four transactions, of which the largest was the acquisition of a European RMI-oriented Shutters & Awnings business in Germany. The divestments impact above mainly reflected the sale in 2011 of our Insulation and Climate Control business together with the disposal in 2012 of our German-based access controls business.
Concrete Products
Concrete Products was significantly affected by difficult trading conditions in the Netherlands, Germany, Belgium and France in 2012, but the impact was partly offset by improvements in Denmark and Eastern Europe. Further significant cost reduction initiatives were implemented across all activities and countries. Lower trading combined with restructuring costs resulted in operating profit falling significantly below 2011.
The Architectural operations (tiles, pavers, blocks) were negatively impacted in 2012 by the deteriorating market backdrop in the Netherlands, Belgium and France. Sales were lower than in 2011 due to continuing weak consumer confidence and lower government spending in landscaping and civil network products in France, in particular. Despite lower sales and operating profit compared with 2011, our German landscaping activities performed better than expected in 2012 given the challenging market conditions.
Our Structural business experienced very difficult market conditions in 2012 in the Netherlands where residential and non-residential construction activity declined. Further restructuring initiatives were implemented in order to adjust our cost base and production footprint to the changed market conditions. In Belgium we also saw a negative impact on sales and operating profit in 2012 due to continuing market deterioration, but this was partly offset by the continued strong
performance of our specialities business, which supplies the residential, industrial and agricultural sector. Our business in Denmark continued to perform strongly in 2012 and showed further improvement in operating profit compared with 2011. Trading conditions for our activities in Eastern Europe, especially Hungary and Poland, showed improvement and operating profit increased.
Clay Products
Both new and repair and maintenance activity declined in the United Kingdom in 2012 and industry brick volumes were down 3% versus 2011. While we also saw lower volumes at our UK brick business in 2012 we achieved higher average prices and, excluding the pension gain in 2011, operating profit was maintained broadly in line with 2011. Difficult trading conditions were experienced in Mainland Europe, with particularly challenging markets in the Netherlands. This resulted in lower overall sales and operating profit for our Clay business.
Lightside Building Products
Lightside Building Products activities also showed a decline compared with 2011 but not to the same extent as our Concrete and Clay Products activities. The Outdoor Security business was negatively impacted by the very difficult trading conditions across Europe, as sales and operating profit in the Netherlands, Germany, France and the UK declined in 2012. However, the performance of our Nordic and Mobile Fencing activities was broadly in line with 2011 and Germany in particular has begun to benefit from restructuring activities started in 2011.
During 2012, our footprint in the attractive RMI-focussed Shutters & Awnings segment was significantly expanded by an acquisition in Germany. The underlying Shutters & Awnings business in the Netherlands was impacted by negative economic sentiment and operating profit, while still at a satisfactory level, was lower than in 2011.
In Construction Accessories operating profit was lower in 2012 due to strong price competition in Mainland European markets. In contrast, the UK market experienced increased levels of activity in the London area. Our activities in China, after a difficult start to 2012, made progress. In April 2012, we acquired a business in southeast Asia, expanding our footprint in this developing region.
| * | Defined as earnings before interest, taxes, depreciation, amortisation, asset impairment charges, profit on disposals and the Group’s share of equity accounted investments’ result after tax. | |
Americas Products– 2012
| | | | | | | | | | | | | | | | | | | | | | | | | | |
| Results | | | | | | | | | | | | | | | | Analysis of change |
| € million | | %
Change | | 2012R | | 2011 | | Total
Change | | | | | | | | Organic | | Acquisitions | | Divestments | | Restructuring/ Impairment | | Exchange | | IFRS 11 Impact |
| Sales revenue | | +18% | | 2,806 | | 2,378 | | +428 | | | | | | | | +174 | | +67 | | - | | - | | +187 | | - |
| EBITDA (as defined)* | | +24% | | 204 | | 164 | | +40 | | | | | | | | +21 | | +5 | | - | | +2 | | +12 | | - |
| Operating profit | | +105% | | 86 | | 42 | | +44 | | | | | | | | +39 | | +1 | | - | | +2 | | +2 | | - |
| EBITDA (as defined)* margin | | 7.3% | | 6.9% | | | | | | | | | | | | | | | | | | | | |
| Operating profit margin | | | | 3.1% | | 1.8% | | | | | | | | | | | | | | | | | | | | |
| | | | | | Restructuring costs amounted to €2 million (2011: €4 million) Impairment charges of €4 million were incurred (2011: €4 million) |
| | | | | | |
2012 saw good progress for our Americas Products segment helped by a strong recovery in residential construction in the United States and an ongoing pick-up in overall economic activity. Like-for-like sales were 7% ahead of 2011. The combination of input cost pressures and very competitive pricing required a continued tight focus on operational excellence initiatives. Nevertheless, with the benefit of organic growth, market share gains and cost reduction initiatives, the segment achieved a significant increase in US Dollar operating profit and growth in both EBITDA (as defined)* and operating profit margins in 2012.
Americas Products completed 9 acquisitions in 2012 for a total spend of €112 million. Of particular note was the acquisition by our Architectural Products Group (APG) of paver plant facilities in Ontario, Canada (3) and in Florida (4), increasing our market share in Ontario and extending the reach of our Florida operations to the southwest of the state with resultant transportation benefits. The acquisition of 5 packaged cement mix plants in Texas further strengthened APG’s national presence in packaged concrete products. The Precast group acquired 5 plants in California further consolidating its leadership position in this large market and facilitated our objective of expanding into new precast product segments in this state, including bridge girders, manholes and box culverts.
Architectural Products
APG supplies a broad range of concrete masonry and hardscape products, packaged products, clay brick, fencing and lightweight aggregates to the construction industry, with the DIY and professional RMI segments being significant end-users. The business benefited from good weather early in 2012 and from an improving residential construction market although APG’s non-residential construction market segments remained weak. Activity was more robust in the west and the south but remained challenged in the northeast and midwest. The improving housing market, product innovation and effective marketing drove gains across our business in 2012, while further cost reduction measures were implemented to offset the impact of higher input costs. Overall, APG recorded an increase in operating profit for 2012 on a 3% increase in like-for-like sales.
Precast
The Precast business saw an improved market environment in 2012 and registered solid gains as targeted growth initiatives began to deliver. Improvements were seen in all regions with particular progress in many hard-hit Sunbelt markets. Commercial and infrastructure markets remained subdued but energy and environment-related markets were positive. In our traditional precast products, volumes increased 19% over 2011. Our enclosures business showed further improvement in profitability and the construction accessories business posted better results in 2012. Overall the Precast group’s like-for-like sales increased by 12% and operating profit advanced significantly.
BuildingEnvelope®
Commercial building activity showed only a modest improvement in 2012, resulting in another year of challenging market conditions for this business. Despite these conditions, our initiatives to gain market share and differentiate the business through innovative technology drove top-line growth. The pricing environment remained difficult, especially for larger project work. However, organic sales rose 8% in 2012 with improvements well balanced across regions. Our Engineered Glazing Systems business, which had held up well as large projects were completed during 2011, was impacted by somewhat lower activity levels in 2012. Our traditional Architectural Glass and Storefronts business benefited from a focus on increased commercial RMI spend. Our focus on tight cost controls, quality and improved processes resulted in higher overall operating profit for the business.
South America
Results for our operations in Argentina were slightly lower than in 2011, with improved results in our clay block operation offset by continuing price competition and cost inflation pressures in our tile business. Our Chilean businesses had another year in which operating profit improved. Overall, sales for our South American operations in 2012 were higher and operating profit was slightly better than in 2011.
| * | Defined as earnings before interest, taxes, depreciation, amortisation, asset impairment charges, profit on disposals and the Group’s share of equity accounted investments’ result after tax. | |
Europe Distribution – 2012
| | | | | | | | | | | | | | | | | | | | | | | | | | |
| Results | | | | | | | | | | | | | | | | Analysis of change |
| € million | | %
Change | | 2012R | | 2011 | | Total
Change | | | | | | | | Organic | | Acquisitions | | Divestments | | Restructuring | | Exchange | | IFRS 11 Impact |
| Sales revenue | | -9% | | 3,956 | | 4,340 | | -384 | | | | | | | | -294 | | +65 | | - | | - | | +29 | | -184 |
| EBITDA (as defined)* | | -19% | | 217 | | 267 | | -50 | | | | | | | | -42 | | +2 | | - | | +1 | | +2 | | -13 |
| Operating profit | | -24% | | 145 | | 190 | | -45 | | | | | | | | -42 | | +1 | | - | | +3 | | +2 | | -9 |
| EBITDA (as defined)* margin | | 5.5% | | 6.2% | | | | | | | | | | | | | | | | | | | | |
| Operating profit margin | | | | 3.7% | | 4.4% | | | | | | | | | | | | | | | | | | | | |
| | | | | | Restructuring costs amounted to €3 million (2011:€4 million) No impairment charges were incurred (2011: €2 million) |
| | | | | | |
Adverse weather conditions in the early months of 2012 combined with weaker market demand in the Netherlands and Switzerland resulted in a sharp decline in first-half profits. However, despite continuing market weakness, a disciplined approach to pricing combined with strong cost and procurement management delivered a robust second-half trading performance for 2012 with both EBITDA (as defined)* and operating profit margins in line with the period from July to December 2011. As a result, the full-year EBITDA (as defined)* decline including the -€13 million impact of the change in accounting for joint ventures was limited to 19% (down 29% in the first-half) while full-year operating profit fell 24% compared with a first-half decline of 39%.
In 2012 Europe Distribution continued to expand its Sanitary, Heating and Plumbing business and added two Belgian specialist merchants with a total of 16 branches, strengthening our market presence in what is a key market for the segment. In the Netherlands we acquired a specialist merchant of finishing products, adding 6 branches to the Dutch Professional Builders Merchants business.
Professional Builders Merchants
With 360 locations in six countries, Professional Builders Merchants has strong market positions in all of its regions. Overall operating profit for this business was lower than in 2011. Markets in the Benelux were weak in 2012 and this resulted in lower sales and operating profit. Sales levels in France were slightly lower compared with 2011 but operating profit was maintained due to the strong focus on costs, purchasing and pricing. Our operations in Switzerland saw a decline in sales in 2012 impacted by the severe winter weather and the strength of the Swiss Franc which affected competitiveness; however, strict cost control measures alleviated the impact on operating profit. Austria again showed a strong performance in 2012 and for the fourth year in a row reported an increase in operating profit. In Germany like-for-like sales decreased during 2012 due to poor early weather and a weak garden season; as a result, profits fell short of 2011 levels.
DIY
Our DIY platform in Europe operates a network of 198 stores under three different brands; Gamma and Karwei in the Benelux and Bauking in Germany. Overall operating profit in 2012 for DIY was behind 2011.
In the Netherlands, continued weakness in consumer confidence put pressure on sales levels in 2012; however, the adverse impact on operating profit was lessened due to specific purchasing initiatives and good cost control. In Belgium our network of 19 stores reported an increase in operating profit in 2012 as a result of continued progress realised on operational effectiveness. With consumer confidence also under pressure in Germany during the latter part of 2012, operating profit for our 48-store DIY network in Germany declined.
Sanitary, Heating and Plumbing
Our SHAP business services the specialist needs of plumbers, heating specialists and installers, and of gas and water technicians from a total of 119 branches in three countries with annualised turnover of almost €600 million. With the benefit of acquisitions during 2012, operating profit was well ahead of 2011. Our businesses in Germany and Switzerland performed well in 2012 delivering improvements in sales and operating profit compared with 2011. The business in Belgium performed strongly and once more exceeded expectations.
| * | Defined as earnings before interest, taxes, depreciation, amortisation, asset impairment charges, profit on disposals and the Group’s share of equity accounted investments’ result after tax. | |
Americas Distribution– 2012
| | | | | | | | | | | | | | | | | | | | | | | | | | |
| Results | | | | | | | | | | | | | | | | Analysis of change |
| € million | | %
Change | | 2012R | | 2011 | | Total
Change | | | | | | | | Organic | | Acquisitions | | Divestments | | Restructuring | | Exchange | | IFRS 11 Impact |
| Sales revenue | | +18% | | 1,576 | | 1,335 | | +241 | | | | | | | | +29 | | +100 | | - | | - | | +112 | | - |
| EBITDA (as defined)* | | +28% | | 83 | | 65 | | +18 | | | | | | | | +9 | | +4 | | - | | - | | +5 | | - |
| Operating profit | | +31% | | 59 | | 45 | | +14 | | | | | | | | +9 | | +1 | | - | | - | | +4 | | - |
| EBITDA (as defined)* margin | | 5.3% | | 4.9% | | | | | | | | | | | | | | | | | | | | |
| Operating profit margin | | | | 3.7% | | 3.4% | | | | | | | | | | | | | | | | | | | | |
| | | | | | Restructuring costs amounted to €1 million (2011: €1 million) No impairment charges were incurred (2011: nil) |
| | | | | | |
Americas Distribution, trading as Allied Building Products (“Allied”), saw contrasting patterns across its main trading activities in 2012. Our Exterior Products business had a strong first half due to an unusually warm winter and momentum from 2011, but experienced a more challenging second half of 2012 as re-roofing demand weakened and competition for work intensified. In contrast, the Interior Products business showed continuing improvements in both volumes and pricing throughout 2012. With total like-for-like sales up by 2% and incremental contributions from acquisitions completed in 2011, overall US Dollar sales and operating profit were ahead of 2011.
The ongoing evolution of Allied’s organisational structure provided further consolidation and efficiency opportunities. Management maintained its focus on logistics, pricing initiatives and administrative rationalisation to enable greater control and scalability. As we continued to simplify our branch operating structure, smaller regions were merged in order to improve acquisition integration and enhance operating synergies. As a result we saw improvement in both EBITDA (as defined)* and operating profit margins in 2012.
Development activity in 2012 was quiet following a busy year in 2011. Two greenfield locations were added to strengthen existing market positions and provide scope for further growth. The acquisition impact shown above primarily reflects the 15-branch Minnesota-headquartered Exterior Products distributor that was acquired in December 2011.
TriBuilt, Allied’s proprietary private label brand (5% of sales), continued to show strong growth in 2012. In addition, new customer service initiatives were implemented to further differentiate Allied in the marketplace. Overall, progress was made in 2012 to increase brand recognition and build strong customer loyalty.
Exterior Products
Allied is the third largest roofing and siding distributor in the United States. Demand is influenced by residential and commercial replacement activity (75% of sales volume is RMI-related) with key products having an average life span of 25 years. All regions within the Exterior Products business were profitable in 2012 and the full-year impact of 2011 acquisitions added to the sales and operating profit of the northern plains/upper midwest markets. However, competitive pressures across the industry in the second half of 2012 impacted margins in both acquired and heritage businesses. In late-October 2012, our operations in the New York/New Jersey area were severely impacted by Hurricane Sandy but December saw some benefit as post-hurricane repair and refurbishment work commenced.
Interior Products
Allied is also the third largest Interior Products distributor in the United States. This business sells wallboard, steel studs and acoustical ceiling systems to specialised contractors, and has low exposure to weather-driven replacement activity. It is heavily dependent on the new commercial construction market which has been at historically low levels in recent years. Activity in this business finished 2012 on a strong note. Wallboard volumes and prices increased in 2012 which resulted in higher sales across all regions and, combined with the benefits of cost reduction programmes undertaken in previous years, contributed to an improvement in operating profit.
| * | Defined as earnings before interest, taxes, depreciation, amortisation, asset impairment charges, profit on disposals and the Group’s share of equity accounted investments’ result after tax. | |

62 CRH
Board of Directors
| | | | |
|
| | |
Nicky Hartery Chairman Appointed to the Board:June 2004 Nationality:Irish Age:62 Committee membership: Acquisitions Committee; Finance Committee; Nomination and Corporate Governance Committee; Remuneration Committee | |  | | Skills and experience: Nicky was Vice President of Manufacturing and Business Operations for Dell Inc.’s Europe, Middle East and Africa (EMEA) operations from 2000 to 2008. Prior to joining Dell, he was Executive Vice President at Eastman Kodak and previously held the position of President and Chief Executive Officer at Verbatim Corporation, based in the United States.Qualifications: C.Eng, FIEI, MBA. External appointments:Chief Executive of Prodigium, a consulting company which provides business advisory services; non-executive director of Musgrave Group plc, a privately-owned international food retailer, and of Eircom Limited, a telecommunications services provider in Ireland. |
|
|
| | |
Albert Manifold Chief Executive Appointed to the Board:January 2009 Nationality:Irish Age:51 Committee membership:Acquisitions Committee; Finance Committee | |  | | Skills and experience:Albert joined CRH in 1998. Prior to this he was Chief Operating Officer with a private equity group. He was appointed Chief Operating Officer and to the CRH Board in January 2009, and as Group Chief Executive with effect from 1 January 2014. Prior to his appointment to the CRH Board, Albert held a variety of senior positions, including Finance Director, and subsequently Managing Director, of the Europe Materials Division and Group Development Director of CRH. He has extensive experience of the buildings materials industry and CRH’s international expansion.Qualifications: FCPA, MBA, MBS. |
|
|
| | |
Maeve Carton Finance Director Appointed to the Board:May 2010 Nationality:Irish Age:55 Committee membership:Acquisitions Committee; Finance Committee | |  | | Skills and experience:Since joining CRH in 1988, Maeve has held a number of roles in the Group Finance area and was appointed Group Controller in 2001, Head of Group Finance in January 2009 and to the position of Finance Director in May 2010. She has broad-ranging experience of CRH’s reporting, control, budgetary and capital expenditure processes and has been extensively involved in CRH’s evaluation of acquisitions. Prior to joining CRH, she worked for a number of years as a chartered accountant in an international accountancy practice.Qualifications: MA, FCA. External appointments:Director of The British Irish Chamber of Commerce, a business and employers organisation. |
|
|
| | |
Mark Towe Chief Executive Officer Oldcastle, Inc. Appointed to the Board:July 2008 Nationality:United States Age:64 Committee membership: Not Applicable | |  | | Skills and experience:Mark joined CRH in 1997. In 2000, he was appointed President of Oldcastle Materials, Inc. and became the Chief Executive Officer of this Division in 2006. He was appointed to his current position of Chief Executive Officer of Oldcastle, Inc. (the holding company for CRH’s operations in the Americas) in July 2008. With more than 40 years of experience in the building materials industry, he has overall responsibility for the Group’s operations in the Americas. |
|
|
Board of Directors continued overleaf

Board Of Directors|continued
| | | | |
|
| | |
Ernst Bärtschi Non-executive Director Appointed to the Board:October 2011 Nationality:Swiss Age:61 Committee membership: Audit Committee (Financial expert) | |  | | Skills and experience: Ernst was Chief Executive of Sika AG, a manufacturer of speciality chemicals for construction and general industry, until 31 December 2011. Prior to joining Sika, he worked for the Schindler Group and was Chief Finance Officer between 1997 and 2001. Over the course of his career he has gained extensive experience in India, China and the Far East generally.Qualifications: LIC.OEC.HSG External appointments:Member of the board of Bucher Industries AG, a mechanical and vehicle engineering company based in Switzerland; member of the advisory board of China Renaissance Capital Investment Inc., a private equity investment company in Hong Kong, China. |
|
|
| | |
William (Bill) Egan Non-executive Director Appointed to the Board:January 2007 Nationality:United States Age:68 Committee membership:Nomination and Corporate Governance Committee; Remuneration Committee | |  | | Skills and experience:Bill is founder and General Partner of Alta Communications and Marion Equity Partners LLC, Massachusetts-based venture capital firms. He is past Chairman of Cephalon Inc., and past President and Chairman of the National Venture Capital Association.Qualifications: BA, MBA. External appointments:Director of the Irish venture capital company Delta Partners Limited; serves on the boards of several communications, cable and information technology companies. |
|
|
| | |
Utz-Hellmuth Felcht Non-executive Director Appointed to the Board:July 2007 Nationality:German Age:66 Committee membership:Acquisitions Committee; Finance Committee | |  | | Skills and experience:Utz-Hellmuth was, until May 2011, Chairman of the Supervisory Board of Süd-Chemie Aktiengesellschaft. He was also Chief Executive of Degussa AG, Germany’s third largest chemical company, until May 2006. External appointments:Partner in the private equity group One Equity Partners Europe GmbH; Chairman of the Supervisory board of German rail company Deutsche Bahn AG; director of Jungbunzlauer Holding AG. |
|
|
| | |
Jan Maarten de Jong Non-executive Director Appointed to the Board:January 2004 Nationality:Dutch Age:68 Committee membership:Acquisitions Committee; Finance Committee | |  | | Skills and experience:Jan Maarten is a member of the Supervisory Board of Heineken N.V. He is a former member of the Managing Board of ABN Amro Bank N.V. and following his retirement he continued to be a Special Advisor to the board of that company until April 2006. External appointments:Director of a number of European banking, insurance and industrial holding companies, including AON Groep Nederland B.V. and Nutreco N.V. |
|
|
| | |
John Kennedy Non-executive Director Appointed to the Board:June 2009 Nationality:Irish Age:63 Committeemembership:Nomination and Corporate Governance Committee; Remuneration Committee | |  | | Skills and experience:John is past Chairman of Wellstream Holdings plc. In a 40-year career, he has served as Executive Vice President of Halliburton Company, President of Dresser Enterprises and Chief Operations Officer of Brown and Root Services. He is a past director of the UK Atomic Energy Authority and Integra Group.Qualifications: M.Sc, BE, C.Eng, FIEE. External appointments:Non-executive Chairman of Lamprell plc; director of Maxwell Drummond International Limited, Hydrasun Holdings Limited, Welltec A/S and BiFold Group Limited. |
| | | | |
|
| | |
Don McGovern Non-executive Director Appointed to the Board:July 2013 Nationality:United States Age:62 Committee membership: Audit Committee (Financial expert) | |  | | Skills and experience: Don was Vice Chairman, Global Assurance at PricewaterhouseCoopers (PwC), from 2008 until June 2013. He retired from PwC in June 2013 following a 39 year career with the firm, during which time he directed the US firm’s services for a number of large public company clients. He has held various leadership roles in PwC and was, from July 2001 to June 2008, a member of, and past lead director for, the Board of Partners and Principals of the US firm as well as a member of PwC’s Global Board.Qualifications: CPA, MBA. |
|
|
| | |
Heather Ann McSharry Non-executive Director Appointed to the Board:February 2012 Nationality:Irish Age:52 Committee membership:Audit Committee | |  | | Skills and experience:Heather Ann is a former Managing Director Ireland of Reckitt Benckiser and Boots Healthcare and was previously a non-executive director of Bank of Ireland plc.Qualifications: BComm, MBS. External appointments:Non-executive director of Greencore Group plc and Jazz Pharmaceuticals plc; Chairman of the Bank of Ireland Pension Fund Trustees Board; director of Ergonomics Solutions International, IDA Ireland and the Institute of Directors. |
|
|
| | |
Dan O’Connor Non-executive Director* Appointed to the Board:June 2006 Nationality:Irish Age:54 Committee membership:Audit Committee (Financial expert); Nomination and Corporate Governance Committee; Remuneration Committee | |  | | Skills and experience:Dan is a former President and Chief Executive Officer of GE Consumer Finance - Europe and a former Senior Vice- President of GE. He was Executive Chairman of Allied Irish Banks, plc until October 2010.Qualifications: BComm, FCA. * Dan O’Connor is Senior Independent Director |
|
|
| | |
Henk Rottinghuis Non-executive Director Appointed to the Board:February 2014 Nationality:Dutch Age:58 Committee membership:Not applicable | |  | | Skills and experience:Henk has a background in distribution, wholesale and logistics. He was until 2010, Chief Executive Officer at Pon Holdings B.V., a large, privately-held international company which is focussed on the supply and distribution of passenger cars and trucks, and equipment for the construction and marine sectors.Qualifications: Master’s degree in Dutch Law. External appointments:Chairman of the Supervisory Board of Stork Technical Services; member of the Supervisory Boards of the Royal Bank of Scotland N.V., and the retail groups Blokker Holding B.V. and Detailresult Groep. |
|
|
| | | | | | | | | | |
| | | | | | | | Corporate Governance Report Chairman’s Introduction | | |
| | CRH plc has a secondary listing on The Irish Stock Exchange. For this reason, CRH plc is not subject to the same ongoing listing requirements as would apply to an Irish company with a primary listing on the Irish Stock Exchange. For further information, shareholders should consult their own financial adviser. Further details on the Group’s listing arrangements, including its primary listing on the London Stock Exchange, are set out on page 68. | | | |  | | The following report outlines our approach to corporate governance and how we implement the 2012 UK Corporate Governance Code (the Code). We complied in full with the provisions of the Code in 2013. We also have procedures in place for compliance with our obligations under the applicable rules and regulations issued by the Securities & Exchange Commission. Shareholder Engagement and Communications The CRH Board is committed to very high standards of corporate governance and to ensuring that CRH is at the forefront of best practice in this area. Integral to this is shareholder engagement, and we devote considerable time and resources to this area each year. We operate an extensive investor relations programme. During 2013, members of the senior management team spent a combined total of 63 days meeting with investors. These meetings covered over 50% of our shareholder base and focussed principally on operational matters, including the Group’s performance and strategy. To ensure that shareholders also had an opportunity to discuss governance matters, prior to the 2013 Annual General Meeting, I invited the Group’s major shareholders to meet with me. Dan O’Connor, Senior Independent Director and Chairman of the Remuneration Committee, and Neil Colgan, Company Secretary, also participated in the meetings. No issues of concern were raised during these meetings. I will again invite our major shareholders to discuss governance matters in advance of the 2014 Annual General Meeting. | | |
As outlined in the Remuneration Committee Chairman’s statement on pages 85 to 87, we also consulted extensively with the Group’s major shareholders, various shareholder organisations and proxy voting agencies on the Group’s proposed new remuneration structures.
Amongst the new provisions introduced to the Code in September 2012, which were effective for CRH from 1 January 2013, was a requirement that the Directors include a statement in the Annual Report“that they consider the report and accounts, taken as a whole, is fair, balanced and understandable and provides the information necessary for shareholders to assess the company’s performance, business model and strategy”. I believe that, in relation to the Group’s shareholder communications and news releases, this is a standard against which CRH has always measured itself. Indeed, a consistent area of feedback from shareholders we meet through our investor relations programme is an appreciation for our straight-forward communication style. Nevertheless, we took the opportunity of this new provision of the Code to review with management the procedures for drafting and finalising the Annual Report. This review focussed on ensuring that the Annual Report would be fair and balanced in representing CRH’s strategy and performance, while also making sure that the Annual Report would be readily understandable by our stakeholders. As referred to in my introductory comments to this year’s Annual Report on page 3, the Company is in the process of a wide-ranging
portfolio review which will impact on the future shape of the Group. The outcome of the review will no doubt have an impact, over time, on the way in which we communicate the objectives, strategy and performance of the Group.
Board Renewal and Diversity
Following the announcement in February 2013 of Myles Lee’s intention to retire as Chief Executive and from the Board at the end of 2013, a major focus during 2013 was the succession process for the role of Chief Executive. We announced in July 2013 that Albert Manifold would succeed Myles with effect from 1 January 2014. The process for the appointment of the Chief Executive is set out in theNomination and Corporate Governance CommitteeReport on page 79. In the last 12 months we have also welcomed two new non-executive Directors to the Board, Don McGovern, a US citizen and former senior partner with PricewaterhouseCoopers, and Henk Rottinghuis, a Dutch citizen and former Chief Executive Officer of Pon Holdings B.V., a large, privately held international company focussed on the supply and distribution of passenger cars and trucks, and equipment for the construction and marine sectors.
Ensuring that there is an appropriate balance of skills, knowledge and experience on the Board and that it is suitably diverse in terms of culture and gender is a key focus for me as Chairman. Our Board has for a long time been diverse from an international and business perspective and one of the core elements of our Board renewal policy is gender diversity. Currently the Board
has two female Directors, who following the 2014 Annual General Meeting will represent 17% of the Board. We are focussed on increasing this percentage as part of our ongoing Board renewal process. In doing this, we need to continue to ensure that we appoint the right people with the right experience to fit the needs of the Company. On the recommendation of theNomination and Corporate Governance Committee, the Board has expanded its policy for the recruitment of non-executive Directors by setting itself the goal of increasing the number of female Directors to circa 25% by the end of 2015. Our Board renewal policy is set out on pages 68 and 69.
Conclusion
I am satisfied that CRH’s governance structures are appropriate for a Group of our size and complexity. Nevertheless, it is vital that these structures evolve in line with best practice and your Board, through the work of theNomination and Corporate Governance Committee, keeps developments in this area under review.
Nicky Hartery
Chairman
Corporate Governance Report |continued
Listings and Corporate Governance Codes
CRH, which is incorporated in Ireland and subject to Irish company law, has a premium listing on the London Stock Exchange, a secondary listing on the Irish Stock Exchange and its American Depositary Shares are listed on the New York Stock Exchange.
This Report describes CRH’s governance principles and practice and the Group’s risk management and internal control systems. The Report also sets out how CRH applies the main and supporting principles of the 2012 UK Corporate Governance Code (the Code). CRH also takes into account the disclosure requirements set out in the corporate governance annex to the listing rules of the Irish Stock Exchange.
A copy of the Code can be obtained from the Financial Reporting Council’s website, www.frc.org.uk.
Board of Directors

What are the responsibilities of the Board?

The Board is responsible for the leadership, oversight, control, development and long-term success of the Group. It is also responsible for instilling the appropriate culture, values and behaviour throughout the organisation.
There is a formal schedule of matters reserved to the Board for consideration and decision. This includes appointment of Directors, approval of the Annual Report, the Interim Results, the annual budget, major acquisitions, the issuance of guarantees, significant capital expenditure and the strategic plans for the Group. The Group’s strategy, which is regularly reviewed by the Board, and its business model are summarised in the Strategy Review on pages 27 to 31.
The Board has delegated some of its responsibilities to Committees of the Board. The work of each Committee is set out on pages 73 to 81 of this Report. While responsibility for monitoring the effectiveness of the Group’s risk management and internal control systems has been delegated to theAudit Committee1, the Board retains ultimate responsibility for determining the Group’s “risk tolerance” and annually considers a report in relation to the monitoring, controlling and reporting of identified risks and uncertainties. In addition, the Board receives regular reports from the Chairman of theAudit Committee in relation to the work of that Committee in the area of risk management.
Individual Directors may seek independent professional advice, at the expense of the Company, in the furtherance of their duties as a Director.
The Group has a Directors’ and Officers’ Liability insurance policy in place.
How do the roles of the Chairman and Chief Executive differ?
It has been CRH’s practice since the formation of the Group in the 1970s that the roles of Chairman and Chief Executive are not combined.
The Board has delegated responsibility for the management of the Group, through the Chief Executive, to executive management. There is a clear division of responsibilities between the roles of the Chairman and the Chief Executive which is set out in writing and has been approved by the Board. A summary of the respective roles is set out in the table to the right.
What is the membership structure of the Board?
It is CRH’s practice that a majority of the Board comprises non-executive Directors.
At present, there are three executive and ten non-executive Directors. Biographical details are set out on pages 63 to 65. Non-executive Directors are expected to challenge management proposals constructively and to examine and review management performance in meeting agreed objectives and targets. In addition, they are expected to draw on their experience and knowledge in respect of any challenges facing the Group and in relation to the development of proposals on strategy.
We consider the current size and composition of the Board to be within a range which is appropriate. We also believe that the current size of the Board is sufficiently large to enable its Committees to operate without undue reliance on individual non-executive Directors, while being dynamic and responsive to the needs of the Group. The spread of nationalities of the Directors reflects the geographical reach of the Group and we consider that the Board as a whole has the appropriate blend of skills, knowledge and experience, from a wide range of industries, regions and backgrounds, necessary to lead the Group.
None of the executive Directors is a non-executive director of another listed company.
Responsibilities of Chairman and Chief Executive
Chairmanis responsible for
The efficient and effective working of the Board
Ensuring that Board agendas cover the key strategic issues confronting the Group, that the Board reviews and approves management’s plans for the Group and that the Directors receive accurate, timely, clear and relevant information
Making certain that the Board applies sufficient challenge to management proposals and examines and reviews management performance in meeting agreed objectives and targets
Overseeing the search for new Board members
Chief Executiveis responsible for
Full day-to-day operational and profit performance of the Group and is accountable to the Board for all authority delegated to executive management
Executing strategy agreed with the Board and reporting regularly on the progress and performance of the Group
Co-ordinating and overseeing the profitable growth of the Group’s diverse portfolio of international businesses
Maximising the contribution of senior management to business planning, operational control and profit performance
The current membership structure of the board is set out in the table on page 69.
How does the Board plan for succession and what is its policy on diversity?
The Board plans for its own succession with the assistance of theNomination and Corporate Governance Committee.
For non-executive appointments, independent consultants are engaged to search for suitable candidates. The process to identify, evaluate and appoint a non-executive Director with the suitable experience, skills and time commitment takes into account both the needs of CRH and the tenure and skills of existing Board members. As a result, the renewal and
| 1 | In accordance with Regulation 91(6)(b) of the European Communities (Statutory Audits) (Directive 2006/43) Regulations 2010. |
Corporate Governance Report |continued
| | | | |
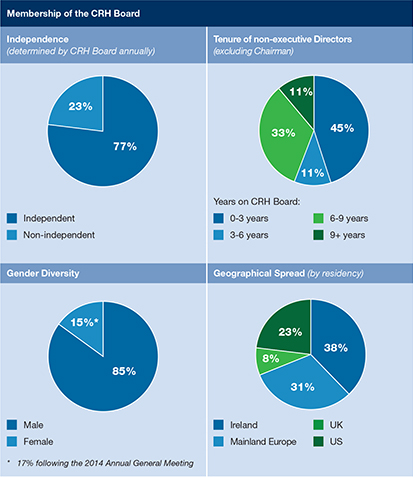 | |
What criteria are used to determine the independence of non-executive Directors?
The Board considers the principles relating to independence contained in the Code, together with the guidance provided by a number of shareholder voting agencies, and takes into account a Director’s character, objectivity and integrity.
The independence of non-executive Board members is considered annually. The Board is assisted in this by the annual review carried out by the Senior Independent Director which addresses the independence of the individual members of the Board (see Performance appraisal and Board evaluation section on page 70), and by the work of theNomination and Corporate Governance Committee, which annually reviews each Board member’s directorships, and considers any relevant business relationships between Board members. We have concluded that all of the non-executive Directors bring independent judgement to bear on issues of strategy, performance, resources, key appointments and standards, and have determined that each of the non-executive Directors is independent.
When was the Chairman appointed and does he have non-CRH commitments?
There have been no changes in the non-CRH commitments of Nicky Hartery since his appointment as Chairman.
Nicky Hartery was appointed Chairman of the Group in 2012. On his appointment as Chairman, he met the independence criteria set out in the Code. Although he holds a number of other directorships (see details on page 63), the Board considers that these do not interfere with the discharge of his duties to CRH.
Who is the Senior Independent Director?
The Senior Independent Director is available to shareholders who have concerns that cannot be addressed through the Chairman, Chief Executive or Finance Director.
Dan O’Connor was appointed as Senior Independent Director in 2012. |
refreshment of non-executive Directors is a continuous process. The non-executive Directors meet regularly with the Chief Executive to discuss senior management succession planning to ensure appropriate talent management structures are in place to provide a pool of potential candidates for key executive Director appointments. External consultants are engaged for executive Director recruitment if, and when, required. In line with evolving best practice, during 2013 independent consultants were engaged to identify potential external candidates for consideration during the process to appoint a successor to Myles Lee as Chief Executive (see page 79 for more details on the Chief Executive succession process). We are committed to ensuring that the Board is sufficiently diverse and appropriately balanced. In its work in the area of Board | | renewal, theNomination and Corporate Governance Committee looks at the following four criteria when considering non-executive Director candidates: – international business experience, particularly in the regions in which the Group operates or in which it intends to expand; – skills, knowledge and expertise in areas relevant to the operation of the Board; – diversity, including nationality and gender; and – the need for an appropriately sized Board. During the ongoing process of Board renewal, each, or a combination, of these factors can take priority. However, the Board has set itself the target of increasing the percentage of female Board members to circa 25% by the end of 2015. | |
Corporate Governance Report |continued
Who is the Company Secretary?
All Directors have access to the advice and services of the Company Secretary, Neil Colgan, who is responsible to the Board for ensuring that Board procedures are complied with.
Neil was appointed Company Secretary in June 2009. The appointment and removal of the Company Secretary is a matter for the Board.
For what period are non-executive Directors appointed?
Non-executive Directors are typically expected to serve two three-year terms, although they may be invited to serve for further periods.
The standard terms of the letter of appointment for non-executive Directors, which states that they are generally expected to serve two terms of three years, are available for inspection at the Company’s registered office and at the Annual General Meeting. A non-executive Director’s term of office is subject to his annual re-election by shareholders and their letter of appointment does not provide for any compensation for loss of office.
How are the induction, training and development needs of Directors catered for?
The Chairman agrees a tailored and comprehensive induction programme with each new Director.
New Directors are provided with extensive briefing materials on the Group and its operations, the procedures relating to the Board and its Committees and their duties and responsibilities as Directors under legislation and regulations that apply to the Company.
A typical induction programme, which generally takes place over the first year of a Director’s appointment, would cover the topics set out in the upper table on page 71.
Sessions are held periodically with the Chairman at which progress is reviewed and feedback is sought.
For newly-appointed members of the Audit Committee, training arrangements include the topics set out in the lower table on page 71.
Members of theAudit Committee receive periodic updates on accounting developments.
Directors can also avail of opportunities to hear the views of, and meet with, the Group’s shareholders. Directors regularly receive copies of research and analysis conducted on CRH and the building materials sector. The Board receives regular updates from the external auditors in relation to regulatory and accounting developments. Updates in relation to other relevant matters, for example, changes in company law, are provided from time to time.
What processes are in place for appraising the performance of Directors and for evaluating the effectiveness of the Board and its Committees?
An annual review of individual Directors’ performance is conducted by the Chairman and each Director is provided with feedback gathered from other members of the Board.
The performance of individual Directors is assessed against a number of measures, including the ability of the Director to contribute to the development of strategy, to understand the major risks affecting the Group, to contribute to the cohesion of the Board, to commit the time required to fulfil the role and to listen to and respect the views of other Directors and the management team. As part of that review process the Chairman discusses with each individual their training and development needs and, where appropriate, agrees suitable arrangements to be put in place to address those needs.
Each year, the Senior Independent Director conducts an annual review of corporate governance, the balance of skills, experience, independence and knowledge of the Company on the Board, the operation and performance of the Board and its Committees and the effectiveness of Board communications. This is achieved through discussion in one-to-one sessions with each Director, aided by the completion by each Director of a questionnaire in advance. The meetings, which cover specific topics and allow for free-ranging discussion, provide a forum for an open and frank discourse. The Senior Independent Director circulates a written report to the Board each year, which summarises the outcome of the review and sets out any recommendations from Board members in relation to areas where improvements can be made. Consideration of the Senior Independent Director’s report is a formal agenda item at a scheduled Board meeting each year.
Led by the Senior Independent Director, the non-executive Directors meet at least annually in the absence of the Chairman to review his performance.
When was the last external Board evaluation completed and what was the outcome?
The 2012 review was facilitated by ICSA Board Evaluation, which has an extensive record in facilitating evaluations in large listed companies both in Ireland and the UK.
An externally facilitated Board evaluation was carried out by an independent third party, ICSA Board Evaluation (“ICSA”) in 2012. The Board’s performance was rated as “very good” on a six-point scale, ranging from poor to excellent. ICSA made eight recommendations to further improve the effectiveness of the Board, relating to the following:
| – | enhancing the existing processes in place regarding strategy reviews, outcome tracking, Board renewal and Director development; |
| – | providing for an increased number of non-executive Director meetings without executives present; |
| – | taking fuller advantage of the opportunities afforded by Board visits for employee engagement; and |
| – | rationalising Board documentation and updating Board protocols to take account of advances in technology and communications. |
All of the recommendations arising from the 2012 external review have been implemented. The next external evaluation will be conducted in 2015.
What are the requirements regarding the retirement and re-election of Directors?
All Directors retire at each Annual General Meeting and, unless they are stepping down from the Board, submit themselves to shareholders for re-election.
Re-appointment of Directors retiring at Annual General Meetings is not automatic. Directors who are seeking re-election are subject to a satisfactory performance appraisal. All Directors are subject to the Memorandum and Articles of Association of the Company (a summary of provisions in the Memorandum and Articles of Association relating to the Directors is set out on page 189).
Corporate Governance Report |continued
| | |
Induction Programme | | |
Board Members | | |
Topic | | Sessions with |
Group strategy and finance: | | |
Group strategy, the current challenges facing the Group and the trading backdrop Financial reporting, trading results, acquisition models, funding sources/debt maturity, group treasury and credit rating metrics | | Chief Executive, Finance Director, Head of Financial Operations, Group Treasurer |
Divisional strategy and structure: Divisional strategy and organisational structure Development priorities IT strategy | | Chief Executive, Heads of Divisions, Senior Operational Management |
Senior management team: | | |
Succession planning Leadership development programmes Remuneration trends | | Chief Executive |
Directors’ legal duties and responsibilities: | | |
Legal duties and responsibilities Management of inside information Dealings in CRH securities Listing rule requirements | | Finance Director, Company Secretary and the Group’s legal advisers |
Compliance & ethics, health & safety, risk management, investor relations and remuneration: | | |
Compliance & ethics policies and the structures in place to ensure ongoing compliance Health & safety programme, including the fatality elimination programme, and the Group’s Corporate Social Responsibility policies Investor Relations programme and the views of the Group’s major investors Enterprise Risk Management, insurance arrangements and captive insurance programme | | Finance Director, Head of Compliance & Ethics, Head of Investor Relations, Group Sustainability Manager, Group Strategic Financial Risk Manager, the Group’s stockbrokers and theRemuneration Committee’sremuneration advisers |
| | |
| |
Audit Committee | | |
| |
Topic | | Sessions with |
External Audit Audit planning Auditors’ responsibilities | | Finance Director, Senior Finance Executives, Head of Internal Audit and external auditors |
Internal Audit Strategy and workplan IT audit | |
Corporate Governance Report |continued
How often does the Board meet?
Details of the number of Board and Committee meetings during 2013, and of Directors’ attendance at those meetings, is set out in the table on page 80.
There were eight full meetings of the Board during 2013.
Each year, additional meetings, to consider specific matters, are held when and if required. Prior to their appointment, potential non-executive Directors are made aware of the calendar of meetings and are asked to confirm that they are able to allocate sufficient time to meet the expectations of their role. The agreement of the Chairman is required before a non-executive Director accepts additional commitments that might impact adversely on the time he or she is able to devote to CRH.
The Board typically makes two visits each year to Board operations; one in Europe and one in North America. Each visit lasts between three and five days and incorporates a scheduled Board meeting. In 2013, these visits were to Ukraine, and to Georgia in the United States.
How are Board agendas determined?
The Chairman sets the agenda for each meeting in consultation with the Chief Executive and Company Secretary.
In setting the agendas, the Chairman ensures that sufficient time is allocated to strategy setting and review, performance monitoring, portfolio management, including acquisitions and divestments, succession planning and talent management. Board agendas typically cover items set out in the table above.
The non-executive Directors generally meet before or after each Board meeting without executives being present.
The papers for meetings are generally circulated electronically in the week prior to the meeting.
Typical Board Agenda Items
Recurring items on each agenda:
| | – | Board matters(including Board Committee updates) |
| | – | Trading results and cost saving initiatives |
| | – | Acquisitions/Disposals/Capital Expenditure Projects |
Periodic agenda items during the year:
| | – | Full-year/interim financial results and reports |
| | – | Investor interaction and feedback |
| | – | Group strategy and Divisional strategy updates |
| | – | Performance review of acquisitions against the original Board proposal following three years of Group ownership |
| | – | Human resources and succession planning |
| | – | Risk management & internal controls |
| | – | Health & Safety review, with a particular focus on the Group’s fatality elimination programme |
Are the Directors subject to securities dealing policies or codes?
Directors are required to obtain clearance from the Chairman and Chief Executive before dealing in CRH securities.
Details of the CRH shares held by Directors are set out on page 100. CRH has a policy on dealings in securities that applies to all Directors and senior management. Directors and senior management are prohibited from
dealing in CRH securities during designated prohibited periods and at any time at which the individual is in possession of inside information (as defined in the Market Abuse (Directive 2003/6/EC) Regulations 2005). The policy adopts the terms of the Model Code, as set out in the Listing Rules published by the UK Listing Authority subject to amendments in relation to Irish company law and taxation references.
What are the Committees of the Board?
The Board has established five permanent Committees to assist in the execution of its responsibilities.
The current permanent Committees1 of the Board are theAcquisitions Committee, theAudit Committee, theFinance Committee, theNomination and Corporate Governance Committee and theRemuneration Committee.
In addition, ad-hoc committees are formed from time to time to deal with specific matters. Each of the permanent Committees has Terms of Reference, under which authority is delegated to them by the Board. The Chairman of each Committee reports to the Board on its deliberations and minutes of all Committee meetings are circulated to all Directors.
The current membership of each Committee and each member’s length of service is set out in the relevant sections in the remainder of this report. Attendance at meetings held in 2013 is set out on page 80.
Chairmen of the Committees attend the Annual General Meeting and are available to answer questions from shareholders.
| ¹ | The terms of reference of these committees comply fully with the Code requirements; CRH considers that they are generally responsive to the relevant NYSE rules but may not address all aspects of these rules. |
| | | | | | | | | | |
| | | | | | | | Audit Committee | | |
| | TheAudit Committee consists of four non-executive Directors1. The biographical details of each member are set out on pages 64 and 65. The primary responsibilities of the Committee are to: – monitor the financial reporting process, the integrity of the financial statements, including the Annual and Interim Reports, preliminary results announcements, interim management statements and any other formal announcement relating to the financial performance of the Company, and to review significant financial reporting issues and judgements exercised in the preparation thereof; – monitor the audit of the financial statements; – keep under review the effectiveness of the Company’s internal financial controls and the internal control and risk management systems and review and approve statements to be included in the Annual Report regarding internal control and risk management; – review the Company’s arrangements for its employees to raise concerns, in confidence, about possible wrongdoing in financial reporting or other matters and review the Company’s procedures and systems for detecting fraud and preventing bribery; – keep under review the adequacy of the Group’s Compliance & Ethics function; – monitor and review the effectiveness of the Internal Audit function; – review the effectiveness of the audit process and the independence and objectivity of the external auditors; – develop and monitor the policy on non-audit services to be provided by the external auditors; – approve the remuneration and terms of engagement of the external auditors; – make recommendations to the Board in relation to the appointment or removal of the external auditor. The responsibilities of theAudit Committee are set out in full in its Terms of Reference, which are available on the CRH website, www.crh.com. 1 The Board has determined that all of the non-executive Directors on the Audit Committee are independent according to the requirements of Rule 10A 3 of the rules of the Securities and Exchange Commission. | | | | 


| | Chairman’s overview I succeeded Jan Maarten de Jong as Chairman of the Committee in September 2013. On behalf of the Committee, I would like to express my appreciation to Jan Maarten for his significant contribution to the work of the Committee, both as a member since 2004 and as Chairman between May 2007 and August 2013. On a number of occasions during 2013, beginning in July, the Committee met with Ernst & Young to agree and monitor the progress of the 2013 audit. The following risks were identified as being a key focus: – Impairment of goodwill; – Impairment of property, plant and equipment, and financial assets; – Accounting for acquisitions and disposals; and – Contract revenue recognition. The potential for impairment was highlighted in the 2013 Interim Results announcement in August due to the continuing difficulties in the Group’s European markets. Subsequently, as announced in the November Interim Management Statement, a Group-wide portfolio review was initiated by the Board to identify those businesses which offer the most attractive future returns and to prioritise capital allocation. The Statement indicated that the review would likely result in the disposal of some non-core businesses which, coupled with the continuing difficult environment in Europe, could give rise to impairment charges in 2013. This issue, therefore, became a key area of focus for the Committee in its discussions with management and Ernst & Young on the 2013 Consolidated Financial Statements and the related audit. Impairment As outlined in note 3 to the Consolidated Financial Statements, a total non-cash impairment charge of €755 million was recorded in the financial statements in respect of the year ended 31 December 2013, of which €373 million related to goodwill. While the continuing economic difficulties in Europe | | |
| | | | | | | |
Corporate Governance Report |continued
gave rise to some impairment, the main driver of the charge in 2013 was the outcome of the initial phase of the Group’s portfolio review, which identified a number of non-core businesses which no longer meet CRH’s long-term returns criteria and which are now candidates for disposal. An orderly disposal process is underway.
For the purposes of its annual impairment testing process, the Group assesses the recoverable amount of each of CRH’s cash-generating units (CGUs – see details in note 15 to the Consolidated Financial Statements), based on a value-in-use computation. In addition, the Group annually assesses the need for impairment of other non-current assets (property, plant and equipment and financial assets).
The Committee met on a number of occasions in late 2013 and early 2014 and considered a number of issues, including:
| | – | the impact the changing economic circumstances had on the assumptions used in the impairment models used by management; and |
| | – | the processes used by management to ascertain the value of non-core businesses that management believed the Board should consider exiting and the levels of impairment where that value was less than the carrying value of these businesses. |
In 2013, the annual impairment review resulted in total impairment charges of €72 million in respect of businesses which have been identified as core businesses for the Group going forward. Of this total, €58 million related to our Benelux CGU in Europe Materials, which has experienced a difficult trading environment and has formed part of the Group’s goodwill sensitivity disclosures
for a number of years. The continuing difficult environment, coupled with the impact of strong competition and the expectation of a slower than previously anticipated sales recovery, resulted in a significant reduction in the recoverable amount of this CGU at year-end 2013 compared with prior years.
The portfolio review which I referred to above resulted in the identification of 45 non-core business units which are in line for divestment. For each of these businesses, a valuation was prepared based on the estimated fair value less costs of disposal. The valuations were then compared to the carrying value of each business, resulting in an additional total impairment charge of €683 million. Although the review is ongoing, the impairment exercise is complete and, in the light of current conditions and outlook, management does not anticipate further impairment to arise as the review continues.
Following its deliberations, the Committee was satisfied that the assumptions and models used by management were appropriate.
Accounting for Acquisitions and Disposals
Total acquisition consideration in 2013 for the Group amounted to €720 million while the gross proceeds of disposals amounted to €283 million. The Committee discussed with management and Ernst & Young the accounting treatment for newly acquired businesses and recently disposed entities and was satisfied that the treatment in 2013 was appropriate.
Contract Revenue Recognition
IAS 11 requires revenue and expenses to be recognised on uncompleted contracts, with the underlying principle that, once the outcome of a long-term construction contract can be reliably estimated,
revenue and expenses associated with that contract should be recognised by reference to the stage of completion of the contract activity at the balance sheet date. If it is anticipated that the contract will be loss-making, the expected loss must be recognised immediately. Following discussions with management and Ernst & Young, the Committee was satisfied that contract revenue recognition was not a material issue for the Group in 2013 as the majority of contracts were completed within the financial year.
In addition to the above significant issues, the Committee also gave particular emphasis to the following matters in its work during 2013:
Group Pension Liabilities
During 2013, the Committee continued to review, with the help of external pensions experts, the plans and initiatives in place to mitigate the Group’s pension scheme liabilities.
Cyber Security
During the year, the Committee received and considered reports from management and Ernst & Young in relation to the Group’s readiness in terms of cyber security.
IT Implementation Projects
The Committee reviewed with management the status of a number of ongoing IT implementation projects in Europe.
Assessment of Ernst & Young
The Committee’s primary means of assessing the effectiveness of the external audit process is by monitoring performance against the agreed audit plan. In addition, each year the Committee considers (i) the experience and knowledge of the Ernst & Young audit team; (ii) the results of post-audit interviews with management and theAudit Committee Chairman; (iii) the
Corporate Governance Report | continued
transparency reports issued under EU regulations by Ernst & Young Ireland; and (iv) where applicable, relevant reports by regulatory bodies on the performance of Ernst & Young.
Management also undertakes periodic reviews of the effectiveness of the external auditors (the last such review was conducted in 2009).
Audit Tendering/Rotation
Ernst & Young have been the Group’s auditors since 1988. In last year’s Audit Committee Report, Jan Maarten de Jong outlined new requirements of the Code regarding audit tendering and the transitional arrangements put forward by the Financial Reporting Council in terms of the timing of any audit tender. In summary, implementing the Code provisions and following the transitional arrangements would mean that the Company would need to put the CRH audit out to tender by the end of the 2015 audit. In the interests of fairness and competition, we believe it would not be appropriate to exclude Ernst & Young from any tender process. Since the publication of last year’s Annual Report, provisional agreement has been reached on draft EU regulations (the “Regulations”) on the reform of the audit sector. The Regulations, which are expected to be finalised during the first half of 2014, include a requirement for mandatory auditor rotation. In other words, the Regulations, in their current form, would prevent Ernst & Young from participating in an audit tender process. If implemented, the Regulations would also effectively override the requirements of the Code. The Committee has, therefore, concluded that a decision on the timeframe for putting the audit to tender should be deferred until the Regulations are finalised.
There are no contractual obligations which act to restrict the Committee’s choice of external auditor. The Committee has considered the risk of withdrawal by Ernst & Young from the market and the potential impact on the Group, were that eventuality to materialise.
Advisory Vote at the 2014 Annual General Meeting on the continuance of Ernst & Young as external auditors
Under Irish company law, the incumbent auditor is automatically re-appointed at a company’s annual general meeting unless he has indicated his unwillingness to continue in office or a resolution is passed appointing someone else or expressly providing that he shall not be re-appointed. In this respect, Irish company law differs from the requirements that apply in other jurisdictions, for example in the UK, where auditors must be re-appointed annually by shareholders. Notwithstanding the provisions of Irish company law, the Committee recommended to the Board that shareholders should be provided with an opportunity to have a say on the continuance in office of Ernst & Young. Accordingly, in addition to the usual resolution to authorise the Directors to set the remuneration of the auditors required under Irish company law, the agenda for the 2014 Annual General Meeting will contain a non-binding vote on the continuance of Ernst & Young in office as auditors.
Further details in relation to the external auditors, including information on how auditor objectivity and independence are maintained, are included on page 76.
Ernst Bärtschi
Corporate Governance Report |continued
| | | | | | |
Audit Committee Members The biographies of the members of theAudit Committee are set out on pages 64 and 65. The tenure of each Committee member is as follows: | | In recent years, there has been a significant increase in the resources allocated to IT Audit. The Committee meets regularly with the senior IT Audit Manager to discuss IT Audit strategy, the key areas of focus and agrees the annual IT Audit workplan. Assessments of the Internal Audit function are carried out periodically by management and validated by an independent third party assessor. The next assessment of the Internal Audit function is scheduled to take place during 2014. The last assessment was conducted in late-2009. Risk Management and Internal Control The Board has delegated responsibility for monitoring the effectiveness of the Group’s risk management and internal control systems to the Audit Committee. Further details in relation to the Committee’s work in this area are set out in the section on Risk Management and Internal Control on page 81. Independence of External Auditors TheAudit Committee has put in place safeguards to ensure that the independence of the audit is not compromised. Such safeguards include: – seeking confirmation from the external auditors that they are, in their professional judgement, independent from the Group; – obtaining from the external auditors an account of all relationships between the auditors and the Group; – monitoring the Group’s policy prohibiting the employment of former staff of the external auditors, who were part of the CRH audit team, in senior management positions until two years have elapsed since the completion of the audit; – monitoring the number of former employees of the external auditors currently employed in senior positions in the Group and assessing whether those appointments impair, or appear to impair, the auditors’ judgement or independence; – considering whether, taken as a whole, the various relationships between the Group and the external auditors impair, or appear to impair, the auditors’ judgement or independence; | | 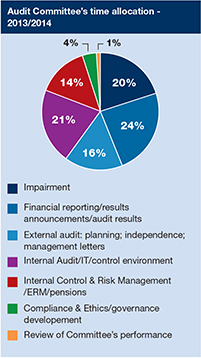
– reviewing the economic importance of the Group to the external auditors and assessing whether that importance impairs, or appears to impair, the external auditors’ judgement or independence. The Group external audit engagement partner is replaced every five years and other senior audit staff are rotated every seven years. The Group has a policy governing the conduct of non-audit work by the auditors3. The policy, which was updated in 2012, is available |
E.J. Bärtschi, Chairman | | 2.0 years | | |
H.A. McSharry | | 2.0 years | | |
D.A. McGovern, Jr. | | 0.5 years | | |
D.N. O’Connor | | 0.5 years �� | | |
Mr. O’Connor previously served on the Committee between June 2006 and May 2012. Mr. Bärtschi, Mr. McGovern and Mr. O’Connor have been designated by the Board as the Committee’s Financial Experts. Work of Committee in period between February 2013 and February 2014 Between February 2013 and February 2014 theAudit Committee met 12 times1. The chart opposite sets out how theAudit Committee allocated its time in the last 12 months. A typical calendar of meetings, which includes a general outline of the main agenda items, is also set out on page 77. The Finance Director and the Head of Internal Audit generally attend Committee meetings. The external auditors, Ernst & Young, attend the majority of meetings and have direct access to the Chairman of the Committee at all times. Other attendees are noted against the relevant agenda item. During 2013, the Committee met with the Head of Internal Audit, and separately with the external auditors, in the absence of management. The Chairman of the Committee formally reported to the Board in February 2014 on how the Committee discharged its responsibilities in respect of the financial year ended 31 December 2013. The Committee reviewed its Terms of Reference in December 2013 and proposed some minor updating amendments, which the Board approved. Internal Audit The Head of Internal Audit attends the majority of the meetings of theAudit Committee. The Committee agrees the Internal Audit strategy, its charter and the annual workplan, which is developed on a risk-based approach. The Head of Internal Audit reports to theAudit Committee on the findings of internal audit reviews and related follow-ups and the outcome of control testing in connection with Section 404 of the Sarbanes-Oxley Act 20022. | | |
| | | | 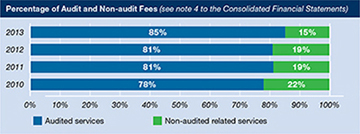
¹ Attendance by non-independent directors and management is by invitation only. 2 A copy of Section 404 of the Sarbanes-Oxley Act 2002 can be obtained from the US Securitiesand Exchange Commission’s website www.sec.gov. 3 The term of any general pre-approval is twelve months from the date of pre-approval. |
Corporate Governance Report |continued
| | | | | | | | | | |
on the CRH website. Under the policy, the external auditors are prohibited from performing services where they: – may be required to audit their own work; – participate in activities that would normally be undertaken by management; – are remunerated through a ‘success fee’ structure; or – act in an advocacy role for the Group. Other than the above, the Group does not impose an automatic ban on the external auditors undertaking non-audit work. The external auditors are permitted to provide non-audit services that are not, or are not perceived to be, in conflict with auditor independence, provided they have the skill and competence to carry out the work and are considered by the Committee to be the most appropriate party to undertake such work in the best interests of the Group. The engagement of the external auditors to provide any non-audit services must be pre-approved by theAudit Committee or entered into pursuant to pre-approval policies and procedures established by the Committee. The pre-approval policy specifies the services that are prohibited and the services which have general pre-approval. The Committee has delegated to the Finance Director responsibility for confirming whether a service, which has general pre-approval, can be provided by Ernst & Young. In addition, Internal Audit reviews the pre-approval process to ensure that it is robust in addressing the requirements of the PCAOB and does not impinge on Ernst & Young’s independence. The Finance Director reports regularly to the Committee on services which have been approved. In 2013, the external auditors provided a number of audit-related services, including Sarbanes-Oxley Section 404 attestation, and non-audit services, including due diligence services associated with proposed acquisitions and disposals. Ernst & Young were also engaged during 2013 in a number of jurisdictions in which the Group operates to provide help with local tax compliance, advice on taxation laws and other related matters; assignments which typically involve relatively small fees. TheAudit Committee is satisfied that the external auditors’ knowledge of the Group was an important factor in choosing them to provide these services. The Committee is also satisfied that the fees paid to Ernst & Young for non-audit work, which amounted to 15% of the total fee in 2013, did not compromise their independence or integrity. Details of the amounts paid to the external auditors during the year for audit and other services are set out in note 4 to the Consolidated Financial Statements on page 137. | | | | Typical Audit Committee Calendar |
| | | Meeting | | | | Activity | | Attendees by invitation
(in addition to the Finance Director and the Head of Internal Audit) |
| | | February | | – | | Consideration of the financial statements (including report from the external auditors on Integrated Audit Results and Communications) | | Chief Executive |
| | | | | – | | Approval of external audit fee | | |
| | | | | – | | Internal Audit review of savings announced under the Group’s cost-reduction programme | | |
| | | | | – | | Annual assessment of risk management and internal control systems | | Group Strategic Financial Risk Manager |
| | | | | – | | Approval of Internal Audit workplan | | |
| | | | | – | | Review of reports on the operation of the CRH Code of Business Conduct, the Competition/Anti-trust Compliance Code and the arrangements in place to enable employees to raise concerns, in confidence, in relation to possible wrongdoing in financial reporting or other matters | | Head of Compliance & Ethics |
| | | March | | – | | Review of Annual Report on Form 20-F | | Senior finance personnel |
| | | May | | – | | Review of interim management statement1 | | Group Chairman, Chief Executive |
| | | July | | – | | Preliminary consideration of interim results | | Chief Executive |
| | | | | – | | Approval of the external audit plan | | |
| | | | | – | | Updates on accounting and auditing developments | | |
| | | | | – | | Update on Internal Audit work/activities | | |
| | | | | – | | Enterprise Risk Management review | | Group Strategic Financial Risk Manager |
| | | August | | – | | Review of interim results announcement | | Group Chairman, Chief Executive |
| | | September | | – | | Meeting with senior finance personnel from the Americas Divisions | | Senior finance personnel |
| | | | | – | | Preliminary review of goodwill impairment and sensitivity analysis | | |
| | | October | | – | | Meeting with senior finance personnel from the European Divisions | | Senior finance personnel |
| | | | | – | | Preliminary review of interim management statement | | |
| | | November | | – | | Review of interim management statement1 | | Group Chairman, Chief Executive |
| | | December | | – | | Review of outcome of goodwill impairment and sensitivity analysis | | Senior finance personnel |
| | | | | – | | Update on Internal Audit work/activities | | |
| | | | | – | | Approval of non-audit fees provided by external auditors | | |
| | | | | – | | Review of the Committee’s performance and Terms of Reference | | |
| | | | | – | | Enterprise Risk Management review | | Group Strategic Financial Risk Manager |
| | | | 1 A Committee of the Group Chairman, Audit Committee Chairman, Chief Executive and Finance Director is authorised from time to time to review and approve the release of interim management statements |
| | | | | | | | | | |
| | | | | |
| | | | | | | | | | |
| | The Nomination and CorporateGovernance Committee consists of four non-executive Directors. The primary responsibilities of the Committee are: – regularly reviewing the size, structure and composition (including skills, knowledge, experience and diversity) of the Board and making recommendations to the Board regarding any changes; – giving consideration to succession planning for Directors and senior executives; – identifying and recommending candidates to fill Board vacancies; – in respect of the appointment of a chairman, preparing a job specification including the time commitment expected; – keeping under review the leadership needs of the organisation; – approving the Terms of Reference for external board evaluations; – keeping under review corporate governance developments with the aim of ensuring that CRH’s governance policies and practices continue to be in line with best practice; – ensuring that the principles and provisions set out in the Code (and any other governance code that applies to the Company) are observed; and – reviewing the disclosures and statements made in the Corporate Governance Report to shareholders. The responsibilities of theNomination and Corporate Governance Committee are set out in full in its Terms of Reference, which are available on the CRH website, www.crh.com. | | | | | | 


| | |
Nomination and Corporate
Governance Committee
Chairman’s overview
During 2013, the members of the Committee, together with Jan Maarten de Jong (then Chairman of theAudit Committee), were appointed by the Board as theSuccession Committee to co-ordinate the process for the appointment of the successor to Myles Lee. Myles informed the Board in February 2013 of his intention to retire from the Board and as Chief Executive with effect from 31 December 2013. In line with evolving best practice, theSuccession Committee decided that external and internal candidates should be considered. Accordingly, the Committee engaged the services of Egon Zehnder, London, to identify suitable candidates with the skills and experience to warrant consideration for the role. Following a comprehensive process, which took place over a number of months, theSuccession Committee recommended to the Board that Albert Manifold, the Group’s Chief Operating Officer, be appointed as successor to Myles.
During 2013, and to-date in 2014, the Committee identified and recommended to the Board that the following individuals be appointed as non-executive Directors:
| | – | Don McGovern, appointed with effect from 1 July 2013; and |
| | – | Henk Rottinghuis, appointed on 18 February 2014. |
Biographies for Don and Henk are included on page 65. The Committee worked with the following recruitment agencies in relation to these appointments:
| – | Board Works Limited; and |
Neither of these agencies has any other connection with the Company.
As set out in my introduction to the Corporate Governance Report, on the recommendation of the Committee, the Board has expanded the Board renewal policy by setting itself the goal of increasing the number of female Directors to circa 25% by the end of 2015.
Utz-Hellmuth Felcht was appointed to the Board in 2007 and completed his second three-year term in 2013. Following a comprehensive performance review, on the recommendation of the Committee, the Board has asked Utz to continue on the Board for a third three-year term.
Audit Committee Chairman
Following the completion of Jan Maarten de Jong’s maximum tenure of nine years on theAudit Committee, the Committee recommended to the Board that he be succeeded by Ernst Bärtschi as Chairman of theAudit Committee. Ernst brings considerable experience to theAudit
Committee and has been designated as one of the Committee’s financial experts since his appointment to theAudit Committee in March 2012.
Corporate Governance Developments
During 2013, the Committee also considered developments in the area of corporate governance, including the recent introduction in the UK of the Companies Act 2006 (Strategic Report and Directors’ Report) Regulations 2013 and the Large and Medium-sized Companies and Groups (Accounts and Reports) (Amendment) Regulations 2013 (together, the “Regulations”). While CRH, as an Irish incorporated and domiciled company, is not subject to the Regulations, we recommended to the Board that CRH should seek to apply the provisions of the Regulations to the extent possible under Irish company law.
Nicky Hartery
Nomination and Corporate
Governance Committee Chairman

Corporate Governance Report| continued
Nomination and Corporate Governance Committee Members
The biographies of the members of theNomination and Corporate Governance Committee are set out on pages 63 to 65.
The tenure of each Committee member is as follows:
| | |
| | | |
N. Hartery, Chairman | | 9.5 years |
W.P. Egan | | 6.5 years |
J.W. Kennedy | | 4.5 years |
D.N. O’Connor | | 1.5 years |
| | | |
Normally, the maximum tenure for Committee membership is three terms of three years. During the year, the Board amended the Terms of Reference of theNomination and Corporate Governance Committee to make it clear that the Group Chairman’s tenure on the Committee is not limited to three terms of three years.
Work of Committee in period between February 2013 and February 2014
Between February 2013 and February 2014 theNomination and Corporate Governance Committee met seven times. The chart above sets out how theNomination and Corporate Governance Committee allocated its time in the last 12 months.
The factors taken into account by theNomination and Corporate Governance Committee in considering the composition of the Board are set out in the policy for Board renewal which is detailed on pages 68 and 69.
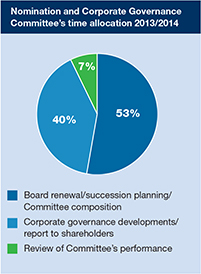
The Committee establishes processes for the identification of suitable candidates for appointment to the Board and oversees succession planning for the Board and senior management.
As referred to in the section dealing with the independence of non-executive Directors on page 69, each year the Committee reviews details of the non-CRH directorships of each Director, including any relationship between those companies and the Group. The Committee also reviews any business
relationships between individual Board members.
The Committee reviewed its Terms of Reference in December 2013 and proposed minor updating amendments, which the Board approved.
Remuneration Committee
The Directors’ Remuneration Report on pages 85 to 116 contains an overview of the responsibilities and activities of theRemuneration Committee during 2013.
Under its Terms of Reference, the Remuneration Committee must be made up of at least three members, all of whom must be independent non-executive Directors. Members of the Committee can serve for up to a maximum of three terms of three years. The Group Chairman may be a member of the Committee provided he was independent on appointment as Chairman and the Board continues to consider him to be independent. Only members of the Committee have the right to attend Committee meetings. However, other individuals such as the Group Chairman, if not a member of the Committee, the Chief Executive and external advisers may be invited to attend for all or part of any meeting as and when appropriate. The Chief Executive is fully consulted about remuneration proposals.
Remuneration Committee Members
The biographies of the members of theRemuneration Committee are set out on pages 63 to 65.
| | | | | | | | | | | | | | | | | | | | | | | | | | | | | | | | | | | | | | | | | | | | | | | | |
Attendance at Board and Board Committee meetings during the year ended 31 December 2013 | |
| | | Board | | | Acquisitions | | | Audit | | | Finance | | | Nomination | | | Remuneration | |
| | | | No. of Meetings | | | | No. of Meetings | | | | No. of Meetings | | | | No. of Meetings | | | | No. of Meetings | | | | No. of Meetings | |
| | | | Total | | | | Attended | | | | Total | | | | Attended | | | | Total | | | | Attended | | | | Total | | | | Attended | | | | Total | | | | Attended | | | | Total | | | | Attended | |
| | | | | | | | | | | | | |
E. Bärtschi | | | 8 | | | | 8 | | | | | | | | | | | | 8 | | | | 8 | | | | | | | | | | | | | | | | | | | | | | | | | |
M. Carton | | | 8 | | | | 8 | | | | 5 | | | | 5 | | | | | | | | | | | | 5 | | | | 5 | | | | | | | | | | | | | | | | | |
W.P. Egan | | | 8 | | | | 8 | | | | | | | | | | | | | | | | | | | | | | | | | | | | 6 | | | | 6 | | | | 9 | | | | 9 | |
U-H. Felcht | | | 8 | | | | 7 | | | | 5 | | | | 5 | | | | | | | | | | | | 5 | | | | 5 | | | | | | | | | | | | | | | | | |
N. Hartery | | | 8 | | | | 8 | | | | 5 | | | | 5 | | | | | | | | | | | | 5 | | | | 5 | | | | 6 | | | | 6 | | | | 9 | | | | 9 | |
J.M. de Jong | | | 8 | | | | 8 | | | | 3 | | | | 2 | | | | 5 | | | | 5 | | | | 1 | | | | 0 | | | | | | | | | | | | | | | | | |
J.W. Kennedy | | | 8 | | | | 8 | | | | | | | | | | | | | | | | | | | | | | | | | | | | 6 | | | | 6 | | | | 9 | | | | 9 | |
M. Lee* | | | 8 | | | | 8 | | | | 5 | | | | 5 | | | | | | | | | | | | 5 | | | | 5 | | | | | | | | | | | | | | | | | |
H.A. McSharry | | | 8 | | | | 8 | | | | | | | | | | | | 8 | | | | 8 | | | | | | | | | | | | | | | | | | | | | | | | | |
A. Manifold | | | 8 | | | | 8 | | | | 5 | | �� | | 5 | | | | | | | | | | | | | | | | | | | | | | | | | | | | | | | | | |
D.A. McGovern, Jr.** | | | 4 | | | | 4 | | | | | | | | | | | | 3 | | | | 3 | | | | | | | | | | | | | | | | | | | | | | | | | |
D.N. O’Connor | | | 8 | | | | 8 | | | | 2 | | | | 2 | | | | 3 | | | | 3 | | | | 4 | | | | 4 | | | | 6 | | | | 6 | | | | 9 | | | | 9 | |
M. Towe | | | 8 | | | | 8 | | | | | | | | | | | | | | | | | | | | | | | | | | | | | | | | | | | | | | | | | |
* Retired December 2013 | | | | | | | | | | | | | | | | | | | | | |
| ** Appointed to Board July 2013 | | | | | | | | | | | | | | | | | | | | | |
| | | | | | | | | | | | | | | | | | | | | | |
Corporate Governance Report| continued
The tenure of each Committee member is as follows:
| | |
| | | |
D.N. O’Connor, Chairman | | 1.5 years |
W.P. Egan | | 6.5 years |
N. Hartery | | 9.5 years |
J.W. Kennedy | | 4.5 years |
| | | |
During the year, the Board amended the Terms of Reference of theRemuneration Committee to make it clear that the Group Chairman’s tenure on the Committee was not limited to three terms of three years.
In addition, the Committee reviewed its Terms of Reference in December 2013 and proposed minor updating amendments, which the Board approved.
Acquisitions Committee
Acquisitions Committee Members
The biographies of the members of theAcquisitions Committee are set out on pages 63 and 64.
The tenure of each Committee member is as follows:
| | |
| | | |
N. Hartery, Chairman | | 1.5 years |
M. Carton | | 3.5 years |
U-H. Felcht | | 2.0 years |
J.M. de Jong | | 0.5 years |
A. Manifold | | 5.0 years |
| | | |
The attendance at Acquisitions Committee meetings is set out in the table on page 80.
Role and Responsibilities
TheAcquisitions Committee has been delegated authority by the Board to approve acquisitions and disposals and large capital expenditure projects up to agreed limits.
Finance Committee
Finance Committee Members
The biographies of the members of theFinance Committee are set out on pages 63 and 64.
The tenure of each Committee member is as follows:
| | |
| | | |
N. Hartery, Chairman | | 1.5 years |
M. Carton | | 3.5 years |
U-H. Felcht | | 6.5 years |
J.M. de Jong | | 0.5 years |
A. Manifold | | 0.2 years |
| | | |
The attendance atFinance Committee meetings is set out in the table on page 80.
Role and Responsibilities
TheFinance Committee is responsible for:
| – | advising the Board on the financial requirements of the Group and on appropriate funding arrangements; |
| – | considering and making recommendations to the Board in relation to the issue and buy-back of shares and debt instruments and to the Group’s financing arrangements; |
| – | considering and making recommendations to the Board in relation to dividend levels on the Ordinary Shares; |
| – | keeping the Board advised of the financial implications of Board decisions in relation to acquisitions; |
| – | assisting management, at their request, in considering any financial or taxation aspect of the Group’s affairs; and |
| – | reviewing the Group’s insurance arrangements. |
Risk Management and Internal Control
The Board has delegated responsibility for the monitoring of the effectiveness of the Group’s risk management and internal control systems to theAudit Committee1. Such systems are designed to manage rather than eliminate the risk of failure to achieve business objectives and, in the case of internal control systems, can provide only reasonable and not absolute assurance against material misstatement or loss.
The Directors confirm that the Group’s ongoing process for identifying, evaluating and managing its principal risks and uncertainties (as outlined in the Risk Factors on pages 34 to 40) is in accordance with the updated Turnbull guidance (Internal Control: Revised Guidance for Directors on the Combined Code) published in October 2005. The process has been in place throughout the accounting period and up to the date of approval of the Annual Report and Consolidated Financial Statements.
Group management has responsibility for major strategic development and financing decisions. Responsibility for operational issues is devolved, subject to limits of authority, to product group and operating company management. Management at all levels is responsible for internal control over the business functions that have been delegated. This embedding of the system of internal control throughout the Group’s operations ensures that the organisation is capable of responding quickly to evolving business risks, and that significant internal control issues, should they arise, are reported promptly to appropriate levels of management.
During the year, the Board andAuditCommittee received, on a regular basis, reports from management on the key risks to the business and the steps being taken to manage such risks. They also considered whether the significant risks faced by the Group were being identified, evaluated and appropriately managed, having regard to the balance of risk, cost and opportunity. In addition, theAudit Committee met with internal auditors on a regular basis and satisfied itself as to the adequacy of the Group’s internal control system; met with the Chairman of theRemuneration Committee to ensure that the Group’s remuneration policies and structures were appropriate and in line with the Group’s risk tolerance; and reviewed the principal risks and uncertainties outlined on pages 34 to 40. TheAudit Committee also met with, and received reports from, the external auditors. The Chairman of theAudit Committee reported regularly to the Board on all significant issues considered by the Committee and the minutes of its meetings were circulated to all Directors.
The Directors confirm that, in addition to the monitoring carried out by theAudit Committee under its Terms of Reference, they have reviewed the effectiveness of the Group’s risk management and internal control systems up to and including the date of approval of the Consolidated Financial Statements. This had regard to all material controls, including financial, operational and compliance controls that could affect the Group’s business.
Management’s Report on Internal Control over Financial Reporting
In accordance with the requirements of section 404 of the Sarbanes-Oxley Act 2002, the following report is provided by management in respect of the Company’s internal control over financial reporting. As defined by the Securities and Exchange Commission, internal control over financial reporting is a process designed by, or under the supervision of, the Company’s principal executive and principal financial officers, or persons performing similar functions, and effected by the Company’s Board of Directors, management and other personnel, to provide reasonable assurance regarding the reliability of financial reporting and the preparation of the Consolidated Financial Statements for external purposes in accordance with generally accepted accounting principles and includes those policies and procedures that:
| – | Pertain to the maintenance of records that in reasonable detail accurately and fairly reflect the transactions and dispositions of the assets of the Company; |
| – | Provide reasonable assurance that transactions are recorded as necessary |
1 In accordance with Regulation 91(6)(b) of the European Communities (Statutory Audits) (Directive 2006/43) Regulations 2010.
Corporate Governance Report| continued
to permit preparation of Consolidated Financial Statements in accordance with generally accepted accounting principles, and that receipts and expenditures of the Company are being made only in accordance with authorisations of management and directors of the Company; and
| – | Provide reasonable assurance regarding prevention or timely detection of unauthorised acquisition, use or disposition of the Company’s assets that could have a material effect on the Consolidated Financial Statements. |
In connection with the preparation of the Company’s annual Consolidated Financial Statements, management has undertaken an assessment of the effectiveness of the Company’s internal control over financial reporting as of 31 December 2013, based on criteria established inInternal Control - Integrated Framework (1992), issued by the Committee of Sponsoring Organisations of the Treadway Commission.
As permitted by the Securities and Exchange Commission, the Company has elected to exclude an assessment of the internal controls of acquisitions made during the year 2013. These acquisitions, which are listed in note 31 to the Consolidated Financial Statements, constituted 2.4% of total assets and 3.5% of net assets, as of 31 December 2013 and 1.7% and 2.0% of revenue and loss for the financial year, respectively, for the year then ended.
Management’s assessment included an evaluation of the design of the Company’s internal control over financial reporting and testing of the operational effectiveness of those controls. Based on this assessment, management has concluded and hereby reports that as of 31 December 2013, the Company’s internal control over financial reporting is effective.
Our auditors, Ernst & Young, a registered public accounting firm, who have audited the Consolidated Financial Statements for the year ended 31 December 2013, have audited the effectiveness of the Company’s internal controls over financial reporting. Their report, on which an unqualified opinion is expressed thereon, is included on page 119.
Changes in Internal Control over Financial Reporting
During 2013, there has been no change in our internal control over financial reporting identified in connection with the evaluation required by Rules 13a-15 that occurred during the period covered by this Annual Report that has materially affected, or is reasonably likely to materially affect, our internal control over financial reporting.
Evaluation of Disclosure Controls and Procedures
Management has evaluated the effectiveness of the design and operation of the disclosure controls and procedures as defined in Exchange Act Rules 13a-15(e) as of 31 December 2013. Based on that evaluation, the Chief Executive and the Finance Director have concluded that these disclosure controls and procedures were effective as of such date at the level of providing reasonable assurance.
In designing and evaluating our disclosure controls and procedures, management, including the Chief Executive and the Finance Director, recognised that any controls and procedures, no matter how well designed and operated, can provide only reasonable assurance of achieving the desired control objectives, and management necessarily was required to apply its judgement in evaluating the cost-benefit relationship of possible controls and procedures. Because of the inherent limitations in all control systems, no evaluation of controls can provide absolute assurance that all control issues and instances of fraud, if any, within the Company have been detected.
Compliance and Ethics
The Group Compliance & Ethics (C&E) programme continues to develop in scope and reach. The structure of the C&E organisation was strengthened considerably in recent years with a dedicated Country Compliance network available to support our operating management to achieve our compliance objectives in all locations.
CRH’s Code of Business Conduct1 (COBC) and related policies were updated and approved by the Board in February 2012 and the C&E team’s primary focus since then has been to ensure all relevant employees receive appropriate training. Over the past two years over 30,000 employees have participated in Code of Business Conduct training and a further 10,000 have also undertaken advanced instruction on competition law, anti-bribery awareness and steps to counter the potential for corruption and fraud.
In addition, our development teams and procurement teams have received appropriate instruction on both our C&E Mergers, Acquisitions and Joint Venture Due Diligence Programme and our Ethical Procurement Code. We also developed a Supplier Code of Conduct in 2013, to communicate our minimum Corporate Social Responsibility requirements to existing and new suppliers to the Group and to outline how we ensure compliance with these requirements. Similar procedures have been developed for any
engagements with business partners. Further guidelines developed during the year include:
| – | the CRH Leading with Integrity Manual (A Handbook for Managers and Directors) to assist operating company management in setting the tone from the top and fostering a culture of integrity; and |
| – | Gifts & Hospitality Guidelines, to provide more guidance in this area. |
In February 2014, the COBC was further revised and presented to the Board for approval. The new Code has scored an “A” rating by New York Stock Exchange Governance Services and incorporates some welcome new features, including learning aids, an ethical decision-making guide and a clear focus on the core values of the Group: Honesty, Integrity and Respect. It will be translated and distributed during 2014 and related training will be migrated to an on-line module. A robust communication plan is in place to complement the training programme. A multi-lingual “hotline” facility is also available to employees as a secure channel to report ethical issues that concern them or suspected violations of our Codes. All hotline reports received are fully reviewed and investigated by appropriately qualified personnel.
The C&E programme has been integrated into standard Internal Audit procedures and forms part of an annual management certification process. Its effectiveness is also regularly reviewed by the C&E function with appropriate oversight from senior management and theAudit Committee. The collective goal is to ensure the message is clearly understood that at CRH “there is never a good business reason to do the wrong thing”.
Sustainability and Corporate Social Responsibility
Sustainability and Corporate Social Responsibility (CSR) concepts are embedded in all CRH operations and activities. Excellence in the areas of health & safety, environment and climate change, governance and people and community is a daily key priority of line management. The Group’s policies and implementation systems are summarised on pages 32 and 33. During 2013, CRH was again recognised by several leading socially responsible investment (SRI) agencies as being among the leaders in its sector in these important areas.
| 1 | The Code of Business Conduct is applicable to all Group employees including the Chief Executive and senior financial officers. The Code promotes honest and ethical conduct; full, fair, accurate, timely and understandable disclosures and compliance with applicable governmental laws, rules and regulations and complies with the applicable code of ethics regulations of the United States Securities and Exchange Commission arising from the Sarbanes-Oxley Act. | |
Corporate Governance Report |continued
| | | | | | |
| Communications with Shareholders | | | | Investor Relations Activities |
Communications with shareholders are given high priority and the Group devotes considerable time and resources each year to shareholder engagement. We recognise the importance of effective dialogue as an integral element of good corporate governance. The Investor Relations team, together with the Chief Executive, Finance Director and other senior executives, meet regularly with institutional shareholders (each year covering over 50% of shareholder base). Detailed reports on the issues covered in those meetings and the views of shareholders are circulated to the Board after each group of meetings. During 2013, the Chairman, Senior Independent Director and Company Secretary participated in a number of conference calls with some of the Group’s major shareholders in advance of the 2013 Annual General Meeting. The meetings were organised to provide those shareholders with an opportunity to discuss the resolutions on the 2013 Annual General Meeting agenda and corporate governance matters generally. Also, as outlined in the Directors’ Remuneration Report on page 86, the Senior Independent Director and Company Secretary met with the Group’s major shareholders, various shareholder and proxy voting agencies to discuss the Company’s proposed new remuneration structures. | | | | Formal Announcements: including the release of the annual and interim results and the issuance of interim management statements. These announcements are typically accompanied by presentations and webcasts or conference calls. Investor Roadshows: typically held following the release of formal announcements, provide an opportunity for the management team to meet existing and/or potential investors in a concentrated set of meetings. Industry Conferences: attendance at key sector and investor conferences affords members of the senior management team the opportunity to engage with key investors and analysts. Investor Briefings: every 18-24 months, the Company holds capital market days, which include presentations on various aspects of CRH’s operations and strategy and provide an opportunity for investors and analysts to meet with CRH’s wider management team. Media Briefings: each year, the Company provides media briefings on numerous issues. |
| | | In addition to the activities set out in the above table, major acquisitions are notified to the Stock Exchanges in accordance with the requirements of the Listing Rules and development updates, giving details of other acquisitions completed and major capital expenditure projects, are usually issued in January and July each year. | | We respond throughout the year to correspondence from shareholders on a wide range of issues. The Chief Executive made a presentation to shareholders at the 2013 Annual General Meeting on CRH’s businesses and how management approach conducting the Group’s affairs across its wide geographical footprint. General Meetings The Company’s Annual General Meeting (AGM), which is held in Ireland, affords individual shareholders the opportunity to question the Chairman and the Board. All Directors attended the 2013 AGM. The Notice of the AGM, which specifies the time, date, place and the business to be transacted, is sent to shareholders at least 20 working days before the meeting. At the meeting, resolutions are voted on by way of a poll using an electronic voting system. The votes of shareholders present at the meeting are added to the proxy votes received in advance and the total number of votes for, against and withheld for each resolution are announced. This information is made available on the Company’s website following the meeting. All other general meetings are called Extraordinary General Meetings (EGMs). An EGM called for the passing of a special resolution must be called by at least 21 clear days’ notice. A quorum for a general meeting of the Company is constituted by five or more shareholders present in person and entitled to vote. The passing of resolutions at a meeting of the Company, other than special resolutions, requires a simple majority. To be passed, a special resolution requires a majority of at least 75% of the votes cast. Shareholders have the right to attend, speak, ask questions and vote at general meetings. In accordance with Irish company law, the Company specifies record dates for general |
The following are available on the CRH website, www.crh.com: | |
Corporate Governance section: | |
| |
– Terms of Reference ofAcquisitions Committee (amended December 2010) – Terms of Reference ofAudit Committee (amended December 2013) – Terms of Reference ofFinance Committee (amended February 2004) – Terms of Reference ofNomination and Corporate Governance Committee (amended December 2013) – Terms of Reference ofRemuneration Committee (amended December 2013) – The Memorandum and Articles of Association of the Company – Pre-approval policy for non-audit services provided by the auditors – Compliance & Ethics statement, Code of Business Conduct and Hotline contact numbers | |
Investors section: | |
– Annual and Interim Reports, the Annual Report on Form 20-F, Interim Management Statements and copies of presentations to analysts and investors – News releases – Presentations and video recordings of executive presentations at capital markets days in London and New York in November 2012 – Webcast recordings of key investor briefings – General Meeting dates, notices, shareholder circulars, presentations and poll results – Answers to Frequently Asked Questions, including questions regarding dividends and shareholder rights in respect of general meetings | |
Corporate Governance Report |continued
meetings, by which date shareholders must be registered in the Register of Members of the Company to be entitled to attend. Record dates are specified in the notes to the Notice of a general meeting. Shareholders may exercise their right to vote by appointing, by electronic means or in writing, a proxy/proxies to vote some or all of their shares. The requirements for the receipt of valid proxy forms are set out in the notes to the Notice convening the meeting and in the notes on the proxy form. A shareholder, or a group of shareholders, holding at least 5% of the issued share capital of the Company, has the right to requisition a general meeting. A shareholder, or a group of shareholders, holding at least 3% of the issued share capital of the Company, has the right to put an item on the agenda of an AGM or to table a draft resolution for inclusion in the agenda of a general meeting, subject to any contrary provision in Irish company law.
Going Concern
The Company’s business activities, together with the factors likely to affect its future development, performance and position are set out in the Strategy Review on pages 27 to 40. The financial position of the Company, its cash flows, liquidity position and borrowing facilities are described in the Business Performance Review on pages 42 to 51. In addition, notes 21 to 25 to the Consolidated Financial Statements include the Company’s objectives, policies and processes for managing its capital; its financial risk management objectives; details of its financial instruments and hedging activities; and its exposures to credit, currency and liquidity risks.
The Company has considerable financial resources and a large number of customers and suppliers across different geographic areas and industries. In addition, the local nature of building materials means that the Group’s products are not usually shipped cross-border.
Having assessed the relevant business risks, the Directors believe that the Company is well placed to manage these risks successfully, and they have a reasonable expectation that the Company, and the Group as a whole, have adequate resources to continue in operational existence for the foreseeable future. For this reason, they continue to adopt the going concern basis in preparing the Consolidated Financial Statements.
Compliance Statement
Non-US companies such as CRH are exempt from most of the corporate governance rules of the NYSE. In common with companies listed on the Irish Stock Exchange and the London Stock Exchange, CRH’s corporate governance practices reflect, inter alia, compliance with (a) domestic company law; (b) the Listing Rules of the UK Listing Authority and the Irish Stock Exchange; and (c) the Code, which is appended to the listing rules of the London and Irish Stock Exchanges.
CRH has adopted a robust set of board governance principles, which reflect the Code and its principles-based approach to corporate governance. Accordingly, the way in which CRH makes determinations of Directors’ independence differs from the NYSE rules. The Board has determined that, in its judgement, all of the Non-executive Directors are independent. In doing so, however, the board did not explicitly take into consideration the independence requirements outlined in the NYSE’s listing standards.
Shareholder Approval of Equity Compensation Plans
The NYSE rules require that shareholders must be given the opportunity to vote on all equity-compensation plans and material revisions to those plans. CRH complies with Irish requirements, which are similar to the NYSE rules. The CRH Board, however, does not explicitly take into consideration the NYSE’s detailed definition on what are considered “material revisions” and did not seek shareholder approval for the 2013 RSP (defined below).
During 2013, the Board approved the adoption of the 2013 Restricted Share Plan (the “2013 RSP”) and, subsequently, awards were made to senior executives (excluding executive Board Directors). As (i) executive Directors were excluded from the award and (ii) no shares were allotted or re-issued to satisfy the awards, the listing rules of the London and Irish Stock Exchanges did not require shareholder approval of the RSP and such approval was not sought. No further awards will be made under the 2013 RSP.
| | | | | | | | | | | | |
| | | | | | | | | | | | |
| | | | | | | | | | | | |
| | | | | | | | | | | | |
| | | | | | | | | | | | |
| | | | | | Directors’ Remuneration Report | | |
| | | | |
| | | | | | | | |
| | TheRemuneration Committee consists of four non-executive Directors considered by the Board to be independent. They bring the range of experience of large organisations and public companies, including experience in the area of senior executive remuneration, to enable the Committee to fulfil its role. Their biographical details are set out on pages 63 to 65. The main focus of the Committee is to: – determine and agree with the Board the Group’s policy on executive remuneration; – seek shareholder approval for the policy at least every three years; – ensure that CRH’s remuneration structures are fair and responsible; – consider and approve salaries and other terms of the remuneration packages for the executive Directors and the Chairman. In addition, the Committee: – recommends and monitors the level and structure of remuneration for senior management; and – oversees the preparation of this Directors’ Remuneration Report. In considering remuneration levels for executive Directors particularly, the Committee takes into account remuneration trends across the CRH Group, which has a diverse range of operations in 35 countries, in geographic regions which are often at different stages in the economic cycle. Additional details in relation to the Committee, its role and responsibilities and how it operates are included in theRemuneration Committee section of the Corporate Governance report on page 80. The Chief Executive attends meetings except when his own remuneration is being discussed. | | | |     | | | | Introduction On behalf of the Board, I am pleased to introduce the Directors’ Remuneration Report for the year ended 31 December 2013. Format and content of Directors’ Remuneration Report and 2014
Annual General Meeting Best practice and regulatory requirements in the area of remuneration in the UK have been evolving over recent years. In 2013, significant new legislative requirements were brought into force in the UK in relation to executive remuneration by the Large and Medium-sized Companies and Groups (Accounts and Reports) (Amendment) Regulations (the “2013 UK Regulations”). While as an Irish incorporated company, CRH is not subject to those UK regulatory requirements, the Group has sought to apply the new requirements on a voluntary basis to the extent possible under Irish law. We are continuing this approach in respect of the 2013 UK Regulations. As a result, at the 2014 Annual General Meeting there will be two separate advisory shareholder votes on: (i) the Group’s remuneration policy for Directors (the “Policy Report”) (see pages 105 to 116); and (ii) the Group’s pay to executive Directors in 2013 and the proposed implementation of the Group’s remuneration policy for 2014 (the “Annual Statement on Remuneration”) (see pages 88 to 104). Under the 2013 UK Regulations, shareholder votes on policy reports are binding. However, as an Irish incorporated company, CRH cannot rely on the statutory provisions applicable to UK companies under the 2013 UK Regulations which, in certain circumstances, can resolve any inconsistency between a remuneration policy and any contractual or other right of a Director. Therefore, the Policy Report is being submitted to shareholders as an advisory resolution. | | |
| | | | | | |
| | | | | | | | | | | | |
| | | | | | |
| | | | | | | | | | | | |
Directors’ Remuneration Report| continued
| | | | | | |
Nevertheless, theRemuneration Committee’s intention is to operate within this policy as if it were binding. The vote on the Annual Statement on Remuneration is broadly equivalent to the existing “Say on Pay” vote on the way in which remuneration issues have been dealt with by the Committee. At the 2014 Annual General Meeting there will also be a resolution to approve a new Performance Share Plan. Remuneration Review Notwithstanding the high level of support for CRH’s approach to remuneration in recent years, following the Annual General Meeting held in May 2013, the Committee carried out an extensive review of the Group’s remuneration policy and arrangements. A number of factors drove the timing for the review: – the last major review was conducted in 2009, since when there have been a number of developments in the area of recommended remuneration practice; – a desire to ensure that CRH’s remuneration structures remain appropriate as the Group’s strategy evolves, continues to be at the forefront of best practice and reflect shareholder expectations for FTSE100 companies; – the transition to a new Chief Executive with effect from 1 January 2014. At the commencement of the process theRemuneration Committee set out a number of guiding principles for the review. These are set out in table 1. Against this background, the Committee decided to make the following changes to CRH’s remuneration arrangements: – the long-term incentive framework will be simplified with executive Directors participating in a single Performance | | Share Plan going forward. Performance share award levels will be 250% of base salary for the Chief Executive and 200% for other executive Directors. To ensure management is incentivised to drive shareholder value creation, awards will vest subject to a combination of relative Total Shareholder Return (TSR) compared to peers and cumulative cash flow targets over a three-year period; – the package will be adjusted to provide a better balance between driving short-term performance and rewarding long-term success, and to reflect typical market practice. The annual bonus opportunity will be set at 150% of base salary for all executive Directors. There will be no changes to the performance measures for the annual bonus as these were considered to remain appropriate; and – the annual bonus framework will be re-calibrated to increase the alignment between the expectations of shareholders and bonus awards. The level of bonus payout for target levels of performance will be reduced to 50% and the deferral structure will be simplified and made more consistent, with 25% of any bonus being deferred. These changes give rise to a moderate increase in the overall incentive opportunity. TheRemuneration Committee considers this appropriate as total remuneration remains within a market competitive range. A number of best practice features have been introduced. Malus provisions have been included in the Deferred Share Plan and the Performance Share Plan. A two-year post-vesting holding period has also been introduced into the Performance Share Plan. | | During the review, the Committee considered the remuneration structure compared with other companies of similar size and complexity. It also considered general market best practice, guidance issued by shareholder organisations and correspondence received from shareholders setting out their policies on remuneration. Shareholder Consultation On behalf of the Committee, I sent a summary of the proposed remuneration structure to the Group’s major shareholders and shareholder organisations, including the Association of British Insurers, the Irish Association of Investment Managers, the UK National Association of Pension Funds and to various proxy voting agencies. I subsequently engaged with a number of those shareholders and organisations to hear their views on the proposals. The dialogue with shareholders was consultative in nature. We set out proposals for the areas where we felt the structures needed to change. We sought the views of shareholders in each of those areas. There was a general appreciation for the approach adopted by the Committee, for the general structure of the policy and for the provisions to improve shareholder alignment. There were some common themes in the responses to some of the proposals and, I think it is fair to say, occasional responses that were representative of the philosophy of individual institutions. The Committee considered the feedback from each shareholder or organisation in finalising the incentive framework. Further details on the outcome of the review and the way in which the remuneration policy will be implemented in 2014 are set out in detail in the Annual Statement on Remuneration on pages 88 to 104. 2013 Annual Bonus Awards Turning now to 2013, the bonus awards for 2013 were 29.7% of maximum (35.6% of salary) for Irish Directors and 71% of maximum (95% of salary) for Mark Towe, Chief Executive, Oldcastle, Inc., the holding company for CRH’s Americas operations. As 2013 bonus levels for the Irish Directors were less than target performance, the payment is entirely in cash. The percentage of Mark Towe’s |
Guiding Principles for Review of Remuneration Framework | | Table 1 | |
Continued alignment with strategy; our remuneration policy should incentivise executives to deliver on long-term strategic goals | | Increased shareholder alignment by extending reward horizons | |
Simplification of CRH’s remuneration framework to improve the line of sight for participants and to increase clarity for shareholders | | Reflect best practice requirements while being flexible and responsive to evolving business needs throughout the economic cycle | |
| | | | | |
| | | | | |
Directors’ Remuneration Report| continued
bonus in excess of target will be deferred for three years.
As can be seen from the key financial figures on page 7, 2013 turned out to be a much more challenging year than anticipated in our European operations. However there was strong discipline in relation to cash management, which resulted in net debt remaining broadly in line with 2012 despite a total spend of €1.2 billion on acquisitions, investments and capital expenditure. This resulted in a payout under the cash flow component.
The award made to Mark Towe reflected the improvements in the performance of the Group’s operations in the United States, which saw like-for-like sales up 5% in the second half of the year and improved EBITDA (as defined)* margins in all three Americas segments (Materials, Products and Distribution).
There was also a payout for each Director under the personal component of the plan, reflecting achievements in a range of areas relevant to the individuals.
Further details in relation to the annual bonus plan for 2013 are set out on pages 92 to 94.
Vesting of Long-Term Incentives
2011 Performance Share Plan Award
In respect of the award made in 2011 under the 2006 Performance Share Plan, which was subject to relative TSR performance in the three year period to 31 December 2013, theRemuneration Committee determined in February 2014 that 49% of the award had vested. The Company’s TSR performance over the period was between median and upper quartile when assessed against both the Eurofirst 300 Index and the building materials sector (as set out in table 15 on page 95).
2011 Share Option Award
The grant of options in 2011 under the 2010 Scheme did not meet the three year Earnings Per Share (EPS) performance criteria and, accordingly, the options will lapse in April 2014.
2009 Chief Executive Long-Term Incentive Plan
The payout level under Myles Lee’s five year Chief Executive Long-Term Incentive Plan (the “2009 CEO LTIP”) was €778,127, which represents 33.7% of the potential opportunity of
€2.3 million under the 2009 CEO LTIP. This payout reflects above-median TSR performance against our peers and strong progress against strategic objectives, in particular, cost reduction, cash generation and portfolio development. Details of the components of the 2009 CEO LTIP and the payout level are set out on pages 95 to 97.
Goodwill Impairment/Long-Term Incentives
As indicated in the 2013 November Interim Management Statement (the “IMS”), a detailed assessment of the Group’s portfolio was commenced in the latter part of 2013 to identify and focus on the businesses which offer the most attractive future returns for our shareholders. The purpose of the review was to look at how CRH can drive returns and growth in the coming years. The IMS advised that the review was likely to result in the decision to make disposals of non-core businesses which, together with the impact of the continuing difficult environment in Europe, could give rise to a non-cash impairment charge in our 2013 Consolidated Financial Statements. Having taken into account these disclosures in the IMS, and following discussion with the Group’s external advisors, the Committee determined that it was reasonable to conclude that the long-term incentives with a TSR performance period ending in December 2013 should vest.
Executive Directors’ Salaries
As part of the remuneration review, theRemuneration Committee also considered CRH’s executive Director salary levels. The Committee concluded that the salary for Maeve Carton, Finance Director, is currently positioned below the market level given her experience and ability in the role and, therefore, an increase to €675,000 to reflect her experience and performance was appropriate (with the increase to be implemented over two years, subject to continued individual and business performance).
The salary for the new Chief Executive, Albert Manifold, has been set at €1,200,000. The Committee believed it was appropriate for Albert to be appointed on broadly the same salary as the outgoing Chief Executive, rather than phasing the salary in over a number of years, given that the former
Chief Executive had received minor salary increases since 2009 and that there is no current intention to appoint a replacement as Chief Operating Officer.
Conclusion
I believe that theRemuneration Committee has implemented the Group’s existing policies in 2013 in an appropriate manner and has revised the remuneration structures for the Group, for 2014 onwards, in a progressive way using clear principles and introducing new best practice measures.
Our shareholders and other organisations involved in the remuneration consultation process invested a considerable amount of time and resources in reviewing the proposals and providing feedback to us. On behalf of theRemuneration Committee, I would like to thank them for their valuable contribution.
Overall, in finalising the revised remuneration structures and policies I believe we have responded in a fair and balanced way to the feedback we received and I would encourage all shareholders to vote in favour of each of the three remuneration-related resolutions to be put to the 2014 Annual General Meeting.
Dan O’Connor
Remuneration Committee Chairman
| * | Defined as earnings before interest, taxes, depreciation, amortisation, asset impairment charges, profit on disposals and the Group’s share of equity accounted investments’ result after tax. |
Directors’ Remuneration Report| continued
| | | | |
Annual Statement on Remuneration The following sets out details of how CRH’s remuneration policy will operate for 2014, remuneration paid in respect of 2013, details of how theRemuneration Committee works and other areas of disclosure. Remuneration Review As referred to in the Committee Chairman’s Statement, a remuneration review was carried out during 2013 to ensure that remuneration arrangements remain aligned with strategy and shareholder value creation while reflecting best practice for companies with a primary listing on the London Stock Exchange. The key principles of the review and how the proposed changes align with these principles are summarised in table 2. Based on the review, theRemuneration Committee drafted a revised remuneration structure for the Group. The Committee Chairman subsequently met with major shareholders, shareholder representative bodies and proxy agents to discuss the proposals. The feedback received during the meetings was taken into account during the process to finalise the revised incentive framework. Final Incentive Framework The final remuneration framework approved by the Committee and the changes from the existing policy are set out in table 4 on page 89. Implementation of Remuneration Policy in 2014 | | 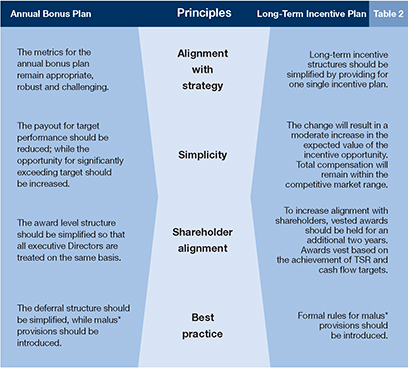
* Malus: A mechanism whereby the Remuneration Committee may decide not to release deferred share or performance share plan awards if an unusual event such as a material financial misstatement occurred, significant losses were incurred or the Company suffered significant reputational damage |
| | | | |
| The Group’s remuneration policy is set out in the Remuneration Policy Report on pages 105 to 116. Shareholders will be requested to approve the policy at the 2014 Annual General Meeting and it is intended that the policy will | | be effective from that date. The following sections summarise how theRemuneration Committee intends to apply the remuneration policy for executive Directors in 2014. | | 2014 Salaries Executive Directors salaries for 2014 will be as follows: – Chief Executive, Albert Manifold - €1,200,000; – Finance Director, Maeve Carton - €625,000, representing an increase of 9.7% (2013: €570,000); and – Chief Executive, Oldcastle, Inc., Mark Towe - US$1,377,000, representing an increase of 2% (2013: US$1,350,000). The Committee believed it was appropriate for the salary for the new Chief Executive, Albert Manifold, to be at broadly the same salary as the outgoing Chief Executive, rather than phasing the salary in over a number of years. The rationale for this is that there is no current intention to appoint a replacement as Chief Operating Officer. In addition, since 2009, salary increases for his predecessor had been very limited (see table 3 for details of salary increases since 2009). The salary level is within the market competitive range for the breadth and complexity of the role and the Committee considers that this positioning is appropriate. |
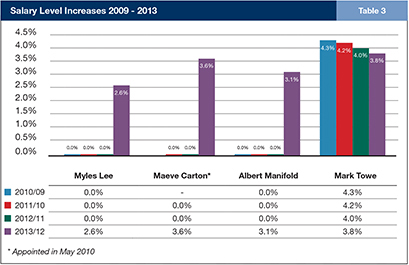
| |
| | | |
| | | |
| | | |
| | | |
| | | |
| | | |
| | | |
Directors’ Remuneration Report| continued
| | | | | | | | | | |
| | | | Framework 2009-2013 | | Final Framework | | Comments | | Table 4 |
| | Annual Bonus | | 80% of award based on financial performance (profit, EPS growth, cash flow, return on net assets) 20% based on individual personal, safety and strategic goals | | No changes proposed TheRemuneration Committee has committed to increase the level of disclosure in relation to bonus payments in the Directors’ Remuneration Report | | The Committee considered that metrics for the annual bonus plan remain appropriate, robust and challenging Table 12 on page 94 summarises the bonuses paid between 2009 and 2013 |
| | | | Two-thirds of maximum bonus awarded for delivering target performance | | 50% of maximum bonus awarded for delivering target performance | | The payout level for target performance is being reduced to better reflect typical market norms |
| | | | Maximum award size of: Irish-based Directors: 120% of salary US-based Director: 135% of salary | | Maximum award size of 150% of salary for all executive Directors | | The total remuneration opportunity is being re-balanced to better reflect typical market practice and to provide an increased incentive for significantly outperforming key annual targets |
| | | | Any bonus award greater than target performance deferred for three years | | 25% of all bonus awards deferred for three years | | This provides a simpler and more consistent approach to bonus deferral TheRemuneration Committee will look at increasing the level of deferral over time |
| | | | No malus provisions | | Malus provisions for deferred share awards to provide the ability to scale back awards prior to vesting in the event of material misstatement, serious reputational damage or the Company suffering serious losses | | Best practice provision |
| | Performance Share Plan | | Vesting based on relative TSR performance against a sector peer group (50% of award) and the Eurofirst 300, a cross-sector index (50% of award).(2006 Performance Share Plan) | | Vesting based: – 75% on TSR performance against sector peers; and – 25% on cumulative cash flow target. (2014 Performance Share Plan) | | TSR incentivises management to outperform key peers Cumulative cash flow supports dividend delivery and business development activity |
| | | | 3-year performance period No post-vesting holding period | | 3-year performance period Vested awards will be required to be held for a further 2 years post-vesting | | The 2-year post-vesting holding period was introduced to increase shareholder alignment |
| | | | Annual award size of up to 150% of salary, with awards also being granted under the Share Option Plan (up to 150% of salary) and the CEO LTIP (see below) | | Annual award size of: – CEO: 250% of salary; – Other executive Directors: 200% of salary; and – Awards in exceptional circumstances will be limited to 350% of base salary. | | Award levels reflect the fact that no further awards will be granted under the Share Option Plan and the CEO LTIP |
| | | | No formal rules for operation of malus provisions | | Malus provisions for unvested share awards (see above annual bonus section for circumstances in which it may operate) | | Best practice provision |
| | Share Option Scheme | | Vesting based on performance against EPS growth targets | | No further awards Award opportunity incorporated into the 2014 Performance Share Plan | | The Committee decided to discontinue the use of the Share Option Scheme to simplify the reward structure |
| | | | 3-year performance period | | | | |
| | | | Annual award size of 150% of salary | | | | |
| | CEO Long-Term Incentive Plan | | 5-year cash LTIP Awards based on relative TSR, EPS growth and strategic development of the Group | | No further awards Award opportunity incorporated into the 2014 Performance Share Plan | | The Committee decided to discontinue the use of the CEO LTIP to simplify the reward structure |
| | | | Maximum award of 40% of cumulative salary over the period | | | | |
| | | | | | | | |
| | | | | | | | |
Directors’ Remuneration Report| continued
As part of the remuneration review the Committee considered the positioning of base salary of the other executive Directors and concluded that the base salary for the Finance Director is currently at the lower end of market practice. Maeve Carton was appointed to the role of Finance Director in May 2010 and since this time has performed very strongly. The Committee considers that the positioning of her salary does not reflect the scope and responsibilities of her role and her performance. The Committee, therefore, intends to rectify this by awarding her a salary increase to be spread over two years, with the second increment subject to continued individual and business performance.
The Committee has decided that Ms. Carton’s salary should be increased to €675,000 as follows:
| | |
| 2014 | | increase to €625,000 (+9.7%) |
| 2015 | | increase to €675,000 (+8%) |
2014 Benefits
Employment-related benefits include the use of a company car, medical/life assurance (which in the case of the Chief Executive extends to his spouse and dependent children) and the reimbursement of legal fees incurred by the Chief Executive in connection with his service agreement, and the payment of related income tax.
2014 Annual Bonus Plan
The 2014 Annual Bonus Plan will be operated in line with the revised remuneration structure outlined in table 4. In terms of the relative weighting of the components of the plan, the Committee will increase the focus on return on net assets, which will lead to a corresponding reduction in the percentage of the plan which is linked to EPS. This reflects the Group’s focus for 2014, and the period ahead, which is on building returns and margins. The targets themselves are considered by the Board to be commercially sensitive.
2014 Performance Share Plan Award
If approved by shareholders at the Annual General Meeting to be held on 7 May 2014, awards will be made under the 2014 Performance Share Plan (the “2014 PSP”) on the basis set out below. 75% of each award will be subject to a Total Shareholder Return (TSR) performance measure, with performance being measured against sector peers (see table 5). The vesting schedule is shown in table 6. The Committee believes that, for a cyclical business such as CRH, TSR is the most appropriate performance measure at present and is a key measure of the value generated for shareholders.
The TSR performance measure will be subject to a financial underpin. When determining vesting under the 2014 PSP the Committee will review whether the TSR performance has been
impacted by unusual events and whether it is, therefore, an appropriate reflection of underlying performance. In addition, the Committee will consider EPS performance in the period to ensure that TSR performance was consistent with the objectives of the performance criteria and had not been distorted by extraneous factors.
The remaining 25% of each award will be subject to a cumulative cash flow metric. This Group financial measure supports dividend delivery, development activity and, in the context of the portfolio review announced in November 2013, provides an emphasis on asset/business disposals. The cash flow target will be based on a cumulative adjusted cash flow figure over three financial years (2014 – 2016). The definition of cash flow will be adjusted to exclude:
| – | dividends to shareholders; |
| – | acquisition/investment expenditure; |
| – | share issues (scrip dividend, share options, other); |
| – | financing cash flows (new loans/ repayments); |
| – | back funding pension payments; and |
| – | foreign exchange translation. |
TheRemuneration Committee considers that it is appropriate to make these adjustments in order to remove items that do not reflect the quality of management’s operational performance, or are largely outside of management control. This will ensure that management remains incentivised to make decisions which are in the best long-term interests of the business and shareholders.
The cumulative adjusted cash flow target for awards made in 2014 will be as shown on table 7.
The adjusted cash flow target is set taking into account the Company’s five year plan and market expectations. TheRemuneration Committee considers the cash flow targets to be demanding with significant stretch ensuring that only exceptional performance will result in a maximum payout.
A detailed summary of the provisions of the 2014 PSP will be included in a circular to be sent to shareholders with the Notice of the 2014 Annual General Meeting.
Pensions
There is no change to the pension arrangements for 2014. Maeve Carton and Albert Manifold are participants in a contributory defined benefit plan which is based on an accrual rate of 1/60th of pensionable salary1 for each year of pensionable service and is designed to provide two-thirds of career average salary2 at retirement for full service. There is provision
for Ms. Carton and Mr. Manifold to retire at 60 years of age. If either Ms. Carton or Mr. Manifold leave service prior to Normal Retirement Age they will become entitled to a deferred pension, payable from Normal Retirement Age, based on the pension they have accrued to their date of leaving.
The Finance Act 2006 established a cap on pension provision by introducing a penalty tax charge on pension assets in excess of the higher of €5 million (in the Finance Act 2011, this threshold was reduced to €2.3 million and reduced further to €2 million by the Finance (No. 2) Act 2013) or the value of individual accrued pension entitlements as at 7 December 2005. As a result of these legislative changes, theRemuneration Committee decided that executive Directors should have the option of continuing to accrue pension benefits as previously, or of choosing an alternative arrangement, by accepting pension benefits limited by the cap, with a similar overall cost to the Group. Ms. Carton and Mr. Manifold chose to opt for the alternative arrangement which involved capping their pensions in line with the provisions of the Finance Act 2006 and receiving a supplementary taxable non-pensionable cash allowance in lieu of pension benefits foregone. These allowances are similar in value to the reduction in the Company’s liability represented by the pension benefits foregone. They are calculated based on actuarial advice as the equivalent of the reduction in the Company’s liability to each individual and spread over the term to retirement as annual compensation allowances. Based on his salary with effect from 1 January 2014, the Group’s actuaries have estimated that the payment to Mr. Manifold will be in the range of 45% to 50% of his base salary.
The defined benefit scheme in which executive Directors participate is closed to new entrants.
Mr. Towe participates in a defined contribution retirement plan in respect of basic salary; and in addition he participates in an unfunded defined contribution Supplemental Executive Retirement Plan (SERP), also in respect of basic salary, to which contributions are made at an agreed rate (20%), offset by contributions made to the other retirement plan.
| 1 | Pensionable salary is defined as basic annual salary and excludes any fluctuating emoluments. |
| 2 | With effect from 1 January 2012. |
Directors’ Remuneration Report| continued
| | | | | | | | | | | | |
| | | | Peer Group for TSR Performance Metric for 2014 Performance Share Plan Award | | Table 5 | | |
| | | | | | |
| | | | Boral | | Italcementi | | Titan Cement | | | | |
| | | | Buzzi Unicem | | Kingspan Group | | Travis Perkins | | | | |
| | | | Cemex | | Lafarge | | Vulcan Materials | | | | |
| | | | Grafton Group | | Martin Marietta Materials | | Weinerberger | | | | |
| | | | Heidelberg Cement | | Saint Gobain | | Wolseley | | | | |
| | | | Holcim | | | | | | | | |
| | | | | | | | | | |
| | | | 2014 Performance Share Plan Metrics (75% of Award) | | Table 6 | | |
| | | | 3-year TSR* performance compared to peer group | | Vesting level | | | | |
| | | | | |
| | | | Equal to or greater than 75thpercentile | | 100% | | | | |
| | | | Between 50thand 75thpercentile | | Straight line between 25% and 100% | | |
| | | | Equal to 50thpercentile | | 25% | | | | |
| | | | Below 50thpercentile | | 0% | | | | |
| | | |
| | | | * The methodology for calculating TSR assumes all dividends are reinvested on the ex-dividend date at the closing share price on that day; the open and close price is based on the three-month average closing price on the last day before the start of the performance period and the final day of the performance period respectively. | | |
| | | | | | | | | | |
| | | | Cumulative Cash Flow in 2014 - 2016 (25% of award) | | Vesting Level | | Table 7 | | |
| | | | | |
| | | | Equal to or greater than€3.5bn | | 100% | | | | |
| | | | Between€2.9bn and€3.5bn | | Straight line between 25% and 100% | | | | |
| | | | Equal to€2.9bn | | 25% | | | | |
| | | | Below€2.9bn | | 0% | | | | |
Directors’ Remuneration Report| continued
Remuneration received by executive Directors in respect of 2013
Details of Directors’ remuneration charged against profit in the year are given in table 37 in the Other Disclosures section. Details of individual remuneration for executive Directors for the year ended 31 December 2013, including explanatory notes, are given in table 8.
Basic Salary and Benefits
TheRemuneration Committee reviewed salary levels in early 2013 and determined that salary increases for executive Directors in the range of 2.6% to 3.8% were appropriate. The increases, which were effective from 1 January 2013, were in line with general trends in CRH operations around the world.
Employment-related benefits include the use of company cars and medical/life assurance. In 2013, the monetary value of benefits ranged from €13,000 to €59,000.
2013 Annual Bonus Plan
The structure of CRH’s Annual Bonus Plan, which applied between 2009 and 2013 inclusive, is set out in table 9.
Table 10 sets out the bonus levels for 2013 in terms of each of the components of the plan.
As the 2013 bonus levels were less than target performance for Mr. Lee, Mr. Manifold and Ms. Carton, the payments are entirely in cash. The amount in excess of target for Mr. Towe (5.3% of salary being €53,874) will be deferred into shares to be held for three years.
TheRemuneration Committee believes that the disclosure of the actual targets of the Annual Bonus Plan, either prospectively or retrospectively, would be commercially sensitive.
The background against which theRemuneration Committee set the targets for 2013, was the Board’s expectation for ongoing improvements in our businesses in the Americas and a stabilisation in the trading backdrop in our European operations, enabling the Group to achieve progress in 2013. As can be seen from the EPS outcome (before non-cash impairments) which reduced to 59.5c per share (-40%), 2013 turned out to be a much more challenging year than anticipated in our European operations. As a result, there was a 0% payout under the EPS
| | | | | | | | | | | | | | | | | | | | | | | | | | | | | | | | | | | | | | | | | | |
| | | | Individual Remuneration for the year ended 31 December 2013 (Audited) | | | | Table 8 | | | |
| | | | | | | | | | | |
| | | | | | | | | | | | | Annual Bonus Plan | | | Long- | | | Retirement | | | | | | | | | | | | |
| | | | | | | Basic salary and fees (a) € 000 2013 | | | Benefits (b) € 000 2013 | | | Cash element (c) € 000 2013 | | | Deferred shares (c) € 000 2013 | | | Term
Incentives (d) € 000 2013 | | | benefits expense (e) € 000 2013 | | | Total € 000 2013 | | | Total (f) € 000 2012 | | | Total (f) € 000 2011 | | | |
| | | | | | | | | | | | |
| | | | Executive Directors | | | | | | | | | | | | | | | | | | | | | | | | | | | | | | | | | | | | | | |
| | | | M. Carton | | | 570 | | | | 13 | | | | 203 | | | | - | | | | 373 | | | | 187 | | | | 1,346 | | | | 921 | | | | 1,050 | | | |
| | | | M. Lee | | | 1,180 | | | | 23 | | | | 421 | | | | - | | | | 1,559 | | | | 980 | | | | 4,163 | | | | 2,536 | | | | 2,689 | | | |
| | | | A. Manifold | | | 825 | | | | 31 | | | | 294 | | | | - | | | | 551 | | | | 290 | | | | 1,991 | | | | 1,385 | | | | 1,537 | | | |
| | | | M. Towe | | | 1,016 | | | | 59 | | | | 915 | | | | 54 | | | | 604 | | | | 203 | | | | 2,851 | | | | 1,983 | | | | 1,543 | | | |
| | | | | | | 3,591 | | | | 126 | | | | 1,833 | | | | 54 | | | | 3,087 | | | | 1,660 | | | | 10,351 | | | | 6,825 | | | | 6,819 | | | |
| | |
(a) Basic Salary and Fees: Salary levels for executive Directors increased by between 2.6% and 3.8% in 2013, the first increases since 2009 for Irish-based Directors. The increases were in line with general trends in CRH operations around the world. (b) Benefits: For executive Directors these relate principally to the use of company cars and medical/life assurance. (c) Annual Bonus Plan: Under the executive Directors’ annual bonus plan for 2013, a bonus is payable for meeting clearly defined and stretch targets and strategic goals. The structure of the 2013 plan is set out on pages 92 and 93. (d) Long-Term Incentives: Amounts in the Long-Term Incentive column reflect the value of performance share awards made in 2011, which will vest on 26 February 2014; the vesting level is 49.11%. For the purposes of this table the value of the vesting has been estimated using a share price of€18.08, being the three month average share price to 31 December 2013. The structure of the 2006 Performance Share Plan is set out on page 94. For Mr. Lee the amount also reflects the outcome of the 2009 Chief Executive Long-Term Incentive Plan (€778,127), the structure of which is set out on page 97. The share options granted in 2011 will lapse. (e) Retirement Benefits Expense: The Irish Finance Act 2006 effectively established a cap on pension provision by introducing a penalty tax charge on pension assets in excess of the higher of€5 million or the value of individual prospective pension entitlements as at 7 December 2005. This cap was further reduced by the Irish Finance Act 2011 to€2.3 million and, by the Finance (No. 2) Act 2013, to€2 million. As a result of these legislative changes, the Remuneration Committee has decided that executive Directors who are members of Irish pension schemes should have the option of continuing to accrue pension benefits as previously, or of choosing an alternative arrangement, by accepting pension benefits limited by the cap, with a similar overall cost to the Group. Maeve Carton, Myles Lee and Albert Manifold chose to opt for the alternative arrangement which involved capping their pensions in line with the provisions of the Finance Acts and receiving a supplementary taxable non-pensionable cash allowance, in lieu of prospective pension benefits foregone. These allowances are similar in value to the reduction in the Company’s liability represented by the pension benefit foregone. They are calculated based on actuarial advice as the equivalent of the reduction in the Company’s liability to each individual and spread over the term to retirement as annual compensation allowances. For 2013 the compensation allowances amount to€980,000 (2012:€980,000) for Myles Lee;€290,190 (2012:€288,117) for Albert Manifold and€187,141 (2012:€174,931) for Maeve Carton. (f) Long-term incentive awards, with a performance period which ended in 2012, lapsed. | | |
Directors’ Remuneration Report| continued
| | |
metric. Also, Group RONA performance reduced to under 6% and, therefore, was below a level which would have resulted in a payout. The cash flow outcome reflected strong discipline in relation to cash management, which resulted in net debt remaining broadly in line with 2012 despite a total spend of €1.2 billion on acquisitions, investments and capital expenditure. The payout level was 52% of maximum for the cash flow element. There was a higher level of cash flow payout for Mr. Towe, who also received a payment in relation to Oldcastle’s profit level for the year, where the outcome was 70% of maximum. Mr. Towe’s other targets were based on performance in the Americas Divisions. Overall, Mr. Towe’s bonus payout reflected the improvements in the performance of the Group’s operations in the Americas which represent 60.5% of Group EBITDA (as defined)* and which saw like-for-like sales up 5% in the second half of the year and improved EBITDA (as defined)* margins in all three Americas segments (Materials, Products and Distribution). The payouts in relation to the personal components reflect achievements in a range of areas such as shown in table 11. Payout levels under the Annual Bonus Plan between 2009 and 2013 are shown in table 12. | | 
|
| | | | | | | | | | | | | | | | | | | | | | | | | | | | | | |
2013 Annual Bonus Components and Payout Levels | | Table 10 |
| | | | | | | | | | | | | | | | | | | | | | | | | | | | | | | | | | | | | | | | | | | | | | | | | | | | | | |
| | | | | | | | |
| | | M. Lee % of Salary | | | | | A. Manifold % of Salary | | | | | M. Carton % of Salary | | | | | M. Towe % of Salary | |
| | | | | | | | | | | | | | | |
Component | | Target | | | Max | | | Payout | | | | | Target | | | Max | | | Payout | | | | | Target | | | Max | | | Payout | | | | | Target | | | Max | | | Payout | |
CRH EPS | | | 35.0 | | | | 52.5 | | | | - | | | | | | 35.0 | | | | 52.5 | | | | - | | | | | | 35.0 | | | | 52.5 | | | | - | | | | | | 20.0 | | | | 30.0 | | | | - | |
CRH Cash Flow | | | 20.0 | | | | 30.0 | | | | 15.6 | | | | | | 20.0 | | | | 30.0 | | | | 15.6 | | | | | | 20.0 | | | | 30.0 | | | | 15.6 | | | | | | - | | | | - | | | | - | |
CRH RONA | | | 10.0 | | | | 15.0 | | | | - | | | | | | 10.0 | | | | 15.0 | | | | - | | | | | | 10.0 | | | | 15.0 | | | | - | | | | | | - | | | | - | | | | - | |
Oldcastle* Group PBIT** | | | - | | | | - | | | | - | | | | | | - | | | | - | | | | - | | | | | | - | | | | - | | | | - | | | | | | 25.0 | | | | 37.5 | | | | 35.0 | |
Oldcastle* Cash Flow | | | - | | | | - | | | | - | | | | | | - | | | | - | | | | - | | | | | | - | | | | - | | | | - | | | | | | 20.0 | | | | 30.0 | | | | 27.8 | |
Oldcastle* RONA | | | - | | | | - | | | | - | | | | | | - | | | | - | | | | - | | | | | | - | | | | - | | | | - | | | | | | 10.0 | | | | 15.0 | | | | 14.0 | |
Personal/Strategic | | | 15.0 | | | | 22.5 | | | | 20.0 | | | | | | 15.0 | | | | 22.5 | | | | 20.0 | | | | | | 15.0 | | | | 22.5 | | | | 20.0 | | | | | | 15.0 | | | | 22.5 | | | | 18.5 | |
| | | | 80.0 | | | | 120.0 | | | | 35.6 | | | | | | 80.0 | | | | 120.0 | | | | 35.6 | | | | | | 80.0 | | | | 120.0 | | | | 35.6 | | | | | | 90.0 | | | | 135.0 | | | | 95.3 | |
| | |
* Oldcastle is the holding company for the Group’s operations in the Americas ** PBIT is defined as earnings before interest and taxes | | |
| | | | |
Directors | | Strong delivery in relation to: | | Table 11 |
| |
| M. Lee/A. Manifold | | Senior executive team performance and succession; fundamental re-evaluation of the Group’s development strategy; ongoing progress in relation to cost reduction and capital expenditure management; effective, clear and consistent investor engagement and communications; and ongoing progress in relation to operational excellence, health & safety initiatives and personal development objectives. |
| |
| M. Carton | | Restructuring of Finance organisation; co-ordination of debt and equity investor programmes; successful completion of two bond issues in 2013 at the lowest ever coupons obtained by the Group; continued progress in the programme to mitigate the Group’s defined benefit pension liabilities; review of the organisation of the Group’s IT infrastructure. |
| |
| M. Towe | | Significant input into the Group’s talent management process; leadership and direction for operational excellence and health & safety initiatives in the Americas; continued delivery in relation to acquisitions and the flow of development opportunities. |
| | | | |
* Defined as earnings before interest, taxes, depreciation, amortisation, asset impairment charges, profit on disposals and the Group’s share of equity accounted investments’ result after tax. |
Directors’ Remuneration Report| continued
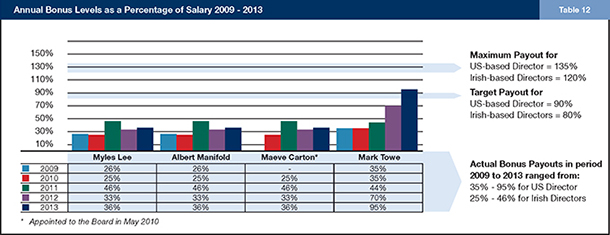
2006 Performance Share Plan
The Performance Share Plan (the “2006 PSP”), which was approved by shareholders in May 2006, is tied to Total Shareholder Return (TSR) over a three-year performance period. Half of the award is assessed against TSR for a group of global building materials companies and the other half against TSR for the constituents of the Eurofirst 300 Index as summarised in table 15.
The performance criteria for the 2006 PSP are set out in table 16. Participants are not entitled to any dividends (or other distributions made) and have no right to vote in respect of the shares subject to the award, until the shares vest.
The rules of the 2006 PSP provide that no award, or portion of an award, which has satisfied the TSR performance criteria should be released unless theRemuneration Committee has confirmed the validity of the TSR performance and reviewed EPS performance to assess its consistency with the objectives of the assessment.
In respect of the award made in 2011, in February 2014, theRemuneration Committee determined that 49% of the award had vested. The Company’s TSR performance, which was reviewed by theRemuneration Committee’s remuneration consultants, was between the 50th and the 75th percentiles when assessed against both the Eurofirst 300 Index and the building materials sector. Prior to making its vesting determination in each case, theRemuneration Committee satisfied itself that the TSR outcome was valid and had not been significantly affected by unusual events or extraneous factors.
For the purpose of the remuneration single figure calculation (see total column in table 8), awards have been valued based on the three-month average share price to 31 December 2013 of €18.08.
During 2013, theRemuneration Committee determined that 0% of the award made under the 2006 PSP in 2010 had vested. Accordingly, the award lapsed in full.
Details of outstanding awards to Directors under the 2006 PSP are provided in table 25. Outstanding awards are subject to the performance conditions outlined in table 16. The 2006 PSP currently has 166 active participants.
2010 Share Option Scheme
At the 2010 Annual General Meeting, shareholders approved the introduction of the current Earnings Per Share (EPS) based share option scheme (the “2010 Scheme”). Options were granted at the market price of the Company’s shares at the time of grant. The vesting period for options is three years, with vesting only occurring once an initial EPS performance target has been reached. Awards under the 2010 Scheme were limited to 150% of salary.
The performance criteria for the 2010 Scheme were agreed with the Irish Association of Investment Managers (the “IAIM”) and are set out in table 17. The performance targets were designed to provide for proportionately more vesting for higher levels of EPS growth.
| | |
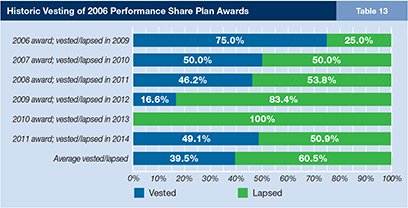
| | Vesting levels are subject to any reduction which theRemuneration Committee deems appropriate in the context of the overall results of the Group. The initial grant of options under the 2010 Scheme made in 2010 did not meet the EPS performance criteria set out in table 17 and, accordingly, the options lapsed on the third anniversary of the date of grant. Similarly, the grant made in 2011 will lapse in full in April 2014. Details of awards to Directors under the 2010 Scheme are provided in tables 26 and 27. TheRemuneration Committee has discretionary powers regarding the implementation of the rules of the 2010 Scheme. These powers have not been exercised since the adoption of the 2010 Scheme. |
Directors’ Remuneration Report| continued
| | | | | | | | | | | | |
| | | | Peer Group used to assess TSR performance for the 2006 PSP Award made in 2011 | | Table 14 | | |
| | | | | | |
| | | | Boral | | Home Depot | | Titan Cement | | | | |
| | | | Buzzi Unicem | | Italcementi | | Travis Perkins | | | | |
| | | | Cemex | | Kingspan Group | | Vulcan Materials | | | | |
| | | | Grafton Group | | Lafarge | | Wienerberger | | | | |
| | | | Heidelberg Cement | | Martin Marietta Materials | | Wolseley | | | | |
| | | | Holcim | | Saint Gobain | | | | | | |
| | | | The above peer group also applied to the award made in 2010, which had a 0% vesting | | | | |
| | | | | | | | | | |
| | | | TSR Performance Test for the 2006 PSP Award made in 2011 | | Table 15 | | |
| | | | | | | | | | |
| | | | | Peer Group Test (below) | | Eurofirst 300 Index Test | | Total to Vest/Lapse in 2014 | | |
| | | | | |
| | | | TSR performance 2011-2013: Between 50thand 75th percentile | | TSR performance 2011-2013: Between 50thand 75th percentile | | | | |
| | | | - 32.87% vested | | - 16.24% vested | | Vested: 49.11% | | |
| | | | - 17.13% lapsed | | - 33.76% lapsed | | Lapsed: 50.89% | | |
| | | | | | | | | | |
| | | | | | | | | | |
| | | | 2006 Performance Share Plan Metrics | | Table 16 | | |
| | | | 3-year TSR* performance compared to peer group/Eurofirst 300 index | | Vesting level | | | | |
| | | | | |
| | | | Equal to or greater than 75thpercentile | | 100% | | | | |
| | | | Between 50thand 75thpercentile | | Straight line between 30% and 100% | | |
| | | | Equal to 50thpercentile | | 30% | | | | |
| | | | Below 50thpercentile | | 0% | | | | |
| | | |
| | | | * The methodology for calculating TSR assumes all dividends are reinvested on the ex-dividend date at the closing share price on that day; the open and close price is based on the closing price on the last day before the start of the performance period and the final day of the performance period respectively. | | |
| | | | | | | | | | | | |
| | | | 2010 Share Option Scheme Metrics | | Table 17 | | |
| | | | Compound EPS* Growth Performance over three years | | | | |
| | | | Awarded in 2010 & 2011 | | Awarded in 2012 & 2013 | | Vesting Level | | | | |
| | | | Equal to or greater than 27.5% p.a. | | Equal to or greater than 20% p.a. | | 100% | | |
| | | | Between 17.5% and 27.5% p.a. | | Between 13% and 20% p.a. | | Straight line between 40% and 100% | | |
| | | | Between 12.5% and 17.5% p.a. | | Between 10% and 13% p.a. | | Straight line between 20% and 40% | | |
| | | | Equal to 12.5% p.a. | | Equal to 10% p.a. | | 20% | | |
| | | | Less than 12.5% p.a. | | Less than 10% p.a. | | 0% | | |
| | | |
| | | | * The EPS figure used for the purposes of the 2010 Scheme is the basic consolidated earnings per share of the Company for the accounting period concerned as shown in the annual report issued by the Company for that accounting period. | | |
2000 Share Option Scheme
At the Annual General Meeting held in 2000, shareholders approved the introduction of a share option scheme (the 2000 Scheme). This scheme was superceded by the 2010 Scheme referred to above. No awards have been made under the 2000 Scheme since 2009. The performance criteria for the 2000 Scheme are set out in the notes to table 27.
Retirement Benefit Expense
Mr. Lee, Mr. Manifold and Ms. Carton participate in a defined benefit pension scheme up to the pension cap.
There was, therefore, no additional accrual in the year. They received a cash pension supplement, which is detailed in table 8. Mr. Towe received a contribution of 20% of base salary into this pension.
Details regarding pension entitlements for the executive Directors are set out in tables 18 and 19.
Former Chief Executive
Myles Lee retired as Chief Executive, and from the Board, on 31 December 2013. The treatment of his
long-term incentive awards are dealt with below. Mr. Lee received a bonus in respect of performance to the end of 2013 as outlined above. He did not receive any payment in lieu of notice.
Outstanding Share Incentive Awards
Mr. Lee’s outstanding awards under the 2006 PSP, the 2010 Scheme and the 2000 Scheme are set out in tables 25 and 26 on pages 98 and 99. TheRemuneration Committee has determined that the arrangements outlined in table 20 should apply in relation to those awards.
Chief Executive Long-Term Incentive Plan
Mr. Lee also participated in a long-term incentive plan (the “2009 CEO LTIP”), a cash award incorporating targets set for the five-year period 2009-2013.
The 2009 CEO LTIP, the structure of which was the same as for LTIPs put in place for previous CRH Chief Executives, and which incorporated challenging goals in respect of TSR by comparison with a peer group, growth in EPS and the strategic development of the Group is summarised in table 21.
The EPS target for the 2009 CEO LTIP was set at a time when it was difficult to foresee the full extent of the impact that the 2008 financial crisis would have on the Group’s markets. In this context, the Committee has determined that the EPS component had a 0% vesting, reflecting EPS performance in the period since 2009.
TSR performance was above the median compared to the sector peer group (listed in table 22) and, therefore, 17.7% of the awards vested.
As with the EPS targets, the strategic/ qualitative goals were set in early 2009 before the extent of the economic environment which prevailed throughout the period of the 2009 CEO LTIP was fully clear. The Group Chairman undertook a detailed review of the performance and achievements of the Chief Executive during the period in the context of those goals and the factors which had impacted the Group over the past five years, including:
| – | the cost reduction measures to defend profitability (€2.4 billion), which resulted in significant organisational change over the past five years at regional and national level; |
| – | the strong focus on cash generation and dividend maintenance; |
| – | the initiation of the portfolio review process which laid much of the ground work for the review currently being carried out by the new Chief Executive; |
| – | the focussed and selective approach to development activity involving a cumulative spend since 2009 of €2.9 billion; |
| – | significant progress in building up CRH’s |
Directors’ Remuneration Report| continued
| | | | | | | | | | | | | | | | | | | | |
Pension Entitlements - Defined Benefit (Audited) | | | | | | | | Table 18 | |
| | | | | | | |
| | | Increase in accrued personal pension during 2013 (i) € 000 | | | | | | | Transfer value of increase in dependents’ pension (i) € 000 | | | | | | | Total accrued personal pension at year-end (ii) € 000 | |
| Executive Directors | | | | | | | | | | | | | | | | | | | | |
| M. Lee | | | - | | | | | | | | - | | | | | | | | 267 | |
| A. Manifold | | | - | | | | | | | | 46 | | | | | | | | 273 | |
| M. Carton | | | - | | | | | | | | 19 | | | | | | | | 266 | |
| | |
(i) As noted on page 92, the pensions of Myles Lee, Albert Manifold and Maeve Carton have been capped in line with the provisions of the Irish Finance Acts. However, dependents’ pensions continue to accrue resulting in Greenbury transfer values which have been calculated on the basis of actuarial advice. These amounts do not represent sums paid out or due, but are the amounts that the pension scheme would transfer to another pension scheme in relation to benefits accrued in 2013 in the event of these Directors leaving service. (ii) The accrued pensions shown are those which would be payable annually from normal retirement date, except in the case of Myles Lee whose pension is payable from 31 December 2013. Myles Lee reached his normal retirement age date on 3 May 2013 and opted to commute in part his pension for a lump sum of €575,000. He deferred payment of his pension until 31 December 2013. | | |
| | | | | | | | | | | | | | | | | | | | | | | | | | | | |
Pension Entitlements - Defined Contribution (Audited) | | | | | | | Table 19 | |
The accumulated liablilities related to the unfunded Supplemental Executive Retirement Plans for Mark Towe are as follows: | |
| | | As at 31 December 2012 € 000 | | | | | 2013 Contribution € 000 | | | | | 2013 Notional interest €000 | | | | | Translation adjustment € 000 | | | | | As at 31 December 2013 € 000 | |
| | | | | | | | | | | | | (iii) | | | | | | | | | | | |
Executive Director | | | | | | | | | | | | | | | | | | | | | | | | | | | | |
M. Towe | | | 1,731 | | | | | | 191 | | | | | | 85 | | | | | | (84 | ) | | | | | 1,923 | |
| | | | | | | | | | |
(iii) Notional interest, which is calculated based on the average bid yields of United States Treasury
fixed-coupon securities with remaining terms to maturity of approximately 20 years, plus 1.5%, is credited to the above plans. |
| | | | |
Outstanding Share Incentive Awards - Former Chief Executive | | Table 20 |
| | Treatment of Outstanding Awards | | |
2010 Share Option Scheme | | – 2011 award lapses in full (see commentary above) – 2012 award subject to performance in respect of period 2012 – 2014 to be measured at the normal time; award will be pro-rated for time – No award granted in 2013 |
2006 Performance Share Plan | | – 2011 award will vest based on performance to 31 December 2013; determined to be at 49% of maximum (see commentary above) – 2012 award subject to performance in respect of period 2012 – 2014 to be measured at the normal time; award will be pro-rated for time – No award granted in 2013 |
2000 Share Option Scheme | | – Vested awards must be exercised within 12 months of retirement, i.e. by 31 December 2014, or the expiry date of the option if earlier – Unvested awards will remain subject to performance and may be exercised for 12 months from vesting |
| | organisation structure in China and India and the establishment of CRH’s Asia headquarters in Singapore; |
| – | the upgrading of the Group’s talent management structures; and |
| – | mentoring, guiding and supporting executives who have transitioned to the most senior roles in the organisation. |
TheRemuneration Committee considered the report and determined that the appropriate payout for the strategic component was 16% out of a maximum of 20%.
This results in an overall payout level of 33.7% and earnings under the 2009 CEO LTIP of €778,127.
The payment under the 2009 CEO LTIP, which will be made in 2014, will be made in cash and is not pensionable.
Consultancy Agreement
At the request of the current Chief Executive, the outgoing Chief Executive, Myles Lee, has entered into an agreement to provide consultancy services to the Group, for a maximum of 40 days per year at a rate of €2,500 per day. As a result, the Group will retain access to Mr. Lee’s significant knowledge of the industry and he will, when required, provide support to the Chief Executive.
Directors’ Interests in Shares and Share Scheme Awards
Share Scheme Awards
A summary of share scheme awards made to executive Directors in 2013 are set out in table 24. Details of outstanding performance share awards and share options held by executive Directors are shown in tables 25 and 26.
Shareholding Guidelines for Executive Directors
TheRemuneration Committee adopted a policy in 2013 whereby executive Directors are required to build up (and maintain), within five years of appointment, a minimum holding in CRH shares which is equivalent to one times basic salary. For existing executive Directors this level must be achieved by 31 December 2015, unless the executive Director has a significant change in role which results in a step change in salary, in which case the one times salary level must be achieved within five years of the change.
Mr. Manifold’s shareholding as at 31 December 2013 was 0.85 times his salary as Chief Operating Officer. As Chief Executive, based on his new salary, his holding fell to 0.6 times his salary on 1 January 2014. Mr. Manifold will be required to meet the shareholding guideline by 31 December 2017.
The current shareholdings of executive Directors as a multiple of 2014 salary is shown in table 23.
Directors’ Remuneration Report| continued
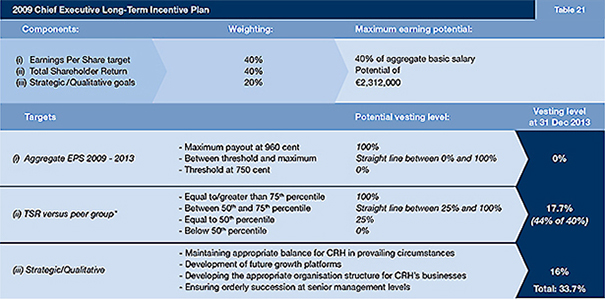
| | | | | | |
* Peer Group used to assess TSR Performance for 2009 CEO LTIP | | Table 22 |
Cemex | | Italcementi | | Titan Cement |
Ciments Français | | Lafarge | | Vulcan Materials |
Eagle Materials | | Martin Marietta Materials | | Wienerberger |
Holcim | | Saint Gobain | | Wolseley |
| | | | | |
| | |
As part of the remuneration review carried out in 2013, theRemuneration Committee considered whether the shareholding level should be increased, particularly in relation to the Chief Executive role. TheRemuneration Committee concluded that, as the guidelines were only recently introduced, it was not appropriate to increase the requirement at this time. However, the Committee will look to increase shareholding guidelines in the future as the Chief Executive builds on his existing holding. Shareholdings of Directors and Company Secretary as at 31 December 2013 Shareholdings of the Directors and Company Secretary as at 31 December 2013 are shown in table 28. | | 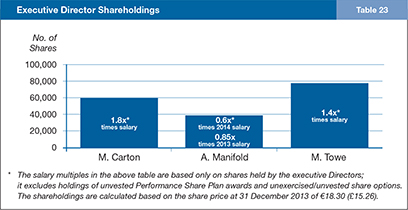
|
Directors’ Remuneration Report| continued
| | | | | | | | | | | | | | | | |
Summary of Scheme Interests Granted in 2013 | | Table 24 |
Directors | | Scheme | | Basis of award
(% of salary) | | Number of
shares | | Face value | | Exercise
price | | Percentage vesting at threshold performance (% of maximum) | | Performance
period end date |
| | | 2006 PSP | | | | | | | | | | | | | | |
| | | (conditional shares) | | 141% | | 72,000 | | € 1,165,680 | | n/a | | 30% | | | | 31-Dec-15 |
A. Manifold | | | | | | | | | | | | | | | | |
| | | 2010 Share Option | | | | | | | | | | | | | | |
| | | Plan (market value options) | | 132% | | 67,500 | | € 1,092,825 | | € 16.19 | | 20% | | | | 31-Dec-15 |
| | | 2006 PSP | | | | | | | | | | | | | | |
| | | (conditional shares) | | 142% | | 50,000 | | € 809,500 | | n/a | | 30% | | | | 31-Dec-15 |
M. Carton | | | | | | | | | | | | | | | | |
| | | 2010 Share Option | | | | | | | | | | | | | | |
| | | Plan (market value options) | | 133% | | 47,000 | | € 760,930 | | € 16.19 | | 20% | | | | 31-Dec-15 |
| | | 2006 PSP | | | | | | | | | | | | | | |
| | | (conditional shares) | | 143% | | 90,000 | | € 1,457,100 | | n/a | | 30% | | | | 31-Dec-15 |
M. Towe | | | | | | | | | | | | | | | | |
| | | 2010 Share Option | | | | | | | | | | | | | | |
| | | Plan (market value | | 135% | | 85,000 | | €1,376,150 | | €16.19 | | 20% | | | | 31-Dec-15 |
| | | options) | | | | | | | | | | | | | | |
| | | | | | | | | | | | | | | | | |
| | | | | | | | | | | | | | | | | | | | | | | | | | | | | | | | | | |
Directors’ Awards under the 2006 Performance Share Plan (i) (Audited) | | | Table 25 | | | |
| | | | | | | | | | | | | | | | | | | | | | | | Market | | | |
| | | 31 December | | | Granted in | | | Released in | | | Lapsed in | | | 31 December | | | Performance | | | Release | | | Price in euro | | | |
| | | 2012 | | | 2013 | | | 2013 (ii) | | | 2013 (ii) | | | 2013 | | | Period | | | Date | | | on award | | | |
| | | | | | | | | |
M. Carton | | | 10,000 | | | | - | | | | - | | | | 10,000 | | | | - | | | | 01/01/10 - 31/12/12 | | | | | | | | 18.51 | | | |
| | | 42,000 | | | | - | | | | - | | | | - | | | | 42,000 | | | | 01/01/11 - 31/12/13 | | | | February 2014 | | | | 16.52 | | | |
| | | 50,000 | | | | - | | | | - | | | | - | | | | 50,000 | | | | 01/01/12 - 31/12/14 | | | | February 2015 | | | | 15.19 | | | |
| | | | - | | | | 50,000 | | | | - | | | | - | | | | 50,000 | | | | 01/01/13 - 31/12/15 | | | | February 2016 | | | | 16.19 | | | |
| | | | 102,000 | | | | 50,000 | | | | - | | | | 10,000 | | | | 142,000 | | | | | | | | | | | | | | | |
| | | | | | | | | |
M. Lee | | | 75,000 | | | | - | | | | - | | | | 75,000 | | | | - | | | | 01/01/10 - 31/12/12 | | | | | | | | 18.51 | | | |
| | | 88,000 | | | | - | | | | - | | | | - | | | | 88,000 | | | | 01/01/11 - 31/12/13 | | | | February 2014 | | | | 16.52 | | | |
| | | | 100,000 | | | | - | | | | - | | | | - | | | | 100,000 | | | | 01/01/12 - 31/12/14 | | | | February 2015 | | | | 15.19 | | | |
| | | | 263,000 | | | | - | | | | - | | | | 75,000 | | | | 188,000 | | | | | | | | | | | | | | | |
| | | | | | | | | | | | | | | | | | | | | | | | | | | | | | | | | | |
A. Manifold | | | 55,000 | | | | - | | | | - | | | | 55,000 | | | | - | | | | 01/01/10 - 31/12/12 | | | | | | | | 18.51 | | | |
| | | 62,000 | | | | - | | | | - | | | | - | | | | 62,000 | | | | 01/01/11 - 31/12/13 | | | | February 2014 | | | | 16.52 | | | |
| | | 70,000 | | | | - | | | | - | | | | - | | | | 70,000 | | | | 01/01/12 - 31/12/14 | | | | February 2015 | | | | 15.19 | | | |
| | | | - | | | | 72,000 | | | | - | | | | - | | | | 72,000 | | | | 01/01/13 - 31/12/15 | | | | February 2016 | | | | 16.19 | | | |
| | | | 187,000 | | | | 72,000 | | | | - | | | | 55,000 | | | | 204,000 | | | | | | | | | | | | | | | |
| | | | | | | | | | | | | | | | | | | | | | | | | | | | | | | | | | |
M. Towe | | | 60,000 | | | | - | | | | - | | | | 60,000 | | | | - | | | | 01/01/10 - 31/12/12 | | | | | | | | 18.51 | | | |
| | | 68,000 | | | | - | | | | - | | | | - | | | | 68,000 | | | | 01/01/11 - 31/12/13 | | | | February 2014 | | | | 16.52 | | | |
| | | 90,000 | | | | - | | | | - | | | | - | | | | 90,000 | | | | 01/01/12 - 31/12/14 | | | | February 2015 | | | | 15.19 | | | |
| | | | - | | | | 90,000 | | | | - | | | | - | | | | 90,000 | | | | 01/01/13 - 31/12/15 | | | | February 2016 | | | | 16.19 | | | |
| | | | 218,000 | | | | 90,000 | | | | - | | | | 60,000 | | | | 248,000 | | | | | | | | | | | | | | | |
| | | | | | | | | | | | | | | | | | |
(i) Performance Share Plan: This is a long-term share incentive plan under which share awards are granted in the form of a provisional allocation of shares for which no exercise price is payable. The shares scheduled for release in February 2014, February 2015 and February 2016 will be allocated to the extent that the relative TSR performance conditions are achieved. The structure of the Performance Share Plan is set out on page 94. | | |
| |
(ii) In 2013, the Remuneration Committee determined that none of the 2010 award had vested and accordingly the awards lapsed. | | |
Directors’ Remuneration Report| continued
| | | | | | | | | | | | | | | | | | | | | | | | | | | | | | | | | | |
Directors’ Share Options (Audited) | | | Table 26 | |
| Details of movements on outstanding options and those exercised during the year are set out in the table below | | | | |
| | | | | | | | | | | | | | | | | | | | Weighted | | | Options exercised during 2013 | |
| | | 31 December
2012 | | | Granted in
2013 | | | Lapsed in
2013 | | | Exercised in
2013 | | | 31 December
2013 | | | | | average option
price at
31 December
2013 | | | Weighted
average
exercise
price | | | Weighted
average market
price at date of
exercise | |
| | | | | | | | | |
| | | | | | | | | | | | | | | | | | | | € | | | € | | | € | |
| | | | | | | | | |
M. Carton | | | 55,831 | | | | - | | | | - | | | | - | | | 55,831 | | | (a | ) | | | 25.75 | | | | - | | | | - | |
| | | | 24,398 | | | | - | | | | - | | | | 11,090 | | | 13,308 | | | (b | ) | | | 15.07 | | | | 11.86 | | | | 17.08 | |
| | | | 127,500 | | | | 47,000 | | | | 35,000 | | | | - | | | 139,500 | | | (c | ) | | | 15.89 | | | | - | | | | - | |
| | | | 1,752 | | | | - | | | | 1,752 | | | | - | | | - | | | (d | ) | | | - | | | | - | | | | - | |
M. Lee | | | 308,435 | | | | - | | | | - | | | | 23,270 | | | 285,165 | | | (a | ) | | | 20.19 | | | | 11.86 | | | | 16.62 | |
| | | | 83,175 | | | | - | | | | - | | | | 44,360 | | | 38,815 | | | (b | ) | | | 15.07 | | | | 11.86 | | | | 16.62 | |
| | | | 275,000 | | | | - | | | | 85,000 | | | | - | | | 190,000 | | | (c | ) | | | 15.75 | | | | - | | | | - | |
| | | | 1,752 | | | | - | | | | 1,752 | | | | - | | | - | | | (d | ) | | | - | | | | - | | | | - | |
A. Manifold | | | 166,445 | | | | - | | | | - | | | | - | | | 166,445 | | | (a | ) | | | 21.97 | | | | - | | | | - | |
| | | | 33,270 | | | | - | | | | - | | | | 16,635 | | | 16,635 | | | (b | ) | | | 15.07 | | | | 11.86 | | | | 16.62 | |
| | | | 192,500 | | | | 67,500 | | | | 60,000 | | | | - | | | 200,000 | | | (c | ) | | | 15.90 | | | | - | | | | - | |
| | | | 2,236 | | | | - | | | | - | | | | - | | | 2,236 | | | (e | ) | | | 13.64 | | | | - | | | | - | |
M. Towe | | | 160,806 | | | | - | | | | - | | | | 5,381 | | | 155,425 | | | (a | ) | | | 23.05 | | | | 15.09 | | | | 17.43 | |
| | | | 49,905 | | | | - | | | | - | | | | - | | | 49,905 | | | (b | ) | | | 15.09 | | | | - | | | | - | |
| | | 230,000 | | | | 85,000 | | | | 70,000 | | | | - | | | 245,000 | | | (c | ) | | | 15.88 | | | | - | | | | - | |
| | | 1,713,005 | | | | 199,500 | | | | 253,504 | | | | 100,736 | | | 1,558,265 | | | | | | | | | | | | | | | | |
| | | | | | | | | | | | | | | | | | | | | | | | | | | | | | | | | | |
| | | | | | | | | | | | | | | | | | | | | | | | | | | | | | | | |
Options by Price (Audited) | | | Table 27 | |
| | | | | | | | | |
| | | 31 December | | | Granted in | | | Lapsed in | | | Exercised in | | | 31 December | | | | | | | Earliest | | | | |
€ | | 2012 | | | 2013 | | | 2013 | | | 2013 | | | 2013 | | | | | | | exercise date | | | Expiry date | |
| | | | | | | | | |
11.8573 | | | 23,270 | | | | - | | | | - | | | | 23,270 | | | - | | | (a | ) | | | | | | | | | | |
11.8573 | | | 72,085 | | | | - | | | | - | | | | 72,085 | | | - | | | (b | ) | | | | | | | | | | |
15.0674 | | | 38,815 | | | | - | | | | - | | | | - | | | 38,815 | | | (a | ) | | | | | February 2014 | | | | April 2014 | |
15.0674 | | | 68,758 | | | | - | | | | - | | | | - | | | 68,758 | | | (b | ) | | | | | | | | | April 2014 | |
15.0854 | | | 27,725 | | | | - | | | | - | | | | 5,381 | | | 22,344 | | | (a | ) | | | | | February 2014 | | | | April 2014 | |
15.0854 | | | 49,905 | | | | - | | | | - | | | | - | | | 49,905 | | | (b | ) | | | | | | | | | April 2014 | |
18.7463 | | | 72,085 | | | | - | | | | - | | | | - | | | 72,085 | | | (a | ) | | | | | February 2014 | | | | April 2015 | |
18.8545 | | | 27,725 | | | | - | | | | - | | | | - | | | 27,725 | | | (a | ) | | | | | February 2014 | | | | April 2015 | |
26.1493 | | | 105,355 | | | | - | | | | - | | | | - | | | 105,355 | | | (a | ) | | | | | | | | | April 2016 | |
29.4855 | | | 86,502 | | | | - | | | | - | | | | - | | | 86,502 | | | (a | ) | | | | | | | | | April 2017 | |
29.8643 | | | 36,043 | | | | - | | | | - | | | | - | | | 36,043 | | | (a | ) | | | | | | | | | April 2017 | |
21.5235 | | | 143,997 | | | | - | | | | - | | | | - | | | 143,997 | | | (a | ) | | | | | | | | | April 2018 | |
16.58 | | | 130,000 | | | | - | | | | - | | | | - | | | 130,000 | | | (a | ) | | | | | | | | | April 2019 | |
18.39 | | | 250,000 | | | | - | | | | 250,000 | | | | - | | | - | | | (c | ) | | | | | | | | | | |
16.38 | | | 265,000 | | | | - | | | | - | | | | - | | | 265,000 | | | (c | ) | | | | | | | | | April 2021 | |
15.19 | | | 310,000 | | | | - | | | | - | | | | - | | | 310,000 | | | (c | ) | | | | | | | | | April 2022 | |
16.19 | | | - | | | | 199,500 | | | | - | | | | - | | | 199,500 | | | (c | ) | | | | | | | | | April 2023 | |
18.3946 | | | 3,504 | | | | - | | | | 3,504 | | | | - | | | - | | | (d | ) | | | | | | | | | | |
13.64 | | | 2,236 | | | | - | | | | - | | | | - | | | 2,236 | | | (e | ) | | | | | August 2017 | | | | January 2018 | |
| | | 1,713,005 | | | | 199,500 | | | | 253,504 | | | | 100,736 | | | 1,558,265 | | | | | | | | | | | | | | |
| | | | | | | | | | | | | | | | | | | | |
| | | |
The market price of the Company’s shares at 31 December 2013 was €18.30 and the range during 2013 was €14.68 to €19.30. (a) Granted under the 2000 Share Option Scheme, these options are only exercisable when EPS growth exceeds the growth of the Irish Consumer Price Index by 5% compounded over a period of at least three years subsequent to the granting of the options. (b) Granted under the 2000 Share Option Scheme, these options are only exercisable if, over a period of at least five years subsequent to the granting of the options, the growth in EPS exceeds the growth of the Irish Consumer Price Index by 10% compounded and places the | | Company in the top 25% of EPS performance of a peer group of international building materials and other manufacturing companies. If below the 75th percentile, these options are not exercisable. (c) Granted under the 2010 Share Option Scheme. Vesting will only occur once an initial performance target has been reached and, thereafter, will be dependent on performance. The performance criteria are set out in table 17 on page 95. (d) Granted under the 2000 Savings-related Share Option Scheme. (e) Granted under the 2010 Savings-related Share Option Scheme. | | |
Directors’ Remuneration Report| continued
| | | | | | | | | | | | | | | | |
Directors’ Interests in Share Capital | | Table 28 | |
|
The interests of the Directors and Company Secretary in the shares of the Company, which are beneficial unless otherwise indicated, are shown below. | |
The Directors and Company Secretary have no beneficial interests in any of the Group’s subsidiary, joint venture or associated undertakings. | |
|
| |
Ordinary Shares | | 7 March 2014 | | | | | 31 December
2013 | | | | | 31 December 2012 | |
| | | | | |
Directors | | | | | | | | | | | | | | | | |
E.J. Bärtschi | | | 25,200 | | | | | | 7,200 | | | | | | 2,000 | |
M. Carton | | | 81,322 | | | | | | 60,100 | | | | | | 45,654 | |
W.P. Egan | | | 16,112 | | | | | | 16,112 | | | | | | 16,112 | |
- Non-beneficial | | | 12,000 | | | | | | 12,000 | | | | | | 12,000 | |
U-H. Felcht | | | 1,285 | | | | | | 1,285 | | | | | | 1,285 | |
N. Hartery | | | 1,430 | | | | | | 1,430 | | | | | | 1,389 | |
J.M. de Jong | | | 15,868 | | | | | | 15,868 | | | | | | 15,288 | |
J.W. Kennedy | | | 1,049 | | | | | | 1,049 | | | | | | 1,009 | |
D.A. McGovern, Jr. | | | 4,000 | | | | | | 4,000 | | | | | | 4,000 | 1 |
H.A. McSharry | | | 3,789 | | | | | | 3,789 | | | | | | 3,676 | |
A. Manifold | | | 53,842 | | | | | | 38,981 | | | | | | 34,934 | |
D.N. O’Connor | | | 16,915 | | | | | | 16,915 | | | | | | 16,416 | |
H.Th. Rottinghuis4 | | | 15,000 | | | | | | - | 1 | | | | | - | |
M. Towe | | | 115,511 | 3 | | | | | 77,117 | | | | | | 69,628 | 2 |
| | | | | |
Secretary | | | | | | | | | | | | | | | | |
N. Colgan | | | 12,835 | | | | | | 10,836 | | | | | | 10,747 | |
| | | 376,158 | | | | | | 266,682 | | | | | | 234,138 | |
| | | |
Of the above holdings, the following are held in the form of American Depository Receipts: | | | | | | | | |
| | | 7 March | | | | | 31 December | | | | | 31 December | |
| | | 2014 | | | | | 2013 | | | | | 2012 | |
| | | | | |
W.P. Egan | | | 15,000 | | | | | | 15,000 | | | | | | 15,000 | |
- Non-beneficial | | | 12,000 | | | | | | 12,000 | | | | | | 12,000 | |
D.A. McGovern, Jr. | | | 4,000 | | | | | | 4,000 | | | | | | 4,000 | 1 |
| |
| | | | | | | | | | |
1 Holding as at date of appointment. |
2 Prior year balance adjusted to exclude 3,397 American Depository Shares held in a 401(K)(pension) plan as those shares constitute an asset of the pension plan and do not form part of Mr. Towe’s interests in CRH. |
3 Excluding the award of 2,561 Deferred Shares in March 2014. See page 92 for more details. 4 Mr. H. Rottinghuis became a Director on 18 February 2014. |
Directors’ Remuneration Report| continued
Non-executive Directors
Remuneration Policy for 2014
The remuneration of non-executive Directors is determined by the Board of Directors as a whole. In determining the remuneration, the Board receives recommendations from a committee of the Chairman and the executive Directors. TheRemuneration Committee determines the remuneration of the Chairman within the framework or broad policy agreed with the Board.
Fees for the non-executive Directors and the Chairman were reviewed during 2013. It was concluded that CRH’s fees are competitively positioned at present and should remain unchanged in 2014.
Fees for 2014 are set out in table 29.
Remuneration Paid in 2013
Remuneration paid to non-executive Directors in 2013 is set out in table 30.
| | | | | | |
Non-executive Director Fee Structure | | | Table 29 |
Role | | Amount | | | |
Group Chairman(including non-executive Director salary and fees for committee work) | | | €450,000 | | | |
Non-executive Director(basic salary and fees for committee work) | | | €90,000 | | | |
Additional fees: | | | | | | |
| | |
Senior Independent Director/Remuneration Committee Chairman* | | | €34,000 | | | |
Audit Committee Chairman | | | €34,000 | | | |
Fee for Europe-based non-executive Directors | | | €15,000 | | | |
Fee for US-based non-executive Directors | | | €30,000 | | | |
|
* If the roles of Senior Independent Director and Remuneration Committee Chair are not combined, fees of €25,000 and €15,000 apply respectively |
| | | | | | | | | | | | | | | | | | | | | | | | |
Individual Remuneration for the year ended 31 December 2013 (Audited) | | | Table 30 | |
| | | | | | |
| | | Basic salary | | | | | | Other | | | | | | | | | | |
| | | and fees | | | Benefits | | | remuneration | | | | | | | | | | |
| | | (a) | | | (b) | | | (c) | | | Total | | | Total | | | Total | |
| | | € 000 | | | € 000 | | | € 000 | | | € 000 | | | € 000 | | | € 000 | |
| | | 2013 | | | 2013 | | | 2013 | | | 2013 | | | 2012 | | | 2011 | |
| | | | | | |
Non-executive Directors | | | | | | | | | | | | | | | | | | | | | | | | |
E.J. Bärtschi | | | 68 | | | | - | | | | 48 | | | | 116 | | | | 105 | | | | 15 | |
W.P. Egan | | | 68 | | | | - | | | | 52 | | | | 120 | | | | 120 | | | | 120 | |
U-H. Felcht | | | 68 | | | | - | | | | 37 | | | | 105 | | | | 105 | | | | 105 | |
N. Hartery (d) | | | 68 | | | | 23 | | | | 382 | | | | 473 | | | | 305 | | | | 124 | |
J.M. de Jong | | | 68 | | | | - | | | | 60 | | | | 128 | | | | 139 | | | | 139 | |
J.W. Kennedy | | | 68 | | | | - | | | | 37 | | | | 105 | | | | 105 | | | | 105 | |
D.A. McGovern Jr. (e) | | | 34 | | | | - | | | | 26 | | | | 60 | | | | - | | | | - | |
K. McGowan (d) | | | - | | | | - | | | | - | | | | - | | | | 145 | | | | 405 | |
H.A. McSharry (f) | | | 68 | | | | - | | | | 22 | | | | 90 | | | | 77 | | | | - | |
D.N. O’Connor | | | 68 | | | | - | | | | 56 | | | | 124 | | | | 112 | | | | 90 | |
J.M.C. O’Connor (g) | | | - | | | | - | | | | - | | | | - | | | | - | | | | 31 | |
W.I. O’Mahony (g) | | | - | | | | - | | | | - | | | | - | | | | - | | | | 103 | |
| | | | 578 | | | | 23 | | | | 720 | | | | 1,321 | | | | 1,213 | | | | 1,237 | |
| | | | | | | | | | | | |
(a) Fee levels for non-executive Directors were unchanged in 2013. (b) Benefits: In the case of Nicky Hartery the amount reflects the reimbursement of travel expenses from his residence to his Chairman’s office in Dublin, which have been grossed up for Irish tax purposes. (c) Other Remuneration: Includes remuneration for Chairman, Board Committee work and allowances for non-executive Directors based outside of Ireland. (d) Nicky Hartery became Chairman on 9 May 2012 succeeding Kieran McGowan who retired as a non-executive Director on the same date. (e) Don McGovern became a Director on 1 July 2013. (f) Heather Ann McSharry became a Director on 22 February 2012. (g) Joyce O’Connor retired on 4 May 2011 while Liam O’Mahony retired on 31 December 2011. |
Directors’ Remuneration Report| continued
Other Disclosures
Fees Paid to Former Directors
No payments have been made to former Directors in excess of the de minimis threshold of €20,000 per annum agreed by the Committee.
Executives’ External Appointments
Maeve Carton is a non-executive Director of the British and Irish Chamber of Commerce. Ms. Carton does not receive fees for carrying out this role.
Total Shareholder Return
The value at 31 December 2013 of €100 invested in 2003 and 2008 respectively, compared with the value of €100 invested in the Eurofirst 300 Index and the FTSE100 Index (which CRH joined in December 2011) is shown in the graphs in tables 35 and 36.
Compound TSR growth since the formation of the Group in 1970 (assuming the reinvestment of dividends) is 15.7%.
Remuneration Paid to Chief Executive in past five years
Table 32 shows the total remuneration paid to the Chief Executive in the period 2009 to 2013 inclusive and shows bonuses and vested long-term incentive awards as a percentage of the maximum bonus and award that could have been received in each year.
The percentage increase in the Chief Executive’s salary in the period 2009 to 2013 is set out in table 3 on page 88.
The percentage change in the Chief Executive’s salary, benefits and bonus between 2012 and 2013 was as follows:
| | | | |
Salary | | +2.6% | | |
Benefits | | 0% | | |
Bonus | | +9.9% | | |
The combined percentage change was +4.4%.
There was no change in the total average employment costs in respect of employees in the Group as a whole between 2012 and 2013.
Relative Importance of Spend on Pay
Table 33 sets out the amount paid by the Group in remuneration to employees compared to dividend distributions made to shareholders in 2012 and 2013. The average number of employees is set out in note 6 to the Consolidated Financial Statements on page 138.
TheRemuneration Committee and Advisors
The non-executive Directors who were members of theRemuneration Committee during 2013 are identified on page 85. There have been no changes in the membership of theRemuneration Committee to date in 2014. The attendance record at Committee meetings is set out on page 80.
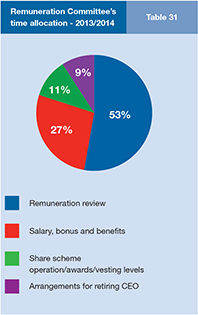
Work of Committee in period between February 2013 and February 2014
Between February 2013 and February 2014 theRemuneration Committee has met nine times. Table 31 sets out how theRemuneration Committee allocated its time in the last 12 months. An overview of the remuneration review process, which was a significant focus for the Committee during this period, and the outcome of the review, is set out in the Remuneration Review section in the Committee Chairman’s statement on page 86.
Risk Policies and Systems
During 2013, the Chairman of theRemuneration Committee reviewed with theAudit Committeethe proposed changes to the Group’s remuneration structures, outlined in the Committee Chairman’s statement, from a risk perspective.
Remuneration Consultants
Prior to commencing work on the remuneration review, the Committee invited a number of leading experts to tender for the role of its remuneration advisor. Deloitte LLP was appointed. Deloitte are signatories to the Voluntary Code of Conduct in relation to executive remuneration consulting in the UK. The Committee is comfortable that the advice provided by Deloitte is robust and independent and that the Deloitte engagement partner and team that provide remuneration advice to the Committee do not have connections with CRH plc that may impair their independence.
During 2013 and to date in 2014, Deloitte provided the following remuneration services:
| – | analysis of CRH’s existing remuneration structures; |
| – | research and advice regarding remuneration trends, best practice and remuneration levels for executive and non-executive Directors in companies of similar size and complexity; |
| – | guidance and advice in relation to the development of revised remuneration proposals and support services in relation to the shareholder consultation process; |
| – | preparation of rules of share incentive plans for executive Directors and below-Board executives, and the rules of the bonus deferral plan; |
| – | analysis of TSR workings in respect of vesting tests for the 2009 Chief Executive Long-Term Incentive Plan and awards under the 2006 Performance Share Plan; |
| – | advice in relation to remuneration matters generally; and |
| – | attendance at Committee meetings, when required. |
Deloitte also provide other consultancy services to the Company in relation to support for Internal Audit, when required, and in respect of talent management and human resources, taxation and sustainability.
In respect of work carried out by Deloitte on behalf of theRemuneration Committee in 2013, fees in the amount of €177,200 were incurred. Work in respect of the remuneration review was charged on the basis of fees agreed during the tender process. Additional work was based on time taken and expenses incurred.
Prior to the appointment of Deloitte, theRemuneration Committee’s advisor was Mercer.
2013 Annual General Meeting “Say on Pay” Vote
The voting outcome in respect of CRH’s “Say on Pay” resolutions since the introduction of the vote at the Annual General Meeting in 2010 is set out in table 34. The percentage of votes in favour at the 2013 Annual General Meeting was 97.8%, while the percentage of votes cast against the resolution was 2.2%. The number of votes withheld was 1,602,077 (0.2% of issued share capital). The total of votes in favour, against and withheld in respect of the 2013 “Say on Pay” resolution was 510,517,534 (70% of the shares in issue, excluding Treasury Shares).
As referred to in the Chairman’s introduction to the Corporate Governance Report on page 66, the Chairman and theRemuneration Committee Chairman met with a number of the Group’s major shareholders in advance of the 2013 Annual General Meeting. No issues of concern in relation to remuneration arose. As the voting was overwhelmingly in favour of the
Directors’ Remuneration Report| continued
| | |
“Say on Pay” resolution, following the meeting the Committee determined that there were no concerns with the Group’s remuneration structures that required investigation. The factors which led to the remuneration review carried out following the 2013 Annual General Meeting are set out in the Committee Chairman’s statement on page 86. * Defined as earnings before interest, taxes, depreciation, amortisation, asset impairment charges, profit on disposals and the Group’s share of equity accounted investments’ result after tax. | | 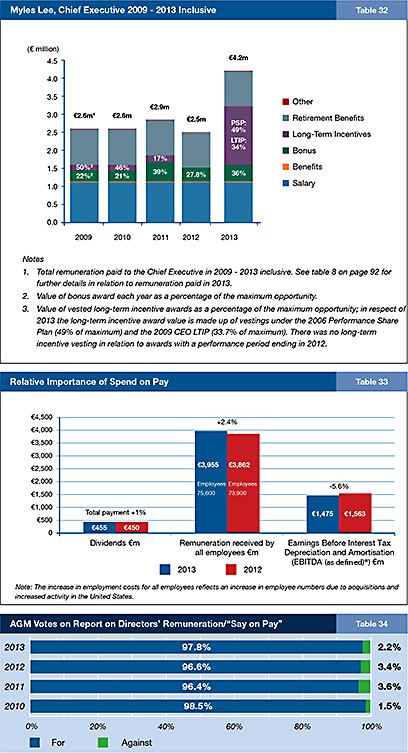 |
Directors’ Remuneration Report| continued
| (i) | For the purposes of comparability, the FTSE100 Index has been converted to euro using the closing exchange rate at each year end. |
Details of remuneration charged against profit in 2013
| | | | | | | | | | | | | | | | |
Directors’ Remuneration1(Audited) | | | | | | | | Table 37 | | | |
| | | | | |
| | | | | 2013 | | | 2012 | | | 2011 | | | |
| | | | | € 000 | | | € 000 | | | € 000 | | | |
| | | | | |
Notes | | | | | | | | | | | | | | | | |
| | Executive Directors | | | | | | | | | | | | | | |
| | Basic salary | | | 3,591 | | | | 3,512 | | | | 3,398 | | | |
| | Performance-related incentive plan | | | | | | | | | | | | | | |
| | - cash element | | | 1,833 | | | | 1,540 | | | | 1,559 | | | |
| | - deferred shares element | | | 54 | | | | - | | | | - | | | |
| | Retirement benefits expense | | | 1,660 | | | | 1,645 | | | | 1,727 | | | |
| | Benefits | | | 126 | | | | 128 | | | | 135 | | | |
| | | | | 7,264 | | | | 6,825 | | | | 6,819 | | | |
| | | | | |
| | Provision for Chief Executive Long-Term Incentive Plan2 | | | (1,062 | ) | | | 460 | | | | 460 | | | |
| | Total executive Directors’ remuneration | | | 6,202 | | | | 7,285 | | | | 7,279 | | | |
| | | | | |
| | Average number of executive Directors | | | 4.00 | | | | 4.00 | | | | 4.00 | | | |
| | | | | |
| | Non-executive Directors | | | | | | | | | | | | | | |
| | Fees | | | 578 | | | | 557 | | | | 578 | | | |
| | Other remuneration | | | 720 | | | | 656 | | | | 659 | | | |
| | Benefits | | | 23 | | | | - | | | | - | | | |
| | Total non-executive Directors’ remuneration | | | 1,321 | | | | 1,213 | | | | 1,237 | | | |
| | | | | |
| | Average number of non-executive Directors | | | 8.50 | | | | 8.20 | | | | 8.52 | | | |
| | | | | |
| | Payments to former Directors3 | | | 23 | | | | 29 | | | | 47 | | | |
| | Total Directors’ remuneration | | | 7,546 | | | | 8,527 | | | | 8,563 | | | |
| | |
Notes to Directors’ remuneration 1 See analysis of 2013 remuneration by individual in tables 8 and 30. 2 As set out on page 95, former Chief Executive Myles Lee had a special long-term incentive plan tied to the achievement of exceptional growth and key strategic goals for the five-year period 2009 to 2013 with a total maximum earnings potential of 40% of aggregate basic salary, amounting to a potential €2,312,000. As detailed on page 96, the actual earnings under this plan amount to €778,127, payment of which will be made in 2014. Annual provisions of 40% of basic salary were made in respect of this plan for the years 2009 through 2012 amounting in total to €1,840,000. The difference between the total provided for and the sum paid, which amounts to €1,061,873, is reflected as a reduction in the amount of total Directors’ remuneration for 2013. 3 Consulting and other fees paid to a number of former Directors. | | |
Directors’ Remuneration Report| continued
Remuneration Policy Report
The following sets out the Group’s Directors’ Remuneration Policy (the “Policy”). As an Irish-incorporated company, CRH is not required to comply with section 439A of the UK Companies Act 2006 which requires UK companies to submit their remuneration policy to a binding shareholder vote. However, maintaining high levels of corporate governance is important to CRH and, therefore, the Company intends to submit this Policy to an advisory shareholder vote at the 2014 Annual General Meeting. The Committee’s intention is to operate within this Policy unless it is not practical to do so in exceptional circumstances. As an Irish-incorporated company, CRH cannot rely on the statutory provisions applicable to UK companies under the 2013 UK Regulations which, in certain circumstances, can resolve any inconsistency between a remuneration policy and any contractual or other right of a Director. In the event there were to be such an inconsistency the Company may be obliged to honour any such right, notwithstanding it may be inconsistent with the Policy. This Policy will apply to payments made from the date of the 2014 Annual General Meeting.
TheRemuneration Committee’s aim is to make sure that CRH’s pay structures are fair, responsible and competitive, in order that CRH can attract and retain staff of the calibre necessary for it to compete in all of its markets.
The Group’s remuneration structures are designed to drive performance and link rewards to responsibility and the individual contribution of executives. It is policy to grant participation in the Group’s performance-related plans to key management to encourage identification with shareholders’ interests and to create a community of interest among different regions and nationalities.
The Policy, which is derived from the overall Group policy, is designed to:
| – | help attract and retain Directors of the highest calibre who can bring their experience and independent views to the policy, strategic decisions and governance of CRH; |
| – | properly reward and motivate executive Directors to perform in the long-term interest of the shareholders; |
| – | provide an appropriate blend of fixed and variable remuneration and short and long-term incentives for executive Directors; |
| – | complement CRH’s strategy of fostering entrepreneurship in its regional companies by rewarding the creation of shareholder value through organic and acquisitive growth; |
| – | reflect the spread of the Group’s operations so that remuneration packages in each geographical area are appropriate and competitive for that area; and |
| – | reflect the risk policies of the Group. |
In setting remuneration levels, theRemuneration Committee takes into consideration the remuneration practices of other international companies of similar size and scope and trends in executive remuneration generally, in each of the regions in which the Company operates. TheRemuneration Committee also takes into account the EU Commission’s recommendations on remuneration in listed companies.
Directors’ Remuneration Report| continued
| | | | | | | | |
| Policy table | | Further details regarding the operation of the Policy for the 2014 financial year can be found on pages 88 to 91 of the Annual Statement on Remuneration |
| | Fixed | | | | | | |
Element | | Base salary | | | | Pension | | |
| | | | |
Purpose and link to strategy | | • Competitive salaries help to attract and retain staff with the experience and knowledge required to enable the Group to compete in its markets. | | | | • Pension arrangements provide competitive and appropriate retirement plans. • Given the long-term nature of the business, pension is an important part of the remuneration package to support creation of value and succession planning. | | |
| | | | |
| Operation | | • Base salaries are set by the Committee taking into account: – the size and scope of the executive Director’s role and responsibilities; – the individual’s skills, experience and performance; – salary levels at FTSE listed companies of a similar size and complexity to CRH and other international construction and building materials companies; and – pay and conditions elsewhere in the Group. • Base salary is normally reviewed annually with changes generally effective on 1 January, although the Committee may make an out-of-cycle increase if it considers it to be appropriate. | | | | • Irish-based executive Directors participate in a contributory defined benefit scheme. • The US-based executive Director participates in a defined contribution scheme and in an unfunded Supplemental Executive Retirement Plan (SERP). • The defined benefit scheme which the Directors participate in is closed to new entrants. • For new appointments to the Board, the Committee may determine that alternative pension provisions will operate (for example a defined contribution scheme or cash contribution). When determining pension arrangements for new appointments, the Committee will give regard to existing entitlements, the cost of the arrangements, market practice and the pension arrangements received elsewhere in the Group. | | |
| | | | |
Maximum opportunity | | • Base salaries are set at a level which the Committee considers to be appropriate taking into consideration the factors outlined in the “operation” section. • While there is no maximum base salary, normally increases will be in line with the typical level of increase awarded to other employees in the Group but may be higher in certain circumstances. These circumstances may include: – where a new executive Director has been appointed at a lower salary, higher increases may be awarded over an initial period as the executive Director gains in experience and the salary is moved to what the Committee considers is an appropriate positioning; – where there has been a significant increase in the scope or responsibility of an executive Director’s role or where an individual has been internally promoted, higher salary increases may be awarded; and – where a larger increase is considered necessary to reflect significant changes in market practice. | | | | • The defined benefit pension is provided through an Irish Revenue approved retirement benefit scheme up until the pension cap established in the Finance Act 2006 (see details on page 90). Accrued benefits for service to 31 December 2011 are based on pensionable salary and years of service as at that date (annual accrual of 1/60th), with this tranche being revalued annually at the Consumer Price Index subject to a 5% ceiling. For service subsequent to that date, a career-average revalued earnings system was introduced with each year of service being subject to annual revaluation on the same basis as outlined above. Irish-based executive Directors receive a supplementary taxable non-pensionable cash allowance in lieu of pension benefits foregone as a result of the pension cap. These allowances are similar in value to the reduction in the Company’s liability represented by the pension benefit foregone. Whilst there is no absolute maximum to the quantum of these payments they are calculated based on actuarial advice as the equivalent of the reduction in the Company’s liability to each individual and spread over the term to retirement as annual compensation allowances. • The US-based executive Director participates in a defined contribution retirement plan in respect of basic salary; and in addition he participates in an unfunded defined contribution SERP also in respect of basic salary, to which contributions are made at an agreed rate (20%), offset by contributions made to the other retirement plan. | | |
| | | | |
Performance measures | | n/a | | | | n/a | | |
Directors’ Remuneration Report| continued
| | | | | | |
| | | | Table 38 | | |
| | | |
| | | | | | |
| | | Benefits | | |
| | |
| | | • To provide a market-competitive level of benefits for executive Directors. | | |
| | |
| | | • The Committee’s policy is to set benefit provision at an appropriate market competitive level taking into account market practice, the level of benefits provided for other employees in the Group, the individual’s home jurisdiction and the jurisdiction in which the individual is based. • Employment-related benefits include the use of company cars (or a car allowance), medical insurance for the Director and his/her family/life assurance. • In the event that the Chief Executive falls ill or is injured in such a way as which would constitute ill-health or disablement so that the Chief Executive could not work for a period of more than six months, in lieu of the early ill-health retirement provisions in the pension scheme which would otherwise operate in such cases, he shall be entitled to receive a disability salary of€1,000,000 per annum. Such payment would cease when the Chief Executive reaches age 60, returns to work or if the service agreement is terminated. • The Chief Executive, Oldcastle, Inc. also receives benefits in relation to club membership and short-term disability insurance. • Benefits may also be provided in respect of legal fees incurred in respect of agreeing service contracts, or similar agreements (for which the Company may settle any tax incurred by the executive Director) and a gift on retirement. • The Committee may remove benefits that executive Directors receive or introduce other benefits if it is considered appropriate to do so. The Company may also pay the tax due on benefits if it considers that it is appropriate to do so. • All-employee share schemes – executive Directors are eligible to participate in the Company’s all-employee share schemes on the same terms as other employees. • Relocation policy – Where executive Directors are required to relocate to take up their role, the Committee may determine that they should receive appropriate relocation and ongoing expatriate benefits. The level of such benefits would be determined based on individual circumstances taking into account typical market practice. | | |
| | |
| | | • The level of benefit provided will depend on the cost of providing individual items and the individual’s circumstances, and therefore the Committee has not set a maximum level of benefits. | | |
| | |
| | n/a | | |
Directors’ Remuneration Report| continued
| | | | |
Policy tablecontinued | | |
| | Performance-related pay | | |
Element | | Annual Bonus Plan | | |
| | |
Purpose and link to strategy | | • The Annual Performance-related Incentive Plan is designed to reward the creation of shareholder value through operational excellence and organic and acquisitive growth. The Plan incentivises executive Directors to deliver Group and individual goals that support long-term value creation. • A Deferred Annual Performance-related Incentive Plan element links the value of executive Directors’ reward with the long-term performance of the CRH share price and aligns the interests of executive Directors with shareholders’ interests. • A ‘malus’ provision enables the Company to mitigate risk. | | |
| | |
| Operation | | • The Annual Performance-related Incentive Plan rewards executive Directors for meeting Company performance goals over a financial year of the Company. Targets are set annually by the Committee. • The annual bonus is paid in a mix of cash and shares (structured as a deferred share award). • For 2014: – 75% of the bonus will be paid in cash; and – 25% will be paid in shares. • In future years, the Committee may determine that a different balance between cash and shares is appropriate and adjust the relevant payments accordingly. • When assessing performance and determining bonus payouts the Committee also considers the underlying financial performance of the business to ensure it is consistent with the overall award level. • The deferred element of the bonus will be structured as a conditional share award or nil-cost option and will normally vest after three years from grant (or a different period determined by the Committee). Deferred share awards may be settled in cash. • Dividend equivalents may be paid on deferred share awards in respect of dividends paid during the vesting period. These payments may be made in cash or shares and may assume the reinvestment of dividends on a cumulative basis. • For deferred awards granted from 2014, malus provisions apply (see below). Cash bonus payments may be subject to clawback of the net amount paid for a period of three years from payment. | | |
| | |
Maximum opportunity | | • Maximum annual opportunity of 150% of base salary. | | |
| | |
Performance measures | | • The Annual Performance-related Incentive Plan is based on achieving clearly defined and stretching annual targets and strategic goals set by the Committee each year based on key business priorities. • The performance metrics used are a mix of financial targets including return goals and personal/strategic objectives generally including safety. Currently 80% of the bonus is based on financial performance measures. The Committee may vary the weightings of measures but no less than 50% shall be based on financial performance measures. • A portion of the bonus metrics for any Director may be linked to his/her specific area of responsibility. • Up to 50% of the maximum bonus will be paid for achieving target levels of performance. | | |
Directors’ Remuneration Report| continued
| | | | | | |
| | | | Table 38 | | |
| | | |
| | | | | | |
| | | 2014 Performance Share Plan (PSP) | | |
| | |
| | | • The role of the PSP is to align the interest of key management across different regions and nationalities with those of shareholders through an interest in CRH shares and by incentivising the achievement of long-term performance goals. | | |
| | |
| | | • Awards (in the form of conditional share awards or nil-cost options) normally vest based on performance over a period of not less than three years. Awards may also be settled in cash. • Awards are normally subject to an additional holding period ending on the fifth anniversary of the grant date (or another date determined by the Committee). • Dividend equivalents may be paid on PSP awards that vest in respect of dividends paid during the vesting period until the end of the holding period. These payments may be made in cash or shares and may assume reinvestment on a cumulative basis. • For 2014 awards onwards, malus provisions (as set out in the rules of the PSP) will apply to awards (see below). | | |
| | |
| | | • The normal maximum award is 250% of salary per annum. In exceptional circumstances, the Committee may grant awards of up to 350% of base salary. • For 2014 the intended award levels are: – Chief Executive – 250% of base salary – Other executive Directors – 200% of base salary | | |
| | |
| | | • Awards to be granted in 2014 will vest based on a relative TSR compared to key peers and cumulative cash flow performance. • For threshold levels of performance 25% of the award vests with straight-line vesting to maximum. • When determining vesting under the PSP the Committee will review whether the TSR performance has been impacted by unusual events and whether it, therefore, reflects the underlying performance of the business. In addition, the Committee will consider financial performance (including EPS) in the period to ensure that TSR performance is consistent with the objectives of the performance criteria and was not distorted by extraneous factors. • The Committee may amend the performance conditions if an event occurs that causes it to consider that an amended performance condition would be more appropriate and would not be materially less difficult to satisfy. | | |
Directors’ Remuneration Report| continued
Plan Rules
The Deferred Annual Performance-related Incentive Plan, the Performance Share Plans and the Share Option Schemes shall be operated in accordance with the relevant plan rules. The rules for the 2014 Performance Share Plan (the “2014 PSP”) will be put forward for shareholder approval at the 2014 Annual General Meeting. Awards may be (a) adjusted in accordance with the rules in the event of a variation of the Company’s share capital, merger, de-merger, special dividend or other event that, in the opinion of the Committee, materially affects the price of shares and (b) amended in accordance with the 2014 PSP rules.
Clawback/Malus
For Deferred Annual Performance-related Incentive Plan awards and Performance Share Plan awards granted from 2014 onwards, the Committee has the discretion to reduce or impose further conditions on awards prior to vesting in certain circumstances, including:
| – | a material misstatement of the Company’s audited financial results; |
| – | a material failure of risk management; or |
| – | serious reputational damage to the Company or one of its businesses as a result of a participant’s misconduct or otherwise. |
Cash bonus payments may be subject to clawback of the net amount paid for a period of three years from payment in the circumstances outlined above.
Other elements of remuneration are not subject to clawback or malus provisions.
Minor Amendments
The Committee may make minor changes to this Policy for regulatory, exchange control, tax or administrative purposes or to take account of a change in legislation without seeking shareholder approval for that amendment.
Legacy Awards
Prior to the implementation of the 2014 PSP, awards were granted under the 2006 Performance Share Plan (the “2006 PSP”), which was approved at the 2006 Annual General Meeting. Awards under this plan may continue to vest under this Policy. It is not intended that further awards will be granted under the 2006 PSP.
Awards under the 2006 PSP were granted in the form of conditional shares and vest subject to meeting relative TSR performance conditions over a three-year performance period. 50% of awards are based on TSR compared to the constituents of the Eurofirst 300 Index with 50% of awards being based on TSR compared to a bespoke group of peer companies (details of which are set out in table 14 in the Annual Statement on
Remuneration). 30% vests for median performance with 100% vesting for upper quartile performance (straight-line vesting in-between). Awards will only vest if the Committee is satisfied that the Company’s TSR performance has not been significantly affected by unusual events and the Company’s EPS growth is consistent with the objectives of the performance assessment. Whilst the current intention of the Committee is to settle the awards in shares, it may also satisfy awards in cash.
There are no clawback or malus provisions in the 2006 PSP.
Executive Directors also have outstanding awards under the 2010 Share Option Scheme, which was approved by shareholders at the 2010 Annual General Meeting. This Scheme is no longer in use. Awards were granted in the form of market value options and vest subject to EPS growth performance over a three-year performance period. At vesting the Committee has the discretion to adjust the level of vesting of awards in the event that the Committee considers that this is appropriate (in exceptional circumstances such as changes to accounting policies or unforeseen developments) or to reduce the vesting level where appropriate to reflect factors such as the participant’s contribution to the Group. The Committee may also vary, substitute or waive the performance conditions applicable to an award if it considers that they are no longer appropriate and the varied or substituted condition would be a fairer measure and neither more or less difficult to satisfy.
There are also market value options outstanding for executive Directors under the 2000 Share Option Scheme (approved by shareholders at the 2000 Annual General Meeting). Awards vest based on meeting EPS performance goals over three consecutive years during the life of the option. No further options may be granted under this Scheme. Details of the outstanding 2006 PSP awards and the options granted under the 2000 and 2010 Option Schemes are set out in tables 25 and 26 of the Annual Statement on Remuneration.
General
In addition to any payments required to be made pursuant to any applicable employment laws, theRemuneration Committee reserves the right to make any remuneration payments and payments for loss of office (including exercising any discretions available to it in connection with such payments) notwithstanding that they are not in line with the Policy set out in this report where the terms of the payment were agreed (i) before the policy came into effect or (ii) at a time when the relevant individual was not a Director of the Company and, in the opinion of the Committee, the payment was not in consideration for the
individual becoming a Director of the Company. For these purposes “payments” includes the Committee satisfying awards of variable remuneration and an award over shares is “agreed” at the time the award is granted.
Information Supporting the Policy Table
Selection of Performance Measures
(i) Annual Bonus
Annual incentive plan targets are selected each year to incentivise executive Directors to achieve annual financial, operational, strategic and personal goals across a range of metrics which are considered important for delivering long-term performance excellence.
(ii) Performance Share Plan
The ultimate goal of our strategy is to provide long-term sustainable value for all of our shareholders. Performance measures for PSP awards to be granted in 2014 are, therefore, focussed on achieving relative outperformance of TSR against our key peers and generating cash in the business to support further investment and dividend payments to shareholders.
Targets for the Annual Bonus and PSP are set each year by the Committee taking into account internal plans and external expectations. Targets are calibrated to be stretching but motivational to management and to be aligned with the long-term creation of shareholder value.
Remuneration Arrangements throughout the Group
CRH employs approximately 76,000 people at over 3,400 locations around the world. Remuneration arrangements throughout the organisation therefore differ depending on the specific role being undertaken, the level of seniority and responsibilities, the location of the role and local market practice. However, remuneration arrangements are designed based on the principle that reward should be set at a level which is appropriate to retain and motivate individuals of the necessary calibre to fulfil the roles without paying more than is considered necessary to achieve this. The reward framework is designed to incentivise employees to deliver the requirements of their roles and add value for shareholders.
The Group operates Share Participation Plans and Savings-related Share Option Schemes for eligible employees in all regions where the regulations permit the operation of such plans. In total there are approximately 6,500 employees of all categories who are shareholders in the Group.
Directors’ Remuneration Report| continued
| | | | | | | | | | |
| | Remuneration Policy for non-executive Directors | | | | Table 39 |
| | Approach to setting fees | | Basis of fees | | Other items | | | | |
| | | | |
| | • The remuneration of non-executive Directors is determined by a Board committee of the Chairman and the executive Directors. • TheRemuneration Committee determines the remuneration of the Chairman within the framework or broad policy agreed with the Board. • Remuneration is set at a level which will attract individuals with the necessary experience and ability to make a substantial contribution to the Company’s affairs and reflect the time and travel demands of Board duties. • Fees are set taking into account typical practice at other companies of a similar size and complexity to CRH. • Fees are reviewed at appropriate intervals. | | • Fees are paid in cash. • Non-executive Director fees policy is to pay: – a basic fee for membership of the Board; – an additional fee for chairing a Committee; – an additional fee for the role of Senior Independent Director (SID) (if the SID is not the Chairman of the Remuneration Committee); – an additional fee to reflect committee work (combined fee for all committee roles); and – an additional fee based on the location of the Director to reflect time spent travelling to Board meetings. • Other fees may also be paid to reflect other Board roles or responsibilities. • In accordance with the Articles of Association, shareholders set the maximum aggregate amount of the fees payable to non-executive Directors. The current limit of€750,000 was set by shareholders at the Annual General Meeting held in 2005. | | • The non-executive Directors do not participate in any of the Company’s performance-related incentive plans or share schemes. • Non-executive Directors do not receive pensions. • The Group Chairman is reimbursed for expenses incurred in travelling from his residence to his CRH office. The Company settles any tax incurred on this on his behalf. • Non-executive Directors do not currently receive any benefits. However, benefits may be provided in the future if, in the view of the Board (for non-executive Directors or for the Chairman), this was considered appropriate. The Company may settle any tax due on benefits. | | |
Remuneration Policy for New Hires
CRH has a strong history of succession planning and developing internal executive talent.
The Committee’s key principle when determining appropriate remuneration arrangements for a new executive Director (appointed from within the organisation or externally) is that arrangements are in the best interests of both CRH and its shareholders without paying more than is considered necessary by the Committee to recruit an executive of the required calibre to develop and deliver the business strategy.
The Committee would generally seek to align the remuneration package offered with our remuneration policy outlined in table 38. Although in exceptional circumstances, the Committee may make remuneration proposals on hiring a new executive Director which are outside the standard policy to facilitate the hiring of someone of the calibre required to deliver the Group’s strategy. When determining appropriate remuneration arrangements the Committee will take into account all relevant factors including (among others) the level of opportunity, the type of remuneration opportunity being forfeited and the jurisdiction the candidate was recruited from. Any remuneration offered would be within the limit on variable pay outlined below.
Variable remuneration in respect of an executive Director’s appointment shall be limited to 500% of base salary measured at the time of award. This limit is in line with the Plan maximum outlined in table 38. This limit excludes any awards made to compensate the Director for awards forfeited from his or her previous employer.
The Committee may make awards on appointing an executive Director to buy-out remuneration terms forfeited on leaving a previous employer. In doing so, the Committee will take account of relevant factors including any performance conditions attached to these awards, the form in which they were granted (e.g. cash or shares) and the time over which they would have vested. The Committee’s key principle is that buy-out awards will generally be made on a comparable basis to those forfeited.
To facilitate awards outlined above, the Committee may grant awards under Company incentive schemes or under Listing Rule 9.4.2 which allows for the granting of awards, to facilitate, in unusual circumstances, the recruitment of an executive Director, without seeking prior shareholder approval or under other relevant company incentive plans. The use of Listing Rule 9.4.2 shall be limited to buy-out awards.
In the event that an internal candidate is promoted to the Board, legacy terms and conditions will normally be honoured, including pension entitlements and any outstanding incentive awards.
In the event of the appointment of a new Chairman or non-executive Director, remuneration arrangements will normally reflect the policy outlined above for the Chairman and non-executive Directors. Other remuneration arrangements may be provided to a new Chairman or non-executive Director if these arrangements are considered appropriate in accordance with the principles set out above.
Directors’ Remuneration Report| continued
| | | | |
Remuneration Outcomes in Different Performance Scenarios Remuneration at CRH consists of fixed pay (salary, pension and benefits), short-term variable pay and long-term variable pay. A significant portion of executive Directors’ | | remuneration is linked to the delivery of key business goals over the short and long-term and the creation of shareholder value. Tables 41 to 43 show hypothetical values of the remuneration package for executive Directors under three assumed performance scenarios. | | No share price growth or the payment of dividend equivalents has been assumed in these scenarios. Potential benefits under all employee share schemes have not been included. |
| | | | | | | | |
| | Performance Scenario | | Payout Level | | Table 40 |
| | | Minimum | | • No bonus payout • No vesting under the Performance Share Plan | | |
| | | On-Target Performance | | • 50% annual bonus payout (75% of salary) • 25% vesting under the Performance Share Plan (62.5% of salary for the Chief Executive and 50% for other Directors) | | |
| | Maximum Performance | | • 100% annual bonus payout (150% of salary) • 100% Performance Share Plan vesting (250% of salary for the Chief Executive and 200% for other Directors) | | |
| | | | | | | | |
Fixed Pay | | | | | | Table 44 |
| | | Salary with effect from 1 January 2014 | | Benefits paid in 2013 | | Pension | | Total Fixed Pay |
| | | | |
Chief Executive (Albert Manifold) | | € 1,200,000 | | € 31,000 | | € 550,000 | | € 1,781,000 |
| | | | |
Finance Director (Maeve Carton) | | € 625,000 | | € 13,000 | | € 243,000 | | € 881,000 |
| | | | |
Chief Executive, Oldcastle, Inc. (Mark Towe) | | US$1,377,000 | | US$79,000 | | US$275,400
(20%) | | US$1,731,400 |
Directors’ Remuneration Report| continued
| | | | | | | | |
| | Chief Executive Service Contract | | Table 45 | | |
| | | Notice period | | • 12 months’ notice by the Company or the executive. | | |
| | | Expiry date | | • Indefinite duration. • Terms of contract will automatically terminate on the executive’s 62ndbirthday. | | |
| | | Termination
payments | | • On lawful termination of employment, the Committee may, at its absolute discretion, make a termination payment in lieu of 12 months’ notice based on base salary, benefits and pension contribution due during that period. • Where the Company terminates the contract lawfully without notice then no payment in lieu of notice shall be due. • If, in the event of a change of control, there is a diminution in the role and responsibilities of the Chief Executive, he may terminate the contract; on such termination a payment equal to one year’s remuneration (being salary, pension, other benefits and vested incentive awards) will be made to the executive. | | |
| | | Disability | | • In the event that the Chief Executive falls ill or is injured in such a way as which would constitute ill-health or disablement so that the Chief Executive could not work for a period of more than six months, in lieu of the early ill-health retirement provisions in the pension scheme which would otherwise operate in such cases, he shall be entitled to receive a disability salary of€1,000,000 per annum. Such payment would cease when the Chief Executive reaches age 60, returns to work or if the service agreement is terminated. | | |
| | Other information | | • The Company retains the ability to suspend the executive from employment on full salary and to require the executive to observe a period of “garden leave” of up to 12 months on full salary, contractual benefits and pension contribution. | | |
Executive Director Service Contracts and Policy on Payment for Loss of Office
When determining leaving arrangements for an executive Director the Committee takes into account any contractual agreements (including any incentive arrangements) and the performance and conduct of the individual.
Service Contracts
It is intended that the Chief Executive will enter into a service contract during the course of 2014. It is anticipated that the summary in table 45 will represent the key remuneration terms of this contract. However, some minor terms may differ.
The Finance Director (Maeve Carton) and Chief Executive, Oldcastle, Inc. (Mark Towe) do not currently have service contracts. The Committee will therefore determine the amount paid on termination taking into account the circumstances around departure and the prevailing employment law circumstances.
The Committee’s policy in this area is that service contracts will be put in place for newly appointed executive Directors and in cases where there is a significant step change in Directors’ responsibilities. It is currently anticipated that these terms will be similar to those agreed with the Chief Executive.
Under Irish company law, CRH is not required to make service contracts available for inspection as the notice period is less than 12 months. Service contracts will only be available with the executive Director’s consent due to data protection reasons.
Annual Bonus
Executive Directors may, at the discretion of the Committee, remain eligible to receive an Annual Performance-related Incentive Plan award for the financial year in which they leave employment. Such Annual Performance-related Incentive Plan award will be determined by the Committee taking into account time in employment and performance.
Share Plan Rules – Leaver Provisions
The treatment of outstanding share awards in the event that an executive Director leaves is governed by the relevant share plan rules. Table 46 summarises leaver provisions under the executive share plans.
“Good leaver” circumstances are defined in the 2014 PSP and deferred annual performance incentive plans as ill-health, injury, disability, the participants employing company or business being sold out of the Group or any other reason at the Committee’s absolute discretion (except where a participant is summarily dismissed).
Where an individual leaves by mutual agreement the Committee has discretion to determine the treatment of outstanding share awards.
Individuals who are dismissed for gross misconduct would not be treated as “good leavers”.
Under the 2000 Share Option Scheme, if a participant leaves employment in the event of death, retirement (on age or health grounds), redundancy, or in cases where a subsidiary is
divested, the Committee will determine the extent to which options vest. In cases of death and retirement, options may be exercised within 12 months of cessation of office of employment. In other circumstances, where the Committee uses its discretion to deem an individual a “good leaver” then the exercise window is six months. Where an individual ceases office or employment for other reasons, option awards will normally lapse.
Where an executive ceases employment as a result of summary dismissal they will normally forfeit outstanding share incentive awards.
The Committee may allow awards to vest early at its discretion in the event an executive Director is to be transferred to a jurisdiction where he would suffer a tax disadvantage or he would be subject to restrictions in connection with his award, the underlying shares or the sales proceeds.
Directors’ Remuneration Report| continued
| | | | | | | | | | | | |
Share Plans - Leaver Provisions | | | | | | Table 46 |
| | Death | | | | ‘Good leavers’ as determined by the Committee in accordance with the Plan rules | | | | Leavers in other circumstances | | |
| | | | | | | | | | | | |
Deferred Annual Performance Incentive Plan 2014 | | • Unvested awards vest, unless the Committee determines otherwise, to the extent determined by the Committee. • Awards in the form of nil-cost options may be exercised for 12 months from death (or another period determined by the Committee). | | | | • Awards shall normally vest in full at the normal vesting date. Alternatively, the Committee may determine that awards should vest in full at cessation of employment. • Where awards vesting in such circumstances are granted in the form of nil-cost options participants shall have six months from vesting to exercise their award. • Where awards have already vested at cessation of employment, participants shall have six months from cessation of employment to exercise their option. | | | | • Awards will lapse on the individual’s cessation of office or employment. |
2014 Performance Share Plan | | • Unvested awards shall vest as soon as practicable following death unless the Committee determines otherwise. The number of shares vesting shall be determined by the Committee taking into account the extent to which the performance condition has been met and, if the Committee determines, the length of time that has elapsed since the award was granted until the date of death (or if death occurs during an applicable holding period, to the beginning of the holding period). • Awards in the form of nil-cost options may be exercised for 12 months from death (or another period determined by the Committee). | | | | • Awards shall normally vest at the normal vesting date. Alternatively, the Committee may determine that awards should vest at the time the individual leaves. • The level of vesting shall be determined by the Committee taking into account the extent to which the performance condition has been met and, unless the Committee determines otherwise, the period of time that has elapsed since the date of grant until the date of cessation (or if cessation occurs during an applicable holding period, to the beginning of the holding period). • Awards vesting in such circumstances in the form of nil-cost options may be exercised for six months from vesting (or another period determined by the Committee). Where a nil-cost option was already vested at cessation of employment, participants may exercise such options for six months from cessation (or another period determined by the Committee). | | | | • Awards will lapse on the individual’s cessation of office or employment. |
Directors’ Remuneration Report| continued
| | | | | | | | | | | | |
| | | | | | Table 46 |
| | Death | | | | ‘Good leavers’ as determined by the Committee in accordance with the plan rules | | | | Leavers in other circumstances | | |
| | | | | | | | | | | | |
2010 Share Option Scheme | | • The Committee may determine the extent to which options shall vest. Options shall be exercisable for 12 months from vesting or from death (whichever is later). | | | | Retirement (for age or health reasons) • The Committee may determine the extent to which options may be exercised on the same terms as if the individual had not ceased to hold employment or office having determined the extent to which the performance conditions applicable to the award have been satisfied. Options shall be exercisable for 12 months from vesting or from the participant’s cessation (whichever is later). Redundancy, early retirement, sale of the individual’s employing subsidiary out of the Group or for any other reason determined by the Committee. • The Committee may determine the extent to which the option may be exercised having determined the extent to which the performance conditions applicable to the award have been satisfied. Options shall be exercisable for six months from vesting or cessation of employment (whichever is later). • Where a participant has ceased to hold office or employment because of health reasons, redundancy, retirement or sale of his employing subsidiary out of the Group, the Committee may waive any relevant performance conditions, in which case options may be scaled down by reference to the participant’s performance and the proportion of the relevant performance period the participant has served. | | | | • Awards will normally lapse. |
2006 Performance Share Plan (It is not intended that further awards will be made under this Plan) | | • Awards may vest to the extent determined by the Committee. | | | | Ill-health, injury, disability, redundancy, retirement, the sale of the entity or business that employs the individual out of the Group or for any other reason at the Committee’s discretion. • Awards may vest to the extent determined by the Committee. | | | | • Awards will normally lapse. |
Directors’ Remuneration Report| continued
Change of Control
In the event of a change of control of the Company, the Committee will determine the treatment of share awards.
In the event of a change of control of the Company:
| a) | awards granted under the 2014 PSP will vest taking into account the extent to which any performance condition has been satisfied and, unless the Committee determines otherwise, the period of time that has elapsed since grant and the relevant event (or if the event occurs during an applicable holding period, to the beginning of the holding period); |
| b) | awards granted under the 2014 Deferred Annual Performance-related Incentive Plan may, at the discretion of the Committee, vest in full; |
| c) | awards granted under the 2006 PSP may, at the discretion of the Committee, vest in full; |
| d) | options granted under the 2000 Share Option Scheme may be exercised to the extent determined by the Committee; and |
| e) | options granted under the 2010 Share Option Scheme may be exercised to the extent determined by the Committee and may be subject to personal performance and time pro-rating (by reference to the proportion of the performance period that has elapsed). |
If the Company is wound up or there is a demerger, delisting, special dividend or other similar event which the Committee considers may affect the price of the Company’s shares:
| a) | awards granted under the 2014 PSP may, at the Committee’s discretion, vest taking into account the extent to which any performance condition has been satisfied and, unless the Committee determines otherwise, the period of time that has elapsed since the date of grant and the relevant event (or if the event occurs during an applicable holding period, to the beginning of the holding period); |
| b) | awards granted under the 2014 Deferred Annual Performance-related Incentive Plan will vest to the extent the Committee determines; and |
| c) | awards granted under the 2006 PSP will also vest on a voluntary winding-up, merger or demerger of the Company to the extent determined by the Committee. |
Non-executive Director - Letters of Appointment
Non-executive Directors serve under letters of appointment, copies of which are available for inspection at the Company’s Registered Office and at the Annual General Meeting.
In line with the UK Corporate Governance Code, all non-executive Directors submit themselves for re-election by shareholders every year at the Annual General Meeting. All non-executive Director appointments can be terminated by either party without notice. There is no payment in lieu of notice provided.
Considering Employee Views
When setting remuneration policy for executive Directors, theRemuneration Committee reviews and has regard to the remuneration trends across the Group and considers how executive Director remuneration compares to that for all employees to ensure that the structure and quantum of executive pay remains appropriate in this context.
The Company does not currently consult directly with employees when developing the Directors’ remuneration policy and there is no current intention to do so in the future.
Consulting with Shareholders
The Committee believes that it is very important to maintain open dialogue with shareholders on remuneration matters. CRH made significant changes to remuneration arrangements during the year and consulted extensively with shareholders in relation to this. Shareholder views were important in shaping the final proposals.
The Committee will continue to liaise with shareholders regarding remuneration matters more generally and CRH arrangements as appropriate. It is the Committee’s intention to consult with major shareholders in advance of making any material changes to remuneration arrangements.
On behalf of the Board
Dan O’Connor
Chairman Remuneration Committee and Senior Independent Director

REPORT OF INDEPENDENT REGISTERED
PUBLIC ACCOUNTING FIRM
To the Board of Directors and Shareholders of CRH public limited company (CRH plc):
We have audited the accompanying Consolidated Balance Sheets of CRH plc as of 31 December 2013 and 2012, and the related Consolidated Income Statements and Consolidated Statements of Comprehensive Income, Changes in Equity and Cash Flows for each of the three years in the period ended 31 December 2013. These Consolidated Financial Statements are the responsibility of the Company’s management. Our responsibility is to express an opinion on these Consolidated Financial Statements based on our audits.
We conducted our audits in accordance with the standards of the Public Company Accounting Oversight Board (United States). Those standards require that we plan and perform the audit to obtain reasonable assurance about whether the Consolidated Financial Statements are free of material misstatement. An audit includes examining, on a test basis, evidence supporting the amounts and disclosures in the Consolidated Financial Statements. An audit also includes assessing the accounting principles used and significant estimates made by management, as well as evaluating the overall Consolidated Financial Statement presentation. We believe that our audits provide a reasonable basis for our opinion.
In our opinion, the Consolidated Financial Statements referred to above present fairly, in all material respects, the consolidated financial position of CRH plc at 31 December 2013 and 2012, and the consolidated results of its operations and its consolidated cash flows for each of the three years in the period ended 31 December 2013, in conformity with International Financial Reporting Standards as issued by the International Accounting Standards Board.
As described in Note 1 to CRH plc’s Consolidated Financial Statements, on 1 January 2013, CRH plc adopted International Financial Reporting Standard 11Joint Arrangements on a modified retrospective basis and the amendments to International Accounting Standard 19Employee Benefits (revised) on a retrospective basis, resulting in a revision to the 31 December 2012 Consolidated Balance Sheet, which includes disclosure of the 1 January 2012 Consolidated Balance Sheet, and the 31 December 2012 and 2011 Consolidated Income Statements, Statements of Comprehensive Income, Statements of Changes in Equity and Statements of Cash Flows.
We also have audited, in accordance with the standards of the Public Company Accounting Oversight Board (United States), CRH plc’s internal control over financial reporting as of 31 December 2013, based on criteria established in Internal Control-Integrated Framework issued by the Committee of Sponsoring Organisations of the Treadway Commission (1992 Framework) and our report dated 12 March 2014 expressed an unqualified opinion thereon.
ERNST & YOUNG
Dublin, Ireland
12 March 2014
REPORT OF INDEPENDENT REGISTERED PUBLIC ACCOUNTING FIRM ON INTERNAL CONTROL OVER FINANCIAL REPORTING
To the Board of Directors and Shareholders of CRH public limited company (CRH plc):
We have audited CRH plc’s internal control over financial reporting as of 31 December 2013, based on criteria established in Internal Control-Integrated Framework issued by the Committee of Sponsoring Organisations of the Treadway Commission (1992 Framework) (the “COSO criteria”). CRH plc’s management is responsible for maintaining effective internal control over financial reporting, and for its assessment of the effectiveness of internal control over financial reporting included in the accompanying Management’s Report on Internal Control over Financial Reporting. Our responsibility is to express an opinion on the Company’s internal control over financial reporting based on our audit.
We conducted our audit in accordance with the standards of the Public Company Accounting Oversight Board (United States). Those standards require that we plan and perform the audit to obtain reasonable assurance about whether effective internal control over financial reporting was maintained in all material respects. Our audit included obtaining an understanding of internal control over financial reporting, assessing the risk that a material weakness exists, testing and evaluating the design and operating effectiveness of internal control based on the assessed risk, and performing such other procedures as we considered necessary in the circumstances. We believe that our audit provides a reasonable basis for our opinion.
A company’s internal control over financial reporting is a process designed to provide reasonable assurance regarding the reliability of financial reporting and the preparation of Consolidated Financial Statements for external purposes in accordance with generally accepted accounting principles. A company’s internal control over financial reporting includes those policies and procedures that (1) pertain to the maintenance of records that, in reasonable detail, accurately and fairly reflect the transactions and dispositions of the assets of the company; (2) provide reasonable assurance that transactions are recorded as necessary to permit preparation of Consolidated Financial Statements in accordance with generally accepted accounting principles, and that receipts and expenditures of the company are being made only in accordance with authorisations of management and directors of the company; and (3) provide reasonable assurance regarding prevention or timely detection of unauthorised acquisition, use, or disposition of the company’s assets that could have a material effect on the Consolidated Financial Statements.
Because of its inherent limitations, internal control over financial reporting may not prevent or detect misstatements. Also, projections of any evaluation of effectiveness to future periods are subject to the risk that controls may become inadequate because of changes in conditions, or that the degree of compliance with the policies or procedures may deteriorate.
As indicated in the accompanying Management’s Report on Internal Control over Financial Reporting, management’s assessment of and conclusion on the effectiveness of internal control over financial reporting did not include the internal controls of business combinations completed during the year ended 31 December 2013, which are included in the 2013 Consolidated Financial Statements of CRH plc and constituted 2.4% and 3.5% of total and net assets, respectively, as of 31 December 2013 and 1.7% and 2.0% of revenues and loss for the financial year, respectively, for the year then ended. Our audit of internal control over financial reporting of CRH plc also did not include an evaluation of the internal control over financial reporting of business combinations completed during the year ended 31 December 2013.
In our opinion, CRH plc maintained, in all material respects, effective internal control over financial reporting as of 31 December 2013, based on the COSO criteria.
We also have audited, in accordance with the standards of the Public Company Accounting Oversight Board (United States), the 2013 Consolidated Financial Statements of CRH plc and our report dated 12 March 2014 expressed an unqualified opinion thereon.
ERNST & YOUNG
Dublin, Ireland
12 March 2014
Consolidated Income Statement
for the financial year ended 31 December 2013
| | | | | | | | | | | | | | | | |
| | | | | | 2013 €m | | | Restated* 2012 €m | | | Restated* 2011 €m | |
| | Notes | | | | | | | | | | | | | | | |
| | 2 | | | Revenue | | | 18,031 | | | | 18,084 | | | | 18,081 | |
| | 3 | | | Cost of sales | | | (13,314 | ) | | | (13,161 | ) | | | (13,179 | ) |
| | | | Gross profit | | | 4,717 | | | | 4,923 | | | | 4,902 | |
| | 3 | | | Operating costs | | | (4,617 | ) | | | (4,118 | ) | | | (4,031 | ) |
| | 2,4,6,7 | | | Group operating profit | | | 100 | | | | 805 | | | | 871 | |
| | 2,5 | | | Profit on disposals | | | 26 | | | | 230 | | | | 55 | |
| | | | Profit before finance costs | | | 126 | | | | 1,035 | | | | 926 | |
| | 9 | | | Finance costs | | | (262 | ) | | | (271 | ) | | | (262 | ) |
| | 9 | | | Finance income | | | 13 | | | | 15 | | | | 33 | |
| | 9 | | | Other financial expense | | | (48 | ) | | | (49 | ) | | | (41 | ) |
| | 10 | | | Share of equity accounted investments’ (loss)/profit | | | (44 | ) | | | (84 | ) | | | 42 | |
| | 2 | | | (Loss)/profit before tax | | | (215 | ) | | | 646 | | | | 698 | |
| | 11 | | | Income tax expense | | | (80 | ) | | | (106 | ) | | | (111 | ) |
| | | | Group (loss)/profit for the financial year | | | (295 | ) | | | 540 | | | | 587 | |
| | | | |
| | | | (Loss)/profit attributable to: | | | | | | | | | | | | |
| | | | Equity holders of the Company | | | (296 | ) | | | 538 | | | | 580 | |
| | | | Non-controlling interests | | | 1 | | | | 2 | | | | 7 | |
| | | | Group (loss)/profit for the financial year | | | (295 | ) | | | 540 | | | | 587 | |
| | | | |
| | 13 | | | Basic (loss)/earnings per Ordinary Share | | | (40.6c | ) | | | 74.6c | | | | 81.2c | |
| | | | |
| | 13 | | | Diluted (loss)/earnings per Ordinary Share | | | (40.6c | ) | | | 74.5c | | | | 81.2c | |
| | | | |
| | | | All of the results relate to continuing operations. | | | | | | | | | | | | |
Consolidated Statement of Comprehensive Income
for the financial year ended 31 December 2013
| | | | | | | | | | | | | | | | |
| | | | | | 2013 €m | | | Restated* 2012 €m | | | Restated* 2011 €m | |
| | Notes | | | | | | | | | | | | | | | |
| | | | Group (loss)/profit for the financial year | | | (295 | ) | | | 540 | | | | 587 | |
| | | | |
| | | | Other comprehensive income | | | | | | | | | | | | |
| | | | Items that may be reclassified to profit or loss in subsequent years: | | | | | | | | | | | | |
| | | | Currency translation effects | | | (373 | ) | | | (51 | ) | | | 107 | |
| | 25 | | | (Losses)/gains relating to cash flow hedges | | | (2 | ) | | | 1 | | | | (7 | ) |
| | | | | | | (375 | ) | | | (50 | ) | | | 100 | |
| | | | Items that will not be reclassified to profit or loss in subsequent years: | | | | | | | | | | | | |
| | 28 | | | Remeasurement of retirement benefit obligations | | | 162 | | | | (146 | ) | | | (259 | ) |
| | 11 | | | Tax on items recognised directly within other comprehensive income | | | (43 | ) | | | 23 | | | | 54 | |
| | | | | | | 119 | | | | (123 | ) | | | (205 | ) |
| | | | |
| | | | Total other comprehensive income for the year | | | (256 | ) | | | (173 | ) | | | (105 | ) |
| | | | |
| | | | Total comprehensive income for the financial year | | | (551 | ) | | | 367 | | | | 482 | |
| | | | |
| | | | Attributable to: | | | | | | | | | | | | |
| | | | Equity holders of the Company | | | (552 | ) | | | 366 | | | | 475 | |
| | | | Non-controlling interests | | | 1 | | | | 1 | | | | 7 | |
| | | | Total comprehensive income for the financial year | | | (551 | ) | | | 367 | | | | 482 | |
| | * | Details of the restatement are contained in the Accounting Policies on page 124 and in note 1 to the Consolidated Financial Statements. |
Consolidated Balance Sheet
as at 31 December 2013
| | | | | | | | | | | | | | | | |
| | | | | | 2013 €m | | | Restated* 2012 €m | | | Restated* as at 1 January 2012 €m | |
| | Notes | | | | | | | | | | | | | | | |
| | | | ASSETS | | | | | | | | | | | | |
| | | | Non-current assets | | | | | | | | | | | | |
| | 14 | | | Property, plant and equipment | | | 7,539 | | | | 7,971 | | | | 8,008 | |
| | 15 | | | Intangible assets | | | 3,911 | | | | 4,267 | | | | 4,148 | |
| | 16 | | | Investments accounted for using the equity method | | | 1,340 | | | | 1,422 | | | | 2,073 | |
| | 16 | | | Other financial assets | | | 23 | | | | 34 | | | | 34 | |
| | 18 | | | Other receivables | | | 93 | | | | 83 | | | | 60 | |
| | 25 | | | Derivative financial instruments | | | 63 | | | | 120 | | | | 163 | |
| | 27 | | | Deferred income tax assets | | | 107 | | | | 191 | | | | 274 | |
| | | | Total non-current assets | | | 13,076 | | | | 14,088 | | | | 14,760 | |
| | | | |
| | | | Current assets | | | | | | | | | | | | |
| | 17 | | | Inventories | | | 2,254 | | | | 2,333 | | | | 2,179 | |
| | 18 | | | Trade and other receivables | | | 2,516 | | | | 2,520 | | | | 2,542 | |
| | 16 | | | Asset held for sale | | | - | | | | 143 | | | | - | |
| | | | Current income tax recoverable | | | 26 | | | | 17 | | | | 8 | |
| | 25 | | | Derivative financial instruments | | | 17 | | | | 52 | | | | 24 | |
| | 23 | | | Cash and cash equivalents | | | 2,540 | | | | 1,747 | | | | 1,246 | |
| | | | Total current assets | | | 7,353 | | | | 6,812 | | | | 5,999 | |
| | | | |
| | | | Total assets | | | 20,429 | | | | 20,900 | | | | 20,759 | |
| | | | |
| | | | EQUITY | | | | | | | | | | | | |
| | | | Capital and reserves attributable to the Company’s equity holders | | | | | | | | | | | | |
| | 29 | | | Equity share capital | | | 251 | | | | 249 | | | | 247 | |
| | 29 | | | Preference share capital | | | 1 | | | | 1 | | | | 1 | |
| | 29 | | | Share premium account | | | 4,219 | | | | 4,133 | | | | 4,047 | |
| | 29 | | | Treasury Shares and own shares | | | (118 | ) | | | (146 | ) | | | (183 | ) |
| | | | Other reserves | | | 197 | | | | 182 | | | | 168 | |
| | | | Foreign currency translation reserve | | | (542 | ) | | | (169 | ) | | | (119 | ) |
| | | | Retained income | | | 5,654 | | | | 6,303 | | | | 6,358 | |
| | | | | | | 9,662 | | | | 10,553 | | | | 10,519 | |
| | | | Non-controlling interests | | | 24 | | | | 36 | | | | 41 | |
| | | | Total equity | | | 9,686 | | | | 10,589 | | | | 10,560 | |
| | | | |
| | | | LIABILITIES | | | | | | | | | | | | |
| | | | Non-current liabilities | | | | | | | | | | | | |
| | 24 | | | Interest-bearing loans and borrowings | | | 4,579 | | | | 4,161 | | | | 4,300 | |
| | 25 | | | Derivative financial instruments | | | 34 | | | | 14 | | | | - | |
| | 27 | | | Deferred income tax liabilities | | | 1,166 | | | | 1,232 | | | | 1,336 | |
| | 19 | | | Other payables | | | 289 | | | | 277 | | | | 184 | |
| | 28 | | | Retirement benefit obligations | | | 410 | | | | 653 | | | | 636 | |
| | 26 | | | Provisions for liabilities | | | 231 | | | | 256 | | | | 244 | |
| | | | Total non-current liabilities | | | 6,709 | | | | 6,593 | | | | 6,700 | |
| | | | |
| | | | Current liabilities | | | | | | | | | | | | |
| | 19 | | | Trade and other payables | | | 2,754 | | | | 2,775 | | | | 2,717 | |
| | | | Current income tax liabilities | | | 151 | | | | 180 | | | | 193 | |
| | 24 | | | Interest-bearing loans and borrowings | | | 961 | | | | 647 | | | | 458 | |
| | 25 | | | Derivative financial instruments | | | 19 | | | | 6 | | | | 10 | |
| | 26 | | | Provisions for liabilities | | | 149 | | | | 110 | | | | 121 | |
| | | | Total current liabilities | | | 4,034 | | | | 3,718 | | | | 3,499 | |
| | | | |
| | | | Total liabilities | | | 10,743 | | | | 10,311 | | | | 10,199 | |
| | | | |
| | | | Total equity and liabilities | | | 20,429 | | | | 20,900 | | | | 20,759 | |
| | * | Details of the restatement are contained in the Accounting Policies on page 124 and in note 1 to the Consolidated Financial Statements. |
Consolidated Statement of Changes in Equity
for the financial year ended 31 December 2013
| | | | | | | | | | | | | | | | | | | | | | | | | | | | | | | | | | | | |
| | | | | | Attributable to the equity holders of the Company | | | | | | | |
| | | | | | Issued share capital €m | | | Share premium account €m | | | Treasury Shares/ own shares €m | | | Other reserves €m | | | Foreign currency translation reserve €m | | | Retained income €m | | | Non- controlling interests €m | | | Total equity €m | |
| | Notes | | | | | | | | | | | | | | | | | | | | | | | | | | | | | | | | | | | |
| | | | At 1 January 2013 as reported | | | 250 | | | | 4,133 | | | | (146 | ) | | | 182 | | | | (169 | ) | | | 6,287 | | | | 36 | | | | 10,573 | |
| | | | Change in accounting policy | | | - | | | | - | | | | - | | | | - | | | | - | | | | 16 | | | | - | | | | 16 | |
| | | | At 1 January 2013 restated* | | | 250 | | | | 4,133 | | | | (146 | ) | | | 182 | | | | (169 | ) | | | 6,303 | | | | 36 | | | | 10,589 | |
| | | | Group loss for the financial year | | | - | | | | - | | | | - | | | | - | | | | - | | | | (296 | ) | | | 1 | | | | (295 | ) |
| | | | Other comprehensive income | | | - | | | | - | | | | - | | | | - | | | | (373 | ) | | | 117 | | | | - | | | | (256 | ) |
| | | | Total comprehensive income | | | - | | | | - | | | | - | | | | - | | | | (373 | ) | | | (179 | ) | | | 1 | | | | (551 | ) |
| | 29 | | | Issue of share capital (net of expenses) | | | 2 | | | | 86 | | | | - | | | | - | | | | - | | | | - | | | | - | | | | 88 | |
| | 8 | | | Share-based payment expense | | | | | | | | | | | | | | | | | | | | | | | | | | | | | | | | |
| | | | - share option schemes | | | - | | | | - | | | | - | | | | 1 | | | | - | | | | - | | | | - | | | | 1 | |
| | | | - Performance Share Plan (PSP) | | | - | | | | - | | | | - | | | | 14 | | | | - | | | | - | | | | - | | | | 14 | |
| | 29 | | | Treasury/own shares reissued | | | - | | | | - | | | | 34 | | | | - | | | | - | | | | (34 | ) | | | - | | | | - | |
| | 29 | | | Shares acquired by Employee Benefit Trust (own shares) | | | - | | | | - | | | | (6 | ) | | | - | | | | - | | | | - | | | | - | | | | (6 | ) |
| | | | Share option exercises | | | - | | | | - | | | | - | | | | - | | | | - | | | | 19 | | | | - | | | | 19 | |
| | 12 | | | Dividends (including shares issued in lieu of dividends) | | | - | | | | - | | | | - | | | | - | | | | - | | | | (455 | ) | | | (1 | ) | | | (456 | ) |
| | 31 | | | Non-controlling interests arising on acquisition of subsidiaries | | | - | | | | - | | | | - | | | | - | | | | - | | | | - | | | | 1 | | | | 1 | |
| | | | Acquisition of non-controlling interests | | | - | | | | - | | | | - | | | | - | | | | - | | | | - | | | | (13 | ) | | | (13 | ) |
| | | | At 31 December 2013 | | | 252 | | | | 4,219 | | | | (118 | ) | | | 197 | | | | (542 | ) | | | 5,654 | | | | 24 | | | | 9,686 | |
| | | | | | | | | |
| | | | for the financial year ended 31 December 2012 | | | | | | | | | | | | | | | | | | | | | | | | | | | | | | | | |
| | | | At 1 January 2012 as reported | | | 248 | | | | 4,047 | | | | (183 | ) | | | 168 | | | | (119 | ) | | | 6,348 | | | | 74 | | | | 10,583 | �� |
| | | | Change in accounting policy (IFRS 11 and IAS 19R) | | | - | | | | - | | | | - | | | | - | | | | - | | | | 10 | | | | (33 | ) | | | (23 | ) |
| | | | At 1 January 2012 restated* | | | 248 | | | | 4,047 | | | | (183 | ) | | | 168 | | | | (119 | ) | | | 6,358 | | | | 41 | | | | 10,560 | |
| | | | Group profit for the financial year | | | - | | | | - | | | | - | | | | - | | | | - | | | | 538 | | | | 2 | | | | 540 | |
| | | | Other comprehensive income | | | - | | | | - | | | | - | | | | - | | | | (50 | ) | | | (122 | ) | | | (1 | ) | | | (173 | ) |
| | | | Total comprehensive income | | | - | | | | - | | | | - | | | | - | | | | (50 | ) | | | 416 | | | | 1 | | | | 367 | |
| | 29 | | | Issue of share capital (net of expenses) | | | 2 | | | | 86 | | | | - | | | | - | | | | - | | | | - | | | | - | | | | 88 | |
| | 8 | | | Share-based payment expense | | | | | | | | | | | | | | | | | | | | | | | | | | | | | | | | |
| | | | - Performance Share Plan (PSP) | | | - | | | | - | | | | - | | | | 14 | | | | - | | | | - | | | | - | | | | 14 | |
| | 29 | | | Treasury/own shares reissued | | | - | | | | - | | | | 37 | | | | - | | | | - | | | | (37 | ) | | | - | | | | - | |
| | | | Share option exercises | | | - | | | | - | | | | - | | | | - | | | | - | | | | 16 | | | | - | | | | 16 | |
| | 12 | | | Dividends (including shares issued in lieu of dividends) | | | - | | | | - | | | | - | | | | - | | | | - | | | | (450 | ) | | | (4 | ) | | | (454 | ) |
| | | | Acquisition of non-controlling interests | | | - | | | | - | | | | - | | | | - | | | | - | | | | - | | | | (2 | ) | | | (2 | ) |
| | | | At 31 December 2012 restated* | | | 250 | | | | 4,133 | | | | (146 | ) | | | 182 | | | | (169 | ) | | | 6,303 | | | | 36 | | | | 10,589 | |
| | | | | | | | | |
| | | | for the financial year ended 31 December 2011 | | | | | | | | | | | | | | | | | | | | | | | | | | | | | | | | |
| | | | At 1 January 2011 | | | 245 | | | | 3,915 | | | | (199 | ) | | | 147 | | | | (226 | ) | | | 6,446 | | | | 83 | | | | 10,411 | |
| | | | Change in accounting policy (for IAS 19R only) | | | - | | | | - | | | | - | | | | - | | | | - | | | | 5 | | | | - | | | | 5 | |
| | | | At 1 January 2011 restated* | | | 245 | | | | 3,915 | | | | (199 | ) | | | 147 | | | | (226 | ) | | | 6,451 | | | | 83 | | | | 10,416 | |
| | | | Group profit for the financial year | | | - | | | | - | | | | - | | | | - | | | | - | | | | 580 | | | | 7 | | | | 587 | |
| | | | Other comprehensive income | | | - | | | | - | | | | - | | | | - | | | | 107 | | | | (212 | ) | | | - | | | | (105 | ) |
| | | | Total comprehensive income | | | - | | | | - | | | | - | | | | - | | | | 107 | | | | 368 | | | | 7 | | | | 482 | |
| | 29 | | | Issue of share capital (net of expenses) | | | 3 | | | | 132 | | | | - | | | | - | | | | - | | | | - | | | | - | | | | 135 | |
| | 8 | | | Share-based payment expense | | | | | | | | | | | | | | | | | | | | | | | | | | | | | | | | |
| | | | - share option schemes | | | - | | | | - | | | | - | | | | 9 | | | | - | | | | - | | | | - | | | | 9 | |
| | | | - Performance Share Plan (PSP) | | | - | | | | - | | | | - | | | | 12 | | | | - | | | | - | | | | - | | | | 12 | |
| | | | Treasury/own shares reissued | | | - | | | | - | | | | 16 | | | | - | | | | - | | | | (16 | ) | | | - | | | | - | |
| | | | Share option exercises | | | - | | | | - | | | | - | | | | - | | | | - | | | | 6 | | | | - | | | | 6 | |
| | 12 | | | Dividends (including shares issued in lieu of dividends) | | | - | | | | - | | | | - | | | | - | | | | - | | | | (445 | ) | | | (9 | ) | | | (454 | ) |
| | 31 | | | Non-controlling interests arising on acquisition of subsidiaries | | | - | | | | - | | | | - | | | | - | | | | - | | | | - | | | | (2 | ) | | | (2 | ) |
| | | | Acquisition of non-controlling interests | | | - | | | | - | | | | - | | | | - | | | | - | | | | (6 | ) | | | (5 | ) | | | (11 | ) |
| | | | At 31 December 2011 restated* | | | 248 | | | | 4,047 | | | | (183 | ) | | | 168 | | | | (119 | ) | | | 6,358 | | | | 74 | | | | 10,593 | |
| | * | Details of the restatement are contained in the Accounting Policies on page 124 and in note 1 to the Consolidated Financial Statements. |
Consolidated Statement of Cash Flows
for the financial year ended 31 December 2013
| | | | | | | | | | | | | | | | |
| | | | | | 2013 €m | | | Restated* 2012 €m | | | Restated* 2011 €m | |
| | Notes | | | | | | | | | | | | | | | |
| | | | |
| | | | Cash flows from operating activities | | | | | | | | | | | | |
| | | | (Loss)/profit before tax | | | (215 | ) | | | 646 | | | | 698 | |
| | 9 | | | Finance costs (net) | | | 297 | | | | 305 | | | | 270 | |
| | 10 | | | Share of equity accounted investments’ result | | | 44 | | | | 84 | | | | (42 | ) |
| | 5 | | | Profit on disposals | | | (26 | ) | | | (230 | ) | | | (55 | ) |
| | | | Group operating profit | | | 100 | | | | 805 | | | | 871 | |
| | 3 | | | Depreciation charge | | | 671 | | | | 686 | | | | 726 | |
| | 3 | | | Amortisation of intangible assets | | | 54 | | | | 44 | | | | 38 | |
| | 3 | | | Impairment charge | | | 650 | | | | 28 | | | | 21 | |
| | 8 | | | Share-based payment expense | | | 15 | | | | 14 | | | | 21 | |
| | | | Other (primarily pension payments) | | | (96 | ) | | | (152 | ) | | | (109 | ) |
| | 20 | | | Net movement on working capital and provisions | | | 77 | | | | (58 | ) | | | (211 | ) |
| | | | Cash generated from operations | | | 1,471 | | | | 1,367 | | | | 1,357 | |
| | | | Interest paid (including finance leases) | | | (269 | ) | | | (258 | ) | | | (239 | ) |
| | | | Decrease in liquid investments | | | - | | | | - | | | | 4 | |
| | | | Corporation tax paid | | | (110 | ) | | | (124 | ) | | | (96 | ) |
| | | | Net cash inflow from operating activities | | | 1,092 | | | | 985 | | | | 1,026 | |
| | | | |
| | | | Cash flows from investing activities | | | | | | | | | | | | |
| | 5 | | | Proceeds from disposals (net of cash disposed) | | | 122 | | | | 782 | | | | 442 | |
| | | | Interest received | | | 13 | | | | 16 | | | | 32 | |
| | | | Dividends received from equity accounted investments | | | 33 | | | | 35 | | | | 20 | |
| | 14 | | | Purchase of property, plant and equipment | | | (497 | ) | | | (544 | ) | | | (576 | ) |
| | 31 | | | Acquisition of subsidiaries (net of cash acquired) | | | (336 | ) | | | (418 | ) | | | (507 | ) |
| | 16 | | | Other investments and advances | | | (78 | ) | | | (56 | ) | | | (24 | ) |
| | 20 | | | Deferred and contingent acquisition consideration paid | | | (105 | ) | | | (30 | ) | | | (21 | ) |
| | | | Net cash outflow from investing activities | | | (848 | ) | | | (215 | ) | | | (634 | ) |
| | | | |
| | | | Cash flows from financing activities | | | | | | | | | | | | |
| | | | Proceeds from exercise of share options | | | 19 | | | | 16 | | | | 6 | |
| | | | Acquisition of non-controlling interests | | | (13 | ) | | | (2 | ) | | | (11 | ) |
| | | | Increase in interest-bearing loans, borrowings and finance leases | | | 1,491 | | | | 487 | | | | 101 | |
| | | | Net cash flow arising from derivative financial instruments | | | 64 | | | | 13 | | | | (63 | ) |
| | 29 | | | Treasury/own shares purchased | | | (6 | ) | | | - | | | | - | |
| | | | Repayment of interest-bearing loans, borrowings and finance leases | | | (586 | ) | | | (394 | ) | | | (552 | ) |
| | 12 | | | Dividends paid to equity holders of the Company | | | (367 | ) | | | (362 | ) | | | (310 | ) |
| | 12 | | | Dividends paid to non-controlling interests | | | (1 | ) | | | (4 | ) | | | (9 | ) |
| | | | Net cash inflow/(outflow) from financing activities | | | 601 | | | | (246 | ) | | | (838 | ) |
| | | | |
| | | | Increase/(decrease) in cash and cash equivalents | | | 845 | | | | 524 | | | | (446 | ) |
| | | | |
| | | | Reconciliation of opening to closing cash and cash equivalents | | | | | | | | | | | | |
| | 21 | | | Cash and cash equivalents at 1 January | | | 1,747 | | | | 1,246 | | | | 1,730 | |
| | | | Translation adjustment | | | (52 | ) | | | (23 | ) | | | 11 | |
| | | | Increase/(decrease) in cash and cash equivalents | | | 845 | | | | 524 | | | | (446 | ) |
| | 21 | | | Cash and cash equivalents at 31 December | | | 2,540 | | | | 1,747 | | | | 1,295 | |
| | * | Details of the restatement are contained in the Accounting Policies on page 124 and in note 1 to the Consolidated Financial Statements. |
Accounting Policies
(including key accounting estimates and assumptions)
Statement of Compliance
The Consolidated Financial Statements of CRH plc have been prepared in accordance with International Financial Reporting Standards (IFRS) as adopted by the International Accounting Standards Board.
CRH plc, the Parent Company, is a publicly traded limited company incorporated and domiciled in the Republic of Ireland.
Basis of Preparation
The Consolidated Financial Statements, which are presented in euro millions, have been prepared under the historical cost convention as modified by the measurement at fair value of share-based payments, retirement benefit obligations and certain financial assets and liabilities including derivative financial instruments.
The accounting policies set out below have been applied consistently by all the Group’s subsidiaries, joint ventures and associates to all periods presented in these Consolidated Financial Statements.
Certain prior year disclosures have been amended to conform to current year presentation.
Adoption of IFRS and International Financial Reporting Interpretations Committee (IFRIC) interpretations
| (i) | The following standards and amendments have been adopted during the financial year |
| | • | | IAS 1Presentation of Financial Statements - amendments |
| | • | | IFRS 7Financial Instruments: Disclosures - amendments |
| | • | | IFRS 10Consolidated Financial Statements |
| | • | | IFRS 11Joint Arrangements, IAS 28Investments in Associates and Joint Ventures |
| | • | | IFRS 12Disclosure of Interests in Other Entities |
| | • | | IFRS 13Fair Value Measurement |
| | • | | IAS 19Employee Benefits (revised) |
| | • | | IFRIC 20Stripping Costs in the Production Phase of a Surface Mine |
| | • | | Improvements to IFRS 2009-2011 cycle |
– IFRS 11Joint Arrangements
Under IAS 31Interests in Joint Ventures, the Group’s net interests in its joint arrangements were classified as joint ventures and the Group’s share of assets, liabilities, revenue, income and expenses were proportionately consolidated. Since the adoption of IFRS 11, the Group now accounts for its interests in joint ventures using the equity method of accounting. The change to equity accounting had no impact on the Group’s result after tax but impacted each line in the Consolidated Income Statement. The Group’s Consolidated Balance Sheet was also impacted on a line by line basis but net assets remained unchanged.
– IAS 19Employee Benefits (revised)
The application of IAS 19 (revised) resulted in a number of amendments to the Group’s accounting for retirement benefit obligations. The most significant change was in how the net interest expense was calculated. Under the revised standard, the Group no longer takes a credit for the expected return on assets and the net interest expense has been calculated by multiplying the discount rate by the net pension liability, both as determined at the start of the annual reporting period, adjusted for contributions and benefit payments in the year.
The Group’s Swiss schemes contain a number of risk-sharing features. Under IAS 19 (revised), contributions from employees that are set out in the formal terms of the plan reduce measurements of the net retirement benefit obligation (if they are required to reduce a deficit arising from losses on plan assets or actuarial losses) or reduce current service cost (if they are linked to service). In addition, the defined benefit pension obligations relating to
the Group’s Swiss schemes have now been completed using generational rather than periodic tables; this change has been applied prospectively from 1 January 2013.
As required by IAS 8Accounting Policies, Changes in Accounting Estimates, and Errors the nature and effect of changes arising as a result of the adoption of IFRS 11 and IAS 19 (revised) on the Consolidated Income Statement, Consolidated Statement of Cash Flows and Consolidated Balance Sheet are disclosed in note 1 on pages 131 to 133. Under the transitional provisions of IFRS 11 the Group is not required to disclose the impact that the adoption of IFRS 11 has had on the current period or on the reported results for 2011. If IAS 19 (revised) had not been applied in the current period the Group’s net interest expense would have been lower by approximately €20 million and remeasurement adjustments recognised in other comprehensive income would have been approximately €30 million higher.
The application of the remaining standards and interpretations did not result in material changes to the Group’s Consolidated Financial Statements.
| (ii) | IFRS and IFRIC interpretations being adopted in subsequent years |
IFRS 9Financial Instruments as issued reflects the IASB’s work on the replacement of IAS 39Financial Instruments: Recognition and Measurement and applies to the classification and measurement of financial assets and liabilities as defined in IAS 39 and the application of hedge accounting. The Group will assess the impact of IFRS 9 when the final standard including all phases is issued.
There are no other IFRS or IFRIC interpretations that are effective subsequent to the CRH 2013 financial year-end that would have a material impact on the Group.
Key Accounting Policies which involve Estimates, Assumptions and Judgements
The preparation of the Consolidated Financial Statements in accordance with IFRS requires management to make certain estimates, assumptions and judgements that affect the application of accounting policies and the reported amounts of assets, liabilities, income and expenses at the end of the reporting period. Management believes that the estimates, assumptions and judgements upon which it relies are reasonable based on the information available to it at the time that those estimates, assumptions and judgements are made. In some cases, the accounting treatment of a particular transaction is specifically dictated by IFRS and does not require management’s judgement in its application.
Management consider that their use of estimates, assumptions and judgements in the application of the Group’s accounting policies are inter-related and therefore discuss them together below. The critical accounting policies which involve significant estimates or assumptions or judgements, the actual outcome of which could have a material impact on the Group’s results and financial position outlined below, are as follows:
Impairment of long-lived assets and goodwill – Notes 14 and 15
Impairment of property, plant and equipment and goodwill
The carrying values of items of property, plant and equipment are reviewed for indicators of impairment at each reporting date and are subject to impairment testing when events or changes in circumstances indicate that the carrying values may not be recoverable. Goodwill is subject to impairment testing on an annual basis and at any time during the year if an indicator of impairment is considered to exist. A decision to dispose of a business unit represents one such indicator and in these circumstances the recoverable amount is assessed on a fair value less costs of disposal basis. In the year in which a business combination is effected and where some or all of the goodwill allocated to a particular cash-generating unit arose in respect of that combination, the cash-generating unit is tested for impairment prior to the end of the relevant annual period.
Property, plant and equipment assets are reviewed for potential impairment by applying a series of external and internal indicators specific to the assets under consideration; these indicators encompass macroeconomic issues
including the inherent cyclicality of the building materials sector, actual obsolescence or physical damage, a deterioration in forecast performance in the internal reporting cycle and restructuring and rationalisation programmes.
Where the carrying value exceeds the estimated recoverable amount (being the greater of fair value less costs of disposal and value-in-use), an impairment loss is recognised by writing down the assets to their recoverable amount. In assessing value-in-use, the estimated future cash flows are discounted to their present value using a pre-tax discount rate that reflects current market assessments of the time value of money and the risks specific to the asset for which the future cash flow estimates have not been adjusted. The estimates of future cash flows exclude cash inflows or outflows attributable to financing activities and income tax. For an asset that does not generate largely independent cash inflows, the recoverable amount is determined by reference to the cash-generating unit to which the asset belongs. Impairment losses arising in respect of goodwill are not reversed once recognised.
Goodwill relating to associates and joint ventures is included in the carrying amount of the investment and is neither amortised nor individually tested for impairment. Where indicators of impairment of an investment arise in accordance with the requirements of IAS 39Financial Instruments: Recognition and Measurement, the carrying amount is tested for impairment by comparing its recoverable amount with its carrying amount.
The impairment testing process requires management to make significant judgements and estimates regarding the future cash flows expected to be generated by the use of and, if applicable, the eventual disposal of, long-lived assets and goodwill as well as other factors to determine the fair value of the assets. Management periodically evaluates and updates the estimates based on the conditions which influence these variables. A detailed discussion of the impairment methodology applied and key assumptions used by the Group in the context of long-lived assets and goodwill are provided in notes 14 and 15 to the Consolidated Financial Statements.
The assumptions and conditions for determining impairments of long-lived assets and goodwill reflect management’s best assumptions and estimates, but these items involve inherent uncertainties described above, many of which are not under management’s control. As a result, the accounting for such items could result in different estimates or amounts if management used different assumptions or if different conditions occur in future accounting periods.
Retirement benefit obligations – Note 28
Costs arising in respect of the Group’s defined contribution pension schemes are charged to the Consolidated Income Statement in the period in which they are incurred. The Group has no legal or constructive obligation to pay further contributions in the event that the fund does not hold sufficient assets to meet its benefit commitments.
The liabilities and costs associated with the Group’s defined benefit pension schemes (both funded and unfunded) are assessed on the basis of the projected unit credit method by professionally qualified actuaries and are arrived at using actuarial assumptions based on market expectations at the balance sheet date. The discount rates employed in determining the present value of the schemes’ liabilities are determined by reference to market yields at the balance sheet date on high-quality corporate bonds of a currency and term consistent with the currency and term of the associated post-employment benefit obligations.
The net surplus or deficit arising on the Group’s defined benefit pension schemes, together with the liabilities associated with the unfunded schemes, are shown either within non-current assets or non-current liabilities in the Consolidated Balance Sheet. The deferred tax impact of pension scheme surpluses and deficits is disclosed separately within deferred tax assets or liabilities as appropriate. Remeasurements, comprising actuarial gains and losses and the return on plan assets (excluding net interest), are recognised immediately in the Consolidated Balance Sheet with a corresponding debit or credit to retained earnings through other comprehensive income in the
period in which they occur. Remeasurements are not reclassified to profit or loss in subsequent periods.
The defined benefit pension asset or liability in the Consolidated Balance Sheet comprises the total for each plan of the present value of the defined benefit obligation less the fair value of plan assets out of which the obligations are to be settled directly. Plan assets are assets that are held by a long-term employee benefit fund or qualifying insurance policies. Fair value is based on market price information and, in the case of published securities, it is the published bid price. The value of any defined benefit asset is limited to the present value of any economic benefits available in the form of refunds from the plan and reductions in the future contributions to the plan.
The Group’s obligation in respect of post-employment healthcare and life assurance benefits represents the amount of future benefit that employees have earned in return for service in the current and prior periods. The obligation is computed on the basis of the projected unit credit method and is discounted to present value using a discount rate equating to the market yield at the balance sheet date on high-quality corporate bonds of a currency and term consistent with the currency and estimated term of the post-employment obligations.
Assumptions
The assumptions underlying the actuarial valuations from which the amounts recognised in the Consolidated Financial Statements are determined (including discount rates, rates of increase in future compensation levels, mortality rates and healthcare cost trend rates) are updated annually based on current economic conditions and for any relevant changes to the terms and conditions of the pension and post-retirement plans. These assumptions can be affected by (i) for the discount rate, changes in the rates of return on high-quality corporate bonds; (ii) for future compensation levels, future labour market conditions and (iii) for healthcare cost trend rates, the rate of medical cost inflation in the relevant regions. The weighted average actuarial assumptions used and sensitivity analysis in relation to the significant assumptions employed in the determination of pension and other post-retirement liabilities are contained in note 28 to the Consolidated Financial Statements.
While management believes that the assumptions used are appropriate, differences in actual experience or changes in assumptions may affect the obligations and expenses recognised in future accounting periods. The assets and liabilities of defined benefit pension schemes may exhibit significant period-on-period volatility attributable primarily to changes in bond yields and longevity. In addition to future service contributions, significant cash contributions may be required to remediate past service deficits.
Provisions for liabilities – Note 26
A provision is recognised when the Group has a present obligation (either legal or constructive) as a result of a past event, it is probable that a transfer of economic benefits will be required to settle the obligation and a reliable estimate can be made of the amount of the obligation. Where the Group anticipates that a provision will be reimbursed, the reimbursement is recognised as a separate asset only when it is virtually certain that the reimbursement will arise. The expense relating to any provision is presented in the Consolidated Income Statement net of any reimbursement. Provisions are measured at the present value of the expenditures expected to be required to settle the obligation. The increase in the provision due to passage of time is recognised as interest expense. Provisions arising on business combination activity are recognised only to the extent that they would have qualified for recognition in the financial statements of the acquiree prior to acquisition. Provisions are not recognised for future operating losses.
Accounting Policies |continued
Rationalisation and redundancy provisions
Provisions for rationalisation and redundancy are established when a detailed restructuring plan has been drawn up, resolved upon by the responsible decision-making level of management and communicated to the employees who are affected by the plan. These provisions are recognised at the present value of future disbursements and cover only expenses that arise directly from restructuring measures and are necessary for restructuring; these provisions exclude costs related to future business operations. Restructuring measures may include the sale or termination of business units, site closures, and relocation of business activities, changes in management structure or a fundamental reorganisation of departments or business units.
Environmental and remediation provisions
The measurement of environmental and remediation provisions is based on an evaluation of currently available facts with respect to each individual site and considers factors such as existing technology, currently enacted laws and regulations and prior experience in remediation of sites. Inherent uncertainties exist in such evaluations primarily due to unknown conditions, changing governmental regulations and legal standards regarding liability, the protracted length of the clean-up periods and evolving technologies. The environmental and remediation liabilities provided for in the Consolidated Financial Statements reflect the information available to management at the time of determination of the liability and are adjusted periodically as remediation efforts progress or as additional technical or legal information becomes available. Due to the inherent uncertainties described above, many of which are not under management’s control, the accounting for such items could result in different amounts if management used different assumptions or if different conditions occur in future accounting periods.
Legal contingencies
The status of each significant claim and legal proceeding in which the Group is involved is reviewed by management on a periodic basis and the Group’s potential financial exposure is assessed. If the potential loss from any claim or legal proceeding is considered probable, and the amount can be estimated, a liability is recognised for the estimated loss. Because of the uncertainties inherent in such matters, the related provisions are based on the best information available at the time; the issues taken into account by management and factored into the assessment of legal contingencies include, as applicable, the status of settlement negotiations, interpretations of contractual obligations, prior experience with similar contingencies/claims, the availability of insurance to protect against the downside exposure and advice obtained from legal counsel and other third parties. As additional information becomes available on pending claims, the potential liability is reassessed and revisions are made to the amounts accrued where appropriate. Such revisions in the estimates of the potential liabilities could have a material impact on the results of operations and financial position of the Group.
Taxation – current and deferred – Notes 11 and 27
Current tax represents the expected tax payable (or recoverable) on the taxable profit for the year using tax rates enacted for the period. Any interest or penalties arising are included within current tax. Where items are accounted for outside of profit or loss, the related income tax is recognised either in other comprehensive income or directly in equity as appropriate.
Deferred tax is recognised using the liability method on temporary differences arising at the balance sheet date between the tax bases of assets and liabilities and their carrying amounts in the Consolidated Financial Statements. However, deferred tax liabilities are not recognised if they arise from the initial recognition of goodwill; in addition, deferred income tax is not accounted for if it arises from initial recognition of an asset or liability in a transaction other than a business combination that at the time of the transaction affects neither accounting nor taxable profit or loss. For the most part, no provision has been made for temporary differences applicable to investments in subsidiaries and joint ventures as the Group is in a position to control the timing of reversal of the temporary differences and it is probable that the temporary differences will not reverse in the foreseeable future. However, a temporary difference has been recognised to the extent that specific assets have been identified for sale or where there is a specific
intention to unwind the temporary difference in the foreseeable future. Due to the absence of control in the context of associates (significant influence only), deferred tax liabilities are recognised where appropriate in respect of CRH’s investments in these entities on the basis that the exercise of significant influence would not necessarily prevent earnings being remitted by other shareholders in the undertaking.
Deferred tax is determined using tax rates (and laws) that have been enacted or substantially enacted by the balance sheet date and are expected to apply when the related deferred income tax asset is realised or the deferred income tax liability is settled. Deferred tax assets and liabilities are not subject to discounting.
Deferred tax assets are recognised in respect of all deductible temporary differences, carry-forward of unused tax credits and unused tax losses to the extent that it is probable that taxable profits will be available against which the temporary differences can be utilised. The carrying amounts of deferred tax assets are subject to review at each balance sheet date and are reduced to the extent that future taxable profits are considered to be inadequate to allow all or part of any deferred tax asset to be utilised.
The Group’s income tax charge is based on reported profit and expected statutory tax rates, which reflect various allowances and reliefs and tax planning opportunities available to the Group in the multiple tax jurisdictions in which it operates. The determination of the Group’s provision for income tax requires certain judgements and estimates in relation to matters where the ultimate tax outcome may not be certain. The recognition or non-recognition of deferred tax assets as appropriate also requires judgement as it involves an assessment of the future recoverability of those assets. In addition, the Group is subject to tax audits which can involve complex issues that could require extended periods for resolution. Although management believes that the estimates included in the Consolidated Financial Statements and its tax return positions are reasonable, no assurance can be given that the final outcome of these matters will not be different than that which is reflected in the Group’s historical income tax provisions and accruals. Any such differences could have a material impact on the income tax provision and profit for the period in which such a determination is made.
Property, plant and equipment – Note 14
The Group’s accounting policy for property, plant and equipment is considered critical because the carrying value of €7,539 million at 31 December 2013 represents a significant portion (37%) of total assets at that date. Property, plant and equipment are stated at cost less any accumulated depreciation and any accumulated impairments except for certain items that had been revalued to fair value prior to the date of transition to IFRS (1 January 2004).
Repair and maintenance expenditure is included in an asset’s carrying amount or recognised as a separate asset, as appropriate, only when it is probable that future economic benefits associated with the item will flow to the Group and the cost of the item can be measured reliably. All other repair and maintenance expenditure is charged to the Consolidated Income Statement during the financial period in which it is incurred.
Borrowing costs incurred in the construction of major assets which take a substantial period of time to complete are capitalised in the financial period in which they are incurred.
In the application of the Group’s accounting policy, judgement is exercised by management in the determination of residual values and useful lives. Depreciation and depletion is calculated to write off the book value of each item of property, plant and equipment over its useful economic life on a straight-line basis at the following rates:
Land and buildings: The book value of mineral-bearing land, less an estimate of its residual value, is depleted over the period of the mineral extraction in the proportion which production for the year bears to the latest estimates of mineral reserves. Land other than mineral-bearing land is not depreciated. In general, buildings are depreciated at 2.5% per annum (“p.a.”).
Plant and machinery: These are depreciated at rates ranging from 3.3% p.a. to 20% p.a. depending on the type of asset. Plant and machinery includes transport which is, on average, depreciated at 20% p.a.
Depreciation methods, useful lives and residual values are reviewed at each financial year-end. Changes in the expected useful life or the expected pattern of consumption of future economic benefits embodied in the asset are accounted for by changing the depreciation period or method as appropriate on a prospective basis. For the Group’s accounting policy on impairment of property, plant and equipment please see impairment of long-lived assets and goodwill.
Other Significant Accounting Policies
Basis of consolidation
The Consolidated Financial Statements include the financial statements of the Parent Company and all subsidiaries, joint ventures and associates, drawn up to 31 December each year. The financial year-ends of the Group’s subsidiaries, joint ventures and associates are co-terminous.
Subsidiaries
Subsidiaries are all entities over which the Group has control. The Group controls an entity when the Group is exposed to, or has rights to, variable returns from its involvement with the entity and has the ability to affect those returns through its power over the entity. Subsidiaries are fully consolidated from the date on which control is transferred to the Group. They are deconsolidated from the date that control ceases. A change in the ownership interest of a subsidiary without a change in control is accounted for as an equity transaction.
Non-controlling interests represent the portion of the equity of a subsidiary not attributable either directly or indirectly to the Parent Company and are presented separately in the Consolidated Income Statement and within equity in the Consolidated Balance Sheet, distinguished from Parent Company shareholders’ equity. Acquisitions of non-controlling interests are accounted for as transactions with equity holders in their capacity as equity holders and therefore no goodwill is recognised as a result of such transactions. On an acquisition by acquisition basis, the Group recognises any non-controlling interest in the acquiree either at fair value or at the non-controlling interest’s proportionate share of the acquiree’s net assets.
Investments in associates and joint ventures – Notes 10 and 16
An associate is an entity over which the Group has significant influence. Significant influence is the power to participate in the financial and operating policy decisions of an entity, but is not control or joint control over those policies.
A joint venture is a type of joint arrangement whereby the parties that have joint control of the arrangement have rights to the net assets of the joint venture. Joint control is the contractually agreed sharing of control of the arrangement, which exists only when decisions about the relevant activities require unanimous consent of the parties sharing control.
The Group’s investments in its associates and joint ventures are accounted for using the equity method from the date significant influence/joint control is deemed to arise until the date on which significant influence/joint control ceases to exist.
The Consolidated Income Statement reflects the Group’s share of profit after tax of the related associates and joint ventures. Investments in associates and joint ventures are carried in the Consolidated Balance Sheet at cost adjusted in respect of post-acquisition changes in the Group’s share of net assets, less any impairment in value. If necessary, impairment losses on the carrying amount of an investment are reported within the Group’s share of equity accounted investments results in the Consolidated Income Statement. If the Group’s share of losses exceeds the carrying amount of an associate or joint venture, the carrying amount is reduced to nil and recognition of further losses is discontinued except to the extent that the Group has incurred obligations in respect of the associate or joint venture.
Transactions eliminated on consolidation
Intra-group balances and transactions, income and expenses, and any unrealised gains or losses arising from such transactions, are eliminated in
preparing the Consolidated Financial Statements. Unrealised gains arising from transactions with joint ventures and associates are eliminated to the extent of the Group’s interest in the entity. Unrealised losses are eliminated in the same manner as unrealised gains, but only to the extent that there is no evidence of impairment in the Group’s interest in the entity.
Revenue recognition
Revenue represents the value of goods and services supplied and is net of trade discounts and value added tax/sales tax. Other than in the case of construction contracts, revenue is recognised to the extent that revenue and related costs incurred or to be incurred are subject to reliable measurement, that it is probable that economic benefits will flow to the Group and that the significant risks and rewards of ownership have passed to the buyer, usually on delivery of the goods.
Construction contracts
The Group engages primarily in the performance of fixed price contracts, as opposed to cost plus contracts, and recognises revenue in accordance with the percentage-of-completion method, with the completion percentage being computed generally by reference to the proportion that contract costs incurred at the balance sheet date bear to the total estimated costs of the contract.
Contract costs are recognised as incurred. When the outcome of a construction contract can be estimated reliably and it is probable that the contract will be profitable, contract revenue is recognised over the period of the contract. When the outcome of a construction contract cannot be estimated reliably, contract revenue is recognised only to the extent of contract costs incurred where it is probable that these costs will be recoverable. When it is probable that total contract costs will exceed total contract revenue, the expected loss is recognised immediately as an expense. Revenue and/or costs in respect of variations or contracts claims and incentive payments, to the extent that they arise, are recognised when it is probable that the amount, which can be measured reliably, will be recovered from/paid to the customer.
If circumstances arise that may change the original estimates of revenues, costs or extent of progress towards completion, estimates are revised. These revisions may result in increases or decreases in revenue or costs and are reflected in income in the period in which the circumstances that give rise to the revision became known by management.
Segment reporting – Note 2
Operating segments are reported in a manner consistent with the internal organisational and management structure and the internal reporting information provided to the Chief Operating Decision-Maker who is responsible for allocating resources and assessing performance of the operating segments.
Share-based payments – Note 8
The Group operates Share Option Schemes, a Performance Share Plan and a Restricted Share Plan. Its policy in relation to the granting of share options and the granting of awards under the Performance Share Plan together with the nature of the underlying market and non-market performance and other vesting conditions are addressed in the Directors’ Remuneration Report on page 88. The Group’s employee share options and shares awarded under the Performance Share Plan and Restricted Share Plan are equity-settled share-based payments as defined in IFRS 2Share-Based Payment.
Share options
For share option awards, the Group measures the services received and the corresponding increase in equity at fair value at the grant date using the trinomial model (a lattice option-pricing model in accordance with IFRS 2). Fair value is determined on the basis that the services to be rendered by employees as consideration for the granting of share options will be received over the vesting period, which is assessed as at the grant date. The share options granted by the Company are at market value at date of grant and are not subject to market-based vesting conditions within the meaning of IFRS 2.
Accounting Policies |continued
The cost is recognised, together with a corresponding increase in equity, over the period in which the performance and/or service conditions are fulfilled. The cumulative expense recognised at each reporting date until the vesting date reflects the extent to which the vesting period has expired and the Group’s best estimate of the number of equity instruments that will ultimately vest. The Consolidated Income Statement expense/credit for a period represents the movement in cumulative expense recognised at the beginning and end of that period. The cumulative charge to the Consolidated Income Statement is reversed only where the performance condition is not met or where an employee in receipt of share options leaves service prior to completion of the expected vesting period and those options forfeit in consequence.
No expense is recognised for awards that do not ultimately vest, except for share-based payments where vesting is conditional upon a non-vesting condition which is treated as vesting irrespective of whether or not it is satisfied, provided that all other performance and/or service conditions are satisfied.
Where an award is cancelled, it is treated as if it is vested on the date of cancellation, and any expense not yet recognised for the award is recognised immediately. This includes any award where non-vesting conditions within the control of either the Company or the employee are not met. All cancellations of awards are treated equally.
The proceeds received net of any directly attributable transaction costs are credited to share capital (nominal value) and share premium when the options are exercised.
The dilutive effect of outstanding options is reflected as additional share dilution in the determination of diluted earnings per share.
To the extent that the Group receives a tax deduction relating to the services paid in shares, deferred tax in respect of share options is provided on the basis of the difference between the market price of the underlying equity as at the date of the financial statements and the exercise price of the option; where the amount of any tax deduction (or estimated future tax deduction) exceeds the amount of the related cumulative remuneration expense, the current or deferred tax associated with the excess is recognised directly in equity.
The Group has no exposure in respect of cash-settled share-based payment transactions and share-based payment transactions with cash alternatives.
Awards under the Performance Share Plan
The fair value of shares awarded under the Performance Share Plan is determined using a Monte Carlo simulation technique and is expensed in the Consolidated Income Statement over the vesting period. The Performance Share Plan contains inter alia a total shareholder return-based (and hence market-based) vesting condition; accordingly, the fair value assigned to the related equity instruments at the grant date is adjusted so as to reflect the anticipated likelihood as at the grant date of achieving the market-based vesting condition. Awards are treated as vesting irrespective of whether or not the market condition is satisfied, provided that all other performance and/or service conditions are satisfied.
Awards under the Restricted Share Plan
The fair value of shares granted under the Restricted Share Plan is calculated as the market price of the shares at the date of grant reduced by the present value of dividends expected to be paid over the vesting period.
Business combinations – Note 31
The Group applies the acquisition method in accounting for business combinations. The cost of an acquisition is measured as the aggregate of the consideration transferred (excluding amounts relating to the settlement of pre-existing relationships), the amount of any non-controlling interest in the acquiree and, in a business combination achieved in stages, the acquisition-date fair value of the acquirer’s previously-held equity interest in the acquiree. Transaction costs that the Group incurs in connection with a business combination are expensed as incurred.
To the extent that settlement of all or any part of a business combination is deferred, the fair value of the deferred component is determined through discounting the amounts payable to their present value at the date of
exchange. The discount component is unwound as an interest charge in the Consolidated Income Statement over the life of the obligation. Where a business combination agreement provides for an adjustment to the cost of the combination contingent on future events, the amount of the adjustment is included in the cost at the acquisition date at fair value. The fair value of contingent consideration at acquisition date is arrived at through discounting the expected payment (based on scenario modelling) to present value. In general, in order for contingent consideration to become payable, pre-defined profit and/or profit/net asset ratios must be exceeded. Subsequent changes to the fair value of the contingent consideration will be recognised in profit or loss unless the contingent consideration is classified as equity, in which case it is not remeasured and settlement is accounted for within equity.
The assets and liabilities arising on business combination activity are measured at their acquisition-date fair values. Contingent liabilities assumed in business combination activity are recognised as of the acquisition date, where such contingent liabilities are present obligations arising from past events and their fair value can be measured reliably. In the case of a business combination achieved in stages, the acquisition-date fair value of the acquirer’s previously-held equity interest in the acquiree is remeasured to fair value as at the acquisition date through profit or loss. When the initial accounting for a business combination is determined provisionally, any adjustments to the provisional values allocated to the identifiable assets and liabilities (and contingent liabilities, if relevant) are made within the measurement period, a period of no more than one year from the acquisition date.
Goodwill – Note 15
Goodwill arising on a business combination is initially measured at cost being the excess of the cost of an acquisition over the net identifiable assets and liabilities assumed at the date of acquisition and relates to the future economic benefits arising from assets which are not capable of being individually identified and separately recognised. Following initial recognition, goodwill is measured at cost less any accumulated impairment losses. If the cost of the acquisition is lower than the fair value of the net assets of the subsidiary acquired, the identification and measurement of the related assets and liabilities and contingent liabilities are revisited and the cost is reassessed with any remaining balance recognised immediately in the Consolidated Income Statement.
The carrying amount of goodwill in respect of associates and joint ventures is included in investments accounted for using the equity method (i.e. within financial assets) in the Consolidated Balance Sheet.
Where a subsidiary is disposed of or terminated through closure, the carrying value of any goodwill of that subsidiary is included in the determination of the net profit or loss on disposal/termination.
Intangible assets (other than goodwill) arising on business combinations – Note 15
An intangible asset is capitalised separately from goodwill as part of a business combination at cost (fair value at date of acquisition) to the extent that it is probable that the expected future economic benefits attributable to the asset will flow to the Group and that its cost can be measured reliably.
Subsequent to initial recognition, intangible assets are carried at cost less any accumulated amortisation and any accumulated impairment losses. The carrying values of definite-lived intangible assets (the Group does not currently have any indefinite-lived intangible assets other than goodwill) are reviewed for indicators of impairment at each reporting date and are subject to impairment testing when events or changes in circumstances indicate that the carrying values may not be recoverable.
The amortisation of intangible assets is calculated to write off the book value of definite-lived intangible assets over their useful lives on a straight-line basis on the assumption of zero residual value. In general, definite-lived intangible assets are amortised over periods ranging from one to ten years, depending on the nature of the intangible asset.
Amortisation periods, useful lives, expected patterns of consumption and residual values are reviewed at each financial year-end. Changes in the expected useful life or the expected pattern of consumption of future economic benefits embodied in the asset are accounted for by changing the amortisation period or method as appropriate on a prospective basis.
Other financial assets – Note 16
All investments are initially recognised at the fair value of consideration given plus any directly attributable transaction costs. Where equity investments are actively traded in organised financial markets, fair value is determined by reference to Stock Exchange quoted market bid prices at the close of business on the balance sheet date. Unquoted equity investments are recorded at historical cost given that it is impracticable to determine fair value in accordance with IAS 39 and are included within financial assets in the Consolidated Balance Sheet.
Leases – Notes 4 and 30
Leases where the lessor retains substantially all the risks and rewards of ownership are classified as operating leases. Operating lease rentals are charged to the Consolidated Income Statement on a straight-line basis over the lease term.
Inventories and construction contracts – Note 17
Inventories are stated at the lower of cost and net realisable value. Cost is based on the first-in, first-out principle (and weighted average, where appropriate) and includes all expenditure incurred in acquiring the inventories and bringing them to their present location and condition. Raw materials are valued on the basis of purchase cost on a first-in, first-out basis. In the case of finished goods and work-in-progress, cost includes direct materials, direct labour and attributable overheads based on normal operating capacity and excludes borrowing costs.
Net realisable value is the estimated proceeds of sale less all further costs to completion, and less all costs to be incurred in marketing, selling and distribution. Estimates of net realisable value are based on the most reliable evidence available at the time the estimates are made, taking into consideration fluctuations of price or cost directly relating to events occurring after the end of the period, the likelihood of short-term changes in buyer preferences, product obsolescence or perishability (all of which are generally low given the nature of the Group’s products) and the purpose for which the inventory is held. Materials and other supplies held for use in the production of inventories are not written down below cost if the finished goods, in which they will be incorporated, are expected to be sold at or above cost.
Amounts recoverable on construction contracts, which are included in receivables, are stated at the net invoiced value of the work done less amounts received as progress payments on account. Cumulative costs incurred, net of amounts transferred to cost of sales, after deducting foreseeable losses, provisions for contingencies and payments on account not matched with revenue, are included as construction contract balances in inventories. Cost includes all expenditure directly related to specific projects and an allocation of fixed and variable overheads incurred in the Group’s contract activities based on normal operating capacity.
Trade and other receivables – Note 18
Trade receivables are carried at original invoice amount less an allowance for potentially uncollectible debts. Provision is made when there is objective evidence that the Group will not be in a position to collect the associated debts. Bad debts are written-off in the Consolidated Income Statement on identification.
Cash and cash equivalents – Note 23
Cash and cash equivalents comprise cash balances held for the purpose of meeting short-term cash commitments and investments which are readily convertible to a known amount of cash and are subject to an insignificant risk of change in value. Bank overdrafts are included within currentinterest-bearing loans and borrowings in the Consolidated Balance Sheet.
Where the overdrafts are repayable on demand and form an integral part of cash management, they are netted against cash and cash equivalents for the purposes of the Consolidated Statement of Cash Flows.
Interest-bearing loans and borrowings – Note 24
All loans and borrowings are initially recorded at the fair value of the consideration received net of directly attributable transaction costs. Subsequent to initial recognition, current and non-current interest-bearing loans and borrowings are, in general, measured at amortised cost employing the effective interest methodology. Fixed rate term loans, which have been hedged to floating rates (using interest rate swaps), are measured at amortised cost adjusted for changes in value attributable to the hedged risks arising from changes in underlying market interest rates. The computation of amortised cost includes any issue costs and any discount or premium materialising on settlement.
Gains and losses are recognised in the Consolidated Income Statement through amortisation on the basis of the period of the loans and borrowings.
Borrowing costs arising on financial instruments are recognised as an expense in the period in which they are incurred (unless capitalised as part of the cost of property, plant and equipment).
Derivative financial instruments and hedging
practices – Note 25
In order to manage interest rate, foreign currency and commodity risks and to realise the desired currency profile of borrowings, the Group employs derivative financial instruments (principally interest rate swaps, currency swaps and forward foreign exchange contracts). Derivative financial instruments are recognised initially at fair value on the date on which a derivative contract is entered into and are subsequently remeasured at fair value. The carrying value of derivatives is fair value based on discounted future cash flows and adjusted for counterparty risk. Future floating rate cash flows are estimated based on future interest rates (from observable yield curves at the end of the reporting period). Fixed and floating rate cash flows are discounted at future interest rates and translated at period end foreign exchange rates.
At the inception of a derivative transaction, the Group documents the relationship between the hedged item and the hedging instrument together with its risk management objective and the strategy underlying the proposed transaction. The Group also documents its assessment, both at the inception of the hedging relationship and subsequently on an ongoing basis, of the effectiveness of the hedging instrument in offsetting movements in the fair values or cash flows of the hedged items. Where derivatives do not fulfil the criteria for hedge accounting, changes in fair values are reported in the Consolidated Income Statement.
Fair value and cash flow hedges
The Group uses fair value hedges and cash flow hedges in its treasury activities. For the purposes of hedge accounting, hedges are classified either as fair value hedges (which entail hedging the exposure to movements in the fair value of a recognised asset or liability or an unrecognised firm commitment that could affect profit or loss) or cash flow hedges (which hedge exposure to fluctuations in future cash flows derived from a particular risk associated with a recognised asset or liability, or a highly probable forecast transaction that could affect profit or loss).
Where the conditions for hedge accounting are satisfied and the hedging instrument concerned is classified as a fair value hedge, any gain or loss stemming from the remeasurement of the hedging instrument to fair value is reported in the Consolidated Income Statement. In addition, any gain or loss on the hedged item which is attributable to the hedged risk is adjusted against the carrying amount of the hedged item and reflected in the Consolidated Income Statement. Where the adjustment is to the carrying amount of a hedged interest-bearing financial instrument, the adjustment is amortised to the Consolidated Income Statement with the objective of achieving full amortisation by maturity.
Where a derivative financial instrument is designated as a hedge of the variability in cash flows of a recognised asset or liability or a highly
Accounting Policies |continued
probable forecast transaction that could affect profit or loss, the effective part of any gain or loss on the derivative financial instrument is recognised as other comprehensive income, net of the income tax effect, with the ineffective portion being reported in the Consolidated Income Statement. The associated gains or losses that had previously been recognised as other comprehensive income are transferred to the Consolidated Income Statement contemporaneously with the materialisation of the hedged transaction. Any gain or loss arising in respect of changes in the time value of the derivative financial instrument is excluded from the measurement of hedge effectiveness and is recognised immediately in the Consolidated Income Statement.
Hedge accounting is discontinued when the hedging instrument expires or is sold, terminated or exercised, or no longer qualifies for hedge accounting. At that point in time, any cumulative gain or loss on the hedging instrument recognised as other comprehensive income remains there until the forecast transaction occurs. If a hedged transaction is no longer anticipated to occur, the net cumulative gain or loss previously recognised as other comprehensive income is transferred to the Consolidated Income Statement in the period.
Net investment hedges
Where foreign currency borrowings provide a hedge against a net investment in a foreign operation, and the hedge is deemed to be effective, foreign exchange differences are taken directly to a foreign currency translation reserve. The ineffective portion of any gain or loss on the hedging instrument is recognised immediately in the Consolidated Income Statement. Cumulative gains and losses remain in equity until disposal of the net investment in the foreign operation at which point the related differences are transferred to the Consolidated Income Statement as part of the overall gain or loss on sale.
Fair value hierarchy – Note 25
For financial reporting purposes, fair value measurements are categorised into Level 1, 2 or 3 based on the degree to which inputs to the fair value measurements are observable and the significance of the inputs to the fair value measurement in its entirety, which are described as follows:
Level 1: quoted prices (unadjusted) in active markets for identical assets or liabilities
Level 2: valuation techniques for which the lowest level of inputs which have a significant effect on the recorded fair value are observable, either directly or indirectly
Level 3: valuation techniques for which the lowest level of inputs that have a significant effect on the recorded fair value are not based on observable market data
Share capital and dividends – Notes 12 and 29
Treasury Shares and own shares
Ordinary Shares acquired by the Parent Company or purchased by the Employee Benefit Trust on behalf of the Parent Company under the terms of the Performance Share Plan and the Restricted Share Plan are deducted from equity and presented on the face of the Consolidated Balance Sheet. No gain or loss is recognised in profit or loss on the purchase, sale, issue or cancellation of the Parent Company’s Ordinary Shares.
Dividends
Dividends on Ordinary Shares are recognised as a liability in the Consolidated Financial Statements in the period in which they are declared by the Parent Company.
Emission rights
Emission rights are accounted for such that a liability is recognised only in circumstances where emission rights have been exceeded from the perspective of the Group as a whole and the differential between actual and permitted emissions will have to be remedied through the purchase of the required additional rights at fair value; assets and liabilities arising in respect of under and over-utilisation of emission credits respectively are accordingly netted against one another in the preparation of the
Consolidated Financial Statements. To the extent that excess emission rights are disposed of during a financial period, the profit or loss materialising thereon is recognised immediately within cost of sales in the Consolidated Income Statement.
Foreign currency translation
Items included in the financial statements of each of the Group’s entities are measured using the currency of the primary economic environment in which the entity operates (“the functional currency”). The Consolidated Financial Statements are presented in euro, which is the presentation currency of the Group and the functional currency of the Parent Company.
Transactions in foreign currencies are recorded at the rate ruling at the date of the transaction. Monetary assets and liabilities denominated in foreign currencies are retranslated at the rate of exchange ruling at the balance sheet date. All currency translation differences are taken to the Consolidated Income Statement with the exception of all monetary items that provide an effective hedge for a net investment in a foreign operation. These are recognised in other comprehensive income until the disposal of the net investment, at which time they are recognised in the Consolidated Income Statement.
Results and cash flows of subsidiaries, joint ventures and associates with non-euro functional currencies have been translated into euro at average exchange rates for the year, and the related balance sheets have been translated at the rates of exchange ruling at the balance sheet date. Adjustments arising on translation of the results of non-euro subsidiaries, joint ventures and associates at average rates, and on restatement of the opening net assets at closing rates, are recognised in a separate translation reserve within equity, net of differences on related currency borrowings. All other translation differences are taken to the Consolidated Income Statement.
Goodwill and fair value adjustments arising on acquisition of a foreign operation are regarded as assets and liabilities of the foreign operation, are expressed in the functional currency of the foreign operation, are recorded in euro at the exchange rate at the date of the transaction and are subsequently retranslated at the applicable closing rates.
The principal exchange rates used for the translation of results, cash flows and balance sheets into euro were as follows:
| | | | | | | | | | | | | | | | | | | | | | | | |
| | | |
| | | Average | | | Year-end | |
| euro 1 = | | 2013 | | | 2012 | | | 2011 | | | 2013 | | | 2012 | | | 2011 | |
| | | | | | |
US Dollar | | | 1.3281 | | | | 1.2848 | | | | 1.3922 | | | | 1.3791 | | | | 1.3194 | | | | 1.2939 | |
Pound Sterling | | | 0.8493 | | | | 0.8109 | | | | 0.8679 | | | | 0.8337 | | | | 0.8161 | | | | 0.8353 | |
Polish Zloty | | | 4.1975 | | | | 4.1847 | | | | 4.1212 | | | | 4.1543 | | | | 4.0740 | | | | 4.4580 | |
Ukrainian Hryvnia | | | 10.8339 | | | | 10.3933 | | | | 11.1202 | | | | 11.3583 | | | | 10.6259 | | | | 10.3752 | |
Swiss Franc | | | 1.2311 | | | | 1.2053 | | | | 1.2326 | | | | 1.2276 | | | | 1.2072 | | | | 1.2156 | |
Canadian Dollar | | | 1.3684 | | | | 1.2842 | | | | 1.3763 | | | | 1.4671 | | | | 1.3137 | | | | 1.3215 | |
Argentine Peso | | | 7.2892 | | | | 5.8492 | | | | 5.7508 | | | | 8.9910 | | | | 6.4890 | | | | 5.5746 | |
Turkish Lira | | | 2.5335 | | | | 2.3135 | | | | 2.3388 | | | | 2.9605 | | | | 2.3551 | | | | 2.4432 | |
Indian Rupee | | | 77.9300 | | | | 68.5973 | | | | 64.9067 | | | | 85.3660 | | | | 72.5600 | | | | 68.713 | |
Chinese Renminbi | | | 8.1646 | | | | 8.1052 | | | | 8.9968 | | | | 8.3491 | | | | 8.2207 | | | | 8.1588 | |
| | | | | | | | | | | | | | | | | | | | | | | | | |
Notes on Consolidated Financial Statements
1. Adoption of New Accounting Standards
As noted in the Accounting Policies on page 124, the Group adopted IFRS 11Joint Arrangements and IAS 19Employee Benefits (revised) on 1 January 2013. As required by IAS 8Accounting Policies, Changes in Accounting Estimates andErrors, the financial impact of the adoption of these standards is outlined below.
| | | | | | | | | | | | | | | | |
| | | Year ended 31 December 2012 | |
| | | | | | Adoption of | | | | |
| | | As reported €m | | | IFRS 11 €m | | | IAS 19R €m | | | Restated €m | |
| | | | |
Impact on Consolidated Income Statement | | | | | | | | | | | | | | | | |
| | | | |
Revenue | | | 18,659 | | | | (575 | ) | | | - | | | | 18,084 | |
Cost of sales | | | (13,562 | ) | | | 401 | | | | - | | | | (13,161 | ) |
Gross profit | | | 5,097 | | | | (174 | ) | | | - | | | | 4,923 | |
Operating costs | | | (4,252 | ) | | | 134 | | | | - | | | | (4,118 | ) |
Group operating profit | | | 845 | | | | (40 | ) | | | - | | | | 805 | |
Profit on disposals | | | 230 | | | | - | | | | - | | | | 230 | |
Profit before finance costs | | | 1,075 | | | | (40 | ) | | | - | | | | 1,035 | |
Finance costs | | | (277 | ) | | | 6 | | | | - | | | | (271 | ) |
Finance income | | | 19 | | | | (4 | ) | | | - | | | | 15 | |
Other financial expense | | | (31 | ) | | | - | | | | (18 | ) | | | (49 | ) |
Share of equity accounted investments’ (loss)/profit | | | (112 | ) | | | 28 | | | | - | | | | (84 | ) |
Profit before tax | | | 674 | | | | (10 | ) | | | (18 | ) | | | 646 | |
Income tax expense | | | (120 | ) | | | 10 | | | | 4 | | | | (106 | ) |
Group profit for the financial year | | | 554 | | | | - | | | | (14 | ) | | | 540 | |
| | | | |
Basic earnings per Ordinary Share | | | 76.5c | | | | - | | | | (1.9c | ) | | | 74.6c | |
| | | | |
Diluted earnings per Ordinary Share | | | 76.4c | | | | - | | | | (1.9c | ) | | | 74.5c | |
| | | | |
Impact on Consolidated Statement of Comprehensive Income | | | | | | | | | | | | | | | | |
| | | | |
Group profit for the financial year | | | 554 | | | | - | | | | (14 | ) | | | 540 | |
| | | | |
Items that will not be reclassified to profit or loss in subsequent years: | | | | | | | | | | | | | | | | |
Remeasurement of retirement benefit obligations | | | (171 | ) | | | - | | | | 25 | | | | (146 | ) |
Tax on items recognised directly within other comprehensive income | | | 28 | | | | - | | | | (5 | ) | | | 23 | |
| | | | |
Impact on Consolidated Statement of Cash Flows | | | | | | | | | | | | | | | | |
| | | | |
Net cash inflow from operating activities | | | 1,025 | | | | (40 | ) | | | - | | | | 985 | |
Net cash outflow from investing activities | | | (269 | ) | | | 54 | | | | - | | | | (215 | ) |
Net cash outflow from financing activities | | | (257 | ) | | | 11 | | | | - | | | | (246 | ) |
Increase in cash and cash equivalents | | | 499 | | | | 25 | | | | - | | | | 524 | |
1. Adoption of New Accounting Standards |continued
| | | | | | | | | | | | |
| | | Year ended 31 December 2011* | |
| | | As reported €m | | | Adoption of IFRS 19R €m | | | Restated €m | |
| | | |
Impact on Consolidated Income Statement | | | | | | | | | | | | |
| | | |
Revenue | | | 18,081 | | | | - | | | | 18,081 | |
Cost of sales | | | (13,179 | ) | | | - | | | | (13,179 | ) |
Gross profit | | | 4,902 | | | | - | | | | 4,902 | |
Operating costs | | | (4,031 | ) | | | - | | | | (4,031 | ) |
Group operating profit | | | 871 | | | | - | | | | 871 | |
Profit on disposals | | | 55 | | | | - | | | | 55 | |
Profit before finance costs | | | 926 | | | | - | | | | 926 | |
Finance costs | | | (262 | ) | | | - | | | | (262 | ) |
Finance income | | | 33 | | | | - | | | | 33 | |
Other financial expense | | | (28 | ) | | | (13 | ) | | | (41 | ) |
Share of equity accounted investments’ profit | | | 42 | | | | - | | | | 42 | |
Profit before tax | | | 711 | | | | (13 | ) | | | 698 | |
Income tax expense | | | (114 | ) | | | 3 | | | | (111 | ) |
Group profit for the financial year | | | 597 | | | | (10 | ) | | | 587 | |
| | | |
Basic earnings per Ordinary Share | | | 82.6c | | | | (1.4c | ) | | | 81.2c | |
| | | |
Diluted earnings per Ordinary Share | | | 82.6c | | | | (1.4c | ) | | | 81.2c | |
| | | |
Impact on Consolidated Statement of Comprehensive Income | | | | | | | | | | | | |
| | | |
Group profit for the financial year | | | 597 | | | | (10 | ) | | | 587 | |
| | | |
Items that will not be reclassified to profit or loss in subsequent years: | | | | | | | | | | | | |
Remeasurement of retirement benefit obligations | | | (278 | ) | | | 19 | | | | (259 | ) |
Tax on items recognised directly within other comprehensive income | | | 58 | | | | (4 | ) | | | 54 | |
| | | |
Impact on Consolidated Statement of Cash Flows | | | | | | | | | | | | |
| | | |
Net cash inflow from operating activities | | | 1,026 | | | | - | | | | 1,026 | |
Net cash outflow from investing activities | | | (634 | ) | | | - | | | | (634 | ) |
Net cash outflow from financing activities | | | (838 | ) | | | - | | | | (838 | ) |
Decrease in cash and cash equivalents | | | (446 | ) | | | - | | | | (446 | ) |
| * | As outlined in the Group’s accounting policies on page 124, under the transitional provisions of IFRS 11 Joint Arrangements, the Group is not required to present restated results for the year ended 31 December 2011 and thus only presents the impact of adoption of IAS 19 revised. |
1. Adoption of New Accounting Standards |continued
Impact on Consolidated Balance Sheet
| | | | | | | | | | | | | | | | | | | | | | | | | | | | | | | | | | |
| | | As at 31 December 2012 | | | | | As at 1 January 2012 | |
| | | | | | Adoption of | | | | | | | | | | | Adoption of | | | | |
| | | As reported €m | | | IFRS 11 €m | | | IAS 19R €m | | | Restated €m | | | | | As reported €m | | | IFRS 11 €m | | | IAS 19R €m | | | Restated €m | |
| | | | | | | | | |
ASSETS | | | | | | | | | | | | | | | | | | | | | | | | | | | | | | | | | | |
Non-current assets | | | | | | | | | | | | | | | | | | | | | | | | | | | | | | | | | | |
Property, plant and equipment | | | 8,448 | | | | (477 | ) | | | - | | | | 7,971 | | | | | | 8,936 | | | | (928 | ) | | | - | | | | 8,008 | |
Intangible assets | | | 4,446 | | | | (179 | ) | | | - | | | | 4,267 | | | | | | 4,488 | | | | (340 | ) | | | - | | | | 4,148 | |
Investments accounted for using the equity method | | | 835 | | | | 587 | | | | - | | | | 1,422 | | | | | | 1,089 | | | | 984 | | | | - | | | | 2,073 | |
Other financial assets | | | 36 | | | | (2 | ) | | | - | | | | 34 | | | | | | 36 | | | | (2 | ) | | | - | | | | 34 | |
Other receivables | | | 86 | | | | (3 | ) | | | - | | | | 83 | | | | | | 62 | | | | (2 | ) | | | - | | | | 60 | |
Derivative financial instruments | | | 120 | | | | - | | | | - | | | | 120 | | | | | | 181 | | | | (18 | ) | | | - | | | | 163 | |
Deferred income tax assets | | | 197 | | | | (2 | ) | | | (4 | ) | | | 191 | | | | | | 290 | | | | (13 | ) | | | (3 | ) | | | 274 | |
Total non-current assets | | | 14,168 | | | | (76 | ) | | | (4 | ) | | | 14,088 | | | | | | 15,082 | | | | (319 | ) | | | (3 | ) | | | 14,760 | |
| | | | | | | | | |
Current assets | | | | | | | | | | | | | | | | | | | | | | | | | | | | | | | | | | |
Inventories | | | 2,397 | | | | (64 | ) | | | - | | | | 2,333 | | | | | | 2,286 | | | | (107 | ) | | | - | | | | 2,179 | |
Trade and other receivables | | | 2,592 | | | | (72 | ) | | | - | | | | 2,520 | | | | | | 2,663 | | | | (121 | ) | | | - | | | | 2,542 | |
Asset held for sale | | | 143 | | | | - | | | | - | | | | 143 | | | | | | - | | | | - | | | | - | | | | - | |
Current income tax recoverable | | | 17 | | | | - | | | | - | | | | 17 | | | | | | 8 | | | | - | | | | - | | | | 8 | |
Derivative financial instruments | | | 52 | | | | - | | | | - | | | | 52 | | | | | | 24 | | | | - | | | | - | | | | 24 | |
Liquid investments | | | 31 | | | | (31 | ) | | | - | | | | - | | | | | | 29 | | | | (29 | ) | | | - | | | | - | |
Cash and cash equivalents | | | 1,768 | | | | (21 | ) | | | - | | | | 1,747 | | | | | | 1,295 | | | | (49 | ) | | | - | | | | 1,246 | |
Total current assets | | | 7,000 | | | | (188 | ) | | | - | | | | 6,812 | | | | | | 6,305 | | | | (306 | ) | | | - | | | | 5,999 | |
| | | | | | | | | |
Total assets | | | 21,168 | | | | (264 | ) | | | (4 | ) | | | 20,900 | | | | | | 21,387 | | | | (625 | ) | | | (3 | ) | | | 20,759 | |
| | | | | | | | | |
EQUITY | | | | | | | | | | | | | | | | | | | | | | | | | | | | | | | | | | |
Other components of equity | | | 4,250 | | | | - | | | | - | | | | 4,250 | | | | | | 4,161 | | | | - | | | | - | | | | 4,161 | |
Retained income | | | 6,287 | | | | - | | | | 16 | | | | 6,303 | | | | | | 6,348 | | | | - | | | | 10 | | | | 6,358 | |
| | | 10,537 | | | | - | | | | 16 | | | | 10,553 | | | | | | 10,509 | | | | - | | | | 10 | | | | 10,519 | |
Non-controlling interests | | | 36 | | | | - | | | | - | | | | 36 | | | | | | 74 | | | | (33 | ) | | | - | | | | 41 | |
Total equity | | | 10,573 | | | | - | | | | 16 | | | | 10,589 | | | | | | 10,583 | | | | (33 | ) | | | 10 | | | | 10,560 | |
| | | | | | | | | |
LIABILITIES | | | | | | | | | | | | | | | | | | | | | | | | | | | | | | | | | | |
Non-current liabilities | | | | | | | | | | | | | | | | | | | | | | | | | | | | | | | | | | |
Interest-bearing loans and borrowings | | | 4,239 | | | | (78 | ) | | | - | | | | 4,161 | | | | | | 4,463 | | | | (163 | ) | | | - | | | | 4,300 | |
Derivative financial instruments | | | 14 | | | | - | | | | - | | | | 14 | | | | | | 20 | | | | (20 | ) | | | - | | | | - | |
Deferred income tax liabilities | | | 1,301 | | | | (69 | ) | | | - | | | | 1,232 | | | | | | 1,492 | | | | (156 | ) | | | - | | | | 1,336 | |
Other payables | | | 296 | | | | (19 | ) | | | - | | | | 277 | | | | | | 204 | | | | (20 | ) | | | - | | | | 184 | |
Retirement benefit obligations | | | 674 | | | | (1 | ) | | | (20 | ) | | | 653 | | | | | | 664 | | | | (15 | ) | | | (13 | ) | | | 636 | |
Provisions for liabilities | | | 257 | | | | (1 | ) | | | - | | | | 256 | | | | | | 252 | | | | (8 | ) | | | - | | | | 244 | |
Total non-current liabilities | | | 6,781 | | | | (168 | ) | | | (20 | ) | | | 6,593 | | | | | | 7,095 | | | | (382 | ) | | | (13 | ) | | | 6,700 | |
| | | | | | | | | |
Current liabilities | | | | | | | | | | | | | | | | | | | | | | | | | | | | | | | | | | |
Trade and other payables | | | 2,841 | | | | (66 | ) | | | - | | | | 2,775 | | | | | | 2,858 | | | | (141 | ) | | | - | | | | 2,717 | |
Current income tax liabilities | | | 181 | | | | (1 | ) | | | - | | | | 180 | | | | | | 201 | | | | (8 | ) | | | - | | | | 193 | |
Interest-bearing loans and borrowings | | | 676 | | | | (29 | ) | | | - | | | | 647 | | | | | | 519 | | | | (61 | ) | | | - | | | | 458 | |
Derivative financial instruments | | | 6 | | | | - | | | | - | | | | 6 | | | | | | 10 | | | | - | | | | - | | | | 10 | |
Provisions for liabilities | | | 110 | | | | - | | | | - | | | | 110 | | | | | | 121 | | | | - | | | | - | | | | 121 | |
Total current liabilities | | | 3,814 | | | | (96 | ) | | | - | | | | 3,718 | | | | | | 3,709 | | | | (210 | ) | | | - | | | | 3,499 | |
| | | | | | | | | |
Total liabilities | | | 10,595 | | | | (264 | ) | | | (20 | ) | | | 10,311 | | | | | | 10,804 | | | | (592 | ) | | | (13 | ) | | | 10,199 | |
| | | | | | | | | |
Total equity and liabilities | | | 21,168 | | | | (264 | ) | | | (4 | ) | | | 20,900 | | | | | | 21,387 | | | | (625 | ) | | | (3 | ) | | | 20,759 | |
As outlined in the Group’s accounting policies on page 124, the Group adopted IFRS 11 and IAS 19R on 1 January 2013. As required under IAS 1, the Group has presented a third balance sheet at the beginning of the previous period (1 January 2012).
2. Segment Information
CRH is a diversified international building materials group which manufactures and distributes a range of building materials products from the fundamentals of heavy materials and elements to construct the frame, through value-added products that complete the building envelope, to distribution channels which service construction fit-out and renewal. Based on these key strategic drivers across the value chain, the Group was organised in 2013 into six business segments comprising Europe Materials (including activities in China and India), Europe Products (including activities in Australia and Southeast Asia), Europe Distribution, Americas Materials, Americas Products and Americas Distribution. No operating segments have been aggregated to form these segments.
Materials businesses are predominantly engaged in the production and sale of a range of primary materials including cement, aggregates, readymixed concrete, asphalt/bitumen and agricultural/chemical lime.
Products businesses are predominantly engaged in the production and sale of architectural and structural concrete products, clay products, fabricated and tempered glass products, construction accessories and the provision of a wide range of inter-related products and services to the construction sector.
Distribution businesses encompass builders merchanting activities and Do-It-Yourself (DIY) stores engaged in the marketing and sale of supplies to the construction sector and to the general public.
The principal factors employed in the identification of the six segments reflected in this note include the Group’s organisational structure in 2013, the nature of the reporting lines to the Chief Operating Decision-Maker (as defined in IFRS 8Operating Segments), the structure of internal reporting documentation such as management accounts and budgets, and the degree of homogeneity of products, services and geographical areas within each of the segments from which revenue is derived.
The Chief Operating Decision-Maker monitors the operating results of segments separately in order to allocate resources between segments and to assess performance. Segment performance is predominantly evaluated based on operating profit. During the year the Chief Operating Decision-Maker received information relating to the results of our joint venture operations on both a proportionate consolidation basis and equity accounting basis (see note 10 for results of our joint venture operations). As performance is also evaluated using operating profit before depreciation and amortisation (EBITDA (as defined)*), supplemental information based on EBITDA (as defined)* is also provided below. Given that net finance costs and income tax are managed on a centralised basis, these items are not allocated between operating segments for the purposes of the information presented to the Chief Operating Decision-Maker and are accordingly omitted from the detailed segmental analysis below. There are no asymmetrical allocations to reporting segments which would require disclosure.
A. Operating segments disclosures - Consolidated Income Statement data
| | | | | | | | | | | | | | | | | | | | | | | | | | | | | | | | | | | | | | | | | | | | | | | | |
| | | Continuing operations - year ended 31 December | |
| | | Materials | | | Products | | | Distribution | | | Total Group | |
| | | 2013
€m | | | 2012
€m | | | 2011
€m | | | 2013
€m | | | 2012
€m | | | 2011
€m | | | 2013
€m | | | 2012
€m | | | 2011
€m | | | 2013
€m | | | 2012
€m | | | 2011†
€m | |
| | | | | | | | | | | | |
Revenue | | | | | | | | | | | | | | | | | | | | | | | | | | | | | | | | | | | | | | | | | | | | | | | | |
Europe | | | 2,266 | | | | 2,383 | | | | 2,985 | | | | 2,376 | | | | 2,477 | | | | 2,648 | | | | 3,936 | | | | 3,956 | | | | 4,340 | | | | 8,578 | | | | 8,816 | | | | 9,973 | |
Americas | | | 4,721 | | | | 4,886 | | | | 4,395 | | | | 3,068 | | | | 2,806 | | | | 2,378 | | | | 1,664 | | | | 1,576 | | | | 1,335 | | | | 9,453 | | | | 9,268 | | | | 8,108 | |
| | | | 6,987 | | | | 7,269 | | | | 7,380 | | | | 5,444 | | | | 5,283 | | | | 5,026 | | | | 5,600 | | | | 5,532 | | | | 5,675 | | | | 18,031 | | | | 18,084 | | | | 18,081 | |
|
Group operating profit before depreciation and amortisation (EBITDA (as defined)*) | |
Europe | | | 278 | | | | 352 | | | | 436 | | | | 119 | | | | 152 | | | | 194 | | | | 186 | | | | 217 | | | | 267 | | | | 583 | | | | 721 | | | | 897 | |
Americas | | | 557 | | | | 555 | | | | 530 | | | | 246 | | | | 204 | | | | 164 | | | | 89 | | | | 83 | | | | 65 | | | | 892 | | | | 842 | | | | 759 | |
| | | | 835 | | | | 907 | | | | 966 | | | | 365 | | | | 356 | | | | 358 | | | | 275 | | | | 300 | | | | 332 | | | | 1,475 | | | | 1,563 | | | | 1,656 | |
|
Depreciation, amortisation and impairment (i) | |
Europe | | | 239 | | | | 135 | | | | 172 | | | | 525 | | | | 133 | | | | 128 | | | | 80 | | | | 72 | | | | 77 | | | | 844 | | | | 340 | | | | 377 | |
Americas | | | 331 | | | | 276 | | | | 266 | | | | 178 | | | | 118 | | | | 122 | | | | 22 | | | | 24 | | | | 20 | | | | 531 | | | | 418 | | | | 408 | |
| | | | 570 | | | | 411 | | | | 438 | | | | 703 | | | | 251 | | | | 250 | | | | 102 | | | | 96 | | | | 97 | | | | 1,375 | | | | 758 | | | | 785 | |
|
Group operating profit (EBIT) | |
Europe | | | 39 | | | | 217 | | | | 264 | | | | (406 | ) | | | 19 | | | | 66 | | | | 106 | | | | 145 | | | | 190 | | | | (261 | ) | | | 381 | | | | 520 | |
Americas | | | 226 | | | | 279 | | | | 264 | | | | 68 | | | | 86 | | | | 42 | | | | 67 | | | | 59 | | | | 45 | | | | 361 | | | | 424 | | | | 351 | |
| | | | 265 | | | | 496 | | | | 528 | | | | (338 | ) | | | 105 | | | | 108 | | | | 173 | | | | 204 | | | | 235 | | | | 100 | | | | 805 | | | | 871 | |
| | | |
Profit on disposals (ii) | | | | 26 | | | | 230 | | | | 55 | |
Finance costs less income | | | | (249 | ) | | | (256 | ) | | | (229 | ) |
Other financial expense | | | | (48 | ) | | | (49 | ) | | | (41 | ) |
Share of equity accounted investments’ (loss)/profit (iii) | | | | (44 | ) | | | (84 | ) | | | 42 | |
(Loss)/profit before tax | | | | | | | | | | | | | | | | | | | | | | | | | | | | | | | | | | | | | | | (215 | ) | | | 646 | | | | 698 | |
|
(i) See note 3 for details of the impairment charge. | |
|
(ii) Profit/(loss) on disposals (note 5) | |
Europe | | | 7 | | | | 148 | | | | 14 | | | | 5 | | | | 54 | | | | 20 | | | | (2 | ) | | | 3 | | | | 7 | | | | 10 | | | | 205 | | | | 41 | |
Americas | | | 19 | | | | 24 | | | | 14 | | | | (3 | ) | | | 1 | | | | - | | | | - | | | | - | | | | - | | | | 16 | | | | 25 | | | | 14 | |
| | | | 26 | | | | 172 | | | | 28 | | | | 2 | | | | 55 | | | | 20 | | | | (2 | ) | | | 3 | | | | 7 | | | | 26 | | | | 230 | | | | 55 | |
|
(iii) Share of equity accounted investments’ (loss)/profit (note 10) | |
Europe | | | (60 | ) | | | (98 | ) | | | 41 | | | | - | | | | (1 | ) | | | - | | | | 9 | | | | 14 | | | | - | | | | (51 | ) | | | (85 | ) | | | 41 | |
Americas | | | 7 | | | | 1 | | | | 1 | | | | - | | | | - | | | | - | | | | - | | | | - | | | | - | | | | 7 | | | | 1 | | | | 1 | |
| | | | (53 | ) | | | (97 | ) | | | 42 | | | | - | | | | (1 | ) | | | - | | | | 9 | | | | 14 | | | | - | | | | (44 | ) | | | (84 | ) | | | 42 | |
| * | EBITDA is defined as earnings before interest, taxes, depreciation, amortisation, asset impairment charges, profit on disposals and the Group’s share of equity accounted investments’ result after tax. |
| † | The 2011 numbers presented above have been restated to reflect the impact of IAS 19 Employee Benefits (revised) only; the Group has availed of the transitional exemption available under IFRS 11 Joint Arrangements and is not restating 2011 for IFRS 11. |
2. Segment Information |continued
B. Operating segments disclosures - Consolidated Balance Sheet data
| | | | | | | | | | | | | | | | | | | | | | | | | | | | | | | | |
| | | Continuing operations - year ended 31 December | |
| | | Materials | | | Products | | | Distribution | | | Total Group | |
| | | 2013 €m | | | 2012 €m | | | 2013 €m | | | 2012 €m | | | 2013 €m | | | 2012 €m | | | 2013 €m | | | 2012 €m | |
| | | | | | | | |
Total assets | | | | | | | | | | | | | | | | | | | | | | | | | | | | | | | | |
Europe | | | 3,399 | | | | 3,411 | | | | 1,974 | | | | 2,473 | | | | 2,217 | | | | 2,247 | | | | 7,590 | | | | 8,131 | |
Americas | | | 5,510 | | | | 5,826 | | | | 2,360 | | | | 2,403 | | | | 853 | | | | 814 | | | | 8,723 | | | | 9,043 | |
| | | | 8,909 | | | | 9,237 | | | | 4,334 | | | | 4,876 | | | | 3,070 | | | | 3,061 | | | | 16,313 | | | | 17,174 | |
Reconciliation to total assets as reported in the Consolidated Balance Sheet: | |
Investments accounted for using the equity method | | | | 1,340 | | | | 1,422 | |
Other financial assets | | | | 23 | | | | 34 | |
Derivative financial instruments (current and non-current) | | | | 80 | | | | 172 | |
Asset held for sale | | | | - | | | | 143 | |
Income tax assets (current and deferred) | | | | 133 | | | | 208 | |
Cash and cash equivalents | | | | 2,540 | | | | 1,747 | |
Total assets as reported in the Consolidated Balance Sheet | | | | 20,429 | | | | 20,900 | |
| | | | | | | | |
Total liabilities | | | | | | | | | | | | | | | | | | | | | | | | | | | | | | | | |
Europe | | | 870 | | | | 1,064 | | | | 738 | | | | 716 | | | | 542 | | | | 594 | | | | 2,150 | | | | 2,374 | |
Americas | | | 772 | | | | 890 | | | | 656 | | | | 580 | | | | 255 | | | | 227 | | | | 1,683 | | | | 1,697 | |
| | | | 1,642 | | | | 1,954 | | | | 1,394 | | | | 1,296 | | | | 797 | | | | 821 | | | | 3,833 | | | | 4,071 | |
Reconciliation to total liabilities as reported in the Consolidated Balance Sheet: | |
Interest-bearing loans and borrowings (current and non-current) | | | | 5,540 | | | | 4,808 | |
Derivative financial instruments (current and non-current) | | | | 53 | | | | 20 | |
Income tax liabilities (current and deferred) | | | | 1,317 | | | | 1,412 | |
Total liabilities as reported in the Consolidated Balance Sheet | | | | 10,743 | | | | 10,311 | |
C. Operating segments disclosures - other items
| | | | | | | | | | | | | | | | | | | | | | | | | | | | | | | | | | | | | | | | | | | | | | | | | | |
| | | | | Continuing operations - year ended 31 December | |
| | | | | Materials | | | Products | | | Distribution | | | Total Group | |
| | | | | 2013 €m | | | 2012 €m | | | 2011
€m | | | 2013
€m | | | 2012 €m | | | 2011
€m | | | 2013
€m | | | 2012
€m | | | 2011
€m | | | 2013
€m | | | 2012
€m | | | 2011
€m | |
Additions to non-current assets | | | | | | | | | | | | | | | | | | | | | | | | | | | | | | | | | | | | | | | | | | | | | | | | |
Europe: | | Property, plant and equipment (note 14) | | | 78 | | | | 101 | | | | 189 | | | | 67 | | | | 84 | | | | 77 | | | | 49 | | | | 70 | | | | 51 | | | | 194 | | | | 255 | | | | 317 | |
| | Financial assets (note 16) | | | 68 | | | | 30 | | | | 18 | | | | 2 | | | | 16 | | | | - | | | | 1 | | | | 1 | | | | 1 | | | | 71 | | | | 47 | | | | 19 | |
Americas: | | Property, plant and equipment (note 14) | | | 199 | | | | 212 | | | | 192 | | | | 83 | | | | 69 | | | | 54 | | | | 21 | | | | 8 | | | | 13 | | | | 303 | | | | 289 | | | | 259 | |
| | | Financial assets (note 16) | | | 7 | | | | 9 | | | | 5 | | | | - | | | | - | | | | - | | | | - | | | | - | | | | - | | | | 7 | | | | 9 | | | | 5 | |
| | | | | | 352 | | | | 352 | | | | 404 | | | | 152 | | | | 169 | | | | 131 | | | | 71 | | | | 79 | | | | 65 | | | | 575 | | | | 600 | | | | 600 | |
D. Entity-wide disclosures
Section 1: Information about products and services
The Group’s revenue from external customers in respect of its principal products and services is analysed in the disclosures above. Segment revenue includes€3,268 million (2012:€3,456 million; 2011:€3,171 million) in respect of revenue applicable to construction contracts. The bulk of our construction activities are performed by our Americas Materials reportable segment, are for the most part short-term in nature and are generally completed within the same financial reporting period.
Revenue derived through the supply of services and intersegment revenue is not material to the Group. The transfer pricing policy implemented by the Group between operating segments and across its constituent entities is described in greater detail in note 32. In addition, due to the nature of building materials, which exhibit a low value-to-weight ratio, the Group’s revenue streams include a low level of cross-border transactions.
Section 2: Information about geographical areas and customers
CRH has a presence in 35 countries worldwide. The revenues from external customers and non-current assets (as defined in IFRS 8) attributable to the country of domicile and all foreign countries of operation are as follows; regions which exceed 10% of total external Group revenue have been highlighted separately on the basis of materiality.
| | | | | | | | | | | | | | | | | | | | |
| | | Year ended 31 December Revenue by destination | | | As at 31 December Non-current assets | |
| | | 2013
€m | | | 2012
€m | | | 2011
€m | | | 2013
€m | | | 2012
€m | |
Country of domicile - Republic of Ireland | | | 278 | | | | 267 | | | | 308 | | | | 475 | | | | 497 | |
Benelux (mainly the Netherlands) | | | 2,324 | | | | 2,327 | | | | 2,593 | | | | 1,280 | | | | 1,464 | |
Americas (mainly the United States) | | | 9,468 | | | | 9,285 | | | | 8,125 | | | | 6,488 | | | | 6,822 | |
Other | | | 5,961 | | | | 6,205 | | | | 7,055 | | | | 4,547 | | | | 4,877 | |
Group totals | | | 18,031 | | | | 18,084 | | | | 18,081 | | | | 12,790 | | | | 13,660 | |
There are no material dependencies or concentrations on individual customers which would warrant disclosure under IFRS 8. The individual entities within the Group have a large number of customers spread across various activities, end-uses and geographies.
3. Cost Analysis
| | | | | | | | | | | | |
| | | 2013 €m | | | 2012 €m | | | 2011 €m | |
| | | |
Cost of sales analysis | | | | | | | | | | | | |
| | | |
Raw materials and goods for resale | | | 7,240 | | | | 7,282 | | | | 7,994 | |
Employment costs (note 6) | | | 1,974 | | | | 1,946 | | | | 1,791 | |
Energy conversion costs | | | 644 | | | | 670 | | | | 780 | |
Repairs and maintenance | | | 421 | | | | 411 | | | | 416 | |
Depreciation, amortisation and impairment (i) | | | 792 | | | | 559 | | | | 556 | |
Change in inventory (note 20) | | | 37 | | | | (93 | ) | | | (69 | ) |
Other production expenses (primarily sub-contractor costs and equipment rental) | | | 2,206 | | | | 2,386 | | | | 1,711 | |
Total | | | 13,314 | | | | 13,161 | | | | 13,179 | |
| | | |
Operating costs analysis | | | | | | | | | | | | |
| | | |
Selling and distribution costs | | | 2,893 | | | | 2,892 | | | | 2,804 | |
Administrative expenses | | | 1,724 | | | | 1,226 | | | | 1,227 | |
Total | | | 4,617 | | | | 4,118 | | | | 4,031 | |
(i) Depreciation, amortisation and impairment analysis
| | | | | | | | | | | | | | | | | | | | | | | | | | | | | | | | | | | | |
| | | Cost of sales | | | Operating costs | | | Total | |
| | | 2013
€m | | | 2012
€m | | | 2011
€m | | | 2013 €m | | | 2012
€m | | | 2011
€m | | | 2013
€m | | | 2012
€m | | | 2011
€m | |
| | | | | | | | | |
Depreciation and depletion (note 14) | | | 521 | | | | 538 | | | | 556 | | | | 150 | | | | 148 | | | | 170 | | | | 671 | | | | 686 | | | | 726 | |
Impairment of property, plant and equipment (note 14) | | | 271 | | | | 21 | | | | - | | | | 4 | | | | 4 | | | | 16 | | | | 275 | | | | 25 | | | | 16 | |
Impairment of intangible assets (note 15) | | | - | | | | - | | | | - | | | | 375 | | | | 3 | | | | 5 | | | | 375 | | | | 3 | | | | 5 | |
Amortisation of intangible assets (note 15) | | | - | | | | - | | | | - | | | | 54 | | | | 44 | | | | 38 | | | | 54 | | | | 44 | | | | 38 | |
Total | | | 792 | | | | 559 | | | | 556 | | | | 583 | | | | 199 | | | | 229 | | | | 1,375 | | | | 758 | | | | 785 | |
Segmental analysis of 2013 impairment charges
| | | | | | | | | | | | | | | | | | | | | | | | | | | | |
| | | Materials | | | Products | | | Distribution | | | Total | |
| | | Europe
€m | | | Americas
€m | | | Europe
€m | | | Americas
€m | | | Europe
€m | | | Americas
€m | | | 2013
€m | |
| | | | | | | |
Annual impairment process (note 15) | | | 58 | | | | - | | | | - | | | | 10 | | | | 4 | | | | - | | | | 72 | |
Portfolio review (ii) | | | 43 | | | | 60 | | | | 414 | | | | 61 | | | | - | | | | - | | | | 578 | |
Included in operating profit | | | 101 | | | | 60 | | | | 414 | | | | 71 | | | | 4 | | | | - | | | | 650 | |
Portfolio review - included in share of equity accounted investments (ii) | | | 101 | | | | - | | | | - | | | | - | | | | 4 | | | | - | | | | 105 | |
Total | | | 202 | | | | 60 | | | | 414 | | | | 71 | | | | 8 | | | | - | | | | 755 | |
Asset impairment charges of€174 million arose in 2012 (2011:€32 million),€28 million (2011:€21 million) of which were recorded within operating profit (Europe Products€24 million (2011:€15 million), Europe Distribution€nil million (2011:€2 million) and Americas Products€4 million (2011:€4 million).
(ii) Impairments arising from portfolio review
In November 2013, a Group-wide portfolio review was initiated to identify and focus on those businesses within our portfolio which offer the most attractive future returns, and to prioritise capital allocation to ensure profitable growth across our network of businesses. This review has resulted in the identification of 45 (34 Europe, 11 Americas) business units which will not meet our future returns objectives and are in line for divestment. None of these businesses have been classified as held-for-sale or as discontinued operations at 31 December 2013 as they did not meet the relevant criteria under IFRS 5. The decision to divest of these business units has resulted in the need to assess each of them separately for impairment.
For each of the business units identified, a valuation was prepared based on the estimated fair value less costs of disposal. The valuations were then compared to the carrying value of each business and where that valuation fell below the carrying value an impairment charge was taken.
The largest impairments have arisen in two businesses within the Europe Products segment amounting to€99 million (€58 million goodwill and€41 million property, plant and equipment) and€75 million (all goodwill). The recoverable amount of these businesses is calculated based on their fair value less costs of disposal (income-based valuation approach) using real pre-tax discount rates of 8.9% and 9.2% respectively. Both businesses serve the residential new-build sector in mature markets.
In addition, financial asset impairments of€105 million have been recorded (see note 10), primarily in respect of a re-assessment of the carrying value of two equity accounted investments in our Europe Materials segment. The recoverable amount of these financial assets is based on their fair value less costs of disposal (income-based valuation approach) using real pre-tax discount rates of 9.2% and 9.8% respectively.
3. Cost Analysis |continued
Sensitivity analysis
Fair value less costs of disposal for businesses identified for divestment in the portfolio review was calculated using either an income-based valuation approach or a market-based valuation approach. In respect of those businesses that used the latter valuation approach, a 10% decrease in valuation would result in an additional impairment of€28 million.
In respect of the remaining businesses which employed an income-based valuation approach, the following table provides valuation sensitivity analysis.
| | | | | | | | |
| | | Additional impairment that would arise as a result of | |
| | |
| | | 0.5% reduction in EBITDA (as defined)* margin €m | | | 0.5% increase in pre-tax discount rate €m | |
| | |
Income-based valuation approach | | | 74 | | | | 36 | |
4. Operating Profit Disclosures
| | | | | | | | | | | | |
| | | 2013
€m | | | 2012
€m | | | 2011
€m | |
| | | |
Operating lease rentals | | | | | | | | | | | | |
| | | |
- hire of plant and machinery | | | 108 | | | | 99 | | | | 98 | |
- land and buildings | | | 220 | | | | 187 | | | | 173 | |
- other operating leases | | | 47 | | | | 69 | | | | 49 | |
Total | | | 375 | | | | 355 | | | | 320 | |
|
Auditor’s remuneration | |
| Fees for professional services provided by the Group’s independent auditors in respect of each of the following categories were: | |
| | | |
Audit fees (i) | | | 14 | | | | 14 | | | | 13 | |
Audit-related fees (ii) | | | 2 | | | | 2 | | | | 2 | |
Tax fees | | | 1 | | | | 1 | | | | 1 | |
All other fees | | | - | | | | - | | | | - | |
Total | | | 17 | | | | 17 | | | | 16 | |
| (i) | Audit fees includes Sarbanes-Oxley attestation but exclude€1 million (2012:€1 million; 2011:€2 million) paid to auditors other than the Group’s auditors. |
| (ii) | Audit-related fees include attestation services that are closely related to the performance of the audit. |
| * | EBITDA is defined as earnings before interest, taxes, depreciation, amortisation, asset impairment charges, profit on disposals and the Group’s share of equity accounted investments’ result after tax. |
5. Profit on Disposals
| | | | | | | | | | | | | | | | | | | | | | | | | | | | | | | | | | | | |
| | | Business disposals | | | Disposal of other
non-current assets | | | Total | |
| | | 2013
€m | | | 2012 (ii)
€m | | | 2011 (iii)
€m | | | 2013
€m | | | 2012
€m | | | 2011
€m | | | 2013
€m | | | 2012
€m | | | 2011
€m | |
Assets/(liabilities) disposed of at net carrying amount: | | | | | | | | | | | | | | | | | | | | | | | | | | | | | | | | | | | | |
- non-current assets (notes 14,15,16) | | | 43 | | | | 432 | | | | 334 | | | | 66 | | | | 90 | | | | 74 | | | | 109 | | | | 522 | | | | 408 | |
- cash and cash equivalents | | | - | | | | 3 | | | | 38 | | | | - | | | | - | | | | - | | | | - | | | | 3 | | | | 38 | |
- working capital and provisions (note 20) | | | 6 | | | | 21 | | | | 35 | | | | - | | | | - | | | | - | | | | 6 | | | | 21 | | | | 35 | |
- asset held for sale (i) (note 16) | | | 139 | | | | - | | | | - | | | | - | | | | - | | | | - | | | | 139 | | | | - | | | | - | |
- current tax | | | - | | | | - | | | | 1 | | | | - | | | | - | | | | - | | | | - | | | | - | | | | 1 | |
- interest-bearing loans and borrowings | | | (17 | ) | | | (2 | ) | | | (50 | ) | | | - | | | | - | | | | - | | | | (17 | ) | | | (2 | ) | | | (50 | ) |
- deferred tax (note 27) | | | - | | | | 1 | | | | (9 | ) | | | - | | | | - | | | | - | | | | - | | | | 1 | | | | (9 | ) |
- retirement benefit obligations (note 28) | | | - | | | | (4 | ) | | | - | | | | - | | | | - | | | | - | | | | - | | | | (4 | ) | | | - | |
Net assets disposed | | | 171 | | | | 451 | | | | 349 | | | | 66 | | | | 90 | | | | 74 | | | | 237 | | | | 541 | | | | 423 | |
Re-classification of currency translation effects on disposal | | | 3 | | | | 14 | | | | 2 | | | | - | | | | - | | | | - | | | | 3 | | | | 14 | | | | 2 | |
Total | | | 174 | | | | 465 | | | | 351 | | | | 66 | | | | 90 | | | | 74 | | | | 240 | | | | 555 | | | | 425 | |
Proceeds from disposals (net of disposal costs) | | | 26 | | | | 652 | | | | 378 | | | | 96 | | | | 133 | | | | 102 | | | | 122 | | | | 785 | | | | 480 | |
Asset exchange (i) (note 31) | | | 144 | | | | - | | | | - | | | | - | | | | - | | | | - | | | | 144 | | | | - | | | | - | |
(Loss)/profit on disposals | | | (4 | ) | | | 187 | | | | 27 | | | | 30 | | | | 43 | | | | 28 | | | | 26 | | | | 230 | | | | 55 | |
| | | | | | | | | |
Net cash inflow arising on disposal | | | | | | | | | | | | | | | | | | | | | | | | | | | | | | | | | | | | |
Cash proceeds | | | 26 | | | | 652 | | | | 378 | | | | 96 | | | | 133 | | | | 102 | | | | 122 | | | | 785 | | | | 480 | |
Less: cash and cash equivalents disposed | | | - | | | | (3 | ) | | | (38 | ) | | | - | | | | - | | | | - | | | | - | | | | (3 | ) | | | (38 | ) |
Total | | | 26 | | | | 649 | | | | 340 | | | | 96 | | | | 133 | | | | 102 | | | | 122 | | | | 782 | | | | 442 | |
| (i) | On 25 February 2013, the Group transferred its 26% stake in Corporacion Uniland to Cementos Portland Valderrivas in exchange for a 99% stake in Cementos Lemona, an integrated cement, readymixed concrete and aggregates business. |
| (ii) | This relates principally to the disposal of our 49% investment in our Portuguese joint venture, Secil (which was part of the Europe Materials segment). |
| (iii) | The disposals in 2011 relate principally to the disposal of the Insulation and Climate Control business in Europe Products and the disposal of our 35% associate investment in the Trialis distribution business in France. |
6. Employment
The average number of employees is as follows:
| | | | | | | | | | | | | | | | |
| Year ended 31 December 2013 | | Materials | | | Products | | | Distribution | | | Total Group | |
| | | | |
Europe | | | 9,440 | | | | 15,613 | | | | 11,388 | | | | 36,441 | |
Americas | | | 18,216 | | | | 17,276 | | | | 3,709 | | | | 39,201 | |
Total | | | 27,656 | | | | 32,889 | | | | 15,097 | | | | 75,642 | |
| | | | |
Year ended 31 December 2012 | | | | | | | | | | | | | | | | |
| | | | |
Europe | | | 9,473 | | | | 16,129 | | | | 11,174 | | | | 36,776 | |
Americas | | | 18,106 | | | | 15,546 | | | | 3,532 | | | | 37,184 | |
Total | | | 27,579 | | | | 31,675 | | | | 14,706 | | | | 73,960 | |
| | | | |
Year ended 31 December 2011 | | | | | | | | | | | | | | | | |
| | | | |
Europe | | | 11,649 | | | | 16,636 | | | | 12,147 | | | | 40,432 | |
Americas | | | 17,805 | | | | 14,895 | | | | 3,301 | | | | 36,001 | |
Total | | | 29,454 | | | | 31,531 | | | | 15,448 | | | | 76,433 | |
Employment costs charged in the Consolidated Income Statement are analysed as follows:
| | | | | | | | | | | | |
| | | 2013
€m | | | 2012
€m | | | 2011
€m | |
Wages and salaries | | | 2,915 | | | | 2,876 | | | | 2,692 | |
Social welfare costs | | | 360 | | | | 359 | | | | 344 | |
Other employment-related costs | | | 464 | | | | 432 | | | | 378 | |
Share-based payment expense (note 8) | | | 15 | | | | 14 | | | | 21 | |
Total retirement benefits expense (note 28) | | | 201 | | | | 181 | | | | 171 | |
Total | | | 3,955 | | | | 3,862 | | | | 3,606 | |
Total charge analysed between: | | | | | | | | | | | | |
Cost of sales | | | 1,974 | | | | 1,946 | | | | 1,791 | |
Operating costs | | | 1,959 | | | | 1,891 | | | | 1,795 | |
Finance costs (net) - applicable to retirement benefit obligations (note 9) | | | 22 | | | | 25 | | | | 20 | |
Total | | | 3,955 | | | | 3,862 | | | | 3,606 | |
7. Directors’ Emoluments and Interests
Directors’ emoluments (which are included in administrative expenses in note 3) and interests are given in the Directors’ Remuneration Report pages 85 to 116 of this Annual Report.
8. Share-based Payment Expense
| | | | | | | | | | | | |
| | | 2013
€m | | | 2012
€m | | | 2011
€m | |
| | | |
Share option expense | | | 1 | | | | - | | | | 9 | |
Performance Share Plan and Restricted Share Plan expense | | | 14 | | | | 14 | | | | 12 | |
Total | | | 15 | | | | 14 | | | | 21 | |
Share-based payment expense is reflected in operating costs in the Consolidated Income Statement.
Share option schemes
In May 2010, shareholders approved the adoption of new share option and savings-related share option schemes, which replaced schemes approved by shareholders in May 2000. The general terms and conditions applicable to the new share option and savings-related share option schemes were set out in a circular issued to shareholders on 31 March 2010, a copy of which is available on www.crh.com.
Due to the immateriality of the savings-related schemes’ expense and the level of savings-related share options outstanding, detailed financial disclosures have not been provided in relation to these schemes.
Details of options granted under the share option schemes (excluding savings-related share option schemes)
| | | | | | | | | | | | | | | | | | | | | | | | |
| | | Weighted average exercise price | | | Number of
options | | | Weighted average
exercise price | | | Number of
options | | | Weighted average
exercise price | | | Number of
options | |
| | | | | | 2013 | | | | | | 2012 | | | | | | 2011 | |
| | | | | | |
Outstanding at beginning of year | | | €18.84 | | | | 23,295,955 | | | | €19.13 | | | | 23,591,756 | | | | €19.38 | | | | 23,515,521 | |
Granted (a) | | | €16.19 | | | | 3,853,400 | | | | €15.19 | | | | 3,889,100 | | | | €16.38 | | | | 3,558,500 | |
Exercised (b) | | | €13.21 | | | | (1,245,029 | ) | | | €11.98 | | | | (1,010,780 | ) | | | €13.36 | | | | (229,898 | ) |
Lapsed | | | €18.53 | | | | (4,105,439 | ) | | | €18.68 | | | | (3,174,121 | ) | | | €18.30 | | | | (3,252,367 | ) |
| | | | | | |
Outstanding at end of year | | | €18.75 | | | | 21,798,887 | | | | €18.84 | | | | 23,295,955 | | | | €19.13 | | | | 23,591,756 | |
Exercisable at end of year | | | €17.94 | | | | 2,114,772 | | | | €16.24 | | | | 3,364,448 | | | | €16.03 | | | | 6,497,695 | |
| (a) | Granted in April 2013 (2012: April; 2011: April), the level of vesting of these options will be determined by reference to certain performance targets (see page 94). If the performance criteria have been met, these options, or portion thereof as appropriate, may be exercised after the expiration of three years from their date of grant. All options granted have a life of ten years. |
| (b) | The weighted average share price at the date of exercise of these options was€17.28 (2012:€14.95; 2011:€15.11). |
| | | | | | | | | | | | |
| | | 2013 | | | 2012 | | | 2011 | |
| | | |
| Weighted average remaining contractual life for the share options outstanding at 31 December (years) | | | 5.54 | | | | 5.69 | | | | 5.53 | |
| | | |
| Euro-denominated options outstanding at the end of the year (number) | | | 21,683,559 | | | | 23,182,257 | | | | 23,473,569 | |
| Range of exercise prices (€) | | | 15.07-29.86 | | | | 11.86-29.86 | | | | 11.86-29.86 | |
| | | |
| Sterling-denominated options outstanding at the end of the year (number) | | | 115,328 | | | | 113,698 | | | | 118,187 | |
| Range of exercise prices (Stg£) | | | 10.04-20.23 | | | | 8.17-20.23 | | | | 8.17-20.23 | |
|
| The CRH share price at 31 December 2013 was€18.30 (2012:€15.30; 2011:€15.36). The following analysis shows the number of outstanding share options with exercise prices lower/higher than the year-end share price: | |
| | | |
| Number of options with exercise prices lower than year-end price: | | | | | | | | | | | | |
| Exercisable | | | 506,581 | | | | 1,677,365 | | | | 2,780,082 | |
Not exercisable | | | 13,788,399 | | | | 5,382,296 | | | | 1,613,397 | |
| | | | 14,294,980 | | | | 7,059,661 | | | | 4,393,479 | |
| | | |
| Number of options with exercise prices higher than year-end price: | | | | | | | | | | | | |
| Exercisable | | | 1,608,191 | | | | 1,687,083 | | | | 3,717,613 | |
Not exercisable | | | 5,895,716 | | | | 14,549,211 | | | | 15,480,664 | |
| | | | 7,503,907 | | | | 16,236,294 | | | | 19,198,277 | |
| | | |
Total options outstanding | | | 21,798,887 | | | | 23,295,955 | | | | 23,591,756 | |
8. Share-based Payment Expense |continued
Fair values
The weighted average fair value assigned to the 3-year euro-denominated options granted in 2013 under the 2010 share option scheme was€3.61 (2012:€3.43; 2011:€4.03). The fair values of these options were determined using the following assumptions:
| | | | | | | | | | | | |
| | | 2013 | | | 2012 | | | 2011 | |
| | | |
Weighted average exercise price | | | €16.19 | | | | €15.19 | | | | €16.38 | |
Risk-free interest rate | | | 0.36% | | | | 0.80% | | | | 2.68% | |
Expected dividend payments over the expected life | | | €3.25 | | | | €3.25 | | | | €3.25 | |
Expected volatility | | | 33.7% | | | | 33.8% | | | | 32.9% | |
Expected life in years | | | 5 | | | | 5 | | | | 5 | |
The expected volatility was determined using a historical sample of 61 month-end CRH share prices. Share options are granted at market value at the date of grant. The expected lives of the options are based on historical data and are therefore not necessarily indicative of exercise patterns that may materialise.
Other than the assumptions listed above, no other features of option grants were factored into the determination of fair value. No relevant modifications were effected to either the 2010 share option scheme or the previously approved 2000 share option scheme during the course of 2013.
Performance Share Plan
The Group operates a Performance Share Plan which was approved by shareholders in May 2006.
The expense of€13 million (2012:€14 million; 2011:€12 million) reported in the Consolidated Income Statement has been arrived at through applying a Monte Carlo simulation technique to model the combination of market-based and non-market-based performance conditions in the Plan.
Due to the immateriality of the Restricted Share Plan expense and the level of awards outstanding in this plan at 31 December 2013, detailed financial disclosures have not been provided in relation to this share-based payment arrangement.
Details of awards granted under the Performance Share Plan
| | | | | | | | | | | | | | | | | | | | | | | | |
| | | | | | Period to | | | Number of Shares | | | | |
| | | Share price at date of award | | | earliest
release
date | | | Initial
award | | | Cumulative lapses to date | | | Net outstanding | | | Fair value | |
| | | | | | |
Granted in 2010 | | | €18.51 | | | | 3 years | | | | 1,459,750 | | | | (1,459,750 | ) | | | - | | | | €10.01 | |
| | | | | | |
Granted in 2011 | | | €16.52 | | | | 3 years | | | | 1,684,250 | | | | (172,000 | ) | | | 1,512,250 | | | | €9.72 | |
| | | | | | |
Granted in 2012 | | | €15.63 | | | | 3 years | | | | 2,079,000 | | | | (116,500 | ) | | | 1,962,500 | | | | €7.77 | |
| | | | | | |
Granted in 2013 | | | €16.69 | | | | 3 years | | | | 1,195,500 | | | | (71,750 | ) | | | 1,123,750 | | | | €8.54 | |
The fair value of the shares awarded was determined using a Monte Carlo simulation technique taking account of peer group total shareholder return, volatilities and correlations, together with the following assumptions:
| | | | | | | | | | | | |
| | | 2013 | | | 2012 | | | 2011 | |
| | | |
Risk-free interest rate (%) | | | 0.10 | | | | 0.33 | | | | 2.08 | |
Expected volatility (%) | | | 31.3 | | | | 35.4 | | | | 38.6 | |
The expected volatility was determined using a historical sample of 37 month-end CRH share prices.
9. Finance Costs and Finance Income
| | | | | | | | | | | | |
| | | 2013
€m | | | 2012
€m | | | 2011
€m | |
| | | |
Finance costs | | | | | | | | | | | | |
Interest payable on borrowings | | | 323 | | | | 327 | | | | 335 | |
Net income on interest rate and currency swaps | | | (55 | ) | | | (47 | ) | | | (65 | ) |
Mark-to-market of derivatives and related fixed rate debt: | | | | | | | | | | | | |
- interest rate swaps (i) | | | 68 | | | | 22 | | | | 12 | |
- currency swaps and forward contracts | | | 1 | | | | 3 | | | | (2 | ) |
- fixed rate debt (i) | | | (79 | ) | | | (34 | ) | | | (15 | ) |
Net loss on interest rate swaps not designated as hedges | | | 4 | | | | - | | | | (3 | ) |
Net finance cost on gross debt including related derivatives | | | 262 | | | | 271 | | | | 262 | |
| | | |
Finance income | | | | | | | | | | | | |
Interest receivable on loans to joint ventures and associates | | | (3 | ) | | | (2 | ) | | | (3 | ) |
Interest receivable on cash and cash equivalents and other | | | (10 | ) | | | (13 | ) | | | (30 | ) |
Finance income | | | (13 | ) | | | (15 | ) | | | (33 | ) |
Finance costs less income | | | 249 | | | | 256 | | | | 229 | |
| | | |
Other financial expense | | | | | | | | | | | | |
Unwinding of discount element of provisions for liabilities (note 26) | | | 15 | | | | 15 | | | | 15 | |
Unwinding of discount applicable to deferred and contingent acquisition consideration (note 19) | | | 11 | | | | 9 | | | | 6 | |
Pension-related finance cost (net) (note 28) | | | 22 | | | | 25 | | | | 20 | |
Total | | | 48 | | | | 49 | | | | 41 | |
| (i) | The Group uses interest rate swaps to convert fixed rate debt to floating rate. Fixed rate debt, which has been converted to floating rate through the use of interest rate swaps, is stated in the Consolidated Balance Sheet at adjusted value to reflect movements in underlying fixed rates. The movement on this adjustment, together with the offsetting movement in the fair value of the related interest rate swaps, is included in finance costs in each reporting period. |
10. Share of Equity Accounted Investments’ (Loss)/Profit
The Group’s share of joint ventures’ and associates’ results after tax is equity accounted and is presented as a single-line item in the Consolidated Income Statement in 2013 and 2012. In 2011 the Group’s share of associates’ results after tax was equity accounted while the share of joint ventures’ was proportionately consolidated in the Consolidated Financial Statements.
The Group’s share of equity accounted investments’ results after tax is analysed as follows between the principal Consolidated Income Statement captions:
| | | | | | | | | | | | | | | | | | | | | | | | | | | | | | | | | | | | |
| | | Joint Ventures | | | Associates | | | Total | |
| | | 2013
€m | | | 2012 €m | | | 2011
(below) | | | 2013
€m | | | 2012 (ii) €m | | | 2011
€m | | | 2013
€m | | | 2012
€m | | | 2011
€m | |
| | | | | | | | | |
Group share of: | | | | | | | | | | | | | | | | | | | | | | | | | | | | | | | | | | | | |
Revenue | | | 469 | | | | 575 | | | | - | | | | 961 | | | | 978 | | | | 1,095 | | | | 1,430 | | | | 1,553 | | | | 1,095 | |
| | | | | | | | | |
EBITDA (as defined)* | | | 60 | | | | 77 | | | | - | | | | 109 | | | | 118 | | | | 138 | | | | 169 | | | | 195 | | | | 138 | |
Depreciation and amortisation | | | (27 | ) | | | (37 | ) | | | - | | | | (39 | ) | | | (50 | ) | | | (46 | ) | | | (66 | ) | | | (87 | ) | | | (46 | ) |
Impairment (i) | | | (54 | ) | | | - | | | | - | | | | (51 | ) | | | (146 | ) | | | (11 | ) | | | (105 | ) | | | (146 | ) | | | (11 | ) |
Operating (loss)/profit | | | (21 | ) | | | 40 | | | | - | | | | 19 | | | | (78 | ) | | | 81 | | | | (2 | ) | | | (38 | ) | | | 81 | |
Finance costs (net) | | | (2 | ) | | | (2 | ) | | | - | | | | (22 | ) | | | (26 | ) | | | (19 | ) | | | (24 | ) | | | (28 | ) | | | (19 | ) |
(Loss)/profit before tax | | | (23 | ) | | | 38 | | | | - | | | | (3 | ) | | | (104 | ) | | | 62 | | | | (26 | ) | | | (66 | ) | | | 62 | |
Income tax expense | | | (5 | ) | | | (10 | ) | | | - | | | | (13 | ) | | | (8 | ) | | | (20 | ) | | | (18 | ) | | | (18 | ) | | | (20 | ) |
(Loss)/profit after tax | | | (28 | ) | | | 28 | | | | - | | | | (16 | ) | | | (112 | ) | | | 42 | | | | (44 | ) | | | (84 | ) | | | 42 | |
An analysis of the result after tax by operating segment is presented in note 2. The aggregated balance sheet data (analysed between current and non-current assets and liabilities) in respect of the Group’s investment in joint ventures and associates is presented in note 16.
| (i) | See note 3 for details of the impairment charge. |
| (ii) | During 2012, the Group recognised an impairment charge of€146 million in respect of our 26% investment in our associate Corporacion Uniland (part of the Europe Materials segment). During 2013, the Group transferred its 26% stake in Corporacion Uniland to Cementos Portland Valderrivas in exchange for a 99% stake in Cementos Lemona (see note 5 for further details). |
The Group’s share of the income and expenses of its joint ventures for the year ended 31 December 2011, which was proportionately consolidated in the 2011 Consolidated Financial Statements, is as follows:
| | | | |
| | | 2011
€m | |
| |
Group share of: | | | | |
Revenue | | | 707 | |
| |
EBITDA (as defined)* | | | 113 | |
Depreciation and amortisation | | | (53 | ) |
Operating profit | | | 60 | |
Profit on disposals | | | 2 | |
Profit before finance costs | | | 62 | |
Finance costs (net) | | | (6 | ) |
Profit before tax | | | 56 | |
Income tax expense | | | (11 | ) |
Profit after tax | | | 45 | |
| * | EBITDA is defined as earnings before interest, taxes, depreciation, amortisation, asset impairment charges and profit on disposals. |
11. Income Tax Expense
| | | | | | | | | | | | |
| Recognised within the Consolidated Income Statement | | 2013
€m | | | 2012
€m | | | 2011
€m | |
| | | |
(a) Current tax | | | | | | | | | | | | |
Republic of Ireland | | | (1 | ) | | | (4 | ) | | | - | |
Overseas | | | 77 | | | | 103 | | | | 194 | |
Total current tax expense | | | 76 | | | | 99 | | | | 194 | |
| | | |
(b) Deferred tax | | | | | | | | | | | | |
Origination and reversal of temporary differences: | | | | | | | | | | | | |
Retirement benefit obligations | | | 16 | | | | 20 | | | | 24 | |
Share-based payment expense | | | (1 | ) | | | 1 | | | | - | |
Derivative financial instruments | | | 4 | | | | (9 | ) | | | 5 | |
Other items | | | (15 | ) | | | (5 | ) | | | (112 | ) |
Total deferred tax expense | | | 4 | | | | 7 | | | | (83 | ) |
| | | |
Income tax expense reported in the Consolidated Income Statement | | | 80 | | | | 106 | | | | 111 | |
| | | |
Recognised within equity | | | | | | | | | | | | |
| | | |
(a) Within the Consolidated Statement of Comprehensive Income: | | | | | | | | | | | | |
Deferred tax - retirement benefit obligations | | | (43 | ) | | | 23 | | | | 52 | |
Deferred tax - cash flow hedges | | | - | | | | - | | | | 2 | |
Income tax recognised directly within equity | | | (43 | ) | | | 23 | | | | 54 | |
| | | |
Reconciliation of applicable tax rate to effective tax rate | | | | | | | | | | | | |
| | | |
(Loss)/profit before tax (€m) | | | (215 | ) | | | 646 | | | | 698 | |
Tax charge expressed as a percentage of (loss)/profit before tax (effective tax rate): | | | | | | | | | | | | |
- current tax expense only | | | (35.3% | ) | | | 15.3% | | | | 27.8% | |
- total income tax expense (current and deferred) | | | (37.2% | ) | | | 16.4% | | | | 15.9% | |
|
The following table reconciles the applicable Republic of Ireland statutory tax rate to the
effective tax rate (current and deferred) of the Group: | |
| |
| | | % of (loss)/profit before tax | |
| | | |
Irish corporation tax rate | | | 12.5 | | | | 12.5 | | | | 12.5 | |
Higher tax rates on overseas earnings | | | 17.8 | | | | 3.1 | | | | 4.5 | |
Other items (primarily comprising items not chargeable to tax/expenses not deductible for tax): | | | | | | | | | | | | |
- arising from 2013 impairment | | | (70.2 | ) | | | - | | | | - | |
- other items | | | 2.7 | | | | 0.8 | | | | (1.1 | ) |
Total effective tax rate | | | (37.2 | ) | | | 16.4 | | | | 15.9 | |
Other disclosures
Effective tax rate
The 2013 income statement includes an impairment charge of€755 million with an associated tax credit of€25 million. The 2013 effective tax rate excluding the aforementioned impairment charge and related tax credit is 19.4%.
Changes in tax rates
The total tax charge in future periods will be affected by any changes to the tax rates in force in the countries in which the Group operates.
Excess of capital allowances over depreciation
The current tax charge will also be impacted by changes in the excess of tax depreciation (capital allowances) over accounting depreciation. Based on current capital investment plans, the Group expects to continue to be in a position to claim capital allowances in excess of depreciation in future years.
Investments in subsidiaries
Given that participation exemptions and tax credits would be available in the context of the Group’s investments in subsidiaries in the majority of the jurisdictions in which the Group operates, the aggregate amount of temporary differences in respect of which deferred tax liabilities have not been recognised would be immaterial.
Proposed dividends
There are no income tax consequences for the Company in respect of dividends proposed prior to issuance of the Consolidated Financial Statements and for which a liability has not been recognised.
12. Dividends
The dividends paid and proposed in respect of each class of share capital are as follows:
| | | | | | | | | | | | |
| | | 2013
€m | | | 2012
€m | | | 2011
€m | |
| | | |
Dividends to shareholders | | | | | | | | | | | | |
Preference | | | | | | | | | | | | |
5% Cumulative Preference Shares€3,175 (2012:€3,175; 2011:€3,175) | | | - | | | | - | | | | - | |
7% ‘A’ Cumulative Preference Shares€77,521 (2012:€77,521; 2011:€77,521) | | | - | | | | - | | | | - | |
Equity | | | | | | | | | | | | |
Final - paid 44.00c per Ordinary Share (2012: 44.00c; 2011: 44.00c) | | | 320 | | | | 317 | | | | 312 | |
Interim - paid 18.50c per Ordinary Share (2012: 18.50c; 2011: 18.50c) | | | 135 | | | | 133 | | | | 133 | |
Total | | | 455 | | | | 450 | | | | 445 | |
| | | |
Dividends proposed (memorandum disclosure) | | | | | | | | | | | | |
Equity | | | | | | | | | | | | |
Final 2013 - proposed 44.00c per Ordinary Share (2012: 44.00c; 2011: 44.00c) | | | 323 | | | | 320 | | | | 316 | |
| | | |
Reconciliation to Consolidated Statement of Cash Flows | | | | | | | | | | | | |
Dividends to shareholders | | | 455 | | | | 450 | | | | 445 | |
Less: issue of scrip shares in lieu of cash dividends (note 29) | | | (88 | ) | | | (88 | ) | | | (135 | ) |
Dividends paid to equity holders of the Company | | | 367 | | | | 362 | | | | 310 | |
Dividends paid by subsidiaries to non-controlling interests | | | 1 | | | | 4 | | | | 9 | |
Total dividends paid | | | 368 | | | | 366 | | | | 319 | |
13. Earnings per Ordinary Share
The computation of basic and diluted earnings per Ordinary Share is set out below:
| | | | | | | | | | | | |
| | | 2013
€m | | | 2012
€m | | | 2011
€m | |
| | | |
Numerator computations | | | | | | | | | | | | |
Group (loss)/profit for the financial year | | | (295 | ) | | | 540 | | | | 587 | |
Profit attributable to non-controlling interests | | | (1 | ) | | | (2 | ) | | | (7 | ) |
(Loss)/profit attributable to equity holders of the Company | | | (296 | ) | | | 538 | | | | 580 | |
Preference dividends | | | - | | | | - | | | | - | |
| (Loss)/profit attributable to ordinary equity holders of the Company - numerator for basic/diluted earnings per Ordinary Share | | | (296 | ) | | | 538 | | | | 580 | |
| | | |
Denominator computations | | | | | | | | | | | | |
Denominator for basic earnings per Ordinary Share | | | | | | | | | | | | |
Weighted average number of Ordinary Shares (millions) outstanding for the year (i) | | | 729.2 | | | | 721.9 | | | | 714.4 | |
Effect of dilutive potential Ordinary Shares (employee share options) (millions) (i) and (ii) | | | - | | | | 0.3 | | | | 0.3 | |
Denominator for diluted earnings per Ordinary Share | | | 729.2 | | | | 722.2 | | | | 714.7 | |
| | | |
Basic (loss)/earnings per Ordinary Share | | | (40.6c | ) | | | 74.6c | | | | 81.2c | |
| | | |
Diluted (loss)/earnings per Ordinary Share | | | (40.6c | ) | | | 74.5c | | | | 81.2c | |
| (i) | The weighted average number of Ordinary Shares included in the computation of basic and diluted earnings per Ordinary Share has been adjusted to exclude shares held by the Employee Benefit Trust and Ordinary Shares repurchased and held by the Company (CRH plc) as Treasury Shares given that these shares do not rank for dividend. The number of Ordinary Shares so held at the balance sheet date is detailed in note 29. |
| (ii) | Contingently issuable Ordinary Shares (totalling 24,282,615 at 31 December 2013, 24,856,007 at 31 December 2012 and 21,429,061 at 31 December 2011) are excluded from the computation of diluted earnings per Ordinary Share where the conditions governing exercisability have not been satisfied as at the end of the reporting period. |
14. Property, Plant and Equipment
| | | | | | | | | | | | | | | | |
| | | Land and buildings (i) €m | | | Plant and machinery €m | | | Assets in course of construction €m | | | Total €m | |
| | | | |
At 31 December 2013 | | | | | | | | | | | | | | | | |
Cost/deemed cost | | | 5,912 | | | | 8,847 | | | | 229 | | | | 14,988 | |
Accumulated depreciation (and impairment charges) | | | (1,816 | ) | | | (5,633 | ) | | | - | | | | (7,449 | ) |
Net carrying amount | | | 4,096 | | | | 3,214 | | | | 229 | | | | 7,539 | |
| | | | |
At 1 January 2013, net carrying amount | | | 4,313 | | | | 3,371 | | | | 287 | | | | 7,971 | |
Translation adjustment | | | (129 | ) | | | (114 | ) | | | (8 | ) | | | (251 | ) |
Reclassifications | | | 7 | | | | 144 | | | | (151 | ) | | | - | |
Additions at cost | | | 46 | | | | 350 | | | | 101 | | | | 497 | |
Arising on acquisition (note 31) | | | 132 | | | | 210 | | | | - | | | | 342 | |
Disposals at net carrying amount | | | (30 | ) | | | (44 | ) | | | - | | | | (74 | ) |
Depreciation charge for year | | | (132 | ) | | | (539 | ) | | | - | | | | (671 | ) |
Impairment charge for year (ii) | | | (111 | ) | | | (164 | ) | | | - | | | | (275 | ) |
At 31 December 2013, net carrying amount | | | 4,096 | | | | 3,214 | | | | 229 | | | | 7,539 | |
| | | | |
The equivalent disclosure for the prior year is as follows: | | | | | | | | | | | | | | | | |
| | | | |
At 31 December 2012 | | | | | | | | | | | | | | | | |
Cost/deemed cost | | | 5,838 | | | | 8,694 | | | | 287 | | | | 14,819 | |
Accumulated depreciation (and impairment charges) | | | (1,525 | ) | | | (5,323 | ) | | | - | | | | (6,848 | ) |
Net carrying amount | | | 4,313 | | | | 3,371 | | | | 287 | | | | 7,971 | |
| | | | |
At 1 January 2012, net carrying amount | | | 4,269 | | | | 3,181 | | | | 558 | | | | 8,008 | |
Translation adjustment | | | (28 | ) | | | (21 | ) | | | 2 | | | | (47 | ) |
Reclassifications | | | 30 | | | | 352 | | | | (382 | ) | | | - | |
Additions at cost | | | 58 | | | | 378 | | | | 108 | | | | 544 | |
Arising on acquisition (note 31) | | | 156 | | | | 96 | | | | 1 | | | | 253 | |
Disposals at net carrying amount | | | (38 | ) | | | (38 | ) | | | - | | | | (76 | ) |
Depreciation charge for year | | | (126 | ) | | | (560 | ) | | | - | | | | (686 | ) |
Impairment charge for year (ii) | | | (8 | ) | | | (17 | ) | | | - | | | | (25 | ) |
At 31 December 2012, net carrying amount | | | 4,313 | | | | 3,371 | | | | 287 | | | | 7,971 | |
| | | | |
At 1 January 2012 | | | | | | | | | | | | | | | | |
Cost/deemed cost | | | 5,750 | | | | 8,225 | | | | 558 | | | | 14,533 | |
Accumulated depreciation (and impairment charges) | | | (1,481 | ) | | | (5,044 | ) | | | - | | | | (6,525 | ) |
Net carrying amount | | | 4,269 | | | | 3,181 | | | | 558 | | | | 8,008 | |
| (i) | The carrying value of mineral-bearing land included in the land and buildings category above amounted to€1,824 million at the balance sheet date (2012:€1,835 million). |
| (ii) | See note 3 for details of the impairment charge. |
Future purchase commitments for property, plant and equipment
| | | | | | | | |
| | | 2013 €m | | | 2012 €m | |
| | |
Contracted for but not provided in the financial statements | | | 155 | | | | 176 | |
| | |
Authorised by the Directors but not contracted for | | | 91 | | | | 82 | |
15. Intangible Assets
| | | | | | | | | | | | | | | | | | | | |
| | | | | | Other intangible assets | | | | |
| | | Goodwill
€m | | | Marketing-
related €m | | | Customer-
related (i)
€m | | | Contract-
based
€m | | | Total
€m | |
| | | | | |
At 31 December 2013 | | | | | | | | | | | | | | | | | | | | |
Cost/deemed cost | | | 4,158 | | | | 48 | | | | 420 | | | | 31 | | | | 4,657 | |
Accumulated amortisation (and impairment charges) | | | (424 | ) | | | (36 | ) | | | (269 | ) | | | (17 | ) | | | (746 | ) |
Net carrying amount | | | 3,734 | | | | 12 | | | | 151 | | | | 14 | | | | 3,911 | |
| | | | | |
At 1 January 2013, net carrying amount | | | 4,067 | | | | 17 | | | | 177 | | | | 6 | | | | 4,267 | |
Translation adjustment | | | (117 | ) | | | (1 | ) | | | (2 | ) | | | (1 | ) | | | (121 | ) |
Arising on acquisition (note 31) | | | 169 | | | | 1 | | | | 20 | | | | 18 | | | | 208 | |
Disposals | | | (12 | ) | | | - | | | | - | | | | (2 | ) | | | (14 | ) |
Amortisation charge for year | | | - | | | | (5 | ) | | | (42 | ) | | | (7 | ) | | | (54 | ) |
Impairment charge for year | | | (373 | ) | | | - | | | | (2 | ) | | | - | | | | (375 | ) |
At 31 December 2013, net carrying amount | | | 3,734 | | | | 12 | | | | 151 | | | | 14 | | | | 3,911 | |
| | | | | |
The equivalent disclosure for the prior year is as follows: | | | | | | | | | | | | | | | | | | | | |
| | | | | |
At 31 December 2012 | | | | | | | | | | | | | | | | | | | | |
Cost/deemed cost | | | 4,122 | | | | 51 | | | | 413 | | | | 17 | | | | 4,603 | |
Accumulated amortisation (and impairment charges) | | | (55 | ) | | | (34 | ) | | | (236 | ) | | | (11 | ) | | | (336 | ) |
Net carrying amount | | | 4,067 | | | | 17 | | | | 177 | | | | 6 | | | | 4,267 | |
| | | | | |
At 1 January 2012, net carrying amount | | | 3,967 | | | | 14 | | | | 160 | | | | 7 | | | | 4,148 | |
Translation adjustment | | | (32 | ) | | | - | | | | - | | | | (1 | ) | | | (33 | ) |
Arising on acquisition (note 31) | | | 162 | | | | 8 | | | | 56 | | | | 1 | | | | 227 | |
Reclassifications | | | (13 | ) | | | - | | | | - | | | | - | | | | (13 | ) |
Disposals | | | (15 | ) | | | - | | | | - | | | | - | | | | (15 | ) |
Amortisation charge for year | | | - | | | | (5 | ) | | | (38 | ) | | | (1 | ) | | | (44 | ) |
Impairment charge for year | | | (2 | ) | | | - | | | | (1 | ) | | | - | | | | (3 | ) |
At 31 December 2012, net carrying amount | | | 4,067 | | | | 17 | | | | 177 | | | | 6 | | | | 4,267 | |
| | | | | |
At 1 January 2012 | | | | | | | | | | | | | | | | | | | | |
Cost/deemed cost | | | 4,020 | | | | 44 | | | | 360 | | | | 18 | | | | 4,442 | |
Accumulated amortisation (and impairment charges) | | | (53 | ) | | | (30 | ) | | | (200 | ) | | | (11 | ) | | | (294 | ) |
Net carrying amount | | | 3,967 | | | | 14 | | | | 160 | | | | 7 | | | | 4,148 | |
| (i) | The customer-related intangible assets relate predominantly to non-contractual customer relationships. |
Goodwill
The net book value of goodwill capitalised under previous GAAP (Irish GAAP) as at the transition date to IFRS (1 January 2004) has been treated as deemed cost. Goodwill arising on acquisition since that date is capitalised at cost.
Cash-generating units
Goodwill acquired through business combination activity has been allocated to cash-generating units (CGUs) that are expected to benefit from synergies in that combination. The cash-generating units represent the lowest level within the Group at which the associated goodwill is monitored for internal management purposes, and are not larger than the operating segments determined in accordance with IFRS 8Operating Segments. A total of 19 (2012: 21) cash-generating units have been identified and these are analysed between the six business segments in the Group below. The decrease in the number of CGUs in 2013 relates to organisational changes in our Americas Products and Europe Materials segments. All businesses within the various cash-generating units exhibit similar and/or consistent profit margin and asset intensity characteristics. Assets, liabilities, deferred tax and goodwill have been assigned to the CGUs on a reasonable and consistent basis.
Significant under-performance in any of CRH’s major cash-generating units may give rise to a material write-down of goodwill which would have a substantial impact on the Group’s income and equity.
| | | | | | | | | | | | | | | | |
| | | Cash-generating units | | | Goodwill (€m) | |
| | | 2013 | | | 2012 | | | 2013 | | | 2012 | |
| | | | |
Europe Materials | | | 7 | | | | 8 | | | | 579 | | | | 579 | |
Europe Products* | | | 1 | | | | 1 | | | | 431 | | | | 679 | |
Europe Distribution | | | 1 | | | | 1 | | | | 641 | | | | 629 | |
Americas Materials | | | 7 | | | | 7 | | | | 1,151 | | | | 1,231 | |
Americas Products | | | 2 | | | | 3 | | | | 618 | | | | 629 | |
Americas Distribution | | | 1 | | | | 1 | | | | 314 | | | | 320 | |
Total cash-generating units | | | 19 | | | | 21 | | | | 3,734 | | | | 4,067 | |
| * | Included in the goodwill number of €431 million in respect of Europe Products at 31 December 2013 is an amount of €62 million in respect of businesses identified for divestment as part of the portfolio review, which have been tested separately (see note 3). |
15. Intangible Assets |continued
Impairment testing methodology and results
Goodwill is subject to impairment testing on an annual basis. The recoverable amount of each of the 19 CGUs is determined based on a value-in-use computation. The cash flow forecasts are primarily based on a five-year strategic plan document formally approved by senior management and the Board of Directors and specifically exclude the impact of future development activity. These cash flows are projected forward for an additional five years to determine the basis for an annuity-based terminal value, calculated on the same basis as the Group’s acquisition modelling methodology. As in prior years, the terminal value is based on a 20-year annuity. The projected cash flows assume zero growth in real cash flows beyond the initial evaluation period. The value-in-use represents the present value of the future cash flows, including the terminal value, discounted at a rate appropriate to each CGU. The real pre-tax discount rates used range from 7.8% to 11.7% (2012: 7.6% to 12.6%); these rates are in line with the Group’s estimated weighted average cost of capital, arrived at using the Capital Asset Pricing Model.
The 2013 annual goodwill impairment testing process has resulted in an impairment of€58 million being recorded in respect of our Benelux CGU in Europe Materials. The CGU, which has formed part of our sensitivity disclosures for the last number of years, has experienced a difficult trading environment in 2013, resulting in a slower recovery now being forecast for the CGU than previously anticipated. These updated assumptions underlying the value-in-use model projections result in a present value (using a real pre-tax discount rate of 9.4%) of€241 million and a related goodwill impairment being recorded of€58 million. A sensitivity analysis in respect of this CGU is presented below.
| | | | |
| | | Additional impairment that would arise as a result of |
| | | 0.5% reduction in EBITDA | | 0.5% increase in pre-tax |
| | | (as defined)* margin | | discount rate |
| | | €m | | €m |
Benelux CGU | | 14 | | 11 |
Key sources of estimation uncertainty
The cash flows have been arrived at taking account of the Group’s strong financial position, its established history of earnings and cash flow generation and the nature of the building materials industry, where product obsolescence is very low. However, expected future cash flows are inherently uncertain and are therefore liable to material change over time. The key assumptions employed in arriving at the estimates of future cash flows factored into impairment testing are subjective and include projected EBITDA (as defined)* margins, net cash flows, discount rates used and the duration of the discounted cash flow model.
Significant goodwill amounts
The goodwill allocated to the Europe Products, Europe Distribution and the Oldcastle Building Products (Americas Products segment) CGUs accounts for between 10% and 20% of the total carrying amount of€3,734 million. The goodwill allocated to each of the remaining CGUs is less than 10% of the total carrying value in all other cases. The additional disclosures required for the three CGUs with significant goodwill are as follows:
| | | | | | | | | | | | | | | | | | | | | | | | |
| | | Europe Products | | | Europe
Distribution | | | Oldcastle
Building Products | |
| | | 2013 | | | 2012 | | | 2013 | | | 2012 | | | 2013 | | | 2012 | |
| | | | | | |
Goodwill allocated to the cash-generating unit at balance sheet date | | | €369m** | | | | €679m | | | | €641m | | | | €629m | | | | €615m | | | | €625m | |
| | | | | | |
Discount rate applied to the cash flow projections (real pre-tax) | | | 9.9% | | | | 9.1% | | | | 9.4% | | | | 9.7% | | | | 11.7% | | | | 11.3% | |
| | | | | | |
Average EBITDA (as defined)* margin over the initial 5-year period | | | 11.3% | | | | 9.4% | | | | 6.4% | | | | 6.9% | | | | 10.6% | | | | 10.1% | |
| | | | | | |
Value-in-use (present value of future cash flows) | | | €1,168m | | | | €1,847m | | | | €2,201m | | | | €2,242m | | | | €2,380m | | | | €2,217m | |
| | | | | | |
Excess of value-in-use over carrying amount | | | €284m | | | | €140m | | | | €431m | | | | €684m | | | | €579m | | | | €389m | |
| | | | | | | | | | | | | | | | | | | | | | | | |
| ** | Excludes€62 million of goodwill in respect of businesses identified for divestment as part of the portfolio review. |
The key assumptions and methodology used in respect of these three CGUs are consistent with those described above. The values applied to each of the key estimates and assumptions are specific to the individual CGUs and were derived from a combination of internal and external factors based on historical experience and took into account the cash flows specifically associated with these businesses. The cash flows and 20-year annuity-based terminal value were projected in line with the methodology disclosed above.
Europe Products, Europe Distribution and Oldcastle Building Products are not included in the CGUs referred to in the “Sensitivity analysis” section below. Given the magnitude of the excess of value-in-use over carrying amount, and our belief that the key assumptions are reasonable, management believe that it is not reasonably possible that there would be a change in the key assumptions such that the carrying amount would exceed the value-in-use. Consequently no further disclosures relating to sensitivity of the value-in-use computations for the Europe Products, Europe Distribution or Oldcastle Building Products CGUs are considered to be warranted.
Sensitivity analysis
Sensitivity analysis has been performed and results in additional disclosures in respect of 1 of the other 19 CGUs. The key assumptions, methodology used and values applied to each of the key assumptions for this cash-generating unit are in line with those outlined above. This CGU had goodwill of€224 million at the date of testing. The table below identifies the amounts by which each of the following assumptions may either decline or increase to arrive at a zero excess of the present value of future cash flows over the book value of net assets in an Americas CGU.
| | | | |
Reduction in EBITDA (as defined)* margin | | | 1.0 percentage points | |
Reduction in profit before tax | | | 10.1% | |
Reduction in net cash flow | | | 9.6% | |
Increase in pre-tax discount rate | | | 0.9 percentage points | |
The average EBITDA (as defined)* margin for the CGU over the initial 5-year period was 10.8%. The value-in-use (being the present value of the future net cash flows) was€595 million and the carrying amount was€535 million, resulting in an excess of value-in-use over carrying amount of€60 million.
| * | EBITDA is defined as earnings before interest, taxes, depreciation, amortisation, asset impairment charges, profit on disposals and the Group’s share of equity accounted investments’ result after tax. | |
16. Financial Assets
| | | | | | | | | | | | | | | | | | | | |
| | | Investments accounted for using the equity method (i.e. joint ventures and associates) | | | | | | | |
| | | Share of net
assets €m | | | Loans
€m | | | Total
€m | | | Asset held
for sale
€m | | | Other (i)
€m | |
| | | | | |
At 1 January 2013 | | | 1,291 | | | | 131 | | | | 1,422 | | | | 143 | | | | 34 | |
Translation adjustment | | | (72 | ) | | | (5 | ) | | | (77 | ) | | | (1 | ) | | | (1 | ) |
Investments and advances | | | 64 | | | | 10 | | | | 74 | | | | - | | | | 4 | |
Disposals and repayments | | | - | | | | (7 | ) | | | (7 | ) | | | (139 | ) | | | (14 | ) |
Arising on acquisition (note 31) | | | 2 | | | | - | | | | 2 | | | | - | | | | - | |
Retained loss | | | (74 | ) | | | - | | | | (74 | ) | | | (3 | ) | | | - | |
At 31 December 2013 | | | 1,211 | | | | 129 | | | | 1,340 | | | | - | | | | 23 | |
| |
The equivalent disclosure for the prior year is as follows: | | | | | |
| | | | | |
At 1 January 2012 | | | 1,923 | | | | 150 | | | | 2,073 | | | | - | | | | 34 | |
Translation adjustment | | | (24 | ) | | | (2 | ) | | | (26 | ) | | | - | | | | - | |
Investments and advances | | | 52 | | | | 4 | | | | 56 | | | | - | | | | - | |
Disposals and repayments | | | (410 | ) | | | (21 | ) | | | (431 | ) | | | - | | | | - | |
Reclassifications | | | 13 | | | | - | | | | 13 | | | | - | | | | - | |
Transfer to asset held for sale | | | (143 | ) | | | - | | | | (143 | ) | | | 143 | | | | - | |
Retained loss | | | (120 | ) | | | - | | | | (120 | ) | | | - | | | | - | |
At 31 December 2012 | | | 1,291 | | | | 131 | | | | 1,422 | | | | 143 | | | | 34 | |
(i) Other financial assets primarily comprise trade investments carried at historical cost.
Summarised financial information for the Group’s investment in joint ventures and associates which are accounted for using the equity method is as follows:
| | | | | | | | | | | | | | | | | | | | | | | | |
| | | Joint Ventures | | | Associates | | | Total | |
| | | 2013
€m | | | 2012
€m | | | 2013
€m | | | 2012
€m | | | 2013
€m | | | 2012
€m | |
Non-current assets | | | 600 | | | | 663 | | | | 862 | | | | 837 | | | | 1,462 | | | | 1,500 | |
Current assets | | | 176 | | | | 188 | | | | 557 | | | | 641 | | | | 733 | | | | 829 | |
Non-current liabilities | | | (174 | ) | | | (168 | ) | | | (230 | ) | | | (194 | ) | | | (404 | ) | | | (362 | ) |
Current liabilities | | | (106 | ) | | | (96 | ) | | | (474 | ) | | | (580 | ) | | | (580 | ) | | | (676 | ) |
Net assets | | | 496 | | | | 587 | | | | 715 | | | | 704 | | | | 1,211 | | | | 1,291 | |
A listing of the principal equity accounted investments is contained in Exhibit 8 to the Annual Report.
The Group holds a 21.13% stake (2012: 21.13%) in Samse S.A., a publicly-listed distributor in France which is accounted for as an associate investment above. The fair value of this investment was€58 million (2012:€39 million) (level 1 input in the fair value hierarchy) as at the balance sheet date. Fair value has been calculated based on the number of shares held multiplied by the closing share price at 31 December 2013.
For details of the impairments recorded as a result of the portfolio review process see note 3.
17. Inventories
| | | | | | | | |
| | | 2013
€m | | | 2012
€m | |
| | |
Raw materials | | | 606 | | | | 628 | |
Work-in-progress (i) | | | 86 | | | | 87 | |
Finished goods | | | 1,562 | | | | 1,618 | |
Total inventories at the lower of cost and net realisable value | | | 2,254 | | | | 2,333 | |
| (i) | Work-in-progress includes€2 million (2012:€1 million) in respect of the cumulative costs incurred, net of amounts transferred to cost of sales under percentage-of-completion accounting, for construction contracts in progress at the balance sheet date. |
An analysis of the Group’s cost of sales expense is provided in note 3 to the financial statements.
Write-downs of inventories recognised as an expense within cost of sales amounted to€19 million (2012:€12 million; 2011:€14 million).
18. Trade and Other Receivables
| | | | | | | | |
| | | 2013
€m | | | 2012
€m | |
Current | | | | | | | | |
Trade receivables | | | 1,725 | | | | 1,706 | |
Amounts receivable in respect of construction contracts (i) | | | 422 | | | | 469 | |
Total trade receivables, gross | | | 2,147 | | | | 2,175 | |
Provision for impairment | | | (118 | ) | | | (123 | ) |
Total trade receivables, net | | | 2,029 | | | | 2,052 | |
Amounts receivable from equity accounted investments | | | 4 | | | | 3 | |
Prepayments and other receivables | | | 483 | | | | 465 | |
Total | | | 2,516 | | | | 2,520 | |
| | |
Non-current | | | | | | | | |
Other receivables | | | 93 | | | | 83 | |
The carrying amounts of current and non-current trade and other receivables approximate their fair value largely due to the short-term maturities and nature of these instruments.
| (i) | Includes unbilled revenue and retentions held by customers in respect of construction contracts at the balance sheet date amounting to€121 million and€63 million respectively (2012:€137 million and€65 million respectively). |
Valuation and qualifying accounts (provision for impairment)
The movements in the provision for impairment of receivables during the financial year were as follows:
| | | | | | | | | | | | |
| | | 2013
€m | | | 2012
€m | | | 2011
€m | |
At 1 January | | | 123 | | | | 136 | | | | 151 | |
Translation adjustment | | | (2 | ) | | | - | | | | 1 | |
Provided during year | | | 36 | | | | 40 | | | | 56 | |
Written-off during year | | | (33 | ) | | | (50 | ) | | | (50 | ) |
Recovered during year | | | (6 | ) | | | (3 | ) | | | (5 | ) |
At 31 December | | | 118 | | | | 123 | | | | 153 | |
Information in relation to the Group’s credit risk management is provided in note 22 to the financial statements.
Aged analysis
The aged analysis of gross trade receivables and amounts receivable in respect of construction contracts at the balance sheet date was as follows:
| | | | | | | | |
| | | 2013
€m | | | 2012
€m | |
Neither past due nor impaired | | | 1,554 | | | | 1,637 | |
Past due but not impaired: | | | | | | | | |
- less than 60 days | | | 290 | | | | 218 | |
- 60 days or greater but less than 120 days | | | 126 | | | | 113 | |
- 120 days or greater | | | 53 | | | | 54 | |
Past due and impaired (partial or full provision) | | | 124 | | | | 153 | |
Total | | | 2,147 | | | | 2,175 | |
Trade receivables and amounts receivable in respect of construction contracts are in general receivable within 90 days of the balance sheet date.
19. Trade and Other Payables
| | | | | | | | |
| | | 2013
€m | | | 2012
€m | |
| | |
Current | | | | | | | | |
Trade payables | | | 1,495 | | | | 1,469 | |
Construction contract-related payables (i) | | | 103 | | | | 97 | |
Deferred and contingent acquisition consideration (ii) | | | 24 | | | | 105 | |
Accruals and other payables | | | 1,093 | | | | 1,067 | |
Amounts payable to equity accounted investments | | | 39 | | | | 37 | |
Total | | | 2,754 | | | | 2,775 | |
| | |
Non-current | | | | | | | | |
Other payables | | | 105 | | | | 85 | |
Deferred and contingent acquisition consideration (ii) | | | 184 | | | | 192 | |
Total | | | 289 | | | | 277 | |
| (i) | Construction contract-related payables include billings in excess of revenue, together with advances received from customers in respect of work to be performed under construction contracts and foreseeable losses thereon. |
Other than deferred and contingent consideration, the carrying amounts of trade and other payables approximate their fair value largely due to the short-term maturities and nature of these instruments.
| (ii) | Deferred and contingent acquisition consideration |
| | The fair value of total contingent consideration is€120 million (2012:€141 million), (level 3 input in the fair value hierarchy) and deferred consideration is€88 million (2012:€156 million). On an undiscounted basis, the corresponding basis for which the Group may be liable for contingent consideration range from€nil million to a maximum of€149 million. The movement in deferred and contingent consideration during the financial year was as follows: |
| | | | | | | | |
At 1 January | | | 297 | | | | 151 | |
Translation adjustment | | | (9 | ) | | | (3 | ) |
Arising on acquisitions and investments during the year | | | 17 | | | | 170 | |
Changes in estimate | | | (3 | ) | | | - | |
Paid during the year | | | (105 | ) | | | (30 | ) |
Discount unwinding | | | 11 | | | | 9 | |
At 31 December | | | 208 | | | | 297 | |
20. Movement in Working Capital and Provisions for Liabilities
| | | | | | | | | | | | | | | | | | | | |
| | | Inventories €m | | | Trade and other receivables €m | | | Trade
and other
payables €m | | | Provisions
for liabilities €m | | | Total €m | |
At 1 January 2013 | | | 2,333 | | | | 2,603 | | | | (3,052 | ) | | | (366 | ) | | | 1,518 | |
Translation adjustment | | | (74 | ) | | | (80 | ) | | | 91 | | | | 9 | | | | (54 | ) |
Arising on acquisition (note 31) | | | 41 | | | | 53 | | | | (80 | ) | | | (14 | ) | | | - | |
Disposals | | | (9 | ) | | | (4 | ) | | | 7 | | | | - | | | | (6 | ) |
Deferred and contingent acquisition consideration: | | | | | | | | | | | | | | | | | | | | |
- arising on acquisitions during year (note 31) | | | - | | | | - | | | | (17 | ) | | | - | | | | (17 | ) |
- paid during year | | | - | | | | - | | | | 105 | | | | - | | | | 105 | |
Interest accruals and discount unwinding | | | - | | | | - | | | | (14 | ) | | | (15 | ) | | | (29 | ) |
(Decrease)/increase in working capital and provisions for liabilities | | | (37 | ) | | | 37 | | | | (83 | ) | | | 6 | | | | (77 | ) |
At 31 December 2013 | | | 2,254 | | | | 2,609 | | | | (3,043 | ) | | | (380 | ) | | | 1,440 | |
| | | | | |
The equivalent disclosure for the prior years is as follows: | | | | | | | | | | | | | | | | | | | | |
| | | | | |
At 1 January 2012 | | | 2,179 | | | | 2,602 | | | | (2,901 | ) | | | (365 | ) | | | 1,515 | |
Translation adjustment | | | (15 | ) | | | (5 | ) | | | 8 | | | | 2 | | | | (10 | ) |
Arising on acquisition (note 31) | | | 98 | | | | 103 | | | | (57 | ) | | | (1 | ) | | | 143 | |
Disposals | | | (22 | ) | | | (23 | ) | | | 23 | | | | 1 | | | | (21 | ) |
Deferred and contingent acquisition consideration: | | | | | | | | | | | | | | | | | | | | |
- arising on acquisitions during year (note 31) | | | - | | | | - | | | | (151 | ) | | | - | | | | (151 | ) |
- paid during year | | | - | | | | - | | | | 30 | | | | - | | | | 30 | |
Interest accruals and discount unwinding | | | - | | | | - | | | | (31 | ) | | | (15 | ) | | | (46 | ) |
Increase/(decrease) in working capital and provisions for liabilities | | | 93 | | | | (74 | ) | | | 27 | | | | 12 | | | | 58 | |
At 31 December 2012 | | | 2,333 | | | | 2,603 | | | | (3,052 | ) | | | (366 | ) | | | 1,518 | |
| | | | | |
At 1 January 2011 | | | 2,187 | | | | 2,419 | | | | (2,849 | ) | | | (387 | ) | | | 1,370 | |
Translation adjustment | | | 32 | | | | 38 | | | | (38 | ) | | | (7 | ) | | | 25 | |
Arising on acquisition (note 31) | | | 53 | | | | 62 | | | | (49 | ) | | | (15 | ) | | | 51 | |
Disposals | | | (55 | ) | | | (90 | ) | | | 102 | | | | 8 | | | | (35 | ) |
Deferred and contingent acquisition consideration: | | | | | | | | | | | | | | | | | | | | |
- arising on acquisitions during year (note 31) | | | - | | | | - | | | | (42 | ) | | | - | | | | (42 | ) |
- paid during year | | | - | | | | - | | | | 21 | | | | - | | | | 21 | |
Interest accruals and discount unwinding | | | - | | | | 1 | | | | (11 | ) | | | (15 | ) | | | (25 | ) |
Increase/(decrease) in working capital and provisions for liabilities | | | 69 | | | | 295 | | | | (196 | ) | | | 43 | | | | 211 | |
At 31 December 2011 | | | 2,286 | | | | 2,725 | | | | (3,062 | ) | | | (373 | ) | | | 1,576 | |
21. Analysis of Net Debt
Components of net debt
Net debt is a non-GAAP measure which we provide to investors as we believe they find it useful. Net debt comprises cash and cash equivalents, derivative financial instrument assets and liabilities and interest-bearing loans and borrowings and enables investors to see the economic effects of these in total (see note 22 for details of the capital and risk management policies employed by the Group). Net debt is commonly used in computations such as net debt as a % of total equity and net debt as a % of market capitalisation.
| | | | | | | | | | | | | | | | | | |
| | | As at 31 December 2013 | | | | | As at 31 December 2012 | |
| | | Fair value (i)
€m | | | Book value
€m | | | | | Fair value (i)
€m | | | Book value €m | |
Cash and cash equivalents (note 23) | | | 2,540 | | | | 2,540 | | | | | | 1,747 | | | | 1,747 | |
Interest-bearing loans and borrowings (note 24) | | | (5,799 | ) | | | (5,540 | ) | | | | | (5,142 | ) | | | (4,808 | ) |
Derivative financial instruments (net) (note 25) | | | 27 | | | | 27 | | | | | | 152 | | | | 152 | |
Group net debt | | | (3,232 | ) | | | (2,973 | ) | | | | | (3,243 | ) | | | (2,909 | ) |
(i) All interest-bearing loans and borrowings are Level 2 fair value measurements.
The following table shows the effective interest rates on period-end fixed, gross and net debt:
| | | | | | | | | | | | | | | | | | | | | | | | | | |
| | | As at 31 December 2013 | | | | | As at 31 December 2012 | |
| | | €m | | | Interest rate | | | Weighted average fixed period
Years | | | | | €m | | | Interest
rate | | | Weighted average
fixed period Years | |
Interest-bearing loans and borrowings nominal - fixed rate (i) | | | (5,362 | ) | | | | | | | | | | | | | (4,516 | ) | | | | | | | | |
Derivative financial instruments - fixed rate | | | 1,518 | | | | | | | | | | | | | | 1,314 | | | | | | | | | |
Net fixed rate debt including derivatives | | | (3,844 | ) | | | 5.5% | | | | 5.1 | | | | | | (3,202 | ) | | | 6.3% | | | | 4.4 | |
Interest-bearing loans and borrowings nominal - floating rate (ii) | | | (54 | ) | | | | | | | | | | | | | (82 | ) | | | | | | | | |
Adjustment of debt from nominal to book value (i) | | | (124 | ) | | | | | | | | | | | | | (210 | ) | | | | | | | | |
Derivative financial instruments - currency floating rate | | | (1,491 | ) | | | | | | | | | | | | | (1,162 | ) | | | | | | | | |
Gross debt including derivative financial instruments | | | (5,513 | ) | | | 4.6% | | | | | | | | | | (4,656 | ) | | | 5.3% | | | | | |
Cash and cash equivalents - floating rate | | | 2,540 | | | | | | | | | | | | | | 1,747 | | | | | | | | | |
Net debt including derivative financial instruments | | | (2,973 | ) | | | | | | | | | | | | | (2,909 | ) | | | | | | | | |
| (i) | Of the Group’s nominal fixed rate debt at 31 December 2013,€1,882 million (2012:€2,087 million) was hedged to floating rate at inception using interest rate swaps. The balance of nominal fixed rate debt of€3,480 million (2012:€2,429 million) pertains to financial liabilities measured at amortised cost in accordance with IAS 39. |
| (ii) | Floating rate debt comprises bank borrowings and finance leases bearing interest at rates set in advance for periods ranging from overnight to less than one year largely by reference to inter-bank interest rates. |
Reconciliation of opening to closing net debt
| | | | | | | | | | | | |
| | | 2013
€m | | | 2012
€m | | | 2011
€m | |
At 1 January | | | (2,909 | ) | | | (3,335 | ) | | | (3,473 | ) |
Decrease in liquid investments | | | - | | | | - | | | | (4 | ) |
Debt in acquired companies | | | (44 | ) | | | (42 | ) | | | (47 | ) |
Debt in disposed companies | | | 17 | | | | 2 | | | | 50 | |
Increase in interest-bearing loans, borrowings and finance leases | | | (1,491 | ) | | | (487 | ) | | | (101 | ) |
Net cash flow arising from derivative financial instruments | | | (64 | ) | | | (13 | ) | | | 63 | |
Repayment of interest-bearing loans, borrowings and finance leases | | | 586 | | | | 394 | | | | 552 | |
Increase/(decrease) in cash and cash equivalents | | | 845 | | | | 524 | | | | (446 | ) |
Mark-to-market adjustment | | | 10 | | | | 9 | | | | (18 | ) |
Translation adjustment | | | 77 | | | | 39 | | | | (59 | ) |
At 31 December | | | (2,973 | ) | | | (2,909 | ) | | | (3,483 | ) |
21. Analysis of Net Debt |continued
Currency profile
The currency profile of the Group’s net debt and net worth (capital and reserves attributable to the Company’s equity holders) as at 31 December 2013 and 2012 is as follows:
| | | | | | | | | | | | | | | | | | | | | | | | |
| | | euro
€m | | | US
Dollar
€m | | | Pound
Sterling
€m | | | Swiss
Franc
€m | | | Other (iii)
€m | | | Total
€m | |
| | | | | | |
Net debt by major currency including derivative financial instruments | | | (1,304 | ) | | | (1,476 | ) | | | (57 | ) | | | 11 | | | | (147 | ) | | | (2,973 | ) |
| | | | | | |
Non-debt assets and liabilities analysed as follows: | | | | | | | | | | | | | | | | | | | | | | | | |
Non-current assets | | | 3,378 | | | | 6,293 | | | | 433 | | | | 796 | | | | 2,113 | | | | 13,013 | |
Current assets | | | 1,568 | | | | 2,138 | | | | 234 | | | | 330 | | | | 526 | | | | 4,796 | |
Non-current liabilities | | | (522 | ) | | | (1,221 | ) | | | (107 | ) | | | (169 | ) | | | (77 | ) | | | (2,096 | ) |
Current liabilities | | | (1,126 | ) | | | (1,221 | ) | | | (208 | ) | | | (198 | ) | | | (301 | ) | | | (3,054 | ) |
Non-controlling interests | | | (8 | ) | | | (3 | ) | | | - | | | | (12 | ) | | | (1 | ) | | | (24 | ) |
Capital and reserves attributable to the Company’s equity holders | | | 1,986 | | | | 4,510 | | | | 295 | | | | 758 | | | | 2,113 | | | | 9,662 | |
| | | | | | |
The equivalent disclosure for the prior year is as follows: | | | | | | | | | | | | | | | | | | | | | | | | |
| | | | | | |
Net debt by major currency including derivative financial instruments | | | (856 | ) | | | (1,828 | ) | | | (49 | ) | | | (3 | ) | | | (173 | ) | | | (2,909 | ) |
| | | | | | |
Non-debt assets and liabilities analysed as follows: | | | | | | | | | | | | | | | | | | | | | | | | |
Non-current assets | | | 3,583 | | | | 6,682 | | | | 522 | | | | 870 | | | | 2,311 | | | | 13,968 | |
Current assets | | | 1,721 | | | | 2,181 | | | | 235 | | | | 358 | | | | 518 | | | | 5,013 | |
Non-current liabilities | | | (571 | ) | | | (1,356 | ) | | | (150 | ) | | | (243 | ) | | | (98 | ) | | | (2,418 | ) |
Current liabilities | | | (1,118 | ) | | | (1,279 | ) | | | (197 | ) | | | (211 | ) | | | (260 | ) | | | (3,065 | ) |
Non-controlling interests | | | (20 | ) | | | (3 | ) | | | - | | | | (11 | ) | | | (2 | ) | | | (36 | ) |
Capital and reserves attributable to the Company’s equity holders | | | 2,739 | | | | 4,397 | | | | 361 | | | | 760 | | | | 2,296 | | | | 10,553 | |
| (iii) | The principal currencies included in this category are the Polish Zloty, the Indian Rupee, the Ukrainian Hryvnia, the Chinese Renminbi, the Turkish Lira, the Canadian Dollar, the Israeli Shekel and the Argentine Peso. |
22. Capital and Financial Risk Management
Capital management
Overall summary
The primary objectives of CRH’s capital management strategy are to ensure that the Group maintains a strong credit rating to support its business and to create shareholder value by managing the debt and equity balance and the cost of capital. No changes were made in the objectives, policies or processes for managing capital during 2013.
The Board periodically reviews the capital structure of the Group, including the cost of capital and the risks associated with each class of capital. The Group manages and, if necessary, adjusts its capital structure taking account of underlying economic conditions; any material adjustments to the Group’s capital structure in terms of the relative proportions of debt and equity are approved by the Board. In order to maintain or adjust the capital structure, the Group may issue new shares, dispose of assets, amend investment plans, alter dividend policy or return capital to shareholders. The Group is committed to optimising the use of its balance sheet within the confines of the overall objective to maintain an investment grade credit rating.
The capital structure of the Group, which comprises net debt and capital and reserves attributable to the Company’s equity holders, may be summarised as follows:
| | | | | | | | |
| | | 2013
€m | | | 2012
€m | |
Capital and reserves attributable to the Company’s equity holders | | | 9,662 | | | | 10,553 | |
Net debt | | | 2,973 | | | | 2,909 | |
Capital and net debt | | | 12,635 | | | | 13,462 | |
Financial risk management objectives and policies
The Group uses financial instruments throughout its businesses: interest-bearing loans and borrowings, cash and cash equivalents and finance leases are used to finance the Group’s operations; trade receivables and trade payables arise directly from operations; and derivatives, principally interest rate and currency swaps and forward foreign exchange contracts, are used to manage interest rate risks and currency exposures and to achieve the desired profile of borrowings. The Group does not trade in financial instruments nor does it enter into any leveraged derivative transactions.
The Group’s corporate treasury function provides services to the business units, co-ordinates access to domestic and international financial markets, and monitors and manages the financial risks relating to the operations of the Group. The Head of Group Financial Operations reports to the Finance Director and the activities of the corporate treasury function are subject to regular internal audit. Systems are in place to monitor and control the Group’s liquidity risks. The Group’s net debt position forms part of the monthly documentation presented to the Board of Directors.
The main risks attaching to the Group’s financial instruments are interest rate risk, foreign currency risk, credit risk and liquidity risk. Commodity price risk arising from financial instruments is of minimal relevance given that exposure is confined to a small number of contracts entered into for the purpose of hedging future movements in energy costs. The Board reviews and agrees policies for the prudent management of each of these risks as documented below.
Interest rate risk
The Group’s exposure to market risk for changes in interest rates stems predominantly from its long-term debt obligations. Interest cost is managed using a mix of fixed and floating rate debt. With the objective of managing this mix in a cost-efficient manner, the Group enters into interest rate swaps, under which the Group contracts to exchange, at predetermined intervals, the difference between fixed and variable interest amounts calculated by reference to a pre-agreed notional principal. Such contracts enable the Group to mitigate the risk of changing interest rates on the fair value of issued fixed rate debt and the cash flow exposures of issued floating rate debt.
The majority of these swaps are designated under IAS 39 to hedge underlying debt obligations and qualify for hedge accounting; undesignated financial instruments are termed “not designated as hedges” in the analysis of derivative financial instruments presented in note 25. The following table demonstrates the impact on (loss)/profit before tax and total equity of a range of possible changes in the interest rates applicable to net floating rate borrowings, with all other variables held constant. These impacts are calculated based on the closing balance sheet for the relevant period and assume all floating interest rates and interest curves change by the same amount. For (loss)/profit before tax, the impact shown is the impact on closing balance sheet floating rate net debt for a full year while for total equity the impact shown is the impact on the value of financial instruments.
| | | | | | |
Percentage change in cost of borrowings | | | | +/- 1% | | +/- 0.5% |
| | | |
Impact on (loss)/profit before tax | | 2013 | | +/- €10m | | +/- €5m |
| | 2012 | | +/-€5m | | +/-€3m |
| | 2011 | | -/+€8m | | -/+€4m |
| | | |
Impact on total equity | | 2013 | | -/+ €8m | | -/+ €4m |
| | 2012 | | +/-€1m | | +/-€0.5m |
| | 2011 | | +/-€2m | | +/-€1m |
22. Capital and Financial Risk Management |continued
Foreign currency risk
Due to the nature of building materials, which in general exhibit a low value-to-weight ratio, CRH’s activities are conducted primarily in the local currency of the country of operation resulting in low levels of foreign currency transaction risk; variances arising in this regard are reflected in operating costs or cost of sales in the Consolidated Income Statement in the period in which they arise.
Given the Group’s presence in 35 countries worldwide, the principal foreign exchange risk arises from fluctuations in the euro value of the Group’s net investment in a wide basket of currencies other than the euro; such changes are reported separately within the Consolidated Statement of Comprehensive Income. A currency profile of the Group’s net debt and net worth is presented in note 21. The Group’s established policy is to spread its net worth across the currencies of its various operations with the objective of limiting its exposure to individual currencies and thus promoting consistency with the geographical balance of its operations. In order to achieve this objective, the Group manages its borrowings, where practicable and cost effective, to hedge a portion of its foreign currency assets. Hedging is done using currency borrowings in the same currency as the assets being hedged or through the use of other hedging methods such as currency swaps.
The following table demonstrates the sensitivity of (loss)/profit before tax and equity to selected movements in the relevant€/US$ exchange rate (with all other variables held constant); the US Dollar has been selected as the appropriate currency for this analysis given the materiality of the Group’s activities in the United States. The impact on (loss)/profit before tax is based on changing the€/US$ exchange rate used in calculating (loss)/profit before tax for the period. The impact on total equity and financial instruments is calculated by changing the€/US$ exchange rate used in measuring the closing balance sheet.
| | | | | | |
Percentage change in relevant€/US$ exchange rate | | | | +/- 5% | | +/- 2.5% |
| | | |
Impact on (loss)/profit before tax | | 2013 | | -/+ €14m | | -/+ €7m |
| | 2012 | | -/+€14m | | -/+€7m |
| | 2011 | | -/+€8m | | -/+€4m |
| | | |
Impact on total equity* | | 2013 | | -/+ €215m | | -/+ €110m |
| | 2012 | | -/+ €210m | | -/+ €108m |
| | 2011 | | -/+ €203m | | -/+ €104m |
| | | |
* Includes the impact on financial instruments which is as follows: | | 2013 | | +/- €70m | | +/- €36m |
| | 2012 | | +/-€87m | | +/-€45m |
| | 2011 | | +/- €105m | | +/- €54m |
Financial instruments include deposits, money market funds, bank loans, medium term notes and other fixed term debt, interest rate swaps, commodity swaps and foreign exchange contracts. They exclude trade receivables and trade payables.
Credit/counterparty risk
In addition to cash at bank and in hand, the Group holds significant cash balances which are invested on a short-term basis and are classified as cash equivalents (see note 23). These deposits and other financial instruments (principally certain derivatives and loans and receivables included within financial assets) give rise to credit risk on amounts due from counterparty financial institutions (stemming from their insolvency or a downgrade in their credit ratings). Credit risk is managed by limiting the aggregate amount and duration of exposure to any one counterparty primarily depending on its credit rating and by regular review of these ratings. Acceptable credit ratings are high investment-grade ratings - generally counterparties have ratings of A2/A or higher from Moody’s/ Standard & Poor’s ratings agencies. The maximum exposure arising in the event of default on the part of the counterparty (including insolvency) is the carrying value of the relevant financial instrument.
In its worldwide insurance programme, the Group carries appropriate levels of insurance for typical business risks (including product liability) with various leading insurance companies. However, in the event of the failure of one or more of its insurance counterparties, the Group could be impacted by losses where recovery from such counterparties is not possible.
Credit risk arising in the context of the Group’s operations is not significant with the total bad debt provision at the balance sheet date amounting to 5.5% of gross trade receivables (2012: 5.7%). Customer credit risk is managed at appropriate Group locations according to established policies, procedures and controls. Customer credit quality is assessed in line with strict credit rating criteria and credit limits established where appropriate. Outstanding customer balances are regularly monitored and a review for indicators of impairment (evidence of financial difficulty of the customer, payment default, breach of contract etc.) is carried out at each reporting date. Significant balances are reviewed individually while smaller balances are grouped and assessed collectively. Receivables balances are in general unsecured and non-interest-bearing. The trade receivables balances disclosed in note 18 comprise a large number of customers spread across the Group’s activities and geographies with balances classified as neither past due nor impaired representing 72% of the total trade receivables balance at the balance sheet date (2012: 75%); amounts receivable from related parties (notes 18 and 32) are immaterial. Factoring and credit guarantee arrangements are employed in certain of the Group’s operations where deemed to be of benefit by operational management.
Liquidity risk
The principal liquidity risks faced by the Group stem from the maturation of debt obligations and derivative transactions. A downgrade of CRH’s credit ratings may give rise to increases in funding costs in respect of future debt and may impair the Group’s ability to raise funds on acceptable terms. The Group’s corporate treasury function ensures that sufficient resources are available to meet such liabilities as they fall due through a combination of cash and cash equivalents, cash flows and undrawn committed bank facilities. Flexibility in funding sources is achieved through a variety of means including (i) maintaining cash and cash equivalents only with a diversity of highly-rated counterparties; (ii) limiting the maturity of such balances; (iii) borrowing the bulk of the Group’s debt requirements under committed bank lines or other term financing; and (iv) having surplus committed lines of credit.
The undrawn committed facilities available to the Group as at the balance sheet date are quantified in note 24; these facilities span a wide number of highly-rated financial institutions thus minimising any potential exposure arising from concentrations in borrowing sources. The repayment schedule (analysed by maturity date) applicable to the Group’s outstanding interest-bearing loans and borrowings as at the balance sheet date is also presented in note 24.
22. Capital and Financial Risk Management |continued
The tables below show the projected contractual undiscounted total cash outflows (principal and interest) arising from the Group’s trade and other payables, gross debt and derivative financial instruments. The tables also include the gross cash inflows projected to arise from derivative financial instruments. These projections are based on the interest and foreign exchange rates applying at the end of the relevant financial year.
| | | | | | | | | | | | | | | | | | | | | | | | | | | | |
| | | Within
1 year
€m | | | Between
1 and 2
years
€m | | | Between
2 and 3
years
€m | | | Between
3 and 4
years
€m | | | Between
4 and 5
years
€m | | | After
5 years
€m | | | Total
€m | |
| | | | | | | |
At 31 December 2013 | | | | | | | | | | | | | | | | | | | | | | | | | | | | |
Financial liabilities - cash outflows | | | | | | | | | | | | | | | | | | | | | | | | | | | | |
Trade and other payables | | | 2,754 | | | | 140 | | | | 20 | | | | 22 | | | | 22 | | | | 128 | | | | 3,086 | |
Finance leases | | | 3 | | | | 2 | | | | 1 | | | | 6 | | | | 1 | | | | 2 | | | | 15 | |
Other interest-bearing loans and borrowings | | | 955 | | | | 353 | | | | 1,203 | | | | - | | | | 472 | | | | 2,445 | | | | 5,428 | |
Interest payments on finance leases | | | 1 | | | | 1 | | | | - | | | | - | | | | - | | | | - | | | | 2 | |
Interest payments on other interest-bearing loans and borrowings | | | 263 | | | | 214 | | | | 178 | | | | 134 | | | | 116 | | | | 318 | | | | 1,223 | |
Cross-currency swaps - gross cash outflows | | | 2,196 | | | | 327 | | | | - | | | | - | | | | - | | | | - | | | | 2,523 | |
Gross projected cash outflows | | | 6,172 | | | | 1,037 | | | | 1,402 | | | | 162 | | | | 611 | | | | 2,893 | | | | 12,277 | |
| | | | | | | |
Derivative financial instruments - cash inflows | | | | | | | | | | | | | | | | | | | | | | | | | | | | |
Interest rate swaps - net cash inflows | | | (40 | ) | | | (30 | ) | | | (20 | ) | | | (12 | ) | | | (13 | ) | | | (22 | ) | | | (137 | ) |
Cross-currency swaps - gross cash inflows | | | (2,183 | ) | | | (308 | ) | | | - | | | | - | | | | - | | | | - | | | | (2,491 | ) |
Gross projected cash inflows | | | (2,223 | ) | | | (338 | ) | | | (20 | ) | | | (12 | ) | | | (13 | ) | | | (22 | ) | | | (2,628 | ) |
| | | |
The equivalent disclosure for the prior year is as follows: | | | | | | | | | | | | | |
| | | | | | | |
At 31 December 2012 | | | | | | | | | | | | | | | | | | | | | | | | | | | | |
Financial liabilities - cash outflows | | | | | | | | | | | | | | | | | | | | | | | | | | | | |
Trade and other payables | | | 2,775 | | | | 145 | | | | 41 | | | | 13 | | | | 21 | | | | 118 | | | | 3,113 | |
Finance leases | | | 3 | | | | 3 | | | | 1 | | | | 1 | | | | 6 | | | | 3 | | | | 17 | |
Other interest-bearing loans and borrowings | | | 634 | | | | 905 | | | | 350 | | | | 1,257 | | | | 1 | | | | 1,457 | | | | 4,604 | |
Interest payments on finance leases | | | 1 | | | | 1 | | | | - | | | | 1 | | | | - | | | | 1 | | | | 4 | |
Interest payments on other interest-bearing loans and borrowings | | | 284 | | | | 224 | | | | 176 | | | | 138 | | | | 93 | | | | 264 | | | | 1,179 | |
Cross-currency swaps - gross cash outflows | | | 2,201 | | | | 29 | | | | 343 | | | | 8 | | | | - | | | | - | | | | 2,581 | |
Gross projected cash outflows | | | 5,898 | | | | 1,307 | | | | 911 | | | | 1,418 | | | | 121 | | | | 1,843 | | | | 11,498 | |
| | | | | | | |
Derivative financial instruments - cash inflows | | | | | | | | | | | | | | | | | | | | | | | | | | | | |
Interest rate swaps - net cash inflows | | | (57 | ) | | | (34 | ) | | | (25 | ) | | | (20 | ) | | | (11 | ) | | | (7 | ) | | | (154 | ) |
Cross-currency swaps - gross cash inflows | | | (2,216 | ) | | | (27 | ) | | | (332 | ) | | | (8 | ) | | | - | | | | - | | | | (2,583 | ) |
Gross projected cash inflows | | | (2,273 | ) | | | (61 | ) | | | (357 | ) | | | (28 | ) | | | (11 | ) | | | (7 | ) | | | (2,737 | ) |
Commodity price risk
The fair value of derivatives used to hedge future energy costs was€4 million unfavourable as at the balance sheet date (2012:€2 million unfavourable).
23. Cash and Cash Equivalents
Cash and cash equivalents balances are spread across a wide number of highly-rated financial institutions. The credit risk attaching to these items is documented in note 22.
Cash and cash equivalents, are included in the Consolidated Balance Sheet and Consolidated Statement of Cash Flows at fair value and, are analysed as follows:
| | | | | | | | |
| | | 2013 | | | 2012 | |
| | | €m | | | €m | |
Cash at bank and in hand | | | 582 | | | | 604 | |
Investments (short-term deposits) | | | 1,958 | | | | 1,143 | |
Total | | | 2,540 | | | | 1,747 | |
Cash at bank earns interest at floating rates based on daily deposit bank rates. Short-term deposits are made for varying periods of between one day and three months depending on the immediate cash requirements of the Group, and earn interest at the respective short-term deposit rates.
24. Interest-bearing Loans and Borrowings
Loans and borrowings outstanding
| | | | | | | | |
| | | 2013
€m | | | 2012
€m | |
Bank overdrafts | | | 40 | | | | 54 | |
Bank loans | | | 28 | | | | 48 | |
Finance leases | | | 15 | | | | 17 | |
Bonds and private placements | | | 5,439 | | | | 4,670 | |
Other | | | 18 | | | | 19 | |
Interest-bearing loans and borrowings* | | | 5,540 | | | | 4,808 | |
| * | Including loans of €1 million (2012: €3 million) secured on specific items of property, plant and equipment; these figures do not include finance leases. |
Maturity profile of loans and borrowings and undrawn committed facilities
| | | | | | | | | | | | | | | | | | |
| | | As at 31 December 2013 | | | | | As at 31 December 2012 | |
| | | Loans and
borrowings €m | | | Undrawn
committed facilities**
€m | | | | | Loans and borrowings
€m | | | Undrawn
committed facilities** €m | |
| | | | | |
Within one year | | | 961 | | | | - | | | | | | 647 | | | | 150 | |
Between one and two years | | | 349 | | | | 40 | | | | | | 928 | | | | - | |
Between two and three years | | | 1,240 | | | | 1,625 | | | | | | 347 | | | | 40 | |
Between three and four years | | | 4 | | | | 85 | | | | | | 1,314 | | | | 1,626 | |
Between four and five years | | | 506 | | | | 200 | | | | | | 5 | | | | - | |
After five years | | | 2,480 | | | | - | | | | | | 1,567 | | | | 1 | |
Total | | | 5,540 | | | | 1,950 | | | | | | 4,808 | | | | 1,817 | |
| ** | The Group manages its borrowing ability by entering into committed borrowing agreements. Revolving committed bank facilities are generally available to the Group for periods of up to five years from the date of inception. The figures shown above are the undrawn committed facilities available to be drawn by the Group at 31 December 2013. |
Guarantees
The Company has given letters of guarantee to secure obligations of subsidiary undertakings as follows:€5.5 billion in respect of loans, bank advances, derivative obligations and future lease obligations (2012:€4.8 billion),€270 million in respect of letters of credit (2012:€289 million) and€nil million in respect of other obligations (2012:€7 million).
Pursuant to the provisions of Section 17, Companies (Amendment) Act, 1986, the Company has guaranteed the liabilities of its wholly-owned subsidiary undertakings and the Oldcastle Finance Company and Oldcastle North America Funding Company general partnerships in the Republic of Ireland for the financial year ended 31 December 2013 and, as a result, such subsidiary undertakings and the general partnerships have been exempted from the filing provisions of Section 7, Companies (Amendment) Act, 1986 and Regulation 20 of the European Communities (Accounts) Regulations, 1993 respectively.
Lender covenants
The Group’s major bank facilities and debt issued pursuant to Note Purchase Agreements in private placements require the Group to maintain certain financial covenants. Non-compliance with financial covenants would give the relevant lenders the right to terminate facilities and demand early repayment of any sums drawn thereunder thus altering the maturity profile of the Group’s debt and the Group’s liquidity. Calculations for financial covenants are completed for twelve month periods half-yearly on 30 June and 31 December. The Group was in full compliance with its financial covenants throughout each of the periods presented. The Group is not aware of any stated events of default as defined in the Agreements.
The financial covenants are:
| (1) | Minimum interest cover defined as PBITDA/net interest (all as defined in the relevant agreement) cover at no lower than 4.5 times. As at 31 December 2013 the ratio was 6.3 times (2012: 6.5 times; 2011: 7.4 times); |
| (2) | Minimum net worth defined as total equity plus deferred tax liabilities and capital grants less repayable capital grants being in aggregate no lower than€5.1 billion (2012:€5.1 billion) (such minimum being adjusted for foreign exchange translation impacts). As at 31 December 2013 net worth (as defined in the relevant agreement) was€10.9 billion (2012:€11.8 billion). |
25. Derivative Financial Instruments
The fair values of derivative financial instruments are analysed by year of maturity and by accounting designation as follows:
| | | | | | | | | | | | | | | | | | | | |
| | | Fair
value hedges
€m | | | Cash flow hedges €m | | | Net
investment
hedges €m | | | Not
designated
as hedges
€m | | | Total
€m | |
| | | | | |
At 31 December 2013 | | | | | | | | | | | | | | | | | | | | |
| | | | | |
Derivative assets | | | | | | | | | | | | | | | | | | | | |
Within one year - current assets | | | 9 | | | | - | | | | 8 | | | | - | | | | 17 | |
| | | | | |
Between one and two years | | | - | | | | - | | | | - | | | | - | | | | - | |
Between two and three years | | | 30 | | | | - | | | | - | | | | - | | | | 30 | |
Between three and four years | | | - | | | | - | | | | - | | | | - | | | | - | |
Between four and five years | | | 28 | | | | - | | | | - | | | | - | | | | 28 | |
After five years | | | - | | | | - | | | | - | | | | 5 | | | | 5 | |
Non-current assets | | | 58 | | | | - | | | | - | | | | 5 | | | | 63 | |
| | | | | |
Total derivative assets | | | 67 | | | | - | | | | 8 | | | | 5 | | | | 80 | |
| | | | | |
Derivative liabilities | | | | | | | | | | | | | | | | | | | | |
Within one year - current liabilities | | | - | | | | (2 | ) | | | (17 | ) | | | - | | | | (19 | ) |
| | | | | |
Between one and two years | | | - | | | | (21 | ) | | | - | | | | - | | | | (21 | ) |
Between two and three years | | | - | | | | (1 | ) | | | - | | | | - | | | | (1 | ) |
Between three and four years | | | - | | | | (1 | ) | | | - | | | | - | | | | (1 | ) |
Between four and five years | | | - | | | | - | | | | - | | | | - | | | | - | |
After five years | | | (11 | ) | | | - | | | | - | | | | - | | | | (11 | ) |
Non-current liabilities | | | (11 | ) | | | (23 | ) | | | - | | | | - | | | | (34 | ) |
| | | | | |
Total derivative liabilities | | | (11 | ) | | | (25 | ) | | | (17 | ) | | | - | | | | (53 | ) |
| | | | | |
Net asset arising on derivative financial instruments | | | 56 | | | | (25 | ) | | | (9 | ) | | | 5 | | | | 27 | |
| | |
The equivalent disclosure for the prior year is as follows: | | | | | | | | | |
| | | | | |
At 31 December 2012 | | | | | | | | | | | | | | | | | | | | |
| | | | | |
Derivative assets | | | | | | | | | | | | | | | | | | | | |
Within one year - current assets | | | 48 | | | | - | | | | 4 | | | | - | | | | 52 | |
| | | | | |
Between one and two years | | | 24 | | | | - | | | | - | | | | - | | | | 24 | |
Between two and three years | | | - | | | | - | | | | - | | | | - | | | | - | |
Between three and four years | | | 45 | | | | - | | | | - | | | | - | | | | 45 | |
Between four and five years | | | - | | | | - | | | | - | | | | - | | | | - | |
After five years | | | 51 | | | | - | | | | - | | | | - | | | | 51 | |
Non-current assets | | | 120 | | | | - | | | | - | | | | - | | | | 120 | |
| | | | | |
Total derivative assets | | | 168 | | | | - | | | | 4 | | | | - | | | | 172 | |
| | | | | |
Derivative liabilities | | | | | | | | | | | | | | | | | | | | |
Within one year - current liabilities | | | - | | | | (1 | ) | | | (5 | ) | | | - | | | | (6 | ) |
| | | | | |
Between one and two years | | | - | | | | (1 | ) | | | - | | | | - | | | | (1 | ) |
Between two and three years | | | - | | | | (13 | ) | | | - | | | | - | | | | (13 | ) |
Between three and four years | | | - | | | | - | | | | - | | | | - | | | | - | |
Between four and five years | | | - | | | | - | | | | - | | | | - | | | | - | |
After five years | | | - | | | | - | | | | - | | | | - | | | | - | |
Non-current liabilities | | | - | | | | (14 | ) | | | - | | | | - | | | | (14 | ) |
| | | | | |
Total derivative liabilities | | | - | | | | (15 | ) | | | (5 | ) | | | - | | | | (20 | ) |
| | | | | |
Net asset arising on derivative financial instruments | | | 168 | | | | (15 | ) | | | (1 | ) | | | - | | | | 152 | |
25. Derivative Financial Instruments |continued
At 31 December 2013 and 2012, the Group had no master netting or similar arrangements, collateral posting requirements, and enforceable right of set-off agreements with any of its derivative counterparts.
Fair value hedges consist of interest rate swaps and currency swaps. These instruments hedge risks arising from changes in asset/ liability fair values due to interest rate and foreign exchange rate movements.
Cash flow hedges consist of forward foreign exchange and commodity contracts and interest rate and currency swaps. These instruments hedge risks arising to future cash flows from movements in foreign exchange rates, commodity prices and interest rates. Cash flow hedges are expected to affect profit and loss over the period to maturity.
Net investment hedges comprise cross-currency swaps and hedge changes in the value of net investments due to currency movements.
The profit/(loss) arising on fair value, cash flow, net investment hedges and related hedged items reflected in the Consolidated Income Statement is shown below:
| | | | | | | | | | | | |
| | | 2013
€m | | | 2012
€m | | | 2011
€m | |
| | | |
Cash flow hedges - ineffectiveness | | | - | | | | (3 | ) | | | 2 | |
Fair value of hedge instruments | | | (68 | ) | | | (16 | ) | | | 12 | |
Fair value of the hedged items | | | 71 | | | | 21 | | | | (17 | ) |
| | | |
Components of other comprehensive income - cash flow hedges | | | | | | | | | | | | |
| | | |
(Losses)/gains arising during the year: | | | | | | | | | | | | |
- commodity forward contracts | | | (2 | ) | | | - | | | | (4 | ) |
- interest rate swaps | | | - | | | | - | | | | (1 | ) |
| | | |
Reclassification adjustments for losses/(gains) included in: | | | | | | | | | | | | |
- the Consolidated Income Statement | | | - | | | | 1 | | | | (2 | ) |
Total | | | (2 | ) | | | 1 | | | | (7 | ) |
| | | |
| Fair value hierarchy | | | | | 2013 | | | 2012 | |
| | | | | | Level 2
€m | | | Level 2
€m | |
| | | |
Assets measured at fair value | | | | | | | | | | | | |
Fair value hedges - cross currency and interest rate swaps | | | | | | | 67 | | | | 168 | |
Net investment hedges - cross currency swaps | | | | | | | 8 | | | | 4 | |
Not designated as hedges (held-for-trading) - interest rate swaps | | | | | | | 5 | | | | - | |
Total | | | | | | | 80 | | | | 172 | |
| | | |
Liabilities measured at fair value | | | | | | | | | | | | |
Fair value hedges - cross currency and interest rate swaps | | | | | | | (11 | ) | | | - | |
Cash flow hedges - cross currency, interest rate swaps and commodity forwards | | | | | | | (25 | ) | | | (15 | ) |
Net investment hedges - cross currency swaps | | | | | | | (17 | ) | | | (5 | ) |
Total | | | | | | | (53 | ) | | | (20 | ) |
At 31 December 2013 and 2012 there were no derivatives valued using Level 1 or Level 3 fair value techniques. Valuation methods for Levels 1, 2 and 3 are described in the “fair value hierarchy” section of the accounting policies on page 130.
26. Provisions for Liabilities
| | | | | | | | | | | | | | | | | | | | | | | | | | | | | | | | | | | | |
| Net present cost | | At 1
January
€m | | | Translation
adjustment
€m | | | Arising on
acquisition
(note 31)
€m | | | Provided during year €m | | | Utilised during
year €m | | | Disposed during year €m | | | Reversed
unused
€m | | | Discount
unwinding
€m | | | At 31
December
€m | |
| | | | | | | | | |
31 December 2013 | | | | | | | | | | | | | | | | | | | | | | | | | | | | | | | | | | | | |
Insurance (i) | | | 191 | | | | (7 | ) | | | - | | | | 42 | | | | (50 | ) | | | - | | | | (4 | ) | | | 9 | | | | 181 | |
Environment and remediation (ii) | | | 82 | | | | (1 | ) | | | 5 | | | | 6 | | | | (4 | ) | | | - | | | | (4 | ) | | | 3 | | | | 87 | |
Rationalisation and redundancy (iii) | | | 26 | | | | - | | | | 5 | | | | 55 | | | | (38 | ) | | | - | | | | (6 | ) | | | 1 | | | | 43 | |
Other (iv) | | | 67 | | | | (1 | ) | | | 4 | | | | 14 | | | | (11 | ) | | | - | | | | (6 | ) | | | 2 | | | | 69 | |
Total | | | 366 | | | | (9 | ) | | | 14 | | | | 117 | | | | (103 | ) | | | - | | | | (20 | ) | | | 15 | | | | 380 | |
| | | | | | | | | |
Analysed as: | | | | | | | | | | | | | | | | | | | | | | | | | | | | | | | | | | | | |
Non-current liabilities | | | 256 | | | | | | | | | | | | | | | | | | | | | | | | | | | | | | | | 231 | |
Current liabilities | | | 110 | | | | | | | | | | | | | | | | | | | | | | | | | | | | | | | | 149 | |
Total | | | 366 | | | | | | | | | | | | | | | | | | | | | | | | | | | | | | | | 380 | |
| |
The equivalent disclosure for the prior year is as follows: | | | | | |
| | | | | | | | | |
31 December 2012 | | | | | | | | | | | | | | | | | | | | | | | | | | | | | | | | | | | | |
Insurance (i) | | | 199 | | | | (2 | ) | | | - | | | | 51 | | | | (45 | ) | | | - | | | | (22 | ) | | | 10 | | | | 191 | |
Environment and remediation (ii) | | | 85 | | | | - | | | | - | | | | 2 | | | | (4 | ) | | | (1 | ) | | | (2 | ) | | | 2 | | | | 82 | |
Rationalisation and redundancy (iii) | | | 13 | | | | - | | | | - | | | | 48 | | | | (35 | ) | | | - | | | | (1 | ) | | | 1 | | | | 26 | |
Other (iv) | | | 68 | | | | - | | | | 1 | | | | 15 | | | | (8 | ) | | | - | | | | (11 | ) | | | 2 | | | | 67 | |
Total | | | 365 | | | | (2 | ) | | | 1 | | | | 116 | | | | (92 | ) | | | (1 | ) | | | (36 | ) | | | 15 | | | | 366 | |
| | | | | | | | | |
Analysed as: | | | | | | | | | | | | | | | | | | | | | | | | | | | | | | | | | | | | |
Non-current liabilities | | | 244 | | | | | | | | | | | | | | | | | | | | | | | | | | | | | | | | 256 | |
Current liabilities | | | 121 | | | | | | | | | | | | | | | | | | | | | | | | | | | | | | | | 110 | |
Total | | | 365 | | | | | | | | | | | | | | | | | | | | | | | | | | | | | | | | 366 | |
| (i) | This provision relates to actual and potential obligations arising under the self-insurance components of the Group’s insurance arrangements which comprise employers’ liability (workers’ compensation in the United States), public and products liability (general liability in the United States), automobile liability, property damage, business interruption and various other insurances; a substantial proportion of the total provision pertains to claims which are classified as “incurred but not reported”. Due to the extended timeframe associated with many of the insurances, a significant proportion of the total provision is subject to periodic actuarial valuation. The projected cash flows underlying the discounting process are established through the application of actuarial triangulations, which are extrapolated from historical claims experience. The triangulations applied in the discounting process indicate that the Group’s insurance provisions have an average life of six years (2012: six years). |
| (ii) | This provision comprises obligations governing site remediation and improvement costs to be incurred in compliance with either local or national environmental regulations together with constructive obligations stemming from established best practice. Whilst a significant element of the total provision will reverse in the medium-term (two to ten years), the majority of the legal and constructive obligations applicable to long-lived assets (principally mineral-bearing land) will unwind over a 30-year timeframe. In discounting the related obligations, expected future cash outflows have been determined with due regard to extraction status and anticipated remaining life. |
| (iii) | These provisions relate to irrevocable commitments under various rationalisation and redundancy programmes, none of which is individually material to the Group. In 2013,€55 million (2012:€48 million; 2011:€26 million) was provided in respect of rationalisation and redundancy activities as a consequence of undertaking various cost reduction initiatives across all operations. These initiatives included removing excess capacity from manufacturing and distribution networks and scaling operations to match market supply and demand; implementation of these initiatives resulted in a reduction in staffing levels in all business segments over recent years. The Group expects that these provisions will be utilised within one to two years of the balance sheet date (2012: one to two years). |
| (iv) | This includes provisions relating to guarantees and warranties of€14 million (2012:€13 million) throughout the Group at 31 December 2013. The Group expects that these provisions will be utilised within two years of the balance sheet date (2012: two to three years). |
Discount rate sensitivity analysis
All non-current provisions are discounted at a rate of 5% (2012: 5%; 2011: 5%), consistent with the average effective interest rate for the Group’s borrowings. There is no impact (2012:€1 million; 2011:€nil million) on profit before tax of a 1% change in the discount rate applicable to provisions, with all other variables held constant.
27. Deferred Income Tax
The deductible and taxable temporary differences in respect of which deferred tax has been recognised are as follows:
| | | | | | | | |
| | | 2013
€m | | | 2012 €m | |
| | |
Reported in balance sheet after offset | | | | | | | | |
Deferred tax liabilities | | | 1,166 | | | | 1,232 | |
Deferred tax assets | | | (107 | ) | | | (191 | ) |
Net deferred income tax liability | | | 1,059 | | | | 1,041 | |
| | |
Deferred income tax assets (deductible temporary differences) | | | | | | | | |
Deficits on Group retirement benefit obligations (note 28) | | | 74 | | | | 135 | |
Revaluation of derivative financial instruments to fair value | | | 15 | | | | 21 | |
Tax loss carryforwards | | | 98 | | | | 129 | |
Share-based payment expense | | | 2 | | | | 1 | |
Provisions for liabilities and working capital-related items | | | 144 | | | | 181 | |
Other deductible temporary differences | | | 38 | | | | 47 | |
Total | | | 371 | | | | 514 | |
Deferred income tax assets have been recognised in respect of all deductible temporary differences, with the exception of some tax loss carryforwards. The amount of tax losses where recovery is not probable and is therefore not recognised in the Consolidated Balance Sheet is€712 million (2012:€357 million). The vast majority will expire post 2018 (2012: 2017).
| | | | | | | | |
Deferred income tax liabilities (taxable temporary differences) | | | | | | | | |
Taxable temporary differences principally attributable to accelerated tax depreciation and fair value adjustments arising on acquisition (i) | | | 1,400 | | | | 1,522 | |
Revaluation of derivative financial instruments to fair value | | | 13 | | | | 15 | |
Rolled-over capital gains | | | 17 | | | | 18 | |
Total | | | 1,430 | | | | 1,555 | |
| | |
(i) Fair value adjustments arising on acquisition principally relate to property, plant and equipment. | | | | | | | | |
| | |
Movement in net deferred income tax liability | | | | | | | | |
At 1 January | | | 1,041 | | | | 1,062 | |
Translation adjustment | | | (37 | ) | | | (15 | ) |
Net expense for the year (note 11) | | | 4 | | | | 7 | |
Arising on acquisition (note 31) | | | 8 | | | | 9 | |
Disposal (note 5) | | | - | | | | 1 | |
Movement in deferred tax asset on Group retirement benefit obligations | | | 43 | | | | (23 | ) |
At 31 December | | | 1,059 | | | | 1,041 | |
28. Retirement Benefit Obligations
The Group operates either defined benefit or defined contribution pension schemes in all of its principal operating areas.
The Group operates defined benefit pension schemes in the Republic of Ireland, Britain and Northern Ireland, the Netherlands, Belgium, Germany, Switzerland and the United States; for the purposes of the disclosures which follow, the schemes in the Republic of Ireland, the Netherlands, Belgium and Germany have been aggregated into a “Eurozone” category on the basis of common currency and financial assumptions. The majority of the defined benefit pension schemes operated by the Group are funded as disclosed in the analysis of the defined benefit obligation presented below with unfunded schemes restricted to one scheme in each of the Netherlands and the United States and three schemes in Germany.
All funded defined benefit schemes are administered by separate funds that are legally separate from the Group under the jurisdiction of Trustees. Each of the Group’s schemes operate under broadly similar regulatory frameworks. The Trustees of the various pension funds in existence across the Group are required by law and by their articles of association to act in the best interests of the scheme participants and are responsible for the definition of investment strategy and for scheme administration. The level of benefits available to members depends on length of service and either their average salary over their period of employment or their salary in the final years leading up to retirement. The Group’s pension schemes in Switzerland are contribution-based schemes with guarantees to provide further contributions in the event that certain targets are not met largely in relation to investment return and the annuity conversion factor on retirement.
Provision has been made in the financial statements for post-retirement healthcare obligations in respect of certain current and former employees principally in the United States and for long-term service commitments in respect of certain employees in the Eurozone and Switzerland. These obligations are unfunded in nature and the required disclosures form part of this note.
Defined benefit pension schemes - principal risks
Through its defined benefit pension schemes and post-retirement healthcare plans, the Group is exposed to a number of risks, the most significant of which are detailed below:
Asset volatility: Under IFRS, the assets of the Group’s defined benefit pension schemes are reported at fair value (using bid prices, where relevant). The majority of the schemes’ assets comprise of equities, bonds and property all of which may fluctuate significantly in value from period to period. Given that liabilities are discounted to present value based on bond yields and that bond prices are inversely related to yields, an increase in the liability discount rate (which would reduce liabilities) would reduce bond values though not necessarily by an equal magnitude.
Given the maturity of certain of the Group’s funded defined benefit pension schemes, de-risking frameworks have been introduced to mitigate deficit volatility and enable better matching of investment returns with the cash outflows related to benefit obligations. These frameworks entail the usage of asset-liability matching techniques whereby triggers are set for the conversion of equity holdings into bonds of similar average duration to the relevant liabilities.
Discount rates: The discount rates employed in determining the present value of the schemes’ liabilities are determined by reference to market yields at the balance sheet date on high-quality corporate bonds of a currency and term consistent with the currency and term of the associated post-employment benefit obligations. Changes in discount rates impact the quantum of liabilities as discussed above.
Inflation risk: Some of the Group’s pension obligations have an inflation linkage; higher inflation will lead to higher liabilities (although in most cases, caps on the level of inflationary increases are in place to protect the scheme against extreme inflation).
Longevity risk: In the majority of cases, the Group’s defined benefit pension schemes provide benefits for life with spousal and dependent child reversionary provisions; increases in life expectancy will therefore give rise to higher liabilities.
Financial assumptions - scheme liabilities
The major long-term assumptions used by the Group’s actuaries in the computation of scheme liabilities as at 31 December 2013, 31 December 2012 and 31 December 2011 are as follows:
| | | | | | | | | | | | | | | | | | | | | | | | | | | | | | | | | | | | | | | | | | | | | | | | |
| | | Eurozone | | | Britain and Northern Ireland | | | Switzerland | | | United States | |
| | | 2013 | | | 2012 | | | 2011 | | | 2013 | | | 2012 | | | 2011 | | | 2013 | | | 2012 | | | 2011 | | | 2013 | | | 2012 | | | 2011 | |
| | | % | | | % | | | % | | | % | | | % | | | % | | | % | | | % | | | % | | | % | | | % | | | % | |
| | | | | | | | | | | | |
Rate of increase in: | | | | | | | | | | | | | | | | | | | | | | | | | | | | | | | | | | | | | | | | | | | | | | | | |
- salaries | | | 4.00 | | | | 4.00 | | | | 4.00 | | | | 4.30 | | | | 4.00 | | | | 4.00 | | | | 2.25 | | | | 2.25 | | | | 2.25 | | | | 3.50 | | | | 3.50 | | | | 3.50 | |
- pensions in payment | | | 2.00 | | | | 2.00 | | | | 2.00 | | | | 3.30-3.50 | | | | 3.00-3.40 | | | | 3.00-3.40 | | | | 0.25 | | | | 0.25 | | | | 0.25 | | | | - | | | | - | | | | - | |
Inflation | | | 2.00 | | | | 2.00 | | | | 2.00 | | | | 3.30 | | | | 3.00 | | | | 3.00 | | | | 1.25 | | | | 1.25 | | | | 1.25 | | | | 2.00 | | | | 2.00 | | | | 2.00 | |
Discount rate | | | 3.70 | | | | 3.80 | | | | 5.00 | | | | 4.60 | | | | 4.50 | | | | 4.70 | | | | 2.35 | | | | 1.85 | | | | 2.35 | | | | 4.70 | | | | 3.75 | | | | 4.60 | |
Medical cost trend rate | | | n/a | | | | n/a | | | | 5.25 | | | | n/a | | | | n/a | | | | n/a | | | | n/a | | | | n/a | | | | n/a | | | | 7.40 | | | | 6.25 | | | | 7.00 | |
The mortality assumptions employed in determining the present value of scheme liabilities under IAS 19 are in accordance with the underlying funding valuations and represent actuarial best practice in the relevant jurisdictions taking account of mortality experience and industry circumstances. With regard to the most material of the Group’s schemes, the future life expectations factored into the relevant valuations, based on retirement at 65 years of age for current and future retirees, are as follows:
| | | | | | | | | | | | | | | | | | | | | | | | | | | | | | | | | | | | |
| | | Republic of Ireland | | | Britain and Northern Ireland | | | Switzerland | |
| | | 2013 | | | 2012 | | | 2011 | | | 2013 | | | 2012 | | | 2011 | | | 2013 | | | 2012 | | | 2011 | |
Current retirees | | | | | | | | | | | | | | | | | | | | | | | | | | | | | | | | | | | | |
- male | | | 22.7 | | | | 22.6 | | | | 22.5 | | | | 23.2 | | | | 23.2 | | | | 22.7 | | | | 21.3 | | | | 19.7 | | | | 19.6 | |
- female | | | 24.9 | | | | 24.4 | | | | 24.1 | | | | 25.7 | | | | 25.8 | | | | 25.3 | | | | 23.8 | | | | 22.0 | | | | 21.9 | |
| | | | | | | | | |
Future retirees | | | | | | | | | | | | | | | | | | | | | | | | | | | | | | | | | | | | |
- male | | | 25.7 | | | | 25.7 | | | | 25.3 | | | | 25.5 | | | | 24.8 | | | | 24.1 | | | | 23.5 | | | | 19.7 | | | | 19.6 | |
- female | | | 26.7 | | | | 26.7 | | | | 26.5 | | | | 28.2 | | | | 27.4 | | | | 26.7 | | | | 25.9 | | | | 22.0 | | | | 21.9 | |
The above data allow for future improvements in life expectancy.
28. Retirement Benefit Obligations |continued
Impact on Consolidated Income Statement
The total retirement benefit expense in the Consolidated Income Statement is as follows:
| | | | | | | | | | | | |
| | | 2013 | | | 2012 | | | 2011 | |
| | | €m | | | €m | | | €m | |
Total defined contribution expense | | | 149 | | | | 142 | | | | 134 | |
Total defined benefit expense | | | 52 | | | | 39 | | | | 37 | |
Total expense in Consolidated Income Statement | | | 201 | | | | 181 | | | | 171 | |
At 31 December 2013,€34 million (2012:€38 million) was included in other payables in respect of defined contribution pension liabilities.
Analysis of defined benefit expense
| | | | | | | | | | | | | | | | | | | | | | | | | | | | | | | | | | | | | | | | | | | | | | | | | | | | | | | | | | | | |
| | | Eurozone | | | Britain and Northern Ireland | | | Switzerland | | | United States | | | Total Group | |
| | | 2013 | | | 2012 | | | 2011 | | | 2013 | | | 2012 | | | 2011 | | | 2013 | | | 2012 | | | 2011 | | | 2013 | | | 2012 | | | 2011 | | | 2013 | | | 2012 | | | 2011 | |
| | | €m | | | €m | | | €m | | | €m | | | €m | | | €m | | | €m | | | €m | | | €m | | | €m | | | €m | | | €m | | | €m | | | €m | | | €m | |
| | |
Charged in arriving at Group profit before finance costs: | | | | | | | | | |
| Current service cost | | | 11 | | | | 7 | | | | 11 | | | | 13 | | | | 14 | | | | 13 | | | | 27 | | | | 25 | | | | 21 | | | | - | | | | (2 | ) | | | 1 | | | | 51 | | | | 44 | | | | 46 | |
| Administration expenses | | | 1 | | | | - | | | | - | | | | 1 | | | | 2 | | | | 1 | | | | 1 | | | | - | | | | - | | | | - | | | | - | | | | - | | | | 3 | | | | 2 | | | | 1 | |
| Past service costs | | | (6 | ) | | | (33 | ) | | | (15 | ) | | | (3 | ) | | | - | | | | (15 | ) | | | (15 | ) | | | 1 | | | | - | | | | - | | | | - | | | | - | | | | (24 | ) | | | (32 | ) | | | (30 | ) |
| Subtotal | | | 6 | | | | (26 | ) | | | (4 | ) | | | 11 | | | | 16 | | | | (1 | ) | | | 13 | | | | 26 | | | | 21 | | | | - | | | | (2 | ) | | | 1 | | | | 30 | | | | 14 | | | | 17 | |
| | |
Included in finance income and finance costs respectively: | | | | | | | | | |
| Interest income on scheme assets | | | (27 | ) | | | (29 | ) | | | (33 | ) | | | (26 | ) | | | (26 | ) | | | (25 | ) | | | (12 | ) | | | (16 | ) | | | (17 | ) | | | (6 | ) | | | (7 | ) | | | (8 | ) | | | (71 | ) | | | (78 | ) | | | (83 | ) |
| Interest cost on scheme liabilities | | | 39 | | | | 44 | | | | 44 | | | | 30 | | | | 31 | | | | 30 | | | | 14 | | | | 17 | | | | 18 | | | | 10 | | | | 11 | | | | 11 | | | | 93 | | | | 103 | | | | 103 | |
| Net interest expense | | | 12 | | | | 15 | | | | 11 | | | | 4 | | | | 5 | | | | 5 | | | | 2 | | | | 1 | | | | 1 | | | | 4 | | | | 4 | | | | 3 | | | | 22 | | | | 25 | | | | 20 | |
| Net charge to Consolidated Income Statement | | | 18 | | | | (11 | ) | | | 7 | | | | 15 | | | | 21 | | | | 4 | | | | 15 | | | | 27 | | | | 22 | | | | 4 | | | | 2 | | | | 4 | | | | 52 | | | | 39 | | | | 37 | |
Past service costs include curtailment and settlement gains. During 2013, the Group implemented changes to the terms of a number of its defined benefit pension schemes in Switzerland giving rise to a curtailment gain of€15 million.
No reimbursement rights have been recognised as assets in accordance with IAS19 Employee Benefits.
Reconciliation of scheme assets (bid value)
| | | | | | | | | | | | | | | | | | | | | | | | | | | | | | | | | | | | | | | | |
| | | Eurozone | | | Britain and Northern Ireland | | | Switzerland | | | United States | | | Total Group | |
| | | 2013 | | | 2012 | | | 2013 | | | 2012 | | | 2013 | | | 2012 | | | 2013 | | | 2012 | | | 2013 | | | 2012 | |
| | | €m | | | €m | | | €m | | | €m | | | €m | | | €m | | | €m | | | €m | | | €m | | | €m | |
| | | | | | | | | | |
At 1 January | | | 710 | | | | 551 | | | | 597 | | | | 525 | | | | 661 | | | | 628 | | | | 174 | | | | 159 | | | | 2,142 | | | | 1,863 | |
Movement in year | | | | | | | | | | | | | | | | | | | | | | | | | | | | | | | | | | | | | | | | |
Administration expenses | | | (1 | ) | | | - | | | | (1 | ) | | | (2 | ) | | | (1 | ) | | | - | | | | - | | | | - | | | | (3 | ) | | | (2 | ) |
Past service costs | | | - | | | | (3 | ) | | | - | | | | - | | | | - | | | | - | | | | - | | | | (1 | ) | | | - | | | | (4 | ) |
Interest income on scheme assets | | | 27 | | | | 29 | | | | 26 | | | | 26 | | | | 12 | | | | 16 | | | | 6 | | | | 7 | | | | 71 | | | | 78 | |
Return on scheme assets excluding interest income | | | 30 | | | | 57 | | | | 44 | | | | 35 | | | | 25 | | | | 32 | | | | 9 | | | | 10 | | | | 108 | | | | 134 | |
Employer contributions paid | | | 70 | | | | 114 | | | | 28 | | | | 20 | | | | 17 | | | | 18 | | | | 9 | | | | 14 | | | | 124 | | | | 166 | |
Contributions paid by plan participants | | | 3 | | | | 3 | | �� | | - | | | | - | | | | 10 | | | | 11 | | | | - | | | | - | | | | 13 | | | | 14 | |
Benefit and settlement payments | | | (49 | ) | | | (41 | ) | | | (21 | ) | | | (19 | ) | | | (31 | ) | | | (33 | ) | | | (11 | ) | | | (11 | ) | | | (112 | ) | | | (104 | ) |
Disposals | | | - | | | | - | | | | - | | | | - | | | | - | | | | (15 | ) | | | - | | | | - | | | | - | | | | (15 | ) |
Translation adjustment | | | - | | | | - | | | | (11 | ) | | | 12 | | | | (10 | ) | | | 4 | | | | (8 | ) | | | (4 | ) | | | (29 | ) | | | 12 | |
At 31 December | | | 790 | | | | 710 | | | | 662 | | | | 597 | | | | 683 | | | | 661 | | | | 179 | | | | 174 | | | | 2,314 | | | | 2,142 | |
28. Retirement Benefit Obligations | continued
Reconciliation of actuarial value of liabilities
| | | | | | | | | | | | | | | | | | | | | | | | | | | | | | | | | | | | | | | | |
| | | Eurozone | | | Britain and Northern Ireland | | | Switzerland | | | United States | | | Total Group | |
| | | 2013 | | | 2012 | | | 2013 | | | 2012 | | | 2013 | | | 2012 | | | 2013 | | | 2012 | | | 2013 | | | 2012 | |
| | | €m | | | €m | | | €m | | | €m | | | €m | | | €m | | | €m | | | €m | | | €m | | | €m | |
| | | | | | | | | | |
At 1 January | | | (1,054 | ) | | | (896 | ) | | | (705 | ) | | | (652 | ) | | | (765 | ) | | | (702 | ) | | | (271 | ) | | | (249 | ) | | | (2,795 | ) | | | (2,499 | ) |
Movement in year | | | | | | | | | | | | | | | | | | | | | | | | | | | | | | | | | | | | | | | | |
Current service cost | | | (11 | ) | | | (7 | ) | | | (13 | ) | | | (14 | ) | | | (27 | ) | | | (25 | ) | | | - | | | | 2 | | | | (51 | ) | | | (44 | ) |
Past service costs | | | 6 | | | | 36 | | | | 3 | | | | - | | | | 15 | | | | (1 | ) | | | - | | | | 1 | | | | 24 | | | | 36 | |
Interest cost on scheme liabilities | | | (39 | ) | | | (44 | ) | | | (30 | ) | | | (31 | ) | | | (14 | ) | | | (17 | ) | | | (10 | ) | | | (11 | ) | | | (93 | ) | | | (103 | ) |
Remeasurements | | | | | | | | | | | | | | | | | | | | | | | | | | | | | | | | | | | | | | | | |
- experience variations | | | 23 | | | | (4 | ) | | | 2 | | | | 11 | | | | 17 | | | | 7 | | | | - | | | | (1 | ) | | | 42 | | | | 13 | |
- actuarial (loss)/gain from changes in financial assumptions | | | (16 | ) | | | (175 | ) | | | (13 | ) | | | (23 | ) | | | 64 | | | | (60 | ) | | | 30 | | | | (30 | ) | | | 65 | | | | (288 | ) |
- actuarial loss from changes in demographic assumptions | | | - | | | | (2 | ) | | | (2 | ) | | | - | | | | (51 | ) | | | (3 | ) | | | - | | | | - | | | | (53 | ) | | | (5 | ) |
Contributions paid by plan participants | | | (3 | ) | | | (3 | ) | | | - | | | | - | | | | (10 | ) | | | (11 | ) | | | - | | | | - | | | | (13 | ) | | | (14 | ) |
Benefit and settlement payments | | | 49 | | | | 41 | | | | 21 | | | | 19 | | | | 31 | | | | 33 | | | | 11 | | | | 11 | | | | 112 | | | | 104 | |
Disposals | | | - | | | | - | | | | - | | | | - | | | | - | | | | 19 | | | | - | | | | - | | | | - | | | | 19 | |
Translation adjustment | | | - | | | | - | | | | 14 | | | | (15 | ) | | | 13 | | | | (5 | ) | | | 11 | | | | 6 | | | | 38 | | | | (14 | ) |
At 31 December | | | (1,045 | ) | | | (1,054 | ) | | | (723 | ) | | | (705 | ) | | | (727 | ) | | | (765 | ) | | | (229 | ) | | | (271 | ) | | | (2,724 | ) | | | (2,795 | ) |
| | | | | | | | | | |
Recoverable deficit in schemes | | | (255 | ) | | | (344 | ) | | | (61 | ) | | | (108 | ) | | | (44 | ) | | | (104 | ) | | | (50 | ) | | | (97 | ) | | | (410 | ) | | | (653 | ) |
Related deferred income tax asset | | | 39 | | | | 51 | | | | 6 | | | | 25 | | | | 9 | | | | 21 | | | | 20 | | | | 38 | | | | 74 | | | | 135 | |
Net pension liability | | | (216 | ) | | | (293 | ) | | | (55 | ) | | | (83 | ) | | | (35 | ) | | | (83 | ) | | | (30 | ) | | | (59 | ) | | | (336 | ) | | | (518 | ) |
|
During the year, settlement payments of€11 million (2012:€nil million) were made in respect of some of the Group’s schemes in the Eurozone (€7 million) and Switzerland (€4 million). | |
| | | |
| Split of scheme liabilities - funded and unfunded | | | | | | | | | | | | | |
| | | | | | | | | | |
Funded defined benefit pension schemes | | | (999 | ) | | | (1,009 | ) | | | (723 | ) | | | (705 | ) | | | (722 | ) | | | (760 | ) | | | (219 | ) | | | (260 | ) | | | (2,663 | ) | | | (2,734 | ) |
Unfunded defined benefit pension schemes | | | (40 | ) | | | (39 | ) | | | - | | | | - | | | | - | | | | - | | | | (7 | ) | | | (7 | ) | | | (47 | ) | | | (46 | ) |
Total - defined benefit pension schemes | | | (1,039 | ) | | | (1,048 | ) | | | (723 | ) | | | (705 | ) | | | (722 | ) | | | (760 | ) | | | (226 | ) | | | (267 | ) | | | (2,710 | ) | | | (2,780 | ) |
Post-retirement healthcare obligations (unfunded) | | | - | | | | - | | | | - | | | | - | | | | - | | | | - | | | | (3 | ) | | | (4 | ) | | | (3 | ) | | | (4 | ) |
Long-term service commitments (unfunded) | | | (6 | ) | | | (6 | ) | | | - | | | | - | | | | (5 | ) | | | (5 | ) | | | - | | | | - | | | | (11 | ) | | | (11 | ) |
Actuarial value of liabilities (present value) | | | (1,045 | ) | | | (1,054 | ) | | | (723 | ) | | | (705 | ) | | | (727 | ) | | | (765 | ) | | | (229 | ) | | | (271 | ) | | | (2,724 | ) | | | (2,795 | ) |
Sensitivity analysis
The impact of a movement (as indicated below) in the principal actuarial assumptions would be as follows:
| | | | | | | | | | | | | | | | | | | | | | |
| | | | | Eurozone
2013 €m | | | Britain and
Northern
Ireland
2013 €m | | | Switzerland
2013 €m | | | United
States
2013 €m | | | Total
Group
2013 €m | |
| | | | | |
Scheme liabilities at 31 December 2013 | | | (1,045 | ) | | | (723 | ) | | | (727 | ) | | | (229 | ) | | | (2,724 | ) |
| | | | | | |
Revised liabilities | | | | | | | | | | | | | | | | | | | | | | |
Discount rate | | Decrease by 0.25% | | | (1,088 | ) | | | (759 | ) | | | (757 | ) | | | (236 | ) | | | (2,840 | ) |
Inflation rate | | Increase by 0.25% | | | (1,086 | ) | | | (750 | ) | | | (727 | ) | | | (229 | ) | | | (2,792 | ) |
Life expectancy | | Increase by 1 year | | | (1,072 | ) | | | (745 | ) | | | (741 | ) | | | (234 | ) | | | (2,792 | ) |
The above sensitivity analysis is derived through changing the individual assumption while holding all other assumptions constant.
28. Retirement Benefit Obligations |continued
Split of scheme assets
| | | | | | | | | | | | | | | | | | | | | | | | | | | | | | | | | | | | | | | | |
| | | Eurozone | | | Britain and Northern Ireland | | | Switzerland | | | United States | | | Total Group | |
| | | 2013 | | | 2012 | | | 2013 | | | 2012 | | | 2013 | | | 2012 | | | 2013 | | | 2012 | | | 2013 | | | 2012 | |
| | | €m | | | €m | | | €m | | | €m | | | €m | | | €m | | | €m | | | €m | | | €m | | | €m | |
| | | | | | | | | | |
Investments quoted in active markets | | | | | | | | | | | | | | | | | | | | | | | | | | | | | | | | | | | | | | | | |
Equity instruments: | | | | | | | | | | | | | | | | | | | | | | | | | | | | | | | | | | | | | | | | |
- Developed markets | | | 262 | | | | 343 | | | | 340 | | | | 294 | | | | 229 | | | | 190 | | | | 92 | | | | 91 | | | | 923 | | | | 918 | |
- Emerging markets | | | 12 | | | | 10 | | | | 53 | | | | 39 | | | | - | | | | - | | | | - | | | | - | | | | 65 | | | | 49 | |
Debt instruments: | | | | | | | | | | | | | | | | | | | | | | | | | | | | | | | | | | | | | | | | |
- Non Government debt instruments | | | 29 | | | | 26 | | | | 139 | | | | 137 | | | | 210 | | | | 176 | | | | 26 | | | | 21 | | | | 404 | | | | 360 | |
- Government debt instruments | | | 390 | | | | 220 | | | | 69 | | | | 72 | | | | 58 | | | | 48 | | | | 51 | | | | 50 | | | | 568 | | | | 390 | |
Property | | | 29 | | | | 27 | | | | 43 | | | | 41 | | | | 68 | | | | 67 | | | | - | | | | - | | | | 140 | | | | 135 | |
Cash and cash equivalents | | | 47 | | | | 72 | | | | 1 | | | | 7 | | | | 2 | | | | 2 | | | | 4 | | | | 3 | | | | 54 | | | | 84 | |
Investment funds | | | 12 | | | | - | | | | 9 | | | | 5 | | | | - | | | | - | | | | 6 | | | | 8 | | | | 27 | | | | 13 | |
Assets held by insurance company | | | - | | | | - | | | | - | | | | - | | | | 5 | | | | 4 | | | | - | | | | 1 | | | | 5 | | | | 5 | |
| | | | | | | | | | |
Unquoted investments | | | | | | | | | | | | | | | | | | | | | | | | | | | | | | | | | | | | | | | | |
Property | | | 2 | | | | 2 | | | | - | | | | - | | | | 68 | | | | 66 | | | | - | | | | - | | | | 70 | | | | 68 | |
Cash and cash equivalents | | | 4 | | | | 4 | | | | 2 | | | | 1 | | | | 31 | | | | 89 | | | | - | | | | - | | | | 37 | | | | 94 | |
Investment funds | | | - | | | | - | | | | 6 | | | | - | | | | - | | | | - | | | | - | | | | - | | | | 6 | | | | - | |
Assets held by insurance company | | | 3 | | | | 6 | | | | - | | | | 1 | | | | 12 | | | | 19 | | | | - | | | | - | | | | 15 | | | | 26 | |
Total | | | 790 | | | | 710 | | | | 662 | | | | 597 | | | | 683 | | | | 661 | | | | 179 | | | | 174 | | | | 2,314 | | | | 2,142 | |
Actuarial valuations - funding requirements and future cash flows
In accordance with statutory requirements in Ireland and Britain (minimum funding requirements), additional annual contributions and lump-sum payments are required to certain of the schemes in place in those jurisdictions. The funding requirements in relation to the Group’s defined benefit schemes are assessed in accordance with the advice of independent and qualified actuaries and valuations are prepared in this regard either annually, where local requirements mandate that this be done, or at triennial intervals at a maximum in all other cases. In Ireland and Britain, either the attained age or projected unit credit methods are used in the valuations. In the Netherlands and Switzerland, the actuarial valuations reflect the current unit method, while the valuations are performed in accordance with the projected unit credit methodology in Germany. In the United States, valuations are performed using a variety of actuarial cost methodologies - current unit, projected unit and aggregate cost. The dates of the actuarial valuations range from December 2010 to December 2013.
In general, actuarial valuations are not available for public inspection; however, the results of valuations are advised to the members of the various schemes.
The maturity profile of the Group’s contracted payments (on a discounted basis) to certain schemes in the Eurozone (Ireland) and Britain and Northern Ireland is as follows:
| | | | | | | | | | | | | | | | | | | | | | | | | | | | | | | | | | | | |
| | | Eurozone | | | Britain and Northern Ireland | | | Total Group | |
| | | 2013 | | | 2012 | | | 2011 | | | 2013 | | | 2012 | | | 2011 | | | 2013 | | | 2012 | | | 2011 | |
| | | €m | | | €m | | | €m | | | €m | | | €m | | | €m | | | €m | | | €m | | | €m | |
Within one year | | | 18 | | | | 18 | | | | - | | | | 7 | | | | 18 | | | | 8 | | | | 25 | | | | 36 | | | | 8 | |
Between one and two years | | | 17 | | | | 17 | | | | - | | | | 7 | | | | 7 | | | | 8 | | | | 24 | | | | 24 | | | | 8 | |
Between two and three years | | | 16 | | | | 16 | | | | - | | | | 7 | | | | 6 | | | | 8 | | | | 23 | | | | 22 | | | | 8 | |
Between three and four years | | | 16 | | | | 16 | | | | - | | | | 6 | | | | 6 | | | | 7 | | | | 22 | | | | 22 | | | | 7 | |
Between four and five years | | | 15 | | | | 15 | | | | - | | | | 6 | | | | 6 | | | | 7 | | | | 21 | | | | 21 | | | | 7 | |
After five years | | | - | | | | 15 | | | | - | | | | 47 | | | | 41 | | | | 43 | | | | 47 | | | | 56 | | | | 43 | |
| | | 82 | | | | 97 | | | | - | | | | 80 | | | | 84 | | | | 81 | | | | 162 | | | | 181 | | | | 81 | |
Employer contributions payable in the 2014 financial year including minimum funding payments (expressed using year-end exchange rates for 2013) are estimated at€115 million.
Average duration and scheme composition
| | | | | | | | | | | | | | | | | | | | | | | | | | | | | | | | | | | | | | | | | | | | | | | | |
| | | Eurozone | | | Britain and Northern Ireland | | | Switzerland | | | United States | |
| | | 2013 | | | 2012 | | | 2011 | | | 2013 | | | 2012 | | | 2011 | | | 2013 | | | 2012 | | | 2011 | | | 2013 | | | 2012 | | | 2011 | |
Average duration of defined benefit obligation (years) | | | 15.9 | | | | 16.9 | | | | 15.6 | | | | 18.1 | | | | 20.8 | | | | 20.4 | | | | 16.0 | | | | 16.0 | | | | 17.0 | | | | 13.3 | | | | 13.2 | | | | 12.8 | |
| | | | | | | | | | | | |
Allocation of defined benefit obligation by participant: | | | | | | | | | | | | | | | | | | | | | | | | | | | | | | | | | | | | | | | | | | | | | | | | |
Active plan participants | | | 39% | | | | 40% | | | | 47% | | | | 27% | | | | 28% | | | | 32% | | | | 86% | | | | 87% | | | | 88% | | | | 36% | | | | 38% | | | | 40% | |
Deferred plan participants | | | 20% | | | | 20% | | | | 11% | | | | 34% | | | | 34% | | | | 36% | | | | - | | | | - | | | | - | | | | 30% | | | | 30% | | | | 30% | |
Retirees | | | 41% | | | | 40% | | | | 42% | | | | 39% | | | | 38% | | | | 32% | | | | 14% | | | | 13% | | | | 12% | | | | 34% | | | | 32% | | | | 30% | |
29. Share Capital and Reserves
| | | | | | | | | | | | | | | | | | |
| | | 2013 | | | | | 2012 | |
| Equity Share Capital | | Ordinary Shares of €0.32 each (i) | | | Income Shares of €0.02 each (ii) | | | | | Ordinary Shares of €0.32 each (i) | | | Income Shares of €0.02 each (ii) | |
| | | | | |
Authorised | | | | | | | | | | | | | | | | | | |
At 1 January 2013 and 31 December 2013 (€m) | | | 320 | | | | 20 | | | | | | 320 | | | | 20 | |
| | | | | |
Number of Shares at 1 January 2013 and 31 December 2013 (‘000s) | | | 1,000,000 | | | | 1,000,000 | | | | | | 1,000,000 | | | | 1,000,000 | |
| | | | | |
Allotted, called-up and fully paid | | | | | | | | | | | | | | | | | | |
At 1 January (€m) | | | 235 | | | | 14 | | | | | | 233 | | | | 14 | |
Issue of scrip shares in lieu of cash dividends (iii) | | | 2 | | | | - | | | | | | 2 | | | | - | |
At 31 December (€m) | | | 237 | | | | 14 | | | | | | 235 | | | | 14 | |
| |
| The movement in the number of shares (expressed in ‘000s) during the financial year was as follows: | | | | | |
| | | | | |
At 1 January | | | 733,821 | | | | 733,821 | | | | | | 727,897 | | | | 727,897 | |
Issue of scrip shares in lieu of cash dividends (iii) | | | 5,410 | | | | 5,410 | | | | | | 5,924 | | | | 5,924 | |
At 31 December | | | 739,231 | | | | 739,231 | | | | | | 733,821 | | | | 733,821 | |
| (i) | The Ordinary Shares represent 93.68% of the total issued share capital. |
| (ii) | The Income Shares, which represent 5.85% of the total issued share capital, were created on 29 August 1988 for the express purpose of giving shareholders the choice of receiving dividends on either their Ordinary Shares or on their Income Shares (by notice of election to the Company). The Income Shares carried a different tax credit to the Ordinary Shares. The creation of the Income Shares was achieved by the allotment of fully paid Income Shares to each shareholder equal to his/her holding of Ordinary Shares but the shareholder is not entitled to an Income Share certificate, as a certificate for Ordinary Shares is deemed to include an equal number of Income Shares and a shareholder may only sell, transfer or transmit Income Shares with an equivalent number of Ordinary Shares. Income Shares carry no voting rights. Due to changes in Irish tax legislation since the creation of the Income Shares, dividends on the Company’s shares no longer carry a tax credit. As elections made by shareholders to receive dividends on their holding of Income Shares were no longer relevant, the Articles of Association were amended on 8 May 2002 to cancel such elections. |
Share schemes
The aggregate number of shares which may be committed for issue in respect of any share option scheme, savings-related share option scheme, share participation scheme, performance share plan or any subsequent option scheme or share plan, may not exceed 10% of the issued Ordinary share capital from time to time.
Share option schemes
Details of share options granted under the Company’s share option schemes and the terms attaching thereto are provided in note 8 to the financial statements and on page 94 of the Directors’ Remuneration Report.
| | | | | | | | |
| | | Number of Shares | |
| | | 2013 | | | 2012 | |
| | |
Options exercised during the year (satisfied by the reissue of Treasury Shares) | | | 1,310,187 | | | | 1,163,827 | |
Share participation schemes
As at 31 December 2013, 7,386,047 (2012: 7,272,632) Ordinary Shares had been appropriated to participation schemes. In the financial year ended 31 December 2013, the appropriation of 113,415 shares was satisfied by the reissue of Treasury Shares (2012: 154,045). The Ordinary Shares appropriated pursuant to these schemes were issued at market value on the dates of appropriation. The shares issued pursuant to these schemes are excluded from the scope of IFRS 2Share-based Payment and are hence not factored into the expense computation and the associated disclosures in note 8.
Restricted Share Plan
During the year, the Employee Benefit Trust purchased 391,250 shares on behalf of CRH plc in respect of awards under the 2013 Restricted Share Plan.
The nominal value of own shares, on which dividends have been waived by the Trustees of the 2013 Restricted Share Plan, amounted to€0.1 million at 31 December 2013.
| (iii) | Issue of scrip shares in lieu of cash dividends: |
| | | | | | | | | | | | | | | | | | | | | | | | | | |
| | | Number of Shares | | | | | Price per Share | |
| | | 2013 | | | 2012 | | | 2011 | | | | | 2013 | | | 2012 | | | 2011 | |
| | | | | | | |
| May 2013 - Final 2012 dividend (2012: Final 2011 dividend; 2011: Final 2010 dividend) | | | 2,011,165 | | | | 2,653,368 | | | | 6,950,139 | | | | | € | 17.01 | | | € | 15.40 | | | € | 15.35 | |
| October 2013 - Interim 2013 dividend (2012: Interim 2012 dividend; 2011: Interim 2011 dividend) | | | 3,398,992 | | | | 3,270,169 | | | | 2,438,854 | | | | | € | 15.79 | | | € | 14.27 | | | € | 11.50 | |
| Total | | | 5,410,157 | | | | 5,923,537 | | | | 9,388,993 | | | | | | | | | | | | | | | |
29. Share Capital and Reserves |continued
| | | | | | | | | | | | | | | | | | |
| Preference Share Capital | | 5% Cumulative Preference Shares of €1.27 each(iv) | | | | | 7% ‘A’ Cumulative Preference Shares of €1.27 each(v) | |
| | | Number of
Shares (‘000s) | | | €m | | | | | Number of
Shares (‘000s) | | | €m | |
| | | | | |
Authorised | | | | | | | | | | | | | | | | | | |
At 1 January 2013 and 31 December 2013 | | | 150 | | | | - | | | | | | 872 | | | | 1 | |
| | | | | |
Allotted, called-up and fully paid | | | | | | | | | | | | | | | | | | |
At 1 January 2013 and 31 December 2013 | | | 50 | | | | - | | | | | | 872 | | | | 1 | |
There was no movement in the number of cumulative preference shares in either the current or the prior year.
| (iv) | The holders of the 5% Cumulative Preference Shares are entitled to a fixed cumulative preference dividend at a rate of 5% per annum and priority in a winding-up to repayment of capital, but have no further right to participate in profits or assets and are not entitled to be present or vote at general meetings unless their dividend is in arrears. Dividends on the 5% Cumulative Preference Shares are payable half-yearly on 15 April and 15 October in each year. The 5% Cumulative Preference Shares represent 0.03% of the total issued share capital. |
| (v) | The holders of the 7% ‘A’ Cumulative Preference Shares are entitled to a fixed cumulative preference dividend at a rate of 7% per annum, and subject to the rights of the holders of the 5% Cumulative Preference Shares, priority in a winding-up to repayment of capital, but have no further right to participate in profits or assets and are not entitled to be present or vote at general meetings unless their dividend is in arrears or unless the business of the meeting includes certain matters, which are specified in the Articles of Association. Dividends on the 7% ‘A’ Cumulative Preference Shares are payable half-yearly on 5 April and 5 October in each year. The 7% ‘A’ Cumulative Preference Shares represent 0.44% of the total issued share capital. |
| | | | | | | | |
| Treasury Shares/own shares | | 2013
€m | | | 2012
€m | |
| | |
At 1 January | | | (146 | ) | | | (183 | ) |
Treasury Shares/own shares reissued | | | 34 | | | | 37 | |
Shares acquired by Employee Benefit Trust (own shares) | | | (6 | ) | | | - | |
At 31 December | | | (118 | ) | | | (146 | ) |
As at the balance sheet date, the total number of Treasury Shares held was 5,951,104 (2012: 7,374,706); the nominal value of these shares was€2 million (2012:€3 million). During the year ended 31 December 2013, 1,423,602 shares were reissued (2012: 1,317,872) to satisfy exercises and appropriations under the Group’s share option and share participation schemes. These reissued Treasury Shares were previously purchased at an average price of€24.08 (2012:€24.11). No Treasury Shares were purchased during 2013 or 2012.
| | | | | | | | | | | | |
| Reconciliation of shares issued to net proceeds | | 2013
€m | | | 2012
€m | | | 2011
€m | |
| | | |
Shares issued at nominal amount: | | | | | | | | | | | | |
- scrip shares issued in lieu of cash dividends | | | 2 | | | | 2 | | | | 3 | |
Premium on shares issued | | | 86 | | | | 86 | | | | 132 | |
Total value of shares issued | | | 88 | | | | 88 | | | | 135 | |
Issue of scrip shares in lieu of cash dividends (note 12) | | | (88 | ) | | | (88 | ) | | | (135 | ) |
Net proceeds from issue of shares | | | - | | | | - | | | | - | |
| | | |
| Share Premium | | | | | 2013
€m | | | 2012
€m | |
| | | |
At 1 January | | | | | | | 4,133 | | | | 4,047 | |
Premium arising on shares issued | | | | | | | 86 | | | | 86 | |
At 31 December | | | | | | | 4,219 | | | | 4,133 | |
30. Commitments under Operating and Finance Leases
Operating leases
Future minimum rentals payable under non-cancellable operating leases at 31 December are as follows:
| | | | | | | | | | | | |
| | | 2013
€m | | | 2012
€m | | | 2011
€m | |
| | | |
Within one year | | | 301 | | | | 270 | | | | 251 | |
After one year but not more than five years | | | 596 | | | | 653 | | | | 615 | |
More than five years | | | 357 | | | | 398 | | | | 384 | |
| | | | 1,254 | | | | 1,321 | | | | 1,250 | |
Finance leases
Future minimum lease payments under finance leases are not material for the Group.
31. Business Combinations
The principal acquisitions completed during the year ended 31 December 2013 by reportable segment, together with the completion dates, are detailed below; these transactions entailed the acquisition of an effective 100% stake except where indicated to the contrary:
Europe Materials:Spain: Cementos Lemona (99%, 25 February);United Kingdom: Southern Cement (25 February), assets of Cemex in Northern Ireland (13 May) and the cement import facilities of Dudman (31 May);Ukraine: Mykolaiv Cement (99%, 25 September).
Europe Products:Belgium: assets of Echo NV (24 April).
Europe Distribution:Belgium: Halschoor (4 January);the Netherlands: Van Buren (9 January);France: 4 Wolseley locations (1 October).
Americas Materials:Colorado: selected assets of Lafarge in the Western Slopes (3 July);Michigan: Rockwood quarry (10 May) and assets of Waterland Trucking Service (10 May);Mississippi: assets of Rogers Group (3 July);New York: selected assets of Dutchess Quarry and Supply (18 March);Oregon: selected assets of Cemex (15 February) and Turner Gravel (18 November);Pennsylvania: Miller reserves (26 March);West Virginia: Sugarland reserves (17 May).
Americas Products:Canada: Expocrete (18 March);North and South Carolina: concrete product assets of Cemex (8 April);Pennsylvania: assets of Modern Precast Concrete (25 January);Wisconsin: Harmony Outdoor Living (21 March).
Americas Distribution:Florida: assets of Fogleman Builders Supply (3 October);Maryland: assets of Eldersburg Supply (1 April, also Washington DC);Texas: certain assets of JEH Company (18 September).
The identifiable net assets acquired, including adjustments to provisional fair values, were as follows:
| | | | | | | | | | | | |
| | | 2013
€m | | | 2012
€m | | | 2011
€m | |
| | | |
Assets | | | | | | | | | | | | |
Non-current assets | | | | | | | | | | | | |
Property, plant and equipment | | | 342 | | | | 253 | | | | 339 | |
Intangible assets | | | 39 | | | | 65 | | | | 29 | |
Equity accounted investments | | | 2 | | | | - | | | | - | |
Deferred income tax assets | | | - | | | | 10 | | | | 2 | |
Total non-current assets | | | 383 | | | | 328 | | | | 370 | |
| | | |
Current assets | | | | | | | | | | | | |
Inventories | | | 41 | | | | 98 | | | | 53 | |
Trade and other receivables (i) | | | 53 | | | | 103 | | | | 62 | |
Cash and cash equivalents | | | 11 | | | | 19 | | | | 24 | |
Total current assets | | | 105 | | | | 220 | | | | 139 | |
| | | |
Liabilities | | | | | | | | | | | | |
Trade and other payables | | | (80 | ) | | | (57 | ) | | | (49 | ) |
Provisions for liabilities (stated at net present cost) | | | (14 | ) | | | (1 | ) | | | (15 | ) |
Interest-bearing loans and borrowings and finance leases | | | (44 | ) | | | (42 | ) | | | (47 | ) |
Current income tax liabilities | | | - | | | | (3 | ) | | | - | |
Deferred income tax liabilities | | | (8 | ) | | | (19 | ) | | | (29 | ) |
Total liabilities | | | (146 | ) | | | (122 | ) | | | (140 | ) |
| | | |
Total identifiable net assets at fair value | | | 342 | | | | 426 | | | | 369 | |
| | | |
Goodwill arising on acquisition (ii) | | | 169 | | | | 162 | | | | 207 | |
| | | |
Excess of fair value of identifiable net assets over consideration paid (ii) | | | (2 | ) | | | - | | | | (5 | ) |
| | | |
Non-controlling interests* | | | (1 | ) | | | - | | | | 2 | |
Total consideration | | | 508 | | | | 588 | | | | 573 | |
| | | |
Consideration satisfied by: | | | | | | | | | | | | |
Cash payments | | | 347 | | | | 437 | | | | 531 | |
Asset exchange (note 5) | | | 144 | | | | - | | | | - | |
Deferred consideration (stated at net present cost) | | | 4 | | | | 75 | | | | 14 | |
Contingent consideration (iii) | | | 13 | | | | 76 | | | | 28 | |
Total consideration | | | 508 | | | | 588 | | | | 573 | |
| |
* Measured at the non-controlling interests’ proportionate share of the acquiree’s identifiable net assets. | | | | | |
| | | |
Net cash outflow arising on acquisition | | | | | | | | | | | | |
Cash consideration | | | 347 | | | | 437 | | | | 531 | |
Less: cash and cash equivalents acquired | | | (11 | ) | | | (19 | ) | | | (24 | ) |
Total | | | 336 | | | | 418 | | | | 507 | |
31. Business Combinations |continued
None of the acquisitions completed during the financial years 2013, 2012 or 2011 were considered sufficiently material to warrant separate disclosure of the attributable fair values. The initial assignment of fair values to identifiable net assets acquired has been performed on a provisional basis in respect of certain acquisitions; any amendments to these fair values made during the subsequent reporting window (within the measurement period imposed by IFRS 3 Business Combinations) will be subject to subsequent disclosure.
| (i) | The gross contractual value of trade and other receivables as at the respective dates of acquisition amounted to€57 million (2012:€106 million; 2011:€65 million). The fair value of these receivables is€53 million (all of which is expected to be recoverable) (2012:€103 million; 2011:€62 million) and is inclusive of an aggregate allowance for impairment of€4 million (2012:€3 million; 2011:€3 million). |
| (ii) | The principal factor contributing to the recognition of goodwill on acquisitions entered into by the Group is the realisation of cost savings and other synergies with existing entities in the Group which do not qualify for separate recognition as intangible assets. Due to the asset-intensive nature of operations in the Materials business segments, no significant intangible assets are recognised on business combinations in these segments.€49 million of the goodwill recognised in respect of acquisitions completed in 2013 is expected to be deductible for tax purposes (2012:€106 million). An excess of fair value of identifiable net assets over consideration of€2 million arose during the year and is included in operating costs in note 3. |
| (iii) | The fair value of contingent consideration recognised is€13 million (including adjustments to prior year acquisitions of€11 million). On an undiscounted basis, the corresponding future payments on current year acquisitions for which the Group may be liable range from€nil million to a maximum of€7 million. |
Acquisition-related costs amounting to€2 million (2012:€4 million; 2011:€3 million) have been included in operating costs in the Consolidated Income Statement (note 3).
No contingent liabilities were recognised on the acquisitions completed during the financial year or the prior financial years.
The carrying amounts of the assets and liabilities acquired determined in accordance with IFRS before completion of the acquisition, together with the adjustments made to those carrying values to arrive at the fair values disclosed above, were as follows:
| | | | | | | | | | | | | | | | | | | | |
| | | Book
values
€m | | | Fair value
adjustments
€m | | | Accounting
policy
alignments
€m | | | Adjustments
to provisional
fair values
€m | | | Fair
value
€m | |
| | | | | |
Non-current assets | | | 257 | | | | 106 | | | | - | | | | 20 | | | | 383 | |
Current assets | | | 130 | | | | (12 | ) | | | (2 | ) | | | (11 | ) | | | 105 | |
Liabilities | | | (107 | ) | | | (34 | ) | | | - | | | | (5 | ) | | | (146 | ) |
Identifiable net assets acquired | | | 280 | | | | 60 | | | | (2 | ) | | | 4 | | | | 342 | |
Non-controlling interests | | | (2 | ) | | | 1 | | | | - | | | | - | | | | (1 | ) |
Goodwill arising on acquisition (see (ii) above) | | | 224 | | | | (61 | ) | | | 2 | | | | 2 | | | | 167 | |
Total consideration | | | 502 | | | | - | | | | - | | | | 6 | | | | 508 | |
The adjustments to provisional fair values above relate principally to our acquisition of Trap Rock Industries in December 2012. The equivalent disclosure for 2012 is as follows: | |
| | | | | |
Non-current assets | | | 178 | | | | 155 | | | | - | | | | (4 | ) | | | 329 | |
Current assets | | | 217 | | | | 2 | | | | - | | | | - | | | | 219 | |
Liabilities | | | (95 | ) | | | (19 | ) | | | (1 | ) | | | (7 | ) | | | (122 | ) |
Identifiable net assets acquired | | | 300 | | | | 138 | | | | (1 | ) | | | (11 | ) | | | 426 | |
Goodwill arising on acquisition | | | 287 | | | | (138 | ) | | | 1 | | | | 12 | | | | 162 | |
Total consideration | | | 587 | | | | - | | | | - | | | | 1 | | | | 588 | |
The equivalent disclosure for 2011 is as follows: | |
Non-current assets | | | 221 | | | | 151 | | | | - | | | | (2 | ) | | | 370 | |
Current assets | | | 146 | | | | - | | | | (1 | ) | | | (6 | ) | | | 139 | |
Liabilities | | | (127 | ) | | | (23 | ) | | | - | | | | 10 | | | | (140 | ) |
Identifiable net assets acquired | | | 240 | | | | 128 | | | | (1 | ) | | | 2 | | | | 369 | |
Non-controlling interests | | | - | | | | - | | | | - | | | | 2 | | | | 2 | |
Goodwill arising on acquisition | | | 327 | | | | (128 | ) | | | 1 | | | | 2 | | | | 202 | |
Total consideration | | | 567 | | | | - | | | | - | | | | 6 | | | | 573 | |
31. Business Combinations |continued
The following table analyses the 25 acquisitions (2012: 32 acquisitions; 2011: 43 acquisitions) by reportable segment and provides details of the goodwill and consideration figures arising in each of those segments:
| | | | | | | | | | | | | | | | | | | | | | | | | | | | | | | | | | | | |
| Reportable segments | | Number of Acquisitions | | | Goodwill | | | Consideration | |
| | | 2013 | | | 2012 | | | 2011 | | | 2013
€m | | | 2012
€m | | | 2011
€m | | | 2013
€m | | | 2012
€m | | | 2011
€m | |
| | | | | | | | | |
Europe Materials | | | 5 | | | | 2 | | | | 5 | | | | 80 | | | | 26 | | | | 99 | | | | 256 | | | | 58 | | | | 213 | |
Europe Products | | | 1 | | | | 4 | | | | 4 | | | | - | | | | 68 | | | | 4 | | | | 9 | | | | 151 | | | | 9 | |
Europe Distribution | | | 3 | | | | 3 | | | | 5 | | | | 10 | | | | 8 | | | | 8 | | | | 15 | | | | 40 | | | | 26 | |
Americas Materials | | | 9 | | | | 14 | | | | 19 | | | | 19 | | | | 34 | | | | 55 | | | | 76 | | | | 226 | | | | 214 | |
Americas Products | | | 4 | | | | 9 | | | | 4 | | | | 48 | | | | 14 | | | | 5 | | | | 124 | | | | 112 | | | | 28 | |
Americas Distribution | | | 3 | | | | - | | | | 6 | | | | 8 | | | | - | | | | 29 | | | | 22 | | | | - | | | | 77 | |
Group totals | | | 25 | | | | 32 | | | | 43 | | | | 165 | | | | 150 | | | | 200 | | | | 502 | | | | 587 | | | | 567 | |
Adjustments to provisional fair values of prior year acquisitions | | | | | | | | | | | | 6 | | | | 1 | | | | 6 | |
| | | | | | | | | |
Total consideration | | | | | | | | | | | | | | | | | | | | | | | | | | | 508 | | | | 588 | | | | 573 | |
|
| The post-acquisition impact of acquisitions completed during the year on the Group’s result for the financial year was as follows: | |
| | | | | | | | | |
| | | | | | | | | | | | | | | | | | | | | 2013
€m | | | 2012
€m | | | 2011
€m | |
| | | | | | | | | |
Revenue | | | | | | | | | | | | | | | | | | | | | | | | | | | 306 | | | | 270 | | | | 157 | |
Cost of sales | | | | | | | | | | | | | | | | | | | | | | | | | | | (232 | ) | | | (201 | ) | | | (111 | ) |
Gross profit | | | | | | | | | | | | | | | | | | | | | | | | | | | 74 | | | | 69 | | | | 46 | |
Operating costs | | | | | | | | | | | | | | | | | | | | | | | | | | | (63 | ) | | | (56 | ) | | | (30 | ) |
Group operating profit | | | | | | | | | | | | | | | | | | | | | | | | | | | 11 | | | | 13 | | | | 16 | |
Profit on disposals | | | | | | | | | | | | | | | | | | | | | | | | | | | - | | | | - | | | | (1 | ) |
Profit before finance costs | | | | | | | | | | | | | | | | | | | | | | | | | | | 11 | | | | 13 | | | | 15 | |
Finance costs (net) | | | | | | | | | | | | | | | | | | | | | | | | | | | (3 | ) | | | (2 | ) | | | (4 | ) |
Profit before tax | | | | | | | | | | | | | | | | | | | | | | | | | | | 8 | | | | 11 | | | | 11 | |
Income tax expense | | | | | | | | | | | | | | | | | | | | | | | | | | | (2 | ) | | | (4 | ) | | | (3 | ) |
Group profit for the financial year | | | | | | | | | | | | | | | | | | | | | | | | | | | 6 | | | | 7 | | | | 8 | |
The revenue and result of the Group for the financial year determined in accordance with IFRS as though the acquisitions effected during the year had been at the beginning of the year would have been as follows:
| | | | | | | | | | | | | | | | |
| | | Pro-forma 2013 | | | | |
| | | 2013 acquisitions €m | | | CRH Group excluding 2013 acquisitions €m | | | Pro-forma consolidated Group €m | | | Pro-forma 2012 €m | |
| | | | |
Revenue | | | 434 | | | | 17,725 | | | | 18,159 | | | | 19,054 | |
Group (loss)/profit for the financial year | | | 1 | | | | (301 | ) | | | (300 | ) | | | 571 | |
| | |
| | | Pro-forma 2012 | | | | |
| | | 2012 acquisitions €m | | | CRH Group excluding 2012 acquisitions €m | | | Pro-forma consolidated Group €m | | | Pro-forma 2011 €m | |
| | | | |
Revenue | | | 669 | | | | 18,385 | | | | 19,054 | | | | 18,389 | |
Group profit for the financial year | | | 25 | | | | 546 | | | | 571 | | | | 590 | |
There have been no acquisitions completed subsequent to the balance sheet date which would be individually material to the Group, thereby requiring disclosure under either IFRS 3 or IAS 10 Events after the Balance Sheet Date. Development updates, giving details of acquisitions which do not require separate disclosure on the grounds of materiality, are published in January and July each year.
32. Related Party Transactions
The principal related party relationships requiring disclosure in the Consolidated Financial Statements of the Group under IAS 24Related Party Disclosures pertain to: the existence of subsidiaries, joint ventures and associates; transactions with these entities entered into by the Group; and the identification and compensation of key management personnel.
Subsidiaries, joint ventures and associates
The Consolidated Financial Statements include the financial statements of the Company (CRH plc, the ultimate parent) and its subsidiaries, joint ventures and associates as documented in the accounting policies on pages 124 to 130. The Group’s principal subsidiaries, joint ventures and associates are disclosed in Exhibit 8 to the Annual Report.
Sales to and purchases from joint ventures are immaterial in 2013 and 2012. Loans extended by the Group to joint ventures and associates (see note 16) are included in financial assets. Sales to and purchases from associates during the financial year ended 31 December 2013 amounted to€24 million (2012:€21 million; 2011:€25 million) and€411 million (2012:€446 million; 2011:€488 million) respectively. Amounts receivable from and payable to equity accounted investments (arising from the aforementioned sales and purchases transactions) as at the balance sheet date are included as separate line items in notes 18 and 19 to the Consolidated Financial Statements.
Terms and conditions of transactions with subsidiaries, joint ventures and associates
In general, the transfer pricing policy implemented by the Group across its subsidiaries is market-based. Sales to and purchases from joint ventures and associates are conducted in the ordinary course of business and on terms equivalent to those that prevail in arm’s-length transactions. The outstanding balances included in receivables and payables as at the balance sheet date in respect of transactions with joint ventures and associates are unsecured and settlement arises in cash. No guarantees have been either requested or provided in relation to related party receivables and payables. Loans to joint ventures and associates (as disclosed in note 16) are extended on normal commercial terms in the ordinary course of business with interest accruing and, in general, paid to the Group at predetermined intervals.
Key management personnel
For the purposes of the disclosure requirements of IAS 24, the term “key management personnel” (i.e. those persons having authority and responsibility for planning, directing and controlling the activities of the Company) comprises the Board of Directors which manages the business and affairs of the Company.
Key management remuneration amounted to:
| | | | | | | | | | | | |
| | | 2013 €m | | | 2012 €m | | | 2011 €m | |
Short-term benefits | | | 7 | | | | 6 | | | | 6 | |
Post-employment benefits | | | 2 | | | | 2 | | | | 2 | |
Share-based payments - calculated in accordance with the principles disclosed in note 8 | | | 2 | | | | 2 | | | | 2 | |
Total | | | 11 | | | | 10 | | | | 10 | |
Other than these compensation entitlements, there were no other transactions involving key management personnel.
33. Supplemental Guarantor Information
The following consolidating information presents Condensed Balance Sheets as at 31 December 2013 and 2012 and Condensed Group Income Statements and Group Cash Flows for the years ended 31 December 2013, 2012 and 2011 of the Company and CRH America, Inc. as required by Article 3-10(c) of Regulation S-X. This information is prepared in accordance with IFRS with the exception that the subsidiaries are accounted for as investments under the equity method rather than being consolidated. CRH America, Inc. is 100% owned by the company. The Guarantees of the Guarantor are full and unconditional.
CRH America Inc. (the “Issuer”) has the following notes which are fully and unconditionally guaranteed by CRH plc (the “Guarantor”):
| | |
| US$350 million 4.125% Notes due 2016 | | – listed on the New York Stock Exchange |
| US$1,250 million 6.000% Notes due 2016 | | – listed on the New York Stock Exchange |
| US$650 million 8.125% Notes due 2018 | | – listed on the New York Stock Exchange |
| US$400 million 5.75% Notes due 2021 | | – listed on the New York Stock Exchange |
| US$300 million 6.40% Notes due 2033 | | – listed on the Irish Stock Exchange |
33. Supplemental Guarantor Information |continued
Supplemental Condensed Consolidated Balance Sheet as at 31 December 2013
| | | | | | | | | | | | | | | | | | | | |
| | | Guarantor €m | | | Issuer €m | | | Non-Guarantor subsidiaries €m | | | Eliminate and reclassify €m | | | CRH and subsidiaries €m | |
| | | | | |
ASSETS | | | | | | | | | | | | | | | | | | | | |
Non-current assets | | | | | | | | | | | | | | | | | | | | |
Property, plant and equipment | | | - | | | | - | | | | 7,539 | | | | - | | | | 7,539 | |
Intangible assets | | | - | | | | - | | | | 3,911 | | | | - | | | | 3,911 | |
Subsidiaries | | | 4,603 | | | | 183 | | | | 1,682 | | | | (6,468 | ) | | | - | |
Investments accounted for using the equity method | | | - | | | | - | | | | 1,340 | | | | - | | | | 1,340 | |
Advances to subsidiaries and parent undertakings | | | - | | | | 3,469 | | | | - | | | | (3,469 | ) | | | - | |
Other financial assets | | | - | | | | - | | | | 23 | | | | - | | | | 23 | |
Other receivables | | | - | | | | - | | | | 93 | | | | - | | | | 93 | |
Derivative financial instruments | | | - | | | | 58 | | | | 5 | | | | - | | | | 63 | |
Deferred income tax assets | | | - | | | | - | | | | 107 | | | | - | | | | 107 | |
Total non-current assets | | | 4,603 | | | | 3,710 | | | | 14,700 | | | | (9,937 | ) | | | 13,076 | |
| | | | | |
Current assets | | | | | | | | | | | | | | | | | | | | |
Inventories | | | - | | | | - | | | | 2,254 | | | | - | | | | 2,254 | |
Trade and other receivables | | | - | | | | 9 | | | | 2,507 | | | | - | | | | 2,516 | |
Advances to subsidiaries and parent undertakings | | | 6,394 | | | | - | | | | 1,453 | | | | (7,847 | ) | | | - | |
Current income tax recoverable | | | - | | | | - | | | | 26 | | | | - | | | | 26 | |
Derivative financial instruments | | | - | | | | - | | | | 17 | | | | - | | | | 17 | |
Cash and cash equivalents | | | 175 | | | | 174 | | | | 2,191 | | | | - | | | | 2,540 | |
Total current assets | | | 6,569 | | | | 183 | | | | 8,448 | | | | (7,847 | ) | | | 7,353 | |
Total assets | | | 11,172 | | | | 3,893 | | | | 23,148 | | | | (17,784 | ) | | | 20,429 | |
| | | | | |
EQUITY | | | | | | | | | | | | | | | | | | | | |
Capital and reserves attributable to the Company’s equity holders | | | | | | | | | | | | | | | | | | | | |
Equity share capital | | | 251 | | | | - | | | | - | | | | - | | | | 251 | |
Preference share capital | | | 1 | | | | - | | | | - | | | | - | | | | 1 | |
Share premium account | | | 4,219 | | | | 1,747 | | | | (76 | ) | | | (1,671 | ) | | | 4,219 | |
Treasury Shares and own shares | | | (118 | ) | | | - | | | | - | | | | - | | | | (118 | ) |
Other reserves | | | 197 | | | | - | | | | 197 | | | | (197 | ) | | | 197 | |
Foreign currency translation reserve | | | (542 | ) | | | - | | | | - | | | | - | | | | (542 | ) |
Retained income | | | 5,654 | | | | (334 | ) | | | 4,934 | | | | (4,600 | ) | | | 5,654 | |
| | | 9,662 | | | | 1,413 | | | | 5,055 | | | | (6,468 | ) | | | 9,662 | |
Non-controlling interests | | | - | | | | - | | | | 24 | | | | - | | | | 24 | |
Total equity | | | 9,662 | | | | 1,413 | | | | 5,079 | | | | (6,468 | ) | | | 9,686 | |
| | | | | |
LIABILITIES | | | | | | | | | | | | | | | | | | | | |
Non-current liabilities | | | | | | | | | | | | | | | | | | | | |
Interest-bearing loans and borrowings | | | - | | | | 2,279 | | | | 2,300 | | | | - | | | | 4,579 | |
Derivative financial instruments | | | - | | | | - | | | | 34 | | | | - | | | | 34 | |
Deferred income tax liabilities | | | - | | | | - | | | | 1,166 | | | | - | | | | 1,166 | |
Other payables | | | - | | | | - | | | | 289 | | | | - | | | | 289 | |
Advances from subsidiary and parent undertakings | | | - | | | | - | | | | 3,469 | | | | (3,469 | ) | | | - | |
Retirement benefit obligations | | | - | | | | - | | | | 410 | | | | - | | | | 410 | |
Provisions for liabilities | | | - | | | | - | | | | 231 | | | | - | | | | 231 | |
Total non-current liabilities | | | - | | | | 2,279 | | | | 7,899 | | | | (3,469 | ) | | | 6,709 | |
| | | | | |
Current liabilities | | | | | | | | | | | | | | | | | | | | |
Trade and other payables | | | - | | | | 54 | | | | 2,700 | | | | - | | | | 2,754 | |
Advances from subsidiary and parent undertakings | | | 1,453 | | | | - | | | | 6,394 | | | | (7,847 | ) | | | - | |
Current income tax liabilities | | | - | | | | - | | | | 151 | | | | - | | | | 151 | |
Interest-bearing loans and borrowings | | | 57 | | | | 147 | | | | 757 | | | | - | | | | 961 | |
Derivative financial instruments | | | - | | | | - | | | | 19 | | | | - | | | | 19 | |
Provisions for liabilities | | | - | | | | - | | | | 149 | | | | - | | | | 149 | |
Total current liabilities | | | 1,510 | | | | 201 | | | | 10,170 | | | | (7,847 | ) | | | 4,034 | |
Total liabilities | | | 1,510 | | | | 2,480 | | | | 18,069 | | | | (11,316 | ) | | | 10,743 | |
Total equity and liabilities | | | 11,172 | | | | 3,893 | | | | 23,148 | | | | (17,784 | ) | | | 20,429 | |
33. Supplemental Guarantor Information |continued
Supplemental Condensed Consolidated Balance Sheet as at 31 December 2012
| | | | | | | | | | | | | | | | | | | | |
| | | Guarantor €m | | | Issuer €m | | | Non-Guarantor
subsidiaries
€m | | | Eliminate and
reclassify €m | | | CRH and
subsidiaries
€m | |
| | | | | |
ASSETS | | | | | | | | | | | | | | | | | | | | |
Non-current assets | | | | | | | | | | | | | | | | | | | | |
Property, plant and equipment | | | - | | | | - | | | | 7,971 | | | | - | | | | 7,971 | |
Intangible assets | | | - | | | | - | | | | 4,267 | | | | - | | | | 4,267 | |
Subsidiaries | | | 5,115 | | | | 150 | | | | 1,682 | | | | (6,947 | ) | | | - | |
Investments accounted for using the equity method | | | - | | | | - | | | | 1,422 | | | | - | | | | 1,422 | |
Advances to subsidiaries and parent undertakings | | | - | | | | 3,806 | | | | - | | | | (3,806 | ) | | | - | |
Other financial assets | | | - | | | | - | | | | 34 | | | | - | | | | 34 | |
Other recievables | | | - | | | | - | | | | 83 | | | | - | | | | 83 | |
Derivative financial instruments | | | - | | | | 88 | | | | 32 | | | | - | | | | 120 | |
Deferred income tax assets | | | - | | | | - | | | | 191 | | | | - | | | | 191 | |
Total non-current assets | | | 5,115 | | | | 4,044 | | | | 15,682 | | | | (10,753 | ) | | | 14,088 | |
| | | | | |
Current assets | | | | | | | | | | | | | | | | | | | | |
Inventories | | | - | | | | - | | | | 2,333 | | | | - | | | | 2,333 | |
Trade and other receivables | | | - | | | | 13 | | | | 2,507 | | | | - | | | | 2,520 | |
Advances to subsidiaries and parent undertakings | | | 6,394 | | | | - | | | | 1,126 | | | | (7,520 | ) | | | - | |
Asset held for sale | | | - | | | | - | | | | 143 | | | | - | | | | 143 | |
Current income tax recoverable | | | - | | | | - | | | | 17 | | | | - | | | | 17 | |
Derivative financial instruments | | | - | | | | 16 | | | | 36 | | | | - | | | | 52 | |
Cash and cash equivalents | | | 172 | | | | 570 | | | | 1,005 | | | | - | | | | 1,747 | |
Total current assets | | | 6,566 | | | | 599 | | | | 7,167 | | | | (7,520 | ) | | | 6,812 | |
Total assets | | | 11,681 | | | | 4,643 | | | | 22,849 | | | | (18,273 | ) | | | 20,900 | |
| | | | | |
EQUITY | | | | | | | | | | | | | | | | | | | | |
Capital and reserves attributable to the Company’s equity holders | | | | | | | | | | | | | | | | | | | | |
Equity share capital | | | 249 | | | | - | | | | - | | | | - | | | | 249 | |
Preference share capital | | | 1 | | | | - | | | | - | | | | - | | | | 1 | |
Share premium account | | | 4,133 | | | | 1,747 | | | | 236 | | | | (1,983 | ) | | | 4,133 | |
Treasury Shares and own shares | | | (146 | ) | | | - | | | | - | | | | - | | | | (146 | ) |
Other reserves | | | 182 | | | | - | | | | 182 | | | | (182 | ) | | | 182 | |
Foreign currency translation reserve | | | (169 | ) | | | - | | | | - | | | | - | | | | (169 | ) |
Retained income | | | 6,303 | | | | (302 | ) | | | 5,084 | | | | (4,782 | ) | | | 6,303 | |
| | | 10,553 | | | | 1,445 | | | | 5,502 | | | | (6,947 | ) | | | 10,553 | |
Non-controlling interests | | | - | | | | - | | | | 36 | | | | - | | | | 36 | |
Total equity | | | 10,553 | | | | 1,445 | | | | 5,538 | | | | (6,947 | ) | | | 10,589 | |
| | | | | |
LIABILITIES | | | | | | | | | | | | | | | | | | | | |
Non-current liabilities | | | | | | | | | | | | | | | | | | | | |
Interest-bearing loans and borrowings | | | - | | | | 2,572 | | | | 1,589 | | | | - | | | | 4,161 | |
Derivative financial instruments | | | - | | | | - | | | | 14 | | | | - | | | | 14 | |
Deferred income tax liabilities | | | - | | | | - | | | | 1,232 | | | | - | | | | 1,232 | |
Other payables | | | - | | | | - | | | | 277 | | | | - | | | | 277 | |
Advances from subsidiary and parent undertakings | | | - | | | | - | | | | 3,806 | | | | (3,806 | ) | | | - | |
Retirement benefit obligations | | | - | | | | - | | | | 653 | | | | - | | | | 653 | |
Provisions for liabilities | | | - | | | | - | | | | 256 | | | | - | | | | 256 | |
Total non-current liabilities | | | - | | | | 2,572 | | | | 7,827 | | | | (3,806 | ) | | | 6,593 | |
| | | | | |
Current liabilities | | | | | | | | | | | | | | | | | | | | |
Trade and other payables | | | - | | | | 59 | | | | 2,716 | | | | - | | | | 2,775 | |
Advances from subsidiary and parent undertakings | | | 1,126 | | | | - | | | | 6,394 | | | | (7,520 | ) | | | - | |
Current income tax liabilities | | | - | | | | - | | | | 180 | | | | - | | | | 180 | |
Interest-bearing loans and borrowings | | | 2 | | | | 567 | | | | 78 | | | | - | | | | 647 | |
Derivative financial instruments | | | - | | | | - | | | | 6 | | | | - | | | | 6 | |
Provisions for liabilities | | | - | | | | - | | | | 110 | | | | - | | | | 110 | |
Total current liabilities | | | 1,128 | | | | 626 | | | | 9,484 | | | | (7,520 | ) | | | 3,718 | |
Total liabilities | | | 1,128 | | | | 3,198 | | | | 17,311 | | | | (11,326 | ) | | | 10,311 | |
Total equity and liabilities | | | 11,681 | | | | 4,643 | | | | 22,849 | | | | (18,273 | ) | | | 20,900 | |
33. Supplemental Guarantor Information |continued
Supplemental Condensed Consolidated Income Statement
| | | | | | | | | | | | | | | | | | | | |
| | | Year ended 31 December 2013 | |
| | | Guarantor €m | | | Issuer €m | | | Non-Guarantor subsidiaries €m | | | Eliminate and
reclassify €m | | | CRH and subsidiaries €m | |
| | | | | |
Revenue | | | - | | | | - | | | | 18,031 | | | | - | | | | 18,031 | |
Cost of sales | | | - | | | | - | | | | (13,314 | ) | | | - | | | | (13,314 | ) |
Gross profit | | | - | | | | - | | | | 4,717 | | | | - | | | | 4,717 | |
Operating income/(costs) | | | 3 | | | | - | | | | (4,620 | ) | | | - | | | | (4,617 | ) |
Group operating profit | | | 3 | | | | - | | | | 97 | | | | - | | | | 100 | |
Profit on disposals | | | - | | | | - | | | | 26 | | | | - | | | | 26 | |
Profit before finance costs | | | 3 | | | | - | | | | 123 | | | | - | | | | 126 | |
Finance costs | | | - | | | | (242 | ) | | | (270 | ) | | | 250 | | | | (262 | ) |
Finance income | | | - | | | | 250 | | | | 13 | | | | (250 | ) | | | 13 | |
Other financial expense | | | - | | | | - | | | | (48 | ) | | | - | | | | (48 | ) |
Share of subsidiaries’ (loss)/profit before tax | | | (175 | ) | | | 33 | | | | - | | | | 142 | | | | - | |
Share of equity accounted investments’ loss | | | (44 | ) | | | - | | | | (44 | ) | | | 44 | | | | (44 | ) |
(Loss)/profit before tax | | | (216 | ) | | | 41 | | | | (226 | ) | | | 186 | | | | (215 | ) |
Income tax expense | | | (80 | ) | | | (16 | ) | | | (64 | ) | | | 80 | | | | (80 | ) |
Group (loss)/profit for the financial year | | | (296 | ) | | | 25 | | | | (290 | ) | | | 266 | | | | (295 | ) |
| | | | | |
(Loss)/profit attributable to: | | | | | | | | | | | | | | | | | | | | |
Equity holders of the Company | | | (296 | ) | | | 25 | | | | (291 | ) | | | 266 | | | | (296 | ) |
Non-controlling interests | | | - | | | | - | | | | 1 | | | | - | | | | 1 | |
Group (loss)/profit for the financial year | | | (296 | ) | | | 25 | | | | (290 | ) | | | 266 | | | | (295 | ) |
| |
| | | Year ended 31 December 2012 | |
| | | Guarantor €m | | | Issuer €m | | | Non-Guarantor subsidiaries €m | | | Eliminate and
reclassify €m | | | CRH and
subsidiaries €m | |
| | | | | |
Revenue | | | - | | | | - | | | | 18,084 | | | | - | | | | 18,084 | |
Cost of sales | | | - | | | | - | | | | (13,161 | ) | | | - | | | | (13,161 | ) |
Gross profit | | | - | | | | - | | | | 4,923 | | | | - | | | | 4,923 | |
Operating income/(costs) | | | 1,004 | | | | - | | | | (5,122 | ) | | | - | | | | (4,118 | ) |
Group operating profit | | | 1,004 | | | | - | | | | (199 | ) | | | - | | | | 805 | |
Profit on disposals | | | 2 | | | | - | | | | 228 | | | | - | | | | 230 | |
Profit before finance costs | | | 1,006 | | | | - | | | | 29 | | | | - | | | | 1,035 | |
Finance costs | | | - | | | | (205 | ) | | | (279 | ) | | | 213 | | | | (271 | ) |
Finance income | | | - | | | | 213 | | | | 15 | | | | (213 | ) | | | 15 | |
Other financial expense | | | - | | | | - | | | | (49 | ) | | | - | | | | (49 | ) |
Share of subsidiaries’ profit before tax | | | (278 | ) | | | 28 | | | | - | | | | 250 | | | | - | |
Share of equity accounted investments’ loss | | | (84 | ) | | | - | | | | (84 | ) | | | 84 | | | | (84 | ) |
Profit before tax | | | 644 | | | | 36 | | | | (368 | ) | | | 334 | | | | 646 | |
Income tax expense | | | (106 | ) | | | (14 | ) | | | (92 | ) | | | 106 | | | | (106 | ) |
Group profit for the financial year | | | 538 | | | | 22 | | | | (460 | ) | | | 440 | | | | 540 | |
| | | | | |
Profit attributable to: | | | | | | | | | | | | | | | | | | | | |
Equity holders of the Company | | | 538 | | | | 22 | | | | (462 | ) | | | 440 | | | | 538 | |
Non-controlling interests | | | - | | | | - | | | | 2 | | | | - | | | | 2 | |
Group profit for the financial year | | | 538 | | | | 22 | | | | (460 | ) | | | 440 | | | | 540 | |
33. Supplemental Guarantor Information |continued
Supplemental Condensed Consolidated Income Statement
| | | | | | | | | | | | | | | | | | | | |
| | | Year ended 31 December 2011 | |
| | | Guarantor
€m | | | Issuer
€m | | | Non-Guarantor subsidiaries €m | | | Eliminate and
reclassify €m | | | CRH and
subsidiaries
€m | |
| | | | | |
Revenue | | | - | | | | - | | | | 18,081 | | | | - | | | | 18,081 | |
Cost of sales | | | - | | | | - | | | | (13,179 | ) | | | - | | | | (13,179 | ) |
Gross profit | | | - | | | | - | | | | 4,902 | | | | - | | | | 4,902 | |
Operating income/(costs) | | | 39 | | | | - | | | | (4,070 | ) | | | - | | | | (4,031 | ) |
Group operating profit | | | 39 | | | | - | | | | 832 | | | | - | | | | 871 | |
Profit on disposals | | | 14 | | | | - | | | | 41 | | | | - | | | | 55 | |
Profit before finance costs | | | 53 | | | | - | | | | 873 | | | | - | | | | 926 | |
Finance costs | | | - | | | | (294 | ) | | | (273 | ) | | | 305 | | | | (262 | ) |
Finance income | | | - | | | | 305 | | | | 33 | | | | (305 | ) | | | 33 | |
Other financial expense | | | - | | | �� | - | | | | (41 | ) | | | - | | | | (41 | ) |
Share of subsidiaries’ profit before tax | | | 596 | | | | 4 | | | | - | | | | (600 | ) | | | - | |
Share of associates’ profit | | | 42 | | | | - | | | | 42 | | | | (42 | ) | | | 42 | |
Profit before tax | | | 691 | | | | 15 | | | | 634 | | | | (642 | ) | | | 698 | |
Income tax expense | | | (111 | ) | | | (39 | ) | | | (72 | ) | | | 111 | | | | (111 | ) |
Group profit for the financial year | | | 580 | | | | (24 | ) | | | 562 | | | | (531 | ) | | | 587 | |
| | | | | |
Profit attributable to: | | | | | | | | | | | | | | | | | | | | |
Equity holders of the Company | | | 580 | | | | (24 | ) | | | 555 | | | | (531 | ) | | | 580 | |
Non-controlling interests | | | - | | | | - | | | | 7 | | | | - | | | | 7 | |
Group profit for the financial year | | | 580 | | | | (24 | ) | | | 562 | | | | (531 | ) | | | 587 | |
33. Supplemental Guarantor Information |continued
Supplemental Condensed Consolidated Statement of Cash Flow
| | | | | | | | | | | | | | | | | | | | |
| | | Year ended 31 December 2013 | |
| | | Guarantor €m | | | Issuer €m | | | Non-Guarantor subsidiaries €m | | | Eliminate and reclassify €m | | | CRH and subsidiaries €m | |
| | | | | |
Cash flows from operating activities | | | | | | | | | | | | | | | | | | | | |
(Loss)/profit before tax | | | (216 | ) | | | 41 | | | | (226 | ) | | | 186 | | | | (215 | ) |
Finance costs (net) | | | - | | | | (8 | ) | | | 305 | | | | - | | | | 297 | |
Group share of subsidiaries’ profit before tax | | | 175 | | | | (33 | ) | | | - | | | | (142 | ) | | | - | |
Share of equity accounted investments’ result | | | 44 | | | | - | | | | 44 | | | | (44 | ) | | | 44 | |
Profit on disposals | | | - | | | | - | | | | (26 | ) | | | - | | | | (26 | ) |
Group operating profit | | | 3 | | | | - | | | | 97 | | | | - | | | | 100 | |
Depreciation charge | | | - | | | | - | | | | 671 | | | | - | | | | 671 | |
Amortisation of intangible assets | | | - | | | | - | | | | 54 | | | | - | | | | 54 | |
Impairment charge | | | - | | | | - | | | | 650 | | | | - | | | | 650 | |
Share-based payment expense | | | - | | | | - | | | | 15 | | | | - | | | | 15 | |
Other (primarily pension payments) | | | - | | | | - | | | | (96 | ) | | | - | | | | (96 | ) |
Net movement on working capital and provisions | | | - | | | | 1 | | | | 76 | | | | - | | | | 77 | |
Cash generated from operations | | | 3 | | | | 1 | | | | 1,467 | | | | - | | | | 1,471 | |
Interest paid (including finance leases) | | | - | | | | (242 | ) | | | (277 | ) | | | 250 | | | | (269 | ) |
Corporation tax paid | | | - | | | | (16 | ) | | | (94 | ) | | | - | | | | (110 | ) |
Net cash inflow/(outflow) from operating activities | | | 3 | | | | (257 | ) | | | 1,096 | | | | 250 | | | | 1,092 | |
| | | | | |
Cash flows from investing activities | | | | | | | | | | | | | | | | | | | | |
Proceeds from disposals (net of cash disposed) | | | - | | | | - | | | | 122 | | | | - | | | | 122 | |
Interest received | | | - | | | | 250 | | | | 13 | | | | (250 | ) | | | 13 | |
Dividends received from equity accounted investments | | | - | | | | - | | | | 33 | | | | - | | | | 33 | |
Purchase of property, plant and equipment | | | - | | | | - | | | | (497 | ) | | | - | | | | (497 | ) |
Advances from subsidiary and parent undertakings | | | 299 | | | | 179 | | | | - | | | | (478 | ) | | | - | |
Acquisition of subsidiaries (net of cash acquired) | | | - | | | | - | | | | (336 | ) | | | - | | | | (336 | ) |
Other investments and advances | | | - | | | | - | | | | (78 | ) | | | - | | | | (78 | ) |
Deferred and contingent acquisition consideration paid | | | - | | | | - | | | | (105 | ) | | | - | | | | (105 | ) |
Net cash inflow/(outflow) from investing activities | | | 299 | | | | 429 | | | | (848 | ) | | | (728 | ) | | | (848 | ) |
| | | | | |
Cash flows from financing activities | | | | | | | | | | | | | | | | | | | | |
Proceeds from exercise of share options | | | 19 | | | | - | | | | - | | | | - | | | | 19 | |
Acquisition of non-controlling interests | | | - | | | | - | | | | (13 | ) | | | - | | | | (13 | ) |
Advances to subsidiary and parent undertakings | | | - | | | | - | | | | (478 | ) | | | 478 | | | | - | |
Increase in interest-bearing loans, borrowings and finance leases | | | 55 | | | | - | | | | 1,436 | | | | - | | | | 1,491 | |
Net cash flow arising from derivative financial instruments | | | - | | | | 43 | | | | 21 | | | | - | | | | 64 | |
Treasury/own shares purchased | | | (6 | ) | | | - | | | | - | | | | - | | | | (6 | ) |
Repayment of interest-bearing loans, borrowings and finance leases | | | - | | | | (601 | ) | | | 15 | | | | - | | | | (586 | ) |
Dividends paid to equity holders of the Company | | | (367 | ) | | | - | | | | - | | | | - | | | | (367 | ) |
Dividends paid to non-controlling interests | | | - | | | | - | | | | (1 | ) | | | - | | | | (1 | ) |
Net cash (outflow)/inflow from financing activities | | | (299 | ) | | | (558 | ) | | | 980 | | | | 478 | | | | 601 | |
| | | | | |
Increase/(decrease) in cash and cash equivalents | | | 3 | | | | (386 | ) | | | 1,228 | | | | - | | | | 845 | |
| | | | | |
Reconciliation of opening to closing cash and cash equivalents | | | | | | | | | | | | | | | | | | | | |
Cash and cash equivalents at 1 January | | | 172 | | | | 570 | | | | 1,005 | | | | - | | | | 1,747 | |
Translation adjustment | | | - | | | | (10 | ) | | | (42 | ) | | | - | | | | (52 | ) |
Increase/(decrease) in cash and cash equivalents | | | 3 | | | | (386 | ) | | | 1,228 | | | | - | | | | 845 | |
Cash and cash equivalents at 31 December | | | 175 | | | | 174 | | | | 2,191 | | | | - | | | | 2,540 | |
33. Supplemental Guarantor Information |continued
Supplemental Condensed Consolidated Statement of Cash Flow
| | | | | | | | | | | | | | | | | | | | |
| | | Year ended 31 December 2012 | |
| | | Guarantor
€m | | | Issuer
€m | | | Non-Guarantor subsidiaries €m | | | Eliminate and reclassify €m | | | CRH and subsidiaries €m | |
| | | | | |
Cash flows from operating activities | | | | | | | | | | | | | | | | | | | | |
Profit before tax | | | 644 | | | | 36 | | | | (368 | ) | | | 334 | | | | 646 | |
Finance costs (net) | | | - | | | | (8 | ) | | | 313 | | | | - | | | | 305 | |
Group share of subsidiaries’ profit before tax | | | 278 | | | | (28 | ) | | | - | | | | (250 | ) | | | - | |
Share of equity accounted investments’ result | | | 84 | | | | - | | | | 84 | | | | (84 | ) | | | 84 | |
Profit on disposals | | | (2 | ) | | | - | | | | (228 | ) | | | - | | | | (230 | ) |
Group operating profit | | | 1,004 | | | | - | | | | (199 | ) | | | - | | | | 805 | |
Depreciation charge | | | - | | | | - | | | | 686 | | | | - | | | | 686 | |
Amortisation of intangible assets | | | - | | | | - | | | | 44 | | | | - | | | | 44 | |
Impairment charge | | | - | | | | - | | | | 28 | | | | - | | | | 28 | |
Share-based payment expense | | | - | | | | - | | | | 14 | | | | - | | | | 14 | |
Other (primarily pension payments) | | | - | | | | - | | | | (152 | ) | | | - | | | | (152 | ) |
Net movement on working capital and provisions | | | - | | | | 3 | | | | (61 | ) | | | - | | | | (58 | ) |
Cash generated from operations | | | 1,004 | | | | 3 | | | | 360 | | | | - | | | | 1,367 | |
Interest paid (including finance leases) | | | - | | | | (205 | ) | | | (266 | ) | | | 213 | | | | (258 | ) |
Corporation tax paid | | | (1 | ) | | | (14 | ) | | | (109 | ) | | | - | | | | (124 | ) |
Net cash inflow/(outflow) from operating activities | | | 1,003 | | | | (216 | ) | | | (15 | ) | | | 213 | | | | 985 | |
| | | | | |
Cash flows from investing activities | | | | | | | | | | | | | | | | | | | | |
Proceeds from disposals (net of cash disposed) | | | 2 | | | | - | | | | 780 | | | | - | | | | 782 | |
Interest received | | | - | | | | 213 | | | | 16 | | | | (213 | ) | | | 16 | |
Dividends received from equity accounted investments | | | - | | | | - | | | | 35 | | | | - | | | | 35 | |
Purchase of property, plant and equipment | | | - | | | | - | | | | (544 | ) | | | - | | | | (544 | ) |
Advances to subsidiary and parent undertakings | | | (653 | ) | | | (42 | ) | | | - | | | | 695 | | | | - | |
Acquisition of subsidiaries (net of cash acquired) | | | - | | | | - | | | | (418 | ) | | | - | | | | (418 | ) |
Other investments and advances | | | - | | | | - | | | | (56 | ) | | | - | | | | (56 | ) |
Deferred and contingent acquisition consideration paid | | | - | | | | - | | | | (30 | ) | | | - | | | | (30 | ) |
Net cash (outflow)/inflow from investing activities | | | (651 | ) | | | 171 | | | | (217 | ) | | | 482 | | | | (215 | ) |
| | | | | |
Cash flows from financing activities | | | | | | | | | | | | | | | | | | | | |
Proceeds from exercise of share options | | | 16 | | | | - | | | | - | | | | - | | | | 16 | |
Acquisition of non-controlling interests | | | - | | | | - | | | | (2 | ) | | | - | | | | (2 | ) |
Advances from subsidiary and parent undertakings | | | - | | | | - | | | | 695 | | | | (695 | ) | | | - | |
Increase in interest-bearing loans, borrowings and finance leases | | | - | | | | - | | | | 487 | | | | - | | | | 487 | |
Net cash flow arising from derivative financial instruments | | | - | | | | 25 | | | | (12 | ) | | | - | | | | 13 | |
Repayment of interest-bearing loans, borrowings and finance leases | | | (1 | ) | | | (363 | ) | | | (30 | ) | | | - | | | | (394 | ) |
Dividends paid to equity holders of the Company | | | (362 | ) | | | - | | | | - | | | | - | | | | (362 | ) |
Dividends paid to non-controlling interests | | | - | | | | - | | | | (4 | ) | | | - | | | | (4 | ) |
Net cash (outflow)/inflow from financing activities | | | (347 | ) | | | (338 | ) | | | 1,134 | | | | (695 | ) | | | (246 | ) |
| | | | | |
Increase/(decrease) in cash and cash equivalents | | | 5 | | | | (383 | ) | | | 902 | | | | - | | | | 524 | |
| | | | | |
Reconciliation of opening to closing cash and cash equivalents | | | | | | | | | | | | | | | | | | | | |
Cash and cash equivalents at 1 January | | | 167 | | | | 962 | | | | 117 | | | | - | | | | 1,246 | |
Translation adjustment | | | - | | | | (9 | ) | | | (14 | ) | | | - | | | | (23 | ) |
Increase/(decrease) in cash and cash equivalents | | | 5 | | | | (383 | ) | | | 902 | | | | - | | | | 524 | |
Cash and cash equivalents at 31 December | | | 172 | | | | 570 | | | | 1,005 | | | | - | | | | 1,747 | |
33. Supplemental Guarantor Information |continued
Supplemental Condensed Consolidated Statement of Cash Flow
| | | | | | | | | | | | | | | | | | | | |
| | | Year ended 31 December 2011 | |
| | | Guarantor €m | | | Issuer €m | | | Non-Guarantor subsidiaries €m | | | Eliminate and reclassify €m | | | CRH and subsidiaries €m | |
| | | | | |
Cash flows from operating activities | | | | | | | | | | | | | | | | | | | | |
Profit before tax | | | 691 | | | | 15 | | | | 634 | | | | (642 | ) | | | 698 | |
Finance costs (net) | | | - | | | | (11 | ) | | | 281 | | | | - | | | | 270 | |
Group share of subsidiaries’ profit before tax | | | (596 | ) | | | (4 | ) | | | - | | | | 600 | | | | - | |
Share of associates’ result | | | (42 | ) | | | - | | | | (42 | ) | | | 42 | | | | (42 | ) |
Profit on disposals | | | (14 | ) | | | - | | | | (41 | ) | | | - | | | | (55 | ) |
Group operating profit | | | 39 | | | | - | | | | 832 | | | | - | | | | 871 | |
Depreciation charge | | | - | | | | - | | | | 726 | | | | - | | | | 726 | |
Amortisation of intangible assets | | | - | | | | - | | | | 38 | | | | - | | | | 38 | |
Impairment charge | | | - | | | | - | | | | 21 | | | | - | | | | 21 | |
Share-based payment expense | | | - | | | | - | | | | 21 | | | | - | | | | 21 | |
Other (primarily pension payments) | | | - | | | | - | | | | (109 | ) | | | - | | | | (109 | ) |
Net movement on working capital and provisions | | | - | | | | 3 | | | | (214 | ) | | | - | | | | (211 | ) |
Cash generated from operations | | | 39 | | | | 3 | | | | 1,315 | | | | - | | | | 1,357 | |
Interest paid (including finance leases) | | | - | | | | (294 | ) | | | (250 | ) | | | 305 | | | | (239 | ) |
Increase in liquid investments | | | - | | | | - | | | | 4 | | | | - | | | | 4 | |
Corporation tax paid | | | - | | | | (5 | ) | | | (91 | ) | | | - | | | | (96 | ) |
Net cash inflow/(outflow) from operating activities | | | 39 | | | | (296 | ) | | | 978 | | | | 305 | | | | 1,026 | |
| | | | | |
Cash flows from investing activities | | | | | | | | | | | | | | | | | | | | |
Proceeds from disposals (net of cash disposed) | | | 17 | | | | - | | | | 425 | | | | - | | | | 442 | |
Interest received | | | - | | | | 305 | | | | 32 | | | | (305 | ) | | | 32 | |
Dividends received from associates | | | - | | | | - | | | | 20 | | | | - | | | | 20 | |
Purchase of property, plant and equipment | | | - | | | | - | | | | (576 | ) | | | - | | | | (576 | ) |
Advances from subsidiary and parent undertakings | | | 253 | | | | 24 | | | | - | | | | (277 | ) | | | - | |
Acquisition of subsidiaries and joint ventures (net of cash acquired) | | | - | | | | - | | | | (507 | ) | | | - | | | | (507 | ) |
Other investments and advances | | | - | | | | - | | | | (24 | ) | | | - | | | | (24 | ) |
Deferred and contingent acquisition consideration paid | | | - | | | | - | | | | (21 | ) | | | - | | | | (21 | ) |
Net cash inflow/(outflow) from investing activities | | | 270 | | | | 329 | | | | (651 | ) | | | (582 | ) | | | (634 | ) |
| | | | | |
Cash flows from financing activities | | | | | | | | | | | | | | | | | | | | |
Proceeds from exercise of share options | | | 6 | | | | - | | | | - | | | | - | | | | 6 | |
Acquisition of non-controlling interests | | | - | | | | - | | | | (11 | ) | | | - | | | | (11 | ) |
Advances to subsidiary and parent undertakings | | | - | | | | - | | | | (277 | ) | | | 277 | | | | - | |
Increase in interest-bearing loans, borrowings and finance leases | | | - | | | | - | | | | 101 | | | | - | | | | 101 | |
Net cash flow arising from derivative financial instruments | | | - | | | | 27 | | | | (90 | ) | | | - | | | | (63 | ) |
Repayment of interest-bearing loans, borrowings and finance leases | | | (1 | ) | | | (446 | ) | | | (105 | ) | | | - | | | | (552 | ) |
Dividends paid to equity holders of the Company | | | (310 | ) | | | - | | | | - | | | | - | | | | (310 | ) |
Dividends paid to non-controlling interests | | | - | | | | - | | | | (9 | ) | | | - | | | | (9 | ) |
Net cash (outflow)/inflow from financing activities | | | (305 | ) | | | (419 | ) | | | (391 | ) | | | 277 | | | | (838 | ) |
| | | | | |
Increase/(decrease) in cash and cash equivalents | | | 4 | | | | (386 | ) | | | (64 | ) | | | - | | | | (446 | ) |
| | | | | |
Reconciliation of opening to closing cash and cash equivalents | | | | | | | | | | | | | | | | | | | | |
Cash and cash equivalents at 1 January | | | 163 | | | | 1,334 | | | | 233 | | | | - | | | | 1,730 | |
Translation adjustment | | | - | | | | 14 | | | | (3 | ) | | | - | | | | 11 | |
Increase/(decrease) in cash and cash equivalents | | | 4 | | | | (386 | ) | | | (64 | ) | | | - | | | | (446 | ) |
Cash and cash equivalents at 31 December | | | 167 | | | | 962 | | | | 166 | | | | - | | | | 1,295 | |


Shareholder Information
Stock Exchange Listings
CRH has a premium listing on the London Stock Exchange and a secondary listing on the Irish Stock Exchange.
American Depositary Shares (“ADSs”), each representing one Ordinary Share, are listed on the New York Stock Exchange (“NYSE”). The ADSs are evidenced by American Depositary Receipts (“ADRs”) issued by The Bank of New York Mellon (the “Depositary”) as Depositary under an Amended and Restated Deposit Agreement dated 28 November 2006. Each ADS represents one Ordinary Share of the Company. The ticker symbol for the ADSs on the NYSE is CRH.
The following table sets forth, for the periods indicated, the reported high and low closing sales prices for the Ordinary Shares in euro on the Irish Stock Exchange from 2009 through 7 March 2014 and in Sterling on the London Stock Exchange from 6 December 2011 (as the London Stock Exchange became CRH’s sole premium listing on that date) through 7 March 2014. The table also sets forth, for the same periods, the high and low closing sale prices for the ADSs on the NYSE.
| | | | | | | | | | | | | | | | | | | | | | | | | | | | |
| | | Sterling per | | | | | Euro per | | | | | US Dollars | |
| | | Ordinary Share | | | | | Ordinary Share | | | | | per ADS | |
| | | High | | | Low | | | | | High | | | Low | | | | | High | | | Low | |
| | | | | | | | |
Calendar Year | | | | | | | | | | | | | | | | | | | | | | | | | | | | |
2009 | | | | | | | | | | | | € | 20.70 | | | € | 11.50 | | | | | $ | 30.53 | | | $ | 17.37 | |
2010 | | | | | | | | | | | | € | 22.00 | | | € | 11.51 | | | | | $ | 29.43 | | | $ | 14.77 | |
2011 | | £ | 12.80 | (i) | | £ | 11.09 | (i) | | | | € | 17.00 | (ii) | | € | 10.50 | (ii) | | | | $ | 24.95 | | | $ | 14.38 | |
2012 | | £ | 14.09 | | | £ | 10.52 | | | | | € | 16.79 | | | € | 12.99 | | | | | $ | 22.20 | | | $ | 16.35 | |
2013 | | £ | 16.17 | | | £ | 12.15 | | | | | € | 19.30 | | | € | 14.68 | | | | | $ | 26.26 | | | $ | 19.56 | |
| | | | | | | | |
2012 | | | | | | | | | | | | | | | | | | | | | | | | | | | | |
First Quarter | | £ | 14.09 | | | £ | 12.06 | | | | | € | 16.79 | | | € | 14.62 | | | | | $ | 22.20 | | | $ | 18.71 | |
Second Quarter | | £ | 12.99 | | | £ | 10.52 | | | | | € | 15.63 | | | € | 12.99 | | | | | $ | 20.68 | | | $ | 16.35 | |
Third Quarter | | £ | 12.78 | | | £ | 10.97 | | | | | € | 15.92 | | | € | 13.84 | | | | | $ | 20.62 | | | $ | 17.46 | |
Fourth Quarter | | £ | 12.56 | | | £ | 10.90 | | | | | € | 15.38 | | | € | 13.51 | | | | | $ | 20.47 | | | $ | 17.45 | |
| | | | | | | | |
2013 | | | | | | | | | | | | | | | | | | | | | | | | | | | | |
First Quarter | | £ | 15.40 | | | £ | 12.15 | | | | | € | 17.86 | | | € | 14.68 | | | | | $ | 23.05 | | | $ | 19.56 | |
Second Quarter | | £ | 14.77 | | | £ | 12.59 | | | | | € | 17.36 | | | € | 14.81 | | | | | $ | 22.24 | | | $ | 19.62 | |
Third Quarter | | £ | 15.27 | | | £ | 12.92 | | | | | € | 18.13 | | | € | 15.19 | | | | | $ | 24.60 | | | $ | 19.86 | |
Fourth Quarter | | £ | 16.17 | | | £ | 14.19 | | | | | € | 19.30 | | | € | 16.85 | | | | | $ | 26.26 | | | $ | 23.26 | |
| | | | | | | | |
Recent Months | | | | | | | | | | | | | | | | | | | | | | | | | | | | |
September 2013 | | £ | 15.27 | | | £ | 13.75 | | | | | € | 18.13 | | | € | 16.26 | | | | | $ | 24.60 | | | $ | 21.50 | |
October 2013 | | £ | 15.80 | | | £ | 14.43 | | | | | € | 18.63 | | | € | 17.00 | | | | | $ | 25.26 | | | $ | 23.26 | |
November 2013 | | £ | 16.17 | | | £ | 15.05 | | | | | € | 19.30 | | | € | 17.74 | | | | | $ | 26.26 | | | $ | 24.18 | |
December 2013 | | £ | 15.43 | | | £ | 14.19 | | | | | € | 18.60 | | | € | 16.85 | | | | | $ | 25.56 | | | $ | 23.42 | |
January 2014 | | £ | 16.56 | | | £ | 15.39 | | | | | € | 20.01 | | | € | 18.47 | | | | | $ | 27.55 | | | $ | 25.51 | |
February 2014 | | £ | 17.88 | | | £ | 15.54 | | | | | € | 21.82 | | | € | 18.72 | | | | | $ | 29.72 | | | $ | 25.32 | |
March 2014 | | | | | | | | | | | | | | | | | | | | | | | | | | | | |
(through 7 March 2014) | | £ | 17.77 | | | £ | 16.95 | | | | | € | 21.53 | | | € | 20.50 | | | | | $ | 29.53 | | | $ | 28.56 | |
| (i) | The Sterling high and low closing prices displayed for 2011, based on the London Stock Exchange, are only for the period from 6 December 2011, from which date it became the sole premium listing. |
| (ii) | The euro high and low closing prices displayed for 2011 are for the entire period shown and based on the Irish Stock Exchange. |
For further information on CRH shares see note 29 to the Consolidated Financial Statements.
Ownership of Ordinary Shares
Shareholdings as at 31 December 2013
| | | | | | | | |
| Geographic Location1 | | Number of
shares held
‘000s | | | % of total | |
| | |
North America | | | 292,448 | | | | 39.56 | |
United Kingdom | | | 166,254 | | | | 22.49 | |
Europe/Other | | | 122,263 | | | | 16.54 | |
Retail | | | 122,240 | | | | 16.54 | |
Ireland | | | 30,075 | | | | 4.06 | |
Treasury | | | 5,951 | | | | 0.81 | |
| | | | 739,231 | | | | 100 | |
| 1 | This represents a best estimate of the number of shares controlled by fund managers resident in the geographic regions indicated. Private shareholders are classified as retail above. |
| | | | | | | | | | | | | | | | |
| Holdings | | Number of Shareholders | | | % of total | | | Number of
shares held
‘000s | | | % of total | |
| | | | |
1 - 1,000 | | | 15,033 | | | | 59.79 | | | | 5,112 | | | | 0.69 | |
1,001 - 10,000 | | | 8,563 | | | | 34.06 | | | | 25,026 | | | | 3.39 | |
10,001 - 100,000 | | | 1,144 | | | | 4.55 | | | | 31,132 | | | | 4.21 | |
100,001 - 1,000,000 | | | 307 | | | | 1.22 | | | | 106,607 | | | | 14.42 | |
Over 1,000,000 | | | 95 | | | | 0.38 | | | | 571,354 | | | | 77.29 | |
| | | | 25,142 | | | | 100 | | | | 739,231 | | | | 100 | |
Major Shareholders
The Company is not owned or controlled directly or indirectly by any government or by any other corporation or by any other natural or legal person severally or jointly. The major shareholders do not have different voting rights. As at 31 December 2013, the Company had received notification of the following interests in its Ordinary share capital, which were equal to, or in excess of, 3%:
| | | | | | | | | | | | | | | | | | | | | | | | |
| | | 31 December 2013 | | | 31 December 2012 | | | 31 December 2011 | |
| Name | | Holding/Voting
Rights | | | % at year
end | | | Holding/Voting
Rights | | | % at year
end | | | Holding/Voting
Rights | | | % at year
end | |
BlackRock, Inc.2 | | | 43,857,751 | | | | 5.98% | | | | 28,961,677 | | | | 3.98% | | | | 28,961,677 | | | | 4.02% | |
| | | | | | |
The Capital Group Companies, Inc. (“CGC”)3 | | | - | | | | - | | | | 35,763,581 | | | | 4.92% | | | | - | | | | - | |
| | | | | | |
Capital Research & Management Company (“CRMC”)3 | | | - | | | | - | | | | - | | | | - | | | | 69,367,916 | | | | 9.64% | |
| | | | | | |
Harbor International Fund | | | 21,999,275 | | | | 3.00% | | | | 21,999,275 | | | | 3.02% | | | | 21,999,275 | | | | 3.05% | |
| | | | | | |
JP Morgan Chase & Co | | | 42,379,112 | | | | 5.77% | | | | - | | | | - | | | | - | | | | - | |
| | | | | | |
Legal & General Group Plc | | | - | | | | - | | | | 22,496,003 | | | | 3.09% | | | | - | | | | - | |
| | | | | | |
Norges Bank (The Central Bank of Norway) | | | - | | | | - | | | | 21,543,277 | | | | 2.96% | | | | 21,543,277 | | | | 2.99% | |
| | | | | | |
Templeton Global Advisors Limited | | | 21,503,171 | | | | 2.93% | | | | 21,503,171 | | | | 2.96% | | | | 21,503,171 | | | | 2.99% | |
| | | | | | |
UBS AG | | | 26,380,604 | | | | 3.59% | | | | 26,380,604 | | | | 3.63% | | | | 26,380,604 | | | | 3.66% | |
| 2 | BlackRock, Inc. has advised that its interests in CRH shares arise by reason of discretionary investment management arrangements entered into by it or its subsidiaries. |
| 3 | In 2012, CGC advised the Company that, with effect from 1 September 2012, the holdings of CRMC and Capital Group International, Inc. (“CGII”), which were previously reported separately, would be reported in aggregate by CGC, the parent of both CRMC and CGII. |
Since 31 December 2013, the Company has not been advised of any changes in the holdings set out above.
Shareholder Information |continued
Purchases of Equity Securities by the Issuer and Affiliated Persons
Other than the 391,250 shares purchased on the open market by the Employee Benefit Trust in April 2013 referred to in note 29 of the Consolidated Financial Statements, there were no purchases of equity securities by the issuer and/or affiliated persons during the course of 2013.
Dividends
The Company has paid dividends on its Ordinary Shares in respect of each fiscal year since the formation of the Group in 1970. Dividends are paid to shareholders as of record dates, which are determined by the Board of Directors. An interim dividend is normally declared by the Board of Directors in August of each year and is generally paid in October. A final dividend is normally recommended by the Board of Directors following the end of the fiscal year to which it relates and, if approved by the shareholders at an Annual General Meeting, is generally paid in May of that year.
Each ordinary shareholder in CRH holds an Income Share which is tied to each Ordinary Share and may only be transferred or otherwise dealt with in conjunction with that Ordinary Share. The payment of future cash dividends will be dependent upon future earnings, the financial condition of the Group and other factors.
The following table sets forth the amounts of interim, final and total dividends in euro cent per Ordinary Share declared in respect of each fiscal year indicated. Each amount represents the actual dividend payable. Solely for the convenience of the reader, these dividends have been translated into US cents per American Depositary Share (“ADS”) (each representing one Ordinary Share) using the FRB Noon Buying Rate on the date of payment. The final dividend, if approved at the forthcoming Annual General Meeting of shareholders to be held on 7 May 2014, will be paid on 12 May 2014 and will bring the full year dividend for 2013 to 62.50 cent. The proposed final dividend has been translated using the FRB Noon Buying Rate on 7 March 2014.
| | | | | | | | | | | | | | | | | | | | | | | | | | |
| | | Euro cent | | | | | Translated into | |
| | | per ordinary share | | | | | US cents per ADS | |
| Years ended 31 December | | Interim | | | Final | | | Total | | | | | Interim | | | Final | | | Total | |
| | | | | | | |
2009 | | | 18.50 | | | | 44.00 | | | | 62.50 | | | | | | 27.46 | | | | 58.79 | | | | 86.25 | |
2010 | | | 18.50 | | | | 44.00 | | | | 62.50 | | | | | | 25.64 | | | | 62.23 | | | | 87.87 | |
2011 | | | 18.50 | | | | 44.00 | | | | 62.50 | | | | | | 25.43 | | | | 58.36 | | | | 83.79 | |
2012 | | | 18.50 | | | | 44.00 | | | | 62.50 | | | | | | 24.09 | | | | 57.18 | | | | 81.27 | |
2013 | | | 18.50 | | | | 44.00 | a | | | 62.50 | | | | | | 25.52 | | | | 61.02a | | | | 86.54 | |
Dividend Withholding Tax (“DWT”) must be deducted from dividends paid by an Irish resident company, unless a shareholder is entitled to an exemption and has submitted a properly completed exemption form to the Company’s Registrars, Capita Asset Services (the “Registrars”). DWT applies to dividends paid by way of cash or by way of shares under a scrip dividend scheme and is deducted at the standard rate of Income Tax (currently 20%). Non-resident shareholders and certain Irish companies, trusts, pension schemes, investment undertakings and charities may be entitled to claim exemption from DWT. Copies of the exemption form may be obtained from the Registrars. Shareholders should note that DWT will be deducted from dividends in cases where a properly completed form has not been received by the record date for a dividend. Individuals who are resident in Ireland for tax purposes are not entitled to an exemption.
Shareholders who wish to have their dividend paid direct to a bank account, by electronic funds transfer, should complete the required dividend mandate form and submit it to the Registrars. A copy of the mandate form can be obtained from the shareholder services section of the CRH website, www.crh.com, under “Equity Investors”. Alternatively, shareholders can contact the Registrars to obtain a mandate form (see contact details on page 191). Tax vouchers will be sent to the shareholder’s registered address under this arrangement.
Dividends are generally paid in euro. However, in order to avoid costs to shareholders, dividends are paid in Sterling and US Dollars to shareholders whose shares are not held in the CREST system (see below) and whose address, according to the Share Register, is in the UK and the United States respectively, unless they require otherwise.
Dividends in respect of 7% ‘A’ Cumulative Preference Shares are paid half-yearly on 5 April and 5 October.
Dividends in respect of 5% Cumulative Preference Shares are paid half-yearly on 15 April and 15 October.
Shareholders have the option of taking their dividend in the form of shares under the Company’s Scrip Dividend Scheme.
CREST
Transfer of the Company’s shares takes place through the CREST system. Shareholders have the choice of holding their shares in electronic form or in the form of share certificates.
Where shares are held in CREST, dividends are automatically paid in euro unless a currency election is made. CREST members should use the facility in CREST to make currency elections. Such elections must be made in respect of entire holdings as partial elections are not permissible.
Share Plans
The Group operates share option schemes, a performance share plan, share participation schemes and savings-related share option schemes (the “Schemes”) for eligible employees in all regions where the regulations permit the operation of such schemes. A brief description of the Schemes is outlined below. Shares issued (whether by way of the allotment of new shares or the reissue of Treasury Shares) in connection with the Schemes rank pari passu in all respects with the Ordinary and Income shares of the Company.
2000 Share Option Schemes
At the Annual General Meeting held on 3 May 2000, shareholders approved the adoption of Share Option Schemes (the “2000 Share Option Schemes”) to replace schemes which were approved in May 1990. The 2000 Share Option Schemes were replaced by new schemes in May 2010 (see below).
Details of the performance criteria applicable to “basic tier” and “second tier” options granted under the 2000 Share Option Schemes in the 10 years following the Adoption Date are contained in the Directors’ Remuneration Report in table 27 on page 99.
Options may be exercised not later than ten years from the date of grant of the option, and not earlier than the expiration of three years from the date of grant for the basic tier and five years for the second tier. Benefits under the schemes are not pensionable.
2010 Share Option Schemes
At the Annual General Meeting held on 5 May 2010, shareholders approved the adoption of new share option schemes to replace the schemes which were approved in May 2000 (see above).
The 2010 Share Option Schemes (the “2010 Schemes”) are based on one tier of options with a single vesting test. The performance criteria for the 2010 Schemes are EPS-based. Vesting will only occur once an initial performance target has been reached and, thereafter, will be dependent on performance. In considering the level of vesting based on EPS performance, the Remuneration Committee will also consider the overall results of the Group. Please refer to the Directors’ Remuneration Report in table 17 on page 95 in relation to the performance criteria for the 2010 Schemes.
The Remuneration Committee oversees the operation of the 2010 Schemes. No option can be granted under the 2010 Schemes more than ten years after shareholders approve the schemes and no option can be exercised more than ten years after the date of grant, except that where the tenth anniversary falls within a period in which a participant is in possession of unpublished price sensitive information, the latest exercise date shall be extended until 14 days after the expiry of such period.
The 2010 Schemes are available for executive directors and employees of any participating company nominated by the Remuneration Committee. A person cannot be granted an option within two years of his/her agreed retirement date (as defined in the rules of the 2010 Schemes).
In the ten years preceding any given day, the aggregate number of shares in the Company committed for issue under all share schemes operated by the Company shall not exceed 10% of the shares in issue immediately prior to that day. In the ten years preceding any given day, the aggregate number of shares in the Company committed for issue under the 2010 Schemes shall not exceed 5% of the shares in issue immediately prior to that day. A flow rate of 3% over three years will apply for all CRH share schemes in operation.
Option exercises may be satisfied by the allotment of shares, the reissue of Treasury Shares, or the purchase of shares on the market by a third party trustee.
Annual grants are limited to a maximum of 200% of the individual’s remuneration (salary, bonus and benefit-in-kind). This may be exceeded, up to a maximum of 25% of the individual limit, in cases of superior levels of business performance as determined by the Remuneration Committee and in cases where the Committee determines that it is necessary for the recruitment or retention of key employees. Awards under the 2010 Schemes are not pensionable.
Generally options lapse when a participant leaves the Group. However, where cessation occurs by reason of death, ill-health, or agreed retirement age, the participant may be granted a period of 12 months to exercise options after the relevant event. If an option has not vested, the Remuneration Committee may, at its discretion, determine that the 12 month period shall commence on the date on which the option
Shareholder Information |continued
becomes first exercisable. Where cessation occurs for any other reason, the participant may be granted a period of six months to exercise options. If an option has not vested, in cases of redundancy or where a subsidiary ceases to be under the control of the Company, the Remuneration Committee may, at its discretion, determine that the six month period shall commence on the date on which the option becomes first exercisable. In any of the foregoing circumstances, the Committee may also decide that the option should be scaled down by reference to the performance of the participant and on a time apportioned basis. The Committee may also, at its discretion, waive the performance criteria of the 2010 Schemes in which case the award will be scaled down by reference to the performance of the participant and on a time apportioned basis.
There is no automatic vesting in the event of a takeover, reconstruction, amalgamation, de-merger, scheme of arrangement or the winding-up of the Company. However, the Remuneration Committee may, at its discretion, allow options to vest early in these circumstances in full or in part.
In the event of a de-merger, special dividend or similar event or an alteration to the capital structure of the Company, including a capitalisation of reserves or a rights issue, unexercised options may be adjusted as the Remuneration Committee deems appropriate.
2000 Savings-related Share Option Schemes
At the Annual General Meeting held on 3 May 2000, shareholders approved the adoption of savings-related share option schemes. CRH Group schemes were subsequently established in the Republic of Ireland and the United Kingdom (the “2000 Savings-related Share Option Schemes”), under which eligible subsidiary companies of the Group were nominated as participating subsidiaries. No further options will be granted under the 2000 Savings-related Share Option Schemes as those schemes were replaced by new savings-related share option schemes in May 2010 (see below).
At 7 March 2014, 1,897,379 Ordinary Shares have been issued1 pursuant to the 2000 Savings-related Share Option Schemes.
2010 Savings-related Share Option Schemes
At the Annual General Meeting held on 5 May 2010, shareholders approved the adoption of savings-related share option schemes (the “2010 Savings-Related Share Option Scheme”) to replace the 2000 Savings-related Share Option Schemes.
All employees of a participating subsidiary in the Republic of Ireland or United Kingdom, who have satisfied a required qualifying period, are invited to participate in this scheme.
Eligible employees who wish to participate in the scheme enter into a savings contract with a nominated savings institution, for a three or a five year period, to save a maximum of €500 or Stg£250, as appropriate, per month.
At the commencement of each contract period employees are granted an option to acquire Ordinary Shares in the Company at an option price which is equal to the amount proposed to be saved plus the bonus payable by the nominated savings institution at the end of the savings period. The price payable for each Ordinary Share under an option will be not less than the higher of par or 75% (or in the case of the U.K. scheme 80%) of the market value of a share on the day the invitation to apply for the option is issued.
On completion of the savings contract, employees may use the amount saved, together with the bonus earned, to exercise the option.
4,744 Ordinary Shares have been issued1 pursuant to the 2010 Savings-Related Share Option Schemes to date.
Share Participation Schemes
At the Annual General Meeting on 13 May 1987, the shareholders approved the establishment of Share Participation Schemes for the Company, its subsidiaries and companies under its control. Directors and employees of the companies who have at least one year’s service may elect to participate in these Share Participation Schemes. At 7 March 2014, 7,431,943 Ordinary Shares have been issued1 pursuant to the Share Participation Schemes.
| 1 | Whether by way of the allotment of new shares or the reissue of Treasury Shares |
2006 Performance Share Plan
See the Directors’ Remuneration Report on page 94.
Proposed 2014 Performance Share Plan
See the Directors’ Remuneration Report on page 90.
Restricted Share Plan
During 2013, the Board approved the adoption of the 2013 Restricted Share Plan (the “2013 RSP”). Under the rules of the 2013 RSP, certain senior executives (excluding executive Board Directors) received a conditional award of shares in 2013 on a time-vested basis. As (i) executive Directors were excluded from the award and (ii) no shares were allotted or re-issued to satisfy the awards, the listing rules of the London and Irish Stock Exchanges did not require shareholder approval of the 2013 RSP.
During the year, the Employee Benefit Trust purchased 391,250 shares on behalf of CRH plc in respect of awards under the 2013 RSP. No further awards will be made under the 2013 RSP.
American Depositary Shares
Fees and charges payable by a holder of American Depositary Shares (“ADSs”).
The Depositary collects fees for delivery and surrender of ADSs directly from investors or from intermediaries acting for them depositing shares or surrendering ADSs for the purpose of withdrawal. The Depositary collects fees for making distributions to investors by deducting those fees from the amounts distributed or by selling a portion of distributable property to pay the fees. The Depositary may generally refuse to provide fee-attracting services until its fees for those services are paid.
| | |
| Persons depositing or withdrawing shares must pay: | | For: |
| |
| $5.00 (or less) per 100 ADSs (or portion of 100 ADSs) | | • Issuance of ADSs, including issuances resulting from a distribution of shares or rights or other property |
| |
| | | • Cancellation of ADSs for the purpose of withdrawal, including if the deposit agreement terminates |
| |
$5.00 (or less) per 100 ADSs (or portion of 100 ADSs) (A fee equivalent to the fee that would be payable if securities distributed had been shares and the shares had been deposited for issuance of ADSs) | | • Distribution of deposited securities by the Depositary to ADS registered holders |
| |
| Applicable Registration or transfer fees | | • Transfer and registration of shares on our share register to or from the name of the Depositary or its agent when the holder deposits or withdraws shares |
| |
| Applicable Expenses of the Depositary | | • Cable, telex and facsimile transmissions |
| |
| | | • Converting foreign currency to US Dollars |
| |
Applicable Taxes and other governmental charges the Depositary or the custodian have to pay on any ADS or share underlying an ADS, for example, stock transfer taxes, stamp duty or withholding taxes | | • As necessary |
Shareholder Information |continued
Fees and direct and indirect payments made by the Depositary to the Company
The Bank of New York Mellon, as Depositary, has agreed to reimburse certain Company expenses related to the Company’s ADS programme and incurred by the Company in connection with the ADS programme. For the year ended 31 December 2013 the Depositary reimbursed to the Company, or paid amounts on its behalf to third parties, a total sum of $206,986.
The table below sets forth the category of expense that the Depositary has agreed to reimburse the Company and the amounts reimbursed for the year ended 31 December 2013:
| | | | |
| Category of expense reimbursed to the Company | | Amount reimbursed for the year ended 31 December 2013 | |
| |
NYSE listing fees | | | $78,675 | |
Investor relations expenses | | | $74,077 | |
| | | | $152,752 | |
The table below sets forth the types of expenses that the Depositary has paid to third parties and the amounts reimbursed for the year ended 31 December 2013:
| | | | |
| Category of expense waived or paid directly to third parties | | Amount reimbursed for the year ended 31 December 2013 | |
| |
| Printing, distribution and administration costs paid directly to third parties in connection with US shareholder communications and AGM related expenses in connection with the ADS program1 | | | $54,234 | |
| | | | $54,234 | |
| ¹ | During 2013, $54,234 was paid by the Depositary to third parties, relating to services provided in 2013. These fees are SEC approved. |
The Depositary has also agreed to waive fees for standard costs associated with the administration of the ADS programme and has paid certain expenses directly to third parties on behalf of the Company.
Under certain circumstances, including removal of the Depositary or termination of the ADS programme by the Company before November 2016, the Company is required to repay the Depositary, up to a maximum of $250,000, the amounts waived, reimbursed and/or expenses paid by the Depositary to or on behalf of the Company.
Taxation
The following summary outlines the material aspects of US federal income and Republic of Ireland tax law regarding the ownership and disposition of ADSs or Ordinary Shares. Because it is a summary, holders of ADSs or Ordinary Shares are advised to consult their tax advisors with respect to the tax consequences of their ownership or disposition. This summary does not take into account the specific circumstances of any particular holders (such as tax-exempt entities, certain insurance companies, broker-dealers, traders in securities that elect to mark-to-market, investors liable for alternative minimum tax, investors that actually or constructively own 10% or more of the stock of the Company (by vote or value), investors that hold Ordinary Shares or ADSs as part of a straddle or a hedging or conversion transaction, investors that hold Ordinary Shares or ADSs as part of a wash sale for tax purposes or investors whose functional currency is not the US Dollar), some of which may be subject to special rules. In addition, if a partnership holds the Ordinary Shares or ADSs, the US federal income tax treatment of a partner will generally depend on the status of the partner and the tax treatment of the partnership and may not be described fully below. Holders of ADSs or Ordinary Shares are advised to consult their tax advisors with respect to US federal, state and local, Republic of Ireland and other tax consequences of owning and disposing of Ordinary shares and ADSs in their particular circumstances, and in particular whether they are eligible for the benefits of the Income Tax Treaty (as defined below) in respect of their investment in the Ordinary Shares or ADSs.
The statements regarding US and Irish laws set forth below are based, in part, on representations of the Depositary and assume that each obligation in the Deposit Agreement and any related agreement will be performed in accordance with their terms.
This section is based on the Internal Revenue Code of 1986, as amended, its legislative history, existing and proposed US Treasury regulations, published rulings and court decisions, and the laws of the Republic of Ireland all as currently in effect, as well as the Convention between the Government of the
United States of America and the Government of Ireland for the Avoidance of Double Taxation and the Prevention of Fiscal Evasion with Respect to Taxes on Income and Capital Gains (the “Income Tax Treaty”). These laws are subject to change, possibly on a retroactive basis.
In general, holders of ADSs will be treated as the owners of Ordinary Shares represented thereby for the purposes of the Income Tax Treaty and for US federal income tax purposes. Exchanges of Ordinary Shares for ADSs, and ADSs for Ordinary Shares, generally will not be subject to US federal income or Irish tax.
As used herein, the term “US holder” means a beneficial owner of an ADS or Ordinary Share who (i) is a US citizen or resident, a US corporation, an estate whose income is subject to US federal income tax regardless of its source, or a trust if a US court can exercise primary supervision over the trust’s administration and one or more US persons are authorised to control all substantial decisions of the trust, and (ii) is not a resident of, or ordinarily resident in, the Republic of Ireland for purposes of Irish taxes.
Taxation of Dividends paid to US Holders
Under general Irish tax law, US holders are not liable for Irish tax on dividends received from the Company. On the payment of dividends, the Company is obliged to withhold a Dividend Withholding Tax (“DWT”). The statutory rate at present is 20% of the dividend payable. Dividends paid by the Company to a US tax resident individual will be exempt from DWT, provided the following conditions are met:
| 1. | the individual (who must be the beneficial owner) is resident for tax purposes in the US (or any country with which Ireland has a double tax treaty) and neither resident nor ordinarily resident in Ireland; and |
| 2. | the individual signs a declaration to the Company, which states that he/she is a US tax resident individual at the time of making the declaration and that he/she will notify the Company in writing when he/she no longer meets the condition in (1) above; or |
| 3. | the individual provides the Company with a certificate of tax residency from the US tax authorities. |
Dividends paid by the Company to a US tax resident company (which must be the beneficial owner) will be exempt from DWT, provided the following conditions are met:
| 1. | the recipient company is resident for tax purposes in the US (or any country with which Ireland has a double tax treaty) and not under the control, either directly or indirectly, of Irish resident persons; and |
| 2. | the recipient company is not tax resident in Ireland; and |
| 3. | the recipient company provides a declaration to the Company, which states that it is entitled to an exemption from DWT, on the basis that it meets the condition in (1) above at the time of making the declaration, and that it will notify the Company when it no longer meets the condition in (1) above. |
For US federal income tax purposes, and subject to the passive foreign investment company (“PFIC”) rules discussed below, US holders will include in gross income the gross amount of any dividend paid by the Company out of its current or accumulated earnings and profits (as determined for US federal income tax purposes) as ordinary income when the dividend is actually or constructively received by the US holder, in the case of Ordinary Shares, or by the Depositary, in the case of ADSs. Any Irish tax withheld from this dividend payment must be included in this gross amount even though the amount withheld is not in fact received. Dividends paid to non-corporate US holders that constitute qualified dividend income will be taxed at the preferential rates applicable to long-term capital gains provided certain holding period requirements are met. Dividends the Company pays with respect to Ordinary Shares or ADSs generally will be qualified dividend income. Dividends will not be eligible for the dividends received deduction generally allowed to US corporations in respect of dividends received from other US corporations.
The amount of the dividend distribution includable in income of a US holder will be the US Dollar value of the euro payments made, determined at the spot euro/US Dollar rate on the date such dividend distribution is includable in the income of the US holder, regardless of whether the payment is in fact converted to US Dollars. Generally any gain or loss resulting from currency exchange fluctuations during the period from the date the dividend payment is includable in income to the date such payment is converted into US Dollars will be treated as ordinary income or loss and will not be eligible for the special tax rate applicable to qualified dividend income. Such gain or loss will generally be income or loss from sources within the US for foreign tax credit limitation purposes.
Distributions in excess of current and accumulated earnings and profits, as determined for US federal income tax purposes, will be treated as a non-taxable return of capital to the extent of the US holder’s basis in the Ordinary Shares or ADSs and thereafter as capital gain. However, the Company does not
Shareholder Information |continued
calculate earnings and profits in accordance with US federal income tax principles. Accordingly, US holders should expect to generally treat distributions the Company makes as dividends.
For foreign tax credit limitation purposes, dividends the Company pays with respect to Ordinary Shares or ADSs will be income from sources outside the US, and will, depending on your circumstances, be either “passive” or “general” income for purposes of computing the foreign tax credit allowable to a US holder. Any Irish tax withheld from distributions will not be eligible for a foreign tax credit to the extent an exemption from the tax withheld is available to the US holder.
Capital Gains Tax
A US holder will not be liable for Irish tax on gains realised on the sale or other disposition of ADSs or Ordinary Shares unless the ADSs or Ordinary Shares are held in connection with a trade or business carried on by such holder in the Republic of Ireland through a branch or agency. A US holder will be liable for US federal income tax on such gains in the same manner as gains from a sale or other disposition of any other shares in a company. Subject to the PFIC rules below, US holders who sell or otherwise dispose of Ordinary Shares or ADSs will recognise capital gain or loss for US federal income tax purposes equal to the difference between the US Dollar value of the amount realised on the sale or disposition and the tax basis, determined in US Dollars, in the Ordinary Shares or ADSs. Capital gains of a non-corporate US holder are generally taxed at a preferential rate where the holder has a holding period greater than one year, and the capital gain or loss will generally be US source for foreign tax credit limitation purposes.
Capital Acquisitions Tax (Estate/Gift Tax)
Although non-residents may hold Ordinary Shares, the shares are deemed to be situated in the Republic of Ireland, because the Company is required to maintain its Share Register in the Republic of Ireland for Irish Capital Gains Tax purposes. Accordingly, holders of Ordinary Shares may be subject to Irish gift or inheritance tax, notwithstanding that the parties involved are domiciled and resident outside the Republic of Ireland. Certain exemptions apply to gifts and inheritances depending on the relationship between the donor and donee.
Under the Ireland-US Estate Tax Treaty with respect to taxes on the estates of deceased persons, credit against US federal estate tax is available in respect of any Irish inheritance tax payable in respect of transfers of Ordinary Shares.
Additional Federal US Income Tax Considerations
The Company believes that Ordinary Shares and ADSs should not be treated as stock of a PFIC for US federal income tax purposes, but this conclusion is a factual determination that is made annually and thus may be subject to change. If the Company is treated as a PFIC and you are a US holder that did not make a mark-to-market election, you will be subject to special rules with respect to any gain you realise on the sale or other disposition of your Ordinary Shares or ADSs and any excess distribution that the Company makes to you. Generally, any such gain or excess distribution will be allocated ratably over your holding period for the Ordinary Shares or ADSs, the amount allocated to the taxable year in which you realised the gain or received the excess distribution will be taxed as ordinary income, the amount allocated to each prior year will be generally taxed as ordinary income at the highest tax rate in effect for each such year, and an interest charge will be applied to any tax attributable to such gain or excess distribution for the prior years. With certain exceptions, Ordinary Shares or ADSs will be treated as stock in a PFIC if the company was a PFIC at any time during the investor’s holding period in the Ordinary Shares or ADSs. In addition, dividends that you receive from the Company will not constitute qualified dividend income to you if the Company is deemed to be a PFIC either in the taxable year of the distribution or the preceding taxable year, but instead will be taxable at rates applicable to ordinary income.
Stamp Duty
Section 90 Stamp Duties Consolidation Act 1999 exempts from Irish stamp duty transfers of ADSs where the ADSs are dealt in and quoted on a recognised stock exchange in the US and the underlying deposited securities are dealt in and quoted on a recognised stock exchange. The Irish tax authorities regard NASDAQ and the NYSE as recognised stock exchanges. Irish stamp duty will be charged at the rate of 1% of the amount or value of the consideration on any conveyance or transfer on sale of Ordinary Shares (exemption generally available in the case of single transfers with a value of less than €1,000).
Memorandum and Articles of Association
The Company’s Memorandum of Association sets out the objects and powers of the Company. The Articles of Association detail the rights attaching to each share class; the method by which the Company’s shares can be purchased or reissued; the provisions which apply to the holding of and voting at general meetings; and the rules relating to the Directors, including their appointment, retirement, re-election, duties and powers.
A copy of the current Memorandum and Articles of Association can be obtained from the Group’s website, www.crh.com.
The following summarises certain provisions of CRH’s Memorandum and Articles of Association and applicable Irish law.
Objects and Purposes
CRH is incorporated under the name CRH public limited company and is registered in Ireland with registered number 12965. Clause 4 of CRH’s memorandum of association provides that its objects include the business of quarry masters and proprietors, lessees and workers of quarries, sand and gravel pits, mines and the like generally; the business of road-makers and contractors, building contractors, builders merchants and providers and dealers in road making and building materials, timber merchants; and the carrying on of any other business calculated to benefit CRH. The memorandum grants CRH a range of corporate capabilities to effect these objects.
Directors
The Directors manage the business and affairs of CRH.
Directors who are in any way, whether directly or indirectly, interested in contracts or other arrangements with CRH must declare the nature of their interest at a meeting of the Directors, and, subject to certain exemptions, may not vote in respect of any contract or arrangement or other proposal whatsoever in which they have any material interest other than by virtue of their interest in shares or debentures in the Company. However, in the absence of some other material interest not indicated below, a Director is entitled to vote and to be counted in a quorum for the purpose of any vote relating to a resolution concerning the following matters:
| • | the giving of security or indemnity with respect to money lent or obligations taken by the Director at the request or for the benefit of the Company; |
| • | the giving of security or indemnity to a third party with respect to a debt or obligation of the Company which the Director has assumed responsibility for under a guarantee, indemnity or the giving of security; |
| • | any proposal under which the Director is interested concerning the underwriting of Company shares, debentures or other securities; |
| • | any other proposal concerning any other company in which the Director is interested, directly or indirectly (whether as an officer, shareholder or otherwise) provided that the Director is not the holder of 1% or more of the voting interest in the shares of such company; and |
| • | proposals concerning the modification of certain retirement benefits under which the Director may benefit and which have been approved or are subject to approval by the Irish Revenue Commissioners. |
The Directors may exercise all the powers of the Company to borrow money, except that such general power is restricted to the aggregate amount of principal borrowed less cash balances of the Company and its subsidiaries not exceeding an amount twice the aggregate of (a) the share capital of the Company; and (b) the amount standing to the credit of retained income, foreign currency translation reserve and other reserves, capital grants, deferred taxation and non-controlling interest; less any repayable Government grants; less (c) the aggregate amount of Treasury Shares and own shares held by the Company.
The Company in general meeting from time to time determines the fees payable to the Directors. The CRH Board may grant special remuneration to any of its number who being called upon, shall render any special or extra services to the Company or go or reside abroad in connection with the conduct of any of the affairs of the Company.
The qualification of a Director is the holding alone and not jointly with any other person of 1,000 Ordinary Shares in the capital of the Company.
Voting rights
The Articles provide that, at shareholders’ meetings, holders of Ordinary Shares, either in person or by proxy, are entitled on a show of hands to one vote and on a poll to one vote per share. No member is entitled to vote at any general meeting unless all calls or other sums immediately payable in respect of their shares in the Company have been paid.
Laws, Decrees or other Regulations
There are no restrictions under the Memorandum and Articles of Association of the Company or under Irish law that limit the right of non-Irish residents or foreign owners freely to hold their Ordinary Shares or to vote their Ordinary Shares.
Shareholder Information |continued
Liquidation Rights/Return of Capital
In the event of the Company being wound-up, the liquidator may, with the sanction of a shareholders’ special resolution, divide among the holders of the Ordinary Shares the whole or any part of the net assets of the Company (after the return of capital and payment of accrued dividends on the preference shares) in cash or in kind, and may set such values as he deems fair upon any property to be so divided and determine how such division will be carried out. The liquidator may, with a like sanction, vest such assets in trust as he thinks fit, but no shareholders will be compelled to accept any shares or other assets upon which there is any liability.
Variation in Class Rights
Subject to the provisions of the Irish Companies Acts, the rights attached to any class of shares may be varied with the consent in writing of the holders of not less than three-fourths in nominal value of the issued shares of that class, or with the sanction of a special resolution passed at a separate general meeting of the holders of those shares.
Disclosure of Shareholders’ Interests
A shareholder may lose the right to vote by not complying with any statutory notice or notice pursuant to Article 14 of the Articles of Association given by the Company requiring an indication in writing of: (a) the capacity in which the shares are held or any interest therein; (b) the persons who have an interest in the shares and the nature of their interest; or (c) whether any of the voting rights carried by such shares are the subject of any agreement or arrangement under which another person is entitled to control the shareholder’s exercise of these rights.
Issue of Shares
Subject to the provisions of the Irish Companies Acts and the Articles of Association, the issue of shares is at the discretion of the Directors.
Dividends
Shareholders may by ordinary resolution declare final dividends and the Directors may declare interim dividends but no final dividend may be declared in excess of the amount recommended by the Directors and no dividend may be paid otherwise than out of income available for that purpose in accordance with the Irish Companies Acts. There is provision to offer scrip dividends in lieu of cash. The preference shares rank for fixed rate dividends in priority to the Ordinary and Income Shares for the time being of the Company. Any dividend which has remained unclaimed for twelve years from the date of its declaration shall, if the Directors so decide, be forfeited and cease to remain owing by the Company.
Meetings
Shareholder meetings may be convened by majority vote of the Directors or requisitioned by shareholders holding not less than 5% of the voting rights of the Company. A quorum for a general meeting of the Company is constituted by five or more shareholders present in person and entitled to vote. The passing of resolutions at a meeting of the Company, other than special resolutions, requires a simple majority. A special resolution, in respect of which not less than 21 days’ notice in writing must be given, requires the affirmative vote of at least 75% of the votes cast.
Preference Shares
Details of the 5% and 7% ‘A’ Cumulative Preference Shares are disclosed in note 29 to the Consolidated Financial Statements.
Use of electronic communication
Whenever the Company, a Director, the Secretary, a member or any officer or person is required or permitted by the Articles of Association to give information in writing, such information may be given by electronic means or in electronic form, whether as electronic communication or otherwise, provided that the electronic means or electronic form has been approved by the Directors.
Financial Calendar
| | | | |
Announcement of final results for 2013 | | | 25 February 2014 | |
Ex-dividend date | | | 5 March 2014 | |
Record date for dividend | | | 7 March 2014 | |
Latest date for receipt of scrip forms | | | 24 April 2014 | |
Interim Management Statement | | | 7 May 2014 | |
Annual General Meeting | | | 7 May 2014 | |
Dividend payment date and first day of dealing in scrip dividend shares | | | 12 May 2014 | |
Announcement of interim results for 2014 | | | 19 August 2014 | |
Interim Management Statement | | | 11 November 2014 | |
Electronic Communications
Following the introduction of the 2007 Transparency Regulations (Statutory Instrument 277/2007 Transparency (Directive 2004/109/EC) Regulations 2007), and in order to adopt a more environmentally friendly and cost effective approach, the Company provides the Annual Report to shareholders electronically via the CRH website,www.crh.com, and only sends a printed copy to those shareholders who specifically request a copy. Shareholders who choose to do so can receive other shareholder communications, for example, notices of general meetings and shareholder circulars, electronically. However, shareholders will continue to receive printed proxy forms, dividend documentation and, if the Company deems it appropriate, other documentation by post. Shareholders can alter the method by which they receive communications by contacting the Registrars.
Electronic Proxy Voting
Shareholders may lodge a proxy form for the 2014 Annual General Meeting electronically by accessing the Registrars’ website as described below.
CREST members wishing to appoint a proxy via CREST should refer to the CREST Manual and the notes to the Notice of the Annual General Meeting.
Registrars
Enquiries concerning shareholdings should be addressed to:
Capita Asset Services
P.O. Box 7117
Dublin 2
Ireland
Telephone: +353 (0) 1 553 0050
Fax: +353 (0) 1 224 0700
Website: www.capitaassetservices.com
Shareholders with access to the internet may check their accounts by accessing the Registrars’ website and selecting “Shareholder Portal (Ireland)”. This facility allows shareholders to check their shareholdings and dividend payments, register e-mail addresses, appoint proxies electronically and download standard forms required to initiate changes in details held by the Registrars. Shareholders will need to register for a User ID before using some of the services.
Frequently Asked Questions (FAQs)
The Group’s website contains answers to questions frequently asked by shareholders, including questions regarding shareholdings, dividend payments, electronic communications and shareholder rights. The FAQs can be accessed in the Investors section of the website under “Equity Investors”.
Exchange Controls
Certain aspects of CRH’s international monetary operations outside the EU were, prior to 31 December 1992, subject to regulation by the Central Bank of Ireland. These controls have now ceased. There are currently no Irish foreign exchange controls, or other statute or regulations that restrict the export or import of capital, that affect the remittance of dividends, other than dividend withholding tax on the Ordinary Shares, or that affect the conduct of the Company’s operations.
Principal Accountant Fees and Services
Details of auditors’ fees are set out in note 4 to the Consolidated Financial Statements. For details on the audit and non-audit services pre-approval policy see Corporate Governance – Independence of External Auditors on page 76.
Documents on Display
It is possible to read and copy documents referred to in this Annual Report on Form 20-F, which have been filed with the SEC at the SEC’s public reference room located at 100 F Street, NW, Washington, DC 20549. Please call the SEC at 1-800-SEC-0330 for further information on the public reference rooms and their copy charges. The SEC filings are also available to the public from commercial document retrieval services and, for most recent CRH periodic filings only, at the Internet World Wide Web site maintained by the SEC at www.sec.gov.
Exhibits
The following documents are filed as part of this Annual Report:
| 1. | Memorandum and Articles of Association.* |
| 2.1 | Amended and Restated Deposit Agreement dated 28 November 2006, between CRH plc and The Bank of New York Mellon.** |
| 7. | Computation of Ratios of Earnings to Fixed Charges. |
| 8. | Listing of principal subsidiary undertakings and equity accounted investments. |
| 12. | Certifications of Chief Executive Officer and Chief Financial Officer pursuant to Section 302 of the Public Company Accounting Reform and Investor Protection Act of 2002. |
| 13. | Certifications of Chief Executive Officer and Chief Financial Officer pursuant to Section 906 of the Public Company Accounting Reform and Investor Protection Act of 2002.*** |
| 15. | Consent of Independent Registered Public Accounting Firm. |
| 99.1 | Disclosure of Mine Safety and Health Administration (“MSHA”) Safety Data. |
| * | Incorporated by reference to Annual Report on Form 20-F for the year ended 31 December 2012 that was filed by the Company on 27 March 2013. |
| ** | Incorporated by reference to Annual Report on Form 20-F for the year ended 31 December 2006 that was filed by the Company on 3 May 2007. |
| *** | Furnished but not filed. |
192 CRH
Signatures
The registrant hereby certifies that it meets all of the requirements for filing on Form 20-F and that it has duly caused and authorised the undersigned to sign this Annual Report on its behalf.
| | | | | | |
| | | | CRH public limited company |
| | | | (Registrant) | | |
| | | |
| | | | By: | | /s/ M. Carton |
| | | |
| | | | | | Maeve Carton |
| | | | | | Finance Director |
Dated: 13 March 2014 | | | | | | |