UNITED STATES
SECURITIES AND EXCHANGE COMMISSION
Washington, D.C. 20549
FORM N-CSR
CERTIFIED SHAREHOLDER REPORT OF REGISTERED MANAGEMENT INVESTMENT
COMPANIES
Investment Company Act file number: 811-05723
Name of Fund: BlackRock Emerging Markets Fund, Inc.
Fund Address: 100 Bellevue Parkway, Wilmington, DE 19809
Name and address of agent for service: John M. Perlowski, Chief Executive Officer, BlackRock Emerging Markets Fund, Inc., 55 East 52nd Street, New York, NY 10055
Registrant’s telephone number, including area code: (800) 441-7762
Date of fiscal year end: 10/31/2016
Date of reporting period: 10/31/2016
Item 1 – Report to Stockholders
OCTOBER 31, 2016
ANNUAL REPORT
|  |
BlackRock Emerging Markets Fund, Inc.
BlackRock Latin America Fund, Inc.
| Not FDIC Insured • May Lose Value • No Bank Guarantee |
| Table of Contents | ||||
| Page | ||||
| 3 | ||||
Annual Report: | ||||
| 4 | ||||
| 9 | ||||
| 9 | ||||
| Financial Statements: | ||||
| 10 | ||||
| 16 | ||||
| 18 | ||||
| 19 | ||||
| 21 | ||||
| 28 | ||||
| 39 | ||||
| 39 | ||||
Disclosure of Investment Advisory Agreements and Sub-Advisory Agreements | 40 | |||
| 45 | ||||
| 48 | ||||

| 2 | ANNUAL REPORT | OCTOBER 31, 2016 |
| The Markets in Review |
Dear Shareholder,
Central bank policy decisions have continued to provide support to financial markets, while changing economic outlooks and geopolitical risks have been major drivers of investor sentiment. After ending its near-zero interest rate policy at the end of 2015, the Federal Reserve (the “Fed”) remained in focus as investors considered the anticipated pace of future rate hikes. With the European Central Bank and the Bank of Japan having moved into stimulus mode, the divergence in global monetary policies drove heightened market volatility at the beginning of 2016 and caused the U.S. dollar to strengthen considerably.
Financial markets had a rough start to the year as the strong dollar challenged U.S. companies that generate revenues overseas and pressured emerging market currencies and commodities prices. Low and volatile oil prices and signs of slowing growth in China were also meaningful factors behind the decline in risk assets early in the year. However, as the first quarter wore on, these pressures abated and a more tempered outlook for U.S. rate hikes helped the markets rebound.
Volatility spiked in late June when the United Kingdom shocked investors with its vote to leave the European Union. Uncertainty around how the British exit might affect the global economy and political landscape drove investors to high-quality assets, pushing already low global yields to even lower levels. However, risk assets recovered swiftly in July as economic data suggested that the consequences had thus far been contained to the United Kingdom.
In a second episode of surprise vote results, equities fell sharply after the news of Donald Trump’s victory in the U.S. presidential election, but quickly recovered, and the yield curve steepened due to expectations for rising inflation. Broadly, a reflation theme has been building amid signs of rising price pressures, central banks signaling a greater tolerance to let inflation run hotter, and policy emphasis shifting from monetary to fiscal stimulus.
At BlackRock, we believe investors need to think globally, extend their scope across a broad array of asset classes and be prepared to adjust accordingly as market conditions change over time. We encourage you to talk with your financial advisor and visit blackrock.com for further insight about investing in today’s markets.
Sincerely,

Rob Kapito
President, BlackRock Advisors, LLC

Rob Kapito
President, BlackRock Advisors, LLC
| Total Returns as of October 31, 2016 | ||||||||
| 6-month | 12-month | |||||||
U.S. large cap equities | 4.06 | % | 4.51 | % | ||||
U.S. small cap equities | 6.13 | 4.11 | ||||||
International equities | (0.16 | ) | (3.23 | ) | ||||
Emerging market equities | 9.41 | 9.27 | ||||||
3-month Treasury bills | 0.17 | 0.31 | ||||||
U.S. Treasury securities | 0.46 | 4.24 | ||||||
U.S. investment grade | 1.51 | 4.37 | ||||||
Tax-exempt municipal | 0.98 | 4.53 | ||||||
U.S. high yield bonds (Bloomberg Barclays U.S. | 7.59 | 10.16 | ||||||
| Past performance is no guarantee of future results. Index performance is shown for illustrative purposes only. You cannot invest directly in an index. | ||||||||
| THIS PAGE NOT PART OF YOUR FUND REPORT | 3 |
| Fund Summary as of October 31, 2016 | BlackRock Emerging Markets Fund, Inc. |
| Investment Objective |
BlackRock Emerging Markets Fund, Inc.’s (the “Fund”) investment objective is to seek long-term capital appreciation by investing in securities, principally equity securities, of issuers in countries having smaller capital markets.
| Portfolio Management Commentary |
How did the Fund perform?
| • | For the 12-month period ended October 31, 2016, the Fund outperformed the benchmark, the MSCI Emerging Markets Index. |
What factors influenced performance?
| • | The largest contributor to relative performance was the Fund’s stock selection within Brazil and China. The largest individual contributor was a non-benchmark position in the Brazilian rail operator Rumo Logistica SA, based on a strong share sale in April and improving domestic conditions leading up to former President Rousseff’s impeachment in August. Also in Brazil, Banco Itaú and the highway toll operator EcoRodovias Infraestrutura e Logistica SA were among the top contributors to performance. Holdings in the South African gold mining company AngloGold Ashanti Ltd. also added to returns, as gold performed well early in the period in reaction to increased global uncertainty. |
| • | The largest detractors from performance relative to the benchmark were broadly stock-specific in nature. Most notably, within Brazil the decision not to hold positions in the state-owned oil company Petroleo Brasileiro SA (Petrobras) as well as Banco Bradesco SA detracted from performance, as the Brazilian market surged following positive political developments. In addition, the Fund’s non-benchmark position in the information technology (“IT”) company Luxoft Holding, Inc. detracted from performance. The company provides custom software that under- |
lies credit analysis and trading systems for leading banks, and saw its stock sell off in sympathy with the European banking sector following Britain’s vote to exit the European Union. Lastly, the Fund’s underweight position in Samsung Electronics Co. Ltd. weighed on performance as the stock rallied on increased demand for its memory products and OLED display panels. |
Describe recent portfolio activity.
| • | During the period, the most notable change in the Fund’s positioning was a reduction in financial holdings, specifically Chinese banks due to a lack of clarity concerning non-performing loans. The Fund also shifted IT exposure away from hardware manufacturers and into additional e-commerce and consumption-related companies. Conversely, the Fund added exposure to countries that exhibit strong reform momentum driven by political regime change. As such, the Fund had overweights to Brazil, Indonesia and Thailand. The Fund also held an approximate 5% non-benchmark Argentina allocation, based on a positive view of the country’s growth prospects. |
Describe portfolio positioning at period end.
| • | Relative to the MSCI Emerging Markets Index, the Fund ended the period overweight in Brazil, Indonesia and consumer staples, and underweight in South Korea, Taiwan and financials. |
| Portfolio Information |
| Ten Largest Holdings | Percent of Net Assets |
Tencent Holdings Ltd. | 5 | % | ||
Taiwan Semiconductor Manufacturing Co. Ltd. — ADR | 5 | |||
Itau Unibanco Holding SA, Preference Shares — ADR | 4 | |||
Sberbank of Russia PJSC — ADR | 4 | |||
Naspers Ltd., Class N | 3 | |||
Alibaba Group Holding Ltd. — ADR | 3 | |||
China Overseas Land & Investment Ltd. | 2 | |||
Grupo Financiero Banorte SAB de CV, Series O | 2 | |||
PTT PCL | 2 | |||
Anhui Conch Cement Co. Ltd., Class H | 2 |
| Geographic Allocation | Percent of Net Assets |
China | 21 | % | ||
Brazil | 14 | |||
India | 10 | |||
South Korea | 9 | |||
Mexico | 7 | |||
Taiwan | 7 | |||
Hong Kong | 5 | |||
Russia | 5 | |||
Indonesia | 5 | |||
South Africa | 5 | |||
Argentina | 4 | |||
Thailand | 4 | |||
Luxembourg | 2 | |||
Peru | 1 | |||
United States | 1 | |||
Germany | 1 | |||
Liabilities in Excess of Other Assets | (1 | ) |
| 4 | ANNUAL REPORT | OCTOBER 31, 2016 |
| BlackRock Emerging Markets Fund, Inc. |
| Total Return Based on a $10,000 Investment |
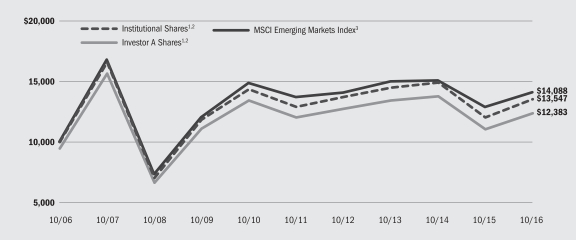
| 1 | Assuming maximum sales charges, if any, transaction costs and other operating expenses, including investment advisory fees. Institutional Shares do not have a sales charge. |
| 2 | Under normal conditions, the Fund invests at least 80% of its net assets plus any borrowings for investment purposes in equity securities of issuers located in countries with developing capital markets. |
| 3 | A free float-adjusted market capitalization index that is designed to measure equity market performance of emerging markets. The MSCI Emerging Markets Index consists of the following 23 emerging market country indexes: Brazil, Chile, China, Colombia, Czech Republic, Egypt, Greece, Hungary, India, Indonesia, Korea, Malaysia, Mexico, Peru, Philippines, Poland, Qatar, Russia, South Africa, Taiwan, Thailand, Turkey and United Arab Emirates. |
| Performance Summary for the Period Ended October 31, 2016 |
| Average Annual Total Returns4 | ||||||||||||||||||||||||||||
| 1 Year | 5 Years | 10 Years | ||||||||||||||||||||||||||
| 6-Month Total Returns | w/o sales charge | w/sales charge | w/o sales charge | w/sales charge | w/o sales charge | w/sales charge | ||||||||||||||||||||||
Institutional | 11.78 | % | 12.47 | % | N/A | 0.98 | % | N/A | 3.08 | % | N/A | |||||||||||||||||
Investor A | 11.52 | 11.95 | 6.07 | % | 0.57 | (0.51 | )% | 2.71 | 2.16 | % | ||||||||||||||||||
Investor C | 11.09 | 11.07 | 10.07 | (0.26 | ) | (0.26 | ) | 1.87 | 1.87 | |||||||||||||||||||
MSCI Emerging Markets Index | 9.41 | 9.27 | N/A | 0.55 | N/A | 3.49 | N/A | |||||||||||||||||||||
| 4 | Assuming maximum sales charges, if any. Average annual total returns with and without sales charges reflect reductions for distribution and service fees. See “About Fund Performance” on page 9 for a detailed description of share classes, including any related sales charges and fees. |
| N/A — Not applicable as share class and index do not have a sales charge. |
| Past performance is not indicative of future results. |
| Performance results may include adjustments made for financial reporting purposes in accordance with U.S. generally accepted accounting principles. |
| Expense Example |
| Actual | Hypothetical6 | |||||||||||||||||||||||||||
| Beginning Account Value May 1, 2016 | Ending Account Value October 31, 2016 | Expenses Paid During the Period5 | Beginning Account Value May 1, 2016 | Ending Account Value October 31, 2016 | Expenses Paid During the Period5 | Annualized Expense Ratio | ||||||||||||||||||||||
Institutional | $ | 1,000.00 | $ | 1,117.80 | $ | 5.96 | $ | 1,000.00 | $ | 1,019.51 | $ | 5.69 | 1.12 | % | ||||||||||||||
Investor A | $ | 1,000.00 | $ | 1,115.20 | $ | 8.67 | $ | 1,000.00 | $ | 1,016.94 | $ | 8.26 | 1.63 | % | ||||||||||||||
Investor C | $ | 1,000.00 | $ | 1,110.90 | $ | 13.05 | $ | 1,000.00 | $ | 1,012.77 | $ | 12.45 | 2.46 | % | ||||||||||||||
| 5 | For each class of the Fund, expenses are equal to the annualized net expense ratio for the class, multiplied by the average account value over the period, multiplied by 184/366 (to reflect the one-half year period shown). |
| 6 | Hypothetical 5% return before expenses is calculated by prorating the number of days in the most recent fiscal half year divided by 366. |
| See “Disclosure of Expenses” on page 9 for further information on how expenses were calculated. |
| ANNUAL REPORT | OCTOBER 31, 2016 | 5 |
| Fund Summary as of October 31, 2016 | BlackRock Latin America Fund, Inc. |
| Investment Objective |
BlackRock Latin America Fund Inc.’s (the “Fund”) investment objective is to seek long-term capital appreciation by investing primarily in Latin American equity and debt securities.
| Portfolio Management Commentary |
How did the Fund perform?
| • | For the 12-month period ended October 31, 2016, the Fund underperformed its benchmark, the MSCI Emerging Markets Latin America Index. |
What factors influenced performance?
| • | Stock selection in Brazil was the largest detractor from performance during the period. In addition, the Fund’s cash position and a non-benchmark position in Argentina weighed on returns. An overweight in Mexico somewhat offset strong stock selection within that country. At the individual security level, holdings in the Brazilian pulp producer Fibria Celulose SA represented the largest detractor, based on weakness in pulp prices and renewed strength in Brazil’s currency. Lastly, an underweight in Banco do Brasil SA detracted from returns, as the stock performed well leading up to Brazil’s presidential impeachment vote. |
| • | Stock selection in Mexico was the largest contributor to returns, most notably an underweight to the telecommunications services (“telecom”) firm America Movil SAB de CV, as the company struggled with the challenging regulatory environment in Mexico, as well as stiff competition in every country where it operates, especially in Mexico and Brazil. Underweights to Chile and Colombia contributed positively to returns, as both markets were relative underperformers. Lastly, an overweight to the state-owned Brazilian oil company Petrobras (Petróleo Brasileiro S.A.) added to performance as the stock benefited from political change in Brazil. |
Describe recent portfolio activity.
| • | During the period, the Fund significantly increased exposure to Brazil, moving from a neutral position to overweight by increasing exposure to |
large-cap stocks ahead of the impeachment of former president Rousseff. Conversely, the Fund reduced exposure to Mexico based on concerns regarding the election cycle in both the United States and Mexico, as well as valuations in Mexico. In Brazil, the Fund added to select banks, energy and beverage companies. Petrobras was moved to an overweight position during the period, as the stock stands to benefit from a stronger Brazilian currency and positive political developments. The Fund also added to its holdings in the Brazilian banks, Itau Unibanco Holding SA and Banco Bradesco SA. In addition, the mining firm Vale SA was reintroduced to the portfolio, given its attractive valuation and more positive sentiment regarding the direction of iron ore prices. These moves were partially funded by the Fund’s exiting of its position in the Mexican broadcaster Grupo Televisa SAB. The stock was close to the investment adviser’s target price, and there were concerns regarding the potential for Univision to renegotiate its content agreement with Grupo Televisa as a result of low ratings. Additionally, the Fund reduced exposure to the cement company Cemex SAB de CV and exited the banking firm Gentera SAB de CV, the industrial multinational Alfa SAB de CV, as well as the telecommunications company America Movil SAB de CV. In terms of country allocation, the Fund added to its non-benchmark position in Argentina while reducing exposure to Peru. |
Describe portfolio positioning at period end.
| • | The Fund remained overweight in Brazil and Peru, and had a non-benchmark allocation to Argentina, while being underweight in Chile, Mexico and Colombia. At the sector level, the Fund was overweight in consumer staples, energy and select banks, and underweight in utilities, consumer discretionary and telecom. |
| 6 | ANNUAL REPORT | OCTOBER 31, 2016 |
| BlackRock Latin America Fund, Inc. |
| Total Return Based on a $10,000 Investment |
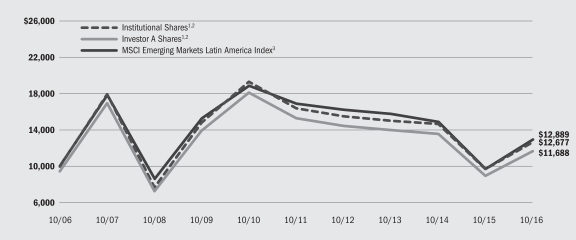
| 1 | Assuming maximum sales charge, if any, transaction costs and other operating expenses, including investment advisory fees. Institutional Shares do not have a sales charge. |
| 2 | Under normal market conditions, the Fund will invest at least 80% of its net assets plus any borrowings for investment purposes in Latin American securities. |
| 3 | A free float-adjusted market capitalization weighted index that is designed to measure the equity market performance of emerging markets in Latin America. |
| Performance Summary for the Period Ended October 31, 2016 |
| Average Annual Total Returns4 | ||||||||||||||||||||||||||||
| 1 Year | 5 Years | 10 Years | ||||||||||||||||||||||||||
| 6-Month Total Returns | w/o sales charge | w/sales charge | w/o sales charge | w/sales charge | w/o sales charge | w/sales charge | ||||||||||||||||||||||
Institutional | 15.21 | % | 30.32 | % | N/A | (5.05 | )% | N/A | 2.40 | % | N/A | |||||||||||||||||
Investor A | 15.02 | 29.91 | 23.09 | % | (5.30 | ) | (6.32 | )% | 2.12 | 1.57 | % | |||||||||||||||||
Investor B | 14.30 | 28.18 | 23.68 | (6.29 | ) | (6.66 | ) | 1.40 | 1.40 | |||||||||||||||||||
Investor C | 14.56 | 28.78 | 27.78 | (6.09 | ) | (6.09 | ) | 1.29 | 1.29 | |||||||||||||||||||
MSCI Emerging Markets Latin America Index | 15.11 | 33.28 | N/A | (5.20 | )` | N/A | 2.57 | N/A | ||||||||||||||||||||
| 4 | Assuming maximum sales charges, if any. Average annual total returns with and without sales charges reflect reductions for distribution and service fees. See “About Fund Performance” on page 9 for a detailed description of share classes, including any related sales charges and fees. |
| N/A — Not applicable as share class and index do not have a sales charge. |
| Past performance is not indicative of future results. |
| Performance results may include adjustments made for financial reporting purposes in accordance with U.S. generally accepted accounting principles. |
| Expense Example |
| Actual | Hypothetical6 | |||||||||||||||||||||||||||
| Beginning Account Value May 1, 2016 | Ending Account Value October 31, 2016 | Expenses Paid During the Period5 | Beginning Account Value May 1, 2016 | Ending Account Value October 31, 2016 | Expenses Paid During the Period5 | Annualized Expense Ratio | ||||||||||||||||||||||
Institutional | $ | 1,000.00 | $ | 1,152.10 | $ | 6.92 | $ | 1,000.00 | $ | 1,018.70 | $ | 6.50 | 1.28 | % | ||||||||||||||
Investor A | $ | 1,000.00 | $ | 1,150.20 | $ | 8.65 | $ | 1,000.00 | $ | 1,017.09 | $ | 8.11 | 1.60 | % | ||||||||||||||
Investor B | $ | 1,000.00 | $ | 1,143.00 | $ | 15.46 | $ | 1,000.00 | $ | 1,010.71 | $ | 14.51 | 2.87 | % | ||||||||||||||
Investor C | $ | 1,000.00 | $ | 1,145.60 | $ | 12.94 | $ | 1,000.00 | $ | 1,013.07 | $ | 12.14 | 2.40 | % | ||||||||||||||
| 5 | For each class of the Fund, expenses are equal to the annualized net expense ratio for the class, multiplied by the average account value over the period, multiplied by 184/366 (to reflect the one-half year period shown). |
| 6 | Hypothetical 5% annual return before expenses is calculated by prorating the number of days in the most recent fiscal half year divided by 366. |
| See “Disclosure of Expenses” on page 9 for further information on how expenses were calculated. |
| ANNUAL REPORT | OCTOBER 31, 2016 | 7 |
| BlackRock Latin America Fund, Inc. | ||||
| Portfolio Information |
| Ten Largest Holdings | Percent of Net Assets |
Itau Unibanco Holding SA, Preference Shares — ADR | 10 | % | ||
Petroleo Brasileiro SA — ADR | 10 | |||
Banco Bradesco SA — ADR | 9 | |||
AMBEV SA — ADR | 6 | |||
Fomento Economico Mexicano SAB de CV — ADR | 4 | |||
Cielo SA | 3 | |||
Grupo Financiero Banorte SAB de CV, Series O | 3 | |||
BM&FBovespa SA | 3 | |||
Cemex SAB de CV — ADR | 3 | |||
BRF SA — ADR | 3 |
| Geographic Allocation | Percent of Net Assets |
Brazil | 65 | % | ||
Mexico | 25 | |||
Peru | 5 | |||
Argentina | 3 | |||
Chile | 1 | |||
Other | 1 | 1 |
| 1 | Other includes a 1% or less investment in each of the following countries: |
| Columbia | and the United States. |
| 8 | ANNUAL REPORT | OCTOBER 31, 2016 |
| About Fund Performance |
| • | Institutional Shares are not subject to any sales charge. These shares bear no ongoing distribution or service fees and are available only to certain eligible investors. |
| • | Investor A Shares are subject to a maximum initial sales charge (front-end load) of 5.25% and a service fee of 0.25% per year (but no distribution fee). Certain redemptions of these shares may be subject to a contingent deferred sales charge (“CDSC”) where no initial sales charge was paid at the time of purchase. These shares are generally available through financial intermediaries. |
| • | Investor B Shares (available only in BlackRock Latin America Fund, Inc.) are subject to a maximum CDSC of 4.50% declining to 0% after six years. In addition, these shares are subject to a distribution fee of 0.75% per year and a service fee of 0.25% per year. These shares automatically convert to Investor A Shares after approximately eight years. (There is no initial sales charge for automatic share conversions.) All returns for periods greater than eight years reflect this conversion. These shares are only available through exchanges and distribution reinvestments by current holders and for purchase by certain employer-sponsored retirement plans. |
| • | Investor C Shares are subject to a 1.00% CDSC if redeemed within one year of purchase. In addition, these shares are subject to a distribution |
fee of 0.75% per year and a service fee of 0.25% per year. These shares are generally available through financial intermediaries. |
Performance information reflects past performance and does not guarantee future results. Current performance may be lower or higher than the performance data quoted. Refer to www.blackrock.com/funds to obtain performance data current to the most recent month end. Performance results do not reflect the deduction of taxes that a shareholder would pay on fund distributions or the redemption of fund shares. Figures shown in the performance tables on the previous pages assume reinvestment of all distributions, if any, at net asset value (“NAV”) on the ex-dividend date. Investment return and principal value of shares will fluctuate so that shares, when redeemed, may be worth more or less than their original cost. Distributions paid to each class of shares will vary because of the different levels of service, distribution and transfer agency fees applicable to each class, which are deducted from the income available to be paid to shareholders.
BlackRock Advisors, LLC (the “Manager”), each Fund’s investment adviser, waived a portion of the Funds’ expenses. Without such waiver, the Funds’ performance would have been lower. The Manager is under no obligation to waive or to continue waiving its fees and such voluntary waiver may be reduced or discontinued at any time. See Note 5 of the Notes to Financial Statements for additional information on waivers.
| Disclosure of Expenses |
Shareholders of these Funds may incur the following charges: (a) transactional expenses, such as sales charges; and (b) operating expenses, including investment advisory fees, service and distribution fees, including 12b-1 fees, acquired fund fees and expenses, and other fund expenses. The expense examples on previous pages (which are based on a hypothetical investment of $1,000 invested on May 1, 2016 and held through October 31, 2016) are intended to assist shareholders both in calculating expenses based on an investment in each Fund and in comparing these expenses with similar costs of investing in other mutual funds.
The expense examples provide information about actual account values and actual expenses. In order to estimate the expenses a shareholder paid during the period covered by this report, shareholders can divide their account value by $1,000 and then multiply the result by the number corresponding to their Fund and share class under the heading entitled “Expenses Paid During the Period.”
The expense examples also provide information about hypothetical account values and hypothetical expenses based on a Fund’s actual expense ratio and an assumed rate of return of 5% per year before expenses. In order to assist shareholders in comparing the ongoing expenses of investing in these Funds and other funds, compare the 5% hypothetical examples with the 5% hypothetical examples that appear in shareholder reports of other funds.
The expenses shown in the expense examples are intended to highlight shareholders’ ongoing costs only and do not reflect any transactional expenses, such as sales charges, if any. Therefore, the hypothetical examples are useful in comparing ongoing expenses only, and will not help shareholders determine the relative total expenses of owning different funds. If these transactional expenses were included, shareholder expenses would have been higher.
| ANNUAL REPORT | OCTOBER 31, 2016 | 9 |
BlackRock Emerging Markets Fund, Inc. (Percentages shown are based on Net Assets) |
| Common Stocks | Shares | Value | ||||||||||
Argentina — 4.1% | ||||||||||||
Grupo Financiero Galicia SA — ADR | 197,818 | $ | 6,160,053 | |||||||||
MercadoLibre, Inc. | 28,727 | 4,826,423 | ||||||||||
YPF SA — ADR | 336,565 | 5,977,394 | ||||||||||
|
| |||||||||||
| 16,963,870 | ||||||||||||
Brazil — 13.0% | ||||||||||||
Ambev SA | 978,412 | 5,771,772 | ||||||||||
Banco Nacional SA, Preference Shares (a) | 42,567,626 | 133 | ||||||||||
BRF SA | 374,666 | 6,267,909 | ||||||||||
EcoRodovias Infraestrutura e Logistica SA (a) | 1,511,425 | 4,484,084 | ||||||||||
Itau Unibanco Holding SA, Preference Shares — ADR | 1,246,946 | 14,876,062 | ||||||||||
Kroton Educacional SA | 758,519 | 3,778,337 | ||||||||||
Linx SA | 473,409 | 2,817,911 | ||||||||||
Multiplan Empreendimentos Imobiliarios SA | 40,139 | 806,678 | ||||||||||
Petroleo Brasileiro SA — ADR (a) | 86,819 | 1,013,178 | ||||||||||
Rumo Logistica Operadora Multimodal SA (a) | 3,161,397 | 7,071,546 | ||||||||||
Telefonica Brasil SA, Preference Shares | 450,550 | 6,518,295 | ||||||||||
|
| |||||||||||
| 53,405,905 | ||||||||||||
China — 20.4% | ||||||||||||
Alibaba Group Holding Ltd. — ADR (a) | 129,690 | 13,188,176 | ||||||||||
Anhui Conch Cement Co. Ltd., Class H | 2,750,000 | 7,600,770 | ||||||||||
Bank of China Ltd., Class H | 9,491,200 | 4,253,187 | ||||||||||
CNOOC Ltd. | 2,396,000 | 3,014,824 | ||||||||||
Ctrip.com International Ltd. — ADR (a) | 74,087 | 3,270,941 | ||||||||||
Hengan International Group Co. Ltd. | 93,000 | 738,859 | ||||||||||
Hollysys Automation Technologies, Ltd. | 244,034 | 4,858,717 | ||||||||||
Jiangsu Expressway Co. Ltd., Class H | 3,154,000 | 4,288,281 | ||||||||||
New Oriental Education & Technology Group, Inc. — ADR (a) | 102,228 | 5,124,690 | ||||||||||
Silergy Corp. | 364,000 | 5,303,393 | ||||||||||
SINA Corp. (a) | 80,648 | 5,817,947 | ||||||||||
Sunny Optical Technology Group Co. Ltd. | 503,000 | 2,453,053 | ||||||||||
Tencent Holdings Ltd. | 796,310 | 21,104,063 | ||||||||||
Weibo Corp. — ADR (a) | 8,365 | 384,874 | ||||||||||
ZTO Express Cayman, Inc. — ADR (a) | 134,226 | 2,272,446 | ||||||||||
|
| |||||||||||
| 83,674,221 | ||||||||||||
Hong Kong — 5.4% | ||||||||||||
AIA Group Ltd. | 1,078,000 | 6,781,700 | ||||||||||
Brilliance China Automotive Holdings Ltd. | 4,578,000 | 5,445,562 | ||||||||||
China Overseas Land & Investment Ltd. | 3,220,000 | 9,885,040 | ||||||||||
|
| |||||||||||
| 22,112,302 | ||||||||||||
India — 9.5% | ||||||||||||
Axis Bank Ltd. | 229,235 | 1,676,866 | ||||||||||
Bharat Petroleum Corp. Ltd. | 410,145 | 4,117,879 | ||||||||||
Housing Development Finance Corp. | 284,961 | 5,884,995 | ||||||||||
ITC Ltd. | 1,833,222 | 6,637,844 | ||||||||||
Jubilant Foodworks Ltd. | 236,087 | 3,568,429 | ||||||||||
Lupin Ltd. | 85,886 | 1,953,329 | ||||||||||
NTPC Ltd. | 3,038,702 | 6,875,362 | ||||||||||
Tata Motors Ltd. — ADR | 160,541 | 6,326,921 | ||||||||||
Vakrangee Ltd. | 495,397 | 1,876,746 | ||||||||||
|
| |||||||||||
| 38,918,371 | ||||||||||||
| Common Stocks | Shares | Value | ||||||||||
Indonesia — 5.3% | ||||||||||||
Bank Central Asia Tbk PT | 4,821,124 | $ | 5,732,052 | |||||||||
Bumi Serpong Damai Tbk PT | 18,018,100 | 2,989,551 | ||||||||||
Semen Indonesia Persero Tbk PT | 8,530,500 | 6,429,961 | ||||||||||
Summarecon Agung Tbk PT | 19,537,300 | 2,467,971 | ||||||||||
Telekomunikasi Indonesia Persero Tbk PT | 13,031,000 | 4,207,367 | ||||||||||
|
| |||||||||||
| 21,826,902 | ||||||||||||
Luxembourg — 1.2% | ||||||||||||
Globant SA (a) | 111,508 | 4,850,598 | ||||||||||
Mexico — 6.8% | ||||||||||||
Arca Continental SAB de CV | 816,502 | 5,081,052 | ||||||||||
Fresnillo PLC | 337,279 | 6,785,777 | ||||||||||
Grupo Aeroportuario del Pacifico SAB de CV, Class B | 123,347 | 1,192,226 | ||||||||||
Grupo Financiero Banorte SAB de CV, Series O | 1,522,246 | 8,964,669 | ||||||||||
Wal-Mart de Mexico SAB de CV | 2,889,515 | 6,113,523 | ||||||||||
|
| |||||||||||
| 28,137,247 | ||||||||||||
Peru — 1.3% | ||||||||||||
Credicorp Ltd. | 36,372 | 5,407,789 | ||||||||||
Russia — 5.3% | ||||||||||||
Novatek OJSC — GDR | 68,484 | 7,301,861 | ||||||||||
Sberbank of Russia PJSC — ADR | 1,537,163 | 14,558,763 | ||||||||||
|
| |||||||||||
| 21,860,624 | ||||||||||||
South Africa — 4.6% | ||||||||||||
Naspers Ltd., Class N | 84,472 | 14,147,390 | ||||||||||
Sanlam Ltd. | 974,474 | 4,720,060 | ||||||||||
|
| |||||||||||
| 18,867,450 | ||||||||||||
South Korea — 9.1% | ||||||||||||
Amorepacific Group | 29,938 | 3,864,670 | ||||||||||
GSretail Co. Ltd. | 57,996 | 2,470,276 | ||||||||||
Korea Aerospace Industries Ltd. | 59,885 | 3,382,363 | ||||||||||
KT&G Corp. | 43,737 | 4,313,785 | ||||||||||
NAVER Corp. | 6,384 | 4,776,287 | ||||||||||
POSCO | 34,686 | 7,217,200 | ||||||||||
Samsung Biologics Co. Ltd. (a) | 2,937 | 349,078 | ||||||||||
Samsung Electronics Co. Ltd. | 396 | 566,410 | ||||||||||
Samsung Electronics Co. Ltd., Preference Shares | 3,481 | 4,002,348 | ||||||||||
SK Hynix, Inc. | 184,578 | 6,601,731 | ||||||||||
|
| |||||||||||
| 37,544,148 | ||||||||||||
Taiwan — 6.8% | ||||||||||||
Formosa Chemicals & Fibre Corp. | 1,533,000 | 4,551,484 | ||||||||||
Land Mark Optoelectronics Corp. | 370,000 | 3,316,295 | ||||||||||
Pixart Imaging, Inc. | 190,000 | 411,227 | ||||||||||
Taiwan Semiconductor Manufacturing Co. Ltd. — ADR | 638,045 | 19,843,199 | ||||||||||
|
| |||||||||||
| 28,122,205 | ||||||||||||
Thailand — 3.6% | ||||||||||||
Kasikornbank PCL — NVDR | 483,400 | 2,372,820 | ||||||||||
PTT PCL | 865,500 | 8,556,697 | ||||||||||
Siam Cement PCL — NVDR | 256,078 | 3,656,722 | ||||||||||
|
| |||||||||||
| 14,586,239 | ||||||||||||
| Portfolio Abbreviations |
| ADR | American Depositary Receipts | |
| GDR | Global Depositary Receipt | |
| NVDR | Non-voting Depository Receipts | |
| PCL | Public Company Limited |
See Notes to Financial Statements.
| 10 | ANNUAL REPORT | OCTOBER 31, 2016 |
Schedule of Investments (continued) | BlackRock Emerging Markets Fund, Inc. |
| Common Stocks | Shares | Value | ||||||||||
United States — 0.6% | ||||||||||||
Luxoft Holding, Inc. (a) | 47,422 | $ | 2,513,366 | |||||||||
| Total Common Stocks — 97.0% | 398,791,237 | |||||||||||
| Participation Notes | ||||||||||||
Brazil — 0.9% | ||||||||||||
Morgan Stanley (Multiplan Empreendimentos Imobiliarios SA), due 04/12/19 | 180,550 | 3,653,808 | ||||||||||
Thailand — 0.1% | ||||||||||||
Deutsche Bank (Kasikornbank PCL), due 03/10/25 (a) | 51,616 | 253,674 | ||||||||||
| Total Participation Notes — 1.0% | 3,907,482 | |||||||||||
| Warrants | ||||||||||||
China — 0.9% | ||||||||||||
Weifu High-Technology Group Co., Ltd. | 1,074,423 | 3,790,980 | ||||||||||
Germany — 0.7% | ||||||||||||
Deutsche Bank AG, (Expires 06/08/26) | 56,985 | 2,675,959 | ||||||||||
Luxembourg — 0.9% | ||||||||||||
Zhengzhou Yutong Bus Co., Ltd. | 1,233,204 | 3,925,023 | ||||||||||
| Total Warrants — 2.5% | 10,391,962 | |||||||||||
| Total Long-Term Investments (Cost — $340,395,204) — 100.5% | 413,090,681 | |||||||||||
| Short-Term Securities | Par (000) | Value | ||||||||||
| Time Deposits | ||||||||||||
Hong Kong — 0.0% | ||||||||||||
Brown Brothers Harriman & Co., 0.01%, 11/01/16 | HKD | 438 | $ | 56,507 | ||||||||
United States — 0.0% | ||||||||||||
Citibank N.A., 0.41%, 11/01/16 | USD | 6 | 5,668 | |||||||||
| Total Time Deposits — 0.0% | 62,175 | |||||||||||
| Shares | ||||||||||||
BlackRock Liquidity Funds, T-Fund, Institutional Class, 0.22% (b)(c) | 3,774,950 | 3,774,950 | ||||||||||
| Total Short-Term Securities (Cost — $3,837,125) — 0.9% | 3,837,125 | |||||||||||
| Total Investments (Cost — $344,232,329) — 101.4% | 416,927,806 | |||||||||||
| Liabilities in Excess of Other Assets — (1.4)% | (5,614,697 | ) | ||||||||||
|
| |||||||||||
Net Assets — 100.0% |
| $ | 411,313,109 | |||||||||
|
| |||||||||||
| Notes to Schedule of Investments |
| (a) | Non-income producing security. |
| (b) | During the year ended October 31, 2016, investments in issuers considered to be affiliates of the Fund for purposes of Section 2(a)(3) of the Investment Company Act of 1940, as amended, were as follows: |
| Shares/ Beneficial Interest Held at October 31, 2015 | Net Activity | Shares/ Beneficial Interest Held at October 31, 2016 | Value at October 31, 2016 | Income | ||||||||||||||||
BlackRock Liquidity Funds, TempFund, Institutional Class | 193,162,427 | (193,162,427 | ) | — | — | $ | 19,943 | |||||||||||||
SL Liquidity Series, LLC, Money Market Series | $ | 3,917,695 | $ | (3,917,695 | ) | — | — | 14,546 | 1 | |||||||||||
BlackRock Liquidity Funds, T-Fund, Institutional Class | — | 3,774,950 | 3,774,950 | $ | 3,774,950 | 494 | ||||||||||||||
Total | $ | 3,774,950 | $ | 34,983 | ||||||||||||||||
|
| |||||||||||||||||||
1 Represents securities lending income earned from the reinvestment of cash collateral from loaned securities, net of fees and collateral investment expenses, and other payments to and from borrowers of securities. |
| |||||||||||||||||||
| (c) | Current yield as of period end. |
| Fair Value Hierarchy as of Period End |
Various inputs are used in determining the fair value of investments. For information about the Fund’s policy regarding valuation of investments, refer to the Notes to Financial Statements.
See Notes to Financial Statements.
| ANNUAL REPORT | OCTOBER 31, 2016 | 11 |
Schedule of Investments (concluded) | BlackRock Emerging Markets Fund, Inc. |
The following tables summarize the Fund’s investments categorized in the disclosure hierarchy:
| Level 1 | Level 2 | Level 3 | Total | |||||||||||||
Assets: | ||||||||||||||||
| Investments: | ||||||||||||||||
| Common Stocks: | ||||||||||||||||
Argentina | $ | 16,963,870 | — | — | $ | 16,963,870 | ||||||||||
Brazil | 53,405,772 | — | $ | 133 | 53,405,905 | |||||||||||
China | 34,917,791 | $ | 48,756,430 | — | 83,674,221 | |||||||||||
Hong Kong | — | 22,112,302 | — | 22,112,302 | ||||||||||||
India | 6,326,921 | 32,591,450 | — | 38,918,371 | ||||||||||||
Indonesia | — | 21,826,902 | — | 21,826,902 | ||||||||||||
Luxembourg | 4,850,598 | — | — | 4,850,598 | ||||||||||||
Mexico | 21,351,470 | 6,785,777 | — | 28,137,247 | ||||||||||||
Peru | 5,407,789 | — | — | 5,407,789 | ||||||||||||
Russia | — | 21,860,624 | — | 21,860,624 | ||||||||||||
South Africa | — | 18,867,450 | — | 18,867,450 | ||||||||||||
South Korea | — | 37,544,148 | — | 37,544,148 | ||||||||||||
Taiwan | 19,843,199 | 8,279,006 | — | 28,122,205 | ||||||||||||
Thailand | 8,556,697 | 6,029,542 | — | 14,586,239 | ||||||||||||
United States | 2,513,366 | — | — | 2,513,366 | ||||||||||||
Participation Notes | — | 253,674 | 3,653,808 | 3,907,482 | ||||||||||||
Warrants | — | 10,391,962 | — | 10,391,962 | ||||||||||||
Time Deposits | — | 62,175 | — | 62,175 | ||||||||||||
Short-Term Securities | 3,774,950 | — | — | 3,774,950 | ||||||||||||
|
| |||||||||||||||
Total | $ | 177,912,423 | $ | 235,361,442 | $ | 3,653,941 | $ | 416,927,806 | ||||||||
|
| |||||||||||||||
The Fund may hold assets and/or liabilities in which the fair value approximates the carrying amount for financial statement purposes. As of period end, foreign currency at value of $1,562,551 is categorized as Level 1 within the disclosure hierarchy.
During the year ended October 31, 2016, there were no transfers between Level 1 and Level 2.
See Notes to Financial Statements.
| 12 | ANNUAL REPORT | OCTOBER 31, 2016 |
Schedule of Investments October 31, 2016 | BlackRock Latin America Fund, Inc. (Percentages shown are based on Net Assets) |
| Common Stocks | Shares | Value | ||||||||||
Argentina — 3.0% | ||||||||||||
Adecoagro SA (a) | 110,000 | $ | 1,210,000 | |||||||||
MercadoLibre, Inc. | 5,000 | 840,050 | ||||||||||
Pampa Energia SA, ADR (a) | 45,000 | 1,533,150 | ||||||||||
YPF SA, ADR | 114,000 | 2,024,640 | ||||||||||
|
| |||||||||||
| 5,607,840 | ||||||||||||
Brazil — 63.5% | ||||||||||||
AMBEV SA — ADR | 1,850,000 | 10,915,000 | ||||||||||
Arezzo Industria e Comercio SA | 130,000 | 1,204,292 | ||||||||||
Banco Bradesco SA — ADR | 1,550,000 | 16,135,500 | ||||||||||
BM&FBovespa SA | 1,041,000 | 6,131,203 | ||||||||||
Bradespar SA, Preference Shares | 150,000 | 609,962 | ||||||||||
BRF SA | 38,000 | 635,714 | ||||||||||
BRF SA — ADR | 315,000 | 5,266,800 | ||||||||||
CCR SA | 525,000 | 2,853,619 | ||||||||||
Cielo SA | 640,000 | 6,496,241 | ||||||||||
Iguatemi Empresa de Shopping Centers SA | 150,000 | 1,416,823 | ||||||||||
Iochpe-Maxion SA | 215,000 | 1,091,165 | ||||||||||
Itau Unibanco Holding SA, Preference Shares — ADR | 1,595,000 | 19,028,350 | ||||||||||
Klabin SA, Preference Shares | 365,000 | 1,881,031 | ||||||||||
Kroton Educacional SA | 600,000 | 2,988,722 | ||||||||||
Petroleo Brasileiro SA — ADR (a) | 1,600,000 | 17,787,500 | ||||||||||
Raia Drogasil SA | 130,000 | 2,885,902 | ||||||||||
Rumo Logistica Operadora Multimodal SA (a) | 1,500,000 | 3,355,263 | ||||||||||
Sao Martinho SA | 60,000 | 1,194,925 | ||||||||||
Telefonica Brasil SA — ADR | 125,000 | 1,800,000 | ||||||||||
Telefonica Brasil SA, Preference Shares | 285,000 | 4,123,214 | ||||||||||
Transmissora Alianca de Energia Eletrica SA | 165,168 | 1,073,696 | ||||||||||
Ultrapar Participacoes SA | 190,000 | 4,305,357 | ||||||||||
Vale SA, Preference Shares — ADR | 400,000 | 2,576,000 | ||||||||||
Vale SA — ADR | 285,000 | 1,972,200 | ||||||||||
Valid Solucoes e Servicos de Seguranca em Meios de Pagamento e Identificacao SA | 75,000 | 702,773 | ||||||||||
|
| |||||||||||
| 118,431,252 | ||||||||||||
Chile — 1.5% | ||||||||||||
Empresa Nacional de Electricidad SA | 600,000 | 413,897 | ||||||||||
Empresa Nacional de Electricidad SA — ADR | 24,000 | 498,240 | ||||||||||
Endesa SA | 600,000 | 279,186 | ||||||||||
Endesa SA — ADR | 24,000 | 344,880 | ||||||||||
Itau CorpBanca | 132,000,000 | 1,199,927 | ||||||||||
|
| |||||||||||
| 2,736,130 | ||||||||||||
Colombia — 0.4% | ||||||||||||
Cemex Latam Holdings SA (a) | 220,000 | 818,018 | ||||||||||
Mexico — 24.9% | ||||||||||||
Alsea SAB de CV | 325,000 | 1,212,925 | ||||||||||
Arca Continental SAB de CV | 415,000 | 2,582,525 | ||||||||||
Cemex SAB de CV — ADR (a) | 650,000 | 5,642,000 | ||||||||||
Controladora Vuela Cia de Aviacion SAB de CV — ADR (a) | 75,000 | 1,433,250 | ||||||||||
Corp. Inmobiliaria Vesta SAB de CV | 865,000 | 1,308,872 | ||||||||||
Fibra Uno Administracion SA de CV | 1,280,000 | 2,442,707 | ||||||||||
Fomento Economico Mexicano SAB de CV — ADR | 85,000 | 8,131,950 | ||||||||||
Grupo Aeroportuario del Centro Norte SAB de CV | 215,000 | 1,250,915 | ||||||||||
Grupo Bimbo SAB de CV, Series A | 1,000,000 | 2,693,508 | ||||||||||
Grupo Financiero Banorte SAB de CV, Series O | 1,100,000 | 6,478,017 | ||||||||||
Grupo Mexico SAB de CV, Series B | 2,000,000 | 4,927,782 | ||||||||||
Infraestructura Energetica Nova SAB de CV | 358,807 | 1,588,539 | ||||||||||
Mexico Real Estate Management SA de CV (a) | 550,000 | 692,847 | ||||||||||
PLA Administradora Industrial S de RL de CV (a) | 755,000 | 1,251,077 | ||||||||||
| Common Stocks | Shares | Value | ||||||||||
Mexico (continued) | ||||||||||||
Wal-Mart de Mexico SAB de CV | 2,250,000 | $ | 4,760,462 | |||||||||
|
| |||||||||||
| 46,397,376 | ||||||||||||
Peru — 5.2% | ||||||||||||
Compania de Minas Buenaventura SA — ADR (a) | 150,000 | 1,993,500 | ||||||||||
Credicorp Ltd. | 33,000 | 4,906,440 | ||||||||||
Grana y Montero SA — ADR | 90,000 | 750,600 | ||||||||||
Southern Copper Corp. | 75,000 | 2,129,250 | ||||||||||
|
| |||||||||||
| 9,779,790 | ||||||||||||
| Total Common Stocks — 98.5% | 183,770,406 | |||||||||||
| Corporate Bonds | Par (000) | |||||||||||
Brazil — 0.4% | ||||||||||||
Hypermarcas SA, 11.30%, 10/15/18 | BRL | 549 | 57,023 | |||||||||
Klabin SA: | ||||||||||||
12.24%, 1/08/19 (b)(c) | 24 | 383,067 | ||||||||||
7.25%, 6/15/20 | 22 | 114,831 | ||||||||||
2.50%, 6/15/22 | 21 | 105,997 | ||||||||||
Lupatech SA, Series 1, 6.50%, 4/15/18 (a)(c)(d) | 2,128 | 33,333 | ||||||||||
|
| |||||||||||
| 694,251 | ||||||||||||
| Total Corporate Bonds — 0.4% | 694,251 | |||||||||||
| Participation Notes — 1.0% | Shares | |||||||||||
Brazil — 1.0% | ||||||||||||
Morgan Stanley BV, (Lojas Renner SA), due 2/27/17 | USD | 185,000 | 1,861,766 | |||||||||
| Warrants — 0.0% | ||||||||||||
Brazil — 0.0% | ||||||||||||
Klabin SA (Expires 06/15/20) | 22,282 | — | ||||||||||
| Total Long-Term Investments (Cost — $136,221,986) — 99.9% | 186,326,423 | |||||||||||
| Short-Term Securities | Par (000) | |||||||||||
| Time Deposits — 0.0% | ||||||||||||
United States — 0.0% | ||||||||||||
Citibank N.A., 0.41%, 11/01/16 | USD | 7 | 7,250 | |||||||||
| Shares | ||||||||||||
BlackRock Liquidity Funds, T-Fund, Institutional Class, 0.22% (e)(f) | 639,493 | 639,493 | ||||||||||
| Total Short-Term Securities (Cost — $646,743) — 0.3% | 646,743 | |||||||||||
| Total Investments (Cost — $136,868,729) — 100.2% | 186,973,166 | |||||||||||
| Liabilities in Excess of Other Assets — (0.2)% | (339,212 | ) | ||||||||||
|
| |||||||||||
Net Assets — 100.0% |
| $ | 186,633,954 | |||||||||
|
| |||||||||||
See Notes to Financial Statements.
| ANNUAL REPORT | OCTOBER 31, 2016 | 13 |
Schedule of Investments (continued) | BlackRock Latin America Fund, Inc. |
| Notes to Schedule of Investments |
| (a) | Non-income producing security. |
| (b) | Step-up bond that pays an initial coupon rate for the first period and then a higher coupon rate for the following periods. Rate as of period end. |
| (c) | Convertible security. |
| (d) | Issuer filed for bankruptcy and/or is in default. |
| (e) | Current yield as of period end. |
| (f) | During the year ended October 31, 2016, investments in issuers considered to be affiliates of the Fund for purposes of Section 2(a)(3) of the Investment Company Act of 1940, as amended, were as follows: |
| Affiliate | Shares/ Beneficial Interest Held at October 31, 2015 | Net Activity | Shares/ Beneficial Interest Held at October 31, 2016 | Value at October 31, 2016 | Income | |||||||||||||||
BlackRock Liquidity Funds, TempFund, Institutional Class | 1,410,505 | (1,410,505 | ) | — | — | $ | 9,558 | |||||||||||||
SL Liquidity Series, LLC, Money Market Series | $ | 1,070,034 | $ | (1,070,034 | ) | — | — | 5,624 | 1 | |||||||||||
BlackRock Liquidity Funds, T-Fund, Institutional Class | — | 639,493 | 639,493 | $ | 639,493 | 638 | ||||||||||||||
Total | $ | 639,493 | $ | 15,820 | ||||||||||||||||
|
|
|
| |||||||||||||||||
1 Represents securities lending income earned from the reinvestment of cash collateral from loaned securities, net of fees and collateral investment expenses, and other payments to and from borrowers of securities. |
| |||||||||||||||||||
| Fair Value Hierarchy as of Period End |
Various inputs are used in determining the fair value of investments. For information about the Fund’s policy regarding valuation of investments, refer to the Notes to Financial Statements.
The following tables summarize the Fund’s investments categorized in the disclosure hierarchy:
| Level 1 | Level 2 | Level 3 | Total | |||||||||||||
Assets: | ||||||||||||||||
| Investments: | ||||||||||||||||
| Common Stocks: | ||||||||||||||||
Argentina | $ | 5,607,840 | — | — | $ | 5,607,840 | ||||||||||
Brazil | 118,431,252 | — | — | 118,431,252 | ||||||||||||
Chile | 2,736,130 | — | — | 2,736,130 | ||||||||||||
Colombia | 818,018 | — | — | 818,018 | ||||||||||||
Mexico | 46,397,376 | — | — | 46,397,376 | ||||||||||||
Peru | 9,779,790 | — | — | 9,779,790 | ||||||||||||
Corporate Bonds | — | $ | 637,228 | $ | 57,023 | 694,251 | ||||||||||
Participation Notes | — | — | 1,861,766 | 1,861,766 | ||||||||||||
Short-Term Securities | 639,493 | 7,250 | — | 646,743 | ||||||||||||
|
| |||||||||||||||
Total | $ | 184,409,899 | $ | 644,478 | $ | 1,918,789 | $ | 186,973,166 | ||||||||
|
| |||||||||||||||
The Fund may hold assets and/or liabilities in which the fair value approximates the carrying amount for financial statement purposes. As of period end, foreign currency at value of $132,607 is categorized as Level 1 within the disclosure hierarchy.
During the year ended October 31, 2016, there were no transfers between Level 1 and Level 2.
See Notes to Financial Statements.
| 14 | ANNUAL REPORT | OCTOBER 31, 2016 |
Schedule of Investments (concluded) | BlackRock Latin America Fund, Inc. |
A reconciliation of Level 3 investments is presented when the Fund had a significant amount of Level 3 investments at the beginning and/or end of the period in relation to net assets. The following table is a reconciliation of Level 3 investments for which significant unobservable inputs were used in determining fair value:
Corporate Bonds | Participation Notes | Total | ||||||||||
Assets: | ||||||||||||
Opening Balance, as of October 31, 2015 | $ | 538,607 | $ | 1,407,084 | $ | 1,945,691 | ||||||
Transfers into Level 3 | — | — | — | |||||||||
Transfers out of Level 3 | (431,992 | ) | — | (431,992 | ) | |||||||
Accrued discounts/premiums | — | — | — | |||||||||
Net realized gain (loss) | (81,293 | ) | 21,338 | (59,955 | ) | |||||||
Net change in unrealized appreciation (depreciation)1,2 | 112,734 | 647,852 | 760,586 | |||||||||
Purchases | — | — | — | |||||||||
Sales | (81,033 | ) | (214,508 | ) | (295,541 | ) | ||||||
|
| |||||||||||
Closing Balance, as of October 31, 2016 | $ | 57,023 | $ | 1,861,766 | $ | 1,918,789 | ||||||
|
| |||||||||||
Net change in unrealized appreciation (depreciation) on investments still held at October 31, 20162 | $ | 112,734 | $ | 591,682 | $ | 704,416 | ||||||
|
| |||||||||||
1 Included in the related net change in unrealized appreciation (depreciation) in the Statements of Operations. |
| |||||||||||
2 Any difference between net change in unrealized appreciation (depreciation) and net change in unrealized appreciation (depreciation) on investments still held at October 31, 2016 is generally due to investments no longer held or categorized as Level 3 at period end. |
| |||||||||||
The Fund’s investments that are categorized as Level 3 were valued utilizing third party pricing information without adjustment. Such valuations are based on unobservable inputs. A significant change in third party information inputs could result in a significantly lower or higher value of such Level 3 investments.
See Notes to Financial Statements.
| ANNUAL REPORT | OCTOBER 31, 2016 | 15 |
| Statements of Assets and Liabilities |
| October 31, 2016 | BlackRock Emerging Markets Fund, Inc. | BlackRock Latin America Fund, Inc. | ||||||
| Assets | ||||||||
Investments at value — unaffiliated1 | $ | 413,152,856 | $ | 186,333,673 | ||||
Investments at value — affiliated2 | 3,774,950 | 639,493 | ||||||
Foreign currency at value3 | 1,562,551 | 132,607 | ||||||
| Receivables: | ||||||||
Investments sold — unaffiliated | 11,397,656 | 1,011,220 | ||||||
Capital shares sold | 268,598 | 239,394 | ||||||
Dividends — unaffiliated | 169,849 | 636,961 | ||||||
Dividends — affiliated | 127 | 166 | ||||||
Interest — unaffiliated | — | 57,637 | ||||||
Prepaid expenses | 46,838 | 37,053 | ||||||
|
| |||||||
Total assets | 430,373,425 | 189,088,204 | ||||||
|
| |||||||
| Liabilities | ||||||||
| Payables: | ||||||||
Investments purchased — unaffiliated | 14,853,793 | 1,439,457 | ||||||
Capital shares redeemed | 3,126,492 | 522,966 | ||||||
Other accrued expenses | 577,025 | 242,767 | ||||||
Investment advisory fees | 360,351 | 154,094 | ||||||
Service and distribution fees | 128,426 | 42,135 | ||||||
Deferred foreign capital gain tax | 5,292 | 48,386 | ||||||
Officer’s and Directors’ fees | 4,515 | 3,189 | ||||||
Other affiliates | 4,422 | 1,256 | ||||||
|
| |||||||
Total liabilities | 19,060,316 | 2,454,250 | ||||||
|
| |||||||
Net Assets | $ | 411,313,109 | $ | 186,633,954 | ||||
|
| |||||||
| Net Assets Consist of | ||||||||
Paid-in capital | $ | 474,670,009 | $ | 232,325,295 | ||||
Undistributed net investment income | 1,833,247 | 1,822,779 | ||||||
Accumulated net realized loss | (137,874,562 | ) | (97,587,766 | ) | ||||
Net unrealized appreciation (depreciation) | 72,684,415 | 50,073,646 | ||||||
|
| |||||||
Net Assets | $ | 411,313,109 | $ | 186,633,954 | ||||
|
| |||||||
1 Investments at cost — unaffiliated | $ | 340,457,379 | $ | 136,229,236 | ||||
2 Investments at cost — affiliated | $ | 3,774,950 | $ | 639,493 | ||||
3 Foreign currency at cost | $ | 1,562,382 | $ | 133,678 | ||||
| See Notes to Financial Statements. | ||||||
| 16 | ANNUAL REPORT | OCTOBER 31, 2016 | ||||
| Statements of Assets and Liabilities (concluded) |
| October 31, 2016 | BlackRock Emerging Markets Fund, Inc. | BlackRock Latin America Fund, Inc. | ||||||
| Net Asset Value | ||||||||
| Institutional: | ||||||||
Net assets | $ | 120,938,833 | $ | 56,866,869 | ||||
|
| |||||||
Shares outstanding, 100 million shares authorized | 6,599,747 | 1,257,620 | ||||||
|
| |||||||
Net asset value | $ | 18.32 | $ | 45.22 | ||||
|
| |||||||
Par value | $ | 0.100 | $ | 0.100 | ||||
|
| |||||||
| Investor A: | ||||||||
Net assets | $ | 191,204,518 | $ | 105,413,749 | ||||
|
| |||||||
Shares outstanding, 100 million shares authorized | 10,848,587 | 2,365,265 | ||||||
|
| |||||||
Net asset value | $ | 17.62 | $ | 44.57 | ||||
|
| |||||||
Par value | $ | 0.100 | $ | 0.100 | ||||
|
| |||||||
| Investor B: | ||||||||
Net assets | — | $ | 236,385 | |||||
|
| |||||||
Shares outstanding, 100 million shares authorized | — | 5,730 | ||||||
|
| |||||||
Net asset value | — | $ | 41.25 | |||||
|
| |||||||
Par value | — | $ | 0.100 | |||||
|
| |||||||
| Investor C: | ||||||||
Net assets | $ | 99,169,758 | $ | 24,116,951 | ||||
|
| |||||||
Shares outstanding, 100 million shares authorized | 6,643,474 | 596,228 | ||||||
|
| |||||||
Net asset value | $ | 14.93 | $ | 40.45 | ||||
|
| |||||||
Par value | $ | 0.100 | $ | 0.100 | ||||
|
| |||||||
| See Notes to Financial Statements. | ||||||
| ANNUAL REPORT | OCTOBER 31, 2016 | 17 | ||||
| Statements of Operations |
| Year Ended October 31, 2016 | BlackRock Emerging Markets Fund, Inc. | BlackRock Latin America Fund, Inc. | ||||||
| Investment Income | ||||||||
Dividends — unaffiliated | $ | 10,241,187 | $ | 4,851,364 | ||||
Dividends — affiliated | 20,437 | 10,196 | ||||||
Interest — unaffiliated | 19,900 | 184,657 | ||||||
Securities lending — affiliated — net | 14,546 | 5,624 | ||||||
Foreign taxes withheld | (904,883 | ) | (353,269 | ) | ||||
|
| |||||||
Total Investment Income | 9,391,187 | 4,698,572 | ||||||
|
| |||||||
| Expenses | ||||||||
Investment advisory | 4,292,692 | 1,658,853 | ||||||
Service and distribution — class specific | 1,516,313 | 465,490 | ||||||
Transfer agent — class specific | 1,018,213 | 346,727 | ||||||
Custodian | 197,018 | 77,116 | ||||||
Accounting services | 142,887 | 37,318 | ||||||
Professional | 93,504 | 74,781 | ||||||
Registration | 85,949 | 59,364 | ||||||
Printing | 46,725 | 24,419 | ||||||
Officer and Directors | 20,607 | 13,383 | ||||||
Miscellaneous | 31,029 | 24,034 | ||||||
|
| |||||||
Total expenses | 7,444,937 | 2,781,485 | ||||||
| Less: | ||||||||
Fees waived by the Manager | (4,426 | ) | (2,150 | ) | ||||
Fees paid indirectly | (47 | ) | (364 | ) | ||||
|
| |||||||
Total expenses after fees waived and paid indirectly | 7,440,464 | 2,778,971 | ||||||
|
| |||||||
Net investment income | 1,950,723 | 1,919,601 | ||||||
|
| |||||||
| Realized and Unrealized Gain (Loss) | ||||||||
| Net realized gain (loss) from: | ||||||||
Investments | (6,256,487 | ) | (14,370,388 | )1 | ||||
Foreign currency transactions | (518,883 | ) | (23,223 | ) | ||||
|
| |||||||
| (6,775,370 | ) | (14,393,611 | ) | |||||
|
| |||||||
| Net change in unrealized appreciation (depreciation) on: | ||||||||
Investments | 53,193,576 | 2 | 55,593,202 | 3 | ||||
Foreign currency translations | 341,421 | 185,009 | ||||||
|
| |||||||
| 53,534,997 | 55,778,211 | |||||||
|
| |||||||
Net realized and unrealized gain | 46,759,627 | 41,384,600 | ||||||
|
| |||||||
Net Increase in Net Assets Resulting from Operations | $ | 48,710,350 | $ | 43,304,201 | ||||
|
| |||||||
1 Including $7,286 realized foreign capital gain tax. |
| |||||||
2 Including $(5,292) unrealized foreign capital gain tax. |
| |||||||
3 Including $(48,386) unrealized foreign capital gain tax. |
| |||||||
| See Notes to Financial Statements. | ||||||
| 18 | ANNUAL REPORT | OCTOBER 31, 2016 | ||||
| Statements of Changes in Net Assets | BlackRock Emerging Markets Fund, Inc. |
| Year Ended October 31, | ||||||||
| Increase (Decrease) in Net Assets: | 2016 | 2015 | ||||||
| Operations | ||||||||
Net investment income | $ | 1,950,723 | $ | 5,561,859 | ||||
Net realized loss | (6,775,370 | ) | (67,254,918 | ) | ||||
Net change in unrealized appreciation (depreciation) | 53,534,997 | (100,398,173 | ) | |||||
|
| |||||||
Net increase (decrease) in net assets resulting from operations | 48,710,350 | (162,091,232 | ) | |||||
|
| |||||||
| Distributions to Shareholders1 | ||||||||
| From net investment income: | ||||||||
Institutional | (1,981,110 | ) | (2,841,195 | ) | ||||
Investor A | (1,730,786 | ) | (328,181 | ) | ||||
Investor C | (298,064 | ) | — | |||||
|
| |||||||
Decrease in net assets resulting from distributions to shareholders | (4,009,960 | ) | (3,169,376 | ) | ||||
|
| |||||||
| Capital Share Transactions | ||||||||
Net decrease in net assets derived from capital share transactions | (106,972,143 | ) | (189,154,921 | ) | ||||
|
| |||||||
| Net Assets | ||||||||
Total decrease in net assets | (62,271,753 | ) | (354,415,529 | ) | ||||
Beginning of year | 473,584,862 | 828,000,391 | ||||||
|
| |||||||
End of year | $ | 411,313,109 | $ | 473,584,862 | ||||
|
| |||||||
Undistributed net investment income, end of year | $ | 1,833,247 | $ | 4,100,248 | ||||
|
| |||||||
1 Distributions for annual periods determined in accordance with federal income tax regulations. |
| |||||||
| See Notes to Financial Statements. | ||||||
| ANNUAL REPORT | OCTOBER 31, 2016 | 19 | ||||
| Statements of Changes in Net Assets | BlackRock Latin America Fund, Inc. |
| Year Ended October 31, | ||||||||
| Increase (Decrease) in Net Assets: | 2016 | 2015 | ||||||
| Operations | ||||||||
Net investment income | $ | 1,919,601 | $ | 1,739,213 | ||||
Net realized loss | (14,393,611 | ) | (22,840,827 | ) | ||||
Net change in unrealized appreciation (depreciation) | 55,778,211 | (75,271,244 | ) | |||||
|
| |||||||
Net increase (decrease) in net assets resulting from operations | 43,304,201 | (96,372,858 | ) | |||||
|
| |||||||
| Distributions to Shareholders1 | ||||||||
| From net investment income: | ||||||||
Institutional | (342,238 | ) | (1,688,848 | ) | ||||
Investor A | (365,980 | ) | (3,149,648 | ) | ||||
Investor B | — | (14,311 | ) | |||||
Investor C | — | (488,390 | ) | |||||
|
| |||||||
Decrease in net assets resulting from distributions to shareholders | (708,218 | ) | (5,341,197 | ) | ||||
|
| |||||||
| Capital Share Transactions | ||||||||
Net decrease in net assets derived from capital share transactions | (18,647,180 | ) | (54,655,555 | ) | ||||
|
| |||||||
| Net Assets | ||||||||
Total increase (decrease) in net assets | 23,948,803 | (156,369,610 | ) | |||||
Beginning of year | 162,685,151 | 319,054,761 | ||||||
|
| |||||||
End of year | $ | 186,633,954 | $ | 162,685,151 | ||||
|
| |||||||
Undistributed net investment income, end of year | $ | 1,822,779 | $ | 705,383 | ||||
|
| |||||||
1 Distributions for annual periods determined in accordance with federal income tax regulations. | ||||||||
| See Notes to Financial Statements. | ||||||
| 20 | ANNUAL REPORT | OCTOBER 31, 2016 | ||||
| Financial Highlights | BlackRock Emerging Markets Fund, Inc. |
| Institutional | ||||||||||||||||||||
| Year Ended October 31, | ||||||||||||||||||||
| 2016 | 2015 | 2014 | 2013 | 2012 | ||||||||||||||||
| Per Share Operating Performance | ||||||||||||||||||||
Net asset value, beginning of year | $ | 16.51 | $ | 20.56 | $ | 20.10 | $ | 19.28 | $ | 18.23 | ||||||||||
|
| |||||||||||||||||||
Net investment income1 | 0.16 | 0.19 | 0.18 | 0.19 | 0.29 | |||||||||||||||
Net realized and unrealized gain (loss) | 1.86 | (4.13 | ) | 0.39 | 0.90 | 0.85 | ||||||||||||||
|
| |||||||||||||||||||
Net increase (decrease) from investment operations | 2.02 | (3.94 | ) | 0.57 | 1.09 | 1.14 | ||||||||||||||
|
| |||||||||||||||||||
Distributions from net investment income2 | (0.21 | ) | (0.11 | ) | (0.11 | ) | (0.27 | ) | (0.09 | ) | ||||||||||
|
| |||||||||||||||||||
Net asset value, end of year | $ | 18.32 | $ | 16.51 | $ | 20.56 | $ | 20.10 | $ | 19.28 | ||||||||||
|
| |||||||||||||||||||
| Total Return3 | ||||||||||||||||||||
Based on net asset value | 12.47% | (19.24)% | 2.86% | 5.67% | 4 | 6.37% | ||||||||||||||
|
| |||||||||||||||||||
| Ratios to Average Net Assets | ||||||||||||||||||||
Total expenses | 1.20% | 1.17% | 5 | 1.17% | 1.29% | 1.33% | ||||||||||||||
|
| |||||||||||||||||||
Total expenses after fees waived and paid indirectly | 1.20% | 1.17% | 5 | 1.16% | 1.29% | 1.33% | ||||||||||||||
|
| |||||||||||||||||||
Net investment income | 0.97% | 0.98% | 5 | 0.88% | 0.95% | 1.53% | ||||||||||||||
|
| |||||||||||||||||||
| Supplemental Data | ||||||||||||||||||||
Net assets, end of year (000) | $ | 120,939 | $ | 169,509 | $ | 467,132 | $ | 186,724 | $ | 116,883 | ||||||||||
|
| |||||||||||||||||||
Portfolio turnover rate | 92% | 103% | 94% | 71% | 155% | |||||||||||||||
|
| |||||||||||||||||||
| 1 | Based on average shares outstanding. |
| 2 | Distributions for annual periods determined in accordance with federal income tax regulations. |
| 3 | Where applicable, assumes the reinvestment of distributions. |
| 4 | Includes a payment from an affiliate to compensate for forgone securities lending revenue which impacted the Fund’s total return. Not including this payment, the Fund’s total return would have been 5.51%. |
| 5 | Excludes 0.01% of expenses incurred indirectly as a result of investments in underlying funds. |
| See Notes to Financial Statements. | ||||||
| ANNUAL REPORT | OCTOBER 31, 2016 | 21 | ||||
| Financial Highlights (continued) | BlackRock Emerging Markets Fund, Inc. |
| Investor A | ||||||||||||||||||||
| Year Ended October 31, | ||||||||||||||||||||
| 2016 | 2015 | 2014 | 2013 | 2012 | ||||||||||||||||
| Per Share Operating Performance | ||||||||||||||||||||
Net asset value, beginning of year | $ | 15.89 | $ | 19.81 | $ | 19.38 | $ | 18.61 | $ | 17.60 | ||||||||||
|
| |||||||||||||||||||
Net investment income1 | 0.08 | 0.10 | 0.06 | 0.13 | 0.22 | |||||||||||||||
Net realized and unrealized gain (loss) | 1.79 | (3.99 | ) | 0.42 | 0.86 | 0.83 | ||||||||||||||
|
| |||||||||||||||||||
Net increase (decrease) from investment operations | 1.87 | (3.89 | ) | 0.48 | 0.99 | 1.05 | ||||||||||||||
|
| |||||||||||||||||||
Distributions from net investment income2 | (0.14 | ) | (0.03 | ) | (0.05 | ) | (0.22 | ) | (0.04 | ) | ||||||||||
|
| |||||||||||||||||||
Net asset value, end of year | $ | 17.62 | $ | 15.89 | $ | 19.81 | $ | 19.38 | $ | 18.61 | ||||||||||
|
| |||||||||||||||||||
| Total Return3 | ||||||||||||||||||||
Based on net asset value | 11.95% | (19.67)% | 2.46% | 5.30% | 4 | 6.02% | ||||||||||||||
|
| |||||||||||||||||||
| Ratios to Average Net Assets | ||||||||||||||||||||
Total expenses | 1.68% | 1.62% | 5 | 1.58% | 1.60% | 1.67% | ||||||||||||||
|
| |||||||||||||||||||
Total expenses after fees waived and paid indirectly | 1.68% | 1.62% | 5 | 1.58% | 1.60% | 1.67% | ||||||||||||||
|
| |||||||||||||||||||
Net investment income | 0.51% | 0.56% | 5 | 0.32% | 0.69% | 1.24% | ||||||||||||||
|
| |||||||||||||||||||
| Supplemental Data | ||||||||||||||||||||
Net assets, end of year (000) | $ | 191,205 | $ | 193,165 | $ | 231,467 | $ | 215,490 | $ | 174,637 | ||||||||||
|
| |||||||||||||||||||
Portfolio turnover rate | 92% | 103% | 94% | 71% | 155% | |||||||||||||||
|
| |||||||||||||||||||
| 1 | Based on average shares outstanding. |
| 2 | Distributions for annual periods determined in accordance with federal income tax regulations. |
| 3 | Where applicable, excludes the effects of any sales charges and assumes the reinvestment of distributions. |
| 4 | Includes a payment from an affiliate to compensate for forgone securities lending revenue which impacted the Fund’s total return. Not including this payment, the Fund’s total return would have been 5.13%. |
| 5 | Excludes 0.01% of expenses incurred indirectly as a result of investments in underlying funds. |
| See Notes to Financial Statements. | ||||||
| 22 | ANNUAL REPORT | OCTOBER 31, 2016 | ||||
| Financial Highlights (concluded) | BlackRock Emerging Markets Fund, Inc. |
| Investor C | ||||||||||||||||||||
| Year Ended October 31, | ||||||||||||||||||||
| 2016 | 2015 | 2014 | 2013 | 2012 | ||||||||||||||||
| Per Share Operating Performance | ||||||||||||||||||||
Net asset value, beginning of year | $ | 13.48 | $ | 16.91 | $ | 16.65 | $ | 16.02 | $ | 15.26 | ||||||||||
|
| |||||||||||||||||||
Net investment income (loss)1 | (0.04 | ) | (0.04 | ) | (0.08 | ) | (0.03 | ) | 0.06 | |||||||||||
Net realized and unrealized gain (loss) | 1.53 | (3.39 | ) | 0.34 | 0.74 | 0.71 | ||||||||||||||
|
| |||||||||||||||||||
Net increase (decrease) from investment operations | 1.49 | (3.43 | ) | 0.26 | 0.71 | 0.77 | ||||||||||||||
|
| |||||||||||||||||||
Distributions from net investment income2 | (0.04 | ) | — | — | (0.08 | ) | (0.01 | ) | ||||||||||||
|
| |||||||||||||||||||
Net asset value, end of year | $ | 14.93 | $ | 13.48 | $ | 16.91 | $ | 16.65 | $ | 16.02 | ||||||||||
|
| |||||||||||||||||||
| Total Return3 | ||||||||||||||||||||
Based on net asset value | 11.07% | (20.28)% | 1.56% | 4.45% | 4 | 5.07% | ||||||||||||||
|
| |||||||||||||||||||
| Ratios to Average Net Assets | ||||||||||||||||||||
Total expenses | 2.52% | 2.44% | 5 | 2.41% | 2.46% | 2.56% | ||||||||||||||
|
| |||||||||||||||||||
Total expenses after fees waived and paid indirectly | 2.52% | 2.44% | 5 | 2.41% | 2.46% | 2.56% | ||||||||||||||
|
| |||||||||||||||||||
Net investment income (loss) | (0.33)% | (0.26)% | 5 | (0.49)% | (0.18)% | 0.38% | ||||||||||||||
|
| |||||||||||||||||||
| Supplemental Data | ||||||||||||||||||||
Net assets, end of year (000) | $ | 99,170 | $ | 110,911 | $ | 128,684 | $ | 119,015 | $ | 102,559 | ||||||||||
|
| |||||||||||||||||||
Portfolio turnover rate | 92% | 103% | 94% | 71% | 155% | |||||||||||||||
|
| |||||||||||||||||||
| 1 | Based on average shares outstanding. |
| 2 | Distributions for annual periods determined in accordance with federal income tax regulations. |
| 3 | Where applicable, excludes the effects of any sales charges and assumes the reinvestment of distributions. |
| 4 | Includes a payment from an affiliate to compensate for forgone securities lending revenue which impacted the Fund’s total return. Not including this payment, the Fund’s total return would have been 4.27%. |
| 5 | Excludes 0.01% of expenses incurred indirectly as a result of investments in underlying funds. |
| See Notes to Financial Statements. | ||||||
| ANNUAL REPORT | OCTOBER 31, 2016 | 23 | ||||
| Financial Highlights | BlackRock Latin America Fund, Inc. |
| Institutional | ||||||||||||||||||||
| Year Ended October 31, | ||||||||||||||||||||
| 2016 | 2015 | 2014 | 2013 | 2012 | ||||||||||||||||
| Per Share Operating Performance | ||||||||||||||||||||
Net asset value, beginning of year | $ | 34.98 | $ | 54.16 | $ | 56.13 | $ | 58.82 | $ | 62.80 | ||||||||||
|
| |||||||||||||||||||
Net investment income1 | 0.56 | 0.49 | 1.08 | 0.79 | 0.94 | |||||||||||||||
Net realized and unrealized gain (loss) | 9.95 | (18.53 | ) | (2.52 | ) | (2.48 | ) | (4.38 | ) | |||||||||||
|
| |||||||||||||||||||
Net increase (decrease) from investment operations | 10.51 | (18.04 | ) | (1.44 | ) | (1.69 | ) | (3.44 | ) | |||||||||||
|
| |||||||||||||||||||
Distributions from net investment income2 | (0.27 | ) | (1.14 | ) | (0.53 | ) | (1.00 | ) | (0.54 | ) | ||||||||||
|
| |||||||||||||||||||
Net asset value, end of year | $ | 45.22 | $ | 34.98 | $ | 54.16 | $ | 56.13 | $ | 58.82 | ||||||||||
|
| |||||||||||||||||||
| Total Return3 | ||||||||||||||||||||
Based on net asset value | 30.32% | (33.77)% | (2.51)% | (3.01)% | (5.43)% | |||||||||||||||
|
| |||||||||||||||||||
| Ratios to Average Net Assets | ||||||||||||||||||||
Total expenses | 1.33% | 1.32% | 1.25% | 1.27% | 1.32% | |||||||||||||||
|
| |||||||||||||||||||
Total expenses after fees waived and paid indirectly | 1.33% | 1.32% | 1.25% | 1.27% | 1.32% | |||||||||||||||
|
| |||||||||||||||||||
Net investment income | 1.52% | 1.14% | 1.99% | 1.36% | 1.55% | |||||||||||||||
|
| |||||||||||||||||||
| Supplemental Data | ||||||||||||||||||||
Net assets, end of year (000) | $ | 56,867 | $ | 45,472 | $ | 87,941 | $ | 110,295 | $ | 125,473 | ||||||||||
|
| |||||||||||||||||||
Portfolio turnover rate | 58% | 35% | 42% | 66% | 50% | |||||||||||||||
|
| |||||||||||||||||||
| 1 | Based on average shares outstanding. |
| 2 | Distributions for annual periods determined in accordance with federal income tax regulations. |
| 3 | Where applicable, assumes the reinvestment of distributions. |
| See Notes to Financial Statements. | ||||||
| 24 | ANNUAL REPORT | OCTOBER 31, 2016 | ||||
| Financial Highlights (continued) | BlackRock Latin America Fund, Inc. |
| Investor A | ||||||||||||||||||||
| Year Ended October 31, | ||||||||||||||||||||
| 2016 | 2015 | 2014 | 2013 | 2012 | ||||||||||||||||
| Per Share Operating Performance | ||||||||||||||||||||
Net asset value, beginning of year | $ | 34.45 | $ | 53.31 | $ | 55.21 | $ | 57.90 | $ | 61.67 | ||||||||||
|
| |||||||||||||||||||
Net investment income1 | 0.42 | 0.35 | 0.92 | 0.61 | 0.78 | |||||||||||||||
Net realized and unrealized gain (loss) | 9.83 | (18.24 | ) | (2.47 | ) | (2.43 | ) | (4.25 | ) | |||||||||||
|
| |||||||||||||||||||
Net increase (decrease) from investment operations | 10.25 | (17.89 | ) | (1.55 | ) | (1.82 | ) | (3.47 | ) | |||||||||||
|
| |||||||||||||||||||
Distributions from net investment income2 | (0.13 | ) | (0.97 | ) | (0.35 | ) | (0.87 | ) | (0.30 | ) | ||||||||||
|
| |||||||||||||||||||
Net asset value, end of year | $ | 44.57 | $ | 34.45 | $ | 53.31 | $ | 55.21 | $ | 57.90 | ||||||||||
|
| |||||||||||||||||||
| Total Return3 | ||||||||||||||||||||
Based on net asset value | 29.91% | (33.96)% | (2.78)% | (3.27)% | (5.60)% | |||||||||||||||
|
| |||||||||||||||||||
| Ratios to Average Net Assets | ||||||||||||||||||||
Total expenses | 1.65% | 1.61% | 1.53% | 1.53% | 1.53% | |||||||||||||||
|
| |||||||||||||||||||
Total expenses after fees waived and paid indirectly | 1.65% | 1.61% | 1.53% | 1.53% | 1.53% | |||||||||||||||
|
| |||||||||||||||||||
Net investment income | 1.17% | 0.83% | 1.72% | 1.06% | 1.32% | |||||||||||||||
|
| |||||||||||||||||||
| Supplemental Data | ||||||||||||||||||||
Net assets, end of year (000) | $ | 105,414 | $ | 93,494 | $ | 178,571 | $ | 236,205 | $ | 315,531 | ||||||||||
|
| |||||||||||||||||||
Portfolio turnover rate | 58% | 35% | 42% | 66% | 50% | |||||||||||||||
|
| |||||||||||||||||||
| 1 | Based on average shares outstanding. |
| 2 | Distributions for annual periods determined in accordance with federal income tax regulations. |
| 3 | Where applicable, excludes the effects of any sales charges and assumes the reinvestment of distributions. |
| See Notes to Financial Statements. | ||||||
| ANNUAL REPORT | OCTOBER 31, 2016 | 25 | ||||
| Financial Highlights (continued) | BlackRock Latin America Fund, Inc. |
| Investor B | ||||||||||||||||||||
| Year Ended October 31, | ||||||||||||||||||||
| 2016 | 2015 | 2014 | 2013 | 2012 | ||||||||||||||||
| Per Share Operating Performance | ||||||||||||||||||||
Net asset value, beginning of year | $ | 32.18 | $ | 49.60 | $ | 51.51 | $ | 53.96 | $ | 57.68 | ||||||||||
|
| |||||||||||||||||||
Net investment income (loss)1 | 0.07 | (0.11 | ) | 0.35 | 0.08 | 0.24 | ||||||||||||||
Net realized and unrealized gain (loss) | 9.00 | (17.04 | ) | (2.26 | ) | (2.28 | ) | (3.96 | ) | |||||||||||
|
| |||||||||||||||||||
Net increase (decrease) from investment operations | 9.07 | (17.15 | ) | (1.91 | ) | (2.20 | ) | (3.72 | ) | |||||||||||
|
| |||||||||||||||||||
Distributions from net investment income2 | — | (0.27 | ) | — | (0.25 | ) | — | |||||||||||||
|
| |||||||||||||||||||
Net asset value, end of year | $ | 41.25 | $ | 32.18 | $ | 49.60 | $ | 51.51 | $ | 53.96 | ||||||||||
|
| |||||||||||||||||||
| Total Return3 | ||||||||||||||||||||
Based on net asset value | 28.18% | (34.71)% | (3.71)% | (4.12)% | (6.45)% | |||||||||||||||
|
| |||||||||||||||||||
| Ratios to Average Net Assets | ||||||||||||||||||||
Total expenses | 3.01% | 2.69% | 2.51% | 2.44% | 2.41% | |||||||||||||||
|
| |||||||||||||||||||
Total expenses after fees waived and paid indirectly | 3.00% | 2.69% | 2.51% | 2.44% | 2.41% | |||||||||||||||
|
| |||||||||||||||||||
Net investment income (loss) | 0.23% | (0.27)% | 0.71% | 0.15% | 0.43% | |||||||||||||||
|
| |||||||||||||||||||
| Supplemental Data | ||||||||||||||||||||
Net assets, end of year (000) | $ | 236 | $ | 932 | $ | 2,820 | $ | 5,009 | $ | 7,989 | ||||||||||
|
| |||||||||||||||||||
Portfolio turnover rate | 58% | 35% | 42% | 66% | 50% | |||||||||||||||
|
| |||||||||||||||||||
| 1 | Based on average shares outstanding. |
| 2 | Distributions for annual periods determined in accordance with federal income tax regulations. |
| 3 | Where applicable, excludes the effects of any sales charges and assumes the reinvestment of distributions. |
| See Notes to Financial Statements. | ||||||
| 26 | ANNUAL REPORT | OCTOBER 31, 2016 | ||||
| Financial Highlights (concluded) | BlackRock Latin America Fund, Inc. |
| Investor C | ||||||||||||||||||||
| Year Ended October 31, | ||||||||||||||||||||
| 2016 | 2015 | 2014 | 2013 | 2012 | ||||||||||||||||
| Per Share Operating Performance | ||||||||||||||||||||
Net asset value, beginning of year | $ | 31.41 | $ | 48.57 | $ | 50.37 | $ | 52.79 | $ | 56.39 | ||||||||||
|
| |||||||||||||||||||
Net investment income (loss)1 | 0.12 | (0.02 | ) | 0.43 | 0.13 | 0.27 | ||||||||||||||
Net realized and unrealized gain (loss) | 8.92 | (16.64 | ) | (2.23 | ) | (2.24 | ) | (3.87 | ) | |||||||||||
|
| |||||||||||||||||||
Net increase (decrease) from investment operations | 9.04 | (16.66 | ) | (1.80 | ) | (2.11 | ) | (3.60 | ) | |||||||||||
|
| |||||||||||||||||||
Distributions from net investment income2 | — | (0.50 | ) | — | (0.31 | ) | — | |||||||||||||
|
| |||||||||||||||||||
Net asset value, end of year | $ | 40.45 | $ | 31.41 | $ | 48.57 | $ | 50.37 | $ | 52.79 | ||||||||||
|
| |||||||||||||||||||
| Total Return3 | ||||||||||||||||||||
Based on net asset value | 28.78% | (34.53)% | (3.57)% | (4.05)% | (6.38)% | |||||||||||||||
|
| |||||||||||||||||||
| Ratios to Average Net Assets | ||||||||||||||||||||
Total expenses | 2.51% | 2.48% | 2.36% | 2.35% | 2.35% | |||||||||||||||
|
| |||||||||||||||||||
Total expenses after fees waived and paid indirectly | 2.51% | 2.47% | 2.36% | 2.35% | 2.35% | |||||||||||||||
|
| |||||||||||||||||||
Net investment income (loss) | 0.37% | (0.04)% | 0.88% | 0.25% | 0.49% | |||||||||||||||
|
| |||||||||||||||||||
| Supplemental Data | ||||||||||||||||||||
Net assets, end of year (000) | $ | 24,117 | $ | 22,787 | $ | 49,724 | $ | 72,047 | $ | 111,344 | ||||||||||
|
| |||||||||||||||||||
Portfolio turnover rate | 58% | 35% | 42% | 66% | 50% | |||||||||||||||
|
| |||||||||||||||||||
| 1 | Based on average shares outstanding. |
| 2 | Distributions for annual periods determined in accordance with federal income tax regulations. |
| 3 | Where applicable, excludes the effects of any sales charges and assumes the reinvestment of distributions. |
| See Notes to Financial Statements. | ||||||
| ANNUAL REPORT | OCTOBER 31, 2016 | 27 | ||||
| Notes to Financial Statements |
1. Organization:
BlackRock Emerging Markets Fund, Inc. and BlackRock Latin America Fund, Inc. are each registered under the Investment Company Act of 1940, as amended (the “1940 Act”), as open-end management investment companies. Each Fund is organized as a Maryland corporation. The following are referred to herein collectively as the “Funds” or individually, a “Fund”:
| Fund Name | Herein Referred To As | Diversification Classification | ||||||
BlackRock Emerging Markets Fund, Inc | Emerging Markets | Non-diversified | ||||||
BlackRock Latin America Fund, Inc | Latin America | Non-diversified | ||||||
Each Fund offers multiple classes of shares. All classes of shares have identical voting, dividend, liquidation and other rights and are subject to the same terms and conditions, except that certain classes bear expenses related to the shareholder servicing and distribution of such shares. Institutional Shares are sold only to certain eligible investors. Investor A and Investor C Shares are generally available through financial intermediaries. Investor B Shares are available only through exchanges and dividend and capital gain reinvestments by existing shareholders, and for purchase by certain employer-sponsored retirement plans. Each class has exclusive voting rights with respect to matters relating to its shareholder servicing and distribution expenditures (except that Investor B shareholders may vote on material changes to the Investor A distribution and service plan).
| Share Class | Initial Sales Charge | CDSC | Conversion Privilege | |||||||
Institutional | No | No | None | |||||||
Investor A Shares | Yes | No | 1 | None | ||||||
Investor B Shares | No | Yes | To Investor A Shares after approximately 8 years | |||||||
Investor C Shares | No | Yes | None | |||||||
| 1 | Investor A Shares may be subject to a contingent deferred sales charge (“CDSC”) for certain redemptions where no initial sales charge was paid at the time of purchase. |
The Funds, together with certain other registered investment companies advised by BlackRock Advisors, LLC (the “Manager”) or its affiliates, are included in a complex of open-end funds referred to as the Equity-Liquidity Complex.
2. Significant Accounting Policies:
The financial statements are prepared in conformity with accounting principles generally accepted in the United States of America (“U.S. GAAP”), which may require management to make estimates and assumptions that affect the reported amounts of assets and liabilities in the financial statements, disclosure of contingent assets and liabilities at the date of the financial statements and the reported amounts of increases and decreases in net assets from operations during the reporting period. Actual results could differ from those estimates. Each Fund is considered an investment company under U.S. GAAP and follows the accounting and reporting guidance applicable to investment companies. Below is a summary of significant accounting policies:
Foreign Currency: Each Fund’s books and records are maintained in U.S. dollars. Purchases and sales of investments are recorded at the rates of exchange prevailing on the respective dates of such transactions. Generally, when the U.S. dollar rises in value against a foreign currency, the investments denominated in that currency will lose value; the opposite effect occurs if the U.S. dollar falls in relative value.
Each Fund does not isolate the portion of the results of operations arising as a result of changes in the exchange rates from the changes in the market prices of investments held or sold for financial reporting purposes. Accordingly, the effects of changes in exchange rates on investments are not segregated in the Statements of Operations from the effects of changes in market prices of those investments, but are included as a component of net realized and unrealized gain (loss) from investments. Each Fund reports realized currency gains (losses) on foreign currency related transactions as components of net realized gain (loss) for financial reporting purposes, whereas such components are generally treated as ordinary income for federal income tax purposes.
Segregation and Collateralization: In cases where a Fund enters into certain investments (e.g., forward foreign currency exchange contracts) that would be treated as “senior securities” for 1940 Act purposes, a Fund may segregate or designate on its books and records cash or liquid assets having a market value at least equal to the amount of its future obligations under such investments. Doing so allows the investment to be excluded from treatment as a “senior security.” Furthermore, if required by an exchange or counterparty agreement, the Funds may be required to deliver/deposit cash and/or securities to/with an exchange, or broker-dealer or custodian as collateral for certain investments or obligations.
Investment Transactions and Investment Income: For financial reporting purposes, investment transactions are recorded on the dates the transactions are entered into (the trade dates). Realized gains and losses on investment transactions are determined on the identified cost basis. Dividend income is recorded on the ex-dividend date. Dividends from foreign securities where the ex-dividend date may have passed are subsequently recorded when
| 28 | ANNUAL REPORT | OCTOBER 31, 2016 |
| Notes to Financial Statements (continued) | ||||
the Funds are informed of the ex-dividend date. Under the applicable foreign tax laws, a withholding tax at various rates may be imposed on capital gains, dividends and interest. Interest income, including amortization and accretion of premiums and discounts on debt securities, is recognized on the accrual basis. Income, expenses and realized and unrealized gains and losses are allocated daily to each class based on its relative net assets.
Distributions: Distributions paid by the Funds are recorded on the ex-dividend date. The character and timing of distributions are determined in accordance with federal income tax regulations, which may differ from U.S. GAAP.
Indemnifications: In the normal course of business, a Fund enters into contracts that contain a variety of representations that provide general indemnification. A Fund’s maximum exposure under these arrangements is unknown because it involves future potential claims against a Fund, which cannot be predicted with any certainty.
Other: Expenses directly related to a Fund or its classes are charged to that Fund or the applicable class. Other operating expenses shared by several funds, including other funds managed by the Manager, are prorated among those funds on the basis of relative net assets or other appropriate methods. Expenses directly related to the Funds and other shared expenses prorated to the Funds are allocated daily to each class based on its relative net assets or other appropriate methods.
Through May 31, 2016, the Funds had an arrangement with their custodian whereby credits were earned on uninvested cash balances, which could be used to reduce custody fees and/or overdraft charges. Credits previously earned may be utilized until December 31, 2016. Under current arrangements effective June 1, 2016, the Funds no longer earn credits on uninvested cash, and may incur charges on uninvested cash balances and overdrafts, subject to certain conditions.
3. Investment Valuation and Fair Value Measurements:
Investment Valuation Policies: The Funds’ investments are valued at fair value (also referred to as “market value” within the financial statements) as of the close of trading on the New York Stock Exchange (“NYSE”) (generally 4:00 p.m., Eastern time). U.S. GAAP defines fair value as the price the Funds would receive to sell an asset or pay to transfer a liability in an orderly transaction between market participants at the measurement date. The Funds determine the fair values of their financial instruments using various independent dealers or pricing services under policies approved by the Board of Directors of each Fund (the “Board”). The BlackRock Global Valuation Methodologies Committee (the “Global Valuation Committee”) is the committee formed by management to develop global pricing policies and procedures and to oversee the pricing function for all financial instruments.
Fair Value Inputs and Methodologies: The following methods and inputs are used to establish the fair value of each Fund’s assets and liabilities:
| • | Equity investments traded on a recognized securities exchange are valued at the official closing price each day, if available. For equity investments traded on more than one exchange, the official closing price on the exchange where the stock is primarily traded is used. Equity investments traded on a recognized exchange for which there were no sales on that day may be valued at the last available bid (long positions) or ask (short positions) price. |
| • | Fixed-income securities for which market quotations are readily available are generally valued using the last available bid prices or current market quotations provided by independent dealers or third party pricing services. Floating rate loan interests are valued at the mean of the bid prices from one or more independent brokers or dealers as obtained from a third party pricing service. Pricing services generally value fixed-income securities assuming orderly transactions of an institutional round lot size, but the Funds may hold or transact in such securities in smaller, odd lot sizes. Odd lots often trade at lower prices than institutional round lots. The pricing services may use matrix pricing or valuation models that utilize certain inputs and assumptions to derive values, including transaction data (e.g., recent representative bids and offers), credit quality information, perceived market movements, news, and other relevant information. Certain fixed-income securities, including asset-backed and mortgage related securities may be valued based on valuation models that consider the estimated cash flows of each tranche of the entity, establish a benchmark yield and develop an estimated tranche specific spread to the benchmark yield based on the unique attributes of the tranche. The amortized cost method of valuation may be used with respect to debt obligations with sixty days or less remaining to maturity unless the Manager determines such method does not represent fair value. |
| • | Generally, trading in foreign instruments is substantially completed each day at various times prior to the close of trading on the NYSE. Occasionally, events affecting the values of such instruments may occur between the foreign market close and the close of trading on the NYSE that may not be reflected in the computation of the Funds’ net assets. Each business day, the Funds use a pricing service to assist with the valuation of certain foreign exchange-traded equity securities and foreign exchange-traded over-the-counter (“OTC”) options (the “Systematic Fair Value Price”). Using current market factors, the Systematic Fair Value Price is designed to value such foreign securities and foreign options at fair value as of the close of trading on the NYSE, which follows the close of the local markets. |
| ANNUAL REPORT | OCTOBER 31, 2016 | 29 |
| Notes to Financial Statements (continued) |
| • | The Funds value their investment in SL Liquidity Series, LLC, Money Market Series (the “Money Market Series”) at fair value, which is ordinarily based upon its pro rata ownership in the underlying fund’s net assets. The Money Market Series seeks current income consistent with maintaining liquidity and preserving capital. Although the Money Market Series is not registered under the 1940 Act, its investments may follow the parameters of investments by a money market fund that is subject to Rule 2a-7 under the 1940 Act. |
| • | Securities and other assets and liabilities denominated in foreign currencies are translated into U.S. dollars using exchange rates determined as of the close of trading on the NYSE. Forward foreign currency exchange contracts are valued at the mean between the bid and ask prices and are determined as of the close of trading on the NYSE. Interpolated values are derived when the settlement date of the contract is an interim date for which quotations are not available. |
| • | Participation notes are valued on the basis of last available bid prices or current market quotations provided by dealers or pricing services. |
If events (e.g., a company announcement, market volatility or a natural disaster) occur that are expected to materially affect the value of such investments, or in the event that the application of these methods of valuation results in a price for an investment that is deemed not to be representative of the market value of such investment, or if a price is not available, the investment will be valued by the Global Valuation Committee, or its delegate, in accordance with a policy approved by the Board as reflecting fair value (“Fair Valued Investments”). When determining the price for Fair Valued Investments, the Global Valuation Committee, or its delegate, seeks to determine the price that each Fund might reasonably expect to receive or pay from the current sale or purchase of that asset or liability in an arm’s-length transaction. Fair value determinations shall be based upon all available factors that the Global Valuation Committee, or its delegate, deems relevant and consistent with the principles of fair value measurement.
The Global Valuation Committee, or its delegate, employs various methods for calibrating valuation approaches for investments where an active market does not exist, including regular due diligence of each Fund’s pricing vendors, regular reviews of key inputs and assumptions, transactional back-testing or disposition analysis to compare unrealized gains and losses to realized gains and losses, reviews of missing or stale prices and large movements in market values and reviews of any market related activity. The pricing of all Fair Valued Investments is subsequently reported to the Board or a committee thereof on a quarterly basis. As a result of the inherent uncertainty in valuation of these investments, the fair values may differ from the values that would have been used had an active market existed.
For investments in equity or debt issued by privately-held companies or funds (“Private Company” or collectively, the “Private Companies”) and other Fair Valued Investments, the fair valuation methodologies that are used by third party pricing services include the market approach, income approach and the cost approach, using one or a combination of but not limited to the following inputs.
| Standard Inputs Generally Considered By Third Party Pricing Services | ||
Market approach | (i) recent market transactions, including subsequent rounds of financing, in the underlying investment or comparable issuers; | |
(ii) recapitalizations and other transactions across the capital structure; and | ||
(iii) market multiples of comparable issuers. | ||
Income approach | (i) future cash flows discounted to present and adjusted as appropriate for liquidity, credit, and/or market risks; | |
(ii) quoted prices for similar investments or assets in active markets; and | ||
(iii) other risk factors, such as interest rates, yield curves, volatilities, prepayment speeds, loss severities, credit risks, recovery rates, liquidation amounts and/or default rates. | ||
Cost approach | (i) audited or unaudited financial statements, investor communications and financial or operational metrics issued by the Private Company; | |
(ii) changes in the valuation of relevant indices or publicly traded companies comparable to the Private Company; | ||
(iii) relevant news and other public sources; and | ||
(iv) known secondary market transactions in the Private Company’s interests and merger or acquisition activity in companies comparable to the Private Company. |
Investments in series of preferred stock issued by Private Companies are typically valued utilizing market approach in determining the enterprise value of the company. Such investments often contain rights and preferences that differ from other series of preferred and common stock of the same issuer. Techniques such as an option pricing model (“OPM”), a probability weighted expected return model (“PWERM”) or a hybrid of those techniques are used in allocating enterprise value of the company, as deemed appropriate under the circumstances. The use of OPM and PWERM techniques involve a determination of the exit scenarios of the investment in order to appropriately allocate the enterprise value of the company among the various parts of its capital structure.
The Private Companies are not subject to the public company disclosure, timing, and reporting standards as other investments held by a Fund. Typically, the most recently available information by a Private Company is as of a date that is earlier than the date a Fund is calculating its net
| 30 | ANNUAL REPORT | OCTOBER 31, 2016 |
| Notes to Financial Statements (continued) | ||||
asset value (“NAV”). This factor may result in a difference between the value of the investment and the price a Fund could receive upon the sale of the investment.
Fair Value Hierarchy: Various inputs are used in determining the fair value of investments. These inputs to valuation methodologies are categorized into a fair value hierarchy consisting of three broad levels for financial statement purposes as follows:
| • | Level 1 — unadjusted price quotations in active markets/exchanges for identical assets or liabilities that each Fund has the ability to access |
| • | Level 2 — other observable inputs (including, but not limited to, quoted prices for similar assets or liabilities in markets that are active, quoted prices for identical or similar assets or liabilities in markets that are not active, inputs other than quoted prices that are observable for the assets or liabilities (such as interest rates, yield curves, volatilities, prepayment speeds, loss severities, credit risks and default rates) or other market–corroborated inputs) |
| • | Level 3 — unobservable inputs based on the best information available in the circumstances, to the extent observable inputs are not available (including each Fund’s own assumptions used in determining the fair value of investments) |
The hierarchy gives the highest priority to unadjusted quoted prices in active markets for identical assets or liabilities (Level 1 measurements) and the lowest priority to unobservable inputs (Level 3 measurements). Accordingly, the degree of judgment exercised in determining fair value is greatest for instruments categorized in Level 3. The inputs used to measure fair value may fall into different levels of the fair value hierarchy. In such cases, for disclosure purposes, the fair value hierarchy classification is determined based on the lowest level input that is significant to the fair value measurement in its entirety. Investments classified within Level 3 have significant unobservable inputs used by the Global Valuation Committee in determining the price for Fair Valued Investments. Level 3 investments include equity or debt issued by privately-held companies. There may not be a secondary market, and/or there are a limited number of investors. Level 3 investments may also be adjusted to reflect illiquidity and/or non-transferability, with the amount of such discount estimated by the Global Valuation Committee in the absence of market information.
Changes in valuation methodologies may result in transfers into or out of an assigned level within the hierarchy. In accordance with each Fund’s policy, transfers between different levels of the fair value hierarchy are deemed to have occurred as of the beginning of the reporting period. The categorization of a value determined for investments is based on the pricing transparency of the investments and is not necessarily an indication of the risks associated with investing in those securities.
4. Securities and Other Investments:
Participation Notes: Participation notes (“P-Notes”) are promissory notes issued by banks or broker-dealers that are designed to offer a return measured by the change in the value of the underlying security or basket of securities (the “underlying security”) while not holding the actual shares of the underlying security. These investments are typically used to gain exposure to securities traded in foreign markets that may be restricted due to country-specific regulations. When the P-Note matures, the issuer will pay or receive the difference between the value of the underlying security at the time of the purchase and the underlying security’s value at maturity of the P-Notes. Income received on P-Notes is recorded by a Fund as dividend income — unaffiliated in the Statements of Operations. An investment in a P-Note involves additional risks beyond the risks normally associated with a direct investment in the underlying security. While the holder of a P-Note is entitled to receive from the bank or broker-dealer any dividends paid by the underlying security, the holder is not entitled to the same rights (e.g., voting rights) as a direct owner of the underlying security. P-Notes are considered general unsecured contractual obligations of the bank or broker-dealer. The holder of a P-Note must rely on the creditworthiness of the issuer for its investment returns on the P-Notes and has no rights against the issuer of the underlying security. A P-Note may be more volatile and less liquid than other investments held by a Fund since the P-Note generally is dependent on the liquidity in the local trading market for the underlying security.
Warrants: Warrants entitle a Fund to purchase a specified number of shares of common stock and are non-income producing. The purchase price and number of shares are subject to adjustment under certain conditions until the expiration date of the warrants, if any. If the price of the underlying stock does not rise above the strike price before the warrant expires, the warrant generally expires without any value and a Fund will lose any amount it paid for the warrant. Thus, investments in warrants may involve more risk than investments in common stock. Warrants may trade in the same markets as their underlying stock; however, the price of the warrant does not necessarily move with the price of the underlying stock.
Securities Lending: The Funds may lend their securities to approved borrowers, such as brokers, dealers and other financial institutions. The borrower pledges and maintains with the Funds collateral consisting of cash, an irrevocable letter of credit issued by a bank, or securities issued or guaranteed by the U.S. Government. The initial collateral received by each Fund is required to have a value of at least 102% of the current value of the loaned
| ANNUAL REPORT | OCTOBER 31, 2016 | 31 |
| Notes to Financial Statements (continued) |
securities for securities traded on U.S. exchanges and a value of at least 105% for all other securities. The collateral is maintained thereafter at a value equal to at least 100% of the current market value of the securities on loan. The market value of the loaned securities is determined at the close of each business day of the Fund and any additional required collateral is delivered to the Fund, or excess collateral returned by the Fund, on the next business day. During the term of the loan, the Funds are entitled to all distributions made on or in respect of the loaned securities, but does not receive interest income on securities received as collateral. Loans of securities are terminable at any time and the borrower, after notice, is required to return borrowed securities within the standard time period for settlement of securities transactions.
The market value of any securities on loan, all of which were classified as common stocks in the Funds’ Schedules of Investments, and the value of any related collateral are shown separately in the Statements of Assets and Liabilities as a component of investments at value — unaffiliated, and collateral on securities loaned at value, respectively. As of period end, any securities on loan were collateralized by cash and/or U.S. Government obligations. Cash collateral invested by the securities lending agent, BlackRock Investment Management, LLC (“BIM”), if any, is disclosed in the Schedules of Investments.
Securities lending transactions are entered into by the Funds under Master Securities Lending Agreements (each, an “MSLA”), which provide the right, in the event of default (including bankruptcy or insolvency), for the non-defaulting party to liquidate the collateral and calculate a net exposure to the defaulting party or request additional collateral. In the event that a borrower defaults, the Funds, as lenders, would offset the market value of the collateral received against the market value of the securities loaned. When the value of the collateral is greater than that of the market value of the securities loaned, the lender is left with a net amount payable to the defaulting party. However, bankruptcy or insolvency laws of a particular jurisdiction may impose restrictions on or prohibitions against such a right of offset in the event of an MSLA counterparty’s bankruptcy or insolvency. Under the MSLA, absent an event of default, the borrower can resell or re-pledge the loaned securities and a Fund can reinvest cash collateral received in connection with loaned securities. Upon an event of default, the parties’ obligations to return the securities or collateral to the other party are extinguished, and the parties can resell or re-pledge the loaned securities or the collateral received in connection with the loaned securities in order to satisfy the defaulting party’s net payment obligation for all transactions under the MSLA. The defaulting party remains liable for any deficiency.
The risks of securities lending include the risk that the borrower may not provide additional collateral when required or may not return the securities when due. To mitigate these risks, the Funds benefit from a borrower default indemnity provided by BIM. BIM’s indemnity allows for full replacement of the securities loaned if the collateral received does not cover the value on the securities loaned in the event of borrower default. Each Fund could suffer a loss if the value of an investment purchased with cash collateral falls below the market value of loaned securities or if the value of an investment purchased with cash collateral falls below the value of the original cash collateral received.
5. Investment Advisory Agreement and Other Transactions with Affiliates:
The PNC Financial Services Group, Inc. is the largest stockholder and an affiliate of BlackRock, Inc. (“BlackRock”) for 1940 Act purposes.
Investment Advisory: Each Fund entered into an Investment Advisory Agreement with the Manager, the Funds’ investment adviser, an indirect, wholly-owned subsidiary of BlackRock, to provide investment advisory and administration services. The Manager is responsible for the management of each Fund’s portfolio and provides the personnel, facilities, equipment and certain other services necessary to the operations of each Fund.
For such services, each Fund pays the Manager a monthly fee at an annual rate equal to the following percentages of the average daily value of each Fund’s net assets.
| Average Daily Net Assets | Investment Advisory Fees | |||
First $1 Billion | 1.00% | |||
$1 Billion — $3 Billion | 0.94% | |||
$3 Billion — $5 Billion | 0.90% | |||
$5 Billion — $10 Billion | 0.87% | |||
Greater than $10 Billion | 0.85% | |||
The Manager entered into separate sub-advisory agreements with BlackRock International Limited (“BIL”), an affiliate of the Manager. The Manager pays BIL for services it provides, a monthly fee that is a percentage of the investment advisory fees paid by each Fund to the Manager.
| 32 | ANNUAL REPORT | OCTOBER 31, 2016 |
| Notes to Financial Statements (continued) | ||||
Service and Distribution Fees: The Funds entered into a Distribution Agreement and Distribution Plans with BlackRock Investments, LLC (“BRIL”), an affiliate of the Manager. Pursuant to the Distribution Plan and in accordance with Rule 12b-1 under the 1940 Act, each Fund pays BRIL ongoing service and distribution fees. The fees are accrued daily and paid monthly at annual rates based upon the average daily net assets of the relevant share class of each Fund as follows:
| Service Fee | Distribution Fee | |||||||
Investor A | 0.25% | — | ||||||
Investor B | 0.25% | 0.75% | ||||||
Investor C | 0.25% | 0.75% | ||||||
BRIL and broker-dealers, pursuant to sub-agreements with BRIL, provide shareholder servicing and distribution services to the Funds. The ongoing service and/or distribution fee compensates BRIL and each broker-dealer for providing shareholder servicing and/or distribution related services to the shareholders.
For the year ended October 31, 2016, the following table shows the class specific service and distribution fees borne directly by each share class of each Fund:
| Investor A | Investor B | Investor C | Total | |||||||||||||
Emerging Markets | $ | 474,128 | — | $ | 1,042,185 | $ | 1,516,313 | |||||||||
Latin America | $ | 245,086 | $ | 5,000 | $ | 215,404 | $ | 465,490 | ||||||||
Transfer Agent: Pursuant to written agreements, certain financial intermediaries, some of which may be affiliates, provide the Funds with sub-accounting, recordkeeping, sub-transfer agency and other administrative services with respect to sub-accounts they service. For these services, these entities receive an asset-based fee or an annual fee per shareholder account, which will vary depending on share class and/or net assets. For the year ended October 31, 2016, the Funds paid the following amounts to affiliates of BlackRock in return for these services, which are included in transfer agent — class specific in the Statements of Operations:
| Institutional | Investor A | Investor B | Investor C | Total | ||||||||||||||||
Latin America | $ | 161 | — | — | $ | 4 | $ | 165 | ||||||||||||
The Manager maintains a call center that is responsible for providing certain shareholder services to the Funds. Shareholder services include responding to inquiries and processing subscriptions and redemptions transactions based upon instructions from shareholders. For the year ended October 31, 2016, each Fund reimbursed the Manager the following amounts for costs incurred in running the call center, which are included in transfer agent — class specific in the Statements of Operations:
| Institutional | Investor A | Investor B | Investor C | Total | ||||||||||||||||
Emerging Markets | $ | 1,811 | $ | 9,124 | — | $ | 3,186 | $ | 14,121 | |||||||||||
Latin America | $ | 800 | $ | 9,781 | $ | 201 | $ | 1,035 | $ | 11,817 | ||||||||||
For the year ended October 31, 2016, the following table shows the class specific transfer agent fees borne directly by each class of each Fund:
| Institutional | Investor A | Investor B | Investor C | Total | ||||||||||||||||
Emerging Markets | $ | 75,896 | $ | 553,896 | — | $ | 388,421 | $ | 1,018,213 | |||||||||||
Latin America | $ | 67,436 | $ | 205,964 | $ | 4,050 | $ | 69,277 | $ | 346,727 | ||||||||||
Other Fees: For the year ended October 31, 2016, affiliates earned underwriting discounts, direct commissions and dealer concessions on sales of each Fund’s Investor A Shares as follows:
| Emerging Markets | Latin America | |||||||
Investor A | $ | 17,490 | $ | 2,589 | ||||
For the year ended October 31, 2016, affiliates received CDSCs as follows:
| Emerging Markets | Latin America | |||||||
Investor A | $ | 1,426 | — | |||||
Investor B | — | $ | 125 | |||||
Investor C | $ | 13,405 | $ | 1,259 | ||||
| ANNUAL REPORT | OCTOBER 31, 2016 | 33 |
| Notes to Financial Statements (continued) |
Expense Waivers and Reimbursements: The Manager voluntarily agreed to waive its investment advisory fees by the amount of investment advisory fees each Fund pays to the Manager indirectly through its investment in affiliated money market funds. These amounts are included in fees waived by the Manager in the Statements of Operations. For the year ended October 31, 2016, the amounts waived were as follows:
| Emerging Markets | Latin America | |||||||
Amounts waived | $ | 4,426 | $ | 2,150 | ||||
Effective September 1, 2016, the Manager has voluntarily agreed to waive the investment advisory fee payable by each Fund with respect to any portion of such Fund’s assets estimated to be attributable to investments in other equity and fixed-income exchange-traded funds managed by the Manager or its affiliates that have a contractual management fee. This voluntary waiver may be reduced or discontinued at any time without notice.
For the year ended October 31, 2016, the Funds reimbursed the Manager for certain accounting services, which is included in accounting services in the Statements of Operations. The reimbursements were as follows:
| Emerging Markets | Latin America | |||||||
Amounts waived | $ | 5,716 | $ | 1,083 | ||||
Securities Lending: The U.S. Securities and Exchange Commission has issued an exemptive order which permits BIM, an affiliate of the Manager, to serve as securities lending agent for the Funds, subject to applicable conditions. As securities lending agent, BIM bears all operational costs directly related to securities lending. The Funds are responsible for expenses in connection with the investment of cash collateral received for securities on loan (the “collateral investment expenses”). The cash collateral is invested in a private investment company managed by the Manager or its affiliates. However, BIM has agreed to cap the collateral investment expenses of the private investment company to an annual rate of 0.04%. The investment adviser to the private investment company will not charge any advisory fees with respect to shares purchased by the Funds.
Securities lending income is equal to the total of income earned from the reinvestment of cash collateral, net of fees and other payments to and from borrowers of securities, and less the collateral investment expenses. Each Fund retains a portion of securities lending income and remits a remaining portion to BIM as compensation for its services as securities lending agent. Pursuant to a securities lending agreement, BIM may lend securities only when the difference between the borrower rebate rate and the risk free rate exceeds a certain level (such securities, the “specials only securities”).
Pursuant to such agreement, each Fund retains 80% of securities lending income. In addition, commencing the business day following the date that the aggregate securities lending income earned across certain funds in the Equity-Liquidity Complex in a calendar year exceeds a specified threshold, each Fund, pursuant to the securities lending agreement, will retain for the remainder of the calendar year securities lending income in an amount equal to 85% of securities lending income.
The share of securities lending income earned by each Fund is shown as securities lending — affiliated — net in the Statements of Operations. For the year ended October 31, 2016, each Fund paid BIM the following amounts for securities lending agent services:
| Emerging Markets | Latin America | |||||||
Securities lending services | $ | 3,473 | $ | 1,315 | ||||
Officers and Directors: Certain officers and/or directors of the Funds are officers and/or directors of BlackRock or its affiliates. The Funds reimburse the Manager for a portion of the compensation paid to the Funds’ Chief Compliance Officer, which is included in Officer and Directors in the Statements of Operations.
Other Transactions: The Funds may purchase securities from, or sell securities to, an affiliated fund provided the affiliation is due solely to having a common investment adviser, common officers, or common directors. For the year ended October 31, 2016, the purchase and sale transactions which resulted in net realized gains (losses) with an affiliated fund in compliance with Rule 17a-7 under the 1940 Act were as follows:
| Purchases | Sales | Net Realized Gain (Loss) | ||||||||||
Emerging Markets | $ | 1,149,336 | $ | 1,250,761 | $ | 240,968 | ||||||
Latin America | $ | 659,400 | — | — | ||||||||
| 34 | ANNUAL REPORT | OCTOBER 31, 2016 |
| Notes to Financial Statements (continued) | ||||
6. Purchases and Sales:
For the year ended October 31, 2016, purchases and sales of investments excluding short-term securities, were as follows:
| Emerging Markets | Latin America | |||||||
Purchases | $ | 394,339,828 | $ | 94,969,961 | ||||
Sales | $ | 494,868,450 | $ | 108,115,107 | ||||
7. Income Tax Information:
It is the Funds’ policy to comply with the requirements of the Internal Revenue Code of 1986, as amended, applicable to regulated investment companies, and to distribute substantially all of their taxable income to their shareholders. Therefore, no federal income tax provision is required.
Each Fund files U.S. federal and various state and local tax returns. No income tax returns are currently under examination. The statute of limitations on each Fund’s U.S. federal tax returns generally remains open for each of the four years ended October 31, 2016. The statutes of limitations on each Fund’s state and local tax returns may remain open for an additional year depending upon the jurisdiction.
Management has analyzed tax laws and regulations and their application to the Funds as of October 31, 2016, inclusive of the open tax return years, and does not believe that there are any uncertain tax positions that require recognition of a tax liability in the Funds’ financial statements.
U.S. GAAP requires that certain components of net assets be adjusted to reflect permanent differences between financial and tax reporting. These reclassifications have no effect on net assets or net asset values per share. As of period end, the following permanent differences attributable to foreign currency transactions, the characterization of expenses, and the sale of stock of passive foreign investment companies by the Funds were reclassified to the following accounts:
| Emerging Markets | Latin America | |||||||
Undistributed net investment income | $ | (207,764 | ) | $ | (93,987 | ) | ||
Accumulated net realized loss | $ | 207,764 | $ | 93,987 | ||||
The tax character of distributions paid was as follows:
| Emerging Markets | Latin America | |||||||||||
Ordinary income | 10/31/2016 | $ | 4,009,960 | $ | 708,218 | |||||||
| 10/31/2015 | $ | 3,169,376 | $ | 5,341,197 | ||||||||
As of period end, the tax components of accumulated net losses were as follows:
| Emerging Markets | Latin America | |||||||
Undistributed ordinary income | $ | 3,971,599 | $ | 1,830,847 | ||||
Capital loss carryforwards | (131,948,452 | ) | (90,085,029 | ) | ||||
Net unrealized gains1 | 64,619,953 | 42,562,841 | ||||||
|
|
|
| |||||
Total | $ | (63,356,900 | ) | $ | (45,691,341 | ) | ||
|
|
|
| |||||
| 1 | The difference between book-basis and tax-basis net unrealized gains was attributable primarily to the tax deferral of losses on wash sales, the realization for tax purposes of unrealized gains/losses on certain foreign currency contracts and the realization for tax purposes of unrealized gain on investments in passive foreign investment companies. |
As of October 31, 2016, the Funds had capital loss carryforwards available to offset future realized capital gains through the indicated expiration dates as follows:
| Expires October 31, | Emerging Markets | Latin America | ||||||
No expiration date1 | $ | 120,350,166 | $ | 46,116,386 | ||||
2017 | 11,598,286 | 43,968,643 | ||||||
|
|
|
| |||||
Total | $ | 131,948,452 | $ | 90,085,029 | ||||
|
|
|
| |||||
| 1 | Must be utilized prior to losses subject to expiration. |
| ANNUAL REPORT | OCTOBER 31, 2016 | 35 |
| Notes to Financial Statements (continued) |
As of October 31, 2016, gross unrealized appreciation and depreciation based on cost for federal income tax purposes were as follows:
| Emerging Markets | Latin America | |||||||
Tax cost | $ | 352,296,970 | $ | 144,380,349 | ||||
|
|
|
| |||||
Gross unrealized appreciation | $ | 74,648,425 | $ | 50,571,314 | ||||
Gross unrealized depreciation | (10,017,589 | ) | (7,978,497 | ) | ||||
|
|
|
| |||||
Net unrealized appreciation | $ | 64,630,836 | $ | 42,592,817 | ||||
|
|
|
| |||||
8. Bank Borrowings:
The Funds, along with certain other funds managed by the Manager and its affiliates (“Participating Funds”), is a party to a 364-day, $2.1 billion credit agreement with a group of lenders. Under this agreement, the Funds may borrow to fund shareholder redemptions. Excluding commitments designated for certain individual funds, the Participating Funds, including the Funds, can borrow up to an aggregate commitment amount of $1.6 billion at any time outstanding, subject to asset coverage and other limitations as specified in the agreement. The credit agreement has the following terms: a fee of 0.12% per annum on unused commitment amounts and interest at a rate equal to the higher of (a) one-month LIBOR (but, in any event, not less than 0.00%) on the date the loan is made plus 0.80% per annum or (b) the Fed Funds rate (but, in any event, not less than 0.00%) in effect from time to time plus 0.80% per annum on amounts borrowed. The agreement expires in April 2017 unless extended or renewed. Prior to April 21, 2016, the credit agreement had a fee per annum of 0.06% on unused commitment amounts and interest at a rate equal to the higher of (a) one-month LIBOR (but, in any event, not less than 0.00%) on the date the loan is made plus 0.80% per annum or (b) the Fed Funds rate (but, in any event, not less than 0.00%) in effect from time to time plus 0.80% per annum on amounts borrowed. Participating Funds paid administration, legal and arrangement fees, which, if applicable, are included in miscellaneous expenses in the Statements of Operations. These fees were allocated among such funds based upon portions of the aggregate commitment available to them and relative net assets of Participating Funds. During the year ended October 31, 2016, the Funds did not borrow under the credit agreement.
9. Principal Risks:
In the normal course of business, certain Funds invest in securities and enter into transactions where risks exist due to fluctuations in the market (market risk) or failure of the issuer to meet all its obligations, including the ability to pay principal and interest when due (issuer credit risk). The value of securities held by the Funds may decline in response to certain events, including those directly involving the issuers of securities owned by the Funds. Investments in the securities of issuers domiciled in countries with emerging capital markets involve certain additional risks that do not generally apply to investments in securities of issuers in more developed capital markets, such as (i) low or nonexistent trading volume, resulting in a lack of liquidity and increased volatility in prices for such securities; (ii) uncertain national policies and social, political and economic instability, increasing the potential for expropriation of assets, confiscatory taxation, high rates of inflation or unfavorable diplomatic developments; and (iii) possible fluctuations in exchange rates, differing legal systems and the existence or possible imposition of exchange controls, custodial restrictions or other foreign or U.S. governmental laws or restrictions applicable to such investments. Changes arising from the general economy, the overall market and local, regional or global political and/or social instability, as well as currency, interest rate and price fluctuations, may also affect the securities’ value.
Counterparty Credit Risk: Similar to issuer credit risk, the Funds may be exposed to counterparty credit risk, or the risk that an entity may fail to or be unable to perform on its commitments related to unsettled or open transactions. The Funds manage counterparty credit risk by entering into transactions only with counterparties that the Manager believes have the financial resources to honor their obligations and by monitoring the financial stability of those counterparties. Financial assets, which potentially expose the Funds to market, issuer and counterparty credit risks, consist principally of financial instruments and receivables due from counterparties. The extent of the Funds’ exposure to market, issuer and counterparty credit risks with respect to these financial assets is approximately their value recorded in the Statements of Assets and Liabilities, less any collateral held by the Funds.
Valuation Risk: The market values of equities, such as common stocks and preferred securities or equity related investments, such as futures and options, may decline due to general market conditions which are not specifically related to a particular company. They may also decline due to factors which affect a particular industry or industries. A Fund may invest in illiquid investments and may experience difficulty in selling those investments in a timely manner at the price that they believes the investments are worth. Prices may fluctuate widely over short or extended periods in response to company, market or economic news. Markets also tend to move in cycles, with periods of rising and falling prices. This volatility may cause each Fund’s NAV to experience significant increases or decreases over short periods of time. If there is a general decline in the securities and other markets, the NAV of a Fund may lose value, regardless of the individual results of the securities and other instruments in which the Fund invests.
| 36 | ANNUAL REPORT | OCTOBER 31, 2016 |
| Notes to Financial Statements (continued) | ||||
Concentration Risk: Latin America invests a substantial amount of its assets in issuers located in a single country or a limited number of countries. When the Fund concentrates its investments in this manner, it assumes the risk that economic, political and social conditions in those countries may have a significant impact on its investment performance. Foreign issuers may not be subject to the same uniform accounting, auditing and financial reporting standards and practices as used in the United States. Foreign securities markets may also be less liquid, more volatile and less subject to governmental supervision not typically associated with investing in U.S. securities. Investment percentages in specific countries are presented in the Schedule of Investments.
As of period end, Latin America’s investments had the following industry classifications:
| Industry | Percent of Net Assets | |||
Bank | 26 | % | ||
Oil, Gas & Consumable Fuels | 13 | |||
Beverages | 12 | |||
Metal & Mining | 8 | |||
Food Products | 6 | |||
Other1 | 35 | |||
| 1 | All other industries held was less than 5% of net assets. |
10. Capital Share Transactions:
Transactions in capital shares for each class were as follows:
| Year Ended October 31, 2016 | Year Ended October 31, 2015 | |||||||||||||||||||
| Emerging Markets | Shares | Amount | Shares | Amount | ||||||||||||||||
| Institutional | ||||||||||||||||||||
Shares sold | 1,277,003 | $ | 20,250,856 | 11,688,582 | $ | 220,323,424 | ||||||||||||||
Shares issued in reinvestment of distributions | 120,690 | 1,861,033 | 144,097 | 2,760,865 | ||||||||||||||||
Shares redeemed | (5,065,591 | ) | (84,653,192 | ) | (24,288,826 | ) | (428,109,488 | ) | ||||||||||||
|
|
|
| |||||||||||||||||
Net decrease | (3,667,898 | ) | $ | (62,541,303 | ) | (12,456,147 | ) | $ | (205,025,199 | ) | ||||||||||
|
|
|
| |||||||||||||||||
| Investor A | ||||||||||||||||||||
Shares sold | 2,880,670 | $ | 45,551,784 | 3,447,061 | $ | 61,932,631 | ||||||||||||||
Shares issued in reinvestment of distributions | 108,713 | 1,619,830 | 16,435 | 304,346 | ||||||||||||||||
Shares redeemed | (4,294,309 | ) | (69,108,610 | ) | (2,996,802 | ) | (54,683,654 | ) | ||||||||||||
|
|
|
| |||||||||||||||||
Net increase (decrease) | (1,304,926 | ) | $ | (21,936,996 | ) | 466,694 | $ | 7,553,323 | ||||||||||||
|
|
|
| |||||||||||||||||
| Investor B | ||||||||||||||||||||
Shares sold | — | — | 855 | $ | 14,384 | |||||||||||||||
Shares redeemed | — | — | (42,007 | ) | (706,053 | ) | ||||||||||||||
|
|
|
| |||||||||||||||||
Net decrease | — | — | (41,152 | ) | $ | (691,669 | ) | |||||||||||||
|
|
|
| |||||||||||||||||
| Investor C | ||||||||||||||||||||
Shares sold | 1,360,604 | $ | 17,544,192 | 2,421,392 | $ | 36,931,920 | ||||||||||||||
Shares issued in reinvestment of distributions | 21,912 | 278,503 | — | — | ||||||||||||||||
Shares redeemed | (2,964,944 | ) | (40,316,539 | ) | (1,803,292 | ) | (27,923,296 | ) | ||||||||||||
|
|
|
| |||||||||||||||||
Net increase (decrease) | (1,582,428 | ) | $ | (22,493,844 | ) | 618,100 | $ | 9,008,624 | ||||||||||||
|
|
|
| |||||||||||||||||
Total Net Decrease | (6,555,252 | ) | $ | (106,972,143 | ) | (11,412,505 | ) | $ | (189,154,921 | ) | ||||||||||
|
|
|
| |||||||||||||||||
| ANNUAL REPORT | OCTOBER 31, 2016 | 37 |
| Notes to Financial Statements (concluded) |
| Year Ended October 31, 2016 | Year Ended October 31, 2015 | |||||||||||||||||||
| Latin America | Shares | Amount | Shares | Amount | ||||||||||||||||
| Institutional | ||||||||||||||||||||
Shares sold | 591,555 | $ | 20,946,101 | 550,715 | $ | 23,578,567 | ||||||||||||||
Shares issued in reinvestment of distributions | 9,396 | 309,433 | 32,763 | 1,470,584 | ||||||||||||||||
Shares redeemed | (643,196 | ) | (22,358,941 | ) | (907,295 | ) | (39,274,640 | ) | ||||||||||||
|
|
|
| |||||||||||||||||
Net decrease | (42,245 | ) | $ | (1,103,407 | ) | (323,817 | ) | $ | (14,225,489 | ) | ||||||||||
|
|
|
| |||||||||||||||||
| Investor A | ||||||||||||||||||||
Shares sold | 1,063,826 | $ | 39,117,103 | 309,560 | $ | 13,091,135 | ||||||||||||||
Shares issued in reinvestment of distributions | 9,973 | 324,519 | 63,004 | 2,792,237 | ||||||||||||||||
Shares redeemed | (1,422,316 | ) | (52,041,960 | ) | (1,008,316 | ) | (43,501,756 | ) | ||||||||||||
|
|
|
| |||||||||||||||||
Net decrease | (348,517 | ) | $ | (12,600,338 | ) | (635,752 | ) | $ | (27,618,384 | ) | ||||||||||
|
|
|
| |||||||||||||||||
| Investor B | ||||||||||||||||||||
Shares sold | — | $ | 17 | 2 | $ | 129 | ||||||||||||||
Shares issued in reinvestment of distributions | — | — | 322 | 13,492 | ||||||||||||||||
Shares redeemed | (23,242 | ) | (766,561 | ) | (28,207 | ) | (1,124,722 | ) | ||||||||||||
|
|
|
| |||||||||||||||||
Net decrease | (23,242 | ) | $ | (766,544 | ) | (27,883 | ) | $ | (1,111,101 | ) | ||||||||||
|
|
|
| |||||||||||||||||
| Investor C | ||||||||||||||||||||
Shares sold | 63,884 | $ | 2,038,804 | 52,311 | $ | 2,058,716 | ||||||||||||||
Shares issued in reinvestment of distributions | — | — | 10,994 | 447,651 | ||||||||||||||||
Shares redeemed | (193,111 | ) | (6,215,695 | ) | (361,650 | ) | (14,206,948 | ) | ||||||||||||
|
|
|
| |||||||||||||||||
Net decrease | (129,227 | ) | $ | (4,176,891 | ) | (298,345 | ) | $ | (11,700,581 | ) | ||||||||||
|
|
|
| |||||||||||||||||
Total Net Decrease | (543,231 | ) | $ | (18,647,180 | ) | (1,285,797 | ) | $ | (54,655,555 | ) | ||||||||||
|
|
|
| |||||||||||||||||
11. Subsequent Events:
Management has evaluated the impact of all subsequent events on the Funds through the date the financial statements were issued and has determined that there were no subsequent events requiring adjustment or additional disclosure in the financial statements.
| 38 | ANNUAL REPORT | OCTOBER 31, 2016 |
| Report of Independent Registered Public Accounting Firm |
To the Shareholders and Board of Directors of BlackRock Emerging Markets Fund, Inc. and BlackRock Latin America Fund, Inc.:
We have audited the accompanying statements of assets and liabilities of BlackRock Emerging Markets Fund, Inc. and BlackRock Latin America Fund, Inc. (collectively, the “Funds”), including the schedules of investments as of October 31, 2016, the related statements of operations for the year then ended, the statements of changes in net assets for each of the two years in the period then ended and the financial highlights for each of the five years in the period then ended. These financial statements and financial highlights are the responsibility of the Funds’ management. Our responsibility is to express an opinion on these financial statements and financial highlights based on our audits.
We conducted our audits in accordance with the standards of the Public Company Accounting Oversight Board (United States). Those standards require that we plan and perform the audit to obtain reasonable assurance about whether the financial statements and financial highlights are free of material misstatement. The Funds are not required to have, nor were we engaged to perform, an audit of their internal control over financial reporting. Our audits included consideration of internal control over financial reporting as a basis for designing audit procedures that are appropriate in the circumstances, but not for the purpose of expressing an opinion on the effectiveness of the Funds’ internal control over financial reporting. Accordingly, we express no such opinion. An audit also includes examining, on a test basis, evidence supporting the amounts and disclosures in the financial statements, assessing the accounting principles used and significant estimates made by management, as well as evaluating the overall financial statement presentation. Our procedures included confirmation of securities owned as of October 31, 2016, by correspondence with the custodian and brokers; where replies were not received from brokers, we performed other auditing procedures. We believe that our audits provide a reasonable basis for our opinion.
In our opinion, the financial statements and financial highlights referred to above present fairly, in all material respects, the financial position of BlackRock Emerging Markets Fund, Inc. and BlackRock Latin America Fund, Inc. as of October 31, 2016, the results of their operations for the year then ended, the changes in their net assets for each of the two years in the period then ended and the financial highlights for each of the five years in the period then ended, in conformity with accounting principles generally accepted in the United States of America.
Deloitte & Touche LLP
Boston, Massachusetts
December 22, 2016
| Important Tax Information (Unaudited) |
During the fiscal year ended October 31, 2016, the following information is provided with respect to the ordinary income distributions paid:
| Payable Date | Emerging Markets | Latin America | ||||||||||
Qualified Dividend Income for Individuals1,2 | 12/16/15 | 100.00% | 100.00% | |||||||||
Foreign Source Income2 | 12/16/15 | 100.00% | 100.00% | |||||||||
Foreign Taxes Paid Per Share3 | 12/16/15 | $0.087689 | $0.124135 | |||||||||
| 1 | The Funds hereby designate the percentage indicated above or the maximum amount allowable by law. |
| 2 | Expressed as a percentage of the cash distribution grossed-up for foreign taxes. |
| 3 | The foreign taxes paid represent taxes incurred by the Funds on income received by the Funds from foreign sources. Foreign taxes paid may be included in taxable income with an offsetting deduction from gross income or may be taken as a credit for taxes paid to foreign governments. You should consult your tax advisor regarding the appropriate treatment of foreign taxes paid. |
| ANNUAL REPORT | OCTOBER 31, 2016 | 39 |
| Disclosure of Investment Advisory Agreements and Sub-Advisory Agreements | ||||
The Board of Directors of BlackRock Emerging Markets Fund, Inc. (“Emerging Markets Fund”) met in person on April 21, 2016 and May 18-20, 2016 to consider the approval of the investment advisory agreement (the “Emerging Markets Advisory Agreement”) between Emerging Markets Fund and BlackRock Advisors, LLC (the “Manager”), its investment advisor. The Board of Directors of Emerging Markets Fund also considered the approval of the sub-advisory agreement (the “Emerging Markets Sub-Advisory Agreement”) between the Manager and BlackRock International Limited (“BIL” or the “Sub-Advisor”) with respect to Emerging Markets Fund.
The Board of Directors of BlackRock Latin America Fund, Inc. (“Latin America Fund”) met in person on April 21, 2016 and May 18-20, 2016 to consider the approval of the investment advisory agreement (the “Latin America Advisory Agreement”) between Latin America Fund and the Manager, its investment advisor. The Board of Directors of Latin America Fund also considered the approval of the sub-advisory agreement (the “Latin America Sub-Advisory Agreement”) between the Manager and BIL with respect to Latin America Fund.
Emerging Markets Fund and Latin America Fund are referred to herein individually as a “Fund” or collectively as the “Funds.” The Manager and the Sub-Advisor are referred to herein as “BlackRock.” The Emerging Markets Advisory Agreement, the Emerging Markets Sub-Advisory Agreement, the Latin America Advisory Agreement and the Latin America Sub-Advisory Agreement are referred to herein individually as an “Agreement” or collectively as the “Agreements.” For simplicity: (a) the Board of Directors of Emerging Markets Fund and the Board of Directors of Latin America Fund are referred to herein individually as the “Board” and collectively as the “Boards” and the members are referred to as “Board Members”; and (b) the meetings held on April 21, 2016 are referred to as the “April Meeting” and the meetings held on May 18-20, 2016 are referred to as the “May Meeting.”
Activities and Composition of the Boards
On the date of the May Meeting, each Board consisted of fifteen individuals, thirteen of whom were not “interested persons” of the pertinent Fund as defined in the Investment Company Act of 1940, as amended (the “1940 Act”) (the “Independent Board Members”). The Board Members are responsible for the oversight of the operations of the pertinent Fund and perform the various duties imposed on the directors of investment companies by the 1940 Act. The Independent Board Members have retained independent legal counsel to assist them in connection with their duties. The Chair of each Board is an Independent Board Member. Each Board has established five standing committees: an Audit Committee, a Governance and Nominating Committee, a Compliance Committee, a Performance Oversight and Contract Committee and an Executive Committee, each of which is chaired by an Independent Board Member and composed of Independent Board Members (except for the Executive Committee, which also has one interested Board Member).
The Agreements
Pursuant to the 1940 Act, each Board is required to consider the continuation of the pertinent Agreements on an annual basis. The Boards have four quarterly meetings per year, each extending over two days, a fifth one-day meeting to consider specific information surrounding the consideration of renewing the pertinent Agreements and additional in-person and telephonic meetings as needed. In connection with this year-long deliberative process, the Boards assessed, among other things, the nature, extent and quality of the services provided to the Funds by BlackRock, BlackRock’s personnel and affiliates, including (as applicable): investment management; administrative and shareholder services; the oversight of fund service providers; marketing; risk oversight; compliance; and ability to meet applicable legal and regulatory requirements.
The Boards, acting directly and through their committees, consider at each of their meetings, and from time to time as appropriate, factors that are relevant to their annual consideration of the renewal of the Agreements, including the services and support provided by BlackRock to the Funds and their shareholders. BlackRock also furnished additional information to the Boards in response to specific questions from the Boards. This additional information is discussed further below in the section titled “Board Considerations in Approving the Agreements.” Among the matters the Boards considered, with respect to each Fund, as pertinent, were: (a) investment performance for one-year, three-year, five-year, ten-year, and/or since inception periods, as applicable, against peer funds, applicable benchmark, and performance metrics, as applicable, as well as senior management’s and portfolio managers’ analysis of the reasons for any over-performance or underperformance relative to its peers, benchmarks, and other performance metrics, as applicable; (b) fees, including advisory, administration, if applicable, and other amounts paid to BlackRock and its affiliates by the Fund for services; (c) Fund operating expenses and how BlackRock allocates expenses to the Fund; (d) the resources devoted to, risk oversight of, and compliance reports relating to, implementation of the Fund’s investment objective(s), policies and restrictions, and meeting regulatory requirements; (e) the Fund’s compliance with its compliance policies and procedures; (f) the nature, cost and character of non-investment management services provided by BlackRock and its affiliates; (g) BlackRock’s and other service providers’ internal controls and risk and compliance oversight mechanisms; (h) BlackRock’s implementation of the proxy voting policies approved by the Board; (i) the use of brokerage commissions and execution quality of portfolio transactions; (j) BlackRock’s implementation of the Fund’s valuation and liquidity procedures; (k) an analysis of management fees
| 40 | ANNUAL REPORT | OCTOBER 31, 2016 |
| Disclosure of Investment Advisory Agreements and Sub-Advisory Agreements (continued) | ||
for products with similar investment mandates across the open-end fund, exchange-traded fund (“ETF”), closed-end fund and institutional account product channels, as applicable, and the similarities and differences between these products and the services provided as compared to the Fund; (l) BlackRock’s compensation methodology for its investment professionals and the incentives and accountability it creates, along with investment professionals’ investments in the fund(s) they manage; and (m) periodic updates on BlackRock’s business.
Board Considerations in Approving the Agreements
The Approval Process: Prior to the April Meeting, the Boards requested and received materials specifically relating to the Agreements. The Boards are continuously engaged in a process with their independent legal counsel and BlackRock to review the nature and scope of the information provided to better assist their deliberations. The materials provided in connection with the April Meeting included (a) information independently compiled and prepared by Broadridge Financial Solutions, Inc. (“Broadridge”) on the fees and expenses of each Fund as compared with a peer group of funds as determined by Broadridge (“Expense Peers”) and the investment performance of each Fund as compared with a peer group of funds as determined by Broadridge;1 (b) information on the profits realized by BlackRock and its affiliates pursuant to the Agreements and a discussion of fall-out benefits to BlackRock and its affiliates; (c) a general analysis provided by BlackRock concerning investment management fees charged to other clients, such as institutional clients, sub-advised mutual funds, ETFs and closed-end funds, under similar investment mandates, as well as the performance of such other clients, as applicable; (d) review of non-management fees; (e) the existence, impact and sharing of potential economies of scale; (f) a summary of aggregate amounts paid by each Fund to BlackRock; and (g) sales and redemption data regarding each Fund’s shares.
At the April Meeting, each Board reviewed materials relating to its consideration of the pertinent Agreements. As a result of the discussions that occurred during the April Meeting, and as a culmination of each Board’s year-long deliberative process, the Boards presented BlackRock with questions and requests for additional information. BlackRock responded to these requests with additional written information in advance of the May Meeting.
At the May Meeting, (a) the Board of Emerging Markets Fund, including the Independent Board Members, approved the continuation of the Emerging Markets Advisory Agreement between the Manager and Emerging Markets Fund and the Emerging Markets Sub-Advisory Agreement between the Manager and BIL with respect to Emerging Markets Fund, each for a one-year term ending June 30, 2017; and (b) the Board of Latin America Fund, including the Independent Board Members, approved the continuation of the Latin America Advisory Agreement between the Manager and Latin America Fund and the Latin America Sub-Advisory Agreement between the Manager and BIL with respect to Latin America Fund, each for a one-year term ending June 30, 2017. In approving the continuation of the pertinent Agreements, each Board considered, with respect to the applicable Fund, (a) the nature, extent and quality of the services provided by BlackRock; (b) the investment performance of the Fund; (c) the advisory fee and the cost of the services and profits to be realized by BlackRock and its affiliates from their relationship with the Fund; (d) the Fund’s costs to investors compared to the costs of Expense Peers and performance compared to the relevant performance metrics as previously discussed; (e) the sharing of potential economies of scale; (f) fall-out benefits to BlackRock and its affiliates as a result of its relationship with the Fund; and (g) other factors deemed relevant by the Board Members.
Each Board also considered other matters it deemed important to the approval process, such as other payments made to BlackRock or its affiliates, securities lending and cash management, services related to the valuation and pricing of the portfolio holdings of the applicable Fund, and advice from independent legal counsel with respect to the review process and materials submitted for the Board’s review. Each Board noted the willingness of BlackRock personnel to engage in open, candid discussions with the Board. The Boards did not identify any particular information as determinative, and each Board Member may have attributed different weights to the various items considered.
A. Nature, Extent and Quality of the Services Provided by BlackRock: Each Board, including the Independent Board Members, reviewed the nature, extent and quality of services provided by BlackRock, including the investment advisory services and the resulting performance of the applicable Fund. Throughout the year, each Board compared Fund performance to the performance of a comparable group of mutual funds, relevant benchmark, and performance metrics, as applicable. The Boards met with BlackRock’s senior management personnel responsible for investment activities, including the senior investment officers. Each Board also reviewed the materials provided by the applicable Fund’s portfolio management team discussing the Fund’s performance and the Fund’s investment objective(s), strategies and outlook.
Each Board considered, among other factors, with respect to BlackRock: the number, education and experience of investment personnel generally and the applicable Fund’s portfolio management team; BlackRock’s research capabilities; investments by portfolio managers in the funds they manage; portfolio trading capabilities; use of technology; commitment to compliance; credit analysis capabilities; risk analysis and oversight
| 1 | Funds are ranked by Broadridge in quartiles, ranging from first to fourth, where first is the most desirable quartile position and fourth is the least desirable. |
| ANNUAL REPORT | OCTOBER 31, 2016 | 41 |
| Disclosure of Investment Advisory Agreements and Sub-Advisory Agreements (continued) | ||
capabilities; and the approach to training and retaining portfolio managers and other research, advisory and management personnel. Each Board engaged in a review of BlackRock’s compensation structure with respect to the applicable Fund’s portfolio management team and BlackRock’s ability to attract and retain high-quality talent and create performance incentives.
In addition to investment advisory services, the Boards considered the quality of the administrative and other non-investment advisory services provided to the Funds. BlackRock and its affiliates provide the Funds with certain administrative, shareholder and other services (in addition to any such services provided to the Funds by third parties) and officers and other personnel as are necessary for the operations of the Funds. In particular, BlackRock and its affiliates provide the Funds with administrative services including, among others: (i) preparing disclosure documents, such as the prospectus, the summary prospectus (as applicable), the statement of additional information and periodic shareholder reports; (ii) oversight of daily accounting and pricing; (iii) preparing periodic filings with regulators; (iv) overseeing and coordinating the activities of other service providers; (v) organizing Board meetings and preparing the materials for such Board meetings; (vi) providing legal and compliance support; (vii) furnishing analytical and other support to assist the Boards in their consideration of strategic issues such as the merger, consolidation or repurposing of certain open-end funds; and (viii) performing other administrative functions necessary for the operation of the Funds, such as tax reporting, fulfilling regulatory filing requirements and call center services. The Boards reviewed the structure and duties of BlackRock’s fund administration, shareholder services, and legal & compliance departments and considered BlackRock’s policies and procedures for assuring compliance with applicable laws and regulations.
B. The Investment Performance of the Funds and BlackRock: Each Board, including the Independent Board Members, also reviewed and considered the performance history of the applicable Fund. In preparation for the April Meeting, the Boards were provided with reports independently prepared by Broadridge, which included a comprehensive analysis of each Fund’s performance. The Boards also reviewed a narrative and statistical analysis of the Broadridge data that was prepared by BlackRock. In connection with their review, the Boards received and reviewed information regarding the investment performance of each Fund as compared to other funds in the Fund’s applicable Broadridge category. The Boards were provided with a description of the methodology used by Broadridge to select peer funds and periodically meet with Broadridge representatives to review its methodology. Each Board was provided with information on the composition of the Broadridge performance universes and expense universes. Each Board and its Performance Oversight and Contract Committee regularly review, and meet with Fund management to discuss, the performance of the pertinent Fund throughout the year.
In evaluating performance, the Boards recognized that the performance data reflects a snapshot of a period as of a particular date and that selecting a different performance period could produce significantly different results. Further, the Boards recognized that it is possible that long-term performance can be adversely affected by even one period of significant underperformance so that a single investment decision or theme has the ability to affect long-term performance disproportionately.
The Board of Latin America Fund noted that for each of the one-, three- and five-year periods reported, Latin America Fund ranked in the third quartile against its Broadridge Performance Universe. The Board and BlackRock reviewed and discussed the reasons for the Fund’s underperformance during these periods. The Board was informed that, among other things, the Fund’s overweight position in Brazil and underweight position in Mexico were the primary drivers of underperformance during the periods.
The Board of Emerging Markets Fund noted that for the one-, three- and five-year periods reported, Emerging Markets Fund ranked in the fourth, third and third quartiles, respectively, against its Broadridge Performance Universe. The Board and BlackRock reviewed and discussed the reasons for the Fund’s underperformance during these periods. The Board was informed that, among other things, the Fund’s underperformance in 2015 was the main driver of underperformance across the one-, three-, and five-year periods. Slowing markets coupled with a sharp deceleration in the Chinese economy, a collapse in global commodity prices, and rising political instability across the asset class were the primary detractors from performance in 2015.
The Boards and BlackRock discussed BlackRock’s strategy for improving the investment performance of Emerging Markets Fund and Latin America Fund. With respect to each Fund, discussions covered topics such as: investment risks undertaken by the Fund; performance attribution; the Fund’s investment personnel; and the resources appropriate to support the Fund’s investment processes. The Boards and BlackRock also discussed BlackRock’s active equity platform, and it was noted that BlackRock has recruited a Head of Global Active Equity, and has appointed a Chief Performance Officer to provide analysis of investment performance to senior management and the Boards.
C. Consideration of the Advisory/Management Fees and the Cost of the Services and Profits to be Realized by BlackRock and its Affiliates from their Relationship with the Funds: Each Board, including the Independent Board Members, reviewed the applicable Fund’s contractual management fee
| 42 | ANNUAL REPORT | OCTOBER 31, 2016 |
| Disclosure of Investment Advisory Agreements and Sub-Advisory Agreements (continued) | ||
rate compared with the other funds in its Broadridge category. The contractual management fee rate represents a combination of the advisory fee and any administrative fees, before taking into account any reimbursements or fee waivers. Each Board also compared the applicable Fund’s total expense ratio, as well as its actual management fee rate, to those of other funds in its Broadridge category. The total expense ratio represents a fund’s total net operating expenses, including any 12b-1 or non 12b-1 service fees. The total expense ratio gives effect to any expense reimbursements or fee waivers that benefit a fund, and the actual management fee rate gives effect to any management fee reimbursements or waivers that benefit a fund. The Boards considered the services provided and the fees charged by BlackRock and its affiliates to other types of clients with similar investment mandates, as applicable, including institutional accounts and sub-advised mutual funds (including mutual funds sponsored by third parties).
The Boards received and reviewed statements relating to BlackRock’s financial condition. The Boards reviewed BlackRock’s profitability methodology and were also provided with a profitability analysis that detailed the revenues earned and the expenses incurred by BlackRock for services provided to the Funds. The Boards reviewed BlackRock’s profitability with respect to the Funds and other funds the Board currently oversees for the year ended December 31, 2015 compared to available aggregate profitability data provided for the prior two years. The Boards reviewed BlackRock’s profitability with respect to certain other U.S. fund complexes managed by the Manager and/or its affiliates. The Boards reviewed BlackRock’s assumptions and methodology of allocating expenses in the profitability analysis, noting the inherent limitations in allocating costs among various advisory products. The Boards recognized that profitability may be affected by numerous factors including, among other things, fee waivers and expense reimbursements by the Manager, the types of funds managed, precision of expense allocations and business mix. As a result, calculating and comparing profitability at individual fund levels is difficult.
The Boards noted that, in general, individual fund or product line profitability of other advisors is not publicly available. The Boards reviewed BlackRock’s overall operating margin, in general, compared to that of certain other publicly-traded asset management firms. The Boards considered the differences between BlackRock and these other firms, including the contribution of technology at BlackRock, BlackRock’s expense management, and the relative product mix.
In addition, each Board considered the cost of the services provided to the applicable Fund by BlackRock, and BlackRock’s and its affiliates’ profits relating to the management and distribution of the applicable Fund and the other funds advised by BlackRock and its affiliates. As part of its analysis, each Board reviewed BlackRock’s methodology in allocating its costs of managing the applicable Fund, to the Fund. The Boards may receive and review information from independent third parties as part of their annual evaluation. Each Board considered whether BlackRock has the financial resources necessary to attract and retain high quality investment management personnel to perform its obligations under the pertinent Agreements and to continue to provide the high quality of services that is expected by that Board. The Boards further considered factors including but not limited to BlackRock’s commitment of time, assumption of risk, and liability profile in servicing the Funds in contrast to what is required of BlackRock with respect to other products with similar investment mandates across the open-end fund, ETF, closed-end fund, sub-advised mutual fund and institutional account product channels, as applicable.
The Board of Emerging Markets Fund noted that the Fund’s contractual management fee rate ranked in the first quartile, and that the actual management fee rate and total expense ratio ranked in the second and third quartiles, respectively, relative to the Fund’s Expense Peers.
The Board of Latin America Fund noted that the Fund’s contractual management fee rate ranked in the first quartile, and that the actual management fee rate and total expense ratio ranked in the third and second quartiles, respectively, relative to the Fund’s Expense Peers.
The Boards also noted that each Fund has an advisory fee arrangement that includes breakpoints that adjust the fee rate downward as the size of the Fund increases above certain contractually specified levels.
D. Economies of Scale: Each Board, including the Independent Board Members, considered the extent to which economies of scale might be realized as the assets of the applicable Fund increase, as well as the existence of expense caps, as applicable. Each Board also considered the extent to which the applicable Fund benefits from such economies in a variety of ways and whether there should be changes in the advisory fee rate or breakpoint structure in order to enable the Fund to more fully participate in these economies of scale. Each Board considered the applicable Fund’s asset levels and whether the current fee schedule was appropriate. In their consideration, the Board Members took into account the existence of any expense caps and further considered the continuation and/or implementation, as applicable, of such caps.
E. Other Factors Deemed Relevant by the Board Members: Each Board, including the Independent Board Members, also took into account other ancillary or “fall-out” benefits that BlackRock or its affiliates may derive from their respective relationships with the applicable Fund, both tangible and intangible, such as BlackRock’s ability to leverage its investment professionals who manage other portfolios and risk management personnel, an
| ANNUAL REPORT | OCTOBER 31, 2016 | 43 |
| Disclosure of Investment Advisory Agreements and Sub-Advisory Agreements (concluded) | ||
increase in BlackRock’s profile in the investment advisory community, and the engagement of BlackRock’s affiliates as service providers to the Fund, including for administrative, distribution, securities lending and cash management services. The Boards also considered BlackRock’s overall operations and its efforts to expand the scale of, and improve the quality of, its operations. The Boards also noted that BlackRock may use and benefit from third party research obtained by soft dollars generated by certain registered fund transactions to assist in managing all or a number of its other client accounts. Each Board further noted that it had considered the investment by BlackRock’s funds in affiliated ETFs without any offset against the management fees payable by the funds to BlackRock.
In connection with their consideration of the Agreements, the Boards also received information regarding BlackRock’s brokerage and soft dollar practices. The Boards received reports from BlackRock which included information on brokerage commissions and trade execution practices throughout the year.
The Boards noted the competitive nature of the open-end fund marketplace, and that shareholders are able to redeem their Fund shares if they believe that the pertinent Fund’s fees and expenses are too high or if they are dissatisfied with the performance of the Fund.
Conclusion
The Board of Emerging Markets Fund, including the Independent Board Members, approved the continuation of the Emerging Markets Advisory Agreement between the Manager and Emerging Markets Fund and the Emerging Markets Sub-Advisory Agreement between the Manager and BIL with respect to Emerging Markets Fund, each for a one-year term ending June 30, 2017. The Board of Latin America Fund, including the Independent Board Members, approved the continuation of the Latin America Advisory Agreement between the Manager and Latin America Fund and the Latin America Sub-Advisory Agreement between the Manager and BIL with respect to Latin America Fund, each for a one-year term ending June 30, 2017.
Based upon its evaluation of all of the aforementioned factors in their totality, as well as other information, each Board, including the Independent Board Members, was satisfied that the terms of the applicable Agreements were fair and reasonable and in the best interest of the applicable Fund and its shareholders. In arriving at a decision to approve the applicable Agreements, each Board did not identify any single factor or group of factors as all-important or controlling, but considered all factors together, and different Board Members may have attributed different weights to the various factors considered. The Independent Board Members were also assisted by the advice of independent legal counsel in making this determination. The contractual fee arrangements for each Fund reflect the results of several years of review by the pertinent Board Members and predecessor Board Members, and discussions between such Board Members (and predecessor Board Members) and BlackRock. As a result, the Board Members’ conclusions may be based in part on their consideration of these arrangements in prior years.
| 44 | ANNUAL REPORT | OCTOBER 31, 2016 |
| Officers and Directors |
| Name, Address1 and Year of Birth | Position(s) Held with the Fund | Length of Time Served3 | Principal Occupation(s) During Past Five Years | Number of BlackRock- Advised Registered Investment Companies (“RICs”) Consisting of Investment Portfolios (“Portfolios”) Overseen | Public Company and Other Investment Company Directorships Held During Past Five Years | |||||
| Independent Directors2 | ||||||||||
Rodney D. Johnson
1941 | Chair of the Board and Director | Since 2007 | President, Fairmount Capital Advisors, Inc. from 1987 to 2013; Member of the Archdiocesan Investment Committee of the Archdiocese of Philadelphia from 2004 to 2012; Director, The Committee of Seventy (civic) from 2006 to 2012; Director, Fox Chase Cancer Center from 2004 to 2011; Director, The Mainstay (non-profit) since 2016. | 26 RICs consisting of 143 Portfolios | None | |||||
David O. Beim
1940 | Director | Since 2007 | Professor of Professional Practice at the Columbia University Graduate School of Business from 1991 to 2014; Trustee, Phillips Exeter Academy from 2002 to 2012; Chairman, Wave Hill, Inc. (public garden and cultural center) from 1990 to 2006. | 26 RICs consisting of 143 Portfolios | None | |||||
Susan J. Carter
1956 | Director | Since 2016 | Director, Pacific Pension Institute since 2014; Advisory Board Member, Center for Private Equity and Entrepreneurship at Tuck School of Business since 1997; Senior Advisor, Commonfund Capital, Inc. (“CCI”) (investment adviser) in 2015; Chief Executive Officer, CCI from 2013 to 2014; President & Chief Executive Officer, CCI from 1997 to 2013; Advisory Board Member, Girls Who Invest since 2015; Advisory Board Member, Bridges Ventures since 2016. | 26 RICs consisting of 143 Portfolios | None | |||||
Collette Chilton
1958 | Director | Since 2015 | Chief Investment Officer, Williams College since 2006; Chief Investment Officer, Lucent Asset Management Corporation from 1998 to 2006. | 26 RICs consisting of 143 Portfolios | None | |||||
Neil A. Cotty
1954 | Director | Since 2016 | Bank of America Corporation from 1996 to 2015, serving in various senior finance leadership roles, including Chief Accounting Officer, from 2009 to 2015, Chief Financial Officer of Global Banking, Markets and Wealth Management from 2008 to 2009, Chief Accounting Officer from 2004 to 2008, Chief Financial Officer of Consumer Bank from 2003 to 2004, Chief Financial Officer of Global Corporate Investment Bank from 1999 to 2002. | 26 RICs consisting of 143 Portfolios | None | |||||
Dr. Matina S. Horner
1939 | Director | Since 2007 | Executive Vice President, Teachers Insurance and Annuity Association and College Retirement Equities Fund from 1989 to 2003. | 26 RICs consisting of 143 Portfolios | NSTAR (electric and gas utility) | |||||
Cynthia A. Montgomery
1952 | Director | Since 2007 | Professor, Harvard Business School since 1989; Director, McLean Hospital from 2005 to 2012. | 26 RICs consisting of 143 Portfolios | Newell Rubbermaid, Inc. (manufacturing) | |||||
Joseph P. Platt
1947 | Director | Since 2007 | General Partner, Thorn Partners, LP (private investments) since 1998; Director, WQED Multi-Media (public broadcasting not-for-profit) since 2001; Chair, Basic Health International (non-profit) since 2015. | 26 RICs consisting of 143 Portfolios | Greenlight Capital Re, Ltd. (reinsurance company); Consol Energy Inc. | |||||
Robert C. Robb, Jr.
1945 | Director | Since 2007 | Partner, Lewis, Eckert, Robb and Company (management and financial consulting firm) since 1981 and Principal since 2010. | 26 RICs consisting of 143 Portfolios | None | |||||
Mark Stalnecker
1951 | Director | Since 2015 | Chief Investment Officer, University of Delaware from 1999 to 2013; Trustee, Winterthur Museum and Country Estate from 2001 to 2015; Member of the Investment Committee, Delaware Public Employees’ Retirement System since 2002; Member of the Investment Committee, Christiana Care Health System since 2009; Member of the Investment Committee, Delaware Community Foundation from 2013 to 2014; Director, SEI Private Trust Co. from 2001 to 2014. | 26 RICs consisting of 143 Portfolios | None |
| ANNUAL REPORT | OCTOBER 31, 2016 | 45 |
| Officers and Directors (continued) |
| Name, Address1 and Year of Birth | Position(s) Held with the Fund | Length of Time Served3 | Principal Occupation(s) During Past Five Years | Number of BlackRock- Advised Registered Investment Companies (“RICs”) Consisting of Investment Portfolios (“Portfolios”) Overseen | Public Company and Other Investment Company Directorships Held During Past Five Years | |||||
| Independent Directors2 (concluded) | ||||||||||
Kenneth L. Urish
1951 | Director | Since 2007 | Managing Partner, Urish Popeck & Co., LLC (certified public accountants and consultants) since 1976; Past-Chairman of the Professional Ethics Committee of the Pennsylvania Institute of Certified Public Accountants and Committee Member thereof since 2007; Member of External Advisory Board, The Pennsylvania State University Accounting Department since founding in 2001; Principal, UP Strategic Wealth Investment Advisors, LLC since 2013; Trustee, The Holy Family Institute from 2001 to 2010; President and Trustee, Pittsburgh Catholic Publishing Associates from 2003 to 2008; Director, Inter-Tel from 2006 to 2007. | 26 RICs consisting of 143 Portfolios | None | |||||
Claire A. Walton
1957 | Director | Since 2016 | Chief Operating Officer and Chief Financial Officer of Liberty Square Asset Management, LP from 1998 to 2015; General Partner of Neon Liberty Capital Management, LLC since 2003; Director, Boston Hedge Fund Group since 2009; Director, Woodstock Ski Runners since 2013; Director, Massachusetts Council on Economic Education from 2013 to 2015. | 26 RICs consisting of 143 Portfolios | None | |||||
Frederick W. Winter
1945 | Director | Since 2007 | Director, Alkon Corporation since 1992; Dean Emeritus of the Joseph M. Katz School of Business, University of Pittsburgh, Dean and Professor from 1997 to 2005, Professor until 2013. | 26 RICs consisting of 143 Portfolios | None | |||||
| Interested Directors4 | ||||||||||
Barbara G. Novick
1960 | Director | Since 2015 | Vice Chairman of BlackRock, Inc. since 2006; Chair of BlackRock's Government Relations Steering Committee since 2009; Head of the Global Client Group of BlackRock, Inc. from 1988 to 2008. | 100 RICs consisting of 217 Portfolios | None | |||||
John M. Perlowski
1964 | Director, President and Chief Executive Officer | Since 2015 (Director); Since 2010 (President and Chief Executive Officer) | Managing Director of BlackRock, Inc. since 2009; Head of BlackRock Global Fund & Accounting Services since 2009; Managing Director and Chief Operating Officer of the Global Product Group at Goldman Sachs Asset Management, L.P. from 2003 to 2009; Treasurer of Goldman Sachs Mutual Funds from 2003 to 2009 and Senior Vice President thereof from 2007 to 2009; Director of Goldman Sachs Offshore Funds from 2002 to 2009; Director of Family Resource Network (charitable foundation) since 2009. | 128 RICs consisting of 315 Portfolios | None | |||||
1 The address of each Director is c/o BlackRock, Inc., 55 East 52nd Street, New York, NY 10055. | ||||||||||
2 Independent Directors serve until their resignation, retirement, removal or death, or until December 31 of the year in which they turn 75. The Board has determined to extend the terms of Independent Directors on a case-by-case basis, as appropriate. The Board has unanimously approved extending the mandatory retirement age for David O. Beim and Dr. Matina S. Horner until December 31, 2016, which the Board believes is in the best interests of shareholders of the Funds. | ||||||||||
3 Following the combination of Merrill Lynch Investment Managers, L.P. (“MLIM”) and BlackRock, Inc. (“BlackRock”) in September 2006, the various legacy MLIM and legacy BlackRock fund boards were realigned and consolidated into three new fund boards in 2007. As a result, although the chart shows certain Independent Directors as joining the Board in 2007, those Independent Directors first became members of the boards of other legacy MLIM or legacy BlackRock funds as follows: David O. Beim, 1998; Dr. Matina S. Horner, 2004; Rodney D. Johnson, 1995; Cynthia A. Montgomery, 1994; Joseph P. Platt, 1999; Robert C. Robb, Jr., 1999; Kenneth L. Urish, 1999; and Frederick W. Winter, 1999. | ||||||||||
4 Ms. Novick and Mr. Perlowski are both “interested persons,” as defined in the 1940 Act, of the Funds based on their positions with BlackRock and its affiliates. Mr. Perlowski and Ms. Novick are also board members of certain complexes of BlackRock registered open-end and closed-end funds. Mr. Perlowski is also a board member of the BlackRock Equity-Bond Complex and the BlackRock Closed-End Complex, and Ms. Novick is a board member of the BlackRock Closed-End Complex. | ||||||||||
| 46 | ANNUAL REPORT | OCTOBER 31, 2016 |
| Officers and Directors (concluded) |
| Name, Address1 and Year of Birth | Position(s) Held with the Funds | Length of Time Served as an Officer | Principal Occupation(s) During Past Five Years | |||
| Officers Who Are Not Directors2 | ||||||
Thomas Callahan
1968 | Vice President | Since 2016 | Managing Director of BlackRock, Inc. since 2013; Head of BlackRock’s Global Cash Management Business since 2016; Co-Head of the Global Cash Management Business from 2014 to 2016; Deputy Head of the Global Cash Management Business from 2013 to 2014; Member of the Cash Management Group Executive Committee since 2013; Chief Executive Officer of NYSE Liffe U.S. from 2008 to 2013. | |||
Jennifer McGovern
1977 | Vice President | Since 2014 | Managing Director of BlackRock, Inc. since 2016; Director of BlackRock, Inc. from 2011 to 2015; Head of Product Structure and Oversight for BlackRock’s U.S. Wealth Advisory Group since 2013; Vice President of BlackRock, Inc. from 2008 to 2010. | |||
Neal J. Andrews
1966 | Chief Financial Officer | Since 2007 | Managing Director of BlackRock, Inc. since 2006; Senior Vice President and Line of Business Head of Fund Accounting and Administration at PNC Global Investment Servicing (U.S.) Inc. from 1992 to 2006. | |||
Jay M. Fife 1970
| Treasurer | Since 2007 | Managing Director of BlackRock, Inc. since 2007; Director of BlackRock, Inc. in 2006; Assistant Treasurer of the MLIM and Fund Asset Management, L.P. advised funds from 2005 to 2006; Director of MLIM Fund Services Group from 2001 to 2006. | |||
Charles Park
1967 | Chief Compliance Officer | Since 2014 | Anti-Money Laundering Compliance Officer for the BlackRock-advised Funds in the Equity-Bond Complex, the Equity-Liquidity Complex and the Closed-End Complex from 2014 to 2015; Chief Compliance Officer of BlackRock Advisors, LLC and the BlackRock-advised Funds in the Equity-Bond Complex, the Equity-Liquidity Complex and the Closed-End Complex since 2014; Principal of and Chief Compliance Officer for iShares® Delaware Trust Sponsor LLC since 2012 and BlackRock Fund Advisors (“BFA”) since 2006; Chief Compliance Officer for the BFA-advised iShares® exchange traded funds since 2006; Chief Compliance Officer for BlackRock Asset Management International Inc. since 2012. | |||
Fernanda Piedra
1969 | Anti-Money Laundering Compliance Officer | Since 2015 | Director of BlackRock, Inc. since 2014; Anti-Money Laundering Compliance Officer and Regional Head of Financial Crime for the Americas at BlackRock, Inc. since 2014; Head of Regulatory Changes and Remediation for the Asset Wealth Management Division of Deutsche Bank from 2010 to 2014; Vice President of Goldman Sachs (Anti-Money Laundering/Suspicious Activities Group) from 2004 to 2010. | |||
Benjamin Archibald
1975 | Secretary | Since 2012 | Managing Director of BlackRock, Inc. since 2014; Director of BlackRock, Inc. from 2010 to 2013; Secretary of the iShares® exchange traded funds since 2015; Secretary of the BlackRock-advised mutual funds since 2012. | |||
1 The address of each Officer is c/o BlackRock, Inc., 55 East 52nd Street, New York, NY 10055. | ||||||
2 Officers of the Funds serve at the pleasure of the Board. | ||||||
| Further information about the Funds’ Officers and Directors is available in the Funds’ Statement of Additional Information, which can be obtained without charge by calling (800) 441-7762. | ||||||
Investment Adviser BlackRock Advisors, LLC Wilmington, DE 19809 | Sub-Adviser BlackRock International Limited Edinburgh, EH3 8BL United Kingdom | Custodian Brown Brothers Harriman & Co. Boston, MA 02109 | Transfer Agent BNY Mellon Investment Wilmington, DE 19809 | Address of the Funds 100 Bellevue Parkway Wilmington, DE 19809 | ||||
Distributor BlackRock Investments, LLC New York, NY 10022 | Independent Registered Deloitte & Touche LLP Boston, MA 02116 | Legal Counsel Sidley Austin LLP New York, NY 10019 | Accounting Agent State Street Bank and Boston, MA 02110 | |||||
| ANNUAL REPORT | OCTOBER 31, 2016 | 47 |
| Additional Information |
| General Information |
Electronic Delivery
Shareholders can sign up for e-mail notifications of quarterly statements, annual and semi-annual shareholder reports and prospectuses by enrolling in the electronic delivery program. Electronic copies of shareholder reports and prospectuses are available on BlackRock’s website.
To enroll in electronic delivery:
Shareholders Who Hold Accounts with Investment Advisers, Banks or Brokerages:
Please contact your financial advisor. Please note that not all investment advisers, banks or brokerages may offer this service.
Householding
The Funds will mail only one copy of shareholder documents, including prospectuses, annual and semi-annual reports and proxy statements, to shareholders with multiple accounts at the same address. This practice is commonly called “householding” and is intended to reduce expenses and eliminate duplicate mailings of shareholder documents. Mailings of your shareholder documents may be householded indefinitely unless you instruct us otherwise. If you do not want the mailing of these documents to be combined with those for other members of your household, please call the Funds at (800) 441-7762.
Availability of Quarterly Schedule of Investments
The Funds file their complete schedule of portfolio holdings with the SEC for the first and third quarters of each fiscal year on Form N-Q. The Funds’ Forms N-Q are available on the SEC’s website at http://www.sec.gov and may also be reviewed and copied at the SEC’s Public Reference Room in Washington, D.C. Information on the operation of the Public Reference Room or how to access documents on the SEC’s website without charge may be obtained by calling (800) SEC-0330. The Funds’ Forms N-Q may also be obtained upon request and without charge by calling (800) 441-7762.
Availability of Proxy Voting Policies and Procedures
A description of the policies and procedures that the Funds use to determine how to vote proxies relating to portfolio securities is available upon request and without charge (1) by calling (800) 441-7762; (2) at http://www.blackrock.com; and (3) on the SEC’s website at http://www.sec.gov.
Availability of Proxy Voting Record
Information about how the Funds voted proxies relating to securities held in the Funds’ portfolios during the most recent 12-month period ended June 30 is available upon request and without charge (1) at http://www.blackrock.com; or by calling (800) 441-7762 and (2) on the SEC’s website at http://www.sec.gov.
BlackRock’s Mutual Fund Family
BlackRock offers a diverse lineup of open-end mutual funds crossing all investment styles and managed by experts in equity, fixed income and tax-exempt investing. Visit http://www.blackrock.com for more information.
| 48 | ANNUAL REPORT | OCTOBER 31, 2016 |
| Additional Information (concluded) |
| Shareholder Privileges |
Account Information
Call us at (800) 441-7762 from 8:00 AM to 6:00 PM ET on any business day to get information about your account balances, recent transactions and share prices. You can also reach us on the Web at http://www.blackrock.com/funds.
Automatic Investment Plans
Investor Class shareholders who want to invest regularly can arrange to have $50 or more automatically deducted from their checking or savings account and invested in any of the BlackRock funds.
Systematic Withdrawal Plans
Investor Class shareholders can establish a systematic withdrawal plan and receive periodic payments of $50 or more from their BlackRock funds, as long as their account balance is at least $10,000.
Retirement Plans
Shareholders may make investments in conjunction with Traditional, Rollover, Roth, Coverdell, Simple IRAs, SEP IRAs and 403(b) Plans.
| BlackRock Privacy Principles |
BlackRock is committed to maintaining the privacy of its current and former fund investors and individual clients (collectively, “Clients”) and to safeguarding their non-public personal information. The following information is provided to help you understand what personal information BlackRock collects, how we protect that information and why in certain cases we share such information with select parties.
If you are located in a jurisdiction where specific laws, rules or regulations require BlackRock to provide you with additional or different privacy-related rights beyond what is set forth below, then BlackRock will comply with those specific laws, rules or regulations.
BlackRock obtains or verifies personal non-public information from and about you from different sources, including the following: (i) information we receive from you or, if applicable, your financial intermediary, on applications, forms or other documents; (ii) information about your transactions with us, our affiliates, or others; (iii) information we receive from a consumer reporting agency; and (iv) from visits to our websites.
BlackRock does not sell or disclose to non-affiliated third parties any non-public personal information about its Clients, except as permitted by law or as is necessary to respond to regulatory requests or to service Client accounts. These non-affiliated third parties are required to protect the confidentiality and security of this information and to use it only for its intended purpose.
We may share information with our affiliates to service your account or to provide you with information about other BlackRock products or services that may be of interest to you. In addition, BlackRock restricts access to non-public personal information about its Clients to those BlackRock employees with a legitimate business need for the information. BlackRock maintains physical, electronic and procedural safeguards that are designed to protect the non-public personal information of its Clients, including procedures relating to the proper storage and disposal of such information.
| ANNUAL REPORT | OCTOBER 31, 2016 | 49 |
This report is intended for current holders. It is not authorized for use as an offer of sale or a solicitation of an offer to buy shares of the Funds unless preceded or accompanied by the Funds’ current prospectus. Past performance results shown in this report should not be considered a representation of future performance. Investment returns and principal value of shares will fluctuate so that shares, when redeemed, may be worth more or less than their original cost. Statements and other information herein are as dated and are subject to change.

| EMLA-10/16-AR | ||
 | ||
| Item 2 – | Code of Ethics – The registrant (or the “Fund”) has adopted a code of ethics, as of the end of the period covered by this report, applicable to the registrant’s principal executive officer, principal financial officer, principal accounting officer or controller, or persons performing similar functions. During the period covered by this report, the code of ethics was amended to update certain information and to make other non-material changes. During the period covered by this report, there have been no waivers granted under the code of ethics. The registrant undertakes to provide a copy of the code of ethics to any person upon request, without charge, by calling 1-800-441-7762. |
| Item 3 – | Audit Committee Financial Expert – The registrant’s board of directors (the “board of directors”), has determined that (i) the registrant has the following audit committee financial expert serving on its audit committee and (ii) each audit committee financial expert is independent: Kenneth L. Urish |
Under applicable securities laws, a person determined to be an audit committee financial expert will not be deemed an “expert” for any purpose, including without limitation for the purposes of Section 11 of the Securities Act of 1933, as a result of being designated or identified as an audit committee financial expert. The designation or identification of a person as an audit committee financial expert does not impose on such person any duties, obligations, or liabilities greater than the duties, obligations, and liabilities imposed on such person as a member of the audit committee and board of directors in the absence of such designation or identification.
| Item 4 – | Principal Accountant Fees and Services |
The following table presents fees billed by Deloitte & Touche LLP (“D&T”) in each of the last two fiscal years for the services rendered to the Fund:
| (a) Audit Fees | (b) Audit-Related Fees1 | (c) Tax Fees2 | (d) All Other Fees3 | |||||||||||||
| Entity Name | Current Fiscal Year End | Previous Fiscal Year End | Current Fiscal Year End | Previous Fiscal Year End | Current Fiscal Year End | Previous Fiscal Year End | Current Fiscal Year End | Previous Fiscal Year End | ||||||||
| BlackRock Emerging Markets Fund | $39,138 | $39,138 | $0 | $0 | $14,127 | $14,127 | $0 | $0 | ||||||||
The following table presents fees billed by D&T that were required to be approved by the registrant’s audit committee (the “Committee”) for services that relate directly to the operations or financial reporting of the Fund and that are rendered on behalf of BlackRock Advisors, LLC (“Investment Adviser” or “BlackRock”) and entities controlling, controlled by, or under common control with BlackRock (not including any sub-adviser whose role is primarily portfolio management and is subcontracted with or overseen by another investment adviser) that provide ongoing services to the Fund (“Fund Service Providers”):
| Current Fiscal Year End | Previous Fiscal Year End | |||
(b) Audit-Related Fees1 | $0 | $0 | ||
(c) Tax Fees2 | $0 | $0 | ||
(d) All Other Fees3 | $2,129,000 | $2,391,000 |
1 The nature of the services includes assurance and related services reasonably related to the performance of the audit of financial statements not included in Audit Fees.
2 The nature of the services includes tax compliance, tax advice and tax planning.
3 Aggregate fees borne by BlackRock in connection with the review of compliance procedures and attestation thereto performed by D&T with respect to all of the registered closed-end funds and some of the registered open-end funds advised by BlackRock.
2
(e)(1) Audit Committee Pre-Approval Policies and Procedures:
The Committee has adopted policies and procedures with regard to the pre-approval of services. Audit, audit-related and tax compliance services provided to the registrant on an annual basis require specific pre-approval by the Committee. The Committee also must approve other non-audit services provided to the registrant and those non-audit services provided to the Investment Adviser and Fund Service Providers that relate directly to the operations and the financial reporting of the registrant. Certain of these non-audit services that the Committee believes are (a) consistent with the SEC’s auditor independence rules and (b) routine and recurring services that will not impair the independence of the independent accountants may be approved by the Committee without consideration on a specific case-by-case basis (“general pre-approval”). The term of any general pre-approval is 12 months from the date of the pre-approval, unless the Committee provides for a different period. Tax or other non-audit services provided to the registrant which have a direct impact on the operations or financial reporting of the registrant will only be deemed pre-approved provided that any individual project does not exceed $10,000 attributable to the registrant or $50,000 per project. For this purpose, multiple projects will be aggregated to determine if they exceed the previously mentioned cost levels.
Any proposed services exceeding the pre-approved cost levels will require specific pre-approval by the Committee, as will any other services not subject to general pre-approval (e.g., unanticipated but permissible services). The Committee is informed of each service approved subject to general pre-approval at the next regularly scheduled in-person board meeting. At this meeting, an analysis of such services is presented to the Committee for ratification. The Committee may delegate to the Committee Chairman the authority to approve the provision of and fees for any specific engagement of permitted non-audit services, including services exceeding pre-approved cost levels.
(e)(2) None of the services described in each of Items 4(b) through (d) were approved by the Committee pursuant to the de minimus exception in paragraph (c)(7)(i)(C) of Rule 2-01 of Regulation S-X.
(f) Not Applicable
(g) The aggregate non-audit fees paid to the accountant for services rendered by the accountant to the registrant, the Investment Adviser and the Fund Service Providers were:
| Entity Name | Current Fiscal Year End | Previous Fiscal Year End | ||||
| BlackRock Emerging Markets Fund | $14,127 | $14,127 |
Additionally, SSAE 16 Review (Formerly, SAS No. 70) fees for the current and previous fiscal years of $2,129,000 and $2,391,000, respectively, were billed by D&T to the Investment Adviser.
(h) The Committee has considered and determined that the provision of non-audit services that were rendered to the Investment Adviser and the Fund Service Providers that were not pre-approved pursuant to paragraph (c)(7)(ii) of Rule 2-01 of Regulation S-X is compatible with maintaining the principal accountant’s independence.
| Item 5 – | Audit Committee of Listed Registrants – Not Applicable |
3
| Item 6 – | Investments |
| (a) The registrant’s Schedule of Investments is included as part of the Report to Stockholders filed under Item 1 of this Form. |
| (b) Not Applicable due to no such divestments during the semi-annual period covered since the previous Form N-CSR filing. |
| Item 7 – | Disclosure of Proxy Voting Policies and Procedures for Closed-End Management Investment Companies – Not Applicable |
| Item 8 – | Portfolio Managers of Closed-End Management Investment Companies – Not Applicable |
| Item 9 – | Purchases of Equity Securities by Closed-End Management Investment Company and Affiliated Purchasers – Not Applicable |
| Item 10 – | Submission of Matters to a Vote of Security Holders – There have been no material changes to these procedures. |
| Item 11 – | Controls and Procedures |
| (a) The registrant’s principal executive and principal financial officers, or persons performing similar functions, have concluded that the registrant’s disclosure controls and procedures (as defined in Rule 30a-3(c) under the Investment Company Act of 1940, as amended (the “1940 Act”)) are effective as of a date within 90 days of the filing of this report based on the evaluation of these controls and procedures required by Rule 30a-3(b) under the 1940 Act and Rule 15d-15(b) under the Securities Exchange Act of 1934, as amended. |
| (b) There were no changes in the registrant’s internal control over financial reporting (as defined in Rule 30a-3(d) under the 1940 Act) that occurred during the second fiscal quarter of the period covered by this report that have materially affected, or are reasonably likely to materially affect, the registrant’s internal control over financial reporting. |
| Item 12 – | Exhibits attached hereto |
| (a)(1) Code of Ethics – See Item 2 |
| (a)(2) Certifications – Attached hereto |
| (a)(3) Not Applicable |
| (b) Certifications – Attached hereto |
4
Pursuant to the requirements of the Securities Exchange Act of 1934 and the Investment Company Act of 1940, the registrant has duly caused this report to be signed on its behalf by the undersigned, thereunto duly authorized.
| BlackRock Emerging Markets Fund, Inc. | ||
| By: | /s/ John M. Perlowski | |
| John M. Perlowski | ||
| Chief Executive Officer (principal executive officer) of | ||
| BlackRock Emerging Markets Fund, Inc. | ||
| Date: January 4, 2017 | ||
Pursuant to the requirements of the Securities Exchange Act of 1934 and the Investment Company Act of 1940, this report has been signed below by the following persons on behalf of the registrant and in the capacities and on the dates indicated.
| By: | /s/ John M. Perlowski | |
| John M. Perlowski | ||
| Chief Executive Officer (principal executive officer) of | ||
| BlackRock Emerging Markets Fund, Inc. | ||
| Date: January 4, 2017 | ||
| By: | /s/ Neal J. Andrews | |
| Neal J. Andrews | ||
| Chief Financial Officer (principal financial officer) of | ||
| BlackRock Emerging Markets Fund, Inc. | ||
| Date: January 4, 2017 | ||
5